| | | FREE WRITING PROSPECTUS |
| | | FILED PURSUANT TO RULE 433 |
| | | REGISTRATION FILE NO.: 333-255934-04 |
| | | |
| Dated January 17, 2023 | BMO 2023-C4 |
Structural and Collateral Term Sheet |
BMO 2023-C4 Mortgage Trust |
$785,102,870 (Approximate Mortgage Pool Balance) |
| |
$692,853,000 (Approximate Offered Certificates) |
| |
BMO Commercial Mortgage Securities LLC Depositor |
|
Commercial Mortgage Pass-Through Certificates, Series 2023-C4 |
| |
Bank of Montreal Citi Real Estate Funding Inc. LMF Commercial, LLC Argentic Real Estate Finance LLC 3650 Real Estate Investment Trust 2 LLC Natixis Real Estate Capital LLC Oceanview Commercial Mortgage Finance, LLC Greystone Commercial Mortgage Capital LLC Starwood Mortgage Capital LLC Sponsors and Mortgage Loan Sellers |
| BMO Capital Markets | Natixis | Citigroup |
| Co-Lead Managers and Joint Bookrunners |
Bancroft Capital, LLC
Co-Manager | | Drexel Hamilton
Co-Manager |
| THE INFORMATION IN THIS STRUCTURAL AND COLLATERAL TERM SHEET IS NOT COMPLETE AND MAY BE AMENDED PRIOR TO THE TIME OF SALE. THIS TERM SHEET IS NOT AN OFFER TO SELL THESE SECURITIES AND IT IS NOT A SOLICITATION OF AN OFFER TO BUY THESE SECURITIES IN ANY JURISDICTION WHERE THE OFFER OR SALE IS NOT PERMITTED. |
| |
| Dated January 17, 2023 | BMO 2023-C4 |
This material is for your information, and none of BMO Capital Markets Corp., Citigroup Global Markets Inc., Natixis Securities Americas LLC, Bancroft Capital, LLC and Drexel Hamilton, LLC (the “Underwriters”) are soliciting any action based upon it. This material is not to be construed as an offer to sell or the solicitation of any offer to buy any security in any jurisdiction where such an offer or solicitation would be illegal.
The depositor has filed a registration statement (including the prospectus) with the Securities and Exchange Commission (File No. 333-255934) for the offering to which this communication relates. Before you invest, you should read the prospectus in the registration statement and other documents the depositor has filed with the Securities and Exchange Commission for more complete information about the depositor, the issuing entity and this offering. You may get these documents for free by visiting EDGAR on the SEC website at www.sec.gov. Alternatively, the depositor or BMO Capital Markets Corp., any other underwriter, or any dealer participating in this offering will arrange to send you the prospectus if you request it by calling 1-866-864-7760. The Offered Certificates referred to in these materials, and the asset pool backing them, are subject to modification or revision (including the possibility that one or more Classes of Certificates may be split, combined or eliminated at any time prior to issuance or availability of a final prospectus) and are offered on a “when, as and if issued” basis. You understand that, when you are considering the purchase of these Certificates, a contract of sale will come into being no sooner than the date on which the relevant Class has been priced and we have verified the allocation of Certificates to be made to you; any “indications of interest” expressed by you, and any “soft circles” generated by us, will not create binding contractual obligations for you or us.
Neither this document nor anything contained in this document shall form the basis for any contract or commitment whatsoever. The information contained in this document is preliminary as of the date of this document, supersedes any previous such information delivered to you and will be superseded by any such information subsequently delivered prior to the time of sale. These materials are subject to change, completion or amendment from time to time. The information should be reviewed only in conjunction with the entire offering document relating to the Commercial Mortgage Pass-Through Certificates, Series 2023-C4 (the “Offering Document”). All of the information contained herein is subject to the same limitations and qualifications contained in the Offering Document. The information contained herein does not contain all relevant information relating to the underlying mortgage loans or mortgaged properties. Such information is described elsewhere in the Offering Document. The information contained herein will be more fully described elsewhere in the Offering Document. The information contained herein should not be viewed as projections, forecasts, predictions or opinions with respect to value. Prior to making any investment decision, prospective investors are strongly urged to read the Offering Document its entirety. Neither the Securities and Exchange Commission nor any state securities commission has approved or disapproved of these securities or determined if this free writing prospectus is truthful or complete. Any representation to the contrary is a criminal offense.
This document has been prepared by the Underwriters for information purposes only and does not constitute, in whole or in part, a prospectus for the purposes of Regulation (EU) 2017/1129 (as amended or superseded) and/or Part VI of the Financial Services and Markets Act 2000 (as amended) or other offering document.
The attached information contains certain tables and other statistical analyses (the “Computational Materials”) which have been prepared in reliance upon information furnished by the Mortgage Loan Sellers. Numerous assumptions were used in preparing the Computational Materials, which may or may not be reflected herein. As such, no assurance can be given as to the Computational Materials’ accuracy, appropriateness or completeness in any particular context; or as to whether the Computational Materials and/or the assumptions upon which they are based reflect present market conditions or future market performance. The Computational Materials should not be construed as either projections or predictions or as legal, tax, financial or accounting advice. You should consult your own counsel, accountant and other advisors as to the legal, tax, business, financial and related aspects of a purchase of these Certificates. Any weighted average lives, yields and principal payment periods shown in the Computational Materials are based on prepayment and/or loss assumptions, and changes in such prepayment and/or loss assumptions may dramatically affect such weighted average lives, yields and principal payment periods. In addition, it is possible that prepayments or losses on the underlying assets will occur at rates higher or lower than the rates shown in the attached Computational Materials. The specific characteristics of the Certificates may differ from those shown in the Computational Materials due to differences between the final underlying assets and the preliminary underlying assets used in preparing the Computational Materials. The principal amount and designation of any security described in the Computational Materials are subject to change prior to issuance. None of the Underwriters or any of their respective affiliates make any representation or warranty as to the actual rate or timing of payments or losses on any of the underlying assets or the payments or yield on the Certificates. The information in this presentation is based upon management forecasts and reflects prevailing conditions and management’s views as of this date, all of which are subject to change. In preparing this presentation, we have relied upon and assumed, without independent verification, the accuracy and completeness of all information available from public sources or which was provided to us by or on behalf of the Mortgage Loan Sellers or which was otherwise reviewed by us.
This document contains forward-looking statements. If and when included in this document, the words “expects”, “intends”, “anticipates”, “estimates” and analogous expressions and all statements that are not historical facts, including statements about our beliefs or expectations, are intended to identify forward-looking statements. Any forward-looking statements are made subject to risks and uncertainties which could cause actual results to differ materially from those stated. Those risks and uncertainties include, among other things, declines in general economic and business conditions, increased competition, changes in demographics, changes in political and social conditions, regulatory initiatives and changes in consumer preferences, many of which are beyond our control and the control of any other person or entity related to this offering. The forward-looking statements made in this document are made as of the date hereof. We have no obligation to update or revise any forward-looking statement.
BMO Capital Markets is a trade name used by BMO Financial Group for the wholesale banking businesses of Bank of Montreal, BMO Harris Bank N.A. (member FDIC), Bank of Montreal Europe p.l.c, and Bank of Montreal (China) Co. Ltd, the institutional broker dealer business of BMO Capital Markets Corp. (Member FINRA and SIPC) and the agency broker dealer business of Clearpool Execution Services, LLC (Member FINRA and SIPC) in the U.S., and the institutional broker dealer businesses of BMO Nesbitt Burns Inc. (Member Investment Industry Regulatory Organization of Canada and Member Canadian Investor Protection Fund) in Canada and Asia, Bank of Montreal Europe p.l.c. (authorized and regulated by the Central Bank of Ireland) in Europe and BMO Capital Markets Limited (authorized and regulated by the Financial Conduct Authority) in the UK and Australia.
IMPORTANT NOTICE RELATING TO AUTOMATICALLY-GENERATED EMAIL DISCLAIMERS
Any legends, disclaimers or other notices that may appear at the bottom of any email communication to which this document is attached relating to (1) these materials not constituting an offer (or a solicitation of an offer), (2) no representation that these materials are accurate or complete and may not be updated or (3) these materials possibly being confidential, are not applicable to these materials and should be disregarded. Such legends, disclaimers or other notices have been automatically generated as a result of these materials having been sent via Bloomberg or another system.
THE CERTIFICATES REFERRED TO IN THESE MATERIALS ARE SUBJECT TO MODIFICATION OR REVISION (INCLUDING THE POSSIBILITY THAT ONE OR MORE CLASSES OF CERTIFICATES MAY BE SPLIT, COMBINED OR ELIMINATED AT ANY TIME PRIOR TO ISSUANCE OR AVAILABILITY OF A FINAL PROSPECTUS) AND ARE OFFERED ON A “WHEN, AS AND IF ISSUED” BASIS.
THE UNDERWRITERS MAY FROM TIME TO TIME PERFORM INVESTMENT BANKING SERVICES FOR, OR SOLICIT INVESTMENT BANKING BUSINESS FROM, ANY COMPANY NAMED IN THESE MATERIALS. THE UNDERWRITERS AND/OR THEIR AFFILIATES OR RESPECTIVE EMPLOYEES MAY FROM TIME TO TIME HAVE A LONG OR SHORT POSITION IN ANY CERTIFICATE OR CONTRACT DISCUSSED IN THESE MATERIALS.
| THE INFORMATION IN THIS STRUCTURAL AND COLLATERAL TERM SHEET IS NOT COMPLETE AND MAY BE AMENDED PRIOR TO THE TIME OF SALE. THIS TERM SHEET IS NOT AN OFFER TO SELL THESE SECURITIES AND IT IS NOT A SOLICITATION OF AN OFFER TO BUY THESE SECURITIES IN ANY JURISDICTION WHERE THE OFFER OR SALE IS NOT PERMITTED. |
| | 2 | |
| Structural and Collateral Term Sheet | | BMO 2023-C4 |
| Indicative Capital Structure |
| Offered Certificates | | | | | | |
Classes of Certificates | Expected Ratings (Fitch/KBRA/Moody’s)(1) | Approximate Initial Certificate Balance or Notional Amount(2) | Approximate Initial Credit Support(3) | Initial
Pass-
Through Rate(4) | Pass-Through
Rate Description | Expected Weighted Avg.
Life (yrs.)(5) | Expected Principal Window(5) |
| Class A-1 | AAAsf/AAA(sf)/Aaa(sf) | $4,403,000 | | 30.000% | % | (6) | 2.57 | 3/23-3/27 |
| Class A-2 | AAAsf/AAA(sf)/Aaa(sf) | $163,126,000 | | 30.000% | % | (6) | 4.66 | 3/27-4/28 |
| Class A-3 | AAAsf/AAA(sf)/Aaa(sf) | $9,922,000 | | 30.000% | % | (6) | 6.50 | 8/29-8/29 |
| Class A-4 | AAAsf/AAA(sf)/Aaa(sf) | (7) | | 30.000% | % | (6) | (7) | (7) |
| Class A-5 | AAAsf/AAA(sf)/Aaa(sf) | (7) | | 30.000% | % | (6) | (7) | (7) |
| Class A-SB | AAAsf/AAA(sf)/Aaa(sf) | $7,994,000 | | 30.000% | % | (6) | 7.04 | 4/28-10/31 |
| Class X-A | AAAsf/AAA(sf)/Aaa(sf) | $549,572,000 | (8) | N/A | % | Variable IO(9) | N/A | N/A |
| Class X-B | AA-sf/AAA(sf)/NR | $143,281,000 | (8) | N/A | % | Variable IO(9) | N/A | N/A |
| Class A-S | AAAsf/AAA(sf)/Aa2(sf) | $75,566,000 | | 20.375% | % | (6) | 9.84 | 12/32-12/32 |
| Class B | AA-sf/AA(sf)/NR | $34,348,000 | | 16.000% | % | (6) | 9.91 | 12/32-1/33 |
| Class C | A-sf/A-(sf)/NR | $33,367,000 | | 11.750% | % | (6) | 9.92 | 1/33-1/33 |
| Non-Offered Certificates(10) | | | | | |
Classes of Certificates | Expected Ratings (Fitch/KBRA/Moody’s)(1) | Approximate Initial Certificate Balance or Notional Amount(2) | Approximate Initial Credit Support(3) | Initial Pass-
Through Rate(4) | Pass-Through Rate Description | Expected Weighted Avg. Life (yrs.)(5) | Expected Principal Window(5) |
| Class X-D | BBBsf/BBB+(sf)/NR | $20,609,000 | (8) | N/A | % | Variable IO(9) | N/A | N/A |
| Class D(11) | BBBsf/BBB+(sf)/NR | $20,609,000 | | 9.125% | % | (6) | 9.92 | 1/33-1/33 |
| Class E-RR(11) | BBB-sf/BBB-(sf)/NR | $14,721,000 | | 7.250% | % | (6) | 9.92 | 1/33-1/33 |
| Class F-RR(11) | BBsf/BBB-(sf)/NR | $7,851,000 | | 6.250% | % | (6) | 9.92 | 1/33-1/33 |
| Class G-RR(11) | BB-sf/BB(sf)/NR | $7,851,000 | | 5.250% | % | (6) | 9.92 | 1/33-1/33 |
| Class J-RR(11) | B-sf/BB-(sf)/NR | $8,832,000 | | 4.125% | % | (6) | 9.92 | 1/33-1/33 |
| Class K-RR(11) | NR/NR/NR | $32,385,870 | | 0.000% | % | (6) | 9.99 | 1/33-2/33 |
| Class R(12) | N/A | N/A | | N/A | N/A | N/A | N/A | N/A |
| (1) | It is a condition of issuance that the offered certificates and certain classes of non-offered certificates receive the ratings set forth above. The anticipated ratings shown are those of Fitch Ratings, Inc. (“Fitch”), Kroll Bond Rating Agency, LLC (“KBRA”) and Moody’s Investors Service Inc. (“Moody’s”), as indicated. Subject to the discussion under “Ratings” in the Preliminary Prospectus, the ratings on the certificates address the likelihood of the timely receipt by holders of all payments of interest to which they are entitled on each distribution date and, except in the case of the interest only certificates, the ultimate receipt by holders of all payments of principal to which they are entitled on or before the applicable rated final distribution date. Certain nationally recognized statistical rating organizations, as defined in Section 3(a)(62) of the Securities Exchange Act of 1934, as amended, that were not hired by the depositor may use information they receive pursuant to Rule 17g-5 under the Securities Exchange Act of 1934, as amended, or otherwise to rate the offered certificates. We cannot assure you as to what ratings a non-hired nationally recognized statistical rating organization would assign. See “Risk Factors—Other Risks Relating to the Certificates—Nationally Recognized Statistical Rating Organizations May Assign Different Ratings to the Certificates; Ratings of the Certificates Reflect Only the Views of the Applicable Rating Agencies as of the Dates Such Ratings Were Issued; Ratings May Affect ERISA Eligibility; Ratings May Be Downgraded” in the Preliminary Prospectus. Fitch, KBRA and Moody’s have informed us that the “sf” designation in the ratings represents an identifier of structured finance product ratings. For additional information about this identifier, prospective investors can go to the related rating agency’s website. The depositor and the underwriters have not verified, do not adopt and do not accept responsibility for any statements made by the rating agencies on those websites. Credit ratings referenced throughout this Term Sheet are forward-looking opinions about credit risk and express a rating agency’s opinion about the willingness and ability of an issuer of securities to meet its financial obligations in full and on time. Ratings are not indications of investment merit and are not buy, sell or hold recommendations, a measure of asset value or an indication of the suitability of an investment. |
| (2) | Approximate, subject to a variance of plus or minus 5% and further subject to any additional variances described in the footnotes below. In addition, the notional amounts of the Class X-A, Class X-B and Class X-D certificates (collectively, the “Class X certificates”) may vary depending upon the final pricing of the classes of principal balance certificates (as defined in footnote (6) below) whose certificate balances comprise such notional amounts, and, if as a result of such pricing (a) the pass-through rate of any class of Class X certificates, would be equal to zero at all times, such class of certificates will not be issued on the closing date of this securitization or (b) the pass-through rate of any class of principal balance certificates whose certificate balance comprises such notional amount is at all times equal to the weighted average of the net interest rates on the mortgage loans (in each case, adjusted, if necessary, to accrue on the basis of a 360-day year consisting of twelve 30-day months) as in effect from time to time, the certificate balance of such class of principal balance certificates may not be part of, and there may be a corresponding reduction in, such notional amount of the related class of Class X certificates. |
| (3) | "Approximate Initial Credit Support" means, with respect to any class of principal balance certificates, the quotient, expressed as a percentage, of (i) the aggregate of the initial certificate balances of all classes of principal balance certificates, if any, junior to the subject class of principal balance certificates, divided by (ii) the aggregate of the initial certificate balances of all classes of principal balance certificates. The approximate initial credit support percentages set forth for the Class A-1, Class A-2, Class A-3, Class A-4, Class A-5 and Class A-SB certificates are represented in the aggregate. |
| (4) | Approximate per annum rate as of the closing date. |
| (5) | Determined assuming no prepayments prior to the maturity date or any anticipated repayment date, as applicable, for any mortgage loan and based on the modeling assumptions described under “Yield, Prepayment and Maturity Considerations” in the Preliminary Prospectus. |
| (6) | For any distribution date, the pass-through rate for each class of the Class A-1, Class A-2, Class A-3, Class A-4, Class A-5, Class A-SB, Class A-S, Class B, Class C, Class D, Class E-RR, Class F-RR, Class G-RR, Class J-RR and Class K-RR certificates (collectively, the “principal balance certificates”, and collectively with the Class X certificates and the Class R certificates, the “certificates”) will generally be equal to one of (i) a fixed per annum rate, (ii) the weighted average of the net interest rates on the mortgage loans (in each case, adjusted, if necessary, to accrue on the basis of a 360-day year consisting of twelve 30-day months) as in effect from time to time, (iii) a rate equal to the lesser of a specified per annum rate and the weighted average rate described in clause (ii), or (iv) the weighted average rate described in clause (ii) less a specified percentage, but no less than 0.000%. See “Description of the Certificates—Distributions—Pass-Through Rates” in the Preliminary Prospectus. |
| (7) | The exact initial certificate balances of the Class A-4 and Class A-5 certificates are unknown and will be determined based on the final pricing of those classes of certificates. However, the respective initial certificate balances, weighted average lives and principal windows of the Class A-4 and Class A-5 certificates are expected to be within the applicable ranges reflected in the following chart. The aggregate initial certificate balance of the Class A-4 and Class A-5 certificates is expected to be approximately $364,127,000 subject to a variance of plus or minus 5%. |
| THE INFORMATION IN THIS STRUCTURAL AND COLLATERAL TERM SHEET IS NOT COMPLETE AND MAY BE AMENDED PRIOR TO THE TIME OF SALE. THIS TERM SHEET IS NOT AN OFFER TO SELL THESE SECURITIES AND IT IS NOT A SOLICITATION OF AN OFFER TO BUY THESE SECURITIES IN ANY JURISDICTION WHERE THE OFFER OR SALE IS NOT PERMITTED. |
| | 3 | |
| Structural and Collateral Term Sheet | | BMO 2023-C4 |
| Indicative Capital Structure |
Class of
Certificates | Expected Range of Initial
Certificate Balances | Expected Range
of Weighted Avg.
Lives (Yrs) | Expected Range of
Principal Windows |
| Class A-4 | $0 – $136,000,000 | N/A – 9.25 | N/A – 10/31-8/32 |
| Class A-5 | $228,127,000 – $364,127,000 | 9.54 – 9.72 | 8/32-12/32 – 10/31-12/32 |
| (8) | The Class X certificates will not have certificate balances and will not be entitled to receive distributions of principal. Interest will accrue on each class of Class X certificates at the related pass-through rate based upon the related notional amount. The notional amount of each class of the Class X certificates will be equal to the certificate balance or the aggregate of the certificate balances, as applicable, from time to time of the class or classes of principal balance certificates identified in the same row as such class of Class X certificates in the chart below (as to such class of Class X certificates, the “corresponding principal balance certificates”): |
Class of Class X
Certificates | Class(es) of Corresponding
Principal Balance Certificates |
| Class X-A | Class A-1, Class A-2, Class A-3, Class A-4, Class A-5 and Class A-SB |
| Class X-B | Class A-S, Class B and Class C |
| Class X-D | Class D |
| (9) | The pass-through rate for each class of Class X certificates will generally be a per annum rate equal to the excess, if any, of (i) the weighted average of the net interest rates on the mortgage loans (in each case, adjusted, if necessary, to accrue on the basis of a 360-day year consisting of twelve 30-day months) as in effect from time to time, over (ii) the pass-through rate (or, if applicable, the weighted average of the pass-through rates) of the class or classes of corresponding principal balance certificates as in effect from time to time, as described in the Preliminary Prospectus. |
| (10) | The classes of certificates set forth below “Non-Offered Certificates” in the table are not offered hereby. |
| (11) | In satisfaction of the risk retention obligations of Bank of Montreal (as retaining sponsor with respect to this securitization transaction), all of the Class E-RR, Class F-RR, Class G-RR, Class J-RR and Class K-RR certificates (collectively, the “HRR Certificates”), with an aggregate fair value expected to represent at least 5.0% of the fair value, as of the closing date for this transaction, of all of the “ABS interests” (i.e. all of the certificates (other than the Class R certificates)) issued by the issuing entity, will collectively constitute an “eligible horizontal residual interest” that is to be purchased and retained by Sabal Strategic Opportunities Fund, L.P., a Delaware limited partnership, or its affiliate, in accordance with the credit risk retention rules applicable to this securitization transaction. The certificate balances of the Class D and Class E-RR certificates may be reallocated between those classes based on the determination of the aggregate fair value, as of the closing date for this transaction, of all the certificates (other than the Class R certificates), in order to satisfy the foregoing. “Retaining sponsor,” “ABS interests” and “eligible horizontal residual interest” have the meanings given to such terms in Regulation RR. See “Credit Risk Retention” in the Preliminary Prospectus. |
| (12) | The Class R certificates will not have a certificate balance, notional amount, pass-through rate, rating or rated final distribution date. The Class R certificates will represent the residual interests in each of two separate REMICs, as further described in the Preliminary Prospectus. The Class R certificates will not be entitled to distributions of principal or interest. |
| THE INFORMATION IN THIS STRUCTURAL AND COLLATERAL TERM SHEET IS NOT COMPLETE AND MAY BE AMENDED PRIOR TO THE TIME OF SALE. THIS TERM SHEET IS NOT AN OFFER TO SELL THESE SECURITIES AND IT IS NOT A SOLICITATION OF AN OFFER TO BUY THESE SECURITIES IN ANY JURISDICTION WHERE THE OFFER OR SALE IS NOT PERMITTED. |
| | 4 | |
| Structural and Collateral Term Sheet | | BMO 2023-C4 |
| Summary of Transaction Terms |
| Publicly Offered Certificates: | $692,853,000 monthly pay, multi-class, commercial mortgage REMIC Pass-Through Certificates. |
| Co-Lead Managers and Joint Bookrunners: | BMO Capital Markets Corp., Natixis Securities Americas LLC and Citigroup Global Markets Inc. |
| Co-Managers: | Bancroft Capital, LLC and Drexel Hamilton, LLC |
| Sponsors and Mortgage Loan Sellers: | Bank of Montreal (“BMO”) (48.4%); Citi Real Estate Funding Inc. (“CREFI”) (10.5%); LMF Commercial, LLC (“LMF”) (9.8%); Argentic Real Estate Finance LLC (“AREF”) (6.5%); 3650 Real Estate Investment Trust 2 LLC (“3650 REIT”) (6.1%); Natixis Real Estate Capital LLC (“Natixis”) (5.9%); Oceanview Commercial Mortgage Finance, LLC (“Oceanview”) (5.9%); Greystone Commercial Mortgage Capital LLC (“GCMC”) (5.3%); and Starwood Mortgage Capital LLC (“SMC”) (1.6%). |
| Master Servicer: | Midland Loan Services, a Division of PNC Bank, National Association. |
| Special Servicer: | LNR Partners, LLC. |
| Directing Holder/Controlling Class Representative: | Sabal Strategic Opportunities Fund, L.P. |
| Trustee: | Computershare Trust Company, National Association. |
| Certificate Administrator: | Computershare Trust Company, National Association. |
| Operating Advisor: | Pentalpha Surveillance LLC |
| Asset Representations Reviewer: | Pentalpha Surveillance LLC |
| Rating Agencies: | Fitch Ratings, Inc. (“Fitch”), Kroll Bond Rating Agency, LLC (“KBRA”) and Moody’s Investors Service Inc. (“Moody’s”). |
| U.S. Credit Risk Retention: | For a discussion on the manner in which BMO as retaining sponsor, intends to satisfy the U.S. credit risk retention requirements, see “Credit Risk Retention” in the Preliminary Prospectus. |
| EU Credit Risk Retention: | The transaction is not structured to satisfy the EU risk retention and due diligence requirements. |
| Closing Date: | On or about February 14, 2023. |
| Cut-off Date: | With respect to each mortgage loan, the related due date in February 2023, or in the case of any mortgage loan that has its first due date after February 2023, the date that would have been its due date in February 2023 under the terms of that mortgage loan if a monthly debt service payment were scheduled to be due in that month. |
| Distribution Date: | The 4th business day after the Determination Date in each month, commencing in March 2023. |
| Determination Date: | 11th day of each month, or if the 11th day is not a business day, the next succeeding business day, commencing in March 2023. |
| Assumed Final Distribution Date: | The Distribution Date in February 2033 which is the latest anticipated repayment date of the Certificates. |
| Rated Final Distribution Date: | The Distribution Date in February 2056. |
| Tax Treatment: | The Publicly Offered Certificates are expected to be treated as REMIC “regular interests” for U.S. federal income tax purposes. |
| Form of Offering: | The Class A-1, Class A-2, Class A-3, Class A-4, Class A-5, Class A-SB, Class X-A, Class X-B, Class A-S, Class B and Class C Certificates (the “Publicly Offered Certificates”) will be offered publicly. The Class X-D, Class D, Class E-RR, Class F-RR, Class G-RR, Class J-RR, Class K-RR and Class R Certificates (the “Privately Offered Certificates”) will be offered domestically to Qualified Institutional Buyers and to Institutional Accredited Investors (other than the Class R Certificates) and to institutions that are not U.S. Persons pursuant to Regulation S (other than the Class R Certificates). |
| SMMEA Status: | The Certificates will not constitute “mortgage related securities” for purposes of SMMEA. |
| ERISA: | The Publicly Offered Certificates are expected to be ERISA eligible. |
| Optional Termination: | On any Distribution Date on which the aggregate principal balance of the pool of mortgage loans is less than 1% of the aggregate principal balance of the mortgage loans as of the cut-off date, certain entities specified in the Preliminary Prospectus will have the option to purchase all of the remaining mortgage loans (and all property acquired through exercise of remedies in respect of any mortgage loan) at the price specified in the Preliminary Prospectus. Refer to “Pooling and Servicing Agreement—Termination; Retirement of Certificates” in the Preliminary Prospectus. |
| Minimum Denominations: | The Publicly Offered Certificates (other than the Class X-A and Class X-B Certificates) will be issued in minimum denominations of $10,000 and integral multiples of $1 in excess of $10,000. The Class X-A and Class X-B will be issued in minimum denominations of $1,000,000 and in integral multiples of $1 in excess of $1,000,000. |
| Settlement Terms: | DTC, Euroclear and Clearstream Banking. |
| Analytics: | The transaction is expected to be modeled by Bloomberg, L.P., Trepp, LLC, Intex Solutions, Inc., BlackRock Financial Management, Inc., CMBS.com, Inc., Moody’s Analytics, Markit Group Limited, RealINSIGHT, Thompson Reuters Corporation, Intercontinental Exchange | ICE Data Services, KBRA Analytics, LLC and DealView Technologies Ltd. |
| Risk Factors: | THE CERTIFICATES INVOLVE CERTAIN RISKS AND MAY NOT BE SUITABLE FOR ALL INVESTORS. REFER TO THE “SUMMARY OF RISK FACTORS” AND “RISK FACTORS” SECTIONS OF THE PRELIMINARY PROSPECTUS. |
| THE INFORMATION IN THIS STRUCTURAL AND COLLATERAL TERM SHEET IS NOT COMPLETE AND MAY BE AMENDED PRIOR TO THE TIME OF SALE. THIS TERM SHEET IS NOT AN OFFER TO SELL THESE SECURITIES AND IT IS NOT A SOLICITATION OF AN OFFER TO BUY THESE SECURITIES IN ANY JURISDICTION WHERE THE OFFER OR SALE IS NOT PERMITTED. |
| | 5 | |
| Structural and Collateral Term Sheet | | BMO 2023-C4 |
| Collateral Characteristics |
Mortgage Loan Seller | Number of Mortgage Loans | Number of Mortgaged Properties | Aggregate
Cut-off Date Balance | |
| BMO | 20 | 47 | $379,932,162 | 48.4% |
| CREFI | 4 | 13 | $82,501,292 | 10.5% |
| LMF | 5 | 16 | $77,200,000 | 9.8% |
| AREF | 2 | 2 | $51,000,000 | 6.5% |
| 3650 REIT | 3 | 16 | $47,650,000 | 6.1% |
| Natixis | 2 | 3 | $46,560,897 | 5.9% |
| Oceanview | 5 | 5 | $46,062,500 | 5.9% |
| GCMC | 3 | 5 | $42,000,000 | 5.3% |
| SMC | 2 | 2 | $12,196,019 | 1.6% |
| Total: | 46 | 109 | $785,102,870 | 100.0% |
| Loan Pool | |
| | Initial Pool Balance (“IPB”): | $785,102,870 |
| | Number of Mortgage Loans: | 46 |
| | Number of Mortgaged Properties: | 109 |
| | Average Cut-off Date Balance per Mortgage Loan: | $17,067,454 |
| | Weighted Average Current Mortgage Rate: | 5.89592% |
| | 10 Largest Mortgage Loans as % of IPB: | 36.5% |
| | Weighted Average Remaining Term to Maturity: | 103 months |
| | Weighted Average Seasoning: | 4 months |
| | | |
| Credit Statistics | |
| | Weighted Average UW NCF Debt Service Coverage Ratio (“DSCR”)(1)(2): | 1.94x |
| | Weighted Average UW NOI Debt Yield (“DY”)(1): | 12.2% |
| | Weighted Average Cut-off Date Loan-to-Value Ratio (“LTV”)(1)(3): | 53.0% |
| | Weighted Average Maturity Date/ARD LTV(1)(3): | 51.7% |
| | | |
| Other Statistics | |
| | % of Mortgage Loans with Additional Debt: | 17.7% |
| | % of Mortgage Loans with Single Tenants(4): | 25.8% |
| % of Mortgage Loans secured by Multiple Properties: | 28.6% |
| | |
| Amortization | |
| | Weighted Average Original Amortization Term(5): | 353 months |
| | Weighted Average Remaining Amortization Term(5): | 352 months |
| | % of Mortgage Loans with Interest-Only: | 72.1% |
| | % of Mortgage Loans with Partial Interest-Only followed by Amortizing Balloon: | 21.4% |
| | % of Mortgage Loans with Amortizing Balloon: | 6.5% |
| | | |
| Lockboxes(6) | |
| | % of Mortgage Loans with Hard Lockboxes: | 52.0% |
| | % of Mortgage Loans with Springing Lockboxes: | 36.8% |
| | % of Mortgage Loans with Soft Lockboxes: | 6.9% |
| | % of Mortgage Loans with Soft (Residential); Hard (Commercial) Lockboxes: | 4.4% |
| | | |
| Reserves | |
| | % of Mortgage Loans Requiring Monthly Tax Reserves: | 65.3% |
| | % of Mortgage Loans Requiring Monthly Insurance Reserves: | 42.7% |
| | % of Mortgage Loans Requiring Monthly CapEx Reserves: | 62.9% |
| | % of Mortgage Loans Requiring Monthly TI/LC Reserves(7): | 38.7% |
| (1) | In the case of Loan Nos. 1, 2, 3, 5, 6, 7, 8, 9, 10, 12, 15, 21, 22, 26, 28, 30 and 33, the UW NCF DSCR, UW NOI DY, Cut-off Date LTV and Maturity Date/ARD LTV calculations include the related Pari Passu Companion Loan(s). In the case of Loan Nos. 1, 3, 8, 18, 27 and 30, the UW NCF DSCR, UW NOI DY, Cut-off Date LTV and Maturity Date/ARD LTV calculations exclude the related Subordinate Companion Loans and/or mezzanine loans. |
| (2) | For the mortgage loans that are interest-only for the entire term and accrue interest on an Actual/360 basis, the Monthly Debt Service Amount ($) was calculated as 1/12th of the product of (i) the Original Balance ($), (ii) the Interest Rate % and (iii) 365/360. |
| (3) | In the case of Loan Nos. 7, 11 and 15, the Cut-off Date LTV and Maturity/ARD LTV are calculated by using an appraised value based on an as portfolio assumption. In the case of Loan No. 14, the Cut-off Date LTV and the Maturity Date/ARD LTV for Coliseum Marketplace mortgaged property are calculated by using an appraised value based on a prospective value upon stabilization. In the case of Loan No. 21, the Cut-off Date LTV and the Maturity Date/ARD LTV are calculated by using an as portfolio assuming reserve. In the case of Loan Nos. 17 and 36, the Cut-off Date LTV and Maturity/ARD LTV are calculated by using an appraised value based on an as complete assumption. Refer to “Description of the Mortgage Pool—Certain Calculations and Definitions—Appraised Value” in the Preliminary Prospectus for additional details. |
(4) Includes mortgage loans that are secured by multiple properties if each such property is occupied by a single tenant.
| (5) | Excludes 31 mortgage loans that are interest-only for the entire term. |
| (6) | For a more detailed description of lockboxes, refer to “Description of the Mortgage Pool—Certain Calculations and Definitions” and “—Certain Terms of the Mortgage Loans—Mortgaged Property Accounts” in the Preliminary Prospectus. |
| (7) | Calculated only with respect to the Cut-off Date Balance of mortgage loans secured or partially secured by office, industrial, retail and mixed use properties. |
| THE INFORMATION IN THIS STRUCTURAL AND COLLATERAL TERM SHEET IS NOT COMPLETE AND MAY BE AMENDED PRIOR TO THE TIME OF SALE. THIS TERM SHEET IS NOT AN OFFER TO SELL THESE SECURITIES AND IT IS NOT A SOLICITATION OF AN OFFER TO BUY THESE SECURITIES IN ANY JURISDICTION WHERE THE OFFER OR SALE IS NOT PERMITTED. |
| | 6 | |
| Structural and Collateral Term Sheet | | BMO 2023-C4 |
| Collateral Characteristics |
| Ten Largest Mortgage Loans |
| No. | Loan Name | City, State | Mortgage Loan Seller | No.
of Prop. | Cut-off Date Balance | % of IPB | Square Feet / Rooms / Units | Property Type | UW
NCF DSCR(1) | UW NOI DY(1) | Cut-off Date LTV(1) | Maturity Date/ARD LTV(1) |
| 1 | 70 Hudson Street | Jersey City, NJ | Natixis | 1 | $36,000,000 | 4.6% | 431,281 | Office | 4.10x | 13.3% | 40.5% | 40.5% |
| 2 | Rialto Industrial | Rialto, CA | AREF | 1 | $35,000,000 | 4.5% | 1,106,124 | Industrial | 1.23x | 9.7% | 51.7% | 51.7% |
| 3 | Gilardian NYC Portfolio | New York, NY | BMO | 2 | $28,000,000 | 3.6% | 153 | Multifamily | 2.61x | 11.5% | 39.5% | 39.5% |
| 4 | Weston at Copperfield | Houston, TX | BMO | 1 | $28,000,000 | 3.6% | 330 | Multifamily | 1.79x | 8.1% | 42.3% | 42.3% |
| 5 | IPG Portfolio | Various, Various | CREFI | 8 | $28,000,000 | 3.6% | 1,791,714 | Industrial | 1.64x | 11.1% | 52.3% | 52.3% |
| 6 | Latitude at South Portland | Portland, ME | BMO | 1 | $27,000,000 | 3.4% | 256 | Multifamily | 1.58x | 8.0% | 63.9% | 63.9% |
| 7 | Orizon Aerostructures | Various, Various | BMO | 4 | $27,000,000 | 3.4% | 785,000 | Industrial | 1.83x | 12.6% | 48.9% | 48.9% |
| 8 | Park West Village | New York, NY | BMO | 1 | $26,000,000 | 3.3% | 850 | Multifamily | 2.60x | 12.3% | 32.6% | 32.6% |
| 9 | Green Acres | Valley Stream, NY | BMO | 1 | $26,000,000 | 3.3% | 2,081,286 | Retail | 2.10x | 13.0% | 54.5% | 54.5% |
| 10 | 575 Broadway | New York, NY | CREFI | 1 | $25,951,292 | 3.3% | 176,648 | Mixed Use | 1.38x | 12.6% | 59.1% | 54.7% |
| | | | | | | | | | | | | |
| | Top 3 Total/Weighted Average | 4 | $99,000,000 | 12.6% | | | 2.66x | 11.5% | 44.2% | 44.2% |
| | Top 5 Total/Weighted Average | 13 | $155,000,000 | 19.7% | | | 2.32x | 10.8% | 45.3% | 45.3% |
| | Top 10 Total/Weighted Average | 21 | $286,951,292 | 36.5% | | | 2.13x | 11.2% | 48.3% | 47.9% |
| | Non-Top 10 Total/Weighted Average | 88 | $498,151,578 | 63.5% | | | 1.84x | 12.7% | 55.8% | 53.9% |
| (1) | In the case of Loan Nos. 1, 2, 3, 5, 6, 7, 8, 9, 10, 12, 15, 21, 22, 26, 28, 30 and 33, the UW NCF DSCR, UW NOI DY, Cut-off Date LTV and Maturity Date/ARD LTV calculations include the related Pari Passu Companion Loan(s). In the case of Loan Nos. 1, 3, 8, 18, 27 and 30, the UW NCF DSCR, UW NOI DY, Cut-off Date LTV and Maturity Date/ARD LTV calculations exclude the related Subordinate Companion Loans and/or subordinate mezzanine loans.
|
| THE INFORMATION IN THIS STRUCTURAL AND COLLATERAL TERM SHEET IS NOT COMPLETE AND MAY BE AMENDED PRIOR TO THE TIME OF SALE. THIS TERM SHEET IS NOT AN OFFER TO SELL THESE SECURITIES AND IT IS NOT A SOLICITATION OF AN OFFER TO BUY THESE SECURITIES IN ANY JURISDICTION WHERE THE OFFER OR SALE IS NOT PERMITTED. |
| | 7 | |
| Structural and Collateral Term Sheet | | BMO 2023-C4 |
| Collateral Characteristics |
| Pari Passu Companion Loan Summary |
No. | Loan Name | | Trust Cut-off Date Balance | Aggregate Pari Passu Loan Cut-off Date Balance(1) | Controlling Pooling/Trust & Servicing Agreement | Master Servicer | Special Servicer | Related Pari Passu Loan(s) Securitizations | Related Pari Passu Loan(s) Original Balance |
| 1 | 70 Hudson Street | Natixis | $36,000,000 | $84,000,000 | BBCMS 2022-C18 | Midland | Rialto | BBCMS 2022-C16 BBCMS 2022-C18 | $48,000,000 $36,000,000 |
| 2 | Rialto Industrial | AREF | $35,000,000 | $146,000,000 | BBCMS 2022-C18(2) | Midland(2) | Rialto(2) | BBCMS 2022-C18 Future Securitization(s) | $68,000,000 $78,000,000 |
| 3 | Gilardian NYC Portfolio | BMO | $28,000,000 | $27,750,000 | BMO 2023-C4(3) | Midland(3) | LNR(3) | Future Securitization(s) | $27,750,000 |
| 5 | IPG Portfolio | CREFI | $28,000,000 | $75,000,000 | BMARK 2022-B37 | Midland | Rialto | Benchmark 2022-B37 3650R 2022-PF2 | $60,000,000 $15,000,000 |
| 6 | Latitude at South Portland | BMO | $27,000,000 | $28,192,000 | BMO 2023-C4(3) | Midland(3) | LNR(3) | Future Securitization(s) | $28,192,000 |
| 7 | Orizon Aerostructures | BMO | $27,000,000 | $34,095,000 | BMO 2023-C4(3) | Midland(3) | LNR(3) | Future Securitization(s) | $34,095,000 |
| 8 | Park West Village(4) | BMO | $26,000,000 | $161,500,000 | BBCMS 2022-C17 | KeyBank | KeyBank | BBCMS 2022-C17 BBCMS 2022-C18 BMO 2022-C3 Benchmark 2022-B37 Future Securitization(s) | $47,500,000 $7,500,000 $37,500,000 $62,500,000 $6,500,000 |
| 9 | Green Acres | BMO | $26,000,000 | $344,000,000 | BMO 2023-C4(3) | Midland(3) | LNR(3) | Future Securitization(s) | $344,000,000 |
| 10 | 575 Broadway | CREFI | $25,951,292 | $101,210,038 | BMO 2023-C4(3) | Midland(3) | LNR(3) | Future Securitization(s) | $101,400,000 |
| 12 | Great Lakes Crossing Outlets | BMO | $25,750,000 | $154,250,000 | BMO 2023-C4(3) | Midland(3) | LNR(3) | Future Securitization(s) | $154,250,000 |
| 15 | WRS Retail Portfolio | LMF | $24,000,000 | $60,000,000 | BBCMS 2022-C18 | Midland | Rialto | BBCMS 2022-C18 | $60,000,000 |
| 21 | Triple Net Portfolio | 3650 REIT | $20,000,000 | $73,500,000 | 3650R 2022-PF2 | Midland | 3650 REIT Loan Servicing LLC | 3650R 2022-PF2 Future Securitization(s) | $53,500,000 $20,000,000 |
| 22 | Stoney Creek Hotel Portfolio | BMO | $17,000,000 | $13,900,000 | BMO 2023-C4 | Midland | LNR | Future Securitization(s) | $13,900,000 |
| 26 | 800 Cesar Chavez | 3650 REIT | $15,000,000 | $23,000,000 | 3650R 2022-PF2 | Midland | 3650 REIT Loan Servicing LLC | 3650R 2022-PF2 Future Securitization(s) | $13,000,000 $10,000,000 |
| 28 | Kingston Square Apartments | BMO | $14,000,000 | $37,000,000 | BMO 2022-C3 | Midland | Midland | BMO 2022-C3 | $37,000,000 |
| 30 | PetSmart HQ | 3650 REIT | $12,650,000 | $55,350,000 | 3650R 2021-PF1 | Midland | 3650 REIT Loan Servicing LLC | 3650R 2021-PF1 3650R 2022-PF2 Future Securitization(s) | $23,000,000 $10,000,000 $22,350,000 |
| 33 | Oak Ridge Office Park | Natixis | $10,560,897 | $15,841,346 | BBCMS 2022-C16 | Midland | LNR | BBCMS 2022-C16 | $16,200,000 |
| (1) | In the case of Loan Nos. 1, 3, 8, 18, 27 and 30, the Aggregate Pari Passu Loan Cut-off Date Balance excludes the related Subordinate Companion Loan(s) and one or more subordinate mezzanine loans. |
| (2) | In the case of Loan No. 2, until the securitization of the related controlling pari passu companion loan, the related whole loan will be serviced and administered pursuant to the pooling and servicing agreement for the BBCMS 2022-C18 securitization transaction by the parties thereto. Upon the securitization of the related controlling pari-passu companion loan, servicing of the related whole loan will shift to the servicers under the servicing agreement with respect to such future securitization transaction, which servicing agreement will become the Controlling Pooling/Trust & Servicing Agreement. |
| THE INFORMATION IN THIS STRUCTURAL AND COLLATERAL TERM SHEET IS NOT COMPLETE AND MAY BE AMENDED PRIOR TO THE TIME OF SALE. THIS TERM SHEET IS NOT AN OFFER TO SELL THESE SECURITIES AND IT IS NOT A SOLICITATION OF AN OFFER TO BUY THESE SECURITIES IN ANY JURISDICTION WHERE THE OFFER OR SALE IS NOT PERMITTED. |
| | 8 | |
| Structural and Collateral Term Sheet | | BMO 2023-C4 |
| Collateral Characteristics |
| (3) | In the case of Loan Nos. 3, 6, 7, 9, 10 and 12, until the securitization of the related controlling pari passu companion loan, the related whole loan will be serviced and administered pursuant to the pooling and servicing agreement for the BMO 2023-C4 securitization transaction by the parties thereto. Upon the securitization of the related controlling pari-passu companion loan, servicing of the related whole loan will shift to the servicers under the servicing agreement with respect to such future securitization transaction, which servicing agreement will become the Controlling Pooling/Trust & Servicing Agreement. |
| (4) | In the case of Loan No. 8, the related Whole Loan includes two Subordinate Companion Loans. |
| THE INFORMATION IN THIS STRUCTURAL AND COLLATERAL TERM SHEET IS NOT COMPLETE AND MAY BE AMENDED PRIOR TO THE TIME OF SALE. THIS TERM SHEET IS NOT AN OFFER TO SELL THESE SECURITIES AND IT IS NOT A SOLICITATION OF AN OFFER TO BUY THESE SECURITIES IN ANY JURISDICTION WHERE THE OFFER OR SALE IS NOT PERMITTED. |
| | 9 | |
| Structural and Collateral Term Sheet | | BMO 2023-C4 |
| Collateral Characteristics |
No. | Loan Name | Trust
Cut-off Date Balance | Pari Passu Loan(s) Cut-off Date Balance | Subordinate Debt Cut-off Date Balance(1)(2) | Total Debt Cut-off Date Balance | Mortgage Loan UW NCF DSCR(3) | Total Debt UW NCF DSCR | Mortgage Loan
Cut-off Date LTV(3) | Total Debt Cut-off Date LTV | Mortgage Loan UW NOI DY (3) | Total Debt UW NOI DY |
| 1 | 70 Hudson Street | $36,000,000 | $84,000,000 | $76,950,000 | $196,950,000 | 4.10x | 2.50x | 40.5% | 66.5% | 13.3% | 8.1% |
| 3 | Gilardian NYC Portfolio | $28,000,000 | $27,750,000 | $37,750,000 | $93,500,000 | 2.61x | 1.14x | 39.5% | 66.3% | 11.5% | 6.9% |
| 8 | Park West Village | $26,000,000 | $161,500,000 | $177,500,000 | $365,000,000 | 2.60x | 1.34x | 32.6% | 63.5% | 12.3% | 6.3% |
| 18 | Naples Center | $22,000,000 | $0 | $2,000,000 | $24,000,000 | 1.25x | 1.11x | 61.3% | 66.9% | 9.9% | 9.1% |
| 27 | 180-186 Cedar Street | $14,189,000 | $0 | $1,695,000 | $15,884,000 | 1.41x | 1.15x | 57.7% | 64.6% | 9.0% | 8.1% |
| 30 | PetSmart HQ | $12,650,000 | $55,350,000 | $12,000,000 | $80,000,000 | 2.26x | 1.51x | 62.6% | 73.7% | 10.5% | 8.9% |
(1) In the case of Loans Nos. 1 and 8, subordinate debt represents one or more Subordinate Companion Loans.
(2) In the case of Loan Nos. 3, 18, 27 and 30, subordinate debt represents one or more subordinate mezzanine loans.
| (3) | Mortgage Loan UW NCF DSCR, Mortgage Loan Cut-off Date LTV and Mortgage Loan UW NOI DY calculations include any related Pari Passu Companion Loans (if applicable), but exclude the related Subordinate Companion Loans and one or more subordinate mezzanine loans. |
| THE INFORMATION IN THIS STRUCTURAL AND COLLATERAL TERM SHEET IS NOT COMPLETE AND MAY BE AMENDED PRIOR TO THE TIME OF SALE. THIS TERM SHEET IS NOT AN OFFER TO SELL THESE SECURITIES AND IT IS NOT A SOLICITATION OF AN OFFER TO BUY THESE SECURITIES IN ANY JURISDICTION WHERE THE OFFER OR SALE IS NOT PERMITTED. |
| | 10 | |
| Structural and Collateral Term Sheet | | BMO 2023-C4 |
| Collateral Characteristics |
| Mortgaged Properties by Type(1) |
| | | | | | Weighted Average |
| Property Type | Property Subtype | Number of Properties | Cut-off Date Principal Balance | % of IPB | UW
NCF DSCR(2)(3) | UW
NOI DY (2) | Cut-off Date LTV(2)(4) | Maturity Date/ARD LTV(2)(4) |
| Multifamily | Garden | 6 | $74,564,000 | 9.5% | 1.54x | 8.9% | 56.6% | 54.1% |
| | High Rise | 3 | 54,000,000 | 6.9 | 2.61x | 11.9% | 36.2% | 36.2% |
| | Mid Rise | 2 | 41,189,000 | 5.2 | 1.52x | 8.3% | 61.8% | 61.8% |
| | Low Rise | 1 | 4,000,000 | 0.5 | 1.48x | 9.0% | 55.6% | 55.6% |
| | Subtotal: | 12 | $173,753,000 | 22.1% | 1.86x | 9.7% | 51.4% | 50.4% |
| Industrial | Warehouse/Distribution | 25 | $80,267,156 | 10.2% | 1.64x | 11.2% | 50.9% | 50.9% |
| | Manufacturing | 16 | 50,594,063 | 6.4 | 1.76x | 11.4% | 52.5% | 52.5% |
| | Flex | 3 | 26,268,793 | 3.3 | 2.25x | 14.1% | 52.1% | 52.1% |
| | Warehouse | 1 | 15,000,000 | 1.9 | 2.00x | 8.4% | 53.7% | 53.7% |
| | Subtotal: | 45 | $172,130,011 | 21.9% | 1.80x | 11.4% | 51.8% | 51.8% |
| Retail | Anchored | 3 | $33,550,000 | 4.3% | 1.99x | 13.5% | 56.0% | 56.0% |
| | Shadow Anchored | 14 | 31,450,000 | 4.0 | 1.49x | 11.2% | 58.9% | 57.9% |
| | Unanchored | 2 | 27,596,019 | 3.5 | 1.55x | 11.1% | 50.8% | 49.2% |
| | Regional Mall | 1 | 26,000,000 | 3.3 | 2.10x | 13.0% | 54.5% | 54.5% |
| | Outlet Center | 1 | 25,750,000 | 3.3 | 2.50x | 17.5% | 45.0% | 45.0% |
| | Subtotal: | 21 | $144,346,019 | 18.4% | 1.91x | 13.2% | 53.4% | 52.9% |
| Hospitality | Limited Service | 11 | $58,350,662 | 7.4% | 2.18x | 19.1% | 56.0% | 51.0% |
| | Extended Stay | 2 | 29,100,000 | 3.7 | 1.88x | 15.4% | 56.8% | 54.0% |
| | Full Service | 1 | 22,000,000 | 2.8 | 1.69x | 14.4% | 58.7% | 55.5% |
| | Subtotal: | 14 | $109,450,662 | 13.9% | 2.00x | 17.2% | 56.7% | 52.7% |
| Mixed Use | Retail/Office | 2 | $47,951,292 | 6.1% | 1.32x | 11.4% | 60.1% | 56.0% |
| | Office/Retail | 1 | 25,000,000 | 3.2 | 1.43x | 9.6% | 51.2% | 51.2% |
| | Retail/Multifamily | 1 | 8,250,000 | 1.1 | 1.58x | 8.3% | 64.0% | 64.0% |
| | Subtotal: | 4 | $81,201,292 | 10.3% | 1.38x | 10.5% | 57.8% | 55.4% |
| Office | CBD | 2 | $48,650,000 | 6.2% | 3.62x | 12.6% | 46.2% | 46.2% |
| | Suburban | 4 | 28,209,386 | 3.6 | 1.80x | 11.9% | 57.1% | 52.1% |
| | Subtotal: | 6 | $76,859,386 | 9.8% | 2.95x | 12.3% | 50.2% | 48.4% |
| Self Storage | Self Storage | 5 | $19,362,500 | 2.5% | 2.40x | 12.2% | 49.1% | 49.1% |
| Manufactured Housing | Manufactured Housing | 2 | $8,000,000 | 1.0% | 1.37x | 9.7% | 45.6% | 45.6% |
| Total / Weighted Average: | 109 | $785,102,870 | 100.0% | 1.94x | 12.2% | 53.0% | 51.7% |
| (1) | Because this table presents information relating to the mortgaged properties and not mortgage loans, the information for mortgage loans secured by more than one mortgaged property is based on allocated loan amounts, individual appraised values, net cash flow or net operating income with respect to such individual mortgaged properties, as applicable. |
| (2) | In the case of Loan Nos. 1, 2, 3, 5, 6, 7, 8, 9, 10, 12, 15, 21, 22, 26, 28, 30 and 33, the UW NCF DSCR, UW NOI DY, Cut-off Date LTV and Maturity Date/ARD LTV calculations include the related Pari Passu Companion Loan(s). In the case of Loan Nos. 1, 3, 8, 18, 27 and 30, the UW NCF DSCR, UW NOI DY, Cut-off Date LTV and Maturity Date/ARD LTV calculations exclude the related Subordinate Companion Loans and/or related mezzanine loans. |
| (3) | For the mortgage loans that are interest-only for the entire term or until the anticipated repayment date and accrue interest on an Actual/360 basis, the Monthly Debt Service Amount ($) was calculated as 1/12th of the product of (i) the Original Balance ($), (ii) the Interest Rate % and (iii) 365/360. |
| (4) | In the case of Loan Nos. 7, 11 and 15, the Cut-off Date Loan-to-Value Ratio and Maturity/ARD Loan-to-Value Ratio are calculated by using an appraised value based on an as portfolio assumption. In the case of Loan No. 14, the Cut-off Date Loan-to-Value Ratio and the Maturity Date/ARD Loan-to-Value Ratio are calculated by using an appraised value based on a prospective value upon stabilization. In the case of Loan No. 21, the Cut-off Date Loan-to-Value Ratio and the Maturity Date/ARD Loan-to-Value Ratio are calculated by using an as portfolio assuming reserves. In the case of Loan Nos. 17 and 36, the Cut-off Date Loan-to-Value Ratio and Maturity/ARD Loan-to-Value Ratio are calculated by using an appraised value based on an as complete assumption. Refer to “Description of the Mortgage Pool—Certain Calculations and Definitions—Appraised Value” in the Preliminary Prospectus for additional details. |
| THE INFORMATION IN THIS STRUCTURAL AND COLLATERAL TERM SHEET IS NOT COMPLETE AND MAY BE AMENDED PRIOR TO THE TIME OF SALE. THIS TERM SHEET IS NOT AN OFFER TO SELL THESE SECURITIES AND IT IS NOT A SOLICITATION OF AN OFFER TO BUY THESE SECURITIES IN ANY JURISDICTION WHERE THE OFFER OR SALE IS NOT PERMITTED. |
| | 11 | |
| Structural and Collateral Term Sheet | | BMO 2023-C4 |
| Collateral Characteristics |
| Mortgaged Properties by Location(1) |
| | | | | Weighted Average |
State | Number of Properties | Cut-off Date Principal Balance | % of IPB | UW
NCF DSCR(2)(3) | UW
NOI DY(2) | Cut-off Date LTV(2)(4) | Maturity Date/ARD LTV(2)(4) |
| New York | 8 | $154,309,682 | 19.7% | 1.96x | 11.5% | 47.8% | 47.1% |
| Florida | 7 | 101,050,019 | 12.9 | 1.69x | 13.7% | 57.8% | 53.8% |
| Texas | 4 | 62,090,667 | 7.9 | 1.68x | 10.6% | 53.8% | 51.2% |
| California | 6 | 57,585,373 | 7.3 | 1.50x | 9.2% | 53.5% | 53.5% |
| New Jersey | 2 | 50,189,000 | 6.4 | 3.34x | 12.1% | 45.4% | 45.4% |
| Georgia | 6 | 43,412,608 | 5.5 | 1.99x | 12.6% | 55.4% | 55.3% |
| Virginia | 7 | 34,457,428 | 4.4 | 1.79x | 11.6% | 55.4% | 55.4% |
| Michigan | 4 | 33,039,434 | 4.2 | 2.44x | 16.2% | 47.3% | 47.3% |
| Maine | 1 | 27,000,000 | 3.4 | 1.58x | 8.0% | 63.9% | 63.9% |
| North Carolina | 15 | 26,710,922 | 3.4 | 1.61x | 11.6% | 54.7% | 54.0% |
| Arizona | 2 | 25,150,000 | 3.2 | 2.12x | 12.8% | 58.3% | 58.3% |
| Maryland | 2 | 24,350,662 | 3.1 | 1.88x | 14.4% | 56.6% | 54.3% |
| Indiana | 2 | 24,300,000 | 3.1 | 1.43x | 9.5% | 63.4% | 62.3% |
| Kansas | 3 | 19,391,305 | 2.5 | 1.83x | 12.6% | 48.9% | 48.9% |
| Missouri | 3 | 13,198,997 | 1.7 | 2.85x | 19.4% | 43.8% | 41.8% |
| Tennessee | 3 | 12,427,658 | 1.6 | 1.95x | 13.0% | 65.6% | 54.2% |
| South Carolina | 5 | 12,282,497 | 1.6 | 1.65x | 11.7% | 53.5% | 52.9% |
| Iowa | 3 | 10,472,751 | 1.3 | 2.14x | 17.6% | 44.2% | 42.2% |
| Oklahoma | 4 | 10,464,194 | 1.3 | 1.82x | 11.8% | 51.8% | 51.8% |
| Ohio | 3 | 7,956,293 | 1.0 | 2.04x | 10.3% | 56.7% | 56.7% |
| Illinois | 6 | 7,917,359 | 1.0 | 2.48x | 20.6% | 48.0% | 45.3% |
| Alabama | 3 | 6,447,553 | 0.8 | 1.83x | 11.9% | 48.5% | 48.5% |
| Louisiana | 1 | 5,360,000 | 0.7 | 1.25x | 9.1% | 64.6% | 58.9% |
| Kentucky | 1 | 5,010,780 | 0.6 | 2.17x | 13.5% | 47.4% | 47.4% |
| Arkansas | 5 | 3,974,236 | 0.5 | 2.17x | 13.5% | 47.4% | 47.4% |
| Utah | 2 | 3,942,894 | 0.5 | 1.68x | 10.1% | 56.1% | 56.1% |
| Wisconsin | 1 | 2,610,559 | 0.3 | 1.64x | 11.1% | 52.3% | 52.3% |
| Total / Weighted Average: | 109 | $785,102,870 | 100.0% | 1.94x | 12.2% | 53.0% | 51.7% |
| (1) | Because this table presents information relating to the mortgaged properties and not mortgage loans, the information for mortgage loans secured by more than one mortgaged property is based on allocated loan amounts, individual appraised values, net cash flow or net operating income with respect to such individual mortgaged properties, as applicable. |
| (2) | In the case of Loan Nos. 1, 2, 3, 5, 6, 7, 8, 9, 10, 12, 15, 21, 22, 26, 28, 30 and 33, the UW NCF DSCR, UW NOI DY Yield, Cut-off Date LTV and Maturity Date/ARD LTV calculations include the related Pari Passu Companion Loan(s). In the case of Loan Nos. 1, 3, 8, 18, 27 and 30, the UW NCF DSCR, UW NOI DY, Cut-off Date LTV and Maturity Date/ARD LTV calculations exclude the related Subordinate Companion Loans and/or related mezzanine loans. |
| (3) | For the mortgage loans that are interest-only for the entire term or until the anticipated repayment date and accrue interest on an Actual/360 basis, the Monthly Debt Service Amount ($) was calculated as 1/12th of the product of (i) the Original Balance ($), (ii) the Interest Rate % and (iii) 365/360. |
| (4) | In the case of Loan Nos. 7, 11 and 15, the Cut-off Date Loan-to-Value Ratio and Maturity/ARD Loan-to-Value Ratio are calculated by using an appraised value based on an as portfolio assumption. In the case of Loan No. 14, the Cut-off Date Loan-to-Value Ratio and the Maturity Date/ARD Loan-to-Value Ratio are calculated by using an appraised value based on a prospective value upon stabilization. In the case of Loan No. 21, the Cut-off Date Loan-to-Value Ratio and the Maturity Date/ARD Loan-to-Value Ratio are calculated by using an as portfolio assuming reserves. In the case of Loan Nos. 17 and 36, the Cut-off Date Loan-to-Value Ratio and Maturity/ARD Loan-to-Value Ratio are calculated by using an appraised value based on an as complete assumption. Refer to “Description of the Mortgage Pool—Certain Calculations and Definitions—Appraised Value” in the Preliminary Prospectus for additional details.
|
| THE INFORMATION IN THIS STRUCTURAL AND COLLATERAL TERM SHEET IS NOT COMPLETE AND MAY BE AMENDED PRIOR TO THE TIME OF SALE. THIS TERM SHEET IS NOT AN OFFER TO SELL THESE SECURITIES AND IT IS NOT A SOLICITATION OF AN OFFER TO BUY THESE SECURITIES IN ANY JURISDICTION WHERE THE OFFER OR SALE IS NOT PERMITTED. |
| | 12 | |
| Structural and Collateral Term Sheet | | BMO 2023-C4 |
| Collateral Characteristics |
| Cut-off Date Principal Balance |
| | | | | Weighted Average |
Range of Cut-off Date Principal
Balances | Number
of Loans | Cut-off Date
Principal
Balance | % of IPB | Mortgage
Rate | Remaining
Loan Term | UW
NCF DSCR(1)(2) | UW
NOI
DY(1) | Cut-off
Date LTV(1)(3) | Maturity Date/ARD LTV(1)(3) |
| $2,800,000 | - | $4,999,999 | 5 | $19,412,500 | 2.5% | 5.56871% | 113 | 1.92x | 10.7% | 52.9% | 52.9% |
| $5,000,000 | - | $9,999,999 | 7 | 45,760,681 | 5.8 | 5.96104% | 105 | 1.66x | 11.2% | 56.2% | 52.5% |
| $10,000,000 | - | $19,999,999 | 13 | 178,849,897 | 22.8 | 5.76613% | 109 | 1.87x | 12.9% | 58.4% | 55.8% |
| $20,000,000 | - | $29,999,999 | 19 | 470,079,792 | 59.9 | 6.03193% | 103 | 1.88x | 12.1% | 51.8% | 50.9% |
| $30,000,000 | - | $36,000,000 | 2 | 71,000,000 | 9.0 | 5.36989% | 83 | 2.69x | 11.5% | 46.0% | 46.0% |
| Total / Weighted Average: | 46 | $785,102,870 | 100.0% | 5.89592% | 103 | 1.94x | 12.2% | 53.0% | 51.7% |
| | | | | Weighted Average |
Range of
Mortgage Interest Rates | Number
of Loans | Cut-off Date
Principal
Balance | % of
IPB | Mortgage
Rate | Remaining
Loan Term | UW
NCF
DSCR(1)(2) | UW
NOI
DY(1) | Cut-off
Date LTV(1)(3) | Maturity
Date/ARD
LTV(1)(3) |
| 3.19200% | - | 3.49999% | 1 | $36,000,000 | 4.6% | 3.19200% | 49 | 4.10x | 13.3% | 40.5% | 40.5% |
| 3.50000% | - | 3.99999% | 1 | 10,560,897 | 1.3 | 3.80400% | 105 | 1.91x | 12.9% | 68.8% | 55.4% |
| 4.00000% | - | 4.49999% | 4 | 83,650,000 | 10.7 | 4.27432% | 85 | 2.17x | 9.7% | 46.5% | 46.5% |
| 4.50000% | - | 4.99999% | 5 | 68,812,500 | 8.8 | 4.73330% | 90 | 2.20x | 10.7% | 48.7% | 48.7% |
| 5.00000% | - | 5.49999% | 6 | 66,514,000 | 8.5 | 5.19545% | 106 | 1.60x | 9.3% | 63.9% | 61.6% |
| 5.50000% | - | 5.99999% | 4 | 54,300,000 | 6.9 | 5.88343% | 81 | 1.77x | 11.2% | 58.6% | 58.1% |
| 6.00000% | - | 6.49999% | 8 | 170,967,500 | 21.8 | 6.30939% | 118 | 1.94x | 13.6% | 52.2% | 51.3% |
| 6.50000% | - | 6.99999% | 13 | 218,800,000 | 27.9 | 6.76600% | 118 | 1.78x | 13.6% | 53.4% | 51.8% |
| 7.00000% | - | 7.61000% | 4 | 75,497,973 | 9.6 | 7.50248% | 97 | 1.35x | 11.5% | 55.5% | 52.7% |
| Total / Weighted Average: | 46 | $785,102,870 | 100.0% | 5.89592% | 103 | 1.94x | 12.2% | 53.0% | 51.7% |
| Original Term to Maturity in Months |
| | | | | Weighted Average |
Original Term to
Maturity in Months | Number
of Loans | Cut-off Date
Principal
Balance | % of
IPB | Mortgage
Rate | Remaining
Loan Term | UW
NCF
DSCR(1)(2) | UW
NOI
DY(1) | Cut-off
Date
LTV(1)(3) | Maturity
Date/ARD
LTV(1)(3) |
| 60 | 6 | $150,201,292 | 19.1 | % | 4.97951% | 55 | 2.61x | 12.3% | 45.9% | 45.1% |
| 84 | 2 | 22,950,000 | 2.9 | | 5.03174% | 69 | 1.82x | 10.2% | 65.3% | 64.2% |
| 120 | 38 | 611,951,578 | 77.9 | | 6.15326% | 116 | 1.78x | 12.2% | 54.3% | 52.9% |
| Total / Weighted Average: | 46 | $785,102,870 | 100.0 | % | 5.89592% | 103 | 1.94x | 12.2% | 53.0% | 51.7% |
| Remaining Term to Maturity in Months |
| | | | | Weighted Average |
Range of Remaining Term to
Maturity in Months | Number
of Loans | Cut-off Date
Principal
Balance | % of
IPB | Mortgage
Rate | Remaining
Loan Term | UW
NCF DSCR(1)(2) | UW
NOI
DY(1)(3) | Cut-off
Date LTV(1)(3) | Maturity
Date/ARD
LTV(1)(3) |
| 49 | - | 60 | 6 | $150,201,292 | 19.1 | % | 4.97951% | 55 | 2.61x | 12.3% | 45.9% | 45.1% |
| 61 | - | 114 | 15 | 181,587,397 | 23.1 | | 4.78200% | 106 | 1.79x | 9.5% | 58.7% | 57.0% |
| 115 | - | 120 | 25 | 453,314,181 | 57.7 | | 6.64578% | 118 | 1.78x | 13.2% | 53.1% | 51.8% |
| Total / Weighted Average: | 46 | $785,102,870 | 100.0 | % | 5.89592% | 103 | 1.94x | 12.2% | 53.0% | 51.7% |
| (1) | In the case of Loan Nos. 1, 2, 3, 5, 6, 7, 8, 9, 10, 12, 15, 21, 22, 26, 28, 30 and 33, the UW NCF DSCR, UW NOI DY, Cut-off Date LTV and Maturity Date/ARD LTV calculations include the related Pari Passu Companion Loan(s). In the case of Loan Nos. 1, 3, 8, 18, 27 and 30, the UW NCF DSCR, UW NOI DY, Cut-off Date LTV and Maturity Date/ARD LTV calculations exclude the related Subordinate Companion Loans and/or related mezzanine loans. |
| (2) | For the mortgage loans that are interest-only for the entire term or until the anticipated repayment date and accrue interest on an Actual/360 basis, the Monthly Debt Service Amount ($) was calculated as 1/12th of the product of (i) the Original Balance ($), (ii) the Interest Rate % and (iii) 365/360. |
| (3) | In the case of Loan Nos. 7, 11 and 15, the Cut-off Date Loan-to-Value Ratio and Maturity/ARD Loan-to-Value Ratio are calculated by using an appraised value based on an as portfolio assumption. In the case of Loan No. 14, the Cut-off Date Loan-to-Value Ratio and the Maturity Date/ARD Loan-to-Value Ratio are calculated by using an appraised value based on a prospective value upon stabilization. In the case of Loan No. 21, the Cut-off Date Loan-to-Value Ratio and the Maturity Date/ARD Loan-to-Value Ratio are calculated by using an as portfolio assuming reserves. In the case of Loan Nos. 17 and 36, the Cut-off Date Loan-to-Value Ratio and Maturity/ARD Loan-to-Value Ratio are calculated by using an appraised value based on an as complete assumption. Refer to “Description of the Mortgage Pool—Certain Calculations and Definitions—Appraised Value” in the Preliminary Prospectus for additional details. |
| THE INFORMATION IN THIS STRUCTURAL AND COLLATERAL TERM SHEET IS NOT COMPLETE AND MAY BE AMENDED PRIOR TO THE TIME OF SALE. THIS TERM SHEET IS NOT AN OFFER TO SELL THESE SECURITIES AND IT IS NOT A SOLICITATION OF AN OFFER TO BUY THESE SECURITIES IN ANY JURISDICTION WHERE THE OFFER OR SALE IS NOT PERMITTED. |
| | 13 | |
| Structural and Collateral Term Sheet | | BMO 2023-C4 |
| Collateral Characteristics |
Original Amortization Term in Months |
| | | | | Weighted Average |
Original
Amortization
Term in Months | Number
of Loans | Cut-off Date
Principal
Balance | % of
IPB | Mortgage
Rate | Remaining
Loan Term | UW
NCF
DSCR(1)(2) | UW
NOI
DY(1) | Cut-off
Date LTV(1)(3) | Maturity
Date/ARD
LTV(1)(3) |
| Interest Only | 31 | $566,080,000 | 72.1 | % | 5.64357% | 102 | 2.05x | 11.5% | 50.4% | 50.4% |
| 300 | 1 | 25,951,292 | 3.3 | | 7.49000% | 58 | 1.38x | 12.6% | 59.1% | 54.7% |
| 360 | 14 | 193,071,578 | 24.6 | | 6.42154% | 114 | 1.71x | 14.1% | 59.9% | 55.2% |
| Total / Weighted Average: | 46 | $785,102,870 | 100.0 | % | 5.89592% | 103 | 1.94x | 12.2% | 53.0% | 51.7% |
| Remaining Amortization Term in Months |
| | | | | Weighted Average |
Range of Remaining
Amortization Term in Months | Number
of Loans | Cut-off Date
Principal
Balance | % of
IPB | Mortgage
Rate | Remaining
Loan Term | UW
NCF
DSCR(1)(2) | UW
NOI
DY(1) | Cut-off
Date LTV(1)(3) | Maturity
Date/ARD
LTV(1)(3) |
| Interest Only | 31 | $566,080,000 | 72.1 | % | 5.64357% | 102 | 2.05x | 11.5% | 50.4% | 50.4% |
| 298 | 1 | 25,951,292 | 3.3 | | 7.49000% | 58 | 1.38x | 12.6% | 59.1% | 54.7% |
| 345 | - | 360 | 14 | 193,071,578 | 24.6 | | 6.42154% | 114 | 1.71x | 14.1% | 59.9% | 55.2% |
| Total / Weighted Average: | 46 | $785,102,870 | 100.0 | % | 5.89592% | 103 | 1.94x | 12.2% | 53.0% | 51.7% |
| | | | | Weighted Average |
| Amortization Types | Number
of Loans | Cut-off Date
Principal
Balance | % of
IPB | Mortgage
Rate | Remaining
Loan Term | UW
NCF
DSCR(1)(2) | UW
NOI
DY(1) | Cut-off
Date LTV(1)(3) | Maturity
Date/ARD
LTV(1)(3) |
| Interest Only | 31 | $566,080,000 | 72.1 | % | 5.64357% | 102 | 2.05x | 11.5% | 50.4% | 50.4% |
| Interest Only, Amortizing Balloon | 11 | 167,964,000 | 21.4 | | 6.51298% | 114 | 1.71x | 14.2% | 59.5% | 55.5% |
| Amortizing Balloon | 4 | 51,058,870 | 6.5 | | 6.66380% | 85 | 1.54x | 13.0% | 60.9% | 53.9% |
| Total / Weighted Average: | 46 | $785,102,870 | 100.0 | % | 5.89592% | 103 | 1.94x | 12.2% | 53.0% | 51.7% |
| Underwritten Net Cash Flow Debt Service Coverage Ratios(1)(2) |
| | | | | Weighted Average |
Range of Underwritten Net Cash
Flow Debt Service Coverage
Ratios | Number
of Loans | Cut-off Date
Principal
Balance | % of
IPB | Mortgage
Rate | Remaining
Loan Term | UW
NCF DSCR(1)(2) | UW
NOI
DY(1) | Cut-off
Date LTV(1)(3) | Maturity
Date/ARD
LTV(1)(3) |
| 1.23x | - | 1.49x | 14 | $198,254,954 | 25.3 | % | 6.70181% | 107 | 1.34x | 10.4% | 57.7% | 55.3% |
| 1.50x | - | 1.59x | 5 | 73,400,000 | 9.3 | | 5.66552% | 109 | 1.55x | 9.0% | 58.4% | 58.4% |
| 1.60x | - | 1.69x | 3 | 56,996,019 | 7.3 | | 6.65116% | 117 | 1.66x | 12.7% | 54.9% | 52.9% |
| 1.70x | - | 1.79x | 3 | 64,000,000 | 8.2 | | 5.00450% | 113 | 1.76x | 9.2% | 50.0% | 50.0% |
| 1.80x | - | 1.89x | 3 | 59,600,000 | 7.6 | | 6.45661% | 117 | 1.82x | 12.9% | 55.4% | 54.0% |
| 1.90x | - | 1.99x | 3 | 44,060,897 | 5.6 | | 6.17937% | 115 | 1.95x | 15.4% | 60.8% | 55.3% |
| 2.00x | - | 2.99x | 14 | 252,791,000 | 32.2 | | 5.58967% | 95 | 2.35x | 14.2% | 48.1% | 47.6% |
| 4.00x | - | 4.10x | 1 | 36,000,000 | 4.6 | | 3.19200% | 49 | 4.10x | 13.3% | 40.5% | 40.5% |
| Total / Weighted Average: | 46 | $785,102,870 | 100.0 | % | 5.89592% | 103 | 1.94x | 12.2% | 53.0% | 51.7% |
| (1) | In the case of Loan Nos. 1, 2, 3, 5, 6, 7, 8, 9, 10, 12, 15, 21, 22, 26, 28, 30 and 33, the UW NCF DSCR, UW NOI DY, Cut-off Date LTV and Maturity Date/ARD LTV calculations include the related Pari Passu Companion Loan(s). In the case of Loan Nos. 1, 3, 8, 18, 27 and 30, the UW NCF DSCR, UW NOI DY, Cut-off Date LTV and Maturity Date/ARD LTV calculations exclude the related Subordinate Companion Loans and/or related mezzanine loans. |
| (2) | For the mortgage loans that are interest-only for the entire term or until the anticipated repayment date and accrue interest on an Actual/360 basis, the Monthly Debt Service Amount ($) was calculated as 1/12th of the product of (i) the Original Balance ($), (ii) the Interest Rate % and (iii) 365/360. |
| (3) | In the case of Loan Nos. 7, 11 and 15, the Cut-off Date Loan-to-Value Ratio and Maturity/ARD Loan-to-Value Ratio are calculated by using an appraised value based on an as portfolio assumption. In the case of Loan No. 14, the Cut-off Date Loan-to-Value Ratio and the Maturity Date/ARD Loan-to-Value Ratio are calculated by using an appraised value based on a prospective value upon stabilization. In the case of Loan No. 21, the Cut-off Date Loan-to-Value Ratio and the Maturity Date/ARD Loan-to-Value Ratio are calculated by using an as portfolio assuming reserves. In the case of Loan Nos. 17 and 36, the Cut-off Date Loan-to-Value Ratio and Maturity/ARD Loan-to-Value Ratio are calculated by using an appraised value based on an as complete assumption. Refer to “Description of the Mortgage Pool—Certain Calculations and Definitions—Appraised Value” in the Preliminary Prospectus for additional details. |
| THE INFORMATION IN THIS STRUCTURAL AND COLLATERAL TERM SHEET IS NOT COMPLETE AND MAY BE AMENDED PRIOR TO THE TIME OF SALE. THIS TERM SHEET IS NOT AN OFFER TO SELL THESE SECURITIES AND IT IS NOT A SOLICITATION OF AN OFFER TO BUY THESE SECURITIES IN ANY JURISDICTION WHERE THE OFFER OR SALE IS NOT PERMITTED. |
| | 14 | |
| Structural and Collateral Term Sheet | | BMO 2023-C4 |
| Collateral Characteristics |
| LTV Ratios as of the Cut-off Date(1)(3) |
| | | | | Weighted Average |
Range of
Cut-off Date LTVs | Number of Loans | Cut-off Date Principal Balance | % of IPB | Mortgage Rate | Remaining Loan Term | UW
NCF
DSCR(1)(2) | UW
NOI
DY(1) | Cut-off
Date
LTV(1)(3) | Maturity Date/ARD LTV(1)(3) |
| 32.6% | - | 49.9% | 13 | $265,628,500 | 33.8 | % | 5.35168% | 95 | 2.44x | 13.1% | 43.5% | 43.3% |
| 50.0% | - | 59.9% | 21 | 347,552,811 | 44.3 | | 6.50723% | 108 | 1.71x | 12.2% | 55.0% | 53.7% |
| 60.0% | - | 64.9% | 9 | 139,810,662 | 17.8 | | 5.62077% | 106 | 1.67x | 10.6% | 62.4% | 60.5% |
| 65.0% | - | 69.9% | 2 | 20,860,897 | 2.7 | | 4.86605% | 92 | 1.60x | 11.4% | 68.8% | 60.7% |
| 70.0% | - | 72.1% | 1 | 11,250,000 | 1.4 | | 5.19000% | 111 | 1.37x | 9.4% | 72.1% | 64.1% |
| Total / Weighted Average: | 46 | $785,102,870 | 100.0 | % | 5.89592% | 103 | 1.94x | 12.2% | 53.0% | 51.7% |
| LTV Ratios as of the Maturity Date(1)(3) |
| | | | | Weighted Average |
Range of
Maturity Date LTVs | Number of Loans | Cut-off Date Principal Balance | % of IPB | Mortgage Rate | Remaining Loan Term | UW
NCF
DSCR(1)(2) | UW
NOI
DY(1) | Cut-off
Date
LTV(1)(3) | Maturity Date/ARD LTV(1)(3) |
| 32.6% | - | 49.9% | 14 | $272,624,519 | 34.7 | % | 5.40180% | 96 | 2.42x | 13.2% | 43.8% | 43.4% |
| 50.0% | - | 59.9% | 25 | 407,028,351 | 51.8 | | 6.43897% | 109 | 1.69x | 12.3% | 56.3% | 54.3% |
| 60.0% | - | 64.9% | 6 | 95,150,000 | 12.1 | | 4.98225% | 101 | 1.71x | 9.1% | 64.0% | 63.0% |
| 65.0% | - | 66.2% | 1 | 10,300,000 | 1.3 | | 5.95500% | 78 | 1.29x | 9.8% | 68.7% | 66.2% |
| Total / Weighted Average: | 46 | $785,102,870 | 100.0 | % | 5.89592% | 103 | 1.94x | 12.2% | 53.0% | 51.7% |
| | | | | Weighted Average |
| Prepayment Protection | Number of Loans | Cut-off Date Principal Balance | % of IPB | Mortgage Rate | Remaining Loan Term | UW
NCF DSCR(1)(2) | UW
NOI
DY(1) | Cut-off
Date LTV(1)(3) | Maturity Date/ARD LTV(1)(3) |
| Defeasance | 37 | $603,511,870 | 76.9 | % | 6.00353% | 106 | 1.78x | 11.9% | 54.4% | 52.7% |
| Defeasance or Yield Maintenance | 5 | 139,778,500 | 17.8 | | 5.58283% | 100 | 2.52x | 13.0% | 47.5% | 47.5% |
| Yield Maintenance | 4 | 41,812,500 | 5.3 | | 5.38939% | 79 | 2.29x | 12.8% | 52.5% | 52.5% |
| Total / Weighted Average: | 46 | $785,102,870 | 100.0 | % | 5.89592% | 103 | 1.94x | 12.2% | 53.0% | 51.7% |
| | | | | Weighted Average |
| Loan Purpose | Number of Loans | Cut-off Date Principal Balance | % of IPB | Mortgage Rate | Remaining Loan Term | UW
NCF DSCR(1)(2) | UW
NOI
DY(1) | Cut-off
Date LTV(1)(3) | Maturity Date/ARD LTV(1)(3) |
| Refinance | 30 | $477,873,708 | 60.9 | % | 5.93505% | 101 | 1.88x | 12.3% | 54.1% | 52.4% |
| Acquisition | 14 | 269,229,162 | 34.3 | | 5.74269% | 105 | 2.12x | 12.2% | 50.4% | 49.7% |
| Refinance and Acquisition | 1 | 24,000,000 | 3.1 | | 6.88000% | 117 | 1.39x | 11.5% | 57.8% | 56.4% |
| Recapitalization | 1 | 14,000,000 | 1.8 | | 5.82000% | 115 | 1.53x | 9.2% | 59.5% | 59.5% |
| Total / Weighted Average: | 46 | $785,102,870 | 100.0 | % | 5.89592% | 103 | 1.94x | 12.2% | 53.0% | 51.7% |
| (1) | In the case of Loan Nos. 1, 2, 3, 5, 6, 7, 8, 9, 10, 12, 15, 21, 22, 26, 28, 30 and 33, the UW NCF DSCR, UW NOI DY, Cut-off Date LTV and Maturity Date/ARD LTV calculations include the related Pari Passu Companion Loan(s). In the case of Loan Nos. 1, 3, 8, 18, 27 and 30, the UW NCF DSCR, UW NOI DY, Cut-off Date LTV and Maturity Date/ARD LTV calculations exclude the related Subordinate Companion Loans and/or related mezzanine loans. |
| (2) | For the mortgage loans that are interest-only for the entire term or until the anticipated repayment date and accrue interest on an Actual/360 basis, the Monthly Debt Service Amount ($) was calculated as 1/12th of the product of (i) the Original Balance ($), (ii) the Interest Rate % and (iii) 365/360. |
| (3) | In the case of Loan Nos. 7, 11 and 15, the Cut-off Date Loan-to-Value Ratio and Maturity/ARD Loan-to-Value Ratio are calculated by using an appraised value based on an as portfolio assumption. In the case of Loan No. 14, the Cut-off Date Loan-to-Value Ratio and the Maturity Date/ARD Loan-to-Value Ratio are calculated by using an appraised value based on a prospective value upon stabilization. In the case of Loan No. 21, the Cut-off Date Loan-to-Value Ratio and the Maturity Date/ARD Loan-to-Value Ratio are calculated by using an as portfolio assuming reserves. In the case of Loan Nos. 17 and 36, the Cut-off Date Loan-to-Value Ratio and Maturity/ARD Loan-to-Value Ratio are calculated by using an appraised value based on an as complete assumption. Refer to “Description of the Mortgage Pool—Certain Calculations and Definitions—Appraised Value” in the Preliminary Prospectus for additional details. |
| THE INFORMATION IN THIS STRUCTURAL AND COLLATERAL TERM SHEET IS NOT COMPLETE AND MAY BE AMENDED PRIOR TO THE TIME OF SALE. THIS TERM SHEET IS NOT AN OFFER TO SELL THESE SECURITIES AND IT IS NOT A SOLICITATION OF AN OFFER TO BUY THESE SECURITIES IN ANY JURISDICTION WHERE THE OFFER OR SALE IS NOT PERMITTED. |
| | 15 | |
| Structural and Collateral Term Sheet | | BMO 2023-C4 |
| Collateral Characteristics |
| Previous Securitization History(1) |
| No. | Mortgage Loan Seller | Loan/Property Name | Location | Property Type | Cut-off Date Principal Balance | % of IPB | Previous Securitization |
| 4 | BMO | Weston at Copperfield | Houston, TX | Multifamily | $28,000,000 | 3.6% | FREMF 2019-KF58 |
| 8 | BMO | Park West Village | New York, NY | Multifamily | $26,000,000 | 3.3% | UBSCM 2017-C2, UBSCM 2017-C3, UBSCM 2017-C4 |
| 9 | BMO | Green Acres | Valley Stream, NY | Retail | $26,000,000 | 3.3% | COMM 2013-GAM |
| 10 | CREFI | 575 Broadway | New York, NY | Mixed Use | $25,951,292 | 3.3% | UBSBB 2013-C6 |
| 15.01 | LMF | Hudson Bridge Crossing | Stockbridge, GA | Retail | $3,800,000 | 0.5% | COMM 2014-LC15 |
| 15.02 | LMF | Shoppes at Westgate | Leland, NC | Retail | $2,771,429 | 0.4% | COMM 2014-LC15 |
| 15.03 | LMF | Shoppes at Richland | Aiken, SC | Retail | $2,442,857 | 0.3% | COMM 2014-LC15 |
| 15.04 | LMF | Shoppes at White Knoll | Lexington, SC | Retail | $2,185,714 | 0.3% | COMM 2014-LC15 |
| 15.05 | LMF | Chamblee Village | Atlanta, GA | Retail | $2,014,286 | 0.3% | COMM 2014-LC15 |
| 15.07 | LMF | Grandview Station | Marion, NC | Retail | $1,914,286 | 0.2% | COMM 2014-LC15 |
| 15.08 | LMF | Glenn View Station | Durham, NC | Retail | $1,857,143 | 0.2% | COMM 2014-LC15 |
| 15.09 | LMF | Shoppes at Raeford | Raeford, NC | Retail | $1,485,714 | 0.2% | COMM 2014-LC15 |
| 15.10 | LMF | Shoppes at Oxford | Oxford, NC | Retail | $1,457,143 | 0.2% | COMM 2014-LC15 |
| 15.11 | LMF | Shoppes at Goldsboro | Goldsboro, NC | Retail | $1,257,143 | 0.2% | COMM 2014-LC15 |
| 15.12 | LMF | Village at Red Bridge | Locust, NC | Retail | $885,714 | 0.1% | COMM 2014-LC15 |
| 18 | Oceanview | Naples Center | Naples, FL | Mixed Use | $22,000,000 | 2.8% | GSMS 2013-GC14 |
| 19 | LMF | Hampton by Hilton Inn & Suites Wellington | Wellington, FL | Hospitality | $21,000,000 | 2.7% | MSBAM 2014-C16 |
| 23 | LMF | TownePlace Suites Port St. Lucie I-95 | Port St. Lucie, FL | Hospitality | $16,600,000 | 2.1% | ACRES 2021-FL2 |
| 25.01 | GCMC | Norton Commons | Norton, VA | Retail | $8,550,000 | 1.1% | GSMS 2013-GC16 |
| 25.02 | GCMC | Marketplace At Locust Grove | Locust Grove, GA | Retail | $4,850,000 | 0.6% | CGCMT 2013-GC15 |
| 25.03 | GCMC | Lexington Shopping Center | Lexington, NC | Retail | $2,600,000 | 0.3% | CGCMT 2013-GC15 |
| 28 | BMO | Kingston Square Apartments | Indianapolis, IN | Multifamily | $14,000,000 | 1.8% | ARCLO 2021-FL2 |
| 29 | LMF | Hampton by Hilton Inn West Palm Beach-Lake Worth-Turnpike | Lake Worth, FL | Hospitality | $12,800,000 | 1.6% | MSBAM 2014-C16 |
| 33.01 | Natixis | Oak Ridge Technical Center | Oak Ridge, TN | Office | $7,687,350 | 1.0% | JPMCC 2012-C6 |
| 33.02 | Natixis | Oak Ridge Corporate Center | Oak Ridge, TN | Office | $2,873,547 | 0.4% | JPMCC 2012-C6 |
| (1) | The table above represents the properties for which the previously existing debt was most recently securitized, based on information provided by the related borrower or obtained through searches of a third-party database. |
| THE INFORMATION IN THIS STRUCTURAL AND COLLATERAL TERM SHEET IS NOT COMPLETE AND MAY BE AMENDED PRIOR TO THE TIME OF SALE. THIS TERM SHEET IS NOT AN OFFER TO SELL THESE SECURITIES AND IT IS NOT A SOLICITATION OF AN OFFER TO BUY THESE SECURITIES IN ANY JURISDICTION WHERE THE OFFER OR SALE IS NOT PERMITTED. |
| | 16 | |
| Structural and Collateral Term Sheet | | BMO 2023-C4 |
| Class A-2 and Class A-3(1) |
Class A-2
No. | Loan Name | Location | Cut-off Date Balance | % of IPB | Maturity Date Balance | % of Certificate Class(2) | Original Loan Term | Remaining Loan Term | UW NCF DSCR(3)(4) | UW NOI DY(3) | Cut-off Date LTV(3) | Maturity Date/ARD LTV(3) |
| 1 | 70 Hudson Street | Jersey City, NJ | $36,000,000 | 4.6 | % | $36,000,000 | 22.1% | 60 | 49 | 4.10x | 13.3% | 40.5% | 40.5% |
| 3 | Gilardian NYC Portfolio | New York, NY | 28,000,000 | 3.6 | | 28,000,000 | 17.2 | 60 | 59 | 2.61x | 11.5% | 39.5% | 39.5% |
| 8 | Park West Village | New York, NY | 26,000,000 | 3.3 | | 26,000,000 | 15.9 | 60 | 54 | 2.60x | 12.3% | 32.6% | 32.6% |
| 9 | Green Acres | Valley Stream, NY | 26,000,000 | 3.3 | | 26,000,000 | 15.9 | 60 | 59 | 2.10x | 13.0% | 54.5% | 54.5% |
| 10 | 575 Broadway | New York, NY | 25,951,292 | 3.3 | | 24,012,064 | 14.7 | 60 | 58 | 1.38x | 12.6% | 59.1% | 54.7% |
| 30 | PetSmart HQ | Phoenix, AZ | 12,650,000 | 1.6 | | 12,650,000 | 7.8 | 84 | 62 | 2.26x | 10.5% | 62.6% | 62.6% |
| 35 | 1136 Crescent Ave | Atlanta, GA | 8,250,000 | 1.1 | | 8,250,000 | 5.1 | 60 | 57 | 1.58x | 8.3% | 64.0% | 64.0% |
| Total / Weighted Average: | | $162,851,292 | 20.7 | % | $160,912,064 | 98.6% | 62 | 56 | 2.58x | 12.2% | 47.2% | 46.5% |
| (1) | The table above presents the mortgage loans whose balloon payments would be applied to pay down the certificate balances of the Class A-2 Certificates, assuming a 0% CPR and applying the “Modeling Assumptions” described in the Preliminary Prospectus, including the assumptions that (i) none of the mortgage loans in the pool experience prepayments, defaults or losses; (ii) there are no extensions of maturity dates of any mortgage loans in the pool; and (iii) each mortgage loan in the pool is paid in full on its stated maturity date. Each Class of Certificates, including the Class A-2 Certificates, evidences undivided ownership interests in the entire pool of mortgage loans. Debt service coverage ratio, debt yield and loan-to-value ratio information does not take into account subordinate debt (whether or not secured by the mortgaged property), if any, that is allowed under the terms of any mortgage loans. See Annex A-1 to the Preliminary Prospectus. |
(2) Reflects the percentage equal to the Percentage of the Maturity Date Balance divided by the initial Class A-2 Certificate Balance.
| (3) | In the case of Loan Nos. 1, 3, 8, 9, 10 and 30, the UW NCF DSCR, UW NOI DY, Cut-off Date LTV and Maturity Date/ARD LTV calculations include the related Pari Passu Companion Loan(s). In the case of Loan Nos. 1, 3 and 8, the UW NCF DSCR, UW NOI DY, Cut-off Date LTV and Maturity Date/ARD LTV calculations exclude the related Subordinate Companion Loans and/or related mezzanine loans. |
| (4) | For the mortgage loans that are interest-only for the entire term or until the anticipated repayment date and accrue interest on an Actual/360 basis, the Monthly Debt Service Amount ($) was calculated as 1/12th of the product of (i) the Original Balance ($), (ii) the Interest Rate % and (iii) 365/360. |
Class A-3
No. | Loan Name | Location | Cut-off Date Balance | % of IPB | Maturity Date Balance | % of Certificate Class(2) | Original Loan Term | Remaining Loan Term | UW NCF DSCR(3) | UW NOI DY | Cut-off Date LTV | Maturity Date/ARD LTV |
| 34 | Gary Indiana Portfolio | Gary, IN | $10,300,000 | 1.3% | $9,922,758 | 100.0% | 84 | 78 | 1.29x | 9.8% | 68.7% | 66.2% |
| Total / Weighted Average: | $10,300,000 | 1.3% | $9,922,758 | 100.0% | 84 | 78 | 1.29x | 9.8% | 68.7% | 66.2% |
| (1) | The table above presents the mortgage loan whose balloon payment would be applied to pay down the certificate balance of the Class A-3 Certificates, assuming a 0% CPR and applying the “Modeling Assumptions” described in the Preliminary Prospectus, including the assumptions that (i) none of the mortgage loans in the pool experience prepayments, defaults or losses; (ii) there are no extensions of maturity dates of any mortgage loans in the pool; and (iii) each mortgage loan in the pool is paid in full on its stated maturity date. Each Class of Certificates, including the Class A-3 Certificates, evidences undivided ownership interests in the entire pool of mortgage loans. Debt service coverage ratio, debt yield and loan-to-value ratio information does not take into account subordinate debt (whether or not secured by the mortgaged property), if any, that is allowed under the terms of any mortgage loan. See Annex A-1 to the Preliminary Prospectus. |
| (2) | Reflects the percentage equal to the Percentage of the Maturity Date Balance divided by the initial Class A-3 Certificate Balance. |
| (3) | For the mortgage loans that are interest-only for the entire term or until the anticipated repayment date and accrue interest on an Actual/360 basis, the Monthly Debt Service Amount ($) was calculated as 1/12th of the product of (i) the Original Balance ($), (ii) the Interest Rate % and (iii) 365/360. |
| THE INFORMATION IN THIS STRUCTURAL AND COLLATERAL TERM SHEET IS NOT COMPLETE AND MAY BE AMENDED PRIOR TO THE TIME OF SALE. THIS TERM SHEET IS NOT AN OFFER TO SELL THESE SECURITIES AND IT IS NOT A SOLICITATION OF AN OFFER TO BUY THESE SECURITIES IN ANY JURISDICTION WHERE THE OFFER OR SALE IS NOT PERMITTED. |
| | 17 | |
| Structural and Collateral Term Sheet | | BMO 2023-C4 |
| Structural Overview |
| ■ Certificates: | | The “Certificates” will consist of the Class A-1, Class A-2, Class A-3, Class A-4, Class A-5, Class A-SB, Class X-A, Class X-B, Class X-D, Class A-S, Class B, Class C, Class D, Class E-RR, Class F-RR, Class G-RR, Class J-RR, Class K-RR and Class R certificates. The Class A-1, Class A-2, Class A-3, Class A-4, Class A-5, Class A-SB, Class A-S, Class B, Class C, Class D, Class E-RR, Class F-RR, Class G-RR, Class J-RR and Class K-RR certificates are collectively referred to as the “Principal Balance Certificates”. The Class X-A, Class X-B and Class X-D certificates are collectively referred to as the “Class X Certificates”. The Principal Balance Certificates and the Class X Certificates are collectively referred to as the “Regular Certificates”. |
| ■ Accrual: | | Each Class of Certificates (other than the Class R Certificates) will accrue interest on a 30/360 basis. The Class R Certificates will not accrue interest. |
| ■ Distributions: | | The aggregate amount available for distribution to holders of the Certificates on each distribution date will be the gross amount of interest, principal, yield maintenance charges and prepayment premiums collected with respect to the mortgage loans in the applicable one-month collection period, net of specified expenses of the issuing entity, including fees payable therefrom to, and losses, liabilities, advances (with interest thereon), costs and expenses reimbursable or indemnifiable therefrom to, the master servicer, the special servicer, the certificate administrator, the trustee, the operating advisor, the asset representations reviewer and CREFC®. On each Distribution Date, funds available for distribution to holders of the Certificates (exclusive of any portion thereof that represents (i) any yield maintenance charges and prepayment premiums collected on the mortgage loans and/or (ii) any excess interest accrued after the related anticipated repayment date on any mortgage loan with an anticipated repayment date) (“Available Funds”) will be distributed in the following amounts and order of priority (in each case to the extent of remaining available funds): 1. Class A-1, Class A-2, Class A-3, Class A-4, Class A-5, Class A-SB, Class X-A, Class X-B and Class X-D certificates: to interest on the Class A-1, Class A-2, Class A-3, Class A-4, Class A-5, Class A-SB, Class X-A, Class X-B and Class X-D certificates, up to, and pro rata in accordance with, their respective interest entitlements. 2. Class A-1, Class A-2, Class A-3, Class A-4, Class A-5 and Class A-SB certificates: to the extent of Available Funds allocable to principal received or advanced on the mortgage loans, (i) to principal on the Class A-SB certificates until their certificate balance is reduced to the Class A-SB scheduled principal balance set forth in Annex F to the Preliminary Prospectus for the relevant Distribution Date, then (ii) to principal on the Class A-1 certificates until their certificate balance is reduced to zero, all funds available for distribution of principal remaining after the distributions to the Class A-SB certificates in clause (i) above, then (iii) to principal on the Class A-2 certificates until their certificate balance is reduced to zero, all funds available for distribution of principal remaining after the distributions to the Class A-1 certificates in clause (ii) above, then (iv) to principal on the Class A-3 certificates until their certificate balance is reduced to zero, all funds available for distribution of principal remaining after the distributions to the Class A-2 certificates in clause (iii) above, then (v) to principal on the Class A-4 certificates until their certificate balance is reduced to zero, all funds available for distribution of principal remaining after the distributions to the Class A-3 certificates in clause (iv) above, then (vi) to principal on the Class A-5 certificates until their certificate balance is reduced to zero, all funds available for distribution of principal remaining after the distributions to the Class A-4 certificates in clause (v) above and then (vii) to principal on the Class A-SB certificates until their certificate balance is reduced to zero, all funds available for distribution of principal remaining after the distributions to the Class A-5 certificates in clause (vi) above. However, if the certificate balances of each and every class of the Class A-S, Class B, Class C, Class D, Class E-RR, Class F-RR, Class G-RR, Class J-RR and Class K-RR certificates have been reduced to zero as a result of the allocation of mortgage loan losses and other unanticipated expenses to those certificates, then Available Funds allocable to principal will be distributed to the Class A-1, Class A-2, Class A-3, Class A-4, Class A-5 and Class A-SB certificates, pro rata, based on their respective certificate balances (and the schedule for the Class A-SB principal distributions will be disregarded). 3. Class A-1, Class A-2, Class A-3, Class A-4, Class A-5 and Class A-SB certificates: to reimburse the Class A-1, Class A-2, Class A-3, Class A-4, Class A-5 and Class A-SB certificates, pro rata, for any unreimbursed losses on the mortgage loans that were previously allocated to reduce the certificate balances of those classes, together with interest at their respective pass-through rates. 4. Class A-S certificates: (i) first, to interest on the Class A-S certificates in the amount of their interest entitlement; (ii) next, to the extent of Available Funds allocable to principal remaining after distributions in respect of principal to each class of Principal Balance Certificates with a higher principal payment priority (in this case, the Class A-1, Class A-2, Class A-3, Class A-4, Class A-5 and Class A-SB certificates), to principal on the Class A-S certificates until their |
| THE INFORMATION IN THIS STRUCTURAL AND COLLATERAL TERM SHEET IS NOT COMPLETE AND MAY BE AMENDED PRIOR TO THE TIME OF SALE. THIS TERM SHEET IS NOT AN OFFER TO SELL THESE SECURITIES AND IT IS NOT A SOLICITATION OF AN OFFER TO BUY THESE SECURITIES IN ANY JURISDICTION WHERE THE OFFER OR SALE IS NOT PERMITTED. |
| | 18 | |
| Structural and Collateral Term Sheet | | BMO 2023-C4 |
| Structural Overview |
| | certificate balance is reduced to zero; and (iii) next, to reimburse the Class A-S certificates for any unreimbursed losses on the mortgage loans that were previously allocated to reduce the certificate balance of that class, together with interest at its pass-through rate. 5. Class B certificates: (i) first, to interest on the Class B certificates in the amount of their interest entitlement; (ii) next, to the extent of Available Funds allocable to principal remaining after distributions in respect of principal to each class of Principal Balance Certificates with a higher principal payment priority (in this case, the Class A-1, Class A-2, Class A-3, Class A-4, Class A-5, Class A-SB and Class A-S certificates), to principal on the Class B certificates until their certificate balance is reduced to zero; and (iii) next, to reimburse Class B certificates for any unreimbursed losses on the mortgage loans that were previously allocated to reduce the certificate balance of that class, together with interest at its pass-through rate. 6. Class C certificates: (i) first, to interest on the Class C certificates in the amount of their interest entitlement; (ii) next, to the extent of Available Funds allocable to principal remaining after distributions in respect of principal to each class of Principal Balance Certificates with a higher principal payment priority (in this case, the Class A-1, Class A-2, Class A-3, Class A-4, Class A-5, Class A-SB, Class A-S and Class B certificates), to principal on the Class C certificates until their certificate balance is reduced to zero; and (iii) next, to reimburse the Class C certificates for any unreimbursed losses on the mortgage loans that were previously allocated to reduce the certificate balance of that class, together with interest at its pass-through rate. 7. After the Class A-1, Class A-2, Class A-3, Class A-4, Class A-5, Class A-SB, Class X-A, Class X-B, Class X-D, Class A-S, Class B and Class C certificates are paid all amounts to which they are entitled on such Distribution Date, the remaining Available Funds will be used to pay interest and principal and to reimburse (with interest) any unreimbursed losses to the Class D, Class E-RR, Class F-RR, Class G-RR, Class J-RR and Class K-RR certificates, sequentially in that order and with respect to each such class in a manner analogous to the Class C certificates pursuant to clause 6 above. |
■ Realized Losses: | | The certificate balances of the Principal Balance Certificates will each be reduced without distribution on any Distribution Date as a write-off to the extent of any loss realized on the mortgage loans allocated to the related class on such Distribution Date. On each Distribution Date, any such losses will be applied to the respective classes of Principal Balance Certificates in the following order, in each case until the related certificate balance is reduced to zero: first to the Class K-RR certificates, second, to the Class J-RR certificates; third, to the Class G-RR certificates; fourth, to the Class F-RR certificates; fifth, to the Class E-RR certificates; sixth, to the Class D certificates; seventh, to the Class C certificates; eighth, to the Class B certificates; ninth, to the Class A-S certificates; and, finally pro rata, to the Class A-1, Class A-2, Class A-3, Class A-4, Class A-5 and Class A-SB certificates, based on their then current respective certificate balances. The notional amount of each class of Class X Certificates will be reduced to reflect reductions in the certificate balance(s) of the class (or classes, as applicable) of Corresponding Principal Balance Certificates as a result of allocations of losses realized on the mortgage loans to such class(es) of Principal Balance Certificates. |
| ■ Prepayment Premiums and Yield Maintenance Charges: | | On each Distribution Date, until the notional amounts of the Class X-A, Class X-B and Class X-D certificates and the certificate balances of the Class A-1, Class A-2, Class A-3, Class A-4, Class A-5, Class A-SB, Class A-S, Class B, Class C, Class D and Class E-RR certificates have been reduced to zero, each yield maintenance charge collected on the mortgage loans during the related one-month collection period (or, in the case of an outside serviced mortgage loan, that accompanied a principal prepayment included in the Available Funds for such Distribution Date) is required to be distributed to holders of the Regular Certificates (excluding holders of the Class F-RR, Class G-RR, Class J-RR and Class K-RR certificates) as follows: (a) first such yield maintenance charge will be allocated between (i) the group (the “YM Group A”) of the Class A-1, Class A-2, Class A-3, Class A-4, Class A-5, Class A-SB and Class X-A certificates, (ii) the group (the “YM Group A-S/B/C”) comprised of the Class A-S, Class B, Class C and Class X-B certificates, (iii) the group (the “YM Group D”) comprised of the Class X-D and Class D certificates, and (iv) the group (the “YM Group E-RR”, and the YM Group A, the YM Group A-S/B/C, the YM Group D and the YM Group E-RR , together, the “YM Groups”) comprised solely of the Class E-RR certificates, pro rata, based upon the aggregate amount of principal distributed to the class or classes of Principal Balance Certificates in each YM Group on such Distribution Date, and (b) then the portion of such yield maintenance charge allocated to each YM Group will be further allocated as among the classes of Regular Certificates in such YM Group, in the following manner: (i) each class of Principal Balance Certificates in such YM Group will entitle the applicable certificateholders to receive on the applicable Distribution Date that portion of such yield maintenance charge equal to the product of (X) a fraction whose numerator is the amount of principal distributed to such class of Principal Balance Certificates on such Distribution Date and whose denominator is the total amount of principal distributed to all of the Principal Balance Certificates in that YM Group on such Distribution Date, (Y) except in the case of any YM Group comprised solely of a class or classes of Principal Balance Certificates, the Base Interest Fraction (as defined in the Preliminary Prospectus) for the related principal prepayment and such class of Principal Balance Certificates, and (Z) the portion of such yield maintenance charge allocated to such YM |
| THE INFORMATION IN THIS STRUCTURAL AND COLLATERAL TERM SHEET IS NOT COMPLETE AND MAY BE AMENDED PRIOR TO THE TIME OF SALE. THIS TERM SHEET IS NOT AN OFFER TO SELL THESE SECURITIES AND IT IS NOT A SOLICITATION OF AN OFFER TO BUY THESE SECURITIES IN ANY JURISDICTION WHERE THE OFFER OR SALE IS NOT PERMITTED. |
| | 19 | |
| Structural and Collateral Term Sheet | | BMO 2023-C4 |
| Structural Overview |
| | Group, and (ii) the portion of such yield maintenance charge allocated to such YM Group and remaining after such distributions with respect to the Principal Balance Certificates in such YM Group will be distributed to the class of Class X Certificates (if any) in such YM Group. If there is more than one class of Principal Balance Certificates in any YM Group entitled to distributions of principal on any particular Distribution Date on which yield maintenance charges are distributable to such classes, the aggregate portion of such yield maintenance charges allocated to such YM Group will be allocated among all such classes of Principal Balance Certificates up to, and on a pro rata basis in accordance with, their respective entitlements in those yield maintenance charges in accordance with the prior sentence of this paragraph. If a prepayment premium (calculated as a percentage of the amount prepaid) is imposed in connection with a prepayment rather than a yield maintenance charge, then the prepayment premium so collected will be allocated as described above. For this purpose, the discount rate used to calculate the Base Interest Fraction will be the discount rate used to determine the yield maintenance charge for mortgage loans that require payment at the greater of a yield maintenance charge or a minimum amount equal to a fixed percentage of the principal balance of the mortgage loan or, for mortgage loans that only have a prepayment premium based on a fixed percentage of the principal balance of the mortgage loan, such other discount rate as may be specified in the related loan documents. After the notional amounts of the Class X-A, Class X-B and Class X-D certificates and the certificate balances of the Class A-1, Class A-2, Class A-3, Class A-4, Class A-5, Class A-SB, Class A-S, Class B, Class C, Class D and Class E-RR certificates have been reduced to zero, all prepayment premiums and yield maintenance charges with respect to the mortgage loans will be allocated among the holders of the Class F-RR, Class G-RR, Class K-RR and Class J-RR certificates as provided in the BMO 2023-C4 pooling and servicing agreement. No yield maintenance charges or prepayment premiums will be distributed to the holders of the Class R certificates. For a description of prepayment premiums and yield maintenance charges required on the mortgage loans, see Annex A to the Preliminary Prospectus. See also “Certain Legal Aspects of the Mortgage Loans—Default Interest and Limitations on Prepayments” in the Preliminary Prospectus. |
| ■ Advances: | | The master servicer and, if it fails to do so, the trustee, will be obligated to make P&I advances with respect to each mortgage loan in the issuing entity and, with respect to all of the mortgage loans serviced under the BMO 2023-C4 pooling and servicing agreement, servicing advances, including paying delinquent property taxes, condominium assessments, insurance premiums and ground lease rents, but only to the extent that those advances are not deemed non-recoverable from collections on the related mortgage loan and, in the case of servicing advances, any related companion loans as described below. P&I advances are subject to reduction in connection with any appraisal reductions that may occur. The special servicer will have no obligation to make any advances, provided that, in an urgent or emergency situation requiring the making of a property protection advance, the special servicer may, in its sole discretion, make a property protection advance and will be entitled to reimbursement from the master servicer for such advance. The master servicer, the special servicer and the trustee will each be entitled to receive interest on advances they make at the prime rate (and, solely in the case of the master servicer, subject to a floor of 2.0% per annum), compounded annually. |
■ Serviced Mortgage Loans/Outside Serviced Mortgage Loans: | | One or more whole loans may each constitute an “outside serviced whole loan”, in which case (as identified under “Collateral Characteristics—Pari Passu Companion Loan Summary” above), the BMO 2023-C4 pooling and servicing agreement is not the Controlling PSA, and each related mortgage loan constitutes an “outside serviced mortgage loan,” each related companion loan constitutes an “outside serviced companion loan,” and each related Controlling PSA constitutes an “outside servicing agreement.” One or more whole loans may be identified in the Preliminary Prospectus as a “servicing shift whole loan”, in which case the related mortgage loan constitutes a “servicing shift mortgage loan” and each related companion loan constitutes a “servicing shift companion loan”. Any servicing shift whole loan will initially be serviced pursuant to the BMO 2023-C4 pooling and servicing agreement during which time such mortgage loan, such whole loan and each related companion loan will be a serviced mortgage loan, a serviced whole loan and a serviced companion loan (each as defined below), respectively. However, upon the inclusion of the related controlling pari passu companion loan in a future securitization transaction, the servicing of such mortgage loan will shift to the servicing agreement governing such securitization transaction, and such mortgage loan, such whole loan and each related companion loan will be an outside serviced mortgage loan, an outside serviced whole loan and an outside serviced companion loan, respectively. All of the mortgage loans transferred to the issuing entity (other than any outside serviced mortgage loan) are sometimes referred to in this Term Sheet as the “serviced mortgage loans” and, together with any related companion loans, as the “serviced loans” (which signifies that they are being serviced by the master servicer and the special servicer under the BMO 2023-C4 pooling and servicing agreement); each related whole loan constitutes a “serviced whole loan”; and each related |
| THE INFORMATION IN THIS STRUCTURAL AND COLLATERAL TERM SHEET IS NOT COMPLETE AND MAY BE AMENDED PRIOR TO THE TIME OF SALE. THIS TERM SHEET IS NOT AN OFFER TO SELL THESE SECURITIES AND IT IS NOT A SOLICITATION OF AN OFFER TO BUY THESE SECURITIES IN ANY JURISDICTION WHERE THE OFFER OR SALE IS NOT PERMITTED. |
| | 20 | |
| Structural and Collateral Term Sheet | | BMO 2023-C4 |
| Structural Overview |
| | companion loan constitutes a “serviced companion loan.” See “Description of the Mortgage Pool—The Whole Loans” in the Preliminary Prospectus. |
| ■ Appraisal Reduction Amounts: | | An Appraisal Reduction Amount generally will be created with respect to a required appraisal loan (which is a serviced loan as to which certain defaults, modifications or insolvency events have occurred (as further described in the Preliminary Prospectus)) in the amount, if any, by which the principal balance of such required appraisal loan, plus other amounts overdue or advanced in connection with such required appraisal loan, exceeds 90% of the appraised value of the related mortgaged property (subject to certain downward adjustments permitted under the BMO 2023-C4 pooling and servicing agreement) plus certain escrows and reserves (including letters of credit) held with respect to such required appraisal loan; provided that, if so provided in the related co-lender agreement, the holder of a subordinate companion loan may be permitted to post cash or a letter of credit to offset some or all of an Appraisal Reduction Amount. In the case of an outside serviced mortgage loan, any Appraisal Reduction Amounts will be calculated pursuant to, and by a party to, the related outside servicing agreement. In general, any Appraisal Reduction Amount calculated with respect to a whole loan will be allocated first, to any related subordinate companion loan(s) (up to the outstanding principal balance(s) thereof), and then, to the related mortgage loan and any related pari passu companion loan(s) on a pro rata basis in accordance with their respective outstanding principal balances. As a result of an Appraisal Reduction Amount being calculated for and/or allocated to a given mortgage loan, the interest portion of any P&I advance for such mortgage loan will be reduced, which will have the effect of reducing the amount of interest available to the most subordinate class(es) of Certificates then outstanding (i.e., first, to the Class K-RR certificates, then, to the Class J-RR certificates, then, to the Class G-RR certificates, then, to the Class F-RR certificates, then, to the Class E-RR certificates, then, to the Class D certificates, then, to the Class C certificates, then, to the Class B certificates, then, to the Class A-S certificates, and then, pro rata based on interest entitlements, to the Class A-1, Class A-2, Class A-3, Class A-4, Class A-5, Class A-SB, Class X-A, Class X-B and Class X-D certificates). In general, a serviced loan will cease to be a required appraisal loan, and no longer be subject to an Appraisal Reduction Amount, when the same has ceased to be a specially serviced loan (if applicable), has been brought current for at least three consecutive months and no other circumstances exist that would cause such serviced loan to be a required appraisal loan. For various purposes under the BMO 2023-C4 pooling and servicing agreement (including, with respect to the Principal Balance Certificates, for purposes of determining the Non-Reduced Certificates and the Controlling Class, as well as the occurrence of a Control Termination Event and an Operating Advisor Consultation Trigger Event), any Appraisal Reduction Amounts in respect of or allocated to the mortgage loans will be allocated to notionally reduce the certificate balances of the Principal Balance Certificates as follows: first, to the Class K-RR, Class J-RR, Class G-RR, Class F-RR, Class E-RR, Class D, Class C, Class B and Class A-S certificates, in that order, in each case until the related certificate balance is notionally reduced to zero; and then to the Class A-1, Class A-2, Class A-3, Class A-4, Class A-5 and Class A-SB certificates, pro rata based on certificate balance. |
■ Cumulative Appraisal Reduction Amounts: | | A “Cumulative Appraisal Reduction Amount”, as of any date of determination, is equal to the sum of (i) all Appraisal Reduction Amounts then in effect, and (ii) with respect to any AB Modified Loans, any Collateral Deficiency Amounts then in effect. “Collateral Deficiency Amount” means, with respect to any AB Modified Loan as of any date of determination, the excess of (i) the stated principal balance of such AB Modified Loan (taking into account the related junior note(s) included therein), over (ii) the sum of (in the case of a whole loan, solely to the extent allocable to the subject mortgage loan) (x) the most recent appraised value for the related mortgaged property or mortgaged properties, plus (y) solely to the extent not reflected or taken into account in such appraised value and to the extent on deposit with, or otherwise under the control of, the lender as of the date of such determination, any capital or additional collateral contributed by the related borrower at the time the mortgage loan became (and as part of the modification related to) such AB Modified Loan for the benefit of the related mortgaged property or mortgaged properties (provided, that in the case of an outside serviced mortgage loan, the amounts set forth in this clause (y) will be taken into account solely to the extent relevant information is received), plus (z) any other escrows or reserves (in addition to any amounts set forth in the immediately preceding clause (y)) held by the lender in respect of such AB Modified Loan as of the date of such determination. For purposes of determining the identity of the Controlling Class and the existence of a Control Termination Event and an Operating Advisor Consultation Trigger Event, Collateral Deficiency Amounts will be allocable to the respective classes of Control Eligible Certificates (as defined below), in reverse alphabetical order of class designation, in a manner similar to the allocation of Appraisal Reduction Amounts to such classes. “AB Modified Loan” means any corrected mortgage loan (1) that became a corrected mortgage loan (which includes for purposes of this definition any outside serviced mortgage loan that became a “corrected” mortgage loan (or any term substantially similar thereto) pursuant to the related outside servicing agreement) due to a modification thereto that resulted in the creation of an A/B note structure (or similar structure) and as to which the new junior note(s) did not previously exist or the principal |
| THE INFORMATION IN THIS STRUCTURAL AND COLLATERAL TERM SHEET IS NOT COMPLETE AND MAY BE AMENDED PRIOR TO THE TIME OF SALE. THIS TERM SHEET IS NOT AN OFFER TO SELL THESE SECURITIES AND IT IS NOT A SOLICITATION OF AN OFFER TO BUY THESE SECURITIES IN ANY JURISDICTION WHERE THE OFFER OR SALE IS NOT PERMITTED. |
| | 21 | |
| Structural and Collateral Term Sheet | | BMO 2023-C4 |
| Structural Overview |
| | amount of the new junior note(s) was previously part of either an A note held by the trust or the original unmodified mortgage loan and (2) as to which an Appraisal Reduction Amount is not in effect. |
| ■ Age of Appraisals: | | Appraisals (which can be an update of a prior appraisal) with respect to a serviced loan are required to be no older than 9 months for purposes of determining appraisal reductions (other than the annual re-appraisal), market value, and other calculations as described in the Preliminary Prospectus. |
| ■ Sale of Defaulted Loans: | | There will be no “Fair Market Value Purchase Option”. Instead, defaulted mortgage loans will be sold in a process similar to the sale process for REO property. With respect to an outside serviced whole loan, the party acting as special servicer with respect to such outside serviced whole loan pursuant to the related outside servicing agreement (the “outside special servicer”) may offer to sell to any person (or may offer to purchase) for cash such outside serviced whole loan in accordance with the terms of the related outside servicing agreement during such time as such outside serviced whole loan constitutes a defaulted mortgage loan qualifying for sale thereunder and, in connection with any such sale, the related outside special servicer is required to sell both the applicable outside serviced mortgage loan and the related outside serviced pari passu companion loan(s) and, if so provided in the related co-lender agreement or the Controlling PSA, any related subordinate companion loan(s), together as one defaulted loan. |
| ■ Directing Holder: | | The “Directing Holder” with respect to any mortgage loan or whole loan serviced under the BMO 2023-C4 pooling and servicing agreement will be: ● except (i) with respect to an excluded mortgage loan, (ii) with respect to a serviced whole loan as to which the Controlling Note is held outside the issuing entity (sometimes referred to in this Term Sheet as a “serviced outside controlled whole loan”), and (iii) during any period that a Control Termination Event has occurred and is continuing, the Controlling Class Representative; and ● with respect to any serviced outside controlled whole loan (which may include a servicing shift whole loan or any other serviced whole loan with a controlling companion loan held outside the issuing entity), if and for so long as such holder is entitled under the related co-lender agreement to exercise consent rights similar to those entitled to be exercised by the Controlling Class Representative, the holder of the related Controlling Note (during any such period, the “outside controlling note holder”); The applicable directing holder (or equivalent party) with respect to any outside serviced mortgage loan will be, in general, (i) in the event the related Controlling Note is included in the subject outside securitization transaction, the controlling class representative (or equivalent entity) under the related outside servicing agreement, and (ii) in all other cases, the third party holder of the related Controlling Note or its representative (which may be a controlling class representative (or equivalent entity) under a separate securitization transaction to which such note has been transferred (if any)), as provided in the related co-lender agreement. An “excluded mortgage loan” is, if the Controlling Class Representative is the Directing Holder with respect to the subject mortgage loan, a mortgage loan or related whole loan with respect to which the Controlling Class Representative or the holder(s) of more than 50% of the Controlling Class (by certificate balance) is (or are) a Borrower Party (as defined in the Preliminary Prospectus). |
| ■ Controlling Class Representative: | | The “Controlling Class Representative” will be the controlling class certificateholder or other representative designated by at least a majority of the controlling class certificateholders by certificate balance. The “Controlling Class” is, as of any time of determination, the most subordinate class of the Control Eligible Certificates that has an outstanding certificate balance as notionally reduced by any Cumulative Appraisal Reduction Amount allocable to such class, at least equal to 25% of the initial certificate balance of that class of certificates; provided that (except under the circumstances set forth in the next proviso) if no such class meets the preceding requirement, then the Class E-RR certificates will be the controlling class; provided, further, however, that if, at any time, the aggregate outstanding certificate balance of the classes of Principal Balance Certificates senior to the Control Eligible Certificates has been reduced to zero (without regard to the allocation of any Cumulative Appraisal Reduction Amounts), then the “Controlling Class” will be the most subordinate class of Control Eligible Certificates with an outstanding certificate balance greater than zero (without regard to the allocation of any Cumulative Appraisal Reduction Amounts). The “Control Eligible Certificates” consist of the Class E-RR, Class F-RR, Class G-RR, Class J-RR and Class K-RR certificates. See “The Pooling and Servicing Agreement—Directing Holder” in the Preliminary Prospectus. No other class of certificates will be eligible to act as the controlling class or appoint a Controlling Class Representative. No person may exercise any of the rights and powers of the Controlling Class Representative with respect to an excluded mortgage loan. On the Closing Date, Sabal Strategic Opportunities Fund, L.P. or its affiliate, is expected to (i) purchase the Class E-RR, Class F-RR, Class G-RR, Class J-RR and Class K-RR certificates, and (ii) to appoint itself or an affiliate as the initial Controlling Class Representative. |
| THE INFORMATION IN THIS STRUCTURAL AND COLLATERAL TERM SHEET IS NOT COMPLETE AND MAY BE AMENDED PRIOR TO THE TIME OF SALE. THIS TERM SHEET IS NOT AN OFFER TO SELL THESE SECURITIES AND IT IS NOT A SOLICITATION OF AN OFFER TO BUY THESE SECURITIES IN ANY JURISDICTION WHERE THE OFFER OR SALE IS NOT PERMITTED. |
| | 22 | |
| Structural and Collateral Term Sheet | | BMO 2023-C4 |
| Structural Overview |
■ Control Termination Event: | | A “Control Termination Event” will with respect to any mortgage loan either (a) occur when none of the classes of the Control Eligible Certificates has an outstanding certificate balance (as notionally reduced by any Cumulative Appraisal Reduction Amount then allocable to such class) that is at least equal to 25% of the initial certificate balance of that class of certificates or (b) be deemed to occur as described below; provided, however, that a Control Termination Event will in no event exist at any time that the certificate balance of each class of the Principal Balance Certificates senior to the Control Eligible Certificates (without regard to the allocation of Cumulative Appraisal Reduction Amounts) has been reduced to zero. With respect to excluded mortgage loans as to which the Controlling Class Representative would otherwise be the Directing Holder, a Control Termination Event will be deemed to exist. The holders of Certificates representing the majority of the certificate balance of the most senior class of Control Eligible Certificates whose certificate balance is notionally reduced to less than 25% of the initial certificate balance of that class as a result of an allocation of an Appraisal Reduction Amount or a Collateral Deficiency Amount, as applicable, to such class will have the right to challenge the Special Servicer’s Appraisal Reduction Amount determination or a Collateral Deficiency Amount determination, as applicable, and, at their sole expense, obtain a second appraisal for any serviced loan for which an Appraisal Reduction Event has occurred or as to which there exists a Collateral Deficiency Amount, under the circumstances described in the Preliminary Prospectus. |
■ Consultation Termination Event: | | A “Consultation Termination Event” with respect to any mortgage loan, (a) when none of the classes of Control Eligible Certificates has an outstanding certificate balance, without regard to the allocation of any Cumulative Appraisal Reduction Amount, that is equal to or greater than 25% of the initial certificate balance of that class of certificates or (b) be deemed to occur as described below; provided, however, that a Consultation Termination Event will in no event exist at any time that the certificate balance of each class of the Principal Balance Certificates senior to the Control Eligible Certificates (without regard to the allocation of Cumulative Appraisal Reduction Amounts) has been reduced to zero. With respect to excluded mortgage loans as to which the Controlling Class Representative would otherwise be a Consulting Party, a Consultation Termination Event will be deemed to exist. |
■ Control/Consultation Rights: | | With respect to any Serviced Loan, the applicable Directing Holder will be entitled to have consent and/or consultation rights under the BMO 2023-C4 pooling and servicing agreement with respect to certain major decisions (including with respect to assumptions, waivers, certain loan modifications and workouts) and other matters with respect to each serviced loan. After the occurrence and during the continuance of a Control Termination Event, the consent rights of the Controlling Class Representative will terminate, and the Controlling Class Representative will retain non-binding consultation rights under the BMO 2023-C4 pooling and servicing agreement with respect to certain major decisions and other matters with respect to the serviced mortgage loans, other than (i) any excluded mortgage loan and (ii) any serviced outside controlled whole loan. After the occurrence and during the continuance of a Consultation Termination Event, all of these rights of the Controlling Class Representative with respect to the applicable serviced loans will terminate. With respect to any serviced outside controlled whole loan (including any servicing shift whole loan for so long as it is serviced under the BMO 2023-C4 pooling and servicing agreement), the holder of the related Controlling Note or its representative (which holder or representative will not be the Controlling Class Representative) will instead be entitled to exercise the above-described consent and consultation rights, to the extent provided under the related co-lender agreement. With respect to each outside serviced whole loan, the applicable outside controlling class representative or other related controlling noteholder pursuant to, and subject to the limitations set forth in, the related outside servicing agreement and the related co-lender agreement will have consent, consultation, approval and direction rights with respect to certain major decisions (including with respect to assumptions, waivers, loan modifications and workouts) regarding such outside serviced whole loan, as provided for in the related co-lender agreement and in the related outside servicing agreement. To the extent permitted under the related co-lender agreement, the Controlling Class Representative (so long as a Consultation Termination Event does not exist) may have certain consultation rights with respect to each outside serviced whole loan. See “Description of the Mortgage Pool—The Whole Loans” in the Preliminary Prospectus. |
| THE INFORMATION IN THIS STRUCTURAL AND COLLATERAL TERM SHEET IS NOT COMPLETE AND MAY BE AMENDED PRIOR TO THE TIME OF SALE. THIS TERM SHEET IS NOT AN OFFER TO SELL THESE SECURITIES AND IT IS NOT A SOLICITATION OF AN OFFER TO BUY THESE SECURITIES IN ANY JURISDICTION WHERE THE OFFER OR SALE IS NOT PERMITTED. |
| | 23 | |
| Structural and Collateral Term Sheet | | BMO 2023-C4 |
| Structural Overview |
| ■ Termination of Special Servicer: | | At any time, the special servicer (but not any outside special servicer for any outside serviced whole loan) may be removed and replaced by the applicable Directing Holder, if any, with or without cause upon satisfaction of certain conditions specified in the BMO 2023-C4 pooling and servicing agreement. After the occurrence and during the continuance of a Control Termination Event, the holders of at least 25% of the voting rights of the Certificates (without regard to the application of any Appraisal Reduction Amounts) may request a vote to replace the special servicer (with respect to all of the serviced loans other than any serviced outside controlled whole loan). The subsequent vote may result in the termination and replacement of the special servicer if, within 180 days of the initial request for that vote, the holders of (a) at least 66-2/3% of the voting rights allocable to the Certificates of those holders that voted on the matter (provided that holders representing the applicable Certificateholder Quorum voted on the matter), or (b) more than 50% of the voting rights of each class of Certificates that are Non-Reduced Certificates vote affirmatively to so replace. “Non-Reduced Certificates” means each class of Principal Balance Certificates that has an outstanding certificate balance as may be notionally reduced by any Appraisal Reduction Amounts allocated to that class, equal to or greater than 25% of an amount equal to the initial certificate balance of that class of certificates minus all principal payments made on such class of certificates. Notwithstanding the foregoing, but subject to the discussion in the next paragraph, solely with respect to a serviced outside controlled whole loan (including any servicing shift whole loan, for so long as it is serviced pursuant to the BMO 2023-C4 pooling and servicing agreement), only the holder of the related Controlling Note or its representative may terminate the special servicer without cause (solely with respect to the related whole loan) and appoint a replacement special servicer for that whole loan. If the operating advisor determines, in its sole discretion exercised in good faith, that (1) the special servicer has failed to comply with the servicing standard and (2) a replacement of the special servicer would be in the best interest of the certificateholders (as a collective whole), the operating advisor will have the right to recommend the replacement of the special servicer with respect to the serviced loans, resulting in a solicitation of a certificateholder vote. The subsequent vote may result in the termination and replacement of the special servicer if, within 180 days of the initial request for that vote, the holders of at least a majority of the aggregate outstanding principal balance of the Certificates of those holders that voted on the matter (provided that holders representing the applicable Certificateholder Quorum vote on the matter) vote affirmatively to so replace. “Certificateholder Quorum” means a quorum that: (a) for purposes of a vote to terminate and replace the special servicer or the asset representations reviewer at the request of the holders of Certificates evidencing not less than 25% of the voting rights (without regard to the application of any Appraisal Reduction Amounts), consists of the holders of Certificates evidencing at least 50% of the voting rights (taking into account the allocation of any Appraisal Reduction Amounts to notionally reduce the certificate balances of the respective classes of Principal Balance Certificates) of all of the Certificates, on an aggregate basis; and (b) for purposes of a vote to terminate and replace the special servicer based on a recommendation of the operating advisor, consists of the holders of Certificates evidencing at least 20% of the aggregate of the outstanding principal balances of all Certificates, with such quorum including at least (3) holders and/or beneficial owners of Certificates that are not “affiliated” (as defined in Regulation RR) with each other. The related outside special servicer under each outside servicing agreement generally may be (or, if the applicable outside servicing agreement has not yet been executed, it is anticipated that such outside special servicer may be) replaced by the related outside controlling class representative (or an equivalent party), or the vote of the requisite holders of certificates issued, under the applicable outside servicing agreement (depending on whether or not the equivalent of a control termination event or a consultation termination event exists under that outside servicing agreement) or by any applicable other controlling noteholder under the related co-lender agreement in a manner generally similar to the manner in which the special servicer may be replaced under the BMO 2023-C4 pooling and servicing agreement as described above in this “Termination of Special Servicer” section (although there will be differences, in particular as regards certificateholder votes and the timing of when an outside special servicer may be terminated based on the recommendation of an operating advisor). If the special servicer, to its knowledge, becomes a Borrower Party with respect to a mortgage loan, the special servicer will not be permitted to act as special servicer with respect to that mortgage loan. Subject to certain limitations described in the Preliminary Prospectus, any applicable Directing Holder will be entitled to appoint a replacement special servicer for that mortgage loan. If there is no applicable Directing Holder or if the applicable Directing Holder does not take action to appoint a replacement special servicer within the requisite time period, a replacement special servicer will be appointed in the manner specified in the BMO 2023-C4 pooling and servicing agreement. |
| THE INFORMATION IN THIS STRUCTURAL AND COLLATERAL TERM SHEET IS NOT COMPLETE AND MAY BE AMENDED PRIOR TO THE TIME OF SALE. THIS TERM SHEET IS NOT AN OFFER TO SELL THESE SECURITIES AND IT IS NOT A SOLICITATION OF AN OFFER TO BUY THESE SECURITIES IN ANY JURISDICTION WHERE THE OFFER OR SALE IS NOT PERMITTED. |
| | 24 | |
| Structural and Collateral Term Sheet | | BMO 2023-C4 |
| Structural Overview |
| ■ Voting Rights: | | At all times during the term of the BMO 2023-C4 pooling and servicing agreement, the voting rights for the Certificates (the “voting rights”) will be allocated among the respective classes of certificateholders in the following percentages: (1) 1% in the aggregate in the case of the respective classes of the Class X Certificates, allocated pro rata based upon their respective notional amounts as of the date of determination (for so long as the notional amount of at least one class of the Class X Certificates is greater than zero), and (2) in the case of any class of Principal Balance Certificates, a percentage equal to the product of 99% (or, if the notional amounts of all classes of the Class X Certificates have been reduced to zero, 100%) and a fraction, the numerator of which is equal to the certificate balance of such class of Principal Balance Certificates as of the date of determination, and the denominator of which is equal to the aggregate of the certificate balances of all classes of the Principal Balance Certificates, in each case, as of the date of determination, provided, that in certain circumstances described under “The Pooling and Servicing Agreement” in the Preliminary Prospectus, voting rights will only be exercisable by holders of Certificates that are Non-Reduced Certificates and/or may otherwise be exercisable or allocated in a manner that takes into account the allocation of Appraisal Reduction Amounts. The voting rights of any class of certificates are required to be allocated among certificateholders of such class in proportion to their respective percentage interests. The Class R certificates will not be entitled to any voting rights. |
| ■ Servicing Compensation: | | Modification Fees: Certain fees resulting from modifications, amendments, waivers or other changes to the terms of the loan documents, as more fully described in the Preliminary Prospectus, will be used to offset expenses on the related serviced mortgage loan (i.e. reimburse the trust for certain expenses, including unreimbursed advances and interest on unreimbursed advances previously incurred (other than special servicing fees, workout fees and liquidation fees) on the related serviced mortgage loan but not yet reimbursed to the trust or servicers or to pay expenses (other than special servicing fees, workout fees and liquidation fees) that are still outstanding in each case unless as part of the written modification the related borrower is required to pay these amounts on a going forward basis or in the future). Any excess modification fees not so applied to offset expenses will be available as compensation to the master servicer and/or special servicer. Within any prior 12-month period, all such excess modification fees earned by the master servicer or by the special servicer (after taking into account the offset described below applied during such 12-month period) with respect to any serviced mortgage loan will be subject to a cap equal to the greater of (i) 1% of the outstanding principal balance of such mortgage loan after giving effect to such transaction and (ii) $25,000. All excess modification fees earned by the special servicer will be required to offset any future workout fees or liquidation fees payable with respect to the related serviced mortgage loan or related REO property; provided, that if the serviced mortgage loan ceases being a corrected loan, and is subject to a subsequent modification, any excess modification fees earned by the special servicer prior to such serviced mortgage loan ceasing to be a corrected loan will no longer be offset against future liquidation fees and workout fees unless such serviced mortgage loan ceased to be a corrected loan within 18 months of it becoming a modified mortgage loan. Penalty Fees: All late fees and default interest will first be used to reimburse certain expenses previously incurred with respect to the related mortgage loan (including special servicing fees, workout fees and liquidation fees) but not yet reimbursed to the trust, the master servicer or the special servicer or to pay certain expenses (including special servicing fees, workout fees and liquidation fees) that are still outstanding on the related mortgage loan, and any excess received with respect to a serviced loan will be paid to the master servicer (for penalty fees accrued while a non-specially serviced loan) and the special servicer (for penalty fees accrued while a specially serviced loan). To the extent any amounts reimbursed out of penalty charges are subsequently recovered on a related serviced loan, they will be paid to the master servicer or special servicer who would have been entitled to the related penalty charges that were previously used to reimburse such expense. Liquidation / Workout Fees: Liquidation fees will be calculated at the lesser of (a) 1.0% or (b) with respect to any serviced mortgage loan (or related serviced whole loan, if applicable) or related REO Property, such lesser rate as would result in a liquidation fee of $1,000,000, for each serviced loan that is a specially serviced loan and any REO property, subject in any case to a minimum liquidation fee of $25,000. For any serviced loan that is a corrected loan, workout fees will be calculated at the lesser of (a) 1.0% and (b) such lower rate as would result in a workout fee of $1,000,000 when applied to each expected payment of principal and interest (other than (i) default interest and (ii) any “excess interest” accrued after the related anticipated repayment date on any mortgage loan with an anticipated repayment date) on the related serviced loan (or related serviced whole loan, if |
| THE INFORMATION IN THIS STRUCTURAL AND COLLATERAL TERM SHEET IS NOT COMPLETE AND MAY BE AMENDED PRIOR TO THE TIME OF SALE. THIS TERM SHEET IS NOT AN OFFER TO SELL THESE SECURITIES AND IT IS NOT A SOLICITATION OF AN OFFER TO BUY THESE SECURITIES IN ANY JURISDICTION WHERE THE OFFER OR SALE IS NOT PERMITTED. |
| | 25 | |
| Structural and Collateral Term Sheet | | BMO 2023-C4 |
| Structural Overview |
| | applicable) from the date such serviced loan becomes a corrected loan through and including the then related maturity date, subject in any case to a minimum workout fee of $25,000. Notwithstanding the foregoing, in connection with a maturity default, no liquidation or workout fee will be payable in connection with a payoff or refinancing of the related serviced loan within 90 days of the maturity default, but the special servicer may collect and retain appropriate fees from the related borrower in connection with the subject liquidation or workout. In the case of an outside serviced whole loan, calculation of the foregoing amounts payable to the related outside servicer or outside special servicer may be different than as described above. For example, the extent to which modification fees and penalty fees are applied to offset expenses may be different and liquidation fees and workout fees may be subject to different caps or no caps. |
| ■ Operating Advisor: | | The operating advisor will, in general and under certain circumstances described in the Preliminary Prospectus, have the following rights and responsibilities with respect to the serviced mortgage loans: ● are viewing the actions of the special servicer with respect to specially serviced loans and with respect to certain major decisions regarding non-specially serviced loans as to which the operating advisor has consultation rights; ● reviewing reports provided by the special servicer to the extent set forth in the BMO 2023-C4 pooling and servicing agreement; ● reviewing for accuracy certain calculations made by the special servicer; ● issuing an annual report generally setting forth, among other things, its assessment of whether the special servicer is performing its duties in compliance with the servicing standard and the BMO 2023-C4 pooling and servicing agreement and identifying any material deviations therefrom; ● recommending the replacement of the special servicer if the operating advisor determines, in its sole discretion exercised in good faith, that (1) the special servicer has failed to comply with the servicing standard and (2) a replacement of the special servicer would be in the best interest of the certificateholders (as a collective whole); and ● after the occurrence and during the continuance of an Operating Advisor Consultation Trigger Event, consulting on a non-binding basis with the special servicer with respect to certain major decisions (and such other matters as are set forth in the BMO 2023-C4 pooling and servicing agreement) in respect of the applicable serviced mortgage loan(s) and/or related companion loan(s). An “Operating Advisor Consultation Trigger Event” will occur when the aggregate outstanding certificate balance of the HRR Certificates (as notionally reduced by any Cumulative Appraisal Reduction Amounts then allocable to the HRR Certificates) is 25% or less of the initial aggregate certificate balance of the HRR Certificates. With respect to excluded mortgage loans, an Operating Advisor Consultation Trigger Event will be deemed to exist. Notwithstanding the foregoing, the operating advisor will generally have no obligations or consultation rights as operating advisor under the BMO 2023-C4 pooling and servicing agreement with respect to any outside serviced mortgage loan or any related REO property. The operating advisor will be subject to termination and replacement if the holders of at least 15% of the voting rights of Non-Reduced Certificates vote to terminate and replace the operating advisor and such termination and replacement is affirmatively voted for by the holders of more than 50% of the voting rights allocable to the Non-Reduced Certificates of those holders that exercise their right to vote (provided that holders entitled to exercise at least 50% of the voting rights allocable to the Non-Reduced Certificates exercise their right to vote within 180 days of the initial request for a vote). The holders initiating such vote will be responsible for the fees and expenses in connection with the vote and replacement. See “The Pooling and Servicing Agreement—Operating Advisor” in the Preliminary Prospectus. |
| ■ Asset Representations Reviewer: | | The asset representations reviewer will be required to review certain delinquent mortgage loans after a specified delinquency threshold has been exceeded and the required percentage of certificateholders vote to direct a review of such delinquent mortgage loans. An asset review will occur when either (1) mortgage loans with an aggregate outstanding principal balance of 25% or more of the aggregate outstanding principal balance of all of the mortgage loans (including any REO mortgage loans) held by the issuing entity as of the end of the applicable collection period are at least 60 days delinquent in respect of their related monthly payments or balloon payment, if any (for purposes of this paragraph, “delinquent loans”) or (2) at least 15 mortgage loans are delinquent |
| THE INFORMATION IN THIS STRUCTURAL AND COLLATERAL TERM SHEET IS NOT COMPLETE AND MAY BE AMENDED PRIOR TO THE TIME OF SALE. THIS TERM SHEET IS NOT AN OFFER TO SELL THESE SECURITIES AND IT IS NOT A SOLICITATION OF AN OFFER TO BUY THESE SECURITIES IN ANY JURISDICTION WHERE THE OFFER OR SALE IS NOT PERMITTED. |
| | 26 | |
| Structural and Collateral Term Sheet | | BMO 2023-C4 |
| Structural Overview |
| | loans as of the end of the applicable collection period and the aggregate outstanding principal balance of such delinquent loans constitutes at least 20% of the aggregate outstanding principal balance of all of the mortgage loans (including any REO mortgage loans) held by the issuing entity as of the end of the applicable collection period. The asset representations reviewer may be terminated and replaced without cause. Upon (i) the written direction of certificateholders evidencing not less than 25% of the voting rights requesting a vote to terminate and replace the asset representations reviewer with a proposed successor asset representations reviewer that is an eligible asset representations reviewer, and (ii) payment by such holders to the certificate administrator of the reasonable fees and expenses to be incurred by the certificate administrator in connection with administering such vote, the certificate administrator will promptly provide notice of such request to all certificateholders and the asset representations reviewer by posting such notice on its internet website, and by mailing such notice to all certificateholders and the asset representations reviewer. Upon the affirmative vote of certificateholders evidencing at least 75% of the voting rights allocable to those holders that exercise their right to vote (provided that holders representing the applicable Certificateholder Quorum exercise their right to vote within 180 days of the initial request for a vote), the trustee will be required to terminate all of the rights and obligations of the asset representations reviewer under the BMO 2023-C4 pooling and servicing agreement by written notice to the asset representations reviewer, and the proposed successor asset representations reviewer will be appointed. See “The Pooling and Servicing Agreement—The Asset Representations Reviewer” in the Preliminary Prospectus. |
| ■ Dispute Resolution Provisions: | | The mortgage loan sellers will be subject to the dispute resolution provisions set forth in the BMO 2023-C4 pooling and servicing agreement to the extent those provisions are triggered with respect to any mortgage loan sold to the depositor by a mortgage loan seller and such mortgage loan seller will be obligated under the related mortgage loan purchase agreement to comply with all applicable provisions and to take part in any mediation or arbitration proceedings that may result. Generally, in the event that a Repurchase Request (as defined in the Preliminary Prospectus) with respect to a mortgage loan is not “Resolved” (as defined below) within 180 days after the related mortgage loan seller receives such Repurchase Request, then the enforcing servicer will be required to send a notice to the “Initial Requesting Certificateholder” (if any) indicating the enforcing servicer’s intended course of action with respect to the Repurchase Request. If (a) the enforcing servicer’s intended course of action with respect to the Repurchase Request does not involve pursuing further action to exercise rights against the applicable mortgage loan seller with respect to the Repurchase Request and the Initial Requesting Certificateholder, if any, or any other certificateholder or certificate owner of Certificates wishes to exercise its right to refer the matter to mediation (including nonbinding arbitration) or arbitration, or (b) the enforcing servicer’s intended course of action is to pursue further action to exercise rights against the related mortgage loan seller with respect to the Repurchase Request but the Initial Requesting Certificateholder, if any, or any other certificateholder or certificate owner of Certificates does not agree with the dispute resolution method selected by the enforcing servicer, then the Initial Requesting Certificateholder, if any, or such other certificateholder or certificate owner may deliver a written notice to the enforcing servicer indicating its intent to exercise its right to refer the matter to either mediation or arbitration. In addition, any other certificateholder or certificate owner of Certificates may deliver, within the time frame provided in the BMO 2023-C4 pooling and servicing agreement, a written notice requesting the right to participate in any dispute resolution consultation that is conducted by the enforcing servicer following the enforcing servicer’s receipt of the notice described in the preceding sentence. “Resolved” means, with respect to a Repurchase Request, (i) that any material breach of representations and warranties or a material document defect has been cured, (ii) the related mortgage loan has been repurchased in accordance with the related mortgage loan purchase agreement, (iii) a mortgage loan has been substituted for the related mortgage loan in accordance with the related mortgage loan purchase agreement, (iv) the applicable mortgage loan seller has made a “loss of value payment”, (v) a contractually binding agreement has been entered into between the enforcing servicer, on behalf of the issuing entity, and the related mortgage loan seller that settles the related mortgage loan seller’s obligations under the related mortgage loan purchase agreement, or (vi) the related mortgage loan is no longer property of the issuing entity as a result of a sale or other disposition in accordance with the BMO 2023-C4 pooling and servicing agreement. See “The Pooling and Servicing Agreement—Dispute Resolution Provisions” in the Preliminary Prospectus. |
| ■ Liquidated Loan Waterfall: | | Upon liquidation of any mortgage loan, all net liquidation proceeds related to the mortgage loan (but not any related companion loan) will be applied (after allocation to offset certain advances and expenses) so that amounts allocated as a recovery of accrued and unpaid interest will not, in the first instance, include any delinquent interest that was not advanced as a result of Appraisal Reduction Amounts or interest that accrued on any junior note(s) if such mortgage loan is an AB Modified Loan. After the adjusted interest amount is so allocated, any remaining liquidation proceeds will be allocated to pay principal on the mortgage loan until the unpaid principal amount of the mortgage loan has been reduced to zero. Any remaining liquidation proceeds will then be allocated to pay delinquent interest |
| THE INFORMATION IN THIS STRUCTURAL AND COLLATERAL TERM SHEET IS NOT COMPLETE AND MAY BE AMENDED PRIOR TO THE TIME OF SALE. THIS TERM SHEET IS NOT AN OFFER TO SELL THESE SECURITIES AND IT IS NOT A SOLICITATION OF AN OFFER TO BUY THESE SECURITIES IN ANY JURISDICTION WHERE THE OFFER OR SALE IS NOT PERMITTED. |
| | 27 | |
| Structural and Collateral Term Sheet | | BMO 2023-C4 |
| Structural Overview |
| | that was not advanced as a result of Appraisal Reduction Amounts and any interest that accrued on any junior note(s) if such mortgage loan is an AB Modified Loan. |
| ■ Credit Risk Retention: | | This securitization transaction will be subject to the credit risk retention rules of Section 15G of the Securities Exchange Act of 1934, as amended. An economic interest in the credit risk of the mortgage loans in this transaction is expected to be retained pursuant to risk retention regulations (as codified at 12 CFR Part 244) promulgated under Section 15G (“Regulation RR”), as an “eligible horizontal residual interest” in the form of the HRR Certificates. Bank of Montreal will act as retaining sponsor under Regulation RR for this securitization transaction and is expected, on the Closing Date, to satisfy its risk retention obligation through the purchase by a third party purchaser of the HRR Certificates. For a further discussion of the manner in which the credit risk retention requirements are expected to be satisfied by Bank of Montreal, as retaining sponsor for this securitization transaction, see “Credit Risk Retention” in the Preliminary Prospectus. |
| ■ Investor Communications: | | The certificate administrator is required to include on any Form 10–D any request received from a certificateholder to communicate with other certificateholders related to certificateholders exercising their rights under the terms of the BMO 2023-C4 pooling and servicing agreement. Any certificateholder wishing to communicate with other certificateholders regarding the exercise of its rights under the terms of the BMO 2023-C4 pooling and servicing agreement will be able to deliver a written request signed by an authorized representative of the requesting investor to the certificate administrator. |
| ■ Deal Website: | | The certificate administrator will maintain a deal website including, but not limited to: ● all special notices delivered. ● summaries of final asset status reports. ● all appraisals in connection with an appraisal reduction plus any subsequent appraisal updates. ● an “Investor Q&A Forum” and a voluntary investor registry. |
| ■ Cleanup Call: | | On any Distribution Date on which the aggregate unpaid principal balance of the mortgage loans (including mortgage loans as to which the related mortgaged properties have become REO properties) remaining in the issuing entity is less than 1% of the aggregate principal balance of the pool of mortgage loans as of the Cut-off Date, certain specified persons will have the option to purchase all of the remaining mortgage loans (and all property acquired through exercise of remedies in respect of any mortgage loan) at the price specified in the Preliminary Prospectus. Exercise of the option will terminate the issuing entity and retire the then outstanding certificates. If the aggregate certificate balances of the Class A-1, Class A-2, Class A-3, Class A-4, Class A-5, Class A-SB, Class A-S, Class B, Class C and Class D certificates and the notional amounts of the Class X-A, Class X-B and Class X-D certificates have been reduced to zero and if the master servicer has received from the remaining certificateholders the payment specified in the BMO 2023-C4 pooling and servicing agreement, the issuing entity could also be terminated in connection with an exchange of all the then-outstanding certificates (excluding the Class R certificates) for the mortgage loans remaining in the issuing entity, as further described under “The Pooling and Servicing Agreement—Optional Termination; Optional Mortgage Loan Purchase” in the Preliminary Prospectus. |
The Offered Certificates involve certain risks and may not be suitable for all investors. For information regarding certain risks associated with an investment in the Offered Certificates, see “Summary of Risk Factors” and “Risk Factors” in the Preliminary Prospectus. Capitalized terms used but not otherwise defined in this Term Sheet have the respective meanings assigned to those terms in the Preliminary Prospectus.
| THE INFORMATION IN THIS STRUCTURAL AND COLLATERAL TERM SHEET IS NOT COMPLETE AND MAY BE AMENDED PRIOR TO THE TIME OF SALE. THIS TERM SHEET IS NOT AN OFFER TO SELL THESE SECURITIES AND IT IS NOT A SOLICITATION OF AN OFFER TO BUY THESE SECURITIES IN ANY JURISDICTION WHERE THE OFFER OR SALE IS NOT PERMITTED. |
| | 28 | |
| Structural and Collateral Term Sheet | | BMO 2023-C4 |
| |
| No. 1 – 70 Hudson Street |

| THE INFORMATION IN THIS STRUCTURAL AND COLLATERAL TERM SHEET IS NOT COMPLETE AND MAY BE AMENDED PRIOR TO THE TIME OF SALE. THIS TERM SHEET IS NOT AN OFFER TO SELL THESE SECURITIES AND IT IS NOT A SOLICITATION OF AN OFFER TO BUY THESE SECURITIES IN ANY JURISDICTION WHERE THE OFFER OR SALE IS NOT PERMITTED. |
| | 29 | |
| Structural and Collateral Term Sheet | | BMO 2023-C4 |
| |
| No. 1 – 70 Hudson Street |
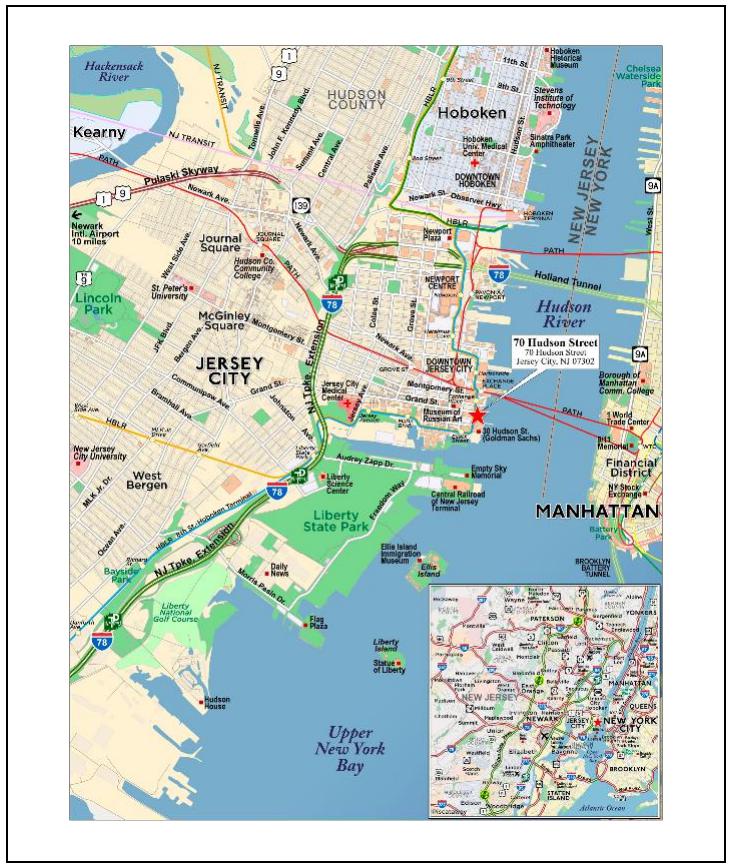
| THE INFORMATION IN THIS STRUCTURAL AND COLLATERAL TERM SHEET IS NOT COMPLETE AND MAY BE AMENDED PRIOR TO THE TIME OF SALE. THIS TERM SHEET IS NOT AN OFFER TO SELL THESE SECURITIES AND IT IS NOT A SOLICITATION OF AN OFFER TO BUY THESE SECURITIES IN ANY JURISDICTION WHERE THE OFFER OR SALE IS NOT PERMITTED. |
| | 30 | |
| Structural and Collateral Term Sheet | | BMO 2023-C4 |
| |
| No. 1 – 70 Hudson Street |
| Mortgage Loan Information | | Property Information |
| Mortgage Loan Seller: | Natixis | | Single Asset / Portfolio: | Single Asset |
| Original Principal Balance(1): | $36,000,000 | | Title: | Fee |
| Cut-off Date Principal Balance(1): | $36,000,000 | | Property Type – Subtype: | Office – CBD |
| % of IPB: | 4.6% | | Net Rentable Area (SF): | 431,281 |
| Loan Purpose: | Acquisition | | Location: | Jersey City, NJ |
| Borrower: | 70 Hudson LLC | | Year Built / Renovated: | 2002 / 2018 |
| Borrower Sponsor: | NAP | | Occupancy: | 94.1% |
| Interest Rate: | 3.19200% | | Occupancy Date: | 9/30/2022 |
| Note Date: | 2/11/2022 | | 4th Most Recent NOI (As of)(4): | $1,587,874 (12/31/2019) |
| Maturity Date: | 3/8/2027 | | 3rd Most Recent NOI (As of)(4): | $6,836,402 (12/31/2020) |
| Interest-only Period: | 60 months | | 2nd Most Recent NOI (As of)(4): | $14,298,336 (12/31/2021) |
| Original Term: | 60 months | | Most Recent NOI (As of)(5): | $15,425,668 (T-6 Annualized 9/30/2022) |
| Original Amortization Term: | None | | UW Economic Occupancy: | 94.0% |
| Amortization Type: | Interest Only | | UW Revenues: | $22,465,058 |
| Call Protection(2): | YM1(35),DorYM1(18),O(7) | | UW Expenses: | $6,481,062 |
| Lockbox / Cash Management: | Hard / Springing | | UW NOI: | $15,983,997 |
| Additional Debt(1): | Yes | | UW NCF: | $15,919,304 |
| Additional Debt Balance(1): | $84,000,000 / $76,950,000 | | Appraised Value / Per SF: | $296,000,000 / $686 |
| Additional Debt Type(1): | Pari Passu / Subordinate | | Appraisal Date: | 10/19/2022 |
| | | | | |
| Escrows and Reserves(3) | | Financial Information(1) |
| | Initial | Monthly | Initial Cap | | | Senior Notes | Whole Loan |
| Taxes: | $263,338 | $131,669 | N/A | | Cut-off Date Loan / SF: | $278 | $457 |
| Insurance: | $313,920 | $26,160 | N/A | | Maturity Date Loan / SF: | $278 | $457 |
| Replacement Reserves: | $0 | $5,391 | N/A | | Cut-off Date LTV: | 40.5% | 66.5% |
| TI/LC Reserve: | $0 | $0 | N/A | | Maturity Date LTV: | 40.5% | 66.5% |
| Other: | $306,422 | $0 | N/A | | UW NCF DSCR: | 4.10x | 2.50x |
| | | | | | UW NOI Debt Yield: | 13.3% | 8.1% |
| | | | | | | | |
| Sources and Uses |
| Sources | Proceeds | % of Total | | Uses | Proceeds | % of Total | |
| Senior Loan(1) | $120,000,000 | 38.9 | % | | Purchase Price | $300,000,000 | 97.3 | % |
| Subordinate Loan(1) | 76,950,000 | 24.9 | | | Closing Costs | 7,587,304 | 2.5 | |
| Borrower Sponsor Equity | 111,520,984 | 36.2 | | | Upfront Reserve | 883,680 | 0.3 | |
| Total Sources | $308,470,984 | 100.0 | % | | Total Uses | $308,470,984 | 100.0 | % |
| (1) | The 70 Hudson Street Mortgage Loan (as defined below) is part of a whole loan evidenced by six senior pari passu notes totaling $120.0 million and one subordinate companion note of $76.95 million, with an aggregate outstanding principal balance as of the Cut-off Date of $196.95 million (the “70 Hudson Street Whole Loan”). The Financial Information in the chart above reflects the Cut-off Date Balance and Maturity Date Balance of the 70 Hudson Street Senior Notes (as defined below) and the 70 Hudson Street Whole Loan. |
| (2) | The borrower has the option to prepay (with the payment of a yield maintenance premium) the 70 Hudson Street Whole Loan at any time prior to the open prepayment period. In addition, the borrower has the option to defease the 70 Hudson Street Whole Loan in full, but not in part, on and after the first payment date following the earlier to occur of (i) two years after the closing date of the securitization that includes the last note to be securitized and (ii) February 11, 2026. |
| (3) | For a full description of Escrows and Reserves, please refer to “Escrows and Reserves” below. |
| (4) | The increase in NOI from 2019 to 2021 was driven by an increase in occupancy. |
| (5) | The 70 Hudson Street Property (as defined below) was acquired in February 2022. Therefore, the Most Recent NOI is based on the annualized six-month period through September 2022. |
The Loan. The largest mortgage loan (the “70 Hudson Street Mortgage Loan”) is part of a whole loan with an aggregate outstanding principal balance as of the Cut-off Date of $196.95 million consisting of six pari passu senior notes with an aggregate outstanding principal balance as of the Cut-off Date of $120.0 million (the “70 Hudson Street Senior Notes”) and one subordinate companion note with an outstanding principal balance as of the Cut-off Date of $76.95 million (the “70 Hudson Street Subordinate Companion Note”). The 70 Hudson Street Whole Loan was originated by Natixis Real Estate Capital LLC on February 11, 2022. The 70 Hudson Street Whole Loan is secured by the borrower’s fee interest in a 431,281 square foot, Class A office property located in Jersey City, New Jersey (the “70 Hudson Street Property”). Notes A-A-3, A-A-4, A-A-5 and A-A-6 with an outstanding principal balance as of the Cut-off Date of $36.0 million, will be included in the
| THE INFORMATION IN THIS STRUCTURAL AND COLLATERAL TERM SHEET IS NOT COMPLETE AND MAY BE AMENDED PRIOR TO THE TIME OF SALE. THIS TERM SHEET IS NOT AN OFFER TO SELL THESE SECURITIES AND IT IS NOT A SOLICITATION OF AN OFFER TO BUY THESE SECURITIES IN ANY JURISDICTION WHERE THE OFFER OR SALE IS NOT PERMITTED. |
| | 31 | |
| Structural and Collateral Term Sheet | | BMO 2023-C4 |
| |
| No. 1 – 70 Hudson Street |
BMO 2023-C4 trust. The 70 Hudson Street Whole Loan has a five-year term, is interest-only for the full term of the loan and accrues interest at a rate of 3.19200% per annum on an Actual/360 basis. Note A-B is the controlling note for the 70 Hudson Street Whole Loan. Upon the occurrence of a control appraisal period, Note A-A-1 will be the controlling note. The 70 Hudson Street Whole Loan is serviced under the BBCMS 2022-C18 pooling and servicing agreement. See “Description of the Mortgage Pool—The Whole Loans—The 70 Hudson Street Pari Passu-AB Whole Loan” and “The Pooling and Servicing Agreement—Servicing of the Outside Serviced Mortgage Loans” in the Preliminary Prospectus.
| Whole Loan Summary |
| Note | Original Balance | Cut-off Date Balance | Note Holder | Lead Servicer for Whole Loan | Controlling Piece |
| A-A-1 | $36,000,000 | $36,000,000 | BBCMS 2022-C18 | Yes | No |
| A-A-2 | $48,000,000 | $48,000,000 | BBCMS 2022-C16 | No | No |
| A-A-3 | $12,000,000 | $12,000,000 | BMO 2023-C4 | No | No |
| A-A-4 | $12,000,000 | $12,000,000 | BMO 2023-C4 | No | No |
| A-A-5 | $6,000,000 | $6,000,000 | BMO 2023-C4 | No | No |
| A-A-6 | $6,000,000 | $6,000,000 | BMO 2023-C4 | No | No |
| Total Senior Notes | $120,000,000 | $120,000,000 | | | |
| A-B | $76,950,000 | $76,950,000 | John Hancock Life Insurance Company (U.S.A.) | No | Yes(1) |
| Whole Loan | $196,950,000 | $196,950,000 | | | |
| (1) | Note A-B is the controlling note for the 70 Hudson Street Whole Loan. Upon the occurrence of a control appraisal period, Note A-A-1 will be controlling note. The 70 Hudson Street Whole Loan will be serviced under the BBCMS 2022-C18 pooling and servicing agreement. |
The Property. The 70 Hudson Street Property is a Class A, 12-story office building totaling 431,281 square feet located in Jersey City, New Jersey, situated within Jersey City’s waterfront district along New Jersey’s Gold Coast with views of Manhattan and the Statue of Liberty. The 70 Hudson Street Property was built in 2002 and most recently renovated in 2018, including a new atrium lobby, upgraded/renovated parking garage, roof replacement and upgraded common corridor and retail entryways. Tenants at the 70 Hudson Street Property have access to a dedicated parking structure, which has 226 parking spaces (approximately 0.5 spaces per 1,000 square feet). The 70 Hudson Street Property has access to Manhattan through multiple public transportation options (PATH, NY Waterway Ferry and NJ Transit Bus & Rail Services) offering direct access into Midtown and Downtown Manhattan. The 70 Hudson Street Property is 94.1% occupied by seven tenants with a weighted average remaining lease term of approximately 10.0 years as of the Cut-off Date with three tenants (78.5% of NRA) having a weighted average remaining lease term of approximately 10 years as of the Cut-off Date.
COVID-19 Update. As of November 2, 2022, 70 Hudson Street is open and operating. As of the date of this term sheet, the 70 Hudson Street Mortgage Loan is not subject to any modification or forbearance requests.
Major Tenants. The three largest tenants based on net rentable area are TD Ameritrade, Fidessa Corporation and Federal Home Loan Bank of New York.
TD Ameritrade (208,396 square feet; 48.3% of NRA; 51.9% of underwritten base rent; Moody’s/S&P/Fitch: A2/A/A). TD Ameritrade, a subsidiary of Charles Schwab, is an online brokerage that provides services to both individuals and institutions that invest online. The company hosts over 11 million customer accounts from across the world. Investors use the company’s electronic trading platforms to buy and sell securities such as stocks, ETFs, mutual funds, options, futures, foreign exchange, and fixed-income investments. Customers can trade these financial securities on their computer or via mobile phone applications. In October 2020, TD Ameritrade was acquired by The Charles Schwab Corporation. The two companies, as of February 2022, have a combined $7.69 trillion in client assets, 33.4 million brokerage accounts, and 6.6 million daily average trades. TD Ameritrade spent approximately $40.3 million ($193.34 per square foot) on tenant improvements to its occupied space. TD Ameritrade has been in occupancy since March 2019. TD Ameritrade has no termination option and has one, seven- or ten-year renewal option remaining.
Fidessa Corporation (78,000 square feet; 18.1% of NRA; 18.0% of underwritten base rent; Moody’s/S&P/Fitch: NR/NR/NR). Fidessa Corporation (“Fidessa”) is a British based financial software company offering financial consulting, investment, trading, and advising services. Fidessa offers both buy-side solutions and sell-side solutions, global connectivity services and solutions, market data services, and investment infrastructure to customers around the globe. Buy-side products and services include compliance, decision support, order and execution management, trading, and portfolio management. Sell-side products and services include order management, advanced trading tools, smart order routing, high frequency trading, compliance, and business intelligence. Fidessa offers both enterprise solutions, and a SaaS platform to help connect
| THE INFORMATION IN THIS STRUCTURAL AND COLLATERAL TERM SHEET IS NOT COMPLETE AND MAY BE AMENDED PRIOR TO THE TIME OF SALE. THIS TERM SHEET IS NOT AN OFFER TO SELL THESE SECURITIES AND IT IS NOT A SOLICITATION OF AN OFFER TO BUY THESE SECURITIES IN ANY JURISDICTION WHERE THE OFFER OR SALE IS NOT PERMITTED. |
| | 32 | |
| Structural and Collateral Term Sheet | | BMO 2023-C4 |
| |
| No. 1 – 70 Hudson Street |
customers around the globe. Fidessa spent approximately $15.0 million ($192.78 per square foot) on tenant improvements to its occupied space. Fidessa has been in occupancy since March 2017. Fidessa has no termination option and has one, ten-year renewal option remaining.
Federal Home Loan Bank of New York (52,041 square feet; 12.1% of NRA; 12.6% of underwritten base rent; Moody’s/S&P/Fitch: Aaa/AA+/NR). The Federal Home Loan Bank of New York is part of the congressionally chartered, nationwide Federal Home Loan Bank System, which was created in 1932 to provide a flexible credit liquidity source for member community lenders engaged in home mortgage and neighborhood lending. The Federal Home Loan Bank of New York helps community lenders in New Jersey, New York, Puerto Rico and the U.S. Virgin Islands advance housing and community growth. The Federal Home Loan Bank of New York increases the availability of mortgages and home financing to families of all income levels by offering high-value correspondent and cash management services to assist their members, more effectively serve their neighborhoods and meet their Community Reinvestment Act responsibilities. The Federal Home Loan Bank of New York spent approximately $21.2 million ($407.28 per square foot) on tenant improvements to its occupied space. The Federal Home Loan Bank of New York has been in occupancy since February 2018. The Federal Home Loan Bank of New York has no termination or appropriation option and has one, five-year renewal option remaining.
Environmental. According to a Phase I environmental assessment dated October 24, 2022, there was no evidence of any recognized environmental conditions at the 70 Hudson Street Property.
The following table presents certain information relating to the historical and current occupancy of the 70 Hudson Street Property. The seller of the 70 Hudson Street Property acquired it vacant in 2016 and has since invested over $21.0 million towards capital improvements and leasing up the 70 Hudson Street Property.
| Historical and Current Occupancy(1) |
| 2018 | 2019 | 2020 | 2021 | Current(2) |
| 31.5% | 71.3% | 94.0% | 94.1% | 94.1% |
(1) Historical occupancies are as of December 31 of each respective year.
(2) Current occupancy is as of September 30, 2022
The following table presents certain information relating to the largest tenants based on net rentable area of the 70 Hudson Street Property:
| Top Tenant Summary(1) |
| Tenant | Ratings
Moody’s/S&P/Fitch(2) | Net
Rentable
Area
(SF) | % of
Total
NRA | UW
Base
Rent
PSF(3) | UW Base
Rent(3) | % of
Total
UW Base
Rent(3) | Lease
Expiration
Date |
| TD Ameritrade | A2/A/A | 208,396 | 48.3 | % | $48.91 | $10,193,424 | 51.9 | % | 6/30/2033 |
| Fidessa Corporation | NR/NR/NR | 78,000 | 18.1 | | $45.27 | 3,530,850 | 18.0 | | 12/31/2032 |
| Federal Home Loan Bank of New York | Aaa/AA+/NR | 52,041 | 12.1 | | $47.62 | 2,478,225 | 12.6 | | 12/31/2033 |
| Gucci America, Inc. | NR/A/NR | 51,824 | 12.0 | | $50.58 | 2,621,067 | 13.3 | | 12/31/2029 |
| New Jersey CVS Pharmacy, LLC | Baa2/BBB/NR | 11,659 | 2.7 | | $60.00 | 699,540 | 3.6 | | 10/31/2038 |
| Top Five Tenants | | 401,920 | 93.2 | % | $48.57 | $19,523,108 | 99.4 | % | |
| Other Tenants(4) | | 3,713 | 0.9 | % | $32.29 | $119,910 | 0.6 | % | |
| Occupied Collateral Total / Wtd. Avg. | 405,633 | 94.1 | % | $48.43 | $19,643,018 | 100.0 | % | |
| Vacant Space | | 25,648 | 5.9 | % | | | | |
| Collateral Total | | 431,281 | 100.0 | % | | | | |
| | | | | | | | |
| (1) | Based on the underwritten rent roll dated September 30, 2022. |
| (2) | In certain instances, ratings provided are those of the parent company of the entity shown, whether or not the parent company guarantees the lease. |
| (3) | UW Base Rent, UW Base Rent PSF and % of Total UW Base Rent are inclusive of approximately $558,355 of contractual rent steps through December 1, 2023 and approximately $385,165 of straight line rent. |
| (4) | Maman NJ City, LLC leases 2,000 square feet with a rent commencement date of November 25, 2021. The first-year rent was 10% of gross sales of the tenant, the second-year base rent will be $45.00 PSF, the third-year base rent will be $60.00 PSF and 2.75% rent steps annually thereafter. Given unknown gross sales of the tenant, the UW Base Rent is $0 for Maman NJ City, LLC. |
| THE INFORMATION IN THIS STRUCTURAL AND COLLATERAL TERM SHEET IS NOT COMPLETE AND MAY BE AMENDED PRIOR TO THE TIME OF SALE. THIS TERM SHEET IS NOT AN OFFER TO SELL THESE SECURITIES AND IT IS NOT A SOLICITATION OF AN OFFER TO BUY THESE SECURITIES IN ANY JURISDICTION WHERE THE OFFER OR SALE IS NOT PERMITTED. |
| | 33 | |
| Structural and Collateral Term Sheet | | BMO 2023-C4 |
| |
| No. 1 – 70 Hudson Street |
The following table presents certain information relating to the tenant lease expirations of the 70 Hudson Street Property:
| Lease Rollover Schedule(1) |
| Year | Number
of
Leases
Expiring | Net
Rentable
Area
Expiring | % of
NRA
Expiring | UW Base
Rent
Expiring(2)(3) | % of UW
Base
Rent
Expiring(2) | Cumulative
Net
Rentable
Area
Expiring | Cumulative
% of NRA
Expiring | Cumulative
UW Base
Rent
Expiring(2) | Cumulative
% of UW
Base Rent
Expiring(2) |
| Vacant | NAP | 25,648 | 5.9 | % | NAP | NAP | 25,648 | 5.9% | NAP | NAP |
| 2022 & MTM | 0 | 0 | 0.0 | | $0 | 0.0 | % | 25,648 | 5.9% | $0 | 0.0% |
| 2023 | 0 | 0 | 0.0 | | 0 | 0.0 | | 25,648 | 5.9% | $0 | 0.0% |
| 2024 | 0 | 0 | 0.0 | | 0 | 0.0 | | 25,648 | 5.9% | $0 | 0.0% |
| 2025 | 0 | 0 | 0.0 | | 0 | 0.0 | | 25,648 | 5.9% | $0 | 0.0% |
| 2026 | 0 | 0 | 0.0 | | 0 | 0.0 | | 25,648 | 5.9% | $0 | 0.0% |
| 2027 | 0 | 0 | 0.0 | | 0 | 0.0 | | 25,648 | 5.9% | $0 | 0.0% |
| 2028 | 0 | 0 | 0.0 | | 0 | 0.0 | | 25,648 | 5.9% | $0 | 0.0% |
| 2029 | 1 | 51,824 | 12.0 | | 2,621,067 | 13.3 | | 77,472 | 18.0% | $2,621,067 | 13.3% |
| 2030 | 1 | 1,713 | 0.4 | | 119,910 | 0.6 | | 79,185 | 18.4% | $2,740,977 | 14.0% |
| 2031 | 1 | 2,000 | 0.5 | | 0 | 0.0 | | 81,185 | 18.8% | $2,740,977 | 14.0% |
| 2032 | 1 | 78,000 | 18.1 | | 3,530,850 | 18.0 | | 159,185 | 36.9% | $6,271,828 | 31.9% |
| 2033 & Beyond | 3 | 272,096 | 63.1 | | 13,371,190 | 68.1 | | 431,281 | 100.0% | $19,643,018 | 100.0% |
| Total | 7 | 431,281 | 100.0 | % | $19,643,018 | 100.0 | % | | | | |
| (1) | Based on the underwritten rent roll dated September 30, 2022. |
| (2) | UW Base Rent Expiring, % of UW Base Rent Expiring, Cumulative UW Base Rent Expiring and Cumulative % of UW Base Rent Expiring are inclusive of approximately $558,355 of contractual rent steps through December 1, 2023 and approximately $385,165 of straight line rent. |
| (3) | Maman NJ City, LLC leases 2,000 square feet with a rent commencement date of November 25, 2021. The first-year rent was 10% of gross sales of the tenant, the second-year base rent will be $45.00 PSF, the third-year base rent will be $60.00 PSF and 2.75% rent steps annually thereafter. Given unknown gross sales of the tenant, the UW Base Rent is $0 for Maman NJ City, LLC. |
The following table presents certain information relating to the operating history and underwritten cash flows of the 70 Hudson Street Property:
| Operating History and Underwriting Net Cash Flow |
| | 2019 | 2020 | 2021 | TTM(1) | Underwritten | Per Square
Foot | %(2) |
| Base Rent(3) | $5,535,328 | $9,834,710 | $17,445,367 | $19,010,898 | $18,699,497 | $43.36 | 78.2 | % |
| Rent Steps(4) | 0 | 0 | 0 | 0 | 558,355 | 1.29 | 2.3 | |
| Straight-Line Rent | 0 | 0 | 0 | 0 | 385,165 | 0.89 | 1.6 | |
| Vacant Income | 0 | 0 | 0 | 0 | 1,102,864 | 2.56 | 4.6 | |
| Gross Potential Rent | $5,535,328 | $9,834,710 | $17,445,367 | $19,010,898 | $20,745,882 | $48.10 | 86.8 | % |
| Total Reimbursements | 531,016 | 665,556 | 921,565 | 1,431,220 | 1,798,717 | 4.17 | 7.5 | |
| Total Other Income | 1,164,511 | 1,518,118 | 1,340,257 | 1,351,198 | 1,354,400 | 3.14 | 5.7 | |
| Net Rental Income | $7,230,855 | $12,018,384 | $19,707,189 | $21,793,316 | $23,898,998 | $55.41 | 100.0 | % |
| (Vacancy/Credit Loss) | 0 | 0 | 0 | 0 | (1,433,940) | (3.32) | (6.0 | ) |
| Effective Gross Income | $7,230,855 | $12,018,384 | $19,707,189 | $21,793,316 | $22,465,058 | $52.09 | 94.0 | % |
| Total Expenses | 5,642,981 | 5,181,982 | 5,408,854 | 6,367,648 | 6,481,062 | 15.03 | 28.8 | |
| Net Operating Income | $1,587,874 | $6,836,402 | $14,298,335 | $15,425,668 | $15,983,997 | $37.06 | 71.2 | % |
| Total TI/LC, Capex/RR | 0 | 0 | 0 | 0 | 64,692 | 0.15 | 0.3 | |
| Net Cash Flow | $1,587,874 | $6,836,402 | $14,298,335 | $15,425,668 | $15,919,304 | $36.91 | 70.9 | % |
| (1) | TTM is based on the trailing six months annualized ending on September 30, 2022. |
| (2) | % column represents percent of Net Rental Income for all revenue lines and represents percent of Effective Gross Income for the remainder of the fields. |
| (3) | Base Rent is based on the underwritten rent roll as of September 30, 2022. The increase in UW Base Rent from 2021 Base Rent is associated with the expiration of a free rent period. |
| (4) | Rent Steps totaling approximately $558,355 are taken through December 1, 2023. |
| THE INFORMATION IN THIS STRUCTURAL AND COLLATERAL TERM SHEET IS NOT COMPLETE AND MAY BE AMENDED PRIOR TO THE TIME OF SALE. THIS TERM SHEET IS NOT AN OFFER TO SELL THESE SECURITIES AND IT IS NOT A SOLICITATION OF AN OFFER TO BUY THESE SECURITIES IN ANY JURISDICTION WHERE THE OFFER OR SALE IS NOT PERMITTED. |
| | 34 | |
| Structural and Collateral Term Sheet | | BMO 2023-C4 |
| |
| No. 1 – 70 Hudson Street |
The Market. The 70 Hudson Street Property is situated within the Hudson Waterfront office submarket of Jersey City. The Hudson Waterfront office submarket has established itself as a long-standing institutional market for both investors and tenants. The Hudson Waterfront office submarket has attracted tenants such as JP Morgan, Goldman Sachs, AIG, Mizuho, Bank of NY, RBC, Pearson Education, Marsh & McLennan, BNP Paribas, Merck, New York Life, and Ernst & Young. There has been significant residential growth in the area with over 13,000 rental units throughout 38 buildings constructed since 2010. In addition, 3,410 units are under construction and 19,500 units are approved. The 70 Hudson Street Property is located at the Exchange Place PATH Station, near Metro-Area mass transit system services (PATH, NJ Transit-Hudson-Bergen Line Light Rail, NY Waterway Ferry and NJ Transit Bus & Rail Services).
According to a third-party report, as of December 13, 2022, the Hudson Waterfront office submarket had an inventory of approximately 31.5 million square feet, overall vacancy in the market of approximately 13.9% and average asking rents of $42.35 per square foot. According to a third-party market report, the estimated 2021 population within a one-, three- and five-mile radius of the 70 Hudson Street Property is 67,445, 879,441 and 1,892,770, respectively. The estimated 2021 average household income within the same radii is $205,471, $167,096 and $168,161, respectively.
The following table presents certain information relating to comparable office leases for the 70 Hudson Street Property:
| Comparable Office Leases(1) |
| Property / Location | Tenant SF | Year Built / Renovated | Tenant | Rent PSF | Lease Date | Lease Term | Structure |
70 Hudson Street Jersey City, NJ | 388,944(2) | 2002 / 2018 | Various | $48.33(2) | Various(2) | Various(2) | Modified Gross |
Exchange Place Center 10 Exchange Place Jersey City, NJ | 5,932 9,920 78,709 | 1988 / 2019 | Nagarro, Inc. Zim America Integrated Shipping Ace | $44.50 $42.50 $43.00 | Sep-2022
May-2022 Feb-2021 | 5.3 Yrs. 10.8 Yrs. 8.9 Yrs. | Modified Gross |
Evertrust Plaza 1 Evertrust Plaza Jersey City, NJ | 6,989 2,532 | 1986 / NAP | Celltrion Inc. Staci Flex Made Logistics | $36.00 $36.50 | Aug-2022 Aug-2022 | 5.2 Yrs. 3.2 Yrs. | Modified Gross |
Goldman Sachs 30 Hudson Street Jersey City, NJ | 111,416 227,852 | 2004 / NAP | Merck & Company AIG | $46.00 $45.00 | Sep-2020 Jun-2020 | 10.4 Yrs. 15.0 Yrs. | Modified Gross |
Harborside Financial Center 3 210 Hudson Street Jersey City, NJ | 4,491 | 1928 / 1986 | Flipt | $45.00 | Sep-2020 | 5.3 Yrs. | Modified Gross |
Colgate Center 101 Hudson Street Jersey City, NJ | 6,694 6,923 10,525 13,588 | 1992 / NAP | Trend Micro Insight Catastrophe Insurance
NJ Institute of Technology DealCloud | $46.00 $45.00 $47.00 $46.00 | Jul-2021 Jul-2021 Jul-2020 Jun-2020 | 5.3 Yrs. 10.8 Yrs. 5.3 Yrs. 3.1 Yrs. | Modified Gross |
Newport Tower 525 Washington Boulevard Jersey City, NJ | 183,087 4,672 23,204 | 1992 / NAP | BNP Super Micro Computer Temco Service Industries, Inc. | $39.25 $46.00 $43.00 | Jun-2020 May-2020 Nov-2019 | 20.0 Yrs. 1.5 Yrs. 11.0 Yrs. | Modified Gross |
Office Property 15 Exchange Place Jersey City, NJ | 5,274 14,073 | 1920 / 2017 | Claro Enterprise Drivewealth Holdings | $38.00 $41.00 | Sep-2021 Aug-2021 | 3.0 Yrs. 7.0 Yrs. | Modified Gross |
International Financial Tower 95 Christopher Columbus Drive Jersey City, NJ | 310,137 | 1989 / NAP | Pershing | $37.50 | Jul-2021 | 16.0 Yrs. | Modified Gross |
| (1) | Source: Appraisal unless otherwise indicated. |
| (2) | Tenant SF, Rent PSF, Lease Date and Lease Term for the 70 Hudson Street Property is based on underwritten rent from the underwritten rent roll dated September 30, 2022. Tenant SF represents office space occupied by tenants with modified gross lease structure. Rent PSF is inclusive of (i) contractual rent steps on office tenants through December 1, 2023 in the amount of approximately $557,846 and (ii) straight line rent on office tenants in the amount of approximately $384,604. |
| THE INFORMATION IN THIS STRUCTURAL AND COLLATERAL TERM SHEET IS NOT COMPLETE AND MAY BE AMENDED PRIOR TO THE TIME OF SALE. THIS TERM SHEET IS NOT AN OFFER TO SELL THESE SECURITIES AND IT IS NOT A SOLICITATION OF AN OFFER TO BUY THESE SECURITIES IN ANY JURISDICTION WHERE THE OFFER OR SALE IS NOT PERMITTED. |
| | 35 | |
| Structural and Collateral Term Sheet | | BMO 2023-C4 |
| |
| No. 1 – 70 Hudson Street |
The following table presents certain information relating to comparable sales for the 70 Hudson Street Property:
| Comparable Sales(1) |
| Property Location | Sale Date | Total NRA
(SF) | Total Occupancy | Sale Price | Sale Price PSF | Adjusted Sales
Price PSF |
70 Hudson Street Jersey City, NJ | | 431,281(2) | 94.1 | %(2) | NAP | NAP | NAP |
Colgate Center 101 Hudson Street Jersey City, NJ | Oct-2022 | 1,347,712 | 74.0 | % | $346,000,000 | $257 | $257 |
Key West Corporate Center 9713, 9715, 9717 Key West Avenue Rockville, MD | Jun-2022 | 298,300 | 100.0 | % | $148,000,000 | $496 | $496 |
15 Exchange Place Jersey City, NJ | Feb-2022 | 136,000 | 71.0 | % | $48,000,000 | $353 | $353 |
Warren Corporate Center 100 and 200 Everest Way Warren, NJ | Jun-2021 | 315,494 | 100.0 | % | $150,250,000 | $476 | $476 |
Two Washingtonian Center 9737 Washingtonian Boulevard Gaithersburg, MD | Sep-2021 | 274,805 | 100.0 | % | $119,000,000 | $433 | $433 |
Newport Office Center 545 Washington Boulevard Jersey City, NJ | Jan-2020 | 866,706 | 95.0 | % | $372,800,000 | $430 | $430 |
179 Lincoln on the Greenway 179 Lincoln Street Boston, MA | Jan-2020 | 221,474 | 85.0 | % | $155,650,000 | $703 | $703 |
(1) Source: Appraisal unless otherwise indicated.
(2) Based on the underwritten rent roll dated September 30, 2022.
The Borrower. The borrower is 70 Hudson LLC, a Delaware limited liability company. The borrower is structured as a single purpose bankruptcy-remote entity, with two independent directors. Legal counsel to the borrower delivered a non-consolidation opinion in connection with the origination of the 70 Hudson Street Whole Loan. There is no non-recourse carveout guarantor or separate environmental indemnitor with respect to the 70 Hudson Street Whole Loan. The 70 Hudson Street Whole Loan is recourse to the borrower.
The Borrower Sponsor. The borrower sponsor is Hana Alternative Asset Management Co., Ltd. (“Hana”), which is an investment management firm affiliated with HANA Financial Group, specializing in alternative investments. Hana was founded in 2006 as the first asset management company to specialize in commercial real estate in Korea. As of November 2022, Hana had approximately $7.35 billion USD of assets under management of which 66.8% are investments in real estate.
Property Management. The 70 Hudson Street Property is managed by CBRE, Inc.
Escrows and Reserves. At origination, the borrower deposited into escrow (i) approximately $263,338 for real estate taxes, (ii) approximately $313,920 for insurance premiums, (iii) $200,000 for the rent abatement reserve and (iv) approximately $106,422 for the Maman reserve for outstanding approved leasing expense.
Tax Escrows – On a monthly basis, the borrower is required to escrow 1/12th of the annual estimated real estate taxes, which currently equates to approximately $131,669.
Insurance Escrows – On a monthly basis, the borrower is required to escrow 1/12th of the annual estimated insurance premiums, which currently equates to approximately $26,160.
Replacement Reserve – On a monthly basis, the borrower is required to escrow $5,391 for replacement reserves.
Lockbox / Cash Management. The 70 Hudson Street Whole Loan is structured with a hard lockbox and springing cash management upon the occurrence and continuance of a Cash Management Period (as defined below). The borrower is required to cause each tenant at the 70 Hudson Street Property to deposit rents directly into a lender-controlled lockbox account. In addition, the borrower is required to cause all rents received by the borrower or property manager with respect to the 70 Hudson Street Property to be deposited into such lockbox account within one business day. During the continuance of a Cash Management Period, all funds in the lockbox account are required to be swept daily to a lender-controlled cash management account and disbursed in accordance with the 70 Hudson Street Whole Loan documents, and excess funds on deposit in the cash management account (after payments of required monthly reserve deposits, debt service payment on the 70 Hudson Street Whole Loan, operating expenses and cash management bank fees) will be applied as follows: (a)
| THE INFORMATION IN THIS STRUCTURAL AND COLLATERAL TERM SHEET IS NOT COMPLETE AND MAY BE AMENDED PRIOR TO THE TIME OF SALE. THIS TERM SHEET IS NOT AN OFFER TO SELL THESE SECURITIES AND IT IS NOT A SOLICITATION OF AN OFFER TO BUY THESE SECURITIES IN ANY JURISDICTION WHERE THE OFFER OR SALE IS NOT PERMITTED. |
| | 36 | |
| Structural and Collateral Term Sheet | | BMO 2023-C4 |
| |
| No. 1 – 70 Hudson Street |
if a Significant Tenant Trigger Event (as defined below) has occurred and is continuing (and no other Cash Management Period is then continuing), to a Significant Tenant (as defined below) reserve subaccount, (b) if a Cash Management Period (other than a Cash Management Period solely due to a Significant Tenant Trigger Event) has occurred and is continuing, to an excess cash flow reserve account or (c) if no Cash Management Period has occurred and is continuing, to the borrower.
A “Cash Management Period” means a period commencing upon the occurrence of (i) an event of default under the 70 Hudson Street Whole Loan, (ii) at the end of a calendar quarter, the debt yield on the 70 Hudson Street Whole Loan is less than 6.50%, or (iii) the occurrence of a Significant Tenant Trigger Event; and will end (x) with respect to clause (i) above, if the lender has accepted a cure of such event of default; (y) with respect to clause (ii) above, the debt yield on the 70 Hudson Street Whole Loan is at least equal to 6.75% for two consecutive calendar quarters; and (z) with respect to clause (iii) above, the cure of such Significant Tenant Trigger Event.
A “Significant Tenant Trigger Event” will commence upon the earliest to occur of (i) any Significant Tenant is in default of any monetary or material non-monetary term of its Significant Tenant lease, (ii) any Significant Tenant (a) terminates its lease or (b) notifies the borrower or manager, in writing, that it intends to terminate its Significant Tenant lease, or (iii) any Significant Tenant becomes insolvent or a debtor in any bankruptcy action.
A “Significant Tenant” means TD Ameritrade and thereafter, any acceptable significant replacement tenant.
Subordinate Debt. The 70 Hudson Street Property also secures the 70 Hudson Street Subordinate Companion Note, which has an outstanding Cut-off Date principal balance of $76,950,000. The 70 Hudson Street Subordinate Companion Note accrues interest at a rate of 3.19200% per annum. The 70 Hudson Street Senior Notes are senior in right of payment to the 70 Hudson Street Subordinate Companion Note. The 70 Hudson Street Whole Loan has a Cut-off Date LTV Ratio, UW NCF DSCR and UW NOI Debt Yield of 66.5%, 2.50x and 8.1%, respectively.
Mezzanine Debt. None.
Partial Release. Not permitted.
Ground Lease. None.
| THE INFORMATION IN THIS STRUCTURAL AND COLLATERAL TERM SHEET IS NOT COMPLETE AND MAY BE AMENDED PRIOR TO THE TIME OF SALE. THIS TERM SHEET IS NOT AN OFFER TO SELL THESE SECURITIES AND IT IS NOT A SOLICITATION OF AN OFFER TO BUY THESE SECURITIES IN ANY JURISDICTION WHERE THE OFFER OR SALE IS NOT PERMITTED. |
| | 37 | |
| Structural and Collateral Term Sheet | | BMO 2023-C4 |
| |
| No. 2 – Rialto Industrial |
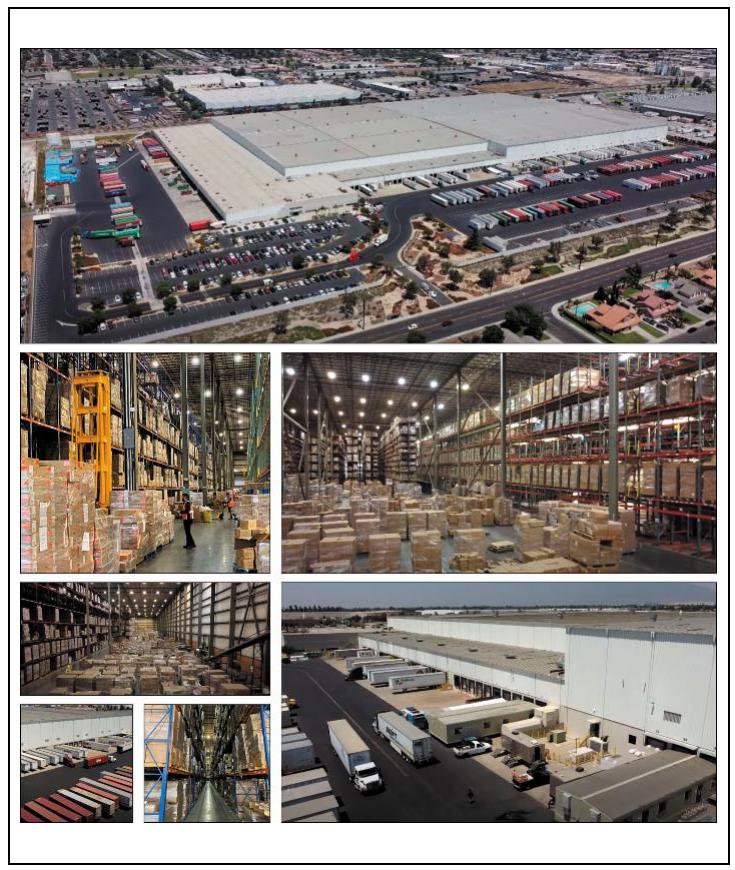
| THE INFORMATION IN THIS STRUCTURAL AND COLLATERAL TERM SHEET IS NOT COMPLETE AND MAY BE AMENDED PRIOR TO THE TIME OF SALE. THIS TERM SHEET IS NOT AN OFFER TO SELL THESE SECURITIES AND IT IS NOT A SOLICITATION OF AN OFFER TO BUY THESE SECURITIES IN ANY JURISDICTION WHERE THE OFFER OR SALE IS NOT PERMITTED. |
| | 38 | |
| Structural and Collateral Term Sheet | | BMO 2023-C4 |
| |
| No. 2 – Rialto Industrial |

| THE INFORMATION IN THIS STRUCTURAL AND COLLATERAL TERM SHEET IS NOT COMPLETE AND MAY BE AMENDED PRIOR TO THE TIME OF SALE. THIS TERM SHEET IS NOT AN OFFER TO SELL THESE SECURITIES AND IT IS NOT A SOLICITATION OF AN OFFER TO BUY THESE SECURITIES IN ANY JURISDICTION WHERE THE OFFER OR SALE IS NOT PERMITTED. |
| | 39 | |
| Structural and Collateral Term Sheet | | BMO 2023-C4 |
| |
| No. 2 – Rialto Industrial |
| Mortgage Loan Information | | Property Information |
| Mortgage Loan Seller: | AREF | | Single Asset / Portfolio: | Single Asset |
| Original Principal Balance(1): | $35,000,000 | | Title: | Fee |
| Cut-off Date Principal Balance(1): | $35,000,000 | | Property Type – Subtype: | Industrial – Warehouse/ |
| % of IPB: | 4.5% | | | Distribution |
| Loan Purpose: | Refinance | | Net Rentable Area (SF): | 1,106,124 |
| Borrower: | Rialto Merrill Holdings LLC | | Location: | Rialto, CA |
| Borrower Sponsors: | Ezra Danziger, Paul Reisz and | | Year Built / Renovated: | 1989 / 2020 |
| | Solomon Weber | | Occupancy: | 100.0% |
| Interest Rate: | 7.61000% | | Occupancy Date: | 2/6/2023 |
| Note Date: | 11/10/2022 | | 4th Most Recent NOI (As of)(4): | NAV |
| Maturity Date: | 12/6/2032 | | 3rd Most Recent NOI (As of)(4): | NAV |
| Interest-only Period: | 120 months | | 2nd Most Recent NOI (As of)(4): | NAV |
| Original Term: | 120 months | | Most Recent NOI (As of)(4): | NAV |
| Original Amortization Term: | None | | UW Economic Occupancy: | 95.0% |
| Amortization Type: | Interest Only | | UW Revenues: | $22,349,341 |
| Call Protection(2): | L(26),D(90),O(4) | | UW Expenses: | $4,721,514 |
| Lockbox / Cash Management: | Hard / Springing | | UW NOI: | $17,627,827 |
| Additional Debt(1): | Yes | | UW NCF: | $17,185,377 |
| Additional Debt Balance(1): | $146,000,000 | | Appraised Value / Per SF(5): | $350,000,000 / $316 |
| Additional Debt Type(1): | Pari Passu | | Appraisal Date: | 10/12/2022 |
| | | | | |
| Escrows and Reserves(3) | | Financial Information(1) |
| | Initial | Monthly | Initial Cap | | Cut-off Date Loan / SF: | $164 |
| Taxes: | $514,722 | $128,681 | N/A | | Maturity Date Loan / SF: | $164 |
| Insurance: | $122,072 | $61,036 | N/A | | Cut-off Date LTV: | 51.7% |
| Replacement Reserves: | $0 | $9,218 | N/A | | Maturity Date LTV: | 51.7% |
| Immediate Repairs: | $8,125 | $0 | N/A | | UW NCF DSCR: | 1.23x |
| Rent Abatement Reserve: | $9,402,054 | $0 | N/A | | UW NOI Debt Yield: | 9.7% |
| Litigation Reserve | $50,000 | Springing | $50,000 | | | |
| | | | | | | |
| Sources and Uses |
| Sources | Proceeds | % of Total | | Uses | Proceeds | % of Total | |
| Whole Loan(1) | $181,000,000 | 100.0 | % | | Loan Payoff | $130,724,472 | 72.2 | % |
| | | | | Closing Costs(6) | 24,015,699 | 13.3 | |
| | | | | Return of Equity | 16,162,856 | 8.9 | |
| | | | | Upfront Reserves | 10,096,973 | 5.6 | |
| Total Sources | $181,000,000 | 100.0 | % | | Total Uses | $181,000,000 | 100.0 | % |
| (1) | The Rialto Industrial Mortgage Loan (as defined below) is part of a whole loan evidenced by eight pari passu notes with an aggregate outstanding principal balance as of the Cut-off Date of $181.0 million (the “Rialto Industrial Whole Loan”). The Financial Information in the chart above reflects the Rialto Industrial Whole Loan. |
| (2) | The lockout period will be at least 26 months beginning with and including the first payment date on January 6, 2023. Defeasance of the Rialto Industrial Whole Loan is permitted after the date that is the earlier of (i) two years from the closing date of the securitization that includes the last note to be securitized and (ii) November 10, 2025. The assumed lockout period of 26 payments is based on the anticipated closing date of the BMO 2023-C4 securitization trust in February 2023. The actual lockout period may be longer. |
| (3) | For a full description of Escrows and Reserves, please refer to “Escrows and Reserves” below. |
| (4) | Operating history is not available as the Rialto Industrial Property (as defined below) has been occupied under a triple net lease from March 2020 and was vacant from 2018 to March 2020. |
| (5) | The appraisal also concluded to a “go-dark” value of $303,000,000 and land value of $242,000,000. |
| (6) | Closing Costs include approximately $15.0 million in payment to third-party contractors for the cost of the TI Project (as defined below). |
The Loan. The second largest mortgage loan (the “Rialto Industrial Mortgage Loan”) is part of a fixed rate whole loan secured by the borrower’s fee interest in an industrial warehouse/distribution facility in Rialto, California (the “Rialto Industrial Property”). The Rialto Industrial Whole Loan is evidenced by eight pari passu notes and accrues interest at a rate of 7.61000% per annum. The Rialto Industrial Whole Loan has a 10-year term and is interest only for the entire term. The non-controlling Note A-2 and Note A-6, with an aggregate original principal balance of $35,000,000, will be included in the BMO 2023-C4 securitization trust. The Rialto Industrial Whole Loan will be serviced pursuant to the pooling and servicing agreement for the BBCMS 2022-C18 trust until the controlling Note A-4 is securitized, whereupon the Rialto Industrial Whole
| THE INFORMATION IN THIS STRUCTURAL AND COLLATERAL TERM SHEET IS NOT COMPLETE AND MAY BE AMENDED PRIOR TO THE TIME OF SALE. THIS TERM SHEET IS NOT AN OFFER TO SELL THESE SECURITIES AND IT IS NOT A SOLICITATION OF AN OFFER TO BUY THESE SECURITIES IN ANY JURISDICTION WHERE THE OFFER OR SALE IS NOT PERMITTED. |
| | 40 | |
| Structural and Collateral Term Sheet | | BMO 2023-C4 |
| |
| No. 2 – Rialto Industrial |
Loan will be serviced pursuant to the pooling and servicing agreement for such future securitization. See “Description of the Mortgage Pool—The Whole Loans—The Outside Serviced Pari Passu Whole Loans” and “The Pooling and Servicing Agreement—Servicing of the Outside Serviced Mortgage Loans” in the Preliminary Prospectus.
| Whole Loan Summary |
| Note | Original
Balance | Cut-off Date
Balance | | Note Holder | Controlling Piece |
| A-1 | $65,000,000 | $65,000,000 | | BBCMS 2022-C18 | No |
| A-2 | $30,000,000 | $30,000,000 | | BMO 2023-C4 | No |
| A-3(1) | $30,000,000 | $30,000,000 | | AREF or an affiliate | No |
| A-4(1) | $25,000,000 | $25,000,000 | | AREF or an affiliate | Yes |
| A-5(1) | $20,000,000 | $20,000,000 | | AREF or an affiliate | No |
| A-6 | $5,000,000 | $5,000,000 | | BMO 2023-C4 | No |
| A-7(1) | $3,000,000 | $3,000,000 | | AREF or an affiliate | No |
| A-8 | $3,000,000 | $3,000,000 | | BBCMS 2022-C18 | No |
| Whole Loan | $181,000,000 | $181,000,000 | | | |
| (1) | Expected to be contributed to one or more future securitization(s). |
The Property. The Rialto Industrial Property is a 1,106,124 square foot industrial warehouse/distribution facility in the Inland Empire industrial market in Rialto, California approximately seven miles west of downtown San Bernardino. Situated on 55.57 acres, the Rialto Industrial Property features a single-story building constructed in 1989 and renovated in 2020. The Rialto Industrial Property includes 1,089,119 square feet of warehouse space and 17,005 square feet of office space (1.5% of net rentable area). The majority clear height of the improvements is 53 to 58 feet with approximately 5% of the building at the west end having a lower clear component of approximately 21 feet. Additionally, approximately 100,000 square feet of the mezzanine area is utilized for storage and materials handling and sorting along the south end of the building that is not included in the 1,106,124 million square feet of net rentable area. The Rialto Industrial Property also contains an on-site fueling station, truck maintenance building (currently being converted into a fitness center as an amenity for the employees), a grade level overhead door, 132 dock high overhead doors, 12 rail doors to the BNSF (freight railroad) spur at the north side of the building and includes 8,000 amps of power. The Rialto Industrial Property has above standard yard functionality on both the south and west sides with 317 striped excess trailer spaces. The Rialto Industrial Property is currently 100.0% occupied by Rialto Distribution LLC (“Rialto Distribution” or the “Tenant”), an affiliate of the borrower sponsor, under a new 20-year lease that expires in October 2042. The Rialto Industrial Property serves as the west coast headquarters for Rialto Distribution and its operating affiliate, All-Ways Pacific LLC, who is the lease guarantor. A true lease opinion was obtained at loan closing.
The Rialto Industrial Property previously served as a national distribution facility for Toys “R” Us until they filed bankruptcy and vacated in 2018. In March 2020, Rialto Distribution entered into a lease with prior ownership along with an option agreement to purchase the Rialto Industrial Property for approximately $123.35 million ($112 per square foot). Between 2020 and 2021, the Tenant completed renovations that include the installation of Early Suppression Fire Response (“ESFR”) sprinkler systems throughout approximately 600,000 square feet of the facility with the remainder of the facility’s sprinkler system comprising in-rack sprinklers. This modernization project allowed the Tenant to make full use of the minimum 53 feet clear heights by stacking to 50 feet. In August 2021, Rialto Distribution exercised the purchase option and subsequently entered into a new, owner-occupied affiliated lease as part of the acquisition financing. Additional capital expenditures were completed through September 2022 including the renovation of over 17,000 square feet of office space, installation of an in-floor laser guidance system for forklifts, restroom additions/upgrades, capital repairs and maintenance to the entire facility, and removal of obsolete systems and equipment such as conveyer belt systems left behind by prior ownership to increase the usability of the facility. Total tenant improvements and capital expenditure invested by the Tenant into the Rialto Industrial Property totaled approximately $8.0 million. Furthermore, approximately $4.5 million was invested in warehouse relocation expenses, equipment rentals, and capital repairs / maintenance. By increasing the usable clear heights of the Rialto Industrial Property significantly through converting approximately 600,000 square feet of space to ESFR sprinkler systems and removing obsolete systems and equipment to free up space and improve efficiencies, the Tenant increased its maximum pallet capacity from 44,000 pallets to 100,000 pallets and its actual pallet utilization from 45,810 pallets in July 2020 to 123,593 pallets as of October 2022 (170% increase). At the origination of the Rialto Industrial Whole Loan, the
| THE INFORMATION IN THIS STRUCTURAL AND COLLATERAL TERM SHEET IS NOT COMPLETE AND MAY BE AMENDED PRIOR TO THE TIME OF SALE. THIS TERM SHEET IS NOT AN OFFER TO SELL THESE SECURITIES AND IT IS NOT A SOLICITATION OF AN OFFER TO BUY THESE SECURITIES IN ANY JURISDICTION WHERE THE OFFER OR SALE IS NOT PERMITTED. |
| | 41 | |
| Structural and Collateral Term Sheet | | BMO 2023-C4 |
| |
| No. 2 – Rialto Industrial |
Tenant entered into a newly amended 20-year lease at a starting rent of $17.00 per square foot triple net with 3.00% annual increases. The appraisal concluded to a market rent of $17.40 per square foot for the space.
According to the appraisal, the purchase price under the option agreement was predicated on the then “as is” condition of the Rialto Industrial Property, which required a substantial amount of work and based on the lease date and option date the price reflects pre-COVID pricing since which time the Inland Empire industrial market experienced rapid growth in rents and compression in cap rates (see “The Market” below), with rents effectively doubling during this time on top of cap rate compression throughout. Furthermore, the Rialto Industrial Property is located in an opportunity zone which holds various tax benefits from long-term ownership and property improvements. In August 2022, the borrower sponsors received an unsolicited offer to purchase the Rialto Industrial Property for $350 million based on a 10-year leaseback at $17.40 per square foot triple-net with 3.5% annual increase or $325 million for delivery of a vacant building.
The Tenant is currently performing further upgrades to the Rialto Industrial Property which are estimated to cost no more than approximately $15 million ($13.56 per square foot) (the “TI Project”), with the contractors being responsible for any expenses over $15 million. The TI Project includes the removal of the existing conveyer modules, installation of new racking systems, and replacement of the existing sprinkler system on one side of the building comprising an estimated 500,000 square feet with ESFR sprinklers. The TI Project is expected to increase the pallet racking capacity of the entire 1.1 million square foot facility by 40%, which the Tenant projects will generate an additional $19 million in annual revenue with no additional underlying real estate costs. Rialto Distribution expects the TI Project to be complete by August 2023. In the event that the TI Project is not completed by June 30, 2024, a Cash Management Period (as defined below) commences.
Sole Tenant. Rialto Distribution (1,106,124 square feet; 100.0% of NRA; 100.0% of underwritten base rent): Rialto Distribution was formed in 2020 as an operating affiliate of All-Ways Pacific LLC, which was formed in 2013 as a third-party warehousing and distribution provider. The Rialto Distribution lease is guaranteed by the operating affiliate All-Ways Pacific LLC. Rialto Distribution and All-Ways Pacific LLC report financials on a combined basis. For the trailing 12-month period ending July 2022, All-Ways Pacific and Rialto Distribution reported a combined revenue of $89.4 million and an adjusted EBITDAR of approximately $40.2 million. Rialto Distribution has been a tenant at the Rialto Industrial Property since July 2020 and in 2022 extended its lease term to expire in October 2042. The lease is structured as triple net with Rialto Distribution also being responsible for all capital expenditure costs. Rialto Distribution has no renewal options and no termination options.
Rialto Distribution plans to sublease 100,000 square feet (9.0% of NRA) of its space to I World, LLC. The sublease is expected to commence in the first quarter of 2023 and will have a lease expiration in December 2032. The rent under the sublease will be $19.20 per square foot, increasing by 4.0% annually, plus $2.40 per square foot in estimated expense reimbursement. I World, LLC is one of Rialto Distribution’s top corporate accounts on the West Coast. Under the terms of the Rialto Industrial Whole Loan documents, the borrower is permitted to allow future subleases which in the aggregate do not account for greater than 20% of NRA at the Rialto Industrial Property. A sublease comprising less than 5% of NRA does not require lender approval so long as the sublease rent and terms are equal to or superior to the Rialto Distribution lease. Any future sublease comprising 5% or greater of NRA requires lender approval.
Environmental. According to the Phase I environmental assessment dated October 24, 2022, there was no evidence of any recognized environmental conditions at the Rialto Industrial Property.
The following table presents certain information relating to the historical and current occupancy of the Rialto Industrial Property:
| Historical and Current Occupancy |
| 2020(1) | 2021(1) | Current(2) |
| 100.0% | 100.0% | 100.0% |
| (1) | Rialto Distribution signed a lease in March 2020 to occupy the entire Rialto Industrial Property. The Rialto Industrial Property had previously been owned and occupied by Toys “R” Us, who filed for bankruptcy in 2018 and subsequently sold and vacated the Rialto Industrial Property. |
| (2) | Current Occupancy is as of February 6, 2023. |
| THE INFORMATION IN THIS STRUCTURAL AND COLLATERAL TERM SHEET IS NOT COMPLETE AND MAY BE AMENDED PRIOR TO THE TIME OF SALE. THIS TERM SHEET IS NOT AN OFFER TO SELL THESE SECURITIES AND IT IS NOT A SOLICITATION OF AN OFFER TO BUY THESE SECURITIES IN ANY JURISDICTION WHERE THE OFFER OR SALE IS NOT PERMITTED. |
| | 42 | |
| Structural and Collateral Term Sheet | | BMO 2023-C4 |
| |
| No. 2 – Rialto Industrial |
The following table presents certain information relating to the sole tenant for the Rialto Industrial Property:
| Tenant Summary(1) |
| Tenant | Ratings
Moody’s/S&P/Fitch | Net
Rentable
Area (SF) | % of
Total NRA | UW Base
Rent PSF | UW Base
Rent | % of
Total
UW Base
Rent | Lease
Expiration Date |
| Rialto Distribution LLC(2) | NR/NR/NR | 1,106,124 | 100.0% | $17.00 | $18,804,108 | 100.0% | 10/31/2042 |
| Occupied Collateral Total / Wtd. Avg. | | 1,106,124 | 100.0% | $17.00 | $18,804,108 | 100.0% | |
| Vacant Space | | 0 | 0.0% | | | | |
| Collateral Total | | 1,106,124 | 100.0% | | | | |
| | | | | | | | |
| (1) | Based on the underwritten rent roll. |
| (2) | Rialto Distribution plans to sublease 100,000 square feet of its space to I World, LLC at $19.20 per square foot. The sublease is expected to commence in the first quarter of 2023. |
The following table presents certain information relating to the tenant lease expiration dates of the Rialto Industrial Property:
| Lease Rollover Schedule(1) |
| Year | Number
of
Leases
Expiring | Net
Rentable
Area
Expiring | % of
NRA
Expiring | UW Base
Rent
Expiring | % of UW
Base
Rent
Expiring | Cumulative
Net
Rentable
Area
Expiring | Cumulative
% of NRA
Expiring | Cumulative
UW Base
Rent
Expiring | Cumulative
% of UW
Base Rent
Expiring |
| Vacant | NAP | 0 | 0.0 | % | NAP | NAP | | 0 | 0.0% | NAP | NAP |
| 2022 & MTM | 0 | 0 | 0.0 | | $0 | 0.0 | % | 0 | 0.0% | $0 | 0.0% |
| 2023 | 0 | 0 | 0.0 | | 0 | 0.0 | | 0 | 0.0% | $0 | 0.0% |
| 2024 | 0 | 0 | 0.0 | | 0 | 0.0 | | 0 | 0.0% | $0 | 0.0% |
| 2025 | 0 | 0 | 0.0 | | 0 | 0.0 | | 0 | 0.0% | $0 | 0.0% |
| 2026 | 0 | 0 | 0.0 | | 0 | 0.0 | | 0 | 0.0% | $0 | 0.0% |
| 2027 | 0 | 0 | 0.0 | | 0 | 0.0 | | 0 | 0.0% | $0 | 0.0% |
| 2028 | 0 | 0 | 0.0 | | 0 | 0.0 | | 0 | 0.0% | $0 | 0.0% |
| 2029 | 0 | 0 | 0.0 | | 0 | 0.0 | | 0 | 0.0% | $0 | 0.0% |
| 2030 | 0 | 0 | 0.0 | | 0 | 0.0 | | 0 | 0.0% | $0 | 0.0% |
| 2031 | 0 | 0 | 0.0 | | 0 | 0.0 | | 0 | 0.0% | $0 | 0.0% |
| 2032 | 0 | 0 | 0.0 | | 0 | 0.0 | | 0 | 0.0% | $0 | 0.0% |
| 2033 & Beyond | 1 | 1,106,124 | 100.0 | | 18,804,108 | 100.0 | | 1,106,124 | 100.0% | $18,804,108 | 100.0% |
| Total | 1 | 1,106,124 | 100.0 | % | $18,804,108 | 100.0 | % | | | | |
| (1) | Based on the underwritten rent roll. |
| THE INFORMATION IN THIS STRUCTURAL AND COLLATERAL TERM SHEET IS NOT COMPLETE AND MAY BE AMENDED PRIOR TO THE TIME OF SALE. THIS TERM SHEET IS NOT AN OFFER TO SELL THESE SECURITIES AND IT IS NOT A SOLICITATION OF AN OFFER TO BUY THESE SECURITIES IN ANY JURISDICTION WHERE THE OFFER OR SALE IS NOT PERMITTED. |
| | 43 | |
| Structural and Collateral Term Sheet | | BMO 2023-C4 |
| |
| No. 2 – Rialto Industrial |
The following table presents certain information relating to the operating history and underwritten cash flows at the Rialto Industrial Property:
| Operating History and Underwritten Net Cash Flow(1) |
| | Underwritten | Per Square
Foot | %(2) |
| Rents in Place | $18,804,108 | $17.00 | 79.9 | % |
| Vacant Income | 0 | 0.00 | 0.0 | |
| Contractual Rent Steps | 0 | 0.00 | 0.0 | |
| Gross Potential Rent | $18,804,108 | $17.00 | 79.9 | % |
| Total Reimbursements | 4,721,514 | 4.27 | 20.1 | |
| Net Rental Income | $23,525,622 | $21.27 | 100.0 | % |
| Other Income | 0 | 0.00 | 0.0 | |
| (Vacancy/Credit Loss) | (1,176,281) | (1.06) | (5.0 | ) |
| Effective Gross Income | $22,349,341 | $20.21 | 95.0 | % |
| Total Expenses | 4,721,514 | 4.27 | 21.1 | |
| Net Operating Income | $17,627,827 | $15.94 | 78.9 | % |
| Capital Expenditures | 110,612 | 0.10 | 0.5 | |
| TI/LC | 331,837 | 0.30 | 1.5 | |
| Net Cash Flow | $17,185,377 | $15.54 | 76.9 | % |
| | | | |
| (1) | Operating history is not available as the Rialto Industrial Property was occupied under a triple net lease from March 2020 and was vacant from 2018 to March 2020. |
| (2) | % column represents percent of Net Rental Income for all revenue lines and represents percent of Effective Gross Income for the remainder of fields. |
The Market. The Rialto Industrial Property is located in Rialto, California, approximately seven miles east of downtown San Bernardino and forms part of the Riverside-San Bernardino-Ontario Metropolitan Statistical Area (“MSA”). The MSA has a population of approximately 4.6 million residents with an average household income of $104,810. The top three industries within the MSA are healthcare/social assistance, retail trade, and construction.
The Rialto Industrial Property is located approximately two miles from Interstate 10, and approximately 14 miles east from Ontario International Airport. The Rialto Industrial Property is situated in an opportunity zone in the central portion of Rialto, with the surrounding neighborhood consisting primarily of industrial properties and residential homes. According to the appraisal, the estimated 2022 population within a one-, three- and five-mile radius was 24,257, 183,460, and 372,058, respectively. Additionally, for the same period, the median household income within a one-, three- and five-mile radius was $61,886, $62,381, and $65,943, respectively.
According to the appraisal, the Rialto Industrial Property is located within the Inland Empire industrial market. According to a third-party research report, as of the second quarter of 2022, the Inland Empire industrial market had an inventory of approximately 599 million square feet, a vacancy rate of 0.2% and average rent of $17.16 per square foot, triple net. The vacancy rate decreased 0.10% quarter over quarter to a historic low in the Inland Empire industrial market. Approximately 20.1 million square feet is expected to be completed in 2022 of which 42.3% is pre-leased. Even as construction activity ramped up, most new warehouses that completed construction were immediately occupied in the second quarter of 2022, leaving little to no available product in the market. Rents increased 98.6% year over year to $17.16 per square foot in the second quarter of 2022 due to limited availability and persistent high levels of demand. According to a third-party research report, the severe lack of available space coupled with high demand fueled rent growth in the Inland Empire industrial market. Low availability, strong industrial demand, and new class A developments are projected to continue to push rents upwards. Landlords continue to be cautious about signing preleases on new development to take advantage of future rent increases. The appraiser concluded to a market rent of $17.40 per square foot for the Rialto Industrial Property.
| THE INFORMATION IN THIS STRUCTURAL AND COLLATERAL TERM SHEET IS NOT COMPLETE AND MAY BE AMENDED PRIOR TO THE TIME OF SALE. THIS TERM SHEET IS NOT AN OFFER TO SELL THESE SECURITIES AND IT IS NOT A SOLICITATION OF AN OFFER TO BUY THESE SECURITIES IN ANY JURISDICTION WHERE THE OFFER OR SALE IS NOT PERMITTED. |
| | 44 | |
| Structural and Collateral Term Sheet | | BMO 2023-C4 |
| |
| No. 2 – Rialto Industrial |
The following table presents certain information relating to comparable industrial sales for the Rialto Industrial Property:
| Comparable Industrial Sales(1) |
| Property / Location | Gross
Building
Area (SF) | Year Built /
Renovated | Occupancy | Sale
Date | Sale Price | Price
PSF | Cap Rate |
| Rialto Industrial | 1,106,124(2) | 1989 / 2020 | 100.0%(2) | | | | |
| Rialto, CA |
| Amazon Fulfillment Center | 1,080,308 | 2021 / NAP | 100.0% | Sep-22 | $189,000,000 | $175 | 4.75% |
| Visalia, CA |
| Central Commerce Center | 457,125 | 2022 / NAP | 100.0% | Aug-22 | $121,079,086 | $265 | 4.37% |
| San Bernardino, CA |
| Perris Ridge Commerce Center – Building 2 | 579,708 | 2014 / NAP | 100.0% | Aug-22 | $169,646,861 | $293 | 4.72% |
| Perris, CA |
| Logistics Center at Eastvale | 1,057,419 | 2022 / NAP | 71.0% | Jul-22 | $470,000,000 | $444 | 3.20% |
| Eastvale, CA |
| (1) | Information obtained from the appraisal. |
| (2) | Occupancy is as of February 6, 2023. |
The following table presents certain information relating to comparable industrial leases for the Rialto Industrial Property:
| Comparable Industrial Rental Summary(1) |
| Property Name/Location | Year Built | Gross Building Area (SF) | Tenant
Size (SF) | Tenant Name | Clear
Height | Rent
PSF | Commencement | Lease
Term
(Years) |
Rialto Industrial 1110 West Merrill Avenue Rialto, CA | 1989 | 1,106,124(2) | 1,106,124(2) | Rialto Distribution(2) | 53' – 58' | $17.00(2) | Nov-22(2) | 20.0(2) |
Building 2 and 3 of Goodman Logistics Center Fullerton 2289 and 2099 E Orangethorpe Avenue Fullerton, CA | 2022 | 1,025,262 | 538,226 | Samsung Electronics
America Inc. | 40' | $24.00 | Nov-22 | 10.2 |
Haven Gateway Centre 2250 Sequoia Avenue Ontario, CA | 2000 | 610,944 | 610,944 | Disney | 32' | $18.60 | Nov-22 | 5.0 |
Agua Mansa Commerce Park – 2 5400 El Rivino Road Jurupa Valley, CA | 2022 | 1,186,950 | 1,186,950 | Target | 40' | $12.60 | Sep-22 | 15.0 |
Citrus Commerce Center Bldg. 2 11281 Citrus Ave Fontana, CA | 2017 | 1,003,567 | 1,003,567 | Confidential | 36' | $18.60 | Oct-22 | 5.0 |
I-10 Logistics Center 36312 and 36324 Cherry Valley Blvd Cherry Valley, CA | 2023 | 1,832,667 | 1,832,667 | Shien Fashion Group | 40' | $11.16 | Mar-23 | 10.3 |
| | (1) | Information obtained from the appraisal unless otherwise indicated. |
| (2) | Based on the underwritten rent roll. |
The Borrower. The borrowing entity for the Rialto Industrial Whole Loan is Rialto Merrill Holdings LLC, a single purpose entity with two independent directors. Legal counsel to the Rialto Industrial Whole Loan borrower delivered a non-consolidation opinion in connection with the origination of the Rialto Industrial Whole Loan.
The Borrower Sponsors. The borrower sponsors and non-recourse carveout guarantors are Ezra Danziger, Paul Reisz, and Solomon Weber. Ezra Danziger, Paul Reisz, and Solomon Weber are the principals of Rialto Distribution and All-Ways
| THE INFORMATION IN THIS STRUCTURAL AND COLLATERAL TERM SHEET IS NOT COMPLETE AND MAY BE AMENDED PRIOR TO THE TIME OF SALE. THIS TERM SHEET IS NOT AN OFFER TO SELL THESE SECURITIES AND IT IS NOT A SOLICITATION OF AN OFFER TO BUY THESE SECURITIES IN ANY JURISDICTION WHERE THE OFFER OR SALE IS NOT PERMITTED. |
| | 45 | |
| Structural and Collateral Term Sheet | | BMO 2023-C4 |
| |
| No. 2 – Rialto Industrial |
Pacific. Paul Reisz currently serves as the chief commercial officer of Rialto Distribution. Ezra Danziger currently serves as the CEO of Rialto Distribution and All-Ways Pacific.
The borrower is subject to pending litigation (the “Saadia Litigation”) in which Saadia Square LLC (“Saadia”), an indirect equity holder in the prior owner of the Rialto Industrial Property, alleges that it held an unrecorded right of first offer for the purchase of the Rialto Industrial Property (the “ROFO”) and that the ROFO was violated when the borrower purchased the Rialto Industrial Property pursuant to a separate option to purchase the Rialto Industrial Property granted to a borrower affiliate (the “Option”). The prior owner of the Rialto Industrial Property (the “Rialto Industrial Seller”) is indirectly owned by SM Logistics Holdco LLC (“SM Holdco”), which in turn has two members: Saadia and SM Logistics Member LLC (“SM Holdco Member”). Saadia alleges a scheme by the borrower and other defendants (including SM Holdco Member which allegedly, as the indirect controlling equity holder of the Rialto Industrial Seller, caused the Rialto Industrial Seller to sell the Rialto Industrial Property to the borrower in violation of SM Holdco’s operating agreement which contained the ROFO) to deny Saadia the benefits of the ROFO and included causes of action for breach of contract due to an alleged failure to honor the ROFO, breach of the covenant of good faith and fair dealing, intentional interference, specific performance and injunctive relief, and declaratory judgment. Saadia is seeking specific enforcement of the ROFO and damages to be determined at trial. See “Description of the Mortgage Pool—Litigation and Other Legal Considerations” in the Preliminary Prospectus.
Property Management. The Rialto Industrial Property is managed by RD Real Estate Holdings LLC, an affiliate of the borrower.
Escrows and Reserves. At origination, the borrower deposited into escrow $9,402,054 for a rent abatement fund, approximately $514,722 for real estate taxes, approximately $122,072 for insurance reserves, $50,000 for a litigation reserve, and $8,125 for immediate repairs.
Tax Escrows – On a monthly basis, the borrower is required to escrow 1/12th of the annual estimated tax payments, which currently equates to approximately $128,681.
Insurance Escrows – On a monthly basis, the borrower is required to escrow 1/12th of the estimated insurance payments, which currently equates to approximately $61,036.
Replacement Reserves – On a monthly basis, the borrower is required to escrow approximately $9,218 for replacement reserves ($0.10 per square foot annually).
Litigation Reserve – If at any time prior to the Transfer Restriction Termination Date (as defined below) the funds in the litigation reserve fall below $25,000, the borrower is required to deposit an amount such that the funds on deposit in the litigation reserve are equal to $50,000.
“Transfer Restriction Termination Date” means the date on which (i) a court of competent jurisdiction issues a final, non-appealable order or judgment in the Saadia Litigation dismissing all of the claims against the borrower with respect to the Rialto Industrial Property under the Saadia Litigation relating to specific performance or any other injunctive or other relief then being sought that, if granted, would adversely affect the borrower’s title to the Rialto Industrial Property or the validity or priority of the lien of the mortgage, or (ii) the borrower and the plaintiff in the Saadia Litigation have entered into a final written settlement as to all claims made with respect to the Rialto Industrial Property with respect to the Saadia Litigation, which settlement includes (A) an unconditional written release of the borrower and the lender of all such claims and (B) payment in full of all amounts to be paid in connection with such settlement.
Lockbox / Cash Management. The Rialto Industrial Whole Loan is structured with a hard lockbox and springing cash management. The borrower is required to deliver a notice to the Tenant at the Rialto Industrial Property instructing it to deposit rents directly into a lender-controlled lockbox account. In addition, the borrower is required to cause all rents received by the borrower or the property manager with respect to the Rialto Industrial Property to be deposited into such lockbox account within one business day of receipt. All amounts in the lockbox account are remitted on each business day to the borrower at any time other than during the continuance of a Cash Management Period. Upon the occurrence and during the continuance of a Cash Management Period, all amounts are required to be remitted to a lender-controlled cash management account on each business day to be applied and disbursed in accordance with the Rialto Industrial Whole Loan documents. During the continuance of a Cash Management Period, all excess cash flow funds remaining in the cash management account after the application of such funds in accordance with the Rialto Industrial Whole Loan documents will be held by the lender, during the continuance of a Cash Management Period continuing solely as a result of a Lease
| THE INFORMATION IN THIS STRUCTURAL AND COLLATERAL TERM SHEET IS NOT COMPLETE AND MAY BE AMENDED PRIOR TO THE TIME OF SALE. THIS TERM SHEET IS NOT AN OFFER TO SELL THESE SECURITIES AND IT IS NOT A SOLICITATION OF AN OFFER TO BUY THESE SECURITIES IN ANY JURISDICTION WHERE THE OFFER OR SALE IS NOT PERMITTED. |
| | 46 | |
| Structural and Collateral Term Sheet | | BMO 2023-C4 |
| |
| No. 2 – Rialto Industrial |
Sweep Period (as defined below), in a special rollover reserve subaccount, or otherwise in a cash collateral subaccount as additional collateral for the Rialto Industrial Whole Loan.
A “Cash Management Period” means the occurrence of (i) an event of default, (ii) the commencement of a Lease Sweep Period, (iii) an event of default under a Permitted Future Mezzanine Loan (as defined below) has occurred, (iv) if, as of June 30, 2024, the TI Project has not been completed in accordance with the Rialto Industrial Whole Loan documents, (v) June 6, 2032, or (vi) if, as of December 31, 2022, the required repairs have not been completed in accordance with the Rialto Industrial Whole Loan documents; and will end if, prior to June 6, 2032 (A) with respect to the matters described in clause (i) above, such event of default has been cured, such cure has been accepted by the lender and no other event of default has occurred and is continuing, or (B) with respect to the matter described in clause (ii) above, such Lease Sweep Period has ended, or (C) with respect to the matter described in clause (iii) above, receipt by the lender of notice that the event of default under a Permitted Future Mezzanine Loan has been cured or waived, or (D) with respect to the matter described in clause (iv) above, the earlier of (x) the delivery to the lender of evidence reasonably acceptable to the lender that the TI Project has been completed in accordance with the Rialto Industrial Whole Loan documents and (y) the date on which the remaining costs to complete the TI Project has been deposited into the cash collateral subaccount solely on account of a Cash Management Period continuing pursuant to such clause (iv) (i.e., such amount may not include any amount deposited into the cash collateral subaccount during a Cash Management Period continuing pursuant to such clauses (i) through (iii) and clause (v) of this definition) and/or through equity funded by the borrower into the cash collateral subaccount or (E) with respect to the matter described in clause (vi) above, upon completion of the required repairs in accordance with the Rialto Industrial Whole Loan documents. So long as no event of default is then continuing, at the borrower’s request, funds deposited into the cash collateral subaccount solely on account of a Cash Management Period continuing pursuant to clause (iv) above, may be utilized by the borrower for the payment of TI Project costs and expenses.
A “Lease Sweep Period” commences upon the occurrence of any of the following:
| (i) | any Lease Sweep Lease (as defined below) (or any material portion thereof) is surrendered, cancelled or terminated prior to its then current expiration date or any Lease Sweep Tenant (as defined below) gives notice of its intention to terminate, surrender or cancel its Lease Sweep Lease (or any material portion thereof); or |
| (ii) | any Lease Sweep Tenant discontinues its business in any material portion of its premises (i.e., “goes dark”) or gives notice that it intends to do the same; or |
| (iii) | the occurrence of (x) a monetary default under any Lease Sweep Lease by the applicable Lease Sweep Tenant thereunder or (y) a non-monetary default under any Lease Sweep Lease by the applicable Lease Sweep Tenant thereunder and such non-monetary default would cause a material adverse effect; or |
| (iv) | the occurrence of a Lease Sweep Tenant insolvency proceeding; or |
| (v) | if, as of any calculation date commencing on June 30, 2023 and continuing thereafter on each subsequent calculation date during the term, the gross revenue of the Tenant and the Tenant’s lease guarantor (collectively, “Rialto Group”) is equal to or less than $71,554,025, as reflected in the most recent financial statements (provided that, if the financial statements required pursuant to the Rialto Industrial Whole Loan documents are not delivered to the lender as and when required thereunder, a Lease Sweep Period would be deemed to have commenced and be ongoing, unless and until such reports are delivered and they indicate that, in fact, no Lease Sweep Period is ongoing under this clause (v)); or |
| (vi) | if, as of any calculation date commencing on June 30, 2023 and continuing thereafter on each subsequent calculation date during the term, the ratio of the Rialto Group total debt to annual Rialto Group gross revenue is equal to or exceeds 75%, as reflected in the most recent financial statements delivered (provided that, if the financial statements required are not delivered to the lender as and when required thereunder, a Lease Sweep Period would be deemed to have commenced and be ongoing, unless and until such reports are delivered and they indicate that, in fact, no Lease Sweep Period is ongoing under this clause (vi)); or |
| (vii) | if, as of any calculation date commencing on June 30, 2024 and continuing thereafter on each subsequent calculation date during the term, the ratio of the Rialto Group’s EBITDAR to the aggregate amount of all rents and other amounts payable (including, without limitation, percentage rents and reimbursements (if any) for taxes, insurance, management fees and operating expenses) by Rialto Group (whether to the borrower pursuant to the Tenant’s lease or otherwise) during the then immediately preceding 12 month period is less than 1.40x, as reflected in the most recent financial statements delivered (provided that, if the financial statements required are not delivered to the lender as and when required thereunder, a Lease Sweep Period would be deemed to have commenced and be ongoing, unless and until such reports are delivered and they indicate that, in fact, no Lease Sweep Period is ongoing under this clause (vii)). |
| THE INFORMATION IN THIS STRUCTURAL AND COLLATERAL TERM SHEET IS NOT COMPLETE AND MAY BE AMENDED PRIOR TO THE TIME OF SALE. THIS TERM SHEET IS NOT AN OFFER TO SELL THESE SECURITIES AND IT IS NOT A SOLICITATION OF AN OFFER TO BUY THESE SECURITIES IN ANY JURISDICTION WHERE THE OFFER OR SALE IS NOT PERMITTED. |
| | 47 | |
| Structural and Collateral Term Sheet | | BMO 2023-C4 |
| |
| No. 2 – Rialto Industrial |
A “Lease Sweep Lease” means (x) the Rialto Distribution lease or (y) any lease in replacement of the Rialto Distribution lease (or a portion thereof) that, either individually or when taken together with any other lease with the same tenant or its affiliates, and assuming the exercise of all expansion rights and preferential rights to lease additional space contained in such lease (a) covers 220,000 or more rentable square feet of the Rialto Industrial Property or (b) has a gross annual rent of more than 20.0% of the total annual rents of the Rialto Industrial Property.
A “Lease Sweep Tenant” means any tenant under a Lease Sweep Lease.
Subordinate Debt. None.
Mezzanine Debt. The borrower is permitted to incur a future mezzanine loan up to $19,000,000 (the “Permitted Future Mezzanine Loan”) subject to the satisfaction of the requirements set forth in the Rialto Industrial Whole Loan documents, including but not limited to: (i) the aggregate loan-to-value ratio based on the Rialto Industrial Whole Loan and the Permitted Future Mezzanine Loan is no greater than 70%; (ii) the actual combined debt service coverage ratio based on the Rialto Industrial Whole Loan and the Permitted Future Mezzanine Loan (taking into account the anticipated monthly principal and interest payments due under the Permitted Future Mezzanine Loan) is no less than 1.10x; (iii) the actual combined net cash flow debt yield based on the Rialto Industrial Whole Loan and the Permitted Future Mezzanine Loan is no less than 8.5%; (iv) the execution of an intercreditor agreement reasonably acceptable to the lender and the rating agencies; (v) receipt of a rating agency confirmation; and (vi) the Permitted Future Mezzanine Loan has a term expiring on or after the Rialto Industrial Whole Loan maturity date.
Partial Release. Not permitted.
Ground Lease. None.
| THE INFORMATION IN THIS STRUCTURAL AND COLLATERAL TERM SHEET IS NOT COMPLETE AND MAY BE AMENDED PRIOR TO THE TIME OF SALE. THIS TERM SHEET IS NOT AN OFFER TO SELL THESE SECURITIES AND IT IS NOT A SOLICITATION OF AN OFFER TO BUY THESE SECURITIES IN ANY JURISDICTION WHERE THE OFFER OR SALE IS NOT PERMITTED. |
| | 48 | |
| Structural and Collateral Term Sheet | | BMO 2023-C4 |
| |
| No. 3 – Gilardian NYC Portfolio |
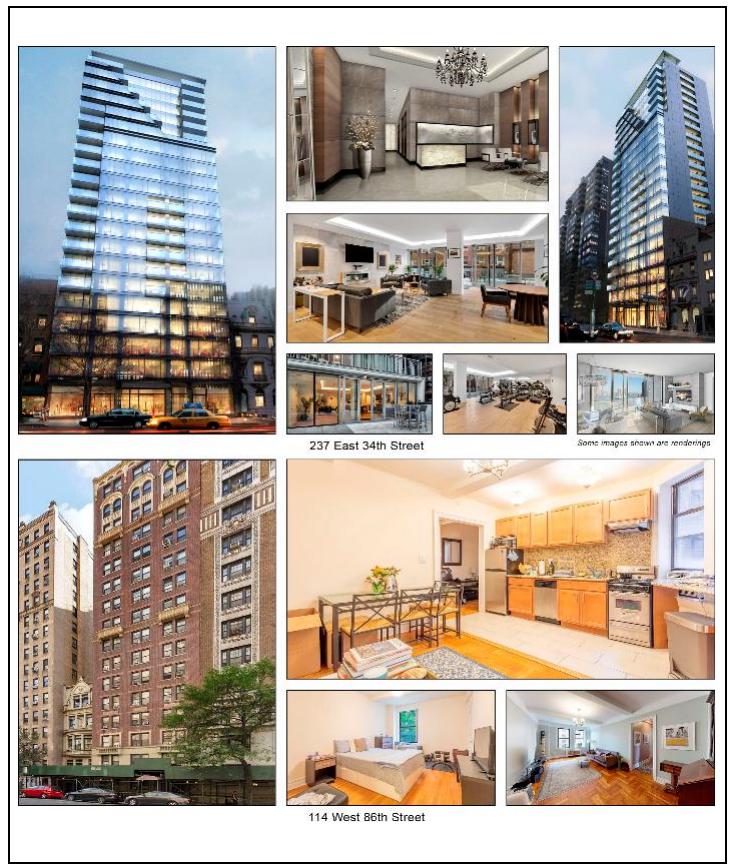
| THE INFORMATION IN THIS STRUCTURAL AND COLLATERAL TERM SHEET IS NOT COMPLETE AND MAY BE AMENDED PRIOR TO THE TIME OF SALE. THIS TERM SHEET IS NOT AN OFFER TO SELL THESE SECURITIES AND IT IS NOT A SOLICITATION OF AN OFFER TO BUY THESE SECURITIES IN ANY JURISDICTION WHERE THE OFFER OR SALE IS NOT PERMITTED. |
| | 49 | |
| Structural and Collateral Term Sheet | | BMO 2023-C4 |
| |
| No. 3 – Gilardian NYC Portfolio |
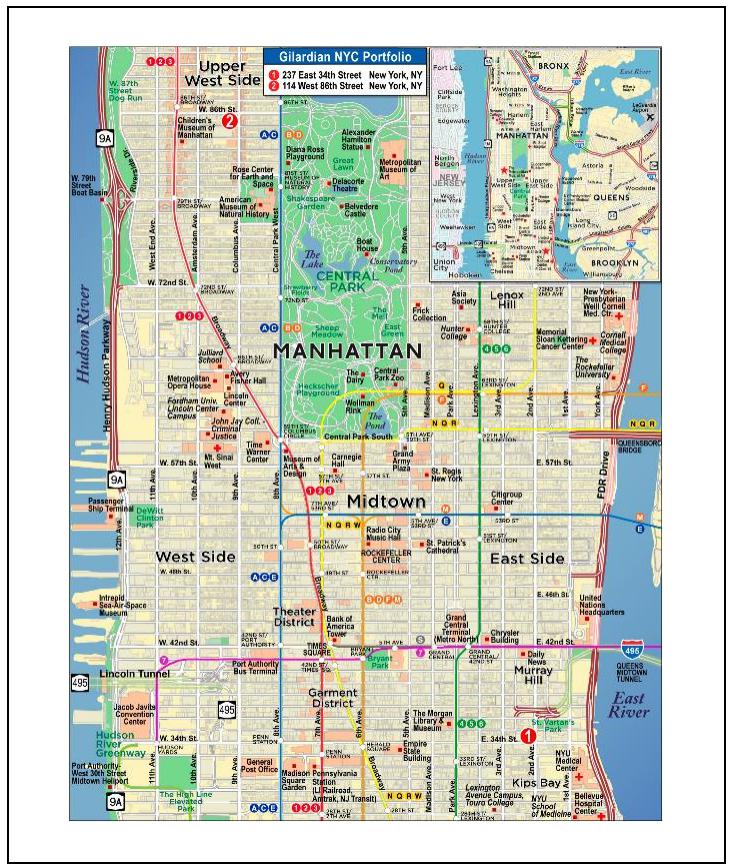
| THE INFORMATION IN THIS STRUCTURAL AND COLLATERAL TERM SHEET IS NOT COMPLETE AND MAY BE AMENDED PRIOR TO THE TIME OF SALE. THIS TERM SHEET IS NOT AN OFFER TO SELL THESE SECURITIES AND IT IS NOT A SOLICITATION OF AN OFFER TO BUY THESE SECURITIES IN ANY JURISDICTION WHERE THE OFFER OR SALE IS NOT PERMITTED. |
| | 50 | |
| Structural and Collateral Term Sheet | | BMO 2023-C4 |
| |
| No. 3 – Gilardian NYC Portfolio |
| Mortgage Loan Information | | Property Information |
| Mortgage Loan Seller: | BMO | | Single Asset / Portfolio: | Portfolio |
| Original Principal Balance(1): | $28,000,000 | | Title: | Fee |
| Cut-off Date Principal Balance(1): | $28,000,000 | | Property Type – Subtype: | Multifamily – High Rise |
| % of IPB: | 3.6% | | Net Rentable Area (Units): | 153 |
| Loan Purpose: | Refinance | | Location: | New York, NY |
| Borrowers: | 114 West 86th Street Realty, LLC and Theater House Apartments, LLC | | Year Built / Renovated: | Various / NAP |
| Borrower Sponsors: | Robert Gilardian and Albert Gilardian | | Occupancy: | 98.7% |
| Interest Rate: | 4.3381166% | | Occupancy Date: | 11/1/2022 |
| Note Date: | 12/20/2022 | | 4th Most Recent NOI (As of): | $4,928,695 (12/31/2019) |
| Maturity Date: | 1/6/2028 | | 3rd Most Recent NOI (As of): | $4,604,973 (12/31/2020) |
| Interest-only Period: | 60 months | | 2nd Most Recent NOI (As of): | $4,274,426 (12/31/2021) |
| Original Term: | 60 months | | Most Recent NOI (As of): | $5,840,124 (TTM 9/30/2022) |
| Original Amortization Term: | None | | UW Economic Occupancy: | 98.0% |
| Amortization Type: | Interest Only | | UW Revenues: | $9,607,348 |
| Call Protection: | L(25),D(31),O(4) | | UW Expenses: | $3,194,304 |
| Lockbox / Cash Management: | Soft / Springing | | UW NOI: | $6,413,044 |
| Additional Debt(1): | Yes | | UW NCF: | $6,407,048 |
| Additional Debt Balance(1): | $27,750,000 / $37,750,000 | | Appraised Value / Per Unit(3): | $141,000,000 / $921,569 |
| Additional Debt Type(1): | Pari Passu / Mezzanine | | Appraisal Date: | 10/28/2022 |
| | | | | |
| Escrows and Reserves(2) | | Financial Information(1) |
| | Initial | Monthly | Initial Cap | | | Whole Loan | Total Debt |
| Taxes: | $395,800 | Springing | N/A | | Cut-off Date Loan / Unit: | $364,379 | $611,111 |
| Insurance: | $21,801 | Springing | N/A | | Maturity Date Loan / Unit: | $364,379 | $611,111 |
| Replacement Reserve: | $100,000 | Springing | $90,000 | | Cut-off Date LTV(3): | 39.5% | 66.3% |
| TI/LC: | $0 | $500 | N/A | | Maturity Date LTV(3): | 39.5% | 66.3% |
| Deferred Maintenance: | $199,183 | $0 | N/A | | UW NCF DSCR: | 2.61x | 1.14x |
| | | | | | UW NOI Debt Yield: | 11.5% | 6.9% |
| | | | | | | |
| Sources and Uses |
| Sources | Proceeds | % of Total | | Uses | Proceeds | % of Total | |
| Whole Loan | $55,750,000 | 56.1 | % | | Loan Payoff | $88,000,000 | 88.6 | % |
| Mezzanine | 37,750,000 | 38.0 | | | Closing Costs | 10,637,875 | 10.7 | |
| Sponsor Equity | 5,854,659 | 5.9 | | | Reserves | 716,784 | 0.7 | |
| Total Sources | $99,354,659 | 100.0 | % | | Total Uses | $99,354,659 | 100.0 | % |
| (1) | The Gilardian NYC Portfolio Mortgage Loan (as defined below) is part of a whole loan evidenced by two pari passu notes with an aggregate original principal balance of $55,750,000. The Gilardian NYC Portfolio Total Debt (as defined below) also includes two mezzanine loans with an aggregate principal balance of $37,750,000. Financial Information in the chart above reflects the Gilardian NYC Portfolio Whole Loan (as defined below) and, where indicated, the Gilardian NYC Portfolio Total Debt. For additional information, see “The Loan” below |
| (2) | For a full description of Escrows and Reserves, see “Escrows and Reserves” below. |
| (3) | The Cut-off Date LTV and Maturity Date LTV are based on the aggregate "as-is" appraised value of $141,000,000. |
The Loan. The third largest mortgage loan (the “Gilardian NYC Portfolio Mortgage Loan”) is part of a whole loan evidenced by two pari passu promissory notes in the aggregate original principal amount of $55,750,000 (the “Gilardian NYC Portfolio Whole Loan”) and is secured by a first lien mortgage on the borrowers’ fee interest in two multifamily high rise properties located in New York, New York (the “Gilardian NYC Portfolio Properties”). The Gilardian NYC Portfolio Whole Loan has a five-year term and is interest only for the full term. The “Gilardian NYC Portfolio Total Debt” consists of the Gilardian NYC Portfolio Whole Loan and two mezzanine loans, the Mezzanine A Loan (as defined below) having a principal amount of $26,000,000 and the Mezzanine B Loan (as defined below) having a principal amount of $11,750,000, with an aggregate Cut-off Date balance of $93,500,000. For additional information, see “Mezzanine Debt” below.
| THE INFORMATION IN THIS STRUCTURAL AND COLLATERAL TERM SHEET IS NOT COMPLETE AND MAY BE AMENDED PRIOR TO THE TIME OF SALE. THIS TERM SHEET IS NOT AN OFFER TO SELL THESE SECURITIES AND IT IS NOT A SOLICITATION OF AN OFFER TO BUY THESE SECURITIES IN ANY JURISDICTION WHERE THE OFFER OR SALE IS NOT PERMITTED. |
| | 51 | |
| Structural and Collateral Term Sheet | | BMO 2023-C4 |
| |
| No. 3 – Gilardian NYC Portfolio |
The non-controlling Note A-1, with an original principal balance of $28,000,000, will be included in the BMO 2023-C4 securitization trust. The remaining note is expected to be contributed to another securitization trust. The Gilardian NYC Portfolio Whole Loan will be serviced pursuant to the pooling and servicing agreement for the BMO 2023-C4 trust until the controlling note A-2 is securitized, whereupon the Gilardian NYC Portfolio Whole Loan will be serviced pursuant to the pooling and servicing agreement for such future securitization. See “The Pooling and Servicing Agreement” in the Preliminary Prospectus. The relationship between the holders of the notes evidencing the Gilardian NYC Portfolio Whole Loan will be governed by a co-lender agreement as described under “Description of the Mortgage Pool—The Whole Loans—The Serviced Pari Passu Whole Loans” and “—The Whole Loans—The Outside Serviced Pari Passu Whole Loans” in the Preliminary Prospectus.
| Whole Loan Summary |
| Note | Original Balance | Cut-off Date Balance | | Note Holder | Controlling Piece |
| A-1 | $28,000,000 | $28,000,000 | | BMO 2023-C4 | No |
| A-2(1) | $27,750,000 | $27,750,000 | | BMO | Yes |
| Whole Loan | $55,750,000 | $55,750,000 | | | |
| (1) | Expected to be contributed to a future securitization. |
The Properties. The Gilardian NYC Portfolio Properties are comprised of two multifamily high rise properties located in New York, New York that were built in 2015 and 1928, the “237 East 34th Street Property” and the “114 West 86th Street Property” respectively.
The following table presents certain information relating to the Gilardian NYC Portfolio Properties:
| Portfolio Summary(1) |
| Property Name | Year Built /
Renovated | Units(2) | Occupancy
%(2) | Allocated
Cut-off Date
Loan Amount
(“ALA”) | % of
ALA | Appraised
Value | % of
Appraised
Value | UW NOI(2) | % of
UW
NOI |
| 237 East 34th Street | 2015 / NAP | 105 | 99.0 | % | $20,603,209 | 73.6 | % | $106,300,000 | 75.4 | % | $5,158,238 | 80.4 | % |
| 114 West 86th Street | 1928 / NAP | 48 | 97.9 | | 7,396,791 | 26.4 | | 34,700,000 | 24.6 | | 1,254,806 | 19.6 | |
| Total/Wtd. Avg. | | 153 | 98.7 | % | $28,000,000 | 100.0 | % | $141,000,000 | 100.0 | % | $6,413,044 | 100.0 | % |
| (1) | Source: Appraisal unless otherwise indicated. |
| (2) | Based on the underwritten rent roll as of November 1, 2022. |
237 East 34th Street Property. As of November 1, 2022, the 237 East 34th Street Property was 99.0% occupied. The 0.17-acre parcel is improved with a 25-story apartment building. The improvements are steel and masonry construction. The 237 East 34th Street Property features 105 units total with studio, one-, two- and three-bedroom layouts ranging in size from 403 to 1,192 square feet. Market rents range from $4,000 to $11,750 per month, with an average market rent of approximately $5,755 and an average unit size of 738 square feet. Unit features include central HVAC, granite countertops, stacked washer/dryer, smoke alarms, dishwasher and an electric oven / range combination. Community amenities include an attended lobby, resident lounge, rooftop deck, storage units and a fitness center.
The following table presents detailed information with respect to the current market rate units at the 237 East 34th Street Property:
| As Is Market Rate Unit Summary |
| Unit Type | No. of Units(1) | % of Total | Average Unit
Size (SF)(1) | Average
Monthly
Rental Rate(1) | Average
Monthly
Rental Rate
per SF(1) | Average
Monthly
Market Rental
Rate(2) | Average
Monthly
Market Rental
Rate per SF(2) |
| Studio 1 Bath | 28 | 26.7 | % | 465 | $3,993 | $8.58 | $4,000 | $8.60 |
| 1 Bed 1 Bath | 19 | 18.1 | | 599 | $4,813 | $8.04 | $5,000 | $8.35 |
| 2 Bed 1 Bath | 7 | 6.7 | | 682 | $4,634 | $6.80 | $6,500 | $9.53 |
| 2 Bed 2 Bath | 50 | 47.6 | | 948 | $6,794 | $7.16 | $6,800 | $7.17 |
| 3 Bed 3 Bath | 1 | 1.0 | | 859 | $10,571 | $12.31 | $11,750 | $13.68 |
| Total/Wtd. Avg. | 105 | 100.0 | % | 738 | $5,581 | $7.57 | $5,755 | $7.8 |
| (1) | Based on the underwritten rent roll as of November 1, 2022. |
| THE INFORMATION IN THIS STRUCTURAL AND COLLATERAL TERM SHEET IS NOT COMPLETE AND MAY BE AMENDED PRIOR TO THE TIME OF SALE. THIS TERM SHEET IS NOT AN OFFER TO SELL THESE SECURITIES AND IT IS NOT A SOLICITATION OF AN OFFER TO BUY THESE SECURITIES IN ANY JURISDICTION WHERE THE OFFER OR SALE IS NOT PERMITTED. |
| | 52 | |
| Structural and Collateral Term Sheet | | BMO 2023-C4 |
| |
| No. 3 – Gilardian NYC Portfolio |
114 West 86th Street Property. As of November 1, 2022, the 114 West 86th Street Property was 97.9% occupied. The 0.09-acre parcel is improved with a 16-story apartment building. The improvements are brick construction. The 114 West 86th Street Property features 48 units total, 15 of which are rent stabilized and 3 are rent controlled, with one-, two- and three-bedroom layouts ranging in size from 700 to 1,450 square feet. Market rents range from approximately $934 to $10,000 per month, with an average market rent of $4,547 and an average unit size of 909 square feet. Unit features include granite countertops, heating, smoke alarms, dishwasher and an electric oven/range combination. Community amenities include a laundry area and doorman.
The following table presents detailed information with respect to the current market rate units at the 114 West 86th Street Property:
| As Is Market Rate Unit Summary |
| Unit Type | No. of Units(1) | % of Total | Average Unit
Size (SF)(1) | Average
Monthly
Rental Rate(1) | Average
Monthly
Rental Rate
per SF(1) | Average
Monthly
Market Rental
Rate(2) | Average
Monthly
Market Rental
Rate per SF(2) |
| 1 Bed 1 Bath | 18 | 60.0 | % | 722 | $3,790 | $5.25 | $5,200 | $7.20 |
| 1 Bed 1 Bath | 1 | 3.3 | | 1,250 | $5,395 | $4.32 | $8,500 | $6.80 |
| 2 Bed 1 Bath | 1 | 3.3 | | 750 | $4,250 | $5.67 | $6,750 | $9.00 |
| 2 Bed 2 Bath | 9 | 30.0 | | 1,200 | $5,502 | $4.58 | $8,500 | $7.08 |
| 3 Bed 2 Bath | 1 | 3.3 | | 1,450 | $7,800 | $5.38 | $10,000 | $6.90 |
| Total/Wtd. Avg. | 30 | 100.0 | % | 908 | $4,506 | $4.96 | $6,512 | $7.17 |
| (1) | Based on the underwritten rent roll as of November 1, 2022. |
The following table presents detailed information with respect to the rent-controlled units at the 114 West 86th Street Property:
| As Is Rent-Controlled Unit Summary |
| Unit Type | No. of Units(1) | % of Total | Average Unit
Size (SF)(1) | Average
Monthly Rental
Rate(1) | Average Monthly
Rental Rate per
SF(1) |
| 1 Bed 1 Bath | 1 | 33.3 | % | 750 | $934 | $1.24 |
| 2 Bed 2 Bath | 2 | 66.7 | | 1,200 | $1,100 | $0.92 |
| Total/Wtd. Avg. | 3 | 100.0 | % | 1,050 | $1,044 | $0.99 |
| (1) | Based on the underwritten rent roll as of November 1, 2022. |
The following table presents detailed information with respect to the rent stabilized units at the 114 West 86th Street Property:
| As Is Rent-Stabilized Unit Summary |
| Unit Type | No. of Units(1) | % of Total | Average Unit Size
(SF)(1) | Average
Monthly Rental
Rate(1) | Average Monthly
Rental Rate per
SF(1) |
| 1 Bed 1 Bath | 10 | 66.7 | % | 725 | $1,555 | $2.14 |
| 2 Bed 2 Bath | 5 | 33.3 | | 1,200 | $1,509 | $1.26 |
| Total/Wtd. Avg. | 15 | 10 0.0 | % | 883 | $1,540 | $1.74 |
| (1) | Based on the underwritten rent roll as of November 1, 2022. |
Environmental. According to the Phase I environmental assessments dated November 2, 2022, there was no evidence of any recognized environmental conditions at the Gilardian NYC Portfolio Properties.
| THE INFORMATION IN THIS STRUCTURAL AND COLLATERAL TERM SHEET IS NOT COMPLETE AND MAY BE AMENDED PRIOR TO THE TIME OF SALE. THIS TERM SHEET IS NOT AN OFFER TO SELL THESE SECURITIES AND IT IS NOT A SOLICITATION OF AN OFFER TO BUY THESE SECURITIES IN ANY JURISDICTION WHERE THE OFFER OR SALE IS NOT PERMITTED. |
| | 53 | |
| Structural and Collateral Term Sheet | | BMO 2023-C4 |
| |
| No. 3 – Gilardian NYC Portfolio |
The following table presents certain information relating to the historical and current occupancy of the Gilardian NYC Portfolio Properties:
| Historical and Current Occupancy(1) |
| Property | 2019 | 2020 | 2021 | Current(2) |
| 237 East 34th Street | 93.7% | 92.8% | 99.0% | 99.0% |
| 114 West 86th Street | 98.3% | 88.6% | 95.7% | 97.9% |
| (1) | Historical occupancy is as of December 31 of each respective year. |
| (2) | Current Occupancy is as of November 1, 2022. |
The following table presents certain information relating to the operating history and underwritten cash flows of the Gilardian NYC Portfolio Properties:
| Operating History and Underwritten Net Cash Flow |
| | 2019 | 2020 | 2021 | TTM(1) | Underwritten | Per Unit | %(2) | As-Stab |
| Gross Potential Rent | $8,088,028 | $7,468,310 | $7,224,118 | $8,203,993 | $9,140,919 | $59,745 | 100.0 | % | $9,934,113 |
| Commercial Income | 0 | 0 | 47,468 | 427,215 | 623,595 | 4,076 | 6.8 | | 623,595 |
| Net Rental Income | $8,088,028 | $7,468,310 | $7,271,587 | $8,631,208 | $9,764,514 | $63,820 | 106.8 | % | $10,557,708 |
| (Vacancy/Credit Loss) | 0 | 0 | 0 | 0 | (190,936) | (1,248) | (2.1 | ) | (316,731) |
| Other Income | 34,525 | 46,855 | 29,634 | 22,998 | 33,771 | 221 | 0.4 | | 35,828 |
| Effective Gross Income | $8,122,553 | $7,515,165 | $7,301,221 | $8,654,206 | $9,607,348 | $62,793 | 105.1 | % | $10,276,804 |
| Total Expenses | 3,193,859 | 2,910,192 | 3,026,795 | 2,814,082 | 3,194,304 | 20,878 | 33.2 | | 3,411,409 |
| Net Operating Income | $4,928,695 | $4,604,973 | $4,274,426 | $5,840,124 | $6,413,044 | $41,915 | 66.8 | % | $6,865,396 |
| Total TI/LC, Capex/RR | 0 | 0 | 0 | 0 | 5,996 | 39 | 0.1 | | 5,996 |
| Net Cash Flow | $4,928,695 | $4,604,973 | $4,274,426 | $5,840,124 | $6,407,048 | $41,876 | 66.7 | % | $6,859,400 |
| (1) | TTM reflects the trailing 12 months ending September 30, 2022. |
| (2) | % column represents percent of Gross Potential Rent for revenue fields and represents percent of Effective Gross Income for the remainder of fields. |
The Markets. According to the appraisals, the Gilardian NYC Portfolio Properties are located in the New York Metro apartment market. According to the appraisals, as of the second quarter of 2022, the New York Metro apartment market average monthly asking rent per unit was $4,112 and vacancy was 3.5%. According to the appraisal, the 114 West 86th Street Property is located in the Upper West Side apartment submarket. As of the second quarter of 2022, the Upper West Side apartment submarket average monthly asking rent per unit was $5,588 and vacancy was 3.8%. According to the appraisal, the 237 East 34th Street Property is located in the Stuyvesant / Turtle Bay apartment submarket. As of the second quarter of 2022, the Upper West Side apartment submarket average monthly asking rent per unit was $5,587 and vacancy was 2.5%.
According to the appraisal, the 2021 population within a 0.25-, 0.5- and 0.75-mile radius of the 114 West 86th Street Property is 24,532, 72,731 and 115,378, respectively. The 2021 median household income within the same radii is $129,405, $131,030 and $129,817, respectively.
According to the appraisal, the 2021 population within a 0.25-, 0.5- and 0.75-mile radius of the 237 East 34th Street Property is 26,750, 68,214 and 109,294, respectively. The 2021 median household income within the same radii is $133,475, $128,486 and $131,136, respectively.
| THE INFORMATION IN THIS STRUCTURAL AND COLLATERAL TERM SHEET IS NOT COMPLETE AND MAY BE AMENDED PRIOR TO THE TIME OF SALE. THIS TERM SHEET IS NOT AN OFFER TO SELL THESE SECURITIES AND IT IS NOT A SOLICITATION OF AN OFFER TO BUY THESE SECURITIES IN ANY JURISDICTION WHERE THE OFFER OR SALE IS NOT PERMITTED. |
| | 54 | |
| Structural and Collateral Term Sheet | | BMO 2023-C4 |
| |
| No. 3 – Gilardian NYC Portfolio |
The following table presents certain information relating to comparable multifamily rental properties to the 114 West 86th Street Property:
| Comparable Rental Summary(1) |
Property Name /
Property Address | Year Built /
Renovated | Occupancy | # of
Units | Unit Mix | Average SF per
Unit | Average Rent
per SF(3) | Average
Rent per
Unit(3) |
114 West 86th Street Property(2) 114 West 86th Street New York, NY | 1928 / NAP | 97.9% | 48 | 1BR / 1BA FM 1BR / 1BA RC 1BR / 1BA RS 2BR / 1BA FM 2BR / 2BA FM 2BR / 2BA RC 2BR / 2BA RS 3BR / 2BA FM | 750 750 725 750 1,200 1,200 1,200 1,450 | $5.17 $1.24 $2.14 $5.67 $5.16 $0.92 $1.26 $5.38 | $3,874 $934 $1,555 $4,250 $6,189 $1,100 $1,509 $7,800 |
Stonehenge Tower 210 West 89th Street New York, NY | 1963 / NAP | 99.0% | 148 | Studio / BA 1BR / 1BA 2BR / 2BA 3BR / 2BA | 460 672 850 1,000 | $7.61 $6.55 $7.76 $7.56 | $3,500 $4,401 $6,595 $7,561 |
120 W 86th Street 120 West 86th Street New York, NY | 1912 / NAP | 89.0% | 47 | 1BR / 1BA 2BR / 1BA 3BR / 2BA | 500 700 900 | $9.00 $9.14 $9.01 | $4,500 $6,400 $8,113 |
The Greystone 212 West 91st Street New York, NY | 1923 / NAP | 98.0% | 366 | Studio / 1BA 1BR / 1BA 2BR / 2BA 3BR / 2BA 4BR / 3BA | 550 799 950 1,807 2,091 | $6.04 $6.95 $9.12 $6.62 $6.22 | $3,324 $5,550 $8,667 $11,960 $13,006 |
Parc Cameron Apartments 41 West 86th Street New York, NY | 1927 / NAP | 95.0% | 166 | Studio / 1BA 1BR / 1BA 2BR / 1BA 4BR / 2BA | 355 622 886 2,300 | $9.26 $7.47 $6.90 $5.01 | $3,286 $4,646 $6,114 $11,533 |
James Marquis 101 West 90th Street New York, NY | 1986 / NAP | 96.0% | 202 | Studio / 1BA 1BR / 1BA 2BR / 1BA 3BR / 2BA 4BR / 2BA | 544 678 965 1,434 1,519 | $6.52 $6.37 $5.86 $5.64 $4.85 | $3,549 $4,317 $5,652 $8,091 $7,362 |
| (1) | Source: Appraisal, unless otherwise indicated. |
| (2) | Based on the underwritten rent roll as of November 1, 2022. |
| (3) | Average Rent per Unit and Average Rent per SF is inclusive of all units at the 114 West 86th Street Property which included 15 rent stabilized units and 3 rent controlled units. |
| THE INFORMATION IN THIS STRUCTURAL AND COLLATERAL TERM SHEET IS NOT COMPLETE AND MAY BE AMENDED PRIOR TO THE TIME OF SALE. THIS TERM SHEET IS NOT AN OFFER TO SELL THESE SECURITIES AND IT IS NOT A SOLICITATION OF AN OFFER TO BUY THESE SECURITIES IN ANY JURISDICTION WHERE THE OFFER OR SALE IS NOT PERMITTED. |
| | 55 | |
| Structural and Collateral Term Sheet | | BMO 2023-C4 |
| |
| No. 3 – Gilardian NYC Portfolio |
The following table presents certain information relating to comparable multifamily rental properties to the 237 East 34th Street Property:
| Comparable Rental Summary(1) |
| Property Address | Year Built /
Renovated | Occupancy | # of
Units | Unit Mix | Average SF per
Unit | Average Rent
per SF | Average
Rent per
Unit |
237 East 34th Street Property(2) 237 East 34th Street New York, NY | 2015 / NAP | 99.0% | 105 | Studio / 1BA 1BR / 1BA 2BR / 1BA 2BR / 2BA 3BR / 3BA | 465 599 682 948 859 | $8.58 $8.48 $6.80 $7.16 $12.31 | $3,993 $5,081 $4,634 $6,794 $10,571 |
The Epic 126-128 West 32nd Street New York, NY | 2007 / NAP | 96.7% | 458 | Studio / 1BA 1BR / 1BA 2BR / 2BA 3BR / 2BA 4BR / 3BA | 560 961 864 1,350 1,400 | $6.59 $4.84 $5.76 $6.71 $6.06 | $3,692 $4,656 $4,973 $9,056 $8,485 |
Murray Hill Marquis 150 East 34th Street New York, NY | 2017 / NAP | 92.5% | 252 | Studio / 1BA 1BR / 1BA 2BR / 2BA 3BR / 2BA | 491 697 994 1,515 | $7.10 $6.01 $5.43 $4.72 | $3,486 $4,190 $5,397 $7,149 |
The Beatrice 105 West 29th Street New York, NY | 2010 / NAP | 93.0% | 302 | Studio / 1BA 1BR / 1BA 2BR / 2BA 3BR / 3BA | 497 695 1,008 1,738 | $9.30 $8.88 $8.86 $10.30 | $4,620 $6,173 $8,927 $17,899 |
The Lewis 411 West 35th Street New York, NY | 2015 / NAP | 100.0% | 186 | Studio / 1BA 1BR / 1BA 2BR / 1BA | 426 629 903 | $7.57 $6.48 $6.61 | $3,225 $4,076 $5,971 |
The Greywood 3-5 West 36th New York, NY | 2013 / NAP | 100.0% | 72 | Studio / 1BA 1BR / 1BA 2BR / 1BA | 608 722 900 | $5.30 $5.39 $5.55 | $3,220 $3,893 $4,992 |
House39 225 East 39th Street New York, NY | 2017 / NAP | 94.4% | 297 | Studio / 1BA 1BR / 1BA 2BR / 2BA 3BR / 2BA | 501 685 976 1,386 | $8.14 $7.41 $7.61 $7.81 | $4,077 $5,078 $7,432 $10,828 |
| (1) | Source: Appraisal, unless otherwise indicated. |
| (2) | Based on the underwritten rent roll as of November 1, 2022. |
The Borrowers. The borrowers are 114 West 86th Street Realty, LLC and Theater House Apartments, LLC, each a Delaware limited liability company and special purpose entity with one independent director for each borrower entity. Legal counsel to the borrowers provided a non-consolidation opinion in connection with the origination of the Gilardian NYC Portfolio Whole Loan.
The Borrower Sponsors. The borrower sponsors and guarantors are Robert Gilardian and Albert Gilardian.
Property Management. The Gilardian NYC Portfolio Properties are managed by A.J. Clarke Real Estate Corp., a third party property management company founded in 1943 and headquartered in New York, New York.
Escrows and Reserves. At origination, the borrowers were required to deposit into escrow (i) approximately $395,800 for real estate taxes, (ii) approximately $21,801 for insurance premiums, (iii) $199,183 for deferred maintenance and (iv) $100,000 for the replacement reserve.
| THE INFORMATION IN THIS STRUCTURAL AND COLLATERAL TERM SHEET IS NOT COMPLETE AND MAY BE AMENDED PRIOR TO THE TIME OF SALE. THIS TERM SHEET IS NOT AN OFFER TO SELL THESE SECURITIES AND IT IS NOT A SOLICITATION OF AN OFFER TO BUY THESE SECURITIES IN ANY JURISDICTION WHERE THE OFFER OR SALE IS NOT PERMITTED. |
| | 56 | |
| Structural and Collateral Term Sheet | | BMO 2023-C4 |
| |
| No. 3 – Gilardian NYC Portfolio |
Tax Escrows – Upon the occurrence of a Trigger Event (as defined below), the borrowers are required to escrow 1/12th of the annual estimated tax payments on a monthly basis, which currently equates to approximately $197,384.
Insurance Escrows – Monthly payments in the insurance reserve have been waived by the lender due to the borrower carrying a blanket policy so long as (i) no event of default has occurred or is continuing, (ii) the liability and casualty policies maintained by borrower covering the Gilardian NYC Portfolio Properties constitute a blanket or umbrella policy approved by the lender, (iii) the borrower provides evidence of the policy renewal and paid receipts for the payment of the insurance premiums by no later than ten days prior to the expiration of policy and thirty days prior to the delinquency of payment on such policy.
Replacement Reserves – On a monthly basis, the borrowers are required to escrow $3,449 for replacement reserves, so long as funds in the replacement reserve do not exceed $90,000. The borrowers will cease monthly deposits until funds in the replacement reserve fall below $30,000, at which point the borrowers will resume monthly deposits.
Lockbox / Cash Management. The Gilardian NYC Portfolio Whole Loan is structured with a soft lockbox and springing cash management. The Gilardian NYC Portfolio Whole Loan requires that during the continuance of a Trigger Event, the borrowers or property managers, as applicable, direct tenants to pay all rents directly into a lockbox account controlled by the borrowers. Upon the occurrence and during the continuance of a Trigger Event, all funds in the lockbox account are required to be swept daily to a cash management account under the control of the borrowers to be applied and disbursed in accordance with the Gilardian NYC Portfolio Whole Loan documents, and all excess cash flow funds remaining in the cash management account after the application of such funds in accordance with the Gilardian NYC Portfolio Whole Loan documents are required to disbursed to an excess cash reserve.
A “Trigger Event” will commence upon the earliest of the following: (i) the occurrence of an event of default under the Gilardian NYC Portfolio Whole Loan documents, (ii) the debt service coverage ratio for the Gilardian NYC Portfolio Total Debt is less than 1.05x for two consecutive calendar quarters or (iii) an event of default under each of the mezzanine loans.
A Trigger Event will end: (a) with regard to clause (i) of the prior sentence, upon the cure of such event of default and the lender’s acceptance of such cure in its sole and absolute discretion, (b) with regard to clause (ii) of the prior sentence, upon the debt service coverage ratio for the Gilardian NYC Portfolio Total Debt being greater than or equal to 1.05x for two consecutive calendar quarters and (c) with regard to clause (iii) of the prior sentence, a cure of such event of default under each of the mezzanine loans.
Subordinate Debt. None.
Mezzanine Debt. John Hancock Life Insurance Company (U.S.A.) originated a Mezzanine A Loan in the amount of $26,000,000 secured by the Mezzanine A Loan borrowers’ interests in the mortgage borrower, as collateral for the Mezzanine A Loan (the “Mezzanine A Loan”). The Mezzanine A Loan is coterminous with the Gilardian NYC Portfolio Whole Loan. The Mezzanine A Loan accrues interest at a rate of 7.35000% per annum and requires interest-only payments until its maturity date.
TCM CRE REIT LLC originated a Mezzanine B Loan in the amount of $11,750,000 secured by the Mezzanine B Loan borrowers’ interests in the Mezzanine A Loan borrower, as collateral for the Mezzanine B Loan (the “Mezzanine B Loan”). The Mezzanine B Loan is coterminous with the Gilardian NYC Portfolio Whole Loan. The Mezzanine B Loan accrues interest at a rate of 10.50000% per annum and requires interest-only payments until its maturity date.
Partial Release. After the defeasance lockout period, the borrower may release either of the Gilardian NYC Portfolio Properties from the lien of the Gilardian NYC Portfolio Whole Loan by defeasing 120% of the allocated loan amount with respect to the applicable release property, provided that (a) the post-defeasance debt service coverage ratio for the undefeased note, based on income from the remaining property, will be not less than the greater of 1.10x, and pre-defeasance debt service coverage ratio, and (b) the post-defeasance loan-to-value ratio for the remaining property will not exceed the lesser of (i) 66.3%, and (ii) pre-defeasance loan-to-value ratio that existed immediately preceding such partial defeasance event.
Ground Lease. None.
| THE INFORMATION IN THIS STRUCTURAL AND COLLATERAL TERM SHEET IS NOT COMPLETE AND MAY BE AMENDED PRIOR TO THE TIME OF SALE. THIS TERM SHEET IS NOT AN OFFER TO SELL THESE SECURITIES AND IT IS NOT A SOLICITATION OF AN OFFER TO BUY THESE SECURITIES IN ANY JURISDICTION WHERE THE OFFER OR SALE IS NOT PERMITTED. |
| | 57 | |
| Structural and Collateral Term Sheet | | BMO 2023-C4 |
| |
| No. 4 – Weston at Copperfield |
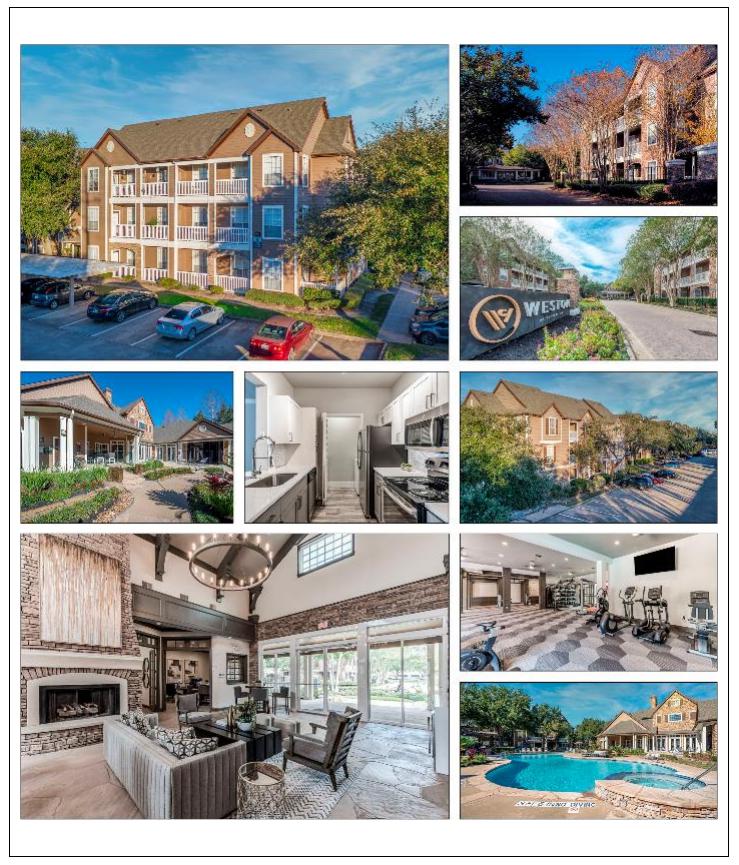
| THE INFORMATION IN THIS STRUCTURAL AND COLLATERAL TERM SHEET IS NOT COMPLETE AND MAY BE AMENDED PRIOR TO THE TIME OF SALE. THIS TERM SHEET IS NOT AN OFFER TO SELL THESE SECURITIES AND IT IS NOT A SOLICITATION OF AN OFFER TO BUY THESE SECURITIES IN ANY JURISDICTION WHERE THE OFFER OR SALE IS NOT PERMITTED. |
| | 58 | |
| Structural and Collateral Term Sheet | | BMO 2023-C4 |
| |
| No. 4 – Weston at Copperfield |
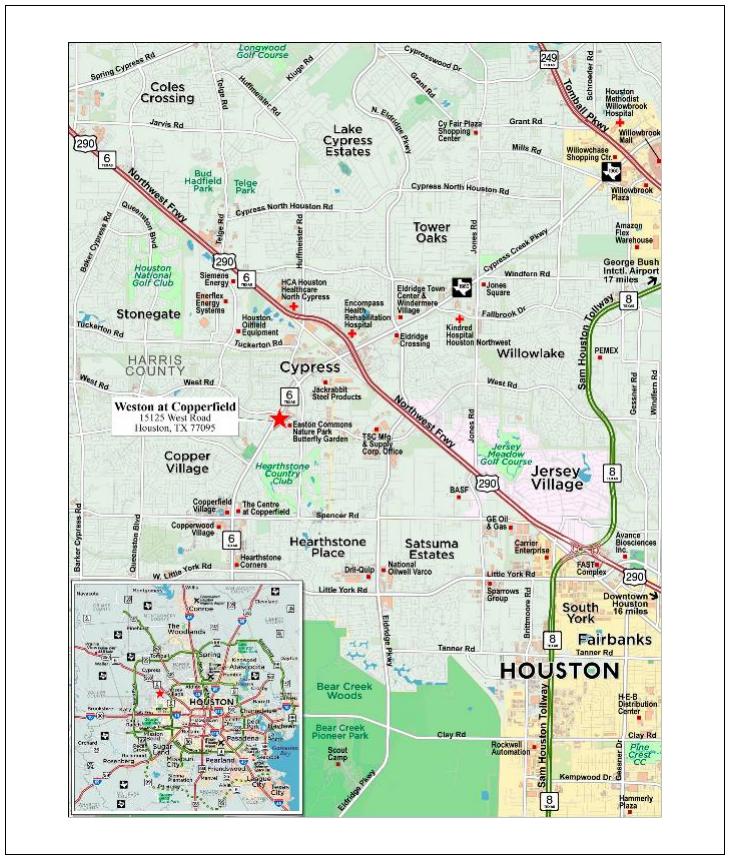
| THE INFORMATION IN THIS STRUCTURAL AND COLLATERAL TERM SHEET IS NOT COMPLETE AND MAY BE AMENDED PRIOR TO THE TIME OF SALE. THIS TERM SHEET IS NOT AN OFFER TO SELL THESE SECURITIES AND IT IS NOT A SOLICITATION OF AN OFFER TO BUY THESE SECURITIES IN ANY JURISDICTION WHERE THE OFFER OR SALE IS NOT PERMITTED. |
| | 59 | |
| Structural and Collateral Term Sheet | | BMO 2023-C4 |
| |
| No. 4 – Weston at Copperfield |
| Mortgage Loan Information | | Property Information |
| Mortgage Loan Seller: | BMO | | Single Asset / Portfolio: | Single Asset |
| Original Principal Balance: | $28,000,000 | | Title: | Fee |
| Cut-off Date Principal Balance: | $28,000,000 | | Property Type – Subtype: | Multifamily – Garden |
| % of IPB: | 3.6% | | Net Rentable Area (Units): | 330 |
| Loan Purpose: | Acquisition | | Location: | Houston, TX |
| Borrower: | CF Weston Multifamily DST | | Year Built / Renovated: | 1998 / 2018 |
| Borrower Sponsor: | CF Real Estate Holdings, LLC | | Occupancy: | 90.3% |
| Interest Rate: | 4.29600% | | Occupancy Date: | 10/31/2022 |
| Note Date: | 3/25/2022 | | 4th Most Recent NOI (As of): | $2,197,012 (12/31/2019) |
| Maturity Date: | 4/1/2032 | | 3rd Most Recent NOI (As of): | $2,131,513 (12/31/2020) |
| Interest-only Period: | 120 months | | 2nd Most Recent NOI (As of): | $2,445,381 (12/31/2021) |
| Original Term: | 120 months | | Most Recent NOI (As of)(2): | $3,372,481 (TTM 10/31/2022) |
| Original Amortization Term: | None | | UW Economic Occupancy: | 86.4% |
| Amortization Type: | Interest Only | | UW Revenues: | $4,920,907 |
| Call Protection: | L(34),D(83),O(3) | | UW Expenses: | $2,657,613 |
| Lockbox / Cash Management: | Springing / Springing | | UW NOI: | $2,263,294 |
| Additional Debt: | No | | UW NCF: | $2,180,794 |
| Additional Debt Balance: | N/A | | Appraised Value / Per Unit: | $66,160,000 / $200,485 |
| Additional Debt Type: | N/A | | Appraisal Date: | 2/28/2022 |
| | | | | |
| Escrows and Reserves(1) | | Financial Information |
| | Initial | Monthly | Initial Cap | | Cut-off Date Loan / Unit: | $84,848 |
| Taxes: | $515,805 | $73,686 | N/A | | Maturity Date Loan / Unit: | $84,848 |
| Insurance: | $0 | Springing | N/A | | Cut-off Date LTV: | 42.3% |
| Replacement Reserves: | $20,625 | $6,875 | N/A | | Maturity Date LTV: | 42.3% |
| | | | | | UW NCF DSCR: | 1.79x |
| | | | | | UW NOI Debt Yield: | 8.1% |
| | | | | | | |
| Sources and Uses |
| Sources | Proceeds | % of Total | | Uses | Proceeds | % of Total |
| Mortgage Loan | $28,000,000 | 41.8 | % | | Purchase Price | $66,000,000 | 98.5 | % |
| Borrower Sponsor Equity | 38,993,677 | 58.2 | | | Upfront Reserves | 536,430 | 0.8 | |
| | | | | Closing Costs | 457,247 | 0.7 | |
| Total Sources | $66,993,677 | 100.0 | % | | Total Uses | $66,993,677 | 100.0 | % |
| (1) | For a full description of Escrows and Reserves, please refer to “Escrows and Reserves” below. |
| (2) | Most Recent NOI does not include March 2022 because the borrower acquired the Weston at Copperfield Property (as defined below) in March 2022. |
The Loan. The fourth largest mortgage loan (the “Weston at Copperfield Mortgage Loan”) is secured by the borrower’s fee interest in a 330-unit, garden-style multifamily property located in Houston, Texas (the “Weston at Copperfield Property”). The Weston at Copperfield Mortgage Loan was originated on March 25, 2022 by Arbor Private Label, LLC and subsequently acquired by Bank of Montreal on January 6, 2023. The Weston at Copperfield Mortgage Loan accrues interest at an interest rate of 4.29600% per annum. The Weston at Copperfield Mortgage Loan has an original term of 120 months, has a remaining term of 110 months and is interest only for the entire term. The scheduled maturity date of the Weston at Copperfield Mortgage Loan is the due date that occurs on April 1, 2032.
The Property. The Weston at Copperfield Property consists of 12, three-story multifamily buildings, totaling 330 residential units on approximately 12.58 acres. The Weston at Copperfield Property is located in Houston, Texas and is situated on the south side of West Road between Easton Commons Drive and Highway 6. The Weston at Copperfield Property was built in 1998, and features a range of one-bedroom, two-bedroom, and three-bedroom residential units. The Weston at Copperfield Property units all feature ceramic tile and carpet flooring, central air, full stainless steel kitchen appliances, solid surface countertops, oversize walk-in closets and steam showers. Community spaces include an outdoor grill, gated
| THE INFORMATION IN THIS STRUCTURAL AND COLLATERAL TERM SHEET IS NOT COMPLETE AND MAY BE AMENDED PRIOR TO THE TIME OF SALE. THIS TERM SHEET IS NOT AN OFFER TO SELL THESE SECURITIES AND IT IS NOT A SOLICITATION OF AN OFFER TO BUY THESE SECURITIES IN ANY JURISDICTION WHERE THE OFFER OR SALE IS NOT PERMITTED. |
| | 60 | |
| Structural and Collateral Term Sheet | | BMO 2023-C4 |
| |
| No. 4 – Weston at Copperfield |
entrance, clubhouse, playground, and pool. The Weston at Copperfield Property has 54 carports, 60 garages and 439 surface parking spaces, totaling 553 parking spaces and resulting in a ratio of approximately 1.68 parking spaces per unit.
The following table presents detailed information with respect to the unit mix at the Weston at Copperfield Property:
| Unit Mix Summary(1) |
| Unit Type | No. of Units | % of Total | Average Unit
Size (SF) | Average
Monthly
Rental Rate(2) | Average
Monthly
Rental Rate
per SF(2) | Average
Monthly
Market Rental
Rate | Average
Monthly
Market Rental
Rate per SF |
| 1 Bed / 1 Bath - A1 | 19 | 5.8 | % | 643 | $995 | $1.55 | $1,080 | $1.68 |
| 1 Bed / 1 Bath - A1F | 17 | 5.2 | | 643 | $1,052 | $1.64 | $1,100 | $1.71 |
| 1 Bed / 1 Bath - A1Q | 36 | 10.9 | | 643 | $1,124 | $1.75 | $1,230 | $1.91 |
| 1 Bed / 1 Bath - A2 | 10 | 3.0 | | 711 | $1,051 | $1.48 | $1,110 | $1.56 |
| 1 Bed / 1 Bath - A2F | 14 | 4.2 | | 711 | $1,049 | $1.48 | $1,130 | $1.59 |
| 1 Bed / 1 Bath - A2Q | 25 | 7.6 | | 711 | $1,139 | $1.60 | $1,260 | $1.77 |
| 1 Bed / 1 Bath - A3 | 18 | 5.5 | | 802 | $1,153 | $1.44 | $1,210 | $1.51 |
| 1 Bed / 1 Bath - A3F | 28 | 8.5 | | 802 | $1,185 | $1.48 | $1,230 | $1.53 |
| 1 Bed / 1 Bath - A3Q | 33 | 10.0 | | 802 | $1,271 | $1.58 | $1,360 | $1.70 |
| 2 Bed / 2 Bath - B1 | 6 | 1.8 | | 1,040 | $1,399 | $1.34 | $1,470 | $1.41 |
| 2 Bed / 2 Bath - B1F | 18 | 5.5 | | 1,040 | $1,416 | $1.36 | $1,490 | $1.43 |
| 2 Bed / 2 Bath - B1Q | 25 | 7.6 | | 1,040 | $1,506 | $1.45 | $1,640 | $1.58 |
| 2 Bed / 2 Bath - B2 | 9 | 2.7 | | 1,095 | $1,449 | $1.32 | $1,490 | $1.36 |
| 2 Bed / 2 Bath - B2F | 20 | 6.1 | | 1,095 | $1,449 | $1.32 | $1,510 | $1.38 |
| 2 Bed / 2 Bath - B2Q | 18 | 5.5 | | 1,095 | $1,484 | $1.36 | $1,650 | $1.51 |
| 2 Bed / 2 Bath - B3 | 4 | 1.2 | | 1,099 | $1,407 | $1.28 | $1,520 | $1.38 |
| 2 Bed / 2 Bath - B3F | 11 | 3.3 | | 1,099 | $1,456 | $1.33 | $1,540 | $1.40 |
| 2 Bed / 2 Bath - B3Q | 8 | 2.4 | | 1,099 | $1,552 | $1.41 | $1,690 | $1.54 |
| 3 Bed / 2 Bath - C1 | 1 | 0.3 | | 1,295 | $0 | $0.00 | $1,795 | $1.39 |
| 3 Bed / 2 Bath - C1F | 6 | 1.8 | | 1,295 | $1,725 | $1.33 | $1,815 | $1.40 |
| 3 Bed / 2 Bath - C1Q | 4 | 1.2 | | 1,295 | $1,756 | $1.36 | $1,945 | $1.50 |
| Total/Wtd. Avg. | 330 | 100.0 | % | 868 | $1,265 | $1.50 | $1,364 | $1.60 |
| (1) | Based on the underwritten rent roll as of October 31, 2022. Average Monthly Rental Rate and Average Monthly Rental Rate per SF reflect average monthly in-place rent for occupied units. |
| (2) | Average Monthly Rental Rate and Average Monthly Rental Rate per SF are inclusive of employee discounts on two separate units. |
Environmental. According to the Phase I report dated March 8, 2022, there was no evidence of any recognized environmental conditions at the Weston at Copperfield Property.
The following table presents certain information relating to the historical and current occupancy of the Weston at Copperfield Property:
| Historical and Current Multifamily Occupancy(1) |
| 2019 | 2020 | 2021 | Current(2) |
| 93.0% | 95.0% | 95.3% | 90.3% |
| (1) | Historical occupancies are as of December 31 for each respective year. |
| (2) | Current occupancy is as of October 31, 2022. |
| THE INFORMATION IN THIS STRUCTURAL AND COLLATERAL TERM SHEET IS NOT COMPLETE AND MAY BE AMENDED PRIOR TO THE TIME OF SALE. THIS TERM SHEET IS NOT AN OFFER TO SELL THESE SECURITIES AND IT IS NOT A SOLICITATION OF AN OFFER TO BUY THESE SECURITIES IN ANY JURISDICTION WHERE THE OFFER OR SALE IS NOT PERMITTED. |
| | 61 | |
| Structural and Collateral Term Sheet | | BMO 2023-C4 |
| |
| No. 4 – Weston at Copperfield |
The following table presents certain information relating to the operating history and underwritten cash flows of the Weston at Copperfield Property:
| Operating History and Underwritten Net Cash Flow |
| | 2019 | 2020 | 2021 | TTM(1) | Underwritten | Per Unit | %(2) |
| Gross Potential Rent | $4,193,238 | $4,406,688 | $4,625,263 | $4,940,251 | $5,079,127 | $15,391 | 100.0 | % |
| (Vacancy) | (290,030) | (297,542) | (243,434) | (379,273) | (556,440) | (1,686) | (11.0 | ) |
| (Bad Debt) | (44,901) | (57,363) | (95,048) | (121,832) | (121,832) | (369) | (2.4 | ) |
| (Concessions) | (42,241) | (82,011) | (58,189) | (10,219) | (10,219) | (31) | (0.2 | ) |
| (Non-Revenue) | 0 | 0 | 0 | (5,566) | (14,579) | (44) | (0.3 | ) |
| Net Rental Income | $3,816,067 | $3,969,772 | $4,228,592 | $4,423,361 | $4,376,056 | $13,261 | 86.2 | % |
| Other Income(3) | 411,001 | 433,927 | 545,616 | 544,850 | 544,850 | 1,651 | 10.7 | |
| Effective Gross Income | $4,227,068 | $4,403,699 | $4,774,208 | $4,968,211 | $4,920,907 | $14,912 | 96.9 | % |
| Total Expenses | 2,030,056 | 2,272,186 | 2,328,827 | 1,595,730 | 2,657,613 | 8,053 | 54.0 | |
| Net Operating Income | $2,197,012 | $2,131,513 | $2,445,381 | $3,372,481 | $2,263,294 | $6,858 | 46.0 | % |
| Replacement Reserve | 0 | 0 | 0 | 0 | 82,500 | 250 | 1.7 | |
| Net Cash Flow | $2,197,012 | $2,131,513 | $2,445,381 | $3,372,481 | $2,180,794 | $6,608 | 44.3 | % |
| (1) | TTM reflects the trailing 12 months (excluding March 2022) ending October 31, 2022. TTM does not include March 2022 because the borrower acquired the Weston at Copperfield Property in March 2022. |
| (2) | % column represents percent of Gross Potential Rent for revenue fields and represents percent of Effective Gross Income for the remainder of fields. |
| (3) | Other Income includes trailing 12-month annualized utility reimbursements and trailing 12 months other income and parking income. |
The Market. The Weston at Copperfield Property is located in Houston, Texas, within the Houston-The Woodlands-Sugar Land, TX Metropolitan Statistical Area (the “Houston MSA”). According to the appraisal, the unemployment rate in the Houston MSA as of December 2021 was 4.8% but is expected to decrease to 3.7% by 2026. The leading industries in Houston are manufacturing, wholesale trade, agriculture/mining, finance/insurance/real estate, and retail trade sectors. The largest employer in Houston is Exxon Mobil Corp., which employs 13,000 people. The Weston at Copperfield Property is located in the northwest area of the Houston MSA on West Road, a major thoroughfare connecting to Highway 6 and U.S. 290. The METRO system is located approximately 2.5 miles from the Weston at Copperfield Property. The local area is primarily occupied by retail, industrial, office and multifamily developments.
The Weston at Copperfield Property is situated in the Cypress/Fairbanks multifamily submarket. According to the appraisal, as of the fourth quarter of 2021, the Cypress/Fairbanks multifamily submarket had an overall vacancy rate of 5.3%, with net absorption totaling 830 units. The vacancy rate decreased 1.7% over the past 12 months. Rental rates increased by $65 from the fourth quarter of 2020 to the fourth quarter of 2021 and ended at $1,130 per unit per month.
According to the appraisal, the 2021 population within a one-, three-, and five-mile radius of the Weston at Copperfield Property was 15,996, 134,016, and 332,371, respectively. According to the appraisal, the 2021 median household income within a one-, three-, and five-mile radius of the Weston at Copperfield Property was $70,170, $71,513, and $76,380, respectively.
| THE INFORMATION IN THIS STRUCTURAL AND COLLATERAL TERM SHEET IS NOT COMPLETE AND MAY BE AMENDED PRIOR TO THE TIME OF SALE. THIS TERM SHEET IS NOT AN OFFER TO SELL THESE SECURITIES AND IT IS NOT A SOLICITATION OF AN OFFER TO BUY THESE SECURITIES IN ANY JURISDICTION WHERE THE OFFER OR SALE IS NOT PERMITTED. |
| | 62 | |
| Structural and Collateral Term Sheet | | BMO 2023-C4 |
| |
| No. 4 – Weston at Copperfield |
The following table presents certain information relating to comparable multifamily rental properties to the Weston at Copperfield Property:
| Comparable Rental Summary(1) |
| Property / Location | Year Built /
Renovated | Occupancy | # of Units | Unit Mix | Average SF
per Unit | Average Rent
per SF | Average Rent
per Unit |
| Weston at Copperfield(2) | 1998 / 2018 | 90.3% | 200 | 1 Bed 1 Bath | 722 | $1.57 | $1,135 |
| 15125 West Road | 119 | 2 Bed 2 Bath | 1,073 | $1.36 | $1,464 |
| Houston, TX | 11 | 3 Bed 2 Bath | 1,295 | $1.34 | $1,735 |
| Carrington Place | 2004 / NAP | 98.0% | 110 | 1 Bed 1 Bath | 841 | $1.45 | $1,223 |
| Houston, TX | | | 172 | 2 Bed 2 Bath | 1,188 | $1.30 | $1,539 |
| 12700 FM 1960 Road West | | | 42 | 3 Bed 2 Bath | 1,487 | $1.17 | $1,742 |
| Cortland Copper Springs | 2003 / NAP | 94.0% | 180 | 1 Bed 1 Bath | 746 | $1.78 | $1,326 |
| Houston, TX | | | 160 | 2 Bed 2 Bath | 1,077 | $1.49 | $1,606 |
| 13333 West Road | | | 36 | 3 Bed 2 Bath | 1,337 | $1.49 | $1,988 |
| Cortland Copperleaf | 2003 / 2018 | 95.0% | 126 | 1 Bed 1 Bath | 772 | $1.76 | $1,355 |
| Houston, TX | | | 78 | 2 Bed 2 Bath | 1,138 | $1.48 | $1,686 |
| 14811 West Road | | | 36 | 3 Bed 2 Bath | 1,414 | $1.26 | $1,788 |
| Crossroads Ranch | 1998 / 2019 | 94.0% | 128 | 1 Bed 1 Bath | 697 | $1.60 | $1,112 |
| Houston, TX | | | 48 | 2 Bed 1 Bath | 908 | $1.43 | $1,300 |
| 12655 Crossroads Park Drive | | | 48 | 2 Bed 2 Bath | 1,115 | $1.33 | $1,485 |
| | | | 32 | 3 Bed 2 Bath | 1,250 | $1.35 | $1,685 |
| Trails at Eldridge Parkway | 2003 / 2018 | 94.0% | 240 | 1 Bed 1 Bath | 790 | $1.17 | $925 |
| Houston, TX | | | 144 | 2 Bed 2 Bath | 1,109 | $1.56 | $1,726 |
| 10000 North Eldridge Parkway | | | 6 | 3 Bed 2 Bath | 1,436 | $1.34 | $1,923 |
| (1) | Source: Appraisal, unless otherwise indicated. |
| (2) | Based on underwritten rent roll dated as of October 31, 2022. Average Rent per SF and Average Rent per Unit reflect average monthly in-place rent for occupied units. |
The Borrower. The borrower under the Weston at Copperfield Mortgage Loan is CF Weston Multifamily DST, a special-purpose entity and Delaware statutory trust with one independent director. Legal counsel to the borrower delivered a non-consolidation opinion in connection with the origination of the Weston at Copperfield Mortgage Loan.
The Borrower Sponsor. The borrower sponsor and non-recourse carveout guarantor is CF Real Estate Holdings, LLC, (“CF REH”) a Delaware limited liability company. CF REH is an affiliate of Cantor Fitzgerald, L.P. and Cantor Fitzgerald Investors, LLC (collectively, “Cantor Fitzgerald”). Cantor Fitzgerald has invested more than $2 billion in its commercial real estate business infrastructure. In 2020, Cantor Fitzgerald participated in more than $72 billion of total real estate transactions.
Property Management. The Weston at Copperfield Property is managed by CAF Management, LLC (“CAF Management”), a third party property management company headquartered in Frisco, Texas. CAF Management currently manages 75 multifamily properties across Texas, Oklahoma and Arizona.
Escrows and Reserves. At origination of the Weston at Copperfield Mortgage Loan, the borrower deposited (i) approximately $515,805 into a real estate tax reserve account and (ii) $20,625 into a replacement reserve account.
Tax Escrows – The borrower is required to deposit into a real estate tax reserve, on a monthly basis, approximately $73,686.
Insurance Escrows – Monthly payments in the insurance reserve have been waived by the lender so long as the borrower is carrying a blanket policy.
Replacement Reserves – The borrower is required to deposit into a replacement reserve, on a monthly basis, an amount equal to $6,875.
Lockbox / Cash Management. The Weston at Copperfield Mortgage Loan is structured with a springing lockbox and springing cash management. Upon the occurrence of a Trigger Event (as defined below), the borrower or property manager will deposit all revenues relating to the Weston at Copperfield Property into a lender-controlled lockbox account within two business days of receipt.
A “Trigger Event” will commence upon (i) the occurrence and continuance of an event of default, or (ii) the debt service coverage ratio of the Weston at Copperfield Mortgage Loan being less than 1.10x and will be cured when (A) with respect
| THE INFORMATION IN THIS STRUCTURAL AND COLLATERAL TERM SHEET IS NOT COMPLETE AND MAY BE AMENDED PRIOR TO THE TIME OF SALE. THIS TERM SHEET IS NOT AN OFFER TO SELL THESE SECURITIES AND IT IS NOT A SOLICITATION OF AN OFFER TO BUY THESE SECURITIES IN ANY JURISDICTION WHERE THE OFFER OR SALE IS NOT PERMITTED. |
| | 63 | |
| Structural and Collateral Term Sheet | | BMO 2023-C4 |
| |
| No. 4 – Weston at Copperfield |
to clause (i) above, no event of default is continuing or (B) with respect to clause (ii) above, the debt service coverage ratio of the Weston at Copperfield Mortgage Loan is greater than 1.10x for two consecutive calendar quarters.
Subordinate Debt. None.
Mezzanine Debt. The borrower is permitted to incur a future mezzanine loan (the “Mezzanine Debt”), subject to the satisfaction of the requirements set forth in the Weston at Copperfield Mortgage Loan documents, which include, but are not limited to: (i) the mortgage lender receives at least 30 days’ prior written notice of the intention to incur Mezzanine Debt (the “Mezzanine Notice”), (ii) the security granted in connection with such Mezzanine Debt consists only of a pledge of all of the membership or partnership interests in the borrower, (iii) the aggregate debt yield based on the Weston at Copperfield Mortgage Loan and the Mezzanine Debt is equal to or greater than 8.14%, (iv) the aggregate loan-to-value ratio based on the Weston at Copperfield Mortgage Loan and the Mezzanine Debt is no greater than 42.32%, (v) the execution of an intercreditor agreement acceptable to the mortgage lender and satisfactory to the rating agencies, (vi) the Mezzanine Debt is subordinate in all respects to the Weston at Copperfield Mortgage Loan pursuant to the intercreditor agreement, (vii) the Mezzanine Debt is not cross-defaulted or cross-collateralized with any other properties or loans and is co-terminus with the Weston at Copperfield Mortgage Loan, (viii) the Mezzanine Debt may only be prepaid after the expiration of the prepayment lockout period of the Weston at Copperfield Mortgage Loan or simultaneously with the defeasance of the Weston at Copperfield Mortgage Loan, (ix) the borrower procures and delivers a mezzanine loan policy for the benefit of the mezzanine lender and facilitates the appropriate updates to the mortgage lender’s title insurance policy as requested by the mortgage lender’s counsel and (x) the borrower pays to the mortgage lender a $10,000 review fee concurrently with its issuance of a Mezzanine Notice to the mortgage lender.
Partial Release. Not permitted.
Ground Lease. None.
| THE INFORMATION IN THIS STRUCTURAL AND COLLATERAL TERM SHEET IS NOT COMPLETE AND MAY BE AMENDED PRIOR TO THE TIME OF SALE. THIS TERM SHEET IS NOT AN OFFER TO SELL THESE SECURITIES AND IT IS NOT A SOLICITATION OF AN OFFER TO BUY THESE SECURITIES IN ANY JURISDICTION WHERE THE OFFER OR SALE IS NOT PERMITTED. |
| | 64 | |
| Structural and Collateral Term Sheet | | BMO 2023-C4 |
| |
| No. 5 – IPG Portfolio |
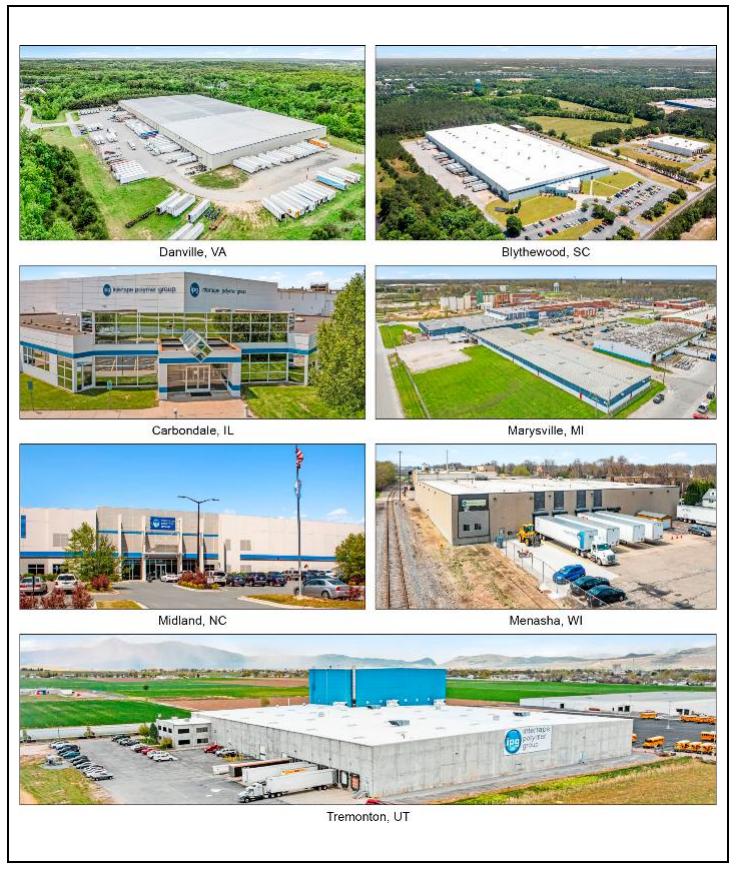
| THE INFORMATION IN THIS STRUCTURAL AND COLLATERAL TERM SHEET IS NOT COMPLETE AND MAY BE AMENDED PRIOR TO THE TIME OF SALE. THIS TERM SHEET IS NOT AN OFFER TO SELL THESE SECURITIES AND IT IS NOT A SOLICITATION OF AN OFFER TO BUY THESE SECURITIES IN ANY JURISDICTION WHERE THE OFFER OR SALE IS NOT PERMITTED. |
| | 65 | |
| Structural and Collateral Term Sheet | | BMO 2023-C4 |
| |
| No. 5 – IPG Portfolio |
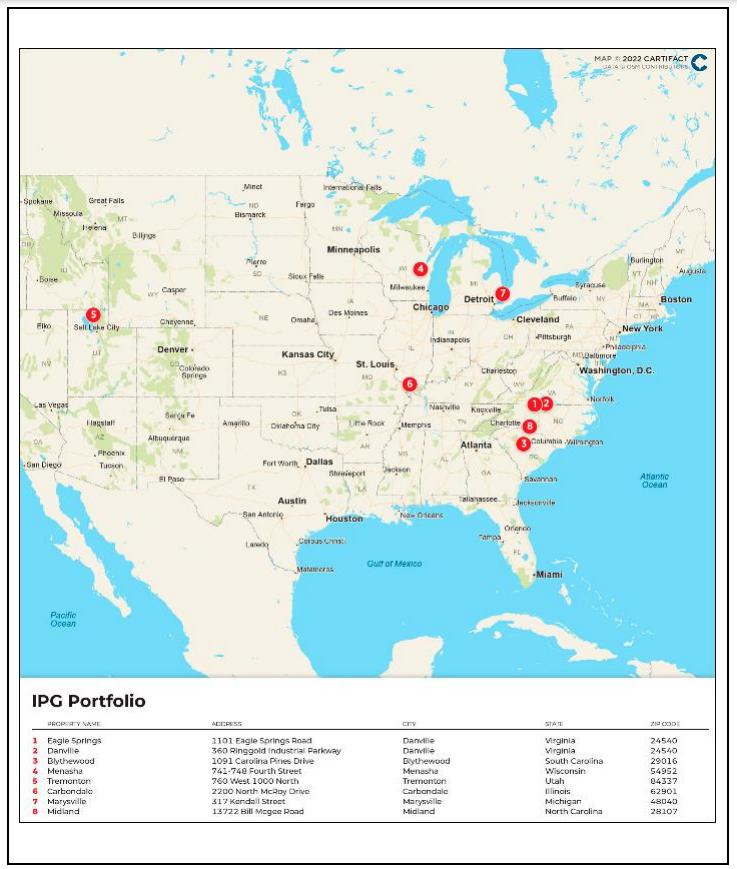
| THE INFORMATION IN THIS STRUCTURAL AND COLLATERAL TERM SHEET IS NOT COMPLETE AND MAY BE AMENDED PRIOR TO THE TIME OF SALE. THIS TERM SHEET IS NOT AN OFFER TO SELL THESE SECURITIES AND IT IS NOT A SOLICITATION OF AN OFFER TO BUY THESE SECURITIES IN ANY JURISDICTION WHERE THE OFFER OR SALE IS NOT PERMITTED. |
| | 66 | |
| Structural and Collateral Term Sheet | | BMO 2023-C4 |
| |
| No. 5 – IPG Portfolio |
| Mortgage Loan Information | | Property Information |
| Mortgage Loan Seller: | CREFI | | Single Asset / Portfolio: | Portfolio |
| Original Principal Balance(1): | $28,000,000 | | Title: | Fee |
| Cut-off Date Principal Balance(1): | $28,000,000 | | Property Type – Subtype: | Industrial – Various |
| % of IPB: | 3.6% | | Net Rentable Area (SF): | 1,791,714 |
| Loan Purpose: | Acquisition | | Location: | Various |
| Borrower: | AGNL SEAL, L.P. | | Year Built / Renovated(3): | Various / Various |
| Borrowers Sponsors: | AG Net Lease IV Corp., AG Net | | Occupancy: | 100.0% |
| | Lease IV (Q) Corp. and AG Net | | Occupancy Date: | 2/6/2023 |
| | Lease Realty Fund IV Investments | | 4th Most Recent NOI (As of)(4): | NAV |
| | (H-1), L.P. | | 3rd Most Recent NOI (As of)(4): | NAV |
| Interest Rate: | 6.33000% | | 2nd Most Recent NOI (As of)(4): | NAV |
| Note Date: | 9/29/2022 | | Most Recent NOI (As of)(4): | NAV |
| Maturity Date: | 10/6/2032 | | UW Economic Occupancy: | 95.0% |
| Interest-only Period: | 120 months | | UW Revenues: | $14,015,432 |
| Original Term: | 120 months | | UW Expenses: | $2,610,886 |
| Original Amortization Term: | None | | UW NOI: | $11,404,546 |
| Amortization Type: | Interest Only | | UW NCF: | $10,826,623 |
| Call Protection: | YM4(28),DorYM1(85),O(7) | | Appraised Value / Per SF: | $196,800,000 / $110 |
| Lockbox / Cash Management: | Hard / Springing | | Appraisal Date(5): | Various |
| Additional Debt(1): | Yes | | | |
| Additional Debt Balance(1): | $75,000,000 | | | |
| Additional Debt Type(1): | Pari Passu | | | |
| | | | | |
| | | | | |
| Escrows and Reserves(2) | | Financial Information(1) |
| | Initial | Monthly | Initial Cap | | Cut-off Date Loan / SF: | $57 |
| Taxes: | $0 | Springing | N/A | | Maturity Date Loan / SF: | $57 |
| Insurance: | $0 | Springing | N/A | | Cut-off Date LTV: | 52.3% |
| Replacement Reserve: | $0 | Springing | N/A | | Maturity Date LTV: | 52.3% |
| | | | | | UW NCF DSCR: | 1.64x |
| | | | | | UW NOI Debt Yield: | 11.1% |
| | | | | | | |
| Sources and Uses |
| Sources | Proceeds | % of Total | | Uses | Proceeds | % of Total | |
| Whole Loan | $103,000,000 | 57.3 | % | | Purchase Price | $177,000,000 | 98.5 | % |
| Principal’s New Cash Contribution | 73,350,575 | 40.8 | | | Closing Costs | 2,652,115 | 1.5 | |
| Other Sources | 3,301,540 | 1.8 | | | | | |
| Total Sources | $179,652,115 | 100.0 | % | | Total Uses | $179,652,115 | 100.0 | % |
| (1) | The IPG Portfolio Mortgage Loan (as defined below) is part of a whole loan evidenced by four pari passu notes with an aggregate outstanding principal balance of $103.0 million as of the Cut-off Date. The financial information in the chart above is based on such $103.0 million whole loan. |
| (2) | For a full description of Escrows and Reserves, please refer to “Escrows and Reserves” below. |
| (3) | The IPG Portfolio Whole Loan (as defined below) is secured by the fee interest in eight industrial properties which were built between 1920 and 2016. See “Portfolio Summary” table herein. |
| (4) | Historical financial information is not available for the IPG Portfolio Properties (as defined below) since the borrower acquired the IPG Portfolio Properties in a sale-leaseback transaction with a single-tenant and leases were not previously in place. |
| (5) | Appraised values are provided by appraisal reports dated between August 12, 2022 and August 17, 2022. |
| THE INFORMATION IN THIS STRUCTURAL AND COLLATERAL TERM SHEET IS NOT COMPLETE AND MAY BE AMENDED PRIOR TO THE TIME OF SALE. THIS TERM SHEET IS NOT AN OFFER TO SELL THESE SECURITIES AND IT IS NOT A SOLICITATION OF AN OFFER TO BUY THESE SECURITIES IN ANY JURISDICTION WHERE THE OFFER OR SALE IS NOT PERMITTED. |
| | 67 | |
| Structural and Collateral Term Sheet | | BMO 2023-C4 |
| |
| No. 5 – IPG Portfolio |
The Loan. The fifth largest mortgage loan (the “IPG Portfolio Mortgage Loan”) is part of a whole loan (the “IPG Portfolio Whole Loan”) evidenced by four pari passu notes with an aggregate outstanding balance as of the Cut-off Date of $103,000,000 secured by a first mortgage encumbering the borrower’s fee interest in a portfolio of eight industrial properties totaling 1,791,714 SF across Virginia, Michigan, Illinois, Wisconsin, Utah, North Carolina and South Carolina (collectively, the “IPG Portfolio Properties”). The IPG Portfolio Whole Loan was originated on September 29, 2022 by Citi Real Estate Funding Inc. (“CREFI”). The IPG Portfolio Mortgage Loan, which will be included in the BMO 2023-C4 securitization trust, is evidenced by the non-controlling notes A-2-2 and A-3 which have outstanding balances as of the Cut-off Date of $8,000,000 and $20,000,000 respectively. The proceeds of the IPG Portfolio Whole Loan were primarily used to acquire the IPG Portfolio Properties in a sale-leaseback transaction with the sole tenant at each of the IPG Portfolio Properties, Intertape Polymer Group (“IPG”), and to pay origination costs.
The IPG Portfolio Whole Loan has an initial term of 120 months and a remaining term of 116 months as of the Cut-off Date. The IPG Portfolio Whole Loan has a 10-year interest only term and accrues interest at a rate of 6.33000% per annum. The scheduled maturity date of the IPG Portfolio Whole Loan is the due date in October, 2032. Voluntary prepayment of the IPG Portfolio Whole Loan in whole or in part is permitted on or after the due date occurring in April 2032 without the payment of any prepayment premium. In addition, the IPG Portfolio Whole Loan may be voluntarily prepaid in whole or in part at any time beginning on the due date in November 2022 with the payment of a yield maintenance premium. Defeasance of the IPG Portfolio Whole Loan in whole or in part is permitted after the date that is earlier of (i) two years from the closing date of the securitization that includes the last note of the IPG Portfolio Whole Loan to be securitized and (ii) September 29, 2025.
The table below summarizes the promissory notes that comprise the IPG Portfolio Whole Loan. The relationship between the holders of the notes evidencing the IPG Portfolio Whole Loan is governed by a co-lender agreement as described under “Description of the Mortgage Pool—The Whole Loans—The Outside Serviced Pari Passu Whole Loans” in the Preliminary Prospectus. The IPG Portfolio Whole Loan is being serviced pursuant to the BMARK 2022-B37 pooling and servicing agreement. See “The Pooling and Servicing Agreement—Servicing of the Outside Serviced Mortgage Loans” and “Description of the Mortgage Pool—The Whole Loans—The Outside Serviced Pari Passu Whole Loans” in the Preliminary Prospectus.
| Whole Loan Summary |
| Note | Original Balance | Cut-off Date Balance | Note Holder | Controlling Piece |
| A-1 | $60,000,000 | $60,000,000 | BMARK 2022-B37 | Yes |
| A-2-1 | $15,000,000 | $15,000,000 | 3650R 2022-PF2 | No |
| A-2-2 | $8,000,000 | $8,000,000 | BMO 2023-C4 | No |
| A-3 | $20,000,000 | $20,000,000 | BMO 2023-C4 | No |
| Whole Loan | $103,000,000 | $103,000,000 | | |
The Properties. The IPG Portfolio Properties consist of eight single tenant industrial buildings totaling 1,791,714 SF located across seven states: Virginia, Michigan, Illinois, Wisconsin, Utah, North Carolina and South Carolina. Each of the IPG Portfolio Properties is 100.0% occupied by IPG, the sole tenant at the IPG Portfolio Properties with average rents of $6.78 PSF pursuant to leases expiring on September 30, 2042.
The following table presents certain information relating to the IPG Portfolio Properties:
| Portfolio Summary |
| Property | City, State | Allocated
Whole Loan
Amount | Property Subtype | % of
Allocated
Loan Amount | Net Rentable
Area (SF)(1) | Year Built /
Renovated(2) | Appraised
Value(2) | UW EGI(1) | % of UW EGI |
| Eagle Springs | Danville, VA | $21,066,376 | Warehouse/Distribution | 20.5 | % | 317,670 | 1987 / 2017 | $40,000,000 | $2,568,301 | 18.3 | % |
| Danville | Danville, VA | 20,989,251 | Warehouse/Distribution | 20.4 | | 316,507 | 2004 / NAP | 40,000,000 | 2,543,184 | 18.1 | |
| Blythewood | Blythewood, SC | 19,662,098 | Manufacturing | 19.1 | | 350,563 | 1999 / 2014 | 37,600,000 | 2,442,402 | 17.4 | |
| Menasha | Menasha, WI | 9,603,128 | Manufacturing | 9.3 | | 156,860 | 1920 / 2004 | 17,500,000 | 1,488,208 | 10.6 | |
| Tremonton | Tremonton, UT | 8,440,132 | Manufacturing | 8.2 | | 118,503 | 1997 / NAP | 17,600,000 | 1,155,469 | 8.2 | |
| Carbondale | Carbondale, IL | 8,213,458 | Warehouse/Distribution | 8.0 | | 193,730 | 1995 / NAP | 16,900,000 | 1,400,936 | 10.0 | |
| Marysville | Marysville, MI | ;7,621,886 | Manufacturing | 7.4 | | 233,264 | 1943 / 1987 | 14,400,000 | 1,396,402 | 10.0 | |
| Midland | Midland, NC | 7,403,671 | Warehouse/Distribution | 7.2 | | 104,617 | 2016 / NAP | 12,800,000 | 1,020,529 | 7.3 | |
| Total / Wtd. Avg. | | $103,000,000 | | 100.0 | % | 1,791,714 | | $196,800,000 | $14,015,432 | 100.0 | % |
| (1) | Based on the underwritten rent rolls dated February 6, 2023. |
| (2) | Source: Appraisal unless otherwise stated. |
| THE INFORMATION IN THIS STRUCTURAL AND COLLATERAL TERM SHEET IS NOT COMPLETE AND MAY BE AMENDED PRIOR TO THE TIME OF SALE. THIS TERM SHEET IS NOT AN OFFER TO SELL THESE SECURITIES AND IT IS NOT A SOLICITATION OF AN OFFER TO BUY THESE SECURITIES IN ANY JURISDICTION WHERE THE OFFER OR SALE IS NOT PERMITTED. |
| | 68 | |
| Structural and Collateral Term Sheet | | BMO 2023-C4 |
| |
| No. 5 – IPG Portfolio |
Major Tenant. The sole tenant, IPG is a manufacturer of paper and film-based pressure-sensitive and water-activated tapes, stretch and shrink films, protective packaging, woven and non-woven products and packaging machinery for industrial and retail use. IPG also specializes in high performance tape products engineered for demanding aerospace, marine, automotive and industrial applications. Headquartered in Sarasota, Florida, IPG employs approximately 3,800 employees with operations in 34 locations, including 22 manufacturing facilities in North America, five in Asia and two in Europe. IPG was founded in 1981 and based in Sarasota, Florida and Montreal, Canada.
Environmental. According to Phase I environmental reports dated as of September 21, 2022, there are no recognized environmental conditions or recommendations for further action at the IPG Portfolio Properties other than (i) a recognized environmental condition due to prior industrial operations at the Marysville property and (ii) a recognized environmental condition due to prior industrial operations at the Menasha property that resulted in petroleum impacts to soil. The Marysville property was previously used for various industrial purposes, including magnesium processing for the manufacture of shell casings during World War II and production of various adhesive tapes since the late 1950s. These former industrial operations involved the use of chemicals and petroleum products. With respect to the Menasha property, in 1995 and 1996 a limited soil and groundwater investigation was conducted in an area of stained gravel near the rail unloading area on the south side of the site. This investigation included the advancement of a total of sixteen soil borings and installation of one temporary monitoring well. No further investigation or remediation was conducted. In a letter dated February 17, 1997, the Wisconsin Department of Natural Resources granted case closure for the matter subject to no continuing obligations related to management of impacted soils remaining at the time of case closure. See “Description of the Mortgage Pool—Environmental Considerations” in the Preliminary Prospectus.
The following table presents certain information relating to the historical and current occupancy of the IPG Portfolio Properties:
| Historical and Current Occupancy(1) |
| 2019 | 2020 | 2021 | 2/6/2023(2) |
| NAV | NAV | NAV | 100.0% |
| (1) | Historical occupancies are unavailable due to the acquisition of IPG Portfolio Properties at origination of the IPG Portfolio Whole Loan in a sale-leaseback transaction. |
| (2) | Based on the underwritten rent rolls dated as of February 6, 2023. |
The following table presents certain information relating to the sole tenant at the IPG Portfolio Properties:
| Tenant Summary(1) |
| Tenant | Ratings Moody’s/S&P/Fitch(2) | Net
Rentable
Area (SF) | % of
Total
NRA | UW Base
Rent PSF | UW Base
Rent | % of
Total UW
Base
Rent | Lease
Expiration
Date |
| Intertape Polymer Group(3) | NR/NR/NR | 1,791,714 | 100.0% | $6.78 | $12,142,200 | 100.0% | 9/30/2042 |
| Total Occupied | | 1,791,714 | 100.0% | $6.78 | $12,142,200 | 100.0% | |
| Vacant Space | | 0 | 0.0 | | | | |
| Total / Wtd. Avg. | | 1,791,714 | 100.0% | | | | |
| (1) | Based on the underwritten rent rolls dated February 6, 2023. |
| (2) | In certain instances, ratings provided are those of the parent company of the entity shown, regardless of whether the parent company guarantees the lease. |
| (3) | Intertape Polymer Group has one, ten-year renewal option. |
| THE INFORMATION IN THIS STRUCTURAL AND COLLATERAL TERM SHEET IS NOT COMPLETE AND MAY BE AMENDED PRIOR TO THE TIME OF SALE. THIS TERM SHEET IS NOT AN OFFER TO SELL THESE SECURITIES AND IT IS NOT A SOLICITATION OF AN OFFER TO BUY THESE SECURITIES IN ANY JURISDICTION WHERE THE OFFER OR SALE IS NOT PERMITTED. |
| | 69 | |
| Structural and Collateral Term Sheet | | BMO 2023-C4 |
| |
| No. 5 – IPG Portfolio |
The following table presents certain information relating to the tenant lease expiration dates at the IPG Portfolio Properties:
| Lease Rollover Schedule(1)(2) |
Year | Number of
Leases
Expiring | Net
Rentable
Area
Expiring | % of Net
Rental
Area
Expiring | UW Base
Rent
Expiring | % of UW Base Rent Expiring | Cumulative
Net
Rentable
Area
Expiring | Cumulative % of NRA
Expiring | Cumulative
UW Base Rent
Expiring | Cumulative % of UW
Base Rent
Expiring |
| Vacant | NAP | 0 | 0.0 | % | NAP | NAP | 0 | 0.0% | NAP | NAP |
| 2022 & MTM | 0 | 0 | 0.0 | | $0 | 0.0 | % | 0 | 0.0% | $0 | 0.0% |
| 2023 | 0 | 0 | 0.0 | | 0 | 0.0 | | 0 | 0.0% | $0 | 0.0% |
| 2024 | 0 | 0 | 0.0 | | 0 | 0.0 | | 0 | 0.0% | $0 | 0.0% |
| 2025 | 0 | 0 | 0.0 | | 0 | 0.0 | | 0 | 0.0% | $0 | 0.0% |
| 2026 | 0 | 0 | 0.0 | | 0 | 0.0 | | 0 | 0.0% | $0 | 0.0% |
| 2027 | 0 | 0 | 0.0 | | 0 | 0.0 | | 0 | 0.0% | $0 | 0.0% |
| 2028 | 0 | 0 | 0.0 | | 0 | 0.0 | | 0 | 0.0% | $0 | 0.0% |
| 2029 | 0 | 0 | 0.0 | | 0 | 0.0 | | 0 | 0.0% | $0 | 0.0% |
| 2030 | 0 | 0 | 0.0 | | 0 | 0.0 | | 0 | 0.0% | $0 | 0.0% |
| 2032 | 0 | 0 | 0.0 | | 0 | 0.0 | | 0 | 0.0% | $0 | 0.0% |
| 2033 & Beyond | 8 | 1,791,714 | 100.0 | | 12,142,200 | 100.0 | | 1,791,714 | 100.0% | $12,142,200 | 100.0% |
| Total | 8 | 1,791,714 | 100.0 | % | $12,142,200 | 100.0 | % | | | | |
| (1) | Based on the underwritten rent rolls dated February 6, 2023. |
| (2) | Certain tenants may have termination or contraction options (which may become exercisable prior to the originally stated expiration date of the tenant lease) that are not considered in the above Lease Rollover Schedule. |
The following table presents certain information relating to the underwritten cash flows of the IPG Portfolio Properties:
| Underwritten Net Cash Flow(1)(2) |
| | Underwritten | Per Square
Foot | %(3) |
| Rents in Place | $12,142,200 | $6.78 | 82.3 | % |
| Rent Steps | 0 | 0.00 | 0.0 | |
| Gross Potential Rent | $12,142,200 | $6.78 | 82.3 | % |
| Potential Income from | 0 | 0.00 | 0.0 | |
| Vacant Space | 0 | 0.00 | 0.0 | |
| Total Reimbursements | 2,610,886 | 1.46 | 17.7 | |
| Net Rental Income | $14,753,086 | $8.23 | 100.0 | % |
| (Vacancy/Credit Loss) | (737,654) | (0.41) | (5.0 | ) |
| Other Income | 0 | 0.00 | 0.0 | |
| Effective Gross Income | $14,015,432 | $7.82 | 95.0 | % |
| Total Expenses | 2,610,886 | 1.46 | 18.6 | |
| Net Operating Income | $11,404,546 | $6.37 | 81.4 | % |
| Total TI/LC, Cap Ex / RR | 577,923 | 0.32 | 4.1 | |
| Net Cash Flow | $10,826,623 | $6.04 | 77.2 | % |
| (1) | Based on underwritten rent rolls dated February 6, 2023. |
| (2) | Historical financial information is unavailable due to the acquisition of IPG Portfolio Properties at origination of the IPG Portfolio Whole Loan in a sale-leaseback transaction. |
| (3) | % column represents percent of Net Rental Income for all revenue fields and represents percent of Effective Gross Income for the remainder of fields. |
The Market. The eight properties comprising the IPG Portfolio Properties are located across seven states and have the following state concentrations based on total square footage: Virginia – 35.4%, South Carolina – 19.6%, Michigan – 13.0%, Illinois – 10.8%, Wisconsin – 8.8%, Utah – 6.6% and North Carolina – 5.8%.
| THE INFORMATION IN THIS STRUCTURAL AND COLLATERAL TERM SHEET IS NOT COMPLETE AND MAY BE AMENDED PRIOR TO THE TIME OF SALE. THIS TERM SHEET IS NOT AN OFFER TO SELL THESE SECURITIES AND IT IS NOT A SOLICITATION OF AN OFFER TO BUY THESE SECURITIES IN ANY JURISDICTION WHERE THE OFFER OR SALE IS NOT PERMITTED. |
| | 70 | |
| Structural and Collateral Term Sheet | | BMO 2023-C4 |
| |
| No. 5 – IPG Portfolio |
The following table presents certain market information with respect to the IPG Portfolio Properties:
| Market Analysis(1) |
| Property Name | City/State | Market | Submarket | Submarket
Inventory
(SF) | Submarket
Vacancy | Concluded
Market
Rent PSF | UW Base
Rent
PSF(2) |
| Eagle Springs | Danville, VA | Greensboro NC | Danville | 9,598,004 | 1.5% | $6.50 | $7.39 |
| Danville | Danville, VA | Greensboro NC | Danville | 9,598,004 | 1.5% | $6.50 | $7.39 |
| Blythewood | Blythewood, SC | Columbia | NE Columbia | 8,156,794 | 8.5% | $5.50 | $6.25 |
| Menasha | Menasha, WI | Neenah | Menasha | 3,796,944 | 1.4% | $7.25 | $8.17 |
| Tremonton | Tremonton, UT | Ogden-Clearfield MSA | Utah | NAV | NAV | $7.80 | $8.66 |
| Carbondale | Carbondale, IL | 50-Mile radius | Carbondale Marion - MSA | 2,840,545 | 12.9% | $4.50 | $5.24 |
| Marysville | Marysville, MI | Detroit | St. Clair County | 14,059,029 | 2.1% | $4.00 | $4.78 |
| Midland | Midland, NC | Charlotte | Cabarrus County | 22,629,581 | 6.2% | $6.75 | $7.89 |
| (1) | Source: Appraisal unless otherwise indicated. |
| (2) | Based on the underwritten rent rolls dated as of February 6, 2023. |
The Borrower. The borrower is AGNL SEAL, L.P., a Delaware limited partnership. The borrower is a special purpose bankruptcy-remote entity with one independent director in its organizational structure. Legal counsel to the borrower delivered a non-consolidation opinion in connection with the origination of the IPG Portfolio Whole Loan.
The Borrower Sponsors. The borrower sponsors and non-recourse carveout guarantors are AG Net Lease IV Corp., AG Net Lease IV (Q) Corp. and AG Net Lease Realty Fund IV Investments (H-1), L.P., severally (but not jointly), and each of which is a subsidiary of Angelo Gordon’s Net Lease Realty Fund IV. Angelo Gordon was founded in 1988 and is a privately held alternative investment firm, managing approximately $52 billion across a broad range of credit and real estate strategies. For over 30 years, Angelo Gordon has been investing on behalf of pension funds, corporations, endowments, foundations, sovereign wealth funds and individuals. Over its entire history, Angelo Gordon’s investment approach has consistently relied on disciplined portfolio construction backed by rigorous research and a strong focus on capital preservation. Angelo Gordon’s Net Lease business provides real estate sale-leaseback financing to less-than-investment grade owner-occupiers of corporate real estate.
Property Management. The IPG Portfolio Properties are self-managed.
Escrows and Reserves. At origination of the IPG Portfolio Whole Loan, the borrower was not required to deposit any upfront reserves.
Tax Reserve – On each monthly payment date during a Tax Trigger Period (as defined below), the borrower will be required to deposit into a real estate tax reserve 1/12 of the real estate taxes that the lender estimates will be payable during the next 12 months. A “Tax Trigger Period” means each monthly payment date during any period when (i) a Trigger Period (as defined below) is then continuing and (ii) neither the borrower nor the Specified Tenant (as defined below) has (A) timely paid the taxes directly to the appropriate taxing authority and (B) provided evidence of such payment to the lender.
Insurance Reserve – On each monthly payment date during an Insurance Trigger Period (defined below), the borrower will be required to deposit into an insurance reserve 1/12 of the insurance premiums that the lender estimates will be payable for the renewal of coverage. An “Insurance Trigger Period” means any period when (i) a Trigger Period is then continuing and (ii) neither the borrower nor the Specified Tenant has (A) timely paid the insurance premiums due on the insurance policies required under the IPG Portfolio Whole Loan documents to the issuer of such insurance policies and (B) provided evidence of such payment to the lender.
Replacement Reserve – On each monthly payment date during a Replacement Reserve Trigger Period (as defined below), the borrower will be required to deposit approximately $14,958 into a replacement reserve account. A “Replacement Reserve Trigger Period” means each monthly payment date during any period when: (i) a Trigger Period is then continuing and (ii) neither the borrower nor the Specified Tenant has diligently made the replacements and/or alterations to any individual IPG Portfolio Property required pursuant to the IPG Portfolio Whole Loan documents.
Lockbox / Cash Management. The IPG Portfolio Whole Loan is structured with a hard lockbox and springing cash management. At origination of the IPG Portfolio Whole Loan, the borrower was required to deliver a tenant direction letter
| THE INFORMATION IN THIS STRUCTURAL AND COLLATERAL TERM SHEET IS NOT COMPLETE AND MAY BE AMENDED PRIOR TO THE TIME OF SALE. THIS TERM SHEET IS NOT AN OFFER TO SELL THESE SECURITIES AND IT IS NOT A SOLICITATION OF AN OFFER TO BUY THESE SECURITIES IN ANY JURISDICTION WHERE THE OFFER OR SALE IS NOT PERMITTED. |
| | 71 | |
| Structural and Collateral Term Sheet | | BMO 2023-C4 |
| |
| No. 5 – IPG Portfolio |
to the existing tenant at the IPG Portfolio Properties, directing it to remit its rent checks directly to the lender-controlled lockbox. The borrower is required to cause revenue received by the borrower or the property manager from the IPG Portfolio Properties to be immediately deposited into such lockbox. All funds deposited into the lockbox are required to be transferred on each business day to or at the direction of the borrower unless a Trigger Period exists. Upon the occurrence and during the continuance of a Trigger Period, all funds in the lockbox account are required to be swept on each business day to a cash management account under the control of the lender to be applied and disbursed in accordance with the IPG Portfolio Whole Loan documents, and all excess cash flow funds remaining in the cash management account after the application of such funds in accordance with the IPG Portfolio Whole Loan documents are required to be held by the lender in an excess cash flow reserve account and as additional collateral for the IPG Portfolio Whole Loan. Upon the cure of the applicable Trigger Period, so long as no other Trigger Period exists, the lender is required to return any amounts remaining on deposit in the excess cash flow reserve account to the borrower. Upon an event of default under the IPG Portfolio Whole Loan documents, the lender will apply funds to the debt in such priority as it may determine.
A “Trigger Period” means a period (A) commencing upon the earliest of (i) an event of default, (ii) a DSCR Event (as defined below) or (iii) a Specified Tenant Trigger Period (as defined below); and (B) expiring upon (x) with regard to any Trigger Period commenced in connection with clause (A)(i) above, the cure (if applicable) of such event of default, (y) with regard to any Trigger Period commenced in connection with clause (A)(ii) above, the date that the debt service coverage ratio is equal to or greater than 1.20x for two consecutive calendar quarters and (z) with regard to any Trigger Period commenced in connection with clause (A)(iii) above, the satisfaction of the Specified Tenant Cure Conditions (as defined below). Notwithstanding the foregoing, a Trigger Period will not be deemed to expire in the event that a Trigger Period then exists for any other reason.
A “Specified Tenant Trigger Period” means a period (A) commencing upon the first to occur of (i) an event of default by the Specified Tenant under the Specified Tenant lease arising directly as result of the Specified Tenant’s failure to be in actual, physical possession (and not merely constructive possession) of, or abandoning, the Specified Tenant space (or applicable portion thereof), (ii) any termination or cancellation of the Specified Tenant lease (including, without limitation, rejection in any bankruptcy or similar insolvency proceeding) or (iii) any bankruptcy or similar insolvency of the Specified Tenant; and (B) expiring upon the lender’s receipt of evidence reasonably acceptable to the lender (which such evidence includes, without limitation, a duly executed estoppel certificate from the applicable Specified Tenant in form and substance acceptable to the lender) of the satisfaction of the applicable Specified Tenant Cure Conditions.
The “Specified Tenant Cure Conditions” mean (A) with respect to clause (A)(i) of the definition of Specified Tenant Trigger Period, the lender’s receipt of satisfactory evidence that the event of default by the applicable Specified Tenant under the Specified Tenant lease arising directly as a result of the Specified Tenant’s failure to be in actual, physical possession of, or abandoning, the Specified Tenant space (or applicable portion thereof) has been cured, (B) with respect to clause (A)(ii) of the definition of Specified Tenant Trigger Period, the Specified Tenant space has been re-leased pursuant to one or more replacement leases approved by the lender in accordance with the IPG Portfolio Whole Loan documents and the tenant(s) thereunder are in actual physical occupancy of the property and paying full unabated rent, and (C) with respect to clause (A)(iii) of the definition of Specified Tenant Trigger Period, (i) the applicable Specified Tenant is no longer insolvent or subject to any bankruptcy or insolvency proceedings and has affirmed the applicable Specified Tenant lease pursuant to a final, non-appealable order of a court of competent jurisdiction, (ii) if the Specified Tenant lease is assumed or assigned to a new entity in connection with such proceedings, the bankruptcy court has issued a final order approving the Specified Tenant’s reorganization plan or (iii) if the Specified Tenant lease is rejected or otherwise terminated due to any bankruptcy or insolvency proceedings, the IPG Portfolio Property has been re-leased pursuant to one or more replacement leases approved by the lender in accordance with the IPG Portfolio Whole Loan Documents and the tenants thereunder are in actual physical occupancy of the applicable IPG Portfolio Property and paying full unabated rent.
A “Specified Tenant” means, as applicable, (a) Intertape Polymer Corp., a Delaware corporation, together with its successors and permitted assigns, and any parent or affiliate thereof providing credit support or a guaranty under the Specified Tenant lease or (b) any replacement tenant of IPG approved in accordance with the IPG Portfolio Whole Loan Documents.
A “DSCR Event” means that the debt service coverage ratio is less than 1.20x for two consecutive calendar quarters.
Subordinate Debt. None.
Mezzanine Debt. Provided that no event of default is continuing under the IPG Portfolio Whole Loan documents, at any time from and after the earlier to occur of (i) the date that is two years after the closing date of the securitization that includes
| THE INFORMATION IN THIS STRUCTURAL AND COLLATERAL TERM SHEET IS NOT COMPLETE AND MAY BE AMENDED PRIOR TO THE TIME OF SALE. THIS TERM SHEET IS NOT AN OFFER TO SELL THESE SECURITIES AND IT IS NOT A SOLICITATION OF AN OFFER TO BUY THESE SECURITIES IN ANY JURISDICTION WHERE THE OFFER OR SALE IS NOT PERMITTED. |
| | 72 | |
| Structural and Collateral Term Sheet | | BMO 2023-C4 |
| |
| No. 5 – IPG Portfolio |
the last note of the IPG Portfolio Whole Loan to be securitized and (ii) September 29, 2025, an indirect or direct parent entity of the borrower is permitted to obtain a mezzanine loan secured by the direct or indirect equity interests in the borrower, provided that certain conditions are satisfied, including but not limited to: (i) the principal amount of the mezzanine loan may not be greater than the amount which will yield (x) an aggregate loan-to-value ratio for the IPG Portfolio Whole Loan and such mezzanine loan that does not exceed 56.5%, (y) an aggregate DSCR for the IPG Portfolio Whole Loan and such mezzanine loan that is not less than 1.66x and (z) and an aggregate debt yield for the IPG Portfolio Whole Loan and such mezzanine loan that is not less than 10.51%, (ii) the mezzanine lender enters into an intercreditor agreement reasonably acceptable to the mortgage lender and the mezzanine lender, (iii) if required by the mortgage lender, the borrower delivers a rating agency confirmation with respect to the mezzanine loan, and (iv) the maturity of the mezzanine loan is co-terminous with, or longer than, the maturity of the IPG Portfolio Whole Loan.
Partial Release. The borrower is permitted to a release of one or more of the Tremonton mortgaged property, the Carbondale mortgaged property, the Midland mortgaged property or the Marysville mortgaged property from the lien of the IPG Portfolio Whole Loan documents subject to satisfaction of the applicable conditions set forth therein, including, without limitation, that: (i) no event of default has occurred and is continuing under the IPG Portfolio Whole Loan documents, (ii) the defeasance collateral or partial prepayment, as applicable, is in an amount equal to 110% of the allocated loan amount for the individual IPG Portfolio Property to be released, (iii) the borrower has delivered a REMIC opinion, (iv) if requested by the lender, the borrower delivers a rating agency confirmation, (v) the debt service coverage ratio for the IPG Portfolio Whole Loan after any such release is no less than the greater of (x) the debt service coverage ratio immediately prior to such release and (y) 1.66x; (vi) the debt yield for the IPG Portfolio Whole Loan after any such release is no less than the greater of (x) the debt yield immediately prior to such release and (y) 10.51%, and (vii) the loan-to-value ratio for the IPG Portfolio Whole Loan after any such release is no greater than the lesser of (x) the loan-to-value ratio immediately prior to such release and (y) 56.5%.
Ground Lease. None.
| THE INFORMATION IN THIS STRUCTURAL AND COLLATERAL TERM SHEET IS NOT COMPLETE AND MAY BE AMENDED PRIOR TO THE TIME OF SALE. THIS TERM SHEET IS NOT AN OFFER TO SELL THESE SECURITIES AND IT IS NOT A SOLICITATION OF AN OFFER TO BUY THESE SECURITIES IN ANY JURISDICTION WHERE THE OFFER OR SALE IS NOT PERMITTED. |
| | 73 | |
| Structural and Collateral Term Sheet | | BMO 2023-C4 |
| No. 6 – Latitude at South Portland |
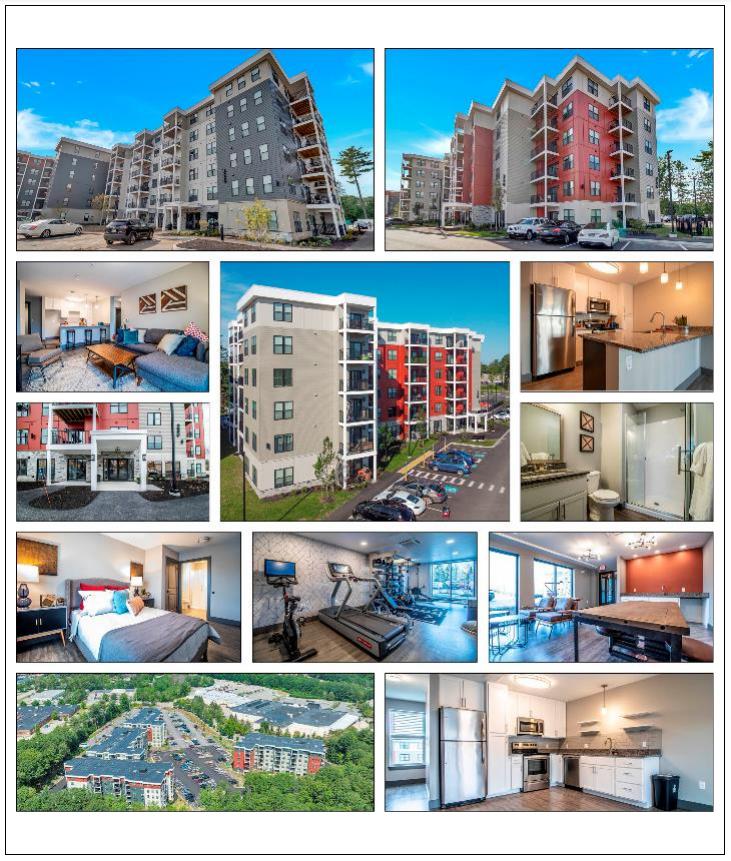
| THE INFORMATION IN THIS STRUCTURAL AND COLLATERAL TERM SHEET IS NOT COMPLETE AND MAY BE AMENDED PRIOR TO THE TIME OF SALE. THIS TERM SHEET IS NOT AN OFFER TO SELL THESE SECURITIES AND IT IS NOT A SOLICITATION OF AN OFFER TO BUY THESE SECURITIES IN ANY JURISDICTION WHERE THE OFFER OR SALE IS NOT PERMITTED. |
| | 74 | |
| Structural and Collateral Term Sheet | | BMO 2023-C4 |
| No. 6 – Latitude at South Portland |
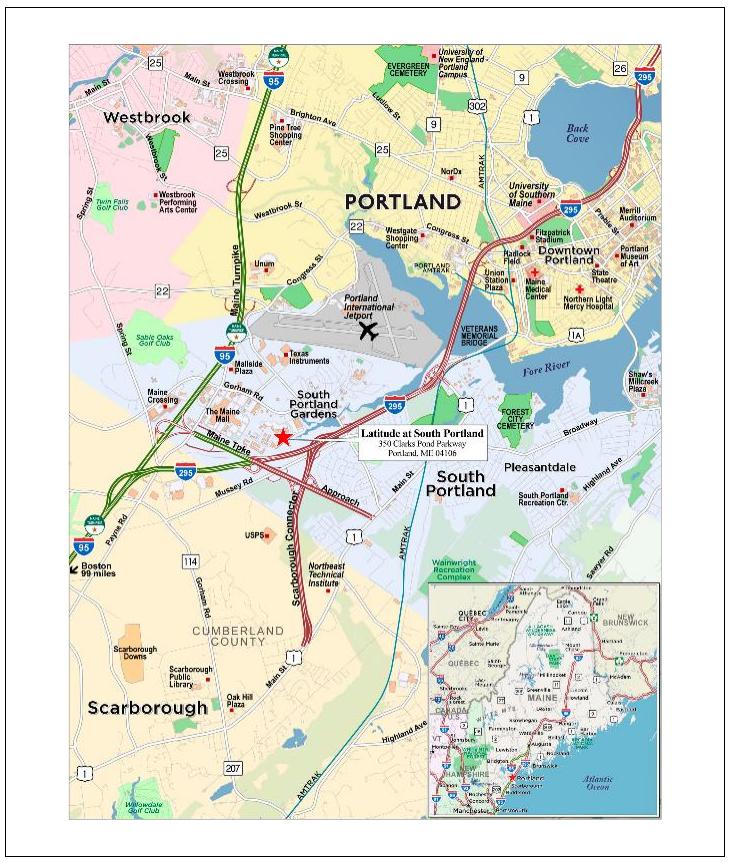
| THE INFORMATION IN THIS STRUCTURAL AND COLLATERAL TERM SHEET IS NOT COMPLETE AND MAY BE AMENDED PRIOR TO THE TIME OF SALE. THIS TERM SHEET IS NOT AN OFFER TO SELL THESE SECURITIES AND IT IS NOT A SOLICITATION OF AN OFFER TO BUY THESE SECURITIES IN ANY JURISDICTION WHERE THE OFFER OR SALE IS NOT PERMITTED. |
| | 75 | |
| Structural and Collateral Term Sheet | | BMO 2023-C4 |
| No. 6 – Latitude at South Portland |
| Mortgage Loan Information | | Property Information |
| Mortgage Loan Seller: | BMO | | Single Asset / Portfolio: | Single Asset |
| Original Principal Balance(1): | $27,000,000 | | Title: | Fee |
| Cut-off Date Principal Balance(1): | $27,000,000 | | Property Type – Subtype: | Multifamily – Mid Rise |
| % of IPB: | 3.4% | | Net Rentable Area (Units): | 256 |
| Loan Purpose: | Refinance | | Location: | Portland, ME |
| Borrower: | 350 Clarks Pond, LLC | | Year Built / Renovated: | 2020 - 2021 / NAP |
| Borrower Sponsors: | Christopher Urso and Lisa Urso | | Occupancy: | 99.2% |
| Interest Rate: | 4.92000% | | Occupancy Date: | 12/13/2022 |
| Note Date: | 5/5/2022 | | 4th Most Recent NOI (As of)(3): | NAP |
| Maturity Date: | 6/1/2032 | | 3rd Most Recent NOI (As of)(3): | NAP |
| Interest-only Period: | 120 months | | 2nd Most Recent NOI (As of): | $1,563,996 (12/31/2021) |
| Original Term: | 120 months | | Most Recent NOI (As of): | $3,761,448 (TTM 10/31/2022) |
| Original Amortization Term: | None | | UW Economic Occupancy: | 94.2% |
| Amortization Type: | Interest Only | | UW Revenues: | $6,458,417 |
| Call Protection: | L(32),D(85),O(3) | | UW Expenses: | $2,069,832 |
| Lockbox / Cash Management: | Springing / Springing | | UW NOI: | $4,388,585 |
| Additional Debt(1): | Yes | | UW NCF: | $4,337,385 |
| Additional Debt Balance(1): | $28,192,000 | | Appraised Value / Per Unit: | $86,400,000 / $337,500 |
| Additional Debt Type(1): | Pari Passu | | Appraisal Date: | 3/31/2022 |
| | | | | |
| Escrows and Reserves(2) | | Financial Information(1) |
| | Initial | Monthly | Initial Cap | | Cut-off Date Loan / Unit: | $215,594 | | |
| Taxes: | $152,880 | $50,960 | N/A | | Maturity Date Loan / Unit: | $215,594 | | |
| Insurance: | $23,683 | $7,894 | N/A | | Cut-off Date LTV: | 63.9% | | |
| Replacement Reserves: | $16,000 | $5,333 | N/A | | Maturity Date LTV: | 63.9% | | |
| | | | | | UW NCF DSCR: | 1.58x | | |
| | | | | | UW NOI Debt Yield: | 8.0% | | |
| | | | | | | |
| Sources and Uses |
| Sources | Proceeds | % of Total | | Uses | Proceeds | % of Total |
| Whole Loan | $55,192,000 | 100.0 | % | | Loan Payoff | $37,190,041 | 67.4 | % |
| | | | | Principal Equity Distribution | 16,374,270 | 29.7 | |
| | | | | Closing Costs | 1,435,126 | 2.6 | |
| | | | | Upfront Reserves | 192,563 | 0.3 | |
| Total Sources | $55,192,000 | 100.0 | % | | Total Uses | $55,192,000 | 100.0 | % |
| (1) | The Latitude at South Portland Mortgage Loan (as defined below) is part of a whole loan evidenced by two pari passu promissory notes in the aggregate original principal amount of $55,192,000. Financial Information in the table above is based on the Latitude at South Portland Whole Loan (as defined below). |
| (2) | For a full description of Escrows and Reserves, please refer to “Escrows and Reserves” below. |
| (3) | 4th Most Recent NOI (As of) and 3rd Most Recent NOI (As of) are not available because the construction of the Latitude at South Portland Property (as defined below) was completed in January 2022. |
The Loan. The sixth largest mortgage loan (the “Latitude at South Portland Mortgage Loan”) is part of a whole loan evidenced by two pari passu promissory notes in the aggregate original principal amount of $55,192,000 (the “Latitude at South Portland Whole Loan”) and is secured by the borrower’s fee interest in a 256-unit, mid rise multifamily property consisting of four buildings located in Portland, Maine (the “Latitude at South Portland Property”). The Latitude at South Portland Whole Loan was originated on May 5, 2022 by Arbor Private Label, LLC and subsequently acquired by Bank of Montreal on January 6, 2023. The Latitude at South Portland Whole Loan accrues interest at an interest rate of 4.92000% per annum. The Latitude at South Portland Whole Loan has an original term of 120 months, has a remaining term of 112 months and is interest only for the entire term. The scheduled maturity date of the Latitude at South Portland Whole Loan is the due date that occurs on June 1, 2032.
| THE INFORMATION IN THIS STRUCTURAL AND COLLATERAL TERM SHEET IS NOT COMPLETE AND MAY BE AMENDED PRIOR TO THE TIME OF SALE. THIS TERM SHEET IS NOT AN OFFER TO SELL THESE SECURITIES AND IT IS NOT A SOLICITATION OF AN OFFER TO BUY THESE SECURITIES IN ANY JURISDICTION WHERE THE OFFER OR SALE IS NOT PERMITTED. |
| | 76 | |
| Structural and Collateral Term Sheet | | BMO 2023-C4 |
| No. 6 – Latitude at South Portland |
The non-controlling Note A-1, with an original principal balance of $27,000,000, will be included in the BMO 2023-C4 securitization trust. The remaining note is expected to be contributed to another securitization trust. The Latitude at South Portland Whole Loan will be serviced pursuant to the pooling and servicing agreement for the BMO 2023-C4 trust until the controlling note A-2 is securitized, whereupon the Latitude at South Portland Whole Loan will be serviced pursuant to the pooling and servicing agreement for such future securitization. See “The Pooling and Servicing Agreement” in the Preliminary Prospectus. The relationship between the holders of the notes evidencing the Latitude at South Portland Whole Loan will be governed by a co-lender agreement as described under “Description of the Mortgage Pool—The Whole Loans —The Serviced Pari Passu Whole Loans” and “—The Whole Loans—The Outside Serviced Pari Passu Whole Loans” in the Preliminary Prospectus.
| Whole Loan Summary |
| Note | Original Balance | Cut-off Date Balance | | Note Holder | Controlling Piece |
| A-1 | $27,000,000 | $27,000,000 | | BMO 2023-C4 | No |
| A-2(1) | $28,192,000 | $28,192,000 | | BMO | Yes |
| Whole Loan | $55,192,000 | $55,192,000 | | | |
| (1) | Expected to be contributed to a future securitization. |
The Property. The Latitude at South Portland Property consists of four, six-story multifamily buildings, totaling 256 residential units on approximately 7.51 acres. The Latitude at South Portland Property was built between 2020 and 2021, and the construction of the Latitude at South Portland Property was completed in January 2022. The Latitude at South Portland Property is located in Portland, Maine and is situated right off of Route 295, a major thoroughfare connecting to Interstate 95. The Latitude at South Portland Property was built between 2020 and 2021, and features a range of studio, one-bedroom, and two-bedroom residential units. The Latitude at South Portland Property units all feature ceramic tile and hardwood flooring, central air, full stainless steel sinks, quartz countertops, and a full kitchen appliance package. Community spaces include an outdoor grill area, an office, clubhouse, package lockers, coffee lounge and fitness center. The Latitude at South Portland Property has 391 parking spaces resulting in a ratio of approximately 1.53 parking spaces per unit.
The following table presents detailed information with respect to the unit mix at the Latitude at South Portland Property:
| Unit Mix Summary(1) |
| Unit Type | No. of Units | % of Total
Units | Average Unit
Size (SF) | Average
Monthly
Rental Rate(2) | Average
Monthly
Rental Rate
per SF(2) | Average
Monthly
Market Rental
Rate(3) | Average
Monthly
Market Rental
Rate per SF(3) |
| Studio 1 | 1 | 0.4 | % | 387 | $0 | $0.00 | $1,600 | $4.13 |
| Studio 2 | 1 | 0.4 | | 433 | $1,570 | $3.63 | $1,650 | $3.81 |
| 1 Bed / 1 Bath - Small | 36 | 14.1 | | 663 | $1,794 | $2.71 | $1,800 | $2.71 |
| 1 Bed / 1 Bath - Medium | 48 | 18.8 | | 728 | $1,872 | $2.57 | $1,900 | $2.61 |
| 2 Bed / 1 Bath - Small | 46 | 18.0 | | 785 | $2,228 | $2.84 | $2,200 | $2.80 |
| 2 Bed / 1 Bath – Medium | 94 | 36.7 | | 862 | $2,237 | $2.60 | $2,200 | $2.55 |
| 2 Bed / 1 Bath – Large | 20 | 7.8 | | 927 | $2,317 | $2.50 | $2,300 | $2.48 |
| 2 Bed / 1 Bath – X Large | 10 | 3.9 | | 1,036 | $2,206 | $2.13 | $2,400 | $2.32 |
| Total/Wtd. Avg. | 256 | 100.0 | % | 803 | $2,097 | $2.62 | $2,099 | $2.63 |
| (1) | Based on the underwritten rent roll as of December 13, 2022. Average Monthly Rental Rate and Average Monthly Rental Rate per SF reflect average monthly in-place rent for occupied units. Model units and employee units are considered to be occupied units. |
| (2) | Average Monthly Rental Rate is inclusive of employee discounts on two separate units. |
Environmental. According to the Phase I environmental assessment dated April 5, 2022, there was no evidence of any recognized environmental conditions at the Latitude at South Portland Property.
The following table presents certain information relating to the historical and current occupancy of the Latitude at South Portland Property:
| Historical and Current Multifamily Occupancy |
| 2019(1) | 2020(1) | 2021(2) | Current(3) |
| NAP | NAP | 73.2% | 99.2% |
| (1) | Historical occupancies for 2019 and 2020 were not provided because the construction of the Latitude at South Portland Property was completed in January 2022. |
| (2) | Historical occupancy is as of December 31, 2021. |
| (3) | Current occupancy is based on the underwritten rent roll dated as of December 13, 2022. |
| THE INFORMATION IN THIS STRUCTURAL AND COLLATERAL TERM SHEET IS NOT COMPLETE AND MAY BE AMENDED PRIOR TO THE TIME OF SALE. THIS TERM SHEET IS NOT AN OFFER TO SELL THESE SECURITIES AND IT IS NOT A SOLICITATION OF AN OFFER TO BUY THESE SECURITIES IN ANY JURISDICTION WHERE THE OFFER OR SALE IS NOT PERMITTED. |
| | 77 | |
| Structural and Collateral Term Sheet | | BMO 2023-C4 |
| No. 6 – Latitude at South Portland |
The following table presents certain information relating to the operating history and underwritten cash flows of the Latitude at South Portland Property:
| Operating History and Underwritten Net Cash Flow(1) |
| | 2021 | TTM(2) | Underwritten | Per Unit | %(3) | |
| Gross Potential Rent | $5,600,050 | $6,034,945 | $6,445,272 | $25,177 | 106.2 | % |
| (Vacancy) | (3,085,928) | (603,399) | (322,264) | (1,259) | (5.3 | ) |
| (Bad Debt) | (448) | (19,951) | (19,951) | (78) | (0.3 | ) |
| (Concessions) | (42,795) | (32,496) | (32,226) | (126) | (0.5 | ) |
| Net Rental Income | $2,470,879 | $5,379,099 | $6,070,831 | $23,714 | 100.0 | % |
| Other Income(4) | 205,116 | 387,586 | 387,586 | 1,514 | 6.4 | |
| Effective Gross Income | $2,675,996 | $5,766,685 | $6,458,417 | $25,228 | 106.4 | % |
| | | | | | |
| Total Expenses | 1,112,000 | 2,005,237 | 2,069,832 | 8,085 | 32.0 | |
| | | | | | |
| Net Operating Income | $1,563,996 | $3,761,448 | $4,388,585 | $17,143 | 68.0 | % |
| | | | | | |
| Replacement Reserve | 0 | 0 | 51,200 | 200 | 0.8 | |
| | | | | | |
| Net Cash Flow | $1,563,996 | $3,761,448 | $4,337,385 | $16,943 | 67.2 | % |
| (1) | Historical cash flows were not provided for any year prior to 2021 because the construction of the Latitude at South Portland Property was completed in January 2022. |
| (2) | TTM reflects the trailing 12 months ending October 31, 2022. |
| (3) | % column represents percent of net rental income for revenue fields and represents percent of effective gross income for the remainder of fields. |
| (4) | Other Income includes utility reimbursements. |
The Market. The Latitude at South Portland Property is located in Portland, Maine, within the Portland Multi-Family market. Portland is known for its brick and cobblestone sidewalks lined with shops and restaurants, and having Mercy Hospital, Maine Medical Center, Maine College of Arts and the University of Maine School of Law all located in proximity to downtown Portland. According to the appraisal, the employment rate in Portland is expected to increase 2.9% by 2025. The leading industries in Portland are finance, real estate, and wholesale and retail industries, with approximately half of Portland’s working population employed within the city. The greatest contribution to employment growth coming from the professional services, education and health sectors. The Latitude at South Portland Property is located in Portland off of Route 295, a major thoroughfare connecting to Interstate 95. The local area is primarily occupied by residential, commercial and retail developments.
The Latitude at South Portland Property is situated in the South Portland submarket. According to the appraisal, as of the fourth quarter of 2021, the South Portland submarket had an overall vacancy rate of approximately 7.3%, with net absorption totaling 92 units. The vacancy rate decreased approximately 1.9% from the third quarter of 2021. Rental rates decreased by $118 from the third quarter of 2021 to the fourth quarter of 2021 and ended at $1,733 per unit per month.
According to the appraisal, the 2022 estimated population within a one-, three-, and five-mile radius of the Latitude at South Portland Property is 5,252, 32,271, and 117,537, respectively. According to the appraisal, the 2022 expected median household income within a one-, three-, and five-mile radius of the Latitude at South Portland Property is $64,048, $78,506, and $74,659, respectively.
| THE INFORMATION IN THIS STRUCTURAL AND COLLATERAL TERM SHEET IS NOT COMPLETE AND MAY BE AMENDED PRIOR TO THE TIME OF SALE. THIS TERM SHEET IS NOT AN OFFER TO SELL THESE SECURITIES AND IT IS NOT A SOLICITATION OF AN OFFER TO BUY THESE SECURITIES IN ANY JURISDICTION WHERE THE OFFER OR SALE IS NOT PERMITTED. |
| | 78 | |
| Structural and Collateral Term Sheet | | BMO 2023-C4 |
| No. 6 – Latitude at South Portland |
The following table presents certain information relating to comparable multifamily rental properties to the Latitude at South Portland Property:
| Comparable Rental Summary(1) |
| Property / Location | Year Built /
Renovated | Occupancy | # of
Units | Unit Mix | Average SF
per Unit | Average Rent
per SF | Average Rent
per Unit |
| | 2020-2021 / NAP | 99.2%(2) | 1 | Studio | 387 | $0.00 | $0 |
| | 1 | Studio | 433 | $3.63 | $1,570 |
| | 36 | 1 Bed 1 Bath | 663 | $2.71 | $1,794 |
| Latitude at South Portland(2) | 48 | 1 Bed 1 Bath | 728 | $2.57 | $1,872 |
| 350 Clarks Pond Parkway | 46 | 2 Bed 1 Bath | 785 | $2.84 | $2,228 |
| Portland, ME | 94 | 2 Bed 1 Bath | 862 | $2.60 | $2,237 |
| | 20 | 2 Bed 1 Bath | 927 | $2.50 | $2,317 |
| | 10 | 2 Bed 1 Bath | 1,036 | $2.13 | $2,206 |
| 667 Congress Street | 2017 / NAP | 95.0% | 34 | Studio | 425 | $3.06 | $1,300 |
| Portland, ME | | | 97 | 1 Bed 1 Bath | 602 | $2.66 | $1,600 |
| | | | 8 | 2 Bed 1 Bath | 1,049 | $2.19 | $2,300 |
| 100 Gateway Circle | 2018 / NAP | 100.0% | 30 | Studio | 645 | $2.68 | $1,730 |
| Scarborough, ME | | | 12 | 1 Bed 1 Bath | 735 | $2.41 | $1,770 |
| | | | 10 | 1 Bed 1 Bath | 755 | $2.42 | $1,825 |
| | | | 44 | 1 Bed 1 Bath | 909 | $2.21 | $2,005 |
| | | | 36 | 2 Bed 1 Bath | 1,103 | $2.04 | $2,250 |
| | | | 12 | 2 Bed 1 Bath | 1,105 | $2.08 | $2,300 |
| | | | 102 | 2 Bed 1 Bath | 1,167 | $2.19 | $2,550 |
| | | | 42 | 3 Bed 1 Bath | 1,408 | $1.95 | $2,750 |
| 89 Anderson Street | 2016 / NAP | 100.0% | 9 | Studio | 415 | $3.98 | $1,650 |
| Portland, ME | | | 35 | 1 Bed 1 Bath | 600 | $2.86 | $1,800 |
| | | | 9 | 2 Bed 1 Bath | 700 | $2.37 | $2,200 |
| 1 Ari Drive | 2020 / NAP | 100.0% | 36 | 1 Bed 1 Bath | 740 | $2.36 | $1,750 |
| Westbrook, ME | | | 36 | 2 Bed 1 Bath | 950 | $2.11 | $2,000 |
| 409 Cumberland Avenue | 2015 / NAP | 92.0% | 21 | Studio | 375 | $3.75 | $1,500 |
| Portland, ME | | | 32 | 1 Bed 1 Bath | 560 | NAV | NAV |
| | | | 4 | 2 Bed 1 Bath | 881 | NAV | NAV |
| 586 Westbrook Street | 2021 / NAP | 95.0% | 15 | Studio | 600 | $2.17 | $1,300 |
| South Portland, ME | | | 15 | 1 Bed 1 Bath | 800 | $2.31 | $1,845 |
| | | | 4 | 2 Bed 1 Bath | 1,000 | $2.16 | $2,155 |
| | | | 30 | 3 Bed 1 Bath | 1,200 | $2.50 | $3,000 |
| (1) | Source: Appraisal, unless otherwise indicated. |
| (2) | Based on underwritten rent roll dated as of December 13, 2022. Average Rent per SF and Average Rent per Unit reflect average monthly in-place rent for occupied units. |
The Borrower. The borrower under the Latitude at South Portland Whole Loan is 350 Clarks Pond, LLC, a recycled special-purpose entity and Delaware limited liability company with two independent directors. Legal counsel to the borrower delivered a non-consolidation opinion in connection with the origination of the Latitude at South Portland Whole Loan.
The Borrower Sponsors. The borrower sponsors and non-recourse carveout guarantors are Christopher Urso and Lisa Urso. Christopher Urso founded URS Capital Partners (“URS”) in 2007 as a real estate firm focused on acquiring and managing multifamily properties. Lisa Urso is the wife of Christopher Urso and is chief financial officer of URS and oversees operations for the portfolio owned by URS.
Property Management. The Latitude at South Portland Property is managed by First Communities Management, Inc. (“FCM”), an independent, full-service property management company unaffiliated with the borrower. FCM was founded in 1978 and is headquartered in Atlanta, Georgia. FCM has over 50,000 units under management across over 200 communities, and currently employs over 1,500 people. Among FCM services are acquisition due diligence, financial analysis and reporting, insurance cost control, vendor management and negotiation, market studies, and specialty property services, which include new construction lease-ups, property renovation and repositioning.
Escrows and Reserves. At origination of the Latitude at South Portland Whole Loan, the borrower deposited (i) approximately $152,880 into a real estate tax reserve account, (ii) approximately $23,683 into an insurance reserve account and (iii) $16,000 into a replacement reserve account.
| THE INFORMATION IN THIS STRUCTURAL AND COLLATERAL TERM SHEET IS NOT COMPLETE AND MAY BE AMENDED PRIOR TO THE TIME OF SALE. THIS TERM SHEET IS NOT AN OFFER TO SELL THESE SECURITIES AND IT IS NOT A SOLICITATION OF AN OFFER TO BUY THESE SECURITIES IN ANY JURISDICTION WHERE THE OFFER OR SALE IS NOT PERMITTED. |
| | 79 | |
| Structural and Collateral Term Sheet | | BMO 2023-C4 |
| No. 6 – Latitude at South Portland |
Tax Escrows – On a monthly basis, the borrower is required to escrow 1/12th of the annual estimated tax payments, which currently equates to approximately $50,960.
Insurance Escrows – On a monthly basis, the borrower is required to escrow 1/12th of the annual estimated insurance payments, which currently equates to approximately $7,894.
Replacement Reserves – The borrower is required to deposit into a replacement reserve, on a monthly basis, an amount equal to approximately $5,333.
Lockbox / Cash Management. The Latitude at South Portland Whole Loan is structured with a springing lockbox and springing cash management. Upon the occurrence of a Lockbox Event (as defined below), the borrower will establish, no later than 10 business days from receipt of written notice from the lender that a Lockbox Event has occurred, a lockbox account with an eligible institution acceptable to the lender. Upon an event of default, the borrower or property manager will deposit all revenues relating to the Latitude at South Portland Property into the lender-controlled lockbox account within ten business days of receipt.
A “Lockbox Event” will commence upon (i) the occurrence of an event of default, or (ii) the actual Latitude at South Portland Whole Loan debt service coverage ratio being less than 1.05x for two consecutive calendar quarters and will be cured when (A) with respect to clause (i) above, the cure of such event of default or (B) with respect to clause (ii) above, the actual debt Latitude at South Portland Whole Loan service coverage ratio is 1.05x or greater for two consecutive calendar quarters.
Subordinate Debt. None.
Mezzanine Debt. None.
Partial Release. Not permitted.
Ground Lease. None.
| THE INFORMATION IN THIS STRUCTURAL AND COLLATERAL TERM SHEET IS NOT COMPLETE AND MAY BE AMENDED PRIOR TO THE TIME OF SALE. THIS TERM SHEET IS NOT AN OFFER TO SELL THESE SECURITIES AND IT IS NOT A SOLICITATION OF AN OFFER TO BUY THESE SECURITIES IN ANY JURISDICTION WHERE THE OFFER OR SALE IS NOT PERMITTED. |
| | 80 | |
| Structural and Collateral Term Sheet | | BMO 2023-C4 |
| No. 7 – Orizon Aerostructures |

| THE INFORMATION IN THIS STRUCTURAL AND COLLATERAL TERM SHEET IS NOT COMPLETE AND MAY BE AMENDED PRIOR TO THE TIME OF SALE. THIS TERM SHEET IS NOT AN OFFER TO SELL THESE SECURITIES AND IT IS NOT A SOLICITATION OF AN OFFER TO BUY THESE SECURITIES IN ANY JURISDICTION WHERE THE OFFER OR SALE IS NOT PERMITTED. |
| | 81 | |
| Structural and Collateral Term Sheet | | BMO 2023-C4 |
| No. 7 – Orizon Aerostructures |
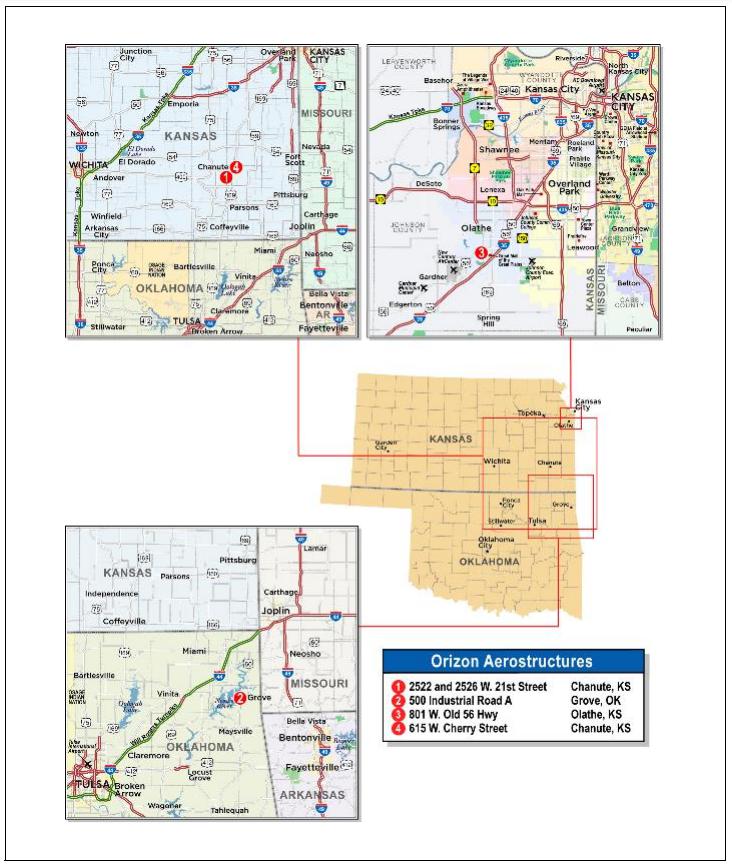
| THE INFORMATION IN THIS STRUCTURAL AND COLLATERAL TERM SHEET IS NOT COMPLETE AND MAY BE AMENDED PRIOR TO THE TIME OF SALE. THIS TERM SHEET IS NOT AN OFFER TO SELL THESE SECURITIES AND IT IS NOT A SOLICITATION OF AN OFFER TO BUY THESE SECURITIES IN ANY JURISDICTION WHERE THE OFFER OR SALE IS NOT PERMITTED. |
| | 82 | |
| Structural and Collateral Term Sheet | | BMO 2023-C4 |
| No. 7 – Orizon Aerostructures |
Mortgage Loan Information | | Property Information |
| Mortgage Loan Seller: | BMO | | Single Asset / Portfolio: | Portfolio |
| Original Principal Balance(1): | $27,000,000 | | Title: | Fee |
| Cut-off Date Principal Balance(1): | $27,000,000 | | Property Type – Subtype: | Industrial – Manufacturing |
| % of IPB: | 3.4% | | Net Rentable Area (SF): | 785,000 |
| Loan Purpose: | Acquisition | | Location: | Various |
| Borrower: | OZN Chanute (Multi) LLC | | Year Built / Renovated: | Various / Various |
| Borrower Sponsor: | LCN North American Fund III, | | Occupancy: | 100.0% |
| | L.P. | | Occupancy Date: | 2/6/2023 |
| Interest Rate: | 6.80500% | | 4th Most Recent NOI (As of)(4): | NAV |
| Note Date: | 11/15/2022 | | 3rd Most Recent NOI (As of)(4): | NAV |
| Maturity Date: | 12/6/2032 | | 2nd Most Recent NOI (As of)(4): | NAV |
| Interest-only Period: | 120 months | | Most Recent NOI (As of)(4): | NAV |
| Original Term: | 120 months | | UW Economic Occupancy: | 95.0% |
| Original Amortization Term: | None | | UW Revenues: | $7,718,750 |
| Amortization Type: | Interest Only | | UW Expenses: | $0 |
| Call Protection(2): | L(26),DorYM1(89),O(5) | | UW NOI: | $7,718,750 |
| Lockbox / Cash Management: | Hard / In Place | | UW NCF: | $7,718,750 |
| Additional Debt(1): | Yes | | Appraised Value / Per SF(5): | $125,000,000 / $159 |
| Additional Debt Balance(1): | $34,095,000 | | Appraisal Date: | 10/17/2022 |
| Additional Debt Type(1): | Pari Passu | | | |
| | | | | |
| Escrows and Reserves(3) | | Financial Information(1) |
| | Initial | Monthly | Initial Cap | | Cut-off Date Loan / SF: | $78 |
| Taxes: | $0 | Springing | N/A | | Maturity Date Loan / SF: | $78 |
| Insurance: | $0 | Springing | N/A | | Cut-off Date LTV(5): | 48.9% |
| Replacement Reserves: | $0 | Springing | N/A | | Maturity Date LTV(5): | 48.9% |
| TI / LC Reserve: | $0 | Springing | N/A | | UW NCF DSCR: | 1.83x |
| | | | | | UW NOI Debt Yield: | 12.6% |
| | | | | | | |
| Sources and Uses |
| Sources | Proceeds | % of Total | | Uses | Proceeds | % of Total |
| Whole Loan(1) | $61,095,000 | 49.7 | % | | Purchase Price | $122,180,000 | 99.4 | % |
| Borrower Sponsor Equity | 61,801,361 | 50.3 | | | Closing Costs | 716,361 | 0.6 | |
| Total Sources | $122,896,361 | 100.0 | % | | Total Uses | $122,896,361 | 100.0 | % |
| (1) | The Orizon Aerostructures Mortgage Loan (as defined below) is part of a whole loan evidenced by five pari passu notes with an aggregate outstanding principal balance as of the Cut-off Date of $61,095,000 (the “Orizon Aerostructures Whole Loan”). The financial information in the chart above is based on the $61,095,000 Orizon Aerostructures Whole Loan. |
| (2) | Prepayment of the Orizon Aerostructures Whole Loan is permitted at any time after the earlier to occur of (a) the end of the two-year and one day period commencing on the closing date of the securitization of the last promissory note representing a portion of the Orizon Aerostructures Whole Loan to be securitized and (b) November 15, 2026. The assumed defeasance and yield maintenance lockout period of 26 payments is based on the closing date of this transaction in February 2023. The actual lockout period may be longer. |
| (3) | For a full description of Escrows and Reserves, please refer to “Escrows and Reserves” below. |
| (4) | The Orizon Aerostructures Properties (as defined below) do not have any operating history as the borrower recently acquired the properties from the prior owner and leased them back to such prior owner in a sale-leaseback transaction, and the related lease commenced on October 13, 2022. |
| (5) | The Appraised Value / Per SF, Cut-Off Date LTV and Maturity Date LTV is based on the As-Is Portfolio Value of $125,000,000. The combined “as-is” individual appraised value is $124,950,000. The Cut-off Date LTV and Maturity Date LTV based on the combined “as-is” individual appraised value is 48.9% and 48.9%, respectively. |
The Loan. The seventh largest mortgage loan (the “Orizon Aerostructures Mortgage Loan”) is part of a fixed rate whole loan secured by the borrower’s fee interest in a 785,000 square foot portfolio of four industrial properties located in Kansas and Oklahoma (the “Orizon Aerostructures Properties”). The Orizon Aerostructures Whole Loan was originated on November 15, 2022 by Bank of Montreal. The Orizon Aerostructures Whole Loan consists of five pari passu notes and accrues interest at a rate of 6.80500% per annum. The Orizon Aerostructures Whole Loan has a 10-year term and is interest only for the entire term. The non-controlling Note A-1, with an original principal balance of $27,000,000, will be included in the BMO 2023-C4 securitization trust. The remaining notes are expected to be contributed to other securitization trusts. The
| THE INFORMATION IN THIS STRUCTURAL AND COLLATERAL TERM SHEET IS NOT COMPLETE AND MAY BE AMENDED PRIOR TO THE TIME OF SALE. THIS TERM SHEET IS NOT AN OFFER TO SELL THESE SECURITIES AND IT IS NOT A SOLICITATION OF AN OFFER TO BUY THESE SECURITIES IN ANY JURISDICTION WHERE THE OFFER OR SALE IS NOT PERMITTED. |
| | 83 | |
| Structural and Collateral Term Sheet | | BMO 2023-C4 |
| No. 7 – Orizon Aerostructures |
Orizon Aerostructures Whole Loan will be serviced pursuant to the pooling and servicing agreement for the BMO 2023-C4 trust until the controlling Note A-5 is securitized, whereupon the Orizon Aerostructures Whole Loan will be serviced pursuant to the pooling and servicing agreement for such future securitization. See “The Pooling and Servicing Agreement” in the Preliminary Prospectus. The relationship between the holders of the notes evidencing the Orizon Aerostructures Whole Loan will be governed by a co-lender agreement as described under “Description of the Mortgage Pool—The Whole Loans —The Serviced Pari Passu Whole Loans” and “—The Whole Loans—The Outside Serviced Pari Passu Whole Loans” in the Preliminary Prospectus.
| Whole Loan Summary |
| Note | Original Balance | Cut-off Date Balance | | Note Holder | Controlling Piece |
| A-1 | $27,000,000 | $27,000,000 | | BMO 2023-C4 | No |
| A-2(1) | $8,000,000 | $8,000,000 | | BMO | No |
| A-3(1) | $11,500,000 | $11,500,000 | | BMO | No |
| A-4(1) | $8,500,000 | $8,500,000 | | BMO | No |
| A-5(1) | $6,095,000 | $6,095,000 | | BMO | Yes |
| Whole Loan | $61,095,000 | $61,095,000 | | | |
| (1) | Expected to be contributed to one or more future securitization(s). |
The Properties. The Orizon Aerostructures Properties consist of four industrial manufacturing buildings, totaling 785,000 square feet. On October 13, 2022, the borrower acquired the Orizon Aerostructures Properties from Orizon Aerostructures, LLC (“Orizon Aerostructures”) for $122,180,000 and leased 100% of the Orizon Aerostructures Properties to Orizon Aerostructures in a sale-leaseback transaction.
2522 and 2526 W. 21st Street, Chanute, KS – The “2522 West 21st Street Property” was built in 1992, 2017 and 2020, and is comprised of one, two-story manufacturing building occupied by a single tenant. The 2522 West 21st Street Property has a total of 300 surface parking spaces, resulting in a ratio equal to 1.00 space per 1,000 square feet, and is situated on approximately 19.21 acres in Chanute, Kansas.
500 Industrial Road A, Grove, OK – The “500 Industrial Road A Property” consists of one, two-story manufacturing building built between 1969 and 2014, with renovations completed in 2012, 2017 and 2018. The 500 Industrial Road A Property is occupied by a single tenant. The 500 Industrial Road A Property has a total of 185 surface parking spaces, resulting in a ratio of approximately 0.84 spaces per 1,000 square feet, and is situated on approximately 18.17 acres in Grove, Oklahoma.
801 W. Old 56 Hwy, Olathe, KS – The “801 West Old 56 Highway Property” was built in 2016 and is comprised of one, two-story manufacturing building occupied by a single tenant. The 801 West Old 56 Highway Property has a total of 199 surface parking spaces, resulting in a ratio of approximately 0.97 spaces per 1,000 square feet, and is situated on approximately 17.13 acres in Olathe, Kansas.
615 W. Cherry Street, Chanute, KS – The “615 West Cherry Street Property” was built in 1968 with planned renovation by the tenant for 2023, and is comprised of one, one-story manufacturing building occupied by a single tenant. The 615 West Cherry Street Property has a total of 64 surface parking spaces, resulting in a ratio of approximately 1.07 spaces per 1,000 square feet, and is situated on approximately 2.66 acres in Chanute, Kansas.
| THE INFORMATION IN THIS STRUCTURAL AND COLLATERAL TERM SHEET IS NOT COMPLETE AND MAY BE AMENDED PRIOR TO THE TIME OF SALE. THIS TERM SHEET IS NOT AN OFFER TO SELL THESE SECURITIES AND IT IS NOT A SOLICITATION OF AN OFFER TO BUY THESE SECURITIES IN ANY JURISDICTION WHERE THE OFFER OR SALE IS NOT PERMITTED. |
| | 84 | |
| Structural and Collateral Term Sheet | | BMO 2023-C4 |
| No. 7 – Orizon Aerostructures |
The following table presents certain information relating to the Orizon Aerostructures Properties:
| Portfolio Summary(1) |
| Property | Subtype | Net
Rentable
Area (SF)(2) | Parking
Spaces | % NOI(2) | ALA | % of
ALA | “As-Is”
Appraised
Value | Clear
Heights
(ft.) | Dock
Doors | Drive-
In Doors |
| 2522 West 21st Street Property | Manufacturing | 300,000 | 300 | NAV | $23,513,213 | 38.5 | % | $47,800,000 | | 20 - 46 | 5 | 7 |
| 500 Industrial Road A Property | Manufacturing | 220,000 | 185 | NAV | 17,216,787 | 28.2 | | 35,000,000 | | 16 - 38 | 2 | 9 |
| 801 West Old 56 Highway Property | Manufacturing | 205,000 | 199 | NAV | 16,036,208 | 26.2 | | 32,600,000 | | 32 | 19 | 0 |
| 615 West Cherry Street Property | Manufacturing | 60,000 | 64 | NAV | 4,328,792 | 7.1 | | 9,550,000 | | 18 | 10 | 1 |
| Total/Wtd. Avg. | 785,000 | 748 | | $61,095,000 | 100.0 | % | $125,000,000 | (3) | | 36 | 17 |
| (1) | Source: Appraisals unless otherwise indicated. |
| (2) | Based on the underwritten rent roll dated February 6, 2023. Individual property cashflows were not provided by the borrower. |
| (3) | The appraised value of $125,000,000 is an “as-portfolio” value. The combined “as-is” individual appraised value of the Orizon Aerostructures Properties is $124,950,000. |
Major Tenant.
Orizon Aerostructures, LLC (785,000 square feet; 100.0% of the NRA; 100.0% of underwritten base rent): Orizon Aerostructures is an aerospace and defense manufacturer founded in 2016, capable of major aircraft subassembly manufacturing, complex monolithic machining (milling/casting/turning) and processing (non-destructive testing/metal processing/paint). Orizon Aerostructures has a total of 750 employees with 1,348,319 items delivered between 2020-2022. Orizon Aerostructures sold the Orizon Aerostructures Properties to the borrower and leased Orizon Aerostructures Properties back from the borrower under a master lease that is a triple net lease with a commencement date of October 13, 2022, and a scheduled expiration date of December 31, 2047. The tenant under the master lease has a 25 year term and has four, 10-year renewal options. Under the master lease, Orizon Aerostructures has no contraction or early termination option with respect to any individual Orizon Aerostructures Property but has the right to sublease any individual Orizon Aerostructures property upon at least thirty days written notice to the landlord under the master lease or cease production operations, whether temporarily or permanently, at any individual Orizon Aerostructures property without any penalty so long as Orizon Aerostructures continues to occupy the Orizon Aerostructures property and conduct business therefrom.
Environmental. According to the Phase I environmental assessments dated August 23, 2022, and August 24, 2022, there was no evidence of any recognized environmental conditions at the Orizon Aerostructures Properties.
The following table presents certain information relating to the historical and current occupancy of the Orizon Aerostructures Properties:
| Historical and Current Occupancy(1) |
| 2019 | 2020 | 2021 | Current(2) |
| 100.0% | 100.0% | 100.0% | 100.0% |
| (1) | Historical occupancy is as of December 31 of each respective year. |
| (2) | Current Occupancy is as of February 6, 2023. |
| THE INFORMATION IN THIS STRUCTURAL AND COLLATERAL TERM SHEET IS NOT COMPLETE AND MAY BE AMENDED PRIOR TO THE TIME OF SALE. THIS TERM SHEET IS NOT AN OFFER TO SELL THESE SECURITIES AND IT IS NOT A SOLICITATION OF AN OFFER TO BUY THESE SECURITIES IN ANY JURISDICTION WHERE THE OFFER OR SALE IS NOT PERMITTED. |
| | 85 | |
| Structural and Collateral Term Sheet | | BMO 2023-C4 |
| No. 7 – Orizon Aerostructures |
The following table presents certain information relating to the sole tenant for the Orizon Aerostructures Properties:
| Tenant Summary(1) |
| Tenant | Ratings
Moody’s
/S&P/Fitch | Net
Rentable
Area (SF) | % of
Total NRA | UW Base
Rent PSF | UW Base Rent | % of Total
UW Base
Rent | Lease
Exp. Date |
| Orizon Aerostructures, LLC | NR/NR/NR | 785,000 | 100.0% | $10.35 | $8,125,000 | 100.0% | 12/31/2047 |
| Occupied Collateral Total / Wtd. Avg. | | 785,000 | 100.0% | $10.35 | $8,125,000 | 100.0% | |
| | | | | | | | |
| Vacant Space | | 0 | 0.0% | | | | |
| | | | | | | | |
| Collateral Total | | 785,000 | 100.0% | | | | |
| | | | | | | | |
| (1) | Based on the underwritten rent roll dated February 6, 2023. The first annual rent payment date under the related lease was January 1, 2023 and will be paid in quarterly installments. |
The following table presents certain information relating to the tenant lease expiration date of the master lease for the Orizon Aerostructures Properties:
| Lease Rollover Schedule(1) |
| Year | Number
of
Leases
Expiring | Net
Rentable
Area
Expiring | % of
NRA
Expiring | UW Base
Rent
Expiring | % of UW
Base
Rent
Expiring | Cumulative
Net
Rentable
Area
Expiring | Cumulative
% of NRA
Expiring | Cumulative
UW Base
Rent
Expiring | Cumulative
% of UW
Base Rent
Expiring |
| Vacant | NAP | 0 | 0.0 | % | NAP | NA | P | 0 | 0.0% | NAP | NAP |
| 2022 & MTM | 0 | 0 | 0.0 | | $0 | 0.0 | % | 0 | 0.0% | $0 | 0.0 | % |
| 2023 | 0 | 0 | 0.0 | | 0 | 0.0 | | 0 | 0.0% | $0 | 0.0 | % |
| 2024 | 0 | 0 | 0.0 | | 0 | 0.0 | | 0 | 0.0% | $0 | 0.0 | % |
| 2025 | 0 | 0 | 0.0 | | 0 | 0.0 | | 0 | 0.0% | $0 | 0.0 | % |
| 2026 | 0 | 0 | 0.0 | | 0 | 0.0 | | 0 | 0.0% | $0 | 0.0 | % |
| 2027 | 0 | 0 | 0.0 | | 0 | 0.0 | | 0 | 0.0% | $0 | 0.0 | % |
| 2028 | 0 | 0 | 0.0 | | 0 | 0.0 | | 0 | 0.0% | $0 | 0.0 | % |
| 2029 | 0 | 0 | 0.0 | | 0 | 0.0 | | 0 | 0.0% | $0 | 0.0 | % |
| 2030 | 0 | 0 | 0.0 | | 0 | 0.0 | | 0 | 0.0% | $0 | 0.0 | % |
| 2031 | 0 | 0 | 0.0 | | 0 | 0.0 | | 0 | 0.0% | $0 | 0.0 | % |
| 2032 | 0 | 0 | 0.0 | | 0 | 0.0 | | 0 | 0.0% | $0 | 0.0 | % |
| 2033 & Beyond | 1 | 785,000 | 100.0 | | 8,125,000 | 100.0 | | 785,000 | 100.0% | $8,125,000 | 100.0 | % |
| Total | 1 | 785,000 | 100.0 | % | $8,125,000 | 100.0 | % | | | | |
| (1) | Based on the underwritten rent roll dated February 6, 2023.
|
| THE INFORMATION IN THIS STRUCTURAL AND COLLATERAL TERM SHEET IS NOT COMPLETE AND MAY BE AMENDED PRIOR TO THE TIME OF SALE. THIS TERM SHEET IS NOT AN OFFER TO SELL THESE SECURITIES AND IT IS NOT A SOLICITATION OF AN OFFER TO BUY THESE SECURITIES IN ANY JURISDICTION WHERE THE OFFER OR SALE IS NOT PERMITTED. |
| | 86 | |
| Structural and Collateral Term Sheet | | BMO 2023-C4 |
| No. 7 – Orizon Aerostructures |
The following table presents certain information relating to the underwritten cash flows of the Orizon Aerostructures Properties:
| Underwritten Net Cash Flow(1) |
| | Underwritten | Per Square
Foot | %(2) | |
| Rents in Place | $8,125,000 | $10.35 | 100.0 | % |
| Rent Steps | 0 | 0.00 | 0.0 | |
| Gross Potential Rent | $8,125,000 | $10.35 | 100.0 | % |
| Other Income | 0 | 0.00 | 0.0 | |
| Net Rental Income | $8,125,000 | $10.35 | 100.0 | % |
| (Vacancy) | (406,250) | (0.52) | (5.0 | ) |
| Effective Gross Income | $7,718,750 | $9.83 | 95.0 | % |
| | | | |
| Total Expenses | 0 | 0.00 | 0.0 | |
| | | | |
| Net Operating Income | $7,718,750 | $9.83 | 100.0 | % |
| | | | |
| Capital Expenditures | 0 | 0.00 | 0.0 | |
| Rollover Reserve | 0 | 0.00 | 0.0 | |
| | | | |
| Net Cash Flow | $7,718,750 | $9.83 | 100.0 | % |
| (1) | The borrower acquired the Orizon Aerostructures Properties from, and leased them back to, Orizon Aerostructures under a master lease that is a triple net lease with the commencement date on October 13, 2022, in a sale-leaseback transaction. |
| (2) | % column represents percent of net rental income for all revenue lines and represents percent of effective gross income for the remainder of fields. |
The Market. The Orizon Aerostructures Properties are located in Chanute, Kansas, Olathe, Kansas, and Grove, Oklahoma.
The following table presents certain market information with respect to the Orizon Aerostructures Properties:
| Market Overview(1) |
| Property | Year Built / Renovated | Net
Rentable
Area
(SF)(2) | Submarket | Property
Vacancy(2) | Submarket
Vacancy | Appraisal
Concluded
Vacancy | Submarket
Inventory
(SF) | UW
Base
Rent
PSF(2) | Submarket
Rent PSF |
| 2522 West 21st Street Property | 1992, 2017, 2020 / NAP | 300,000 | City of Chanute | 0.0% | 0.0% | 0.0% | 605,631 | $10.35 | NAV |
| 500 Industrial Road A Property | 1969, 2001, 2011, 2014 / 2012, 2017, 2018 | 220,000 | Delaware County | 0.0% | 0.0% | 0.0% | 495,512 | $10.35 | NAV |
| 801 West Old 56 Highway Property | 2016 / NAP | 205,000 | Johnson County | 0.0% | 5.5% | 0.0% | 84,827,602 | $10.35 | $5.13 |
| 615 West Cherry Street Property | 1968 / 2023 | 60,000 | City of Chanute | 0.0% | 0.0% | 0.0% | 605,631 | $10.35 | NAV |
| Total/Wtd. Avg. | | 785,000 | | | | | | | |
| (1) | Source: Appraisal unless otherwise indicated. |
| (2) | Based on the underwritten rent roll dated February 6, 2023.
|
| THE INFORMATION IN THIS STRUCTURAL AND COLLATERAL TERM SHEET IS NOT COMPLETE AND MAY BE AMENDED PRIOR TO THE TIME OF SALE. THIS TERM SHEET IS NOT AN OFFER TO SELL THESE SECURITIES AND IT IS NOT A SOLICITATION OF AN OFFER TO BUY THESE SECURITIES IN ANY JURISDICTION WHERE THE OFFER OR SALE IS NOT PERMITTED. |
| | 87 | |
| Structural and Collateral Term Sheet | | BMO 2023-C4 |
| No. 7 – Orizon Aerostructures |
The following table presents certain demographic information with respect to the Orizon Aerostructures Properties:
| Demographics Overview |
| Property | Net
Rentable
Area
(SF)(1) | ALA | % of ALA | UW NCF(1) | % of UW
NCF(1) | Estimated
2022
Population
(5-mile
Radius)(2) | Estimated
2022 Average
Household
Income
(5-mile
Radius)(2) |
| 2522 West 21st Street Property | 300,000 | $10,391,305 | 38.5 | % | NAV | NAV | 9,736 | $66,323 |
| 500 Industrial Road A Property | 220,000 | 7,608,695 | 28.2 | | NAV | NAV | 13,025 | $69,533 |
| 801 West Old 56 Highway Property | 205,000 | 7,086,957 | 26.2 | | NAV | NAV | 136,827 | $121,172 |
| 615 West Cherry Street Property | 60,000 | 1,913,043 | 7.1 | | NAV | NAV | 9,736 | $66,323 |
| Total/Wtd. Avg. | 785,000 | $27,000,000 | 100.0 | % | | | | |
| (1) | Based on the underwritten rent roll dated February 6, 2023. The Orizon Aerostructures Properties are leased to the tenant under a master lease and no individual rent for each building is provided for in the master lease, and the tenant is not permitted to terminate the master lease with respect to any individual property. Accordingly, individual property cashflows are not available. |
The following table presents certain information relating to comparable industrial leases to the Orizon Aerostructures Properties:
| Comparable Industrial Leases(1) |
| Property Location | Year Built /
Renovated | NRA (SF) | Tenant | Lease Size
(SF) | Rent PSF | Commencement | Lease Term
(Years) | Lease
Type |
2522 West 21st Street Chanute, KS | 1992, 2017, 2020 / NAP | 300,000(2) | Orizon Aerostructures, LLC | 300,000(2) | $10.35(2) | Oct-2022(2) | 25.2(2) | Triple Net(2) |
500 Industrial Road A Grove, OK | 1969, 2001, 2011, 2014 / 2012, 2017, 2018 | 220,000(2) | Orizon Aerostructures, LLC | 220,000(2) | $10.35(2) | Oct-2022(2) | 25.2(2) | Triple Net(2) |
801 West Old 56 Highway Olathe, KS | 2016 / NAP | 205,000(2) | Orizon Aerostructures, LLC | 205,000(2) | $10.35(2) | Oct-2022(2) | 25.2(2) | Triple Net(2) |
615 West Cherry Street Chanute, KS | 1968 / 2023 | 60,000(2) | Orizon Aerostructures, LLC | 60,000(2) | $10.35(2) | Oct-2022(2) | 25.2(2) | Triple Net(2) |
CrossMar North Bentonville, AR | 2022 / NAV | 286,000 | Canoo Technologies | 286,000 | $7.90 | Dec-2022 | 15.0 | Triple Net |
Centergate Business Park Building II Lowell, AR | 2022 / NAV | 100,000 | UL, LLC | 100,000 | $7.85 | Oct-2022 | 10.3 | Triple Net |
Unison Industries Beavercreek, OH | 2022 / NAV | 280,000 | Unison Industries, LLC | 280,000 | $11.36 | Jun-2022 | 15.5 | Triple Net |
Warren Industrial Building Warren, MI | 2006 / NAV | 144,281 | Syncreon | 144,281 | $8.50 | Mar-2022 | 7.0 | Triple Net |
Industrial Building Wentzville, MO | 2021 / NAV | 210,995 | Lear Corporation | 210,995 | $7.75 | Jan-2022 | 10.0 | Triple Net |
Oakland Park VI Highland Park, MI | 2002 / 2017 | 114,000 | Valeo Front End | 114,000 | $8.63 | Dec-2021 | 0.5 | Triple Net |
| (1) | Source: Appraisal unless otherwise indicated. |
| (2) | Based on the underwritten rent roll dated February 6, 2023. |
The Borrower. The borrower is OZN Chanute (Multi) LLC, a Delaware limited liability company and single purpose entity with one independent director. Legal counsel to the borrower delivered a non-consolidation opinion in connection with the origination of the Orizon Aerostructures Whole Loan.
The Borrower Sponsor. The borrower sponsor for the Orizon Aerostructures Whole Loan is LCN North American Fund III, L.P., a Delaware limited partnership (“LCN”), a real estate private equity firm that pursues a single strategy of corporate credit-focused, commercial real estate sale-leaseback and build-to-suit investments. With offices in New York, Luxembourg, Amsterdam, and London, LCN currently has over $5 billion in assets under management. LCN’s institutional investors include insurance companies, corporate and public pension funds, as well as several other highly regarded, well known professional investors. The non-recourse carveout guarantor for the Orizon Aerostructures Whole Loan is LCN North American Fund III REIT, a Maryland real estate investment trust.
| THE INFORMATION IN THIS STRUCTURAL AND COLLATERAL TERM SHEET IS NOT COMPLETE AND MAY BE AMENDED PRIOR TO THE TIME OF SALE. THIS TERM SHEET IS NOT AN OFFER TO SELL THESE SECURITIES AND IT IS NOT A SOLICITATION OF AN OFFER TO BUY THESE SECURITIES IN ANY JURISDICTION WHERE THE OFFER OR SALE IS NOT PERMITTED. |
| | 88 | |
| Structural and Collateral Term Sheet | | BMO 2023-C4 |
| No. 7 – Orizon Aerostructures |
Property Management. The Orizon Aerostructures Properties are self-managed.
Escrows and Reserves. At loan origination, there was no requirement for any upfront reserve.
Tax Reserve – On each due date, the borrower will be required to deposit an amount equal to 1/12th of the real estate taxes that the lender estimates will be payable during the next ensuing 12-months, provided such tax reserve will be conditionally waived so long as (i) the borrower has provided the lender with evidence that the master tenant is required to pay such taxes when due with respect to the Orizon Aerostructures Properties directly to the applicable governmental taxing authority, (ii) no event of default has occurred or is continuing, and (iii) no Trigger Period (as defined below) is continuing.
Insurance Reserve – On each due date, the borrower will be required to deposit an amount equal to 1/12th of the annual insurance premiums that the lender estimates will be payable for the renewal of coverage if the borrower does not maintain an approved blanket or umbrella policy, provided such insurance reserve will be conditionally waived so long as (i) the borrower pays all insurance premiums when due and payable, (ii) no event of default has occurred or is continuing, and (iii) no Trigger Period is continuing.
Replacement Reserve – On a monthly basis until the Orizon Aerostructures Whole Loan is either paid or defeased in full, the borrower is required to escrow an amount equal to approximately $13,083 for capital expenditures, provided such replacement reserve will be conditionally waived so long as (i) no event of default has occurred or is continuing, (ii) no Trigger Period is continuing, and (iii) the Trigger Lease (as defined below) is in full force and effect, there are no defaults thereunder and Trigger Tenant (as defined below) is directly paying the costs necessary to maintain each individual Orizon Aerostructures property in a good and safe condition and repair.
Rollover Reserve – On a monthly basis until the Orizon Aerostructures Whole Loan is either paid or defeased in full, the borrower is required to escrow an amount equal to approximately $65,417 for rollover reserves, provided such rollover reserve will be conditionally waived so long as (i) no event of default has occurred or is continuing, (ii) no Trigger Period is continuing, and (iii) the Trigger Lease is in full force and effect and there are no defaults thereunder.
Lockbox / Cash Management. The Orizon Aerostructures Whole Loan is structured with a hard lockbox and in place cash management. The borrower is required to cause all rents to be deposited directly into the lender-controlled lockbox account. The Orizon Aerostructures Whole Loan documents also require that all rents be directly transferred to the cash management account and applied on each payment date (i) to make deposits into the tax and insurance reserves, (ii) to pay debt service on the Orizon Aerostructures Whole Loan, (iii) to make deposits into the replacement reserves, (iv) to make deposits into the rollover reserves, (v) to pay any other amounts then due and payable under the Orizon Aerostructures Whole Loan documents (including, without limitation, to the cash management bank and servicer for fees and expenses incurred in connection with the Orizon Aerostructures Whole Loan documents), and (vi) to fund an amount equal to the monthly operating expense budgeted amount and any then-current lender-approved extraordinary expenses, if any, with any excess cash after such application (A) during a Trigger Period, retained by the lender as additional cash collateral for the Orizon Aerostructures Whole Loan, and (B) so long as no Trigger Period is in effect, required to be deposited into borrower’s operating account. All excess cash then on deposit with the lender will be released to borrower when the Trigger Period is cured and no event of default then exists.
A “Trigger Period” will commence upon (i) the occurrence of an event of default under the Orizon Aerostructures Whole Loan, (ii) the Orizon Aerostructures Whole Loan debt yield being less than 9.5% determined pursuant to the Orizon Aerostructures Whole Loan documents or (iii) the commencement of a Trigger Lease Event (as defined below), and will end upon (A) with respect to a Trigger Period continuing pursuant to clause (i), (x) the event of default commencing the Trigger Period having been cured and such cure having been accepted by the lender, (y) defeasance of the Orizon Aerostructures Whole Loan, or (z) payment in full of the Orizon Aerostructures Whole Loan, (B) with respect to a Trigger Period continuing due to clause (ii), the date that the Orizon Aerostructures Whole Loan debt yield is at least 9.5% for two consecutive calendar quarters, or (C) with respect to a Trigger Period continuing due to clause (iii), termination of the Trigger Lease Event.
A “Trigger Lease Event” will commence on the first due date following the occurrence of any of the following: (i) the date that the master lease is terminated prior to its then current expiration date; (ii) the master lease tenant vacates over 50% of its leased space or discontinues its business (i.e., “goes dark”) for a period in excess of 90 consecutive days; (iii) the master
| THE INFORMATION IN THIS STRUCTURAL AND COLLATERAL TERM SHEET IS NOT COMPLETE AND MAY BE AMENDED PRIOR TO THE TIME OF SALE. THIS TERM SHEET IS NOT AN OFFER TO SELL THESE SECURITIES AND IT IS NOT A SOLICITATION OF AN OFFER TO BUY THESE SECURITIES IN ANY JURISDICTION WHERE THE OFFER OR SALE IS NOT PERMITTED. |
| | 89 | |
| Structural and Collateral Term Sheet | | BMO 2023-C4 |
| No. 7 – Orizon Aerostructures |
lease tenant is the subject of a legal proceeding under one or more laws as further described in the Orizon Aerostructures Whole Loan documents.
A Trigger Lease Event will end when (A) with respect to a Trigger Lease Event continuing pursuant to clause (i), the Trigger Tenant has found a replacement tenant, (B) with respect to a Trigger Period continuing due to clause (ii), the Trigger Tenant is open for business and operating in more than 75% of its leased space and utilizing more than 85% of its leased space, for no less than 60 consecutive days, or (C) with respect to a Trigger Period continuing due to clause (iii), the legal proceeding that the Trigger Tenant is subject to has ended as further described in the Orizon Aerostructures Whole Loan documents.
The “Trigger Lease” is the lease with the Trigger Tenant, as such lease may be amended, modified, restated, renewed, extended or assigned from time to time, collectively with any guaranty or similar instrument furnished thereunder.
The “Trigger Tenant” is the mater lease tenant, Orizon Aerostructures, LLC, and any replacement tenant occupying all or any portion of the space at the Orizon Aerostructures Properties leased as of November 15, 2022 to such tenant (and any parent company thereof or guarantor of such replacement tenant’s lease, as applicable).
Subordinate Debt. None.
Mezzanine Debt. None.
Partial Release. Not permitted.
Ground Lease. None.
| THE INFORMATION IN THIS STRUCTURAL AND COLLATERAL TERM SHEET IS NOT COMPLETE AND MAY BE AMENDED PRIOR TO THE TIME OF SALE. THIS TERM SHEET IS NOT AN OFFER TO SELL THESE SECURITIES AND IT IS NOT A SOLICITATION OF AN OFFER TO BUY THESE SECURITIES IN ANY JURISDICTION WHERE THE OFFER OR SALE IS NOT PERMITTED. |
| | 90 | |
| Structural and Collateral Term Sheet | | BMO 2023-C4 |
| No. 8 – Park West Village |
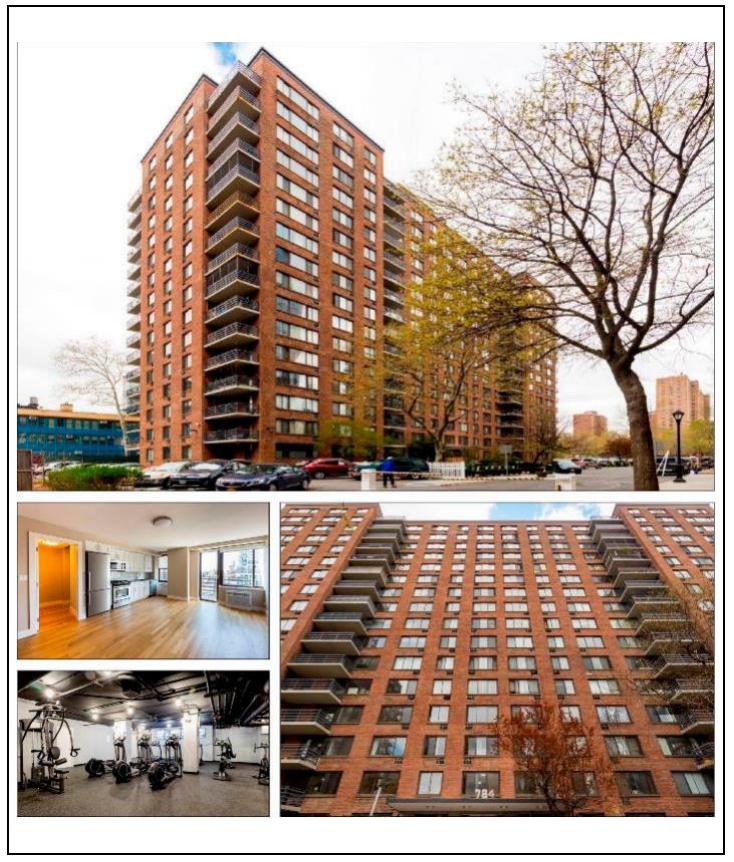
| THE INFORMATION IN THIS STRUCTURAL AND COLLATERAL TERM SHEET IS NOT COMPLETE AND MAY BE AMENDED PRIOR TO THE TIME OF SALE. THIS TERM SHEET IS NOT AN OFFER TO SELL THESE SECURITIES AND IT IS NOT A SOLICITATION OF AN OFFER TO BUY THESE SECURITIES IN ANY JURISDICTION WHERE THE OFFER OR SALE IS NOT PERMITTED. |
| | 91 | |
| Structural and Collateral Term Sheet | | BMO 2023-C4 |
| No. 8 – Park West Village |
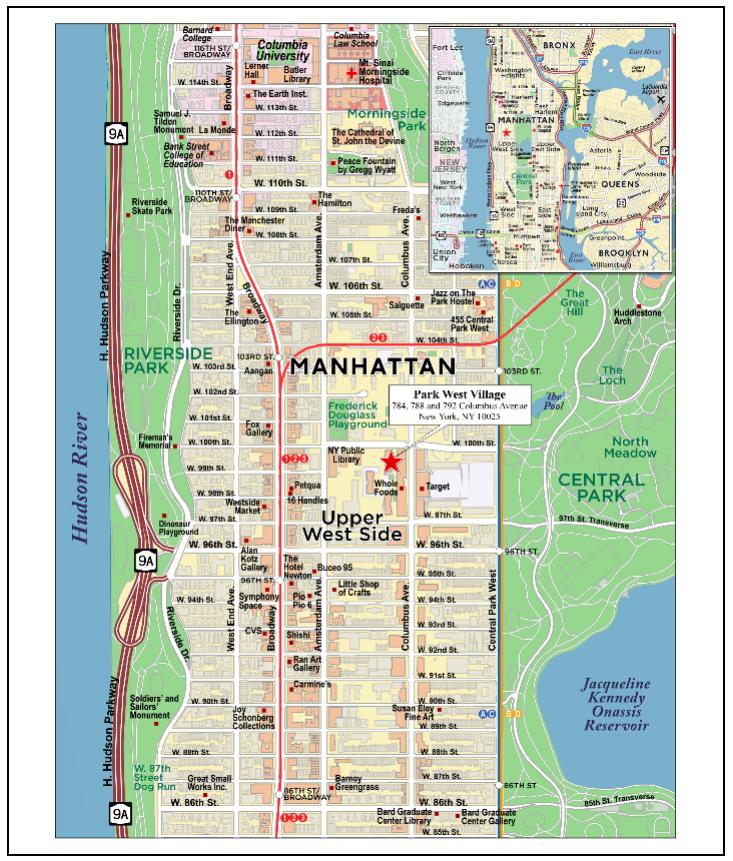
| THE INFORMATION IN THIS STRUCTURAL AND COLLATERAL TERM SHEET IS NOT COMPLETE AND MAY BE AMENDED PRIOR TO THE TIME OF SALE. THIS TERM SHEET IS NOT AN OFFER TO SELL THESE SECURITIES AND IT IS NOT A SOLICITATION OF AN OFFER TO BUY THESE SECURITIES IN ANY JURISDICTION WHERE THE OFFER OR SALE IS NOT PERMITTED. |
| | 92 | |
| Structural and Collateral Term Sheet | | BMO 2023-C4 |
| No. 8 – Park West Village |
| Mortgage Loan Information | | Property Information |
| Mortgage Loan Seller: | BMO | | Single Asset / Portfolio: | Single Asset |
| Original Principal Balance(1): | $26,000,000 | | Title: | Fee |
| Cut-off Date Principal Balance(1): | $26,000,000 | | Property Type – Subtype: | Multifamily – High Rise |
| % of IPB: | 3.3% | | Net Rentable Area (Units): | 850 |
| Loan Purpose: | Refinance | | Location: | New York, NY |
| Borrowers: | CF PWV LLC and SM PWV LLC | | Year Built / Renovated: | 1950, 1958, 1963 / 2014 |
| Borrower Sponsors: | Meyer Chetrit and | | Occupancy: | 94.7% |
| | Amended and Restated 2013 | | Occupancy Date: | 7/22/2022 |
| | LG Revocable Trust | | 4th Most Recent NOI (As of): | $16,725,571 (12/31/2019) |
| Interest Rate: | 4.65000% | | 3rd Most Recent NOI (As of): | $14,592,031 (12/31/2020) |
| Note Date: | 8/3/2022 | | 2nd Most Recent NOI (As of): | $13,357,008 (12/31/2021) |
| Maturity Date: | 8/6/2027 | | Most Recent NOI (As of)(4): | $15,491,417 (TTM 5/31/2022) |
| Interest-only Period: | 60 months | | UW Economic Occupancy: | 91.3% |
| Original Term: | 60 months | | UW Revenues: | $32,787,176 |
| Original Amortization Term: | None | | UW Expenses: | $9,786,898 |
| Amortization Type: | Interest Only | | UW NOI(4): | $23,000,278 |
| Call Protection: | L(30),D(25),O(5) | | UW NCF(4): | $23,000,278 |
| Lockbox / Cash Management: | Soft (Residential); Hard | | Appraised Value / Per Unit: | $575,000,000 / $676,471 |
| | (Commercial) / In Place | | Appraisal Date: | 1/20/2022 |
| Additional Debt(1): | Yes | | | |
| Additional Debt Balance(1)(2): | $161,500,000 / $177,500,000 | | | |
| Additional Debt Type(1)(2): | Pari Passu / Subordinate | | | |
| | | | | |
| Escrows and Reserves(3) | | Financial Information(1) |
| | Initial | Monthly | Initial Cap | | | Senior Loan | Whole Loan |
| Taxes: | $919,476 | $459,738 | N/A | | Cut-off Date Loan / Unit: | $220,588 | $429,412 |
| Insurance: | $0 | Springing | N/A | | Maturity Date Loan / Unit: | $220,588 | $429,412 |
| Replacement Reserves: | $850,000 | $0 | N/A | | Cut-off Date LTV: | 32.6% | 63.5% |
| Other Reserves: | $12,778,500 | Springing | N/A | | Maturity Date LTV: | 32.6% | 63.5% |
| | | | | | UW NCF DSCR(4): | 2.60x | 1.34x |
| | | | | | UW NOI Debt Yield(4): | 12.3% | 6.3% |
| | | | | | | | |
| Sources and Uses |
| Sources | Proceeds | % of Total | | Uses | Proceeds | % of Total |
| Senior Loan | $187,500,000 | 49.2 | % | | Loan Payoff | $321,864,741 | 84.5 | % |
| Subordinate Notes | 177,500,000 | 46.6 | | | Closing Costs | 44,400,316 | 11.7 | |
| Sponsor Equity | 15,813,033 | 4.2 | | | Upfront Reserves | 14,547,976 | 3.8 | |
| Total Sources | $380,813,033 | 100.0 | % | | Total Uses | $380,813,033 | 100.0 | % |
| (1) | The Park West Village Mortgage Loan (as defined below) is part of the Park West Village Senior Loan (as defined below), with an original aggregate principal balance of $187,500,000. The Park West Village Senior Loan is part of the Park West Village Whole Loan (as defined below), with an original aggregate principal balance of $365,000,000. The Financial Information in the chart above reflects the Park West Village Senior Loan and the Park West Village Whole Loan. For additional information, see “The Loan” below. |
| (2) | The subordinate notes consist of (i) the B-A Note with an original principal balance of $66,500,000 and (ii) the B-B Note with an original principal balance of $111,000,000, which is junior to the B-A Note in right of payment. The B-A Note was contributed to the BBCMS 2022-C17 trust and backs only the related loan-specific certificates issued by the BBCMS 2022-C17 trust. For additional information, see “The Loan” below. |
| (3) | For a full description of Escrows and Reserves, please refer to “Escrows and Reserves” below. |
| (4) | UW NOI is greater than Most Recent NOI due in part to the borrower sponsors recently renovating 29 units, which has increased rents at the Park West Village Property (as defined below). Additionally, the UW NOI and UW NCF include disbursements from a Supplemental Income Reserve (as defined below) of $4,920,000. The Park West Village Senior Loan UW NCF DSCR and Park West Village Whole Loan UW NCF DSCR excluding credit for the upfront Supplemental Income Reserve are 2.05x and 1.05x respectively. The Park West Village Senior Loan UW NOI Debt Yield and Park West Village Whole Loan UW NOI Debt Yield excluding credit for the upfront Supplemental Income Reserve are 9.6% and 5.0%, respectively. Please refer to “Escrows and Reserves” below. |
The Loan. The eighth largest mortgage loan (the “Park West Village Mortgage Loan”) is part of a whole loan (the “Park West Village Whole Loan”) that is evidenced by 13 pari passu senior promissory notes in the aggregate original principal
| THE INFORMATION IN THIS STRUCTURAL AND COLLATERAL TERM SHEET IS NOT COMPLETE AND MAY BE AMENDED PRIOR TO THE TIME OF SALE. THIS TERM SHEET IS NOT AN OFFER TO SELL THESE SECURITIES AND IT IS NOT A SOLICITATION OF AN OFFER TO BUY THESE SECURITIES IN ANY JURISDICTION WHERE THE OFFER OR SALE IS NOT PERMITTED. |
| | 93 | |
| Structural and Collateral Term Sheet | | BMO 2023-C4 |
| No. 8 – Park West Village |
amount of $187,500,000 (collectively, the “Park West Village Senior Loan”), one subordinate promissory Note B-A in the original principal amount of $66,500,000 (the “Park West Village Note B-A” or the “Park West Village Note B-A Subordinate Companion Loan”) and one further subordinate promissory Note B-B in the original principal amount of $111,000,000 (the “Park West Village Note B-B” or the “Park West Village Note B-B Subordinate Companion Loan” and together with the Park West Village Note B-A, the “Park West Village Subordinate Companion Notes” or “Park West Village Subordinate Companion Loans”). The Park West Village Senior Loan was co-originated on August 3, 2022 by Bank of Montreal (“BMO”), Starwood Mortgage Capital LLC (“SMC”) and Citi Real Estate Funding Inc. (“CREFI”). The Park West Village Note B-A Subordinate Companion Loan was originated on August 3, 2022 by BMO. The Park West Village Note B-B Subordinate Companion Loan was originated on August 3, 2022 by Park West Village Grand Avenue Partners, LLC, an affiliate of Oaktree Capital Management, L.P. (“PWV Grand Avenue”). The Park West Village Whole Loan is secured by a first lien mortgage on the borrowers’ fee simple interest in two, 16-story multifamily buildings and one, 16 story mixed use building, consisting of 850 residential units and one commercial unit located in the Upper West Side neighborhood of New York, New York (collectively, the “Park West Village Property”).
The Park West Village Mortgage Loan is evidenced by the non-controlling Note A-2-1, with a principal balance as of the Cut-off Date of $26,000,000. The remaining Park West Village pari passu senior promissory notes and the Park West Village Note B-A were contributed to other securitization trusts, as set forth in the table below, and the Park West Village Note B-B is currently held by PWV Grand Avenue. The Park West Village Senior Loan is senior in right of payment to the Park West Village Subordinate Companion Loans, and the Park West Village Note B-A Subordinate Companion Loan is senior in right of payment to the Park West Village Note B-B Subordinate Companion Loan. The Park West Village Note B-B will be the initial controlling note and PWV Grand Avenue, as the holder of such initial controlling note, will be entitled to exercise certain control rights with respect to the Park West Village Whole Loan under the related co-lender agreement. The Park West Village Note B-A will become the controlling note if the Note B-B Control Appraisal Period (as defined in the related co-lender agreement) has occurred and is continuing, and the Note A-1 will become the controlling note if both the Note B-B Control Appraisal Period and the Note B-A Control Appraisal Period (as defined in the related co-lender agreement) have occurred and are continuing, as further described in the table below. The Park West Village Whole Loan will be serviced pursuant to the pooling and servicing agreement for the BBCMS 2022-C17 securitization into which the Note A-1, which is the lead note, was contributed. For additional information, see “Subordinate Debt” below. The relationship between the holders of the notes evidencing the Park West Village Whole Loan is governed by a co-lender agreement as described under “Description of the Mortgage Pool—The Whole Loans—The Park West Village Pari Passu-AB Whole Loan” and “The Pooling and Servicing Agreement—Servicing of the Outside Serviced Mortgage Loans” in the Preliminary Prospectus.
| Whole Loan Summary |
| Note | Original Balance | Cut-off Date Balance | | Note Holder | Controlling
Piece |
| A-1(1) | $17,500,000 | $17,500,000 | | BBCMS 2022-C17 | Yes |
| A-2-1 | $26,000,000 | $26,000,000 | | BMO 2023-C4 | No |
| A-2-2 | $6,500,000 | $6,500,000 | | BMO | No |
| A-3 | $7,500,000 | $7,500,000 | | BBCMS 2022-C18 | No |
| A-4 | $5,000,000 | $5,000,000 | | BMO 2022-C3 | No |
| A-5 | $17,500,000 | $17,500,000 | | Benchmark 2022-B37 | No |
| A-6 | $15,000,000 | $15,000,000 | | Benchmark 2022-B37 | No |
| A-7 | $15,000,000 | $15,000,000 | | Benchmark 2022-B37 | No |
| A-8 | $15,000,000 | $15,000,000 | | Benchmark 2022-B37 | No |
| A-9 | $17,500,000 | $17,500,000 | | BMO 2022-C3 | No |
| A-10 | $15,000,000 | $15,000,000 | | BMO 2022-C3 | No |
| A-11 | $15,000,000 | $15,000,000 | | BBCMS 2022-C17 | No |
| A-12 | $15,000,000 | $15,000,000 | | BBCMS 2022-C17 | No |
| Total Senior Loan | $187,500,000 | $187,500,000 | | | |
| B-A(1) | $66,500,000 | $66,500,000 | | BBCMS 2022-C17 (Loan Specific) | Yes |
| B-B(1) | $111,000,000 | $111,000,000 | | PWV Grand Avenue | Yes |
| Whole Loan | $365,000,000 | $365,000,000 | | | |
| (1) | The initial controlling note is Note B-B, but if a Note B-B Control Appraisal Period for the Park West Village Whole Loan is continuing, the controlling note will be Note B-A. If a Note B-A Control Appraisal Period and a Note B-B Control Appraisal Period are continuing, the controlling note will be Note A-1. Note B-A was contributed to the BBCMS 2022-C17 securitization trust and backs only the related loan-specific certificates issued by the BBCMS 2022-C17 securitization trust. The loan-specific controlling class representative designated pursuant to the pooling and servicing agreement for the BBCMS 2022-C17 securitization will be entitled to exercise the rights of the controlling note if Note B-A becomes the controlling note, and the directing certificate holder for the pooled certificates issued by the BBCMS 2022-C17 securitization trust will be entitled to exercise the rights of the controlling note if Note A-1 becomes the controlling note, in each case to the extent provided in the related co-lender agreement |
| THE INFORMATION IN THIS STRUCTURAL AND COLLATERAL TERM SHEET IS NOT COMPLETE AND MAY BE AMENDED PRIOR TO THE TIME OF SALE. THIS TERM SHEET IS NOT AN OFFER TO SELL THESE SECURITIES AND IT IS NOT A SOLICITATION OF AN OFFER TO BUY THESE SECURITIES IN ANY JURISDICTION WHERE THE OFFER OR SALE IS NOT PERMITTED. |
| | 94 | |
| Structural and Collateral Term Sheet | | BMO 2023-C4 |
| No. 8 – Park West Village |
and the pooling and servicing agreement for the BBCMS 2022-C17 securitization. See “Description of the Mortgage Pool—The Whole Loans—The Park West Village Pari Passu-A/B Whole Loan” in the Preliminary Prospectus.
The Property. The Park West Village Property consists of two, 16-story multifamily buildings and one, 16-story mixed use building, comprised of 850 residential units totaling 643,708 square feet and one commercial unit totaling 1,039 square feet. The commercial tenant at the Park West Village Property has a remaining weighted average lease term of approximately 0.4 years. The Park West Village Property is located in the Upper West Side neighborhood and is situated near the 96th Street and 103rd Street subway stations with access to the A, B, and C subway lines. The Park West Village Property was built in 1950, 1958, and 1963 and renovated in 2014, and features a range of studio, one-bedroom, two-bedroom, three-bedroom, and four-bedroom residential units. Of the 850 residential units, 418 of the units are rent-stabilized. The Park West Village Property units all feature hardwood flooring, nearly nine-foot ceiling heights, full kitchen appliances, and certain units include a private balcony. Renovated units feature granite or marble countertop kitchens, stainless steel appliances including a refrigerator, dishwasher, microwave, and gas-fired stove and oven, and washer and dryer. Community spaces include an outdoor children’s playground, dog run, valet services, and onsite surface parking.
The sole commercial tenant, Carol Maryan Architect, P.C. (“Carol Maryan Architect”), occupies 1,039 square feet (100.0% of the commercial NRA and 0.2% of the total NRA, 100.0% of the underwritten commercial base rent and 0.3% of the total underwritten base rent) with a lease expiration of July 31, 2023. Carol Maryan Architect is a boutique architectural firm founded by Carol Maryan in 1983. Carol Maryan Architect provides architectural and interior designs to an array of clients, including private individuals, corporations, developers, creative services firms, and public entities.
Borrower Sponsors’ Renovation Plan. The information set forth below regarding the borrower sponsors’ renovation plans reflects forward-looking statements and certain projections provided by the borrower sponsors, assuming, among other things, that the borrowers will complete certain projected renovations by December 1, 2024 and that all of the newly renovated and currently unoccupied units will be leased at current market rate rent and all of the currently occupied units will continue to be leased at the current contractual rental rates. We cannot assure you that such assumptions and projections provided by the borrower sponsors will materialize in the future as expected or at all.
The borrower sponsors have identified 325 units that will be renovated, which consist of 270 units that are projected to receive a light renovation and 55 units that are projected to receive a major renovation. The 55 major renovation units will be combined into 27 units post-renovation. Of the 55 units projected to receive major renovations, 28 units are rent-stabilized, all of which are currently vacant. Major renovations will feature the combination of two or three units into one larger unit or a significant floor plan alteration and are expected to take approximately four to six months to complete. Light renovation units will feature aesthetic and systems upgrades, such as new appliances, countertops, lighting upgrades and removal of carpeting. At origination, the borrowers deposited $7,858,500 into a unit upgrade reserve with the lender, to be disbursed to pay or reimburse the borrowers for unit renovation costs pursuant to the Park West Village Whole Loan documents. See “Escrows and Reserves” below.
The major renovation units are projected to receive an average renovation of approximately $48,109 per unit and are anticipated to increase rent from $46.18 per square foot in-place to $81.00 per square foot. The borrower sponsors have completed 12 major renovations to date, which have been combined into a total of seven units. These major renovations have achieved average annual rent increases from $29.39 per square foot to $72.82 per square foot.
The light renovation units are projected to receive an average renovation of $19,306 per unit and are anticipated to increase rent from $65.31 per square foot in-place to $81.00 per square foot. The borrower sponsors have completed 17 light renovations to date. These light renovations have achieved average annual rent increases from $38.24 per square foot to $85.59 per square foot.
| THE INFORMATION IN THIS STRUCTURAL AND COLLATERAL TERM SHEET IS NOT COMPLETE AND MAY BE AMENDED PRIOR TO THE TIME OF SALE. THIS TERM SHEET IS NOT AN OFFER TO SELL THESE SECURITIES AND IT IS NOT A SOLICITATION OF AN OFFER TO BUY THESE SECURITIES IN ANY JURISDICTION WHERE THE OFFER OR SALE IS NOT PERMITTED. |
| | 95 | |
| Structural and Collateral Term Sheet | | BMO 2023-C4 |
| No. 8 – Park West Village |
The following table presents detailed information with respect to the current market rate units at the Park West Village Property:
| As Is Market Rate Unit Summary |
| Unit Type | No. of Units(1) | % of Total | Average Unit Size (SF)(1) | Average Monthly Rental Rate(1) | Average Monthly Rental Rate per SF(1) | Average Monthly Market Rental Rate(2) | Average Monthly Market Rental Rate per SF(2) |
| Studio | 166 | 38.4 | % | 464 | $2,869 | $6.19 | $3,243 | $5.85 |
| 1 Bedroom | 164 | 38.0 | | 836 | $4,505 | $5.39 | $4,768 | $5.08 |
| 2 Bedroom | 89 | 20.6 | | 918 | $5,140 | $5.62 | $5,355 | $5.39 |
| 3 Bedroom | 12 | 2.8 | | 1,264 | $7,708 | $6.05 | $8,977 | $5.74 |
| 4 Bedroom | 1 | 0.2 | | 1,832 | $7,500 | $4.09 | $7,500 | $4.09 |
| Total/Wtd. Avg. | 432 | 100.0 | % | 724 | $4,091 | $5.67 | $4,477 | $5.37 |
| (1) | Based on the underwritten rent roll as of July 22, 2022. |
The following table presents detailed information with respect to the current rent-stabilized units at the Park West Village Property:
| As Is Rent-Stabilized Unit Summary |
| Unit Type | No. of Units(1) | % of Total | Average Unit Size (SF)(1) | Average Monthly Rental Rate(1) | Average Monthly Rental Rate per SF(1) | Average Monthly Market Rental Rate(2) | Average Monthly Market Rental Rate per SF(2) |
| Studio | 115 | 27.5 | % | 469 | $1,175 | $2.52 | $1,318 | $2.49 |
| 1 Bedroom | 225 | 53.8 | | 842 | $1,337 | $1.58 | $1,417 | $1.59 |
| 2 Bedroom | 77 | 18.4 | | 1,119 | $1,779 | $1.58 | $1,843 | $1.51 |
| 3 Bedroom | 1 | 0.2 | | 1,153 | $3,000 | $2.60 | $3,000 | $2.60 |
| Total/Wtd. Avg. | 418 | 100.0 | % | 791 | $1,378 | $1.73 | $1,473 | $1.72 |
| (1) | Based on the underwritten rent roll as of July 22, 2022. |
The following table presents detailed information with respect to the projected post-renovation market rate units at the Park West Village Property:
| Projected Post-Renovation Market Rate Unit Summary |
| Unit Type | No. of Units(1) | % of Total | Average Unit Size (SF)(1) | Average Monthly Rental Rate(1) | Average Monthly Rental Rate per SF(1) | Average Monthly Market Rental Rate(2) | Average Monthly Market Rental Rate per SF(2) |
| Studio | 155 | 38.3 | % | 464 | $3,085 | $6.66 | $3,243 | $5.85 |
| 1 Bedroom | 153 | 37.8 | | 837 | $5,450 | $6.51 | $4,768 | $5.08 |
| 2 Bedroom | 85 | 21.0 | | 910 | $6,108 | $6.71 | $5,355 | $5.39 |
| 3 Bedroom | 11 | 2.7 | | 1,298 | $8,835 | $6.80 | $8,977 | $5.74 |
| 4 Bedroom | 1 | 0.2 | | 1,832 | $12,366 | $6.75 | $7,500 | $4.09 |
| 5 Bedroom | NAP | NAP | NAP | NAP | NAP | NAP | NAP |
| Total/Wtd. Avg. | 405 | 100.0 | % | 724 | $4,792 | $6.62 | $4,477 | $5.37 |
| (1) | Based on the underwritten rent roll as of July 22, 2022. |
| THE INFORMATION IN THIS STRUCTURAL AND COLLATERAL TERM SHEET IS NOT COMPLETE AND MAY BE AMENDED PRIOR TO THE TIME OF SALE. THIS TERM SHEET IS NOT AN OFFER TO SELL THESE SECURITIES AND IT IS NOT A SOLICITATION OF AN OFFER TO BUY THESE SECURITIES IN ANY JURISDICTION WHERE THE OFFER OR SALE IS NOT PERMITTED. |
| | 96 | |
| Structural and Collateral Term Sheet | | BMO 2023-C4 |
| No. 8 – Park West Village |
The following table presents detailed information with respect to the projected post-renovation rent-stabilized units at the Park West Village Property:
| Projected Post-Renovation Rent-Stabilized Unit Summary |
| Unit Type | No. of Units(1) | % of Total | Average Unit
Size (SF)(1) | Average
Monthly
Rental Rate(1) | Average
Monthly
Rental Rate
per SF(1) | Average
Monthly
Market Rental
Rate(2) | Average
Monthly
Market Rental
Rate per SF(2) |
| Studio | 105 | 25.2 | % | 465 | $1,292 | $2.78 | $1,318 | $2.49 |
| 1 Bedroom | 212 | 50.8 | | 847 | $1,468 | $1.73 | $1,417 | $1.59 |
| 2 Bedroom | 88 | 21.1 | | 1,163 | $3,241 | $2.79 | $1,843 | $1.51 |
| 3 Bedroom | 10 | 2.4 | | 1,529 | $9,872 | $6.46 | $3,000 | $2.60 |
| 4 Bedroom | 1 | 0.2 | | 1,700 | $11,473 | $6.75 | NAP | NAP |
| 5 Bedroom | 1 | 0.2 | | 2,642 | $17,831 | $6.75 | NAP | NAP |
| Total/Wtd. Avg. | 417 | 100.0 | % | 840 | $2,063 | $2.46 | $1,473 | $1.72 |
| (1) | Based on the underwritten rent roll as of July 22, 2022. |
Environmental. According to the Phase I report dated January 20, 2022, there was no evidence of any recognized environmental conditions at the Park West Village Property. The Phase I environmental assessment, however, identified historical recognized environmental conditions at the Park West Village Property.
The following table presents certain information relating to the historical and current occupancy of the Park West Village Property:
| Historical and Current Multifamily Occupancy(1) |
| 2019 | 2020 | 2021 | Current(2) |
| 94.2% | 91.2% | 87.9% | 94.7% |
| (1) | Historical occupancies are as of July 31 of each respective year. |
| (2) | Current occupancy is as of July 22, 2022. |
| THE INFORMATION IN THIS STRUCTURAL AND COLLATERAL TERM SHEET IS NOT COMPLETE AND MAY BE AMENDED PRIOR TO THE TIME OF SALE. THIS TERM SHEET IS NOT AN OFFER TO SELL THESE SECURITIES AND IT IS NOT A SOLICITATION OF AN OFFER TO BUY THESE SECURITIES IN ANY JURISDICTION WHERE THE OFFER OR SALE IS NOT PERMITTED. |
| | 97 | |
| Structural and Collateral Term Sheet | | BMO 2023-C4 |
| No. 8 – Park West Village |
The following table presents certain information relating to the operating history and underwritten cash flows of the Park West Village Property:
| Operating History and Underwritten Net Cash Flow |
| | 2019 | 2020 | 2021 | TTM(1) | Underwritten | Per Unit | %(2) |
| Residential Base Rent | $24,956,720 | $22,792,744 | $22,129,703 | $24,536,542 | $28,419,283 | $33,434 | 83.9 | % |
| Commercial Base Rent | 71,777 | 70,353 | 75,268 | 74,908 | 79,852 | 94 | 0.2 | |
| Gross Potential Rent | $25,028,497 | $22,863,097 | $22,204,971 | $24,611,451 | $28,499,136 | $33,528 | 84.2 | % |
| Total Reimbursements | 2,945 | 17,850 | 0 | 0 | 11,355 | 13 | 0.0 | |
| Supplemental Income Reserve(3) | 0 | 0 | 0 | 0 | 4,919,913 | 5,788 | 14.5 | |
| Total Other Income | 567,004 | 760,807 | 477,438 | 424,187 | 424,187 | 499 | 1.3 | |
| Net Rental Income | $25,598,446 | $23,641,754 | $22,682,409 | $25,035,638 | $33,854,591 | $39,829 | 100.0 | % |
| (Vacancy/Credit Loss) | (2,062) | (2,942) | 0 | 0 | (1,067,415) | (1,256) | (3.2 | ) |
| Effective Gross Income | $25,596,385 | $23,638,812 | $22,682,409 | $25,035,638 | $32,787,176 | $38,573 | 96.8 | % |
| Total Expenses | 8,870,813 | 9,046,781 | 9,325,401 | 9,544,221 | 9,786,898 | 11,514 | 29.8 | |
| Net Operating Income(3) | $16,725,571 | $14,592,031 | $13,357,008 | $15,491,417 | $23,000,278 | $27,059 | 70.2 | % |
| Total Capex/RR(4) | 0 | 0 | 0 | 0 | 0 | 0 | 0 | |
| Net Cash Flow | $16,725,571 | $14,592,031 | $13,357,008 | $15,491,417 | $23,000,278 | $27,059 | 70.2 | % |
| (1) | TTM represents the trailing 12 months ending May 2022. |
| (2) | % column represents percent of Net Rental Income for all revenue lines and represents percent of Effective Gross Income for the remainder of the fields. |
| (3) | The Underwritten Net Operating Income is greater than the TTM Net Operating Income due in part to (i) the borrower sponsors recently renovating 29 units, which has increased rents at the Park West Village Property and (ii) disbursements from the Supplemental Income Reserve. Please refer to “Escrows and Reserves” below. |
| (4) | The borrower sponsors funded five years’ worth of Capex/RR at origination. |
The Market. The Park West Village Property is located in New York, New York, within the New York, NY-NJ-PA Core Based Statistical Area. According to the appraisal, the unemployment rate from 2011 through 2021 in New York City increased at an average annual rate of 0.3% and is expected to decrease at an average annual rate of 4.7% between 2022 and 2026. The estimated 2021 median annual household income in New York City was $68,261. The leading industries in New York City are education and health, professional and business, government, and trade, transportation and utilities. The largest employer in New York City is Northwell Health, which employs 68,088 people. The Park West Village Property is located on the blocks bound by Columbus Avenue, Amsterdam Avenue, West 97th Street and West 100th Street. The buildings at 784 Columbus Avenue and 792 Columbus Avenue have street frontage on West 97th and 100th Streets, respectively. The building at 788 Columbus Avenue does not have street frontage; however, all three of the Park West Village Property buildings are accessible from Columbus Avenue via a breezeway through the development to the east of the subject buildings, which comprises the entire blockfront of Columbus Avenue from West 97th Street to West 100th Street. The Upper West Side is primarily residential in nature, with adequate retail to support the area. Manhattan’s central business district is located to the southeast of the Upper West Side. Immediately to the south is the Clinton area, which is characterized by a wide range of uses including residential, office buildings and the Theater District. The neighborhood bordering the Upper West Side to the north is known as Morningside Heights, which is primarily residential and home to Columbia University. The Park West Village Property benefits from its proximity to Columbus Avenue, as well as Broadway, which is dense with prime retail and commercial space.
The Park West Village Property is situated in the Upper West Side multifamily submarket. According to a third party commercial real estate information and analytics provider, as of February 2022, the Upper West Side multifamily submarket had an overall vacancy rate of 2.2%, with net absorption totaling 11 units. The vacancy rate decreased 1.7% over the past 12 months. Rental rates increased by 5.9% for the past 12 months and ended at $4,760 per unit per month. A total of 336 units are still under construction at the end of the first quarter of 2022.
According to the appraisal, the 2021 population for New York City was approximately 8,305,600 and is forecasted to grow to approximately 8,317,700 in 2022, and approximately 8,335,900 in 2026.
| THE INFORMATION IN THIS STRUCTURAL AND COLLATERAL TERM SHEET IS NOT COMPLETE AND MAY BE AMENDED PRIOR TO THE TIME OF SALE. THIS TERM SHEET IS NOT AN OFFER TO SELL THESE SECURITIES AND IT IS NOT A SOLICITATION OF AN OFFER TO BUY THESE SECURITIES IN ANY JURISDICTION WHERE THE OFFER OR SALE IS NOT PERMITTED. |
| | 98 | |
| Structural and Collateral Term Sheet | | BMO 2023-C4 |
| No. 8 – Park West Village |
The following table presents certain information relating to comparable multifamily rental properties to the Park West Village Property:
| Comparable Rental Summary(1) |
| Property / Location | Year Built | Occupancy | # of Units | Unit Mix | Average SF per Unit | Average Rent per SF | Average Rent per Unit |
| Park West Village(2) | 1950, 1958, 1963 | 94.7% | 850 | Studio | 466 | $4.79 | $2,226 |
| 784, 788 and 792 Columbus | 1 Bed | 840 | $3.22 | $2,711 |
| Avenue | 2 Bed | 1,011 | $3.63 | $3,663 |
| New York, NY | 3 Bed | 1,255 | $5.79 | $7,316 |
| | 4 Bed | 1,832 | $4.09 | $7,500 |
| West 96th Apartments | 1987 | 95.2% | 207 | 1 Bed | 733 | $6.28 | $4,606 |
| 750 Columbus Avenue | 2 Bed | 1,006 | $6.25 | $6,287 |
| New York, NY | 3 Bed | 1,421 | $6.23 | $8,853 |
| The Westmont Apartments | 1986 | 100.0% | 163 | Studio | 610 | $5.75 | $3,509 |
| 730 Columbus Avenue | 1 Bed | 802 | $5.59 | $4,479 |
| New York, NY | 2 Bed | 1095 | $5.81 | $6,360 |
| | 3 Bed | 1,403 | $5.67 | $7,951 |
| Stonehenge Village | 1930 | 94.5% | 414 | Studio | 515 | $5.92 | $3,050 |
| 160 West 97th Street | 1 Bed | 686 | $6.41 | $4,400 |
| New York, NY | 2 Bed | 951 | $5.96 | $5,667 |
| | 3 Bed | 1,123 | $5.79 | $6,500 |
| The Greystone | 1923 | 98.6% | 366 | Studio | 321 | $9.14 | $2,938 |
| 212 West 91st Street | 1 Bed | 583 | $6.53 | $3,809 |
| New York, NY | 2 Bed | 955 | $6.13 | $5,850 |
| Columbus Square | 2009 | 93.7% | 710 | Studio | 445 | $8.13 | $3,616 |
| 808 Columbus Avenue | 1 Bed | 649 | $7.67 | $4,979 |
| New York, NY | 2 Bed | 970 | $7.46 | $7,235 |
| | 3 Bed | 1,376 | $6.28 | $8,640 |
| The Paris New York | 1931 | 98.9% | 176 | Studio | 516 | $6.19 | $3,195 |
| 752 West End Avenue | 1 Bed | 501 | $6.13 | $3,070 |
| New York, NY | 2 Bed | 1,065 | $5.97 | $6,362 |
| | 3 Bed | 1,894 | $5.33 | $10,095 |
| The Lyric | 1996 | 98.6% | 285 | Studio | 527 | $6.86 | $3,618 |
| 255 West 94th Street | 1 Bed | 677 | $6.95 | $4,701 |
| New York, NY | 2 Bed | 1,077 | $6.80 | $7,320 |
| (1) | Source: Appraisal, unless otherwise indicated. |
| (2) | Based on underwritten rent roll dated as of July 22, 2022. Average Rent per SF and Average Rent per Unit reflect average monthly in-place rent for occupied units. |
The Borrowers. The borrowers under the Park West Village Whole Loan are CF PWV LLC and SM PWV LLC, as tenants-in-common, each a single-purpose Delaware limited liability company with two independent directors. Legal counsel to the borrowers delivered a non-consolidation opinion in connection with the origination of the Park West Village Whole Loan.
The Borrower Sponsors. The borrower sponsors and non-recourse carveout guarantors are Meyer Chetrit and Amended and Restated 2013 LG Revocable Trust, a trust established by Laurance Gluck. Meyer Chetrit is one of the controllers of The Chetrit Group. The Chetrit Group is an experienced, privately held New York City real estate development firm controlled by two brothers: Joseph and Meyer Chetrit. The Chetrit Group, which is headquartered in Manhattan, has ownership interests in over 14 million square feet of commercial and residential real estate across the United States, including New York, Chicago, Miami, and Los Angeles, as well as internationally.
Laurence Gluck is the founder of Stellar Management, a real estate development and management firm founded in 1985. Based in New York City, Stellar Management owns and manages a portfolio of over 13,000 apartments in 100 buildings located across New York City and over three million square feet of office space. Prior to founding Stellar Management, Laurence Gluck served as a real estate attorney at Proskauer, Rose, Goetz & Mendelsohn and later as a partner at Dreyer & Traub. Laurence Gluck also formerly served as a member of the Board of Governors of the Real Estate Board of New York.
Property Management. The Park West Village Property is managed by PWV Management LLC, an affiliate of the borrowers.
| THE INFORMATION IN THIS STRUCTURAL AND COLLATERAL TERM SHEET IS NOT COMPLETE AND MAY BE AMENDED PRIOR TO THE TIME OF SALE. THIS TERM SHEET IS NOT AN OFFER TO SELL THESE SECURITIES AND IT IS NOT A SOLICITATION OF AN OFFER TO BUY THESE SECURITIES IN ANY JURISDICTION WHERE THE OFFER OR SALE IS NOT PERMITTED. |
| | 99 | |
| Structural and Collateral Term Sheet | | BMO 2023-C4 |
| No. 8 – Park West Village |
Escrows and Reserves. At origination of the Park West Village Whole Loan, the borrowers deposited approximately (i) $919,476 into a real estate tax reserve account, (ii) $850,000 into a replacement reserve account, (iii) $7,858,500 into a unit upgrade reserve account and (iv) $4,920,000 into a supplemental income reserve account.
Tax Escrows – The borrowers are required to deposit into a real estate tax reserve, on a monthly basis, 1/12th of the taxes that the lender estimates will be payable over the next-ensuing 12-month period (initially estimated to be approximately $459,738).
Insurance Escrows – The borrowers are required to deposit into an insurance reserve, on a monthly basis, 1/12th of the amount which will be sufficient to pay the insurance premiums due for the renewal of coverage afforded by such policies; provided, however, such insurance reserve has been conditionally waived so long as (i) no event of default under the Park West Village Whole Loan is continuing, (ii) the borrowers maintain a blanket policy meeting the requirements of the Park West Village Whole Loan documents and (iii) evidence of renewal and payment within 10 days. The borrowers are currently maintaining a blanket policy.
Supplemental Income Reserve – The borrowers deposited $4,920,000 into a supplemental income reserve account (the “Supplemental Income Reserve”) at origination of the Park West Village Whole Loan. Unless and until the Park West Village Property (excluding the amount on deposit in the Supplemental Income Reserve) achieves a 6.25% “transient” Park West Village Whole Loan debt yield (calculated on the basis of annualized net cash flow for a three-month period ending with the most recently completed month), the lender may require the borrowers to make additional Supplemental Income Reserve deposits if and to the extent the lender determines, in its reasonable discretion on a quarterly basis after July 6, 2023 during the Park West Village Whole Loan term, that additional supplemental income reserve deposits are required in order to achieve (when the additional deposit and all other deposits in the Supplemental Income Reserve account are added to net cash flow for the Park West Village Property) a 6.25% transient Park West Village Whole Loan debt yield for the following 12, 9, 6 or 3 months (such applicable 12-, 9-, 6- or 3- month period depending on the quarter with respect to which such determination by the lender is made). The guarantors provided a related carry guaranty of certain carry costs, including real estate taxes, insurance premiums, debt service and operating expenses, for any period until the Park West Village Property achieves a 6.25% transient Park West Village Whole Loan debt yield (excluding the amount on deposit in the Supplemental Income Reserve). The obligations of the guarantors under such carry guaranty are limited to the additional Supplemental Income Reserve deposit amounts as and when due.
So long as no event of default under the Park West Village Whole Loan is continuing, on each payment date, the lender is required to transfer the Monthly Supplemental Income Reserve Disbursement Amount (as defined below) from the Supplemental Income Reserve to the cash management account. Such funds deposited into the cash management account will be required to be applied with all other funds then on deposit in the cash management account in the order of priority set forth in the Park West Village Whole Loan documents, as described under “Lockbox / Cash Management” below. So long as no event of default under the Park West Village Whole Loan is continuing, upon such time as the lender has reasonably determined that the Park West Village Property (excluding the amount on deposit in the Supplemental Income Reserve) has achieved for one calendar quarter a 6.25% or higher “transient” Park West Village Whole Loan debt yield (calculated on the basis of annualized net cash flow for a three-month period ending with the most recently completed month), then upon the borrowers’ written request, all of the funds in the Supplemental Income Reserve will be required to be disbursed to the borrowers; provided, however, if a Cash Trap Period (as defined below) is then continuing, then such funds will not be disbursed to the borrowers, and such funds will instead be deposited into the excess cash reserve account, to be applied in accordance with the terms of the Park West Village Whole Loan documents.
“Monthly Supplemental Income Reserve Disbursement Amount” means 1/12th of (x) the initial Supplemental Income Reserve deposit with respect to the first 12 payment dates occurring during the term of the Park West Village Whole Loan, and (y) each Supplemental Income Reserve additional deposit amount with respect to the 12 payment dates following the date that the borrowers are required to deposit such Supplemental Income Reserve additional deposit amount pursuant to the terms of the Park West Village Whole Loan documents; provided that, if at any time the lender reassesses the Supplemental Income Reserve additional deposit amount in accordance with the terms of the Park West Village Whole Loan documents, the Monthly Supplemental Income Reserve Disbursement Amount will be adjusted so that all of the funds in the Supplemental Income Reserve will be disbursed in equal monthly installments ending on such Supplemental Income Reserve reassessment date (i.e., so that there will be no funds in the Supplemental Income Reserve on deposit on such Supplemental Income Reserve reassessment date).
| THE INFORMATION IN THIS STRUCTURAL AND COLLATERAL TERM SHEET IS NOT COMPLETE AND MAY BE AMENDED PRIOR TO THE TIME OF SALE. THIS TERM SHEET IS NOT AN OFFER TO SELL THESE SECURITIES AND IT IS NOT A SOLICITATION OF AN OFFER TO BUY THESE SECURITIES IN ANY JURISDICTION WHERE THE OFFER OR SALE IS NOT PERMITTED. |
| | 100 | |
| Structural and Collateral Term Sheet | | BMO 2023-C4 |
| No. 8 – Park West Village |
Lockbox / Cash Management. The Park West Village Whole Loan is structured with a hard lockbox for commercial tenants and a soft lockbox for residential tenants, and in place cash management. The borrowers are required to deposit all rents collected from residential tenants into the lockbox account within three business days of receipt. The borrowers are required to deliver a tenant direction letter to commercial tenants to deposit all rents directly to the lockbox account. The borrowers are required to cause all amounts deposited into the lockbox account to be transferred on each business day to a cash management account controlled by the lender. Absent an event of default under the Park West Village Whole Loan documents, funds on deposit in the cash management account are applied on each monthly payment date in amounts and in the order of priority set forth in the Park West Village Whole Loan Documents, including any required tax and insurance reserve deposits, deposit account bank fees, monthly debt service on the Park West Village Whole Loan, other amounts payable to the lender under the Park West Village Whole Loan, operating expenses and extraordinary expenses reflected in the annual budget or otherwise approved by lender, with the remaining funds in the cash management account to be disbursed to the borrowers unless a Cash Trap Period is then continuing, in which event the remaining funds will be deposited into an excess cash reserve account under the lender’s control, and released to the borrower when the Cash Trap Period ends. Upon an event of default under the Park West Village Whole Loan documents, the lender will apply funds in such priority as it may determine.
A “Cash Trap Period” means a period commencing upon the earliest to occur of (i) an event of default; (ii) any bankruptcy action of the borrowers, principal, guarantor or manager has occurred; and (iii) the failure by the borrowers, after stabilization (i.e. until a Park West Village Whole Loan debt yield of at least 6.25% has been achieved (without taking into account any disbursement of Supplemental Income Reserve funds) for one calendar quarter, provided no event of default then exists), to maintain a Park West Village Whole Loan debt service coverage ratio of at least 1.20x and will be cured when (a) with respect to clause (i) above, the lender accepts a cure of the event of default; (b) in the case of a bankruptcy action by or against manager only, the borrowers replace the manager with a qualified replacement as defined in the Park West Village Whole Loan documents; or (c) with respect to clause (iii) above, the Park West Village Whole Loan debt service coverage ratio is equal to or greater than 1.25x for one calendar quarter.
Subordinate Debt. The Park West Village Property also secures the Park West Village Note B-A Subordinate Companion Loan, which has a Cut-off Date principal balance of $66,500,000, and the Park West Village Note B-B Subordinate Companion Loan, which has a Cut-off Date principal balance of $111,000,000. The Park West Village Subordinate Companion Loans accrue interest at 4.65000% per annum. The Park West Village Senior Loan is senior in right of payment to the Park West Village Note B-A Subordinate Companion Loan and the Park West Village Note B-B Subordinate Companion Loan, and the Park West Village Note B-A Subordinate Companion Loan is senior in right of payment to the Park West Village Note B-B Subordinate Companion Loan.
| Whole Loan Metrics |
| | % of Whole Loan | Cumulative Cut-off Date LTV | Cumulative UW NOI Debt Yield(1) | Cumulative UW NCF DSCR(1) |
| A Notes | 51.4% | 32.6% | 12.3% | 2.60x |
| B-A Note | 18.2% | 44.2% | 9.1% | 1.92x |
| B-B Note | 30.4% | 63.5% | 6.3% | 1.34x |
| (1) | The UW NOI and UW NCF include disbursements from a Supplemental Income Reserve of $4,920,000. Please refer to “Escrows and Reserves” above. |
Mezzanine Debt. None.
Partial Release. Not permitted.
Ground Lease. None.
| THE INFORMATION IN THIS STRUCTURAL AND COLLATERAL TERM SHEET IS NOT COMPLETE AND MAY BE AMENDED PRIOR TO THE TIME OF SALE. THIS TERM SHEET IS NOT AN OFFER TO SELL THESE SECURITIES AND IT IS NOT A SOLICITATION OF AN OFFER TO BUY THESE SECURITIES IN ANY JURISDICTION WHERE THE OFFER OR SALE IS NOT PERMITTED. |
| | 101 | |
| Structural and Collateral Term Sheet | | BMO 2023-C4 |
| No. 9 – Green Acres |
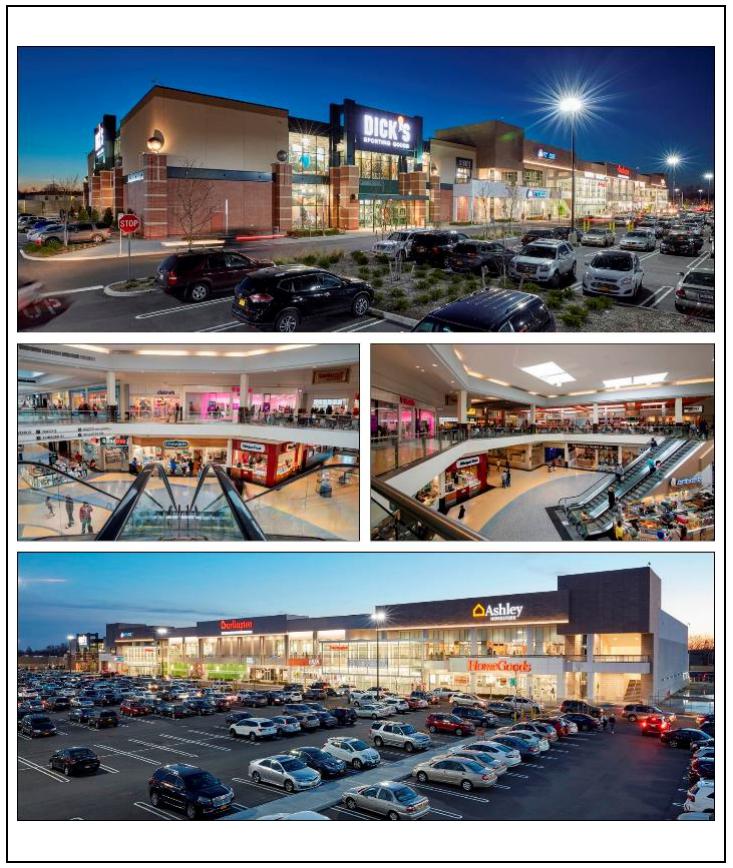
| THE INFORMATION IN THIS STRUCTURAL AND COLLATERAL TERM SHEET IS NOT COMPLETE AND MAY BE AMENDED PRIOR TO THE TIME OF SALE. THIS TERM SHEET IS NOT AN OFFER TO SELL THESE SECURITIES AND IT IS NOT A SOLICITATION OF AN OFFER TO BUY THESE SECURITIES IN ANY JURISDICTION WHERE THE OFFER OR SALE IS NOT PERMITTED. |
| | 102 | |
| Structural and Collateral Term Sheet | | BMO 2023-C4 |
| No. 9 – Green Acres |
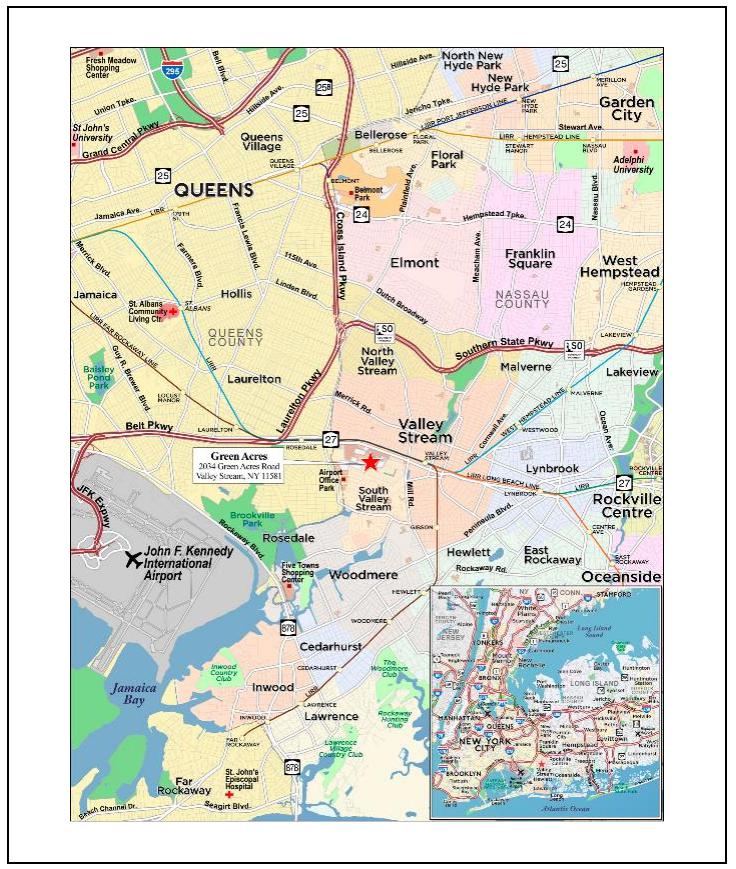
| THE INFORMATION IN THIS STRUCTURAL AND COLLATERAL TERM SHEET IS NOT COMPLETE AND MAY BE AMENDED PRIOR TO THE TIME OF SALE. THIS TERM SHEET IS NOT AN OFFER TO SELL THESE SECURITIES AND IT IS NOT A SOLICITATION OF AN OFFER TO BUY THESE SECURITIES IN ANY JURISDICTION WHERE THE OFFER OR SALE IS NOT PERMITTED. |
| | 103 | |
| Structural and Collateral Term Sheet | | BMO 2023-C4 |
| No. 9 – Green Acres |
| Mortgage Loan Information | | Property Information |
| Mortgage Loan Seller: | BMO | | Single Asset / Portfolio: | Single Asset |
| Original Principal Balance(1): | $26,000,000 | | Title: | Fee and Leasehold |
| Cut-off Date Principal Balance(1): | $26,000,000 | | Property Type – Subtype: | Retail – Regional Mall |
| % of IPB: | 3.3% | | Net Rentable Area (SF): | 2,081,286 |
| Loan Purpose: | Refinance | | Location: | Valley Stream, NY |
| Borrowers: | Valley Stream Green Acres LLC and Green Acres Adjacent LLC | | Year Built / Renovated: | 1956, 2016 / 1982, 2006, 2007 |
| Borrower Sponsor: | The Macerich Partnership, L.P. | | Occupancy: | 97.7% |
| Interest Rate: | 5.89900% | | Occupancy Date: | 12/12/2022 |
| Note Date: | 1/3/2023 | | 4th Most Recent NOI (As of): | $53,314,510 (12/31/2019) |
| Maturity Date: | 1/6/2028 | | 3rd Most Recent NOI (As of): | $41,001,586 (12/31/2020) |
| Interest-only Period: | 60 months | | 2nd Most Recent NOI (As of): | $46,618,790 (12/31/2021) |
| Original Term: | 60 months | | Most Recent NOI (As of): | $45,174,388 (TTM 9/30/2022) |
| Original Amortization Term: | None | | UW Economic Occupancy: | 96.2% |
| Amortization Type: | Interest Only | | UW Revenues: | $83,514,884 |
| Call Protection: | L(25),YM1(30),O(5) | | UW Expenses: | $35,580,356 |
| Lockbox / Cash Management(2): | Hard / Springing | | UW NOI: | $47,934,528 |
| Additional Debt(1): | Yes | | UW NCF: | $46,364,767 |
| Additional Debt Balance(1): | $344,000,000 | | Appraised Value / Per SF(4): | $679,000,000 / $326 |
| Additional Debt Type(1): | Pari Passu | | Appraisal Date: | 10/30/2022 |
| | | | | |
| Escrows and Reserves(3) | | Financial Information(1) |
| | Initial | Monthly | Initial Cap | | Cut-off Date Loan / SF: | $178 |
| Taxes: | $0 | Springing | N/A | | Maturity Date Loan / SF: | $178 |
| Insurance: | $0 | Springing | N/A | | Cut-off Date LTV(4): | 54.5% |
| Replacement Reserves: | $0 | Springing | $558,072 | | Maturity Date LTV(4): | 54.5% |
| TI/LC: | $4,068,135 | $0 | N/A | | UW NCF DSCR: | 2.10x |
| Rollover Reserve: | $0 | Springing | $2,094,342 | | UW NOI Debt Yield: | 13.0% |
| Gap Rent Reserve: | $743,644 | $0 | N/A | | | |
| | | | | | | |
| Sources and Uses |
| Sources | Proceeds | % of Total | | Uses | Proceeds | % of Total |
| Whole Loan | $370,000,000 | 96.9 | % | | Loan Payoff | $364,192,834 | 95.4 | % |
| Equity Contribution | 11,744,495 | 3.1 | | | Closing Costs | 12,739,883 | 3.3 | |
| | | | | Upfront Reserves | 4,811,779 | 1.3 | |
| Total Sources | $381,744,495 | 100.0 | % | | Total Uses | $381,744,495 | 100.0 | % |
| (1) | The Green Acres Mortgage Loan (as defined below) is part of a whole loan evidenced by 16 pari passu notes with an aggregate original principal balance of $370,000,000. Financial Information in the chart above reflects the Green Acres Whole Loan (as defined below). For additional information, see “The Loan” below. |
| (2) | The borrowers are required to cause rents to be deposited into a lockbox account established at origination under the Green Acres Whole Loan documents, and the borrowers will have access to the funds in the lockbox account and use the lockbox account as an operating account so long as no Trigger Period continues. During the continuance of a Trigger Period, the borrowers will not have any further access to the funds in the lockbox account except as otherwise expressly provided in the Green Acres Whole Loan documents. |
| (3) | For a full description of Escrows and Reserves, please refer to “Escrows and Reserves” below. |
| (4) | The as-is appraised value for the property is based on the assumption that the PILOT documents will be extended to 2031 and $119.1 million was included in the total concluded as-is value of $679.0 million as the present value of the PILOT benefits through 2031. However, in the absence of the PILOT tax benefits beyond 2026, the as-is value of the property would be reduced by approximately $58.0pg 105 |
| (5) | million resulting in an estimated value of $621.0 million. The Cut-off Date LTV and Maturity Date LTV based on the estimated value of $621.0 million would be 59.6%. |
The Loan. The ninth largest mortgage loan (the “Green Acres Mortgage Loan”) is part of a whole loan (the “Green Acres Whole Loan”) evidenced by 16 pari passu promissory notes issued by Green Acres Adjacent LLC and Valley Stream Green Acres LLC in the aggregate original principal amount of $370,000,000. The Green Acres Mortgage Loan is evidenced by the non-controlling Notes A-6 and A-8, which have an aggregate outstanding principal balance as of the Cut-off Date of $26,000,000. The Green Acres Mortgage Loan will be included in the BMO 2023-C4 securitization trust and represent approximately 3.3% of the Initial Pool Balance. The Green Acres Whole Loan was co-originated on January 3, 2023 by Bank of Montreal (“BMO”), Goldman Sachs Bank USA (“GS”), Morgan Stanley Bank, N.A. (“MS”), and DBR Investments Co. Limited (“DBRI”). The Green Acres Whole Loan is secured by (i) the applicable borrower’s fee interest in a retail mega-
| THE INFORMATION IN THIS STRUCTURAL AND COLLATERAL TERM SHEET IS NOT COMPLETE AND MAY BE AMENDED PRIOR TO THE TIME OF SALE. THIS TERM SHEET IS NOT AN OFFER TO SELL THESE SECURITIES AND IT IS NOT A SOLICITATION OF AN OFFER TO BUY THESE SECURITIES IN ANY JURISDICTION WHERE THE OFFER OR SALE IS NOT PERMITTED. |
| | 104 | |
| Structural and Collateral Term Sheet | | BMO 2023-C4 |
| No. 9 – Green Acres |
campus comprised of Green Acres Mall (as defined below) and Green Acres Commons (as defined below) that are adjacent with each other and located in Valley Stream, New York (other than a 9.08 acre portion of such regional mall (representing approximately 8.3% of the net rentable area of the Green Acres Property (as defined below)), the fee interest in which is owned by Walmart, an anchor tenant (such portion of the regional mall owned by Walmart, the “Walmart Parcel”)) and (ii) the applicable borrower’s ground leasehold interest in the Walmart Parcel that is leased back to Walmart. As used in this term sheet, the term “Green Acres Property” collectively refers to the regional enclosed mall and the retail power center (including the Walmart Parcel) but does not include any portion of the regional mall that is occupied by Home Depot and Target (which own their own parcels), except as otherwise expressly indicated herein. The Green Acres Whole Loan proceeds were used to refinance the existing debt on the Green Acres Property, fund upfront reserves and pay origination costs. The Green Acres Whole Loan accrues interest at a fixed rate of 5.89900% per annum. The table below summarizes the promissory notes that comprise the Green Acres Whole Loan. The relationship between the holders of the Green Acres Whole Loan is governed by a co-lender agreement as described under “Description of the Mortgage Pool—The Whole Loans—The Serviced Pari Passu Whole Loans” and “—The Whole Loans—The Outside Serviced Pari Passu Whole Loans” in the Preliminary Prospectus. The Green Acres Whole Loan will be serviced pursuant to the pooling and servicing agreement for the BMO 2023-C4 trust until the controlling Note A-1 is securitized, whereupon the Green Acres Whole Loan will be serviced pursuant to the pooling and servicing agreement for such future securitization. See “The Pooling and Servicing Agreement” in the Preliminary Prospectus.
| Whole Loan Summary |
| Note | Original Balance | Cut-off Date Balance | | Note Holder | Controlling
Piece |
| A-1(1) | $50,000,000 | $50,000,000 | | GS | Yes |
| A-2(1) | $30,000,000 | $30,000,000 | | GS | No |
| A-3(1) | $20,000,000 | $20,000,000 | | GS | No |
| A-4(1) | $24,000,000 | $24,000,000 | | BMO | No |
| A-5(1) | $22,000,000 | $22,000,000 | | BMO | No |
| A-6 | $20,000,000 | $20,000,000 | | BMO 2023-C4 | No |
| A-7(1) | $18,000,000 | $18,000,000 | | BMO | No |
| A-8 | $6,000,000 | $6,000,000 | | BMO 2023-C4 | No |
| A-9(1) | $50,000,000 | $50,000,000 | | MS | No |
| A-10(1) | $20,000,000 | $20,000,000 | | MS | No |
| A-11(1) | $10,000,000 | $10,000,000 | | MS | No |
| A-12(1) | $10,000,000 | $10,000,000 | | MS | No |
| A-13(1) | $30,000,000 | $30,000,000 | | DBRI | No |
| A-14(1) | $25,000,000 | $25,000,000 | | DBRI | No |
| A-15(1) | $20,000,000 | $20,000,000 | | DBRI | No |
| A-16(1) | $15,000,000 | $15,000,000 | | DBRI | No |
| Whole Loan | $370,000,000 | $370,000,000 | | | |
| (1) | Expected to be contributed to one or more future securitization(s). |
The Property. The Green Acres Property is a retail mega-campus comprised of a two-level regional mall known as “Green Acres Mall” and an adjacent two story retail power center known as “Green Acres Commons”, totaling 2,081,286 square feet on an approximately 120.8 acre site in Valley Stream, New York. Green Acres Mall was built in 1956 and most recently renovated in 2007. Green Acres Commons was built in 2016. The Green Acres Property provides parking via 9,092 surface parking and parking garage spaces, resulting in a parking ratio of approximately 4.4 spaces per 1,000 square feet of net rentable area. As of December 12, 2022, the Green Acres Property was 97.7% leased by over 150 tenants (including temporary tenants, which make up approximately 1.7% of net rentable area), of which 62.1% of net rentable area is occupied by 11 major tenants. A portion of the Green Acres Property is currently occupied by certain temporary tenants and no underwritten base rent is attributable to those temporary tenants. Green Acres Adjacent LLC owns Green Acres Commons and Valley Stream Green Acres LLC owns Green Acres Mall and the leasehold interest in the Walmart Parcel. The fee interests in the Green Acres Property owned by the applicable borrower represents approximately 91.7% of the net rentable area, and the leasehold interest in the Walmart Parcel owned by the applicable borrower represents approximately 8.3% of the net rentable area. The fee interest in the Walmart Parcel is owned by Walmart, an anchor tenant and is ground leased to the applicable borrower. See “Ground Lease” below. The Green Acres Property is shadow anchored by Home Depot and Target, and the space occupied by Home Depot and Target is not part of the collateral securing the Green Acres Whole Loan. The information relating to the Green Acres Property in this term sheet does not include any space occupied by Home Depot or Target, unless otherwise expressly stated herein.
| THE INFORMATION IN THIS STRUCTURAL AND COLLATERAL TERM SHEET IS NOT COMPLETE AND MAY BE AMENDED PRIOR TO THE TIME OF SALE. THIS TERM SHEET IS NOT AN OFFER TO SELL THESE SECURITIES AND IT IS NOT A SOLICITATION OF AN OFFER TO BUY THESE SECURITIES IN ANY JURISDICTION WHERE THE OFFER OR SALE IS NOT PERMITTED. |
| | 105 | |
| Structural and Collateral Term Sheet | | BMO 2023-C4 |
| No. 9 – Green Acres |
Major Tenants. The three largest tenants based on underwritten base rent are BJ’s Wholesale Club, Walmart and DICK’s Sporting Goods, each of which is an anchor tenant.
BJ’s Wholesale Club (127,750 square feet; 6.1% of NRA, 7.1% of underwritten base rent, Moody’s/S&P/Fitch: NR/BB+/NR): Founded in 1984 and headquartered in Marlborough, Massachusetts, BJ’s Wholesale Club (“BJ’s”) is a warehouse club operator and retailer with 235 clubs and 164 gas stations, located primarily in the eastern United States. BJ’s is a membership only retailer and as of October 2022, has over 6.5 million members and received approximately $16.7 billion in annual total revenues as of 2022. BJ’s has been a tenant at the Green Acres Property since 2007, with its current lease expiration date in January 2027 and seven additional 5-year extension options. Additionally, BJ’s recently executed a lease for a 5,000 SF fueling station with an expected rent commencement date of September 1, 2023. $227,767 in gap rent was reserved at origination.
Walmart (173,450 square feet; 8.3% of NRA, 6.3% of underwritten base rent, Moody’s/S&P/Fitch: Aa2/AA/AA): Founded in 1962 and headquartered in Bentonville, Arkansas, Walmart is an international supermarket chain operating approximately 10,500 stores under 46 different banners in 24 countries. Walmart employs approximately 2.3 million people worldwide. Walmart has been a tenant at the Walmart Parcel since 2003 under a lease (representing approximately $3,463,189 in underwritten base rent) expiring on August 31, 2028. Walmart has two 5-year extension options remaining. Walmart is also temporarily occupying certain temporary space under a lease with an original commencement date of February 1, 2022 and a lease expiration date of January 31, 2023. No underwritten base rent or net rentable area is attributable to such temporary lease. Walmart owns the fee interest in the Walmart Parcel and ground leases such interest to the applicable borrower, which in turn leases the Walmart Parcel to Walmart as described above. See “Ground Lease” below.
DICK’s Sporting Goods (70,714 square feet; 3.4% of NRA, 4.5% of underwritten base rent, Moody’s/S&P/Fitch: Baa3/BBB/NR): Founded in 1948 and headquartered in Pittsburgh, Pennsylvania, DICK’s Sporting Goods (“Dick’s”) is a sporting goods retail chain with 850 stores including Dick’s, Golf Galaxy, Field & Stream, Public Lands, Going Going Gone! and Warehouse Sale stores. Dick’s has been a tenant at the Green Acres Property since July 2016 under a lease expiring in January 2027. Dick’s has three 5-year extension options remaining.
Environmental. The Phase I environmental assessment at the Green Acres Property dated December 20, 2022 identified six recognized environmental conditions related to the following: (i) historical auto repair operations and an associated oil/water separator used at the Green Acres Property and reportedly removed, but for which no closure documentation is available, (ii) free product observed in a monitoring well at an adjacent property, (iii) three cases of petroleum impacts to soil and groundwater at adjacent properties, and (iv) a vapor migration concern identified in connection with the Green Acres Property’s long-term historic use of hazardous chemicals. See “Preliminary Prospectus—Description of the Mortgage Pool—Environmental Considerations”.
The following table presents certain information relating to the historical occupancy of the Green Acres Property:
| Historical and Current Occupancy |
| 2020(1) | 2021(1) | Current(2) |
| 89.8% | 93.2% | 97.7% |
| (1) | Historical Occupancies are as of December 31 of each respective year and include all signed leases and specialty leasing greater than 6 months for mall and freestanding tenants. Occupancy does not include gross leasable area for anchor tenants. |
| (2) | Based on the underwritten rent roll dated December 12, 2022, including leases executed by the origination date of January 3, 2023. |
| THE INFORMATION IN THIS STRUCTURAL AND COLLATERAL TERM SHEET IS NOT COMPLETE AND MAY BE AMENDED PRIOR TO THE TIME OF SALE. THIS TERM SHEET IS NOT AN OFFER TO SELL THESE SECURITIES AND IT IS NOT A SOLICITATION OF AN OFFER TO BUY THESE SECURITIES IN ANY JURISDICTION WHERE THE OFFER OR SALE IS NOT PERMITTED. |
| | 106 | |
| Structural and Collateral Term Sheet | | BMO 2023-C4 |
| No. 9 – Green Acres |
The following table presents certain information relating to the largest tenants based on net rentable area of the Green Acres Property:
| Top 10 Tenant Summary(1) |
| Tenant | Ratings
Moody’s/S&P/Fitch(2) | Net
Rentable
Area (SF) | % of
Total
NRA | UW Base
Rent PSF(3) | UW Base
Rent(3) | % of Total
UW Base
Rent(3) | Sales
PSF/Year(4) | UW Occ.
Costs | Lease
Exp. Date |
| Macy's and Macy’s Men’s and Furniture(5)(6) | Ba2/BB+/BBB- | 390,503 | 18.8 | % | $2.62 | $1,024,993 | 1.9 | % | $188 | 7.6% | Various(6) |
| Walmart(5) | Aa2/AA/AA | 173,450 | 8.3 | | $19.97 | 3,463,189 | 6.3 | | NAV | NAV | 8/31/2028 |
| SEARS(5)(7) | NR/NR/NR | 144,537 | 6.9 | | $0.86 | 125,000 | 0.2 | | NAV | NAV | 10/31/2028 |
| BJ's Wholesale Club(5)(8) | NR/BB+/NR | 127,750 | 6.1 | | $30.38 | 3,881,310 | 7.1 | | $863 | 5.1% | 1/31/2027 |
| KOHL'S(5)(7) | Ba2/BB+/BBB- | 116,392 | 5.6 | | $17.61 | 2,049,642 | 3.8 | | NAV | NAV | 1/31/2031 |
| DICK'S Sporting Goods(5) | Baa3/BBB/NR | 70,714 | 3.4 | | $34.65 | 2,450,240 | 4.5 | | $173 | 29.4% | 1/31/2027 |
| Burlington(5) | NR/BB+/NR | 61,837 | 3.0 | | $24.25 | 1,499,547 | 2.7 | | $398 | 9.9% | 1/31/2032 |
| Best Buy(5) | A3/BBB+/NR | 44,400 | 2.1 | | $45.81 | 2,033,802 | 3.7 | | NAV | NAV | 1/31/2027 |
| 24 HOUR FITNESS(5) | NR/NR/NR | 40,262 | 1.9 | | $33.00 | 1,328,646 | 2.4 | | NAV | NAV | 12/31/2031 |
| Raymour & Flanigan | NR/NR/NR | 38,903 | 1.9 | | $47.23 | 1,837,502 | 3.4 | | $507 | 9.3% | 7/31/2026 |
| Top 10 Tenants | | 1,208,748 | 58.1 | % | $16.29 | $19,693,871 | 36.1 | % | | | |
| Other Tenants | | 824,076 | 39.6 | % | $42.34 | $34,889,912 | 63.9 | % | | | |
Occupied Collateral Total /
Wtd. Avg. | | 2,032,824 | 97.7 | % | $26.85 | $54,583,783 | 100.0 | % | | | |
| | | | | | | | | | |
| Vacant Space | | 48,462 | 2.3 | % | | | | | | |
| | | | | | | | | | |
| Collateral Total | | 2,081,286 | 100.0 | % | | | | | | |
| | | | | | | | | | |
| (1) | Based on the underwritten rent roll dated December 12, 2022. |
| (2) | In certain instances, ratings provided are those of the parent company of the entity shown, whether or not the parent company guarantees the lease. |
| (3) | UW Base Rent, % of Total UW Base Rent and UW Base Rent PSF include contractual rent steps through February 2024. |
| (4) | Sales PSF/Year are as of the trailing 12-month period ending September 30, 2022 as provided by the tenants to the borrowers or estimated based on anecdotal information provided by the tenants to the borrowers. |
| (5) | The Green Acres Property has 11 major tenants (9 of which are shown in the table above). The 11 anchor and major tenants (including Primark and Shopper’s World, which are not shown in the table above) represent approximately 62.1% of Net Rentable Area and approximately 34.7% of Total UW Base Rent. |
| (6) | Macy’s Men’s and Furniture occupies 123,827 square feet of the Green Acres Property (representing approximately $475,000 in underwritten base rent) under a lease that has an original commencement date of July 1, 2004 and a lease expiration date of July 31, 2034, and Macy’s occupies 266,676 square feet of the Green Acres Property (representing approximately $549,993 in underwritten base rent) and has an original commencement date of August 19, 1986 and a lease expiration date of August 18, 2026. Macy’s has one eight-year and eleven-month extension option remaining. For purposes of the number of tenants shown in this term sheet, Macy’s and Macy’s Men’s & Furniture are treated as a single tenant. |
| (7) | KOHL’S and SEARS have vacated the leased premises. Each tenant remains in control of the leased space and is obligated to pay full rent under the terms of their respective lease. |
| (8) | Information in this table includes recently executed lease for a 5,000 SF fueling station that has an expected rent commencement date of September 1, 2023. $227,767 in gap rent was reserved at origination. |
| THE INFORMATION IN THIS STRUCTURAL AND COLLATERAL TERM SHEET IS NOT COMPLETE AND MAY BE AMENDED PRIOR TO THE TIME OF SALE. THIS TERM SHEET IS NOT AN OFFER TO SELL THESE SECURITIES AND IT IS NOT A SOLICITATION OF AN OFFER TO BUY THESE SECURITIES IN ANY JURISDICTION WHERE THE OFFER OR SALE IS NOT PERMITTED. |
| | 107 | |
| Structural and Collateral Term Sheet | | BMO 2023-C4 |
| No. 9 – Green Acres |
The following table presents certain information relating to the tenant lease expirations at the Green Acres Property:
| Lease Rollover Schedule(1)(2) |
| Year | Number of
Leases
Expiring(3)(4) | Net
Rentable
Area
Expiring | % of
NRA
Expiring | UW Base
Rent
Expiring(5)(6) | % of UW
Base Rent
Expiring(5)(6) | Cumulative
Net
Rentable
Area
Expiring | Cumulative
% of NRA
Expiring | Cumulative
UW Base
Rent
Expiring(5)(6) | Cumulative
% of UW
Base Rent
Expiring(5)(6) |
| Vacant | NAP | 48,462 | 2.3 | % | NAP | N | AP | 48,462 | 2.3% | NAP | N | AP |
| 2023 & MTM | 25 | 132,183 | 6.4 | | $5,381,671 | 9.9 | % | 180,645 | 8.7% | $5,381,671 | 9.9 | % |
| 2024 | 16 | 59,279 | 2.8 | | 3,304,451 | 6.1 | | 239,924 | 11.5% | $8,686,122 | 15.9 | % |
| 2025 | 23 | 103,199 | 5.0 | | 4,405,507 | 8.1 | | 343,123 | 16.5% | $13,091,630 | 24.0 | % |
| 2026 | 18 | 474,521 | 22.8 | | 8,833,644 | 16.2 | | 817,644 | 39.3% | $21,925,273 | 40.2 | % |
| 2027 | 21 | 317,183 | 15.2 | | 14,275,570 | 26.2 | | 1,134,827 | 54.5% | $36,200,843 | 66.3 | % |
| 2028 | 6 | 329,772 | 15.8 | | 4,510,131 | 8.3 | | 1,464,599 | 70.4% | $40,710,974 | 74.6 | % |
| 2029 | 7 | 18,831 | 0.9 | | 937,351 | 1.7 | | 1,483,430 | 71.3% | $41,648,326 | 76.3 | % |
| 2030 | 5 | 14,437 | 0.7 | | 1,257,971 | 2.3 | | 1,497,867 | 72.0% | $42,906,297 | 78.6 | % |
| 2031 | 6 | 165,348 | 7.9 | | 4,001,519 | 7.3 | | 1,663,215 | 79.9% | $46,907,815 | 85.9 | % |
| 2032 | 3 | 94,565 | 4.5 | | 2,304,890 | 4.2 | | 1,757,780 | 84.5% | $49,212,706 | 90.2 | % |
| 2033 | 3 | 24,165 | 1.2 | | 508,680 | 0.9 | | 1,781,945 | 85.6% | $49,721,386 | 91.1 | % |
| 2034 & Beyond | 7 | 264,497 | 12.7 | | 4,406,833 | 8.1 | | 2,046,442 | 98.3% | $54,128,219 | 99.2 | % |
| Storage / Other(3)(4) | 98 | 34,844 | 1.7 | | 455,564 | 0.8 | | 2,081,286 | 100.0% | $54,583,783 | 100.0 | % |
| Total | 238 | 2,081,286 | 100.0 | % | $54,583,783 | 100.0 | % | | | | |
| (1) | Based on the underwritten rent roll dated December 12, 2022. |
| (2) | Certain leases may have termination options that are exercisable prior to the originally stated expiration date of the lease and that are not considered in this Lease Rollover Schedule. |
| (3) | Macy’s Men’s & Furniture occupies 123,827 square feet of the Green Acres Property (representing approximately $475,000 in underwritten base rent) under a lease that has an original commencement date of July 1, 2004 and a lease expiration date of July 31, 2034, and Macy’s occupies 266,676 square feet of the Green Acres Property (representing approximately $549,993 underwritten base rent) and has an original commencement date of August 19, 1986 and a lease expiration date of August 18, 2026. Macy’s has one eight year and eleven-month extension option remaining. |
| (4) | The number of leases shown above include two leases delivered by Macy’s and Macy’s Men’s & Furniture and 98 storage and specialty, business development, or temporary leases that are not typical tenant leases and are short term in nature. The UW Base Rent attributable to the storage leases is $455,564 and income attributable to the specialty, business development, or temporary leases is included in Other Commercial Income. |
| (5) | UW Base Rent Expiring, % of UW Base Rent Expiring and Cumulative UW Base Rent Expiring and Cumulative % of UW Base Rent Expiring include contractual rent steps through February 2024 and percent in lieu revenue for Charlotte Russe, Famous Footwear, Forever 21 and H&M. |
| (6) | KOHL’S and SEARS have vacated the leased premises. Each tenant remains in control of the leased space and is obligated to pay full rent under the terms of their respective lease. |
| THE INFORMATION IN THIS STRUCTURAL AND COLLATERAL TERM SHEET IS NOT COMPLETE AND MAY BE AMENDED PRIOR TO THE TIME OF SALE. THIS TERM SHEET IS NOT AN OFFER TO SELL THESE SECURITIES AND IT IS NOT A SOLICITATION OF AN OFFER TO BUY THESE SECURITIES IN ANY JURISDICTION WHERE THE OFFER OR SALE IS NOT PERMITTED. |
| | 108 | |
| Structural and Collateral Term Sheet | | BMO 2023-C4 |
| No. 9 – Green Acres |
The following table presents certain information relating to the operating history and underwritten cash flows of the Green Acres Property:
| Operating History and Underwritten Net Cash Flow |
| | 2019 | 2020 | 2021 | 9/30/2022 TTM(1) | Underwritten(1) | Per Square
Foot | %(2) | |
| Rents in Place | $54,088,539 | $49,202,740 | $49,588,493 | $49,664,599 | $54,583,783 | $26.23 | 62.2 | % |
| Vacant Income(3) | 0 | 0 | 0 | 0 | 3,360,780 | 1.61 | 3.8 | |
| Gross Potential Rent | $54,088,539 | $49,202,740 | $49,588,493 | $49,664,599 | $57,944,563 | $27.84 | 66.0 | % |
| Other Commercial Income(4) | 3,268,004 | 2,784,950 | 3,769,123 | 4,016,903 | 4,039,298 | 1.94 | 4.6 | |
| Total Reimbursements | 22,054,115 | 21,108,945 | 22,240,864 | 23,011,578 | 25,461,533 | 12.23 | 29.0 | |
| UW Adjustments | 0 | 0 | 0 | 0 | 339,465 | 0.16 | 0.4 | |
| Other Revenue(5) | 769,425 | 102,602 | 95,907 | 180,781 | 23,686 | 0.01 | 0.0 | |
| Net Rental Income | $80,180,083 | $73,199,237 | $75,694,387 | $76,873,861 | $87,808,544 | $42.19 | 100.0 | % |
| (Vacancy/Credit Loss)(6) | (233,163) | (4,190,515) | 1,209,488 | 112,688 | (4,293,661) | (2.06) | (4.9 | ) |
| Effective Gross Income | $79,946,920 | $69,008,722 | $76,903,875 | $76,986,549 | $83,514,884 | $40.13 | 95.1 | % |
| Total Expenses(7) | 26,632,410 | 28,007,136 | 30,285,085 | 31,812,161 | 35,580,356 | 17.10 | 42.6 | |
| Net Operating Income | $53,314,510 | $41,001,586 | $46,618,790 | $45,174,388 | $47,934,528 | $23.03 | 57.4 | % |
| Capital Expenditures | 0 | 0 | 0 | 0 | 455,855 | 0.22 | 0.5 | |
| TI/LC | 0 | 0 | 0 | 0 | 1,113,906 | 0.54 | 1.3 | |
| Net Cash Flow(8) | $53,314,510 | $41,001,586 | $46,618,790 | $45,174,388 | $46,364,767 | $22.28 | 55.5 | % |
| (1) | TTM reflects the trailing 12-month period ending September 30, 2022. Underwritten rents are higher than TTM Rents due to the inclusion of rent steps underwritten to the maximum increase per the tenants' contractual lease terms. Contractual rent steps are through February 2024. |
| (2) | % column represents percent of Net Rental Income for all revenue lines and represents percent of Effective Gross Income for the remainder of fields. |
| (3) | Vacant Income reflects the gross up of vacancy at average in-place rents. |
| (4) | Other Commercial Income includes overage / percentage rent, kiosk revenue, temporary revenue, specialty revenue and business development income. |
| (5) | Other Revenue reflects the borrowers’ in-place miscellaneous income. |
| (6) | The underwritten economic occupancy is 96.2%. The Green Acres Property was 97.7% leased based on the December 12, 2022 rent roll, including leases executed by the origination date of January 3, 2023. |
| (7) | The management fee is underwritten to reflect 3.0% of Effective Gross Income. Real estate taxes were underwritten based on the actual tax bills for all of the property tax parcels at the Green Acres Property (including the Walmart Parcel), inclusive of any tax reimbursements or expenses payable by the tenants and payment-in-lieu of taxes (“PILOT”) payable by the borrowers for 2022 under the related PILOT documents that are scheduled to expire on December 31, 2026, with one five-year extension period that requires Hempstead IDA (as defined below) approval. According to the appraisal, the tax benefits for 2023 under the PILOT documents are expected to be $15,365,892, and if the PILOT documents are not renewed in 2027, the total amount of real estate taxes payable by the borrowers is expected to increase by approximately $17.1 million in 2027. See “Payment in Lieu of Taxes” below. |
| (8) | The historical financial statements for years 2019-2022 do not include Borrower’s actual income and expense for the following: lease termination income, bankruptcy settlements, GAAP adjustments for non-cash items, including the straight lining of rents, mark to market rent adjustments under SFAS 141, tenant interest and penalties, bad debt reserves and capitalized development costs (taxes, insurance, interest). Historical capital expenditures and leasing capital which includes tenant allowances, Borrower’s construction cost for build-out of tenant spaces and leasing commissions, are also excluded. |
The Market. The Green Acres Property is located in Valley Stream, New York, within the Nassau-Suffolk metropolitan division (the “Nassau-Suffolk MSA”). The Nassau-Suffolk MSA economy is driven by the education and health services, transportation and utilities, trade and government sectors. The Nassau-Suffolk MSA’s largest employers include Northwell Health, Inc., Catholic Health System of Long Island, Inc., the County of Nassau, the United States Federal Government and the County of Suffolk.
The Green Acres Property is located in a densely populated commercial area on the border of Queens along the major arterial Sunrise Highway, and approximately 5 miles from John F. Kennedy airport. The local area is composed of retail and commercial buildings to the north, south and east, with industrial uses located to the west. Outside of local commercial districts, the area is developed with multifamily residential uses. The local area is accessed by Sunrise Highway, the Belt Parkway, and the Cross Island Parkway, all of which are arterials leading east to west. The Long Island Railroad has two stations within walking distance: the Rosedale and Valley Stream stations, which can be reached via the Jamaica, Far Rockaway, Long Beach, West Hempstead, and Babylon branches. According to the appraisal, approximately 60,000 cars pass the Green Acres Property daily.
According to the appraisal, the trade area for a retail center is between 5.0-25.0 miles in radius and consists of its top competitors, of which the primary trade area makes up between 55.0-60.0% of its sales and the secondary trade area makes up between 20.0-25.0%. According to the appraisal, the 2021 population in the primary-, secondary- and total trade area of the Green Acres Property was 438,195, 480,549 and 918,745, respectively. Additionally, for the same period, the average household income within the same areas was $108,258, $104,108 and $106,034, respectively.
| THE INFORMATION IN THIS STRUCTURAL AND COLLATERAL TERM SHEET IS NOT COMPLETE AND MAY BE AMENDED PRIOR TO THE TIME OF SALE. THIS TERM SHEET IS NOT AN OFFER TO SELL THESE SECURITIES AND IT IS NOT A SOLICITATION OF AN OFFER TO BUY THESE SECURITIES IN ANY JURISDICTION WHERE THE OFFER OR SALE IS NOT PERMITTED. |
| | 109 | |
| Structural and Collateral Term Sheet | | BMO 2023-C4 |
| No. 9 – Green Acres |
According to the appraisal, the Green Acres Property is located within the Long Island retail market and the Hempstead retail submarket. As of the second quarter of 2022, the Long Island retail market contained approximately 24.1 million square feet of retail space inventory with a vacancy rate of 8.6% and an average asking rental rate of $28.70 per square foot. The Hempstead retail submarket contained approximately 4.8 million square feet of retail space with a vacancy rate of 6.2% and an average asking rental rate of $32.43 per square foot as of the second quarter 2022.
The following table presents certain information relating to comparable retail centers for the Green Acres Property:
| Competitive Retail Center Summary(1) |
| Property Name/Location | Year Built / Renovated or Expanded | Total NRA (SF) | Total Occupancy | Distance to Subject | Sales PSF | Major Tenants |
Green Acres 2034 Green Acres Road Valley Stream, NY | 1956, 2016 / 1982, 2006, 2007 | 2,081,286(2) | 97.7% | NAP | $727.22(2) | Macy’s Walmart Dick’s Sporting Goods BJ’s Wholesale Club Primark 24 Hour Fitness Burlington Best Buy Shopper’s World Target (non-collateral) Home Depot (non-collateral) |
Roosevelt Field Mall 630 Old Country Road Garden City, NY | 1956 / 1993, 1997 | 2,372,053 | 98.0% | 7.7 miles | $1,165.00 | Bloomingdale’s Dick’s Sporting Goods JC Penney Macy’s Neiman Marcus Nordstrom Primark |
Queens Center Mall(3) 90-15 Queens Boulevard Queens, NY | 1973 / 2004 | 962,798 | 98.0% | 9.1 miles | $1,721.00 | H&M J.C. Penney Macy’s XXI Forever |
Kings Plaza Shopping Center(3) 5100 Kings Plaza Brooklyn, NY | 1969 / 2000 | 1,212,000 | 99.0% | 11.1 miles | $804.00 | Best Buy Burlington H&M Lowe’s Macy’s Primark Target XXI Forever Zara |
Broadway Commons 358 Broadway Mall Hicksville, NY | 1956 / 1995, 1999 | 1,234,450 | 89.0% | 12.4 miles | $436.00 | H&M IKEA Round One Target Showcase |
| (1) | Source: Appraisal, unless stated otherwise. |
| (2) | Represents sales per square foot as of September 30, 2022. Sales per square foot inclusive of tenants that have been open for 12 months or more and excludes tenants >10,000 SF, arcades and non-retail stores. |
| (3) | The Queens Center Mall and Kings Plaza Shopping Center properties are both owned by the borrower sponsor of the Green Acres Whole Loan. |
The Borrowers. The borrowers for the Green Acres Whole Loan are Valley Stream Green Acres LLC and Green Acres Adjacent LLC, each a single purpose entity with two independent directors. Legal counsel to the borrowers delivered a non-consolidation opinion in connection with the origination of the Green Acres Whole Loan.
The Borrower Sponsor. The borrower sponsor and non-recourse carveout guarantor is The Macerich Partnership, L.P., a Delaware limited partnership headquartered in Santa Monica, California and a provider of real estate investment services. The Macerich Partnership, L.P. acquires, leases, manages, develops, and redevelops malls and community centers.
Property Management. The Green Acres Property is managed by Macerich Property Management Company, LLC, an affiliate of the borrower sponsor.
| THE INFORMATION IN THIS STRUCTURAL AND COLLATERAL TERM SHEET IS NOT COMPLETE AND MAY BE AMENDED PRIOR TO THE TIME OF SALE. THIS TERM SHEET IS NOT AN OFFER TO SELL THESE SECURITIES AND IT IS NOT A SOLICITATION OF AN OFFER TO BUY THESE SECURITIES IN ANY JURISDICTION WHERE THE OFFER OR SALE IS NOT PERMITTED. |
| | 110 | |
| Structural and Collateral Term Sheet | | BMO 2023-C4 |
| No. 9 – Green Acres |
Escrows and Reserves. At origination, the borrowers were required to deposit into escrow (i) $4,068,135 for a reserve (the “TI/LC Reserve”) with respect to outstanding tenant improvement allowances and leasing commissions identified in a schedule to the related loan agreement and (ii) $743,644 for a gap rent reserve (of which $227,767 is earmarked for the fourth largest tenant, BJ’s Wholesale Club).
Tax Escrows – During the continuance of a Trigger Period (as defined below), the borrowers are required to escrow 1/12th of the annual estimated tax payments and, without duplication, PILOT payments on a monthly basis.
Insurance Escrows – During the continuance of a Trigger Period, the borrowers are required to escrow 1/12th of the annual estimated insurance payments on a monthly basis, except if the Green Acres Property is insured under a blanket policy meeting the requirements set forth in the related loan agreement (in which case, no insurance escrows will be required, notwithstanding the occurrence of a Trigger Period).
Replacement Reserves – During the continuance of a Trigger Period, the borrowers are required to escrow an amount equal to the gross leasable area (excluding the Non-Collateral Square Footage (as defined below) of any tenant that is required to pay for all repairs and maintenance costs for its entire leased premises, roof and structural components, and the following tenants: (i) Advantage Toyota, (ii) Aldi, (iii) BJ’s Restaurant, (iv) BJ’s Wholesale Club, (v) Buffalo Wild Wings, (vi) Capital One, (vii) Citizen’s Bank, (viii) Hook & Reel, (ix) Olive Garden, (x) Red Lobster, (xi) Sears, (xii) Sonic Drive-In, (xiii) South Shore Hyundai, (xiv) Vitamin Shoppe, (xv) Macy’s and (xvi) Walmart) multiplied by $0.25 and divided by 12 months. The monthly replacement reserve amount is estimated to be approximately $23,253. The borrowers are permitted to cease monthly deposits when the replacement reserve balance is equal to the sum of 24 monthly deposits, currently estimated to be $558,072. The tenants listed in clause (i) through (xvi) above collectively represent 40.2% of the NRA and 18.6% of UW Base Rent).
Rollover Reserve – During the continuance of a Trigger Period, the borrowers are required to escrow an amount equal to the gross leasable area (excluding the Non-Collateral Square Footage and, to the extent not causing or contributing to the cause of the applicable Trigger Period (including by way of paying reduced rent), Macy’s, Macy’s Mens & Furniture, Burlington, BJ’s Wholesale, Primark, Walmart, Kohl’s, Dick’s and Best Buy) multiplied by $1.00 and divided by 12 months. The monthly rollover reserve amount is estimated to be approximately $87,264. The borrowers are not required to make any monthly deposits when the rollover reserve balance is equal to the sum of 24 monthly deposits, currently estimated to be $2,094,342. The borrowers’ upfront deposit of $743,644 with respect to gap rent is not included in the calculation of the rollover reserve balance for purposes of calculating the rollover reserve cap.
TI/LC Reserve– On each monthly payment date during the continuance of a Tenant Trigger Event (as defined below), all excess cash flow after payment of debt service, operating expenses and other required escrows is required to be deposited in the TI/LC reserve until the amount in the reserve is equal to 12 months of the base rent payable under any applicable leases causing such Tenant Trigger Event. The borrowers have the right to deliver a letter of credit meeting the requirements of the Green Acres Whole Loan documents in lieu of depositing funds into the TI/LC Reserve.
“Non-Collateral Square Footage” means the square footage occupied by Target and Home Depot.
Lockbox / Cash Management. The Green Acres Whole Loan is structured with a hard lockbox and springing cash management. The borrowers and property manager are required to direct the tenants to pay rent directly into the lockbox account, and to deposit any rents otherwise received in such account within three business days after receipt. During the continuance of a Trigger Period (as defined below), all funds in the lockbox account are required to be swept on a weekly basis and on the second business day before each payment date to a lender-controlled cash management account. Funds in the cash management account are required to be applied to debt service and the reserves and escrows described above, with any excess funds (i) to be deposited into the TI/LC Reserve, if the Trigger Period is caused by a Tenant Trigger Event, or into an excess cash flow reserve account held by the lender as cash collateral for the Green Acres Whole Loan, if the Trigger Period is not solely caused by a Tenant Trigger Event, or if (ii) no Trigger Period is continuing, disbursed to borrowers.
A “Trigger Period” means the period commencing upon the occurrence of (i) an event of default, (ii) a Low Debt Service Period (as defined below), or (iii) a Tenant Trigger Event (as defined below). A Trigger Period will end (a) with respect to the matters described in clause (i) above, if the event of default has been waived by the lender, (b) with respect to the matters described in clause (ii) above, if a cure of the Low Debt Service Period occurs or the borrowers deliver additional collateral causing the debt service coverage ratio to equal 1.55x, or (c) with respect to matters described in clause (iii) above, a cure of the Tenant Trigger Event occurs.
| THE INFORMATION IN THIS STRUCTURAL AND COLLATERAL TERM SHEET IS NOT COMPLETE AND MAY BE AMENDED PRIOR TO THE TIME OF SALE. THIS TERM SHEET IS NOT AN OFFER TO SELL THESE SECURITIES AND IT IS NOT A SOLICITATION OF AN OFFER TO BUY THESE SECURITIES IN ANY JURISDICTION WHERE THE OFFER OR SALE IS NOT PERMITTED. |
| | 111 | |
| Structural and Collateral Term Sheet | | BMO 2023-C4 |
| No. 9 – Green Acres |
A “Low Debt Service Period” will commence on any calculation date when the Green Acres Whole Loan debt service coverage ratio is less than 1.50x and end when the Green Acres Whole Loan debt service coverage ratio is at least 1.55x for two consecutive calendar quarters.
A “Tenant Trigger Event” will occur if (i) two or more of BJ’s Wholesale Club, Dick’s Sporting Goods and Best Buy are subject to any Tenant Trigger Condition (as defined below), and/or (ii) Walmart is subject to any Tenant Trigger Condition. For purposes of determining whether a Tenant Trigger Event has occurred, (i) a tenant shall not have “gone dark”, where the subject tenant has ceased business in the subject space but has subleased all or a material portion of its premises to another operator that does not operate the premises for certain prohibited uses, (ii) pronouncements, press releases and similar “corporate statements” by a tenant of its intention with respect to operations at a particular store shall not constitute a basis for asserting that a Tenant Trigger Event has occurred, and (iii) a change in use, the days or hours of operation, or the configuration of its store by a tenant shall not, in and of itself, constitute “going dark” or ceasing to operate.
A “Tenant Trigger Condition” is if any applicable tenant (i) does not maintain an investment grade rating and goes dark for a period in excess of 120 consecutive days (excluding temporary vacancies for the purpose of repair, restoration or permitted alteration), (ii) provides written notice of its intent to not renew its lease, or (iii) does not provide notice of renewal prior to the required date.
Subordinate Debt. None. However, the borrowers are permitted to obtain property assessed clean energy (PACE) or similar loans in an aggregate amount up to $10 million without the consent of the lender.
Mezzanine Debt. None.
Partial Release. The borrowers may obtain a release of one or more Release Parcels (as defined below), subject to satisfaction of certain conditions including, but not limited to, (i) no event of default has occurred and is continuing, (ii) regardless of whether such release of the Release Parcel is successfully consummated, the borrowers pay to the lender a processing fee in the amount of $15,000, (iii) the remaining property constitutes a separate tax lot (or the borrowers shall have filed an application for a separate tax lot and the borrower sponsor guarantees the payment of taxes on the Release Parcel pending the final issuance of such separate tax lot), (iv) the borrowers certify to the lender that the remaining property with all easements appurtenant and other permitted encumbrances thereto will not, strictly as a result of such transfer, be in violation of certain reciprocal easement agreements, the Walmart Ground Lease (as defined below), the PILOT leases or any then applicable law, statute, rule or regulation and (v) satisfaction of any REMIC release conditions.
A ”Release Parcel” is a parcel on the Green Acres Property that is (a) non-income producing and unimproved for tenant occupancy and (b) the release of which does not have any adverse material effect.
Ground Lease. The fee interest in the Walmart Parcel is owned by Walmart, an anchor tenant at the Walmart Parcel. Valley Stream Green Acres LLC (“Valley Stream”), a borrower, owns the leasehold interest in the Walmart Parcel pursuant to a 36-year ground lease, dated as of February 22, 1989 (the “Walmart Ground Lease”), between Walmart, as ground lessor, and Valley Stream, as ground lessee. Valley Stream leased the Walmart Parcel back to Walmart. The term of the Ground Lease commenced on August 13, 1990 and expires August 12, 2026, with two additional six-year extension options. According to the estoppel delivered by Walmart (the “Ground Lease Estoppel”) and Valley Stream, the base rent under the Walmart Ground Lease is a fixed amount equal to approximately $1,080,000 per annum (approximately $90,000 per month) during the initial term of the Walmart Ground Lease as determined in accordance with the terms of the Walmart Ground Lease and approximately $1,500,000 per annum (approximately $125,000 per month) during the extension terms. In addition, Valley Stream is required to return to Walmart a certain amount of any percentage rents paid by Walmart under the space lease as part of the percentage ground lease rent. The Walmart Ground Lease contains standard leasehold mortgagee protections including notice and cure rights and the right to enter into a new ground lease in the event of termination of the Walmart Ground Lease (including rejection of the Walmart Ground Lease in bankruptcy). Pursuant to the Ground Lease Estoppel, Walmart agreed not to amend or modify the ground lease without the lender’s consent.
Payment in Lieu of Taxes. Both Green Acres Mall (excluding the Walmart Parcel) and Green Acres Commons benefit from 10-year tax abatements pursuant to respective payment-in-lieu of taxes agreements dated May 1, 2015 (the “PILOT Agreements”), between the borrowers and the Town of Hempstead Industrial Development Agency (the “Hempstead IDA”), which expire on December 31, 2026, with one five-year extension period that requires Hempstead IDA approval. In connection with the PILOT Agreements, the borrowers lease portions of the Green Acres Property (excluding the Walmart Parcel) to the Hempstead IDA pursuant to the master leases, and the Hempstead IDA subleases such portions of the Green
| THE INFORMATION IN THIS STRUCTURAL AND COLLATERAL TERM SHEET IS NOT COMPLETE AND MAY BE AMENDED PRIOR TO THE TIME OF SALE. THIS TERM SHEET IS NOT AN OFFER TO SELL THESE SECURITIES AND IT IS NOT A SOLICITATION OF AN OFFER TO BUY THESE SECURITIES IN ANY JURISDICTION WHERE THE OFFER OR SALE IS NOT PERMITTED. |
| | 112 | |
| Structural and Collateral Term Sheet | | BMO 2023-C4 |
| No. 9 – Green Acres |
Acres Property (excluding the Walmart Parcel) back to the borrowers. Such leases will be terminated upon the termination of the PILOT Agreements. Pursuant to the terms of the PILOT Agreements and the related leases, the borrowers are obligated to, among other things, (i) comply with certain full-time employment commitments and (ii) in exchange for certain exemptions from property taxes on real and personal property, make annual payment-in-lieu of taxes payments for the 2016 through the 2026 tax years. A failure of the borrowers to comply with the PILOT Agreements may result in an early termination of the PILOT Agreements or a return of certain tax benefits received by the borrowers to the Hempstead IDA. Total annual payment-in-lieu of taxes payments payable by the borrowers commenced at $14,140,000 and increased to $15,400,000 during the fourth and fifth tax abatement years, and are equal to $16,300,000 during the second five tax abatement years. According to the appraisal, the borrowers are expected to receive a tax benefit of approximately $15,365,892 in total under the PILOT Agreement in 2023 assuming that the borrowers comply with the terms of the PILOT Agreements and the leases. Taxes were underwritten to the 2022 actual tax bills for the Green Acres Property, inclusive of the annual payment-in-lieu of taxes payments for 2022. According to the appraisal, if the PILOT documents are not renewed in 2027, the total amount of real estate taxes payable by the borrowers is expected to increase by approximately $17.1 million in 2027.
| THE INFORMATION IN THIS STRUCTURAL AND COLLATERAL TERM SHEET IS NOT COMPLETE AND MAY BE AMENDED PRIOR TO THE TIME OF SALE. THIS TERM SHEET IS NOT AN OFFER TO SELL THESE SECURITIES AND IT IS NOT A SOLICITATION OF AN OFFER TO BUY THESE SECURITIES IN ANY JURISDICTION WHERE THE OFFER OR SALE IS NOT PERMITTED. |
| | 113 | |
| Structural and Collateral Term Sheet | | BMO 2023-C4 |
| No. 10 – 575 Broadway |

| THE INFORMATION IN THIS STRUCTURAL AND COLLATERAL TERM SHEET IS NOT COMPLETE AND MAY BE AMENDED PRIOR TO THE TIME OF SALE. THIS TERM SHEET IS NOT AN OFFER TO SELL THESE SECURITIES AND IT IS NOT A SOLICITATION OF AN OFFER TO BUY THESE SECURITIES IN ANY JURISDICTION WHERE THE OFFER OR SALE IS NOT PERMITTED. |
| | 114 | |
| Structural and Collateral Term Sheet | | BMO 2023-C4 |
| No. 10 – 575 Broadway |
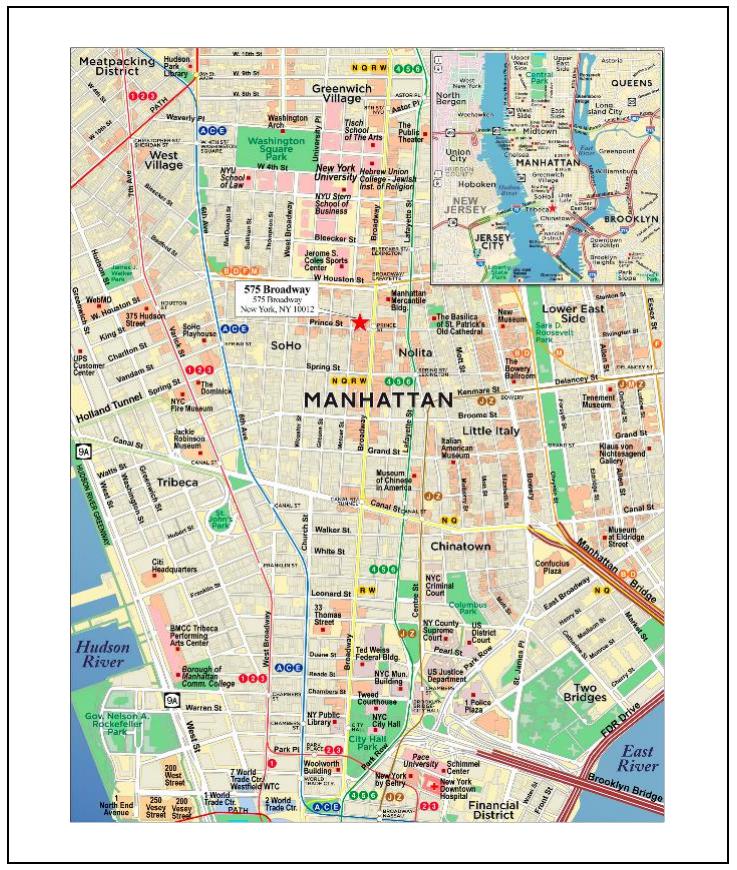
| THE INFORMATION IN THIS STRUCTURAL AND COLLATERAL TERM SHEET IS NOT COMPLETE AND MAY BE AMENDED PRIOR TO THE TIME OF SALE. THIS TERM SHEET IS NOT AN OFFER TO SELL THESE SECURITIES AND IT IS NOT A SOLICITATION OF AN OFFER TO BUY THESE SECURITIES IN ANY JURISDICTION WHERE THE OFFER OR SALE IS NOT PERMITTED. |
| | 115 | |
| Structural and Collateral Term Sheet | | BMO 2023-C4 |
| No. 10 – 575 Broadway |
| Mortgage Loan Information | | Property Information |
| Mortgage Loan Seller: | CREFI | | Single Asset / Portfolio: | Single Asset |
| Original Principal Balance(1): | $26,000,000 | | Title: | Leasehold |
| Cut-off Date Principal Balance(1): | $25,951,292 | | Property Type – Subtype: | Mixed Use – Retail / Office |
| % of IPB: | 3.3% | | Net Rentable Area (SF): | 176,648 |
| Loan Purpose: | Refinance | | Location: | New York, NY |
| Borrower: | 575 Broadway Associates L.P. | | Year Built / Renovated: | 1882 / 2015 |
| Borrower Sponsor: | Peter M. Brant | | Occupancy: | 88.1% |
| Interest Rate: | 7.49000% | | Occupancy Date: | 7/1/2022 |
| Note Date: | 11/29/2022 | | 4th Most Recent NOI (As of): | $22,728,286 (12/31/2019) |
| Maturity Date: | 12/6/2027 | | 3rd Most Recent NOI (As of): | $19,367,711 (12/31/2020) |
| Interest-only Period: | None | | 2nd Most Recent NOI (As of): | $21,718,364 (12/31/2021) |
| Original Term: | 60 months | | Most Recent NOI (As of)(4): | $23,741,393 (TTM 6/30/2022) |
| Original Amortization Term: | 300 months | | UW Economic Occupancy: | 93.4% |
| Amortization Type: | Amortizing Balloon | | UW Revenues: | $27,803,795 |
| Call Protection(2): | L(26),D(28),O(6) | | UW Expenses: | $11,776,167 |
| Lockbox / Cash Management: | Hard / Springing | | UW NOI(4): | $16,027,627 |
| Additional Debt(1): | Yes | | UW NCF: | $15,550,678 |
| Additional Debt Balance(1): | $101,210,038 | | Appraised Value / Per SF: | $215,000,000 / $1,217 |
| Additional Debt Type(1): | Pari Passu | | Appraisal Date: | 9/7/2022 |
| | | | | |
| Escrows and Reserves(3) | | Financial Information(1) |
| | Initial | Monthly | Initial Cap | | Cut-off Date Loan / SF: | $720 |
| Taxes: | $276,774 | $276,774 | N/A | | Maturity Date Loan / SF: | $666 |
| Insurance: | $62,040 | $20,680 | N/A | | Cut-off Date LTV: | 59.1% |
| Replacement Reserves: | $0 | $2,944 | N/A | | Maturity Date LTV: | 54.7% |
| TI/LC: | $0 | $36,802 | N/A | | UW NCF DSCR: | 1.38x |
| Ground Rent: | $424,093 | Springing | N/A | | UW NOI Debt Yield: | 12.6% |
| Outstanding Obligations: | $4,231,492 | $0 | N/A | | | |
| Façade Work | $0 | Springing | N/A | | | |
| | | | | | | |
| Sources and Uses |
| Sources | Proceeds | % of Total | | Uses | Proceeds | % of Total |
| Whole Loan | $127,400,000 | 95.8 | % | | Payoff Existing Debt | $123,945,221 | 93.2 | % |
| Borrower Sponsor Equity | 5,592,260 | 4.2 | | | Upfront Reserves | 4,994,399 | 3.8 | |
| | | | | Closing Costs | 4,052,640 | 3.0 | |
| Total Sources | $132,992,260 | 100.0 | % | | Total Uses | $132,992,260 | 100.0 | % |
| (1) | The 575 Broadway Mortgage Loan (as defined below) is part of the 575 Broadway Whole Loan (as defined below), which is comprised of six pari passu notes with an aggregate outstanding principal balance as of the Cut-off Date of approximately $127.2 million. The Financial Information in the chart above reflects the 575 Broadway Whole Loan. The 575 Broadway Whole Loan was co-originated by Citi Real Estate Funding Inc. (“CREFI”) and Societe Generale Financial Corporation (“SGFC”). |
| (2) | The lockout period will be at least 26 payment dates beginning with and including the first payment date on January 6, 2023. Defeasance of the 575 Broadway Whole Loan is permitted after the date that is the earlier of (i) two years from the closing date of the securitization that includes the last note to be securitized and (ii) November 29, 2025. The assumed lockout period of 26 payments is based on the expected BMO 2023-C4 securitization closing date in February 2023. The actual lockout period may be longer. |
| (3) | For a full description of Escrows and Reserves, please refer to “Escrows and Reserves” below. |
| (4) | The decrease from Most Recent NOI to Underwritten NOI is primarily attributable to (i) Prada’s (as defined below) January 2022 lease renewal at market rent and (ii) the recent decrease in occupancy at the 575 Broadway Property (as defined below) from 100.0% to 88.1%. |
| THE INFORMATION IN THIS STRUCTURAL AND COLLATERAL TERM SHEET IS NOT COMPLETE AND MAY BE AMENDED PRIOR TO THE TIME OF SALE. THIS TERM SHEET IS NOT AN OFFER TO SELL THESE SECURITIES AND IT IS NOT A SOLICITATION OF AN OFFER TO BUY THESE SECURITIES IN ANY JURISDICTION WHERE THE OFFER OR SALE IS NOT PERMITTED. |
| | 116 | |
| Structural and Collateral Term Sheet | | BMO 2023-C4 |
| No. 10 – 575 Broadway |
The Loan. The tenth largest mortgage loan (the “575 Broadway Mortgage Loan”) is part of a whole loan evidenced by six pari passu promissory notes with an aggregate outstanding principal balance as of the Cut-off Date of approximately $127.2 million (the “575 Broadway Whole Loan”) secured by a first mortgage encumbering the borrower’s leasehold interests in a 176,648 square foot retail and office property located in New York, New York (the “575 Broadway Property”). The 575 Broadway Whole Loan was originated on November 29, 2022 by CREFI and SGFC and has a five-year term that amortizes on a 25-year amortization schedule and accrues interest at a fixed rate of 7.49000% per annum. The scheduled maturity date of the 575 Broadway Whole Loan is the due date that occurs December 6, 2027. The 575 Broadway Mortgage Loan is evidenced by the non-controlling Note A-1-1 with an outstanding principal balance as of the Cut-off Date of $25,951,292. The 575 Broadway Mortgage Loan is being contributed to the BMO 2023-C4 trust. The 575 Broadway Mortgage Loan will be serviced pursuant to the pooling and servicing agreement for the BMO 2023-C4 securitization until the securitization of the controlling Note A-2, after which point it will be serviced pursuant to the pooling and servicing agreement for such securitization. The table below summarizes the promissory notes that comprise the 575 Broadway Whole Loan. See “Description of the Mortgage Pool—The Whole Loans—The Serviced Pari Passu Whole Loans” and “—The Whole Loans—The Outside Serviced Pari Passu Whole Loans” and “The Pooling and Servicing Agreement” in the Preliminary Prospectus.
The borrower’s leasehold interest in the 575 Broadway Property is governed by a ground lease (the “Ground Lease”) between 575 Broadway LLC, a New York limited liability company, as the lessor, and the borrower, as the lessee, with a term expiring on June 30, 2060. The current annual base ground rent as of the Cut-off Date is $5,089,118 with CPI increases each January 1 with a minimum increase of 3.5% and a maximum increase of 5.5%. On the date of origination of the 575 Broadway Whole Loan, the borrower was required to deliver a letter of credit to the lender in an amount equal to $5,750,000 to cover potential increases in the security deposit payable pursuant to the Ground Lease (as described below) and which serves as additional collateral for the 575 Broadway Whole Loan.
| Whole Loan Summary |
| Note | Original Balance | Cut-off Date Balance | Note Holder | Controlling Piece |
| A-1-1 | $26,000,000 | $25,951,292 | BMO 2023-C4 | No |
| A-1-2(1) | $14,000,000 | $13,973,772 | CREFI | No |
| A-2(1) | $23,700,000 | $23,655,601 | CREFI | Yes |
| A-3(1) | $28,700,000 | $28,646,234 | SGFC | No |
| A-4(1) | $20,000,000 | $19,962,532 | SGFC | No |
| A-5(1) | $15,000,000 | $14,971,899 | SGFC | No |
| Whole Loan | $127,400,000 | $127,161,330 | | |
| (1) | Expected to be contributed to one or more securitization trust(s). |
The Property. The 575 Broadway Property consists of a six-story, 176,648 square foot retail and office building comprised of the entire northern block-front of Prince Street between Broadway and Mercer Streets in the SoHo neighborhood of Manhattan, New York. The retail component, split between the ground level, a mezzanine level and sub-basement storage space, totals 50,959 square feet (28.8% of NRA) and generates 68.6% of total underwritten base rent. The office component, located on floors two through six with sub-basement storage space, totals 125,689 square feet (71.2% of NRA), and generates 31.4% of total underwritten base rent. As of July 1, 2022, the 575 Broadway Property was 88.1% occupied by three retail tenants and five office tenants. The 575 Broadway Property was built in 1882 and renovated in 2015. Since 2016, the borrower has invested approximately $1.8 million in upgrades to the elevator, gas service and fire alarm and to install a new roof.
Major Tenants.
Estee Lauder (64,122 square feet; 36.3% NRA; 18.0% of underwritten base rent): Estee Lauder is a multinational cosmetics company, manufacturer and marketer of makeup, skincare, fragrance and hair care products founded in 1946. Estee Lauder products are sold in approximately 150 countries and territories under a number of brand names including: Estée Lauder, Clinique, Origins, M·A·C, Bobbi Brown, La Mer, Aveda, Jo Malone London, Too Faced, Dr. Jart+, and The Ordinary. Estee Lauder is also the global licensee of brand names for fragrances and/or cosmetics, including Tom Ford and AERIN. Estee Lauder has been a tenant at the 575 Broadway Property since 2000 under a lease with an expiration date of March 31, 2025, and two, five-year renewal options remaining with no termination options.
| THE INFORMATION IN THIS STRUCTURAL AND COLLATERAL TERM SHEET IS NOT COMPLETE AND MAY BE AMENDED PRIOR TO THE TIME OF SALE. THIS TERM SHEET IS NOT AN OFFER TO SELL THESE SECURITIES AND IT IS NOT A SOLICITATION OF AN OFFER TO BUY THESE SECURITIES IN ANY JURISDICTION WHERE THE OFFER OR SALE IS NOT PERMITTED. |
| | 117 | |
| Structural and Collateral Term Sheet | | BMO 2023-C4 |
| No. 10 – 575 Broadway |
Prada USA Corp. (30,079 square feet; 17.0% NRA; 46.4% of underwritten base rent): Prada USA Corp. (“Prada”) is an Italian luxury fashion house that was founded in 1913 by Mario Prada. Prada specializes in designing leather handbags, travel accessories, shoes, ready-to-wear, perfumes and other fashion accessories. As of December 31, 2021, Prada operated 635 stores across Europe, the Americas, Asia, Japan and the Middle East with approximately 12,572 employees. Prada has been a tenant at the 575 Broadway Property since 1999 under a lease with an expiration date of January 31, 2035, and one, five-year renewal option remaining with no termination options.
H&M (11,049 square feet; 6.3% NRA; 16.2% of underwritten base rent): H&M Hennes & Mauritz (“H&M”) is a global retailer offering affordable apparel for men, women, and children. H&M was incorporated in 1947 and remains under the control of the family of founder Erling Persson. H&M group’s brands are H&M, H&M Home, COS, Weekday, Monki, & Other Stories, ARKET, Afound and Singular Society. As of November 30, 2021, H&M operated approximately 4,801 stores across 75 markets with approximately 155,000 employees. H&M has been a tenant at the 575 Broadway Property since 2014 under a lease with an expiration date of January 31, 2030 and two, five-year renewal options remaining with no termination options.
Environmental. According to a Phase I environmental assessment dated September 14, 2022, there was no evidence of any recognized environmental conditions at the 575 Broadway Property.
The following table presents certain information relating to the historical and current occupancy of the 575 Broadway Property:
| Historical and Current Occupancy(1) |
| 2019 | 2020 | 2021 | Current(2) |
| 100.0% | 100.0% | 100.0% | 88.1% |
| (1) | Historical Occupancies are the annual average physical occupancy of each respective year. |
| (2) | Current Occupancy is as of July 1, 2022. |
| THE INFORMATION IN THIS STRUCTURAL AND COLLATERAL TERM SHEET IS NOT COMPLETE AND MAY BE AMENDED PRIOR TO THE TIME OF SALE. THIS TERM SHEET IS NOT AN OFFER TO SELL THESE SECURITIES AND IT IS NOT A SOLICITATION OF AN OFFER TO BUY THESE SECURITIES IN ANY JURISDICTION WHERE THE OFFER OR SALE IS NOT PERMITTED. |
| | 118 | |
| Structural and Collateral Term Sheet | | BMO 2023-C4 |
| No. 10 – 575 Broadway |
The following table presents certain information relating to the largest tenants based on underwritten base rent of the 575 Broadway Property:
| Top Tenant Summary(1) |
| Tenant | Ratings
Moody’s/S&P/Fitch(2) | Net Rentable Area (SF) | % of
Total NRA | UW Base Rent PSF(3) | UW Base Rent(3) | % of Total
UW Base Rent | Lease
Exp. Date |
| Retail | | | | | | | |
| Prada USA Corp.(4)(5) | NR/NR/NR | 30,079 | | 17.0 | % | $398.95 | | 12,000,000 | 46.4 | % | 1/31/2035 |
| H&M(6)(7) | NR/BBB/NR | 11,049 | | 6.3 | | $378.49 | | 4,181,909 | 16.2 | | 1/31/2030 |
| Lure Fishbar(8)(9) | NR/NR/NR | 9,831 | | 5.6 | | $157.66 | | 1,550,000 | 6.0 | | 9/30/2024 |
| Total Retail | | 50,959 | | 28.8 | % | $347.96 | | $17,731,909 | 68.6 | % | |
| Office | | | | | | | |
| Estee Lauder(10)(11) | A1/A+/NR | 64,122 | | 36.3 | % | $72.58 | | $4,653,663 | 18.0 | % | 3/31/2025 |
| Valor Management LLC(12)(13) | NR/NR/NR | 12,990 | | 7.4 | | $86.00 | | 1,117,140 | 4.3 | | 8/31/2033 |
| Union Editorial NY, LLC | NR/NR/NR | 11,500 | | 6.5 | | $94.76 | | 1,089,776 | 4.2 | | 5/31/2023 |
| 20th Century Acquisitions | NRNR/NR | 9,077 | | 5.1 | | $77.33 | | 701,960 | 2.7 | | 5/31/2025 |
| Manifold Capital Partners | NR/NR/NR | 7,000 | | 4.0 | | $80.00 | | 560,000 | 2.2 | | 8/31/2027 |
| Total Office | | 104,689 | | 59.3 | % | $77.59 | | $8,122,540 | 31.4 | % | |
| | | | | | | | |
| | | | | | | | |
| | | | | | | | |
| Occupied Collateral Total | | 155,648 | | 88.1 | % | $166.11 | | $25,854,449 | 100.0 | % | |
| | | | | | | | |
| Vacant Space | | 21,000 | | 11.9 | % | | | | |
| | | | | | | | |
| Collateral Total | | 176,648 | | 100.0 | % | | | | |
| | | | | | | | |
| (1) | Based on the underwritten rent roll as of July 1, 2022. |
| (2) | In certain instances, ratings provided are those of the parent company of the entity shown, whether or not the parent company guarantees the lease. |
| (3) | UW Base Rent PSF and UW Base Rent include rent steps totaling $306,432 through November 2023 and the average rent steps over the lease term for Estee Lauder. |
| (4) | Prada has one, five-year renewal option remaining. |
| (5) | Prada occupies 25,000 square feet of retail space and 5,079 square feet of basement storage space. The UW Base Rent PSF for Prada’s retail space is $470.00. |
| (6) | H&M has two, five-year renewal options remaining. |
| (7) | H&M occupies 7,215 square feet of retail space and 3,834 square feet of basement storage space. The UW Base Rent PSF for H&M’s retail space is $552.45. |
| (8) | Lure Fishbar has one, five-year renewal option remaining. |
| (9) | Lure Fishbar occupies 5,831 square feet of retail space and 4,000 square feet of basement storage space. The UW Base Rent PSF for Lure Fishbar’s retail space is $224.54. |
| (10) | Estee Lauder has two, five-year renewal options remaining. |
| (11) | Estee Lauder occupies 62,122 square feet of office space and 2,000 square feet of basement storage space. The UW Base Rent PSF for Estee Lauder’s office space is $73.56. |
| (12) | Valor Management LLC is expected to take occupancy on February 1, 2023. At origination, approximately $744,760 was escrowed for free rent. Valor Management LLC has a one-time right to terminate its lease effective on August 31, 2029 with one-year written notice, payment of three months base rent and tax due, plus unamortized Leasing Commissions, landlord's work, and free rent. |
| (13) | Valor Management LLC has one, five-year renewal option remaining. |
| THE INFORMATION IN THIS STRUCTURAL AND COLLATERAL TERM SHEET IS NOT COMPLETE AND MAY BE AMENDED PRIOR TO THE TIME OF SALE. THIS TERM SHEET IS NOT AN OFFER TO SELL THESE SECURITIES AND IT IS NOT A SOLICITATION OF AN OFFER TO BUY THESE SECURITIES IN ANY JURISDICTION WHERE THE OFFER OR SALE IS NOT PERMITTED. |
| | 119 | |
| Structural and Collateral Term Sheet | | BMO 2023-C4 |
| No. 10 – 575 Broadway |
The following table presents certain information relating to tenant lease expirations at the 575 Broadway Property:
| Lease Rollover Schedule(1)(2) |
| Year | Number of Leases Expiring | Net Rentable Area Expiring | % of NRA Expiring | UW Base Rent Expiring(3) | % of UW Base Rent Expiring | Cumulative Net Rentable Area Expiring | Cumulative % of NRA Expiring | Cumulative UW Base Rent Expiring(3) | Cumulative % of UW Base Rent Expiring |
| Vacant | NAP | 21,000 | 11.9 | % | NAP | NA | P | 21,000 | | 11.9% | | NAP | NA | P |
| 2022 & MTM | 0 | 0 | 0.0 | | $0 | 0.0 | % | 21,000 | | 11.9% | | $0 | 0.0 | % |
| 2023 | 1 | 11,500 | 6.5 | | 1,089,776 | 4.2 | | 32,500 | | 18.4% | | $1,089,776 | 4.2 | % |
| 2024 | 1 | 9,831 | 5.6 | | 1,550,000 | 6.0 | | 42,331 | | 24.0% | | $2,639,776 | 10.2 | % |
| 2025 | 2 | 73,199 | 41.4 | | 5,355,623 | 20.7 | | 115,530 | | 65.4% | | $7,995,400 | 30.9 | % |
| 2026 | 0 | 0 | 0.0 | | 0 | 0.0 | | 115,530 | | 65.4% | | $7,995,400 | 30.9 | % |
| 2027 | 1 | 7,000 | 4.0 | | 560,000 | 2.2 | | 122,530 | | 69.4% | | $8,555,400 | 33.1 | % |
| 2028 | 0 | 0 | 0.0 | | 0 | 0.0 | | 122,530 | | 69.4% | | $8,555,400 | 33.1 | % |
| 2029 | 0 | 0 | 0.0 | | 0 | 0.0 | | 122,530 | | 69.4% | | $8,555,400 | 33.1 | % |
| 2030 | 1 | 11,049 | 6.3 | | 4,181,909 | 16.2 | | 133,579 | | 75.6% | | $12,737,309 | 49.3 | % |
| 2031 | 0 | 0 | 0.0 | | 0 | 0.0 | | 133,579 | | 75.6% | | $12,737,309 | 49.3 | % |
| 2032 | 0 | 0 | 0.0 | | 0 | 0.0 | | 133,579 | | 75.6% | | $12,737,309 | 49.3 | % |
| 2033 | 1 | 12,990 | 7.4 | | 1,117,140 | 4.3 | | 146,569 | | 83.0% | | $13,854,449 | 53.6 | % |
| 2034 & Beyond | 1 | 30,079 | 17.0 | | 12,000,000 | 46.4 | | 176,648 | | 100.0% | | $25,854,449 | 100.0 | % |
| Total | 8 | 176,648 | 100.0 | % | $25,854,449 | 100.0 | % | | | | |
| (1) | Based on the underwritten rent roll as of July 1, 2022. |
| (2) | Certain tenants have more than one lease. Certain tenants may have lease termination options that are exercisable prior to the originally stated expiration date of the subject lease and that are not considered in the lease rollover schedule. |
| (3) | UW Base Rent includes rent steps totaling $306,432 through November 2023 and the average rent over the lease term for Estee Lauder. |
The following table presents certain information relating to operating history and underwritten cash flows at the 575 Broadway Property:
| Operating History and Underwritten Net Cash Flow |
| | 2019 | 2020 | 2021 | TTM(1) | Underwritten | Per Square Foot | %(2) |
| Rents in Place(3) | $29,667,889 | $26,400,156 | $29,005,849 | $31,914,767 | $25,548,016 | $144.63 | 89.7 | % |
| Contractual Rent Steps | 0 | 0 | 0 | 0 | 306,432 | 1.73 | 1.1 | |
| Vacant Income | 0 | 0 | 0 | 0 | 1,890,000 | 10.70 | 6.6 | |
| Gross Potential Rent | $29,667,889 | $26,400,156 | $29,005,849 | $31,914,767 | $27,744,449 | $157.06 | 97.4 | % |
| Total Reimbursements | 1,982,596 | 2,392,210 | 2,352,445 | 1,682,876 | 740,598 | 4.19 | 2.6 | |
| Net Rental Income | $31,650,485 | $28,792,366 | $31,358,294 | $33,597,643 | $28,485,047 | $161.25 | 100.0 | % |
| (Vacancy/Credit Loss) | 0 | 0 | 0 | 0 | (1,890,000) | (10.70) | (6.6 | ) |
| Other Income(4) | 1,184,517 | 883,666 | 1,168,922 | 1,194,408 | 1,208,748 | 6.84 | 4.2 | |
| Effective Gross Income | $32,835,002 | $29,676,032 | $32,527,216 | $34,792,051 | $27,803,795 | $157.40 | 97.6 | % |
| Total Expenses | 10,106,716 | 10,308,321 | 10,808,852 | 11,050,658 | 11,776,167 | 66.66 | 42.4 | |
| Net Operating Income(5) | $22,728,286 | $19,367,711 | $21,718,364 | $23,741,393 | $16,027,627 | $90.73 | 57.6 | % |
| Capital Expenditures | 0 | 0 | 0 | 0 | 35,330 | 0.20 | 0.1 | |
| TI/LC | 0 | 0 | 0 | 0 | 441,620 | 2.50 | 1.6 | |
| Net Cash Flow | $22,728,286 | $19,367,711 | $21,718,364 | $23,741,393 | $15,550,678 | $88.03 | 55.9 | % |
| (1) | TTM reflects the trailing 12-month period ending June 30, 2022. |
| (2) | % column represents percent of Net Rental Income for all revenue lines and represents percent of Effective Gross Income for the remainder of fields. |
| (3) | Rents in Place for the reported periods include CPI escalations. |
| (4) | Other Income is comprised of electric income and water/HVAC income for tenants. |
| (5) | The decrease from Most Recent NOI to Underwritten NOI is primarily attributable to (i) Prada’s January 2022 lease renewal at market rent and (ii) the recent decrease in occupancy at the 575 Broadway Property from 100.0% to 88.1%. |
The Market. The 575 Broadway Property is located in the SoHo neighborhood within the New York core based statistical area in the borough of Manhattan. Manhattan forms the political, financial, and cultural core of the city and is the economic growth engine of the Greater New York Region. The city’s other boroughs are Brooklyn, Queens, Staten Island, and the
| THE INFORMATION IN THIS STRUCTURAL AND COLLATERAL TERM SHEET IS NOT COMPLETE AND MAY BE AMENDED PRIOR TO THE TIME OF SALE. THIS TERM SHEET IS NOT AN OFFER TO SELL THESE SECURITIES AND IT IS NOT A SOLICITATION OF AN OFFER TO BUY THESE SECURITIES IN ANY JURISDICTION WHERE THE OFFER OR SALE IS NOT PERMITTED. |
| | 120 | |
| Structural and Collateral Term Sheet | | BMO 2023-C4 |
| No. 10 – 575 Broadway |
Bronx, otherwise known as Kings, Queens, Richmond, and Bronx counties, respectively. The area’s mass transit infrastructure connects the five boroughs as well as the surrounding suburban areas, forming the Greater New York Region. The Greater New York Region covers 21 counties in the southeastern section of New York State, southwestern corner of Connecticut, and Central and Northern New Jersey.
The SoHo neighborhood is a 26-block area bounded by Houston Street, Crosby Street, Canal Street and West Broadway. According to the appraisal, in 1973 SoHo was designated as a historic district known as the SoHo Cast Iron Preservation District. The SoHo Cast Iron Preservation District has the largest concentration of full and partial cast-iron façade buildings anywhere in the world. The district comprises about 500 buildings, many of which are characterized by their cast-iron façades. Over the last decade the SoHo neighborhood has exhibited an increase in residential development. The neighborhood surrounding the 575 Broadway Property contains retailers, galleries, offices and shops, as well as numerous restaurants. The 575 Broadway Property is accessible via several Manhattan commuter transportation hubs including the entrance to the Broadway/Lafayette subway stop located on the ground floor of the 575 Broadway Property.
According to the appraisal, the 575 Broadway Property is located in the SoHo office submarket of Midtown South Manhattan. As of the second quarter of 2022, the SoHo office submarket contained approximately 4.5 million square feet of inventory with an overall vacancy rate of 17.3% (which is lower than the weighted average Midtown South overall office market vacancy rate of 21.3%) The weighted average class B asking rental rate of the SoHo office submarket is $72.20 per square foot. The SoHo office submarket reported 174,591 square feet under construction, no completions and positive absorption of 6,564 square feet.
According to the appraisal, the 575 Broadway Property is located in the SoHo retail submarket. Within the submarket, the 575 Broadway Property comprises the entire northern block-front of Prince Street between Broadway and Mercer Street with corner retail storefront property facing Broadway Street. As of the second quarter of 2022, the SoHo retail submarket contained approximately 635 retail units with a total availability rate of 17.8% compared to a total availability rate of 26.6% within the SoHo retail submarket as of the second quarter of 2021. The average ground floor asking rental rate within the SoHo retail submarket is $310.00 per square foot which represents a 13.0% increase over the average ground floor asking rental rate as of the second quarter of 2021.
| THE INFORMATION IN THIS STRUCTURAL AND COLLATERAL TERM SHEET IS NOT COMPLETE AND MAY BE AMENDED PRIOR TO THE TIME OF SALE. THIS TERM SHEET IS NOT AN OFFER TO SELL THESE SECURITIES AND IT IS NOT A SOLICITATION OF AN OFFER TO BUY THESE SECURITIES IN ANY JURISDICTION WHERE THE OFFER OR SALE IS NOT PERMITTED. |
| | 121 | |
| Structural and Collateral Term Sheet | | BMO 2023-C4 |
| No. 10 – 575 Broadway |
The following table presents certain information relating to comparable office leases to the 575 Broadway Property:
| Comparable Office Lease Summary(1) |
| Property Name/Location | Year Built / Renovated | Size (SF) | Tenant | Suite Size (SF) | Rent PSF | Commencement | Lease Term (Months) |
575 Broadway New York, NY | 1882 / 2015 | 176,648(2) | Estee Lauder(2) Valor Management LLC(2) Union Editorial NY, LLC(2) 20th Century Acquisitions(2) Manifold Capital Partners(2) | 62,122(2) 12,990(2) 11,500(2) 9,077(2) 7,000(2) | (3) | $73.56(2) $86.00(2) $94.76(2) $77.33(2) $80.00(2) | (3) | Various(2) | Various(2) |
434 Broadway New York, NY | 1910 | 61,500 | Modern Post | 14,640 | | $96.00 | | Jun-2022 | 120 |
72-76 Greene Street New York, NY | 1900 | 45,000 | Town Hall Ventures | 3,940 | | $90.00 | | Jun-2022 | 66 |
141 E. Houston Street New York, NY | 2021 | 59,857 | Solana Labs | 21,738 | | $125.00 | | May-2022 | 120 |
490 Broadway New York, NY | 1857 / 2010 | 37,483 | Paige | 11,594 | | $71.00 | | May-2022 | 90 |
817 Broadway New York, NY | 1895 / 2019 | 147,000 | 25 Madison | 9,943 | | $91.00 | | Apr-2022 | 78 |
446 Broadway New York, NY | 1915 / 2021 | 40,147 | Bay City Projects Rally Cabin | 7,462 7,462 7,462 | | $111.00 $95.00 $112.00 | | March-2022 Dec-2021 Sept-2021 | 72 132 120 |
200 Lafayette Street New York, NY | 1900 / 2014 | 100,386 | A16Z | 33,560 | | $87.00 | | Dec-2021 | 127 |
71 Fifth Avenue New York, NY | 1907 | 165,000 | Adyen | 30,415 | | $90.00 | | Sept-2021 | 84 |
| (1) | Source: Appraisal unless otherwise indicated. |
| (2) | Based on the underwritten rent roll as of July 1, 2022. |
| (3) | Suite Size (SF) and Rent PSF for Estee Lauder is based on adjusted base rent and the associated net rentable area (SF) from office units only. |
The following table presents certain information relating to the appraiser’s conclusion of retail market rents within the SoHo retail submarket:
| CONCLUSION OF RETAIL MARKET RENTS(1) |
| FLOORS | RENT/SF ($/SF) |
| Retail -Corner: | $875 |
| Retail - Inline: | $400 |
| Retail-Lower Level: | $200 |
| Retail/Restaurant Lower Level | $225 |
| Storage-Sub-basement | $50 |
| THE INFORMATION IN THIS STRUCTURAL AND COLLATERAL TERM SHEET IS NOT COMPLETE AND MAY BE AMENDED PRIOR TO THE TIME OF SALE. THIS TERM SHEET IS NOT AN OFFER TO SELL THESE SECURITIES AND IT IS NOT A SOLICITATION OF AN OFFER TO BUY THESE SECURITIES IN ANY JURISDICTION WHERE THE OFFER OR SALE IS NOT PERMITTED. |
| | 122 | |
| Structural and Collateral Term Sheet | | BMO 2023-C4 |
| No. 10 – 575 Broadway |
The following table presents certain information relating to comparable retail leases to the 575 Broadway Property:
| Comparable Retail Lease Summary(1) |
| Property Name/Location | Tenant | Suite Size (SF) | Rent PSF | Commencement | Lease Term (Months) |
575 Broadway New York, NY | Prada USA Corp.(2) H&M(2) Lure Fishbar(2) | 25,000(2)(3) 7,215(2)(4) 5,831(2)(4) | $470.00(2)(3) $552.45(2)(4) $224.54(2)(4) | Various(2) | Various(2) |
537 Broadway New York, NY | Guess | 6,000(5) | $400.00(5) | Aug-2022 | 120 |
490 Broadway New York, NY | MINISO | 4,769(5) | $500.00(5) | Aug-2022 | 120 |
523 Broadway New York, NY | Sunglass Hut | 2,124(5) | $300.00(5) | Jul-2022 | 120 |
550 Broadway New York, NY | Vans | 2,500 | $360.00 | Jun-2022 | 120 |
536 Broadway New York, NY | Armani Exchange | 5,447(5) | $385.00(5) | May-2022 | 84 |
542 Broadway New York, NY | Kick Essentials | 1,672 | $287.00 | Apr-2022 | 120 |
446 Broadway New York, NY | Rally Rumi | 2,449(5) 2,950(5) | $275.00(5) $233.05(5) | Feb-2022 Dec-2021 | 132 120 |
581 Broadway New York, NY | Verizon | 4,300 | $372.00 | Jun-2021 | 120 |
462 Broadway New York, NY | Wells Fargo | 5,085 | $408.28 | Sept-2020 | 120 |
555 Broadway New York, NY | Offering | 8,775 | $550.00 | Sept-2022 | 120 |
486 Broadway New York, NY | Offering | 1,654(5) | $750.00(5) | Sept-2022 | 120 |
| (1) | Source: Appraisal unless otherwise indicated. |
| (2) | Based on the underwritten rent roll as of July 1, 2022. |
| (3) | Suite Size (SF) and Rent PSF for Prada are based on adjusted base rent and the associated net rentable area (SF) from Prada’s retail space units. |
| (4) | Suite Size (SF) and Rent PSF for H&M and Lure Fishbar are based on adjusted based rent and the associated net rentable area (SF) from retail units only. |
| (5) | The comparable tenant Suite Size (SF) and Rent PSF reflects only the tenant’s ground unit suite and associated rent. |
The Borrower. The borrower for the 575 Broadway Whole Loan is 575 Broadway Associates L.P., a Delaware limited partnership and special purpose entity. The general partner of the borrower, 575 Broadway GP LLC, a Delaware limited liability company, is a special purpose entity with two independent directors. Legal counsel to the borrower delivered a non-consolidation opinion in connection with the origination of the 575 Broadway Whole Loan.
The Borrower Sponsor. The borrower sponsor and non-recourse carveout guarantor for the 575 Broadway Whole Loan is Peter M. Brant. Mr. Brant is an entrepreneur, manufacturing executive, publisher, philanthropist and chief executive officer of White Birch Paper Company (“White Birch”). White Birch was co-founded by Mr. Brant’s father in 1941 and is one of the largest newsprint manufacturers in North America. As a real estate developer, Mr. Brant was involved in establishing Conyers Farm, a 1,500-acre residential community located in Greenwich, Connecticut and North Castle, New York. Mr. Brant has previously had ownership interests in entities that were subject to bankruptcies. See “Description of the Mortgage Pool—Default History, Bankruptcy Issues and Other Proceedings” in the Preliminary Prospectus.
Property Management. The 575 Broadway Property is managed by A.R.I. Investors Inc., a third-party management company.
Escrows and Reserves. At origination of the 575 Broadway Whole Loan, the borrower deposited (i) approximately $276,774 into a real estate tax reserve account, (ii) approximately $62,040 into an insurance reserve account, (iii) approximately $424,093 into a ground rent reserve account, and (iv) approximately $4,231,492 into an outstanding obligation reserve account, which includes $1,354,785 for rent credits for Prada, $1,324,405 for tenant improvements, $1,177,295 for free rent, and $375,007 for leasing commissions.
Tax Escrows – The borrower is required to deposit into a real estate tax reserve, on a monthly basis, 1/12 of the real estate taxes that lender estimates will be payable during the next 12 months, which currently equates to approximately $276,774.
| THE INFORMATION IN THIS STRUCTURAL AND COLLATERAL TERM SHEET IS NOT COMPLETE AND MAY BE AMENDED PRIOR TO THE TIME OF SALE. THIS TERM SHEET IS NOT AN OFFER TO SELL THESE SECURITIES AND IT IS NOT A SOLICITATION OF AN OFFER TO BUY THESE SECURITIES IN ANY JURISDICTION WHERE THE OFFER OR SALE IS NOT PERMITTED. |
| | 123 | |
| Structural and Collateral Term Sheet | | BMO 2023-C4 |
| No. 10 – 575 Broadway |
Insurance Reserve – The borrower is required to deposit into an insurance reserve, on a monthly basis, 1/12 of the amount which will be sufficient to pay the insurance premiums due for the renewal of coverage afforded by such policies (initially estimated to be approximately $20,680).
Replacement Reserve – The borrower is required to deposit into a replacement reserve, on a monthly basis, an amount equal to approximately $2,944.
TI/LC Reserve – The borrower is required to deposit into a TI/LC Reserve, on a monthly basis, an amount equal to approximately $36,802; provided, however upon the first monthly due date following the date that Estee Lauder renews it lease in accordance with the 575 Broadway Whole Loan documents for a term extending at least two years beyond the 575 Broadway Whole Loan maturity date, the monthly deposits for the TI/LC Reserve will be reduced to approximately $14,721.
Ground Rent Reserve – During the continuance of a Trigger Period (as defined below), the borrower will be required to deposit on a monthly basis an amount equal to (i) all base rent, (ii) additional rent and (iii) other amounts due and payable pursuant to the Ground Lease during the one-month period following the applicable date of deposit.
Façade Work Reserve – In the event that a preservation architect conducts an inspection of the 575 Broadway Property and determines that any work is required to preserve the exterior of the 575 Broadway Property, and such work is reasonably likely to cost in excess of $100,000, the borrower will be required to deposit into a reserve with the lender an amount equal to 100% of the cost required to complete the applicable work, as determined by the lender in its reasonable discretion. See “Description of the Mortgage Pool—Statistical Characteristics of the Mortgage Loans— Zoning and Use Restrictions”.
Lockbox / Cash Management. The 575 Broadway Whole Loan documents is structured with a hard lockbox with springing cash management. At origination of the 575 Broadway Whole Loan, the borrower was required to deliver a notice to each tenant directing each tenant to remit all payments under the applicable lease directly to the lender-controlled lockbox. All funds received by the borrower or the property manager are required to be immediately deposited in such lockbox account. All funds deposited into the lockbox are required to be released to borrower on each business day as borrower elects unless a Trigger Period exists. Upon the occurrence and during the continuance of a Trigger Period, if lender elects (in its sole and absolute discretion) to deliver a restricted account notice, all funds in the lockbox account are required to be swept each business day to a lender-controlled cash management account and disbursed in accordance with the 575 Broadway Whole Loan documents. All excess funds on deposit in the cash management account after the application of such funds in accordance with the 575 Broadway Whole Loan documents are required to be held by the lender in an excess cash flow reserve account as additional collateral for the 575 Broadway Whole Loan. Upon the cure of the applicable Trigger Period, so long as no other Trigger Period exists, the lender is required to return any amounts remaining on deposit in the excess cash flow reserve account to the borrower. Upon an event of default under the 575 Broadway Whole Loan documents, the lender will apply funds to the debt in such priority as it may determine.
A “Trigger Period” means a period (a) commencing upon the earliest of the occurrence of (i) an event of default, (ii) the debt service coverage ratio being less than 1.15x, and (iii) a Specified Tenant Trigger Period (as defined below); and (b) expiring upon (x) with respect to clause (i) above, the cure (if applicable) of such event of default, (y) with respect to clause (ii) above, the date the debt service coverage ratio is equal to or greater than 1.15x for two consecutive calendar quarters and (z) with respect to clause (iii) above, a Specified Tenant Trigger Period no longer exists.
A “Specified Tenant Trigger Period” means a period: (a) commencing upon the earlier to occur of (i) a Specified Tenant (as defined below) being in monetary or material non-monetary default beyond applicable notice and cure periods under the applicable Specified Tenant Lease (as defined below), (ii) the Specified Tenant failing to be in actual, physical possession of the Specified Tenant Space (or applicable portion thereof) (as defined below), (iii) other than in connection with a permitted dark event as described within the 575 Broadway Whole Loan documents, the Specified Tenant failing to be open for business during the customary hours and/or going dark in more than 30% of the applicable Specified Tenant Space, (iv) the Specified Tenant giving notice that it is terminating its lease for all or any portion of the Specified Tenant Space (or applicable portion thereof), (v) any termination or cancellation of any Specified Tenant Lease (including, without limitation, rejection in any bankruptcy or similar insolvency proceedings) and/or any Specified Tenant’s Lease failing to otherwise be in full force and effect, (vi) any bankruptcy or insolvency of a Specified Tenant, (vii) a Specified Tenant failing to extend or renew the applicable Specified Tenant Lease on or prior to the applicable Specified Tenant Extension Deadline (as defined below), (for the avoidance of doubt, as of the origination date, (A) the Specified Tenant Extension Deadline with respect to the lease in place with Estee Lauder will occur on the monthly payment date in March 2024, (B) the Specified
| THE INFORMATION IN THIS STRUCTURAL AND COLLATERAL TERM SHEET IS NOT COMPLETE AND MAY BE AMENDED PRIOR TO THE TIME OF SALE. THIS TERM SHEET IS NOT AN OFFER TO SELL THESE SECURITIES AND IT IS NOT A SOLICITATION OF AN OFFER TO BUY THESE SECURITIES IN ANY JURISDICTION WHERE THE OFFER OR SALE IS NOT PERMITTED. |
| | 124 | |
| Structural and Collateral Term Sheet | | BMO 2023-C4 |
| No. 10 – 575 Broadway |
Tenant Extension Deadline with respect to the lease in place with H&M will occur on the monthly payment date in January 2030, and (C) the Specified Tenant Extension Deadline with respect to the lease in place with Prada will occur on the monthly payment date in January 2035), each in accordance with the applicable terms and conditions for the applicable extension as stated within the Specified Tenant Lease and the 575 Broadway Whole Loan documents for the Specified Tenant Renewal Term (as defined below); and (b) expiring upon the earlier to occur of the lender’s receipt of evidence acceptable to the lender (which such evidence will include a duly executed estoppel certificate for the applicable Specified Tenant in form and substance acceptable to the lender) of (1) satisfaction of the applicable Specified Tenant Cure Conditions (as defined below), (2) the borrower leasing the entire Specified Tenant Space (or applicable portion thereof) pursuant to one or more leases in accordance with the terms and conditions of the 575 Broadway Whole Loan documents, the applicable tenant(s) under such lease(s) being in actual, physical occupancy of the space demised under its lease, all contingencies to effectiveness of each such lease having expired or been satisfied, each such lease has commenced and a rent commencement date having been established (without possibility of delay) and in the lender’s judgement, the applicable Specified Tenant Excess Cash Flow Condition (as defined below) being satisfied or (3) with respect to clause (iii) above, the satisfaction of the ST Cap Condition (as defined below) is satisfied with respect to the applicable Specified Tenant Space, provided, however (x) this clause will only effectively cure a Specified Tenant Trigger Period until the date that is two years prior to the stated maturity date (the “Measuring Date”) and (y) any Specified Tenant Trigger Period which has been cured pursuant to clause (3) would be ongoing as of the Measuring Date if the ST Cap Condition has not been satisfied.
A “Specified Tenant Cure Conditions” means, as applicable, (i) the applicable Specified Tenant has cured all defaults under the applicable Specified Tenant Lease and no other default beyond applicable notice and cure periods under such Specified Tenant Lease occurs for a period of three consecutive months following such cure, (ii) the applicable Specified Tenant is in actual, physical possession of the Specified Tenant Space (or applicable portion thereof) and, unless a permitted dark event is ongoing with respect to the applicable Specified Tenant, the Specified Tenant is open for business during customary hours and not “dark” in the Specified Tenant Space (or applicable portion thereof), (iii) the applicable Specified Tenant has revoked or rescinded all termination or cancellation notices with respect to the applicable Specified Tenant Lease and has re-affirmed the applicable Specified Tenant Lease as being in full force and effect, (iv) with respect to clause (a)(vii) of the definition of Specified Tenant Trigger Period above, the applicable Specified Tenant has renewed or extended the applicable Specified Tenant Renewal Term and in the lender’s judgement, the applicable Specified Tenant Excess Cash Flow Condition is satisfied, (v) with respect to any applicable bankruptcy or insolvency proceedings involving a Specified Tenant, the applicable Specified Tenant is no longer insolvent or subject to any bankruptcy or insolvency proceedings and has affirmed the applicable Specified Tenant Lease pursuant to final, non-appealable order of a court of competent jurisdiction and (vi) the applicable Specified Tenant is paying full, unabated rent under the applicable Specified Tenant Lease.
A “Specified Tenant” means, as applicable (i) Estee Lauder, Prada or H&M, (each related lease, the “Specified Tenant Lease” and the portion of the 575 Broadway Property demised to each Specified Tenant pursuant to the Specified Tenant Lease, the “Specified Tenant Space”), (ii) any other person that, individually or when aggregated with all other leases at the 575 Broadway Property with the same person or its affiliates, either (x) accounts for 15% or more of the rental income for the 575 Broadway Property, or (y) demises 15% or more of the 575 Broadway Property’s gross leasable area (it being acknowledged that in no event will any Specified Tenant pursuant to clause (ii) cease to be a Specified Tenant due to any reduction in the Specified Tenant Space demised pursuant to the applicable Specified Tenant Lease), and (iii) any guarantor(s) of the applicable related Specified Tenant Lease(s).
A “Specified Tenant Extension Deadline” means the earlier to occur of (i) the date occurring twelve months prior to the expiration of the term of the applicable Specified Tenant Lease and (ii) the deadline for the applicable Specified Tenant to renew the applicable Specified Tenant Lease as set forth within the leases.
A “ST Cap Condition” means the Measuring Date has not occurred and the amount in the excess cash flow subaccount (without duplication of any amounts then on deposit to satisfy the Specified Tenant Excess Cash Flow Condition with respect to any other Specified Tenant Trigger Period) is equal to or greater than two years of unabated base rent payable pursuant to the applicable Specified Tenant Lease with respect to which the applicable Specified Tenant Trigger Period has occurred.
A “Specified Tenant Renewal Term” means a term extending at least three years beyond the then applicable expiration date under the applicable Specified Tenant Lease.
| THE INFORMATION IN THIS STRUCTURAL AND COLLATERAL TERM SHEET IS NOT COMPLETE AND MAY BE AMENDED PRIOR TO THE TIME OF SALE. THIS TERM SHEET IS NOT AN OFFER TO SELL THESE SECURITIES AND IT IS NOT A SOLICITATION OF AN OFFER TO BUY THESE SECURITIES IN ANY JURISDICTION WHERE THE OFFER OR SALE IS NOT PERMITTED. |
| | 125 | |
| Structural and Collateral Term Sheet | | BMO 2023-C4 |
| No. 10 – 575 Broadway |
A “Specified Tenant Excess Cash Flow Condition” means (a) with respect to curing any Specified Tenant Trigger Period by re-tenanting the applicable Specified Tenant Space, sufficient funds have been accumulated in the excess cash flow subaccount (during the continuance of a Specified Tenant Trigger Period) to cover all reasonably anticipated leasing commissions, tenant improvement costs, tenant allowances, free rent periods, and/or rent abatement periods to be incurred in connection with such re-tenanting and (b) with respect to curing any Specified Tenant Trigger Period by renewal/extension of any Specified Tenant Lease, sufficient funds have been accumulated in the excess cash flow account (during the continuance of a Specified Tenant Trigger Period) to cover all reasonably anticipated leasing commissions, tenant improvement costs, tenant allowances, free rent periods, and/or rent abatement periods to be incurred in connection with such renewal/extension. For the avoidance of doubt, in no event will any excess cash flow funds which are being utilized to satisfy the Specified Tenant Excess Cash Flow Condition with respect to the cure of any Specified Tenant Trigger Period be available, credited, or otherwise considered in satisfying (x) the Specified Tenant Excess Cash Flow Condition with respect to any other Specified Tenant Trigger Period and/or (y) the ST Cap Condition with respect to any Specified Tenant Trigger Period.
Subordinate Debt. None.
Mezzanine Debt. None.
Partial Release. Not permitted.
Ground Lease. The 575 Broadway Property is subject to a ground lease that expires on June 30, 2060. The current annual ground lease rent as of the Cut-off Date is equal to $5,089,118. Base rent for each subsequent lease year will be an amount equal to the sum of (a) the percentage by which the applicable price index for such lease year exceeds the base index, multiplied by $4,140,000 and (b) $4,140,000. The annual ground lease rent increase is subject to a floor of 3.5% and a ceiling of 5.5% on any adjustment date. See “Description of the Mortgage Pool—Mortgage Pool Characteristics—Fee & Leasehold Estates; Ground Leases” in the Preliminary Prospectus.
| THE INFORMATION IN THIS STRUCTURAL AND COLLATERAL TERM SHEET IS NOT COMPLETE AND MAY BE AMENDED PRIOR TO THE TIME OF SALE. THIS TERM SHEET IS NOT AN OFFER TO SELL THESE SECURITIES AND IT IS NOT A SOLICITATION OF AN OFFER TO BUY THESE SECURITIES IN ANY JURISDICTION WHERE THE OFFER OR SALE IS NOT PERMITTED. |
| | 126 | |
| Structural and Collateral Term Sheet | | BMO 2023-C4 |
| No. 11 – Cadence |
| Mortgage Loan Information | | Property Information |
| Mortgage Loan Seller: | BMO | | Single Asset / Portfolio: | Portfolio |
| Original Principal Balance: | $25,778,500 | | Title: | Fee |
| Cut-off Date Principal Balance: | $25,778,500 | | Property Type - Subtype: | Industrial – Warehouse / Distribution |
| % of IPB: | 3.3% | | Net Rentable Area (SF): | 644,842 |
| Loan Purpose: | Acquisition | | Location: | Various |
| Borrower: | NM CADE, L.L.C. | | Year Built / Renovated: | Various / Various |
| Borrower Sponsors: | New Mountain Net Lease Partners Corporation | | Occupancy: | 100.0% |
| Interest Rate: | 6.15000% | | Occupancy Date: | 2/6/2023 |
| Note Date: | 11/18/2022 | | 4th Most Recent NOI (As of)(1): | NAV |
| Maturity Date: | 12/6/2032 | | 3rd Most Recent NOI (As of)(1): | NAV |
| Interest-only Period: | 120 months | | 2nd Most Recent NOI (As of)(1): | NAV |
| Original Term: | 120 months | | Most Recent NOI (As of)(1): | NAV |
| Original Amortization Term: | None | | UW Economic Occupancy: | 95.0% |
| Amortization Type: | Interest Only | | UW Revenues: | $3,489,194 |
| Call Protection: | L(25),YM1(1),DorYM1(90),O(4) | | UW Expenses: | $0 |
| Lockbox / Cash Management: | Hard / Springing | | UW NOI: | $3,489,194 |
| Additional Debt: | No | | UW NCF: | $3,489,194 |
| Additional Debt Balance: | N/A | | Appraised Value / Per SF(2): | $54,400,000 / $84 |
| Additional Debt Type: | N/A | | Appraisal Date: | 8/31/2022 |
| | | | | |
| Escrows and Reserves | | Financial Information |
| | Initial | Monthly | Initial Cap | | Cut-off Date Loan / SF: | $40 |
| Taxes: | $0 | Springing | N/A | | Maturity Date Loan / SF: | $40 |
| Insurance: | $0 | Springing | N/A | | Cut-off Date LTV(2): | 47.4% |
| Replacement Reserves: | $0 | Springing | $193,453 | | Maturity Date LTV(2): | 47.4% |
| Rollover Reserve: | $0 | Springing | $967,263 | | UW NCF DSCR: | 2.17x |
| | | | | | UW NOI Debt Yield: | 13.5% |
| | | | | | | |
| Sources and Uses |
| Sources | Proceeds | % of Total | | Uses | Proceeds | % of Total |
| Mortgage Loan | $25,778,500 | 49.2 | % | | Purchase Price | $51,557,000 | 98.4 | % |
| Borrower Sponsor Equity | 26,607,796 | 50.8 | | | Closing Costs | 829,296 | 1.6 | |
| | | | | | | |
| Total Sources | $52,386,296 | 100.0 | % | | Total Uses | $52,386,296 | 100.0 | % |
| (1) | The Cadence Properties (as defined below) do not have any operating history because the borrower recently acquired the properties from the prior owner and leased them back to such prior owner in a sale-lease back transaction, and the related lease commenced on August 17, 2022. |
| (2) | The appraised value of $54,400,000 is an “as-portfolio” value. The aggregate “as-is” individual appraised value of the Cadence Properties is $52,475,000. The Cut-off Date LTV and Maturity Date LTV based on the aggregate individual “as-is” appraised value are each 49.1%. |
The Loan. The eleventh largest mortgage loan (the “Cadence Mortgage Loan”) is secured by the borrower’s fee interest in a 644,842 square foot industrial portfolio located in various locations across the United States (the “Cadence Properties”). The Cadence Mortgage Loan was originated on November 18, 2022 by Bank of Montreal. The Cadence Mortgage Loan accrues interest at an interest rate of 6.15000% per annum. The Cadence Mortgage Loan has an original term of 120 months, has a remaining term of 118 months and is interest only for the entire term. The scheduled maturity date of the Cadence Mortgage Loan is the due date that occurs on December 6, 2032.
The Properties. The Cadence Properties consist of 17 industrial facilities totaling 644,842 square feet across the United States. The Cadence Properties are occupied by a single tenant. On August 17, 2022, the borrower acquired the Cadence Properties from “Cadence” and leased 100% of the properties to Cadence in a sale-lease back transaction.
| THE INFORMATION IN THIS STRUCTURAL AND COLLATERAL TERM SHEET IS NOT COMPLETE AND MAY BE AMENDED PRIOR TO THE TIME OF SALE. THIS TERM SHEET IS NOT AN OFFER TO SELL THESE SECURITIES AND IT IS NOT A SOLICITATION OF AN OFFER TO BUY THESE SECURITIES IN ANY JURISDICTION WHERE THE OFFER OR SALE IS NOT PERMITTED. |
| | 127 | |
| Structural and Collateral Term Sheet | | BMO 2023-C4 |
| No. 11 – Cadence |
The following table presents a portfolio summary of the Cadence Properties:
| Portfolio Summary |
| # | Property | City | State | Year Built | Year Renovated | Square Feet | ALA | % of ALA | “As-Is” Appraised Value | In-Place Occupancy(1) |
| 1 | 1175 Early Drive | Winchester | KY | 1975 | 1988 | 165,237 | $5,010,780 | 19.4% | $10,200,000 | 100.0% | |
| 2 | 207 North Forest Hills School Road | Marshville | NC | 1972 | 2008 | 94,104 | 3,684,397 | 14.3 | 7,500,000 | 100.0 | |
| 3 | 8450 Tanner Williams Road | Mobile | AL | 1968 | 2010 | 71,008 | 3,291,395 | 12.8 | 6,700,000 | 100.0 | |
| 4 | 10992 Leadbetter Road | Ashland | VA | 1980 | 2012 | 36,312 | 2,063,263 | 8.0 | 4,200,000 | 100.0 | |
| 5 | 8125 Tridon Drive | Smyrna | TN | 2001 | 2008 | 25,000 | 1,866,761 | 7.2 | 3,800,000 | 100.0 | |
| 6 | 1789 Hock Avenue | North Charleston | SC | 1979 | NAP | 25,577 | 1,670,260 | 6.5 | 3,400,000 | 100.0 | |
| 7 | 222 Industrial Drive | Chickamauga | GA | 1997 | 2007 | 36,300 | 1,498,322 | 5.8 | 3,050,000 | 100.0 | |
| 8 | 701 McDowell Road | Asheboro | NC | 1988, 2000, 2007 | NAP | 35,279 | 1,105,319 | 4.3 | 2,250,000 | 100.0 | |
| 9 | 101 East Jefferson Avenue | West Memphis | AR | 1957, 1980, 1998, 2009 | NAP | 25,000 | 994,787 | 3.9 | 2,025,000 | 100.0 | |
| 10 | 243 County Road 414 | Jonesboro | AR | 1997 | 2001 | 24,600 | 982,506 | 3.8 | 2,000,000 | 100.0 | |
| 11 | 4522 East State Highway 18 | Blytheville | AR | 1999 | NAP | 22,025 | 908,818 | 3.5 | 1,850,000 | 100.0 | |
| 12 | 344 Phillips 273 Road | Lexa | AR | 1996 | NAP | 26,000 | 700,035 | 2.7 | 1,425,000 | 100.0 | |
| 13 | 120 East Blanchard Road | Florence | SC | 1989 | 2018 | 13,998 | 638,629 | 2.5 | 1,300,000 | 100.0 | |
| 14 | 4518 West 21st Street | Tulsa | OK | 1976 | 2007 | 9,066 | 417,565 | 1.6 | 850,000 | 100.0 | |
| 15 | 3701 Stagecoach Road | Jefferson | AR | 1996 | NAP | 10,000 | 388,090 | 1.5 | 790,000 | 100.0 | |
| 16 | 2070 Highway 150 | Bessemer | AL | 1987 | 2006 | 18,374 | 356,158 | 1.4 | 725,000 | 100.0 | |
| 17 | 317-417 Crow Street | Monroe | NC | 1962, 1970 | NAP | 6,962 | 201,415 | 0.8 | 410,000 | 100.0 | |
| | Total | | | | | 644,842 | $25,778,500 | 100.0% | $54,400,000(2) | 100.0% | |
| (1) | Current Occupancy is as of February 6, 2023. |
| (2) | The appraised value of $54,400,000 is an “as-portfolio” value. The aggregate “as-is” individual appraised value of the Cadence Properties is $52,475,000. |
Major Tenant.
Cadence (644,842 square feet; 100.0% of the NRA; 100.0% of underwritten base rent): Cadence is a national manufacturer of lubricants, fuels, and diesel exhaust fluid distribution serving the automotive, commercial, and industrial markets. The Cadence Properties are located across the country and serve as regional hubs offering proximity to end-customers. All of the facilities include an indoor and/or outdoor tank storage for bulk liquids, traditional racked warehouse space utilized to store packaged liquids prior to delivery to end-customers, significant amounts of laydown space, and no on-site processing or refining. Cadence sold the Cadence Properties to the borrower and leased them back from the borrower under a triple net lease with a commencement date of August 17, 2022 and a scheduled expiration date of August 31, 2042. The Cadence lease has two, 10-year renewal options. Cadence’s lease contains no early termination or contraction options. The Cadence master lease is dated as of August 17, 2022 between the borrower and Pugh Lubricants, LLC, Davison Fuels & Oil, LLC, Mid South Sales, LLC, Frost Oil Co., LLC and Brewer-Hendley Oil Co., LLC.
| THE INFORMATION IN THIS STRUCTURAL AND COLLATERAL TERM SHEET IS NOT COMPLETE AND MAY BE AMENDED PRIOR TO THE TIME OF SALE. THIS TERM SHEET IS NOT AN OFFER TO SELL THESE SECURITIES AND IT IS NOT A SOLICITATION OF AN OFFER TO BUY THESE SECURITIES IN ANY JURISDICTION WHERE THE OFFER OR SALE IS NOT PERMITTED. |
| | 128 | |
| Structural and Collateral Term Sheet | | BMO 2023-C4 |
| No. 11 – Cadence |
The following table presents certain information relating to the historical and current occupancy of the Cadence Properties:
| Historical and Current Occupancy(1) |
| 2019 | 2020 | 2021 | Current(2) |
| NAV | NAV | NAV | 100.0% |
| (1) | The historical occupancy is not available because the borrower recently acquired the Cadence Properties from the current sole tenant and leased them back to such tenant in a sale-lease back transaction under a lease that commenced on August 17, 2022. |
| (2) | Current Occupancy is as of February 6, 2023. |
The following table presents certain information relating to the sole tenant for the Cadence Properties:
| Tenant Summary(1) |
| Tenant | Ratings
Moody’s/S&P/Fitch(2) | Net Rentable Area (SF) | % of
Total NRA | UW Base Rent PSF(3) | UW Base Rent(3) | % of Total
UW Base Rent(3) | Lease
Exp. Date |
| Cadence | NR/NR/NR | 644,842 | 100.0% | $5.70 | $3,672,835 | 100.0% | 8/31/2042 |
| Occupied Collateral Total / Wtd. Avg. | | 644,842 | 100.0% | $5.70 | $3,672,835 | 100.0% | |
| | | | | | | | |
| Vacant Space | | 0 | 0.0% | | | | |
| | | | | | | | |
| Collateral Total | | 644,842 | 100.0% | | | | |
| | | | | | | | |
| (1) | Based on the underwritten rent roll dated February 6, 2023. The first rent payment date under the related lease was September 1, 2022. |
| (2) | The ratings shown above are those the parent company of the entity shown, although the parent company does not guarantee the lease. |
| (3) | UW Base Rent PSF, UW Base Rent and % of Total UW Base Rent include rent steps through September 2023. |
The following table presents certain information relating to the tenant lease expiration dates of the Cadence Properties:
| Lease Rollover Schedule(1) |
| Year | Number of Leases Expiring | Net Rentable Area Expiring | % of NRA Expiring | UW Base Rent Expiring(2) | % of UW Base Rent Expiring(2) | Cumulative Net Rentable Area Expiring | Cumulative % of NRA Expiring | Cumulative UW Base Rent Expiring(2) | Cumulative % of UW Base Rent Expiring(2) |
| Vacant | NAP | 0 | 0.0 | % | NAP | NAP | | 0 | 0.0% | | NAP | NA | P |
| 2022 & MTM | 0 | 0 | 0.0 | | $0 | 0.0 | % | 0 | 0.0% | | $0 | 0.0 | % |
| 2023 | 0 | 0 | 0.0 | | 0 | 0.0 | | 0 | 0.0% | | $0 | 0.0 | % |
| 2024 | 0 | 0 | 0.0 | | 0 | 0.0 | | 0 | 0.0% | | $0 | 0.0 | % |
| 2025 | 0 | 0 | 0.0 | | 0 | 0.0 | | 0 | 0.0% | | $0 | 0.0 | % |
| 2026 | 0 | 0 | 0.0 | | 0 | 0.0 | | 0 | 0.0% | | $0 | 0.0 | % |
| 2027 | 0 | 0 | 0.0 | | 0 | 0.0 | | 0 | 0.0% | | $0 | 0.0 | % |
| 2028 | 0 | 0 | 0.0 | | 0 | 0.0 | | 0 | 0.0% | | $0 | 0.0 | % |
| 2029 | 0 | 0 | 0.0 | | 0 | 0.0 | | 0 | 0.0% | | $0 | 0.0 | % |
| 2030 | 0 | 0 | 0.0 | | 0 | 0.0 | | 0 | 0.0% | | $0 | 0.0 | % |
| 2031 | 0 | 0 | 0.0 | | 0 | 0.0 | | 0 | 0.0% | | $0 | 0.0 | % |
| 2032 | 0 | 0 | 0.0 | | 0 | 0.0 | | 0 | 0.0% | | $0 | 0.0 | % |
| 2033 & Beyond | 1 | 644,842 | 100.0 | | 3,672,835 | 100.0 | | 644,842 | 100.0% | | $3,672,835 | 100.0 | % |
| Total | 1 | 644,842 | 100.0 | % | $3,672,835 | 100.0 | % | | | | |
| (1) | Based on the underwritten rent roll dated February 6, 2023. |
| (2) | UW Base Rent Expiring, % of UW Base Rent Expiring, Cumulative UW Base Rent Expiring and Cumulative % of UW Base Rent Expiring include rent steps through September 2023.
|
| THE INFORMATION IN THIS STRUCTURAL AND COLLATERAL TERM SHEET IS NOT COMPLETE AND MAY BE AMENDED PRIOR TO THE TIME OF SALE. THIS TERM SHEET IS NOT AN OFFER TO SELL THESE SECURITIES AND IT IS NOT A SOLICITATION OF AN OFFER TO BUY THESE SECURITIES IN ANY JURISDICTION WHERE THE OFFER OR SALE IS NOT PERMITTED. |
| | 129 | |
| Structural and Collateral Term Sheet | | BMO 2023-C4 |
| No. 11 – Cadence |
The following table presents certain information relating to the underwritten cash flows of the Cadence Mortgage Loan:
| Underwritten Cash Flows |
| | Underwritten | Per Square Foot | %(1) |
| Rents in Place | $3,583,254 | $5.56 | 97.6 | % |
| Rent Steps(2) | 89,581 | 0.14 | 2.4 | |
| Gross Potential Rent | $3,672,835 | $5.70 | 100.0 | % |
| (Vacancy) | (183,642) | (0.28) | (5.0) | |
| Effective Gross Income | $3,489,194 | $5.41 | 95.0 | % |
| Total Expenses(3) | 0 | 0.00 | 0.0 | |
| Net Operating Income | $3,489,194 | $5.41 | 100.0 | % |
| Capital Expenditures(3) | 0 | 0.00 | 0.0 | |
| TI/LC(3) | 0 | 0.00 | 0.0 | |
| Net Cash Flow | $3,489,194 | $5.41 | 100.0 | % |
| (1) | % column represents percent of Gross Potential Rent for all revenue lines and represents percent of Effective Gross Income for the remainder of fields. |
| (2) | Rent Steps include rent steps through September 2023. |
| (3) | The borrower acquired the Cadence Properties from, and leased them back to, Cadence under a triple net lease that commenced on August 17, 2022 in a sale-lease back transaction. |
The Market. The Cadence Properties are located in Arkansas, North Carolina, South Carolina, Alabama, Kentucky, Oklahoma, Georgia, Tennessee and Virginia.
The following table presents certain market information regarding the Cadence Properties and their respective submarkets:
| Market Overview(1) |
| Property | Year Built / Renovated | Net Rentable Area (SF)(2) | Submarket | Property Vacancy(2) | Submarket Vacancy(3) | Appraisal Concluded Vacancy | Submarket Inventory (SF)(3) | UW Base Rent PSF(2) | Submarket Rent PSF(3) |
| 1175 Early Drive | 1975 / 1988 | 165,237 | Clark County | 0.0% | 7.0% | 0.0% | 3,561,717 | $4.29 | $5.87 |
| 207 North Forest Hills School Road | 1972 / 2008 | 94,104 | Union County | 0.0% | 0.9% | 0.0% | 19,806,674 | $5.52 | $8.30 |
| 8450 Tanner Williams Road | 1968 / 2010 | 71,008 | NAV | 0.0% | NAV | 0.0% | NAV | $6.78 | NAV |
| 10992 Leadbetter Road | 1980 / 2012 | 36,312 | I-95 N/Mechanicsville | 0.0% | 1.1% | 0.0% | 9,675,975 | $8.23 | $9.55 |
| 8125 Tridon Drive | 2001 / 2008 | 25,000 | Southeast | 0.0% | 3.4% | 0.0% | 73,767,131 | $10.19 | $9.76 |
| 1789 Hock Avenue | 1979 / NAP | 25,577 | North Charleston | 0.0% | 3.0% | 0.0% | 35,997,786 | $9.19 | $9.18 |
| 222 Industrial Drive | 1997 / 2007 | 36,300 | Walker County | 0.0% | 3.4% | 0.0% | 5,092,486 | $5.82 | $3.24 |
| 701 McDowell Road | 1988, 2000, 2007 / NAP | 35,279 | SW Randolph County | 0.0% | 0.0% | 0.0% | 5,252,954 | $4.43 | $4.25 |
| 101 East Jefferson Avenue | 1957, 1980, 1998, 2009 / NAP | 25,000 | Crittenden County | 0.0% | 9.8% | 0.0% | 6,092,447 | $5.84 | $5.17 |
| 243 County Road 414 | 1997 / 2001 | 24,600 | NAV | 0.0% | NAV | 0.0% | NAV | $5.84 | NAV |
| 4522 East State Highway 18 | 1999 / NAP | 22,025 | NAV | 0.0% | NAV | 0.0% | NAV | $5.84 | NAV |
| 344 Phillips 273 Road | 1996 / NAP | 26,000 | NAV | 0.0% | NAV | 0.0% | NAV | $4.12 | NAV |
| 120 East Blanchard Road | 1989 / 2018 | 13,998 | NAV | 0.0% | NAV | 0.0% | NAV | $6.66 | NAV |
| 4518 West 21st Street | 1976 / 2007 | 9,066 | West Tulsa | 0.0% | 9.8% | 0.0% | 14,117,933 | $6.61 | $5.65 |
| 3701 Stagecoach Road | 1996 / NAP | 10,000 | NAV | 0.0% | NAV | 0.0% | NAV | $5.49 | NAV |
| 2070 Highway 150 | 1987 / 2006 | 18,374 | NAV | 0.0% | NAV | 0.0% | NAV | $2.40 | NAV |
| 317-417 Crow Street | 1962, 1970 / NAP | 6,962 | Union County | 0.0% | 0.9% | 0.0% | 19,806,674 | $4.19 | $8.30 |
| Total/Wtd. Avg. | | 644,842 | | 0.0% | 3.3% | 0.0% | 173,365,103 | $5.70 | $8.53 |
| (1) | Source: Appraisal unless otherwise indicated. |
| (2) | Based on the underwritten rent roll dated February 6, 2023. |
| (3) | Submarket Vacancy, Submarket Inventory (SF) and Submarket Rent PSF is as of the second quarter of 2022.
|
| THE INFORMATION IN THIS STRUCTURAL AND COLLATERAL TERM SHEET IS NOT COMPLETE AND MAY BE AMENDED PRIOR TO THE TIME OF SALE. THIS TERM SHEET IS NOT AN OFFER TO SELL THESE SECURITIES AND IT IS NOT A SOLICITATION OF AN OFFER TO BUY THESE SECURITIES IN ANY JURISDICTION WHERE THE OFFER OR SALE IS NOT PERMITTED. |
| | 130 | |
| Structural and Collateral Term Sheet | | BMO 2023-C4 |
| No. 11 – Cadence |
The following table presents certain information relating to comparable industrial leases to the Cadence Properties:
| Comparable Industrial Leases(1) |
| Property Location | Year Built / Renovated | NRA (SF) | Tenant | Lease Size (SF) | Rent PSF | Commencement | Lease Term (Years) | Lease Type |
| Various (Subject) | Various / Various | Various | Cadence | Various | Various | Aug-2022(2) | 20.1(2) | Triple Net |
7850 Foundation Drive Florence, KY | 1985 / NAP | 63,656 | SRS Distribution, Inc. (Willoughby Supply) | 63,656 | $5.50 | May-2022 | 10.0 | Triple Net |
2857 Nathan Street Newton, NC 28658 | 1972 / 2022 | 86,577 | Restoration Hardware | 86,577 | $4.65 | June-2022 | 10.0 | Triple Net |
5640 Commerce Boulevard East Mobile, AL 36619 | 2002 / NAP | 21,750 | NAV | NAV | $7.50 | NAV | NAV | Triple Net |
3203 Commerce Road Richmond, VA 23234 | 1971 / NAP | 21,060 | United Rentals | 21,060 | $7.42 | Jul-2020 | 4.0 | Triple Net |
566 Brick Church Drive Nashville, TN 37207 | 1998 / NAP | 32,549 | Ratermann Manufacturing | 11,191 | $9.85 | Mar-2021 | 3.0 | Triple Net |
9861 Highway 78 Ladson, SC 29456 | 2003 / NAP | 14,000 | Southeast Industrial Equipment | 14,000 | $8.00 | Aug-2023 | 5.0 | Triple Net |
4400 Amnicola Highway Chattanooga, TN 37406 | 1969 / 2021 | 89,834 | Cedar Electronics | 62,227 | $4.45 | Apr-2021 | 8.0 | Triple Net |
4320 Enterprise Drive Winston-Salem, NC 27106 | 1984 / NAP | 46,500 | Branch Furniture | 26,500 | $5.15 | Feb-2022 | 1.2 | Triple Net |
4517 S. Mendenhall Road Memphis, TN 38141 | 1995 / 2007 | 18,250 | Sunbelt Rentals | 18,250 | $7.31 | May-2014 | 10.0 | Triple Net |
2902 Quality Way Jonesboro, AR 72401 | 1990 / 2013 | 142,206 | Trinity Lighting | 142,206 | $3.75 | Jan-2021 | 15.0 | Absolute Net |
6999 West Heber Springs Road Quitman, AR 72131 | 1978 / 2021 | 25,360 | Nuera Transport | 25,630 | $3.64 | Feb-2022 | 5.0 | Triple Net |
11606 US Highway 67 Benton, AR 72015 | 2009 / NAP | 8,000 | Sharps Warehouse | 8,000 | $6.25 | Aug-2020 | 5.0 | Triple Net |
812 West Darlington Street Florence, SC 29501 | 1955 / 2020 | 8,400 | Redbull Distribution | 8,400 | $9.30 | Jun-2020 | 5.0 | Triple Net |
5666 South 122nd Street Tulsa, OK 74146 | 1997 / NAP | 38,180 | Wallace Production | 2,500 | $7.10 | Jul-2022 | 3.0 | Triple Net |
400 Phillips Road North Little Rock, AR 72117 | 1980 / 2019 | 37,743 | Kimbel Mechanical | 37,743 | $4.25 | Jun-2022 | 7.0 | Triple Net |
10 Monroe Drive Pelham, AL 35124 | 2000 / NAP | 10,500 | Highpoint Properties | 10,500 | $5.00 | May-2018 | 4.0 | Triple Net |
1043-A Robeson Street Fayetteville, NC 28305 | 1988 / 2017 | 12,000 | TruGreen | 12,000 | $8.24 | Mar-2022 | 11.0 | Triple Net |
| (1) | Source: Appraisal unless otherwise indicated. |
| (2) | Based on the underwritten rent roll dated February 6, 2023. |
| THE INFORMATION IN THIS STRUCTURAL AND COLLATERAL TERM SHEET IS NOT COMPLETE AND MAY BE AMENDED PRIOR TO THE TIME OF SALE. THIS TERM SHEET IS NOT AN OFFER TO SELL THESE SECURITIES AND IT IS NOT A SOLICITATION OF AN OFFER TO BUY THESE SECURITIES IN ANY JURISDICTION WHERE THE OFFER OR SALE IS NOT PERMITTED. |
| | 131 | |
| Structural and Collateral Term Sheet | | BMO 2023-C4 |
| No. 12 – Great Lakes Crossing Outlets |
| Mortgage Loan Information | | Property Information |
| Mortgage Loan Seller: | BMO | | Single Asset / Portfolio: | Single Asset |
| Original Principal Balance(1): | $25,750,000 | | Title: | Fee |
| Cut-off Date Principal Balance(1): | $25,750,000 | | Property Type – Subtype: | Retail – Outlet Center |
| % of IPB: | 3.3% | | Net Rentable Area (SF): | 1,128,332 |
| Loan Purpose: | Refinance | | Location: | Auburn Hills, MI |
| Borrower: | Taubman Auburn Hills Associates Limited Partnership | | Year Built / Renovated: | 1998 / 2010 |
| Borrower Sponsor: | The Taubman Realty Group LLC | | Occupancy: | 89.6% |
| Interest Rate: | 6.52100% | | Occupancy Date: | 11/30/2022 |
| Note Date: | 1/5/2023 | | 4th Most Recent NOI (As of): | $34,244,744 (12/31/2019) |
| Maturity Date: | 2/1/2033 | | 3rd Most Recent NOI (As of): | $27,851,384 (12/31/2020) |
| Interest-only Period: | 120 months | | 2nd Most Recent NOI (As of): | $32,911,337 (12/31/2021) |
| Original Term: | 120 months | | Most Recent NOI (As of): | $31,655,635 (TTM 11/30/2022) |
| Original Amortization Term: | None | | UW Economic Occupancy: | 92.6% |
| Amortization Type: | Interest Only | | UW Revenues: | $47,000,639 |
| Call Protection: | L(24),D(90),O(6) | | UW Expenses: | $15,438,872 |
| Lockbox / Cash Management: | Hard / Springing | | UW NOI: | $31,561,767 |
| Additional Debt(1): | Yes | | UW NCF: | $29,734,689 |
| Additional Debt Balance(1): | 154,250,000 | | Appraised Value / Per SF: | $400,000,000 / $355 |
| Additional Debt Type(1): | Pari Passu | | Appraisal Date: | 11/10/2022 |
| | | | | |
| Escrows and Reserves | | Financial Information(1) |
| | Initial | Monthly | Initial Cap | | Cut-off Date Loan / SF: | $160 |
| Taxes: | $0 | Springing | N/A | | Maturity Date Loan / SF: | $160 |
| Insurance: | $0 | Springing | N/A | | Cut-off Date LTV: | 45.0% |
| Replacement Reserves: | $0 | Springing | $519,033 | | Maturity Date LTV: | 45.0% |
| TI / LC: | $0 | $94,028 | $2,256,664 | | UW NCF DSCR: | 2.50x |
| Other Reserves(2): | $1,805,623 | $0 | N/A | | UW NOI Debt Yield: | 17.5% |
| | | | | | | |
| Sources and Uses |
| Sources | Proceeds | % of Total | | Uses | Proceeds | % of Total |
| Whole Loan | $180,000,000 | 99.5 | % | | Loan Payoff | $177,589,210 | 98.1 | % |
| Equity Contribution | 962,977 | 0.5 | | | Upfront Reserves | 1,805,623 | 1.0 | |
| | | | | Closing Costs | 1,568,144 | 0.9 | |
| Total Sources | $180,962,977 | 100.0 | % | | Total Uses | $180,962,977 | 100.0 | % |
| | | | | | | |
| (1) | The Great Lakes Crossing Outlets Mortgage Loan (as defined below) is part of a whole loan evidenced by 10 pari passu notes with an aggregate original principal balance of $180,000,000. Financial Information in the chart above reflects the Great Lakes Crossing Outlets Whole Loan (as defined below). For additional information, see “The Loan” below. |
| (2) | Other Reserves include the initial outstanding TI/LC obligations reserve ($1,581,204) and the initial gap rent reserve ($224,418) |
The Loan. The twelfth largest mortgage loan (the “Great Lakes Crossing Outlets Mortgage Loan”) has an original and Cut-off Date balance of $25,750,000 and is part of a whole loan evidenced by 10 pari passu promissory notes in the aggregate original principal amount of $180,000,000 (the “Great Lakes Crossing Outlets Whole Loan”). The Great Lakes Crossing Outlets Mortgage Loan is evidenced by the non-controlling Note A-3-1 which has an outstanding principal balance as of the Cut-off Date of $25,750,000. The Great Lakes Crossing Outlets Whole Loan is secured by a first mortgage lien on the borrower’s fee interest in a 1,128,332 square foot retail outlet center property located in Auburn Hills, Michigan (the “Great Lakes Crossing Outlets Property”). The Great Lakes Crossing Outlets Whole Loan was co-originated on January 5, 2023 by Bank of Montreal (“BMO”), Goldman Sachs Bank USA (“GS”), and DBR Investments Co. Limited (“DBRI”). The Great Lakes Crossing Outlets Whole Loan has a 10-year term and is interest only for the entire term. The Great Lakes Crossing Outlets Whole Loan proceeds were used to refinance the existing debt on the Great Lakes Crossing Outlets Property, fund upfront reserves, and pay origination costs. The Great Lakes Crossing Outlets Whole Loan accrues interest
| THE INFORMATION IN THIS STRUCTURAL AND COLLATERAL TERM SHEET IS NOT COMPLETE AND MAY BE AMENDED PRIOR TO THE TIME OF SALE. THIS TERM SHEET IS NOT AN OFFER TO SELL THESE SECURITIES AND IT IS NOT A SOLICITATION OF AN OFFER TO BUY THESE SECURITIES IN ANY JURISDICTION WHERE THE OFFER OR SALE IS NOT PERMITTED. |
| | 132 | |
| Structural and Collateral Term Sheet | | BMO 2023-C4 |
| No. 12 – Great Lakes Crossing Outlets |
at a fixed rate of 6.52100% per annum. The Great Lakes Crossing Outlets Mortgage Loan will be serviced pursuant to the pooling and servicing agreement for the BMO 2023-C4 securitization until the securitization of the controlling Note A-1-1, after which point it will be serviced pursuant to the pooling and servicing agreement for such future securitization. See “The Pooling and Servicing Agreement” in the Preliminary Prospectus. The table below summarizes the promissory notes that comprise the Great Lakes Crossing Outlets Whole Loan. The relationship between the holders of the Great Lakes Crossing Outlets Whole Loan is governed by a co-lender agreement as described under “Description of the Mortgage Pool—The Whole Loans—The Serviced Pari Passu Whole Loans” and “—The Whole Loans—The Outside Serviced Pari Passu Whole Loans” in the Preliminary Prospectus
| Whole Loan Summary |
| Note | Original Balance | Cut-off Date Balance | | Note Holder | Controlling Piece |
| A-1-1(1) | $40,000,000 | $40,000,000 | | GS | Yes |
| A-1-2(1) | $20,000,000 | $20,000,000 | | GS | No |
| A-1-3(1) | $10,000,000 | $10,000,000 | | GS | No |
| A-1-4(1) | $10,000,000 | $10,000,000 | | GS | No |
| A-2-1(1) | $20,000,000 | $20,000,000 | | DBRI | No |
| A-2-2(1) | $15,000,000 | $15,000,000 | | DBRI | No |
| A-2-3(1) | $15,000,000 | $15,000,000 | | DBRI | No |
| A-3-1 | $25,750,000 | $25,750,000 | | BMO 2023-C4 | No |
| A-3-2(1) | $14,250,000 | $14,250,000 | | BMO | No |
| A-3-3(1) | $10,000,000 | $10,000,000 | | BMO | No |
| Whole Loan | $180,000,000 | $180,000,000 | | | |
| (1) | Expected to be contributed to one or more future securitization(s). |
The Property. The Great Lakes Crossing Outlets Property is a retail outlet center comprised of a single story shopping center, totaling 1,357,631 square feet, of which 229,299 square feet is not included in the collateral, on an approximately 163.76-acre site in Auburn Hills, Michigan. The Great Lakes Crossing Outlets Property was built in 1998 and renovated in 2010. The Great Lakes Crossing Outlets Property has a total of 7,797 parking spaces, resulting in a ratio of approximately 6.91 spaces per 1,000 square feet of collateral. As of November 30, 2022, the Great Lakes Crossing Outlets Property was 89.6% occupied by 169 tenants.
Major Tenants.
Burlington Coat Factory (81,082 square feet; 7.2% of NRA, 2.5% of underwritten base rent, Moody’s/S&P/Fitch: NR/NR/NR): Founded in 1972 and headquartered in Burlington, New Jersey, Burlington Coat Factory (“Burlington”) is an off-price retail chain that operates 792 stores as of the second quarter of 2021. Burlington has been a tenant at the Great Lakes Crossing Outlets Property since 1998 under a lease expiring in January 2030.
Round 1 Bowling Amusement (59,071 square feet; 5.2% of NRA, 3.2% of underwritten base rent, Moody’s/S&P/Fitch: NR/NR/NR): Founded in 2009 and headquartered in Brea, California, “Round 1 Bowling Amusement” is a multi-entertainment facility offering a variety of entertainment activities in an indoor facility complex. Round 1 Bowling Amusement has more than 132 stores in America and Japan. Round 1 Bowling Amusement has been a tenant at the Great Lakes Crossing Outlets Property since 2017 under a lease expiring in September 2027.
Forever 21 (47,203 SF, 4.2% of NRA, 1.6% of underwritten rent, Moody’s/S&P/Fitch: NR/NR/NR): Founded in 1984 and headquartered in Los Angeles, California, “Forever 21” is a retail chain that offers high style designs and fashion basics. Forever 21 is located in more than 540 locations globally and online. Forever 21 has been a tenant at the Great Lakes Crossing Outlets Property since 2010 under a lease expiring in January 2023.
The following table presents certain information relating to the historical and current occupancy of the Great Lakes Crossing Outlets Property:
| Historical and Current Occupancy |
| 2019(1) | 2020(1) | 2021(1) | Current(2)(3) |
| 92.9% | 91.0% | 91.9% | 89.6% |
| (1) | Historical Occupancies are as of December 31 of each respective year. |
| (2) | Current Occupancy is as of November 30, 2022. |
| (3) | Includes four tenants that have signed leases but have not taken physical occupancy.
|
| THE INFORMATION IN THIS STRUCTURAL AND COLLATERAL TERM SHEET IS NOT COMPLETE AND MAY BE AMENDED PRIOR TO THE TIME OF SALE. THIS TERM SHEET IS NOT AN OFFER TO SELL THESE SECURITIES AND IT IS NOT A SOLICITATION OF AN OFFER TO BUY THESE SECURITIES IN ANY JURISDICTION WHERE THE OFFER OR SALE IS NOT PERMITTED. |
| | 133 | |
| Structural and Collateral Term Sheet | | BMO 2023-C4 |
| No. 12 – Great Lakes Crossing Outlets |
The following table presents certain information relating to the largest tenants based on net rentable area of the Great Lakes Crossing Outlets Property:
| Top 10 Tenant Summary(1) |
| Tenant | Ratings
Moody’s/S&P/Fitch(2) | Net Rentable Area (SF) | % of
Total NRA | UW Base Rent PSF | UW Base Rent | % of Total
UW Base Rent | Lease
Exp. Date |
| Burlington Coat Factory(3) | NR/BB+/NR | 81,082 | 7.2 | % | $12.67 | $1,026,943 | 2.5 | % | 1/31/2030 |
| Round 1 Bowling Amusement(3) | NR/NR/NR | 59,071 | 5.2 | | $22.13 | 1,307,500 | 3.2 | | 9/30/2027 |
| Forever 21(3) | NR/NR/NR | 47,203 | 4.2 | | $14.26 | 673,193 | 1.6 | | 1/31/2023 |
| Marshalls(3) | NR/NR/NR | 35,191 | 3.1 | | $21.16 | 744,692 | 1.8 | | 1/31/2027 |
| TJ Maxx(3) | A2/A/NR | 34,766 | 3.1 | | $21.16 | 735,699 | 1.8 | | 1/31/2027 |
| Nordstrom Rack(3) | Ba1/BB+/BBB- | 34,613 | 3.1 | | $17.00 | 588,421 | 1.4 | | 6/30/2030 |
| Legoland Discovery Center(3) | B2/B-/NR | 32,543 | 2.9 | | $10.82 | 352,178 | 0.9 | | 12/31/2031 |
| Planet Fitness | NR/NR/NR | 27,710 | 2.5 | | $14.48 | 401,373 | 1.0 | | 12/31/2028 |
| Camille La Vie | NR/NR/NR | 22,963 | 2.0 | | $16.72 | 383,835 | 0.9 | | 1/31/2028 |
| Arhaus The Loft | NR/NR/NR | 22,726 | 2.0 | | $22.66 | 515,023 | 1.3 | | 1/31/2030 |
| | | | | | | | |
| Major Tenants | | 397,868 | 35.3 | % | $16.91 | $6,728,857 | 16.5 | % | |
| Other Tenants | | 612,876 | 54.3 | % | $55.70 | $34,137,205 | 83.5 | % | |
| Occupied Collateral Total / Wtd. Avg. | | 1,010,744 | 89.6 | % | $40.43 | $40,866,062 | 100.0 | % | |
| | | | | | | | |
| Vacant Space | | 117,588 | 10.4 | % | | | | |
| | | | | | | | |
| Collateral Total | | 1,128,332 | 100.0 | % | | ��� | | |
| | | | | | | | |
| (1) | Based on underwritten rent roll dated November 30, 2022. |
| (2) | Ratings provided are for the parent company of the entity listed in the “Tenant” field whether or not the parent company guarantees the lease. |
| (3) | Anchor tenants for the Great Lakes Crossing Outlets Property represent approximately 28.8% of Net Rentable Area and approximately 13.3% of Total UW Base Rent. |
The following table presents certain information relating to the tenant lease expirations at the Great Lakes Crossing Outlets Property:
| Lease Rollover Schedule(1)(2) |
| Year | Number of Leases Expiring | Net Rentable Area Expiring | % of NRA Expiring | UW Base Rent Expiring | % of UW Base Rent Expiring | Cumulative Net Rentable Area Expiring | Cumulative % of NRA Expiring | Cumulative UW Base Rent Expiring | Cumulative % of UW Base Rent Expiring |
| Vacant | NAP | 117,588 | 10.4 | % | NAP | NA | P | 117,588 | 10.4% | | NAP | NAP | |
| 2022 & MTM | 3 | 5,584 | 0.5 | | $293,508 | 0.7 | % | 123,172 | 10.9% | | $293,508 | 0.7% | |
| 2023 | 30 | 144,015 | 12.8 | | 5,283,313 | 12.9 | | 267,187 | 23.7% | | $5,576,821 | 13.6% | |
| 2024 | 38 | 88,679 | 7.9 | | 4,847,810 | 11.9 | | 355,866 | 31.5% | | $10,424,632 | 25.5% | |
| 2025 | 34 | 141,288 | 12.5 | | 8,770,136 | 21.5 | | 497,154 | 44.1% | | $19,194,767 | 47.0% | |
| 2026 | 16 | 43,108 | 3.8 | | 3,665,300 | 9.0 | | 540,262 | 47.9% | | $22,860,067 | 55.9% | |
| 2027 | 20 | 187,481 | 16.6 | | 6,903,724 | 16.9 | | 727,743 | 64.5% | | $29,763,791 | 72.8% | |
| 2028 | 14 | 124,499 | 11.0 | | 4,180,946 | 10.2 | | 852,242 | 75.5% | | $33,944,737 | 83.1% | |
| 2029 | 8 | 34,775 | 3.1 | | 1,377,153 | 3.4 | | 887,017 | 78.6% | | $35,321,890 | 86.4% | |
| 2030 | 9 | 183,219 | 16.2 | | 3,885,077 | 9.5 | | 1,070,236 | 94.9% | | $39,206,967 | 95.9% | |
| 2031 | 3 | 38,939 | 3.5 | | 854,484 | 2.1 | | 1,109,175 | 98.3% | | $40,061,451 | 98.0% | |
| 2032 | 4 | 3,576 | 0.3 | | 446,249 | 1.1 | | 1,112,751 | 98.6% | | $40,507,699 | 99.1% | |
| 2033 & Beyond | 1 | 15,581 | 1.4 | | 358,363 | 0.9 | | 1,128,332 | 100.0% | | $40,866,062 | 100.0% | |
| Collateral Total | 180 | 1,128,332 | 100.0 | % | $40,866,062 | 100.0 | % | | | | |
| (1) | Based on the underwritten rent roll dated November 30, 2022. |
| (2) | Certain leases may have termination options that are exercisable prior to the originally stated expiration date of the lease and that are not considered in this Lease Rollover Schedule. |
| THE INFORMATION IN THIS STRUCTURAL AND COLLATERAL TERM SHEET IS NOT COMPLETE AND MAY BE AMENDED PRIOR TO THE TIME OF SALE. THIS TERM SHEET IS NOT AN OFFER TO SELL THESE SECURITIES AND IT IS NOT A SOLICITATION OF AN OFFER TO BUY THESE SECURITIES IN ANY JURISDICTION WHERE THE OFFER OR SALE IS NOT PERMITTED. |
| | 134 | |
| Structural and Collateral Term Sheet | | BMO 2023-C4 |
| No. 12 – Great Lakes Crossing Outlets |
The following table presents certain information relating to the operating history and underwritten cash flows of the Great Lakes Crossing Outlets Property:
| Operating History and Underwritten Net Cash Flow |
| | 2019 | 2020 | 2021 | TTM(1) | Underwritten | Per Square Foot | %(2) |
| Rents in Place | $27,351,881 | $24,157,616 | $25,715,947 | $27,665,175 | $28,969,473 | $25.67 | 57.1 | % |
| Other Revenue/Rents | 21,677,084 | 19,516,740 | 19,612,241 | 19,003,929 | 21,777,155 | 19.30 | 42.9 | |
| Gross Potential Rent | $49,028,964 | $43,674,356 | $45,328,188 | $46,669,104 | $50,746,628 | $44.97 | 100.0 | % |
| (Vacancy/Credit Loss) | (479,579) | (2,965,788) | 1,933,578 | (244,977) | (3,745,989) | (3.32) | (7.4 | ) |
| Effective Gross Income | $48,549,386 | $40,708,568 | $47,261,766 | $46,424,127 | $47,000,639 | $41.65 | 92.6 | % |
| | | | | | | | |
| Total Expenses(3) | 14,304,642 | 12,857,184 | 14,350,428 | 14,768,491 | 15,438,872 | 13.68 | 32.8 | |
| | | | | | | | |
| Net Operating Income | $34,244,744 | $27,851,384 | $32,911,337 | $31,655,635 | $31,561,767 | $27.97 | 67.2 | % |
| | | | | | | | |
| Capital Expenditures | 0 | 0 | 0 | 0 | 259,516 | 0.23 | 0.6 | |
| TI / LC | 0 | 0 | 0 | 0 | 1,567,562 | 1.39 | 3.3 | |
| | | | | | | | |
| Net Cash Flow | $34,244,744 | $27,851,384 | $32,911,337 | $31,655,635 | $29,734,689 | $26.35 | 63.3 | % |
| (1) | TTM represents the trailing 12-month period ending November 30, 2022. |
| (2) | % column represents percent of Gross Potential Rent for all revenue lines and represents percent of Effective Gross Income for the remainder of fields. |
| (3) | Total Expenses include real estate taxes and a management fee equal to 4.0% of Effective Gross Income. |
The Market. The Great Lakes Crossing Outlets Property is located in Auburn Hills, Michigan, within the Detroit metropolitan statistical area (the “Detroit MSA”). According to the appraisal, the Detroit MSA has grown to be the second largest metropolitan area in the Midwest, having a strategic regional location, a good transportation system, and a large manufacturing base. The presence of Ford, General Motors and Chrysler has historically supported much of the economic growth and employment in the Detroit MSA, and as of the past few decades is beginning to rely on the health care industry for long-term growth. According to the appraisal, as of August 2022, the unemployment rate in the Detroit MSA was 3.5%, representing a 2.65% increase in employment from the year prior.
The Great Lakes Crossing Outlets Property is located alongside I-75, which according to the appraisal has a daily traffic count of 71,265 vehicles. According to the appraisal, the Great Lakes Crossing Outlets Property is conveniently accessible to the 2.1 million residents that live within the trade area, providing a strong local customer base. Further, given its proximate location to Canada, the Great Lakes Crossing Outlets Property benefits from cross-border commerce. According to the appraisal, as of 2022, the estimated population within a one-mile, three-mile and five-mile radius totaled 2,140, 42,016 and 135,040 people, respectively, and average household income for the same radii was $89,356, $90,320 and $99,774, respectively.
According to the appraisal, the Great Lakes Crossing Outlets Property is situated within the Detroit retail market and the Pontiac submarket. As of the third quarter of 2022, the Detroit retail market contained total inventory of approximately 260.5 million square feet with an approximate 5.0% vacancy rate and average annual rental rates of $17.80 per square foot, and the Pontiac submarket contained a total inventory of approximately 8.2 million square feet with an approximate 2.7% vacancy rate and average annual rental rates of $17.93 per square foot.
| THE INFORMATION IN THIS STRUCTURAL AND COLLATERAL TERM SHEET IS NOT COMPLETE AND MAY BE AMENDED PRIOR TO THE TIME OF SALE. THIS TERM SHEET IS NOT AN OFFER TO SELL THESE SECURITIES AND IT IS NOT A SOLICITATION OF AN OFFER TO BUY THESE SECURITIES IN ANY JURISDICTION WHERE THE OFFER OR SALE IS NOT PERMITTED. |
| | 135 | |
| Structural and Collateral Term Sheet | | BMO 2023-C4 |
| No. 12 – Great Lakes Crossing Outlets |
The appraiser identified five comparable retail rentals to the Great Lakes Crossing Outlets Property:
| Competitive Retail Center Summary(1) |
| Property Name/Location | Year Built / Renovated or Expanded | Total NRA (SF) | Total Occupancy | Distance to Subject | Sales PSF | Anchor Tenants |
Great Lakes Crossing Outlets 4000 Baldwin Road Auburn Hills, MI | 1998 / 2010 | 1,128,332 | 89.6% | NAP | $503.40(2) | Nordstrom Rack TJ Maxx Burlington Coat Factory |
Westfield Santa Anita Arcadia, CA | 1973 / 2014, 2021 | 1,480,000 | 89.0% | 2,287 miles | $608.00 | JCPenney Nordstrom Macy’s |
Biltmore Fashion Park Scottsdale, AZ | 1963 / 2021 | 384,342 | 87.0% | 2,024 miles | $830.00 | Sak’s Fifth Avenue Macy’s |
Westfield Brandon Brandon, FL | 1995 / 2007 | 1,149,543 | 93.0% | 1,213 miles | $711.00(3) | NAV |
Galleria Edina Edina, MN | 1974 / 2006 | 398,585 | 99.0% | 720 miles | $891.00 | Rypen Furniture |
University Mall South Burlington, VT | 1979 / 2018 | 613,915 | 95.0% | 637 miles | $325.00 | Target JCPenney Kohl’s |
| (1) | Source: Appraisal unless otherwise indicated. |
| (2) | Based on October 2022 Trailing Twelve months reported sales figures. |
| (3) | Includes Apple sales figures. Sales excluding Apple are $550. |
| THE INFORMATION IN THIS STRUCTURAL AND COLLATERAL TERM SHEET IS NOT COMPLETE AND MAY BE AMENDED PRIOR TO THE TIME OF SALE. THIS TERM SHEET IS NOT AN OFFER TO SELL THESE SECURITIES AND IT IS NOT A SOLICITATION OF AN OFFER TO BUY THESE SECURITIES IN ANY JURISDICTION WHERE THE OFFER OR SALE IS NOT PERMITTED. |
| | 136 | |
| Structural and Collateral Term Sheet | | BMO 2023-C4 |
| No. 13 – 315 5th Avenue |
| Mortgage Loan Information | | Property Information |
| Mortgage Loan Seller: | BMO | | Single Asset / Portfolio: | Single Asset |
| Original Principal Balance: | $25,000,000 | | Title: | Fee |
| Cut-off Date Principal Balance: | $25,000,000 | | Property Type – Subtype: | Mixed Use – Office / Retail |
| % of IPB: | 3.2% | | Net Rentable Area (SF): | 52,500 |
| Loan Purpose: | Refinance | | Location: | New York, NY |
| Borrower: | 315 5th Avenue Equities, LLC | | Year Built / Renovated: | 1907 / 1995 |
| Borrower Sponsors: | Robert Gilardian and Albert Gilardian | | Occupancy: | 87.7% |
| Interest Rate: | 6.55000% | | Occupancy Date: | 12/1/2022 |
| Note Date: | 12/20/2022 | | 4th Most Recent NOI (As of): | $2,725,154 (12/31/2019) |
| Maturity Date: | 1/6/2033 | | 3rd Most Recent NOI (As of): | $1,334,728 (12/31/2020) |
| Interest-only Period: | 120 months | | 2nd Most Recent NOI (As of): | $1,967,238 (12/31/2021) |
| Original Term: | 120 months | | Most Recent NOI (As of): | $2,113,847 (TTM 7/31/2022) |
| Original Amortization Term: | None | | UW Economic Occupancy: | 89.9% |
| Amortization Type: | Interest Only | | UW Revenues: | $3,729,703 |
| Call Protection: | L(25),D(91),O(4) | | UW Expenses: | $1,328,249 |
| Lockbox / Cash Management: | Hard / Springing | | UW NOI: | $2,401,455 |
| Additional Debt(1): | No | | UW NCF: | $2,376,080 |
| Additional Debt Balance: | NAP | | Appraised Value / Per SF: | $48,800,000 / $930 |
| Additional Debt Type: | NAP | | Appraisal Date: | 10/27/2022 |
| | | | | |
| Escrows and Reserves | | Financial Information |
| | Initial | Monthly | Initial Cap | | Cut-off Date Loan / SF: | $476 |
| Taxes: | $136,216 | Springing | N/A | | Maturity Date Loan / SF: | $476 |
| Insurance: | $0 | Springing | N/A | | Cut-off Date LTV: | 51.2% |
| Replacement Reserves: | $0 | $656 | N/A | | Maturity Date LTV: | 51.2% |
| TI / LC Reserve: | $350,000 | $4,375 | N/A | | UW NCF DSCR: | 1.43x |
| Deferred Maintenance: | $26,950 | $0 | N/A | | UW NOI Debt Yield: | 9.6% |
| | | | | | | |
| Sources and Uses |
| Sources | Proceeds | % of Total | | Uses | Proceeds | % of Total |
| Mortgage Loan | $25,000,000 | 90.4 | % | | Loan Payoff | $26,086,088 | 94.3 | % |
| Sponsor Equity | 2,668,064 | 9.6 | | | Closing Costs | 1,068,811 | 3.9 | |
| | | | | Upfront Reserves | 513,166 | 1.9 | |
| Total Sources | $27,668,064 | 100.0 | % | | Total Uses | $27,668,064 | 100.0 | % |
| (1) | The 315 5th Avenue Mortgage Loan (as defined below) permits future mezzanine indebtedness provided (i) no event of default has occurred, (ii) only one secondary loan is originated and (iii) the principal amount of the mezzanine loan does not exceed $5,150,000. |
The Loan. The thirteenth largest mortgage loan (the “315 5th Avenue Mortgage Loan”) is secured by the borrower’s fee interest in a 52,500 square foot, retail / office property located in New York, New York (the “315 5th Avenue Property”). The 315 5th Avenue Mortgage Loan was originated on December 20, 2022 by Bank of Montreal. The 315 5th Avenue Mortgage Loan accrues interest at an interest rate of 6.55000% per annum. The 315 5th Avenue Mortgage Loan has an original term of 120 months, has a remaining term of 119 months and is interest only for the entire term. The scheduled maturity date of the 315 5th Avenue Mortgage Loan is the due date that occurs on January 6, 2033.
The Property. The 315 5th Avenue Property is an 11-story office/retail building with a total of 52,500 square feet, which consists of 48,150 square feet of office space and 4,350 square feet of retail space, located on the southeast corner of 5th Avenue and 32nd Street in New York, New York within the Midtown Manhattan South area. The 315 5th Avenue Property, which sits on a 0.1-acre parcel of land, was built in 1907 and renovated in 1995. The 315 5th Avenue Property features 13 basement storage rooms for tenants, polished concrete and hardwood flooring, at least two security cameras on each floor, two passenger elevators, and one freight elevator. The 315 5th Avenue Property features frontage on a connector street which connects two primary arterials. As of December 1, 2022, the 315 5th Avenue Property was 87.7% leased to 30 office
| THE INFORMATION IN THIS STRUCTURAL AND COLLATERAL TERM SHEET IS NOT COMPLETE AND MAY BE AMENDED PRIOR TO THE TIME OF SALE. THIS TERM SHEET IS NOT AN OFFER TO SELL THESE SECURITIES AND IT IS NOT A SOLICITATION OF AN OFFER TO BUY THESE SECURITIES IN ANY JURISDICTION WHERE THE OFFER OR SALE IS NOT PERMITTED. |
| | 137 | |
| Structural and Collateral Term Sheet | | BMO 2023-C4 |
| No. 13 – 315 5th Avenue |
tenants and five retail tenants. The retail space within the 315 5th Avenue Property is currently 100.0% leased to 315 Natural World (1,400 total square feet across two units), Sweet Churros (800 square feet), Ktown Creamery NY LLC (800 square feet), Masksheets (700 square feet) and Bakehouse 32 (650 square feet), which collectively account for 8.3% of NRA and are all located on the street level of the building.
Major Tenants. The three largest tenants based on underwritten base rent are Gogi Inc, d/b/a Soju House (Bar/Restaurant) / Gogi Inc. d/b/a Nubiana (Korean BBQ) (collectively, “Gogi”), Gilar Realty (“Gilar”) and American Friends of Shalva.
Gogi (9,900 square feet; 18.9% of NRA; 21.0% of underwritten base rent). Gogi has leased a 4,950 square foot unit occupying the entire second floor at the 315 5th Avenue Property since September 5, 2012 (“Soju House”) and began a lease for a 4,950 square foot unit occupying the entire third floor on December 1, 2020 (“Nubiana”). Gogi’s lease on the Soju House unit expires on July 31, 2031 and has no early termination options. Gogi’s lease on the Nubiana unit expires on April 30, 2031 and has no early termination options other than with respect to casualty or condemnation. The 315 5th Avenue Property is being utilized by Gogi as a Korean BBQ restaurant in the Nubiana unit and a Korean gastropub in the Soju House unit. Gogi is family owned and operated. Gogi exercised a 10-year extension option for the Soju House unit on May 21, 2021.
Gilar (4,950 square feet; 9.4% of NRA; 10.8% of underwritten base rent). Gilar is a real estate company owned by the sponsors, Robert Gilardian and Albert Gilardian. This location serves as the company’s headquarters. Gilar has been at the 315 5th Avenue Property since December 1, 2021 and leases the full eleventh floor. Gilar’s lease expires on November 30, 2036 and has no early termination options other than with respect to casualty or condemnation. The Gilar lease is guaranteed by the sponsor and the 315 5th Avenue Mortgage Loan documents include a guarantee of the payment and performance of the Gilar lease.
American Friends of Shalva (2,325 square feet; 4.4% of NRA; 3.8% of underwritten base rent). American Friends of Shalva is a charitable organization for the care and inclusion of persons with disabilities. American Friends of Shalva has been at the 315 5th Avenue Property since August 28, 2003 and currently occupies a unit on the sixth floor. American Friends of Shalva’s lease expires on January 31, 2024 and has no early termination options. American Friends of Shalva has executed seven extension agreements since entering into its original lease.
The following table presents certain information relating to the historical and current occupancy of the 315 5th Avenue Property:
| Historical and Current Occupancy(1) |
| 2019 | 2020 | 2021(2) | Current(3) |
| 89.6% | 86.0% | 87.5% | 87.7% |
| (1) | Historical Occupancies are as of December 31 of each respective year. |
| (2) | Gilar, a tenant affiliated with the borrower, began its occupancy in December 2021 and represents approximately 9.4% of NRA. |
| (3) | Current Occupancy is based on the underwritten rent roll dated December 1, 2022. |
| THE INFORMATION IN THIS STRUCTURAL AND COLLATERAL TERM SHEET IS NOT COMPLETE AND MAY BE AMENDED PRIOR TO THE TIME OF SALE. THIS TERM SHEET IS NOT AN OFFER TO SELL THESE SECURITIES AND IT IS NOT A SOLICITATION OF AN OFFER TO BUY THESE SECURITIES IN ANY JURISDICTION WHERE THE OFFER OR SALE IS NOT PERMITTED. |
| | 138 | |
| Structural and Collateral Term Sheet | | BMO 2023-C4 |
| No. 13 – 315 5th Avenue |
The following table presents certain information relating to the largest tenants based on net rentable area of the 315 5th Avenue Property:
| Top Tenant Summary(1) |
| Tenant | Tenant Type | Ratings Moody’s/S&P/Fitch | Net Rentable Area (SF) | % of
Total
NRA | UW Base Rent PSF(2) | UW Base Rent(2) | % of Total UW Base Rent(2) | Lease Expiration Date |
| Gogi | Office | NR/NR/NR | 9,900 | | 18.9 | % | $67.22 | $665,521 | 21.0 | % | Various(3) |
| Gilar | Office | NR/NR/NR | 4,950 | | 9.4 | | $68.96 | 341,345 | 10.8 | | 11/30/2036 |
| American Friends of Shalva | Office | NR/NR/NR | 2,325 | | 4.4 | | $51.44 | 119,606 | 3.8 | | 1/31/2024 |
| Secret Stylash | Office | NR/NR/NR | 1,885 | | 3.6 | | $51.28 | 96,667 | 3.0 | | 12/31/2024(4) |
| Empire Lash Studio | Office | NR/NR/NR | 1,675 | | 3.2 | | $47.28 | 79,200 | 2.5 | | 4/30/2027 |
| Chungdam PT Services | Office | NR/NR/NR | 1,630 | | 3.1 | | $44.17 | 72,000 | 2.3 | | 8/31/2027(5) |
| Pro Lash & Waxing | Office | NR/NR/NR | 1,535 | | 2.9 | | $57.10 | 87,645 | 2.8 | | 7/31/2023(6) |
| V Golden Bird Inc | Office | NR/NR/NR | 1,500 | | 2.9 | | $51.20 | 76,800 | 2.4 | | 8/31/2024(7) |
| 315 Natural World | Retail | NR/NR/NR | 1,400 | | 2.7 | | $207.79 | 290,906 | 9.2 | | 7/31/2025(8) |
| Vestium LLC | Office | NR/NR/NR | 1,400 | | 2.7 | | $40.29 | 56,400 | 1.8 | | 1/15/2025 |
| Top Tenants | | | 28,200 | | 53.7 | % | $66.88 | $1,886,089 | 59.5 | % | |
| Remaining Tenants | | | 17,865 | | 34.0 | % | $71.93 | $1,284,981 | 40.5 | % | |
| Occupied Collateral Total / Wtd. Avg. | | | 46,065 | | 87.7 | % | $68.84 | $3,171,070 | 100.0 | % | |
| Vacant Space | | | 6,435 | | 12.3 | | | | | |
| Collateral Total | | | 52,500 | | 100.0 | % | | | | |
| (1) | Based on underwritten rent roll dated December 1, 2022. |
| (2) | UW Base Rent, UW Base Rent PSF and % of Total UW Base Rent are comprised of contractual rent steps through December 2023. |
| (3) | Gogi occupies 9,900 square feet with two separate leases, each having a different expiration date. The Soju House unit has a lease expiration date of July 31, 2031 and the Nubiana unit has a lease expiration date of April 30, 2031. |
| (4) | Secret Stylash occupies 1,885 square feet with two separate leases sharing an expiration date. Secret Stylash has exercised a three- and a five-year extension option. |
| (5) | Chungdam PT Services has exercised a three-year extension option and two, five-year extension options. |
| (6) | Pro Lash & Waxing occupies 1,535 square feet with two separate leases sharing an expiration date of July 31, 2023. |
| (7) | V Golden Bird Inc has exercised a two-year extension option. |
| (8) | 315 Natural World occupies 1,400 square feet with two separate leases sharing an expiration date of July 31, 2025. 315 Natural World has exercised a five-year extension option for each unit. |
| THE INFORMATION IN THIS STRUCTURAL AND COLLATERAL TERM SHEET IS NOT COMPLETE AND MAY BE AMENDED PRIOR TO THE TIME OF SALE. THIS TERM SHEET IS NOT AN OFFER TO SELL THESE SECURITIES AND IT IS NOT A SOLICITATION OF AN OFFER TO BUY THESE SECURITIES IN ANY JURISDICTION WHERE THE OFFER OR SALE IS NOT PERMITTED. |
| | 139 | |
| Structural and Collateral Term Sheet | | BMO 2023-C4 |
| No. 13 – 315 5th Avenue |
The following table presents certain information relating to the tenant lease expirations of the 315 5th Avenue Property:
| Lease Rollover Schedule(1)(2) |
| Year | Number of Leases Expiring | NRA
Expiring | % of NRA
Expiring | UW Base
Rent
Expiring(3) | % of UW
Base Rent Expiring(3) | Cumulative
Net Rentable Area Expiring | Cumulative
% of NRA Expiring | Cumulative UW Base Rent Expiring(3) | Cumulative% of UW Base Rent Expiring(3) |
| Vacant | NAP | 6,435 | | 12.3 | % | NAP | NA | P | 6,435 | | 12.3% | | NAP | NA | P |
| 2022 & MTM | 2 | 1,625 | | 3.1 | | $67,776 | 2.1 | % | 8,060 | | 15.4% | | $67,776 | 2.1 | % |
| 2023 | 13 | 9,150 | | 17.4 | | 489,859 | 15.4 | | 17,210 | | 32.8% | | $557,635 | 17.6 | % |
| 2024 | 8 | 8,830 | | 16.8 | | 469,925 | 14.8 | | 26,040 | | 49.6% | | $1,027,561 | 32.4 | % |
| 2025 | 5 | 3,720 | | 7.1 | | 393,494 | 12.4 | | 29,760 | | 56.7% | | $1,421,054 | 44.8 | % |
| 2026 | 2 | 1,660 | | 3.2 | | 154,236 | 4.9 | | 31,420 | | 59.8% | | $1,575,290 | 49.7 | % |
| 2027 | 5 | 5,430 | | 10.3 | | 460,682 | 14.5 | | 36,850 | | 70.2% | | $2,035,972 | 64.2 | % |
| 2028 | 0 | 0 | | 0.0 | | 0 | 0.0 | | 36,850 | | 70.2% | | $2,035,972 | 64.2 | % |
| 2029 | 1 | 800 | | 1.5 | | 128,232 | 4.0 | | 37,650 | | 71.7% | | $2,164,204 | 68.2 | % |
| 2030 | 0 | 0 | | 0.0 | | 0 | 0.0 | | 37,650 | | 71.7% | | $2,164,204 | 68.2 | % |
| 2031 | 2 | 9,900 | | 18.9 | | 665,521 | 21.0 | | 47,550 | | 90.6% | | $2,829,726 | 89.2 | % |
| 2032 | 0 | 0 | | 0.0 | | 0 | 0.0 | | 47,550 | | 90.6% | | $2,829,726 | 89.2 | % |
| 2033 & Beyond | 1 | 4,950 | | 9.4 | | 341,345 | 10.8 | | 52,500 | | 100.0% | | $3,171,070 | 100.0 | % |
| Total | 39 | 52,500 | | 100.0 | % | $3,171,070 | 100.0 | % | | | | |
| (1) | Based on the underwritten rent roll dated December 1, 2022. |
| (2) | Certain leases may have termination options that are exercisable prior to the originally stated expiration date of the lease and that are not considered in this Lease Rollover Schedule. |
| (3) | UW Base Rent Expiring, % of UW Base Rent Expiring, Cumulative UW Base Rent Expiring and Cumulative % of UW Base Rent Expiring are comprised of contractual rent steps through December 2023. |
The following table presents certain information relating to the operating history and underwritten cash flows of the 315 5th Avenue Property:
| Operating History and Underwritten Net Cash Flow |
| | 2019 | 2020 | 2021 | TTM(1) | Underwritten | Per
Square Foot | %(2) |
| Commercial Rent(3) | $3,382,022 | $2,355,406 | $2,757,378 | $2,971,900 | $3,584,197 | $68.27 | 97.1 | % |
| Reimbursements | 535,697 | 246,733 | 348,532 | 383,029 | 521,604 | 9.94 | 14.1 | |
| Gross Potential Rent | $3,917,719 | $2,602,140 | $3,105,910 | $3,354,929 | $4,105,802 | $78.21 | 111.2 | % |
| Vacancy | 0 | 0 | 0 | 0 | (413,127) | (7.87) | (11.2 | ) |
| Net Rental Income | $3,917,719 | $2,602,140 | $3,105,910 | $3,354,929 | $3,692,675 | $70.34 | 100.0 | % |
| Other Income | 1,800 | 1,800 | 400 | 18,250 | 37,029 | 0.71 | 1.0 | |
| Effective Gross Income | $3,919,519 | $2,603,940 | $3,106,310 | $3,373,179 | $3,729,703 | $71.04 | 101.0 | % |
| Total Expenses | 1,194,365 | 1,269,211 | 1,139,072 | 1,259,332 | 1,328,249 | 25.30 | 35.6 | |
| Net Operating Income | $2,725,154 | $1,334,728 | $1,967,238 | $2,113,847 | $2,401,455 | $45.74 | 64.4 | % |
| Cap Ex, Total TI / LC | 0 | 0 | 0 | 0 | 25,375 | 0.48 | 0.7 | |
| Net Cash Flow | $2,725,154 | $1,334,728 | $1,967,238 | $2,113,847 | $2,376,080 | $45.26 | 63.7 | % |
| (1) | TTM reflects the trailing 12 months ending July 31, 2022. |
| (2) | % column represents percent of Net Rental Income for all revenue lines and represents percent of Effective Gross Income for the remainder of the fields. |
| (3) | Commercial Rent includes approximately $64,169 comprised of contractual rent steps through December 2023. |
The Market. The 315 5th Avenue Property is situated in the Midtown Manhattan South area of New York, New York, which neighborhood is bordered by 5th Avenue and 32nd Street. Midtown is home to some of the city's most prominent attractions, including the Empire State Building, the Chrysler Building, the Hudson Yards Redevelopment Project, the headquarters of the United Nations, Grand Central Terminal, and Rockefeller Center, as well as tourist destinations such as Broadway and Times Square. The 315 5th Avenue Property grants access to north-south buses that run along Fifth, Sixth, Seventh and Eighth Avenues. Crosstown bus service is provided along 14th and 23rd Streets. Area subway stations include the L, A, C and E lines at West 14th Street and Eighth Avenue, the F, M and L train at West 14th/16th Streets at Sixth Avenue, and the 4, 5, 6, N, Q, R and W trains at 14th Street and Union Square. 28th Street also has the 1 train at 7th Avenue, R and W
| THE INFORMATION IN THIS STRUCTURAL AND COLLATERAL TERM SHEET IS NOT COMPLETE AND MAY BE AMENDED PRIOR TO THE TIME OF SALE. THIS TERM SHEET IS NOT AN OFFER TO SELL THESE SECURITIES AND IT IS NOT A SOLICITATION OF AN OFFER TO BUY THESE SECURITIES IN ANY JURISDICTION WHERE THE OFFER OR SALE IS NOT PERMITTED. |
| | 140 | |
| Structural and Collateral Term Sheet | | BMO 2023-C4 |
| No. 13 – 315 5th Avenue |
trains at Broadway and the 6 train on Park Avenue South. The local area has an abundance of retail, personal services, schools, hospitals, parks and recreational facilities.
According to a third-party market research report, the 315 5th Avenue Property is located in the Midtown office submarket of the New York City market. As of the fourth quarter of 2022, the Midtown office submarket reported total inventory of approximately 21.9 million SF with a 19.7% vacancy rate and average asking rent of $53.64 PSF.
The following table presents information relating to comparable retail leases for the 315 5th Avenue Property:
| Comparable Retail Leases(1) |
| Property / Location | Tenant SF | Year Built / Renovated | Tenant | Rent PSF | Commencement Date | Lease Term (Mos.) | Lease Type |
315 5th Avenue New York, NY | 1,400(2) | 1907 / 1995 | 315 Natural World | $207.79 | (2) | Aug-12 | 1552) | Mod Gross |
73 Fifth Avenue New York, NY | 2,500 | 1907 / NAV | Warby Parker | $350.00 | | Sep-22 | 120 | Mod Gross |
437 Fifth Avenue New York, NY | 2,300 | 1906 / NAV | MedRite | $250.00 | | Jul-22 | 120 | Mod Gross |
120 Fifth Avenue New York, NY | 8,186 | 1906 / NAV | Allbirds | $350.00 | | Dec-21 | 120 | Mod Gross |
312 Fifth Avenue New York, NY | 2,500 | 1920 / 2018 | Joomak Banjum | $200.00 | | May-21 | 120 | Mod Gross |
135 Fifth Avenue New York, NY | 3,350 | 1899 / NAV | Avocado Mattress | $190.00 | | Feb-21 | 84 | Mod Gross |
| (1) | Source: Appraisal unless otherwise indicated. |
| (2) | Based on the underwritten rent roll dated December 1, 2022. |
The following table presents information relating to comparable office properties for the 315 5th Avenue Property:
| Comparable Office Rental Summary(1) |
| Property / Location | Year Built | Occ. | Size (SF) | Tenant | Suite Size (SF) | Rent PSF | Commencement | Lease Type | Lease Term (Months) |
315 5th Avenue New York, NY | 1907 | 87.7%(2) | 52,500 | Various(3) | Various | $56.72(3) | Various | Mod Gross | Various |
411 Fifth Avenue New York, NY | 1915 | NAV | NAV | Confidential | 9,012 | $48.00 | Oct-22 | Mod Gross | 60 |
303-305 Fifth Avenue New York, NY | 1928 | NAV | NAV | Confidential | 1,245 | $54.07 | Sep-22 | Mod Gross | 24 |
349 Fifth Avenue New York, NY | 1904 | NAV | NAV | Atelier Giorgetti | 8,000 | $75.00 | Apr-22 | Mod Gross | 36 |
347 Fifth Avenue New York, NY | 1907 | NAV | NAV | Gratuitive Psycho | 1,000 | $52.00 | Oct-21 | Mod Gross | 60 |
236 Fifth Avenue New York, NY | 1907 | NAV | NAV | LifeMD | 7,500 | $65.00 | Sep-21 | Mod Gross | 36 |
| (1) | Source: Appraisal unless otherwise indicated. |
| (2) | Based on the underwritten rent roll dated December 1, 2022. |
| (3) | Includes all office tenants. |
| THE INFORMATION IN THIS STRUCTURAL AND COLLATERAL TERM SHEET IS NOT COMPLETE AND MAY BE AMENDED PRIOR TO THE TIME OF SALE. THIS TERM SHEET IS NOT AN OFFER TO SELL THESE SECURITIES AND IT IS NOT A SOLICITATION OF AN OFFER TO BUY THESE SECURITIES IN ANY JURISDICTION WHERE THE OFFER OR SALE IS NOT PERMITTED. |
| | 141 | |
| Structural and Collateral Term Sheet | | BMO 2023-C4 |
| No. 14 – Patuxent & Coliseum |
| Mortgage Loan Information | | Property Information |
| Mortgage Loan Seller: | CREFI | | Single Asset / Portfolio: | Portfolio |
| Original Principal Balance: | $25,000,000 | | Title: | Fee |
| Cut-off Date Principal Balance: | $25,000,000 | | Property Type – Subtype: | Retail – Anchored |
| % of IPB: | 3.2% | | Net Rentable Area (SF): | 370,716 |
| Loan Purpose: | Refinance | | Location(2): | Various |
| Borrowers: | Cedar PCP-SAN Souci, LLC and | | Year Built / Renovated(2): | Various / Various |
| | Cedar-Coliseum FF, LLC | | Occupancy: | 86.8% |
| Borrower Sponsors: | Cedar Realty Trust Partnership, | | Occupancy Date: | 1/1/2023 |
| | L.P., Wheeler Real Estate | | 4th Most Recent NOI (As of): | $3,836,243 (12/31/2019) |
| | Investment Trust, Inc. and Cedar | | 3rd Most Recent NOI (As of): | $3,732,471 (12/31/2020) |
| | Realty Trust, Inc. | | 2nd Most Recent NOI (As of): | $2,792,703 (12/31/2021) |
| Interest Rate: | 6.35000% | | Most Recent NOI (As of): | $2,823,035 (TTM 10/31/2022) |
| Note Date: | 12/21/2022 | | UW Economic Occupancy: | 82.9% |
| Maturity Date: | 1/6/2033 | | UW Revenues: | $4,709,313 |
| Interest-only Period: | 120 months | | UW Expenses: | $1,059,101 |
| Original Term: | 120 months | | UW NOI(3): | $3,650,212 |
| Original Amortization Term: | None | | UW NCF: | $3,317,104 |
| Amortization Type: | Interest Only | | Appraised Value / Per SF(4): | $46,500,000 / $125 |
| Call Protection: | L(25),D(91),O(4) | | Appraisal Date(5): | Various |
| Lockbox / Cash Management: | Springing / Springing | | | |
| Additional Debt: | No | | | |
| Additional Debt Balance: | N/A | | | |
| Additional Debt Type: | N/A | | | |
| | | | | |
| Escrows and Reserves | | Financial Information |
| | Initial | Monthly | Initial Cap | | Cut-off Date Loan / SF: | $67 |
| Taxes: | $117,347 | $39,116 | N/A | | Maturity Date Loan / SF: | $67 |
| Insurance: | $9,520 | $9,520 | N/A | | Cut-off Date LTV(4): | 53.8% |
| Replacement Reserves: | $0 | $15,376 | N/A | | Maturity Date LTV(4): | 53.8% |
| Deferred Maintenance: | $269,788 | $0 | N/A | | UW NCF DSCR: | 2.06x |
TI / LC: | $0 | $12,245 | $550,000 | | UW NOI Debt Yield: | 14.6% |
| Other(1): | $3,911,894 | $0 | N/A | | | |
| | | | | | | |
| Sources and Uses |
| Sources | Proceeds | % of Total | | Uses | Proceeds | % of Total |
| Mortgage Loan | $25,000,000 | 100.0% | | Loan Payoff | $19,256,643 | 77.0 | % |
| | | | | Upfront Reserves | 4,308,549 | 17.2 | |
| | | | | Closing Costs | 835,239 | 3.3 | |
| | | | | Return of Equity | 599,569 | 2.4 | |
| Total Sources | $25,000,000 | 100.0% | | Total Uses | $25,000,000 | 100.0 | % |
| (1) | Other initial reserves represents an upfront unfunded obligations reserve. |
| (2) | The Patuxent & Coliseum Properties (as defined below) are located in California, Maryland and Hampton, Virginia and were built in 1987 and 2000, respectively. One of the two mortgaged properties, the Coliseum Marketplace Property (as defined below) was renovated in 2011. See “Portfolio Summary” table herein. |
| (3) | The increase in UW NOI over Most Recent NOI is primarily driven by One Life Gym which accounts for 13.0% of the total underwritten base rent. One Life Gym signed a lease effective November 17, 2022 and is expected to take occupancy on March 1, 2023. |
| (4) | The Coliseum Marketplace Appraised Value reflects the prospective value upon stabilization. The “as-is” sum of the values on an individual basis is $42,000,000, which represents a Cut-off Date LTV and Maturity Date LTV of 59.5%. |
| (5) | The Appraisal Dates for the Patuxent Crossing Property (as defined below) and Coliseum Marketplace Property are November 20, 2022 and November 12, 2024, respectively. The “as is” Appraisal Date for the Coliseum Marketplace Property is November 12, 2022. |
The Loan. The fourteenth largest mortgage loan (the “Patuxent & Coliseum Mortgage Loan”) is secured by a first mortgage lien on the borrowers’ fee simple interest in two anchored retail properties located in California, Maryland and Hampton, Virginia (the “Patuxent & Coliseum Properties”). The Patuxent & Coliseum Mortgage Loan was originated on December 21, 2022 by Citi Real Estate Funding Inc. and accrues interest at an interest rate of 6.35000% per annum. The
| THE INFORMATION IN THIS STRUCTURAL AND COLLATERAL TERM SHEET IS NOT COMPLETE AND MAY BE AMENDED PRIOR TO THE TIME OF SALE. THIS TERM SHEET IS NOT AN OFFER TO SELL THESE SECURITIES AND IT IS NOT A SOLICITATION OF AN OFFER TO BUY THESE SECURITIES IN ANY JURISDICTION WHERE THE OFFER OR SALE IS NOT PERMITTED. |
| | 142 | |
| Structural and Collateral Term Sheet | | BMO 2023-C4 |
| No. 14 – Patuxent & Coliseum |
Patuxent & Coliseum Mortgage Loan has an original term of 120 months, has a remaining term of 119 months and is interest only for the entire term. The scheduled maturity date of the Patuxent & Coliseum Mortgage Loan is the due date that occurs January 6, 2033.
The Properties. The Patuxent & Coliseum Properties consist of two anchored retail buildings located in California, Maryland and Hampton, Virginia, totaling 370,716 square feet of net rentable area in the aggregate. As of January 1, 2023, the Patuxent & Coliseum Properties were 86.8% occupied by 37 tenants ranging in size from 1,200 to 61,400 square feet under lease.
The “Patuxent Crossing Property” is a 264,068 square foot, two-parcel multi-tenant anchored retail property built in 1987. The Patuxent Crossing Property anchor space is 100% leased by Shopper’s Food, Marshalls, HomeGoods, World Gym, Jo-Ann Fabrics, Dollar Tree and US Postal Service. The anchored tenants began to occupy the Patuxent Crossing Property as early as 1991 and have lease expirations between January 31, 2025 and December 31, 2029. Additionally, Shopper’s Food, Marshalls and the US Postal Service have renewed their leases since 2020. The Patuxent Crossing Property is situated on an approximately 28.46-acre parcel and is located along the southern portion of Route 235 and on both the east and west sides of MacArthur Road. The Patuxent Crossing Property has a multi-tenant design and as of January 1, 2023, the Patuxent Crossing Property was 83.6% occupied by 28 tenants ranging in size from 1,200 to 61,400 square feet under lease.
The “Coliseum Marketplace Property” is a 106,648 square foot, one-story multi-tenant anchored retail property built in 2000 and renovated in 2011. The Coliseum Marketplace Property anchor space is 100% leased by One Life Gym and Michaels. One Life Gym is expected to take occupancy on March 1, 2023 with a 15 year lease expiring on August 31, 2038. Michaels has occupied the Coliseum Marketplace Property since 2012 and has a lease expiration of February 28, 2029. The Coliseum Marketplace Property is situated on an approximately 11.19-acre parcel and is located along the east side of Coliseum Drive, less than one-mile north of W. Mercury Boulevard, the primary east-west commercial arterial within the area. The Coliseum Marketplace Property has a multi-tenant design and as of January 1, 2023, the Coliseum Marketplace Property was 94.9% occupied by nine tenants ranging in size from 1,500 to 57,662 square feet under lease.
The following table presents certain information relating to the Patuxent & Coliseum Properties:
| Portfolio Summary |
| Property | City, State(1) | Year Built / Renovated(1) | Net Rentable Area (SF)(2) | Occupancy %(2) | Allocated Loan Amount | % of Allocated Loan Amount | Appraised Value(3) | UW Base Rent(2) | UW NOI % |
| Patuxent Crossing | California, Maryland | 1987 / NAP | 264,068 | 83.6 | % | $16,800,000 | 67.2 | % | $31,200,000 | $2,711,821 | 69.2 | % |
| Coliseum Marketplace | Hampton, Virginia | 2000 / 2011 | 106,648 | 94.9 | | 8,200,000 | 32.8 | | 15,300,000 | 1,180,360 | 30.8 | |
| Total / Wtd. Avg. | | | 370,716 | 86.8 | % | $25,000,000 | 100.0 | % | $46,500,000 | $3,892,181 | 100.0 | % |
| (1) | Information obtained from appraisals. |
| (2) | Based on the underwritten rent rolls dated January 1, 2023. |
| (3) | The Coliseum Marketplace Property Appraised Value reflects the prospective value upon stabilization. The “as-is” Appraised Value on an individual basis is $10,800,000 for the Coliseum Marketplace Property. |
Major Tenants. The three largest tenants at the Patuxent & Coliseum Properties based on underwritten base rent are One Life Gym, Shopper’s Food and Marshalls.
The largest tenant is One Life Gym (57,662 square feet; 15.6% of NRA; 13.0% of underwritten base rent). Founded in 2009, One Life Gym is a health club which offers personal and group training programs, yoga and pilates studios, and provides swimming, basketball, racquetball, and volleyball access. One Life Gym is a subsidiary of US Fitness Holdings, LLC. US Fitness Holdings, LLC operates and develops multi-purpose health clubs under the Onelife Fitness and Crunch Fitness brands and has over 50 locations in Virginia, Maryland, the District of Columbia, Georgia and West Virginia. One Life Gym is expected to take occupancy of its space on March 1, 2023 following completion of certain improvements by the borrowers pursuant to such tenant’s lease following which such lease is expected to have an expiration date of August 31, 2038. One Life Fitness has two, five-year renewal options and no termination options.
The second largest tenant is Shopper’s Food (61,400 square feet; 16.6% of NRA; 10.1% of underwritten base rent). Founded in 1949, Shopper’s Food is a full-service supermarket that serves the District of Columbia, Maryland, and Northern Virginia markets. Shopper’s Food originally took occupancy of its space in 2000. Shopper's Food assigned its lease to Fairland Market, Inc. d/b/a McKay’s Food and Pharmacy (“McKay’s”) in early 2020. McKay’s thereafter went dark in its
| THE INFORMATION IN THIS STRUCTURAL AND COLLATERAL TERM SHEET IS NOT COMPLETE AND MAY BE AMENDED PRIOR TO THE TIME OF SALE. THIS TERM SHEET IS NOT AN OFFER TO SELL THESE SECURITIES AND IT IS NOT A SOLICITATION OF AN OFFER TO BUY THESE SECURITIES IN ANY JURISDICTION WHERE THE OFFER OR SALE IS NOT PERMITTED. |
| | 143 | |
| Structural and Collateral Term Sheet | | BMO 2023-C4 |
| No. 14 – Patuxent & Coliseum |
space. On June 1, 2020, the related borrower delivered notice to McKay’s of an uncured default due to failure to pay rent other charges due under such tenant’s lease. On December 19, 2022, Shopper's Food took an assignment of the lease from McKay’s. Shopper's Food has a lease expiration of May 31, 2028. Shopper’s Food has seven, five-year renewal options and no termination options.
The third largest tenant is Marshalls (27,000 square feet; 7.3% of NRA; 7.3% of underwritten base rent). Founded in 1956, Marshalls is an off-price apparel and home fashions retailer which offers apparel for men, women, children, pets and home furnishings. Marshalls is a subsidiary of The TJX Companies, Inc. The TJX Companies, Inc. is a global off-price apparel and home fashions retailer and owns Marshalls, T.J. Maxx, HomeGoods and Sierra. Marshalls has been occupying its space since 2007, renewed its lease in 2022 and has a lease expiration of September 30, 2027. Marshalls has two, five-year renewal options and no termination options.
The following table presents certain information relating to the historical and current occupancy of the Patuxent & Coliseum Properties:
| Historical and Current Occupancy(1) |
| Property Name | 2019 | 2020 | 2021 | TTM 10/31/2022 | Current(2)(3) |
| Patuxent Crossing | 82.3 | % | 82.3 | % | 82.3 | % | 82.3 | % | 83.6 | % |
| Coliseum Marketplace | 100.0 | | 99.5 | | 63.5 | | 45.9 | | 94.9 | |
| Total / Wtd. Avg. | 87.4 | % | 87.3 | % | 76.9 | % | 71.8 | % | 86.8 | % |
| (1) | Historical occupancies are the annual average physical occupancy of each respective year or other 12-month period. |
| (2) | Current occupancy is based on the underwritten rent rolls as of January 1, 2023. |
| (3) | The increase in Current Occupancy over TTM 10/31/2022 Occupancy is primarily driven by One Life Gym which accounts for 15.6% of the total net rentable area. One Life Gym signed a lease effective November 17, 2022 and is expected to take occupancy on March 1, 2023. |
| THE INFORMATION IN THIS STRUCTURAL AND COLLATERAL TERM SHEET IS NOT COMPLETE AND MAY BE AMENDED PRIOR TO THE TIME OF SALE. THIS TERM SHEET IS NOT AN OFFER TO SELL THESE SECURITIES AND IT IS NOT A SOLICITATION OF AN OFFER TO BUY THESE SECURITIES IN ANY JURISDICTION WHERE THE OFFER OR SALE IS NOT PERMITTED. |
| | 144 | |
| Structural and Collateral Term Sheet | | BMO 2023-C4 |
| No. 14 – Patuxent & Coliseum |
The following table presents certain information relating to the largest tenants based on underwritten base rent of the Patuxent & Coliseum Properties:
| Top Tenant Summary(1) |
| Tenant | Property | Ratings Moody’s/S&P/ Fitch(2) | Net Rentable Area (SF) | % of Total NRA | UW Base Rent PSF(3) | UW Base Rent(3) | % of Total UW Base Rent(3) | Lease Exp. Date |
| One Life Gym | Coliseum Marketplace | NR/NR/NR | 57,662 | 15.6 | % | $8.75 | $504,543 | 13.0 | % | 8/31/2038 |
| Shopper’s Food | Patuxent Crossing | NR/NR/NR | 61,400 | 16.6 | | $ 6.41 | 393,604 | 10.1 | | 5/31/2028 |
| Marshalls | Patuxent Crossing | A2/A/NR | 27,000 | 7.3 | | $10.50 | 283,500 | 7.3 | | 9/30/2027 |
| HomeGoods | Patuxent Crossing | A2/A/NR | 19,688 | 5.3 | | $11.25 | 221,490 | 5.7 | | 9/30/2027 |
| Michaels | Coliseum Marketplace | NR/NR/NR | 23,981 | 6.5 | | $9.00 | 215,829 | 5.5 | | 2/28/2029 |
| World Gym | Patuxent Crossing | NR/NR/NR | 15,612 | 4.2 | | $11.75 | 183,441 | 4.7 | | 12/31/2029 |
| Jo-Ann Fabrics | Patuxent Crossing | B3/B-/NR | 14,058 | 3.8 | | $10.06 | 141,423 | 3.6 | | 1/31/2025 |
| Slim Chickens | Patuxent Crossing | NR/NR/NR | 3,000 | 0.8 | | $46.67 | 140,000 | 3.6 | | 12/31/2037 |
| Sonabank | Coliseum Marketplace | NR/NR/NR | 4,710 | 1.3 | | $26.67 | 125,637 | 3.2 | | 9/30/2030 |
| Wag n Wash | Patuxent Crossing | NR/NR/NR | 6,561 | 1.8 | | $18.37 | 120,526 | 3.1 | | 6/30/2026 |
| Major Tenants | | | 233,672 | 63.0 | % | $9.97 | $2,329,993 | 59.9 | % | |
| Other Tenants | | | 88,241 | 23.8 | % | $17.70 | $1,562,188 | 40.1 | % | |
| Occupied Collateral Total / Wtd. Avg. | | 321,913 | 86.8 | % | $12.09 | $3,892,181 | 100.0 | % | |
| Vacant Space | | | 48,803 | 13.2 | % | | | | |
| Collateral Total | | | 370,716 | 100.0 | % | | | | |
| | | | | | | | | |
| (1) | Based on the underwritten rent rolls dated January 1, 2023. |
| (2) | Ratings provided are for the parent company of the entity listed in the “Tenant” field whether or not the parent company guarantees the lease. |
| (3) | UW Base Rent, UW Base Rent PSF and % of Total UW Base Rent include rent steps of $20,275 in the aggregate occurring between December 1, 2022 and November 1, 2023 for 13 of the tenants. |
The following table presents certain information relating to the tenant lease expirations at the Patuxent & Coliseum Properties:
| Lease Rollover Schedule(1)(2) |
| Year | Number of Leases Expiring | Net Rentable Area Expiring | % of NRA Expiring | UW Base Rent Expiring(3) | % of UW Base Rent Expiring(3) | Cumulative Net Rentable Area Expiring | Cumulative % of NRA Expiring | Cumulative UW Base Rent Expiring(3) | Cumulative % of UW Base Rent Expiring(3) |
| Vacant | NAP | 48,803 | 13.2 | % | NAP | NAP | | 48,803 | 13.2% | | NAP | NAP | |
| 2022 & MTM | 1 | 3,848 | 1.0 | | $71,150 | 1.8 | % | 52,651 | 14.2% | | $71,150 | 1.8% | |
| 2023 | 3 | 9,982 | 2.7 | | 216,224 | 5.6 | | 62,633 | 16.9% | | $287,374 | 7.4% | |
| 2024 | 5 | 13,753 | 3.7 | | 235,810 | 6.1 | | 76,386 | 20.6% | | $523,184 | 13.4% | |
| 2025 | 7 | 36,969 | 10.0 | | 533,080 | 13.7 | | 113,355 | 30.6% | | $1,056,264 | 27.1% | |
| 2026 | 4 | 19,061 | 5.1 | | 307,448 | 7.9 | | 132,416 | 35.7% | | $1,363,712 | 35.0% | |
| 2027 | 4 | 59,692 | 16.1 | | 675,602 | 17.4 | | 192,108 | 51.8% | | $2,039,314 | 52.4% | |
| 2028 | 6 | 70,043 | 18.9 | | 599,044 | 15.4 | | 262,151 | 70.7% | | $2,638,359 | 67.8% | |
| 2029 | 2 | 39,593 | 10.7 | | 399,270 | 10.3 | | 301,744 | 81.4% | | $3,037,629 | 78.0% | |
| 2030 | 1 | 4,710 | 1.3 | | 125,637 | 3.2 | | 306,454 | 82.7% | | $3,163,266 | 81.3% | |
| 2031 | 1 | 2,400 | 0.6 | | 57,600 | 1.5 | | 308,854 | 83.3% | | $3,220,866 | 82.8% | |
| 2032 | 1 | 1,200 | 0.3 | | 26,772 | 0.7 | | 310,054 | 83.6% | | $3,247,638 | 83.4% | |
| 2033 & Beyond | 2 | 60,662 | 16.4 | | 644,543 | 16.6 | | 370,716 | 100.0% | | $3,892,181 | 100.0% | |
| Total | 37 | 370,716 | 100.0 | % | $3,892,181 | 100.0 | % | | | | |
| (1) | Based on underwritten rent rolls as of January 1, 2023. |
| (2) | Certain tenants may have early termination options that are not reflected in the Lease Rollover Schedule. |
| (3) | UW Base Rent Expiring, % of UW Base Rent Expiring, Cumulative UW Base Rent Expiring and Cumulative % of UW Base Rent Expiring includes rent steps of $20,275 in the aggregate occurring between December 1, 2022 and November 1, 2023 for 13 of the tenants. |
| THE INFORMATION IN THIS STRUCTURAL AND COLLATERAL TERM SHEET IS NOT COMPLETE AND MAY BE AMENDED PRIOR TO THE TIME OF SALE. THIS TERM SHEET IS NOT AN OFFER TO SELL THESE SECURITIES AND IT IS NOT A SOLICITATION OF AN OFFER TO BUY THESE SECURITIES IN ANY JURISDICTION WHERE THE OFFER OR SALE IS NOT PERMITTED. |
| | 145 | |
| Structural and Collateral Term Sheet | | BMO 2023-C4 |
| No. 14 – Patuxent & Coliseum |
The following table presents certain information relating to the operating history and underwritten cash flows of the Patuxent & Coliseum Properties:
| Operating History and Underwritten Net Cash Flow |
| | 2019 | 2020 | 2021 | TTM(1) | Underwritten | Per Square Foot | %(2) |
| Base Rent(3) | $4,152,542 | $3,794,141 | $2,963,378 | $3,027,165 | $3,871,906 | $10.44 | 68.2 | % |
| Contractual Rent Steps(4) | 0 | 0 | 0 | 0 | 20,275 | 0.05 | 0.4 | |
| Potential Income from Vacant Space | 0 | 0 | 0 | 0 | 966,388 | 2.61 | 17.0 | |
| Total Reimbursements | 788,228 | 799,133 | 635,665 | 594,957 | 796,811 | 2.15 | 14.0 | |
| Other Income | 49,642 | 290,200 | 341,832 | 334,593 | 20,322 | 0.05 | 0.4 | |
| Gross Potential Rent | $4,990,411 | $4,883,474 | $3,940,875 | $3,956,715 | $5,675,701 | $15.31 | 100.0 | % |
| Vacancy & Credit Loss | 0 | 0 | 0 | 0 | (966,388) | (2.61) | (17.0) | |
| Effective Gross Income | $4,990,411 | $4,883,474 | $3,940,875 | $3,956,715 | $4,709,313 | $12.70 | 83.0 | % |
| Real Estate Taxes | 495,139 | 506,479 | 493,647 | 459,496 | 469,386 | 1.27 | 10.0 | |
| Insurance | 110,996 | 128,236 | 151,758 | 170,208 | 108,799 | 0.29 | 2.3 | |
| Management Fee | 149,712 | 146,504 | 118,226 | 118,701 | 141,279 | 0.38 | 3.0 | |
| Other Operating Expenses | 398,321 | 369,783 | 384,541 | 385,275 | 339,636 | 0.92 | 7.2 | |
| Total Expenses | 1,154,168 | 1,151,002 | 1,148,172 | 1,133,681 | 1,059,101 | 2.86 | 22.5 | % |
| Net Operating Income | $3,836,243 | $3,732,471 | $2,792,703 | $2,823,035 | $3,650,212 | $9.85 | 77.5 | % |
| Replacement Reserves | 0 | 0 | 0 | 0 | 184,507 | 0.50 | 3.9 | |
| TI / LC | 0 | 0 | 0 | 0 | 148,602 | 0.40 | 3.2 | |
| Net Cash Flow | $3,836,243 | $3,732,471 | $2,792,703 | $2,823,035 | $3,317,104 | $8.95 | 70.4 | % |
| (1) | TTM reflects the trailing 12 months ending October 31, 2022. |
| (2) | % column represents percent of Gross Potential Rent for all revenue fields and represents percent of Effective Gross Income for the remainder of fields. |
| (3) | Based on the underwritten rent rolls dated as of January 1, 2023. |
| (4) | Contractual Rent Steps represent an increase of $20,275 occurring between December 1, 2022 and November 1, 2023 for 13 of the tenants. |
The Market. The Patuxent & Coliseum Properties are located in California, Maryland and Hampton, Virginia which represent 69.7% and 30.3% of underwritten base rent, respectively.
The Patuxent Crossing Property is located in California, Saint Mary’s County, Maryland which is part of the California-Lexington Park Metropolitan Statistical Area (“MSA”). Specifically, the Patuxent Crossing Property is located within the St. Mary’s County submarket of the Washington D.C. market. As of 2022, the California-Lexington Park MSA had a population of 115,234 and experienced an annual growth rate of approximately 0.77% since 2010. In the third quarter of 2022, the submarket reported an inventory of approximately 5.2 million square feet, with an average asking rent of $10.19 and an overall vacancy rate of 6.9%. In the prior three years, new construction of 7,776 square feet has been added to the Saint Mary’s County inventory, representing 0.1% of the submarket’s current inventory.
The Coliseum Marketplace Property is located in Hampton, Hampton City County, Virginia which is part of the Hamptons Roads MSA. Specifically, the Coliseum Marketplace Property is located within the Mercury Central submarket of the Hampton Roads market. As of 2022, the Hamptons Roads MSA had a population of 1,817,180 and experienced an annual growth rate of approximately 0.49% since 2010. In the third quarter of 2022, the submarket reported an inventory of approximately 6.8 million square feet, with an average asking rent of $13.53 and an overall vacancy rate of 4.1%. In the prior three years, new construction of 117,709 square feet has been added to the Mercury Central inventory, representing 1.7% of the submarket’s current inventory.
The following table presents certain information relating to the market areas for the Patuxent & Coliseum Properties:
| Market Summary(1) |
| Property Name | City/State | Market | Submarket | Submarket Inventory (SF) | Submarket Vacancy |
| Patuxent Crossing | California, Maryland | Washington D.C. | St. Mary’s County | 5,216,122 | 6.9% | |
| Coliseum Marketplace | Hampton, Virginia | Hampton Roads | Mercury Central | 6,791,535 | 4.1% | |
| THE INFORMATION IN THIS STRUCTURAL AND COLLATERAL TERM SHEET IS NOT COMPLETE AND MAY BE AMENDED PRIOR TO THE TIME OF SALE. THIS TERM SHEET IS NOT AN OFFER TO SELL THESE SECURITIES AND IT IS NOT A SOLICITATION OF AN OFFER TO BUY THESE SECURITIES IN ANY JURISDICTION WHERE THE OFFER OR SALE IS NOT PERMITTED. |
| | 146 | |
| Structural and Collateral Term Sheet | | BMO 2023-C4 |
| No. 15 – WRS Retail Portfolio |
| Mortgage Loan Information | | Property Information |
| Mortgage Loan Seller: | LMF | | Single Asset / Portfolio: | Portfolio |
| Original Principal Balance(1): | $24,000,000 | | Title: | Fee |
| Cut-off Date Principal Balance(1): | $24,000,000 | | Property Type – Subtype: | Retail – Shadow Anchored |
| % of IPB: | 3.1% | | Net Rentable Area (SF): | 549,973 |
| Loan Purpose: | Refinance and Acquisition | | Location: | Various |
| Borrower: | WRS Centers Shops, LLC | | Year Built / Renovated: | Various / Various |
| Borrower Sponsors: | Arthur Joseph Kepes and Thomas Scott Smith | | Occupancy: | 89.1% |
| Interest Rate: | 6.88000% | | Occupancy Date: | 10/25/2022 |
| Note Date: | 10/28/2022 | | 4th Most Recent NOI (As of): | NAV |
| Maturity Date: | 11/6/2032 | | 3rd Most Recent NOI (As of): | $8,579,044 (12/31/2020) |
| Interest-only Period: | 90 months | | 2nd Most Recent NOI (As of): | $8,140,091 (12/31/2021) |
| Original Term: | 120 months | | Most Recent NOI (As of): | $8,834,188 (TTM 8/31/2022) |
| Original Amortization Term: | 360 months | | UW Economic Occupancy: | 88.8% |
| Amortization Type: | Interest Only, Amortizing Balloon | | UW Revenues: | $12,448,561 |
| Call Protection: | L(27),D(89),O(4) | | UW Expenses: | $2,819,467 |
| Lockbox / Cash Management: | Springing / Springing | | UW NOI: | $9,629,095 |
| Additional Debt(1): | Yes | | UW NCF: | $9,216,615 |
| Additional Debt Balance(1): | $60,000,000 | | Appraised Value / Per SF(2): | $145,320,000 / $264 |
| Additional Debt Type(1): | Pari Passu | | Appraisal Date(3): | 10/27/2022 |
| | | | | |
| Escrows and Reserves | | Financial Information(1) |
| | Initial | Monthly | Cap | | Cut-off Date Loan / SF: | $153 |
| Taxes: | $551,903 | $87,604 | N/A | | Maturity Date Loan / SF: | $149 |
| Insurance: | $248,209 | $39,398 | N/A | | Cut-off Date LTV(2): | 57.8% |
| Replacement Reserves: | $0 | $6,875 | $412,480 | | Maturity Date LTV(2): | 56.4% |
| TI/LC: | $1,000,000 | Springing | $1,000,000 | | UW NCF DSCR: | 1.39x |
| Deferred Maintenance: | $42,313 | $0 | N/A | | UW NOI Debt Yield: | 11.5% |
| Free Rent Reserve: | $275,300 | $0 | N/A | | | |
Unfunded Tenant Obligations Reserve: | $1,050,197 | $0 | N/A | | | |
| | | | | | | |
| Sources and Uses |
| Sources | Proceeds | % of Total | | Uses | Proceeds | % of Total |
| Whole Loan | $84,000,000 | 98.3 | % | | Loan Payoff(4) | $66,344,516 | 77.6 | % |
| Borrower Sponsor Equity | 1,488,632 | 1.7 | | | Purchase Price(4) | 11,800,000 | 13.8 | |
| | | | | Closing Costs | 4,176,196 | 4.9 | |
| | | | | Upfront Reserves | 3,167,921 | 3.7 | |
| Total Sources | $85,488,632 | 100.0 | % | | Total Uses | $85,488,632 | 100.0 | % |
| (1) | The WRS Retail Portfolio Mortgage Loan (as defined below) is part of a whole loan evidenced by four pari passu notes with an aggregate outstanding principal balance as of the Cut-off Date of $84.0 million (“WRS Retail Portfolio Whole Loan”). The financial information in the chart reflects the WRS Retail Portfolio Whole Loan. |
| (2) | The Appraised Value / Per SF, Cut-Off Date LTV and Maturity Date LTV is based on the as-portfolio value of $145,320,000. The combined “as-is” individual appraised value is $142,000,000. The Cut-off Date LTV and Maturity Date LTV based on the combined “as-is” individual appraised value is 59.2% and 57.7%, respectively. |
| (3) | Appraisal Dates for the WRS Retail Portfolio Properties (as defined below) range from September 12, 2022 to September 22, 2022. |
| (4) | The WRS Retail Portfolio Whole Loan was used to refinance existing debt on 11 of the WRS Retail Portfolio Properties and to acquire the Shoppes at Sanford property. |
The Loan. The fifteenth largest mortgage loan (the “WRS Retail Portfolio Mortgage Loan”) is part of a fixed rate whole loan secured by the borrower’s fee interest in a 549,973 square foot, 12-property retail shadow-anchored portfolio located in North Carolina, South Carolina and Georgia (each individually, a “WRS Retail Portfolio Property”, and collectively, the “WRS Retail Portfolio Properties”). The WRS Retail Portfolio Whole Loan consists of four pari passu notes and accrues interest at a rate of 6.88000% per annum. The WRS Retail Portfolio Whole Loan has a 10-year term and is interest-only for the first 90 months of the loan term, followed by monthly payments of interest and principal sufficient to amortize the loan over a 30-year amortization schedule. The WRS Retail Portfolio Whole Loan has an outstanding original principal balance
| THE INFORMATION IN THIS STRUCTURAL AND COLLATERAL TERM SHEET IS NOT COMPLETE AND MAY BE AMENDED PRIOR TO THE TIME OF SALE. THIS TERM SHEET IS NOT AN OFFER TO SELL THESE SECURITIES AND IT IS NOT A SOLICITATION OF AN OFFER TO BUY THESE SECURITIES IN ANY JURISDICTION WHERE THE OFFER OR SALE IS NOT PERMITTED. |
| | 147 | |
| Structural and Collateral Term Sheet | | BMO 2023-C4 |
| No. 15 – WRS Retail Portfolio |
as of the Cut-off Date of $84,000,000. The non-controlling Note A-2 with an original principal balance of $24,000,000, will be included in the BMO 2023-C4 securitization trust. The remaining notes are the controlling Note A-1 and non-controlling Note A-3 and Note A-4, with an aggregate original principal balance of $60,000,000 that were contributed to the BBCMS 2022-C18 trust. The WRS Retail Portfolio Whole Loan will be serviced pursuant to the pooling and servicing agreement for the BBCMS 2022-C18 trust. See “Description of the Mortgage Pool—The Whole Loans—The Outside Serviced Pari Passu Whole Loans” and “Pooling and Servicing Agreement—Servicing of the Outside Serviced Mortgage Loans” in the Preliminary Prospectus.
| Whole Loan Summary |
| Note | Original Balance | Cut-off Date Balance | | Note Holder | Controlling Piece |
| A-1 | $50,000,000 | | $50,000,000 | | | BBCMS 2022-C18 | Yes |
| A-2 | $24,000,000 | | $24,000,000 | | | BMO 2023-C4 | No |
| A-3 | $5,000,000 | | $5,000,000 | | | BBCMS 2022-C18 | No |
| A-4 | $5,000,000 | | $5,000,000 | | | BBCMS 2022-C18 | No |
| Whole Loan | $84,000,000 | | $84,000,000 | | | | |
The Properties. The WRS Retail Portfolio Properties consist of 12 retail properties, totaling 549,973 square feet located in three states, each of which is shadow-anchored by Wal-Mart. The geographical concentrations by Cut-off Date Balance include North Carolina (eight properties, 56.5% of the allocated Cut-off Date Balance), Georgia (two properties, 24.2% of the allocated Cut-off Date Balance) and South Carolina (two properties, 19.3% of the allocated Cut-off Date Balance).
Built between 2006 and 2011, the WRS Retail Portfolio Properties range in size from 26,700 square feet to 67,050 square feet. As of October 25, 2022, the WRS Retail Portfolio Properties were 89.1% occupied.
| WRS Retail Portfolio Properties Summary |
| Property Name | Property Type - Subtype | Net Rentable Area (SF) | Year Built /
Renovated | Allocated Whole Loan Amount | % of ALA | Appraised Value | UW NCF |
| Hudson Bridge Crossing – Stockbridge, GA | Retail – Shadow Anchored | 67,050 | 2006 / NAP | $13,300,000 | 15.8% | | $22,500,000 | $1,451,494 |
| Shoppes at Westgate – Leland, NC | Retail – Shadow Anchored | 47,700 | 2006 / NAP | $9,700,000 | 11.5% | | $15,000,000 | $1,053,013 |
| Shoppes at Richland – Aiken, SC | Retail – Shadow Anchored | 53,100 | 2007 / NAP | $8,550,000 | 10.2% | | $14,200,000 | $937,674 |
| Shoppes at White Knoll – Lexington, SC | Retail – Shadow Anchored | 40,100 | 2007 / NAP | $7,650,000 | 9.1% | | $11,100,000 | $838,040 |
| Chamblee Village – Atlanta, GA | Retail – Shadow Anchored | 38,993 | 2006 / NAP | $7,050,000 | 8.4% | | $13,000,000 | $772,587 |
| Shoppes at Sanford – Sanford, NC | Retail – Shadow Anchored | 50,300 | 2007 / 2017 | $6,750,000 | 8.0% | | $12,400,000 | $742,566 |
| Grandview Station – Marion, NC | Retail – Shadow Anchored | 41,100 | 2011 / NAP | $6,700,000 | 8.0% | | $9,300,000 | $735,353 |
| Glenn View Station – Durham, NC | Retail – Shadow Anchored | 56,830 | 2008 / NAP | $6,500,000 | 7.7% | | $11,900,000 | $721,623 |
| Shoppes at Raeford – Raeford, NC | Retail – Shadow Anchored | 47,550 | 2010 / NAP | $5,200,000 | 6.2% | | $10,600,000 | $569,613 |
| Shoppes at Oxford – Oxford, NC | Retail – Shadow Anchored | 39,550 | 2009 / NAP | $5,100,000 | 6.1% | | $8,100,000 | $566,264 |
| Shoppes at Goldsboro – Goldsboro, NC | Retail – Shadow Anchored | 41,000 | 2007 / NAP | $4,400,000 | 5.2% | | $8,400,000 | $487,118 |
| Village at Red Bridge – Locust, NC | Retail – Shadow Anchored | 26,700 | 2010 / NAP | $3,100,000 | 3.7% | | $5,500,000 | $341,270 |
| Total | | 549,973 | | $84,000,000 | 100.0% | | $145,320,000(1) | $9,216,615 |
| (1) | The appraised value of $145,320,000 is an “as-portfolio” value. The combined “as-is” individual appraised value of the WRS Retail Portfolio Properties is $142,000,000. |
Major Tenants.
Dollar Tree (91,000 square feet; 16.5% of NRA; 10.7% of underwritten rent; Moody’s/S&P/Fitch: Baa2/BBB/NR): Dollar Tree is one of the nation’s leading value retailers offering a wide variety of products including, but not limited to party supplies, home décor, health and beauty supplies, home and office goods, food and seasonal items. Founded in 1953 in Norfolk, Virginia as K&K 5&10, the Dollar Tree has evolved into a Fortune 120 company, operating approximately 7,900 stores and 16 distribution centers across 48 contiguous U.S. states and five Canadian provinces. Dollar Tree reported net sales of $26.3 billion as of year-end 2021. Dollar Tree has a co-tenancy clause tied to Wal-Mart. If Wal-Mart, its successor or assigns, vacates or cease operations, the tenant is required to pay 50% of base rent and 100% of additional rent after a period of 60 days while the Wal-Mart space remains vacant. If the Wal-Mart space remains unoccupied for nine months, the tenant has an ongoing right to terminate upon 30 days’ notice. Dollar Tree is a tenant at Grandview Station property, Village at Red Bridge property, Shoppes at Oxford property, Glenn View Station property, Shoppes at Raeford property, Shoppes at Goldsboro property, Shoppes at Westgate property, Shoppes at Richland property, Hudson Bridge Crossing property, and Shoppes at White Knoll property.
| THE INFORMATION IN THIS STRUCTURAL AND COLLATERAL TERM SHEET IS NOT COMPLETE AND MAY BE AMENDED PRIOR TO THE TIME OF SALE. THIS TERM SHEET IS NOT AN OFFER TO SELL THESE SECURITIES AND IT IS NOT A SOLICITATION OF AN OFFER TO BUY THESE SECURITIES IN ANY JURISDICTION WHERE THE OFFER OR SALE IS NOT PERMITTED. |
| | 148 | |
| Structural and Collateral Term Sheet | | BMO 2023-C4 |
| No. 15 – WRS Retail Portfolio |
Shoe Show/Shoe Department (37,950 square feet; 6.9% of NRA; 5.6% of underwritten rent): Founded in 1960, Shoe Show/Shoe Department are brands operating within Shoe Show, Inc. Shoe Show/Shoe Department provides branded footwear, bags and accessories at affordable prices. Brands operating within Shoe Show, Inc. include Shoe Show, Shoe Department, Burlington Shoes, Shoebilee, Shoe Department Encore, Burlington Shoes Encore and Shoe Show Mega. Shoe Show, Inc. currently operates approximately 1,100 stores in 47 states. The Shoe Show/Shoe Department tenants at the WRS Retail Portfolio Properties have termination and co-tenancy clauses tied to Wal-Mart. If Wal-Mart ceases its operation and is not replaced within 90 days of its closing of business by another major tenant, then the Shoe Show/Shoe Department tenant is required to remain in the premises and pay only 4% of percentage rent and its proportionate share of operating expenses. However, if such violation is not cured after 12 months from the date Wal-Mart vacates the premises, then the tenant will have an ongoing option to terminate the lease. Shoe Show/Shoe Department is a tenant at Grandview Station property, Shoppes at Oxford property, Glenn View Station property, Shoppes at Sanford property, Shoppes at Westgage property, Shoppes at Richland property, Hudson Bridge Crossing property and Shoppes at White Knoll property.
Children’s Healthcare of Atlanta, Inc. (17,650 square feet; 3.2% of NRA; 4.0% of underwritten rent): Founded in 1915, Children’s Healthcare of Atlanta, Inc. (“CHOA, Inc.”) is a leading pediatric healthcare provider. With three hospitals, neighborhood locations and more than 600 beds, CHOA, Inc. is the largest healthcare provider for children in Georgia and one of the largest pediatric clinical care providers in the country. CHOA, Inc. was ranked in all 10 specialty areas in the U.S. News & World Report’s “Best Children’s Hospitals in the Nation” for 2022-2023, with nine specialties ranked in the top 20. CHOA, Inc. is a tenant at Hudson Bridge Crossing property.
The following table presents certain information relating to the historical and current occupancy of the WRS Retail Portfolio Properties:
| Historical and Current Occupancy |
| 2019(1) | 2020(1) | 2021(1) | Current(2) |
| 83.2% | 82.5% | 82.8% | 89.1% |
| | (1) | Historical Occupancies are as of December 31 of each respective year. |
| | (2) | Current Occupancy is as of the October 25, 2022 underwritten rent roll. |
| THE INFORMATION IN THIS STRUCTURAL AND COLLATERAL TERM SHEET IS NOT COMPLETE AND MAY BE AMENDED PRIOR TO THE TIME OF SALE. THIS TERM SHEET IS NOT AN OFFER TO SELL THESE SECURITIES AND IT IS NOT A SOLICITATION OF AN OFFER TO BUY THESE SECURITIES IN ANY JURISDICTION WHERE THE OFFER OR SALE IS NOT PERMITTED. |
| | 149 | |
| Structural and Collateral Term Sheet | | BMO 2023-C4 |
| No. 15 – WRS Retail Portfolio |
The following table presents certain information relating to the largest tenants based on the underwritten base rent of the WRS Retail Portfolio Properties:
| Top Tenant Summary(1) |
| Tenant | No. of Leases | Ratings
Moody’s/S&P/Fitch(2) | Net Rentable Area (SF) | % of
Total NRA | UW Base Rent PSF(3) | UW Base Rent(3) | % of Total
UW Base Rent | Avg. Remaining Lease Term (Years) |
| Dollar Tree(4) | 10 | Baa2/BBB/NR | 91,000 | 16.5 | % | $11.87 | $1,080,500 | 10.7 | % | 3.4 |
| Shoe Show / Shoe Department(5) | 8 | NR/NR/NR | 37,950 | 6.9 | | $14.97 | 568,053 | 5.6 | | 3.8 |
| Children’s Healthcare of Atlanta, Inc. | 1 | NR/NR/NR | 17,650 | 3.2 | | $22.84 | 403,126 | 4.0 | | 3.3 |
| GameStop(6) | 6 | NR/NR/NR | 11,500 | 2.1 | | $26.77 | 307,896 | 3.1 | | 2.0 |
| Major Tenants | | | 158,100 | 28.7 | % | $14.92 | $2,359,575 | 23.4 | % | |
| Non-Major Tenants | | | 332,148 | 60.4 | % | $23.28 | $7,733,350 | 76.6 | % | |
| Occupied Collateral Total / Wtd. Avg. | | | 490,248 | 89.1 | % | $20.59 | $10,092,925 | 100.0 | % | |
| | | | | | | | | |
| Vacant Space | | | 59,725 | 10.9 | % | | | | |
| | | | | | | | | |
| Collateral Total | | | 549,973 | 100.0 | % | | | | |
| | | | | | | | | |
| (1) | Based on the underwritten rent roll as of October 25, 2022. |
| (2) | Ratings provided are for the parent company of the entity, whether or not the parent company guarantees the lease. |
| (3) | UW Base Rent PSF and UW Base Rent include rent steps totaling $218,174.56 through December 2023. |
| (4) | Dollar Tree has a co-tenancy clause tied to Wal-Mart. If Wal-Mart (or its successor or assign) vacates or ceases operations, the tenant is required to pay 50% of base rent and 100% of additional rent after a period of 60 days while the Wal-Mart space remains vacant. If the Wal-Mart space remains unoccupied for nine months, the tenant has an ongoing right to terminate upon 30 days’ notice. |
| (5) | The Shoe Show/Shoe Department tenants have a termination and co-tenancy clause tied to Wal-Mart. If Wal-Mart ceases its operation and is not replaced with 90 days of its closing of business by another major tenant, then the tenant is required to remain in the premises and pay only 4% of percentage rent and its proportionate share of operating expenses. However, if such violation is not cured after 12 months from the date Wal-Mart vacates the premises, then the tenant will have an option to terminate the lease. The Shoe Show/Shoe Department tenant at the Shoppes at Oxford property and the Glenn View Station property is a month-to-month tenant and was excluded when calculating Avg. Remaining Lease Term. |
| (6) | The GameStop tenants have a co-tenancy clause tied to Wal-Mart. If Wal-Mart (or its successor or assigns) vacates or cease operations, the tenant is required to pay 50% of base rent after a period of 30 days while the Wal-Mart space remains vacant. If the Wal-Mart space remains unoccupied for 180 days, the tenant has an ongoing right to terminate upon 30 days’ notice. GameStop is a tenant at the Shoppes at Sanford property, the Shoppes at Westgate property, the Shoppes at Richland property, the Shoppes at White Knoll property, the Chamblee Village property, and the Hudson Bridge Crossing property. |
| THE INFORMATION IN THIS STRUCTURAL AND COLLATERAL TERM SHEET IS NOT COMPLETE AND MAY BE AMENDED PRIOR TO THE TIME OF SALE. THIS TERM SHEET IS NOT AN OFFER TO SELL THESE SECURITIES AND IT IS NOT A SOLICITATION OF AN OFFER TO BUY THESE SECURITIES IN ANY JURISDICTION WHERE THE OFFER OR SALE IS NOT PERMITTED. |
| | 150 | |
| Structural and Collateral Term Sheet | | BMO 2023-C4 |
| No. 15 – WRS Retail Portfolio |
The following table presents certain information relating to the tenant lease expirations of the WRS Retail Portfolio Properties:
| Lease Rollover Schedule(1)(2) |
| Year | Number of Leases Expiring | Net Rentable Area Expiring | % of NRA Expiring | UW Base Rent Expiring(3) | % of UW Base Rent Expiring | Cumulative Net Rentable Area Expiring | Cumulative % of NRA Expiring | Cumulative UW Base Rent Expiring(3) | Cumulative % of UW Base Rent Expiring |
| Vacant | NAP | 59,725 | 10.9 | % | NAP | NA | P | 59,725 | 10.9% | | NAP | NA | P |
| 2022 & MTM | 5 | 12,250 | 2.2 | | $195,723 | 1.9 | % | 71,975 | 13.1% | | $195,723 | 1.9 | % |
| 2023 | 26 | 61,400 | 11.2 | | 1,299,418 | 12.9 | | 133,375 | 24.3% | | $1,495,142 | 14.8 | % |
| 2024 | 21 | 64,430 | 11.7 | | 1,210,222 | 12.0 | | 197,805 | 36.0% | | $2,705,363 | 26.8 | % |
| 2025 | 32 | 69,400 | 12.6 | | 1,415,400 | 14.0 | | 267,205 | 48.6% | | $4,120,763 | 40.8 | % |
| 2026 | 29 | 90,660 | 16.5 | | 2,167,945 | 21.5 | | 357,865 | 65.1% | | $6,288,708 | 62.3 | % |
| 2027 | 38 | 119,150 | 21.7 | | 2,245,135 | 22.2 | | 477,015 | 86.7% | | $8,533,844 | 84.6 | % |
| 2028 | 15 | 39,199 | 7.1 | | 836,024 | 8.3 | | 516,214 | 93.9% | | $9,369,868 | 92.8 | % |
| 2029 | 1 | 4,800 | 0.9 | | 97,200 | 1.0 | | 521,014 | 94.7% | | $9,467,068 | 93.8 | % |
| 2030 | 1 | 1,200 | 0.2 | | 33,600 | 0.3 | | 522,214 | 95.0% | | $9,500,668 | 94.1 | % |
| 2031 | 1 | 4,000 | 0.7 | | 76,400 | 0.8 | | 526,214 | 95.7% | | $9,577,068 | 94.9 | % |
| 2032 & Beyond | 6 | 23,759 | 4.3 | | 515,858 | 5.1 | | 549,973 | 100.0% | | $10,092,925 | 100.0 | % |
| Total | 175 | 549,973 | 100.0 | % | $10,092,925 | 100.0 | % | | | | |
| (1) | Based on the underwritten rent roll dated October 25, 2022. |
| (2) | Certain tenants may have early termination options that are not reflected in the Lease Rollover Schedule. |
| (3) | UW Base Rent Expiring and Cumulative UW Base Rent Expiring include rent steps of $218,174.56 through December 2023. |
| THE INFORMATION IN THIS STRUCTURAL AND COLLATERAL TERM SHEET IS NOT COMPLETE AND MAY BE AMENDED PRIOR TO THE TIME OF SALE. THIS TERM SHEET IS NOT AN OFFER TO SELL THESE SECURITIES AND IT IS NOT A SOLICITATION OF AN OFFER TO BUY THESE SECURITIES IN ANY JURISDICTION WHERE THE OFFER OR SALE IS NOT PERMITTED. |
| | 151 | |
| Structural and Collateral Term Sheet | | BMO 2023-C4 |
| No. 15 – WRS Retail Portfolio |
The following table presents certain information relating to the operating history and underwritten cash flows at the WRS Retail Portfolio Properties:
| Operating History and Underwritten Net Cash Flow |
| | 2020 | 2021 | TTM(1) | Underwritten | Per Square Foot | %(2) |
| Rents in Place | $9,088,535 | $8,767,074 | $9,319,161 | $9,874,751 | $17.95 | 71.2 | % |
| Straight Line Rent | 0 | 0 | 0 | 17,130 | 0.03 | 0.1 | |
| Vacancy Gross Up | 0 | 0 | 0 | 1,249,850 | 2.27 | 9.0 | |
| Rent Steps | 0 | 0 | 0 | 218,175 | 0.40 | 1.6 | |
| Gross Potential Rent | $9,088,535 | $8,767,074 | $9,319,161 | $11,359,905 | $20.66 | 82.0 | % |
| Total Reimbursements | 1,835,118 | 1,764,798 | 2,047,389 | 2,501,075 | 4.55 | 18.0 | |
| Net Rental Income | $10,923,653 | $10,531,872 | $11,366,550 | $13,860,981 | $25.20 | 100.0 | % |
| (Vacancy/Credit Loss) | 0 | 0 | 0 | (1,552,121) | (2.82) | (11.2 | ) |
| Other Income(3) | 123,718 | 146,973 | 139,702 | 139,702 | 0.25 | 1.0 | |
| Effective Gross Income | $11,047,371 | $10,678,844 | $11,506,252 | $12,448,561 | $22.63 | 89.8 | % |
| Total Expenses | 2,468,327 | 2,538,754 | 2,672,064 | 2,819,467 | 5.13 | 22.6 | |
| Net Operating Income | $8,579,044 | $8,140,091 | $8,834,188 | $9,629,095 | $17.51 | 77.4 | % |
| Total TI/LC, Capex/RR | 0 | 0 | 0 | 412,480 | 0.75 | 3.3 | |
| Net Cash Flow | $8,579,044 | $8,140,091 | $8,834,188 | $9,216,615 | $16.76 | 74.0 | % |
| (1) | TTM represents trailing 12 months as of August 31, 2022. |
| (2) | % column represents percent of Net Rental Income for all revenue lines and represents percent of Effective Gross Income for the remainder of fields. |
| (3) | Other Income is underwritten based on the trailing-12 months ending August 31, 2022 and also included income from ancillary tenants such as ATM or recycling. |
| THE INFORMATION IN THIS STRUCTURAL AND COLLATERAL TERM SHEET IS NOT COMPLETE AND MAY BE AMENDED PRIOR TO THE TIME OF SALE. THIS TERM SHEET IS NOT AN OFFER TO SELL THESE SECURITIES AND IT IS NOT A SOLICITATION OF AN OFFER TO BUY THESE SECURITIES IN ANY JURISDICTION WHERE THE OFFER OR SALE IS NOT PERMITTED. |
| | 152 | |
| Structural and Collateral Term Sheet | | BMO 2023-C4 |
| No. 15 – WRS Retail Portfolio |
The Market. The WRS Retail Portfolio Properties are geographically diverse with properties located in three different states and eleven different markets.
The following table presents certain market information with respect to the WRS Retail Portfolio Properties:
| WRS Retail Portfolio Properties Market Summary(1) |
| Property Name | Market | Submarket | Submarket Vacancy | UW Rental
Rate PSF(2) | Market
Rent Rate PSF(3) |
| Shoppes at Sanford – Sanford, NC | Lee and Harnett Counties | Lee County | 3.4% | $22.34 | $22.96 |
| Grandview Station – Marion, NC | McDowell and Burke Counties | McDowell County | 7.3% | $18.91 | $19.00 |
| Shoppes at Raeford – Raeford, NC | Fayetteville | Hoke County | 1.9% | $17.92 | $18.75 |
| Shoppes at Oxford – Oxford, NC | Granville and Wake Counties | Granville County | 1.3% | $15.75 | $17.43 |
| Shoppes at Goldsboro – Goldsboro, NC | Wayne and Johnston Counties | Wayne County | 4.2% | $18.23 | $18.95 |
| Village at Red Bridge – Locust, NC | Charlotte | Cabarrus County | 3.2% | $18.87 | $18.62 |
| Glenn View Station – Durham, NC | Raleigh/Durham | North Durham | 1.7% | $17.69 | $18.73 |
| Shoppes at Westgate – Leland, NC | Wilmington | Leland | 1.6% | $22.84 | $19.47 |
| Hudson Bridge Crossing – Stockbridge, GA | Atlanta | Riverdale/Jonesboro | 5.4% | $24.41 | $22.77 |
| Chamblee Village – Atlanta, GA | Atlanta | Chamblee/Doraville | 3.4% | $26.86 | $27.54 |
| Shoppes at Richland – Aiken, SC | Augusta-Richmond County, GA-SC | Outlying Aiken County | 5.0% | $19.98 | $20.59 |
| Shoppes at White Knoll – Lexington, SC | Columbia, SC | Lexington | 2.6% | $21.87 | $21.47 |
| (2) | UW Rental Rate PSF is based on the underwritten rent rolls dated October 25, 2022. |
| (3) | Market Rent Rate PSF is based on the appraiser’s conclusion. |
| THE INFORMATION IN THIS STRUCTURAL AND COLLATERAL TERM SHEET IS NOT COMPLETE AND MAY BE AMENDED PRIOR TO THE TIME OF SALE. THIS TERM SHEET IS NOT AN OFFER TO SELL THESE SECURITIES AND IT IS NOT A SOLICITATION OF AN OFFER TO BUY THESE SECURITIES IN ANY JURISDICTION WHERE THE OFFER OR SALE IS NOT PERMITTED. |
| | 153 | |
| Structural and Collateral Term Sheet | | BMO 2023-C4 |
| Contacts |
| BMO Capital Markets CMBS Capital Markets & Banking |
| Contact | E-mail | Phone Number |
| Paul Vanderslice | paul.vanderslice@bmo.com | (203) 451-4151 |
| Managing Director | | |
| | | |
| David Schell | david.schell@bmo.com | (201) 723-4872 |
| Managing Director | | |
| | | |
| Ravish Kamath | ravish.kamath@bmo.com | (860) 771-0788 |
| Director | | |
| | | |
| BMO Capital Markets CMBS Trading & Structuring |
| Contact | E-Mail | Phone Number |
| Andrew Noonan | andrew.noonan@bmo.com | (917) 843-4252 |
| Managing Director | | |
| | | |
| Mary Kunka | mary.kunka@bmo.com | (201) 247-4182 |
| Managing Director | | |
| | | |
| Kiran Manda | kiran.manda@bmo.com | (347) 831-4776 |
| Managing Director | | |
| | | |
| Michael Chen | lei4.chen@bmo.com | (718) 869-0700 |
| Director | | |
| | | |
| BMO Capital Markets Securitized Products Syndicate |
| Contact | E-Mail | Phone Number |
| Alex Smith-Constantine | alex.smithconstantine@bmo.com | (201) 637-9725 |
| Managing Director | | |
| | | |
| Trinian Donohoe | trinian.donohoe@bmo.com | (212) 702-1866 |
| Vice President | | |
| | | |
| Natixis CMBS Capital Markets |
| Contact | E-Mail | Phone Number |
Precilla Torres | Precilla.torres@natixis.com | (212) 891-6102 |
| Managing Director | | |
| | | |
| Andrew Florio | florio@natixis.com | (212) 891-5725 |
| Executive Director | | |
| | | |
| William Han | William.han@natixis.com | (212) 891-5765 |
| Director | | |
| | | |
| Michele Biancolin | Michele.biancolin@natixis.com | (212) 891-1986 |
| Director | | |
| | | |
| Citigroup CMBS Capital Markets and Securitization |
| Contact | E-Mail | Phone Number |
| Rick Simpson | richard.simpson@citi.com | (212) 816-5343 |
| Managing Director | | |
| | | |
| Jason Mercandetti | jason.mercandetti@citi.com | (212) 816-6384 |
| Director | | |
| | | |
| Citigroup Structuring, Trading & Syndicate |
| Contact | E-Mail | Phone Number |
| Raul Orozco | raul.d.orozco@citi.com | (212) 723-1295 |
| Managing Director | | |
| | | |
| Mattison Perry | mattison.perry@citi.com | (212) 723-1295 |
| Director | | |
| | | |
| | | |
| THE INFORMATION IN THIS STRUCTURAL AND COLLATERAL TERM SHEET IS NOT COMPLETE AND MAY BE AMENDED PRIOR TO THE TIME OF SALE. THIS TERM SHEET IS NOT AN OFFER TO SELL THESE SECURITIES AND IT IS NOT A SOLICITATION OF AN OFFER TO BUY THESE SECURITIES IN ANY JURISDICTION WHERE THE OFFER OR SALE IS NOT PERMITTED. |
| | 154 | |