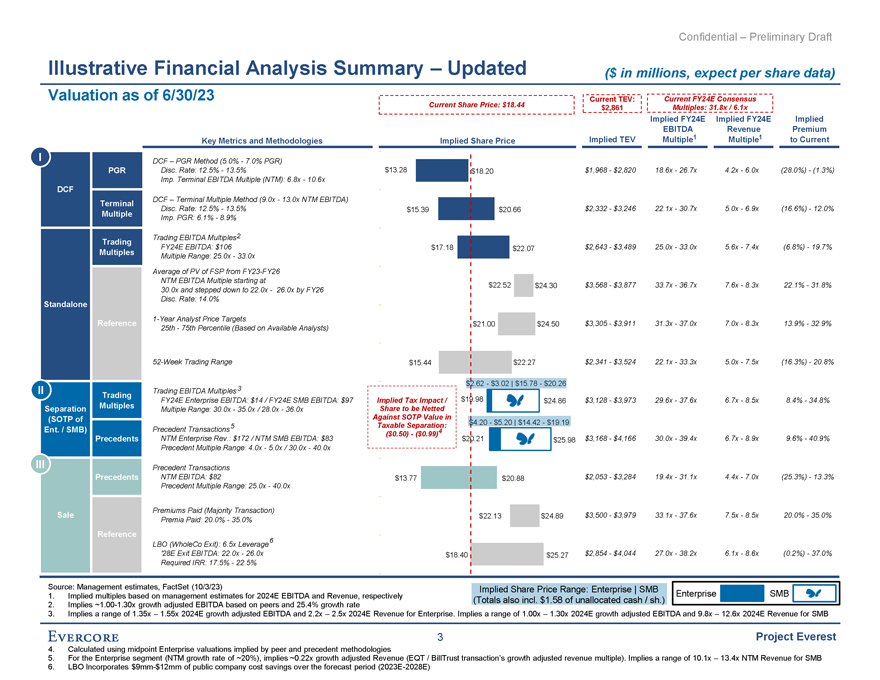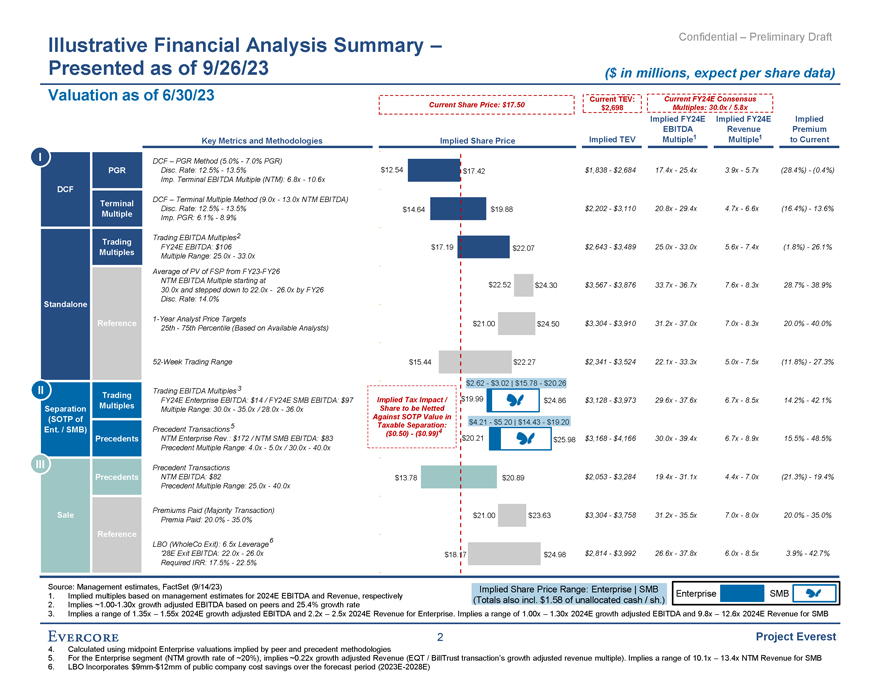
Illustrative Financial Analysis Summary – Confidential – Preliminary Draft Presented as of 9/26/23 ($ in millions, expect per share data) Valuation as of 6/30/23 Current TEV: Current FY24E Consensus Current Share Price: $17.50 $2,698 Multiples: 30.0x / 5.8x Implied FY24E Implied FY24E Implied EBITDA Revenue Premium Key Metrics and Methodologies Implied Share Price Implied TEV Multiple1 Multiple1 to Current I DCF – PGR Method (5.0%—7.0% PGR) PGR Disc. Rate: 12.5%—13.5% $12.54 $17.42 $1,838—$2,684 17.4x—25.4x 3.9x—5.7x (28.4%)—(0.4%) Imp. Terminal EBITDA Multiple (NTM): 6.8x—10.6x DCF DCF – Terminal Multiple Method (9.0x—13.0x NTM EBITDA) Terminal Disc. Rate: 12.5%—13.5% $14.64 $19.88 $2,202—$3,110 20.8x—29.4x 4.7x—6.6x (16.4%)—13.6% Multiple Imp. PGR: 6.1%—8.9% Trading Trading EBITDA Multiples2 FY24E EBITDA: $106 $17.19 $22.07 $2,643—$3,489 25.0x—33.0x 5.6x—7.4x (1.8%)—26.1% Multiples Multiple Range: 25.0x—33.0x Average of PV of FSP from FY23-FY26 NTM EBITDA Multiple starting at $22.52 $24.30 $3,567—$3,876 33.7x—36.7x 7.6x—8.3x 28.7%—38.9% 30.0x and stepped down to 22.0x— 26.0x by FY26 Disc. Rate: 14.0% Standalone 1-Year Analyst Price Targets Reference $21.00 $24.50 $3,304—$3,910 31.2x—37.0x 7.0x—8.3x 20.0%—40.0% 25th—75th Percentile (Based on Available Analysts) 52-Week Trading Range $15.44 $22.27 $2,341—$3,524 22.1x—33.3x 5.0x—7.5x (11.8%)—27.3% $2.62—$3.02 | $15.78—$20.26 II Trading Trading EBITDA Multiples 3 Multiples FY24E Enterprise EBITDA: $14 / FY24E SMB EBITDA: $97 Implied Tax Impact / $19.99 $24.86 $3,128—$3,973 29.6x—37 14.2%—42.1% Separation Multiple Range: 30.0x—35.0x / 28.0x—36.0x Share to be Netted (SOTP of Against SOTP Value in Taxable Separation: $4.21—$5.20 | $14.43—$19.20 Ent. / SMB) Precedent Transactions5 ($0.50)—($0.99)4 Precedents NTM Enterprise Rev.: $172 / NTM SMB EBITDA: $83 $20.21 $25.98 $3,168—$4,166 30.0x—39.4x 15.5%—48.5% Precedent Multiple Range: 4.0x—5.0x / 30.0x—40.0x III Precedent Transactions Precedents NTM EBITDA: $82 $13.78 $20.89 $2,053—$3,284 19.4x—31.1x 4.4x—7.0x (21.3%)—19.4% Precedent Multiple Range: 25.0x—40.0x Premiums Paid (Majority Transaction) Sale $21.00 $23.63 $3,304—$3,758 31.2x—35.5x 7.0x—8.0x 20.0%—35.0% Premia Paid: 20.0%—35.0% Reference 6 LBO (WholeCo Exit): 6.5x Leverage ’28E Exit EBITDA: 22.0x—26.0x $18.17 $24.98 $2,814—$3,992 26.6x—37.8x 6.0x—8.5x 3.9%—42.7% Required IRR: 17.5%—22.5% Source: Management estimates, FactSet (9/14/23) Implied Share Price Range: Enterprise | SMB 1. Implied multiples based on management estimates for 2024E EBITDA and Revenue, respectively Enterprise SMB (Totals also incl. $1.58 of unallocated cash / sh.) 2. Implies ~1.00-1.30x growth adjusted EBITDA based on peers and 25.4% growth rate 3. Implies a range of 1.35x – 1.55x 2024E growth adjusted EBITDA and 2.2x – 2.5x 2024E Revenue for Enterprise. Implies a range of 1.00x – 1.30x 2024E growth adjusted EBITDA and 9.8x – 12.6x 2024E Revenue for SMB 2 Project Everest 4. Calculated using midpoint Enterprise valuations implied by peer and precedent methodologies 5. For the Enterprise segment (NTM growth rate of ~20%), implies ~0.22x growth adjusted Revenue (EQT / BillTrust transaction’s growth adjusted revenue multiple). Implies a range of 10.1x – 13.4x NTM Revenue for SMB 6. LBO Incorporates $9mm-$12mm of public company cost savings over the forecast period (2023E-2028E)