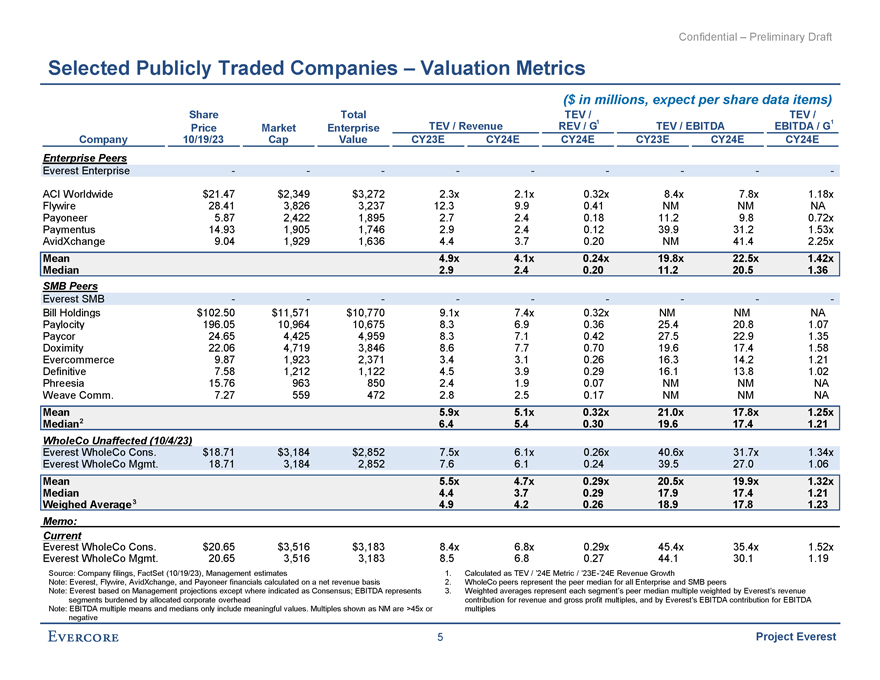
Confidential -Preliminary Draft Selected Publicly Traded Companies—Valuation Metrics ($ in millions, expect per share data items) Share Total TEV I TEVI 1 1 Price Market Enterprise TEV I Revenue REV IG TEV I EBITDA EBITDAIG Com~an~ 10119123 Ca~ Value CY23E CY24E CY24E CY23E CY24E CY24E Entem.rise Peers Everest Enterprise ACI Worldwide $21.47 $2,349 $3,272 2.3x 2.1x 0.32x 8.4x 7.8x 1.18x Flyvvire 28.41 3,826 3,237 12.3 9.9 0.41 NM NM NA Payoneer 5.87 2,422 1,895 2.7 2.4 0.18 11.2 9.8 0.72x Paymentus 14.93 1,905 1,746 2.9 2.4 0.12 39.9 31.2 1.53x AvidXchange 9.04 1,929 1,636 4.4 3.7 0.20 NM 41.4 2.25x Mean 4.9x 4.1x 0.24x 19.8x 22.5x 1.42x Median 2.9 2.4 0.20 11.2 20.5 1.36 SMBPeers Everest SMB Bill Holdings $102.50 $11 ,571 $10,770 9.1x 7.4x 0.32x NM NM NA Paylocity 196.05 10,964 10,675 8.3 6.9 0.36 25.4 20.8 1.07 Paycor 24.65 4,425 4,959 8.3 7.1 0.42 27.5 22.9 1.35 Doximity 22.06 4,719 3,846 8.6 7.7 0.70 19.6 17.4 1.58 Evercom merce 9.87 1,923 2,371 3.4 3.1 0.26 16.3 14.2 1.21 Definitive 7.58 1,212 1,122 4.5 3.9 0.29 16.1 13.8 1.02 Phreesia 15.76 963 850 2.4 1.9 0.07 NM NM NA Weave Comm. 7.27 559 472 2.8 2.5 0.17 NM NM NA Mean 5.9x 5.1x 0.32x 21.0x 17.8x 1.25x Median2 6.4 5.4 0.30 19.6 17.4 1.21 Who/eCo Unaffected (10/4123l Everest WholeCo Cons. $18.71 $3,184 $2,852 7.5x 6.1 x 0.26x 40.6x 31.7x 1.34x Everest WholeCo Mgmt. 18.71 3,184 2,852 7.6 6.1 0.24 39.5 27.0 1.06 Mean 5.5x 4.7x 0.29x 20.5x 19.9x 1.32x Median 4.4 3.7 0.29 17.9 17.4 1.21 Weiqhed Averaqe 3 4.9 4.2 0.26 18.9 17.8 1.23 Memo: Current Everest WholeCo Cons. $20.65 $3,516 $3,183 8.4x 6.8x 0.29x 45.4x 35.4x 1.52x Everest WholeCo Mgmt. 20.65 3,516 3,183 8.5 6.8 0.27 44.1 30.1 1.19 Source: Company filings, FactSet (10119/23), Management estimates 1. Calculated as TEV I ‘24E Metric I ‘23E-‘24E Revenue Growth Note: Everest, Flywire, AvidXchange, and Payoneer financials calculated on a net revenue basis 2. WholeCo peers represent the peer median for all Enterprise and SMB peers Note: Everest based on Management projections except where indicated as Consensus; EBITDA represents 3. Weighted averages represent each segment’s peer median multiple weighted by Everest’s revenue segments burdened by allocated corporate overhead contribution for revenue and gross profit multiples, and by Everest’ s EBITDA contribution for EBITDA Note: EBITDA multiple means and medians only include meaningful values. Multiples shO\Nn as NM are >45x or multiples negative EvERCORE 5 Project Everest