Exhibit (c)(ii)

CONFIDENTIAL SPECIAL COMMITTEE PROCESS UPDATE October 2024 Project Vista Highly Illustrative and Subject to Material Revision

CONFIDENTIAL Review status of active counterpartiesBid status Areas of differentiation Path forward and timeline Determine messaging to counterparties and next steps Discuss valuation and liquidity considerations Today’s Agenda 1 2 3 A C B2
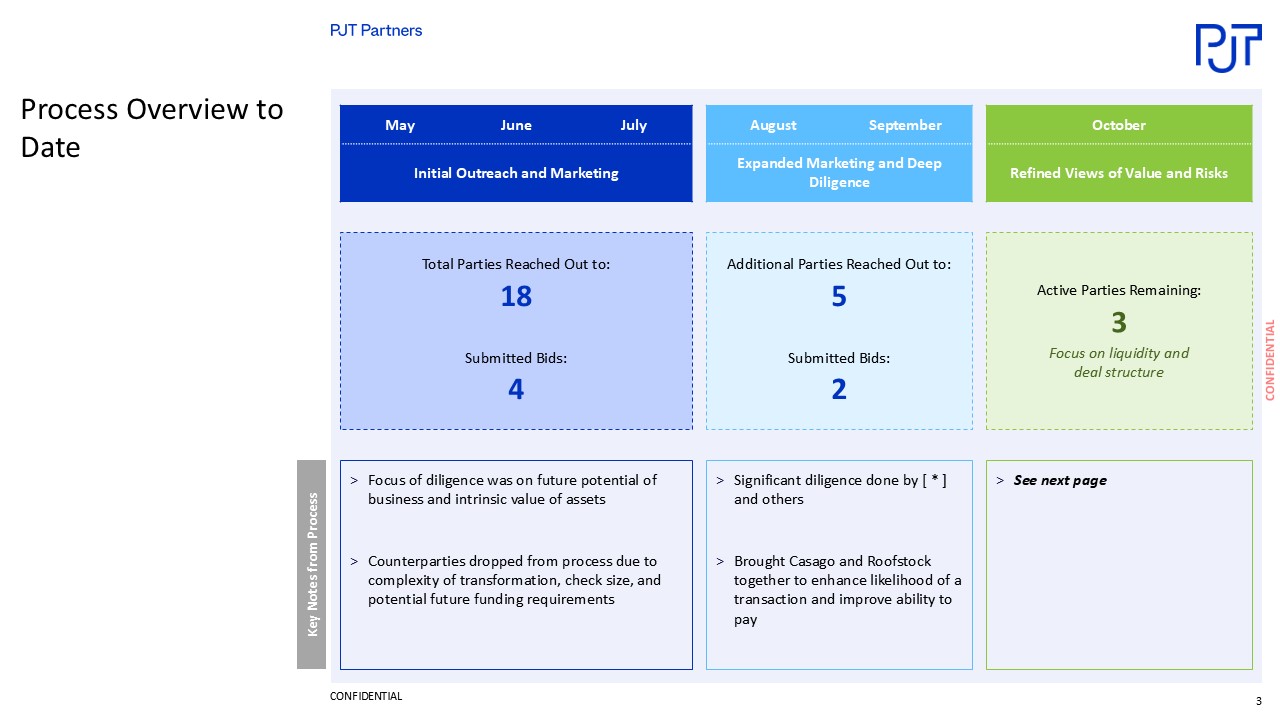
CONFIDENTIAL Process Overview to Date May June July Initial Outreach and Marketing August September Expanded Marketing and Deep Diligence October Refined Views of Value and Risks Total Parties Reached Out to: 18 Submitted Bids: 4 Additional Parties Reached Out to: 5 Submitted Bids: 2 Active Parties Remaining: 3 Focus on liquidity and deal structure Key Notes from Process Focus of diligence was on future potential of business and intrinsic value of assets Counterparties dropped from process due to complexity of transformation, check size, and potential future funding requirements Significant diligence done by KSL Capital and others >Brought Casago and Roofstock together to enhance likelihood of a transaction and improve ability to pay See next page
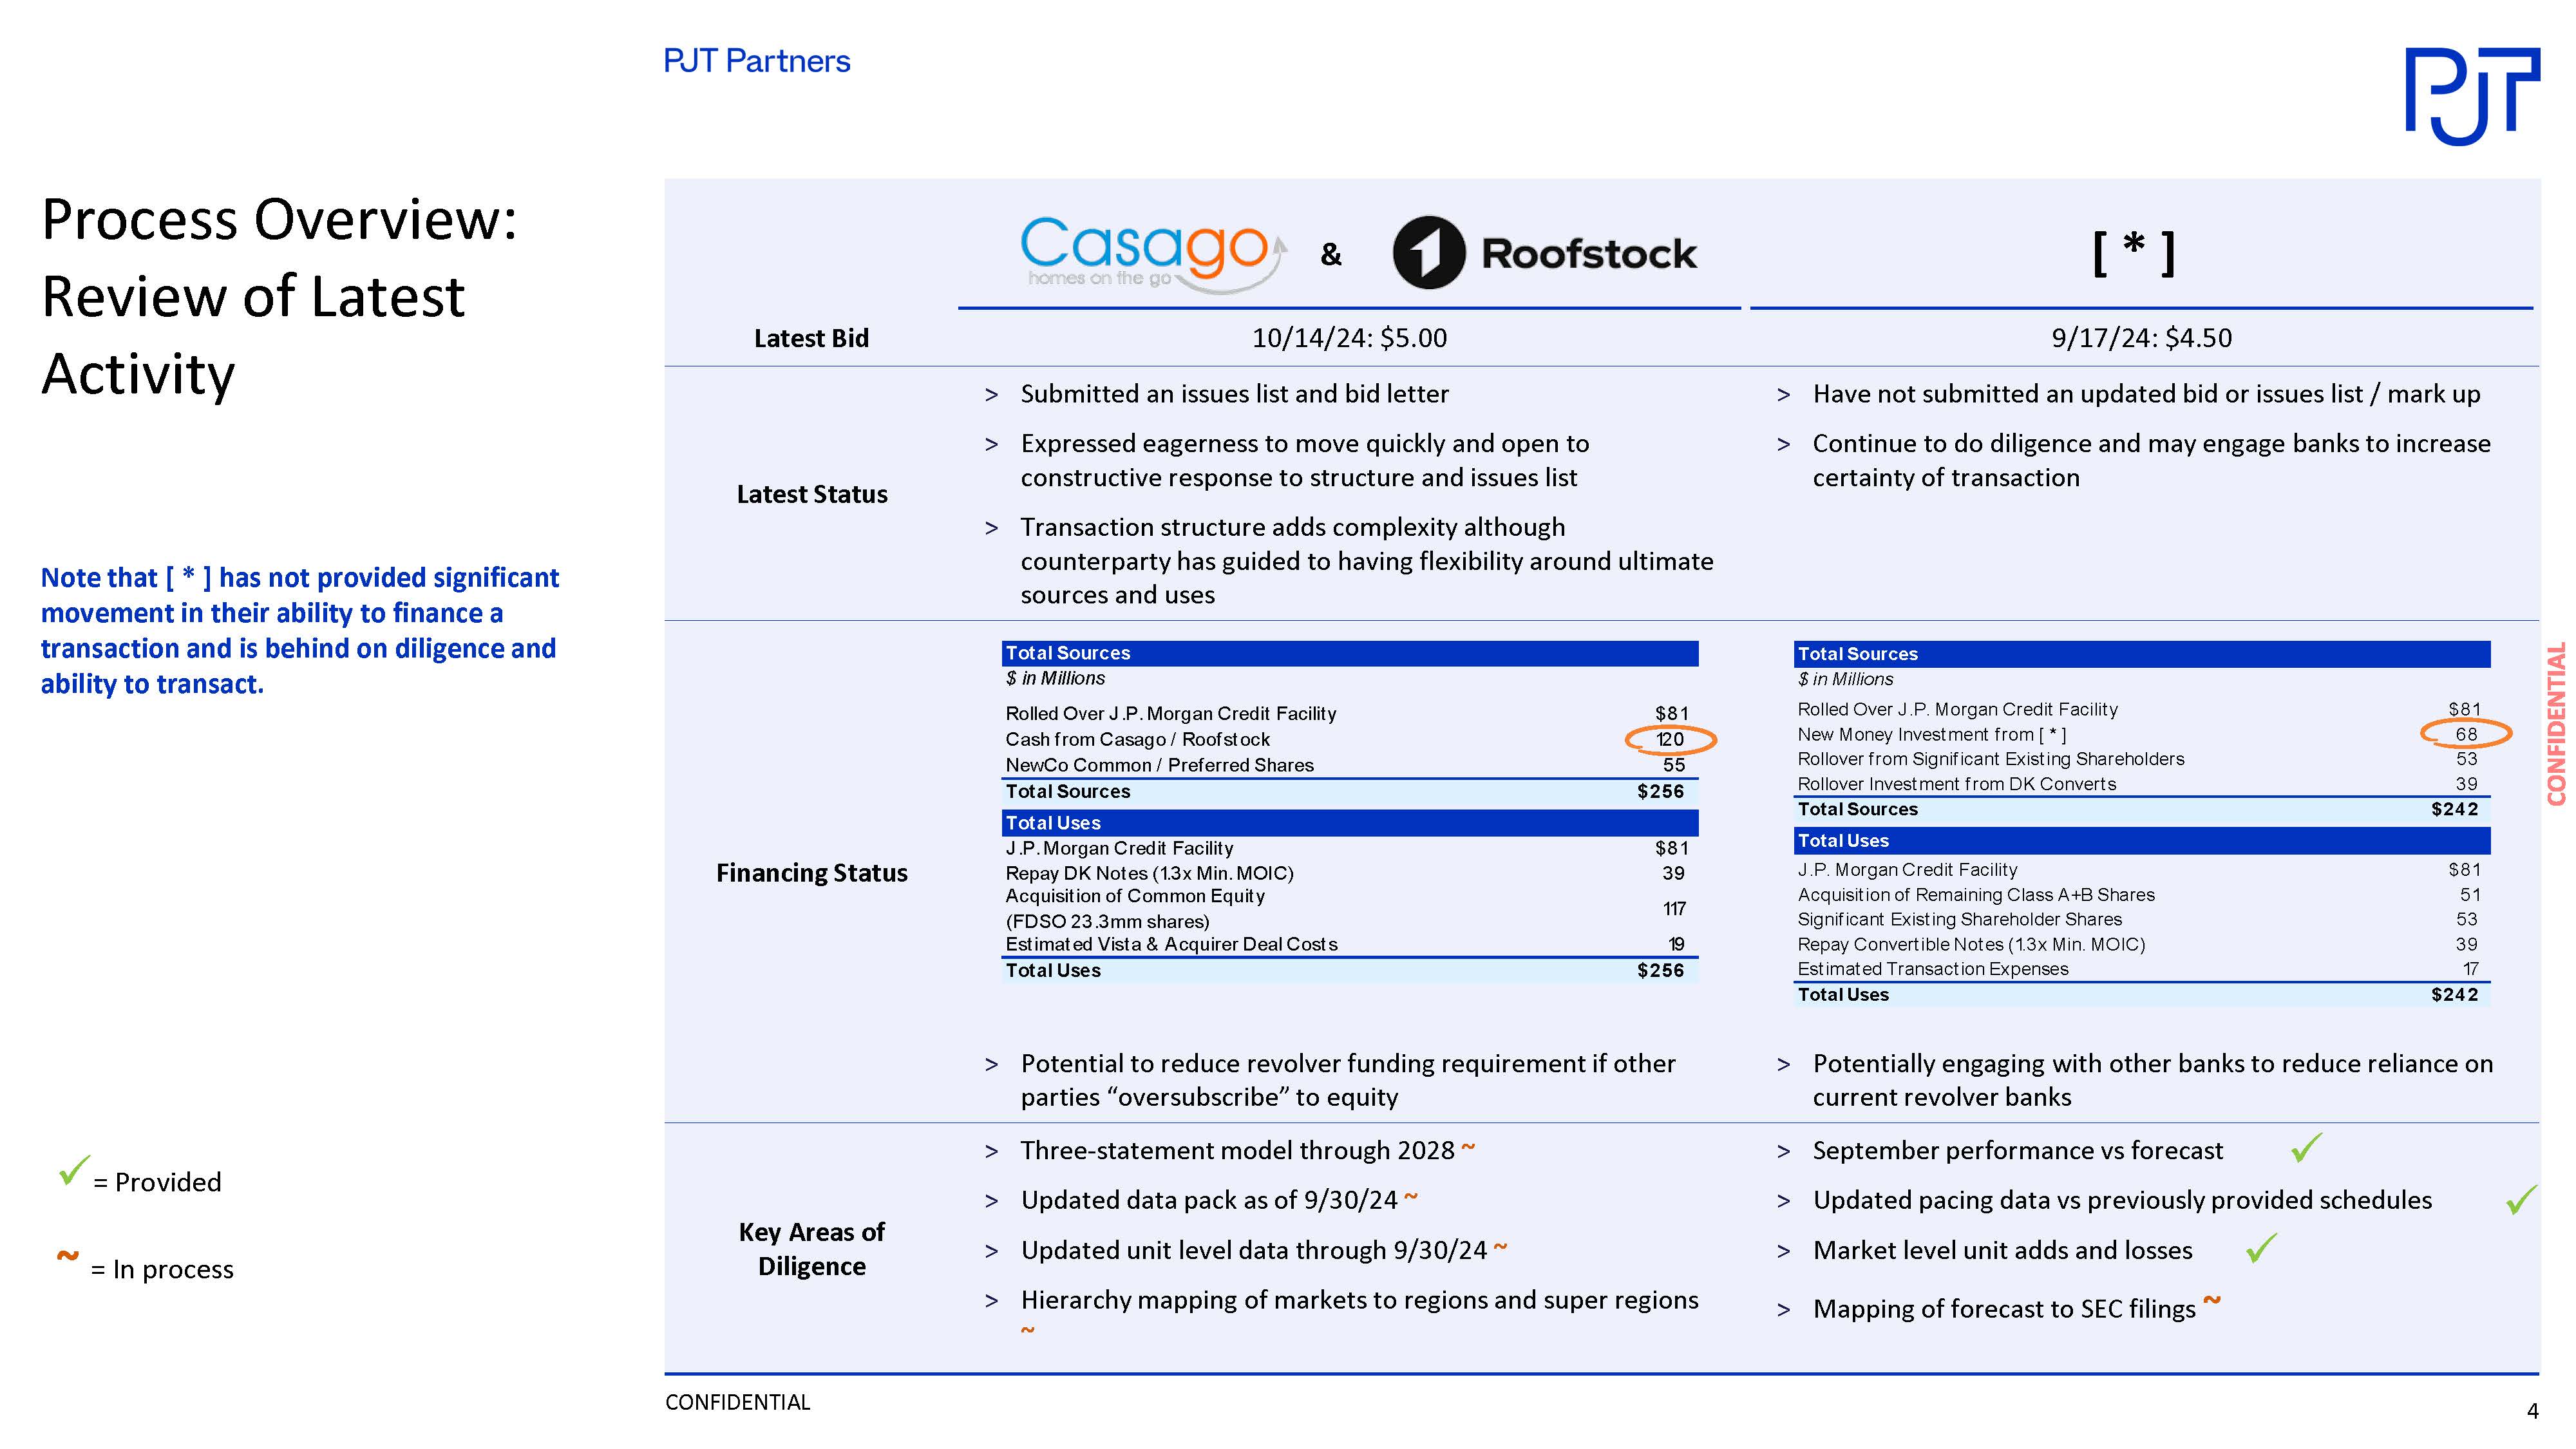
CONFIDENTIAL Process Overview: Review of Latest Activity Latest Bid 10/14/24: $5.00 9/17/24: $4.50 Latest Status Submitted an issues list and bid letter Expressed eagerness to move quickly and open to constructive response to structure and issues list Transaction structure adds complexity although counterparty has guided to having flexibility around ultimate sources and uses Have not submitted an updated bid or issues list / mark up Continue to do diligence and may engage banks to increase certainty of transaction Financing Status Potential to reduce revolver funding requirement if other parties “oversubscribe” to equity Potentially engaging with other banks to reduce reliance on current revolver banks Key Areas of Diligence Three-statement model through 2028 ~ Updated data pack as of 9/30/24 ~ Updated unit level data through 9/30/24 ~ Hierarchy mapping of markets to regions and super regions ~ September performance vs forecast Updated pacing data vs previously provided schedules Market level unit adds and losses Mapping of forecast to SEC filings ~ Total Sources $ in Millions Rolled Over J.P. Morgan Credit Facility $81 Cash from Casago / Roofstock 120 NewCo Common / Preferred Shares 55 Total Sources $256 Total Uses J.P. Morgan Credit Facility $81 Repay DK Notes (1.3x Min. MOIC) 39 Acquisition of Common Equity (FDSO 23.3mm shares) 117 Estimated Vista & Acquirer Deal Costs 19 Total Uses $256 Total Sources $ in Millions Rolled Over J.P. Morgan Credit Facility $81 New Money Investment from KSL 68 Rollover from Significant Existing Shareholders 53 Rollover Investment from DK Converts 39 Total Sources $242 Total Uses J.P. Morgan Credit Facility $81 Acquisition of Remaining Class A+B Shares 51 Significant Existing Shareholder Shares 53 Repay Convertible Notes (1.3x Min. MOIC) 39 Estimated Transaction Expenses 17 Total Uses $242 Note that Revedy has not provided significant movement in their ability to finance a transaction and is behind on diligence and ability to transact. = Provided = In process
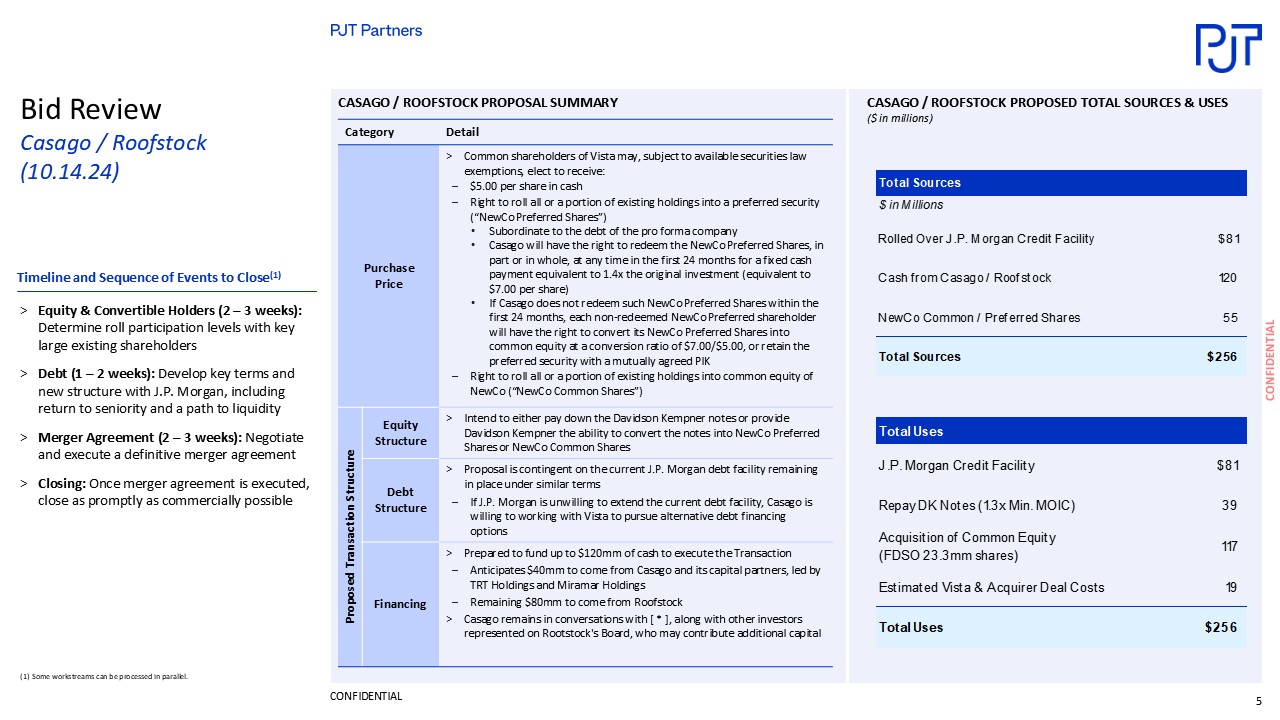
CONFIDENTIAL Bid Review Casago / Roofstock (10.14.24) Timeline and Sequence of Events to Close(1) Equity & Convertible Holders (2 – 3 weeks): Determine roll participation levels with key large existing shareholders Debt (1 – 2 weeks): Develop key terms and new structure with J.P. Morgan, including return to seniority and a path to liquidity Merger Agreement (2 – 3 weeks): Negotiate and execute a definitive merger agreement Closing: Once merger agreement is executed, close as promptly as commercially possible (1) Some workstreams can be processed in parallel. Proposed Transaction Structure Equity Structure Intend to either pay down the Davidson Kempner notes or provide Davidson Kempner the ability to convert the notes into NewCo Preferred Shares or NewCo Common Shares Debt Structure Proposal is contingent on the current J.P. Morgan debt facility remaining in place under similar terms If J.P. Morgan is unwilling to extend the current debt facility, Casago is willing to working with Vista to pursue alternative debt financing options Financing Prepared to fund up to $120mm of cash to execute the Transaction Anticipates $40mm to come from Casago and its capital partners, led by TRT Holdings and Miramar Holdings Remaining $80mm to come from Roofstock Casago remains in conversations with Macquarie, along with other investors represented on Rootstock's Board, who may contribute additional capital CASAGO / ROOFSTOCK PROPOSAL SUMMARY Category Detail Purchase Price Common shareholders of Vista may, subject to available securities law exemptions, elect to receive: $5.00 per share in cash Right to roll all or a portion of existing holdings into a preferred security (“NewCo Preferred Shares”) Subordinate to the debt of the pro forma company Casago will have the right to redeem the NewCo Preferred Shares, in part or in whole, at any time in the first 24 months for a fixed cash payment equivalent to 1.4x the original investment (equivalent to $7.00 per share) If Casago does not redeem such NewCo Preferred Shares within the first 24 months, each non-redeemed NewCo Preferred shareholder will have the right to convert its NewCo Preferred Shares into common equity at a conversion ratio of $7.00/$5.00, or retain the preferred security with a mutually agreed PIK Right to roll all or a portion of existing holdings into common equity of NewCo (“NewCo Common Shares”) CASAGO / ROOFSTOCK PROPOSED TOTAL SOURCES & USES ($ in millions) Total Sources $ in Millions Rolled Over J.P. Morgan Credit Facility $81 Cash from Casago / Roofstock 120 NewCo Common / Preferred Shares 55 Total Sources $256 Total Uses J.P. Morgan Credit Facility $81 Repay DK Notes (1.3x Min. MOIC) 39 Acquisition of Common Equity (FDSO 23.3mm shares) 117 Estimated Vista & Acquirer Deal Costs 19 Total Uses $256 5
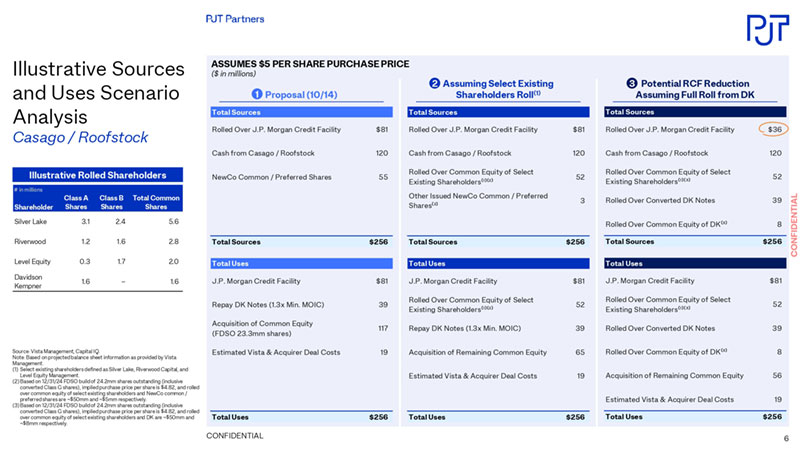
Illustrative Sources and Uses Scenario Analysis Casago / Roofstock Source: Vista Management, Capital IQ. Note: Based on projected balance sheet information as provided by Vista Management. (1) Select existing shareholders defined as Silver Lake, Riverwood Capital, and Level Equity Management. (2)Based on 12/31/24 FDSO build of 24.2mm shares outstanding (inclusive converted Class G shares), implied purchase price per share is $4.82, and rolled over common equity of select existing shareholders and NewCo common / preferred shares are ~$50mm and ~$5mm respectively. (3)Based on 12/31/24 FDSO build of 24.2mm shares outstanding (inclusive converted Class G shares), implied purchase price per share is $4.82, and rolled over common equity of select existing shareholders and DK are ~$50mm and ~$8mm respectively. 6 Illustrative Rolled Shareholders # in millions Shareholder Class A Shares Class B Shares Total Common Shares Silver Lake 3.1 2.4 5.6 Riverwood 1.2 1.6 2.8 Level Equity 0.3 1.7 2.0 Davidson Kempner 1.6 – 1.6 ASSUMES $5 PER SHARE PURCHASE PRICE ($ in millions) 1 Proposal (10/14) Total Sources Rolled Over J.P. Morgan Credit Facility $81 Cash from Casago / Roofstock 120 NewCo Common / Preferred Shares 55 Total Sources $256 Total Uses J.P. Morgan Credit Facility $81 Repay DK Notes (1.3x Min. MOIC) 39 Acquisition of Common Equity (FDSO 23.3mm shares) 117 Estimated Vista & Acquirer Deal Costs 19 Total Uses $256 2 Assuming Select Existing Shareholders Roll(1) Total Sources Rolled Over J.P. Morgan Credit Facility $81 Cash from Casago / Roofstock 120 Rolled Over Common Equity of Select Existing Shareholders⁽¹⁾⁽²⁾ 52 Other Issued NewCo Common / Preferred Shares⁽²⁾ 3 Total Sources $256 Total Uses J.P. Morgan Credit Facility $81 Rolled Over Common Equity of Select Existing Shareholders⁽¹⁾⁽²⁾ 52 Repay DK Notes (1.3x Min. MOIC) 39 Acquisition of Remaining Common Equity 65 Estimated Vista & Acquirer Deal Costs 19 Total Uses $256 3 Potential RCF Reduction Assuming Full Roll from DK Total Sources Rolled Over J.P. Morgan Credit Facility $36 Cash from Casago / Roofstock 120 Rolled Over Common Equity of Select Existing Shareholders⁽¹⁾⁽³⁾ 52 Rolled Over Converted DK Notes 39 Rolled Over Common Equity of DK⁽³⁾ 8 Total Sources $256 Total Uses J.P. Morgan Credit Facility $81 Rolled Over Common Equity of Select Existing Shareholders⁽¹⁾⁽³⁾ 52 Rolled Over Converted DK Notes 39 Rolled Over Common Equity of DK⁽³⁾ 8 Acquisition of Remaining Common Equity 56 Estimated Vista & Acquirer Deal Costs 19 Total Uses $256
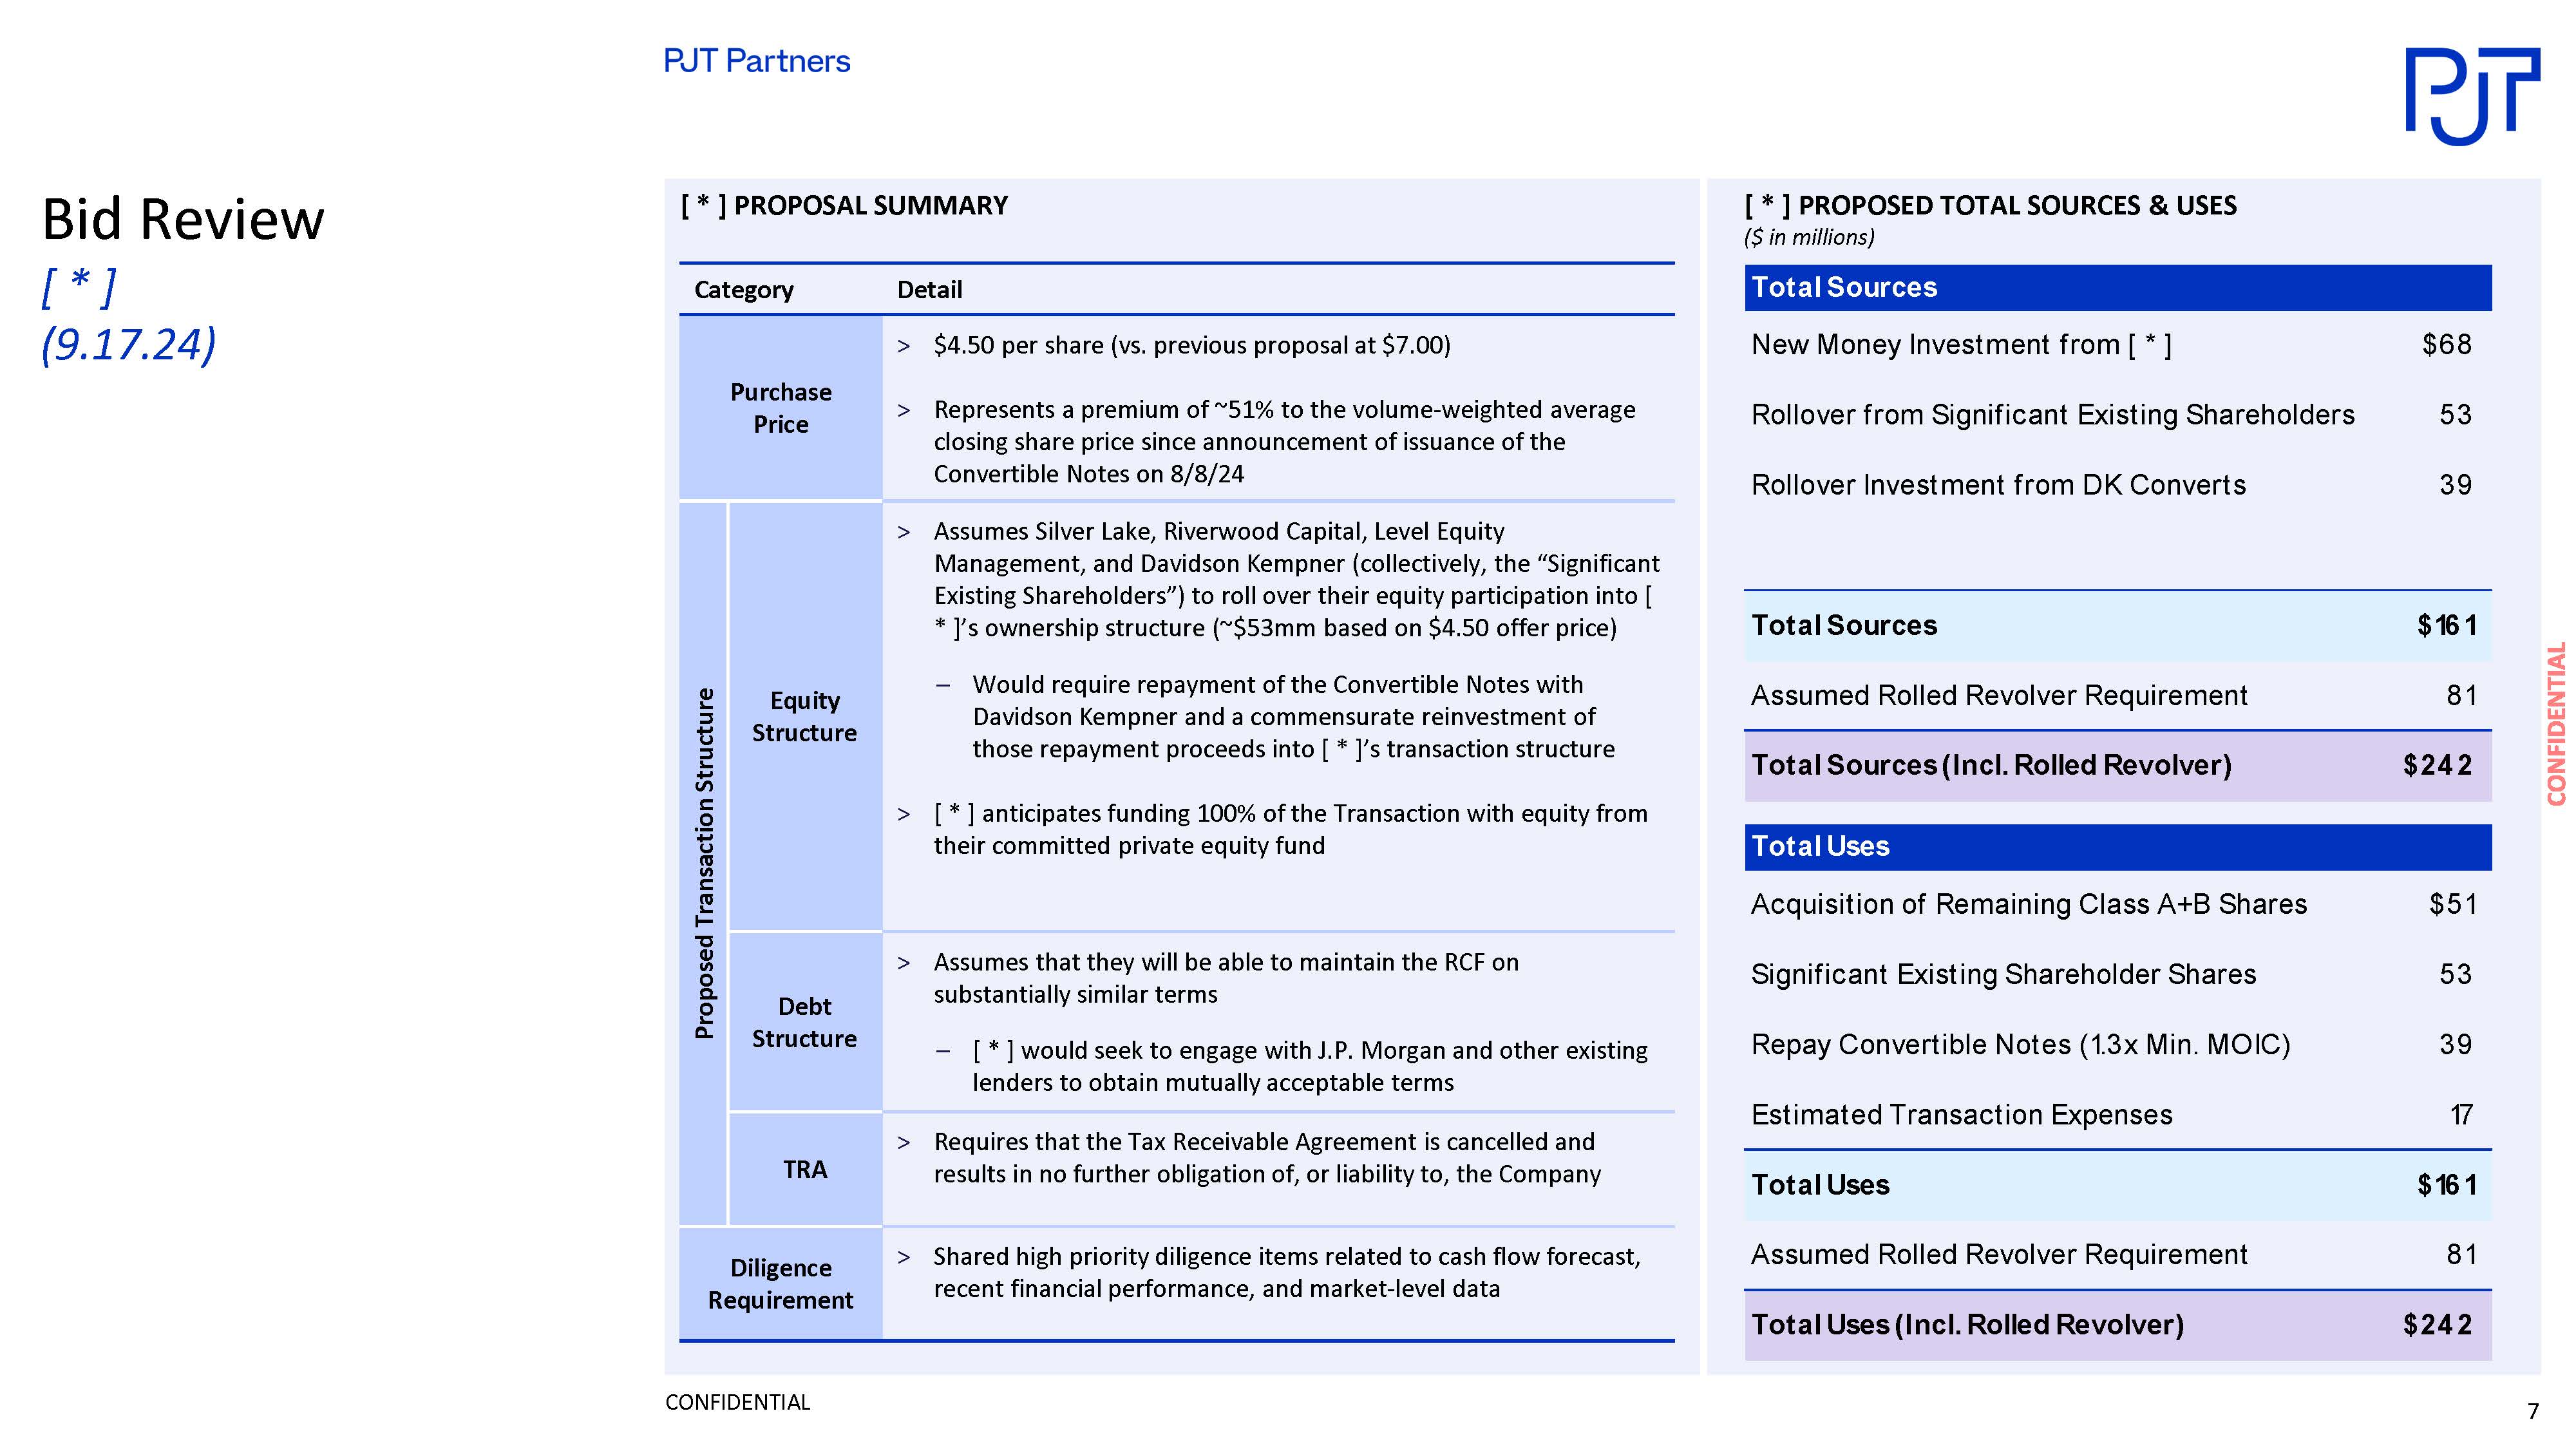
Bid Review KSL (9.17.24) KSL PROPOSAL SUMMARY Category Detail Purchase Price $4.50 per share (vs. previous proposal at $7.00) Represents a premium of ~51% to the volume-weighted average closing share price since announcement of issuance of the Convertible Notes on 8/8/24 Proposed Transaction Structure Equity Structure Assumes Silver Lake, Riverwood Capital, Level Equity Management, and Davidson Kempner (collectively, the “Significant Existing Shareholders”) to roll over their equity participation into KSL’s ownership structure (~$53mm based on $4.50 offer price) Would require repayment of the Convertible Notes with Davidson Kempner and a commensurate reinvestment of those repayment proceeds into KSL’s transaction structure KSL anticipates funding 100% of the Transaction with equity from their committed private equity fund Debt Structure Assumes that they will be able to maintain the RCF on substantially similar terms KSL would seek to engage with J.P. Morgan and other existing lenders to obtain mutually acceptable terms TRA Requires that the Tax Receivable Agreement is cancelled and results in no further obligation of, or liability to, the Company Diligence Requirement Shared high priority diligence items related to cash flow forecast, recent financial performance, and market-level data KSL PROPOSED TOTAL SOURCES & USES ($ in millions) Total Sources New Money Investment from KSL $68 Rollover from Significant Existing Shareholders 53 Rollover Investment from DK Converts 39 Total Sources $161 Assumed Rolled Revolver Requirement 81 Total Sources (Incl. Rolled Revolver) $242 Total Uses Acquisition of Remaining Class A+B Shares $51 Significant Existing Shareholder Shares 53 Repay Convertible Notes (1.3x Min. MOIC) 39 Estimated Transaction Expenses 17 Total Uses $161 Assumed Rolled Revolver Requirement 81 Total Uses (Incl. Rolled Revolver) $242 CONFIDENTIAL 7
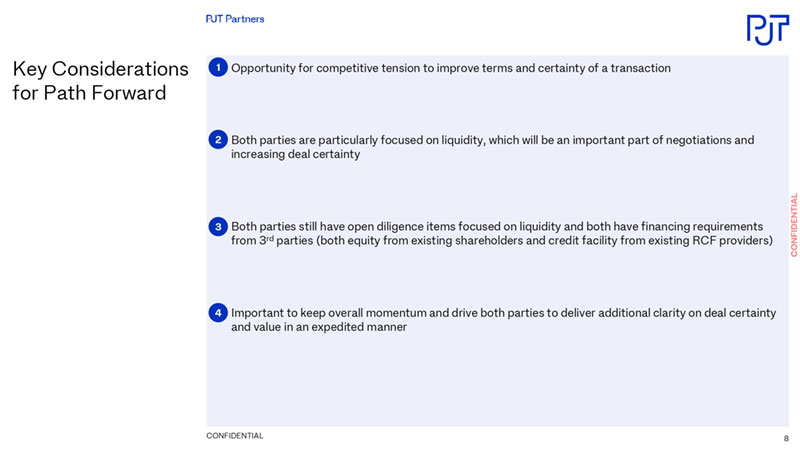
CONFIDENTIAL Opportunity for competitive tension to improve terms and certainty of a transaction Both parties are particularly focused on liquidity, which will be an important part of negotiations and increasing deal certainty Both parties still have open diligence items focused on liquidity and both have financing requirements from 3rd parties (both equity from existing shareholders and credit facility from existing RCF providers) Important to keep overall momentum and drive both parties to deliver additional clarity on deal certainty and value in an expedited manner Key Considerations for Path Forward 1 2 3 48
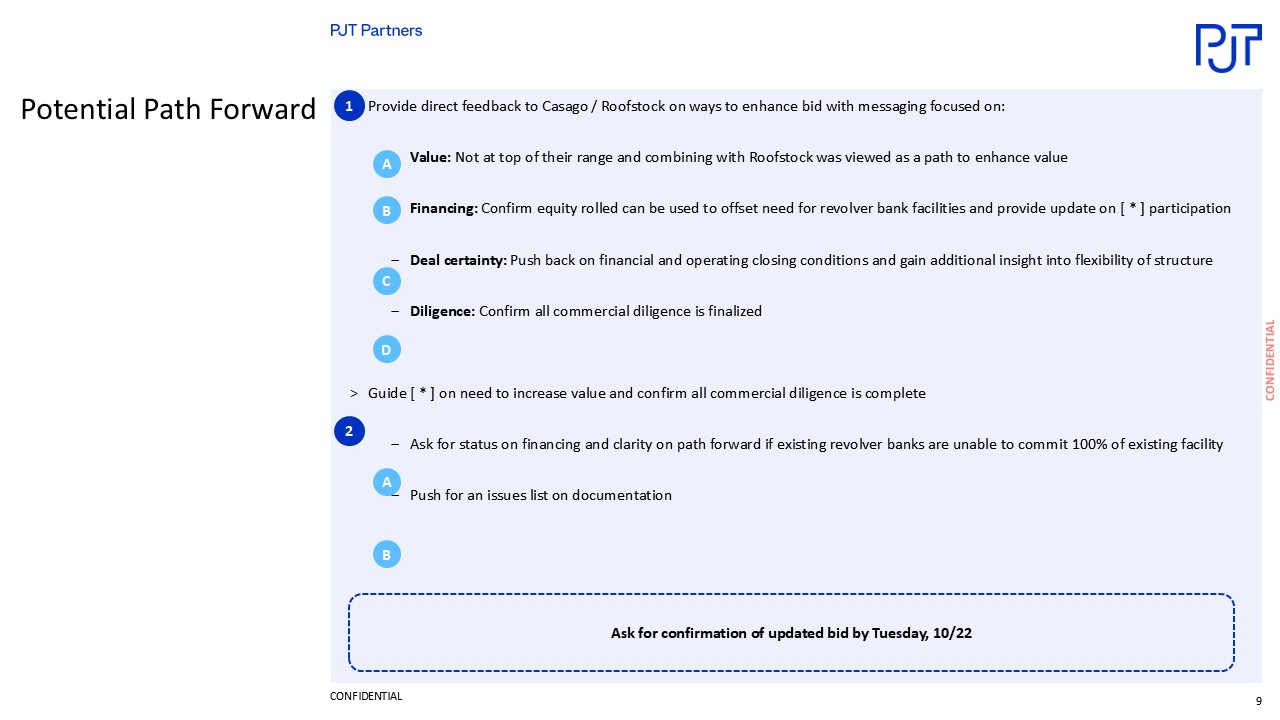
CONFIDENTIAL Provide direct feedback to Casago / Roofstock on ways to enhance bid with messaging focused on:Value: Not at top of their range and combining with Roofstock was viewed as a path to enhance value Financing: Confirm equity rolled can be used to offset need for revolver bank facilities and provide update on Macquarie participation Deal certainty: Push back on financial and operating closing conditions and gain additional insight into flexibility of structure Diligence: Confirm all commercial diligence is finalized Guide KSL on need to increase value and confirm all commercial diligence is completeAsk for status on financing and clarity on path forward if existing revolver banks are unable to commit 100% of existing facility Push for an issues list on documentation Potential Path Forward 1 2 A B Ask for confirmation of updated bid by Tuesday, 10/22 C D A B9

CONFIDENTIAL I.Valuation Considerations
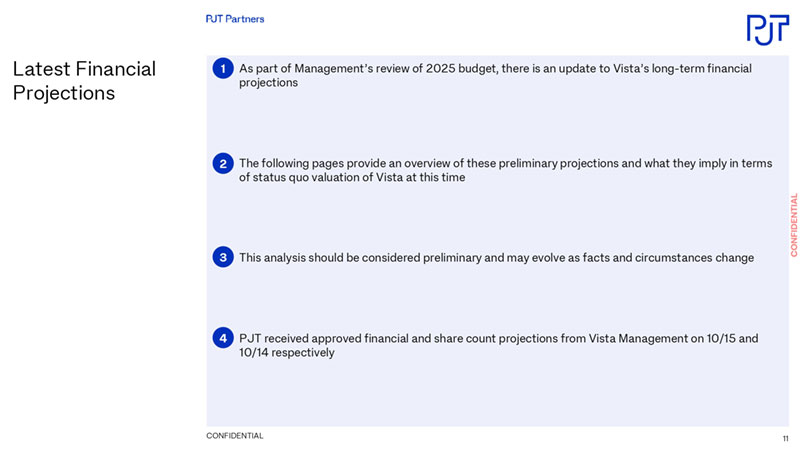
CONFIDENTIAL As part of Management’s review of 2025 budget, there is an update to Vista’s long-term financial projections The following pages provide an overview of these preliminary projections and what they imply in terms of status quo valuation of Vista at this time This analysis should be considered preliminary and may evolve as facts and circumstances change PJT received approved financial and share count projections from Vista Management on 10/15 and 10/14 respectively Latest Financial Projections 1 2 3 411

CONFIDENTIAL $923 $841 $871 $940 $1,006 $1,052 (17.4%) (8.8%) 3.5% 8.0% 7.0% 4.6% 2024E 2025E 2026E 2027E 2028E 2029E Source: Company filings, Vista Management. (1) Reflects Adj. EBITDA unburdened by restructuring expense and business combination costs. NET REVENUE $ in millions ADJUSTED EBITDA(1) $ in millions Latest Financial Projections Growth % Margin % ($6) $16 $23 $50 $79 $81 NM 1.8% 2.7% 5.4% 7.8% 7.7% 2024E 2025E 2026E 2027E 2028E 2029E Highly Illustrative and Subject to Material Revision Based on financials provided by Vista Management on 10/15/24 (subject to change).12
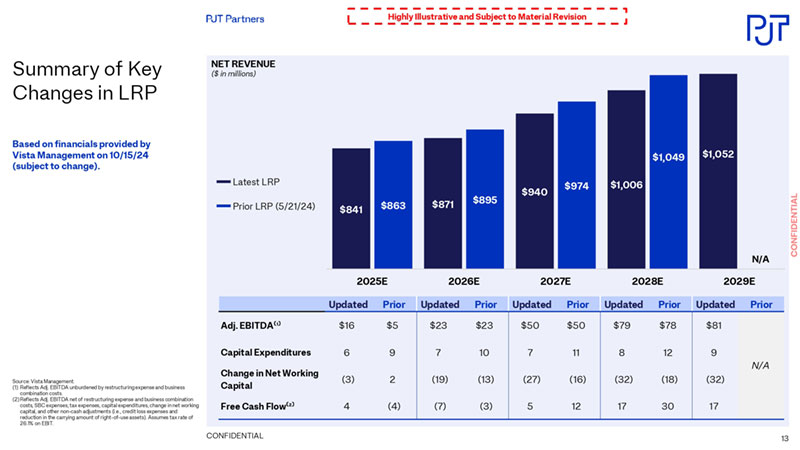
CONFIDENTIAL $841 $871 $940 $1,006 $1,052 $863 $895 $974 $1,049 2025E 2026E 2027E 2028E 2029E Updated Prior Updated Prior Updated Prior Updated Prior Updated Prior Adj. EBITDA⁽¹⁾ $16 $5 $23 $23 $50 $50 $79 $78 $81 Capital Expenditures 6 9 7 10 7 11 8 12 9 Change in Net Working Capital (3) 2 (19) (13) (27) (16) (32) (18) (32) Free Cash Flow⁽²⁾ 4 (4) (7) (3) 5 12 17 30 17 N/A Source: Vista Management. (1) Reflects Adj. EBITDA unburdened by restructuring expense and business combination costs. (2)Reflects Adj. EBITDA net of restructuring expense and business combination costs, SBC expenses, tax expenses, capital expenditures, change in net working capital, and other non-cash adjustments (i.e., credit loss expenses and reduction in the carrying amount of right-of-use assets). Assumes tax rate of 26.1% on EBIT. Summary of Key Changes in LRP Latest LRP Prior LRP (5/21/24) NET REVENUE ($ in millions) Highly Illustrative and Subject to Material Revision N/A Based on financials provided by Vista Management on 10/15/24 (subject to change).13
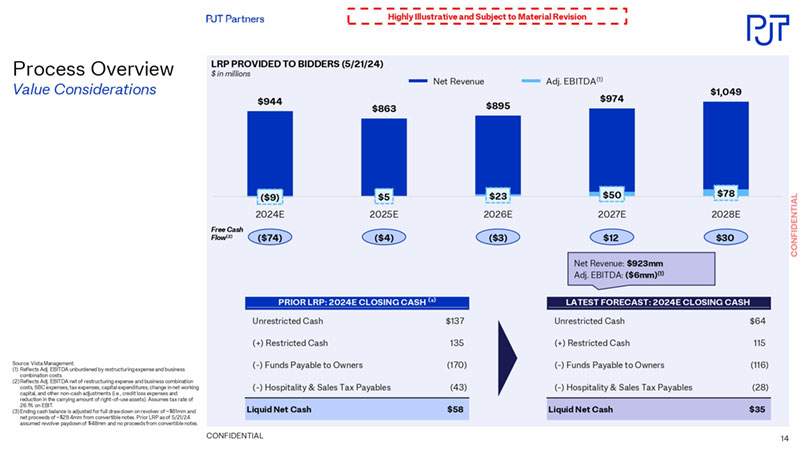
CONFIDENTIAL Source: Vista Management. (1) Reflects Adj. EBITDA unburdened by restructuring expense and business combination costs. (2)Reflects Adj. EBITDA net of restructuring expense and business combination costs, SBC expenses, tax expenses, capital expenditures, change in net working capital, and other non-cash adjustments (i.e., credit loss expenses and reduction in the carrying amount of right-of-use assets). Assumes tax rate of 26.1% on EBIT. (3)Ending cash balance is adjusted for full draw down on revolver of ~$81mm and net proceeds of ~$29.4mm from convertible notes. Prior LRP as of 5/21/24 assumed revolver paydown of $48mm and no proceeds from convertible notes. LRP PROVIDED TO BIDDERS (5/21/24) $ in millions Process Overview Value Considerations ($9) $5 $23 $50 $78 $944 $863 $895 $974 $1,049 ($74) ($4) ($3) $12 $30 2024E 2025E 2026E 2027E 2028E Free Cash Flow(2) Highly Illustrative and Subject to Material Revision PRIOR LRP: 2024E CLOSING CASH ⁽³⁾ LATEST FORECAST: 2024E CLOSING CASH Unrestricted Cash $137 (+) Restricted Cash 135 (-) Funds Payable to Owners (170) (-) Hospitality & Sales Tax Payables (43) Liquid Net Cash $58 LATEST FORECAST: 2024E CLOSING CASH Unrestricted Cash $64 (+) Restricted Cash 115 (-) Funds Payable to Owners (116) (-) Hospitality & Sales Tax Payables (28) Liquid Net Cash $35 Net Revenue: $923mm Adj. EBITDA: ($6mm)(1) Net Revenue Adj. EBITDA(1)14
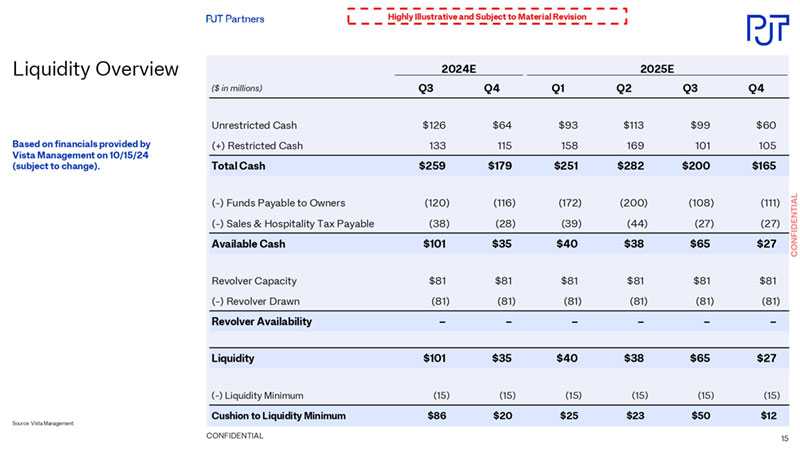
CONFIDENTIAL Liquidity Overview Highly Illustrative and Subject to Material Revision Source: Vista Management. 2024E 2025E ($ in millions) Q3 Q4 Q1 Q2 Q3 Q4 Unrestricted Cash $126 $64 $93 $113 $99 $60 (+) Restricted Cash 133 115 158 169 101 105 Total Cash $259 $179 $251 $282 $200 $165 (-) Funds Payable to Owners (120) (116) (172) (200) (108) (111) (-) Sales & Hospitality Tax Payable (38) (28) (39) (44) (27) (27) Available Cash $101 $35 $40 $38 $65 $27 Revolver Capacity $81 $81 $81 $81 $81 $81 (-) Revolver Drawn (81) (81) (81) (81) (81) (81) Revolver Availability – – – – – – Liquidity $101 $35 $40 $38 $65 $27 (-) Liquidity Minimum (15) (15) (15) (15) (15) (15) Cushion to Liquidity Minimum $86 $20 $25 $23 $50 $12 Based on financials provided by Vista Management on 10/15/24 (subject to change).15
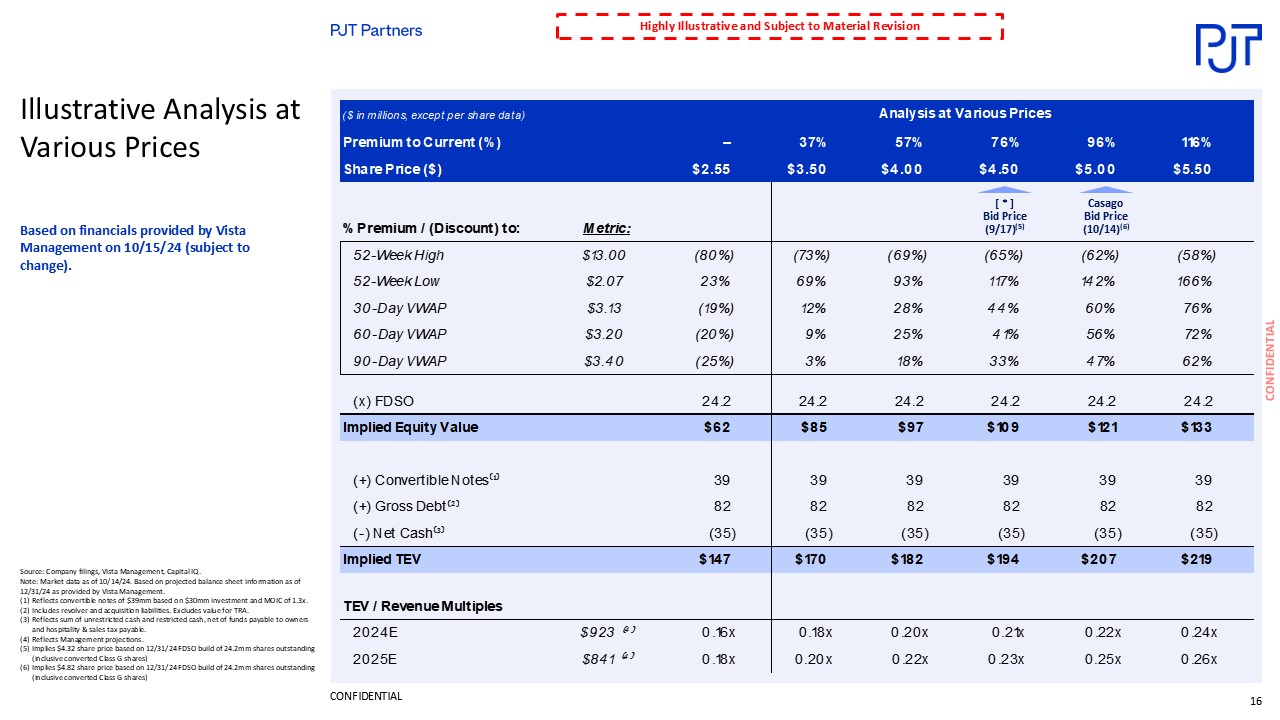
CONFIDENTIAL Illustrative Analysis at Various Prices ($ in millions, except per share data) Analysis at Various Prices Premium to Current (%) – 37% 57% 76% 96% 116% Share Price ($) $2.55 $3.50 $4.00 $4.50 $5.00 $5.50 % Premium / (Discount) to: Metric: 52-Week High $13.00 (80%) (73%) (69%) (65%) (62%) (58%) 52-Week Low $2.07 23% 69% 93% 117% 142% 166% 30-Day VWAP $3.13 (19%) 12% 28% 44% 60% 76% 60-Day VWAP $3.20 (20%) 9% 25% 41% 56% 72% 90-Day VWAP $3.40 (25%) 3% 18% 33% 47% 62% (x) FDSO 24.2 24.2 24.2 24.2 24.2 24.2 Implied Equity Value $62 $85 $97 $109 $121 $133 (+) Convertible Notes⁽¹⁾ 39 39 39 39 39 39 (+) Gross Debt⁽²⁾ 82 82 82 82 82 82 (-) Net Cash⁽³⁾ (35) (35) (35) (35) (35) (35) Implied TEV $147 $170 $182 $194 $207 $219 TEV / Revenue Multiples 2024E $923 ⁽⁴⁾ 0.16x 0.18x 0.20x 0.21x 0.22x 0.24x 2025E $841 ⁽⁴⁾ 0.18x 0.20x 0.22x 0.23x 0.25x 0.26x Highly Illustrative and Subject to Material Revision Source: Company filings, Vista Management, Capital IQ. Note: Market data as of 10/14/24. Based on projected balance sheet information as of 12/31/24 as provided by Vista Management. (1) Reflects convertible notes of $39mm based on $30mm investment and MOIC of 1.3x. (2) Includes revolver and acquisition liabilities. Excludes value for TRA. (3)Reflects sum of unrestricted cash and restricted cash, net of funds payable to owners and hospitality & sales tax payable. (4)Reflects Management projections. (5) Implies $4.32 share price based on 12/31/24 FDSO build of 24.2mm shares outstanding (inclusive converted Class G shares) (6) Implies $4.82 share price based on 12/31/24 FDSO build of 24.2mm shares outstanding (inclusive converted Class G shares) Casago Bid Price (10/14)(6) KSL Bid Price (9/17)(5) Based on financials provided by Vista Management on 10/15/24 (subject to change).16
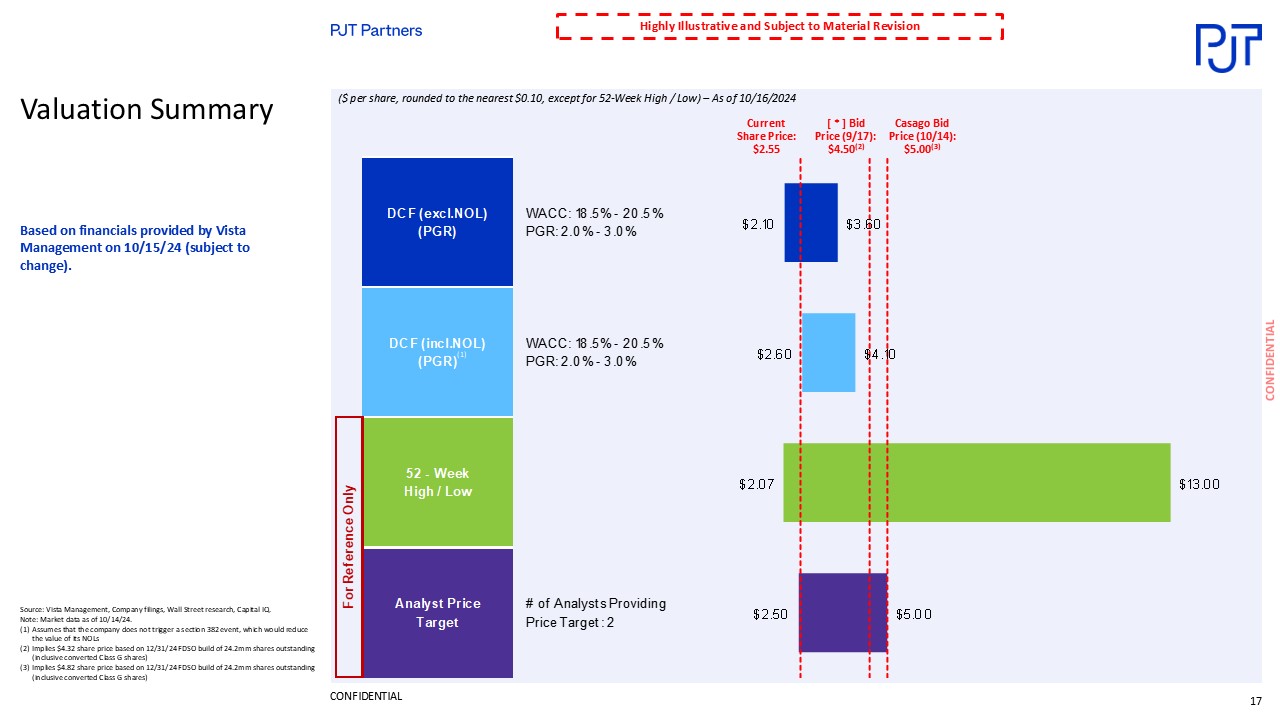
CONFIDENTIAL Valuation Summary Source: Vista Management, Company filings, Wall Street research, Capital IQ. Note: Market data as of 10/14/24. (1) Assumes that the company does not trigger a section 382 event, which would reduce the value of its NOLs (2) Implies $4.32 share price based on 12/31/24 FDSO build of 24.2mm shares outstanding (inclusive converted Class G shares) (3) Implies $4.82 share price based on 12/31/24 FDSO build of 24.2mm shares outstanding (inclusive converted Class G shares) Highly Illustrative and Subject to Material Revision Current Share Price: $2.55 ($ per share, rounded to the nearest $0.10, except for 52-Week High / Low) – As of 10/16/2024 DCF (excl.NOL) (PGR) WACC: 18.5% - 20.5% PGR: 2.0% - 3.0% DCF (incl.NOL) (PGR) WACC: 18.5% - 20.5% PGR: 2.0% - 3.0% 52 - Week High / Low Analyst Price Target # of Analysts Providing Price Target: 2 For Reference Only $2.10 $2.60 $2.07 $2.50 $3.60 $4.10 $13.00 $5.00 KSL Bid Price (9/17): $4.50(2) Casago Bid Price (10/14): $5.00(3) (1) Based on financials provided by Vista Management on 10/15/24 (subject to change).17
CONFIDENTIAL IV.Appendix 18
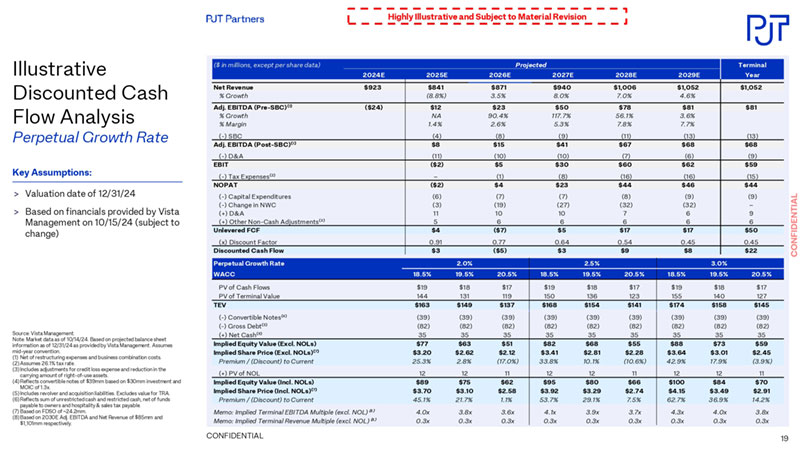
CONFIDENTIAL ($ in millions, except per share data) Projected Terminal 2024E 2025E 2026E 2027E 2028E 2029E Year Net Revenue $923 $841 $871 $940 $1,006 $1,052 $1,052 % Growth (8.8%) 3.5% 8.0% 7.0% 4.6% Adj. EBITDA (Pre-SBC)⁽¹⁾ ($24) $12 $23 $50 $78 $81 $81 % Growth NA 90.4% 117.7% 56.1% 3.6% % Margin 1.4% 2.6% 5.3% 7.8% 7.7% (-) SBC (4) (8) (9) (11) (13) (13) Adj. EBITDA (Post-SBC)⁽¹⁾ $8 $15 $41 $67 $68 $68 (-) D&A (11) (10) (10) (7) (6) (9) EBIT ($2) $5 $30 $60 $62 $59 (-) Tax Expenses⁽²⁾ – (1) (8) (16) (16) (15) NOPAT ($2) $4 $23 $44 $46 $44 (-) Capital Expenditures (6) (7) (7) (8) (9) (9) (-) Change in NWC (3) (19) (27) (32) (32) – (+) D&A 11 10 10 7 6 9 (+) Other Non-Cash Adjustments⁽³⁾ 5 6 6 6 6 6 Unlevered FCF $4 ($7) $5 $17 $17 $50 (x) Discount Factor 0.91 0.77 0.64 0.54 0.45 0.45 Discounted Cash Flow $3 ($5) $3 $9 $8 $22 Source: Vista Management. Note: Market data as of 10/14/24. Based on projected balance sheet information as of 12/31/24 as provided by Vista Management. Assumes mid-year convention. (1) Net of restructuring expenses and business combination costs. (2)Assumes 26.1% tax rate. (3) Includes adjustments for credit loss expense and reduction in the carrying amount of right-of-use assets. (4)Reflects convertible notes of $39mm based on $30mm investment and MOIC of 1.3x. (5) Includes revolver and acquisition liabilities. Excludes value for TRA. (6)Reflects sum of unrestricted cash and restricted cash, net of funds payable to owners and hospitality & sales tax payable. (7) Based on FDSO of ~24.2mm. (8)Based on 2030E Adj. EBITDA and Net Revenue of $85mm and $1,101mm respectively. Illustrative Discounted Cash Flow Analysis Perpetual Growth Rate Highly Illustrative and Subject to Material Revision Perpetual Growth Rate 2.0% 2.5% 3.0% WACC 18.5% 19.5% 20.5% 18.5% 19.5% 20.5% 18.5% 19.5% 20.5% PV of Cash Flows $19 $18 $17 $19 $18 $17 $19 $18 $17 PV of Terminal Value 144 131 119 150 136 123 155 140 127 TEV $163 $149 $137 $168 $154 $141 $174 $158 $145 (-) Convertible Notes⁽⁴⁾ (39) (39) (39) (39) (39) (39) (39) (39) (39) (-) Gross Debt⁽⁵⁾ (82) (82) (82) (82) (82) (82) (82) (82) (82) (+) Net Cash⁽⁶⁾ 35 35 35 35 35 35 35 35 35 Implied Equity Value (Excl. NOLs) $77 $63 $51 $82 $68 $55 $88 $73 $59 Implied Share Price (Excl. NOLs)⁽⁷⁾ $3.20 $2.62 $2.12 $3.41 $2.81 $2.28 $3.64 $3.01 $2.45 Premium / (Discount) to Current 25.3% 2.8% (17.0%) 33.8% 10.1% (10.6%) 42.9% 17.9% (3.9%) (+) PV of NOL 12 12 11 12 12 11 12 12 11 Implied Equity Value (Incl. NOLs) $89 $75 $62 $95 $80 $66 $100 $84 $70 Implied Share Price (Incl. NOLs)⁽⁷⁾ $3.70 $3.10 $2.58 $3.92 $3.29 $2.74 $4.15 $3.49 $2.91 Premium / (Discount) to Current 45.1% 21.7% 1.1% 53.7% 29.1% 7.5% 62.7% 36.9% 14.2% Memo: Implied Terminal EBITDA Multiple (excl. NOL)⁽⁸⁾ 4.0x 3.8x 3.6x 4.1x 3.9x 3.7x 4.3x 4.0x 3.8x Memo: Implied Terminal Revenue Multiple (excl. NOL)⁽⁸⁾ 0.3x 0.3x 0.3x 0.3x 0.3x 0.3x 0.3x 0.3x 0.3x Key Assumptions: Valuation date of 12/31/24 Based on financials provided by Vista Management on 10/15/24 (subject to change) 19

CONFIDENTIAL NOL Valuation Highly Illustrative and Subject to Material Revision Source: Vista Management. (1) Assumes that the company does not trigger a section 382 event, which would reduce the value of its NOLs. (2)Taxable income assumes ~62% of Vista Holding estimate. (3)TRA payout assumes 85% of value of TRA NOLs utilized, based on 26.1% tax rate. (4)Assumes cost of equity of 19.5%. Key Assumptions(1): Valuation date of 12/31/24 Perpetual growth rate in post-forecast period (2030E – 2038E) Assumes 26.1% effective tax rate Based on financials provided by Vista Management on 10/15/24 (subject to change) ($ in millions, except per share data) Projected 2024E 2025E 2026E 2027E 2028E 2029E 2030E 2031E 2032E 2033E 2034E 2035E 2036E 2037E 2038E Pretax Income ($148) ($14) ($3) $23 $54 $58 $60 $62 $64 $66 $68 $70 $72 $74 $76 Taxable Income⁽²⁾ (9) (9) (5) 8 21 22 22 23 24 26 28 31 35 40 43 Pre-TCJA NOLs Beginning Balance $10 $10 $10 $10 $2 – – – – – – – – – – (-) Utilization – – – (8) (2) – – – – – – – – – – Ending Balance $10 $10 $10 $2 – – – – – – – – – – – Total Federal NOLs (excl. Pre-TCJA) Beginning Balance $212 $220 $229 $235 $235 $219 $202 $184 $166 $146 $125 $103 $78 $50 $18 (+) Additions 9 9 5 – – – – – – – – – – – – (-) Utilization – – – – (15) (17) (18) (18) (20) (21) (22) (25) (28) (32) (18) Ending Balance $220 $229 $235 $235 $219 $202 $184 $166 $146 $125 $103 $78 $50 $18 – NOLs Utilized – – – $8 $17 $17 $18 $18 $20 $21 $22 $25 $28 $32 $18 (x) Tax Rate 26.1% 26.1% 26.1% 26.1% 26.1% 26.1% 26.1% 26.1% 26.1% 26.1% 26.1% 26.1% 26.1% 26.1% Value of NOLs – – $2 $5 $5 $5 $5 $5 $5 $6 $7 $7 $8 $5 TRA NOLs Utilized – – – – – – – – – 11 22 25 28 32 18 TRA Payout on NOL Usage⁽³⁾ – – – – – – – – – $2 $5 $6 $6 $7 $4 Value of NOLs to Vista – – $2 $5 $5 $5 $5 $5 $3 $1 $1 $1 $1 $1 (x) Discount Factor⁽⁴⁾ 0.91 0.76 0.63 0.52 0.43 0.36 0.30 0.25 0.20 0.17 0.14 0.12 0.10 0.08 PV of NOLs – – $1 $2 $2 $2 $1 $1 $1 $0 $0 $0 $0 $0 Perpetual Growth Rate 2.0% 2.5% 3.0% Cost of Equity 18.5% 19.5% 20.5% 18.5% 19.5% 20.5% 18.5% 19.5% 20.5% Sum of NOLs Utilized $244 $244 $244 $244 $244 $244 $244 $244 $244 Sum of PV of NOLs $12 $12 $11 $12 $12 $11 $12 $12 $1120
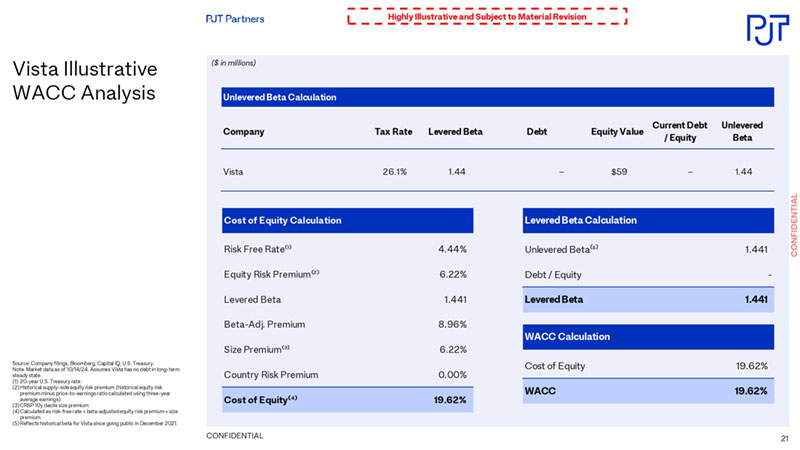
CONFIDENTIAL Vista Illustrative WACC Analysis Source: Company filings, Bloomberg, Capital IQ, U.S. Treasury. Note: Market data as of 10/14/24. Assumes Vista has no debt in long-term steady state. (1) 20-year U.S. Treasury rate. (2)Historical supply-side equity risk premium (historical equity risk premium minus price-to-earnings ratio calculated using three-year average earnings). (3)CRSP 10y decile size premium. (4)Calculated as risk-free rate + beta-adjusted equity risk premium + size premium. (5)Reflects historical beta for Vista since going public in December 2021. Highly Illustrative and Subject to Material Revision Unlevered Beta Calculation Company Tax Rate Levered Beta Debt Equity Value Current Debt / Equity Unlevered Beta Vista 26.1% 1.44 – $59 – 1.44 Cost of Equity Calculation Risk Free Rate⁽¹⁾ 4.44% Equity Risk Premium⁽²⁾ 6.22% Levered Beta 1.441 Beta-Adj. Premium 8.96% Size Premium⁽³⁾ 6.22% Country Risk Premium 0.00% Cost of Equity⁽⁴⁾ 19.62% Levered Beta Calculation Unlevered Beta⁽⁵⁾ 1.441 Debt / Equity - Levered Beta 1.441 WACC Calculation Cost of Equity 19.62% WACC 19.62% ($ in millions)21
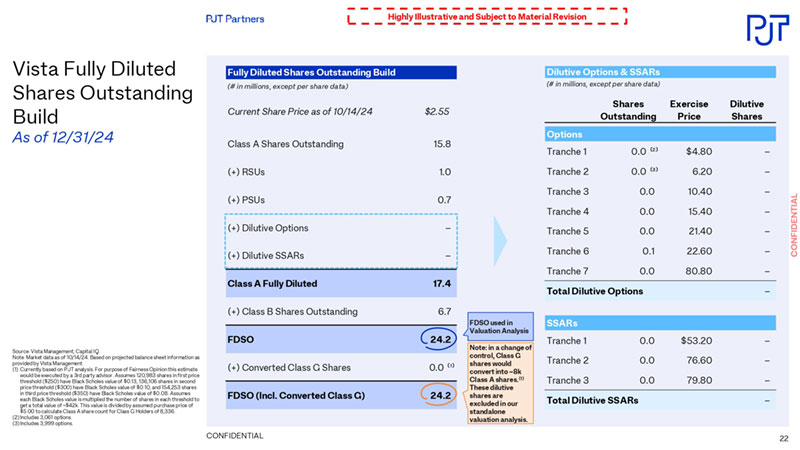
CONFIDENTIAL Vista Fully Diluted Shares Outstanding Build As of 12/31/24 Source: Vista Management, Capital IQ. Note: Market data as of 10/14/24. Based on projected balance sheet information as provided by Vista Management. (1) Currently based on PJT analysis. For purpose of Fairness Opinion this estimate would be executed by a 3rd party advisor. Assumes 120,983 shares in first price threshold ($250) have Black Scholes value of $0.13, 136,106 shares in second price threshold ($300) have Black Scholes value of $0.10, and 154,253 shares in third price threshold ($350) have Black Scholes value of $0.08. Assumes each Black Scholes value is multiplied the number of shares in each threshold to get a total value of ~$42k. This value is divided by assumed purchase price of $5.00 to calculate Class A share count for Class G Holders of 8,336. (2) Includes 3,061 options. (3) Includes 3,999 options. Fully Diluted Shares Outstanding Build (# in millions, except per share data) Current Share Price as of 10/14/24 $2.55 Class A Shares Outstanding 15.8 (+) RSUs 1.0 (+) PSUs 0.7 (+) Dilutive Options – (+) Dilutive SSARs – Class A Fully Diluted 17.4 (+) Class B Shares Outstanding 6.7 FDSO 24.2 (+) Converted Class G Shares 0.0 ⁽¹⁾ FDSO (Incl. Converted Class G) 24.2 Dilutive Options & SSARs (# in millions, except per share data) Shares Outstanding Exercise Price Dilutive Shares Options Tranche 1 0.0 ⁽²⁾ $4.80 – Tranche 2 0.0 ⁽³⁾ 6.20 – Tranche 3 0.0 10.40 – Tranche 4 0.0 15.40 – Tranche 5 0.0 21.40 – Tranche 6 0.1 22.60 – Tranche 7 0.0 80.80 – Total Dilutive Options – SSARs Tranche 1 0.0 $53.20 – Tranche 2 0.0 76.60 – Tranche 3 0.0 79.80 – Total Dilutive SSARs – Highly Illustrative and Subject to Material Revision FDSO used in Valuation Analysis Note: in a change of control, Class G shares would convert into ~8k Class A shares.(1) These dilutive shares are excluded in our standalone valuation analysis.22
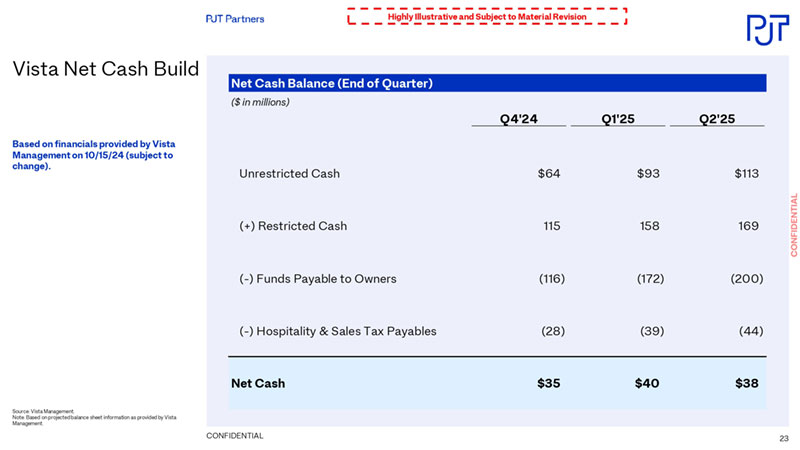
CONFIDENTIAL Net Cash Balance (End of Quarter) ($ in millions) Q4'24 Q1'25 Q2'25 Unrestricted Cash $64 $93 $113 (+) Restricted Cash 115 158 169 (-) Funds Payable to Owners (116) (172) (200) (-) Hospitality & Sales Tax Payables (28) (39) (44) Net Cash $35 $40 $38 Vista Net Cash Build Source: Vista Management. Note: Based on projected balance sheet information as provided by Vista Management. Highly Illustrative and Subject to Material Revision Based on financials provided by Vista Management on 10/15/24 (subject to change).23
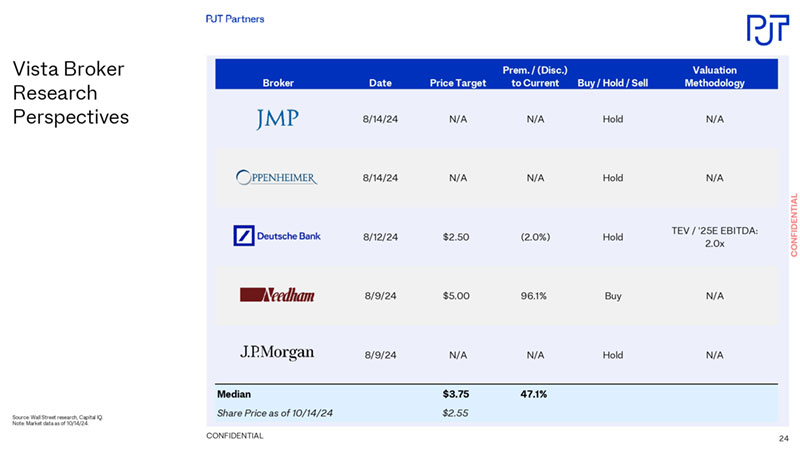
CONFIDENTIALBroker Date Price Target Prem. / (Disc.) to Current Buy / Hold / Sell Valuation Methodology 8/14/24 N/A N/A Hold N/A 8/14/24 N/A N/A Hold N/A 8/12/24 $2.50 (2.0%) Hold TEV / '25E EBITDA: 2.0x 8/9/24 $5.00 96.1% Buy N/A 8/9/24 N/A N/A Hold N/A Median $3.75 47.1% Share Price as of 10/14/24 $2.55 Vista Broker Research Perspectives Source: Wall Street research, Capital IQ. Note: Market data as of 10/14/24. 24
CONFIDENTIAL This document contains highly confidential information and is solely for informational purposes. You should not rely upon it or use it to form the definitive basis for any decision or action whatsoever, with respect to any proposed transaction or otherwise. You and your affiliates and agents must hold this document and any oral information provided in connection with this document, as well as any information derived by you from the information contained herein, in strict confidence and may not communicate, reproduce or disclose it to any other person, or refer to it publicly, in whole or in part at any time, except with our prior written consent. If you are not the intended recipient of this document, please delete and destroy all copies immediately. This document is “as is” and is based, in part, on information obtained from other sources. We have assumed and relied upon the accuracy and completeness of such information for purposes of this document and have not independently verified any such information. Neither we nor any of our affiliates or agents, makes any representation or warranty, express or implied, in relation to the accuracy or completeness of the information contained in this document or any oral information provided in connection herewith, or any data it generates and expressly disclaim any and all liability (whether direct or indirect, in contract, tort or otherwise) in relation to any of such information or any errors or omissions therein. Any views or terms contained herein are preliminary, and are based on financial, economic, market and other conditions prevailing as of the date of this document and are subject to change. We undertake no obligation or responsibility to update any of the information contained in this document. Past performance does not guarantee or predict future performance. This document does not constitute an offer to sell or the solicitation of an offer to buy any security, nor does it constitute an offer or commitment to lend, syndicate or arrange a financing, underwrite or purchase or act as an agent or advisor or in any other capacity with respect to any transaction, or commit capital, or to participate in any trading strategies, and does not constitute legal, regulatory, accounting or tax advice to the recipient. This document does not constitute and should not be considered as any form of financial opinion or recommendation by us or any of our affiliates. This document is not a research report nor should it be construed as such. This document may include information from the S&P Capital IQ Platform Service. Such information is subject to the following: “Copyright © 2024, S&P Capital IQ (and its affiliates, as applicable). This may contain information obtained from third parties, including ratings from credit ratings agencies such as Standard & Poor’s. Reproduction and distribution of third party content in any form is prohibited except with the prior written permission of the related third party. Third party content providers do not guarantee the accuracy, completeness, timeliness or availability of any information, including ratings, and are not responsible for any errors or omissions (negligent or otherwise), regardless of the cause, or for the results obtained from the use of such content. THIRD PARTY CONTENT PROVIDERS GIVE NO EXPRESS OR IMPLIED WARRANTIES, INCLUDING, BUT NOT LIMITED TO, ANY WARRANTIES OF MERCHANTABILITY OR FITNESS FOR A PARTICULAR PURPOSE OR USE. THIRD PARTY CONTENT PROVIDERS SHALL NOT BE LIABLE FOR ANY DIRECT, INDIRECT, INCIDENTAL, EXEMPLARY, COMPENSATORY, PUNITIVE, SPECIAL OR CONSEQUENTIAL DAMAGES, COSTS, EXPENSES, LEGAL FEES, OR LOSSES (INCLUDING LOST INCOME OR PROFITS AND OPPORTUNITY COSTS OR LOSSES CAUSED BY NEGLIGENCE) IN CONNECTION WITH ANY USE OF THEIR CONTENT, INCLUDING RATINGS. Credit ratings are statements of opinions and are not statements of fact or recommendations to purchase, hold or sell securities. They do not address the suitability of securities or the suitability of securities for investment purposes, and should not be relied on as investment advice.” This document may include information from SNL Financial LC. Such information is subject to the following: “CONTAINS COPYRIGHTED AND TRADE SECRET MATERIAL DISTRIBUTED UNDER LICENSE FROM SNL. FOR RECIPIENT’S INTERNAL USE ONLY.” PJT Partners is an SEC registered broker-dealer and is a member of FINRA and SIPC.PJT Partners is represented in the United Kingdom by PJT Partners (UK) Limited.PJT Partners (UK) Limited is authorised and regulated by the Financial Conduct Authority (Ref No. 678983) and is a company registered in England and Wales (No. 9424559).PJT Partners is represented in the European Economic Union by PJT Partners Park Hill (Spain) A.V., S.A.U., a firm authorized and regulated by the Comision Nacional del Mercado de Valores (“CNMV”). PJT Partners is represented in Hong Kong by PJT Partners (HK) Limited, authorised and regulated by the Securities and Futures Commission, and in Australia, by PJT Partners (HK) Limited, by relying on a passport license approved by the Australia Securities and Investment Commission. PJT Partners is represented in Japan by PJT Partners Japan K.K., a registered Type II Financial Instruments Business Operator (Registration Number: Director of Kanto Local Finance Bureau Kin-sho No. 3409), authorised and regulated by the Financial Services Agency and the Kanto Local Finance Bureau. In connection with our capital raising services in Canada, PJT Partners relies on the international dealer exemption pursuant to subsection 8.18(2) of National Instrument 31-103 Registration Requirements.Please see https://pjtpartners.com/regulatory-disclosure for more information. Copyright © 2024, PJT Partners LP (and its affiliates, as applicable). Disclaimer 25