Exhibit (c)(iv)

CONFIDENTIAL SPECIAL COMMITTEE UPDATE December 2024 Project Vista

CONFIDENTIAL Casago / Roofstock (“C/R”) has provided an updated proposal concerning the purchase price at various unit counts at closing (the “Ladder”) as well as an updated proposal related to the liquidity requirement at closingC/R’s proposal retains the termination right, but they have moved the threshold down to 25,000 units from 30,000 units in their previous offer C/R proposal also requires Vista’s working capital at close to be no more than $7.5mm lower than Vista’s October forecast C/R was requested to provide a proposal of what a Ladder would look like without a termination right, however they messaged that their existing investors would not do a transaction without such a right These pages provide analysis of how the current offer would impact purchase price across a number of scenarios related to churn and liquidity Additionally, included in these materials is an illustrative potential counter proposal Drivers of this potential counter include:The initial price adjustment threshold will have sufficient cushion to existing Forecast to account for incremental risk associated with deal announcement Unit count thresholds reduce over time to ensure alignment on speed to close Inclusion of a termination fee to further ensure alignment on getting to close Termination threshold reduces over time on the same schedule as the purchase price adjustment thresholds Remove any termination right associated with liquidity and the existing RCF covenant Executive Summary 2
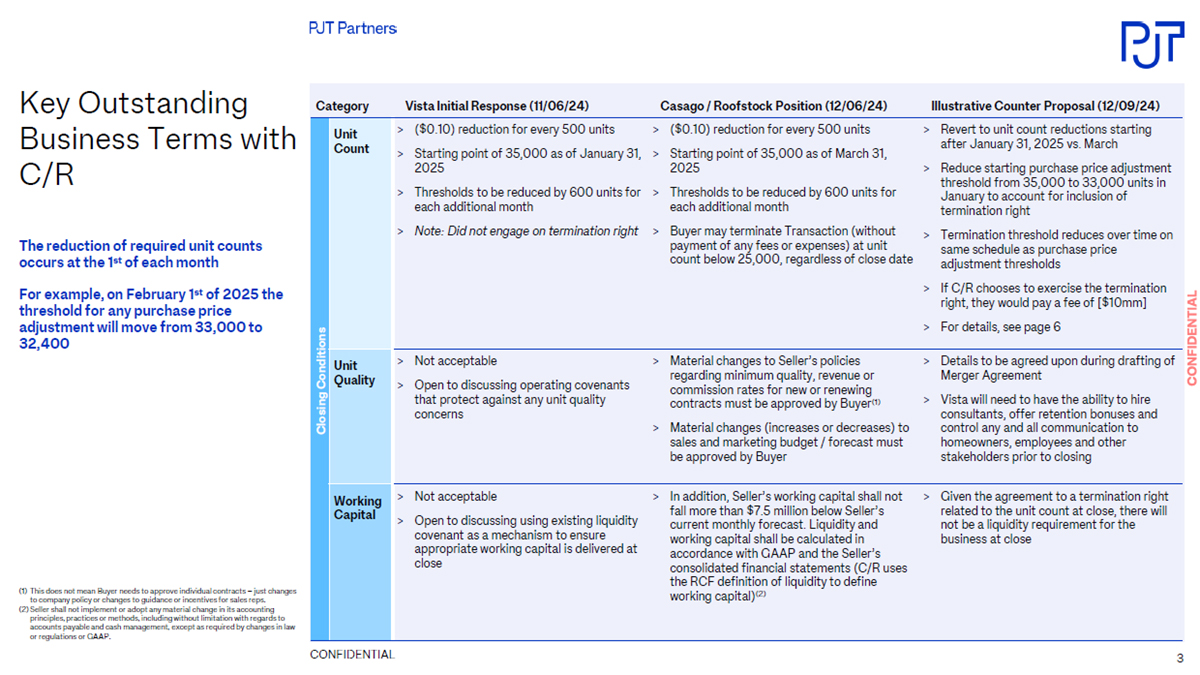
CONFIDENTIALCategory Vista Initial Response (11/06/24) Casago / Roofstock Position (12/06/24) Illustrative Counter Proposal (12/09/24) Closing Conditions Unit Count ($0.10) reduction for every 500 units Starting point of 35,000 as of January 31, 2025 Thresholds to be reduced by 600 units for each additional month Note: Did not engage on termination right ($0.10) reduction for every 500 units Starting point of 35,000 as of March 31, 2025 Thresholds to be reduced by 600 units for each additional month Buyer may terminate Transaction (without payment of any fees or expenses) at unit count below 25,000, regardless of close date Revert to unit count reductions starting after January 31, 2025 vs. March Reduce starting purchase price adjustment threshold from 35,000 to 33,000 units in January to account for inclusion of termination right Termination threshold reduces over time on same schedule as purchase price adjustment thresholds If C/R chooses to exercise the termination right, they would pay a fee of [$10mm] For details, see page 6 Unit Quality Not acceptable Open to discussing operating covenants that protect against any unit quality concerns Material changes to Seller’s policies regarding minimum quality, revenue or commission rates for new or renewing contracts must be approved by Buyer(1) Material changes (increases or decreases) to sales and marketing budget / forecast must be approved by Buyer Details to be agreed upon during drafting of Merger Agreement Vista will need to have the ability to hire consultants, offer retention bonuses and control any and all communication to homeowners, employees and other stakeholders prior to closing Working Capital Not acceptable Open to discussing using existing liquidity covenant as a mechanism to ensure appropriate working capital is delivered at close In addition, Seller’s working capital shall not fall more than $7.5 million below Seller’s current monthly forecast. Liquidity and working capital shall be calculated in accordance with GAAP and the Seller’s consolidated financial statements (C/R uses the RCF definition of liquidity to define working capital)(2) Given the agreement to a termination right related to the unit count at close, there will not be a liquidity requirement for the business at close
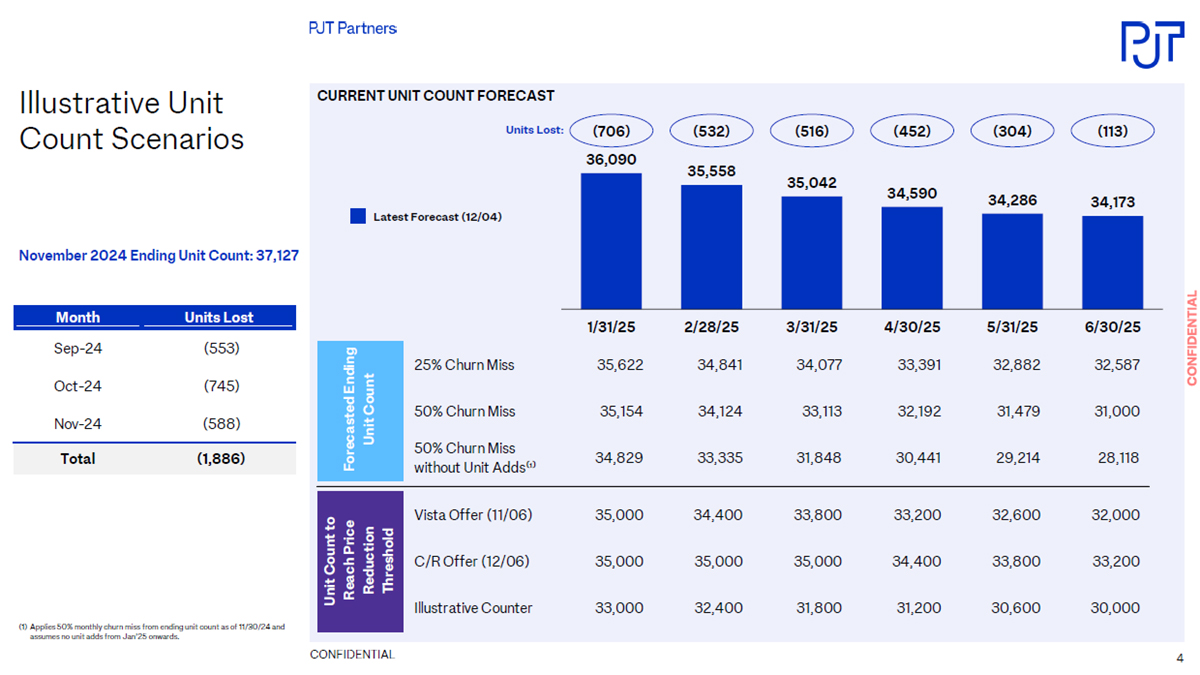
CONFIDENTIAL (1) Applies 50% monthly churn miss from ending unit count as of 11/30/24 and assumes no unit adds from Jan’25 onwards. Illustrative Unit Count Scenarios CURRENT UNIT COUNT FORECAST Latest Forecast (12/04) 36,090 35,558 35,042 34,590 34,286 34,173 (706) (532) (516) (452) (304) (113) 1/31/25 2/28/25 3/31/25 4/30/25 5/31/25 6/30/25 Units Lost: 25% Churn Miss 35,622 34,841 34,077 33,391 32,882 32,587 50% Churn Miss 35,154 34,124 33,113 32,192 31,479 31,000 50% Churn Miss without Unit Adds⁽¹⁾ 34,829 33,335 31,848 30,441 29,214 28,118 Vista Offer (11/06) 35,000 34,400 33,800 33,200 32,600 32,000 C/R Offer (12/06) 35,000 35,000 35,000 34,400 33,800 33,200 Illustrative Counter 33,000 32,400 31,800 31,200 30,600 30,000 Forecasted Ending Unit Count Unit Count to Reach Price Reduction Threshold Month Units Lost Sep-24 (553) Oct-24 (745) Nov-24 (588) Total (1,886) November 2024 Ending Unit Count: 37,1274

CONFIDENTIAL C/R Proposed Unit Count Purchase Schedule (12/06) (1) Unit count must be greater than or equal to threshold to receive implied purchase price. Termination Threshold: 25,000 C/R Proposal (12/06/24) Purchase Price per Share Unit Count Threshold by Close Date⁽¹⁾ Price Reduction Implied Price 3/31/2025 4/30/2025 Headline Purchase Price $4.81 35,000 34,400 ($0.10) $4.71 34,500 33,900 ($0.20) $4.61 34,000 33,400 ($0.30) $4.51 33,500 32,900 ($0.40) $4.41 33,000 32,400 ($0.50) $4.31 32,500 31,900 ($0.60) $4.21 32,000 31,400 ($0.70) $4.11 31,500 30,900 ($0.80) $4.01 31,000 30,400 ($0.90) $3.91 30,500 29,900 ($1.00) $3.81 30,000 29,400 ($1.10) $3.71 29,500 28,900 ($1.20) $3.61 29,000 28,400 ($1.30) $3.51 28,500 27,900 ($1.40) $3.41 28,000 27,400 ($1.50) $3.31 27,500 26,900 ($1.60) $3.21 27,000 26,400 ($1.70) $3.11 26,500 25,900 ($1.80) $3.01 26,000 25,400 ($1.90) $2.91 25,500 ($2.00) $2.81 25,000 C/R proposal delays reduction of Unit Count until March and adds termination right November 2024 Ending Unit Count: 37,1275
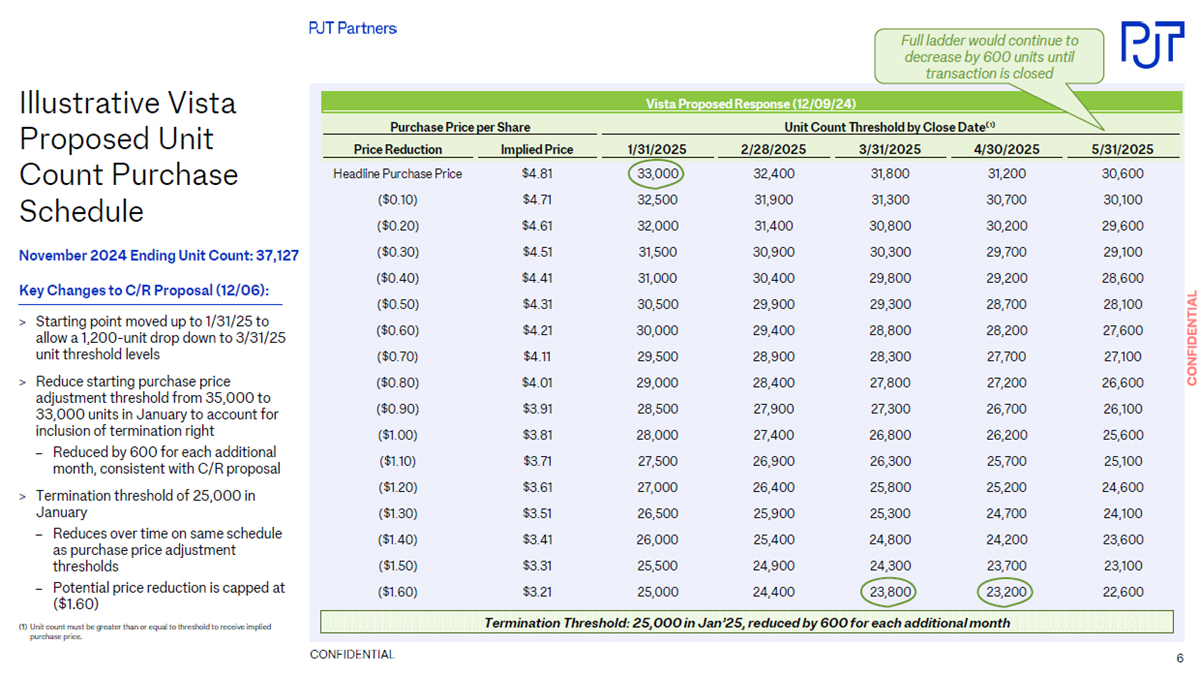
CONFIDENTIAL Illustrative Vista Proposed Unit Count Purchase Schedule Key Changes to C/R Proposal (12/06): Starting point moved up to 1/31/25 to allow a 1,200-unit drop down to 3/31/25 unit threshold levels Reduce starting purchase price adjustment threshold from 35,000 to 33,000 units in January to account for inclusion of termination right Reduced by 600 for each additional month, consistent with C/R proposal Termination threshold of 25,000 in January Reduces over time on same schedule as purchase price adjustment thresholds Potential price reduction is capped at ($1.60) Termination Threshold: 25,000 in Jan’25, reduced by 600 for each additional month Vista Proposed Response (12/09/24) Purchase Price per Share Unit Count Threshold by Close Date⁽¹⁾ Price Reduction Implied Price 1/31/2025 2/28/2025 3/31/2025 4/30/2025 5/31/2025 Headline Purchase Price $4.81 33,000 32,400 31,800 31,200 30,600 ($0.10) $4.71 32,500 31,900 31,300 30,700 30,100 ($0.20) $4.61 32,000 31,400 30,800 30,200 29,600 ($0.30) $4.51 31,500 30,900 30,300 29,700 29,100 ($0.40) $4.41 31,000 30,400 29,800 29,200 28,600 ($0.50) $4.31 30,500 29,900 29,300 28,700 28,100 ($0.60) $4.21 30,000 29,400 28,800 28,200 27,600 ($0.70) $4.11 29,500 28,900 28,300 27,700 27,100 ($0.80) $4.01 29,000 28,400 27,800 27,200 26,600 ($0.90) $3.91 28,500 27,900 27,300 26,700 26,100 ($1.00) $3.81 28,000 27,400 26,800 26,200 25,600 ($1.10) $3.71 27,500 26,900 26,300 25,700 25,100 ($1.20) $3.61 27,000 26,400 25,800 25,200 24,600 ($1.30) $3.51 26,500 25,900 25,300 24,700 24,100 ($1.40) $3.41 26,000 25,400 24,800 24,200 23,600 ($1.50) $3.31 25,500 24,900 24,300 23,700 23,100 ($1.60) $3.21 25,000 24,400 23,800 23,200 22,600 Full ladder would continue to decrease by 600 units until transaction is closed (1) Unit count must be greater than or equal to threshold to receive implied purchase price. November 2024 Ending Unit Count: 37,127 6

CONFIDENTIAL $2.50 $3.00 $3.50 $4.00 $4.50 $5.00 Proposed Unit Count Purchase Schedule Mar’25 IMPLIED PURCHASE PRICE PER SHARE BASED ON ILLUSTRATIVE ENDING UNIT COUNT Illustrative Vista Proposed Schedule C/R Proposed Schedule 34,077 B 33,113 C 31,848 D 35,042 A 31,800 31,300 30,800 30,300 29,800 29,300 28,800 28,300 27,800 27,300 26,800 26,300 25,800 25,300 24,800 24,300 23,800 $4.81 35,127 W 33,127 X 31,127 Y 29,127 Z $4.71 / < 31,800 $4.01 / < 28,300 $4.71 / < 35,000 $4.01 / < 31,500 $3.21 / < 24,300 $2.81 / < 25,500 35,000 34,500 34,000 33,500 33,000 32,500 32,000 31,500 31,000 30,500 30,000 29,500 29,000 28,500 28,000 27,500 27,000 26,500 26,000 25,500 25,000 Vista Stock Price 12/6/24 $4.25 30-Day VWAP $3.34 60-Day VWAP $2.95 Units Lost per Month⁽ ¹⁾ Net Churn 500 (1.4%) 1,000 (2.8%) 1,500 (4.3%) 2,000 (5.9%) W X Y Z B C D Forecast w/ 25% Churn Miss Forecast Unit w/ 50% Churn Miss Forecast w/ 50% Churn Miss & No Unit Adds A Latest Forecast (12/04) Source: Capital IQ (1) Represents units lost per month from actual ending unit count as of 11/30/2024. 7
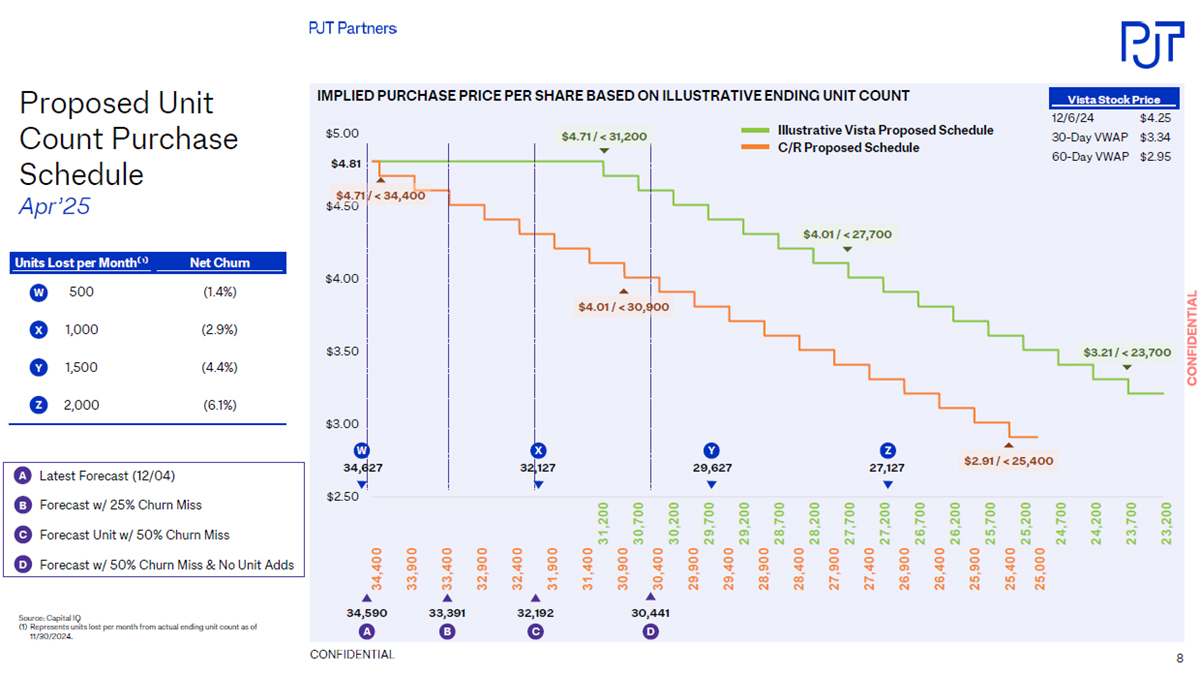
CONFIDENTIAL $2.50 $3.00 $3.50 $4.00 $4.50 $5.00 Proposed Unit Count Purchase Schedule Apr’25 IMPLIED PURCHASE PRICE PER SHARE BASED ON ILLUSTRATIVE ENDING UNIT COUNT 33,391 B 32,192 C 30,441 D 34,590 A $4.81 34,627 W 32,127 X 29,627 Y 27,127 Z Units Lost per Month⁽ ¹⁾ Net Churn 500 (1.4%) 1,000 (2.9%) 1,500 (4.4%) 2,000 (6.1%) W X Y Z Source: Capital IQ (1) Represents units lost per month from actual ending unit count as of 11/30/2024. $4.71 / < 34,400 $4.01 / < 30,900 $2.91 / < 25,400 31,200 30,700 30,200 29,700 29,200 28,700 28,200 27,700 27,200 26,700 26,200 25,700 25,200 24,700 24,200 23,700 23,200 $4.71 / < 31,200 $3.21 / < 23,700 34,400 33,900 33,400 32,900 32,400 31,900 31,400 30,900 30,400 29,900 29,400 28,900 28,400 27,900 27,400 26,900 26,400 25,900 25,400 25,000 $4.01 / < 27,700 B C D Forecast w/ 25% Churn Miss Forecast Unit w/ 50% Churn Miss Forecast w/ 50% Churn Miss & No Unit Adds A Latest Forecast (12/04) Illustrative Vista Proposed Schedule C/R Proposed Schedule Vista Stock Price 12/6/24 $4.25 30-Day VWAP $3.34 60-Day VWAP $2.958
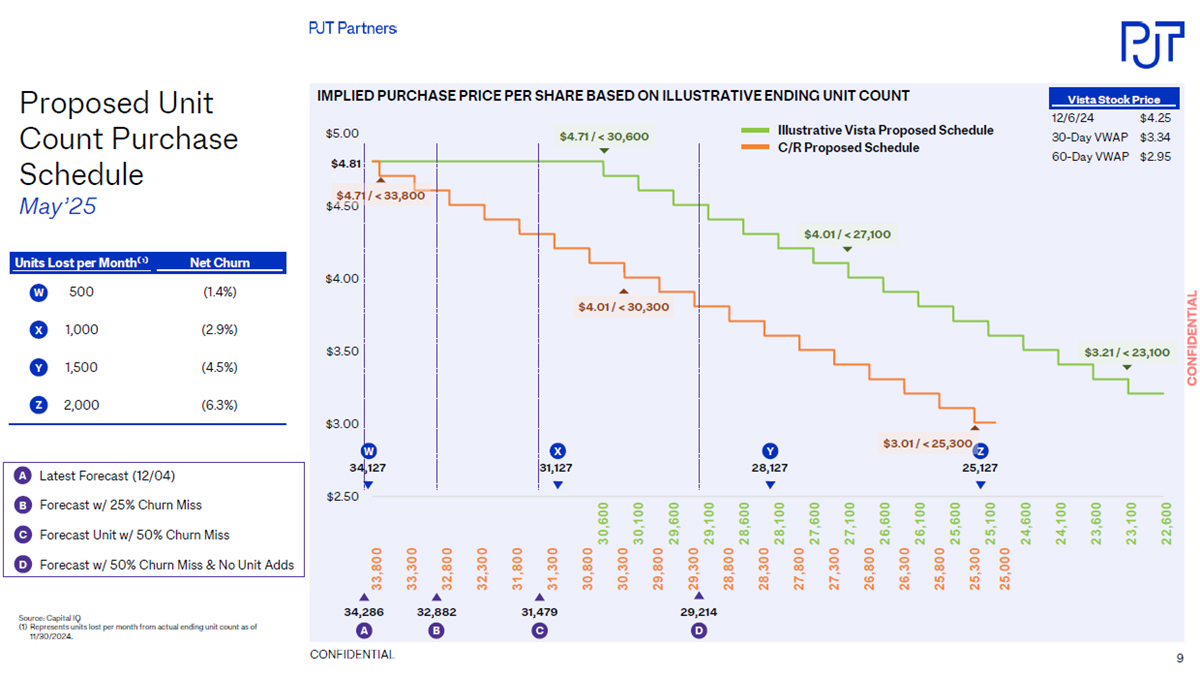
CONFIDENTIAL $2.50 $3.00 $3.50 $4.00 $4.50 $5.00 Proposed Unit Count Purchase Schedule May’25 IMPLIED PURCHASE PRICE PER SHARE BASED ON ILLUSTRATIVE ENDING UNIT COUNT 32,882 B 31,479 C 29,214 D 34,286 A 33,800 33,300 32,800 32,300 31,800 31,300 30,800 30,300 29,800 29,300 28,800 28,300 27,800 27,300 26,800 26,300 25,800 25,300 25,000 $4.81 34,127 W 31,127 X 28,127 Y 25,127 Z $4.71 / < 33,800 $4.01 / < 30,300 $3.01 / < 25,300 $4.71 / < 30,600 $3.21 / < 23,100 30,600 30,100 29,600 29,100 28,600 28,100 27,600 27,100 26,600 26,100 25,600 25,100 24,600 24,100 23,600 23,100 22,600 $4.01 / < 27,100 Units Lost per Month⁽ ¹⁾ Net Churn 500 (1.4%) 1,000 (2.9%) 1,500 (4.5%) 2,000 (6.3%) W X Y Z B C D Forecast w/ 25% Churn Miss Forecast Unit w/ 50% Churn Miss Forecast w/ 50% Churn Miss & No Unit Adds A Latest Forecast (12/04) Illustrative Vista Proposed Schedule C/R Proposed Schedule Vista Stock Price 12/6/24 $4.25 30-Day VWAP $3.34 60-Day VWAP $2.95 Source: Capital IQ (1) Represents units lost per month from actual ending unit count as of 11/30/2024. 9
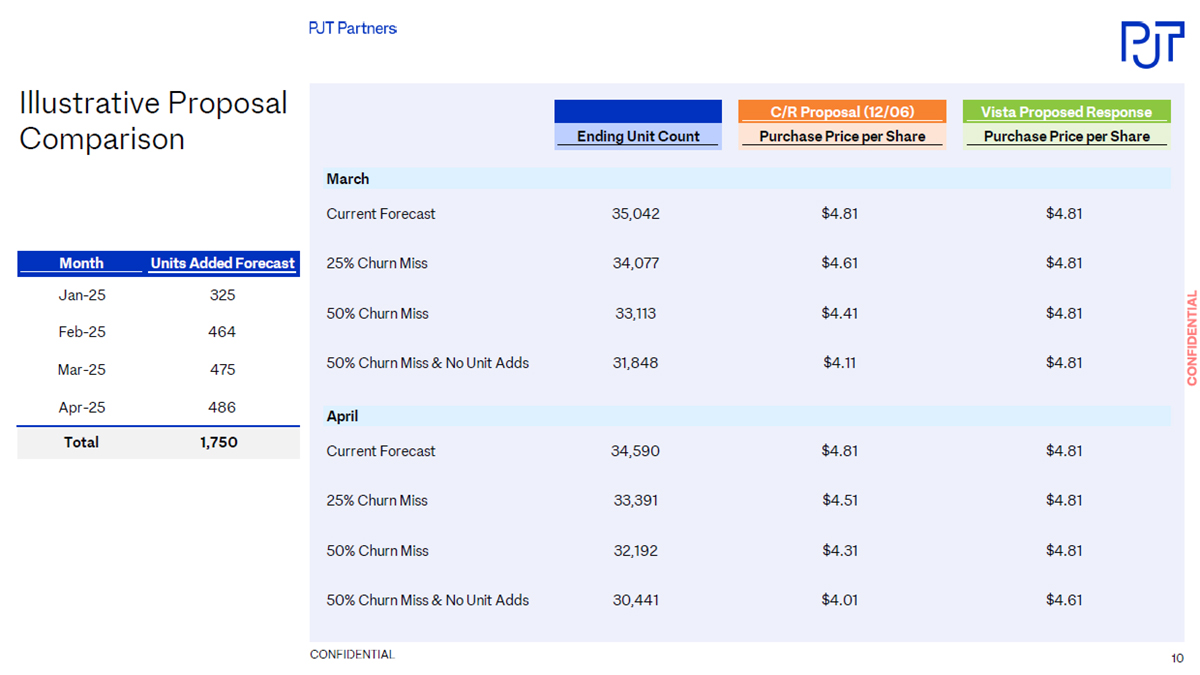
CONFIDENTIAL Illustrative Proposal Comparison C/R Proposal (12/06) Vista Proposed Response Ending Unit Count Purchase Price per Share Purchase Price per Share March Current Forecast 35,042 $4.81 $4.81 25% Churn Miss 34,077 $4.61 $4.81 50% Churn Miss 33,113 $4.41 $4.81 50% Churn Miss & No Unit Adds 31,848 $4.11 $4.81 April Current Forecast 34,590 $4.81 $4.81 25% Churn Miss 33,391 $4.51 $4.81 50% Churn Miss 32,192 $4.31 $4.81 50% Churn Miss & No Unit Adds 30,441 $4.01 $4.61 Month Units Added Forecast Jan-25 325 Feb-25 464 Mar-25 475 Apr-25 486 Total 1,75010
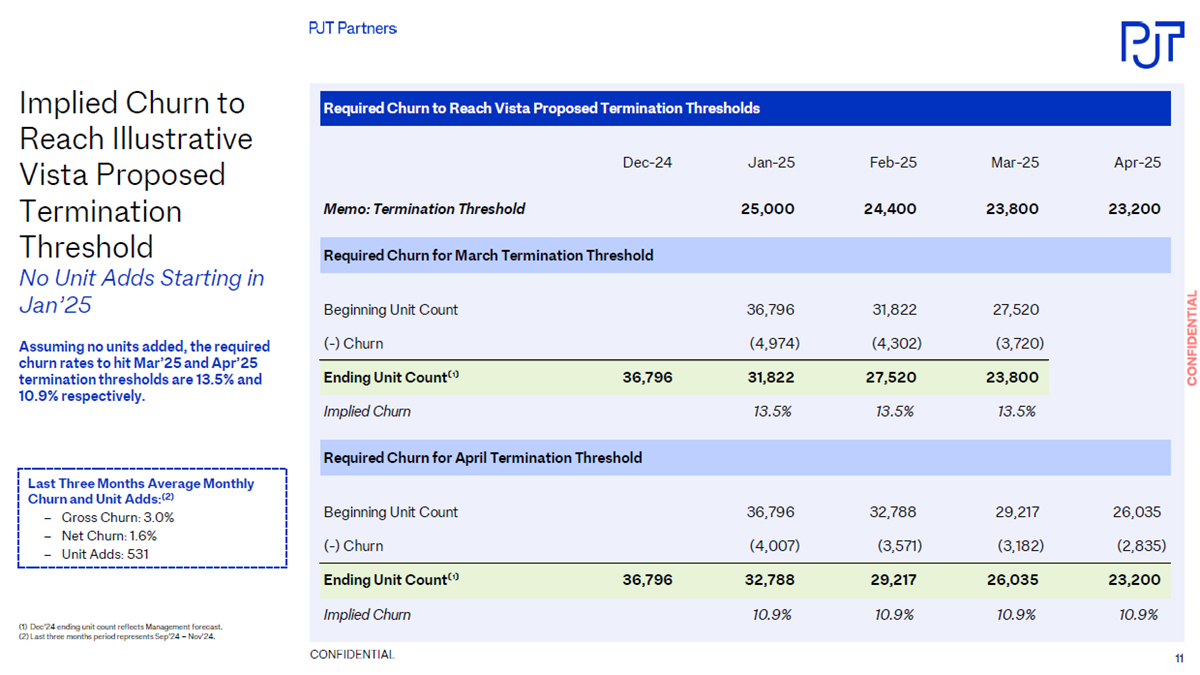
CONFIDENTIAL Implied Churn to Reach Illustrative Vista Proposed Termination Threshold No Unit Adds Starting in Jan’25 (1) Dec’24 ending unit count reflects Management forecast. (2) Last three months period represents Sep’24 – Nov’24. Required Churn to Reach Vista Proposed Termination Thresholds Dec-24 Jan-25 Feb-25 Mar-25 Apr-25 Memo: Termination Threshold 25,000 24,400 23,800 23,200 Required Churn for March Termination Threshold Beginning Unit Count 36,796 31,822 27,520 (-) Churn (4,974) (4,302) (3,720) Ending Unit Count⁽¹⁾ 36,796 31,822 27,520 23,800 Implied Churn 13.5% 13.5% 13.5% Required Churn for April Termination Threshold Beginning Unit Count 36,796 32,788 29,217 26,035 (-) Churn (4,007) (3,571) (3,182) (2,835) Ending Unit Count⁽¹⁾ 36,796 32,788 29,217 26,035 23,200 Implied Churn 10.9% 10.9% 10.9% 10.9% Assuming no units added, the required churn rates to hit Mar’25 and Apr’25 termination thresholds are 13.5% and 10.9% respectively. Last Three Months Average Monthly Churn and Unit Adds:(2) Gross Churn: 3.0% Net Churn: 1.6% Unit Adds: 531 11
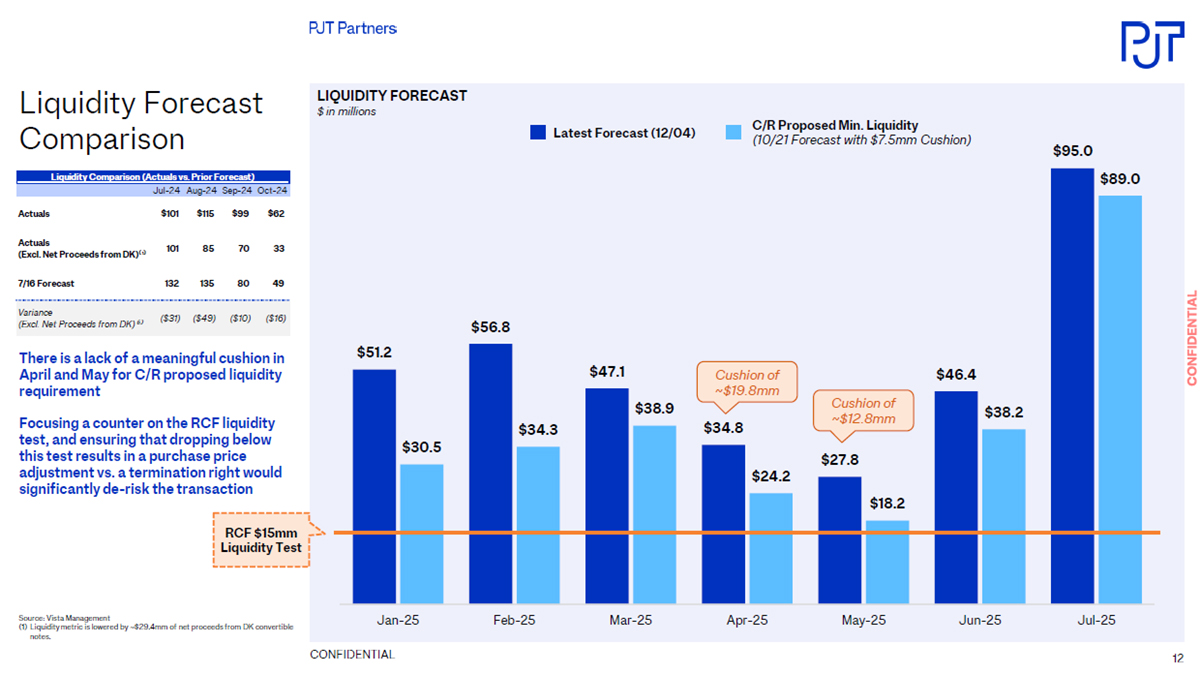
CONFIDENTIAL $51.2 $56.8 $47.1 $34.8 $27.8 $46.4 $95.0 $30.5 $34.3 $38.9 $24.2 $18.2 $38.2 $89.0 Jan-25 Feb-25 Mar-25 Apr-25 May-25 Jun-25 Jul-25 Liquidity Forecast Comparison Source: Vista Management (1) Liquidity metric is lowered by ~$29.4mm of net proceeds from DK convertible notes. LIQUIDITY FORECAST $ in millions RCF $15mm Liquidity Test Liquidity Comparison (Actuals vs. Prior Forecast) Jul-24 Aug-24 Sep-24 Oct-24 Actuals $101 $115 $99 $62 Actuals (Excl. Net Proceeds from DK)⁽¹⁾ 101 85 70 33 7/16 Forecast 132 135 80 49 Variance (Excl. Net Proceeds from DK)⁽ ¹⁾ ($31) ($49) ($10) ($16) Latest Forecast (12/04) C/R Proposed Min. Liquidity (10/21 Forecast with $7.5mm Cushion) Cushion of ~$19.8mm Cushion of ~$12.8mm There is a lack of a meaningful cushion in April and May for C/R proposed liquidity requirement Focusing a counter on the RCF liquidity test, and ensuring that dropping below this test results in a purchase price adjustment vs. a termination right would significantly de-risk the transaction12

CONFIDENTIAL $56.8 $47.1 $34.8 $27.8 $54.2 $43.5 $30.8 $23.5 $51.0 $39.0 $25.7 $17.7 $34.3 $38.9 $24.2 $18.2 Feb-25 Mar-25 Apr-25 May-25 Liquidity Forecast Comparison Downside Churn Scenario Source: Vista Management (1) Liquidity metric is lowered by ~$29.4mm of net proceeds from DK convertible notes. LIQUIDITY FORECAST $ in millions RCF $15mm Liquidity Test Liquidity Comparison (Actuals vs. Prior Forecast) Jul-24 Aug-24 Sep-24 Oct-24 Actuals $101 $115 $99 $62 Actuals (Excl. Net Proceeds from DK)⁽¹⁾ 101 85 70 33 7/16 Forecast 132 135 80 49 Variance (Excl. Net Proceeds from DK)⁽ ¹⁾ ($31) ($49) ($10) ($16) Latest Forecast (12/04) C/R Proposed Min. Liquidity (10/21 Forecast with $7.5mm Cushion) Latest Forecast w/ 25% Churn Miss Latest Forecast w/ 50% Churn Miss13

CONFIDENTIAL I.Appendix 14
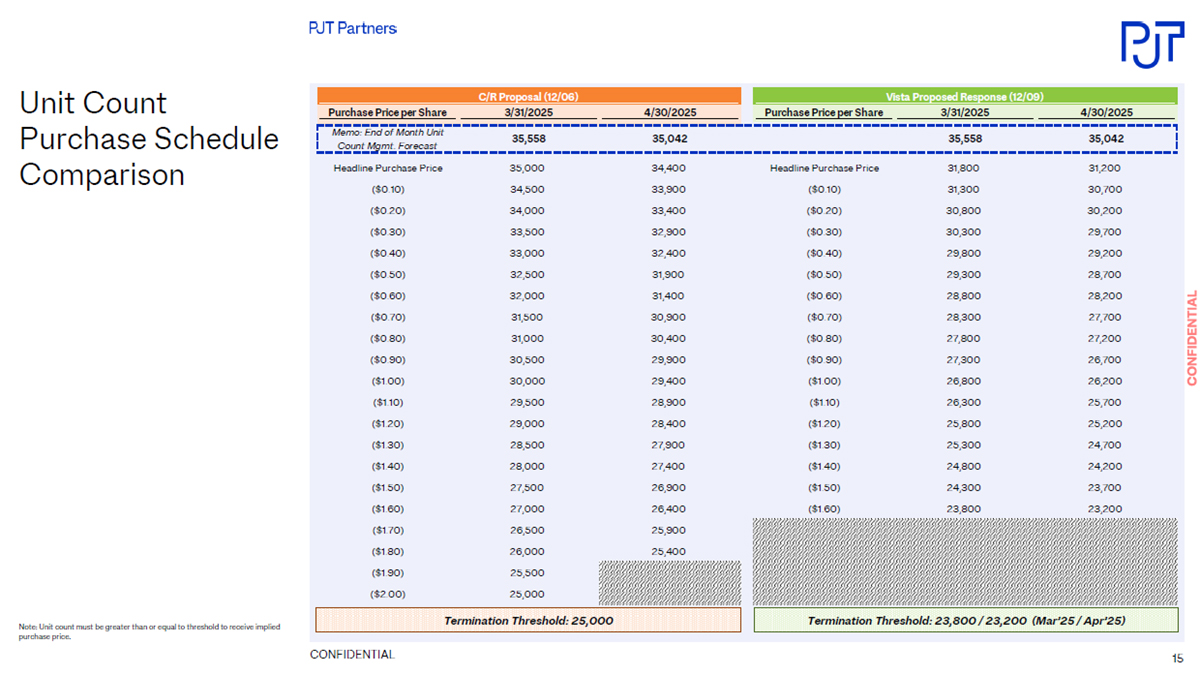
CONFIDENTIAL Unit Count Purchase Schedule Comparison Termination Threshold: 25,000 Termination Threshold: 23,800 / 23,200 (Mar’25 / Apr’25) C/R Proposal (12/06) Vista Proposed Response (12/09) Purchase Price per Share 3/31/2025 4/30/2025 Purchase Price per Share 3/31/2025 4/30/2025 Memo: End of Month Unit Count Mgmt. Forecast 35,558 35,042 35,558 35,042 Headline Purchase Price 35,000 34,400 Headline Purchase Price 31,800 31,200 ($0.10) 34,500 33,900 ($0.10) 31,300 30,700 ($0.20) 34,000 33,400 ($0.20) 30,800 30,200 ($0.30) 33,500 32,900 ($0.30) 30,300 29,700 ($0.40) 33,000 32,400 ($0.40) 29,800 29,200 ($0.50) 32,500 31,900 ($0.50) 29,300 28,700 ($0.60) 32,000 31,400 ($0.60) 28,800 28,200 ($0.70) 31,500 30,900 ($0.70) 28,300 27,700 ($0.80) 31,000 30,400 ($0.80) 27,800 27,200 ($0.90) 30,500 29,900 ($0.90) 27,300 26,700 ($1.00) 30,000 29,400 ($1.00) 26,800 26,200 ($1.10) 29,500 28,900 ($1.10) 26,300 25,700 ($1.20) 29,000 28,400 ($1.20) 25,800 25,200 ($1.30) 28,500 27,900 ($1.30) 25,300 24,700 ($1.40) 28,000 27,400 ($1.40) 24,800 24,200 ($1.50) 27,500 26,900 ($1.50) 24,300 23,700 ($1.60) 27,000 26,400 ($1.60) 23,800 23,200 ($1.70) 26,500 25,900 ($1.80) 26,000 25,400 ($1.90) 25,500 ($2.00) 25,000 Note: Unit count must be greater than or equal to threshold to receive implied purchase price.15
CONFIDENTIAL This document contains highly confidential information and is solely for informational purposes. You should not rely upon it or use it to form the definitive basis for any decision or action whatsoever, with respect to any proposed transaction or otherwise. You and your affiliates and agents must hold this document and any oral information provided in connection with this document, as well as any information derived by you from the information contained herein, in strict confidence and may not communicate, reproduce or disclose it to any other person, or refer to it publicly, in whole or in part at any time, except with our prior written consent. If you are not the intended recipient of this document, please delete and destroy all copies immediately. This document is “as is” and is based, in part, on information obtained from other sources. We have assumed and relied upon the accuracy and completeness of such information for purposes of this document and have not independently verified any such information. Neither we nor any of our affiliates or agents, makes any representation or warranty, express or implied, in relation to the accuracy or completeness of the information contained in this document or any oral information provided in connection herewith, or any data it generates and expressly disclaim any and all liability (whether direct or indirect, in contract, tort or otherwise) in relation to any of such information or any errors or omissions therein. Any views or terms contained herein are preliminary, and are based on financial, economic, market and other conditions prevailing as of the date of this document and are subject to change. We undertake no obligation or responsibility to update any of the information contained in this document. Past performance does not guarantee or predict future performance. This document does not constitute an offer to sell or the solicitation of an offer to buy any security, nor does it constitute an offer or commitment to lend, syndicate or arrange a financing, underwrite or purchase or act as an agent or advisor or in any other capacity with respect to any transaction, or commit capital, or to participate in any trading strategies, and does not constitute legal, regulatory, accounting or tax advice to the recipient. This document does not constitute and should not be considered as any form of financial opinion or recommendation by us or any of our affiliates. This document is not a research report nor should it be construed as such. This document may include information from the S&P Capital IQ Platform Service. Such information is subject to the following: “Copyright © 2024, S&P Capital IQ (and its affiliates, as applicable). This may contain information obtained from third parties, including ratings from credit ratings agencies such as Standard & Poor’s. Reproduction and distribution of third party content in any form is prohibited except with the prior written permission of the related third party. Third party content providers do not guarantee the accuracy, completeness, timeliness or availability of any information, including ratings, and are not responsible for any errors or omissions (negligent or otherwise), regardless of the cause, or for the results obtained from the use of such content. THIRD PARTY CONTENT PROVIDERS GIVE NO EXPRESS OR IMPLIED WARRANTIES, INCLUDING, BUT NOT LIMITED TO, ANY WARRANTIES OF MERCHANTABILITY OR FITNESS FOR A PARTICULAR PURPOSE OR USE. THIRD PARTY CONTENT PROVIDERS SHALL NOT BE LIABLE FOR ANY DIRECT, INDIRECT, INCIDENTAL, EXEMPLARY, COMPENSATORY, PUNITIVE, SPECIAL OR CONSEQUENTIAL DAMAGES, COSTS, EXPENSES, LEGAL FEES, OR LOSSES (INCLUDING LOST INCOME OR PROFITS AND OPPORTUNITY COSTS OR LOSSES CAUSED BY NEGLIGENCE) IN CONNECTION WITH ANY USE OF THEIR CONTENT, INCLUDING RATINGS. Credit ratings are statements of opinions and are not statements of fact or recommendations to purchase, hold or sell securities. They do not address the suitability of securities or the suitability of securities for investment purposes, and should not be relied on as investment advice.” This document may include information from SNL Financial LC. Such information is subject to the following: “CONTAINS COPYRIGHTED AND TRADE SECRET MATERIAL DISTRIBUTED UNDER LICENSE FROM SNL. FOR RECIPIENT’S INTERNAL USE ONLY.” PJT Partners is an SEC registered broker-dealer and is a member of FINRA and SIPC.PJT Partners is represented in the United Kingdom by PJT Partners (UK) Limited.PJT Partners (UK) Limited is authorised and regulated by the Financial Conduct Authority (Ref No. 678983) and is a company registered in England and Wales (No. 9424559).PJT Partners is represented in the European Economic Union by PJT Partners Park Hill (Spain) A.V., S.A.U., a firm authorized and regulated by the Comision Nacional del Mercado de Valores (“CNMV”). PJT Partners is represented in Hong Kong by PJT Partners (HK) Limited, authorised and regulated by the Securities and Futures Commission, and in Australia, by PJT Partners (HK) Limited, by relying on a passport license approved by the Australia Securities and Investment Commission. PJT Partners is represented in Japan by PJT Partners Japan K.K., a registered Type II Financial Instruments Business Operator (Registration Number: Director of Kanto Local Finance Bureau Kin-sho No. 3409), authorised and regulated by the Financial Services Agency and the Kanto Local Finance Bureau. In connection with our capital raising services in Canada, PJT Partners relies on the international dealer exemption pursuant to subsection 8.18(2) of National Instrument 31-103 Registration Requirements.Please see https://pjtpartners.com/regulatory-disclosure for more information. Copyright © 2024, PJT Partners LP (and its affiliates, as applicable). Disclaimer 16