UNITED STATES
SECURITIES AND EXCHANGE COMMISSION
Washington, D.C. 20549
FORM N-CSR
CERTIFIED SHAREHOLDER REPORT OF REGISTERED
MANAGEMENT INVESTMENT COMPANIES
Investment Company Act file number: 811-23731
BONDBLOXX ETF TRUST
(Exact name of Registrant as specified in charter)
700 Larkspur Landing Circle, Suite 250, Larkspur, CA 94939
(Address of principal executive offices)(Zip code)
BondBloxx Investment Management Corporation
700 Larkspur Landing Circle, Suite 250,
Larkspur, CA 94939
(Name and address of agent for service)
Registrant’s telephone number, including area code: (800) 896-5089
Date of fiscal year end:
October 31
Date of reporting period:
October 31, 2023
ITEM 1. REPORTS TO STOCKHOLDERS.
The following is a copy of the report transmitted to shareholders pursuant to Rule 30e-1 under the Investment Company Act of 1940 (17 CFR 270.30e-1).
![]()
BondBloxxSM ETF Trust
Annual Report
October 31, 2023
BondBloxx USD High Yield Bond Industrial Sector ETF| XHYI |NYSE Arca
BondBloxx USD High Yield Bond Telecom, Media & Technology Sector ETF| XHYT |NYSE Arca
BondBloxx USD High Yield Bond Healthcare Sector ETF| XHYH |NYSE Arca
BondBloxx USD High Yield Bond Financial & REIT Sector ETF| XHYF |NYSE Arca
BondBloxx USD High Yield Bond Energy Sector ETF| XHYE |NYSE Arca
BondBloxx USD High Yield Bond Consumer Cyclicals Sector ETF| XHYC |NYSE Arca
BondBloxx USD High Yield Bond Consumer Non-Cyclicals Sector ETF| XHYD |NYSE Arca
BondBloxx USD High Yield Bond Sector Rotation ETF| HYSA |NYSE Arca
BondBloxx B Rated USD High Yield Corporate Bond ETF| XB |NYSE Arca
BondBloxx BB Rated USD High Yield Corporate Bond ETF| XBB |NYSE Arca
BondBloxx CCC Rated USD High Yield Corporate Bond ETF| XCCC |NYSE Arca
BondBloxx JP Morgan USD Emerging Markets 1-10 Year Bond ETF| XEMD | Cboe BZX
BondBloxx Bloomberg Six Month Target Duration US Treasury ETF| XHLF |NYSE Arca
BondBloxx Bloomberg One Year Target Duration US Treasury ETF| XONE |NYSE Arca
BondBloxx Bloomberg Two Year Target Duration US Treasury ETF| XTWO |NYSE Arca
BondBloxx Bloomberg Three Year Target Duration US Treasury ETF| XTRE |NYSE Arca
BondBloxx Bloomberg Five Year Target Duration US Treasury ETF| XFIV |NYSE Arca
BondBloxx Bloomberg Seven Year Target Duration US Treasury ETF| XSVN |NYSE Arca
BondBloxx Bloomberg Ten Year Target Duration US Treasury ETF| XTEN |NYSE Arca
BondBloxx Bloomberg Twenty Year Target Duration US Treasury ETF| XTWY |NYSE Arca
BondBloxx Investment Management Corporation | bondbloxxetf.com | 800.896.5089
Table of Contents
Shareholder Letter (Unaudited)
Dear Shareholder,
The U.S. economy demonstrated remarkable resilience throughout 2023. Despite consensus expectations for a second-half recession driven by inflation and higher borrowing costs, economic indicators consistently outperformed projections. A notable example of this was that the U.S. economy grew almost 5% in the third quarter of 2023, the fastest expansion in nearly two years. A significant contributor to the economy’s ongoing resilience has been the enduring strength of the U.S. jobs market, which fueled continued household spending and caused businesses to restock to meet strong demand.
Inflation levels eased through most of 2023, allowing the Federal Reserve to halt further rate increases at its July, September, meetings as the U.S. economy continued to absorb prior adjustments. However, recent inflation data is still above the Fed’s 2% target, hovering in the low-to-mid 3% range for headline CPI. If in Q1 inflation remains persistent, the Fed could hold rates at these levels longer and have less reason to start cutting rates in the coming months.
Total return performance returned to positive in 2023 for most segments of the fixed income market, a welcome change from last year’s outlier year of [broad US fixed income market U.S. financial market losses. The U.S. high yield market experienced the best performance among broad fixed income asset classes for the second year in a row, outperforming U.S. Aggregate, U.S. Treasuries, investment grade corporates, and emerging markets sovereign debt. High yield performance was led by CCC-rated debt and the Consumer Cyclical industry sector.
Looking ahead, based on continued economic resilience and the Fed likely near the end of its rate hiking cycle, we believe now is the time for investors to increase their allocation to income, as we expect attractive forward returns in the coming year.
Within fixed income, we see opportunities for investors to look beyond broad-based benchmark ETFs to establish more precise exposures as away to seek outperformance.
At BondBloxx, we are committed to helping investors seize opportunities across fixed income markets. Our unique and innovative product suites span target duration U.S. Treasuries, credit rating and sector-specific high yield bonds, and short duration emerging markets.
Specific strategies we continue to view as compelling include:
| ■ | High yield corporates – to seek attractive income as well as total return outperformance potential from tactical credit quality and industry sector selection |
| ■ | BBB corporates – to take advantage of this rating category’s strong fundamentals as well as yield levels not seen in 15 years |
| ■ | Short-term U.S. Treasuries – to potentially generate higher income, manage cash positions, and maintain liquidity |
| ■ | Intermediate-term U.S. Treasuries – to capture attractive total return potential considering the possible end to the Fed rate hike cycle, a slowing U.S. economy, and a normalization of the yield curve |
| ■ | Shorter-duration emerging markets sovereign debt – to reduce both interest rate and spread duration risk while benefiting from attractive yields and total return potential. |
We are thankful for your investment and the trust you have placed in BondBloxx. We wish you a happy and prosperous New Year.
Joanna Gallegos

President, BondBloxx ETF Trust
There are risks associated with investing, including possible loss of principal. Fixed income investments are subject to interest rate risk; their value will normally decline as interest rates rise. Fixed income investments are also subject to credit risk, the risk that the issuer of a bond will fail to pay interest and principal in a timely manner.
1
Fund Performance Overview (Unaudited)
High Yield Sectors
The U.S. economy showed remarkable resilience over the 12-month period ending October 31, 2023 in the face of higher interest rates, persistent inflation and numerous external shocks. Economic growth was fueled by steady consumer spending, as the enduring strength of the labor market shored up household confidence. Gross Domestic Product grew at an annualized pace of 5.2% in the third quarter of 2023 - the fastest expansion in close to two years. The U.S. unemployment rate held near historic lows throughout the period. Meanwhile, signs of weakness were evident in areas such as housing, industrial production, and manufacturing.
Inflation pressures in the U.S. eased substantially from the 40-year peak reached in mid-2022, as annual consumer price growth hovered between 3.0% and 4.0% by mid-2023, down from 9.1% at its peak. This favorable trend in consumer price growth during the period enabled the Federal Reserve to slow its interest rate tightening campaign, having kept its policy rate unchanged at three of the last four meetings. This follows an aggressive 525 basis points in total rate increases over the previous 18 months.
After a year of double-digit declines across most asset classes, most fixed income sectors generated positive returns during the 12-month period ending in October 2023, led by higher-income generating sectors such as U.S. high yield and emerging markets. The overall equity market rose over 10%, driven by the technology sector and potential impacts of artificial intelligence, while other equity sectors and small-cap stocks lagged.
U.S High yield bonds generated positive returns for the 12-month period ending October 31, 2023, as a strong U.S. economy kept corporate cash flows relatively healthy, investor expectations of a recession receded, and the Federal Reserve approached the end of its interest rate hiking program. Owing to rising yields beginning in late 2021, a higher level of income helped insulate the asset class from price shocks. As measured by the BofA ICE Cash Pay High Yield Constrained Index, a broad benchmark of the asset class, U.S. high yield returned +5.79% for the 12-month period ending October 31, 2023.
While all sectors of U.S. high yield reported positive returns during the period, a high level of variance was recorded among the different industry sectors, driven by macroeconomic trends and idiosyncratic events. Robust consumer spending led to outperformance in the consumer cyclicals sectors (+8.71%), while strong balance sheets and ratings upgrades drove outperformance in the energy sector (+7.37%). Conversely, the telecommunications and media sector lagged (+1.28%) due to competitive cost pressures and several issuer-specific balance sheet problems.
2
BONDBLOXX ETF TRUST
BondBloxx USD High Yield Bond Industrial Sector ETF Growth
Fund Performance Overview (Unaudited) (Continued)
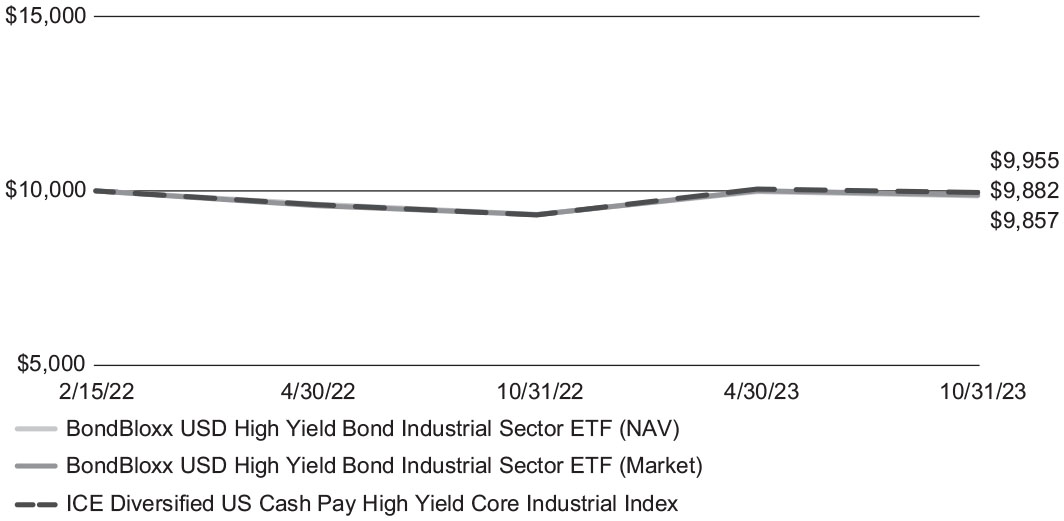
The following graph depicts the hypothetical $10,000 investment in the BondBloxx USD High Yield Bond Industrial Sector ETF (XHYI) at net asset value and market price as compared to the ICE Diversified US Cash Pay High Yield Core Industrial Index(1) from the Fund’s inception date (February 15, 2022(2)) to October 31, 2023.
BondBloxx USD High Yield Bond Industrial Sector ETF
Growth of a Hypothetical $10,000 Investment
| Average Annual Total Returns as of October 31, 2023 | ||||
| BondBloxx USD High Yield Bond | Since | |||
| Industrial Sector ETF | 1 year | Inception(2) | ||
| Net Asset Value | 5.77% | (0.84)% | ||
| Market Value | 6.12% | (0.70)% | ||
| ICE Diversified US Cash Pay High Yield | ||||
| Core Industrial Index | 7.00% | (0.26)% |
| (1) | The ICE Diversified US Cash Pay High Yield Core Industrial Index is a rules-based index consisting of U.S. dollar-denominated below investment grade bonds (as determined by ICE Data Indices, LLC or its affiliates (collectively “Index Provider” or “IDI”)) that contains issuers from the industrial sector, including the basic materials, capital goods, transportation and services subsectors. |
| (2) | The Fund commenced operations on February 15, 2022. Shares of XHYI were listed on the NYSE Arca, Inc. on February 17, 2022. |
Past performance does not guarantee future results. The performance data quoted represents past performance and current returns may be lower or higher. The investment return and principal will fluctuate so that an investor’s shares, when redeemed, may be worth more or less than the original cost. To obtain performance information current to the most recent month end, please visit https://bondbloxxetf.com/.
Net asset value (“NAV”) returns are based on the dollar value of a single share of the Fund, calculated using the value of the underlying assets of the Fund minus its liabilities, divided by the number of shares outstanding. The NAV is typically calculated at 4:00 pm Eastern time on each business day the NewYork Stock Exchange is open for trading. Market returns are based on the trade price at which shares are bought and sold on the NYSE Arca, Inc. using the last share trade. Market performance does not represent the returns you would receive if you traded shares at other times. Total return reflects reinvestment of distributions on ex-date for NAV returns and payment date for market value returns. The market price of the Fund’s shares may differ significantly from their NAV during periods of market volatility. The referenced indices are shown for informational purposes only and are not meant to represent the Fund. One cannot invest directly in an index.
The Fund’s performance assumes the reinvestment of all dividends and all capital gains. Returns shown do not reflect the deduction of taxes that a shareholder would pay on Fund distributions or the sale of Fund shares.
As stated in the current prospectus, the expense ratio is 0.35%. Please refer to the Financial Highlights herein for the most recent expense ratio information.
3
BONDBLOXX ETF TRUST
BondBloxx USD High Yield Bond Telecom, Media & Technology Sector ETF Growth
Fund Performance Overview (Unaudited) (Continued)
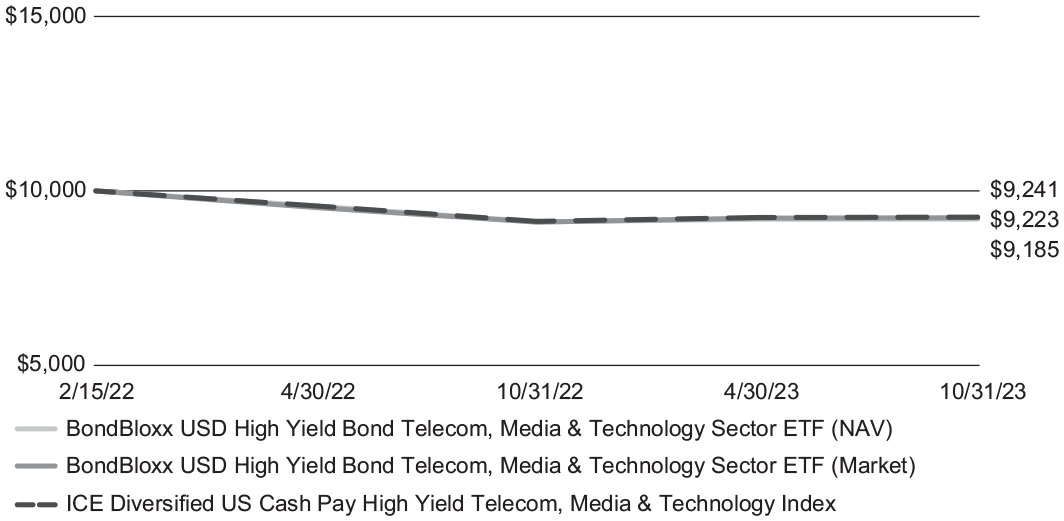
The following graph depicts the hypothetical $10,000 investment in the BondBloxx USD High Yield Bond Telecom, Media & Technology Sector ETF (XHYT) at net asset value and market price as compared to the ICE Diversified US Cash Pay High Yield Telecom, Media & Technology Index(1) from the Fund’s inception date (February 15, 2022(2)) to October 31, 2023.
BondBloxx USD High Yield Bond Telecom, Media & Technology Sector ETF
Growth of a Hypothetical $10,000 Investment
| Average Annual Total Returns as of October 31, 2023 | ||||
| BondBloxx USD High Yield Bond | Since | |||
| Telecom, Media & Technology Sector ETF | 1 year | Inception(2) | ||
| Net Asset Value | 0.89% | (4.86)% | ||
| Market Value | 1.39% | (4.64)% | ||
| ICE Diversified US Cash Pay High Yield | ||||
| Telecom, Media & Technology Index | 1.35% | (4.52)% |
| (1) | The ICE Diversified US Cash Pay HighYieldTelecom, Media &Technology Index is a rules-based index consisting of U.S. dollar-denominated below investment grade bonds (as determined by ICE Data Indices, LLC or its affiliates (collectively “Index Provider” or “IDI”)) that contains issuers from the telecom, media and technology sector, including the telecommunications, technology & electronics, and media sub-sectors. |
| (2) | The Fund commenced operations on February 15, 2022. Shares of XHYT were listed on the NYSE Arca, Inc. on February 17, 2022. |
Past performance does not guarantee future results. The performance data quoted represents past performance and current returns may be lower or higher. The investment return and principal will fluctuate so that an investor’s shares, when redeemed, may be worth more or less than the original cost. To obtain performance information current to the most recent month end, please visit https://bondbloxxetf.com/.
Net asset value (“NAV”) returns are based on the dollar value of a single share of the Fund, calculated using the value of the underlying assets of the Fund minus its liabilities, divided by the number of shares outstanding. The NAV is typically calculated at 4:00 pm Eastern time on each business day the NewYork Stock Exchange is open for trading. Market returns are based on the trade price at which shares are bought and sold on the NYSE Arca, Inc. using the last share trade. Market performance does not represent the returns you would receive if you traded shares at other times. Total return reflects reinvestment of distributions on ex-date for NAV returns and payment date for market value returns. The market price of the Fund’s shares may differ significantly from their NAV during periods of market volatility. The referenced indices are shown for informational purposes only and are not meant to represent the Fund. One cannot invest directly in an index.
The Fund’s performance assumes the reinvestment of all dividends and all capital gains. Returns shown do not reflect the deduction of taxes that a shareholder would pay on Fund distributions or the sale of Fund shares.
As stated in the current prospectus, the expense ratio is 0.35%. Please refer to the Financial Highlights herein for the most recent expense ratio information.
4
BONDBLOXX ETF TRUST
BondBloxx USD High Yield Bond Healthcare Sector ETF Growth
Fund Performance Overview (Unaudited) (Continued)
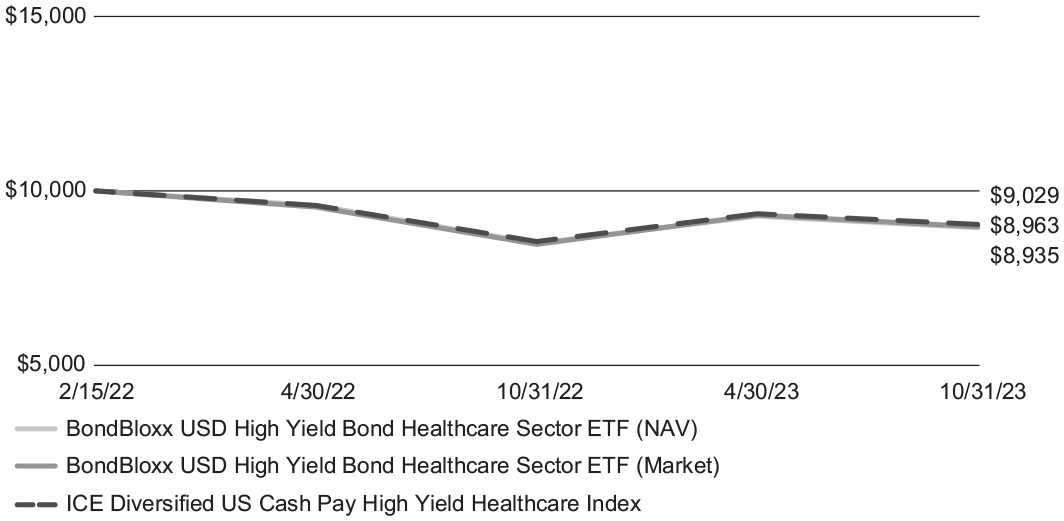
The following graph depicts the hypothetical $10,000 investment in the BondBloxx USD High Yield Bond Healthcare Sector ETF (XHYH) at net asset value and market price as compared to the ICE Diversified US Cash Pay High Yield Healthcare Index(1) from the Fund’s inception date (February 15, 2022(2)) to October 31, 2023.
BondBloxx USD High Yield Bond Healthcare Sector ETF
Growth of a Hypothetical $10,000 Investment
| Average Annual Total Returns as of October 31, 2023 | ||||
| BondBloxx USD High Yield Bond | Since | |||
| Healthcare Sector ETF | 1 year | Inception(2) | ||
| Net Asset Value | 5.36% | (6.38)% | ||
| Market Value | 6.03% | (6.23)% | ||
| ICE Diversified US Cash Pay High Yield | ||||
| Healthcare Index | 5.80% | (5.81)% |
| (1) | The ICE Diversified US Cash Pay High Yield Healthcare Index is a rules-based index consisting of U.S. dollar-denominated below investment grade bonds (as determined by ICE Data Indices, LLC or its affiliates (collectively “Index Provider” or “IDI”)) that contains issuers from the healthcare sector, including the health facilities, health services, managed care, medical products, and pharmaceuticals sub-sectors. |
| (2) | The Fund commenced operations on February 15, 2022. Shares of XHYH were listed on the NYSE Arca, Inc. on February 17, 2022. |
Past performance does not guarantee future results. The performance data quoted represents past performance and current returns may be lower or higher. The investment return and principal will fluctuate so that an investor’s shares, when redeemed, may be worth more or less than the original cost. To obtain performance information current to the most recent month end, please visit https://bondbloxxetf.com/.
Net asset value (“NAV”) returns are based on the dollar value of a single share of the Fund, calculated using the value of the underlying assets of the Fund minus its liabilities, divided by the number of shares outstanding. The NAV is typically calculated at 4:00 pm Eastern time on each business day the NewYork Stock Exchange is open for trading. Market returns are based on the trade price at which shares are bought and sold on the NYSE Arca, Inc. using the last share trade. Market performance does not represent the returns you would receive if you traded shares at other times. Total return reflects reinvestment of distributions on ex-date for NAV returns and payment date for market value returns. The market price of the Fund’s shares may differ significantly from their NAV during periods of market volatility. The referenced indices are shown for informational purposes only and are not meant to represent the Fund. One cannot invest directly in an index.
The Fund’s performance assumes the reinvestment of all dividends and all capital gains. Returns shown do not reflect the deduction of taxes that a shareholder would pay on Fund distributions or the sale of Fund shares.
As stated in the current prospectus, the expense ratio is 0.35%. Please refer to the Financial Highlights herein for the most recent expense ratio information.
5
BONDBLOXX ETF TRUST
BondBloxx USD High Yield Bond Financial & REIT Sector ETF Growth
Fund Performance Overview (Unaudited) (Continued)
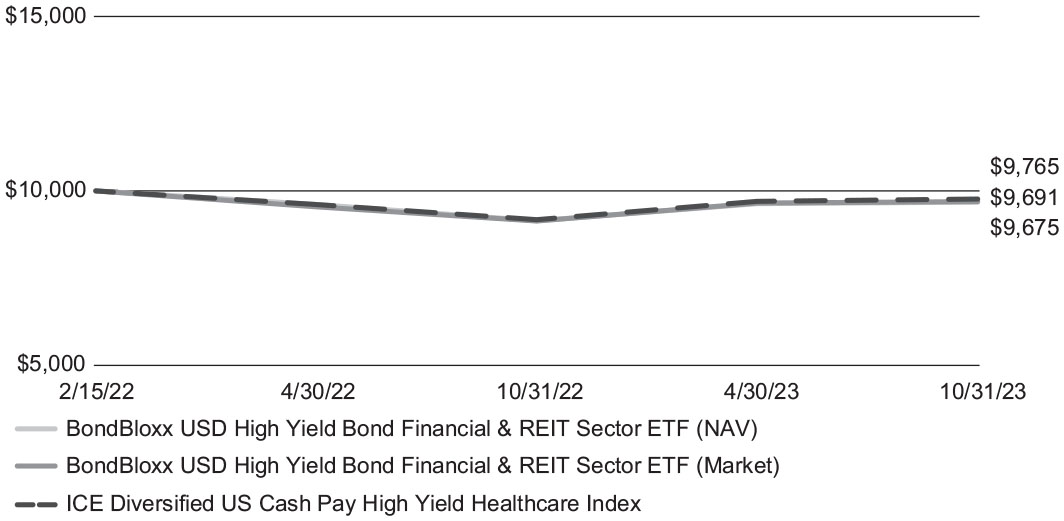
The following graph depicts the hypothetical $10,000 investment in the BondBloxx USD High Yield Bond Financial & REIT Sector ETF (XHYF) at net asset value and market price as compared to the ICE Diversified US Cash Pay High Yield Financial & REIT Index(1) from the Fund’s inception date (February 15, 2022(2)) to October 31, 2023.
BondBloxx USD High Yield Bond Financial & REIT Sector ETF
Growth of a Hypothetical $10,000 Investment
| Average Annual Total Returns as of October 31, 2023 | ||||
| BondBloxx USD High Yield Bond | Since | |||
| Financial & REIT Sector ETF | 1 year | Inception(2) | ||
| Net Asset Value | 5.91% | (1.91)% | ||
| Market Value | 6.17% | (1.83)% | ||
| ICE Diversified US Cash Pay High Yield | ||||
| Financial & REIT Index | 6.53% | (1.38)% |
| (1) | The ICE Diversified US Cash Pay High Yield Financial & REIT Index is a rules-based index consisting of U.S. dollar-denominated below investment grade bonds (as determined by ICE Data Indices, LLC or its affiliates (collectively “Index Provider” or “IDI”)) that contains issuers from the financial sector, including the banking, financial services, and insurance sub-sectors, and the REIT sector. The REIT sector is comprised solely of debt issued by real estate investment trusts. |
| (2) | The Fund commenced operations on February 15, 2022. Shares of XHYF were listed on the NYSE Arca, Inc. on February 17, 2022. |
Past performance does not guarantee future results. The performance data quoted represents past performance and current returns may be lower or higher. The investment return and principal will fluctuate so that an investor’s shares, when redeemed, may be worth more or less than the original cost. To obtain performance information current to the most recent month end, please visit https://bondbloxxetf.com/.
Net asset value (“NAV”) returns are based on the dollar value of a single share of the Fund, calculated using the value of the underlying assets of the Fund minus its liabilities, divided by the number of shares outstanding. The NAV is typically calculated at 4:00 pm Eastern time on each business day the NewYork Stock Exchange is open for trading. Market returns are based on the trade price at which shares are bought and sold on the NYSE Arca, Inc. using the last share trade. Market performance does not represent the returns you would receive if you traded shares at other times. Total return reflects reinvestment of distributions on ex-date for NAV returns and payment date for market value returns. The market price of the Fund’s shares may differ significantly from their NAV during periods of market volatility. The referenced indices are shown for informational purposes only and are not meant to represent the Fund. One cannot invest directly in an index.
The Fund’s performance assumes the reinvestment of all dividends and all capital gains. Returns shown do not reflect the deduction of taxes that a shareholder would pay on Fund distributions or the sale of Fund shares.
As stated in the current prospectus, the expense ratio is 0.35%. Please refer to the Financial Highlights herein for the most recent expense ratio information.
6
BONDBLOXX ETF TRUST
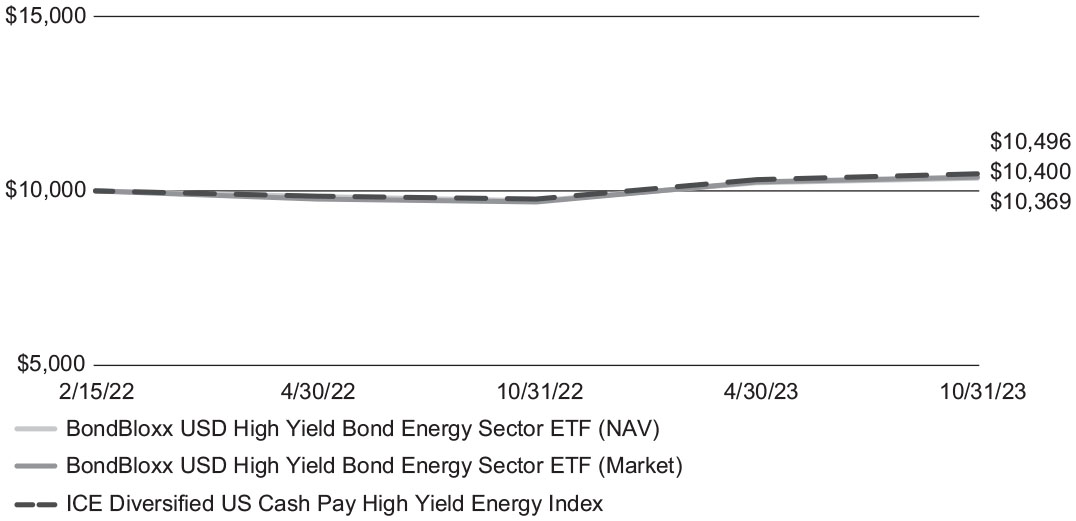
BondBloxx USD High Yield Bond Energy Sector ETF Growth
Fund Performance Overview (Unaudited) (Continued)
The following graph depicts the hypothetical $10,000 investment in the BondBloxx USD High Yield Bond Energy Sector ETF (XHYE) at net asset value and market price as compared to the ICE Diversified US Cash Pay High Yield Energy Index(1) from the Fund’s inception date (February 15, 2022(2)) to October 31, 2023.
BondBloxx USD High Yield Bond Energy Sector ETF
Growth of a Hypothetical $10,000 Investment
| Average Annual Total Returns as of October 31, 2023 | ||||
| BondBloxx USD High Yield Bond | Since | |||
| Energy Sector ETF | 1 year | Inception(2) | ||
| Net Asset Value | 6.73% | 2.15% | ||
| Market Value | 7.43% | 2.33% | ||
| ICE Diversified US Cash Pay High Yield | ||||
| Energy Index | 7.48% | 2.88% |
| (1) | The ICE Diversified US Cash Pay High Yield Energy Index is a rules-based index consisting of U.S. dollar-denominated below investment grade bonds (as determined by ICE Data Indices, LLC or its affiliates (collectively “Index Provider” or “IDI”)) that contains issuers from the energy sector, including the exploration & production, gas distribution, oil field equipment & services, and oil refining & marketing sub-sectors. |
| (2) | The Fund commenced operations on February 15, 2022. Shares of XHYE were listed on the NYSE Arca, Inc. on February 17, 2022. |
Past performance does not guarantee future results. The performance data quoted represents past performance and current returns may be lower or higher. The investment return and principal will fluctuate so that an investor’s shares, when redeemed, may be worth more or less than the original cost. To obtain performance information current to the most recent month end, please visit https://bondbloxxetf.com/.
Net asset value (“NAV”) returns are based on the dollar value of a single share of the Fund, calculated using the value of the underlying assets of the Fund minus its liabilities, divided by the number of shares outstanding. The NAV is typically calculated at 4:00 pm Eastern time on each business day the NewYork Stock Exchange is open for trading. Market returns are based on the trade price at which shares are bought and sold on the NYSE Arca, Inc. using the last share trade. Market performance does not represent the returns you would receive if you traded shares at other times. Total return reflects reinvestment of distributions on ex-date for NAV returns and payment date for market value returns. The market price of the Fund’s shares may differ significantly from their NAV during periods of market volatility. The referenced indices are shown for informational purposes only and are not meant to represent the Fund. One cannot invest directly in an index.
The Fund’s performance assumes the reinvestment of all dividends and all capital gains. Returns shown do not reflect the deduction of taxes that a shareholder would pay on Fund distributions or the sale of Fund shares.
As stated in the current prospectus, the expense ratio is 0.35%. Please refer to the Financial Highlights herein for the most recent expense ratio information.
7
BONDBLOXX ETF TRUST
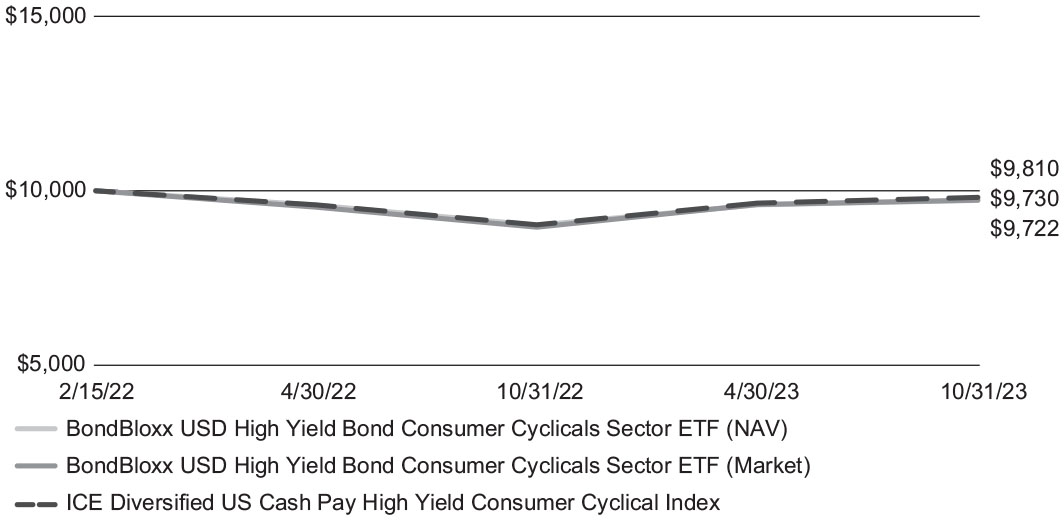
BondBloxx USD High Yield Bond Consumer Cyclicals Sector ETF Growth
Fund Performance Overview (Unaudited) (Continued)
The following graph depicts the hypothetical $10,000 investment in the BondBloxx USD High Yield Bond Consumer Cyclicals Sector ETF (XHYC) at net asset value and market price as compared to the ICE Diversified US Cash Pay High Yield Consumer Cyclical Index(1) from the Fund’s inception date (February 15, 2022(2)) to October 31, 2023.
BondBloxx USD High Yield Bond Consumer Cyclicals Sector ETF
Growth of a Hypothetical $10,000 Investment
| Average Annual Total Returns as of October 31, 2023 | ||||
| BondBloxx USD High Yield Bond | Since | |||
| Consumer Cyclicals Sector ETF | 1 year | Inception(2) | ||
| Net Asset Value | 7.98% | (1.64)% | ||
| Market Value | 8.77% | (1.59)% | ||
| ICE Diversified US Cash Pay High Yield | ||||
| Consumer Cyclical Index | 8.81% | (1.12)% |
| (1) | The ICE Diversified US Cash Pay High Yield Consumer Cyclical Index is a rules-based index consisting of U.S. dollar-denominated below investment grade bonds (as determined by ICE Data Indices, LLC or its affiliates (collectively “Index Provider” or “IDI”)) that contains issuers from the consumer cyclicals sector (companies whose performance is generally more closely connected to the business cycle and current economic conditions), including the automotive, leisure, real estate development & management, department stores, and specialty retail subsectors. |
| (2) | The Fund commenced operations on February 15, 2022. Shares of XHYC were listed on the NYSE Arca, Inc. on February 17, 2022. |
Past performance does not guarantee future results. The performance data quoted represents past performance and current returns may be lower or higher. The investment return and principal will fluctuate so that an investor’s shares, when redeemed, may be worth more or less than the original cost. To obtain performance information current to the most recent month end, please visit https://bondbloxxetf.com/.
Net asset value (“NAV”) returns are based on the dollar value of a single share of the Fund, calculated using the value of the underlying assets of the Fund minus its liabilities, divided by the number of shares outstanding. The NAV is typically calculated at 4:00 pm Eastern time on each business day the New York Stock Exchange is open for trading. Market returns are based on the trade price at which shares are bought and sold on the NYSE Arca, Inc. using the last share trade. Market performance does not represent the returns you would receive if you traded shares at other times. Total return reflects reinvestment of distributions on ex-date for NAV returns and payment date for market value returns. The market price of the Fund’s shares may differ significantly from their NAV during periods of market volatility. The referenced indices are shown for informational purposes only and are not meant to represent the Fund. One cannot invest directly in an index.
The Fund’s performance assumes the reinvestment of all dividends and all capital gains. Returns shown do not reflect the deduction of taxes that a shareholder would pay on Fund distributions or the sale of Fund shares.
As stated in the current prospectus, the expense ratio is 0.35%. Please refer to the Financial Highlights herein for the most recent expense ratio information.
8
BONDBLOXX ETF TRUST
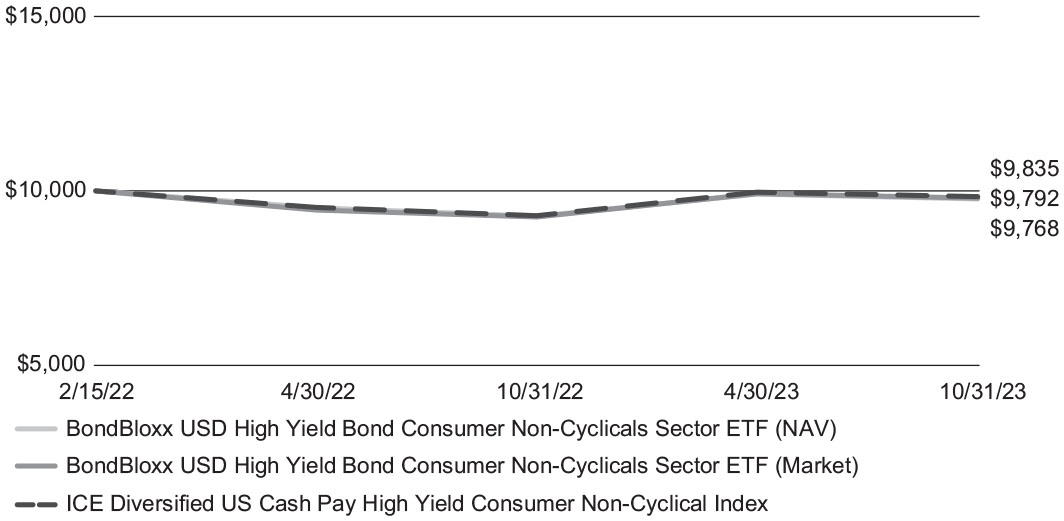
BondBloxx USD High Yield Bond Consumer Non-Cyclicals Sector ETF Growth
Fund Performance Overview (Unaudited) (Continued)
The following graph depicts the hypothetical $10,000 investment in the BondBloxx USD High Yield Bond Consumer Non-Cyclicals Sector ETF (XHYD) at net asset value and market price as compared to the ICE Diversified US Cash Pay High Yield Consumer Non-Cyclical Index(1) from the Fund’s inception date (February 15, 2022(2)) to October 31, 2023.
BondBloxx USD High Yield Bond Consumer Non-Cyclicals Sector ETF
Growth of a Hypothetical $10,000 Investment
| Average Annual Total Returns as of October 31, 2023 | ||||
| BondBloxx USD High Yield Bond | Since | |||
| Consumer Non-Cyclicals Sector ETF | 1 year | Inception(2) | ||
| Net Asset Value | 5.40% | (1.36)% | ||
| Market Value | 5.92% | (1.23)% | ||
| ICE Diversified US Cash Pay High Yield | ||||
| Consumer Non-Cyclical Index | 5.96% | (0.97)% |
| (1) | The ICE Diversified US Cash Pay High Yield Consumer Non-Cyclical Index is a rules-based index consisting of U.S. dollar-denominated below investment grade bonds (as determined by ICE Data Indices, LLC or its affiliates (collectively “Index Provider” or “IDI”)) that contains issuers from the consumer non-cyclicals sector (companies whose performance is generally less closely connected to the business cycle and current economic conditions), including the consumer goods, discount stores, food & drug retail, restaurants, and utilities sub-sectors. |
| (2) | The Fund commenced operations on February 15, 2022. Shares of XHYD were listed on the NYSE Arca, Inc. on February 17, 2022. |
Past performance does not guarantee future results. The performance data quoted represents past performance and current returns may be lower or higher. The investment return and principal will fluctuate so that an investor’s shares, when redeemed, may be worth more or less than the original cost. To obtain performance information current to the most recent month end, please visit https://bondbloxxetf.com/.
Net asset value (“NAV”) returns are based on the dollar value of a single share of the Fund, calculated using the value of the underlying assets of the Fund minus its liabilities, divided by the number of shares outstanding. The NAV is typically calculated at 4:00 pm Eastern time on each business day the NewYork Stock Exchange is open for trading. Market returns are based on the trade price at which shares are bought and sold on the NYSE Arca, Inc. using the last share trade. Market performance does not represent the returns you would receive if you traded shares at other times. Total return reflects reinvestment of distributions on ex-date for NAV returns and payment date for market value returns. The market price of the Fund’s shares may differ significantly from their NAV during periods of market volatility. The referenced indices are shown for informational purposes only and are not meant to represent the Fund. One cannot invest directly in an index.
The Fund’s performance assumes the reinvestment of all dividends and all capital gains. Returns shown do not reflect the deduction of taxes that a shareholder would pay on Fund distributions or the sale of Fund shares.
As stated in the current prospectus, the expense ratio is 0.35%. Please refer to the Financial Highlights herein for the most recent expense ratio information.
9
BONDBLOXX ETF TRUST
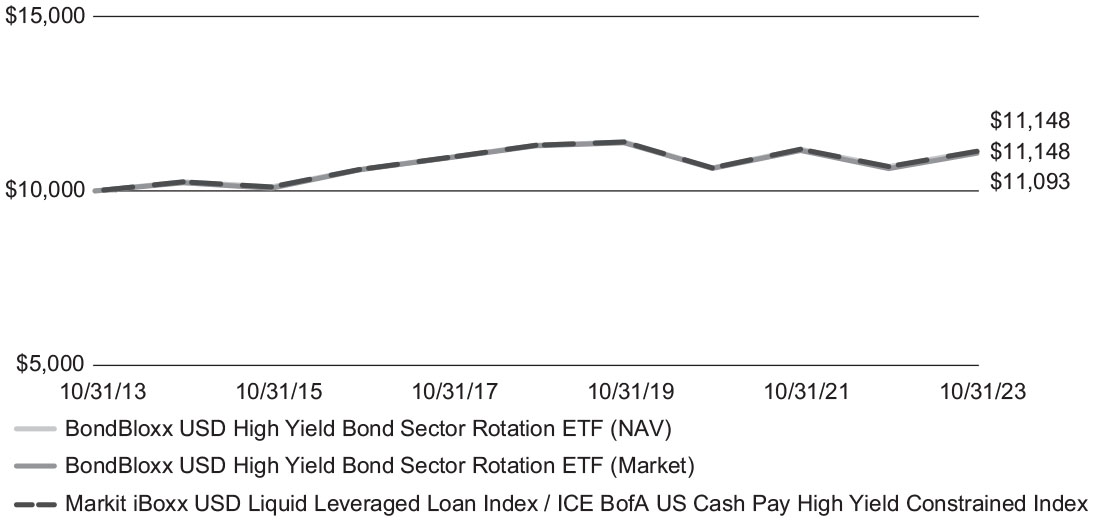
BondBloxx USD High Yield Bond Sector Rotation ETF Growth
Fund Performance Overview (Unaudited) (Continued)
The following graph depicts the hypothetical $10,000 investment in the BondBloxx USD High Yield Bond Sector Rotation ETF (HYSA) at net asset value and market price as compared to a blended index Markit iBoxx USD Liquid Leveraged Loan Index and ICE BofA US Cash Pay High Yield Constrained Index(1) for the ten year period ended October 31, 2023.
BondBloxx USD High Yield Bond Sector Rotation ETF
Growth of a Hypothetical $10,000 Investment
| Average Annual Total Returns as of October 31, 2023 | ||||||||||
| BondBloxx USD High Yield Bond | Since | |||||||||
| Sector Rotation ETF | 1 year | 3 years | 5 years | 10 years | Inception(2) | |||||
| Net Asset Value | 4.14% | 1.48% | (0.31)% | 1.09% | 1.44% | |||||
| Market Value | 4.19% | 1.36% | (0.38)% | 1.04% | 1.41% | |||||
| Markit iBoxx USD Liquid Leveraged Loan Index / ICE BofA US Cash Pay High Yield | ||||||||||
| Constrained Index | 4.14% | 1.48% | (0.31)% | 1.09% | 1.44% | |||||
The Fund acquired the assets and liabilities of the Highland/iBoxx Senior Loan ETF (the “Predecessor ETF”), a series of the NexPoint Funds I, at the close of business on September 15, 2023. As a result of the reorganization, the Fund is the accounting successor of the Predecessor ETF. Performance results shown in the graph and the performance table above for the periods prior to September 16, 2023, reflect the performance of the Predecessor ETF.
| (1) | The Markit iBoxx USD Liquid Leveraged Loan Index, is comprised of about 100 of the most liquid, tradable leveraged loans, as identified by Markit’s Loans Liquidity service. Markit iBoxx USD Liquid Leveraged Loan Index is the Predecessor ETF’s index benchmark for the period from commencement of operations, November 6, 2012, through the acquisition on September 15, 2023. |
The ICE BofA US Cash Pay High Yield Constrained Index is a rules-based index consisting of U.S. dollar-denominated below investment grade corporate debt, currently in a coupon paying period, that is publicly issued in the U.S. domestic market. ICE BofA US Cash Pay High Yield Constrained Index began on September 16, 2023. This Fund is actively managed and does not seek to track the performance of the ICE BofA US Cash Pay High Yield Constrained Index.
| (2) | The Fund commenced operations on November 6, 2012. The Fund was acquired as from the Predecessor ETF of the close of business on September 15, 2023. Shares of HYSA were listed on the NYSE Arca, Inc. on September 18, 2023. Prior to September 16, 2023, the Predecessor Fund was advised by a different investment adviser, had a different investment objective and policies and was a passively-managed fund that sought to track the performance of the Markit iBoxx USD Liquid Leveraged Loan Index. |
Past performance does not guarantee future results. The performance data quoted represents past performance and current returns may be lower or higher. The investment return and principal will fluctuate so that an investor’s shares, when redeemed, may be worth more or less than the original cost. To obtain performance information current to the most recent month end, please visit https://bondbloxxetf.com/.
10
BONDBLOXX ETF TRUST
BondBloxx USD High Yield Bond Sector Rotation ETF Growth
Fund Performance Overview (Unaudited) (Continued)
Net asset value (“NAV”) returns are based on the dollar value of a single share of the Fund, calculated using the value of the underlying assets of the Fund minus its liabilities, divided by the number of shares outstanding. The NAV is typically calculated at 4:00 pm Eastern time on each business day the NewYork Stock Exchange is open for trading. Market returns are based on the trade price at which shares are bought and sold on the NYSE Arca, Inc. using the last share trade. Market performance does not represent the returns you would receive if you traded shares at other times. Total return reflects reinvestment of distributions on ex-date for NAV returns and payment date for market value returns. The market price of the Fund’s shares may differ significantly from their NAV during periods of market volatility. The referenced indices are shown for informational purposes only and are not meant to represent the Fund. One cannot invest directly in an index.
The Fund’s performance assumes the reinvestment of all dividends and all capital gains. Returns shown do not reflect the deduction of taxes that a shareholder would pay on Fund distributions or the sale of Fund shares.
As stated in the current prospectus, the expense ratio is 0.55%. Please refer to the Financial Highlights herein for the most recent expense ratio information.
11
BONDBLOXX ETF TRUST
Fund Performance Overview (Unaudited) (Continued)
The U.S. economy showed remarkable resilience over the 12-month period ending October 31, 2023 in the face of higher interest rates, persistent inflation and numerous external shocks. Economic growth was fueled by steady consumer spending, as the enduring strength of the labor market shored up household confidence. Gross Domestic Product grew at an annualized pace of 5.2% in the third quarter of 2023 - the fastest expansion in close to two years. The U.S. unemployment rate held near historic lows throughout the period. Meanwhile, signs of weakness were evident in areas such as housing, industrial production, and manufacturing.
Inflation pressures in the U.S. eased substantially from the 40-year peak reached in mid-2022, as annual consumer price growth hovered between 3.0% and 4.0% by mid-2023, down from 9.1% at its peak. This favorable trend in consumer price growth during the period enabled the Federal Reserve to slow its interest rate tightening campaign, having kept its policy rate unchanged at three of the last four meetings. This follows an aggressive 525 basis points in total rate increases over the previous 18 months.
After a year of double-digit declines across most asset classes, most fixed income sectors generated positive returns during the 12-month period ending in October 2023, led by higher-income generating sectors such as U.S. high yield and emerging markets. The overall equity market rose over 10%, driven by the technology sector and potential impacts of artificial intelligence, while other equity sectors and small-cap stocks lagged.
U.S high yield bonds generated positive returns for the 12-month period ending October 31, 2023, as a strong U.S. economy kept corporate cash flows relatively healthy, investor expectations of a recession receded, and the Federal Reserve approached the end of its interest rate hiking program. Owing to rising yields beginning in late 2021, a higher level of income helped insulate the asset class from price shocks. As measured by the BofA ICE Cash Pay High Yield Constrained Index, a broad benchmark of the asset class, U.S. high yield returned +5.79% for the 12-month period ending October 31, 2023.
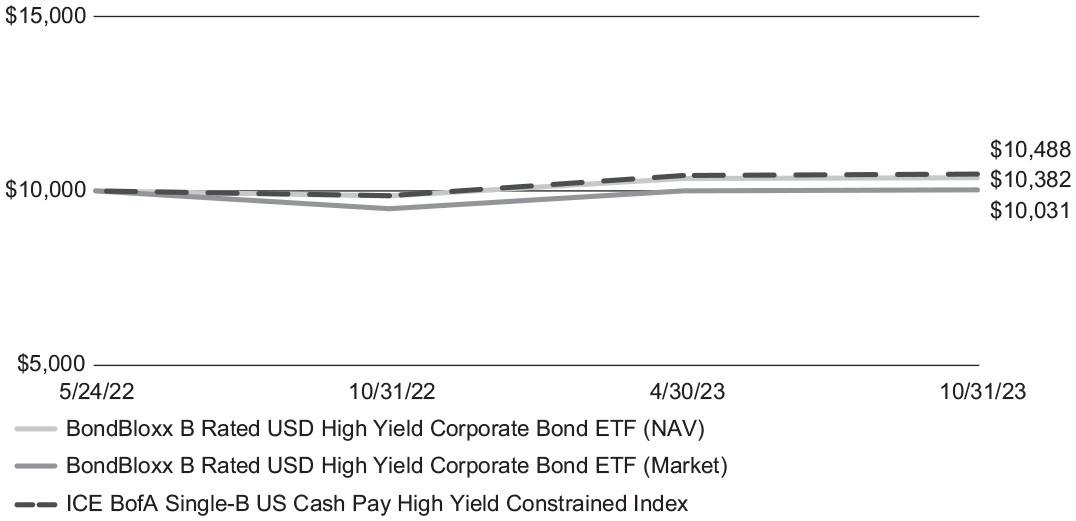
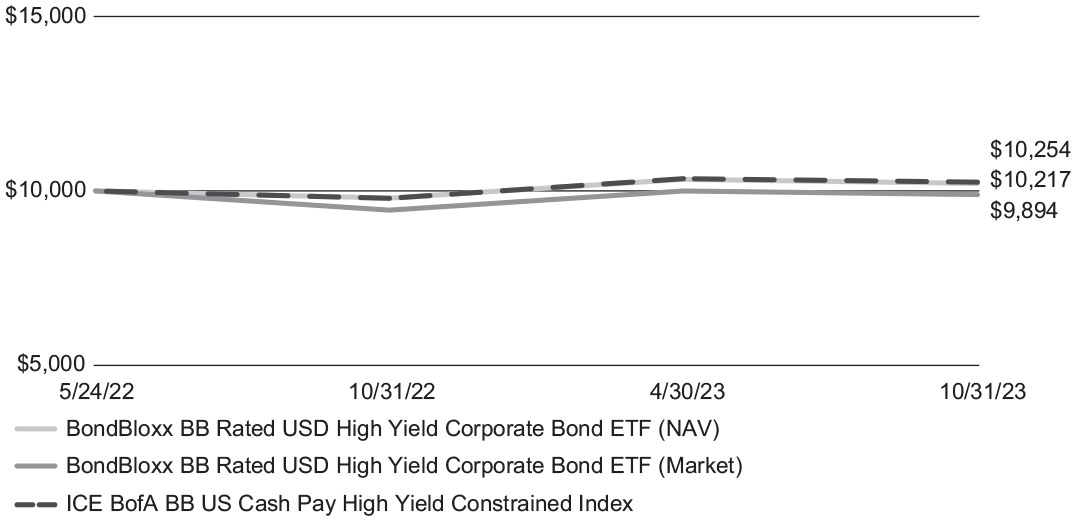
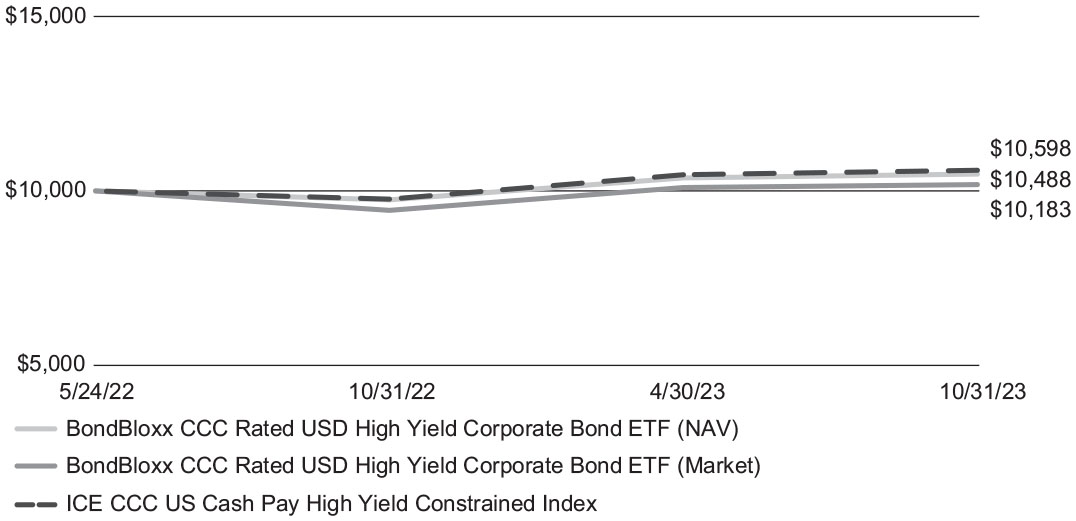
Lower-rated high yield bonds outperformed for the 12-month period, as fears of recession in the U.S. abated and higher yields provided a comfortable cushion against interest rate fears and security price volatility. The ICE CCC US Cash Pay High Yield Constrained Index returned +8.30% for the period from November 1, 2022 to October 31, 2023. While generating positive returns, securities bonds with higher credit ratings were negatively impacted by interest rates, with BB and single-B rated high yield bonds returning +4.68% and +6.23%, respectively, as measured by ICE Index Services.
12
BONDBLOXX ETF TRUST
BondBloxx B Rated USD High Yield Corporate Bond ETF Growth
Fund Performance Overview (Unaudited) (Continued)
The following graph depicts the hypothetical $10,000 investment in the BondBloxx B Rated USD High Yield Corporate Bond ETF (XB) at net asset value and market price as compared to the ICE BofA Single-B US Cash Pay High Yield Constrained Index(1) from the Fund’s inception date (May 24, 2022(2)) to October 31, 2023.
BondBloxx B Rated USD High Yield Corporate Bond ETF
Growth of a Hypothetical $10,000 Investment
| Average Annual Total Returns as of October 31, 2023 | ||||
| BondBloxx B Rated USD High Yield | Since | |||
| Corporate Bond ETF | 1 year | Inception(2) | ||
| Net Asset Value | 5.35% | 2.64% | ||
| Market Value | 5.77% | 0.22% | ||
| ICE BofA Single-B US Cash Pay High Yield | ||||
| Constrained Index | 6.35% | 3.37% |
| (1) | The ICE BofA Single-B US Cash Pay High Yield Constrained Index contains all bonds in the ICE BofA US Cash Pay High Yield Index (the “Underlying Index”) that are rated B1 through B3, based on an average of Moody’s Investors Services Inc. (“Moody’s”), S&P Global Ratings (“S&P”) and Fitch Ratings, Inc. (“Fitch”), but caps issuer exposure at 2%. |
| (2) | The Fund commenced operations on May 24, 2022. Shares of XB were listed on the NYSE Arca, Inc. on May 26, 2022. |
Past performance does not guarantee future results. The performance data quoted represents past performance and current returns may be lower or higher. The investment return and principal will fluctuate so that an investor’s shares, when redeemed, may be worth more or less than the original cost. To obtain performance information current to the most recent month end, please visit https://bondbloxxetf.com/.
Net asset value (“NAV”) returns are based on the dollar value of a single share of the Fund, calculated using the value of the underlying assets of the Fund minus its liabilities, divided by the number of shares outstanding. The NAV is typically calculated at 4:00 pm Eastern time on each business day the NewYork Stock Exchange is open for trading. Market returns are based on the trade price at which shares are bought and sold on the NYSE Arca, Inc. using the last share trade. Market performance does not represent the returns you would receive if you traded shares at other times. Total return reflects reinvestment of distributions on ex-date for NAV returns and payment date for market value returns. The market price of the Fund’s shares may differ significantly from their NAV during periods of market volatility. The referenced indices are shown for informational purposes only and are not meant to represent the Fund. One cannot invest directly in an index.
The Fund’s performance assumes the reinvestment of all dividends and all capital gains. Returns shown do not reflect the deduction of taxes that a shareholder would pay on Fund distributions or the sale of Fund shares.
As stated in the current prospectus, the expense ratio is 0.30%. Please refer to the Financial Highlights herein for the most recent expense ratio information.
13
BONDBLOXX ETF TRUST
BondBloxx BB Rated USD High Yield Corporate Bond ETF Growth
Fund Performance Overview (Unaudited) (Continued)
The following graph depicts the hypothetical $10,000 investment in the BondBloxx BB Rated USD High Yield Corporate Bond ETF (XBB) at net asset value and market price as compared to the ICE BofA BB US Cash Pay High Yield Constrained Index(1) from the Fund’s inception date (May 24, 2022(2)) to October 31, 2023.
BondBloxx BB Rated USD High Yield Corporate Bond ETF
Growth of a Hypothetical $10,000 Investment
| Average Annual Total Returns as of October 31, 2023 | ||||
| BondBloxx BB Rated USD High Yield | Since | |||
| Corporate Bond ETF | 1 year | Inception(2) | ||
| Net Asset Value | 4.33% | 1.50% | ||
| Market Value | 4.78% | (0.74)% | ||
| ICE BofA BB US Cash Pay High Yield | ||||
| Constrained Index | 4.79% | 1.76% |
| (1) | The ICE BofA BB US Cash Pay High Yield Constrained Index contains all bonds in the ICE BofA US Cash Pay High Yield Index (the “Underlying Index”) that are rated BB1 though BB3, based on an average of Moody’s Investors Services, Inc. (“Moody’s”), S&P Global Ratings (“S&P”) and Fitch Ratings, Inc. (“Fitch”), but caps issuer exposure at 2%. |
| (2) | The Fund commenced operations on May 24, 2022. Shares of XBB were listed on the NYSE Arca, Inc. on May 26, 2022. |
Past performance does not guarantee future results. The performance data quoted represents past performance and current returns may be lower or higher. The investment return and principal will fluctuate so that an investor’s shares, when redeemed, may be worth more or less than the original cost. To obtain performance information current to the most recent month end, please visit https://bondbloxxetf.com/.
Net asset value (“NAV”) returns are based on the dollar value of a single share of the Fund, calculated using the value of the underlying assets of the Fund minus its liabilities, divided by the number of shares outstanding. The NAV is typically calculated at 4:00 pm Eastern time on each business day the NewYork Stock Exchange is open for trading. Market returns are based on the trade price at which shares are bought and sold on the NYSE Arca, Inc. using the last share trade. Market performance does not represent the returns you would receive if you traded shares at other times. Total return reflects reinvestment of distributions on ex-date for NAV returns and payment date for market value returns. The market price of the Fund’s shares may differ significantly from their NAV during periods of market volatility. The referenced indices are shown for informational purposes only and are not meant to represent the Fund. One cannot invest directly in an index.
The Fund’s performance assumes the reinvestment of all dividends and all capital gains. Returns shown do not reflect the deduction of taxes that a shareholder would pay on Fund distributions or the sale of Fund shares.
As stated in the current prospectus, the expense ratio is 0.20%. Please refer to the Financial Highlights herein for the most recent expense ratio information.
14
BONDBLOXX ETF TRUST
BondBloxx CCC Rated USD High Yield Corporate Bond ETF Growth
Fund Performance Overview (Unaudited) (Continued)
The following graph depicts the hypothetical $10,000 investment in the BondBloxx CCC Rated USD High Yield Corporate Bond ETF (XCCC) at net asset value and market price as compared to the ICE CCC US Cash Pay High Yield Constrained Index(1) from the Fund’s inception date (May 24, 2022(2)) to October 31, 2023.
BondBloxx CCC Rated USD High Yield Corporate Bond ETF
Growth of a Hypothetical $10,000 Investment
| Average Annual Total Returns as of October 31, 2023 | ||||
| BondBloxx CCC Rated USD High Yield | Since | |||
| Corporate Bond ETF | 1 year | Inception(2) | ||
| Net Asset Value | 7.66% | 3.37% | ||
| Market Value | 7.91% | 1.28% | ||
| ICE CCC US Cash Pay High Yield | ||||
| Constrained Index | 8.57% | 4.12% |
| (1) | The ICE CCC US Cash Pay High Yield Constrained Index contains all bonds in the ICE BofA US Cash Pay High Yield Index (the “Underlying Index”) that are rated CCC1 through CCC3, based on an average of Moody’s Investors Services, Inc. (“Moody’s”), S&P Global Ratings (“S&P”) and Fitch Ratings, Inc. (“Fitch”), but caps issuer exposure at 2%. |
| (2) | The Fund commenced operations on May 24, 2022. Shares of XCCC were listed on the NYSE Arca, Inc. on May 26, 2022. |
Past performance does not guarantee future results. The performance data quoted represents past performance and current returns may be lower or higher. The investment return and principal will fluctuate so that an investor’s shares, when redeemed, may be worth more or less than the original cost. To obtain performance information current to the most recent month end, please visit https://bondbloxxetf.com/.
Net asset value (“NAV”) returns are based on the dollar value of a single share of the Fund, calculated using the value of the underlying assets of the Fund minus its liabilities, divided by the number of shares outstanding. The NAV is typically calculated at 4:00 pm Eastern time on each business day the NewYork Stock Exchange is open for trading. Market returns are based on the trade price at which shares are bought and sold on the NYSE Arca, Inc. using the last share trade. Market performance does not represent the returns you would receive if you traded shares at other times. Total return reflects reinvestment of distributions on ex-date for NAV returns and payment date for market value returns. The market price of the Fund’s shares may differ significantly from their NAV during periods of market volatility. The referenced indices are shown for informational purposes only and are not meant to represent the Fund. One cannot invest directly in an index.
The Fund’s performance assumes the reinvestment of all dividends and all capital gains. Returns shown do not reflect the deduction of taxes that a shareholder would pay on Fund distributions or the sale of Fund shares.
As stated in the current prospectus, the expense ratio is 0.40%. Please refer to the Financial Highlights herein for the most recent expense ratio information.
15
BONDBLOXX ETF TRUST
Fund Performance Overview (Unaudited) (Continued)
The U.S. economy showed remarkable resilience over the 12-month period ending October 31, 2023 in the face of higher interest rates, persistent inflation and numerous external shocks. Economic growth was fueled by steady consumer spending, as the enduring strength of the labor market shored up household confidence. Gross Domestic Product grew at an annualized pace of 5.2% in the third quarter of 2023 - the fastest expansion in close to two years. The U.S. unemployment rate held near historic lows throughout the period. Meanwhile, signs of weakness were evident in areas such as housing, industrial production, and manufacturing.
Inflation pressures in the U.S. eased substantially from the 40-year peak reached in mid-2022, as annual consumer price growth hovered between 3.0% and 4.0% by mid-2023, down from 9.1% at its peak. This favorable trend in consumer price growth during the period enabled the Federal Reserve to slow its interest rate tightening campaign, having kept its policy rate unchanged at three of the last four meetings. This follows an aggressive 525 basis points in total rate increases over the previous 18 months.
After a year of double-digit declines across most asset classes, most fixed income sectors generated positive returns during the 12-month period ending in October 2023, led by higher-income generating sectors such as U.S. high yield and emerging markets. The overall equity market rose over 10%, driven by the technology sector and potential impacts of artificial intelligence, while other equity sectors and small-cap stocks lagged.
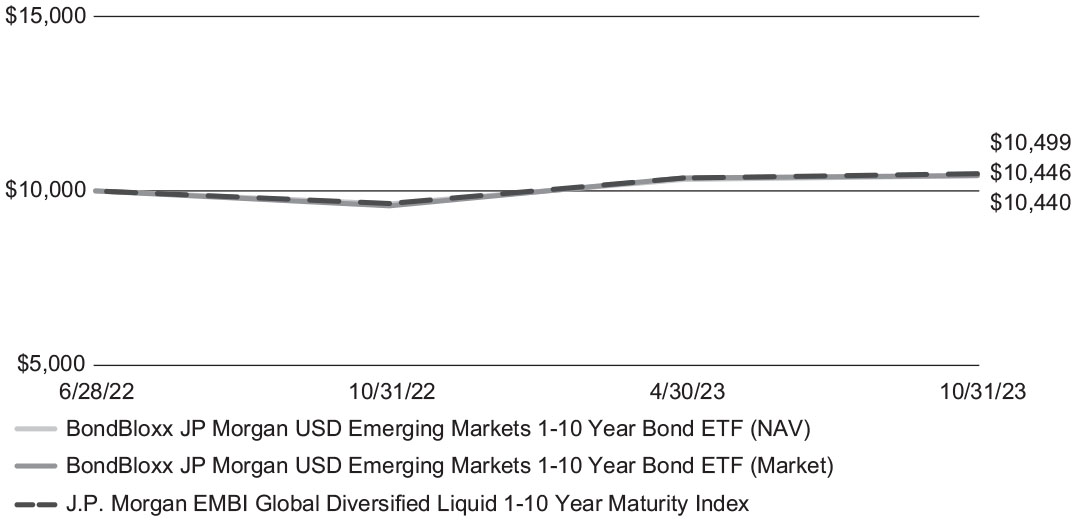
Emerging markets debt generated strong positive returns during the 12-month period ending October 31, 2023, with the JP Morgan EMBI Global Diversified 1-10 Liquid Index returning +8.96% for the period. Returns in emerging markets debt were driven by resiliency across commodity markets, especially oil, and positive progress on debt restructuring talks from several distressed issuers. Additionally, returns were bolstered by a declining dollar, as the Federal Reserve nears the end of its interest rate hikes, lower forecasts of a recession in the U.S., and attractive yields in the asset class, cushioning investors from price volatility.
16
BONDBLOXX ETF TRUST
BondBloxx JP Morgan USD Emerging Markets 1-10 Year Bond ETF Growth
Fund Performance Overview (Unaudited) (Continued)
The following graph depicts the hypothetical $10,000 investment in the BondBloxx JP Morgan USD Emerging Markets 1-10 Year Bond ETF (XEMD) at net asset value and market price as compared to the J.P. Morgan EMBI Global Diversified Liquid 1-10 Year Maturity Index(1) from the Fund’s inception date (June 28, 2022(2)) to October 31, 2023.
BondBloxx JP Morgan USD Emerging Markets 1-10 Year Bond ETF
Growth of a Hypothetical $10,000 Investment
| Average Annual Total Returns as of October 31, 2023 | ||||
| BondBloxx JP Morgan USD Emerging Markets | Since | |||
| 1-10 Year Bond ETF | 1 year | Inception(2) | ||
| Net Asset Value | 8.50% | 3.26% | ||
| Market Value | 9.17% | 3.32% | ||
| J.P. Morgan EMBI Global Diversified Liquid | ||||
| 1-10 Year Maturity Index | 8.96% | 3.69% |
| (1) | The J.P. Morgan EMBI Global Diversified Liquid 1-10 Year Maturity Index contains all bonds with at least $1 billion in face amount outstanding in the J.P. Morgan EMBI Global Diversified Index (the “Underlying Index”) that have an average life below 10 years at each month-end rebalance. The Underlying Index is a broad, diverse U.S. dollar-denominated emerging markets debt benchmark that tracks the total return of actively-traded external debt instruments in emerging market countries. |
| (2) | The Fund commenced operations on June 28, 2022. Shares of XEMD were listed on the Cboe BZX, Inc. on June 30, 2022. |
Past performance does not guarantee future results. The performance data quoted represents past performance and current returns may be lower or higher. The investment return and principal will fluctuate so that an investor’s shares, when redeemed, may be worth more or less than the original cost. To obtain performance information current to the most recent month end, please visit https://bondbloxxetf.com/.
Net asset value (“NAV”) returns are based on the dollar value of a single share of the Fund, calculated using the value of the underlying assets of the Fund minus its liabilities, divided by the number of shares outstanding. The NAV is typically calculated at 4:00 pm Eastern time on each business day the NewYork Stock Exchange is open for trading. Market returns are based on the trade price at which shares are bought and sold on the NYSE Arca, Inc. using the last share trade. Market performance does not represent the returns you would receive if you traded shares at other times. Total return reflects reinvestment of distributions on ex-date for NAV returns and payment date for market value returns. The market price of the Fund’s shares may differ significantly from their NAV during periods of market volatility. The referenced indices are shown for informational purposes only and are not meant to represent the Fund. One cannot invest directly in an index.
The Fund’s performance assumes the reinvestment of all dividends and all capital gains. Returns shown do not reflect the deduction of taxes that a shareholder would pay on Fund distributions or the sale of Fund shares.
As stated in the current prospectus, the expense ratio is 0.29%. Please refer to the Financial Highlights herein for the most recent expense ratio information.
17
Fund Performance Overview (Unaudited) (Continued)
U.S. Treasury
The U.S. economy showed remarkable resilience over the 12-month period ending October 31, 2023 in the face of higher interest rates, persistent inflation and numerous external shocks. Economic growth was fueled by steady consumer spending, as the enduring strength of the labor market shored up household confidence. Gross Domestic Product grew at an annualized pace of 5.2% in the third quarter of 2023 - the fastest expansion in close to two years. The U.S. unemployment rate held near historic lows throughout the period. Meanwhile, signs of weakness were evident in areas such as housing, industrial production, and manufacturing.
Inflation pressures in the U.S. eased substantially from the 40-year peak reached in mid-2022, as annual consumer price growth hovered between 3.0% and 4.0% by mid-2023, down from 9.1% at its peak. This favorable trend in consumer price growth during the period enabled the Federal Reserve to slow its interest rate tightening campaign, having kept its policy rate unchanged at three of the last four meetings. This follows an aggressive 525 basis points in total rate increases over the previous 18 months.
After a year of double-digit declines across most asset classes, most fixed income sectors generated positive returns during the 12-month period ending in October 2023, led by higher-income generating sectors such as U.S. high yield and emerging markets. The overall equity market rose over 10%, driven by the technology sector and potential impacts of artificial intelligence, while other equity sectors and small-cap stocks lagged.
Yields on U.S. Treasuries rose during the period from October 31, 2022 to October 21, 2023 as the Federal Reserve raised interest rates in an effort to contain inflation. During the 12-month period, the Fed raised its target policy rate from 3.25% to 5.50%, completing a cumulative +5.25% in rate increases that began in early 2022. While annual inflation came down significantly from a peak of 9.1% in mid-2022 to 3.0% in mid-2023, annual price growth remained above the Fed’s oft-stated 2.0% target, which drove fears of entrenched inflation as well as additional Fed actions.
During the 12-month period, the yield on the benchmark 2-year Treasury rose by +0.60%, from 4.49% to 5.09%. The yield on the benchmark 10-year note rose by +0.88%, from 4.05% to 4.93%.
Shorter-dated Treasury securities earned positive returns during the period, as the income generated by interest payments more than compensated investors for downward security price movement. Meanwhile, returns were negative in longer maturities. For example, the Bloomberg US Treasury One Year Duration Index generated a return of +4.05% while the Bloomberg US Treasury Ten Year Duration Index returned -4.20% over the period.
18
BONDBLOXX ETF TRUST
BondBloxx Bloomberg Six Month Target Duration US Treasury ETF Growth
Fund Performance Overview (Unaudited) (Continued)
The following graph depicts the hypothetical $10,000 investment in the BondBloxx Bloomberg Six Month Target Duration US Treasury ETF (XHLF) at net asset value and market price as compared to the Bloomberg US Treasury 6 Month Duration Index(1) from the Fund’s inception date (September 13, 2022(2)) to October 31, 2023.
BondBloxx Bloomberg Six Month Target Duration US Treasury ETF
Growth of a Hypothetical $10,000 Investment
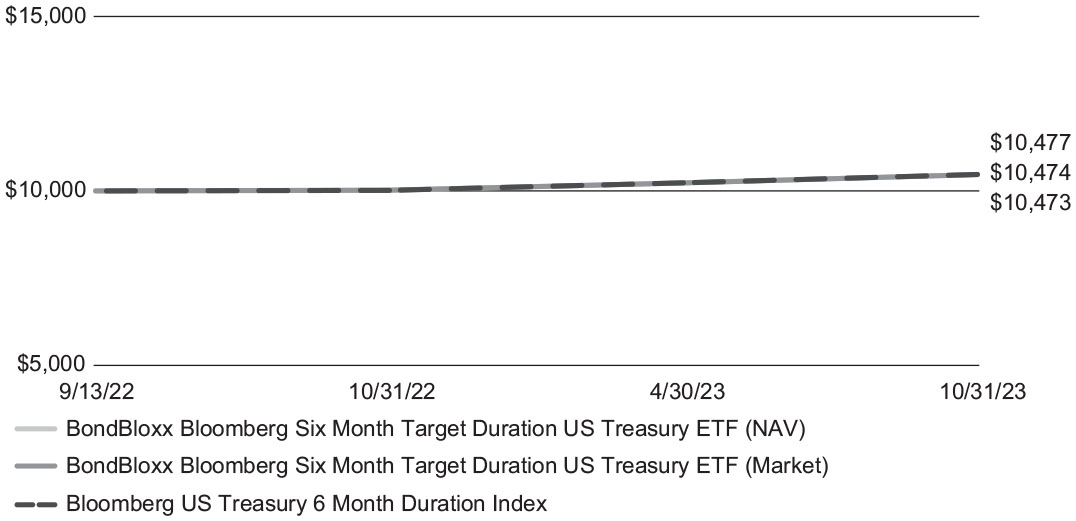
| Average Annual Total Returns as of October 31, 2023 | ||||
| BondBloxx Bloomberg Six Month | Since | |||
| Target Duration US Treasury ETF | 1 year | Inception(2) | ||
| Net Asset Value | 4.55% | 4.17% | ||
| Market Value | 4.50% | 4.19% | ||
| Bloomberg US Treasury 6 Month | ||||
| Duration Index | 4.60% | 4.20% |
| (1) | The Bloomberg US Treasury 6 Month Duration Index is comprised of certain U.S. Treasury notes and bonds that are included in the Bloomberg US Treasury Bill Index (the “Underlying Index”). The Index is constructed using two underlying “duration buckets” of U.S. Treasury notes and bonds included in the Underlying Index that are weighted by market capitalization of their component securities and then blended according to the weighting required to match the 6 month target duration of the Index at the monthly rebalancing date. |
| (2) | The Fund commenced operations on September 13, 2022. Shares of XHLF were listed on the NYSE Arca, Inc. on September 15, 2022. |
Past performance does not guarantee future results. The performance data quoted represents past performance and current returns may be lower or higher. The investment return and principal will fluctuate so that an investor’s shares, when redeemed, may be worth more or less than the original cost. To obtain performance information current to the most recent month end, please visit https://bondbloxxetf.com/.
Net asset value (“NAV”) returns are based on the dollar value of a single share of the Fund, calculated using the value of the underlying assets of the Fund minus its liabilities, divided by the number of shares outstanding. The NAV is typically calculated at 4:00 pm Eastern time on each business day the NewYork Stock Exchange is open for trading. Market returns are based on the trade price at which shares are bought and sold on the NYSE Arca, Inc. using the last share trade. Market performance does not represent the returns you would receive if you traded shares at other times. Total return reflects reinvestment of distributions on ex-date for NAV returns and payment date for market value returns. The market price of the Fund’s shares may differ significantly from their NAV during periods of market volatility. The referenced indices are shown for informational purposes only and are not meant to represent the Fund. One cannot invest directly in an index.
The Fund’s performance assumes the reinvestment of all dividends and all capital gains. Returns shown do not reflect the deduction of taxes that a shareholder would pay on Fund distributions or the sale of Fund shares.
As stated in the current prospectus, the expense ratio is 0.03%. Please refer to the Financial Highlights herein for the most recent expense ratio information.
19
BONDBLOXX ETF TRUST
BondBloxx Bloomberg One Year Target Duration US Treasury ETF Growth
Fund Performance Overview (Unaudited) (Continued)
The following graph depicts the hypothetical $10,000 investment in the BondBloxx Bloomberg One Year Target Duration US Treasury ETF (XONE) at net asset value and market price as compared to the Bloomberg US Treasury 1 Year Duration Index(1) from the Fund’s inception date (September 13, 2022(2)) to October 31, 2023.
BondBloxx Bloomberg OneYear Target Duration US Treasury ETF
Growth of a Hypothetical $10,000 Investment
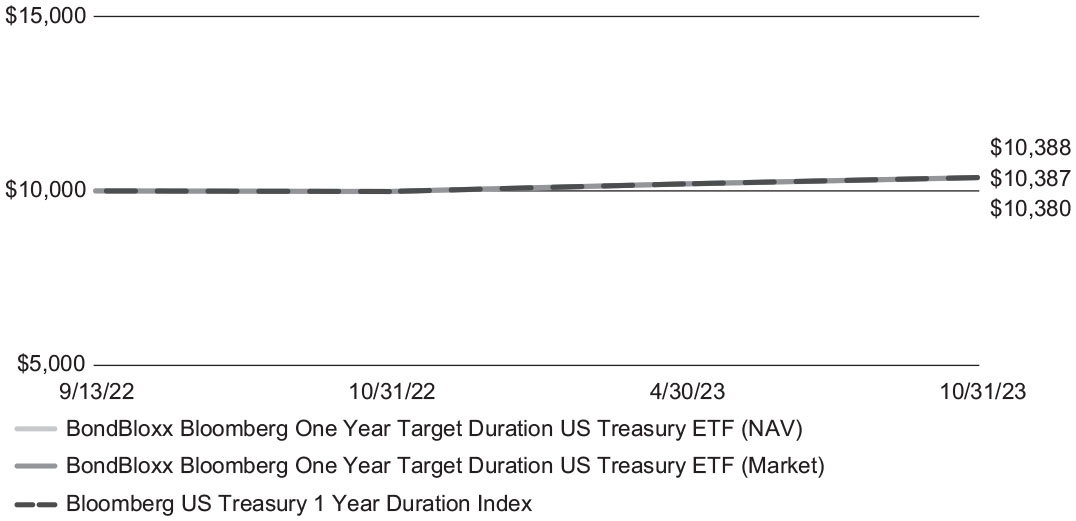
| Average Annual Total Returns as of October 31, 2023 | ||||
| BondBloxx Bloomberg One Year | Since | |||
| Target Duration US Treasury ETF | 1 year | Inception(2) | ||
| Net Asset Value | 4.01% | 3.35% | ||
| Market Value | 4.02% | 3.44% | ||
| Bloomberg US Treasury 1 Year | ||||
| Duration Index | 4.05% | 3.42% |
| (1) | The Bloomberg US Treasury 1 Year Duration Index is comprised of certain U.S. Treasury notes and bonds that are included in the Bloomberg US Short Treasury Index and Bloomberg US Treasury Index (each an “Underlying Index”). The Index is constructed using two underlying “duration buckets” of U.S. Treasury notes and bonds included in the Underlying Index that are weighted by market capitalization of their component securities and then blended according to the weighting required to match the 1 year target duration of the Index at the monthly rebalancing date. |
| (2) | The Fund commenced operations on September 13, 2022. Shares of XONE were listed on the NYSE Arca, Inc. on September 15, 2022. |
Past performance does not guarantee future results. The performance data quoted represents past performance and current returns may be lower or higher. The investment return and principal will fluctuate so that an investor’s shares, when redeemed, may be worth more or less than the original cost. To obtain performance information current to the most recent month end, please visit https://bondbloxxetf.com/.
Net asset value (“NAV”) returns are based on the dollar value of a single share of the Fund, calculated using the value of the underlying assets of the Fund minus its liabilities, divided by the number of shares outstanding. The NAV is typically calculated at 4:00 pm Eastern time on each business day the NewYork Stock Exchange is open for trading. Market returns are based on the trade price at which shares are bought and sold on the NYSE Arca, Inc. using the last share trade. Market performance does not represent the returns you would receive if you traded shares at other times. Total return reflects reinvestment of distributions on ex-date for NAV returns and payment date for market value returns. The market price of the Fund’s shares may differ significantly from their NAV during periods of market volatility. The referenced indices are shown for informational purposes only and are not meant to represent the Fund. One cannot invest directly in an index.
The Fund’s performance assumes the reinvestment of all dividends and all capital gains. Returns shown do not reflect the deduction of taxes that a shareholder would pay on Fund distributions or the sale of Fund shares.
As stated in the current prospectus, the expense ratio is 0.03%. Please refer to the Financial Highlights herein for the most recent expense ratio information.
20
BONDBLOXX ETF TRUST
BondBloxx Bloomberg Two Year Target Duration US Treasury ETF Growth
Fund Performance Overview (Unaudited) (Continued)
The following graph depicts the hypothetical $10,000 investment in the BondBloxx Bloomberg Two Year Target Duration US Treasury ETF (XTWO) at net asset value and market price as compared to the Bloomberg US Treasury 2 Year Duration Index(1) from the Fund’s inception date (September 13, 2022(2)) to October 31, 2023.
BondBloxx Bloomberg TwoYear Target Duration US Treasury ETF
Growth of a Hypothetical $10,000 Investment
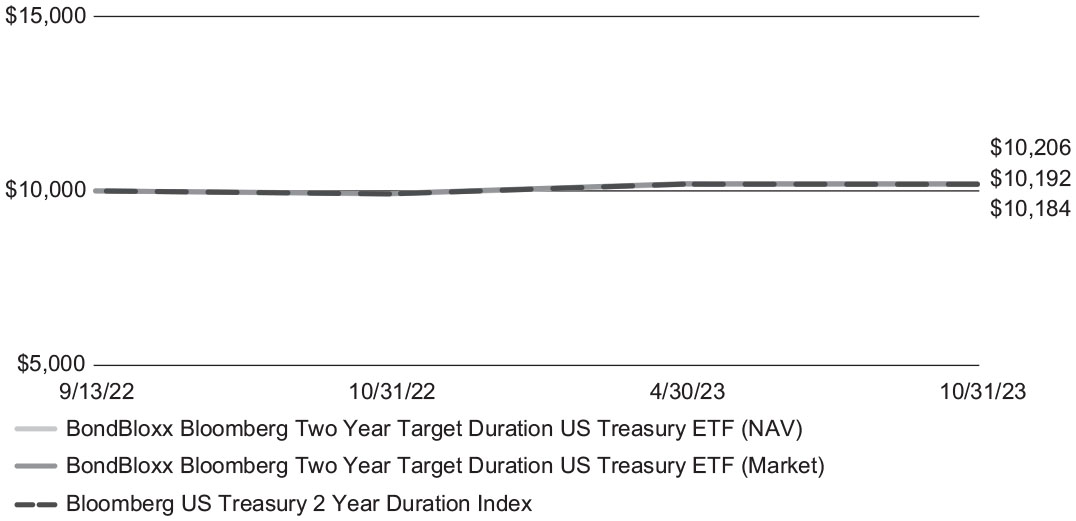
| Average Annual Total Returns as of October 31, 2023 | ||||
| BondBloxx Bloomberg Two Year | Since | |||
| Target Duration US Treasury ETF | 1 year | Inception(2) | ||
| Net Asset Value | 2.76% | 1.62% | ||
| Market Value | 2.82% | 1.83% | ||
| Bloomberg US Treasury 2 Year | ||||
| Duration Index | 2.81% | 1.69% |
| (1) | The Bloomberg US Treasury 2 Year Duration Index is comprised of certain U.S. Treasury notes and bonds that are included in the Bloomberg US Treasury Index (the “Underlying Index”). The Index is constructed using two underlying “duration buckets” of U.S. Treasury notes and bonds included in the Underlying Index that are weighted by market capitalization of their component securities and then blended according to the weighting required to match the 2 year target duration of the Index at the monthly rebalancing date. |
| (2) | The Fund commenced operations on September 13, 2022. Shares of XTWO were listed on the NYSE Arca, Inc. on September 15, 2022. |
Past performance does not guarantee future results. The performance data quoted represents past performance and current returns may be lower or higher. The investment return and principal will fluctuate so that an investor’s shares, when redeemed, may be worth more or less than the original cost. To obtain performance information current to the most recent month end, please visit https://bondbloxxetf.com/.
Net asset value (“NAV”) returns are based on the dollar value of a single share of the Fund, calculated using the value of the underlying assets of the Fund minus its liabilities, divided by the number of shares outstanding. The NAV is typically calculated at 4:00 pm Eastern time on each business day the NewYork Stock Exchange is open for trading. Market returns are based on the trade price at which shares are bought and sold on the NYSE Arca, Inc. using the last share trade. Market performance does not represent the returns you would receive if you traded shares at other times. Total return reflects reinvestment of distributions on ex-date for NAV returns and payment date for market value returns. The market price of the Fund’s shares may differ significantly from their NAV during periods of market volatility. The referenced indices are shown for informational purposes only and are not meant to represent the Fund. One cannot invest directly in an index.
The Fund’s performance assumes the reinvestment of all dividends and all capital gains. Returns shown do not reflect the deduction of taxes that a shareholder would pay on Fund distributions or the sale of Fund shares.
As stated in the current prospectus, the expense ratio is 0.05%. Please refer to the Financial Highlights herein for the most recent expense ratio information.
21
BONDBLOXX ETF TRUST
BondBloxx Bloomberg Three Year Target Duration US Treasury ETF Growth
Fund Performance Overview (Unaudited) (Continued)
The following graph depicts the hypothetical $10,000 investment in the BondBloxx Bloomberg Three Year Target Duration US Treasury ETF (XTRE) at net asset value and market price as compared to the Bloomberg US Treasury 3 Year Duration Index(1) from the Fund’s inception date (September 13, 2022(2)) to October 31, 2023.
BondBloxx Bloomberg ThreeYear Target Duration US Treasury ETF
Growth of a Hypothetical $10,000 Investment
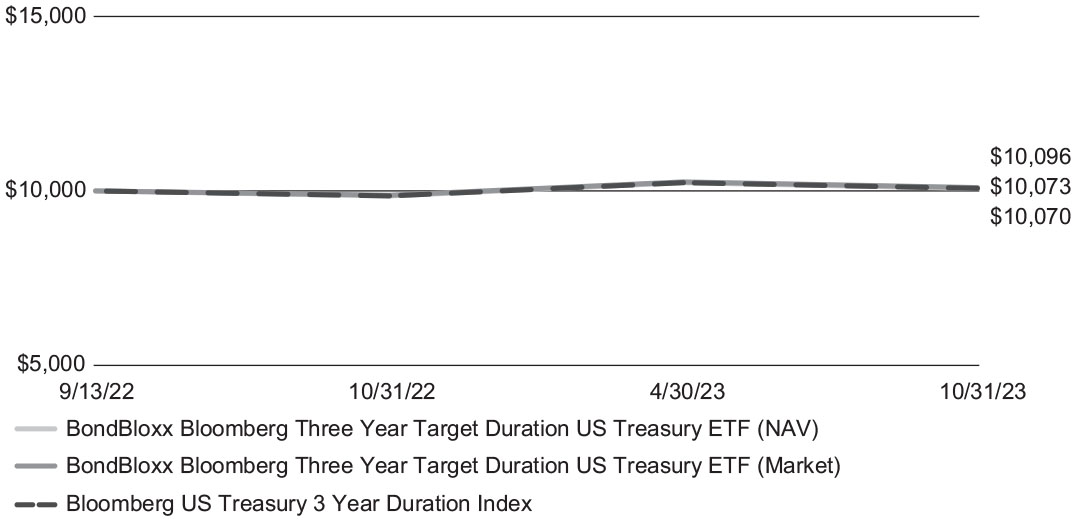
| Average Annual Total Returns as of October 31, 2023 | ||||
| BondBloxx Bloomberg Three Year | Since | |||
| Target Duration US Treasury ETF | 1 year | Inception(2) | ||
| Net Asset Value | 2.18% | 0.62% | ||
| Market Value | 2.24% | 0.86% | ||
| Bloomberg US Treasury 3 Year | ||||
| Duration Index | 2.21% | 0.64% |
| (1) | The Bloomberg US Treasury 3 Year Duration Index is comprised of certain U.S. Treasury notes and bonds that are included in the Bloomberg US Treasury Index (the “Underlying Index”). The Index is constructed using two underlying “duration buckets” of U.S. Treasury notes and bonds included in the Underlying Index that are weighted by market capitalization of their component securities and then blended according to the weighting required to match the 3 year target duration of the Index at the monthly rebalancing date. |
| (2) | The Fund commenced operations on September 13, 2022. Shares of XTRE were listed on the NYSE Arca, Inc. on September 15, 2022. |
Past performance does not guarantee future results. The performance data quoted represents past performance and current returns may be lower or higher. The investment return and principal will fluctuate so that an investor’s shares, when redeemed, may be worth more or less than the original cost. To obtain performance information current to the most recent month end, please visit https://bondbloxxetf.com/.
Net asset value (“NAV”) returns are based on the dollar value of a single share of the Fund, calculated using the value of the underlying assets of the Fund minus its liabilities, divided by the number of shares outstanding. The NAV is typically calculated at 4:00 pm Eastern time on each business day the NewYork Stock Exchange is open for trading. Market returns are based on the trade price at which shares are bought and sold on the NYSE Arca, Inc. using the last share trade. Market performance does not represent the returns you would receive if you traded shares at other times. Total return reflects reinvestment of distributions on ex-date for NAV returns and payment date for market value returns. The market price of the Fund’s shares may differ significantly from their NAV during periods of market volatility. The referenced indices are shown for informational purposes only and are not meant to represent the Fund. One cannot invest directly in an index.
The Fund’s performance assumes the reinvestment of all dividends and all capital gains. Returns shown do not reflect the deduction of taxes that a shareholder would pay on Fund distributions or the sale of Fund shares.
As stated in the current prospectus, the expense ratio is 0.05%. Please refer to the Financial Highlights herein for the most recent expense ratio information.
22
BONDBLOXX ETF TRUST
BondBloxx Bloomberg Five Year Target Duration US Treasury ETF Growth
Fund Performance Overview (Unaudited) (Continued)
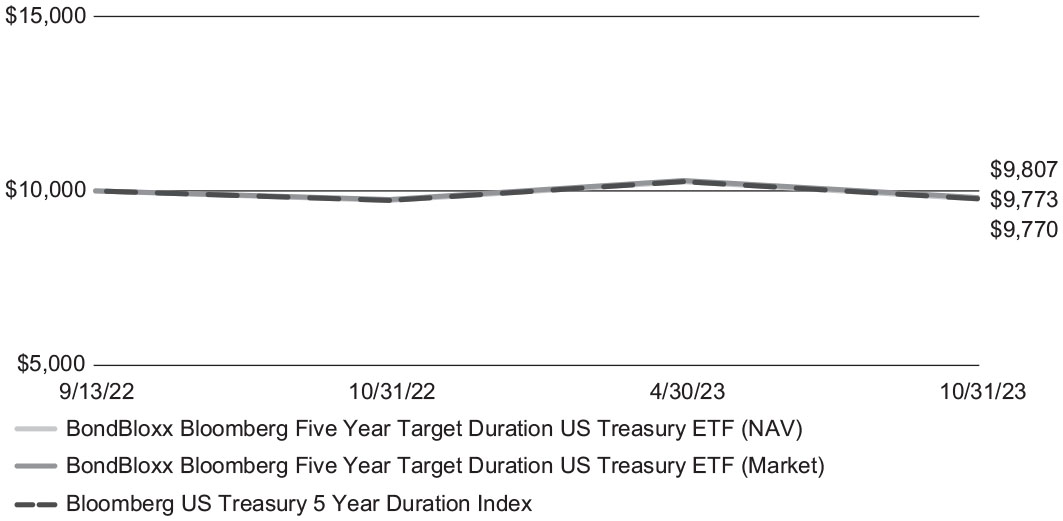
The following graph depicts the hypothetical $10,000 investment in the BondBloxx Bloomberg Five Year Target Duration US Treasury ETF (XFIV) at net asset value and market price as compared to the Bloomberg US Treasury 5Year Duration Index(1) from the Fund’s inception date (September 13, 2022(2)) to October 31, 2023.
BondBloxx Bloomberg FiveYear Target Duration US Treasury ETF
Growth of a Hypothetical $10,000 Investment
| Average Annual Total Returns as of October 31, 2023 | ||||
| BondBloxx Bloomberg Five Year | Since | |||
| Target Duration US Treasury ETF | 1 year | Inception(2) | ||
| Net Asset Value | 0.46% | (2.04)% | ||
| Market Value | 0.59% | (1.71)% | ||
| Bloomberg US Treasury 5 Year | ||||
| Duration Index | 0.49% | (2.01)% |
| (1) | The Bloomberg US Treasury 5 Year Duration Index is comprised of certain U.S. Treasury notes and bonds that are included in the Bloomberg US Treasury Index (the “Underlying Index”). The Index is constructed using two underlying “duration buckets” of U.S. Treasury notes and bonds included in the Underlying Index that are weighted by market capitalization of their component securities and then blended according to the weighting required to match the 5 year target duration of the Index at the monthly rebalancing date. |
| (2) | The Fund commenced operations on September 13, 2022. Shares of XFIV were listed on the NYSE Arca, Inc. on September 15, 2022. |
Past performance does not guarantee future results. The performance data quoted represents past performance and current returns may be lower or higher. The investment return and principal will fluctuate so that an investor’s shares, when redeemed, may be worth more or less than the original cost. To obtain performance information current to the most recent month end, please visit https://bondbloxxetf.com/.
Net asset value (“NAV”) returns are based on the dollar value of a single share of the Fund, calculated using the value of the underlying assets of the Fund minus its liabilities, divided by the number of shares outstanding. The NAV is typically calculated at 4:00 pm Eastern time on each business day the NewYork Stock Exchange is open for trading. Market returns are based on the trade price at which shares are bought and sold on the NYSE Arca, Inc. using the last share trade. Market performance does not represent the returns you would receive if you traded shares at other times. Total return reflects reinvestment of distributions on ex-date for NAV returns and payment date for market value returns. The market price of the Fund’s shares may differ significantly from their NAV during periods of market volatility. The referenced indices are shown for informational purposes only and are not meant to represent the Fund. One cannot invest directly in an index.
The Fund’s performance assumes the reinvestment of all dividends and all capital gains. Returns shown do not reflect the deduction of taxes that a shareholder would pay on Fund distributions or the sale of Fund shares.
As stated in the current prospectus, the expense ratio is 0.05%. Please refer to the Financial Highlights herein for the most recent expense ratio information.
23
BONDBLOXX ETF TRUST
BondBloxx Bloomberg Seven Year Target Duration US Treasury ETF Growth
Fund Performance Overview (Unaudited) (Continued)
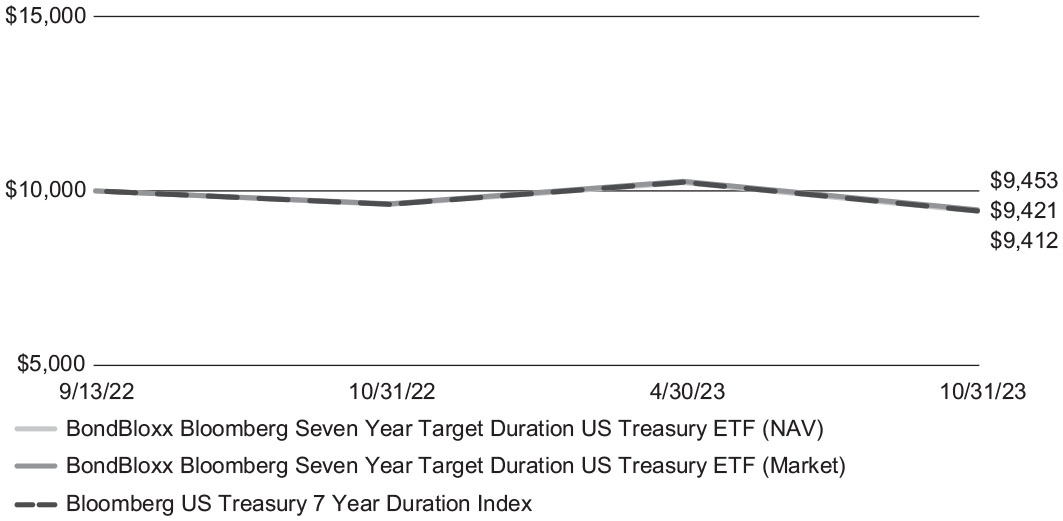
The following graph depicts the hypothetical $10,000 investment in the BondBloxx Bloomberg Seven Year Target Duration US Treasury ETF (XSVN) at net asset value and market price as compared to the Bloomberg US Treasury 7 Year Duration Index(1) from the Fund’s inception date (September 13, 2022(2)) to October 31, 2023.
BondBloxx Bloomberg SevenYear Target Duration US Treasury ETF
Growth of a Hypothetical $10,000 Investment
| Average Annual Total Returns as of October 31, 2023 | ||||
| BondBloxx Bloomberg Seven Year | Since | |||
| Target Duration US Treasury ETF | 1 year | Inception(2) | ||
| Net Asset Value | (2.04)% | (5.22)% | ||
| Market Value | (1.79)% | (4.88)% | ||
| Bloomberg US Treasury 7 Year | ||||
| Duration Index | (1.99)% | (5.14)% |
| (1) | The Bloomberg US Treasury 7 Year Duration Index is comprised of certain U.S. Treasury notes and bonds that are included in the Bloomberg US Treasury Index (the “Underlying Index”). The Index is constructed using two underlying “duration buckets” of U.S. Treasury notes and bonds included in the Underlying Index that are weighted by market capitalization of their component securities and then blended according to the weighting required to match the 7 year target duration of the Index at the monthly rebalancing date. |
| (2) | The Fund commenced operations on September 13, 2022. Shares of XSVN were listed on the NYSE Arca, Inc. on September 15, 2022. |
Past performance does not guarantee future results. The performance data quoted represents past performance and current returns may be lower or higher. The investment return and principal will fluctuate so that an investor’s shares, when redeemed, may be worth more or less than the original cost. To obtain performance information current to the most recent month end, please visit https://bondbloxxetf.com/.
Net asset value (“NAV”) returns are based on the dollar value of a single share of the Fund, calculated using the value of the underlying assets of the Fund minus its liabilities, divided by the number of shares outstanding. The NAV is typically calculated at 4:00 pm Eastern time on each business day the NewYork Stock Exchange is open for trading. Market returns are based on the trade price at which shares are bought and sold on the NYSE Arca, Inc. using the last share trade. Market performance does not represent the returns you would receive if you traded shares at other times. Total return reflects reinvestment of distributions on ex-date for NAV returns and payment date for market value returns. The market price of the Fund’s shares may differ significantly from their NAV during periods of market volatility. The referenced indices are shown for informational purposes only and are not meant to represent the Fund. One cannot invest directly in an index.
The Fund’s performance assumes the reinvestment of all dividends and all capital gains. Returns shown do not reflect the deduction of taxes that a shareholder would pay on Fund distributions or the sale of Fund shares.
As stated in the current prospectus, the expense ratio is 0.05%. Please refer to the Financial Highlights herein for the most recent expense ratio information.
24
BONDBLOXX ETF TRUST
BondBloxx Bloomberg Ten Year Target Duration US Treasury ETF Growth
Fund Performance Overview (Unaudited) (Continued)
The following graph depicts the hypothetical $10,000 investment in the BondBloxx Bloomberg Ten Year Target Duration US Treasury ETF (XTEN) at net asset value and market price as compared to the Bloomberg US Treasury 10 Year Duration Index(1) from the Fund’s inception date (September 13, 2022(2)) to October 31, 2023.
BondBloxx Bloomberg TenYear Target Duration US Treasury ETF
Growth of a Hypothetical $10,000 Investment
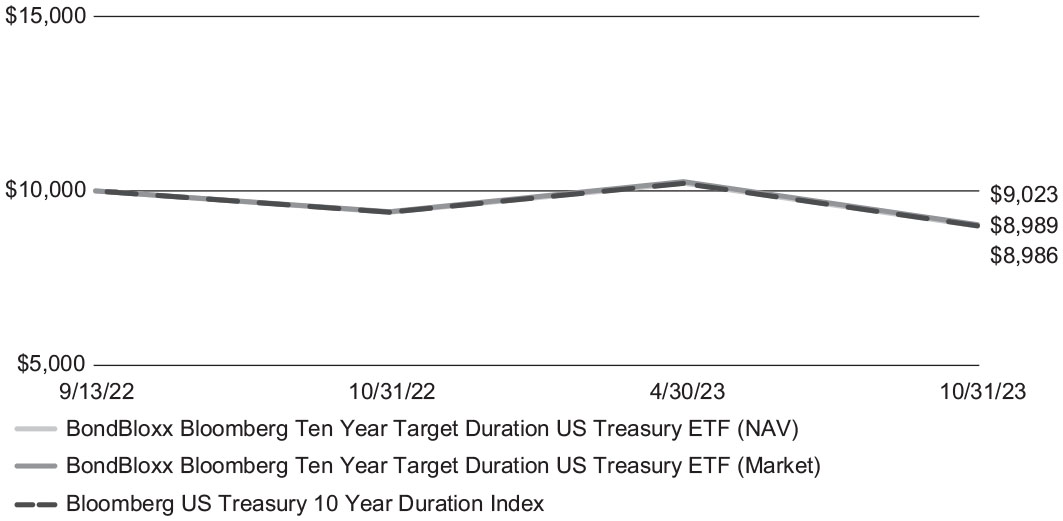
| Average Annual Total Returns as of October 31, 2023 | ||||
| BondBloxx Bloomberg Ten Year | Since | |||
| Target Duration US Treasury ETF | 1 year | Inception(2) | ||
| Net Asset Value | (4.23)% | (9.02)% | ||
| Market Value | (3.98)% | (8.72)% | ||
| Bloomberg US Treasury 10 Year | ||||
| Duration Index | (4.20)% | (8.99)% |
| (1) | The Bloomberg US Treasury 10 Year Duration Index is comprised of certain U.S. Treasury notes and bonds that are included in the Bloomberg USTreasury Index (the “Underlying Index”). The Index is constructed using two underlying “duration buckets” of U.S. Treasury notes and bonds included in the Underlying Index that are weighted by market capitalization of their component securities and then blended according to the weighting required to match the 10 year target duration of the Index at the monthly rebalancing date. |
| (2) | The Fund commenced operations on September 13, 2022. Shares of XTEN were listed on the NYSE Arca, Inc. on September 15, 2022. |
Past performance does not guarantee future results. The performance data quoted represents past performance and current returns may be lower or higher. The investment return and principal will fluctuate so that an investor’s shares, when redeemed, may be worth more or less than the original cost. To obtain performance information current to the most recent month end, please visit https://bondbloxxetf.com/.
Net asset value (“NAV”) returns are based on the dollar value of a single share of the Fund, calculated using the value of the underlying assets of the Fund minus its liabilities, divided by the number of shares outstanding. The NAV is typically calculated at 4:00 pm Eastern time on each business day the NewYork Stock Exchange is open for trading. Market returns are based on the trade price at which shares are bought and sold on the NYSE Arca, Inc. using the last share trade. Market performance does not represent the returns you would receive if you traded shares at other times. Total return reflects reinvestment of distributions on ex-date for NAV returns and payment date for market value returns. The market price of the Fund’s shares may differ significantly from their NAV during periods of market volatility. The referenced indices are shown for informational purposes only and are not meant to represent the Fund. One cannot invest directly in an index.
The Fund’s performance assumes the reinvestment of all dividends and all capital gains. Returns shown do not reflect the deduction of taxes that a shareholder would pay on Fund distributions or the sale of Fund shares.
As stated in the current prospectus, the expense ratio is 0.075%. Please refer to the Financial Highlights herein for the most recent expense ratio information.
25
BONDBLOXX ETF TRUST
BondBloxx Bloomberg Twenty Year Target Duration US Treasury ETF Growth
Fund Performance Overview (Unaudited) (Continued)
The following graph depicts the hypothetical $10,000 investment in the BondBloxx Bloomberg Twenty Year Target Duration US Treasury ETF (XTWY) at net asset value and market price as compared to the Bloomberg US Treasury 20 Year Duration Index(1) from the Fund’s inception date (September 13, 2022(2)) to October 31, 2023.
BondBloxx Bloomberg TwentyYear Target Duration US Treasury ETF
Growth of a Hypothetical $10,000 Investment
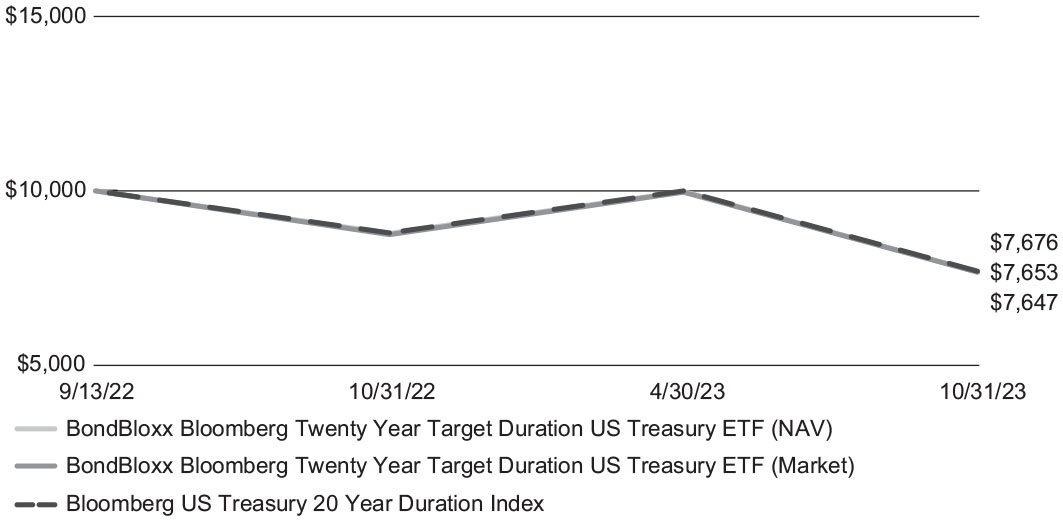
| Average Annual Total Returns as of October 31, 2023 | ||||
| BondBloxx Bloomberg Twenty Year | Since | |||
| Target Duration US Treasury ETF | 1 year | Inception(2) | ||
| Net Asset Value | (12.73)% | (21.06)% | ||
| Market Value | (12.45)% | (21.20)% | ||
| Bloomberg US Treasury 20 Year | ||||
| Duration Index | (12.60)% | (20.84)% |
| (1) | The Bloomberg US Treasury 20 Year Duration Index is comprised of certain U.S. Treasury notes and bonds that are included in the Bloomberg USTreasury Index (the “Underlying Index”). The Index is constructed using two underlying “duration buckets” of U.S. Treasury notes and bonds included in the Underlying Index that are weighted by market capitalization of their component securities and then blended according to the weighting required to match the 20 year target duration of the Index at the monthly rebalancing date. |
| (2) | The Fund commenced operations on September 13, 2022. Shares of XTWY were listed on the NYSE Arca, Inc. on September 15, 2022. |
Past performance does not guarantee future results. The performance data quoted represents past performance and current returns may be lower or higher. The investment return and principal will fluctuate so that an investor’s shares, when redeemed, may be worth more or less than the original cost. To obtain performance information current to the most recent month end, please visit https://bondbloxxetf.com/.
Net asset value (“NAV”) returns are based on the dollar value of a single share of the Fund, calculated using the value of the underlying assets of the Fund minus its liabilities, divided by the number of shares outstanding. The NAV is typically calculated at 4:00 pm Eastern time on each business day the NewYork Stock Exchange is open for trading. Market returns are based on the trade price at which shares are bought and sold on the NYSE Arca, Inc. using the last share trade. Market performance does not represent the returns you would receive if you traded shares at other times. Total return reflects reinvestment of distributions on ex-date for NAV returns and payment date for market value returns. The market price of the Fund’s shares may differ significantly from their NAV during periods of market volatility. The referenced indices are shown for informational purposes only and are not meant to represent the Fund. One cannot invest directly in an index.
The Fund’s performance assumes the reinvestment of all dividends and all capital gains. Returns shown do not reflect the deduction of taxes that a shareholder would pay on Fund distributions or the sale of Fund shares.
As stated in the current prospectus, the expense ratio is 0.125%. Please refer to the Financial Highlights herein for the most recent expense ratio information.
26
Fund Expense Examples (Unaudited)
As a shareholder, you incur two types of costs: (1) transaction costs for purchasing and selling shares; and (2) ongoing costs, including management fees and other Fund expenses. The following examples are intended to help you understand your ongoing costs (in dollars) of investing in the Fund and to compare these costs with the ongoing costs of investing in other funds. This example is intended to help you compare the cost of owning shares of the Fund with the cost of investing in other funds. The example assumes that you invest $1,000 in the Fund at the beginning of the period (May 1, 2023) or on date of Fund’s commencement of investment operations and held for the entire period until October 31, 2023. The example also assumes that your investment has a 5% return each year and that the Fund’s operating expenses remain the same.
Actual Expenses
The first line under each Fund in the tables below provides information about actual account values and actual expenses. You may use the information, together with the amount you invested, to estimate the expenses that you paid over the period. Simply divide your account value by $1,000 (for example, an $8,600 account value divided by $1,000 = 8.6), then multiply the result by the number in the first line under the heading entitled “Expenses paid during period” to estimate the expenses you paid on your account during this period.
Hypothetical Example for Comparison Purposes
The second line under each Fund in the tables below provides information about hypothetical account values and hypothetical expenses based on each Fund’s actual expense ratio and an assumed rate of return of 5% per year before expenses, which is not the Fund’s actual return. The hypothetical account values and expenses may not be used to estimate the actual ending account balance or expenses you paid for the period. You may use this information to compare the ongoing costs of investing in the Fund with other funds. To do so, compare this 5% hypothetical example with the 5% hypothetical examples that appear in the shareholder reports of the other funds.
Please note that the expenses shown in the table are meant to highlight your ongoing costs only and do not reflect any transactional costs, such as brokerage commissions paid on purchases and sales of Fund shares. Therefore, the second line under the Fund in the table is useful in comparing ongoing Fund costs only and will not help you determine the relative total costs of owning different funds. In addition, if these transactional costs were included, your costs would have been higher.
| Beginning Account Value | Ending Account Value | Annualized Expense Ratios for the Period | Expenses Paid During the Period(1) | ||||||||||||
| Fund | 5/1/2023 | 10/31/2023 | 10/31/2023 | 10/31/2023 | |||||||||||
| BondBloxx USD High Yield Bond | |||||||||||||||
| Industrial Sector ETF | |||||||||||||||
| Actual Expenses | $ | 1,000.00 | $ | 987.65 | 0.35% | $ | 1.75 | ||||||||
| Hypothetical (5% return before expenses) | $ | 1,000.00 | $ | 1,023.44 | 0.35% | $ | 1.79 | ||||||||
| BondBloxx USD High Yield Bond | |||||||||||||||
| Telecom, Media & Technology Sector ETF | |||||||||||||||
| Actual Expenses | $ | 1,000.00 | $ | 1,000.54 | 0.35% | $ | 1.76 | ||||||||
| Hypothetical (5% return before expenses) | $ | 1,000.00 | $ | 1,023.44 | 0.35% | $ | 1.79 | ||||||||
| BondBloxx USD High Yield Bond | |||||||||||||||
| Healthcare Sector ETF | |||||||||||||||
| Actual Expenses | $ | 1,000.00 | $ | 964.00 | 0.35% | $ | 1.73 | ||||||||
| Hypothetical (5% return before expenses) | $ | 1,000.00 | $ | 1,023.44 | 0.35% | $ | 1.79 | ||||||||
27
BONDBLOXX ETF TRUST
Fund Expense Examples (Unaudited) (Continued)
| �� | Beginning Account Value | Ending Account Value | Annualized Expense Ratios for the Period | Expenses Paid During the Period(1) | |||||||||||
| Fund | 5/1/2023 | 10/31/2023 | 10/31/2023 | 10/31/2023 | |||||||||||
| BondBloxx USD High Yield Bond | |||||||||||||||
| Financial & REIT Sector ETF | |||||||||||||||
| Actual Expenses | $ | 1,000.00 | $ | 1,004.65 | 0.35% | $ | 1.77 | ||||||||
| Hypothetical (5% return before expenses) | $ | 1,000.00 | $ | 1,023.44 | 0.35% | $ | 1.79 | ||||||||
| BondBloxx USD High Yield Bond | |||||||||||||||
| Energy Sector ETF | |||||||||||||||
| Actual Expenses | $ | 1,000.00 | $ | 1,012.88 | 0.35% | $ | 1.78 | ||||||||
| Hypothetical (5% return before expenses) | $ | 1,000.00 | $ | 1,023.44 | 0.35% | $ | 1.79 | ||||||||
| BondBloxx USD High Yield Bond | |||||||||||||||
| Consumer Cyclicals Sector ETF | |||||||||||||||
| Actual Expenses | $ | 1,000.00 | $ | 1,013.54 | 0.35% | $ | 1.78 | ||||||||
| Hypothetical (5% return before expenses) | $ | 1,000.00 | $ | 1,023.44 | 0.35% | $ | 1.79 | ||||||||
| BondBloxx USD High Yield Bond | |||||||||||||||
| Consumer Non-Cyclicals Sector ETF | |||||||||||||||
| Actual Expenses | $ | 1,000.00 | $ | 985.89 | 0.35% | $ | 1.75 | ||||||||
| Hypothetical (5% return before expenses) | $ | 1,000.00 | $ | 1,023.44 | 0.35% | $ | 1.79 | ||||||||
| Fund | Beginning Account Value 7/1/2023(2) | Ending Account Value 10/31/2023 | Annualized Expense Ratios for the Period 10/31/2023 | Expenses Paid During the Period(3) 10/31/2023 | |||||||||||
| BondBloxx USD High Yield Bond | |||||||||||||||
| Sector Rotation ETF(4) | |||||||||||||||
| Actual Expenses | $ | 1,000.00 | $ | 988.64 | 0.41% | $ | 1.37 | ||||||||
| Hypothetical (5% return before expenses) | $ | 1,000.00 | $ | 1,023.14 | 0.41% | $ | 2.09 | ||||||||
| Fund | Beginning Account Value 5/1/2023 | Ending Account Value 10/31/2023 | Annualized Expense Ratios for the Period 10/31/2023 | Expenses Paid During the Period(1) 10/31/2023 | |||||||||||
| BondBloxx B Rated USD High Yield | |||||||||||||||
| Corporate Bond ETF | |||||||||||||||
| Actual Expenses | $ | 1,000.00 | $ | 1,002.02 | 0.30% | $ | 1.51 | ||||||||
| Hypothetical (5% return before expenses) | $ | 1,000.00 | $ | 1,023.69 | 0.30% | $ | 1.53 | ||||||||
| BondBloxx BB Rated USD High Yield | |||||||||||||||
| Corporate Bond ETF | |||||||||||||||
| Actual Expenses | $ | 1,000.00 | $ | 988.51 | 0.20% | $ | 1.00 | ||||||||
| Hypothetical (5% return before expenses) | $ | 1,000.00 | $ | 1,024.20 | 0.20% | $ | 1.02 | ||||||||
| BondBloxx CCC Rated USD High Yield | |||||||||||||||
| Corporate Bond ETF | |||||||||||||||
| Actual Expenses | $ | 1,000.00 | $ | 1,010.65 | 0.40% | $ | 2.03 | ||||||||
| Hypothetical (5% return before expenses) | $ | 1,000.00 | $ | 1,023.19 | 0.40% | $ | 2.04 | ||||||||
| BondBloxx JP Morgan USD Emerging Markets | |||||||||||||||
| 1-10 Year Bond ETF | |||||||||||||||
| Actual Expenses | $ | 1,000.00 | $ | 1,010.39 | 0.29% | $ | 1.47 | ||||||||
| Hypothetical (5% return before expenses) | $ | 1,000.00 | $ | 1,023.74 | 0.29% | $ | 1.48 | ||||||||
| BondBloxx Bloomberg Six Month | |||||||||||||||
| Target Duration US Treasury ETF | |||||||||||||||
| Actual Expenses | $ | 1,000.00 | $ | 1,023.47 | 0.03% | $ | 0.15 | ||||||||
| Hypothetical (5% return before expenses) | $ | 1,000.00 | $ | 1,025.05 | 0.03% | $ | 0.15 | ||||||||
28
BONDBLOXX ETF TRUST
Fund Expense Examples (Unaudited) (Continued)
| Fund | Beginning Account Value 5/1/2023 | Ending Account Value 10/31/2023 | Annualized Expense Ratios for the Period 10/31/2023 | Expenses Paid During the Period(1) 10/31/2023 | |||||||||||
| BondBloxx Bloomberg One Year | |||||||||||||||
| Target Duration US Treasury ETF | |||||||||||||||
| Actual Expenses | $ | 1,000.00 | $ | 1,017.91 | 0.03% | $ | 0.15 | ||||||||
| Hypothetical (5% return before expenses) | $ | 1,000.00 | $ | 1,025.05 | 0.03% | $ | 0.15 | ||||||||
| BondBloxx Bloomberg Two Year | |||||||||||||||
| Target Duration US Treasury ETF | |||||||||||||||
| Actual Expenses | $ | 1,000.00 | $ | 999.41 | 0.05% | $ | 0.25 | ||||||||
| Hypothetical (5% return before expenses) | $ | 1,000.00 | $ | 1,024.95 | 0.05% | $ | 0.26 | ||||||||
| BondBloxx Bloomberg Three Year | |||||||||||||||
| Target Duration US Treasury ETF | |||||||||||||||
| Actual Expenses | $ | 1,000.00 | $ | 983.56 | 0.05% | $ | 0.25 | ||||||||
| Hypothetical (5% return before expenses) | $ | 1,000.00 | $ | 1,024.95 | 0.05% | $ | 0.26 | ||||||||
| BondBloxx Bloomberg Five Year | |||||||||||||||
| Target Duration US Treasury ETF | |||||||||||||||
| Actual Expenses | $ | 1,000.00 | $ | 951.52 | 0.05% | $ | 0.25 | ||||||||
| Hypothetical (5% return before expenses) | $ | 1,000.00 | $ | 1,024.95 | 0.05% | $ | 0.26 | ||||||||
| BondBloxx Bloomberg Seven Year | |||||||||||||||
| Target Duration US Treasury ETF | |||||||||||||||
| Actual Expenses | $ | 1,000.00 | $ | 918.83 | 0.05% | $ | 0.24 | ||||||||
| Hypothetical (5% return before expenses) | $ | 1,000.00 | $ | 1,024.95 | 0.05% | $ | 0.26 | ||||||||
| BondBloxx Bloomberg Ten Year | |||||||||||||||
| Target Duration US Treasury ETF | |||||||||||||||
| Actual Expenses | $ | 1,000.00 | $ | 878.83 | 0.075% | $ | 0.36 | ||||||||
| Hypothetical (5% return before expenses) | $ | 1,000.00 | $ | 1,024.83 | 0.075% | $ | 0.38 | ||||||||
| BondBloxx Bloomberg Twenty Year | |||||||||||||||
| Target Duration US Treasury ETF | |||||||||||||||
| Actual Expenses | $ | 1,000.00 | $ | 766.67 | 0.125% | $ | 0.56 | ||||||||
| Hypothetical (5% return before expenses) | $ | 1,000.00 | $ | 1,024.58 | 0.125% | $ | 0.64 | ||||||||
| (1) | Expenses are equal to the Fund’s annualized expense ratio, multiplied by the average account value over the period, multiplied by the 184 days in the period, then divided by 365. |
| (2) | Fiscal year end changed from June 30, 2023 to October 31, 2023. |
| (3) | Expenses are equal to the Fund’s annualized expense ratio, multiplied by the average account value over the period, multiplied by the 54 days in the period, then divided by 365. |
| (4) | The Fund acquired the assets and liabilities of the Predecessor ETF, a series of the NexPoint Funds I, at the close of business on September 15, 2023. As a result of the reorganization, the Fund is the accounting successor of the Predecessor ETF. Financial information above for the periods prior to September 16, 2023, reflect the performance of the Predecessor ETF. Prior to September 16, 2023, the Predecessor Fund had a different investment adviser, had a different investment objective and policies, and was a passively-managed fund that sought to track the performance of the Markit iBoxx USD Liquid Leveraged Loan Index. |
29
BondBloxx USD High Yield Bond Industrial Sector ETF
Portfolio of Investments
October 31, 2023
| Face | ||||||||||||||
| Rate (%) | Maturity | Amount | Value | |||||||||||
| CORPORATE BONDS – 97.8% | ||||||||||||||
| ADVERTISING – 0.1% | ||||||||||||||
| Summer BC Bidco B LLC(1) | 5.50 | 10/31/26 | $ | 63,000 | $ | 54,917 | ||||||||
| AEROSPACE/DEFENSE – 9.1% | ||||||||||||||
| Bombardier, Inc.(1) | 6.00 | 02/15/28 | 115,000 | 101,876 | ||||||||||
| Bombardier, Inc.(1) | 7.13 | 06/15/26 | 182,000 | 175,340 | ||||||||||
| Bombardier, Inc.(1) | 7.45 | 05/01/34 | 79,000 | 88,677 | ||||||||||
| Bombardier, Inc.(1) | 7.50 | 03/15/25 | 54,000 | 53,997 | ||||||||||
| Bombardier, Inc.(1) | 7.50 | 02/01/29 | 115,000 | 106,640 | ||||||||||
| Bombardier, Inc.(1) | 7.88 | 04/15/27 | 285,000 | 274,554 | ||||||||||
| Moog, Inc.(1) | 4.25 | 12/15/27 | 74,000 | 65,964 | ||||||||||
| Rolls-Royce PLC(1) | 3.63 | 10/14/25 | 147,000 | 137,931 | ||||||||||
| Rolls-Royce PLC(1) | 5.75 | 10/15/27 | 157,000 | 148,963 | ||||||||||
| Spirit AeroSystems, Inc. | 3.85 | 06/15/26 | 50,000 | 46,248 | ||||||||||
| Spirit AeroSystems, Inc. | 4.60 | 06/15/28 | 120,000 | 95,052 | ||||||||||
| Spirit AeroSystems, Inc.(1) | 7.50 | 04/15/25 | 180,000 | 179,758 | ||||||||||
| Spirit AeroSystems, Inc.(1) | 9.38 | 11/30/29 | 126,000 | 129,551 | ||||||||||
| TransDigm, Inc. | 4.63 | 01/15/29 | 179,000 | 154,543 | ||||||||||
| TransDigm, Inc. | 4.88 | 05/01/29 | 115,000 | 99,778 | ||||||||||
| TransDigm, Inc. | 5.50 | 11/15/27 | 402,000 | 374,650 | ||||||||||
| TransDigm, Inc.(1) | 6.25 | 03/15/26 | 660,000 | 645,417 | ||||||||||
| TransDigm, Inc.(1) | 6.75 | 08/15/28 | 320,000 | 311,115 | ||||||||||
| TransDigm, Inc.(1) | 6.88 | 12/15/30 | 220,000 | 212,637 | ||||||||||
| TransDigm, Inc. | 7.50 | 03/15/27 | 85,000 | 84,983 | ||||||||||
| Triumph Group, Inc. | 7.75 | 08/15/25 | 68,000 | 64,668 | ||||||||||
| Triumph Group, Inc.(1) | 9.00 | 03/15/28 | 180,000 | 175,048 | ||||||||||
| 3,727,390 | ||||||||||||||
| AIRLINES – 7.1% | ||||||||||||||
| Air Canada(1) | 3.88 | 08/15/26 | 183,000 | 166,685 | ||||||||||
| Allegiant Travel Co.(1) | 7.25 | 08/15/27 | 85,000 | 77,012 | ||||||||||
| American Airlines Group, Inc.(1) | 3.75 | 03/01/25 | 82,000 | 76,583 | ||||||||||
| American Airlines, Inc.(1) | 7.25 | 02/15/28 | 110,000 | 102,413 | ||||||||||
| American Airlines, Inc.(1) | 11.75 | 07/15/25 | 297,000 | 315,045 | ||||||||||
| American Airlines, Inc./AAdvantage Loyalty IP Ltd.(1) | 5.50 | 04/20/26 | 435,833 | 424,255 | ||||||||||
| American Airlines, Inc./AAdvantage Loyalty IP Ltd.(1) | 5.75 | 04/20/29 | 455,000 | 410,879 | ||||||||||
| Delta Air Lines, Inc. | 3.75 | 10/28/29 | 74,000 | 62,993 | ||||||||||
| Delta Air Lines, Inc. | 4.38 | 04/19/28 | 64,000 | 58,853 | ||||||||||
| Delta Air Lines, Inc. | 7.38 | 01/15/26 | 120,000 | 121,318 | ||||||||||
| Hawaiian Brand Intellectual Property Ltd./HawaiianMiles Loyalty Ltd.(1) | 5.75 | 01/20/26 | 183,000 | 135,429 | ||||||||||
| Spirit Loyalty Cayman Ltd./Spirit IP Cayman Ltd.(1) | 8.00 | 09/20/25 | 78,000 | 57,633 | ||||||||||
| Spirit Loyalty Cayman Ltd./Spirit IP Cayman Ltd.(1) | 8.00 | 09/20/25 | 90,000 | 66,499 | ||||||||||
| United Airlines Holdings, Inc. | 4.88 | 01/15/25 | 48,000 | 46,568 | ||||||||||
| United Airlines, Inc.(1) | 4.38 | 04/15/26 | 303,000 | 281,369 | ||||||||||
| United Airlines, Inc.(1) | 4.63 | 04/15/29 | 309,000 | 261,291 | ||||||||||
| VistaJet Malta Finance PLC/Vista Management Holding, Inc.(1) | 6.38 | 02/01/30 | 145,000 | 96,855 | ||||||||||
| VistaJet Malta Finance PLC/Vista Management Holding, Inc.(1) | 7.88 | 05/01/27 | 80,000 | 61,613 | ||||||||||
| VistaJet Malta Finance PLC/Vista Management Holding, Inc.(1) | 9.50 | 06/01/28 | 75,000 | 57,544 | ||||||||||
| 2,880,837 | ||||||||||||||
The accompanying notes are an integral part of these financial statements.
30
BONDBLOXX ETF TRUST
BondBloxx USD High Yield Bond Industrial Sector ETF
Portfolio of Investments (Continued)
October 31, 2023
| Face | ||||||||||||||
| Rate (%) | Maturity | Amount | Value | |||||||||||
| AUTO MANUFACTURERS – 0.5% | ||||||||||||||
| JB Poindexter & Co., Inc.(1) | 7.13 | 04/15/26 | $ | 85,000 | $ | 81,126 | ||||||||
| PM General Purchaser LLC(1) | 9.50 | 10/01/28 | 89,000 | 83,747 | ||||||||||
| Wabash National Corp.(1) | 4.50 | 10/15/28 | 60,000 | 49,725 | ||||||||||
| 214,598 | ||||||||||||||
| AUTO PARTS & EQUIPMENT – 0.3% | ||||||||||||||
| Dornoch Debt Merger Sub, Inc.(1) | 6.63 | 10/15/29 | 99,000 | 77,990 | ||||||||||
| Titan International, Inc. | 7.00 | 04/30/28 | 60,000 | 54,883 | ||||||||||
| 132,873 | ||||||||||||||
| BUILDING MATERIALS – 6.6% | ||||||||||||||
| AmeriTex Hold Co. Intermediate LLC(1) | 10.25 | 10/15/28 | 80,000 | 75,740 | ||||||||||
| Boise Cascade Co.(1) | 4.88 | 07/01/30 | 60,000 | 51,682 | ||||||||||
| Builders FirstSource, Inc.(1) | 4.25 | 02/01/32 | 198,000 | 157,816 | ||||||||||
| Builders FirstSource, Inc.(1) | 5.00 | 03/01/30 | 82,000 | 71,651 | ||||||||||
| Builders FirstSource, Inc.(1) | 6.38 | 06/15/32 | 106,000 | 97,156 | ||||||||||
| Camelot Return Merger Sub, Inc.(1) | 8.75 | 08/01/28 | 105,000 | 98,148 | ||||||||||
| Cornerstone Building Brands, Inc.(1) | 6.13 | 01/15/29 | 52,000 | 38,066 | ||||||||||
| CP Atlas Buyer, Inc.(1) | 7.00 | 12/01/28 | 78,000 | 59,531 | ||||||||||
| Eco Material Technologies, Inc.(1) | 7.88 | 01/31/27 | 79,000 | 74,889 | ||||||||||
| Emerald Debt Merger Sub LLC(1) | 6.63 | 12/15/30 | 345,000 | 328,613 | ||||||||||
| Griffon Corp. | 5.75 | 03/01/28 | 146,000 | 131,991 | ||||||||||
| James Hardie International Finance DAC(1) | 5.00 | 01/15/28 | 60,000 | 55,446 | ||||||||||
| JELD-WEN, Inc.(1) | 4.88 | 12/15/27 | 60,000 | 50,920 | ||||||||||
| Knife River Corp.(1) | 7.75 | 05/01/31 | 65,000 | 64,857 | ||||||||||
| Louisiana-Pacific Corp.(1) | 3.63 | 03/15/29 | 52,000 | 42,898 | ||||||||||
| Masonite International Corp.(1) | 3.50 | 02/15/30 | 50,000 | 39,650 | ||||||||||
| Masonite International Corp.(1) | 5.38 | 02/01/28 | 80,000 | 73,764 | ||||||||||
| MIWD Holdco II LLC/MIWD Finance Corp.(1) | 5.50 | 02/01/30 | 78,000 | 61,987 | ||||||||||
| New Enterprise Stone & Lime Co., Inc.(1) | 5.25 | 07/15/28 | 87,000 | 76,877 | ||||||||||
| Oscar Acquisition Co. LLC/Oscar Finance, Inc.(1) | 9.50 | 04/15/30 | 90,000 | 79,490 | ||||||||||
| PGT Innovations, Inc.(1) | 4.38 | 10/01/29 | 89,000 | 83,171 | ||||||||||
| Smyrna Ready Mix Concrete LLC(1) | 6.00 | 11/01/28 | 167,000 | 154,563 | ||||||||||
| Standard Industries, Inc./NJ(1) | 3.38 | 01/15/31 | 162,000 | 122,780 | ||||||||||
| Standard Industries, Inc./NJ(1) | 4.38 | 07/15/30 | 245,000 | 200,406 | ||||||||||
| Standard Industries, Inc./NJ(1) | 4.75 | 01/15/28 | 153,000 | 137,097 | ||||||||||
| Standard Industries, Inc./NJ(1) | 5.00 | 02/15/27 | 130,000 | 120,307 | ||||||||||
| Summit Materials LLC/Summit Materials Finance Corp.(1) | 5.25 | 01/15/29 | 102,000 | 92,461 | ||||||||||
| Summit Materials LLC/Summit Materials Finance Corp.(1) | 6.50 | 03/15/27 | 50,000 | 48,733 | ||||||||||
| 2,690,690 | ||||||||||||||
| CHEMICALS – 9.9% | ||||||||||||||
| Ashland, Inc.(1) | 3.38 | 09/01/31 | 67,000 | 51,449 | ||||||||||
| Ashland, Inc. | 6.88 | 05/15/43 | 45,000 | 42,488 | ||||||||||
| ASP Unifrax Holdings, Inc.(1) | 5.25 | 09/30/28 | 120,000 | 81,193 | ||||||||||
| ASP Unifrax Holdings, Inc.(1) | 7.50 | 09/30/29 | 63,000 | 33,773 | ||||||||||
| Avient Corp.(1) | 5.75 | 05/15/25 | 100,000 | 98,087 | ||||||||||
| Avient Corp.(1) | 7.13 | 08/01/30 | 110,000 | 105,948 | ||||||||||
| Axalta Coating Systems LLC(1) | 3.38 | 02/15/29 | 107,000 | 88,042 | ||||||||||
| Axalta Coating Systems LLC/Axalta Coating Systems Dutch Holding B BV(1) | 4.75 | 06/15/27 | 75,000 | 69,138 | ||||||||||
| Chemours Co.(1) | 4.63 | 11/15/29 | 95,000 | 73,474 | ||||||||||
The accompanying notes are an integral part of these financial statements.
31
BONDBLOXX ETF TRUST
BondBloxx USD High Yield Bond Industrial Sector ETF
Portfolio of Investments (Continued)
October 31, 2023
| Face | ||||||||||||||
| Rate (%) | Maturity | Amount | Value | |||||||||||
| CHEMICALS – 9.9% (Continued) | ||||||||||||||
| Chemours Co. | 5.38 | 05/15/27 | $ | 73,000 | $ | 66,021 | ||||||||
| Chemours Co.(1) | 5.75 | 11/15/28 | 120,000 | 101,599 | ||||||||||
| CVR Partners LP/CVR Nitrogen Finance Corp.(1) | 6.13 | 06/15/28 | 85,000 | 75,092 | ||||||||||
| Element Solutions, Inc.(1) | 3.88 | 09/01/28 | 120,000 | 102,240 | ||||||||||
| GPD Cos, Inc.(1) | 10.13 | 04/01/26 | 75,000 | 67,632 | ||||||||||
| HB Fuller Co. | 4.00 | 02/15/27 | 40,000 | 36,154 | ||||||||||
| HB Fuller Co. | 4.25 | 10/15/28 | 50,000 | 43,377 | ||||||||||
| Herens Holdco Sarl(1) | 4.75 | 05/15/28 | 55,000 | 42,654 | ||||||||||
| Illuminate Buyer LLC/Illuminate Holdings IV, Inc.(1) | 9.00 | 07/01/28 | 68,000 | 63,604 | ||||||||||
| INEOS Finance PLC(1) | 6.75 | 05/15/28 | 65,000 | 60,771 | ||||||||||
| INEOS Quattro Finance 2 PLC(1) | 3.38 | 01/15/26 | 75,000 | 71,705 | ||||||||||
| Ingevity Corp.(1) | 3.88 | 11/01/28 | 85,000 | 69,085 | ||||||||||
| Innophos Holdings, Inc.(1) | 9.38 | 02/15/28 | 45,000 | 42,490 | ||||||||||
| Iris Holding, Inc.(1) | 10.00 | 12/15/28 | 60,000 | 43,843 | ||||||||||
| LSF11 A5 Hold Co. LLC(1) | 6.63 | 10/15/29 | 52,000 | 42,233 | ||||||||||
| Mativ Holdings, Inc.(1) | 6.88 | 10/01/26 | 55,000 | 49,558 | ||||||||||
| Minerals Technologies, Inc.(1) | 5.00 | 07/01/28 | 60,000 | 52,526 | ||||||||||
| NOVA Chemicals Corp.(1) | 4.25 | 05/15/29 | 86,000 | 63,687 | ||||||||||
| NOVA Chemicals Corp.(1) | 5.00 | 05/01/25 | 75,000 | 70,908 | ||||||||||
| NOVA Chemicals Corp.(1) | 5.25 | 06/01/27 | 163,000 | 137,942 | ||||||||||
| Nufarm Australia Ltd./Nufarm Americas, Inc.(1) | 5.00 | 01/27/30 | 55,000 | 47,774 | ||||||||||
| Olin Corp. | 5.00 | 02/01/30 | 80,000 | 69,186 | ||||||||||
| Olin Corp. | 5.13 | 09/15/27 | 75,000 | 68,841 | ||||||||||
| Olin Corp. | 5.63 | 08/01/29 | 102,000 | 92,840 | ||||||||||
| Olympus Water US Holding Corp.(1) | 4.25 | 10/01/28 | 120,000 | 95,876 | ||||||||||
| Olympus Water US Holding Corp.(1) | 6.25 | 10/01/29 | 60,000 | 45,055 | ||||||||||
| Olympus Water US Holding Corp.(1) | 7.13 | 10/01/27 | 50,000 | 46,085 | ||||||||||
| Olympus Water US Holding Corp.(1) | 9.75 | 11/15/28 | 260,000 | 254,267 | ||||||||||
| Polar US Borrower LLC/Schenectady International Group, Inc.(1) | 6.75 | 05/15/26 | 47,000 | 20,958 | ||||||||||
| Rain Carbon, Inc.(1) | 12.25 | 09/01/29 | 70,000 | 71,312 | ||||||||||
| Rayonier AM Products, Inc.(1) | 7.63 | 01/15/26 | 70,000 | 59,572 | ||||||||||
| SCIH Salt Holdings, Inc.(1) | 4.88 | 05/01/28 | 167,000 | 144,390 | ||||||||||
| SCIH Salt Holdings, Inc.(1) | 6.63 | 05/01/29 | 105,000 | 88,123 | ||||||||||
| SCIL IV LLC/SCIL USA Holdings LLC(1) | 5.38 | 11/01/26 | 115,000 | 102,122 | ||||||||||
| SK Invictus Intermediate II Sarl(1) | 5.00 | 10/30/29 | 100,000 | 75,601 | ||||||||||
| SNF Group SACA(1) | 3.13 | 03/15/27 | 60,000 | 53,236 | ||||||||||
| SNF Group SACA(1) | 3.38 | 03/15/30 | 45,000 | 36,073 | ||||||||||
| TPC Group, Inc.(1) | 13.00 | 12/16/27 | 55,000 | 55,075 | ||||||||||
| Trinseo Materials Operating SCA/Trinseo Materials Finance, Inc.(1) | 5.13 | 04/01/29 | 70,000 | 29,536 | ||||||||||
| Tronox, Inc.(1) | 4.63 | 03/15/29 | 162,000 | 127,768 | ||||||||||
| Valvoline, Inc.(1) | 3.63 | 06/15/31 | 82,000 | 62,438 | ||||||||||
| Valvoline, Inc.(1) | 4.25 | 02/15/30 | 90,000 | 88,241 | ||||||||||
| Vibrantz Technologies, Inc.(1) | 9.00 | 02/15/30 | 115,000 | 91,654 | ||||||||||
| WR Grace Holdings LLC(1) | 4.88 | 06/15/27 | 116,000 | 104,355 | ||||||||||
| WR Grace Holdings LLC(1) | 5.63 | 08/15/29 | 168,000 | 130,361 | ||||||||||
| WR Grace Holdings LLC(1) | 7.38 | 03/01/31 | 55,000 | 51,034 | ||||||||||
| 4,058,486 | ||||||||||||||
The accompanying notes are an integral part of these financial statements.
32
BONDBLOXX ETF TRUST
BondBloxx USD High Yield Bond Industrial Sector ETF
Portfolio of Investments (Continued)
October 31, 2023
| Face | ||||||||||||||
| Rate (%) | Maturity | Amount | Value | |||||||||||
| COAL – 0.4% | ||||||||||||||
| Alliance Resource Operating Partners LP/Alliance Resource Finance Corp.(1) | 7.50 | 05/01/25 | $ | 44,000 | $ | 43,718 | ||||||||
| Conuma Resources Ltd.(1) | 13.13 | 05/01/28 | 40,000 | 37,034 | ||||||||||
| SunCoke Energy, Inc.(1) | 4.88 | 06/30/29 | 74,000 | 62,026 | ||||||||||
| 142,778 | ||||||||||||||
| COMMERCIAL SERVICES – 13.6% | ||||||||||||||
| ADT Security Corp.(1) | 4.13 | 08/01/29 | 151,000 | 129,683 | ||||||||||
| ADT Security Corp.(1) | 4.88 | 07/15/32 | 110,000 | 92,139 | ||||||||||
| Adtalem Global Education, Inc.(1) | 5.50 | 03/01/28 | 60,000 | 54,703 | ||||||||||
| Albion Financing 1 Sarl/Aggreko Holdings, Inc.(1) | 6.13 | 10/15/26 | 83,000 | 76,871 | ||||||||||
| Albion Financing 2 Sarl(1) | 8.75 | 04/15/27 | 70,000 | 64,294 | ||||||||||
| Allied Universal Holdco LLC/Allied Universal Finance Corp.(1) | 6.00 | 06/01/29 | 145,000 | 104,926 | ||||||||||
| Allied Universal Holdco LLC/Allied Universal Finance Corp.(1) | 6.63 | 07/15/26 | 295,000 | 276,511 | ||||||||||
| Allied Universal Holdco LLC/Allied Universal Finance Corp.(1) | 9.75 | 07/15/27 | 155,000 | 134,814 | ||||||||||
| Allied Universal Holdco LLC/Allied Universal Finance Corp./Atlas Luxco 4 Sarl(1) | 4.63 | 06/01/28 | 189,000 | 154,783 | ||||||||||
| Allied Universal Holdco LLC/Allied Universal Finance Corp./Atlas Luxco 4 Sarl(1) | 4.63 | 06/01/28 | 115,000 | 93,822 | ||||||||||
| Alta Equipment Group, Inc.(1) | 5.63 | 04/15/26 | 50,000 | 44,779 | ||||||||||
| APi Group DE, Inc.(1) | 4.13 | 07/15/29 | 45,000 | 36,781 | ||||||||||
| APi Group DE, Inc.(1) | 4.75 | 10/15/29 | 49,000 | 42,009 | ||||||||||
| Aptim Corp.(1) | 7.75 | 06/15/25 | 75,000 | 68,837 | ||||||||||
| APX Group, Inc.(1) | 5.75 | 07/15/29 | 120,000 | 99,895 | ||||||||||
| APX Group, Inc.(1) | 6.75 | 02/15/27 | 90,000 | 86,995 | ||||||||||
| Avis Budget Car Rental LLC/Avis Budget Finance, Inc.(1) | 4.75 | 04/01/28 | 80,000 | 68,721 | ||||||||||
| Avis Budget Car Rental LLC/Avis Budget Finance, Inc.(1) | 5.38 | 03/01/29 | 92,000 | 78,892 | ||||||||||
| Avis Budget Car Rental LLC/Avis Budget Finance, Inc.(1) | 5.75 | 07/15/27 | 55,000 | 50,514 | ||||||||||
| Avis Budget Car Rental LLC/Avis Budget Finance, Inc.(1) | 5.75 | 07/15/27 | 55,000 | 50,613 | ||||||||||
| Brink’s Co.(1) | 4.63 | 10/15/27 | 91,000 | 82,391 | ||||||||||
| Brink’s Co.(1) | 5.50 | 07/15/25 | 60,000 | 58,448 | ||||||||||
| CoreLogic, Inc.(1) | 4.50 | 05/01/28 | 115,000 | 91,259 | ||||||||||
| Garda World Security Corp.(1) | 4.63 | 02/15/27 | 90,000 | 80,366 | ||||||||||
| Garda World Security Corp.(1) | 6.00 | 06/01/29 | 75,000 | 57,249 | ||||||||||
| Garda World Security Corp.(1) | 7.75 | 02/15/28 | 60,000 | 57,763 | ||||||||||
| Garda World Security Corp.(1) | 9.50 | 11/01/27 | 88,000 | 80,049 | ||||||||||
| Graham Holdings Co.(1) | 5.75 | 06/01/26 | 60,000 | 57,809 | ||||||||||
| Grand Canyon University | 5.13 | 10/01/28 | 60,000 | 53,238 | ||||||||||
| Herc Holdings, Inc.(1) | 5.50 | 07/15/27 | 183,000 | 172,215 | ||||||||||
| Hertz Corp.(1) | 4.63 | 12/01/26 | 75,000 | 62,893 | ||||||||||
| Hertz Corp.(1) | 5.00 | 12/01/29 | 150,000 | 107,876 | ||||||||||
| Korn Ferry(1) | 4.63 | 12/15/27 | 60,000 | 54,637 | ||||||||||
| Matthews International Corp.(1) | 5.25 | 12/01/25 | 45,000 | 42,864 | ||||||||||
| Neptune Bidco US, Inc.(1) | 9.29 | 04/15/29 | 398,000 | 351,629 | ||||||||||
| NESCO Holdings II, Inc.(1) | 5.50 | 04/15/29 | 141,000 | 121,046 | ||||||||||
| Port of Newcastle Investments Financing Pty Ltd.(1) | 5.90 | 11/24/31 | 45,000 | 37,663 | ||||||||||
| Prime Security Services Borrower LLC/Prime Finance, Inc.(1) | 3.38 | 08/31/27 | 155,000 | 136,433 | ||||||||||
| Prime Security Services Borrower LLC/Prime Finance, Inc.(1) | 5.75 | 04/15/26 | 203,000 | 197,131 | ||||||||||
| Prime Security Services Borrower LLC/Prime Finance, Inc.(1) | 6.25 | 01/15/28 | 195,000 | 181,018 | ||||||||||
| Signal Parent, Inc.(1) | 6.13 | 04/01/29 | 45,000 | 25,693 | ||||||||||
| Sotheby’s(1) | 7.38 | 10/15/27 | 118,000 | 105,509 | ||||||||||
| Sotheby’s/Bidfair Holdings, Inc.(1) | 5.88 | 06/01/29 | 45,000 | 35,929 | ||||||||||
The accompanying notes are an integral part of these financial statements.
33
BONDBLOXX ETF TRUST
BondBloxx USD High Yield Bond Industrial Sector ETF
Portfolio of Investments (Continued)
October 31, 2023
| Face | ||||||||||||||
| Rate (%) | Maturity | Amount | Value | |||||||||||
| COMMERCIAL SERVICES – 13.6% (Continued) | ||||||||||||||
| TriNet Group, Inc.(1) | 3.50 | 03/01/29 | $ | 78,000 | $ | 64,489 | ||||||||
| TriNet Group, Inc.(1) | 7.13 | 08/15/31 | 60,000 | 58,068 | ||||||||||
| United Rentals North America, Inc. | 3.75 | 01/15/32 | 109,000 | 86,815 | ||||||||||
| United Rentals North America, Inc. | 3.88 | 11/15/27 | 115,000 | 105,729 | ||||||||||
| United Rentals North America, Inc. | 3.88 | 02/15/31 | 172,000 | 141,776 | ||||||||||
| United Rentals North America, Inc. | 4.00 | 07/15/30 | 108,000 | 90,909 | ||||||||||
| United Rentals North America, Inc. | 4.88 | 01/15/28 | 250,000 | 232,192 | ||||||||||
| United Rentals North America, Inc. | 5.25 | 01/15/30 | 120,000 | 109,703 | ||||||||||
| United Rentals North America, Inc. | 5.50 | 05/15/27 | 76,000 | 73,505 | ||||||||||
| VT Topco, Inc.(1) | 8.50 | 08/15/30 | 75,000 | 73,241 | ||||||||||
| WASH Multifamily Acquisition, Inc.(1) | 5.75 | 04/15/26 | 130,000 | 120,368 | ||||||||||
| Williams Scotsman, Inc.(1) | 4.63 | 08/15/28 | 75,000 | 66,710 | ||||||||||
| Williams Scotsman, Inc.(1) | 6.13 | 06/15/25 | 80,000 | 78,689 | ||||||||||
| Williams Scotsman, Inc.(1) | 7.38 | 10/01/31 | 75,000 | 73,818 | ||||||||||
| WW International, Inc.(1) | 4.50 | 04/15/29 | 75,000 | 46,940 | ||||||||||
| ZipRecruiter, Inc.(1) | 5.00 | 01/15/30 | 85,000 | 66,476 | ||||||||||
| 5,551,118 | ||||||||||||||
| COMPUTERS – 0.8% | ||||||||||||||
| ASGN, Inc.(1) | 4.63 | 05/15/28 | 84,000 | 74,479 | ||||||||||
| Conduent Business Services LLC/Conduent State & Local Solutions, Inc.(1) | 6.00 | 11/01/29 | 79,000 | 65,216 | ||||||||||
| Crane NXT Co. | 4.20 | 03/15/48 | 55,000 | 33,330 | ||||||||||
| KBR, Inc.(1) | 4.75 | 09/30/28 | 40,000 | 35,017 | ||||||||||
| Science Applications International Corp.(1) | 4.88 | 04/01/28 | 60,000 | 53,603 | ||||||||||
| Tempo Acquisition LLC/Tempo Acquisition Finance Corp.(1) | 5.75 | 06/01/25 | 45,000 | 43,904 | ||||||||||
| 305,549 | ||||||||||||||
| DISTRIBUTION/WHOLESALE – 1.8% | ||||||||||||||
| American Builders & Contractors Supply Co., Inc.(1) | 3.88 | 11/15/29 | 60,000 | 50,037 | ||||||||||
| American Builders & Contractors Supply Co., Inc.(1) | 4.00 | 01/15/28 | 108,000 | 97,061 | ||||||||||
| BCPE Empire Holdings, Inc.(1) | 7.63 | 05/01/27 | 100,000 | 91,815 | ||||||||||
| H&E Equipment Services, Inc.(1) | 3.88 | 12/15/28 | 188,000 | 159,448 | ||||||||||
| Ritchie Bros Holdings, Inc.(1) | 6.75 | 03/15/28 | 85,000 | 83,404 | ||||||||||
| Ritchie Bros Holdings, Inc.(1) | 7.75 | 03/15/31 | 120,000 | 120,450 | ||||||||||
| Windsor Holdings III LLC(1) | 8.50 | 06/15/30 | 120,000 | 116,966 | ||||||||||
| 719,181 | ||||||||||||||
| ELECTRIC – 0.2% | ||||||||||||||
| Pike Corp.(1) | 5.50 | 09/01/28 | 110,000 | 94,176 | ||||||||||
| ELECTRICAL COMPONENTS & EQUIPMENT – 1.1% | ||||||||||||||
| EnerSys(1) | 4.38 | 12/15/27 | 45,000 | 39,905 | ||||||||||
| WESCO Distribution, Inc.(1) | 7.13 | 06/15/25 | 228,000 | 228,090 | ||||||||||
| WESCO Distribution, Inc.(1) | 7.25 | 06/15/28 | 200,000 | 198,944 | ||||||||||
| 466,939 | ||||||||||||||
| ELECTRONICS – 0.8% | ||||||||||||||
| Atkore, Inc.(1) | 4.25 | 06/01/31 | 63,000 | 52,144 | ||||||||||
| Imola Merger Corp.(1) | 4.75 | 05/15/29 | 305,000 | 266,161 | ||||||||||
| 318,305 | ||||||||||||||
The accompanying notes are an integral part of these financial statements.
34
BONDBLOXX ETF TRUST
BondBloxx USD High Yield Bond Industrial Sector ETF
Portfolio of Investments (Continued)
October 31, 2023
| Face | ||||||||||||||
| Rate (%) | Maturity | Amount | Value | |||||||||||
| ENERGY-ALTERNATE SOURCES – 0.2% | ||||||||||||||
| Enviva Partners LP/Enviva Partners Finance Corp.(1) | 6.50 | 01/15/26 | $ | 115,000 | $ | 80,913 | ||||||||
| ENGINEERING & CONSTRUCTION – 2.8% | ||||||||||||||
| AECOM | 5.13 | 03/15/27 | 152,000 | 143,678 | ||||||||||
| Arcosa, Inc.(1) | 4.38 | 04/15/29 | 60,000 | 52,419 | ||||||||||
| Artera Services LLC(1) | 9.03 | 12/04/25 | 147,000 | 132,538 | ||||||||||
| Brand Industrial Services, Inc.(1) | 10.38 | 08/01/30 | 200,000 | 198,750 | ||||||||||
| Brundage-Bone Concrete Pumping Holdings, Inc.(1) | 6.00 | 02/01/26 | 55,000 | 52,059 | ||||||||||
| Dycom Industries, Inc.(1) | 4.50 | 04/15/29 | 75,000 | 64,806 | ||||||||||
| Fluor Corp. | 3.50 | 12/15/24 | 5,000 | 4,809 | ||||||||||
| Fluor Corp. | 4.25 | 09/15/28 | 125,000 | 113,475 | ||||||||||
| Global Infrastructure Solutions, Inc.(1) | 5.63 | 06/01/29 | 60,000 | 48,097 | ||||||||||
| Global Infrastructure Solutions, Inc.(1) | 7.50 | 04/15/32 | 44,000 | 36,039 | ||||||||||
| Great Lakes Dredge & Dock Corp.(1) | 5.25 | 06/01/29 | 50,000 | 40,917 | ||||||||||
| Railworks Holdings LP/Railworks Rally, Inc.(1) | 8.25 | 11/15/28 | 52,000 | 49,498 | ||||||||||
| TopBuild Corp.(1) | 3.63 | 03/15/29 | 60,000 | 50,084 | ||||||||||
| TopBuild Corp.(1) | 4.13 | 02/15/32 | 75,000 | 59,432 | ||||||||||
| Tutor Perini Corp.(1) | 6.88 | 05/01/25 | 75,000 | 64,574 | ||||||||||
| Weekley Homes LLC/Weekley Finance Corp.(1) | 4.88 | 09/15/28 | 60,000 | 51,598 | ||||||||||
| 1,162,773 | ||||||||||||||
| ENVIRONMENTAL CONTROL – 3.3% | ||||||||||||||
| Clean Harbors, Inc.(1) | 4.88 | 07/15/27 | 85,000 | 79,330 | ||||||||||
| Clean Harbors, Inc.(1) | 5.13 | 07/15/29 | 40,000 | 36,022 | ||||||||||
| Clean Harbors, Inc.(1) | 6.38 | 02/01/31 | 80,000 | 76,134 | ||||||||||
| Covanta Holding Corp.(1) | 4.88 | 12/01/29 | 115,000 | 89,877 | ||||||||||
| Covanta Holding Corp. | 5.00 | 09/01/30 | 63,000 | 48,868 | ||||||||||
| Enviri Corp.(1) | 5.75 | 07/31/27 | 70,000 | 59,238 | ||||||||||
| GFL Environmental, Inc.(1) | 3.50 | 09/01/28 | 115,000 | 98,600 | ||||||||||
| GFL Environmental, Inc.(1) | 3.75 | 08/01/25 | 116,000 | 109,843 | ||||||||||
| GFL Environmental, Inc.(1) | 4.00 | 08/01/28 | 115,000 | 99,091 | ||||||||||
| GFL Environmental, Inc.(1) | 4.25 | 06/01/25 | 75,000 | 72,178 | ||||||||||
| GFL Environmental, Inc.(1) | 4.38 | 08/15/29 | 85,000 | 72,582 | ||||||||||
| GFL Environmental, Inc.(1) | 4.75 | 06/15/29 | 108,000 | 94,652 | ||||||||||
| GFL Environmental, Inc.(1) | 5.13 | 12/15/26 | 75,000 | 71,250 | ||||||||||
| Madison IAQ LLC(1) | 4.13 | 06/30/28 | 110,000 | 91,997 | ||||||||||
| Madison IAQ LLC(1) | 5.88 | 06/30/29 | 151,000 | 117,142 | ||||||||||
| Stericycle, Inc.(1) | 3.88 | 01/15/29 | 75,000 | 63,808 | ||||||||||
| Waste Pro USA, Inc.(1) | 5.50 | 02/15/26 | 75,000 | 69,017 | ||||||||||
| 1,349,629 | ||||||||||||||
| FOOD SERVICE – 0.9% | ||||||||||||||
| Aramark Services, Inc.(1) | 5.00 | 04/01/25 | 85,000 | 83,167 | ||||||||||
| Aramark Services, Inc.(1) | 5.00 | 02/01/28 | 171,000 | 156,999 | ||||||||||
| TKC Holdings, Inc.(1) | 6.88 | 05/15/28 | 65,000 | 56,284 | ||||||||||
| TKC Holdings, Inc.(1) | 10.50 | 05/15/29 | 107,000 | 85,689 | ||||||||||
| 382,139 | ||||||||||||||
| FOREST PRODUCTS & PAPER – 0.8% | ||||||||||||||
| Ahlstrom Holding 3 Oy(1) | 4.88 | 02/04/28 | 50,000 | 41,087 | ||||||||||
| Domtar Corp.(1) | 6.75 | 10/01/28 | 95,000 | 77,422 | ||||||||||
The accompanying notes are an integral part of these financial statements.
35
BONDBLOXX ETF TRUST
BondBloxx USD High Yield Bond Industrial Sector ETF
Portfolio of Investments (Continued)
October 31, 2023
| Face | ||||||||||||||
| Rate (%) | Maturity | Amount | Value | |||||||||||
| FOREST PRODUCTS & PAPER – 0.8% (Continued) | ||||||||||||||
| Glatfelter Corp.(1) | 4.75 | 11/15/29 | $ | 78,000 | $ | 51,334 | ||||||||
| Mercer International, Inc. | 5.13 | 02/01/29 | 132,000 | 103,660 | ||||||||||
| Mercer International, Inc. | 5.50 | 01/15/26 | 45,000 | 41,895 | ||||||||||
| 315,398 | ||||||||||||||
| HAND/MACHINE TOOLS – 0.2% | ||||||||||||||
| Werner FinCo LP/Werner FinCo, Inc.(1) | 11.50 | 06/15/28 | 60,000 | 60,659 | ||||||||||
| HOLDING COMPANIES-DIVERS – 0.1% | ||||||||||||||
| Stena International SA(1) | 6.13 | 02/01/25 | 50,000 | 49,052 | ||||||||||
| HOME BUILDERS – 3.8% | ||||||||||||||
| Adams Homes, Inc.(1) | 9.25 | 10/15/28 | 40,000 | 38,730 | ||||||||||
| Ashton Woods USA LLC/Ashton Woods Finance Co.(1) | 4.63 | 08/01/29 | 56,000 | 45,368 | ||||||||||
| Ashton Woods USA LLC/Ashton Woods Finance Co.(1) | 4.63 | 04/01/30 | 65,000 | 50,393 | ||||||||||
| Ashton Woods USA LLC/Ashton Woods Finance Co.(1) | 6.63 | 01/15/28 | 30,000 | 27,482 | ||||||||||
| Beazer Homes USA, Inc. | 5.88 | 10/15/27 | 55,000 | 49,140 | ||||||||||
| Beazer Homes USA, Inc. | 7.25 | 10/15/29 | 54,000 | 49,310 | ||||||||||
| Brookfield Residential Properties, Inc./Brookfield Residential US LLC(1) | 4.88 | 02/15/30 | 75,000 | 57,106 | ||||||||||
| Brookfield Residential Properties, Inc./Brookfield Residential US LLC(1) | 5.00 | 06/15/29 | 60,000 | 47,001 | ||||||||||
| Brookfield Residential Properties, Inc./Brookfield Residential US LLC(1) | 6.25 | 09/15/27 | 85,000 | 74,033 | ||||||||||
| Century Communities, Inc.(1) | 3.88 | 08/15/29 | 75,000 | 60,609 | ||||||||||
| Century Communities, Inc. | 6.75 | 06/01/27 | 75,000 | 72,483 | ||||||||||
| Dream Finders Homes, Inc.(1) | 8.25 | 08/15/28 | 45,000 | 44,565 | ||||||||||
| Empire Communities Corp.(1) | 7.00 | 12/15/25 | 70,000 | 65,127 | ||||||||||
| Installed Building Products, Inc.(1) | 5.75 | 02/01/28 | 47,000 | 42,464 | ||||||||||
| KB Home | 4.00 | 06/15/31 | 63,000 | 49,271 | ||||||||||
| KB Home | 4.80 | 11/15/29 | 40,000 | 34,704 | ||||||||||
| KB Home | 6.88 | 06/15/27 | 49,000 | 48,679 | ||||||||||
| KB Home | 7.25 | 07/15/30 | 52,000 | 49,985 | ||||||||||
| LGI Homes, Inc.(1) | 4.00 | 07/15/29 | 47,000 | 36,014 | ||||||||||
| M/I Homes, Inc. | 3.95 | 02/15/30 | 45,000 | 35,848 | ||||||||||
| M/I Homes, Inc. | 4.95 | 02/01/28 | 65,000 | 58,197 | ||||||||||
| Mattamy Group Corp.(1) | 4.63 | 03/01/30 | 92,000 | 75,224 | ||||||||||
| Mattamy Group Corp.(1) | 5.25 | 12/15/27 | 75,000 | 67,475 | ||||||||||
| Shea Homes LP/Shea Homes Funding Corp. | 4.75 | 02/15/28 | 70,000 | 61,611 | ||||||||||
| Shea Homes LP/Shea Homes Funding Corp. | 4.75 | 04/01/29 | 45,000 | 38,089 | ||||||||||
| Taylor Morrison Communities, Inc.(1) | 5.13 | 08/01/30 | 78,000 | 65,644 | ||||||||||
| Taylor Morrison Communities, Inc.(1) | 5.75 | 01/15/28 | 68,000 | 61,802 | ||||||||||
| Taylor Morrison Communities, Inc.(1) | 5.88 | 06/15/27 | 75,000 | 70,394 | ||||||||||
| Tri Pointe Homes, Inc. | 5.25 | 06/01/27 | 45,000 | 40,778 | ||||||||||
| Tri Pointe Homes, Inc. | 5.70 | 06/15/28 | 55,000 | 49,036 | ||||||||||
| 1,566,562 | ||||||||||||||
| INTERNET – 1.9% | ||||||||||||||
| EquipmentShare.com, Inc.(1) | 9.00 | 05/15/28 | 160,000 | 150,600 | ||||||||||
| Uber Technologies, Inc.(1) | 4.50 | 08/15/29 | 225,000 | 198,857 | ||||||||||
| Uber Technologies, Inc.(1) | 6.25 | 01/15/28 | 75,000 | 72,307 | ||||||||||
| Uber Technologies, Inc.(1) | 7.50 | 05/15/25 | 150,000 | 150,341 | ||||||||||
| Uber Technologies, Inc.(1) | 7.50 | 09/15/27 | 187,000 | 187,662 | ||||||||||
| 759,767 | ||||||||||||||
The accompanying notes are an integral part of these financial statements.
36
BONDBLOXX ETF TRUST
BondBloxx USD High Yield Bond Industrial Sector ETF
Portfolio of Investments (Continued)
October 31, 2023
| Face | ||||||||||||||
| Rate (%) | Maturity | Amount | Value | |||||||||||
| IRON/STEEL – 3.9% | ||||||||||||||
| ATI, Inc. | 4.88 | 10/01/29 | $ | 47,000 | $ | 40,091 | ||||||||
| ATI, Inc. | 5.13 | 10/01/31 | 50,000 | 41,326 | ||||||||||
| ATI, Inc. | 5.88 | 12/01/27 | 55,000 | 51,089 | ||||||||||
| ATI, Inc. | 7.25 | 08/15/30 | 65,000 | 62,650 | ||||||||||
| Baffinland Iron Mines Corp./Baffinland Iron Mines LP(1) | 8.75 | 07/15/26 | 85,000 | 81,786 | ||||||||||
| Big River Steel LLC/BRS Finance Corp.(1) | 6.63 | 01/31/29 | 110,000 | 108,778 | ||||||||||
| Carpenter Technology Corp. | 6.38 | 07/15/28 | 65,000 | 61,906 | ||||||||||
| Carpenter Technology Corp. | 7.63 | 03/15/30 | 40,000 | 39,542 | ||||||||||
| Cleveland-Cliffs, Inc.(1) | 4.63 | 03/01/29 | 55,000 | 47,474 | ||||||||||
| Cleveland-Cliffs, Inc.(1) | 4.88 | 03/01/31 | 50,000 | 41,322 | ||||||||||
| Cleveland-Cliffs, Inc. | 5.88 | 06/01/27 | 85,000 | 81,075 | ||||||||||
| Cleveland-Cliffs, Inc.(1) | 6.75 | 03/15/26 | 123,000 | 122,431 | ||||||||||
| Cleveland-Cliffs, Inc.(1) | 6.75 | 04/15/30 | 115,000 | 106,771 | ||||||||||
| Commercial Metals Co. | 3.88 | 02/15/31 | 45,000 | 36,588 | ||||||||||
| Commercial Metals Co. | 4.13 | 01/15/30 | 49,000 | 41,414 | ||||||||||
| Commercial Metals Co. | 4.38 | 03/15/32 | 45,000 | 36,254 | ||||||||||
| Mineral Resources Ltd.(1) | 8.00 | 11/01/27 | 90,000 | 87,068 | ||||||||||
| Mineral Resources Ltd.(1) | 8.13 | 05/01/27 | 105,000 | 102,253 | ||||||||||
| Mineral Resources Ltd.(1) | 8.50 | 05/01/30 | 97,000 | 92,985 | ||||||||||
| Mineral Resources Ltd.(1) | 9.25 | 10/01/28 | 170,000 | 170,213 | ||||||||||
| TMS International Corp./DE(1) | 6.25 | 04/15/29 | 52,000 | 41,080 | ||||||||||
| United States Steel Corp. | 6.65 | 06/01/37 | 40,000 | 38,159 | ||||||||||
| United States Steel Corp. | 6.88 | 03/01/29 | 76,000 | 73,924 | ||||||||||
| 1,606,179 | ||||||||||||||
| MACHINERY-CONSTRUCTION & MINING – 0.6% | ||||||||||||||
| BWX Technologies, Inc.(1) | 4.13 | 06/30/28 | 65,000 | 57,273 | ||||||||||
| BWX Technologies, Inc.(1) | 4.13 | 04/15/29 | 55,000 | 47,089 | ||||||||||
| Manitowoc Co., Inc.(1) | 9.00 | 04/01/26 | 45,000 | 44,155 | ||||||||||
| Terex Corp.(1) | 5.00 | 05/15/29 | 90,000 | 78,881 | ||||||||||
| 227,398 | ||||||||||||||
| MACHINERY-DIVERSIFIED – 2.6% | ||||||||||||||
| ATS Corp.(1) | 4.13 | 12/15/28 | 55,000 | 47,293 | ||||||||||
| Chart Industries, Inc.(1) | 7.50 | 01/01/30 | 218,000 | 214,345 | ||||||||||
| Chart Industries, Inc.(1) | 9.50 | 01/01/31 | 80,000 | 82,494 | ||||||||||
| GrafTech Finance, Inc.(1) | 4.63 | 12/15/28 | 80,000 | 58,722 | ||||||||||
| GrafTech Global Enterprises, Inc.(1) | 9.88 | 12/15/28 | 65,000 | 58,288 | ||||||||||
| Maxim Crane Works Holdings Capital LLC(1) | 11.50 | 09/01/28 | 75,000 | 73,286 | ||||||||||
| Mueller Water Products, Inc.(1) | 4.00 | 06/15/29 | 68,000 | 58,216 | ||||||||||
| OT Merger Corp.(1) | 7.88 | 10/15/29 | 47,000 | 28,227 | ||||||||||
| SPX FLOW, Inc.(1) | 8.75 | 04/01/30 | 78,000 | 71,594 | ||||||||||
| Titan Acquisition Ltd./Titan Co.-Borrower LLC(1) | 7.75 | 04/15/26 | 100,000 | 93,105 | ||||||||||
| TK Elevator Holdco GmbH(1) | 7.63 | 07/15/28 | 60,000 | 54,176 | ||||||||||
| TK Elevator US Newco, Inc.(1) | 5.25 | 07/15/27 | 240,000 | 218,750 | ||||||||||
| 1,058,496 | ||||||||||||||
The accompanying notes are an integral part of these financial statements.
37
BONDBLOXX ETF TRUST
BondBloxx USD High Yield Bond Industrial Sector ETF
Portfolio of Investments (Continued)
October 31, 2023
| Face | ||||||||||||||
| Rate (%) | Maturity | Amount | Value | |||||||||||
| METAL FABRICATE/HARDWARE – 0.6% | ||||||||||||||
| Advanced Drainage Systems, Inc.(1) | 5.00 | 09/30/27 | $ | 55,000 | $ | 51,352 | ||||||||
| Advanced Drainage Systems, Inc.(1) | 6.38 | 06/15/30 | 75,000 | 70,885 | ||||||||||
| Interpipe Holdings PLC(1) | 8.38 | 05/13/26 | 10,000 | 7,450 | ||||||||||
| Park-Ohio Industries, Inc. | 6.63 | 04/15/27 | 55,000 | 47,770 | ||||||||||
| Roller Bearing Co. of America, Inc.(1) | 4.38 | 10/15/29 | 75,000 | 63,695 | ||||||||||
| 241,152 | ||||||||||||||
| MINING – 4.8% | ||||||||||||||
| Arsenal AIC Parent LLC(1) | 8.00 | 10/01/30 | 105,000 | 103,819 | ||||||||||
| Century Aluminum Co.(1) | 7.50 | 04/01/28 | 40,000 | 37,833 | ||||||||||
| Coeur Mining, Inc.(1) | 5.13 | 02/15/29 | 48,000 | 40,008 | ||||||||||
| Compass Minerals International, Inc.(1) | 6.75 | 12/01/27 | 74,000 | 69,775 | ||||||||||
| Constellium SE(1) | 3.75 | 04/15/29 | 76,000 | 62,653 | ||||||||||
| Constellium SE(1) | 5.63 | 06/15/28 | 50,000 | 45,760 | ||||||||||
| Constellium SE(1) | 5.88 | 02/15/26 | 40,000 | 38,380 | ||||||||||
| Eldorado Gold Corp.(1) | 6.25 | 09/01/29 | 78,000 | 66,979 | ||||||||||
| FMG Resources August 2006 Pty Ltd.(1) | 4.38 | 04/01/31 | 230,000 | 185,678 | ||||||||||
| FMG Resources August 2006 Pty Ltd.(1) | 4.50 | 09/15/27 | 90,000 | 81,142 | ||||||||||
| FMG Resources August 2006 Pty Ltd.(1) | 5.88 | 04/15/30 | 105,000 | 94,361 | ||||||||||
| FMG Resources August 2006 Pty Ltd.(1) | 6.13 | 04/15/32 | 120,000 | 106,116 | ||||||||||
| Hecla Mining Co. | 7.25 | 02/15/28 | 73,000 | 69,788 | ||||||||||
| Hudbay Minerals, Inc.(1) | 4.50 | 04/01/26 | 97,000 | 90,380 | ||||||||||
| Hudbay Minerals, Inc.(1) | 6.13 | 04/01/29 | 85,000 | 76,165 | ||||||||||
| IAMGOLD Corp.(1) | 5.75 | 10/15/28 | 68,000 | 53,635 | ||||||||||
| JW Aluminum Continuous Cast Co.(1) | 10.25 | 06/01/26 | 42,000 | 41,822 | ||||||||||
| Kaiser Aluminum Corp.(1) | 4.50 | 06/01/31 | 86,000 | 63,657 | ||||||||||
| Kaiser Aluminum Corp.(1) | 4.63 | 03/01/28 | 75,000 | 62,564 | ||||||||||
| New Gold, Inc.(1) | 7.50 | 07/15/27 | 58,000 | 54,480 | ||||||||||
| Novelis Corp.(1) | 3.25 | 11/15/26 | 115,000 | 102,497 | ||||||||||
| Novelis Corp.(1) | 3.88 | 08/15/31 | 112,000 | 87,648 | ||||||||||
| Novelis Corp.(1) | 4.75 | 01/30/30 | 243,000 | 206,439 | ||||||||||
| Perenti Finance Pty Ltd.(1) | 6.50 | 10/07/25 | 65,000 | 63,537 | ||||||||||
| Taseko Mines Ltd.(1) | 7.00 | 02/15/26 | 63,000 | 57,206 | ||||||||||
| 1,962,322 | ||||||||||||||
| MISCELLANEOUS MANUFACTURER – 1.7% | ||||||||||||||
| Amsted Industries, Inc.(1) | 4.63 | 05/15/30 | 60,000 | 48,482 | ||||||||||
| Amsted Industries, Inc.(1) | 5.63 | 07/01/27 | 62,000 | 57,130 | ||||||||||
| Calderys Financing LLC(1) | 11.25 | 06/01/28 | 85,000 | 85,850 | ||||||||||
| EnPro Industries, Inc. | 5.75 | 10/15/26 | 55,000 | 52,170 | ||||||||||
| FXI Holdings, Inc.(1) | 12.25 | 11/15/26 | 113,000 | 93,824 | ||||||||||
| FXI Holdings, Inc.(1) | 12.25 | 11/15/26 | 72,000 | 59,940 | ||||||||||
| Hillenbrand, Inc. | 3.75 | 03/01/31 | 55,000 | 43,038 | ||||||||||
| Hillenbrand, Inc. | 5.00 | 09/15/26 | 55,000 | 52,814 | ||||||||||
| Hillenbrand, Inc. | 5.75 | 06/15/25 | 60,000 | 58,860 | ||||||||||
| LSB Industries, Inc.(1) | 6.25 | 10/15/28 | 85,000 | 75,498 | ||||||||||
| Trinity Industries, Inc.(1) | 7.75 | 07/15/28 | 60,000 | 59,287 | ||||||||||
| 686,893 | ||||||||||||||
The accompanying notes are an integral part of these financial statements.
38
BONDBLOXX ETF TRUST
BondBloxx USD High Yield Bond Industrial Sector ETF
Portfolio of Investments (Continued)
October 31, 2023
| Face | ||||||||||||||
| Rate (%) | Maturity | Amount | Value | |||||||||||
| OFFICE FURNISHINGS – 0.2% | ||||||||||||||
| Interface, Inc.(1) | 5.50 | 12/01/28 | $ | 47,000 | $ | 39,556 | ||||||||
| Steelcase, Inc. | 5.13 | 01/18/29 | 68,000 | 60,018 | ||||||||||
| 99,574 | ||||||||||||||
| OFFICE/BUSINESS EQUIPMENT – 0.2% | ||||||||||||||
| Pitney Bowes, Inc.(1) | 6.88 | 03/15/27 | 60,000 | 49,722 | ||||||||||
| Pitney Bowes, Inc.(1) | 7.25 | 03/15/29 | 50,000 | 37,551 | ||||||||||
| 87,273 | ||||||||||||||
| PACKAGING & CONTAINERS – 11.1% | ||||||||||||||
| Ardagh Metal Packaging Finance USA LLC/Ardagh Metal Packaging Finance PLC(1) | 3.25 | 09/01/28 | 90,000 | 73,406 | ||||||||||
| Ardagh Metal Packaging Finance USA LLC/Ardagh Metal Packaging Finance PLC(1) | 4.00 | 09/01/29 | 155,000 | 116,463 | ||||||||||
| Ardagh Metal Packaging Finance USA LLC/Ardagh Metal Packaging Finance PLC(1) | 6.00 | 06/15/27 | 95,000 | 89,894 | ||||||||||
| Ardagh Packaging Finance PLC/Ardagh Holdings USA, Inc.(1) | 4.13 | 08/15/26 | 190,000 | 167,869 | ||||||||||
| Ardagh Packaging Finance PLC/Ardagh Holdings USA, Inc.(1) | 5.25 | 04/30/25 | 108,000 | 104,130 | ||||||||||
| Ardagh Packaging Finance PLC/Ardagh Holdings USA, Inc.(1) | 5.25 | 08/15/27 | 115,000 | 83,788 | ||||||||||
| Ardagh Packaging Finance PLC/Ardagh Holdings USA, Inc.(1) | 5.25 | 08/15/27 | 151,000 | 110,017 | ||||||||||
| Ball Corp. | 2.88 | 08/15/30 | 195,000 | 152,315 | ||||||||||
| Ball Corp. | 3.13 | 09/15/31 | 130,000 | 100,808 | ||||||||||
| Ball Corp. | 4.88 | 03/15/26 | 115,000 | 110,571 | ||||||||||
| Ball Corp. | 5.25 | 07/01/25 | 150,000 | 147,837 | ||||||||||
| Ball Corp. | 6.00 | 06/15/29 | 150,000 | 144,012 | ||||||||||
| Ball Corp. | 6.88 | 03/15/28 | 115,000 | 114,781 | ||||||||||
| Berry Global, Inc.(1) | 4.50 | 02/15/26 | 40,000 | 37,725 | ||||||||||
| Berry Global, Inc.(1) | 5.63 | 07/15/27 | 80,000 | 76,448 | ||||||||||
| Cascades, Inc./Cascades USA, Inc.(1) | 5.38 | 01/15/28 | 65,000 | 58,819 | ||||||||||
| Clearwater Paper Corp.(1) | 4.75 | 08/15/28 | 50,000 | 44,188 | ||||||||||
| Clearwater Paper Corp.(1) | 5.38 | 02/01/25 | 30,000 | 30,289 | ||||||||||
| Clydesdale Acquisition Holdings, Inc.(1) | 6.63 | 04/15/29 | 80,000 | 72,760 | ||||||||||
| Clydesdale Acquisition Holdings, Inc.(1) | 8.75 | 04/15/30 | 161,000 | 128,506 | ||||||||||
| Crown Americas LLC | 5.25 | 04/01/30 | 79,000 | 71,489 | ||||||||||
| Crown Americas LLC/Crown Americas Capital Corp.V | 4.25 | 09/30/26 | 60,000 | 56,790 | ||||||||||
| Crown Americas LLC/Crown Americas Capital Corp.VI | 4.75 | 02/01/26 | 135,000 | 129,978 | ||||||||||
| Crown Cork & Seal Co., Inc. | 7.38 | 12/15/26 | 50,000 | 50,810 | ||||||||||
| Graham Packaging Co., Inc.(1) | 7.13 | 08/15/28 | 79,000 | 60,608 | ||||||||||
| Graphic Packaging International LLC(1) | 3.50 | 03/15/28 | 75,000 | 64,979 | ||||||||||
| Graphic Packaging International LLC(1) | 3.50 | 03/01/29 | 55,000 | 45,749 | ||||||||||
| Graphic Packaging International LLC(1) | 3.75 | 02/01/30 | 60,000 | 49,141 | ||||||||||
| Graphic Packaging International LLC(1) | 4.75 | 07/15/27 | 42,000 | 39,155 | ||||||||||
| Intelligent Packaging Ltd. FinCo., Inc./Intelligent Packaging Ltd. Co.-Issuer LLC(1) | 6.00 | 09/15/28 | 105,000 | 86,314 | ||||||||||
| Mauser Packaging Solutions Holding Co.(1) | 7.88 | 08/15/26 | 420,000 | 393,800 | ||||||||||
| Mauser Packaging Solutions Holding Co.(1) | 9.25 | 04/15/27 | 200,000 | 166,782 | ||||||||||
| OI European Group BV(1) | 4.75 | 02/15/30 | 65,000 | 55,394 | ||||||||||
| Owens-Brockway Glass Container, Inc.(1) | 6.38 | 08/15/25 | 45,000 | 43,956 | ||||||||||
| Owens-Brockway Glass Container, Inc.(1) | 6.63 | 05/13/27 | 90,000 | 85,596 | ||||||||||
| Owens-Brockway Glass Container, Inc.(1) | 7.25 | 05/15/31 | 105,000 | 96,206 | ||||||||||
| Pactiv Evergreen Group Issuer LLC/Pactiv Evergreen Group Issuer, Inc.(1) | 4.38 | 10/15/28 | 75,000 | 63,887 | ||||||||||
| Pactiv Evergreen Group Issuer, Inc./Pactiv Evergreen Group Issuer LLC(1) | 4.00 | 10/15/27 | 150,000 | 131,047 | ||||||||||
The accompanying notes are an integral part of these financial statements.
39
BONDBLOXX ETF TRUST
BondBloxx USD High Yield Bond Industrial Sector ETF
Portfolio of Investments (Continued)
October 31, 2023
| Face | ||||||||||||||
| Rate (%) | Maturity | Amount | Value | |||||||||||
| PACKAGING & CONTAINERS – 11.1% (Continued) | ||||||||||||||
| Sealed Air Corp.(1) | 4.00 | 12/01/27 | $ | 65,000 | $ | 57,213 | ||||||||
| Sealed Air Corp.(1) | 5.00 | 04/15/29 | 65,000 | 57,723 | ||||||||||
| Sealed Air Corp.(1) | 5.13 | 12/01/24 | 65,000 | 63,771 | ||||||||||
| Sealed Air Corp.(1) | 5.50 | 09/15/25 | 58,000 | 56,169 | ||||||||||
| Sealed Air Corp.(1) | 6.88 | 07/15/33 | 70,000 | 65,725 | ||||||||||
| Sealed Air Corp./Sealed Air Corp. US(1) | 6.13 | 02/01/28 | 117,000 | 111,508 | ||||||||||
| Silgan Holdings, Inc. | 4.13 | 02/01/28 | 85,000 | 75,157 | ||||||||||
| Trident TPI Holdings, Inc.(1) | 12.75 | 12/31/28 | 95,000 | 97,197 | ||||||||||
| TriMas Corp.(1) | 4.13 | 04/15/29 | 63,000 | 52,405 | ||||||||||
| Trivium Packaging Finance BV(1) | 5.50 | 08/15/26 | 157,000 | 142,568 | ||||||||||
| Trivium Packaging Finance BV(1) | 8.50 | 08/15/27 | 105,000 | 87,772 | ||||||||||
| 4,523,515 | ||||||||||||||
| RETAIL – 3.3% | ||||||||||||||
| Beacon Roofing Supply, Inc.(1) | 4.13 | 05/15/29 | 49,000 | 41,187 | ||||||||||
| Beacon Roofing Supply, Inc.(1) | 4.50 | 11/15/26 | 50,000 | 46,648 | ||||||||||
| Beacon Roofing Supply, Inc.(1) | 6.50 | 08/01/30 | 90,000 | 86,025 | ||||||||||
| BlueLinx Holdings, Inc.(1) | 6.00 | 11/15/29 | 47,000 | 39,605 | ||||||||||
| Foundation Building Materials, Inc.(1) | 6.00 | 03/01/29 | 63,000 | 52,026 | ||||||||||
| GYP Holdings III Corp.(1) | 4.63 | 05/01/29 | 55,000 | 45,152 | ||||||||||
| LBM Acquisition LLC(1) | 6.25 | 01/15/29 | 125,000 | 98,881 | ||||||||||
| Park River Holdings, Inc.(1) | 5.63 | 02/01/29 | 50,000 | 36,651 | ||||||||||
| Park River Holdings, Inc.(1) | 6.75 | 08/01/29 | 45,000 | 34,369 | ||||||||||
| Patrick Industries, Inc.(1) | 4.75 | 05/01/29 | 50,000 | 40,675 | ||||||||||
| Patrick Industries, Inc.(1) | 7.50 | 10/15/27 | 50,000 | 47,681 | ||||||||||
| Specialty Building Products Holdings LLC/SBP Finance Corp.(1) | 6.38 | 09/30/26 | 110,000 | 102,443 | ||||||||||
| SRS Distribution, Inc.(1) | 4.63 | 07/01/28 | 98,000 | 85,598 | ||||||||||
| SRS Distribution, Inc.(1) | 6.00 | 12/01/29 | 130,000 | 108,364 | ||||||||||
| SRS Distribution, Inc.(1) | 6.13 | 07/01/29 | 70,000 | 58,689 | ||||||||||
| Staples, Inc.(1) | 7.50 | 04/15/26 | 310,000 | 253,099 | ||||||||||
| Staples, Inc.(1) | 10.75 | 04/15/27 | 140,000 | 77,262 | ||||||||||
| White Capital Buyer LLC(1) | 6.88 | 10/15/28 | 95,000 | 83,005 | ||||||||||
| 1,337,360 | ||||||||||||||
| SOFTWARE – 1.0% | ||||||||||||||
| Camelot Finance SA(1) | 4.50 | 11/01/26 | 105,000 | 97,179 | ||||||||||
| Clarivate Science Holdings Corp.(1) | 3.88 | 07/01/28 | 138,000 | 118,658 | ||||||||||
| Clarivate Science Holdings Corp.(1) | 4.88 | 07/01/29 | 140,000 | 118,251 | ||||||||||
| Dun & Bradstreet Corp.(1) | 5.00 | 12/15/29 | 68,000 | 58,575 | ||||||||||
| 392,663 | ||||||||||||||
| TRANSPORTATION – 1.5% | ||||||||||||||
| Carriage Purchaser, Inc.(1) | 7.88 | 10/15/29 | 47,000 | 34,878 | ||||||||||
| Danaos Corp.(1) | 8.50 | 03/01/28 | 40,000 | 39,865 | ||||||||||
| First Student Bidco, Inc./First Transit Parent, Inc.(1) | 4.00 | 07/31/29 | 95,000 | 76,585 | ||||||||||
| Forward Air Corp.(1) | 9.50 | 10/15/31 | 110,000 | 107,340 | ||||||||||
| Rand Parent LLC(1) | 8.50 | 02/15/30 | 130,000 | 118,838 | ||||||||||
| Watco Cos LLC/Watco Finance Corp.(1) | 6.50 | 06/15/27 | 90,000 | 83,952 | ||||||||||
The accompanying notes are an integral part of these financial statements.
40
BONDBLOXX ETF TRUST
BondBloxx USD High Yield Bond Industrial Sector ETF
Portfolio of Investments (Continued)
October 31, 2023
| Face | ||||||||||||||
| Rate (%) | Maturity | Amount | Value | |||||||||||
| TRANSPORTATION – 1.5% (Continued) | ||||||||||||||
| XPO CNW, Inc. | 6.70 | 05/01/34 | $ | 45,000 | $ | 41,672 | ||||||||
| XPO Escrow Sub LLC(1) | 7.50 | 11/15/27 | 55,000 | 55,050 | ||||||||||
| XPO, Inc.(1) | 7.13 | 06/01/31 | 70,000 | 68,271 | ||||||||||
| 626,451 | ||||||||||||||
| TOTAL CORPORATE BONDS (Cost - $41,675,605) | 39,934,005 | |||||||||||||
| SHORT-TERM INVESTMENTS – 1.0% | ||||||||||||||
| TIME DEPOSITS – 1.0% | ||||||||||||||
| Sumitomo, Tokyo | 4.68 | 11/01/23 | 412,811 | 412,811 | ||||||||||
| TOTAL SHORT-TERM INVESTMENTS (Cost - $412,811) | 412,811 | |||||||||||||
| TOTAL INVESTMENTS – 98.8% (Cost - $42,088,416) | $ | 40,346,816 | ||||||||||||
| OTHER ASSETS LESS LIABILITIES – 1.2% | 497,638 | |||||||||||||
| NET ASSETS – 100.0% | $ | 40,844,454 | ||||||||||||
| (1) | Security was purchased pursuant to Rule 144A under the Securities Act of 1933 and may not be resold subject to that Rule except to qualified institutional buyers. The aggregate value of Rule 144A holdings at October 31, 2023, amounts to $33,913,161 and represents 83.0% of net assets. These securities have been deemed liquid under procedures approved by the Trust’s Board of Trustees. |
The accompanying notes are an integral part of these financial statements.
41
BONDBLOXX ETF TRUST
BondBloxx USD High Yield Bond Telecom, Media & Technology Sector ETF
Portfolio of Investments
October 31, 2023
| Face | ||||||||||||||
| Rate (%) | Maturity | Amount | Value | |||||||||||
| CORPORATE BONDS – 97.5% | ||||||||||||||
| ADVERTISING – 3.3% | ||||||||||||||
| Advantage Sales & Marketing, Inc.(1) | 6.50 | 11/15/28 | $ | 95,000 | $ | 77,562 | ||||||||
| Clear Channel International BV(1) | 6.63 | 08/01/25 | 35,000 | 34,256 | ||||||||||
| Clear Channel Outdoor Holdings, Inc.(1) | 5.13 | 08/15/27 | 170,000 | 151,243 | ||||||||||
| Clear Channel Outdoor Holdings, Inc.(1) | 7.50 | 06/01/29 | 135,000 | 98,406 | ||||||||||
| Clear Channel Outdoor Holdings, Inc.(1) | 7.75 | 04/15/28 | 120,000 | 91,862 | ||||||||||
| Clear Channel Outdoor Holdings, Inc.(1) | 9.00 | 09/15/28 | 90,000 | 87,722 | ||||||||||
| CMG Media Corp.(1) | 8.88 | 12/15/27 | 112,000 | 86,635 | ||||||||||
| Lamar Media Corp. | 3.63 | 01/15/31 | 67,000 | 54,213 | ||||||||||
| Lamar Media Corp. | 3.75 | 02/15/28 | 77,000 | 68,455 | ||||||||||
| Lamar Media Corp. | 4.00 | 02/15/30 | 65,000 | 55,066 | ||||||||||
| Lamar Media Corp. | 4.88 | 01/15/29 | 50,000 | 45,897 | ||||||||||
| Stagwell Global LLC(1) | 5.63 | 08/15/29 | 137,000 | 113,387 | ||||||||||
| 964,704 | ||||||||||||||
| AUTO PARTS & EQUIPMENT – 1.5% | ||||||||||||||
| Clarios Global LP(1) | 6.75 | 05/15/25 | 55,000 | 54,616 | ||||||||||
| Clarios Global LP/Clarios US Finance Co.(1) | 6.25 | 05/15/26 | 106,000 | 103,734 | ||||||||||
| Clarios Global LP/Clarios US Finance Co.(1) | 6.75 | 05/15/28 | 100,000 | 97,587 | ||||||||||
| Clarios Global LP/Clarios US Finance Co.(1) | 8.50 | 05/15/27 | 195,000 | 192,358 | ||||||||||
| 448,295 | ||||||||||||||
| COMMERCIAL SERVICES – 0.5% | ||||||||||||||
| Cimpress PLC | 7.00 | 06/15/26 | 67,000 | 62,059 | ||||||||||
| Deluxe Corp.(1) | 8.00 | 06/01/29 | 65,000 | 51,496 | ||||||||||
| RR Donnelley & Sons Co.(1) | 9.75 | 07/31/28 | 35,000 | 34,347 | ||||||||||
| 147,902 | ||||||||||||||
| COMPUTERS – 6.2% | ||||||||||||||
| Ahead DB Holdings LLC(1) | 6.63 | 05/01/28 | 47,000 | 38,589 | ||||||||||
| Crowdstrike Holdings, Inc. | 3.00 | 02/15/29 | 95,000 | 79,500 | ||||||||||
| McAfee Corp.(1) | 7.38 | 02/15/30 | 248,000 | 198,616 | ||||||||||
| NCR Atleos Escrow Corp.(1) | 9.50 | 04/01/29 | 170,000 | 166,819 | ||||||||||
| NCR Voyix Corp.(1) | 5.00 | 10/01/28 | 80,000 | 69,190 | ||||||||||
| NCR Voyix Corp.(1) | 5.13 | 04/15/29 | 147,000 | 126,566 | ||||||||||
| NCR Voyix Corp.(1) | 5.25 | 10/01/30 | 30,000 | 24,878 | ||||||||||
| Presidio Holdings, Inc.(1) | 4.88 | 02/01/27 | 65,000 | 59,636 | ||||||||||
| Presidio Holdings, Inc.(1) | 8.25 | 02/01/28 | 67,000 | 63,469 | ||||||||||
| Seagate HDD Cayman | 4.09 | 06/01/29 | 47,000 | 40,570 | ||||||||||
| Seagate HDD Cayman | 4.13 | 01/15/31 | 42,000 | 33,442 | ||||||||||
| Seagate HDD Cayman | 4.75 | 01/01/25 | 65,000 | 63,651 | ||||||||||
| Seagate HDD Cayman | 4.88 | 06/01/27 | 55,000 | 51,712 | ||||||||||
| Seagate HDD Cayman | 5.75 | 12/01/34 | 60,000 | 50,847 | ||||||||||
| Seagate HDD Cayman(1) | 8.25 | 12/15/29 | 85,000 | 86,479 | ||||||||||
| Seagate HDD Cayman(1) | 8.50 | 07/15/31 | 75,000 | 76,405 | ||||||||||
| Seagate HDD Cayman(1) | 9.63 | 12/01/32 | 77,800 | 83,023 | ||||||||||
| Unisys Corp.(1) | 6.88 | 11/01/27 | 60,000 | 44,020 | ||||||||||
| Vericast Corp.(1) | 11.00 | 09/15/26 | 152,000 | 161,310 | ||||||||||
The accompanying notes are an integral part of these financial statements.
42
BONDBLOXX ETF TRUST
BondBloxx USD High Yield Bond Telecom, Media & Technology Sector ETF
Portfolio of Investments (Continued)
October 31, 2023
| Face | ||||||||||||||
| Rate (%) | Maturity | Amount | Value | |||||||||||
| COMPUTERS – 6.2% (Continued) | ||||||||||||||
| Virtusa Corp.(1) | 7.13 | 12/15/28 | $ | 42,000 | $ | 33,276 | ||||||||
| Western Digital Corp. | 4.75 | 02/15/26 | 288,000 | 270,337 | ||||||||||
| 1,822,335 | ||||||||||||||
| ELECTRONICS – 2.0% | ||||||||||||||
| Coherent Corp.(1) | 5.00 | 12/15/29 | 122,000 | 103,691 | ||||||||||
| Sensata Technologies BV(1) | 4.00 | 04/15/29 | 125,000 | 106,403 | ||||||||||
| Sensata Technologies BV(1) | 5.00 | 10/01/25 | 105,000 | 102,203 | ||||||||||
| Sensata Technologies BV(1) | 5.63 | 11/01/24 | 35,000 | 34,688 | ||||||||||
| Sensata Technologies BV(1) | 5.88 | 09/01/30 | 60,000 | 54,869 | ||||||||||
| Sensata Technologies, Inc.(1) | 3.75 | 02/15/31 | 95,000 | 76,162 | ||||||||||
| Sensata Technologies, Inc.(1) | 4.38 | 02/15/30 | 55,000 | 46,549 | ||||||||||
| TTM Technologies, Inc.(1) | 4.00 | 03/01/29 | 65,000 | 53,381 | ||||||||||
| 577,946 | ||||||||||||||
| ENGINEERING & CONSTRUCTION – 0.8% | ||||||||||||||
| ATP Tower Holdings LLC/Andean Tower Partners Colombia SAS/Andean Telecom Par(1) | 4.05 | 04/27/26 | 45,000 | 38,497 | ||||||||||
| Cellnex Finance Co. SA(1) | 3.88 | 07/07/41 | 75,000 | 50,045 | ||||||||||
| HTA Group Ltd./Mauritius(1) | 7.00 | 12/18/25 | 102,000 | 98,850 | ||||||||||
| VM Consolidated, Inc.(1) | 5.50 | 04/15/29 | 45,000 | 39,894 | ||||||||||
| 227,286 | ||||||||||||||
| ENTERTAINMENT – 1.1% | ||||||||||||||
| Allen Media LLC/Allen Media Co.-Issuer, Inc.(1) | 10.50 | 02/15/28 | 80,000 | 41,740 | ||||||||||
| Banijay Entertainment SASU(1) | 8.13 | 05/01/29 | 50,000 | 48,793 | ||||||||||
| Lions Gate Capital Holdings LLC(1) | 5.50 | 04/15/29 | 92,000 | 60,630 | ||||||||||
| WMG Acquisition Corp.(1) | 3.00 | 02/15/31 | 130,000 | 101,033 | ||||||||||
| WMG Acquisition Corp.(1) | 3.75 | 12/01/29 | 69,000 | 57,995 | ||||||||||
| WMG Acquisition Corp.(1) | 3.88 | 07/15/30 | 35,000 | 29,128 | ||||||||||
| 339,319 | ||||||||||||||
| INTERNET – 5.5% | ||||||||||||||
| ANGI Group LLC(1) | 3.88 | 08/15/28 | 60,000 | 45,053 | ||||||||||
| Arches Buyer, Inc.(1) | 4.25 | 06/01/28 | 120,000 | 99,520 | ||||||||||
| Arches Buyer, Inc.(1) | 6.13 | 12/01/28 | 60,000 | 48,523 | ||||||||||
| Cablevision Lightpath LLC(1) | 3.88 | 09/15/27 | 60,000 | 49,031 | ||||||||||
| Cablevision Lightpath LLC(1) | 5.63 | 09/15/28 | 50,000 | 37,467 | ||||||||||
| Cars.com, Inc.(1) | 6.38 | 11/01/28 | 50,000 | 44,556 | ||||||||||
| Cogent Communications Group, Inc.(1) | 3.50 | 05/01/26 | 62,000 | 56,187 | ||||||||||
| Cogent Communications Group, Inc.(1) | 7.00 | 06/15/27 | 60,000 | 56,750 | ||||||||||
| Gen Digital, Inc.(1) | 5.00 | 04/15/25 | 137,000 | 132,779 | ||||||||||
| Gen Digital, Inc.(1) | 6.75 | 09/30/27 | 110,000 | 107,198 | ||||||||||
| Gen Digital, Inc.(1) | 7.13 | 09/30/30 | 75,000 | 73,054 | ||||||||||
| Getty Images, Inc.(1) | 9.75 | 03/01/27 | 40,000 | 39,407 | ||||||||||
| Go Daddy Operating Co. LLC/GD Finance Co., Inc.(1) | 3.50 | 03/01/29 | 105,000 | 88,244 | ||||||||||
| Go Daddy Operating Co. LLC/GD Finance Co., Inc.(1) | 5.25 | 12/01/27 | 65,000 | 60,986 | ||||||||||
| ION Trading Technologies Sarl(1) | 5.75 | 05/15/28 | 60,000 | 49,859 | ||||||||||
| Match Group Holdings II LLC(1) | 3.63 | 10/01/31 | 62,000 | 47,640 | ||||||||||
| Match Group Holdings II LLC(1) | 4.13 | 08/01/30 | 60,000 | 48,823 | ||||||||||
| Match Group Holdings II LLC(1) | 4.63 | 06/01/28 | 33,000 | 29,666 | ||||||||||
The accompanying notes are an integral part of these financial statements.
43
BONDBLOXX ETF TRUST
BondBloxx USD High Yield Bond Telecom, Media & Technology Sector ETF
Portfolio of Investments (Continued)
October 31, 2023
| Face | ||||||||||||||
| Rate (%) | Maturity | Amount | Value | |||||||||||
| INTERNET – 5.5% (Continued) | ||||||||||||||
| Match Group Holdings II LLC(1) | 5.00 | 12/15/27 | $ | 75,000 | $ | 69,247 | ||||||||
| Match Group Holdings II LLC(1) | 5.63 | 02/15/29 | 55,000 | 49,709 | ||||||||||
| Millennium Escrow Corp.(1) | 6.63 | 08/01/26 | 95,000 | 70,635 | ||||||||||
| Newfold Digital Holdings Group, Inc.(1) | 6.00 | 02/15/29 | 80,000 | 52,644 | ||||||||||
| Newfold Digital Holdings Group, Inc.(1) | 11.75 | 10/15/28 | 55,000 | 55,612 | ||||||||||
| Northwest Fiber LLC/Northwest Fiber Finance Sub, Inc.(1) | 4.75 | 04/30/27 | 65,000 | 58,076 | ||||||||||
| Northwest Fiber LLC/Northwest Fiber Finance Sub, Inc.(1) | 6.00 | 02/15/28 | 35,000 | 29,013 | ||||||||||
| Northwest Fiber LLC/Northwest Fiber Finance Sub, Inc.(1) | 10.75 | 06/01/28 | 15,000 | 14,372 | ||||||||||
| TripAdvisor, Inc.(1) | 7.00 | 07/15/25 | 60,000 | 59,458 | ||||||||||
| Ziff Davis, Inc.(1) | 4.63 | 10/15/30 | 60,000 | 50,301 | ||||||||||
| 1,623,810 | ||||||||||||||
| MACHINERY-CONSTRUCTION & MINING – 0.3% | ||||||||||||||
| Vertiv Group Corp.(1) | 4.13 | 11/15/28 | 110,000 | 96,257 | ||||||||||
| MEDIA – 39.8% | ||||||||||||||
| Altice Financing SA(1) | 5.00 | 01/15/28 | 155,000 | 126,183 | ||||||||||
| Altice Financing SA(1) | 5.75 | 08/15/29 | 252,000 | 195,148 | ||||||||||
| AMC Networks, Inc. | 4.25 | 02/15/29 | 122,000 | 75,098 | ||||||||||
| AMC Networks, Inc. | 4.75 | 08/01/25 | 102,000 | 93,003 | ||||||||||
| Beasley Mezzanine Holdings LLC(1) | 8.63 | 02/01/26 | 35,000 | 23,144 | ||||||||||
| Block Communications, Inc.(1) | 4.88 | 03/01/28 | 35,000 | 28,771 | ||||||||||
| Cable One, Inc.(1) | 4.00 | 11/15/30 | 80,000 | 59,650 | ||||||||||
| CCO Holdings LLC/CCO Holdings Capital Corp.(1) | 4.25 | 02/01/31 | 375,000 | 292,115 | ||||||||||
| CCO Holdings LLC/CCO Holdings Capital Corp.(1) | 4.25 | 01/15/34 | 248,000 | 179,338 | ||||||||||
| CCO Holdings LLC/CCO Holdings Capital Corp.(1) | 4.50 | 08/15/30 | 342,000 | 274,683 | ||||||||||
| CCO Holdings LLC/CCO Holdings Capital Corp. | 4.50 | 05/01/32 | 359,000 | 275,102 | ||||||||||
| CCO Holdings LLC/CCO Holdings Capital Corp.(1) | 4.50 | 06/01/33 | 222,000 | 165,762 | ||||||||||
| CCO Holdings LLC/CCO Holdings Capital Corp.(1) | 4.75 | 03/01/30 | 380,000 | 314,014 | ||||||||||
| CCO Holdings LLC/CCO Holdings Capital Corp.(1) | 4.75 | 02/01/32 | 150,000 | 117,229 | ||||||||||
| CCO Holdings LLC/CCO Holdings Capital Corp.(1) | 5.00 | 02/01/28 | 312,000 | 280,398 | ||||||||||
| CCO Holdings LLC/CCO Holdings Capital Corp.(1) | 5.13 | 05/01/27 | 407,000 | 375,094 | ||||||||||
| CCO Holdings LLC/CCO Holdings Capital Corp.(1) | 5.38 | 06/01/29 | 186,000 | 163,055 | ||||||||||
| CCO Holdings LLC/CCO Holdings Capital Corp.(1) | 5.50 | 05/01/26 | 93,000 | 88,784 | ||||||||||
| CCO Holdings LLC/CCO Holdings Capital Corp.(1) | 6.38 | 09/01/29 | 195,000 | 178,651 | ||||||||||
| CCO Holdings LLC/CCO Holdings Capital Corp.(1) | 7.38 | 03/01/31 | 135,000 | 127,662 | ||||||||||
| CSC Holdings LLC(1) | 3.38 | 02/15/31 | 120,000 | 76,853 | ||||||||||
| CSC Holdings LLC(1) | 4.13 | 12/01/30 | 132,000 | 88,548 | ||||||||||
| CSC Holdings LLC(1) | 4.50 | 11/15/31 | 180,000 | 119,053 | ||||||||||
| CSC Holdings LLC(1) | 4.63 | 12/01/30 | 257,000 | 130,514 | ||||||||||
| CSC Holdings LLC(1) | 5.00 | 11/15/31 | 110,000 | 56,334 | ||||||||||
| CSC Holdings LLC(1) | 5.38 | 02/01/28 | 120,000 | 95,673 | ||||||||||
| CSC Holdings LLC(1) | 5.50 | 04/15/27 | 190,000 | 159,042 | ||||||||||
| CSC Holdings LLC(1) | 5.75 | 01/15/30 | 277,000 | 145,356 | ||||||||||
| CSC Holdings LLC(1) | 6.50 | 02/01/29 | 215,000 | 170,299 | ||||||||||
| CSC Holdings LLC(1) | 7.50 | 04/01/28 | 125,000 | 80,245 | ||||||||||
| CSC Holdings LLC(1) | 11.25 | 05/15/28 | 125,000 | 119,367 | ||||||||||
| Cumulus Media New Holdings, Inc.(1) | 6.75 | 07/01/26 | 40,000 | 28,637 | ||||||||||
| Directv Financing LLC/Directv Financing Co.-Obligor, Inc.(1) | 5.88 | 08/15/27 | 460,000 | 403,498 | ||||||||||
The accompanying notes are an integral part of these financial statements.
44
BONDBLOXX ETF TRUST
BondBloxx USD High Yield Bond Telecom, Media & Technology Sector ETF
Portfolio of Investments (Continued)
October 31, 2023
| Face | ||||||||||||||
| Rate (%) | Maturity | Amount | Value | |||||||||||
| MEDIA – 39.8% (Continued) | ||||||||||||||
| DISH DBS Corp. | 5.13 | 06/01/29 | $ | 190,000 | $ | 98,075 | ||||||||
| DISH DBS Corp.(1) | 5.25 | 12/01/26 | 345,000 | 278,941 | ||||||||||
| DISH DBS Corp.(1) | 5.75 | 12/01/28 | 310,000 | 225,719 | ||||||||||
| DISH DBS Corp. | 5.88 | 11/15/24 | 245,000 | 225,117 | ||||||||||
| DISH DBS Corp. | 7.38 | 07/01/28 | 132,000 | 74,682 | ||||||||||
| DISH DBS Corp. | 7.75 | 07/01/26 | 252,000 | 169,165 | ||||||||||
| DISH Network Corp.(1) | 11.75 | 11/15/27 | 435,000 | 431,255 | ||||||||||
| Gannett Holdings LLC(1) | 6.00 | 11/01/26 | 42,000 | 35,491 | ||||||||||
| GCI LLC(1) | 4.75 | 10/15/28 | 75,000 | 64,429 | ||||||||||
| Gray Escrow II, Inc.(1) | 5.38 | 11/15/31 | 92,000 | 58,062 | ||||||||||
| Gray Television, Inc.(1) | 4.75 | 10/15/30 | 172,000 | 110,469 | ||||||||||
| Gray Television, Inc.(1) | 5.88 | 07/15/26 | 85,000 | 75,778 | ||||||||||
| Gray Television, Inc.(1) | 7.00 | 05/15/27 | 100,000 | 84,896 | ||||||||||
| iHeartCommunications, Inc.(1) | 4.75 | 01/15/28 | 55,000 | 38,971 | ||||||||||
| iHeartCommunications, Inc.(1) | 5.25 | 08/15/27 | 99,000 | 72,646 | ||||||||||
| iHeartCommunications, Inc. | 6.38 | 05/01/26 | 85,000 | 69,369 | ||||||||||
| iHeartCommunications, Inc. | 8.38 | 05/01/27 | 133,000 | 81,657 | ||||||||||
| LCPR Senior Secured Financing DAC(1) | 5.13 | 07/15/29 | 100,000 | 78,002 | ||||||||||
| LCPR Senior Secured Financing DAC(1) | 6.75 | 10/15/27 | 145,000 | 131,373 | ||||||||||
| Liberty Interactive LLC | 8.25 | 02/01/30 | 65,000 | 16,738 | ||||||||||
| Liberty Interactive LLC | 8.50 | 07/15/29 | 35,000 | 9,238 | ||||||||||
| McGraw-Hill Education, Inc.(1) | 5.75 | 08/01/28 | 100,000 | 84,390 | ||||||||||
| McGraw-Hill Education, Inc.(1) | 8.00 | 08/01/29 | 90,000 | 74,277 | ||||||||||
| Midcontinent Communications/Midcontinent Finance Corp.(1) | 5.38 | 08/15/27 | 45,000 | 40,884 | ||||||||||
| News Corp.(1) | 3.88 | 05/15/29 | 125,000 | 107,131 | ||||||||||
| News Corp.(1) | 5.13 | 02/15/32 | 60,000 | 51,865 | ||||||||||
| Nexstar Media, Inc.(1) | 4.75 | 11/01/28 | 125,000 | 105,112 | ||||||||||
| Nexstar Media, Inc.(1) | 5.63 | 07/15/27 | 213,000 | 191,849 | ||||||||||
| Paramount Global | 6.25 | 02/28/57 | 80,000 | 57,470 | ||||||||||
| Paramount Global | 6.38 | 03/30/62 | 122,000 | 89,898 | ||||||||||
| Radiate Holdco LLC/Radiate Finance, Inc.(1) | 4.50 | 09/15/26 | 117,000 | 89,572 | ||||||||||
| Radiate Holdco LLC/Radiate Finance, Inc.(1) | 6.50 | 09/15/28 | 122,000 | 60,517 | ||||||||||
| Scripps Escrow II, Inc.(1) | 3.88 | 01/15/29 | 65,000 | 49,413 | ||||||||||
| Scripps Escrow II, Inc.(1) | 5.38 | 01/15/31 | 45,000 | 27,977 | ||||||||||
| Scripps Escrow, Inc.(1) | 5.88 | 07/15/27 | 55,000 | 41,163 | ||||||||||
| Sinclair Television Group, Inc.(1) | 4.13 | 12/01/30 | 87,000 | 55,055 | ||||||||||
| Sinclair Television Group, Inc.(1) | 5.13 | 02/15/27 | 30,000 | 23,636 | ||||||||||
| Sinclair Television Group, Inc.(1) | 5.50 | 03/01/30 | 65,000 | 35,397 | ||||||||||
| Sirius XM Radio, Inc.(1) | 3.13 | 09/01/26 | 123,000 | 110,432 | ||||||||||
| Sirius XM Radio, Inc.(1) | 3.88 | 09/01/31 | 185,000 | 139,491 | ||||||||||
| Sirius XM Radio, Inc.(1) | 4.00 | 07/15/28 | 250,000 | 212,839 | ||||||||||
| Sirius XM Radio, Inc.(1) | 4.13 | 07/01/30 | 185,000 | 147,075 | ||||||||||
| Sirius XM Radio, Inc.(1) | 5.00 | 08/01/27 | 185,000 | 169,793 | ||||||||||
| Sirius XM Radio, Inc.(1) | 5.50 | 07/01/29 | 157,000 | 139,289 | ||||||||||
| Spanish Broadcasting System, Inc.(1) | 9.75 | 03/01/26 | 37,000 | 22,824 | ||||||||||
| TEGNA, Inc. | 4.63 | 03/15/28 | 125,000 | 108,281 | ||||||||||
| TEGNA, Inc.(1) | 4.75 | 03/15/26 | 67,000 | 62,593 | ||||||||||
| TEGNA, Inc. | 5.00 | 09/15/29 | 135,000 | 113,278 | ||||||||||
| Townsquare Media, Inc.(1) | 6.88 | 02/01/26 | 65,000 | 60,143 | ||||||||||
The accompanying notes are an integral part of these financial statements.
45
BONDBLOXX ETF TRUST
BondBloxx USD High Yield Bond Telecom, Media & Technology Sector ETF
Portfolio of Investments (Continued)
October 31, 2023
| Face | ||||||||||||||
| Rate (%) | Maturity | Amount | Value | |||||||||||
| MEDIA – 39.8% (Continued) | ||||||||||||||
| Univision Communications, Inc.(1) | 4.50 | 05/01/29 | $ | 127,000 | $ | 101,093 | ||||||||
| Univision Communications, Inc.(1) | 5.13 | 02/15/25 | 129,000 | 126,097 | ||||||||||
| Univision Communications, Inc.(1) | 6.63 | 06/01/27 | 185,000 | 169,110 | ||||||||||
| Univision Communications, Inc.(1) | 7.38 | 06/30/30 | 115,000 | 101,372 | ||||||||||
| Univision Communications, Inc.(1) | 8.00 | 08/15/28 | 65,000 | 61,434 | ||||||||||
| UPC Broadband FinCo. BV(1) | 4.88 | 07/15/31 | 151,000 | 120,690 | ||||||||||
| UPC Holding BV(1) | 5.50 | 01/15/28 | 60,000 | 52,404 | ||||||||||
| Urban One, Inc.(1) | 7.38 | 02/01/28 | 90,000 | 74,085 | ||||||||||
| Videotron Ltd.(1) | 3.63 | 06/15/29 | 50,000 | 42,195 | ||||||||||
| Videotron Ltd.(1) | 5.13 | 04/15/27 | 85,000 | 79,190 | ||||||||||
| Virgin Media Finance PLC(1) | 5.00 | 07/15/30 | 117,000 | 92,099 | ||||||||||
| Virgin Media Secured Finance PLC(1) | 4.50 | 08/15/30 | 115,000 | 94,966 | ||||||||||
| Virgin Media Secured Finance PLC(1) | 5.50 | 05/15/29 | 175,000 | 155,143 | ||||||||||
| Virgin Media Vendor Financing Notes IV DAC(1) | 5.00 | 07/15/28 | 65,000 | 55,242 | ||||||||||
| VZ Secured Financing BV(1) | 5.00 | 01/15/32 | 192,000 | 145,811 | ||||||||||
| Ziggo Bond Co. BV(1) | 5.13 | 02/28/30 | 70,000 | 51,071 | ||||||||||
| Ziggo Bond Co. BV(1) | 6.00 | 01/15/27 | 75,000 | 68,776 | ||||||||||
| Ziggo BV(1) | 4.88 | 01/15/30 | 122,000 | 97,546 | ||||||||||
| 11,696,344 | ||||||||||||||
| OFFICE/BUSINESS EQUIPMENT – 0.7% | ||||||||||||||
| Xerox Corp. | 4.80 | 03/01/35 | 32,000 | 19,503 | ||||||||||
| Xerox Corp. | 6.75 | 12/15/39 | 45,000 | 29,339 | ||||||||||
| Xerox Holdings Corp.(1) | 5.00 | 08/15/25 | 90,000 | 82,888 | ||||||||||
| Xerox Holdings Corp.(1) | 5.50 | 08/15/28 | 95,000 | 73,531 | ||||||||||
| 205,261 | ||||||||||||||
| PACKAGING & CONTAINERS – 1.0% | ||||||||||||||
| LABL, Inc.(1) | 5.88 | 11/01/28 | 65,000 | 55,128 | ||||||||||
| LABL, Inc.(1) | 6.75 | 07/15/26 | 90,000 | 82,821 | ||||||||||
| LABL, Inc.(1) | 8.25 | 11/01/29 | 60,000 | 44,662 | ||||||||||
| LABL, Inc.(1) | 9.50 | 11/01/28 | 35,000 | 33,870 | ||||||||||
| LABL, Inc.(1) | 10.50 | 07/15/27 | 80,000 | 69,342 | ||||||||||
| 285,823 | ||||||||||||||
| SEMICONDUCTORS – 2.1% | ||||||||||||||
| Amkor Technology, Inc.(1) | 6.63 | 09/15/27 | 65,000 | 63,333 | ||||||||||
| ams-OSRAM AG(1) | 7.00 | 07/31/25 | 60,000 | 58,952 | ||||||||||
| Entegris Escrow Corp.(1) | 4.75 | 04/15/29 | 200,000 | 179,304 | ||||||||||
| Entegris Escrow Corp.(1) | 5.95 | 06/15/30 | 112,000 | 102,591 | ||||||||||
| Entegris, Inc.(1) | 3.63 | 05/01/29 | 50,000 | 41,865 | ||||||||||
| Entegris, Inc.(1) | 4.38 | 04/15/28 | 50,000 | 44,667 | ||||||||||
| ON Semiconductor Corp.(1) | 3.88 | 09/01/28 | 90,000 | 77,415 | ||||||||||
| Synaptics, Inc.(1) | 4.00 | 06/15/29 | 45,000 | 37,182 | ||||||||||
| 605,309 | ||||||||||||||
| SOFTWARE – 9.8% | ||||||||||||||
| Alteryx, Inc.(1) | 8.75 | 03/15/28 | 60,000 | 59,305 | ||||||||||
| Boxer Parent Co., Inc.(1) | 7.13 | 10/02/25 | 77,000 | 76,038 | ||||||||||
| Boxer Parent Co., Inc.(1) | 9.13 | 03/01/26 | 40,000 | 39,878 | ||||||||||
The accompanying notes are an integral part of these financial statements.
46
BONDBLOXX ETF TRUST
BondBloxx USD High Yield Bond Telecom, Media & Technology Sector ETF
Portfolio of Investments (Continued)
October 31, 2023
| Face | ||||||||||||||
| Rate (%) | Maturity | Amount | Value | |||||||||||
| SOFTWARE – 9.8% (Continued) | ||||||||||||||
| Capstone Borrower, Inc.(1) | 8.00 | 06/15/30 | $ | 45,000 | $ | 43,707 | ||||||||
| Castle US Holding Corp.(1) | 9.50 | 02/15/28 | 40,000 | 21,106 | ||||||||||
| Central Parent LLC/CDK Global II LLC/CDK Financing Co., Inc.(1) | 8.00 | 06/15/29 | 95,000 | 93,931 | ||||||||||
| Central Parent, Inc./CDK Global, Inc.(1) | 7.25 | 06/15/29 | 95,000 | 91,364 | ||||||||||
| Cloud Software Group, Inc.(1) | 6.50 | 03/31/29 | 498,000 | 437,696 | ||||||||||
| Cloud Software Group, Inc.(1) | 9.00 | 09/30/29 | 475,000 | 404,940 | ||||||||||
| Elastic NV(1) | 4.13 | 07/15/29 | 70,000 | 59,065 | ||||||||||
| Fair Isaac Corp.(1) | 4.00 | 06/15/28 | 109,000 | 97,186 | ||||||||||
| Fair Isaac Corp.(1) | 5.25 | 05/15/26 | 50,000 | 48,171 | ||||||||||
| Helios Software Holdings, Inc./ION Corporate Solutions Finance Sarl(1) | 4.63 | 05/01/28 | 45,000 | 37,823 | ||||||||||
| MicroStrategy, Inc.(1) | 6.13 | 06/15/28 | 60,000 | 54,369 | ||||||||||
| Open Text Corp.(1) | 3.88 | 02/15/28 | 105,000 | 91,377 | ||||||||||
| Open Text Corp.(1) | 3.88 | 12/01/29 | 112,000 | 91,732 | ||||||||||
| Open Text Holdings, Inc.(1) | 4.13 | 02/15/30 | 115,000 | 95,433 | ||||||||||
| Open Text Holdings, Inc.(1) | 4.13 | 12/01/31 | 80,000 | 62,932 | ||||||||||
| PTC, Inc.(1) | 3.63 | 02/15/25 | 62,000 | 59,833 | ||||||||||
| PTC, Inc.(1) | 4.00 | 02/15/28 | 65,000 | 57,707 | ||||||||||
| Rackspace Technology Global, Inc.(1) | 3.50 | 02/15/28 | 35,000 | 15,405 | ||||||||||
| Rackspace Technology Global, Inc.(1) | 5.38 | 12/01/28 | 73,000 | 21,419 | ||||||||||
| RingCentral, Inc.(1) | 8.50 | 08/15/30 | 50,000 | 47,557 | ||||||||||
| ROBLOX Corp.(1) | 3.88 | 05/01/30 | 122,000 | 99,122 | ||||||||||
| Rocket Software, Inc.(1) | 6.50 | 02/15/29 | 70,000 | 57,165 | ||||||||||
| SS&C Technologies, Inc.(1) | 5.50 | 09/30/27 | 250,000 | 234,818 | ||||||||||
| Twilio, Inc. | 3.63 | 03/15/29 | 63,000 | 52,441 | ||||||||||
| Twilio, Inc. | 3.88 | 03/15/31 | 63,000 | 50,353 | ||||||||||
| Veritas US, Inc./Veritas Bermuda Ltd.(1) | 7.50 | 09/01/25 | 217,000 | 177,816 | ||||||||||
| West Technology Group LLC(1) | 8.50 | 04/10/27 | 45,000 | 38,925 | ||||||||||
| ZoomInfo Technologies LLC/ZoomInfo Finance Corp.(1) | 3.88 | 02/01/29 | 80,000 | 66,130 | ||||||||||
| 2,884,744 | ||||||||||||||
| TELECOMMUNICATIONS – 22.9% | ||||||||||||||
| Altice France Holding SA(1) | 6.00 | 02/15/28 | 135,000 | 59,332 | ||||||||||
| Altice France Holding SA(1) | 10.50 | 05/15/27 | 185,000 | 100,801 | ||||||||||
| Altice France SA/France(1) | 5.13 | 01/15/29 | 60,000 | 41,473 | ||||||||||
| Altice France SA/France(1) | 5.13 | 07/15/29 | 312,000 | 213,828 | ||||||||||
| Altice France SA/France(1) | 5.50 | 01/15/28 | 140,000 | 104,155 | ||||||||||
| Altice France SA/France(1) | 5.50 | 10/15/29 | 248,000 | 170,784 | ||||||||||
| Altice France SA/France(1) | 8.13 | 02/01/27 | 227,000 | 191,611 | ||||||||||
| British Telecommunications PLC(1) | 4.25 | 11/23/81 | 60,000 | 52,468 | ||||||||||
| British Telecommunications PLC(1) | 4.88 | 11/23/81 | 62,000 | 50,129 | ||||||||||
| C&W Senior Financing DAC(1) | 6.88 | 09/15/27 | 132,000 | 113,622 | ||||||||||
| Ciena Corp.(1) | 4.00 | 01/31/30 | 50,000 | 41,718 | ||||||||||
| CommScope Technologies LLC(1) | 5.00 | 03/15/27 | 142,000 | 52,400 | ||||||||||
| CommScope Technologies LLC(1) | 6.00 | 06/15/25 | 155,000 | 93,233 | ||||||||||
| CommScope, Inc.(1) | 4.75 | 09/01/29 | 155,000 | 106,009 | ||||||||||
| CommScope, Inc.(1) | 6.00 | 03/01/26 | 190,000 | 159,853 | ||||||||||
| CommScope, Inc.(1) | 7.13 | 07/01/28 | 60,000 | 22,557 | ||||||||||
| CommScope, Inc.(1) | 8.25 | 03/01/27 | 107,000 | 44,590 | ||||||||||
The accompanying notes are an integral part of these financial statements.
47
BONDBLOXX ETF TRUST
BondBloxx USD High Yield Bond Telecom, Media & Technology Sector ETF
Portfolio of Investments (Continued)
October 31, 2023
| Face | ||||||||||||||
| Rate (%) | Maturity | Amount | Value | |||||||||||
| TELECOMMUNICATIONS – 22.9% (Continued) | ||||||||||||||
| Connect FinCo. Sarl/Connect US FinCo. LLC(1) | 6.75 | 10/01/26 | $ | 260,000 | $ | 242,654 | ||||||||
| Consolidated Communications, Inc.(1) | 5.00 | 10/01/28 | 55,000 | 41,479 | ||||||||||
| Consolidated Communications, Inc.(1) | 6.50 | 10/01/28 | 87,000 | 68,904 | ||||||||||
| Embarq Corp. | 8.00 | 06/01/36 | 150,000 | 81,908 | ||||||||||
| Frontier Communications Holdings LLC(1) | 5.00 | 05/01/28 | 225,000 | 194,456 | ||||||||||
| Frontier Communications Holdings LLC(1) | 5.88 | 10/15/27 | 150,000 | 136,877 | ||||||||||
| Frontier Communications Holdings LLC | 5.88 | 11/01/29 | 95,000 | 71,522 | ||||||||||
| Frontier Communications Holdings LLC(1) | 6.00 | 01/15/30 | 125,000 | 94,245 | ||||||||||
| Frontier Communications Holdings LLC(1) | 6.75 | 05/01/29 | 125,000 | 99,069 | ||||||||||
| Frontier Communications Holdings LLC(1) | 8.63 | 03/15/31 | 90,000 | 84,706 | ||||||||||
| Frontier Communications Holdings LLC(1) | 8.75 | 05/15/30 | 152,000 | 144,988 | ||||||||||
| GoTo Group, Inc.(1) | 5.50 | 09/01/27 | 117,000 | 61,145 | ||||||||||
| Hughes Satellite Systems Corp. | 5.25 | 08/01/26 | 95,000 | 85,529 | ||||||||||
| Hughes Satellite Systems Corp. | 6.63 | 08/01/26 | 90,000 | 76,366 | ||||||||||
| Iliad Holding SASU(1) | 6.50 | 10/15/26 | 150,000 | 140,303 | ||||||||||
| Iliad Holding SASU(1) | 7.00 | 10/15/28 | 105,000 | 95,105 | ||||||||||
| Intelsat Jackson Holdings SA(1) | 6.50 | 03/15/30 | 375,000 | 330,199 | ||||||||||
| Level 3 Financing, Inc.(1) | 3.40 | 03/01/27 | 95,000 | 88,040 | ||||||||||
| Level 3 Financing, Inc.(1) | 3.63 | 01/15/29 | 105,000 | 53,747 | ||||||||||
| Level 3 Financing, Inc.(1) | 3.75 | 07/15/29 | 112,000 | 57,075 | ||||||||||
| Level 3 Financing, Inc.(1) | 3.88 | 11/15/29 | 95,000 | 84,740 | ||||||||||
| Level 3 Financing, Inc.(1) | 4.25 | 07/01/28 | 147,000 | 83,261 | ||||||||||
| Level 3 Financing, Inc.(1) | 4.63 | 09/15/27 | 123,000 | 81,902 | ||||||||||
| Level 3 Financing, Inc.(1) | 10.50 | 05/15/30 | 117,000 | 117,196 | ||||||||||
| Lumen Technologies, Inc.(1) | 4.00 | 02/15/27 | 158,000 | 106,794 | ||||||||||
| Lumen Technologies, Inc.(1) | 4.50 | 01/15/29 | 47,000 | 12,925 | ||||||||||
| Lumen Technologies, Inc.(1) | 5.13 | 12/15/26 | 55,000 | 27,072 | ||||||||||
| Lumen Technologies, Inc. | 7.60 | 09/15/39 | 42,000 | 12,298 | ||||||||||
| Lumen Technologies, Inc. | 7.65 | 03/15/42 | 35,000 | 9,833 | ||||||||||
| Millicom International Cellular SA(1) | 4.50 | 04/27/31 | 115,000 | 86,825 | ||||||||||
| Millicom International Cellular SA(1) | 5.13 | 01/15/28 | 45,000 | 38,919 | ||||||||||
| Millicom International Cellular SA(1) | 6.25 | 03/25/29 | 74,700 | 65,035 | ||||||||||
| Qwest Corp. | 7.25 | 09/15/25 | 30,000 | 28,765 | ||||||||||
| Rogers Communications, Inc.(1) | 5.25 | 03/15/82 | 95,000 | 83,720 | ||||||||||
| Sable International Finance Ltd.(1) | 5.75 | 09/07/27 | 80,000 | 72,582 | ||||||||||
| Telecom Italia Capital SA | 6.00 | 09/30/34 | 82,000 | 67,573 | ||||||||||
| Telecom Italia Capital SA | 6.38 | 11/15/33 | 165,000 | 140,857 | ||||||||||
| Telecom Italia Capital SA | 7.20 | 07/18/36 | 125,000 | 108,203 | ||||||||||
| Telecom Italia Capital SA | 7.72 | 06/04/38 | 130,000 | 114,904 | ||||||||||
| Telesat Canada/Telesat LLC(1) | 4.88 | 06/01/27 | 45,000 | 26,806 | ||||||||||
| Telesat Canada/Telesat LLC(1) | 5.63 | 12/06/26 | 65,000 | 41,544 | ||||||||||
| United States Cellular Corp. | 6.70 | 12/15/33 | 70,000 | 66,500 | ||||||||||
| Viasat, Inc.(1) | 5.63 | 09/15/25 | 90,000 | 83,689 | ||||||||||
| Viasat, Inc.(1) | 5.63 | 04/15/27 | 75,000 | 65,543 | ||||||||||
| Viasat, Inc.(1) | 6.50 | 07/15/28 | 50,000 | 35,492 | ||||||||||
| Viasat, Inc.(1) | 7.50 | 05/30/31 | 90,000 | 59,022 | ||||||||||
| Viavi Solutions, Inc.(1) | 3.75 | 10/01/29 | 50,000 | 38,975 | ||||||||||
| Vmed O2 UK Financing I PLC(1) | 4.25 | 01/31/31 | 167,000 | 131,516 | ||||||||||
| Vmed O2 UK Financing I PLC(1) | 4.75 | 07/15/31 | 175,000 | 141,018 | ||||||||||
The accompanying notes are an integral part of these financial statements.
48
BONDBLOXX ETF TRUST
BondBloxx USD High Yield Bond Telecom, Media & Technology Sector ETF
Portfolio of Investments (Continued)
October 31, 2023
| Face | ||||||||||||||
| Rate (%) | Maturity | Amount | Value | |||||||||||
| TELECOMMUNICATIONS – 22.9% (Continued) | ||||||||||||||
| Vodafone Group PLC | 3.25 | 06/04/81 | $ | 64,000 | $ | 56,280 | ||||||||
| Vodafone Group PLC | 4.13 | 06/04/81 | 127,000 | 96,242 | ||||||||||
| Vodafone Group PLC | 5.13 | 06/04/81 | 120,000 | 76,460 | ||||||||||
| Vodafone Group PLC | 7.00 | 04/04/79 | 245,000 | 237,113 | ||||||||||
| Windstream Escrow LLC/Windstream Escrow Finance Corp.(1) | 7.75 | 08/15/28 | 175,000 | 138,935 | ||||||||||
| Zayo Group Holdings, Inc.(1) | 4.00 | 03/01/27 | 185,000 | 139,454 | ||||||||||
| Zayo Group Holdings, Inc.(1) | 6.13 | 03/01/28 | 132,000 | 87,567 | ||||||||||
| 6,732,440 | ||||||||||||||
| TOTAL CORPORATE BONDS (Cost - $30,096,994) | 28,657,775 | |||||||||||||
| SHORT-TERM INVESTMENTS – 1.0% | ||||||||||||||
| TIME DEPOSITS – 1.0% | ||||||||||||||
| Citibank, New York | 4.68 | 11/01/23 | 298,012 | 298,012 | ||||||||||
| TOTAL SHORT-TERM INVESTMENTS (Cost - $298,012) | 298,012 | |||||||||||||
| TOTAL INVESTMENTS – 98.5% (Cost - $30,395,006) | $ | 28,955,787 | ||||||||||||
| OTHER ASSETS LESS LIABILITIES – 1.5% | 438,986 | |||||||||||||
| NET ASSETS – 100.0% | $ | 29,394,773 | ||||||||||||
| (1) | Security was purchased pursuant to Rule 144A under the Securities Act of 1933 and may not be resold subject to that Rule except to qualified institutional buyers. The aggregate value of Rule 144A holdings at October 31, 2023, amounts to $24,743,866 and represents 84.2% of net assets. These securities have been deemed liquid under procedures approved by the Trust’s Board of Trustees. |
The accompanying notes are an integral part of these financial statements.
49
BONDBLOXX ETF TRUST
BondBloxx USD High Yield Bond Healthcare Sector ETF
Portfolio of Investments
October 31, 2023
| Rate (%) | Maturity | Face Amount | Value | ||||||||||
| CORPORATE BONDS – 97.6% | |||||||||||||
| BIOTECHNOLOGY – 0.2% | |||||||||||||
| Emergent BioSolutions, Inc.(1) | 3.88 | 08/15/28 | $ | 53,000 | $ | 20,892 | |||||||
| COMMERCIAL SERVICES – 7.4% | |||||||||||||
| AMN Healthcare, Inc.(1) | 4.00 | 04/15/29 | 35,000 | 29,028 | |||||||||
| AMN Healthcare, Inc.(1) | 4.63 | 10/01/27 | 70,000 | 62,900 | |||||||||
| Carriage Services, Inc.(1) | 4.25 | 05/15/29 | 48,000 | 39,311 | |||||||||
| MPH Acquisition Holdings LLC(1) | 5.50 | 09/01/28 | 128,000 | 108,947 | |||||||||
| MPH Acquisition Holdings LLC(1) | 5.75 | 11/01/28 | 125,000 | 93,312 | |||||||||
| Service Corp. International/US | 3.38 | 08/15/30 | 105,000 | 84,220 | |||||||||
| Service Corp. International/US | 4.00 | 05/15/31 | 98,000 | 79,433 | |||||||||
| Service Corp. International/US | 4.63 | 12/15/27 | 68,000 | 62,962 | |||||||||
| Service Corp. International/US | 5.13 | 06/01/29 | 91,000 | 83,492 | |||||||||
| StoneMor, Inc.(1) | 8.50 | 05/15/29 | 48,000 | 38,383 | |||||||||
| Verscend Escrow Corp.(1) | 9.75 | 08/15/26 | 135,000 | 134,136 | |||||||||
| 816,124 | |||||||||||||
| HEALTHCARE-PRODUCTS – 13.8% | |||||||||||||
| Avantor Funding, Inc.(1) | 3.88 | 11/01/29 | 95,000 | 79,589 | |||||||||
| Avantor Funding, Inc.(1) | 4.63 | 07/15/28 | 197,000 | 175,594 | |||||||||
| Bausch & Lomb Escrow Corp.(1) | 8.38 | 10/01/28 | 175,000 | 174,037 | |||||||||
| Embecta Corp.(1) | 5.00 | 02/15/30 | 64,000 | 50,893 | |||||||||
| Garden Spinco Corp.(1) | 8.63 | 07/20/30 | 45,000 | 46,479 | |||||||||
| Hologic, Inc.(1) | 3.25 | 02/15/29 | 120,000 | 100,871 | |||||||||
| Hologic, Inc.(1) | 4.63 | 02/01/28 | 48,000 | 43,702 | |||||||||
| Medline Borrower LP(1) | 3.88 | 04/01/29 | 560,000 | 473,368 | |||||||||
| Medline Borrower LP(1) | 5.25 | 10/01/29 | 305,000 | 259,923 | |||||||||
| Teleflex, Inc.(1) | 4.25 | 06/01/28 | 63,000 | 55,665 | |||||||||
| Teleflex, Inc. | 4.63 | 11/15/27 | 60,000 | 54,960 | |||||||||
| 1,515,081 | |||||||||||||
| HEALTHCARE-SERVICES – 53.6% | |||||||||||||
| Acadia Healthcare Co., Inc.(1) | 5.00 | 04/15/29 | 58,000 | 51,775 | |||||||||
| Acadia Healthcare Co., Inc.(1) | 5.50 | 07/01/28 | 58,000 | 53,606 | |||||||||
| AHP Health Partners, Inc.(1) | 5.75 | 07/15/29 | 35,000 | 28,733 | |||||||||
| Catalent Pharma Solutions, Inc.(1) | 3.13 | 02/15/29 | 68,000 | 53,536 | |||||||||
| Catalent Pharma Solutions, Inc.(1) | 3.50 | 04/01/30 | 81,000 | 63,664 | |||||||||
| Catalent Pharma Solutions, Inc.(1) | 5.00 | 07/15/27 | 60,000 | 53,620 | |||||||||
| Charles River Laboratories International, Inc.(1) | 3.75 | 03/15/29 | 60,000 | 50,710 | |||||||||
| Charles River Laboratories International, Inc.(1) | 4.00 | 03/15/31 | 63,000 | 51,492 | |||||||||
| Charles River Laboratories International, Inc.(1) | 4.25 | 05/01/28 | 63,000 | 56,044 | |||||||||
| CHS/Community Health Systems, Inc.(1) | 4.75 | 02/15/31 | 128,000 | 85,942 | |||||||||
| CHS/Community Health Systems, Inc.(1) | 5.25 | 05/15/30 | 187,000 | 132,974 | |||||||||
| CHS/Community Health Systems, Inc.(1) | 5.63 | 03/15/27 | 238,000 | 193,548 | |||||||||
| CHS/Community Health Systems, Inc.(1) | 6.00 | 01/15/29 | 106,000 | 80,408 | |||||||||
| CHS/Community Health Systems, Inc.(1) | 6.13 | 04/01/30 | 157,000 | 61,002 | |||||||||
| CHS/Community Health Systems, Inc.(1) | 6.88 | 04/01/28 | 93,000 | 40,422 | |||||||||
| CHS/Community Health Systems, Inc.(1) | 6.88 | 04/15/29 | 175,000 | 72,442 | |||||||||
| CHS/Community Health Systems, Inc.(1) | 8.00 | 03/15/26 | 263,000 | 240,757 | |||||||||
| CHS/Community Health Systems, Inc.(1) | 8.00 | 12/15/27 | 83,000 | 70,487 | |||||||||
The accompanying notes are an integral part of these financial statements.
50
BONDBLOXX ETF TRUST
BondBloxx USD High Yield Bond Healthcare Sector ETF
Portfolio of Investments (Continued)
October 31, 2023
| Rate (%) | Maturity | Face Amount | Value | ||||||||||
| HEALTHCARE-SERVICES – 53.6% (Continued) | |||||||||||||
| DaVita, Inc.(1) | 3.75 | 02/15/31 | $ | 182,000 | $ | 130,980 | |||||||
| DaVita, Inc.(1) | 4.63 | 06/01/30 | 343,000 | 269,090 | |||||||||
| Encompass Health Corp. | 4.50 | 02/01/28 | 95,000 | 85,744 | |||||||||
| Encompass Health Corp. | 4.63 | 04/01/31 | 50,000 | 41,679 | |||||||||
| Encompass Health Corp. | 4.75 | 02/01/30 | 105,000 | 90,851 | |||||||||
| Encompass Health Corp. | 5.75 | 09/15/25 | 42,000 | 41,002 | |||||||||
| Fortrea Holdings, Inc.(1) | 7.50 | 07/01/30 | 70,000 | 67,637 | |||||||||
| Global Medical Response, Inc.(1) | 6.50 | 10/01/25 | 75,000 | 47,758 | |||||||||
| HealthEquity, Inc.(1) | 4.50 | 10/01/29 | 75,000 | 64,339 | |||||||||
| Heartland Dental LLC/Heartland Dental Finance Corp.(1) | 8.50 | 05/01/26 | 35,000 | 31,889 | |||||||||
| Heartland Dental LLC/Heartland Dental Finance Corp.(1) | 10.50 | 04/30/28 | 90,000 | 86,614 | |||||||||
| IQVIA, Inc.(1) | 5.00 | 10/15/26 | 128,000 | 122,162 | |||||||||
| IQVIA, Inc.(1) | 5.00 | 05/15/27 | 140,000 | 131,855 | |||||||||
| IQVIA, Inc.(1) | 6.50 | 05/15/30 | 60,000 | 58,275 | |||||||||
| Legacy LifePoint Health LLC(1) | 4.38 | 02/15/27 | 75,000 | 62,087 | |||||||||
| LifePoint Health, Inc.(1) | 5.38 | 01/15/29 | 63,000 | 38,231 | |||||||||
| LifePoint Health, Inc.(1) | 9.88 | 08/15/30 | 100,000 | 90,500 | |||||||||
| LifePoint Health, Inc.(1) | 11.00 | 10/15/30 | 135,000 | 127,214 | |||||||||
| ModivCare Escrow Issuer, Inc.(1) | 5.00 | 10/01/29 | 60,000 | 43,788 | |||||||||
| ModivCare, Inc.(1) | 5.88 | 11/15/25 | 63,000 | 59,602 | |||||||||
| Molina Healthcare, Inc.(1) | 3.88 | 11/15/30 | 80,000 | 65,344 | |||||||||
| Molina Healthcare, Inc.(1) | 3.88 | 05/15/32 | 94,000 | 73,974 | |||||||||
| Molina Healthcare, Inc.(1) | 4.38 | 06/15/28 | 100,000 | 89,139 | |||||||||
| Pediatrix Medical Group, Inc.(1) | 5.38 | 02/15/30 | 48,000 | 41,459 | |||||||||
| Prime Healthcare Services, Inc.(1) | 7.25 | 11/01/25 | 110,000 | 100,217 | |||||||||
| Radiology Partners, Inc.(1) | 9.25 | 02/01/28 | 76,000 | 28,657 | |||||||||
| RegionalCare Hospital Partners Holdings, Inc./LifePoint Health, Inc.(1) | 9.75 | 12/01/26 | 155,000 | 145,082 | |||||||||
| RP Escrow Issuer LLC(1) | 5.25 | 12/15/25 | 99,000 | 70,643 | |||||||||
| Select Medical Corp.(1) | 6.25 | 08/15/26 | 151,000 | 147,018 | |||||||||
| Star Parent, Inc.(1) | 9.00 | 10/01/30 | 125,000 | 124,204 | |||||||||
| Surgery Center Holdings, Inc.(1) | 10.00 | 04/15/27 | 37,000 | 36,965 | |||||||||
| Tenet Healthcare Corp. | 4.25 | 06/01/29 | 170,000 | 145,667 | |||||||||
| Tenet Healthcare Corp. | 4.38 | 01/15/30 | 180,000 | 152,419 | |||||||||
| Tenet Healthcare Corp. | 4.63 | 06/15/28 | 75,000 | 66,788 | |||||||||
| Tenet Healthcare Corp. | 4.88 | 01/01/26 | 253,000 | 242,709 | |||||||||
| Tenet Healthcare Corp. | 5.13 | 11/01/27 | 180,000 | 166,336 | |||||||||
| Tenet Healthcare Corp. | 6.13 | 10/01/28 | 310,000 | 287,798 | |||||||||
| Tenet Healthcare Corp. | 6.13 | 06/15/30 | 250,000 | 231,693 | |||||||||
| Tenet Healthcare Corp. | 6.25 | 02/01/27 | 188,000 | 180,461 | |||||||||
| Tenet Healthcare Corp.(1) | 6.75 | 05/15/31 | 165,000 | 156,896 | |||||||||
| Tenet Healthcare Corp. | 6.88 | 11/15/31 | 47,000 | 43,386 | |||||||||
| Toledo Hospital | 4.98 | 11/15/45 | 25,000 | 14,598 | |||||||||
| Toledo Hospital | 5.33 | 11/15/28 | 40,000 | 30,750 | |||||||||
| Toledo Hospital | 6.02 | 11/15/48 | 57,000 | 38,190 | |||||||||
| US Acute Care Solutions LLC(1) | 6.38 | 03/01/26 | 93,000 | 79,212 | |||||||||
| 5,892,064 | |||||||||||||
The accompanying notes are an integral part of these financial statements.
51
BONDBLOXX ETF TRUST
BondBloxx USD High Yield Bond Healthcare Sector ETF
Portfolio of Investments (Continued)
October 31, 2023
| Rate (%) | Maturity | Face Amount | Value | ||||||||||
| PHARMACEUTICALS – 19.6% | |||||||||||||
| 180 Medical, Inc.(1) | 3.88 | 10/15/29 | $ | 65,000 | $ | 54,073 | |||||||
| AdaptHealth LLC(1) | 4.63 | 08/01/29 | 60,000 | 44,910 | |||||||||
| AdaptHealth LLC(1) | 5.13 | 03/01/30 | 75,000 | 56,887 | |||||||||
| AdaptHealth LLC(1) | 6.13 | 08/01/28 | 45,000 | 36,989 | |||||||||
| Bausch Health Cos, Inc.(1) | 4.88 | 06/01/28 | 200,000 | 99,989 | |||||||||
| Bausch Health Cos, Inc.(1) | 5.50 | 11/01/25 | 205,000 | 176,972 | |||||||||
| Bausch Health Cos, Inc.(1) | 5.75 | 08/15/27 | 70,000 | 36,466 | |||||||||
| Bausch Health Cos, Inc.(1) | 6.13 | 02/01/27 | 120,000 | 67,070 | |||||||||
| Bausch Health Cos, Inc.(1) | 11.00 | 09/30/28 | 215,000 | 131,688 | |||||||||
| Bausch Health Cos, Inc.(1) | 14.00 | 10/15/30 | 45,000 | 24,460 | |||||||||
| Cheplapharm Arzneimittel GmbH(1) | 5.50 | 01/15/28 | 60,000 | 53,278 | |||||||||
| Elanco Animal Health, Inc. | 6.65 | 08/28/28 | 93,000 | 89,048 | |||||||||
| Grifols SA(1) | 4.75 | 10/15/28 | 88,000 | 73,996 | |||||||||
| Jazz Securities DAC(1) | 4.38 | 01/15/29 | 187,000 | 162,790 | |||||||||
| Option Care Health, Inc.(1) | 4.38 | 10/31/29 | 64,000 | 53,560 | |||||||||
| Organon & Co./Organon Foreign Debt Co.-Issuer BV(1) | 4.13 | 04/30/28 | 253,000 | 218,765 | |||||||||
| Organon & Co./Organon Foreign Debt Co.-Issuer BV(1) | 5.13 | 04/30/31 | 250,000 | 195,486 | |||||||||
| Owens & Minor, Inc.(1) | 4.50 | 03/31/29 | 58,000 | 46,589 | |||||||||
| Owens & Minor, Inc.(1) | 6.63 | 04/01/30 | 71,000 | 62,124 | |||||||||
| P&L Development LLC/PLD Finance Corp.(1) | 7.75 | 11/15/25 | 58,000 | 39,014 | |||||||||
| Perrigo Finance Unlimited Co. | 3.90 | 12/15/24 | 85,000 | 82,530 | |||||||||
| Perrigo Finance Unlimited Co. | 4.38 | 03/15/26 | 85,000 | 79,882 | |||||||||
| Perrigo Finance Unlimited Co. | 4.65 | 06/15/30 | 100,000 | 83,621 | |||||||||
| Perrigo Finance Unlimited Co. | 4.90 | 12/15/44 | 33,000 | 22,577 | |||||||||
| PRA Health Sciences, Inc.(1) | 2.88 | 07/15/26 | 64,000 | 58,574 | |||||||||
| Prestige Brands, Inc.(1) | 3.75 | 04/01/31 | 77,000 | 61,234 | |||||||||
| Prestige Brands, Inc.(1) | 5.13 | 01/15/28 | 50,000 | 46,150 | |||||||||
| 2,158,722 | |||||||||||||
| SOFTWARE – 3.0% | |||||||||||||
| AthenaHealth Group, Inc.(1) | 6.50 | 02/15/30 | 291,000 | 238,059 | |||||||||
| Consensus Cloud Solutions, Inc.(1) | 6.00 | 10/15/26 | 40,000 | 37,088 | |||||||||
| Consensus Cloud Solutions, Inc.(1) | 6.50 | 10/15/28 | 60,000 | 49,788 | |||||||||
| 324,935 | |||||||||||||
| TOTAL CORPORATE BONDS (Cost - $11,545,287) | 10,727,818 | ||||||||||||
| SHORT-TERM INVESTMENTS – 2.2% | |||||||||||||
| TIME DEPOSITS – 2.2% | |||||||||||||
| Citibank, New York | 4.68 | 11/01/23 | 236,677 | 236,677 | |||||||||
| TOTAL SHORT-TERM INVESTMENTS (Cost - $236,677) | 236,677 | ||||||||||||
| TOTAL INVESTMENTS – 99.8% (Cost - $11,781,964) | $ | 10,964,495 | |||||||||||
| OTHER ASSETS LESS LIABILITIES – 0.2% | 23,950 | ||||||||||||
| NET ASSETS – 100.0% | $ | 10,988,445 | |||||||||||
| (1) | Security was purchased pursuant to Rule 144A under the Securities Act of 1933 and may not be resold subject to that Rule except to qualified institutional buyers. The aggregate value of Rule 144A holdings at October 31, 2023, amounts to $8,145,022 and represents 74.1% of net assets. These securities have been deemed liquid under procedures approved by the Trust’s Board of Trustees. |
The accompanying notes are an integral part of these financial statements.
52
BONDBLOXX ETF TRUST
BondBloxx USD High Yield Bond Financial & REIT Sector ETF
Portfolio of Investments
October 31, 2023
| Rate (%) | Maturity | Face Amount | Value | ||||||||||
| CORPORATE BONDS – 97.7% | |||||||||||||
| ADVERTISING – 1.4% | |||||||||||||
| Outfront Media Capital LLC/Outfront Media Capital Corp.(1) | 4.25 | 01/15/29 | $ | 115,000 | $ | 93,786 | |||||||
| Outfront Media Capital LLC/Outfront Media Capital Corp.(1) | 4.63 | 03/15/30 | 108,000 | 86,774 | |||||||||
| Outfront Media Capital LLC/Outfront Media Capital Corp.(1) | 5.00 | 08/15/27 | 143,000 | 127,147 | |||||||||
| Outfront Media Capital LLC/Outfront Media Capital Corp.(1) | 6.25 | 06/15/25 | 95,000 | 93,785 | |||||||||
| 401,492 | |||||||||||||
| BANKS – 8.9% | |||||||||||||
| Associated Banc-Corp. | 4.25 | 01/15/25 | 55,000 | 52,736 | |||||||||
| Dresdner Funding Trust I(1) | 8.15 | 06/30/31 | 225,000 | 235,828 | |||||||||
| Freedom Mortgage Corp.(1) | 6.63 | 01/15/27 | 125,000 | 108,303 | |||||||||
| Freedom Mortgage Corp.(1) | 7.63 | 05/01/26 | 115,000 | 105,940 | |||||||||
| Freedom Mortgage Corp.(1) | 12.00 | 10/01/28 | 180,000 | 180,763 | |||||||||
| Freedom Mortgage Corp.(1) | 12.25 | 10/01/30 | 110,000 | 110,146 | |||||||||
| Intesa Sanpaolo SpA(1) | 4.20 | 06/01/32 | 170,000 | 120,950 | |||||||||
| Intesa Sanpaolo SpA(1) | 4.95 | 06/01/42 | 165,000 | 96,897 | |||||||||
| Intesa Sanpaolo SpA(1) | 5.71 | 01/15/26 | 345,000 | 327,392 | |||||||||
| Pacific Western Bank | 3.25 | 05/01/31 | 90,000 | 66,798 | |||||||||
| Popular, Inc. | 7.25 | 03/13/28 | 90,000 | 89,329 | |||||||||
| Standard Chartered PLC(1),(2) | 7.01 | - | 165,000 | 151,834 | |||||||||
| Texas Capital Bancshares, Inc. | 4.00 | 05/06/31 | 85,000 | 70,188 | |||||||||
| UniCredit SpA(1) | 5.46 | 06/30/35 | 337,000 | 276,615 | |||||||||
| UniCredit SpA(1) | 5.86 | 06/19/32 | 232,000 | 208,809 | |||||||||
| UniCredit SpA(1) | 7.30 | 04/02/34 | 282,000 | 261,770 | |||||||||
| Valley National Bancorp | 3.00 | 06/15/31 | 65,000 | 52,017 | |||||||||
| Western Alliance Bancorp. | 3.00 | 06/15/31 | 140,000 | 107,310 | |||||||||
| 2,623,625 | |||||||||||||
| COMMERCIAL SERVICES – 5.3% | |||||||||||||
| Block, Inc. | 2.75 | 06/01/26 | 225,000 | 202,128 | |||||||||
| Block, Inc. | 3.50 | 06/01/31 | 227,000 | 175,416 | |||||||||
| CoreCivic, Inc. | 4.75 | 10/15/27 | 55,000 | 47,830 | |||||||||
| CoreCivic, Inc. | 8.25 | 04/15/26 | 132,000 | 133,759 | |||||||||
| CPI CG, Inc.(1) | 8.63 | 03/15/26 | 63,000 | 60,098 | |||||||||
| GEO Group, Inc. | 10.50 | 06/30/28 | 65,000 | 64,893 | |||||||||
| GTCR W-2 Merger Sub LLC(1) | 7.50 | 01/15/31 | 495,000 | 489,184 | |||||||||
| Mobius Merger Sub, Inc.(1) | 9.00 | 06/01/30 | 115,000 | 103,197 | |||||||||
| Paysafe Finance PLC/Paysafe Holdings US Corp.(1) | 4.00 | 06/15/29 | 80,000 | 64,437 | |||||||||
| PROG Holdings, Inc.(1) | 6.00 | 11/15/29 | 135,000 | 114,572 | |||||||||
| Shift4 Payments LLC/Shift4 Payments Finance Sub, Inc.(1) | 4.63 | 11/01/26 | 100,000 | 92,490 | |||||||||
| 1,548,004 | |||||||||||||
| DIVERSIFIED FINANCIAL SERVICES – 31.1% | |||||||||||||
| AG Issuer LLC(1) | 6.25 | 03/01/28 | 115,000 | 106,067 | |||||||||
| AG TTMT Escrow Issuer LLC(1) | 8.63 | 09/30/27 | 105,000 | 105,590 | |||||||||
| Ally Financial, Inc. | 5.75 | 11/20/25 | 240,000 | 229,323 | |||||||||
| Ally Financial, Inc. | 6.70 | 02/14/33 | 110,000 | 92,510 | |||||||||
| Aretec Escrow Issuer, Inc.(1) | 7.50 | 04/01/29 | 90,000 | 76,445 | |||||||||
| Armor Holdco, Inc.(1) | 8.50 | 11/15/29 | 80,000 | 69,891 | |||||||||
| Brightsphere Investment Group, Inc. | 4.80 | 07/27/26 | 60,000 | 54,536 | |||||||||
The accompanying notes are an integral part of these financial statements.
53
BONDBLOXX ETF TRUST
BondBloxx USD High Yield Bond Financial & REIT Sector ETF
Portfolio of Investments (Continued)
October 31, 2023
| Rate (%) | Maturity | Face Amount | Value | ||||||||||
| DIVERSIFIED FINANCIAL SERVICES – 31.1% (Continued) | |||||||||||||
| Burford Capital Global Finance LLC(1) | 6.25 | 04/15/28 | $ | 90,000 | $ | 81,543 | |||||||
| Burford Capital Global Finance LLC(1) | 6.88 | 04/15/30 | 80,000 | 72,094 | |||||||||
| Burford Capital Global Finance LLC(1) | 9.25 | 07/01/31 | 85,000 | 84,001 | |||||||||
| Castlelake Aviation Finance DAC(1) | 5.00 | 04/15/27 | 95,000 | 83,918 | |||||||||
| Coinbase Global, Inc.(1) | 3.38 | 10/01/28 | 225,000 | 165,412 | |||||||||
| Coinbase Global, Inc.(1) | 3.63 | 10/01/31 | 170,000 | 115,734 | |||||||||
| Credit Acceptance Corp.(1) | 5.13 | 12/31/24 | 90,000 | 87,309 | |||||||||
| Credit Acceptance Corp. | 6.63 | 03/15/26 | 90,000 | 85,535 | |||||||||
| Curo Group Holdings Corp.(1) | 7.50 | 08/01/28 | 160,000 | 63,200 | |||||||||
| Curo Group Holdings Corp.(1) | 7.50 | 08/01/28 | 65,000 | 15,031 | |||||||||
| Enova International, Inc.(1) | 8.50 | 09/15/25 | 85,000 | 80,027 | |||||||||
| Finance of America Funding LLC(1) | 7.88 | 11/15/25 | 80,000 | 66,011 | |||||||||
| GGAM Finance Ltd.(1) | 7.75 | 05/15/26 | 90,000 | 89,379 | |||||||||
| GGAM Finance Ltd.(1) | 8.00 | 06/15/28 | 130,000 | 128,371 | |||||||||
| goeasy Ltd.(1) | 4.38 | 05/01/26 | 75,000 | 67,838 | |||||||||
| goeasy Ltd.(1) | 5.38 | 12/01/24 | 117,000 | 114,797 | |||||||||
| Hightower Holding LLC(1) | 6.75 | 04/15/29 | 70,000 | 59,775 | |||||||||
| Jane Street Group/JSG Finance, Inc.(1) | 4.50 | 11/15/29 | 138,000 | 117,752 | |||||||||
| Jefferies Finance LLC/JFIN Co.-Issuer Corp.(1) | 5.00 | 08/15/28 | 227,000 | 181,421 | |||||||||
| Jefferson Capital Holdings LLC(1) | 6.00 | 08/15/26 | 70,000 | 61,204 | |||||||||
| LD Holdings Group LLC(1) | 6.13 | 04/01/28 | 140,000 | 77,176 | |||||||||
| LD Holdings Group LLC(1) | 6.50 | 11/01/25 | 110,000 | 88,578 | |||||||||
| LFS Topco LLC(1) | 5.88 | 10/15/26 | 70,000 | 59,091 | |||||||||
| Macquarie Airfinance Holdings Ltd.(1) | 8.13 | 03/30/29 | 115,000 | 113,391 | |||||||||
| Macquarie Airfinance Holdings Ltd.(1) | 8.38 | 05/01/28 | 115,000 | 114,753 | |||||||||
| Midcap Financial Issuer Trust(1) | 5.63 | 01/15/30 | 90,000 | 69,357 | |||||||||
| Midcap Financial Issuer Trust(1) | 6.50 | 05/01/28 | 230,000 | 195,164 | |||||||||
| Nationstar Mortgage Holdings, Inc.(1) | 5.00 | 02/01/26 | 108,000 | 100,495 | |||||||||
| Nationstar Mortgage Holdings, Inc.(1) | 5.13 | 12/15/30 | 150,000 | 121,551 | |||||||||
| Nationstar Mortgage Holdings, Inc.(1) | 5.50 | 08/15/28 | 195,000 | 172,547 | |||||||||
| Nationstar Mortgage Holdings, Inc.(1) | 5.75 | 11/15/31 | 135,000 | 112,556 | |||||||||
| Nationstar Mortgage Holdings, Inc.(1) | 6.00 | 01/15/27 | 137,000 | 127,463 | |||||||||
| Navient Corp. | 4.88 | 03/15/28 | 130,000 | 106,909 | |||||||||
| Navient Corp. | 5.00 | 03/15/27 | 165,000 | 145,090 | |||||||||
| Navient Corp. | 5.50 | 03/15/29 | 135,000 | 109,507 | |||||||||
| Navient Corp. | 5.63 | 08/01/33 | 124,000 | 84,075 | |||||||||
| Navient Corp. | 6.75 | 06/25/25 | 115,000 | 112,285 | |||||||||
| Navient Corp. | 6.75 | 06/15/26 | 95,000 | 90,100 | |||||||||
| Navient Corp. | 9.38 | 07/25/30 | 145,000 | 136,807 | |||||||||
| NFP Corp.(1) | 4.88 | 08/15/28 | 125,000 | 109,574 | |||||||||
| NFP Corp.(1) | 6.88 | 08/15/28 | 475,000 | 406,246 | |||||||||
| NFP Corp.(1) | 7.50 | 10/01/30 | 80,000 | 75,849 | |||||||||
| NFP Corp.(1) | 8.50 | 10/01/31 | 75,000 | 73,812 | |||||||||
| OneMain Finance Corp. | 3.50 | 01/15/27 | 170,000 | 143,800 | |||||||||
| OneMain Finance Corp. | 3.88 | 09/15/28 | 138,000 | 109,241 | |||||||||
| OneMain Finance Corp. | 4.00 | 09/15/30 | 187,000 | 137,007 | |||||||||
| OneMain Finance Corp. | 5.38 | 11/15/29 | 145,000 | 119,379 | |||||||||
| OneMain Finance Corp. | 6.63 | 01/15/28 | 170,000 | 154,821 | |||||||||
The accompanying notes are an integral part of these financial statements.
54
BONDBLOXX ETF TRUST
BondBloxx USD High Yield Bond Financial & REIT Sector ETF
Portfolio of Investments (Continued)
October 31, 2023
| Rate (%) | Maturity | Face Amount | Value | ||||||||||
| DIVERSIFIED FINANCIAL SERVICES – 31.1% (Continued) | |||||||||||||
| OneMain Finance Corp. | 6.88 | 03/15/25 | $ | 275,000 | $ | 271,610 | |||||||
| OneMain Finance Corp. | 7.13 | 03/15/26 | 357,000 | 347,159 | |||||||||
| OneMain Finance Corp. | 9.00 | 01/15/29 | 110,000 | 107,156 | |||||||||
| Osaic Holdings, Inc.(1) | 10.75 | 08/01/27 | 95,000 | 94,539 | |||||||||
| Oxford Finance LLC/Oxford Finance Co.-Issuer II, Inc.(1) | 6.38 | 02/01/27 | 90,000 | 82,107 | |||||||||
| PennyMac Financial Services, Inc.(1) | 4.25 | 02/15/29 | 150,000 | 122,683 | |||||||||
| PennyMac Financial Services, Inc.(1) | 5.38 | 10/15/25 | 145,000 | 138,252 | |||||||||
| PennyMac Financial Services, Inc.(1) | 5.75 | 09/15/31 | 115,000 | 93,877 | |||||||||
| PHH Mortgage Corp.(1) | 7.88 | 03/15/26 | 85,000 | 73,424 | |||||||||
| PRA Group, Inc.(1) | 5.00 | 10/01/29 | 82,000 | 54,502 | |||||||||
| PRA Group, Inc.(1) | 7.38 | 09/01/25 | 70,000 | 65,522 | |||||||||
| PRA Group, Inc.(1) | 8.38 | 02/01/28 | 80,000 | 65,950 | |||||||||
| Rocket Mortgage LLC/Rocket Mortgage Co.-Issuer, Inc.(1) | 2.88 | 10/15/26 | 260,000 | 226,645 | |||||||||
| Rocket Mortgage LLC/Rocket Mortgage Co.-Issuer, Inc.(1) | 3.63 | 03/01/29 | 170,000 | 138,381 | |||||||||
| Rocket Mortgage LLC/Rocket Mortgage Co.-Issuer, Inc.(1) | 3.88 | 03/01/31 | 289,000 | 223,810 | |||||||||
| Rocket Mortgage LLC/Rocket Mortgage Co.-Issuer, Inc.(1) | 4.00 | 10/15/33 | 185,000 | 136,191 | |||||||||
| SLM Corp. | 3.13 | 11/02/26 | 115,000 | 100,112 | |||||||||
| SLM Corp. | 4.20 | 10/29/25 | 115,000 | 107,086 | |||||||||
| StoneX Group, Inc.(1) | 8.63 | 06/15/25 | 80,000 | 80,341 | |||||||||
| Synchrony Financial | 7.25 | 02/02/33 | 170,000 | 144,255 | |||||||||
| United Wholesale Mortgage LLC(1) | 5.50 | 11/15/25 | 185,000 | 176,066 | |||||||||
| United Wholesale Mortgage LLC(1) | 5.50 | 04/15/29 | 160,000 | 134,178 | |||||||||
| United Wholesale Mortgage LLC(1) | 5.75 | 06/15/27 | 108,000 | 98,382 | |||||||||
| World Acceptance Corp.(1) | 7.00 | 11/01/26 | 65,000 | 52,959 | |||||||||
| 9,156,525 | |||||||||||||
| ELECTRIC – 0.2% | |||||||||||||
| Terraform Global Operating LP(1) | 6.13 | 03/01/26 | 80,000 | 76,980 | |||||||||
| ELECTRONICS – 0.3% | |||||||||||||
| Likewize Corp.(1) | 9.75 | 10/15/25 | 95,000 | 94,441 | |||||||||
| ENGINEERING & CONSTRUCTION – 0.2% | |||||||||||||
| INNOVATE Corp.(1) | 8.50 | 02/01/26 | 70,000 | 54,007 | |||||||||
| INSURANCE – 14.3% | |||||||||||||
| Acrisure LLC/Acrisure Finance, Inc.(1) | 4.25 | 02/15/29 | 160,000 | 131,377 | |||||||||
| Acrisure LLC/Acrisure Finance, Inc.(1) | 6.00 | 08/01/29 | 117,000 | 94,496 | |||||||||
| Acrisure LLC/Acrisure Finance, Inc.(1) | 7.00 | 11/15/25 | 237,000 | 230,114 | |||||||||
| Acrisure LLC/Acrisure Finance, Inc.(1) | 10.13 | 08/01/26 | 60,000 | 60,436 | |||||||||
| Alliant Holdings Intermediate LLC/Alliant Holdings Co.-Issuer(1) | 4.25 | 10/15/27 | 172,000 | 151,395 | |||||||||
| Alliant Holdings Intermediate LLC/Alliant Holdings Co.-Issuer(1) | 5.88 | 11/01/29 | 97,000 | 80,660 | |||||||||
| Alliant Holdings Intermediate LLC/Alliant Holdings Co.-Issuer(1) | 6.75 | 10/15/27 | 305,000 | 278,810 | |||||||||
| Alliant Holdings Intermediate LLC/Alliant Holdings Co.-Issuer(1) | 6.75 | 04/15/28 | 285,000 | 271,125 | |||||||||
| AmWINS Group, Inc.(1) | 4.88 | 06/30/29 | 175,000 | 150,018 | |||||||||
| Assurant, Inc. | 7.00 | 03/27/48 | 90,000 | 86,578 | |||||||||
| AssuredPartners, Inc.(1) | 5.63 | 01/15/29 | 120,000 | 101,915 | |||||||||
| AssuredPartners, Inc.(1) | 7.00 | 08/15/25 | 117,000 | 114,885 | |||||||||
The accompanying notes are an integral part of these financial statements.
55
BONDBLOXX ETF TRUST
BondBloxx USD High Yield Bond Financial & REIT Sector ETF
Portfolio of Investments (Continued)
October 31, 2023
| Rate (%) | Maturity | Face Amount | Value | ||||||||||
| INSURANCE – 14.3% (Continued) | |||||||||||||
| BroadStreet Partners, Inc.(1) | 5.88 | 04/15/29 | $ | 165,000 | $ | 144,002 | |||||||
| Constellation Insurance, Inc.(1) | 6.63 | 05/01/31 | 55,000 | 47,716 | |||||||||
| Constellation Insurance, Inc.(1) | 6.80 | 01/24/30 | 90,000 | 77,105 | |||||||||
| Genworth Holdings, Inc. | 6.50 | 06/15/34 | 60,000 | 52,158 | |||||||||
| Global Atlantic Finance Co.(1) | 4.70 | 10/15/51 | 170,000 | 118,585 | |||||||||
| GTCR AP Finance, Inc.(1) | 8.00 | 05/15/27 | 103,000 | 100,376 | |||||||||
| HUB International Ltd.(1) | 5.63 | 12/01/29 | 125,000 | 107,770 | |||||||||
| HUB International Ltd.(1) | 7.00 | 05/01/26 | 380,000 | 370,248 | |||||||||
| HUB International Ltd.(1) | 7.25 | 06/15/30 | 490,000 | 478,475 | |||||||||
| Jones Deslauriers Insurance Management, Inc.(1) | 8.50 | 03/15/30 | 165,000 | 162,267 | |||||||||
| Jones Deslauriers Insurance Management, Inc.(1) | 10.50 | 12/15/30 | 70,000 | 69,541 | |||||||||
| Liberty Mutual Group, Inc.(1) | 4.13 | 12/15/51 | 105,000 | 83,543 | |||||||||
| Liberty Mutual Group, Inc.(1) | 4.30 | 02/01/61 | 180,000 | 94,194 | |||||||||
| Liberty Mutual Group, Inc.(1) | 7.80 | 03/15/37 | 95,000 | 91,512 | |||||||||
| MGIC Investment Corp. | 5.25 | 08/15/28 | 150,000 | 138,023 | |||||||||
| NMI Holdings, Inc.(1) | 7.38 | 06/01/25 | 90,000 | 90,215 | |||||||||
| Ryan Specialty LLC(1) | 4.38 | 02/01/30 | 90,000 | 77,200 | |||||||||
| USI, Inc./NY(1) | 6.88 | 05/01/25 | 143,000 | 141,841 | |||||||||
| 4,196,580 | |||||||||||||
| INTERNET – 0.2% | |||||||||||||
| Acuris Finance US, Inc./Acuris Finance Sarl(1) | 5.00 | 05/01/28 | 80,000 | 63,076 | |||||||||
| INVESTMENT COMPANIES – 3.7% | |||||||||||||
| Compass Group Diversified Holdings LLC(1) | 5.00 | 01/15/32 | 70,000 | 55,171 | |||||||||
| Compass Group Diversified Holdings LLC(1) | 5.25 | 04/15/29 | 227,000 | 194,080 | |||||||||
| Icahn Enterprises LP/Icahn Enterprises Finance Corp. | 4.38 | 02/01/29 | 170,000 | 131,100 | |||||||||
| Icahn Enterprises LP/Icahn Enterprises Finance Corp. | 5.25 | 05/15/27 | 330,000 | 282,818 | |||||||||
| Icahn Enterprises LP/Icahn Enterprises Finance Corp. | 6.25 | 05/15/26 | 282,000 | 257,995 | |||||||||
| Icahn Enterprises LP/Icahn Enterprises Finance Corp. | 6.38 | 12/15/25 | 170,000 | 160,090 | |||||||||
| 1,081,254 | |||||||||||||
| OIL & GAS – 0.2% | |||||||||||||
| Greenfire Resources Ltd.(1) | 12.00 | 10/01/28 | 65,000 | 64,741 | |||||||||
| PIPELINES – 0.4% | |||||||||||||
| FTAI Infra Escrow Holdings LLC(1) | 10.50 | 06/01/27 | 130,000 | 126,482 | |||||||||
| REAL ESTATE INVESTMENT TRUST (REITS) – 28.2% | |||||||||||||
| Apollo Commercial Real Estate Finance, Inc.(1) | 4.63 | 06/15/29 | 117,000 | 89,688 | |||||||||
| Blackstone Mortgage Trust, Inc.(1) | 3.75 | 01/15/27 | 82,000 | 68,262 | |||||||||
| Brandywine Operating Partnership LP | 3.95 | 11/15/27 | 100,000 | 82,946 | |||||||||
| Brandywine Operating Partnership LP | 4.55 | 10/01/29 | 75,000 | 57,474 | |||||||||
| Brandywine Operating Partnership LP | 7.80 | 03/15/28 | 75,000 | 67,662 | |||||||||
| Brookfield Property REIT, Inc./BPR Cumulus LLC/BPR Nimbus LLC/ GGSI Sellco LL(1) | 4.50 | 04/01/27 | 170,000 | 142,010 | |||||||||
| Brookfield Property REIT, Inc./BPR Cumulus LLC/BPR Nimbus LLC/ GGSI Sellco LL(1) | 5.75 | 05/15/26 | 213,000 | 195,275 | |||||||||
The accompanying notes are an integral part of these financial statements.
56
BONDBLOXX ETF TRUST
BondBloxx USD High Yield Bond Financial & REIT Sector ETF
Portfolio of Investments (Continued)
October 31, 2023
| Rate (%) | Maturity | Face Amount | Value | ||||||||||
| REAL ESTATE INVESTMENT TRUST (REITS) – 28.2% (Continued) | |||||||||||||
| CTR Partnership LP/CareTrust Capital Corp.(1) | 3.88 | 06/30/28 | $ | 90,000 | $ | 75,716 | |||||||
| Diversified Healthcare Trust | 4.38 | 03/01/31 | 120,000 | 82,703 | |||||||||
| Diversified Healthcare Trust | 9.75 | 06/15/25 | 110,000 | 106,804 | |||||||||
| Global Net Lease, Inc./Global Net Lease Operating Partnership LP(1) | 3.75 | 12/15/27 | 115,000 | 87,118 | |||||||||
| HAT Holdings I LLC/HAT Holdings II LLC(1) | 3.38 | 06/15/26 | 225,000 | 198,300 | |||||||||
| HAT Holdings I LLC/HAT Holdings II LLC(1) | 3.75 | 09/15/30 | 85,000 | 61,109 | |||||||||
| HAT Holdings I LLC/HAT Holdings II LLC(1) | 6.00 | 04/15/25 | 90,000 | 87,549 | |||||||||
| Iron Mountain Information Management Services, Inc.(1) | 5.00 | 07/15/32 | 174,000 | 142,578 | |||||||||
| Iron Mountain, Inc.(1) | 4.50 | 02/15/31 | 250,000 | 204,767 | |||||||||
| Iron Mountain, Inc.(1) | 4.88 | 09/15/27 | 222,000 | 203,155 | |||||||||
| Iron Mountain, Inc.(1) | 4.88 | 09/15/29 | 225,000 | 196,259 | |||||||||
| Iron Mountain, Inc.(1) | 5.00 | 07/15/28 | 105,000 | 94,082 | |||||||||
| Iron Mountain, Inc.(1) | 5.25 | 03/15/28 | 190,000 | 174,009 | |||||||||
| Iron Mountain, Inc.(1) | 5.25 | 07/15/30 | 295,000 | 256,515 | |||||||||
| Iron Mountain, Inc.(1) | 5.63 | 07/15/32 | 135,000 | 115,480 | |||||||||
| Iron Mountain, Inc.(1) | 7.00 | 02/15/29 | 230,000 | 223,080 | |||||||||
| Ladder Capital Finance Holdings LLLP/Ladder Capital Finance Corp.(1) | 4.25 | 02/01/27 | 130,000 | 113,697 | |||||||||
| Ladder Capital Finance Holdings LLLP/Ladder Capital Finance Corp.(1) | 4.75 | 06/15/29 | 147,000 | 118,411 | |||||||||
| Ladder Capital Finance Holdings LLLP/Ladder Capital Finance Corp.(1) | 5.25 | 10/01/25 | 76,000 | 72,325 | |||||||||
| MPT Operating Partnership LP/MPT Finance Corp. | 3.50 | 03/15/31 | 293,000 | 177,970 | |||||||||
| MPT Operating Partnership LP/MPT Finance Corp. | 4.63 | 08/01/29 | 207,000 | 143,712 | |||||||||
| MPT Operating Partnership LP/MPT Finance Corp. | 5.00 | 10/15/27 | 320,000 | 247,522 | |||||||||
| MPT Operating Partnership LP/MPT Finance Corp. | 5.25 | 08/01/26 | 110,000 | 94,817 | |||||||||
| Necessity Retail REIT, Inc./American Finance Operating Partner LP(1) | 4.50 | 09/30/28 | 117,000 | 87,728 | |||||||||
| Office Properties Income Trust | 2.40 | 02/01/27 | 75,000 | 41,924 | |||||||||
| Office Properties Income Trust | 2.65 | 06/15/26 | 65,000 | 42,800 | |||||||||
| Office Properties Income Trust | 3.45 | 10/15/31 | 93,000 | 45,672 | |||||||||
| Office Properties Income Trust | 4.50 | 02/01/25 | 150,000 | 128,413 | |||||||||
| Park Intermediate Holdings LLC/PK Domestic Property LLC/PK Finance Co.-Issuer(1) | 4.88 | 05/15/29 | 170,000 | 142,025 | |||||||||
| Park Intermediate Holdings LLC/PK Domestic Property LLC/PK Finance Co.-Issuer(1) | 5.88 | 10/01/28 | 165,000 | 148,772 | |||||||||
| Park Intermediate Holdings LLC/PK Domestic Property LLC/PK Finance Co.-Issuer(1) | 7.50 | 06/01/25 | 150,000 | 148,600 | |||||||||
| RHP Hotel Properties LP/RHP Finance Corp.(1) | 4.50 | 02/15/29 | 142,000 | 120,998 | |||||||||
| RHP Hotel Properties LP/RHP Finance Corp. | 4.75 | 10/15/27 | 155,000 | 141,038 | |||||||||
| RHP Hotel Properties LP/RHP Finance Corp.(1) | 7.25 | 07/15/28 | 90,000 | 87,331 | |||||||||
| Rithm Capital Corp.(1) | 6.25 | 10/15/25 | 122,000 | 115,571 | |||||||||
| RLJ Lodging Trust LP(1) | 3.75 | 07/01/26 | 115,000 | 103,609 | |||||||||
| RLJ Lodging Trust LP(1) | 4.00 | 09/15/29 | 115,000 | 93,859 | |||||||||
| SBA Communications Corp. | 3.13 | 02/01/29 | 340,000 | 281,455 | |||||||||
| SBA Communications Corp. | 3.88 | 02/15/27 | 341,000 | 310,839 | |||||||||
| Service Properties Trust | 3.95 | 01/15/28 | 87,000 | 65,128 | |||||||||
| Service Properties Trust | 4.38 | 02/15/30 | 85,000 | 58,723 | |||||||||
| Service Properties Trust | 4.50 | 03/15/25 | 80,000 | 74,789 | |||||||||
| Service Properties Trust | 4.75 | 10/01/26 | 107,000 | 91,075 | |||||||||
| Service Properties Trust | 4.95 | 02/15/27 | 100,000 | 83,353 | |||||||||
| Service Properties Trust | 4.95 | 10/01/29 | 95,000 | 68,584 | |||||||||
| Service Properties Trust | 5.25 | 02/15/26 | 75,000 | 67,148 | |||||||||
The accompanying notes are an integral part of these financial statements.
57
BONDBLOXX ETF TRUST
BondBloxx USD High Yield Bond Financial & REIT Sector ETF
Portfolio of Investments (Continued)
October 31, 2023
| Rate (%) | Maturity | Face Amount | Value | ||||||||||
| REAL ESTATE INVESTMENT TRUST (REITS) – 28.2% (Continued) | |||||||||||||
| Service Properties Trust | 5.50 | 12/15/27 | $ | 100,000 | $ | 84,526 | |||||||
| Service Properties Trust | 7.50 | 09/15/25 | 180,000 | 175,076 | |||||||||
| Starwood Property Trust, Inc.(1) | 3.63 | 07/15/26 | 90,000 | 79,568 | |||||||||
| Starwood Property Trust, Inc.(1) | 3.75 | 12/31/24 | 90,000 | 85,138 | |||||||||
| Starwood Property Trust, Inc.(1) | 4.38 | 01/15/27 | 115,000 | 98,780 | |||||||||
| Starwood Property Trust, Inc. | 4.75 | 03/15/25 | 115,000 | 110,169 | |||||||||
| Uniti Group LP/Uniti Fiber Holdings, Inc./CSL Capital LLC(1) | 6.00 | 01/15/30 | 160,000 | 97,167 | |||||||||
| Uniti Group LP/Uniti Group Finance, Inc./CSL Capital LLC(1) | 4.75 | 04/15/28 | 125,000 | 101,141 | |||||||||
| Uniti Group LP/Uniti Group Finance, Inc./CSL Capital LLC(1) | 6.50 | 02/15/29 | 252,000 | 163,949 | |||||||||
| Uniti Group LP/Uniti Group Finance, Inc./CSL Capital LLC(1) | 10.50 | 02/15/28 | 590,000 | 568,585 | |||||||||
| XHR LP(1) | 4.88 | 06/01/29 | 110,000 | 93,180 | |||||||||
| XHR LP(1) | 6.38 | 08/15/25 | 105,000 | 101,953 | |||||||||
| 8,289,661 | |||||||||||||
| RETAIL – 0.7% | |||||||||||||
| FirstCash, Inc.(1) | 4.63 | 09/01/28 | 110,000 | 96,603 | |||||||||
| FirstCash, Inc.(1) | 5.63 | 01/01/30 | 128,000 | 114,111 | |||||||||
| 210,714 | |||||||||||||
| SOFTWARE – 0.3% | |||||||||||||
| ACI Worldwide, Inc.(1) | 5.75 | 08/15/26 | 90,000 | 86,485 | |||||||||
| TRANSPORTATION – 0.4% | |||||||||||||
| Cargo Aircraft Management, Inc.(1) | 4.75 | 02/01/28 | 132,000 | 116,646 | |||||||||
| TRUCKING & LEASING – 1.9% | |||||||||||||
| AerCap Global Aviation Trust(1) | 6.50 | 06/15/45 | 112,000 | 109,990 | |||||||||
| Fortress Transportation & Infrastructure Investors LLC(1) | 5.50 | 05/01/28 | 230,000 | 209,416 | |||||||||
| Fortress Transportation & Infrastructure Investors LLC(1) | 6.50 | 10/01/25 | 150,000 | 148,668 | |||||||||
| Fortress Transportation & Infrastructure Investors LLC(1) | 9.75 | 08/01/27 | 85,000 | 87,542 | |||||||||
| 555,616 | |||||||||||||
| TOTAL CORPORATE BONDS (Cost - $29,699,477) | 28,746,329 | ||||||||||||
| SHORT-TERM INVESTMENTS – 1.0% | |||||||||||||
| TIME DEPOSITS – 1.0% | |||||||||||||
| Sumitomo, Tokyo | 4.68 | 11/01/23 | 289,034 | 289,034 | |||||||||
| TOTAL SHORT-TERM INVESTMENTS (Cost - $289,034) | 289,034 | ||||||||||||
| TOTAL INVESTMENTS – 98.7% (Cost - $29,988,511) | $ | 29,035,363 | |||||||||||
| OTHER ASSETS LESS LIABILITIES – 1.3% | 370,291 | ||||||||||||
| NET ASSETS – 100.0% | $ | 29,405,654 | |||||||||||
| (1) | Security was purchased pursuant to Rule 144A under the Securities Act of 1933 and may not be resold subject to that Rule except to qualified institutional buyers. The aggregate value of Rule 144A holdings at October 31, 2023, amounts to $20,654,538 and represents 70.2% of net assets. These securities have been deemed liquid under procedures approved by the Trust’s Board of Trustees. | |
| (2) | Security is perpetual in nature and has no stated maturity date. |
The accompanying notes are an integral part of these financial statements.
58
BONDBLOXX ETF TRUST
BondBloxx USD High Yield Bond Energy Sector ETF
Portfolio of Investments
October 31, 2023
| Rate (%) | Maturity | Face Amount | Value | ||||||||||
| CORPORATE BONDS – 98.4% | |||||||||||||
| CHEMICALS – 1.2% | |||||||||||||
| Methanex Corp. | 4.25 | 12/01/24 | $ | 45,000 | $ | 43,987 | |||||||
| Methanex Corp. | 5.13 | 10/15/27 | 100,000 | 91,608 | |||||||||
| Methanex Corp. | 5.25 | 12/15/29 | 100,000 | 88,533 | |||||||||
| Methanex Corp. | 5.65 | 12/01/44 | 45,000 | 33,293 | |||||||||
| 257,421 | |||||||||||||
| OIL & GAS – 50.7% | |||||||||||||
| Aethon United BR LP/Aethon United Finance Corp.(1) | 8.25 | 02/15/26 | 105,000 | 104,388 | |||||||||
| Antero Resources Corp.(1) | 5.38 | 03/01/30 | 80,000 | 73,074 | |||||||||
| Antero Resources Corp.(1) | 7.63 | 02/01/29 | 61,000 | 61,822 | |||||||||
| Ascent Resources Utica Holdings LLC/ARU Finance Corp.(1) | 5.88 | 06/30/29 | 65,000 | 57,488 | |||||||||
| Ascent Resources Utica Holdings LLC/ARU Finance Corp.(1) | 7.00 | 11/01/26 | 85,000 | 82,163 | |||||||||
| Ascent Resources Utica Holdings LLC/ARU Finance Corp.(1) | 8.25 | 12/31/28 | 65,000 | 64,605 | |||||||||
| Ascent Resources Utica Holdings LLC/ARU Finance Corp.(1) | 9.00 | 11/01/27 | 55,000 | 69,672 | |||||||||
| Baytex Energy Corp.(1) | 8.50 | 04/30/30 | 120,000 | 118,966 | |||||||||
| Baytex Energy Corp.(1) | 8.75 | 04/01/27 | 55,000 | 55,489 | |||||||||
| Berry Petroleum Co. LLC(1) | 7.00 | 02/15/26 | 60,000 | 57,651 | |||||||||
| California Resources Corp.(1) | 7.13 | 02/01/26 | 82,000 | 82,389 | |||||||||
| Callon Petroleum Co. | 6.38 | 07/01/26 | 40,000 | 39,102 | |||||||||
| Callon Petroleum Co.(1) | 7.50 | 06/15/30 | 90,000 | 87,268 | |||||||||
| Callon Petroleum Co.(1) | 8.00 | 08/01/28 | 95,000 | 93,986 | |||||||||
| Calumet Specialty Products Partners LP/Calumet Finance Corp.(1) | 8.13 | 01/15/27 | 45,000 | 42,076 | |||||||||
| Calumet Specialty Products Partners LP/Calumet Finance Corp.(1) | 9.75 | 07/15/28 | 45,000 | 42,043 | |||||||||
| Calumet Specialty Products Partners LP/Calumet Finance Corp.(1) | 11.00 | 04/15/25 | 64,000 | 64,233 | |||||||||
| Chesapeake Energy Corp.(1) | 5.50 | 02/01/26 | 75,000 | 72,882 | |||||||||
| Chesapeake Energy Corp.(1) | 5.88 | 02/01/29 | 75,000 | 70,686 | |||||||||
| Chesapeake Energy Corp.(1) | 6.75 | 04/15/29 | 130,000 | 127,325 | |||||||||
| Chord Energy Corp.(1) | 6.38 | 06/01/26 | 60,000 | 58,965 | |||||||||
| CITGO Petroleum Corp.(1) | 6.38 | 06/15/26 | 85,000 | 83,592 | |||||||||
| CITGO Petroleum Corp.(1) | 7.00 | 06/15/25 | 170,000 | 167,220 | |||||||||
| CITGO Petroleum Corp.(1) | 8.38 | 01/15/29 | 160,000 | 158,617 | |||||||||
| Civitas Resources, Inc.(1) | 5.00 | 10/15/26 | 65,000 | 60,884 | |||||||||
| Civitas Resources, Inc.(1) | 8.38 | 07/01/28 | 205,000 | 206,519 | |||||||||
| Civitas Resources, Inc.(1) | 8.63 | 11/01/30 | 120,000 | 122,266 | |||||||||
| Civitas Resources, Inc.(1) | 8.75 | 07/01/31 | 200,000 | 202,103 | |||||||||
| CNX Resources Corp.(1) | 6.00 | 01/15/29 | 67,000 | 61,502 | |||||||||
| CNX Resources Corp.(1) | 7.25 | 03/14/27 | 55,000 | 54,180 | |||||||||
| CNX Resources Corp.(1) | 7.38 | 01/15/31 | 74,000 | 70,786 | |||||||||
| Comstock Resources, Inc.(1) | 5.88 | 01/15/30 | 140,000 | 119,847 | |||||||||
| Comstock Resources, Inc.(1) | 6.75 | 03/01/29 | 175,000 | 159,408 | |||||||||
| Crescent Energy Finance LLC(1) | 7.25 | 05/01/26 | 95,000 | 92,060 | |||||||||
| Crescent Energy Finance LLC(1) | 9.25 | 02/15/28 | 125,000 | 126,018 | |||||||||
| CrownRock LP/CrownRock Finance, Inc.(1) | 5.00 | 05/01/29 | 55,000 | 51,925 | |||||||||
| CrownRock LP/CrownRock Finance, Inc.(1) | 5.63 | 10/15/25 | 125,000 | 123,075 | |||||||||
| CVR Energy, Inc.(1) | 5.25 | 02/15/25 | 80,000 | 78,548 | |||||||||
| CVR Energy, Inc.(1) | 5.75 | 02/15/28 | 60,000 | 53,964 | |||||||||
| Diamond Foreign Asset Co./Diamond Finance LLC(1) | 8.50 | 10/01/30 | 80,000 | 78,050 | |||||||||
The accompanying notes are an integral part of these financial statements.
59
BONDBLOXX ETF TRUST
BondBloxx USD High Yield Bond Energy Sector ETF
Portfolio of Investments (Continued)
October 31, 2023
| Rate (%) | Maturity | Face Amount | Value | ||||||||||
| OIL & GAS – 50.7% (Continued) | |||||||||||||
| Earthstone Energy Holdings LLC(1) | 8.00 | 04/15/27 | $ | 80,000 | $ | 81,235 | |||||||
| Earthstone Energy Holdings LLC(1) | 9.88 | 07/15/31 | 75,000 | 80,850 | |||||||||
| Encino Acquisition Partners Holdings LLC(1) | 8.50 | 05/01/28 | 97,000 | 94,661 | |||||||||
| Endeavor Energy Resources LP/EER Finance, Inc.(1) | 5.75 | 01/30/28 | 135,000 | 129,641 | |||||||||
| Energean PLC(1) | 6.50 | 04/30/27 | 70,000 | 58,647 | |||||||||
| EnQuest PLC(1) | 11.63 | 11/01/27 | 45,000 | 42,527 | |||||||||
| Global Marine, Inc. | 7.00 | 06/01/28 | 40,000 | 33,700 | |||||||||
| Gran Tierra Energy International Holdings Ltd.(1) | 6.25 | 02/15/25 | 40,000 | 37,224 | |||||||||
| Gran Tierra Energy, Inc.(1) | 7.75 | 05/23/27 | 48,000 | 40,786 | |||||||||
| Gran Tierra Energy, Inc.(1) | 9.50 | 10/15/29 | 45,000 | 38,687 | |||||||||
| Gulfport Energy Corp.(1) | 8.00 | 05/17/26 | 60,000 | 59,963 | |||||||||
| Harbour Energy PLC(1) | 5.50 | 10/15/26 | 75,000 | 69,555 | |||||||||
| Hilcorp Energy I LP/Hilcorp Finance Co.(1) | 5.75 | 02/01/29 | 85,000 | 76,616 | |||||||||
| Hilcorp Energy I LP/Hilcorp Finance Co.(1) | 6.00 | 04/15/30 | 75,000 | 66,671 | |||||||||
| Hilcorp Energy I LP/Hilcorp Finance Co.(1) | 6.00 | 02/01/31 | 80,000 | 70,378 | |||||||||
| Hilcorp Energy I LP/Hilcorp Finance Co.(1) | 6.25 | 11/01/28 | 90,000 | 84,235 | |||||||||
| Hilcorp Energy I LP/Hilcorp Finance Co.(1) | 6.25 | 04/15/32 | 70,000 | 61,214 | |||||||||
| Ithaca Energy North Sea PLC(1) | 9.00 | 07/15/26 | 95,000 | 91,384 | |||||||||
| Magnolia Oil & Gas Operating LLC/Magnolia Oil & Gas Finance Corp.(1) | 6.00 | 08/01/26 | 60,000 | 57,663 | |||||||||
| Matador Resources Co. | 5.88 | 09/15/26 | 95,000 | 91,629 | |||||||||
| Matador Resources Co.(1) | 6.88 | 04/15/28 | 75,000 | 73,576 | |||||||||
| MEG Energy Corp.(1) | 5.88 | 02/01/29 | 90,000 | 84,191 | |||||||||
| MEG Energy Corp.(1) | 7.13 | 02/01/27 | 45,000 | 45,365 | |||||||||
| Moss Creek Resources Holdings, Inc.(1) | 7.50 | 01/15/26 | 105,000 | 100,379 | |||||||||
| Moss Creek Resources Holdings, Inc.(1) | 10.50 | 05/15/27 | 51,000 | 50,468 | |||||||||
| Murphy Oil Corp. | 5.88 | 12/01/27 | 85,000 | 81,817 | |||||||||
| Murphy Oil Corp. | 5.88 | 12/01/42 | 45,000 | 34,624 | |||||||||
| Murphy Oil Corp. | 6.38 | 07/15/28 | 55,000 | 53,322 | |||||||||
| Murphy Oil Corp. | 7.05 | 05/01/29 | 40,000 | 39,259 | |||||||||
| Nabors Industries Ltd.(1) | 7.25 | 01/15/26 | 85,000 | 79,920 | |||||||||
| Nabors Industries Ltd.(1) | 7.50 | 01/15/28 | 60,000 | 53,046 | |||||||||
| Nabors Industries, Inc. | 5.75 | 02/01/25 | 70,000 | 68,171 | |||||||||
| Nabors Industries, Inc.(1) | 7.38 | 05/15/27 | 90,000 | 83,746 | |||||||||
| Neptune Energy Bondco PLC(1) | 6.63 | 05/15/25 | 119,000 | 117,920 | |||||||||
| Noble Finance II LLC(1) | 8.00 | 04/15/30 | 90,000 | 90,040 | |||||||||
| Northern Oil & Gas, Inc.(1) | 8.13 | 03/01/28 | 105,000 | 103,775 | |||||||||
| Northern Oil & Gas, Inc.(1) | 8.75 | 06/15/31 | 70,000 | 69,734 | |||||||||
| Parkland Corp.(1) | 4.50 | 10/01/29 | 120,000 | 103,330 | |||||||||
| Parkland Corp.(1) | 4.63 | 05/01/30 | 111,000 | 94,749 | |||||||||
| Parkland Corp.(1) | 5.88 | 07/15/27 | 75,000 | 71,881 | |||||||||
| PBF Holding Co. LLC/PBF Finance Corp. | 6.00 | 02/15/28 | 120,000 | 110,458 | |||||||||
| PBF Holding Co. LLC/PBF Finance Corp.(1) | 7.88 | 09/15/30 | 70,000 | 67,625 | |||||||||
| Permian Resources Operating LLC(1) | 5.38 | 01/15/26 | 45,000 | 43,246 | |||||||||
| Permian Resources Operating LLC(1) | 5.88 | 07/01/29 | 97,000 | 90,370 | |||||||||
| Permian Resources Operating LLC(1) | 6.88 | 04/01/27 | 50,000 | 49,235 | |||||||||
| Permian Resources Operating LLC(1) | 7.00 | 01/15/32 | 70,000 | 67,925 | |||||||||
| Permian Resources Operating LLC(1) | 7.75 | 02/15/26 | 50,000 | 50,009 | |||||||||
| Petrofac Ltd.(1) | 9.75 | 11/15/26 | 90,000 | 61,339 | |||||||||
The accompanying notes are an integral part of these financial statements.
60
BONDBLOXX ETF TRUST
BondBloxx USD High Yield Bond Energy Sector ETF
Portfolio of Investments (Continued)
October 31, 2023
| Rate (%) | Maturity | Face Amount | Value | ||||||||||
| OIL & GAS – 50.7% (Continued) | |||||||||||||
| Precision Drilling Corp.(1) | 6.88 | 01/15/29 | $ | 60,000 | $ | 55,613 | |||||||
| Precision Drilling Corp.(1) | 7.13 | 01/15/26 | 45,000 | 44,382 | |||||||||
| Range Resources Corp.(1) | 4.75 | 02/15/30 | 63,000 | 56,012 | |||||||||
| Range Resources Corp. | 4.88 | 05/15/25 | 105,000 | 102,214 | |||||||||
| Range Resources Corp. | 8.25 | 01/15/29 | 90,000 | 92,001 | |||||||||
| Rockcliff Energy II LLC(1) | 5.50 | 10/15/29 | 105,000 | 94,886 | |||||||||
| Seadrill Finance Ltd.(1) | 8.38 | 08/01/30 | 85,000 | 85,120 | |||||||||
| Sitio Royalties Operating Partnership LP/Sitio Finance Corp.(1) | 7.88 | 11/01/28 | 85,000 | 83,930 | |||||||||
| SM Energy Co. | 5.63 | 06/01/25 | 55,000 | 53,591 | |||||||||
| SM Energy Co. | 6.50 | 07/15/28 | 60,000 | 57,821 | |||||||||
| SM Energy Co. | 6.63 | 01/15/27 | 60,000 | 58,363 | |||||||||
| SM Energy Co. | 6.75 | 09/15/26 | 55,000 | 54,074 | |||||||||
| Southwestern Energy Co. | 4.75 | 02/01/32 | 165,000 | 142,058 | |||||||||
| Southwestern Energy Co. | 5.38 | 02/01/29 | 105,000 | 97,098 | |||||||||
| Southwestern Energy Co. | 5.38 | 03/15/30 | 175,000 | 160,691 | |||||||||
| Southwestern Energy Co. | 5.70 | 01/23/25 | 40,000 | 39,556 | |||||||||
| Southwestern Energy Co. | 8.38 | 09/15/28 | 55,000 | 56,842 | |||||||||
| Strathcona Resources Ltd./Alberta(1) | 6.88 | 08/01/26 | 75,000 | 69,261 | |||||||||
| Sunoco LP/Sunoco Finance Corp. | 4.50 | 05/15/29 | 120,000 | 104,088 | |||||||||
| Sunoco LP/Sunoco Finance Corp. | 4.50 | 04/30/30 | 110,000 | 94,069 | |||||||||
| Sunoco LP/Sunoco Finance Corp. | 5.88 | 03/15/28 | 55,000 | 52,085 | |||||||||
| Sunoco LP/Sunoco Finance Corp. | 6.00 | 04/15/27 | 90,000 | 86,745 | |||||||||
| Sunoco LP/Sunoco Finance Corp.(1) | 7.00 | 09/15/28 | 70,000 | 68,199 | |||||||||
| Talos Production, Inc. | 12.00 | 01/15/26 | 95,000 | 98,809 | |||||||||
| Teine Energy Ltd.(1) | 6.88 | 04/15/29 | 60,000 | 55,624 | |||||||||
| Transocean Aquila Ltd.(1) | 8.00 | 09/30/28 | 35,000 | 34,521 | |||||||||
| Transocean Poseidon Ltd.(1) | 6.88 | 02/01/27 | 48,750 | 47,820 | |||||||||
| Transocean Titan Financing Ltd.(1) | 8.38 | 02/01/28 | 80,000 | 80,403 | |||||||||
| Transocean, Inc. | 6.80 | 03/15/38 | 90,000 | 64,326 | |||||||||
| Transocean, Inc.(1) | 7.25 | 11/01/25 | 54,000 | 52,738 | |||||||||
| Transocean, Inc.(1) | 7.50 | 01/15/26 | 85,000 | 81,485 | |||||||||
| Transocean, Inc. | 7.50 | 04/15/31 | 60,000 | 48,534 | |||||||||
| Transocean, Inc.(1) | 8.00 | 02/01/27 | 85,000 | 79,858 | |||||||||
| Transocean, Inc.(1) | 8.75 | 02/15/30 | 171,000 | 170,641 | |||||||||
| Transocean, Inc.(1) | 11.50 | 01/30/27 | 105,000 | 109,353 | |||||||||
| Valaris Ltd.(1) | 8.38 | 04/30/30 | 155,000 | 152,232 | |||||||||
| Vermilion Energy, Inc.(1) | 5.63 | 03/15/25 | 33,000 | 32,210 | |||||||||
| Vermilion Energy, Inc.(1) | 6.88 | 05/01/30 | 61,000 | 56,977 | |||||||||
| Viper Energy Partners LP(1) | 5.38 | 11/01/27 | 65,000 | 61,668 | |||||||||
| Viper Energy Partners LP(1) | 7.38 | 11/01/31 | 50,000 | 49,922 | |||||||||
| Vital Energy, Inc.(1) | 7.75 | 07/31/29 | 44,000 | 39,886 | |||||||||
| Vital Energy, Inc. | 9.50 | 01/15/25 | 62,000 | 62,348 | |||||||||
| Vital Energy, Inc. | 9.75 | 10/15/30 | 75,000 | 73,574 | |||||||||
| Vital Energy, Inc. | 10.13 | 01/15/28 | 100,000 | 100,353 | |||||||||
| W&T Offshore, Inc.(1) | 11.75 | 02/01/26 | 35,000 | 36,184 | |||||||||
| 10,401,788 | |||||||||||||
The accompanying notes are an integral part of these financial statements.
61
BONDBLOXX ETF TRUST
BondBloxx USD High Yield Bond Energy Sector ETF
Portfolio of Investments (Continued)
October 31, 2023
| Rate (%) | Maturity | Face Amount | Value | ||||||||||
| OIL & GAS SERVICES – 4.9% | |||||||||||||
| Archrock Partners LP/Archrock Partners Finance Corp.(1) | 6.25 | 04/01/28 | $ | 110,000 | $ | 102,281 | |||||||
| Archrock Partners LP/Archrock Partners Finance Corp.(1) | 6.88 | 04/01/27 | 75,000 | 72,175 | |||||||||
| Bristow Group, Inc.(1) | 6.88 | 03/01/28 | 60,000 | 55,639 | |||||||||
| CGG SA(1) | 8.75 | 04/01/27 | 75,000 | 66,264 | |||||||||
| CSI Compressco LP/CSI Compressco Finance, Inc.(1) | 7.50 | 04/01/25 | 55,000 | 53,260 | |||||||||
| Enerflex Ltd.(1) | 9.00 | 10/15/27 | 95,000 | 86,546 | |||||||||
| Oceaneering International, Inc. | 6.00 | 02/01/28 | 45,000 | 41,337 | |||||||||
| USA Compression Partners LP/USA Compression Finance Corp. | 6.88 | 04/01/26 | 110,000 | 106,936 | |||||||||
| USA Compression Partners LP/USA Compression Finance Corp. | 6.88 | 09/01/27 | 100,000 | 95,915 | |||||||||
| Weatherford International Ltd.(1) | 6.50 | 09/15/28 | 42,000 | 42,261 | |||||||||
| Weatherford International Ltd.(1) | 8.63 | 04/30/30 | 229,000 | 231,612 | |||||||||
| Welltec International ApS(1) | 8.25 | 10/15/26 | 50,000 | 50,724 | |||||||||
| 1,004,950 | |||||||||||||
| PIPELINES – 40.9% | |||||||||||||
| Antero Midstream Partners LP/Antero Midstream Finance Corp.(1) | 5.38 | 06/15/29 | 113,000 | 102,714 | |||||||||
| Antero Midstream Partners LP/Antero Midstream Finance Corp.(1) | 5.75 | 03/01/27 | 85,000 | 81,322 | |||||||||
| Antero Midstream Partners LP/Antero Midstream Finance Corp.(1) | 5.75 | 01/15/28 | 95,000 | 89,156 | |||||||||
| Antero Midstream Partners LP/Antero Midstream Finance Corp.(1) | 7.88 | 05/15/26 | 80,000 | 80,645 | |||||||||
| Blue Racer Midstream LLC/Blue Racer Finance Corp.(1) | 6.63 | 07/15/26 | 45,000 | 44,188 | |||||||||
| Blue Racer Midstream LLC/Blue Racer Finance Corp.(1) | 7.63 | 12/15/25 | 90,000 | 90,210 | |||||||||
| Buckeye Partners LP | 3.95 | 12/01/26 | 85,000 | 77,560 | |||||||||
| Buckeye Partners LP(1) | 4.13 | 03/01/25 | 70,000 | 66,736 | |||||||||
| Buckeye Partners LP | 4.13 | 12/01/27 | 60,000 | 52,194 | |||||||||
| Buckeye Partners LP(1) | 4.50 | 03/01/28 | 80,000 | 69,688 | |||||||||
| Buckeye Partners LP | 5.60 | 10/15/44 | 30,000 | 20,168 | |||||||||
| Buckeye Partners LP | 5.85 | 11/15/43 | 60,000 | 42,461 | |||||||||
| CNX Midstream Partners LP(1) | 4.75 | 04/15/30 | 60,000 | 49,502 | |||||||||
| CQP Holdco LP/BIP-V Chinook Holdco LLC(1) | 5.50 | 06/15/31 | 200,000 | 174,173 | |||||||||
| Crestwood Midstream Partners LP/Crestwood Midstream Finance Corp.(1) | 5.63 | 05/01/27 | 85,000 | 81,844 | |||||||||
| Crestwood Midstream Partners LP/Crestwood Midstream Finance Corp. | 5.75 | 04/01/25 | 65,000 | 64,250 | |||||||||
| Crestwood Midstream Partners LP/Crestwood Midstream Finance Corp.(1) | 6.00 | 02/01/29 | 105,000 | 101,704 | |||||||||
| Crestwood Midstream Partners LP/Crestwood Midstream Finance Corp.(1) | 7.38 | 02/01/31 | 90,000 | 90,810 | |||||||||
| Crestwood Midstream Partners LP/Crestwood Midstream Finance Corp.(1) | 8.00 | 04/01/29 | 65,000 | 66,503 | |||||||||
| Delek Logistics Partners LP/Delek Logistics Finance Corp.(1) | 7.13 | 06/01/28 | 60,000 | 54,661 | |||||||||
| DT Midstream, Inc.(1) | 4.13 | 06/15/29 | 155,000 | 133,418 | |||||||||
| DT Midstream, Inc.(1) | 4.38 | 06/15/31 | 150,000 | 124,717 | |||||||||
| EnLink Midstream LLC | 5.38 | 06/01/29 | 75,000 | 68,689 | |||||||||
| EnLink Midstream LLC(1) | 5.63 | 01/15/28 | 75,000 | 70,792 | |||||||||
| EnLink Midstream LLC(1) | 6.50 | 09/01/30 | 140,000 | 134,507 | |||||||||
| EnLink Midstream Partners LP | 4.15 | 06/01/25 | 59,000 | 56,805 | |||||||||
| EnLink Midstream Partners LP | 4.85 | 07/15/26 | 75,000 | 70,574 | |||||||||
| EnLink Midstream Partners LP | 5.05 | 04/01/45 | 50,000 | 35,899 | |||||||||
| EnLink Midstream Partners LP | 5.45 | 06/01/47 | 75,000 | 56,460 | |||||||||
| EnLink Midstream Partners LP | 5.60 | 04/01/44 | 60,000 | 47,240 | |||||||||
| EQM Midstream Partners LP | 4.13 | 12/01/26 | 75,000 | 69,646 | |||||||||
| EQM Midstream Partners LP(1) | 4.50 | 01/15/29 | 120,000 | 105,354 | |||||||||
| EQM Midstream Partners LP(1) | 4.75 | 01/15/31 | 145,000 | 122,250 | |||||||||
The accompanying notes are an integral part of these financial statements.
62
BONDBLOXX ETF TRUST
BondBloxx USD High Yield Bond Energy Sector ETF
Portfolio of Investments (Continued)
October 31, 2023
| Rate (%) | Maturity | Face Amount | Value | ||||||||||
| PIPELINES – 40.9% (Continued) | |||||||||||||
| EQM Midstream Partners LP | 5.50 | 07/15/28 | $ | 120,000 | $ | 112,108 | |||||||
| EQM Midstream Partners LP(1) | 6.00 | 07/01/25 | 61,000 | 59,713 | |||||||||
| EQM Midstream Partners LP(1) | 6.50 | 07/01/27 | 123,000 | 119,676 | |||||||||
| EQM Midstream Partners LP | 6.50 | 07/15/48 | 85,000 | 71,964 | |||||||||
| EQM Midstream Partners LP(1) | 7.50 | 06/01/27 | 75,000 | 74,355 | |||||||||
| EQM Midstream Partners LP(1) | 7.50 | 06/01/30 | 75,000 | 73,664 | |||||||||
| Genesis Energy LP/Genesis Energy Finance Corp. | 6.25 | 05/15/26 | 50,000 | 47,702 | |||||||||
| Genesis Energy LP/Genesis Energy Finance Corp. | 6.50 | 10/01/25 | 79,000 | 77,250 | |||||||||
| Genesis Energy LP/Genesis Energy Finance Corp. | 7.75 | 02/01/28 | 100,000 | 94,249 | |||||||||
| Genesis Energy LP/Genesis Energy Finance Corp. | 8.00 | 01/15/27 | 145,000 | 139,368 | |||||||||
| Genesis Energy LP/Genesis Energy Finance Corp. | 8.88 | 04/15/30 | 65,000 | 62,890 | |||||||||
| Global Partners LP/GLP Finance Corp. | 6.88 | 01/15/29 | 45,000 | 39,753 | |||||||||
| Global Partners LP/GLP Finance Corp. | 7.00 | 08/01/27 | 60,000 | 56,604 | |||||||||
| Harvest Midstream I LP(1) | 7.50 | 09/01/28 | 120,000 | 113,829 | |||||||||
| Hess Midstream Operations LP(1) | 4.25 | 02/15/30 | 100,000 | 85,662 | |||||||||
| Hess Midstream Operations LP(1) | 5.13 | 06/15/28 | 80,000 | 73,943 | |||||||||
| Hess Midstream Operations LP(1) | 5.50 | 10/15/30 | 60,000 | 54,525 | |||||||||
| Hess Midstream Operations LP(1) | 5.63 | 02/15/26 | 120,000 | 116,330 | |||||||||
| Holly Energy Partners LP/Holly Energy Finance Corp.(1) | 5.00 | 02/01/28 | 75,000 | 69,502 | |||||||||
| Holly Energy Partners LP/Holly Energy Finance Corp.(1) | 6.38 | 04/15/27 | 60,000 | 58,147 | |||||||||
| Howard Midstream Energy Partners LLC(1) | 6.75 | 01/15/27 | 60,000 | 56,759 | |||||||||
| Howard Midstream Energy Partners LLC(1) | 8.88 | 07/15/28 | 75,000 | 75,462 | |||||||||
| ITT Holdings LLC(1) | 6.50 | 08/01/29 | 176,000 | 147,370 | |||||||||
| Kinetik Holdings LP(1) | 5.88 | 06/15/30 | 140,000 | 128,594 | |||||||||
| Martin Midstream Partners LP/Martin Midstream Finance Corp.(1) | 11.50 | 02/15/28 | 60,000 | 58,670 | |||||||||
| New Fortress Energy, Inc.(1) | 6.50 | 09/30/26 | 210,000 | 188,292 | |||||||||
| New Fortress Energy, Inc.(1) | 6.75 | 09/15/25 | 185,000 | 171,804 | |||||||||
| NGL Energy Operating LLC/NGL Energy Finance Corp.(1) | 7.50 | 02/01/26 | 290,000 | 283,348 | |||||||||
| NGL Energy Partners LP/NGL Energy Finance Corp. | 6.13 | 03/01/25 | 45,000 | 43,979 | |||||||||
| NGL Energy Partners LP/NGL Energy Finance Corp. | 7.50 | 04/15/26 | 50,000 | 47,752 | |||||||||
| Northriver Midstream Finance LP(1) | 5.63 | 02/15/26 | 80,000 | 75,726 | |||||||||
| NuStar Logistics LP | 5.63 | 04/28/27 | 73,000 | 68,898 | |||||||||
| NuStar Logistics LP | 5.75 | 10/01/25 | 90,000 | 87,191 | |||||||||
| NuStar Logistics LP | 6.00 | 06/01/26 | 75,000 | 72,435 | |||||||||
| NuStar Logistics LP | 6.38 | 10/01/30 | 90,000 | 83,341 | |||||||||
| Rockies Express Pipeline LLC(1) | 3.60 | 05/15/25 | 60,000 | 56,841 | |||||||||
| Rockies Express Pipeline LLC(1) | 4.80 | 05/15/30 | 40,000 | 33,671 | |||||||||
| Rockies Express Pipeline LLC(1) | 4.95 | 07/15/29 | 80,000 | 70,591 | |||||||||
| Rockies Express Pipeline LLC(1) | 6.88 | 04/15/40 | 75,000 | 62,497 | |||||||||
| Rockies Express Pipeline LLC(1) | 7.50 | 07/15/38 | 40,000 | 37,019 | |||||||||
| Summit Midstream Holdings LLC/Summit Midstream Finance Corp. | 5.75 | 04/15/25 | 25,000 | 23,544 | |||||||||
| Summit Midstream Holdings LLC/Summit Midstream Finance Corp.(1),(2) | 9.00 | 10/15/26 | 122,000 | 117,240 | |||||||||
| Tallgrass Energy Partners LP/Tallgrass Energy Finance Corp.(1) | 5.50 | 01/15/28 | 120,000 | 105,234 | |||||||||
| Tallgrass Energy Partners LP/Tallgrass Energy Finance Corp.(1) | 6.00 | 03/01/27 | 50,000 | 45,796 | |||||||||
| Tallgrass Energy Partners LP/Tallgrass Energy Finance Corp.(1) | 6.00 | 12/31/30 | 100,000 | 84,286 | |||||||||
| Tallgrass Energy Partners LP/Tallgrass Energy Finance Corp.(1) | 6.00 | 09/01/31 | 71,000 | 59,818 | |||||||||
| Tallgrass Energy Partners LP/Tallgrass Energy Finance Corp.(1) | 7.50 | 10/01/25 | 90,000 | 88,756 | |||||||||
| TransMontaigne Partners LP/TLP Finance Corp. | 6.13 | 02/15/26 | 45,000 | 38,445 | |||||||||
The accompanying notes are an integral part of these financial statements.
63
BONDBLOXX ETF TRUST
BondBloxx USD High Yield Bond Energy Sector ETF
Portfolio of Investments (Continued)
October 31, 2023
| Rate (%) | Maturity | Face Amount | Value | ||||||||||
| PIPELINES – 40.9% (Continued) | |||||||||||||
| Venture Global Calcasieu Pass LLC(1) | 3.88 | 08/15/29 | $ | 175,000 | $ | 145,785 | |||||||
| Venture Global Calcasieu Pass LLC(1) | 3.88 | 11/01/33 | 182,000 | 137,723 | |||||||||
| Venture Global Calcasieu Pass LLC(1) | 4.13 | 08/15/31 | 175,000 | 140,881 | |||||||||
| Venture Global Calcasieu Pass LLC(1) | 6.25 | 01/15/30 | 150,000 | 141,646 | |||||||||
| Venture Global LNG, Inc.(1) | 8.13 | 06/01/28 | 335,000 | 325,481 | |||||||||
| Venture Global LNG, Inc.(1) | 8.38 | 06/01/31 | 340,000 | 324,700 | |||||||||
| Venture Global LNG, Inc.(1) | 9.50 | 02/01/29 | 350,000 | 355,798 | |||||||||
| Venture Global LNG, Inc.(1) | 9.88 | 02/01/32 | 200,000 | 202,923 | |||||||||
| 8,386,370 | |||||||||||||
| RETAIL – 0.4% | |||||||||||||
| Superior Plus LP/Superior General Partner, Inc.(1) | 4.50 | 03/15/29 | 90,000 | 76,857 | |||||||||
| WATER – 0.3% | |||||||||||||
| Solaris Midstream Holdings LLC(1) | 7.63 | 04/01/26 | 60,000 | 57,289 | |||||||||
| TOTAL CORPORATE BONDS (Cost - $20,673,284) | 20,184,675 | ||||||||||||
| SHORT-TERM INVESTMENTS – 0.7% | |||||||||||||
| TIME DEPOSITS – 0.7% | |||||||||||||
| ANZ National Bank, London | 4.68 | 11/01/23 | 138,136 | 138,136 | |||||||||
| TOTAL SHORT-TERM INVESTMENTS (Cost - $138,136) | 138,136 | ||||||||||||
| TOTAL INVESTMENTS – 99.1% (Cost - $20,811,420) | $ | 20,322,811 | |||||||||||
| OTHER ASSETS LESS LIABILITIES – 0.9% | 192,277 | ||||||||||||
| NET ASSETS – 100.0% | $ | 20,515,088 | |||||||||||
| (1) | Security was purchased pursuant to Rule 144A under the Securities Act of 1933 and may not be resold subject to that Rule except to qualified institutional buyers. The aggregate value of Rule 144A holdings at October 31, 2023, amounts to $15,602,325 and represents 76.1% of net assets. These securities have been deemed liquid under procedures approved by the Trust’s Board of Trustees. | |
| (2) | Includes step-up bonds that pay an initial coupon rate for the first period and then a higher coupon rate for the following periods. The rate reported is the rate in effect as of October 31, 2023. |
The accompanying notes are an integral part of these financial statements.
64
BONDBLOXX ETF TRUST
BondBloxx USD High Yield Bond Consumer Cyclicals Sector ETF
Portfolio of Investments
October 31, 2023
| Rate (%) | Maturity | Face Amount | Value | ||||||||||
| CORPORATE BONDS – 97.9% | |||||||||||||
| APPAREL – 2.2% | |||||||||||||
| Crocs, Inc.(1) | 4.13 | 08/15/31 | $ | 47,000 | $ | 35,773 | |||||||
| Crocs, Inc.(1) | 4.25 | 03/15/29 | 40,000 | 32,848 | |||||||||
| Hanesbrands, Inc.(1) | 4.88 | 05/15/26 | 108,000 | 99,348 | |||||||||
| Hanesbrands, Inc.(1) | 9.00 | 02/15/31 | 80,000 | 74,347 | |||||||||
| Kontoor Brands, Inc.(1) | 4.13 | 11/15/29 | 49,000 | 40,399 | |||||||||
| Levi Strauss & Co.(1) | 3.50 | 03/01/31 | 60,000 | 46,780 | |||||||||
| Under Armour, Inc. | 3.25 | 06/15/26 | 75,000 | 68,377 | |||||||||
| William Carter Co.(1) | 5.63 | 03/15/27 | 60,000 | 56,912 | |||||||||
| Wolverine World Wide, Inc.(1) | 4.00 | 08/15/29 | 70,000 | 52,267 | |||||||||
| 507,051 | |||||||||||||
| AUTO MANUFACTURERS – 15.5% | |||||||||||||
| Allison Transmission, Inc.(1) | 3.75 | 01/30/31 | 120,000 | 95,226 | |||||||||
| Allison Transmission, Inc.(1) | 4.75 | 10/01/27 | 40,000 | 36,520 | |||||||||
| Allison Transmission, Inc.(1) | 5.88 | 06/01/29 | 72,000 | 66,824 | |||||||||
| Aston Martin Capital Holdings Ltd.(1) | 10.50 | 11/30/25 | 140,000 | 138,603 | |||||||||
| Ford Holdings LLC | 9.30 | 03/01/30 | 23,000 | 24,673 | |||||||||
| Ford Motor Co. | 3.25 | 02/12/32 | 192,000 | 145,062 | |||||||||
| Ford Motor Co. | 4.35 | 12/08/26 | 110,000 | 103,779 | |||||||||
| Ford Motor Co. | 4.75 | 01/15/43 | 153,000 | 106,472 | |||||||||
| Ford Motor Co. | 5.29 | 12/08/46 | 103,000 | 74,936 | |||||||||
| Ford Motor Co. | 6.10 | 08/19/32 | 130,000 | 120,341 | |||||||||
| Ford Motor Co. | 6.63 | 10/01/28 | 28,000 | 27,699 | |||||||||
| Ford Motor Co. | 7.40 | 11/01/46 | 27,000 | 25,364 | |||||||||
| Ford Motor Co. | 7.45 | 07/16/31 | 78,000 | 78,773 | |||||||||
| Ford Motor Co. | 9.63 | 04/22/30 | 38,000 | 42,414 | |||||||||
| Ford Motor Credit Co. LLC | 2.30 | 02/10/25 | 125,000 | 118,175 | |||||||||
| Ford Motor Credit Co. LLC | 2.70 | 08/10/26 | 115,000 | 103,192 | |||||||||
| Ford Motor Credit Co. LLC | 2.90 | 02/16/28 | 60,000 | 51,103 | |||||||||
| Ford Motor Credit Co. LLC | 2.90 | 02/10/29 | 76,000 | 62,252 | |||||||||
| Ford Motor Credit Co. LLC | 3.38 | 11/13/25 | 155,000 | 144,794 | |||||||||
| Ford Motor Credit Co. LLC | 3.63 | 06/17/31 | 81,000 | 64,075 | |||||||||
| Ford Motor Credit Co. LLC | 3.82 | 11/02/27 | 60,000 | 53,556 | |||||||||
| Ford Motor Credit Co. LLC | 4.00 | 11/13/30 | 125,000 | 103,065 | |||||||||
| Ford Motor Credit Co. LLC | 4.06 | 11/01/24 | 110,000 | 107,188 | |||||||||
| Ford Motor Credit Co. LLC | 4.13 | 08/04/25 | 105,000 | 100,185 | |||||||||
| Ford Motor Credit Co. LLC | 4.13 | 08/17/27 | 103,000 | 93,624 | |||||||||
| Ford Motor Credit Co. LLC | 4.27 | 01/09/27 | 75,000 | 69,472 | |||||||||
| Ford Motor Credit Co. LLC | 4.39 | 01/08/26 | 76,000 | 72,121 | |||||||||
| Ford Motor Credit Co. LLC | 4.54 | 08/01/26 | 50,000 | 47,075 | |||||||||
| Ford Motor Credit Co. LLC | 4.69 | 06/09/25 | 45,000 | 43,513 | |||||||||
| Ford Motor Credit Co. LLC | 4.95 | 05/28/27 | 110,000 | 103,287 | |||||||||
| Ford Motor Credit Co. LLC | 5.11 | 05/03/29 | 100,000 | 91,110 | |||||||||
| Ford Motor Credit Co. LLC | 5.13 | 06/16/25 | 130,000 | 126,611 | |||||||||
| Ford Motor Credit Co. LLC | 6.80 | 05/12/28 | 115,000 | 114,783 | |||||||||
| Ford Motor Credit Co. LLC | 6.95 | 03/06/26 | 110,000 | 110,305 | |||||||||
| Ford Motor Credit Co. LLC | 6.95 | 06/10/26 | 65,000 | 65,235 | |||||||||
| Ford Motor Credit Co. LLC | 7.20 | 06/10/30 | 65,000 | 65,026 | |||||||||
The accompanying notes are an integral part of these financial statements.
65
BONDBLOXX ETF TRUST
BondBloxx USD High Yield Bond Consumer Cyclicals Sector ETF
Portfolio of Investments (Continued)
October 31, 2023
| Rate (%) | Maturity | Face Amount | Value | ||||||||||
| AUTO MANUFACTURERS – 15.5% (Continued) | |||||||||||||
| Ford Motor Credit Co. LLC | 7.35 | 11/04/27 | $ | 108,000 | $ | 109,585 | |||||||
| Ford Motor Credit Co. LLC | 7.35 | 03/06/30 | 85,000 | 85,463 | |||||||||
| Jaguar Land Rover Automotive PLC(1) | 4.50 | 10/01/27 | 60,000 | 51,798 | |||||||||
| Jaguar Land Rover Automotive PLC(1) | 5.50 | 07/15/29 | 62,000 | 53,511 | |||||||||
| Jaguar Land Rover Automotive PLC(1) | 5.88 | 01/15/28 | 80,000 | 72,082 | |||||||||
| Jaguar Land Rover Automotive PLC(1) | 7.75 | 10/15/25 | 90,000 | 90,160 | |||||||||
| McLaren Finance PLC(1) | 7.50 | 08/01/26 | 76,000 | 65,558 | |||||||||
| 3,524,590 | |||||||||||||
| AUTO PARTS & EQUIPMENT – 7.3% | |||||||||||||
| Adient Global Holdings Ltd.(1) | 4.88 | 08/15/26 | 97,000 | 90,445 | |||||||||
| Adient Global Holdings Ltd.(1) | 7.00 | 04/15/28 | 65,000 | 64,051 | |||||||||
| Adient Global Holdings Ltd.(1) | 8.25 | 04/15/31 | 60,000 | 58,449 | |||||||||
| American Axle & Manufacturing, Inc. | 5.00 | 10/01/29 | 75,000 | 59,333 | |||||||||
| American Axle & Manufacturing, Inc. | 6.50 | 04/01/27 | 65,000 | 61,335 | |||||||||
| American Axle & Manufacturing, Inc. | 6.88 | 07/01/28 | 44,000 | 39,258 | |||||||||
| Dana, Inc. | 4.25 | 09/01/30 | 52,000 | 41,226 | |||||||||
| Dana, Inc. | 4.50 | 02/15/32 | 43,000 | 33,722 | |||||||||
| Dana, Inc. | 5.38 | 11/15/27 | 49,000 | 45,136 | |||||||||
| Dana, Inc. | 5.63 | 06/15/28 | 49,000 | 44,463 | |||||||||
| Dealer Tire LLC/DT Issuer LLC(1) | 8.00 | 02/01/28 | 60,000 | 56,339 | |||||||||
| Goodyear Tire & Rubber Co. | 4.88 | 03/15/27 | 85,000 | 78,271 | |||||||||
| Goodyear Tire & Rubber Co. | 5.00 | 05/31/26 | 110,000 | 104,158 | |||||||||
| Goodyear Tire & Rubber Co. | 5.00 | 07/15/29 | 115,000 | 99,076 | |||||||||
| Goodyear Tire & Rubber Co. | 5.25 | 04/30/31 | 58,000 | 47,757 | |||||||||
| Goodyear Tire & Rubber Co. | 5.25 | 07/15/31 | 72,000 | 58,696 | |||||||||
| Goodyear Tire & Rubber Co. | 5.63 | 04/30/33 | 59,000 | 47,367 | |||||||||
| Goodyear Tire & Rubber Co. | 9.50 | 05/31/25 | 101,000 | 102,275 | |||||||||
| Real Hero Merger Sub 2, Inc.(1) | 6.25 | 02/01/29 | 75,000 | 59,736 | |||||||||
| Tenneco, Inc.(1) | 8.00 | 11/17/28 | 235,000 | 188,834 | |||||||||
| ZF North America Capital, Inc.(1) | 4.75 | 04/29/25 | 130,000 | 125,567 | |||||||||
| ZF North America Capital, Inc.(1) | 6.88 | 04/14/28 | 75,000 | 72,762 | |||||||||
| ZF North America Capital, Inc.(1) | 7.13 | 04/14/30 | 75,000 | 72,848 | |||||||||
| 1,651,104 | |||||||||||||
| COMMERCIAL SERVICES – 1.2% | |||||||||||||
| Metis Merger Sub LLC(1) | 6.50 | 05/15/29 | 86,000 | 70,364 | |||||||||
| Sabre GLBL, Inc.(1) | 8.63 | 06/01/27 | 100,000 | 83,028 | |||||||||
| Sabre GLBL, Inc.(1) | 11.25 | 12/15/27 | 75,000 | 66,833 | |||||||||
| Upbound Group, Inc.(1) | 6.38 | 02/15/29 | 55,000 | 47,357 | |||||||||
| 267,582 | |||||||||||||
| DISTRIBUTION/WHOLESALE – 0.2% | |||||||||||||
| G-III Apparel Group Ltd.(1) | 7.88 | 08/15/25 | 48,000 | 47,610 | |||||||||
| DIVERSIFIED FINANCIAL SERVICES – 0.2% | |||||||||||||
| Cobra Acquisition Co. LLC(1) | 6.38 | 11/01/29 | 50,000 | 35,688 | |||||||||
The accompanying notes are an integral part of these financial statements.
66
BONDBLOXX ETF TRUST
BondBloxx USD High Yield Bond Consumer Cyclicals Sector ETF
Portfolio of Investments (Continued)
October 31, 2023
| Rate (%) | Maturity | Face Amount | Value | ||||||||||
| ENTERTAINMENT – 20.7% | |||||||||||||
| Affinity Interactive(1) | 6.88 | 12/15/27 | $ | 65,000 | $ | 53,037 | |||||||
| AMC Entertainment Holdings, Inc.(1) | 7.50 | 02/15/29 | 117,000 | 82,067 | |||||||||
| Boyne USA, Inc.(1) | 4.75 | 05/15/29 | 82,000 | 71,472 | |||||||||
| Caesars Entertainment, Inc.(1) | 4.63 | 10/15/29 | 150,000 | 123,426 | |||||||||
| Caesars Entertainment, Inc.(1) | 6.25 | 07/01/25 | 422,000 | 415,536 | |||||||||
| Caesars Entertainment, Inc.(1) | 7.00 | 02/15/30 | 243,000 | 234,742 | |||||||||
| Caesars Entertainment, Inc.(1) | 8.13 | 07/01/27 | 196,000 | 194,369 | |||||||||
| Caesars Resort Collection LLC/CRC FinCo., Inc.(1) | 5.75 | 07/01/25 | 119,000 | 117,241 | |||||||||
| CCM Merger, Inc.(1) | 6.38 | 05/01/26 | 32,000 | 30,317 | |||||||||
| CDI Escrow Issuer, Inc.(1) | 5.75 | 04/01/30 | 142,000 | 127,011 | |||||||||
| Cedar Fair LP | 5.25 | 07/15/29 | 60,000 | 51,730 | |||||||||
| Cedar Fair LP/Canada’s Wonderland Co./Magnum Management Corp./ Millennium Op | 5.38 | 04/15/27 | 60,000 | 55,612 | |||||||||
| Cedar Fair LP/Canada’s Wonderland Co./Magnum Management Corp./ Millennium Op(1) | 5.50 | 05/01/25 | 130,000 | 127,535 | |||||||||
| Cedar Fair LP/Canada’s Wonderland Co./Magnum Management Corp./ Millennium Op | 6.50 | 10/01/28 | 37,000 | 34,282 | |||||||||
| Churchill Downs, Inc.(1) | 4.75 | 01/15/28 | 95,000 | 85,189 | |||||||||
| Churchill Downs, Inc.(1) | 5.50 | 04/01/27 | 71,000 | 66,657 | |||||||||
| Churchill Downs, Inc.(1) | 6.75 | 05/01/31 | 75,000 | 69,281 | |||||||||
| Cinemark USA, Inc.(1) | 5.25 | 07/15/28 | 96,000 | 82,998 | |||||||||
| Cinemark USA, Inc.(1) | 5.88 | 03/15/26 | 45,000 | 42,775 | |||||||||
| Empire Resorts, Inc.(1) | 7.75 | 11/01/26 | 38,000 | 30,850 | |||||||||
| Everi Holdings, Inc.(1) | 5.00 | 07/15/29 | 49,000 | 41,217 | |||||||||
| Golden Entertainment, Inc.(1) | 7.63 | 04/15/26 | 40,000 | 40,033 | |||||||||
| International Game Technology PLC(1) | 4.13 | 04/15/26 | 85,000 | 80,063 | |||||||||
| International Game Technology PLC(1) | 5.25 | 01/15/29 | 90,000 | 81,971 | |||||||||
| International Game Technology PLC(1) | 6.25 | 01/15/27 | 90,000 | 87,795 | |||||||||
| International Game Technology PLC(1) | 6.50 | 02/15/25 | 70,000 | 69,595 | |||||||||
| Jacobs Entertainment, Inc.(1) | 6.75 | 02/15/29 | 60,000 | 51,052 | |||||||||
| Light & Wonder International, Inc.(1) | 7.00 | 05/15/28 | 87,000 | 84,889 | |||||||||
| Light & Wonder International, Inc.(1) | 7.25 | 11/15/29 | 59,000 | 57,275 | |||||||||
| Light & Wonder International, Inc.(1) | 7.50 | 09/01/31 | 70,000 | 68,429 | |||||||||
| Live Nation Entertainment, Inc.(1) | 3.75 | 01/15/28 | 60,000 | 52,590 | |||||||||
| Live Nation Entertainment, Inc.(1) | 4.75 | 10/15/27 | 123,000 | 112,520 | |||||||||
| Live Nation Entertainment, Inc.(1) | 4.88 | 11/01/24 | 71,000 | 69,554 | |||||||||
| Live Nation Entertainment, Inc.(1) | 5.63 | 03/15/26 | 37,000 | 35,471 | |||||||||
| Live Nation Entertainment, Inc.(1) | 6.50 | 05/15/27 | 147,000 | 143,563 | |||||||||
| Merlin Entertainments Ltd.(1) | 5.75 | 06/15/26 | 73,000 | 68,344 | |||||||||
| Midwest Gaming Borrower LLC/Midwest Gaming Finance Corp.(1) | 4.88 | 05/01/29 | 92,000 | 76,673 | |||||||||
| Mohegan Tribal Gaming Authority(1) | 8.00 | 02/01/26 | 146,000 | 134,306 | |||||||||
| Motion Bondco DAC(1) | 6.63 | 11/15/27 | 25,000 | 22,396 | |||||||||
| Odeon FinCo. PLC(1) | 12.75 | 11/01/27 | 50,000 | 49,853 | |||||||||
| Ontario Gaming GTA LP(1) | 8.00 | 08/01/30 | 50,000 | 48,930 | |||||||||
| Penn Entertainment, Inc.(1) | 4.13 | 07/01/29 | 67,000 | 52,116 | |||||||||
| Penn Entertainment, Inc.(1) | 5.63 | 01/15/27 | 35,000 | 31,957 | |||||||||
| Premier Entertainment Sub LLC/Premier Entertainment Finance Corp.(1) | 5.63 | 09/01/29 | 97,000 | 68,300 | |||||||||
| Premier Entertainment Sub LLC/Premier Entertainment Finance Corp.(1) | 5.88 | 09/01/31 | 87,000 | 59,160 | |||||||||
| Raptor Acquisition Corp./Raptor Co.-Issuer LLC(1) | 4.88 | 11/01/26 | 43,000 | 40,055 | |||||||||
The accompanying notes are an integral part of these financial statements.
67
BONDBLOXX ETF TRUST
BondBloxx USD High Yield Bond Consumer Cyclicals Sector ETF
Portfolio of Investments (Continued)
October 31, 2023
| Rate (%) | Maturity | Face Amount | Value | ||||||||||
| ENTERTAINMENT – 20.7% (Continued) | |||||||||||||
| Resorts World Las Vegas LLC/RWLV Capital, Inc.(1) | 4.63 | 04/16/29 | $ | 117,000 | $ | 89,979 | |||||||
| Resorts World Las Vegas LLC/RWLV Capital, Inc.(1) | 4.63 | 04/06/31 | 50,000 | 35,305 | |||||||||
| Resorts World Las Vegas LLC/RWLV Capital, Inc.(1) | 8.45 | 07/27/30 | 50,000 | 46,151 | |||||||||
| Scientific Games Holdings LP/Scientific Games US FinCo., Inc.(1) | 6.63 | 03/01/30 | 98,000 | 84,370 | |||||||||
| SeaWorld Parks & Entertainment, Inc.(1) | 5.25 | 08/15/29 | 87,000 | 75,873 | |||||||||
| Six Flags Entertainment Corp.(1) | 5.50 | 04/15/27 | 60,000 | 54,678 | |||||||||
| Six Flags Entertainment Corp.(1) | 7.25 | 05/15/31 | 95,000 | 87,506 | |||||||||
| Six Flags Theme Parks, Inc.(1) | 7.00 | 07/01/25 | 48,000 | 47,714 | |||||||||
| Speedway Motorsports LLC/Speedway Funding II, Inc.(1) | 4.88 | 11/01/27 | 43,000 | 38,422 | |||||||||
| Universal Entertainment Corp.(1),(2) | 8.75 | 12/11/24 | 92,000 | 95,303 | |||||||||
| Vail Resorts, Inc.(1) | 6.25 | 05/15/25 | 75,000 | 74,602 | |||||||||
| Wynn Resorts Finance LLC/Wynn Resorts Capital Corp.(1) | 5.13 | 10/01/29 | 92,000 | 78,549 | |||||||||
| Wynn Resorts Finance LLC/Wynn Resorts Capital Corp.(1) | 7.13 | 02/15/31 | 75,000 | 69,921 | |||||||||
| 4,702,607 | |||||||||||||
| HOLDING COMPANIES-DIVERS – 0.3% | |||||||||||||
| Benteler International AG(1) | 10.50 | 05/15/28 | 60,000 | 60,498 | |||||||||
| HOME BUILDERS – 0.7% | |||||||||||||
| Forestar Group, Inc.(1) | 3.85 | 05/15/26 | 53,000 | 47,231 | |||||||||
| Forestar Group, Inc.(1) | 5.00 | 03/01/28 | 35,000 | 30,758 | |||||||||
| Thor Industries, Inc.(1) | 4.00 | 10/15/29 | 60,000 | 48,438 | |||||||||
| Winnebago Industries, Inc.(1) | 6.25 | 07/15/28 | 38,000 | 35,774 | |||||||||
| 162,201 | |||||||||||||
| INTERNET – 1.4% | |||||||||||||
| GrubHub Holdings, Inc.(1) | 5.50 | 07/01/27 | 65,000 | 47,873 | |||||||||
| Rakuten Group, Inc.(1),(3) | 5.13 | - | 90,000 | 65,516 | |||||||||
| Rakuten Group, Inc.(1),(3) | 6.25 | - | 130,000 | 82,112 | |||||||||
| Rakuten Group, Inc.(1) | 10.25 | 11/30/24 | 116,000 | 117,452 | |||||||||
| 312,953 | |||||||||||||
| LEISURE TIME – 17.3% | |||||||||||||
| Carnival Corp.(1) | 4.00 | 08/01/28 | 292,000 | 254,228 | |||||||||
| Carnival Corp.(1) | 5.75 | 03/01/27 | 403,000 | 360,095 | |||||||||
| Carnival Corp.(1) | 6.00 | 05/01/29 | 242,000 | 204,639 | |||||||||
| Carnival Corp.(1) | 7.00 | 08/15/29 | 70,000 | 68,703 | |||||||||
| Carnival Corp.(1) | 7.63 | 03/01/26 | 167,000 | 162,522 | |||||||||
| Carnival Corp.(1) | 9.88 | 08/01/27 | 108,000 | 112,651 | |||||||||
| Carnival Corp.(1) | 10.50 | 06/01/30 | 120,000 | 121,883 | |||||||||
| Carnival Holdings Bermuda Ltd.(1) | 10.38 | 05/01/28 | 255,000 | 272,107 | |||||||||
| Life Time, Inc.(1) | 5.75 | 01/15/26 | 108,000 | 104,691 | |||||||||
| Life Time, Inc.(1) | 8.00 | 04/15/26 | 65,000 | 63,429 | |||||||||
| Lindblad Expeditions Holdings, Inc.(1) | 9.00 | 05/15/28 | 50,000 | 48,140 | |||||||||
| Lindblad Expeditions LLC(1) | 6.75 | 02/15/27 | 28,000 | 25,541 | |||||||||
| NCL Corp. Ltd.(1) | 3.63 | 12/15/24 | 74,000 | 70,057 | |||||||||
| NCL Corp. Ltd.(1) | 5.88 | 03/15/26 | 167,000 | 150,031 | |||||||||
| NCL Corp. Ltd.(1) | 5.88 | 02/15/27 | 120,000 | 110,577 | |||||||||
| NCL Corp. Ltd.(1) | 7.75 | 02/15/29 | 75,000 | 65,518 | |||||||||
| NCL Corp. Ltd.(1) | 8.13 | 01/15/29 | 100,000 | 97,806 | |||||||||
The accompanying notes are an integral part of these financial statements.
68
BONDBLOXX ETF TRUST
BondBloxx USD High Yield Bond Consumer Cyclicals Sector ETF
Portfolio of Investments (Continued)
October 31, 2023
| Face | ||||||||||||||
| Rate (%) | Maturity | Amount | Value | |||||||||||
| LEISURE TIME – 17.3% (Continued) | ||||||||||||||
| NCL Corp. Ltd.(1) | 8.38 | 02/01/28 | $ | 71,000 | $ | 70,398 | ||||||||
| NCL Finance Ltd.(1) | 6.13 | 03/15/28 | 72,000 | 60,270 | ||||||||||
| Royal Caribbean Cruises Ltd. | 3.70 | 03/15/28 | 60,000 | 51,189 | ||||||||||
| Royal Caribbean Cruises Ltd.(1) | 4.25 | 07/01/26 | 75,000 | 69,036 | ||||||||||
| Royal Caribbean Cruises Ltd.(1) | 5.38 | 07/15/27 | 122,000 | 112,554 | ||||||||||
| Royal Caribbean Cruises Ltd.(1) | 5.50 | 08/31/26 | 130,000 | 122,819 | ||||||||||
| Royal Caribbean Cruises Ltd.(1) | 5.50 | 04/01/28 | 187,000 | 170,683 | ||||||||||
| Royal Caribbean Cruises Ltd.(1) | 7.25 | 01/15/30 | 85,000 | 83,932 | ||||||||||
| Royal Caribbean Cruises Ltd. | 7.50 | 10/15/27 | 37,000 | 36,479 | ||||||||||
| Royal Caribbean Cruises Ltd.(1) | 8.25 | 01/15/29 | 130,000 | 133,395 | ||||||||||
| Royal Caribbean Cruises Ltd.(1) | 9.25 | 01/15/29 | 120,000 | 125,384 | ||||||||||
| Royal Caribbean Cruises Ltd.(1) | 11.50 | 06/01/25 | 62,000 | 65,574 | ||||||||||
| Royal Caribbean Cruises Ltd.(1) | 11.63 | 08/15/27 | 150,000 | 162,831 | ||||||||||
| Viking Cruises Ltd.(1) | 5.88 | 09/15/27 | 140,000 | 126,253 | ||||||||||
| Viking Cruises Ltd.(1) | 7.00 | 02/15/29 | 65,000 | 58,880 | ||||||||||
| Viking Cruises Ltd.(1) | 9.13 | 07/15/31 | 85,000 | 83,589 | ||||||||||
| Viking Ocean Cruises Ship VII Ltd.(1) | 5.63 | 02/15/29 | 42,000 | 37,268 | ||||||||||
| VOC Escrow Ltd.(1) | 5.00 | 02/15/28 | 80,000 | 71,951 | ||||||||||
| 3,935,103 | ||||||||||||||
| LODGING – 11.2% | ||||||||||||||
| Boyd Gaming Corp. | 4.75 | 12/01/27 | 125,000 | 113,984 | ||||||||||
| Boyd Gaming Corp.(1) | 4.75 | 06/15/31 | 108,000 | 89,758 | ||||||||||
| Full House Resorts, Inc.(1) | 8.25 | 02/15/28 | 53,000 | 44,673 | ||||||||||
| Genting New York LLC/GENNY Capital, Inc.(1) | 3.30 | 02/15/26 | 65,000 | 58,018 | ||||||||||
| Hilton Domestic Operating Co., Inc.(1) | 3.63 | 02/15/32 | 182,000 | 144,033 | ||||||||||
| Hilton Domestic Operating Co., Inc.(1) | 3.75 | 05/01/29 | 95,000 | 81,869 | ||||||||||
| Hilton Domestic Operating Co., Inc.(1) | 4.00 | 05/01/31 | 142,000 | 117,753 | ||||||||||
| Hilton Domestic Operating Co., Inc. | 4.88 | 01/15/30 | 120,000 | 107,841 | ||||||||||
| Hilton Domestic Operating Co., Inc.(1) | 5.38 | 05/01/25 | 60,000 | 59,133 | ||||||||||
| Hilton Domestic Operating Co., Inc.(1) | 5.75 | 05/01/28 | 62,000 | 59,458 | ||||||||||
| Hilton Grand Vacations Borrower Escrow LLC/Hilton Grand Vacations Borrower Esc(1) | 4.88 | 07/01/31 | 60,000 | 47,578 | ||||||||||
| Hilton Grand Vacations Borrower Escrow LLC/Hilton Grand Vacations Borrower Esc(1) | 5.00 | 06/01/29 | 103,000 | 86,365 | ||||||||||
| Hilton Worldwide Finance LLC/Hilton Worldwide Finance Corp. | 4.88 | 04/01/27 | 75,000 | 70,801 | ||||||||||
| Las Vegas Sands Corp. | 2.90 | 06/25/25 | 65,000 | 61,075 | ||||||||||
| Las Vegas Sands Corp. | 3.50 | 08/18/26 | 125,000 | 114,508 | ||||||||||
| Las Vegas Sands Corp. | 3.90 | 08/08/29 | 92,000 | 79,547 | ||||||||||
| Marriott Ownership Resorts, Inc.(1) | 4.50 | 06/15/29 | 82,000 | 67,454 | ||||||||||
| Marriott Ownership Resorts, Inc. | 4.75 | 01/15/28 | 25,000 | 21,516 | ||||||||||
| MGM Resorts International | 4.63 | 09/01/26 | 50,000 | 46,509 | ||||||||||
| MGM Resorts International | 4.75 | 10/15/28 | 95,000 | 82,982 | ||||||||||
| MGM Resorts International | 5.50 | 04/15/27 | 83,000 | 77,512 | ||||||||||
| MGM Resorts International | 5.75 | 06/15/25 | 80,000 | 78,300 | ||||||||||
| MGM Resorts International | 6.75 | 05/01/25 | 92,000 | 91,585 | ||||||||||
| Station Casinos LLC(1) | 4.50 | 02/15/28 | 81,000 | 70,032 | ||||||||||
| Station Casinos LLC(1) | 4.63 | 12/01/31 | 65,000 | 51,396 | ||||||||||
| Sugarhouse HSP Gaming Prop Mezz LP/Sugarhouse HSP Gaming Finance Corp.(1) | 5.88 | 05/15/25 | 32,000 | 30,667 | ||||||||||
The accompanying notes are an integral part of these financial statements.
69
BONDBLOXX ETF TRUST
BondBloxx USD High Yield Bond Consumer Cyclicals Sector ETF
Portfolio of Investments (Continued)
October 31, 2023
| Face | ||||||||||||||
| Rate (%) | Maturity | Amount | Value | |||||||||||
| LODGING – 11.2% (Continued) | ||||||||||||||
| Travel + Leisure Co.(1) | 4.50 | 12/01/29 | $ | 80,000 | $ | 66,042 | ||||||||
| Travel + Leisure Co.(1) | 4.63 | 03/01/30 | 42,000 | 34,423 | ||||||||||
| Travel + Leisure Co. | 6.60 | 10/01/25 | 25,000 | 24,476 | ||||||||||
| Travel + Leisure Co.(1) | 6.63 | 07/31/26 | 147,000 | 143,556 | ||||||||||
| Wyndham Hotels & Resorts, Inc.(1) | 4.38 | 08/15/28 | 60,000 | 53,005 | ||||||||||
| Wynn Las Vegas LLC/Wynn Las Vegas Capital Corp.(1) | 5.25 | 05/15/27 | 108,000 | 99,870 | ||||||||||
| Wynn Las Vegas LLC/Wynn Las Vegas Capital Corp.(1) | 5.50 | 03/01/25 | 180,000 | 176,880 | ||||||||||
| 2,552,599 | ||||||||||||||
| MISCELLANEOUS MANUFACTURER – 0.3% | ||||||||||||||
| Gates Global LLC/Gates Corp.(1) | 6.25 | 01/15/26 | 70,000 | 68,628 | ||||||||||
| REAL ESTATE – 3.6% | ||||||||||||||
| Anywhere Real Estate Group LLC/Anywhere Co.-Issuer Corp.(1) | 7.00 | 04/15/30 | 135,200 | 111,624 | ||||||||||
| Cushman & Wakefield US Borrower LLC(1) | 6.75 | 05/15/28 | 81,000 | 73,946 | ||||||||||
| Cushman & Wakefield US Borrower LLC(1) | 8.88 | 09/01/31 | 50,000 | 47,452 | ||||||||||
| Five Point Operating Co. LP/Five Point Capital Corp.(1) | 7.88 | 11/15/25 | 76,000 | 71,446 | ||||||||||
| Greystar Real Estate Partners LLC(1) | 7.75 | 09/01/30 | 50,000 | 49,191 | ||||||||||
| Howard Hughes Corp.(1) | 4.13 | 02/01/29 | 77,000 | 61,873 | ||||||||||
| Howard Hughes Corp.(1) | 4.38 | 02/01/31 | 80,000 | 60,992 | ||||||||||
| Howard Hughes Corp.(1) | 5.38 | 08/01/28 | 92,000 | 80,977 | ||||||||||
| Hunt Cos, Inc.(1) | 5.25 | 04/15/29 | 81,000 | 63,947 | ||||||||||
| Kennedy-Wilson, Inc. | 4.75 | 03/01/29 | 34,000 | 25,619 | ||||||||||
| Kennedy-Wilson, Inc. | 4.75 | 02/01/30 | 123,000 | 89,920 | ||||||||||
| Kennedy-Wilson, Inc. | 5.00 | 03/01/31 | 65,000 | 46,696 | ||||||||||
| Realogy Group LLC/Realogy Co.-Issuer Corp.(1) | 5.25 | 04/15/30 | 35,000 | 21,829 | ||||||||||
| Realogy Group LLC/Realogy Co.-Issuer Corp.(1) | 5.75 | 01/15/29 | 29,000 | 18,304 | ||||||||||
| 823,816 | ||||||||||||||
| RETAIL – 15.4% | ||||||||||||||
| Academy Ltd.(1) | 6.00 | 11/15/27 | 48,000 | 45,242 | ||||||||||
| Asbury Automotive Group, Inc. | 4.50 | 03/01/28 | 50,000 | 44,362 | ||||||||||
| Asbury Automotive Group, Inc.(1) | 4.63 | 11/15/29 | 100,000 | 84,716 | ||||||||||
| Asbury Automotive Group, Inc. | 4.75 | 03/01/30 | 55,000 | 46,743 | ||||||||||
| Asbury Automotive Group, Inc.(1) | 5.00 | 02/15/32 | 71,000 | 57,660 | ||||||||||
| At Home Group, Inc.(1) | 4.88 | 07/15/28 | 37,000 | 13,135 | ||||||||||
| Bath & Body Works, Inc. | 5.25 | 02/01/28 | 77,000 | 70,687 | ||||||||||
| Bath & Body Works, Inc.(1) | 6.63 | 10/01/30 | 122,000 | 113,105 | ||||||||||
| Bath & Body Works, Inc. | 6.69 | 01/15/27 | 40,000 | 38,708 | ||||||||||
| Bath & Body Works, Inc. | 6.75 | 07/01/36 | 75,000 | 64,768 | ||||||||||
| Bath & Body Works, Inc. | 6.88 | 11/01/35 | 110,000 | 97,181 | ||||||||||
| Bath & Body Works, Inc. | 6.95 | 03/01/33 | 40,000 | 34,629 | ||||||||||
| Bath & Body Works, Inc. | 7.50 | 06/15/29 | 65,000 | 63,558 | ||||||||||
| Bath & Body Works, Inc.(1) | 9.38 | 07/01/25 | 20,000 | 20,618 | ||||||||||
| Evergreen Acqco 1 LP/TVI, Inc.(1) | 9.75 | 04/26/28 | 61,000 | 61,609 | ||||||||||
| Fertitta Entertainment LLC/Fertitta Entertainment Finance Co., Inc.(1) | 4.63 | 01/15/29 | 123,000 | 103,494 | ||||||||||
| Fertitta Entertainment LLC/Fertitta Entertainment Finance Co., Inc.(1) | 6.75 | 01/15/30 | 157,000 | 124,913 | ||||||||||
| Foot Locker, Inc.(1) | 4.00 | 10/01/29 | 49,000 | 36,077 | ||||||||||
| Gap, Inc.(1) | 3.63 | 10/01/29 | 92,000 | 70,387 | ||||||||||
The accompanying notes are an integral part of these financial statements.
70
BONDBLOXX ETF TRUST
BondBloxx USD High Yield Bond Consumer Cyclicals Sector ETF
Portfolio of Investments (Continued)
October 31, 2023
| Face | ||||||||||||||
| Rate (%) | Maturity | Amount | Value | |||||||||||
| RETAIL – 15.4% (Continued) | ||||||||||||||
| Gap, Inc.(1) | 3.88 | 10/01/31 | $ | 92,000 | $ | 66,170 | ||||||||
| Group 1 Automotive, Inc.(1) | 4.00 | 08/15/28 | 92,000 | 79,287 | ||||||||||
| Guitar Center, Inc.(1) | 8.50 | 01/15/26 | 65,000 | 54,791 | ||||||||||
| Ken Garff Automotive LLC(1) | 4.88 | 09/15/28 | 48,000 | 40,638 | ||||||||||
| Kohl’s Corp. | 4.25 | 07/17/25 | 40,000 | 37,397 | ||||||||||
| Kohl’s Corp. | 4.63 | 05/01/31 | 72,000 | 49,313 | ||||||||||
| Kohl’s Corp. | 5.55 | 07/17/45 | 44,000 | 25,568 | ||||||||||
| LCM Investments Holdings II LLC(1) | 4.88 | 05/01/29 | 125,000 | 104,885 | ||||||||||
| LCM Investments Holdings II LLC(1) | 8.25 | 08/01/31 | 60,000 | 57,132 | ||||||||||
| Lithia Motors, Inc.(1) | 3.88 | 06/01/29 | 102,000 | 84,496 | ||||||||||
| Lithia Motors, Inc.(1) | 4.38 | 01/15/31 | 65,000 | 52,695 | ||||||||||
| Lithia Motors, Inc.(1) | 4.63 | 12/15/27 | 50,000 | 45,163 | ||||||||||
| LSF9 Atlantis Holdings LLC/Victra Finance Corp.(1) | 7.75 | 02/15/26 | 98,000 | 88,562 | ||||||||||
| Macy’s Retail Holdings LLC | 4.30 | 02/15/43 | 30,000 | 16,482 | ||||||||||
| Macy’s Retail Holdings LLC | 4.50 | 12/15/34 | 60,000 | 40,265 | ||||||||||
| Macy’s Retail Holdings LLC | 5.13 | 01/15/42 | 23,000 | 14,191 | ||||||||||
| Macy’s Retail Holdings LLC(1) | 5.88 | 04/01/29 | 70,000 | 61,784 | ||||||||||
| Macy’s Retail Holdings LLC(1) | 5.88 | 03/15/30 | 40,000 | 33,888 | ||||||||||
| Macy’s Retail Holdings LLC(1) | 6.13 | 03/15/32 | 50,000 | 41,350 | ||||||||||
| Michaels Cos, Inc.(1) | 5.25 | 05/01/28 | 108,000 | 78,354 | ||||||||||
| Michaels Cos, Inc.(1) | 7.88 | 05/01/29 | 152,000 | 84,916 | ||||||||||
| NMG Holding Co., Inc./Neiman Marcus Group LLC(1) | 7.13 | 04/01/26 | 135,000 | 126,403 | ||||||||||
| Nordstrom, Inc. | 4.00 | 03/15/27 | 61,000 | 53,917 | ||||||||||
| Nordstrom, Inc. | 4.25 | 08/01/31 | 60,000 | 44,023 | ||||||||||
| Nordstrom, Inc. | 4.38 | 04/01/30 | 57,000 | 44,312 | ||||||||||
| Nordstrom, Inc. | 5.00 | 01/15/44 | 114,000 | 68,645 | ||||||||||
| Nordstrom, Inc. | 6.95 | 03/15/28 | 28,000 | 26,383 | ||||||||||
| Penske Automotive Group, Inc. | 3.50 | 09/01/25 | 65,000 | 61,758 | ||||||||||
| Penske Automotive Group, Inc. | 3.75 | 06/15/29 | 65,000 | 53,710 | ||||||||||
| PetSmart, Inc./PetSmart Finance Corp.(1) | 4.75 | 02/15/28 | 147,000 | 130,235 | ||||||||||
| PetSmart, Inc./PetSmart Finance Corp.(1) | 7.75 | 02/15/29 | 140,000 | 129,025 | ||||||||||
| QVC, Inc. | 4.38 | 09/01/28 | 65,000 | 32,996 | ||||||||||
| QVC, Inc. | 4.45 | 02/15/25 | 70,000 | 60,356 | ||||||||||
| QVC, Inc. | 4.75 | 02/15/27 | 68,000 | 38,734 | ||||||||||
| QVC, Inc. | 5.45 | 08/15/34 | 48,000 | 20,366 | ||||||||||
| QVC, Inc. | 5.95 | 03/15/43 | 37,000 | 15,429 | ||||||||||
| Sally Holdings LLC/Sally Capital, Inc. | 5.63 | 12/01/25 | 82,000 | 79,345 | ||||||||||
| Sonic Automotive, Inc.(1) | 4.63 | 11/15/29 | 78,000 | 65,036 | ||||||||||
| Sonic Automotive, Inc.(1) | 4.88 | 11/15/31 | 65,000 | 51,845 | ||||||||||
| Victoria’s Secret & Co.(1) | 4.63 | 07/15/29 | 70,000 | 51,542 | ||||||||||
| 3,502,979 | ||||||||||||||
| SOFTWARE – 0.1% | ||||||||||||||
| CWT Travel Group, Inc.(1) | 8.50 | 11/19/26 | 76,000 | 22,800 | ||||||||||
| TEXTILES – 0.3% | ||||||||||||||
| Eagle Intermediate Global Holding BV/Eagle US Finance LLC(1) | 7.50 | 05/01/25 | 81,000 | 53,966 | ||||||||||
| TOTAL CORPORATE BONDS (Cost - $22,943,986) | 22,231,775 | |||||||||||||
The accompanying notes are an integral part of these financial statements.
71
BONDBLOXX ETF TRUST
BondBloxx USD High Yield Bond Consumer Cyclicals Sector ETF
Portfolio of Investments (Continued)
October 31, 2023
| Face | ||||||||||||||
| Rate (%) | Maturity | Amount | Value | |||||||||||
| SHORT-TERM INVESTMENTS – 0.6% | ||||||||||||||
| TIME DEPOSITS – 0.6% | ||||||||||||||
| Sumitomo Mitsui Trust Bank, London | 4.68 | 11/01/23 | $ | 136,952 | $ | 136,952 | ||||||||
| TOTAL SHORT-TERM INVESTMENTS (Cost - $136,952) | 136,952 | |||||||||||||
| TOTAL INVESTMENTS – 98.5% (Cost - $23,080,938) | $ | 22,368,727 | ||||||||||||
| OTHER ASSETS LESS LIABILITIES – 1.5% | 346,649 | |||||||||||||
| NET ASSETS – 100.0% | $ | 22,715,376 | ||||||||||||
| (1) | Security was purchased pursuant to Rule 144A under the Securities Act of 1933 and may not be resold subject to that Rule except to qualified institutional buyers. The aggregate value of Rule 144A holdings at October 31, 2023, amounts to $15,841,028 and represents 69.7% of net assets. These securities have been deemed liquid under procedures approved by the Trust’s Board of Trustees. | |
| (2) | Includes step-up bonds that pay an initial coupon rate for the first period and then a higher coupon rate for the following periods. The rate reported is the rate in effect as of October 31, 2023. | |
| (3) | Security is perpetual in nature and has no stated maturity date. |
The accompanying notes are an integral part of these financial statements.
72
BONDBLOXX ETF TRUST
BondBloxx USD High Yield Bond Consumer Non-Cyclicals Sector ETF
Portfolio of Investments
October 31, 2023
| Face | ||||||||||||||
| Rate (%) | Maturity | Amount | Value | |||||||||||
| CORPORATE BONDS – 97.8% | ||||||||||||||
| AGRICULTURE – 2.7% | ||||||||||||||
| Darling Ingredients, Inc.(1) | 5.25 | 04/15/27 | $ | 53,000 | $ | 50,481 | ||||||||
| Darling Ingredients, Inc.(1) | 6.00 | 06/15/30 | 97,000 | 91,097 | ||||||||||
| Turning Point Brands, Inc.(1) | 5.63 | 02/15/26 | 25,000 | 23,044 | ||||||||||
| Vector Group Ltd.(1) | 5.75 | 02/01/29 | 85,000 | 72,109 | ||||||||||
| Vector Group Ltd.(1) | 10.50 | 11/01/26 | 54,000 | 54,085 | ||||||||||
| 290,816 | ||||||||||||||
| BEVERAGES – 1.1% | ||||||||||||||
| Primo Water Holdings, Inc.(1) | 4.38 | 04/30/29 | 72,000 | 60,833 | ||||||||||
| Triton Water Holdings, Inc.(1) | 6.25 | 04/01/29 | 72,000 | 59,404 | ||||||||||
| 120,237 | ||||||||||||||
| BUILDING MATERIALS – 0.3% | ||||||||||||||
| ACProducts Holdings, Inc.(1) | 6.38 | 05/15/29 | 49,000 | 29,965 | ||||||||||
| CHEMICALS – 0.6% | ||||||||||||||
| Cerdia Finanz GmbH(1) | 10.50 | 02/15/27 | 60,000 | 59,134 | ||||||||||
| COMMERCIAL SERVICES – 0.4% | ||||||||||||||
| Legends Hospitality Holding Co. LLC/Legends Hospitality Co.-Issuer, Inc.(1) | 5.00 | 02/01/26 | 42,000 | 40,093 | ||||||||||
| COSMETICS/PERSONAL CARE – 3.5% | ||||||||||||||
| Coty, Inc.(1) | 5.00 | 04/15/26 | 90,000 | 86,079 | ||||||||||
| Coty, Inc.(1) | 6.50 | 04/15/26 | 45,000 | 44,370 | ||||||||||
| Coty, Inc./HFC Prestige Products, Inc./HFC Prestige International US LLC(1) | 4.75 | 01/15/29 | 50,000 | 44,319 | ||||||||||
| Coty, Inc./HFC Prestige Products, Inc./HFC Prestige International US LLC(1) | 6.63 | 07/15/30 | 75,000 | 71,541 | ||||||||||
| Edgewell Personal Care Co.(1) | 4.13 | 04/01/29 | 53,000 | 44,394 | ||||||||||
| Edgewell Personal Care Co.(1) | 5.50 | 06/01/28 | 72,000 | 65,786 | ||||||||||
| Oriflame Investment Holding PLC(1) | 5.13 | 05/04/26 | 55,000 | 17,490 | ||||||||||
| 373,979 | ||||||||||||||
| DISTRIBUTION/WHOLESALE – 0.2% | ||||||||||||||
| Resideo Funding, Inc.(1) | 4.00 | 09/01/29 | 30,000 | 24,116 | ||||||||||
| ELECTRIC – 28.9% | ||||||||||||||
| Algonquin Power & Utilities Corp. | 4.75 | 01/18/82 | 77,000 | 60,869 | ||||||||||
| Atlantica Sustainable Infrastructure PLC(1) | 4.13 | 06/15/28 | 42,000 | 36,323 | ||||||||||
| Calpine Corp.(1) | 3.75 | 03/01/31 | 91,000 | 72,616 | ||||||||||
| Calpine Corp.(1) | 4.50 | 02/15/28 | 121,000 | 109,218 | ||||||||||
| Calpine Corp.(1) | 4.63 | 02/01/29 | 65,000 | 54,953 | ||||||||||
| Calpine Corp.(1) | 5.00 | 02/01/31 | 85,000 | 68,645 | ||||||||||
| Calpine Corp.(1) | 5.13 | 03/15/28 | 140,000 | 125,423 | ||||||||||
| Calpine Corp.(1) | 5.25 | 06/01/26 | 42,000 | 40,236 | ||||||||||
| Clearway Energy Operating LLC(1) | 3.75 | 02/15/31 | 90,000 | 70,282 | ||||||||||
| Clearway Energy Operating LLC(1) | 3.75 | 01/15/32 | 36,000 | 27,310 | ||||||||||
| Clearway Energy Operating LLC(1) | 4.75 | 03/15/28 | 85,000 | 75,959 | ||||||||||
| DPL, Inc. | 4.13 | 07/01/25 | 42,000 | 39,647 | ||||||||||
The accompanying notes are an integral part of these financial statements.
73
BONDBLOXX ETF TRUST
BondBloxx USD High Yield Bond Consumer Non-Cyclicals Sector ETF
Portfolio of Investments (Continued)
October 31, 2023
| Face | ||||||||||||||
| Rate (%) | Maturity | Amount | Value | |||||||||||
| ELECTRIC – 28.9% (Continued) | ||||||||||||||
| DPL, Inc. | 4.35 | 04/15/29 | $ | 37,000 | $ | 30,216 | ||||||||
| Drax FinCo. PLC(1) | 6.63 | 11/01/25 | 48,000 | 46,241 | ||||||||||
| Edison International | 8.13 | 06/15/53 | 50,000 | 48,337 | ||||||||||
| Electricite de France SA(1),(2) | 9.13 | - | 150,000 | 154,330 | ||||||||||
| Emera, Inc. | 6.75 | 06/15/76 | 120,000 | 113,302 | ||||||||||
| FirstEnergy Corp. | 1.60 | 01/15/26 | 30,000 | 27,051 | ||||||||||
| FirstEnergy Corp. | 2.05 | 03/01/25 | 25,000 | 23,553 | ||||||||||
| FirstEnergy Corp. | 2.25 | 09/01/30 | 45,000 | 34,768 | ||||||||||
| FirstEnergy Corp. | 2.65 | 03/01/30 | 60,000 | 48,455 | ||||||||||
| FirstEnergy Corp. | 3.40 | 03/01/50 | 85,000 | 51,500 | ||||||||||
| FirstEnergy Corp. | 4.15 | 07/15/27 | 152,000 | 140,817 | ||||||||||
| FirstEnergy Corp. | 5.10 | 07/15/47 | 62,000 | 51,479 | ||||||||||
| FirstEnergy Corp. | 7.38 | 11/15/31 | 45,000 | 48,580 | ||||||||||
| Leeward Renewable Energy Operations LLC(1) | 4.25 | 07/01/29 | 36,000 | 29,444 | ||||||||||
| NextEra Energy Operating Partners LP(1) | 3.88 | 10/15/26 | 48,000 | 43,687 | ||||||||||
| NextEra Energy Operating Partners LP(1) | 4.50 | 09/15/27 | 59,000 | 52,885 | ||||||||||
| NRG Energy, Inc.(1) | 3.38 | 02/15/29 | 51,000 | 41,569 | ||||||||||
| NRG Energy, Inc.(1) | 3.63 | 02/15/31 | 102,000 | 77,099 | ||||||||||
| NRG Energy, Inc.(1) | 3.88 | 02/15/32 | 105,000 | 78,188 | ||||||||||
| NRG Energy, Inc.(1) | 5.25 | 06/15/29 | 77,000 | 68,023 | ||||||||||
| NRG Energy, Inc. | 5.75 | 01/15/28 | 100,000 | 93,695 | ||||||||||
| NRG Energy, Inc. | 6.63 | 01/15/27 | 20,000 | 19,430 | ||||||||||
| Pattern Energy Operations LP/Pattern Energy Operations, Inc.(1) | 4.50 | 08/15/28 | 61,000 | 53,234 | ||||||||||
| PG&E Corp. | 5.00 | 07/01/28 | 97,000 | 87,968 | ||||||||||
| PG&E Corp. | 5.25 | 07/01/30 | 102,000 | 89,498 | ||||||||||
| Talen Energy Supply LLC(1) | 8.63 | 06/01/30 | 120,000 | 122,053 | ||||||||||
| TransAlta Corp. | 6.50 | 03/15/40 | 30,000 | 26,511 | ||||||||||
| TransAlta Corp. | 7.75 | 11/15/29 | 42,000 | 41,833 | ||||||||||
| Vistra Operations Co. LLC(1) | 4.38 | 05/01/29 | 126,000 | 107,164 | ||||||||||
| Vistra Operations Co. LLC(1) | 5.00 | 07/31/27 | 127,000 | 116,293 | ||||||||||
| Vistra Operations Co. LLC(1) | 5.50 | 09/01/26 | 102,000 | 97,136 | ||||||||||
| Vistra Operations Co. LLC(1) | 5.63 | 02/15/27 | 127,000 | 119,626 | ||||||||||
| Vistra Operations Co. LLC(1) | 7.75 | 10/15/31 | 110,000 | 106,307 | ||||||||||
| 3,071,753 | ||||||||||||||
| ELECTRICAL COMPONENTS & EQUIPMENT – 1.3% | ||||||||||||||
| Energizer Holdings, Inc.(1) | 4.38 | 03/31/29 | 83,000 | 67,850 | ||||||||||
| Energizer Holdings, Inc.(1) | 4.75 | 06/15/28 | 60,000 | 51,300 | ||||||||||
| Energizer Holdings, Inc.(1) | 6.50 | 12/31/27 | 25,000 | 23,331 | ||||||||||
| 142,481 | ||||||||||||||
| ENERGY-ALTERNATE SOURCES – 2.2% | ||||||||||||||
| Sunnova Energy Corp.(1) | 5.88 | 09/01/26 | 37,000 | 30,003 | ||||||||||
| Sunnova Energy Corp.(1) | 11.75 | 10/01/28 | 40,000 | 34,153 | ||||||||||
| TerraForm Power Operating LLC(1) | 4.75 | 01/15/30 | 67,000 | 56,693 | ||||||||||
| TerraForm Power Operating LLC(1) | 5.00 | 01/31/28 | 72,000 | 66,032 | ||||||||||
| Topaz Solar Farms LLC(1) | 5.75 | 09/30/39 | 52,065 | 47,356 | ||||||||||
| 234,237 | ||||||||||||||
The accompanying notes are an integral part of these financial statements.
74
BONDBLOXX ETF TRUST
BondBloxx USD High Yield Bond Consumer Non-Cyclicals Sector ETF
Portfolio of Investments (Continued)
October 31, 2023
| Face | ||||||||||||||
| Rate (%) | Maturity | Amount | Value | |||||||||||
| FOOD – 23.5% | ||||||||||||||
| Albertsons Cos, Inc./Safeway, Inc./New Albertsons LP/Albertsons LLC(1) | 3.25 | 03/15/26 | $ | 73,000 | $ | 67,503 | ||||||||
| Albertsons Cos, Inc./Safeway, Inc./New Albertsons LP/Albertsons LLC(1) | 3.50 | 03/15/29 | 138,000 | 117,810 | ||||||||||
| Albertsons Cos, Inc./Safeway, Inc./New Albertsons LP/Albertsons LLC(1) | 4.63 | 01/15/27 | 133,000 | 124,778 | ||||||||||
| Albertsons Cos, Inc./Safeway, Inc./New Albertsons LP/Albertsons LLC(1) | 4.88 | 02/15/30 | 97,000 | 86,712 | ||||||||||
| Albertsons Cos, Inc./Safeway, Inc./New Albertsons LP/Albertsons LLC(1) | 5.88 | 02/15/28 | 77,000 | 73,833 | ||||||||||
| Albertsons Cos, Inc./Safeway, Inc./New Albertsons LP/Albertsons LLC(1) | 6.50 | 02/15/28 | 75,000 | 73,714 | ||||||||||
| Albertsons Cos, Inc./Safeway, Inc./New Albertsons LP/Albertsons LLC(1) | 7.50 | 03/15/26 | 60,000 | 61,012 | ||||||||||
| Aragvi Finance International DAC(1) | 8.45 | 04/29/26 | 48,000 | 33,060 | ||||||||||
| B&G Foods, Inc. | 5.25 | 04/01/25 | 28,000 | 26,904 | ||||||||||
| B&G Foods, Inc. | 5.25 | 09/15/27 | 54,000 | 44,488 | ||||||||||
| B&G Foods, Inc.(1) | 8.00 | 09/15/28 | 55,000 | 53,666 | ||||||||||
| C&S Group Enterprises LLC(1) | 5.00 | 12/15/28 | 37,000 | 28,661 | ||||||||||
| Chobani LLC/Chobani Finance Corp., Inc.(1) | 4.63 | 11/15/28 | 42,000 | 36,353 | ||||||||||
| Chobani LLC/Chobani Finance Corp., Inc.(1) | 7.50 | 04/15/25 | 54,000 | 53,095 | ||||||||||
| H-Food Holdings LLC/Hearthside Finance Co., Inc.(1) | 8.50 | 06/01/26 | 35,000 | 8,083 | ||||||||||
| Ingles Markets, Inc.(1) | 4.00 | 06/15/31 | 36,000 | 28,664 | ||||||||||
| Lamb Weston Holdings, Inc.(1) | 4.13 | 01/31/30 | 100,000 | 84,931 | ||||||||||
| Lamb Weston Holdings, Inc.(1) | 4.38 | 01/31/32 | 70,000 | 57,991 | ||||||||||
| Lamb Weston Holdings, Inc.(1) | 4.88 | 05/15/28 | 47,000 | 43,445 | ||||||||||
| Performance Food Group, Inc.(1) | 4.25 | 08/01/29 | 102,000 | 86,172 | ||||||||||
| Performance Food Group, Inc.(1) | 5.50 | 10/15/27 | 112,000 | 104,846 | ||||||||||
| Performance Food Group, Inc.(1) | 6.88 | 05/01/25 | 20,000 | 19,919 | ||||||||||
| Pilgrim’s Pride Corp. | 3.50 | 03/01/32 | 90,000 | 68,674 | ||||||||||
| Pilgrim’s Pride Corp. | 4.25 | 04/15/31 | 95,000 | 78,354 | ||||||||||
| Pilgrim’s Pride Corp. | 6.25 | 07/01/33 | 100,000 | 92,025 | ||||||||||
| Pilgrim’s Pride Corp. | 6.88 | 05/15/34 | 50,000 | 47,372 | ||||||||||
| Post Holdings, Inc.(1) | 4.50 | 09/15/31 | 106,000 | 85,888 | ||||||||||
| Post Holdings, Inc.(1) | 4.63 | 04/15/30 | 143,000 | 119,940 | ||||||||||
| Post Holdings, Inc.(1) | 5.50 | 12/15/29 | 120,000 | 107,136 | ||||||||||
| Post Holdings, Inc.(1) | 5.63 | 01/15/28 | 97,000 | 90,240 | ||||||||||
| Post Holdings, Inc.(1) | 5.75 | 03/01/27 | 41,000 | 39,124 | ||||||||||
| Safeway, Inc. | 7.25 | 02/01/31 | 25,000 | 25,215 | ||||||||||
| SEG Holding LLC/SEG Finance Corp.(1) | 5.63 | 10/15/28 | 30,000 | 30,082 | ||||||||||
| Sigma Holdco BV(1) | 7.88 | 05/15/26 | 47,000 | 39,369 | ||||||||||
| Simmons Foods, Inc./Simmons Prepared Foods, Inc./Simmons Pet Food, Inc./Simmons Feed(1) | 4.63 | 03/01/29 | 85,000 | 69,142 | ||||||||||
| TreeHouse Foods, Inc. | 4.00 | 09/01/28 | 48,000 | 39,092 | ||||||||||
| United Natural Foods, Inc.(1) | 6.75 | 10/15/28 | 48,000 | 37,815 | ||||||||||
| US Foods, Inc.(1) | 4.63 | 06/01/30 | 53,000 | 45,305 | ||||||||||
| US Foods, Inc.(1) | 4.75 | 02/15/29 | 90,000 | 79,479 | ||||||||||
| US Foods, Inc.(1) | 6.88 | 09/15/28 | 45,000 | 44,038 | ||||||||||
| US Foods, Inc.(1) | 7.25 | 01/15/32 | 50,000 | 49,144 | ||||||||||
| 2,503,074 | ||||||||||||||
| GAS – 2.2% | ||||||||||||||
| AmeriGas Partners LP/AmeriGas Finance Corp. | 5.50 | 05/20/25 | 71,000 | 68,125 | ||||||||||
| AmeriGas Partners LP/AmeriGas Finance Corp. | 5.75 | 05/20/27 | 58,000 | 53,361 | ||||||||||
| AmeriGas Partners LP/AmeriGas Finance Corp. | 5.88 | 08/20/26 | 67,000 | 62,876 | ||||||||||
| AmeriGas Partners LP/AmeriGas Finance Corp.(1) | 9.38 | 06/01/28 | 45,000 | 44,513 | ||||||||||
| 228,875 | ||||||||||||||
The accompanying notes are an integral part of these financial statements.
75
BONDBLOXX ETF TRUST
BondBloxx USD High Yield Bond Consumer Non-Cyclicals Sector ETF
Portfolio of Investments (Continued)
October 31, 2023
| Face | ||||||||||||||
| Rate (%) | Maturity | Amount | Value | |||||||||||
| HOME FURNISHINGS – 1.2% | ||||||||||||||
| Tempur Sealy International, Inc.(1) | 3.88 | 10/15/31 | $ | 80,000 | $ | 60,014 | ||||||||
| Tempur Sealy International, Inc.(1) | 4.00 | 04/15/29 | 77,000 | 63,282 | ||||||||||
| �� | 123,296 | |||||||||||||
| HOUSEHOLD PRODUCTS/WARES – 3.0% | ||||||||||||||
| ACCO Brands Corp.(1) | 4.25 | 03/15/29 | 55,000 | 45,715 | ||||||||||
| Central Garden & Pet Co. | 4.13 | 10/15/30 | 53,000 | 43,291 | ||||||||||
| Central Garden & Pet Co.(1) | 4.13 | 04/30/31 | 37,000 | 29,480 | ||||||||||
| Central Garden & Pet Co. | 5.13 | 02/01/28 | 30,000 | 27,789 | ||||||||||
| Kronos Acquisition Holdings, Inc./KIK Custom Products, Inc.(1) | 5.00 | 12/31/26 | 57,000 | 51,619 | ||||||||||
| Kronos Acquisition Holdings, Inc./KIK Custom Products, Inc.(1) | 7.00 | 12/31/27 | 45,000 | 38,303 | ||||||||||
| Spectrum Brands, Inc.(1) | 3.88 | 03/15/31 | 48,000 | 38,470 | ||||||||||
| Spectrum Brands, Inc.(1) | 5.00 | 10/01/29 | 30,000 | 26,947 | ||||||||||
| Spectrum Brands, Inc.(1) | 5.50 | 07/15/30 | 25,000 | 22,369 | ||||||||||
| 323,983 | ||||||||||||||
| HOUSEWARES – 5.9% | ||||||||||||||
| CD&R Smokey Buyer, Inc.(1) | 6.75 | 07/15/25 | 67,000 | 64,098 | ||||||||||
| Newell Brands, Inc. | 4.88 | 06/01/25 | 48,000 | 46,107 | ||||||||||
| Newell Brands, Inc. | 5.20 | 04/01/26 | 198,000 | 187,124 | ||||||||||
| Newell Brands, Inc. | 6.38 | 09/15/27 | 49,000 | 46,042 | ||||||||||
| Newell Brands, Inc. | 6.38 | 04/01/36 | 42,000 | 33,021 | ||||||||||
| Newell Brands, Inc. | 6.50 | 04/01/46 | 65,000 | 45,719 | ||||||||||
| Newell Brands, Inc. | 6.63 | 09/15/29 | 53,000 | 48,857 | ||||||||||
| Scotts Miracle-Gro Co. | 4.00 | 04/01/31 | 50,000 | 37,245 | ||||||||||
| Scotts Miracle-Gro Co. | 4.38 | 02/01/32 | 40,000 | 29,357 | ||||||||||
| Scotts Miracle-Gro Co. | 4.50 | 10/15/29 | 50,000 | 39,553 | ||||||||||
| Scotts Miracle-Gro Co. | 5.25 | 12/15/26 | 15,000 | 13,968 | ||||||||||
| SWF Escrow Issuer Corp.(1) | 6.50 | 10/01/29 | 60,000 | 35,601 | ||||||||||
| 626,692 | ||||||||||||||
| LEISURE TIME – 1.1% | ||||||||||||||
| Acushnet Co.(1) | 7.38 | 10/15/28 | 35,000 | 35,098 | ||||||||||
| MajorDrive Holdings IV LLC(1) | 6.38 | 06/01/29 | 54,000 | 41,906 | ||||||||||
| Vista Outdoor, Inc.(1) | 4.50 | 03/15/29 | 48,000 | 44,709 | ||||||||||
| 121,713 | ||||||||||||||
| PHARMACEUTICALS – 1.7% | ||||||||||||||
| BellRing Brands, Inc.(1) | 7.00 | 03/15/30 | 85,000 | 82,644 | ||||||||||
| Herbalife Nutrition Ltd./HLF Financing, Inc.(1) | 7.88 | 09/01/25 | 61,000 | 57,461 | ||||||||||
| HLF Financing Sarl LLC/Herbalife International, Inc.(1) | 4.88 | 06/01/29 | 60,000 | 41,035 | ||||||||||
| 181,140 | ||||||||||||||
| RETAIL – 18.0% | ||||||||||||||
| 1011778 BC ULC/New Red Finance, Inc.(1) | 3.50 | 02/15/29 | 83,000 | 71,057 | ||||||||||
| 1011778 BC ULC/New Red Finance, Inc.(1) | 3.88 | 01/15/28 | 157,000 | 140,306 | ||||||||||
| 1011778 BC ULC/New Red Finance, Inc.(1) | 4.00 | 10/15/30 | 283,000 | 232,054 | ||||||||||
| 1011778 BC ULC/New Red Finance, Inc.(1) | 4.38 | 01/15/28 | 72,000 | 64,894 | ||||||||||
| 1011778 BC ULC/New Red Finance, Inc.(1) | 5.75 | 04/15/25 | 48,000 | 47,653 | ||||||||||
| 99 Escrow Issuer, Inc.(1) | 7.50 | 01/15/26 | 35,000 | 12,357 | ||||||||||
| Arko Corp.(1) | 5.13 | 11/15/29 | 47,000 | 38,158 | ||||||||||
The accompanying notes are an integral part of these financial statements.
76
BONDBLOXX ETF TRUST
BondBloxx USD High Yield Bond Consumer Non-Cyclicals Sector ETF
Portfolio of Investments (Continued)
October 31, 2023
| Face | ||||||||||||||
| Rate (%) | Maturity | Amount | Value | |||||||||||
| RETAIL – 18.0% (Continued) | ||||||||||||||
| Bloomin’ Brands, Inc./OSI Restaurant Partners LLC(1) | 5.13 | 04/15/29 | $ | 30,000 | $ | 26,047 | ||||||||
| Brinker International, Inc.(1) | 8.25 | 07/15/30 | 35,000 | 33,878 | ||||||||||
| Carrols Restaurant Group, Inc.(1) | 5.88 | 07/01/29 | 30,000 | 24,377 | ||||||||||
| CEC Entertainment LLC(1) | 6.75 | 05/01/26 | 67,000 | 62,634 | ||||||||||
| Dave & Buster’s, Inc.(1) | 7.63 | 11/01/25 | 42,000 | 41,727 | ||||||||||
| eG Global Finance PLC(1) | 6.75 | 02/07/25 | 69,000 | 68,367 | ||||||||||
| eG Global Finance PLC(1) | 8.50 | 10/30/25 | 57,000 | 56,125 | ||||||||||
| Ferrellgas LP/Ferrellgas Finance Corp.(1) | 5.38 | 04/01/26 | 60,000 | 56,216 | ||||||||||
| Ferrellgas LP/Ferrellgas Finance Corp.(1) | 5.88 | 04/01/29 | 89,000 | 78,618 | ||||||||||
| GPS Hospitality Holding Co. LLC/GPS FinCo., Inc.(1) | 7.00 | 08/15/28 | 41,000 | 27,902 | ||||||||||
| IRB Holding Corp.(1) | 7.00 | 06/15/25 | 77,000 | 76,495 | ||||||||||
| KFC Holding Co./Pizza Hut Holdings LLC/Taco Bell of America LLC(1) | 4.75 | 06/01/27 | 73,000 | 69,100 | ||||||||||
| Marks & Spencer PLC(1) | 7.13 | 12/01/37 | 30,000 | 27,377 | ||||||||||
| Murphy Oil USA, Inc.(1) | 3.75 | 02/15/31 | 47,000 | 37,811 | ||||||||||
| Murphy Oil USA, Inc. | 4.75 | 09/15/29 | 50,000 | 44,326 | ||||||||||
| Murphy Oil USA, Inc. | 5.63 | 05/01/27 | 30,000 | 29,027 | ||||||||||
| Papa John’s International, Inc.(1) | 3.88 | 09/15/29 | 42,000 | 34,502 | ||||||||||
| Sizzling Platter LLC/Sizzling Platter Finance Corp.(1) | 8.50 | 11/28/25 | 35,000 | 34,913 | ||||||||||
| Suburban Propane Partners LP/Suburban Energy Finance Corp.(1) | 5.00 | 06/01/31 | 67,000 | 55,566 | ||||||||||
| Suburban Propane Partners LP/Suburban Energy Finance Corp. | 5.88 | 03/01/27 | 35,000 | 33,198 | ||||||||||
| Yum! Brands, Inc. | 3.63 | 03/15/31 | 108,000 | 87,813 | ||||||||||
| Yum! Brands, Inc. | 4.63 | 01/31/32 | 108,000 | 92,143 | ||||||||||
| Yum! Brands, Inc.(1) | 4.75 | 01/15/30 | 79,000 | 70,417 | ||||||||||
| Yum! Brands, Inc. | 5.35 | 11/01/43 | 35,000 | 29,841 | ||||||||||
| Yum! Brands, Inc. | 5.38 | 04/01/32 | 100,000 | 90,000 | ||||||||||
| Yum! Brands, Inc. | 6.88 | 11/15/37 | 25,000 | 24,707 | ||||||||||
| 1,919,606 | ||||||||||||||
| TOTAL CORPORATE BONDS (Cost - $10,947,276) | 10,415,190 | |||||||||||||
| SHORT-TERM INVESTMENTS – 2.2% | ||||||||||||||
| TIME DEPOSITS – 2.2% | ||||||||||||||
| ANZ National Bank, London | 4.68 | 11/01/23 | 231,320 | 231,320 | ||||||||||
| TOTAL SHORT-TERM INVESTMENTS (Cost - $231,320) | 231,320 | |||||||||||||
| TOTAL INVESTMENTS – 100.0% (Cost - $11,178,596) | $ | 10,646,510 | ||||||||||||
| OTHER ASSETS LESS LIABILITIES – (0.0)% | (3,889 | ) | ||||||||||||
| NET ASSETS – 100.0% | $ | 10,642,621 | ||||||||||||
| (1) | Security was purchased pursuant to Rule 144A under the Securities Act of 1933 and may not be resold subject to that Rule except to qualified institutional buyers. The aggregate value of Rule 144A holdings at October 31, 2023, amounts to $7,702,067 and represents 72.4% of net assets. These securities have been deemed liquid under procedures approved by the Trust’s Board of Trustees. | |
| (2) | Security is perpetual in nature and has no stated maturity date. |
The accompanying notes are an integral part of these financial statements.
77
BONDBLOXX ETF TRUST
BondBloxx USD High Yield Bond Sector Rotation ETF
Portfolio of Investments
October 31, 2023
| Shares | Value | |||||||
| EXCHANGE-TRADED FUNDS – 99.7% | ||||||||
| UNITED STATES(a) – 99.7% | ||||||||
| BondBloxx USD High Yield Bond Consumer Cyclicals Sector ETF | 130,397 | $ | 4,568,276 | |||||
| BondBloxx USD High Yield Bond Consumer Non-Cyclicals Sector ETF | 96,829 | 3,449,049 | ||||||
| BondBloxx USD High Yield Bond Energy Sector ETF | 103,597 | 3,857,082 | ||||||
| BondBloxx USD High Yield Bond Financial & REIT Sector ETF | 65,748 | 2,280,404 | ||||||
| BondBloxx USD High Yield Bond Healthcare Sector ETF | 54,151 | 1,705,318 | ||||||
| BondBloxx USD High Yield Bond Industrial Sector ETF | 207,046 | 7,371,542 | ||||||
| BondBloxx USD High Yield Bond Telecom Media & Technology Sector ETF | 159,836 | 5,238,481 | ||||||
| TOTAL EXCHANGE-TRADED FUNDS (Cost - $29,263,782) | 28,470,152 | |||||||
| Face | ||||||||||||||
| Rate (%) | Maturity | Amount | ||||||||||||
| SHORT-TERM INVESTMENTS – 0.5% | ||||||||||||||
| TIME DEPOSITS – 0.5% | ||||||||||||||
| Citibank, New York | 4.68 | 11/01/23 | $ | 131,033 | 131,033 | |||||||||
| TOTAL SHORT-TERM INVESTMENTS (Cost - $131,033) | 131,033 | |||||||||||||
| TOTAL INVESTMENTS – 100.2% (Cost - $29,394,815) | $ | 28,601,185 | ||||||||||||
| OTHER ASSETS LESS LIABILITIES – (0.2)% | (33,403 | ) | ||||||||||||
| NET ASSETS – 100.0% | $ | 28,567,782 | ||||||||||||
| (a) | Represents investments in Affiliated Funds. |
The accompanying notes are an integral part of these financial statements.
78
BONDBLOXX ETF TRUST
BondBloxx B Rated USD High Yield Corporate Bond ETF
Portfolio of Investments
October 31, 2023
| Face | ||||||||||||||
| Rate (%) | Maturity | Amount | Value | |||||||||||
| CORPORATE BONDS – 97.5% | ||||||||||||||
| ADVERTISING – 1.3% | ||||||||||||||
| Advantage Sales & Marketing, Inc.(1) | 6.50 | 11/15/28 | $ | 25,000 | $ | 20,411 | ||||||||
| Clear Channel Outdoor Holdings, Inc.(1) | 5.13 | 08/15/27 | 45,000 | 40,035 | ||||||||||
| Clear Channel Outdoor Holdings, Inc.(1) | 9.00 | 09/15/28 | 25,000 | 24,367 | ||||||||||
| Outfront Media Capital LLC/Outfront Media Capital Corp.(1) | 4.25 | 01/15/29 | 10,000 | 8,155 | ||||||||||
| Outfront Media Capital LLC/Outfront Media Capital Corp.(1) | 4.63 | 03/15/30 | 15,000 | 12,052 | ||||||||||
| Outfront Media Capital LLC/Outfront Media Capital Corp.(1) | 5.00 | 08/15/27 | 25,000 | 22,229 | ||||||||||
| Outfront Media Capital LLC/Outfront Media Capital Corp.(1) | 6.25 | 06/15/25 | 10,000 | 9,872 | ||||||||||
| Stagwell Global LLC(1) | 5.63 | 08/15/29 | 35,000 | 28,968 | ||||||||||
| Summer BC Bidco B LLC(1) | 5.50 | 10/31/26 | 10,000 | 8,717 | ||||||||||
| 174,806 | ||||||||||||||
| AEROSPACE/DEFENSE – 3.7% | ||||||||||||||
| Bombardier, Inc.(1) | 6.00 | 02/15/28 | 30,000 | 26,576 | ||||||||||
| Bombardier, Inc.(1) | 7.13 | 06/15/26 | 35,000 | 33,719 | ||||||||||
| Bombardier, Inc.(1) | 7.45 | 05/01/34 | 10,000 | 11,225 | ||||||||||
| Bombardier, Inc.(1) | 7.50 | 03/15/25 | 11,000 | 11,000 | ||||||||||
| Bombardier, Inc.(1) | 7.50 | 02/01/29 | 25,000 | 23,183 | ||||||||||
| Bombardier, Inc.(1) | 7.88 | 04/15/27 | 50,000 | 48,167 | ||||||||||
| Spirit AeroSystems, Inc.(1) | 7.50 | 04/15/25 | 40,000 | 39,946 | ||||||||||
| TransDigm, Inc. | 4.63 | 01/15/29 | 25,000 | 21,584 | ||||||||||
| TransDigm, Inc. | 4.88 | 05/01/29 | 10,000 | 8,676 | ||||||||||
| TransDigm, Inc. | 5.50 | 11/15/27 | 65,000 | 60,578 | ||||||||||
| TransDigm, Inc.(1) | 6.25 | 03/15/26 | 85,000 | 83,122 | ||||||||||
| TransDigm, Inc.(1) | 6.75 | 08/15/28 | 50,000 | 48,612 | ||||||||||
| TransDigm, Inc.(1) | 6.88 | 12/15/30 | 30,000 | 28,996 | ||||||||||
| TransDigm, Inc. | 7.50 | 03/15/27 | 10,000 | 9,998 | ||||||||||
| Triumph Group, Inc.(1) | 9.00 | 03/15/28 | 35,000 | 34,037 | ||||||||||
| 489,419 | ||||||||||||||
| AIRLINES – 0.7% | ||||||||||||||
| American Airlines Group, Inc.(1) | 3.75 | 03/01/25 | 15,000 | 14,009 | ||||||||||
| Hawaiian Brand Intellectual Property Ltd./HawaiianMiles Loyalty Ltd.(1) | 5.75 | 01/20/26 | 40,000 | 29,602 | ||||||||||
| United Airlines Holdings, Inc. | 4.88 | 01/15/25 | 10,000 | 9,702 | ||||||||||
| VistaJet Malta Finance PLC/Vista Management Holding, Inc.(1) | 6.38 | 02/01/30 | 30,000 | 20,039 | ||||||||||
| VistaJet Malta Finance PLC/Vista Management Holding, Inc.(1) | 7.88 | 05/01/27 | 15,000 | 11,552 | ||||||||||
| VistaJet Malta Finance PLC/Vista Management Holding, Inc.(1) | 9.50 | 06/01/28 | 15,000 | 11,509 | ||||||||||
| 96,413 | ||||||||||||||
| APPAREL – 0.5% | ||||||||||||||
| Crocs, Inc.(1) | 4.13 | 08/15/31 | 20,000 | 15,222 | ||||||||||
| Hanesbrands, Inc.(1) | 4.88 | 05/15/26 | 30,000 | 27,597 | ||||||||||
| Hanesbrands, Inc.(1) | 9.00 | 02/15/31 | 15,000 | 13,940 | ||||||||||
| Wolverine World Wide, Inc.(1) | 4.00 | 08/15/29 | 15,000 | 11,200 | ||||||||||
| 67,959 | ||||||||||||||
| AUTO MANUFACTURERS – 0.7% | ||||||||||||||
| Jaguar Land Rover Automotive PLC(1) | 4.50 | 10/01/27 | 15,000 | 12,950 | ||||||||||
| Jaguar Land Rover Automotive PLC(1) | 5.50 | 07/15/29 | 15,000 | 12,946 | ||||||||||
| Jaguar Land Rover Automotive PLC(1) | 5.88 | 01/15/28 | 20,000 | 18,021 | ||||||||||
| Jaguar Land Rover Automotive PLC(1) | 7.75 | 10/15/25 | 20,000 | 20,035 | ||||||||||
The accompanying notes are an integral part of these financial statements.
79
BONDBLOXX ETF TRUST
BondBloxx B Rated USD High Yield Corporate Bond ETF
Portfolio of Investments (Continued)
October 31, 2023
| Face | ||||||||||||||
| Rate (%) | Maturity | Amount | Value | |||||||||||
| AUTO MANUFACTURERS – 0.7% (Continued) | ||||||||||||||
| JB Poindexter & Co., Inc.(1) | 7.13 | 04/15/26 | $ | 15,000 | $ | 14,316 | ||||||||
| Wabash National Corp.(1) | 4.50 | 10/15/28 | 10,000 | 8,287 | ||||||||||
| 86,555 | ||||||||||||||
| AUTO PARTS & EQUIPMENT – 2.2% | ||||||||||||||
| Adient Global Holdings Ltd.(1) | 4.88 | 08/15/26 | 30,000 | 27,973 | ||||||||||
| Adient Global Holdings Ltd.(1) | 8.25 | 04/15/31 | 10,000 | 9,742 | ||||||||||
| American Axle & Manufacturing, Inc. | 5.00 | 10/01/29 | 30,000 | 23,733 | ||||||||||
| American Axle & Manufacturing, Inc. | 6.50 | 04/01/27 | 15,000 | 14,154 | ||||||||||
| Clarios Global LP(1) | 6.75 | 05/15/25 | 10,000 | 9,930 | ||||||||||
| Clarios Global LP/Clarios US Finance Co.(1) | 6.25 | 05/15/26 | 30,000 | 29,359 | ||||||||||
| Clarios Global LP/Clarios US Finance Co.(1) | 6.75 | 05/15/28 | 20,000 | 19,517 | ||||||||||
| Goodyear Tire & Rubber Co. | 4.88 | 03/15/27 | 20,000 | 18,417 | ||||||||||
| Goodyear Tire & Rubber Co. | 5.00 | 05/31/26 | 25,000 | 23,672 | ||||||||||
| Goodyear Tire & Rubber Co. | 5.25 | 04/30/31 | 15,000 | 12,351 | ||||||||||
| Goodyear Tire & Rubber Co. | 5.25 | 07/15/31 | 20,000 | 16,305 | ||||||||||
| Goodyear Tire & Rubber Co. | 5.63 | 04/30/33 | 15,000 | 12,042 | ||||||||||
| Goodyear Tire & Rubber Co. | 9.50 | 05/31/25 | 20,000 | 20,253 | ||||||||||
| Tenneco, Inc.(1) | 8.00 | 11/17/28 | 55,000 | 44,195 | ||||||||||
| Titan International, Inc. | 7.00 | 04/30/28 | 10,000 | 9,147 | ||||||||||
| 290,790 | ||||||||||||||
| BANKS – 0.5% | ||||||||||||||
| Freedom Mortgage Corp.(1) | 6.63 | 01/15/27 | 15,000 | 12,996 | ||||||||||
| Freedom Mortgage Corp.(1) | 7.63 | 05/01/26 | 25,000 | 23,031 | ||||||||||
| Freedom Mortgage Corp.(1) | 12.00 | 10/01/28 | 20,000 | 20,085 | ||||||||||
| Freedom Mortgage Corp.(1) | 12.25 | 10/01/30 | 10,000 | 10,013 | ||||||||||
| 66,125 | ||||||||||||||
| BEVERAGES – 0.1% | ||||||||||||||
| Primo Water Holdings, Inc.(1) | 4.38 | 04/30/29 | 20,000 | 16,898 | ||||||||||
| BUILDING MATERIALS – 0.9% | ||||||||||||||
| AmeriTex Hold Co. Intermediate LLC(1) | 10.25 | 10/15/28 | 15,000 | 14,201 | ||||||||||
| Camelot Return Merger Sub, Inc.(1) | 8.75 | 08/01/28 | 20,000 | 18,695 | ||||||||||
| Eco Material Technologies, Inc.(1) | 7.88 | 01/31/27 | 15,000 | 14,219 | ||||||||||
| Griffon Corp. | 5.75 | 03/01/28 | 30,000 | 27,121 | ||||||||||
| JELD-WEN, Inc.(1) | 4.88 | 12/15/27 | 10,000 | 8,487 | ||||||||||
| MIWD Holdco II LLC/MIWD Finance Corp.(1) | 5.50 | 02/01/30 | 15,000 | 11,921 | ||||||||||
| New Enterprise Stone & Lime Co., Inc.(1) | 5.25 | 07/15/28 | 15,000 | 13,255 | ||||||||||
| PGT Innovations, Inc.(1) | 4.38 | 10/01/29 | 15,000 | 14,017 | ||||||||||
| 121,916 | ||||||||||||||
| CHEMICALS – 2.7% | ||||||||||||||
| ASP Unifrax Holdings, Inc.(1) | 5.25 | 09/30/28 | 25,000 | 16,915 | ||||||||||
| Axalta Coating Systems LLC(1) | 3.38 | 02/15/29 | 20,000 | �� | 16,456 | |||||||||
| Axalta Coating Systems LLC/Axalta Coating Systems Dutch Holding B BV(1) | 4.75 | 06/15/27 | 15,000 | 13,828 | ||||||||||
| Cerdia Finanz GmbH(1) | 10.50 | 02/15/27 | 20,000 | 19,711 | ||||||||||
| CVR Partners LP/CVR Nitrogen Finance Corp.(1) | 6.13 | 06/15/28 | 15,000 | 13,252 | ||||||||||
| GPD Cos, Inc.(1) | 10.13 | 04/01/26 | 15,000 | 13,526 | ||||||||||
| Mativ Holdings, Inc.(1) | 6.88 | 10/01/26 | 10,000 | 9,011 | ||||||||||
The accompanying notes are an integral part of these financial statements.
80
BONDBLOXX ETF TRUST
BondBloxx B Rated USD High Yield Corporate Bond ETF
Portfolio of Investments (Continued)
October 31, 2023
| Face | ||||||||||||||
| Rate (%) | Maturity | Amount | Value | |||||||||||
| CHEMICALS – 2.7% (Continued) | ||||||||||||||
| Olympus Water US Holding Corp.(1) | 4.25 | 10/01/28 | $ | 20,000 | $ | 15,979 | ||||||||
| Olympus Water US Holding Corp.(1) | 9.75 | 11/15/28 | 60,000 | 58,677 | ||||||||||
| Rain Carbon, Inc.(1) | 12.25 | 09/01/29 | 10,000 | 10,188 | ||||||||||
| Rayonier AM Products, Inc.(1) | 7.63 | 01/15/26 | 20,000 | 17,021 | ||||||||||
| SCIH Salt Holdings, Inc.(1) | 4.88 | 05/01/28 | 30,000 | 25,938 | ||||||||||
| SCIL IV LLC/SCIL USA Holdings LLC(1) | 5.38 | 11/01/26 | 20,000 | 17,760 | ||||||||||
| SK Invictus Intermediate II Sarl(1) | 5.00 | 10/30/29 | 20,000 | 15,120 | ||||||||||
| Tronox, Inc.(1) | 4.63 | 03/15/29 | 30,000 | 23,661 | ||||||||||
| Valvoline, Inc.(1) | 3.63 | 06/15/31 | 20,000 | 15,229 | ||||||||||
| Valvoline, Inc.(1) | 4.25 | 02/15/30 | 15,000 | 14,707 | ||||||||||
| WR Grace Holdings LLC(1) | 4.88 | 06/15/27 | 35,000 | 31,486 | ||||||||||
| 348,465 | ||||||||||||||
| COMMERCIAL SERVICES – 5.3% | ||||||||||||||
| Albion Financing 2Sarl(1) | 8.75 | 04/15/27 | 15,000 | 13,777 | ||||||||||
| Allied Universal Holdco LLC/Allied Universal Finance Corp.(1) | 6.63 | 07/15/26 | 60,000 | 56,240 | ||||||||||
| Allied Universal Holdco LLC/Allied Universal Finance Corp./Atlas Luxco 4 Sarl(1) | 4.63 | 06/01/28 | 45,000 | 36,853 | ||||||||||
| Allied Universal Holdco LLC/Allied Universal Finance Corp./Atlas Luxco 4 Sarl(1) | 4.63 | 06/01/28 | 10,000 | 8,159 | ||||||||||
| APi Group DE, Inc.(1) | 4.13 | 07/15/29 | 15,000 | 12,260 | ||||||||||
| APX Group, Inc.(1) | 5.75 | 07/15/29 | 25,000 | 20,812 | ||||||||||
| Avis Budget Car Rental LLC/Avis Budget Finance, Inc.(1) | 5.38 | 03/01/29 | 30,000 | 25,726 | ||||||||||
| Avis Budget Car Rental LLC/Avis Budget Finance, Inc.(1) | 5.75 | 07/15/27 | 25,000 | 22,961 | ||||||||||
| Carriage Services, Inc.(1) | 4.25 | 05/15/29 | 10,000 | 8,190 | ||||||||||
| CoreLogic, Inc.(1) | 4.50 | 05/01/28 | 20,000 | 15,871 | ||||||||||
| Garda World Security Corp.(1) | 4.63 | 02/15/27 | 15,000 | 13,394 | ||||||||||
| Garda World Security Corp.(1) | 7.75 | 02/15/28 | 15,000 | 14,441 | ||||||||||
| Herc Holdings, Inc.(1) | 5.50 | 07/15/27 | 35,000 | 32,937 | ||||||||||
| Hertz Corp.(1) | 4.63 | 12/01/26 | 15,000 | 12,579 | ||||||||||
| Hertz Corp.(1) | 5.00 | 12/01/29 | 30,000 | 21,575 | ||||||||||
| Legends Hospitality Holding Co. LLC/Legends Hospitality Co.-Issuer, Inc.(1) | 5.00 | 02/01/26 | 10,000 | 9,546 | ||||||||||
| Mobius Merger Sub, Inc.(1) | 9.00 | 06/01/30 | 15,000 | 13,460 | ||||||||||
| MPH Acquisition Holdings LLC(1) | 5.50 | 09/01/28 | 30,000 | 25,534 | ||||||||||
| Neptune Bidco US, Inc.(1) | 9.29 | 04/15/29 | 75,000 | 66,262 | ||||||||||
| NESCO Holdings II, Inc.(1) | 5.50 | 04/15/29 | 25,000 | 21,462 | ||||||||||
| Paysafe Finance PLC/Paysafe Holdings US Corp.(1) | 4.00 | 06/15/29 | 10,000 | 8,055 | ||||||||||
| Prime Security Services Borrower LLC/Prime Finance, Inc.(1) | 6.25 | 01/15/28 | 40,000 | 37,132 | ||||||||||
| PROG Holdings, Inc.(1) | 6.00 | 11/15/29 | 20,000 | 16,974 | ||||||||||
| RR Donnelley & Sons Co.(1) | 9.75 | 07/31/28 | 10,000 | 9,813 | ||||||||||
| Sabre GLBL, Inc.(1) | 8.63 | 06/01/27 | 25,000 | 20,757 | ||||||||||
| Sabre GLBL, Inc.(1) | 11.25 | 12/15/27 | 15,000 | 13,367 | ||||||||||
| Sotheby’s(1) | 7.38 | 10/15/27 | 30,000 | 26,824 | ||||||||||
| StoneMor, Inc.(1) | 8.50 | 05/15/29 | 10,000 | 7,996 | ||||||||||
| Upbound Group, Inc.(1) | 6.38 | 02/15/29 | 5,000 | 4,305 | ||||||||||
| VT Topco, Inc.(1) | 8.50 | 08/15/30 | 15,000 | 14,648 | ||||||||||
| WASH Multifamily Acquisition, Inc.(1) | 5.75 | 04/15/26 | 25,000 | 23,148 | ||||||||||
| Williams Scotsman, Inc.(1) | 4.63 | 08/15/28 | 20,000 | 17,789 | ||||||||||
| Williams Scotsman, Inc.(1) | 6.13 | 06/15/25 | 10,000 | 9,836 | ||||||||||
The accompanying notes are an integral part of these financial statements.
81
BONDBLOXX ETF TRUST
BondBloxx B Rated USD High Yield Corporate Bond ETF
Portfolio of Investments (Continued)
October 31, 2023
| Face | ||||||||||||||
| Rate (%) | Maturity | Amount | Value | |||||||||||
| COMMERCIAL SERVICES – 5.3% (Continued) | ||||||||||||||
| Williams Scotsman, Inc.(1) | 7.38 | 10/01/31 | $ | 10,000 | $ | 9,842 | ||||||||
| WW International, Inc.(1) | 4.50 | 04/15/29 | 15,000 | 9,388 | ||||||||||
| ZipRecruiter, Inc.(1) | 5.00 | 01/15/30 | 15,000 | 11,731 | ||||||||||
| 693,644 | ||||||||||||||
| COMPUTERS – 0.8% | ||||||||||||||
| Conduent Business Services LLC/Conduent State & Local Solutions, Inc.(1) | 6.00 | 11/01/29 | 15,000 | 12,382 | ||||||||||
| NCR Voyix Corp.(1) | 5.00 | 10/01/28 | 25,000 | 21,622 | ||||||||||
| NCR Voyix Corp.(1) | 5.13 | 04/15/29 | 35,000 | 30,135 | ||||||||||
| NCR Voyix Corp.(1) | 5.25 | 10/01/30 | 15,000 | 12,439 | ||||||||||
| Presidio Holdings, Inc.(1) | 4.88 | 02/01/27 | 15,000 | 13,762 | ||||||||||
| Science Applications International Corp.(1) | 4.88 | 04/01/28 | 15,000 | 13,401 | ||||||||||
| 103,741 | ||||||||||||||
| DISTRIBUTION/WHOLESALE – 0.6% | ||||||||||||||
| American Builders & Contractors Supply Co., Inc.(1) | 3.88 | 11/15/29 | 10,000 | 8,339 | ||||||||||
| G-III Apparel Group Ltd.(1) | 7.88 | 08/15/25 | 10,000 | 9,919 | ||||||||||
| H&E Equipment Services, Inc.(1) | 3.88 | 12/15/28 | 40,000 | 33,925 | ||||||||||
| Ritchie Bros Holdings, Inc.(1) | 7.75 | 03/15/31 | 25,000 | 25,094 | ||||||||||
| 77,277 | ||||||||||||||
| DIVERSIFIED FINANCIAL SERVICES – 1.7% | ||||||||||||||
| AG Issuer LLC(1) | 6.25 | 03/01/28 | 15,000 | 13,835 | ||||||||||
| AG TTMT Escrow Issuer LLC(1) | 8.63 | 09/30/27 | 15,000 | 15,084 | ||||||||||
| Castlelake Aviation Finance DAC(1) | 5.00 | 04/15/27 | 10,000 | 8,833 | ||||||||||
| Coinbase Global, Inc.(1) | 3.38 | 10/01/28 | 35,000 | 25,731 | ||||||||||
| Coinbase Global, Inc.(1) | 3.63 | 10/01/31 | 15,000 | 10,212 | ||||||||||
| Enova International, Inc.(1) | 8.50 | 09/15/25 | 10,000 | 9,415 | ||||||||||
| LFS Topco LLC(1) | 5.88 | 10/15/26 | 10,000 | 8,441 | ||||||||||
| Nationstar Mortgage Holdings, Inc.(1) | 5.00 | 02/01/26 | 15,000 | 13,958 | ||||||||||
| Nationstar Mortgage Holdings, Inc.(1) | 5.13 | 12/15/30 | 25,000 | 20,258 | ||||||||||
| Nationstar Mortgage Holdings, Inc.(1) | 5.50 | 08/15/28 | 10,000 | 8,848 | ||||||||||
| Nationstar Mortgage Holdings, Inc.(1) | 5.75 | 11/15/31 | 20,000 | 16,675 | ||||||||||
| Nationstar Mortgage Holdings, Inc.(1) | 6.00 | 01/15/27 | 20,000 | 18,608 | ||||||||||
| NFP Corp.(1) | 4.88 | 08/15/28 | 25,000 | 21,915 | ||||||||||
| NFP Corp.(1) | 8.50 | 10/01/31 | 10,000 | 9,842 | ||||||||||
| Oxford Finance LLC/Oxford Finance Co.-Issuer II, Inc.(1) | 6.38 | 02/01/27 | 10,000 | 9,123 | ||||||||||
| PHH Mortgage Corp.(1) | 7.88 | 03/15/26 | 10,000 | 8,638 | ||||||||||
| 219,416 | ||||||||||||||
| ELECTRIC – 0.6% | ||||||||||||||
| Calpine Corp.(1) | 5.00 | 02/01/31 | 40,000 | 32,303 | ||||||||||
| Calpine Corp.(1) | 5.13 | 03/15/28 | 45,000 | 40,315 | ||||||||||
| 72,618 | ||||||||||||||
| ELECTRICAL COMPONENTS & EQUIPMENT – 0.3% | ||||||||||||||
| Energizer Holdings, Inc.(1) | 4.38 | 03/31/29 | 25,000 | 20,437 | ||||||||||
| Energizer Holdings, Inc.(1) | 4.75 | 06/15/28 | 25,000 | 21,375 | ||||||||||
| 41,812 | ||||||||||||||
The accompanying notes are an integral part of these financial statements.
82
BONDBLOXX ETF TRUST
BondBloxx B Rated USD High Yield Corporate Bond ETF
Portfolio of Investments (Continued)
October 31, 2023
| Face | ||||||||||||||
| Rate (%) | Maturity | Amount | Value | |||||||||||
| ELECTRONICS – 0.3% | ||||||||||||||
| Coherent Corp.(1) | 5.00 | 12/15/29 | $ | 30,000 | $ | 25,498 | ||||||||
| Likewize Corp.(1) | 9.75 | 10/15/25 | 10,000 | 9,941 | ||||||||||
| 35,439 | ||||||||||||||
| ENERGY-ALTERNATE SOURCES – 0.3% | ||||||||||||||
| Enviva Partners LP/Enviva Partners Finance Corp.(1) | 6.50 | 01/15/26 | 25,000 | 17,590 | ||||||||||
| Sunnova Energy Corp.(1) | 5.88 | 09/01/26 | 10,000 | 8,109 | ||||||||||
| Sunnova Energy Corp.(1) | 11.75 | 10/01/28 | 10,000 | 8,538 | ||||||||||
| 34,237 | ||||||||||||||
| ENGINEERING & CONSTRUCTION – 0.7% | ||||||||||||||
| Brand Industrial Services, Inc.(1) | 10.38 | 08/01/30 | 40,000 | 39,750 | ||||||||||
| Brundage-Bone Concrete Pumping Holdings, Inc.(1) | 6.00 | 02/01/26 | 10,000 | 9,465 | ||||||||||
| Global Infrastructure Solutions, Inc.(1) | 5.63 | 06/01/29 | 20,000 | 16,032 | ||||||||||
| HTA Group Ltd./Mauritius(1) | 7.00 | 12/18/25 | 30,000 | 29,074 | ||||||||||
| 94,321 | ||||||||||||||
| ENTERTAINMENT – 6.2% | ||||||||||||||
| Affinity Interactive(1) | 6.88 | 12/15/27 | 15,000 | 12,239 | ||||||||||
| Banijay Entertainment SASU(1) | 8.13 | 05/01/29 | 15,000 | 14,638 | ||||||||||
| Boyne USA, Inc.(1) | 4.75 | 05/15/29 | 20,000 | 17,432 | ||||||||||
| Caesars Entertainment, Inc.(1) | 4.63 | 10/15/29 | 35,000 | 28,799 | ||||||||||
| Caesars Entertainment, Inc.(1) | 6.25 | 07/01/25 | 100,000 | 98,468 | ||||||||||
| Caesars Entertainment, Inc.(1) | 7.00 | 02/15/30 | 60,000 | 57,961 | ||||||||||
| Caesars Entertainment, Inc.(1) | 8.13 | 07/01/27 | 40,000 | 39,667 | ||||||||||
| CCM Merger, Inc.(1) | 6.38 | 05/01/26 | 10,000 | 9,474 | ||||||||||
| CDI Escrow Issuer, Inc.(1) | 5.75 | 04/01/30 | 35,000 | 31,306 | ||||||||||
| Cedar Fair LP | 5.25 | 07/15/29 | 20,000 | 17,243 | ||||||||||
| Cedar Fair LP/Canada’s Wonderland Co./Magnum Management Corp./Millennium Op | 5.38 | 04/15/27 | 20,000 | 18,537 | ||||||||||
| Churchill Downs, Inc.(1) | 4.75 | 01/15/28 | 25,000 | 22,418 | ||||||||||
| Churchill Downs, Inc.(1) | 5.50 | 04/01/27 | 20,000 | 18,777 | ||||||||||
| Churchill Downs, Inc.(1) | 6.75 | 05/01/31 | 10,000 | 9,238 | ||||||||||
| Cinemark USA, Inc.(1) | 5.25 | 07/15/28 | 35,000 | 30,260 | ||||||||||
| Everi Holdings, Inc.(1) | 5.00 | 07/15/29 | 15,000 | 12,617 | ||||||||||
| Jacobs Entertainment, Inc.(1) | 6.75 | 02/15/29 | 15,000 | 12,763 | ||||||||||
| Light & Wonder International, Inc.(1) | 7.00 | 05/15/28 | 15,000 | 14,636 | ||||||||||
| Light & Wonder International, Inc.(1) | 7.25 | 11/15/29 | 20,000 | 19,415 | ||||||||||
| Light & Wonder International, Inc.(1) | 7.50 | 09/01/31 | 15,000 | 14,663 | ||||||||||
| Lions Gate Capital Holdings LLC(1) | 5.50 | 04/15/29 | 25,000 | 16,476 | ||||||||||
| Live Nation Entertainment, Inc.(1) | 4.75 | 10/15/27 | 35,000 | 32,018 | ||||||||||
| Live Nation Entertainment, Inc.(1) | 4.88 | 11/01/24 | 20,000 | 19,593 | ||||||||||
| Merlin Entertainments Ltd.(1) | 5.75 | 06/15/26 | 10,000 | 9,362 | ||||||||||
| Midwest Gaming Borrower LLC/Midwest Gaming Finance Corp.(1) | 4.88 | 05/01/29 | 25,000 | 20,835 | ||||||||||
| Mohegan Tribal Gaming Authority(1) | 8.00 | 02/01/26 | 35,000 | 32,197 | ||||||||||
| Odeon FinCo. PLC(1) | 12.75 | 11/01/27 | 10,000 | 9,971 | ||||||||||
| Ontario Gaming GTA LP(1) | 8.00 | 08/01/30 | 10,000 | 9,786 | ||||||||||
| Penn Entertainment, Inc.(1) | 5.63 | 01/15/27 | 25,000 | 22,827 | ||||||||||
| Premier Entertainment Sub LLC/Premier Entertainment Finance Corp.(1) | 5.63 | 09/01/29 | 35,000 | 24,644 | ||||||||||
| Premier Entertainment Sub LLC/Premier Entertainment Finance Corp.(1) | 5.88 | 09/01/31 | 10,000 | 6,800 | ||||||||||
The accompanying notes are an integral part of these financial statements.
83
BONDBLOXX ETF TRUST
BondBloxx B Rated USD High Yield Corporate Bond ETF
Portfolio of Investments (Continued)
October 31, 2023
| Face | ||||||||||||||
| Rate (%) | Maturity | Amount | Value | |||||||||||
| ENTERTAINMENT – 6.2% (Continued) | ||||||||||||||
| Scientific Games Holdings LP/Scientific Games US FinCo., Inc.(1) | 6.63 | 03/01/30 | $ | 25,000 | $ | 21,523 | ||||||||
| SeaWorld Parks & Entertainment, Inc.(1) | 5.25 | 08/15/29 | 20,000 | 17,442 | ||||||||||
| Six Flags Entertainment Corp.(1) | 5.50 | 04/15/27 | 20,000 | 18,226 | ||||||||||
| Six Flags Entertainment Corp.(1) | 7.25 | 05/15/31 | 20,000 | 18,422 | ||||||||||
| Wynn Resorts Finance LLC/Wynn Resorts Capital Corp.(1) | 5.13 | 10/01/29 | 25,000 | 21,345 | ||||||||||
| Wynn Resorts Finance LLC/Wynn Resorts Capital Corp.(1) | 7.13 | 02/15/31 | 15,000 | 13,984 | ||||||||||
| 816,002 | ||||||||||||||
| ENVIRONMENTAL CONTROL – 0.8% | ||||||||||||||
| Covanta Holding Corp.(1) | 4.88 | 12/01/29 | 25,000 | 19,539 | ||||||||||
| Covanta Holding Corp. | 5.00 | 09/01/30 | 10,000 | 7,757 | ||||||||||
| Enviri Corp.(1) | 5.75 | 07/31/27 | 15,000 | 12,694 | ||||||||||
| GFL Environmental, Inc.(1) | 4.00 | 08/01/28 | 20,000 | 17,233 | ||||||||||
| GFL Environmental, Inc.(1) | 4.38 | 08/15/29 | 20,000 | 17,078 | ||||||||||
| GFL Environmental, Inc.(1) | 4.75 | 06/15/29 | 20,000 | 17,528 | ||||||||||
| Madison IAQ LLC(1) | 4.13 | 06/30/28 | 20,000 | 16,727 | ||||||||||
| 108,556 | ||||||||||||||
| FOOD – 2.4% | ||||||||||||||
| Aragvi Finance International DAC(1) | 8.45 | 04/29/26 | 20,000 | 13,775 | ||||||||||
| B&G Foods, Inc.(1) | 8.00 | 09/15/28 | 15,000 | 14,636 | ||||||||||
| Chobani LLC/Chobani Finance Corp., Inc.(1) | 4.63 | 11/15/28 | 15,000 | 12,983 | ||||||||||
| Performance Food Group, Inc.(1) | 4.25 | 08/01/29 | 30,000 | 25,345 | ||||||||||
| Performance Food Group, Inc.(1) | 5.50 | 10/15/27 | 35,000 | 32,764 | ||||||||||
| Post Holdings, Inc.(1) | 4.50 | 09/15/31 | 44,000 | 35,652 | ||||||||||
| Post Holdings, Inc.(1) | 4.63 | 04/15/30 | 10,000 | 8,388 | ||||||||||
| Post Holdings, Inc.(1) | 5.50 | 12/15/29 | 55,000 | 49,104 | ||||||||||
| Post Holdings, Inc.(1) | 5.63 | 01/15/28 | 35,000 | 32,561 | ||||||||||
| Simmons Foods, Inc./Simmons Prepared Foods, Inc./Simmons Pet Food, Inc./Simmons Feed(1) | 4.63 | 03/01/29 | 25,000 | 20,336 | ||||||||||
| United Natural Foods, Inc.(1) | 6.75 | 10/15/28 | 15,000 | 11,817 | ||||||||||
| US Foods, Inc.(1) | 4.63 | 06/01/30 | 15,000 | 12,822 | ||||||||||
| US Foods, Inc.(1) | 4.75 | 02/15/29 | 25,000 | 22,078 | ||||||||||
| US Foods, Inc.(1) | 6.88 | 09/15/28 | 10,000 | 9,786 | ||||||||||
| US Foods, Inc.(1) | 7.25 | 01/15/32 | 15,000 | 14,743 | ||||||||||
| 316,790 | ||||||||||||||
| FOOD SERVICE – 0.5% | ||||||||||||||
| Aramark Services, Inc.(1) | 5.00 | 04/01/25 | 20,000 | 19,568 | ||||||||||
| Aramark Services, Inc.(1) | 5.00 | 02/01/28 | 30,000 | 27,544 | ||||||||||
| TKC Holdings, Inc.(1) | 6.88 | 05/15/28 | 15,000 | 12,989 | ||||||||||
| 60,101 | ||||||||||||||
| FOREST PRODUCTS & PAPER – 0.2% | ||||||||||||||
| Mercer International, Inc. | 5.13 | 02/01/29 | 35,000 | 27,486 | ||||||||||
| GAS – 0.5% | ||||||||||||||
| AmeriGas Partners LP/AmeriGas Finance Corp. | 5.50 | 05/20/25 | 15,000 | 14,393 | ||||||||||
| AmeriGas Partners LP/AmeriGas Finance Corp. | 5.75 | 05/20/27 | 15,000 | 13,800 | ||||||||||
The accompanying notes are an integral part of these financial statements.
84
BONDBLOXX ETF TRUST
BondBloxx B Rated USD High Yield Corporate Bond ETF
Portfolio of Investments (Continued)
October 31, 2023
| Face | ||||||||||||||
| Rate (%) | Maturity | Amount | Value | |||||||||||
| GAS – 0.5% (Continued) | ||||||||||||||
| AmeriGas Partners LP/AmeriGas Finance Corp. | 5.88 | 08/20/26 | $ | 20,000 | $ | 18,769 | ||||||||
| AmeriGas Partners LP/AmeriGas Finance Corp.(1) | 9.38 | 06/01/28 | 15,000 | 14,837 | ||||||||||
| 61,799 | ||||||||||||||
| HEALTHCARE-PRODUCTS – 1.7% | ||||||||||||||
| Bausch & Lomb Escrow Corp.(1) | 8.38 | 10/01/28 | 35,000 | 34,807 | ||||||||||
| Embecta Corp.(1) | 5.00 | 02/15/30 | 15,000 | 11,928 | ||||||||||
| Medline Borrower LP(1) | 3.88 | 04/01/29 | 125,000 | 105,663 | ||||||||||
| Medline Borrower LP(1) | 5.25 | 10/01/29 | 75,000 | 63,916 | ||||||||||
| 216,314 | ||||||||||||||
| HEALTHCARE-SERVICES – 5.7% | ||||||||||||||
| Acadia Healthcare Co., Inc.(1) | 5.00 | 04/15/29 | 20,000 | 17,853 | ||||||||||
| Acadia Healthcare Co., Inc.(1) | 5.50 | 07/01/28 | 10,000 | 9,242 | ||||||||||
| Catalent Pharma Solutions, Inc.(1) | 3.13 | 02/15/29 | 20,000 | 15,746 | ||||||||||
| Catalent Pharma Solutions, Inc.(1) | 3.50 | 04/01/30 | 20,000 | 15,719 | ||||||||||
| Catalent Pharma Solutions, Inc.(1) | 5.00 | 07/15/27 | 10,000 | 8,937 | ||||||||||
| CHS/Community Health Systems, Inc.(1) | 4.75 | 02/15/31 | 30,000 | 20,143 | ||||||||||
| CHS/Community Health Systems, Inc.(1) | 5.25 | 05/15/30 | 45,000 | 31,999 | ||||||||||
| CHS/Community Health Systems, Inc.(1) | 5.63 | 03/15/27 | 65,000 | 52,860 | ||||||||||
| CHS/Community Health Systems, Inc.(1) | 6.00 | 01/15/29 | 25,000 | 18,964 | ||||||||||
| CHS/Community Health Systems, Inc.(1) | 8.00 | 03/15/26 | 70,000 | 64,080 | ||||||||||
| DaVita, Inc.(1) | 3.75 | 02/15/31 | 35,000 | 25,188 | ||||||||||
| DaVita, Inc.(1) | 4.63 | 06/01/30 | 85,000 | 66,684 | ||||||||||
| Encompass Health Corp. | 4.50 | 02/01/28 | 25,000 | 22,564 | ||||||||||
| Encompass Health Corp. | 4.63 | 04/01/31 | 10,000 | 8,336 | ||||||||||
| Encompass Health Corp. | 4.75 | 02/01/30 | 25,000 | 21,631 | ||||||||||
| HealthEquity, Inc.(1) | 4.50 | 10/01/29 | 20,000 | 17,157 | ||||||||||
| Heartland Dental LLC/Heartland Dental Finance Corp.(1) | 10.50 | 04/30/28 | 15,000 | 14,436 | ||||||||||
| Legacy LifePoint Health LLC(1) | 4.38 | 02/15/27 | 20,000 | 16,557 | ||||||||||
| LifePoint Health, Inc.(1) | 9.88 | 08/15/30 | 20,000 | 18,100 | ||||||||||
| LifePoint Health, Inc.(1) | 11.00 | 10/15/30 | 30,000 | 28,270 | ||||||||||
| ModivCare Escrow Issuer, Inc.(1) | 5.00 | 10/01/29 | 15,000 | 10,947 | ||||||||||
| ModivCare, Inc.(1) | 5.88 | 11/15/25 | 15,000 | 14,191 | ||||||||||
| Prime Healthcare Services, Inc.(1) | 7.25 | 11/01/25 | 25,000 | 22,777 | ||||||||||
| Select Medical Corp.(1) | 6.25 | 08/15/26 | 35,000 | 34,077 | ||||||||||
| Star Parent, Inc.(1) | 9.00 | 10/01/30 | 25,000 | 24,841 | ||||||||||
| Tenet Healthcare Corp. | 6.13 | 10/01/28 | 75,000 | 69,628 | ||||||||||
| Tenet Healthcare Corp. | 6.25 | 02/01/27 | 40,000 | 38,396 | ||||||||||
| Tenet Healthcare Corp. | 6.88 | 11/15/31 | 10,000 | 9,231 | ||||||||||
| US Acute Care Solutions LLC(1) | 6.38 | 03/01/26 | 25,000 | 21,294 | ||||||||||
| 739,848 | ||||||||||||||
| HOME BUILDERS – 0.8% | ||||||||||||||
| Adams Homes, Inc.(1) | 9.25 | 10/15/28 | 15,000 | 14,524 | ||||||||||
| Ashton Woods USA LLC/Ashton Woods Finance Co.(1) | 4.63 | 08/01/29 | 10,000 | 8,101 | ||||||||||
| Ashton Woods USA LLC/Ashton Woods Finance Co.(1) | 4.63 | 04/01/30 | 15,000 | 11,629 | ||||||||||
| Beazer Homes USA, Inc. | 5.88 | 10/15/27 | 20,000 | 17,869 | ||||||||||
| Brookfield Residential Properties, Inc./Brookfield Residential US LLC(1) | 4.88 | 02/15/30 | 20,000 | 15,228 | ||||||||||
The accompanying notes are an integral part of these financial statements.
85
BONDBLOXX ETF TRUST
BondBloxx B Rated USD High Yield Corporate Bond ETF
Portfolio of Investments (Continued)
October 31, 2023
| Face | ||||||||||||||
| Rate (%) | Maturity | Amount | Value | |||||||||||
| HOME BUILDERS – 0.8% (Continued) | ||||||||||||||
| Brookfield Residential Properties, Inc./Brookfield Residential US LLC(1) | 6.25 | 09/15/27 | $ | 25,000 | $ | 21,775 | ||||||||
| Empire Communities Corp.(1) | 7.00 | 12/15/25 | 15,000 | 13,956 | ||||||||||
| 103,082 | ||||||||||||||
| HOUSEHOLD PRODUCTS/WARES – 0.2% | ||||||||||||||
| Kronos Acquisition Holdings, Inc./KIK Custom Products, Inc.(1) | 5.00 | 12/31/26 | 10,000 | 9,056 | ||||||||||
| Spectrum Brands, Inc.(1) | 3.88 | 03/15/31 | 25,000 | 20,037 | ||||||||||
| 29,093 | ||||||||||||||
| HOUSEWARES – 0.4% | ||||||||||||||
| CD&R Smokey Buyer, Inc.(1) | 6.75 | 07/15/25 | 20,000 | 19,134 | ||||||||||
| Scotts Miracle-Gro Co. | 4.00 | 04/01/31 | 20,000 | 14,898 | ||||||||||
| Scotts Miracle-Gro Co. | 4.50 | 10/15/29 | 25,000 | 19,776 | ||||||||||
| 53,808 | ||||||||||||||
| INSURANCE – 1.5% | ||||||||||||||
| Acrisure LLC/Acrisure Finance, Inc.(1) | 4.25 | 02/15/29 | 20,000 | 16,422 | ||||||||||
| Alliant Holdings Intermediate LLC/Alliant Holdings Co.-Issuer(1) | 4.25 | 10/15/27 | 25,000 | 22,005 | ||||||||||
| Alliant Holdings Intermediate LLC/Alliant Holdings Co.-Issuer(1) | 6.75 | 04/15/28 | 35,000 | 33,296 | ||||||||||
| AmWINS Group, Inc.(1) | 4.88 | 06/30/29 | 25,000 | 21,431 | ||||||||||
| HUB International Ltd.(1) | 7.25 | 06/15/30 | 65,000 | 63,471 | ||||||||||
| Jones Deslauriers Insurance Management, Inc.(1) | 8.50 | 03/15/30 | 25,000 | 24,586 | ||||||||||
| Ryan Specialty LLC(1) | 4.38 | 02/01/30 | 15,000 | 12,867 | ||||||||||
| 194,078 | ||||||||||||||
| INTERNET – 2.5% | ||||||||||||||
| ANGI Group LLC(1) | 3.88 | 08/15/28 | 15,000 | 11,263 | ||||||||||
| Arches Buyer, Inc.(1) | 4.25 | 06/01/28 | 30,000 | 24,880 | ||||||||||
| Cablevision Lightpath LLC(1) | 3.88 | 09/15/27 | 10,000 | 8,172 | ||||||||||
| Cars.com, Inc.(1) | 6.38 | 11/01/28 | 10,000 | 8,911 | ||||||||||
| Cogent Communications Group, Inc.(1) | 7.00 | 06/15/27 | 15,000 | 14,188 | ||||||||||
| EquipmentShare.com, Inc.(1) | 9.00 | 05/15/28 | 30,000 | 28,238 | ||||||||||
| GrubHub Holdings, Inc.(1) | 5.50 | 07/01/27 | 15,000 | 11,048 | ||||||||||
| ION Trading Technologies Sarl(1) | 5.75 | 05/15/28 | 10,000 | 8,310 | ||||||||||
| Millennium Escrow Corp.(1) | 6.63 | 08/01/26 | 25,000 | 18,588 | ||||||||||
| Newfold Digital Holdings Group, Inc.(1) | 11.75 | 10/15/28 | 15,000 | 15,167 | ||||||||||
| Northwest Fiber LLC/Northwest Fiber Finance Sub, Inc.(1) | 4.75 | 04/30/27 | 10,000 | 8,935 | ||||||||||
| Rakuten Group, Inc.(1),(2) | 5.13 | - | 15,000 | 10,919 | ||||||||||
| Rakuten Group, Inc.(1),(2) | 6.25 | - | 35,000 | 22,107 | ||||||||||
| TripAdvisor, Inc.(1) | 7.00 | 07/15/25 | 15,000 | 14,865 | ||||||||||
| Uber Technologies, Inc.(1) | 4.50 | 08/15/29 | 45,000 | 39,771 | ||||||||||
| Uber Technologies, Inc.(1) | 6.25 | 01/15/28 | 15,000 | 14,461 | ||||||||||
| Uber Technologies, Inc.(1) | 7.50 | 05/15/25 | 30,000 | 30,068 | ||||||||||
| Uber Technologies, Inc.(1) | 7.50 | 09/15/27 | 30,000 | 30,106 | ||||||||||
| 319,997 | ||||||||||||||
| INVESTMENT COMPANIES – 0.3% | ||||||||||||||
| Compass Group Diversified Holdings LLC(1) | 5.25 | 04/15/29 | 40,000 | 34,199 | ||||||||||
The accompanying notes are an integral part of these financial statements.
86
BONDBLOXX ETF TRUST
BondBloxx B Rated USD High Yield Corporate Bond ETF
Portfolio of Investments (Continued)
October 31, 2023
| Face | ||||||||||||||
| Rate (%) | Maturity | Amount | Value | |||||||||||
| IRON/STEEL – 0.3% | ||||||||||||||
| ATI, Inc. | 4.88 | 10/01/29 | $ | 10,000 | $ | 8,530 | ||||||||
| ATI, Inc. | 5.13 | 10/01/31 | 15,000 | 12,398 | ||||||||||
| ATI, Inc. | 7.25 | 08/15/30 | 15,000 | 14,457 | ||||||||||
| TMS International Corp./DE(1) | 6.25 | 04/15/29 | 10,000 | 7,900 | ||||||||||
| 43,285 | ||||||||||||||
| LEISURE TIME – 4.2% | ||||||||||||||
| Carnival Corp.(1) | 5.75 | 03/01/27 | 95,000 | 84,886 | ||||||||||
| Carnival Corp.(1) | 6.00 | 05/01/29 | 45,000 | 38,053 | ||||||||||
| Carnival Corp.(1) | 7.63 | 03/01/26 | 45,000 | 43,793 | ||||||||||
| Carnival Corp.(1) | 10.50 | 06/01/30 | 40,000 | 40,628 | ||||||||||
| Carnival Holdings Bermuda Ltd.(1) | 10.38 | 05/01/28 | 50,000 | 53,354 | ||||||||||
| Life Time, Inc.(1) | 8.00 | 04/15/26 | 15,000 | 14,637 | ||||||||||
| Lindblad Expeditions LLC(1) | 6.75 | 02/15/27 | 10,000 | 9,122 | ||||||||||
| NCL Corp. Ltd.(1) | 5.88 | 02/15/27 | 30,000 | 27,644 | ||||||||||
| NCL Corp. Ltd.(1) | 8.13 | 01/15/29 | 25,000 | 24,452 | ||||||||||
| NCL Corp. Ltd.(1) | 8.38 | 02/01/28 | 15,000 | 14,873 | ||||||||||
| Royal Caribbean Cruises Ltd. | 3.70 | 03/15/28 | 10,000 | 8,532 | ||||||||||
| Royal Caribbean Cruises Ltd.(1) | 4.25 | 07/01/26 | 25,000 | 23,012 | ||||||||||
| Royal Caribbean Cruises Ltd.(1) | 5.38 | 07/15/27 | 25,000 | 23,064 | ||||||||||
| Royal Caribbean Cruises Ltd.(1) | 5.50 | 08/31/26 | 25,000 | 23,619 | ||||||||||
| Royal Caribbean Cruises Ltd.(1) | 5.50 | 04/01/28 | 45,000 | 41,073 | ||||||||||
| Royal Caribbean Cruises Ltd. | 7.50 | 10/15/27 | 10,000 | 9,859 | ||||||||||
| Royal Caribbean Cruises Ltd.(1) | 11.63 | 08/15/27 | 40,000 | 43,422 | ||||||||||
| VOC Escrow Ltd.(1) | 5.00 | 02/15/28 | 30,000 | 26,981 | ||||||||||
| 551,004 | ||||||||||||||
| LODGING – 1.8% | ||||||||||||||
| Hilton Grand Vacations Borrower Escrow LLC/Hilton Grand Vacations Borrower Esc(1) | 4.88 | 07/01/31 | 10,000 | 7,930 | ||||||||||
| Hilton Grand Vacations Borrower Escrow LLC/Hilton Grand Vacations Borrower Esc(1) | 5.00 | 06/01/29 | 30,000 | 25,155 | ||||||||||
| Marriott Ownership Resorts, Inc.(1) | 4.50 | 06/15/29 | 25,000 | 20,565 | ||||||||||
| MGM Resorts International | 4.63 | 09/01/26 | 15,000 | 13,953 | ||||||||||
| MGM Resorts International | 4.75 | 10/15/28 | 20,000 | 17,470 | ||||||||||
| MGM Resorts International | 5.50 | 04/15/27 | 15,000 | 14,008 | ||||||||||
| MGM Resorts International | 5.75 | 06/15/25 | 25,000 | 24,469 | ||||||||||
| MGM Resorts International | 6.75 | 05/01/25 | 20,000 | 19,910 | ||||||||||
| Station Casinos LLC(1) | 4.50 | 02/15/28 | 25,000 | 21,615 | ||||||||||
| Station Casinos LLC(1) | 4.63 | 12/01/31 | 10,000 | 7,907 | ||||||||||
| Wynn Las Vegas LLC/Wynn Las Vegas Capital Corp.(1) | 5.25 | 05/15/27 | 30,000 | 27,741 | ||||||||||
| Wynn Las Vegas LLC/Wynn Las Vegas Capital Corp.(1) | 5.50 | 03/01/25 | 36,000 | 35,376 | ||||||||||
| 236,099 | ||||||||||||||
| MACHINERY-CONSTRUCTION & MINING – 0.4% | ||||||||||||||
| Manitowoc Co., Inc.(1) | 9.00 | 04/01/26 | 10,000 | 9,812 | ||||||||||
| Terex Corp.(1) | 5.00 | 05/15/29 | 20,000 | 17,529 | ||||||||||
| Vertiv Group Corp.(1) | 4.13 | 11/15/28 | 25,000 | 21,877 | ||||||||||
| 49,218 | ||||||||||||||
The accompanying notes are an integral part of these financial statements.
87
BONDBLOXX ETF TRUST
BondBloxx B Rated USD High Yield Corporate Bond ETF
Portfolio of Investments (Continued)
October 31, 2023
| Face | ||||||||||||||
| Rate (%) | Maturity | Amount | Value | |||||||||||
| MACHINERY-DIVERSIFIED – 0.8% | ||||||||||||||
| ATS Corp.(1) | 4.13 | 12/15/28 | $ | 10,000 | $ | 8,599 | ||||||||
| Chart Industries, Inc.(1) | 7.50 | 01/01/30 | 45,000 | 44,246 | ||||||||||
| Chart Industries, Inc.(1) | 9.50 | 01/01/31 | 15,000 | 15,468 | ||||||||||
| TK Elevator US Newco, Inc.(1) | 5.25 | 07/15/27 | 45,000 | 41,015 | ||||||||||
| 109,328 | ||||||||||||||
| MEDIA – 7.1% | ||||||||||||||
| Altice Financing SA(1) | 5.00 | 01/15/28 | 30,000 | 24,423 | ||||||||||
| Altice Financing SA(1) | 5.75 | 08/15/29 | 65,000 | 50,336 | ||||||||||
| Cable One, Inc.(1) | 4.00 | 11/15/30 | 20,000 | 14,913 | ||||||||||
| CSC Holdings LLC(1) | 3.38 | 02/15/31 | 25,000 | 16,011 | ||||||||||
| CSC Holdings LLC(1) | 4.13 | 12/01/30 | 30,000 | 20,125 | ||||||||||
| CSC Holdings LLC(1) | 4.50 | 11/15/31 | 50,000 | 33,070 | ||||||||||
| CSC Holdings LLC(1) | 5.38 | 02/01/28 | 25,000 | 19,932 | ||||||||||
| CSC Holdings LLC(1) | 5.50 | 04/15/27 | 40,000 | 33,482 | ||||||||||
| CSC Holdings LLC(1) | 6.50 | 02/01/29 | 50,000 | 39,604 | ||||||||||
| CSC Holdings LLC(1) | 11.25 | 05/15/28 | 25,000 | 23,874 | ||||||||||
| Cumulus Media New Holdings, Inc.(1) | 6.75 | 07/01/26 | 10,000 | 7,159 | ||||||||||
| DISH DBS Corp.(1) | 5.25 | 12/01/26 | 90,000 | 72,767 | ||||||||||
| DISH DBS Corp.(1) | 5.75 | 12/01/28 | 75,000 | 54,609 | ||||||||||
| DISH Network Corp.(1) | 11.75 | 11/15/27 | 90,000 | 89,225 | ||||||||||
| GCI LLC(1) | 4.75 | 10/15/28 | 20,000 | 17,181 | ||||||||||
| Gray Escrow II, Inc.(1) | 5.38 | 11/15/31 | 45,000 | 28,400 | ||||||||||
| Gray Television, Inc.(1) | 4.75 | 10/15/30 | 5,000 | 3,211 | ||||||||||
| Gray Television, Inc.(1) | 5.88 | 07/15/26 | 20,000 | 17,830 | ||||||||||
| Gray Television, Inc.(1) | 7.00 | 05/15/27 | 35,000 | 29,714 | ||||||||||
| iHeartCommunications, Inc.(1) | 4.75 | 01/15/28 | 15,000 | 10,629 | ||||||||||
| iHeartCommunications, Inc.(1) | 5.25 | 08/15/27 | 20,000 | 14,676 | ||||||||||
| iHeartCommunications, Inc. | 6.38 | 05/01/26 | 25,000 | 20,403 | ||||||||||
| McGraw-Hill Education, Inc.(1) | 5.75 | 08/01/28 | 25,000 | 21,098 | ||||||||||
| Scripps Escrow II, Inc.(1) | 5.38 | 01/15/31 | 10,000 | 6,217 | ||||||||||
| Scripps Escrow, Inc.(1) | 5.88 | 07/15/27 | 15,000 | 11,226 | ||||||||||
| Sinclair Television Group, Inc.(1) | 5.13 | 02/15/27 | 15,000 | 11,818 | ||||||||||
| Sinclair Television Group, Inc.(1) | 5.50 | 03/01/30 | 5,000 | 2,723 | ||||||||||
| Townsquare Media, Inc.(1) | 6.88 | 02/01/26 | 15,000 | 13,879 | ||||||||||
| Univision Communications, Inc.(1) | 4.50 | 05/01/29 | 25,000 | 19,900 | ||||||||||
| Univision Communications, Inc.(1) | 5.13 | 02/15/25 | 29,000 | 28,348 | ||||||||||
| Univision Communications, Inc.(1) | 6.63 | 06/01/27 | 50,000 | 45,705 | ||||||||||
| Univision Communications, Inc.(1) | 7.38 | 06/30/30 | 25,000 | 22,037 | ||||||||||
| Univision Communications, Inc.(1) | 8.00 | 08/15/28 | 15,000 | 14,177 | ||||||||||
| UPC Holding BV(1) | 5.50 | 01/15/28 | 10,000 | 8,734 | ||||||||||
| Urban One, Inc.(1) | 7.38 | 02/01/28 | 25,000 | 20,579 | ||||||||||
| Virgin Media Finance PLC(1) | 5.00 | 07/15/30 | 30,000 | 23,615 | ||||||||||
| Virgin Media Vendor Financing Notes IV DAC(1) | 5.00 | 07/15/28 | 10,000 | 8,499 | ||||||||||
| Ziggo Bond Co. BV(1) | 5.13 | 02/28/30 | 10,000 | 7,296 | ||||||||||
| Ziggo Bond Co. BV(1) | 6.00 | 01/15/27 | 25,000 | 22,925 | ||||||||||
| 930,350 | ||||||||||||||
| METAL FABRICATE/HARDWARE – 0.1% | ||||||||||||||
| Roller Bearing Co. of America, Inc.(1) | 4.38 | 10/15/29 | 15,000 | 12,739 | ||||||||||
The accompanying notes are an integral part of these financial statements.
88
BONDBLOXX ETF TRUST
BondBloxx B Rated USD High Yield Corporate Bond ETF
Portfolio of Investments (Continued)
October 31, 2023
| Rate (%) | Maturity | Face Amount | Value | |||||||||||
| MINING – 1.0% | ||||||||||||||
| Compass Minerals International, Inc.(1) | 6.75 | 12/01/27 | $ | 15,000 | $ | 14,144 | ||||||||
| Constellium SE(1) | 3.75 | 04/15/29 | 25,000 | 20,609 | ||||||||||
| Eldorado Gold Corp.(1) | 6.25 | 09/01/29 | 15,000 | 12,881 | ||||||||||
| Hecla Mining Co. | 7.25 | 02/15/28 | 10,000 | 9,560 | ||||||||||
| Hudbay Minerals, Inc.(1) | 4.50 | 04/01/26 | 15,000 | 13,976 | ||||||||||
| Hudbay Minerals, Inc.(1) | 6.13 | 04/01/29 | 20,000 | 17,921 | ||||||||||
| Kaiser Aluminum Corp.(1) | 4.50 | 06/01/31 | 15,000 | 11,103 | ||||||||||
| Kaiser Aluminum Corp.(1) | 4.63 | 03/01/28 | 15,000 | 12,513 | ||||||||||
| New Gold, Inc.(1) | 7.50 | 07/15/27 | 10,000 | 9,393 | ||||||||||
| Taseko Mines Ltd.(1) | 7.00 | 02/15/26 | 10,000 | 9,080 | ||||||||||
| 131,180 | ||||||||||||||
| MISCELLANEOUS MANUFACTURERS – 0.4% | ||||||||||||||
| Calderys Financing LLC(1) | 11.25 | 06/01/28 | 15,000 | 15,150 | ||||||||||
| EnPro Industries, Inc. | 5.75 | 10/15/26 | 10,000 | 9,486 | ||||||||||
| Gates Global LLC/Gates Corp.(1) | 6.25 | 01/15/26 | 15,000 | 14,706 | ||||||||||
| LSB Industries, Inc.(1) | 6.25 | 10/15/28 | 15,000 | 13,323 | ||||||||||
| 52,665 | ||||||||||||||
| OFFICE/BUSINESS EQUIPMENT – 0.1% | ||||||||||||||
| Pitney Bowes, Inc.(1) | 6.88 | 03/15/27 | 20,000 | 16,574 | ||||||||||
| OIL & GAS – 7.0% | ||||||||||||||
| Aethon United BR LP/Aethon United Finance Corp.(1) | 8.25 | 02/15/26 | 25,000 | 24,854 | ||||||||||
| Ascent Resources Utica Holdings LLC/ARU Finance Corp.(1) | 5.88 | 06/30/29 | 10,000 | 8,844 | ||||||||||
| Ascent Resources Utica Holdings LLC/ARU Finance Corp.(1) | 7.00 | 11/01/26 | 30,000 | 28,999 | ||||||||||
| Ascent Resources Utica Holdings LLC/ARU Finance Corp.(1) | 8.25 | 12/31/28 | 10,000 | 9,939 | ||||||||||
| Berry Petroleum Co. LLC(1) | 7.00 | 02/15/26 | 15,000 | 14,413 | ||||||||||
| California Resources Corp.(1) | 7.13 | 02/01/26 | 20,000 | 20,095 | ||||||||||
| Callon Petroleum Co.(1) | 7.50 | 06/15/30 | 20,000 | 19,393 | ||||||||||
| Callon Petroleum Co.(1) | 8.00 | 08/01/28 | 25,000 | 24,733 | ||||||||||
| CITGO Petroleum Corp.(1) | 6.38 | 06/15/26 | 20,000 | 19,669 | ||||||||||
| CITGO Petroleum Corp.(1) | 7.00 | 06/15/25 | 35,000 | 34,428 | ||||||||||
| CITGO Petroleum Corp.(1) | 8.38 | 01/15/29 | 25,000 | 24,784 | ||||||||||
| Comstock Resources, Inc.(1) | 5.88 | 01/15/30 | 25,000 | 21,401 | ||||||||||
| Comstock Resources, Inc.(1) | 6.75 | 03/01/29 | 40,000 | 36,436 | ||||||||||
| CVR Energy, Inc.(1) | 5.25 | 02/15/25 | 30,000 | 29,455 | ||||||||||
| Diamond Foreign Asset Co./Diamond Finance LLC(1) | 8.50 | 10/01/30 | 15,000 | 14,634 | ||||||||||
| Earthstone Energy Holdings LLC(1) | 8.00 | 04/15/27 | 15,000 | 15,232 | ||||||||||
| Earthstone Energy Holdings LLC(1) | 9.88 | 07/15/31 | 15,000 | 16,170 | ||||||||||
| Encino Acquisition Partners Holdings LLC(1) | 8.50 | 05/01/28 | 20,000 | 19,518 | ||||||||||
| Energean PLC(1) | 6.50 | 04/30/27 | 15,000 | 12,567 | ||||||||||
| Gran Tierra Energy, Inc.(1) | 7.75 | 05/23/27 | 15,000 | 12,746 | ||||||||||
| Gran Tierra Energy, Inc.(1) | 9.50 | 10/15/29 | 15,000 | 12,895 | ||||||||||
| Gulfport Energy Corp.(1) | 8.00 | 05/17/26 | 15,000 | 14,991 | ||||||||||
| Ithaca Energy North Sea PLC(1) | 9.00 | 07/15/26 | 20,000 | 19,239 | ||||||||||
| Magnolia Oil & Gas Operating LLC/Magnolia Oil & Gas Finance Corp.(1) | 6.00 | 08/01/26 | 10,000 | 9,610 | ||||||||||
| Moss Creek Resources Holdings, Inc.(1) | 7.50 | 01/15/26 | 35,000 | 33,460 | ||||||||||
| Nabors Industries, Inc.(1) | 7.38 | 05/15/27 | 20,000 | 18,610 | ||||||||||
| Noble Finance II LLC(1) | 8.00 | 04/15/30 | 20,000 | 20,009 | ||||||||||
The accompanying notes are an integral part of these financial statements.
89
BONDBLOXX ETF TRUST
BondBloxx B Rated USD High Yield Corporate Bond ETF
Portfolio of Investments (Continued)
October 31, 2023
| Face | ||||||||||||||
| Rate (%) | Maturity | Amount | Value | |||||||||||
| OIL & GAS – 7.0% (Continued) | ||||||||||||||
| Northern Oil & Gas, Inc.(1) | 8.13 | 03/01/28 | $ | 25,000 | $ | 24,708 | ||||||||
| Northern Oil & Gas, Inc.(1) | 8.75 | 06/15/31 | 15,000 | 14,943 | ||||||||||
| Permian Resources Operating LLC(1) | 5.88 | 07/01/29 | 25,000 | 23,291 | ||||||||||
| Permian Resources Operating LLC(1) | 7.00 | 01/15/32 | 10,000 | 9,704 | ||||||||||
| Permian Resources Operating LLC(1) | 7.75 | 02/15/26 | 25,000 | 25,005 | ||||||||||
| Precision Drilling Corp.(1) | 6.88 | 01/15/29 | 20,000 | 18,538 | ||||||||||
| Rockcliff Energy II LLC(1) | 5.50 | 10/15/29 | 20,000 | 18,073 | ||||||||||
| Sitio Royalties Operating Partnership LP/Sitio Finance Corp.(1) | 7.88 | 11/01/28 | 20,000 | 19,748 | ||||||||||
| Strathcona Resources Ltd./Alberta(1) | 6.88 | 08/01/26 | 15,000 | 13,852 | ||||||||||
| Talos Production, Inc. | 12.00 | 01/15/26 | 20,000 | 20,802 | ||||||||||
| Teine Energy Ltd.(1) | 6.88 | 04/15/29 | 10,000 | 9,271 | ||||||||||
| Transocean Aquila Ltd.(1) | 8.00 | 09/30/28 | 15,000 | 14,795 | ||||||||||
| Transocean Titan Financing Ltd.(1) | 8.38 | 02/01/28 | 25,000 | 25,126 | ||||||||||
| Transocean, Inc.(1) | 8.75 | 02/15/30 | 28,500 | 28,440 | ||||||||||
| Valaris Ltd.(1) | 8.38 | 04/30/30 | 35,000 | 34,375 | ||||||||||
| Vermilion Energy, Inc.(1) | 6.88 | 05/01/30 | 20,000 | 18,681 | ||||||||||
| Vital Energy, Inc.(1) | 7.75 | 07/31/29 | 10,000 | 9,065 | ||||||||||
| Vital Energy, Inc. | 9.50 | 01/15/25 | 20,000 | 20,112 | ||||||||||
| Vital Energy, Inc. | 9.75 | 10/15/30 | 10,000 | 9,810 | ||||||||||
| Vital Energy, Inc. | 10.13 | 01/15/28 | 15,000 | 15,053 | ||||||||||
| 910,516 | ||||||||||||||
| OIL & GAS SERVICES – 1.4% | ||||||||||||||
| Archrock Partners LP/Archrock Partners Finance Corp.(1) | 6.25 | 04/01/28 | 40,000 | 37,193 | ||||||||||
| Bristow Group, Inc.(1) | 6.88 | 03/01/28 | 10,000 | 9,273 | ||||||||||
| CGG SA(1) | 8.75 | 04/01/27 | 15,000 | 13,253 | ||||||||||
| CSI Compressco LP/CSI Compressco Finance, Inc.(1) | 7.50 | 04/01/25 | 10,000 | 9,684 | ||||||||||
| Enerflex Ltd.(1) | 9.00 | 10/15/27 | 20,000 | 18,220 | ||||||||||
| USA Compression Partners LP/USA Compression Finance Corp. | 6.88 | 04/01/26 | 25,000 | 24,304 | ||||||||||
| USA Compression Partners LP/USA Compression Finance Corp. | 6.88 | 09/01/27 | 20,000 | 19,183 | ||||||||||
| Weatherford International Ltd.(1) | 8.63 | 04/30/30 | 45,000 | 45,513 | ||||||||||
| 176,623 | ||||||||||||||
| PACKAGING & CONTAINERS – 2.1% | ||||||||||||||
| Ardagh Metal Packaging Finance USA LLC/Ardagh Metal Packaging Finance PLC(1) | 4.00 | 09/01/29 | 30,000 | 22,541 | ||||||||||
| Clydesdale Acquisition Holdings, Inc.(1) | 6.63 | 04/15/29 | 15,000 | 13,642 | ||||||||||
| Intelligent Packaging Ltd. FinCo., Inc./Intelligent Packaging Ltd. Co.-Issuer LLC(1) | 6.00 | 09/15/28 | 20,000 | 16,441 | ||||||||||
| LABL, Inc.(1) | 5.88 | 11/01/28 | 25,000 | 21,203 | ||||||||||
| LABL, Inc.(1) | 6.75 | 07/15/26 | 20,000 | 18,405 | ||||||||||
| Mauser Packaging Solutions Holding Co.(1) | 7.88 | 08/15/26 | 80,000 | 75,010 | ||||||||||
| Owens-Brockway Glass Container, Inc.(1) | 6.63 | 05/13/27 | 25,000 | 23,777 | ||||||||||
| Owens-Brockway Glass Container, Inc.(1) | 7.25 | 05/15/31 | 20,000 | 18,325 | ||||||||||
| Pactiv Evergreen Group Issuer LLC/Pactiv Evergreen Group Issuer, Inc.(1) | 4.38 | 10/15/28 | 20,000 | 17,036 | ||||||||||
| Pactiv Evergreen Group Issuer, Inc./Pactiv Evergreen Group Issuer LLC(1) | 4.00 | 10/15/27 | 25,000 | 21,841 | ||||||||||
| Trivium Packaging Finance BV(1) | 5.50 | 08/15/26 | 30,000 | 27,242 | ||||||||||
| 275,463 | ||||||||||||||
The accompanying notes are an integral part of these financial statements.
90
BONDBLOXX ETF TRUST
BondBloxx B Rated USD High Yield Corporate Bond ETF
Portfolio of Investments (Continued)
October 31, 2023
| Face | ||||||||||||||
| Rate (%) | Maturity | Amount | Value | |||||||||||
| PHARMACEUTICALS – 2.6% | ||||||||||||||
| AdaptHealth LLC(1) | 4.63 | 08/01/29 | $ | 15,000 | $ | 11,227 | ||||||||
| AdaptHealth LLC(1) | 5.13 | 03/01/30 | 20,000 | 15,170 | ||||||||||
| AdaptHealth LLC(1) | 6.13 | 08/01/28 | 10,000 | 8,220 | ||||||||||
| Bausch Health Cos, Inc.(1) | 4.88 | 06/01/28 | 40,000 | 19,998 | ||||||||||
| Bausch Health Cos, Inc.(1) | 5.50 | 11/01/25 | 50,000 | 43,164 | ||||||||||
| Bausch Health Cos, Inc.(1) | 6.13 | 02/01/27 | 40,000 | 22,357 | ||||||||||
| Bausch Health Cos, Inc.(1) | 11.00 | 09/30/28 | 55,000 | 33,687 | ||||||||||
| BellRing Brands, Inc.(1) | 7.00 | 03/15/30 | 25,000 | 24,307 | ||||||||||
| Cheplapharm Arzneimittel GmbH(1) | 5.50 | 01/15/28 | 15,000 | 13,320 | ||||||||||
| Elanco Animal Health, Inc. | 6.65 | 08/28/28 | 20,000 | 19,150 | ||||||||||
| Grifols SA(1) | 4.75 | 10/15/28 | 20,000 | 16,817 | ||||||||||
| Herbalife Nutrition Ltd./HLF Financing, Inc.(1) | 7.88 | 09/01/25 | 15,000 | 14,130 | ||||||||||
| HLF Financing Sarl LLC/Herbalife International, Inc.(1) | 4.88 | 06/01/29 | 20,000 | 13,678 | ||||||||||
| Option Care Health, Inc.(1) | 4.38 | 10/31/29 | 15,000 | 12,553 | ||||||||||
| Organon & Co./Organon Foreign Debt Co.-Issuer BV(1) | 5.13 | 04/30/31 | 60,000 | 46,917 | ||||||||||
| Owens & Minor, Inc.(1) | 4.50 | 03/31/29 | 15,000 | 12,049 | ||||||||||
| Owens & Minor, Inc.(1) | 6.63 | 04/01/30 | 15,000 | 13,125 | ||||||||||
| 339,869 | ||||||||||||||
| PIPELINES – 2.4% | ||||||||||||||
| Blue Racer Midstream LLC/Blue Racer Finance Corp.(1) | 7.63 | 12/15/25 | 30,000 | 30,070 | ||||||||||
| Delek Logistics Partners LP/Delek Logistics Finance Corp.(1) | 7.13 | 06/01/28 | 15,000 | 13,665 | ||||||||||
| FTAI Infra Escrow Holdings LLC(1) | 10.50 | 06/01/27 | 20,000 | 19,459 | ||||||||||
| Genesis Energy LP/Genesis Energy Finance Corp. | 6.50 | 10/01/25 | 25,000 | 24,446 | ||||||||||
| Genesis Energy LP/Genesis Energy Finance Corp. | 7.75 | 02/01/28 | 25,000 | 23,562 | ||||||||||
| Genesis Energy LP/Genesis Energy Finance Corp. | 8.00 | 01/15/27 | 40,000 | 38,446 | ||||||||||
| Global Partners LP/GLP Finance Corp. | 7.00 | 08/01/27 | 20,000 | 18,868 | ||||||||||
| Howard Midstream Energy Partners LLC(1) | 6.75 | 01/15/27 | 10,000 | 9,460 | ||||||||||
| Howard Midstream Energy Partners LLC(1) | 8.88 | 07/15/28 | 20,000 | 20,123 | ||||||||||
| ITT Holdings LLC(1) | 6.50 | 08/01/29 | 35,000 | 29,307 | ||||||||||
| Martin Midstream Partners LP/Martin Midstream Finance Corp.(1) | 11.50 | 02/15/28 | 10,000 | 9,778 | ||||||||||
| NGL Energy Operating LLC/NGL Energy Finance Corp.(1) | 7.50 | 02/01/26 | 60,000 | 58,624 | ||||||||||
| Summit Midstream Holdings LLC/Summit Midstream Finance Corp.(1),(3) | 9.00 | 10/15/26 | 25,000 | 24,025 | ||||||||||
| 319,833 | ||||||||||||||
| REAL ESTATE – 0.8% | ||||||||||||||
| Anywhere Real Estate Group LLC/Anywhere Co.-Issuer Corp.(1) | 7.00 | 04/15/30 | 29,400 | 24,273 | ||||||||||
| Five Point Operating Co. LP/Five Point Capital Corp.(1) | 7.88 | 11/15/25 | 20,000 | 18,802 | ||||||||||
| Hunt Cos, Inc.(1) | 5.25 | 04/15/29 | 15,000 | 11,842 | ||||||||||
| Kennedy-Wilson, Inc. | 4.75 | 03/01/29 | 35,000 | 26,373 | ||||||||||
| Kennedy-Wilson, Inc. | 5.00 | 03/01/31 | 15,000 | 10,776 | ||||||||||
| Realogy Group LLC/Realogy Co.-Issuer Corp.(1) | 5.25 | 04/15/30 | 15,000 | 9,355 | ||||||||||
| Realogy Group LLC/Realogy Co.-Issuer Corp.(1) | 5.75 | 01/15/29 | 2,000 | 1,262 | ||||||||||
| 102,683 | ||||||||||||||
| REAL ESTATE INVESTMENT TRUST (REITS) – 2.5% | ||||||||||||||
| Apollo Commercial Real Estate Finance, Inc.(1) | 4.63 | 06/15/29 | 15,000 | 11,498 | ||||||||||
| Office Properties Income Trust | 2.40 | 02/01/27 | 10,000 | 5,590 | ||||||||||
| Office Properties Income Trust | 2.65 | 06/15/26 | 10,000 | 6,585 | ||||||||||
The accompanying notes are an integral part of these financial statements.
91
BONDBLOXX ETF TRUST
BondBloxx B Rated USD High Yield Corporate Bond ETF
Portfolio of Investments (Continued)
October 31, 2023
| Face | ||||||||||||||
| Rate (%) | Maturity | Amount | Value | |||||||||||
| REAL ESTATE INVESTMENT TRUST (REITS) – 2.5% (Continued) | ||||||||||||||
| Office Properties Income Trust | 3.45 | 10/15/31 | $ | 10,000 | $ | 4,911 | ||||||||
| Office Properties Income Trust | 4.50 | 02/01/25 | 15,000 | 12,841 | ||||||||||
| Park Intermediate Holdings LLC/PK Domestic Property LLC/PK Finance Co.-Issuer(1) | 4.88 | 05/15/29 | 20,000 | 16,709 | ||||||||||
| Park Intermediate Holdings LLC/PK Domestic Property LLC/PK Finance Co.-Issuer(1) | 5.88 | 10/01/28 | 20,000 | 18,033 | ||||||||||
| Park Intermediate Holdings LLC/PK Domestic Property LLC/PK Finance Co.-Issuer(1) | 7.50 | 06/01/25 | 20,000 | 19,813 | ||||||||||
| RHP Hotel Properties LP/RHP Finance Corp.(1) | 4.50 | 02/15/29 | 15,000 | 12,782 | ||||||||||
| RHP Hotel Properties LP/RHP Finance Corp. | 4.75 | 10/15/27 | 25,000 | 22,748 | ||||||||||
| RHP Hotel Properties LP/RHP Finance Corp.(1) | 7.25 | 07/15/28 | 10,000 | 9,703 | ||||||||||
| Rithm Capital Corp.(1) | 6.25 | 10/15/25 | 15,000 | 14,210 | ||||||||||
| Service Properties Trust | 3.95 | 01/15/28 | 25,000 | 18,715 | ||||||||||
| Service Properties Trust | 4.38 | 02/15/30 | 10,000 | 6,909 | ||||||||||
| Service Properties Trust | 4.95 | 10/01/29 | 10,000 | 7,219 | ||||||||||
| Service Properties Trust | 5.25 | 02/15/26 | 30,000 | 26,859 | ||||||||||
| Uniti Group LP/Uniti Group Finance, Inc./CSL Capital LLC(1) | 4.75 | 04/15/28 | 20,000 | 16,183 | ||||||||||
| Uniti Group LP/Uniti Group Finance, Inc./CSL Capital LLC(1) | 10.50 | 02/15/28 | 70,000 | 67,459 | ||||||||||
| XHR LP(1) | 4.88 | 06/01/29 | 25,000 | 21,177 | ||||||||||
| XHR LP(1) | 6.38 | 08/15/25 | 5,000 | 4,855 | ||||||||||
| 324,799 | ||||||||||||||
| RETAIL – 4.6% | ||||||||||||||
| 1011778 BC ULC/New Red Finance, Inc.(1) | 4.00 | 10/15/30 | 85,000 | 69,698 | ||||||||||
| 1011778 BC ULC/New Red Finance, Inc.(1) | 4.38 | 01/15/28 | 20,000 | 18,026 | ||||||||||
| Arko Corp.(1) | 5.13 | 11/15/29 | 15,000 | 12,178 | ||||||||||
| Bath & Body Works, Inc. | 6.95 | 03/01/33 | 10,000 | 8,657 | ||||||||||
| Brinker International, Inc.(1) | 8.25 | 07/15/30 | 10,000 | 9,679 | ||||||||||
| CEC Entertainment LLC(1) | 6.75 | 05/01/26 | 20,000 | 18,697 | ||||||||||
| Dave & Buster’s, Inc.(1) | 7.63 | 11/01/25 | 15,000 | 14,903 | ||||||||||
| eG Global Finance PLC(1) | 6.75 | 02/07/25 | 37,000 | 36,661 | ||||||||||
| Evergreen Acqco 1 LP/TVI, Inc.(1) | 9.75 | 04/26/28 | 13,000 | 13,130 | ||||||||||
| Ferrellgas LP/Ferrellgas Finance Corp.(1) | 5.38 | 04/01/26 | 20,000 | 18,739 | ||||||||||
| Ferrellgas LP/Ferrellgas Finance Corp.(1) | 5.88 | 04/01/29 | 25,000 | 22,084 | ||||||||||
| Fertitta Entertainment LLC/Fertitta Entertainment Finance Co., Inc.(1) | 4.63 | 01/15/29 | 30,000 | 25,242 | ||||||||||
| IRB Holding Corp.(1) | 7.00 | 06/15/25 | 20,000 | 19,869 | ||||||||||
| Ken Garff Automotive LLC(1) | 4.88 | 09/15/28 | 10,000 | 8,466 | ||||||||||
| LCM Investments Holdings II LLC(1) | 4.88 | 05/01/29 | 30,000 | 25,172 | ||||||||||
| LCM Investments Holdings II LLC(1) | 8.25 | 08/01/31 | 15,000 | 14,283 | ||||||||||
| LSF9 Atlantis Holdings LLC/Victra Finance Corp.(1) | 7.75 | 02/15/26 | 25,000 | 22,592 | ||||||||||
| Michaels Cos, Inc.(1) | 5.25 | 05/01/28 | 25,000 | 18,138 | ||||||||||
| Papa John’s International, Inc.(1) | 3.88 | 09/15/29 | 10,000 | 8,215 | ||||||||||
| Patrick Industries, Inc.(1) | 4.75 | 05/01/29 | 10,000 | 8,135 | ||||||||||
| PetSmart, Inc./PetSmart Finance Corp.(1) | 7.75 | 02/15/29 | 35,000 | 32,256 | ||||||||||
| QVC, Inc. | 4.38 | 09/01/28 | 15,000 | 7,614 | ||||||||||
| QVC, Inc. | 4.45 | 02/15/25 | 15,000 | 12,934 | ||||||||||
| QVC, Inc. | 4.75 | 02/15/27 | 20,000 | 11,393 | ||||||||||
| QVC, Inc. | 5.45 | 08/15/34 | 10,000 | 4,243 | ||||||||||
| QVC, Inc. | 5.95 | 03/15/43 | 10,000 | 4,170 | ||||||||||
The accompanying notes are an integral part of these financial statements.
92
BONDBLOXX ETF TRUST
BondBloxx B Rated USD High Yield Corporate Bond ETF
Portfolio of Investments (Continued)
October 31, 2023
| Face | ||||||||||||||
| Rate (%) | Maturity | Amount | Value | |||||||||||
| RETAIL – 4.6% (Continued) | ||||||||||||||
| Sizzling Platter LLC/Sizzling Platter Finance Corp.(1) | 8.50 | 11/28/25 | $ | 10,000 | $ | 9,975 | ||||||||
| Specialty Building Products Holdings LLC/SBP Finance Corp.(1) | 6.38 | 09/30/26 | 20,000 | 18,626 | ||||||||||
| SRS Distribution, Inc.(1) | 4.63 | 07/01/28 | 20,000 | 17,469 | ||||||||||
| Staples, Inc.(1) | 7.50 | 04/15/26 | 60,000 | 48,987 | ||||||||||
| Suburban Propane Partners LP/Suburban Energy Finance Corp.(1) | 5.00 | 06/01/31 | 20,000 | 16,587 | ||||||||||
| Suburban Propane Partners LP/Suburban Energy Finance Corp. | 5.88 | 03/01/27 | 10,000 | 9,485 | ||||||||||
| Victoria’s Secret & Co.(1) | 4.63 | 07/15/29 | 20,000 | 14,726 | ||||||||||
| 601,029 | ||||||||||||||
| SEMICONDUCTORS – 0.1% | ||||||||||||||
| ams-OSRAM AG(1) | 7.00 | 07/31/25 | 10,000 | 9,825 | ||||||||||
| SOFTWARE – 3.1% | ||||||||||||||
| ACI Worldwide, Inc.(1) | 5.75 | 08/15/26 | 15,000 | 14,414 | ||||||||||
| Alteryx, Inc.(1) | 8.75 | 03/15/28 | 10,000 | 9,884 | ||||||||||
| Boxer Parent Co., Inc.(1) | 7.13 | 10/02/25 | 20,000 | 19,750 | ||||||||||
| Capstone Borrower, Inc.(1) | 8.00 | 06/15/30 | 10,000 | 9,713 | ||||||||||
| Central Parent LLC/CDK Global II LLC/CDK Financing Co., Inc.(1) | 8.00 | 06/15/29 | 20,000 | 19,775 | ||||||||||
| Central Parent, Inc./CDK Global, Inc.(1) | 7.25 | 06/15/29 | 25,000 | 24,043 | ||||||||||
| Clarivate Science Holdings Corp.(1) | 4.88 | 07/01/29 | 25,000 | 21,116 | ||||||||||
| Cloud Software Group, Inc.(1) | 6.50 | 03/31/29 | 115,000 | 101,075 | ||||||||||
| Consensus Cloud Solutions, Inc.(1) | 6.50 | 10/15/28 | 25,000 | 20,745 | ||||||||||
| Dun & Bradstreet Corp.(1) | 5.00 | 12/15/29 | 15,000 | 12,921 | ||||||||||
| Elastic NV(1) | 4.13 | 07/15/29 | 15,000 | 12,657 | ||||||||||
| Helios Software Holdings, Inc./ION Corporate Solutions Finance Sarl(1) | 4.63 | 05/01/28 | 10,000 | 8,405 | ||||||||||
| MicroStrategy, Inc.(1) | 6.13 | 06/15/28 | 15,000 | 13,592 | ||||||||||
| SS&C Technologies, Inc.(1) | 5.50 | 09/30/27 | 60,000 | 56,356 | ||||||||||
| Veritas US, Inc./Veritas Bermuda Ltd.(1) | 7.50 | 09/01/25 | 50,000 | 40,971 | ||||||||||
| ZoomInfo Technologies LLC/ZoomInfo Finance Corp.(1) | 3.88 | 02/01/29 | 20,000 | 16,533 | ||||||||||
| 401,950 | ||||||||||||||
| TELECOMMUNICATIONS – 7.0% | ||||||||||||||
| Altice France SA/France(1) | 5.13 | 07/15/29 | 65,000 | 44,548 | ||||||||||
| Altice France SA/France(1) | 5.50 | 01/15/28 | 50,000 | 37,198 | ||||||||||
| Altice France SA/France(1) | 5.50 | 10/15/29 | 60,000 | 41,319 | ||||||||||
| Altice France SA/France(1) | 8.13 | 02/01/27 | 50,000 | 42,205 | ||||||||||
| C&W Senior Financing DAC(1) | 6.88 | 09/15/27 | 35,000 | 30,127 | ||||||||||
| CommScope, Inc.(1) | 4.75 | 09/01/29 | 35,000 | 23,938 | ||||||||||
| CommScope, Inc.(1) | 6.00 | 03/01/26 | 45,000 | 37,860 | ||||||||||
| Consolidated Communications, Inc.(1) | 5.00 | 10/01/28 | 5,000 | 3,771 | ||||||||||
| Consolidated Communications, Inc.(1) | 6.50 | 10/01/28 | 30,000 | 23,760 | ||||||||||
| Frontier Communications Holdings LLC(1) | 5.00 | 05/01/28 | 55,000 | 47,534 | ||||||||||
| Frontier Communications Holdings LLC(1) | 5.88 | 10/15/27 | 40,000 | 36,501 | ||||||||||
| Frontier Communications Holdings LLC | 5.88 | 11/01/29 | 25,000 | 18,821 | ||||||||||
| Frontier Communications Holdings LLC(1) | 6.00 | 01/15/30 | 20,000 | 15,079 | ||||||||||
| Frontier Communications Holdings LLC(1) | 6.75 | 05/01/29 | 25,000 | 19,814 | ||||||||||
| Frontier Communications Holdings LLC(1) | 8.63 | 03/15/31 | 15,000 | 14,118 | ||||||||||
| Frontier Communications Holdings LLC(1) | 8.75 | 05/15/30 | 35,000 | 33,385 | ||||||||||
| GoTo Group, Inc.(1) | 5.50 | 09/01/27 | 25,000 | 13,065 | ||||||||||
| Hughes Satellite Systems Corp. | 6.63 | 08/01/26 | 20,000 | 16,970 | ||||||||||
The accompanying notes are an integral part of these financial statements.
93
BONDBLOXX ETF TRUST
BondBloxx B Rated USD High Yield Corporate Bond ETF
Portfolio of Investments (Continued)
October 31, 2023
| Face | ||||||||||||||
| Rate (%) | Maturity | Amount | Value | |||||||||||
| TELECOMMUNICATIONS – 7.0% (Continued) | ||||||||||||||
| Iliad Holding SASU(1) | 6.50 | 10/15/26 | $ | 35,000 | $ | 32,737 | ||||||||
| Iliad Holding SASU(1) | 7.00 | 10/15/28 | 25,000 | 22,644 | ||||||||||
| Level 3 Financing, Inc.(1) | 3.40 | 03/01/27 | 20,000 | 18,535 | ||||||||||
| Level 3 Financing, Inc.(1) | 3.63 | 01/15/29 | 20,000 | 10,238 | ||||||||||
| Level 3 Financing, Inc.(1) | 3.75 | 07/15/29 | 20,000 | 10,192 | ||||||||||
| Level 3 Financing, Inc.(1) | 3.88 | 11/15/29 | 30,000 | 26,760 | ||||||||||
| Level 3 Financing, Inc.(1) | 4.25 | 07/01/28 | 40,000 | 22,656 | ||||||||||
| Level 3 Financing, Inc.(1) | 4.63 | 09/15/27 | 30,000 | 19,976 | ||||||||||
| Level 3 Financing, Inc.(1) | 10.50 | 05/15/30 | 20,000 | 20,033 | ||||||||||
| Lumen Technologies, Inc.(1) | 4.00 | 02/15/27 | 35,000 | 23,657 | ||||||||||
| Qwest Corp. | 7.25 | 09/15/25 | 10,000 | 9,588 | ||||||||||
| Telecom Italia Capital SA | 6.00 | 09/30/34 | 35,000 | 28,842 | ||||||||||
| Telecom Italia Capital SA | 6.38 | 11/15/33 | 25,000 | 21,342 | ||||||||||
| Telecom Italia Capital SA | 7.20 | 07/18/36 | 25,000 | 21,641 | ||||||||||
| Telecom Italia Capital SA | 7.72 | 06/04/38 | 30,000 | 26,516 | ||||||||||
| Viasat, Inc.(1) | 5.63 | 09/15/25 | 15,000 | 13,948 | ||||||||||
| Viasat, Inc.(1) | 6.50 | 07/15/28 | 25,000 | 17,746 | ||||||||||
| Viasat, Inc.(1) | 7.50 | 05/30/31 | 15,000 | 9,837 | ||||||||||
| Windstream Escrow LLC/Windstream Escrow Finance Corp.(1) | 7.75 | 08/15/28 | 40,000 | 31,757 | ||||||||||
| Zayo Group Holdings, Inc.(1) | 4.00 | 03/01/27 | 40,000 | 30,152 | ||||||||||
| 918,810 | ||||||||||||||
| WATER – 0.1% | ||||||||||||||
| Solaris Midstream Holdings LLC(1) | 7.63 | 04/01/26 | 10,000 | 9,548 | ||||||||||
| TOTAL CORPORATE BONDS (Cost - $13,351,893) | 12,736,394 | |||||||||||||
| SHORT-TERM INVESTMENTS – 1.5% | ||||||||||||||
| TIME DEPOSITS – 1.5% | ||||||||||||||
| JP Morgan Chase, New York | 4.68 | 11/01/23 | 191,231 | 191,231 | ||||||||||
| TOTAL SHORT-TERM INVESTMENTS (Cost - $191,231) | 191,231 | |||||||||||||
| TOTAL INVESTMENTS – 99.0% (Cost - $13,543,124) | $ | 12,927,625 | ||||||||||||
| OTHER ASSETS LESS LIABILITIES – 1.0% | 125,583 | |||||||||||||
| NET ASSETS – 100.0% | $ | 13,053,208 | ||||||||||||
| (1) | Security was purchased pursuant to Rule 144A under the Securities Act of 1933 and may not be resold subject to that Rule except to qualified institutional buyers. The aggregate value of Rule 144A holdings at October 31, 2023, amounts to $11,339,834 and represents 86.9% of net assets. These securities have been deemed liquid under procedures approved by the Trust’s Board of Trustees. |
| (2) | Security is perpetual in nature and has no stated maturity date. |
| (3) | Includes step-up bonds that pay an initial coupon rate for the first period and then a higher coupon rate for the following periods. The rate reported is the rate in effect as of October 31, 2023. |
The accompanying notes are an integral part of these financial statements.
94
BONDBLOXX ETF TRUST
BondBloxx BB Rated USD High Yield Corporate Bond ETF
Portfolio of Investments
October 31, 2023
| Face | ||||||||||||||
| Rate (%) | Maturity | Amount | Value | |||||||||||
| CORPORATE BONDS – 97.8% | ||||||||||||||
| ADVERTISING – 0.3% | ||||||||||||||
| Lamar Media Corp. | 3.63 | 01/15/31 | $ | 50,000 | $ | 40,458 | ||||||||
| Lamar Media Corp. | 3.75 | 02/15/28 | 50,000 | 44,451 | ||||||||||
| Lamar Media Corp. | 4.00 | 02/15/30 | 40,000 | 33,887 | ||||||||||
| Lamar Media Corp. | 4.88 | 01/15/29 | 45,000 | 41,307 | ||||||||||
| 160,103 | ||||||||||||||
| AEROSPACE/DEFENSE – 0.6% | ||||||||||||||
| Moog, Inc.(1) | 4.25 | 12/15/27 | 45,000 | 40,113 | ||||||||||
| Rolls-Royce PLC(1) | 3.63 | 10/14/25 | 95,000 | 89,139 | ||||||||||
| Rolls-Royce PLC(1) | 5.75 | 10/15/27 | 85,000 | 80,649 | ||||||||||
| Spirit AeroSystems, Inc. | 3.85 | 06/15/26 | 25,000 | 23,124 | ||||||||||
| Spirit AeroSystems, Inc.(1) | 9.38 | 11/30/29 | 80,000 | 82,255 | ||||||||||
| 315,280 | ||||||||||||||
| AGRICULTURE – 0.4% | ||||||||||||||
| Darling Ingredients, Inc.(1) | 5.25 | 04/15/27 | 50,000 | 47,623 | ||||||||||
| Darling Ingredients, Inc.(1) | 6.00 | 06/15/30 | 85,000 | 79,828 | ||||||||||
| Turning Point Brands, Inc.(1) | 5.63 | 02/15/26 | 20,000 | 18,435 | ||||||||||
| Vector Group Ltd.(1) | 5.75 | 02/01/29 | 75,000 | 63,626 | ||||||||||
| 209,512 | ||||||||||||||
| AIRLINES – 2.9% | ||||||||||||||
| Air Canada(1) | 3.88 | 08/15/26 | 105,000 | 95,639 | ||||||||||
| Allegiant Travel Co.(1) | 7.25 | 08/15/27 | 55,000 | 49,831 | ||||||||||
| American Airlines, Inc.(1) | 7.25 | 02/15/28 | 65,000 | 60,517 | ||||||||||
| American Airlines, Inc.(1) | 11.75 | 07/15/25 | 175,000 | 185,633 | ||||||||||
| American Airlines, Inc./AAdvantage Loyalty IP Ltd.(1) | 5.50 | 04/20/26 | 254,167 | 247,414 | ||||||||||
| American Airlines, Inc./AAdvantage Loyalty IP Ltd.(1) | 5.75 | 04/20/29 | 270,000 | 243,818 | ||||||||||
| Delta Air Lines, Inc. | 3.75 | 10/28/29 | 45,000 | 38,306 | ||||||||||
| Delta Air Lines, Inc. | 4.38 | 04/19/28 | 40,000 | 36,783 | ||||||||||
| Delta Air Lines, Inc. | 7.38 | 01/15/26 | 70,000 | 70,769 | ||||||||||
| Spirit Loyalty Cayman Ltd./Spirit IP Cayman Ltd.(1) | 8.00 | 09/20/25 | 45,000 | 33,250 | ||||||||||
| Spirit Loyalty Cayman Ltd./Spirit IP Cayman Ltd.(1) | 8.00 | 09/20/25 | 55,000 | 40,638 | ||||||||||
| United Airlines, Inc.(1) | 4.38 | 04/15/26 | 175,000 | 162,507 | ||||||||||
| United Airlines, Inc.(1) | 4.63 | 04/15/29 | 180,000 | 152,209 | ||||||||||
| 1,417,314 | ||||||||||||||
| APPAREL – 0.3% | ||||||||||||||
| Kontoor Brands, Inc.(1) | 4.13 | 11/15/29 | 35,000 | 28,856 | ||||||||||
| Levi Strauss & Co.(1) | 3.50 | 03/01/31 | 45,000 | 35,085 | ||||||||||
| Under Armour, Inc. | 3.25 | 06/15/26 | 55,000 | 50,143 | ||||||||||
| William Carter Co.(1) | 5.63 | 03/15/27 | 45,000 | 42,684 | ||||||||||
| 156,768 | ||||||||||||||
| AUTO MANUFACTURERS – 2.3% | ||||||||||||||
| Allison Transmission, Inc.(1) | 3.75 | 01/30/31 | 100,000 | 79,355 | ||||||||||
| Allison Transmission, Inc.(1) | 4.75 | 10/01/27 | 30,000 | 27,390 | ||||||||||
| Allison Transmission, Inc.(1) | 5.88 | 06/01/29 | 40,000 | 37,125 | ||||||||||
| Ford Motor Co. | 3.25 | 02/12/32 | 80,000 | 60,443 | ||||||||||
| Ford Motor Co. | 4.75 | 01/15/43 | 55,000 | 38,274 | ||||||||||
The accompanying notes are an integral part of these financial statements.
95
BONDBLOXX ETF TRUST
BondBloxx BB Rated USD High Yield Corporate Bond ETF
Portfolio of Investments (Continued)
October 31, 2023
| Face | ||||||||||||||
| Rate (%) | Maturity | Amount | Value | |||||||||||
| AUTO MANUFACTURERS – 2.3% (Continued) | ||||||||||||||
| Ford Motor Co. | 5.29 | 12/08/46 | $ | 30,000 | $ | 21,826 | ||||||||
| Ford Motor Co. | 6.10 | 08/19/32 | 40,000 | 37,028 | ||||||||||
| Ford Motor Co. | 6.63 | 10/01/28 | 10,000 | 9,892 | ||||||||||
| Ford Motor Co. | 7.40 | 11/01/46 | 10,000 | 9,394 | ||||||||||
| Ford Motor Co. | 7.45 | 07/16/31 | 25,000 | 25,248 | ||||||||||
| Ford Motor Co. | 9.63 | 04/22/30 | 20,000 | 22,323 | ||||||||||
| Ford Motor Credit Co. LLC | 2.30 | 02/10/25 | 30,000 | 28,362 | ||||||||||
| Ford Motor Credit Co. LLC | 2.70 | 08/10/26 | 55,000 | 49,353 | ||||||||||
| Ford Motor Credit Co. LLC | 2.90 | 02/16/28 | 20,000 | 17,034 | ||||||||||
| Ford Motor Credit Co. LLC | 2.90 | 02/10/29 | 20,000 | 16,382 | ||||||||||
| Ford Motor Credit Co. LLC | 3.38 | 11/13/25 | 55,000 | 51,379 | ||||||||||
| Ford Motor Credit Co. LLC | 3.63 | 06/17/31 | 30,000 | 23,732 | ||||||||||
| Ford Motor Credit Co. LLC | 3.82 | 11/02/27 | 20,000 | 17,852 | ||||||||||
| Ford Motor Credit Co. LLC | 4.00 | 11/13/30 | 40,000 | 32,981 | ||||||||||
| Ford Motor Credit Co. LLC | 4.06 | 11/01/24 | 55,000 | 53,594 | ||||||||||
| Ford Motor Credit Co. LLC | 4.13 | 08/04/25 | 40,000 | 38,166 | ||||||||||
| Ford Motor Credit Co. LLC | 4.13 | 08/17/27 | 55,000 | 49,993 | ||||||||||
| Ford Motor Credit Co. LLC | 4.39 | 01/08/26 | 30,000 | 28,469 | ||||||||||
| Ford Motor Credit Co. LLC | 4.54 | 08/01/26 | 20,000 | 18,830 | ||||||||||
| Ford Motor Credit Co. LLC | 4.95 | 05/28/27 | 70,000 | 65,728 | ||||||||||
| Ford Motor Credit Co. LLC | 5.11 | 05/03/29 | 35,000 | 31,888 | ||||||||||
| Ford Motor Credit Co. LLC | 5.13 | 06/16/25 | 70,000 | 68,175 | ||||||||||
| Ford Motor Credit Co. LLC | 5.58 | 03/18/24 | 15,000 | 14,945 | ||||||||||
| Ford Motor Credit Co. LLC | 6.80 | 05/12/28 | 40,000 | 39,925 | ||||||||||
| Ford Motor Credit Co. LLC | 7.35 | 11/04/27 | 45,000 | 45,660 | ||||||||||
| Ford Motor Credit Co. LLC | 7.35 | 03/06/30 | 45,000 | 45,245 | ||||||||||
| 1,105,991 | ||||||||||||||
| AUTO PARTS & EQUIPMENT – 0.8% | ||||||||||||||
| Adient Global Holdings Ltd.(1) | 7.00 | 04/15/28 | 40,000 | 39,416 | ||||||||||
| Dana, Inc. | 4.25 | 09/01/30 | 60,000 | 47,568 | ||||||||||
| Dana, Inc. | 5.38 | 11/15/27 | 55,000 | 50,663 | ||||||||||
| Dana, Inc. | 5.63 | 06/15/28 | 20,000 | 18,148 | ||||||||||
| Goodyear Tire & Rubber Co. | 5.00 | 07/15/29 | 75,000 | 64,615 | ||||||||||
| ZF North America Capital, Inc.(1) | 4.75 | 04/29/25 | 100,000 | 96,590 | ||||||||||
| ZF North America Capital, Inc.(1) | 6.88 | 04/14/28 | 40,000 | 38,806 | ||||||||||
| ZF North America Capital, Inc.(1) | 7.13 | 04/14/30 | 60,000 | 58,278 | ||||||||||
| 414,084 | ||||||||||||||
| BANKS – 1.7% | ||||||||||||||
| Associated Banc-Corp. | 4.25 | 01/15/25 | 25,000 | 23,971 | ||||||||||
| Dresdner Funding Trust I(1) | 8.15 | 06/30/31 | 85,000 | 89,091 | ||||||||||
| Intesa Sanpaolo SpA(1) | 4.20 | 06/01/32 | 70,000 | 49,803 | ||||||||||
| Intesa Sanpaolo SpA(1) | 4.95 | 06/01/42 | 70,000 | 41,108 | ||||||||||
| Intesa Sanpaolo SpA(1) | 5.71 | 01/15/26 | 125,000 | 118,620 | ||||||||||
| Pacific Western Bank | 3.25 | 05/01/31 | 35,000 | 25,977 | ||||||||||
| Popular, Inc. | 7.25 | 03/13/28 | 35,000 | 34,739 | ||||||||||
| Standard Chartered PLC(1),(2) | 7.01 | - | 65,000 | 59,813 | ||||||||||
| Texas Capital Bancshares, Inc. | 4.00 | 05/06/31 | 35,000 | 28,901 | ||||||||||
The accompanying notes are an integral part of these financial statements.
96
BONDBLOXX ETF TRUST
BondBloxx BB Rated USD High Yield Corporate Bond ETF
Portfolio of Investments (Continued)
October 31, 2023
| Face | ||||||||||||||
| Rate (%) | Maturity | Amount | Value | |||||||||||
| BANKS – 1.7% (Continued) | ||||||||||||||
| UniCredit SpA(1) | 5.46 | 06/30/35 | $ | 125,000 | $ | 102,602 | ||||||||
| UniCredit SpA(1) | 5.86 | 06/19/32 | 90,000 | 81,003 | ||||||||||
| UniCredit SpA(1) | 7.30 | 04/02/34 | 115,000 | 106,750 | ||||||||||
| Valley National Bancorp | 3.00 | 06/15/31 | 30,000 | 24,008 | ||||||||||
| Western Alliance Bancorp. | 3.00 | 06/15/31 | 50,000 | 38,325 | ||||||||||
| 824,711 | ||||||||||||||
| BUILDING MATERIALS – 2.2% | ||||||||||||||
| Boise Cascade Co.(1) | 4.88 | 07/01/30 | 35,000 | 30,148 | ||||||||||
| Builders FirstSource, Inc.(1) | 4.25 | 02/01/32 | 115,000 | 91,661 | ||||||||||
| Builders FirstSource, Inc.(1) | 5.00 | 03/01/30 | 45,000 | 39,321 | ||||||||||
| Builders FirstSource, Inc.(1) | 6.38 | 06/15/32 | 65,000 | 59,577 | ||||||||||
| Emerald Debt Merger Sub LLC(1) | 6.63 | 12/15/30 | 200,000 | 190,500 | ||||||||||
| James Hardie International Finance DAC(1) | 5.00 | 01/15/28 | 35,000 | 32,343 | ||||||||||
| Knife River Corp.(1) | 7.75 | 05/01/31 | 35,000 | 34,923 | ||||||||||
| Louisiana-Pacific Corp.(1) | 3.63 | 03/15/29 | 35,000 | 28,874 | ||||||||||
| Masonite International Corp.(1) | 5.38 | 02/01/28 | 75,000 | 69,154 | ||||||||||
| Smyrna Ready Mix Concrete LLC(1) | 6.00 | 11/01/28 | 95,000 | 87,925 | ||||||||||
| Standard Industries, Inc./NJ(1) | 3.38 | 01/15/31 | 105,000 | 79,580 | ||||||||||
| Standard Industries, Inc./NJ(1) | 4.38 | 07/15/30 | 130,000 | 106,338 | ||||||||||
| Standard Industries, Inc./NJ(1) | 4.75 | 01/15/28 | 95,000 | 85,125 | ||||||||||
| Standard Industries, Inc./NJ(1) | 5.00 | 02/15/27 | 75,000 | 69,408 | ||||||||||
| Summit Materials LLC/Summit Materials Finance Corp.(1) | 5.25 | 01/15/29 | 60,000 | 54,389 | ||||||||||
| Summit Materials LLC/Summit Materials Finance Corp.(1) | 6.50 | 03/15/27 | 25,000 | 24,366 | ||||||||||
| 1,083,632 | ||||||||||||||
| CHEMICALS – 2.2% | ||||||||||||||
| Ashland, Inc.(1) | 3.38 | 09/01/31 | 45,000 | 34,555 | ||||||||||
| Ashland, Inc. | 6.88 | 05/15/43 | 25,000 | 23,604 | ||||||||||
| Avient Corp.(1) | 5.75 | 05/15/25 | 60,000 | 58,852 | ||||||||||
| Avient Corp.(1) | 7.13 | 08/01/30 | 60,000 | 57,790 | ||||||||||
| Chemours Co.(1) | 4.63 | 11/15/29 | 50,000 | 38,671 | ||||||||||
| Chemours Co. | 5.38 | 05/15/27 | 45,000 | 40,698 | ||||||||||
| Chemours Co.(1) | 5.75 | 11/15/28 | 70,000 | 59,266 | ||||||||||
| Element Solutions, Inc.(1) | 3.88 | 09/01/28 | 70,000 | 59,640 | ||||||||||
| HB Fuller Co. | 4.00 | 02/15/27 | 50,000 | 45,192 | ||||||||||
| INEOS Finance PLC(1) | 6.75 | 05/15/28 | 35,000 | 32,723 | ||||||||||
| INEOS Quattro Finance 2 PLC(1) | 3.38 | 01/15/26 | 45,000 | 43,023 | ||||||||||
| Ingevity Corp.(1) | 3.88 | 11/01/28 | 45,000 | 36,574 | ||||||||||
| Methanex Corp. | 4.25 | 12/01/24 | 20,000 | 19,550 | ||||||||||
| Methanex Corp. | 5.13 | 10/15/27 | 80,000 | 73,287 | ||||||||||
| Methanex Corp. | 5.25 | 12/15/29 | 50,000 | 44,266 | ||||||||||
| Methanex Corp. | 5.65 | 12/01/44 | 20,000 | 14,797 | ||||||||||
| Minerals Technologies, Inc.(1) | 5.00 | 07/01/28 | 40,000 | 35,017 | ||||||||||
| NOVA Chemicals Corp.(1) | 4.25 | 05/15/29 | 55,000 | 40,730 | ||||||||||
| NOVA Chemicals Corp.(1) | 5.00 | 05/01/25 | 45,000 | 42,545 | ||||||||||
| NOVA Chemicals Corp.(1) | 5.25 | 06/01/27 | 85,000 | 71,933 | ||||||||||
| Nufarm Australia Ltd./Nufarm Americas, Inc.(1) | 5.00 | 01/27/30 | 35,000 | 30,402 | ||||||||||
| Olin Corp. | 5.00 | 02/01/30 | 50,000 | 43,241 | ||||||||||
The accompanying notes are an integral part of these financial statements.
97
BONDBLOXX ETF TRUST
BondBloxx BB Rated USD High Yield Corporate Bond ETF
Portfolio of Investments (Continued)
October 31, 2023
| Face | ||||||||||||||
| Rate (%) | Maturity | Amount | Value | |||||||||||
| CHEMICALS – 2.2% (Continued) | ||||||||||||||
| Olin Corp. | 5.13 | 09/15/27 | $ | 45,000 | $ | 41,304 | ||||||||
| Olin Corp. | 5.63 | 08/01/29 | 50,000 | 45,510 | ||||||||||
| SNF Group SACA(1) | 3.13 | 03/15/27 | 40,000 | 35,491 | ||||||||||
| SNF Group SACA(1) | 3.38 | 03/15/30 | 20,000 | 16,032 | ||||||||||
| 1,084,693 | ||||||||||||||
| COAL – 0.1% | ||||||||||||||
| SunCoke Energy, Inc.(1) | 4.88 | 06/30/29 | 45,000 | 37,718 | ||||||||||
| COMMERCIAL SERVICES – 4.0% | ||||||||||||||
| ADT Security Corp.(1) | 4.13 | 08/01/29 | 85,000 | 73,000 | ||||||||||
| ADT Security Corp.(1) | 4.88 | 07/15/32 | 70,000 | 58,634 | ||||||||||
| Adtalem Global Education, Inc.(1) | 5.50 | 03/01/28 | 40,000 | 36,469 | ||||||||||
| Albion Financing 1 Sarl/Aggreko Holdings, Inc.(1) | 6.13 | 10/15/26 | 50,000 | 46,308 | ||||||||||
| AMN Healthcare, Inc.(1) | 4.00 | 04/15/29 | 25,000 | 20,735 | ||||||||||
| AMN Healthcare, Inc.(1) | 4.63 | 10/01/27 | 50,000 | 44,928 | ||||||||||
| APX Group, Inc.(1) | 6.75 | 02/15/27 | 50,000 | 48,330 | ||||||||||
| Block, Inc. | 2.75 | 06/01/26 | 95,000 | 85,343 | ||||||||||
| Block, Inc. | 3.50 | 06/01/31 | 85,000 | 65,685 | ||||||||||
| Brink’s Co.(1) | 4.63 | 10/15/27 | 65,000 | 58,851 | ||||||||||
| Brink’s Co.(1) | 5.50 | 07/15/25 | 25,000 | 24,353 | ||||||||||
| CoreCivic, Inc. | 4.75 | 10/15/27 | 20,000 | 17,393 | ||||||||||
| CoreCivic, Inc. | 8.25 | 04/15/26 | 60,000 | 60,800 | ||||||||||
| Graham Holdings Co.(1) | 5.75 | 06/01/26 | 35,000 | 33,722 | ||||||||||
| Grand Canyon University | 5.13 | 10/01/28 | 35,000 | 31,056 | ||||||||||
| GTCR W-2 Merger Sub LLC(1) | 7.50 | 01/15/31 | 190,000 | 187,767 | ||||||||||
| Korn Ferry(1) | 4.63 | 12/15/27 | 35,000 | 31,871 | ||||||||||
| Prime Security Services Borrower LLC/Prime Finance, Inc.(1) | 3.38 | 08/31/27 | 80,000 | 70,417 | ||||||||||
| Prime Security Services Borrower LLC/Prime Finance, Inc.(1) | 5.75 | 04/15/26 | 125,000 | 121,386 | ||||||||||
| Service Corp. International/US | 3.38 | 08/15/30 | 80,000 | 64,168 | ||||||||||
| Service Corp. International/US | 4.00 | 05/15/31 | 75,000 | 60,791 | ||||||||||
| Service Corp. International/US | 4.63 | 12/15/27 | 20,000 | 18,518 | ||||||||||
| Service Corp. International/US | 5.13 | 06/01/29 | 85,000 | 77,987 | ||||||||||
| Shift4 Payments LLC/Shift4 Payments Finance Sub, Inc.(1) | 4.63 | 11/01/26 | 45,000 | 41,621 | ||||||||||
| TriNet Group, Inc.(1) | 3.50 | 03/01/29 | 40,000 | 33,071 | ||||||||||
| TriNet Group, Inc.(1) | 7.13 | 08/15/31 | 40,000 | 38,712 | ||||||||||
| United Rentals North America, Inc. | 3.75 | 01/15/32 | 75,000 | 59,735 | ||||||||||
| United Rentals North America, Inc. | 3.88 | 11/15/27 | 70,000 | 64,357 | ||||||||||
| United Rentals North America, Inc. | 3.88 | 02/15/31 | 90,000 | 74,185 | ||||||||||
| United Rentals North America, Inc. | 4.00 | 07/15/30 | 80,000 | 67,340 | ||||||||||
| United Rentals North America, Inc. | 4.88 | 01/15/28 | 155,000 | 143,959 | ||||||||||
| United Rentals North America, Inc. | 5.25 | 01/15/30 | 55,000 | 50,281 | ||||||||||
| United Rentals North America, Inc. | 5.50 | 05/15/27 | 30,000 | 29,015 | ||||||||||
| 1,940,788 | ||||||||||||||
| COMPUTERS – 1.7% | ||||||||||||||
| ASGN, Inc.(1) | 4.63 | 05/15/28 | 55,000 | 48,766 | ||||||||||
| Crane NXT Co. | 4.20 | 03/15/48 | 30,000 | 18,180 | ||||||||||
| Crowdstrike Holdings, Inc. | 3.00 | 02/15/29 | 65,000 | 54,394 | ||||||||||
| KBR, Inc.(1) | 4.75 | 09/30/28 | 25,000 | 21,886 | ||||||||||
The accompanying notes are an integral part of these financial statements.
98
BONDBLOXX ETF TRUST
BondBloxx BB Rated USD High Yield Corporate Bond ETF
Portfolio of Investments (Continued)
October 31, 2023
| Face | ||||||||||||||
| Rate (%) | Maturity | Amount | Value | |||||||||||
| COMPUTERS – 1.7% (Continued) | ||||||||||||||
| NCR Atleos Escrow Corp.(1) | 9.50 | 04/01/29 | $ | 125,000 | $ | 122,661 | ||||||||
| Seagate HDD Cayman | 4.09 | 06/01/29 | 65,000 | 56,108 | ||||||||||
| Seagate HDD Cayman | 4.13 | 01/15/31 | 13,000 | 10,351 | ||||||||||
| Seagate HDD Cayman | 4.75 | 01/01/25 | 45,000 | 44,066 | ||||||||||
| Seagate HDD Cayman | 4.88 | 06/01/27 | 50,000 | 47,011 | ||||||||||
| Seagate HDD Cayman | 5.75 | 12/01/34 | 50,000 | 42,373 | ||||||||||
| Seagate HDD Cayman(1) | 8.25 | 12/15/29 | 40,000 | 40,696 | ||||||||||
| Seagate HDD Cayman(1) | 8.50 | 07/15/31 | 40,000 | 40,750 | ||||||||||
| Seagate HDD Cayman(1) | 9.63 | 12/01/32 | 55,850 | 59,599 | ||||||||||
| Tempo Acquisition LLC/Tempo Acquisition Finance Corp.(1) | 5.75 | 06/01/25 | 25,000 | 24,391 | ||||||||||
| Unisys Corp.(1) | 6.88 | 11/01/27 | 40,000 | 29,347 | ||||||||||
| Western Digital Corp. | 4.75 | 02/15/26 | 205,000 | 192,427 | ||||||||||
| 853,006 | ||||||||||||||
| COSMETICS/PERSONAL CARE – 0.7% | ||||||||||||||
| Coty, Inc.(1) | 5.00 | 04/15/26 | 80,000 | 76,515 | ||||||||||
| Coty, Inc.(1) | 6.50 | 04/15/26 | 50,000 | 49,299 | ||||||||||
| Coty, Inc./HFC Prestige Products, Inc./HFC Prestige International US LLC(1) | 4.75 | 01/15/29 | 40,000 | 35,455 | ||||||||||
| Coty, Inc./HFC Prestige Products, Inc./HFC Prestige International US LLC(1) | 6.63 | 07/15/30 | 65,000 | 62,003 | ||||||||||
| Edgewell Personal Care Co.(1) | 4.13 | 04/01/29 | 35,000 | 29,317 | ||||||||||
| Edgewell Personal Care Co.(1) | 5.50 | 06/01/28 | 75,000 | 68,527 | ||||||||||
| 321,116 | ||||||||||||||
| DISTRIBUTION/WHOLESALE – 0.4% | ||||||||||||||
| American Builders & Contractors Supply Co., Inc.(1) | 4.00 | 01/15/28 | 60,000 | 53,923 | ||||||||||
| Resideo Funding, Inc.(1) | 4.00 | 09/01/29 | 20,000 | 16,077 | ||||||||||
| Ritchie Bros Holdings, Inc.(1) | 6.75 | 03/15/28 | 50,000 | 49,061 | ||||||||||
| Windsor Holdings III LLC(1) | 8.50 | 06/15/30 | 70,000 | 68,230 | ||||||||||
| 187,291 | ||||||||||||||
| DIVERSIFIED FINANCIAL SERVICES – 5.0% | ||||||||||||||
| Ally Financial, Inc. | 5.75 | 11/20/25 | 90,000 | 85,996 | ||||||||||
| Ally Financial, Inc. | 6.70 | 02/14/33 | 50,000 | 42,050 | ||||||||||
| Brightsphere Investment Group, Inc. | 4.80 | 07/27/26 | 25,000 | 22,723 | ||||||||||
| Burford Capital Global Finance LLC(1) | 6.25 | 04/15/28 | 35,000 | 31,711 | ||||||||||
| Burford Capital Global Finance LLC(1) | 6.88 | 04/15/30 | 35,000 | 31,541 | ||||||||||
| Burford Capital Global Finance LLC(1) | 9.25 | 07/01/31 | 35,000 | 34,589 | ||||||||||
| Credit Acceptance Corp.(1) | 5.13 | 12/31/24 | 20,000 | 19,402 | ||||||||||
| Credit Acceptance Corp. | 6.63 | 03/15/26 | 50,000 | 47,520 | ||||||||||
| GGAM Finance Ltd.(1) | 7.75 | 05/15/26 | 35,000 | 34,759 | ||||||||||
| GGAM Finance Ltd.(1) | 8.00 | 06/15/28 | 50,000 | 49,373 | ||||||||||
| goeasy Ltd.(1) | 4.38 | 05/01/26 | 25,000 | 22,613 | ||||||||||
| goeasy Ltd.(1) | 5.38 | 12/01/24 | 50,000 | 49,059 | ||||||||||
| Jane Street Group/JSG Finance, Inc.(1) | 4.50 | 11/15/29 | 50,000 | 42,664 | ||||||||||
| Jefferies Finance LLC/JFIN Co.-Issuer Corp.(1) | 5.00 | 08/15/28 | 90,000 | 71,929 | ||||||||||
| Jefferson Capital Holdings LLC(1) | 6.00 | 08/15/26 | 25,000 | 21,858 | ||||||||||
| Macquarie Airfinance Holdings Ltd.(1) | 8.13 | 03/30/29 | 50,000 | 49,300 | ||||||||||
| Macquarie Airfinance Holdings Ltd.(1) | 8.38 | 05/01/28 | 45,000 | 44,903 | ||||||||||
| Midcap Financial Issuer Trust(1) | 5.63 | 01/15/30 | 35,000 | 26,972 | ||||||||||
| Midcap Financial Issuer Trust(1) | 6.50 | 05/01/28 | 85,000 | 72,126 | ||||||||||
The accompanying notes are an integral part of these financial statements.
99
BONDBLOXX ETF TRUST
BondBloxx BB Rated USD High Yield Corporate Bond ETF
Portfolio of Investments (Continued)
October 31, 2023
| Face | ||||||||||||||
| Rate (%) | Maturity | Amount | Value | |||||||||||
| DIVERSIFIED FINANCIAL SERVICES – 5.0% (Continued) | ||||||||||||||
| Navient Corp. | 4.88 | 03/15/28 | $ | 45,000 | $ | 37,007 | ||||||||
| Navient Corp. | 5.00 | 03/15/27 | 60,000 | 52,760 | ||||||||||
| Navient Corp. | 5.50 | 03/15/29 | 65,000 | 52,725 | ||||||||||
| Navient Corp. | 5.63 | 08/01/33 | 50,000 | 33,901 | ||||||||||
| Navient Corp. | 6.75 | 06/25/25 | 50,000 | 48,820 | ||||||||||
| Navient Corp. | 6.75 | 06/15/26 | 40,000 | 37,937 | ||||||||||
| Navient Corp. | 9.38 | 07/25/30 | 45,000 | 42,458 | ||||||||||
| OneMain Finance Corp. | 3.50 | 01/15/27 | 55,000 | 46,523 | ||||||||||
| OneMain Finance Corp. | 3.88 | 09/15/28 | 50,000 | 39,580 | ||||||||||
| OneMain Finance Corp. | 4.00 | 09/15/30 | 85,000 | 62,276 | ||||||||||
| OneMain Finance Corp. | 5.38 | 11/15/29 | 65,000 | 53,515 | ||||||||||
| OneMain Finance Corp. | 6.63 | 01/15/28 | 70,000 | 63,750 | ||||||||||
| OneMain Finance Corp. | 6.88 | 03/15/25 | 65,000 | 64,199 | ||||||||||
| OneMain Finance Corp. | 7.13 | 03/15/26 | 185,000 | 179,900 | ||||||||||
| OneMain Finance Corp. | 9.00 | 01/15/29 | 45,000 | 43,836 | ||||||||||
| PennyMac Financial Services, Inc.(1) | 4.25 | 02/15/29 | 60,000 | 49,073 | ||||||||||
| PennyMac Financial Services, Inc.(1) | 5.38 | 10/15/25 | 55,000 | 52,441 | ||||||||||
| PennyMac Financial Services, Inc.(1) | 5.75 | 09/15/31 | 45,000 | 36,734 | ||||||||||
| PRA Group, Inc.(1) | 5.00 | 10/01/29 | 25,000 | 16,616 | ||||||||||
| PRA Group, Inc.(1) | 7.38 | 09/01/25 | 25,000 | 23,401 | ||||||||||
| PRA Group, Inc.(1) | 8.38 | 02/01/28 | 40,000 | 32,975 | ||||||||||
| Rocket Mortgage LLC/Rocket Mortgage Co.-Issuer, Inc.(1) | 2.88 | 10/15/26 | 115,000 | 100,247 | ||||||||||
| Rocket Mortgage LLC/Rocket Mortgage Co.-Issuer, Inc.(1) | 3.63 | 03/01/29 | 65,000 | 52,910 | ||||||||||
| Rocket Mortgage LLC/Rocket Mortgage Co.-Issuer, Inc.(1) | 3.88 | 03/01/31 | 120,000 | 92,932 | ||||||||||
| Rocket Mortgage LLC/Rocket Mortgage Co.-Issuer, Inc.(1) | 4.00 | 10/15/33 | 55,000 | 40,489 | ||||||||||
| SLM Corp. | 3.13 | 11/02/26 | 85,000 | 73,996 | ||||||||||
| StoneX Group, Inc.(1) | 8.63 | 06/15/25 | 30,000 | 30,128 | ||||||||||
| Synchrony Financial | 7.25 | 02/02/33 | 65,000 | 55,156 | ||||||||||
| United Wholesale Mortgage LLC(1) | 5.50 | 11/15/25 | 80,000 | 76,137 | ||||||||||
| United Wholesale Mortgage LLC(1) | 5.50 | 04/15/29 | 70,000 | 58,703 | ||||||||||
| United Wholesale Mortgage LLC(1) | 5.75 | 06/15/27 | 25,000 | 22,774 | ||||||||||
| 2,474,987 | ||||||||||||||
| ELECTRIC – 5.2% | ||||||||||||||
| Algonquin Power & Utilities Corp. | 4.75 | 01/18/82 | 65,000 | 51,383 | ||||||||||
| Atlantica Sustainable Infrastructure PLC(1) | 4.13 | 06/15/28 | 30,000 | 25,945 | ||||||||||
| Calpine Corp.(1) | 3.75 | 03/01/31 | 100,000 | 79,798 | ||||||||||
| Calpine Corp.(1) | 4.50 | 02/15/28 | 95,000 | 85,750 | ||||||||||
| Calpine Corp.(1) | 5.25 | 06/01/26 | 35,000 | 33,530 | ||||||||||
| Clearway Energy Operating LLC(1) | 3.75 | 02/15/31 | 95,000 | 74,186 | ||||||||||
| Clearway Energy Operating LLC(1) | 3.75 | 01/15/32 | 25,000 | 18,966 | ||||||||||
| Clearway Energy Operating LLC(1) | 4.75 | 03/15/28 | 70,000 | 62,555 | ||||||||||
| DPL, Inc. | 4.13 | 07/01/25 | 65,000 | 61,358 | ||||||||||
| DPL, Inc. | 4.35 | 04/15/29 | 15,000 | 12,250 | ||||||||||
| Drax FinCo. PLC(1) | 6.63 | 11/01/25 | 45,000 | 43,351 | ||||||||||
| Edison International | 8.13 | 06/15/53 | 40,000 | 38,670 | ||||||||||
| Electricite de France SA(1),(2) | 9.13 | - | 130,000 | 133,753 | ||||||||||
| Emera, Inc. | 6.75 | 06/15/76 | 105,000 | 99,140 | ||||||||||
| FirstEnergy Corp. | 2.65 | 03/01/30 | 50,000 | 40,379 | ||||||||||
The accompanying notes are an integral part of these financial statements.
100
BONDBLOXX ETF TRUST
BondBloxx BB Rated USD High Yield Corporate Bond ETF
Portfolio of Investments (Continued)
October 31, 2023
| Face | ||||||||||||||
| Rate (%) | Maturity | Amount | Value | |||||||||||
| ELECTRIC – 5.2% (Continued) | ||||||||||||||
| FirstEnergy Corp. | 3.40 | 03/01/50 | $ | 80,000 | $ | 48,471 | ||||||||
| FirstEnergy Corp. | 4.15 | 07/15/27 | 210,000 | 194,549 | ||||||||||
| FirstEnergy Corp. | 5.10 | 07/15/47 | 54,000 | 44,837 | ||||||||||
| FirstEnergy Corp. | 7.38 | 11/15/31 | 45,000 | 48,580 | ||||||||||
| Leeward Renewable Energy Operations LLC(1) | 4.25 | 07/01/29 | 40,000 | 32,715 | ||||||||||
| NextEra Energy Operating Partners LP(1) | 3.88 | 10/15/26 | 30,000 | 27,304 | ||||||||||
| NextEra Energy Operating Partners LP(1) | 4.50 | 09/15/27 | 60,000 | 53,781 | ||||||||||
| NRG Energy, Inc.(1) | 3.38 | 02/15/29 | 50,000 | 40,754 | ||||||||||
| NRG Energy, Inc.(1) | 3.63 | 02/15/31 | 90,000 | 68,029 | ||||||||||
| NRG Energy, Inc.(1) | 3.88 | 02/15/32 | 95,000 | 70,742 | ||||||||||
| NRG Energy, Inc.(1) | 5.25 | 06/15/29 | 70,000 | 61,839 | ||||||||||
| NRG Energy, Inc. | 5.75 | 01/15/28 | 65,000 | 60,902 | ||||||||||
| NRG Energy, Inc. | 6.63 | 01/15/27 | 35,000 | 34,002 | ||||||||||
| Pattern Energy Operations LP/Pattern Energy Operations, Inc.(1) | 4.50 | 08/15/28 | 55,000 | 47,997 | ||||||||||
| PG&E Corp. | 5.00 | 07/01/28 | 85,000 | 77,085 | ||||||||||
| PG&E Corp. | 5.25 | 07/01/30 | 90,000 | 78,969 | ||||||||||
| Talen Energy Supply LLC(1) | 8.63 | 06/01/30 | 105,000 | 106,796 | ||||||||||
| Terraform Global Operating LP(1) | 6.13 | 03/01/26 | 35,000 | 33,679 | ||||||||||
| TransAlta Corp. | 6.50 | 03/15/40 | 25,000 | 22,093 | ||||||||||
| TransAlta Corp. | 7.75 | 11/15/29 | 35,000 | 34,861 | ||||||||||
| Vistra Operations Co. LLC(1) | 4.38 | 05/01/29 | 130,000 | 110,566 | ||||||||||
| Vistra Operations Co. LLC(1) | 5.00 | 07/31/27 | 85,000 | 77,834 | ||||||||||
| Vistra Operations Co. LLC(1) | 5.50 | 09/01/26 | 85,000 | 80,946 | ||||||||||
| Vistra Operations Co. LLC(1) | 5.63 | 02/15/27 | 130,000 | 122,451 | ||||||||||
| Vistra Operations Co. LLC(1) | 7.75 | 10/15/31 | 100,000 | 96,642 | ||||||||||
| 2,537,438 | ||||||||||||||
| ELECTRICAL COMPONENTS & EQUIPMENT – 0.5% | ||||||||||||||
| EnerSys(1) | 4.38 | 12/15/27 | 20,000 | 17,736 | ||||||||||
| WESCO Distribution, Inc.(1) | 7.13 | 06/15/25 | 130,000 | 130,051 | ||||||||||
| WESCO Distribution, Inc.(1) | 7.25 | 06/15/28 | 115,000 | 114,393 | ||||||||||
| 262,180 | ||||||||||||||
| ELECTRONICS – 1.1% | ||||||||||||||
| Atkore, Inc.(1) | 4.25 | 06/01/31 | 35,000 | 28,969 | ||||||||||
| Imola Merger Corp.(1) | 4.75 | 05/15/29 | 175,000 | 152,715 | ||||||||||
| Sensata Technologies BV(1) | 4.00 | 04/15/29 | 110,000 | 93,635 | ||||||||||
| Sensata Technologies BV(1) | 5.00 | 10/01/25 | 85,000 | 82,736 | ||||||||||
| Sensata Technologies BV(1) | 5.88 | 09/01/30 | 55,000 | 50,297 | ||||||||||
| Sensata Technologies, Inc.(1) | 3.75 | 02/15/31 | 90,000 | 72,153 | ||||||||||
| TTM Technologies, Inc.(1) | 4.00 | 03/01/29 | 45,000 | 36,956 | ||||||||||
| 517,461 | ||||||||||||||
| ENERGY-ALTERNATE SOURCES – 0.3% | ||||||||||||||
| TerraForm Power Operating LLC(1) | 4.75 | 01/15/30 | 60,000 | 50,770 | ||||||||||
| TerraForm Power Operating LLC(1) | 5.00 | 01/31/28 | 65,000 | 59,612 | ||||||||||
| Topaz Solar Farms LLC(1) | 5.75 | 09/30/39 | 47,159 | 42,894 | ||||||||||
| 153,276 | ||||||||||||||
The accompanying notes are an integral part of these financial statements.
101
BONDBLOXX ETF TRUST
BondBloxx BB Rated USD High Yield Corporate Bond ETF
Portfolio of Investments (Continued)
October 31, 2023
| Face | ||||||||||||||
| Rate (%) | Maturity | Amount | Value | |||||||||||
| ENGINEERING & CONSTRUCTION – 0.8% | ||||||||||||||
| AECOM | 5.13 | 03/15/27 | $ | 85,000 | $ | 80,346 | ||||||||
| Arcosa, Inc.(1) | 4.38 | 04/15/29 | 30,000 | 26,209 | ||||||||||
| ATP Tower Holdings LLC/Andean Tower Partners Colombia SAS/Andean Telecom Par(1) | 4.05 | 04/27/26 | 35,000 | 29,942 | ||||||||||
| Cellnex Finance Co. SA(1) | 3.88 | 07/07/41 | 55,000 | 36,700 | ||||||||||
| Dycom Industries, Inc.(1) | 4.50 | 04/15/29 | 45,000 | 38,884 | ||||||||||
| Fluor Corp. | 4.25 | 09/15/28 | 80,000 | 72,624 | ||||||||||
| TopBuild Corp.(1) | 3.63 | 03/15/29 | 35,000 | 29,216 | ||||||||||
| TopBuild Corp.(1) | 4.13 | 02/15/32 | 45,000 | 35,659 | ||||||||||
| Weekley Homes LLC/Weekley Finance Corp.(1) | �� | 4.88 | 09/15/28 | 30,000 | 25,799 | |||||||||
| 375,379 | ||||||||||||||
| ENTERTAINMENT – 1.9% | ||||||||||||||
| Caesars Resort Collection LLC/CRC Finco, Inc.(1) | 5.75 | 07/01/25 | 90,000 | 88,670 | ||||||||||
| Cedar Fair LP/Canada’s Wonderland Co./Magnum Management Corp./Millennium Op(1) | 5.50 | 05/01/25 | 95,000 | 93,199 | ||||||||||
| International Game Technology PLC(1) | 4.13 | 04/15/26 | 75,000 | 70,644 | ||||||||||
| International Game Technology PLC(1) | 5.25 | 01/15/29 | 75,000 | 68,309 | ||||||||||
| International Game Technology PLC(1) | 6.25 | 01/15/27 | 50,000 | 48,775 | ||||||||||
| International Game Technology PLC(1) | 6.50 | 02/15/25 | 43,000 | 42,751 | ||||||||||
| Live Nation Entertainment, Inc.(1) | 3.75 | 01/15/28 | 50,000 | 43,825 | ||||||||||
| Live Nation Entertainment, Inc.(1) | 6.50 | 05/15/27 | 100,000 | 97,662 | ||||||||||
| Raptor Acquisition Corp./Raptor Co.-Issuer LLC(1) | 4.88 | 11/01/26 | 30,000 | 27,945 | ||||||||||
| Resorts World Las Vegas LLC/RWLV Capital, Inc.(1) | 4.63 | 04/16/29 | 115,000 | 88,441 | ||||||||||
| Resorts World Las Vegas LLC/RWLV Capital, Inc.(1) | 8.45 | 07/27/30 | 35,000 | 32,306 | ||||||||||
| Six Flags Theme Parks, Inc.(1) | 7.00 | 07/01/25 | 36,000 | 35,786 | ||||||||||
| Vail Resorts, Inc.(1) | 6.25 | 05/15/25 | 50,000 | 49,735 | ||||||||||
| WMG Acquisition Corp.(1) | 3.00 | 02/15/31 | 75,000 | 58,288 | ||||||||||
| WMG Acquisition Corp.(1) | 3.75 | 12/01/29 | 50,000 | 42,025 | ||||||||||
| WMG Acquisition Corp.(1) | 3.88 | 07/15/30 | 40,000 | 33,289 | ||||||||||
| 921,650 | ||||||||||||||
| ENVIRONMENTAL CONTROL – 0.7% | ||||||||||||||
| Clean Harbors, Inc.(1) | 4.88 | 07/15/27 | 55,000 | 51,331 | ||||||||||
| Clean Harbors, Inc.(1) | 5.13 | 07/15/29 | 20,000 | 18,011 | ||||||||||
| Clean Harbors, Inc.(1) | 6.38 | 02/01/31 | 45,000 | 42,826 | ||||||||||
| GFL Environmental, Inc.(1) | 3.50 | 09/01/28 | 75,000 | 64,304 | ||||||||||
| GFL Environmental, Inc.(1) | 3.75 | 08/01/25 | 80,000 | 75,754 | ||||||||||
| GFL Environmental, Inc.(1) | 4.25 | 06/01/25 | 20,000 | 19,247 | ||||||||||
| GFL Environmental, Inc.(1) | 5.13 | 12/15/26 | 45,000 | 42,750 | ||||||||||
| Stericycle, Inc.(1) | 3.88 | 01/15/29 | 45,000 | 38,285 | ||||||||||
| 352,508 | ||||||||||||||
| FOOD – 2.0% | ||||||||||||||
| Albertsons Cos, Inc./Safeway, Inc./New Albertsons LP/Albertsons LLC(1) | 3.25 | 03/15/26 | 110,000 | 101,717 | ||||||||||
| Albertsons Cos, Inc./Safeway, Inc./New Albertsons LP/Albertsons LLC(1) | 3.50 | 03/15/29 | 125,000 | 106,712 | ||||||||||
| Albertsons Cos, Inc./Safeway, Inc./New Albertsons LP/Albertsons LLC(1) | 4.63 | 01/15/27 | 145,000 | 136,036 | ||||||||||
| Albertsons Cos, Inc./Safeway, Inc./New Albertsons LP/Albertsons LLC(1) | 4.88 | 02/15/30 | 80,000 | 71,515 | ||||||||||
| Albertsons Cos, Inc./Safeway, Inc./New Albertsons LP/Albertsons LLC(1) | 5.88 | 02/15/28 | 55,000 | 52,738 | ||||||||||
| Albertsons Cos, Inc./Safeway, Inc./New Albertsons LP/Albertsons LLC(1) | 6.50 | 02/15/28 | 70,000 | 68,800 | ||||||||||
The accompanying notes are an integral part of these financial statements.
102
BONDBLOXX ETF TRUST
BondBloxx BB Rated USD High Yield Corporate Bond ETF
Portfolio of Investments (Continued)
October 31, 2023
| Face | ||||||||||||||
| Rate (%) | Maturity | Amount | Value | |||||||||||
| FOOD – 2.0% (Continued) | ||||||||||||||
| Ingles Markets, Inc.(1) | 4.00 | 06/15/31 | $ | 30,000 | $ | 23,887 | ||||||||
| Lamb Weston Holdings, Inc.(1) | 4.13 | 01/31/30 | 75,000 | 63,698 | ||||||||||
| Lamb Weston Holdings, Inc.(1) | 4.38 | 01/31/32 | 65,000 | 53,848 | ||||||||||
| Lamb Weston Holdings, Inc.(1) | 4.88 | 05/15/28 | 50,000 | 46,219 | ||||||||||
| Pilgrim’s Pride Corp. | 3.50 | 03/01/32 | 80,000 | 61,043 | ||||||||||
| Pilgrim’s Pride Corp. | 4.25 | 04/15/31 | 85,000 | 70,106 | ||||||||||
| Pilgrim’s Pride Corp. | 6.25 | 07/01/33 | 90,000 | 82,822 | ||||||||||
| Pilgrim’s Pride Corp. | 6.88 | 05/15/34 | 40,000 | 37,898 | ||||||||||
| Safeway, Inc. | 7.25 | 02/01/31 | 25,000 | 25,215 | ||||||||||
| 1,002,254 | ||||||||||||||
| FOREST PRODUCTS & PAPER – 0.1% | ||||||||||||||
| Domtar Corp.(1) | 6.75 | 10/01/28 | 60,000 | 48,898 | ||||||||||
| HEALTHCARE-PRODUCTS – 0.8% | ||||||||||||||
| Avantor Funding, Inc.(1) | 3.88 | 11/01/29 | 75,000 | 62,834 | ||||||||||
| Avantor Funding, Inc.(1) | 4.63 | 07/15/28 | 135,000 | 120,331 | ||||||||||
| Hologic, Inc.(1) | 3.25 | 02/15/29 | 85,000 | 71,450 | ||||||||||
| Hologic, Inc.(1) | 4.63 | 02/01/28 | 40,000 | 36,418 | ||||||||||
| Teleflex, Inc.(1) | 4.25 | 06/01/28 | 25,000 | 22,089 | ||||||||||
| Teleflex, Inc. | 4.63 | 11/15/27 | 60,000 | 54,960 | ||||||||||
| 368,082 | ||||||||||||||
| HEALTHCARE-SERVICES – 3.0% | ||||||||||||||
| Charles River Laboratories International, Inc.(1) | 3.75 | 03/15/29 | 45,000 | 38,032 | ||||||||||
| Charles River Laboratories International, Inc.(1) | 4.00 | 03/15/31 | 45,000 | 36,780 | ||||||||||
| Charles River Laboratories International, Inc.(1) | 4.25 | 05/01/28 | 45,000 | 40,032 | ||||||||||
| Fortrea Holdings, Inc.(1) | 7.50 | 07/01/30 | 50,000 | 48,313 | ||||||||||
| IQVIA, Inc.(1) | 5.00 | 10/15/26 | 100,000 | 95,439 | ||||||||||
| IQVIA, Inc.(1) | 5.00 | 05/15/27 | 85,000 | 80,055 | ||||||||||
| IQVIA, Inc.(1) | 6.50 | 05/15/30 | 50,000 | 48,563 | ||||||||||
| Molina Healthcare, Inc.(1) | 3.88 | 11/15/30 | 55,000 | 44,924 | ||||||||||
| Molina Healthcare, Inc.(1) | 3.88 | 05/15/32 | 60,000 | 47,217 | ||||||||||
| Molina Healthcare, Inc.(1) | 4.38 | 06/15/28 | 78,000 | 69,529 | ||||||||||
| Pediatrix Medical Group, Inc.(1) | 5.38 | 02/15/30 | 40,000 | 34,549 | ||||||||||
| Tenet Healthcare Corp. | 4.25 | 06/01/29 | 135,000 | 115,676 | ||||||||||
| Tenet Healthcare Corp. | 4.38 | 01/15/30 | 120,000 | 101,613 | ||||||||||
| Tenet Healthcare Corp. | 4.63 | 06/15/28 | 50,000 | 44,525 | ||||||||||
| Tenet Healthcare Corp. | 4.88 | 01/01/26 | 195,000 | 187,068 | ||||||||||
| Tenet Healthcare Corp. | 5.13 | 11/01/27 | 130,000 | 120,131 | ||||||||||
| Tenet Healthcare Corp. | 6.13 | 06/15/30 | 165,000 | 152,917 | ||||||||||
| Tenet Healthcare Corp.(1) | 6.75 | 05/15/31 | 130,000 | 123,615 | ||||||||||
| Toledo Hospital | 4.98 | 11/15/45 | 25,000 | 14,598 | ||||||||||
| Toledo Hospital | 5.33 | 11/15/28 | 25,000 | 19,219 | ||||||||||
| Toledo Hospital | 6.02 | 11/15/48 | 40,000 | 26,800 | ||||||||||
| 1,489,595 | ||||||||||||||
| HOLDING COMPANIES-DIVERS – 0.2% | ||||||||||||||
| Benteler International AG(1) | 10.50 | 05/15/28 | 50,000 | 50,415 | ||||||||||
| Stena International SA(1) | 6.13 | 02/01/25 | 35,000 | 34,337 | ||||||||||
| 84,752 | ||||||||||||||
The accompanying notes are an integral part of these financial statements.
103
BONDBLOXX ETF TRUST
BondBloxx BB Rated USD High Yield Corporate Bond ETF
Portfolio of Investments (Continued)
October 31, 2023
| Face | ||||||||||||||
| Rate (%) | Maturity | Amount | Value | |||||||||||
| HOME BUILDERS – 1.4% | ||||||||||||||
| Century Communities, Inc.(1) | 3.88 | 08/15/29 | $ | 40,000 | $ | 32,325 | ||||||||
| Century Communities, Inc. | 6.75 | 06/01/27 | 50,000 | 48,322 | ||||||||||
| Forestar Group, Inc.(1) | 3.85 | 05/15/26 | 35,000 | 31,190 | ||||||||||
| Forestar Group, Inc.(1) | 5.00 | 03/01/28 | 30,000 | 26,364 | ||||||||||
| KB Home | 4.00 | 06/15/31 | 40,000 | 31,283 | ||||||||||
| KB Home | 4.80 | 11/15/29 | 15,000 | 13,014 | ||||||||||
| KB Home | 6.88 | 06/15/27 | 15,000 | 14,902 | ||||||||||
| KB Home | 7.25 | 07/15/30 | 50,000 | 48,063 | ||||||||||
| LGI Homes, Inc.(1) | 4.00 | 07/15/29 | 30,000 | 22,987 | ||||||||||
| M/I Homes, Inc. | 3.95 | 02/15/30 | 20,000 | 15,933 | ||||||||||
| M/I Homes, Inc. | 4.95 | 02/01/28 | 40,000 | 35,813 | ||||||||||
| Mattamy Group Corp.(1) | 4.63 | 03/01/30 | 60,000 | 49,059 | ||||||||||
| Mattamy Group Corp.(1) | 5.25 | 12/15/27 | 40,000 | 35,987 | ||||||||||
| Shea Homes LP/Shea Homes Funding Corp. | 4.75 | 02/15/28 | 40,000 | 35,206 | ||||||||||
| Shea Homes LP/Shea Homes Funding Corp. | 4.75 | 04/01/29 | 20,000 | 16,928 | ||||||||||
| Taylor Morrison Communities, Inc.(1) | 5.13 | 08/01/30 | 40,000 | 33,664 | ||||||||||
| Taylor Morrison Communities, Inc.(1) | 5.75 | 01/15/28 | 45,000 | 40,899 | ||||||||||
| Taylor Morrison Communities, Inc.(1) | 5.88 | 06/15/27 | 40,000 | 37,543 | ||||||||||
| Thor Industries, Inc.(1) | 4.00 | 10/15/29 | 45,000 | 36,329 | ||||||||||
| Tri Pointe Homes, Inc. | 5.70 | 06/15/28 | 55,000 | 49,036 | ||||||||||
| Winnebago Industries, Inc.(1) | 6.25 | 07/15/28 | 25,000 | 23,535 | ||||||||||
| 678,382 | ||||||||||||||
| HOME FURNISHINGS – 0.2% | ||||||||||||||
| Tempur Sealy International, Inc.(1) | 3.88 | 10/15/31 | 70,000 | 52,513 | ||||||||||
| Tempur Sealy International, Inc.(1) | 4.00 | 04/15/29 | 80,000 | 65,747 | ||||||||||
| 118,260 | ||||||||||||||
| HOUSEHOLD PRODUCTS/WARES – 0.3% | ||||||||||||||
| ACCO Brands Corp.(1) | 4.25 | 03/15/29 | 55,000 | 45,715 | ||||||||||
| Central Garden & Pet Co. | 4.13 | 10/15/30 | 55,000 | 44,924 | ||||||||||
| Central Garden & Pet Co.(1) | 4.13 | 04/30/31 | 45,000 | 35,854 | ||||||||||
| 126,493 | ||||||||||||||
| HOUSEWARES – 0.7% | ||||||||||||||
| Newell Brands, Inc. | 4.88 | 06/01/25 | 45,000 | 43,225 | ||||||||||
| Newell Brands, Inc. | 5.20 | 04/01/26 | 175,000 | 165,387 | ||||||||||
| Newell Brands, Inc. | 6.38 | 09/15/27 | 50,000 | 46,982 | ||||||||||
| Newell Brands, Inc. | 6.38 | 04/01/36 | 35,000 | 27,517 | ||||||||||
| Newell Brands, Inc. | 6.50 | 04/01/46 | 65,000 | 45,719 | ||||||||||
| Newell Brands, Inc. | 6.63 | 09/15/29 | 35,000 | 32,264 | ||||||||||
| 361,094 | ||||||||||||||
| INSURANCE – 0.7% | ||||||||||||||
| Assurant, Inc. | 7.00 | 03/27/48 | 35,000 | 33,669 | ||||||||||
| Constellation Insurance, Inc.(1) | 6.63 | 05/01/31 | 25,000 | 21,689 | ||||||||||
| Constellation Insurance, Inc.(1) | 6.80 | 01/24/30 | 35,000 | 29,985 | ||||||||||
| Genworth Holdings, Inc. | 6.50 | 06/15/34 | 25,000 | 21,733 | ||||||||||
| Global Atlantic Finance Co.(1) | 4.70 | 10/15/51 | 65,000 | 45,341 | ||||||||||
| Liberty Mutual Group, Inc.(1) | 4.13 | 12/15/51 | 70,000 | 55,696 | ||||||||||
The accompanying notes are an integral part of these financial statements.
104
BONDBLOXX ETF TRUST
BondBloxx BB Rated USD High Yield Corporate Bond ETF
Portfolio of Investments (Continued)
October 31, 2023
| Face | ||||||||||||||
| Rate (%) | Maturity | Amount | Value | |||||||||||
| INSURANCE – 0.7% (Continued) | ||||||||||||||
| Liberty Mutual Group, Inc.(1) | 4.30 | 02/01/61 | $ | 85,000 | $ | 44,480 | ||||||||
| MGIC Investment Corp. | 5.25 | 08/15/28 | 60,000 | 55,209 | ||||||||||
| NMI Holdings, Inc.(1) | 7.38 | 06/01/25 | 35,000 | 35,084 | ||||||||||
| 342,886 | ||||||||||||||
| INTERNET – 1.4% | ||||||||||||||
| Cogent Communications Group, Inc.(1) | 3.50 | 05/01/26 | 40,000 | 36,250 | ||||||||||
| Gen Digital, Inc.(1) | 5.00 | 04/15/25 | 85,000 | 82,381 | ||||||||||
| Gen Digital, Inc.(1) | 6.75 | 09/30/27 | 85,000 | 82,835 | ||||||||||
| Gen Digital, Inc.(1) | 7.13 | 09/30/30 | 59,000 | 57,469 | ||||||||||
| Go Daddy Operating Co. LLC/GD Finance Co., Inc.(1) | 3.50 | 03/01/29 | 75,000 | 63,031 | ||||||||||
| Go Daddy Operating Co. LLC/GD Finance Co., Inc.(1) | 5.25 | 12/01/27 | 50,000 | 46,913 | ||||||||||
| Match Group Holdings II LLC(1) | 3.63 | 10/01/31 | 45,000 | 34,577 | ||||||||||
| Match Group Holdings II LLC(1) | 4.13 | 08/01/30 | 45,000 | 36,617 | ||||||||||
| Match Group Holdings II LLC(1) | 4.63 | 06/01/28 | 45,000 | 40,454 | ||||||||||
| Match Group Holdings II LLC(1) | 5.00 | 12/15/27 | 40,000 | 36,932 | ||||||||||
| Match Group Holdings II LLC(1) | 5.63 | 02/15/29 | 30,000 | 27,114 | ||||||||||
| Rakuten Group, Inc.(1) | 10.25 | 11/30/24 | 85,000 | 86,064 | ||||||||||
| Ziff Davis, Inc.(1) | 4.63 | 10/15/30 | 45,000 | 37,725 | ||||||||||
| 668,362 | ||||||||||||||
| INVESTMENT COMPANIES – 0.7% | ||||||||||||||
| Icahn Enterprises LP/Icahn Enterprises Finance Corp. | 4.38 | 02/01/29 | 75,000 | 57,838 | ||||||||||
| Icahn Enterprises LP/Icahn Enterprises Finance Corp. | 5.25 | 05/15/27 | 150,000 | 128,554 | ||||||||||
| Icahn Enterprises LP/Icahn Enterprises Finance Corp. | 6.25 | 05/15/26 | 105,000 | 96,062 | ||||||||||
| Icahn Enterprises LP/Icahn Enterprises Finance Corp. | 6.38 | 12/15/25 | 40,000 | 37,668 | ||||||||||
| 320,122 | ||||||||||||||
| IRON/STEEL – 1.5% | ||||||||||||||
| Big River Steel LLC/BRS Finance Corp.(1) | 6.63 | 01/31/29 | 70,000 | 69,222 | ||||||||||
| Carpenter Technology Corp. | 6.38 | 07/15/28 | 30,000 | 28,572 | ||||||||||
| Carpenter Technology Corp. | 7.63 | 03/15/30 | 30,000 | 29,656 | ||||||||||
| Cleveland-Cliffs, Inc.(1) | 4.63 | 03/01/29 | 30,000 | 25,895 | ||||||||||
| Cleveland-Cliffs, Inc.(1) | 4.88 | 03/01/31 | 30,000 | 24,793 | ||||||||||
| Cleveland-Cliffs, Inc. | 5.88 | 06/01/27 | 50,000 | 47,691 | ||||||||||
| Cleveland-Cliffs, Inc.(1) | 6.75 | 03/15/26 | 75,000 | 74,653 | ||||||||||
| Cleveland-Cliffs, Inc.(1) | 6.75 | 04/15/30 | 65,000 | 60,349 | ||||||||||
| Commercial Metals Co. | 3.88 | 02/15/31 | 55,000 | 44,719 | ||||||||||
| Commercial Metals Co. | 4.13 | 01/15/30 | 25,000 | 21,130 | ||||||||||
| Mineral Resources Ltd.(1) | 8.00 | 11/01/27 | 45,000 | 43,534 | ||||||||||
| Mineral Resources Ltd.(1) | 8.13 | 05/01/27 | 63,000 | 61,352 | ||||||||||
| Mineral Resources Ltd.(1) | 8.50 | 05/01/30 | 65,000 | 62,310 | ||||||||||
| Mineral Resources Ltd.(1) | 9.25 | 10/01/28 | 100,000 | 100,125 | ||||||||||
| United States Steel Corp. | 6.65 | 06/01/37 | 25,000 | 23,849 | ||||||||||
| United States Steel Corp. | 6.88 | 03/01/29 | 39,000 | 37,935 | ||||||||||
| 755,785 | ||||||||||||||
| LEISURE TIME – 1.5% | ||||||||||||||
| Acushnet Co.(1) | 7.38 | 10/15/28 | 30,000 | 30,084 | ||||||||||
| Carnival Corp.(1) | 4.00 | 08/01/28 | 210,000 | 182,836 | ||||||||||
The accompanying notes are an integral part of these financial statements.
105
BONDBLOXX ETF TRUST
BondBloxx BB Rated USD High Yield Corporate Bond ETF
Portfolio of Investments (Continued)
October 31, 2023
| Face | ||||||||||||||
| Rate (%) | Maturity | Amount | Value | |||||||||||
| LEISURE TIME – 1.5% (Continued) | ||||||||||||||
| Carnival Corp.(1) | 7.00 | 08/15/29 | $ | 45,000 | $ | 44,166 | ||||||||
| Carnival Corp.(1) | 9.88 | 08/01/27 | 65,000 | 67,799 | ||||||||||
| Life Time, Inc.(1) | 5.75 | 01/15/26 | 80,000 | 77,549 | ||||||||||
| Royal Caribbean Cruises Ltd.(1) | 7.25 | 01/15/30 | 70,000 | 69,121 | ||||||||||
| Royal Caribbean Cruises Ltd.(1) | 8.25 | 01/15/29 | 70,000 | 71,828 | ||||||||||
| Royal Caribbean Cruises Ltd.(1) | 9.25 | 01/15/29 | 100,000 | 104,486 | ||||||||||
| Royal Caribbean Cruises Ltd.(1) | 11.50 | 06/01/25 | 46,000 | 48,652 | ||||||||||
| Vista Outdoor, Inc.(1) | 4.50 | 03/15/29 | 45,000 | 41,914 | ||||||||||
| 738,435 | ||||||||||||||
| LODGING – 2.2% | ||||||||||||||
| Boyd Gaming Corp. | 4.75 | 12/01/27 | 85,000 | 77,509 | ||||||||||
| Boyd Gaming Corp.(1) | 4.75 | 06/15/31 | 85,000 | 70,643 | ||||||||||
| Genting New York LLC/GENNY Capital, Inc.(1) | 3.30 | 02/15/26 | 45,000 | 40,166 | ||||||||||
| Hilton Domestic Operating Co., Inc.(1) | 3.63 | 02/15/32 | 135,000 | 106,838 | ||||||||||
| Hilton Domestic Operating Co., Inc.(1) | 3.75 | 05/01/29 | 80,000 | 68,942 | ||||||||||
| Hilton Domestic Operating Co., Inc.(1) | 4.00 | 05/01/31 | 90,000 | 74,632 | ||||||||||
| Hilton Domestic Operating Co., Inc. | 4.88 | 01/15/30 | 90,000 | 80,880 | ||||||||||
| Hilton Domestic Operating Co., Inc.(1) | 5.38 | 05/01/25 | 35,000 | 34,494 | ||||||||||
| Hilton Domestic Operating Co., Inc.(1) | 5.75 | 05/01/28 | 45,000 | 43,155 | ||||||||||
| Hilton Worldwide Finance LLC/Hilton Worldwide Finance Corp. | 4.88 | 04/01/27 | 50,000 | 47,200 | ||||||||||
| Las Vegas Sands Corp. | 2.90 | 06/25/25 | 50,000 | 46,981 | ||||||||||
| Las Vegas Sands Corp. | 3.50 | 08/18/26 | 85,000 | 77,866 | ||||||||||
| Las Vegas Sands Corp. | 3.90 | 08/08/29 | 65,000 | 56,202 | ||||||||||
| Travel + Leisure Co.(1) | 4.50 | 12/01/29 | 55,000 | 45,404 | ||||||||||
| Travel + Leisure Co.(1) | 4.63 | 03/01/30 | 20,000 | 16,392 | ||||||||||
| Travel + Leisure Co. | 6.00 | 04/01/27 | 40,000 | 37,400 | ||||||||||
| Travel + Leisure Co. | 6.60 | 10/01/25 | 40,000 | 39,161 | ||||||||||
| Travel + Leisure Co.(1) | 6.63 | 07/31/26 | 55,000 | 53,711 | ||||||||||
| Wyndham Hotels & Resorts, Inc.(1) | 4.38 | 08/15/28 | 45,000 | 39,754 | ||||||||||
| 1,057,330 | ||||||||||||||
| MACHINERY-CONSTRUCTION & MINING – 0.1% | ||||||||||||||
| BWX Technologies, Inc.(1) | 4.13 | 06/30/28 | 35,000 | 30,839 | ||||||||||
| BWX Technologies, Inc.(1) | 4.13 | 04/15/29 | 35,000 | 29,966 | ||||||||||
| 60,805 | ||||||||||||||
| MACHINERY-DIVERSIFIED – 0.2% | ||||||||||||||
| GrafTech Finance, Inc.(1) | 4.63 | 12/15/28 | 45,000 | 33,031 | ||||||||||
| GrafTech Global Enterprises, Inc.(1) | 9.88 | 12/15/28 | 40,000 | 35,870 | ||||||||||
| Mueller Water Products, Inc.(1) | 4.00 | 06/15/29 | 45,000 | 38,525 | ||||||||||
| 107,426 | ||||||||||||||
| MEDIA – 7.1% | ||||||||||||||
| AMC Networks, Inc. | 4.25 | 02/15/29 | 95,000 | 58,478 | ||||||||||
| AMC Networks, Inc. | 4.75 | 08/01/25 | 75,000 | 68,384 | ||||||||||
| CCO Holdings LLC/CCO Holdings Capital Corp.(1) | 4.25 | 02/01/31 | 110,000 | 85,687 | ||||||||||
| CCO Holdings LLC/CCO Holdings Capital Corp.(1) | 4.25 | 01/15/34 | 90,000 | 65,082 | ||||||||||
| CCO Holdings LLC/CCO Holdings Capital Corp.(1) | 4.50 | 08/15/30 | 130,000 | 104,411 | ||||||||||
| CCO Holdings LLC/CCO Holdings Capital Corp. | 4.50 | 05/01/32 | 120,000 | 91,956 | ||||||||||
The accompanying notes are an integral part of these financial statements.
106
BONDBLOXX ETF TRUST
BondBloxx BB Rated USD High Yield Corporate Bond ETF
Portfolio of Investments (Continued)
October 31, 2023
| Face | ||||||||||||||
| Rate (%) | Maturity | Amount | Value | |||||||||||
| MEDIA – 7.1% (Continued) | ||||||||||||||
| CCO Holdings LLC/CCO Holdings Capital Corp.(1) | 4.50 | 06/01/33 | $ | 75,000 | $ | 56,001 | ||||||||
| CCO Holdings LLC/CCO Holdings Capital Corp.(1) | 4.75 | 03/01/30 | 130,000 | 107,426 | ||||||||||
| CCO Holdings LLC/CCO Holdings Capital Corp.(1) | 4.75 | 02/01/32 | 45,000 | 35,169 | ||||||||||
| CCO Holdings LLC/CCO Holdings Capital Corp.(1) | 5.00 | 02/01/28 | 95,000 | 85,378 | ||||||||||
| CCO Holdings LLC/CCO Holdings Capital Corp.(1) | 5.13 | 05/01/27 | 150,000 | 138,241 | ||||||||||
| CCO Holdings LLC/CCO Holdings Capital Corp.(1) | 5.38 | 06/01/29 | 55,000 | 48,215 | ||||||||||
| CCO Holdings LLC/CCO Holdings Capital Corp.(1) | 5.50 | 05/01/26 | 30,000 | 28,640 | ||||||||||
| CCO Holdings LLC/CCO Holdings Capital Corp.(1) | 6.38 | 09/01/29 | 70,000 | 64,131 | ||||||||||
| CCO Holdings LLC/CCO Holdings Capital Corp.(1) | 7.38 | 03/01/31 | 50,000 | 47,282 | ||||||||||
| Directv Financing LLC/Directv Financing Co.-Obligor, Inc.(1) | 5.88 | 08/15/27 | 330,000 | 289,466 | ||||||||||
| Gannett Holdings LLC(1) | 6.00 | 11/01/26 | 30,000 | 25,351 | ||||||||||
| LCPR Senior Secured Financing DAC(1) | 5.13 | 07/15/29 | 75,000 | 58,501 | ||||||||||
| LCPR Senior Secured Financing DAC(1) | 6.75 | 10/15/27 | 100,000 | 90,602 | ||||||||||
| News Corp.(1) | 3.88 | 05/15/29 | 100,000 | 85,704 | ||||||||||
| News Corp.(1) | 5.13 | 02/15/32 | 40,000 | 34,577 | ||||||||||
| Nexstar Media, Inc.(1) | 4.75 | 11/01/28 | 95,000 | 79,885 | ||||||||||
| Nexstar Media, Inc.(1) | 5.63 | 07/15/27 | 145,000 | 130,602 | ||||||||||
| Paramount Global | 6.25 | 02/28/57 | 55,000 | 39,511 | ||||||||||
| Paramount Global | 6.38 | 03/30/62 | 90,000 | 66,318 | ||||||||||
| Scripps Escrow II, Inc.(1) | 3.88 | 01/15/29 | 55,000 | 41,811 | ||||||||||
| Sinclair Television Group, Inc.(1) | 4.13 | 12/01/30 | 70,000 | 44,297 | ||||||||||
| Sirius XM Radio, Inc.(1) | 3.13 | 09/01/26 | 85,000 | 76,315 | ||||||||||
| Sirius XM Radio, Inc.(1) | 3.88 | 09/01/31 | 125,000 | 94,251 | ||||||||||
| Sirius XM Radio, Inc.(1) | 4.00 | 07/15/28 | 170,000 | 144,731 | ||||||||||
| Sirius XM Radio, Inc.(1) | 4.13 | 07/01/30 | 140,000 | 111,300 | ||||||||||
| Sirius XM Radio, Inc.(1) | 5.00 | 08/01/27 | 135,000 | 123,903 | ||||||||||
| Sirius XM Radio, Inc.(1) | 5.50 | 07/01/29 | 120,000 | 106,463 | ||||||||||
| TEGNA, Inc. | 4.63 | 03/15/28 | 95,000 | 82,294 | ||||||||||
| TEGNA, Inc.(1) | 4.75 | 03/15/26 | 40,000 | 37,369 | ||||||||||
| TEGNA, Inc. | 5.00 | 09/15/29 | 100,000 | 83,910 | ||||||||||
| UPC Broadband FinCo. BV(1) | 4.88 | 07/15/31 | 110,000 | 87,920 | ||||||||||
| Videotron Ltd.(1) | 3.63 | 06/15/29 | 20,000 | 16,878 | ||||||||||
| Videotron Ltd.(1) | 5.13 | 04/15/27 | 85,000 | 79,190 | ||||||||||
| Virgin Media Secured Finance PLC(1) | 4.50 | 08/15/30 | 80,000 | 66,063 | ||||||||||
| Virgin Media Secured Finance PLC(1) | 5.50 | 05/15/29 | 125,000 | 110,817 | ||||||||||
| VZ Secured Financing BV(1) | 5.00 | 01/15/32 | 125,000 | 94,929 | ||||||||||
| Ziggo BV(1) | 4.88 | 01/15/30 | 100,000 | 79,956 | ||||||||||
| 3,467,395 | ||||||||||||||
| METAL FABRICATE/HARDWARE – 0.1% | ||||||||||||||
| Advanced Drainage Systems, Inc.(1) | 5.00 | 09/30/27 | 25,000 | 23,342 | ||||||||||
| Advanced Drainage Systems, Inc.(1) | 6.38 | 06/15/30 | 50,000 | 47,257 | ||||||||||
| 70,599 | ||||||||||||||
| MINING – 1.2% | ||||||||||||||
| Arsenal AIC Parent LLC(1) | 8.00 | 10/01/30 | 65,000 | 64,269 | ||||||||||
| FMG Resources August 2006 Pty Ltd.(1) | 4.38 | 04/01/31 | 125,000 | 100,912 | ||||||||||
| FMG Resources August 2006 Pty Ltd.(1) | 4.50 | 09/15/27 | 55,000 | 49,587 | ||||||||||
| FMG Resources August 2006 Pty Ltd.(1) | 5.88 | 04/15/30 | 60,000 | 53,920 | ||||||||||
The accompanying notes are an integral part of these financial statements.
107
BONDBLOXX ETF TRUST
BondBloxx BB Rated USD High Yield Corporate Bond ETF
Portfolio of Investments (Continued)
October 31, 2023
| Face | ||||||||||||||
| Rate (%) | Maturity | Amount | Value | |||||||||||
| MINING – 1.2% (Continued) | ||||||||||||||
| FMG Resources August 2006 Pty Ltd.(1) | 6.13 | 04/15/32 | $ | 80,000 | $ | 70,744 | ||||||||
| Novelis Corp.(1) | 3.25 | 11/15/26 | 65,000 | 57,933 | ||||||||||
| Novelis Corp.(1) | 3.88 | 08/15/31 | 70,000 | 54,780 | ||||||||||
| Novelis Corp.(1) | 4.75 | 01/30/30 | 135,000 | 114,688 | ||||||||||
| Perenti Finance Pty Ltd.(1) | 6.50 | 10/07/25 | 35,000 | 34,213 | ||||||||||
| 601,046 | ||||||||||||||
| MISCELLANEOUS MANUFACTURERS – 0.4% | ||||||||||||||
| Amsted Industries, Inc.(1) | 4.63 | 05/15/30 | 20,000 | 16,161 | ||||||||||
| Amsted Industries, Inc.(1) | 5.63 | 07/01/27 | 55,000 | 50,679 | ||||||||||
| Hillenbrand, Inc. | 3.75 | 03/01/31 | 35,000 | 27,388 | ||||||||||
| Hillenbrand, Inc. | 5.00 | 09/15/26 | 25,000 | 24,006 | ||||||||||
| Hillenbrand, Inc. | 5.75 | 06/15/25 | 40,000 | 39,240 | ||||||||||
| Trinity Industries, Inc.(1) | 7.75 | 07/15/28 | 35,000 | 34,584 | ||||||||||
| 192,058 | ||||||||||||||
| OFFICE FURNISHINGS – 0.1% | ||||||||||||||
| Steelcase, Inc. | 5.13 | 01/18/29 | 40,000 | 35,305 | ||||||||||
| OFFICE/BUSINESS EQUIPMENT – 0.3% | ||||||||||||||
| Xerox Corp. | 4.80 | 03/01/35 | 30,000 | 18,284 | ||||||||||
| Xerox Corp. | 6.75 | 12/15/39 | 25,000 | 16,299 | ||||||||||
| Xerox Holdings Corp.(1) | 5.00 | 08/15/25 | 70,000 | 64,469 | ||||||||||
| Xerox Holdings Corp.(1) | 5.50 | 08/15/28 | 60,000 | 46,440 | ||||||||||
| 145,492 | ||||||||||||||
| OIL & GAS – 6.4% | ||||||||||||||
| Antero Resources Corp.(1) | 5.38 | 03/01/30 | 50,000 | 45,672 | ||||||||||
| Antero Resources Corp.(1) | 7.63 | 02/01/29 | 44,000 | 44,593 | ||||||||||
| Baytex Energy Corp.(1) | 8.50 | 04/30/30 | 65,000 | 64,440 | ||||||||||
| Baytex Energy Corp.(1) | 8.75 | 04/01/27 | 40,000 | 40,355 | ||||||||||
| Chesapeake Energy Corp.(1) | 5.50 | 02/01/26 | 45,000 | 43,729 | ||||||||||
| Chesapeake Energy Corp.(1) | 5.88 | 02/01/29 | 45,000 | 42,412 | ||||||||||
| Chesapeake Energy Corp.(1) | 6.75 | 04/15/29 | 85,000 | 83,251 | ||||||||||
| Chord Energy Corp.(1) | 6.38 | 06/01/26 | 35,000 | 34,396 | ||||||||||
| Civitas Resources, Inc.(1) | 5.00 | 10/15/26 | 40,000 | 37,467 | ||||||||||
| Civitas Resources, Inc.(1) | 8.38 | 07/01/28 | 120,000 | 120,889 | ||||||||||
| Civitas Resources, Inc.(1) | 8.63 | 11/01/30 | 90,000 | 91,700 | ||||||||||
| Civitas Resources, Inc.(1) | 8.75 | 07/01/31 | 115,000 | 116,209 | ||||||||||
| CNX Resources Corp.(1) | 6.00 | 01/15/29 | 45,000 | 41,307 | ||||||||||
| CNX Resources Corp.(1) | 7.25 | 03/14/27 | 24,000 | 23,642 | ||||||||||
| CNX Resources Corp.(1) | 7.38 | 01/15/31 | 55,000 | 52,611 | ||||||||||
| Crescent Energy Finance LLC(1) | 7.25 | 05/01/26 | 60,000 | 58,143 | ||||||||||
| Crescent Energy Finance LLC(1) | 9.25 | 02/15/28 | 80,000 | 80,651 | ||||||||||
| CrownRock LP/CrownRock Finance, Inc.(1) | 5.00 | 05/01/29 | 20,000 | 18,882 | ||||||||||
| CrownRock LP/CrownRock Finance, Inc.(1) | 5.63 | 10/15/25 | 92,000 | 90,583 | ||||||||||
| Endeavor Energy Resources LP/EER Finance, Inc.(1) | 5.75 | 01/30/28 | 85,000 | 81,626 | ||||||||||
| Harbour Energy PLC(1) | 5.50 | 10/15/26 | 45,000 | 41,733 | ||||||||||
| Hilcorp Energy I LP/Hilcorp Finance Co.(1) | 5.75 | 02/01/29 | 50,000 | 45,069 | ||||||||||
The accompanying notes are an integral part of these financial statements.
108
BONDBLOXX ETF TRUST
BondBloxx BB Rated USD High Yield Corporate Bond ETF
Portfolio of Investments (Continued)
October 31, 2023
| Face | ||||||||||||||
| Rate (%) | Maturity | Amount | Value | |||||||||||
| OIL & GAS – 6.4% (Continued) | ||||||||||||||
| Hilcorp Energy I LP/Hilcorp Finance Co.(1) | 6.00 | 04/15/30 | $ | 55,000 | $ | 48,892 | ||||||||
| Hilcorp Energy I LP/Hilcorp Finance Co.(1) | 6.00 | 02/01/31 | 45,000 | 39,588 | ||||||||||
| Hilcorp Energy I LP/Hilcorp Finance Co.(1) | 6.25 | 11/01/28 | 60,000 | 56,157 | ||||||||||
| Hilcorp Energy I LP/Hilcorp Finance Co.(1) | 6.25 | 04/15/32 | 40,000 | 34,979 | ||||||||||
| Matador Resources Co. | 5.88 | 09/15/26 | 60,000 | 57,871 | ||||||||||
| Matador Resources Co.(1) | 6.88 | 04/15/28 | 45,000 | 44,146 | ||||||||||
| MEG Energy Corp.(1) | 5.88 | 02/01/29 | 50,000 | 46,773 | ||||||||||
| MEG Energy Corp.(1) | 7.13 | 02/01/27 | 35,000 | 35,284 | ||||||||||
| Murphy Oil Corp. | 5.88 | 12/01/27 | 55,000 | 52,940 | ||||||||||
| Murphy Oil Corp. | 5.88 | 12/01/42 | 45,000 | 34,624 | ||||||||||
| Murphy Oil Corp. | 6.38 | 07/15/28 | 50,000 | 48,474 | ||||||||||
| Neptune Energy Bondco PLC(1) | 6.63 | 05/15/25 | 75,000 | 74,319 | ||||||||||
| Parkland Corp.(1) | 4.50 | 10/01/29 | 75,000 | 64,581 | ||||||||||
| Parkland Corp.(1) | 4.63 | 05/01/30 | 75,000 | 64,020 | ||||||||||
| Parkland Corp.(1) | 5.88 | 07/15/27 | 35,000 | 33,545 | ||||||||||
| PBF Holding Co. LLC/PBF Finance Corp. | 6.00 | 02/15/28 | 75,000 | 69,037 | ||||||||||
| PBF Holding Co. LLC/PBF Finance Corp.(1) | 7.88 | 09/15/30 | 45,000 | 43,473 | ||||||||||
| Petrofac Ltd.(1) | 9.75 | 11/15/26 | 50,000 | 34,077 | ||||||||||
| Range Resources Corp.(1) | 4.75 | 02/15/30 | 45,000 | 40,008 | ||||||||||
| Range Resources Corp. | 4.88 | 05/15/25 | 60,000 | 58,408 | ||||||||||
| Range Resources Corp. | 8.25 | 01/15/29 | 55,000 | 56,223 | ||||||||||
| Seadrill Finance Ltd.(1) | 8.38 | 08/01/30 | 50,000 | 50,071 | ||||||||||
| SM Energy Co. | 5.63 | 06/01/25 | 30,000 | 29,231 | ||||||||||
| SM Energy Co. | 6.50 | 07/15/28 | 35,000 | 33,729 | ||||||||||
| SM Energy Co. | 6.63 | 01/15/27 | 35,000 | 34,045 | ||||||||||
| SM Energy Co. | 6.75 | 09/15/26 | 40,000 | 39,326 | ||||||||||
| Southwestern Energy Co. | 4.75 | 02/01/32 | 100,000 | 86,096 | ||||||||||
| Southwestern Energy Co. | 5.38 | 02/01/29 | 75,000 | 69,355 | ||||||||||
| Southwestern Energy Co. | 5.38 | 03/15/30 | 100,000 | 91,823 | ||||||||||
| Southwestern Energy Co. | 5.70 | 01/23/25 | 60,000 | 59,333 | ||||||||||
| Sunoco LP/Sunoco Finance Corp. | 4.50 | 05/15/29 | 85,000 | 73,729 | ||||||||||
| Sunoco LP/Sunoco Finance Corp. | 4.50 | 04/30/30 | 70,000 | 59,862 | ||||||||||
| Sunoco LP/Sunoco Finance Corp. | 5.88 | 03/15/28 | 15,000 | 14,205 | ||||||||||
| Sunoco LP/Sunoco Finance Corp. | 6.00 | 04/15/27 | 55,000 | 53,011 | ||||||||||
| Sunoco LP/Sunoco Finance Corp.(1) | 7.00 | 09/15/28 | 50,000 | 48,714 | ||||||||||
| Viper Energy Partners LP(1) | 5.38 | 11/01/27 | 40,000 | 37,950 | ||||||||||
| Viper Energy Partners LP(1) | 7.38 | 11/01/31 | 35,000 | 34,946 | ||||||||||
| 3,152,205 | ||||||||||||||
| OIL & GAS SERVICES – 0.1% | ||||||||||||||
| Oceaneering International, Inc. | 6.00 | 02/01/28 | 30,000 | 27,558 | ||||||||||
| Weatherford International Ltd.(1) | 6.50 | 09/15/28 | 33,000 | 33,205 | ||||||||||
| 60,763 | ||||||||||||||
| PACKAGING & CONTAINERS – 3.0% | ||||||||||||||
| Ardagh Metal Packaging Finance USA LLC/Ardagh Metal Packaging Finance PLC(1) | 3.25 | 09/01/28 | 50,000 | 40,781 | ||||||||||
| Ardagh Metal Packaging Finance USA LLC/Ardagh Metal Packaging Finance PLC(1) | 6.00 | 06/15/27 | 55,000 | 52,044 | ||||||||||
| Ardagh Packaging Finance PLC/Ardagh Holdings USA, Inc.(1) | 4.13 | 08/15/26 | 115,000 | 101,605 | ||||||||||
| Ardagh Packaging Finance PLC/Ardagh Holdings USA, Inc.(1) | 5.25 | 04/30/25 | 55,000 | 53,029 | ||||||||||
| Ball Corp. | 2.88 | 08/15/30 | 140,000 | 109,354 | ||||||||||
The accompanying notes are an integral part of these financial statements.
109
BONDBLOXX ETF TRUST
BondBloxx BB Rated USD High Yield Corporate Bond ETF
Portfolio of Investments (Continued)
October 31, 2023
| Face | ||||||||||||||
| Rate (%) | Maturity | Amount | Value | |||||||||||
| PACKAGING & CONTAINERS – 3.0% (Continued) | ||||||||||||||
| Ball Corp. | 3.13 | 09/15/31 | $ | 55,000 | $ | 42,650 | ||||||||
| Ball Corp. | 4.88 | 03/15/26 | 60,000 | 57,689 | ||||||||||
| Ball Corp. | 5.25 | 07/01/25 | 95,000 | 93,630 | ||||||||||
| Ball Corp. | 6.00 | 06/15/29 | 100,000 | 96,008 | ||||||||||
| Ball Corp. | 6.88 | 03/15/28 | 55,000 | 54,895 | ||||||||||
| Berry Global, Inc.(1) | 5.63 | 07/15/27 | 70,000 | 66,892 | ||||||||||
| Cascades, Inc./Cascades USA, Inc.(1) | 5.38 | 01/15/28 | 45,000 | 40,721 | ||||||||||
| Clearwater Paper Corp.(1) | 4.75 | 08/15/28 | 45,000 | 39,769 | ||||||||||
| Crown Americas LLC | 5.25 | 04/01/30 | 50,000 | 45,246 | ||||||||||
| Crown Americas LLC/Crown Americas Capital Corp.V | 4.25 | 09/30/26 | 55,000 | 52,057 | ||||||||||
| Crown Americas LLC/Crown Americas Capital Corp.VI | 4.75 | 02/01/26 | 85,000 | 81,838 | ||||||||||
| Graphic Packaging International LLC(1) | 3.50 | 03/15/28 | 70,000 | 60,647 | ||||||||||
| Graphic Packaging International LLC(1) | 3.75 | 02/01/30 | 60,000 | 49,141 | ||||||||||
| OI European Group BV(1) | 4.75 | 02/15/30 | 35,000 | 29,828 | ||||||||||
| Sealed Air Corp.(1) | 4.00 | 12/01/27 | 35,000 | 30,807 | ||||||||||
| Sealed Air Corp.(1) | 5.00 | 04/15/29 | 45,000 | 39,962 | ||||||||||
| Sealed Air Corp.(1) | 5.13 | 12/01/24 | 20,000 | 19,622 | ||||||||||
| Sealed Air Corp.(1) | 5.50 | 09/15/25 | 30,000 | 29,053 | ||||||||||
| Sealed Air Corp.(1) | 6.88 | 07/15/33 | 45,000 | 42,252 | ||||||||||
| Sealed Air Corp./Sealed Air Corp. US(1) | 6.13 | 02/01/28 | 75,000 | 71,480 | ||||||||||
| Silgan Holdings, Inc. | 4.13 | 02/01/28 | 50,000 | 44,210 | ||||||||||
| TriMas Corp.(1) | 4.13 | 04/15/29 | 30,000 | 24,955 | ||||||||||
| 1,470,165 | ||||||||||||||
| PHARMACEUTICALS – 1.3% | ||||||||||||||
| 180 Medical, Inc.(1) | 3.88 | 10/15/29 | 50,000 | 41,594 | ||||||||||
| Jazz Securities DAC(1) | 4.38 | 01/15/29 | 140,000 | 121,875 | ||||||||||
| Organon & Co./Organon Foreign Debt Co.-Issuer BV(1) | 4.13 | 04/30/28 | 185,000 | 159,967 | ||||||||||
| Perrigo Finance Unlimited Co. | 3.90 | 12/15/24 | 25,000 | 24,273 | ||||||||||
| Perrigo Finance Unlimited Co. | 4.38 | 03/15/26 | 95,000 | 89,280 | ||||||||||
| Perrigo Finance Unlimited Co. | 4.65 | 06/15/30 | 70,000 | 58,534 | ||||||||||
| Perrigo Finance Unlimited Co. | 4.90 | 12/15/44 | 25,000 | 17,104 | ||||||||||
| PRA Health Sciences, Inc.(1) | 2.88 | 07/15/26 | 50,000 | 45,761 | ||||||||||
| Prestige Brands, Inc.(1) | 3.75 | 04/01/31 | 55,000 | 43,739 | ||||||||||
| Prestige Brands, Inc.(1) | 5.13 | 01/15/28 | 35,000 | 32,305 | ||||||||||
| 634,432 | ||||||||||||||
| PIPELINES – 8.5% | ||||||||||||||
| Antero Midstream Partners LP/Antero Midstream Finance Corp.(1) | 5.38 | 06/15/29 | 90,000 | 81,808 | ||||||||||
| Antero Midstream Partners LP/Antero Midstream Finance Corp.(1) | 5.75 | 03/01/27 | 60,000 | 57,404 | ||||||||||
| Antero Midstream Partners LP/Antero Midstream Finance Corp.(1) | 5.75 | 01/15/28 | 30,000 | 28,154 | ||||||||||
| Antero Midstream Partners LP/Antero Midstream Finance Corp.(1) | 7.88 | 05/15/26 | 50,000 | 50,403 | ||||||||||
| Buckeye Partners LP | 3.95 | 12/01/26 | 60,000 | 54,748 | ||||||||||
| Buckeye Partners LP(1) | 4.13 | 03/01/25 | 49,000 | 46,715 | ||||||||||
| Buckeye Partners LP | 4.13 | 12/01/27 | 48,000 | 41,755 | ||||||||||
| Buckeye Partners LP(1) | 4.50 | 03/01/28 | 30,000 | 26,133 | ||||||||||
| Buckeye Partners LP | 5.85 | 11/15/43 | 55,000 | 38,922 | ||||||||||
| CNX Midstream Partners LP(1) | 4.75 | 04/15/30 | 35,000 | 28,876 | ||||||||||
| CQP Holdco LP/BIP-V Chinook Holdco LLC(1) | 5.50 | 06/15/31 | 125,000 | 108,858 | ||||||||||
| Crestwood Midstream Partners LP/Crestwood Midstream Finance Corp.(1) | 5.63 | 05/01/27 | 45,000 | 43,329 | ||||||||||
The accompanying notes are an integral part of these financial statements.
110
BONDBLOXX ETF TRUST
BondBloxx BB Rated USD High Yield Corporate Bond ETF
Portfolio of Investments (Continued)
October 31, 2023
| Face | ||||||||||||||
| Rate (%) | Maturity | Amount | Value | |||||||||||
| PIPELINES – 8.5% (Continued) | ||||||||||||||
| Crestwood Midstream Partners LP/Crestwood Midstream Finance Corp. | 5.75 | 04/01/25 | $ | 45,000 | $ | 44,481 | ||||||||
| Crestwood Midstream Partners LP/Crestwood Midstream Finance Corp.(1) | 6.00 | 02/01/29 | 80,000 | 77,488 | ||||||||||
| Crestwood Midstream Partners LP/Crestwood Midstream Finance Corp.(1) | 7.38 | 02/01/31 | 50,000 | 50,450 | ||||||||||
| Crestwood Midstream Partners LP/Crestwood Midstream Finance Corp.(1) | 8.00 | 04/01/29 | 30,000 | 30,694 | ||||||||||
| DT Midstream, Inc.(1) | 4.13 | 06/15/29 | 90,000 | 77,469 | ||||||||||
| DT Midstream, Inc.(1) | 4.38 | 06/15/31 | 95,000 | 78,987 | ||||||||||
| EnLink Midstream LLC | 5.38 | 06/01/29 | 45,000 | 41,214 | ||||||||||
| EnLink Midstream LLC(1) | 5.63 | 01/15/28 | 40,000 | 37,756 | ||||||||||
| EnLink Midstream LLC(1) | 6.50 | 09/01/30 | 90,000 | 86,469 | ||||||||||
| EnLink Midstream Partners LP | 4.15 | 06/01/25 | 43,000 | 41,400 | ||||||||||
| EnLink Midstream Partners LP | 4.85 | 07/15/26 | 25,000 | 23,525 | ||||||||||
| EnLink Midstream Partners LP | 5.05 | 04/01/45 | 40,000 | 28,719 | ||||||||||
| EnLink Midstream Partners LP | 5.45 | 06/01/47 | 55,000 | 41,404 | ||||||||||
| EnLink Midstream Partners LP | 5.60 | 04/01/44 | 30,000 | 23,620 | ||||||||||
| EQM Midstream Partners LP | 4.13 | 12/01/26 | 45,000 | 41,788 | ||||||||||
| EQM Midstream Partners LP(1) | 4.50 | 01/15/29 | 60,000 | 52,677 | ||||||||||
| EQM Midstream Partners LP(1) | 4.75 | 01/15/31 | 105,000 | 88,526 | ||||||||||
| EQM Midstream Partners LP | 5.50 | 07/15/28 | 75,000 | 70,067 | ||||||||||
| EQM Midstream Partners LP(1) | 6.00 | 07/01/25 | 25,000 | 24,472 | ||||||||||
| EQM Midstream Partners LP(1) | 6.50 | 07/01/27 | 80,000 | 77,838 | ||||||||||
| EQM Midstream Partners LP | 6.50 | 07/15/48 | 45,000 | 38,099 | ||||||||||
| EQM Midstream Partners LP(1) | 7.50 | 06/01/27 | 50,000 | 49,570 | ||||||||||
| EQM Midstream Partners LP(1) | 7.50 | 06/01/30 | 50,000 | 49,110 | ||||||||||
| Harvest Midstream I LP(1) | 7.50 | 09/01/28 | 70,000 | 66,400 | ||||||||||
| Hess Midstream Operations LP(1) | 4.25 | 02/15/30 | 105,000 | 89,945 | ||||||||||
| Hess Midstream Operations LP(1) | 5.50 | 10/15/30 | 20,000 | 18,175 | ||||||||||
| Hess Midstream Operations LP(1) | 5.63 | 02/15/26 | 100,000 | 96,941 | ||||||||||
| Holly Energy Partners LP/Holly Energy Finance Corp.(1) | 5.00 | 02/01/28 | 45,000 | 41,701 | ||||||||||
| Holly Energy Partners LP/Holly Energy Finance Corp.(1) | 6.38 | 04/15/27 | 35,000 | 33,919 | ||||||||||
| Kinetik Holdings LP(1) | 5.88 | 06/15/30 | 90,000 | 82,668 | ||||||||||
| New Fortress Energy, Inc.(1) | 6.50 | 09/30/26 | 125,000 | 112,078 | ||||||||||
| New Fortress Energy, Inc.(1) | 6.75 | 09/15/25 | 120,000 | 111,440 | ||||||||||
| Northriver Midstream Finance LP(1) | 5.63 | 02/15/26 | 50,000 | 47,329 | ||||||||||
| NuStar Logistics LP | 5.63 | 04/28/27 | 55,000 | 51,909 | ||||||||||
| NuStar Logistics LP | 6.00 | 06/01/26 | 95,000 | 91,751 | ||||||||||
| NuStar Logistics LP | 6.38 | 10/01/30 | 50,000 | 46,301 | ||||||||||
| Rockies Express Pipeline LLC(1) | 3.60 | 05/15/25 | 30,000 | 28,420 | ||||||||||
| Rockies Express Pipeline LLC(1) | 4.80 | 05/15/30 | 25,000 | 21,044 | ||||||||||
| Rockies Express Pipeline LLC(1) | 4.95 | 07/15/29 | 40,000 | 35,296 | ||||||||||
| Rockies Express Pipeline LLC(1) | 7.50 | 07/15/38 | 80,000 | 74,037 | ||||||||||
| Tallgrass Energy Partners LP/Tallgrass Energy Finance Corp.(1) | 5.50 | 01/15/28 | 110,000 | 96,465 | ||||||||||
| Tallgrass Energy Partners LP/Tallgrass Energy Finance Corp.(1) | 6.00 | 12/31/30 | 65,000 | 54,786 | ||||||||||
| Tallgrass Energy Partners LP/Tallgrass Energy Finance Corp.(1) | 6.00 | 09/01/31 | 35,000 | 29,488 | ||||||||||
| Tallgrass Energy Partners LP/Tallgrass Energy Finance Corp.(1) | 7.50 | 10/01/25 | 55,000 | 54,240 | ||||||||||
| Venture Global Calcasieu Pass LLC(1) | 3.88 | 08/15/29 | 120,000 | 99,967 | ||||||||||
| Venture Global Calcasieu Pass LLC(1) | 3.88 | 11/01/33 | 110,000 | 83,239 | ||||||||||
| Venture Global Calcasieu Pass LLC(1) | 4.13 | 08/15/31 | 110,000 | 88,554 | ||||||||||
| Venture Global Calcasieu Pass LLC(1) | 6.25 | 01/15/30 | 85,000 | 80,266 | ||||||||||
The accompanying notes are an integral part of these financial statements.
111
BONDBLOXX ETF TRUST
BondBloxx BB Rated USD High Yield Corporate Bond ETF
Portfolio of Investments (Continued)
October 31, 2023
| Face | ||||||||||||||
| Rate (%) | Maturity | Amount | Value | |||||||||||
| PIPELINES – 8.5% (Continued) | ||||||||||||||
| Venture Global LNG, Inc.(1) | 8.13 | 06/01/28 | $ | 205,000 | $ | 199,175 | ||||||||
| Venture Global LNG, Inc.(1) | 8.38 | 06/01/31 | 195,000 | 186,225 | ||||||||||
| Venture Global LNG, Inc.(1) | 9.50 | 02/01/29 | 220,000 | 223,644 | ||||||||||
| Venture Global LNG, Inc.(1) | 9.88 | 02/01/32 | 135,000 | 136,973 | ||||||||||
| 4,165,304 | ||||||||||||||
| REAL ESTATE – 0.6% | ||||||||||||||
| Cushman & Wakefield US Borrower LLC(1) | 6.75 | 05/15/28 | 55,000 | 50,210 | ||||||||||
| Cushman & Wakefield US Borrower LLC(1) | 8.88 | 09/01/31 | 35,000 | 33,217 | ||||||||||
| Greystar Real Estate Partners LLC(1) | 7.75 | 09/01/30 | 35,000 | 34,433 | ||||||||||
| Howard Hughes Corp.(1) | 4.13 | 02/01/29 | 55,000 | 44,195 | ||||||||||
| Howard Hughes Corp.(1) | 4.38 | 02/01/31 | 65,000 | 49,556 | ||||||||||
| Howard Hughes Corp.(1) | 5.38 | 08/01/28 | 65,000 | 57,212 | ||||||||||
| 268,823 | ||||||||||||||
| REAL ESTATE INVESTMENT TRUST (REITS) – 4.1% | ||||||||||||||
| Blackstone Mortgage Trust, Inc.(1) | 3.75 | 01/15/27 | 35,000 | 29,136 | ||||||||||
| Brandywine Operating Partnership LP | 3.95 | 11/15/27 | 45,000 | 37,326 | ||||||||||
| Brandywine Operating Partnership LP | 4.55 | 10/01/29 | 35,000 | 26,821 | ||||||||||
| Brandywine Operating Partnership LP | 7.80 | 03/15/28 | 20,000 | 18,043 | ||||||||||
| Brookfield Property REIT, Inc./BPR Cumulus LLC/BPR Nimbus LLC/GGSI Sellco LL(1) | 4.50 | 04/01/27 | 100,000 | 83,535 | ||||||||||
| Brookfield Property REIT, Inc./BPR Cumulus LLC/BPR Nimbus LLC/GGSI Sellco LL(1) | 5.75 | 05/15/26 | 50,000 | 45,839 | ||||||||||
| CTR Partnership LP/CareTrust Capital Corp.(1) | 3.88 | 06/30/28 | 30,000 | 25,239 | ||||||||||
| Global Net Lease, Inc./Global Net Lease Operating Partnership LP(1) | 3.75 | 12/15/27 | 40,000 | 30,302 | ||||||||||
| HAT Holdings I LLC/HAT Holdings II LLC(1) | 3.38 | 06/15/26 | 85,000 | 74,913 | ||||||||||
| HAT Holdings I LLC/HAT Holdings II LLC(1) | 3.75 | 09/15/30 | 30,000 | 21,568 | ||||||||||
| HAT Holdings I LLC/HAT Holdings II LLC(1) | 6.00 | 04/15/25 | 40,000 | 38,911 | ||||||||||
| Iron Mountain Information Management Services, Inc.(1) | 5.00 | 07/15/32 | 75,000 | 61,456 | ||||||||||
| Iron Mountain, Inc.(1) | 4.50 | 02/15/31 | 75,000 | 61,430 | ||||||||||
| Iron Mountain, Inc.(1) | 4.88 | 09/15/27 | 85,000 | 77,784 | ||||||||||
| Iron Mountain, Inc.(1) | 4.88 | 09/15/29 | 90,000 | 78,503 | ||||||||||
| Iron Mountain, Inc.(1) | 5.00 | 07/15/28 | 25,000 | 22,400 | ||||||||||
| Iron Mountain, Inc.(1) | 5.25 | 03/15/28 | 65,000 | 59,529 | ||||||||||
| Iron Mountain, Inc.(1) | 5.25 | 07/15/30 | 130,000 | 113,041 | ||||||||||
| Iron Mountain, Inc.(1) | 5.63 | 07/15/32 | 60,000 | 51,325 | ||||||||||
| Iron Mountain, Inc.(1) | 7.00 | 02/15/29 | 105,000 | 101,841 | ||||||||||
| Ladder Capital Finance Holdings LLLP/Ladder Capital Finance Corp.(1) | 4.25 | 02/01/27 | 55,000 | 48,102 | ||||||||||
| Ladder Capital Finance Holdings LLLP/Ladder Capital Finance Corp.(1) | 4.75 | 06/15/29 | 65,000 | 52,359 | ||||||||||
| Ladder Capital Finance Holdings LLLP/Ladder Capital Finance Corp.(1) | 5.25 | 10/01/25 | 20,000 | 19,033 | ||||||||||
| MPT Operating Partnership LP/MPT Finance Corp. | 3.50 | 03/15/31 | 120,000 | 72,889 | ||||||||||
| MPT Operating Partnership LP/MPT Finance Corp. | 4.63 | 08/01/29 | 75,000 | 52,070 | ||||||||||
| MPT Operating Partnership LP/MPT Finance Corp. | 5.00 | 10/15/27 | 125,000 | 96,688 | ||||||||||
| MPT Operating Partnership LP/MPT Finance Corp. | 5.25 | 08/01/26 | 40,000 | 34,479 | ||||||||||
| Necessity Retail REIT, Inc./American Finance Operating Partner LP(1) | 4.50 | 09/30/28 | 50,000 | 37,491 | ||||||||||
| RLJ Lodging Trust LP(1) | 3.75 | 07/01/26 | 45,000 | 40,543 | ||||||||||
| RLJ Lodging Trust LP(1) | 4.00 | 09/15/29 | 45,000 | 36,727 | ||||||||||
| SBA Communications Corp. | 3.13 | 02/01/29 | 130,000 | 107,615 | ||||||||||
| SBA Communications Corp. | 3.88 | 02/15/27 | 135,000 | 123,059 | ||||||||||
The accompanying notes are an integral part of these financial statements.
112
BONDBLOXX ETF TRUST
BondBloxx BB Rated USD High Yield Corporate Bond ETF
Portfolio of Investments (Continued)
October 31, 2023
| Face | ||||||||||||||
| Rate (%) | Maturity | Amount | Value | |||||||||||
| REAL ESTATE INVESTMENT TRUST (REITS) – 4.1% (Continued) | ||||||||||||||
| Service Properties Trust | 5.50 | 12/15/27 | $ | 35,000 | $ | 29,584 | ||||||||
| Service Properties Trust | 7.50 | 09/15/25 | 80,000 | 77,812 | ||||||||||
| Starwood Property Trust, Inc.(1) | 3.63 | 07/15/26 | 40,000 | 35,364 | ||||||||||
| Starwood Property Trust, Inc.(1) | 3.75 | 12/31/24 | 43,000 | 40,677 | ||||||||||
| Starwood Property Trust, Inc.(1) | 4.38 | 01/15/27 | 45,000 | 38,653 | ||||||||||
| Starwood Property Trust, Inc. | 4.75 | 03/15/25 | 30,000 | 28,740 | ||||||||||
| 2,030,827 | ||||||||||||||
| RETAIL – 5.2% | ||||||||||||||
| 1011778 BC ULC/New Red Finance, Inc.(1) | 3.50 | 02/15/29 | 70,000 | 59,928 | ||||||||||
| 1011778 BC ULC/New Red Finance, Inc.(1) | 3.88 | 01/15/28 | 135,000 | 120,645 | ||||||||||
| 1011778 BC ULC/New Red Finance, Inc.(1) | 5.75 | 04/15/25 | 45,000 | 44,675 | ||||||||||
| Academy Ltd.(1) | 6.00 | 11/15/27 | 35,000 | 32,989 | ||||||||||
| Asbury Automotive Group, Inc. | 4.50 | 03/01/28 | 40,000 | 35,490 | ||||||||||
| Asbury Automotive Group, Inc.(1) | 4.63 | 11/15/29 | 65,000 | 55,065 | ||||||||||
| Asbury Automotive Group, Inc. | 4.75 | 03/01/30 | 40,000 | 33,995 | ||||||||||
| Asbury Automotive Group, Inc.(1) | 5.00 | 02/15/32 | 55,000 | 44,666 | ||||||||||
| Bath & Body Works, Inc. | 5.25 | 02/01/28 | 40,000 | 36,721 | ||||||||||
| Bath & Body Works, Inc.(1) | 6.63 | 10/01/30 | 85,000 | 78,803 | ||||||||||
| Bath & Body Works, Inc. | 6.69 | 01/15/27 | 25,000 | 24,192 | ||||||||||
| Bath & Body Works, Inc. | 6.75 | 07/01/36 | 55,000 | 47,496 | ||||||||||
| Bath & Body Works, Inc. | 6.88 | 11/01/35 | 75,000 | 66,260 | ||||||||||
| Bath & Body Works, Inc. | 7.50 | 06/15/29 | 45,000 | 44,001 | ||||||||||
| Bath & Body Works, Inc.(1) | 9.38 | 07/01/25 | 35,000 | 36,081 | ||||||||||
| Beacon Roofing Supply, Inc.(1) | 4.50 | 11/15/26 | 25,000 | 23,324 | ||||||||||
| Beacon Roofing Supply, Inc.(1) | 6.50 | 08/01/30 | 55,000 | 52,571 | ||||||||||
| FirstCash, Inc.(1) | 4.63 | 09/01/28 | 45,000 | 39,520 | ||||||||||
| FirstCash, Inc.(1) | 5.63 | 01/01/30 | 55,000 | 49,032 | ||||||||||
| Foot Locker, Inc.(1) | 4.00 | 10/01/29 | 35,000 | 25,769 | ||||||||||
| Gap, Inc.(1) | 3.63 | 10/01/29 | 80,000 | 61,206 | ||||||||||
| Gap, Inc.(1) | 3.88 | 10/01/31 | 65,000 | 46,750 | ||||||||||
| Group 1 Automotive, Inc.(1) | 4.00 | 08/15/28 | 65,000 | 56,018 | ||||||||||
| KFC Holding Co./Pizza Hut Holdings LLC/Taco Bell of America LLC(1) | 4.75 | 06/01/27 | 55,000 | 52,062 | ||||||||||
| Kohl’s Corp. | 4.25 | 07/17/25 | 25,000 | 23,373 | ||||||||||
| Kohl’s Corp. | 4.63 | 05/01/31 | 65,000 | 44,518 | ||||||||||
| Kohl’s Corp. | 5.55 | 07/17/45 | 30,000 | 17,433 | ||||||||||
| Lithia Motors, Inc.(1) | 3.88 | 06/01/29 | 70,000 | 57,988 | ||||||||||
| Lithia Motors, Inc.(1) | 4.38 | 01/15/31 | 60,000 | 48,642 | ||||||||||
| Lithia Motors, Inc.(1) | 4.63 | 12/15/27 | 25,000 | 22,582 | ||||||||||
| Macy’s Retail Holdings LLC | 4.30 | 02/15/43 | 25,000 | 13,735 | ||||||||||
| Macy’s Retail Holdings LLC | 4.50 | 12/15/34 | 40,000 | 26,844 | ||||||||||
| Macy’s Retail Holdings LLC | 5.13 | 01/15/42 | 25,000 | 15,425 | ||||||||||
| Macy’s Retail Holdings LLC(1) | 5.88 | 04/01/29 | 40,000 | 35,305 | ||||||||||
| Macy’s Retail Holdings LLC(1) | 5.88 | 03/15/30 | 25,000 | 21,180 | ||||||||||
| Macy’s Retail Holdings LLC(1) | 6.13 | 03/15/32 | 40,000 | 33,080 | ||||||||||
| Marks & Spencer PLC(1) | 7.13 | 12/01/37 | 30,000 | 27,377 | ||||||||||
| Murphy Oil USA, Inc.(1) | 3.75 | 02/15/31 | 40,000 | 32,179 | ||||||||||
| Murphy Oil USA, Inc. | 4.75 | 09/15/29 | 50,000 | 44,326 | ||||||||||
| Murphy Oil USA, Inc. | 5.63 | 05/01/27 | 20,000 | 19,352 | ||||||||||
The accompanying notes are an integral part of these financial statements.
113
BONDBLOXX ETF TRUST
BondBloxx BB Rated USD High Yield Corporate Bond ETF
Portfolio of Investments (Continued)
October 31, 2023
| Face | ||||||||||||||
| Rate (%) | Maturity | Amount | Value | |||||||||||
| RETAIL – 5.2% (Continued) | ||||||||||||||
| Nordstrom, Inc. | 4.00 | 03/15/27 | $ | 30,000 | $ | 26,516 | ||||||||
| Nordstrom, Inc. | 4.25 | 08/01/31 | 25,000 | 18,343 | ||||||||||
| Nordstrom, Inc. | 4.38 | 04/01/30 | 45,000 | 34,983 | ||||||||||
| Nordstrom, Inc. | 5.00 | 01/15/44 | 105,000 | 63,226 | ||||||||||
| Nordstrom, Inc. | 6.95 | 03/15/28 | 25,000 | 23,556 | ||||||||||
| Penske Automotive Group, Inc. | 3.50 | 09/01/25 | 50,000 | 47,506 | ||||||||||
| Penske Automotive Group, Inc. | 3.75 | 06/15/29 | 44,000 | 36,357 | ||||||||||
| PetSmart, Inc./PetSmart Finance Corp.(1) | 4.75 | 02/15/28 | 105,000 | 93,026 | ||||||||||
| Sally Holdings LLC/Sally Capital, Inc. | 5.63 | 12/01/25 | 60,000 | 58,057 | ||||||||||
| Sonic Automotive, Inc.(1) | 4.63 | 11/15/29 | 50,000 | 41,690 | ||||||||||
| Sonic Automotive, Inc.(1) | 4.88 | 11/15/31 | 50,000 | 39,881 | ||||||||||
| Superior Plus LP/Superior General Partner, Inc.(1) | 4.50 | 03/15/29 | 50,000 | 42,698 | ||||||||||
| Yum! Brands, Inc. | 3.63 | 03/15/31 | 80,000 | 65,047 | ||||||||||
| Yum! Brands, Inc. | 4.63 | 01/31/32 | 80,000 | 68,254 | ||||||||||
| Yum! Brands, Inc.(1) | 4.75 | 01/15/30 | 95,000 | 84,679 | ||||||||||
| Yum! Brands, Inc. | 5.35 | 11/01/43 | 25,000 | 21,315 | ||||||||||
| Yum! Brands, Inc. | 5.38 | 04/01/32 | 105,000 | 94,500 | ||||||||||
| Yum! Brands, Inc. | 6.88 | 11/15/37 | 30,000 | 29,648 | ||||||||||
| 2,539,880 | ||||||||||||||
| SEMICONDUCTORS – 0.8% | ||||||||||||||
| Amkor Technology, Inc.(1) | 6.63 | 09/15/27 | 50,000 | 48,718 | ||||||||||
| Entegris Escrow Corp.(1) | 4.75 | 04/15/29 | 150,000 | 134,478 | ||||||||||
| Entegris Escrow Corp.(1) | 5.95 | 06/15/30 | 60,000 | 54,959 | ||||||||||
| Entegris, Inc.(1) | 3.63 | 05/01/29 | 40,000 | 33,492 | ||||||||||
| Entegris, Inc.(1) | 4.38 | 04/15/28 | 40,000 | 35,733 | ||||||||||
| ON Semiconductor Corp.(1) | 3.88 | 09/01/28 | 60,000 | 51,610 | ||||||||||
| Synaptics, Inc.(1) | 4.00 | 06/15/29 | 40,000 | 33,051 | ||||||||||
| 392,041 | ||||||||||||||
| SOFTWARE – 1.5% | ||||||||||||||
| Camelot Finance SA(1) | 4.50 | 11/01/26 | 60,000 | 55,531 | ||||||||||
| Clarivate Science Holdings Corp.(1) | 3.88 | 07/01/28 | 80,000 | 68,787 | ||||||||||
| Fair Isaac Corp.(1) | 4.00 | 06/15/28 | 75,000 | 66,871 | ||||||||||
| Fair Isaac Corp.(1) | 5.25 | 05/15/26 | 40,000 | 38,537 | ||||||||||
| Open Text Corp.(1) | 3.88 | 02/15/28 | 85,000 | 73,972 | ||||||||||
| Open Text Corp.(1) | 3.88 | 12/01/29 | 65,000 | 53,237 | ||||||||||
| Open Text Holdings, Inc.(1) | 4.13 | 02/15/30 | 80,000 | 66,388 | ||||||||||
| Open Text Holdings, Inc.(1) | 4.13 | 12/01/31 | 65,000 | 51,132 | ||||||||||
| PTC, Inc.(1) | 3.63 | 02/15/25 | 40,000 | 38,602 | ||||||||||
| PTC, Inc.(1) | 4.00 | 02/15/28 | 50,000 | 44,390 | ||||||||||
| RingCentral, Inc.(1) | 8.50 | 08/15/30 | 35,000 | 33,290 | ||||||||||
| ROBLOX Corp.(1) | 3.88 | 05/01/30 | 90,000 | 73,123 | ||||||||||
| Twilio, Inc. | 3.63 | 03/15/29 | 45,000 | 37,458 | ||||||||||
| Twilio, Inc. | 3.88 | 03/15/31 | 40,000 | 31,970 | ||||||||||
| 733,288 | ||||||||||||||
| TELECOMMUNICATIONS – 2.9% | ||||||||||||||
| British Telecommunications PLC(1) | 4.25 | 11/23/81 | 45,000 | 39,351 | ||||||||||
| British Telecommunications PLC(1) | 4.88 | 11/23/81 | 40,000 | 32,341 | ||||||||||
The accompanying notes are an integral part of these financial statements.
114
BONDBLOXX ETF TRUST
BondBloxx BB Rated USD High Yield Corporate Bond ETF
Portfolio of Investments (Continued)
October 31, 2023
| Face | ||||||||||||||
| Rate (%) | Maturity | Amount | Value | |||||||||||
| TELECOMMUNICATIONS – 2.9% (Continued) | ||||||||||||||
| Ciena Corp.(1) | 4.00 | 01/31/30 | $ | 30,000 | $ | 25,031 | ||||||||
| Connect FinCo. Sarl/Connect US FinCo. LLC(1) | 6.75 | 10/01/26 | 185,000 | 172,658 | ||||||||||
| Hughes Satellite Systems Corp. | 5.25 | 08/01/26 | 65,000 | 58,520 | ||||||||||
| Intelsat Jackson Holdings SA(1) | 6.50 | 03/15/30 | 265,000 | 233,341 | ||||||||||
| Millicom International Cellular SA(1) | 4.50 | 04/27/31 | 95,000 | 71,725 | ||||||||||
| Millicom International Cellular SA(1) | 6.25 | 03/25/29 | 76,500 | 66,603 | ||||||||||
| Rogers Communications, Inc.(1) | 5.25 | 03/15/82 | 65,000 | 57,282 | ||||||||||
| Sable International Finance Ltd.(1) | 5.75 | 09/07/27 | 50,000 | 45,364 | ||||||||||
| United States Cellular Corp. | 6.70 | 12/15/33 | 45,000 | 42,750 | ||||||||||
| Viasat, Inc.(1) | 5.63 | 04/15/27 | 50,000 | 43,695 | ||||||||||
| Viavi Solutions, Inc.(1) | 3.75 | 10/01/29 | 30,000 | 23,385 | ||||||||||
| Vmed O2 UK Financing I PLC(1) | 4.25 | 01/31/31 | 130,000 | 102,378 | ||||||||||
| Vmed O2 UK Financing I PLC(1) | 4.75 | 07/15/31 | 120,000 | 96,698 | ||||||||||
| Vodafone Group PLC | 3.25 | 06/04/81 | 50,000 | 43,969 | ||||||||||
| Vodafone Group PLC | 4.13 | 06/04/81 | 100,000 | 75,781 | ||||||||||
| Vodafone Group PLC | 5.13 | 06/04/81 | 90,000 | 57,345 | ||||||||||
| Vodafone Group PLC | 7.00 | 04/04/79 | 160,000 | 154,848 | ||||||||||
| 1,443,065 | ||||||||||||||
| TRANSPORTATION – 0.7% | ||||||||||||||
| Cargo Aircraft Management, Inc.(1) | 4.75 | 02/01/28 | 50,000 | 44,184 | ||||||||||
| Danaos Corp.(1) | 8.50 | 03/01/28 | 25,000 | 24,916 | ||||||||||
| First Student Bidco, Inc./First Transit Parent, Inc.(1) | 4.00 | 07/31/29 | 55,000 | 44,339 | ||||||||||
| Forward Air Corp.(1) | 9.50 | 10/15/31 | 65,000 | 63,428 | ||||||||||
| Rand Parent LLC(1) | 8.50 | 02/15/30 | 75,000 | 68,560 | ||||||||||
| XPO CNW, Inc. | 6.70 | 05/01/34 | 25,000 | 23,151 | ||||||||||
| XPO Escrow Sub LLC(1) | 7.50 | 11/15/27 | 30,000 | 30,027 | ||||||||||
| XPO, Inc.(1) | 7.13 | 06/01/31 | 40,000 | 39,012 | ||||||||||
| 337,617 | ||||||||||||||
| TRUCKING & LEASING – 0.4% | ||||||||||||||
| AerCap Global Aviation Trust(1) | 6.50 | 06/15/45 | 45,000 | 44,192 | ||||||||||
| Fortress Transportation & Infrastructure Investors LLC(1) | 5.50 | 05/01/28 | 85,000 | 77,393 | ||||||||||
| Fortress Transportation & Infrastructure Investors LLC(1) | 6.50 | 10/01/25 | 55,000 | 54,512 | ||||||||||
| Fortress Transportation & Infrastructure Investors LLC(1) | 9.75 | 08/01/27 | 40,000 | 41,196 | ||||||||||
| 217,293 | ||||||||||||||
| TOTAL CORPORATE BONDS (Cost - $50,405,948) | 47,993,445 | |||||||||||||
| SHORT-TERM INVESTMENTS – 0.4% | ||||||||||||||
| TIME DEPOSITS – 0.4% | ||||||||||||||
| ANZ National Bank, London | 4.68 | 11/01/23 | 207,180 | 207,180 | ||||||||||
| TOTAL SHORT-TERM INVESTMENTS (Cost - $207,180) | 207,180 | |||||||||||||
| TOTAL INVESTMENTS – 98.2% (Cost - $50,613,128) | $ | 48,200,625 | ||||||||||||
| OTHER ASSETS LESS LIABILITIES – 1.8% | 874,152 | |||||||||||||
| NET ASSETS – 100.0% | $ | 49,074,777 | ||||||||||||
| (1) | Security was purchased pursuant to Rule 144A under the Securities Act of 1933 and may not be resold subject to that Rule except to qualified institutional buyers. The aggregate value of Rule 144A holdings at October 31, 2023, amounts to $33,626,378 and represents 68.5% of net assets. These securities have been deemed liquid under procedures approved by the Trust’s Board of Trustees. |
| (2) | Security is perpetual in nature and has no stated maturity date. |
The accompanying notes are an integral part of these financial statements.
115
BONDBLOXX ETF TRUST
BondBloxx CCC Rated USD High Yield Corporate Bond ETF
Portfolio of Investments
October 31, 2023
| Shares | Value | |||||||||||||
| COMMON STOCKS – 0.0% | ||||||||||||||
| REAL ESTATE – 0.0% | ||||||||||||||
| WeWork, Inc. Class A* | 1,339 | $ | 3,053 | |||||||||||
| TOTAL COMMON STOCKS (Cost - $49,477) | 3,053 | |||||||||||||
| Face | ||||||||||||||
| Rate (%) | Maturity | Amount | ||||||||||||
| CORPORATE BONDS – 96.5% | ||||||||||||||
| ADVERTISING – 2.0% | ||||||||||||||
| Clear Channel Outdoor Holdings, Inc.(1) | 7.50 | 06/01/29 | $ | 185,000 | 134,852 | |||||||||
| Clear Channel Outdoor Holdings, Inc.(1) | 7.75 | 04/15/28 | 175,000 | 133,966 | ||||||||||
| CMG Media Corp.(1) | 8.88 | 12/15/27 | 155,000 | 119,897 | ||||||||||
| 388,715 | ||||||||||||||
| AEROSPACE/DEFENSE – 0.9% | ||||||||||||||
| Spirit AeroSystems, Inc. | 4.60 | 06/15/28 | 120,000 | 95,051 | ||||||||||
| Triumph Group, Inc. | 7.75 | 08/15/25 | 85,000 | 80,835 | ||||||||||
| 175,886 | ||||||||||||||
| AGRICULTURE – 0.5% | ||||||||||||||
| Vector Group Ltd.(1) | 10.50 | 11/01/26 | 95,000 | 95,150 | ||||||||||
| AUTO MANUFACTURERS – 2.0% | ||||||||||||||
| Aston Martin Capital Holdings Ltd.(1) | 10.50 | 11/30/25 | 200,000 | 198,005 | ||||||||||
| McLaren Finance PLC(1) | 7.50 | 08/01/26 | 110,000 | 94,886 | ||||||||||
| PM General Purchaser LLC(1) | 9.50 | 10/01/28 | 105,000 | 98,802 | ||||||||||
| 391,693 | ||||||||||||||
| AUTO PARTS & EQUIPMENT – 2.7% | ||||||||||||||
| Clarios Global LP/Clarios US Finance Co.(1) | 8.50 | 05/15/27 | 285,000 | 281,138 | ||||||||||
| Dealer Tire LLC/DT Issuer LLC(1) | 8.00 | 02/01/28 | 90,000 | 84,509 | ||||||||||
| Dornoch Debt Merger Sub, Inc.(1) | 6.63 | 10/15/29 | 115,000 | 90,594 | ||||||||||
| Real Hero Merger Sub 2, Inc.(1) | 6.25 | 02/01/29 | 105,000 | 83,631 | ||||||||||
| 539,872 | ||||||||||||||
| BEVERAGES – 0.5% | ||||||||||||||
| Triton Water Holdings, Inc.(1) | 6.25 | 04/01/29 | 125,000 | 103,131 | ||||||||||
| BIOTECHNOLOGY – 0.2% | ||||||||||||||
| Emergent BioSolutions, Inc.(1) | 3.88 | 08/15/28 | 80,000 | 31,535 | ||||||||||
| BUILDING MATERIALS – 1.3% | ||||||||||||||
| ACProducts Holdings, Inc.(1) | 6.38 | 05/15/29 | 90,000 | 55,037 | ||||||||||
| Cornerstone Building Brands, Inc.(1) | 6.13 | 01/15/29 | 55,000 | 40,262 | ||||||||||
| CP Atlas Buyer, Inc.(1) | 7.00 | 12/01/28 | 87,000 | 66,400 | ||||||||||
| Oscar Acquisition Co. LLC/Oscar Finance, Inc.(1) | 9.50 | 04/15/30 | 110,000 | 97,154 | ||||||||||
| 258,853 | ||||||||||||||
| CHEMICALS – 3.7% | ||||||||||||||
| ASP Unifrax Holdings, Inc.(1) | 7.50 | 09/30/29 | 70,000 | 37,525 | ||||||||||
| Illuminate Buyer LLC/Illuminate Holdings IV, Inc.(1) | 9.00 | 07/01/28 | 80,000 | 74,828 | ||||||||||
| Innophos Holdings, Inc.(1) | 9.38 | 02/15/28 | 50,000 | 47,211 | ||||||||||
| Iris Holding, Inc.(1) | 10.00 | 12/15/28 | 70,000 | 51,150 | ||||||||||
The accompanying notes are an integral part of these financial statements.
116
BONDBLOXX ETF TRUST
BondBloxx CCC Rated USD High Yield Corporate Bond ETF
Portfolio of Investments (Continued)
October 31, 2023
| Face | ||||||||||||||
| Rate (%) | Maturity | Amount | Value | |||||||||||
| CHEMICALS – 3.7% (Continued) | ||||||||||||||
| LSF11 A5 Hold Co. LLC(1) | 6.63 | 10/15/29 | $ | 63,000 | $ | 51,167 | ||||||||
| Olympus Water US Holding Corp.(1) | 6.25 | 10/01/29 | 70,000 | 52,564 | ||||||||||
| Polar US Borrower LLC/Schenectady International Group, Inc.(1) | 6.75 | 05/15/26 | 35,000 | 15,607 | ||||||||||
| SCIH Salt Holdings, Inc.(1) | 6.63 | 05/01/29 | 125,000 | 104,909 | ||||||||||
| Trinseo Materials Operating SCA/Trinseo Materials Finance, Inc.(1) | 5.13 | 04/01/29 | 80,000 | 33,756 | ||||||||||
| Vibrantz Technologies, Inc.(1) | 9.00 | 02/15/30 | 130,000 | 103,609 | ||||||||||
| WR Grace Holdings LLC(1) | 5.63 | 08/15/29 | 210,000 | 162,952 | ||||||||||
| 735,278 | ||||||||||||||
| COAL – 0.2% | ||||||||||||||
| Conuma Resources Ltd.(1) | 13.13 | 05/01/28 | 45,000 | 41,664 | ||||||||||
| COMMERCIAL SERVICES – 5.8% | ||||||||||||||
| Allied Universal Holdco LLC/Allied Universal Finance Corp.(1) | 6.00 | 06/01/29 | 175,000 | 126,634 | ||||||||||
| Allied Universal Holdco LLC/Allied Universal Finance Corp.(1) | 9.75 | 07/15/27 | 185,000 | 160,907 | ||||||||||
| Aptim Corp.(1) | 7.75 | 06/15/25 | 90,000 | 82,604 | ||||||||||
| Cimpress PLC | 7.00 | 06/15/26 | 95,000 | 87,995 | ||||||||||
| Deluxe Corp.(1) | 8.00 | 06/01/29 | 85,000 | 67,340 | ||||||||||
| Garda World Security Corp.(1) | 6.00 | 06/01/29 | 90,000 | 68,699 | ||||||||||
| Garda World Security Corp.(1) | 9.50 | 11/01/27 | 105,000 | 95,513 | ||||||||||
| Metis Merger Sub LLC(1) | 6.50 | 05/15/29 | 125,000 | 102,273 | ||||||||||
| MPH Acquisition Holdings LLC(1) | 5.75 | 11/01/28 | 170,000 | 126,904 | ||||||||||
| Signal Parent, Inc.(1) | 6.13 | 04/01/29 | 50,000 | 28,548 | ||||||||||
| Verscend Escrow Corp.(1) | 9.75 | 08/15/26 | 190,000 | 188,784 | ||||||||||
| 1,136,201 | ||||||||||||||
| COMPUTERS – 3.6% | ||||||||||||||
| Ahead DB Holdings LLC(1) | 6.63 | 05/01/28 | 70,000 | 57,473 | ||||||||||
| McAfee Corp.(1) | 7.38 | 02/15/30 | 360,000 | 288,313 | ||||||||||
| Presidio Holdings, Inc.(1) | 8.25 | 02/01/28 | 95,000 | 89,993 | ||||||||||
| Vericast Corp.(1) | 11.00 | 09/15/26 | 215,000 | 228,169 | ||||||||||
| Virtusa Corp.(1) | 7.13 | 12/15/28 | 60,000 | 47,538 | ||||||||||
| 711,486 | ||||||||||||||
| COSMETICS/PERSONAL CARE – 0.2% | ||||||||||||||
| Oriflame Investment Holding PLC(1) | 5.13 | 05/04/26 | 95,000 | 30,210 | ||||||||||
| DISTRIBUTION/WHOLESALE – 0.5% | ||||||||||||||
| BCPE Empire Holdings, Inc.(1) | 7.63 | 05/01/27 | 115,000 | 105,588 | ||||||||||
| DIVERSIFIED FINANCIAL SERVICES – 4.5% | ||||||||||||||
| Aretec Escrow Issuer, Inc.(1) | 7.50 | 04/01/29 | 70,000 | 59,457 | ||||||||||
| Armor Holdco, Inc.(1) | 8.50 | 11/15/29 | 64,000 | 55,913 | ||||||||||
| Cobra Acquisition Co. LLC(1) | 6.38 | 11/01/29 | 70,000 | 49,963 | ||||||||||
| Curo Group Holdings Corp.(1) | 7.50 | 08/01/28 | 80,000 | 18,500 | ||||||||||
| Curo Group Holdings Corp.(1) | 7.50 | 08/01/28 | 106,000 | 41,870 | ||||||||||
| Finance of America Funding LLC(1) | 7.88 | 11/15/25 | 60,000 | 49,508 | ||||||||||
| Hightower Holding LLC(1) | 6.75 | 04/15/29 | 55,000 | 46,966 | ||||||||||
| LD Holdings Group LLC(1) | 6.13 | 04/01/28 | 105,000 | 57,882 | ||||||||||
The accompanying notes are an integral part of these financial statements.
117
BONDBLOXX ETF TRUST
BondBloxx CCC Rated USD High Yield Corporate Bond ETF
Portfolio of Investments (Continued)
October 31, 2023
| Face | ||||||||||||||
| Rate (%) | Maturity | Amount | Value | |||||||||||
| DIVERSIFIED FINANCIAL SERVICES – 4.5% (Continued) | ||||||||||||||
| LD Holdings Group LLC(1) | 6.50 | 11/01/25 | $ | 85,000 | $ | 68,447 | ||||||||
| NFP Corp.(1) | 6.88 | 08/15/28 | 370,000 | 316,444 | ||||||||||
| Osaic Holdings, Inc.(1) | 10.75 | 08/01/27 | 75,000 | 74,636 | ||||||||||
| World Acceptance Corp.(1) | 7.00 | 11/01/26 | 50,000 | 40,738 | ||||||||||
| 880,324 | ||||||||||||||
| ELECTRIC – 0.5% | ||||||||||||||
| Pike Corp.(1) | 5.50 | 09/01/28 | 125,000 | 107,018 | ||||||||||
| ENGINEERING & CONSTRUCTION – 1.6% | ||||||||||||||
| Artera Services LLC(1) | 9.03 | 12/04/25 | 170,000 | 153,275 | ||||||||||
| Great Lakes Dredge & Dock Corp.(1) | 5.25 | 06/01/29 | 55,000 | 45,009 | ||||||||||
| INNOVATE Corp.(1) | 8.50 | 02/01/26 | 60,000 | 46,292 | ||||||||||
| Tutor Perini Corp.(1) | 6.88 | 05/01/25 | 85,000 | 73,184 | ||||||||||
| 317,760 | ||||||||||||||
| ENTERTAINMENT – 1.9% | ||||||||||||||
| Allen Media LLC/Allen Media Co.-Issuer, Inc.(1) | 10.50 | 02/15/28 | 110,000 | 57,393 | ||||||||||
| AMC Entertainment Holdings, Inc.(1) | 7.50 | 02/15/29 | 165,000 | 115,736 | ||||||||||
| Motion Bondco DAC(1) | 6.63 | 11/15/27 | 70,000 | 62,708 | ||||||||||
| Universal Entertainment Corp.(1),(2) | 8.75 | 12/11/24 | 135,000 | 139,847 | ||||||||||
| 375,684 | ||||||||||||||
| ENVIRONMENTAL CONTROL – 1.1% | ||||||||||||||
| Madison IAQ LLC(1) | 5.88 | 06/30/29 | 180,000 | 139,639 | ||||||||||
| Waste Pro USA, Inc.(1) | 5.50 | 02/15/26 | 85,000 | 78,220 | ||||||||||
| 217,859 | ||||||||||||||
| FOOD – 1.9% | ||||||||||||||
| B&G Foods, Inc. | 5.25 | 04/01/25 | 55,000 | 52,848 | ||||||||||
| B&G Foods, Inc. | 5.25 | 09/15/27 | 95,000 | 78,267 | ||||||||||
| Chobani LLC/Chobani Finance Corp., Inc.(1) | 7.50 | 04/15/25 | 95,000 | 93,408 | ||||||||||
| H-Food Holdings LLC/Hearthside Finance Co., Inc.(1) | 8.50 | 06/01/26 | 60,000 | 13,856 | ||||||||||
| Sigma Holdco BV(1) | 7.88 | 05/15/26 | 85,000 | 71,199 | ||||||||||
| TreeHouse Foods, Inc. | 4.00 | 09/01/28 | 85,000 | 69,225 | ||||||||||
| 378,803 | ||||||||||||||
| FOOD SERVICE – 0.5% | ||||||||||||||
| TKC Holdings, Inc.(1) | 10.50 | 05/15/29 | 120,000 | 96,099 | ||||||||||
| FOREST PRODUCTS & PAPER – 0.3% | ||||||||||||||
| Glatfelter Corp.(1) | 4.75 | 11/15/29 | 85,000 | 55,941 | ||||||||||
| HAND/MACHINE TOOLS – 0.4% | ||||||||||||||
| Werner FinCo LP/Werner FinCo, Inc.(1) | 11.50 | 06/15/28 | 70,000 | 70,769 | ||||||||||
| HEALTHCARE-SERVICES – 4.4% | ||||||||||||||
| AHP Health Partners, Inc.(1) | 5.75 | 07/15/29 | 55,000 | 45,152 | ||||||||||
| CHS/Community Health Systems, Inc.(1) | 6.13 | 04/01/30 | 215,000 | 83,538 | ||||||||||
| CHS/Community Health Systems, Inc.(1) | 6.88 | 04/01/28 | 130,000 | 56,503 | ||||||||||
| CHS/Community Health Systems, Inc.(1) | 6.88 | 04/15/29 | 255,000 | 105,559 | ||||||||||
| Global Medical Response, Inc.(1) | 6.50 | 10/01/25 | 105,000 | 66,862 | ||||||||||
The accompanying notes are an integral part of these financial statements.
118
BONDBLOXX ETF TRUST
BondBloxx CCC Rated USD High Yield Corporate Bond ETF
Portfolio of Investments (Continued)
October 31, 2023
| Face | ||||||||||||||
| Rate (%) | Maturity | Amount | Value | |||||||||||
| HEALTHCARE-SERVICES – 4.4% (Continued) | ||||||||||||||
| Heartland Dental LLC/Heartland Dental Finance Corp.(1) | 8.50 | 05/01/26 | $ | 54,000 | $ | 49,201 | ||||||||
| LifePoint Health, Inc.(1) | 5.38 | 01/15/29 | 87,000 | 52,794 | ||||||||||
| Radiology Partners, Inc.(1) | 9.25 | 02/01/28 | 110,000 | 41,477 | ||||||||||
| RegionalCare Hospital Partners Holdings, Inc./LifePoint Health, Inc.(1) | 9.75 | 12/01/26 | 220,000 | 205,922 | ||||||||||
| RP Escrow Issuer LLC(1) | 5.25 | 12/15/25 | 140,000 | 99,900 | ||||||||||
| Surgery Center Holdings, Inc.(1) | 10.00 | 04/15/27 | 55,000 | 54,949 | ||||||||||
| 861,857 | ||||||||||||||
| HOUSEHOLD PRODUCTS/WARES – 0.4% | ||||||||||||||
| Kronos Acquisition Holdings, Inc./KIK Custom Products, Inc.(1) | 7.00 | 12/31/27 | 90,000 | 76,606 | ||||||||||
| HOUSEWARES – 0.3% | ||||||||||||||
| SWF Escrow Issuer Corp.(1) | 6.50 | 10/01/29 | 110,000 | 65,268 | ||||||||||
| INSURANCE – 7.5% | ||||||||||||||
| Acrisure LLC/Acrisure Finance, Inc.(1) | 6.00 | 08/01/29 | 85,000 | 68,651 | ||||||||||
| Acrisure LLC/Acrisure Finance, Inc.(1) | 7.00 | 11/15/25 | 173,000 | 167,973 | ||||||||||
| Acrisure LLC/Acrisure Finance, Inc.(1) | 10.13 | 08/01/26 | 69,000 | 69,502 | ||||||||||
| Alliant Holdings Intermediate LLC/Alliant Holdings Co.-Issuer(1) | 5.88 | 11/01/29 | 85,000 | 70,681 | ||||||||||
| Alliant Holdings Intermediate LLC/Alliant Holdings Co.-Issuer(1) | 6.75 | 10/15/27 | 230,000 | 210,250 | ||||||||||
| AssuredPartners, Inc.(1) | 5.63 | 01/15/29 | 95,000 | 80,683 | ||||||||||
| AssuredPartners, Inc.(1) | 7.00 | 08/15/25 | 85,000 | 83,463 | ||||||||||
| BroadStreet Partners, Inc.(1) | 5.88 | 04/15/29 | 125,000 | 109,093 | ||||||||||
| GTCR AP Finance, Inc.(1) | 8.00 | 05/15/27 | 85,000 | 82,834 | ||||||||||
| HUB International Ltd.(1) | 5.63 | 12/01/29 | 96,000 | 82,768 | ||||||||||
| HUB International Ltd.(1) | 7.00 | 05/01/26 | 300,000 | 292,301 | ||||||||||
| Jones Deslauriers Insurance Management, Inc.(1) | 10.50 | 12/15/30 | 55,000 | 54,639 | ||||||||||
| USI, Inc./NY(1) | 6.88 | 05/01/25 | 110,000 | 109,109 | ||||||||||
| 1,481,947 | ||||||||||||||
| INTERNET – 1.4% | ||||||||||||||
| Arches Buyer, Inc.(1) | 6.13 | 12/01/28 | 87,000 | 70,358 | ||||||||||
| Cablevision Lightpath LLC(1) | 5.63 | 09/15/28 | 70,000 | 52,453 | ||||||||||
| Newfold Digital Holdings Group, Inc.(1) | 6.00 | 02/15/29 | 110,000 | 72,385 | ||||||||||
| Northwest Fiber LLC/Northwest Fiber Finance Sub, Inc.(1) | 6.00 | 02/15/28 | 50,000 | 41,447 | ||||||||||
| Northwest Fiber LLC/Northwest Fiber Finance Sub, Inc.(1) | 10.75 | 06/01/28 | 45,000 | 43,116 | ||||||||||
| 279,759 | ||||||||||||||
| IRON/STEEL – 0.5% | ||||||||||||||
| Baffinland Iron Mines Corp./Baffinland Iron Mines LP(1) | 8.75 | 07/15/26 | 105,000 | 101,030 | ||||||||||
| LEISURE TIME – 4.3% | ||||||||||||||
| MajorDrive Holdings IV LLC(1) | 6.38 | 06/01/29 | 90,000 | 69,844 | ||||||||||
| NCL Corp. Ltd.(1) | 3.63 | 12/15/24 | 80,000 | 75,738 | ||||||||||
| NCL Corp. Ltd.(1) | 5.88 | 03/15/26 | 200,000 | 179,678 | ||||||||||
| NCL Corp. Ltd.(1) | 7.75 | 02/15/29 | 85,000 | 74,254 | ||||||||||
| NCL Finance Ltd.(1) | 6.13 | 03/15/28 | 75,000 | 62,781 | ||||||||||
| Viking Cruises Ltd.(1) | 5.88 | 09/15/27 | 145,000 | 130,762 | ||||||||||
| Viking Cruises Ltd.(1) | 6.25 | 05/15/25 | 45,000 | 44,015 | ||||||||||
| Viking Cruises Ltd.(1) | 7.00 | 02/15/29 | 87,000 | 78,808 | ||||||||||
| Viking Cruises Ltd.(1) | 9.13 | 07/15/31 | 130,000 | 127,842 | ||||||||||
| 843,722 | ||||||||||||||
The accompanying notes are an integral part of these financial statements.
119
BONDBLOXX ETF TRUST
BondBloxx CCC Rated USD High Yield Corporate Bond ETF
Portfolio of Investments (Continued)
October 31, 2023
| Face | ||||||||||||||
| Rate (%) | Maturity | Amount | Value | |||||||||||
| LODGING – 0.3% | ||||||||||||||
| Full House Resorts, Inc.(1) | 8.25 | 02/15/28 | $ | 70,000 | $ | 59,002 | ||||||||
| MACHINERY-DIVERSIFIED – 1.9% | ||||||||||||||
| Maxim Crane Works Holdings Capital LLC(1) | 11.50 | 09/01/28 | 90,000 | 87,944 | ||||||||||
| OT Merger Corp.(1) | 7.88 | 10/15/29 | 54,000 | 32,431 | ||||||||||
| SPX FLOW, Inc.(1) | 8.75 | 04/01/30 | 90,000 | 82,609 | ||||||||||
| Titan Acquisition Ltd./Titan Co.-Borrower LLC(1) | 7.75 | 04/15/26 | 115,000 | 107,070 | ||||||||||
| TK Elevator Holdco GmbH(1) | 7.63 | 07/15/28 | 70,000 | 63,205 | ||||||||||
| 373,259 | ||||||||||||||
| MEDIA – 6.4% | ||||||||||||||
| Beasley Mezzanine Holdings LLC(1) | 8.63 | 02/01/26 | 50,000 | 33,063 | ||||||||||
| CSC Holdings LLC(1) | 4.63 | 12/01/30 | 280,000 | 142,194 | ||||||||||
| CSC Holdings LLC(1) | 5.00 | 11/15/31 | 50,000 | 25,606 | ||||||||||
| CSC Holdings LLC(1) | 5.75 | 01/15/30 | 260,000 | 136,435 | ||||||||||
| CSC Holdings LLC(1) | 7.50 | 04/01/28 | 120,000 | 77,035 | ||||||||||
| DISH DBS Corp. | 5.13 | 06/01/29 | 125,000 | 64,523 | ||||||||||
| DISH DBS Corp. | 5.88 | 11/15/24 | 165,000 | 151,610 | ||||||||||
| DISH DBS Corp. | 7.38 | 07/01/28 | 95,000 | 53,748 | ||||||||||
| DISH DBS Corp. | 7.75 | 07/01/26 | 165,000 | 110,763 | ||||||||||
| iHeartCommunications, Inc. | 8.38 | 05/01/27 | 160,000 | 98,233 | ||||||||||
| Liberty Interactive LLC | 8.25 | 02/01/30 | 140,000 | 36,051 | ||||||||||
| McGraw-Hill Education, Inc.(1) | 8.00 | 08/01/29 | 110,000 | 90,783 | ||||||||||
| Radiate Holdco LLC/Radiate Finance, Inc.(1) | 4.50 | 09/15/26 | 155,000 | 118,664 | ||||||||||
| Radiate Holdco LLC/Radiate Finance, Inc.(1) | 6.50 | 09/15/28 | 175,000 | 86,807 | ||||||||||
| Spanish Broadcasting System, Inc.(1) | 9.75 | 03/01/26 | 55,000 | 33,928 | ||||||||||
| 1,259,443 | ||||||||||||||
| METAL FABRICATE/HARDWARE – 0.3% | ||||||||||||||
| Park-Ohio Industries, Inc. | 6.63 | 04/15/27 | 60,000 | 52,113 | ||||||||||
| MINING – 0.6% | ||||||||||||||
| Coeur Mining, Inc.(1) | 5.13 | 02/15/29 | 55,000 | 45,843 | ||||||||||
| IAMGOLD Corp.(1) | 5.75 | 10/15/28 | 80,000 | 63,100 | ||||||||||
| 108,943 | ||||||||||||||
| MISCELLANEOUS MANUFACTURERS – 0.9% | ||||||||||||||
| FXI Holdings, Inc.(1) | 12.25 | 11/15/26 | 135,000 | 112,091 | ||||||||||
| FXI Holdings, Inc.(1) | 12.25 | 11/15/26 | 82,000 | 68,265 | ||||||||||
| 180,356 | ||||||||||||||
| OIL & GAS – 4.3% | ||||||||||||||
| Calumet Specialty Products Partners LP/Calumet Finance Corp.(1) | 8.13 | 01/15/27 | 55,000 | 51,426 | ||||||||||
| Calumet Specialty Products Partners LP/Calumet Finance Corp.(1) | 9.75 | 07/15/28 | 60,000 | 56,057 | ||||||||||
| Calumet Specialty Products Partners LP/Calumet Finance Corp.(1) | 11.00 | 04/15/25 | 73,000 | 73,265 | ||||||||||
| Global Marine, Inc. | 7.00 | 06/01/28 | 45,000 | 37,913 | ||||||||||
| Nabors Industries Ltd.(1) | 7.25 | 01/15/26 | 95,000 | 89,322 | ||||||||||
| Nabors Industries Ltd.(1) | 7.50 | 01/15/28 | 70,000 | 61,887 | ||||||||||
| Nabors Industries, Inc. | 5.75 | 02/01/25 | 85,000 | 82,779 | ||||||||||
| Transocean, Inc. | 6.80 | 03/15/38 | 65,000 | 46,457 | ||||||||||
| Transocean, Inc.(1) | 7.25 | 11/01/25 | 45,000 | 43,949 | ||||||||||
| Transocean, Inc.(1) | 7.50 | 01/15/26 | 70,000 | 67,105 | ||||||||||
The accompanying notes are an integral part of these financial statements.
120
BONDBLOXX ETF TRUST
BondBloxx CCC Rated USD High Yield Corporate Bond ETF
Portfolio of Investments (Continued)
October 31, 2023
| Face | ||||||||||||||
| Rate (%) | Maturity | Amount | Value | |||||||||||
| OIL & GAS – 4.3% (Continued) | ||||||||||||||
| Transocean, Inc. | 7.50 | 04/15/31 | $ | 75,000 | $ | 60,668 | ||||||||
| Transocean, Inc.(1) | 8.00 | 02/01/27 | 80,000 | 75,161 | ||||||||||
| Transocean, Inc.(1) | 11.50 | 01/30/27 | 90,000 | 93,731 | ||||||||||
| 839,720 | ||||||||||||||
| PACKAGING & CONTAINERS – 5.2% | ||||||||||||||
| Ardagh Packaging Finance PLC/Ardagh Holdings USA, Inc.(1) | 5.25 | 08/15/27 | 140,000 | 102,002 | ||||||||||
| Ardagh Packaging Finance PLC/Ardagh Holdings USA, Inc.(1) | 5.25 | 08/15/27 | 175,000 | 127,503 | ||||||||||
| Clydesdale Acquisition Holdings, Inc.(1) | 8.75 | 04/15/30 | 195,000 | 155,644 | ||||||||||
| Graham Packaging Co., Inc.(1) | 7.13 | 08/15/28 | 87,000 | 66,745 | ||||||||||
| LABL, Inc.(1) | 8.25 | 11/01/29 | 80,000 | 59,550 | ||||||||||
| LABL, Inc.(1) | 10.50 | 07/15/27 | 120,000 | 104,013 | ||||||||||
| Mauser Packaging Solutions Holding Co.(1) | 9.25 | 04/15/27 | 235,000 | 195,969 | ||||||||||
| Trident TPI Holdings, Inc.(1) | 12.75 | 12/31/28 | 110,000 | 112,544 | ||||||||||
| Trivium Packaging Finance BV(1) | 8.50 | 08/15/27 | 120,000 | 100,311 | ||||||||||
| 1,024,281 | ||||||||||||||
| PHARMACEUTICALS – 0.4% | ||||||||||||||
| Bausch Health Cos, Inc.(1) | 14.00 | 10/15/30 | 60,000 | 32,614 | ||||||||||
| P&L Development LLC/PLD Finance Corp.(1) | 7.75 | 11/15/25 | 80,000 | 53,812 | ||||||||||
| 86,426 | ||||||||||||||
| PIPELINES – 1.0% | ||||||||||||||
| NGL Energy Partners LP/NGL Energy Finance Corp. | 6.13 | 03/01/25 | 65,000 | 63,525 | ||||||||||
| NGL Energy Partners LP/NGL Energy Finance Corp. | 7.50 | 04/15/26 | 45,000 | 42,977 | ||||||||||
| Summit Midstream Holdings LLC/Summit Midstream Finance Corp. | 5.75 | 04/15/25 | 45,000 | 42,379 | ||||||||||
| TransMontaigne Partners LP/TLP Finance Corp. | 6.13 | 02/15/26 | 60,000 | 51,261 | ||||||||||
| 200,142 | ||||||||||||||
| REAL ESTATE INVESTMENT TRUST (REITS) – 1.7% | ||||||||||||||
| Diversified Healthcare Trust | 4.38 | 03/01/31 | 90,000 | 62,027 | ||||||||||
| Diversified Healthcare Trust | 9.75 | 06/15/25 | 85,000 | 82,531 | ||||||||||
| Uniti Group LP/Uniti Fiber Holdings, Inc./CSL Capital LLC(1) | 6.00 | 01/15/30 | 120,000 | 72,875 | ||||||||||
| Uniti Group LP/Uniti Group Finance, Inc./CSL Capital LLC(1) | 6.50 | 02/15/29 | 195,000 | 126,865 | ||||||||||
| 344,298 | ||||||||||||||
| RETAIL – 6.7% | ||||||||||||||
| 99 Escrow Issuer, Inc.(1) | 7.50 | 01/15/26 | 60,000 | 21,183 | ||||||||||
| At Home Group, Inc.(1) | 4.88 | 07/15/28 | 50,000 | 17,750 | ||||||||||
| Carrols Restaurant Group, Inc.(1) | 5.88 | 07/01/29 | 55,000 | 44,691 | ||||||||||
| Fertitta Entertainment LLC/Fertitta Entertainment Finance Co., Inc.(1) | 6.75 | 01/15/30 | 220,000 | 175,037 | ||||||||||
| Foundation Building Materials, Inc.(1) | 6.00 | 03/01/29 | 70,000 | 57,806 | ||||||||||
| GPS Hospitality Holding Co. LLC/GPS FinCo., Inc.(1) | 7.00 | 08/15/28 | 70,000 | 47,637 | ||||||||||
| Guitar Center, Inc.(1) | 8.50 | 01/15/26 | 95,000 | 80,079 | ||||||||||
| LBM Acquisition LLC(1) | 6.25 | 01/15/29 | 145,000 | 114,702 | ||||||||||
| Michaels Cos, Inc.(1) | 7.88 | 05/01/29 | 220,000 | 122,904 | ||||||||||
| NMG Holding Co., Inc./Neiman Marcus Group LLC(1) | 7.13 | 04/01/26 | 190,000 | 177,901 | ||||||||||
| Park River Holdings, Inc.(1) | 5.63 | 02/01/29 | 60,000 | 43,982 | ||||||||||
| Park River Holdings, Inc.(1) | 6.75 | 08/01/29 | 50,000 | 38,188 | ||||||||||
| SRS Distribution, Inc.(1) | 6.00 | 12/01/29 | 150,000 | 125,035 | ||||||||||
| SRS Distribution, Inc.(1) | 6.13 | 07/01/29 | 80,000 | 67,073 | ||||||||||
| Staples, Inc.(1) | 10.75 | 04/15/27 | 165,000 | 91,058 | ||||||||||
| White Capital Buyer LLC(1) | 6.88 | 10/15/28 | 110,000 | 96,111 | ||||||||||
| 1,321,137 | ||||||||||||||
The accompanying notes are an integral part of these financial statements.
121
BONDBLOXX ETF TRUST
BondBloxx CCC Rated USD High Yield Corporate Bond ETF
Portfolio of Investments (Continued)
October 31, 2023
| Face | ||||||||||||||
| Rate (%) | Maturity | Amount | Value | |||||||||||
| SOFTWARE – 5.4% | ||||||||||||||
| AthenaHealth Group, Inc.(1) | 6.50 | 02/15/30 | $ | 420,000 | $ | 343,590 | ||||||||
| Boxer Parent Co., Inc.(1) | 9.13 | 03/01/26 | 59,000 | 58,820 | ||||||||||
| Castle US Holding Corp.(1) | 9.50 | 02/15/28 | 50,000 | 26,382 | ||||||||||
| Cloud Software Group, Inc.(1) | 9.00 | 09/30/29 | 470,000 | 400,677 | ||||||||||
| CWT Travel Group, Inc.(1) | 8.50 | 11/19/26 | 80,000 | 24,000 | ||||||||||
| Rackspace Technology Global, Inc.(1) | 3.50 | 02/15/28 | 71,000 | 31,250 | ||||||||||
| Rackspace Technology Global, Inc.(1) | 5.38 | 12/01/28 | 90,000 | 26,407 | ||||||||||
| Rocket Software, Inc.(1) | 6.50 | 02/15/29 | 100,000 | 81,665 | ||||||||||
| West Technology Group LLC(1) | 8.50 | 04/10/27 | 70,000 | 60,550 | ||||||||||
| 1,053,341 | ||||||||||||||
| TELECOMMUNICATIONS – 4.7% | ||||||||||||||
| Altice France Holding SA(1) | 6.00 | 02/15/28 | 190,000 | 83,504 | ||||||||||
| Altice France Holding SA(1) | 10.50 | 05/15/27 | 275,000 | 149,839 | ||||||||||
| CommScope Technologies LLC(1) | 5.00 | 03/15/27 | 126,000 | 46,496 | ||||||||||
| CommScope Technologies LLC(1) | 6.00 | 06/15/25 | 205,000 | 123,309 | ||||||||||
| CommScope, Inc.(1) | 7.13 | 07/01/28 | 105,000 | 39,475 | ||||||||||
| CommScope, Inc.(1) | 8.25 | 03/01/27 | 140,000 | 58,342 | ||||||||||
| Embarq Corp. | 8.00 | 06/01/36 | 212,000 | 115,763 | ||||||||||
| Lumen Technologies, Inc.(1) | 4.50 | 01/15/29 | 125,000 | 34,375 | ||||||||||
| Lumen Technologies, Inc.(1) | 5.13 | 12/15/26 | 40,000 | 19,689 | ||||||||||
| Lumen Technologies, Inc. | 7.60 | 09/15/39 | 60,000 | 17,568 | ||||||||||
| Lumen Technologies, Inc. | 7.65 | 03/15/42 | 50,000 | 14,047 | ||||||||||
| Telesat Canada/Telesat LLC(1) | 4.88 | 06/01/27 | 70,000 | 41,698 | ||||||||||
| Telesat Canada/Telesat LLC(1) | 5.63 | 12/06/26 | 85,000 | 54,327 | ||||||||||
| Zayo Group Holdings, Inc.(1) | 6.13 | 03/01/28 | 190,000 | 126,044 | ||||||||||
| 924,476 | ||||||||||||||
| TEXTILES – 0.4% | ||||||||||||||
| Eagle Intermediate Global Holding BV/Eagle US Finance LLC(1) | 7.50 | 05/01/25 | 120,000 | 79,950 | ||||||||||
| TRANSPORTATION – 0.7% | ||||||||||||||
| Carriage Purchaser, Inc.(1) | 7.88 | 10/15/29 | 55,000 | 40,815 | ||||||||||
| Watco Cos LLC/Watco Finance Corp.(1) | 6.50 | 06/15/27 | 105,000 | 97,944 | ||||||||||
| 138,759 | ||||||||||||||
| TOTAL CORPORATE BONDS (Cost - $20,074,288) | 19,001,354 | |||||||||||||
| SHORT-TERM INVESTMENTS – 2.8% | ||||||||||||||
| TIME DEPOSITS – 2.8% | ||||||||||||||
| ANZ National Bank, London | 4.68 | 11/01/23 | 547,687 | 547,687 | ||||||||||
| TOTAL SHORT-TERM INVESTMENTS (Cost - $547,687) | 547,687 | |||||||||||||
| TOTAL INVESTMENTS – 99.3% (Cost - $20,671,452) | $ | 19,552,094 | ||||||||||||
| OTHER ASSETS LESS LIABILITIES – 0.7% | 128,315 | |||||||||||||
| NET ASSETS – 100.0% | $ | 19,680,409 | ||||||||||||
| * | Non-income producing security. |
| (1) | Security was purchased pursuant to Rule 144A under the Securities Act of 1933 and may not be resold subject to that Rule except to qualified institutional buyers. The aggregate value of Rule 144A holdings at October 31, 2023, amounts to $17,250,197 and represents 87.7% of net assets. These securities have been deemed liquid under procedures approved by the Trust’s Board of Trustees. |
| (2) | Includes step-up bonds that pay an initial coupon rate for the first period and then a higher coupon rate for the following periods. The rate reported is the rate in effect as of October 31, 2023. |
The accompanying notes are an integral part of these financial statements.
122
BONDBLOXX ETF TRUST
BondBloxx JP Morgan USD Emerging Markets 1-10 Year Bond ETF
Portfolio of Investments
October 31, 2023
| Face | ||||||||||||||
| Rate (%) | Maturity | Amount | Value | |||||||||||
| CORPORATE BONDS – 11.3% | ||||||||||||||
| BANKS – 0.3% | ||||||||||||||
| Banco Nacional de Comercio Exterior SNC/Cayman Islands | 4.38 | 10/14/25 | $ | 200,000 | $ | 193,642 | ||||||||
| Banco Nacional de Panama | 2.50 | 08/11/30 | 425,000 | 315,579 | ||||||||||
| 509,221 | ||||||||||||||
| CHEMICALS – 0.5% | ||||||||||||||
| CNAC HK Finbridge Co. Ltd. | 3.00 | 09/22/30 | 200,000 | 160,942 | ||||||||||
| CNAC HK Finbridge Co. Ltd. | 3.38 | 06/19/24 | 275,000 | 270,511 | ||||||||||
| CNAC HK Finbridge Co. Ltd. | 4.13 | 07/19/27 | 200,000 | 185,905 | ||||||||||
| CNAC HK Finbridge Co. Ltd. | 5.13 | 03/14/28 | 300,000 | 286,504 | ||||||||||
| 903,862 | ||||||||||||||
| COMMERCIAL SERVICES – 0.4% | ||||||||||||||
| DP World Crescent Ltd. | 3.88 | 07/18/29 | 400,000 | 356,000 | ||||||||||
| DP World Crescent Ltd. | 4.85 | 09/26/28 | 200,000 | 189,750 | ||||||||||
| Pelabuhan Indonesia Persero PT | 4.25 | 05/05/25 | 200,000 | 194,023 | ||||||||||
| 739,773 | ||||||||||||||
| DIVERSIFIED FINANCIAL SERVICES – 0.2% | ||||||||||||||
| Power Sector Assets & Liabilities Management Corp. | 7.39 | 12/02/24 | 425,000 | 430,661 | ||||||||||
| ELECTRIC – 1.5% | ||||||||||||||
| Comision Federal de Electricidad | 4.69 | 05/15/29 | 200,000 | 178,000 | ||||||||||
| Eskom Holdings SOC Ltd. | 6.35 | 08/10/28 | 450,000 | 408,938 | ||||||||||
| Eskom Holdings SOC Ltd. | 7.13 | 02/11/25 | 550,000 | 540,375 | ||||||||||
| Perusahaan Perseroan Persero PT Perusahaan Listrik Negara | 4.13 | 05/15/27 | 275,000 | 258,527 | ||||||||||
| Perusahaan Perseroan Persero PT Perusahaan Listrik Negara | 5.45 | 05/21/28 | 200,000 | 194,494 | ||||||||||
| SPIC MTN Co. Ltd. | 1.63 | 07/27/25 | 225,000 | 209,563 | ||||||||||
| State Grid Overseas Investment BVI Ltd. | 1.63 | 08/05/30 | 225,000 | 175,503 | ||||||||||
| State Grid Overseas Investment BVI Ltd. | 3.50 | 05/04/27 | 600,000 | 562,338 | ||||||||||
| Three Gorges Finance I Cayman Islands Ltd. | 3.15 | 06/02/26 | 225,000 | 212,391 | ||||||||||
| 2,740,129 | ||||||||||||||
| INSURANCE – 0.2% | ||||||||||||||
| China Life Insurance Overseas Co. Ltd./Hong Kong | 5.35 | 08/15/33 | 350,000 | 340,288 | ||||||||||
| INVESTMENT COMPANIES – 0.9% | ||||||||||||||
| Gaci First Investment Co. | 4.75 | 02/14/30 | 200,000 | 188,250 | ||||||||||
| Gaci First Investment Co. | 5.00 | 10/13/27 | 250,000 | 243,047 | ||||||||||
| Gaci First Investment Co. | 5.25 | 10/13/32 | 300,000 | 285,750 | ||||||||||
| MDGH GMTN RSC Ltd. | 2.50 | 11/07/24 | 200,000 | 192,850 | ||||||||||
| MDGH GMTN RSC Ltd. | 2.50 | 05/21/26 | 75,000 | 69,375 | ||||||||||
| MDGH GMTN RSC Ltd. | 2.88 | 11/07/29 | 225,000 | 193,289 | ||||||||||
| MDGH GMTN RSC Ltd. | 2.88 | 05/21/30 | 200,000 | 169,917 | ||||||||||
| MDGH GMTN RSC Ltd. | 3.38 | 03/28/32 | 200,000 | 169,125 | ||||||||||
| MDGH GMTN RSC Ltd. | 5.50 | 04/28/33 | 200,000 | 194,250 | ||||||||||
| 1,705,853 | ||||||||||||||
| MINING – 0.7% | ||||||||||||||
| Corp. Nacional del Cobre de Chile | 3.00 | 09/30/29 | 325,000 | 270,465 | ||||||||||
| Corp. Nacional del Cobre de Chile | 3.15 | 01/14/30 | 300,000 | 248,850 | ||||||||||
| Corp. Nacional del Cobre de Chile | 3.63 | 08/01/27 | 325,000 | 297,700 | ||||||||||
The accompanying notes are an integral part of these financial statements.
123
BONDBLOXX ETF TRUST
BondBloxx JP Morgan USD Emerging Markets 1-10 Year Bond ETF
Portfolio of Investments (Continued)
October 31, 2023
| Face | ||||||||||||||
| Rate (%) | Maturity | Amount | Value | |||||||||||
| MINING – 0.7% (Continued) | ||||||||||||||
| Indonesia Asahan Aluminium PT/Mineral Industri Indonesia Persero PT | 4.75 | 05/15/25 | $ | 200,000 | $ | 195,800 | ||||||||
| Indonesia Asahan Aluminium PT/Mineral Industri Indonesia Persero PT | 5.45 | 05/15/30 | 200,000 | 185,652 | ||||||||||
| 1,198,467 | ||||||||||||||
| OIL & GAS – 5.7% | ||||||||||||||
| EDO Sukuk Ltd. | 5.88 | 09/21/33 | 400,000 | 384,950 | ||||||||||
| Oil & Gas Holding Co. BSCC | 7.50 | 10/25/27 | 475,000 | 479,156 | ||||||||||
| Pertamina Persero PT | 1.40 | 02/09/26 | 200,000 | 180,605 | ||||||||||
| Petroleos del Peru SA | 4.75 | 06/19/32 | 400,000 | 268,546 | ||||||||||
| Petroleos Mexicanos | 4.50 | 01/23/26 | 175,000 | 157,141 | ||||||||||
| Petroleos Mexicanos | 5.35 | 02/12/28 | 350,000 | 282,485 | ||||||||||
| Petroleos Mexicanos | 5.95 | 01/28/31 | 625,000 | 444,844 | ||||||||||
| Petroleos Mexicanos | 6.49 | 01/23/27 | 250,000 | 221,722 | ||||||||||
| Petroleos Mexicanos | 6.50 | 03/13/27 | 650,000 | 573,748 | ||||||||||
| Petroleos Mexicanos | 6.50 | 01/23/29 | 200,000 | 162,200 | ||||||||||
| Petroleos Mexicanos | 6.70 | 02/16/32 | 1,175,000 | 862,156 | ||||||||||
| Petroleos Mexicanos | 6.84 | 01/23/30 | 400,000 | 311,600 | ||||||||||
| Petroleos Mexicanos | 6.88 | 08/04/26 | 400,000 | 369,300 | ||||||||||
| Petroleos Mexicanos | 8.75 | 06/02/29 | 300,000 | 264,795 | ||||||||||
| Petroleos Mexicanos | 10.00 | 02/07/33 | 275,000 | 244,475 | ||||||||||
| Petronas Capital Ltd. | 2.48 | 01/28/32 | 700,000 | 544,387 | ||||||||||
| Petronas Capital Ltd. | 3.50 | 03/18/25 | 850,000 | 824,003 | ||||||||||
| Petronas Capital Ltd. | 3.50 | 04/21/30 | 1,300,000 | 1,132,281 | ||||||||||
| QatarEnergy | 1.38 | 09/12/26 | 600,000 | 531,027 | ||||||||||
| QatarEnergy | 2.25 | 07/12/31 | 900,000 | 704,672 | ||||||||||
| Sinopec Group Overseas Development 2015 Ltd. | 3.25 | 04/28/25 | 275,000 | 265,258 | ||||||||||
| Sinopec Group Overseas Development 2017 Ltd. | 3.63 | 04/12/27 | 250,000 | 235,090 | ||||||||||
| Sinopec Group Overseas Development 2018 Ltd. | 1.45 | 01/08/26 | 250,000 | 229,479 | ||||||||||
| Sinopec Group Overseas Development 2018 Ltd. | 2.15 | 05/13/25 | 200,000 | 189,279 | ||||||||||
| Sinopec Group Overseas Development 2018 Ltd. | 2.30 | 01/08/31 | 225,000 | 182,408 | ||||||||||
| Sinopec Group Overseas Development 2018 Ltd. | 2.70 | 05/13/30 | 275,000 | 232,756 | ||||||||||
| Sinopec Group Overseas Development 2018 Ltd. | 2.95 | 11/12/29 | 250,000 | 217,961 | ||||||||||
| 10,496,324 | ||||||||||||||
| PIPELINES – 0.6% | ||||||||||||||
| Southern Gas Corridor CJSC | 6.88 | 03/24/26 | 1,150,000 | 1,135,389 | ||||||||||
| TRANSPORTATION – 0.3% | ||||||||||||||
| Transnet SOC Ltd. | 8.25 | 02/06/28 | 550,000 | 521,812 | ||||||||||
| TOTAL CORPORATE BONDS (Cost - $21,697,899) | 20,721,779 | |||||||||||||
| GOVERNMENT AGENCIES AND OBLIGATIONS – 86.9% | ||||||||||||||
| GOVERNMENT AGENCIES – 3.2% | ||||||||||||||
| Bank Gospodarstwa Krajowego | 5.38 | 05/22/33 | 950,000 | 887,062 | ||||||||||
| Bank Gospodarstwa Krajowego | 6.25 | 10/31/28 | 500,000 | 505,625 | ||||||||||
| China Development Bank | 1.00 | 10/27/25 | 225,000 | 206,053 | ||||||||||
| Export-Import Bank of China | 2.88 | 04/26/26 | 200,000 | 189,088 | ||||||||||
| Export-Import Bank of China | 3.63 | 07/31/24 | 275,000 | 270,442 | ||||||||||
| Export-Import Bank of China | 3.88 | 05/16/26 | 350,000 | 339,932 | ||||||||||
| Export-Import Bank of India | 2.25 | 01/13/31 | 600,000 | 459,126 | ||||||||||
The accompanying notes are an integral part of these financial statements.
124
BONDBLOXX ETF TRUST
BondBloxx JP Morgan USD Emerging Markets 1-10 Year Bond ETF
Portfolio of Investments (Continued)
October 31, 2023
| Face | ||||||||||||||
| Rate (%) | Maturity | Amount | Value | |||||||||||
| GOVERNMENT AGENCIES – 3.2% (Continued) | ||||||||||||||
| Export-Import Bank of India | 3.25 | 01/15/30 | $ | 600,000 | $ | 506,034 | ||||||||
| Export-Import Bank of India | 3.38 | 08/05/26 | 575,000 | 540,330 | ||||||||||
| Export-Import Bank of India | 3.88 | 02/01/28 | 575,000 | 528,186 | ||||||||||
| Export-Import Bank of India | 5.50 | 01/18/33 | 550,000 | 516,334 | ||||||||||
| Finance Department Government of Sharjah | 6.50 | 11/23/32 | 200,000 | 194,250 | ||||||||||
| MFB Magyar Fejlesztesi Bank Zrt | 6.50 | 06/29/28 | 725,000 | 714,136 | ||||||||||
| 5,856,598 | ||||||||||||||
| GOVERNMENT OBLIGATIONS – 83.7% | ||||||||||||||
| Abu Dhabi Government International Bond | 1.63 | 06/02/28 | 400,000 | 341,375 | ||||||||||
| Abu Dhabi Government International Bond | 1.70 | 03/02/31 | 300,000 | 234,258 | ||||||||||
| Abu Dhabi Government International Bond | 1.88 | 09/15/31 | 350,000 | 273,378 | ||||||||||
| Abu Dhabi Government International Bond | 2.13 | 09/30/24 | 425,000 | 411,483 | ||||||||||
| Abu Dhabi Government International Bond | 2.50 | 04/16/25 | 600,000 | 573,609 | ||||||||||
| Abu Dhabi Government International Bond | 2.50 | 09/30/29 | 600,000 | 516,849 | ||||||||||
| Abu Dhabi Government International Bond | 3.13 | 05/03/26 | 500,000 | 472,969 | ||||||||||
| Abu Dhabi Government International Bond | 3.13 | 10/11/27 | 800,000 | 738,608 | ||||||||||
| Abu Dhabi Government International Bond | 3.13 | 04/16/30 | 625,000 | 550,488 | ||||||||||
| Angolan Government International Bond | 8.00 | 11/26/29 | 1,050,000 | 845,250 | ||||||||||
| Angolan Government International Bond | 8.25 | 05/09/28 | 1,000,000 | 853,750 | ||||||||||
| Angolan Government International Bond | 8.75 | 04/14/32 | 1,000,000 | 787,500 | ||||||||||
| Argentine Republic Government International Bond(1) | 0.75 | 07/09/30 | 4,500,000 | 1,257,750 | ||||||||||
| Argentine Republic Government International Bond(1) | 3.63 | 07/09/35 | 4,900,000 | 1,212,750 | ||||||||||
| Argentine Republic Government International Bond(1) | 4.25 | 01/09/38 | 2,800,000 | 847,000 | ||||||||||
| Bahrain Government International Bond | 5.25 | 01/25/33 | 400,000 | 327,500 | ||||||||||
| Bahrain Government International Bond | 5.45 | 09/16/32 | 700,000 | 591,500 | ||||||||||
| Bahrain Government International Bond | 5.63 | 09/30/31 | 475,000 | 415,031 | ||||||||||
| Bahrain Government International Bond | 6.75 | 09/20/29 | 600,000 | 581,250 | ||||||||||
| Bahrain Government International Bond | 7.00 | 01/26/26 | 525,000 | 524,344 | ||||||||||
| Bahrain Government International Bond | 7.00 | 10/12/28 | 750,000 | 749,062 | ||||||||||
| Bahrain Government International Bond | 7.38 | 05/14/30 | 475,000 | 470,844 | ||||||||||
| Bolivian Government International Bond | 4.50 | 03/20/28 | 600,000 | 312,000 | ||||||||||
| Brazilian Government International Bond | 2.88 | 06/06/25 | 600,000 | 571,695 | ||||||||||
| Brazilian Government International Bond | 3.75 | 09/12/31 | 575,000 | 477,825 | ||||||||||
| Brazilian Government International Bond | 3.88 | 06/12/30 | 1,200,000 | 1,033,350 | ||||||||||
| Brazilian Government International Bond | 4.25 | 01/07/25 | 1,450,000 | 1,418,847 | ||||||||||
| Brazilian Government International Bond | 4.50 | 05/30/29 | 700,000 | 646,618 | ||||||||||
| Brazilian Government International Bond | 4.63 | 01/13/28 | 975,000 | 931,788 | ||||||||||
| Brazilian Government International Bond | 6.00 | 04/07/26 | 750,000 | 758,381 | ||||||||||
| Brazilian Government International Bond | 6.00 | 10/20/33 | 700,000 | 647,500 | ||||||||||
| CBB International Sukuk Co. 7 SPC | 6.88 | 10/05/25 | 475,000 | 473,813 | ||||||||||
| CBB International Sukuk Programme Co.W.L.L. | 3.88 | 05/18/29 | 475,000 | 406,719 | ||||||||||
| CBB International Sukuk Programme Co.W.L.L. | 3.95 | 09/16/27 | 525,000 | 476,438 | ||||||||||
| CBB International Sukuk Programme Co.W.L.L. | 4.50 | 03/30/27 | 475,000 | 441,750 | ||||||||||
| CBB International Sukuk Programme Co.W.L.L. | 6.25 | 11/14/24 | 475,000 | 470,979 | ||||||||||
| CBB International Sukuk Programme Co.W.L.L. | 6.25 | 10/18/30 | 500,000 | 478,750 | ||||||||||
| Chile Government International Bond | 2.45 | 01/31/31 | 375,000 | 302,344 | ||||||||||
| Chile Government International Bond | 2.55 | 01/27/32 | 425,000 | 335,219 | ||||||||||
| Chile Government International Bond | 2.55 | 07/27/33 | 650,000 | 487,987 | ||||||||||
The accompanying notes are an integral part of these financial statements.
125
BONDBLOXX ETF TRUST
BondBloxx JP Morgan USD Emerging Markets 1-10 Year Bond ETF
Portfolio of Investments (Continued)
October 31, 2023
| Face | ||||||||||||||
| Rate (%) | Maturity | Amount | Value | |||||||||||
| GOVERNMENT OBLIGATIONS – 83.7% (Continued) | ||||||||||||||
| Chile Government International Bond | 2.75 | 01/31/27 | $ | 425,000 | $ | 388,903 | ||||||||
| Chile Government International Bond | 3.24 | 02/06/28 | 450,000 | 410,625 | ||||||||||
| China Government International Bond | 0.55 | 10/21/25 | 350,000 | 319,953 | ||||||||||
| China Government International Bond | 0.75 | 10/26/24 | 200,000 | 191,334 | ||||||||||
| China Government International Bond | 1.20 | 10/21/30 | 550,000 | 431,450 | ||||||||||
| China Government International Bond | 1.25 | 10/26/26 | 300,000 | 269,148 | ||||||||||
| China Government International Bond | 1.75 | 10/26/31 | 250,000 | 199,539 | ||||||||||
| China Government International Bond | 1.95 | 12/03/24 | 350,000 | 337,346 | ||||||||||
| China Government International Bond | 2.13 | 12/03/29 | 375,000 | 322,271 | ||||||||||
| China Government International Bond | 2.63 | 11/02/27 | 250,000 | 229,674 | ||||||||||
| Colombia Government International Bond | 3.00 | 01/30/30 | 550,000 | 424,325 | ||||||||||
| Colombia Government International Bond | 3.13 | 04/15/31 | 900,000 | 666,000 | ||||||||||
| Colombia Government International Bond | 3.25 | 04/22/32 | 750,000 | 537,375 | ||||||||||
| Colombia Government International Bond | 3.88 | 04/25/27 | 725,000 | 660,837 | ||||||||||
| Colombia Government International Bond | 4.50 | 01/28/26 | 550,000 | 528,597 | ||||||||||
| Colombia Government International Bond | 4.50 | 03/15/29 | 750,000 | 652,875 | ||||||||||
| Colombia Government International Bond | 8.00 | 04/20/33 | 600,000 | 586,200 | ||||||||||
| Costa Rica Government International Bond | 6.13 | 02/19/31 | 700,000 | 667,625 | ||||||||||
| Costa Rica Government International Bond | 6.55 | 04/03/34 | 800,000 | 763,400 | ||||||||||
| Dominican Republic International Bond | 4.50 | 01/30/30 | 900,000 | 764,550 | ||||||||||
| Dominican Republic International Bond | 4.88 | 09/23/32 | 1,400,000 | 1,137,500 | ||||||||||
| Dominican Republic International Bond | 5.50 | 01/27/25 | 550,000 | 541,346 | ||||||||||
| Dominican Republic International Bond | 5.50 | 02/22/29 | 700,000 | 639,450 | ||||||||||
| Dominican Republic International Bond | 5.95 | 01/25/27 | 775,000 | 747,166 | ||||||||||
| Dominican Republic International Bond | 6.00 | 07/19/28 | 600,000 | 569,400 | ||||||||||
| Dominican Republic International Bond | 6.00 | 02/22/33 | 875,000 | 773,063 | ||||||||||
| Dominican Republic International Bond | 6.88 | 01/29/26 | 700,000 | 698,432 | ||||||||||
| Ecuador Government International Bond | ZCP | 07/31/30 | 600,000 | 180,300 | ||||||||||
| Ecuador Government International Bond(1) | 3.50 | 07/31/35 | 4,275,000 | 1,637,325 | ||||||||||
| Ecuador Government International Bond(1) | 6.00 | 07/31/30 | 1,950,000 | 995,475 | ||||||||||
| Egypt Government International Bond | 5.80 | 09/30/27 | 450,000 | 291,375 | ||||||||||
| Egypt Government International Bond | 5.88 | 06/11/25 | 625,000 | 507,615 | ||||||||||
| Egypt Government International Bond | 5.88 | 02/16/31 | 625,000 | 344,531 | ||||||||||
| Egypt Government International Bond | 6.59 | 02/21/28 | 575,000 | 370,875 | ||||||||||
| Egypt Government International Bond | 7.05 | 01/15/32 | 400,000 | 228,000 | ||||||||||
| Egypt Government International Bond | 7.30 | 09/30/33 | 450,000 | 249,750 | ||||||||||
| Egypt Government International Bond | 7.50 | 01/31/27 | 825,000 | 577,500 | ||||||||||
| Egypt Government International Bond | 7.60 | 03/01/29 | 775,000 | 488,250 | ||||||||||
| Egypt Government International Bond | 7.63 | 05/29/32 | 725,000 | 416,875 | ||||||||||
| Egyptian Financial Co. for Sovereign Taskeek | 10.88 | 02/28/26 | 700,000 | 650,234 | ||||||||||
| Ethiopia International Bond | 6.63 | 12/11/24 | 550,000 | 350,372 | ||||||||||
| Ghana Government International Bond(2) | 6.38 | 02/11/27 | 725,000 | 319,000 | ||||||||||
| Ghana Government International Bond(2) | 7.63 | 05/16/29 | 550,000 | 239,250 | ||||||||||
| Ghana Government International Bond(2) | 7.75 | 04/07/29 | 575,000 | 250,844 | ||||||||||
| Ghana Government International Bond(2) | 8.13 | 01/18/26 | 575,000 | 256,594 | ||||||||||
| Ghana Government International Bond(2) | 8.13 | 03/26/32 | 750,000 | 320,625 | ||||||||||
| Ghana Government International Bond(2) | 8.63 | 04/07/34 | 500,000 | 218,125 | ||||||||||
| Ghana Government International Bond | 10.75 | 10/14/30 | 600,000 | 377,250 | ||||||||||
The accompanying notes are an integral part of these financial statements.
126
BONDBLOXX ETF TRUST
BondBloxx JP Morgan USD Emerging Markets 1-10 Year Bond ETF
Portfolio of Investments (Continued)
October 31, 2023
| Face | ||||||||||||||
| Rate (%) | Maturity | Amount | Value | |||||||||||
| GOVERNMENT OBLIGATIONS – 83.7% (Continued) | ||||||||||||||
| Hazine Mustesarligi Varlik Kiralama AS | 4.49 | 11/25/24 | $ | 225,000 | $ | 218,813 | ||||||||
| Hazine Mustesarligi Varlik Kiralama AS | 5.13 | 06/22/26 | 475,000 | 442,938 | ||||||||||
| Hazine Mustesarligi Varlik Kiralama AS | 7.25 | 02/24/27 | 650,000 | 632,268 | ||||||||||
| Hazine Mustesarligi Varlik Kiralama AS | 9.76 | 11/13/25 | 450,000 | 466,875 | ||||||||||
| Hungary Government International Bond | 2.13 | 09/22/31 | 1,300,000 | 940,537 | ||||||||||
| Hungary Government International Bond | 5.25 | 06/16/29 | 1,050,000 | 991,788 | ||||||||||
| Hungary Government International Bond | 6.13 | 05/22/28 | 850,000 | 844,798 | ||||||||||
| Hungary Government International Bond | 6.25 | 09/22/32 | 950,000 | 915,184 | ||||||||||
| Indonesia Government International Bond | 1.85 | 03/12/31 | 250,000 | 191,535 | ||||||||||
| Indonesia Government International Bond | 2.15 | 07/28/31 | 200,000 | 154,886 | ||||||||||
| Indonesia Government International Bond | 2.85 | 02/14/30 | 250,000 | 212,120 | ||||||||||
| Indonesia Government International Bond | 3.50 | 01/11/28 | 225,000 | 207,422 | ||||||||||
| Indonesia Government International Bond | 3.55 | 03/31/32 | 200,000 | 169,838 | ||||||||||
| Indonesia Government International Bond | 3.85 | 07/18/27 | 200,000 | 188,106 | ||||||||||
| Indonesia Government International Bond | 3.85 | 10/15/30 | 275,000 | 245,202 | ||||||||||
| Indonesia Government International Bond | 4.10 | 04/24/28 | 200,000 | 188,118 | ||||||||||
| Indonesia Government International Bond | 4.13 | 01/15/25 | 475,000 | 468,516 | ||||||||||
| Indonesia Government International Bond | 4.35 | 01/08/27 | 250,000 | 240,759 | ||||||||||
| Indonesia Government International Bond | 4.55 | 01/11/28 | 220,000 | 211,980 | ||||||||||
| Indonesia Government International Bond | 4.65 | 09/20/32 | 250,000 | 229,286 | ||||||||||
| Indonesia Government International Bond | 4.75 | 01/08/26 | 400,000 | 394,220 | ||||||||||
| Indonesia Government International Bond | 4.75 | 02/11/29 | 225,000 | 215,806 | ||||||||||
| Indonesia Government International Bond | 4.85 | 01/11/33 | 200,000 | 186,918 | ||||||||||
| Iraq International Bond | 5.80 | 01/15/28 | 492,188 | 439,329 | ||||||||||
| Ivory Coast Government International Bond | 6.13 | 06/15/33 | 750,000 | 616,875 | ||||||||||
| Jamaica Government International Bond | 6.75 | 04/28/28 | 800,000 | 813,936 | ||||||||||
| Jordan Government International Bond | 5.75 | 01/31/27 | 600,000 | 544,125 | ||||||||||
| Jordan Government International Bond | 5.85 | 07/07/30 | 700,000 | 593,688 | ||||||||||
| Jordan Government International Bond | 6.13 | 01/29/26 | 600,000 | 558,375 | ||||||||||
| Jordan Government International Bond | 7.50 | 01/13/29 | 650,000 | 605,719 | ||||||||||
| Kazakhstan Government International Bond | 3.88 | 10/14/24 | 900,000 | 890,213 | ||||||||||
| Kazakhstan Government International Bond | 5.13 | 07/21/25 | 1,450,000 | 1,458,881 | ||||||||||
| KSA Sukuk Ltd. | 2.25 | 05/17/31 | 375,000 | 297,188 | ||||||||||
| KSA Sukuk Ltd. | 2.97 | 10/29/29 | 375,000 | 325,781 | ||||||||||
| KSA Sukuk Ltd. | 3.63 | 04/20/27 | 800,000 | 753,000 | ||||||||||
| KSA Sukuk Ltd. | 4.27 | 05/22/29 | 600,000 | 564,000 | ||||||||||
| KSA Sukuk Ltd. | 4.30 | 01/19/29 | 450,000 | 426,938 | ||||||||||
| KSA Sukuk Ltd. | 4.51 | 05/22/33 | 600,000 | 546,000 | ||||||||||
| KSA Sukuk Ltd. | 5.27 | 10/25/28 | 325,000 | 321,750 | ||||||||||
| Kuwait International Government Bond | 3.50 | 03/20/27 | 2,650,000 | 2,514,240 | ||||||||||
| Lebanon Government International Bond(2) | 6.00 | 01/27/23 | 600,000 | 38,901 | ||||||||||
| Lebanon Government International Bond(2) | 6.10 | 10/04/22 | 1,700,000 | 110,568 | ||||||||||
| Lebanon Government International Bond(2) | 6.65 | 02/26/30 | 1,200,000 | 78,318 | ||||||||||
| Lebanon Government International Bond(2) | 6.85 | 03/23/27 | 1,300,000 | 84,635 | ||||||||||
| Lebanon Government International Bond(2) | 8.25 | 04/12/21 | 700,000 | 44,324 | ||||||||||
| Magyar Export-Import Bank Zrt | 6.13 | 12/04/27 | 650,000 | 637,406 | ||||||||||
| Malaysia Sovereign Sukuk Bhd | 3.04 | 04/22/25 | 550,000 | 532,414 | ||||||||||
| Malaysia Sukuk Global Bhd | 3.18 | 04/27/26 | 550,000 | 524,799 | ||||||||||
The accompanying notes are an integral part of these financial statements.
127
BONDBLOXX ETF TRUST
BondBloxx JP Morgan USD Emerging Markets 1-10 Year Bond ETF
Portfolio of Investments (Continued)
October 31, 2023
| Face | ||||||||||||||
| Rate (%) | Maturity | Amount | Value | |||||||||||
| GOVERNMENT OBLIGATIONS – 83.7% (Continued) | ||||||||||||||
| Mexico Government International Bond | 2.66 | 05/24/31 | $ | 575,000 | $ | 449,075 | ||||||||
| Mexico Government International Bond | 3.25 | 04/16/30 | 350,000 | 295,575 | ||||||||||
| Mexico Government International Bond | 3.75 | 01/11/28 | 325,000 | 300,462 | ||||||||||
| Mexico Government International Bond | 4.13 | 01/21/26 | 325,000 | 316,652 | ||||||||||
| Mexico Government International Bond | 4.15 | 03/28/27 | 400,000 | 384,178 | ||||||||||
| Mexico Government International Bond | 4.50 | 04/22/29 | 500,000 | 463,000 | ||||||||||
| Mexico Government International Bond | 4.75 | 04/27/32 | 400,000 | 355,000 | ||||||||||
| Mexico Government International Bond | 4.88 | 05/19/33 | 350,000 | 308,000 | ||||||||||
| Mexico Government International Bond | 5.40 | 02/09/28 | 200,000 | 196,700 | ||||||||||
| Mexico Government International Bond | 8.30 | 08/15/31 | 150,000 | 169,425 | ||||||||||
| Morocco Government International Bond | 3.00 | 12/15/32 | 600,000 | 450,000 | ||||||||||
| Morocco Government International Bond | 5.95 | 03/08/28 | 730,000 | 717,225 | ||||||||||
| Morocco Government International Bond | 6.50 | 09/08/33 | 700,000 | 673,750 | ||||||||||
| Nigeria Government International Bond | 6.13 | 09/28/28 | 600,000 | 490,500 | ||||||||||
| Nigeria Government International Bond | 6.50 | 11/28/27 | 1,075,000 | 929,875 | ||||||||||
| Nigeria Government International Bond | 7.14 | 02/23/30 | 750,000 | 604,688 | ||||||||||
| Nigeria Government International Bond | 7.38 | 09/28/33 | 700,000 | 528,500 | ||||||||||
| Nigeria Government International Bond | 7.63 | 11/21/25 | 650,000 | 635,375 | ||||||||||
| Nigeria Government International Bond | 7.88 | 02/16/32 | 850,000 | 682,125 | ||||||||||
| Nigeria Government International Bond | 8.38 | 03/24/29 | 725,000 | 637,094 | ||||||||||
| Nigeria Government International Bond | 8.75 | 01/21/31 | 600,000 | 516,750 | ||||||||||
| Oman Government International Bond | 4.75 | 06/15/26 | 1,075,000 | 1,033,903 | ||||||||||
| Oman Government International Bond | 5.38 | 03/08/27 | 700,000 | 678,125 | ||||||||||
| Oman Government International Bond | 5.63 | 01/17/28 | 1,075,000 | 1,039,882 | ||||||||||
| Oman Government International Bond | 6.00 | 08/01/29 | 975,000 | 949,406 | ||||||||||
| Oman Government International Bond | 6.25 | 01/25/31 | 750,000 | 731,250 | ||||||||||
| Oman Government International Bond | 6.75 | 10/28/27 | 625,000 | 632,227 | ||||||||||
| Oman Government International Bond | 7.38 | 10/28/32 | 450,000 | 468,563 | ||||||||||
| Oman Sovereign Sukuk Co. | 4.40 | 06/01/24 | 700,000 | 693,000 | ||||||||||
| Oman Sovereign Sukuk Co. | 4.88 | 06/15/30 | 800,000 | 751,000 | ||||||||||
| Oman Sovereign Sukuk Co. | 5.93 | 10/31/25 | 650,000 | 649,188 | ||||||||||
| Pakistan Global Sukuk Programme Co. Ltd. | 7.95 | 01/31/29 | 575,000 | 351,316 | ||||||||||
| Pakistan Government International Bond | 6.00 | 04/08/26 | 775,000 | 426,204 | ||||||||||
| Pakistan Government International Bond | 6.88 | 12/05/27 | 875,000 | 464,271 | ||||||||||
| Pakistan Government International Bond | 7.38 | 04/08/31 | 825,000 | 407,088 | ||||||||||
| Panama Government International Bond | 2.25 | 09/29/32 | 850,000 | 577,362 | ||||||||||
| Panama Government International Bond | 3.16 | 01/23/30 | 625,000 | 503,281 | ||||||||||
| Panama Government International Bond | 3.30 | 01/19/33 | 450,000 | 331,762 | ||||||||||
| Panama Government International Bond | 3.75 | 03/16/25 | 500,000 | 482,500 | ||||||||||
| Panama Government International Bond | 3.88 | 03/17/28 | 400,000 | 359,700 | ||||||||||
| Paraguay Government International Bond | 4.95 | 04/28/31 | 600,000 | 546,450 | ||||||||||
| Perusahaan Penerbit SBSN Indonesia III | 1.50 | 06/09/26 | 250,000 | 225,536 | ||||||||||
| Perusahaan Penerbit SBSN Indonesia III | 2.55 | 06/09/31 | 250,000 | 200,870 | ||||||||||
| Perusahaan Penerbit SBSN Indonesia III | 2.80 | 06/23/30 | 200,000 | 167,710 | ||||||||||
| Perusahaan Penerbit SBSN Indonesia III | 4.15 | 03/29/27 | 350,000 | 333,900 | ||||||||||
| Perusahaan Penerbit SBSN Indonesia III | 4.33 | 05/28/25 | 350,000 | 343,930 | ||||||||||
| Perusahaan Penerbit SBSN Indonesia III | 4.35 | 09/10/24 | 275,000 | 271,968 | ||||||||||
| Perusahaan Penerbit SBSN Indonesia III | 4.40 | 06/06/27 | 325,000 | 311,781 | ||||||||||
The accompanying notes are an integral part of these financial statements.
128
BONDBLOXX ETF TRUST
BondBloxx JP Morgan USD Emerging Markets 1-10 Year Bond ETF
Portfolio of Investments (Continued)
October 31, 2023
| Face | ||||||||||||||
| Rate (%) | Maturity | Amount | Value | |||||||||||
| GOVERNMENT OBLIGATIONS – 83.7% (Continued) | ||||||||||||||
| Perusahaan Penerbit SBSN Indonesia III | 4.40 | 03/01/28 | $ | 325,000 | $ | 310,648 | ||||||||
| Perusahaan Penerbit SBSN Indonesia III | 4.45 | 02/20/29 | 200,000 | 189,876 | ||||||||||
| Perusahaan Penerbit SBSN Indonesia III | 4.55 | 03/29/26 | 300,000 | 292,999 | ||||||||||
| Perusahaan Penerbit SBSN Indonesia III | 4.70 | 06/06/32 | 300,000 | 279,547 | ||||||||||
| Peruvian Government International Bond | 1.86 | 12/01/32 | 425,000 | 300,262 | ||||||||||
| Peruvian Government International Bond | 2.78 | 01/23/31 | 1,575,000 | 1,265,512 | ||||||||||
| Philippine Government International Bond | 1.65 | 06/10/31 | 450,000 | 337,887 | ||||||||||
| Philippine Government International Bond | 2.46 | 05/05/30 | 375,000 | 308,661 | ||||||||||
| Philippine Government International Bond | 3.00 | 02/01/28 | 650,000 | 587,831 | ||||||||||
| Philippine Government International Bond | 3.75 | 01/14/29 | 550,000 | 506,679 | ||||||||||
| Philippine Government International Bond | 5.00 | 07/17/33 | 400,000 | 377,032 | ||||||||||
| Philippine Government International Bond | 5.50 | 03/30/26 | 375,000 | 376,147 | ||||||||||
| Philippine Government International Bond | 6.38 | 01/15/32 | 375,000 | 389,565 | ||||||||||
| Philippine Government International Bond | 7.75 | 01/14/31 | 600,000 | 669,903 | ||||||||||
| Philippine Government International Bond | 9.50 | 02/02/30 | 700,000 | 832,881 | ||||||||||
| Philippine Government International Bond | 10.63 | 03/16/25 | 450,000 | 481,036 | ||||||||||
| Qatar Government International Bond | 3.25 | 06/02/26 | 950,000 | 902,125 | ||||||||||
| Qatar Government International Bond | 3.40 | 04/16/25 | 525,000 | 508,530 | ||||||||||
| Qatar Government International Bond | 3.75 | 04/16/30 | 800,000 | 731,875 | ||||||||||
| Qatar Government International Bond | 4.00 | 03/14/29 | 1,250,000 | 1,177,734 | ||||||||||
| Qatar Government International Bond | 4.50 | 04/23/28 | 800,000 | 775,896 | ||||||||||
| Qatar Government International Bond | 9.75 | 06/15/30 | 325,000 | 401,706 | ||||||||||
| RAK Capital | 3.09 | 03/31/25 | 200,000 | 192,250 | ||||||||||
| Republic of Azerbaijan International Bond | 3.50 | 09/01/32 | 650,000 | 510,412 | ||||||||||
| Republic of Kenya Government International Bond | 6.30 | 01/23/34 | 500,000 | 345,000 | ||||||||||
| Republic of Kenya Government International Bond | 6.88 | 06/24/24 | 1,150,000 | 1,108,313 | ||||||||||
| Republic of Kenya Government International Bond | 7.25 | 02/28/28 | 600,000 | 489,000 | ||||||||||
| Republic of Kenya Government International Bond | 8.00 | 05/22/32 | 700,000 | 552,125 | ||||||||||
| Republic of Poland Government International Bond | 3.25 | 04/06/26 | 1,000,000 | 948,460 | ||||||||||
| Republic of Poland Government International Bond | 4.88 | 10/04/33 | 1,400,000 | 1,300,187 | ||||||||||
| Republic of Poland Government International Bond | 5.50 | 11/16/27 | 950,000 | 956,735 | ||||||||||
| Republic of Poland Government International Bond | 5.75 | 11/16/32 | 900,000 | 894,064 | ||||||||||
| Republic of South Africa Government International Bond | 4.30 | 10/12/28 | 1,050,000 | 906,937 | ||||||||||
| Republic of South Africa Government International Bond | 4.85 | 09/27/27 | 450,000 | 415,969 | ||||||||||
| Republic of South Africa Government International Bond | 4.85 | 09/30/29 | 950,000 | 809,875 | ||||||||||
| Republic of South Africa Government International Bond | 4.88 | 04/14/26 | 550,000 | 524,562 | ||||||||||
| Republic of South Africa Government International Bond | 5.88 | 09/16/25 | 900,000 | 889,065 | ||||||||||
| Republic of South Africa Government International Bond | 5.88 | 06/22/30 | 625,000 | 550,000 | ||||||||||
| Republic of South Africa Government International Bond | 5.88 | 04/20/32 | 625,000 | 528,906 | ||||||||||
| Romanian Government International Bond | 3.00 | 02/27/27 | 850,000 | 772,143 | ||||||||||
| Romanian Government International Bond | 3.00 | 02/14/31 | 800,000 | 634,984 | ||||||||||
| Romanian Government International Bond | 3.63 | 03/27/32 | 650,000 | 515,629 | ||||||||||
| Romanian Government International Bond | 5.25 | 11/25/27 | 600,000 | 581,626 | ||||||||||
| Romanian Government International Bond | 6.63 | 02/17/28 | 650,000 | 652,301 | ||||||||||
| Romanian Government International Bond | 7.13 | 01/17/33 | 920,000 | 915,060 | ||||||||||
| Saudi Government International Bond | 2.25 | 02/02/33 | 650,000 | 489,938 | ||||||||||
| Saudi Government International Bond | 2.50 | 02/03/27 | 275,000 | 249,906 | ||||||||||
| Saudi Government International Bond | 2.75 | 02/03/32 | 225,000 | 181,969 | ||||||||||
The accompanying notes are an integral part of these financial statements.
129
BONDBLOXX ETF TRUST
BondBloxx JP Morgan USD Emerging Markets 1-10 Year Bond ETF
Portfolio of Investments (Continued)
October 31, 2023
| Face | ||||||||||||||
| Rate (%) | Maturity | Amount | Value | |||||||||||
| GOVERNMENT OBLIGATIONS – 83.7% (Continued) | ||||||||||||||
| Saudi Government International Bond | 2.90 | 10/22/25 | $ | 350,000 | $ | 331,550 | ||||||||
| Saudi Government International Bond | 3.25 | 10/26/26 | 900,000 | 843,750 | ||||||||||
| Saudi Government International Bond | 3.25 | 10/22/30 | 350,000 | 300,563 | ||||||||||
| Saudi Government International Bond | 3.63 | 03/04/28 | 1,100,000 | 1,018,875 | ||||||||||
| Saudi Government International Bond | 4.00 | 04/17/25 | 800,000 | 778,792 | ||||||||||
| Saudi Government International Bond | 4.38 | 04/16/29 | 850,000 | 799,000 | ||||||||||
| Saudi Government International Bond | 4.50 | 04/17/30 | 500,000 | 468,750 | ||||||||||
| Saudi Government International Bond | 4.75 | 01/18/28 | 725,000 | 703,250 | ||||||||||
| Saudi Government International Bond | 4.88 | 07/18/33 | 475,000 | 443,531 | ||||||||||
| Saudi Government International Bond | 5.50 | 10/25/32 | 500,000 | 490,625 | ||||||||||
| Senegal Government International Bond | 6.25 | 05/23/33 | 625,000 | 497,656 | ||||||||||
| Serbia International Bond | 2.13 | 12/01/30 | 700,000 | 515,204 | ||||||||||
| Serbia International Bond | 6.50 | 09/26/33 | 550,000 | 517,760 | ||||||||||
| Sharjah Sukuk Program Ltd. | 2.94 | 06/10/27 | 225,000 | 202,781 | ||||||||||
| Sharjah Sukuk Program Ltd. | 3.23 | 10/23/29 | 200,000 | 172,375 | ||||||||||
| Sharjah Sukuk Program Ltd. | 3.85 | 04/03/26 | 200,000 | 190,250 | ||||||||||
| Sharjah Sukuk Program Ltd. | 4.23 | 03/14/28 | 250,000 | 232,048 | ||||||||||
| Sri Lanka Government International Bond(2) | 5.75 | 04/18/23 | 725,000 | 379,175 | ||||||||||
| Sri Lanka Government International Bond(2) | 6.20 | 05/11/27 | 900,000 | 450,639 | ||||||||||
| Sri Lanka Government International Bond(2) | 6.75 | 04/18/28 | 725,000 | 363,805 | ||||||||||
| Sri Lanka Government International Bond(2) | 6.85 | 03/14/24 | 600,000 | 310,992 | ||||||||||
| Sri Lanka Government International Bond(2) | 6.85 | 11/03/25 | 1,300,000 | 673,231 | ||||||||||
| Sri Lanka Government International Bond(2) | 7.55 | 03/28/30 | 1,675,000 | 840,415 | ||||||||||
| Trinidad & Tobago Government International Bond | 4.50 | 08/04/26 | 600,000 | 573,660 | ||||||||||
| Tunisian Republic International Bond | 5.75 | 01/30/25 | 575,000 | 401,781 | ||||||||||
| Turkiye Government International Bond | 4.25 | 03/13/25 | 425,000 | 406,937 | ||||||||||
| Turkiye Government International Bond | 4.25 | 04/14/26 | 325,000 | 299,406 | ||||||||||
| Turkiye Government International Bond | 4.75 | 01/26/26 | 300,000 | 282,375 | ||||||||||
| Turkiye Government International Bond | 4.88 | 10/09/26 | 550,000 | 508,062 | ||||||||||
| Turkiye Government International Bond | 5.13 | 02/17/28 | 425,000 | 377,719 | ||||||||||
| Turkiye Government International Bond | 5.25 | 03/13/30 | 425,000 | 352,219 | ||||||||||
| Turkiye Government International Bond | 5.60 | 11/14/24 | 500,000 | 493,750 | ||||||||||
| Turkiye Government International Bond | 5.88 | 06/26/31 | 375,000 | 312,656 | ||||||||||
| Turkiye Government International Bond | 5.95 | 01/15/31 | 500,000 | 422,500 | ||||||||||
| Turkiye Government International Bond | 6.00 | 03/25/27 | 700,000 | 659,750 | ||||||||||
| Turkiye Government International Bond | 6.13 | 10/24/28 | 600,000 | 546,000 | ||||||||||
| Turkiye Government International Bond | 6.35 | 08/10/24 | 425,000 | 423,406 | ||||||||||
| Turkiye Government International Bond | 6.38 | 10/14/25 | 500,000 | 488,125 | ||||||||||
| Turkiye Government International Bond | 6.50 | 09/20/33 | 300,000 | 252,750 | ||||||||||
| Turkiye Government International Bond | 7.38 | 02/05/25 | 650,000 | 654,875 | ||||||||||
| Turkiye Government International Bond | 7.63 | 04/26/29 | 850,000 | 812,812 | ||||||||||
| Turkiye Government International Bond | 8.60 | 09/24/27 | 425,000 | 431,906 | ||||||||||
| Turkiye Government International Bond | 9.13 | 07/13/30 | 400,000 | 400,500 | ||||||||||
| Turkiye Government International Bond | 9.38 | 03/14/29 | 450,000 | 459,562 | ||||||||||
| Turkiye Government International Bond | 9.38 | 01/19/33 | 450,000 | 451,125 | ||||||||||
| Turkiye Government International Bond | 9.88 | 01/15/28 | 725,000 | 761,250 | ||||||||||
| Turkiye Government International Bond | 11.88 | 01/15/30 | 325,000 | 375,375 | ||||||||||
| UAE Government International Bond | 2.00 | 10/19/31 | 225,000 | 177,050 | ||||||||||
The accompanying notes are an integral part of these financial statements.
130
BONDBLOXX ETF TRUST
BondBloxx JP Morgan USD Emerging Markets 1-10 Year Bond ETF
Portfolio of Investments (Continued)
October 31, 2023
| Face | ||||||||||||||
| Rate (%) | Maturity | Amount | Value | |||||||||||
| GOVERNMENT OBLIGATIONS – 83.7% (Continued) | ||||||||||||||
| UAE Government International Bond | 4.05 | 07/07/32 | $ | 450,000 | $ | 411,047 | ||||||||
| UAE Government International Bond | 4.92 | 09/25/33 | 200,000 | 192,938 | ||||||||||
| Ukraine Government International Bond | 6.88 | 05/21/31 | 1,000,000 | 250,500 | ||||||||||
| Ukraine Government International Bond | 7.75 | 09/01/25 | 775,000 | 239,766 | ||||||||||
| Ukraine Government International Bond | 7.75 | 09/01/26 | 750,000 | 218,274 | ||||||||||
| Ukraine Government International Bond | 7.75 | 09/01/27 | 800,000 | 230,400 | ||||||||||
| Ukraine Government International Bond | 7.75 | 09/01/28 | 750,000 | 213,000 | ||||||||||
| Ukraine Government International Bond | 7.75 | 09/01/29 | 750,000 | 211,500 | ||||||||||
| Ukraine Government International Bond | 9.75 | 11/01/30 | 950,000 | 279,300 | ||||||||||
| Uruguay Government International Bond | 4.38 | 10/27/27 | 825,000 | 816,832 | ||||||||||
| Uruguay Government International Bond | 4.38 | 01/23/31 | 1,175,000 | 1,110,559 | ||||||||||
| Uruguay Government International Bond | 5.75 | 10/28/34 | 850,000 | 851,275 | ||||||||||
| Vietnam Government International Bond | 4.80 | 11/19/24 | 600,000 | 589,122 | ||||||||||
| Zambia Government International Bond(2) | 8.50 | 04/14/24 | 600,000 | 369,750 | ||||||||||
| Zambia Government International Bond(2) | 8.97 | 07/30/27 | 700,000 | 429,078 | ||||||||||
| 153,476,195 | ||||||||||||||
| TOTAL GOVERNMENT AGENCIES AND OBLIGATIONS (Cost - $163,807,361) | 159,332,793 | |||||||||||||
| SHORT-TERM INVESTMENTS – 0.5% | ||||||||||||||
| TIME DEPOSITS – 0.5% | ||||||||||||||
| ANZ National Bank, London | 4.68 | 11/01/23 | 896,458 | 896,458 | ||||||||||
| Citibank, London | 2.85 | 11/01/23 | EUR | 671 | 709 | |||||||||
| TOTAL SHORT-TERM INVESTMENTS (Cost - $897,167) | 897,167 | |||||||||||||
| TOTAL INVESTMENTS – 98.7% (Cost - $186,402,427) | $ | 180,951,739 | ||||||||||||
| OTHER ASSETS LESS LIABILITIES – 1.3% | 2,467,029 | |||||||||||||
| NET ASSETS – 100.0% | $ | 183,418,768 | ||||||||||||
| ZCP | Indicates a zero coupon rate. |
| EUR | Euro. |
| (1) | Includes step-up bonds that pay an initial coupon rate for the first period and then a higher coupon rate for the following periods. The rate reported is the rate in effect as of October 31, 2023. | |
| (2) | Defaulted security. Security has not paid its last interest payment and/or interest is not being accrued. |
The accompanying notes are an integral part of these financial statements.
131
BONDBLOXX ETF TRUST
BondBloxx JP Morgan USD Emerging Markets 1-10 Year Bond ETF
Portfolio of Investments (Continued)
October 31, 2023
COUNTRY DIVERSIFICATION
BondBloxx JP Morgan USD Emerging Markets 1-10 Year Bond ETF invested, as a percentage of net assets, in the following countries as of October 31, 2023:
| Country | Percent of Net Assets | |||
| Angola | 1.4 | % | ||
| Argentina | 1.8 | % | ||
| Azerbaijan | 0.9 | % | ||
| Bahrain | 3.8 | % | ||
| Bolivia | 0.2 | % | ||
| Brazil | 3.5 | % | ||
| British Virgin Islands | 1.4 | % | ||
| Cayman Islands | 3.3 | % | ||
| Chile | 1.5 | % | ||
| China | 2.0 | % | ||
| Colombia | 2.2 | % | ||
| Costa Rica | 0.8 | % | ||
| Dominican Republic | 3.2 | % | ||
| Ecuador | 1.5 | % | ||
| Egypt | 2.2 | % | ||
| Ethiopia | 0.2 | % | ||
| Ghana | 1.1 | % | ||
| Hong Kong | 0.5 | % | ||
| Hungary | 2.8 | % | ||
| India | 1.4 | % | ||
| Indonesia | 4.2 | % | ||
| Iraq | 0.2 | % | ||
| Ivory Coast | 0.3 | % | ||
| Jamaica | 0.4 | % | ||
| Jordan | 1.3 | % | ||
| Kazakhstan | 1.3 | % | ||
| Kenya | 1.4 | % | ||
| Kuwait | 1.4 | % | ||
| Lebanon | 0.2 | % | ||
| Country | Percent of Net Assets | |||
| Malaysia | 1.9 | % | ||
| Mexico | 4.1 | % | ||
| Morocco | 1.0 | % | ||
| Nigeria | 2.7 | % | ||
| Oman | 4.2 | % | ||
| Pakistan | 0.9 | % | ||
| Panama | 1.4 | % | ||
| Paraguay | 0.3 | % | ||
| Peru | 1.0 | % | ||
| Philippines | 2.9 | % | ||
| Poland | 3.0 | % | ||
| Qatar | 3.1 | % | ||
| Romania | 2.2 | % | ||
| Saudi Arabia | 3.9 | % | ||
| Senegal | 0.3 | % | ||
| Serbia | 0.6 | % | ||
| South Africa | 3.3 | % | ||
| Sri Lanka | 1.6 | % | ||
| Trinidad and Tobago | 0.3 | % | ||
| Tunisia | 0.2 | % | ||
| Turkey | 6.5 | % | ||
| Ukraine | 0.9 | % | ||
| United Arab Emirates | 3.3 | % | ||
| Uruguay | 1.5 | % | ||
| Vietnam | 0.3 | % | ||
| Zambia | 0.4 | % | ||
| Other* | 1.8 | % | ||
| 100.0 | % | |||
| * | Includes cash and any non-equity securities and net other assets (liabilities). |
The accompanying notes are an integral part of these financial statements.
132
BONDBLOXX ETF TRUST
BondBloxx Bloomberg Six Month Target Duration US Treasury ETF
Portfolio of Investments
October 31, 2023
| Face | ||||||||||||||
| Rate (%) | Maturity | Amount | Value | |||||||||||
| SHORT-TERM INVESTMENTS – 102.0% | ||||||||||||||
| GOVERNMENT OBLIGATIONS – 101.9% | ||||||||||||||
| U.S. Treasury Bill | ZCP | 11/02/23 | $ | 26,342,100 | $ | 26,338,273 | ||||||||
| U.S. Treasury Bill | ZCP | 11/07/23 | 3,708,800 | 3,705,543 | ||||||||||
| U.S. Treasury Bill | ZCP | 11/09/23 | 25,013,500 | 24,984,073 | ||||||||||
| U.S. Treasury Bill | ZCP | 11/14/23 | 7,312,700 | 7,298,763 | ||||||||||
| U.S. Treasury Bill | ZCP | 11/16/23 | 18,070,600 | 18,030,985 | ||||||||||
| U.S. Treasury Bill | ZCP | 11/21/23 | 8,697,200 | 8,671,629 | ||||||||||
| U.S. Treasury Bill | ZCP | 11/24/23 | 3,481,900 | 3,470,147 | ||||||||||
| U.S. Treasury Bill | ZCP | 11/28/23 | 19,025,400 | 18,949,955 | ||||||||||
| U.S. Treasury Bill | ZCP | 11/30/23 | 27,289,100 | 27,172,958 | ||||||||||
| U.S. Treasury Bill | ZCP | 12/05/23 | 12,271,400 | 12,210,273 | ||||||||||
| U.S. Treasury Bill | ZCP | 12/07/23 | 22,798,900 | 22,678,575 | ||||||||||
| U.S. Treasury Bill | ZCP | 12/12/23 | 12,448,200 | 12,373,274 | ||||||||||
| U.S. Treasury Bill | ZCP | 12/14/23 | 20,681,800 | 20,551,240 | ||||||||||
| U.S. Treasury Bill | ZCP | 12/19/23 | 12,944,400 | 12,852,792 | ||||||||||
| U.S. Treasury Bill | ZCP | 12/21/23 | 17,186,200 | 17,059,754 | ||||||||||
| U.S. Treasury Bill | ZCP | 12/28/23 | 57,171,900 | 56,691,059 | ||||||||||
| U.S. Treasury Bill | ZCP | 01/02/24 | 6,524,300 | 6,464,778 | ||||||||||
| U.S. Treasury Bill | ZCP | 01/04/24 | 7,212,300 | 7,144,438 | ||||||||||
| U.S. Treasury Bill | ZCP | 01/09/24 | 7,031,800 | 6,960,745 | ||||||||||
| U.S. Treasury Bill | ZCP | 01/11/24 | 9,174,300 | 9,078,517 | ||||||||||
| U.S. Treasury Bill | ZCP | 01/16/24 | 3,021,000 | 2,987,183 | ||||||||||
| U.S. Treasury Bill | ZCP | 01/18/24 | 9,708,700 | 9,597,121 | ||||||||||
| U.S. Treasury Bill | ZCP | 01/23/24 | 1,005,000 | 992,702 | ||||||||||
| U.S. Treasury Bill | ZCP | 01/25/24 | 49,540,300 | 48,921,188 | ||||||||||
| U.S. Treasury Bill | ZCP | 01/30/24 | 1,005,000 | 991,691 | ||||||||||
| U.S. Treasury Bill | ZCP | 02/01/24 | 1,005,000 | 991,375 | ||||||||||
| U.S. Treasury Bill | ZCP | 02/08/24 | 5,935,500 | 5,849,127 | ||||||||||
| U.S. Treasury Bill | ZCP | 02/15/24 | 5,009,200 | 4,930,993 | ||||||||||
| U.S. Treasury Bill | ZCP | 02/22/24 | 41,324,800 | 40,636,385 | ||||||||||
| U.S. Treasury Bill | ZCP | 03/07/24 | 4,138,500 | 4,060,990 | ||||||||||
| U.S. Treasury Bill | ZCP | 03/21/24 | 36,331,100 | 35,575,572 | ||||||||||
| U.S. Treasury Bill | ZCP | 04/18/24 | 41,824,400 | 40,782,151 | ||||||||||
| U.S. Treasury Bill | ZCP | 05/16/24 | 94,138,600 | 91,444,564 | ||||||||||
| U.S. Treasury Bill | ZCP | 06/13/24 | 99,520,600 | 96,313,351 | ||||||||||
| U.S. Treasury Bill | ZCP | 07/11/24 | 99,625,300 | 96,027,806 | ||||||||||
| U.S. Treasury Bill | ZCP | 08/08/24 | 104,801,300 | 100,558,760 | ||||||||||
| U.S. Treasury Bill | ZCP | 09/05/24 | 109,852,700 | 104,973,347 | ||||||||||
| U.S. Treasury Bill | ZCP | 10/03/24 | 115,000,000 | 109,434,095 | ||||||||||
| TOTAL GOVERNMENT OBLIGATIONS (Cost - $1,118,182,480) | 1,117,756,172 | |||||||||||||
| TIME DEPOSITS – 0.1% | ||||||||||||||
| Sumitomo Mitsui Trust Bank, London | 4.68 | 11/01/23 | 687,779 | 687,779 | ||||||||||
| TOTAL TIME DEPOSITS (Cost - $687,779) | 687,779 | |||||||||||||
| TOTAL SHORT-TERM INVESTMENTS (Cost - $1,118,870,259) | 1,118,443,951 | |||||||||||||
| TOTAL INVESTMENTS – 102.0% (Cost - $1,118,870,259) | $ | 1,118,443,951 | ||||||||||||
| OTHER ASSETS LESS LIABILITIES – (2.0)% | (21,558,950 | ) | ||||||||||||
| NET ASSETS – 100.0% | $ | 1,096,885,001 | ||||||||||||
| ZCP | Indicates a zero coupon rate. |
The accompanying notes are an integral part of these financial statements.
133
BONDBLOXX ETF TRUST
BondBloxx Bloomberg One Year Target Duration US Treasury ETF
Portfolio of Investments
October 31, 2023
| Face | ||||||||||||||
| Rate (%) | Maturity | Amount | Value | |||||||||||
| GOVERNMENT OBLIGATIONS – 99.1% | ||||||||||||||
| U.S. Treasury Note | 0.25 | 05/15/24 | $ | 23,114,200 | $ | 22,477,657 | ||||||||
| U.S. Treasury Note | 0.25 | 06/15/24 | 7,544,300 | 7,304,710 | ||||||||||
| U.S. Treasury Note | 0.38 | 07/15/24 | 6,788,900 | 6,551,819 | ||||||||||
| U.S. Treasury Note | 0.38 | 08/15/24 | 9,027,000 | 8,674,030 | ||||||||||
| U.S. Treasury Note | 0.38 | 09/15/24 | 9,019,900 | 8,630,388 | ||||||||||
| U.S. Treasury Note | 0.38 | 04/30/25 | 9,750,000 | 9,075,498 | ||||||||||
| U.S. Treasury Note | 0.50 | 03/31/25 | 9,402,200 | 8,797,484 | ||||||||||
| U.S. Treasury Note | 0.63 | 10/15/24 | 19,500,100 | 18,630,594 | ||||||||||
| U.S. Treasury Note | 0.75 | 11/15/24 | 13,250,200 | 12,629,873 | ||||||||||
| U.S. Treasury Note | 1.00 | 12/15/24 | 12,575,900 | 11,981,492 | ||||||||||
| U.S. Treasury Note | 1.13 | 01/15/25 | 11,783,600 | 11,210,991 | ||||||||||
| U.S. Treasury Note | 1.13 | 02/28/25 | 7,538,700 | 7,137,912 | ||||||||||
| U.S. Treasury Note | 1.25 | 08/31/24 | 7,110,400 | 6,868,202 | ||||||||||
| U.S. Treasury Note | 1.38 | 01/31/25 | 6,524,700 | 6,216,816 | ||||||||||
| U.S. Treasury Note | 1.50 | 09/30/24 | 6,264,900 | 6,045,628 | ||||||||||
| U.S. Treasury Note | 1.50 | 10/31/24 | 4,550,800 | 4,377,567 | ||||||||||
| U.S. Treasury Note | 1.50 | 11/30/24 | 7,972,300 | 7,645,934 | ||||||||||
| U.S. Treasury Note | 1.50 | 02/15/25 | 11,545,800 | 11,001,434 | ||||||||||
| U.S. Treasury Note | 1.75 | 06/30/24 | 6,165,400 | 6,014,878 | ||||||||||
| U.S. Treasury Note | 1.75 | 07/31/24 | 7,620,900 | 7,413,409 | ||||||||||
| U.S. Treasury Note | 1.75 | 12/31/24 | 7,425,200 | 7,124,421 | ||||||||||
| U.S. Treasury Note | 1.75 | 03/15/25 | 11,491,600 | 10,960,113 | ||||||||||
| U.S. Treasury Note | 1.88 | 08/31/24 | 4,476,700 | 4,346,071 | ||||||||||
| U.S. Treasury Note | 2.00 | 05/31/24 | 5,592,300 | 5,481,874 | ||||||||||
| U.S. Treasury Note | 2.00 | 06/30/24 | 9,111,700 | 8,905,619 | ||||||||||
| U.S. Treasury Note | 2.00 | 02/15/25 | 12,801,500 | 12,277,689 | ||||||||||
| U.S. Treasury Note | 2.13 | 07/31/24 | 1,071,600 | 1,045,438 | ||||||||||
| U.S. Treasury Note | 2.13 | 09/30/24 | 1,286,900 | 1,248,972 | ||||||||||
| U.S. Treasury Note | 2.13 | 11/30/24 | 5,318,500 | 5,135,573 | ||||||||||
| U.S. Treasury Note | 2.13 | 05/15/25 | 11,825,000 | 11,292,182 | ||||||||||
| U.S. Treasury Note | 2.25 | 10/31/24 | 3,213,400 | 3,114,488 | ||||||||||
| U.S. Treasury Note | 2.25 | 11/15/24 | 13,861,700 | 13,417,963 | ||||||||||
| U.S. Treasury Note | 2.25 | 12/31/24 | 6,051,200 | 5,839,644 | ||||||||||
| U.S. Treasury Note | 2.38 | 08/15/24 | 12,837,000 | 12,528,862 | ||||||||||
| U.S. Treasury Note | 2.50 | 05/15/24 | 5,303,300 | 5,219,607 | ||||||||||
| U.S. Treasury Note | 2.50 | 05/31/24 | 19,500,300 | 19,170,852 | ||||||||||
| U.S. Treasury Note | 2.50 | 01/31/25 | 6,022,200 | 5,818,598 | ||||||||||
| U.S. Treasury Note | 2.63 | 03/31/25 | 3,229,000 | 3,113,652 | ||||||||||
| U.S. Treasury Note | 2.63 | 04/15/25 | 11,043,800 | 10,641,737 | ||||||||||
| U.S. Treasury Note | 2.75 | 02/28/25 | 6,023,500 | 5,827,501 | ||||||||||
| U.S. Treasury Note | 2.75 | 05/15/25 | 10,500,000 | 10,120,195 | ||||||||||
| U.S. Treasury Note | 2.88 | 04/30/25 | 5,895,200 | 5,697,043 | ||||||||||
| U.S. Treasury Note | 3.00 | 06/30/24 | 11,728,100 | 11,537,976 | ||||||||||
| U.S. Treasury Note | 3.00 | 07/31/24 | 34,798,000 | 34,165,247 | ||||||||||
| U.S. Treasury Note | 3.25 | 08/31/24 | 20,875,000 | 20,495,825 | ||||||||||
| U.S. Treasury Note | 3.88 | 03/31/25 | 10,026,000 | 9,838,600 | ||||||||||
| U.S. Treasury Note | 3.88 | 04/30/25 | 9,713,400 | 9,526,341 | ||||||||||
| U.S. Treasury Note | 4.13 | 01/31/25 | 10,574,000 | 10,422,412 | ||||||||||
The accompanying notes are an integral part of these financial statements.
134
BONDBLOXX ETF TRUST
BondBloxx Bloomberg One Year Target Duration US Treasury ETF
Portfolio of Investments (Continued)
October 31, 2023
| Face | ||||||||||||||
| Rate (%) | Maturity | Amount | Value | |||||||||||
| GOVERNMENT OBLIGATIONS – 99.1% (Continued) | ||||||||||||||
| U.S. Treasury Note | 4.25 | 09/30/24 | $ | 13,597,700 | $ | 13,452,162 | ||||||||
| U.S. Treasury Note | 4.25 | 12/31/24 | 9,751,600 | 9,627,420 | ||||||||||
| U.S. Treasury Note | 4.25 | 05/31/25 | 9,800,000 | 9,659,699 | ||||||||||
| U.S. Treasury Note | 4.38 | 10/31/24 | 17,303,700 | 17,123,566 | ||||||||||
| U.S. Treasury Note | 4.50 | 11/30/24 | 9,786,200 | 9,690,058 | ||||||||||
| U.S. Treasury Note | 4.63 | 02/28/25 | 10,083,100 | 9,996,448 | ||||||||||
| TOTAL GOVERNMENT OBLIGATIONS (Cost - $523,829,991) | 522,550,164 | |||||||||||||
| SHORT-TERM INVESTMENTS – 0.3% | ||||||||||||||
| TIME DEPOSITS – 0.3% | ||||||||||||||
| Sumitomo Mitsui Trust Bank, London | 4.68 | 11/01/23 | 1,547,559 | 1,547,559 | ||||||||||
| TOTAL SHORT-TERM INVESTMENTS (Cost - $1,547,559) | 1,547,559 | |||||||||||||
| TOTAL INVESTMENTS – 99.4% (Cost - $525,377,550) | $ | 524,097,723 | ||||||||||||
| OTHER ASSETS LESS LIABILITIES – 0.6% | 3,128,850 | |||||||||||||
| NET ASSETS – 100.0% | $ | 527,226,573 | ||||||||||||
The accompanying notes are an integral part of these financial statements.
135
BONDBLOXX ETF TRUST
BondBloxx Bloomberg Two Year Target Duration US Treasury ETF
Portfolio of Investments
October 31, 2023
| Face | ||||||||||||||
| Rate (%) | Maturity | Amount | Value | |||||||||||
| GOVERNMENT OBLIGATIONS – 98.9% | ||||||||||||||
| U.S. Treasury Bond | 6.50 | 11/15/26 | $ | 108,000 | $ | 112,814 | ||||||||
| U.S. Treasury Bond | 6.63 | 02/15/27 | 90,400 | 95,146 | ||||||||||
| U.S. Treasury Note | 0.25 | 05/31/25 | 756,000 | 699,728 | ||||||||||
| U.S. Treasury Note | 0.25 | 07/31/25 | 2,749,400 | 2,526,870 | ||||||||||
| U.S. Treasury Note | 0.25 | 08/31/25 | 1,372,800 | 1,257,265 | ||||||||||
| U.S. Treasury Note | 0.25 | 09/30/25 | 1,200,000 | 1,095,609 | ||||||||||
| U.S. Treasury Note | 0.25 | 10/31/25 | 1,917,400 | 1,743,860 | ||||||||||
| U.S. Treasury Note | 0.38 | 04/30/25 | 972,000 | 904,757 | ||||||||||
| U.S. Treasury Note | 0.38 | 11/30/25 | 2,921,700 | 2,655,209 | ||||||||||
| U.S. Treasury Note | 0.38 | 12/31/25 | 1,720,000 | 1,558,884 | ||||||||||
| U.S. Treasury Note | 0.38 | 01/31/26 | 2,389,000 | 2,156,259 | ||||||||||
| U.S. Treasury Note | 0.50 | 03/31/25 | 1,061,100 | 992,854 | ||||||||||
| U.S. Treasury Note | 0.50 | 02/28/26 | 1,891,000 | 1,706,406 | ||||||||||
| U.S. Treasury Note | 0.63 | 07/31/26 | 1,917,000 | 1,708,526 | ||||||||||
| U.S. Treasury Note | 0.75 | 11/15/24 | 1,361,300 | 1,297,569 | ||||||||||
| U.S. Treasury Note | 0.75 | 03/31/26 | 2,293,000 | 2,077,404 | ||||||||||
| U.S. Treasury Note | 0.75 | 04/30/26 | 2,385,500 | 2,153,007 | ||||||||||
| U.S. Treasury Note | 0.75 | 05/31/26 | 2,313,200 | 2,080,434 | ||||||||||
| U.S. Treasury Note | 0.75 | 08/31/26 | 2,061,700 | 1,837,410 | ||||||||||
| U.S. Treasury Note | 0.88 | 06/30/26 | 1,710,800 | 1,541,324 | ||||||||||
| U.S. Treasury Note | 0.88 | 09/30/26 | 1,958,600 | 1,748,892 | ||||||||||
| U.S. Treasury Note | 1.00 | 12/15/24 | 1,139,000 | 1,085,164 | ||||||||||
| U.S. Treasury Note | 1.13 | 01/15/25 | 1,697,400 | 1,614,917 | ||||||||||
| U.S. Treasury Note | 1.13 | 10/31/26 | 1,944,000 | 1,742,538 | ||||||||||
| U.S. Treasury Note | 1.25 | 11/30/26 | 2,000,000 | 1,794,297 | ||||||||||
| U.S. Treasury Note | 1.38 | 01/31/25 | 382,000 | 363,974 | ||||||||||
| U.S. Treasury Note | 1.38 | 08/31/26 | 775,800 | 704,069 | ||||||||||
| U.S. Treasury Note | 1.50 | 11/30/24 | 1,076,200 | 1,032,143 | ||||||||||
| U.S. Treasury Note | 1.50 | 02/15/25 | 4,875,700 | 4,645,818 | ||||||||||
| U.S. Treasury Note | 1.50 | 08/15/26 | 1,743,000 | 1,589,398 | ||||||||||
| U.S. Treasury Note | 1.63 | 02/15/26 | 2,102,000 | 1,949,769 | ||||||||||
| U.S. Treasury Note | 1.63 | 05/15/26 | 2,286,000 | 2,105,978 | ||||||||||
| U.S. Treasury Note | 1.63 | 09/30/26 | 627,600 | 572,759 | ||||||||||
| U.S. Treasury Note | 1.63 | 10/31/26 | 782,600 | 712,166 | ||||||||||
| U.S. Treasury Note | 1.63 | 11/30/26 | 770,600 | 699,771 | ||||||||||
| U.S. Treasury Note | 1.75 | 12/31/24 | 810,800 | 777,956 | ||||||||||
| U.S. Treasury Note | 1.75 | 03/15/25 | 3,322,000 | 3,168,358 | ||||||||||
| U.S. Treasury Note | 1.75 | 12/31/26 | 800,000 | 727,469 | ||||||||||
| U.S. Treasury Note | 1.88 | 06/30/26 | 696,000 | 643,963 | ||||||||||
| U.S. Treasury Note | 1.88 | 07/31/26 | 1,433,000 | 1,321,887 | ||||||||||
| U.S. Treasury Note | 2.00 | 02/15/25 | 513,400 | 492,393 | ||||||||||
| U.S. Treasury Note | 2.00 | 11/15/26 | 1,756,200 | 1,614,263 | ||||||||||
| U.S. Treasury Note | 2.13 | 11/30/24 | 540,000 | 521,427 | ||||||||||
| U.S. Treasury Note | 2.13 | 05/15/25 | 500,000 | 477,471 | ||||||||||
| U.S. Treasury Note | 2.13 | 05/31/26 | 1,606,300 | 1,497,749 | ||||||||||
| U.S. Treasury Note | 2.25 | 12/31/24 | 500,000 | 482,520 | ||||||||||
| U.S. Treasury Note | 2.25 | 11/15/25 | 2,047,600 | 1,937,542 | ||||||||||
| U.S. Treasury Note | 2.50 | 01/31/25 | 400,000 | 386,477 | ||||||||||
The accompanying notes are an integral part of these financial statements.
136
BONDBLOXX ETF TRUST
BondBloxx Bloomberg Two Year Target Duration US Treasury ETF
Portfolio of Investments (Continued)
October 31, 2023
| Face | ||||||||||||||
| Rate (%) | Maturity | Amount | Value | |||||||||||
| GOVERNMENT OBLIGATIONS – 98.9% (Continued) | ||||||||||||||
| U.S. Treasury Note | 2.50 | 02/28/26 | $ | 226,000 | $ | 213,791 | ||||||||
| U.S. Treasury Note | 2.63 | 04/15/25 | 1,156,600 | 1,114,493 | ||||||||||
| U.S. Treasury Note | 2.63 | 12/31/25 | 200,000 | 190,250 | ||||||||||
| U.S. Treasury Note | 2.75 | 02/28/25 | 573,000 | 554,355 | ||||||||||
| U.S. Treasury Note | 2.75 | 05/15/25 | 2,759,000 | 2,659,202 | ||||||||||
| U.S. Treasury Note | 2.88 | 06/15/25 | 2,157,400 | 2,080,543 | ||||||||||
| U.S. Treasury Note | 3.00 | 07/15/25 | 2,538,400 | 2,449,655 | ||||||||||
| U.S. Treasury Note | 3.13 | 08/15/25 | 3,069,000 | 2,964,462 | ||||||||||
| U.S. Treasury Note | 3.50 | 09/15/25 | 1,000,000 | 971,445 | ||||||||||
| U.S. Treasury Note | 3.63 | 05/15/26 | 1,363,100 | 1,320,397 | ||||||||||
| U.S. Treasury Note | 3.75 | 04/15/26 | 1,911,000 | 1,857,552 | ||||||||||
| U.S. Treasury Note | 3.88 | 04/30/25 | 708,000 | 694,365 | ||||||||||
| U.S. Treasury Note | 3.88 | 01/15/26 | 135,600 | 132,395 | ||||||||||
| U.S. Treasury Note | 4.00 | 12/15/25 | 1,083,000 | 1,060,494 | ||||||||||
| U.S. Treasury Note | 4.00 | 02/15/26 | 3,090,400 | 3,023,522 | ||||||||||
| U.S. Treasury Note | 4.13 | 06/15/26 | 407,000 | 398,892 | ||||||||||
| U.S. Treasury Note | 4.25 | 12/31/24 | 1,499,000 | 1,479,911 | ||||||||||
| U.S. Treasury Note | 4.25 | 05/31/25 | 674,600 | 664,942 | ||||||||||
| U.S. Treasury Note | 4.25 | 10/15/25 | 1,853,900 | 1,825,186 | ||||||||||
| U.S. Treasury Note | 4.38 | 08/15/26 | 1,430,000 | 1,409,611 | ||||||||||
| U.S. Treasury Note | 4.50 | 11/30/24 | 884,800 | 876,108 | ||||||||||
| U.S. Treasury Note | 4.50 | 11/15/25 | 430,000 | 425,364 | ||||||||||
| U.S. Treasury Note | 4.50 | 07/15/26 | 1,396,300 | 1,381,028 | ||||||||||
| U.S. Treasury Note | 4.63 | 06/30/25 | 1,026,800 | 1,018,116 | ||||||||||
| U.S. Treasury Note | 4.63 | 03/15/26 | 1,634,600 | 1,621,447 | ||||||||||
| U.S. Treasury Note | 4.63 | 09/15/26 | 1,401,000 | 1,390,711 | ||||||||||
| U.S. Treasury Note | 4.63 | 10/15/26 | 1,600,000 | 1,588,063 | ||||||||||
| U.S. Treasury Note | 5.00 | 08/31/25 | 750,000 | 748,491 | ||||||||||
| U.S. Treasury Note | 5.00 | 09/30/25 | 1,100,000 | 1,098,023 | ||||||||||
| TOTAL GOVERNMENT OBLIGATIONS (Cost - $105,055,365) | 103,825,277 | |||||||||||||
| SHORT-TERM INVESTMENTS – 0.3% | ||||||||||||||
| TIME DEPOSITS – 0.3% | ||||||||||||||
| Sumitomo Mitsui Trust Bank, London | 4.68 | 11/01/23 | 314,373 | 314,373 | ||||||||||
| TOTAL SHORT-TERM INVESTMENTS (Cost - $314,373) | 314,373 | |||||||||||||
| TOTAL INVESTMENTS – 99.2% (Cost - $105,369,738) | $ | 104,139,650 | ||||||||||||
| OTHER ASSETS LESS LIABILITIES – 0.8% | 889,880 | |||||||||||||
| NET ASSETS – 100.0% | $ | 105,029,530 | ||||||||||||
The accompanying notes are an integral part of these financial statements.
137
BONDBLOXX ETF TRUST
BondBloxx Bloomberg Three Year Target Duration US Treasury ETF
Portfolio of Investments
October 31, 2023
| Face | ||||||||||||||
| Rate (%) | Maturity | Amount | Value | |||||||||||
| GOVERNMENT OBLIGATIONS – 99.1% | ||||||||||||||
| U.S. Treasury Note | 0.38 | 11/30/25 | $ | 981,600 | $ | 892,067 | ||||||||
| U.S. Treasury Note | 0.38 | 12/31/25 | 523,600 | 474,553 | ||||||||||
| U.S. Treasury Note | 0.38 | 01/31/26 | 1,214,200 | 1,095,910 | ||||||||||
| U.S. Treasury Note | 0.38 | 07/31/27 | 407,200 | 345,118 | ||||||||||
| U.S. Treasury Note | 0.38 | 09/30/27 | 543,200 | 457,137 | ||||||||||
| U.S. Treasury Note | 0.50 | 02/28/26 | 535,600 | 483,316 | ||||||||||
| U.S. Treasury Note | 0.50 | 04/30/27 | 375,200 | 322,965 | ||||||||||
| U.S. Treasury Note | 0.50 | 06/30/27 | 214,400 | 183,312 | ||||||||||
| U.S. Treasury Note | 0.50 | 08/31/27 | 375,200 | 318,495 | ||||||||||
| U.S. Treasury Note | 0.50 | 10/31/27 | 513,800 | 433,097 | ||||||||||
| U.S. Treasury Note | 0.63 | 07/31/26 | 1,149,800 | 1,024,759 | ||||||||||
| U.S. Treasury Note | 0.63 | 11/30/27 | 517,200 | 436,812 | ||||||||||
| U.S. Treasury Note | 0.63 | 12/31/27 | 600,000 | 505,172 | ||||||||||
| U.S. Treasury Note | 0.75 | 03/31/26 | 877,400 | 794,904 | ||||||||||
| U.S. Treasury Note | 0.75 | 04/30/26 | 1,134,000 | 1,023,479 | ||||||||||
| U.S. Treasury Note | 0.75 | 05/31/26 | 830,200 | 746,661 | ||||||||||
| U.S. Treasury Note | 0.75 | 08/31/26 | 722,500 | 643,900 | ||||||||||
| U.S. Treasury Note | 0.88 | 06/30/26 | 1,120,200 | 1,009,230 | ||||||||||
| U.S. Treasury Note | 0.88 | 09/30/26 | 776,400 | 693,271 | ||||||||||
| U.S. Treasury Note | 1.13 | 10/31/26 | 514,400 | 461,091 | ||||||||||
| U.S. Treasury Note | 1.13 | 02/28/27 | 171,600 | 152,141 | ||||||||||
| U.S. Treasury Note | 1.25 | 11/30/26 | 1,021,600 | 916,527 | ||||||||||
| U.S. Treasury Note | 1.25 | 12/31/26 | 573,400 | 513,439 | ||||||||||
| U.S. Treasury Note | 1.50 | 08/15/26 | 206,800 | 188,576 | ||||||||||
| U.S. Treasury Note | 1.50 | 01/31/27 | 862,600 | 775,969 | ||||||||||
| U.S. Treasury Note | 1.63 | 02/15/26 | 129,400 | 120,029 | ||||||||||
| U.S. Treasury Note | 1.63 | 05/15/26 | 230,200 | 212,072 | ||||||||||
| U.S. Treasury Note | 1.63 | 10/31/26 | 273,400 | 248,794 | ||||||||||
| U.S. Treasury Note | 1.63 | 11/30/26 | 181,000 | 164,364 | ||||||||||
| U.S. Treasury Note | 1.88 | 02/28/27 | 863,000 | 784,150 | ||||||||||
| U.S. Treasury Note | 2.00 | 11/15/26 | 562,600 | 517,131 | ||||||||||
| U.S. Treasury Note | 2.25 | 02/15/27 | 225,000 | 207,237 | ||||||||||
| U.S. Treasury Note | 2.25 | 08/15/27 | 514,400 | 468,024 | ||||||||||
| U.S. Treasury Note | 2.25 | 11/15/27 | 476,800 | 431,392 | ||||||||||
| U.S. Treasury Note | 2.38 | 05/15/27 | 362,000 | 332,786 | ||||||||||
| U.S. Treasury Note | 2.50 | 03/31/27 | 300,000 | 277,945 | ||||||||||
| U.S. Treasury Note | 2.63 | 05/31/27 | 614,400 | 569,328 | ||||||||||
| U.S. Treasury Note | 2.75 | 04/30/27 | 750,000 | 699,229 | ||||||||||
| U.S. Treasury Note | 2.75 | 07/31/27 | 754,400 | 699,853 | ||||||||||
| U.S. Treasury Note | 2.75 | 02/15/28 | 650,000 | 597,441 | ||||||||||
| U.S. Treasury Note | 3.13 | 08/31/27 | 562,600 | 528,558 | ||||||||||
| U.S. Treasury Note | 3.25 | 06/30/27 | 1,053,200 | 996,591 | ||||||||||
| U.S. Treasury Note | 3.50 | 01/31/28 | 413,800 | 392,464 | ||||||||||
| U.S. Treasury Note | 3.63 | 05/15/26 | 350,000 | 339,035 | ||||||||||
| U.S. Treasury Note | 3.63 | 03/31/28 | 488,800 | 465,296 | ||||||||||
| U.S. Treasury Note | 3.88 | 01/15/26 | 375,200 | 366,333 | ||||||||||
| U.S. Treasury Note | 3.88 | 11/30/27 | 482,000 | 464,471 | ||||||||||
| U.S. Treasury Note | 3.88 | 12/31/27 | 401,800 | 387,046 | ||||||||||
The accompanying notes are an integral part of these financial statements.
138
BONDBLOXX ETF TRUST
BondBloxx Bloomberg Three Year Target Duration US Treasury ETF
Portfolio of Investments (Continued)
October 31, 2023
| Face | ||||||||||||||
| Rate (%) | Maturity | Amount | Value | |||||||||||
| GOVERNMENT OBLIGATIONS – 99.1% (Continued) | ||||||||||||||
| U.S. Treasury Note | 4.00 | 02/15/26 | $ | 375,200 | $ | 367,080 | ||||||||
| U.S. Treasury Note | 4.00 | 02/29/28 | 491,400 | 475,314 | ||||||||||
| U.S. Treasury Note | 4.13 | 06/15/26 | 600,000 | 588,047 | ||||||||||
| U.S. Treasury Note | 4.13 | 09/30/27 | 528,200 | 514,314 | ||||||||||
| U.S. Treasury Note | 4.13 | 10/31/27 | 616,200 | 599,592 | ||||||||||
| U.S. Treasury Note | 4.38 | 08/15/26 | 206,800 | 203,852 | ||||||||||
| U.S. Treasury Note | 4.50 | 07/15/26 | 206,800 | 204,538 | ||||||||||
| U.S. Treasury Note | 4.63 | 03/15/26 | 348,200 | 345,398 | ||||||||||
| U.S. Treasury Note | 4.63 | 09/15/26 | 200,000 | 198,531 | ||||||||||
| TOTAL GOVERNMENT OBLIGATIONS (Cost - $29,234,758) | 28,658,136 | |||||||||||||
| SHORT-TERM INVESTMENTS – 0.4% | ||||||||||||||
| TIME DEPOSITS – 0.4% | ||||||||||||||
| ANZ National Bank, London | 4.68 | 11/01/23 | 107,941 | 107,941 | ||||||||||
| TOTAL SHORT-TERM INVESTMENTS (Cost - $107,941) | 107,941 | |||||||||||||
| TOTAL INVESTMENTS – 99.5% (Cost - $29,342,699) | $ | 28,766,077 | ||||||||||||
| OTHER ASSETS LESS LIABILITIES – 0.5% | 154,754 | |||||||||||||
| NET ASSETS – 100.0% | $ | 28,920,831 | ||||||||||||
The accompanying notes are an integral part of these financial statements.
139
BONDBLOXX ETF TRUST
BondBloxx Bloomberg Five Year Target Duration US Treasury ETF
Portfolio of Investments
October 31, 2023
| Rate (%) | Maturity | Face Amount | Value | |||||||||||
| GOVERNMENT OBLIGATIONS – 98.8% | ||||||||||||||
| U.S. Treasury Bond | 5.25 | 02/15/29 | $ | 50,600 | $ | 51,428 | ||||||||
| U.S. Treasury Note | 0.75 | 01/31/28 | 1,250,000 | 1,054,736 | ||||||||||
| U.S. Treasury Note | 1.00 | 07/31/28 | 799,900 | 669,979 | ||||||||||
| U.S. Treasury Note | 1.13 | 02/29/28 | 607,800 | 520,049 | ||||||||||
| U.S. Treasury Note | 1.13 | 08/31/28 | 455,800 | 383,068 | ||||||||||
| U.S. Treasury Note | 1.25 | 03/31/28 | 1,309,000 | 1,123,132 | ||||||||||
| U.S. Treasury Note | 1.25 | 04/30/28 | 1,102,400 | 943,413 | ||||||||||
| U.S. Treasury Note | 1.25 | 05/31/28 | 506,500 | 432,048 | ||||||||||
| U.S. Treasury Note | 1.25 | 06/30/28 | 840,800 | 715,107 | ||||||||||
| U.S. Treasury Note | 1.25 | 09/30/28 | 857,300 | 722,878 | ||||||||||
| U.S. Treasury Note | 1.38 | 10/31/28 | 802,000 | 678,599 | ||||||||||
| U.S. Treasury Note | 1.38 | 12/31/28 | 639,600 | 538,163 | ||||||||||
| U.S. Treasury Note | 1.50 | 11/30/28 | 730,200 | 620,328 | ||||||||||
| U.S. Treasury Note | 1.50 | 02/15/30 | 1,453,800 | 1,188,936 | ||||||||||
| U.S. Treasury Note | 1.63 | 08/15/29 | 790,400 | 662,917 | ||||||||||
| U.S. Treasury Note | 1.75 | 01/31/29 | 597,000 | 511,135 | ||||||||||
| U.S. Treasury Note | 1.75 | 11/15/29 | 798,300 | 670,447 | ||||||||||
| U.S. Treasury Note | 1.88 | 02/28/29 | 560,400 | 481,900 | ||||||||||
| U.S. Treasury Note | 2.38 | 03/31/29 | 513,500 | 452,281 | ||||||||||
| U.S. Treasury Note | 2.38 | 05/15/29 | 1,421,000 | 1,249,203 | ||||||||||
| U.S. Treasury Note | 2.63 | 02/15/29 | 673,300 | 602,998 | ||||||||||
| U.S. Treasury Note | 2.63 | 07/31/29 | 553,400 | 490,559 | ||||||||||
| U.S. Treasury Note | 2.75 | 05/31/29 | 1,347,800 | 1,207,123 | ||||||||||
| U.S. Treasury Note | 2.88 | 05/15/28 | 253,200 | 232,944 | ||||||||||
| U.S. Treasury Note | 2.88 | 08/15/28 | 1,098,900 | 1,006,094 | ||||||||||
| U.S. Treasury Note | 2.88 | 04/30/29 | 536,400 | 484,394 | ||||||||||
| U.S. Treasury Note | 3.13 | 11/15/28 | 405,200 | 373,718 | ||||||||||
| U.S. Treasury Note | 3.13 | 08/31/29 | 1,503,900 | 1,367,962 | ||||||||||
| U.S. Treasury Note | 3.25 | 06/30/29 | 924,900 | 849,354 | ||||||||||
| U.S. Treasury Note | 3.50 | 04/30/28 | 961,500 | 909,857 | ||||||||||
| U.S. Treasury Note | 3.50 | 01/31/30 | 1,015,000 | 937,805 | ||||||||||
| U.S. Treasury Note | 3.50 | 04/30/30 | 867,600 | 799,582 | ||||||||||
| U.S. Treasury Note | 3.63 | 03/31/30 | 1,102,500 | 1,024,162 | ||||||||||
| U.S. Treasury Note | 3.75 | 05/31/30 | 866,400 | 809,678 | ||||||||||
| U.S. Treasury Note | 3.75 | 06/30/30 | 866,400 | 809,069 | ||||||||||
| U.S. Treasury Note | 3.88 | 09/30/29 | 746,600 | 706,820 | ||||||||||
| U.S. Treasury Note | 3.88 | 11/30/29 | 579,600 | 547,881 | ||||||||||
| U.S. Treasury Note | 3.88 | 12/31/29 | 1,250,400 | 1,181,042 | ||||||||||
| U.S. Treasury Note | 4.00 | 06/30/28 | 607,800 | 586,788 | ||||||||||
| U.S. Treasury Note | 4.00 | 10/31/29 | 1,441,000 | 1,372,553 | ||||||||||
| U.S. Treasury Note | 4.00 | 02/28/30 | 812,400 | 771,717 | ||||||||||
| U.S. Treasury Note | 4.00 | 07/31/30 | 1,086,000 | 1,028,900 | ||||||||||
| U.S. Treasury Note | 4.13 | 08/31/30 | 901,600 | 860,112 | ||||||||||
| U.S. Treasury Note | 4.38 | 08/31/28 | 531,800 | 521,683 | ||||||||||
| U.S. Treasury Note | 4.63 | 09/30/28 | 557,100 | 551,986 | ||||||||||
| U.S. Treasury Note | 4.63 | 09/30/30 | 911,700 | 896,458 | ||||||||||
| U.S. Treasury Note | 4.88 | 10/31/28 | 350,000 | 350,779 | ||||||||||
| U.S. Treasury Note | 4.88 | 10/31/30 | 1,175,000 | 1,172,797 | ||||||||||
| TOTAL GOVERNMENT OBLIGATIONS (Cost - $37,655,569) | 36,124,562 | |||||||||||||
The accompanying notes are an integral part of these financial statements.
140
BONDBLOXX ETF TRUST
BondBloxx Bloomberg Five Year Target Duration US Treasury ETF
Portfolio of Investments (Continued)
October 31, 2023
| Rate (%) | Maturity | Face Amount | Value | |||||||||||
| SHORT-TERM INVESTMENTS – 0.4% | ||||||||||||||
| TIME DEPOSITS – 0.4% | ||||||||||||||
| Skandinaviska Enskilda Banken, Stockholm | 4.68 | 11/01/23 | $ | 128,667 | $ | 128,667 | ||||||||
| TOTAL SHORT-TERM INVESTMENTS (Cost - $128,667) | 128,667 | |||||||||||||
| TOTAL INVESTMENTS – 99.2% (Cost - $37,784,236) | $ | 36,253,229 | ||||||||||||
| OTHER ASSETS LESS LIABILITIES – 0.8% | 280,096 | |||||||||||||
| NET ASSETS – 100.0% | $ | 36,533,325 | ||||||||||||
The accompanying notes are an integral part of these financial statements.
141
BONDBLOXX ETF TRUST
BondBloxx Bloomberg Seven Year Target Duration US Treasury ETF
Portfolio of Investments
October 31, 2023
| Rate (%) | Maturity | Face Amount | Value | |||||||||||
| GOVERNMENT OBLIGATIONS – 98.8% | ||||||||||||||
| U.S. Treasury Note | 0.63 | 05/15/30 | $ | 1,151,900 | $ | 878,324 | ||||||||
| U.S. Treasury Note | 0.63 | 08/15/30 | 1,496,000 | 1,130,532 | ||||||||||
| U.S. Treasury Note | 0.88 | 11/15/30 | 1,544,200 | 1,180,951 | ||||||||||
| U.S. Treasury Note | 1.13 | 02/15/31 | 1,358,200 | 1,052,287 | ||||||||||
| U.S. Treasury Note | 1.25 | 08/15/31 | 5,377,600 | 4,119,746 | ||||||||||
| U.S. Treasury Note | 1.38 | 11/15/31 | 5,270,900 | 4,046,239 | ||||||||||
| U.S. Treasury Note | 1.50 | 02/15/30 | 1,906,200 | 1,558,914 | ||||||||||
| U.S. Treasury Note | 1.63 | 08/15/29 | 225,000 | 188,710 | ||||||||||
| U.S. Treasury Note | 1.63 | 05/15/31 | 1,528,300 | 1,217,267 | ||||||||||
| U.S. Treasury Note | 1.75 | 11/15/29 | 426,800 | 358,445 | ||||||||||
| U.S. Treasury Note | 1.88 | �� | 02/15/32 | 4,878,000 | 3,877,248 | |||||||||
| U.S. Treasury Note | 2.38 | 05/15/29 | 381,600 | 335,465 | ||||||||||
| U.S. Treasury Note | 2.63 | 07/31/29 | 1,156,100 | 1,024,819 | ||||||||||
| U.S. Treasury Note | 2.75 | 08/15/32 | 4,701,700 | 3,978,079 | ||||||||||
| U.S. Treasury Note | 2.88 | 05/15/32 | 4,745,600 | 4,072,689 | ||||||||||
| U.S. Treasury Note | 3.13 | 08/31/29 | 1,085,300 | 987,199 | ||||||||||
| U.S. Treasury Note | 3.25 | 06/30/29 | 785,800 | 721,616 | ||||||||||
| U.S. Treasury Note | 3.38 | 05/15/33 | 4,664,600 | 4,125,620 | ||||||||||
| U.S. Treasury Note | 3.50 | 01/31/30 | 533,500 | 492,925 | ||||||||||
| U.S. Treasury Note | 3.50 | 04/30/30 | 477,000 | 439,604 | ||||||||||
| U.S. Treasury Note | 3.50 | 02/15/33 | 4,651,200 | 4,164,641 | ||||||||||
| U.S. Treasury Note | 3.63 | 03/31/30 | 426,800 | 396,474 | ||||||||||
| U.S. Treasury Note | 3.75 | 05/31/30 | 533,500 | 498,572 | ||||||||||
| U.S. Treasury Note | 3.75 | 06/30/30 | 426,800 | 398,558 | ||||||||||
| U.S. Treasury Note | 3.88 | 11/30/29 | 470,100 | 444,373 | ||||||||||
| U.S. Treasury Note | 3.88 | 12/31/29 | 640,200 | 604,689 | ||||||||||
| U.S. Treasury Note | 3.88 | 08/15/33 | 4,945,300 | 4,552,380 | ||||||||||
| U.S. Treasury Note | 4.00 | 02/28/30 | 533,500 | 506,783 | ||||||||||
| U.S. Treasury Note | 4.00 | 07/31/30 | 426,800 | 404,360 | ||||||||||
| U.S. Treasury Note | 4.13 | 08/31/30 | 426,800 | 407,161 | ||||||||||
| U.S. Treasury Note | 4.13 | 11/15/32 | 4,600,900 | 4,335,270 | ||||||||||
| U.S. Treasury Note | 4.63 | 09/30/30 | 356,700 | 350,736 | ||||||||||
| U.S. Treasury Note | 4.88 | 10/31/30 | 150,000 | 149,719 | ||||||||||
| TOTAL GOVERNMENT OBLIGATIONS (Cost - $55,167,372) | 53,000,395 | |||||||||||||
| SHORT-TERM INVESTMENTS – 0.1% | ||||||||||||||
| TIME DEPOSITS – 0.1% | ||||||||||||||
| Sumitomo Mitsui Trust Bank, London | 4.68 | 11/01/23 | 49,199 | 49,199 | ||||||||||
| TOTAL SHORT-TERM INVESTMENTS (Cost - $49,199) | 49,199 | |||||||||||||
| TOTAL INVESTMENTS – 98.9% (Cost - $55,216,571) | $ | 53,049,594 | ||||||||||||
| OTHER ASSETS LESS LIABILITIES – 1.1% | 600,933 | |||||||||||||
| NET ASSETS – 100.0% | $ | 53,650,527 | ||||||||||||
The accompanying notes are an integral part of these financial statements.
142
BONDBLOXX ETF TRUST
BondBloxx Bloomberg Ten Year Target Duration US Treasury ETF
Portfolio of Investments
October 31, 2023
| Rate (%) | Maturity | Face Amount | Value | |||||||||||
| GOVERNMENT OBLIGATIONS – 98.4% | ||||||||||||||
| U.S. Treasury Bond | 1.88 | 02/15/41 | $ | 1,700,000 | $ | 1,048,422 | ||||||||
| U.S. Treasury Bond | 2.25 | 05/15/41 | 2,213,800 | 1,452,114 | ||||||||||
| U.S. Treasury Bond | 2.38 | 02/15/42 | 1,550,000 | 1,024,090 | ||||||||||
| U.S. Treasury Bond | 2.75 | 08/15/42 | 582,600 | 407,957 | ||||||||||
| U.S. Treasury Bond | 2.75 | 11/15/42 | 873,200 | 608,852 | ||||||||||
| U.S. Treasury Bond | 2.88 | 05/15/43 | 1,165,200 | 824,743 | ||||||||||
| U.S. Treasury Bond | 3.00 | 05/15/42 | 644,000 | �� | 471,881 | |||||||||
| U.S. Treasury Bond | 3.13 | 02/15/42 | 664,000 | 498,311 | ||||||||||
| U.S. Treasury Bond | 3.13 | 02/15/43 | 768,400 | 568,556 | ||||||||||
| U.S. Treasury Bond | 3.25 | 05/15/42 | 1,603,600 | 1,221,492 | ||||||||||
| U.S. Treasury Bond | 3.38 | 08/15/42 | 1,335,800 | 1,033,888 | ||||||||||
| U.S. Treasury Bond | 3.38 | 05/15/44 | 855,400 | 651,106 | ||||||||||
| U.S. Treasury Bond | 3.63 | 08/15/43 | 874,600 | 697,835 | ||||||||||
| U.S. Treasury Bond | 3.63 | 02/15/44 | 907,400 | 720,674 | ||||||||||
| U.S. Treasury Bond | 3.75 | 08/15/41 | 428,200 | 354,536 | ||||||||||
| U.S. Treasury Bond | 3.88 | 08/15/40 | 630,200 | 535,670 | ||||||||||
| U.S. Treasury Bond | 3.88 | 02/15/43 | 1,881,800 | 1,564,834 | ||||||||||
| U.S. Treasury Bond | 3.88 | 05/15/43 | 1,415,800 | 1,175,778 | ||||||||||
| U.S. Treasury Bond | 4.00 | 11/15/42 | 1,516,800 | 1,285,844 | ||||||||||
| U.S. Treasury Bond | 4.25 | 05/15/39 | 403,600 | 364,627 | ||||||||||
| U.S. Treasury Bond | 4.25 | 11/15/40 | 526,400 | 468,743 | ||||||||||
| U.S. Treasury Bond | 4.38 | 02/15/38 | 233,600 | 217,832 | ||||||||||
| U.S. Treasury Bond | 4.38 | 05/15/40 | 574,800 | 522,215 | ||||||||||
| U.S. Treasury Bond | 4.38 | 08/15/43 | 941,400 | 839,390 | ||||||||||
| U.S. Treasury Bond | 4.50 | 02/15/36 | 170,200 | 164,137 | ||||||||||
| U.S. Treasury Bond | 4.50 | 05/15/38 | 258,200 | 243,031 | ||||||||||
| U.S. Treasury Bond | 4.63 | 02/15/40 | 1,376,000 | 1,290,968 | ||||||||||
| U.S. Treasury Bond | 4.75 | 02/15/41 | 654,600 | 619,620 | ||||||||||
| U.S. Treasury Bond | 5.00 | 05/15/37 | 181,800 | 182,297 | ||||||||||
| U.S. Treasury Note | 0.63 | 05/15/30 | 1,459,200 | 1,112,640 | ||||||||||
| U.S. Treasury Note | 0.63 | 08/15/30 | 1,834,600 | 1,386,413 | ||||||||||
| U.S. Treasury Note | 0.88 | 11/15/30 | 1,374,600 | 1,051,247 | ||||||||||
| U.S. Treasury Note | 1.13 | 02/15/31 | 1,612,800 | 1,249,542 | ||||||||||
| U.S. Treasury Note | 1.25 | 08/15/31 | 1,304,000 | 998,986 | ||||||||||
| U.S. Treasury Note | 1.38 | 11/15/31 | 3,036,000 | 2,330,604 | ||||||||||
| U.S. Treasury Note | 1.63 | 05/15/31 | 2,560,900 | 2,039,717 | ||||||||||
| U.S. Treasury Note | 1.88 | 02/15/32 | 1,335,500 | 1,061,514 | ||||||||||
| U.S. Treasury Note | 2.75 | 08/15/32 | 2,851,400 | 2,412,552 | ||||||||||
| U.S. Treasury Note | 2.88 | 05/15/32 | 2,720,000 | 2,334,313 | ||||||||||
| U.S. Treasury Note | 3.38 | 05/15/33 | 1,246,600 | 1,102,559 | ||||||||||
| U.S. Treasury Note | 3.50 | 02/15/33 | 2,097,200 | 1,877,813 | ||||||||||
| U.S. Treasury Note | 3.88 | 08/15/33 | 973,200 | 895,876 | ||||||||||
| U.S. Treasury Note | 4.13 | 11/15/32 | 1,080,400 | 1,018,024 | ||||||||||
| TOTAL GOVERNMENT OBLIGATIONS (Cost - $45,039,658) | 41,931,243 | |||||||||||||
The accompanying notes are an integral part of these financial statements.
143
BONDBLOXX ETF TRUST
BondBloxx Bloomberg Ten Year Target Duration US Treasury ETF
Portfolio of Investments (Continued)
October 31, 2023
| Rate (%) | Maturity | Face Amount | Value | |||||||||||
| SHORT-TERM INVESTMENTS – 0.1% | ||||||||||||||
| TIME DEPOSITS – 0.1% | ||||||||||||||
| Citibank, New York | 4.68 | 11/01/23 | $ | 32,949 | $ | 32,949 | ||||||||
| TOTAL SHORT-TERM INVESTMENTS (Cost - $32,949) | 32,949 | |||||||||||||
| TOTAL INVESTMENTS – 98.5% (Cost - $45,072,607) | $ | 41,964,192 | ||||||||||||
| OTHER ASSETS LESS LIABILITIES – 1.5% | 646,256 | |||||||||||||
| NET ASSETS – 100.0% | $ | 42,610,448 | ||||||||||||
The accompanying notes are an integral part of these financial statements.
144
BONDBLOXX ETF TRUST
BondBloxx Bloomberg Twenty Year Target Duration US Treasury ETF
Portfolio of Investments
October 31, 2023
| Rate (%) | Maturity | Face Amount | Value | |||||||||||
| GOVERNMENT OBLIGATIONS – 98.7% | ||||||||||||||
| U.S. Treasury Bond | 1.25 | 05/15/50 | $ | 1,890,000 | $ | 831,452 | ||||||||
| U.S. Treasury Bond | 1.38 | 08/15/50 | 2,104,200 | 957,740 | ||||||||||
| U.S. Treasury Bond | 1.63 | 11/15/50 | 2,078,500 | 1,017,815 | ||||||||||
| U.S. Treasury Bond | 1.88 | 02/15/51 | 2,323,900 | 1,220,229 | ||||||||||
| U.S. Treasury Bond | 1.88 | 11/15/51 | 2,152,000 | 1,122,739 | ||||||||||
| U.S. Treasury Bond | 2.00 | 02/15/50 | 1,596,800 | 874,248 | ||||||||||
| U.S. Treasury Bond | 2.00 | 08/15/51 | 2,320,700 | 1,254,810 | ||||||||||
| U.S. Treasury Bond | 2.25 | 08/15/49 | 1,356,300 | 791,846 | ||||||||||
| U.S. Treasury Bond | 2.25 | 02/15/52 | 1,980,000 | 1,140,047 | ||||||||||
| U.S. Treasury Bond | 2.38 | 11/15/49 | 1,284,500 | 771,703 | ||||||||||
| U.S. Treasury Bond | 2.38 | 05/15/51 | 2,338,400 | 1,393,540 | ||||||||||
| U.S. Treasury Bond | 2.88 | 05/15/52 | 1,856,600 | 1,239,135 | ||||||||||
| U.S. Treasury Bond | 3.00 | 08/15/52 | 1,772,600 | 1,216,308 | ||||||||||
| U.S. Treasury Bond | 3.63 | 02/15/53 | 1,762,000 | 1,373,259 | ||||||||||
| U.S. Treasury Strip | ZCP | 02/15/44 | 961,400 | 331,533 | ||||||||||
| U.S. Treasury Strip | ZCP | 11/15/44 | 736,600 | 243,927 | ||||||||||
| U.S. Treasury Strip | ZCP | 02/15/45 | 345,000 | 112,907 | ||||||||||
| U.S. Treasury Strip | ZCP | 08/15/45 | 388,000 | 123,576 | ||||||||||
| U.S. Treasury Strip | ZCP | 02/15/46 | 714,200 | 221,793 | ||||||||||
| U.S. Treasury Strip | ZCP | 08/15/46 | 875,000 | 265,081 | ||||||||||
| U.S. Treasury Strip | ZCP | 05/15/47 | 250,000 | 73,003 | ||||||||||
| U.S. Treasury Strip | ZCP | 08/15/47 | 1,160,200 | 335,189 | ||||||||||
| U.S. Treasury Strip | ZCP | 11/15/47 | 925,300 | 264,614 | ||||||||||
| U.S. Treasury Strip | ZCP | 02/15/48 | 1,126,000 | 318,095 | ||||||||||
| U.S. Treasury Strip | ZCP | 08/15/48 | 1,276,000 | 353,641 | ||||||||||
| U.S. Treasury Strip | ZCP | 02/15/49 | 1,721,200 | 468,926 | ||||||||||
| U.S. Treasury Strip | ZCP | 05/15/49 | 2,066,600 | 559,839 | ||||||||||
| U.S. Treasury Strip | ZCP | 02/15/50 | 680,000 | 180,426 | ||||||||||
| U.S. Treasury Strip | ZCP | 05/15/50 | 1,716,400 | 451,058 | ||||||||||
| U.S. Treasury Strip | ZCP | 08/15/50 | 1,593,000 | 413,589 | ||||||||||
| U.S. Treasury Strip | ZCP | 11/15/50 | 1,902,100 | 489,679 | ||||||||||
| U.S. Treasury Strip | ZCP | 02/15/51 | 1,567,000 | 400,473 | ||||||||||
| U.S. Treasury Strip | ZCP | 05/15/51 | 725,000 | 183,629 | ||||||||||
| U.S. Treasury Strip | ZCP | 08/15/51 | 900,000 | 225,984 | ||||||||||
| U.S. Treasury Strip | ZCP | 11/15/51 | 2,026,000 | 504,561 | ||||||||||
| U.S. Treasury Strip | ZCP | 02/15/52 | 1,784,000 | 440,669 | ||||||||||
| U.S. Treasury Strip | ZCP | 08/15/52 | 1,751,000 | 427,730 | ||||||||||
| U.S. Treasury Strip | ZCP | 05/15/53 | 845,000 | 202,140 | ||||||||||
| TOTAL GOVERNMENT OBLIGATIONS (Cost - $27,731,445) | 22,796,933 | |||||||||||||
| SHORT-TERM INVESTMENTS – 0.1% | ||||||||||||||
| TIME DEPOSITS – 0.1% | ||||||||||||||
| ANZ National Bank, London | 4.68 | 11/01/23 | 25,018 | 25,018 | ||||||||||
| TOTAL SHORT-TERM INVESTMENTS (Cost - $25,018) | 25,018 | |||||||||||||
| TOTAL INVESTMENTS – 98.8% (Cost - $27,756,463) | $ | 22,821,951 | ||||||||||||
| OTHER ASSETS LESS LIABILITIES – 1.2% | 267,543 | |||||||||||||
| NET ASSETS – 100.0% | $ | 23,089,494 | ||||||||||||
| ZCP | Indicates a zero coupon rate. |
The accompanying notes are an integral part of these financial statements.
145
Statements of Assets and Liabilities
October 31, 2023
| BondBloxx USD High Yield Bond Industrial Sector ETF | BondBloxx USD High Yield Bond Telecom, Media & Technology Sector ETF | BondBloxx USD High Yield Bond Healthcare Sector ETF | BondBloxx USD High Yield Bond Financial & REIT Sector ETF | BondBloxx USD High Yield Bond Energy Sector ETF | ||||||||||||||||
| ASSETS: | ||||||||||||||||||||
| Investments in securities, at value | $ | 40,346,816 | $ | 28,955,787 | $ | 10,964,495 | $ | 29,035,363 | $ | 20,322,811 | ||||||||||
| Cash | - | 711 | 1,697 | 625 | 310 | |||||||||||||||
| Receivable for investments sold | 721,274 | - | - | 506,952 | 754,818 | |||||||||||||||
| Interest income receivable | 683,856 | 553,347 | 175,906 | 486,012 | 355,266 | |||||||||||||||
| TOTAL ASSETS | 41,751,946 | 29,509,845 | 11,142,098 | 30,028,952 | 21,433,205 | |||||||||||||||
| LIABILITIES: | ||||||||||||||||||||
| Due to custodian | 1,004 | - | - | - | - | |||||||||||||||
| Payable for investments purchased | 893,842 | 106,277 | 150,372 | 614,568 | 912,040 | |||||||||||||||
| Management fees payable (Note 3) | 12,646 | 8,795 | 3,281 | 8,730 | 6,077 | |||||||||||||||
| TOTAL LIABILITIES | 907,492 | 115,072 | 153,653 | 623,298 | 918,117 | |||||||||||||||
| NET ASSETS | $ | 40,844,454 | $ | 29,394,773 | $ | 10,988,445 | $ | 29,405,654 | $ | 20,515,088 | ||||||||||
| COMPONENTS OF NET ASSETS | ||||||||||||||||||||
| Paid-in capital | 42,397,945 | 30,698,703 | 12,313,806 | 30,399,382 | 21,058,788 | |||||||||||||||
| Total distributable earnings/(accumulated loss) | (1,553,491 | ) | (1,303,930 | ) | (1,325,361 | ) | (993,728 | ) | (543,700 | ) | ||||||||||
| NET ASSETS | $ | 40,844,454 | $ | 29,394,773 | $ | 10,988,445 | $ | 29,405,654 | $ | 20,515,088 | ||||||||||
| Shares outstanding | 1,150,000 | 900,000 | 350,000 | 850,000 | 552,500 | |||||||||||||||
| Net asset value, offering and redemption price per share | $ | 35.52 | $ | 32.66 | $ | 31.40 | $ | 34.59 | $ | 37.13 | ||||||||||
| Investment in securities, at cost | $ | 42,088,416 | $ | 30,395,006 | $ | 11,781,964 | $ | 29,988,511 | $ | 20,811,420 | ||||||||||
The accompanying notes are an integral part of these financial statements.
146
BONDBLOXX ETF TRUST
Statements of Assets and Liabilities (Continued)
October 31, 2023
| BondBloxx USD High Yield Bond Consumer Cyclicals Sector ETF | BondBloxx USD High Yield Bond Consumer Non-Cyclicals Sector ETF | BondBloxx USD High Yield Bond Sector Rotation ETF | BondBloxx B Rated USD High Yield Corporate Bond ETF | BondBloxx BB Rated USD High Yield Corporate Bond ETF | ||||||||||||||||
| ASSETS: | ||||||||||||||||||||
| Investments in securities, at value | $ | 22,368,727 | $ | 10,646,510 | $ | 28,601,185 | (a) | $ | 12,927,625 | $ | 48,200,625 | |||||||||
| Cash | 388 | 303 | 32 | 449 | 1,870 | |||||||||||||||
| Receivable for investments sold | 39,576 | 35,222 | - | 131,496 | 964,477 | |||||||||||||||
| Interest income receivable | 411,793 | 150,973 | - | 220,386 | 749,266 | |||||||||||||||
| Due from the Adviser | - | - | 38,814 | - | - | |||||||||||||||
| Due from Transfer Agent | - | - | 26,757 | - | - | |||||||||||||||
| TOTAL ASSETS | 22,820,484 | 10,833,008 | 28,666,788 | 13,279,956 | 49,916,238 | |||||||||||||||
| LIABILITIES: | ||||||||||||||||||||
| Payable for investments purchased | 98,376 | 187,238 | - | 223,418 | 832,800 | |||||||||||||||
| Management fees payable (Note 3) | 6,732 | 3,149 | - | 3,330 | 8,661 | |||||||||||||||
| Administration fees payable (Note 3) | - | - | 4,317 | - | - | |||||||||||||||
| Legal fees payable | - | - | 14,155 | - | - | |||||||||||||||
| Trustees’ fees payable (Note 3) | - | - | 4,963 | - | - | |||||||||||||||
| Other accrued expenses payable | - | - | 75,571 | - | - | |||||||||||||||
| TOTAL LIABILITIES | 105,108 | 190,387 | 99,006 | 226,748 | 841,461 | |||||||||||||||
| NET ASSETS | $ | 22,715,376 | $ | 10,642,621 | $ | 28,567,782 | $ | 13,053,208 | $ | 49,074,777 | ||||||||||
| COMPONENTS OF NET ASSETS | ||||||||||||||||||||
| Paid-in capital | 23,397,571 | 11,186,387 | 88,587,762 | 13,819,684 | 51,928,576 | |||||||||||||||
| Total distributable earnings/(accumulated loss) | (682,195 | ) | (543,766 | ) | (60,019,980 | ) | (766,476 | ) | (2,853,799 | ) | ||||||||||
| NET ASSETS | $ | 22,715,376 | $ | 10,642,621 | $ | 28,567,782 | $ | 13,053,208 | $ | 49,074,777 | ||||||||||
| Shares outstanding | 650,000 | 300,000 | 2,010,000 | 350,000 | 1,300,000 | |||||||||||||||
| Net asset value, offering and redemption price per share | $ | 34.95 | $ | 35.48 | $ | 14.21 | $ | 37.29 | $ | 37.75 | ||||||||||
| Investment in securities, at cost | $ | 23,080,938 | $ | 11,178,596 | $ | 29,394,815 | (a) | $ | 13,543,124 | $ | 50,613,128 | |||||||||
| (a) | For the BondBloxx USD High Yield Bond Sector Rotation ETF, $28,470,152 is invested in affiliated investment companies of the BondBloxx ETF Trust. |
The accompanying notes are an integral part of these financial statements.
147
BONDBLOXX ETF TRUST
Statements of Assets and Liabilities (Continued)
October 31, 2023
| BondBloxx CCC Rated USD High Yield Corporate Bond ETF | BondBloxx JP Morgan USD Emerging Markets 1-10 Year Bond ETF | BondBloxx Bloomberg Six Month Target Duration US Treasury ETF | BondBloxx Bloomberg One Year Target Duration US Treasury ETF | BondBloxx Bloomberg Two Year Target Duration US Treasury ETF | ||||||||||||||||
| ASSETS: | ||||||||||||||||||||
| Investments in securities, at value | $ | 19,552,094 | $ | 180,951,739 | $ | 1,118,443,951 | $ | 524,097,723 | $ | 104,139,650 | ||||||||||
| Cash | 456 | - | 16,860 | 2,381 | 632 | |||||||||||||||
| Foreign currency, at value | - | 2 | - | - | - | |||||||||||||||
| Receivable for investments sold | - | 3,595,233 | 87,892,974 | 55,133,940 | 11,982,700 | |||||||||||||||
| Interest income receivable | 510,268 | 2,259,462 | - | 2,849,597 | 558,407 | |||||||||||||||
| TOTAL ASSETS | 20,062,818 | 186,806,436 | 1,206,353,785 | 582,083,641 | 116,681,389 | |||||||||||||||
| LIABILITIES: | ||||||||||||||||||||
| Due to custodian | - | 21,752 | - | - | - | |||||||||||||||
| Payable for investments purchased | 376,991 | 3,321,267 | 109,440,989 | 54,842,696 | 11,647,273 | |||||||||||||||
| Management fees payable (Note 3) | 5,418 | 44,649 | 27,795 | 14,372 | 4,586 | |||||||||||||||
| TOTAL LIABILITIES | 382,409 | 3,387,668 | 109,468,784 | 54,857,068 | 11,651,859 | |||||||||||||||
| NET ASSETS | $ | 19,680,409 | $ | 183,418,768 | $ | 1,096,885,001 | $ | 527,226,573 | $ | 105,029,530 | ||||||||||
| COMPONENTS OF NET ASSETS | ||||||||||||||||||||
| Paid-in capital | 20,949,221 | 188,877,985 | 1,093,229,065 | 527,382,821 | 106,587,874 | |||||||||||||||
| Total distributable earnings/(accumulated loss) | (1,268,812 | ) | (5,459,217 | ) | 3,655,936 | (156,248 | ) | (1,558,344 | ) | |||||||||||
| NET ASSETS | $ | 19,680,409 | $ | 183,418,768 | $ | 1,096,885,001 | $ | 527,226,573 | $ | 105,029,530 | ||||||||||
| Shares outstanding | 550,000 | 4,750,000 | 21,810,000 | 10,600,000 | 2,150,000 | |||||||||||||||
| Net asset value, offering and redemption price per share | $ | 35.78 | $ | 38.61 | $ | 50.29 | $ | 49.74 | $ | 48.85 | ||||||||||
| Investment in securities, at cost | $ | 20,671,452 | $ | 186,402,427 | $ | 1,118,870,259 | $ | 525,377,550 | $ | 105,369,738 | ||||||||||
| Foreign currency, at cost | $ | - | $ | 709 | $ | - | $ | - | $ | - | ||||||||||
The accompanying notes are an integral part of these financial statements.
148
BONDBLOXX ETF TRUST
Statements of Assets and Liabilities (Continued)
October 31, 2023
| BondBloxx Bloomberg Three Year Target Duration US Treasury ETF | BondBloxx Bloomberg Five Year Target Duration US Treasury ETF | BondBloxx Bloomberg Seven Year Target Duration US Treasury ETF | BondBloxx Bloomberg Ten Year Target Duration US Treasury ETF | BondBloxx Bloomberg Twenty Year Target Duration US Treasury ETF | ||||||||||||||||
| ASSETS: | ||||||||||||||||||||
| Investments in securities, at value | $ | 28,766,077 | $ | 36,253,229 | $ | 53,049,594 | $ | 41,964,192 | $ | 22,821,951 | ||||||||||
| Cash | 335 | 204 | 173 | 194 | 151 | |||||||||||||||
| Receivable for investments sold | 2,450,396 | 2,573,073 | 2,286,577 | 3,280,926 | 3,934,905 | |||||||||||||||
| Receivable for shares created | - | - | 23,488,868 | - | - | |||||||||||||||
| Interest income receivable | 138,836 | 221,929 | 504,172 | 475,691 | 182,258 | |||||||||||||||
| TOTAL ASSETS | 31,355,644 | 39,048,435 | 79,329,384 | 45,721,003 | 26,939,265 | |||||||||||||||
| LIABILITIES: | ||||||||||||||||||||
| Payable for investments purchased | 2,433,612 | 2,513,573 | 25,677,609 | 3,107,905 | 3,847,251 | |||||||||||||||
| Management fees payable (Note 3) | 1,201 | 1,537 | 1,248 | 2,650 | 2,520 | |||||||||||||||
| TOTAL LIABILITIES | 2,434,813 | 2,515,110 | 25,678,857 | 3,110,555 | 3,849,771 | |||||||||||||||
| NET ASSETS | $ | 28,920,831 | $ | 36,533,325 | $ | 53,650,527 | $ | 42,610,448 | $ | 23,089,494 | ||||||||||
| COMPONENTS OF NET ASSETS | ||||||||||||||||||||
| Paid-in capital | 29,799,321 | 38,707,832 | 56,319,552 | 46,977,481 | 30,423,290 | |||||||||||||||
| Total distributable earnings/(accumulated loss) | (878,490 | ) | (2,174,507 | ) | (2,669,025 | ) | (4,367,033 | ) | (7,333,796 | ) | ||||||||||
| NET ASSETS | $ | 28,920,831 | $ | 36,533,325 | $ | 53,650,527 | $ | 42,610,448 | $ | 23,089,494 | ||||||||||
| Shares outstanding | 600,000 | 780,000 | 1,190,000 | 990,000 | 630,000 | |||||||||||||||
| Net asset value, offering and redemption price per share | $ | 48.20 | $ | 46.84 | $ | 45.08 | $ | 43.04 | $ | 36.65 | ||||||||||
| Investment in securities, at cost | $ | 29,342,699 | $ | 37,784,236 | $ | 55,216,571 | $ | 45,072,607 | $ | 27,756,463 | ||||||||||
The accompanying notes are an integral part of these financial statements.
149
Statements of Operations
For the Year Ended October 31, 2023
| BondBloxx USD High Yield Bond Industrial Sector ETF | BondBloxx USD High Yield Bond Telecom, Media & Technology Sector ETF | BondBloxx USD High Yield Bond Healthcare Sector ETF | BondBloxx USD High Yield Bond Financial & REIT Sector ETF | BondBloxx USD High Yield Bond Energy Sector ETF | ||||||||||||||||
| INVESTMENT INCOME: | ||||||||||||||||||||
| Interest income | $ | 1,358,158 | $ | 1,025,683 | $ | 495,310 | $ | 913,333 | $ | 725,428 | ||||||||||
| Total income | 1,358,158 | 1,025,683 | 495,310 | 913,333 | 725,428 | |||||||||||||||
| EXPENSES: | ||||||||||||||||||||
| Management fees (Note 3) | 62,689 | 40,096 | 20,209 | 39,649 | 35,251 | |||||||||||||||
| Total Expenses | 62,689 | 40,096 | 20,209 | 39,649 | 35,251 | |||||||||||||||
| NET INVESTMENT INCOME/(LOSS) | 1,295,469 | 985,587 | 475,101 | 873,684 | 690,177 | |||||||||||||||
| NET REALIZED AND UNREALIZED GAIN/(LOSS) ON INVESTMENTS: | ||||||||||||||||||||
| Net realized gain/(loss) on: | ||||||||||||||||||||
| Investments in securities | (262,560 | ) | (285,345 | ) | (630,266 | ) | (342,114 | ) | (286,942 | ) | ||||||||||
| Net realized gain/(loss) | (262,560 | ) | (285,345 | ) | (630,266 | ) | (342,114 | ) | (286,942 | ) | ||||||||||
| Change in unrealized appreciation/(depreciation) on: | ||||||||||||||||||||
| Investments in securities | (1,326,269 | ) | (950,315 | ) | 6,287 | (504,288 | ) | (86,272 | ) | |||||||||||
| Change in unrealized appreciation/(depreciation) | (1,326,269 | ) | (950,315 | ) | 6,287 | (504,288 | ) | (86,272 | ) | |||||||||||
| Net Realized and Unrealized Gain/(Loss) on Investments | (1,588,829 | ) | (1,235,660 | ) | (623,979 | ) | (846,402 | ) | (373,214 | ) | ||||||||||
| Net Increase/(Decrease) in Net Assets Resulting from Operations | $ | (293,360 | ) | $ | (250,073 | ) | $ | (148,878 | ) | $ | 27,282 | $ | 316,963 | |||||||
The accompanying notes are an integral part of these financial statements.
150
BONDBLOXX ETF TRUST
Statements of Operations (Continued)
For the Period Ended October 31, 2023
| BondBloxx USD High Yield Bond Consumer Cyclicals Sector ETF | BondBloxx USD High Yield Bond Consumer Non-Cyclicals Sector ETF | BondBloxx USD High Yield Bond Sector Rotation ETF(1)(2) | BondBloxx USD High Yield Bond Sector Rotation ETF(2)(3) | BondBloxx B Rated USD High Yield Corporate Bond ETF | ||||||||||||||||
| INVESTMENT INCOME: | ||||||||||||||||||||
| Interest income | $ | 970,795 | $ | 395,761 | $ | 453,520 | $ | 2,258,474 | $ | 996,731 | ||||||||||
| Affiliated dividend income | - | - | 172,258 | - | - | |||||||||||||||
| Total income | 970,795 | 395,761 | 625,778 | 2,258,474 | 996,731 | |||||||||||||||
| EXPENSES: | ||||||||||||||||||||
| Management fees (Note 3) | 43,109 | 20,692 | 45,348 | 131,659 | 35,401 | |||||||||||||||
| Trustees’ fees (Note 3) | - | - | 4,569 | 9,655 | - | |||||||||||||||
| Administration fees (Note 3) | - | - | 1,905 | 41,854 | - | |||||||||||||||
| Audit fess | - | - | 7,076 | 57,750 | - | |||||||||||||||
| Legal fees | - | - | 3,680 | 35,000 | - | |||||||||||||||
| Pricing fees | - | - | 23,726 | 20,965 | - | |||||||||||||||
| Custodian fees | - | - | 2,282 | 17,732 | - | |||||||||||||||
| Registration fees | - | - | (38,308 | ) | 13,785 | - | ||||||||||||||
| Shareholder reporting fees | - | - | 4,773 | 6,903 | - | |||||||||||||||
| Insurance expense | - | - | 1,935 | 6,896 | - | |||||||||||||||
| Professional fees | - | - | 19,695 | 6,000 | - | |||||||||||||||
| Other expenses | - | - | 14,417 | 35,910 | - | |||||||||||||||
| Total Expenses | 43,109 | 20,692 | 91,098 | 384,109 | 35,401 | |||||||||||||||
| Fee waiver and expense reimbursement | - | - | (49,340 | ) | (227,045 | ) | - | |||||||||||||
| Net Expenses | 43,109 | 20,692 | 41,758 | 157,064 | 35,401 | |||||||||||||||
| NET INVESTMENT INCOME/(LOSS) | 927,686 | 375,069 | 584,020 | 2,101,410 | 961,330 | |||||||||||||||
| NET REALIZED AND UNREALIZED GAIN/(LOSS) ON INVESTMENTS: | ||||||||||||||||||||
| Net realized gain/(loss) on: | ||||||||||||||||||||
| Unaffiliated investments in securities | (578,968 | ) | (360,001 | ) | (471,042 | ) | (2,145,701 | ) | (201,007 | ) | ||||||||||
| Affiliated investments in securities | - | - | (44,503 | ) | - | - | ||||||||||||||
| Net realized gain/(loss) | (578,968 | ) | (360,001 | ) | (515,545 | ) | (2,145,701 | ) | (201,007 | ) | ||||||||||
| Change in unrealized appreciation/(depreciation) on: | ||||||||||||||||||||
| Unaffiliated investments in securities | 110,662 | 64,831 | 364,570 | 2,220,850 | (194,628 | ) | ||||||||||||||
| Affiliated investments in securities | - | - | (793,631 | ) | - | - | ||||||||||||||
| Change in unrealized appreciation/(depreciation) | 110,662 | 64,831 | (429,061 | ) | 2,220,850 | (194,628 | ) | |||||||||||||
| Net Realized and Unrealized Gain/(Loss) on Investments | (468,306 | ) | (295,170 | ) | (944,606 | ) | 75,149 | (395,635 | ) | |||||||||||
| Net Increase/(Decrease) in Net Assets Resulting from Operations | $ | 459,380 | $ | 79,899 | $ | (360,586 | ) | $ | 2,176,559 | $ | 565,695 | |||||||||
| (1) | Fiscal year end changed from June 30, 2023 to October 31, 2023. Disclosed amounts are for the period from July 1, 2023 to October 31, 2023. |
| (2) | The Fund acquired the assets and liabilities of the Predecessor ETF, a series of the NexPoint Funds I at the close of business on September 15, 2023. As a result of the reorganization, the Fund is the accounting successor of the Predecessor ETF. Financial information above for the periods prior to September 16, 2023, reflect the performance of the Predecessor ETF. |
| (3) | For the fiscal year July 1, 2022 to June 30, 2023. |
The accompanying notes are an integral part of these financial statements.
151
BONDBLOXX ETF TRUST
Statements of Operations (Continued)
For the Year Ended October 31, 2023
| BondBloxx BB Rated USD High Yield Corporate Bond ETF | BondBloxx CCC Rated USD High Yield Corporate Bond ETF | BondBloxx JP Morgan USD Emerging Markets 1-10 Year Bond ETF | BondBloxx Bloomberg Six Month Target Duration US Treasury ETF | BondBloxx Bloomberg One Year Target Duration US Treasury ETF | ||||||||||||||||
| INVESTMENT INCOME: | ||||||||||||||||||||
| Interest income | $ | 3,093,621 | $ | 1,269,591 | $ | 12,020,443 | $ | 24,068,889 | $ | 14,554,709 | ||||||||||
| Total income | 3,093,621 | 1,269,591 | 12,020,443 | 24,068,889 | 14,554,709 | |||||||||||||||
| EXPENSES: | ||||||||||||||||||||
| Management fees (Note 3) | 93,764 | 40,283 | 523,093 | 143,107 | 86,782 | |||||||||||||||
| Total Expenses | 93,764 | 40,283 | 523,093 | 143,107 | 86,782 | |||||||||||||||
| NET INVESTMENT INCOME/(LOSS) | 2,999,857 | 1,229,308 | 11,497,350 | 23,925,782 | 14,467,927 | |||||||||||||||
| NET REALIZED AND UNREALIZED GAIN/(LOSS) ON INVESTMENTS: | ||||||||||||||||||||
| Net realized gain/(loss) on: | ||||||||||||||||||||
| Investments in securities | (839,618 | ) | (375,809 | ) | (782,115 | ) | (879,120 | ) | (4,456,879 | ) | ||||||||||
| Foreign currency transactions | - | - | 11 | - | - | |||||||||||||||
| Net realized gain/(loss) | (839,618 | ) | (375,809 | ) | (782,104 | ) | (879,120 | ) | (4,456,879 | ) | ||||||||||
| Change in unrealized appreciation/(depreciation) on: | ||||||||||||||||||||
| Investments in securities | (515,770 | ) | (458,130 | ) | 3,614,441 | (360,110 | ) | (1,080,182 | ) | |||||||||||
| Foreign currency transactions | - | - | 38 | - | - | |||||||||||||||
| Change in unrealized appreciation/(depreciation) | (515,770 | ) | (458,130 | ) | 3,614,479 | (360,110 | ) | (1,080,182 | ) | |||||||||||
| Net Realized and Unrealized Gain/(Loss) on Investments | (1,355,388 | ) | (833,939 | ) | 2,832,375 | (1,239,230 | ) | (5,537,061 | ) | |||||||||||
| Net Increase/(Decrease) in Net Assets Resulting from Operations | $ | 1,644,469 | $ | 395,369 | $ | 14,329,725 | $ | 22,686,552 | $ | 8,930,866 | ||||||||||
The accompanying notes are an integral part of these financial statements.
152
BONDBLOXX ETF TRUST
Statements of Operations (Continued)
For the Year Ended October 31, 2023
| BondBloxx Bloomberg Two Year Target Duration US Treasury ETF | BondBloxx Bloomberg Three Year Target Duration US Treasury ETF | BondBloxx Bloomberg Five Year Target Duration US Treasury ETF | BondBloxx Bloomberg Seven Year Target Duration US Treasury ETF | BondBloxx Bloomberg Ten Year Target Duration US Treasury ETF | ||||||||||||||||
| INVESTMENT INCOME: | ||||||||||||||||||||
| Interest income | $ | 3,492,089 | $ | 999,368 | $ | 1,240,867 | $ | 950,555 | $ | 986,017 | ||||||||||
| Total income | 3,492,089 | 999,368 | 1,240,867 | 950,555 | 986,017 | |||||||||||||||
| EXPENSES: | ||||||||||||||||||||
| Management fees (Note 3) | 40,999 | 12,194 | 16,430 | 12,857 | 19,007 | |||||||||||||||
| Total Expenses | 40,999 | 12,194 | 16,430 | 12,857 | 19,007 | |||||||||||||||
| NET INVESTMENT INCOME/(LOSS) | 3,451,090 | 987,174 | 1,224,437 | 937,698 | 967,010 | |||||||||||||||
| NET REALIZED AND UNREALIZED GAIN/(LOSS) ON INVESTMENTS: | ||||||||||||||||||||
| Net realized gain/(loss) on: | ||||||||||||||||||||
| Investments in securities | (847,127 | ) | (326,389 | ) | (742,194 | ) | (495,159 | ) | (1,342,079 | ) | ||||||||||
| Net realized gain/(loss) | (847,127 | ) | (326,389 | ) | (742,194 | ) | (495,159 | ) | (1,342,079 | ) | ||||||||||
| Change in unrealized appreciation/(depreciation) on: | ||||||||||||||||||||
| Investments in securities | (828,781 | ) | (288,445 | ) | (947,289 | ) | (1,400,117 | ) | (1,910,985 | ) | ||||||||||
| Change in unrealized appreciation/(depreciation) | (828,781 | ) | (288,445 | ) | (947,289 | ) | (1,400,117 | ) | (1,910,985 | ) | ||||||||||
| Net Realized and Unrealized Gain/(Loss) on Investments | (1,675,908 | ) | (614,834 | ) | (1,689,483 | ) | (1,895,276 | ) | (3,253,064 | ) | ||||||||||
| Net Increase/(Decrease) in Net Assets Resulting from Operations | $ | 1,775,182 | $ | 372,340 | $ | (465,046 | ) | $ | (957,578 | ) | $ | (2,286,054 | ) | |||||||
The accompanying notes are an integral part of these financial statements.
153
BONDBLOXX ETF TRUST
Statements of Operations (Continued)
For the Year Ended October 31, 2023
| BondBloxx Bloomberg Twenty Year Target Duration US Treasury ETF | ||||
| INVESTMENT INCOME: | ||||
| Interest income | $ | 980,751 | ||
| Total income | 980,751 | |||
| EXPENSES: | ||||
| Management fees (Note 3) | 31,125 | |||
| Total Expenses | 31,125 | |||
| NET INVESTMENT INCOME/(LOSS) | 949,626 | |||
| NET REALIZED AND UNREALIZED GAIN/(LOSS) ON INVESTMENTS: | ||||
| Net realized gain/(loss) on: | ||||
| Investments in securities | (2,604,799 | ) | ||
| Net realized gain/(loss) | (2,604,799 | ) | ||
| Change in unrealized appreciation/(depreciation) on: | ||||
| Investments in securities | (2,773,615 | ) | ||
| Change in unrealized appreciation/(depreciation) | (2,773,615 | ) | ||
| Net Realized and Unrealized Gain/(Loss) on Investments | (5,378,414 | ) | ||
| Net Increase/(Decrease) in Net Assets Resulting from Operations | $ | (4,428,788 | ) | |
The accompanying notes are an integral part of these financial statements.
154
Statements of Changes in Net Assets
| BondBloxx USD High Yield Bond Industrial Sector ETF | BondBloxx USD High Yield Bond Telecom, Media & Technology Sector ETF | |||||||||||||||
| For the Year Ended October 31, 2023 | For the Period Ended October 31, 2022(1) | For the Year Ended October 31, 2023 | For the Period Ended October 31, 2022(1) | |||||||||||||
| OPERATIONS: | ||||||||||||||||
| Net investment income/(loss) | $ | 1,295,469 | $ | 211,122 | $ | 985,587 | $ | 154,093 | ||||||||
| Net realized gain/(loss) on investments | (262,560 | ) | (157,974 | ) | (285,345 | ) | (16,556 | ) | ||||||||
| Net change in unrealized appreciation/(depreciation) on investments | (1,326,269 | ) | (415,331 | ) | (950,315 | ) | (488,904 | ) | ||||||||
| Net increase/(decrease) in net assets resulting from operations | (293,360 | ) | (362,183 | ) | (250,073 | ) | (351,367 | ) | ||||||||
| DISTRIBUTIONS TO SHAREHOLDERS: | ||||||||||||||||
| Distributions from distributable earnings | (1,039,987 | ) | (192,726 | ) | (773,573 | ) | (135,149 | ) | ||||||||
| CAPITAL TRANSACTIONS: | ||||||||||||||||
| Proceeds from shares sold | 42,210,745 | 11,592,075 | 28,696,710 | 7,628,270 | ||||||||||||
| Cost of shares redeemed | (3,607,670 | ) | (7,462,440 | ) | (1,757,155 | ) | (3,662,890 | ) | ||||||||
| Net increase/(decrease) in net assets from capital transactions | 38,603,075 | 4,129,635 | 26,939,555 | 3,965,380 | ||||||||||||
| Increase/(decrease) in net assets | 37,269,728 | 3,574,726 | 25,915,909 | 3,478,864 | ||||||||||||
| NET ASSETS: | ||||||||||||||||
| Beginning of year | 3,574,726 | - | 3,478,864 | - | ||||||||||||
| End of year | $ | 40,844,454 | $ | 3,574,726 | $ | 29,394,773 | $ | 3,478,864 | ||||||||
| CHANGES IN SHARES OUTSTANDING: | ||||||||||||||||
| Shares outstanding, beginning of year | 100,000 | - | 100,000 | - | ||||||||||||
| Shares sold | 1,150,000 | 300,000 | 850,000 | 200,000 | ||||||||||||
| Shares redeemed | (100,000 | ) | (200,000 | ) | (50,000 | ) | (100,000 | ) | ||||||||
| Shares outstanding, end of year | 1,150,000 | 100,000 | 900,000 | 100,000 | ||||||||||||
| (1) | Funds commenced operations on February 15, 2022. |
The accompanying notes are an integral part of these financial statements.
155
BONDBLOXX ETF TRUST
Statements of Changes in Net Assets (Continued)
| BondBloxx USD High Yield Bond Healthcare Sector ETF | BondBloxx USD High Yield Bond Financial & REIT Sector ETF | |||||||||||||||
| For the Year Ended October 31, 2023 | For the Period Ended October 31, 2022(1) | For the Year Ended October 31, 2023 | For the Period Ended October 31, 2022(1) | |||||||||||||
| OPERATIONS: | ||||||||||||||||
| Net investment income/(loss) | $ | 475,101 | $ | 290,762 | $ | 873,684 | $ | 198,526 | ||||||||
| Net realized gain/(loss) on investments | (630,266 | ) | (494,318 | ) | (342,114 | ) | (218,621 | ) | ||||||||
| Net change in unrealized appreciation/(depreciation) on investments | 6,287 | (823,756 | ) | (504,288 | ) | (448,860 | ) | |||||||||
| Net increase/(decrease) in net assets resulting from operations | (148,878 | ) | (1,027,312 | ) | 27,282 | (468,955 | ) | |||||||||
| DISTRIBUTIONS TO SHAREHOLDERS: | ||||||||||||||||
| Distributions from distributable earnings | (462,631 | ) | (226,994 | ) | (689,760 | ) | (180,578 | ) | ||||||||
| CAPITAL TRANSACTIONS: | ||||||||||||||||
| Proceeds from shares sold | 9,936,130 | 14,908,080 | 28,367,350 | 7,829,930 | ||||||||||||
| Cost of shares redeemed | (6,495,240 | ) | (5,494,710 | ) | (1,798,040 | ) | (3,681,575 | ) | ||||||||
| Net increase/(decrease) in net assets from capital transactions | 3,440,890 | 9,413,370 | 26,569,310 | 4,148,355 | ||||||||||||
| Increase/(decrease) in net assets | 2,829,381 | 8,159,064 | 25,906,832 | 3,498,822 | ||||||||||||
| NET ASSETS: | ||||||||||||||||
| Beginning of year | 8,159,064 | - | 3,498,822 | - | ||||||||||||
| End of year | $ | 10,988,445 | $ | 8,159,064 | $ | 29,405,654 | $ | 3,498,822 | ||||||||
| CHANGES IN SHARES OUTSTANDING: | ||||||||||||||||
| Shares outstanding, beginning of year | 250,000 | - | 100,000 | - | ||||||||||||
| Shares sold | 300,000 | 400,000 | 800,000 | 200,000 | ||||||||||||
| Shares redeemed | (200,000 | ) | (150,000 | ) | (50,000 | ) | (100,000 | ) | ||||||||
| Shares outstanding, end of year | 350,000 | 250,000 | 850,000 | 100,000 | ||||||||||||
| (1) | Funds commenced operations on February 15, 2022. |
The accompanying notes are an integral part of these financial statements.
156
BONDBLOXX ETF TRUST
Statements of Changes in Net Assets (Continued)
| BondBloxx USD High Yield Bond Energy Sector ETF | BondBloxx USD High Yield Bond Consumer Cyclicals Sector ETF | |||||||||||||||
| For the Year Ended October 31, 2023 | For the Period Ended October 31, 2022(1) | For the Year Ended October 31, 2023 | For the Period Ended October 31, 2022(1) | |||||||||||||
| OPERATIONS: | ||||||||||||||||
| Net investment income/(loss) | $ | 690,177 | $ | 288,196 | $ | 927,686 | $ | 274,094 | ||||||||
| Net realized gain/(loss) on investments | (286,942 | ) | (14,475 | ) | (578,968 | ) | (32,565 | ) | ||||||||
| Net change in unrealized appreciation/(depreciation) on investments | (86,272 | ) | (402,337 | ) | 110,662 | (822,873 | ) | |||||||||
| Net increase/(decrease) in net assets resulting from operations | 316,963 | (128,616 | ) | 459,380 | (581,344 | ) | ||||||||||
| DISTRIBUTIONS TO SHAREHOLDERS: | ||||||||||||||||
| Distributions from distributable earnings | (606,084 | ) | (247,535 | ) | (826,902 | ) | (234,348 | ) | ||||||||
| CAPITAL TRANSACTIONS: | ||||||||||||||||
| Proceeds from shares sold | 20,703,110 | 11,658,325 | 21,363,810 | 11,458,995 | ||||||||||||
| Cost of shares redeemed | (7,414,975 | ) | (3,866,100 | ) | (5,206,265 | ) | (3,717,950 | ) | ||||||||
| Net increase/(decrease) in net assets from capital transactions | 13,288,135 | 7,792,225 | 16,157,545 | 7,741,045 | ||||||||||||
| Increase/(decrease) in net assets | 12,999,014 | 7,416,074 | 15,790,023 | 6,925,353 | ||||||||||||
| NET ASSETS: | ||||||||||||||||
| Beginning of year | 7,516,074 | 100,000 | (2) | 6,925,353 | - | |||||||||||
| End of year | $ | 20,515,088 | $ | 7,516,074 | $ | 22,715,376 | $ | 6,925,353 | ||||||||
| CHANGES IN SHARES OUTSTANDING: | ||||||||||||||||
| Shares outstanding, beginning of year | 202,500 | 2,500 | 200,000 | - | ||||||||||||
| Shares sold | 550,000 | 300,000 | 600,000 | 300,000 | ||||||||||||
| Shares redeemed | (200,000 | ) | (100,000 | ) | (150,000 | ) | (100,000 | ) | ||||||||
| Shares outstanding, end of year | 552,500 | 202,500 | 650,000 | 200,000 | ||||||||||||
| (1) | Funds commenced operations on February 15, 2022. |
| (2) | Beginning capital of $100,000 was contributed by BondBloxx Investment Management Corporation, Investment Adviser to the Fund, in exchange for 2,500 Shares of the Fund at a net asset value of $40 per share, in connection with the seeding of the Trust. |
The accompanying notes are an integral part of these financial statements.
157
BONDBLOXX ETF TRUST
Statements of Changes in Net Assets (Continued)
| BondBloxx USD High Yield Bond Consumer Non-Cyclicals Sector ETF | BondBloxx USD High Yield Bond Sector Rotation ETF(3) | |||||||||||||||||||
| For the Year Ended October 31, 2023 | For the Period Ended October 31, 2022(1) | For the Period Ended October 31, 2023(4) | For the Year Ended June 30, 2023 | For the Year Ended June 30, 2022 | ||||||||||||||||
| OPERATIONS: | ||||||||||||||||||||
| Net investment income/(loss) | $ | 375,069 | $ | 212,769 | $ | 584,020 | $ | 2,101,410 | $ | 1,106,815 | ||||||||||
| Net realized gain/(loss) on investments | (360,001 | ) | (41,479 | ) | (515,545 | ) | (2,145,701 | ) | (476,200 | ) | ||||||||||
| Net change in unrealized appreciation/(depreciation) on investments | 64,831 | (596,917 | ) | (429,061 | ) | 2,220,850 | (2,858,784 | ) | ||||||||||||
| Net increase/(decrease) in net assets resulting from operations | 79,899 | (425,627 | ) | (360,586 | ) | 2,176,559 | (2,228,169 | ) | ||||||||||||
| DISTRIBUTIONS TO SHAREHOLDERS: | ||||||||||||||||||||
| Distributions from distributable earnings | (339,571 | ) | (187,215 | ) | (533,623 | ) | (2,101,410 | ) | (1,282,174 | ) | ||||||||||
| Return of capital | - | - | - | (60,985 | ) | (10,748 | ) | |||||||||||||
| Total distributions | (339,571 | ) | (187,215 | ) | (533,623 | ) | (2,162,395 | ) | (1,292,922 | ) | ||||||||||
| CAPITAL TRANSACTIONS: | ||||||||||||||||||||
| Proceeds from shares sold | 9,148,635 | 9,715,390 | 4,410,006 | 26,591,706 | 35,681,184 | |||||||||||||||
| Cost of shares redeemed | (3,594,970 | ) | (3,753,920 | ) | (1,268,145 | ) | (34,058,196 | ) | (41,987,938 | ) | ||||||||||
| Net increase/(decrease) in net assets from capital transactions | 5,553,665 | 5,961,470 | 3,141,861 | (7,466,490 | ) | (6,306,754 | ) | |||||||||||||
| Increase/(decrease) in net assets | 5,293,993 | 5,348,628 | 2,247,652 | (7,452,326 | ) | (9,827,845 | ) | |||||||||||||
| NET ASSETS: | ||||||||||||||||||||
| Beginning of period | 5,348,628 | - | 26,320,130 | 33,772,456 | 43,600,301 | |||||||||||||||
| End of period | $ | 10,642,621 | $ | 5,348,628 | $ | 28,567,782 | $ | 26,320,130 | $ | 33,772,456 | ||||||||||
| CHANGES IN SHARES OUTSTANDING: | ||||||||||||||||||||
| Shares outstanding, beginning of period | 150,000 | - | 1,800,000 | 2,300,000 | 2,700,000 | |||||||||||||||
| Shares sold | 250,000 | 250,000 | 300,000 | 1,800,000 | 2,300,000 | |||||||||||||||
| Shares redeemed | (100,000 | ) | (100,000 | ) | (90,000 | ) | (2,300,000 | ) | (2,700,000 | ) | ||||||||||
| Shares outstanding, end of period | 300,000 | 150,000 | 2,010,000 | 1,800,000 | 2,300,000 | |||||||||||||||
| (1) | Funds commenced operations on February 15, 2022. |
| (3) | The Fund acquired the assets and liabilities of the Predecessor ETF, a series of the NexPoint Funds I at the close of business on September 15, 2023. As a result of the reorganization, the Fund is the accounting successor of the Predecessor ETF. Financial information above for the periods prior to September 16, 2023, reflect the performance of the Predecessor ETF. |
| (4) | Fiscal year end changed from June 30, 2023 to October 31, 2023. |
The accompanying notes are an integral part of these financial statements.
158
BONDBLOXX ETF TRUST
Statements of Changes in Net Assets (Continued)
| BondBloxx B Rated USD High Yield Corporate Bond ETF | BondBloxx BB Rated USD High Yield Corporate Bond ETF | |||||||||||||||
| For the Year Ended October 31, 2023 | For the Period Ended October 31, 2022(5) | For the Year Ended October 31, 2023 | For the Period Ended October 31, 2022(5) | |||||||||||||
| OPERATIONS: | ||||||||||||||||
| Net investment income/(loss) | $ | 961,330 | $ | 437,741 | $ | 2,999,857 | $ | 1,116,612 | ||||||||
| Net realized gain/(loss) on investments | (201,007 | ) | (135,771 | ) | (839,618 | ) | (165,061 | ) | ||||||||
| Net change in unrealized appreciation/(depreciation) on investments | (194,628 | ) | (420,871 | ) | (515,770 | ) | (1,896,733 | ) | ||||||||
| Net increase/(decrease) in net assets resulting from operations | 565,695 | (118,901 | ) | 1,644,469 | (945,182 | ) | ||||||||||
| DISTRIBUTIONS TO SHAREHOLDERS: | ||||||||||||||||
| Distributions from distributable earnings | (948,646 | ) | (357,380 | ) | (2,930,252 | ) | (891,418 | ) | ||||||||
| CAPITAL TRANSACTIONS: | ||||||||||||||||
| Proceeds from shares sold | 1,919,410 | 13,978,525 | 17,507,495 | 44,217,930 | ||||||||||||
| Cost of shares redeemed | - | (1,985,495 | ) | (9,528,265 | ) | - | ||||||||||
| Net increase/(decrease) in net assets from capital transactions | 1,919,410 | 11,993,030 | 7,979,230 | 44,217,930 | ||||||||||||
| Increase/(decrease) in net assets | 1,536,459 | 11,516,749 | 6,693,447 | 42,381,330 | ||||||||||||
| NET ASSETS: | ||||||||||||||||
| Beginning of year | 11,516,749 | - | 42,381,330 | - | ||||||||||||
| End of year | $ | 13,053,208 | $ | 11,516,749 | $ | 49,074,777 | $ | 42,381,330 | ||||||||
| CHANGES IN SHARES OUTSTANDING: | ||||||||||||||||
| Shares outstanding, beginning of year | 300,000 | - | 1,100,000 | - | ||||||||||||
| Shares sold | 50,000 | 350,000 | 450,000 | 1,100,000 | ||||||||||||
| Shares redeemed | - | (50,000 | ) | (250,000 | ) | - | ||||||||||
| Shares outstanding, end of year | 350,000 | 300,000 | 1,300,000 | 1,100,000 | ||||||||||||
| (5) | Funds commenced operations on May 24, 2022. |
The accompanying notes are an integral part of these financial statements.
159
BONDBLOXX ETF TRUST
Statements of Changes in Net Assets (Continued)
| BondBloxx CCC Rated USD High Yield Corporate Bond ETF | BondBloxx JP Morgan USD Emerging Markets 1-10 Year Bond ETF | |||||||||||||||
| For the Year Ended October 31, 2023 | For the Period Ended October 31, 2022(5) | For the Year Ended October 31, 2023 | For the Period Ended October 31, 2022(6) | |||||||||||||
| OPERATIONS: | ||||||||||||||||
| Net investment income/(loss) | $ | 1,229,308 | $ | 473,536 | $ | 11,497,350 | $ | 3,611,435 | ||||||||
| Net realized gain/(loss) on investments | (375,809 | ) | 24,514 | (782,104 | ) | (279,512 | ) | |||||||||
| Net change in unrealized appreciation/(depreciation) on investments | (458,130 | ) | (661,228 | ) | 3,614,479 | (9,065,137 | ) | |||||||||
| Net increase/(decrease) in net assets resulting from operations | 395,369 | (163,178 | ) | 14,329,725 | (5,733,214 | ) | ||||||||||
| DISTRIBUTIONS TO SHAREHOLDERS: | ||||||||||||||||
| Distributions from distributable earnings | (1,187,914 | ) | (351,099 | ) | (11,393,515 | ) | (2,662,213 | ) | ||||||||
| CAPITAL TRANSACTIONS: | ||||||||||||||||
| Proceeds from shares sold | 12,914,935 | 13,761,276 | 11,771,310 | 177,106,675 | ||||||||||||
| Cost of shares redeemed | (3,690,915 | ) | (1,998,065 | ) | - | - | ||||||||||
| Net increase/(decrease) in net assets from capital transactions | 9,224,020 | 11,763,211 | 11,771,310 | 177,106,675 | ||||||||||||
| Increase/(decrease) in net assets | 8,431,475 | 11,248,934 | 14,707,520 | 168,711,248 | ||||||||||||
| NET ASSETS: | ||||||||||||||||
| Beginning of year | 11,248,934 | - | 168,711,248 | - | ||||||||||||
| End of year | $ | 19,680,409 | $ | 11,248,934 | $ | 183,418,768 | $ | 168,711,248 | ||||||||
| CHANGES IN SHARES OUTSTANDING: | ||||||||||||||||
| Shares outstanding, beginning of year | 300,000 | - | 4,450,000 | - | ||||||||||||
| Shares sold | 350,000 | 350,000 | 300,000 | 4,450,000 | ||||||||||||
| Shares redeemed | (100,000 | ) | (50,000 | ) | - | - | ||||||||||
| Shares outstanding, end of year | 550,000 | 300,000 | 4,750,000 | 4,450,000 | ||||||||||||
| (5) | Funds commenced operations on May 24, 2022. |
| (6) | Fund commenced operations on June 28, 2022. |
The accompanying notes are an integral part of these financial statements.
160
BONDBLOXX ETF TRUST
Statements of Changes in Net Assets (Continued)
| BondBloxx Bloomberg Six Month Target Duration US Treasury ETF | BondBloxx Bloomberg One Year Target Duration US Treasury ETF | |||||||||||||||
| For the Year Ended October 31, 2023 | For the Period Ended October 31, 2022(7) | For the Year Ended October 31, 2023 | For the Period Ended October 31, 2022(7) | |||||||||||||
| OPERATIONS: | ||||||||||||||||
| Net investment income/(loss) | $ | 23,925,782 | $ | 124,097 | $ | 14,467,927 | $ | 175,542 | ||||||||
| Net realized gain/(loss) on investments | (879,120 | ) | (9,692 | ) | (4,456,879 | ) | (22,869 | ) | ||||||||
| Net change in unrealized appreciation/(depreciation) on investments | (360,110 | ) | (66,198 | ) | (1,080,182 | ) | (199,645 | ) | ||||||||
| Net increase/(decrease) in net assets resulting from operations | 22,686,552 | 48,207 | 8,930,866 | (46,972 | ) | |||||||||||
| DISTRIBUTIONS TO SHAREHOLDERS: | ||||||||||||||||
| Distributions from distributable earnings | (19,195,046 | ) | - | (11,946,611 | ) | - | ||||||||||
| CAPITAL TRANSACTIONS: | ||||||||||||||||
| Proceeds from shares sold | 1,561,833,583 | 50,046,404 | 1,328,686,554 | 39,471,361 | ||||||||||||
| Cost of shares redeemed | (518,534,699 | ) | - | (837,868,625 | ) | - | ||||||||||
| Net increase/(decrease) in net assets from capital transactions | 1,043,298,884 | 50,046,404 | 490,817,929 | 39,471,361 | ||||||||||||
| Increase/(decrease) in net assets | 1,046,790,390 | 50,094,611 | 487,802,184 | 39,424,389 | ||||||||||||
| NET ASSETS: | ||||||||||||||||
| Beginning of year | 50,094,611 | - | 39,424,389 | - | ||||||||||||
| End of year | $ | 1,096,885,001 | $ | 50,094,611 | $ | 527,226,573 | $ | 39,424,389 | ||||||||
| CHANGES IN SHARES OUTSTANDING: | ||||||||||||||||
| Shares outstanding, beginning of year | 1,000,000 | - | 790,000 | - | ||||||||||||
| Shares sold | 31,150,000 | 1,000,000 | 26,690,000 | 790,000 | ||||||||||||
| Shares redeemed | (10,340,000 | ) | - | (16,880,000 | ) | - | ||||||||||
| Shares outstanding, end of year | 21,810,000 | 1,000,000 | 10,600,000 | 790,000 | ||||||||||||
| (7) | Funds commenced operations on September 13, 2022. |
The accompanying notes are an integral part of these financial statements.
161
BONDBLOXX ETF TRUST
Statements of Changes in Net Assets (Continued)
| BondBloxx Bloomberg Two Year Target Duration US Treasury ETF | BondBloxx Bloomberg Three Year Target Duration US Treasury ETF | |||||||||||||||
| For the Year Ended October 31, 2023 | For the Period Ended October 31, 2022(7) | For the Year Ended October 31, 2023 | For the Period Ended October 31, 2022(7) | |||||||||||||
| OPERATIONS: | ||||||||||||||||
| Net investment income/(loss) | $ | 3,451,090 | $ | 166,264 | $ | 987,174 | $ | 99,501 | ||||||||
| Net realized gain/(loss) on investments | (847,127 | ) | (31,288 | ) | (326,389 | ) | (73,209 | ) | ||||||||
| Net change in unrealized appreciation/(depreciation) on investments | (828,781 | ) | (401,307 | ) | (288,445 | ) | (288,177 | ) | ||||||||
| Net increase/(decrease) in net assets resulting from operations | 1,775,182 | (266,331 | ) | 372,340 | (261,885 | ) | ||||||||||
| DISTRIBUTIONS TO SHAREHOLDERS: | ||||||||||||||||
| Distributions from distributable earnings | (3,191,299 | ) | - | (987,439 | ) | - | ||||||||||
| CAPITAL TRANSACTIONS: | ||||||||||||||||
| Proceeds from shares sold | 144,785,822 | 36,889,007 | 14,840,962 | 20,407,929 | ||||||||||||
| Cost of shares redeemed | (74,962,851 | ) | - | (5,451,076 | ) | - | ||||||||||
| Net increase/(decrease) in net assets from capital transactions | 69,822,971 | 36,889,007 | 9,389,886 | 20,407,929 | ||||||||||||
| Increase/(decrease) in net assets | 68,406,854 | 36,622,676 | 8,774,787 | 20,146,044 | ||||||||||||
| NET ASSETS: | ||||||||||||||||
| Beginning of year | 36,622,676 | - | 20,146,044 | - | ||||||||||||
| End of year | $ | 105,029,530 | $ | 36,622,676 | $ | 28,920,831 | $ | 20,146,044 | ||||||||
| CHANGES IN SHARES OUTSTANDING: | ||||||||||||||||
| Shares outstanding, beginning of year | 740,000 | - | 410,000 | - | ||||||||||||
| Shares sold | 2,930,000 | 740,000 | 300,000 | 410,000 | ||||||||||||
| Shares redeemed | (1,520,000 | ) | - | (110,000 | ) | - | ||||||||||
| Shares outstanding, end of year | 2,150,000 | 740,000 | 600,000 | 410,000 | ||||||||||||
| (7) | Funds commenced operations on September 13, 2022. |
The accompanying notes are an integral part of these financial statements.
162
BONDBLOXX ETF TRUST
Statements of Changes in Net Assets (Continued)
| BondBloxx Bloomberg Five Year Target Duration US Treasury ETF | BondBloxx Bloomberg Seven Year Target Duration US Treasury ETF | |||||||||||||||
| For the Year Ended October 31, 2023 | For the Period Ended October 31, 2022(7) | For the Year Ended October 31, 2023 | For the Period Ended October 31, 2022(7) | |||||||||||||
| OPERATIONS: | ||||||||||||||||
| Net investment income/(loss) | $ | 1,224,437 | $ | 87,675 | $ | 937,698 | $ | 86,877 | ||||||||
| Net realized gain/(loss) on investments | (742,194 | ) | (35,055 | ) | (495,159 | ) | (96,098 | ) | ||||||||
| Net change in unrealized appreciation/(depreciation) on investments | (947,289 | ) | (583,718 | ) | (1,400,117 | ) | (766,860 | ) | ||||||||
| Net increase/(decrease) in net assets resulting from operations | (465,046 | ) | (531,098 | ) | (957,578 | ) | (776,081 | ) | ||||||||
| DISTRIBUTIONS TO SHAREHOLDERS: | ||||||||||||||||
| Distributions from distributable earnings | (1,188,187 | ) | - | (923,627 | ) | - | ||||||||||
| CAPITAL TRANSACTIONS: | ||||||||||||||||
| Proceeds from shares sold | 21,336,190 | 20,857,369 | 35,499,443 | 21,308,037 | ||||||||||||
| Cost of shares redeemed | (3,475,903 | ) | - | (499,667 | ) | - | ||||||||||
| Net increase/(decrease) in net assets from capital transactions | 17,860,287 | 20,857,369 | 34,999,776 | 21,308,037 | ||||||||||||
| Increase/(decrease) in net assets | 16,207,054 | 20,326,271 | 33,118,571 | 20,531,956 | ||||||||||||
| NET ASSETS: | ||||||||||||||||
| Beginning of year | 20,326,271 | - | 20,531,956 | - | ||||||||||||
| End of year | $ | 36,533,325 | $ | 20,326,271 | $ | 53,650,527 | $ | 20,531,956 | ||||||||
| CHANGES IN SHARES OUTSTANDING: | ||||||||||||||||
| Shares outstanding, beginning of year | 420,000 | - | 430,000 | - | ||||||||||||
| Shares sold | 430,000 | 420,000 | 770,000 | 430,000 | ||||||||||||
| Shares redeemed | (70,000 | ) | - | (10,000 | ) | - | ||||||||||
| Shares outstanding, end of year | 780,000 | 420,000 | 1,190,000 | 430,000 | ||||||||||||
| (7) | Funds commenced operations on September 13, 2022. |
The accompanying notes are an integral part of these financial statements.
163
BONDBLOXX ETF TRUST
Statements of Changes in Net Assets (Continued)
| BondBloxx Bloomberg Ten Year Target Duration US Treasury ETF | BondBloxx Bloomberg Twenty Year Target Duration US Treasury ETF | |||||||||||||||
| For the Year Ended October 31, 2023 | For the Period Ended October 31, 2022(7) | For the Year Ended October 31, 2023 | For the Period Ended October 31, 2022(7) | |||||||||||||
| OPERATIONS: | ||||||||||||||||
| Net investment income/(loss) | $ | 967,010 | $ | 85,267 | $ | 949,626 | $ | 93,182 | ||||||||
| Net realized gain/(loss) on investments | (1,342,079 | ) | (71,927 | ) | (2,604,799 | ) | (616,657 | ) | ||||||||
| Net change in unrealized appreciation/(depreciation) on investments | (1,910,985 | ) | (1,197,430 | ) | (2,773,615 | ) | (2,160,897 | ) | ||||||||
| Net increase/(decrease) in net assets resulting from operations | (2,286,054 | ) | (1,184,090 | ) | (4,428,788 | ) | (2,684,372 | ) | ||||||||
| DISTRIBUTIONS TO SHAREHOLDERS: | ||||||||||||||||
| Distributions from distributable earnings | (896,889 | ) | - | (948,088 | ) | - | ||||||||||
| CAPITAL TRANSACTIONS: | ||||||||||||||||
| Proceeds from shares sold | 25,726,389 | 21,251,092 | 22,835,539 | 24,072,128 | ||||||||||||
| Cost of shares redeemed | - | - | (15,756,925 | ) | - | |||||||||||
| Net increase/(decrease) in net assets from capital transactions | 25,726,389 | 21,251,092 | 7,078,614 | 24,072,128 | ||||||||||||
| Increase/(decrease) in net assets | 22,543,446 | 20,067,002 | 1,701,738 | 21,387,756 | ||||||||||||
| NET ASSETS: | ||||||||||||||||
| Beginning of year | 20,067,002 | - | 21,387,756 | - | ||||||||||||
| End of year | $ | 42,610,448 | $ | 20,067,002 | $ | 23,089,494 | $ | 21,387,756 | ||||||||
| CHANGES IN SHARES OUTSTANDING: | ||||||||||||||||
| Shares outstanding, beginning of year | 430,000 | - | 490,000 | - | ||||||||||||
| Shares sold | 560,000 | 430,000 | 490,000 | 490,000 | ||||||||||||
| Shares redeemed | - | - | (350,000 | ) | - | |||||||||||
| Shares outstanding, end of year | 990,000 | 430,000 | 630,000 | 490,000 | ||||||||||||
| (7) | Funds commenced operations on September 13, 2022. |
The accompanying notes are an integral part of these financial statements.
164
Financial Highlights
For a share outstanding throughout the period presented.
| BondBloxx USD High Yield Bond Industrial Sector ETF | BondBloxx USD High Yield Bond Telecom, Media & Technology Sector ETF | |||||||||||||||
| For the Year Ended October 31, 2023 | For the Period Ended October 31, 2022(1) | For the Year Ended October 31, 2023 | For the Period Ended October 31, 2022(1) | |||||||||||||
| Net Asset Value, beginning of period | $ | 35.75 | $ | 39.89 | $ | 34.79 | $ | 39.65 | ||||||||
| Income/(loss) from operations: | ||||||||||||||||
| Net investment income/(loss)(2) | 2.65 | 1.55 | 2.92 | 1.54 | ||||||||||||
| Net realized and unrealized gain/(loss) on investments | (0.59 | )(15) | (4.25 | ) | (2.60 | )(15) | (5.05 | ) | ||||||||
| Total income/(loss) from operations | 2.06 | (2.70 | ) | 0.32 | (3.51 | ) | ||||||||||
| Distributions to shareholders: | ||||||||||||||||
| Net investment income | (2.29 | ) | (1.44 | ) | (2.45 | ) | (1.35 | ) | ||||||||
| Total distributions | (2.29 | ) | (1.44 | ) | (2.45 | ) | (1.35 | ) | ||||||||
| Net Asset Value, end of year | $ | 35.52 | $ | 35.75 | $ | 32.66 | $ | 34.79 | ||||||||
| Market Value, end of year | $ | 35.60 | $ | 35.71 | $ | 32.77 | $ | 34.73 | ||||||||
| Total Return at Net Asset Value(3) | 5.77 | % | (6.81 | )% | 0.89 | % | (8.96 | )% | ||||||||
| Total Return at Market Value(4) | 6.12 | % | (6.88 | )% | 1.39 | % | (9.03 | )% | ||||||||
| Net Assets, end of period (millions) | $ | 40.8 | $ | 3.6 | $ | 29.4 | $ | 3.5 | ||||||||
| Ratios to average net assets: | ||||||||||||||||
| Expenses(5) | 0.35 | % | 0.35 | % | 0.35 | % | 0.35 | % | ||||||||
| Net investment income/(loss)(5)(6) | 7.23 | % | 5.87 | % | 8.60 | % | 5.93 | % | ||||||||
| Portfolio turnover rate(7) | 21 | % | 9 | % | 14 | % | 13 | % | ||||||||
| (1) | Funds commenced operations on February 15, 2022. Shares of XHYI and XHYT were listed on the NYSE Arca, Inc. on February 17, 2022. |
| (2) | Based on average daily shares outstanding. |
| (3) | Net asset value total return is calculated assuming an initial investment made at the net asset value at the beginning of the period, reinvestment of all distributions at net asset value during the period, and redemption at net asset value on the last day of the period. Net asset value total return includes adjustments in accordance with accounting principles generally accepted in the United States of America (“GAAP”) and as such, the net asset value for financial reporting purposes and the returns based upon those net asset values may differ from the net asset value and returns for shareholder transactions. Total return calculated for a period of less than one year is not annualized. |
| (4) | Market price total return is calculated assuming an initial investment made at the market price at the beginning of the period, reinvestment of all distributions at net asset value during the period and sale at the market price on the last day of the period. Total return calculated for a period of less than one year is not annualized. |
| (5) | Annualized. |
| (6) | Net investment income/(loss) represents income earned by the Fund from its underlying investments less expenses incurred by the Fund during the period. |
| (7) | Portfolio turnover rate is not annualized and excludes the value of portfolio securities received or delivered as a result of in-kind creations or redemptions of the Fund’s capital shares. |
| (15) | Calculation of the net realized and unrealized gains (losses) per share do not correlate with the Fund’s net realized and unrealized gains (losses) presented on the Statements of Operations due to the timing of capital transactions in relation to the fluctuating market values of the Fund’s investments. |
The accompanying notes are an integral part of these financial statements.
165
BONDBLOXX ETF TRUST
Financial Highlights (Continued)
For a share outstanding throughout the period presented.
| BondBloxx USD High Yield Bond Healthcare Sector ETF | BondBloxx USD High Yield Bond Financial & REIT Sector ETF | |||||||||||||||
| For the Year Ended October 31, 2023 | For the Period Ended October 31, 2022(1) | For the Year Ended October 31, 2023 | For the Period Ended October 31, 2022(1) | |||||||||||||
| Net Asset Value, beginning of period | $ | 32.64 | $ | 39.84 | $ | 34.99 | $ | 39.74 | ||||||||
| Income/(loss) from operations: | ||||||||||||||||
| Net investment income/(loss)(2) | 2.70 | 1.62 | 2.74 | 1.46 | ||||||||||||
| Net realized and unrealized gain/(loss) on investments | (0.94 | )(15) | (7.58 | ) | (0.70 | )(15) | (4.86 | ) | ||||||||
| Total income/(loss) from operations | 1.76 | (5.96 | ) | 2.04 | (3.40 | ) | ||||||||||
| Distributions to shareholders: | ||||||||||||||||
| Net investment income | (3.00 | ) | (1.24 | ) | (2.44 | ) | (1.35 | ) | ||||||||
| Total distributions | (3.00 | ) | (1.24 | ) | (2.44 | ) | (1.35 | ) | ||||||||
| Net Asset Value, end of year | $ | 31.40 | $ | 32.64 | $ | 34.59 | $ | 34.99 | ||||||||
| Market Value, end of year | $ | 31.49 | $ | 32.52 | $ | 34.68 | $ | 34.99 | ||||||||
| Total Return at Net Asset Value(3) | 5.36 | % | (15.19 | )% | 5.91 | % | (8.65 | )% | ||||||||
| Total Return at Market Value(4) | 6.03 | % | (15.47 | )% | 6.17 | % | (8.72 | )% | ||||||||
| Net Assets, end of period (millions) | $ | 11.0 | $ | 8.2 | $ | 29.4 | $ | 3.5 | ||||||||
| Ratios to average net assets: | ||||||||||||||||
| Expenses(5) | 0.35 | % | 0.35 | % | 0.35 | % | 0.35 | % | ||||||||
| Net investment income/(loss)(5)(6) | 8.23 | % | 6.39 | % | 7.71 | % | 5.57 | % | ||||||||
| Portfolio turnover rate(7) | 18 | % | 37 | % | 32 | % | 21 | % | ||||||||
| (1) | Funds commenced operations on February 15, 2022. Shares of XHYH and XHYF were listed on the NYSE Arca, Inc. on February 17, 2022. |
| (2) | Based on average daily shares outstanding. |
| (3) | Net asset value total return is calculated assuming an initial investment made at the net asset value at the beginning of the period, reinvestment of all distributions at net asset value during the period, and redemption at net asset value on the last day of the period. Net asset value total return includes adjustments in accordance with accounting principles generally accepted in the United States of America and as such, the net asset value for financial reporting purposes and the returns based upon those net asset values may differ from the net asset value and returns for shareholder transactions. Total return calculated for a period of less than one year is not annualized. |
| (4) | Market price total return is calculated assuming an initial investment made at the market price at the beginning of the period, reinvestment of all distributions at net asset value during the period and sale at the market price on the last day of the period. Total return calculated for a period of less than one year is not annualized. |
| (5) | Annualized. |
| (6) | Net investment income/(loss) represents income earned by the Fund from its underlying investments less expenses incurred by the Fund during the period. |
| (7) | Portfolio turnover rate is not annualized and excludes the value of portfolio securities received or delivered as a result of in-kind creations or redemptions of the Fund’s capital shares. |
| (15) | Calculation of the net realized and unrealized gains (losses) per share do not correlate with the Fund’s net realized and unrealized gains (losses) presented on the Statements of Operations due to the timing of capital transactions in relation to the fluctuating market values of the Fund’s investments. |
The accompanying notes are an integral part of these financial statements.
166
BONDBLOXX ETF TRUST
Financial Highlights (Continued)
For a share outstanding throughout the period presented.
| BondBloxx USD High Yield Bond Energy Sector ETF | BondBloxx USD High Yield Bond Consumer Cyclicals Sector ETF | |||||||||||||||
| For the Year Ended October 31, 2023 | For the Period Ended October 31, 2022(1) | For the Year Ended October 31, 2023 | For the Period Ended October 31, 2022(1) | |||||||||||||
| Net Asset Value, beginning of period | $ | 37.12 | $ | 39.62 | $ | 34.63 | $ | 39.87 | ||||||||
| Income/(loss) from operations: | ||||||||||||||||
| Net investment income/(loss)(2) | 2.58 | 1.62 | 2.70 | 1.57 | ||||||||||||
| Net realized and unrealized gain/(loss) on investments | (0.14 | )(15) | (2.74 | ) | 0.02 | (15) | (5.49 | ) | ||||||||
| Total income/(loss) from operations | 2.44 | (1.12 | ) | 2.72 | (3.92 | ) | ||||||||||
| Distributions to shareholders: | ||||||||||||||||
| Net investment income | (2.43 | ) | (1.38 | ) | (2.40 | ) | (1.32 | ) | ||||||||
| Total distributions | (2.43 | ) | (1.38 | ) | (2.40 | ) | (1.32 | ) | ||||||||
| Net Asset Value, end of year | $ | 37.13 | $ | 37.12 | $ | 34.95 | $ | 34.63 | ||||||||
| Market Value, end of year | $ | 37.23 | $ | 36.97 | $ | 35.03 | $ | 34.45 | ||||||||
| Total Return at Net Asset Value(3) | 6.73 | % | (2.84 | )% | 7.98 | % | (9.96 | )% | ||||||||
| Total Return at Market Value(4) | 7.43 | % | (3.19 | )% | 8.77 | % | (10.54 | )% | ||||||||
| Net Assets, end of period (millions) | $ | 20.5 | $ | 7.5 | $ | 22.7 | $ | 6.9 | ||||||||
| Ratios to average net assets: | ||||||||||||||||
| Expenses(5) | 0.35 | % | 0.35 | % | 0.35 | % | 0.35 | % | ||||||||
| Net investment income/(loss)(5)(6) | 6.85 | % | 6.03 | % | 7.53 | % | 6.05 | % | ||||||||
| Portfolio turnover rate(7) | 37 | % | 21 | % | 24 | % | 12 | % | ||||||||
| (1) | Funds commenced operations on February 15, 2022. Shares of XHYE and XHYC were listed on the NYSE Arca, Inc. on February 17, 2022. | |
| (2) | Based on average daily shares outstanding. | |
| (3) | Net asset value total return is calculated assuming an initial investment made at the net asset value at the beginning of the period, reinvestment of all distributions at net asset value during the period, and redemption at net asset value on the last day of the period. Net asset value total return includes adjustments in accordance with accounting principles generally accepted in the United States of America and as such, the net asset value for financial reporting purposes and the returns based upon those net asset values may differ from the net asset value and returns for shareholder transactions. Total return calculated for a period of less than one year is not annualized. | |
| (4) | Market price total return is calculated assuming an initial investment made at the market price at the beginning of the period, reinvestment of all distributions at net asset value during the period and sale at the market price on the last day of the period. Total return calculated for a period of less than one year is not annualized. | |
| (5) | Annualized. | |
| (6) | Net investment income/(loss) represents income earned by the Fund from its underlying investments less expenses incurred by the Fund during the period. | |
| (7) | Portfolio turnover rate is not annualized and excludes the value of portfolio securities received or delivered as a result of in-kind creations or redemptions of the Fund’s capital shares. | |
| (15) | Calculation of the net realized and unrealized gains (losses) per share do not correlate with the Fund’s net realized and unrealized gains (losses) presented on the Statements of Operations due to the timing of capital transactions in relation to the fluctuating market values of the Fund’s investments. |
The accompanying notes are an integral part of these financial statements.
167
BONDBLOXX ETF TRUST
Financial Highlights (Continued)
For a share outstanding throughout the period presented.
| BondBloxx USD High Yield Bond Consumer Non-Cyclicals Sector ETF | ||||||||
| For the Year Ended October 31, 2023 | For the Period Ended October 31, 2022(1) | |||||||
| Net Asset Value, beginning of period | $ | 35.66 | $ | 39.80 | ||||
| Income/(loss) from operations: | ||||||||
| Net investment income/(loss)(2) | 2.31 | 1.44 | ||||||
| Net realized and unrealized gain/(loss) on investments | (0.40 | )(15) | (4.33 | ) | ||||
| Total income/(loss) from operations | 1.91 | (2.89 | ) | |||||
| Distributions to shareholders: | ||||||||
| Net investment income | (2.09 | ) | (1.25 | ) | ||||
| Total distributions | (2.09 | ) | (1.25 | ) | ||||
| Net Asset Value, end of year | $ | 35.48 | $ | 35.66 | ||||
| Market Value, end of year | $ | 35.62 | $ | 35.62 | ||||
| Total Return at Net Asset Value(3) | 5.40 | % | (7.32 | )% | ||||
| Total Return at Market Value(4) | 5.92 | % | (7.55 | )% | ||||
| Net Assets, end of period (millions) | $ | 10.6 | $ | 5.3 | ||||
| Ratios to average net assets: | ||||||||
| Expenses(5) | 0.35 | % | 0.35 | % | ||||
| Net investment income/(loss)(5)(6) | 6.34 | % | 5.47 | % | ||||
| Portfolio turnover rate(7) | 15 | % | 25 | % | ||||
| (1) | Funds commenced operations on February 15, 2022. Shares of XHYD were listed on the NYSE Arca, Inc. on February 17, 2022. | |
| (2) | Based on average daily shares outstanding. | |
| (3) | Net asset value total return is calculated assuming an initial investment made at the net asset value at the beginning of the period, reinvestment of all distributions at net asset value during the period, and redemption at net asset value on the last day of the period. Net asset value total return includes adjustments in accordance with accounting principles generally accepted in the United States of America and as such, the net asset value for financial reporting purposes and the returns based upon those net asset values may differ from the net asset value and returns for shareholder transactions. Total return calculated for a period of less than one year is not annualized. | |
| (4) | Market price total return is calculated assuming an initial investment made at the market price at the beginning of the period, reinvestment of all distributions at net asset value during the period and sale at the market price on the last day of the period. Total return calculated for a period of less than one year is not annualized. | |
| (5) | Annualized. | |
| (6) | Net investment income/(loss) represents income earned by the Fund from its underlying investments less expenses incurred by the Fund during the period. | |
| (7) | Portfolio turnover rate is not annualized and excludes the value of portfolio securities received or delivered as a result of in-kind creations or redemptions of the Fund’s capital shares. | |
| (15) | Calculation of the net realized and unrealized gains (losses) per share do not correlate with the Fund’s net realized and unrealized gains (losses) presented on the Statements of Operations due to the timing of capital transactions in relation to the fluctuating market values of the Fund’s investments. |
The accompanying notes are an integral part of these financial statements.
168
BONDBLOXX ETF TRUST
Financial Highlights (Continued)
For a share outstanding throughout the period presented.
| BondBloxx USD High Yield Bond Sector Rotation ETF(9) | ||||||||||||||||||||||||
For the Period Ended | For the Year Ended June 30, 2023 | For the Year Ended June 30, 2022 | For the Year Ended June 30, 2021 | For the Year Ended June 30, 2020 | For the Year Ended June 30, 2019 | |||||||||||||||||||
| Net Asset Value, beginning of period | $ | 14.62 | $ | 14.68 | $ | 16.15 | $ | 15.72 | $ | 17.55 | $ | 18.10 | ||||||||||||
| Income/(loss) from operations: | ||||||||||||||||||||||||
| Net investment income/(loss)(2) | 0.28 | 1.06 | 0.43 | 0.43 | 0.71 | 0.89 | ||||||||||||||||||
| Net realized and unrealized gain/(loss) on investments | (0.44 | ) | 0.00 | (11) | (1.38 | ) | 0.36 | (1.85 | ) | (0.55 | ) | |||||||||||||
| Total income/(loss) from operations | (0.16 | ) | 1.06 | (0.95 | ) | 0.79 | (1.14 | ) | 0.34 | |||||||||||||||
| Distributions to shareholders: | ||||||||||||||||||||||||
| Net investment income | (0.25 | ) | (1.09 | ) | (0.52 | ) | (0.36 | ) | (0.67 | ) | (0.89 | ) | ||||||||||||
| Return of capital | - | (0.03 | ) | (0.00 | )(11) | - | (0.02 | ) | - | |||||||||||||||
| Total distributions | (0.25 | ) | (1.12 | ) | (0.52 | ) | (0.36 | ) | (0.69 | ) | (0.89 | ) | ||||||||||||
| Net Asset Value, end of year | $ | 14.21 | $ | 14.62 | $ | 14.68 | $ | 16.15 | $ | 15.72 | $ | 17.55 | ||||||||||||
| Market Value, end of year | $ | 14.16 | $ | 14.66 | $ | 14.72 | $ | 16.14 | $ | 15.75 | $ | 17.54 | ||||||||||||
| Total Return at Net Asset Value(3) | (1.14 | )% | 7.44 | % | (6.07 | )% | 5.08 | % | (6.69 | )% | 1.94 | % | ||||||||||||
| Total Return at Market Value(4) | (1.70 | )% | 7.44 | % | (5.76 | )% | 4.82 | % | (6.45 | )% | 1.94 | % | ||||||||||||
| Net Assets, end of period (millions) | $ | 28.6 | $ | 26.3 | $ | 33.8 | $ | 43.6 | $ | 77.0 | $ | 263.3 | ||||||||||||
| Ratios to average net assets: | ||||||||||||||||||||||||
| Gross operating expenses | 0.90 | %(5)(16) | 1.31 | % | 0.76 | % | 1.36 | % | 1.12 | % | 0.82 | % | ||||||||||||
| Excluded from Expense Cap - Expedited settlement facility fees | - | % | - | % | 0.01 | % | 0.11 | % | 0.19 | % | 0.06 | % | ||||||||||||
| Total operating expenses (net of waiver/reimbursement, if applicable, but gross of all other operating expenses) | 0.41 | %(5)(16) | 0.55 | % | 0.56 | % | 0.66 | % | 0.75 | % | 0.61 | % | ||||||||||||
| Net investment income/(loss)(6) | 5.80 | %(5) | 7.18 | % | 2.73 | % | 2.68 | % | 4.13 | % | 4.98 | % | ||||||||||||
| Portfolio turnover rate(7) | 107 | %(17) | 123 | % | 157 | % | 215 | % | 344 | % | 186 | % | ||||||||||||
| (2) | Based on average daily shares outstanding. |
| (3) | Net asset value total return is calculated assuming an initial investment made at the net asset value at the beginning of the period, reinvestment of all distributions at net asset value during the period, and redemption at net asset value on the last day of the period. Net asset value total return includes adjustments in accordance with accounting principles generally accepted in the United States of America and as such, the net asset value for financial reporting purposes and the returns based upon those net asset values may differ from the net asset value and returns for shareholder transactions. Total return calculated for a period of less than one year is not annualized. |
| (4) | Market price total return is calculated assuming an initial investment made at the market price at the beginning of the period, reinvestment of all distributions at net asset value during the period and sale at the market price on the last day of the period. Total return calculated for a period of less than one year is not annualized. |
| (5) | Annualized. |
| (6) | Net investment income/(loss) represents income earned by the Fund from its underlying investments less expenses incurred by the Fund during the period. |
| (7) | Portfolio turnover rate is not annualized and excludes the value of portfolio securities received or delivered as a result of in-kind creations or redemptions of the Fund’s capital shares. |
| (9) | The Fund acquired the assets and liabilities of the Predecessor ETF, a series of the NexPoint Funds I, at the close of business on September 15, 2023. As a result of the reorganization, the Fund is the accounting successor of the Predecessor ETF. Financial information above for the periods prior to September 16, 2023, reflect the performance of the Predecessor ETF. Prior to September 16, 2023, the Predecessor Fund had a different investment adviser, had a different investment objective and policies, and was a passively-managed fund that sought to track the performance of the Markit iBoxx USD Liquid Leveraged Loan Index. |
| (10) | Fiscal year end changed from June 30, 2023 to October 31, 2023. |
| (11) | Amount represents less than $0.005 per share. |
| (16) | Does not include expenses of the investment companies in which the fund invests. |
| (17) | Portfolio turnover rate related to the change in investment strategy and re-balancing is 107%. |
The accompanying notes are an integral part of these financial statements.
169
BONDBLOXX ETF TRUST
Financial Highlights (Continued)
For a share outstanding throughout the period presented.
| BondBloxx B Rated USD High Yield Corporate Bond ETF | BondBloxx BB Rated USD High Yield Corporate Bond ETF | |||||||||||||||
| For the Year Ended October 31, 2023 | For the Period Ended October 31, 2022(12) | For the Year Ended October 31, 2023 | For the Period Ended October 31, 2022(12) | |||||||||||||
| Net Asset Value, beginning of period | $ | 38.39 | $ | 40.08 | $ | 38.53 | $ | 40.17 | ||||||||
| Income/(loss) from operations: | ||||||||||||||||
| Net investment income/(loss)(2) | 3.13 | 1.35 | 2.48 | 1.04 | ||||||||||||
| Net realized and unrealized gain/(loss) on investments | (1.11 | ) | (1.94 | ) | (0.82 | ) | (1.87 | ) | ||||||||
| Total income/(loss) from operations | 2.02 | (0.59 | ) | 1.66 | (0.83 | ) | ||||||||||
| Distributions to shareholders: | ||||||||||||||||
| Net investment income | (3.12 | ) | (1.10 | ) | (2.44 | ) | (0.81 | ) | ||||||||
| Total distributions | (3.12 | ) | (1.10 | ) | (2.44 | ) | (0.81 | ) | ||||||||
| Net Asset Value, end of year | $ | 37.29 | $ | 38.39 | $ | 37.75 | $ | 38.53 | ||||||||
| Market Value, end of year | $ | 37.39 | $ | 38.33 | $ | 37.86 | $ | 38.47 | ||||||||
| Total Return at Net Asset Value(3) | 5.35 | % | (1.45 | )% | 4.33 | % | (2.07 | )% | ||||||||
| Total Return at Market Value(4) | 5.77 | % | (5.16 | )% | 4.78 | % | (5.57 | )% | ||||||||
| Net Assets, end of period (millions) | $ | 13.1 | $ | 11.5 | $ | 49.1 | $ | 42.4 | ||||||||
| Ratios to average net assets: | ||||||||||||||||
| Expenses(5) | 0.30 | % | 0.30 | % | 0.20 | % | 0.20 | % | ||||||||
| Net investment income/(loss)(5)(6) | 8.15 | % | 7.87 | % | 6.40 | % | 6.03 | % | ||||||||
| Portfolio turnover rate(7) | 31 | % | 8 | % | 29 | % | 13 | % | ||||||||
| (2) | Based on average daily shares outstanding. | |
| (3) | Net asset value total return is calculated assuming an initial investment made at the net asset value at the beginning of the period, reinvestment of all distributions at net asset value during the period, and redemption at net asset value on the last day of the period. Net asset value total return includes adjustments in accordance with accounting principles generally accepted in the United States of America and as such, the net asset value for financial reporting purposes and the returns based upon those net asset values may differ from the net asset value and returns for shareholder transactions. Total return calculated for a period of less than one year is not annualized. | |
| (4) | Market price total return is calculated assuming an initial investment made at the market price at the beginning of the period, reinvestment of all distributions at net asset value during the period and sale at the market price on the last day of the period. Total return calculated for a period of less than one year is not annualized. | |
| (5) | Annualized. | |
| (6) | Net investment income/(loss) represents income earned by the Fund from its underlying investments less expenses incurred by the Fund during the period. | |
| (7) | Portfolio turnover rate is not annualized and excludes the value of portfolio securities received or delivered as a result of in-kind creations or redemptions of the Fund’s capital shares. | |
| (12) | Funds commenced operations on May 24, 2022. Shares of XB and XBB were listed on the NYSE Arca, Inc. on May 26, 2022. |
The accompanying notes are an integral part of these financial statements.
170
BONDBLOXX ETF TRUST
Financial Highlights (Continued)
For a share outstanding throughout the period presented.
| BondBloxx CCC Rated USD High Yield Corporate Bond ETF | BondBloxx JP Morgan USD Emerging Markets 1-10 Year Bond ETF | |||||||||||||||
| For the Year Ended October 31, 2023 | For the Period Ended October 31, 2022(12) | For the Year Ended October 31, 2023 | For the Period Ended October 31, 2022(13) | |||||||||||||
| Net Asset Value, beginning of period | $ | 37.50 | $ | 40.00 | $ | 37.91 | $ | 40.00 | ||||||||
| Income/(loss) from operations: | ||||||||||||||||
| Net investment income/(loss)(2) | 4.56 | 1.99 | 2.52 | 0.83 | ||||||||||||
| Net realized and unrealized gain/(loss) on investments | (1.77 | ) | (3.01 | ) | 0.68 | (2.32 | ) | |||||||||
| Total income/(loss) from operations | 2.79 | (1.02 | ) | 3.20 | (1.49 | ) | ||||||||||
| Distributions to shareholders: | ||||||||||||||||
| Net investment income | (4.51 | ) | (1.48 | ) | (2.50 | ) | (0.60 | ) | ||||||||
| Total distributions | (4.51 | ) | (1.48 | ) | (2.50 | ) | (0.60 | ) | ||||||||
| Net Asset Value, end of year | $ | 35.78 | $ | 37.50 | $ | 38.61 | $ | 37.91 | ||||||||
| Market Value, end of year | $ | 35.83 | $ | 37.45 | $ | 38.61 | $ | 37.67 | ||||||||
| Total Return at Net Asset Value(3) | 7.66 | % | (2.59 | )% | 8.50 | % | (3.78 | )% | ||||||||
| Total Return at Market Value(4) | 7.91 | % | (5.63 | )% | 9.17 | % | (4.32 | )% | ||||||||
| Net Assets, end of period (millions) | $ | 19.7 | $ | 11.2 | $ | 183.4 | $ | 168.7 | ||||||||
| Ratios to average net assets: | ||||||||||||||||
| Expenses(5) | 0.40 | % | 0.40 | % | 0.29 | % | 0.29 | % | ||||||||
| Net investment income/(loss)(5)(6) | 12.21 | % | 11.58 | % | 6.37 | % | 6.09 | % | ||||||||
| Portfolio turnover rate(7) | 25 | % | 12 | % | 23 | % | 9 | % | ||||||||
| (2) | Based on average daily shares outstanding. |
| (3) | Net asset value total return is calculated assuming an initial investment made at the net asset value at the beginning of the period, reinvestment of all distributions at net asset value during the period, and redemption at net asset value on the last day of the period. Net asset value total return includes adjustments in accordance with accounting principles generally accepted in the United States of America and as such, the net asset value for financial reporting purposes and the returns based upon those net asset values may differ from the net asset value and returns for shareholder transactions. Total return calculated for a period of less than one year is not annualized. |
| (4) | Market price total return is calculated assuming an initial investment made at the market price at the beginning of the period, reinvestment of all distributions at net asset value during the period and sale at the market price on the last day of the period. Total return calculated for a period of less than one year is not annualized. |
| (5) | Annualized. |
| (6) | Net investment income/(loss) represents income earned by the Fund from its underlying investments less expenses incurred by the Fund during the period. |
| (7) | Portfolio turnover rate is not annualized and excludes the value of portfolio securities received or delivered as a result of in-kind creations or redemptions of the Fund’s capital shares. |
| (12) | Funds commenced operations on May 24, 2022. Shares of XCCC were listed on the NYSE Arca, Inc. on May 26, 2022. |
| (13) | Funds commenced operations on June 28, 2022. Shares of XEMD were listed on the NYSE Arca, Inc. on June 30, 2022. |
The accompanying notes are an integral part of these financial statements.
171
BONDBLOXX ETF TRUST
Financial Highlights (Continued)
For a share outstanding throughout the period presented.
| BondBloxx Bloomberg Six Month Target Duration US Treasury ETF | BondBloxx Bloomberg One Year Target Duration US Treasury ETF | |||||||||||||||
| For the Year Ended October 31, 2023 | For the Period Ended October 31, 2022(14) | For the Year Ended October 31, 2023 | For the Period Ended October 31, 2022(14) | |||||||||||||
| Net Asset Value, beginning of period | $ | 50.09 | $ | 50.00 | $ | 49.90 | $ | 50.00 | ||||||||
| Income/(loss) from operations: | ||||||||||||||||
| Net investment income/(loss)(2) | 2.53 | 0.25 | 2.51 | 0.27 | ||||||||||||
| Net realized and unrealized gain/(loss) on investments | (0.30 | ) | (0.16 | ) | (0.56 | )(15) | (0.37 | ) | ||||||||
| Total income/(loss) from operations | 2.23 | 0.09 | 1.95 | (0.10 | ) | |||||||||||
| Distributions to shareholders: | ||||||||||||||||
| Net investment income | (2.03 | ) | - | (2.11 | ) | - | ||||||||||
| Total distributions | (2.03 | ) | - | (2.11 | ) | - | ||||||||||
| Net Asset Value, end of year | $ | 50.29 | $ | 50.09 | $ | 49.74 | $ | 49.90 | ||||||||
| Market Value, end of year | $ | 50.31 | $ | 50.13 | $ | 49.76 | $ | 49.91 | ||||||||
| Total Return at Net Asset Value(3) | 4.55 | % | 0.18 | % | 4.01 | % | (0.20 | )% | ||||||||
| Total Return at Market Value(4) | 4.50 | % | 0.22 | % | 4.02 | % | (0.14 | )% | ||||||||
| Net Assets, end of period (millions) | $ | 1,096.9 | $ | 50.1 | $ | 527.2 | $ | 39.4 | ||||||||
| Ratios to average net assets: | ||||||||||||||||
| Expenses(5) | 0.03 | % | 0.03 | % | 0.03 | % | 0.03 | % | ||||||||
| Net investment income/(loss)(5)(6) | 5.02 | % | 3.53 | % | 5.00 | % | 3.83 | % | ||||||||
| Portfolio turnover rate(7) | - | % | 24 | % | 85 | % | 19 | % | ||||||||
| (2) | Based on average daily shares outstanding. | |
| (3) | Net asset value total return is calculated assuming an initial investment made at the net asset value at the beginning of the period, reinvestment of all distributions at net asset value during the period, and redemption at net asset value on the last day of the period. Net asset value total return includes adjustments in accordance with accounting principles generally accepted in the United States of America and as such, the net asset value for financial reporting purposes and the returns based upon those net asset values may differ from the net asset value and returns for shareholder transactions. Total return calculated for a period of less than one year is not annualized. | |
| (4) | Market price total return is calculated assuming an initial investment made at the market price at the beginning of the period, reinvestment of all distributions at net asset value during the period and sale at the market price on the last day of the period. Total return calculated for a period of less than one year is not annualized. | |
| (5) | Annualized. | |
| (6) | Net investment income/(loss) represents income earned by the Fund from its underlying investments less expenses incurred by the Fund during the period. | |
| (7) | Portfolio turnover rate is not annualized and excludes the value of portfolio securities received or delivered as a result of in-kind creations or redemptions of the Fund’s capital shares. | |
| (14) | Funds commenced operations on September 13, 2022. Shares of XHLF and XONE were listed on the NYSE Arca, Inc. on September 15, 2022. | |
| (15) | Calculation of the net realized and unrealized gains (losses) per share do not correlate with the Fund’s net realized and unrealized gains (losses) presented on the Statements of Operations due to the timing of capital transactions in relation to the fluctuating market values of the Fund’s investments. |
The accompanying notes are an integral part of these financial statements.
172
BONDBLOXX ETF TRUST
Financial Highlights (Continued)
For a share outstanding throughout the period presented.
| BondBloxx Bloomberg Two Year Target Duration US Treasury ETF | BondBloxx Bloomberg Three Year Target Duration US Treasury ETF | |||||||||||||||
For the Year Ended | For the Period Ended | For the Year Ended October 31, 2023 | For the Period Ended October 31, 2022(14) | |||||||||||||
| Net Asset Value, beginning of period | $ | 49.49 | $ | 49.94 | $ | 49.14 | $ | 49.86 | ||||||||
| Income/(loss) from operations: | ||||||||||||||||
| Net investment income/(loss)(2) | 2.09 | 0.26 | 1.99 | 0.28 | ||||||||||||
| Net realized and unrealized gain/(loss) on investments | (0.75 | ) | (0.71 | ) | (0.92 | ) | (1.00 | ) | ||||||||
| Total income/(loss) from operations | 1.34 | (0.45 | ) | 1.07 | (0.72 | ) | ||||||||||
| Distributions to shareholders: | ||||||||||||||||
| Net investment income | (1.98 | ) | - | (2.01 | ) | - | ||||||||||
| Total distributions | (1.98 | ) | - | (2.01 | ) | - | ||||||||||
| Net Asset Value, end of year | $ | 48.85 | $ | 49.49 | $ | 48.20 | $ | 49.14 | ||||||||
| Market Value, end of year | $ | 48.87 | $ | 49.48 | $ | 48.21 | $ | 49.12 | ||||||||
| Total Return at Net Asset Value(3) | 2.76 | % | (0.90 | )% | 2.18 | % | (1.44 | )% | ||||||||
| Total Return at Market Value(4) | 2.82 | % | (0.74 | )% | 2.24 | % | (1.25 | )% | ||||||||
| Net Assets, end of period (millions) | $ | 105.0 | $ | 36.6 | $ | 28.9 | $ | 20.1 | ||||||||
| Ratios to average net assets: | ||||||||||||||||
| Expenses(5) | 0.05 | % | 0.05 | % | 0.05 | % | 0.05 | % | ||||||||
| Net investment income/(loss)(5)(6) | 4.21 | % | 3.74 | % | 4.05 | % | 3.99 | % | ||||||||
| Portfolio turnover rate(7) | 68 | % | 12 | % | 80 | % | 20 | % | ||||||||
| (2) | Based on average daily shares outstanding. | |
| (3) | Net asset value total return is calculated assuming an initial investment made at the net asset value at the beginning of the period, reinvestment of all distributions at net asset value during the period, and redemption at net asset value on the last day of the period. Net asset value total return includes adjustments in accordance with accounting principles generally accepted in the United States of America and as such, the net asset value for financial reporting purposes and the returns based upon those net asset values may differ from the net asset value and returns for shareholder transactions. Total return calculated for a period of less than one year is not annualized. | |
| (4) | Market price total return is calculated assuming an initial investment made at the market price at the beginning of the period, reinvestment of all distributions at net asset value during the period and sale at the market price on the last day of the period. Total return calculated for a period of less than one year is not annualized. | |
| (5) | Annualized. | |
| (6) | Net investment income/(loss) represents income earned by the Fund from its underlying investments less expenses incurred by the Fund during the period. | |
| (7) | Portfolio turnover rate is not annualized and excludes the value of portfolio securities received or delivered as a result of in-kind creations or redemptions of the Fund’s capital shares. | |
| (14) | Funds commenced operations on September 13, 2022. Shares of XTWO and XTRE were listed on the NYSE Arca, Inc. on September 15, 2022. |
The accompanying notes are an integral part of these financial statements.
173
BONDBLOXX ETF TRUST
Financial Highlights (Continued)
For a share outstanding throughout the period presented.
| BondBloxx Bloomberg Five Year Target Duration US Treasury ETF | BondBloxx Bloomberg Seven Year Target Duration US Treasury ETF | |||||||||||||||
| For the Year Ended October 31, 2023 | For the Period Ended October 31, 2022(14) | For the Year Ended October 31, 2023 | For the Period Ended October 31, 2022(14) | |||||||||||||
| Net Asset Value, beginning of period | $ | 48.40 | $ | 49.77 | $ | 47.75 | $ | 49.70 | ||||||||
| Income/(loss) from operations: | ||||||||||||||||
| Net investment income/(loss)(2) | 1.83 | 0.24 | 1.77 | 0.23 | ||||||||||||
| Net realized and unrealized gain/(loss) on investments | (1.56 | ) | (1.61 | ) | (2.66 | ) | (2.18 | ) | ||||||||
| Total income/(loss) from operations | 0.27 | (1.37 | ) | (0.89 | ) | (1.95 | ) | |||||||||
| Distributions to shareholders: | ||||||||||||||||
| Net investment income | (1.83 | ) | - | (1.78 | ) | - | ||||||||||
| Total distributions | (1.83 | ) | - | (1.78 | ) | - | ||||||||||
| Net Asset Value, end of year | $ | 46.84 | $ | 48.40 | $ | 45.08 | $ | 47.75 | ||||||||
| Market Value, end of year | $ | 46.86 | $ | 48.36 | $ | 45.13 | $ | 47.68 | ||||||||
| Total Return at Net Asset Value(3) | 0.46 | % | (2.75 | )% | (2.04 | )% | (3.92 | )% | ||||||||
| Total Return at Market Value(4) | 0.59 | % | (2.50 | )% | (1.79 | )% | (3.75 | )% | ||||||||
| Net Assets, end of period (millions) | $ | 36.5 | $ | 20.3 | $ | 53.7 | $ | 20.5 | ||||||||
| Ratios to average net assets: | ||||||||||||||||
| Expenses(5) | 0.05 | % | 0.05 | % | 0.05 | % | 0.05 | % | ||||||||
| Net investment income/(loss)(5)(6) | 3.73 | % | 3.49 | % | 3.65 | % | 3.45 | % | ||||||||
| Portfolio turnover rate(7) | 88 | % | 8 | % | 64 | % | 19 | % | ||||||||
| (2) | Based on average daily shares outstanding. | |
| (3) | Net asset value total return is calculated assuming an initial investment made at the net asset value at the beginning of the period, reinvestment of all distributions at net asset value during the period, and redemption at net asset value on the last day of the period. Net asset value total return includes adjustments in accordance with accounting principles generally accepted in the United States of America and as such, the net asset value for financial reporting purposes and the returns based upon those net asset values may differ from the net asset value and returns for shareholder transactions. Total return calculated for a period of less than one year is not annualized. | |
| (4) | Market price total return is calculated assuming an initial investment made at the market price at the beginning of the period, reinvestment of all distributions at net asset value during the period and sale at the market price on the last day of the period. Total return calculated for a period of less than one year is not annualized. | |
| (5) | Annualized. | |
| (6) | Net investment income/(loss) represents income earned by the Fund from its underlying investments less expenses incurred by the Fund during the period. | |
| (7) | Portfolio turnover rate is not annualized and excludes the value of portfolio securities received or delivered as a result of in-kind creations or redemptions of the Fund’s capital shares. | |
| (14) | Funds commenced operations on September 13, 2022. Shares of XFIV and XSVN were listed on the NYSE Arca, Inc. on September 15, 2022. |
The accompanying notes are an integral part of these financial statements.
174
BONDBLOXX ETF TRUST
Financial Highlights (Continued)
For a share outstanding throughout the period presented.
| BondBloxx Bloomberg Ten Year Target Duration US Treasury ETF | BondBloxx Bloomberg Twenty Year Target Duration US Treasury ETF | |||||||||||||||
| For the Year Ended October 31, 2023 | For the Period Ended October 31, 2022(14) | For the Year Ended October 31, 2023 | For the Period Ended October 31, 2022(14) | |||||||||||||
| Net Asset Value, beginning of period | $ | 46.67 | $ | 49.74 | $ | 43.65 | $ | 49.78 | ||||||||
| Income/(loss) from operations: | ||||||||||||||||
| Net investment income/(loss)(2) | 1.81 | 0.23 | 1.74 | 0.23 | ||||||||||||
| Net realized and unrealized gain/(loss) on investments | (3.64 | ) | (3.30 | ) | (6.98 | ) | (6.36 | ) | ||||||||
| Total income/(loss) from operations | (1.83 | ) | (3.07 | ) | (5.24 | ) | (6.13 | ) | ||||||||
| Distributions to shareholders: | ||||||||||||||||
| Net investment income | (1.80 | ) | - | (1.76 | ) | - | ||||||||||
| Total distributions | (1.80 | ) | - | (1.76 | ) | - | ||||||||||
| Net Asset Value, end of year | $ | 43.04 | $ | 46.67 | $ | 36.65 | $ | 43.65 | ||||||||
| Market Value, end of year | $ | 43.09 | $ | 46.60 | $ | 36.74 | $ | 43.62 | ||||||||
| Total Return at Net Asset Value(3) | (4.23 | )% | (6.17 | )% | (12.73 | )% | (12.31 | )% | ||||||||
| Total Return at Market Value(4) | (3.98 | )% | (6.03 | )% | (12.45 | )% | (12.66 | )% | ||||||||
| Net Assets, end of period (millions) | $ | 42.6 | $ | 20.1 | $ | 23.1 | $ | 21.4 | ||||||||
| Ratios to average net assets: | ||||||||||||||||
| Expenses(5) | 0.075 | % | 0.075 | % | 0.125 | % | 0.125 | % | ||||||||
| Net investment income/(loss)(5)(6) | 3.82 | % | 3.44 | % | 3.81 | % | 3.54 | % | ||||||||
| Portfolio turnover rate(7) | 84 | % | 12 | % | 93 | % | 45 | % | ||||||||
| (2) | Based on average daily shares outstanding. | |
| (3) | Net asset value total return is calculated assuming an initial investment made at the net asset value at the beginning of the period, reinvestment of all distributions at net asset value during the period, and redemption at net asset value on the last day of the period. Net asset value total return includes adjustments in accordance with accounting principles generally accepted in the United States of America and as such, the net asset value for financial reporting purposes and the returns based upon those net asset values may differ from the net asset value and returns for shareholder transactions. Total return calculated for a period of less than one year is not annualized. | |
| (4) | Market price total return is calculated assuming an initial investment made at the market price at the beginning of the period, reinvestment of all distributions at net asset value during the period and sale at the market price on the last day of the period. Total return calculated for a period of less than one year is not annualized. | |
| (5) | Annualized. | |
| (6) | Net investment income/(loss) represents income earned by the Fund from its underlying investments less expenses incurred by the Fund during the period. | |
| (7) | Portfolio turnover rate is not annualized and excludes the value of portfolio securities received or delivered as a result of in-kind creations or redemptions of the Fund’s capital shares. | |
| (14) | Funds commenced operations on September 13, 2022. Shares of XTEN and XTWY were listed on the NYSE Arca, Inc. on September 15, 2022. |
The accompanying notes are an integral part of these financial statements.
175
Notes to the Financial Statements
October 31, 2023
1. ORGANIZATION
The BondBloxx ETF Trust (the “Trust”) is a Delaware statutory trust organized on August 17, 2021 and is authorized to issue multiple series or portfolios. The Trust is an open-end management investment company, registered under the Investment Company Act of 1940, as amended (the “1940 Act”). The Trust’s shares are registered under the Securities Act of 1933, as amended. The Trust currently consists of Bond shares of twenty separate series: BondBloxx USD High Yield Bond Industrial Sector ETF, BondBloxx USD High Yield Bond Telecom, Media & Technology Sector ETF, BondBloxx USD High Yield Bond Healthcare Sector ETF, BondBloxx USD High Yield Bond Financial & REIT Sector ETF, BondBloxx USD High Yield Bond Energy Sector ETF, BondBloxx USD High Yield Bond Consumer Cyclicals Sector ETF, BondBloxx USD High Yield Bond Consumer Non-Cyclicals Sector ETF, BondBloxx USD High Yield Bond Sector Rotation ETF, BondBloxx B Rated USD High Yield Corporate Bond ETF, BondBloxx BB Rated USD High Yield Corporate Bond ETF, BondBloxx CCC Rated USD High Yield Corporate Bond ETF, BondBloxx JP Morgan USD Emerging Markets 1-10 Year Bond ETF, BondBloxx Bloomberg Six Month Target Duration US Treasury ETF, BondBloxx Bloomberg One Year Target Duration US Treasury ETF, BondBloxx Bloomberg Two Year Target Duration US Treasury ETF, BondBloxx Bloomberg Three Year Target Duration US Treasury ETF, BondBloxx Bloomberg Five Year Target Duration US Treasury ETF, BondBloxx Bloomberg Seven Year Target Duration US Treasury ETF, BondBloxx Bloomberg Ten Year Target Duration US Treasury ETF and BondBloxx Bloomberg Twenty Year Target Duration US Treasury ETF (each, a “Fund” and collectively, the “Funds”). Each series operates as an exchange-traded fund. The Funds are classified as “non-diversified” under the 1940 Act.
Each Fund is managed by BondBloxx Investment Management Corporation (“BIM” or “Adviser”) and generally seeks to track the investment results of each Index (the “Index”). The following table details the Index and commencement of operations of each Fund. Each Index models the performance of the bonds of issuers within a particular sector or group of sectors.
| Fund Name | Actual Index | Commencement of Operations | ||
| BondBloxx USD High Yield Bond Industrial Sector ETF | ICE Diversified US Cash Pay High Yield Core Industrial Index | February 15, 2022 | ||
| BondBloxx USD High Yield Bond Telecom, Media & Technology Sector ETF | ICE Diversified US Cash Pay High Yield Telecom, Media & Technology Index | February 15, 2022 | ||
| BondBloxx USD High Yield Bond Healthcare Sector ETF | ICE Diversified US Cash Pay High Yield Healthcare Index | February 15, 2022 | ||
| BondBloxx USD High Yield Bond Financial & REIT Sector ETF | ICE Diversified US Cash Pay High Yield Financial & REIT Index | February 15, 2022 | ||
| BondBloxx USD High Yield Bond Energy Sector ETF | ICE Diversified US Cash Pay High Yield Energy Index | February 15, 2022 | ||
| BondBloxx USD High Yield Bond Consumer Cyclicals Sector ETF | ICE Diversified US Cash Pay High Yield Consumer Cyclical Index | February 15, 2022 | ||
| BondBloxx USD High Yield Bond Consumer Non-Cyclicals Sector ETF | ICE Diversified US Cash Pay High Yield Consumer Non-Cyclical Index | February 15, 2022 | ||
| BondBloxx USD High Yield Bond Sector Rotation ETF | ICE BofA US Cash Pay High Yield Constrained Index | September 16, 2023* | ||
| BondBloxx B Rated USD High Yield Corporate Bond ETF | ICE BofA Single-B US Cash Pay High Yield Constrained Index | May 24, 2022 | ||
| BondBloxx BB Rated USD High Yield Corporate Bond ETF | ICE BofA BB US Cash Pay High Yield Constrained Index | May 24, 2022 | ||
| BondBloxx CCC Rated USD High Yield Corporate Bond ETF | ICE CCC US Cash Pay High Yield Constrained Index | May 24, 2022 |
176
BONDBLOXX ETF TRUST
Notes to the Financial Statements (Continued)
October 31, 2023
| Fund Name | Actual Index | Commencement of Operations | ||
| BondBloxx JP Morgan USD Emerging Markets 1-10 Year Bond ETF | J.P. Morgan EMBI Global Diversified Liquid 1-10 Year Maturity Index | June 28, 2022 | ||
| BondBloxx Bloomberg Six Month Target Duration US Treasury ETF | Bloomberg US Treasury 6 Month Duration Index | September 13, 2022 | ||
| BondBloxx Bloomberg One Year Target Duration US Treasury ETF | Bloomberg US Treasury 1 Year Duration Index | September 13, 2022 | ||
| BondBloxx Bloomberg Two Year Target Duration US Treasury ETF | Bloomberg US Treasury 2 Year Duration Index | September 13, 2022 | ||
| BondBloxx Bloomberg Three Year Target Duration US Treasury ETF | Bloomberg US Treasury 3 Year Duration Index | September 13, 2022 | ||
| BondBloxx Bloomberg Five Year Target Duration US Treasury ETF | Bloomberg US Treasury 5 Year Duration Index | September 13, 2022 | ||
| BondBloxx Bloomberg Seven Year Target Duration US Treasury ETF | Bloomberg US Treasury 7 Year Duration Index | September 13, 2022 | ||
| BondBloxx Bloomberg Ten Year Target Duration US Treasury ETF | Bloomberg US Treasury 10 Year Duration Index | September 13, 2022 | ||
| BondBloxx Bloomberg Twenty Year Target Duration US Treasury ETF | Bloomberg US Treasury 20 Year Duration Index | September 13, 2022 |
| * | Represents the date of BondBloxx USD High Yield Bond Sector Rotation ETF merger into BondBloxx ETF Trust. |
The BondBloxx USD High Yield Bond Sector Rotation ETF commenced investment operations on September 16, 2023. As of the close of business on September 15, 2023, the BondBloxx USD High Yield Bond Sector Rotation ETF acquired the assets and assumed the liabilities of the Highland/iBoxx Senior Loan ETF (the “Highland/iBoxx Senior Loan ETF Predecessor Fund”), a series of NexPoint Funds I in a tax-free reorganization as set out in the Agreement and Plan of Reorganization. The proposed Plan of Reorganization was approved by the Trust’s Board on March 16, 2023, by the NexPoint Funds I on June 2, 2023, and by beneficial owners of the Highland/iBoxx Senior Loan ETF Predecessor Fund on August 30, 2023. The tax-free reorganization was accomplished on September 15, 2023. As a result of the reorganization, BondBloxx USD High Yield Bond Sector Rotation ETF assumed the performance and accounting history of the Highland/iBoxx Senior Loan ETF Predecessor Fund. Financial information included for the dates prior to the reorganization is that of the Highland/iBoxx Senior Loan ETF Predecessor Fund.
Prior to September 16, 2023, the Predecessor Fund had a different investment adviser, had a different investment objective and policies, and was a passively-managed fund that sought to track the performance of the Markit iBoxx USD Liquid Leveraged Loan Index.
The net assets contributed to BondBloxx USD High Yield Bond Sector Rotation ETF resulting from this tax-free transaction were $30,655,426, cost of investments transferred of $30,665,582, undistributed income of $9, and accumulated gain loss of $58,804,271 including net unrealized appreciation of $0. For financial reporting purposes, assets received and shares issued were recorded at fair value; however, the cost basis of the investments received was carried forward to align ongoing reporting of BondBloxx USD High Yield Bond Sector Rotation ETF’s realized and unrealized gains and losses with amounts distributable to shareholders for tax purposes.
The reorganization was accomplished by the following tax-free exchange in which each shareholder of the Highland/iBoxx Senior Loan ETF Predecessor Fund received shares of BondBloxx USD High Yield Bond Sector Rotation ETF representing the same aggregate net asset value contributed as noted below:
| Shares Issued | Net Assets | ||||
| 2,100,000 | $ | 30,655,426 | |||
177
BONDBLOXX ETF TRUST
Notes to the Financial Statements (Continued)
October 31, 2023
2. SUMMARY OF SIGNIFICANT ACCOUNTING POLICIES
Basis of Presentation
The following is a summary of significant accounting policies consistently followed by the Funds. These policies are in conformity with accounting principles generally accepted in the United States of America. Management has determined that each Fund is an investment company in accordance with the Financial Accounting Standards Board (“FASB”) Accounting Standards Codification (“ASC”)Topic 946,“Financial Services – Investment Companies,” for the purpose of financial reporting.
Security transactions and Income recognition
Security transactions are recorded on a trade date. The specific identification method is used for determining realized gains or losses for financial statements and income tax purposes. Interest income is recognized on an accrual basis. Discounts and premiums on securities purchased are accreted and amortized using the effective yield method and included in interest income. Securities purchased or sold on a when-issued or delayed-delivery basis may be settled beyond a standard settlement period for the security after the trade date.
Foreign Currency Translation
The market values of foreign securities, currency holdings and other assets and liabilities denominated in foreign currencies are translated into U.S. dollars based on the current exchange rates each business day. Purchases and sales of securities and income and expense items denominated in foreign currencies, if any, are translated into U.S. dollars at the exchange rate in effect on the transaction date. The Funds do not separately report the effects of changes in foreign exchange rates from changes in market prices on securities held. Such changes are included in net realized gain (loss) and net change in unrealized appreciation (depreciation) from investments on the Statements of Operations. The Funds may invest in foreign currency-denominated securities and may engage in foreign currency transactions either on a spot (cash) basis at the rate prevailing in the currency exchange market at the time or through a forward foreign currency contract. Realized foreign exchange gains (losses) arising from sales of spot foreign currencies, currency gains (losses) realized between the trade and settlement dates on securities transactions and the difference between the recorded amounts of dividends, interest, and foreign withholding taxes and the U.S. dollar equivalent of the amounts actually received or paid are included in net realized gain (loss) on foreign currency transactions on the Statements of Operations. Net unrealized foreign exchange gains (losses) arising from changes in foreign exchange rates on foreign denominated assets and liabilities other than investments in securities held at the end of the reporting period are included in net change in unrealized appreciation (depreciation) on foreign currency transactions on the Statements of Operations.
Use of Estimates
The preparation of financial statements in conformity with GAAP requires management to make estimates and assumptions that affect the reported amounts of assets and liabilities and disclosure of contingent assets and liabilities at the date of the financial statements and the reported amounts of increases and decreases in net assets from operations during the reporting period. Actual results could differ from those estimates and such differences could be material.
Cash
Cash includes non-restricted cash held with a financial institution.
178
BONDBLOXX ETF TRUST
Notes to the Financial Statements (Continued)
October 31, 2023
Investment Valuation
The Net Asset Value per share (“NAV”) of each Fund normally is determined once daily Monday through Friday, generally as of the regularly scheduled close of business of the New York Stock Exchange (“NYSE”) (normally 4:00 p.m., Eastern time) on each day that the NYSE is open for trading, based on prices of the Fund’s assets at the time of closing, provided that (i) any Fund assets or liabilities denominated in currencies other than the U.S. dollar are translated into U.S. dollars at the prevailing market rates on the date of valuation as quoted by one or more data service providers and (ii) U.S. fixed-income assets may be valued as of the announced closing time for trading in fixed-income instruments in a particular market or exchange.
Pursuant to Rule 2a-5 under the 1940 Act, each Fund has designated the Adviser as the “valuation designee” with respect to the fair valuation of each of the Fund’s portfolio securities. Fair valued securities are those for which market quotations were not readily available, including in circumstances under which it was determined by the Adviser that prices received were not reflective of their market values.
The NAV of each Fund is calculated by dividing the value of the net assets of the Fund (i.e., the value of its total assets less total liabilities) by the total number of outstanding shares of the Fund, generally rounded to the nearest cent.
The value of the securities and other assets and liabilities held by each Fund are determined pursuant to valuation policies and procedures approved by the Board of Trustees (the “Board” or “Trustees”) and administered by BIM. BIM serves as the Funds’ valuation designee for purposes of compliance with the Rule 24a-5 under the 1940 Act.
Each Fund values fixed-income portfolio securities at the midpoint between the bid and ask prices, or at current market price quotations provided by dealers, or at prices (including evaluated prices) supplied by the Fund’s approved independent third-party pricing services, each in accordance with valuation policies and procedures approved by the Board. Pricing services may use matrix pricing or valuation models that utilize certain inputs and assumptions to derive values. Pricing services generally value fixed-income securities assuming orderly transactions of an institutional round lot size, but the Fund may hold or transact in such securities in smaller odd lot sizes. Odd lots often trade at lower prices than institutional round lots. An amortized cost method of valuation may be used with respect to debt obligations with sixty days or less remaining to maturity unless BIM determines in good faith that such method does not represent fair value.
Shares of underlying ETFs are valued at their most recent closing price on an exchange.
Generally, trading in non-U.S. securities and money market instruments is substantially completed each day at various times prior to the close of business on the NYSE. The values of such securities used in computing the NAV of the Fund are determined as of such times.
When market quotations are not readily available or are believed by BIM to be unreliable, each Fund’s investments are valued at fair value. Fair value determinations are made by BIM in accordance with policies and procedures approved by the Board. BIM may conclude that a market quotation is not readily available or is unreliable if a security or other asset or liability does not have a price source due to its lack of trading or other reasons, if a market quotation differs significantly from recent price quotations or otherwise no longer appears to reflect fair value, where the security or other asset or liability is thinly traded, when there is a significant event subsequent to the most recent market quotation, or if the trading market on which a security is listed is suspended or closed and no appropriate alternative trading market is available. A “significant event” is deemed to occur if BIM determines, in its reasonable business judgment prior to or at the time of pricing the Fund’s assets or liabilities, that the event is likely to cause a material change to the closing market price of one or more assets or liabilities held by the Fund.
Fair value represents a good faith approximation of the value of an asset or liability. The fair value of an asset or liability held by a Fund is the amount the Fund might reasonably expect to receive from the current sale of that asset or the cost to extinguish that liability in an arm’s-length transaction. Valuing a Fund’s investments using fair value pricing, in the absence of readily available and reliable market quotations, may result in prices that are based on subjective judgments, which may lead to prices that may differ materially from current market valuations and that may not be the prices at which those investments could have been sold during the period in which the particular fair values were used. Use of fair value prices and certain current market valuations could result in a difference between the prices used to calculate a Fund’s NAV and the prices used by the Index, which, in turn, could result in a difference between the Fund’s performance and the performance of the Index.
179
BONDBLOXX ETF TRUST
Notes to the Financial Statements (Continued)
October 31, 2023
Various inputs are used in determining the value of the Funds’ investments. The three levels defined by the hierarchy are as follows:
| ■ | Level 1 – Quoted prices in active markets or exchanges for identical assets and liabilities. |
| ■ | Level 2 – Significant other observable inputs, which may include, but are not limited to, quoted prices for similar assets or liabilities in markets that are active, quoted prices for identical or similar assets or liabilities in markets that are not active, inputs other than quoted prices that are observable for the assets or liabilities (such as interest rates, yield curves, volatilities, prepayment speeds, loss severities, credit risks and default rates) or other market corroborated inputs. |
| ■ | Level 3 – Significant unobservable inputs based on the best information available in the circumstances, to the extent observable inputs are not available, which may include assumptions made by BIM used in determining the fair value of investments. |
The inputs or methodology used for valuing assets and liabilities are not necessarily an indication of the risk associated with investing in those assets and liabilities.
The following table summarizes the valuation of the Funds’ fair value hierarchy levels as of October 31, 2023:
BondBloxx USD High Yield Bond Industrial Sector ETF
| Assets | Level 1 | Level 2 | Level 3 | Total | ||||||||||||
| Corporate Bonds | $ | - | $ | 39,934,005 | $ | - | $ | 39,934,005 | ||||||||
| Time Deposits | - | 412,811 | - | 412,811 | ||||||||||||
| Total Investments | $ | - | $ | 40,346,816 | $ | - | $ | 40,346,816 | ||||||||
BondBloxx USD High Yield Bond Telecom, Media & Technology Sector ETF
| Assets | Level 1 | Level 2 | Level 3 | Total | ||||||||||||
| Corporate Bonds | $ | - | $ | 28,657,775 | $ | - | $ | 28,657,775 | ||||||||
| Time Deposits | - | 298,012 | - | 298,012 | ||||||||||||
| Total Investments | $ | - | $ | 28,955,787 | $ | - | $ | 28,955,787 | ||||||||
BondBloxx USD High Yield Bond Healthcare Sector ETF
| Assets | Level 1 | Level 2 | Level 3 | Total | ||||||||||||
| Corporate Bonds | $ | - | $ | 10,727,818 | $ | - | $ | 10,727,818 | ||||||||
| Time Deposits | - | 236,677 | - | 236,677 | ||||||||||||
| Total Investments | $ | - | $ | 10,964,495 | $ | - | $ | 10,964,495 | ||||||||
BondBloxx USD High Yield Bond Financial & REIT Sector ETF
| Assets | Level 1 | Level 2 | Level 3 | Total | ||||||||||||
| Corporate Bonds | $ | - | $ | 28,746,329 | $ | - | $ | 28,746,329 | ||||||||
| Time Deposits | - | 289,034 | - | 289,034 | ||||||||||||
| Total Investments | $ | - | $ | 29,035,363 | $ | - | $ | 29,035,363 | ||||||||
180
BONDBLOXX ETF TRUST
Notes to the Financial Statements (Continued)
October 31, 2023
BondBloxx USD High Yield Bond Energy Sector ETF
| Assets | Level 1 | Level 2 | Level 3 | Total | ||||||||||||
| Corporate Bonds | $ | - | $ | 20,184,675 | $ | - | $ | 20,184,675 | ||||||||
| Time Deposits | - | 138,136 | - | 138,136 | ||||||||||||
| Total Investments | $ | - | $ | 20,322,811 | $ | - | $ | 20,322,811 | ||||||||
BondBloxx USD High Yield Bond Consumer Cyclicals Sector ETF
| Assets | Level 1 | Level 2 | Level 3 | Total | ||||||||||||
| Corporate Bonds | $ | - | $ | 22,231,775 | $ | - | $ | 22,231,775 | ||||||||
| Time Deposits | - | 136,952 | - | 136,952 | ||||||||||||
| Total Investments | $ | - | $ | 22,368,727 | $ | - | $ | 22,368,727 | ||||||||
BondBloxx USD High Yield Bond Consumer Non-Cyclicals Sector ETF
| Assets | Level 1 | Level 2 | Level 3 | Total | ||||||||||||
| Corporate Bonds | $ | - | $ | 10,415,190 | $ | - | $ | 10,415,190 | ||||||||
| Time Deposits | - | 231,320 | - | 231,320 | ||||||||||||
| Total Investments | $ | - | $ | 10,646,510 | $ | - | $ | 10,646,510 | ||||||||
BondBloxx USD High Yield Bond Sector Rotation ETF
| Assets | Level 1 | Level 2 | Level 3 | Total | ||||||||||||
| Exchange-Traded Funds | $ | 28,470,152 | $ | - | $ | - | $ | 28,470,152 | ||||||||
| Time Deposits | - | 131,033 | - | 131,033 | ||||||||||||
| Total Investments | $ | 28,470,152 | $ | 131,033 | $ | - | $ | 28,601,185 | ||||||||
BondBloxx B Rated USD High Yield Corporate Bond ETF
| Assets | Level 1 | Level 2 | Level 3 | Total | ||||||||||||
| Corporate Bonds | $ | - | $ | 12,736,394 | $ | - | $ | 12,736,394 | ||||||||
| Time Deposits | - | 191,231 | - | 191,231 | ||||||||||||
| Total Investments | $ | - | $ | 12,927,625 | $ | - | $ | 12,927,625 | ||||||||
BondBloxx BB Rated USD High Yield Corporate Bond ETF
| Assets | Level 1 | Level 2 | Level 3 | Total | ||||||||||||
| Corporate Bonds | $ | - | $ | 47,993,445 | $ | - | $ | 47,993,445 | ||||||||
| Time Deposits | - | 207,180 | - | 207,180 | ||||||||||||
| Total Investments | $ | - | $ | 48,200,625 | $ | - | $ | 48,200,625 | ||||||||
BondBloxx CCC Rated USD High Yield Corporate Bond ETF
| Assets | Level 1 | Level 2 | Level 3 | Total | ||||||||||||
| Common Stocks | $ | 3,053 | $ | - | $ | - | $ | 3,053 | ||||||||
| Corporate Bonds | - | 19,001,354 | - | 19,001,354 | ||||||||||||
| Time Deposits | - | 547,687 | - | 547,687 | ||||||||||||
| Total Investments | $ | 3,053 | $ | 19,549,041 | $ | - | $ | 19,552,094 | ||||||||
181
BONDBLOXX ETF TRUST
Notes to the Financial Statements (Continued)
October 31, 2023
BondBloxx JP Morgan USD Emerging Markets 1-10 Year Bond ETF
| Assets | Level 1 | Level 2 | Level 3 | Total | ||||||||||||
| Corporate Bonds | $ | - | $ | 20,721,779 | $ | - | $ | 20,721,779 | ||||||||
| Government Agencies and Obligations | - | 159,332,793 | - | 159,332,793 | ||||||||||||
| Time Deposits | - | 897,167 | - | 897,167 | ||||||||||||
| Total Investments | $ | - | $ | 180,951,739 | $ | - | $ | 180,951,739 | ||||||||
BondBloxx Bloomberg Six Month Target Duration US Treasury ETF
| Assets | Level 1 | Level 2 | Level 3 | Total | ||||||||||||
| Government Obligations | $ | - | $ | 1,117,756,172 | $ | - | $ | 1,117,756,172 | ||||||||
| Time Deposits | - | 687,779 | - | 687,779 | ||||||||||||
| Total Investments | $ | - | $ | 1,118,443,951 | $ | - | $ | 1,118,443,951 | ||||||||
BondBloxx Bloomberg One Year Target Duration US Treasury ETF
| Assets | Level 1 | Level 2 | Level 3 | Total | ||||||||||||
| Government Obligations | $ | - | $ | 522,550,164 | $ | - | $ | 522,550,164 | ||||||||
| Time Deposits | - | 1,547,559 | - | 1,547,559 | ||||||||||||
| Total Investments | $ | - | $ | 524,097,723 | $ | - | $ | 524,097,723 | ||||||||
BondBloxx Bloomberg Two Year Target Duration US Treasury ETF
| Assets | Level 1 | Level 2 | Level 3 | Total | ||||||||||||
| Government Obligations | $ | - | $ | 103,825,277 | $ | - | $ | 103,825,277 | ||||||||
| Time Deposits | - | 314,373 | - | 314,373 | ||||||||||||
| Total Investments | $ | - | $ | 104,139,650 | $ | - | $ | 104,139,650 | ||||||||
BondBloxx Bloomberg Three Year Target Duration US Treasury ETF
| Assets | Level 1 | Level 2 | Level 3 | Total | ||||||||||||
| Government Obligations | $ | - | $ | 28,658,136 | $ | - | $ | 28,658,136 | ||||||||
| Time Deposits | - | 107,941 | - | 107,941 | ||||||||||||
| Total Investments | $ | - | $ | 28,766,077 | $ | - | $ | 28,766,077 | ||||||||
BondBloxx Bloomberg Five Year Target Duration US Treasury ETF
| Assets | Level 1 | Level 2 | Level 3 | Total | ||||||||||||
| Government Obligations | $ | - | $ | 36,124,562 | $ | - | $ | 36,124,562 | ||||||||
| Time Deposits | - | 128,667 | - | 128,667 | ||||||||||||
| Total Investments | $ | - | $ | 36,253,229 | $ | - | $ | 36,253,229 | ||||||||
182
BONDBLOXX ETF TRUST
Notes to the Financial Statements (Continued)
October 31, 2023
BondBloxx Bloomberg Seven Year Target Duration US Treasury ETF
| Assets | Level 1 | Level 2 | Level 3 | Total | ||||||||||||
| Government Obligations | $ | - | $ | 53,000,395 | $ | - | $ | 53,000,395 | ||||||||
| Time Deposits | - | 49,199 | - | 49,199 | ||||||||||||
| Total Investments | $ | - | $ | 53,049,594 | $ | - | $ | 53,049,594 | ||||||||
BondBloxx Bloomberg Ten Year Target Duration US Treasury ETF
| Assets | Level 1 | Level 2 | Level 3 | Total | ||||||||||||
| Government Obligations | $ | - | $ | 41,931,243 | $ | - | $ | 41,931,243 | ||||||||
| Time Deposits | - | 32,949 | - | 32,949 | ||||||||||||
| Total Investments | $ | - | $ | 41,964,192 | $ | - | $ | 41,964,192 | ||||||||
BondBloxx Bloomberg Twenty Year Target Duration US Treasury ETF
| Assets | Level 1 | Level 2 | Level 3 | Total | ||||||||||||
| Government Obligations | $ | - | $ | 22,796,933 | $ | - | $ | 22,796,933 | ||||||||
| Time Deposits | - | 25,018 | - | 25,018 | ||||||||||||
| Total Investments | $ | - | $ | 22,821,951 | $ | - | $ | 22,821,951 | ||||||||
Bonds
Each Fund invests a substantial portion of its assets in U.S. dollar-denominated bonds. A bond is an interest-bearing security issued by a U.S. or non-U.S. company, or U.S. or non-U.S. governmental unit. The issuer of a bond has a contractual obligation to pay interest at a stated rate on specific dates and to repay principal (the bond’s face value) periodically or on a specified maturity date. Bonds generally are used by corporations and governments to borrow money from investors.
Perpetual Bonds are fixed income securities with no maturity date but pay a coupon in perpetuity (with no specified ending or maturity date). Unlike typical fixed income securities, there is no obligation for perpetual bonds to repay principal. The coupon payments, however, are mandatory. While perpetual bonds have no maturity date, they may have a callable date in which the perpetuity is eliminated and the issuer may return the principal received on the specified call date. Additionally, a perpetual bond may have additional features, such as interest rate increases at periodic dates or an increase as of a predetermined point in the future.
Restricted Investments are subject to legal or contractual restrictions on resale and may generally be sold privately, but may be required to be registered or exempted from such registration before being sold to the public. Private placement securities are generally considered to be restricted except for those securities traded between qualified institutional investors under the provisions of Rule 144A of the Securities Act of 1933. Restricted investments held by the Funds as of October 31, 2023, as applicable, are disclosed in the Notes to Portfolios of Investments.
Securities Issued by U.S. Government Agencies or Government-Sponsored Enterprises are obligations of and, in certain cases, guaranteed by, the U.S. Government, its agencies or instrumentalities. Some U.S. Government securities, such as Treasury bills, notes and bonds, and securities guaranteed by the Government National Mortgage Association, are supported by the full faith and credit of the U.S. Government; others, such as those of the Federal Home Loan Banks, are supported by the right of the issuer to borrow from the U.S. Department of the Treasury (the “U.S. Treasury”); and others, such as those of the Federal National Mortgage Association (“FNMA” or “Fannie Mae”), are supported by the discretionary authority of the U.S. Government to purchase the agency’s obligations. U.S. Government securities may include zero coupon securities which do not distribute interest on a current basis and tend to be subject to a greater risk than interest-paying securities of similar maturities.
183
BONDBLOXX ETF TRUST
Notes to the Financial Statements (Continued)
October 31, 2023
Government-related guarantors (i.e., not backed by the full faith and credit of the U.S. Government) include FNMA and the Federal Home Loan Mortgage Corporation (“FHLMC” or “Freddie Mac”). FNMA is a government-sponsored corporation. FNMA purchases conventional (i.e., not insured or guaranteed by any government agency) residential mortgages from a list of approved seller/servicers which include state and federally chartered savings and loan associations, mutual savings banks, commercial banks and credit unions and mortgage bankers. Pass-through securities issued by FNMA are guaranteed as to timely payment of principal and interest by FNMA, but are not backed by the full faith and credit of the U.S. Government. FHLMC issues Participation Certificates (“PCs”), which are pass-through securities, each representing an undivided interest in a pool of residential mortgages. FHLMC guarantees the timely payment of interest and ultimate collection of principal, but PCs are not backed by the full faith and credit of the U.S. Government.
In June 2019, FNMA and FHLMC started issuing Uniform Mortgage Backed Securities in place of their current offerings of TBA-eligible securities (the “Single Security Initiative”). The Single Security Initiative seeks to support the overall liquidity of the TBA market and aligns the characteristics of FNMA and FHLMC certificates. The effects that the Single Security Initiative may have on the market for TBA and other mortgage-backed securities are uncertain.
Roll-timing strategies can be used where a Fund seeks to extend the expiration or maturity of a position, such as a TBA security on an underlying asset, by closing out the position before expiration and opening a new position with respect to substantially the same underlying asset with a later expiration date. TBA securities purchased or sold are reflected on the Statements of Assets and Liabilities as an asset or liability, respectively. Recently finalized FINRA rules include mandatory margin requirements for the TBA market that require the Funds to post collateral in connection with their TBA transactions.
There is no similar requirement applicable to the Funds’ TBA counterparties. The required collateralization of TBA trades could increase the cost of TBA transactions to the Funds and impose added operational complexity.
Separate Trading of Registered Interest and Principal of Securities (“STRIPS”) are U.S. Treasury fixed income securities in which the principal is separated, or stripped, from the interest and each takes the form of zero coupon securities. A STRIP is sold at a significant discount to face value and offers no interest payments; rather, investors receive payment at maturity. Zero coupon securities do not distribute interest on a current basis and tend to be subject to greater risk than interest-paying securities.
Defaulted Securities
Certain Funds may hold defaulted securities or other securities which were placed in non-accrual status as the collection of a portion or all of the interest has been deemed to be uncollectible. Debt obligations may be placed on non-accrual status and the related interest income, amortization or accretion may be reduced or stopped entirely. Additionally, current income accruals and interest receivables may be written off when it becomes probable that the interest will not be collected, and the amount of uncollectible interest can be reasonably estimated. A debt obligation is removed from non-accrual status when the issuer resumes interest payments or when collectability of interest is probable.
Time Deposits
The Funds place excess cash balances into overnight time deposits with one or more eligible deposit institutions that meet credit and risk standards approved by the Funds. These are classified as short-term investments in the Funds’ Portfolio of Investments.
Reclassification
GAAP requires that certain components of net assets be adjusted to reflect permanent differences between financial and tax reporting. These reclassifications have no effect on net assets or the NAV per Share.
184
BONDBLOXX ETF TRUST
Notes to the Financial Statements (Continued)
October 31, 2023
Distribution of Income and Gains
The Funds intend to declare and make distributions of net investment income monthly. Distributions of net realized capital gains earned by the Funds, if any, are distributed at least annually. Distributions from income and capital gains are determined in accordance with federal income tax regulations, which may differ from GAAP.
Organizational and Offering Costs
The Adviser has agreed to bear all organizational and offering expenses for the Funds.
3. INVESTMENT ADVISORY AND OTHER AGREEMENTS
Investment Adviser
The Adviser furnishes investment management services to the Funds pursuant to an Investment Advisory Agreement with the Trust’s Board on behalf of each Fund, subject to the supervision and direction of the Board. The Adviser is registered with the SEC as an investment adviser under the Investment Advisers Act of 1940, as amended, as of date of these financial statements.
Pursuant to the Investment Advisory Agreement between BIM and the Trust (entered into on behalf of each Fund other than HYSA), BIM is responsible for substantially all expenses of the Funds, except the management fees, interest expenses, taxes, expenses incurred with respect to the acquisition and disposition of portfolio securities and the execution of portfolio transactions, including brokerage commissions, distribution fees or expenses, litigation expenses and any extraordinary expenses (as determined by a majority of the Trustees who are not “interested persons” of the Trust). With respect to HYSA, the Fund pays the adviser a fee based on a percentage of the Fund’s average daily net assets at the annual rate of 0.45%. Pursuant to an expenses limitation agreement with BIM, BIM has contractually agreed to waive fees and/or reimburse operating expenses (other than interest, brokerage, taxes, extraordinary expenses and non-affiliated acquired fund fees and expenses) so that the ratio of the Fund’s net total annual operating expenses will not exceed 0.55% through the anniversary of the listing date of the Fund in 2026, subject to recapture as described below (the “Fee Waiver”). The Fee Waiver may be terminated prior to the anniversary of the listing date of the Fund in 2026 only upon written agreement of the Trust and BIM. The Fee Waiver may be modified by BIM to decrease the Fund’s net total annual operating expenses at any time. BIM is also permitted to recapture amounts waived and/or reimbursed within two years after the fiscal year in which BIM waived fees and/or reimbursed expenses if the Fund’s net total annual operating expenses have fallen to a level below the limit described above. In no case will BIM recapture any amount that would result, on any particular business day of the Fund, in the Fund’s expense ratio exceeding both (1) the expense cap in place at the time such amounts were waived and (2) the Fund’s current expense cap. During the period ended October 31, 2023, HYSA waived $13,667 of affiliated fund fees and expenses, which are not recoupable by HYSA from BIM in future fiscal periods pursuant to the terms of the expense limitation agreement.
As of October 31, 2023, pursuant to the above, fees previously waived and reimbursed by the Investment Adviser that may be subject to possible future reimbursement to the Investment Adviser were as follows for HYSA:
| Expiring Fiscal Year Ending, October 31, 2025 | ||
| $ | 35,673 | |
Previous fees waived under the previous Investment Advisor through reorganization date are no longer recoupable.
185
BONDBLOXX ETF TRUST
Notes to the Financial Statements (Continued)
October 31, 2023
For its investment advisory services to the Funds, BIM will be paid a management fee from each Fund based on a percentage of each Fund’s average daily net assets, at the annual rates set forth below:
| Fund | Management Fee | ||
| BondBloxx USD High Yield Bond Industrial Sector ETF | 0.35% | ||
| BondBloxx USD High Yield Bond Telecom, Media & Technology Sector ETF | 0.35% | ||
| BondBloxx USD High Yield Bond Healthcare Sector ETF | 0.35% | ||
| BondBloxx USD High Yield Bond Financial & REIT Sector ETF | 0.35% | ||
| BondBloxx USD High Yield Bond Energy Sector ETF | 0.35% | ||
| BondBloxx USD High Yield Bond Consumer Cyclicals Sector ETF | 0.35% | ||
| BondBloxx USD High Yield Bond Consumer Non-Cyclicals Sector ETF | 0.35% | ||
| BondBloxx USD High Yield Bond Sector Rotation ETF | 0.45% | ||
| BondBloxx B Rated USD High Yield Corporate Bond ETF | 0.30% | ||
| BondBloxx BB Rated USD High Yield Corporate Bond ETF | 0.20% | ||
| BondBloxx CCC Rated USD High Yield Corporate Bond ETF | 0.40% | ||
| BondBloxx JP Morgan USD Emerging Markets 1-10 Year Bond ETF | 0.29% | ||
| BondBloxx Bloomberg Six Month Target Duration US Treasury ETF | 0.03% | ||
| BondBloxx Bloomberg One Year Target Duration US Treasury ETF | 0.03% | ||
| BondBloxx Bloomberg Two Year Target Duration US Treasury ETF | 0.05% | ||
| BondBloxx Bloomberg Three Year Target Duration US Treasury ETF | 0.05% | ||
| BondBloxx Bloomberg Five Year Target Duration US Treasury ETF | 0.05% | ||
| BondBloxx Bloomberg Seven Year Target Duration US Treasury ETF | 0.05% | ||
| BondBloxx Bloomberg Ten Year Target Duration US Treasury ETF | 0.075% | ||
| BondBloxx Bloomberg Twenty Year Target Duration US Treasury ETF | 0.125% |
BIM may from time to time voluntarily waive and/or reimburse fees or expenses in order to limit total annual fund operating expenses (excluding acquired fund fees and expenses, if any). Any such voluntary waiver or reimbursement may be eliminated by BIM at any time. Any waivers/reimbursements are not subject to recoupment by the Adviser.
Pursuant for sub-advisor agreement with Delaware Investments Fund Advisers, a series of Macquarie Investment Management Business Trust, Delaware acts as sub-adviser to HYSA. BIM compensates Delaware for its sub-advisory services out of its management fee.
Other Service Providers
Brown Brothers Harriman & Co. (“BBH”) is the Trust administrator, fund accountant, transfer and dividend agent and custodian. BBH is primarily in the business of providing custody, administrative, fund accounting and transfer agent services to retail and institutional mutual funds.
Foreside Fund Services, LLC (the “Distributor”) is the distributor for the shares of the Trust. The Distributor is a registered broker-dealer and member of the Financial Industry Regulatory Authority, Inc. (“FINRA”).
ACA Group provides the Trust with a Chief Compliance Officer.
Ropes & Gray LLP is counsel to the Trust.
Cohen & Company, Ltd. serves as the Trust’s independent registered public accounting firm. The independent registered public accounting firm is responsible for auditing the annual financial statements of the Funds.
186
BONDBLOXX ETF TRUST
Notes to the Financial Statements (Continued)
October 31, 2023
The following expense disclosures are applicable only to BondBloxx USD High Yield Bond Sector Rotation ETF.
Administration Fees
Prior to September 16, 2023, SEI Investments Global Funds Services (the “Administrator”) served as the Fund’s Administrator pursuant to an Administration Agreement. For its services under the Administration Agreement, the Administrator received a monthly administration fee from the Fund, calculated and assessed in arrears based on the aggregate net assets of the Fund, subject to an annual minimum fee. For the period from July 1, 2023 to September 15, 2023, the Fund paid $11,871 for these services.
Service and Distribution Fees
Prior to September 16, 2023, SEI Investments Distribution Co. (the “Distributor”) served as the Fund’s underwriter and distributor of shares pursuant to a Distribution Agreement. Under the Distribution Agreement, the Distributor, as agent, receives orders to create and redeem shares in Creation Unit Aggregations and transmits such orders to the Fund’s custodian and transfer agent. The Distributor has no obligation to sell any specific quantity of Fund shares. The Distributor bears the following costs and expenses relating to the distribution of shares: (i) the costs of processing and maintaining records of creations of Creation Units; (ii) all cost of maintaining the records required of a registered broker/dealer; (iii) the expenses of maintaining its registration or qualification as a dealer or broker under Federal or state laws; (iv) filing fees; and (v) all other expenses incurred in connection with the distribution services as contemplated in the Distribution Agreement. The Distributor does not maintain any secondary market in Fund shares.
4. PURCHASE AND SALE OF FUND SHARES
The Funds will offer, issue and redeem shares (“Shares”) at NAV only in aggregations of a specified number of Shares (each a “Creation Unit”). The Funds may issue and redeem Creation Units of its Shares only to certain authorized participants that have entered into agreements with the Distributor (“Authorized Participants”) in exchange for a designated basket of portfolio investments (including any portion of such investments for which cash may be substituted) (“Deposit Instruments”), together with the deposit of a specified cash payment (“Cash Component”). Shares of the Funds will be listed and trade on NYSE Arca, Inc. or Cboe BZX (the “Exchanges”), the national securities exchanges. Shares of the Funds will be traded in the secondary market and elsewhere at market prices that may be at, above or below the Funds’ NAV. Shares will be redeemable only in Creation Units by Authorized Participants, and, generally, in exchange for securities in-kind and/or a cash amount. Creation Units typically are large blocks of a specified number of shares or multiples thereof. In the event of liquidation of a Fund, the Trust may lower the number of shares in a Creation Unit.
Shares may be issued in advance of receipt of Deposit Instruments, subject to various conditions, including a requirement that the Authorized Participant maintain with the Trust a cash deposit marked to the market value of the omitted Deposit Instruments. Transaction fees and other costs associated with creations or redemptions that include cash may be higher than the transaction fees and other costs associated with in-kind creations or redemptions. In all cases, conditions with respect to creations and redemptions of Shares and fees will be limited in accordance with the requirements of Securities and Exchange Commission (“SEC”) rules and regulations applicable to management investment companies offering redeemable securities.
187
BONDBLOXX ETF TRUST
Notes to the Financial Statements (Continued)
October 31, 2023
5. INVESTMENT TRANSACTIONS
The cost of purchases and the proceeds from sales of investment securities (excluding in-kind subscriptions and redemptions, US government securities and short-term investments) for the year or period ended October 31, 2023 were as follows:
| Purchases | Sales | |||||||
| BondBloxx USD High Yield Bond Industrial Sector ETF | $ | 3,657,672 | $ | 3,544,943 | ||||
| BondBloxx USD High Yield Bond Telecom, Media & Technology Sector ETF | 1,449,821 | 1,461,881 | ||||||
| BondBloxx USD High Yield Bond Healthcare Sector ETF | 1,040,311 | 1,124,419 | ||||||
| BondBloxx USD High Yield Bond Financial & REIT Sector ETF | 3,281,046 | 3,391,607 | ||||||
| BondBloxx USD High Yield Bond Energy Sector ETF | 3,555,716 | 3,446,666 | ||||||
| BondBloxx USD High Yield Bond Consumer Cyclicals Sector ETF | 2,808,832 | 2,924,629 | ||||||
| BondBloxx USD High Yield Bond Consumer Non-Cyclicals Sector ETF | 882,422 | 1,008,357 | ||||||
| BondBloxx USD High Yield Bond Sector Rotation ETF^ | 61,895,272 | 27,810,140 | ||||||
| BondBloxx B Rated USD High Yield Corporate Bond ETF | 3,468,580 | 3,664,231 | ||||||
| BondBloxx BB Rated USD High Yield Corporate Bond ETF | 12,706,030 | 12,948,210 | ||||||
| BondBloxx CCC Rated USD High Yield Corporate Bond ETF | 2,438,286 | 2,715,333 | ||||||
| BondBloxx JP Morgan USD Emerging Markets 1-10 Year Bond ETF | 38,685,669 | 40,688,103 | ||||||
| ^ | For the period from July 1, 2023 to October 31, 2023. |
The cost of purchases and the proceeds from sales of US government securities (excluding in-kind subscriptions and redemptions, investment securities and short-term investments) for the year ended October 31, 2023 were as follows:
| Purchases | Sales | |||||||
| BondBloxx USD High Yield Bond Industrial Sector ETF | $ | 29,667 | $ | 29,702 | ||||
| BondBloxx USD High Yield Bond Telecom, Media & Technology Sector ETF | 109,362 | 109,943 | ||||||
| BondBloxx USD High Yield Bond Financial & REIT Sector ETF | 69,187 | 69,325 | ||||||
| BondBloxx USD High Yield Bond Energy Sector ETF | 173,374 | 174,124 | ||||||
| BondBloxx USD High Yield Bond Consumer Cyclicals Sector ETF | 123,503 | 124,650 | ||||||
| BondBloxx B Rated USD High Yield Corporate Bond ETF | 98,888 | 99,007 | ||||||
| BondBloxx BB Rated USD High Yield Corporate Bond ETF | 619,849 | 624,666 | ||||||
| BondBloxx CCC Rated USD High Yield Corporate Bond ETF | 148,333 | 149,319 | ||||||
| BondBloxx JP Morgan USD Emerging Markets 1-10 Year Bond ETF | 1,932,083 | 2,411,133 | ||||||
| BondBloxx Bloomberg One Year Target Duration US Treasury ETF | 242,462,045 | 248,594,284 | ||||||
| BondBloxx Bloomberg Two Year Target Duration US Treasury ETF | 54,379,222 | 55,454,067 | ||||||
| BondBloxx Bloomberg Three Year Target Duration US Treasury ETF | 19,428,510 | 20,233,063 | ||||||
| BondBloxx Bloomberg Five Year Target Duration US Treasury ETF | 28,329,227 | 28,797,490 | ||||||
| BondBloxx Bloomberg Seven Year Target Duration US Treasury ETF | 17,442,037 | 17,827,110 | ||||||
| BondBloxx Bloomberg Ten Year Target Duration US Treasury ETF | 20,850,991 | 21,174,240 | ||||||
| BondBloxx Bloomberg Twenty Year Target Duration US Treasury ETF | 22,564,958 | 22,865,085 | ||||||
188
BONDBLOXX ETF TRUST
Notes to the Financial Statements (Continued)
October 31, 2023
For the year or period ended October 31, 2023, the costs of in-kind subscriptions and the proceeds from in-kind redemptions were as follows:
| Purchases | Sales | |||||||
| BondBloxx USD High Yield Bond Industrial Sector ETF | $ | 41,211,708 | $ | 3,474,979 | ||||
| BondBloxx USD High Yield Bond Telecom, Media & Technology Sector ETF | 27,958,036 | 1,720,450 | ||||||
| BondBloxx USD High Yield Bond Healthcare Sector ETF | 9,724,316 | 6,371,988 | ||||||
| BondBloxx USD High Yield Bond Financial & REIT Sector ETF | 27,824,873 | 1,739,468 | ||||||
| BondBloxx USD High Yield Bond Energy Sector ETF | 20,282,386 | 7,211,530 | ||||||
| BondBloxx USD High Yield Bond Consumer Cyclicals Sector ETF | 20,873,230 | 4,954,820 | ||||||
| BondBloxx USD High Yield Bond Consumer Non-Cyclicals Sector ETF | 9,004,694 | 3,495,685 | ||||||
| BondBloxx USD High Yield Bond Sector Rotation ETF^ | - | 1,265,346 | ||||||
| BondBloxx B Rated USD High Yield Corporate Bond ETF | 1,862,706 | - | ||||||
| BondBloxx BB Rated USD High Yield Corporate Bond ETF | 16,804,049 | 9,269,454 | ||||||
| BondBloxx CCC Rated USD High Yield Corporate Bond ETF | 12,400,302 | 3,603,427 | ||||||
| BondBloxx JP Morgan USD Emerging Markets 1-10 Year Bond ETF | 11,259,219 | - | ||||||
| BondBloxx Bloomberg Six Month Target Duration US Treasury ETF | 1,546,847,971 | 441,448,898 | ||||||
| BondBloxx Bloomberg One Year Target Duration US Treasury ETF | 1,320,207,866 | 833,914,553 | ||||||
| BondBloxx Bloomberg Two Year Target Duration US Treasury ETF | 142,989,669 | 74,531,259 | ||||||
| BondBloxx Bloomberg Three Year Target Duration US Treasury ETF | 14,864,140 | 5,412,838 | ||||||
| BondBloxx Bloomberg Five Year Target Duration US Treasury ETF | 21,080,908 | 3,462,807 | ||||||
| BondBloxx Bloomberg Seven Year Target Duration US Treasury ETF | 35,092,542 | 423,242 | ||||||
| BondBloxx Bloomberg Ten Year Target Duration US Treasury ETF | 25,393,641 | - | ||||||
| BondBloxx Bloomberg Twenty Year Target Duration US Treasury ETF | 22,445,396 | 15,465,454 | ||||||
| ^ | Fiscal year end changed from June 30, 2023 to October 31, 2023. |
6. AFFILIATE TRANSACTIONS
Investments in issuers considered to be affiliates of the fund during the period ended October 31, 2023 for purposes of Section 2(a)(3) of the Investment Company Act of 1940, as amended, were as follows:
BondBloxx USD High Yield Bond Sector Rotation ETF
| Affiliated Investment Company | Value as of June 30, 2023^ | Purchases | Realized Gain (Loss) on Investment Securities | Change in Unrealized Appreciation (Depreciation) of Investment Securities | Sales | Value as of October 31, 2023 | Dividends | |||||||||||||||||||||
| BondBloxx USD High Yield Bond Consumer Cyclicals Sector ETF | $ | - | $ | 4,892,112 | $ | (7,215 | ) | $ | (114,280 | ) | $ | (202,341 | ) | $ | 4,568,276 | $ | 28,737 | |||||||||||
| BondBloxx USD High Yield Bond Consumer Non- Cyclicals Sector ETF | - | 3,672,272 | (4,422 | ) | (65,844 | ) | (152,957 | ) | 3,449,049 | 16,290 | ||||||||||||||||||
| BondBloxx USD High Yield Bond Energy Sector ETF | - | 4,126,049 | (5,515 | ) | (70,280 | ) | (193,172 | ) | 3,857,082 | 19,857 | ||||||||||||||||||
| BondBloxx USD High Yield Bond Financial & REIT Sector ETF | - | 2,447,129 | (3,548 | ) | (55,623 | ) | (107,554 | ) | 2,280,404 | 15,058 | ||||||||||||||||||
189
BONDBLOXX ETF TRUST
Notes to the Financial Statements (Continued)
October 31, 2023
Affiliated Investment Company | Value as of June 30, 2023^ | Purchases | Realized Gain (Loss) on Investment Securities | Change in Unrealized Appreciation (Depreciation) of Investment Securities | Sales | Value as of October 31, 2023 | Dividends | |||||||||||||||||||||
| BondBloxx USD High Yield Bond Healthcare Sector ETF | $ | - | $ | 1,850,421 | $ | (2,799 | ) | $ | (66,503 | ) | $ | (75,801 | ) | $ | 1,705,318 | $ | 11,572 | |||||||||||
| BondBloxx USD High Yield Bond Industrial Sector ETF | - | 7,959,509 | (12,328 | ) | (218,765 | ) | (356,874 | ) | 7,371,542 | 43,430 | ||||||||||||||||||
| BondBloxx USD High Yield Bond Telecom, Media & Technology Sector ETF | - | 5,683,462 | (8,676 | ) | (202,336 | ) | (233,969 | ) | 5,238,481 | 37,314 | ||||||||||||||||||
| - | 30,630,954 | (44,503 | ) | (793,631 | ) | (1,322,668 | ) | 28,470,152 | 172,258 | |||||||||||||||||||
| ^ | Fiscal year end changed from June 30, 2023 to October 31, 2023. |
7. FEDERAL INCOME TAXES
The Funds intend to qualify as a “regulated investment company” under Subchapter M of the Internal Revenue Code of 1986, as amended. If so qualified, the Funds will not be subject to federal income tax to the extent they distribute substantially all of their net investment income and net capital gains to their shareholders. Management of the Funds is required to determine whether a tax position taken by the Funds is more likely than not to be sustained upon examination by the applicable taxing authority. Management of the Funds has reviewed tax positions taken in the tax periods that remain subject to examination by all major tax jurisdictions, including federal, and has concluded that no provision for unrecognized tax benefits or expenses is required in these financial statements. The Funds recognize interest and penalties, if any, related to unrecognized tax benefits as income tax expense on the Statements of Operations. During the year or period ended October 31, 2023, the Funds did not incur any interest or penalties.
At October 31, 2023, the cost of investments and net unrealized appreciation (depreciation) for federal income tax purposes was as follows:
Cost | Gross Unrealized Appreciation | Gross Unrealized Depreciation | Net Unrealized Appreciation (Depreciation) | |||||||||||||
| BondBloxx USD High Yield Bond Industrial Sector ETF | $ | 42,089,151 | $ | 25,988 | $ | (1,768,323 | ) | $ | (1,742,335 | ) | ||||||
| BondBloxx USD High Yield Bond Telecom, Media & Technology Sector ETF | 30,396,536 | 31,744 | (1,472,493 | ) | (1,440,749 | ) | ||||||||||
| BondBloxx USD High Yield Bond Healthcare Sector ETF | 11,781,964 | 5,777 | (823,246 | ) | (817,469 | ) | ||||||||||
| BondBloxx USD High Yield Bond Financial & REIT Sector ETF | 29,993,864 | 26,938 | (985,439 | ) | (958,501 | ) | ||||||||||
| BondBloxx USD High Yield Bond Energy Sector ETF | 20,813,306 | 24,396 | (514,891 | ) | (490,495 | ) | ||||||||||
| BondBloxx USD High Yield Bond Consumer Cyclicals Sector ETF | 23,080,938 | 87,342 | (799,553 | ) | (712,211 | ) | ||||||||||
| BondBloxx USD High Yield Bond Consumer Non-Cyclicals Sector ETF | 11,179,626 | 12,630 | (545,746 | ) | (533,116 | ) | ||||||||||
| BondBloxx USD High Yield Bond Sector Rotation ETF^ | 29,395,802 | - | (794,617 | ) | (794,617 | ) | ||||||||||
| BondBloxx B Rated USD High Yield Corporate Bond ETF | 13,543,442 | 45,020 | (660,837 | ) | (615,817 | ) | ||||||||||
| BondBloxx BB Rated USD High Yield Corporate Bond ETF | 50,614,041 | 41,223 | (2,454,639 | ) | (2,413,416 | ) | ||||||||||
| BondBloxx CCC Rated USD High Yield Corporate Bond ETF | 20,671,452 | 109,927 | (1,229,285 | ) | (1,119,358 | ) | ||||||||||
190
BONDBLOXX ETF TRUST
Notes to the Financial Statements (Continued)
October 31, 2023
| Cost | Gross Unrealized Appreciation | Gross Unrealized Depreciation | Net Unrealized Appreciation (Depreciation) | |||||||||||||
| BondBloxx JP Morgan USD Emerging Markets 1-10 Year Bond ETF | $ | 186,430,431 | $ | 2,664,021 | $ | (8,142,713 | ) | $ | (5,478,692 | ) | ||||||
| BondBloxx Bloomberg Six Month Target Duration US Treasury ETF | 1,118,882,194 | 1,546 | (439,789 | ) | (438,243 | ) | ||||||||||
| BondBloxx Bloomberg One Year Target Duration US Treasury ETF | 525,384,799 | 5,857 | (1,292,933 | ) | (1,287,076 | ) | ||||||||||
| BondBloxx Bloomberg Two Year Target Duration US Treasury ETF | 105,369,793 | 176 | (1,230,319 | ) | (1,230,143 | ) | ||||||||||
| BondBloxx Bloomberg Three Year Target Duration US Treasury ETF | 29,348,437 | - | (582,360 | ) | (582,360 | ) | ||||||||||
| BondBloxx Bloomberg Five Year Target Duration US Treasury ETF | 37,784,236 | (1,531,007 | ) | (1,531,007 | ) | |||||||||||
| BondBloxx Bloomberg Seven Year Target Duration US Treasury ETF | 55,248,147 | - | (2,198,553 | ) | (2,198,553 | ) | ||||||||||
| BondBloxx Bloomberg Ten Year Target Duration US Treasury ETF | 45,075,300 | - | (3,111,108 | ) | (3,111,108 | ) | ||||||||||
| BondBloxx Bloomberg Twenty Year Target Duration US Treasury ETF | 27,882,180 | - | (5,060,229 | ) | (5,060,229 | ) | ||||||||||
| ^ | Fiscal year end changed from June 30, 2023 to October 31, 2023. |
The differences between book-basis and tax-basis components of unrealized appreciation/(depreciation) are primarily attributable to tax deferral of losses on wash sales for tax purposes.
At October 31, 2023, the components of distributable earnings/loss on tax basis were as follows:
| Undistributed Income | Undistributed Long-term Capital Gains | Accumulated Capital Gains/ (Losses) | Net Unrealized Appreciation/ (Depreciation) | Total Earnings/ (Losses) | ||||||||||||||||
| BondBloxx USD High Yield Bond Industrial Sector ETF | $ | 273,878 | $ | - | $ | (85,034 | ) | $ | (1,742,335 | ) | $ | (1,553,491 | ) | |||||||
| BondBloxx USD High Yield Bond Telecom, Media & Technology Sector ETF | 230,958 | - | (94,139 | ) | (1,440,749 | ) | (1,303,930 | ) | ||||||||||||
| BondBloxx USD High Yield Bond Healthcare Sector ETF | 76,238 | - | (584,130 | ) | (817,469 | ) | (1,325,361 | ) | ||||||||||||
| BondBloxx USD High Yield Bond Financial & REIT Sector ETF | 201,872 | - | (237,099 | ) | (958,501 | ) | (993,728 | ) | ||||||||||||
| BondBloxx USD High Yield Bond Energy Sector ETF | 124,754 | - | (177,959 | ) | (490,495 | ) | (543,700 | ) | ||||||||||||
| BondBloxx USD High Yield Bond Consumer Cyclicals Sector ETF | 140,530 | - | (110,514 | ) | (712,211 | ) | (682,195 | ) | ||||||||||||
| BondBloxx USD High Yield Bond Consumer Non-Cyclicals Sector ETF | 61,052 | - | (71,702 | ) | (533,116 | ) | (543,766 | ) | ||||||||||||
| BondBloxx USD High Yield Bond Sector Rotation ETF^ | 50,397 | - | (59,275,760 | ) | (794,617 | ) | (60,019,980 | ) | ||||||||||||
| BondBloxx B Rated USD High Yield Corporate Bond ETF | 93,045 | - | (243,704 | ) | (615,817 | ) | (766,476 | ) | ||||||||||||
| BondBloxx BB Rated USD High Yield Corporate Bond ETF | 294,799 | - | (735,182 | ) | (2,413,416 | ) | (2,853,799 | ) | ||||||||||||
| BondBloxx CCC Rated USD High Yield Corporate Bond ETF | 163,831 | - | (313,285 | ) | (1,119,358 | ) | (1,268,812 | ) | ||||||||||||
191
BONDBLOXX ETF TRUST
Notes to the Financial Statements (Continued)
October 31, 2023
| Undistributed Income | Undistributed Long-term Capital Gains | Accumulated Capital Gains/ (Losses) | Net Unrealized Appreciation/ (Depreciation) | Total Earnings/ (Losses) | ||||||||||||||||
| BondBloxx JP Morgan USD Emerging Markets 1-10 Year Bond ETF | $ | 1,053,068 | $ | - | $ | (1,033,623 | ) | $ | (5,478,662 | ) | $ | (5,459,217 | ) | |||||||
| BondBloxx Bloomberg Six Month Target Duration US Treasury ETF | 4,854,833 | - | (760,654 | ) | (438,243 | ) | 3,655,936 | |||||||||||||
| BondBloxx Bloomberg One Year Target Duration US Treasury ETF | 2,696,858 | - | (1,566,030 | ) | (1,287,076 | ) | (156,248 | ) | ||||||||||||
| BondBloxx Bloomberg Two Year Target Duration US Treasury ETF | 426,055 | - | (754,256 | ) | (1,230,143 | ) | (1,558,344 | ) | ||||||||||||
| BondBloxx Bloomberg Three Year Target Duration US Treasury ETF | 99,236 | - | (395,366 | ) | (582,360 | ) | (878,490 | ) | ||||||||||||
| BondBloxx Bloomberg Five Year Target Duration US Treasury ETF | 123,925 | - | (767,425 | ) | (1,531,007 | ) | (2,174,507 | ) | ||||||||||||
| BondBloxx Bloomberg Seven Year Target Duration US Treasury ETF | 100,948 | - | (571,420 | ) | (2,198,553 | ) | (2,669,025 | ) | ||||||||||||
| BondBloxx Bloomberg Ten Year Target Duration US Treasury ETF | 155,388 | - | (1,411,313 | ) | (3,111,108 | ) | (4,367,033 | ) | ||||||||||||
| BondBloxx Bloomberg Twenty Year Target Duration US Treasury ETF | 94,720 | - | (2,368,287 | ) | (5,060,229 | ) | (7,333,796 | ) | ||||||||||||
| ^ | Fiscal year end changed from June 30, 2023 to October 31, 2023. |
At October 31, 2023, the effect of permanent book/tax reclassifications primarily related to in-kind transactions resulted in increase/(decrease) to the components of net assets as follows:
| Total Distributable Earnings | Paid-in Capital | |||||||
| BondBloxx USD High Yield Bond Industrial Sector ETF | $ | 199,929 | $ | (199,929 | ) | |||
| BondBloxx USD High Yield Bond Telecom, Media & Technology Sector ETF | 206,232 | (206,232 | ) | |||||
| BondBloxx USD High Yield Bond Healthcare Sector ETF | 540,454 | (540,454 | ) | |||||
| BondBloxx USD High Yield Bond Financial & REIT Sector ETF | 158,365 | (158,365 | ) | |||||
| BondBloxx USD High Yield Bond Energy Sector ETF | 121,572 | (121,572 | ) | |||||
| BondBloxx USD High Yield Bond Consumer Cyclicals Sector ETF | 501,019 | (501,019 | ) | |||||
| BondBloxx USD High Yield Bond Consumer Non-Cyclicals Sector ETF | 328,748 | (328,748 | ) | |||||
| BondBloxx USD High Yield Bond Sector Rotation ETF^ | 42,951 | (42,951 | ) | |||||
| BondBloxx B Rated USD High Yield Corporate Bond ETF | - | - | ||||||
| BondBloxx BB Rated USD High Yield Corporate Bond ETF | 268,584 | (268,584 | ) | |||||
| BondBloxx CCC Rated USD High Yield Corporate Bond ETF | 86,000 | (86,000 | ) | |||||
| BondBloxx JP Morgan USD Emerging Markets 1-10 Year Bond ETF | - | - | ||||||
| BondBloxx Bloomberg Six Month Target Duration US Treasury ETF | 116,223 | (116,223 | ) | |||||
| BondBloxx Bloomberg One Year Target Duration US Treasury ETF | 2,906,469 | (2,906,469 | ) | |||||
| BondBloxx Bloomberg Two Year Target Duration US Treasury ETF | 124,104 | (124,104 | ) | |||||
| BondBloxx Bloomberg Three Year Target Duration US Treasury ETF | (1,506 | ) | 1,506 | |||||
| BondBloxx Bloomberg Five Year Target Duration US Treasury ETF | 9,824 | (9,824 | ) | |||||
| BondBloxx Bloomberg Seven Year Target Duration US Treasury ETF | (11,739 | ) | 11,739 | |||||
| BondBloxx Bloomberg Ten Year Target Duration US Treasury ETF | - | - | ||||||
| BondBloxx Bloomberg Twenty Year Target Duration US Treasury ETF | 727,452 | (727,452 | ) | |||||
| ^ | Fiscal year end changed from June 30, 2023 to October 31, 2023. |
192
BONDBLOXX ETF TRUST
Notes to the Financial Statements (Continued)
October 31, 2023
The tax character of distributions paid during the period indicated was as follow:
| Year Ended October 31, 2023 | Year Ended 2022 | |||||||||||||||
| Ordinary Income* | Long-Term Capital Gain | Ordinary Income* | Long-Term Capital Gain | |||||||||||||
| BondBloxx USD High Yield Bond Industrial Sector ETF | $ | 1,039,987 | $ | - | $ | 192,726 | $ | - | ||||||||
| BondBloxx USD High Yield Bond Telecom, Media & Technology Sector ETF | 773,573 | - | 135,149 | - | ||||||||||||
| BondBloxx USD High Yield Bond Healthcare Sector ETF | 462,631 | - | 226,994 | - | ||||||||||||
| BondBloxx USD High Yield Bond Financial & REIT Sector ETF | 689,760 | - | 180,578 | - | ||||||||||||
| BondBloxx USD High Yield Bond Energy Sector ETF | 606,084 | - | 247,535 | - | ||||||||||||
| BondBloxx USD High Yield Bond Consumer Cyclicals Sector ETF | 826,902 | - | 234,348 | - | ||||||||||||
| BondBloxx USD High Yield Bond Consumer Non-Cyclicals Sector ETF | 339,571 | - | 187,215 | - | ||||||||||||
| Period Ended October 31, 2023 | Year Ended June 30, 2023 | Year Ended June 30, 2022 | ||||||||||||||||||||||||||||||
| Ordinary Income* | Long-Term Capital Gain | Ordinary Income* | Long-Term Capital Gain | Return of Capital | Ordinary Income* | Long-Term Capital Gain | Return of Capital | |||||||||||||||||||||||||
| BondBloxx USD High Yield Bond Sector Rotation ETF^ | $ | 533,623 | $ | - | $ | 2,101,410 | $ | - | $ | 60,985 | $ | 1,282,174 | $ | - | $ | 10,748 | ||||||||||||||||
| Year Ended October 31, 2023 | Year Ended October 31, 2022 | |||||||||||||||
| Ordinary Income* | Long-Term Capital Gain | Ordinary Income* | Long-Term Capital Gain | |||||||||||||
| BondBloxx B Rated USD High Yield Corporate Bond ETF | $ | 948,646 | $ | - | $ | 357,380 | $ | - | ||||||||
| BondBloxx BB Rated USD High Yield Corporate Bond ETF | 2,930,252 | - | 891,418 | - | ||||||||||||
| BondBloxx CCC Rated USD High Yield Corporate Bond ETF | 1,187,914 | - | 351,099 | - | ||||||||||||
| BondBloxx JP Morgan USD Emerging Markets 1-10 Year Bond ETF | 11,393,515 | - | 2,662,213 | - | ||||||||||||
| BondBloxx Bloomberg Six Month Target Duration US Treasury ETF | 19,195,046 | - | - | - | ||||||||||||
| BondBloxx Bloomberg One Year Target Duration US Treasury ETF | 11,946,611 | - | - | - | ||||||||||||
| BondBloxx Bloomberg Two Year Target Duration US Treasury ETF | 3,191,299 | - | - | - | ||||||||||||
| BondBloxx Bloomberg Three Year Target Duration US Treasury ETF | 987,439 | - | - | - | ||||||||||||
| BondBloxx Bloomberg Five Year Target Duration US Treasury ETF | 1,188,187 | - | - | - | ||||||||||||
| BondBloxx Bloomberg Seven Year Target Duration US Treasury ETF | 923,627 | - | - | - | ||||||||||||
| BondBloxx Bloomberg Ten Year Target Duration US Treasury ETF | 896,889 | - | - | - | ||||||||||||
| BondBloxx Bloomberg Twenty Year Target Duration US Treasury ETF | 948,088 | - | - | - | ||||||||||||
| ^ | Fiscal year end changed from June 30, 2023 to October 31, 2023. | |
| * | For tax purpose short-term capital gain distributions are considered ordinary income distributions. |
193
BONDBLOXX ETF TRUST
Notes to the Financial Statements (Continued)
October 31, 2023
At October 31, 2023, for Federal income tax purposes, the Funds have capital loss carryforwards available as shown in the table below, to the extent provided by regulations, to offset future capital gains for an unlimited period. To the extent that these capital loss carryforwards are used to offset future capital gains, it is probable that the capital gains so offset will not be distributed to shareholders.
| Short-Term | Long-Term | Total Amount | ||||||||||
| BondBloxx USD High Yield Bond Industrial Sector ETF | $ | 49,425 | $ | 35,609 | $ | 85,034 | ||||||
| BondBloxx USD High Yield Bond Telecom, Media & Technology Sector ETF | 36,227 | 57,912 | 94,139 | |||||||||
| BondBloxx USD High Yield Bond Healthcare Sector ETF | 522,425 | 61,705 | 584,130 | |||||||||
| BondBloxx USD High Yield Bond Financial & REIT Sector ETF | 132,354 | 104,745 | 237,099 | |||||||||
| BondBloxx USD High Yield Bond Energy Sector ETF | 52,323 | 125,636 | 177,959 | |||||||||
| BondBloxx USD High Yield Bond Consumer Cyclicals Sector ETF | 68,328 | 42,186 | 110,514 | |||||||||
| BondBloxx USD High Yield Bond Consumer Non-Cyclicals Sector ETF | 42,066 | 29,636 | 71,702 | |||||||||
| BondBloxx USD High Yield Bond Sector Rotation ETF^ | 31,529,721 | 27,746,039 | 59,275,760 | |||||||||
| BondBloxx B Rated USD High Yield Corporate Bond ETF | 164,172 | 79,532 | 243,704 | |||||||||
| BondBloxx BB Rated USD High Yield Corporate Bond ETF | 613,275 | 121,907 | 735,182 | |||||||||
| BondBloxx CCC Rated USD High Yield Corporate Bond ETF | 279,511 | 33,774 | 313,285 | |||||||||
| BondBloxx JP Morgan USD Emerging Markets 1-10 Year Bond ETF | 832,231 | 201,392 | 1,033,623 | |||||||||
| BondBloxx Bloomberg Six Month Target Duration US Treasury ETF | 760,654 | - | 760,654 | |||||||||
| BondBloxx Bloomberg One Year Target Duration US Treasury ETF | 1,566,030 | - | 1,566,030 | |||||||||
| BondBloxx Bloomberg Two Year Target Duration US Treasury ETF | 562,011 | 192,245 | 754,256 | |||||||||
| BondBloxx Bloomberg Three Year Target Duration US Treasury ETF | 368,140 | 27,226 | 395,366 | |||||||||
| BondBloxx Bloomberg Five Year Target Duration US Treasury ETF | 637,966 | 129,459 | 767,425 | |||||||||
| BondBloxx Bloomberg Seven Year Target Duration US Treasury ETF | 462,168 | 109,252 | 571,420 | |||||||||
| BondBloxx Bloomberg Ten Year Target Duration US Treasury ETF | 981,095 | 430,218 | 1,411,313 | |||||||||
| BondBloxx Bloomberg Twenty Year Target Duration US Treasury ETF | 2,360,953 | 7,334 | 2,368,287 | |||||||||
| ^ | Fiscal year end changed from June 30, 2023 to October 31, 2023. |
8. RELATED PARTIES
At October 31, 2023, certain officers and Trustees of the Trust are also officers or employees of the Adviser or affiliated with the Distributor.
9. INDEMNIFICATIONS
In the normal course of business, the Trust, on behalf of the Funds, enters into contracts with third-party service providers that contain a variety of representations and warranties and that provide general indemnifications. Additionally, under the Trust organizational documents, the officers and Trustees are indemnified against certain liabilities arising out of the performance of their duties to the Trust. The Funds’ maximum exposure under these arrangements is unknown, as it involves possible future claims that may or may not be made against the Funds. The Adviser is of the view that the risk of loss to the Funds in connection with the Funds’ indemnification obligations is remote; however, there can be no assurance that such obligations will not result in material liabilities that adversely affect the Funds.
194
BONDBLOXX ETF TRUST
Notes to the Financial Statements (Continued)
October 31, 2023
10. INVESTMENT RISKS (Unaudited)
A discussion of some of the principal risks associated with an investment in a Fund is contained in each Fund’s Prospectus. An investment in a Fund should be made with an understanding that the value of the Fund’s portfolio securities may fluctuate in accordance with changes in the financial condition of the issuers of the portfolio securities, the value of bonds in general, and other factors that affect the market.
High Yield Bonds Risk. Bonds that are rated below investment-grade (sometimes referred to as “junk bonds,” which may include those bonds rated below “BBB-” by S&P Global Ratings and Fitch, or below “Baa3” by Moody’s), or similar bonds that are unrated, may be deemed speculative, may involve greater levels of risk than higher-rated bonds of similar maturity and may be more likely to default.
U.S. Treasury Obligations Risk. U.S. Treasury obligations may differ from other securities in their interest rates, maturities, times of issuance and other characteristics and may provide relatively lower returns than those of other securities. Similar to other issuers, changes to the financial condition or credit rating of the U.S. Government may cause the value of the Fund’s U.S. Treasury obligations to decline.
U.S. Government Obligations Risk. While U.S. Treasury obligations are backed by the “full faith and credit” of the U.S. Government, such securities are nonetheless subject to credit risk (i.e., the risk that the U.S. Government may be, or be perceived to be, unable or unwilling to honor its financial obligations, such as making payments). Securities issued or guaranteed by federal agencies or authorities and U.S. Government-sponsored instrumentalities or enterprises may or may not be backed by the full faith and credit of the U.S. Government.
Emerging Markets Risks. Investments in emerging market issuers are subject to a greater risk of loss than investments in issuers located or operating in more developed markets. This is due to, among other things, the potential for greater market volatility, lower trading volume, higher levels of inflation, political and economic instability, greater risk of a market shutdown and more governmental limitations on foreign investments in emerging market countries than are typically found in more developed markets. Companies in many emerging markets are not subject to the same degree of regulatory requirements, accounting standards or auditor oversight as companies in more developed countries, and as a result, information about the securities in which the Fund invests may be less reliable or complete. Moreover, emerging markets often have less reliable securities valuations and greater risks associated with custody of securities than developed markets. There may be significant obstacles to obtaining information necessary for investigations into or litigation against companies and shareholders may have limited legal remedies. The Fund is not actively managed and does not select investments based on investor protection considerations. In addition, emerging markets often have greater risk of capital controls through such measures as taxes or interest rate control than developed markets. Certain emerging market countries may also lack the infrastructure necessary to attract large amounts of foreign trade and investment. Local securities markets in emerging market countries may trade a small number of securities and may be unable to respond effectively to changes in trading volume, potentially making prompt liquidation of holdings difficult or impossible at times. Settlement procedures in emerging market countries are frequently less developed and reliable than those in the U.S. (and other developed countries). In addition, significant delays may occur in certain markets in registering the transfer of securities. There could be additional impacts on the value of the Fund as a result of sustainability risks, in particular those caused by environmental changes related to climate change, social issues (including relating to labor rights) and governance risk (including but not limited to risks around board independence, ownership and control, or audit and tax management). Additionally, disclosures or third-party data coverage associated with sustainability risks is generally less available or transparent in these markets.
Interest Rate Risk. During periods of very low or negative interest rates, the Fund may be unable to maintain positive returns or pay dividends to Fund shareholders. Very low or negative interest rates may magnify interest rate risk. Changing interest rates, including rates that fall below zero, may have unpredictable effects on markets, result in heightened market volatility and detract from the Fund’s performance to the extent the Fund is exposed to such interest rates. Additionally, under certain market conditions in which interest rates are low and the market prices for portfolio securities have increased, the Fund may have a very low, or even negative yield. A low or negative yield would cause the Fund to lose money in certain
195
BONDBLOXX ETF TRUST
Notes to the Financial Statements (Continued)
October 31, 2023
conditions and over certain time periods. An increase in interest rates will generally cause the value of securities held by the Fund to decline, may lead to heightened volatility in the fixed-income markets and may adversely affect the liquidity of certain fixed-income investments, including those held by the Fund. The recent historically low interest rate environment heightens the risks associated with rising interest rates that may result from central bank or government intervention or other inflationary pressures.
Concentration Risk. The Funds may be susceptible to an increased risk of loss, including losses due to adverse events that affect the Funds’ investments more than the market as a whole, to the extent that the Funds’ investments are concentrated in the securities of a particular issuer or issuers, sector, sub-sector, market segment, market, industry, group of industries, country, group of countries, region or asset class. The Funds may be more adversely affected by the underperformance of those securities, may experience increased price volatility and may be more susceptible to adverse economic, market, political or regulatory occurrences affecting those securities and/or other assets than a fund that does not concentrate its investments.
Inflation Risk. Inflation is a sustained rise in overall price levels. Moderate inflation is associated with economic growth, while high inflation can signal an overheated economy. Inflation risk is the risk that the value of assets or income from investments will be less in the future as inflation decreases the value of money (i.e., as inflation increases, the values of the Fund’s assets can decline). Inflation poses a “stealth” threat to investors because it reduces savings and investment returns. Central banks, such as the U.S. Federal Reserve, generally attempt to control inflation by regulating the pace of economic activity. They typically attempt to affect economic activity by raising and lowering short-term interest rates. At times, governments may attempt to manage inflation through fiscal policy, such as by raising taxes or reducing spending, thereby reducing economic activity; conversely, governments can attempt to combat deflation with tax cuts and increased spending designed to stimulate economic activity. Inflation rates may change frequently and significantly as a result of various factors, including unexpected shifts in the domestic or global economy and changes in economic policies, and the Fund’s investments may not keep pace with inflation, which may result in losses to Fund shareholders. This risk is greater for fixed-income instruments with longer maturities.
Affiliated ETF Risk. The Adviser receives advisory fees from the Underlying Funds. It is possible that a conflict of interest among the Fund and the Underlying Funds could affect how the Adviser fulfills its fiduciary duties to the Fund and the Underlying Funds. The Adviser may have an incentive to take into account the effect on an Underlying Fund in which the Fund may invest in determining whether, and under what circumstances, to purchase or sell shares in that Underlying Fund. In addition, the fees payable to the Adviser by certain of the Underlying Funds may be higher than the fee payable by the Fund. However, the Adviser has a fiduciary duty to act in the Fund’s best interests when selecting the Underlying Funds.
Market Risk. The Fund could lose money over short periods due to short-term market movements and over longer periods during more prolonged market downturns. Local, regional or global events such as war, acts of terrorism, the spread of infectious illness or other public health issues, recessions, the advent of significant inflation, or other events could have a significant impact on the Fund and its investments and could result in increased premiums or discounts to the Fund’s NAV.
Market Trading Risk. The Fund faces numerous market trading risks, including the potential lack of an active market for Fund shares or the Fund’s underlying portfolio securities, losses from trading in secondary markets, periods of high volatility and disruptions in the creation/redemption process. ANY OF THESE FACTORS, AMONGOTHERS, MAY LEAD TO THE FUND’S SHARES TRADING AT A PREMIUM OR DISCOUNT TO NAV. Accordingly, if a shareholder purchases Fund shares at a time when the market price is at a premium to the NAV, or sells shares at a time when the market price is at a discount to the NAV, the shareholder may sustain losses.
Investment in the Underlying Funds Risk. The Fund invests a substantial portion of its assets in the Underlying Funds. Accordingly, the Fund’s investment performance will be directly related to the performance of the Underlying Funds, and the Fund is subject to the risk factors associated with the investments of the Underlying Funds and will be affected by the investment policies and practices of the Underlying Funds in direct proportion to the amount of assets allocated to each. To the extent the Fund is exposed more heavily to one or more particular Sectors, its performance will be especially sensitive to risks associated with those Sectors.
196
BONDBLOXX ETF TRUST
Notes to the Financial Statements (Continued)
October 31, 2023
A strategy used by the Underlying Funds may fail to produce the intended results. If the Fund has allocated a higher portion of its net assets to a particular Underlying Fund, it may be more susceptible to adverse developments affecting that Underlying Fund and may be more susceptible to losses because of these developments. The Fund’s ability to achieve its investment objective will depend on the ability of the Underlying Funds to achieve their investment objectives. There can be no assurance that the investment objective of any Underlying Fund can be achieved. With respect to the Underlying Funds, which are all designed to track an index, the price and movement of an ETF designed to track an index may not track the index and may result in a loss. In addition, ETFs may trade at a price above (premium) or below (discount) their net asset value, especially during periods of significant market volatility or stress, causing investors to pay significantly more or less than the value of the ETF’s underlying portfolio. Certain ETFs traded on exchanges may be thinly traded and experience large spreads between the “ask” price quoted by a seller and the “bid” price offered by a buyer.
The Fund’s NAV will change with changes in the value of the Underlying Funds and other investments based on their market valuations. The Fund’s market price may deviate from value of the Fund’s underlying holdings, particularly in times of market stress, and as a result, investors may pay more or receive less than the underlying value of the Fund’s shares bought or sold. See also “-Exchange-Traded Fund (ETF) and Other Investment Company Risk” below. An investment in the Fund will entail more costs and expenses than a direct investment in the Underlying Funds.
Exchange-Traded Fund (ETF) and Other Investment Company Risk. The Fund may invest in shares of other investment companies and ETFs, including the affiliated Underlying Funds. Shareholders bear both their proportionate share of the Fund’s expenses and similar expenses of the underlying investment company or ETF when the Fund invests in shares of another investment company or ETF. The Fund is subject to the risks associated with the ETF or investment company’s investments. The price and movement of an ETF designed to track an index may not track the index and may result in a loss. In addition, ETFs may trade at a price above (premium) or below (discount) their net asset value, especially during periods of significant market volatility or stress, causing investors to pay significantly more or less than the value of the ETF’s underlying portfolio. Certain ETFs traded on exchanges may be thinly traded and experience large spreads between the “ask” price quoted by a seller and the “bid” price offered by a buyer.
Non-Diversification Risk. The Funds are classified as “non-diversified” funds under the 1940 Act. Accordingly, a Fund may invest a greater portion of its assets in the securities of a single issuer than if it were a “diversified” fund. To the extent that a Fund invests a higher percentage of its assets in the securities of a single issuer, the Fund is subject to a higher degree of risk associated with and developments affecting that issuer than a fund that invests more widely.
LIBOR Transition Risk. The risk related to the anticipated discontinuation of the London Interbank Offered Rate (“LIBOR”) by the end of 2021. On November 30, 2020, the administrator of LIBOR announced a delay in the phase out of a majority of the U.S. dollar LIBOR publications until June 30, 2023, and the remainder of LIBOR publications are expected to end at the end of 2021. Certain instruments held by the Funds may rely in some fashion upon LIBOR. Although the transition process away from LIBOR has become increasingly well-defined in advance of the anticipated discontinuation date, there remains uncertainty regarding the nature of any replacement rate, and any potential effects of the transition away from LIBOR on the Funds or on certain instruments in which the Funds invest can be difficult to ascertain. The transition process may involve, among other things, increased volatility or illiquidity in markets for instruments that currently rely on LIBOR, and may result in a reduction in value of certain instruments held by the Funds.
Russian Invasion of Ukraine. Russia launched a large-scale invasion of Ukraine on February 24, 2022. The extent and duration of the military action, resulting sanctions and resulting future market disruptions in the region are impossible to predict, but could be significant. Any such disruptions caused by Russian military action or other actions (e.g., cyberattacks and espionage) or resulting actual and threatened responses to such activity, including purchasing and financing restrictions, sanctions, tariffs or cyberattacks on Russian entities or individuals could have a severe adverse effect on the region, including significant negative impacts on the economy and the markets for certain securities and commodities, such as oil and natural gas, as well as other sectors. How long such military action and related events will last cannot be predicted. These and any related events could have significant impact on Fund performance and the value of an investment in the Fund.
197
BONDBLOXX ETF TRUST
Notes to the Financial Statements (Continued)
October 31, 2023
11. NEW ACCOUNTING PRONOUNCEMENTS
In June 2022, the FASB issued ASU 2022-03, “FairValue Measurement (Topic 820): FairValue Measurement of Equity Securities Subject to Contractual Sale Restrictions.” The ASU clarifies that a contractual restriction on the sale of an equity security is not considered part of the unit of account of the equity security and, therefore, is not considered in measuring the fair value. The amendments also require additional disclosures related to equity securities subject to contractual sale restrictions. The ASU is effective for fiscal years beginning after December 15, 2023 and interim periods within those fiscal years. Management is evaluating the implications of this guidance to future financial statements.
12. SUBSEQUENT EVENTS
Management has evaluated the need for disclosure and/or adjustments resulting from subsequent events through the date the financial statements were issued. Based on this evaluation, no adjustments were required to the financial statements.
198
Report of Independent Registered Public Accounting Firm
To the Shareholders and Board of Trustees of
BondBloxx ETF Trust
Opinion on the Financial Statements
We have audited the accompanying statements of assets and liabilities, including the portfolios of investments, of BondBloxx ETF Trust comprising the funds listed below (the “Funds”) as of October 31, 2023, the related statements of operations, the statements of changes in net assets, the related notes, and the financial highlights for each of the years or periods indicated below (collectively referred to as the “financial statements”). In our opinion, the financial statements present fairly, in all material respects, the financial position of each of the Funds as of October 31, 2023, the results of their operations, the changes in net assets, and the financial highlights for each of the years or periods indicated below, in conformity with accounting principles generally accepted in the United States of America.
| Fund Name | Statements of Operations | Statements of Changes in Net Assets | Financial Highlights | |||
BondBloxx USD High Yield Bond Industrial Sector ETF, BondBloxx USD High Yield Bond Telecom, Media & Technology Sector ETF, BondBloxx USD High Yield Bond Healthcare Sector ETF, | For the year ended October 31, 2023 | For the year ended October 31, 2023 and the period from February 15, 2022 (commencement of operations) through October 31, 2022 | ||||
| BondBloxx USD High Yield Bond Financial & REIT Sector ETF, | ||||||
| BondBloxx USD High Yield Bond Energy Sector ETF, | ||||||
| BondBloxx USD High Yield Bond Consumer Cyclicals Sector ETF, | ||||||
| BondBloxx USD High Yield Bond Consumer Non-Cyclicals Sector ETF | ||||||
BondBloxx B Rated USD High Yield Corporate Bond ETF, BondBloxx BB Rated USD High Yield Corporate Bond ETF, BondBloxx CCC Rated USD High Yield Corporate Bond ETF | For the year ended October 31, 2023 | For the year ended October 31, 2023 and the period from May 24, 2022 (commencement of operations) through October 31, 2022 | ||||
| BondBloxx JP Morgan USD Emerging Markets 1-10 Year Bond ETF | For the year ended October 31, 2023 | For the year ended October 31, 2023 and the period from June 28, 2022 (commencement of operations) through October 31, 2022 | ||||
BondBloxx Bloomberg Six Month Target Duration US Treasury ETF, BondBloxx Bloomberg One Year Target Duration US Treasury ETF, | For the year ended October 31, 2023 | For the year ended October 31, 2023 and the period from September 13, 2022 (commencement of operations) through October 31, 2022 | ||||
| BondBloxx Bloomberg Two Year Target Duration US Treasury ETF, | ||||||
| BondBloxx Bloomberg Three Year Target Duration US Treasury ETF, | ||||||
| BondBloxx Bloomberg Five Year Target Duration US Treasury ETF, | ||||||
| BondBloxx Bloomberg Seven Year Target Duration US Treasury ETF, | ||||||
| BondBloxx Bloomberg Ten Year Target Duration US Treasury ETF, | ||||||
| BondBloxx Bloomberg Twenty Year Target Duration US Treasury ETF | ||||||
199
BONDBLOXX ETF TRUST
Report of Independent Registered Public Accounting Firm (Continued)
| Fund Name | Statements of Operations | Statements of Changes in Net Assets | Financial Highlights | |||
| BondBloxx USD High Yield Bond Sector Rotation ETF | For the period July 1, 2023 through October 31, 2023 and for the year ended June 30, 2023 | For the period July 1, 2023 through October 31, 2023 and for the years ended June 30, 2023 and 2022 | For the period July 1, 2023 through October 31, 2023 and for the years ended June 30, 2023, 2022, 2021, and 2020 |
The BondBloxx USD High Yield Bond Sector Rotation ETF’s financial highlights for the year ended June 30, 2019, were audited by other auditors whose report dated August 30, 2019, expressed an unqualified opinion on those financial highlights.
Basis for Opinion
These financial statements are the responsibility of the Funds’ management. Our responsibility is to express an opinion on the Funds’ financial statements based on our audits. We are a public accounting firm registered with the Public Company Accounting Oversight Board (United States) (“PCAOB”) and are required to be independent with respect to the Funds in accordance with the U.S. federal securities laws and the applicable rules and regulations of the Securities and Exchange Commission and the PCAOB.
We conducted our audits in accordance with the standards of the PCAOB. Those standards require that we plan and perform the audit to obtain reasonable assurance about whether the financial statements are free of material misstatement whether due to error or fraud.
Our audits included performing procedures to assess the risks of material misstatement of the financial statements, whether due to error or fraud, and performing procedures that respond to those risks. Such procedures included examining, on a test basis, evidence regarding the amounts and disclosures in the financial statements. Our procedures included confirmation of securities owned as of October 31, 2023, by correspondence with the custodian and brokers; when replies were not received from brokers, we performed other auditing procedures. Our audits also included evaluating the accounting principles used and significant estimates made by management, as well as evaluating the overall presentation of the financial statements. We believe that our audits provide a reasonable basis for our opinion.
We have served as auditor of one or more of the Funds within BondBloxx ETF Trust since 2020.

COHEN & COMPANY, LTD.
Cleveland, Ohio
December 22, 2023
200
Liquidity Risk Management Program (Unaudited)
Consistent with Rule 22e-4 under the Investment Company Act of 1940 (the “Liquidity Rule”), the Funds have adopted and implemented a written liquidity risk management program (the “Program”). The Program seeks to assess and manage each Fund’s liquidity risk, which is defined as the risk that a Fund is unable to meet investor redemption requests without significantly diluting the remaining investors’ interests in the Fund. The Funds’ Board of Trustees (the “Board”) has approved the designation of the Adviser as the Liquidity Program Administrator (“LPA”) to oversee the implementation and monitoring of the Program.
Each of the Funds qualifies as an “In-Kind ETF” under the Liquidity Rule and the Program, which means that it meets redemptions through in-kind transfers of securities, positions and assets other than a de minimis amount of cash and publishes its portfolio holdings daily. As In-Kind ETFs, the Funds are exempt from certain Liquidity Rule requirements, including classification of portfolio holdings and the requirement to establish a highly liquid investment minimum.
Consistent with the Liquidity Rule, the Program includes provisions that require, no less frequently than annually, assessments of the Funds’ liquidity risks, including a review of specific factors set forth in the Program as applicable to each Fund. In addition, the Program includes provisions designed to comply with the Liquidity Rule’s limitation on investments in “illiquid investments” (as defined in the Liquidity Rule) to no more than 15% of a Fund’s net assets as well as provisions regarding the maintenance and monitoring of In-Kind ETF status and periodic reporting to the Funds’ Board.
At a meeting of the Board of Trustees on November 14, 2023, the LPA provided a written report (the “Report”) to the Board as required by the Liquidity Rule addressing the operation, adequacy, and effectiveness the Program, including any material changes to the Program for the period from Fund inception through September 30, 2023 (“Reporting Period”). The Report included a discussion of the annual assessment of each Fund’s liquidity risk, including a review, as applicable of the Funds’ investment strategies and liquidity of portfolio investments. In addition, the Board received reports on the arbitrage function and the level of active participation by Authorized Participants and its relationship to each Fund’s liquidity and the effect of pricing/spreads and basket assets on each Fund’s liquidity.
There were no material changes to the Program, there were no significant liquidity events impacting any Fund, and it is the LPA’s assessment that the Program is adequately designed and has been effective in managing each Fund’s liquidity risk and in implementing the requirements of the Liquidity Rule. The Report concluded that each Fund qualified as an In-Kind ETF during the Reporting Period and, given the intention to continue to meet redemptions only through in-kind transfers of securities, each Fund will continue to be classified as an In-Kind ETF.
There can be no assurance that the Program will achieve its objectives in the future. Additional information regarding risks of investing in each Fund, including liquidity risks presented by each Fund’s investment portfolio, is found in the Fund’s Prospectus and Statement of Additional Information.
201
Supplemental Information (Unaudited)
Quarterly Portfolio Schedule. BondBloxx ETF Trust files their complete schedules of portfolio holdings with the SEC for the first and third quarters of each fiscal year to date on Form N-PORT. The Forms N-PORT will be available on the SEC’s website at www.sec.gov. In addition, the Funds’ full portfolio holdings are updated daily and available on the Funds’ website at https://bondbloxxetf.com/.
Proxy Voting Policy. Information with respect to how proxies relating to the Funds’ portfolio securities were voted during the 12-month period ended June 30 will be available: (i) without charge, upon request, by calling (800) 896-5089 or through the Funds’ website at https://bondbloxxetf.com/; and (ii) on the SEC’s website at www.sec.gov.
Proxy Voting Record. BIM, as an adviser to a 1940 Act Funds, is required to comply with Rule 30b1-4 under the 1940 Act (the “Proxy Rule”), that requires investment companies to file annual report Form N-PX. The adviser must provide the Fund Administrator with the voting records in order to comply with this filing. On an annual basis, following the end of the 12-month period ending June 30, the Adviser will furnish to the Trust’s administrator a full record detailing all how the Adviser voted all Trust proxies for the prior 12-month period.
Premium/Discount Information. Information about the difference between daily market values on the secondary market for shares of the Funds in BondBloxx ETF Trust and such Funds’ net asset value can be found on our website, https://bondbloxxetf.com/.
Code of Ethics. The Trust and the Adviser have each adopted codes of ethics pursuant to Rule 17j-1 of the 1940 Act. Each code of ethics may be examined at the office of the SEC in Washington, D.C. or on the Internet at the SEC’s website at www.sec.gov.
Tax Information
Form 1099-DIV and other year-end tax information provide shareholders with actual calendar year amounts that should be included in their tax returns. Shareholders should consult their tax advisors. The Funds designate the following amounts or, if subsequently determined to be different, the maximum allowable for its year/period ended October 31, 2023.
| Qualified Dividend Income* | Dividends Received Deduction* | Qualified Interest Income | ||||||||||
| BondBloxx Bloomberg Six Month Target Duration US Treasury ETF | 0.00 | % | 0.00 | % | 100.00 | % | ||||||
| BondBloxx Bloomberg One Year Target Duration US Treasury ETF | 0.00 | % | 0.00 | % | 100.00 | % | ||||||
| BondBloxx Bloomberg Two Year Target Duration US Treasury ETF | 0.00 | % | 0.00 | % | 100.00 | % | ||||||
| BondBloxx Bloomberg Three Year Target Duration US Treasury ETF | 0.00 | % | 0.00 | % | 100.00 | % | ||||||
| BondBloxx Bloomberg Five Year Target Duration US Treasury ETF | 0.00 | % | 0.00 | % | 100.00 | % | ||||||
| BondBloxx Bloomberg Seven Year Target Duration US Treasury ETF | 0.00 | % | 0.00 | % | 100.00 | % | ||||||
| BondBloxx Bloomberg Ten Year Target Duration US Treasury ETF | 0.00 | % | 0.00 | % | 100.00 | % | ||||||
| BondBloxx Bloomberg Twenty Year Target Duration US Treasury ETF | 0.00 | % | 0.00 | % | 100.00 | % | ||||||
| * | The above percentage is based on ordinary income dividends paid to shareholders during the Funds’ fiscal year/period. |
202
Board Approval of Investment Advisory and Sub-Advisory Agreements (Unaudited)
BondBloxx USD High Yield Bond Sector Rotation ETF
Under Section 15(c) of the Investment Company Act of 1940, as amended (the “1940 Act”), the Board of Trustees of BondBloxx ETF Trust (the “Board”) (the “Trust”), including a majority of the Trustees who are not “interested persons” (as that term is defined in the 1940 Act) of the Trust (the “Independent Trustees”), is required to consider and approve the Investment Advisory Agreement between the Trust and BondBloxx Investment Management Corporation (“BondBloxx”) (the “Advisory Agreement”), as well as any sub-advisory agreements.
At a meeting held on March 16, 2023 (the “March Meeting”), the Board, including a majority of the Independent Trustees, considered and approved the Advisory Agreement with respect to the BondBloxx USD High Yield Bond Sector Rotation ETF (the “Sector Rotation Fund”) for an initial two-year period. In addition, the Board approved the Investment Sub-Advisory Agreement among theTrust, on behalf of the Fund, BondBloxx and Delaware Investments Fund Advisers, a series of Macquarie Investment Management Business Trust (the “Sub-Adviser”), for an initial two-year period (the “Sub-Advisory Agreement,” and together with the Advisory Agreement, the “Agreements”).
General Information
The following information summarizes the Board’s considerations associated with its review of the Agreements. In connection with theTrustees’ deliberations, BondBloxx furnished information to theTrustees necessary for a majority of the Independent Trustees to make the determination that the Agreements were in the best interests of the Sector Rotation Fund and its shareholders. Prior to voting, the Independent Trustees reviewed the Agreements with management and their independent legal counsel and received materials from such counsel discussing the legal standards relating to the Agreements for their consideration.
Advisory Agreement
In approving the Advisory Agreement, the Board, including the Independent Trustees, considered various factors, including: (1) the nature, extent and quality of the services to be provided to the Sector Rotation Fund by BondBloxx; (2) BondBloxx’s proposed compensation under the Advisory Agreement; (3) the estimated expenses of the Sector Rotation Fund; (4) the estimated costs of services to be provided to the Sector Rotation Fund and the anticipated profits to be realized by BondBloxx from its management of the Sector Rotation Fund; (5) the potential for economies of scale and the sharing of any economies of scale with the Sector Rotation Fund’s shareholders; (6) the fees paid by and services provided to comparable high yield bond exchange-traded funds (“ETFs”); and (7) other potential benefits to BondBloxx from its relationships with the Sector Rotation Fund. The material factors and conclusions that formed the basis for the Board, including the Independent Trustees, to approve the Advisory Agreement are discussed below.
Nature, Extent and Quality of Services to be Provided. In considering the nature, extent and quality of the services to be provided by BondBloxx under the Advisory Agreement, the Board reviewed information provided by BondBloxx relating to its operations and personnel. The Board considered the level and depth of knowledge and professional experience and qualifications of BondBloxx’s personnel. The Board also took into account the systems and resources that BondBloxx intended to devote to investment management, oversight of the Sub-Adviser, and legal and compliance. Based on the foregoing, the Board concluded that it was satisfied with the nature, extent and quality of the services to be provided to the Sector Rotation Fund by BondBloxx under the Advisory Agreement.
Performance. The Board took into account that BondBloxx does not currently advise any “actively managed” ETFs and does not operate any affiliated advisory entities. The Board took into consideration the professional experience and investment capabilities of the individuals who are expected to serve as portfolio managers to the Sector Rotation Fund, including individuals from the Sub-Adviser. In addition, the Board considered BondBloxx’s investment philosophy and portfolio oversight process and the systems and tools BondBloxx and the Sub-Adviser are expected to use in managing the Sector Rotation Fund in accordance with its investment objective and investment strategies. Based on the foregoing, the Board concluded that BondBloxx is qualified to manage the Sector Rotation Fund’s assets in accordance with the Sector Rotation Fund’s investment objective and investment strategies.
203
BONDBLOXX ETF TRUST
Board Approval of Investment Advisory and Sub-Advisory Agreements (Unaudited) (Continued)
BondBloxx USD High Yield Bond Sector Rotation ETF
Proposed Compensation and Estimated Expenses. The Board considered the proposed compensation that the Sector Rotation Fund is required to pay to BondBloxx under the Advisory Agreement and the estimated expense ratios of the Sector Rotation Fund. The Board took into account that BondBloxx has contractually agreed to waive fees and/or reimburse operating expenses (other than interest, brokerage, taxes, extraordinary expenses and non-affiliated acquired fund fees and expenses) so that the ratio of the Sector Rotation Fund’s net total annual operating expenses will not exceed 0.55% through the anniversary of the listing date of the Fund in 2026. The Board noted that under this agreement, BondBloxx is permitted to recapture amounts waived and/or reimbursed within two years after the fiscal year in which BIM waived fees and/or reimbursed expenses if the Fund’s net total annual operating expenses have fallen to a level below the limit described above. The Board also took into account the sub-advisory fees payable to the Sub-Adviser. In addition, the Board took into account the expense ratios of comparable high yield bond ETFs relative to the estimated expense ratios of the Sector Rotation Fund. Based on the foregoing, the Board concluded that the Sector Rotation Fund’s advisory fee is reasonable in view of the services to be received by the Sector Rotation Fund from BondBloxx and the other factors considered.
Costs of Services, Anticipated Profitability and Fall-out Benefits The Board considered the estimated cost of services to be provided and the profits to be realized by BondBloxx in connection with its provision of services to the Sector Rotation Fund pursuant to the Advisory Agreement. The Board noted potential benefits to BondBloxx that could accrue as a result of managing the Sector Rotation Fund, including potential reputational benefits. Based upon the foregoing, the Board concluded that BondBloxx’s anticipated profitability from its relationship with the Sector Rotation Fund was reasonable.
Potential Economies of Scale. The Board considered the proposed reorganization of Highland/iBoxx Senior Loan ETF (the “Target Fund”) with and into the Sector Rotation Fund (the “Reorganization”). The Board noted BondBloxx’s expectations that, assuming the Reorganization is approved by the Board, the board of the Target Fund and the shareholders of the Target Fund, in acquiring the assets of the Target Fund, the Sector Rotation Fund would be able to immediately implement its actively managed high yield sector allocation strategy without a “ramp up” period. The Board noted the competitive environment in which the Sector Rotation Fund will operate. The Board considered the effect of potential future asset growth on the Sector Rotation Fund’s performance and expenses and potential economies of scale to be realized by BondBloxx as the Fund’s assets increase over time. Based on the foregoing, the Board concluded that the amount and structure of the proposed compensation to be paid by the Sector Rotation Fund to BondBloxx is appropriate.
Sub-Advisory Agreement
In approving the Sub-Advisory Agreement, the Board, including the Independent Trustees, considered various additional factors, including: (1) the nature, extent and quality of the services to be provided to the Sector Rotation Fund by the Sub-Adviser; (2) the Sub-Adviser’s proposed compensation under the Sub-Advisory Agreement; and (3) other potential benefits to the Sub-Adviser from its relationships with the Sector Rotation Fund. The material factors and conclusions that formed the basis for the Board, including the Independent Trustees, to approve the Sub-Advisory Agreement are discussed below.
Nature, Extent and Quality of Services to be Provided. In considering the nature, extent and quality of the services to be provided by the Sub-Adviser under the Sub-Advisory Agreement, the Board reviewed information provided by the Sub-Adviser relating to its operations and personnel. The Board considered the level and depth of knowledge and professional experience and qualifications of the Sub-Adviser’s personnel. The Board also took into account the systems and resources that the Sub-Adviser intended to devote to investment management, legal and compliance. Based on the foregoing, the Board concluded that it was satisfied with the nature, extent and quality of the services to be provided to the Sector Rotation Fund by the Sub-Adviser under the Sub-Advisory Agreement.
204
BONDBLOXX ETF TRUST
Board Approval of Investment Advisory and Sub-Advisory Agreements (Unaudited) (Continued)
BondBloxx USD High Yield Bond Sector Rotation ETF
Performance. The Board took into consideration the professional experience and investment capabilities of the individuals from the Sub-Adviser who are expected to serve as senior portfolio managers to the Sector Rotation Fund. In addition, the Board considered the Sub-Adviser’s investment philosophy and portfolio construction process and the systems and tools the Sub-Adviser is expected to use to provide a program consisting of asset allocation advisory services to the Sector Rotation Fund. Based on the foregoing, the Board concluded that the Sub-Adviser is qualified to serve as sub-adviser of the Sector Rotation Fund.
Proposed Compensation and Estimated Expenses. The Board considered the proposed compensation that BondBloxx is required to pay the Sub-Adviser under the Sub-Advisory Agreement, which compensation would be based on a percentage of the average daily net assets of the Fund. The Board took into account that under the Sub-Adviser Agreement, the Sub-Adviser will bear all expenses in connection with the performance of its services, excluding those costs of the Fund associated with brokerage activities. The Board noted BondBloxx’s view that the fees to be paid to the Sub-Adviser are priced at competitive levels. Based on the foregoing, the Board concluded that the Sector Rotation Fund’s sub-advisory fee is reasonable in view of the services to be received by the Sector Rotation Fund from the Sub-Adviser and the other factors considered.
Costs of Services, Anticipated Profitability and Fall-out Benefits. The Board considered the estimated cost of services to be provided and the profits to be realized by the Sub-Adviser in connection with its provision of services to the Sector Rotation Fund pursuant to the Sub-Advisory Agreement. The Board noted potential benefits to the Sub-Adviser that could accrue as a result of the Sub-Adviser’s association with BondBloxx and the Sector Rotation Fund generally, including potential reputational benefits. Based upon the foregoing, the Board concluded that BondBloxx’s anticipated profitability from its relationship with the Sector Rotation Fund was reasonable.
Conclusion
The Board, including the Independent Trustees, did not identify any single factor as controlling, and each Trustee may have attributed different weight to various factors. Based on a review of the factors described above, as well as such other factors as deemed appropriate by the Board, the Board, including a majority of the Independent Trustees, determined that terms of Agreements, including the compensation payable to BondBloxx under the Advisory Agreement and the compensation payable to the Sub-Adviser under the Sub-Advisory Agreement, were in the best interests of the Sector Rotation Fund and its shareholders. Accordingly, the Board, including a majority of the Independent Trustees, voted to approve the Agreements, each for an initial two-year period.
205
Board of Trustees and Executive Officers (Unaudited)
The Board has responsibility for the overall management and operations of the Funds, including general supervision of the duties performed by the Adviser and other service providers. Each Trustee serves until he or she resigns, is removed, dies, retires or becomes incapacitated. Each officer shall hold office until his or her successor is elected and qualifies or until his or her death, resignation or removal. Trustees who are not “interested persons” (as defined in the 1940 Act) of the Trust are referred to as independent trustees (“Independent Trustees”).
The address of each Trustee and officer is c/o BondBloxx ETF Trust, 700 Larkspur Landing Circle, Suite 250, Larkspur, CA 94939. The Board has designated Joanna Gallegos as its Board Chair. David Lonergan serves as the Lead Independent Trustee.
Independent Trustees
| Name (Age) | Position(s) Held with the Fund | Term of Office and Length of Time Served | Principal Occupation(s) During the Past 5 Years | Number of Portfolios in the Fund Complex Overseen by the Trustee | Other Directorships Held by the Trustee |
| Allan Eberhart, (61) | Trustee, Nominating and Governance Committee Chair | 2021–present | Professor of Finance, Founding Director (now Senior Associate Dean) of Master of Science in Finance program, McDonough School of Business, Georgetown University, since 1989 | 20 | None |
| David Lonergan (52) | Lead Independent Trustee | 2021–present | Retired; Chief Investment Officer Vista Capital Advisors (2017); Managing Director Global Co-Head Securities Lending and Finance BlackRock (1994–2014) | 20 | Advisory Board Member, Make-A-Wish Greater Bay Area (since 2017) |
| Stephen Messinger (60) | Trustee, Audit Committee Chair | 2021–present | President, Di Costa Partners, 2019-present (registered fund governance advisory); Managing Director, BlackRock, Inc. (2016–2019); Executive Vice President, iShares ETFs (2016–2019) | 20 | Director, Ricochet Foundation (since 2018) |
| H. Michael Williams (62) | Trustee | 2021–present | Retired; Educator, Director of Intercollegiate Athletics, University of California (2014–2018) | 20 | Director, The Spencer Foundation (since 2019) |
206
BONDBLOXX ETF TRUST
Board of Trustees and Executive Officers (Unaudited) (Continued)
Interested Trustee
| Name (Age) | Position(s) Held with the Fund | Term of Office and Length of Time Served | Principal Occupation(s) During the Past 5 Years | Number of Portfolios in the Fund Complex Overseen by the Trustee | Other Directorships Held by the Trustee |
| Joanna Gallegos (47) | Interested Trustee and Board Chair | 2021–present | Chief Operating Officer, BondBloxx Investment Management Corporation, since 2021; Head of Global ETF Strategy (2019–2021), Head of US ETFs (2017–2019) and Head of ETF Product Development (2013–2017), J.P. Morgan Asset Management | 20 | None |
Officers
| Name (Age) | Position | Principal Occupation(s) During the Past 5 Years |
| Joanna Gallegos (47) | Chief Executive Officer, President and Secretary | Chief Operating Officer, BondBloxx Investment Management Corporation, since 2021; Head of Global ETF Strategy (2019–2021), Head of US ETFs (2017–2019) and Head of ETF Product Development (2013–2017), J.P. Morgan Asset Management; Managing Director/Director, BlackRock, Inc. (1999–2013) |
| Tony Kelly (51) | Chief Financial Officer, Chief Accounting Officer, Vice President and Treasurer | Head of ETF Product and Capital Markets, BondBloxx Investment Management Corporation, since 2021; Managing Director and Head of ETF Product, Goldman Sachs Asset Management (2015–2021); Managing Director/Director, BlackRock, Inc. (2000–2015) |
| Kevin Hourihan (44) | Chief Compliance Officer, AML Compliance Officer | Senior Principal Consultant; Fund Chief Compliance Officer – ACA Global, LLC, since 2022; Chief Compliance Officer, Ashmore Funds (2017–2022); Chief Compliance Officer, Ashmore Investment Management (US) Corp. (2014–2022); Chief Compliance Officer, Ashmore Equities Investment Management (2015–2019). |
207
BONDBLOXX ETF TRUST
General Information (Unaudited)
Investment Adviser
BondBloxx Investment Management Corporation
700 Larkspur Landing Circle, Suite 250
Larkspur, CA 94939
Administrator, Fund Accountant, Transfer and Dividend Agent and Custodian
Brown Brothers Harriman & Co.
50 Post Office Square
Boston, MA 02110
Distributor
Foreside Fund Services, LLC
Three Canal Plaza, Suite 100
Portland, ME 04101
Chief Compliance Officer
ACA Group
480 East Swedesford Road, Suite 220
Wayne, PA 19087
Independent Registered Public Accounting Firm
Cohen & Company, Ltd.
1350 Euclid Avenue, Suite 800
Cleveland, OH 44115
Legal Counsel
Ropes & Gray LLP
3 Embarcadero Center
San Francisco, CA 94111
208
![]()
This report is intended for the Funds’ shareholders. It may not be distributed to prospective investors unless it is preceded or accompanied by the current prospectus.
BondBloxx Investment Management Corporation | bondbloxxetf.com | 800.896.5089
As of the period ended October 31, 2023, the Registrant has adopted a code of ethics that applies to the Registrant’s principal executive officer and principal financial officer, principal accounting officer or controller or persons performing similar functions. During the period covered by this report, there have been no changes to, amendments to or waivers from any provision of the code of ethics. The Registrant undertakes to provide a copy of the code of ethics to any person upon request, without charge, who calls 1-800-896-5089.
ITEM 3. AUDIT COMMITTEE FINANCIAL EXPERT.
The Board of Trustees of the Registrant has determined that Stephen A. Messinger possesses the attributes identified in Instruction (b) of Item 3 to Form N-CSR to qualify as an “audit committee financial expert,” and has designated Mr. Messinger as the Registrant’s audit committee financial expert. Mr. Messinger is an “independent” Trustee for purposes of Item 3 to Form N-CSR.
Under applicable securities laws, a person determined to be an audit committee financial expert will not be deemed an “expert” for any purpose, including without limitation for the purposes of Section 11 of the Securities Act of 1933, as a result of being designated or identified as an audit committee financial expert. The designation or identification of a person as an audit committee financial expert does not impose on such person any duties, obligations or liabilities greater than the duties, obligations and liabilities imposed on such person as a member of the audit committee and board of directors in the absence of such designation or identification. The designation or identification of a person as an audit committee financial expert does not affect the duties, obligations or liability of any other member of the audit committee or board of directors.
ITEM 4. PRINCIPAL ACCOUNTANT FEES AND SERVICES.
The following fees paid to Cohen & Company, Ltd., the Registrant’s principal accounting firm (the “Auditor”), are for services rendered for each of the last two fiscal years ended October 31, 2023 and October 31, 2022, the Trust’s first two years of operation.
| a) | Audit Fees |
The aggregate fees billed for each of the last two fiscal years ended October 31, 2023 and October 31, 2022, for professional services rendered by the Auditor for the audit of the Registrant’s annual financial statements, or services that are normally provided by the Auditor in connection with statutory and regulatory filings or engagements for each of the last two fiscal years, were $300,000 in 2023 and $285,000 in 2022.
| b) | Audit Related Fees |
The aggregate fees billed for each of the last two fiscal years ended October 31, 2023 and October 31, 2022, for assurance and related services rendered to the Registrant by the Auditor that are reasonably related to the performance of the audit of the Registrant’s financial statements and are not reported under paragraph (a) of this Item were $0 in 2023 and $15,000 in 2022.
| c) | Tax Fees |
The aggregate fees billed for each of the last two fiscal years ended October 31, 2023 and October 31, 2022, for professional services rendered to the Registrant by the Auditor for tax compliance, tax advice and tax planning were $70,000 in 2023 and $66,500 in 2022. These services consisted of (i) review or preparation of U.S. federal, state, local and excise tax returns; (ii) U.S. federal, state and local entity tax planning, advice and assistance regarding statutory, regulatory or administrative developments, and (iii) tax advice regarding tax qualification.
| d) | All Other Fees |
The aggregate fees billed for each of the last two fiscal years ended October 31, 2023 and October 31, 2022, for products and services provided by the Auditor, other than the services reported in paragraphs (a) through (c) of this Item were $0 for 2023 and $0 for 2022.
| e) |
| (1) | Pursuant to the Registrant’s Audit Committee Charter that has been adopted by the audit committee, the audit committee shall (a) oversee the scope of the Trust’s audit, the Trust’s accounting and financial reporting policies and practices and its internal controls, and enhance the quality and objectivity of the audit function; (b) approve, and recommend to the Board Members for ratification, the selection, appointment, retention or termination of the Trust’s independent auditors, as well as approving the compensation thereof; and (c) approve all audit and non-audit services provided to the Trust and certain other persons by such independent auditors. |
| (2) | The percentage of services described in each of paragraphs (b) through (d) of this Item that were approved by the audit committee pursuant to paragraph (c)(7)(i)(C) of Rule 2-01 of Regulation S-X, with respect to: Audit-Related Fees were 0% for 2023 and 0% for 2022; Tax Fees were 0% for 2023 and 0% for 2022; and Other Fees were 0% for 2023 and 0% for 2022. |
| f) | Not applicable. |
| g) | The aggregate non-audit fees billed by the Auditor for services rendered to the Registrant and rendered to the Registrant’s investment adviser (not including any sub-adviser whose role is primarily portfolio management and is subcontracted with or overseen by another investment adviser), and any entity controlling, controlled by or under common control with the investment adviser that provides ongoing services to the Registrant was $70,000 in 2023 and $66,500 in 2022. |
| h) | The Registrant’s audit committee has considered and determined that the provision of non-audit services that were rendered to the Registrant’s investment adviser (not including any sub-adviser whose role is primarily portfolio management and is subcontracted with or overseen by another investment adviser), and any entity controlling, controlled by or under common control with the investment adviser that provides ongoing services to the Registrant that were not pre-approved pursuant to paragraph (c)(7)(ii) of Rule 2-01 of Regulation S-X is compatible with maintaining the principal accountant’s independence. |
| i) | Not applicable. |
| j) | Not applicable. |
ITEM 5. AUDIT COMMITTEE OF LISTED REGISTRANTS.
| (a) | The Registrant is an issuer as defined in Section 10A-3 of the Securities Exchange Act of 1934 and has a separately designated standing Audit Committee in accordance with Section 3(a)(58)(A) of such Act. All the Board’s independent Trustees, Stephen A. Messinger, Allan C. Eberhart, David A. Lonergan and H. Michael Williams, are members of the Audit Committee. |
| (b) | Not applicable. |
ITEM 6. INVESTMENTS.
| (a) | A Schedule of Investments in securities of unaffiliated issuers as of the close of the Reporting Period is included as part of the report to shareholders filed under Item 1 of this Form N-CSR. |
| (b) | Not Applicable. |
ITEM 7. DISCLOSURE OF PROXY VOTING POLICIES AND PROCEDURES FOR CLOSED-END MANAGEMENT INVESTMENT COMPANIES.
Not Applicable.
ITEM 8. Portfolio Managers of Closed-End Management Investment Companies.
Not Applicable.
ITEM 9. PURCHASES OF EQUITY SECURITIES BY CLOSED-END MANAGEMENT INVESTMENT COMPANIES AND AFFILIATED PURCHASERS.
Not Applicable.
ITEM 10. SUBMISSION OF MATTERS TO A VOTE OF SECURITY HOLDERS.
There have been no material changes to the procedures by which the shareholders may recommend nominees to the Registrant’s board of directors, where those changes were implemented after the Registrant last provided disclosure in response to the requirements of Item 407(c)(2)(iv) of Regulation S-K (as required by Item 22(b)(15) of Schedule 14A (17 CFR 240.14a-101)), or this Item.
ITEM 11. CONTROLS AND PROCEDURES.
| (a) | The Registrant’s principal executive officer and principal financial officer, or persons performing similar functions, have concluded that the Registrant’s disclosure controls and procedures (as defined in Rule 30a-3(c) under the Act (17 CFR 270.30a-3(c))) as of a date within 90 days of the filing date of the report that includes the disclosure required by this paragraph, based on the evaluation of these controls and procedures required by Rule 30a-3(b) under the Act (17 CFR 270.30a-3(b)) and Rules 13a-15(b) or 15d-15(b) under the Exchange Act (17 CFR 240.13a-15(b) or 240.15d-15(b)). |
| (b) | There were no changes in the Registrant’s internal control over financial reporting (as defined in Rule 30a-3(d) under the Act (17 CFR 270.30a-3(d)) that occurred during the period covered by this report that has materially affected, or is reasonably likely to materially affect, the Registrant’s internal control over financial reporting. |
ITEM 12. DISCLOSURE OF SECURITIES LENDING ACTIVITIES FOR CLOSED-END MANAGEMENT INVESTMENT COMPANIES.
Not Applicable.
ITEM 13. EXHIBITS.
(a)(1) Code of Ethics – See Item 2.
SIGNATURES
Pursuant to the requirements of the Securities Exchange Act of 1934 and the Investment Company Act of 1940, the Registrant has duly caused this Report to be signed on its behalf by the undersigned, thereunto duly authorized.
BondBloxx ETF Trust
| By: | /s/ Joanna Gallegos | |
| Joanna Gallegos | ||
| Principal Executive Officer | ||
| BondBloxx ETF Trust | ||
| Date: | January 3, 2024 |
Pursuant to the requirements of the Securities Exchange Act of 1934 and the Investment Company Act of 1940, this report has been signed below by the following persons on behalf of the Registrant and in the capacities and on the dates indicated.
| By: | /s/ Joanna Gallegos | |
| Joanna Gallegos | ||
| Principal Executive Officer | ||
| BondBloxx ETF Trust | ||
| Date: | January 3, 2024 |
BondBloxx ETF Trust
| By: | /s/ Tony Kelly | |
| Tony Kelly | ||
Chief Financial Officer, Chief Accounting Officer, Vice President and Treasurer | ||
| BondBloxx ETF Trust | ||
| Date: | January 3, 2024 |