UNITED STATES
SECURITIES AND EXCHANGE COMMISSION
Washington, D.C. 20549
FORM N-CSR
CERTIFIED SHAREHOLDER REPORT OF REGISTERED
MANAGEMENT INVESTMENT COMPANIES
Investment Company Act file number: 811-23731
BONDBLOXX ETF TRUST
(Exact name of Registrant as specified in charter)
700 Larkspur Landing Circle, Suite 250, Larkspur, CA 94939
(Address of principal executive offices)(Zip code)
BondBloxx Investment Management Corporation
700 Larkspur Landing Circle, Suite 250,
Larkspur, CA 94939
(Name and address of agent for service)
Registrant’s telephone number, including area code: (800) 896-5089
Date of fiscal year end:
October 31
Date of reporting period:
October 31, 2024
Form N-CSR is to be used by management investment companies to file reports with the Commission not later than 10 days after the transmission to stockholders of any report that is required to be transmitted to stockholders under Rule 30e-1 under the Investment Company Act of 1940 (17 CFR 270.30e-1). The Commission may use the information provided on Form N-CSR in its regulatory, disclosure review, inspection, and policymaking roles.
A registrant is required to disclose the information specified by Form N-CSR, and the Commission will make this information public. A registrant is not required to respond to the collection of information contained in Form N-CSR unless the Form displays a currently valid Office of Management and Budget (“OMB”) control number. Please direct comments concerning the accuracy of the information collection burden estimate and any suggestions for reducing the burden to Secretary, Securities and Exchange Commission, 450 Fifth Street, NW, Washington, DC 20549-0609. The OMB has reviewed this collection of information under the clearance requirements of 44 U.S.C. § 3507.
Item 1. Reports To Stockholders.
| (a) | The following is a copy of the report transmitted to shareholders pursuant to Rule 30e-1 under the Investment Company Act of 1940 (17 CFR 270.30e-1). |

XHYI
BondBloxx USD High Yield Bond Industrial Sector ETF
NYSE Arca, Inc.
Annual Shareholder Report as of October 31, 2024
The BondBloxx USD High Yield Bond Industrial Sector ETF (the "Fund") seeks to track the investment results of an index composed of U.S. dollar-denominated, high yield corporate bonds in the industrial sector.
This annual shareholder report contains important information about the Fund for the period from November 1, 2023 to October 31, 2024. You can find additional information about the Fund at https://bondbloxxetf.com/bondbloxx-usd-high-yield-bond-industrial-sector-etf/. You can also request this information by contacting us at 800-896-5089.
What Were The Fund Costs For The Last Year?
(based on a hypothetical $10,000 investment)
| Fund name | Cost of a $10,000 investment | Cost paid as a % of a $10,000 investment |
|---|---|---|
| BondBloxx USD High Yield Bond Industrial Sector ETF | $38 | 0.35% |
How Did The Fund Perform Last Year?
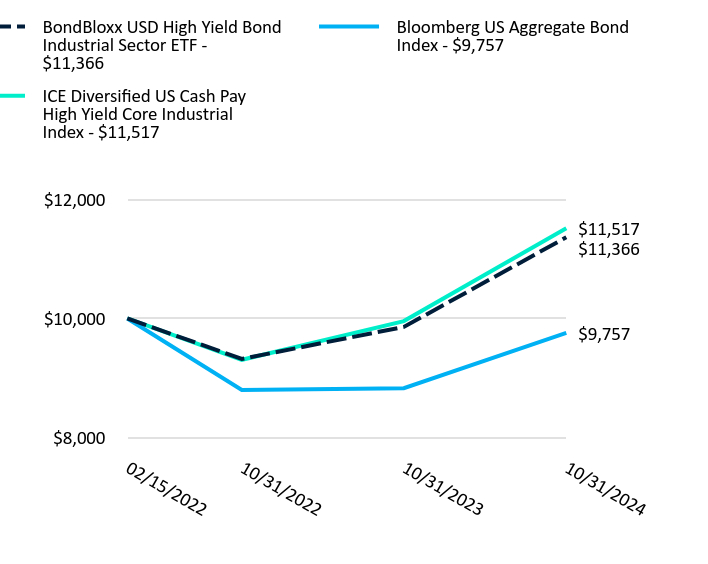
For the fiscal year ended October 31, 2024, the Fund generated a total return of 15.31%, generally in line with its benchmark, the ICE Diversified US Cash Pay High Yield Core Industrial Index, which returned 15.69%.
The Fund’s performance was driven by a combination of income from coupon payments (“income return”) and price gains, driven by declining Treasury yields and a reduction in yield premiums during the period. Resilient economic growth, strong corporate earnings, and healthy capital markets helped to drive investor confidence and positive performance across much of the US High Yield asset class.
In the industrial sector, positive performance contribution was diversified across numerous bond issuers, with robust economic growth supporting a diverse set of sub-sectors, including basic industry, capital goods, and services.
Growth Of $10,000 USD Since Inception
| BondBloxx USD High Yield Bond Industrial Sector ETF | Bloomberg US Aggregate Bond Index | ICE Diversified US Cash Pay High Yield Core Industrial Index | |
|---|---|---|---|
| 02/15/2022 | $10,000 | $10,000 | $10,000 |
| 10/31/2022 | $9,319 | $8,795 | $9,304 |
| 10/31/2023 | $9,857 | $8,826 | $9,955 |
| 10/31/2024 | $11,366 | $9,757 | $11,517 |
The Growth of $10,000 chart reflects a hypothetical $10,000 investment and assumes reinvestment of dividends and capital gains. Fund expenses, including management fees and other expenses were deducted.
Average Annual Total Returns
| Name | 1 Year | Since InceptionFootnote Reference(1) |
|---|---|---|
| Net Asset Value | 15.31% | 4.84% |
| Bloomberg US Aggregate Bond Index | 10.55% | (0.90)% |
| ICE Diversified US Cash Pay High Yield Core Industrial Index | 15.69% | 5.36% |
| Footnote | Description |
Footnote(1) | The Fund commenced operations on February 15, 2022. Shares of XHYI were listed on the NYSE Arca, Inc. on February 17, 2022. |
The performance quoted represents past performance and does not guarantee future results. The investment return and principal will fluctuate. Investor's shares, when sold or redeemed, may be worth more or less than the original cost. Current performance may be lower or higher than the performance quoted. Returns less than one year are not annualized. Shares of the Fund are bought and sold at market price (not net asset value or "NAV") and are not individually redeemed from the Fund. The returns do not reflect the deduction of taxes that a shareholder would pay on Fund distributions or redemption of Fund shares. Visit https://bondbloxxetf.com/bondbloxx-usd-high-yield-bond-industrial-sector-etf/ or, if residing outside of the United States, please call 800-896-5089 for more recent performance data.
XHYI
BondBloxx USD High Yield Bond Industrial Sector ETF
NYSE Arca, Inc.
Key Fund Statistics
| Total Net Assets | $81,994,132 |
| # of Portfolio Holdings | 489 |
| Total Advisory Fees Paid During Reporting Period | $212,994 |
| Portfolio Turnover Rate | 23% |
| Expense Ratio | 0.35% |
| Shares Outstanding | 2,150,000 |
| Fund Launch Date | 2/15/2022 |
| Exchange | NYSE Arca, Inc. |
| CUSIP | 09789C606 |
Top 10 Holdings (% of Net Assets)Footnote Reference*
| JP Morgan Chase, New York 4.18% 11/01/2024 | 1.57% |
| American Airlines, Inc./AAdvantage Loyalty IP Ltd. 5.75% 04/20/2029 | 0.96% |
| EMRLD Borrower LP/Emerald Co.-Issuer, Inc. 6.63% 12/15/2030 | 0.91% |
| Mauser Packaging Solutions Holding Co. 7.88% 04/15/2027 | 0.89% |
| TransDigm, Inc. 6.38% 03/01/2029 | 0.87% |
| TransDigm, Inc. 5.50% 11/15/2027 | 0.84% |
| Allied Universal Holdco LLC 7.88% 02/15/2031 | 0.80% |
| Neptune Bidco US, Inc. 9.29% 04/15/2029 | 0.79% |
| Staples, Inc. 10.75% 09/01/2029 | 0.77% |
| TransDigm, Inc. 6.63% 03/01/2032 | 0.71% |
| Footnote | Description |
Footnote* | Subject to change |
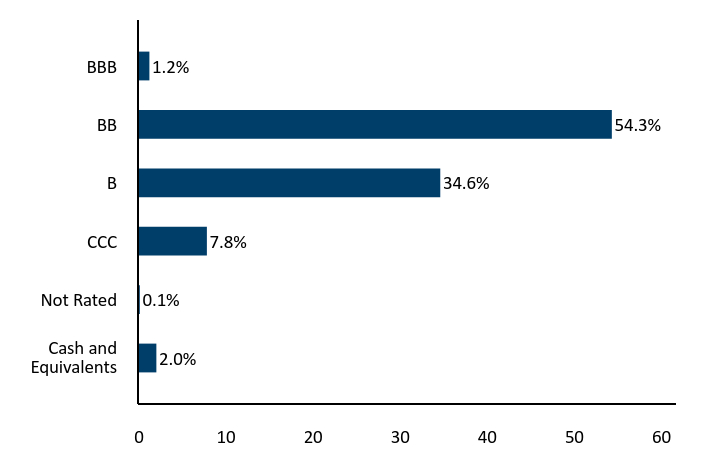
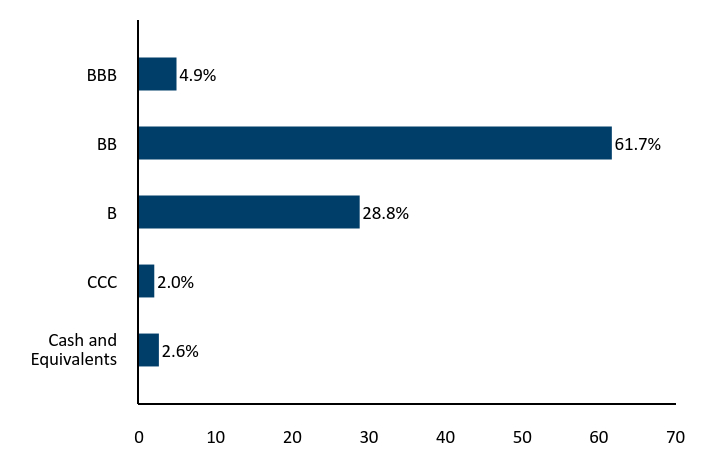
Credit Rating BreakdownFootnote Reference* (% of Net Assets)
| Value | Value |
|---|---|
| Cash and Equivalents | 2.0% |
| Not Rated | 0.1% |
| CCC | 7.8% |
| B | 34.6% |
| BB | 54.3% |
| BBB | 1.2% |
| Footnote | Description |
Footnote* | Credit quality ratings on underlying securities of the Fund are received from S&P Global Ratings (“S&P”), Moody’s Investors Service, Inc. (“Moody’s”) and Fitch Ratings, Inc. ("Fitch") and converted to the equivalent S&P major rating category. This breakdown is provided by Bloomberg. Not rated securities do not necessarily indicate low quality. Below investment grade is represented by a rating of BB and below. Ratings and portfolio credit quality may change over time. |
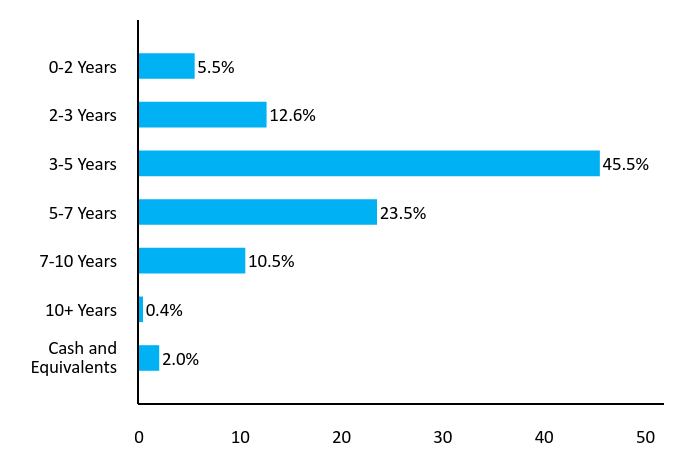
Maturity BreakdownFootnote Reference* (% of Net Assets)
| Value | Value |
|---|---|
| Cash and Equivalents | 2.0% |
| 10+ Years | 0.4% |
| 7-10 Years | 10.5% |
| 5-7 Years | 23.5% |
| 3-5 Years | 45.5% |
| 2-3 Years | 12.6% |
| 0-2 Years | 5.5% |
| Footnote | Description |
Footnote* | This chart represents the amount by percentage (%) maturity breakdown of bonds in the Fund. |
Sub-Sector Breakdown (% of Net Assets)
| Commercial Services | 14.1% |
| Chemicals | 10.2% |
| Packaging & Containers | 9.6% |
| Aerospace/Defense | 8.6% |
| Building Materials | 7.8% |
| Mining | 5.5% |
| Airlines | 5.1% |
| Iron/Steel | 4.6% |
| Home Builders | 4.4% |
| Environmental Control | 3.2% |
| Others | 24.9% |
| Cash and Equivalents | 2.0% |
XHYI
BondBloxx USD High Yield Bond Industrial Sector ETF
NYSE Arca, Inc.
Disclosures
Securities that are rated below investment-grade (sometimes referred to as “junk bonds”) may be deemed speculative, may involve greater levels of risk than higher-rated securities of similar maturity and may be more likely to default. The Fund’s income may decline if interest rates fall. Debt issuers and other counterparties may be unable or unwilling to make timely interest and/or principal payments when due or otherwise honor their obligations.
Privately issued securities are generally not traded on established markets. As a result of the absence of a public trading market, privately issued securities may be deemed to be illiquid investments, may be more difficult to value than publicly traded securities and may be subject to wide fluctuations in value. The Fund is classified as a ”non-diversified” fund under the Investment Company Act of 1940 (the "1940 Act"). The Fund may be susceptible to an increased risk of loss to the extent that the Fund’s investments are concentrated in the securities and/or other assets of a particular issuer or issuers, sector, sub-sector, market segment, market, industry, group of industries, country, group of countries, region or asset class.
Exchange-traded fund ("ETF") shares are bought and sold at market price (not NAV) and are not individually redeemed from the Fund. NAV Returns are calculated using the daily 4:00pm NAV. Market price returns reflect the midpoint of the bid/ask spread as of the close of trading on the exchange where Fund shares are listed. Market price returns do not represent the returns you would receive if you traded shares at other times.
Distributed by Foreside Fund Services, LLC. BondBloxx is a registered investment adviser.
Additional Information
For additional information about the Fund, including its prospectus, financial information, holdings and proxy voting information, please visit https://bondbloxxetf.com/bondbloxx-usd-high-yield-bond-industrial-sector-etf/. For proxy voting records, visit https://bondbloxxetf.com/resources/.

Householding
To reduce Fund expenses, only one copy of most shareholder documents may be mailed to shareholders with multiple accounts at the same address ("householding"). If you prefer that your Fund documents not be householded, please contact BondBloxx at 800-896-5089 or contact your financial intermediary. Your instructions will typically be effective within 30 days of receipt by BondBloxx or your financial intermediary.
BBLX XHYI 1024

XHYT
BondBloxx USD High Yield Bond Telecom, Media & Technology Sector ETF
NYSE Arca, Inc.
Annual Shareholder Report as of October 31, 2024
The BondBloxx USD High Yield Bond Telecom, Media & Technology Sector ETF (the "Fund") seeks to track the investment results of an index composed of U.S. dollar-denominated, high yield corporate bonds in the telecommunications, media and technology sectors.
This annual shareholder report contains important information about the Fund for the period from November 1, 2023 to October 31, 2024. You can find additional information about the Fund at https://bondbloxxetf.com/bondbloxx-usd-high-yield-bond-telecom-media-and-technology-sector-etf/. You can also request this information by contacting us at 800-896-5089.
What Were The Fund Costs For The Last Year?
(based on a hypothetical $10,000 investment)
| Fund name | Cost of a $10,000 investment | Cost paid as a % of a $10,000 investment |
|---|---|---|
| BondBloxx USD High Yield Bond Telecom, Media & Technology Sector ETF | $38 | 0.35% |
How Did The Fund Perform Last Year?
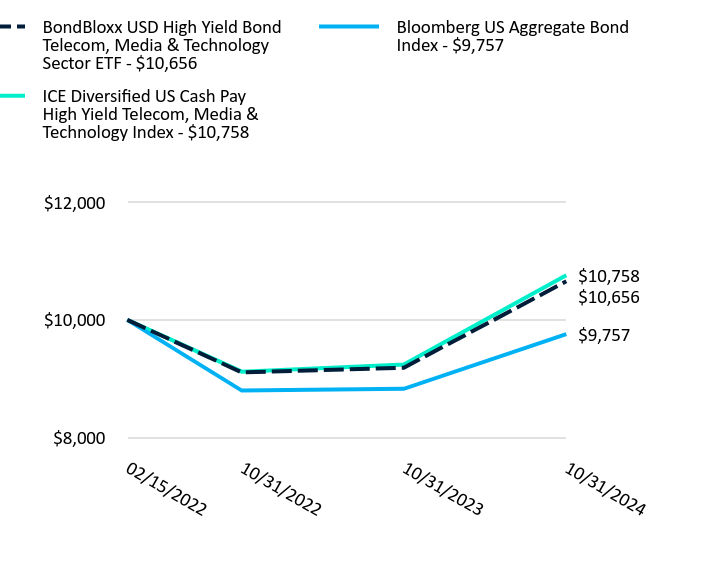
For the fiscal year ended October 31, 2024, the Fund generated a total return of 16.02%, generally in line with its benchmark, the ICE Diversified US Cash Pay High Yield Telecom, Media & Technology Index, which returned 16.42%.
The Fund’s performance was driven by a combination of income from coupon payments (“income return”) and price gains, driven by declining Treasury yields and a reduction in yield premiums during the period. Resilient economic growth, strong corporate earnings, and healthy capital markets helped to drive investor confidence and positive performance across much of the US High Yield asset class.
In the Bond Telecom, Media & Technology Sector, positive performance contribution was diversified across numerous bond issuers. Furthermore, several large bond issuers successfully improved their debt service capabilities through asset sales, refinancing transactions, restructuring, and improved cash flows. With a larger portion of the securities in CCC rated debt as compared to the broad high yield market, the sector benefited from outperformance of lower-rated securities during the period.
Growth Of $10,000 USD Since Inception
| BondBloxx USD High Yield Bond Telecom, Media & Technology Sector ETF | Bloomberg US Aggregate Bond Index | ICE Diversified US Cash Pay High Yield Telecom, Media & Technology Index | |
|---|---|---|---|
| 02/15/2022 | $10,000 | $10,000 | $10,000 |
| 10/31/2022 | $9,104 | $8,795 | $9,118 |
| 10/31/2023 | $9,185 | $8,826 | $9,241 |
| 10/31/2024 | $10,656 | $9,757 | $10,758 |
The Growth of $10,000 chart reflects a hypothetical $10,000 investment and assumes reinvestment of dividends and capital gains. Fund expenses, including management fees and other expenses were deducted.
Average Annual Total Returns
| Name | 1 Year | Since InceptionFootnote Reference(1) |
|---|---|---|
| Net Asset Value | 16.02% | 2.38% |
| Bloomberg US Aggregate Bond Index | 10.55% | (0.90)% |
| ICE Diversified US Cash Pay High Yield Telecom, Media & Technology Index | 16.42% | 2.74% |
| Footnote | Description |
Footnote(1) | The Fund commenced operations on February 15, 2022. Shares of XHYT were listed on the NYSE Arca, Inc. on February 17, 2022. |
The performance quoted represents past performance and does not guarantee future results. The investment return and principal will fluctuate. Investor's shares, when sold or redeemed, may be worth more or less than the original cost. Current performance may be lower or higher than the performance quoted. Returns less than one year are not annualized. Shares of the Fund are bought and sold at market price (not net asset value or "NAV") and are not individually redeemed from the Fund. The returns do not reflect the deduction of taxes that a shareholder would pay on Fund distributions or redemption of Fund shares. Visit https://bondbloxxetf.com/bondbloxx-usd-high-yield-bond-telecom-media-and-technology-sector-etf/ or, if residing outside of the United States, please call 800-896-5089 for more recent performance data.
XHYT
BondBloxx USD High Yield Bond Telecom, Media & Technology Sector ETF
NYSE Arca, Inc.
Key Fund Statistics
| Total Net Assets | $107,929,225 |
| # of Portfolio Holdings | 296 |
| Total Advisory Fees Paid During Reporting Period | $154,408 |
| Portfolio Turnover Rate | 28% |
| Expense Ratio | 0.35% |
| Shares Outstanding | 3,100,000 |
| Fund Launch Date | 2/15/2022 |
| Exchange | NYSE Arca, Inc. |
| CUSIP | 09789C507 |
Top 10 Holdings (% of Net Assets)Footnote Reference*
| JP Morgan Chase, New York 4.18% 11/01/2024 | 1.94% |
| Cloud Software Group, Inc. 6.50% 03/31/2029 | 1.58% |
| Cloud Software Group, Inc. 9.00% 09/30/2029 | 1.54% |
| Directv Financing LLC/Directv Financing Co.-Obligor, Inc. 5.88% 08/15/2027 | 1.44% |
| DISH Network Corp. 11.75% 11/15/2027 | 1.40% |
| CCO Holdings LLC/CCO Holdings Capital Corp. 5.13% 05/01/2027 | 1.28% |
| Intelsat Jackson Holdings SA 6.50% 03/15/2030 | 1.14% |
| DISH DBS Corp. 5.25% 12/01/2026 | 1.12% |
| CCO Holdings LLC/CCO Holdings Capital Corp. 4.25% 02/01/2031 | 1.08% |
| CCO Holdings LLC/CCO Holdings Capital Corp. 4.50% 08/15/2030 | 1.05% |
| Footnote | Description |
Footnote* | Subject to change |
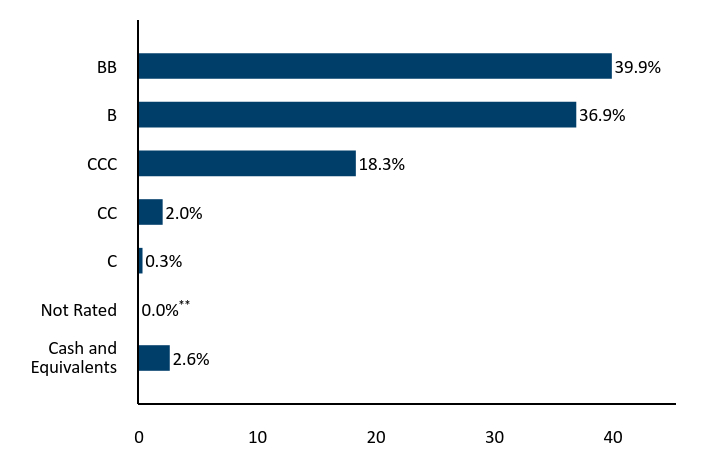
Credit Rating BreakdownFootnote Reference* (% of Net Assets)
| Value | Value |
|---|---|
| Cash and Equivalents | 2.6% |
| Not Rated | 0.0%Footnote Reference** |
| C | 0.3% |
| CC | 2.0% |
| CCC | 18.3% |
| B | 36.9% |
| BB | 39.9% |
| Footnote | Description |
Footnote* | Credit quality ratings on underlying securities of the Fund are received from S&P Global Ratings (“S&P”), Moody’s Investors Service, Inc. (“Moody’s”) and Fitch Ratings, Inc. ("Fitch") and converted to the equivalent S&P major rating category. This breakdown is provided by Bloomberg. Not rated securities do not necessarily indicate low quality. Below investment grade is represented by a rating of BB and below. Ratings and portfolio credit quality may change over time. |
Footnote** | Percentage is less than 0.05%. |
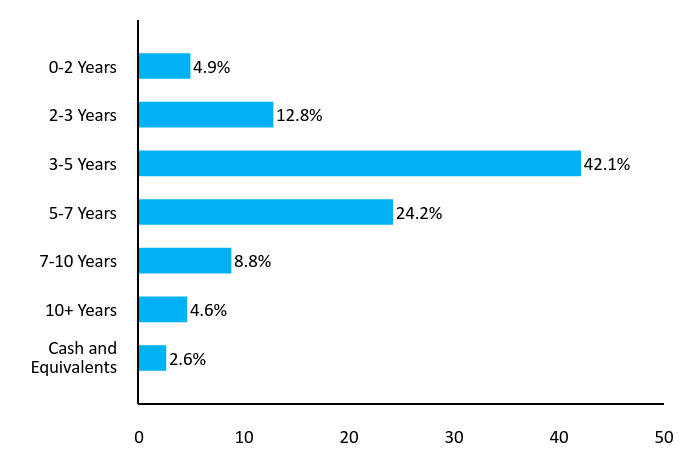
Maturity BreakdownFootnote Reference* (% of Net Assets)
| Value | Value |
|---|---|
| Cash and Equivalents | 2.6% |
| 10+ Years | 4.6% |
| 7-10 Years | 8.8% |
| 5-7 Years | 24.2% |
| 3-5 Years | 42.1% |
| 2-3 Years | 12.8% |
| 0-2 Years | 4.9% |
| Footnote | Description |
Footnote* | This chart represents the amount by percentage (%) maturity breakdown of bonds in the Fund. |
Sub-Sector Breakdown (% of Net Assets)
| Media | 37.8% |
| Telecommunications | 25.5% |
| Software | 11.7% |
| Computers | 5.5% |
| Internet | 5.0% |
| Advertising | 3.5% |
| Semiconductors | 2.1% |
| Electronics | 1.8% |
| Commercial Services | 1.1% |
| Others | 3.4% |
| Cash and Equivalents | 2.6% |
XHYT
BondBloxx USD High Yield Bond Telecom, Media & Technology Sector ETF
NYSE Arca, Inc.
Disclosures
Securities that are rated below investment-grade (sometimes referred to as “junk bonds”) may be deemed speculative, may involve greater levels of risk than higher-rated securities of similar maturity and may be more likely to default. The Fund’s income may decline if interest rates fall. Debt issuers and other counterparties may be unable or unwilling to make timely interest and/or principal payments when due or otherwise honor their obligations.
Privately issued securities are generally not traded on established markets. As a result of the absence of a public trading market, privately issued securities may be deemed to be illiquid investments, may be more difficult to value than publicly traded securities and may be subject to wide fluctuations in value. The Fund is classified as a ”non-diversified” fund under the Investment Company Act of 1940 (the "1940 Act"). The Fund may be susceptible to an increased risk of loss to the extent that the Fund’s investments are concentrated in the securities and/or other assets of a particular issuer or issuers, sector, sub-sector, market segment, market, industry, group of industries, country, group of countries, region or asset class.
Exchange-traded fund ("ETF") shares are bought and sold at market price (not NAV) and are not individually redeemed from the Fund. NAV Returns are calculated using the daily 4:00pm NAV. Market price returns reflect the midpoint of the bid/ask spread as of the close of trading on the exchange where Fund shares are listed. Market price returns do not represent the returns you would receive if you traded shares at other times.
Distributed by Foreside Fund Services, LLC. BondBloxx is a registered investment adviser.
Additional Information
For additional information about the Fund, including its prospectus, financial information, holdings and proxy voting information, please visit https://bondbloxxetf.com/bondbloxx-usd-high-yield-bond-telecom-media-and-technology-sector-etf/. For proxy voting records, visit https://bondbloxxetf.com/resources/.

Householding
To reduce Fund expenses, only one copy of most shareholder documents may be mailed to shareholders with multiple accounts at the same address ("householding"). If you prefer that your Fund documents not be householded, please contact BondBloxx at 800-896-5089 or contact your financial intermediary. Your instructions will typically be effective within 30 days of receipt by BondBloxx or your financial intermediary.
BBLX XHYT 1024

XHYH
BondBloxx USD High Yield Bond Healthcare Sector ETF
NYSE Arca, Inc.
Annual Shareholder Report as of October 31, 2024
The BondBloxx USD High Yield Bond Healthcare Sector ETF (the "Fund") seeks to track the investment results of an index composed of U.S. dollar denominated, high yield corporate bonds in the healthcare sector.
This annual shareholder report contains important information about the Fund for the period from November 1, 2023 to October 31, 2024. You can find additional information about the Fund at https://bondbloxxetf.com/bondbloxx-usd-high-yield-bond-healthcare-sector-etf/. You can also request this information by contacting us at 800-896-5089.
What Were The Fund Costs For The Last Year?
(based on a hypothetical $10,000 investment)
| Fund name | Cost of a $10,000 investment | Cost paid as a % of a $10,000 investment |
|---|---|---|
| BondBloxx USD High Yield Bond Healthcare Sector ETF | $39 | 0.35% |
How Did The Fund Perform Last Year?
For the fiscal year ended October 31, 2024, the Fund generated a total return of 20.50%, generally in line with its benchmark, the ICE Diversified US Cash Pay High Yield Healthcare Index, which returned 20.93%.
The Fund’s performance was driven by a combination of income from coupon payments (“income return”) and price gains, driven by declining Treasury yields and a reduction in yield premiums during the period. Resilient economic growth, strong corporate earnings, and healthy capital markets helped to drive investor confidence and positive performance across much of the US High Yield asset class.
In the healthcare sector, positive performance contribution was diversified across numerous bond issuers. Furthermore, several large bond issuers successfully improved their debt service capabilities through significant asset sales and refinancing transactions. With a larger portion of the healthcare sector in single-B rated debt as compared to the broad high yield market, the sector benefited from outperformance of lower-rated securities during the period.
Growth Of $10,000 USD Since Inception
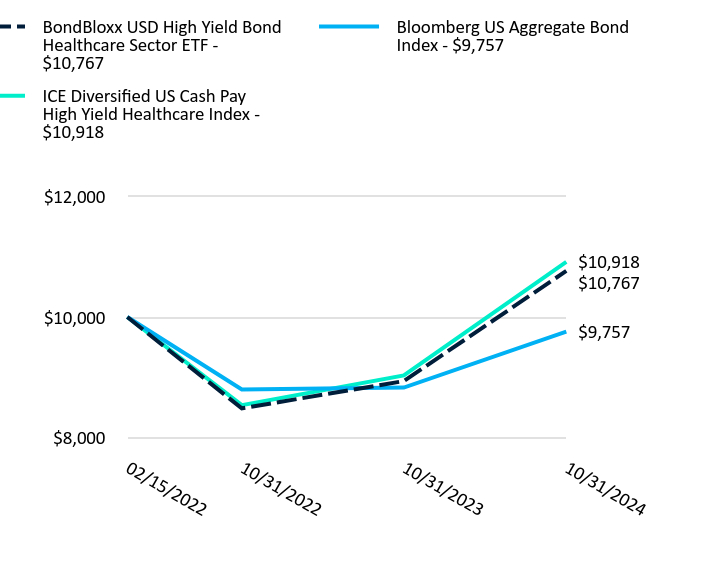
| BondBloxx USD High Yield Bond Healthcare Sector ETF | Bloomberg US Aggregate Bond Index | ICE Diversified US Cash Pay High Yield Healthcare Index | |
|---|---|---|---|
| 02/15/2022 | $10,000 | $10,000 | $10,000 |
| 10/31/2022 | $8,481 | $8,795 | $8,534 |
| 10/31/2023 | $8,935 | $8,826 | $9,029 |
| 10/31/2024 | $10,767 | $9,757 | $10,918 |
The Growth of $10,000 chart reflects a hypothetical $10,000 investment and assumes reinvestment of dividends and capital gains. Fund expenses, including management fees and other expenses were deducted.
Average Annual Total Returns
| Name | 1 Year | Since InceptionFootnote Reference(1) |
|---|---|---|
| Net Asset Value | 20.50% | 2.77% |
| Bloomberg US Aggregate Bond Index | 10.55% | (0.90)% |
| ICE Diversified US Cash Pay High Yield Healthcare Index | 20.93% | 3.30% |
| Footnote | Description |
Footnote(1) | The Fund commenced operations on February 15, 2022. Shares of XHYH were listed on the NYSE Arca, Inc. on February 17, 2022. |
The performance quoted represents past performance and does not guarantee future results. The investment return and principal will fluctuate. Investor's shares, when sold or redeemed, may be worth more or less than the original cost. Current performance may be lower or higher than the performance quoted. Returns less than one year are not annualized. Shares of the Fund are bought and sold at market price (not net asset value or "NAV") and are not individually redeemed from the Fund. The returns do not reflect the deduction of taxes that a shareholder would pay on Fund distributions or redemption of Fund shares. Visit https://bondbloxxetf.com/bondbloxx-usd-high-yield-bond-healthcare-sector-etf/ or, if residing outside of the United States, please call 800-896-5089 for more recent performance data.
XHYH
BondBloxx USD High Yield Bond Healthcare Sector ETF
NYSE Arca, Inc.
Key Fund Statistics
| Total Net Assets | $47,514,873 |
| # of Portfolio Holdings | 116 |
| Total Advisory Fees Paid During Reporting Period | $122,514 |
| Portfolio Turnover Rate | 22% |
| Expense Ratio | 0.35% |
| Shares Outstanding | 1,350,000 |
| Fund Launch Date | 2/15/2022 |
| Exchange | NYSE Arca, Inc. |
| CUSIP | 09789C408 |
Top 10 Holdings (% of Net Assets)Footnote Reference*
| Medline Borrower LP 3.88% 04/01/2029 | 4.09% |
| DaVita, Inc. 4.63% 06/01/2030 | 2.45% |
| Tenet Healthcare Corp. 6.13% 10/01/2028 | 2.43% |
| CHS/Community Health Systems, Inc. 10.88% 01/15/2032 | 2.36% |
| Medline Borrower LP 5.25% 10/01/2029 | 2.36% |
| AthenaHealth Group, Inc. 6.50% 02/15/2030 | 2.16% |
| Tenet Healthcare Corp. 6.13% 06/15/2030 | 2.04% |
| Organon & Co./Organon Foreign Debt Co.-Issuer BV 4.13% 04/30/2028 | 1.93% |
| Organon & Co./Organon Foreign Debt Co.-Issuer BV 5.13% 04/30/2031 | 1.78% |
| CHS/Community Health Systems, Inc. 5.63% 03/15/2027 | 1.66% |
| Footnote | Description |
Footnote* | Subject to change |
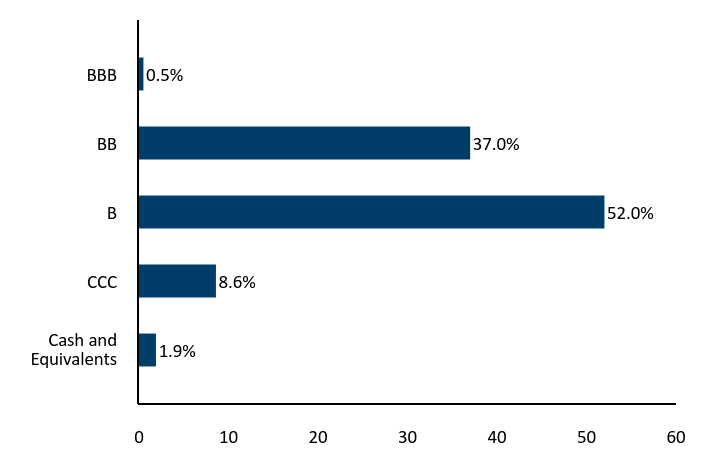
Credit Rating BreakdownFootnote Reference* (% of Net Assets)
| Value | Value |
|---|---|
| Cash and Equivalents | 1.9% |
| CCC | 8.6% |
| B | 52.0% |
| BB | 37.0% |
| BBB | 0.5% |
| Footnote | Description |
Footnote* | Credit quality ratings on underlying securities of the Fund are received from S&P Global Ratings (“S&P”), Moody’s Investors Service, Inc. (“Moody’s”) and Fitch Ratings, Inc. ("Fitch") and converted to the equivalent S&P major rating category. This breakdown is provided by Bloomberg. Not rated securities do not necessarily indicate low quality. Below investment grade is represented by a rating of BB and below. Ratings and portfolio credit quality may change over time. |
Maturity BreakdownFootnote Reference* (% of Net Assets)
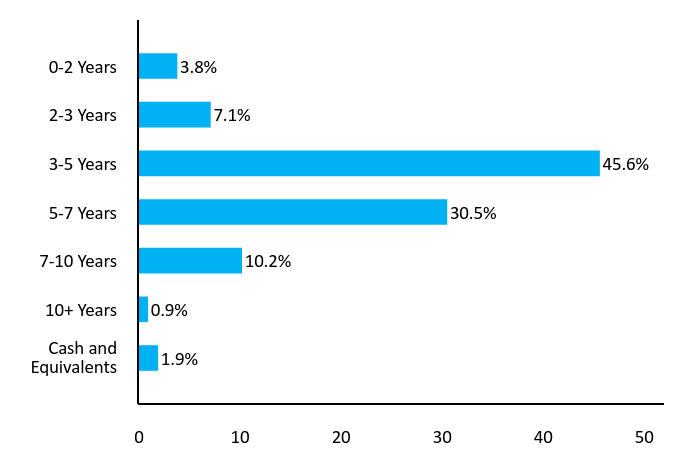
| Value | Value |
|---|---|
| Cash and Equivalents | 1.9% |
| 10+ Years | 0.9% |
| 7-10 Years | 10.2% |
| 5-7 Years | 30.5% |
| 3-5 Years | 45.6% |
| 2-3 Years | 7.1% |
| 0-2 Years | 3.8% |
| Footnote | Description |
Footnote* | This chart represents the amount by percentage (%) maturity breakdown of bonds in the Fund. |
Sub-Sector Breakdown (% of Net Assets)
| Healthcare-Services | 52.4% |
| Pharmaceuticals | 18.9% |
| Healthcare-Products | 15.3% |
| Commercial Services | 6.2% |
| Software | 2.5% |
| Cosmetics/Personal Care | 2.5% |
| Biotechnology | 0.3% |
| Cash and Equivalents | 1.9% |
XHYH
BondBloxx USD High Yield Bond Healthcare Sector ETF
NYSE Arca, Inc.
Disclosures
Securities that are rated below investment-grade (sometimes referred to as “junk bonds”) may be deemed speculative, may involve greater levels of risk than higher-rated securities of similar maturity and may be more likely to default. The Fund’s income may decline if interest rates fall. Debt issuers and other counterparties may be unable or unwilling to make timely interest and/or principal payments when due or otherwise honor their obligations.
Privately issued securities are generally not traded on established markets. As a result of the absence of a public trading market, privately issued securities may be deemed to be illiquid investments, may be more difficult to value than publicly traded securities and may be subject to wide fluctuations in value. The Fund is classified as a ”non-diversified” fund under the Investment Company Act of 1940 (the "1940 Act"). The Fund may be susceptible to an increased risk of loss to the extent that the Fund’s investments are concentrated in the securities and/or other assets of a particular issuer or issuers, sector, sub-sector, market segment, market, industry, group of industries, country, group of countries, region or asset class.
Exchange-traded fund ("ETF") shares are bought and sold at market price (not NAV) and are not individually redeemed from the Fund. NAV Returns are calculated using the daily 4:00pm NAV. Market price returns reflect the midpoint of the bid/ask spread as of the close of trading on the exchange where Fund shares are listed. Market price returns do not represent the returns you would receive if you traded shares at other times.
Distributed by Foreside Fund Services, LLC. BondBloxx is a registered investment adviser.
Additional Information
For additional information about the Fund, including its prospectus, financial information, holdings and proxy voting information, please visit https://bondbloxxetf.com/bondbloxx-usd-high-yield-bond-healthcare-sector-etf/. For proxy voting records, visit https://bondbloxxetf.com/resources/.

Householding
To reduce Fund expenses, only one copy of most shareholder documents may be mailed to shareholders with multiple accounts at the same address ("householding"). If you prefer that your Fund documents not be householded, please contact BondBloxx at 800-896-5089 or contact your financial intermediary. Your instructions will typically be effective within 30 days of receipt by BondBloxx or your financial intermediary.
BBLX XHYH 1024

XHYF
BondBloxx USD High Yield Bond Financial & REIT Sector ETF
NYSE Arca, Inc.
Annual Shareholder Report as of October 31, 2024
The BondBloxx USD High Yield Bond Financial & REIT Sector ETF (the "Fund") seeks to track the investment results of an index composed of U.S. dollar-denominated, high yield corporate bonds in the financial and REIT sector.
This annual shareholder report contains important information about the Fund for the period from November 1, 2023 to October 31, 2024. You can find additional information about the Fund at https://bondbloxxetf.com/bondbloxx-usd-high-yield-bond-financial-and-reit-sector-etf/. You can also request this information by contacting us at 800-896-5089.
What Were The Fund Costs For The Last Year?
(based on a hypothetical $10,000 investment)
| Fund name | Cost of a $10,000 investment | Cost paid as a % of a $10,000 investment |
|---|---|---|
| BondBloxx USD High Yield Bond Financial & REIT Sector ETF | $38 | 0.35% |
How Did The Fund Perform Last Year?
For the fiscal year ended October 31, 2024, the Fund generated a total return of 16.89%, generally in line with its benchmark, the ICE Diversified US Cash Pay High Yield Financial & REIT Index, which returned 17.28%.
The Fund’s performance was driven by a combination of income from coupon payments (“income return”) and price gains, driven by declining Treasury yields and a reduction in yield premiums during the period. Resilient economic growth, strong corporate earnings, and healthy capital markets helped to drive investor confidence and positive performance across much of the US High Yield asset class.
In the financial & REIT sector, positive performance contribution was diversified across numerous bond issuers, with resilient economic conditions supporting subsectors including financial services, REITs, and insurance.
Growth Of $10,000 USD Since Inception
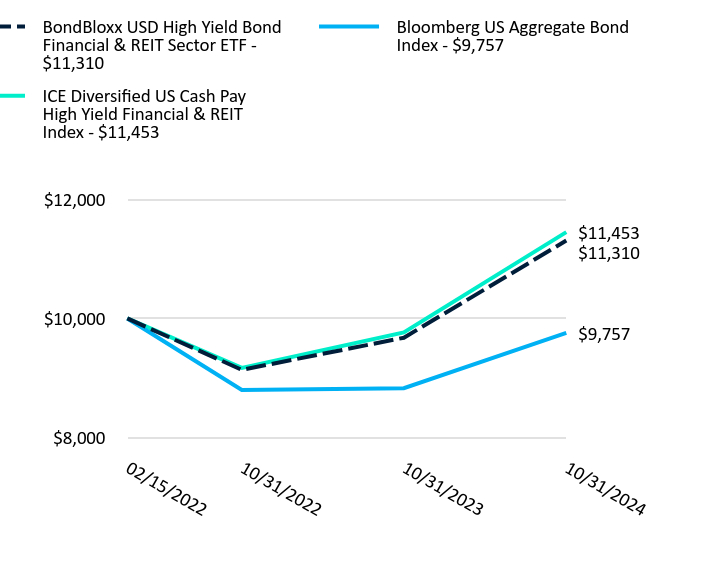
| BondBloxx USD High Yield Bond Financial & REIT Sector ETF | Bloomberg US Aggregate Bond Index | ICE Diversified US Cash Pay High Yield Financial & REIT Index | |
|---|---|---|---|
| 02/15/2022 | $10,000 | $10,000 | $10,000 |
| 10/31/2022 | $9,135 | $8,795 | $9,167 |
| 10/31/2023 | $9,675 | $8,826 | $9,765 |
| 10/31/2024 | $11,310 | $9,757 | $11,453 |
The Growth of $10,000 chart reflects a hypothetical $10,000 investment and assumes reinvestment of dividends and capital gains. Fund expenses, including management fees and other expenses were deducted.
Average Annual Total Returns
| Name | 1 Year | Since InceptionFootnote Reference(1) |
|---|---|---|
| Net Asset Value | 16.89% | 4.66% |
| Bloomberg US Aggregate Bond Index | 10.55% | (0.90)% |
| ICE Diversified US Cash Pay High Yield Financial & REIT Index | 17.28% | 5.14% |
| Footnote | Description |
Footnote(1) | The Fund commenced operations on February 15, 2022. Shares of XHYF were listed on the NYSE Arca, Inc. on February 17, 2022. |
The performance quoted represents past performance and does not guarantee future results. The investment return and principal will fluctuate. Investor's shares, when sold or redeemed, may be worth more or less than the original cost. Current performance may be lower or higher than the performance quoted. Returns less than one year are not annualized. Shares of the Fund are bought and sold at market price (not net asset value or "NAV") and are not individually redeemed from the Fund. The returns do not reflect the deduction of taxes that a shareholder would pay on Fund distributions or redemption of Fund shares. Visit https://bondbloxxetf.com/bondbloxx-usd-high-yield-bond-financial-and-reit-sector-etf/ or, if residing outside of the United States, please call 800-896-5089 for more recent performance data.
XHYF
BondBloxx USD High Yield Bond Financial & REIT Sector ETF
NYSE Arca, Inc.
Key Fund Statistics
| Total Net Assets | $58,221,392 |
| # of Portfolio Holdings | 262 |
| Total Advisory Fees Paid During Reporting Period | $151,449 |
| Portfolio Turnover Rate | 43% |
| Expense Ratio | 0.35% |
| Shares Outstanding | 1,550,000 |
| Fund Launch Date | 2/15/2022 |
| Exchange | NYSE Arca, Inc. |
| CUSIP | 09789C309 |
Top 10 Holdings (% of Net Assets)Footnote Reference*
| HUB International Ltd. 7.25% 06/15/2030 | 1.85% |
| Uniti Group LP/Uniti Group Finance 2019, Inc./CSL Capital LLC 10.50% 02/15/2028 | 1.83% |
| Panther Escrow Issuer LLC 7.13% 06/01/2031 | 1.68% |
| Boost Newco Borrower LLC 7.50% 01/15/2031 | 1.27% |
| Block, Inc. 6.50% 05/15/2032 | 1.11% |
| HUB International Ltd. 7.38% 01/31/2032 | 1.06% |
| OneMain Finance Corp. 7.13% 03/15/2026 | 0.86% |
| Jane Street Group/JSG Finance, Inc. 7.13% 04/30/2031 | 0.84% |
| Intesa Sanpaolo SpA 5.71% 01/15/2026 | 0.82% |
| Alliant Holdings Intermediate LLC/Alliant Holdings Co.-Issuer, Inc. 7.00% 01/15/2031 | 0.80% |
| Footnote | Description |
Footnote* | Subject to change |
Credit Rating BreakdownFootnote Reference* (% of Net Assets)
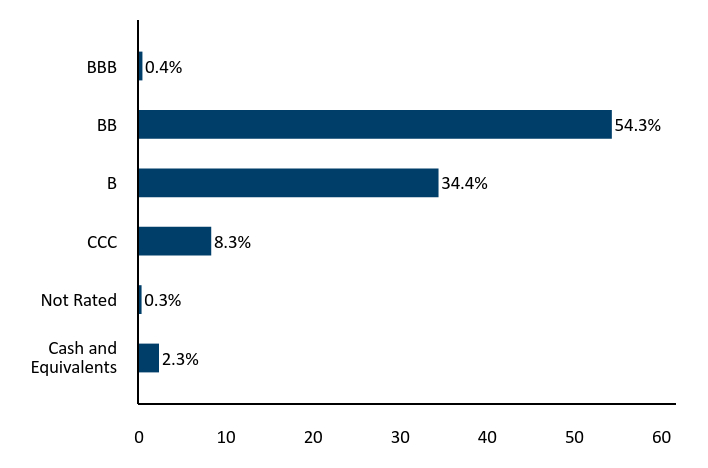
| Value | Value |
|---|---|
| Cash and Equivalents | 2.3% |
| Not Rated | 0.3% |
| CCC | 8.3% |
| B | 34.4% |
| BB | 54.3% |
| BBB | 0.4% |
| Footnote | Description |
Footnote* | Credit quality ratings on underlying securities of the Fund are received from S&P Global Ratings (“S&P”), Moody’s Investors Service, Inc. (“Moody’s”) and Fitch Ratings, Inc. ("Fitch") and converted to the equivalent S&P major rating category. This breakdown is provided by Bloomberg. Not rated securities do not necessarily indicate low quality. Below investment grade is represented by a rating of BB and below. Ratings and portfolio credit quality may change over time. |
Maturity BreakdownFootnote Reference* (% of Net Assets)
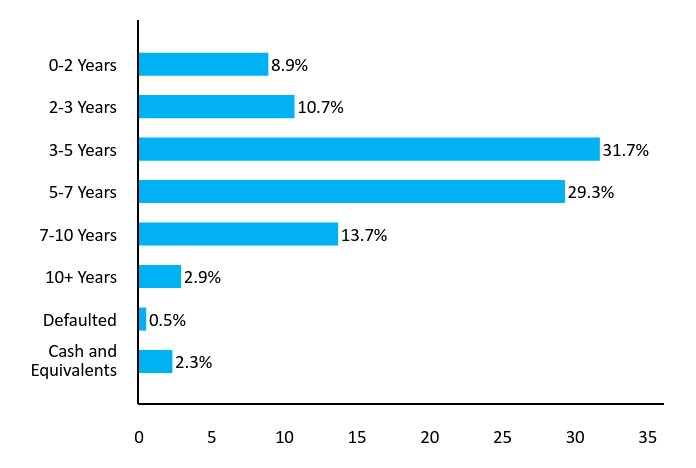
| Value | Value |
|---|---|
| Cash and Equivalents | 2.3% |
| Defaulted | 0.5% |
| 10+ Years | 2.9% |
| 7-10 Years | 13.7% |
| 5-7 Years | 29.3% |
| 3-5 Years | 31.7% |
| 2-3 Years | 10.7% |
| 0-2 Years | 8.9% |
| Footnote | Description |
Footnote* | This chart represents the amount by percentage (%) maturity breakdown of bonds in the Fund. |
Sub-Sector Breakdown (% of Net Assets)
| Diversified Financial Services | 32.7% |
| Real Estate Investment Trusts (REITS) | 24.1% |
| Insurance | 19.0% |
| Banks | 7.0% |
| Commercial Services | 5.5% |
| Investment Companies | 3.2% |
| Trucking & Leasing | 1.9% |
| Advertising | 1.1% |
| Retail | 0.8% |
| Others | 2.4% |
| Cash and Equivalents | 2.3% |
XHYF
BondBloxx USD High Yield Bond Financial & REIT Sector ETF
NYSE Arca, Inc.
Disclosures
Securities that are rated below investment-grade (sometimes referred to as “junk bonds”) may be deemed speculative, may involve greater levels of risk than higher-rated securities of similar maturity and may be more likely to default. The Fund’s income may decline if interest rates fall. Debt issuers and other counterparties may be unable or unwilling to make timely interest and/or principal payments when due or otherwise honor their obligations.
Privately issued securities are generally not traded on established markets. As a result of the absence of a public trading market, privately issued securities may be deemed to be illiquid investments, may be more difficult to value than publicly traded securities and may be subject to wide fluctuations in value. The Fund is classified as a ”non-diversified” fund under the Investment Company Act of 1940 (the "1940 Act"). The Fund may be susceptible to an increased risk of loss to the extent that the Fund’s investments are concentrated in the securities and/or other assets of a particular issuer or issuers, sector, sub-sector, market segment, market, industry, group of industries, country, group of countries, region or asset class.
Exchange-traded fund ("ETF") shares are bought and sold at market price (not NAV) and are not individually redeemed from the Fund. NAV Returns are calculated using the daily 4:00pm NAV. Market price returns reflect the midpoint of the bid/ask spread as of the close of trading on the exchange where Fund shares are listed. Market price returns do not represent the returns you would receive if you traded shares at other times.
Distributed by Foreside Fund Services, LLC. BondBloxx is a registered investment adviser.
Additional Information
For additional information about the Fund, including its prospectus, financial information, holdings and proxy voting information, please visit https://bondbloxxetf.com/bondbloxx-usd-high-yield-bond-financial-and-reit-sector-etf/. For proxy voting records, visit https://bondbloxxetf.com/resources/.

Householding
To reduce Fund expenses, only one copy of most shareholder documents may be mailed to shareholders with multiple accounts at the same address ("householding"). If you prefer that your Fund documents not be householded, please contact BondBloxx at 800-896-5089 or contact your financial intermediary. Your instructions will typically be effective within 30 days of receipt by BondBloxx or your financial intermediary.
BBLX XHYF 1024

XHYE
BondBloxx USD High Yield Bond Energy Sector ETF
NYSE Arca, Inc.
Annual Shareholder Report as of October 31, 2024
The BondBloxx USD High Yield Bond Energy Sector ETF (the "Fund") seeks to track the investment results of an index composed of U.S. dollar-denominated, high yield corporate bonds in the energy sector.
This annual shareholder report contains important information about the Fund for the period from November 1, 2023 to October 31, 2024. You can find additional information about the Fund at https://bondbloxxetf.com/bondbloxx-usd-high-yield-bond-energy-sector-etf/. You can also request this information by contacting us at 800-896-5089.
What Were The Fund Costs For The Last Year?
(based on a hypothetical $10,000 investment)
| Fund name | Cost of a $10,000 investment | Cost paid as a % of a $10,000 investment |
|---|---|---|
| BondBloxx USD High Yield Bond Energy Sector ETF | $37 | 0.35% |
How Did The Fund Perform Last Year?
For the fiscal year ended October 31, 2024, the Fund generated a total return of 12.32%, generally in line with its benchmark, the ICE Diversified US Cash Pay High Yield Energy Index, which returned 12.77%.
The Fund’s performance was driven by a combination of income from coupon payments (“income return”) and price gains, driven by declining Treasury yields and a reduction in yield premiums during the period. Resilient economic growth, strong corporate earnings, and healthy capital markets helped to drive investor confidence and positive performance across much of the US High Yield asset class.
In the energy sector, positive performance contribution was diversified across numerous bond issuers, with robust economic growth supporting energy demand and global oil prices at levels higher than most of the previous decade for much of the period boosting profitability of companies in the sector.
Growth Of $10,000 USD Since Inception
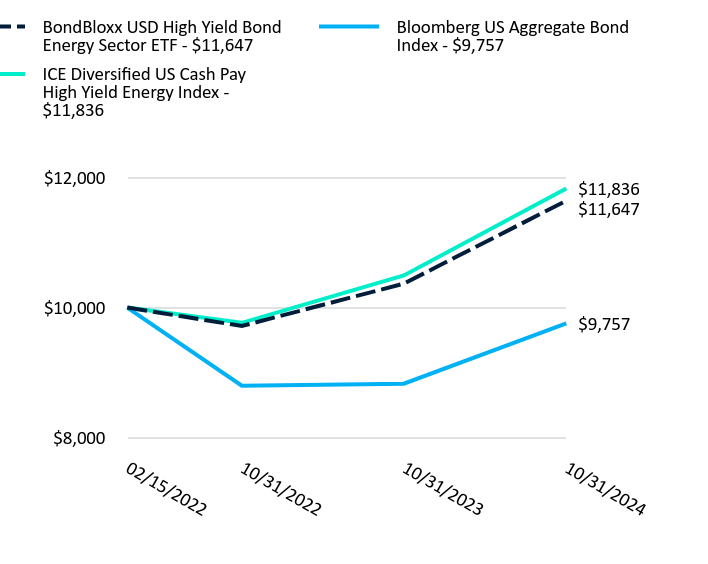
| BondBloxx USD High Yield Bond Energy Sector ETF | Bloomberg US Aggregate Bond Index | ICE Diversified US Cash Pay High Yield Energy Index | |
|---|---|---|---|
| 02/15/2022 | $10,000 | $10,000 | $10,000 |
| 10/31/2022 | $9,716 | $8,795 | $9,765 |
| 10/31/2023 | $10,369 | $8,826 | $10,496 |
| 10/31/2024 | $11,647 | $9,757 | $11,836 |
The Growth of $10,000 chart reflects a hypothetical $10,000 investment and assumes reinvestment of dividends and capital gains. Fund expenses, including management fees and other expenses were deducted.
Average Annual Total Returns
| Name | 1 Year | Since InceptionFootnote Reference(1) |
|---|---|---|
| Net Asset Value | 12.32% | 5.79% |
| Bloomberg US Aggregate Bond Index | 10.55% | (0.90)% |
| ICE Diversified US Cash Pay High Yield Energy Index | 12.77% | 6.42% |
| Footnote | Description |
Footnote(1) | The Fund commenced operations on February 15, 2022. Shares of XHYE were listed on the NYSE Arca, Inc. on February 17, 2022. |
The performance quoted represents past performance and does not guarantee future results. The investment return and principal will fluctuate. Investor's shares, when sold or redeemed, may be worth more or less than the original cost. Current performance may be lower or higher than the performance quoted. Returns less than one year are not annualized. Shares of the Fund are bought and sold at market price (not net asset value or "NAV") and are not individually redeemed from the Fund. The returns do not reflect the deduction of taxes that a shareholder would pay on Fund distributions or redemption of Fund shares. Visit https://bondbloxxetf.com/bondbloxx-usd-high-yield-bond-energy-sector-etf/ or, if residing outside of the United States, please call 800-896-5089 for more recent performance data.
XHYE
BondBloxx USD High Yield Bond Energy Sector ETF
NYSE Arca, Inc.
Key Fund Statistics
| Total Net Assets | $13,674,457 |
| # of Portfolio Holdings | 219 |
| Total Advisory Fees Paid During Reporting Period | $146,768 |
| Portfolio Turnover Rate | 41% |
| Expense Ratio | 0.35% |
| Shares Outstanding | 352,500 |
| Fund Launch Date | 2/15/2022 |
| Exchange | NYSE Arca, Inc. |
| CUSIP | 097890107 |
Top 10 Holdings (% of Net Assets)Footnote Reference*
| Venture Global LNG, Inc. 9.50% 02/01/2029 | 2.26% |
| Citibank, New York 4.18% 11/01/2024 | 1.88% |
| Venture Global LNG, Inc. 8.38% 06/01/2031 | 1.63% |
| Venture Global LNG, Inc. 8.13% 06/01/2028 | 1.48% |
| Venture Global LNG, Inc. 9.88% 02/01/2032 | 1.40% |
| Weatherford International Ltd. 8.63% 04/30/2030 | 1.13% |
| Comstock Resources, Inc. 6.75% 03/01/2029 | 1.02% |
| Civitas Resources, Inc. 8.75% 07/01/2031 | 1.00% |
| Noble Finance II LLC 8.00% 04/15/2030 | 0.96% |
| Venture Global LNG, Inc. 7.00% 01/15/2030 | 0.96% |
| Footnote | Description |
Footnote* | Subject to change |
Credit Rating BreakdownFootnote Reference* (% of Net Assets)
| Value | Value |
|---|---|
| Cash and Equivalents | 2.6% |
| CCC | 2.0% |
| B | 28.8% |
| BB | 61.7% |
| BBB | 4.9% |
| Footnote | Description |
Footnote* | Credit quality ratings on underlying securities of the Fund are received from S&P Global Ratings (“S&P”), Moody’s Investors Service, Inc. (“Moody’s”) and Fitch Ratings, Inc. ("Fitch") and converted to the equivalent S&P major rating category. This breakdown is provided by BondBloxx Investment Management Corporation ("BondBloxx") and takes the medium rating of the three agencies when all three agencies rate a security, the lower of the two ratings if only two agencies rate a security, and one rating if that is all that is provided. Unrated securities do not necessarily indicate low quality. Below investment grade is represented by a rating of BB and below. Ratings and portfolio credit quality may change over time. |
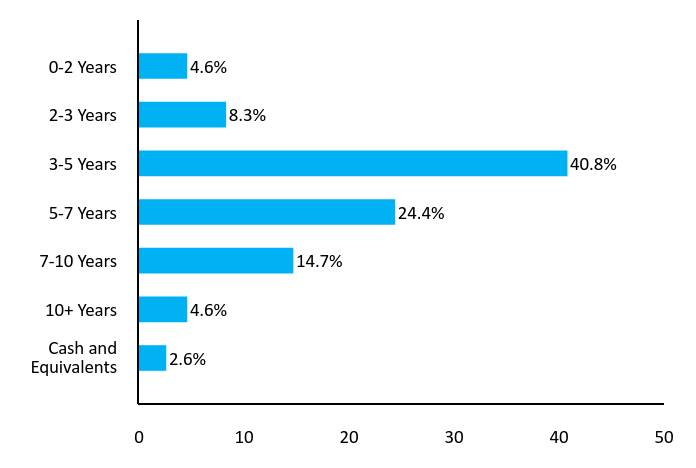
Maturity BreakdownFootnote Reference* (% of Net Assets)
| Value | Value |
|---|---|
| Cash and Equivalents | 2.6% |
| 10+ Years | 4.6% |
| 7-10 Years | 14.7% |
| 5-7 Years | 24.4% |
| 3-5 Years | 40.8% |
| 2-3 Years | 8.3% |
| 0-2 Years | 4.6% |
| Footnote | Description |
Footnote* | This chart represents the amount by percentage (%) maturity breakdown of bonds in the Fund. |
Sub-Sector Breakdown (% of Net Assets)
| Oil & Gas | 48.0% |
| Pipelines | 41.8% |
| Oil & Gas Services | 5.7% |
| Chemicals | 0.7% |
| Gas | 0.6% |
| Retail | 0.6% |
| Cash and Equivalents | 2.6% |
XHYE
BondBloxx USD High Yield Bond Energy Sector ETF
NYSE Arca, Inc.
Disclosures
Securities that are rated below investment-grade (sometimes referred to as “junk bonds”) may be deemed speculative, may involve greater levels of risk than higher-rated securities of similar maturity and may be more likely to default. The Fund’s income may decline if interest rates fall. Debt issuers and other counterparties may be unable or unwilling to make timely interest and/or principal payments when due or otherwise honor their obligations.
Privately issued securities are generally not traded on established markets. As a result of the absence of a public trading market, privately issued securities may be deemed to be illiquid investments, may be more difficult to value than publicly traded securities and may be subject to wide fluctuations in value. The Fund is classified as a ”non-diversified” fund under the Investment Company Act of 1940 (the "1940 Act"). The Fund may be susceptible to an increased risk of loss to the extent that the Fund’s investments are concentrated in the securities and/or other assets of a particular issuer or issuers, sector, sub-sector, market segment, market, industry, group of industries, country, group of countries, region or asset class.
Exchange-traded fund ("ETF") shares are bought and sold at market price (not NAV) and are not individually redeemed from the Fund. NAV Returns are calculated using the daily 4:00pm NAV. Market price returns reflect the midpoint of the bid/ask spread as of the close of trading on the exchange where Fund shares are listed. Market price returns do not represent the returns you would receive if you traded shares at other times.
Distributed by Foreside Fund Services, LLC. BondBloxx is a registered investment adviser.
Additional Information
For additional information about the Fund, including its prospectus, financial information, holdings and proxy voting information, please visit https://bondbloxxetf.com/bondbloxx-usd-high-yield-bond-energy-sector-etf/. For proxy voting records, visit https://bondbloxxetf.com/resources/.

Householding
To reduce Fund expenses, only one copy of most shareholder documents may be mailed to shareholders with multiple accounts at the same address ("householding"). If you prefer that your Fund documents not be householded, please contact BondBloxx at 800-896-5089 or contact your financial intermediary. Your instructions will typically be effective within 30 days of receipt by BondBloxx or your financial intermediary.
BBLX XHYE 1024

XHYC
BondBloxx USD High Yield Bond Consumer Cyclicals Sector ETF
NYSE Arca, Inc.
Annual Shareholder Report as of October 31, 2024
The BondBloxx USD High Yield Bond Consumer Cyclicals Sector ETF (the "Fund") seeks to track the investment results of an index composed of U.S. dollar-denominated, high yield corporate bonds in the consumer cyclicals sector.
This annual shareholder report contains important information about the Fund for the period from November 1, 2023 to October 31, 2024. You can find additional information about the Fund at https://bondbloxxetf.com/bondbloxx-usd-high-yield-bond-consumer-cyclicals-sector-etf/. You can also request this information by contacting us at 800-896-5089.
What Were The Fund Costs For The Last Year?
(based on a hypothetical $10,000 investment)
| Fund name | Cost of a $10,000 investment | Cost paid as a % of a $10,000 investment |
|---|---|---|
| BondBloxx USD High Yield Bond Consumer Cyclicals Sector ETF | $38 | 0.35% |
How Did The Fund Perform Last Year?
For the fiscal year ended October 31, 2024, the Fund generated a total return of 15.09%, generally in line with its benchmark, the ICE Diversified US Cash Pay High Yield Consumer Cyclical Index, which returned 15.48%.
The Fund’s performance was driven by a combination of income from coupon payments (“income return”) and price gains, driven by declining Treasury yields and a reduction in yield premiums during the period. Resilient economic growth, strong corporate earnings, and healthy capital markets helped to drive investor confidence and positive performance across much of the US High Yield asset class.
In the consumer cyclicals sector, positive performance contribution was diversified across numerous bond issuers, notably as many companies in the leisure, retail and hospitality space continued to recover from the effects of the COVID-19 pandemic.
Growth Of $10,000 USD Since Inception

| BondBloxx USD High Yield Bond Consumer Cyclicals Sector ETF | Bloomberg US Aggregate Bond Index | ICE Diversified US Cash Pay High Yield Consumer Cyclical Index | |
|---|---|---|---|
| 02/15/2022 | $10,000 | $10,000 | $10,000 |
| 10/31/2022 | $9,004 | $8,795 | $9,015 |
| 10/31/2023 | $9,722 | $8,826 | $9,810 |
| 10/31/2024 | $11,189 | $9,757 | $11,328 |
The Growth of $10,000 chart reflects a hypothetical $10,000 investment and assumes reinvestment of dividends and capital gains. Fund expenses, including management fees and other expenses were deducted.
Average Annual Total Returns
| Name | 1 Year | Since InceptionFootnote Reference(1) |
|---|---|---|
| Net Asset Value | 15.09% | 4.24% |
| Bloomberg US Aggregate Bond Index | 10.55% | (0.90)% |
| ICE Diversified US Cash Pay High Yield Consumer Cyclical Index | 15.48% | 4.71% |
| Footnote | Description |
Footnote(1) | The Fund commenced operations on February 15, 2022. Shares of XHYC were listed on the NYSE Arca, Inc. on February 17, 2022. |
The performance quoted represents past performance and does not guarantee future results. The investment return and principal will fluctuate. Investor's shares, when sold or redeemed, may be worth more or less than the original cost. Current performance may be lower or higher than the performance quoted. Returns less than one year are not annualized. Shares of the Fund are bought and sold at market price (not net asset value or "NAV") and are not individually redeemed from the Fund. The returns do not reflect the deduction of taxes that a shareholder would pay on Fund distributions or redemption of Fund shares. Visit https://bondbloxxetf.com/bondbloxx-usd-high-yield-bond-consumer-cyclicals-sector-etf/ or, if residing outside of the United States, please call 800-896-5089 for more recent performance data.
XHYC
BondBloxx USD High Yield Bond Consumer Cyclicals Sector ETF
NYSE Arca, Inc.
Key Fund Statistics
| Total Net Assets | $71,330,399 |
| # of Portfolio Holdings | 271 |
| Total Advisory Fees Paid During Reporting Period | $159,415 |
| Portfolio Turnover Rate | 37% |
| Expense Ratio | 0.35% |
| Shares Outstanding | 1,900,000 |
| Fund Launch Date | 2/15/2022 |
| Exchange | NYSE Arca, Inc. |
| CUSIP | 09789C101 |
Top 10 Holdings (% of Net Assets)Footnote Reference*
| Carnival Corp. 5.75% 03/01/2027 | 1.50% |
| Carnival Holdings Bermuda Ltd. 10.38% 05/01/2028 | 1.23% |
| Rakuten Group, Inc. 9.75% 04/15/2029 | 1.19% |
| Caesars Entertainment, Inc. 7.00% 02/15/2030 | 1.16% |
| Royal Caribbean Cruises Ltd. 6.00% 02/01/2033 | 1.10% |
| Carnival Corp. 6.00% 05/01/2029 | 1.09% |
| Rakuten Group, Inc. 11.25% 02/15/2027 | 1.08% |
| JP Morgan Chase, New York 4.18% 11/01/2024 | 0.98% |
| Tenneco, Inc. 8.00% 11/17/2028 | 0.97% |
| Clarios Global LP/Clarios US Finance Co. 8.50% 05/15/2027 | 0.88% |
| Footnote | Description |
Footnote* | Subject to change |
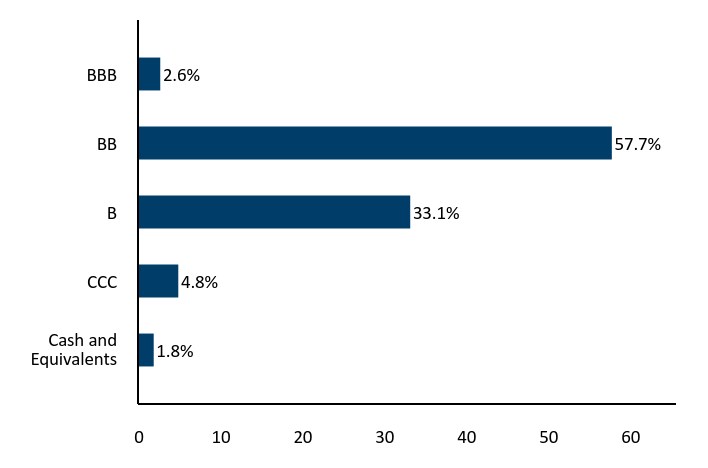
Credit Rating BreakdownFootnote Reference* (% of Net Assets)
| Value | Value |
|---|---|
| Cash and Equivalents | 1.8% |
| CCC | 4.8% |
| B | 33.1% |
| BB | 57.7% |
| BBB | 2.6% |
| Footnote | Description |
Footnote* | Credit quality ratings on underlying securities of the Fund are received from S&P Global Ratings (“S&P”), Moody’s Investors Service, Inc. (“Moody’s”) and Fitch Ratings, Inc. ("Fitch") and converted to the equivalent S&P major rating category. This breakdown is provided by Bloomberg. Not rated securities do not necessarily indicate low quality. Below investment grade is represented by a rating of BB and below. Ratings and portfolio credit quality may change over time. |
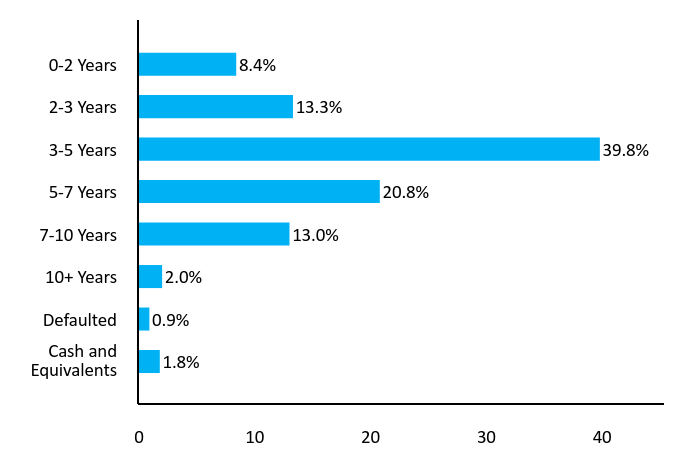
Maturity BreakdownFootnote Reference* (% of Net Assets)
| Value | Value |
|---|---|
| Cash and Equivalents | 1.8% |
| Defaulted | 0.9% |
| 10+ Years | 2.0% |
| 7-10 Years | 13.0% |
| 5-7 Years | 20.8% |
| 3-5 Years | 39.8% |
| 2-3 Years | 13.3% |
| 0-2 Years | 8.4% |
| Footnote | Description |
Footnote* | This chart represents the amount by percentage (%) maturity breakdown of bonds in the Fund. |
Sub-Sector Breakdown (% of Net Assets)
| Entertainment | 20.8% |
| Retail | 18.5% |
| Leisure Time | 17.5% |
| Lodging | 11.9% |
| Auto Parts & Equipment | 10.3% |
| Real Estate | 4.4% |
| Internet | 3.9% |
| Apparel | 3.4% |
| Auto Manufacturers | 2.7% |
| Commercial Services | 2.3% |
| Others | 2.5% |
| Cash and Equivalents | 1.8% |
XHYC
BondBloxx USD High Yield Bond Consumer Cyclicals Sector ETF
NYSE Arca, Inc.
Disclosures
Securities that are rated below investment-grade (sometimes referred to as “junk bonds”) may be deemed speculative, may involve greater levels of risk than higher-rated securities of similar maturity and may be more likely to default. The Fund’s income may decline if interest rates fall. Debt issuers and other counterparties may be unable or unwilling to make timely interest and/or principal payments when due or otherwise honor their obligations.
Privately issued securities are generally not traded on established markets. As a result of the absence of a public trading market, privately issued securities may be deemed to be illiquid investments, may be more difficult to value than publicly traded securities and may be subject to wide fluctuations in value. The Fund is classified as a ”non-diversified” fund under the Investment Company Act of 1940 (the "1940 Act"). The Fund may be susceptible to an increased risk of loss to the extent that the Fund’s investments are concentrated in the securities and/or other assets of a particular issuer or issuers, sector, sub-sector, market segment, market, industry, group of industries, country, group of countries, region or asset class.
Exchange-traded fund ("ETF") shares are bought and sold at market price (not NAV) and are not individually redeemed from the Fund. NAV Returns are calculated using the daily 4:00pm NAV. Market price returns reflect the midpoint of the bid/ask spread as of the close of trading on the exchange where Fund shares are listed. Market price returns do not represent the returns you would receive if you traded shares at other times.
Distributed by Foreside Fund Services, LLC. BondBloxx is a registered investment adviser.
Additional Information
For additional information about the Fund, including its prospectus, financial information, holdings and proxy voting information, please visit https://bondbloxxetf.com/bondbloxx-usd-high-yield-bond-consumer-cyclicals-sector-etf/. For proxy voting records, visit https://bondbloxxetf.com/resources/.

Householding
To reduce Fund expenses, only one copy of most shareholder documents may be mailed to shareholders with multiple accounts at the same address ("householding"). If you prefer that your Fund documents not be householded, please contact BondBloxx at 800-896-5089 or contact your financial intermediary. Your instructions will typically be effective within 30 days of receipt by BondBloxx or your financial intermediary.
BBLX XHYC 1024

XHYD
BondBloxx USD High Yield Bond Consumer Non-Cyclicals Sector ETF
NYSE Arca, Inc.
Annual Shareholder Report as of October 31, 2024
The BondBloxx USD High Yield Bond Consumer Non-Cyclicals Sector ETF (the "Fund") seeks to track the investment results of an index composed of U.S. dollar-denominated, high yield corporate bonds in the consumer non-cyclicals sector.
This annual shareholder report contains important information about the Fund for the period from November 1, 2023 to October 31, 2024. You can find additional information about the Fund at https://bondbloxxetf.com/bondbloxx-usd-high-yield-bond-consumer-non-cyclicals-sector-etf/. You can also request this information by contacting us at 800-896-5089.
What Were The Fund Costs For The Last Year?
(based on a hypothetical $10,000 investment)
| Fund name | Cost of a $10,000 investment | Cost paid as a % of a $10,000 investment |
|---|---|---|
| BondBloxx USD High Yield Bond Consumer Non-Cyclicals Sector ETF | $38 | 0.35% |
How Did The Fund Perform Last Year?
For the fiscal year ended October 31, 2024, the Fund generated a total return of 14.54%, generally in line with its benchmark, the ICE Diversified US Cash Pay High Yield Consumer Non-Cyclical Index, which returned 15.00%.
The Fund’s performance was driven by a combination of income from coupon payments (“income return”) and price gains, driven by declining Treasury yields and a reduction in yield premiums during the period. Resilient economic growth, strong corporate earnings, and healthy capital markets helped to drive investor confidence and positive performance across much of the US High Yield asset class.
In the consumer non-cyclicals sector, positive performance contribution was diversified across numerous bond issuers, with resilient consumer demand supporting companies in sub-sectors including restaurants, food & drug retailers, and consumer products.
Growth Of $10,000 USD Since Inception
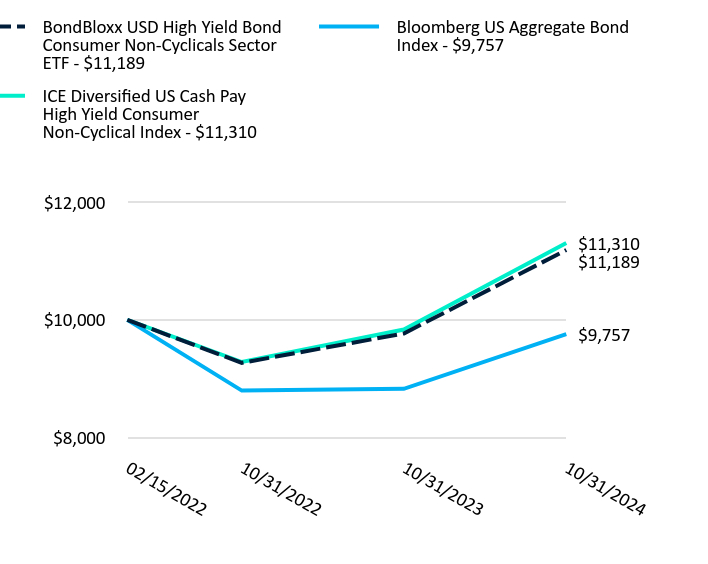
| BondBloxx USD High Yield Bond Consumer Non-Cyclicals Sector ETF | Bloomberg US Aggregate Bond Index | ICE Diversified US Cash Pay High Yield Consumer Non-Cyclical Index | |
|---|---|---|---|
| 02/15/2022 | $10,000 | $10,000 | $10,000 |
| 10/31/2022 | $9,268 | $8,795 | $9,282 |
| 10/31/2023 | $9,768 | $8,826 | $9,835 |
| 10/31/2024 | $11,189 | $9,757 | $11,310 |
The Growth of $10,000 chart reflects a hypothetical $10,000 investment and assumes reinvestment of dividends and capital gains. Fund expenses, including management fees and other expenses were deducted.
Average Annual Total Returns
| Name | 1 Year | Since InceptionFootnote Reference(1) |
|---|---|---|
| Net Asset Value | 14.54% | 4.24% |
| Bloomberg US Aggregate Bond Index | 10.55% | (0.90)% |
| ICE Diversified US Cash Pay High Yield Consumer Non-Cyclical Index | 15.00% | 4.65% |
| Footnote | Description |
Footnote(1) | The Fund commenced operations on February 15, 2022. Shares of XHYD were listed on the NYSE Arca, Inc. on February 17, 2022. |
The performance quoted represents past performance and does not guarantee future results. The investment return and principal will fluctuate. Investor's shares, when sold or redeemed, may be worth more or less than the original cost. Current performance may be lower or higher than the performance quoted. Returns less than one year are not annualized. Shares of the Fund are bought and sold at market price (not net asset value or "NAV") and are not individually redeemed from the Fund. The returns do not reflect the deduction of taxes that a shareholder would pay on Fund distributions or redemption of Fund shares. Visit https://bondbloxxetf.com/bondbloxx-usd-high-yield-bond-consumer-non-cyclicals-sector-etf/ or, if residing outside of the United States, please call 800-896-5089 for more recent performance data.
XHYD
BondBloxx USD High Yield Bond Consumer Non-Cyclicals Sector ETF
NYSE Arca, Inc.
Key Fund Statistics
| Total Net Assets | $30,461,391 |
| # of Portfolio Holdings | 181 |
| Total Advisory Fees Paid During Reporting Period | $47,416 |
| Portfolio Turnover Rate | 34% |
| Expense Ratio | 0.35% |
| Shares Outstanding | 800,000 |
| Fund Launch Date | 2/15/2022 |
| Exchange | NYSE Arca, Inc. |
| CUSIP | 09789C200 |
Top 10 Holdings (% of Net Assets)Footnote Reference*
| JP Morgan Chase, New York 4.18% 11/01/2024 | 2.75% |
| 1011778 BC ULC/New Red Finance, Inc. 4.00% 10/15/2030 | 2.06% |
| Newell Brands, Inc. 5.70% 04/01/2026 | 1.56% |
| Kroger Co. 4.70% 08/15/2026 | 1.37% |
| Electricite de France SA 9.13% | 1.34% |
| Lightning Power LLC 7.25% 08/15/2032 | 1.23% |
| Vistra Operations Co. LLC 7.75% 10/15/2031 | 1.21% |
| 1011778 BC ULC/New Red Finance, Inc. 3.88% 01/15/2028 | 1.15% |
| Calpine Corp. 5.13% 03/15/2028 | 1.11% |
| Post Holdings, Inc. 4.63% 04/15/2030 | 1.08% |
| Footnote | Description |
Footnote* | Subject to change |
Credit Rating BreakdownFootnote Reference* (% of Net Assets)
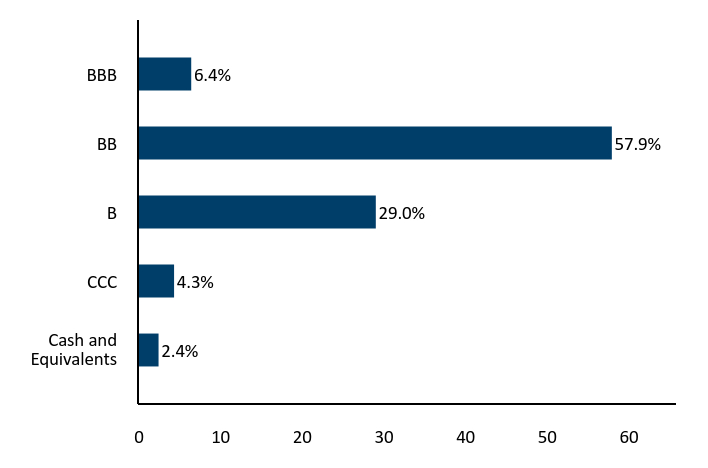
| Value | Value |
|---|---|
| Cash and Equivalents | 2.4% |
| CCC | 4.3% |
| B | 29.0% |
| BB | 57.9% |
| BBB | 6.4% |
| Footnote | Description |
Footnote* | Credit quality ratings on underlying securities of the Fund are received from S&P Global Ratings (“S&P”), Moody’s Investors Service, Inc. (“Moody’s”) and Fitch Ratings, Inc. ("Fitch") and converted to the equivalent S&P major rating category. This breakdown is provided by Bloomberg. Not rated securities do not necessarily indicate low quality. Below investment grade is represented by a rating of BB and below. Ratings and portfolio credit quality may change over time. |
Maturity BreakdownFootnote Reference* (% of Net Assets)
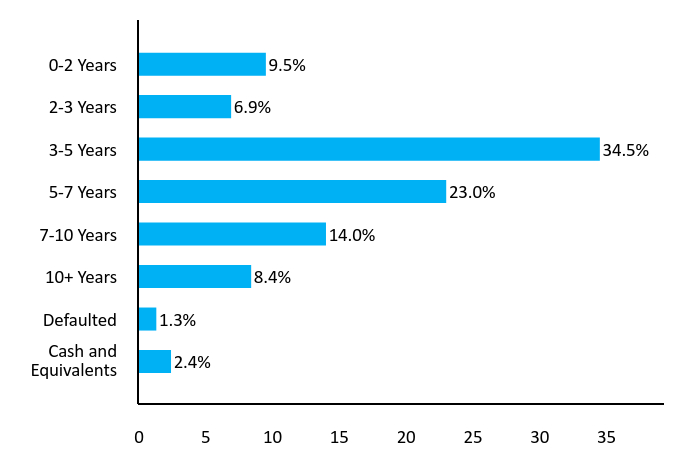
| Value | Value |
|---|---|
| Cash and Equivalents | 2.4% |
| Defaulted | 1.3% |
| 10+ Years | 8.4% |
| 7-10 Years | 14.0% |
| 5-7 Years | 23.0% |
| 3-5 Years | 34.5% |
| 2-3 Years | 6.9% |
| 0-2 Years | 9.5% |
| Footnote | Description |
Footnote* | This chart represents the amount by percentage (%) maturity breakdown of bonds in the Fund. |
Sub-Sector Breakdown (% of Net Assets)
| Electric | 29.0% |
| Food | 25.0% |
| Retail | 19.9% |
| Housewares | 5.3% |
| Cosmetics/Personal Care | 2.6% |
| Household Products/Wares | 2.1% |
| Energy-Alternate Sources | 2.1% |
| Agriculture | 1.8% |
| Leisure Time | 1.8% |
| Others | 8.0% |
| Cash and Equivalents | 2.4% |
XHYD
BondBloxx USD High Yield Bond Consumer Non-Cyclicals Sector ETF
NYSE Arca, Inc.
Disclosures
Securities that are rated below investment-grade (sometimes referred to as “junk bonds”) may be deemed speculative, may involve greater levels of risk than higher-rated securities of similar maturity and may be more likely to default. The Fund’s income may decline if interest rates fall. Debt issuers and other counterparties may be unable or unwilling to make timely interest and/or principal payments when due or otherwise honor their obligations.
Privately issued securities are generally not traded on established markets. As a result of the absence of a public trading market, privately issued securities may be deemed to be illiquid investments, may be more difficult to value than publicly traded securities and may be subject to wide fluctuations in value. The Fund is classified as a ”non-diversified” fund under the Investment Company Act of 1940 (the "1940 Act"). The Fund may be susceptible to an increased risk of loss to the extent that the Fund’s investments are concentrated in the securities and/or other assets of a particular issuer or issuers, sector, sub-sector, market segment, market, industry, group of industries, country, group of countries, region or asset class.
Exchange-traded fund ("ETF") shares are bought and sold at market price (not NAV) and are not individually redeemed from the Fund. NAV Returns are calculated using the daily 4:00pm NAV. Market price returns reflect the midpoint of the bid/ask spread as of the close of trading on the exchange where Fund shares are listed. Market price returns do not represent the returns you would receive if you traded shares at other times.
Distributed by Foreside Fund Services, LLC. BondBloxx is a registered investment adviser.
Additional Information
For additional information about the Fund, including its prospectus, financial information, holdings and proxy voting information, please visit https://bondbloxxetf.com/bondbloxx-usd-high-yield-bond-consumer-non-cyclicals-sector-etf/. For proxy voting records, visit https://bondbloxxetf.com/resources/.

Householding
To reduce Fund expenses, only one copy of most shareholder documents may be mailed to shareholders with multiple accounts at the same address ("householding"). If you prefer that your Fund documents not be householded, please contact BondBloxx at 800-896-5089 or contact your financial intermediary. Your instructions will typically be effective within 30 days of receipt by BondBloxx or your financial intermediary.
BBLX XHYD 1024

HYSA
BondBloxx USD High Yield Bond Sector Rotation ETF
NYSE Arca, Inc.
Annual Shareholder Report as of October 31, 2024
The BondBloxx USD High Yield Bond Sector Rotation ETF (the "Fund") seeks to provide total return by primarily investing its assets in U.S. dollar-denominated, high yield corporate bonds in the various sectors of the fixed income securities market through other exchange-traded funds ("ETFs").
This annual shareholder report contains important information about the Fund for the period from November 1, 2023 to October 31, 2024. You can find additional information about the Fund at https://bondbloxxetf.com/bondbloxx-usd-high-yield-bond-sector-rotation-etf/. You can also request this information by contacting us at 800-896-5089.
What Were The Fund Costs For The Last Year?
(based on a hypothetical $10,000 investment)
| Fund name | Cost of a $10,000 investment | Cost paid as a % of a $10,000 investment |
|---|---|---|
| BondBloxx USD High Yield Bond Sector Rotation ETF | $59 | 0.55%Footnote Reference* |
| Footnote | Description |
Footnote* | Including affiliated acquired fund fees and expenses. |
How Did The Fund Perform Last Year?
For the fiscal year ended October 31, 2024, the Fund generated a total return of 14.75%, underperforming its benchmark, the ICE BofA US Cash Pay High Yield Constrained Index, which returned 16.35%.
Factors that contributed to positive returns included performance of the underlying funds which reported positive results for the period as a result of coupon payments and high yield security price increases, the latter stemming from lower Treasury yields and falling yield premiums as investors expressed confidence in US economic growth and the ability of high yield issuers to service their debt payments.
Factors that contributed to underperformance of the Fund relative to the index included a slightly higher ratings-quality tilt of the underlying funds as compared to the index (the underlying funds normally do not invest in securities that are rated below CCC) and a decrease in the premium to NAV of the market prices of the underlying ETFs, when compared to the period one year prior.
Growth Of $10,000 USD Since Inception
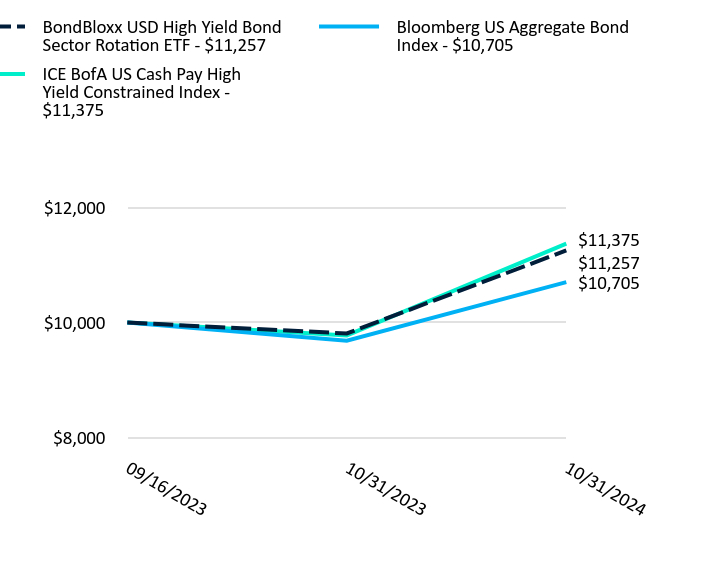
| BondBloxx USD High Yield Bond Sector Rotation ETF | Bloomberg US Aggregate Bond Index | ICE BofA US Cash Pay High Yield Constrained Index | |
|---|---|---|---|
| 09/16/2023 | $10,000 | $10,000 | $10,000 |
| 10/31/2023 | $9,810 | $9,683 | $9,776 |
| 10/31/2024 | $11,257 | $10,705 | $11,375 |
The Growth of $10,000 chart reflects a hypothetical $10,000 investment and assumes reinvestment of dividends and capital gains. Fund expenses, including management fees and other expenses were deducted.
Average Annual Total Returns
| Name | 1 YearFootnote Reference(1) | Since InceptionFootnote Reference(1) |
|---|---|---|
| Net Asset Value | 14.75% | 11.17% |
| Bloomberg US Aggregate Bond Index | 10.55% | 6.28% |
| ICE BofA US Cash Pay High Yield Constrained Index | 16.35% | 12.22% |
| Footnote | Description |
Footnote(1) | The Fund commenced operations on November 6, 2012.The Fund was acquired from the Predecessor ETF as of the close of business on September 15, 2023. Shares of HYSA were listed on the NYSE Arca, Inc. on September 18, 2023. Prior to September 16, 2023, the Predecessor ETF was advised by a different investment adviser, had a different investment objective and policies and was a passively-managed fund that sought to track the performance of the Markit iBoxx USD Liquid Leveraged Loan Index. |
The performance quoted represents past performance and does not guarantee future results. The investment return and principal will fluctuate. Investor's shares, when sold or redeemed, may be worth more or less than the original cost. Current performance may be lower or higher than the performance quoted. Returns less than one year are not annualized. Shares of the Fund are bought and sold at market price (not net asset value or "NAV") and are not individually redeemed from the Fund. The returns do not reflect the deduction of taxes that a shareholder would pay on Fund distributions or redemption of Fund shares. Visit https://bondbloxxetf.com/bondbloxx-usd-high-yield-bond-sector-rotation-etf/ or, if residing outside of the United States, please call 800-896-5089 for more recent performance data.
HYSA
BondBloxx USD High Yield Bond Sector Rotation ETF
NYSE Arca, Inc.
Key Fund Statistics
| Total Net Assets | $28,171,777 |
| # of Portfolio Holdings | 8 |
| Total Advisory Fees Paid During Reporting Period | $- |
| Portfolio Turnover Rate | 25% |
| Expense Ratio (excluding affiliated acquired fund fees and expenses) | 0.20% |
| Shares Outstanding | 1,860,000 |
| Fund Launch Date | 9/16/2023 |
| Exchange | NYSE Arca, Inc. |
| CUSIP | 09789C770 |
Top 10 Holdings (% of Net Assets)Footnote Reference*
| BondBloxx USD High Yield Bond Industrial Sector ETF | 24.11% |
| BondBloxx USD High Yield Bond Telecom Media & Technology Sector ETF | 20.31% |
| BondBloxx USD High Yield Bond Financial & REIT Sector ETF | 14.02% |
| BondBloxx USD High Yield Bond Consumer Cyclicals Sector ETF | 12.64% |
| BondBloxx USD High Yield Bond Energy Sector ETF | 10.04% |
| BondBloxx USD High Yield Bond Healthcare Sector ETF | 9.91% |
| BondBloxx USD High Yield Bond Consumer Non-Cyclicals Sector ETF | 8.91% |
| JP Morgan Chase, New York 4.18% 11/01/2024 | 0.13% |
| Footnote | Description |
Footnote* | Subject to change |
HYSA
BondBloxx USD High Yield Bond Sector Rotation ETF
NYSE Arca, Inc.
Disclosures
Securities that are rated below investment-grade (sometimes referred to as “junk bonds”) may be deemed speculative, may involve greater levels of risk than higher-rated securities of similar maturity and may be more likely to default. The Fund’s income may decline if interest rates fall. Debt issuers and other counterparties may be unable or unwilling to make timely interest and/or principal payments when due or otherwise honor their obligations.
Privately issued securities are generally not traded on established markets. As a result of the absence of a public trading market, privately issued securities may be deemed to be illiquid investments, may be more difficult to value than publicly traded securities and may be subject to wide fluctuations in value. The Fund is classified as a ”non-diversified” fund under the Investment Company Act of 1940 (the "1940 Act"). The Fund may be susceptible to an increased risk of loss to the extent that the Fund’s investments are concentrated in the securities and/or other assets of a particular issuer or issuers, sector, sub-sector, market segment, market, industry, group of industries, country, group of countries, region or asset class.
Exchange-traded fund ("ETF") shares are bought and sold at market price (not NAV) and are not individually redeemed from the Fund. NAV Returns are calculated using the daily 4:00pm NAV. Market price returns reflect the midpoint of the bid/ask spread as of the close of trading on the exchange where Fund shares are listed. Market price returns do not represent the returns you would receive if you traded shares at other times.
Distributed by Foreside Fund Services, LLC. BondBloxx is a registered investment adviser.
Additional Information
For additional information about the Fund, including its prospectus, financial information, holdings and proxy voting information, please visit https://bondbloxxetf.com/bondbloxx-usd-high-yield-bond-sector-rotation-etf/. For proxy voting records, visit https://bondbloxxetf.com/resources/.

Householding
To reduce Fund expenses, only one copy of most shareholder documents may be mailed to shareholders with multiple accounts at the same address ("householding"). If you prefer that your Fund documents not be householded, please contact BondBloxx at 800-896-5089 or contact your financial intermediary. Your instructions will typically be effective within 30 days of receipt by BondBloxx or your financial intermediary.
BBLX HYSA 1024

XBB
BondBloxx BB Rated USD High Yield Corporate Bond ETF
NYSE Arca, Inc.
Annual Shareholder Report as of October 31, 2024
The BondBloxx BB Rated USD High Yield Corporate Bond ETF (the "Fund") seeks to track the investment results of an index composed of BB (or its equivalent) fixed rate U.S. dollar-denominated, high yield corporate bonds.
This annual shareholder report contains important information about the Fund for the period from November 1, 2023 to October 31, 2024. You can find additional information about the Fund at https://bondbloxxetf.com/bondbloxx-bb-rated-usd-high-yield-corporate-bond-etf/. You can also request this information by contacting us at 800-896-5089.
What Were The Fund Costs For The Last Year?
(based on a hypothetical $10,000 investment)
| Fund name | Cost of a $10,000 investment | Cost paid as a % of a $10,000 investment |
|---|---|---|
| BondBloxx BB Rated USD High Yield Corporate Bond ETF | $21 | 0.20% |
How Did The Fund Perform Last Year?
For the fiscal year ended October 31, 2024, the Fund generated a total return of 14.26%, generally in line with its benchmark, the ICE BofA BB US Cash Pay High Yield Constrained Index, which returned 14.45%.
The Fund’s performance was driven by a combination of income from coupon payments (“income return”) and price gains, driven by declining Treasury yields and a reduction in yield premiums during the period. Resilient economic growth, strong corporate earnings, and healthy capital markets helped to drive investor confidence and positive performance.
The strongest performing industry sectors in the Fund included banking and financial services, telecommunications, and media while lagging sectors included capital goods, energy, and leisure.
Growth Of $10,000 USD Since Inception
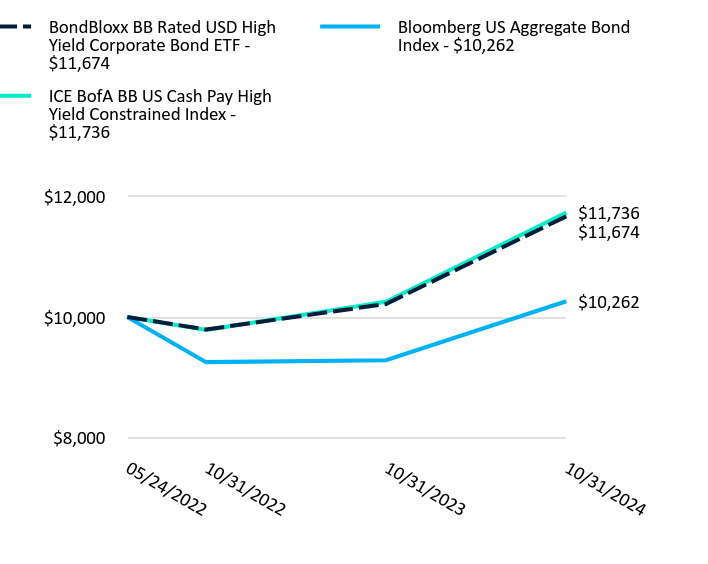
| BondBloxx BB Rated USD High Yield Corporate Bond ETF | Bloomberg US Aggregate Bond Index | ICE BofA BB US Cash Pay High Yield Constrained Index | |
|---|---|---|---|
| 05/24/2022 | $10,000 | $10,000 | $10,000 |
| 10/31/2022 | $9,793 | $9,250 | $9,786 |
| 10/31/2023 | $10,217 | $9,283 | $10,254 |
| 10/31/2024 | $11,674 | $10,262 | $11,736 |
The Growth of $10,000 chart reflects a hypothetical $10,000 investment and assumes reinvestment of dividends and capital gains. Fund expenses, including management fees and other expenses were deducted.
Average Annual Total Returns
| Name | 1 Year | Since InceptionFootnote Reference(1) |
|---|---|---|
| Net Asset Value | 14.26% | 6.56% |
| Bloomberg US Aggregate Bond Index | 10.55% | 1.07% |
| ICE BofA BB US Cash Pay High Yield Constrained Index | 14.45% | 6.79% |
| Footnote | Description |
Footnote(1) | The Fund commenced operations on May 24, 2022. Shares of XBB were listed on the NYSE Arca, Inc. on May 26, 2022. |
The performance quoted represents past performance and does not guarantee future results. The investment return and principal will fluctuate. Investor's shares, when sold or redeemed, may be worth more or less than the original cost. Current performance may be lower or higher than the performance quoted. Returns less than one year are not annualized. Shares of the Fund are bought and sold at market price (not net asset value or "NAV") and are not individually redeemed from the Fund. The returns do not reflect the deduction of taxes that a shareholder would pay on Fund distributions or redemption of Fund shares. Visit https://bondbloxxetf.com/bondbloxx-bb-rated-usd-high-yield-corporate-bond-etf/ or, if residing outside of the United States, please call 800-896-5089 for more recent performance data.
XBB
BondBloxx BB Rated USD High Yield Corporate Bond ETF
NYSE Arca, Inc.
Key Fund Statistics
| Total Net Assets | $60,673,309 |
| # of Portfolio Holdings | 945 |
| Total Advisory Fees Paid During Reporting Period | $112,703 |
| Portfolio Turnover Rate | 39% |
| Expense Ratio | 0.20% |
| Shares Outstanding | 1,500,000 |
| Fund Launch Date | 5/24/2022 |
| Exchange | NYSE Arca, Inc. |
| CUSIP | 09789C705 |
Top 10 Holdings (% of Net Assets)Footnote Reference*
| JP Morgan Chase, New York 4.18% 11/01/2024 | 1.56% |
| Medline Borrower LP 3.88% 04/01/2029 | 0.59% |
| Directv Financing LLC/Directv Financing Co.-Obligor, Inc. 5.88% 08/15/2027 | 0.52% |
| Venture Global LNG, Inc. 9.50% 02/01/2029 | 0.48% |
| EMRLD Borrower LP/Emerald Co.-Issuer, Inc. 6.63% 12/15/2030 | 0.41% |
| Intelsat Jackson Holdings SA 6.50% 03/15/2030 | 0.40% |
| American Airlines, Inc./AAdvantage Loyalty IP Ltd. 5.75% 04/20/2029 | 0.39% |
| TransDigm, Inc. 6.38% 03/01/2029 | 0.39% |
| DaVita, Inc. 4.63% 06/01/2030 | 0.38% |
| Carnival Corp. 5.75% 03/01/2027 | 0.37% |
| Footnote | Description |
Footnote* | Subject to change |
Credit Rating BreakdownFootnote Reference* (% of Net Assets)
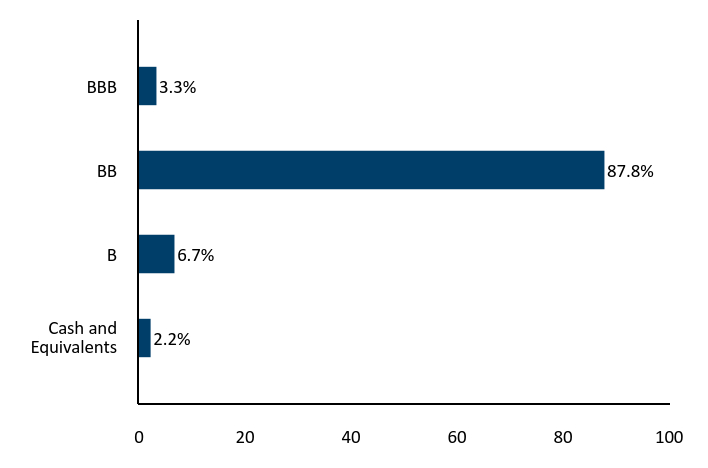
| Value | Value |
|---|---|
| Cash and Equivalents | 2.2% |
| B | 6.7% |
| BB | 87.8% |
| BBB | 3.3% |
| Footnote | Description |
Footnote* | Credit quality ratings on underlying securities of the Fund are received from S&P Global Ratings (“S&P”), Moody’s Investors Service, Inc. (“Moody’s”) and Fitch Ratings, Inc. ("Fitch") and converted to the equivalent S&P major rating category. This breakdown is provided by Bloomberg. Not rated securities do not necessarily indicate low quality. Below investment grade is represented by a rating of BB and below. Ratings and portfolio credit quality may change over time. |
Maturity BreakdownFootnote Reference* (% of Net Assets)
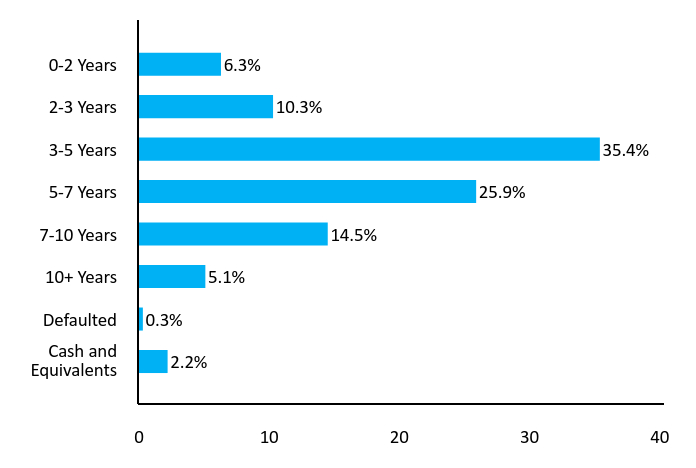
| Value | Value |
|---|---|
| Cash and Equivalents | 2.2% |
| Defaulted | 0.3% |
| 10+ Years | 5.1% |
| 7-10 Years | 14.5% |
| 5-7 Years | 25.9% |
| 3-5 Years | 35.4% |
| 2-3 Years | 10.3% |
| 0-2 Years | 6.3% |
| Footnote | Description |
Footnote* | This chart represents the amount by percentage (%) maturity breakdown of bonds in the Fund. |
Sector Breakdown (%)
| Consumer Cyclical | 20.2% |
| Consumer Non-cyclical | 14.2% |
| Energy | 13.5% |
| Financial | 13.1% |
| Industrial | 11.7% |
| Communications | 11.4% |
| Basic Materials | 5.4% |
| Utilities | 4.7% |
| Technology | 3.4% |
| Diversified | 0.2% |
| Cash and Equivalents | 2.2% |
XBB
BondBloxx BB Rated USD High Yield Corporate Bond ETF
NYSE Arca, Inc.
Disclosures
Securities that are rated below investment-grade (sometimes referred to as “junk bonds”) may be deemed speculative, may involve greater levels of risk than higher-rated securities of similar maturity and may be more likely to default. The Fund’s income may decline if interest rates fall. Debt issuers and other counterparties may be unable or unwilling to make timely interest and/or principal payments when due or otherwise honor their obligations.
Privately issued securities are generally not traded on established markets. As a result of the absence of a public trading market, privately issued securities may be deemed to be illiquid investments, may be more difficult to value than publicly traded securities and may be subject to wide fluctuations in value. The Fund is classified as a ”non-diversified” fund under the Investment Company Act of 1940 (the "1940 Act"). The Fund may be susceptible to an increased risk of loss to the extent that the Fund’s investments are concentrated in the securities and/or other assets of a particular issuer or issuers, sector, sub-sector, market segment, market, industry, group of industries, country, group of countries, region or asset class.
Exchange-traded fund ("ETF") shares are bought and sold at market price (not NAV) and are not individually redeemed from the Fund. NAV Returns are calculated using the daily 4:00pm NAV. Market price returns reflect the midpoint of the bid/ask spread as of the close of trading on the exchange where Fund shares are listed. Market price returns do not represent the returns you would receive if you traded shares at other times.
Distributed by Foreside Fund Services, LLC. BondBloxx is a registered investment adviser.
Additional Information
For additional information about the Fund, including its prospectus, financial information, holdings and proxy voting information, please visit https://bondbloxxetf.com/bondbloxx-bb-rated-usd-high-yield-corporate-bond-etf/. For proxy voting records, visit https://bondbloxxetf.com/resources/.

Householding
To reduce Fund expenses, only one copy of most shareholder documents may be mailed to shareholders with multiple accounts at the same address ("householding"). If you prefer that your Fund documents not be householded, please contact BondBloxx at 800-896-5089 or contact your financial intermediary. Your instructions will typically be effective within 30 days of receipt by BondBloxx or your financial intermediary.
BBLX XBB 1024

XB
BondBloxx B Rated USD High Yield Corporate Bond ETF
NYSE Arca, Inc.
Annual Shareholder Report as of October 31, 2024
The BondBloxx B Rated USD High Yield Corporate Bond ETF (the "Fund") seeks to track the investment results of an index composed of B (or its equivalent) fixed rate U.S. dollar-denominated, high yield corporate bonds.
This annual shareholder report contains important information about the Fund for the period from November 1, 2023 to October 31, 2024.You can find additional information about the Fund at https://bondbloxxetf.com/bondbloxx-b-rated-usd-high-yield-corporate-bond-etf/. You can also request this information by contacting us at 800-896-5089.
What Were The Fund Costs For The Last Year?
(based on a hypothetical $10,000 investment)
| Fund name | Cost of a $10,000 investment | Cost paid as a % of a $10,000 investment |
|---|---|---|
| BondBloxx B Rated USD High Yield Corporate Bond ETF | $32 | 0.30% |
How Did The Fund Perform Last Year?
For the fiscal year ended October 31, 2024, the Fund generated a total return of 14.98%, generally in line with its benchmark, the ICE BofA Single-B US Cash Pay High Yield Constrained Index, which returned 15.40%.
The Fund’s performance was driven by a combination of income from coupon payments (“income return”) and price gains, driven by declining Treasury yields and a reduction in yield premiums during the period. Resilient economic growth, strong corporate earnings, and healthy capital markets helped to drive investor confidence and positive performance.
The strongest performing industry sectors in the Fund included healthcare, transportation, and retail, while lagging sectors included media, telecommunications, and energy.
Growth Of $10,000 USD Since Inception
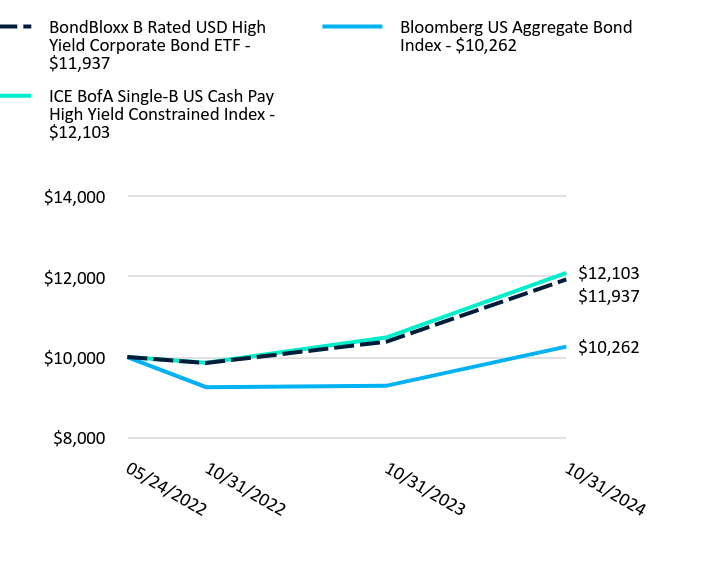
| BondBloxx B Rated USD High Yield Corporate Bond ETF | Bloomberg US Aggregate Bond Index | ICE BofA Single-B US Cash Pay High Yield Constrained Index | |
|---|---|---|---|
| 05/24/2022 | $10,000 | $10,000 | $10,000 |
| 10/31/2022 | $9,855 | $9,250 | $9,862 |
| 10/31/2023 | $10,382 | $9,283 | $10,488 |
| 10/31/2024 | $11,937 | $10,262 | $12,103 |
The Growth of $10,000 chart reflects a hypothetical $10,000 investment and assumes reinvestment of dividends and capital gains. Fund expenses, including management fees and other expenses were deducted.
Average Annual Total Returns
| Name | 1 Year | Since InceptionFootnote Reference(1) |
|---|---|---|
| Net Asset Value | 14.98% | 7.54% |
| Bloomberg US Aggregate Bond Index | 10.55% | 1.07% |
| ICE BofA Single-B US Cash Pay High Yield Constrained Index | 15.40% | 8.15% |
| Footnote | Description |
Footnote(1) | The Fund commenced operations on May 24, 2022. Shares of XB were listed on the NYSE Arca, Inc. on May 26, 2022. |
The performance quoted represents past performance and does not guarantee future results. The investment return and principal will fluctuate. Investor's shares, when sold or redeemed, may be worth more or less than the original cost. Current performance may be lower or higher than the performance quoted. Returns less than one year are not annualized. Shares of the Fund are bought and sold at market price (not net asset value or "NAV") and are not individually redeemed from the Fund. The returns do not reflect the deduction of taxes that a shareholder would pay on Fund distributions or redemption of Fund shares. Visit https://bondbloxxetf.com/bondbloxx-b-rated-usd-high-yield-corporate-bond-etf/ or, if residing outside of the United States, please call 800-896-5089 for more recent performance data.
XB
BondBloxx B Rated USD High Yield Corporate Bond ETF
NYSE Arca, Inc.
Key Fund Statistics
| Total Net Assets | $17,829,725 |
| # of Portfolio Holdings | 639 |
| Total Advisory Fees Paid During Reporting Period | $43,879 |
| Portfolio Turnover Rate | 55% |
| Expense Ratio | 0.30% |
| Shares Outstanding | 450,000 |
| Fund Launch Date | 5/24/2022 |
| Exchange | NYSE Arca, Inc. |
| CUSIP | 09789C804 |
Top 10 Holdings (% of Net Assets)Footnote Reference*
| JP Morgan Chase, New York 4.18% 11/01/2024 | 1.49% |
| Cloud Software Group, Inc. 6.50% 03/31/2029 | 0.88% |
| HUB International Ltd. 7.25% 06/15/2030 | 0.75% |
| Uniti Group LP/Uniti Group Finance 2019, Inc./CSL Capital LLC 10.50% 02/15/2028 | 0.75% |
| Panther Escrow Issuer LLC 7.13% 06/01/2031 | 0.69% |
| TransDigm, Inc. 5.50% 11/15/2027 | 0.64% |
| Mauser Packaging Solutions Holding Co. 7.88% 04/15/2027 | 0.63% |
| 1011778 BC ULC/New Red Finance, Inc. 4.00% 10/15/2030 | 0.58% |
| UKG, Inc. 6.88% 02/01/2031 | 0.57% |
| Tenet Healthcare Corp. 6.13% 10/01/2028 | 0.56% |
| Footnote | Description |
Footnote* | Subject to change |
Credit Rating BreakdownFootnote Reference* (% of Net Assets)
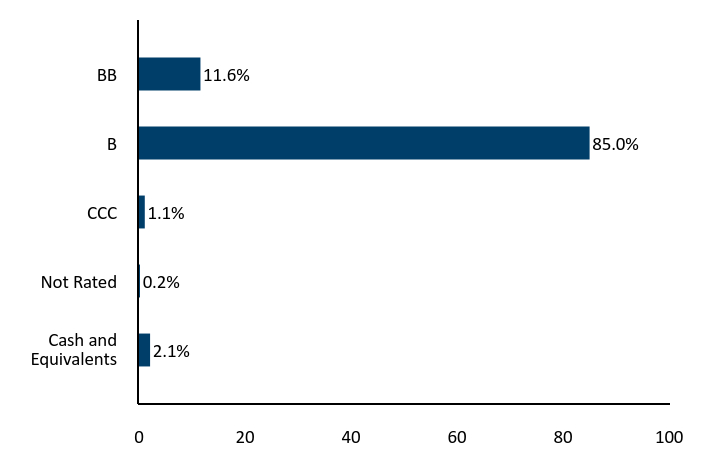
| Value | Value |
|---|---|
| Cash and Equivalents | 2.1% |
| Not Rated | 0.2% |
| CCC | 1.1% |
| B | 85.0% |
| BB | 11.6% |
| Footnote | Description |
Footnote* | Credit quality ratings on underlying securities of the Fund are received from S&P Global Ratings (“S&P”), Moody’s Investors Service, Inc. (“Moody’s”) and Fitch Ratings, Inc. ("Fitch") and converted to the equivalent S&P major rating category. This breakdown is provided by Bloomberg. Not rated securities do not necessarily indicate low quality. Below investment grade is represented by a rating of BB and below. Ratings and portfolio credit quality may change over time. |
Maturity BreakdownFootnote Reference* (% of Net Assets)
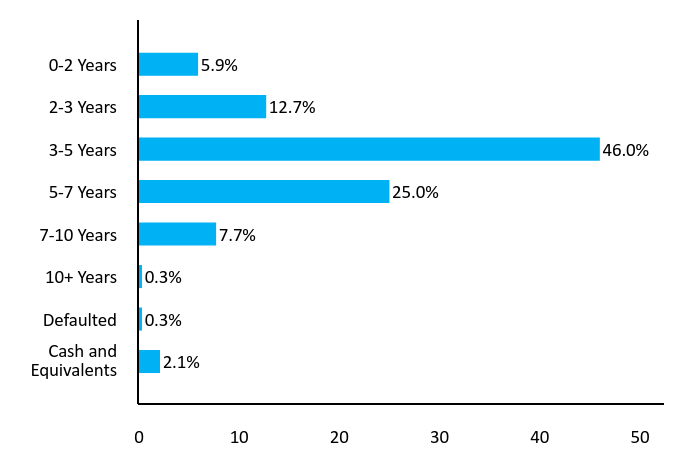
| Value | Value |
|---|---|
| Cash and Equivalents | 2.1% |
| Defaulted | 0.3% |
| 10+ Years | 0.3% |
| 7-10 Years | 7.7% |
| 5-7 Years | 25.0% |
| 3-5 Years | 46.0% |
| 2-3 Years | 12.7% |
| 0-2 Years | 5.9% |
| Footnote | Description |
Footnote* | This chart represents the amount by percentage (%) maturity breakdown of bonds in the Fund. |
Sector Breakdown (%)
| Consumer Non-cyclical | 20.1% |
| Consumer Cyclical | 19.6% |
| Financial | 11.9% |
| Communications | 11.4% |
| Industrial | 11.1% |
| Energy | 10.7% |
| Basic Materials | 5.7% |
| Technology | 5.5% |
| Utilities | 1.9% |
| Cash and Equivalents | 2.1% |
XB
BondBloxx B Rated USD High Yield Corporate Bond ETF
NYSE Arca, Inc.
Disclosures
Securities that are rated below investment-grade (sometimes referred to as “junk bonds”) may be deemed speculative, may involve greater levels of risk than higher-rated securities of similar maturity and may be more likely to default. The Fund’s income may decline if interest rates fall. Debt issuers and other counterparties may be unable or unwilling to make timely interest and/or principal payments when due or otherwise honor their obligations.
Privately issued securities are generally not traded on established markets. As a result of the absence of a public trading market, privately issued securities may be deemed to be illiquid investments, may be more difficult to value than publicly traded securities and may be subject to wide fluctuations in value. The Fund is classified as a ”non-diversified” fund under the Investment Company Act of 1940 (the "1940 Act"). The Fund may be susceptible to an increased risk of loss to the extent that the Fund’s investments are concentrated in the securities and/or other assets of a particular issuer or issuers, sector, sub-sector, market segment, market, industry, group of industries, country, group of countries, region or asset class.
Exchange-traded fund ("ETF") shares are bought and sold at market price (not NAV) and are not individually redeemed from the Fund. NAV Returns are calculated using the daily 4:00pm NAV. Market price returns reflect the midpoint of the bid/ask spread as of the close of trading on the exchange where Fund shares are listed. Market price returns do not represent the returns you would receive if you traded shares at other times.
Distributed by Foreside Fund Services, LLC. BondBloxx is a registered investment adviser.
Additional Information
For additional information about the Fund, including its prospectus, financial information, holdings and proxy voting information, please visit https://bondbloxxetf.com/bondbloxx-b-rated-usd-high-yield-corporate-bond-etf/. For proxy voting records, visit https://bondbloxxetf.com/resources/.

Householding
To reduce Fund expenses, only one copy of most shareholder documents may be mailed to shareholders with multiple accounts at the same address ("householding"). If you prefer that your Fund documents not be householded, please contact BondBloxx at 800-896-5089 or contact your financial intermediary. Your instructions will typically be effective within 30 days of receipt by BondBloxx or your financial intermediary.
BBLX XB 1024

XCCC
BondBloxx CCC Rated USD High Yield Corporate Bond ETF
NYSE Arca, Inc.
Annual Shareholder Report as of October 31, 2024
The BondBloxx CCC Rated USD High Yield Corporate Bond ETF (the "Fund") seeks to track the investment results of an index composed of CCC (or its equivalent) fixed-rate U.S. dollar-denominated, high yield corporate bonds.
This annual shareholder report contains important information about the Fund for the period from November 1, 2023 to October 31, 2024. You can find additional information about the Fund at https://bondbloxxetf.com/bondbloxx-ccc-rated-usd-high-yield-corporate-bond-etf/. You can also request this information by contacting us at 800-896-5089.
What Were The Fund Costs For The Last Year?
(based on a hypothetical $10,000 investment)
| Fund name | Cost of a $10,000 investment | Cost paid as a % of a $10,000 investment |
|---|---|---|
| BondBloxx CCC Rated USD High Yield Corporate Bond ETF | $45 | 0.40% |
How Did The Fund Perform Last Year?
For the fiscal year ended October 31, 2024,the Fund generated a total return of 23.14%, compared to its benchmark, the ICE CCC US Cash Pay High Yield Constrained Index, which returned 23.97%.
The Fund’s performance was driven by a combination of income from coupon payments (“income return”) and price gains, driven by declining Treasury yields and a reduction in yield premiums during the period. Resilient economic growth, strong corporate earnings, and healthy capital markets helped to drive investor confidence and positive performance. For CCC-rated securities in particular, yield premiums compared to similar-duration US Treasuries declined by over 300 basis points during the fiscal year.
The strongest performing industry sectors in the Fund included healthcare, services, and telecommunications, while lagging sectors included retail, energy, and automotive.
Growth Of $10,000 USD Since Inception
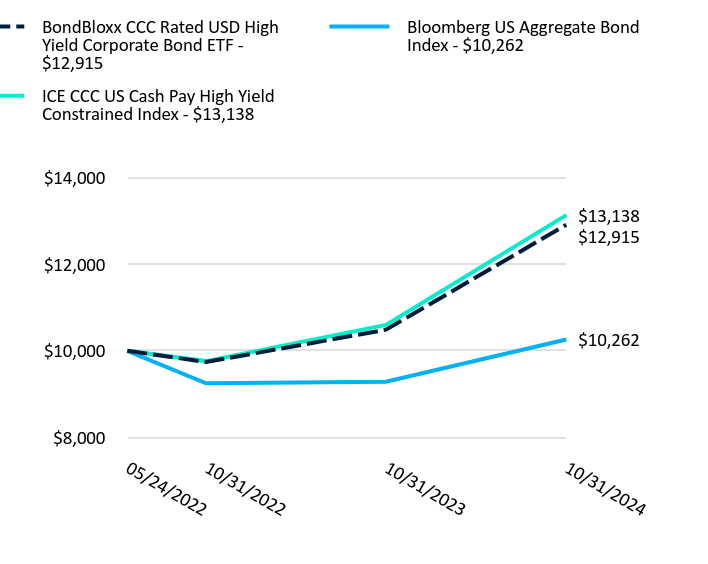
| BondBloxx CCC Rated USD High Yield Corporate Bond ETF | Bloomberg US Aggregate Bond Index | ICE CCC US Cash Pay High Yield Constrained Index | |
|---|---|---|---|
| 05/24/2022 | $10,000 | $10,000 | $10,000 |
| 10/31/2022 | $9,741 | $9,250 | $9,762 |
| 10/31/2023 | $10,488 | $9,283 | $10,598 |
| 10/31/2024 | $12,915 | $10,262 | $13,138 |
The Growth of $10,000 chart reflects a hypothetical $10,000 investment and assumes reinvestment of dividends and capital gains. Fund expenses, including management fees and other expenses were deducted.
Average Annual Total Returns
| Name | 1 Year | Since InceptionFootnote Reference(1) |
|---|---|---|
| Net Asset Value | 23.14% | 11.07% |
| Bloomberg US Aggregate Bond Index | 10.55% | 1.07% |
| ICE CCC US Cash Pay High Yield Constrained Index | 23.97% | 11.85% |
| Footnote | Description |
Footnote(1) | The Fund commenced operations on May 24, 2022. Shares of XCCC were listed on the NYSE Arca, Inc. on May 26, 2022. |
The performance quoted represents past performance and does not guarantee future results. The investment return and principal will fluctuate. Investor's shares, when sold or redeemed, may be worth more or less than the original cost. Current performance may be lower or higher than the performance quoted. Returns less than one year are not annualized. Shares of the Fund are bought and sold at market price (not net asset value or "NAV") and are not individually redeemed from the Fund. The returns do not reflect the deduction of taxes that a shareholder would pay on Fund distributions or redemption of Fund shares. Visit https://bondbloxxetf.com/bondbloxx-ccc-rated-usd-high-yield-corporate-bond-etf/ or, if residing outside of the United States, please call 800-896-5089 for more recent performance data.
XCCC
BondBloxx CCC Rated USD High Yield Corporate Bond ETF
NYSE Arca, Inc.
Key Fund Statistics
| Total Net Assets | $104,503,669 |
| # of Portfolio Holdings | 223 |
| Total Advisory Fees Paid During Reporting Period | $215,565 |
| Portfolio Turnover Rate | 49% |
| Expense Ratio | 0.40% |
| Shares Outstanding | 2,650,000 |
| Fund Launch Date | 5/24/2022 |
| Exchange | NYSE Arca, Inc. |
| CUSIP | 09789C887 |
Top 10 Holdings (% of Net Assets)Footnote Reference*
| Cloud Software Group, Inc. 9.00% 09/30/2029 | 1.95% |
| AthenaHealth Group, Inc. 6.50% 02/15/2030 | 1.91% |
| McAfee Corp. 7.38% 02/15/2030 | 1.68% |
| HUB International Ltd. 7.38% 01/31/2032 | 1.53% |
| JP Morgan Chase, New York 4.18% 11/01/2024 | 1.46% |
| Mauser Packaging Solutions Holding Co. 9.25% 04/15/2027 | 1.19% |
| CommScope LLC 6.00% 03/01/2026 | 1.15% |
| Altice Financing SA 5.75% 08/15/2029 | 1.10% |
| Alliant Holdings Intermediate LLC/Alliant Holdings Co.-Issuer, Inc. 6.75% 10/15/2027 | 1.05% |
| FXI Holdings, Inc. 12.25% 11/15/2026 | 1.03% |
| Footnote | Description |
Footnote* | Subject to change |
Credit Rating BreakdownFootnote Reference* (% of Net Assets)
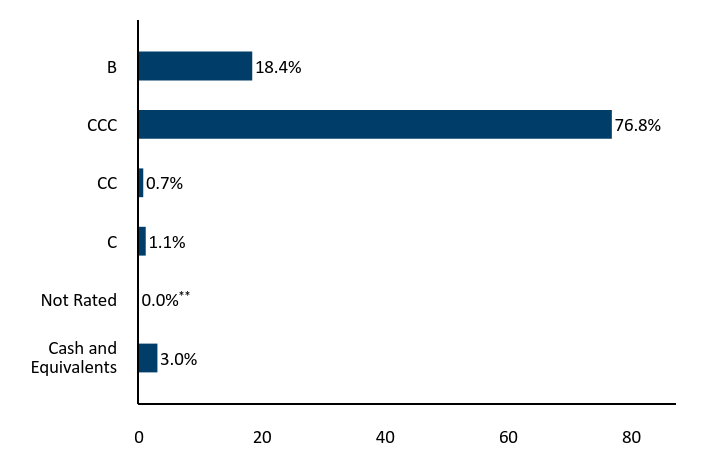
| Value | Value |
|---|---|
| Cash and Equivalents | 3.0% |
| Not Rated | 0.0%Footnote Reference** |
| C | 1.1% |
| CC | 0.7% |
| CCC | 76.8% |
| B | 18.4% |
| Footnote | Description |
Footnote* | Credit quality ratings on underlying securities of the Fund are received from S&P Global Ratings (“S&P”), Moody’s Investors Service, Inc. (“Moody’s”) and Fitch Ratings, Inc. ("Fitch") and converted to the equivalent S&P major rating category. This breakdown is provided by Bloomberg. Not rated securities do not necessarily indicate low quality. Below investment grade is represented by a rating of BB and below. Ratings and portfolio credit quality may change over time. |
Footnote** | Percentage is less than 0.05%. |
Maturity BreakdownFootnote Reference* (% of Net Assets)
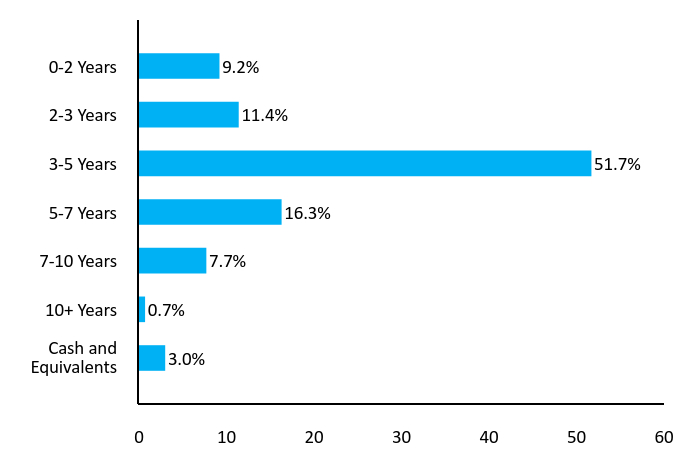
| Value | Value |
|---|---|
| Cash and Equivalents | 3.0% |
| 10+ Years | 0.7% |
| 7-10 Years | 7.7% |
| 5-7 Years | 16.3% |
| 3-5 Years | 51.7% |
| 2-3 Years | 11.4% |
| 0-2 Years | 9.2% |
| Footnote | Description |
Footnote* | This chart represents the amount by percentage (%) maturity breakdown of bonds in the Fund. |
Sector Breakdown (%)
| Communications | 22.1% |
| Financial | 15.2% |
| Industrial | 14.6% |
| Consumer Non-cyclical | 14.2% |
| Consumer Cyclical | 12.9% |
| Technology | 8.3% |
| Basic Materials | 5.5% |
| Energy | 4.2% |
| Cash and Equivalents | 3.0% |
XCCC
BondBloxx CCC Rated USD High Yield Corporate Bond ETF
NYSE Arca, Inc.
Disclosures
Securities that are rated below investment-grade (sometimes referred to as “junk bonds”) may be deemed speculative, may involve greater levels of risk than higher-rated securities of similar maturity and may be more likely to default. The Fund’s income may decline if interest rates fall. Debt issuers and other counterparties may be unable or unwilling to make timely interest and/or principal payments when due or otherwise honor their obligations.
Privately issued securities are generally not traded on established markets. As a result of the absence of a public trading market, privately issued securities may be deemed to be illiquid investments, may be more difficult to value than publicly traded securities and may be subject to wide fluctuations in value. The Fund is classified as a ”non-diversified” fund under the Investment Company Act of 1940 (the "1940 Act"). The Fund may be susceptible to an increased risk of loss to the extent that the Fund’s investments are concentrated in the securities and/or other assets of a particular issuer or issuers, sector, sub-sector, market segment, market, industry, group of industries, country, group of countries, region or asset class.
Exchange-traded fund ("ETF") shares are bought and sold at market price (not NAV) and are not individually redeemed from the Fund. NAV Returns are calculated using the daily 4:00pm NAV. Market price returns reflect the midpoint of the bid/ask spread as of the close of trading on the exchange where Fund shares are listed. Market price returns do not represent the returns you would receive if you traded shares at other times.
Distributed by Foreside Fund Services, LLC. BondBloxx is a registered investment adviser.
Additional Information
For additional information about the Fund, including its prospectus, financial information, holdings and proxy voting information, please visit https://bondbloxxetf.com/bondbloxx-ccc-rated-usd-high-yield-corporate-bond-etf/. For proxy voting records, visit https://bondbloxxetf.com/resources/.

Householding
To reduce Fund expenses, only one copy of most shareholder documents may be mailed to shareholders with multiple accounts at the same address ("householding"). If you prefer that your Fund documents not be householded, please contact BondBloxx at 800-896-5089 or contact your financial intermediary. Your instructions will typically be effective within 30 days of receipt by BondBloxx or your financial intermediary.
BBLX XCCC 1024

BBBS
BondBloxx BBB Rated 1-5 Year Corporate Bond ETF
NYSE Arca, Inc.
Annual Shareholder Report as of October 31, 2024
The BondBloxx BBB Rated 1-5 Year Corporate Bond ETF (the "Fund") seeks to track the investment results of an index composed of BBB-rated, fixed-rate, taxable U.S. dollar-denominated corporate bonds issued by U.S. and non-U.S. corporate issuers with remaining maturities of greater than or equal to one year and less than five years.
This annual shareholder report contains important information about the Fund for the period from January 23, 2024 (commencement of operations) to October 31, 2024. You can find additional information about the Fund at https://bondbloxxetf.com/BondBloxx-BBB-Rated-1-5-Year-Corporate-Bond-ETF/. You can also request this information by contacting us at 800-896-5089.
What Were The Fund Costs For The Last Year?
(based on a hypothetical $10,000 investment)
| Fund name | Cost of a $10,000 investment | Cost paid as a % of a $10,000 investment |
|---|---|---|
| BondBloxx BBB Rated 1-5 Year Corporate Bond ETF | $15 | 0.19% |
How Did The Fund Perform Last Year?
For the period from inception (January 23, 2024) to October 31, 2024, the Fund generated a total return of 4.47%, generally in line with its benchmark, the Bloomberg US Corporate BBB 1-5 Year Index, which returned 4.71%.
The Fund’s performance during the period primarily reflected income from coupon payments (“income return”), complemented by price gains that were driven by a combination of declining Treasury yields and decreasing yield premiums. Treasury yields were driven by shifting market expectations for Federal Reserve policy as inflation and employment data showed consistent moderation. In September 2024, the Federal Reserve reduced its benchmark interest rate by 50 basis points, marking the first rate cut since 2020. Declining yield premiums were driven by resilient economic conditions, healthy corporate earnings, and strong market demand for fixed-income assets.
The strongest performing industry sectors in the Fund included banking, financial services, and real estate, while lagging sectors included retail, healthcare, and transportation.
Growth Of $10,000 USD Since Inception
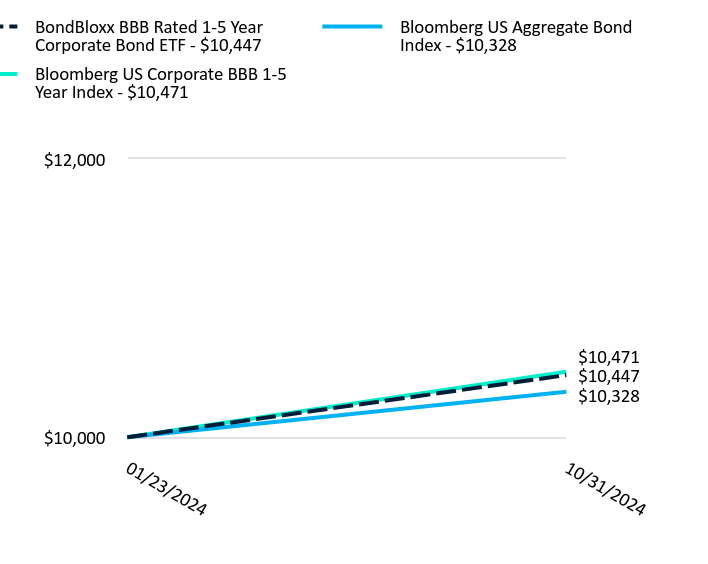
| BondBloxx BBB Rated 1-5 Year Corporate Bond ETF | Bloomberg US Aggregate Bond Index | Bloomberg US Corporate BBB 1-5 Year Index | |
|---|---|---|---|
| 01/23/2024 | $10,000 | $10,000 | $10,000 |
| 10/31/2024 | $10,447 | $10,328 | $10,471 |
The Growth of $10,000 chart reflects a hypothetical $10,000 investment and assumes reinvestment of dividends and capital gains. Fund expenses, including management fees and other expenses were deducted.
Average Annual Total Returns
| Name | Since InceptionFootnote Reference(1) |
|---|---|
| Net Asset Value | 4.47% |
| Bloomberg US Aggregate Bond Index | 3.28% |
| Bloomberg US Corporate BBB 1-5 Year Index | 4.71% |
| Footnote | Description |
Footnote(1) | The Fund commenced operations on January 23, 2024. Shares of BBBS were listed on the NYSE Arca, Inc. on January 25, 2024. |
The performance quoted represents past performance and does not guarantee future results. The investment return and principal will fluctuate. Investor's shares, when sold or redeemed, may be worth more or less than the original cost. Current performance may be lower or higher than the performance quoted. Returns less than one year are not annualized. Shares of the Fund are bought and sold at market price (not net asset value or "NAV") and are not individually redeemed from the Fund. The returns do not reflect the deduction of taxes that a shareholder would pay on Fund distributions or redemption of Fund shares. Visit https://bondbloxxetf.com/BondBloxx-BBB-Rated-1-5-Year-Corporate-Bond-ETF/ or, if residing outside of the United States, please call 800-896-5089 for more recent performance data.
BBBS
BondBloxx BBB Rated 1-5 Year Corporate Bond ETF
NYSE Arca, Inc.
Key Fund Statistics
| Total Net Assets | $63,519,558 |
| # of Portfolio Holdings | 1,138 |
| Total Advisory Fees Paid During Reporting Period | $44,090 |
| Portfolio Turnover Rate | 21% |
| Expense Ratio | 0.19% |
| Shares Outstanding | 1,250,000 |
| Fund Launch Date | 1/23/2024 |
| Exchange | NYSE Arca, Inc. |
| CUSIP | 09789C754 |
Top 10 Holdings (% of Net Assets)Footnote Reference*
| Boeing Co. 2.20% 02/04/2026 | 0.48% |
| CVS Health Corp. 4.30% 03/25/2028 | 0.47% |
| T-Mobile USA, Inc. 3.75% 04/15/2027 | 0.38% |
| Amgen, Inc. 5.15% 03/02/2028 | 0.35% |
| Citigroup, Inc. 4.45% 09/29/2027 | 0.35% |
| AerCap Ireland Capital DAC/AerCap Global Aviation Trust 2.45% 10/29/2026 | 0.34% |
| Warnermedia Holdings, Inc. 3.76% 03/15/2027 | 0.33% |
| AerCap Ireland Capital DAC/AerCap Global Aviation Trust 3.00% 10/29/2028 | 0.32% |
| Verizon Communications, Inc. 4.33% 09/21/2028 | 0.32% |
| Cigna Group 4.38% 10/15/2028 | 0.32% |
| Footnote | Description |
Footnote* | Subject to change |
Credit Rating BreakdownFootnote Reference* (% of Net Assets)

| Value | Value |
|---|---|
| Cash and Equivalents | 1.6% |
| BB | 1.4% |
| BBB | 93.6% |
| A | 3.4% |
| Footnote | Description |
Footnote* | Credit quality ratings on underlying securities of the Fund are received from S&P Global Ratings (“S&P”), Moody’s Investors Service, Inc. (“Moody’s”) and Fitch Ratings, Inc. ("Fitch") and converted to the equivalent S&P major rating category. This breakdown is provided by Bloomberg. Not rated securities do not necessarily indicate low quality. Below investment grade is represented by a rating of BB and below. Ratings and portfolio credit quality may change over time. |
Maturity BreakdownFootnote Reference* (% of Net Assets)
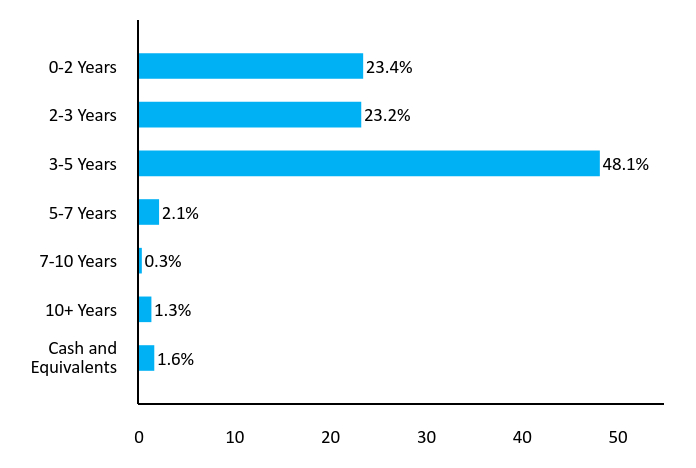
| Value | Value |
|---|---|
| Cash and Equivalents | 1.6% |
| 10+ Years | 1.3% |
| 7-10 Years | 0.3% |
| 5-7 Years | 2.1% |
| 3-5 Years | 48.1% |
| 2-3 Years | 23.2% |
| 0-2 Years | 23.4% |
| Footnote | Description |
Footnote* | This chart represents the amount by percentage (%) maturity breakdown of bonds in the Fund. |
Sector Breakdown (%)
| Financial | 26.3% |
| Consumer Non-cyclical | 17.5% |
| Consumer Cyclical | 10.9% |
| Technology | 8.8% |
| Communications | 8.4% |
| Industrial | 8.4% |
| Utilities | 8.0% |
| Energy | 7.5% |
| Basic Materials | 2.6% |
| Cash and Equivalents | 1.6% |
BBBS
BondBloxx BBB Rated 1-5 Year Corporate Bond ETF
NYSE Arca, Inc.
Disclosures
Securities that are rated below investment-grade (sometimes referred to as “junk bonds”) may be deemed speculative, may involve greater levels of risk than higher-rated securities of similar maturity and may be more likely to default. The Fund’s income may decline if interest rates fall. Debt issuers and other counterparties may be unable or unwilling to make timely interest and/or principal payments when due or otherwise honor their obligations.
Privately issued securities are generally not traded on established markets. As a result of the absence of a public trading market, privately issued securities may be deemed to be illiquid investments, may be more difficult to value than publicly traded securities and may be subject to wide fluctuations in value. The Fund is classified as a ”non-diversified” fund under the Investment Company Act of 1940 (the "1940 Act"). The Fund may be susceptible to an increased risk of loss to the extent that the Fund’s investments are concentrated in the securities and/or other assets of a particular issuer or issuers, sector, sub-sector, market segment, market, industry, group of industries, country, group of countries, region or asset class.
Exchange-traded fund ("ETF") shares are bought and sold at market price (not NAV) and are not individually redeemed from the Fund. NAV Returns are calculated using the daily 4:00pm NAV. Market price returns reflect the midpoint of the bid/ask spread as of the close of trading on the exchange where Fund shares are listed. Market price returns do not represent the returns you would receive if you traded shares at other times.
Distributed by Foreside Fund Services, LLC. BondBloxx is a registered investment adviser.
Additional Information
For additional information about the Fund, including its prospectus, financial information, holdings and proxy voting information, please visit https://bondbloxxetf.com/BondBloxx-BBB-Rated-1-5-Year-Corporate-Bond-ETF/. For proxy voting records, visit https://bondbloxxetf.com/resources/.

Householding
To reduce Fund expenses, only one copy of most shareholder documents may be mailed to shareholders with multiple accounts at the same address ("householding"). If you prefer that your Fund documents not be householded, please contact BondBloxx at 800-896-5089 or contact your financial intermediary. Your instructions will typically be effective within 30 days of receipt by BondBloxx or your financial intermediary.
BBLX BBBS 1024

BBBI
BondBloxx BBB Rated 5-10 Year Corporate Bond ETF
NYSE Arca, Inc.
Annual Shareholder Report as of October 31, 2024
The BondBloxx BBB Rated 5-10 Year Corporate Bond ETF (the "Fund") seeks to track the investment results of an index composed of BBB-rated, fixed-rate, taxable U.S. dollar-denominated corporate bonds issued by U.S. and non-U.S. corporate issuers with remaining maturities of greater than or equal to five years and less than ten years.
This annual shareholder report contains important information about the Fund for the period from January 23, 2024 (commencement of operations) to October 31, 2024. You can find additional information about the Fund at https://bondbloxxetf.com/BondBloxx-BBB-Rated-5-10-Year-Corporate-Bond-ETF/. You can also request this information by contacting us at 800-896-5089.
What Were The Fund Costs For The Last Year?
(based on a hypothetical $10,000 investment)
| Fund name | Cost of a $10,000 investment | Cost paid as a % of a $10,000 investment |
|---|---|---|
| BondBloxx BBB Rated 5-10 Year Corporate Bond ETF | $15 | 0.19% |
How Did The Fund Perform Last Year?
For the period from inception (January 23, 2024) to October 31, 2024, the Fund generated a total return of 4.96%, generally in line with its benchmark, the Bloomberg US Corporate BBB 5-10 Year Index, which returned 5.11%.
The Fund’s performance during the period primarily reflected income from coupon payments (“income return”), complemented by price gains that were driven by a combination of declining Treasury yields and decreasing yield premiums. Treasury yields were driven by shifting market expectations for Federal Reserve policy as inflation and employment data showed consistent moderation. In September 2024, the Federal Reserve reduced its benchmark interest rate by 50 basis points, marking the first rate cut since 2020. Declining yield premiums were driven by resilient economic conditions, healthy corporate earnings, and strong market demand for fixed-income assets.
The strongest performing industry sectors in the Fund included banking, financial services, and real estate, while lagging sectors included media, healthcare, and retail.
Growth Of $10,000 USD Since Inception
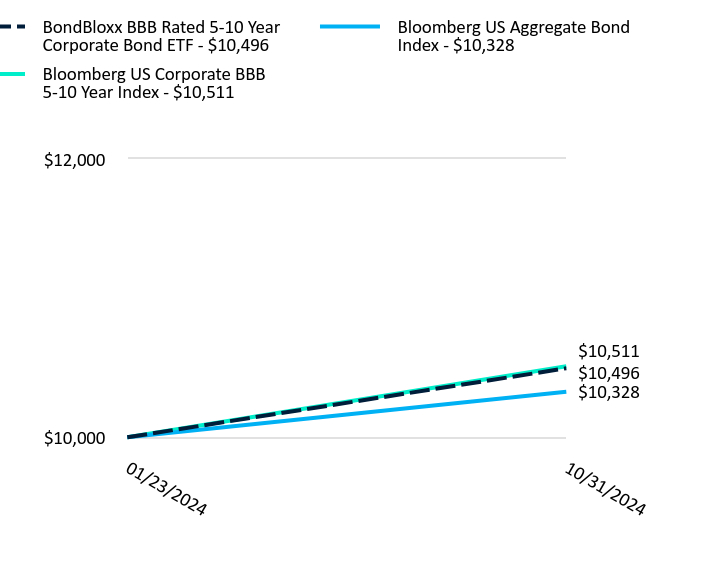
| BondBloxx BBB Rated 5-10 Year Corporate Bond ETF | Bloomberg US Aggregate Bond Index | Bloomberg US Corporate BBB 5-10 Year Index | |
|---|---|---|---|
| 01/23/2024 | $10,000 | $10,000 | $10,000 |
| 10/31/2024 | $10,496 | $10,328 | $10,511 |
The Growth of $10,000 chart reflects a hypothetical $10,000 investment and assumes reinvestment of dividends and capital gains. Fund expenses, including management fees and other expenses were deducted.
Average Annual Total Returns
| Name | Since InceptionFootnote Reference(1) |
|---|---|
| Net Asset Value | 4.96% |
| Bloomberg US Aggregate Bond Index | 3.28% |
| Bloomberg US Corporate BBB 5-10 Year Index | 5.11% |
| Footnote | Description |
Footnote(1) | The Fund commenced operations on January 23, 2024. Shares of BBBI were listed on the NYSE Arca, Inc. on January 25, 2024. |
The performance quoted represents past performance and does not guarantee future results. The investment return and principal will fluctuate. Investor's shares, when sold or redeemed, may be worth more or less than the original cost. Current performance may be lower or higher than the performance quoted. Returns less than one year are not annualized. Shares of the Fund are bought and sold at market price (not net asset value or "NAV") and are not individually redeemed from the Fund. The returns do not reflect the deduction of taxes that a shareholder would pay on Fund distributions or redemption of Fund shares. Visit https://bondbloxxetf.com/BondBloxx-BBB-Rated-5-10-Year-Corporate-Bond-ETF/ or, if residing outside of the United States, please call 800-896-5089 for more recent performance data.
BBBI
BondBloxx BBB Rated 5-10 Year Corporate Bond ETF
NYSE Arca, Inc.
Key Fund Statistics
| Total Net Assets | $7,616,482 |
| # of Portfolio Holdings | 828 |
| Total Advisory Fees Paid During Reporting Period | $7,747 |
| Portfolio Turnover Rate | 27% |
| Expense Ratio | 0.19% |
| Shares Outstanding | 150,000 |
| Fund Launch Date | 1/23/2024 |
| Exchange | NYSE Arca, Inc. |
| CUSIP | 09789C747 |
Top 10 Holdings (% of Net Assets)Footnote Reference*
| T-Mobile USA, Inc. 3.88% 04/15/2030 | 0.69% |
| Warnermedia Holdings, Inc. 4.28% 03/15/2032 | 0.58% |
| Boeing Co. 5.15% 05/01/2030 | 0.52% |
| Citibank, New York 4.18% 11/01/2024 | 0.47% |
| Amgen, Inc. 5.25% 03/02/2033 | 0.46% |
| British Telecommunications PLC 9.63% 12/15/2030 | 0.40% |
| Deutsche Telekom International Finance BV 8.75% 06/15/2030 | 0.39% |
| Verizon Communications, Inc. 2.36% 03/15/2032 | 0.38% |
| Verizon Communications, Inc. 4.02% 12/03/2029 | 0.38% |
| Centene Corp. 4.63% 12/15/2029 | 0.38% |
| Footnote | Description |
Footnote* | Subject to change |
Credit Rating BreakdownFootnote Reference* (% of Net Assets)
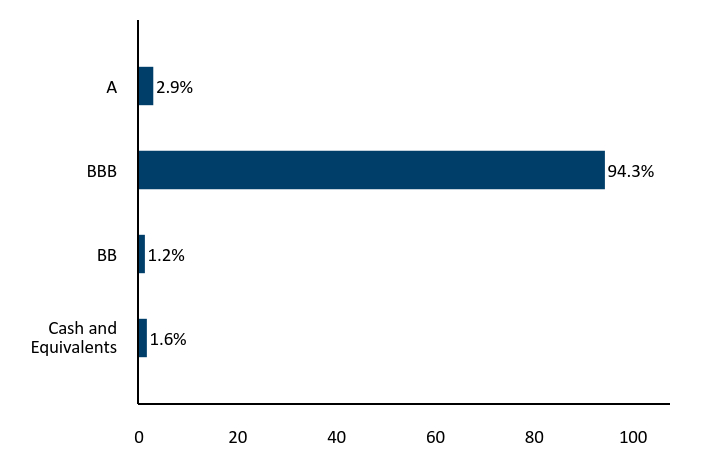
| Value | Value |
|---|---|
| Cash and Equivalents | 1.6% |
| BB | 1.2% |
| BBB | 94.3% |
| A | 2.9% |
| Footnote | Description |
Footnote* | Credit quality ratings on underlying securities of the Fund are received from S&P Global Ratings (“S&P”), Moody’s Investors Service, Inc. (“Moody’s”) and Fitch Ratings, Inc. ("Fitch") and converted to the equivalent S&P major rating category. This breakdown is provided by Bloomberg. Not rated securities do not necessarily indicate low quality. Below investment grade is represented by a rating of BB and below. Ratings and portfolio credit quality may change over time. |
Maturity BreakdownFootnote Reference* (% of Net Assets)
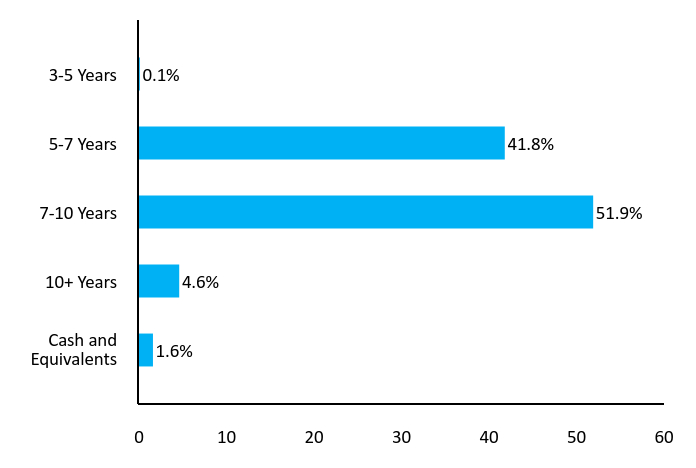
| Value | Value |
|---|---|
| Cash and Equivalents | 1.6% |
| 10+ Years | 4.6% |
| 7-10 Years | 51.9% |
| 5-7 Years | 41.8% |
| 3-5 Years | 0.1% |
| Footnote | Description |
Footnote* | This chart represents the amount by percentage (%) maturity breakdown of bonds in the Fund. |
Sector Breakdown (%)
| Financial | 23.2% |
| Consumer Non-cyclical | 17.1% |
| Communications | 10.7% |
| Technology | 10.0% |
| Energy | 9.7% |
| Industrial | 8.9% |
| Consumer Cyclical | 8.3% |
| Utilities | 7.5% |
| Basic Materials | 3.0% |
| Cash and Equivalents | 1.6% |
BBBI
BondBloxx BBB Rated 5-10 Year Corporate Bond ETF
NYSE Arca, Inc.
Disclosures
Securities that are rated below investment-grade (sometimes referred to as “junk bonds”) may be deemed speculative, may involve greater levels of risk than higher-rated securities of similar maturity and may be more likely to default. The Fund’s income may decline if interest rates fall. Debt issuers and other counterparties may be unable or unwilling to make timely interest and/or principal payments when due or otherwise honor their obligations.
Privately issued securities are generally not traded on established markets. As a result of the absence of a public trading market, privately issued securities may be deemed to be illiquid investments, may be more difficult to value than publicly traded securities and may be subject to wide fluctuations in value. The Fund is classified as a ”non-diversified” fund under the Investment Company Act of 1940 (the "1940 Act"). The Fund may be susceptible to an increased risk of loss to the extent that the Fund’s investments are concentrated in the securities and/or other assets of a particular issuer or issuers, sector, sub-sector, market segment, market, industry, group of industries, country, group of countries, region or asset class.
Exchange-traded fund ("ETF") shares are bought and sold at market price (not NAV) and are not individually redeemed from the Fund. NAV Returns are calculated using the daily 4:00pm NAV. Market price returns reflect the midpoint of the bid/ask spread as of the close of trading on the exchange where Fund shares are listed. Market price returns do not represent the returns you would receive if you traded shares at other times.
Distributed by Foreside Fund Services, LLC. BondBloxx is a registered investment adviser.
Additional Information
For additional information about the Fund, including its prospectus, financial information, holdings and proxy voting information, please visit https://bondbloxxetf.com/BondBloxx-BBB-Rated-5-10-Year-Corporate-Bond-ETF/. For proxy voting records, visit https://bondbloxxetf.com/resources/.

Householding
To reduce Fund expenses, only one copy of most shareholder documents may be mailed to shareholders with multiple accounts at the same address ("householding"). If you prefer that your Fund documents not be householded, please contact BondBloxx at 800-896-5089 or contact your financial intermediary. Your instructions will typically be effective within 30 days of receipt by BondBloxx or your financial intermediary.
BBLX BBBI 1024

BBBL
BondBloxx BBB Rated 10+ Year Corporate Bond ETF
NYSE Arca, Inc.
Annual Shareholder Report as of October 31, 2024
The BondBloxx BBB Rated 10+ Year Corporate Bond ETF (the "Fund") seeks to track the investment results of an index composed of BBB-rated, fixed-rate, taxable U.S. dollar-denominated corporate bonds issued by U.S. and non-U.S. corporate issuers with remaining maturities of greater than or equal to ten years.
This annual shareholder report contains important information about the Fund for the period from January 23, 2024 (commencement of operations) to October 31, 2024. You can find additional information about the Fund at https://bondbloxxetf.com/BondBloxx-BBB-Rated-10-Year-Corporate-Bond-ETF/. You can also request this information by contacting us at 800-896-5089.
What Were The Fund Costs For The Last Year?
(based on a hypothetical $10,000 investment)
| Fund name | Cost of a $10,000 investment | Cost paid as a % of a $10,000 investment |
|---|---|---|
| BondBloxx BBB Rated 10+ Year Corporate Bond ETF | $15 | 0.19% |
How Did The Fund Perform Last Year?
For the period from inception (January 23, 2024) to October 31, 2024, the Fund generated a total return of 3.37%, generally in line with its benchmark, the Bloomberg US Corporate BBB 10+ Year Index, which returned 3.58%.
The Fund’s performance largely reflected income from coupon payments (“income return”) while prices fell slightly during the period. Prices of Treasury and Corporate securities with long-term maturities were negatively impacted during parts of the reporting period by perceptions that the Federal Reserve would need to keep policy rates higher than previously anticipated to combat inflation. Yield premiums were stable during the period, driven by resilient economic conditions, healthy corporate earnings, and strong market demand for fixed income assets.
The strongest performing industry sectors in the fund included banking, consumer goods, and utilities, while lagging sectors included retail, media, and transportation.
Growth Of $10,000 USD Since Inception
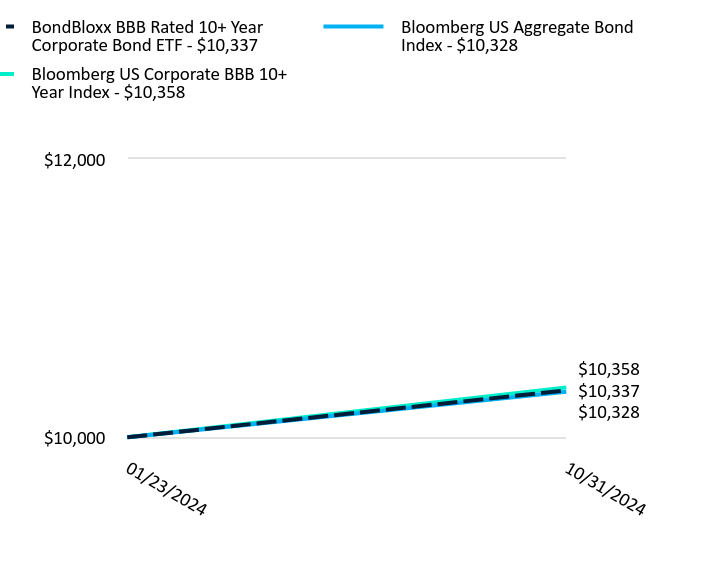
| BondBloxx BBB Rated 10+ Year Corporate Bond ETF | Bloomberg US Aggregate Bond Index | Bloomberg US Corporate BBB 10+ Year Index | |
|---|---|---|---|
| 01/23/2024 | $10,000 | $10,000 | $10,000 |
| 10/31/2024 | $10,337 | $10,328 | $10,358 |
The Growth of $10,000 chart reflects a hypothetical $10,000 investment and assumes reinvestment of dividends and capital gains. Fund expenses, including management fees and other expenses were deducted.
Average Annual Total Returns
| Name | Since InceptionFootnote Reference(1) |
|---|---|
| Net Asset Value | 3.37% |
| Bloomberg US Aggregate Bond Index | 3.28% |
| Bloomberg US Corporate BBB 10+ Year Index | 3.58% |
| Footnote | Description |
Footnote(1) | The Fund commenced operations on January 23, 2024. Shares of BBBL were listed on the NYSE Arca, Inc. on January 25, 2024. |
The performance quoted represents past performance and does not guarantee future results. The investment return and principal will fluctuate. Investor's shares, when sold or redeemed, may be worth more or less than the original cost. Current performance may be lower or higher than the performance quoted. Returns less than one year are not annualized. Shares of the Fund are bought and sold at market price (not net asset value or "NAV") and are not individually redeemed from the Fund. The returns do not reflect the deduction of taxes that a shareholder would pay on Fund distributions or redemption of Fund shares. Visit https://bondbloxxetf.com/BondBloxx-BBB-Rated-10-Year-Corporate-Bond-ETF/ or, if residing outside of the United States, please call 800-896-5089 for more recent performance data.
BBBL
BondBloxx BBB Rated 10+ Year Corporate Bond ETF
NYSE Arca, Inc.
Key Fund Statistics
| Total Net Assets | $7,404,958 |
| # of Portfolio Holdings | 805 |
| Total Advisory Fees Paid During Reporting Period | $8,512 |
| Portfolio Turnover Rate | 25% |
| Expense Ratio | 0.19% |
| Shares Outstanding | 150,000 |
| Fund Launch Date | 1/23/2024 |
| Exchange | NYSE Arca, Inc. |
| CUSIP | 09789C762 |
Top 10 Holdings (% of Net Assets)Footnote Reference*
| Citibank, New York 4.18% 11/01/2024 | 0.74% |
| Goldman Sachs Group, Inc. 6.75% 10/01/2037 | 0.74% |
| CVS Health Corp. 5.05% 03/25/2048 | 0.70% |
| Warnermedia Holdings, Inc. 5.14% 03/15/2052 | 0.61% |
| AT&T, Inc. 3.55% 09/15/2055 | 0.61% |
| Boeing Co. 5.81% 05/01/2050 | 0.57% |
| Boeing Co. 5.93% 05/01/2060 | 0.57% |
| AT&T, Inc. 3.50% 09/15/2053 | 0.56% |
| AT&T, Inc. 3.80% 12/01/2057 | 0.48% |
| Amgen, Inc. 5.65% 03/02/2053 | 0.48% |
| Footnote | Description |
Footnote* | Subject to change |
Credit Rating BreakdownFootnote Reference* (% of Net Assets)
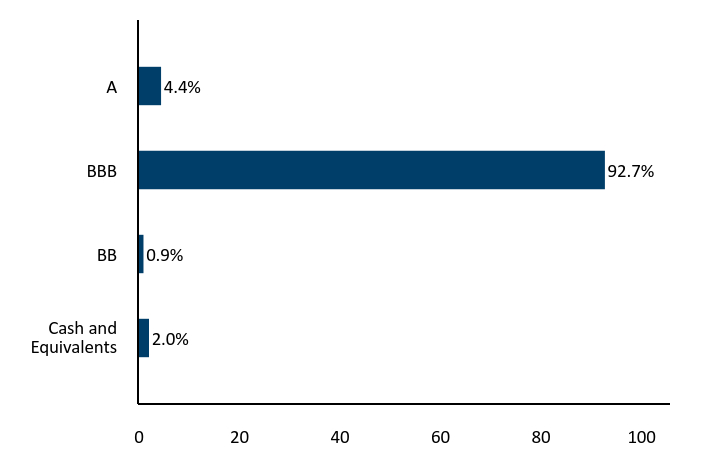
| Value | Value |
|---|---|
| Cash and Equivalents | 2.0% |
| BB | 0.9% |
| BBB | 92.7% |
| A | 4.4% |
| Footnote | Description |
Footnote* | Credit quality ratings on underlying securities of the Fund are received from S&P Global Ratings (“S&P”), Moody’s Investors Service, Inc. (“Moody’s”) and Fitch Ratings, Inc. ("Fitch") and converted to the equivalent S&P major rating category. This breakdown is provided by Bloomberg. Not rated securities do not necessarily indicate low quality. Below investment grade is represented by a rating of BB and below. Ratings and portfolio credit quality may change over time. |
Maturity BreakdownFootnote Reference* (% of Net Assets)

| Value | Value |
|---|---|
| Cash and Equivalents | 2.0% |
| 10+ Years | 98.0% |
| Footnote | Description |
Footnote* | This chart represents the amount by percentage (%) maturity breakdown of bonds in the Fund. |
Sector Breakdown (%)
| Consumer Non-cyclical | 21.6% |
| Communications | 19.0% |
| Energy | 13.2% |
| Financial | 9.4% |
| Industrial | 9.0% |
| Technology | 8.9% |
| Utilities | 6.1% |
| Consumer Cyclical | 5.8% |
| Basic Materials | 5.0% |
| Cash and Equivalents | 2.0% |
BBBL
BondBloxx BBB Rated 10+ Year Corporate Bond ETF
NYSE Arca, Inc.
Disclosures
Securities that are rated below investment-grade (sometimes referred to as “junk bonds”) may be deemed speculative, may involve greater levels of risk than higher-rated securities of similar maturity and may be more likely to default. The Fund’s income may decline if interest rates fall. Debt issuers and other counterparties may be unable or unwilling to make timely interest and/or principal payments when due or otherwise honor their obligations.
Privately issued securities are generally not traded on established markets. As a result of the absence of a public trading market, privately issued securities may be deemed to be illiquid investments, may be more difficult to value than publicly traded securities and may be subject to wide fluctuations in value. The Fund is classified as a ”non-diversified” fund under the Investment Company Act of 1940 (the "1940 Act"). The Fund may be susceptible to an increased risk of loss to the extent that the Fund’s investments are concentrated in the securities and/or other assets of a particular issuer or issuers, sector, sub-sector, market segment, market, industry, group of industries, country, group of countries, region or asset class.
Exchange-traded fund ("ETF") shares are bought and sold at market price (not NAV) and are not individually redeemed from the Fund. NAV Returns are calculated using the daily 4:00pm NAV. Market price returns reflect the midpoint of the bid/ask spread as of the close of trading on the exchange where Fund shares are listed. Market price returns do not represent the returns you would receive if you traded shares at other times.
Distributed by Foreside Fund Services, LLC. BondBloxx is a registered investment adviser.
Additional Information
For additional information about the Fund, including its prospectus, financial information, holdings and proxy voting information, please visit https://bondbloxxetf.com/BondBloxx-BBB-Rated-10-Year-Corporate-Bond-ETF/. For proxy voting records, visit https://bondbloxxetf.com/resources/.

Householding
To reduce Fund expenses, only one copy of most shareholder documents may be mailed to shareholders with multiple accounts at the same address ("householding"). If you prefer that your Fund documents not be householded, please contact BondBloxx at 800-896-5089 or contact your financial intermediary. Your instructions will typically be effective within 30 days of receipt by BondBloxx or your financial intermediary.
BBLX BBBL 1024

XEMD
BondBloxx JP Morgan USD Emerging Markets 1-10 Year Bond ETF
Cboe BZX Exchange, Inc.
Annual Shareholder Report as of October 31, 2024
The BondBloxx JP Morgan USD Emerging Markets 1-10 Year Bond ETF (the "Fund") seeks to track the investment results of an index composed of U.S. dollar-denominated emerging market bonds with an average life of below 10 years.
This annual shareholder report contains important information about the Fund for the period from November 1, 2023 to October 31, 2024.You can find additional information about the Fund at https://bondbloxxetf.com/bondbloxx-jp-morgan-usd-emerging-markets-1-10-year-bond-etf/. You can also request this information by contacting us at 800-896-5089.
What Were The Fund Costs For The Last Year?
(based on a hypothetical $10,000 investment)
| Fund name | Cost of a $10,000 investment | Cost paid as a % of a $10,000 investment |
|---|---|---|
| BondBloxx JP Morgan USD Emerging Markets 1-10 Year Bond ETF | $31 | 0.29% |
How Did The Fund Perform Last Year?
For the fiscal year ended October 31, 2024, the Fund generated a total return of 16.21%, generally in line with its benchmark, the JP Morgan EMBI Global Diversified Liquid 1-10 Year Maturity Index, which returned 16.66%.
The Fund’s performance was driven by a combination of income from coupon payments (“income return”) and price gains, driven by declining Treasury yields and a reduction in yield premiums during the period. These factors were influenced by positive economic and monetary conditions in the United States and abroad, including expectations of looser monetary policy combined with resilient economic growth.
Signs of moderating inflation enabled monetary easing in many emerging markets, while resilient US economic growth supported exports from many emerging markets countries, aiding in their ability to service external debts. Additionally, attractive valuations and yield premiums made emerging markets debt more appealing to investors compared to other fixed-income assets during the period.
Growth Of $10,000 USD Since Inception
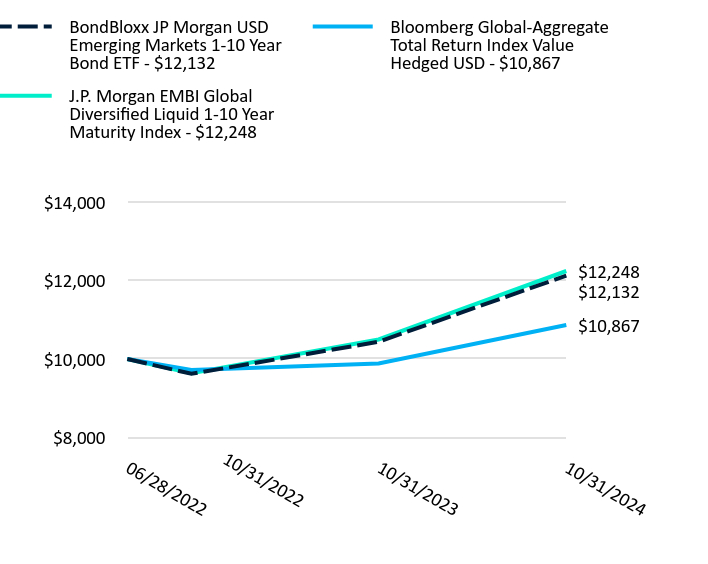
| BondBloxx JP Morgan USD Emerging Markets 1-10 Year Bond ETF | Bloomberg Global-Aggregate Total Return Index Value Hedged USD | J.P. Morgan EMBI Global Diversified Liquid 1-10 Year Maturity Index | |
|---|---|---|---|
| 06/28/2022 | $10,000 | $10,000 | $10,000 |
| 10/31/2022 | $9,622 | $9,719 | $9,635 |
| 10/31/2023 | $10,440 | $9,886 | $10,499 |
| 10/31/2024 | $12,132 | $10,867 | $12,248 |
The Growth of $10,000 chart reflects a hypothetical $10,000 investment and assumes reinvestment of dividends and capital gains. Fund expenses, including management fees and other expenses were deducted.
Average Annual Total Returns
| Name | 1 Year | Since InceptionFootnote Reference(1) |
|---|---|---|
| Net Asset Value | 16.21% | 8.60% |
| Bloomberg Global-Aggregate Total Return Index Value Hedged USD | 9.92% | 3.61% |
| J.P. Morgan EMBI Global Diversified Liquid 1-10 Year Maturity Index | 16.66% | 9.05% |
| Footnote | Description |
Footnote(1) | The Fund commenced operations on June 28, 2022. Shares of XEMD were listed on the Cboe BZX, Inc. on June 30, 2022. |
The performance quoted represents past performance and does not guarantee future results. The investment return and principal will fluctuate. Investor's shares, when sold or redeemed, may be worth more or less than the original cost. Current performance may be lower or higher than the performance quoted. Returns less than one year are not annualized. Shares of the Fund are bought and sold at market price (not net asset value or "NAV") and are not individually redeemed from the Fund. The returns do not reflect the deduction of taxes that a shareholder would pay on Fund distributions or redemption of Fund shares. Visit https://bondbloxxetf.com/bondbloxx-jp-morgan-usd-emerging-markets-1-10-year-bond-etf/ or, if residing outside of the United States, please call 800-896-5089 for more recent performance data.
XEMD
BondBloxx JP Morgan USD Emerging Markets 1-10 Year Bond ETF
Cboe BZX Exchange, Inc.
Key Fund Statistics
| Total Net Assets | $254,856,330 |
| # of Portfolio Holdings | 413 |
| Total Advisory Fees Paid During Reporting Period | $632,132 |
| Portfolio Turnover Rate | 22% |
| Expense Ratio | 0.29% |
| Shares Outstanding | 6,050,000 |
| Fund Launch Date | 6/28/2022 |
| Exchange | Cboe BZX Exchange, Inc. |
| CUSIP | 09789C879 |
Top 10 Holdings (% of Net Assets)Footnote Reference*
| Argentine Republic Government International Bond 4.13% 07/09/2035 | 1.28% |
| Kuwait International Government Bond 3.50% 03/20/2027 | 1.18% |
| Argentine Republic Government International Bond 0.75% 07/09/2030 | 1.12% |
| Ecuador Government International Bond 5.50% 07/31/2035 | 1.08% |
| Argentine Republic Government International Bond 5.00% 01/09/2038 | 0.77% |
| Ghana Government International Bond 5.00% 07/03/2035 | 0.75% |
| Republic of Poland Government International Bond 5.13% 09/18/2034 | 0.67% |
| Kazakhstan Government International Bond 5.13% 07/21/2025 | 0.65% |
| Ghana Government International Bond 5.00% 07/03/2029 | 0.64% |
| Argentine Republic Government International Bond 3.50% 07/09/2041 | 0.61% |
| Footnote | Description |
Footnote* | Subject to change |
Credit Rating BreakdownFootnote Reference* (% of Net Assets)
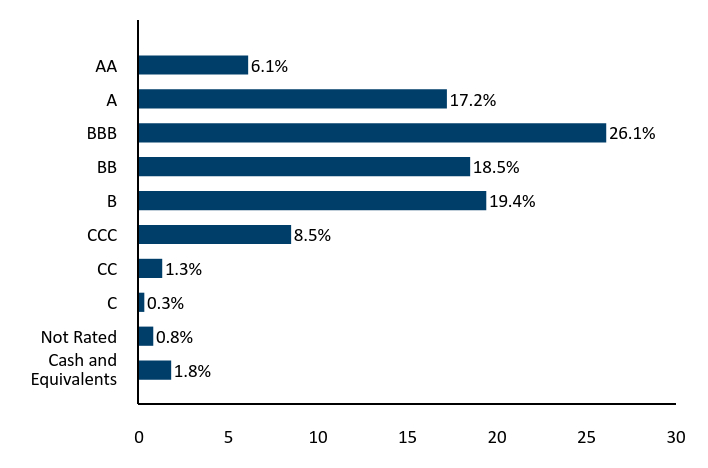
| Value | Value |
|---|---|
| Cash and Equivalents | 1.8% |
| Not Rated | 0.8% |
| C | 0.3% |
| CC | 1.3% |
| CCC | 8.5% |
| B | 19.4% |
| BB | 18.5% |
| BBB | 26.1% |
| A | 17.2% |
| AA | 6.1% |
| Footnote | Description |
Footnote* | Credit quality ratings on underlying securities of the Fund are received from S&P Global Ratings (“S&P”), Moody’s Investors Service, Inc. (“Moody’s”) and Fitch Ratings, Inc. ("Fitch") and converted to the equivalent S&P major rating category. This breakdown is provided by Bloomberg. Not rated securities do not necessarily indicate low quality. Below investment grade is represented by a rating of BB and below. Ratings and portfolio credit quality may change over time. |
Maturity BreakdownFootnote Reference* (% of Net Assets)
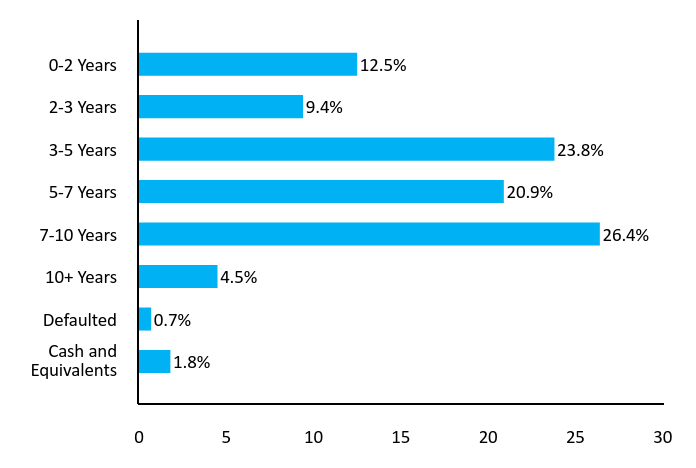
| Value | Value |
|---|---|
| Cash and Equivalents | 1.8% |
| Defaulted | 0.7% |
| 10+ Years | 4.5% |
| 7-10 Years | 26.4% |
| 5-7 Years | 20.9% |
| 3-5 Years | 23.8% |
| 2-3 Years | 9.4% |
| 0-2 Years | 12.5% |
| Footnote | Description |
Footnote* | This chart represents the amount by percentage (%) maturity breakdown of bonds in the Fund. |
Top 10 CountriesFootnote Reference* (% of Net Assets)
| Saudi Arabia | 6.3% |
| Turkey | 5.7% |
| Mexico | 4.1% |
| United Arab Emirates | 4.0% |
| Argentina | 4.0% |
| Poland | 3.7% |
| Oman | 3.7% |
| Bahrain | 3.7% |
| Brazil | 3.5% |
| Indonesia | 3.5% |
| Footnote | Description |
Footnote* | Subject to change |
XEMD
BondBloxx JP Morgan USD Emerging Markets 1-10 Year Bond ETF
Cboe BZX Exchange, Inc.
Disclosures
Securities that are rated below investment-grade (sometimes referred to as “junk bonds”) may be deemed speculative, may involve greater levels of risk than higher-rated securities of similar maturity and may be more likely to default. The Fund’s income may decline if interest rates fall. Debt issuers and other counterparties may be unable or unwilling to make timely interest and/or principal payments when due or otherwise honor their obligations.
Investments in debt securities issued by governments involve the risk that the governmental entities responsible for repayment may be unable or unwilling to pay interest and repay principal when due. In times of economic uncertainty, the prices of these securities may be more volatile than those of corporate debt obligations or of other government debt obligations. Any restructuring of a sovereign debt obligation held by the Fund will likely have a significant adverse effect on the value of the obligation. In the event of default of sovereign debt, the Fund may be unable to pursue legal action against the sovereign issuer or to realize on collateral securing the debt.
Investments in emerging market issuers are subject to a greater risk of loss than investments in issuers located or operating in more developed markets. This is due to, among other things, the potential for greater market volatility, lower trading volume, higher levels of inflation, political and economic instability, greater risk of a market shutdown and more governmental limitations on foreign investments in emerging market countries than are typically found in more developed markets. Companies in many emerging markets are not subject to the same degree of regulatory requirements, accounting standards or auditor oversight as companies in more developed countries, and as a result, information about the securities in which the Fund invests may be less reliable or complete. Moreover, emerging markets often have less reliable securities valuations and greater risks associated with custody of securities than developed markets. There may be significant obstacles to obtaining information necessary for investigations into or litigation against companies and shareholders may have limited legal remedies. The Fund is not actively managed and does not select investments based on investor protection considerations. In addition, emerging markets often have greater risk of capital controls through such measures as taxes or interest rate control than developed markets. Certain emerging market countries may also lack the infrastructure necessary to attract large amounts of foreign trade and investment. Local securities markets in emerging market countries may trade a small number of securities and may be unable to respond effectively to changes in trading volume, potentially making prompt liquidation of holdings difficult or impossible at times. Settlement procedures in emerging market countries are frequently less developed and reliable than those in the U.S. (and other developed countries). In addition, significant delays may occur in certain markets in registering the transfer of securities. There could be additional impacts on the value of the Fund as a result of sustainability risks, in particular those caused by environmental changes related to climate change, social issues (including relating to labor rights) and governance risk (including but not limited to risks around board independence, ownership and control, or audit and tax management). Additionally, disclosures or third-party data coverage associated with sustainability risks is generally less available or transparent in these markets.
Exchange-traded fund ("ETF") shares are bought and sold at market price (not NAV) and are not individually redeemed from the Fund. NAV Returns are calculated using the daily 4:00pm NAV. Market price returns reflect the midpoint of the bid/ask spread as of the close of trading on the exchange where Fund shares are listed. Market price returns do not represent the returns you would receive if you traded shares at other times.
Distributed by Foreside Fund Services, LLC. BondBloxx is a registered investment adviser.
Additional Information
For additional information about the Fund, including its prospectus, financial information, holdings and proxy voting information, please visit https://bondbloxxetf.com/bondbloxx-jp-morgan-usd-emerging-markets-1-10-year-bond-etf/. For proxy voting records, visit https://bondbloxxetf.com/resources/.

Householding
To reduce Fund expenses, only one copy of most shareholder documents may be mailed to shareholders with multiple accounts at the same address ("householding"). If you prefer that your Fund documents not be householded, please contact BondBloxx at 800-896-5089 or contact your financial intermediary. Your instructions will typically be effective within 30 days of receipt by BondBloxx or your financial intermediary.
BBLX XEMD 1024

XHLF
BondBloxx Bloomberg Six Month Target Duration US Treasury ETF
NYSE Arca, Inc.
Annual Shareholder Report as of October 31, 2024
The BondBloxx Bloomberg Six Month Target Duration US Treasury ETF (the "Fund") seeks to track the investment results of an index composed of U.S. Treasury securities with a duration between 1 and 12 months.
This annual shareholder report contains important information about the Fund for the period from November 1, 2023 to October 31, 2024. You can find additional information about the Fund at https://bondbloxxetf.com/bondbloxx-bloomberg-six-month-target-duration-us-treasury-etf/. You can also request this information by contacting us at 800-896-5089.
What Were The Fund Costs For The Last Year?
(based on a hypothetical $10,000 investment)
| Fund name | Cost of a $10,000 investment | Cost paid as a % of a $10,000 investment |
|---|---|---|
| BondBloxx Bloomberg Six Month Target Duration US Treasury ETF | $3 | 0.03% |
How Did The Fund Perform Last Year?
For the fiscal year ended October 31, 2024,the Fund generated a total return of 5.41%, generally in line with its benchmark, the Bloomberg US Treasury Six Month Duration Index, which returned 5.46%.
The Fund’s performance primarily reflected income from coupon payments (“income return”), with contribution from price gains as Treasury yields declined in the second half of the fiscal year. Given the Fund’s focus on the short end of the US Treasury yield curve, the Fund benefited from an inverted yield curve as the Federal Reserve kept policy rates elevated during the period in its effort to combat inflation.
Income for the fiscal year benefited from higher starting yields driven by the Federal Reserve’s 2022–2023 policy actions, which included raising the policy rate by 5.25% to combat inflation.
Growth Of $10,000 USD Since Inception
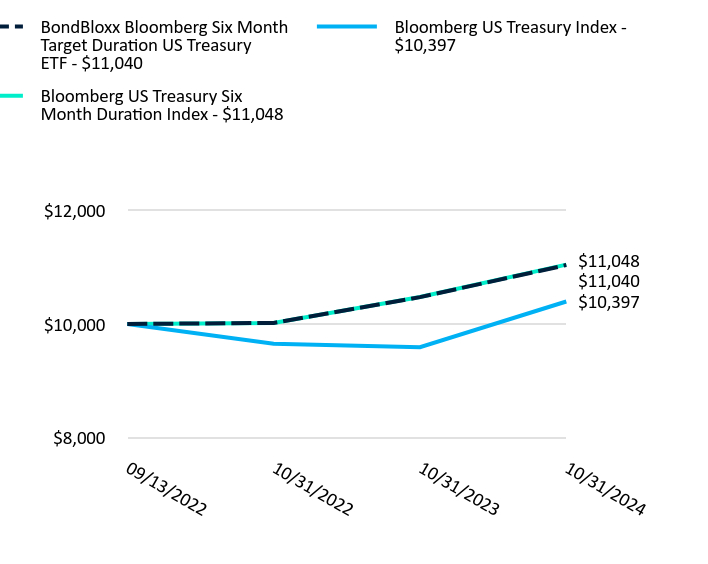
| BondBloxx Bloomberg Six Month Target Duration US Treasury ETF | Bloomberg US Treasury Index | Bloomberg US Treasury Six Month Duration Index | |
|---|---|---|---|
| 09/13/2022 | $10,000 | $10,000 | $10,000 |
| 10/31/2022 | $10,018 | $9,651 | $10,016 |
| 10/31/2023 | $10,474 | $9,590 | $10,477 |
| 10/31/2024 | $11,040 | $10,397 | $11,048 |
The Growth of $10,000 chart reflects a hypothetical $10,000 investment and assumes reinvestment of dividends and capital gains. Fund expenses, including management fees and other expenses were deducted.
Average Annual Total Returns
| Name | 1 Year | Since InceptionFootnote Reference(1) |
|---|---|---|
| Net Asset Value | 5.41% | 4.75% |
| Bloomberg US Treasury Index | 8.41% | 1.84% |
| Bloomberg US Treasury Six Month Duration Index | 5.46% | 4.79% |
| Footnote | Description |
Footnote(1) | The Fund commenced operations on September 13, 2022. Shares of XHLF were listed on the NYSE Arca, Inc. on September 15, 2022. |
The performance quoted represents past performance and does not guarantee future results. The investment return and principal will fluctuate. Investor's shares, when sold or redeemed, may be worth more or less than the original cost. Current performance may be lower or higher than the performance quoted. Returns less than one year are not annualized. Shares of the Fund are bought and sold at market price (not net asset value or "NAV") and are not individually redeemed from the Fund. The returns do not reflect the deduction of taxes that a shareholder would pay on Fund distributions or redemption of Fund shares. Visit https://bondbloxxetf.com/bondbloxx-bloomberg-six-month-target-duration-us-treasury-etf/ or, if residing outside of the United States, please call 800-896-5089 for more recent performance data.
XHLF
BondBloxx Bloomberg Six Month Target Duration US Treasury ETF
NYSE Arca, Inc.
Key Fund Statistics
| Total Net Assets | $899,942,800 |
| # of Portfolio Holdings | 26 |
| Total Advisory Fees Paid During Reporting Period | $327,014 |
| Portfolio Turnover Rate | -% |
| Expense Ratio | 0.03% |
| Shares Outstanding | 17,870,000 |
| Fund Launch Date | 9/13/2022 |
| Exchange | NYSE Arca, Inc. |
| CUSIP | 09789C788 |
Top 10 Holdings (% of Net Assets)Footnote Reference*
| U.S. Treasury Bill ZCP 06/12/2025 | 9.14% |
| U.S. Treasury Bill ZCP 07/10/2025 | 9.11% |
| U.S. Treasury Bill ZCP 08/07/2025 | 9.08% |
| U.S. Treasury Bill ZCP 05/15/2025 | 9.07% |
| U.S. Treasury Bill ZCP 09/04/2025 | 8.93% |
| U.S. Treasury Bill ZCP 04/17/2025 | 7.06% |
| Sumitomo Mitsui Trust Bank, London 4.18% 11/01/2024 | 6.16% |
| U.S. Treasury Bill ZCP 01/23/2025 | 5.59% |
| U.S. Treasury Bill ZCP 12/26/2024 | 5.57% |
| U.S. Treasury Bill ZCP 10/30/2025 | 4.90% |
| Footnote | Description |
Footnote* | Subject to change |
Credit Rating BreakdownFootnote Reference* (% of Net Assets)

| Value | Value |
|---|---|
| Cash and Equivalents | 0.6% |
| AA | 99.4% |
| Footnote | Description |
Footnote* | Credit quality ratings on underlying securities of the Fund are received from S&P Global Ratings (“S&P”), Moody’s Investors Service, Inc. (“Moody’s”) and Fitch Ratings, Inc. ("Fitch") and converted to the equivalent S&P major rating category. This breakdown is provided by Bloomberg. Not rated securities do not necessarily indicate low quality. Below investment grade is represented by a rating of BB and below. Ratings and portfolio credit quality may change over time. |
Maturity BreakdownFootnote Reference* (% of Net Assets)
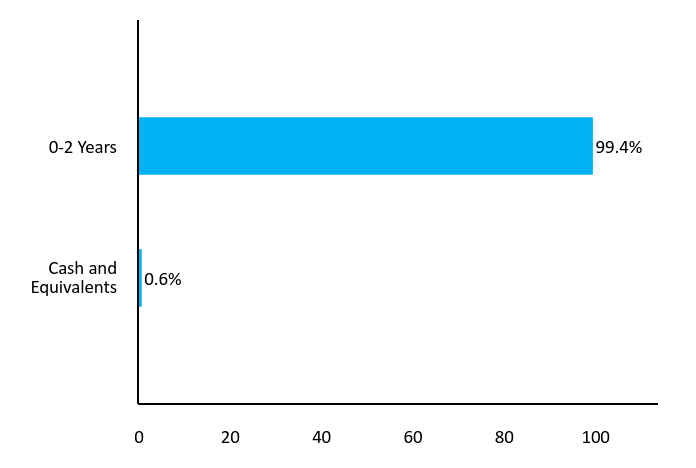
| Value | Value |
|---|---|
| Cash and Equivalents | 0.6% |
| 0-2 Years | 99.4% |
| Footnote | Description |
Footnote* | This chart represents the amount by percentage (%) maturity breakdown of bonds in the Fund. |
XHLF
BondBloxx Bloomberg Six Month Target Duration US Treasury ETF
NYSE Arca, Inc.
Disclosures
U.S. Treasury obligations may differ from other securities in their interest rates, maturities, times of issuance and other characteristics and may provide relatively lower returns than those of other securities. Similar to other issuers, changes to the financial condition or credit rating of the U.S. Government may cause the value of the Fund’s U.S. Treasury obligations to decline.
The Fund may be susceptible to an increased risk of loss to the extent that the Fund’s investments are concentrated in the securities and/or other assets of a particular issuer or issuers, sector, sub-sector, market segment, market, industry, group of industries, country, group of countries, region or asset class.
Exchange-traded fund ("ETF") shares are bought and sold at market price (not NAV) and are not individually redeemed from the Fund. NAV Returns are calculated using the daily 4:00pm NAV. Market price returns reflect the midpoint of the bid/ask spread as of the close of trading on the exchange where Fund shares are listed. Market price returns do not represent the returns you would receive if you traded shares at other times.
Distributed by Foreside Fund Services, LLC. BondBloxx is a registered investment adviser.
Additional Information
For additional information about the Fund, including its prospectus, financial information, holdings and proxy voting information, please visit https://bondbloxxetf.com/bondbloxx-bloomberg-six-month-target-duration-us-treasury-etf/. For proxy voting records, visit https://bondbloxxetf.com/resources/.

Householding
To reduce Fund expenses, only one copy of most shareholder documents may be mailed to shareholders with multiple accounts at the same address ("householding"). If you prefer that your Fund documents not be householded, please contact BondBloxx at 800-896-5089 or contact your financial intermediary. Your instructions will typically be effective within 30 days of receipt by BondBloxx or your financial intermediary.
BBLX XHLF 1024

XONE
BondBloxx Bloomberg One Year Target Duration US Treasury ETF
NYSE Arca, Inc.
Annual Shareholder Report as of October 31, 2024
The BondBloxx Bloomberg One Year Target Duration US Treasury ETF (the "Fund") seeks to track the investment results of an index composed of U.S. Treasury securities with a duration between 6 and 18 months.
This annual shareholder report contains important information about the Fund for the period from November 1, 2023 to October 31, 2024. You can find additional information about the Fund at https://bondbloxxetf.com/bondbloxx-bloomberg-one-year-target-duration-us-treasury-etf/. You can also request this information by contacting us at 800-896-5089.
What Were The Fund Costs For The Last Year?
(based on a hypothetical $10,000 investment)
| Fund name | Cost of a $10,000 investment | Cost paid as a % of a $10,000 investment |
|---|---|---|
| BondBloxx Bloomberg One Year Target Duration US Treasury ETF | $3 | 0.03% |
How Did The Fund Perform Last Year?
For the fiscal year ended October 31, 2024, the Fund generated a total return of 5.52%, generally in line with its benchmark, the Bloomberg US Treasury One Year Duration Index, which returned 5.56%.
The Fund’s performance primarily reflected income from coupon payments (“income return”), with contribution from price gains as Treasury yields declined in the second half of the fiscal year. Given the Fund’s focus on the short end of the US Treasury yield curve, the Fund benefited from an inverted yield curve as the Federal Reserve kept policy rates elevated during the period in its effort to combat inflation.
Income for the fiscal year benefited from higher starting yields driven by the Federal Reserve’s 2022–2023 policy actions, which included raising the policy rate by 5.25% to combat inflation.
Growth Of $10,000 USD Since Inception
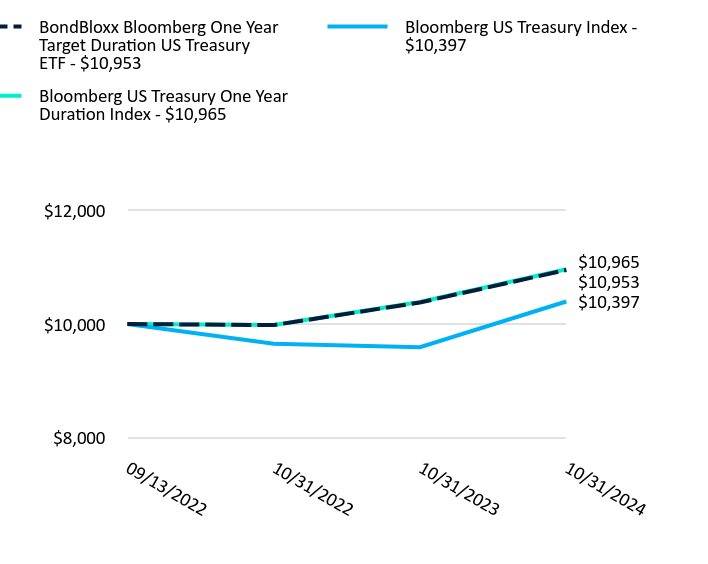
| BondBloxx Bloomberg One Year Target Duration US Treasury ETF | Bloomberg US Treasury Index | Bloomberg US Treasury One Year Duration Index | |
|---|---|---|---|
| 09/13/2022 | $10,000 | $10,000 | $10,000 |
| 10/31/2022 | $9,980 | $9,651 | $9,983 |
| 10/31/2023 | $10,380 | $9,590 | $10,387 |
| 10/31/2024 | $10,953 | $10,397 | $10,965 |
The Growth of $10,000 chart reflects a hypothetical $10,000 investment and assumes reinvestment of dividends and capital gains. Fund expenses, including management fees and other expenses were deducted.
Average Annual Total Returns
| Name | 1 Year | Since InceptionFootnote Reference(1) |
|---|---|---|
| Net Asset Value | 5.52% | 4.36% |
| Bloomberg US Treasury Index | 8.41% | 1.84% |
| Bloomberg US Treasury One Year Duration Index | 5.56% | 4.42% |
| Footnote | Description |
Footnote(1) | The Fund commenced operations on September 13, 2022. Shares of XONE were listed on the NYSE Arca, Inc. on September 15, 2022. |
The performance quoted represents past performance and does not guarantee future results. The investment return and principal will fluctuate. Investor's shares, when sold or redeemed, may be worth more or less than the original cost. Current performance may be lower or higher than the performance quoted. Returns less than one year are not annualized. Shares of the Fund are bought and sold at market price (not net asset value or "NAV") and are not individually redeemed from the Fund. The returns do not reflect the deduction of taxes that a shareholder would pay on Fund distributions or redemption of Fund shares. Visit https://bondbloxxetf.com/bondbloxx-bloomberg-one-year-target-duration-us-treasury-etf/ or, if residing outside of the United States, please call 800-896-5089 for more recent performance data.
XONE
BondBloxx Bloomberg One Year Target Duration US Treasury ETF
NYSE Arca, Inc.
Key Fund Statistics
| Total Net Assets | $533,244,686 |
| # of Portfolio Holdings | 59 |
| Total Advisory Fees Paid During Reporting Period | $146,987 |
| Portfolio Turnover Rate | 66% |
| Expense Ratio | 0.03% |
| Shares Outstanding | 10,720,000 |
| Fund Launch Date | 9/13/2022 |
| Exchange | NYSE Arca, Inc. |
| CUSIP | 09789C861 |
Top 10 Holdings (% of Net Assets)Footnote Reference*
| U.S. Treasury Note 2.00% 08/15/2025 | 2.67% |
| U.S. Treasury Note 2.13% 05/15/2025 | 2.61% |
| U.S. Treasury Note 4.25% 01/31/2026 | 2.53% |
| U.S. Treasury Note 4.88% 04/30/2026 | 2.50% |
| U.S. Treasury Note 4.50% 03/31/2026 | 2.48% |
| U.S. Treasury Note 4.63% 02/28/2026 | 2.46% |
| U.S. Treasury Note 5.00% 09/30/2025 | 2.46% |
| U.S. Treasury Note 0.25% 09/30/2025 | 2.43% |
| U.S. Treasury Note 5.00% 08/31/2025 | 2.40% |
| U.S. Treasury Note 4.88% 05/31/2026 | 2.39% |
| Footnote | Description |
Footnote* | Subject to change |
Credit Rating BreakdownFootnote Reference* (% of Net Assets)
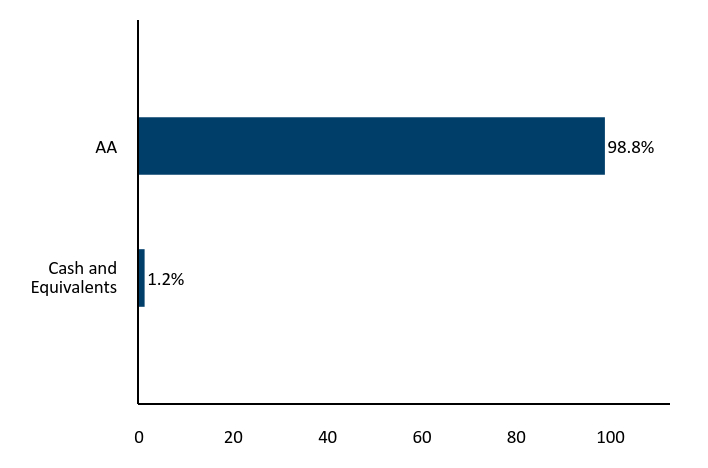
| Value | Value |
|---|---|
| Cash and Equivalents | 1.2% |
| AA | 98.8% |
| Footnote | Description |
Footnote* | Credit quality ratings on underlying securities of the Fund are received from S&P Global Ratings (“S&P”), Moody’s Investors Service, Inc. (“Moody’s”) and Fitch Ratings, Inc. ("Fitch") and converted to the equivalent S&P major rating category. This breakdown is provided by Bloomberg. Not rated securities do not necessarily indicate low quality. Below investment grade is represented by a rating of BB and below. Ratings and portfolio credit quality may change over time. |
Maturity BreakdownFootnote Reference* (% of Net Assets)
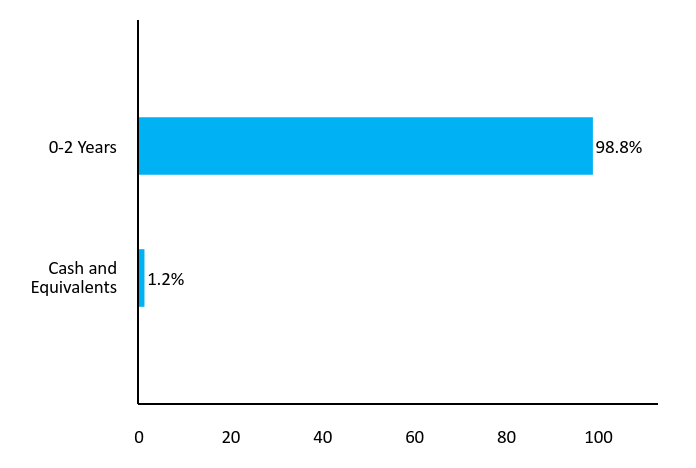
| Value | Value |
|---|---|
| Cash and Equivalents | 1.2% |
| 0-2 Years | 98.8% |
| Footnote | Description |
Footnote* | This chart represents the amount by percentage (%) maturity breakdown of bonds in the Fund. |
XONE
BondBloxx Bloomberg One Year Target Duration US Treasury ETF
NYSE Arca, Inc.
Disclosures
U.S. Treasury obligations may differ from other securities in their interest rates, maturities, times of issuance and other characteristics and may provide relatively lower returns than those of other securities. Similar to other issuers, changes to the financial condition or credit rating of the U.S. Government may cause the value of the Fund’s U.S. Treasury obligations to decline.
The Fund may be susceptible to an increased risk of loss to the extent that the Fund’s investments are concentrated in the securities and/or other assets of a particular issuer or issuers, sector, sub-sector, market segment, market, industry, group of industries, country, group of countries, region or asset class.
Exchange-traded fund ("ETF") shares are bought and sold at market price (not NAV) and are not individually redeemed from the Fund. NAV Returns are calculated using the daily 4:00pm NAV. Market price returns reflect the midpoint of the bid/ask spread as of the close of trading on the exchange where Fund shares are listed. Market price returns do not represent the returns you would receive if you traded shares at other times.
Distributed by Foreside Fund Services, LLC. BondBloxx is a registered investment adviser.
Additional Information
For additional information about the Fund, including its prospectus, financial information, holdings and proxy voting information, please visit https://bondbloxxetf.com/bondbloxx-bloomberg-one-year-target-duration-us-treasury-etf/. For proxy voting records, visit https://bondbloxxetf.com/resources/.

Householding
To reduce Fund expenses, only one copy of most shareholder documents may be mailed to shareholders with multiple accounts at the same address ("householding"). If you prefer that your Fund documents not be householded, please contact BondBloxx at 800-896-5089 or contact your financial intermediary. Your instructions will typically be effective within 30 days of receipt by BondBloxx or your financial intermediary.
BBLX XONE 1024

XTWO
BondBloxx Bloomberg Two Year Target Duration US Treasury ETF
NYSE Arca, Inc.
Annual Shareholder Report as of October 31, 2024
The BondBloxx Bloomberg Two Year Target Duration US Treasury ETF (the "Fund") seeks to track the investment results of an index composed of U.S. Treasury securities with a duration between 1 and 3 years.
This annual shareholder report contains important information about the Fund for the period from November 1, 2023 to October 31, 2024. You can find additional information about the Fund at https://bondbloxxetf.com/bondbloxx-bloomberg-two-year-target-duration-us-treasury-etf/. You can also request this information by contacting us at 800-896-5089.
What Were The Fund Costs For The Last Year?
(based on a hypothetical $10,000 investment)
| Fund name | Cost of a $10,000 investment | Cost paid as a % of a $10,000 investment |
|---|---|---|
| BondBloxx Bloomberg Two Year Target Duration US Treasury ETF | $5 | 0.05% |
How Did The Fund Perform Last Year?
For the fiscal year ended October 31, 2024, the Fund generated a total return of 5.79%, generally in line with its benchmark, the Bloomberg US Treasury Two Year Duration Index, which returned 5.85%.
The Fund’s performance primarily reflected income from coupon payments (“income return”), complemented by price gains as Treasury yields declined in the second half of the fiscal year. This yield decline was driven by shifting market expectations for Federal Reserve policy as inflation and employment data showed consistent moderation. In September 2024, the Federal Reserve reduced its benchmark interest rate by 50 basis points, marking the first rate cut since 2020.
Income for the fiscal year benefited from higher starting yields driven by the Federal Reserve’s 2022–2023 policy actions, which included raising the policy rate by 5.25% to combat inflation.
Growth Of $10,000 USD Since Inception
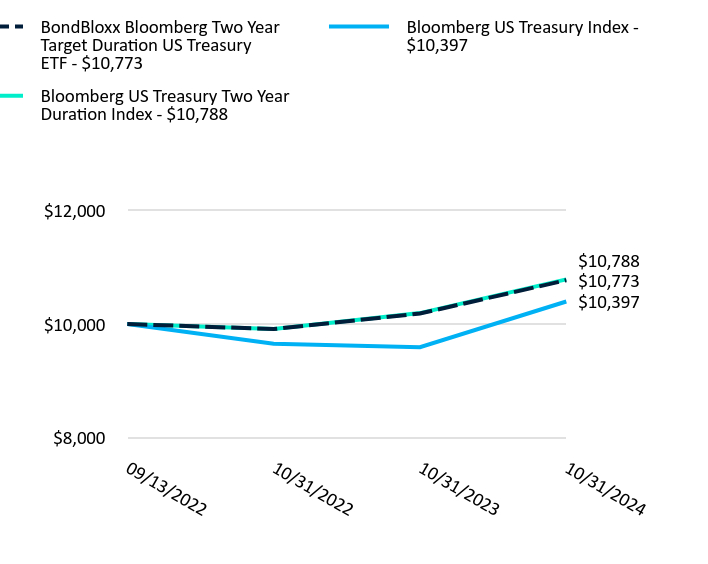
| BondBloxx Bloomberg Two Year Target Duration US Treasury ETF | Bloomberg US Treasury Index | Bloomberg US Treasury Two Year Duration Index | |
|---|---|---|---|
| 09/13/2022 | $10,000 | $10,000 | $10,000 |
| 10/31/2022 | $9,910 | $9,651 | $9,913 |
| 10/31/2023 | $10,184 | $9,590 | $10,192 |
| 10/31/2024 | $10,773 | $10,397 | $10,788 |
The Growth of $10,000 chart reflects a hypothetical $10,000 investment and assumes reinvestment of dividends and capital gains. Fund expenses, including management fees and other expenses were deducted.
Average Annual Total Returns
| Name | 1 Year | Since InceptionFootnote Reference(1) |
|---|---|---|
| Net Asset Value | 5.79% | 3.56% |
| Bloomberg US Treasury Index | 8.41% | 1.84% |
| Bloomberg US Treasury Two Year Duration Index | 5.85% | 3.62% |
| Footnote | Description |
Footnote(1) | The Fund commenced operations on September 13, 2022. Shares of XTWO were listed on the NYSE Arca, Inc. on September 15, 2022. |
The performance quoted represents past performance and does not guarantee future results. The investment return and principal will fluctuate. Investor's shares, when sold or redeemed, may be worth more or less than the original cost. Current performance may be lower or higher than the performance quoted. Returns less than one year are not annualized. Shares of the Fund are bought and sold at market price (not net asset value or "NAV") and are not individually redeemed from the Fund. The returns do not reflect the deduction of taxes that a shareholder would pay on Fund distributions or redemption of Fund shares. Visit https://bondbloxxetf.com/bondbloxx-bloomberg-two-year-target-duration-us-treasury-etf/ or, if residing outside of the United States, please call 800-896-5089 for more recent performance data.
XTWO
BondBloxx Bloomberg Two Year Target Duration US Treasury ETF
NYSE Arca, Inc.
Key Fund Statistics
| Total Net Assets | $150,528,829 |
| # of Portfolio Holdings | 93 |
| Total Advisory Fees Paid During Reporting Period | $57,663 |
| Portfolio Turnover Rate | 66% |
| Expense Ratio | 0.05% |
| Shares Outstanding | 3,050,000 |
| Fund Launch Date | 9/13/2022 |
| Exchange | NYSE Arca, Inc. |
| CUSIP | 09789C853 |
Top 10 Holdings (% of Net Assets)Footnote Reference*
| U.S. Treasury Note 1.50% 01/31/2027 | 1.97% |
| U.S. Treasury Note 1.25% 11/30/2026 | 1.66% |
| U.S. Treasury Note 4.25% 03/15/2027 | 1.64% |
| U.S. Treasury Note 4.50% 04/15/2027 | 1.60% |
| U.S. Treasury Note 0.75% 04/30/2026 | 1.60% |
| U.S. Treasury Note 4.13% 02/15/2027 | 1.58% |
| U.S. Treasury Note 2.38% 05/15/2027 | 1.58% |
| U.S. Treasury Note 0.75% 08/31/2026 | 1.56% |
| U.S. Treasury Note 3.75% 08/15/2027 | 1.56% |
| U.S. Treasury Note 3.38% 09/15/2027 | 1.54% |
| Footnote | Description |
Footnote* | Subject to change |
Credit Rating BreakdownFootnote Reference* (% of Net Assets)

| Value | Value |
|---|---|
| Cash and Equivalents | 1.1% |
| AA | 98.9% |
| Footnote | Description |
Footnote* | Credit quality ratings on underlying securities of the Fund are received from S&P Global Ratings (“S&P”), Moody’s Investors Service, Inc. (“Moody’s”) and Fitch Ratings, Inc. ("Fitch") and converted to the equivalent S&P major rating category. This breakdown is provided by Bloomberg. Not rated securities do not necessarily indicate low quality. Below investment grade is represented by a rating of BB and below. Ratings and portfolio credit quality may change over time. |
Maturity BreakdownFootnote Reference* (% of Net Assets)
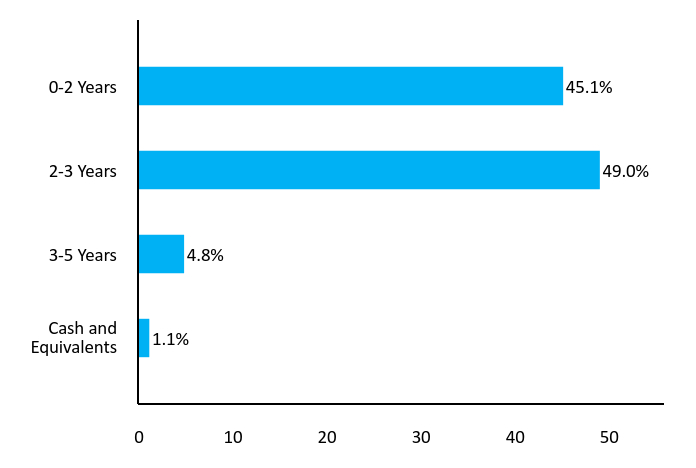
| Value | Value |
|---|---|
| Cash and Equivalents | 1.1% |
| 3-5 Years | 4.8% |
| 2-3 Years | 49.0% |
| 0-2 Years | 45.1% |
| Footnote | Description |
Footnote* | This chart represents the amount by percentage (%) maturity breakdown of bonds in the Fund. |
XTWO
BondBloxx Bloomberg Two Year Target Duration US Treasury ETF
NYSE Arca, Inc.
Disclosures
U.S. Treasury obligations may differ from other securities in their interest rates, maturities, times of issuance and other characteristics and may provide relatively lower returns than those of other securities. Similar to other issuers, changes to the financial condition or credit rating of the U.S. Government may cause the value of the Fund’s U.S. Treasury obligations to decline.
The Fund may be susceptible to an increased risk of loss to the extent that the Fund’s investments are concentrated in the securities and/or other assets of a particular issuer or issuers, sector, sub-sector, market segment, market, industry, group of industries, country, group of countries, region or asset class.
Exchange-traded fund ("ETF") shares are bought and sold at market price (not NAV) and are not individually redeemed from the Fund. NAV Returns are calculated using the daily 4:00pm NAV. Market price returns reflect the midpoint of the bid/ask spread as of the close of trading on the exchange where Fund shares are listed. Market price returns do not represent the returns you would receive if you traded shares at other times.
Distributed by Foreside Fund Services, LLC. BondBloxx is a registered investment adviser.
Additional Information
For additional information about the Fund, including its prospectus, financial information, holdings and proxy voting information, please visit https://bondbloxxetf.com/bondbloxx-bloomberg-two-year-target-duration-us-treasury-etf/. For proxy voting records, visit https://bondbloxxetf.com/resources/.

Householding
To reduce Fund expenses, only one copy of most shareholder documents may be mailed to shareholders with multiple accounts at the same address ("householding"). If you prefer that your Fund documents not be householded, please contact BondBloxx at 800-896-5089 or contact your financial intermediary. Your instructions will typically be effective within 30 days of receipt by BondBloxx or your financial intermediary.
BBLX XTWO 1024

XTRE
BondBloxx Bloomberg Three Year Target Duration US Treasury ETF
NYSE Arca, Inc.
Annual Shareholder Report as of October 31, 2024
The BondBloxx Bloomberg Three Year Target Duration US Treasury ETF (the "Fund") seeks to track the investment results of an index composed of U.S. Treasury securities with a duration between 2 and 4 years.
This annual shareholder report contains important information about the Fund for the period from November 1, 2023 to October 31, 2024. You can find additional information about the Fund at https://bondbloxxetf.com/bondbloxx-bloomberg-three-year-target-duration-us-treasury-etf/. You can also request this information by contacting us at 800-896-5089.
What Were The Fund Costs For The Last Year?
(based on a hypothetical $10,000 investment)
| Fund name | Cost of a $10,000 investment | Cost paid as a % of a $10,000 investment |
|---|---|---|
| BondBloxx Bloomberg Three Year Target Duration US Treasury ETF | $5 | 0.05% |
How Did The Fund Perform Last Year?
For the fiscal year ended October 31, 2024, the Fund generated a total return of 6.30%, generally in line with its benchmark, the Bloomberg US Treasury Three Year Duration Index, which returned 6.38%.
The Fund’s performance primarily reflected income from coupon payments (“income return”), complemented by price gains as Treasury yields declined in the second half of the fiscal year. This yield decline was driven by shifting market expectations for Federal Reserve policy as inflation and employment data showed consistent moderation. In September 2024, the Federal Reserve reduced its benchmark interest rate by 50 basis points, marking the first rate cut since 2020.
Growth Of $10,000 USD Since Inception
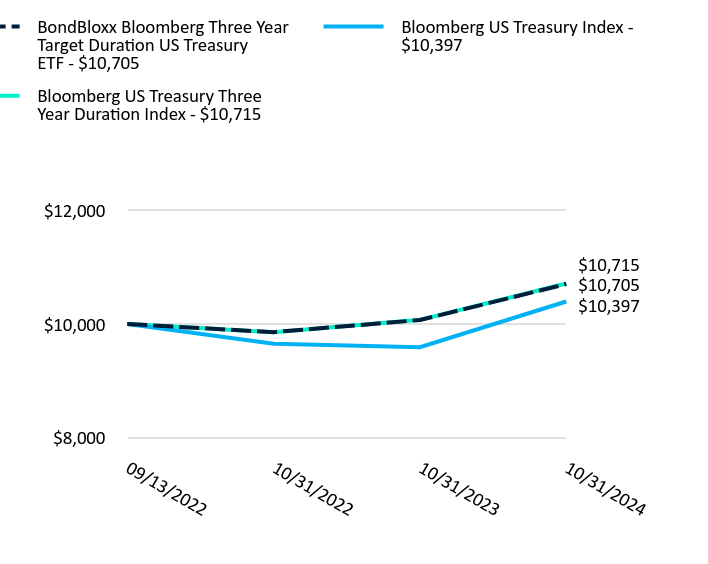
| BondBloxx Bloomberg Three Year Target Duration US Treasury ETF | Bloomberg US Treasury Index | Bloomberg US Treasury Three Year Duration Index | |
|---|---|---|---|
| 09/13/2022 | $10,000 | $10,000 | $10,000 |
| 10/31/2022 | $9,856 | $9,651 | $9,855 |
| 10/31/2023 | $10,070 | $9,590 | $10,073 |
| 10/31/2024 | $10,705 | $10,397 | $10,715 |
The Growth of $10,000 chart reflects a hypothetical $10,000 investment and assumes reinvestment of dividends and capital gains. Fund expenses, including management fees and other expenses were deducted.
Average Annual Total Returns
| Name | 1 Year | Since InceptionFootnote Reference(1) |
|---|---|---|
| Net Asset Value | 6.30% | 3.25% |
| Bloomberg US Treasury Index | 8.41% | 1.84% |
| Bloomberg US Treasury Three Year Duration Index | 6.38% | 3.29% |
| Footnote | Description |
Footnote(1) | The Fund commenced operations on September 13, 2022. Shares of XTRE were listed on the NYSE Arca, Inc. on September 15, 2022. |
The performance quoted represents past performance and does not guarantee future results. The investment return and principal will fluctuate. Investor's shares, when sold or redeemed, may be worth more or less than the original cost. Current performance may be lower or higher than the performance quoted. Returns less than one year are not annualized. Shares of the Fund are bought and sold at market price (not net asset value or "NAV") and are not individually redeemed from the Fund. The returns do not reflect the deduction of taxes that a shareholder would pay on Fund distributions or redemption of Fund shares. Visit https://bondbloxxetf.com/bondbloxx-bloomberg-three-year-target-duration-us-treasury-etf/ or, if residing outside of the United States, please call 800-896-5089 for more recent performance data.
XTRE
BondBloxx Bloomberg Three Year Target Duration US Treasury ETF
NYSE Arca, Inc.
Key Fund Statistics
| Total Net Assets | $100,725,734 |
| # of Portfolio Holdings | 75 |
| Total Advisory Fees Paid During Reporting Period | $26,600 |
| Portfolio Turnover Rate | 72% |
| Expense Ratio | 0.05% |
| Shares Outstanding | 2,050,000 |
| Fund Launch Date | 9/13/2022 |
| Exchange | NYSE Arca, Inc. |
| CUSIP | 09789C846 |
Top 10 Holdings (% of Net Assets)Footnote Reference*
| U.S. Treasury Note 1.50% 01/31/2027 | 2.76% |
| U.S. Treasury Note 1.25% 06/30/2028 | 1.89% |
| U.S. Treasury Note 4.13% 03/31/2029 | 1.88% |
| U.S. Treasury Note 4.25% 02/28/2029 | 1.84% |
| U.S. Treasury Note 1.25% 12/31/2026 | 1.84% |
| U.S. Treasury Note 2.88% 08/15/2028 | 1.80% |
| U.S. Treasury Note 1.00% 07/31/2028 | 1.79% |
| U.S. Treasury Note 1.25% 09/30/2028 | 1.75% |
| U.S. Treasury Note 1.25% 04/30/2028 | 1.75% |
| U.S. Treasury Note 4.88% 10/31/2028 | 1.75% |
| Footnote | Description |
Footnote* | Subject to change |
Credit Rating BreakdownFootnote Reference* (% of Net Assets)

| Value | Value |
|---|---|
| Cash and Equivalents | 1.3% |
| AA | 98.7% |
| Footnote | Description |
Footnote* | Credit quality ratings on underlying securities of the Fund are received from S&P Global Ratings (“S&P”), Moody’s Investors Service, Inc. (“Moody’s”) and Fitch Ratings, Inc. ("Fitch") and converted to the equivalent S&P major rating category. This breakdown is provided by Bloomberg. Not rated securities do not necessarily indicate low quality. Below investment grade is represented by a rating of BB and below. Ratings and portfolio credit quality may change over time. |
Maturity BreakdownFootnote Reference* (% of Net Assets)
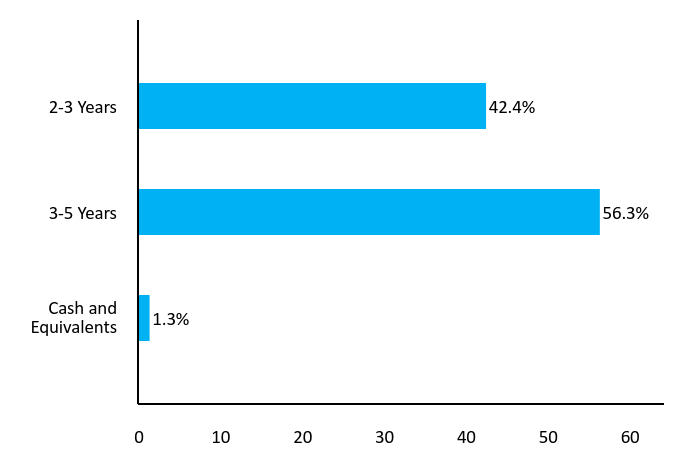
| Value | Value |
|---|---|
| Cash and Equivalents | 1.3% |
| 3-5 Years | 56.3% |
| 2-3 Years | 42.4% |
| Footnote | Description |
Footnote* | This chart represents the amount by percentage (%) maturity breakdown of bonds in the Fund. |
XTRE
BondBloxx Bloomberg Three Year Target Duration US Treasury ETF
NYSE Arca, Inc.
Disclosures
U.S. Treasury obligations may differ from other securities in their interest rates, maturities, times of issuance and other characteristics and may provide relatively lower returns than those of other securities. Similar to other issuers, changes to the financial condition or credit rating of the U.S. Government may cause the value of the Fund’s U.S. Treasury obligations to decline.
The Fund may be susceptible to an increased risk of loss to the extent that the Fund’s investments are concentrated in the securities and/or other assets of a particular issuer or issuers, sector, sub-sector, market segment, market, industry, group of industries, country, group of countries, region or asset class.
Exchange-traded fund ("ETF") shares are bought and sold at market price (not NAV) and are not individually redeemed from the Fund. NAV Returns are calculated using the daily 4:00pm NAV. Market price returns reflect the midpoint of the bid/ask spread as of the close of trading on the exchange where Fund shares are listed. Market price returns do not represent the returns you would receive if you traded shares at other times.
Distributed by Foreside Fund Services, LLC. BondBloxx is a registered investment adviser.
Additional Information
For additional information about the Fund, including its prospectus, financial information, holdings and proxy voting information, please visit https://bondbloxxetf.com/bondbloxx-bloomberg-three-year-target-duration-us-treasury-etf/. For proxy voting records, visit https://bondbloxxetf.com/resources/.

Householding
To reduce Fund expenses, only one copy of most shareholder documents may be mailed to shareholders with multiple accounts at the same address ("householding"). If you prefer that your Fund documents not be householded, please contact BondBloxx at 800-896-5089 or contact your financial intermediary. Your instructions will typically be effective within 30 days of receipt by BondBloxx or your financial intermediary.
BBLX XTRE 1024

XFIV
BondBloxx Bloomberg Five Year Target Duration US Treasury ETF
NYSE Arca, Inc.
Annual Shareholder Report as of October 31, 2024
The BondBloxx Bloomberg Five Year Target Duration US Treasury ETF (the "Fund") seeks to track the investment results of an index composed of U.S. Treasury securities with a duration between 4 and 6 years.
This annual shareholder report contains important information about the Fund for the period from November 1, 2023 to October 31, 2024. You can find additional information about the Fund at https://bondbloxxetf.com/bondbloxx-bloomberg-five-year-target-duration-us-treasury-etf/. You can also request this information by contacting us at 800-896-5089.
What Were The Fund Costs For The Last Year?
(based on a hypothetical $10,000 investment)
| Fund name | Cost of a $10,000 investment | Cost paid as a % of a $10,000 investment |
|---|---|---|
| BondBloxx Bloomberg Five Year Target Duration US Treasury ETF | $5 | 0.05% |
How Did The Fund Perform Last Year?
For the fiscal year ended October 31, 2024, the Fund generated a total return of 7.88%, generally in line with its benchmark, the Bloomberg US Treasury Five Year Duration Index, which returned 7.94%.
The Fund’s performance was driven by a combination of income from coupon payments (“income return”) and price gains as Treasury yields declined in the second half of the fiscal year. This yield decline was driven by shifting market expectations for Federal Reserve policy as inflation and employment data showed consistent moderation. In September 2024, the Federal Reserve reduced its benchmark interest rate by 50 basis points, marking the first rate cut since 2020.
Income for the fiscal year benefited from higher starting yields driven by the Federal Reserve’s 2022–2023 policy actions, which included raising the policy rate by 5.25% to combat inflation.
Growth Of $10,000 USD Since Inception
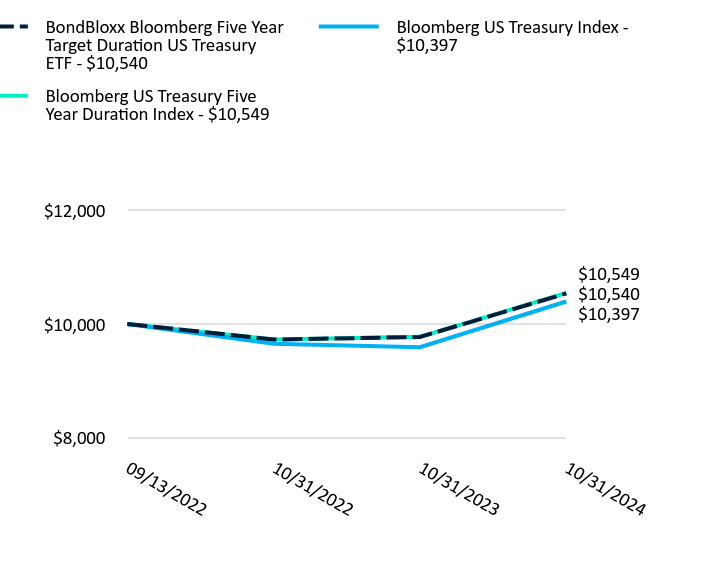
| BondBloxx Bloomberg Five Year Target Duration US Treasury ETF | Bloomberg US Treasury Index | Bloomberg US Treasury Five Year Duration Index | |
|---|---|---|---|
| 09/13/2022 | $10,000 | $10,000 | $10,000 |
| 10/31/2022 | $9,725 | $9,651 | $9,725 |
| 10/31/2023 | $9,770 | $9,590 | $9,773 |
| 10/31/2024 | $10,540 | $10,397 | $10,549 |
The Growth of $10,000 chart reflects a hypothetical $10,000 investment and assumes reinvestment of dividends and capital gains. Fund expenses, including management fees and other expenses were deducted.
Average Annual Total Returns
| Name | 1 Year | Since InceptionFootnote Reference(1) |
|---|---|---|
| Net Asset Value | 7.88% | 2.50% |
| Bloomberg US Treasury Index | 8.41% | 1.84% |
| Bloomberg US Treasury Five Year Duration Index | 7.94% | 2.54% |
| Footnote | Description |
Footnote(1) | The Fund commenced operations on September 13, 2022. Shares of XFIV were listed on the NYSE Arca, Inc. on September 15, 2022. |
The performance quoted represents past performance and does not guarantee future results. The investment return and principal will fluctuate. Investor's shares, when sold or redeemed, may be worth more or less than the original cost. Current performance may be lower or higher than the performance quoted. Returns less than one year are not annualized. Shares of the Fund are bought and sold at market price (not net asset value or "NAV") and are not individually redeemed from the Fund. The returns do not reflect the deduction of taxes that a shareholder would pay on Fund distributions or redemption of Fund shares. Visit https://bondbloxxetf.com/bondbloxx-bloomberg-five-year-target-duration-us-treasury-etf/ or, if residing outside of the United States, please call 800-896-5089 for more recent performance data.
XFIV
BondBloxx Bloomberg Five Year Target Duration US Treasury ETF
NYSE Arca, Inc.
Key Fund Statistics
| Total Net Assets | $122,003,709 |
| # of Portfolio Holdings | 51 |
| Total Advisory Fees Paid During Reporting Period | $39,253 |
| Portfolio Turnover Rate | 95% |
| Expense Ratio | 0.05% |
| Shares Outstanding | 2,510,000 |
| Fund Launch Date | 9/13/2022 |
| Exchange | NYSE Arca, Inc. |
| CUSIP | 09789C838 |
Top 10 Holdings (% of Net Assets)Footnote Reference*
| U.S. Treasury Note 0.88% 11/15/2030 | 5.33% |
| U.S. Treasury Note 0.63% 08/15/2030 | 4.94% |
| U.S. Treasury Note 1.13% 02/15/2031 | 4.78% |
| U.S. Treasury Note 0.63% 05/15/2030 | 4.08% |
| U.S. Treasury Note 4.63% 04/30/2031 | 2.91% |
| U.S. Treasury Note 4.63% 05/31/2031 | 2.86% |
| U.S. Treasury Note 4.13% 03/31/2031 | 2.75% |
| U.S. Treasury Note 4.13% 07/31/2031 | 2.71% |
| U.S. Treasury Note 4.25% 06/30/2029 | 2.62% |
| U.S. Treasury Note 4.25% 06/30/2031 | 2.58% |
| Footnote | Description |
Footnote* | Subject to change |
Credit Rating BreakdownFootnote Reference* (% of Net Assets)

| Value | Value |
|---|---|
| Cash and Equivalents | 1.1% |
| AA | 98.9% |
| Footnote | Description |
Footnote* | Credit quality ratings on underlying securities of the Fund are received from S&P Global Ratings (“S&P”), Moody’s Investors Service, Inc. (“Moody’s”) and Fitch Ratings, Inc. ("Fitch") and converted to the equivalent S&P major rating category. This breakdown is provided by Bloomberg. Not rated securities do not necessarily indicate low quality. Below investment grade is represented by a rating of BB and below. Ratings and portfolio credit quality may change over time. |
Maturity BreakdownFootnote Reference* (% of Net Assets)
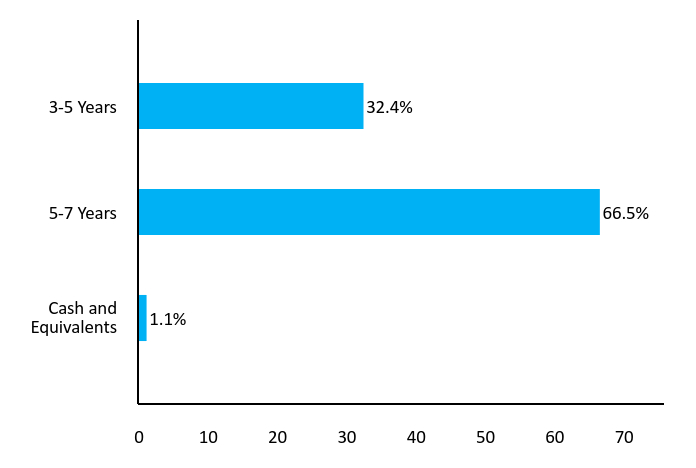
| Value | Value |
|---|---|
| Cash and Equivalents | 1.1% |
| 5-7 Years | 66.5% |
| 3-5 Years | 32.4% |
| Footnote | Description |
Footnote* | This chart represents the amount by percentage (%) maturity breakdown of bonds in the Fund. |
XFIV
BondBloxx Bloomberg Five Year Target Duration US Treasury ETF
NYSE Arca, Inc.
Disclosures
U.S. Treasury obligations may differ from other securities in their interest rates, maturities, times of issuance and other characteristics and may provide relatively lower returns than those of other securities. Similar to other issuers, changes to the financial condition or credit rating of the U.S. Government may cause the value of the Fund’s U.S. Treasury obligations to decline.
The Fund may be susceptible to an increased risk of loss to the extent that the Fund’s investments are concentrated in the securities and/or other assets of a particular issuer or issuers, sector, sub-sector, market segment, market, industry, group of industries, country, group of countries, region or asset class.
Exchange-traded fund ("ETF") shares are bought and sold at market price (not NAV) and are not individually redeemed from the Fund. NAV Returns are calculated using the daily 4:00pm NAV. Market price returns reflect the midpoint of the bid/ask spread as of the close of trading on the exchange where Fund shares are listed. Market price returns do not represent the returns you would receive if you traded shares at other times.
Distributed by Foreside Fund Services, LLC. BondBloxx is a registered investment adviser.
Additional Information
For additional information about the Fund, including its prospectus, financial information, holdings and proxy voting information, please visit https://bondbloxxetf.com/bondbloxx-bloomberg-five-year-target-duration-us-treasury-etf/. For proxy voting records, visit https://bondbloxxetf.com/resources/.

Householding
To reduce Fund expenses, only one copy of most shareholder documents may be mailed to shareholders with multiple accounts at the same address ("householding"). If you prefer that your Fund documents not be householded, please contact BondBloxx at 800-896-5089 or contact your financial intermediary. Your instructions will typically be effective within 30 days of receipt by BondBloxx or your financial intermediary.
BBLX XFIV 1024

XSVN
BondBloxx Bloomberg Seven Year Target Duration US Treasury ETF
NYSE Arca, Inc.
Annual Shareholder Report as of October 31, 2024
The BondBloxx Bloomberg Seven Year Target Duration US Treasury ETF (the "Fund") seeks to track the investment results of an index composed of U.S. Treasury securities with a duration between 5 and 9 years.
This annual shareholder report contains important information about the Fund for the period from November 1, 2023 to October 31, 2024.You can find additional information about the Fund at https://bondbloxxetf.com/bondbloxx-bloomberg-seven-year-target-duration-us-treasury-etf/. You can also request this information by contacting us at 800-896-5089.
What Were The Fund Costs For The Last Year?
(based on a hypothetical $10,000 investment)
| Fund name | Cost of a $10,000 investment | Cost paid as a % of a $10,000 investment |
|---|---|---|
| BondBloxx Bloomberg Seven Year Target Duration US Treasury ETF | $5 | 0.05% |
How Did The Fund Perform Last Year?
For the fiscal year ended October 31, 2024, the Fund generated a total return of 9.15%, generally in line with its benchmark, the Bloomberg US Treasury Seven Year Duration Index, which returned 9.21%.
The Fund’s performance was driven by a combination of income from coupon payments (“income return”) and price gains as Treasury yields declined in the second half of the fiscal year. This yield decline was driven by shifting market expectations for prices and Federal Reserve policy as inflation and employment data showed consistent moderation. In September 2024, the Federal Reserve reduced its benchmark interest rate by 50 basis points, marking the first rate cut since 2020.
Income for the fiscal year benefited from higher starting yields driven by the Federal Reserve’s 2022–2023 policy actions, which included raising the policy rate by 5.25% to combat inflation.
Growth Of $10,000 USD Since Inception
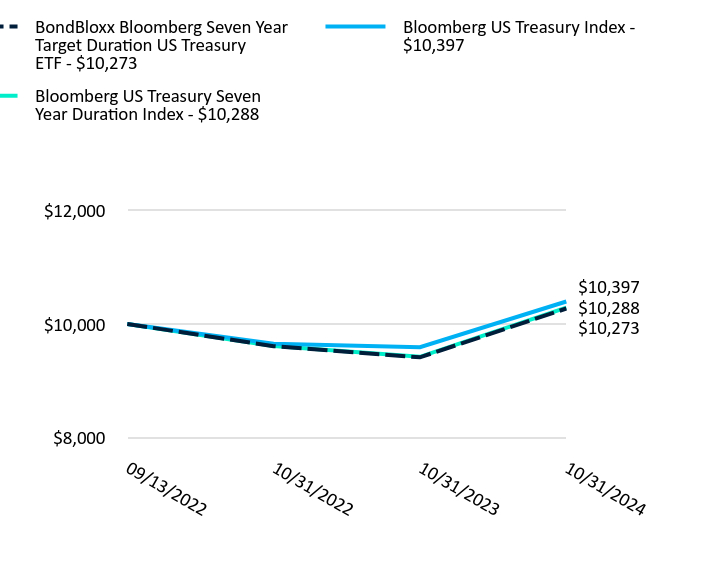
| BondBloxx Bloomberg Seven Year Target Duration US Treasury ETF | Bloomberg US Treasury Index | Bloomberg US Treasury Seven Year Duration Index | |
|---|---|---|---|
| 09/13/2022 | $10,000 | $10,000 | $10,000 |
| 10/31/2022 | $9,608 | $9,651 | $9,612 |
| 10/31/2023 | $9,412 | $9,590 | $9,421 |
| 10/31/2024 | $10,273 | $10,397 | $10,288 |
The Growth of $10,000 chart reflects a hypothetical $10,000 investment and assumes reinvestment of dividends and capital gains. Fund expenses, including management fees and other expenses were deducted.
Average Annual Total Returns
| Name | 1 Year | Since InceptionFootnote Reference(1) |
|---|---|---|
| Net Asset Value | 9.15% | 1.27% |
| Bloomberg US Treasury Index | 8.41% | 1.84% |
| Bloomberg US Treasury Seven Year Duration Index | 9.21% | 1.34% |
| Footnote | Description |
Footnote(1) | The Fund commenced operations on September 13, 2022. Shares of XSVN were listed on the NYSE Arca, Inc. on September 15, 2022. |
The performance quoted represents past performance and does not guarantee future results. The investment return and principal will fluctuate. Investor's shares, when sold or redeemed, may be worth more or less than the original cost. Current performance may be lower or higher than the performance quoted. Returns less than one year are not annualized. Shares of the Fund are bought and sold at market price (not net asset value or "NAV") and are not individually redeemed from the Fund. The returns do not reflect the deduction of taxes that a shareholder would pay on Fund distributions or redemption of Fund shares. Visit https://bondbloxxetf.com/bondbloxx-bloomberg-seven-year-target-duration-us-treasury-etf/ or, if residing outside of the United States, please call 800-896-5089 for more recent performance data.
XSVN
BondBloxx Bloomberg Seven Year Target Duration US Treasury ETF
NYSE Arca, Inc.
Key Fund Statistics
| Total Net Assets | $109,831,219 |
| # of Portfolio Holdings | 36 |
| Total Advisory Fees Paid During Reporting Period | $57,999 |
| Portfolio Turnover Rate | 71% |
| Expense Ratio | 0.05% |
| Shares Outstanding | 2,320,000 |
| Fund Launch Date | 9/13/2022 |
| Exchange | NYSE Arca, Inc. |
| CUSIP | 09789C820 |
Top 10 Holdings (% of Net Assets)Footnote Reference*
| U.S. Treasury Note 4.38% 05/15/2034 | 10.63% |
| U.S. Treasury Note 4.00% 02/15/2034 | 10.44% |
| U.S. Treasury Note 3.88% 08/15/2034 | 10.33% |
| U.S. Treasury Note 4.50% 11/15/2033 | 10.32% |
| U.S. Treasury Note 3.88% 08/15/2033 | 9.36% |
| U.S. Treasury Note 3.50% 02/15/2033 | 8.15% |
| U.S. Treasury Note 3.38% 05/15/2033 | 7.86% |
| U.S. Treasury Note 2.75% 08/15/2032 | 2.15% |
| U.S. Treasury Note 1.25% 08/15/2031 | 2.02% |
| U.S. Treasury Note 1.13% 02/15/2031 | 1.96% |
| Footnote | Description |
Footnote* | Subject to change |
Credit Rating BreakdownFootnote Reference* (% of Net Assets)
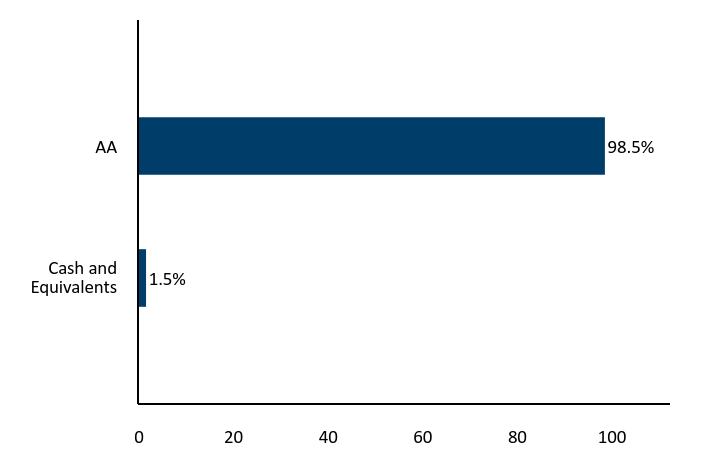
| Value | Value |
|---|---|
| Cash and Equivalents | 1.5% |
| AA | 98.5% |
| Footnote | Description |
Footnote* | Credit quality ratings on underlying securities of the Fund are received from S&P Global Ratings (“S&P”), Moody’s Investors Service, Inc. (“Moody’s”) and Fitch Ratings, Inc. ("Fitch") and converted to the equivalent S&P major rating category. This breakdown is provided by Bloomberg. Not rated securities do not necessarily indicate low quality. Below investment grade is represented by a rating of BB and below. Ratings and portfolio credit quality may change over time. |
Maturity BreakdownFootnote Reference* (% of Net Assets)
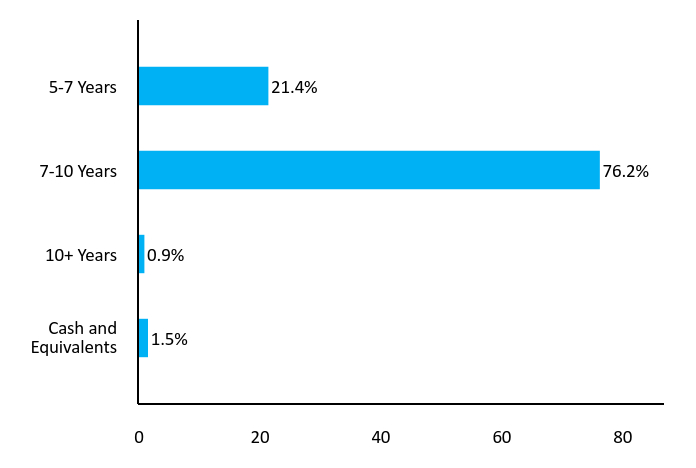
| Value | Value |
|---|---|
| Cash and Equivalents | 1.5% |
| 10+ Years | 0.9% |
| 7-10 Years | 76.2% |
| 5-7 Years | 21.4% |
| Footnote | Description |
Footnote* | This chart represents the amount by percentage (%) maturity breakdown of bonds in the Fund. |
XSVN
BondBloxx Bloomberg Seven Year Target Duration US Treasury ETF
NYSE Arca, Inc.
Disclosures
U.S. Treasury obligations may differ from other securities in their interest rates, maturities, times of issuance and other characteristics and may provide relatively lower returns than those of other securities. Similar to other issuers, changes to the financial condition or credit rating of the U.S. Government may cause the value of the Fund’s U.S. Treasury obligations to decline.
The Fund may be susceptible to an increased risk of loss to the extent that the Fund’s investments are concentrated in the securities and/or other assets of a particular issuer or issuers, sector, sub-sector, market segment, market, industry, group of industries, country, group of countries, region or asset class.
Exchange-traded fund ("ETF") shares are bought and sold at market price (not NAV) and are not individually redeemed from the Fund. NAV Returns are calculated using the daily 4:00pm NAV. Market price returns reflect the midpoint of the bid/ask spread as of the close of trading on the exchange where Fund shares are listed. Market price returns do not represent the returns you would receive if you traded shares at other times.
Distributed by Foreside Fund Services, LLC. BondBloxx is a registered investment adviser.
Additional Information
For additional information about the Fund, including its prospectus, financial information, holdings and proxy voting information, please visit https://bondbloxxetf.com/bondbloxx-bloomberg-seven-year-target-duration-us-treasury-etf/. For proxy voting records, visit https://bondbloxxetf.com/resources/.

Householding
To reduce Fund expenses, only one copy of most shareholder documents may be mailed to shareholders with multiple accounts at the same address ("householding"). If you prefer that your Fund documents not be householded, please contact BondBloxx at 800-896-5089 or contact your financial intermediary. Your instructions will typically be effective within 30 days of receipt by BondBloxx or your financial intermediary.
BBLX XSVN 1024

XTEN
BondBloxx Bloomberg Ten Year Target Duration US Treasury ETF
NYSE Arca, Inc.
Annual Shareholder Report as of October 31, 2024
The BondBloxx Bloomberg Ten Year Target Duration US Treasury ETF (the "Fund") seeks to track the investment results of an index composed of U.S. Treasury securities with a duration between 6 and 14 years.
This annual shareholder report contains important information about the Fund for the period from November 1, 2023 to October 31, 2024. You can find additional information about the Fund at https://bondbloxxetf.com/bondbloxx-bloomberg-ten-year-target-duration-us-treasury-etf/. You can also request this information by contacting us at 800-896-5089.
What Were The Fund Costs For The Last Year?
(based on a hypothetical $10,000 investment)
| Fund name | Cost of a $10,000 investment | Cost paid as a % of a $10,000 investment |
|---|---|---|
| BondBloxx Bloomberg Ten Year Target Duration US Treasury ETF | $8 | 0.075% |
How Did The Fund Perform Last Year?
For the fiscal year ended October 31, 2024, the Fund generated a total return of 11.91%, generally in line with its benchmark, the Bloomberg US Treasury Ten Year Duration Index, which returned 11.99%.
The Fund’s performance was primarily driven by price gains as Treasury yields declined in the second half of the fiscal year, supported by income from coupon payments (“income return”). The decline in yields reflected shifting market expectations for prices and Federal Reserve policy as inflation and employment data showed consistent moderation. In September 2024, the Federal Reserve reduced its benchmark interest rate by 50 basis points, marking the first rate cut since 2020.
Income for the fiscal year benefited from higher starting yields driven by the Federal Reserve’s 2022–2023 policy actions, which included raising the policy rate by 5.25% to combat inflation.
Growth Of $10,000 USD Since Inception
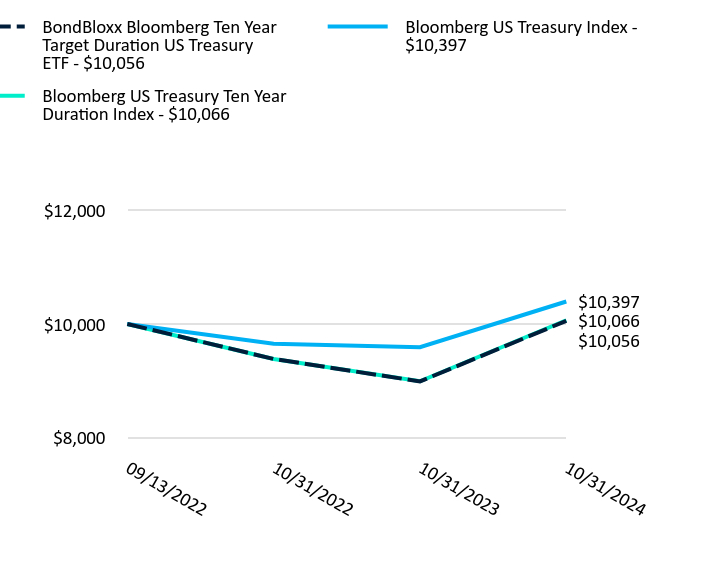
| BondBloxx Bloomberg Ten Year Target Duration US Treasury ETF | Bloomberg US Treasury Index | Bloomberg US Treasury Ten Year Duration Index | |
|---|---|---|---|
| 09/13/2022 | $10,000 | $10,000 | $10,000 |
| 10/31/2022 | $9,383 | $9,651 | $9,383 |
| 10/31/2023 | $8,986 | $9,590 | $8,989 |
| 10/31/2024 | $10,056 | $10,397 | $10,066 |
The Growth of $10,000 chart reflects a hypothetical $10,000 investment and assumes reinvestment of dividends and capital gains. Fund expenses, including management fees and other expenses were deducted.
Average Annual Total Returns
| Name | 1 Year | Since InceptionFootnote Reference(1) |
|---|---|---|
| Net Asset Value | 11.91% | 0.26% |
| Bloomberg US Treasury Index | 8.41% | 1.84% |
| Bloomberg US Treasury Ten Year Duration Index | 11.99% | 0.31% |
| Footnote | Description |
Footnote(1) | The Fund commenced operations on September 13, 2022. Shares of XTEN were listed on the NYSE Arca, Inc. on September 15, 2022. |
The performance quoted represents past performance and does not guarantee future results. The investment return and principal will fluctuate. Investor's shares, when sold or redeemed, may be worth more or less than the original cost. Current performance may be lower or higher than the performance quoted. Returns less than one year are not annualized. Shares of the Fund are bought and sold at market price (not net asset value or "NAV") and are not individually redeemed from the Fund. The returns do not reflect the deduction of taxes that a shareholder would pay on Fund distributions or redemption of Fund shares. Visit https://bondbloxxetf.com/bondbloxx-bloomberg-ten-year-target-duration-us-treasury-etf/ or, if residing outside of the United States, please call 800-896-5089 for more recent performance data.
XTEN
BondBloxx Bloomberg Ten Year Target Duration US Treasury ETF
NYSE Arca, Inc.
Key Fund Statistics
| Total Net Assets | $236,043,777 |
| # of Portfolio Holdings | 60 |
| Total Advisory Fees Paid During Reporting Period | $119,832 |
| Portfolio Turnover Rate | 40% |
| Expense Ratio | 0.075% |
| Shares Outstanding | 5,100,000 |
| Fund Launch Date | 9/13/2022 |
| Exchange | NYSE Arca, Inc. |
| CUSIP | 09789C812 |
Top 10 Holdings (% of Net Assets)Footnote Reference*
| U.S. Treasury Note 4.38% 05/15/2034 | 3.78% |
| U.S. Treasury Note 4.00% 02/15/2034 | 3.70% |
| U.S. Treasury Note 4.50% 11/15/2033 | 3.65% |
| U.S. Treasury Note 3.88% 08/15/2033 | 3.49% |
| U.S. Treasury Note 4.13% 11/15/2032 | 3.48% |
| U.S. Treasury Note 1.63% 05/15/2031 | 3.43% |
| U.S. Treasury Note 1.25% 08/15/2031 | 3.36% |
| U.S. Treasury Note 2.75% 08/15/2032 | 3.35% |
| U.S. Treasury Note 1.38% 11/15/2031 | 3.34% |
| U.S. Treasury Note 3.50% 02/15/2033 | 3.34% |
| Footnote | Description |
Footnote* | Subject to change |
Credit Rating BreakdownFootnote Reference* (% of Net Assets)

| Value | Value |
|---|---|
| Cash and Equivalents | 1.6% |
| AA | 98.4% |
| Footnote | Description |
Footnote* | Credit quality ratings on underlying securities of the Fund are received from S&P Global Ratings (“S&P”), Moody’s Investors Service, Inc. (“Moody’s”) and Fitch Ratings, Inc. ("Fitch") and converted to the equivalent S&P major rating category. This breakdown is provided by Bloomberg. Not rated securities do not necessarily indicate low quality. Below investment grade is represented by a rating of BB and below. Ratings and portfolio credit quality may change over time. |
Maturity BreakdownFootnote Reference* (% of Net Assets)
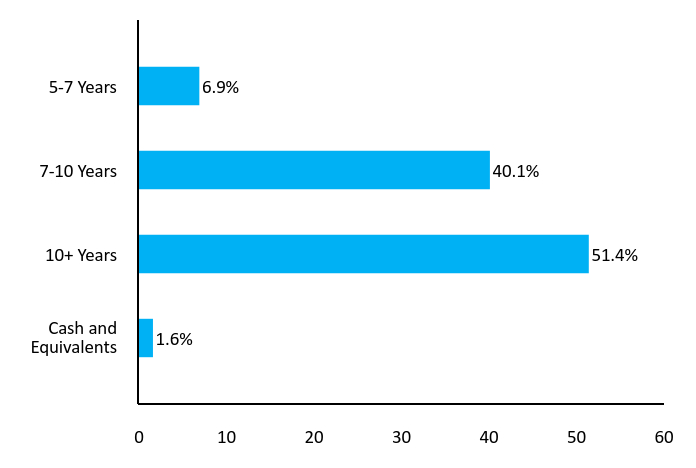
| Value | Value |
|---|---|
| Cash and Equivalents | 1.6% |
| 10+ Years | 51.4% |
| 7-10 Years | 40.1% |
| 5-7 Years | 6.9% |
| Footnote | Description |
Footnote* | This chart represents the amount by percentage (%) maturity breakdown of bonds in the Fund. |
XTEN
BondBloxx Bloomberg Ten Year Target Duration US Treasury ETF
NYSE Arca, Inc.
Disclosures
U.S. Treasury obligations may differ from other securities in their interest rates, maturities, times of issuance and other characteristics and may provide relatively lower returns than those of other securities. Similar to other issuers, changes to the financial condition or credit rating of the U.S. Government may cause the value of the Fund’s U.S. Treasury obligations to decline.
The Fund may be susceptible to an increased risk of loss to the extent that the Fund’s investments are concentrated in the securities and/or other assets of a particular issuer or issuers, sector, sub-sector, market segment, market, industry, group of industries, country, group of countries, region or asset class.
Exchange-traded fund ("ETF") shares are bought and sold at market price (not NAV) and are not individually redeemed from the Fund. NAV Returns are calculated using the daily 4:00pm NAV. Market price returns reflect the midpoint of the bid/ask spread as of the close of trading on the exchange where Fund shares are listed. Market price returns do not represent the returns you would receive if you traded shares at other times.
Distributed by Foreside Fund Services, LLC. BondBloxx is a registered investment adviser.
Additional Information
For additional information about the Fund, including its prospectus, financial information, holdings and proxy voting information, please visit https://bondbloxxetf.com/bondbloxx-bloomberg-ten-year-target-duration-us-treasury-etf/. For proxy voting records, visit https://bondbloxxetf.com/resources/.

Householding
To reduce Fund expenses, only one copy of most shareholder documents may be mailed to shareholders with multiple accounts at the same address ("householding"). If you prefer that your Fund documents not be householded, please contact BondBloxx at 800-896-5089 or contact your financial intermediary. Your instructions will typically be effective within 30 days of receipt by BondBloxx or your financial intermediary.
BBLX XTEN 1024

XTWY
BondBloxx Bloomberg Twenty Year Target Duration US Treasury ETF
NYSE Arca, Inc.
Annual Shareholder Report as of October 31, 2024
The BondBloxx Bloomberg Twenty Year Target Duration US Treasury ETF (the "Fund") seeks to track the investment results of an index composed of U.S. Treasury securities with a duration of 20 years.
This annual shareholder report contains important information about the Fund for the period from November 1, 2023 to October 31, 2024. You can find additional information about the Fund at https://bondbloxxetf.com/bondbloxx-bloomberg-twenty-year-target-duration-us-treasury-etf/. You can also request this information by contacting us at 800-896-5089.
What Were The Fund Costs For The Last Year?
(based on a hypothetical $10,000 investment)
| Fund name | Cost of a $10,000 investment | Cost paid as a % of a $10,000 investment |
|---|---|---|
| BondBloxx Bloomberg Twenty Year Target Duration US Treasury ETF | $14 | 0.125% |
How Did The Fund Perform Last Year?
For the fiscal year ended October 31, 2024, the Fund generated a total return of 17.56%, generally in line with its benchmark, the Bloomberg US Treasury Twenty Year Duration Index, which returned 17.75%.
The Fund’s performance was primarily driven by price gains as Treasury yields declined in the second half of the fiscal year, supported by income from coupon payments (“income return”). Declining yields in the long-duration part of the curve reflected shifting market expectations for prices and Federal Reserve policy as inflation and employment data showed consistent moderation. In September 2024, the Federal Reserve reduced its benchmark interest rate by 50 basis points, marking the first rate cut since 2020.
Income for the fiscal year benefited from higher starting yields driven by the Federal Reserve’s 2022–2023 policy actions, which included raising the policy rate by 5.25% to combat inflation.
Growth Of $10,000 USD Since Inception
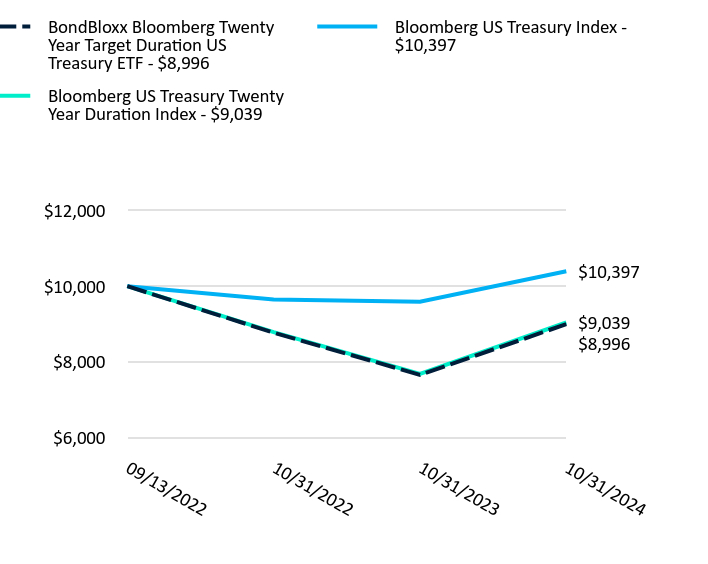
| BondBloxx Bloomberg Twenty Year Target Duration US Treasury ETF | Bloomberg US Treasury Index | Bloomberg US Treasury Twenty Year Duration Index | |
|---|---|---|---|
| 09/13/2022 | $10,000 | $10,000 | $10,000 |
| 10/31/2022 | $8,769 | $9,651 | $8,783 |
| 10/31/2023 | $7,653 | $9,590 | $7,676 |
| 10/31/2024 | $8,996 | $10,397 | $9,039 |
The Growth of $10,000 chart reflects a hypothetical $10,000 investment and assumes reinvestment of dividends and capital gains. Fund expenses, including management fees and other expenses were deducted.
Average Annual Total Returns
| Name | 1 Year | Since InceptionFootnote Reference(1) |
|---|---|---|
| Net Asset Value | 17.56% | (4.84)% |
| Bloomberg US Treasury Index | 8.41% | 1.84% |
| Bloomberg US Treasury Twenty Year Duration Index | 17.75% | (4.63)% |
| Footnote | Description |
Footnote(1) | The Fund commenced operations on September 13, 2022. Shares of XTWY were listed on the NYSE Arca, Inc. on September 15, 2022. |
The performance quoted represents past performance and does not guarantee future results. The investment return and principal will fluctuate. Investor's shares, when sold or redeemed, may be worth more or less than the original cost. Current performance may be lower or higher than the performance quoted. Returns less than one year are not annualized. Shares of the Fund are bought and sold at market price (not net asset value or "NAV") and are not individually redeemed from the Fund. The returns do not reflect the deduction of taxes that a shareholder would pay on Fund distributions or redemption of Fund shares. Visit https://bondbloxxetf.com/bondbloxx-bloomberg-twenty-year-target-duration-us-treasury-etf/ or, if residing outside of the United States, please call 800-896-5089 for more recent performance data.
XTWY
BondBloxx Bloomberg Twenty Year Target Duration US Treasury ETF
NYSE Arca, Inc.
Key Fund Statistics
| Total Net Assets | $52,012,310 |
| # of Portfolio Holdings | 50 |
| Total Advisory Fees Paid During Reporting Period | $41,882 |
| Portfolio Turnover Rate | 151% |
| Expense Ratio | 0.125% |
| Shares Outstanding | 1,260,000 |
| Fund Launch Date | 9/13/2022 |
| Exchange | NYSE Arca, Inc. |
| CUSIP | 09789C796 |
Top 10 Holdings (% of Net Assets)Footnote Reference*
| U.S. Treasury Bond 4.25% 02/15/2054 | 5.23% |
| U.S. Treasury Bond 4.25% 08/15/2054 | 5.14% |
| U.S. Treasury Bond 4.13% 08/15/2053 | 4.37% |
| U.S. Treasury Bond 2.38% 05/15/2051 | 3.94% |
| U.S. Treasury Bond 3.63% 02/15/2053 | 3.93% |
| U.S. Treasury Bond 3.63% 05/15/2053 | 3.84% |
| U.S. Treasury Bond 2.00% 08/15/2051 | 3.56% |
| U.S. Treasury Bond 1.88% 02/15/2051 | 3.48% |
| U.S. Treasury Strip ZCP 05/15/2053 | 3.47% |
| U.S. Treasury Bond 2.88% 05/15/2052 | 3.41% |
| Footnote | Description |
Footnote* | Subject to change |
Credit Rating BreakdownFootnote Reference* (% of Net Assets)
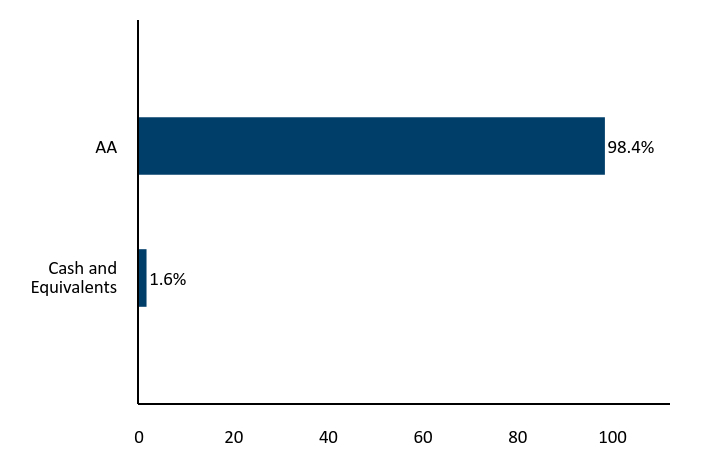
| Value | Value |
|---|---|
| Cash and Equivalents | 1.6% |
| AA | 98.4% |
| Footnote | Description |
Footnote* | Credit quality ratings on underlying securities of the Fund are received from S&P Global Ratings (“S&P”), Moody’s Investors Service, Inc. (“Moody’s”) and Fitch Ratings, Inc. ("Fitch") and converted to the equivalent S&P major rating category. This breakdown is provided by Bloomberg. Not rated securities do not necessarily indicate low quality. Below investment grade is represented by a rating of BB and below. Ratings and portfolio credit quality may change over time. |
Maturity BreakdownFootnote Reference* (% of Net Assets)

| Value | Value |
|---|---|
| Cash and Equivalents | 1.6% |
| 10+ Years | 98.4% |
| Footnote | Description |
Footnote* | This chart represents the amount by percentage (%) maturity breakdown of bonds in the Fund. |
XTWY
BondBloxx Bloomberg Twenty Year Target Duration US Treasury ETF
NYSE Arca, Inc.
Disclosures
U.S. Treasury obligations may differ from other securities in their interest rates, maturities, times of issuance and other characteristics and may provide relatively lower returns than those of other securities. Similar to other issuers, changes to the financial condition or credit rating of the U.S. Government may cause the value of the Fund’s U.S. Treasury obligations to decline.
The Fund may be susceptible to an increased risk of loss to the extent that the Fund’s investments are concentrated in the securities and/or other assets of a particular issuer or issuers, sector, sub-sector, market segment, market, industry, group of industries, country, group of countries, region or asset class.
Exchange-traded fund ("ETF") shares are bought and sold at market price (not NAV) and are not individually redeemed from the Fund. NAV Returns are calculated using the daily 4:00pm NAV. Market price returns reflect the midpoint of the bid/ask spread as of the close of trading on the exchange where Fund shares are listed. Market price returns do not represent the returns you would receive if you traded shares at other times.
Distributed by Foreside Fund Services, LLC. BondBloxx is a registered investment adviser.
Additional Information
For additional information about the Fund, including its prospectus, financial information, holdings and proxy voting information, please visit https://bondbloxxetf.com/bondbloxx-bloomberg-twenty-year-target-duration-us-treasury-etf/. For proxy voting records, visit https://bondbloxxetf.com/resources/.

Householding
To reduce Fund expenses, only one copy of most shareholder documents may be mailed to shareholders with multiple accounts at the same address ("householding"). If you prefer that your Fund documents not be householded, please contact BondBloxx at 800-896-5089 or contact your financial intermediary. Your instructions will typically be effective within 30 days of receipt by BondBloxx or your financial intermediary.
BBLX XTWY 1024

TAXX
BondBloxx IR+M Tax-Aware Short Duration ETF
NYSE Arca, Inc.
Annual Shareholder Report as of October 31, 2024
The BondBloxx IR+M Tax-Aware Short Duration ETF (the "Fund") seeks attractive after-tax income, consistent with preservation of capital.
This annual shareholder report contains important information about the Fund for the period from March 12, 2024 (commencement of operations) to October 31, 2024. You can find additional information about the Fund at https://bondbloxxetf.com/bondbloxx-irm-tax-aware-short-duration-etf/. You can also request this information by contacting us at 800-896-5089.
What Were The Fund Costs For The Last Year?
(based on a hypothetical $10,000 investment)
| Fund name | Cost of a $10,000 investment | Cost paid as a % of a $10,000 investment |
|---|---|---|
| BondBloxx IR+M Tax-Aware Short Duration ETF | $22 | 0.35% |
How Did The Fund Perform Last Year?
For the period from inception (March 12, 2024) to October 31, 2024, the Fund generated a total return of 2.75%, outperforming its benchmark, the Bloomberg Municipal 1-3 Year Index, which returned 1.99%.
The outperformance of the Fund relative to its benchmark was due to a combination of sector allocation and security selection. Within regulatory limits and internal guidelines, the Fund made tactical allocation decisions between Municipal bonds, Corporate Bonds, and Securitized products, capturing relative value opportunities which enhanced performance during the period. Similarly, the Fund made security-selection decisions that further supported positive performance.
Growth Of $10,000 USD Since Inception
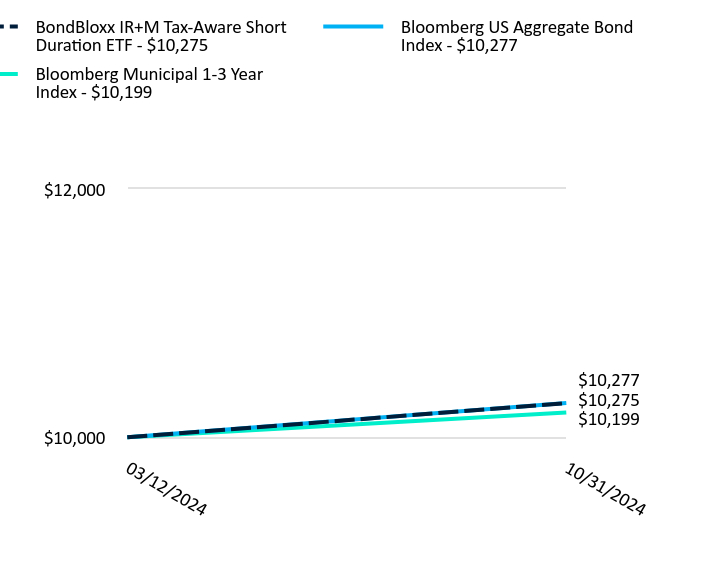
| BondBloxx IR+M Tax-Aware Short Duration ETF | Bloomberg US Aggregate Bond Index | Bloomberg Municipal 1-3 Year Index | |
|---|---|---|---|
| 03/12/2024 | $10,000 | $10,000 | $10,000 |
| 10/31/2024 | $10,275 | $10,277 | $10,199 |
The Growth of $10,000 chart reflects a hypothetical $10,000 investment and assumes reinvestment of dividends and capital gains. Fund expenses, including management fees and other expenses were deducted.
Average Annual Total Returns
| Name | Since InceptionFootnote Reference(1) |
|---|---|
| Net Asset Value | 2.75% |
| Bloomberg US Aggregate Bond Index | 2.77% |
| Bloomberg Municipal 1-3 Year Index | 1.99% |
| Footnote | Description |
Footnote(1) | The Fund commenced operations on March 12, 2024. Shares of TAXX were listed on the NYSE Arca, Inc. on March 14, 2024. |
The performance quoted represents past performance and does not guarantee future results. The investment return and principal will fluctuate. Investor's shares, when sold or redeemed, may be worth more or less than the original cost. Current performance may be lower or higher than the performance quoted. Returns less than one year are not annualized. Shares of the Fund are bought and sold at market price (not net asset value or "NAV") and are not individually redeemed from the Fund. The returns do not reflect the deduction of taxes that a shareholder would pay on Fund distributions or redemption of Fund shares. Visit https://bondbloxxetf.com/bondbloxx-irm-tax-aware-short-duration-etf/ or, if residing outside of the United States, please call 800-896-5089 for more recent performance data.
TAXX
BondBloxx IR+M Tax-Aware Short Duration ETF
NYSE Arca, Inc.
Key Fund Statistics
| Total Net Assets | $105,918,821 |
| # of Portfolio Holdings | 237 |
| Total Advisory Fees Paid During Reporting Period | $143,453 |
| Portfolio Turnover Rate | 18% |
| Expense Ratio | 0.35% |
| Shares Outstanding | 2,100,000 |
| Fund Launch Date | 3/12/2024 |
| Exchange | NYSE Arca, Inc. |
| CUSIP | 09789C721 |
Top 10 Holdings (% of Net Assets)Footnote Reference*
| King County School District No. 411 Issaquah 4.00% 12/01/2031 | 1.69% |
| North Carolina Housing Finance Agency 3.20% 07/01/2056 | 1.19% |
| State of Illinois 5.00% 11/01/2026 | 1.17% |
| Michigan Finance Authority 5.00% 11/15/2025 | 1.16% |
| County of St Joseph IN 5.00% 04/01/2026 | 1.13% |
| Black Belt Energy Gas District 4.00% 10/01/2052 | 1.07% |
| North East Independent School District 3.75% 08/01/2049 | 1.06% |
| Sports & Exhibition Authority of Pittsburgh & Allegheny County 4.00% 02/01/2026 | 1.05% |
| JP Morgan Chase, New York 4.18% 11/01/2024 | 1.05% |
| New York City Transitional Finance Authority Future Tax Secured Revenue 4.00% 05/01/2031 | 1.05% |
| Footnote | Description |
Footnote* | Subject to change |
Credit Rating BreakdownFootnote Reference* (% of Net Assets)
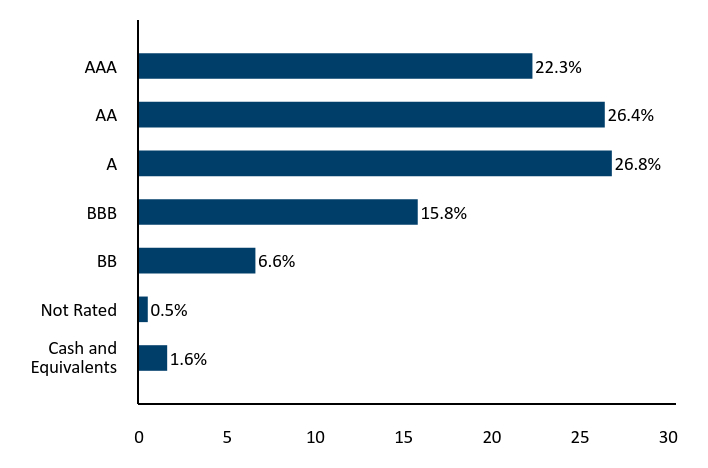
| Value | Value |
|---|---|
| Cash and Equivalents | 1.6% |
| Not Rated | 0.5% |
| BB | 6.6% |
| BBB | 15.8% |
| A | 26.8% |
| AA | 26.4% |
| AAA | 22.3% |
| Footnote | Description |
Footnote* | Credit quality ratings on underlying securities of the Fund are received from S&P Global Ratings (“S&P”), Moody’s Investors Service, Inc. (“Moody’s”) and Fitch Ratings, Inc. ("Fitch") and converted to the equivalent S&P major rating category. This breakdown is provided by Bloomberg. Not rated securities do not necessarily indicate low quality. Below investment grade is represented by a rating of BB and below. Ratings and portfolio credit quality may change over time. |
Maturity BreakdownFootnote Reference* (% of Net Assets)
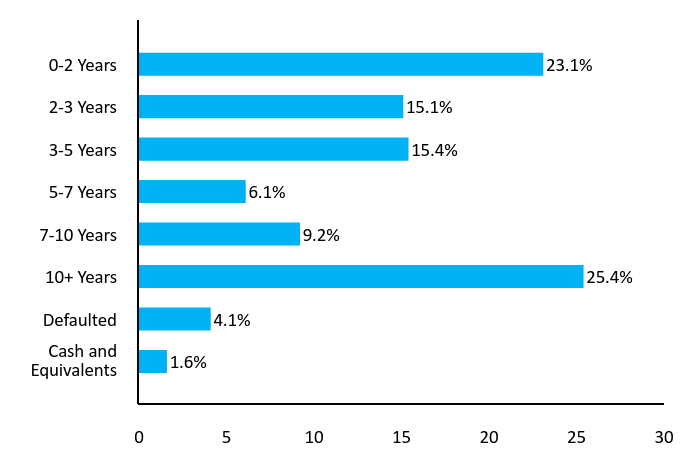
| Value | Value |
|---|---|
| Cash and Equivalents | 1.6% |
| Defaulted | 4.1% |
| 10+ Years | 25.4% |
| 7-10 Years | 9.2% |
| 5-7 Years | 6.1% |
| 3-5 Years | 15.4% |
| 2-3 Years | 15.1% |
| 0-2 Years | 23.1% |
| Footnote | Description |
Footnote* | This chart represents the amount by percentage (%) maturity breakdown of bonds in the Fund. |
Asset Breakdown (% of Net Assets)
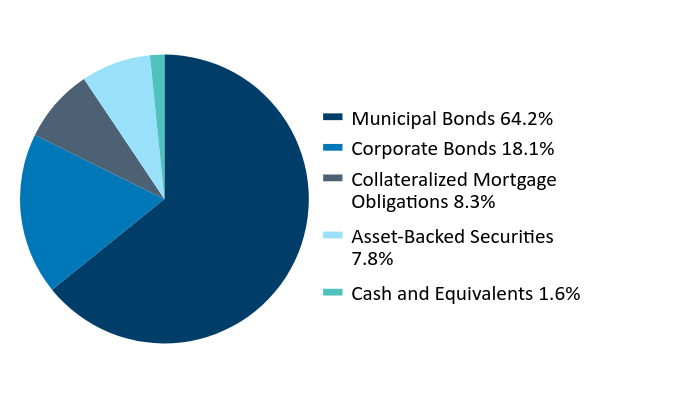
| Value | Value |
|---|---|
| Municipal Bonds | 64.2% |
| Corporate Bonds | 18.1% |
| Collateralized Mortgage Obligations | 8.3% |
| Asset-Backed Securities | 7.8% |
| Cash and Equivalents | 1.6% |
TAXX
BondBloxx IR+M Tax-Aware Short Duration ETF
NYSE Arca, Inc.
Disclosures
Securities that are rated below investment-grade (sometimes referred to as “junk bonds”) may be deemed speculative, may involve greater levels of risk than higher-rated securities of similar maturity and may be more likely to default. The Fund’s income may decline if interest rates fall. Debt issuers and other counterparties may be unable or unwilling to make timely interest and/or principal payments when due or otherwise honor their obligations.
Privately issued securities are generally not traded on established markets. As a result of the absence of a public trading market, privately issued securities may be deemed to be illiquid investments, may be more difficult to value than publicly traded securities and may be subject to wide fluctuations in value. The Fund is classified as a ”non-diversified” fund under the Investment Company Act of 1940 (the "1940 Act"). The Fund may be susceptible to an increased risk of loss to the extent that the Fund’s investments are concentrated in the securities and/or other assets of a particular issuer or issuers, sector, sub-sector, market segment, market, industry, group of industries, country, group of countries, region or asset class.
Exchange-traded fund ("ETF") shares are bought and sold at market price (not NAV) and are not individually redeemed from the Fund. NAV Returns are calculated using the daily 4:00pm NAV. Market price returns reflect the midpoint of the bid/ask spread as of the close of trading on the exchange where Fund shares are listed. Market price returns do not represent the returns you would receive if you traded shares at other times.
Distributed by Foreside Fund Services, LLC. BondBloxx is a registered investment adviser.
Additional Information
For additional information about the Fund, including its prospectus, financial information, holdings and proxy voting information, please visit https://bondbloxxetf.com/bondbloxx-irm-tax-aware-short-duration-etf/. For proxy voting records, visit https://bondbloxxetf.com/resources/.

Householding
To reduce Fund expenses, only one copy of most shareholder documents may be mailed to shareholders with multiple accounts at the same address ("householding"). If you prefer that your Fund documents not be householded, please contact BondBloxx at 800-896-5089 or contact your financial intermediary. Your instructions will typically be effective within 30 days of receipt by BondBloxx or your financial intermediary.
BBLX TAXX 1024
| (b) | Include a copy of each notice transmitted to stockholders in reliance on Rule 30e-3 under the Act (17 CFR 270.30e-3) that contains disclosures specified by paragraph (c)(3) of that rule. |
Not applicable.
Item 2. Code Of Ethics.
As of the period ended October 31, 2024, the Registrant has adopted a code of ethics that applies to the Registrant’s principal executive officer and principal financial officer, principal accounting officer or controller or persons performing similar functions. During the period covered by this report, there have been no changes to, amendments to or waivers from any provision of the code of ethics. The Registrant undertakes to provide a copy of the code of ethics to any person upon request, without charge, who calls 1-800-896-5089.
Item 3. Audit Committee Financial Expert.
The Board of Trustees of the Registrant has determined that Stephen A. Messinger possesses the attributes identified in Instruction (b) of Item 3 to Form N-CSR to qualify as an “audit committee financial expert,” and has designated Mr. Messinger as the Registrant’s audit committee financial expert. Mr. Messinger is an “independent” Trustee for purposes of Item 3 to Form N-CSR.
Under applicable securities laws, a person determined to be an audit committee financial expert will not be deemed an “expert” for any purpose, including without limitation for the purposes of Section 11 of the Securities Act of 1933, as a result of being designated or identified as an audit committee financial expert. The designation or identification of a person as an audit committee financial expert does not impose on such person any duties, obligations or liabilities greater than the duties, obligations and liabilities imposed on such person as a member of the audit committee and board of directors in the absence of such designation or identification. The designation or identification of a person as an audit committee financial expert does not affect the duties, obligations or liability of any other member of the audit committee or board of directors.
Item 4. Principal Accountant Fees And Services.
The following fees paid to Cohen & Company, Ltd., the Registrant’s principal accounting firm (the “Auditor”), are for services rendered for each of the last two fiscal years ended October 31, 2024 and October 31, 2023, the Trust’s first two years of operation.
| a) | Audit Fees |
The aggregate fees billed for each of the last two fiscal years ended October 31, 2024 and October 31, 2023, for professional services rendered by the Auditor for the audit of the Registrant’s annual financial statements, or services that are normally provided by the Auditor in connection with statutory and regulatory filings or engagements for each of the last two fiscal years, were $324,000 in 2024 and $270,000 in 2023.
| b) | Audit Related Fees |
The aggregate fees billed for each of the last two fiscal years ended October 31, 2024 and October 31, 2023, for assurance and related services rendered to the Registrant by the Auditor that are reasonably related to the performance of the audit of the Registrant’s financial statements and are not reported under paragraph (a) of this Item were $0 in 2024 and $0 in 2023.
| c) | Tax Fees |
The aggregate fees billed for each of the last two fiscal years ended October 31, 2024 and October 31, 2023, for professional services rendered to the Registrant by the Auditor for tax compliance, tax advice and tax planning were $84,000 in 2024 and $70,000 in 2023. These services consisted of (i) review or preparation of U.S. federal, state, local and excise tax returns; (ii) U.S. federal, state and local entity tax planning, advice and assistance regarding statutory, regulatory or administrative developments, and (iii) tax advice regarding tax qualification.
| d) | All Other Fees |
The aggregate fees billed for each of the last two fiscal years ended October 31, 2024 and October 31, 2023, for products and services provided by the Auditor, other than the services reported in paragraphs (a) through (c) of this Item were $0 for 2024 and $0 for 2023.
| e) | (1) | Pursuant to the Registrant’s Audit Committee Charter that has been adopted by the audit committee, the audit committee shall (a) oversee the scope of the Trust’s audit, the Trust’s accounting and financial reporting policies and practices and its internal controls, and enhance the quality and objectivity of the audit function; (b) approve, and recommend to the Board Members for ratification, the selection, appointment, retention or termination of the Trust’s independent auditors, as well as approving the compensation thereof; and (c) approve all audit and non-audit services provided to the Trust and certain other persons by such independent auditors. |
| (2) | The percentage of services described in each of paragraphs (b) through (d) of this Item that were approved by the audit committee pursuant to paragraph (c)(7)(i)(C) of Rule 2-01 of Regulation S-X, with respect to: Audit-Related Fees were 0% for 2024 and 0% for 2023; Tax Fees were 100% for 2024 and 100% for 2023; and Other Fees were 0% for 2024 and 0% for 2023. |
| f) | Not applicable. |
| g) | The aggregate non-audit fees billed by the Auditor for services rendered to the Registrant and rendered to the Registrant’s investment adviser (not including any sub-adviser whose role is primarily portfolio management and is subcontracted with or overseen by another investment adviser), and any entity controlling, controlled by or under common control with the investment adviser that provides ongoing services to the Registrant was $84,000 in 2024 and $70,000 in 2023. |
| h) | The Registrant’s audit committee has considered and determined that the provision of non-audit services that were rendered to the Registrant’s investment adviser (not including any sub-adviser whose role is primarily portfolio management and is subcontracted with or overseen by another investment adviser), and any entity controlling, controlled by or under common control with the investment adviser that provides ongoing services to the Registrant that were not pre-approved pursuant to paragraph (c)(7)(ii) of Rule 2-01 of Regulation S-X is compatible with maintaining the principal accountant’s independence. |
| i) | Not applicable. |
| j) | Not applicable. |
Item 5. Audit Committee Of Listed Registrants.
| (a) | The Registrant is an issuer as defined in Section 10A-3 of the Securities Exchange Act of 1934 and has a separately designated standing Audit Committee in accordance with Section 3(a)(58)(A) of such Act. All the Board’s independent Trustees, Stephen A. Messinger, Allan C. Eberhart, David A. Lonergan and H. Michael Williams, are members of the Audit Committee. |
| (b) | Not applicable. |
Item 6. Investments.
| (a) | A Schedule of Investments in securities of unaffiliated issuers as of the close of the Reporting Period is included as part of the report to shareholders filed under Item 1 of this Form N-CSR. |
| (b) | Not Applicable. |
Item 7. Financial Statements and Financial Highlights for Open-End Management Investment Companies.
![]()
BondBloxxSM ETF Trust
Annual Report
Core Financial Statements
October 31, 2024
BondBloxx USD High Yield Bond Industrial Sector ETF | XHYI | NYSE Arca, Inc.
BondBloxx USD High Yield Bond Telecom, Media & Technology Sector ETF | XHYT | NYSE Arca, Inc.
BondBloxx USD High Yield Bond Healthcare Sector ETF | XHYH | NYSE Arca, Inc.
BondBloxx USD High Yield Bond Financial & REIT Sector ETF | XHYF | NYSE Arca, Inc.
BondBloxx USD High Yield Bond Energy Sector ETF | XHYE | NYSE Arca, Inc.
BondBloxx USD High Yield Bond Consumer Cyclicals Sector ETF | XHYC | NYSE Arca, Inc.
BondBloxx USD High Yield Bond Consumer Non-Cyclicals Sector ETF | XHYD | NYSE Arca, Inc.
BondBloxx USD High Yield Bond Sector Rotation ETF | HYSA | NYSE Arca, Inc.
BondBloxx BB Rated USD High Yield Corporate Bond ETF | XBB | NYSE Arca, Inc.
BondBloxx B Rated USD High Yield Corporate Bond ETF | XB | NYSE Arca, Inc.
BondBloxx CCC Rated USD High Yield Corporate Bond ETF | XCCC | NYSE Arca, Inc.
BondBloxx BBB Rated 1-5 Year Corporate Bond ETF | BBBS | NYSE Arca, Inc.
BondBloxx BBB Rated 5-10 Year Corporate Bond ETF | BBBI | NYSE Arca, Inc.
BondBloxx BBB Rated 10+ Year Corporate Bond ETF | BBBL | NYSE Arca, Inc.
BondBloxx JP Morgan USD Emerging Markets 1-10 Year Bond ETF | XEMD | Cboe BZX Exchange, Inc.
BondBloxx Bloomberg Six Month Target Duration US Treasury ETF | XHLF | NYSE Arca, Inc.
BondBloxx Bloomberg One Year Target Duration US Treasury ETF | XONE | NYSE Arca, Inc.
BondBloxx Bloomberg Two Year Target Duration US Treasury ETF | XTWO | NYSE Arca, Inc.
BondBloxx Bloomberg Three Year Target Duration US Treasury ETF | XTRE | NYSE Arca, Inc.
BondBloxx Bloomberg Five Year Target Duration US Treasury ETF | XFIV | NYSE Arca, Inc.
BondBloxx Bloomberg Seven Year Target Duration US Treasury ETF | XSVN | NYSE Arca, Inc.
BondBloxx Bloomberg Ten Year Target Duration US Treasury ETF | XTEN | NYSE Arca, Inc.
BondBloxx Bloomberg Twenty Year Target Duration US Treasury ETF | XTWY | NYSE Arca, Inc.
BondBloxx IR+M Tax-Aware Short Duration ETF | TAXX | NYSE Arca, Inc.
BondBloxx Investment Management Corporation | bondbloxxetf.com | 800.896.5089
Table of Contents
BONDBLOXX ETF TRUST
BondBloxx USD High Yield Bond Industrial Sector ETF
Portfolio of Investments
October 31, 2024
| Rate (%) | Maturity | Face Amount | Value | |||||||||||
| CORPORATE BONDS – 98.0% | ||||||||||||||
| ADVERTISING – 0.9% | ||||||||||||||
| Neptune Bidco US, Inc.(1) | 9.29 | 04/15/29 | $ | 688,000 | $ | 643,441 | ||||||||
| Summer BC Bidco B LLC(1) | 5.50 | 10/31/26 | 103,000 | 101,581 | ||||||||||
| 745,022 | ||||||||||||||
| AEROSPACE/DEFENSE – 8.6% | ||||||||||||||
| AAR Escrow Issuer LLC(1) | 6.75 | 03/15/29 | 145,000 | 148,333 | ||||||||||
| Bombardier, Inc.(1) | 6.00 | 02/15/28 | 180,000 | 179,950 | ||||||||||
| Bombardier, Inc.(1) | 7.00 | 06/01/32 | 180,000 | 184,509 | ||||||||||
| Bombardier, Inc.(1) | 7.25 | 07/01/31 | 200,000 | 206,882 | ||||||||||
| Bombardier, Inc.(1) | 7.45 | 05/01/34 | 134,000 | 145,981 | ||||||||||
| Bombardier, Inc.(1) | 7.50 | 02/01/29 | 200,000 | 208,456 | ||||||||||
| Bombardier, Inc.(1) | 7.88 | 04/15/27 | 271,000 | 271,704 | ||||||||||
| Bombardier, Inc.(1) | 8.75 | 11/15/30 | 210,000 | 227,801 | ||||||||||
| F-Brasile SpA/F-Brasile US LLC(1) | 7.38 | 08/15/26 | 75,000 | 75,247 | ||||||||||
| F-Brasile SpA/F-Brasile US LLC(1) | 7.38 | 08/15/26 | 55,000 | 55,181 | ||||||||||
| Moog, Inc.(1) | 4.25 | 12/15/27 | 134,000 | 127,865 | ||||||||||
| Spirit AeroSystems, Inc. | 3.85 | 06/15/26 | 65,000 | 63,273 | ||||||||||
| Spirit AeroSystems, Inc. | 4.60 | 06/15/28 | 170,000 | 162,364 | ||||||||||
| Spirit AeroSystems, Inc.(1) | 9.38 | 11/30/29 | 241,000 | 260,223 | ||||||||||
| Spirit AeroSystems, Inc.(1) | 9.75 | 11/15/30 | 320,000 | 355,623 | ||||||||||
| TransDigm, Inc. | 4.63 | 01/15/29 | 319,000 | 303,234 | ||||||||||
| TransDigm, Inc. | 4.88 | 05/01/29 | 215,000 | 205,555 | ||||||||||
| TransDigm, Inc. | 5.50 | 11/15/27 | 697,000 | 691,450 | ||||||||||
| TransDigm, Inc.(1) | 6.00 | 01/15/33 | 390,000 | 386,862 | ||||||||||
| TransDigm, Inc.(1) | 6.38 | 03/01/29 | 705,000 | 716,484 | ||||||||||
| TransDigm, Inc.(1) | 6.63 | 03/01/32 | 575,000 | 585,453 | ||||||||||
| TransDigm, Inc.(1) | 6.75 | 08/15/28 | 540,000 | 552,264 | ||||||||||
| TransDigm, Inc.(1) | 6.88 | 12/15/30 | 355,000 | 364,217 | ||||||||||
| TransDigm, Inc.(1) | 7.13 | 12/01/31 | 265,000 | 274,546 | ||||||||||
| Triumph Group, Inc.(1) | 9.00 | 03/15/28 | 255,000 | 265,984 | ||||||||||
| 7,019,441 | ||||||||||||||
| AIRLINES – 5.1% | ||||||||||||||
| Air Canada(1) | 3.88 | 08/15/26 | 322,000 | 311,759 | ||||||||||
| Allegiant Travel Co.(1) | 7.25 | 08/15/27 | 145,000 | 142,968 | ||||||||||
| American Airlines, Inc.(1) | 7.25 | 02/15/28 | 180,000 | 183,104 | ||||||||||
| American Airlines, Inc.(1) | 8.50 | 05/15/29 | 275,000 | 289,178 | ||||||||||
| American Airlines, Inc./AAdvantage Loyalty IP Ltd.(1) | 5.50 | 04/20/26 | 459,000 | 457,956 | ||||||||||
| American Airlines, Inc./AAdvantage Loyalty IP Ltd.(1) | 5.75 | 04/20/29 | 790,000 | 782,935 | ||||||||||
| JetBlue Airways Corp./JetBlue Loyalty LP(1) | 9.88 | 09/20/31 | 530,000 | 551,149 | ||||||||||
| United Airlines, Inc.(1) | 4.38 | 04/15/26 | 533,000 | 524,128 | ||||||||||
| United Airlines, Inc.(1) | 4.63 | 04/15/29 | 494,000 | 473,155 | ||||||||||
| VistaJet Malta Finance PLC/Vista Management Holding, Inc.(1) | 6.38 | 02/01/30 | 265,000 | 227,126 | ||||||||||
| VistaJet Malta Finance PLC/Vista Management Holding, Inc.(1) | 7.88 | 05/01/27 | 135,000 | 131,570 | ||||||||||
| VistaJet Malta Finance PLC/Vista Management Holding, Inc.(1) | 9.50 | 06/01/28 | 120,000 | 118,014 | ||||||||||
| 4,193,042 | ||||||||||||||
The accompanying notes are an integral part of these financial statements.
1
BONDBLOXX ETF TRUST
BondBloxx USD High Yield Bond Industrial Sector ETF
Portfolio of Investments (Continued)
October 31, 2024
| Rate (%) | Maturity | Face Amount | Value | |||||||||||
| APPAREL – 0.2% | ||||||||||||||
| S&S Holdings LLC(1) | 8.38 | 10/01/31 | $ | 160,000 | $ | 160,528 | ||||||||
| AUTO MANUFACTURERS – 0.5% | ||||||||||||||
| JB Poindexter & Co., Inc.(1) | 8.75 | 12/15/31 | 160,000 | 168,071 | ||||||||||
| PM General Purchaser LLC(1) | 9.50 | 10/01/28 | 159,000 | 161,673 | ||||||||||
| Wabash National Corp.(1) | 4.50 | 10/15/28 | 115,000 | 104,814 | ||||||||||
| 434,558 | ||||||||||||||
| AUTO PARTS & EQUIPMENT – 0.3% | ||||||||||||||
| Dornoch Debt Merger Sub, Inc.(1) | 6.63 | 10/15/29 | 159,000 | 133,259 | ||||||||||
| Titan International, Inc. | 7.00 | 04/30/28 | 105,000 | 101,935 | ||||||||||
| 235,194 | ||||||||||||||
| BUILDING MATERIALS – 7.8% | ||||||||||||||
| AmeriTex Hold Co. Intermediate LLC(1) | 10.25 | 10/15/28 | 140,000 | 147,481 | ||||||||||
| Boise Cascade Co.(1) | 4.88 | 07/01/30 | 95,000 | 90,209 | ||||||||||
| Builders FirstSource, Inc.(1) | 4.25 | 02/01/32 | 353,000 | 316,065 | ||||||||||
| Builders FirstSource, Inc.(1) | 5.00 | 03/01/30 | 152,000 | 145,358 | ||||||||||
| Builders FirstSource, Inc.(1) | 6.38 | 06/15/32 | 186,000 | 187,233 | ||||||||||
| Builders FirstSource, Inc.(1) | 6.38 | 03/01/34 | 245,000 | 247,280 | ||||||||||
| Camelot Return Merger Sub, Inc.(1) | 8.75 | 08/01/28 | 165,000 | 165,946 | ||||||||||
| Cornerstone Building Brands, Inc.(1) | 6.13 | 01/15/29 | 67,000 | 59,958 | ||||||||||
| Cornerstone Building Brands, Inc.(1) | 9.50 | 08/15/29 | 170,000 | 175,155 | ||||||||||
| CP Atlas Buyer, Inc.(1) | 7.00 | 12/01/28 | 133,000 | 121,874 | ||||||||||
| Eco Material Technologies, Inc.(1) | 7.88 | 01/31/27 | 159,000 | 160,179 | ||||||||||
| EMRLD Borrower LP/Emerald Co.-Issuer, Inc.(1) | 6.63 | 12/15/30 | 730,000 | 743,339 | ||||||||||
| EMRLD Borrower LP/Emerald Co.-Issuer, Inc.(1) | 6.75 | 07/15/31 | 120,000 | 122,754 | ||||||||||
| Griffon Corp. | 5.75 | 03/01/28 | 266,000 | 261,438 | ||||||||||
| JELD-WEN, Inc.(1) | 4.88 | 12/15/27 | 95,000 | 91,994 | ||||||||||
| JELD-WEN, Inc.(1) | 7.00 | 09/01/32 | 100,000 | 99,204 | ||||||||||
| Knife River Corp.(1) | 7.75 | 05/01/31 | 115,000 | 120,579 | ||||||||||
| Louisiana-Pacific Corp.(1) | 3.63 | 03/15/29 | 92,000 | 86,284 | ||||||||||
| Miter Brands Acquisition Holdco, Inc./MIWD Borrower LLC(1) | 6.75 | 04/01/32 | 190,000 | 193,396 | ||||||||||
| MIWD Holdco II LLC/MIWD Finance Corp.(1) | 5.50 | 02/01/30 | 118,000 | 113,036 | ||||||||||
| New Enterprise Stone & Lime Co., Inc.(1) | 5.25 | 07/15/28 | 142,000 | 137,566 | ||||||||||
| Oscar Acquisition Co. LLC/Oscar Finance, Inc.(1) | 9.50 | 04/15/30 | 155,000 | 151,583 | ||||||||||
| Smyrna Ready Mix Concrete LLC(1) | 6.00 | 11/01/28 | 287,000 | 284,910 | ||||||||||
| Smyrna Ready Mix Concrete LLC(1) | 8.88 | 11/15/31 | 290,000 | 304,890 | ||||||||||
| Standard Industries, Inc./NY(1) | 3.38 | 01/15/31 | 277,000 | 240,716 | ||||||||||
| Standard Industries, Inc./NY(1) | 4.38 | 07/15/30 | 425,000 | 390,869 | ||||||||||
| Standard Industries, Inc./NY(1) | 4.75 | 01/15/28 | 273,000 | 263,554 | ||||||||||
| Standard Industries, Inc./NY(1) | 5.00 | 02/15/27 | 230,000 | 225,405 | ||||||||||
| Standard Industries, Inc./NY(1) | 6.50 | 08/15/32 | 120,000 | 120,858 | ||||||||||
| Summit Materials LLC/Summit Materials Finance Corp.(1) | 5.25 | 01/15/29 | 187,000 | 185,560 | ||||||||||
| Summit Materials LLC/Summit Materials Finance Corp.(1) | 6.50 | 03/15/27 | 80,000 | 80,140 | ||||||||||
| Summit Materials LLC/Summit Materials Finance Corp.(1) | 7.25 | 01/15/31 | 195,000 | 202,803 | ||||||||||
| Wilsonart LLC(1) | 11.00 | 08/15/32 | 135,000 | 133,225 | ||||||||||
| 6,370,841 | ||||||||||||||
The accompanying notes are an integral part of these financial statements.
2
BONDBLOXX ETF TRUST
BondBloxx USD High Yield Bond Industrial Sector ETF
Portfolio of Investments (Continued)
October 31, 2024
| Rate (%) | Maturity | Face Amount | Value | |||||||||||
| CHEMICALS – 10.2% | ||||||||||||||
| Ashland, Inc.(1) | 3.38 | 09/01/31 | $ | 117,000 | $ | 101,296 | ||||||||
| Ashland, Inc. | 6.88 | 05/15/43 | 75,000 | 80,132 | ||||||||||
| ASP Unifrax Holdings, Inc.(1) | 7.10 | 09/30/29 | 161,250 | 95,944 | ||||||||||
| Avient Corp.(1) | 6.25 | 11/01/31 | 170,000 | 170,610 | ||||||||||
| Avient Corp.(1) | 7.13 | 08/01/30 | 190,000 | 195,582 | ||||||||||
| Axalta Coating Systems Dutch Holding B BV(1) | 7.25 | 02/15/31 | 120,000 | 125,555 | ||||||||||
| Axalta Coating Systems LLC(1) | 3.38 | 02/15/29 | 187,000 | 172,165 | ||||||||||
| Axalta Coating Systems LLC/Axalta Coating Systems Dutch Holding B BV(1) | 4.75 | 06/15/27 | 135,000 | 132,414 | ||||||||||
| Chemours Co.(1) | 4.63 | 11/15/29 | 165,000 | 143,436 | ||||||||||
| Chemours Co. | 5.38 | 05/15/27 | 113,000 | 108,910 | ||||||||||
| Chemours Co.(1) | 5.75 | 11/15/28 | 220,000 | 203,344 | ||||||||||
| CVR Partners LP/CVR Nitrogen Finance Corp.(1) | 6.13 | 06/15/28 | 145,000 | 139,278 | ||||||||||
| Element Solutions, Inc.(1) | 3.88 | 09/01/28 | 210,000 | 202,506 | ||||||||||
| GPD Cos, Inc.(1) | 10.13 | 04/01/26 | 120,000 | 114,143 | ||||||||||
| HB Fuller Co. | 4.00 | 02/15/27 | 105,000 | 102,523 | ||||||||||
| HB Fuller Co. | 4.25 | 10/15/28 | 60,000 | 56,908 | ||||||||||
| Herens Holdco Sarl(1) | 4.75 | 05/15/28 | 80,000 | 70,277 | ||||||||||
| Illuminate Buyer LLC/Illuminate Holdings IV, Inc.(1) | 9.00 | 07/01/28 | 113,000 | 114,569 | ||||||||||
| INEOS Finance PLC(1) | 6.75 | 05/15/28 | 110,000 | 111,304 | ||||||||||
| INEOS Finance PLC(1) | 7.50 | 04/15/29 | 190,000 | 196,260 | ||||||||||
| INEOS Quattro Finance 2 PLC(1) | 9.63 | 03/15/29 | 100,000 | 106,057 | ||||||||||
| Ingevity Corp.(1) | 3.88 | 11/01/28 | 150,000 | 138,192 | ||||||||||
| Innophos Holdings, Inc.(1) | 9.38 | 02/15/28 | 60,000 | 56,810 | ||||||||||
| LSF11 A5 Hold Co. LLC(1) | 6.63 | 10/15/29 | 92,000 | 93,886 | ||||||||||
| Mativ Holdings, Inc.(1) | 8.00 | 10/01/29 | 60,000 | 61,128 | ||||||||||
| Methanex Corp. | 5.13 | 10/15/27 | 185,000 | 180,196 | ||||||||||
| Methanex Corp. | 5.25 | 12/15/29 | 185,000 | 178,696 | ||||||||||
| Methanex Corp. | 5.65 | 12/01/44 | 75,000 | 66,538 | ||||||||||
| Minerals Technologies, Inc.(1) | 5.00 | 07/01/28 | 105,000 | 101,728 | ||||||||||
| NOVA Chemicals Corp.(1) | 4.25 | 05/15/29 | 136,000 | 124,022 | ||||||||||
| NOVA Chemicals Corp.(1) | 5.25 | 06/01/27 | 283,000 | 278,016 | ||||||||||
| NOVA Chemicals Corp.(1) | 8.50 | 11/15/28 | 115,000 | 122,073 | ||||||||||
| NOVA Chemicals Corp.(1) | 9.00 | 02/15/30 | 155,000 | 165,280 | ||||||||||
| Nufarm Australia Ltd./Nufarm Americas, Inc.(1) | 5.00 | 01/27/30 | 100,000 | 92,756 | ||||||||||
| OCI NV(1) | 6.70 | 03/16/33 | 155,000 | 154,687 | ||||||||||
| Olin Corp. | 5.00 | 02/01/30 | 125,000 | 119,410 | ||||||||||
| Olin Corp. | 5.13 | 09/15/27 | 141,000 | 139,193 | ||||||||||
| Olin Corp. | 5.63 | 08/01/29 | 162,000 | 159,871 | ||||||||||
| Olympus Water US Holding Corp.(1) | 4.25 | 10/01/28 | 225,000 | 211,999 | ||||||||||
| Olympus Water US Holding Corp.(1) | 6.25 | 10/01/29 | 110,000 | 105,017 | ||||||||||
| Olympus Water US Holding Corp.(1) | 7.13 | 10/01/27 | 90,000 | 91,470 | ||||||||||
| Olympus Water US Holding Corp.(1) | 7.25 | 06/15/31 | 195,000 | 200,267 | ||||||||||
| Olympus Water US Holding Corp.(1) | 9.75 | 11/15/28 | 445,000 | 472,661 | ||||||||||
| Rain Carbon, Inc.(1) | 12.25 | 09/01/29 | 110,000 | 117,419 | ||||||||||
| Rayonier AM Products, Inc.(1) | 7.63 | 01/15/26 | 110,000 | 110,131 | ||||||||||
| SCIH Salt Holdings, Inc.(1) | 4.88 | 05/01/28 | 297,000 | 284,688 | ||||||||||
| SCIH Salt Holdings, Inc.(1) | 6.63 | 05/01/29 | 170,000 | 165,562 | ||||||||||
| SCIL IV LLC/SCIL USA Holdings LLC(1) | 5.38 | 11/01/26 | 200,000 | 197,760 | ||||||||||
The accompanying notes are an integral part of these financial statements.
3
BONDBLOXX ETF TRUST
BondBloxx USD High Yield Bond Industrial Sector ETF
Portfolio of Investments (Continued)
October 31, 2024
| Rate (%) | Maturity | Face Amount | Value | |||||||||||
| CHEMICALS – 10.2% (Continued) | ||||||||||||||
| SK Invictus Intermediate II Sarl(1) | 5.00 | 10/30/29 | $ | 165,000 | $ | 156,502 | ||||||||
| SNF Group SACA(1) | 3.13 | 03/15/27 | 100,000 | 95,223 | ||||||||||
| SNF Group SACA(1) | 3.38 | 03/15/30 | 90,000 | 80,933 | ||||||||||
| TPC Group, Inc.(1) | 13.00 | 12/16/27 | 62,143 | 62,830 | ||||||||||
| Trinseo Materials Operating SCA/Trinseo Materials Finance, Inc.(1) | 5.13 | 04/01/29 | 130,000 | 69,880 | ||||||||||
| Tronox, Inc.(1) | 4.63 | 03/15/29 | 292,000 | 265,233 | ||||||||||
| Vibrantz Technologies, Inc.(1) | 9.00 | 02/15/30 | 185,000 | 173,492 | ||||||||||
| WR Grace Holdings LLC(1) | 4.88 | 06/15/27 | 183,000 | 179,795 | ||||||||||
| WR Grace Holdings LLC(1) | 5.63 | 08/15/29 | 298,000 | 275,544 | ||||||||||
| WR Grace Holdings LLC(1) | 7.38 | 03/01/31 | 105,000 | 108,618 | ||||||||||
| 8,400,719 | ||||||||||||||
| COAL – 0.3% | ||||||||||||||
| Alliance Resource Operating Partners LP/Alliance Resource Finance Corp.(1) | 8.63 | 06/15/29 | 95,000 | 100,365 | ||||||||||
| Coronado Finance Pty Ltd.(1) | 9.25 | 10/01/29 | 60,000 | 61,425 | ||||||||||
| SunCoke Energy, Inc.(1) | 4.88 | 06/30/29 | 134,000 | 121,123 | ||||||||||
| 282,913 | ||||||||||||||
| COMMERCIAL SERVICES – 14.1% | ||||||||||||||
| ADT Security Corp.(1) | 4.13 | 08/01/29 | 266,000 | 248,968 | ||||||||||
| ADT Security Corp.(1) | 4.88 | 07/15/32 | 190,000 | 177,295 | ||||||||||
| Adtalem Global Education, Inc.(1) | 5.50 | 03/01/28 | 110,000 | 107,798 | ||||||||||
| Albion Financing 1 Sarl/Aggreko Holdings, Inc.(1) | 6.13 | 10/15/26 | 138,000 | 138,228 | ||||||||||
| Albion Financing 2 Sarl(1) | 8.75 | 04/15/27 | 130,000 | 133,691 | ||||||||||
| Allied Universal Holdco LLC(1) | 7.88 | 02/15/31 | 640,000 | 651,864 | ||||||||||
| Allied Universal Holdco LLC/Allied Universal Finance Corp.(1) | 6.00 | 06/01/29 | 235,000 | 215,258 | ||||||||||
| Allied Universal Holdco LLC/Allied Universal Finance Corp.(1) | 9.75 | 07/15/27 | 285,000 | 285,885 | ||||||||||
| Allied Universal Holdco LLC/Allied Universal Finance Corp./Atlas Luxco 4 Sarl(1) | 4.63 | 06/01/28 | 279,000 | 261,933 | ||||||||||
| Allied Universal Holdco LLC/Allied Universal Finance Corp./Atlas Luxco 4 Sarl(1) | 4.63 | 06/01/28 | 220,000 | 206,212 | ||||||||||
| Alta Equipment Group, Inc.(1) | 9.00 | 06/01/29 | 120,000 | 106,693 | ||||||||||
| APi Group DE, Inc.(1) | 4.13 | 07/15/29 | 100,000 | 92,329 | ||||||||||
| APi Group DE, Inc.(1) | 4.75 | 10/15/29 | 64,000 | 60,799 | ||||||||||
| Avis Budget Car Rental LLC/Avis Budget Finance, Inc.(1) | 4.75 | 04/01/28 | 145,000 | 136,395 | ||||||||||
| Avis Budget Car Rental LLC/Avis Budget Finance, Inc.(1) | 5.38 | 03/01/29 | 147,000 | 136,960 | ||||||||||
| Avis Budget Car Rental LLC/Avis Budget Finance, Inc.(1) | 5.75 | 07/15/27 | 85,000 | 83,290 | ||||||||||
| Avis Budget Car Rental LLC/Avis Budget Finance, Inc.(1) | 5.75 | 07/15/27 | 105,000 | 103,168 | ||||||||||
| Avis Budget Car Rental LLC/Avis Budget Finance, Inc.(1) | 8.00 | 02/15/31 | 120,000 | 122,791 | ||||||||||
| Avis Budget Car Rental LLC/Avis Budget Finance, Inc.(1) | 8.25 | 01/15/30 | 190,000 | 194,253 | ||||||||||
| Brink’s Co.(1) | 4.63 | 10/15/27 | 146,000 | 142,432 | ||||||||||
| Brink’s Co.(1) | 6.50 | 06/15/29 | 100,000 | 102,073 | ||||||||||
| Brink’s Co.(1) | 6.75 | 06/15/32 | 115,000 | 117,214 | ||||||||||
| CoreCivic, Inc. | 8.25 | 04/15/29 | 135,000 | 141,973 | ||||||||||
| EquipmentShare.com, Inc.(1) | 8.00 | 03/15/33 | 115,000 | 116,198 | ||||||||||
| EquipmentShare.com, Inc.(1) | 8.63 | 05/15/32 | 170,000 | 175,587 | ||||||||||
| EquipmentShare.com, Inc.(1) | 9.00 | 05/15/28 | 280,000 | 289,880 | ||||||||||
| Garda World Security Corp.(1) | 4.63 | 02/15/27 | 150,000 | 146,190 | ||||||||||
| Garda World Security Corp.(1) | 6.00 | 06/01/29 | 135,000 | 126,635 | ||||||||||
| Garda World Security Corp.(1) | 7.75 | 02/15/28 | 115,000 | 118,875 | ||||||||||
| Garda World Security Corp.(1) | 8.25 | 08/01/32 | 140,000 | 139,378 | ||||||||||
The accompanying notes are an integral part of these financial statements.
4
BONDBLOXX ETF TRUST
BondBloxx USD High Yield Bond Industrial Sector ETF
Portfolio of Investments (Continued)
October 31, 2024
| Rate (%) | Maturity | Face Amount | Value | |||||||||||
| COMMERCIAL SERVICES – 14.1% (Continued) | ||||||||||||||
| Garda World Security Corp.(1) | 9.50 | 11/01/27 | $ | 145,000 | $ | 145,208 | ||||||||
| GEO Group, Inc. | 8.63 | 04/15/29 | 175,000 | 183,186 | ||||||||||
| GEO Group, Inc. | 10.25 | 04/15/31 | 165,000 | 176,973 | ||||||||||
| Graham Holdings Co.(1) | 5.75 | 06/01/26 | 95,000 | 95,039 | ||||||||||
| Grand Canyon University | 5.13 | 10/01/28 | 95,000 | 89,171 | ||||||||||
| Herc Holdings, Inc.(1) | 5.50 | 07/15/27 | 323,000 | 321,123 | ||||||||||
| Herc Holdings, Inc.(1) | 6.63 | 06/15/29 | 210,000 | 215,054 | ||||||||||
| Hertz Corp.(1) | 4.63 | 12/01/26 | 120,000 | 90,771 | ||||||||||
| Hertz Corp.(1) | 5.00 | 12/01/29 | 265,000 | 169,430 | ||||||||||
| Hertz Corp.(1) | 12.63 | 07/15/29 | 200,000 | 212,250 | ||||||||||
| Korn Ferry(1) | 4.63 | 12/15/27 | 95,000 | 92,711 | ||||||||||
| Matthews International Corp.(1) | 8.63 | 10/01/27 | 90,000 | 92,911 | ||||||||||
| NESCO Holdings II, Inc.(1) | 5.50 | 04/15/29 | 251,000 | 233,836 | ||||||||||
| Prime Security Services Borrower LLC/Prime Finance, Inc.(1) | 3.38 | 08/31/27 | 265,000 | 249,655 | ||||||||||
| Prime Security Services Borrower LLC/Prime Finance, Inc.(1) | 5.75 | 04/15/26 | 373,000 | 373,448 | ||||||||||
| Prime Security Services Borrower LLC/Prime Finance, Inc.(1) | 6.25 | 01/15/28 | 315,000 | 314,980 | ||||||||||
| Signal Parent, Inc.(1) | 6.13 | 04/01/29 | 65,000 | 42,387 | ||||||||||
| Sotheby’s(1) | 7.38 | 10/15/27 | 193,000 | 188,797 | ||||||||||
| Sotheby’s/Bidfair Holdings, Inc.(1) | 5.88 | 06/01/29 | 80,000 | 70,537 | ||||||||||
| TriNet Group, Inc.(1) | 3.50 | 03/01/29 | 158,000 | 143,845 | ||||||||||
| TriNet Group, Inc.(1) | 7.13 | 08/15/31 | 80,000 | 82,005 | ||||||||||
| United Rentals North America, Inc. | 3.75 | 01/15/32 | 209,000 | 185,504 | ||||||||||
| United Rentals North America, Inc. | 3.88 | 11/15/27 | 180,000 | 173,433 | ||||||||||
| United Rentals North America, Inc. | 3.88 | 02/15/31 | 292,000 | 265,095 | ||||||||||
| United Rentals North America, Inc. | 4.00 | 07/15/30 | 163,000 | 150,679 | ||||||||||
| United Rentals North America, Inc. | 4.88 | 01/15/28 | 430,000 | 421,273 | ||||||||||
| United Rentals North America, Inc. | 5.25 | 01/15/30 | 230,000 | 226,540 | ||||||||||
| United Rentals North America, Inc. | 5.50 | 05/15/27 | 131,000 | 130,831 | ||||||||||
| United Rentals North America, Inc.(1) | 6.13 | 03/15/34 | 290,000 | 292,783 | ||||||||||
| Valvoline, Inc.(1) | 3.63 | 06/15/31 | 142,000 | 123,199 | ||||||||||
| VT Topco, Inc.(1) | 8.50 | 08/15/30 | 120,000 | 126,409 | ||||||||||
| WASH Multifamily Acquisition, Inc.(1) | 5.75 | 04/15/26 | 230,000 | 229,671 | ||||||||||
| Williams Scotsman, Inc.(1) | 4.63 | 08/15/28 | 120,000 | 114,829 | ||||||||||
| Williams Scotsman, Inc.(1) | 6.63 | 06/15/29 | 125,000 | 126,996 | ||||||||||
| Williams Scotsman, Inc.(1) | 7.38 | 10/01/31 | 140,000 | 145,125 | ||||||||||
| WW International, Inc.(1) | 4.50 | 04/15/29 | 105,000 | 26,775 | ||||||||||
| ZipRecruiter, Inc.(1) | 5.00 | 01/15/30 | 145,000 | 130,896 | ||||||||||
| 11,533,600 | ||||||||||||||
| COMPUTERS – 0.9% | ||||||||||||||
| Amentum Holdings, Inc.(1) | 7.25 | 08/01/32 | 265,000 | 274,713 | ||||||||||
| ASGN, Inc.(1) | 4.63 | 05/15/28 | 144,000 | 137,653 | ||||||||||
| Conduent Business Services LLC/Conduent State & Local Solutions, Inc.(1) | 6.00 | 11/01/29 | 124,000 | 117,875 | ||||||||||
| Crane NXT Co. | 4.20 | 03/15/48 | 95,000 | 65,795 | ||||||||||
| KBR, Inc.(1) | 4.75 | 09/30/28 | 70,000 | 67,030 | ||||||||||
| Science Applications International Corp.(1) | 4.88 | 04/01/28 | 105,000 | 103,089 | ||||||||||
| 766,155 | ||||||||||||||
The accompanying notes are an integral part of these financial statements.
5
BONDBLOXX ETF TRUST
BondBloxx USD High Yield Bond Industrial Sector ETF
Portfolio of Investments (Continued)
October 31, 2024
| Rate (%) | Maturity | Face Amount | Value | |||||||||||
| DISTRIBUTION/WHOLESALE – 2.3% | ||||||||||||||
| American Builders & Contractors Supply Co., Inc.(1) | 3.88 | 11/15/29 | $ | 110,000 | $ | 100,131 | ||||||||
| American Builders & Contractors Supply Co., Inc.(1) | 4.00 | 01/15/28 | 173,000 | 164,574 | ||||||||||
| BCPE Empire Holdings, Inc.(1) | 7.63 | 05/01/27 | 160,000 | 161,110 | ||||||||||
| Gates Corp./DE(1) | 6.88 | 07/01/29 | 120,000 | 123,441 | ||||||||||
| H&E Equipment Services, Inc.(1) | 3.88 | 12/15/28 | 335,000 | 309,639 | ||||||||||
| Resideo Funding, Inc.(1) | 4.00 | 09/01/29 | 75,000 | 68,911 | ||||||||||
| Resideo Funding, Inc.(1) | 6.50 | 07/15/32 | 160,000 | 161,229 | ||||||||||
| Ritchie Bros Holdings, Inc.(1) | 6.75 | 03/15/28 | 135,000 | 138,600 | ||||||||||
| Ritchie Bros Holdings, Inc.(1) | 7.75 | 03/15/31 | 210,000 | 221,517 | ||||||||||
| Verde Purchaser LLC(1) | 10.50 | 11/30/30 | 185,000 | 197,695 | ||||||||||
| Windsor Holdings III LLC(1) | 8.50 | 06/15/30 | 210,000 | 221,269 | ||||||||||
| 1,868,116 | ||||||||||||||
| ELECTRIC – 0.6% | ||||||||||||||
| NRG Energy, Inc.(1) | 5.75 | 07/15/29 | 210,000 | 207,787 | ||||||||||
| Pike Corp.(1) | 5.50 | 09/01/28 | 200,000 | 196,169 | ||||||||||
| Pike Corp.(1) | 8.63 | 01/31/31 | 105,000 | 111,691 | ||||||||||
| 515,647 | ||||||||||||||
| ELECTRICAL COMPONENTS & EQUIPMENT – 1.2% | ||||||||||||||
| EnerSys(1) | 4.38 | 12/15/27 | 85,000 | 81,856 | ||||||||||
| EnerSys(1) | 6.63 | 01/15/32 | 75,000 | 77,121 | ||||||||||
| WESCO Distribution, Inc.(1) | 6.38 | 03/15/29 | 230,000 | 234,976 | ||||||||||
| WESCO Distribution, Inc.(1) | 6.63 | 03/15/32 | 225,000 | 230,849 | ||||||||||
| WESCO Distribution, Inc.(1) | 7.25 | 06/15/28 | 350,000 | 358,521 | ||||||||||
| 983,323 | ||||||||||||||
| ELECTRONICS – 0.7% | ||||||||||||||
| Atkore, Inc.(1) | 4.25 | 06/01/31 | 98,000 | 88,415 | ||||||||||
| Imola Merger Corp.(1) | 4.75 | 05/15/29 | 525,000 | 508,013 | ||||||||||
| 596,428 | ||||||||||||||
| ENGINEERING & CONSTRUCTION – 2.7% | ||||||||||||||
| AECOM | 5.13 | 03/15/27 | 272,000 | 270,738 | ||||||||||
| Arcosa, Inc.(1) | 4.38 | 04/15/29 | 115,000 | 108,622 | ||||||||||
| Arcosa, Inc.(1) | 6.88 | 08/15/32 | 155,000 | 159,232 | ||||||||||
| Artera Services LLC(1) | 8.50 | 02/15/31 | 160,000 | 158,725 | ||||||||||
| Brand Industrial Services, Inc.(1) | 10.38 | 08/01/30 | 355,000 | 376,796 | ||||||||||
| Brundage-Bone Concrete Pumping Holdings, Inc.(1) | 6.00 | 02/01/26 | 100,000 | 99,602 | ||||||||||
| Dycom Industries, Inc.(1) | 4.50 | 04/15/29 | 120,000 | 113,452 | ||||||||||
| Fluor Corp. | 4.25 | 09/15/28 | 150,000 | 144,317 | ||||||||||
| Global Infrastructure Solutions, Inc.(1) | 5.63 | 06/01/29 | 100,000 | 97,603 | ||||||||||
| Global Infrastructure Solutions, Inc.(1) | 7.50 | 04/15/32 | 79,000 | 80,396 | ||||||||||
| Great Lakes Dredge & Dock Corp.(1) | 5.25 | 06/01/29 | 85,000 | 79,952 | ||||||||||
| Railworks Holdings LP/Railworks Rally, Inc.(1) | 8.25 | 11/15/28 | 92,000 | 94,506 | ||||||||||
| TopBuild Corp.(1) | 3.63 | 03/15/29 | 95,000 | 87,177 | ||||||||||
| TopBuild Corp.(1) | 4.13 | 02/15/32 | 140,000 | 124,945 | ||||||||||
| Tutor Perini Corp.(1) | 11.88 | 04/30/29 | 105,000 | 115,344 | ||||||||||
| Weekley Homes LLC/Weekley Finance Corp.(1) | 4.88 | 09/15/28 | 115,000 | 110,000 | ||||||||||
| 2,221,407 | ||||||||||||||
The accompanying notes are an integral part of these financial statements.
6
BONDBLOXX ETF TRUST
BondBloxx USD High Yield Bond Industrial Sector ETF
Portfolio of Investments (Continued)
October 31, 2024
| Rate (%) | Maturity | Face Amount | Value | |||||||||||
| ENVIRONMENTAL CONTROL – 3.2% | ||||||||||||||
| Clean Harbors, Inc.(1) | 4.88 | 07/15/27 | $ | 145,000 | $ | 142,913 | ||||||||
| Clean Harbors, Inc.(1) | 5.13 | 07/15/29 | 90,000 | 87,647 | ||||||||||
| Clean Harbors, Inc.(1) | 6.38 | 02/01/31 | 120,000 | 121,016 | ||||||||||
| Enviri Corp.(1) | 5.75 | 07/31/27 | 115,000 | 110,953 | ||||||||||
| GFL Environmental, Inc.(1) | 3.50 | 09/01/28 | 180,000 | 168,909 | ||||||||||
| GFL Environmental, Inc.(1) | 4.00 | 08/01/28 | 210,000 | 198,807 | ||||||||||
| GFL Environmental, Inc.(1) | 4.38 | 08/15/29 | 132,000 | 123,808 | ||||||||||
| GFL Environmental, Inc.(1) | 4.75 | 06/15/29 | 198,000 | 189,750 | ||||||||||
| GFL Environmental, Inc.(1) | 5.13 | 12/15/26 | 135,000 | 133,773 | ||||||||||
| GFL Environmental, Inc.(1) | 6.75 | 01/15/31 | 275,000 | 283,488 | ||||||||||
| Madison IAQ LLC(1) | 4.13 | 06/30/28 | 170,000 | 162,087 | ||||||||||
| Madison IAQ LLC(1) | 5.88 | 06/30/29 | 281,000 | 266,792 | ||||||||||
| Reworld Holding Corp.(1) | 4.88 | 12/01/29 | 185,000 | 172,956 | ||||||||||
| Reworld Holding Corp. | 5.00 | 09/01/30 | 118,000 | 108,696 | ||||||||||
| Stericycle, Inc.(1) | 3.88 | 01/15/29 | 120,000 | 118,132 | ||||||||||
| Waste Pro USA, Inc.(1) | 5.50 | 02/15/26 | 115,000 | 114,794 | ||||||||||
| Wrangler Holdco Corp.(1) | 6.63 | 04/01/32 | 115,000 | 117,547 | ||||||||||
| 2,622,068 | ||||||||||||||
| FOOD SERVICE – 0.7% | ||||||||||||||
| Aramark Services, Inc.(1) | 5.00 | 02/01/28 | 311,000 | 305,685 | ||||||||||
| TKC Holdings, Inc.(1) | 6.88 | 05/15/28 | 115,000 | 113,338 | ||||||||||
| TKC Holdings, Inc.(1) | 10.50 | 05/15/29 | 172,000 | 174,183 | ||||||||||
| 593,206 | ||||||||||||||
| FOREST PRODUCTS & PAPER – 0.9% | ||||||||||||||
| Ahlstrom Holding 3 Oy(1) | 4.88 | 02/04/28 | 80,000 | 75,948 | ||||||||||
| Domtar Corp.(1) | 6.75 | 10/01/28 | 170,000 | 155,637 | ||||||||||
| Glatfelter Corp.(1) | 4.75 | 11/15/29 | 133,000 | 119,593 | ||||||||||
| Mercer International, Inc. | 5.13 | 02/01/29 | 245,000 | 211,741 | ||||||||||
| Mercer International, Inc. | 5.50 | 01/15/26 | 60,000 | 60,000 | ||||||||||
| Mercer International, Inc.(1) | 12.88 | 10/01/28 | 65,000 | 68,905 | ||||||||||
| 691,824 | ||||||||||||||
| HAND/MACHINE TOOLS – 0.1% | ||||||||||||||
| Werner FinCo LP/Werner FinCo, Inc.(1) | 11.50 | 06/15/28 | 100,000 | 111,292 | ||||||||||
| HOLDING COMPANIES-DIVERS – 0.4% | ||||||||||||||
| Stena International SA(1) | 7.25 | 01/15/31 | 210,000 | 218,191 | ||||||||||
| Stena International SA(1) | 7.63 | 02/15/31 | 85,000 | 89,065 | ||||||||||
| 307,256 | ||||||||||||||
| HOME BUILDERS – 4.4% | ||||||||||||||
| Adams Homes, Inc.(1) | 9.25 | 10/15/28 | 95,000 | 99,474 | ||||||||||
| Ashton Woods USA LLC/Ashton Woods Finance Co.(1) | 4.63 | 08/01/29 | 116,000 | 108,528 | ||||||||||
| Ashton Woods USA LLC/Ashton Woods Finance Co.(1) | 4.63 | 04/01/30 | 95,000 | 87,573 | ||||||||||
| Ashton Woods USA LLC/Ashton Woods Finance Co.(1) | 6.63 | 01/15/28 | 50,000 | 50,033 | ||||||||||
| Beazer Homes USA, Inc. | 5.88 | 10/15/27 | 105,000 | 104,569 | ||||||||||
| Beazer Homes USA, Inc. | 7.25 | 10/15/29 | 84,000 | 85,466 | ||||||||||
| Beazer Homes USA, Inc.(1) | 7.50 | 03/15/31 | 55,000 | 56,610 | ||||||||||
The accompanying notes are an integral part of these financial statements.
7
BONDBLOXX ETF TRUST
BondBloxx USD High Yield Bond Industrial Sector ETF
Portfolio of Investments (Continued)
October 31, 2024
| Rate (%) | Maturity | Face Amount | Value | |||||||||||
| HOME BUILDERS – 4.4% (Continued) | ||||||||||||||
| Brookfield Residential Properties, Inc./Brookfield Residential US LLC(1) | 4.88 | 02/15/30 | $ | 145,000 | $ | 134,989 | ||||||||
| Brookfield Residential Properties, Inc./Brookfield Residential US LLC(1) | 5.00 | 06/15/29 | 90,000 | 85,169 | ||||||||||
| Brookfield Residential Properties, Inc./Brookfield Residential US LLC(1) | 6.25 | 09/15/27 | 145,000 | 144,081 | ||||||||||
| Century Communities, Inc.(1) | 3.88 | 08/15/29 | 120,000 | 109,271 | ||||||||||
| Century Communities, Inc. | 6.75 | 06/01/27 | 135,000 | 135,830 | ||||||||||
| Dream Finders Homes, Inc.(1) | 8.25 | 08/15/28 | 70,000 | 73,307 | ||||||||||
| Empire Communities Corp.(1) | 9.75 | 05/01/29 | 125,000 | 130,759 | ||||||||||
| Installed Building Products, Inc.(1) | 5.75 | 02/01/28 | 87,000 | 86,444 | ||||||||||
| K Hovnanian Enterprises, Inc.(1) | 11.75 | 09/30/29 | 105,000 | 115,946 | ||||||||||
| KB Home | 4.00 | 06/15/31 | 108,000 | 97,726 | ||||||||||
| KB Home | 4.80 | 11/15/29 | 70,000 | 67,405 | ||||||||||
| KB Home | 6.88 | 06/15/27 | 84,000 | 86,830 | ||||||||||
| KB Home | 7.25 | 07/15/30 | 97,000 | 100,601 | ||||||||||
| Landsea Homes Corp.(1) | 8.88 | 04/01/29 | 80,000 | 81,706 | ||||||||||
| LGI Homes, Inc.(1) | 4.00 | 07/15/29 | 92,000 | 82,452 | ||||||||||
| LGI Homes, Inc.(1) | 8.75 | 12/15/28 | 95,000 | 100,141 | ||||||||||
| M/I Homes, Inc. | 3.95 | 02/15/30 | 90,000 | 82,320 | ||||||||||
| M/I Homes, Inc. | 4.95 | 02/01/28 | 95,000 | 92,130 | ||||||||||
| Mattamy Group Corp.(1) | 4.63 | 03/01/30 | 147,000 | 137,870 | ||||||||||
| Mattamy Group Corp.(1) | 5.25 | 12/15/27 | 135,000 | 133,398 | ||||||||||
| New Home Co., Inc.(1) | 9.25 | 10/01/29 | 90,000 | 94,413 | ||||||||||
| Shea Homes LP/Shea Homes Funding Corp. | 4.75 | 02/15/28 | 146,000 | 139,424 | ||||||||||
| Shea Homes LP/Shea Homes Funding Corp. | 4.75 | 04/01/29 | 60,000 | 56,960 | ||||||||||
| STL Holding Co. LLC(1) | 8.75 | 02/15/29 | 75,000 | 79,722 | ||||||||||
| Taylor Morrison Communities, Inc.(1) | 5.13 | 08/01/30 | 138,000 | 133,591 | ||||||||||
| Taylor Morrison Communities, Inc.(1) | 5.75 | 01/15/28 | 108,000 | 108,113 | ||||||||||
| Taylor Morrison Communities, Inc.(1) | 5.88 | 06/15/27 | 135,000 | 135,865 | ||||||||||
| Tri Pointe Homes, Inc. | 5.25 | 06/01/27 | 80,000 | 79,223 | ||||||||||
| Tri Pointe Homes, Inc. | 5.70 | 06/15/28 | 100,000 | 99,851 | ||||||||||
| 3,597,790 | ||||||||||||||
| IRON/STEEL – 4.6% | ||||||||||||||
| Algoma Steel, Inc.(1) | 9.13 | 04/15/29 | 100,000 | 102,719 | ||||||||||
| ATI, Inc. | 4.88 | 10/01/29 | 92,000 | 87,234 | ||||||||||
| ATI, Inc. | 5.13 | 10/01/31 | 90,000 | 85,050 | ||||||||||
| ATI, Inc. | 5.88 | 12/01/27 | 100,000 | 99,292 | ||||||||||
| ATI, Inc. | 7.25 | 08/15/30 | 100,000 | 103,727 | ||||||||||
| Baffinland Iron Mines Corp./Baffinland Iron Mines LP(1) | 8.75 | 07/15/26 | 150,000 | 135,930 | ||||||||||
| Big River Steel LLC/BRS Finance Corp.(1) | 6.63 | 01/31/29 | 190,000 | 191,984 | ||||||||||
| Carpenter Technology Corp. | 6.38 | 07/15/28 | 110,000 | 110,509 | ||||||||||
| Carpenter Technology Corp. | 7.63 | 03/15/30 | 75,000 | 77,859 | ||||||||||
| Cleveland-Cliffs, Inc.(1) | 4.63 | 03/01/29 | 120,000 | 112,541 | ||||||||||
| Cleveland-Cliffs, Inc.(1) | 4.88 | 03/01/31 | 85,000 | 78,510 | ||||||||||
| Cleveland-Cliffs, Inc. | 5.88 | 06/01/27 | 135,000 | 135,032 | ||||||||||
| Cleveland-Cliffs, Inc.(1) | 6.75 | 04/15/30 | 180,000 | 180,041 | ||||||||||
| Cleveland-Cliffs, Inc.(1) | 6.88 | 11/01/29 | 200,000 | 200,973 | ||||||||||
| Cleveland-Cliffs, Inc.(1) | 7.00 | 03/15/32 | 375,000 | 375,893 | ||||||||||
| Cleveland-Cliffs, Inc.(1) | 7.38 | 05/01/33 | 200,000 | 201,662 | ||||||||||
The accompanying notes are an integral part of these financial statements.
8
BONDBLOXX ETF TRUST
BondBloxx USD High Yield Bond Industrial Sector ETF
Portfolio of Investments (Continued)
October 31, 2024
| Rate (%) | Maturity | Face Amount | Value | |||||||||||
| IRON/STEEL – 4.6% (Continued) | ||||||||||||||
| Commercial Metals Co. | 3.88 | 02/15/31 | $ | 85,000 | $ | 76,382 | ||||||||
| Commercial Metals Co. | 4.13 | 01/15/30 | 89,000 | 82,668 | ||||||||||
| Commercial Metals Co. | 4.38 | 03/15/32 | 70,000 | 64,463 | ||||||||||
| Infrabuild Australia Pty Ltd.(1) | 14.50 | 11/15/28 | 135,000 | 132,993 | ||||||||||
| Mineral Resources Ltd.(1) | 8.00 | 11/01/27 | 175,000 | 179,613 | ||||||||||
| Mineral Resources Ltd.(1) | 8.13 | 05/01/27 | 185,000 | 186,485 | ||||||||||
| Mineral Resources Ltd.(1) | 8.50 | 05/01/30 | 152,000 | 156,471 | ||||||||||
| Mineral Resources Ltd.(1) | 9.25 | 10/01/28 | 295,000 | 310,938 | ||||||||||
| TMS International Corp./DE(1) | 6.25 | 04/15/29 | 87,000 | 84,253 | ||||||||||
| United States Steel Corp. | 6.65 | 06/01/37 | 65,000 | 66,032 | ||||||||||
| United States Steel Corp. | 6.88 | 03/01/29 | 131,000 | 131,954 | ||||||||||
| 3,751,208 | ||||||||||||||
| MACHINERY-CONSTRUCTION & MINING – 0.7% | ||||||||||||||
| BWX Technologies, Inc.(1) | 4.13 | 06/30/28 | 105,000 | 100,306 | ||||||||||
| BWX Technologies, Inc.(1) | 4.13 | 04/15/29 | 95,000 | 90,078 | ||||||||||
| Manitowoc Co., Inc.(1) | 9.25 | 10/01/31 | 80,000 | 81,332 | ||||||||||
| Terex Corp.(1) | 5.00 | 05/15/29 | 160,000 | 153,932 | ||||||||||
| Terex Corp.(1) | 6.25 | 10/15/32 | 150,000 | 149,423 | ||||||||||
| 575,071 | ||||||||||||||
| MACHINERY-DIVERSIFIED – 2.7% | ||||||||||||||
| ATS Corp.(1) | 4.13 | 12/15/28 | 100,000 | 94,104 | ||||||||||
| Chart Industries, Inc.(1) | 7.50 | 01/01/30 | 383,000 | 398,830 | ||||||||||
| Chart Industries, Inc.(1) | 9.50 | 01/01/31 | 125,000 | 134,506 | ||||||||||
| Esab Corp.(1) | 6.25 | 04/15/29 | 185,000 | 188,489 | ||||||||||
| GrafTech Finance, Inc.(1) | 4.63 | 12/15/28 | 135,000 | 95,673 | ||||||||||
| GrafTech Global Enterprises, Inc.(1) | 9.88 | 12/15/28 | 110,000 | 92,396 | ||||||||||
| Husky Injection Molding Systems Ltd./Titan Co.-Borrower LLC(1) | 9.00 | 02/15/29 | 260,000 | 267,828 | ||||||||||
| Maxim Crane Works Holdings Capital LLC(1) | 11.50 | 09/01/28 | 120,000 | 128,922 | ||||||||||
| Mueller Water Products, Inc.(1) | 4.00 | 06/15/29 | 108,000 | 100,653 | ||||||||||
| OT Merger Corp.(1) | 7.88 | 10/15/29 | 62,000 | 27,388 | ||||||||||
| SPX FLOW, Inc.(1) | 8.75 | 04/01/30 | 133,000 | 138,381 | ||||||||||
| TK Elevator Holdco GmbH(1) | 7.63 | 07/15/28 | 105,000 | 105,957 | ||||||||||
| TK Elevator US Newco, Inc.(1) | 5.25 | 07/15/27 | 410,000 | 403,613 | ||||||||||
| 2,176,740 | ||||||||||||||
| METAL FABRICATE/HARDWARE – 0.8% | ||||||||||||||
| Advanced Drainage Systems, Inc.(1) | 5.00 | 09/30/27 | 85,000 | 83,537 | ||||||||||
| Advanced Drainage Systems, Inc.(1) | 6.38 | 06/15/30 | 135,000 | 136,210 | ||||||||||
| Park-Ohio Industries, Inc. | 6.63 | 04/15/27 | 90,000 | 88,028 | ||||||||||
| Roller Bearing Co. of America, Inc.(1) | 4.38 | 10/15/29 | 120,000 | 112,900 | ||||||||||
| Vallourec SACA(1) | 7.50 | 04/15/32 | 215,000 | 225,452 | ||||||||||
| 646,127 | ||||||||||||||
| MINING – 5.5% | ||||||||||||||
| Alcoa Nederland Holding BV(1) | 4.13 | 03/31/29 | 120,000 | 112,955 | ||||||||||
| Alcoa Nederland Holding BV(1) | 5.50 | 12/15/27 | 210,000 | 208,646 | ||||||||||
| Alcoa Nederland Holding BV(1) | 6.13 | 05/15/28 | 145,000 | 145,377 | ||||||||||
| Alcoa Nederland Holding BV(1) | 7.13 | 03/15/31 | 185,000 | 193,073 | ||||||||||
The accompanying notes are an integral part of these financial statements.
9
BONDBLOXX ETF TRUST
BondBloxx USD High Yield Bond Industrial Sector ETF
Portfolio of Investments (Continued)
October 31, 2024
| Rate (%) | Maturity | Face Amount | Value | |||||||||||
| MINING – 5.5% (Continued) | ||||||||||||||
| Arsenal AIC Parent LLC(1) | 8.00 | 10/01/30 | $ | 185,000 | $ | 194,688 | ||||||||
| Arsenal AIC Parent LLC(1) | 11.50 | 10/01/31 | 135,000 | 150,389 | ||||||||||
| Century Aluminum Co.(1) | 7.50 | 04/01/28 | 50,000 | 50,760 | ||||||||||
| Coeur Mining, Inc.(1) | 5.13 | 02/15/29 | 63,000 | 60,171 | ||||||||||
| Compass Minerals International, Inc.(1) | 6.75 | 12/01/27 | 134,000 | 132,211 | ||||||||||
| Constellium SE(1) | 3.75 | 04/15/29 | 140,000 | 126,813 | ||||||||||
| Constellium SE(1) | 5.63 | 06/15/28 | 75,000 | 73,258 | ||||||||||
| Constellium SE(1) | 6.38 | 08/15/32 | 95,000 | 93,608 | ||||||||||
| Eldorado Gold Corp.(1) | 6.25 | 09/01/29 | 118,000 | 116,209 | ||||||||||
| FMG Resources August 2006 Pty Ltd.(1) | 4.38 | 04/01/31 | 400,000 | 364,484 | ||||||||||
| FMG Resources August 2006 Pty Ltd.(1) | 4.50 | 09/15/27 | 145,000 | 141,255 | ||||||||||
| FMG Resources August 2006 Pty Ltd.(1) | 5.88 | 04/15/30 | 195,000 | 194,238 | ||||||||||
| FMG Resources August 2006 Pty Ltd.(1) | 6.13 | 04/15/32 | 200,000 | 200,852 | ||||||||||
| Hecla Mining Co. | 7.25 | 02/15/28 | 113,000 | 114,442 | ||||||||||
| Hudbay Minerals, Inc.(1) | 4.50 | 04/01/26 | 147,000 | 145,301 | ||||||||||
| Hudbay Minerals, Inc.(1) | 6.13 | 04/01/29 | 150,000 | 151,224 | ||||||||||
| IAMGOLD Corp.(1) | 5.75 | 10/15/28 | 108,000 | 105,402 | ||||||||||
| JW Aluminum Continuous Cast Co.(1) | 10.25 | 06/01/26 | 57,000 | 57,233 | ||||||||||
| Kaiser Aluminum Corp.(1) | 4.50 | 06/01/31 | 151,000 | 134,939 | ||||||||||
| Kaiser Aluminum Corp.(1) | 4.63 | 03/01/28 | 120,000 | 114,450 | ||||||||||
| New Gold, Inc.(1) | 7.50 | 07/15/27 | 98,000 | 99,655 | ||||||||||
| Novelis Corp.(1) | 3.25 | 11/15/26 | 210,000 | 202,197 | ||||||||||
| Novelis Corp.(1) | 3.88 | 08/15/31 | 227,000 | 199,550 | ||||||||||
| Novelis Corp.(1) | 4.75 | 01/30/30 | 378,000 | 354,427 | ||||||||||
| Perenti Finance Pty Ltd.(1) | 7.50 | 04/26/29 | 100,000 | 104,472 | ||||||||||
| Taseko Mines Ltd.(1) | 8.25 | 05/01/30 | 135,000 | 139,670 | ||||||||||
| 4,481,949 | ||||||||||||||
| MISCELLANEOUS MANUFACTURER – 1.7% | ||||||||||||||
| Amsted Industries, Inc.(1) | 4.63 | 05/15/30 | 105,000 | 98,037 | ||||||||||
| Amsted Industries, Inc.(1) | 5.63 | 07/01/27 | 97,000 | 96,413 | ||||||||||
| Calderys Financing LLC(1) | 11.25 | 06/01/28 | 145,000 | 155,037 | ||||||||||
| Enpro, Inc. | 5.75 | 10/15/26 | 95,000 | 94,841 | ||||||||||
| FXI Holdings, Inc.(1) | 12.25 | 11/15/26 | 213,000 | 212,399 | ||||||||||
| FXI Holdings, Inc.(1) | 12.25 | 11/15/26 | 107,000 | 106,244 | ||||||||||
| Hillenbrand, Inc. | 3.75 | 03/01/31 | 95,000 | 83,217 | ||||||||||
| Hillenbrand, Inc. | 5.00 | 09/15/26 | 80,000 | 79,311 | ||||||||||
| Hillenbrand, Inc. | 6.25 | 02/15/29 | 144,000 | 144,723 | ||||||||||
| LSB Industries, Inc.(1) | 6.25 | 10/15/28 | 130,000 | 125,899 | ||||||||||
| Trinity Industries, Inc.(1) | 7.75 | 07/15/28 | 160,000 | 165,527 | ||||||||||
| 1,361,648 | ||||||||||||||
| OFFICE FURNISHINGS – 0.2% | ||||||||||||||
| Interface, Inc.(1) | 5.50 | 12/01/28 | 77,000 | 75,460 | ||||||||||
| Steelcase, Inc. | 5.13 | 01/18/29 | 118,000 | 113,847 | ||||||||||
| 189,307 | ||||||||||||||
The accompanying notes are an integral part of these financial statements.
10
BONDBLOXX ETF TRUST
BondBloxx USD High Yield Bond Industrial Sector ETF
Portfolio of Investments (Continued)
October 31, 2024
| Rate (%) | Maturity | Face Amount | Value | |||||||||||
| OFFICE/BUSINESS EQUIPMENT – 0.2% | ||||||||||||||
| Pitney Bowes, Inc.(1) | 6.88 | 03/15/27 | $ | 105,000 | $ | 103,982 | ||||||||
| Pitney Bowes, Inc.(1) | 7.25 | 03/15/29 | 85,000 | 83,804 | ||||||||||
| 187,786 | ||||||||||||||
| PACKAGING & CONTAINERS – 9.6% | ||||||||||||||
| Ardagh Metal Packaging Finance USA LLC/Ardagh Metal Packaging Finance PLC(1) | 3.25 | 09/01/28 | 160,000 | 144,331 | ||||||||||
| Ardagh Metal Packaging Finance USA LLC/Ardagh Metal Packaging Finance PLC(1) | 4.00 | 09/01/29 | 275,000 | 241,493 | ||||||||||
| Ardagh Metal Packaging Finance USA LLC/Ardagh Metal Packaging Finance PLC(1) | 6.00 | 06/15/27 | 160,000 | 159,693 | ||||||||||
| Ardagh Packaging Finance PLC/Ardagh Holdings USA, Inc.(1) | 4.13 | 08/15/26 | 325,000 | 283,086 | ||||||||||
| Ball Corp. | 2.88 | 08/15/30 | 340,000 | 296,153 | ||||||||||
| Ball Corp. | 3.13 | 09/15/31 | 215,000 | 185,990 | ||||||||||
| Ball Corp. | 4.88 | 03/15/26 | 70,000 | 69,680 | ||||||||||
| Ball Corp. | 6.00 | 06/15/29 | 265,000 | 269,479 | ||||||||||
| Ball Corp. | 6.88 | 03/15/28 | 190,000 | 195,473 | ||||||||||
| Berry Global, Inc.(1) | 4.50 | 02/15/26 | 80,000 | 78,997 | ||||||||||
| Berry Global, Inc.(1) | 5.63 | 07/15/27 | 125,000 | 124,896 | ||||||||||
| Cascades, Inc./Cascades USA, Inc.(1) | 5.38 | 01/15/28 | 120,000 | 118,164 | ||||||||||
| Clearwater Paper Corp.(1) | 4.75 | 08/15/28 | 60,000 | 55,791 | ||||||||||
| Clydesdale Acquisition Holdings, Inc.(1) | 6.63 | 04/15/29 | 125,000 | 125,707 | ||||||||||
| Clydesdale Acquisition Holdings, Inc.(1) | 6.88 | 01/15/30 | 120,000 | 121,898 | ||||||||||
| Clydesdale Acquisition Holdings, Inc.(1) | 8.75 | 04/15/30 | 301,000 | 305,918 | ||||||||||
| Crown Americas LLC | 5.25 | 04/01/30 | 129,000 | 126,980 | ||||||||||
| Crown Americas LLC/Crown Americas Capital Corp.V | 4.25 | 09/30/26 | 110,000 | 107,775 | ||||||||||
| Crown Americas LLC/Crown Americas Capital Corp.VI | 4.75 | 02/01/26 | 240,000 | 238,438 | ||||||||||
| Crown Cork & Seal Co., Inc. | 7.38 | 12/15/26 | 85,000 | 88,338 | ||||||||||
| Graham Packaging Co., Inc.(1) | 7.13 | 08/15/28 | 134,000 | 130,482 | ||||||||||
| Graphic Packaging International LLC(1) | 3.50 | 03/15/28 | 130,000 | 121,493 | ||||||||||
| Graphic Packaging International LLC(1) | 3.50 | 03/01/29 | 85,000 | 77,658 | ||||||||||
| Graphic Packaging International LLC(1) | 3.75 | 02/01/30 | 100,000 | 91,544 | ||||||||||
| Graphic Packaging International LLC(1) | 4.75 | 07/15/27 | 72,000 | 70,652 | ||||||||||
| Graphic Packaging International LLC(1) | 6.38 | 07/15/32 | 135,000 | 136,374 | ||||||||||
Intelligent Packaging Ltd. FinCo., Inc./Intelligent Packaging Ltd. Co.-Issuer LLC(1) | 6.00 | 09/15/28 | 180,000 | 177,891 | ||||||||||
| Iris Holding, Inc.(1) | 10.00 | 12/15/28 | 105,000 | 92,405 | ||||||||||
| Mauser Packaging Solutions Holding Co.(1) | 7.88 | 04/15/27 | 710,000 | 730,412 | ||||||||||
| Mauser Packaging Solutions Holding Co.(1) | 9.25 | 04/15/27 | 350,000 | 358,236 | ||||||||||
| OI European Group BV(1) | 4.75 | 02/15/30 | 105,000 | 95,217 | ||||||||||
| Owens-Brockway Glass Container, Inc.(1) | 6.63 | 05/13/27 | 145,000 | 144,427 | ||||||||||
| Owens-Brockway Glass Container, Inc.(1) | 7.25 | 05/15/31 | 195,000 | 192,031 | ||||||||||
| Owens-Brockway Glass Container, Inc.(1) | 7.38 | 06/01/32 | 75,000 | 73,474 | ||||||||||
| Pactiv Evergreen Group Issuer LLC/Pactiv Evergreen Group Issuer, Inc.(1) | 4.38 | 10/15/28 | 120,000 | 112,976 | ||||||||||
| Pactiv Evergreen Group Issuer, Inc./Pactiv Evergreen Group Issuer LLC(1) | 4.00 | 10/15/27 | 265,000 | 253,334 | ||||||||||
| Sealed Air Corp.(1) | 4.00 | 12/01/27 | 100,000 | 95,804 | ||||||||||
| Sealed Air Corp.(1) | 5.00 | 04/15/29 | 130,000 | 125,687 | ||||||||||
| Sealed Air Corp.(1) | 6.50 | 07/15/32 | 100,000 | 101,597 | ||||||||||
| Sealed Air Corp.(1) | 6.88 | 07/15/33 | 120,000 | 127,228 | ||||||||||
| Sealed Air Corp./Sealed Air Corp. US(1) | 6.13 | 02/01/28 | 217,000 | 219,459 | ||||||||||
| Sealed Air Corp./Sealed Air Corp. US(1) | 7.25 | 02/15/31 | 100,000 | 103,948 | ||||||||||
| Silgan Holdings, Inc. | 4.13 | 02/01/28 | 150,000 | 143,342 | ||||||||||
The accompanying notes are an integral part of these financial statements.
11
BONDBLOXX ETF TRUST
BondBloxx USD High Yield Bond Industrial Sector ETF
Portfolio of Investments (Continued)
October 31, 2024
| Rate (%) | Maturity | Face Amount | Value | |||||||||||
| PACKAGING & CONTAINERS – 9.6% (Continued) | ||||||||||||||
| Trident TPI Holdings, Inc.(1) | 12.75 | 12/31/28 | $ | 165,000 | $ | 181,251 | ||||||||
| TriMas Corp.(1) | 4.13 | 04/15/29 | 108,000 | 100,882 | ||||||||||
| Trivium Packaging Finance BV(1) | 5.50 | 08/15/26 | 276,000 | 273,828 | ||||||||||
| Trivium Packaging Finance BV(1) | 8.50 | 08/15/27 | 185,000 | 184,651 | ||||||||||
| 7,854,563 | ||||||||||||||
| REAL ESTATE – 0.2% | ||||||||||||||
| CoreLogic, Inc.(1) | 4.50 | 05/01/28 | 200,000 | 187,999 | ||||||||||
| RETAIL – 2.5% | ||||||||||||||
| Beacon Roofing Supply, Inc.(1) | 4.13 | 05/15/29 | 92,000 | 85,623 | ||||||||||
| Beacon Roofing Supply, Inc.(1) | 4.50 | 11/15/26 | 70,000 | 68,670 | ||||||||||
| Beacon Roofing Supply, Inc.(1) | 6.50 | 08/01/30 | 165,000 | 167,886 | ||||||||||
| BlueLinx Holdings, Inc.(1) | 6.00 | 11/15/29 | 82,000 | 79,231 | ||||||||||
| Foundation Building Materials, Inc.(1) | 6.00 | 03/01/29 | 108,000 | 95,542 | ||||||||||
| GYP Holdings III Corp.(1) | 4.63 | 05/01/29 | 100,000 | 94,493 | ||||||||||
| LBM Acquisition LLC(1) | 6.25 | 01/15/29 | 190,000 | 175,441 | ||||||||||
| Park River Holdings, Inc.(1) | 5.63 | 02/01/29 | 80,000 | 69,959 | ||||||||||
| Park River Holdings, Inc.(1) | 6.75 | 08/01/29 | 80,000 | 71,485 | ||||||||||
| Patrick Industries, Inc.(1) | 4.75 | 05/01/29 | 85,000 | 80,477 | ||||||||||
| Patrick Industries, Inc.(1) | 6.38 | 11/01/32 | 100,000 | 98,982 | ||||||||||
| Patrick Industries, Inc.(1) | 7.50 | 10/15/27 | 80,000 | 79,900 | ||||||||||
| Specialty Building Products Holdings LLC/SBP Finance Corp.(1) | 7.75 | 10/15/29 | 100,000 | 102,078 | ||||||||||
| Staples, Inc.(1) | 10.75 | 09/01/29 | 655,000 | 634,193 | ||||||||||
| White Capital Buyer LLC(1) | 6.88 | 10/15/28 | 155,000 | 155,648 | ||||||||||
| 2,059,608 | ||||||||||||||
| SOFTWARE – 0.9% | ||||||||||||||
| Camelot Finance SA(1) | 4.50 | 11/01/26 | 185,000 | 181,891 | ||||||||||
| Clarivate Science Holdings Corp.(1) | 3.88 | 07/01/28 | 225,000 | 212,562 | ||||||||||
| Clarivate Science Holdings Corp.(1) | 4.88 | 07/01/29 | 260,000 | 245,979 | ||||||||||
| Dun & Bradstreet Corp.(1) | 5.00 | 12/15/29 | 108,000 | 105,912 | ||||||||||
| 746,344 | ||||||||||||||
| TRANSPORTATION – 2.3% | ||||||||||||||
| Brightline East LLC(1) | 11.00 | 01/31/30 | 350,000 | 316,400 | ||||||||||
| Carriage Purchaser, Inc.(1) | 7.88 | 10/15/29 | 87,000 | 82,064 | ||||||||||
| Danaos Corp.(1) | 8.50 | 03/01/28 | 70,000 | 72,022 | ||||||||||
| First Student Bidco, Inc./First Transit Parent, Inc.(1) | 4.00 | 07/31/29 | 165,000 | 152,056 | ||||||||||
| Genesee & Wyoming, Inc.(1) | 6.25 | 04/15/32 | 185,000 | 186,848 | ||||||||||
| GN Bondco LLC(1) | 9.50 | 10/15/31 | 190,000 | 201,938 | ||||||||||
| Rand Parent LLC(1) | 8.50 | 02/15/30 | 225,000 | 224,750 | ||||||||||
| RXO, Inc.(1) | 7.50 | 11/15/27 | 95,000 | 98,009 | ||||||||||
| Watco Cos LLC/Watco Finance Corp.(1) | 7.13 | 08/01/32 | 185,000 | 190,890 | ||||||||||
| XPO CNW, Inc. | 6.70 | 05/01/34 | 70,000 | 73,390 | ||||||||||
| XPO, Inc.(1) | 7.13 | 06/01/31 | 110,000 | 113,952 | ||||||||||
| XPO, Inc.(1) | 7.13 | 02/01/32 | 155,000 | 161,164 | ||||||||||
| 1,873,483 | ||||||||||||||
| TOTAL CORPORATE BONDS (Cost - $79,891,862) | 80,342,203 | |||||||||||||
The accompanying notes are an integral part of these financial statements.
12
BONDBLOXX ETF TRUST
BondBloxx USD High Yield Bond Industrial Sector ETF
Portfolio of Investments (Continued)
October 31, 2024
| Rate (%) | Maturity | Face Amount | Value | |||||||||||
| SHORT-TERM INVESTMENTS – 1.6% | ||||||||||||||
| TIME DEPOSITS – 1.6% | ||||||||||||||
| JP Morgan Chase, New York | 4.18 | 11/01/24 | $ | 1,291,274 | $ | 1,291,274 | ||||||||
| TOTAL SHORT-TERM INVESTMENTS (Cost - $1,291,274) | 1,291,274 | |||||||||||||
| TOTAL INVESTMENTS – 99.6% (Cost - $81,183,136) | $ | 81,633,477 | ||||||||||||
| OTHER ASSETS LESS LIABILITIES – 0.4% | 360,655 | |||||||||||||
| NET ASSETS – 100.0% | $ | 81,994,132 | ||||||||||||
| (1) | Security was purchased pursuant to Rule 144A under the Securities Act of 1933 and may not be resold subject to that Rule except to qualified institutional buyers. The aggregate value of Rule 144A holdings at October 31, 2024, amounts to $69,492,648 and represents 84.8% of net assets. These securities have been deemed liquid under procedures approved by the Trust’s Board of Trustees. |
The accompanying notes are an integral part of these financial statements.
13
BONDBLOXX ETF TRUST
BondBloxx USD High Yield Bond Telecom, Media & Technology Sector ETF
Portfolio of Investments
October 31, 2024
| Shares | Value | |||||||
| COMMON STOCKS – 0.0% | ||||||||
| MEDIA – 0.0% | ||||||||
| Beasley Broadcast Group, Inc. Class A* | 24 | $ | 307 | |||||
| TOTAL COMMON STOCKS (Cost - $297) | 307 | |||||||
| Rate (%) | Maturity | Face Amount | ||||||||||||
| CORPORATE BONDS – 97.4% | ||||||||||||||
| ADVERTISING – 3.5% | ||||||||||||||
| Advantage Sales & Marketing, Inc.(1) | 6.50 | 11/15/28 | $ | 265,000 | 248,365 | |||||||||
| Clear Channel Outdoor Holdings, Inc.(1) | 5.13 | 08/15/27 | 545,000 | 528,907 | ||||||||||
| Clear Channel Outdoor Holdings, Inc.(1) | 7.50 | 06/01/29 | 440,000 | 376,472 | ||||||||||
| Clear Channel Outdoor Holdings, Inc.(1) | 7.75 | 04/15/28 | 460,000 | 409,914 | ||||||||||
| Clear Channel Outdoor Holdings, Inc.(1) | 7.88 | 04/01/30 | 370,000 | 377,566 | ||||||||||
| Clear Channel Outdoor Holdings, Inc.(1) | 9.00 | 09/15/28 | 320,000 | 336,422 | ||||||||||
| CMG Media Corp.(1) | 8.88 | 12/15/27 | 382,000 | 277,427 | ||||||||||
| Lamar Media Corp. | 3.63 | 01/15/31 | 262,000 | 234,077 | ||||||||||
| Lamar Media Corp. | 3.75 | 02/15/28 | 262,000 | 249,313 | ||||||||||
| Lamar Media Corp. | 4.00 | 02/15/30 | 215,000 | 198,952 | ||||||||||
| Lamar Media Corp. | 4.88 | 01/15/29 | 160,000 | 155,872 | ||||||||||
| Stagwell Global LLC(1) | 5.63 | 08/15/29 | 467,000 | 444,584 | ||||||||||
| 3,837,871 | ||||||||||||||
| COMMERCIAL SERVICES – 1.1% | ||||||||||||||
| Cimpress PLC(1) | 7.38 | 09/15/32 | 225,000 | 221,792 | ||||||||||
| Deluxe Corp.(1) | 8.00 | 06/01/29 | 205,000 | 193,515 | ||||||||||
| RR Donnelley & Sons Co.(1) | 9.50 | 08/01/29 | 470,000 | 473,704 | ||||||||||
| RR Donnelley & Sons Co.(1) | 10.88 | 08/01/29 | 195,000 | 192,438 | ||||||||||
| VM Consolidated, Inc.(1) | 5.50 | 04/15/29 | 155,000 | 150,038 | ||||||||||
| 1,231,487 | ||||||||||||||
| COMPUTERS – 5.5% | ||||||||||||||
| Ahead DB Holdings LLC(1) | 6.63 | 05/01/28 | 177,000 | 171,992 | ||||||||||
| Crowdstrike Holdings, Inc. | 3.00 | 02/15/29 | 325,000 | 295,809 | ||||||||||
| Fortress Intermediate 3, Inc.(1) | 7.50 | 06/01/31 | 320,000 | 333,066 | ||||||||||
| Insight Enterprises, Inc.(1) | 6.63 | 05/15/32 | 215,000 | 219,972 | ||||||||||
| McAfee Corp.(1) | 7.38 | 02/15/30 | 878,000 | 847,194 | ||||||||||
| NCR Atleos Corp.(1) | 9.50 | 04/01/29 | 580,000 | 638,844 | ||||||||||
| NCR Voyix Corp.(1) | 5.00 | 10/01/28 | 280,000 | 269,623 | ||||||||||
| NCR Voyix Corp.(1) | 5.13 | 04/15/29 | 177,000 | 169,318 | ||||||||||
| Seagate HDD Cayman | 4.09 | 06/01/29 | 212,000 | 200,065 | ||||||||||
| Seagate HDD Cayman | 4.13 | 01/15/31 | 117,000 | 105,315 | ||||||||||
| Seagate HDD Cayman | 4.88 | 06/01/27 | 220,000 | 217,164 | ||||||||||
| Seagate HDD Cayman | 5.75 | 12/01/34 | 230,000 | 226,929 | ||||||||||
| Seagate HDD Cayman | 8.25 | 12/15/29 | 215,000 | 231,501 | ||||||||||
| Seagate HDD Cayman | 8.50 | 07/15/31 | 215,000 | 231,946 | ||||||||||
| Seagate HDD Cayman | 9.63 | 12/01/32 | 322,800 | 368,180 | ||||||||||
| Unisys Corp.(1) | 6.88 | 11/01/27 | 210,000 | 205,506 | ||||||||||
| Vericast Corp./Harland Clarke/Checks in the Mail/Valassis Comm/Valassis Direct(1) | 13.00 | 12/15/30 | 52,012 | 61,374 | ||||||||||
| Virtusa Corp.(1) | 7.13 | 12/15/28 | 152,000 | 147,557 | ||||||||||
| Western Digital Corp. | 4.75 | 02/15/26 | 988,000 | 977,036 | ||||||||||
| 5,918,391 | ||||||||||||||
The accompanying notes are an integral part of these financial statements.
14
BONDBLOXX ETF TRUST
BondBloxx USD High Yield Bond Telecom, Media & Technology Sector ETF
Portfolio of Investments (Continued)
October 31, 2024
| Rate (%) | Maturity | Face Amount | Value | |||||||||||
| ELECTRONICS – 1.8% | ||||||||||||||
| Coherent Corp.(1) | 5.00 | 12/15/29 | $ | 427,000 | $ | 409,978 | ||||||||
| Sensata Technologies BV(1) | 4.00 | 04/15/29 | 430,000 | 402,394 | ||||||||||
| Sensata Technologies BV(1) | 5.88 | 09/01/30 | 215,000 | 212,947 | ||||||||||
| Sensata Technologies, Inc.(1) | 3.75 | 02/15/31 | 325,000 | 290,341 | ||||||||||
| Sensata Technologies, Inc.(1) | 4.38 | 02/15/30 | 200,000 | 186,378 | ||||||||||
| Sensata Technologies, Inc.(1) | 6.63 | 07/15/32 | 215,000 | 218,016 | ||||||||||
| TTM Technologies, Inc.(1) | 4.00 | 03/01/29 | 215,000 | 201,194 | ||||||||||
| 1,921,248 | ||||||||||||||
| ENGINEERING & CONSTRUCTION – 0.5% | ||||||||||||||
| ATP Tower Holdings LLC/Andean Tower Partners Colombia SAS/Andean Telecom Partners Peru(1) | 4.05 | 04/27/26 | 170,000 | 164,149 | ||||||||||
| HTA Group Ltd./Mauritius(1) | 7.50 | 06/04/29 | 365,000 | 371,719 | ||||||||||
| 535,868 | ||||||||||||||
| ENTERTAINMENT – 0.5% | ||||||||||||||
| Allen Media LLC/Allen Media Co.-Issuer, Inc.(1) | 10.50 | 02/15/28 | 245,000 | 107,831 | ||||||||||
| Banijay Entertainment SAS(1) | 8.13 | 05/01/29 | 170,000 | 176,435 | ||||||||||
| Lions Gate Capital Holdings 1, Inc.(1) | 5.50 | 04/15/29 | 165,000 | 146,020 | ||||||||||
| Lions Gate Capital Holdings LLC(1) | 5.50 | 04/15/29 | 142,000 | 102,836 | ||||||||||
| 533,122 | ||||||||||||||
| INTERNET – 5.0% | ||||||||||||||
| ANGI Group LLC(1) | 3.88 | 08/15/28 | 215,000 | 194,752 | ||||||||||
| Arches Buyer, Inc.(1) | 4.25 | 06/01/28 | 405,000 | 371,810 | ||||||||||
| Arches Buyer, Inc.(1) | 6.13 | 12/01/28 | 215,000 | 189,469 | ||||||||||
| Cablevision Lightpath LLC(1) | 3.88 | 09/15/27 | 195,000 | 186,145 | ||||||||||
| Cablevision Lightpath LLC(1) | 5.63 | 09/15/28 | 180,000 | 167,282 | ||||||||||
| Cars.com, Inc.(1) | 6.38 | 11/01/28 | 175,000 | 174,636 | ||||||||||
| Cogent Communications Group LLC(1) | 3.50 | 05/01/26 | 247,000 | 240,307 | ||||||||||
| Cogent Communications Group LLC(1) | 7.00 | 06/15/27 | 135,000 | 136,562 | ||||||||||
| Cogent Communications Group, Inc./Cogent Communications Finance, Inc.(1) | 7.00 | 06/15/27 | 160,000 | 161,041 | ||||||||||
| Gen Digital, Inc.(1) | 6.75 | 09/30/27 | 390,000 | 397,014 | ||||||||||
| Gen Digital, Inc.(1) | 7.13 | 09/30/30 | 255,000 | 264,116 | ||||||||||
| Getty Images, Inc.(1) | 9.75 | 03/01/27 | 115,000 | 114,750 | ||||||||||
| Go Daddy Operating Co. LLC/GD Finance Co., Inc.(1) | 3.50 | 03/01/29 | 340,000 | 314,021 | ||||||||||
| Go Daddy Operating Co. LLC/GD Finance Co., Inc.(1) | 5.25 | 12/01/27 | 265,000 | 262,128 | ||||||||||
| ION Trading Technologies Sarl(1) | 5.75 | 05/15/28 | 195,000 | 177,760 | ||||||||||
| ION Trading Technologies Sarl(1) | 9.50 | 05/30/29 | 335,000 | 340,762 | ||||||||||
| Match Group Holdings II LLC(1) | 3.63 | 10/01/31 | 197,000 | 172,771 | ||||||||||
| Match Group Holdings II LLC(1) | 4.13 | 08/01/30 | 215,000 | 195,698 | ||||||||||
| Match Group Holdings II LLC(1) | 4.63 | 06/01/28 | 203,000 | 195,432 | ||||||||||
| Match Group Holdings II LLC(1) | 5.00 | 12/15/27 | 195,000 | 190,561 | ||||||||||
| Match Group Holdings II LLC(1) | 5.63 | 02/15/29 | 180,000 | 178,372 | ||||||||||
| Millennium Escrow Corp.(1) | 6.63 | 08/01/26 | 335,000 | 215,866 | ||||||||||
| Newfold Digital Holdings Group, Inc.(1) | 6.00 | 02/15/29 | 215,000 | 144,641 | ||||||||||
| Newfold Digital Holdings Group, Inc.(1) | 11.75 | 10/15/28 | 220,000 | 217,521 | ||||||||||
| Ziff Davis, Inc.(1) | 4.63 | 10/15/30 | 200,000 | 183,175 | ||||||||||
| 5,386,592 | ||||||||||||||
The accompanying notes are an integral part of these financial statements.
15
BONDBLOXX ETF TRUST
BondBloxx USD High Yield Bond Telecom, Media & Technology Sector ETF
Portfolio of Investments (Continued)
October 31, 2024
| Rate (%) | Maturity | Face Amount | Value | |||||||||||
| MACHINERY-CONSTRUCTION & MINING – 0.3% | ||||||||||||||
| Vertiv Group Corp.(1) | 4.13 | 11/15/28 | $ | 365,000 | $ | 347,679 | ||||||||
| MEDIA – 37.8% | ||||||||||||||
| AMC Networks, Inc. | 4.25 | 02/15/29 | 422,000 | 291,742 | ||||||||||
| AMC Networks, Inc.(1) | 10.25 | 01/15/29 | 375,000 | 386,648 | ||||||||||
| Block Communications, Inc.(1) | 4.88 | 03/01/28 | 125,000 | 118,516 | ||||||||||
| Cable One, Inc.(1) | 4.00 | 11/15/30 | 285,000 | 224,928 | ||||||||||
| CCO Holdings LLC/CCO Holdings Capital Corp.(1) | 4.25 | 02/01/31 | 1,340,000 | 1,163,980 | ||||||||||
| CCO Holdings LLC/CCO Holdings Capital Corp.(1) | 4.25 | 01/15/34 | 873,000 | 698,264 | ||||||||||
| CCO Holdings LLC/CCO Holdings Capital Corp.(1) | 4.50 | 08/15/30 | 1,272,000 | 1,137,122 | ||||||||||
| CCO Holdings LLC/CCO Holdings Capital Corp. | 4.50 | 05/01/32 | 1,259,000 | 1,072,224 | ||||||||||
| CCO Holdings LLC/CCO Holdings Capital Corp.(1) | 4.50 | 06/01/33 | 752,000 | 626,118 | ||||||||||
| CCO Holdings LLC/CCO Holdings Capital Corp.(1) | 4.75 | 03/01/30 | 1,215,000 | 1,106,257 | ||||||||||
| CCO Holdings LLC/CCO Holdings Capital Corp.(1) | 4.75 | 02/01/32 | 515,000 | 445,746 | ||||||||||
| CCO Holdings LLC/CCO Holdings Capital Corp.(1) | 5.00 | 02/01/28 | 1,097,000 | 1,062,564 | ||||||||||
| CCO Holdings LLC/CCO Holdings Capital Corp.(1) | 5.13 | 05/01/27 | 1,407,000 | 1,378,758 | ||||||||||
| CCO Holdings LLC/CCO Holdings Capital Corp.(1) | 5.38 | 06/01/29 | 681,000 | 650,614 | ||||||||||
| CCO Holdings LLC/CCO Holdings Capital Corp.(1) | 5.50 | 05/01/26 | 323,000 | 322,172 | ||||||||||
| CCO Holdings LLC/CCO Holdings Capital Corp.(1) | 6.38 | 09/01/29 | 580,000 | 574,712 | ||||||||||
| CCO Holdings LLC/CCO Holdings Capital Corp.(1) | 7.38 | 03/01/31 | 545,000 | 554,579 | ||||||||||
| CSC Holdings LLC(1) | 3.38 | 02/15/31 | 425,000 | 305,316 | ||||||||||
| CSC Holdings LLC(1) | 4.13 | 12/01/30 | 467,000 | 345,200 | ||||||||||
| CSC Holdings LLC(1) | 4.50 | 11/15/31 | 640,000 | 469,846 | ||||||||||
| CSC Holdings LLC(1) | 5.38 | 02/01/28 | 425,000 | 364,215 | ||||||||||
| CSC Holdings LLC(1) | 5.50 | 04/15/27 | 585,000 | 521,294 | ||||||||||
| CSC Holdings LLC(1) | 6.50 | 02/01/29 | 715,000 | 605,218 | ||||||||||
| CSC Holdings LLC(1) | 11.25 | 05/15/28 | 425,000 | 414,840 | ||||||||||
| CSC Holdings LLC(1) | 11.75 | 01/31/29 | 950,000 | 927,357 | ||||||||||
| Cumulus Media New Holdings, Inc.(1) | 8.00 | 07/01/29 | 140,000 | 57,736 | ||||||||||
| Directv Financing LLC(1) | 8.88 | 02/01/30 | 320,000 | 316,116 | ||||||||||
| Directv Financing LLC/Directv Financing Co.-Obligor, Inc.(1) | 5.88 | 08/15/27 | 1,610,000 | 1,551,946 | ||||||||||
| DISH DBS Corp.(1) | 5.25 | 12/01/26 | 1,305,000 | 1,210,306 | ||||||||||
| DISH DBS Corp.(1) | 5.75 | 12/01/28 | 1,090,000 | 954,389 | ||||||||||
| DISH Network Corp.(1) | 11.75 | 11/15/27 | 1,430,000 | 1,506,347 | ||||||||||
| GCI LLC(1) | 4.75 | 10/15/28 | 255,000 | 240,919 | ||||||||||
| Gray Television, Inc.(1) | 4.75 | 10/15/30 | 347,000 | 218,561 | ||||||||||
| Gray Television, Inc.(1) | 5.38 | 11/15/31 | 567,000 | 342,556 | ||||||||||
| Gray Television, Inc.(1) | 7.00 | 05/15/27 | 290,000 | 282,434 | ||||||||||
| Gray Television, Inc.(1) | 10.50 | 07/15/29 | 545,000 | 566,596 | ||||||||||
| iHeartCommunications, Inc.(1) | 4.75 | 01/15/28 | 205,000 | 126,224 | ||||||||||
| iHeartCommunications, Inc.(1) | 5.25 | 08/15/27 | 324,000 | 218,286 | ||||||||||
| iHeartCommunications, Inc. | 6.38 | 05/01/26 | 340,000 | 288,050 | ||||||||||
| iHeartCommunications, Inc. | 8.38 | 05/01/27 | 403,000 | 209,371 | ||||||||||
| LCPR Senior Secured Financing DAC(1) | 5.13 | 07/15/29 | 360,000 | 302,842 | ||||||||||
| LCPR Senior Secured Financing DAC(1) | 6.75 | 10/15/27 | 500,000 | 469,130 | ||||||||||
| McGraw-Hill Education, Inc.(1) | 5.75 | 08/01/28 | 360,000 | 353,208 | ||||||||||
| McGraw-Hill Education, Inc.(1) | 7.38 | 09/01/31 | 285,000 | 292,152 | ||||||||||
| McGraw-Hill Education, Inc.(1) | 8.00 | 08/01/29 | 280,000 | 282,106 | ||||||||||
The accompanying notes are an integral part of these financial statements.
16
BONDBLOXX ETF TRUST
BondBloxx USD High Yield Bond Telecom, Media & Technology Sector ETF
Portfolio of Investments (Continued)
October 31, 2024
| Rate (%) | Maturity | Face Amount | Value | |||||||||||
| MEDIA – 37.8% (Continued) | ||||||||||||||
| Midcontinent Communications(1) | 8.00 | 08/15/32 | $ | 280,000 | $ | 285,344 | ||||||||
| News Corp.(1) | 3.88 | 05/15/29 | 440,000 | 409,849 | ||||||||||
| News Corp.(1) | 5.13 | 02/15/32 | 215,000 | 206,224 | ||||||||||
| Nexstar Media, Inc.(1) | 4.75 | 11/01/28 | 430,000 | 404,598 | ||||||||||
| Nexstar Media, Inc.(1) | 5.63 | 07/15/27 | 738,000 | 725,861 | ||||||||||
| Paramount Global | 6.25 | 02/28/57 | 280,000 | 251,673 | ||||||||||
| Paramount Global | 6.38 | 03/30/62 | 437,000 | 405,002 | ||||||||||
| Radiate Holdco LLC/Radiate Finance, Inc.(1) | 4.50 | 09/15/26 | 387,000 | 336,691 | ||||||||||
| Scripps Escrow II, Inc.(1) | 3.88 | 01/15/29 | 215,000 | 167,089 | ||||||||||
| Scripps Escrow II, Inc.(1) | 5.38 | 01/15/31 | 175,000 | 105,320 | ||||||||||
| Scripps Escrow, Inc.(1) | 5.88 | 07/15/27 | 185,000 | 162,800 | ||||||||||
| Sinclair Television Group, Inc.(1) | 4.13 | 12/01/30 | 317,000 | 243,892 | ||||||||||
| Sinclair Television Group, Inc.(1) | 5.13 | 02/15/27 | 120,000 | 106,852 | ||||||||||
| Sinclair Television Group, Inc.(1) | 5.50 | 03/01/30 | 210,000 | 144,759 | ||||||||||
| Sirius XM Radio, Inc.(1) | 3.13 | 09/01/26 | 438,000 | 420,539 | ||||||||||
| Sirius XM Radio, Inc.(1) | 3.88 | 09/01/31 | 605,000 | 520,339 | ||||||||||
| Sirius XM Radio, Inc.(1) | 4.00 | 07/15/28 | 880,000 | 822,931 | ||||||||||
| Sirius XM Radio, Inc.(1) | 4.13 | 07/01/30 | 700,000 | 626,838 | ||||||||||
| Sirius XM Radio, Inc.(1) | 5.00 | 08/01/27 | 640,000 | 627,602 | ||||||||||
| Sirius XM Radio, Inc.(1) | 5.50 | 07/01/29 | 542,000 | 526,179 | ||||||||||
| Sunrise FinCo I BV(1) | 4.88 | 07/15/31 | 541,000 | 495,499 | ||||||||||
| Sunrise HoldCo IV BV(1) | 5.50 | 01/15/28 | 200,000 | 198,004 | ||||||||||
| TEGNA, Inc. | 4.63 | 03/15/28 | 425,000 | 400,677 | ||||||||||
| TEGNA, Inc.(1) | 4.75 | 03/15/26 | 237,000 | 234,728 | ||||||||||
| TEGNA, Inc. | 5.00 | 09/15/29 | 475,000 | 443,899 | ||||||||||
| Townsquare Media, Inc.(1) | 6.88 | 02/01/26 | 205,000 | 204,425 | ||||||||||
| Univision Communications, Inc.(1) | 4.50 | 05/01/29 | 457,000 | 406,151 | ||||||||||
| Univision Communications, Inc.(1) | 6.63 | 06/01/27 | 620,000 | 615,753 | ||||||||||
| Univision Communications, Inc.(1) | 7.38 | 06/30/30 | 390,000 | 374,838 | ||||||||||
| Univision Communications, Inc.(1) | 8.00 | 08/15/28 | 660,000 | 671,376 | ||||||||||
| Univision Communications, Inc.(1) | 8.50 | 07/31/31 | 545,000 | 536,094 | ||||||||||
| Urban One, Inc.(1) | 7.38 | 02/01/28 | 255,000 | 189,414 | ||||||||||
| Virgin Media Finance PLC(1) | 5.00 | 07/15/30 | 397,000 | 341,773 | ||||||||||
| Virgin Media Secured Finance PLC(1) | 4.50 | 08/15/30 | 395,000 | 346,303 | ||||||||||
| Virgin Media Secured Finance PLC(1) | 5.50 | 05/15/29 | 625,000 | 591,598 | ||||||||||
| Virgin Media Vendor Financing Notes IV DAC(1) | 5.00 | 07/15/28 | 220,000 | 211,099 | ||||||||||
| VZ Secured Financing BV(1) | 5.00 | 01/15/32 | 662,000 | 595,364 | ||||||||||
| Ziggo Bond Co. BV(1) | 5.13 | 02/28/30 | 215,000 | 194,812 | ||||||||||
| Ziggo Bond Co. BV(1) | 6.00 | 01/15/27 | 285,000 | 284,621 | ||||||||||
| Ziggo BV(1) | 4.88 | 01/15/30 | 422,000 | 391,721 | ||||||||||
| 40,786,036 | ||||||||||||||
| OFFICE/BUSINESS EQUIPMENT – 0.8% | ||||||||||||||
| Xerox Corp. | 4.80 | 03/01/35 | 107,000 | 63,604 | ||||||||||
| Xerox Corp. | 6.75 | 12/15/39 | 155,000 | 104,653 | ||||||||||
| Xerox Holdings Corp.(1) | 5.50 | 08/15/28 | 320,000 | 262,711 | ||||||||||
| Xerox Holdings Corp.(1) | 8.88 | 11/30/29 | 215,000 | 187,333 | ||||||||||
| Zebra Technologies Corp.(1) | 6.50 | 06/01/32 | 215,000 | 220,134 | ||||||||||
| 838,435 | ||||||||||||||
The accompanying notes are an integral part of these financial statements.
17
BONDBLOXX ETF TRUST
BondBloxx USD High Yield Bond Telecom, Media & Technology Sector ETF
Portfolio of Investments (Continued)
October 31, 2024
| Rate (%) | Maturity | Face Amount | Value | |||||||||||
| PACKAGING & CONTAINERS – 1.1% | ||||||||||||||
| LABL, Inc.(1) | 5.88 | 11/01/28 | $ | 225,000 | $ | 209,320 | ||||||||
| LABL, Inc.(1) | 8.25 | 11/01/29 | 200,000 | 176,561 | ||||||||||
| LABL, Inc.(1) | 8.63 | 10/01/31 | 415,000 | 400,299 | ||||||||||
| LABL, Inc.(1) | 9.50 | 11/01/28 | 130,000 | 133,372 | ||||||||||
| LABL, Inc.(1) | 10.50 | 07/15/27 | 295,000 | 292,361 | ||||||||||
| 1,211,913 | ||||||||||||||
| RETAIL – 0.2% | ||||||||||||||
| Liberty Interactive LLC | 8.25 | 02/01/30 | 215,000 | 110,356 | ||||||||||
| Liberty Interactive LLC | 8.50 | 07/15/29 | 130,000 | 69,663 | ||||||||||
| 180,019 | ||||||||||||||
| SEMICONDUCTORS – 2.1% | ||||||||||||||
| Amkor Technology, Inc.(1) | 6.63 | 09/15/27 | 225,000 | 226,100 | ||||||||||
| ams-OSRAM AG(1) | 12.25 | 03/30/29 | 175,000 | 181,909 | ||||||||||
| Entegris, Inc.(1) | 3.63 | 05/01/29 | 230,000 | 211,417 | ||||||||||
| Entegris, Inc.(1) | 4.38 | 04/15/28 | 50,000 | 47,848 | ||||||||||
| Entegris, Inc.(1) | 4.75 | 04/15/29 | 685,000 | 664,171 | ||||||||||
| Entegris, Inc.(1) | 5.95 | 06/15/30 | 447,000 | 446,913 | ||||||||||
| ON Semiconductor Corp.(1) | 3.88 | 09/01/28 | 300,000 | 281,617 | ||||||||||
| Synaptics, Inc.(1) | 4.00 | 06/15/29 | 175,000 | 160,687 | ||||||||||
| 2,220,662 | ||||||||||||||
| SOFTWARE – 11.7% | ||||||||||||||
| Alteryx, Inc.(1) | 8.75 | 03/15/28 | 195,000 | 199,479 | ||||||||||
| Capstone Borrower, Inc.(1) | 8.00 | 06/15/30 | 215,000 | 224,894 | ||||||||||
| Castle US Holding Corp.(1) | 9.50 | 02/15/28 | 135,000 | 61,425 | ||||||||||
| Central Parent LLC/CDK Global II LLC/CDK Financing Co., Inc.(1) | 8.00 | 06/15/29 | 325,000 | 332,428 | ||||||||||
| Central Parent, Inc./CDK Global, Inc.(1) | 7.25 | 06/15/29 | 325,000 | 326,538 | ||||||||||
| Cloud Software Group, Inc.(1) | 6.50 | 03/31/29 | 1,743,000 | 1,703,658 | ||||||||||
| Cloud Software Group, Inc.(1) | 8.25 | 06/30/32 | 775,000 | 797,121 | ||||||||||
| Cloud Software Group, Inc.(1) | 9.00 | 09/30/29 | 1,665,000 | 1,666,131 | ||||||||||
| Dye & Durham Ltd.(1) | 8.63 | 04/15/29 | 235,000 | 249,320 | ||||||||||
| Elastic NV(1) | 4.13 | 07/15/29 | 245,000 | 226,937 | ||||||||||
| Fair Isaac Corp.(1) | 4.00 | 06/15/28 | 379,000 | 360,269 | ||||||||||
| Fair Isaac Corp.(1) | 5.25 | 05/15/26 | 175,000 | 175,339 | ||||||||||
| Helios Software Holdings, Inc./ION Corporate Solutions Finance Sarl(1) | 4.63 | 05/01/28 | 185,000 | 169,735 | ||||||||||
| Helios Software Holdings, Inc./ION Corporate Solutions Finance Sarl(1) | 8.75 | 05/01/29 | 275,000 | 279,475 | ||||||||||
| Open Text Corp.(1) | 3.88 | 02/15/28 | 390,000 | 367,182 | ||||||||||
| Open Text Corp.(1) | 3.88 | 12/01/29 | 362,000 | 330,548 | ||||||||||
| Open Text Holdings, Inc.(1) | 4.13 | 02/15/30 | 390,000 | 358,345 | ||||||||||
| Open Text Holdings, Inc.(1) | 4.13 | 12/01/31 | 280,000 | 251,718 | ||||||||||
| PTC, Inc.(1) | 4.00 | 02/15/28 | 215,000 | 205,867 | ||||||||||
| Rackspace Finance LLC(1) | 3.50 | 05/15/28 | 145,000 | 85,612 | ||||||||||
| RingCentral, Inc.(1) | 8.50 | 08/15/30 | 175,000 | 185,225 | ||||||||||
| ROBLOX Corp.(1) | 3.88 | 05/01/30 | 427,000 | 386,848 | ||||||||||
| Rocket Software, Inc.(1) | 6.50 | 02/15/29 | 245,000 | 228,078 | ||||||||||
| Rocket Software, Inc.(1) | 9.00 | 11/28/28 | 345,000 | 359,997 | ||||||||||
| SS&C Technologies, Inc.(1) | 5.50 | 09/30/27 | 875,000 | 872,117 | ||||||||||
The accompanying notes are an integral part of these financial statements.
18
BONDBLOXX ETF TRUST
BondBloxx USD High Yield Bond Telecom, Media & Technology Sector ETF
Portfolio of Investments (Continued)
October 31, 2024
| Rate (%) | Maturity | Face Amount | Value | |||||||||||
| SOFTWARE – 11.7% (Continued) | ||||||||||||||
| SS&C Technologies, Inc.(1) | 6.50 | 06/01/32 | $ | 320,000 | $ | 325,960 | ||||||||
| Twilio, Inc. | 3.63 | 03/15/29 | 188,000 | 173,279 | ||||||||||
| Twilio, Inc. | 3.88 | 03/15/31 | 238,000 | 214,875 | ||||||||||
| UKG, Inc.(1) | 6.88 | 02/01/31 | 1,075,000 | 1,102,226 | ||||||||||
| West Technology Group LLC(1) | 8.50 | 04/10/27 | 175,000 | 147,517 | ||||||||||
| ZoomInfo Technologies LLC/ZoomInfo Finance Corp.(1) | 3.88 | 02/01/29 | 280,000 | 255,328 | ||||||||||
| 12,623,471 | ||||||||||||||
| TELECOMMUNICATIONS – 25.5% | ||||||||||||||
| Altice Financing SA(1) | 5.00 | 01/15/28 | 515,000 | 436,043 | ||||||||||
| Altice Financing SA(1) | 5.75 | 08/15/29 | 882,000 | 724,370 | ||||||||||
| Altice Financing SA(1) | 9.63 | 07/15/27 | 165,000 | 160,770 | ||||||||||
| Altice France SA/France(1) | 5.13 | 01/15/29 | 382,000 | 286,508 | ||||||||||
| Altice France SA/France(1) | 5.13 | 07/15/29 | 967,000 | 724,368 | ||||||||||
| Altice France SA/France(1) | 5.50 | 01/15/28 | 475,000 | 369,123 | ||||||||||
| Altice France SA/France(1) | 5.50 | 10/15/29 | 823,000 | 617,154 | ||||||||||
| Altice France SA/France(1) | 8.13 | 02/01/27 | 752,000 | 623,404 | ||||||||||
| British Telecommunications PLC(1) | 4.25 | 11/23/81 | 215,000 | 207,494 | ||||||||||
| British Telecommunications PLC(1) | 4.88 | 11/23/81 | 212,000 | 195,152 | ||||||||||
| Ciena Corp.(1) | 4.00 | 01/31/30 | 175,000 | 161,632 | ||||||||||
| CommScope LLC(1) | 4.75 | 09/01/29 | 530,000 | 453,812 | ||||||||||
| CommScope LLC(1) | 6.00 | 03/01/26 | 650,000 | 635,348 | ||||||||||
| Connect FinCo. Sarl/Connect US FinCo. LLC(1) | 9.00 | 09/15/29 | 850,000 | 808,433 | ||||||||||
| Consolidated Communications, Inc.(1) | 5.00 | 10/01/28 | 240,000 | 222,228 | ||||||||||
| Consolidated Communications, Inc.(1) | 6.50 | 10/01/28 | 257,000 | 244,499 | ||||||||||
| Frontier Communications Holdings LLC(1) | 5.00 | 05/01/28 | 700,000 | 688,786 | ||||||||||
| Frontier Communications Holdings LLC(1) | 5.88 | 10/15/27 | 485,000 | 484,281 | ||||||||||
| Frontier Communications Holdings LLC | 5.88 | 11/01/29 | 290,000 | 283,648 | ||||||||||
| Frontier Communications Holdings LLC(1) | 6.00 | 01/15/30 | 455,000 | 445,774 | ||||||||||
| Frontier Communications Holdings LLC(1) | 6.75 | 05/01/29 | 495,000 | 492,772 | ||||||||||
| Frontier Communications Holdings LLC(1) | 8.63 | 03/15/31 | 290,000 | 311,083 | ||||||||||
| Frontier Communications Holdings LLC(1) | 8.75 | 05/15/30 | 517,000 | 547,725 | ||||||||||
| Frontier Florida LLC | 6.86 | 02/01/28 | 120,000 | 124,685 | ||||||||||
| GoTo Group, Inc.(1) | 5.50 | 05/01/28 | 157,837 | 122,079 | ||||||||||
| GoTo Group, Inc.(1) | 5.50 | 05/01/28 | 182,252 | 58,230 | ||||||||||
| Hughes Satellite Systems Corp. | 5.25 | 08/01/26 | 320,000 | 292,664 | ||||||||||
| Hughes Satellite Systems Corp. | 6.63 | 08/01/26 | 320,000 | 277,164 | ||||||||||
| Iliad Holding SASU(1) | 6.50 | 10/15/26 | 305,000 | 307,675 | ||||||||||
| Iliad Holding SASU(1) | 7.00 | 10/15/28 | 370,000 | 375,071 | ||||||||||
| Iliad Holding SASU(1) | 8.50 | 04/15/31 | 415,000 | 442,413 | ||||||||||
| Intelsat Jackson Holdings SA(1) | 6.50 | 03/15/30 | 1,305,000 | 1,229,416 | ||||||||||
| Level 3 Financing, Inc.(1) | 3.63 | 01/15/29 | 150,000 | 113,224 | ||||||||||
| Level 3 Financing, Inc.(1) | 3.75 | 07/15/29 | 177,000 | 130,265 | ||||||||||
| Level 3 Financing, Inc.(1) | 3.88 | 10/15/30 | 180,000 | 137,698 | ||||||||||
| Level 3 Financing, Inc.(1) | 4.00 | 04/15/31 | 215,000 | 163,400 | ||||||||||
| Level 3 Financing, Inc.(1) | 4.25 | 07/01/28 | 185,000 | 154,706 | ||||||||||
| Level 3 Financing, Inc.(1) | 4.50 | 04/01/30 | 325,000 | 261,606 | ||||||||||
| Level 3 Financing, Inc.(1) | 4.88 | 06/15/29 | 290,000 | 249,400 | ||||||||||
The accompanying notes are an integral part of these financial statements.
19
BONDBLOXX ETF TRUST
BondBloxx USD High Yield Bond Telecom, Media & Technology Sector ETF
Portfolio of Investments (Continued)
October 31, 2024
| Rate (%) | Maturity | Face Amount | Value | |||||||||||
| TELECOMMUNICATIONS – 25.5% (Continued) | ||||||||||||||
| Level 3 Financing, Inc.(1) | 10.00 | 10/15/32 | $ | 150,360 | $ | 149,247 | ||||||||
| Level 3 Financing, Inc.(1) | 10.50 | 04/15/29 | 320,000 | 357,873 | ||||||||||
| Level 3 Financing, Inc.(1) | 10.50 | 05/15/30 | 457,000 | 502,129 | ||||||||||
| Level 3 Financing, Inc.(1) | 10.75 | 12/15/30 | 300,000 | 336,710 | ||||||||||
| Level 3 Financing, Inc.(1) | 11.00 | 11/15/29 | 610,000 | 689,094 | ||||||||||
| Lumen Technologies, Inc.(1) | 4.13 | 04/15/29 | 150,000 | 132,000 | ||||||||||
| Lumen Technologies, Inc.(1) | 4.13 | 04/15/30 | 70,000 | 59,675 | ||||||||||
| Lumen Technologies, Inc.(1) | 4.50 | 01/15/29 | 87,000 | 67,952 | ||||||||||
| Lumen Technologies, Inc. | 7.60 | 09/15/39 | 227,000 | 167,203 | ||||||||||
| Lumen Technologies, Inc. | 7.65 | 03/15/42 | 125,000 | 90,681 | ||||||||||
| Lumen Technologies, Inc.(1) | 10.00 | 10/15/32 | 239,000 | 238,402 | ||||||||||
| Millicom International Cellular SA(1) | 4.50 | 04/27/31 | 355,000 | 320,541 | ||||||||||
| Millicom International Cellular SA(1) | 5.13 | 01/15/28 | 171,000 | 165,803 | ||||||||||
| Millicom International Cellular SA(1) | 6.25 | 03/25/29 | 290,700 | 289,109 | ||||||||||
| Millicom International Cellular SA(1) | 7.38 | 04/02/32 | 175,000 | 178,889 | ||||||||||
| Optics Bidco SpA(1) | 6.00 | 09/30/34 | 220,000 | 215,554 | ||||||||||
| Optics Bidco SpA(1) | 6.38 | 11/15/33 | 215,000 | 217,737 | ||||||||||
| Optics Bidco SpA(1) | 7.20 | 07/18/36 | 215,000 | 222,249 | ||||||||||
| Optics Bidco SpA(1) | 7.72 | 06/04/38 | 215,000 | 228,392 | ||||||||||
| Rogers Communications, Inc.(1) | 5.25 | 03/15/82 | 320,000 | 313,787 | ||||||||||
| Sable International Finance Ltd.(1) | 7.13 | 10/15/32 | 435,000 | 437,582 | ||||||||||
| Telecom Italia Capital SA | 6.00 | 09/30/34 | 222,000 | 216,324 | ||||||||||
| Telecom Italia Capital SA | 6.38 | 11/15/33 | 215,000 | 217,554 | ||||||||||
| Telecom Italia Capital SA | 7.20 | 07/18/36 | 215,000 | 218,345 | ||||||||||
| Telecom Italia Capital SA | 7.72 | 06/04/38 | 215,000 | 224,105 | ||||||||||
| Telesat Canada/Telesat LLC(1) | 4.88 | 06/01/27 | 155,000 | 68,343 | ||||||||||
| Telesat Canada/Telesat LLC(1) | 5.63 | 12/06/26 | 230,000 | 102,080 | ||||||||||
| United States Cellular Corp. | 6.70 | 12/15/33 | 230,000 | 248,455 | ||||||||||
| Viasat, Inc.(1) | 5.63 | 04/15/27 | 260,000 | 243,015 | ||||||||||
| Viasat, Inc.(1) | 6.50 | 07/15/28 | 175,000 | 132,185 | ||||||||||
| Viasat, Inc.(1) | 7.50 | 05/30/31 | 315,000 | 207,053 | ||||||||||
| Viavi Solutions, Inc.(1) | 3.75 | 10/01/29 | 175,000 | 158,965 | ||||||||||
| Vmed O2 UK Financing I PLC(1) | 4.25 | 01/31/31 | 582,000 | 502,671 | ||||||||||
| Vmed O2 UK Financing I PLC(1) | 4.75 | 07/15/31 | 615,000 | 533,202 | ||||||||||
| Vmed O2 UK Financing I PLC(1) | 7.75 | 04/15/32 | 320,000 | 320,786 | ||||||||||
| Vodafone Group PLC | 3.25 | 06/04/81 | 189,000 | 181,757 | ||||||||||
| Vodafone Group PLC | 4.13 | 06/04/81 | 469,000 | 422,130 | ||||||||||
| Vodafone Group PLC | 5.13 | 06/04/81 | 400,000 | 320,122 | ||||||||||
| Vodafone Group PLC | 7.00 | 04/04/79 | 880,000 | 923,258 | ||||||||||
| Windstream Services LLC/Windstream Escrow Finance Corp.(1) | 7.75 | 08/15/28 | 610,000 | 613,943 | ||||||||||
| Windstream Services LLC/Windstream Escrow Finance Corp.(1) | 8.25 | 10/01/31 | 350,000 | 354,636 | ||||||||||
| Zayo Group Holdings, Inc.(1) | 4.00 | 03/01/27 | 635,000 | 565,673 | ||||||||||
| Zayo Group Holdings, Inc.(1) | 6.13 | 03/01/28 | 467,000 | 401,425 | ||||||||||
| Zegona Finance PLC(1) | 8.63 | 07/15/29 | 390,000 | 412,913 | ||||||||||
| 27,533,652 | ||||||||||||||
| TOTAL CORPORATE BONDS (Cost - $103,562,696) | 105,106,446 | |||||||||||||
The accompanying notes are an integral part of these financial statements.
20
BONDBLOXX ETF TRUST
BondBloxx USD High Yield Bond Telecom, Media & Technology Sector ETF
Portfolio of Investments (Continued)
October 31, 2024
| Rate (%) | Maturity | Face Amount | Value | |||||||||||
| SHORT-TERM INVESTMENTS – 1.9% | ||||||||||||||
| TIME DEPOSITS – 1.9% | ||||||||||||||
| JP Morgan Chase, New York | 4.18 | 11/01/24 | $ | 2,096,358 | $ | 2,096,358 | ||||||||
| TOTAL SHORT-TERM INVESTMENTS (Cost - $2,096,358) | 2,096,358 | |||||||||||||
| TOTAL INVESTMENTS – 99.3% (Cost - $105,659,351) | $ | 107,203,111 | ||||||||||||
| OTHER ASSETS LESS LIABILITIES – 0.7% | 726,114 | |||||||||||||
| NET ASSETS – 100.0% | $ | 107,929,225 | ||||||||||||
| * | Non-Income producing security. |
| (1) | Security was purchased pursuant to Rule 144A under the Securities Act of 1933 and may not be resold subject to that Rule except to qualified institutional buyers. The aggregate value of Rule 144A holdings at October 31, 2024, amounts to $93,107,124 and represents 86.3% of net assets. These securities have been deemed liquid under procedures approved by the Trust’s Board of Trustees. |
The accompanying notes are an integral part of these financial statements.
21
BONDBLOXX ETF TRUST
BondBloxx USD High Yield Bond Healthcare Sector ETF
Portfolio of Investments
October 31, 2024
| Rate (%) | Maturity | Face Amount | Value | |||||||||||
| CORPORATE BONDS – 98.1% | ||||||||||||||
| BIOTECHNOLOGY – 0.3% | ||||||||||||||
| Emergent BioSolutions, Inc.(1) | 3.88 | 08/15/28 | $ | 203,000 | $ | 163,311 | ||||||||
| COMMERCIAL SERVICES – 6.2% | ||||||||||||||
| AMN Healthcare, Inc.(1) | 4.00 | 04/15/29 | 160,000 | 147,598 | ||||||||||
| AMN Healthcare, Inc.(1) | 4.63 | 10/01/27 | 235,000 | 226,631 | ||||||||||
| Carriage Services, Inc.(1) | 4.25 | 05/15/29 | 183,000 | 167,403 | ||||||||||
| Raven Acquisition Holdings LLC(1) | 6.87 | 11/15/31 | 600,000 | 599,900 | ||||||||||
| Service Corp. International/US | 3.38 | 08/15/30 | 430,000 | 381,394 | ||||||||||
| Service Corp. International/US | 4.00 | 05/15/31 | 358,000 | 323,140 | ||||||||||
| Service Corp. International/US | 4.63 | 12/15/27 | 254,000 | 248,897 | ||||||||||
| Service Corp. International/US | 5.13 | 06/01/29 | 346,000 | 340,342 | ||||||||||
| Service Corp. International/US | 5.75 | 10/15/32 | 345,000 | 339,335 | ||||||||||
| StoneMor, Inc.(1) | 8.50 | 05/15/29 | 183,000 | 163,229 | ||||||||||
| 2,937,869 | ||||||||||||||
| COSMETICS/PERSONAL CARE – 2.5% | ||||||||||||||
| Perrigo Finance Unlimited Co. | 4.90 | 06/15/30 | 355,000 | 336,323 | ||||||||||
| Perrigo Finance Unlimited Co. | 4.90 | 12/15/44 | 148,000 | 118,769 | ||||||||||
| Perrigo Finance Unlimited Co. | 6.13 | 09/30/32 | 307,000 | 303,396 | ||||||||||
| Prestige Brands, Inc.(1) | 3.75 | 04/01/31 | 277,000 | 247,131 | ||||||||||
| Prestige Brands, Inc.(1) | 5.13 | 01/15/28 | 185,000 | 181,329 | ||||||||||
| 1,186,948 | ||||||||||||||
| HEALTHCARE-PRODUCTS – 15.3% | ||||||||||||||
| Avantor Funding, Inc.(1) | 3.88 | 11/01/29 | 365,000 | 336,919 | ||||||||||
| Avantor Funding, Inc.(1) | 4.63 | 07/15/28 | 722,000 | 698,716 | ||||||||||
| Bausch + Lomb Corp.(1) | 8.38 | 10/01/28 | 650,000 | 682,773 | ||||||||||
| Embecta Corp.(1) | 5.00 | 02/15/30 | 234,000 | 211,986 | ||||||||||
| Hologic, Inc.(1) | 3.25 | 02/15/29 | 440,000 | 404,481 | ||||||||||
| Hologic, Inc.(1) | 4.63 | 02/01/28 | 183,000 | 179,698 | ||||||||||
| Medline Borrower LP(1) | 3.88 | 04/01/29 | 2,075,000 | 1,942,802 | ||||||||||
| Medline Borrower LP(1) | 5.25 | 10/01/29 | 1,155,000 | 1,119,733 | ||||||||||
| Medline Borrower LP/Medline Co.-Issuer, Inc.(1) | 6.25 | 04/01/29 | 690,000 | 702,899 | ||||||||||
| Neogen Food Safety Corp.(1) | 8.63 | 07/20/30 | 155,000 | 167,896 | ||||||||||
| Sotera Health Holdings LLC(1) | 7.38 | 06/01/31 | 350,000 | 358,859 | ||||||||||
| Teleflex, Inc.(1) | 4.25 | 06/01/28 | 248,000 | 238,011 | ||||||||||
| Teleflex, Inc. | 4.63 | 11/15/27 | 215,000 | 211,543 | ||||||||||
| 7,256,316 | ||||||||||||||
| HEALTHCARE-SERVICES – 52.4% | ||||||||||||||
| Acadia Healthcare Co., Inc.(1) | 5.00 | 04/15/29 | 228,000 | 214,308 | ||||||||||
| Acadia Healthcare Co., Inc.(1) | 5.50 | 07/01/28 | 198,000 | 192,290 | ||||||||||
| AHP Health Partners, Inc.(1) | 5.75 | 07/15/29 | 130,000 | 126,133 | ||||||||||
| Catalent Pharma Solutions, Inc.(1) | 3.13 | 02/15/29 | 253,000 | 245,815 | ||||||||||
| Catalent Pharma Solutions, Inc.(1) | 3.50 | 04/01/30 | 301,000 | 291,522 | ||||||||||
| Catalent Pharma Solutions, Inc.(1) | 5.00 | 07/15/27 | 235,000 | 233,731 | ||||||||||
| Charles River Laboratories International, Inc.(1) | 3.75 | 03/15/29 | 235,000 | 215,634 | ||||||||||
| Charles River Laboratories International, Inc.(1) | 4.00 | 03/15/31 | 233,000 | 208,408 | ||||||||||
| Charles River Laboratories International, Inc.(1) | 4.25 | 05/01/28 | 218,000 | 207,445 | ||||||||||
The accompanying notes are an integral part of these financial statements.
22
BONDBLOXX ETF TRUST
BondBloxx USD High Yield Bond Healthcare Sector ETF
Portfolio of Investments (Continued)
October 31, 2024
| Rate (%) | Maturity | Face Amount | Value | |||||||||||
| HEALTHCARE-SERVICES – 52.4% (Continued) | ||||||||||||||
| CHS/Community Health Systems, Inc.(1) | 4.75 | 02/15/31 | $ | 488,000 | $ | 407,424 | ||||||||
| CHS/Community Health Systems, Inc.(1) | 5.25 | 05/15/30 | 707,000 | 617,559 | ||||||||||
| CHS/Community Health Systems, Inc.(1) | 5.63 | 03/15/27 | 808,000 | 788,715 | ||||||||||
| CHS/Community Health Systems, Inc.(1) | 6.00 | 01/15/29 | 281,000 | 264,923 | ||||||||||
| CHS/Community Health Systems, Inc.(1) | 6.13 | 04/01/30 | 562,000 | 440,514 | ||||||||||
| CHS/Community Health Systems, Inc.(1) | 6.88 | 04/15/29 | 570,000 | 481,966 | ||||||||||
| CHS/Community Health Systems, Inc.(1) | 8.00 | 12/15/27 | 323,000 | 322,792 | ||||||||||
| CHS/Community Health Systems, Inc.(1) | 10.88 | 01/15/32 | 1,045,000 | 1,121,248 | ||||||||||
| Concentra Escrow Issuer Corp.(1) | 6.88 | 07/15/32 | 295,000 | 303,091 | ||||||||||
| DaVita, Inc.(1) | 3.75 | 02/15/31 | 692,000 | 602,342 | ||||||||||
| DaVita, Inc.(1) | 4.63 | 06/01/30 | 1,263,000 | 1,163,531 | ||||||||||
| DaVita, Inc.(1) | 6.88 | 09/01/32 | 460,000 | 462,813 | ||||||||||
| Encompass Health Corp. | 4.50 | 02/01/28 | 375,000 | 365,106 | ||||||||||
| Encompass Health Corp. | 4.63 | 04/01/31 | 185,000 | 174,243 | ||||||||||
| Encompass Health Corp. | 4.75 | 02/01/30 | 365,000 | 351,304 | ||||||||||
| Fortrea Holdings, Inc.(1) | 7.50 | 07/01/30 | 265,000 | 260,921 | ||||||||||
| HAH Group Holding Co. LLC(1) | 9.75 | 10/01/31 | 315,000 | 321,270 | ||||||||||
| HealthEquity, Inc.(1) | 4.50 | 10/01/29 | 280,000 | 267,193 | ||||||||||
| Heartland Dental LLC/Heartland Dental Finance Corp.(1) | 10.50 | 04/30/28 | 325,000 | 346,256 | ||||||||||
| IQVIA, Inc.(1) | 5.00 | 10/15/26 | 483,000 | 478,153 | ||||||||||
| IQVIA, Inc.(1) | 5.00 | 05/15/27 | 515,000 | 508,834 | ||||||||||
| IQVIA, Inc.(1) | 6.50 | 05/15/30 | 220,000 | 226,192 | ||||||||||
| Kedrion SpA(1) | 6.50 | 09/01/29 | 360,000 | 340,070 | ||||||||||
| LifePoint Health, Inc.(1) | 4.38 | 02/15/27 | 280,000 | 271,705 | ||||||||||
| LifePoint Health, Inc.(1) | 5.38 | 01/15/29 | 233,000 | 213,482 | ||||||||||
| LifePoint Health, Inc.(1) | 9.88 | 08/15/30 | 345,000 | 377,820 | ||||||||||
| LifePoint Health, Inc.(1) | 10.00 | 06/01/32 | 375,000 | 400,579 | ||||||||||
| LifePoint Health, Inc.(1) | 11.00 | 10/15/30 | 520,000 | 580,297 | ||||||||||
| ModivCare, Inc.(1) | 5.00 | 10/01/29 | 220,000 | 150,023 | ||||||||||
| Molina Healthcare, Inc.(1) | 3.88 | 11/15/30 | 300,000 | 271,861 | ||||||||||
| Molina Healthcare, Inc.(1) | 3.88 | 05/15/32 | 344,000 | 305,268 | ||||||||||
| Molina Healthcare, Inc.(1) | 4.38 | 06/15/28 | 375,000 | 360,175 | ||||||||||
| MPH Acquisition Holdings LLC(1) | 5.50 | 09/01/28 | 488,000 | 332,104 | ||||||||||
| MPH Acquisition Holdings LLC(1) | 5.75 | 11/01/28 | 445,000 | 205,205 | ||||||||||
| Pediatrix Medical Group, Inc.(1) | 5.38 | 02/15/30 | 183,000 | 175,047 | ||||||||||
| Prime Healthcare Services, Inc.(1) | 9.38 | 09/01/29 | 695,000 | 706,846 | ||||||||||
| Select Medical Corp.(1) | 6.25 | 08/15/26 | 561,000 | 562,601 | ||||||||||
| Star Parent, Inc.(1) | 9.00 | 10/01/30 | 465,000 | 484,182 | ||||||||||
| Surgery Center Holdings, Inc.(1) | 7.25 | 04/15/32 | 365,000 | 375,240 | ||||||||||
| Tenet Healthcare Corp. | 4.25 | 06/01/29 | 648,000 | 613,509 | ||||||||||
| Tenet Healthcare Corp. | 4.38 | 01/15/30 | 680,000 | 637,951 | ||||||||||
| Tenet Healthcare Corp. | 4.63 | 06/15/28 | 275,000 | 266,068 | ||||||||||
| Tenet Healthcare Corp. | 5.13 | 11/01/27 | 690,000 | 684,681 | ||||||||||
| Tenet Healthcare Corp. | 6.13 | 10/01/28 | 1,155,000 | 1,154,963 | ||||||||||
| Tenet Healthcare Corp. | 6.13 | 06/15/30 | 965,000 | 970,724 | ||||||||||
| Tenet Healthcare Corp. | 6.25 | 02/01/27 | 678,000 | 679,070 | ||||||||||
| Tenet Healthcare Corp. | 6.75 | 05/15/31 | 585,000 | 598,454 | ||||||||||
| Tenet Healthcare Corp. | 6.88 | 11/15/31 | 157,000 | 168,516 | ||||||||||
The accompanying notes are an integral part of these financial statements.
23
BONDBLOXX ETF TRUST
BondBloxx USD High Yield Bond Healthcare Sector ETF
Portfolio of Investments (Continued)
October 31, 2024
| Rate (%) | Maturity | Face Amount | Value | |||||||||||
| HEALTHCARE-SERVICES – 52.4% (Continued) | ||||||||||||||
| Toledo Hospital | 4.98 | 11/15/45 | $ | 120,000 | $ | 90,900 | ||||||||
| Toledo Hospital | 5.33 | 11/15/28 | 145,000 | 141,816 | ||||||||||
| Toledo Hospital | 6.02 | 11/15/48 | 192,000 | 170,277 | ||||||||||
| US Acute Care Solutions LLC(1) | 9.75 | 05/15/29 | 370,000 | 377,854 | ||||||||||
| 24,878,964 | ||||||||||||||
| PHARMACEUTICALS – 18.9% | ||||||||||||||
| 180 Medical, Inc.(1) | 3.88 | 10/15/29 | 235,000 | 218,791 | ||||||||||
| AdaptHealth LLC(1) | 4.63 | 08/01/29 | 215,000 | 195,735 | ||||||||||
| AdaptHealth LLC(1) | 5.13 | 03/01/30 | 285,000 | 261,328 | ||||||||||
| AdaptHealth LLC(1) | 6.13 | 08/01/28 | 170,000 | 167,645 | ||||||||||
| Bausch Health Cos, Inc.(1) | 4.88 | 06/01/28 | 745,000 | 576,522 | ||||||||||
| Bausch Health Cos, Inc.(1) | 5.50 | 11/01/25 | 775,000 | 761,488 | ||||||||||
| Bausch Health Cos, Inc.(1) | 5.75 | 08/15/27 | 220,000 | 181,811 | ||||||||||
| Bausch Health Cos, Inc.(1) | 6.13 | 02/01/27 | 475,000 | 429,281 | ||||||||||
| Bausch Health Cos, Inc.(1) | 11.00 | 09/30/28 | 820,000 | 755,425 | ||||||||||
| Bausch Health Cos, Inc.(1) | 14.00 | 10/15/30 | 150,000 | 133,500 | ||||||||||
| Cheplapharm Arzneimittel GmbH(1) | 5.50 | 01/15/28 | 230,000 | 222,077 | ||||||||||
| Elanco Animal Health, Inc. | 6.65 | 08/28/28 | 333,000 | 341,862 | ||||||||||
| Endo Finance Holdings, Inc.(1) | 8.50 | 04/15/31 | 465,000 | 497,770 | ||||||||||
| Grifols SA(1) | 4.75 | 10/15/28 | 328,000 | 302,591 | ||||||||||
| Jazz Securities DAC(1) | 4.38 | 01/15/29 | 697,000 | 660,193 | ||||||||||
| Mallinckrodt International Finance SA/Mallinckrodt CB LLC(1) | 14.75 | 11/14/28 | 360,000 | 393,685 | ||||||||||
| Option Care Health, Inc.(1) | 4.38 | 10/31/29 | 234,000 | 215,562 | ||||||||||
| Organon & Co./Organon Foreign Debt Co.-Issuer BV(1) | 4.13 | 04/30/28 | 968,000 | 918,043 | ||||||||||
| Organon & Co./Organon Foreign Debt Co.-Issuer BV(1) | 5.13 | 04/30/31 | 925,000 | 844,305 | ||||||||||
| Organon & Co./Organon Foreign Debt Co.-Issuer BV(1) | 6.75 | 05/15/34 | 235,000 | 235,740 | ||||||||||
| Organon & Co./Organon Foreign Debt Co.-Issuer BV(1) | 7.88 | 05/15/34 | 225,000 | 232,536 | ||||||||||
| Owens & Minor, Inc.(1) | 4.50 | 03/31/29 | 221,000 | 199,095 | ||||||||||
| Owens & Minor, Inc.(1) | 6.63 | 04/01/30 | 256,000 | 244,531 | ||||||||||
| 8,989,516 | ||||||||||||||
| SOFTWARE – 2.5% | ||||||||||||||
| AthenaHealth Group, Inc.(1) | 6.50 | 02/15/30 | 1,086,000 | 1,027,858 | ||||||||||
| Consensus Cloud Solutions, Inc.(1) | 6.50 | 10/15/28 | 170,000 | 168,556 | ||||||||||
| 1,196,414 | ||||||||||||||
| TOTAL CORPORATE BONDS (Cost - $46,156,765) | 46,609,338 | |||||||||||||
| SHORT-TERM INVESTMENTS – 1.3% | ||||||||||||||
| TIME DEPOSITS – 1.3% | ||||||||||||||
| JP Morgan Chase, New York | 4.18 | 11/01/24 | 639,800 | 639,800 | ||||||||||
| TOTAL SHORT-TERM INVESTMENTS (Cost - $639,800) | 639,800 | |||||||||||||
| TOTAL INVESTMENTS – 99.4% (Cost - $46,796,565) | $ | 47,249,138 | ||||||||||||
| OTHER ASSETS LESS LIABILITIES – 0.6% | 265,735 | |||||||||||||
| NET ASSETS – 100.0% | $ | 47,514,873 | ||||||||||||
| (1) | Security was purchased pursuant to Rule 144A under the Securities Act of 1933 and may not be resold subject to that Rule except to qualified institutional buyers. The aggregate value of Rule 144A holdings at October 31, 2024, amounts to $36,596,755 and represents 77.0% of net assets. These securities have been deemed liquid under procedures approved by the Trust’s Board of Trustees. |
The accompanying notes are an integral part of these financial statements.
24
BONDBLOXX ETF TRUST
BondBloxx USD High Yield Bond Financial & REIT Sector ETF
Portfolio of Investments
October 31, 2024
| Rate (%) | Maturity | Face Amount | Value | |||||||||||
| CORPORATE BONDS – 97.7% | ||||||||||||||
| ADVERTISING – 1.1% | ||||||||||||||
| Outfront Media Capital LLC/Outfront Media Capital Corp.(1) | 4.25 | 01/15/29 | $ | 170,000 | $ | 159,564 | ||||||||
| Outfront Media Capital LLC/Outfront Media Capital Corp.(1) | 4.63 | 03/15/30 | 153,000 | 142,440 | ||||||||||
| Outfront Media Capital LLC/Outfront Media Capital Corp.(1) | 5.00 | 08/15/27 | 202,000 | 199,125 | ||||||||||
| Outfront Media Capital LLC/Outfront Media Capital Corp.(1) | 7.38 | 02/15/31 | 150,000 | 158,543 | ||||||||||
| 659,672 | ||||||||||||||
| BANKS – 7.0% | �� | |||||||||||||
| Banc of California | 3.25 | 05/01/31 | 120,000 | 109,934 | ||||||||||
| Dresdner Funding Trust I(1) | 8.15 | 06/30/31 | 320,000 | 355,918 | ||||||||||
| Freedom Mortgage Corp.(1) | 6.63 | 01/15/27 | 165,000 | 163,206 | ||||||||||
| Freedom Mortgage Corp.(1) | 7.63 | 05/01/26 | 170,000 | 170,770 | ||||||||||
| Freedom Mortgage Corp.(1) | 12.00 | 10/01/28 | 250,000 | 270,332 | ||||||||||
| Freedom Mortgage Corp.(1) | 12.25 | 10/01/30 | 155,000 | 170,860 | ||||||||||
| Intesa Sanpaolo SpA(1) | 4.20 | 06/01/32 | 245,000 | 214,640 | ||||||||||
| Intesa Sanpaolo SpA(1) | 4.95 | 06/01/42 | 235,000 | 182,353 | ||||||||||
| Intesa Sanpaolo SpA(1) | 5.71 | 01/15/26 | 475,000 | 475,758 | ||||||||||
| Popular, Inc. | 7.25 | 03/13/28 | 135,000 | 139,987 | ||||||||||
| Standard Chartered PLC(1),(2) | 7.01 | - | 250,000 | 266,436 | ||||||||||
| Texas Capital Bancshares, Inc. | 4.00 | 05/06/31 | 115,000 | 109,259 | ||||||||||
| UniCredit SpA(1) | 5.46 | 06/30/35 | 477,000 | 460,430 | ||||||||||
| UniCredit SpA(1) | 5.86 | 06/19/32 | 317,000 | 315,997 | ||||||||||
| UniCredit SpA(1) | 7.30 | 04/02/34 | 396,000 | 414,694 | ||||||||||
| Valley National Bancorp | 3.00 | 06/15/31 | 80,000 | 68,108 | ||||||||||
| Western Alliance Bancorp. | 3.00 | 06/15/31 | 200,000 | 185,262 | ||||||||||
| 4,073,944 | ||||||||||||||
| COMMERCIAL SERVICES – 5.5% | ||||||||||||||
| Block, Inc. | 2.75 | 06/01/26 | 315,000 | 303,570 | ||||||||||
| Block, Inc. | 3.50 | 06/01/31 | 322,000 | 285,736 | ||||||||||
| Block, Inc.(1) | 6.50 | 05/15/32 | 635,000 | 647,075 | ||||||||||
| Boost Newco Borrower LLC(1) | 7.50 | 01/15/31 | 700,000 | 738,626 | ||||||||||
| CPI CG, Inc.(1) | 10.00 | 07/15/29 | 95,000 | 99,613 | ||||||||||
| Dcli Bidco LLC(1) | 7.75 | 11/15/29 | 160,000 | 162,839 | ||||||||||
| Mobius Merger Sub, Inc.(1) | 9.00 | 06/01/30 | 165,000 | 158,476 | ||||||||||
| Paysafe Finance PLC/Paysafe Holdings US Corp.(1) | 4.00 | 06/15/29 | 105,000 | 97,015 | ||||||||||
| PROG Holdings, Inc.(1) | 6.00 | 11/15/29 | 200,000 | 193,518 | ||||||||||
| Shift4 Payments LLC/Shift4 Payments Finance Sub, Inc.(1) | 4.63 | 11/01/26 | 165,000 | 162,384 | ||||||||||
| Shift4 Payments LLC/Shift4 Payments Finance Sub, Inc.(1) | 6.75 | 08/15/32 | 340,000 | 349,091 | ||||||||||
| 3,197,943 | ||||||||||||||
| DIVERSIFIED FINANCIAL SERVICES – 32.7% | ||||||||||||||
| AG Issuer LLC(1) | 6.25 | 03/01/28 | 155,000 | 152,278 | ||||||||||
| AG TTMT Escrow Issuer LLC(1) | 8.63 | 09/30/27 | 165,000 | 170,618 | ||||||||||
| Ally Financial, Inc. | 5.75 | 11/20/25 | 350,000 | 351,470 | ||||||||||
| Ally Financial, Inc. | 6.70 | 02/14/33 | 155,000 | 155,728 | ||||||||||
| Aretec Group, Inc.(1) | 7.50 | 04/01/29 | 125,000 | 120,509 | ||||||||||
| Aretec Group, Inc.(1) | 10.00 | 08/15/30 | 230,000 | 250,897 | ||||||||||
| Armor Holdco, Inc.(1) | 8.50 | 11/15/29 | 120,000 | 117,605 | ||||||||||
| Azorra Finance Ltd.(1) | 7.75 | 04/15/30 | 180,000 | 177,995 | ||||||||||
The accompanying notes are an integral part of these financial statements.
25
BONDBLOXX ETF TRUST
BondBloxx USD High Yield Bond Financial & REIT Sector ETF
Portfolio of Investments (Continued)
October 31, 2024
| Rate (%) | Maturity | Face Amount | Value | |||||||||||
| DIVERSIFIED FINANCIAL SERVICES – 32.7% (Continued) | ||||||||||||||
| Bread Financial Holdings, Inc.(1) | 9.75 | 03/15/29 | $ | 290,000 | $ | 306,570 | ||||||||
| Brightsphere Investment Group, Inc. | 4.80 | 07/27/26 | 85,000 | 83,241 | ||||||||||
| Burford Capital Global Finance LLC(1) | 6.25 | 04/15/28 | 135,000 | 134,804 | ||||||||||
| Burford Capital Global Finance LLC(1) | 6.88 | 04/15/30 | 130,000 | 130,710 | ||||||||||
| Burford Capital Global Finance LLC(1) | 9.25 | 07/01/31 | 210,000 | 225,183 | ||||||||||
| Castlelake Aviation Finance DAC(1) | 5.00 | 04/15/27 | 140,000 | 140,937 | ||||||||||
| Coinbase Global, Inc.(1) | 3.38 | 10/01/28 | 330,000 | 293,643 | ||||||||||
| Coinbase Global, Inc.(1) | 3.63 | 10/01/31 | 230,000 | 192,027 | ||||||||||
| Credit Acceptance Corp. | 6.63 | 03/15/26 | 135,000 | 134,995 | ||||||||||
| Credit Acceptance Corp.(1) | 9.25 | 12/15/28 | 195,000 | 206,584 | ||||||||||
| Encore Capital Group, Inc.(1) | 8.50 | 05/15/30 | 155,000 | 163,521 | ||||||||||
| Encore Capital Group, Inc.(1) | 9.25 | 04/01/29 | 175,000 | 186,550 | ||||||||||
| Enova International, Inc.(1) | 9.13 | 08/01/29 | 155,000 | 159,249 | ||||||||||
| Enova International, Inc.(1) | 11.25 | 12/15/28 | 135,000 | 145,497 | ||||||||||
| Focus Financial Partners LLC(1) | 6.75 | 09/15/31 | 315,000 | 313,154 | ||||||||||
| Freedom Mortgage Holdings LLC(1) | 9.13 | 05/15/31 | 230,000 | 233,270 | ||||||||||
| Freedom Mortgage Holdings LLC(1) | 9.25 | 02/01/29 | 360,000 | 368,933 | ||||||||||
| GGAM Finance Ltd.(1) | 5.88 | 03/15/30 | 125,000 | 123,594 | ||||||||||
| GGAM Finance Ltd.(1) | 6.88 | 04/15/29 | 140,000 | 143,019 | ||||||||||
| GGAM Finance Ltd.(1) | 7.75 | 05/15/26 | 125,000 | 127,276 | ||||||||||
| GGAM Finance Ltd.(1) | 8.00 | 02/15/27 | 220,000 | 227,435 | ||||||||||
| GGAM Finance Ltd.(1) | 8.00 | 06/15/28 | 185,000 | 195,169 | ||||||||||
| Global Aircraft Leasing Co. Ltd.(1) | 8.75 | 09/01/27 | 355,000 | 367,278 | ||||||||||
| goeasy Ltd.(1) | 6.88 | 05/15/30 | 110,000 | 111,851 | ||||||||||
| goeasy Ltd.(1) | 7.63 | 07/01/29 | 200,000 | 205,587 | ||||||||||
| goeasy Ltd.(1) | 9.25 | 12/01/28 | 190,000 | 202,778 | ||||||||||
| Hightower Holding LLC(1) | 6.75 | 04/15/29 | 105,000 | 103,465 | ||||||||||
| Hightower Holding LLC(1) | 9.13 | 01/31/30 | 130,000 | 137,164 | ||||||||||
| Jane Street Group/JSG Finance, Inc.(1) | 4.50 | 11/15/29 | 188,000 | 178,013 | ||||||||||
| Jane Street Group/JSG Finance, Inc.(1) | 6.13 | 11/01/32 | 345,000 | 345,439 | ||||||||||
| Jane Street Group/JSG Finance, Inc.(1) | 7.13 | 04/30/31 | 470,000 | 487,550 | ||||||||||
| Jefferies Finance LLC/JFIN Co.-Issuer Corp.(1) | 5.00 | 08/15/28 | 327,000 | 301,953 | ||||||||||
| Jefferies Finance LLC/JFIN Co.-Issuer Corp.(1) | 6.63 | 10/15/31 | 155,000 | 154,510 | ||||||||||
| Jefferson Capital Holdings LLC(1) | 6.00 | 08/15/26 | 90,000 | 89,774 | ||||||||||
| Jefferson Capital Holdings LLC(1) | 9.50 | 02/15/29 | 140,000 | 149,030 | ||||||||||
| LD Holdings Group LLC(1) | 6.13 | 04/01/28 | 175,000 | 151,792 | ||||||||||
| LD Holdings Group LLC(1) | 8.75 | 11/01/27 | 99,000 | 94,947 | ||||||||||
| LFS Topco LLC(1) | 5.88 | 10/15/26 | 80,000 | 75,498 | ||||||||||
| Midcap Financial Issuer Trust(1) | 5.63 | 01/15/30 | 125,000 | 110,652 | ||||||||||
| Midcap Financial Issuer Trust(1) | 6.50 | 05/01/28 | 330,000 | 312,242 | ||||||||||
| Nationstar Mortgage Holdings, Inc.(1) | 5.00 | 02/01/26 | 153,000 | 151,593 | ||||||||||
| Nationstar Mortgage Holdings, Inc.(1) | 5.13 | 12/15/30 | 205,000 | 192,125 | ||||||||||
| Nationstar Mortgage Holdings, Inc.(1) | 5.50 | 08/15/28 | 290,000 | 283,270 | ||||||||||
| Nationstar Mortgage Holdings, Inc.(1) | 5.75 | 11/15/31 | 190,000 | 181,911 | ||||||||||
| Nationstar Mortgage Holdings, Inc.(1) | 6.00 | 01/15/27 | 187,000 | 186,497 | ||||||||||
| Nationstar Mortgage Holdings, Inc.(1) | 6.50 | 08/01/29 | 230,000 | 230,176 | ||||||||||
| Nationstar Mortgage Holdings, Inc.(1) | 7.13 | 02/01/32 | 315,000 | 322,279 | ||||||||||
The accompanying notes are an integral part of these financial statements.
26
BONDBLOXX ETF TRUST
BondBloxx USD High Yield Bond Financial & REIT Sector ETF
Portfolio of Investments (Continued)
October 31, 2024
| Rate (%) | Maturity | Face Amount | Value | |||||||||||
| DIVERSIFIED FINANCIAL SERVICES – 32.7% (Continued) | ||||||||||||||
| Navient Corp. | 4.88 | 03/15/28 | $ | 165,000 | $ | 157,377 | ||||||||
| Navient Corp. | 5.00 | 03/15/27 | 220,000 | 216,466 | ||||||||||
| Navient Corp. | 5.50 | 03/15/29 | 235,000 | 224,101 | ||||||||||
| Navient Corp. | 5.63 | 08/01/33 | 184,000 | 158,981 | ||||||||||
| Navient Corp. | 6.75 | 06/15/26 | 165,000 | 168,280 | ||||||||||
| Navient Corp. | 9.38 | 07/25/30 | 165,000 | 179,782 | ||||||||||
| Navient Corp. | 11.50 | 03/15/31 | 155,000 | 174,102 | ||||||||||
| OneMain Finance Corp. | 3.50 | 01/15/27 | 230,000 | 219,676 | ||||||||||
| OneMain Finance Corp. | 3.88 | 09/15/28 | 198,000 | 182,704 | ||||||||||
| OneMain Finance Corp. | 4.00 | 09/15/30 | 277,000 | 244,131 | ||||||||||
| OneMain Finance Corp. | 5.38 | 11/15/29 | 245,000 | 235,037 | ||||||||||
| OneMain Finance Corp. | 6.63 | 01/15/28 | 235,000 | 238,862 | ||||||||||
| OneMain Finance Corp. | 7.13 | 03/15/26 | 487,000 | 499,242 | ||||||||||
| OneMain Finance Corp. | 7.13 | 11/15/31 | 235,000 | 237,865 | ||||||||||
| OneMain Finance Corp. | 7.50 | 05/15/31 | 235,000 | 240,509 | ||||||||||
| OneMain Finance Corp. | 7.88 | 03/15/30 | 235,000 | 244,870 | ||||||||||
| OneMain Finance Corp. | 9.00 | 01/15/29 | 290,000 | 307,470 | ||||||||||
| Osaic Holdings, Inc.(1) | 10.75 | 08/01/27 | 140,000 | 144,775 | ||||||||||
| Oxford Finance LLC/Oxford Finance Co.-Issuer II, Inc.(1) | 6.38 | 02/01/27 | 135,000 | 133,112 | ||||||||||
| PennyMac Financial Services, Inc.(1) | 4.25 | 02/15/29 | 215,000 | 200,743 | ||||||||||
| PennyMac Financial Services, Inc.(1) | 5.75 | 09/15/31 | 150,000 | 143,352 | ||||||||||
| PennyMac Financial Services, Inc.(1) | 7.13 | 11/15/30 | 215,000 | 218,418 | ||||||||||
| PennyMac Financial Services, Inc.(1) | 7.88 | 12/15/29 | 230,000 | 241,029 | ||||||||||
| PHH Mortgage Corp.(1) | 7.88 | 03/15/26 | 95,000 | 96,978 | ||||||||||
| PRA Group, Inc.(1) | 5.00 | 10/01/29 | 107,000 | 96,919 | ||||||||||
| PRA Group, Inc.(1) | 8.38 | 02/01/28 | 135,000 | 138,899 | ||||||||||
| PRA Group, Inc.(1) | 8.88 | 01/31/30 | 135,000 | 140,232 | ||||||||||
| Provident Funding Associates LP/PFG Finance Corp.(1) | 9.75 | 09/15/29 | 125,000 | 127,925 | ||||||||||
| Rocket Mortgage LLC/Rocket Mortgage Co.-Issuer, Inc.(1) | 2.88 | 10/15/26 | 365,000 | 347,652 | ||||||||||
| Rocket Mortgage LLC/Rocket Mortgage Co.-Issuer, Inc.(1) | 3.63 | 03/01/29 | 235,000 | 216,661 | ||||||||||
| Rocket Mortgage LLC/Rocket Mortgage Co.-Issuer, Inc.(1) | 3.88 | 03/01/31 | 399,000 | 355,750 | ||||||||||
| Rocket Mortgage LLC/Rocket Mortgage Co.-Issuer, Inc.(1) | 4.00 | 10/15/33 | 275,000 | 237,416 | ||||||||||
| SLM Corp. | 3.13 | 11/02/26 | 160,000 | 151,860 | ||||||||||
| StoneX Group, Inc.(1) | 7.88 | 03/01/31 | 185,000 | 194,800 | ||||||||||
| Synchrony Financial | 7.25 | 02/02/33 | 240,000 | 245,859 | ||||||||||
| United Wholesale Mortgage LLC(1) | 5.50 | 11/15/25 | 255,000 | 253,892 | ||||||||||
| United Wholesale Mortgage LLC(1) | 5.50 | 04/15/29 | 225,000 | 214,794 | ||||||||||
| United Wholesale Mortgage LLC(1) | 5.75 | 06/15/27 | 163,000 | 160,321 | ||||||||||
| VFH Parent LLC/Valor Co.-Issuer, Inc.(1) | 7.50 | 06/15/31 | 165,000 | 169,555 | ||||||||||
| 19,020,232 | ||||||||||||||
| ELECTRIC – 0.6% | ||||||||||||||
| California Buyer Ltd./Atlantica Sustainable Infrastructure PLC(1) | 6.38 | 02/15/32 | 235,000 | 233,523 | ||||||||||
| Terraform Global Operating LP(1) | 6.13 | 03/01/26 | 110,000 | 109,836 | ||||||||||
| 343,359 | ||||||||||||||
| ENGINEERING & CONSTRUCTION – 0.2% | ||||||||||||||
| INNOVATE Corp.(1) | 8.50 | 02/01/26 | 110,000 | 90,054 | ||||||||||
The accompanying notes are an integral part of these financial statements.
27
BONDBLOXX ETF TRUST
BondBloxx USD High Yield Bond Financial & REIT Sector ETF
Portfolio of Investments (Continued)
October 31, 2024
| Rate (%) | Maturity | Face Amount | Value | |||||||||||
| INSURANCE – 19.0% | ||||||||||||||
| Acrisure LLC/Acrisure Finance, Inc.(1) | 4.25 | 02/15/29 | $ | 220,000 | $ | 207,093 | ||||||||
| Acrisure LLC/Acrisure Finance, Inc.(1) | 6.00 | 08/01/29 | 157,000 | 148,720 | ||||||||||
| Acrisure LLC/Acrisure Finance, Inc.(1) | 7.50 | 11/06/30 | 350,000 | 356,166 | ||||||||||
| Acrisure LLC/Acrisure Finance, Inc.(1) | 8.25 | 02/01/29 | 295,000 | 300,069 | ||||||||||
| Acrisure LLC/Acrisure Finance, Inc.(1) | 8.50 | 06/15/29 | 165,000 | 169,682 | ||||||||||
| Alliant Holdings Intermediate LLC/Alliant Holdings Co.-Issuer, Inc.(1) | 4.25 | 10/15/27 | 237,000 | 225,000 | ||||||||||
| Alliant Holdings Intermediate LLC/Alliant Holdings Co.-Issuer, Inc.(1) | 5.88 | 11/01/29 | 147,000 | 138,987 | ||||||||||
| Alliant Holdings Intermediate LLC/Alliant Holdings Co.-Issuer, Inc.(1) | 6.50 | 10/01/31 | 310,000 | 307,350 | ||||||||||
| Alliant Holdings Intermediate LLC/Alliant Holdings Co.-Issuer, Inc.(1) | 6.75 | 10/15/27 | 425,000 | 423,787 | ||||||||||
| Alliant Holdings Intermediate LLC/Alliant Holdings Co.-Issuer, Inc.(1) | 6.75 | 04/15/28 | 396,000 | 398,158 | ||||||||||
| Alliant Holdings Intermediate LLC/Alliant Holdings Co.-Issuer, Inc.(1) | 7.00 | 01/15/31 | 460,000 | 463,479 | ||||||||||
| Alliant Holdings Intermediate LLC/Alliant Holdings Co.-Issuer, Inc.(1) | 7.38 | 10/01/32 | 230,000 | 228,291 | ||||||||||
| AmWINS Group, Inc.(1) | 4.88 | 06/30/29 | 245,000 | 230,830 | ||||||||||
| AmWINS Group, Inc.(1) | 6.38 | 02/15/29 | 250,000 | 251,390 | ||||||||||
| APH Somerset Investor 2 LLC/APH2 Somerset Investor 2 LLC/APH3 Somerset Inves(1) | 7.88 | 11/01/29 | 235,000 | 234,997 | ||||||||||
| Ardonagh FinCo. Ltd.(1) | 7.75 | 02/15/31 | 240,000 | 246,286 | ||||||||||
| Ardonagh Group Finance Ltd.(1) | 8.88 | 02/15/32 | 320,000 | 327,210 | ||||||||||
| Assurant, Inc. | 7.00 | 03/27/48 | 135,000 | 137,357 | ||||||||||
| AssuredPartners, Inc.(1) | 5.63 | 01/15/29 | 170,000 | 161,027 | ||||||||||
| AssuredPartners, Inc.(1) | 7.50 | 02/15/32 | 165,000 | 166,309 | ||||||||||
| Baldwin Insurance Group Holdings LLC/Baldwin Insurance Group Holdings Finance(1) | 7.13 | 05/15/31 | 200,000 | 204,186 | ||||||||||
| BroadStreet Partners, Inc.(1) | 5.88 | 04/15/29 | 240,000 | 229,723 | ||||||||||
| Constellation Insurance, Inc.(1) | 6.63 | 05/01/31 | 80,000 | 78,233 | ||||||||||
| Constellation Insurance, Inc.(1) | 6.80 | 01/24/30 | 145,000 | 143,077 | ||||||||||
| Genworth Holdings, Inc. | 6.50 | 06/15/34 | 80,000 | 79,404 | ||||||||||
| Global Atlantic Finance Co.(1) | 4.70 | 10/15/51 | 245,000 | 235,091 | ||||||||||
| Global Atlantic Finance Co.(1) | 7.95 | 10/15/54 | 185,000 | 192,417 | ||||||||||
| Howden UK Refinance PLC/Howden UK Refinance 2 PLC/Howden US Refinance LLC(1) | 7.25 | 02/15/31 | 320,000 | 326,027 | ||||||||||
| Howden UK Refinance PLC/Howden UK Refinance 2 PLC/Howden US Refinance LLC(1) | 8.13 | 02/15/32 | 165,000 | 167,070 | ||||||||||
| HUB International Ltd.(1) | 5.63 | 12/01/29 | 175,000 | 169,645 | ||||||||||
| HUB International Ltd.(1) | 7.25 | 06/15/30 | 1,040,000 | 1,075,649 | ||||||||||
| HUB International Ltd.(1) | 7.38 | 01/31/32 | 605,000 | 617,539 | ||||||||||
| Jones Deslauriers Insurance Management, Inc.(1) | 8.50 | 03/15/30 | 239,000 | 253,346 | ||||||||||
| Jones Deslauriers Insurance Management, Inc.(1) | 10.50 | 12/15/30 | 155,000 | 167,103 | ||||||||||
| Liberty Mutual Group, Inc.(1) | 4.13 | 12/15/51 | 160,000 | 151,026 | ||||||||||
| Liberty Mutual Group, Inc.(1) | 4.30 | 02/01/61 | 255,000 | 167,979 | ||||||||||
| Liberty Mutual Group, Inc.(1) | 7.80 | 03/15/37 | 135,000 | 150,000 | ||||||||||
| Panther Escrow Issuer LLC(1) | 7.13 | 06/01/31 | 955,000 | 978,618 | ||||||||||
| Ryan Specialty LLC(1) | 4.38 | 02/01/30 | 135,000 | 128,143 | ||||||||||
| Ryan Specialty LLC(1) | 5.88 | 08/01/32 | 195,000 | 194,519 | ||||||||||
| USI, Inc./NY(1) | 7.50 | 01/15/32 | 205,000 | 209,414 | ||||||||||
| 11,040,397 | ||||||||||||||
The accompanying notes are an integral part of these financial statements.
28
BONDBLOXX ETF TRUST
BondBloxx USD High Yield Bond Financial & REIT Sector ETF
Portfolio of Investments (Continued)
October 31, 2024
| Rate (%) | Maturity | Face Amount | Value | |||||||||||
| INTERNET – 0.4% | ||||||||||||||
| Acuris Finance US, Inc./Acuris Finance Sarl(1) | 5.00 | 05/01/28 | $ | 105,000 | $ | 94,881 | ||||||||
| Acuris Finance US, Inc./Acuris Finance Sarl(1) | 9.00 | 08/01/29 | 170,000 | 167,272 | ||||||||||
| 262,153 | ||||||||||||||
| INVESTMENT COMPANIES – 3.2% | ||||||||||||||
| Compass Group Diversified Holdings LLC(1) | 5.00 | 01/15/32 | 95,000 | 87,725 | ||||||||||
| Compass Group Diversified Holdings LLC(1) | 5.25 | 04/15/29 | 317,000 | 305,100 | ||||||||||
| Icahn Enterprises LP/Icahn Enterprises Finance Corp. | 4.38 | 02/01/29 | 230,000 | 192,133 | ||||||||||
| Icahn Enterprises LP/Icahn Enterprises Finance Corp. | 5.25 | 05/15/27 | 460,000 | 428,994 | ||||||||||
| Icahn Enterprises LP/Icahn Enterprises Finance Corp. | 6.25 | 05/15/26 | 396,000 | 389,583 | ||||||||||
| Icahn Enterprises LP/Icahn Enterprises Finance Corp. | 9.00 | 06/15/30 | 235,000 | 227,188 | ||||||||||
| Icahn Enterprises LP/Icahn Enterprises Finance Corp. | 9.75 | 01/15/29 | 220,000 | 220,110 | ||||||||||
| 1,850,833 | ||||||||||||||
| OIL & GAS – 0.3% | ||||||||||||||
| NewCo Holding USD 20 Sarl(1) | 9.38 | 11/07/29 | 205,000 | 204,693 | ||||||||||
| PIPELINES – 0.4% | ||||||||||||||
| FTAI Infra Escrow Holdings LLC(1) | 10.50 | 06/01/27 | 200,000 | 214,403 | ||||||||||
| REAL ESTATE INVESTMENT TRUSTS (REITS) – 24.1% | ||||||||||||||
| Apollo Commercial Real Estate Finance, Inc.(1) | 4.63 | 06/15/29 | 167,000 | 145,014 | ||||||||||
| Blackstone Mortgage Trust, Inc.(1) | 3.75 | 01/15/27 | 112,000 | 104,839 | ||||||||||
| Brandywine Operating Partnership LP | 3.95 | 11/15/27 | 140,000 | 131,138 | ||||||||||
| Brandywine Operating Partnership LP | 4.55 | 10/01/29 | 95,000 | 87,539 | ||||||||||
| Brandywine Operating Partnership LP | 8.30 | 03/15/28 | 120,000 | 126,192 | ||||||||||
| Brandywine Operating Partnership LP | 8.88 | 04/12/29 | 135,000 | 146,422 | ||||||||||
| Brookfield Property REIT, Inc./BPR Cumulus LLC/BPR Nimbus LLC/GGSI Sellco LLC(1) | 4.50 | 04/01/27 | 212,000 | 204,495 | ||||||||||
| Brookfield Property REIT, Inc./BPR Cumulus LLC/BPR Nimbus LLC/GGSI Sellco LLC(1) | 5.75 | 05/15/26 | 270,000 | 267,565 | ||||||||||
| CTR Partnership LP/CareTrust Capital Corp.(1) | 3.88 | 06/30/28 | 135,000 | 128,013 | ||||||||||
| Diversified Healthcare Trust | 4.38 | 03/01/31 | 175,000 | 141,914 | ||||||||||
| Diversified Healthcare Trust | 4.75 | 02/15/28 | 155,000 | 137,271 | ||||||||||
| Global Net Lease, Inc./Global Net Lease Operating Partnership LP(1) | 3.75 | 12/15/27 | 165,000 | 151,480 | ||||||||||
| Hudson Pacific Properties LP | 3.25 | 01/15/30 | 130,000 | 95,071 | ||||||||||
| Hudson Pacific Properties LP | 3.95 | 11/01/27 | 120,000 | 107,739 | ||||||||||
| Hudson Pacific Properties LP | 4.65 | 04/01/29 | 165,000 | 132,163 | ||||||||||
| Hudson Pacific Properties LP | 5.95 | 02/15/28 | 115,000 | 102,079 | ||||||||||
| Iron Mountain Information Management Services, Inc.(1) | 5.00 | 07/15/32 | 239,000 | 225,462 | ||||||||||
| Iron Mountain, Inc.(1) | 4.50 | 02/15/31 | 340,000 | 315,992 | ||||||||||
| Iron Mountain, Inc.(1) | 4.88 | 09/15/27 | 332,000 | 326,513 | ||||||||||
| Iron Mountain, Inc.(1) | 4.88 | 09/15/29 | 310,000 | 298,809 | ||||||||||
| Iron Mountain, Inc.(1) | 5.00 | 07/15/28 | 175,000 | 170,689 | ||||||||||
| Iron Mountain, Inc.(1) | 5.25 | 03/15/28 | 255,000 | 250,497 | ||||||||||
| Iron Mountain, Inc.(1) | 5.25 | 07/15/30 | 430,000 | 416,163 | ||||||||||
| Iron Mountain, Inc.(1) | 5.63 | 07/15/32 | 185,000 | 179,631 | ||||||||||
| Iron Mountain, Inc.(1) | 7.00 | 02/15/29 | 300,000 | 308,754 | ||||||||||
| Ladder Capital Finance Holdings LLLP/Ladder Capital Finance Corp.(1) | 4.25 | 02/01/27 | 195,000 | 188,937 | ||||||||||
The accompanying notes are an integral part of these financial statements.
29
BONDBLOXX ETF TRUST
BondBloxx USD High Yield Bond Financial & REIT Sector ETF
Portfolio of Investments (Continued)
October 31, 2024
| Rate (%) | Maturity | Face Amount | Value | |||||||||||
| REAL ESTATE INVESTMENT TRUSTS (REITS) – 24.1% (Continued) | ||||||||||||||
| Ladder Capital Finance Holdings LLLP/Ladder Capital Finance Corp.(1) | 4.75 | 06/15/29 | $ | 202,000 | $ | 192,641 | ||||||||
| Ladder Capital Finance Holdings LLLP/Ladder Capital Finance Corp.(1) | 7.00 | 07/15/31 | 165,000 | 171,248 | ||||||||||
| MPT Operating Partnership LP/MPT Finance Corp. | 3.50 | 03/15/31 | 413,000 | 292,918 | ||||||||||
| MPT Operating Partnership LP/MPT Finance Corp. | 4.63 | 08/01/29 | 287,000 | 223,502 | ||||||||||
| MPT Operating Partnership LP/MPT Finance Corp. | 5.00 | 10/15/27 | 445,000 | 393,035 | ||||||||||
| MPT Operating Partnership LP/MPT Finance Corp. | 5.25 | 08/01/26 | 155,000 | 146,775 | ||||||||||
| Necessity Retail REIT, Inc./American Finance Operating Partner LP(1) | 4.50 | 09/30/28 | 167,000 | 153,976 | ||||||||||
| Office Properties Income Trust(1) | 9.00 | 03/31/29 | 100,000 | 97,580 | ||||||||||
| Office Properties Income Trust(1) | 9.00 | 09/30/29 | 186,000 | 157,329 | ||||||||||
| Park Intermediate Holdings LLC/PK Domestic Property LLC/PK Finance Co.-Issuer, Inc.(1) | 4.88 | 05/15/29 | 240,000 | 228,821 | ||||||||||
| Park Intermediate Holdings LLC/PK Domestic Property LLC/PK Finance Co.-Issuer, Inc.(1) | 5.88 | 10/01/28 | 230,000 | 227,832 | ||||||||||
| Park Intermediate Holdings LLC/PK Domestic Property LLC/PK Finance Co.-Issuer, inc.(1) | 7.00 | 02/01/30 | 180,000 | 184,527 | ||||||||||
| Pebblebrook Hotel LP/PEB Finance Corp.(1) | 6.38 | 10/15/29 | 130,000 | 129,935 | ||||||||||
| RHP Hotel Properties LP/RHP Finance Corp.(1) | 4.50 | 02/15/29 | 187,000 | 179,204 | ||||||||||
| RHP Hotel Properties LP/RHP Finance Corp. | 4.75 | 10/15/27 | 225,000 | 220,429 | ||||||||||
| RHP Hotel Properties LP/RHP Finance Corp.(1) | 6.50 | 04/01/32 | 310,000 | 313,899 | ||||||||||
| RHP Hotel Properties LP/RHP Finance Corp.(1) | 7.25 | 07/15/28 | 135,000 | 140,139 | ||||||||||
| Rithm Capital Corp.(1) | 8.00 | 04/01/29 | 250,000 | 249,692 | ||||||||||
| RLJ Lodging Trust LP(1) | 3.75 | 07/01/26 | 170,000 | 164,816 | ||||||||||
| RLJ Lodging Trust LP(1) | 4.00 | 09/15/29 | 155,000 | 139,846 | ||||||||||
| SBA Communications Corp. | 3.13 | 02/01/29 | 475,000 | 432,590 | ||||||||||
| SBA Communications Corp. | 3.88 | 02/15/27 | 476,000 | 461,014 | ||||||||||
| Service Properties Trust | 3.95 | 01/15/28 | 132,000 | 113,427 | ||||||||||
| Service Properties Trust | 4.38 | 02/15/30 | 135,000 | 102,312 | ||||||||||
| Service Properties Trust | 4.75 | 10/01/26 | 137,000 | 129,590 | ||||||||||
| Service Properties Trust | 4.95 | 02/15/27 | 140,000 | 130,523 | ||||||||||
| Service Properties Trust | 4.95 | 10/01/29 | 130,000 | 104,026 | ||||||||||
| Service Properties Trust | 5.25 | 02/15/26 | 110,000 | 106,792 | ||||||||||
| Service Properties Trust | 5.50 | 12/15/27 | 130,000 | 123,232 | ||||||||||
| Service Properties Trust | 8.38 | 06/15/29 | 235,000 | 229,873 | ||||||||||
| Service Properties Trust(1) | 8.63 | 11/15/31 | 310,000 | 327,899 | ||||||||||
| Service Properties Trust | 8.88 | 06/15/32 | 155,000 | 144,230 | ||||||||||
| Starwood Property Trust, Inc.(1) | 3.63 | 07/15/26 | 135,000 | 129,525 | ||||||||||
| Starwood Property Trust, Inc.(1) | 4.38 | 01/15/27 | 155,000 | 149,535 | ||||||||||
| Starwood Property Trust, Inc.(1) | 6.00 | 04/15/30 | 125,000 | 122,645 | ||||||||||
| Starwood Property Trust, Inc.(1) | 7.25 | 04/01/29 | 190,000 | 194,663 | ||||||||||
| Uniti Group LP/Uniti Fiber Holdings, Inc./CSL Capital LLC(1) | 6.00 | 01/15/30 | 220,000 | 184,568 | ||||||||||
| Uniti Group LP/Uniti Group Finance 2019, Inc./CSL Capital LLC(1) | 4.75 | 04/15/28 | 190,000 | 174,848 | ||||||||||
| Uniti Group LP/Uniti Group Finance 2019, Inc./CSL Capital LLC(1) | 6.50 | 02/15/29 | 367,000 | 316,370 | ||||||||||
| Uniti Group LP/Uniti Group Finance 2019, Inc./CSL Capital LLC(1) | 10.50 | 02/15/28 | 105,000 | 111,946 | ||||||||||
| Uniti Group LP/Uniti Group Finance 2019, Inc./CSL Capital LLC(1) | 10.50 | 02/15/28 | 895,000 | 954,208 | ||||||||||
| Vornado Realty LP | 2.15 | 06/01/26 | 135,000 | 127,834 | ||||||||||
| Vornado Realty LP | 3.40 | 06/01/31 | 110,000 | 93,671 | ||||||||||
| XHR LP(1) | 4.88 | 06/01/29 | 165,000 | 155,031 | ||||||||||
| 14,018,877 | ||||||||||||||
The accompanying notes are an integral part of these financial statements.
30
BONDBLOXX ETF TRUST
BondBloxx USD High Yield Bond Financial & REIT Sector ETF
Portfolio of Investments (Continued)
October 31, 2024
| Rate (%) | Maturity | Face Amount | Value | |||||||||||
| RETAIL – 0.8% | ||||||||||||||
| FirstCash, Inc.(1) | 4.63 | 09/01/28 | $ | 155,000 | $ | 146,972 | ||||||||
| FirstCash, Inc.(1) | 5.63 | 01/01/30 | 183,000 | 177,849 | ||||||||||
| FirstCash, Inc.(1) | 6.88 | 03/01/32 | 155,000 | 156,960 | ||||||||||
| 481,781 | ||||||||||||||
| SOFTWARE – 0.2% | ||||||||||||||
| ACI Worldwide, Inc.(1) | 5.75 | 08/15/26 | 125,000 | 125,367 | ||||||||||
| TRANSPORTATION – 0.3% | ||||||||||||||
| Cargo Aircraft Management, Inc.(1) | 4.75 | 02/01/28 | 197,000 | 188,146 | ||||||||||
| TRUCKING & LEASING – 1.9% | ||||||||||||||
| Fortress Transportation & Infrastructure Investors LLC(1) | 5.50 | 05/01/28 | 320,000 | 314,034 | ||||||||||
| Fortress Transportation & Infrastructure Investors LLC(1) | 5.88 | 04/15/33 | 160,000 | 156,114 | ||||||||||
| Fortress Transportation & Infrastructure Investors LLC(1) | 7.00 | 05/01/31 | 220,000 | 226,453 | ||||||||||
| Fortress Transportation & Infrastructure Investors LLC(1) | 7.00 | 06/15/32 | 255,000 | 261,812 | ||||||||||
| Fortress Transportation & Infrastructure Investors LLC(1) | 7.88 | 12/01/30 | 155,000 | 163,435 | ||||||||||
| 1,121,848 | ||||||||||||||
| TOTAL CORPORATE BONDS (Cost - $55,486,791) | 56,893,702 | |||||||||||||
| SHORT-TERM INVESTMENTS – 0.6% | ||||||||||||||
| TIME DEPOSITS – 0.6% | ||||||||||||||
| Sumitomo Mitsui Trust Bank, London | 4.18 | 11/01/24 | 359,525 | 359,525 | ||||||||||
| TOTAL SHORT-TERM INVESTMENTS (Cost - $359,525) | 359,525 | |||||||||||||
| TOTAL INVESTMENTS – 98.3% (Cost - $55,846,316) | $ | 57,253,227 | ||||||||||||
| OTHER ASSETS LESS LIABILITIES – 1.7% | 968,165 | |||||||||||||
| NET ASSETS – 100.0% | $ | 58,221,392 | ||||||||||||
| (1) | Security was purchased pursuant to Rule 144A under the Securities Act of 1933 and may not be resold subject to that Rule except to qualified institutional buyers. The aggregate value of Rule 144A holdings at October 31, 2024, amounts to $44,181,168 and represents 75.9% of net assets. These securities have been deemed liquid under procedures approved by the Trust’s Board of Trustees. |
| (2) | Security is perpetual in nature and has no stated maturity date. |
The accompanying notes are an integral part of these financial statements.
31
BONDBLOXX ETF TRUST
BondBloxx USD High Yield Bond Energy Sector ETF
Portfolio of Investments
October 31, 2024
| Rate (%) | Maturity | Face Amount | Value | |||||||||||
| CORPORATE BONDS – 97.4% | ||||||||||||||
| CHEMICALS – 0.7% | ||||||||||||||
| Consolidated Energy Finance SA(1) | 5.63 | 10/15/28 | $ | 45,000 | $ | 36,719 | ||||||||
| Consolidated Energy Finance SA(1) | 12.00 | 02/15/31 | 60,000 | 58,593 | ||||||||||
| 95,312 | ||||||||||||||
| GAS – 0.6% | ||||||||||||||
| AltaGas Ltd.(1) | 7.20 | 10/15/54 | 80,000 | 80,399 | ||||||||||
| OIL & GAS – 48.0% | ||||||||||||||
| Aethon United BR LP/Aethon United Finance Corp.(1) | 7.50 | 10/01/29 | 90,000 | 90,686 | ||||||||||
| Ascent Resources Utica Holdings LLC/ARU Finance Corp.(1) | 5.88 | 06/30/29 | 40,000 | 38,676 | ||||||||||
| Ascent Resources Utica Holdings LLC/ARU Finance Corp.(1) | 6.63 | 10/15/32 | 50,000 | 49,563 | ||||||||||
| Ascent Resources Utica Holdings LLC/ARU Finance Corp.(1) | 8.25 | 12/31/28 | 50,000 | 51,056 | ||||||||||
| Ascent Resources Utica Holdings LLC/ARU Finance Corp.(1) | 9.00 | 11/01/27 | 30,000 | 35,628 | ||||||||||
| Baytex Energy Corp.(1) | 7.38 | 03/15/32 | 50,000 | 48,582 | ||||||||||
| Baytex Energy Corp.(1) | 8.50 | 04/30/30 | 75,000 | 76,371 | ||||||||||
| Berry Petroleum Co. LLC(1) | 7.00 | 02/15/26 | 35,000 | 34,148 | ||||||||||
| Borr IHC Ltd./Borr Finance LLC(1) | 10.00 | 11/15/28 | 125,299 | 128,759 | ||||||||||
| Borr IHC Ltd./Borr Finance LLC(1) | 10.38 | 11/15/30 | 43,908 | 45,334 | ||||||||||
| California Resources Corp.(1) | 8.25 | 06/15/29 | 80,000 | 80,857 | ||||||||||
| Calumet Specialty Products Partners LP/Calumet Finance Corp.(1) | 8.13 | 01/15/27 | 20,000 | 20,140 | ||||||||||
| Calumet Specialty Products Partners LP/Calumet Finance Corp.(1) | 9.75 | 07/15/28 | 35,000 | 35,992 | ||||||||||
| Chord Energy Corp.(1) | 6.38 | 06/01/26 | 35,000 | 35,100 | ||||||||||
| CITGO Petroleum Corp.(1) | 6.38 | 06/15/26 | 55,000 | 55,099 | ||||||||||
| CITGO Petroleum Corp.(1) | 8.38 | 01/15/29 | 100,000 | 104,102 | ||||||||||
| Civitas Resources, Inc.(1) | 5.00 | 10/15/26 | 40,000 | 39,318 | ||||||||||
| Civitas Resources, Inc.(1) | 8.38 | 07/01/28 | 115,000 | 118,993 | ||||||||||
| Civitas Resources, Inc.(1) | 8.63 | 11/01/30 | 90,000 | 94,627 | ||||||||||
| Civitas Resources, Inc.(1) | 8.75 | 07/01/31 | 130,000 | 136,319 | ||||||||||
| CNX Resources Corp.(1) | 6.00 | 01/15/29 | 43,000 | 42,667 | ||||||||||
| CNX Resources Corp.(1) | 7.25 | 03/01/32 | 40,000 | 41,244 | ||||||||||
| CNX Resources Corp.(1) | 7.38 | 01/15/31 | 45,000 | 46,293 | ||||||||||
| Comstock Resources, Inc.(1) | 5.88 | 01/15/30 | 90,000 | 82,308 | ||||||||||
| Comstock Resources, Inc.(1) | 6.75 | 03/01/29 | 105,000 | 100,624 | ||||||||||
| Comstock Resources, Inc.(1) | 6.75 | 03/01/29 | 40,000 | 38,316 | ||||||||||
| Crescent Energy Finance LLC(1) | 7.38 | 01/15/33 | 90,000 | 87,365 | ||||||||||
| Crescent Energy Finance LLC(1) | 7.63 | 04/01/32 | 65,000 | 64,230 | ||||||||||
| Crescent Energy Finance LLC(1) | 9.25 | 02/15/28 | 90,000 | 94,513 | ||||||||||
| CVR Energy, Inc.(1) | 5.75 | 02/15/28 | 30,000 | 27,390 | ||||||||||
| CVR Energy, Inc.(1) | 8.50 | 01/15/29 | 60,000 | 58,235 | ||||||||||
| Diamond Foreign Asset Co./Diamond Finance LLC(1) | 8.50 | 10/01/30 | 50,000 | 51,666 | ||||||||||
| Encino Acquisition Partners Holdings LLC(1) | 8.50 | 05/01/28 | 67,000 | 67,433 | ||||||||||
| Encino Acquisition Partners Holdings LLC(1) | 8.75 | 05/01/31 | 40,000 | 41,097 | ||||||||||
| Energean PLC(1) | 6.50 | 04/30/27 | 40,000 | 39,910 | ||||||||||
| EnQuest PLC(1) | 11.63 | 11/01/27 | 40,000 | 40,475 | ||||||||||
| Global Marine, Inc. | 7.00 | 06/01/28 | 25,000 | 23,680 | ||||||||||
| Gulfport Energy Operating Corp.(1) | 6.75 | 09/01/29 | 60,000 | 60,385 | ||||||||||
| Hilcorp Energy I LP/Hilcorp Finance Co.(1) | 5.75 | 02/01/29 | 55,000 | 52,820 | ||||||||||
| Hilcorp Energy I LP/Hilcorp Finance Co.(1) | 6.00 | 04/15/30 | 41,000 | 39,142 | ||||||||||
The accompanying notes are an integral part of these financial statements.
32
BONDBLOXX ETF TRUST
BondBloxx USD High Yield Bond Energy Sector ETF
Portfolio of Investments (Continued)
October 31, 2024
| Rate (%) | Maturity | Face Amount | Value | |||||||||||
| OIL & GAS – 48.0% (Continued) | ||||||||||||||
| Hilcorp Energy I LP/Hilcorp Finance Co.(1) | 6.00 | 02/01/31 | $ | 55,000 | $ | 52,206 | ||||||||
| Hilcorp Energy I LP/Hilcorp Finance Co.(1) | 6.25 | 11/01/28 | 60,000 | 58,591 | ||||||||||
| Hilcorp Energy I LP/Hilcorp Finance Co.(1) | 6.25 | 04/15/32 | 45,000 | 42,261 | ||||||||||
| Hilcorp Energy I LP/Hilcorp Finance Co.(1) | 6.88 | 05/15/34 | 45,000 | 43,107 | ||||||||||
| Hilcorp Energy I LP/Hilcorp Finance Co.(1) | 7.25 | 02/15/35 | 90,000 | 88,353 | ||||||||||
| Hilcorp Energy I LP/Hilcorp Finance Co.(1) | 8.38 | 11/01/33 | 55,000 | 57,545 | ||||||||||
| Ithaca Energy North Sea PLC(1) | 8.13 | 10/15/29 | 70,000 | 70,193 | ||||||||||
| Karoon USA Finance, Inc.(1) | 10.50 | 05/14/29 | 30,000 | 30,980 | ||||||||||
| Kraken Oil & Gas Partners LLC(1) | 7.63 | 08/15/29 | 45,000 | 44,499 | ||||||||||
| Magnolia Oil & Gas Operating LLC/Magnolia Oil & Gas Finance Corp.(1) | 6.00 | 08/01/26 | 30,000 | 29,967 | ||||||||||
| Matador Resources Co.(1) | 6.25 | 04/15/33 | 70,000 | 68,679 | ||||||||||
| Matador Resources Co.(1) | 6.50 | 04/15/32 | 80,000 | 79,289 | ||||||||||
| Matador Resources Co.(1) | 6.88 | 04/15/28 | 45,000 | 45,848 | ||||||||||
| MEG Energy Corp.(1) | 5.88 | 02/01/29 | 55,000 | 53,969 | ||||||||||
| Moss Creek Resources Holdings, Inc.(1) | 8.25 | 09/01/31 | 65,000 | 63,742 | ||||||||||
| Murphy Oil Corp. | 5.88 | 12/01/42 | 35,000 | 30,755 | ||||||||||
| Murphy Oil Corp. | 6.00 | 10/01/32 | 45,000 | 43,344 | ||||||||||
| Nabors Industries Ltd.(1) | 7.50 | 01/15/28 | 30,000 | 28,567 | ||||||||||
| Nabors Industries, Inc.(1) | 7.38 | 05/15/27 | 65,000 | 65,100 | ||||||||||
| Nabors Industries, Inc.(1) | 8.88 | 08/15/31 | 50,000 | 47,312 | ||||||||||
| Nabors Industries, Inc.(1) | 9.13 | 01/31/30 | 60,000 | 62,018 | ||||||||||
| Noble Finance II LLC(1) | 8.00 | 04/15/30 | 130,000 | 131,859 | ||||||||||
| Northern Oil & Gas, Inc.(1) | 8.13 | 03/01/28 | 55,000 | 55,580 | ||||||||||
| Northern Oil & Gas, Inc.(1) | 8.75 | 06/15/31 | 50,000 | 51,793 | ||||||||||
| Parkland Corp.(1) | 4.50 | 10/01/29 | 75,000 | 69,732 | ||||||||||
| Parkland Corp.(1) | 4.63 | 05/01/30 | 76,000 | 69,918 | ||||||||||
| Parkland Corp.(1) | 5.88 | 07/15/27 | 40,000 | 39,612 | ||||||||||
| Parkland Corp.(1) | 6.63 | 08/15/32 | 45,000 | 44,942 | ||||||||||
| PBF Holding Co. LLC/PBF Finance Corp. | 6.00 | 02/15/28 | 75,000 | 72,846 | ||||||||||
| PBF Holding Co. LLC/PBF Finance Corp.(1) | 7.88 | 09/15/30 | 45,000 | 44,958 | ||||||||||
| Permian Resources Operating LLC(1) | 5.38 | 01/15/26 | 20,000 | 19,919 | ||||||||||
| Permian Resources Operating LLC(1) | 5.88 | 07/01/29 | 67,000 | 66,104 | ||||||||||
| Permian Resources Operating LLC(1) | 6.25 | 02/01/33 | 85,000 | 84,445 | ||||||||||
| Permian Resources Operating LLC(1) | 7.00 | 01/15/32 | 95,000 | 96,985 | ||||||||||
| Permian Resources Operating LLC(1) | 8.00 | 04/15/27 | 50,000 | 51,426 | ||||||||||
| Permian Resources Operating LLC(1) | 9.88 | 07/15/31 | 50,000 | 55,284 | ||||||||||
| Precision Drilling Corp.(1) | 6.88 | 01/15/29 | 35,000 | 34,851 | ||||||||||
| Range Resources Corp.(1) | 4.75 | 02/15/30 | 48,000 | 45,230 | ||||||||||
| Range Resources Corp. | 8.25 | 01/15/29 | 55,000 | 56,707 | ||||||||||
| Seadrill Finance Ltd.(1) | 8.38 | 08/01/30 | 50,000 | 51,101 | ||||||||||
| Sitio Royalties Operating Partnership LP/Sitio Finance Corp.(1) | 7.88 | 11/01/28 | 55,000 | 57,141 | ||||||||||
| SM Energy Co. | 6.50 | 07/15/28 | 40,000 | 39,922 | ||||||||||
| SM Energy Co. | 6.63 | 01/15/27 | 35,000 | 35,020 | ||||||||||
| SM Energy Co. | 6.75 | 09/15/26 | 40,000 | 40,112 | ||||||||||
| SM Energy Co.(1) | 6.75 | 08/01/29 | 55,000 | 54,704 | ||||||||||
| SM Energy Co.(1) | 7.00 | 08/01/32 | 75,000 | 74,440 | ||||||||||
| Strathcona Resources Ltd./Alberta(1) | 6.88 | 08/01/26 | 40,000 | 39,734 | ||||||||||
| Sunoco LP(1) | 7.00 | 05/01/29 | 65,000 | 67,105 | ||||||||||
The accompanying notes are an integral part of these financial statements.
33
BONDBLOXX ETF TRUST
BondBloxx USD High Yield Bond Energy Sector ETF
Portfolio of Investments (Continued)
October 31, 2024
| Rate (%) | Maturity | Face Amount | Value | |||||||||||
| OIL & GAS – 48.0% (Continued) | ||||||||||||||
| Sunoco LP(1) | 7.25 | 05/01/32 | $ | 75,000 | $ | 78,137 | ||||||||
| Sunoco LP/Sunoco Finance Corp. | 4.50 | 05/15/29 | 75,000 | 71,366 | ||||||||||
| Sunoco LP/Sunoco Finance Corp. | 4.50 | 04/30/30 | 65,000 | 61,052 | ||||||||||
| Sunoco LP/Sunoco Finance Corp. | 5.88 | 03/15/28 | 40,000 | 39,941 | ||||||||||
| Sunoco LP/Sunoco Finance Corp. | 6.00 | 04/15/27 | 40,000 | 40,069 | ||||||||||
| Sunoco LP/Sunoco Finance Corp.(1) | 7.00 | 09/15/28 | 50,000 | 51,428 | ||||||||||
| Talos Production, Inc.(1) | 9.00 | 02/01/29 | 55,000 | 56,697 | ||||||||||
| Talos Production, Inc.(1) | 9.38 | 02/01/31 | 55,000 | 56,672 | ||||||||||
| Teine Energy Ltd.(1) | 6.88 | 04/15/29 | 35,000 | 34,592 | ||||||||||
| TGNR Intermediate Holdings LLC(1) | 5.50 | 10/15/29 | 65,000 | 61,421 | ||||||||||
| Transocean Aquila Ltd.(1) | 8.00 | 09/30/28 | 27,231 | 28,084 | ||||||||||
| Transocean Poseidon Ltd.(1) | 6.88 | 02/01/27 | 27,000 | 27,005 | ||||||||||
| Transocean Titan Financing Ltd.(1) | 8.38 | 02/01/28 | 50,000 | 51,491 | ||||||||||
| Transocean, Inc. | 6.80 | 03/15/38 | 60,000 | 49,837 | ||||||||||
| Transocean, Inc. | 7.50 | 04/15/31 | 25,000 | 23,348 | ||||||||||
| Transocean, Inc.(1) | 8.00 | 02/01/27 | 63,000 | 62,866 | ||||||||||
| Transocean, Inc.(1) | 8.25 | 05/15/29 | 75,000 | 75,407 | ||||||||||
| Transocean, Inc.(1) | 8.50 | 05/15/31 | 90,000 | 90,752 | ||||||||||
| Transocean, Inc.(1) | 8.75 | 02/15/30 | 93,500 | 96,939 | ||||||||||
| Valaris Ltd.(1) | 8.38 | 04/30/30 | 100,000 | 101,534 | ||||||||||
| Vermilion Energy, Inc.(1) | 6.88 | 05/01/30 | 36,000 | 35,605 | ||||||||||
| Viper Energy, Inc.(1) | 5.38 | 11/01/27 | 35,000 | 34,629 | ||||||||||
| Viper Energy, Inc.(1) | 7.38 | 11/01/31 | 35,000 | 36,395 | ||||||||||
| Vital Energy, Inc.(1) | 7.75 | 07/31/29 | 29,000 | 28,484 | ||||||||||
| Vital Energy, Inc.(1) | 7.88 | 04/15/32 | 90,000 | 86,548 | ||||||||||
| Vital Energy, Inc. | 9.75 | 10/15/30 | 25,000 | 26,402 | ||||||||||
| W&T Offshore, Inc.(1) | 11.75 | 02/01/26 | 25,000 | 25,121 | ||||||||||
| Wildfire Intermediate Holdings LLC(1) | 7.50 | 10/15/29 | 55,000 | 53,480 | ||||||||||
| 6,562,240 | ||||||||||||||
| OIL & GAS SERVICES – 5.7% | ||||||||||||||
| Archrock Partners LP/Archrock Partners Finance Corp.(1) | 6.25 | 04/01/28 | 70,000 | 70,187 | ||||||||||
| Archrock Partners LP/Archrock Partners Finance Corp.(1) | 6.63 | 09/01/32 | 60,000 | 60,314 | ||||||||||
| Archrock Partners LP/Archrock Partners Finance Corp.(1) | 6.88 | 04/01/27 | 35,000 | 35,130 | ||||||||||
| Bristow Group, Inc.(1) | 6.88 | 03/01/28 | 35,000 | 34,788 | ||||||||||
| Enerflex Ltd.(1) | 9.00 | 10/15/27 | 49,000 | 51,036 | ||||||||||
| Helix Energy Solutions Group, Inc.(1) | 9.75 | 03/01/29 | 30,000 | 32,021 | ||||||||||
| Kodiak Gas Services LLC(1) | 7.25 | 02/15/29 | 65,000 | 66,867 | ||||||||||
| Nine Energy Service, Inc. | 13.00 | 02/01/28 | 25,000 | 16,397 | ||||||||||
| Oceaneering International, Inc. | 6.00 | 02/01/28 | 25,000 | 24,584 | ||||||||||
| Solaris Midstream Holdings LLC(1) | 7.63 | 04/01/26 | 30,000 | 30,184 | ||||||||||
| USA Compression Partners LP/USA Compression Finance Corp. | 6.88 | 09/01/27 | 65,000 | 65,358 | ||||||||||
| USA Compression Partners LP/USA Compression Finance Corp.(1) | 7.13 | 03/15/29 | 95,000 | 96,818 | ||||||||||
| Viridien(1) | 8.75 | 04/01/27 | 45,000 | 43,530 | ||||||||||
| Weatherford International Ltd.(1) | 8.63 | 04/30/30 | 149,000 | 154,119 | ||||||||||
| 781,333 | ||||||||||||||
The accompanying notes are an integral part of these financial statements.
34
BONDBLOXX ETF TRUST
BondBloxx USD High Yield Bond Energy Sector ETF
Portfolio of Investments (Continued)
October 31, 2024
| Rate (%) | Maturity | Face Amount | Value | |||||||||||
| PIPELINES – 41.8% | ||||||||||||||
| Antero Midstream Partners LP/Antero Midstream Finance Corp.(1) | 5.38 | 06/15/29 | $ | 73,000 | $ | 71,153 | ||||||||
| Antero Midstream Partners LP/Antero Midstream Finance Corp.(1) | 5.75 | 03/01/27 | 55,000 | 54,939 | ||||||||||
| Antero Midstream Partners LP/Antero Midstream Finance Corp.(1) | 5.75 | 01/15/28 | 60,000 | 59,723 | ||||||||||
| Antero Midstream Partners LP/Antero Midstream Finance Corp.(1) | 6.63 | 02/01/32 | 50,000 | 50,599 | ||||||||||
| Blue Racer Midstream LLC/Blue Racer Finance Corp.(1) | 6.63 | 07/15/26 | 25,000 | 24,999 | ||||||||||
| Blue Racer Midstream LLC/Blue Racer Finance Corp.(1) | 7.00 | 07/15/29 | 45,000 | 46,195 | ||||||||||
| Blue Racer Midstream LLC/Blue Racer Finance Corp.(1) | 7.25 | 07/15/32 | 50,000 | 51,683 | ||||||||||
| Buckeye Partners LP | 3.95 | 12/01/26 | 60,000 | 57,734 | ||||||||||
| Buckeye Partners LP | 4.13 | 12/01/27 | 30,000 | 28,704 | ||||||||||
| Buckeye Partners LP(1) | 4.50 | 03/01/28 | 40,000 | 38,133 | ||||||||||
| Buckeye Partners LP | 5.60 | 10/15/44 | 25,000 | 21,230 | ||||||||||
| Buckeye Partners LP | 5.85 | 11/15/43 | 40,000 | 34,608 | ||||||||||
| Buckeye Partners LP(1) | 6.88 | 07/01/29 | 60,000 | 61,035 | ||||||||||
| CNX Midstream Partners LP(1) | 4.75 | 04/15/30 | 35,000 | 32,610 | ||||||||||
| CQP Holdco LP/BIP-V Chinook Holdco LLC(1) | 5.50 | 06/15/31 | 120,000 | 114,297 | ||||||||||
| CQP Holdco LP/BIP-V Chinook Holdco LLC(1) | 7.50 | 12/15/33 | 50,000 | 52,940 | ||||||||||
| Delek Logistics Partners LP/Delek Logistics Finance Corp.(1) | 7.13 | 06/01/28 | 40,000 | 39,659 | ||||||||||
| Delek Logistics Partners LP/Delek Logistics Finance Corp.(1) | 8.63 | 03/15/29 | 95,000 | 97,544 | ||||||||||
| DT Midstream, Inc.(1) | 4.13 | 06/15/29 | 100,000 | 93,980 | ||||||||||
| DT Midstream, Inc.(1) | 4.38 | 06/15/31 | 90,000 | 82,861 | ||||||||||
| Energy Transfer LP | 7.13 | 10/01/54 | 40,000 | 40,454 | ||||||||||
| Energy Transfer LP | 8.00 | 05/15/54 | 65,000 | 68,923 | ||||||||||
| EQM Midstream Partners LP | 4.13 | 12/01/26 | 25,000 | 24,477 | ||||||||||
| EQM Midstream Partners LP(1) | 4.50 | 01/15/29 | 80,000 | 77,070 | ||||||||||
| EQM Midstream Partners LP(1) | 4.75 | 01/15/31 | 95,000 | 90,383 | ||||||||||
| EQM Midstream Partners LP | 5.50 | 07/15/28 | 75,000 | 74,499 | ||||||||||
| EQM Midstream Partners LP(1) | 6.38 | 04/01/29 | 60,000 | 60,983 | ||||||||||
| EQM Midstream Partners LP(1) | 6.50 | 07/01/27 | 88,000 | 90,079 | ||||||||||
| EQM Midstream Partners LP | 6.50 | 07/15/48 | 50,000 | 50,357 | ||||||||||
| EQM Midstream Partners LP(1) | 7.50 | 06/01/27 | 50,000 | 51,160 | ||||||||||
| EQM Midstream Partners LP(1) | 7.50 | 06/01/30 | 50,000 | 53,809 | ||||||||||
| Genesis Energy LP/Genesis Energy Finance Corp. | 7.75 | 02/01/28 | 65,000 | 65,700 | ||||||||||
| Genesis Energy LP/Genesis Energy Finance Corp. | 7.88 | 05/15/32 | 70,000 | 70,009 | ||||||||||
| Genesis Energy LP/Genesis Energy Finance Corp. | 8.00 | 01/15/27 | 80,000 | 81,471 | ||||||||||
| Genesis Energy LP/Genesis Energy Finance Corp. | 8.25 | 01/15/29 | 60,000 | 61,328 | ||||||||||
| Genesis Energy LP/Genesis Energy Finance Corp. | 8.88 | 04/15/30 | 35,000 | 36,079 | ||||||||||
| Global Partners LP/GLP Finance Corp. | 6.88 | 01/15/29 | 30,000 | 29,969 | ||||||||||
| Global Partners LP/GLP Finance Corp. | 7.00 | 08/01/27 | 40,000 | 40,155 | ||||||||||
| Global Partners LP/GLP Finance Corp.(1) | 8.25 | 01/15/32 | 40,000 | 40,846 | ||||||||||
| Harvest Midstream I LP(1) | 7.50 | 09/01/28 | 65,000 | 65,805 | ||||||||||
| Harvest Midstream I LP(1) | 7.50 | 05/15/32 | 50,000 | 51,231 | ||||||||||
| Hess Midstream Operations LP(1) | 4.25 | 02/15/30 | 65,000 | 60,744 | ||||||||||
| Hess Midstream Operations LP(1) | 5.13 | 06/15/28 | 55,000 | 53,866 | ||||||||||
| Hess Midstream Operations LP(1) | 5.50 | 10/15/30 | 40,000 | 39,115 | ||||||||||
| Hess Midstream Operations LP(1) | 5.63 | 02/15/26 | 70,000 | 69,885 | ||||||||||
| Hess Midstream Operations LP(1) | 6.50 | 06/01/29 | 50,000 | 50,867 | ||||||||||
| Howard Midstream Energy Partners LLC(1) | 7.38 | 07/15/32 | 50,000 | 51,045 | ||||||||||
| Howard Midstream Energy Partners LLC(1) | 8.88 | 07/15/28 | 55,000 | 58,073 | ||||||||||
The accompanying notes are an integral part of these financial statements.
35
BONDBLOXX ETF TRUST
BondBloxx USD High Yield Bond Energy Sector ETF
Portfolio of Investments (Continued)
October 31, 2024
| Rate (%) | Maturity | Face Amount | Value | |||||||||||
| PIPELINES – 41.8% (Continued) | ||||||||||||||
| ITT Holdings LLC(1) | 6.50 | 08/01/29 | $ | 111,000 | $ | 102,685 | ||||||||
| Kinetik Holdings LP(1) | 5.88 | 06/15/30 | 95,000 | 94,350 | ||||||||||
| Kinetik Holdings LP(1) | 6.63 | 12/15/28 | 70,000 | 71,553 | ||||||||||
| Martin Midstream Partners LP/Martin Midstream Finance Corp.(1) | 11.50 | 02/15/28 | 35,000 | 38,158 | ||||||||||
| New Fortress Energy, Inc.(1) | 6.50 | 09/30/26 | 140,000 | 129,795 | ||||||||||
| New Fortress Energy, Inc.(1) | 8.75 | 03/15/29 | 65,000 | 54,324 | ||||||||||
| NGL Energy Operating LLC/NGL Energy Finance Corp.(1) | 8.13 | 02/15/29 | 85,000 | 85,605 | ||||||||||
| NGL Energy Operating LLC/NGL Energy Finance Corp.(1) | 8.38 | 02/15/32 | 115,000 | 115,974 | ||||||||||
| Northriver Midstream Finance LP(1) | 6.75 | 07/15/32 | 55,000 | 56,490 | ||||||||||
| NuStar Logistics LP | 5.63 | 04/28/27 | 53,000 | 52,628 | ||||||||||
| NuStar Logistics LP | 6.00 | 06/01/26 | 40,000 | 40,059 | ||||||||||
| NuStar Logistics LP | 6.38 | 10/01/30 | 55,000 | 55,667 | ||||||||||
| Prairie Acquiror LP(1) | 9.00 | 08/01/29 | 35,000 | 35,517 | ||||||||||
| Rockies Express Pipeline LLC(1) | 4.80 | 05/15/30 | 30,000 | 27,771 | ||||||||||
| Rockies Express Pipeline LLC(1) | 4.95 | 07/15/29 | 55,000 | 51,709 | ||||||||||
| Rockies Express Pipeline LLC(1) | 6.88 | 04/15/40 | 45,000 | 42,701 | ||||||||||
| Rockies Express Pipeline LLC(1) | 7.50 | 07/15/38 | 20,000 | 20,437 | ||||||||||
| South Bow Canadian Infrastructure Holdings Ltd.(1) | 7.50 | 03/01/55 | 55,000 | 57,157 | ||||||||||
| South Bow Canadian Infrastructure Holdings Ltd.(1) | 7.63 | 03/01/55 | 45,000 | 46,374 | ||||||||||
| Summit Midstream Holdings LLC(1) | 8.63 | 10/31/29 | 50,000 | 51,691 | ||||||||||
| Tallgrass Energy Partners LP/Tallgrass Energy Finance Corp.(1) | 5.50 | 01/15/28 | 70,000 | 67,287 | ||||||||||
| Tallgrass Energy Partners LP/Tallgrass Energy Finance Corp.(1) | 6.00 | 03/01/27 | 35,000 | 34,763 | ||||||||||
| Tallgrass Energy Partners LP/Tallgrass Energy Finance Corp.(1) | 6.00 | 12/31/30 | 70,000 | 65,758 | ||||||||||
| Tallgrass Energy Partners LP/Tallgrass Energy Finance Corp.(1) | 6.00 | 09/01/31 | 36,000 | 33,426 | ||||||||||
| Tallgrass Energy Partners LP/Tallgrass Energy Finance Corp.(1) | 7.38 | 02/15/29 | 75,000 | 75,297 | ||||||||||
| TransMontaigne Partners LP/TLP Finance Corp. | 6.13 | 02/15/26 | 30,000 | 29,532 | ||||||||||
| Venture Global Calcasieu Pass LLC(1) | 3.88 | 08/15/29 | 110,000 | 101,504 | ||||||||||
| Venture Global Calcasieu Pass LLC(1) | 3.88 | 11/01/33 | 117,000 | 101,730 | ||||||||||
| Venture Global Calcasieu Pass LLC(1) | 4.13 | 08/15/31 | 100,000 | 91,208 | ||||||||||
| Venture Global Calcasieu Pass LLC(1) | 6.25 | 01/15/30 | 105,000 | 107,392 | ||||||||||
| Venture Global LNG, Inc.(1) | 7.00 | 01/15/30 | 130,000 | 130,892 | ||||||||||
| Venture Global LNG, Inc.(1) | 8.13 | 06/01/28 | 195,000 | 202,505 | ||||||||||
| Venture Global LNG, Inc.(1) | 8.38 | 06/01/31 | 215,000 | 223,481 | ||||||||||
| Venture Global LNG, Inc.(1) | 9.50 | 02/01/29 | 280,000 | 309,660 | ||||||||||
| Venture Global LNG, Inc.(1) | 9.88 | 02/01/32 | 175,000 | 191,127 | ||||||||||
| 5,719,215 | ||||||||||||||
| RETAIL – 0.6% | ||||||||||||||
| Superior Plus LP/Superior General Partner, Inc.(1) | 4.50 | 03/15/29 | 55,000 | 50,793 | ||||||||||
| Vivo Energy Investments BV(1) | 5.13 | 09/24/27 | 30,000 | 29,414 | ||||||||||
| 80,207 | ||||||||||||||
| TOTAL CORPORATE BONDS (Cost - $13,391,651) | 13,318,706 | |||||||||||||
The accompanying notes are an integral part of these financial statements.
36
BONDBLOXX ETF TRUST
BondBloxx USD High Yield Bond Energy Sector ETF
Portfolio of Investments (Continued)
October 31, 2024
| Rate (%) | Maturity | Face Amount | Value | |||||||||||
| SHORT-TERM INVESTMENTS – 1.9% | ||||||||||||||
| TIME DEPOSITS – 1.9% | ||||||||||||||
| Citibank, New York | 4.18 | 11/01/24 | $ | 256,539 | $ | 256,539 | ||||||||
| TOTAL SHORT-TERM INVESTMENTS (Cost - $256,539) | 256,539 | |||||||||||||
| TOTAL INVESTMENTS – 99.3% (Cost - $13,648,190) | $ | 13,575,245 | ||||||||||||
| OTHER ASSETS LESS LIABILITIES – 0.7% | 99,212 | |||||||||||||
| NET ASSETS – 100.0% | $ | 13,674,457 | ||||||||||||
| (1) | Security was purchased pursuant to Rule 144A under the Securities Act of 1933 and may not be resold subject to that Rule except to qualified institutional buyers. The aggregate value of Rule 144A holdings at October 31, 2024, amounts to $11,594,383 and represents 84.8% of net assets. These securities have been deemed liquid under procedures approved by the Trust’s Board of Trustees. |
The accompanying notes are an integral part of these financial statements.
37
BONDBLOXX ETF TRUST
BondBloxx USD High Yield Bond Consumer Cyclicals Sector ETF
Portfolio of Investments
October 31, 2024
| Rate (%) | Maturity | Face Amount | Value | |||||||||||
| CORPORATE BONDS – 98.2% | ||||||||||||||
| APPAREL – 3.4% | ||||||||||||||
| Crocs, Inc.(1) | 4.13 | 08/15/31 | $ | 122,000 | $ | 107,013 | ||||||||
| Crocs, Inc.(1) | 4.25 | 03/15/29 | 160,000 | 146,917 | ||||||||||
| Hanesbrands, Inc.(1) | 4.88 | 05/15/26 | 348,000 | 344,116 | ||||||||||
| Hanesbrands, Inc.(1) | 9.00 | 02/15/31 | 245,000 | 262,719 | ||||||||||
| Kontoor Brands, Inc.(1) | 4.13 | 11/15/29 | 149,000 | 139,033 | ||||||||||
| Levi Strauss & Co.(1) | 3.50 | 03/01/31 | 195,000 | 172,454 | ||||||||||
| Under Armour, Inc. | 3.25 | 06/15/26 | 235,000 | 226,257 | ||||||||||
| VF Corp. | 2.80 | 04/23/27 | 205,000 | 193,628 | ||||||||||
| VF Corp. | 2.95 | 04/23/30 | 295,000 | 254,854 | ||||||||||
| VF Corp. | 6.00 | 10/15/33 | 115,000 | 115,175 | ||||||||||
| VF Corp. | 6.45 | 11/01/37 | 105,000 | 107,177 | ||||||||||
| William Carter Co.(1) | 5.63 | 03/15/27 | 200,000 | 199,008 | ||||||||||
| Wolverine World Wide, Inc.(1) | 4.00 | 08/15/29 | 210,000 | 179,780 | ||||||||||
| 2,448,131 | ||||||||||||||
| AUTO MANUFACTURERS – 2.7% | ||||||||||||||
| Allison Transmission, Inc.(1) | 3.75 | 01/30/31 | 390,000 | 346,424 | ||||||||||
| Allison Transmission, Inc.(1) | 4.75 | 10/01/27 | 165,000 | 161,044 | ||||||||||
| Allison Transmission, Inc.(1) | 5.88 | 06/01/29 | 197,000 | 196,491 | ||||||||||
| Aston Martin Capital Holdings Ltd.(1) | 10.00 | 03/31/29 | 415,000 | 403,545 | ||||||||||
| Jaguar Land Rover Automotive PLC(1) | 4.50 | 10/01/27 | 200,000 | 193,524 | ||||||||||
| Jaguar Land Rover Automotive PLC(1) | 5.50 | 07/15/29 | 152,000 | 148,461 | ||||||||||
| Jaguar Land Rover Automotive PLC(1) | 5.88 | 01/15/28 | 225,000 | 222,685 | ||||||||||
| McLaren Finance PLC(1) | 7.50 | 08/01/26 | 251,000 | 244,725 | ||||||||||
| 1,916,899 | ||||||||||||||
| AUTO PARTS & EQUIPMENT – 10.3% | ||||||||||||||
| Adient Global Holdings Ltd.(1) | 4.88 | 08/15/26 | 317,000 | 312,620 | ||||||||||
| Adient Global Holdings Ltd.(1) | 7.00 | 04/15/28 | 200,000 | 203,497 | ||||||||||
| Adient Global Holdings Ltd.(1) | 8.25 | 04/15/31 | 190,000 | 196,980 | ||||||||||
| American Axle & Manufacturing, Inc. | 5.00 | 10/01/29 | 240,000 | 217,371 | ||||||||||
| American Axle & Manufacturing, Inc. | 6.50 | 04/01/27 | 205,000 | 204,542 | ||||||||||
| American Axle & Manufacturing, Inc. | 6.88 | 07/01/28 | 159,000 | 157,490 | ||||||||||
| Clarios Global LP/Clarios US Finance Co.(1) | 6.25 | 05/15/26 | 360,000 | 360,947 | ||||||||||
| Clarios Global LP/Clarios US Finance Co.(1) | 6.75 | 05/15/28 | 300,000 | 307,342 | ||||||||||
| Clarios Global LP/Clarios US Finance Co.(1) | 8.50 | 05/15/27 | 625,000 | 629,511 | ||||||||||
| Dana, Inc. | 4.25 | 09/01/30 | 152,000 | 133,035 | ||||||||||
| Dana, Inc. | 4.50 | 02/15/32 | 133,000 | 113,878 | ||||||||||
| Dana, Inc. | 5.38 | 11/15/27 | 164,000 | 160,555 | ||||||||||
| Dana, Inc. | 5.63 | 06/15/28 | 164,000 | 159,330 | ||||||||||
| Garrett Motion Holdings, Inc./Garrett LX I Sarl(1) | 7.75 | 05/31/32 | 320,000 | 319,612 | ||||||||||
| Goodyear Tire & Rubber Co. | 4.88 | 03/15/27 | 275,000 | 265,595 | ||||||||||
| Goodyear Tire & Rubber Co. | 5.00 | 05/31/26 | 365,000 | 359,018 | ||||||||||
| Goodyear Tire & Rubber Co. | 5.00 | 07/15/29 | 320,000 | 289,999 | ||||||||||
| Goodyear Tire & Rubber Co. | 5.25 | 04/30/31 | 223,000 | 196,062 | ||||||||||
| Goodyear Tire & Rubber Co. | 5.25 | 07/15/31 | 237,000 | 208,536 | ||||||||||
| Goodyear Tire & Rubber Co. | 5.63 | 04/30/33 | 184,000 | 159,318 | ||||||||||
| Phinia, Inc.(1) | 6.63 | 10/15/32 | 170,000 | 169,582 | ||||||||||
The accompanying notes are an integral part of these financial statements.
38
BONDBLOXX ETF TRUST
BondBloxx USD High Yield Bond Consumer Cyclicals Sector ETF
Portfolio of Investments (Continued)
October 31, 2024
| Rate (%) | Maturity | Face Amount | Value | |||||||||||
| AUTO PARTS & EQUIPMENT – 10.3% (Continued) | ||||||||||||||
| Phinia, Inc.(1) | 6.75 | 04/15/29 | $ | 216,000 | $ | 220,764 | ||||||||
| Real Hero Merger Sub 2, Inc.(1) | 6.25 | 02/01/29 | 245,000 | 214,226 | ||||||||||
| Tenneco, Inc.(1) | 8.00 | 11/17/28 | 750,000 | 695,124 | ||||||||||
| ZF North America Capital, Inc.(1) | 6.75 | 04/23/30 | 305,000 | 300,902 | ||||||||||
| ZF North America Capital, Inc.(1) | 6.88 | 04/14/28 | 240,000 | 242,301 | ||||||||||
| ZF North America Capital, Inc.(1) | 6.88 | 04/23/32 | 280,000 | 273,774 | ||||||||||
| ZF North America Capital, Inc.(1) | 7.13 | 04/14/30 | 245,000 | 246,591 | ||||||||||
| 7,318,502 | ||||||||||||||
| COMMERCIAL SERVICES – 2.3% | ||||||||||||||
| Belron UK Finance PLC(1) | 5.75 | 10/15/29 | 435,000 | 436,179 | ||||||||||
| Champions Financing, Inc.(1) | 8.75 | 02/15/29 | 240,000 | 242,501 | ||||||||||
| Mavis Tire Express Services Topco Corp.(1) | 6.50 | 05/15/29 | 291,000 | 279,130 | ||||||||||
| Upbound Group, Inc.(1) | 6.38 | 02/15/29 | 180,000 | 171,489 | ||||||||||
| Wand NewCo 3, Inc.(1) | 7.63 | 01/30/32 | 500,000 | 517,169 | ||||||||||
| 1,646,468 | ||||||||||||||
| DISTRIBUTION/WHOLESALE – 0.6% | ||||||||||||||
| Dealer Tire LLC/DT Issuer LLC(1) | 8.00 | 02/01/28 | 200,000 | 197,451 | ||||||||||
| Velocity Vehicle Group LLC(1) | 8.00 | 06/01/29 | 200,000 | 206,211 | ||||||||||
| 403,662 | ||||||||||||||
| DIVERSIFIED FINANCIAL SERVICES – 0.2% | ||||||||||||||
| Cobra Acquisition Co. LLC(1) | 6.38 | 11/01/29 | 160,000 | 132,520 | ||||||||||
| ENTERTAINMENT – 20.8% | ||||||||||||||
| Affinity Interactive(1) | 6.88 | 12/15/27 | 220,000 | 180,775 | ||||||||||
| AMC Entertainment Holdings, Inc.(1) | 7.50 | 02/15/29 | 370,000 | 319,605 | ||||||||||
| Boyne USA, Inc.(1) | 4.75 | 05/15/29 | 272,000 | 259,602 | ||||||||||
| Caesars Entertainment, Inc.(1) | 4.63 | 10/15/29 | 480,000 | 450,320 | ||||||||||
| Caesars Entertainment, Inc.(1) | 6.00 | 10/15/32 | 425,000 | 414,835 | ||||||||||
| Caesars Entertainment, Inc.(1) | 6.50 | 02/15/32 | 600,000 | 608,844 | ||||||||||
| Caesars Entertainment, Inc.(1) | 7.00 | 02/15/30 | 803,000 | 823,747 | ||||||||||
| Caesars Entertainment, Inc.(1) | 8.13 | 07/01/27 | 209,000 | 213,231 | ||||||||||
| CCM Merger, Inc.(1) | 6.38 | 05/01/26 | 97,000 | 96,761 | ||||||||||
| Cedar Fair LP/Canada’s Wonderland Co./Magnum Management Corp./Millennium Operations LLC | 5.25 | 07/15/29 | 210,000 | 202,429 | ||||||||||
| Cedar Fair LP/Canada’s Wonderland Co./Magnum Management Corp./Millennium Operations LLC | 5.38 | 04/15/27 | 210,000 | 208,567 | ||||||||||
| Cedar Fair LP/Canada’s Wonderland Co./Magnum Management Corp./Millennium Operations LLC | 6.50 | 10/01/28 | 102,000 | 102,949 | ||||||||||
| Churchill Downs, Inc.(1) | 4.75 | 01/15/28 | 265,000 | 257,294 | ||||||||||
| Churchill Downs, Inc.(1) | 5.50 | 04/01/27 | 241,000 | 239,743 | ||||||||||
| Churchill Downs, Inc.(1) | 5.75 | 04/01/30 | 482,000 | 474,901 | ||||||||||
| Churchill Downs, Inc.(1) | 6.75 | 05/01/31 | 240,000 | 244,636 | ||||||||||
| Cinemark USA, Inc.(1) | 5.25 | 07/15/28 | 301,000 | 295,668 | ||||||||||
| Cinemark USA, Inc.(1) | 7.00 | 08/01/32 | 200,000 | 205,166 | ||||||||||
| Empire Resorts, Inc.(1) | 7.75 | 11/01/26 | 98,000 | 93,435 | ||||||||||
| Everi Holdings, Inc.(1) | 5.00 | 07/15/29 | 164,000 | 162,849 | ||||||||||
The accompanying notes are an integral part of these financial statements.
39
BONDBLOXX ETF TRUST
BondBloxx USD High Yield Bond Consumer Cyclicals Sector ETF
Portfolio of Investments (Continued)
October 31, 2024
| Rate (%) | Maturity | Face Amount | Value | |||||||||||
| ENTERTAINMENT – 20.8% (Continued) | ||||||||||||||
| International Game Technology PLC(1) | 4.13 | 04/15/26 | $ | 300,000 | $ | 295,898 | ||||||||
| International Game Technology PLC(1) | 5.25 | 01/15/29 | 300,000 | 294,974 | ||||||||||
| International Game Technology PLC(1) | 6.25 | 01/15/27 | 305,000 | 308,242 | ||||||||||
| Jacobs Entertainment, Inc.(1) | 6.75 | 02/15/29 | 200,000 | 197,013 | ||||||||||
| Light & Wonder International, Inc.(1) | 7.00 | 05/15/28 | 287,000 | 288,441 | ||||||||||
| Light & Wonder International, Inc.(1) | 7.25 | 11/15/29 | 196,000 | 200,537 | ||||||||||
| Light & Wonder International, Inc.(1) | 7.50 | 09/01/31 | 210,000 | 217,104 | ||||||||||
| Live Nation Entertainment, Inc.(1) | 3.75 | 01/15/28 | 195,000 | 185,226 | ||||||||||
| Live Nation Entertainment, Inc.(1) | 4.75 | 10/15/27 | 383,000 | 372,999 | ||||||||||
| Live Nation Entertainment, Inc.(1) | 5.63 | 03/15/26 | 102,000 | 101,672 | ||||||||||
| Live Nation Entertainment, Inc.(1) | 6.50 | 05/15/27 | 487,000 | 494,076 | ||||||||||
| Merlin Entertainments Group US Holdings, Inc.(1) | 7.38 | 02/15/31 | 190,000 | 186,470 | ||||||||||
| Merlin Entertainments Ltd.(1) | 5.75 | 06/15/26 | 158,000 | 155,910 | ||||||||||
| Midwest Gaming Borrower LLC/Midwest Gaming Finance Corp.(1) | 4.88 | 05/01/29 | 302,000 | 285,350 | ||||||||||
| Mohegan Tribal Gaming Authority(1) | 8.00 | 02/01/26 | 461,000 | 458,187 | ||||||||||
| Motion Bondco DAC(1) | 6.63 | 11/15/27 | 170,000 | 161,259 | ||||||||||
| Odeon FinCo. PLC(1) | 12.75 | 11/01/27 | 165,000 | 173,834 | ||||||||||
| Ontario Gaming GTA LP/OTG Co.-Issuer, Inc.(1) | 8.00 | 08/01/30 | 145,000 | 149,770 | ||||||||||
| Penn Entertainment, Inc.(1) | 4.13 | 07/01/29 | 162,000 | 145,766 | ||||||||||
| Penn Entertainment, Inc.(1) | 5.63 | 01/15/27 | 160,000 | 157,078 | ||||||||||
| Premier Entertainment Sub LLC/Premier Entertainment Finance Corp.(1) | 5.63 | 09/01/29 | 297,000 | 211,621 | ||||||||||
| Premier Entertainment Sub LLC/Premier Entertainment Finance Corp.(1) | 5.88 | 09/01/31 | 297,000 | 191,882 | ||||||||||
| Raptor Acquisition Corp./Raptor Co.-Issuer LLC(1) | 4.88 | 11/01/26 | 123,000 | 122,068 | ||||||||||
| Resorts World Las Vegas LLC/RWLV Capital, Inc.(1) | 4.63 | 04/16/29 | 387,000 | 341,323 | ||||||||||
| Resorts World Las Vegas LLC/RWLV Capital, Inc.(1) | 4.63 | 04/06/31 | 140,000 | 118,863 | ||||||||||
| Resorts World Las Vegas LLC/RWLV Capital, Inc.(1) | 8.45 | 07/27/30 | 165,000 | 170,269 | ||||||||||
| Scientific Games Holdings LP/Scientific Games US FinCo., Inc.(1) | 6.63 | 03/01/30 | 308,000 | 300,524 | ||||||||||
| SeaWorld Parks & Entertainment, Inc.(1) | 5.25 | 08/15/29 | 292,000 | 280,654 | ||||||||||
| Six Flags Entertainment Corp./DE(1) | 5.50 | 04/15/27 | 205,000 | 203,932 | ||||||||||
| Six Flags Entertainment Corp./DE(1) | 7.25 | 05/15/31 | 325,000 | 333,420 | ||||||||||
| Six Flags Entertainment Corp./Six Flags Theme Parks, Inc.(1) | 6.63 | 05/01/32 | 325,000 | 331,386 | ||||||||||
| Speedway Motorsports LLC/Speedway Funding II, Inc.(1) | 4.88 | 11/01/27 | 143,000 | 139,874 | ||||||||||
| Universal Entertainment Corp.(1) | 9.88 | 08/01/29 | 125,000 | 125,709 | ||||||||||
| Vail Resorts, Inc.(1) | 6.50 | 05/15/32 | 240,000 | 245,958 | ||||||||||
| Wynn Resorts Finance LLC/Wynn Resorts Capital Corp.(1) | 5.13 | 10/01/29 | 307,000 | 298,291 | ||||||||||
| Wynn Resorts Finance LLC/Wynn Resorts Capital Corp.(1) | 6.25 | 03/15/33 | 300,000 | 298,812 | ||||||||||
| Wynn Resorts Finance LLC/Wynn Resorts Capital Corp.(1) | 7.13 | 02/15/31 | 400,000 | 421,094 | ||||||||||
| 14,820,843 | ||||||||||||||
| FOREST PRODUCTS & PAPER – 0.4% | ||||||||||||||
| Glatfelter Corp.(1) | 7.25 | 11/15/31 | 320,000 | 317,531 | ||||||||||
| HOLDING COMPANIES-DIVERS – 0.3% | ||||||||||||||
| Benteler International AG(1) | 10.50 | 05/15/28 | 200,000 | 206,969 | ||||||||||
The accompanying notes are an integral part of these financial statements.
40
BONDBLOXX ETF TRUST
BondBloxx USD High Yield Bond Consumer Cyclicals Sector ETF
Portfolio of Investments (Continued)
October 31, 2024
| Rate (%) | Maturity | Face Amount | Value | |||||||||||
| HOME BUILDERS – 0.8% | ||||||||||||||
| Forestar Group, Inc.(1) | 3.85 | 05/15/26 | $ | 173,000 | $ | 168,767 | ||||||||
| Forestar Group, Inc.(1) | 5.00 | 03/01/28 | 100,000 | 95,792 | ||||||||||
| Thor Industries, Inc.(1) | 4.00 | 10/15/29 | 205,000 | 187,355 | ||||||||||
| Winnebago Industries, Inc.(1) | 6.25 | 07/15/28 | 103,000 | 102,489 | ||||||||||
| 554,403 | ||||||||||||||
| INTERNET – 3.9% | ||||||||||||||
| GrubHub Holdings, Inc.(1) | 5.50 | 07/01/27 | 200,000 | 186,829 | ||||||||||
| Rakuten Group, Inc.(1),(2) | 5.13 | - | 300,000 | 288,563 | ||||||||||
| Rakuten Group, Inc.(1),(2) | 6.25 | - | 400,000 | 362,000 | ||||||||||
| Rakuten Group, Inc.(1) | 9.75 | 04/15/29 | 785,000 | 850,449 | ||||||||||
| Rakuten Group, Inc.(1) | 11.25 | 02/15/27 | 710,000 | 773,314 | ||||||||||
| Wayfair LLC(1) | 7.25 | 10/31/29 | 315,000 | 319,540 | ||||||||||
| 2,780,695 | ||||||||||||||
| LEISURE TIME – 17.5% | ||||||||||||||
| Carnival Corp.(1) | 5.75 | 03/01/27 | 1,068,000 | 1,071,871 | ||||||||||
| Carnival Corp.(1) | 6.00 | 05/01/29 | 777,000 | 778,803 | ||||||||||
| Carnival Corp.(1) | 7.63 | 03/01/26 | 542,000 | 546,129 | ||||||||||
| Carnival Corp.(1) | 10.50 | 06/01/30 | 405,000 | 437,238 | ||||||||||
| Carnival Holdings Bermuda Ltd.(1) | 10.38 | 05/01/28 | 815,000 | 875,422 | ||||||||||
| Life Time, Inc.(1) | 5.75 | 01/15/26 | 358,000 | 358,027 | ||||||||||
| Life Time, Inc.(1) | 6.00 | 11/15/31 | 200,000 | 199,276 | ||||||||||
| Life Time, Inc.(1) | 8.00 | 04/15/26 | 195,000 | 196,079 | ||||||||||
| Lindblad Expeditions Holdings, Inc.(1) | 9.00 | 05/15/28 | 95,000 | 98,974 | ||||||||||
| Lindblad Expeditions LLC(1) | 6.75 | 02/15/27 | 153,000 | 153,846 | ||||||||||
| NCL Corp. Ltd.(1) | 5.88 | 03/15/26 | 572,000 | 571,732 | ||||||||||
| NCL Corp. Ltd.(1) | 5.88 | 02/15/27 | 380,000 | 379,862 | ||||||||||
| NCL Corp. Ltd.(1) | 6.25 | 03/01/30 | 120,000 | 118,782 | ||||||||||
| NCL Corp. Ltd.(1) | 7.75 | 02/15/29 | 240,000 | 254,801 | ||||||||||
| NCL Corp. Ltd.(1) | 8.13 | 01/15/29 | 315,000 | 334,160 | ||||||||||
| NCL Corp. Ltd.(1) | 8.38 | 02/01/28 | 241,000 | 252,631 | ||||||||||
| NCL Finance Ltd.(1) | 6.13 | 03/15/28 | 212,000 | 213,472 | ||||||||||
| Royal Caribbean Cruises Ltd. | 3.70 | 03/15/28 | 175,000 | 166,896 | ||||||||||
| Royal Caribbean Cruises Ltd.(1) | 4.25 | 07/01/26 | 255,000 | 250,326 | ||||||||||
| Royal Caribbean Cruises Ltd.(1) | 5.38 | 07/15/27 | 392,000 | 391,526 | ||||||||||
| Royal Caribbean Cruises Ltd.(1) | 5.50 | 08/31/26 | 400,000 | 400,700 | ||||||||||
| Royal Caribbean Cruises Ltd.(1) | 5.50 | 04/01/28 | 607,000 | 607,341 | ||||||||||
| Royal Caribbean Cruises Ltd.(1) | 5.63 | 09/30/31 | 600,000 | 597,924 | ||||||||||
| Royal Caribbean Cruises Ltd.(1) | 6.00 | 02/01/33 | 780,000 | 785,277 | ||||||||||
| Royal Caribbean Cruises Ltd.(1) | 6.25 | 03/15/32 | 505,000 | 515,174 | ||||||||||
| Royal Caribbean Cruises Ltd. | 7.50 | 10/15/27 | 127,000 | 134,695 | ||||||||||
| Sabre GLBL, Inc.(1) | 8.63 | 06/01/27 | 360,000 | 347,753 | ||||||||||
| Sabre GLBL, Inc.(1) | 11.25 | 12/15/27 | 225,000 | 231,940 | ||||||||||
| Viking Cruises Ltd.(1) | 5.88 | 09/15/27 | 325,000 | 323,151 | ||||||||||
| Viking Cruises Ltd.(1) | 7.00 | 02/15/29 | 205,000 | 206,757 | ||||||||||
| Viking Cruises Ltd.(1) | 9.13 | 07/15/31 | 295,000 | 318,788 | ||||||||||
| Viking Ocean Cruises Ship VII Ltd.(1) | 5.63 | 02/15/29 | 142,000 | 140,152 | ||||||||||
| VOC Escrow Ltd.(1) | 5.00 | 02/15/28 | 255,000 | 248,088 | ||||||||||
| 12,507,593 | ||||||||||||||
The accompanying notes are an integral part of these financial statements.
41
BONDBLOXX ETF TRUST
BondBloxx USD High Yield Bond Consumer Cyclicals Sector ETF
Portfolio of Investments (Continued)
October 31, 2024
| Rate (%) | Maturity | Face Amount | Value | |||||||||||
| LODGING – 11.9% | ||||||||||||||
| Boyd Gaming Corp. | 4.75 | 12/01/27 | $ | 390,000 | $ | 383,395 | ||||||||
| Boyd Gaming Corp.(1) | 4.75 | 06/15/31 | 358,000 | 334,390 | ||||||||||
| Full House Resorts, Inc.(1) | 8.25 | 02/15/28 | 163,000 | 162,856 | ||||||||||
| Genting New York LLC/GENNY Capital, Inc.(1) | 7.25 | 10/01/29 | 250,000 | 253,958 | ||||||||||
| Hilton Domestic Operating Co., Inc.(1) | 3.63 | 02/15/32 | 582,000 | 511,297 | ||||||||||
| Hilton Domestic Operating Co., Inc.(1) | 3.75 | 05/01/29 | 325,000 | 302,952 | ||||||||||
| Hilton Domestic Operating Co., Inc.(1) | 4.00 | 05/01/31 | 442,000 | 402,944 | ||||||||||
| Hilton Domestic Operating Co., Inc. | 4.88 | 01/15/30 | 400,000 | 387,850 | ||||||||||
| Hilton Domestic Operating Co., Inc.(1) | 5.75 | 05/01/28 | 197,000 | 197,576 | ||||||||||
| Hilton Domestic Operating Co., Inc.(1) | 5.88 | 04/01/29 | 220,000 | 223,406 | ||||||||||
| Hilton Domestic Operating Co., Inc.(1) | 5.88 | 03/15/33 | 405,000 | 406,100 | ||||||||||
| Hilton Domestic Operating Co., Inc.(1) | 6.13 | 04/01/32 | 170,000 | 171,848 | ||||||||||
| Hilton Grand Vacations Borrower Escrow LLC/Hilton Grand Vacations Borrower Escrow, Inc.(1) | 4.88 | 07/01/31 | 185,000 | 165,468 | ||||||||||
| Hilton Grand Vacations Borrower Escrow LLC/Hilton Grand Vacations Borrower Escrow, Inc.(1) | 5.00 | 06/01/29 | 343,000 | 321,268 | ||||||||||
| Hilton Grand Vacations Borrower Escrow LLC/Hilton Grand Vacations Borrower Escrow, Inc.(1) | 6.63 | 01/15/32 | 360,000 | 360,393 | ||||||||||
| Hilton Worldwide Finance LLC/Hilton Worldwide Finance Corp. | 4.88 | 04/01/27 | 240,000 | 238,358 | ||||||||||
| Marriott Ownership Resorts, Inc.(1) | 4.50 | 06/15/29 | 197,000 | 182,922 | ||||||||||
| Marriott Ownership Resorts, Inc. | 4.75 | 01/15/28 | 145,000 | 138,690 | ||||||||||
| MGM Resorts International | 4.63 | 09/01/26 | 165,000 | 163,635 | ||||||||||
| MGM Resorts International | 4.75 | 10/15/28 | 295,000 | 285,364 | ||||||||||
| MGM Resorts International | 5.50 | 04/15/27 | 273,000 | 272,588 | ||||||||||
| MGM Resorts International | 6.13 | 09/15/29 | 320,000 | 319,109 | ||||||||||
| MGM Resorts International | 6.50 | 04/15/32 | 305,000 | 305,261 | ||||||||||
| Station Casinos LLC(1) | 4.50 | 02/15/28 | 296,000 | 282,758 | ||||||||||
| Station Casinos LLC(1) | 4.63 | 12/01/31 | 205,000 | 186,441 | ||||||||||
| Station Casinos LLC(1) | 6.63 | 03/15/32 | 180,000 | 181,020 | ||||||||||
| Travel + Leisure Co.(1) | 4.50 | 12/01/29 | 260,000 | 243,022 | ||||||||||
| Travel + Leisure Co.(1) | 4.63 | 03/01/30 | 137,000 | 127,826 | ||||||||||
| Travel + Leisure Co. | 6.00 | 04/01/27 | 150,000 | 151,501 | ||||||||||
| Travel + Leisure Co.(1) | 6.63 | 07/31/26 | 262,000 | 264,404 | ||||||||||
| Wyndham Hotels & Resorts, Inc.(1) | 4.38 | 08/15/28 | 195,000 | 185,740 | ||||||||||
| Wynn Las Vegas LLC/Wynn Las Vegas Capital Corp.(1) | 5.25 | 05/15/27 | 363,000 | 360,571 | ||||||||||
| 8,474,911 | ||||||||||||||
| OIL & GAS SERVICES – 0.2% | ||||||||||||||
| Star Holding LLC(1) | 8.75 | 08/01/31 | 130,000 | 123,794 | ||||||||||
| REAL ESTATE – 4.4% | ||||||||||||||
| Anywhere Real Estate Group LLC/Anywhere Co.-Issuer Corp.(1) | 7.00 | 04/15/30 | 260,200 | 228,290 | ||||||||||
| Anywhere Real Estate Group LLC/Realogy Co.-Issuer Corp.(1) | 5.25 | 04/15/30 | 165,000 | 126,015 | ||||||||||
| Anywhere Real Estate Group LLC/Realogy Co.-Issuer Corp.(1) | 5.75 | 01/15/29 | 219,000 | 180,637 | ||||||||||
| Cushman & Wakefield US Borrower LLC(1) | 6.75 | 05/15/28 | 251,000 | 252,584 | ||||||||||
| Cushman & Wakefield US Borrower LLC(1) | 8.88 | 09/01/31 | 165,000 | 177,923 | ||||||||||
| Five Point Operating Co. LP/Five Point Capital Corp.(1),(3) | 10.50 | 01/15/28 | 191,402 | 196,163 | ||||||||||
| Greystar Real Estate Partners LLC(1) | 7.75 | 09/01/30 | 145,000 | 152,072 | ||||||||||
The accompanying notes are an integral part of these financial statements.
42
BONDBLOXX ETF TRUST
BondBloxx USD High Yield Bond Consumer Cyclicals Sector ETF
Portfolio of Investments (Continued)
October 31, 2024
| Rate (%) | Maturity | Face Amount | Value | |||||||||||
| REAL ESTATE – 4.4% (Continued) | ||||||||||||||
| Howard Hughes Corp.(1) | 4.13 | 02/01/29 | $ | 247,000 | $ | 227,706 | ||||||||
| Howard Hughes Corp.(1) | 4.38 | 02/01/31 | 260,000 | 233,246 | ||||||||||
| Howard Hughes Corp.(1) | 5.38 | 08/01/28 | 297,000 | 289,023 | ||||||||||
| Hunt Cos, Inc.(1) | 5.25 | 04/15/29 | 256,000 | 243,431 | ||||||||||
| Kennedy-Wilson, Inc. | 4.75 | 03/01/29 | 249,000 | 228,515 | ||||||||||
| Kennedy-Wilson, Inc. | 4.75 | 02/01/30 | 223,000 | 199,690 | ||||||||||
| Kennedy-Wilson, Inc. | 5.00 | 03/01/31 | 235,000 | 207,775 | ||||||||||
| Newmark Group, Inc. | 7.50 | 01/12/29 | 190,000 | 201,319 | ||||||||||
| 3,144,389 | ||||||||||||||
| RETAIL – 18.5% | ||||||||||||||
| Academy Ltd.(1) | 6.00 | 11/15/27 | 163,000 | 162,691 | ||||||||||
| Advance Auto Parts, Inc. | 1.75 | 10/01/27 | 145,000 | 128,971 | ||||||||||
| Advance Auto Parts, Inc. | 3.50 | 03/15/32 | 125,000 | 102,906 | ||||||||||
| Advance Auto Parts, Inc. | 3.90 | 04/15/30 | 205,000 | 182,617 | ||||||||||
| Advance Auto Parts, Inc. | 5.90 | 03/09/26 | 120,000 | 121,014 | ||||||||||
| Advance Auto Parts, Inc. | 5.95 | 03/09/28 | 120,000 | 121,034 | ||||||||||
| Asbury Automotive Group, Inc. | 4.50 | 03/01/28 | 165,000 | 159,421 | ||||||||||
| Asbury Automotive Group, Inc.(1) | 4.63 | 11/15/29 | 320,000 | 299,885 | ||||||||||
| Asbury Automotive Group, Inc. | 4.75 | 03/01/30 | 175,000 | 164,829 | ||||||||||
| Asbury Automotive Group, Inc.(1) | 5.00 | 02/15/32 | 236,000 | 217,587 | ||||||||||
| Bath & Body Works, Inc. | 5.25 | 02/01/28 | 177,000 | 174,714 | ||||||||||
| Bath & Body Works, Inc.(1) | 6.63 | 10/01/30 | 352,000 | 352,756 | ||||||||||
| Bath & Body Works, Inc. | 6.69 | 01/15/27 | 105,000 | 107,576 | ||||||||||
| Bath & Body Works, Inc. | 6.75 | 07/01/36 | 225,000 | 226,498 | ||||||||||
| Bath & Body Works, Inc. | 6.88 | 11/01/35 | 320,000 | 325,228 | ||||||||||
| Bath & Body Works, Inc. | 6.95 | 03/01/33 | 100,000 | 99,285 | ||||||||||
| Bath & Body Works, Inc. | 7.50 | 06/15/29 | 195,000 | 201,514 | ||||||||||
| Cougar JV Subsidiary LLC(1) | 8.00 | 05/15/32 | 270,000 | 282,504 | ||||||||||
| Evergreen Acqco 1 LP/TVI, Inc.(1) | 9.75 | 04/26/28 | 178,000 | 187,468 | ||||||||||
| Fertitta Entertainment LLC/Fertitta Entertainment Finance Co., Inc.(1) | 4.63 | 01/15/29 | 393,000 | 367,213 | ||||||||||
| Fertitta Entertainment LLC/Fertitta Entertainment Finance Co., Inc.(1) | 6.75 | 01/15/30 | 497,000 | 452,367 | ||||||||||
| Foot Locker, Inc.(1) | 4.00 | 10/01/29 | 164,000 | 141,084 | ||||||||||
| Gap, Inc.(1) | 3.63 | 10/01/29 | 302,000 | 271,347 | ||||||||||
| Gap, Inc.(1) | 3.88 | 10/01/31 | 292,000 | 251,254 | ||||||||||
| Global Auto Holdings Ltd./AAG FH UK Ltd.(1) | 8.38 | 01/15/29 | 205,000 | 192,700 | ||||||||||
| Global Auto Holdings Ltd./AAG FH UK Ltd.(1) | 8.75 | 01/15/32 | 210,000 | 191,066 | ||||||||||
| Group 1 Automotive, Inc.(1) | 4.00 | 08/15/28 | 312,000 | 293,196 | ||||||||||
| Group 1 Automotive, Inc.(1) | 6.38 | 01/15/30 | 185,000 | 186,292 | ||||||||||
| Guitar Center, Inc.(1) | 8.50 | 01/15/26 | 195,000 | 166,744 | ||||||||||
| Ken Garff Automotive LLC(1) | 4.88 | 09/15/28 | 163,000 | 158,224 | ||||||||||
| Kohl’s Corp. | 4.63 | 05/01/31 | 197,000 | 163,635 | ||||||||||
| Kohl’s Corp. | 5.55 | 07/17/45 | 164,000 | 110,472 | ||||||||||
| LCM Investments Holdings II LLC(1) | 4.88 | 05/01/29 | 390,000 | 368,873 | ||||||||||
| LCM Investments Holdings II LLC(1) | 8.25 | 08/01/31 | 340,000 | 355,347 | ||||||||||
| Lithia Motors, Inc.(1) | 3.88 | 06/01/29 | 317,000 | 291,200 | ||||||||||
| Lithia Motors, Inc.(1) | 4.38 | 01/15/31 | 210,000 | 192,320 | ||||||||||
| Lithia Motors, Inc.(1) | 4.63 | 12/15/27 | 160,000 | 155,379 | ||||||||||
| Macy’s Retail Holdings LLC | 4.30 | 02/15/43 | 100,000 | 69,106 | ||||||||||
The accompanying notes are an integral part of these financial statements.
43
BONDBLOXX ETF TRUST
BondBloxx USD High Yield Bond Consumer Cyclicals Sector ETF
Portfolio of Investments (Continued)
October 31, 2024
| Rate (%) | Maturity | Face Amount | Value | |||||||||||
| RETAIL – 18.5% (Continued) | ||||||||||||||
| Macy’s Retail Holdings LLC | 4.50 | 12/15/34 | $ | 140,000 | $ | 117,105 | ||||||||
| Macy’s Retail Holdings LLC | 5.13 | 01/15/42 | 98,000 | 75,527 | ||||||||||
| Macy’s Retail Holdings LLC(1) | 5.88 | 04/01/29 | 120,000 | 117,371 | ||||||||||
| Macy’s Retail Holdings LLC(1) | 5.88 | 03/15/30 | 170,000 | 164,605 | ||||||||||
| Macy’s Retail Holdings LLC(1) | 6.13 | 03/15/32 | 180,000 | 172,219 | ||||||||||
| Michaels Cos, Inc.(1) | 5.25 | 05/01/28 | 343,000 | 247,247 | ||||||||||
| Michaels Cos, Inc.(1) | 7.88 | 05/01/29 | 442,000 | 235,307 | ||||||||||
| NMG Holding Co., Inc./Neiman Marcus Group LLC(1) | 8.50 | 10/01/28 | 440,000 | 447,747 | ||||||||||
| Nordstrom, Inc. | 4.00 | 03/15/27 | 141,000 | 135,842 | ||||||||||
| Nordstrom, Inc. | 4.25 | 08/01/31 | 170,000 | 149,945 | ||||||||||
| Nordstrom, Inc. | 4.38 | 04/01/30 | 202,000 | 183,310 | ||||||||||
| Nordstrom, Inc. | 5.00 | 01/15/44 | 379,000 | 285,651 | ||||||||||
| Nordstrom, Inc. | 6.95 | 03/15/28 | 118,000 | 122,366 | ||||||||||
| Penske Automotive Group, Inc. | 3.75 | 06/15/29 | 205,000 | 187,761 | ||||||||||
| PetSmart, Inc./PetSmart Finance Corp.(1) | 4.75 | 02/15/28 | 477,000 | 453,979 | ||||||||||
| PetSmart, Inc./PetSmart Finance Corp.(1) | 7.75 | 02/15/29 | 460,000 | 446,969 | ||||||||||
| QVC, Inc. | 5.45 | 08/15/34 | 153,000 | 100,739 | ||||||||||
| QVC, Inc. | 5.95 | 03/15/43 | 122,000 | 74,743 | ||||||||||
| QVC, Inc.(1) | 6.88 | 04/15/29 | 240,000 | 206,993 | ||||||||||
| Sally Holdings LLC/Sally Capital, Inc. | 6.75 | 03/01/32 | 240,000 | 243,196 | ||||||||||
| Sonic Automotive, Inc.(1) | 4.63 | 11/15/29 | 253,000 | 232,527 | ||||||||||
| Sonic Automotive, Inc.(1) | 4.88 | 11/15/31 | 200,000 | 180,004 | ||||||||||
| Staples, Inc.(1) | 12.75 | 01/15/30 | 330,000 | 262,635 | ||||||||||
| Victoria’s Secret & Co.(1) | 4.63 | 07/15/29 | 240,000 | 211,735 | ||||||||||
| Victra Holdings LLC/Victra Finance Corp.(1) | 8.75 | 09/15/29 | 170,000 | 177,638 | ||||||||||
| 13,229,478 | ||||||||||||||
| TOTAL CORPORATE BONDS (Cost - $69,487,341) | 70,026,788 | |||||||||||||
| SHORT-TERM INVESTMENTS – 1.0% | ||||||||||||||
| TIME DEPOSITS – 1.0% | ||||||||||||||
| JP Morgan Chase, New York | 4.18 | 11/01/24 | 701,876 | 701,876 | ||||||||||
| TOTAL SHORT-TERM INVESTMENTS (Cost - $701,876) | 701,876 | |||||||||||||
| TOTAL INVESTMENTS – 99.2% (Cost - $70,189,217) | $ | 70,728,664 | ||||||||||||
| OTHER ASSETS LESS LIABILITIES – 0.8% | 601,735 | |||||||||||||
| NET ASSETS – 100.0% | $ | 71,330,399 | ||||||||||||
| (1) | Security was purchased pursuant to Rule 144A under the Securities Act of 1933 and may not be resold subject to that Rule except to qualified institutional buyers. The aggregate value of Rule 144A holdings at October 31, 2024, amounts to $58,071,377 and represents 81.4% of net assets. These securities have been deemed liquid under procedures approved by the Trust’s Board of Trustees. |
| (2) | Security is perpetual in nature and has no stated maturity date. |
| (3) | Includes step-up bonds that pay an initial coupon rate for the first period and then a higher coupon rate for the following periods. The rate reported is the rate in effect as of October 31, 2024. |
The accompanying notes are an integral part of these financial statements.
44
BONDBLOXX ETF TRUST
BondBloxx USD High Yield Bond Consumer Non-Cyclicals Sector ETF
Portfolio of Investments
October 31, 2024
| Rate (%) | Maturity | Face Amount | Value | |||||||||||
| CORPORATE BONDS – 97.6% | ||||||||||||||
| AGRICULTURE – 1.8% | ||||||||||||||
| Darling Ingredients, Inc.(1) | 5.25 | 04/15/27 | $ | 118,000 | $ | 116,969 | ||||||||
| Darling Ingredients, Inc.(1) | 6.00 | 06/15/30 | 247,000 | 245,507 | ||||||||||
| Turning Point Brands, Inc.(1) | 5.63 | 02/15/26 | 60,000 | 59,827 | ||||||||||
| Vector Group Ltd.(1) | 10.50 | 11/01/26 | 134,000 | 134,166 | ||||||||||
| 556,469 | ||||||||||||||
| BEVERAGES – 1.1% | ||||||||||||||
| Primo Water Holdings, Inc.(1) | 4.38 | 04/30/29 | 177,000 | 166,934 | ||||||||||
| Triton Water Holdings, Inc.(1) | 6.25 | 04/01/29 | 182,000 | 179,971 | ||||||||||
| 346,905 | ||||||||||||||
| BUILDING MATERIALS – 0.8% | ||||||||||||||
| ACProducts Holdings, Inc.(1) | 6.38 | 05/15/29 | 114,000 | 72,533 | ||||||||||
| Masterbrand, Inc.(1) | 7.00 | 07/15/32 | 165,000 | 169,189 | ||||||||||
| 241,722 | ||||||||||||||
| CHEMICALS – 0.8% | ||||||||||||||
| Cerdia Finanz GmbH(1) | 9.38 | 10/03/31 | 220,000 | 226,809 | ||||||||||
| COSMETICS/PERSONAL CARE – 2.6% | ||||||||||||||
| Coty, Inc.(1) | 5.00 | 04/15/26 | 149,000 | 148,358 | ||||||||||
| Coty, Inc./HFC Prestige Products, Inc./HFC Prestige International US LLC(1) | 4.75 | 01/15/29 | 125,000 | 120,703 | ||||||||||
| Coty, Inc./HFC Prestige Products, Inc./HFC Prestige International US LLC(1) | 6.63 | 07/15/30 | 180,000 | 183,722 | ||||||||||
| Edgewell Personal Care Co.(1) | 4.13 | 04/01/29 | 118,000 | 110,278 | ||||||||||
| Edgewell Personal Care Co.(1) | 5.50 | 06/01/28 | 187,000 | 184,436 | ||||||||||
| Oriflame Investment Holding PLC(1) | 5.13 | 05/04/26 | 130,000 | 30,522 | ||||||||||
| 778,019 | ||||||||||||||
| ELECTRIC – 29.0% | ||||||||||||||
| AES Corp. | 7.60 | 01/15/55 | 235,000 | 243,686 | ||||||||||
| Algonquin Power & Utilities Corp. | 4.75 | 01/18/82 | 187,000 | 175,251 | ||||||||||
| Alpha Generation LLC(1) | 6.75 | 10/15/32 | 240,000 | 243,523 | ||||||||||
| Atlantica Sustainable Infrastructure PLC(1) | 4.13 | 06/15/28 | 102,000 | 97,330 | ||||||||||
| Calpine Corp.(1) | 3.75 | 03/01/31 | 211,000 | 190,353 | ||||||||||
| Calpine Corp.(1) | 4.50 | 02/15/28 | 291,000 | 280,462 | ||||||||||
| Calpine Corp.(1) | 4.63 | 02/01/29 | 160,000 | 151,867 | ||||||||||
| Calpine Corp.(1) | 5.00 | 02/01/31 | 210,000 | 198,411 | ||||||||||
| Calpine Corp.(1) | 5.13 | 03/15/28 | 345,000 | 337,500 | ||||||||||
| Clearway Energy Operating LLC(1) | 3.75 | 02/15/31 | 225,000 | 201,088 | ||||||||||
| Clearway Energy Operating LLC(1) | 3.75 | 01/15/32 | 81,000 | 71,840 | ||||||||||
| Clearway Energy Operating LLC(1) | 4.75 | 03/15/28 | 205,000 | 199,036 | ||||||||||
| DPL, Inc. | 4.35 | 04/15/29 | 87,000 | 81,777 | ||||||||||
| Edison International | 7.88 | 06/15/54 | 105,000 | 110,087 | ||||||||||
| Edison International | 8.13 | 06/15/53 | 125,000 | 131,456 | ||||||||||
| Electricite de France SA(1),(2) | 9.13 | - | 360,000 | 408,649 | ||||||||||
| Emera, Inc. | 6.75 | 06/15/76 | 290,000 | 291,445 | ||||||||||
| EUSHI Finance, Inc.(1) | 7.63 | 12/15/54 | 125,000 | 129,743 | ||||||||||
| Leeward Renewable Energy Operations LLC(1) | 4.25 | 07/01/29 | 86,000 | 80,538 | ||||||||||
| Lightning Power LLC(1) | 7.25 | 08/15/32 | 360,000 | 374,834 | ||||||||||
The accompanying notes are an integral part of these financial statements.
45
BONDBLOXX ETF TRUST
BondBloxx USD High Yield Bond Consumer Non-Cyclicals Sector ETF
Portfolio of Investments (Continued)
October 31, 2024
| Rate (%) | Maturity | Face Amount | Value | |||||||||||
| ELECTRIC – 29.0% (Continued) | ||||||||||||||
| NextEra Energy Operating Partners LP(1) | 3.88 | 10/15/26 | $ | 113,000 | $ | 109,024 | ||||||||
| NextEra Energy Operating Partners LP(1) | 4.50 | 09/15/27 | 134,000 | 128,753 | ||||||||||
| NextEra Energy Operating Partners LP(1) | 7.25 | 01/15/29 | 185,000 | 190,460 | ||||||||||
| NRG Energy, Inc.(1) | 3.38 | 02/15/29 | 121,000 | 110,431 | ||||||||||
| NRG Energy, Inc.(1) | 3.63 | 02/15/31 | 257,000 | 227,786 | ||||||||||
| NRG Energy, Inc.(1) | 3.88 | 02/15/32 | 120,000 | 106,650 | ||||||||||
| NRG Energy, Inc.(1) | 5.25 | 06/15/29 | 182,000 | 177,989 | ||||||||||
| NRG Energy, Inc. | 5.75 | 01/15/28 | 195,000 | 195,263 | ||||||||||
| NRG Energy, Inc.(1) | 6.00 | 02/01/33 | 220,000 | 218,920 | ||||||||||
| NRG Energy, Inc.(1) | 6.25 | 11/01/34 | 225,000 | 224,904 | ||||||||||
| Pattern Energy Operations LP/Pattern Energy Operations, Inc.(1) | 4.50 | 08/15/28 | 161,000 | 153,630 | ||||||||||
| PG&E Corp. | 5.00 | 07/01/28 | 242,000 | 236,230 | ||||||||||
| PG&E Corp. | 5.25 | 07/01/30 | 232,000 | 226,284 | ||||||||||
| PG&E Corp. | 7.38 | 03/15/55 | 250,000 | 258,855 | ||||||||||
| Talen Energy Supply LLC(1) | 8.63 | 06/01/30 | 290,000 | 313,055 | ||||||||||
| TransAlta Corp. | 6.50 | 03/15/40 | 70,000 | 72,088 | ||||||||||
| TransAlta Corp. | 7.75 | 11/15/29 | 107,000 | 113,083 | ||||||||||
| Vistra Operations Co. LLC(1) | 4.38 | 05/01/29 | 296,000 | 281,998 | ||||||||||
| Vistra Operations Co. LLC(1) | 5.00 | 07/31/27 | 322,000 | 317,965 | ||||||||||
| Vistra Operations Co. LLC(1) | 5.50 | 09/01/26 | 247,000 | 246,409 | ||||||||||
| Vistra Operations Co. LLC(1) | 5.63 | 02/15/27 | 307,000 | 306,400 | ||||||||||
| Vistra Operations Co. LLC(1) | 6.88 | 04/15/32 | 240,000 | 248,353 | ||||||||||
| Vistra Operations Co. LLC(1) | 7.75 | 10/15/31 | 350,000 | 370,014 | ||||||||||
| 8,833,420 | ||||||||||||||
| ELECTRICAL COMPONENTS & EQUIPMENT – 1.3% | ||||||||||||||
| Energizer Holdings, Inc.(1) | 4.38 | 03/31/29 | 193,000 | 180,706 | ||||||||||
| Energizer Holdings, Inc.(1) | 4.75 | 06/15/28 | 140,000 | 134,542 | ||||||||||
| Energizer Holdings, Inc.(1) | 6.50 | 12/31/27 | 70,000 | 70,866 | ||||||||||
| 386,114 | ||||||||||||||
| ENERGY-ALTERNATE SOURCES – 2.1% | ||||||||||||||
| Sunnova Energy Corp.(1) | 5.88 | 09/01/26 | 102,000 | 91,271 | ||||||||||
| Sunnova Energy Corp.(1) | 11.75 | 10/01/28 | 100,000 | 81,406 | ||||||||||
| TerraForm Power Operating LLC(1) | 4.75 | 01/15/30 | 162,000 | 151,314 | ||||||||||
| TerraForm Power Operating LLC(1) | 5.00 | 01/31/28 | 177,000 | 173,080 | ||||||||||
| Topaz Solar Farms LLC(1) | 5.75 | 09/30/39 | 133,856 | 133,451 | ||||||||||
| 630,522 | ||||||||||||||
| FOOD – 25.0% | ||||||||||||||
| Albertsons Cos, Inc./Safeway, Inc./New Albertsons LP/Albertsons LLC(1) | 3.25 | 03/15/26 | 68,000 | 65,894 | ||||||||||
| Albertsons Cos, Inc./Safeway, Inc./New Albertsons LP/Albertsons LLC(1) | 3.50 | 03/15/29 | 138,000 | 127,635 | ||||||||||
| Albertsons Cos, Inc./Safeway, Inc./New Albertsons LP/Albertsons LLC(1) | 4.63 | 01/15/27 | 133,000 | 130,574 | ||||||||||
| Albertsons Cos, Inc./Safeway, Inc./New Albertsons LP/Albertsons LLC(1) | 4.88 | 02/15/30 | 92,000 | 89,701 | ||||||||||
| Albertsons Cos, Inc./Safeway, Inc./New Albertsons LP/Albertsons LLC(1) | 5.88 | 02/15/28 | 67,000 | 67,168 | ||||||||||
| Albertsons Cos, Inc./Safeway, Inc./New Albertsons LP/Albertsons LLC(1) | 6.50 | 02/15/28 | 80,000 | 81,940 | ||||||||||
| Albertsons Cos, Inc./Safeway, Inc./New Albertsons LP/Albertsons LLC(1) | 7.50 | 03/15/26 | 60,000 | 60,740 | ||||||||||
| Aragvi Finance International DAC(1) | 8.45 | 04/29/26 | 128,000 | 127,590 | ||||||||||
| B&G Foods, Inc. | 5.25 | 09/15/27 | 129,000 | 125,314 | ||||||||||
| B&G Foods, Inc.(1) | 8.00 | 09/15/28 | 195,000 | 202,829 | ||||||||||
The accompanying notes are an integral part of these financial statements.
46
BONDBLOXX ETF TRUST
BondBloxx USD High Yield Bond Consumer Non-Cyclicals Sector ETF
Portfolio of Investments (Continued)
October 31, 2024
| Rate (%) | Maturity | Face Amount | Value | |||||||||||
| FOOD – 25.0% (Continued) | ||||||||||||||
| C&S Group Enterprises LLC(1) | 5.00 | 12/15/28 | $ | 102,000 | $ | 84,552 | ||||||||
| Chobani LLC/Chobani Finance Corp., Inc.(1) | 4.63 | 11/15/28 | 112,000 | 107,656 | ||||||||||
| Chobani LLC/Chobani Finance Corp., Inc.(1) | 7.63 | 07/01/29 | 120,000 | 125,252 | ||||||||||
| Fiesta Purchaser, Inc.(1) | 7.88 | 03/01/31 | 125,000 | 131,211 | ||||||||||
| Fiesta Purchaser, Inc.(1) | 9.63 | 09/15/32 | 100,000 | 104,775 | ||||||||||
| Ingles Markets, Inc.(1) | 4.00 | 06/15/31 | 91,000 | 81,295 | ||||||||||
| KeHE Distributors LLC/KeHE Finance Corp./NextWave Distribution, Inc.(1) | 9.00 | 02/15/29 | 245,000 | 253,994 | ||||||||||
| Kroger Co. | 4.65 | 09/15/29 | 220,000 | 220,042 | ||||||||||
| Kroger Co. | 4.70 | 08/15/26 | 415,000 | 416,452 | ||||||||||
| Lamb Weston Holdings, Inc.(1) | 4.13 | 01/31/30 | 230,000 | 213,722 | ||||||||||
| Lamb Weston Holdings, Inc.(1) | 4.38 | 01/31/32 | 165,000 | 151,339 | ||||||||||
| Lamb Weston Holdings, Inc.(1) | 4.88 | 05/15/28 | 127,000 | 124,539 | ||||||||||
| Performance Food Group, Inc.(1) | 4.25 | 08/01/29 | 237,000 | 222,069 | ||||||||||
| Performance Food Group, Inc.(1) | 5.50 | 10/15/27 | 257,000 | 255,028 | ||||||||||
| Performance Food Group, Inc.(1) | 6.13 | 09/15/32 | 245,000 | 246,331 | ||||||||||
| Pilgrim’s Pride Corp. | 3.50 | 03/01/32 | 205,000 | 179,563 | ||||||||||
| Pilgrim’s Pride Corp. | 4.25 | 04/15/31 | 205,000 | 190,761 | ||||||||||
| Pilgrim’s Pride Corp. | 6.25 | 07/01/33 | 240,000 | 249,435 | ||||||||||
| Pilgrim’s Pride Corp. | 6.88 | 05/15/34 | 125,000 | 135,973 | ||||||||||
| Post Holdings, Inc.(1) | 4.50 | 09/15/31 | 246,000 | 224,112 | ||||||||||
| Post Holdings, Inc.(1) | 4.63 | 04/15/30 | 353,000 | 330,202 | ||||||||||
| Post Holdings, Inc.(1) | 5.50 | 12/15/29 | 315,000 | 307,499 | ||||||||||
| Post Holdings, Inc.(1) | 5.63 | 01/15/28 | 104,000 | 104,933 | ||||||||||
| Post Holdings, Inc.(1) | 6.25 | 02/15/32 | 245,000 | 248,028 | ||||||||||
| Post Holdings, Inc.(1) | 6.25 | 10/15/34 | 100,000 | 99,145 | ||||||||||
| Post Holdings, Inc.(1) | 6.38 | 03/01/33 | 295,000 | 292,592 | ||||||||||
| Safeway, Inc. | 7.25 | 02/01/31 | 25,000 | 25,575 | ||||||||||
| Sigma Holdco BV(1) | 7.88 | 05/15/26 | 74,000 | 73,378 | ||||||||||
| Simmons Foods, Inc./Simmons Prepared Foods, Inc./Simmons Pet Food, Inc./Simmons Feed(1) | 4.63 | 03/01/29 | 215,000 | 199,383 | ||||||||||
| TreeHouse Foods, Inc. | 4.00 | 09/01/28 | 128,000 | 116,781 | ||||||||||
| United Natural Foods, Inc.(1) | 6.75 | 10/15/28 | 128,000 | 123,660 | ||||||||||
| US Foods, Inc.(1) | 4.63 | 06/01/30 | 123,000 | 116,817 | ||||||||||
| US Foods, Inc.(1) | 4.75 | 02/15/29 | 215,000 | 207,353 | ||||||||||
| US Foods, Inc.(1) | 5.75 | 04/15/33 | 110,000 | 108,601 | ||||||||||
| US Foods, Inc.(1) | 6.88 | 09/15/28 | 125,000 | 128,645 | ||||||||||
| US Foods, Inc.(1) | 7.25 | 01/15/32 | 125,000 | 130,033 | ||||||||||
| Viking Baked Goods Acquisition Corp.(1) | 8.63 | 11/01/31 | 215,000 | 214,853 | ||||||||||
| 7,624,964 | ||||||||||||||
| GAS – 1.3% | ||||||||||||||
| AmeriGas Partners LP/AmeriGas Finance Corp. | 5.75 | 05/20/27 | 118,000 | 113,916 | ||||||||||
| AmeriGas Partners LP/AmeriGas Finance Corp. | 5.88 | 08/20/26 | 162,000 | 158,880 | ||||||||||
| AmeriGas Partners LP/AmeriGas Finance Corp.(1) | 9.38 | 06/01/28 | 125,000 | 128,723 | ||||||||||
| 401,519 | ||||||||||||||
| HOME FURNISHINGS – 1.1% | ||||||||||||||
| Tempur Sealy International, Inc.(1) | 3.88 | 10/15/31 | 185,000 | 161,122 | ||||||||||
| Tempur Sealy International, Inc.(1) | 4.00 | 04/15/29 | 202,000 | 186,336 | ||||||||||
| 347,458 | ||||||||||||||
The accompanying notes are an integral part of these financial statements.
47
BONDBLOXX ETF TRUST
BondBloxx USD High Yield Bond Consumer Non-Cyclicals Sector ETF
Portfolio of Investments (Continued)
October 31, 2024
| Rate (%) | Maturity | Face Amount | Value | |||||||||||
| HOUSEHOLD PRODUCTS/WARES – 2.1% | ||||||||||||||
| ACCO Brands Corp.(1) | 4.25 | 03/15/29 | $ | 140,000 | $ | 128,586 | ||||||||
| Central Garden & Pet Co. | 4.13 | 10/15/30 | 123,000 | 111,547 | ||||||||||
| Central Garden & Pet Co.(1) | 4.13 | 04/30/31 | 102,000 | 91,639 | ||||||||||
| Central Garden & Pet Co. | 5.13 | 02/01/28 | 70,000 | 69,236 | ||||||||||
| Kronos Acquisition Holdings, Inc.(1) | 8.25 | 06/30/31 | 150,000 | 148,718 | ||||||||||
| Kronos Acquisition Holdings, Inc.(1) | 10.75 | 06/30/32 | 90,000 | 83,961 | ||||||||||
| 633,687 | ||||||||||||||
| HOUSEWARES – 5.3% | ||||||||||||||
| CD&R Smokey Buyer, Inc./Radio Systems Corp.(1) | 9.50 | 10/15/29 | 185,000 | 187,621 | ||||||||||
| Newell Brands, Inc. | 5.70 | 04/01/26 | 473,000 | 474,409 | ||||||||||
| Newell Brands, Inc. | 6.38 | 09/15/27 | 124,000 | 125,706 | ||||||||||
| Newell Brands, Inc. | 6.63 | 09/15/29 | 118,000 | 119,866 | ||||||||||
| Newell Brands, Inc. | 6.88 | 04/01/36 | 102,000 | 101,636 | ||||||||||
| Newell Brands, Inc. | 7.00 | 04/01/46 | 165,000 | 153,333 | ||||||||||
| Scotts Miracle-Gro Co. | 4.00 | 04/01/31 | 110,000 | 98,598 | ||||||||||
| Scotts Miracle-Gro Co. | 4.38 | 02/01/32 | 100,000 | 90,606 | ||||||||||
| Scotts Miracle-Gro Co. | 4.50 | 10/15/29 | 105,000 | 99,279 | ||||||||||
| Scotts Miracle-Gro Co. | 5.25 | 12/15/26 | 55,000 | 55,009 | ||||||||||
| SWF Holdings I Corp.(1) | 6.50 | 10/01/29 | 160,000 | 104,200 | ||||||||||
| 1,610,263 | ||||||||||||||
| LEISURE TIME – 1.8% | ||||||||||||||
| Acushnet Co.(1) | 7.38 | 10/15/28 | 80,000 | 83,498 | ||||||||||
| Amer Sports Co.(1) | 6.75 | 02/16/31 | 190,000 | 193,176 | ||||||||||
| MajorDrive Holdings IV LLC(1) | 6.38 | 06/01/29 | 134,000 | 128,614 | ||||||||||
| Vista Outdoor, Inc.(1) | 4.50 | 03/15/29 | 128,000 | 130,332 | ||||||||||
| 535,620 | ||||||||||||||
| PHARMACEUTICALS – 1.6% | ||||||||||||||
| BellRing Brands, Inc.(1) | 7.00 | 03/15/30 | 200,000 | 208,355 | ||||||||||
| HLF Financing Sarl LLC/Herbalife International, Inc.(1) | 4.88 | 06/01/29 | 135,000 | 93,204 | ||||||||||
| HLF Financing Sarl LLC/Herbalife International, Inc.(1) | 12.25 | 04/15/29 | 195,000 | 196,343 | ||||||||||
| 497,902 | ||||||||||||||
| RETAIL – 19.9% | ||||||||||||||
| 1011778 BC ULC/New Red Finance, Inc.(1) | 3.50 | 02/15/29 | 173,000 | 159,880 | ||||||||||
| 1011778 BC ULC/New Red Finance, Inc.(1) | 3.88 | 01/15/28 | 367,000 | 350,094 | ||||||||||
| 1011778 BC ULC/New Red Finance, Inc.(1) | 4.00 | 10/15/30 | 693,000 | 626,562 | ||||||||||
| 1011778 BC ULC/New Red Finance, Inc.(1) | 4.38 | 01/15/28 | 187,000 | 180,028 | ||||||||||
| 1011778 BC ULC/New Red Finance, Inc.(1) | 5.63 | 09/15/29 | 125,000 | 124,840 | ||||||||||
| 1011778 BC ULC/New Red Finance, Inc.(1) | 6.13 | 06/15/29 | 295,000 | 300,365 | ||||||||||
| Arko Corp.(1) | 5.13 | 11/15/29 | 117,000 | 107,912 | ||||||||||
| Bloomin’ Brands, Inc./OSI Restaurant Partners LLC(1) | 5.13 | 04/15/29 | 70,000 | 65,085 | ||||||||||
| Brinker International, Inc.(1) | 8.25 | 07/15/30 | 90,000 | 95,876 | ||||||||||
| CEC Entertainment LLC(1) | 6.75 | 05/01/26 | 167,000 | 166,185 | ||||||||||
| Dave & Buster’s, Inc.(1) | 7.63 | 11/01/25 | 97,000 | 97,000 | ||||||||||
| eG Global Finance PLC(1) | 12.00 | 11/30/28 | 265,000 | 294,899 | ||||||||||
| Ferrellgas LP/Ferrellgas Finance Corp.(1) | 5.38 | 04/01/26 | 150,000 | 149,070 | ||||||||||
| Ferrellgas LP/Ferrellgas Finance Corp.(1) | 5.88 | 04/01/29 | 204,000 | 190,611 | ||||||||||
The accompanying notes are an integral part of these financial statements.
48
BONDBLOXX ETF TRUST
BondBloxx USD High Yield Bond Consumer Non-Cyclicals Sector ETF
Portfolio of Investments (Continued)
October 31, 2024
| Rate (%) | Maturity | Face Amount | Value | |||||||||||
| RETAIL – 19.9% (Continued) | ||||||||||||||
| GPS Hospitality Holding Co. LLC/GPS FinCo., Inc.(1) | 7.00 | 08/15/28 | $ | 106,000 | $ | 65,838 | ||||||||
| KFC Holding Co./Pizza Hut Holdings LLC/Taco Bell of America LLC(1) | 4.75 | 06/01/27 | 178,000 | 176,509 | ||||||||||
| Marks & Spencer PLC(1) | 7.13 | 12/01/37 | 75,000 | 82,933 | ||||||||||
| Murphy Oil USA, Inc.(1) | 3.75 | 02/15/31 | 117,000 | 104,094 | ||||||||||
| Murphy Oil USA, Inc. | 4.75 | 09/15/29 | 130,000 | 124,359 | ||||||||||
| Murphy Oil USA, Inc. | 5.63 | 05/01/27 | 65,000 | 65,222 | ||||||||||
| Papa John’s International, Inc.(1) | 3.88 | 09/15/29 | 102,000 | 93,133 | ||||||||||
| Raising Cane’s Restaurants LLC(1) | 9.38 | 05/01/29 | 130,000 | 139,897 | ||||||||||
| Sizzling Platter LLC/Sizzling Platter Finance Corp.(1) | 8.50 | 11/28/25 | 90,000 | 90,191 | ||||||||||
| Suburban Propane Partners LP/Suburban Energy Finance Corp.(1) | 5.00 | 06/01/31 | 152,000 | 139,574 | ||||||||||
| Suburban Propane Partners LP/Suburban Energy Finance Corp. | 5.88 | 03/01/27 | 90,000 | 89,956 | ||||||||||
| Walgreens Boots Alliance, Inc. | 3.20 | 04/15/30 | 125,000 | 99,493 | ||||||||||
| Walgreens Boots Alliance, Inc. | 3.45 | 06/01/26 | 340,000 | 327,322 | ||||||||||
| Walgreens Boots Alliance, Inc. | 4.10 | 04/15/50 | 155,000 | 100,127 | ||||||||||
| Walgreens Boots Alliance, Inc. | 4.50 | 11/18/34 | 70,000 | 54,492 | ||||||||||
| Walgreens Boots Alliance, Inc. | 4.65 | 06/01/46 | 60,000 | 39,225 | ||||||||||
| Walgreens Boots Alliance, Inc. | 4.80 | 11/18/44 | 165,000 | 121,551 | ||||||||||
| Walgreens Boots Alliance, Inc. | 8.13 | 08/15/29 | 190,000 | 189,007 | ||||||||||
| Yum! Brands, Inc. | 3.63 | 03/15/31 | 248,000 | 224,847 | ||||||||||
| Yum! Brands, Inc. | 4.63 | 01/31/32 | 263,000 | 246,865 | ||||||||||
| Yum! Brands, Inc.(1) | 4.75 | 01/15/30 | 199,000 | 192,757 | ||||||||||
| Yum! Brands, Inc. | 5.35 | 11/01/43 | 55,000 | 53,607 | ||||||||||
| Yum! Brands, Inc. | 5.38 | 04/01/32 | 245,000 | 238,776 | ||||||||||
| Yum! Brands, Inc. | 6.88 | 11/15/37 | 90,000 | 100,106 | ||||||||||
| 6,068,288 | ||||||||||||||
| TOTAL CORPORATE BONDS (Cost - $29,569,732) | 29,719,681 | |||||||||||||
| SHORT-TERM INVESTMENTS – 2.7% | ||||||||||||||
| TIME DEPOSITS – 2.7% | ||||||||||||||
| JP Morgan Chase, New York | 4.18 | 11/01/24 | 836,450 | 836,450 | ||||||||||
| TOTAL SHORT-TERM INVESTMENTS (Cost - $836,450) | 836,450 | |||||||||||||
| TOTAL INVESTMENTS – 100.3% (Cost - $30,406,182) | $ | 30,556,131 | ||||||||||||
| OTHER ASSETS LESS LIABILITIES – (0.3)% | (94,740 | ) | ||||||||||||
| NET ASSETS – 100.0% | $ | 30,461,391 | ||||||||||||
| (1) | Security was purchased pursuant to Rule 144A under the Securities Act of 1933 and may not be resold subject to that Rule except to qualified institutional buyers. The aggregate value of Rule 144A holdings at October 31, 2024, amounts to $22,077,304 and represents 72.5% of net assets. These securities have been deemed liquid under procedures approved by the Trust’s Board of Trustees. |
| (2) | Security is perpetual in nature and has no stated maturity date. |
The accompanying notes are an integral part of these financial statements.
49
BONDBLOXX ETF TRUST
BondBloxx USD High Yield Bond Sector Rotation ETF
Portfolio of Investments
October 31, 2024
| Shares | Value | |||||||
| EXCHANGE-TRADED FUNDS – 100.0% | ||||||||
| UNITED STATES(a) – 100.0% | ||||||||
| BondBloxx USD High Yield Bond Consumer Cyclicals Sector ETF | 95,009 | $ | 3,560,158 | |||||
| BondBloxx USD High Yield Bond Consumer Non-Cyclicals Sector ETF | 65,861 | 2,508,764 | ||||||
| BondBloxx USD High Yield Bond Energy Sector ETF | 72,954 | 2,829,791 | ||||||
| BondBloxx USD High Yield Bond Financial & REIT Sector ETF | 105,400 | 3,949,306 | ||||||
| BondBloxx USD High Yield Bond Healthcare Sector ETF | 79,437 | 2,791,909 | ||||||
| BondBloxx USD High Yield Bond Industrial Sector ETF | 178,340 | 6,792,204 | ||||||
| BondBloxx USD High Yield Bond Telecom, Media & Technology Sector ETF | 164,000 | 5,722,665 | ||||||
| TOTAL EXCHANGE-TRADED FUNDS (Cost - $27,441,495) | 28,154,797 | |||||||
| Rate (%) | Maturity | Face | ||||||||||||
| SHORT-TERM INVESTMENTS – 0.1% | ||||||||||||||
| TIME DEPOSITS – 0.1% | ||||||||||||||
| JP Morgan Chase, New York | 4.18 | 11/01/24 | $ | 37,804 | 37,804 | |||||||||
| TOTAL SHORT-TERM INVESTMENTS (Cost - $37,804) | 37,804 | |||||||||||||
| TOTAL INVESTMENTS – 100.1% (Cost - $27,479,299) | $ | 28,192,601 | ||||||||||||
| OTHER ASSETS LESS LIABILITIES – (0.1)% | (20,824 | ) | ||||||||||||
| NET ASSETS – 100.0% | $ | 28,171,777 | ||||||||||||
| (a) | Represents investments in Affiliated Funds. |
The accompanying notes are an integral part of these financial statements.
50
BONDBLOXX ETF TRUST
BondBloxx BB Rated USD High Yield Corporate Bond ETF
Portfolio of Investments
October 31, 2024
| Rate (%) | Maturity | Face Amount | Value | |||||||||||
CORPORATE BONDS – 97.8% | ||||||||||||||
| ADVERTISING – 0.3% | ||||||||||||||
| Lamar Media Corp. | 3.63 | 01/15/31 | $ | 50,000 | $ | 44,671 | ||||||||
| Lamar Media Corp. | 3.75 | 02/15/28 | 55,000 | 52,337 | ||||||||||
| Lamar Media Corp. | 4.00 | 02/15/30 | 45,000 | 41,641 | ||||||||||
| Lamar Media Corp. | 4.88 | 01/15/29 | 35,000 | 34,097 | ||||||||||
| Outfront Media Capital LLC/Outfront Media Capital Corp.(1) | 7.38 | 02/15/31 | 35,000 | 36,994 | ||||||||||
| 209,740 | ||||||||||||||
| AEROSPACE/DEFENSE – 1.9% | ||||||||||||||
| AAR Escrow Issuer LLC(1) | 6.75 | 03/15/29 | 50,000 | 51,149 | ||||||||||
| Moog, Inc.(1) | 4.25 | 12/15/27 | 45,000 | 42,940 | ||||||||||
| Spirit AeroSystems, Inc. | 3.85 | 06/15/26 | 25,000 | 24,336 | ||||||||||
| Spirit AeroSystems, Inc.(1) | 9.38 | 11/30/29 | 80,000 | 86,381 | ||||||||||
| TransDigm, Inc.(1) | 6.00 | 01/15/33 | 115,000 | 114,075 | ||||||||||
| TransDigm, Inc.(1) | 6.38 | 03/01/29 | 230,000 | 233,746 | ||||||||||
| TransDigm, Inc.(1) | 6.63 | 03/01/32 | 205,000 | 208,727 | ||||||||||
| TransDigm, Inc.(1) | 6.75 | 08/15/28 | 180,000 | 184,088 | ||||||||||
| TransDigm, Inc.(1) | 6.88 | 12/15/30 | 120,000 | 123,116 | ||||||||||
| TransDigm, Inc.(1) | 7.13 | 12/01/31 | 109,000 | 112,926 | ||||||||||
| 1,181,484 | ||||||||||||||
| AGRICULTURE – 0.2% | ||||||||||||||
| Darling Ingredients, Inc.(1) | 5.25 | 04/15/27 | 40,000 | 39,651 | ||||||||||
| Darling Ingredients, Inc.(1) | 6.00 | 06/15/30 | 85,000 | 84,486 | ||||||||||
| 124,137 | ||||||||||||||
| AIRLINES – 2.0% | ||||||||||||||
| Air Canada(1) | 3.88 | 08/15/26 | 105,000 | 101,660 | ||||||||||
| Allegiant Travel Co.(1) | 7.25 | 08/15/27 | 45,000 | 44,369 | ||||||||||
| American Airlines, Inc.(1) | 7.25 | 02/15/28 | 84,000 | 85,448 | ||||||||||
| American Airlines, Inc.(1) | 8.50 | 05/15/29 | 95,000 | 99,898 | ||||||||||
| American Airlines, Inc./AAdvantage Loyalty IP Ltd.(1) | 5.50 | 04/20/26 | 150,000 | 149,659 | ||||||||||
| American Airlines, Inc./AAdvantage Loyalty IP Ltd.(1) | 5.75 | 04/20/29 | 240,000 | 237,854 | ||||||||||
| JetBlue Airways Corp./JetBlue Loyalty LP(1) | 9.88 | 09/20/31 | 180,000 | 187,183 | ||||||||||
| United Airlines, Inc.(1) | 4.38 | 04/15/26 | 180,000 | 177,004 | ||||||||||
| United Airlines, Inc.(1) | 4.63 | 04/15/29 | 165,000 | 158,038 | ||||||||||
| 1,241,113 | ||||||||||||||
| APPAREL – 0.5% | ||||||||||||||
| Kontoor Brands, Inc.(1) | 4.13 | 11/15/29 | 35,000 | 32,659 | ||||||||||
| Levi Strauss & Co.(1) | 3.50 | 03/01/31 | 45,000 | 39,797 | ||||||||||
| Under Armour, Inc. | 3.25 | 06/15/26 | 55,000 | 52,954 | ||||||||||
| VF Corp. | 2.80 | 04/23/27 | 45,000 | 42,504 | ||||||||||
| VF Corp. | 2.95 | 04/23/30 | 50,000 | 43,195 | ||||||||||
| VF Corp. | 6.00 | 10/15/33 | 44,000 | 44,067 | ||||||||||
| VF Corp. | 6.45 | 11/01/37 | 25,000 | 25,518 | ||||||||||
| William Carter Co.(1) | 5.63 | 03/15/27 | 45,000 | 44,777 | ||||||||||
| 325,471 | ||||||||||||||
The accompanying notes are an integral part of these financial statements.
51
BONDBLOXX ETF TRUST
BondBloxx BB Rated USD High Yield Corporate Bond ETF
Portfolio of Investments (Continued)
October 31, 2024
| Rate (%) | Maturity | Face Amount | Value | |||||||||||
| AUTO MANUFACTURERS – 0.4% | ||||||||||||||
| Allison Transmission, Inc.(1) | 3.75 | 01/30/31 | $ | 90,000 | $ | 79,944 | ||||||||
| Allison Transmission, Inc.(1) | 4.75 | 10/01/27 | 30,000 | 29,281 | ||||||||||
| Allison Transmission, Inc.(1) | 5.88 | 06/01/29 | 40,000 | 39,897 | ||||||||||
| Jaguar Land Rover Automotive PLC(1) | 4.50 | 10/01/27 | 40,000 | 38,705 | ||||||||||
| Jaguar Land Rover Automotive PLC(1) | 5.50 | 07/15/29 | 35,000 | 34,185 | ||||||||||
| Jaguar Land Rover Automotive PLC(1) | 5.88 | 01/15/28 | 50,000 | 49,485 | ||||||||||
| 271,497 | ||||||||||||||
| AUTO PARTS & EQUIPMENT – 1.0% | ||||||||||||||
| Adient Global Holdings Ltd.(1) | 7.00 | 04/15/28 | 40,000 | 40,699 | ||||||||||
| Clarios Global LP/Clarios US Finance Co.(1) | 6.25 | 05/15/26 | 80,000 | 80,210 | ||||||||||
| Clarios Global LP/Clarios US Finance Co.(1) | 6.75 | 05/15/28 | 65,000 | 66,591 | ||||||||||
| Dana, Inc. | 4.25 | 09/01/30 | 60,000 | 52,514 | ||||||||||
| Dana, Inc. | 5.38 | 11/15/27 | 55,000 | 53,845 | ||||||||||
| Dana, Inc. | 5.63 | 06/15/28 | 20,000 | 19,431 | ||||||||||
| Phinia, Inc.(1) | 6.63 | 10/15/32 | 35,000 | 34,914 | ||||||||||
| Phinia, Inc.(1) | 6.75 | 04/15/29 | 50,000 | 51,103 | ||||||||||
| ZF North America Capital, Inc.(1) | 6.75 | 04/23/30 | 70,000 | 69,059 | ||||||||||
| ZF North America Capital, Inc.(1) | 6.88 | 04/14/28 | 55,000 | 55,527 | ||||||||||
| ZF North America Capital, Inc.(1) | 6.88 | 04/23/32 | 60,000 | 58,666 | ||||||||||
| ZF North America Capital, Inc.(1) | 7.13 | 04/14/30 | 50,000 | 50,325 | ||||||||||
| 632,884 | ||||||||||||||
| BANKS – 1.5% | ||||||||||||||
| Banc of California | 3.25 | 05/01/31 | 35,000 | 32,064 | ||||||||||
| Dresdner Funding Trust I(1) | 8.15 | 06/30/31 | 90,000 | 100,102 | ||||||||||
| Intesa Sanpaolo SpA(1) | 4.20 | 06/01/32 | 60,000 | 52,565 | ||||||||||
| Intesa Sanpaolo SpA(1) | 4.95 | 06/01/42 | 70,000 | 54,318 | ||||||||||
| Intesa Sanpaolo SpA(1) | 5.71 | 01/15/26 | 130,000 | 130,208 | ||||||||||
| Popular, Inc. | 7.25 | 03/13/28 | 35,000 | 36,293 | ||||||||||
| Standard Chartered PLC(1),(2) | 7.01 | - | 65,000 | 69,273 | ||||||||||
| Texas Capital Bancshares, Inc. | 4.00 | 05/06/31 | 35,000 | 33,253 | ||||||||||
| UniCredit SpA(1) | 5.46 | 06/30/35 | 125,000 | 120,658 | ||||||||||
| UniCredit SpA(1) | 5.86 | 06/19/32 | 90,000 | 89,715 | ||||||||||
| UniCredit SpA(1) | 7.30 | 04/02/34 | 110,000 | 115,193 | ||||||||||
| Valley National Bancorp | 3.00 | 06/15/31 | 30,000 | 25,541 | ||||||||||
| Western Alliance Bancorp. | 3.00 | 06/15/31 | 50,000 | 46,315 | ||||||||||
| 905,498 | ||||||||||||||
| BUILDING MATERIALS – 2.6% | ||||||||||||||
| Boise Cascade Co.(1) | 4.88 | 07/01/30 | 35,000 | 33,235 | ||||||||||
| Builders FirstSource, Inc.(1) | 4.25 | 02/01/32 | 110,000 | 98,490 | ||||||||||
| Builders FirstSource, Inc.(1) | 5.00 | 03/01/30 | 45,000 | 43,033 | ||||||||||
| Builders FirstSource, Inc.(1) | 6.38 | 06/15/32 | 55,000 | 55,365 | ||||||||||
| Builders FirstSource, Inc.(1) | 6.38 | 03/01/34 | 90,000 | 90,838 | ||||||||||
| EMRLD Borrower LP/Emerald Co.-Issuer, Inc.(1) | 6.63 | 12/15/30 | 245,000 | 249,477 | ||||||||||
| EMRLD Borrower LP/Emerald Co.-Issuer, Inc.(1) | 6.75 | 07/15/31 | 40,000 | 40,918 | ||||||||||
| Knife River Corp.(1) | 7.75 | 05/01/31 | 35,000 | 36,698 | ||||||||||
The accompanying notes are an integral part of these financial statements.
52
BONDBLOXX ETF TRUST
BondBloxx BB Rated USD High Yield Corporate Bond ETF
Portfolio of Investments (Continued)
October 31, 2024
| Rate (%) | Maturity | Face Amount | Value | |||||||||||
| BUILDING MATERIALS – 2.6% (Continued) | ||||||||||||||
| Louisiana-Pacific Corp.(1) | 3.63 | 03/15/29 | $ | 35,000 | $ | 32,826 | ||||||||
| Masterbrand, Inc.(1) | 7.00 | 07/15/32 | 60,000 | 61,523 | ||||||||||
| Miter Brands Acquisition Holdco, Inc./MIWD Borrower LLC(1) | 6.75 | 04/01/32 | 65,000 | 66,162 | ||||||||||
| Smyrna Ready Mix Concrete LLC(1) | 6.00 | 11/01/28 | 90,000 | 89,344 | ||||||||||
| Smyrna Ready Mix Concrete LLC(1) | 8.88 | 11/15/31 | 100,000 | 105,135 | ||||||||||
| Standard Industries, Inc./NY(1) | 3.38 | 01/15/31 | 100,000 | 86,901 | ||||||||||
| Standard Industries, Inc./NY(1) | 4.38 | 07/15/30 | 140,000 | 128,757 | ||||||||||
| Standard Industries, Inc./NY(1) | 4.75 | 01/15/28 | 80,000 | 77,232 | ||||||||||
| Standard Industries, Inc./NY(1) | 5.00 | 02/15/27 | 75,000 | 73,501 | ||||||||||
| Standard Industries, Inc./NY(1) | 6.50 | 08/15/32 | 39,000 | 39,279 | ||||||||||
| Summit Materials LLC/Summit Materials Finance Corp.(1) | 5.25 | 01/15/29 | 60,000 | 59,538 | ||||||||||
| Summit Materials LLC/Summit Materials Finance Corp.(1) | 6.50 | 03/15/27 | 25,000 | 25,044 | ||||||||||
| Summit Materials LLC/Summit Materials Finance Corp.(1) | 7.25 | 01/15/31 | 65,000 | 67,601 | ||||||||||
| 1,560,897 | ||||||||||||||
| CHEMICALS – 2.2% | ||||||||||||||
| Ashland, Inc.(1) | 3.38 | 09/01/31 | 40,000 | 34,631 | ||||||||||
| Ashland, Inc. | 6.88 | 05/15/43 | 25,000 | 26,711 | ||||||||||
| Avient Corp.(1) | 6.25 | 11/01/31 | 44,000 | 44,158 | ||||||||||
| Avient Corp.(1) | 7.13 | 08/01/30 | 75,000 | 77,203 | ||||||||||
| Axalta Coating Systems Dutch Holding B BV(1) | 7.25 | 02/15/31 | 45,000 | 47,083 | ||||||||||
| Axalta Coating Systems LLC(1) | 3.38 | 02/15/29 | 60,000 | 55,240 | ||||||||||
| Axalta Coating Systems LLC/Axalta Coating Systems Dutch Holding B BV(1) | 4.75 | 06/15/27 | 45,000 | 44,138 | ||||||||||
| Element Solutions, Inc.(1) | 3.88 | 09/01/28 | 70,000 | 67,502 | ||||||||||
| HB Fuller Co. | 4.00 | 02/15/27 | 50,000 | 48,821 | ||||||||||
| INEOS Finance PLC(1) | 6.75 | 05/15/28 | 35,000 | 35,415 | ||||||||||
| INEOS Finance PLC(1) | 7.50 | 04/15/29 | 65,000 | 67,142 | ||||||||||
| INEOS Quattro Finance 2 PLC(1) | 9.63 | 03/15/29 | 40,000 | 42,423 | ||||||||||
| Ingevity Corp.(1) | 3.88 | 11/01/28 | 45,000 | 41,458 | ||||||||||
| Methanex Corp. | 5.13 | 10/15/27 | 60,000 | 58,442 | ||||||||||
| Methanex Corp. | 5.25 | 12/15/29 | 55,000 | 53,126 | ||||||||||
| Methanex Corp. | 5.65 | 12/01/44 | 30,000 | 26,615 | ||||||||||
| Minerals Technologies, Inc.(1) | 5.00 | 07/01/28 | 40,000 | 38,753 | ||||||||||
| NOVA Chemicals Corp.(1) | 4.25 | 05/15/29 | 45,000 | 41,037 | ||||||||||
| NOVA Chemicals Corp.(1) | 5.25 | 06/01/27 | 85,000 | 83,503 | ||||||||||
| NOVA Chemicals Corp.(1) | 8.50 | 11/15/28 | 40,000 | 42,460 | ||||||||||
| NOVA Chemicals Corp.(1) | 9.00 | 02/15/30 | 55,000 | 58,648 | ||||||||||
| Nufarm Australia Ltd./Nufarm Americas, Inc.(1) | 5.00 | 01/27/30 | 35,000 | 32,465 | ||||||||||
| OCI NV(1) | 6.70 | 03/16/33 | 44,000 | 43,911 | ||||||||||
| Olin Corp. | 5.00 | 02/01/30 | 40,000 | 38,211 | ||||||||||
| Olin Corp. | 5.13 | 09/15/27 | 45,000 | 44,423 | ||||||||||
| Olin Corp. | 5.63 | 08/01/29 | 60,000 | 59,212 | ||||||||||
| SNF Group SACA(1) | 3.13 | 03/15/27 | 40,000 | 38,089 | ||||||||||
| SNF Group SACA(1) | 3.38 | 03/15/30 | 20,000 | 17,985 | ||||||||||
| 1,308,805 | ||||||||||||||
The accompanying notes are an integral part of these financial statements.
53
BONDBLOXX ETF TRUST
BondBloxx BB Rated USD High Yield Corporate Bond ETF
Portfolio of Investments (Continued)
October 31, 2024
| Rate (%) | Maturity | Face Amount | Value | |||||||||||
| COAL – 0.2% | ||||||||||||||
| Alliance Resource Operating Partners LP/Alliance Resource Finance Corp.(1) | 8.63 | 06/15/29 | $ | 30,000 | $ | 31,694 | ||||||||
| Coronado Finance Pty Ltd.(1) | 9.25 | 10/01/29 | 35,000 | 35,831 | ||||||||||
| SunCoke Energy, Inc.(1) | 4.88 | 06/30/29 | 45,000 | 40,676 | ||||||||||
| 108,201 | ||||||||||||||
| COMMERCIAL SERVICES – 4.7% | ||||||||||||||
| ADT Security Corp.(1) | 4.13 | 08/01/29 | 90,000 | 84,237 | ||||||||||
| ADT Security Corp.(1) | 4.88 | 07/15/32 | 60,000 | 55,988 | ||||||||||
| Adtalem Global Education, Inc.(1) | 5.50 | 03/01/28 | 40,000 | 39,199 | ||||||||||
| Albion Financing 1 Sarl/Aggreko Holdings, Inc.(1) | 6.13 | 10/15/26 | 50,000 | 50,083 | ||||||||||
| AMN Healthcare, Inc.(1) | 4.00 | 04/15/29 | 25,000 | 23,062 | ||||||||||
| AMN Healthcare, Inc.(1) | 4.63 | 10/01/27 | 50,000 | 48,219 | ||||||||||
| Belron UK Finance PLC(1) | 5.75 | 10/15/29 | 95,000 | 95,257 | ||||||||||
| Block, Inc. | 2.75 | 06/01/26 | 85,000 | 81,916 | ||||||||||
| Block, Inc. | 3.50 | 06/01/31 | 85,000 | 75,427 | ||||||||||
| Block, Inc.(1) | 6.50 | 05/15/32 | 175,000 | 178,328 | ||||||||||
| Boost Newco Borrower LLC(1) | 7.50 | 01/15/31 | 185,000 | 195,208 | ||||||||||
| Brink’s Co.(1) | 4.63 | 10/15/27 | 50,000 | 48,778 | ||||||||||
| Brink’s Co.(1) | 6.50 | 06/15/29 | 30,000 | 30,622 | ||||||||||
| Brink’s Co.(1) | 6.75 | 06/15/32 | 40,000 | 40,770 | ||||||||||
| CoreCivic, Inc. | 8.25 | 04/15/29 | 45,000 | 47,324 | ||||||||||
| Dcli Bidco LLC(1) | 7.75 | 11/15/29 | 35,000 | 35,621 | ||||||||||
| GEO Group, Inc. | 8.63 | 04/15/29 | 60,000 | 62,807 | ||||||||||
| Graham Holdings Co.(1) | 5.75 | 06/01/26 | 35,000 | 35,014 | ||||||||||
| Grand Canyon University | 5.13 | 10/01/28 | 35,000 | 32,853 | ||||||||||
| Herc Holdings, Inc.(1) | 5.50 | 07/15/27 | 110,000 | 109,361 | ||||||||||
| Herc Holdings, Inc.(1) | 6.63 | 06/15/29 | 60,000 | 61,444 | ||||||||||
| Hertz Corp.(1) | 12.63 | 07/15/29 | 65,000 | 68,981 | ||||||||||
| Korn Ferry(1) | 4.63 | 12/15/27 | 35,000 | 34,157 | ||||||||||
| Prime Security Services Borrower LLC/Prime Finance, Inc.(1) | 3.38 | 08/31/27 | 85,000 | 80,078 | ||||||||||
| Prime Security Services Borrower LLC/Prime Finance, Inc.(1) | 5.75 | 04/15/26 | 125,000 | 125,150 | ||||||||||
| Service Corp. International/US | 3.38 | 08/15/30 | 60,000 | 53,218 | ||||||||||
| Service Corp. International/US | 4.00 | 05/15/31 | 75,000 | 67,697 | ||||||||||
| Service Corp. International/US | 4.63 | 12/15/27 | 50,000 | 48,995 | ||||||||||
| Service Corp. International/US | 5.13 | 06/01/29 | 70,000 | 68,855 | ||||||||||
| Service Corp. International/US | 5.75 | 10/15/32 | 69,000 | 67,867 | ||||||||||
| Shift4 Payments LLC/Shift4 Payments Finance Sub, Inc.(1) | 4.63 | 11/01/26 | 35,000 | 34,445 | ||||||||||
| Shift4 Payments LLC/Shift4 Payments Finance Sub, Inc.(1) | 6.75 | 08/15/32 | 100,000 | 102,674 | ||||||||||
| TriNet Group, Inc.(1) | 3.50 | 03/01/29 | 40,000 | 36,416 | ||||||||||
| TriNet Group, Inc.(1) | 7.13 | 08/15/31 | 40,000 | 41,003 | ||||||||||
| United Rentals North America, Inc. | 3.75 | 01/15/32 | 65,000 | 57,693 | ||||||||||
| United Rentals North America, Inc. | 3.88 | 11/15/27 | 60,000 | 57,811 | ||||||||||
| United Rentals North America, Inc. | 3.88 | 02/15/31 | 90,000 | 81,707 | ||||||||||
| United Rentals North America, Inc. | 4.00 | 07/15/30 | 70,000 | 64,709 | ||||||||||
| United Rentals North America, Inc. | 4.88 | 01/15/28 | 160,000 | 156,753 | ||||||||||
| United Rentals North America, Inc. | 5.25 | 01/15/30 | 55,000 | 54,173 | ||||||||||
| United Rentals North America, Inc. | 5.50 | 05/15/27 | 45,000 | 44,942 | ||||||||||
| United Rentals North America, Inc.(1) | 6.13 | 03/15/34 | 95,000 | 95,912 | ||||||||||
| 2,874,754 | ||||||||||||||
The accompanying notes are an integral part of these financial statements.
54
BONDBLOXX ETF TRUST
BondBloxx BB Rated USD High Yield Corporate Bond ETF
Portfolio of Investments (Continued)
October 31, 2024
| Rate (%) | Maturity | Face Amount | Value | |||||||||||
| COMPUTERS – 1.3% | ||||||||||||||
| ASGN, Inc.(1) | 4.63 | 05/15/28 | $ | 45,000 | $ | 43,016 | ||||||||
| Crane NXT Co. | 4.20 | 03/15/48 | 30,000 | 20,777 | ||||||||||
| Crowdstrike Holdings, Inc. | 3.00 | 02/15/29 | 65,000 | 59,162 | ||||||||||
| Insight Enterprises, Inc.(1) | 6.63 | 05/15/32 | 40,000 | 40,925 | ||||||||||
| KBR, Inc.(1) | 4.75 | 09/30/28 | 25,000 | 23,939 | ||||||||||
| NCR Atleos Corp.(1) | 9.50 | 04/01/29 | 115,000 | 126,667 | ||||||||||
| Seagate HDD Cayman | 4.09 | 06/01/29 | 45,000 | 42,467 | ||||||||||
| Seagate HDD Cayman | 4.13 | 01/15/31 | 23,000 | 20,703 | ||||||||||
| Seagate HDD Cayman | 4.88 | 06/01/27 | 50,000 | 49,356 | ||||||||||
| Seagate HDD Cayman | 5.75 | 12/01/34 | 50,000 | 49,332 | ||||||||||
| Seagate HDD Cayman | 8.25 | 12/15/29 | 40,000 | 43,070 | ||||||||||
| Seagate HDD Cayman | 8.50 | 07/15/31 | 40,000 | 43,153 | ||||||||||
| Seagate HDD Cayman | 9.63 | 12/01/32 | 55,850 | 63,702 | ||||||||||
| Western Digital Corp. | 4.75 | 02/15/26 | 195,000 | 192,836 | ||||||||||
| 819,105 | ||||||||||||||
| COSMETICS/PERSONAL CARE – 0.8% | ||||||||||||||
| Coty, Inc.(1) | 5.00 | 04/15/26 | 55,000 | 54,763 | ||||||||||
| Coty, Inc./HFC Prestige Products, Inc./HFC Prestige International US LLC(1) | 4.75 | 01/15/29 | 40,000 | 38,625 | ||||||||||
| Coty, Inc./HFC Prestige Products, Inc./HFC Prestige International US LLC(1) | 6.63 | 07/15/30 | 65,000 | 66,344 | ||||||||||
| Edgewell Personal Care Co.(1) | 4.13 | 04/01/29 | 35,000 | 32,709 | ||||||||||
| Edgewell Personal Care Co.(1) | 5.50 | 06/01/28 | 75,000 | 73,972 | ||||||||||
| Perrigo Finance Unlimited Co. | 4.90 | 06/15/30 | 100,000 | 94,739 | ||||||||||
| Perrigo Finance Unlimited Co. | 4.90 | 12/15/44 | 25,000 | 20,062 | ||||||||||
| Perrigo Finance Unlimited Co. | 6.13 | 09/30/32 | 30,000 | 29,648 | ||||||||||
| Prestige Brands, Inc.(1) | 3.75 | 04/01/31 | 55,000 | 49,069 | ||||||||||
| Prestige Brands, Inc.(1) | 5.13 | 01/15/28 | 35,000 | 34,306 | ||||||||||
| 494,237 | ||||||||||||||
| DISTRIBUTION/WHOLESALE – 0.4% | ||||||||||||||
| American Builders & Contractors Supply Co., Inc.(1) | 3.88 | 11/15/29 | 35,000 | 31,860 | ||||||||||
| American Builders & Contractors Supply Co., Inc.(1) | 4.00 | 01/15/28 | 60,000 | 57,078 | ||||||||||
| Resideo Funding, Inc.(1) | 4.00 | 09/01/29 | 20,000 | 18,376 | ||||||||||
| Resideo Funding, Inc.(1) | 6.50 | 07/15/32 | 60,000 | 60,461 | ||||||||||
| Ritchie Bros Holdings, Inc.(1) | 6.75 | 03/15/28 | 50,000 | 51,333 | ||||||||||
| 219,108 | ||||||||||||||
| DIVERSIFIED FINANCIAL SERVICES – 6.0% | ||||||||||||||
| Ally Financial, Inc. | 5.75 | 11/20/25 | 90,000 | 90,378 | ||||||||||
| Ally Financial, Inc. | 6.70 | 02/14/33 | 40,000 | 40,188 | ||||||||||
| Bread Financial Holdings, Inc.(1) | 9.75 | 03/15/29 | 80,000 | 84,571 | ||||||||||
| Brightsphere Investment Group, Inc. | 4.80 | 07/27/26 | 25,000 | 24,483 | ||||||||||
| Burford Capital Global Finance LLC(1) | 6.25 | 04/15/28 | 35,000 | 34,949 | ||||||||||
| Burford Capital Global Finance LLC(1) | 6.88 | 04/15/30 | 35,000 | 35,191 | ||||||||||
| Burford Capital Global Finance LLC(1) | 9.25 | 07/01/31 | 55,000 | 58,976 | ||||||||||
| Credit Acceptance Corp. | 6.63 | 03/15/26 | 30,000 | 29,999 | ||||||||||
| Credit Acceptance Corp.(1) | 9.25 | 12/15/28 | 55,000 | 58,267 | ||||||||||
| Encore Capital Group, Inc.(1) | 8.50 | 05/15/30 | 40,000 | 42,199 | ||||||||||
| Encore Capital Group, Inc.(1) | 9.25 | 04/01/29 | 45,000 | 47,970 | ||||||||||
The accompanying notes are an integral part of these financial statements.
55
BONDBLOXX ETF TRUST
BondBloxx BB Rated USD High Yield Corporate Bond ETF
Portfolio of Investments (Continued)
October 31, 2024
| Rate (%) | Maturity | Face Amount | Value | |||||||||||
| DIVERSIFIED FINANCIAL SERVICES – 6.0% (Continued) | ||||||||||||||
| GGAM Finance Ltd.(1) | 5.88 | 03/15/30 | $ | 35,000 | $ | 34,606 | ||||||||
| GGAM Finance Ltd.(1) | 6.88 | 04/15/29 | 30,000 | 30,647 | ||||||||||
| GGAM Finance Ltd.(1) | 7.75 | 05/15/26 | 35,000 | 35,637 | ||||||||||
| GGAM Finance Ltd.(1) | 8.00 | 02/15/27 | 60,000 | 62,028 | ||||||||||
| GGAM Finance Ltd.(1) | 8.00 | 06/15/28 | 60,000 | 63,298 | ||||||||||
| Global Aircraft Leasing Co. Ltd.(1) | 8.75 | 09/01/27 | 95,000 | 98,286 | ||||||||||
| goeasy Ltd.(1) | 6.88 | 05/15/30 | 35,000 | 35,589 | ||||||||||
| goeasy Ltd.(1) | 7.63 | 07/01/29 | 50,000 | 51,397 | ||||||||||
| goeasy Ltd.(1) | 9.25 | 12/01/28 | 45,000 | 48,026 | ||||||||||
| Jane Street Group/JSG Finance, Inc.(1) | 4.50 | 11/15/29 | 50,000 | 47,344 | ||||||||||
| Jane Street Group/JSG Finance, Inc.(1) | 6.13 | 11/01/32 | 100,000 | 100,127 | ||||||||||
| Jane Street Group/JSG Finance, Inc.(1) | 7.13 | 04/30/31 | 120,000 | 124,481 | ||||||||||
| Jefferies Finance LLC/JFIN Co.-Issuer Corp.(1) | 5.00 | 08/15/28 | 90,000 | 83,106 | ||||||||||
| Jefferies Finance LLC/JFIN Co.-Issuer Corp.(1) | 6.63 | 10/15/31 | 40,000 | 39,873 | ||||||||||
| Jefferson Capital Holdings LLC(1) | 6.00 | 08/15/26 | 25,000 | 24,937 | ||||||||||
| Jefferson Capital Holdings LLC(1) | 9.50 | 02/15/29 | 35,000 | 37,258 | ||||||||||
| Midcap Financial Issuer Trust(1) | 5.63 | 01/15/30 | 35,000 | 30,983 | ||||||||||
| Midcap Financial Issuer Trust(1) | 6.50 | 05/01/28 | 85,000 | 80,426 | ||||||||||
| Nationstar Mortgage Holdings, Inc.(1) | 5.00 | 02/01/26 | 45,000 | 44,586 | ||||||||||
| Navient Corp. | 4.88 | 03/15/28 | 35,000 | 33,383 | ||||||||||
| Navient Corp. | 5.00 | 03/15/27 | 60,000 | 59,036 | ||||||||||
| Navient Corp. | 5.50 | 03/15/29 | 65,000 | 61,986 | ||||||||||
| Navient Corp. | 5.63 | 08/01/33 | 50,000 | 43,201 | ||||||||||
| Navient Corp. | 6.75 | 06/15/26 | 45,000 | 45,895 | ||||||||||
| Navient Corp. | 9.38 | 07/25/30 | 55,000 | 59,927 | ||||||||||
| Navient Corp. | 11.50 | 03/15/31 | 40,000 | 44,930 | ||||||||||
| OneMain Finance Corp. | 3.50 | 01/15/27 | 80,000 | 76,409 | ||||||||||
| OneMain Finance Corp. | 3.88 | 09/15/28 | 45,000 | 41,524 | ||||||||||
| OneMain Finance Corp. | 4.00 | 09/15/30 | 90,000 | 79,320 | ||||||||||
| OneMain Finance Corp. | 5.38 | 11/15/29 | 65,000 | 62,357 | ||||||||||
| OneMain Finance Corp. | 6.63 | 01/15/28 | 70,000 | 71,150 | ||||||||||
| OneMain Finance Corp. | 7.13 | 03/15/26 | 145,000 | 148,645 | ||||||||||
| OneMain Finance Corp. | 7.13 | 11/15/31 | 40,000 | 40,488 | ||||||||||
| OneMain Finance Corp. | 7.50 | 05/15/31 | 70,000 | 71,641 | ||||||||||
| OneMain Finance Corp. | 7.88 | 03/15/30 | 55,000 | 57,310 | ||||||||||
| OneMain Finance Corp. | 9.00 | 01/15/29 | 75,000 | 79,518 | ||||||||||
| PennyMac Financial Services, Inc.(1) | 4.25 | 02/15/29 | 60,000 | 56,021 | ||||||||||
| PennyMac Financial Services, Inc.(1) | 5.75 | 09/15/31 | 45,000 | 43,006 | ||||||||||
| PennyMac Financial Services, Inc.(1) | 7.13 | 11/15/30 | 40,000 | 40,636 | ||||||||||
| PennyMac Financial Services, Inc.(1) | 7.88 | 12/15/29 | 60,000 | 62,877 | ||||||||||
| PRA Group, Inc.(1) | 5.00 | 10/01/29 | 25,000 | 22,645 | ||||||||||
| PRA Group, Inc.(1) | 8.38 | 02/01/28 | 30,000 | 30,867 | ||||||||||
| PRA Group, Inc.(1) | 8.88 | 01/31/30 | 40,000 | 41,550 | ||||||||||
| Rocket Mortgage LLC/Rocket Mortgage Co.-Issuer, Inc.(1) | 2.88 | 10/15/26 | 100,000 | 95,247 | ||||||||||
| Rocket Mortgage LLC/Rocket Mortgage Co.-Issuer, Inc.(1) | 3.63 | 03/01/29 | 65,000 | 59,927 | ||||||||||
| Rocket Mortgage LLC/Rocket Mortgage Co.-Issuer, Inc.(1) | 3.88 | 03/01/31 | 105,000 | 93,618 | ||||||||||
| Rocket Mortgage LLC/Rocket Mortgage Co.-Issuer, Inc.(1) | 4.00 | 10/15/33 | 75,000 | 64,750 | ||||||||||
| SLM Corp. | 3.13 | 11/02/26 | 45,000 | 42,711 | ||||||||||
The accompanying notes are an integral part of these financial statements.
56
BONDBLOXX ETF TRUST
BondBloxx BB Rated USD High Yield Corporate Bond ETF
Portfolio of Investments (Continued)
October 31, 2024
| Rate (%) | Maturity | Face Amount | Value | |||||||||||
| DIVERSIFIED FINANCIAL SERVICES – 6.0% (Continued) | ||||||||||||||
| StoneX Group, Inc.(1) | 7.88 | 03/01/31 | $ | 50,000 | $ | 52,649 | ||||||||
| Synchrony Financial | 7.25 | 02/02/33 | 65,000 | 66,587 | ||||||||||
| United Wholesale Mortgage LLC(1) | 5.50 | 11/15/25 | 65,000 | 64,718 | ||||||||||
| United Wholesale Mortgage LLC(1) | 5.50 | 04/15/29 | 60,000 | 57,278 | ||||||||||
| United Wholesale Mortgage LLC(1) | 5.75 | 06/15/27 | 45,000 | 44,260 | ||||||||||
| 3,635,873 | ||||||||||||||
| ELECTRIC – 4.6% | ||||||||||||||
| AES Corp. | 7.60 | 01/15/55 | 80,000 | 82,957 | ||||||||||
| Algonquin Power & Utilities Corp. | 4.75 | 01/18/82 | 65,000 | 60,916 | ||||||||||
| Atlantica Sustainable Infrastructure PLC(1) | 4.13 | 06/15/28 | 40,000 | 38,169 | ||||||||||
| California Buyer Ltd./Atlantica Sustainable Infrastructure PLC(1) | 6.38 | 02/15/32 | 50,000 | 49,686 | ||||||||||
| Calpine Corp.(1) | 3.75 | 03/01/31 | 80,000 | 72,172 | ||||||||||
| Calpine Corp.(1) | 4.50 | 02/15/28 | 105,000 | 101,198 | ||||||||||
| Clearway Energy Operating LLC(1) | 3.75 | 02/15/31 | 80,000 | 71,498 | ||||||||||
| Clearway Energy Operating LLC(1) | 3.75 | 01/15/32 | 25,000 | 22,173 | ||||||||||
| Clearway Energy Operating LLC(1) | 4.75 | 03/15/28 | 80,000 | 77,673 | ||||||||||
| DPL, Inc. | 4.35 | 04/15/29 | 40,000 | 37,598 | ||||||||||
| Edison International | 7.88 | 06/15/54 | 35,000 | 36,696 | ||||||||||
| Edison International | 8.13 | 06/15/53 | 50,000 | 52,582 | ||||||||||
| Electricite de France SA(1),(2) | 9.13 | - | 130,000 | 147,567 | ||||||||||
| Emera, Inc. | 6.75 | 06/15/76 | 105,000 | 105,523 | ||||||||||
| EUSHI Finance, Inc.(1) | 7.63 | 12/15/54 | 40,000 | 41,518 | ||||||||||
| Leeward Renewable Energy Operations LLC(1) | 4.25 | 07/01/29 | 30,000 | 28,095 | ||||||||||
| Lightning Power LLC(1) | 7.25 | 08/15/32 | 130,000 | 135,357 | ||||||||||
| NextEra Energy Operating Partners LP(1) | 3.88 | 10/15/26 | 40,000 | 38,593 | ||||||||||
| NextEra Energy Operating Partners LP(1) | 4.50 | 09/15/27 | 50,000 | 48,042 | ||||||||||
| NextEra Energy Operating Partners LP(1) | 7.25 | 01/15/29 | 65,000 | 66,918 | ||||||||||
| NRG Energy, Inc.(1) | 3.38 | 02/15/29 | 40,000 | 36,506 | ||||||||||
| NRG Energy, Inc.(1) | 3.63 | 02/15/31 | 90,000 | 79,769 | ||||||||||
| NRG Energy, Inc.(1) | 3.88 | 02/15/32 | 40,000 | 35,550 | ||||||||||
| NRG Energy, Inc.(1) | 5.25 | 06/15/29 | 60,000 | 58,678 | ||||||||||
| NRG Energy, Inc. | 5.75 | 01/15/28 | 70,000 | 70,094 | ||||||||||
| NRG Energy, Inc.(1) | 6.00 | 02/01/33 | 75,000 | 74,632 | ||||||||||
| NRG Energy, Inc.(1) | 6.25 | 11/01/34 | 80,000 | 79,966 | ||||||||||
| Pattern Energy Operations LP/Pattern Energy Operations, Inc.(1) | 4.50 | 08/15/28 | 55,000 | 52,482 | ||||||||||
| PG&E Corp. | 5.00 | 07/01/28 | 85,000 | 82,973 | ||||||||||
| PG&E Corp. | 5.25 | 07/01/30 | 90,000 | 87,782 | ||||||||||
| Talen Energy Supply LLC(1) | 8.63 | 06/01/30 | 105,000 | 113,347 | ||||||||||
| Terraform Global Operating LP(1) | 6.13 | 03/01/26 | 25,000 | 24,963 | ||||||||||
| TransAlta Corp. | 6.50 | 03/15/40 | 25,000 | 25,746 | ||||||||||
| TransAlta Corp. | 7.75 | 11/15/29 | 35,000 | 36,990 | ||||||||||
| Vistra Operations Co. LLC(1) | 4.38 | 05/01/29 | 110,000 | 104,797 | ||||||||||
| Vistra Operations Co. LLC(1) | 5.00 | 07/31/27 | 100,000 | 98,747 | ||||||||||
| Vistra Operations Co. LLC(1) | 5.50 | 09/01/26 | 85,000 | 84,797 | ||||||||||
| Vistra Operations Co. LLC(1) | 5.63 | 02/15/27 | 125,000 | 124,756 | ||||||||||
| Vistra Operations Co. LLC(1) | 6.88 | 04/15/32 | 90,000 | 93,132 | ||||||||||
| Vistra Operations Co. LLC(1) | 7.75 | 10/15/31 | 125,000 | 132,148 | ||||||||||
| 2,812,786 | ||||||||||||||
The accompanying notes are an integral part of these financial statements.
57
BONDBLOXX ETF TRUST
BondBloxx BB Rated USD High Yield Corporate Bond ETF
Portfolio of Investments (Continued)
October 31, 2024
| Rate (%) | Maturity | Face Amount | Value | |||||||||||
| ELECTRICAL COMPONENTS & EQUIPMENT – 0.5% | ||||||||||||||
| EnerSys(1) | 4.38 | 12/15/27 | $ | 30,000 | $ | 28,890 | ||||||||
| EnerSys(1) | 6.63 | 01/15/32 | 25,000 | 25,707 | ||||||||||
| WESCO Distribution, Inc.(1) | 6.38 | 03/15/29 | 75,000 | 76,623 | ||||||||||
| WESCO Distribution, Inc.(1) | 6.63 | 03/15/32 | 70,000 | 71,820 | ||||||||||
| WESCO Distribution, Inc.(1) | 7.25 | 06/15/28 | 115,000 | 117,800 | ||||||||||
| 320,840 | ||||||||||||||
| ELECTRONICS – 1.0% | ||||||||||||||
| Atkore, Inc.(1) | 4.25 | 06/01/31 | 35,000 | 31,577 | ||||||||||
| Coherent Corp.(1) | 5.00 | 12/15/29 | 90,000 | 86,412 | ||||||||||
| Imola Merger Corp.(1) | 4.75 | 05/15/29 | 170,000 | 164,500 | ||||||||||
| Sensata Technologies BV(1) | 4.00 | 04/15/29 | 115,000 | 107,617 | ||||||||||
| Sensata Technologies BV(1) | 5.88 | 09/01/30 | 55,000 | 54,475 | ||||||||||
| Sensata Technologies, Inc.(1) | 3.75 | 02/15/31 | 90,000 | 80,402 | ||||||||||
| Sensata Technologies, Inc.(1) | 4.38 | 02/15/30 | 30,000 | 27,957 | ||||||||||
| TTM Technologies, Inc.(1) | 4.00 | 03/01/29 | 45,000 | 42,110 | ||||||||||
| 595,050 | ||||||||||||||
| ENERGY-ALTERNATE SOURCES – 0.3% | ||||||||||||||
| TerraForm Power Operating LLC(1) | 4.75 | 01/15/30 | 60,000 | 56,042 | ||||||||||
| TerraForm Power Operating LLC(1) | 5.00 | 01/31/28 | 65,000 | 63,561 | ||||||||||
| Topaz Solar Farms LLC(1) | 5.75 | 09/30/39 | 44,252 | 44,118 | ||||||||||
| 163,721 | ||||||||||||||
| ENGINEERING & CONSTRUCTION – 0.5% | ||||||||||||||
| AECOM | 5.13 | 03/15/27 | 90,000 | 89,582 | ||||||||||
| Dycom Industries, Inc.(1) | 4.50 | 04/15/29 | 45,000 | 42,545 | ||||||||||
| Fluor Corp. | 4.25 | 09/15/28 | 45,000 | 43,295 | ||||||||||
| TopBuild Corp.(1) | 3.63 | 03/15/29 | 35,000 | 32,118 | ||||||||||
| TopBuild Corp.(1) | 4.13 | 02/15/32 | 45,000 | 40,161 | ||||||||||
| Weekley Homes LLC/Weekley Finance Corp.(1) | 4.88 | 09/15/28 | 40,000 | 38,261 | ||||||||||
| 285,962 | ||||||||||||||
| ENTERTAINMENT – 1.9% | ||||||||||||||
| Caesars Entertainment, Inc.(1) | 6.50 | 02/15/32 | 140,000 | 142,064 | ||||||||||
| Caesars Entertainment, Inc.(1) | 7.00 | 02/15/30 | 165,000 | 169,263 | ||||||||||
| International Game Technology PLC(1) | 4.13 | 04/15/26 | 60,000 | 59,180 | ||||||||||
| International Game Technology PLC(1) | 5.25 | 01/15/29 | 65,000 | 63,911 | ||||||||||
| International Game Technology PLC(1) | 6.25 | 01/15/27 | 70,000 | 70,744 | ||||||||||
| Live Nation Entertainment, Inc.(1) | 3.75 | 01/15/28 | 45,000 | 42,744 | ||||||||||
| Live Nation Entertainment, Inc.(1) | 6.50 | 05/15/27 | 100,000 | 101,453 | ||||||||||
| Resorts World Las Vegas LLC/RWLV Capital, Inc.(1) | 4.63 | 04/16/29 | 95,000 | 83,787 | ||||||||||
| Resorts World Las Vegas LLC/RWLV Capital, Inc.(1) | 4.63 | 04/06/31 | 30,000 | 25,471 | ||||||||||
| Resorts World Las Vegas LLC/RWLV Capital, Inc.(1) | 8.45 | 07/27/30 | 35,000 | 36,118 | ||||||||||
| Six Flags Entertainment Corp./Six Flags Theme Parks, Inc.(1) | 6.63 | 05/01/32 | 75,000 | 76,474 | ||||||||||
| Vail Resorts, Inc.(1) | 6.50 | 05/15/32 | 55,000 | 56,365 | ||||||||||
| Wynn Resorts Finance LLC/Wynn Resorts Capital Corp.(1) | 5.13 | 10/01/29 | 80,000 | 77,730 | ||||||||||
| Wynn Resorts Finance LLC/Wynn Resorts Capital Corp.(1) | 6.25 | 03/15/33 | 50,000 | 49,802 | ||||||||||
| Wynn Resorts Finance LLC/Wynn Resorts Capital Corp.(1) | 7.13 | 02/15/31 | 90,000 | 94,746 | ||||||||||
| 1,149,852 | ||||||||||||||
The accompanying notes are an integral part of these financial statements.
58
BONDBLOXX ETF TRUST
BondBloxx BB Rated USD High Yield Corporate Bond ETF
Portfolio of Investments (Continued)
October 31, 2024
| Rate (%) | Maturity | Face Amount | Value | |||||||||||
| ENVIRONMENTAL CONTROL – 0.6% | ||||||||||||||
| Clean Harbors, Inc.(1) | 4.88 | 07/15/27 | $ | 55,000 | $ | 54,208 | ||||||||
| Clean Harbors, Inc.(1) | 5.13 | 07/15/29 | 20,000 | 19,477 | ||||||||||
| Clean Harbors, Inc.(1) | 6.38 | 02/01/31 | 45,000 | 45,381 | ||||||||||
| GFL Environmental, Inc.(1) | 3.50 | 09/01/28 | 70,000 | 65,687 | ||||||||||
| GFL Environmental, Inc.(1) | 5.13 | 12/15/26 | 45,000 | 44,591 | ||||||||||
| GFL Environmental, Inc.(1) | 6.75 | 01/15/31 | 80,000 | 82,469 | ||||||||||
| Stericycle, Inc.(1) | 3.88 | 01/15/29 | 45,000 | 44,300 | ||||||||||
| 356,113 | ||||||||||||||
| FOOD – 2.7% | ||||||||||||||
| Albertsons Cos, Inc./Safeway, Inc./New Albertsons LP/Albertsons LLC(1) | 3.25 | 03/15/26 | 70,000 | 67,832 | ||||||||||
| Albertsons Cos, Inc./Safeway, Inc./New Albertsons LP/Albertsons LLC(1) | 3.50 | 03/15/29 | 130,000 | 120,236 | ||||||||||
| Albertsons Cos, Inc./Safeway, Inc./New Albertsons LP/Albertsons LLC(1) | 4.63 | 01/15/27 | 120,000 | 117,811 | ||||||||||
| Albertsons Cos, Inc./Safeway, Inc./New Albertsons LP/Albertsons LLC(1) | 4.88 | 02/15/30 | 75,000 | 73,126 | ||||||||||
| Albertsons Cos, Inc./Safeway, Inc./New Albertsons LP/Albertsons LLC(1) | 5.88 | 02/15/28 | 55,000 | 55,138 | ||||||||||
| Albertsons Cos, Inc./Safeway, Inc./New Albertsons LP/Albertsons LLC(1) | 6.50 | 02/15/28 | 70,000 | 71,697 | ||||||||||
| Albertsons Cos, Inc./Safeway, Inc./New Albertsons LP/Albertsons LLC(1) | 7.50 | 03/15/26 | 50,000 | 50,617 | ||||||||||
| Ingles Markets, Inc.(1) | 4.00 | 06/15/31 | 30,000 | 26,801 | ||||||||||
| Lamb Weston Holdings, Inc.(1) | 4.13 | 01/31/30 | 85,000 | 78,984 | ||||||||||
| Lamb Weston Holdings, Inc.(1) | 4.38 | 01/31/32 | 65,000 | 59,618 | ||||||||||
| Lamb Weston Holdings, Inc.(1) | 4.88 | 05/15/28 | 40,000 | 39,225 | ||||||||||
| Performance Food Group, Inc.(1) | 4.25 | 08/01/29 | 90,000 | 84,330 | ||||||||||
| Performance Food Group, Inc.(1) | 5.50 | 10/15/27 | 90,000 | 89,309 | ||||||||||
| Performance Food Group, Inc.(1) | 6.13 | 09/15/32 | 90,000 | 90,489 | ||||||||||
| Pilgrim’s Pride Corp. | 3.50 | 03/01/32 | 80,000 | 70,073 | ||||||||||
| Pilgrim’s Pride Corp. | 4.25 | 04/15/31 | 75,000 | 69,791 | ||||||||||
| Pilgrim’s Pride Corp. | 6.25 | 07/01/33 | 85,000 | 88,342 | ||||||||||
| Pilgrim’s Pride Corp. | 6.88 | 05/15/34 | 40,000 | 43,511 | ||||||||||
| Post Holdings, Inc.(1) | 6.25 | 02/15/32 | 90,000 | 91,112 | ||||||||||
| Safeway, Inc. | 7.25 | 02/01/31 | 25,000 | 25,575 | ||||||||||
| US Foods, Inc.(1) | 4.63 | 06/01/30 | 45,000 | 42,738 | ||||||||||
| US Foods, Inc.(1) | 4.75 | 02/15/29 | 80,000 | 77,155 | ||||||||||
| US Foods, Inc.(1) | 5.75 | 04/15/33 | 40,000 | 39,491 | ||||||||||
| US Foods, Inc.(1) | 6.88 | 09/15/28 | 40,000 | 41,166 | ||||||||||
| US Foods, Inc.(1) | 7.25 | 01/15/32 | 45,000 | 46,812 | ||||||||||
| 1,660,979 | ||||||||||||||
| GAS – 0.1% | ||||||||||||||
| AltaGas Ltd.(1) | 7.20 | 10/15/54 | 75,000 | 75,374 | ||||||||||
| HEALTHCARE-PRODUCTS – 1.5% | ||||||||||||||
| Avantor Funding, Inc.(1) | 3.88 | 11/01/29 | 65,000 | 59,999 | ||||||||||
| Avantor Funding, Inc.(1) | 4.63 | 07/15/28 | 140,000 | 135,485 | ||||||||||
| Hologic, Inc.(1) | 3.25 | 02/15/29 | 80,000 | 73,542 | ||||||||||
| Hologic, Inc.(1) | 4.63 | 02/01/28 | 40,000 | 39,278 | ||||||||||
| Medline Borrower LP(1) | 3.88 | 04/01/29 | 385,000 | 360,472 | ||||||||||
| Medline Borrower LP/Medline Co.-Issuer, Inc.(1) | 6.25 | 04/01/29 | 135,000 | 137,524 | ||||||||||
| Teleflex, Inc.(1) | 4.25 | 06/01/28 | 25,000 | 23,993 | ||||||||||
| Teleflex, Inc. | 4.63 | 11/15/27 | 60,000 | 59,035 | ||||||||||
| 889,328 | ||||||||||||||
The accompanying notes are an integral part of these financial statements.
59
BONDBLOXX ETF TRUST
BondBloxx BB Rated USD High Yield Corporate Bond ETF
Portfolio of Investments (Continued)
October 31, 2024
| Rate (%) | Maturity | Face Amount | Value | |||||||||||
| HEALTHCARE-SERVICES – 3.3% | ||||||||||||||
| Charles River Laboratories International, Inc.(1) | 3.75 | 03/15/29 | $ | 45,000 | $ | 41,292 | ||||||||
| Charles River Laboratories International, Inc.(1) | 4.00 | 03/15/31 | 45,000 | 40,251 | ||||||||||
| Charles River Laboratories International, Inc.(1) | 4.25 | 05/01/28 | 45,000 | 42,821 | ||||||||||
| DaVita, Inc.(1) | 3.75 | 02/15/31 | 125,000 | 108,805 | ||||||||||
| DaVita, Inc.(1) | 4.63 | 06/01/30 | 250,000 | 230,311 | ||||||||||
| DaVita, Inc.(1) | 6.88 | 09/01/32 | 80,000 | 80,489 | ||||||||||
| Encompass Health Corp. | 4.50 | 02/01/28 | 75,000 | 73,021 | ||||||||||
| Encompass Health Corp. | 4.63 | 04/01/31 | 25,000 | 23,546 | ||||||||||
| Encompass Health Corp. | 4.75 | 02/01/30 | 75,000 | 72,186 | ||||||||||
| Fortrea Holdings, Inc.(1) | 7.50 | 07/01/30 | 50,000 | 49,230 | ||||||||||
| IQVIA, Inc.(1) | 5.00 | 10/15/26 | 95,000 | 94,047 | ||||||||||
| IQVIA, Inc.(1) | 5.00 | 05/15/27 | 90,000 | 88,922 | ||||||||||
| IQVIA, Inc.(1) | 6.50 | 05/15/30 | 40,000 | 41,126 | ||||||||||
| Molina Healthcare, Inc.(1) | 3.88 | 11/15/30 | 55,000 | 49,841 | ||||||||||
| Molina Healthcare, Inc.(1) | 3.88 | 05/15/32 | 65,000 | 57,681 | ||||||||||
| Molina Healthcare, Inc.(1) | 4.38 | 06/15/28 | 68,000 | 65,312 | ||||||||||
| Pediatrix Medical Group, Inc.(1) | 5.38 | 02/15/30 | 40,000 | 38,262 | ||||||||||
| Tenet Healthcare Corp. | 4.25 | 06/01/29 | 128,000 | 121,187 | ||||||||||
| Tenet Healthcare Corp. | 4.38 | 01/15/30 | 125,000 | 117,270 | ||||||||||
| Tenet Healthcare Corp. | 4.63 | 06/15/28 | 50,000 | 48,376 | ||||||||||
| Tenet Healthcare Corp. | 5.13 | 11/01/27 | 125,000 | 124,036 | ||||||||||
| Tenet Healthcare Corp. | 6.13 | 06/15/30 | 180,000 | 181,068 | ||||||||||
| Tenet Healthcare Corp. | 6.75 | 05/15/31 | 115,000 | 117,645 | ||||||||||
| Toledo Hospital | 4.98 | 11/15/45 | 25,000 | 18,938 | ||||||||||
| Toledo Hospital | 5.33 | 11/15/28 | 25,000 | 24,451 | ||||||||||
| Toledo Hospital | 6.02 | 11/15/48 | 40,000 | 35,474 | ||||||||||
| 1,985,588 | ||||||||||||||
| HOLDING COMPANIES-DIVERS – 0.2% | ||||||||||||||
| Benteler International AG(1) | 10.50 | 05/15/28 | 40,000 | 41,394 | ||||||||||
| Stena International SA(1) | 7.25 | 01/15/31 | 60,000 | 62,340 | ||||||||||
| Stena International SA(1) | 7.63 | 02/15/31 | 35,000 | 36,674 | ||||||||||
| 140,408 | ||||||||||||||
| HOME BUILDERS – 1.6% | ||||||||||||||
| Ashton Woods USA LLC/Ashton Woods Finance Co.(1) | 4.63 | 08/01/29 | 15,000 | 14,034 | ||||||||||
| Ashton Woods USA LLC/Ashton Woods Finance Co.(1) | 4.63 | 04/01/30 | 50,000 | 46,091 | ||||||||||
| Ashton Woods USA LLC/Ashton Woods Finance Co.(1) | 6.63 | 01/15/28 | 25,000 | 25,016 | ||||||||||
| Century Communities, Inc.(1) | 3.88 | 08/15/29 | 40,000 | 36,424 | ||||||||||
| Century Communities, Inc. | 6.75 | 06/01/27 | 50,000 | 50,307 | ||||||||||
| Dream Finders Homes, Inc.(1) | 8.25 | 08/15/28 | 30,000 | 31,417 | ||||||||||
| Forestar Group, Inc.(1) | 3.85 | 05/15/26 | 35,000 | 34,144 | ||||||||||
| Forestar Group, Inc.(1) | 5.00 | 03/01/28 | 30,000 | 28,738 | ||||||||||
| Installed Building Products, Inc.(1) | 5.75 | 02/01/28 | 30,000 | 29,808 | ||||||||||
| KB Home | 4.00 | 06/15/31 | 30,000 | 27,146 | ||||||||||
| KB Home | 4.80 | 11/15/29 | 25,000 | 24,073 | ||||||||||
| KB Home | 6.88 | 06/15/27 | 25,000 | 25,842 | ||||||||||
| KB Home | 7.25 | 07/15/30 | 35,000 | 36,299 | ||||||||||
| LGI Homes, Inc.(1) | 4.00 | 07/15/29 | 30,000 | 26,887 | ||||||||||
The accompanying notes are an integral part of these financial statements.
60
BONDBLOXX ETF TRUST
BondBloxx BB Rated USD High Yield Corporate Bond ETF
Portfolio of Investments (Continued)
October 31, 2024
| Rate (%) | Maturity | Face Amount | Value | |||||||||||
| HOME BUILDERS – 1.6% (Continued) | ||||||||||||||
| LGI Homes, Inc.(1) | 8.75 | 12/15/28 | $ | 30,000 | $ | 31,624 | ||||||||
| M/I Homes, Inc. | 3.95 | 02/15/30 | 30,000 | 27,440 | ||||||||||
| M/I Homes, Inc. | 4.95 | 02/01/28 | 30,000 | 29,094 | ||||||||||
| Mattamy Group Corp.(1) | 4.63 | 03/01/30 | 50,000 | 46,895 | ||||||||||
| Mattamy Group Corp.(1) | 5.25 | 12/15/27 | 40,000 | 39,525 | ||||||||||
| Shea Homes LP/Shea Homes Funding Corp. | 4.75 | 02/15/28 | 40,000 | 38,198 | ||||||||||
| Shea Homes LP/Shea Homes Funding Corp. | 4.75 | 04/01/29 | 30,000 | 28,480 | ||||||||||
| STL Holding Co. LLC(1) | 8.75 | 02/15/29 | 25,000 | 26,574 | ||||||||||
| Taylor Morrison Communities, Inc.(1) | 5.13 | 08/01/30 | 40,000 | 38,722 | ||||||||||
| Taylor Morrison Communities, Inc.(1) | 5.75 | 01/15/28 | 45,000 | 45,047 | ||||||||||
| Taylor Morrison Communities, Inc.(1) | 5.88 | 06/15/27 | 45,000 | 45,288 | ||||||||||
| Thor Industries, Inc.(1) | 4.00 | 10/15/29 | 45,000 | 41,127 | ||||||||||
| Tri Pointe Homes, Inc. | 5.70 | 06/15/28 | 55,000 | 54,918 | ||||||||||
| Winnebago Industries, Inc.(1) | 6.25 | 07/15/28 | 25,000 | 24,876 | ||||||||||
| 954,034 | ||||||||||||||
| HOME FURNISHINGS – 0.2% | ||||||||||||||
| Tempur Sealy International, Inc.(1) | 3.88 | 10/15/31 | 70,000 | 60,965 | ||||||||||
| Tempur Sealy International, Inc.(1) | 4.00 | 04/15/29 | 65,000 | 59,960 | ||||||||||
| 120,925 | ||||||||||||||
| HOUSEHOLD PRODUCTS/WARES – 0.2% | ||||||||||||||
| ACCO Brands Corp.(1) | 4.25 | 03/15/29 | 55,000 | 50,516 | ||||||||||
| Central Garden & Pet Co. | 4.13 | 10/15/30 | 35,000 | 31,741 | ||||||||||
| Central Garden & Pet Co.(1) | 4.13 | 04/30/31 | 45,000 | 40,429 | ||||||||||
| Central Garden & Pet Co. | 5.13 | 02/01/28 | 25,000 | 24,727 | ||||||||||
| 147,413 | ||||||||||||||
| HOUSEWARES – 0.6% | ||||||||||||||
| Newell Brands, Inc. | 5.70 | 04/01/26 | 165,000 | 165,491 | ||||||||||
| Newell Brands, Inc. | 6.38 | 09/15/27 | 35,000 | 35,482 | ||||||||||
| Newell Brands, Inc. | 6.63 | 09/15/29 | 45,000 | 45,712 | ||||||||||
| Newell Brands, Inc. | 6.88 | 04/01/36 | 35,000 | 34,875 | ||||||||||
| Newell Brands, Inc. | 7.00 | 04/01/46 | 70,000 | 65,050 | ||||||||||
| 346,610 | ||||||||||||||
| INSURANCE – 0.8% | ||||||||||||||
| APH Somerset Investor 2 LLC/APH2 Somerset Investor 2 LLC/APH3 Somerset Inves(1) | 7.88 | 11/01/29 | 50,000 | 49,999 | ||||||||||
| Assurant, Inc. | 7.00 | 03/27/48 | 35,000 | 35,611 | ||||||||||
| Constellation Insurance, Inc.(1) | 6.63 | 05/01/31 | 25,000 | 24,448 | ||||||||||
| Constellation Insurance, Inc.(1) | 6.80 | 01/24/30 | 35,000 | 34,536 | ||||||||||
| Genworth Holdings, Inc. | 6.50 | 06/15/34 | 25,000 | 24,814 | ||||||||||
| Global Atlantic Finance Co.(1) | 4.70 | 10/15/51 | 65,000 | 62,371 | ||||||||||
| Global Atlantic Finance Co.(1) | 7.95 | 10/15/54 | 55,000 | 57,205 | ||||||||||
| Liberty Mutual Group, Inc.(1) | 4.13 | 12/15/51 | 50,000 | 47,196 | ||||||||||
| Liberty Mutual Group, Inc.(1) | 4.30 | 02/01/61 | 80,000 | 52,699 | ||||||||||
| Liberty Mutual Group, Inc.(1) | 7.80 | 03/15/37 | 20,000 | 22,222 | ||||||||||
| Ryan Specialty LLC(1) | 4.38 | 02/01/30 | 54,000 | 51,257 | ||||||||||
| Ryan Specialty LLC(1) | 5.88 | 08/01/32 | 40,000 | 39,901 | ||||||||||
| 502,259 | ||||||||||||||
The accompanying notes are an integral part of these financial statements.
61
BONDBLOXX ETF TRUST
BondBloxx BB Rated USD High Yield Corporate Bond ETF
Portfolio of Investments (Continued)
October 31, 2024
| Rate (%) | Maturity | Face Amount | Value | |||||||||||
| INTERNET – 1.5% | ||||||||||||||
| Cogent Communications Group LLC(1) | 3.50 | 05/01/26 | $ | 45,000 | $ | 43,781 | ||||||||
| Gen Digital, Inc.(1) | 6.75 | 09/30/27 | 75,000 | 76,349 | ||||||||||
| Gen Digital, Inc.(1) | 7.13 | 09/30/30 | 59,000 | 61,109 | ||||||||||
| Go Daddy Operating Co. LLC/GD Finance Co., Inc.(1) | 3.50 | 03/01/29 | 75,000 | 69,269 | ||||||||||
| Go Daddy Operating Co. LLC/GD Finance Co., Inc.(1) | 5.25 | 12/01/27 | 50,000 | 49,458 | ||||||||||
| Match Group Holdings II LLC(1) | 3.63 | 10/01/31 | 45,000 | 39,465 | ||||||||||
| Match Group Holdings II LLC(1) | 4.13 | 08/01/30 | 35,000 | 31,858 | ||||||||||
| Match Group Holdings II LLC(1) | 4.63 | 06/01/28 | 45,000 | 43,322 | ||||||||||
| Match Group Holdings II LLC(1) | 5.00 | 12/15/27 | 40,000 | 39,089 | ||||||||||
| Match Group Holdings II LLC(1) | 5.63 | 02/15/29 | 30,000 | 29,729 | ||||||||||
| Rakuten Group, Inc.(1) | 9.75 | 04/15/29 | 170,000 | 184,174 | ||||||||||
| Rakuten Group, Inc.(1) | 11.25 | 02/15/27 | 160,000 | 174,268 | ||||||||||
| Wayfair LLC(1) | 7.25 | 10/31/29 | 60,000 | 60,865 | ||||||||||
| Ziff Davis, Inc.(1) | 4.63 | 10/15/30 | 35,000 | 32,056 | ||||||||||
| 934,792 | ||||||||||||||
| INVESTMENT COMPANIES – 0.6% | ||||||||||||||
| Icahn Enterprises LP/Icahn Enterprises Finance Corp. | 4.38 | 02/01/29 | 55,000 | 45,945 | ||||||||||
| Icahn Enterprises LP/Icahn Enterprises Finance Corp. | 5.25 | 05/15/27 | 130,000 | 121,238 | ||||||||||
| Icahn Enterprises LP/Icahn Enterprises Finance Corp. | 6.25 | 05/15/26 | 105,000 | 103,298 | ||||||||||
| Icahn Enterprises LP/Icahn Enterprises Finance Corp. | 9.00 | 06/15/30 | 70,000 | 67,673 | ||||||||||
| Icahn Enterprises LP/Icahn Enterprises Finance Corp. | 9.75 | 01/15/29 | 55,000 | 55,027 | ||||||||||
| 393,181 | ||||||||||||||
| IRON/STEEL – 1.6% | ||||||||||||||
| Big River Steel LLC/BRS Finance Corp.(1) | 6.63 | 01/31/29 | 65,000 | 65,679 | ||||||||||
| Carpenter Technology Corp. | 6.38 | 07/15/28 | 30,000 | 30,139 | ||||||||||
| Carpenter Technology Corp. | 7.63 | 03/15/30 | 30,000 | 31,144 | ||||||||||
| Cleveland-Cliffs, Inc.(1) | 4.63 | 03/01/29 | 30,000 | 28,135 | ||||||||||
| Cleveland-Cliffs, Inc.(1) | 4.88 | 03/01/31 | 30,000 | 27,709 | ||||||||||
| Cleveland-Cliffs, Inc. | 5.88 | 06/01/27 | 50,000 | 50,012 | ||||||||||
| Cleveland-Cliffs, Inc.(1) | 6.75 | 04/15/30 | 70,000 | 70,016 | ||||||||||
| Cleveland-Cliffs, Inc.(1) | 6.88 | 11/01/29 | 75,000 | 75,365 | ||||||||||
| Cleveland-Cliffs, Inc.(1) | 7.00 | 03/15/32 | 118,000 | 118,281 | ||||||||||
| Cleveland-Cliffs, Inc.(1) | 7.38 | 05/01/33 | 75,000 | 75,623 | ||||||||||
| Commercial Metals Co. | 3.88 | 02/15/31 | 55,000 | 49,423 | ||||||||||
| Commercial Metals Co. | 4.13 | 01/15/30 | 25,000 | 23,221 | ||||||||||
| Mineral Resources Ltd.(1) | 8.00 | 11/01/27 | 50,000 | 51,318 | ||||||||||
| Mineral Resources Ltd.(1) | 8.13 | 05/01/27 | 63,000 | 63,505 | ||||||||||
| Mineral Resources Ltd.(1) | 8.50 | 05/01/30 | 50,000 | 51,471 | ||||||||||
| Mineral Resources Ltd.(1) | 9.25 | 10/01/28 | 100,000 | 105,403 | ||||||||||
| United States Steel Corp. | 6.65 | 06/01/37 | 25,000 | 25,397 | ||||||||||
| United States Steel Corp. | 6.88 | 03/01/29 | 39,000 | 39,284 | ||||||||||
| 981,125 | ||||||||||||||
| LEISURE TIME – 3.5% | ||||||||||||||
| Acushnet Co.(1) | 7.38 | 10/15/28 | 30,000 | 31,312 | ||||||||||
| Amer Sports Co.(1) | 6.75 | 02/16/31 | 70,000 | 71,170 | ||||||||||
| Carnival Corp.(1) | 5.75 | 03/01/27 | 225,000 | 225,816 | ||||||||||
| Carnival Corp.(1) | 6.00 | 05/01/29 | 175,000 | 175,406 | ||||||||||
The accompanying notes are an integral part of these financial statements.
62
BONDBLOXX ETF TRUST
BondBloxx BB Rated USD High Yield Corporate Bond ETF
Portfolio of Investments (Continued)
October 31, 2024
| Rate (%) | Maturity | Face Amount | Value | |||||||||||
LEISURE TIME – 3.5% (Continued) | ||||||||||||||
| Carnival Corp.(1) | 7.63 | 03/01/26 | $ | 136,000 | $ | 137,036 | ||||||||
| Carnival Corp.(1) | 10.50 | 06/01/30 | 85,000 | 91,766 | ||||||||||
| Carnival Holdings Bermuda Ltd.(1) | 10.38 | 05/01/28 | 175,000 | 187,974 | ||||||||||
| Life Time, Inc.(1) | 5.75 | 01/15/26 | 80,000 | 80,006 | ||||||||||
| Life Time, Inc.(1) | 6.00 | 11/15/31 | 40,000 | 39,855 | ||||||||||
| NCL Corp. Ltd.(1) | 8.13 | 01/15/29 | 75,000 | 79,562 | ||||||||||
| NCL Corp. Ltd.(1) | 8.38 | 02/01/28 | 50,000 | 52,413 | ||||||||||
| Royal Caribbean Cruises Ltd. | 3.70 | 03/15/28 | 45,000 | 42,916 | ||||||||||
| Royal Caribbean Cruises Ltd.(1) | 4.25 | 07/01/26 | 60,000 | 58,900 | ||||||||||
| Royal Caribbean Cruises Ltd.(1) | 5.38 | 07/15/27 | 90,000 | 89,891 | ||||||||||
| Royal Caribbean Cruises Ltd.(1) | 5.50 | 08/31/26 | 90,000 | 90,158 | ||||||||||
| Royal Caribbean Cruises Ltd.(1) | 5.50 | 04/01/28 | 130,000 | 130,073 | ||||||||||
| Royal Caribbean Cruises Ltd.(1) | 5.63 | 09/30/31 | 130,000 | 129,550 | ||||||||||
| Royal Caribbean Cruises Ltd.(1) | 6.00 | 02/01/33 | 150,000 | 151,015 | ||||||||||
| Royal Caribbean Cruises Ltd.(1) | 6.25 | 03/15/32 | 115,000 | 117,317 | ||||||||||
| Royal Caribbean Cruises Ltd. | 7.50 | 10/15/27 | 30,000 | 31,818 | ||||||||||
| Viking Ocean Cruises Ship VII Ltd.(1) | 5.63 | 02/15/29 | 30,000 | 29,609 | ||||||||||
| Vista Outdoor, Inc.(1) | 4.50 | 03/15/29 | 45,000 | 45,820 | ||||||||||
| VOC Escrow Ltd.(1) | 5.00 | 02/15/28 | 55,000 | 53,509 | ||||||||||
| 2,142,892 | ||||||||||||||
| LODGING – 2.5% | ||||||||||||||
| Boyd Gaming Corp. | 4.75 | 12/01/27 | 85,000 | 83,560 | ||||||||||
| Boyd Gaming Corp.(1) | 4.75 | 06/15/31 | 75,000 | 70,054 | ||||||||||
| Genting New York LLC/GENNY Capital, Inc.(1) | 7.25 | 10/01/29 | 55,000 | 55,871 | ||||||||||
| Hilton Domestic Operating Co., Inc.(1) | 3.63 | 02/15/32 | 135,000 | 118,600 | ||||||||||
| Hilton Domestic Operating Co., Inc.(1) | 3.75 | 05/01/29 | 75,000 | 69,912 | ||||||||||
| Hilton Domestic Operating Co., Inc.(1) | 4.00 | 05/01/31 | 95,000 | 86,606 | ||||||||||
| Hilton Domestic Operating Co., Inc. | 4.88 | 01/15/30 | 75,000 | 72,722 | ||||||||||
| Hilton Domestic Operating Co., Inc.(1) | 5.75 | 05/01/28 | 45,000 | 45,132 | ||||||||||
| Hilton Domestic Operating Co., Inc.(1) | 5.88 | 04/01/29 | 64,000 | 64,991 | ||||||||||
| Hilton Domestic Operating Co., Inc.(1) | 5.88 | 03/15/33 | 80,000 | 80,217 | ||||||||||
| Hilton Domestic Operating Co., Inc.(1) | 6.13 | 04/01/32 | 35,000 | 35,380 | ||||||||||
| Hilton Grand Vacations Borrower Escrow LLC/Hilton Grand Vacations Borrower Escrow, Inc.(1) | 6.63 | 01/15/32 | 75,000 | 75,082 | ||||||||||
| Hilton Worldwide Finance LLC/Hilton Worldwide Finance Corp. | 4.88 | 04/01/27 | 50,000 | 49,658 | ||||||||||
| MGM Resorts International | 4.63 | 09/01/26 | 35,000 | 34,710 | ||||||||||
| MGM Resorts International | 4.75 | 10/15/28 | 65,000 | 62,877 | ||||||||||
| MGM Resorts International | 5.50 | 04/15/27 | 60,000 | 59,909 | ||||||||||
| MGM Resorts International | 6.13 | 09/15/29 | 60,000 | 59,833 | ||||||||||
| MGM Resorts International | 6.50 | 04/15/32 | 80,000 | 80,068 | ||||||||||
| Travel + Leisure Co.(1) | 4.50 | 12/01/29 | 55,000 | 51,408 | ||||||||||
| Travel + Leisure Co.(1) | 4.63 | 03/01/30 | 25,000 | 23,326 | ||||||||||
| Travel + Leisure Co. | 6.00 | 04/01/27 | 40,000 | 40,400 | ||||||||||
| Travel + Leisure Co.(1) | 6.63 | 07/31/26 | 55,000 | 55,505 | ||||||||||
| Wyndham Hotels & Resorts, Inc.(1) | 4.38 | 08/15/28 | 45,000 | 42,863 | ||||||||||
| Wynn Las Vegas LLC/Wynn Las Vegas Capital Corp.(1) | 5.25 | 05/15/27 | 80,000 | 79,465 | ||||||||||
| 1,498,149 | ||||||||||||||
The accompanying notes are an integral part of these financial statements.
63
BONDBLOXX ETF TRUST
BondBloxx BB Rated USD High Yield Corporate Bond ETF
Portfolio of Investments (Continued)
October 31, 2024
| Rate (%) | Maturity | Face Amount | Value | |||||||||||
| MACHINERY-CONSTRUCTION & MINING – 0.4% | ||||||||||||||
| BWX Technologies, Inc.(1) | 4.13 | 06/30/28 | $ | 35,000 | $ | 33,435 | ||||||||
| BWX Technologies, Inc.(1) | 4.13 | 04/15/29 | 35,000 | 33,187 | ||||||||||
| Terex Corp.(1) | 5.00 | 05/15/29 | 55,000 | 52,914 | ||||||||||
| Terex Corp.(1) | 6.25 | 10/15/32 | 50,000 | 49,808 | ||||||||||
| Vertiv Group Corp.(1) | 4.13 | 11/15/28 | 70,000 | 66,678 | ||||||||||
| 236,022 | ||||||||||||||
| MACHINERY-DIVERSIFIED – 0.4% | ||||||||||||||
| ATS Corp.(1) | 4.13 | 12/15/28 | 30,000 | 28,231 | ||||||||||
| Chart Industries, Inc.(1) | 7.50 | 01/01/30 | 130,000 | 135,373 | ||||||||||
| Esab Corp.(1) | 6.25 | 04/15/29 | 65,000 | 66,226 | ||||||||||
| Mueller Water Products, Inc.(1) | 4.00 | 06/15/29 | 35,000 | 32,619 | ||||||||||
| 262,449 | ||||||||||||||
| MEDIA – 6.3% | ||||||||||||||
| AMC Networks, Inc.(1) | 10.25 | 01/15/29 | 80,000 | 82,485 | ||||||||||
| CCO Holdings LLC/CCO Holdings Capital Corp.(1) | 4.25 | 02/01/31 | 135,000 | 117,267 | ||||||||||
| CCO Holdings LLC/CCO Holdings Capital Corp.(1) | 4.25 | 01/15/34 | 95,000 | 75,985 | ||||||||||
| CCO Holdings LLC/CCO Holdings Capital Corp.(1) | 4.50 | 08/15/30 | 125,000 | 111,746 | ||||||||||
| CCO Holdings LLC/CCO Holdings Capital Corp. | 4.50 | 05/01/32 | 140,000 | 119,231 | ||||||||||
| CCO Holdings LLC/CCO Holdings Capital Corp.(1) | 4.50 | 06/01/33 | 85,000 | 70,771 | ||||||||||
| CCO Holdings LLC/CCO Holdings Capital Corp.(1) | 4.75 | 03/01/30 | 145,000 | 132,022 | ||||||||||
| CCO Holdings LLC/CCO Holdings Capital Corp.(1) | 4.75 | 02/01/32 | 75,000 | 64,914 | ||||||||||
| CCO Holdings LLC/CCO Holdings Capital Corp.(1) | 5.00 | 02/01/28 | 115,000 | 111,390 | ||||||||||
| CCO Holdings LLC/CCO Holdings Capital Corp.(1) | 5.13 | 05/01/27 | 165,000 | 161,688 | ||||||||||
| CCO Holdings LLC/CCO Holdings Capital Corp.(1) | 5.38 | 06/01/29 | 90,000 | 85,984 | ||||||||||
| CCO Holdings LLC/CCO Holdings Capital Corp.(1) | 5.50 | 05/01/26 | 30,000 | 29,923 | ||||||||||
| CCO Holdings LLC/CCO Holdings Capital Corp.(1) | 6.38 | 09/01/29 | 65,000 | 64,407 | ||||||||||
| CCO Holdings LLC/CCO Holdings Capital Corp.(1) | 7.38 | 03/01/31 | 50,000 | 50,879 | ||||||||||
| Directv Financing LLC(1) | 8.88 | 02/01/30 | 60,000 | 59,272 | ||||||||||
| Directv Financing LLC/Directv Financing Co.-Obligor, Inc.(1) | 5.88 | 08/15/27 | 330,000 | 318,101 | ||||||||||
| Gray Television, Inc.(1) | 10.50 | 07/15/29 | 112,000 | 116,438 | ||||||||||
| LCPR Senior Secured Financing DAC(1) | 5.13 | 07/15/29 | 75,000 | 63,092 | ||||||||||
| LCPR Senior Secured Financing DAC(1) | 6.75 | 10/15/27 | 95,000 | 89,135 | ||||||||||
| News Corp.(1) | 3.88 | 05/15/29 | 90,000 | 83,833 | ||||||||||
| News Corp.(1) | 5.13 | 02/15/32 | 40,000 | 38,367 | ||||||||||
| Nexstar Media, Inc.(1) | 4.75 | 11/01/28 | 85,000 | 79,979 | ||||||||||
| Nexstar Media, Inc.(1) | 5.63 | 07/15/27 | 150,000 | 147,533 | ||||||||||
| Paramount Global | 6.25 | 02/28/57 | 55,000 | 49,436 | ||||||||||
| Paramount Global | 6.38 | 03/30/62 | 90,000 | 83,410 | ||||||||||
| Sirius XM Radio, Inc.(1) | 3.13 | 09/01/26 | 85,000 | 81,612 | ||||||||||
| Sirius XM Radio, Inc.(1) | 3.88 | 09/01/31 | 135,000 | 116,109 | ||||||||||
| Sirius XM Radio, Inc.(1) | 4.00 | 07/15/28 | 170,000 | 158,975 | ||||||||||
| Sirius XM Radio, Inc.(1) | 4.13 | 07/01/30 | 125,000 | 111,935 | ||||||||||
| Sirius XM Radio, Inc.(1) | 5.00 | 08/01/27 | 150,000 | 147,094 | ||||||||||
| Sirius XM Radio, Inc.(1) | 5.50 | 07/01/29 | 95,000 | 92,227 | ||||||||||
| Sunrise FinCo I BV(1) | 4.88 | 07/15/31 | 110,000 | 100,748 | ||||||||||
| TEGNA, Inc. | 4.63 | 03/15/28 | 85,000 | 80,135 | ||||||||||
| TEGNA, Inc.(1) | 4.75 | 03/15/26 | 45,000 | 44,569 | ||||||||||
The accompanying notes are an integral part of these financial statements.
64
BONDBLOXX ETF TRUST
BondBloxx BB Rated USD High Yield Corporate Bond ETF
Portfolio of Investments (Continued)
October 31, 2024
| Rate (%) | Maturity | Face Amount | Value | |||||||||||
| MEDIA – 6.3% (Continued) | ||||||||||||||
| TEGNA, Inc. | 5.00 | 09/15/29 | $ | 100,000 | $ | 93,453 | ||||||||
| Virgin Media Secured Finance PLC(1) | 4.50 | 08/15/30 | 80,000 | 70,137 | ||||||||||
| Virgin Media Secured Finance PLC(1) | 5.50 | 05/15/29 | 133,000 | 125,892 | ||||||||||
| VZ Secured Financing BV(1) | 5.00 | 01/15/32 | 135,000 | 121,411 | ||||||||||
| Ziggo BV(1) | 4.88 | 01/15/30 | 85,000 | 78,901 | ||||||||||
| 3,830,486 | ||||||||||||||
| METAL FABRICATE/HARDWARE – 0.3% | ||||||||||||||
| Advanced Drainage Systems, Inc.(1) | 5.00 | 09/30/27 | 25,000 | 24,570 | ||||||||||
| Advanced Drainage Systems, Inc.(1) | 6.38 | 06/15/30 | 50,000 | 50,448 | ||||||||||
| Vallourec SACA(1) | 7.50 | 04/15/32 | 75,000 | 78,646 | ||||||||||
| 153,664 | ||||||||||||||
| MINING – 1.6% | ||||||||||||||
| Alcoa Nederland Holding BV(1) | 4.13 | 03/31/29 | 45,000 | 42,358 | ||||||||||
| Alcoa Nederland Holding BV(1) | 5.50 | 12/15/27 | 60,000 | 59,613 | ||||||||||
| Alcoa Nederland Holding BV(1) | 6.13 | 05/15/28 | 45,000 | 45,117 | ||||||||||
| Alcoa Nederland Holding BV(1) | 7.13 | 03/15/31 | 65,000 | 67,836 | ||||||||||
| Arsenal AIC Parent LLC(1) | 8.00 | 10/01/30 | 65,000 | 68,404 | ||||||||||
| Constellium SE(1) | 3.75 | 04/15/29 | 64,000 | 57,972 | ||||||||||
| Constellium SE(1) | 5.63 | 06/15/28 | 30,000 | 29,303 | ||||||||||
| FMG Resources August 2006 Pty Ltd.(1) | 4.38 | 04/01/31 | 125,000 | 113,901 | ||||||||||
| FMG Resources August 2006 Pty Ltd.(1) | 4.50 | 09/15/27 | 55,000 | 53,580 | ||||||||||
| FMG Resources August 2006 Pty Ltd.(1) | 5.88 | 04/15/30 | 55,000 | 54,785 | ||||||||||
| FMG Resources August 2006 Pty Ltd.(1) | 6.13 | 04/15/32 | 70,000 | 70,298 | ||||||||||
| Novelis Corp.(1) | 3.25 | 11/15/26 | 65,000 | 62,585 | ||||||||||
| Novelis Corp.(1) | 3.88 | 08/15/31 | 70,000 | 61,535 | ||||||||||
| Novelis Corp.(1) | 4.75 | 01/30/30 | 135,000 | 126,581 | ||||||||||
| Perenti Finance Pty Ltd.(1) | 7.50 | 04/26/29 | 30,000 | 31,342 | ||||||||||
| 945,210 | ||||||||||||||
| MISCELLANEOUS MANUFACTURER – 0.4% | ||||||||||||||
| Amsted Industries, Inc.(1) | 4.63 | 05/15/30 | 20,000 | 18,674 | ||||||||||
| Amsted Industries, Inc.(1) | 5.63 | 07/01/27 | 45,000 | 44,727 | ||||||||||
| Hillenbrand, Inc. | 3.75 | 03/01/31 | 35,000 | 30,659 | ||||||||||
| Hillenbrand, Inc. | 5.00 | 09/15/26 | 35,000 | 34,699 | ||||||||||
| Hillenbrand, Inc. | 6.25 | 02/15/29 | 40,000 | 40,201 | ||||||||||
| Trinity Industries, Inc.(1) | 7.75 | 07/15/28 | 54,000 | 55,865 | ||||||||||
| 224,825 | ||||||||||||||
| OFFICE FURNISHINGS – 0.1% | ||||||||||||||
| Steelcase, Inc. | 5.13 | 01/18/29 | 40,000 | 38,592 | ||||||||||
| OFFICE/BUSINESS EQUIPMENT – 0.1% | ||||||||||||||
| Zebra Technologies Corp.(1) | 6.50 | 06/01/32 | 40,000 | 40,955 | ||||||||||
| OIL & GAS – 6.0% | ||||||||||||||
| Ascent Resources Utica Holdings LLC/ARU Finance Corp.(1) | 5.88 | 06/30/29 | 40,000 | 38,676 | ||||||||||
| Ascent Resources Utica Holdings LLC/ARU Finance Corp.(1) | 6.63 | 10/15/32 | 30,000 | 29,738 | ||||||||||
| Ascent Resources Utica Holdings LLC/ARU Finance Corp.(1) | 8.25 | 12/31/28 | 40,000 | 40,845 | ||||||||||
The accompanying notes are an integral part of these financial statements.
65
BONDBLOXX ETF TRUST
BondBloxx BB Rated USD High Yield Corporate Bond ETF
Portfolio of Investments (Continued)
October 31, 2024
| Rate (%) | Maturity | Face Amount | Value | |||||||||||
| OIL & GAS – 6.0% (Continued) | ||||||||||||||
| Ascent Resources Utica Holdings LLC/ARU Finance Corp.(1) | 9.00 | 11/01/27 | $ | 40,000 | $ | 47,504 | ||||||||
| Baytex Energy Corp.(1) | 7.38 | 03/15/32 | 55,000 | 53,441 | ||||||||||
| Baytex Energy Corp.(1) | 8.50 | 04/30/30 | 65,000 | 66,188 | ||||||||||
| Chord Energy Corp.(1) | 6.38 | 06/01/26 | 35,000 | 35,100 | ||||||||||
| Civitas Resources, Inc.(1) | 5.00 | 10/15/26 | 40,000 | 39,318 | ||||||||||
| Civitas Resources, Inc.(1) | 8.38 | 07/01/28 | 115,000 | 118,993 | ||||||||||
| Civitas Resources, Inc.(1) | 8.63 | 11/01/30 | 80,000 | 84,113 | ||||||||||
| Civitas Resources, Inc.(1) | 8.75 | 07/01/31 | 115,000 | 120,590 | ||||||||||
| CNX Resources Corp.(1) | 6.00 | 01/15/29 | 45,000 | 44,651 | ||||||||||
| CNX Resources Corp.(1) | 7.25 | 03/01/32 | 25,000 | 25,778 | ||||||||||
| CNX Resources Corp.(1) | 7.38 | 01/15/31 | 55,000 | 56,580 | ||||||||||
| Crescent Energy Finance LLC(1) | 7.38 | 01/15/33 | 80,000 | 77,658 | ||||||||||
| Crescent Energy Finance LLC(1) | 7.63 | 04/01/32 | 65,000 | 64,230 | ||||||||||
| Crescent Energy Finance LLC(1) | 9.25 | 02/15/28 | 90,000 | 94,513 | ||||||||||
| Diamond Foreign Asset Co./Diamond Finance LLC(1) | 8.50 | 10/01/30 | 50,000 | 51,666 | ||||||||||
| Energean PLC(1) | 6.50 | 04/30/27 | 40,000 | 39,910 | ||||||||||
| Hilcorp Energy I LP/Hilcorp Finance Co.(1) | 5.75 | 02/01/29 | 50,000 | 48,018 | ||||||||||
| Hilcorp Energy I LP/Hilcorp Finance Co.(1) | 6.00 | 04/15/30 | 45,000 | 42,960 | ||||||||||
| Hilcorp Energy I LP/Hilcorp Finance Co.(1) | 6.00 | 02/01/31 | 55,000 | 52,206 | ||||||||||
| Hilcorp Energy I LP/Hilcorp Finance Co.(1) | 6.25 | 11/01/28 | 45,000 | 43,943 | ||||||||||
| Hilcorp Energy I LP/Hilcorp Finance Co.(1) | 6.25 | 04/15/32 | 40,000 | 37,566 | ||||||||||
| Hilcorp Energy I LP/Hilcorp Finance Co.(1) | 6.88 | 05/15/34 | 40,000 | 38,318 | ||||||||||
| Hilcorp Energy I LP/Hilcorp Finance Co.(1) | 7.25 | 02/15/35 | 80,000 | 78,536 | ||||||||||
| Hilcorp Energy I LP/Hilcorp Finance Co.(1) | 8.38 | 11/01/33 | 65,000 | 68,008 | ||||||||||
| Ithaca Energy North Sea PLC(1) | 8.13 | 10/15/29 | 60,000 | 60,165 | ||||||||||
| Matador Resources Co.(1) | 6.25 | 04/15/33 | 60,000 | 58,868 | ||||||||||
| Matador Resources Co.(1) | 6.50 | 04/15/32 | 80,000 | 79,289 | ||||||||||
| Matador Resources Co.(1) | 6.88 | 04/15/28 | 45,000 | 45,848 | ||||||||||
| MEG Energy Corp.(1) | 5.88 | 02/01/29 | 50,000 | 49,063 | ||||||||||
| Murphy Oil Corp. | 5.88 | 12/01/42 | 49,000 | 43,057 | ||||||||||
| Murphy Oil Corp. | 6.00 | 10/01/32 | 30,000 | 28,896 | ||||||||||
| Noble Finance II LLC(1) | 8.00 | 04/15/30 | 120,000 | 121,716 | ||||||||||
| Parkland Corp.(1) | 4.50 | 10/01/29 | 70,000 | 65,083 | ||||||||||
| Parkland Corp.(1) | 4.63 | 05/01/30 | 65,000 | 59,798 | ||||||||||
| Parkland Corp.(1) | 5.88 | 07/15/27 | 45,000 | 44,563 | ||||||||||
| Parkland Corp.(1) | 6.63 | 08/15/32 | 45,000 | 44,942 | ||||||||||
| PBF Holding Co. LLC/PBF Finance Corp. | 6.00 | 02/15/28 | 65,000 | 63,133 | ||||||||||
| PBF Holding Co. LLC/PBF Finance Corp.(1) | 7.88 | 09/15/30 | 45,000 | 44,958 | ||||||||||
| Permian Resources Operating LLC(1) | 5.38 | 01/15/26 | 39,000 | 38,841 | ||||||||||
| Permian Resources Operating LLC(1) | 5.88 | 07/01/29 | 65,000 | 64,131 | ||||||||||
| Permian Resources Operating LLC(1) | 6.25 | 02/01/33 | 65,000 | 64,576 | ||||||||||
| Permian Resources Operating LLC(1) | 7.00 | 01/15/32 | 90,000 | 91,881 | ||||||||||
| Permian Resources Operating LLC(1) | 8.00 | 04/15/27 | 45,000 | 46,284 | ||||||||||
| Permian Resources Operating LLC(1) | 9.88 | 07/15/31 | 40,000 | 44,227 | ||||||||||
| Range Resources Corp.(1) | 4.75 | 02/15/30 | 45,000 | 42,403 | ||||||||||
| Range Resources Corp. | 8.25 | 01/15/29 | 55,000 | 56,707 | ||||||||||
| Seadrill Finance Ltd.(1) | 8.38 | 08/01/30 | 50,000 | 51,101 | ||||||||||
| SM Energy Co. | 6.50 | 07/15/28 | 30,000 | 29,942 | ||||||||||
The accompanying notes are an integral part of these financial statements.
66
BONDBLOXX ETF TRUST
BondBloxx BB Rated USD High Yield Corporate Bond ETF
Portfolio of Investments (Continued)
October 31, 2024
| Rate (%) | Maturity | Face Amount | Value | |||||||||||
| OIL & GAS – 6.0% (Continued) | ||||||||||||||
| SM Energy Co. | 6.63 | 01/15/27 | $ | 35,000 | $ | 35,020 | ||||||||
| SM Energy Co. | 6.75 | 09/15/26 | 40,000 | 40,111 | ||||||||||
| SM Energy Co.(1) | 6.75 | 08/01/29 | 65,000 | 64,650 | ||||||||||
| SM Energy Co.(1) | 7.00 | 08/01/32 | 65,000 | 64,515 | ||||||||||
| Sunoco LP(1) | 7.00 | 05/01/29 | 70,000 | 72,267 | ||||||||||
| Sunoco LP(1) | 7.25 | 05/01/32 | 60,000 | 62,510 | ||||||||||
| Sunoco LP/Sunoco Finance Corp. | 4.50 | 05/15/29 | 65,000 | 61,851 | ||||||||||
| Sunoco LP/Sunoco Finance Corp. | 4.50 | 04/30/30 | 70,000 | 65,748 | ||||||||||
| Sunoco LP/Sunoco Finance Corp. | 5.88 | 03/15/28 | 30,000 | 29,956 | ||||||||||
| Sunoco LP/Sunoco Finance Corp. | 6.00 | 04/15/27 | 55,000 | 55,095 | ||||||||||
| Sunoco LP/Sunoco Finance Corp.(1) | 7.00 | 09/15/28 | 40,000 | 41,142 | ||||||||||
| Valaris Ltd.(1) | 8.38 | 04/30/30 | 95,000 | 96,457 | ||||||||||
| Viper Energy, Inc.(1) | 5.38 | 11/01/27 | 40,000 | 39,576 | ||||||||||
| Viper Energy, Inc.(1) | 7.38 | 11/01/31 | 35,000 | 36,395 | ||||||||||
| 3,643,812 | ||||||||||||||
| OIL & GAS SERVICES – 0.7% | ||||||||||||||
| Archrock Partners LP/Archrock Partners Finance Corp.(1) | 6.25 | 04/01/28 | 70,000 | 70,187 | ||||||||||
| Archrock Partners LP/Archrock Partners Finance Corp.(1) | 6.63 | 09/01/32 | 56,000 | 56,294 | ||||||||||
| Archrock Partners LP/Archrock Partners Finance Corp.(1) | 6.88 | 04/01/27 | 33,000 | 33,122 | ||||||||||
| Enerflex Ltd.(1) | 9.00 | 10/15/27 | 51,000 | 53,119 | ||||||||||
| Helix Energy Solutions Group, Inc.(1) | 9.75 | 03/01/29 | 30,000 | 32,021 | ||||||||||
| Oceaneering International, Inc. | 6.00 | 02/01/28 | 30,000 | 29,501 | ||||||||||
| Weatherford International Ltd.(1) | 8.63 | 04/30/30 | 125,000 | 129,294 | ||||||||||
| 403,538 | ||||||||||||||
| PACKAGING & CONTAINERS – 1.9% | ||||||||||||||
| Ball Corp. | 2.88 | 08/15/30 | 129,000 | 112,364 | ||||||||||
| Ball Corp. | 3.13 | 09/15/31 | 75,000 | 64,880 | ||||||||||
| Ball Corp. | 6.00 | 06/15/29 | 70,000 | 71,183 | ||||||||||
| Ball Corp. | 6.88 | 03/15/28 | 85,000 | 87,448 | ||||||||||
| Berry Global, Inc.(1) | 5.63 | 07/15/27 | 70,000 | 69,942 | ||||||||||
| Cascades, Inc./Cascades USA, Inc.(1) | 5.38 | 01/15/28 | 40,000 | 39,388 | ||||||||||
| Crown Americas LLC | 5.25 | 04/01/30 | 50,000 | 49,217 | ||||||||||
| Crown Americas LLC/Crown Americas Capital Corp.V | 4.25 | 09/30/26 | 30,000 | 29,393 | ||||||||||
| Crown Americas LLC/Crown Americas Capital Corp.VI | 4.75 | 02/01/26 | 75,000 | 74,512 | ||||||||||
| Crown Cork & Seal Co., Inc. | 7.38 | 12/15/26 | 25,000 | 25,982 | ||||||||||
| Graphic Packaging International LLC(1) | 3.50 | 03/15/28 | 55,000 | 51,401 | ||||||||||
| Graphic Packaging International LLC(1) | 3.75 | 02/01/30 | 50,000 | 45,772 | ||||||||||
| Graphic Packaging International LLC(1) | 4.75 | 07/15/27 | 20,000 | 19,625 | ||||||||||
| Graphic Packaging International LLC(1) | 6.38 | 07/15/32 | 50,000 | 50,509 | ||||||||||
| OI European Group BV(1) | 4.75 | 02/15/30 | 35,000 | 31,739 | ||||||||||
| Sealed Air Corp.(1) | 4.00 | 12/01/27 | 35,000 | 33,531 | ||||||||||
| Sealed Air Corp.(1) | 5.00 | 04/15/29 | 30,000 | 29,005 | ||||||||||
| Sealed Air Corp.(1) | 6.50 | 07/15/32 | 30,000 | 30,479 | ||||||||||
| Sealed Air Corp.(1) | 6.88 | 07/15/33 | 45,000 | 47,711 | ||||||||||
| Sealed Air Corp./Sealed Air Corp. US(1) | 6.13 | 02/01/28 | 75,000 | 75,850 | ||||||||||
| Sealed Air Corp./Sealed Air Corp. US(1) | 7.25 | 02/15/31 | 35,000 | 36,382 | ||||||||||
The accompanying notes are an integral part of these financial statements.
67
BONDBLOXX ETF TRUST
BondBloxx BB Rated USD High Yield Corporate Bond ETF
Portfolio of Investments (Continued)
October 31, 2024
| Rate (%) | Maturity | Face Amount | Value | |||||||||||
| PACKAGING & CONTAINERS – 1.9% (Continued) | ||||||||||||||
| Silgan Holdings, Inc. | 4.13 | 02/01/28 | $ | 50,000 | $ | 47,781 | ||||||||
| TriMas Corp.(1) | 4.13 | 04/15/29 | 40,000 | 37,364 | ||||||||||
| 1,161,458 | ||||||||||||||
| PHARMACEUTICALS – 0.8% | ||||||||||||||
| 180 Medical, Inc.(1) | 3.88 | 10/15/29 | 45,000 | 41,896 | ||||||||||
| HLF Financing Sarl LLC/Herbalife International, Inc.(1) | 12.25 | 04/15/29 | 70,000 | 70,482 | ||||||||||
| Jazz Securities DAC(1) | 4.38 | 01/15/29 | 135,000 | 127,871 | ||||||||||
| Organon & Co./Organon Foreign Debt Co.-Issuer BV(1) | 4.13 | 04/30/28 | 175,000 | 165,969 | ||||||||||
| Organon & Co./Organon Foreign Debt Co.-Issuer BV(1) | 6.75 | 05/15/34 | 50,000 | 50,157 | ||||||||||
| 456,375 | ||||||||||||||
| PIPELINES – 6.3% | ||||||||||||||
| Antero Midstream Partners LP/Antero Midstream Finance Corp.(1) | 5.38 | 06/15/29 | 65,000 | 63,356 | ||||||||||
| Antero Midstream Partners LP/Antero Midstream Finance Corp.(1) | 5.75 | 03/01/27 | 60,000 | 59,933 | ||||||||||
| Antero Midstream Partners LP/Antero Midstream Finance Corp.(1) | 5.75 | 01/15/28 | 55,000 | 54,746 | ||||||||||
| Antero Midstream Partners LP/Antero Midstream Finance Corp.(1) | 6.63 | 02/01/32 | 50,000 | 50,599 | ||||||||||
| Buckeye Partners LP | 3.95 | 12/01/26 | 50,000 | 48,112 | ||||||||||
| Buckeye Partners LP | 4.13 | 12/01/27 | 48,000 | 45,926 | ||||||||||
| Buckeye Partners LP(1) | 4.50 | 03/01/28 | 45,000 | 42,900 | ||||||||||
| Buckeye Partners LP | 5.85 | 11/15/43 | 55,000 | 47,587 | ||||||||||
| Buckeye Partners LP(1) | 6.88 | 07/01/29 | 45,000 | 45,776 | ||||||||||
| CNX Midstream Partners LP(1) | 4.75 | 04/15/30 | 35,000 | 32,610 | ||||||||||
| CQP Holdco LP/BIP-V Chinook Holdco LLC(1) | 5.50 | 06/15/31 | 125,000 | 119,060 | ||||||||||
| CQP Holdco LP/BIP-V Chinook Holdco LLC(1) | 7.50 | 12/15/33 | 40,000 | 42,352 | ||||||||||
| DT Midstream, Inc.(1) | 4.13 | 06/15/29 | 95,000 | 89,281 | ||||||||||
| DT Midstream, Inc.(1) | 4.38 | 06/15/31 | 85,000 | 78,258 | ||||||||||
| Energy Transfer LP | 7.13 | 10/01/54 | 35,000 | 35,397 | ||||||||||
| Energy Transfer LP | 8.00 | 05/15/54 | 70,000 | 74,225 | ||||||||||
| EQM Midstream Partners LP | 4.13 | 12/01/26 | 45,000 | 44,059 | ||||||||||
| EQM Midstream Partners LP(1) | 4.50 | 01/15/29 | 65,000 | 62,620 | ||||||||||
| EQM Midstream Partners LP(1) | 4.75 | 01/15/31 | 95,000 | 90,383 | ||||||||||
| EQM Midstream Partners LP | 5.50 | 07/15/28 | 75,000 | 74,499 | ||||||||||
| EQM Midstream Partners LP(1) | 6.38 | 04/01/29 | 54,000 | 54,885 | ||||||||||
| EQM Midstream Partners LP(1) | 6.50 | 07/01/27 | 80,000 | 81,890 | ||||||||||
| EQM Midstream Partners LP | 6.50 | 07/15/48 | 50,000 | 50,357 | ||||||||||
| EQM Midstream Partners LP(1) | 7.50 | 06/01/27 | 40,000 | 40,928 | ||||||||||
| EQM Midstream Partners LP(1) | 7.50 | 06/01/30 | 50,000 | 53,809 | ||||||||||
| Harvest Midstream I LP(1) | 7.50 | 09/01/28 | 70,000 | 70,867 | ||||||||||
| Harvest Midstream I LP(1) | 7.50 | 05/15/32 | 40,000 | 40,984 | ||||||||||
| Hess Midstream Operations LP(1) | 4.25 | 02/15/30 | 95,000 | 88,780 | ||||||||||
| Hess Midstream Operations LP(1) | 5.13 | 06/15/28 | 10,000 | 9,794 | ||||||||||
| Hess Midstream Operations LP(1) | 5.50 | 10/15/30 | 20,000 | 19,557 | ||||||||||
| Hess Midstream Operations LP(1) | 5.63 | 02/15/26 | 85,000 | 84,860 | ||||||||||
| Hess Midstream Operations LP(1) | 6.50 | 06/01/29 | 60,000 | 61,041 | ||||||||||
| Kinetik Holdings LP(1) | 5.88 | 06/15/30 | 80,000 | 79,453 | ||||||||||
| Kinetik Holdings LP(1) | 6.63 | 12/15/28 | 70,000 | 71,553 | ||||||||||
| Northriver Midstream Finance LP(1) | 6.75 | 07/15/32 | 50,000 | 51,354 | ||||||||||
| NuStar Logistics LP | 5.63 | 04/28/27 | 45,000 | 44,684 | ||||||||||
The accompanying notes are an integral part of these financial statements.
68
BONDBLOXX ETF TRUST
BondBloxx BB Rated USD High Yield Corporate Bond ETF
Portfolio of Investments (Continued)
October 31, 2024
| Rate (%) | Maturity | Face Amount | Value | |||||||||||
| PIPELINES – 6.3% (Continued) | ||||||||||||||
| NuStar Logistics LP | 6.00 | 06/01/26 | $ | 45,000 | $ | 45,067 | ||||||||
| NuStar Logistics LP | 6.38 | 10/01/30 | 50,000 | 50,606 | ||||||||||
| Rockies Express Pipeline LLC(1) | 4.80 | 05/15/30 | 25,000 | 23,142 | ||||||||||
| Rockies Express Pipeline LLC(1) | 4.95 | 07/15/29 | 50,000 | 47,008 | ||||||||||
| Rockies Express Pipeline LLC(1) | 7.50 | 07/15/38 | 65,000 | 66,421 | ||||||||||
| South Bow Canadian Infrastructure Holdings Ltd.(1) | 7.50 | 03/01/55 | 50,000 | 51,961 | ||||||||||
| South Bow Canadian Infrastructure Holdings Ltd.(1) | 7.63 | 03/01/55 | 45,000 | 46,374 | ||||||||||
| Venture Global Calcasieu Pass LLC(1) | 3.88 | 08/15/29 | 115,000 | 106,118 | ||||||||||
| Venture Global Calcasieu Pass LLC(1) | 3.88 | 11/01/33 | 100,000 | 86,948 | ||||||||||
| Venture Global Calcasieu Pass LLC(1) | 4.13 | 08/15/31 | 110,000 | 100,328 | ||||||||||
| Venture Global Calcasieu Pass LLC(1) | 6.25 | 01/15/30 | 90,000 | 92,050 | ||||||||||
| Venture Global LNG, Inc.(1) | 7.00 | 01/15/30 | 130,000 | 130,892 | ||||||||||
| Venture Global LNG, Inc.(1) | 8.13 | 06/01/28 | 195,000 | 202,505 | ||||||||||
| Venture Global LNG, Inc.(1) | 8.38 | 06/01/31 | 180,000 | 187,100 | ||||||||||
| Venture Global LNG, Inc.(1) | 9.50 | 02/01/29 | 265,000 | 293,071 | ||||||||||
| Venture Global LNG, Inc.(1) | 9.88 | 02/01/32 | 185,000 | 202,048 | ||||||||||
| 3,838,114 | ||||||||||||||
| REAL ESTATE – 0.6% | ||||||||||||||
| Cushman & Wakefield US Borrower LLC(1) | 6.75 | 05/15/28 | 55,000 | 55,347 | ||||||||||
| Cushman & Wakefield US Borrower LLC(1) | 8.88 | 09/01/31 | 35,000 | 37,741 | ||||||||||
| Greystar Real Estate Partners LLC(1) | 7.75 | 09/01/30 | 35,000 | 36,707 | ||||||||||
| Howard Hughes Corp.(1) | 4.13 | 02/01/29 | 55,000 | 50,704 | ||||||||||
| Howard Hughes Corp.(1) | 4.38 | 02/01/31 | 55,000 | 49,341 | ||||||||||
| Howard Hughes Corp.(1) | 5.38 | 08/01/28 | 65,000 | 63,254 | ||||||||||
| Newmark Group, Inc. | 7.50 | 01/12/29 | 40,000 | 42,383 | ||||||||||
| 335,477 | ||||||||||||||
| REAL ESTATE INVESTMENT TRUSTS (REITS) – 3.6% | ||||||||||||||
| Blackstone Mortgage Trust, Inc.(1) | 3.75 | 01/15/27 | 35,000 | 32,762 | ||||||||||
| Brandywine Operating Partnership LP | 3.95 | 11/15/27 | 45,000 | 42,152 | ||||||||||
| Brandywine Operating Partnership LP | 4.55 | 10/01/29 | 35,000 | 32,251 | ||||||||||
| Brandywine Operating Partnership LP | 8.30 | 03/15/28 | 20,000 | 21,032 | ||||||||||
| Brandywine Operating Partnership LP | 8.88 | 04/12/29 | 30,000 | 32,538 | ||||||||||
| CTR Partnership LP/CareTrust Capital Corp.(1) | 3.88 | 06/30/28 | 40,000 | 37,930 | ||||||||||
| Global Net Lease, Inc./Global Net Lease Operating Partnership LP(1) | 3.75 | 12/15/27 | 40,000 | 36,722 | ||||||||||
| Hudson Pacific Properties LP | 3.25 | 01/15/30 | 30,000 | 21,940 | ||||||||||
| Hudson Pacific Properties LP | 3.95 | 11/01/27 | 35,000 | 31,424 | ||||||||||
| Hudson Pacific Properties LP | 4.65 | 04/01/29 | 45,000 | 36,044 | ||||||||||
| Hudson Pacific Properties LP | 5.95 | 02/15/28 | 30,000 | 26,629 | ||||||||||
| Iron Mountain Information Management Services, Inc.(1) | 5.00 | 07/15/32 | 60,000 | 56,601 | ||||||||||
| Iron Mountain, Inc.(1) | 4.50 | 02/15/31 | 100,000 | 92,939 | ||||||||||
| Iron Mountain, Inc.(1) | 4.88 | 09/15/27 | 80,000 | 78,678 | ||||||||||
| Iron Mountain, Inc.(1) | 4.88 | 09/15/29 | 90,000 | 86,751 | ||||||||||
| Iron Mountain, Inc.(1) | 5.00 | 07/15/28 | 30,000 | 29,261 | ||||||||||
| Iron Mountain, Inc.(1) | 5.25 | 03/15/28 | 84,000 | 82,517 | ||||||||||
| Iron Mountain, Inc.(1) | 5.25 | 07/15/30 | 110,000 | 106,460 | ||||||||||
| Iron Mountain, Inc.(1) | 5.63 | 07/15/32 | 55,000 | 53,404 | ||||||||||
| Iron Mountain, Inc.(1) | 7.00 | 02/15/29 | 95,000 | 97,772 | ||||||||||
The accompanying notes are an integral part of these financial statements.
69
BONDBLOXX ETF TRUST
BondBloxx BB Rated USD High Yield Corporate Bond ETF
Portfolio of Investments (Continued)
October 31, 2024
| Rate (%) | Maturity | Face Amount | Value | |||||||||||
| REAL ESTATE INVESTMENT TRUSTS (REITS) – 3.6% (Continued) | ||||||||||||||
| Ladder Capital Finance Holdings LLLP/Ladder Capital Finance Corp.(1) | 4.25 | 02/01/27 | $ | 55,000 | $ | 53,290 | ||||||||
| Ladder Capital Finance Holdings LLLP/Ladder Capital Finance Corp.(1) | 4.75 | 06/15/29 | 50,000 | 47,684 | ||||||||||
| Ladder Capital Finance Holdings LLLP/Ladder Capital Finance Corp.(1) | 7.00 | 07/15/31 | 40,000 | 41,515 | ||||||||||
| Necessity Retail REIT, Inc./American Finance Operating Partner LP(1) | 4.50 | 09/30/28 | 40,000 | 36,880 | ||||||||||
| Park Intermediate Holdings LLC/PK Domestic Property LLC/PK Finance Co.-Issuer, inc.(1) | 7.00 | 02/01/30 | 45,000 | 46,132 | ||||||||||
| Park Intermediate Holdings LLC/PK Domestic Property LLC/PK Finance Co.-Issuer, Inc.(1) | 4.88 | 05/15/29 | 70,000 | 66,739 | ||||||||||
| Park Intermediate Holdings LLC/PK Domestic Property LLC/PK Finance Co.-Issuer, Inc.(1) | 5.88 | 10/01/28 | 60,000 | 59,434 | ||||||||||
| RHP Hotel Properties LP/RHP Finance Corp.(1) | 4.50 | 02/15/29 | 50,000 | 47,916 | ||||||||||
| RHP Hotel Properties LP/RHP Finance Corp. | 4.75 | 10/15/27 | 60,000 | 58,781 | ||||||||||
| RHP Hotel Properties LP/RHP Finance Corp.(1) | 6.50 | 04/01/32 | 85,000 | 86,069 | ||||||||||
| RHP Hotel Properties LP/RHP Finance Corp.(1) | 7.25 | 07/15/28 | 35,000 | 36,332 | ||||||||||
| RLJ Lodging Trust LP(1) | 3.75 | 07/01/26 | 45,000 | 43,628 | ||||||||||
| RLJ Lodging Trust LP(1) | 4.00 | 09/15/29 | 45,000 | 40,600 | ||||||||||
| SBA Communications Corp. | 3.13 | 02/01/29 | 135,000 | 122,947 | ||||||||||
| SBA Communications Corp. | 3.88 | 02/15/27 | 125,000 | 121,065 | ||||||||||
| Starwood Property Trust, Inc.(1) | 3.63 | 07/15/26 | 40,000 | 38,378 | ||||||||||
| Starwood Property Trust, Inc.(1) | 4.38 | 01/15/27 | 45,000 | 43,413 | ||||||||||
| Starwood Property Trust, Inc.(1) | 6.00 | 04/15/30 | 35,000 | 34,340 | ||||||||||
| Starwood Property Trust, Inc.(1) | 7.25 | 04/01/29 | 50,000 | 51,227 | ||||||||||
| Vornado Realty LP | 2.15 | 06/01/26 | 40,000 | 37,877 | ||||||||||
| Vornado Realty LP | 3.40 | 06/01/31 | 30,000 | 25,547 | ||||||||||
| 2,175,601 | ||||||||||||||
| RETAIL – 5.5% | ||||||||||||||
| 1011778 BC ULC/New Red Finance, Inc.(1) | 3.50 | 02/15/29 | 70,000 | 64,691 | ||||||||||
| 1011778 BC ULC/New Red Finance, Inc.(1) | 3.88 | 01/15/28 | 145,000 | 138,320 | ||||||||||
| 1011778 BC ULC/New Red Finance, Inc.(1) | 5.63 | 09/15/29 | 50,000 | 49,936 | ||||||||||
| 1011778 BC ULC/New Red Finance, Inc.(1) | 6.13 | 06/15/29 | 90,000 | 91,637 | ||||||||||
| Academy Ltd.(1) | 6.00 | 11/15/27 | 35,000 | 34,934 | ||||||||||
| Advance Auto Parts, Inc. | 1.75 | 10/01/27 | 30,000 | 26,684 | ||||||||||
| Advance Auto Parts, Inc. | 3.50 | 03/15/32 | 30,000 | 24,697 | ||||||||||
| Advance Auto Parts, Inc. | 3.90 | 04/15/30 | 40,000 | 35,633 | ||||||||||
| Advance Auto Parts, Inc. | 5.90 | 03/09/26 | 25,000 | 25,211 | ||||||||||
| Advance Auto Parts, Inc. | 5.95 | 03/09/28 | 30,000 | 30,258 | ||||||||||
| Asbury Automotive Group, Inc. | 4.50 | 03/01/28 | 30,000 | 28,986 | ||||||||||
| Asbury Automotive Group, Inc.(1) | 4.63 | 11/15/29 | 70,000 | 65,600 | ||||||||||
| Asbury Automotive Group, Inc. | 4.75 | 03/01/30 | 40,000 | 37,675 | ||||||||||
| Asbury Automotive Group, Inc.(1) | 5.00 | 02/15/32 | 55,000 | 50,709 | ||||||||||
| Bath & Body Works, Inc. | 5.25 | 02/01/28 | 30,000 | 29,613 | ||||||||||
| Bath & Body Works, Inc.(1) | 6.63 | 10/01/30 | 75,000 | 75,161 | ||||||||||
| Bath & Body Works, Inc. | 6.69 | 01/15/27 | 20,000 | 20,491 | ||||||||||
| Bath & Body Works, Inc. | 6.75 | 07/01/36 | 60,000 | 60,400 | ||||||||||
| Bath & Body Works, Inc. | 6.88 | 11/01/35 | 65,000 | 66,062 | ||||||||||
| Bath & Body Works, Inc. | 7.50 | 06/15/29 | 45,000 | 46,503 | ||||||||||
| Beacon Roofing Supply, Inc.(1) | 4.50 | 11/15/26 | 25,000 | 24,525 | ||||||||||
| Beacon Roofing Supply, Inc.(1) | 6.50 | 08/01/30 | 55,000 | 55,962 | ||||||||||
The accompanying notes are an integral part of these financial statements.
70
BONDBLOXX ETF TRUST
BondBloxx BB Rated USD High Yield Corporate Bond ETF
Portfolio of Investments (Continued)
October 31, 2024
| Rate (%) | Maturity | Face Amount | Value | |||||||||||
| RETAIL – 5.5% (Continued) | ||||||||||||||
| FirstCash, Inc.(1) | 4.63 | 09/01/28 | $ | 45,000 | $ | 42,669 | ||||||||
| FirstCash, Inc.(1) | 5.63 | 01/01/30 | 45,000 | 43,733 | ||||||||||
| FirstCash, Inc.(1) | 6.88 | 03/01/32 | 40,000 | 40,506 | ||||||||||
| Foot Locker, Inc.(1) | 4.00 | 10/01/29 | 35,000 | 30,109 | ||||||||||
| Gap, Inc.(1) | 3.63 | 10/01/29 | 65,000 | 58,402 | ||||||||||
| Gap, Inc.(1) | 3.88 | 10/01/31 | 65,000 | 55,930 | ||||||||||
| Group 1 Automotive, Inc.(1) | 4.00 | 08/15/28 | 65,000 | 61,083 | ||||||||||
| Group 1 Automotive, Inc.(1) | 6.38 | 01/15/30 | 45,000 | 45,314 | ||||||||||
| KFC Holding Co./Pizza Hut Holdings LLC/Taco Bell of America LLC(1) | 4.75 | 06/01/27 | 65,000 | 64,455 | ||||||||||
| Kohl’s Corp. | 4.63 | 05/01/31 | 55,000 | 45,685 | ||||||||||
| Kohl’s Corp. | 5.55 | 07/17/45 | 30,000 | 20,208 | ||||||||||
| Lithia Motors, Inc.(1) | 3.88 | 06/01/29 | 70,000 | 64,303 | ||||||||||
| Lithia Motors, Inc.(1) | 4.38 | 01/15/31 | 40,000 | 36,632 | ||||||||||
| Lithia Motors, Inc.(1) | 4.63 | 12/15/27 | 45,000 | 43,700 | ||||||||||
| Macy’s Retail Holdings LLC | 4.30 | 02/15/43 | 25,000 | 17,277 | ||||||||||
| Macy’s Retail Holdings LLC | 4.50 | 12/15/34 | 25,000 | 20,912 | ||||||||||
| Macy’s Retail Holdings LLC | 5.13 | 01/15/42 | 25,000 | 19,267 | ||||||||||
| Macy’s Retail Holdings LLC(1) | 5.88 | 04/01/29 | 40,000 | 39,124 | ||||||||||
| Macy’s Retail Holdings LLC(1) | 5.88 | 03/15/30 | 35,000 | 33,889 | ||||||||||
| Macy’s Retail Holdings LLC(1) | 6.13 | 03/15/32 | 40,000 | 38,271 | ||||||||||
| Marks & Spencer PLC(1) | 7.13 | 12/01/37 | 30,000 | 33,173 | ||||||||||
| Murphy Oil USA, Inc.(1) | 3.75 | 02/15/31 | 40,000 | 35,588 | ||||||||||
| Murphy Oil USA, Inc. | 4.75 | 09/15/29 | 45,000 | 43,047 | ||||||||||
| Murphy Oil USA, Inc. | 5.63 | 05/01/27 | 30,000 | 30,102 | ||||||||||
| Nordstrom, Inc. | 4.00 | 03/15/27 | 30,000 | 28,903 | ||||||||||
| Nordstrom, Inc. | 4.25 | 08/01/31 | 40,000 | 35,281 | ||||||||||
| Nordstrom, Inc. | 4.38 | 04/01/30 | 45,000 | 40,836 | ||||||||||
| Nordstrom, Inc. | 5.00 | 01/15/44 | 80,000 | 60,296 | ||||||||||
| Nordstrom, Inc. | 6.95 | 03/15/28 | 25,000 | 25,925 | ||||||||||
| Penske Automotive Group, Inc. | 3.75 | 06/15/29 | 44,000 | 40,300 | ||||||||||
| PetSmart, Inc./PetSmart Finance Corp.(1) | 4.75 | 02/15/28 | 105,000 | 99,932 | ||||||||||
| Sally Holdings LLC/Sally Capital, Inc. | 6.75 | 03/01/32 | 50,000 | 50,666 | ||||||||||
| Sonic Automotive, Inc.(1) | 4.63 | 11/15/29 | 50,000 | 45,954 | ||||||||||
| Sonic Automotive, Inc.(1) | 4.88 | 11/15/31 | 50,000 | 45,001 | ||||||||||
| Superior Plus LP/Superior General Partner, Inc.(1) | 4.50 | 03/15/29 | 50,000 | 46,175 | ||||||||||
| Vivo Energy Investments BV(1) | 5.13 | 09/24/27 | 30,000 | 29,414 | ||||||||||
| Walgreens Boots Alliance, Inc. | 3.20 | 04/15/30 | 35,000 | 27,858 | ||||||||||
| Walgreens Boots Alliance, Inc. | 3.45 | 06/01/26 | 130,000 | 125,152 | ||||||||||
| Walgreens Boots Alliance, Inc. | 4.10 | 04/15/50 | 70,000 | 45,219 | ||||||||||
| Walgreens Boots Alliance, Inc. | 4.50 | 11/18/34 | 46,000 | 35,809 | ||||||||||
| Walgreens Boots Alliance, Inc. | 4.65 | 06/01/46 | 10,000 | 6,538 | ||||||||||
| Walgreens Boots Alliance, Inc. | 4.80 | 11/18/44 | 60,000 | 44,201 | ||||||||||
| Walgreens Boots Alliance, Inc. | 8.13 | 08/15/29 | 55,000 | 54,712 | ||||||||||
| Yum! Brands, Inc. | 3.63 | 03/15/31 | 85,000 | 77,065 | ||||||||||
| Yum! Brands, Inc. | 4.63 | 01/31/32 | 85,000 | 79,785 | ||||||||||
| Yum! Brands, Inc.(1) | 4.75 | 01/15/30 | 85,000 | 82,333 | ||||||||||
| Yum! Brands, Inc. | 5.35 | 11/01/43 | 25,000 | 24,367 | ||||||||||
The accompanying notes are an integral part of these financial statements.
71
BONDBLOXX ETF TRUST
BondBloxx BB Rated USD High Yield Corporate Bond ETF
Portfolio of Investments (Continued)
October 31, 2024
| Rate (%) | Maturity | Face Amount | Value | |||||||||||
| RETAIL – 5.5% (Continued) | ||||||||||||||
| Yum! Brands, Inc. | 5.38 | 04/01/32 | $ | 85,000 | $ | 82,841 | ||||||||
| Yum! Brands, Inc. | 6.88 | 11/15/37 | 30,000 | 33,369 | ||||||||||
| 3,314,999 | ||||||||||||||
| SEMICONDUCTORS – 0.7% | ||||||||||||||
| Amkor Technology, Inc.(1) | 6.63 | 09/15/27 | 50,000 | 50,244 | ||||||||||
| Entegris, Inc.(1) | 3.63 | 05/01/29 | 40,000 | 36,768 | ||||||||||
| Entegris, Inc.(1) | 4.38 | 04/15/28 | 30,000 | 28,709 | ||||||||||
| Entegris, Inc.(1) | 4.75 | 04/15/29 | 140,000 | 135,743 | ||||||||||
| Entegris, Inc.(1) | 5.95 | 06/15/30 | 75,000 | 74,985 | ||||||||||
| ON Semiconductor Corp.(1) | 3.88 | 09/01/28 | 60,000 | 56,324 | ||||||||||
| Synaptics, Inc.(1) | 4.00 | 06/15/29 | 40,000 | 36,729 | ||||||||||
| 419,502 | ||||||||||||||
| SOFTWARE – 1.3% | ||||||||||||||
| Camelot Finance SA(1) | 4.50 | 11/01/26 | 60,000 | 58,992 | ||||||||||
| Clarivate Science Holdings Corp.(1) | 3.88 | 07/01/28 | 80,000 | 75,578 | ||||||||||
| Elastic NV(1) | 4.13 | 07/15/29 | 50,000 | 46,314 | ||||||||||
| Fair Isaac Corp.(1) | 4.00 | 06/15/28 | 75,000 | 71,293 | ||||||||||
| Fair Isaac Corp.(1) | 5.25 | 05/15/26 | 40,000 | 40,078 | ||||||||||
| Open Text Corp.(1) | 3.88 | 02/15/28 | 80,000 | 75,319 | ||||||||||
| Open Text Corp.(1) | 3.88 | 12/01/29 | 70,000 | 63,918 | ||||||||||
| Open Text Holdings, Inc.(1) | 4.13 | 02/15/30 | 80,000 | 73,507 | ||||||||||
| Open Text Holdings, Inc.(1) | 4.13 | 12/01/31 | 55,000 | 49,445 | ||||||||||
| PTC, Inc.(1) | 4.00 | 02/15/28 | 45,000 | 43,088 | ||||||||||
| RingCentral, Inc.(1) | 8.50 | 08/15/30 | 35,000 | 37,045 | ||||||||||
| ROBLOX Corp.(1) | 3.88 | 05/01/30 | 90,000 | 81,537 | ||||||||||
| Twilio, Inc. | 3.63 | 03/15/29 | 45,000 | 41,476 | ||||||||||
| Twilio, Inc. | 3.88 | 03/15/31 | 40,000 | 36,113 | ||||||||||
| 793,703 | ||||||||||||||
| TELECOMMUNICATIONS – 3.3% | ||||||||||||||
| British Telecommunications PLC(1) | 4.25 | 11/23/81 | 45,000 | 43,429 | ||||||||||
| British Telecommunications PLC(1) | 4.88 | 11/23/81 | 40,000 | 36,821 | ||||||||||
| Ciena Corp.(1) | 4.00 | 01/31/30 | 30,000 | 27,708 | ||||||||||
| Connect FinCo. Sarl/Connect US FinCo. LLC(1) | 9.00 | 09/15/29 | 170,000 | 161,687 | ||||||||||
| Intelsat Jackson Holdings SA(1) | 6.50 | 03/15/30 | 260,000 | 244,941 | ||||||||||
| Millicom International Cellular SA(1) | 4.50 | 04/27/31 | 60,000 | 54,176 | ||||||||||
| Millicom International Cellular SA(1) | 5.13 | 01/15/28 | 18,000 | 17,453 | ||||||||||
| Millicom International Cellular SA(1) | 6.25 | 03/25/29 | 63,000 | 62,655 | ||||||||||
| Millicom International Cellular SA(1) | 7.38 | 04/02/32 | 50,000 | 51,111 | ||||||||||
| Optics Bidco SpA(1) | 6.00 | 09/30/34 | 50,000 | 48,990 | ||||||||||
| Optics Bidco SpA(1) | 6.38 | 11/15/33 | 50,000 | 50,637 | ||||||||||
| Optics Bidco SpA(1) | 7.20 | 07/18/36 | 30,000 | 31,012 | ||||||||||
| Optics Bidco SpA(1) | 7.72 | 06/04/38 | 45,000 | 47,803 | ||||||||||
| Rogers Communications, Inc.(1) | 5.25 | 03/15/82 | 65,000 | 63,738 | ||||||||||
| Sable International Finance Ltd.(1) | 7.13 | 10/15/32 | 75,000 | 75,445 | ||||||||||
| Telecom Italia Capital SA | 6.00 | 09/30/34 | 40,000 | 38,977 | ||||||||||
| Telecom Italia Capital SA | 6.38 | 11/15/33 | 40,000 | 40,475 | ||||||||||
| Telecom Italia Capital SA | 7.20 | 07/18/36 | 40,000 | 40,622 | ||||||||||
The accompanying notes are an integral part of these financial statements.
72
BONDBLOXX ETF TRUST
BondBloxx BB Rated USD High Yield Corporate Bond ETF
Portfolio of Investments (Continued)
October 31, 2024
| Rate (%) | Maturity | Face Amount | Value | |||||||||||
| TELECOMMUNICATIONS – 3.3% (Continued) | ||||||||||||||
| Telecom Italia Capital SA | 7.72 | 06/04/38 | $ | 50,000 | $ | 52,117 | ||||||||
| United States Cellular Corp. | 6.70 | 12/15/33 | 45,000 | 48,611 | ||||||||||
| Viasat, Inc.(1) | 5.63 | 04/15/27 | 50,000 | 46,734 | ||||||||||
| Viavi Solutions, Inc.(1) | 3.75 | 10/01/29 | 30,000 | 27,251 | ||||||||||
| Vmed O2 UK Financing I PLC(1) | 4.25 | 01/31/31 | 115,000 | 99,325 | ||||||||||
| Vmed O2 UK Financing I PLC(1) | 4.75 | 07/15/31 | 125,000 | 108,374 | ||||||||||
| Vmed O2 UK Financing I PLC(1) | 7.75 | 04/15/32 | 50,000 | 50,123 | ||||||||||
| Vodafone Group PLC | 3.25 | 06/04/81 | 45,000 | 43,275 | ||||||||||
| Vodafone Group PLC | 4.13 | 06/04/81 | 90,000 | 81,006 | ||||||||||
| Vodafone Group PLC | 5.13 | 06/04/81 | 80,000 | 64,024 | ||||||||||
| Vodafone Group PLC | 7.00 | 04/04/79 | 170,000 | 178,357 | ||||||||||
| Zegona Finance PLC(1) | 8.63 | 07/15/29 | 80,000 | 84,700 | ||||||||||
| 2,021,577 | ||||||||||||||
| TRANSPORTATION – 0.7% | ||||||||||||||
| Cargo Aircraft Management, Inc.(1) | 4.75 | 02/01/28 | 50,000 | 47,753 | ||||||||||
| Danaos Corp.(1) | 8.50 | 03/01/28 | 25,000 | 25,722 | ||||||||||
| First Student Bidco, Inc./First Transit Parent, Inc.(1) | 4.00 | 07/31/29 | 55,000 | 50,685 | ||||||||||
| Genesee & Wyoming, Inc.(1) | 6.25 | 04/15/32 | 65,000 | 65,649 | ||||||||||
| Rand Parent LLC(1) | 8.50 | 02/15/30 | 75,000 | 74,917 | ||||||||||
| RXO, Inc.(1) | 7.50 | 11/15/27 | 30,000 | 30,950 | ||||||||||
| XPO CNW, Inc. | 6.70 | 05/01/34 | 25,000 | 26,211 | ||||||||||
| XPO, Inc.(1) | 7.13 | 06/01/31 | 40,000 | 41,437 | ||||||||||
| XPO, Inc.(1) | 7.13 | 02/01/32 | 50,000 | 51,988 | ||||||||||
| 415,312 | ||||||||||||||
| TRUCKING & LEASING – 0.5% | ||||||||||||||
| Fortress Transportation & Infrastructure Investors LLC(1) | 5.50 | 05/01/28 | 90,000 | 88,322 | ||||||||||
| Fortress Transportation & Infrastructure Investors LLC(1) | 5.88 | 04/15/33 | 30,000 | 29,271 | ||||||||||
| Fortress Transportation & Infrastructure Investors LLC(1) | 7.00 | 05/01/31 | 70,000 | 72,053 | ||||||||||
| Fortress Transportation & Infrastructure Investors LLC(1) | 7.00 | 06/15/32 | 60,000 | 61,603 | ||||||||||
| Fortress Transportation & Infrastructure Investors LLC(1) | 7.88 | 12/01/30 | 40,000 | 42,177 | ||||||||||
| 293,426 | ||||||||||||||
| TOTAL CORPORATE BONDS (Cost - $58,142,328) | 59,375,282 | |||||||||||||
| SHORT-TERM INVESTMENTS – 1.6% | ||||||||||||||
| TIME DEPOSITS – 1.6% | ||||||||||||||
| JP Morgan Chase, New York | 4.18 | 11/01/24 | 947,417 | 947,417 | ||||||||||
| TOTAL SHORT-TERM INVESTMENTS (Cost - $947,417) | 947,417 | |||||||||||||
| TOTAL INVESTMENTS – 99.4% (Cost - $59,089,745) | $ | 60,322,699 | ||||||||||||
| OTHER ASSETS LESS LIABILITIES – 0.6% | 350,610 | |||||||||||||
| NET ASSETS – 100.0% | $ | 60,673,309 | ||||||||||||
| (1) | Security was purchased pursuant to Rule 144A under the Securities Act of 1933 and may not be resold subject to that Rule except to qualified institutional buyers. The aggregate value of Rule 144A holdings at October 31, 2024, amounts to $45,774,674 and represents 75.4% of net assets. These securities have been deemed liquid under procedures approved by the Trust’s Board of Trustees. |
| (2) | Security is perpetual in nature and has no stated maturity date. |
The accompanying notes are an integral part of these financial statements.
73
BONDBLOXX ETF TRUST
BondBloxx B Rated USD High Yield Corporate Bond ETF
Portfolio of Investments
October 31, 2024
| Rate (%) | Maturity | Face Amount | Value | |||||||||||
| CORPORATE BONDS – 97.9% | ||||||||||||||
| ADVERTISING – 1.9% | ||||||||||||||
| Advantage Sales & Marketing, Inc.(1) | 6.50 | 11/15/28 | $ | 20,000 | $ | 18,744 | ||||||||
| Clear Channel Outdoor Holdings, Inc.(1) | 5.13 | 08/15/27 | 50,000 | 48,524 | ||||||||||
| Clear Channel Outdoor Holdings, Inc.(1) | 7.88 | 04/01/30 | 35,000 | 35,716 | ||||||||||
| Clear Channel Outdoor Holdings, Inc.(1) | 9.00 | 09/15/28 | 30,000 | 31,540 | ||||||||||
| Neptune Bidco US, Inc.(1) | 9.29 | 04/15/29 | 105,000 | 98,199 | ||||||||||
| Outfront Media Capital LLC/Outfront Media Capital Corp.(1) | 4.25 | 01/15/29 | 15,000 | 14,079 | ||||||||||
| Outfront Media Capital LLC/Outfront Media Capital Corp.(1) | 4.63 | 03/15/30 | 15,000 | 13,965 | ||||||||||
| Outfront Media Capital LLC/Outfront Media Capital Corp.(1) | 5.00 | 08/15/27 | 35,000 | 34,502 | ||||||||||
| Stagwell Global LLC(1) | 5.63 | 08/15/29 | 45,000 | 42,840 | ||||||||||
| Summer BC Bidco B LLC(1) | 5.50 | 10/31/26 | 10,000 | 9,862 | ||||||||||
| 347,971 | ||||||||||||||
| AEROSPACE/DEFENSE – 2.7% | ||||||||||||||
| Bombardier, Inc.(1) | 6.00 | 02/15/28 | 30,000 | 29,992 | ||||||||||
| Bombardier, Inc.(1) | 7.00 | 06/01/32 | 35,000 | 35,877 | ||||||||||
| Bombardier, Inc.(1) | 7.25 | 07/01/31 | 35,000 | 36,204 | ||||||||||
| Bombardier, Inc.(1) | 7.45 | 05/01/34 | 15,000 | 16,341 | ||||||||||
| Bombardier, Inc.(1) | 7.50 | 02/01/29 | 35,000 | 36,480 | ||||||||||
| Bombardier, Inc.(1) | 7.88 | 04/15/27 | 36,000 | 36,094 | ||||||||||
| Bombardier, Inc.(1) | 8.75 | 11/15/30 | 25,000 | 27,119 | ||||||||||
| Spirit AeroSystems, Inc.(1) | 9.75 | 11/15/30 | 45,000 | 50,010 | ||||||||||
| TransDigm, Inc. | 4.63 | 01/15/29 | 40,000 | 38,023 | ||||||||||
| TransDigm, Inc. | 4.88 | 05/01/29 | 30,000 | 28,682 | ||||||||||
| TransDigm, Inc. | 5.50 | 11/15/27 | 115,000 | 114,084 | ||||||||||
| Triumph Group, Inc.(1) | 9.00 | 03/15/28 | 33,000 | 34,421 | ||||||||||
| 483,327 | ||||||||||||||
| AGRICULTURE – 0.2% | ||||||||||||||
| Turning Point Brands, Inc.(1) | 5.63 | 02/15/26 | 10,000 | 9,971 | ||||||||||
| Vector Group Ltd.(1) | 10.50 | 11/01/26 | 20,000 | 20,025 | ||||||||||
| 29,996 | ||||||||||||||
| AIRLINES – 0.4% | ||||||||||||||
| VistaJet Malta Finance PLC/Vista Management Holding, Inc.(1) | 6.38 | 02/01/30 | 40,000 | 34,283 | ||||||||||
| VistaJet Malta Finance PLC/Vista Management Holding, Inc.(1) | 7.88 | 05/01/27 | 15,000 | 14,619 | ||||||||||
| VistaJet Malta Finance PLC/Vista Management Holding, Inc.(1) | 9.50 | 06/01/28 | 25,000 | 24,586 | ||||||||||
| 73,488 | ||||||||||||||
| APPAREL – 0.6% | ||||||||||||||
| Crocs, Inc.(1) | 4.13 | 08/15/31 | 20,000 | 17,543 | ||||||||||
| Hanesbrands, Inc.(1) | 4.88 | 05/15/26 | 40,000 | 39,554 | ||||||||||
| Hanesbrands, Inc.(1) | 9.00 | 02/15/31 | 20,000 | 21,446 | ||||||||||
| S&S Holdings LLC(1) | 8.38 | 10/01/31 | 25,000 | 25,083 | ||||||||||
| 103,626 | ||||||||||||||
| AUTO MANUFACTURERS – 0.4% | ||||||||||||||
| Aston Martin Capital Holdings Ltd.(1) | 10.00 | 03/31/29 | 45,000 | 43,758 | ||||||||||
| JB Poindexter & Co., Inc.(1) | 8.75 | 12/15/31 | 20,000 | 21,009 | ||||||||||
| Wabash National Corp.(1) | 4.50 | 10/15/28 | 15,000 | 13,671 | ||||||||||
| 78,438 | ||||||||||||||
The accompanying notes are an integral part of these financial statements.
74
BONDBLOXX ETF TRUST
BondBloxx B Rated USD High Yield Corporate Bond ETF
Portfolio of Investments (Continued)
October 31, 2024
| Rate (%) | Maturity | Face Amount | Value | |||||||||||
| AUTO PARTS & EQUIPMENT – 2.4% | ||||||||||||||
| Adient Global Holdings Ltd.(1) | 4.88 | 08/15/26 | $ | 25,000 | $ | 24,655 | ||||||||
| Adient Global Holdings Ltd.(1) | 8.25 | 04/15/31 | 20,000 | 20,735 | ||||||||||
| American Axle & Manufacturing, Inc. | 5.00 | 10/01/29 | 25,000 | 22,643 | ||||||||||
| American Axle & Manufacturing, Inc. | 6.50 | 04/01/27 | 15,000 | 14,966 | ||||||||||
| American Axle & Manufacturing, Inc. | 6.88 | 07/01/28 | 20,000 | 19,810 | ||||||||||
| Clarios Global LP/Clarios US Finance Co.(1) | 8.50 | 05/15/27 | 65,000 | 65,469 | ||||||||||
| Garrett Motion Holdings, Inc./Garrett LX I Sarl(1) | 7.75 | 05/31/32 | 35,000 | 34,958 | ||||||||||
| Goodyear Tire & Rubber Co. | 4.88 | 03/15/27 | 15,000 | 14,487 | ||||||||||
| Goodyear Tire & Rubber Co. | 5.00 | 05/31/26 | 35,000 | 34,426 | ||||||||||
| Goodyear Tire & Rubber Co. | 5.00 | 07/15/29 | 40,000 | 36,250 | ||||||||||
| Goodyear Tire & Rubber Co. | 5.25 | 04/30/31 | 25,000 | 21,980 | ||||||||||
| Goodyear Tire & Rubber Co. | 5.25 | 07/15/31 | 20,000 | 17,598 | ||||||||||
| Goodyear Tire & Rubber Co. | 5.63 | 04/30/33 | 20,000 | 17,317 | ||||||||||
| Tenneco, Inc.(1) | 8.00 | 11/17/28 | 75,000 | 69,512 | ||||||||||
| Titan International, Inc. | 7.00 | 04/30/28 | 15,000 | 14,562 | ||||||||||
| 429,368 | ||||||||||||||
| BANKS – 0.6% | ||||||||||||||
| Freedom Mortgage Corp.(1) | 6.63 | 01/15/27 | 25,000 | 24,728 | ||||||||||
| Freedom Mortgage Corp.(1) | 7.63 | 05/01/26 | 15,000 | 15,068 | ||||||||||
| Freedom Mortgage Corp.(1) | 12.00 | 10/01/28 | 35,000 | 37,847 | ||||||||||
| Freedom Mortgage Corp.(1) | 12.25 | 10/01/30 | 20,000 | 22,046 | ||||||||||
| 99,689 | ||||||||||||||
| BEVERAGES – 0.2% | ||||||||||||||
| Primo Water Holdings, Inc.(1) | 4.38 | 04/30/29 | 30,000 | 28,294 | ||||||||||
| BUILDING MATERIALS – 1.1% | ||||||||||||||
| AmeriTex Hold Co. Intermediate LLC(1) | 10.25 | 10/15/28 | 15,000 | 15,802 | ||||||||||
| Camelot Return Merger Sub, Inc.(1) | 8.75 | 08/01/28 | 25,000 | 25,143 | ||||||||||
| Cornerstone Building Brands, Inc.(1) | 9.50 | 08/15/29 | 20,000 | 20,606 | ||||||||||
| Eco Material Technologies, Inc.(1) | 7.88 | 01/31/27 | 30,000 | 30,223 | ||||||||||
| Griffon Corp. | 5.75 | 03/01/28 | 40,000 | 39,314 | ||||||||||
| JELD-WEN, Inc.(1) | 4.88 | 12/15/27 | 15,000 | 14,525 | ||||||||||
| JELD-WEN, Inc.(1) | 7.00 | 09/01/32 | 15,000 | 14,881 | ||||||||||
| MIWD Holdco II LLC/MIWD Finance Corp.(1) | 5.50 | 02/01/30 | 15,000 | 14,369 | ||||||||||
| New Enterprise Stone & Lime Co., Inc.(1) | 5.25 | 07/15/28 | 25,000 | 24,219 | ||||||||||
| 199,082 | ||||||||||||||
| CHEMICALS – 3.1% | ||||||||||||||
| ASP Unifrax Holdings, Inc.(1) | 7.10 | 09/30/29 | 18,750 | 11,156 | ||||||||||
| Cerdia Finanz GmbH(1) | 9.38 | 10/03/31 | 35,000 | 36,083 | ||||||||||
| Chemours Co.(1) | 4.63 | 11/15/29 | 30,000 | 26,079 | ||||||||||
| Chemours Co. | 5.38 | 05/15/27 | 15,000 | 14,457 | ||||||||||
| Chemours Co.(1) | 5.75 | 11/15/28 | 30,000 | 27,729 | ||||||||||
| Consolidated Energy Finance SA(1) | 5.63 | 10/15/28 | 20,000 | 16,320 | ||||||||||
| Consolidated Energy Finance SA(1) | 12.00 | 02/15/31 | 20,000 | 19,531 | ||||||||||
| CVR Partners LP/CVR Nitrogen Finance Corp.(1) | 6.13 | 06/15/28 | 20,000 | 19,211 | ||||||||||
| Herens Holdco Sarl(1) | 4.75 | 05/15/28 | 10,000 | 8,785 | ||||||||||
| Mativ Holdings, Inc.(1) | 8.00 | 10/01/29 | 15,000 | 15,282 | ||||||||||
The accompanying notes are an integral part of these financial statements.
75
BONDBLOXX ETF TRUST
BondBloxx B Rated USD High Yield Corporate Bond ETF
Portfolio of Investments (Continued)
October 31, 2024
| Rate (%) | Maturity | Face Amount | Value | |||||||||||
| CHEMICALS – 3.1% (Continued) | ||||||||||||||
| Olympus Water US Holding Corp.(1) | 4.25 | 10/01/28 | $ | 30,000 | $ | 28,266 | ||||||||
| Olympus Water US Holding Corp.(1) | 7.13 | 10/01/27 | 15,000 | 15,245 | ||||||||||
| Olympus Water US Holding Corp.(1) | 7.25 | 06/15/31 | 30,000 | 30,810 | ||||||||||
| Olympus Water US Holding Corp.(1) | 9.75 | 11/15/28 | 70,000 | 74,351 | ||||||||||
| Rain Carbon, Inc.(1) | 12.25 | 09/01/29 | 20,000 | 21,349 | ||||||||||
| SCIH Salt Holdings, Inc.(1) | 4.88 | 05/01/28 | 40,000 | 38,342 | ||||||||||
| SCIL IV LLC/SCIL USA Holdings LLC(1) | 5.38 | 11/01/26 | 30,000 | 29,664 | ||||||||||
| SK Invictus Intermediate II Sarl(1) | 5.00 | 10/30/29 | 30,000 | 28,455 | ||||||||||
| TPC Group, Inc.(1) | 13.00 | 12/16/27 | 8,571 | 8,666 | ||||||||||
| Tronox, Inc.(1) | 4.63 | 03/15/29 | 45,000 | 40,875 | ||||||||||
| WR Grace Holdings LLC(1) | 4.88 | 06/15/27 | 45,000 | 44,212 | ||||||||||
| 554,868 | ||||||||||||||
| COMMERCIAL SERVICES – 6.2% | ||||||||||||||
| Albion Financing 2 Sarl(1) | 8.75 | 04/15/27 | 15,000 | 15,426 | ||||||||||
| Allied Universal Holdco LLC(1) | 7.88 | 02/15/31 | 85,000 | 86,576 | ||||||||||
| Allied Universal Holdco LLC/Allied Universal Finance Corp./Atlas Luxco 4 Sarl(1) | 4.63 | 06/01/28 | 65,000 | 61,024 | ||||||||||
| Allied Universal Holdco LLC/Allied Universal Finance Corp./Atlas Luxco 4 Sarl(1) | 4.63 | 06/01/28 | 25,000 | 23,433 | ||||||||||
| Alta Equipment Group, Inc.(1) | 9.00 | 06/01/29 | 20,000 | 17,782 | ||||||||||
| APi Group DE, Inc.(1) | 4.13 | 07/15/29 | 25,000 | 23,082 | ||||||||||
| Avis Budget Car Rental LLC/Avis Budget Finance, Inc.(1) | 4.75 | 04/01/28 | 15,000 | 14,110 | ||||||||||
| Avis Budget Car Rental LLC/Avis Budget Finance, Inc.(1) | 5.38 | 03/01/29 | 30,000 | 27,951 | ||||||||||
| Avis Budget Car Rental LLC/Avis Budget Finance, Inc.(1) | 5.75 | 07/15/27 | 25,000 | 24,564 | ||||||||||
| Avis Budget Car Rental LLC/Avis Budget Finance, Inc.(1) | 8.00 | 02/15/31 | 25,000 | 25,581 | ||||||||||
| Avis Budget Car Rental LLC/Avis Budget Finance, Inc.(1) | 8.25 | 01/15/30 | 25,000 | 25,560 | ||||||||||
| Carriage Services, Inc.(1) | 4.25 | 05/15/29 | 15,000 | 13,722 | ||||||||||
| Champions Financing, Inc.(1) | 8.75 | 02/15/29 | 25,000 | 25,261 | ||||||||||
| Cimpress PLC(1) | 7.38 | 09/15/32 | 25,000 | 24,644 | ||||||||||
| CPI CG, Inc.(1) | 10.00 | 07/15/29 | 10,000 | 10,486 | ||||||||||
| EquipmentShare.com, Inc.(1) | 8.00 | 03/15/33 | 25,000 | 25,261 | ||||||||||
| EquipmentShare.com, Inc.(1) | 8.63 | 05/15/32 | 20,000 | 20,657 | ||||||||||
| EquipmentShare.com, Inc.(1) | 9.00 | 05/15/28 | 40,000 | 41,411 | ||||||||||
| Garda World Security Corp.(1) | 4.63 | 02/15/27 | 20,000 | 19,492 | ||||||||||
| Garda World Security Corp.(1) | 7.75 | 02/15/28 | 15,000 | 15,505 | ||||||||||
| GEO Group, Inc. | 10.25 | 04/15/31 | 25,000 | 26,814 | ||||||||||
| Matthews International Corp.(1) | 8.63 | 10/01/27 | 10,000 | 10,323 | ||||||||||
| Mobius Merger Sub, Inc.(1) | 9.00 | 06/01/30 | 20,000 | 19,209 | ||||||||||
| NESCO Holdings II, Inc.(1) | 5.50 | 04/15/29 | 35,000 | 32,607 | ||||||||||
| Paysafe Finance PLC/Paysafe Holdings US Corp.(1) | 4.00 | 06/15/29 | 15,000 | 13,859 | ||||||||||
| Prime Security Services Borrower LLC/Prime Finance, Inc.(1) | 6.25 | 01/15/28 | 50,000 | 49,997 | ||||||||||
| PROG Holdings, Inc.(1) | 6.00 | 11/15/29 | 25,000 | 24,190 | ||||||||||
| Raven Acquisition Holdings LLC(1) | 6.88 | 11/15/31 | 50,000 | 49,992 | ||||||||||
| RR Donnelley & Sons Co.(1) | 9.50 | 08/01/29 | 40,000 | 40,315 | ||||||||||
| RR Donnelley & Sons Co.(1) | 10.88 | 08/01/29 | 20,000 | 19,737 | ||||||||||
| Sotheby’s(1) | 7.38 | 10/15/27 | 45,000 | 44,020 | ||||||||||
| Upbound Group, Inc.(1) | 6.38 | 02/15/29 | 15,000 | 14,291 | ||||||||||
| Valvoline, Inc.(1) | 3.63 | 06/15/31 | 20,000 | 17,352 | ||||||||||
| VM Consolidated, Inc.(1) | 5.50 | 04/15/29 | 15,000 | 14,520 | ||||||||||
The accompanying notes are an integral part of these financial statements.
76
BONDBLOXX ETF TRUST
BondBloxx B Rated USD High Yield Corporate Bond ETF
Portfolio of Investments (Continued)
October 31, 2024
| Rate (%) | Maturity | Face Amount | Value | |||||||||||
| COMMERCIAL SERVICES – 6.2% (Continued) | ||||||||||||||
| VT Topco, Inc.(1) | 8.50 | 08/15/30 | $ | 15,000 | $ | 15,801 | ||||||||
| Wand NewCo 3, Inc.(1) | 7.63 | 01/30/32 | 45,000 | 46,545 | ||||||||||
| WASH Multifamily Acquisition, Inc.(1) | 5.75 | 04/15/26 | 35,000 | 34,950 | ||||||||||
| Williams Scotsman, Inc.(1) | 4.63 | 08/15/28 | 20,000 | 19,138 | ||||||||||
| Williams Scotsman, Inc.(1) | 6.63 | 06/15/29 | 20,000 | 20,319 | ||||||||||
| Williams Scotsman, Inc.(1) | 7.38 | 10/01/31 | 20,000 | 20,732 | ||||||||||
| ZipRecruiter, Inc.(1) | 5.00 | 01/15/30 | 25,000 | 22,568 | ||||||||||
| 1,098,807 | ||||||||||||||
| COMPUTERS – 0.9% | ||||||||||||||
| Amentum Holdings, Inc.(1) | 7.25 | 08/01/32 | 40,000 | 41,466 | ||||||||||
| Conduent Business Services LLC/Conduent State & Local Solutions, Inc.(1) | 6.00 | 11/01/29 | 20,000 | 19,012 | ||||||||||
| Fortress Intermediate 3, Inc.(1) | 7.50 | 06/01/31 | 25,000 | 26,021 | ||||||||||
| NCR Voyix Corp.(1) | 5.00 | 10/01/28 | 25,000 | 24,073 | ||||||||||
| NCR Voyix Corp.(1) | 5.13 | 04/15/29 | 18,000 | 17,219 | ||||||||||
| Science Applications International Corp.(1) | 4.88 | 04/01/28 | 15,000 | 14,727 | ||||||||||
| Unisys Corp.(1) | 6.88 | 11/01/27 | 20,000 | 19,572 | ||||||||||
| 162,090 | ||||||||||||||
| DISTRIBUTION/WHOLESALE – 1.0% | ||||||||||||||
| Gates Corp./DE(1) | 6.88 | 07/01/29 | 20,000 | 20,574 | ||||||||||
| H&E Equipment Services, Inc.(1) | 3.88 | 12/15/28 | 50,000 | 46,215 | ||||||||||
| Ritchie Bros Holdings, Inc.(1) | 7.75 | 03/15/31 | 35,000 | 36,919 | ||||||||||
| Velocity Vehicle Group LLC(1) | 8.00 | 06/01/29 | 20,000 | 20,621 | ||||||||||
| Verde Purchaser LLC(1) | 10.50 | 11/30/30 | 25,000 | 26,716 | ||||||||||
| Windsor Holdings III LLC(1) | 8.50 | 06/15/30 | 35,000 | 36,878 | ||||||||||
| 187,923 | ||||||||||||||
| DIVERSIFIED FINANCIAL SERVICES – 3.1% | ||||||||||||||
| AG Issuer LLC(1) | 6.25 | 03/01/28 | 15,000 | 14,737 | ||||||||||
| AG TTMT Escrow Issuer LLC(1) | 8.63 | 09/30/27 | 20,000 | 20,681 | ||||||||||
| Aretec Group, Inc.(1) | 10.00 | 08/15/30 | 25,000 | 27,271 | ||||||||||
| Azorra Finance Ltd.(1) | 7.75 | 04/15/30 | 20,000 | 19,777 | ||||||||||
| Castlelake Aviation Finance DAC(1) | 5.00 | 04/15/27 | 15,000 | 15,100 | ||||||||||
| Coinbase Global, Inc.(1) | 3.38 | 10/01/28 | 40,000 | 35,593 | ||||||||||
| Coinbase Global, Inc.(1) | 3.63 | 10/01/31 | 30,000 | 25,047 | ||||||||||
| Enova International, Inc.(1) | 9.13 | 08/01/29 | 15,000 | 15,411 | ||||||||||
| Enova International, Inc.(1) | 11.25 | 12/15/28 | 20,000 | 21,555 | ||||||||||
| Focus Financial Partners LLC(1) | 6.75 | 09/15/31 | 35,000 | 34,795 | ||||||||||
| Freedom Mortgage Holdings LLC(1) | 9.13 | 05/15/31 | 35,000 | 35,498 | ||||||||||
| Freedom Mortgage Holdings LLC(1) | 9.25 | 02/01/29 | 35,000 | 35,869 | ||||||||||
| LFS Topco LLC(1) | 5.88 | 10/15/26 | 10,000 | 9,437 | ||||||||||
| Nationstar Mortgage Holdings, Inc.(1) | 5.13 | 12/15/30 | 35,000 | 32,802 | ||||||||||
| Nationstar Mortgage Holdings, Inc.(1) | 5.50 | 08/15/28 | 35,000 | 34,188 | ||||||||||
| Nationstar Mortgage Holdings, Inc.(1) | 5.75 | 11/15/31 | 20,000 | 19,149 | ||||||||||
| Nationstar Mortgage Holdings, Inc.(1) | 6.00 | 01/15/27 | 25,000 | 24,933 | ||||||||||
| Nationstar Mortgage Holdings, Inc.(1) | 6.50 | 08/01/29 | 25,000 | 25,019 | ||||||||||
| Nationstar Mortgage Holdings, Inc.(1) | 7.13 | 02/01/32 | 35,000 | 35,809 | ||||||||||
| Oxford Finance LLC/Oxford Finance Co.-Issuer II, Inc.(1) | 6.38 | 02/01/27 | 15,000 | 14,790 | ||||||||||
The accompanying notes are an integral part of these financial statements.
77
BONDBLOXX ETF TRUST
BondBloxx B Rated USD High Yield Corporate Bond ETF
Portfolio of Investments (Continued)
October 31, 2024
| Rate (%) | Maturity | Face Amount | Value | |||||||||||
| DIVERSIFIED FINANCIAL SERVICES – 3.1% (Continued) | ||||||||||||||
| PHH Mortgage Corp.(1) | 7.88 | 03/15/26 | $ | 15,000 | $ | 15,312 | ||||||||
| Provident Funding Associates LP/PFG Finance Corp.(1) | 9.75 | 09/15/29 | 15,000 | 15,351 | ||||||||||
| VFH Parent LLC/Valor Co.-Issuer, Inc.(1) | 7.50 | 06/15/31 | 20,000 | 20,552 | ||||||||||
| 548,676 | ||||||||||||||
| ELECTRIC – 1.5% | ||||||||||||||
| Alpha Generation LLC(1) | 6.75 | 10/15/32 | 40,000 | 40,587 | ||||||||||
| Calpine Corp.(1) | 4.63 | 02/01/29 | 20,000 | 18,983 | ||||||||||
| Calpine Corp.(1) | 5.00 | 02/01/31 | 30,000 | 28,344 | ||||||||||
| Calpine Corp.(1) | 5.13 | 03/15/28 | 65,000 | 63,587 | ||||||||||
| NRG Energy, Inc.(1) | 5.75 | 07/15/29 | 35,000 | 34,631 | ||||||||||
| PG&E Corp. | 7.38 | 03/15/55 | 40,000 | 41,417 | ||||||||||
| Pike Corp.(1) | 5.50 | 09/01/28 | 25,000 | 24,521 | ||||||||||
| Pike Corp.(1) | 8.63 | 01/31/31 | 20,000 | 21,275 | ||||||||||
| 273,345 | ||||||||||||||
| ELECTRICAL COMPONENTS & EQUIPMENT – 0.4% | ||||||||||||||
| Energizer Holdings, Inc.(1) | 4.38 | 03/31/29 | 25,000 | 23,408 | ||||||||||
| Energizer Holdings, Inc.(1) | 4.75 | 06/15/28 | 30,000 | 28,830 | ||||||||||
| Energizer Holdings, Inc.(1) | 6.50 | 12/31/27 | 15,000 | 15,186 | ||||||||||
| 67,424 | ||||||||||||||
| ENERGY-ALTERNATE SOURCES – 0.2% | ||||||||||||||
| Sunnova Energy Corp.(1) | 5.88 | 09/01/26 | 20,000 | 17,896 | ||||||||||
| Sunnova Energy Corp.(1) | 11.75 | 10/01/28 | 15,000 | 12,211 | ||||||||||
| 30,107 | ||||||||||||||
| ENGINEERING & CONSTRUCTION – 1.1% | ||||||||||||||
| Arcosa, Inc.(1) | 4.38 | 04/15/29 | 20,000 | 18,891 | ||||||||||
| Arcosa, Inc.(1) | 6.88 | 08/15/32 | 20,000 | 20,546 | ||||||||||
| Artera Services LLC(1) | 8.50 | 02/15/31 | 20,000 | 19,840 | ||||||||||
| Brand Industrial Services, Inc.(1) | 10.38 | 08/01/30 | 50,000 | 53,070 | ||||||||||
| Brundage-Bone Concrete Pumping Holdings, Inc.(1) | 6.00 | 02/01/26 | 10,000 | 9,960 | ||||||||||
| Global Infrastructure Solutions, Inc.(1) | 5.63 | 06/01/29 | 30,000 | 29,281 | ||||||||||
| HTA Group Ltd./Mauritius(1) | 7.50 | 06/04/29 | 30,000 | 30,552 | ||||||||||
| Railworks Holdings LP/Railworks Rally, Inc.(1) | 8.25 | 11/15/28 | 15,000 | 15,409 | ||||||||||
| 197,549 | ||||||||||||||
| ENTERTAINMENT – 5.0% | ||||||||||||||
| Affinity Interactive(1) | 6.88 | 12/15/27 | 20,000 | 16,434 | ||||||||||
| Banijay Entertainment SAS(1) | 8.13 | 05/01/29 | 15,000 | 15,568 | ||||||||||
| Boyne USA, Inc.(1) | 4.75 | 05/15/29 | 30,000 | 28,633 | ||||||||||
| Caesars Entertainment, Inc.(1) | 4.63 | 10/15/29 | 50,000 | 46,908 | ||||||||||
| Caesars Entertainment, Inc.(1) | 6.00 | 10/15/32 | 40,000 | 39,043 | ||||||||||
| Caesars Entertainment, Inc.(1) | 8.13 | 07/01/27 | 23,000 | 23,466 | ||||||||||
| CCM Merger, Inc.(1) | 6.38 | 05/01/26 | 10,000 | 9,975 | ||||||||||
| Cedar Fair LP/Canada’s Wonderland Co./Magnum Management Corp./Millennium Operations LLC | 5.25 | 07/15/29 | 25,000 | 24,099 | ||||||||||
| Cedar Fair LP/Canada’s Wonderland Co./Magnum Management Corp./Millennium Operations LLC | 5.38 | 04/15/27 | 25,000 | 24,829 | ||||||||||
| Churchill Downs, Inc.(1) | 4.75 | 01/15/28 | 20,000 | 19,418 | ||||||||||
The accompanying notes are an integral part of these financial statements.
78
BONDBLOXX ETF TRUST
BondBloxx B Rated USD High Yield Corporate Bond ETF
Portfolio of Investments (Continued)
October 31, 2024
| Rate (%) | Maturity | Face Amount | Value | |||||||||||
| ENTERTAINMENT – 5.0% (Continued) | ||||||||||||||
| Churchill Downs, Inc.(1) | 5.50 | 04/01/27 | $ | 30,000 | $ | 29,844 | ||||||||
| Churchill Downs, Inc.(1) | 5.75 | 04/01/30 | 55,000 | 54,190 | ||||||||||
| Churchill Downs, Inc.(1) | 6.75 | 05/01/31 | 20,000 | 20,386 | ||||||||||
| Cinemark USA, Inc.(1) | 5.25 | 07/15/28 | 30,000 | 29,469 | ||||||||||
| Cinemark USA, Inc.(1) | 7.00 | 08/01/32 | 20,000 | 20,517 | ||||||||||
| Empire Resorts, Inc.(1) | 7.75 | 11/01/26 | 10,000 | 9,534 | ||||||||||
| Everi Holdings, Inc.(1) | 5.00 | 07/15/29 | 15,000 | 14,895 | ||||||||||
| Jacobs Entertainment, Inc.(1) | 6.75 | 02/15/29 | 15,000 | 14,776 | ||||||||||
| Light & Wonder International, Inc.(1) | 7.00 | 05/15/28 | 25,000 | 25,125 | ||||||||||
| Light & Wonder International, Inc.(1) | 7.25 | 11/15/29 | 25,000 | 25,579 | ||||||||||
| Light & Wonder International, Inc.(1) | 7.50 | 09/01/31 | 20,000 | 20,676 | ||||||||||
| Lions Gate Capital Holdings 1, Inc.(1) | 5.50 | 04/15/29 | 10,000 | 8,850 | ||||||||||
| Lions Gate Capital Holdings LLC(1) | 5.50 | 04/15/29 | 20,000 | 14,484 | ||||||||||
| Live Nation Entertainment, Inc.(1) | 4.75 | 10/15/27 | 45,000 | 43,825 | ||||||||||
| Merlin Entertainments Group US Holdings, Inc.(1) | 7.38 | 02/15/31 | 20,000 | 19,628 | ||||||||||
| Merlin Entertainments Ltd.(1) | 5.75 | 06/15/26 | 15,000 | 14,802 | ||||||||||
| Midwest Gaming Borrower LLC/Midwest Gaming Finance Corp.(1) | 4.88 | 05/01/29 | 25,000 | 23,622 | ||||||||||
| Mohegan Tribal Gaming Authority(1) | 8.00 | 02/01/26 | 50,000 | 49,695 | ||||||||||
| Odeon FinCo. PLC(1) | 12.75 | 11/01/27 | 10,000 | 10,535 | ||||||||||
| Ontario Gaming GTA LP/OTG Co.-Issuer, Inc.(1) | 8.00 | 08/01/30 | 15,000 | 15,493 | ||||||||||
| Penn Entertainment, Inc.(1) | 4.13 | 07/01/29 | 15,000 | 13,497 | ||||||||||
| Penn Entertainment, Inc.(1) | 5.63 | 01/15/27 | 20,000 | 19,635 | ||||||||||
| Raptor Acquisition Corp./Raptor Co.-Issuer LLC(1) | 4.88 | 11/01/26 | 10,000 | 9,924 | ||||||||||
| Scientific Games Holdings LP/Scientific Games US FinCo., Inc.(1) | 6.63 | 03/01/30 | 35,000 | 34,150 | ||||||||||
| SeaWorld Parks & Entertainment, Inc.(1) | 5.25 | 08/15/29 | 30,000 | 28,834 | ||||||||||
| Six Flags Entertainment Corp./DE(1) | 5.50 | 04/15/27 | 20,000 | 19,896 | ||||||||||
| Six Flags Entertainment Corp./DE(1) | 7.25 | 05/15/31 | 35,000 | 35,907 | ||||||||||
| Universal Entertainment Corp.(1) | 9.88 | 08/01/29 | 10,000 | 10,057 | ||||||||||
| 886,198 | ||||||||||||||
| ENVIRONMENTAL CONTROL – 1.1% | ||||||||||||||
| Enviri Corp.(1) | 5.75 | 07/31/27 | 15,000 | 14,472 | ||||||||||
| GFL Environmental, Inc.(1) | 4.00 | 08/01/28 | 35,000 | 33,135 | ||||||||||
| GFL Environmental, Inc.(1) | 4.38 | 08/15/29 | 15,000 | 14,069 | ||||||||||
| GFL Environmental, Inc.(1) | 4.75 | 06/15/29 | 30,000 | 28,750 | ||||||||||
| Madison IAQ LLC(1) | 4.13 | 06/30/28 | 30,000 | 28,604 | ||||||||||
| Reworld Holding Corp.(1) | 4.88 | 12/01/29 | 30,000 | 28,047 | ||||||||||
| Reworld Holding Corp. | 5.00 | 09/01/30 | 15,000 | 13,817 | ||||||||||
| Waste Pro USA, Inc.(1) | 5.50 | 02/15/26 | 20,000 | 19,964 | ||||||||||
| Wrangler Holdco Corp.(1) | 6.63 | 04/01/32 | 20,000 | 20,443 | ||||||||||
| 201,301 | ||||||||||||||
| FOOD – 2.4% | ||||||||||||||
| Aragvi Finance International DAC(1) | 8.45 | 04/29/26 | 25,000 | 24,920 | ||||||||||
| B&G Foods, Inc.(1) | 8.00 | 09/15/28 | 30,000 | 31,205 | ||||||||||
| C&S Group Enterprises LLC(1) | 5.00 | 12/15/28 | 20,000 | 16,579 | ||||||||||
| Chobani LLC/Chobani Finance Corp., Inc.(1) | 4.63 | 11/15/28 | 15,000 | 14,418 | ||||||||||
| Fiesta Purchaser, Inc.(1) | 7.88 | 03/01/31 | 20,000 | 20,994 | ||||||||||
| KeHE Distributors LLC/KeHE Finance Corp./NextWave Distribution, Inc.(1) | 9.00 | 02/15/29 | 40,000 | 41,468 | ||||||||||
The accompanying notes are an integral part of these financial statements.
79
BONDBLOXX ETF TRUST
BondBloxx B Rated USD High Yield Corporate Bond ETF
Portfolio of Investments (Continued)
October 31, 2024
| Rate (%) | Maturity | Face Amount | Value | |||||||||||
| FOOD – 2.4% (Continued) | ||||||||||||||
| Post Holdings, Inc.(1) | 4.50 | 09/15/31 | $ | 39,000 | $ | 35,530 | ||||||||
| Post Holdings, Inc.(1) | 4.63 | 04/15/30 | 50,000 | 46,771 | ||||||||||
| Post Holdings, Inc.(1) | 5.50 | 12/15/29 | 55,000 | 53,690 | ||||||||||
| Post Holdings, Inc.(1) | 5.63 | 01/15/28 | 18,000 | 18,161 | ||||||||||
| Post Holdings, Inc.(1) | 6.25 | 10/15/34 | 20,000 | 19,829 | ||||||||||
| Post Holdings, Inc.(1) | 6.38 | 03/01/33 | 50,000 | 49,592 | ||||||||||
| Simmons Foods, Inc./Simmons Prepared Foods, Inc./Simmons Pet Food, Inc./Simmons Feed(1) | 4.63 | 03/01/29 | 30,000 | 27,821 | ||||||||||
| Viking Baked Goods Acquisition Corp.(1) | 8.63 | 11/01/31 | 35,000 | 34,976 | ||||||||||
| 435,954 | ||||||||||||||
| FOOD SERVICE – 0.4% | ||||||||||||||
| Aramark Services, Inc.(1) | 5.00 | 02/01/28 | 45,000 | 44,231 | ||||||||||
| TKC Holdings, Inc.(1) | 6.88 | 05/15/28 | 20,000 | 19,711 | ||||||||||
| 63,942 | ||||||||||||||
| FOREST PRODUCTS & PAPER – 0.8% | ||||||||||||||
| Ahlstrom Holding 3 Oy(1) | 4.88 | 02/04/28 | 10,000 | 9,493 | ||||||||||
| Domtar Corp.(1) | 6.75 | 10/01/28 | 25,000 | 22,888 | ||||||||||
| Glatfelter Corp.(1) | 4.75 | 11/15/29 | 15,000 | 13,488 | ||||||||||
| Glatfelter Corp.(1) | 7.25 | 11/15/31 | 35,000 | 34,730 | ||||||||||
| Mercer International, Inc. | 5.13 | 02/01/29 | 40,000 | 34,570 | ||||||||||
| Mercer International, Inc. | 5.50 | 01/15/26 | 5,000 | 5,000 | ||||||||||
| Mercer International, Inc.(1) | 12.88 | 10/01/28 | 15,000 | 15,901 | ||||||||||
| 136,070 | ||||||||||||||
| GAS – 0.4% | ||||||||||||||
| AmeriGas Partners LP/AmeriGas Finance Corp. | 5.75 | 05/20/27 | 20,000 | 19,308 | ||||||||||
| AmeriGas Partners LP/AmeriGas Finance Corp. | 5.88 | 08/20/26 | 30,000 | 29,422 | ||||||||||
| AmeriGas Partners LP/AmeriGas Finance Corp.(1) | 9.38 | 06/01/28 | 15,000 | 15,447 | ||||||||||
| 64,177 | ||||||||||||||
| HAND/MACHINE TOOLS – 0.1% | ||||||||||||||
| Werner FinCo LP/Werner FinCo, Inc.(1) | 11.50 | 06/15/28 | 15,000 | 16,694 | ||||||||||
| HEALTHCARE-PRODUCTS – 1.2% | ||||||||||||||
| Bausch + Lomb Corp.(1) | 8.38 | 10/01/28 | 50,000 | 52,521 | ||||||||||
| Embecta Corp.(1) | 5.00 | 02/15/30 | 20,000 | 18,118 | ||||||||||
| Medline Borrower LP(1) | 5.25 | 10/01/29 | 100,000 | 96,947 | ||||||||||
| Neogen Food Safety Corp.(1) | 8.63 | 07/20/30 | 15,000 | 16,248 | ||||||||||
| Sotera Health Holdings LLC(1) | 7.38 | 06/01/31 | 30,000 | 30,759 | ||||||||||
| 214,593 | ||||||||||||||
| HEALTHCARE-SERVICES – 5.8% | ||||||||||||||
| Acadia Healthcare Co., Inc.(1) | 5.00 | 04/15/29 | 15,000 | 14,099 | ||||||||||
| Acadia Healthcare Co., Inc.(1) | 5.50 | 07/01/28 | 25,000 | 24,279 | ||||||||||
| Catalent Pharma Solutions, Inc.(1) | 3.13 | 02/15/29 | 15,000 | 14,574 | ||||||||||
| Catalent Pharma Solutions, Inc.(1) | 3.50 | 04/01/30 | 35,000 | 33,898 | ||||||||||
| Catalent Pharma Solutions, Inc.(1) | 5.00 | 07/15/27 | 20,000 | 19,892 | ||||||||||
The accompanying notes are an integral part of these financial statements.
80
BONDBLOXX ETF TRUST
BondBloxx B Rated USD High Yield Corporate Bond ETF
Portfolio of Investments (Continued)
October 31, 2024
| Rate (%) | Maturity | Face Amount | Value | |||||||||||
| HEALTHCARE-SERVICES – 5.8% (Continued) | ||||||||||||||
| CHS/Community Health Systems, Inc.(1) | 4.75 | 02/15/31 | $ | 35,000 | $ | 29,221 | ||||||||
| CHS/Community Health Systems, Inc.(1) | 5.25 | 05/15/30 | 65,000 | 56,777 | ||||||||||
| CHS/Community Health Systems, Inc.(1) | 5.63 | 03/15/27 | 70,000 | 68,329 | ||||||||||
| CHS/Community Health Systems, Inc.(1) | 6.00 | 01/15/29 | 25,000 | 23,570 | ||||||||||
| CHS/Community Health Systems, Inc.(1) | 8.00 | 12/15/27 | 30,000 | 29,981 | ||||||||||
| CHS/Community Health Systems, Inc.(1) | 10.88 | 01/15/32 | 90,000 | 96,567 | ||||||||||
| Concentra Escrow Issuer Corp.(1) | 6.88 | 07/15/32 | 25,000 | 25,686 | ||||||||||
| HAH Group Holding Co. LLC(1) | 9.75 | 10/01/31 | 30,000 | 30,597 | ||||||||||
| HealthEquity, Inc.(1) | 4.50 | 10/01/29 | 20,000 | 19,085 | ||||||||||
| Heartland Dental LLC/Heartland Dental Finance Corp.(1) | 10.50 | 04/30/28 | 30,000 | 31,962 | ||||||||||
| Kedrion SpA(1) | 6.50 | 09/01/29 | 30,000 | 28,339 | ||||||||||
| LifePoint Health, Inc.(1) | 4.38 | 02/15/27 | 30,000 | 29,111 | ||||||||||
| LifePoint Health, Inc.(1) | 9.88 | 08/15/30 | 30,000 | 32,854 | ||||||||||
| LifePoint Health, Inc.(1) | 11.00 | 10/15/30 | 40,000 | 44,638 | ||||||||||
| MPH Acquisition Holdings LLC(1) | 5.50 | 09/01/28 | 45,000 | 30,624 | ||||||||||
| Prime Healthcare Services, Inc.(1) | 9.38 | 09/01/29 | 55,000 | 55,937 | ||||||||||
| Select Medical Corp.(1) | 6.25 | 08/15/26 | 50,000 | 50,143 | ||||||||||
| Star Parent, Inc.(1) | 9.00 | 10/01/30 | 35,000 | 36,444 | ||||||||||
| Tenet Healthcare Corp. | 6.13 | 10/01/28 | 100,000 | 99,997 | ||||||||||
| Tenet Healthcare Corp. | 6.25 | 02/01/27 | 55,000 | 55,087 | ||||||||||
| Tenet Healthcare Corp. | 6.88 | 11/15/31 | 15,000 | 16,100 | ||||||||||
| US Acute Care Solutions LLC(1) | 9.75 | 05/15/29 | 35,000 | 35,743 | ||||||||||
| 1,033,534 | ||||||||||||||
| HOME BUILDERS – 1.0% | ||||||||||||||
| Adams Homes, Inc.(1) | 9.25 | 10/15/28 | 15,000 | 15,707 | ||||||||||
| Beazer Homes USA, Inc. | 5.88 | 10/15/27 | 25,000 | 24,898 | ||||||||||
| Beazer Homes USA, Inc.(1) | 7.50 | 03/15/31 | 15,000 | 15,439 | ||||||||||
| Brookfield Residential Properties, Inc./Brookfield Residential US LLC(1) | 4.88 | 02/15/30 | 25,000 | 23,274 | ||||||||||
| Brookfield Residential Properties, Inc./Brookfield Residential US LLC(1) | 5.00 | 06/15/29 | 10,000 | 9,463 | ||||||||||
| Brookfield Residential Properties, Inc./Brookfield Residential US LLC(1) | 6.25 | 09/15/27 | 25,000 | 24,842 | ||||||||||
| Empire Communities Corp.(1) | 9.75 | 05/01/29 | 20,000 | 20,921 | ||||||||||
| K Hovnanian Enterprises, Inc.(1) | 11.75 | 09/30/29 | 20,000 | 22,085 | ||||||||||
| Landsea Homes Corp.(1) | 8.88 | 04/01/29 | 10,000 | 10,213 | ||||||||||
| New Home Co., Inc.(1) | 9.25 | 10/01/29 | 10,000 | 10,490 | ||||||||||
| 177,332 | ||||||||||||||
| HOUSEHOLD PRODUCTS/WARES – 0.1% | ||||||||||||||
| Kronos Acquisition Holdings, Inc.(1) | 8.25 | 06/30/31 | 20,000 | 19,829 | ||||||||||
| HOUSEWARES – 0.5% | ||||||||||||||
| CD&R Smokey Buyer, Inc./Radio Systems Corp.(1) | 9.50 | 10/15/29 | 30,000 | 30,425 | ||||||||||
| Scotts Miracle-Gro Co. | 4.00 | 04/01/31 | 15,000 | 13,445 | ||||||||||
| Scotts Miracle-Gro Co. | 4.38 | 02/01/32 | 20,000 | 18,121 | ||||||||||
| Scotts Miracle-Gro Co. | 4.50 | 10/15/29 | 15,000 | 14,183 | ||||||||||
| Scotts Miracle-Gro Co. | 5.25 | 12/15/26 | 10,000 | 10,002 | ||||||||||
| 86,176 | ||||||||||||||
The accompanying notes are an integral part of these financial statements.
81
BONDBLOXX ETF TRUST
BondBloxx B Rated USD High Yield Corporate Bond ETF
Portfolio of Investments (Continued)
October 31, 2024
| Rate (%) | Maturity | Face Amount | Value | |||||||||||
| INSURANCE – 3.8% | ||||||||||||||
| Acrisure LLC/Acrisure Finance, Inc.(1) | 4.25 | 02/15/29 | $ | 25,000 | $ | 23,533 | ||||||||
| Acrisure LLC/Acrisure Finance, Inc.(1) | 7.50 | 11/06/30 | 45,000 | 45,793 | ||||||||||
| Alliant Holdings Intermediate LLC/Alliant Holdings Co.-Issuer, Inc.(1) | 4.25 | 10/15/27 | 30,000 | 28,481 | ||||||||||
| Alliant Holdings Intermediate LLC/Alliant Holdings Co.-Issuer, Inc.(1) | 6.50 | 10/01/31 | 35,000 | 34,701 | ||||||||||
| Alliant Holdings Intermediate LLC/Alliant Holdings Co.-Issuer, Inc.(1) | 6.75 | 04/15/28 | 50,000 | 50,272 | ||||||||||
| Alliant Holdings Intermediate LLC/Alliant Holdings Co.-Issuer, Inc.(1) | 7.00 | 01/15/31 | 60,000 | 60,454 | ||||||||||
| AmWINS Group, Inc.(1) | 4.88 | 06/30/29 | 30,000 | 28,265 | ||||||||||
| AmWINS Group, Inc.(1) | 6.38 | 02/15/29 | 30,000 | 30,167 | ||||||||||
| Ardonagh FinCo. Ltd.(1) | 7.75 | 02/15/31 | 30,000 | 30,786 | ||||||||||
| Baldwin Insurance Group Holdings LLC/Baldwin Insurance Group Holdings Finance(1) | 7.13 | 05/15/31 | 20,000 | 20,418 | ||||||||||
| Howden UK Refinance PLC/Howden UK Refinance 2 PLC/Howden US Refinance LLC(1) | 7.25 | 02/15/31 | 40,000 | 40,753 | ||||||||||
| HUB International Ltd.(1) | 7.25 | 06/15/30 | 130,000 | 134,456 | ||||||||||
| Jones Deslauriers Insurance Management, Inc.(1) | 8.50 | 03/15/30 | 25,000 | 26,501 | ||||||||||
| Panther Escrow Issuer LLC(1) | 7.13 | 06/01/31 | 120,000 | 122,968 | ||||||||||
| 677,548 | ||||||||||||||
| INTERNET – 1.7% | ||||||||||||||
| Acuris Finance US, Inc./Acuris Finance Sarl(1) | 5.00 | 05/01/28 | 15,000 | 13,555 | ||||||||||
| Acuris Finance US, Inc./Acuris Finance Sarl(1) | 9.00 | 08/01/29 | 20,000 | 19,679 | ||||||||||
| ANGI Group LLC(1) | 3.88 | 08/15/28 | 20,000 | 18,116 | ||||||||||
| Arches Buyer, Inc.(1) | 4.25 | 06/01/28 | 40,000 | 36,722 | ||||||||||
| Cablevision Lightpath LLC(1) | 3.88 | 09/15/27 | 15,000 | 14,319 | ||||||||||
| Cars.com, Inc.(1) | 6.38 | 11/01/28 | 20,000 | 19,958 | ||||||||||
| Cogent Communications Group LLC(1) | 7.00 | 06/15/27 | 20,000 | 20,231 | ||||||||||
| Cogent Communications Group, Inc./Cogent Communications Finance, Inc.(1) | 7.00 | 06/15/27 | 10,000 | 10,065 | ||||||||||
| Getty Images, Inc.(1) | 9.75 | 03/01/27 | 10,000 | 9,978 | ||||||||||
| GrubHub Holdings, Inc.(1) | 5.50 | 07/01/27 | 15,000 | 14,012 | ||||||||||
| ION Trading Technologies Sarl(1) | 5.75 | 05/15/28 | 15,000 | 13,674 | ||||||||||
| ION Trading Technologies Sarl(1) | 9.50 | 05/30/29 | 35,000 | 35,602 | ||||||||||
| Newfold Digital Holdings Group, Inc.(1) | 11.75 | 10/15/28 | 20,000 | 19,775 | ||||||||||
| Rakuten Group, Inc.(1),(2) | 5.13 | - | 25,000 | 24,047 | ||||||||||
| Rakuten Group, Inc.(1),(2) | 6.25 | - | 40,000 | 36,200 | ||||||||||
| 305,933 | ||||||||||||||
| INVESTMENT COMPANIES – 0.3% | ||||||||||||||
| Compass Group Diversified Holdings LLC(1) | 5.25 | 04/15/29 | 50,000 | 48,123 | ||||||||||
| IRON/STEEL – 0.5% | ||||||||||||||
| Algoma Steel, Inc.(1) | 9.13 | 04/15/29 | 15,000 | 15,408 | ||||||||||
| ATI, Inc. | 4.88 | 10/01/29 | 10,000 | 9,482 | ||||||||||
| ATI, Inc. | 5.13 | 10/01/31 | 15,000 | 14,175 | ||||||||||
| ATI, Inc. | 5.88 | 12/01/27 | 15,000 | 14,894 | ||||||||||
| ATI, Inc. | 7.25 | 08/15/30 | 20,000 | 20,745 | ||||||||||
| TMS International Corp./DE(1) | 6.25 | 04/15/29 | 15,000 | 14,526 | ||||||||||
| 89,230 | ||||||||||||||
The accompanying notes are an integral part of these financial statements.
82
BONDBLOXX ETF TRUST
BondBloxx B Rated USD High Yield Corporate Bond ETF
Portfolio of Investments (Continued)
October 31, 2024
| Rate (%) | Maturity | Face Amount | Value | |||||||||||
| LEISURE TIME – 1.9% | ||||||||||||||
| Life Time, Inc.(1) | 8.00 | 04/15/26 | $ | 20,000 | $ | 20,111 | ||||||||
| Lindblad Expeditions Holdings, Inc.(1) | 9.00 | 05/15/28 | 10,000 | 10,418 | ||||||||||
| Lindblad Expeditions LLC(1) | 6.75 | 02/15/27 | 10,000 | 10,055 | ||||||||||
| NCL Corp. Ltd.(1) | 5.88 | 03/15/26 | 65,000 | 64,969 | ||||||||||
| NCL Corp. Ltd.(1) | 5.88 | 02/15/27 | 30,000 | 29,989 | ||||||||||
| NCL Corp. Ltd.(1) | 6.25 | 03/01/30 | 10,000 | 9,899 | ||||||||||
| NCL Corp. Ltd.(1) | 7.75 | 02/15/29 | 25,000 | 26,542 | ||||||||||
| NCL Finance Ltd.(1) | 6.13 | 03/15/28 | 25,000 | 25,174 | ||||||||||
| Sabre GLBL, Inc.(1) | 8.63 | 06/01/27 | 40,000 | 38,639 | ||||||||||
| Sabre GLBL, Inc.(1) | 11.25 | 12/15/27 | 20,000 | 20,617 | ||||||||||
| Viking Cruises Ltd.(1) | 5.88 | 09/15/27 | 35,000 | 34,801 | ||||||||||
| Viking Cruises Ltd.(1) | 7.00 | 02/15/29 | 30,000 | 30,257 | ||||||||||
| Viking Cruises Ltd.(1) | 9.13 | 07/15/31 | 20,000 | 21,613 | ||||||||||
| 343,084 | ||||||||||||||
| LODGING – 0.8% | ||||||||||||||
| Hilton Grand Vacations Borrower Escrow LLC/Hilton Grand Vacations Borrower Escrow, Inc.(1) | 4.88 | 07/01/31 | 15,000 | 13,416 | ||||||||||
| Hilton Grand Vacations Borrower Escrow LLC/Hilton Grand Vacations Borrower Escrow, Inc.(1) | 5.00 | 06/01/29 | 35,000 | 32,783 | ||||||||||
| Marriott Ownership Resorts, Inc.(1) | 4.50 | 06/15/29 | 30,000 | 27,856 | ||||||||||
| Station Casinos LLC(1) | 4.50 | 02/15/28 | 30,000 | 28,658 | ||||||||||
| Station Casinos LLC(1) | 4.63 | 12/01/31 | 20,000 | 18,189 | ||||||||||
| Station Casinos LLC(1) | 6.63 | 03/15/32 | 15,000 | 15,085 | ||||||||||
| 135,987 | ||||||||||||||
| MACHINERY-CONSTRUCTION & MINING – 0.1% | ||||||||||||||
| Manitowoc Co., Inc.(1) | 9.25 | 10/01/31 | 10,000 | 10,166 | ||||||||||
| MACHINERY-DIVERSIFIED – 0.7% | ||||||||||||||
| Chart Industries, Inc.(1) | 9.50 | 01/01/31 | 20,000 | 21,521 | ||||||||||
| Husky Injection Molding Systems Ltd./Titan Co.-Borrower LLC(1) | 9.00 | 02/15/29 | 40,000 | 41,205 | ||||||||||
| TK Elevator US Newco, Inc.(1) | 5.25 | 07/15/27 | 60,000 | 59,065 | ||||||||||
| 121,791 | ||||||||||||||
| MEDIA – 3.6% | ||||||||||||||
| AMC Networks, Inc. | 4.25 | 02/15/29 | 40,000 | 27,653 | ||||||||||
| Block Communications, Inc.(1) | 4.88 | 03/01/28 | 10,000 | 9,481 | ||||||||||
| Cable One, Inc.(1) | 4.00 | 11/15/30 | 25,000 | 19,731 | ||||||||||
| GCI LLC(1) | 4.75 | 10/15/28 | 20,000 | 18,896 | ||||||||||
| Gray Television, Inc.(1) | 4.75 | 10/15/30 | 40,000 | 25,194 | ||||||||||
| Gray Television, Inc.(1) | 5.38 | 11/15/31 | 45,000 | 27,187 | ||||||||||
| Gray Television, Inc.(1) | 7.00 | 05/15/27 | 25,000 | 24,348 | ||||||||||
| McGraw-Hill Education, Inc.(1) | 5.75 | 08/01/28 | 35,000 | 34,340 | ||||||||||
| McGraw-Hill Education, Inc.(1) | 7.38 | 09/01/31 | 20,000 | 20,502 | ||||||||||
| Midcontinent Communications(1) | 8.00 | 08/15/32 | 25,000 | 25,477 | ||||||||||
| Scripps Escrow II, Inc.(1) | 3.88 | 01/15/29 | 25,000 | 19,429 | ||||||||||
| Sinclair Television Group, Inc.(1) | 4.13 | 12/01/30 | 25,000 | 19,234 | ||||||||||
| Sunrise Hold Co. IV BV(1) | 5.50 | 01/15/28 | 15,000 | 14,850 | ||||||||||
| Townsquare Media, Inc.(1) | 6.88 | 02/01/26 | 15,000 | 14,958 | ||||||||||
The accompanying notes are an integral part of these financial statements.
83
BONDBLOXX ETF TRUST
BondBloxx B Rated USD High Yield Corporate Bond ETF
Portfolio of Investments (Continued)
October 31, 2024
| Rate (%) | Maturity | Face Amount | Value | |||||||||||
| MEDIA – 3.6% (Continued) | ||||||||||||||
| Univision Communications, Inc.(1) | 4.50 | 05/01/29 | $ | 40,000 | $ | 35,549 | ||||||||
| Univision Communications, Inc.(1) | 6.63 | 06/01/27 | 50,000 | 49,657 | ||||||||||
| Univision Communications, Inc.(1) | 7.38 | 06/30/30 | 35,000 | 33,639 | ||||||||||
| Univision Communications, Inc.(1) | 8.00 | 08/15/28 | 70,000 | 71,207 | ||||||||||
| Univision Communications, Inc.(1) | 8.50 | 07/31/31 | 45,000 | 44,265 | ||||||||||
| Urban One, Inc.(1) | 7.38 | 02/01/28 | 25,000 | 18,570 | ||||||||||
| Virgin Media Finance PLC(1) | 5.00 | 07/15/30 | 40,000 | 34,436 | ||||||||||
| Virgin Media Vendor Financing Notes IV DAC(1) | 5.00 | 07/15/28 | 20,000 | 19,191 | ||||||||||
| Ziggo Bond Co. BV(1) | 5.13 | 02/28/30 | 20,000 | 18,122 | ||||||||||
| Ziggo Bond Co. BV(1) | 6.00 | 01/15/27 | 25,000 | 24,967 | ||||||||||
| 650,883 | ||||||||||||||
| METAL FABRICATE/HARDWARE – 0.1% | ||||||||||||||
| Roller Bearing Co. of America, Inc.(1) | 4.38 | 10/15/29 | 20,000 | 18,817 | ||||||||||
| MINING – 1.3% | ||||||||||||||
| Arsenal AIC Parent LLC(1) | 11.50 | 10/01/31 | 20,000 | 22,280 | ||||||||||
| Century Aluminum Co.(1) | 7.50 | 04/01/28 | 10,000 | 10,152 | ||||||||||
| Coeur Mining, Inc.(1) | 5.13 | 02/15/29 | 10,000 | 9,551 | ||||||||||
| Compass Minerals International, Inc.(1) | 6.75 | 12/01/27 | 15,000 | 14,800 | ||||||||||
| Eldorado Gold Corp.(1) | 6.25 | 09/01/29 | 15,000 | 14,772 | ||||||||||
| Hecla Mining Co. | 7.25 | 02/15/28 | 20,000 | 20,255 | ||||||||||
| Hudbay Minerals, Inc.(1) | 4.50 | 04/01/26 | 25,000 | 24,711 | ||||||||||
| Hudbay Minerals, Inc.(1) | 6.13 | 04/01/29 | 20,000 | 20,163 | ||||||||||
| JW Aluminum Continuous Cast Co.(1) | 10.25 | 06/01/26 | 10,000 | 10,041 | ||||||||||
| Kaiser Aluminum Corp.(1) | 4.50 | 06/01/31 | 20,000 | 17,873 | ||||||||||
| Kaiser Aluminum Corp.(1) | 4.63 | 03/01/28 | 20,000 | 19,075 | ||||||||||
| New Gold, Inc.(1) | 7.50 | 07/15/27 | 20,000 | 20,338 | ||||||||||
| Taseko Mines Ltd.(1) | 8.25 | 05/01/30 | 20,000 | 20,692 | ||||||||||
| 224,703 | ||||||||||||||
| MISCELLANEOUS MANUFACTURER – 0.3% | ||||||||||||||
| Calderys Financing LLC(1) | 11.25 | 06/01/28 | 20,000 | 21,385 | ||||||||||
| Enpro, Inc. | 5.75 | 10/15/26 | 10,000 | 9,983 | ||||||||||
| LSB Industries, Inc.(1) | 6.25 | 10/15/28 | 20,000 | 19,369 | ||||||||||
| 50,737 | ||||||||||||||
| OFFICE FURNISHINGS – 0.1% | ||||||||||||||
| Interface, Inc.(1) | 5.50 | 12/01/28 | 10,000 | 9,800 | ||||||||||
| OFFICE/BUSINESS EQUIPMENT – 0.5% | ||||||||||||||
| Pitney Bowes, Inc.(1) | 6.88 | 03/15/27 | 30,000 | 29,709 | ||||||||||
| Xerox Corp. | 4.80 | 03/01/35 | 10,000 | 5,945 | ||||||||||
| Xerox Corp. | 6.75 | 12/15/39 | 15,000 | 10,128 | ||||||||||
| Xerox Holdings Corp.(1) | 5.50 | 08/15/28 | 25,000 | 20,524 | ||||||||||
| Xerox Holdings Corp.(1) | 8.88 | 11/30/29 | 20,000 | 17,426 | ||||||||||
| 83,732 | ||||||||||||||
The accompanying notes are an integral part of these financial statements.
84
BONDBLOXX ETF TRUST
BondBloxx B Rated USD High Yield Corporate Bond ETF
Portfolio of Investments (Continued)
October 31, 2024
| Rate (%) | Maturity | Face Amount | Value | |||||||||||
| OIL & GAS – 5.5% | ||||||||||||||
| Aethon United BR LP/Aethon United Finance Corp.(1) | 7.50 | 10/01/29 | $ | 40,000 | $ | 40,305 | ||||||||
| Borr IHC Ltd./Borr Finance LLC(1) | 10.00 | 11/15/28 | 48,171 | 49,501 | ||||||||||
| Borr IHC Ltd./Borr Finance LLC(1) | 10.38 | 11/15/30 | 24,393 | 25,186 | ||||||||||
| California Resources Corp.(1) | 8.25 | 06/15/29 | 35,000 | 35,375 | ||||||||||
| CITGO Petroleum Corp.(1) | 6.38 | 06/15/26 | 25,000 | 25,045 | ||||||||||
| CITGO Petroleum Corp.(1) | 8.38 | 01/15/29 | 45,000 | 46,846 | ||||||||||
| Comstock Resources, Inc.(1) | 5.88 | 01/15/30 | 40,000 | 36,581 | ||||||||||
| Comstock Resources, Inc.(1) | 6.75 | 03/01/29 | 15,000 | 14,369 | ||||||||||
| Comstock Resources, Inc.(1) | 6.75 | 03/01/29 | 50,000 | 47,916 | ||||||||||
| CVR Energy, Inc.(1) | 5.75 | 02/15/28 | 25,000 | 22,825 | ||||||||||
| CVR Energy, Inc.(1) | 8.50 | 01/15/29 | 15,000 | 14,559 | ||||||||||
| Encino Acquisition Partners Holdings LLC(1) | 8.50 | 05/01/28 | 30,000 | 30,194 | ||||||||||
| Encino Acquisition Partners Holdings LLC(1) | 8.75 | 05/01/31 | 20,000 | 20,549 | ||||||||||
| EnQuest PLC(1) | 11.63 | 11/01/27 | 15,000 | 15,178 | ||||||||||
| Gulfport Energy Operating Corp.(1) | 6.75 | 09/01/29 | 25,000 | 25,160 | ||||||||||
| Karoon USA Finance, Inc.(1) | 10.50 | 05/14/29 | 10,000 | 10,327 | ||||||||||
| Kraken Oil & Gas Partners LLC(1) | 7.63 | 08/15/29 | 20,000 | 19,777 | ||||||||||
| Magnolia Oil & Gas Operating LLC/Magnolia Oil & Gas Finance Corp.(1) | 6.00 | 08/01/26 | 10,000 | 9,989 | ||||||||||
| Moss Creek Resources Holdings, Inc.(1) | 8.25 | 09/01/31 | 30,000 | 29,419 | ||||||||||
| Nabors Industries, Inc.(1) | 7.38 | 05/15/27 | 30,000 | 30,046 | ||||||||||
| Nabors Industries, Inc.(1) | 9.13 | 01/31/30 | 20,000 | 20,673 | ||||||||||
| NewCo Holding USD 20 Sarl(1) | 9.38 | 11/07/29 | 20,000 | 19,970 | ||||||||||
| Northern Oil & Gas, Inc.(1) | 8.13 | 03/01/28 | 30,000 | 30,316 | ||||||||||
| Northern Oil & Gas, Inc.(1) | 8.75 | 06/15/31 | 20,000 | 20,717 | ||||||||||
| Precision Drilling Corp.(1) | 6.88 | 01/15/29 | 15,000 | 14,936 | ||||||||||
| Sitio Royalties Operating Partnership LP/Sitio Finance Corp.(1) | 7.88 | 11/01/28 | 20,000 | 20,778 | ||||||||||
| Strathcona Resources Ltd./Alberta(1) | 6.88 | 08/01/26 | 15,000 | 14,900 | ||||||||||
| Talos Production, Inc.(1) | 9.00 | 02/01/29 | 30,000 | 30,926 | ||||||||||
| Talos Production, Inc.(1) | 9.38 | 02/01/31 | 20,000 | 20,608 | ||||||||||
| Teine Energy Ltd.(1) | 6.88 | 04/15/29 | 15,000 | 14,825 | ||||||||||
| TGNR Intermediate Holdings LLC(1) | 5.50 | 10/15/29 | 25,000 | 23,623 | ||||||||||
| Transocean Aquila Ltd.(1) | 8.00 | 09/30/28 | 13,615 | 14,042 | ||||||||||
| Transocean Poseidon Ltd.(1) | 6.88 | 02/01/27 | 18,000 | 18,003 | ||||||||||
| Transocean Titan Financing Ltd.(1) | 8.38 | 02/01/28 | 20,000 | 20,596 | ||||||||||
| Transocean, Inc.(1) | 8.75 | 02/15/30 | 38,250 | 39,657 | ||||||||||
| Vermilion Energy, Inc.(1) | 6.88 | 05/01/30 | 15,000 | 14,836 | ||||||||||
| Vital Energy, Inc.(1) | 7.75 | 07/31/29 | 15,000 | 14,733 | ||||||||||
| Vital Energy, Inc.(1) | 7.88 | 04/15/32 | 35,000 | 33,657 | ||||||||||
| Vital Energy, Inc. | 9.75 | 10/15/30 | 15,000 | 15,841 | ||||||||||
| W&T Offshore, Inc.(1) | 11.75 | 02/01/26 | 10,000 | 10,049 | ||||||||||
| Wildfire Intermediate Holdings LLC(1) | 7.50 | 10/15/29 | 20,000 | 19,447 | ||||||||||
| 982,280 | ||||||||||||||
| OIL & GAS SERVICES – 0.8% | ||||||||||||||
| Bristow Group, Inc.(1) | 6.88 | 03/01/28 | 10,000 | 9,939 | ||||||||||
| Kodiak Gas Services LLC(1) | 7.25 | 02/15/29 | 25,000 | 25,718 | ||||||||||
| Solaris Midstream Holdings LLC(1) | 7.63 | 04/01/26 | 10,000 | 10,061 | ||||||||||
| Star Holding LLC(1) | 8.75 | 08/01/31 | 15,000 | 14,284 | ||||||||||
The accompanying notes are an integral part of these financial statements.
85
BONDBLOXX ETF TRUST
BondBloxx B Rated USD High Yield Corporate Bond ETF
Portfolio of Investments (Continued)
October 31, 2024
| Rate (%) | Maturity | Face Amount | Value | |||||||||||
| OIL & GAS SERVICES – 0.8% (Continued) | ||||||||||||||
| USA Compression Partners LP/USA Compression Finance Corp. | 6.88 | 09/01/27 | $ | 30,000 | $ | 30,165 | ||||||||
| USA Compression Partners LP/USA Compression Finance Corp.(1) | 7.13 | 03/15/29 | 40,000 | 40,766 | ||||||||||
| Viridien(1) | 8.75 | 04/01/27 | 20,000 | 19,347 | ||||||||||
| 150,280 | ||||||||||||||
| PACKAGING & CONTAINERS – 2.6% | ||||||||||||||
| Ardagh Metal Packaging Finance USA LLC/Ardagh Metal Packaging Finance PLC(1) | 3.25 | 09/01/28 | 25,000 | 22,552 | ||||||||||
| Ardagh Metal Packaging Finance USA LLC/Ardagh Metal Packaging Finance PLC(1) | 6.00 | 06/15/27 | 25,000 | 24,952 | ||||||||||
| Clearwater Paper Corp.(1) | 4.75 | 08/15/28 | 15,000 | 13,948 | ||||||||||
| Clydesdale Acquisition Holdings, Inc.(1) | 6.63 | 04/15/29 | 15,000 | 15,085 | ||||||||||
| Clydesdale Acquisition Holdings, Inc.(1) | 6.88 | 01/15/30 | 20,000 | 20,316 | ||||||||||
| Intelligent Packaging Ltd. FinCo., Inc./Intelligent Packaging Ltd. Co.-Issuer LLC(1) | 6.00 | 09/15/28 | 30,000 | 29,649 | ||||||||||
| LABL, Inc.(1) | 5.88 | 11/01/28 | 25,000 | 23,258 | ||||||||||
| LABL, Inc.(1) | 8.63 | 10/01/31 | 35,000 | 33,760 | ||||||||||
| LABL, Inc.(1) | 9.50 | 11/01/28 | 10,000 | 10,259 | ||||||||||
| Mauser Packaging Solutions Holding Co.(1) | 7.88 | 04/15/27 | 110,000 | 113,163 | ||||||||||
| Owens-Brockway Glass Container, Inc.(1) | 6.63 | 05/13/27 | 30,000 | 29,881 | ||||||||||
| Owens-Brockway Glass Container, Inc.(1) | 7.25 | 05/15/31 | 30,000 | 29,543 | ||||||||||
| Owens-Brockway Glass Container, Inc.(1) | 7.38 | 06/01/32 | 5,000 | 4,898 | ||||||||||
| Pactiv Evergreen Group Issuer LLC/Pactiv Evergreen Group Issuer, Inc.(1) | 4.38 | 10/15/28 | 30,000 | 28,244 | ||||||||||
| Pactiv Evergreen Group Issuer, Inc./Pactiv Evergreen Group Issuer LLC(1) | 4.00 | 10/15/27 | 30,000 | 28,679 | ||||||||||
| Trivium Packaging Finance BV(1) | 5.50 | 08/15/26 | 45,000 | 44,646 | ||||||||||
| 472,833 | ||||||||||||||
| PHARMACEUTICALS – 3.3% | ||||||||||||||
| AdaptHealth LLC(1) | 4.63 | 08/01/29 | 15,000 | 13,656 | ||||||||||
| AdaptHealth LLC(1) | 5.13 | 03/01/30 | 30,000 | 27,508 | ||||||||||
| AdaptHealth LLC(1) | 6.13 | 08/01/28 | 10,000 | 9,862 | ||||||||||
| Bausch Health Cos, Inc.(1) | 4.88 | 06/01/28 | 75,000 | 58,039 | ||||||||||
| Bausch Health Cos, Inc.(1) | 5.50 | 11/01/25 | 70,000 | 68,780 | ||||||||||
| Bausch Health Cos, Inc.(1) | 5.75 | 08/15/27 | 10,000 | 8,264 | ||||||||||
| Bausch Health Cos, Inc.(1) | 6.13 | 02/01/27 | 40,000 | 36,150 | ||||||||||
| Bausch Health Cos, Inc.(1) | 11.00 | 09/30/28 | 65,000 | 59,881 | ||||||||||
| BellRing Brands, Inc.(1) | 7.00 | 03/15/30 | 30,000 | 31,253 | ||||||||||
| Cheplapharm Arzneimittel GmbH(1) | 5.50 | 01/15/28 | 15,000 | 14,483 | ||||||||||
| Elanco Animal Health, Inc. | 6.65 | 08/28/28 | 30,000 | 30,799 | ||||||||||
| Endo Finance Holdings, Inc.(1) | 8.50 | 04/15/31 | 40,000 | 42,819 | ||||||||||
| HLF Financing Sarl LLC/Herbalife International, Inc.(1) | 4.88 | 06/01/29 | 20,000 | 13,808 | ||||||||||
| Mallinckrodt International Finance SA/Mallinckrodt CB LLC(1) | 14.75 | 11/14/28 | 25,000 | 27,339 | ||||||||||
| Option Care Health, Inc.(1) | 4.38 | 10/31/29 | 20,000 | 18,424 | ||||||||||
| Organon & Co./Organon Foreign Debt Co.-Issuer BV(1) | 5.13 | 04/30/31 | 75,000 | 68,457 | ||||||||||
| Organon & Co./Organon Foreign Debt Co.-Issuer BV(1) | 7.88 | 05/15/34 | 25,000 | 25,837 | ||||||||||
| Owens & Minor, Inc.(1) | 4.50 | 03/31/29 | 25,000 | 22,522 | ||||||||||
| Owens & Minor, Inc.(1) | 6.63 | 04/01/30 | 20,000 | 19,104 | ||||||||||
| 596,985 | ||||||||||||||
| PIPELINES – 4.2% | ||||||||||||||
| Blue Racer Midstream LLC/Blue Racer Finance Corp.(1) | 6.63 | 07/15/26 | 15,000 | 14,999 | ||||||||||
| Blue Racer Midstream LLC/Blue Racer Finance Corp.(1) | 7.00 | 07/15/29 | 20,000 | 20,531 | ||||||||||
| Blue Racer Midstream LLC/Blue Racer Finance Corp.(1) | 7.25 | 07/15/32 | 20,000 | 20,673 | ||||||||||
The accompanying notes are an integral part of these financial statements.
86
BONDBLOXX ETF TRUST
BondBloxx B Rated USD High Yield Corporate Bond ETF
Portfolio of Investments (Continued)
October 31, 2024
| Rate (%) | Maturity | Face Amount | Value | |||||||||||
| PIPELINES – 4.2% (Continued) | ||||||||||||||
| Delek Logistics Partners LP/Delek Logistics Finance Corp.(1) | 7.13 | 06/01/28 | $ | 15,000 | $ | 14,872 | ||||||||
| Delek Logistics Partners LP/Delek Logistics Finance Corp.(1) | 8.63 | 03/15/29 | 40,000 | 41,071 | ||||||||||
| FTAI Infra Escrow Holdings LLC(1) | 10.50 | 06/01/27 | 25,000 | 26,800 | ||||||||||
| Genesis Energy LP/Genesis Energy Finance Corp. | 7.75 | 02/01/28 | 25,000 | 25,269 | ||||||||||
| Genesis Energy LP/Genesis Energy Finance Corp. | 7.88 | 05/15/32 | 30,000 | 30,004 | ||||||||||
| Genesis Energy LP/Genesis Energy Finance Corp. | 8.00 | 01/15/27 | 35,000 | 35,644 | ||||||||||
| Genesis Energy LP/Genesis Energy Finance Corp. | 8.25 | 01/15/29 | 30,000 | 30,664 | ||||||||||
| Genesis Energy LP/Genesis Energy Finance Corp. | 8.88 | 04/15/30 | 15,000 | 15,462 | ||||||||||
| Global Partners LP/GLP Finance Corp. | 6.88 | 01/15/29 | 10,000 | 9,990 | ||||||||||
| Global Partners LP/GLP Finance Corp. | 7.00 | 08/01/27 | 20,000 | 20,077 | ||||||||||
| Global Partners LP/GLP Finance Corp.(1) | 8.25 | 01/15/32 | 20,000 | 20,423 | ||||||||||
| Howard Midstream Energy Partners LLC(1) | 7.38 | 07/15/32 | 20,000 | 20,418 | ||||||||||
| Howard Midstream Energy Partners LLC(1) | 8.88 | 07/15/28 | 25,000 | 26,397 | ||||||||||
| ITT Holdings LLC(1) | 6.50 | 08/01/29 | 45,000 | 41,629 | ||||||||||
| Martin Midstream Partners LP/Martin Midstream Finance Corp.(1) | 11.50 | 02/15/28 | 10,000 | 10,902 | ||||||||||
| New Fortress Energy, Inc.(1) | 6.50 | 09/30/26 | 65,000 | 60,262 | ||||||||||
| New Fortress Energy, Inc.(1) | 8.75 | 03/15/29 | 25,000 | 20,894 | ||||||||||
| NGL Energy Operating LLC/NGL Energy Finance Corp.(1) | 8.13 | 02/15/29 | 35,000 | 35,249 | ||||||||||
| NGL Energy Operating LLC/NGL Energy Finance Corp.(1) | 8.38 | 02/15/32 | 55,000 | 55,466 | ||||||||||
| Prairie Acquiror LP(1) | 9.00 | 08/01/29 | 15,000 | 15,222 | ||||||||||
| Summit Midstream Holdings LLC(1) | 8.63 | 10/31/29 | 20,000 | 20,677 | ||||||||||
| Tallgrass Energy Partners LP/Tallgrass Energy Finance Corp.(1) | 5.50 | 01/15/28 | 25,000 | 24,031 | ||||||||||
| Tallgrass Energy Partners LP/Tallgrass Energy Finance Corp.(1) | 6.00 | 03/01/27 | 20,000 | 19,865 | ||||||||||
| Tallgrass Energy Partners LP/Tallgrass Energy Finance Corp.(1) | 6.00 | 12/31/30 | 30,000 | 28,182 | ||||||||||
| Tallgrass Energy Partners LP/Tallgrass Energy Finance Corp.(1) | 6.00 | 09/01/31 | 20,000 | 18,570 | ||||||||||
| Tallgrass Energy Partners LP/Tallgrass Energy Finance Corp.(1) | 7.38 | 02/15/29 | 30,000 | 30,119 | ||||||||||
| 754,362 | ||||||||||||||
| REAL ESTATE – 0.9% | ||||||||||||||
| Anywhere Real Estate Group LLC/Anywhere Co.-Issuer Corp.(1) | 7.00 | 04/15/30 | 24,400 | 21,408 | ||||||||||
| CoreLogic, Inc.(1) | 4.50 | 05/01/28 | 30,000 | 28,200 | ||||||||||
| Five Point Operating Co. LP/Five Point Capital Corp.(1),(3) | 10.50 | 01/15/28 | 16,791 | 17,209 | ||||||||||
| Hunt Cos, Inc.(1) | 5.25 | 04/15/29 | 25,000 | 23,772 | ||||||||||
| Kennedy-Wilson, Inc. | 4.75 | 03/01/29 | 35,000 | 32,121 | ||||||||||
| Kennedy-Wilson, Inc. | 4.75 | 02/01/30 | 25,000 | 22,387 | ||||||||||
| Kennedy-Wilson, Inc. | 5.00 | 03/01/31 | 15,000 | 13,262 | ||||||||||
| 158,359 | ||||||||||||||
| REAL ESTATE INVESTMENT TRUST (REITS) – 3.4% | ||||||||||||||
| Apollo Commercial Real Estate Finance, Inc.(1) | 4.63 | 06/15/29 | 20,000 | 17,367 | ||||||||||
| Brookfield Property REIT, Inc./BPR Cumulus LLC/BPR Nimbus LLC/GGSI Sellco LLC(1) | 4.50 | 04/01/27 | 25,000 | 24,115 | ||||||||||
| Brookfield Property REIT, Inc./BPR Cumulus LLC/BPR Nimbus LLC/GGSI Sellco LLC(1) | 5.75 | 05/15/26 | 35,000 | 34,684 | ||||||||||
| MPT Operating Partnership LP/MPT Finance Corp. | 3.50 | 03/15/31 | 55,000 | 39,008 | ||||||||||
| MPT Operating Partnership LP/MPT Finance Corp. | 4.63 | 08/01/29 | 35,000 | 27,256 | ||||||||||
| MPT Operating Partnership LP/MPT Finance Corp. | 5.00 | 10/15/27 | 55,000 | 48,577 | ||||||||||
| MPT Operating Partnership LP/MPT Finance Corp. | 5.25 | 08/01/26 | 20,000 | 18,939 | ||||||||||
| Pebblebrook Hotel LP/PEB Finance Corp.(1) | 6.38 | 10/15/29 | 15,000 | 14,993 | ||||||||||
The accompanying notes are an integral part of these financial statements.
87
BONDBLOXX ETF TRUST
BondBloxx B Rated USD High Yield Corporate Bond ETF
Portfolio of Investments (Continued)
October 31, 2024
| Rate (%) | Maturity | Face Amount | Value | |||||||||||
| REAL ESTATE INVESTMENT TRUST (REITS) – 3.4% (Continued) | ||||||||||||||
| Rithm Capital Corp.(1) | 8.00 | 04/01/29 | $ | 30,000 | $ | 29,963 | ||||||||
| Service Properties Trust | 3.95 | 01/15/28 | 20,000 | 17,186 | ||||||||||
| Service Properties Trust | 4.38 | 02/15/30 | 30,000 | 22,736 | ||||||||||
| Service Properties Trust | 4.75 | 10/01/26 | 10,000 | 9,459 | ||||||||||
| Service Properties Trust | 4.95 | 02/15/27 | 15,000 | 13,985 | ||||||||||
| Service Properties Trust | 4.95 | 10/01/29 | 10,000 | 8,002 | ||||||||||
| Service Properties Trust | 5.25 | 02/15/26 | 15,000 | 14,563 | ||||||||||
| Service Properties Trust | 5.50 | 12/15/27 | 25,000 | 23,698 | ||||||||||
| Service Properties Trust | 8.38 | 06/15/29 | 25,000 | 24,455 | ||||||||||
| Service Properties Trust(1) | 8.63 | 11/15/31 | 30,000 | 31,732 | ||||||||||
| Service Properties Trust | 8.88 | 06/15/32 | 20,000 | 18,610 | ||||||||||
| Uniti Group LP/Uniti Group Finance 2019, Inc./CSL Capital LLC(1) | 4.75 | 04/15/28 | 20,000 | 18,405 | ||||||||||
| Uniti Group LP/Uniti Group Finance 2019, Inc./CSL Capital LLC(1) | 10.50 | 02/15/28 | 110,000 | 117,277 | ||||||||||
| Uniti Group LP/Uniti Group Finance 2019, Inc./CSL Capital LLC(1) | 10.50 | 02/15/28 | 15,000 | 15,992 | ||||||||||
| XHR LP(1) | 4.88 | 06/01/29 | 20,000 | 18,792 | ||||||||||
| 609,794 | ||||||||||||||
| RETAIL – 5.3% | ||||||||||||||
| 1011778 BC ULC/New Red Finance, Inc.(1) | 4.00 | 10/15/30 | 115,000 | 103,975 | ||||||||||
| 1011778 BC ULC/New Red Finance, Inc.(1) | 4.38 | 01/15/28 | 30,000 | 28,881 | ||||||||||
| Arko Corp.(1) | 5.13 | 11/15/29 | 20,000 | 18,447 | ||||||||||
| Bath & Body Works, Inc. | 6.95 | 03/01/33 | 10,000 | 9,929 | ||||||||||
| Beacon Roofing Supply, Inc.(1) | 4.13 | 05/15/29 | 10,000 | 9,307 | ||||||||||
| Bloomin’ Brands, Inc./OSI Restaurant Partners LLC(1) | 5.13 | 04/15/29 | 10,000 | 9,298 | ||||||||||
| BlueLinx Holdings, Inc.(1) | 6.00 | 11/15/29 | 10,000 | 9,662 | ||||||||||
| Brinker International, Inc.(1) | 8.25 | 07/15/30 | 15,000 | 15,979 | ||||||||||
| CEC Entertainment LLC(1) | 6.75 | 05/01/26 | 30,000 | 29,854 | ||||||||||
| Cougar JV Subsidiary LLC(1) | 8.00 | 05/15/32 | 25,000 | 26,158 | ||||||||||
| Dave & Buster’s, Inc.(1) | 7.63 | 11/01/25 | 15,000 | 15,000 | ||||||||||
| eG Global Finance PLC(1) | 12.00 | 11/30/28 | 45,000 | 50,077 | ||||||||||
| Evergreen Acqco 1 LP/TVI, Inc.(1) | 9.75 | 04/26/28 | 16,000 | 16,851 | ||||||||||
| Ferrellgas LP/Ferrellgas Finance Corp.(1) | 5.38 | 04/01/26 | 20,000 | 19,876 | ||||||||||
| Ferrellgas LP/Ferrellgas Finance Corp.(1) | 5.88 | 04/01/29 | 35,000 | 32,703 | ||||||||||
| Fertitta Entertainment LLC/Fertitta Entertainment Finance Co., Inc.(1) | 4.63 | 01/15/29 | 35,000 | 32,703 | ||||||||||
| Global Auto Holdings Ltd./AAG FH UK Ltd.(1) | 8.38 | 01/15/29 | 20,000 | 18,800 | ||||||||||
| Global Auto Holdings Ltd./AAG FH UK Ltd.(1) | 8.75 | 01/15/32 | 20,000 | 18,197 | ||||||||||
| GYP Holdings III Corp.(1) | 4.63 | 05/01/29 | 10,000 | 9,449 | ||||||||||
| Ken Garff Automotive LLC(1) | 4.88 | 09/15/28 | 15,000 | 14,561 | ||||||||||
| LCM Investments Holdings II LLC(1) | 4.88 | 05/01/29 | 40,000 | 37,833 | ||||||||||
| LCM Investments Holdings II LLC(1) | 8.25 | 08/01/31 | 35,000 | 36,580 | ||||||||||
| Michaels Cos, Inc.(1) | 5.25 | 05/01/28 | 35,000 | 25,229 | ||||||||||
| Papa John’s International, Inc.(1) | 3.88 | 09/15/29 | 15,000 | 13,696 | ||||||||||
| Patrick Industries, Inc.(1) | 4.75 | 05/01/29 | 10,000 | 9,468 | ||||||||||
| Patrick Industries, Inc.(1) | 6.38 | 11/01/32 | 20,000 | 19,796 | ||||||||||
| Patrick Industries, Inc.(1) | 7.50 | 10/15/27 | 10,000 | 9,987 | ||||||||||
| PetSmart, Inc./PetSmart Finance Corp.(1) | 7.75 | 02/15/29 | 45,000 | 43,725 | ||||||||||
| QVC, Inc. | 5.45 | 08/15/34 | 15,000 | 9,876 | ||||||||||
| QVC, Inc. | 5.95 | 03/15/43 | 10,000 | 6,126 | ||||||||||
| QVC, Inc.(1) | 6.88 | 04/15/29 | 25,000 | 21,562 | ||||||||||
The accompanying notes are an integral part of these financial statements.
88
BONDBLOXX ETF TRUST
BondBloxx B Rated USD High Yield Corporate Bond ETF
Portfolio of Investments (Continued)
October 31, 2024
| Rate (%) | Maturity | Face Amount | Value | |||||||||||
| RETAIL – 5.3% (Continued) | ||||||||||||||
| Raising Cane’s Restaurants LLC(1) | 9.38 | 05/01/29 | $ | 20,000 | $ | 21,523 | ||||||||
| Sizzling Platter LLC/Sizzling Platter Finance Corp.(1) | 8.50 | 11/28/25 | 15,000 | 15,032 | ||||||||||
| Specialty Building Products Holdings LLC/SBP Finance Corp.(1) | 7.75 | 10/15/29 | 20,000 | 20,416 | ||||||||||
| Staples, Inc.(1) | 10.75 | 09/01/29 | 100,000 | 96,823 | ||||||||||
| Suburban Propane Partners LP/Suburban Energy Finance Corp.(1) | 5.00 | 06/01/31 | 25,000 | 22,956 | ||||||||||
| Suburban Propane Partners LP/Suburban Energy Finance Corp. | 5.88 | 03/01/27 | 15,000 | 14,993 | ||||||||||
| Victoria’s Secret & Co.(1) | 4.63 | 07/15/29 | 20,000 | 17,645 | ||||||||||
| Victra Holdings LLC/Victra Finance Corp.(1) | 8.75 | 09/15/29 | 20,000 | 20,899 | ||||||||||
| 953,872 | ||||||||||||||
| SEMICONDUCTORS – 0.1% | ||||||||||||||
| ams-OSRAM AG(1) | 12.25 | 03/30/29 | 15,000 | 15,592 | ||||||||||
| SOFTWARE – 4.0% | ||||||||||||||
| ACI Worldwide, Inc.(1) | 5.75 | 08/15/26 | 15,000 | 15,044 | ||||||||||
| Capstone Borrower, Inc.(1) | 8.00 | 06/15/30 | 20,000 | 20,920 | ||||||||||
| Central Parent LLC/CDK Global II LLC/CDK Financing Co., Inc.(1) | 8.00 | 06/15/29 | 30,000 | 30,686 | ||||||||||
| Central Parent, Inc./CDK Global, Inc.(1) | 7.25 | 06/15/29 | 30,000 | 30,142 | ||||||||||
| Clarivate Science Holdings Corp.(1) | 4.88 | 07/01/29 | 35,000 | 33,112 | ||||||||||
| Cloud Software Group, Inc.(1) | 6.50 | 03/31/29 | 160,000 | 156,389 | ||||||||||
| Cloud Software Group, Inc.(1) | 8.25 | 06/30/32 | 70,000 | 71,998 | ||||||||||
| Consensus Cloud Solutions, Inc.(1) | 6.50 | 10/15/28 | 15,000 | 14,872 | ||||||||||
| Dun & Bradstreet Corp.(1) | 5.00 | 12/15/29 | 15,000 | 14,710 | ||||||||||
| Dye & Durham Ltd.(1) | 8.63 | 04/15/29 | 20,000 | 21,219 | ||||||||||
| Helios Software Holdings, Inc./ION Corporate Solutions Finance Sarl(1) | 4.63 | 05/01/28 | 10,000 | 9,175 | ||||||||||
| Helios Software Holdings, Inc./ION Corporate Solutions Finance Sarl(1) | 8.75 | 05/01/29 | 30,000 | 30,488 | ||||||||||
| Rocket Software, Inc.(1) | 9.00 | 11/28/28 | 30,000 | 31,304 | ||||||||||
| SS&C Technologies, Inc.(1) | 5.50 | 09/30/27 | 85,000 | 84,720 | ||||||||||
| SS&C Technologies, Inc.(1) | 6.50 | 06/01/32 | 25,000 | 25,466 | ||||||||||
| UKG, Inc.(1) | 6.88 | 02/01/31 | 100,000 | 102,533 | ||||||||||
| ZoomInfo Technologies LLC/ZoomInfo Finance Corp.(1) | 3.88 | 02/01/29 | 25,000 | 22,797 | ||||||||||
| 715,575 | ||||||||||||||
| TELECOMMUNICATIONS – 4.7% | ||||||||||||||
| Consolidated Communications, Inc.(1) | 5.00 | 10/01/28 | 15,000 | 13,889 | ||||||||||
| Consolidated Communications, Inc.(1) | 6.50 | 10/01/28 | 30,000 | 28,541 | ||||||||||
| Frontier Communications Holdings LLC(1) | 5.00 | 05/01/28 | 55,000 | 54,119 | ||||||||||
| Frontier Communications Holdings LLC(1) | 5.88 | 10/15/27 | 50,000 | 49,926 | ||||||||||
| Frontier Communications Holdings LLC | 5.88 | 11/01/29 | 25,000 | 24,452 | ||||||||||
| Frontier Communications Holdings LLC(1) | 6.00 | 01/15/30 | 45,000 | 44,087 | ||||||||||
| Frontier Communications Holdings LLC(1) | 6.75 | 05/01/29 | 45,000 | 44,797 | ||||||||||
| Frontier Communications Holdings LLC(1) | 8.63 | 03/15/31 | 30,000 | 32,181 | ||||||||||
| Frontier Communications Holdings LLC(1) | 8.75 | 05/15/30 | 45,000 | 47,674 | ||||||||||
| Frontier Florida LLC | 6.86 | 02/01/28 | 10,000 | 10,390 | ||||||||||
| GoTo Group, Inc.(1) | 5.50 | 05/01/28 | 10,000 | 7,735 | ||||||||||
| Iliad Holding SASU(1) | 6.50 | 10/15/26 | 35,000 | 35,307 | ||||||||||
| Iliad Holding SASU(1) | 7.00 | 10/15/28 | 35,000 | 35,480 | ||||||||||
| Iliad Holding SASU(1) | 8.50 | 04/15/31 | 30,000 | 31,982 | ||||||||||
The accompanying notes are an integral part of these financial statements.
89
BONDBLOXX ETF TRUST
BondBloxx B Rated USD High Yield Corporate Bond ETF
Portfolio of Investments (Continued)
October 31, 2024
| Rate (%) | Maturity | Face Amount | Value | |||||||||||
| TELECOMMUNICATIONS – 4.7% (Continued) | ||||||||||||||
| Level 3 Financing, Inc.(1) | 10.50 | 04/15/29 | $ | 20,000 | $ | 22,367 | ||||||||
| Level 3 Financing, Inc.(1) | 10.50 | 05/15/30 | 30,000 | 32,963 | ||||||||||
| Level 3 Financing, Inc.(1) | 10.75 | 12/15/30 | 35,000 | 39,283 | ||||||||||
| Level 3 Financing, Inc.(1) | 11.00 | 11/15/29 | 65,000 | 73,428 | ||||||||||
| Lumen Technologies, Inc.(1) | 4.13 | 04/15/29 | 10,000 | 8,800 | ||||||||||
| Lumen Technologies, Inc.(1) | 4.13 | 04/15/30 | 15,000 | 12,788 | ||||||||||
| Lumen Technologies, Inc.(1) | 10.00 | 10/15/32 | 20,000 | 19,950 | ||||||||||
| Viasat, Inc.(1) | 6.50 | 07/15/28 | 30,000 | 22,660 | ||||||||||
| Viasat, Inc.(1) | 7.50 | 05/30/31 | 15,000 | 9,860 | ||||||||||
| Windstream Services LLC/Windstream Escrow Finance Corp.(1) | 7.75 | 08/15/28 | 60,000 | 60,388 | ||||||||||
| Windstream Services LLC/Windstream Escrow Finance Corp.(1) | 8.25 | 10/01/31 | 25,000 | 25,331 | ||||||||||
| Zayo Group Holdings, Inc.(1) | 4.00 | 03/01/27 | 60,000 | 53,449 | ||||||||||
| 841,827 | ||||||||||||||
| TRANSPORTATION – 0.6% | ||||||||||||||
| Brightline East LLC(1) | 11.00 | 01/31/30 | 55,000 | 49,720 | ||||||||||
| GN Bondco LLC(1) | 9.50 | 10/15/31 | 25,000 | 26,571 | ||||||||||
| Watco Cos LLC/Watco Finance Corp.(1) | 7.13 | 08/01/32 | 30,000 | 30,955 | ||||||||||
| 107,246 | ||||||||||||||
| TOTAL CORPORATE BONDS (Cost - $17,116,443) | 17,459,407 | |||||||||||||
| SHORT-TERM INVESTMENTS – 1.5% | ||||||||||||||
| TIME DEPOSITS – 1.5% | ||||||||||||||
| JP Morgan Chase, New York | 4.18 | 11/01/24 | 265,739 | 265,739 | ||||||||||
| TOTAL SHORT-TERM INVESTMENTS (Cost - $265,739) | 265,739 | |||||||||||||
| TOTAL INVESTMENTS – 99.4% (Cost - $17,382,182) | $ | 17,725,146 | ||||||||||||
| OTHER ASSETS LESS LIABILITIES – 0.6% | 104,579 | |||||||||||||
| NET ASSETS – 100.0% | $ | 17,829,725 | ||||||||||||
| (1) | Security was purchased pursuant to Rule 144A under the Securities Act of 1933 and may not be resold subject to that Rule except to qualified institutional buyers. The aggregate value of Rule 144A holdings at October 31, 2024, amounts to $15,732,514 and represents 88.2% of net assets. These securities have been deemed liquid under procedures approved by the Trust’s Board of Trustees. |
| (2) | Security is perpetual in nature and has no stated maturity date. |
| (3) | Includes step-up bonds that pay an initial coupon rate for the first period and then a higher coupon rate for the following periods. The rate reported is the rate in effect as of October 31, 2024. |
The accompanying notes are an integral part of these financial statements.
90
BONDBLOXX ETF TRUST
BondBloxx CCC Rated USD High Yield Corporate Bond ETF
Portfolio of Investments
October 31, 2024
| Shares | Value | |||||||||||||
| COMMON STOCKS – 0.0% | ||||||||||||||
| MEDIA – 0.0% | ||||||||||||||
| Beasley Broadcast Group, Inc. Class A* | 119 | $ | 1,521 | |||||||||||
| TOTAL COMMON STOCKS (Cost - $1,474) | 1,521 | |||||||||||||
| Rate (%) | Maturity | Face Amount | ||||||||||||
| CORPORATE BONDS – 97.0% | ||||||||||||||
| ADVERTISING – 2.1% | ||||||||||||||
| Clear Channel Outdoor Holdings, Inc.(1) | 7.50 | 06/01/29 | $ | 925,000 | 791,446 | |||||||||
| Clear Channel Outdoor Holdings, Inc.(1) | 7.75 | 04/15/28 | 904,000 | 805,569 | ||||||||||
| CMG Media Corp.(1) | 8.88 | 12/15/27 | 780,000 | 566,475 | ||||||||||
| 2,163,490 | ||||||||||||||
| AEROSPACE/DEFENSE – 1.0% | ||||||||||||||
| F-Brasile SpA/F-Brasile US LLC(1) | 7.38 | 08/15/26 | 445,000 | 446,469 | ||||||||||
| Spirit AeroSystems, Inc. | 4.60 | 06/15/28 | 615,000 | 587,375 | ||||||||||
| 1,033,844 | ||||||||||||||
| APPAREL – 0.4% | ||||||||||||||
| Wolverine World Wide, Inc.(1) | 4.00 | 08/15/29 | 485,000 | 415,207 | ||||||||||
| AUTO MANUFACTURERS – 1.1% | ||||||||||||||
| McLaren Finance PLC(1) | 7.50 | 08/01/26 | 545,000 | 531,375 | ||||||||||
| PM General Purchaser LLC(1) | 9.50 | 10/01/28 | 570,000 | 579,582 | ||||||||||
| 1,110,957 | ||||||||||||||
| AUTO PARTS & EQUIPMENT – 0.9% | ||||||||||||||
| Dornoch Debt Merger Sub, Inc.(1) | 6.63 | 10/15/29 | 575,000 | 481,913 | ||||||||||
| Real Hero Merger Sub 2, Inc.(1) | 6.25 | 02/01/29 | 525,000 | 459,057 | ||||||||||
| 940,970 | ||||||||||||||
| BEVERAGES – 0.6% | ||||||||||||||
| Triton Water Holdings, Inc.(1) | 6.25 | 04/01/29 | 630,000 | 622,976 | ||||||||||
| BIOTECHNOLOGY – 0.3% | ||||||||||||||
| Emergent BioSolutions, Inc.(1) | 3.88 | 08/15/28 | 395,000 | 317,773 | ||||||||||
| BUILDING MATERIALS – 1.8% | ||||||||||||||
| ACProducts Holdings, Inc.(1) | 6.38 | 05/15/29 | 450,000 | 286,312 | ||||||||||
| Cornerstone Building Brands, Inc.(1) | 6.13 | 01/15/29 | 280,000 | 250,571 | ||||||||||
| CP Atlas Buyer, Inc.(1) | 7.00 | 12/01/28 | 452,000 | 414,188 | ||||||||||
| Oscar Acquisition Co. LLC/Oscar Finance, Inc.(1) | 9.50 | 04/15/30 | 515,000 | 503,647 | ||||||||||
| Wilsonart LLC(1) | 11.00 | 08/15/32 | 445,000 | 439,148 | ||||||||||
| 1,893,866 | ||||||||||||||
| CHEMICALS – 4.3% | ||||||||||||||
| GPD Cos, Inc.(1) | 10.13 | 04/01/26 | 440,000 | 418,522 | ||||||||||
| Illuminate Buyer LLC/Illuminate Holdings IV, Inc.(1) | 9.00 | 07/01/28 | 405,000 | 410,622 | ||||||||||
| Innophos Holdings, Inc.(1) | 9.38 | 02/15/28 | 235,000 | 222,505 | ||||||||||
| LSF11 A5 Hold Co. LLC(1) | 6.63 | 10/15/29 | 308,000 | 314,313 | ||||||||||
| Olympus Water US Holding Corp.(1) | 6.25 | 10/01/29 | 350,000 | 334,146 | ||||||||||
The accompanying notes are an integral part of these financial statements.
91
BONDBLOXX ETF TRUST
BondBloxx CCC Rated USD High Yield Corporate Bond ETF
Portfolio of Investments (Continued)
October 31, 2024
| Rate (%) | Maturity | Face Amount | Value | |||||||||||
| CHEMICALS – 4.3% (Continued) | ||||||||||||||
| Rayonier AM Products, Inc.(1) | 7.63 | 01/15/26 | $ | 400,000 | $ | 400,475 | ||||||||
| SCIH Salt Holdings, Inc.(1) | 6.63 | 05/01/29 | 615,000 | 598,946 | ||||||||||
| Trinseo Materials Operating SCA/Trinseo Materials Finance, Inc.(1) | 5.13 | 04/01/29 | 395,000 | 212,327 | ||||||||||
| Vibrantz Technologies, Inc.(1) | 9.00 | 02/15/30 | 670,000 | 628,323 | ||||||||||
| WR Grace Holdings LLC(1) | 5.63 | 08/15/29 | 1,010,000 | 933,889 | ||||||||||
| 4,474,068 | ||||||||||||||
| COMMERCIAL SERVICES – 5.4% | ||||||||||||||
| Allied Universal Holdco LLC/Allied Universal Finance Corp.(1) | 6.00 | 06/01/29 | 840,000 | 769,433 | ||||||||||
| Allied Universal Holdco LLC/Allied Universal Finance Corp.(1) | 9.75 | 07/15/27 | 925,000 | 927,871 | ||||||||||
| Deluxe Corp.(1) | 8.00 | 06/01/29 | 420,000 | 396,470 | ||||||||||
| Garda World Security Corp.(1) | 6.00 | 06/01/29 | 440,000 | 412,738 | ||||||||||
| Garda World Security Corp.(1) | 8.25 | 08/01/32 | 515,000 | 512,712 | ||||||||||
| Garda World Security Corp.(1) | 9.50 | 11/01/27 | 530,000 | 530,759 | ||||||||||
| Hertz Corp.(1) | 4.63 | 12/01/26 | 445,000 | 336,608 | ||||||||||
| Hertz Corp.(1) | 5.00 | 12/01/29 | 885,000 | 565,832 | ||||||||||
| Mavis Tire Express Services Topco Corp.(1) | 6.50 | 05/15/29 | 635,000 | 609,098 | ||||||||||
| Signal Parent, Inc.(1) | 6.13 | 04/01/29 | 266,000 | 173,462 | ||||||||||
| StoneMor, Inc.(1) | 8.50 | 05/15/29 | 340,000 | 303,268 | ||||||||||
| WW International, Inc.(1) | 4.50 | 04/15/29 | 345,000 | 87,975 | ||||||||||
| 5,626,226 | ||||||||||||||
| COMPUTERS – 2.5% | ||||||||||||||
| Ahead DB Holdings LLC(1) | 6.63 | 05/01/28 | 355,000 | 344,955 | ||||||||||
| McAfee Corp.(1) | 7.38 | 02/15/30 | 1,815,000 | 1,751,317 | ||||||||||
| Vericast Corp./Harland Clarke/Checks in the Mail/Valassis Comm/Valassis Direct(1) | 13.00 | 12/15/30 | 197,648 | 233,225 | ||||||||||
| Virtusa Corp.(1) | 7.13 | 12/15/28 | 300,000 | 291,231 | ||||||||||
| 2,620,728 | ||||||||||||||
| COSMETICS/PERSONAL CARE – 0.1% | ||||||||||||||
| Oriflame Investment Holding PLC(1) | 5.13 | 05/04/26 | 325,000 | 76,304 | ||||||||||
| DISTRIBUTION/WHOLESALE – 1.0% | ||||||||||||||
| BCPE Empire Holdings, Inc.(1) | 7.63 | 05/01/27 | 585,000 | 589,058 | ||||||||||
| Dealer Tire LLC/DT Issuer LLC(1) | 8.00 | 02/01/28 | 440,000 | 434,392 | ||||||||||
| 1,023,450 | ||||||||||||||
| DIVERSIFIED FINANCIAL SERVICES – 2.6% | ||||||||||||||
| Aretec Group, Inc.(1) | 7.50 | 04/01/29 | 350,000 | 337,424 | ||||||||||
| Armor Holdco, Inc.(1) | 8.50 | 11/15/29 | 309,000 | 302,832 | ||||||||||
| Cobra Acquisition Co. LLC(1) | 6.38 | 11/01/29 | 350,000 | 289,887 | ||||||||||
| Hightower Holding LLC(1) | 6.75 | 04/15/29 | 270,000 | 266,054 | ||||||||||
| Hightower Holding LLC(1) | 9.13 | 01/31/30 | 340,000 | 358,737 | ||||||||||
| LD Holdings Group LLC(1) | 6.13 | 04/01/28 | 530,000 | 459,713 | ||||||||||
| LD Holdings Group LLC(1) | 8.75 | 11/01/27 | 290,000 | 278,127 | ||||||||||
| Osaic Holdings, Inc.(1) | 10.75 | 08/01/27 | 365,000 | 377,449 | ||||||||||
| 2,670,223 | ||||||||||||||
The accompanying notes are an integral part of these financial statements.
92
BONDBLOXX ETF TRUST
BondBloxx CCC Rated USD High Yield Corporate Bond ETF
Portfolio of Investments (Continued)
October 31, 2024
| Rate (%) | Maturity | Face Amount | Value | |||||||||||
| ENGINEERING & CONSTRUCTION – 0.9% | ||||||||||||||
| Great Lakes Dredge & Dock Corp.(1) | 5.25 | 06/01/29 | $ | 285,000 | $ | 268,073 | ||||||||
| INNOVATE Corp.(1) | 8.50 | 02/01/26 | 290,000 | 237,415 | ||||||||||
| Tutor Perini Corp.(1) | 11.88 | 04/30/29 | 355,000 | 389,973 | ||||||||||
| 895,461 | ||||||||||||||
| ENTERTAINMENT – 2.1% | ||||||||||||||
| Allen Media LLC/Allen Media Co.-Issuer, Inc.(1) | 10.50 | 02/15/28 | 533,000 | 234,587 | ||||||||||
| AMC Entertainment Holdings, Inc.(1) | 7.50 | 02/15/29 | 835,000 | 721,271 | ||||||||||
| Motion Bondco DAC(1) | 6.63 | 11/15/27 | 345,000 | 327,260 | ||||||||||
| Premier Entertainment Sub LLC/Premier Entertainment Finance Corp.(1) | 5.63 | 09/01/29 | 665,000 | 473,832 | ||||||||||
| Premier Entertainment Sub LLC/Premier Entertainment Finance Corp.(1) | 5.88 | 09/01/31 | 640,000 | 413,483 | ||||||||||
| 2,170,433 | ||||||||||||||
| ENVIRONMENTAL CONTROL – 0.8% | ||||||||||||||
| Madison IAQ LLC(1) | 5.88 | 06/30/29 | 905,000 | 859,241 | ||||||||||
| FOOD – 2.3% | ||||||||||||||
| B&G Foods, Inc. | 5.25 | 09/15/27 | 485,000 | 471,140 | ||||||||||
| Chobani LLC/Chobani Finance Corp., Inc.(1) | 7.63 | 07/01/29 | 425,000 | 443,602 | ||||||||||
| Fiesta Purchaser, Inc.(1) | 9.63 | 09/15/32 | 400,000 | 419,101 | ||||||||||
| Sigma Holdco BV(1) | 7.88 | 05/15/26 | 231,000 | 229,057 | ||||||||||
| TreeHouse Foods, Inc. | 4.00 | 09/01/28 | 440,000 | 401,434 | ||||||||||
| United Natural Foods, Inc.(1) | 6.75 | 10/15/28 | 425,000 | 410,591 | ||||||||||
| 2,374,925 | ||||||||||||||
| FOOD SERVICE – 0.6% | ||||||||||||||
| TKC Holdings, Inc.(1) | 10.50 | 05/15/29 | 590,000 | 597,490 | ||||||||||
| HEALTHCARE-SERVICES – 4.4% | ||||||||||||||
| AHP Health Partners, Inc.(1) | 5.75 | 07/15/29 | 265,000 | 257,118 | ||||||||||
| CHS/Community Health Systems, Inc.(1) | 6.13 | 04/01/30 | 1,080,000 | 846,539 | ||||||||||
| CHS/Community Health Systems, Inc.(1) | 6.88 | 04/15/29 | 1,130,000 | 955,476 | ||||||||||
| LifePoint Health, Inc.(1) | 5.38 | 01/15/29 | 432,000 | 395,812 | ||||||||||
| LifePoint Health, Inc.(1) | 10.00 | 06/01/32 | 705,000 | 753,089 | ||||||||||
| ModivCare, Inc.(1) | 5.00 | 10/01/29 | 445,000 | 303,455 | ||||||||||
| MPH Acquisition Holdings LLC(1) | 5.75 | 11/01/28 | 865,000 | 398,882 | ||||||||||
| Surgery Center Holdings, Inc.(1) | 7.25 | 04/15/32 | 700,000 | 719,638 | ||||||||||
| 4,630,009 | ||||||||||||||
| HOUSEHOLD PRODUCTS/WARES – 0.3% | ||||||||||||||
| Kronos Acquisition Holdings, Inc.(1) | 10.75 | 06/30/32 | 395,000 | 368,494 | ||||||||||
| HOUSEWARES – 0.3% | ||||||||||||||
| SWF Holdings I Corp.(1) | 6.50 | 10/01/29 | 550,000 | 358,188 | ||||||||||
| INSURANCE – 9.2% | ||||||||||||||
| Acrisure LLC/Acrisure Finance, Inc.(1) | 6.00 | 08/01/29 | 440,000 | 416,796 | ||||||||||
| Acrisure LLC/Acrisure Finance, Inc.(1) | 8.25 | 02/01/29 | 842,000 | 856,468 | ||||||||||
The accompanying notes are an integral part of these financial statements.
93
BONDBLOXX ETF TRUST
BondBloxx CCC Rated USD High Yield Corporate Bond ETF
Portfolio of Investments (Continued)
October 31, 2024
| Rate (%) | Maturity | Face Amount | Value | |||||||||||
| INSURANCE – 9.2% (Continued) | ||||||||||||||
| Acrisure LLC/Acrisure Finance, Inc.(1) | 8.50 | 06/15/29 | $ | 440,000 | $ | 452,486 | ||||||||
| Alliant Holdings Intermediate LLC/Alliant Holdings Co.-Issuer, Inc.(1) | 5.88 | 11/01/29 | 370,000 | 349,830 | ||||||||||
| Alliant Holdings Intermediate LLC/Alliant Holdings Co.-Issuer, Inc.(1) | 6.75 | 10/15/27 | 1,100,000 | 1,096,860 | ||||||||||
| Alliant Holdings Intermediate LLC/Alliant Holdings Co.-Issuer, Inc.(1) | 7.38 | 10/01/32 | 570,000 | 565,765 | ||||||||||
| Ardonagh Group Finance Ltd.(1) | 8.88 | 02/15/32 | 875,000 | 894,714 | ||||||||||
| AssuredPartners, Inc.(1) | 5.63 | 01/15/29 | 485,000 | 459,400 | ||||||||||
| AssuredPartners, Inc.(1) | 7.50 | 02/15/32 | 445,000 | 448,531 | ||||||||||
| BroadStreet Partners, Inc.(1) | 5.88 | 04/15/29 | 635,000 | 607,808 | ||||||||||
| Howden UK Refinance PLC/Howden UK Refinance 2 PLC/Howden US Refinance LLC(1) | 8.13 | 02/15/32 | 440,000 | 445,520 | ||||||||||
| HUB International Ltd.(1) | 5.63 | 12/01/29 | 451,000 | 437,200 | ||||||||||
| HUB International Ltd.(1) | 7.38 | 01/31/32 | 1,565,000 | 1,597,436 | ||||||||||
| Jones Deslauriers Insurance Management, Inc.(1) | 10.50 | 12/15/30 | 440,000 | 474,357 | ||||||||||
| USI, Inc./NY(1) | 7.50 | 01/15/32 | 545,000 | 556,736 | ||||||||||
| 9,659,907 | ||||||||||||||
| INTERNET – 1.4% | ||||||||||||||
| Arches Buyer, Inc.(1) | 6.13 | 12/01/28 | 440,000 | 387,750 | ||||||||||
| Cablevision Lightpath LLC(1) | 5.63 | 09/15/28 | 365,000 | 339,211 | ||||||||||
| Millennium Escrow Corp.(1) | 6.63 | 08/01/26 | 695,000 | 447,841 | ||||||||||
| Newfold Digital Holdings Group, Inc.(1) | 6.00 | 02/15/29 | 440,000 | 296,009 | ||||||||||
| 1,470,811 | ||||||||||||||
| IRON/STEEL – 0.9% | ||||||||||||||
| Baffinland Iron Mines Corp./Baffinland Iron Mines LP(1) | 8.75 | 07/15/26 | 505,000 | 457,632 | ||||||||||
| Infrabuild Australia Pty Ltd.(1) | 14.50 | 11/15/28 | 500,000 | 492,568 | ||||||||||
| 950,200 | ||||||||||||||
| LEISURE TIME – 0.4% | ||||||||||||||
| MajorDrive Holdings IV LLC(1) | 6.38 | 06/01/29 | 465,000 | 446,310 | ||||||||||
| LODGING – 0.3% | ||||||||||||||
| Full House Resorts, Inc.(1) | 8.25 | 02/15/28 | 360,000 | 359,682 | ||||||||||
| MACHINERY-DIVERSIFIED – 2.0% | ||||||||||||||
| GrafTech Finance, Inc.(1) | 4.63 | 12/15/28 | 440,000 | 311,824 | ||||||||||
| GrafTech Global Enterprises, Inc.(1) | 9.88 | 12/15/28 | 395,000 | 331,784 | ||||||||||
| Maxim Crane Works Holdings Capital LLC(1) | 11.50 | 09/01/28 | 440,000 | 472,714 | ||||||||||
| OT Merger Corp.(1) | 7.88 | 10/15/29 | 264,000 | 116,618 | ||||||||||
| SPX FLOW, Inc.(1) | 8.75 | 04/01/30 | 440,000 | 457,801 | ||||||||||
| TK Elevator Holdco GmbH(1) | 7.63 | 07/15/28 | 355,000 | 358,235 | ||||||||||
| 2,048,976 | ||||||||||||||
| MEDIA – 7.8% | ||||||||||||||
| CSC Holdings LLC(1) | 3.38 | 02/15/31 | 230,000 | 165,230 | ||||||||||
| CSC Holdings LLC(1) | 4.13 | 12/01/30 | 250,000 | 184,797 | ||||||||||
| CSC Holdings LLC(1) | 4.50 | 11/15/31 | 349,000 | 256,213 | ||||||||||
| CSC Holdings LLC(1) | 5.38 | 02/01/28 | 225,000 | 192,819 | ||||||||||
| CSC Holdings LLC(1) | 5.50 | 04/15/27 | 290,000 | 258,419 | ||||||||||
The accompanying notes are an integral part of these financial statements.
94
BONDBLOXX ETF TRUST
BondBloxx CCC Rated USD High Yield Corporate Bond ETF
Portfolio of Investments (Continued)
October 31, 2024
| Rate (%) | Maturity | Face Amount | Value | |||||||||||
| MEDIA – 7.8% (Continued) | ||||||||||||||
| CSC Holdings LLC(1) | 6.50 | 02/01/29 | $ | 405,000 | $ | 342,816 | ||||||||
| CSC Holdings LLC(1) | 11.25 | 05/15/28 | 215,000 | 209,860 | ||||||||||
| CSC Holdings LLC(1) | 11.75 | 01/31/29 | 473,700 | 462,409 | ||||||||||
| Cumulus Media New Holdings, Inc.(1) | 8.00 | 07/01/29 | 230,000 | 94,851 | ||||||||||
| DISH DBS Corp. | 5.13 | 06/01/29 | 250,000 | 166,586 | ||||||||||
| DISH DBS Corp.(1) | 5.25 | 12/01/26 | 415,000 | 384,887 | ||||||||||
| DISH DBS Corp.(1) | 5.75 | 12/01/28 | 395,000 | 345,857 | ||||||||||
| DISH DBS Corp. | 7.38 | 07/01/28 | 165,000 | 121,070 | ||||||||||
| DISH DBS Corp. | 7.75 | 07/01/26 | 315,000 | 266,798 | ||||||||||
| DISH Network Corp.(1) | 11.75 | 11/15/27 | 675,000 | 711,038 | ||||||||||
| iHeartCommunications, Inc.(1) | 4.75 | 01/15/28 | 415,000 | 255,526 | ||||||||||
| iHeartCommunications, Inc.(1) | 5.25 | 08/15/27 | 665,000 | 448,024 | ||||||||||
| iHeartCommunications, Inc. | 6.38 | 05/01/26 | 705,000 | 597,280 | ||||||||||
| iHeartCommunications, Inc. | 8.38 | 05/01/27 | 835,000 | 433,808 | ||||||||||
| McGraw-Hill Education, Inc.(1) | 8.00 | 08/01/29 | 560,000 | 564,213 | ||||||||||
| Radiate Holdco LLC/Radiate Finance, Inc.(1) | 4.50 | 09/15/26 | 795,000 | 691,652 | ||||||||||
| Scripps Escrow II, Inc.(1) | 5.38 | 01/15/31 | 350,000 | 210,640 | ||||||||||
| Scripps Escrow, Inc.(1) | 5.88 | 07/15/27 | 365,000 | 321,200 | ||||||||||
| Sinclair Television Group, Inc.(1) | 5.13 | 02/15/27 | 240,000 | 213,703 | ||||||||||
| Sinclair Television Group, Inc.(1) | 5.50 | 03/01/30 | 425,000 | 292,965 | ||||||||||
| 8,192,661 | ||||||||||||||
| METAL FABRICATE/HARDWARE – 0.3% | ||||||||||||||
| Park-Ohio Industries, Inc. | 6.63 | 04/15/27 | 305,000 | 298,317 | ||||||||||
| MINING – 0.3% | ||||||||||||||
| IAMGOLD Corp.(1) | 5.75 | 10/15/28 | 380,000 | 370,860 | ||||||||||
| MISCELLANEOUS MANUFACTURER – 1.0% | ||||||||||||||
| FXI Holdings, Inc.(1) | 12.25 | 11/15/26 | 660,000 | 658,139 | ||||||||||
| FXI Holdings, Inc.(1) | 12.25 | 11/15/26 | 417,000 | 414,052 | ||||||||||
| 1,072,191 | ||||||||||||||
| OIL & GAS – 3.8% | ||||||||||||||
| Berry Petroleum Co. LLC(1) | 7.00 | 02/15/26 | 350,000 | 341,476 | ||||||||||
| Calumet Specialty Products Partners LP/Calumet Finance Corp.(1) | 8.13 | 01/15/27 | 300,000 | 302,098 | ||||||||||
| Calumet Specialty Products Partners LP/Calumet Finance Corp.(1) | 9.75 | 07/15/28 | 265,000 | 272,510 | ||||||||||
| Global Marine, Inc. | 7.00 | 06/01/28 | 230,000 | 217,855 | ||||||||||
| Nabors Industries Ltd.(1) | 7.50 | 01/15/28 | 350,000 | 333,285 | ||||||||||
| Nabors Industries, Inc.(1) | 8.88 | 08/15/31 | 475,000 | 449,468 | ||||||||||
| Transocean, Inc. | 6.80 | 03/15/38 | 385,000 | 319,787 | ||||||||||
| Transocean, Inc. | 7.50 | 04/15/31 | 230,000 | 214,798 | ||||||||||
| Transocean, Inc.(1) | 8.00 | 02/01/27 | 405,000 | 404,142 | ||||||||||
| Transocean, Inc.(1) | 8.25 | 05/15/29 | 555,000 | 558,013 | ||||||||||
| Transocean, Inc.(1) | 8.50 | 05/15/31 | 547,000 | 551,568 | ||||||||||
| 3,965,000 | ||||||||||||||
| OIL & GAS SERVICES – 0.2% | ||||||||||||||
| Nine Energy Service, Inc. | 13.00 | 02/01/28 | 255,000 | 167,252 | ||||||||||
The accompanying notes are an integral part of these financial statements.
95
BONDBLOXX ETF TRUST
BondBloxx CCC Rated USD High Yield Corporate Bond ETF
Portfolio of Investments (Continued)
October 31, 2024
| Rate (%) | Maturity | Face Amount | Value | |||||||||||
| PACKAGING & CONTAINERS – 6.6% | ||||||||||||||
| Ardagh Metal Packaging Finance USA LLC/Ardagh Metal Packaging Finance PLC(1) | 4.00 | 09/01/29 | $ | 925,000 | $ | 812,295 | ||||||||
| Ardagh Packaging Finance PLC/Ardagh Holdings USA, Inc.(1) | 4.13 | 08/15/26 | 1,065,000 | 927,652 | ||||||||||
| Clydesdale Acquisition Holdings, Inc.(1) | 8.75 | 04/15/30 | 970,000 | 985,850 | ||||||||||
| Graham Packaging Co., Inc.(1) | 7.13 | 08/15/28 | 452,000 | 440,135 | ||||||||||
| Iris Holding, Inc.(1) | 10.00 | 12/15/28 | 350,000 | 308,017 | ||||||||||
| LABL, Inc.(1) | 8.25 | 11/01/29 | 400,000 | 353,122 | ||||||||||
| LABL, Inc.(1) | 10.50 | 07/15/27 | 605,000 | 599,589 | ||||||||||
| Mauser Packaging Solutions Holding Co.(1) | 9.25 | 04/15/27 | 1,210,000 | 1,238,472 | ||||||||||
| Trident TPI Holdings, Inc.(1) | 12.75 | 12/31/28 | 545,000 | 598,679 | ||||||||||
| Trivium Packaging Finance BV(1) | 8.50 | 08/15/27 | 615,000 | 613,839 | ||||||||||
| 6,877,650 | ||||||||||||||
| PHARMACEUTICALS – 0.8% | ||||||||||||||
| Bausch Health Cos, Inc.(1) | 14.00 | 10/15/30 | 290,000 | 258,100 | ||||||||||
| Grifols SA(1) | 4.75 | 10/15/28 | 620,000 | 571,972 | ||||||||||
| 830,072 | ||||||||||||||
| PIPELINES – 0.2% | ||||||||||||||
| TransMontaigne Partners LP/TLP Finance Corp. | 6.13 | 02/15/26 | 265,000 | 260,868 | ||||||||||
| REAL ESTATE – 0.7% | ||||||||||||||
| Anywhere Real Estate Group LLC/Realogy Co.-Issuer Corp.(1) | 5.25 | 04/15/30 | 385,000 | 294,035 | ||||||||||
| Anywhere Real Estate Group LLC/Realogy Co.-Issuer Corp.(1) | 5.75 | 01/15/29 | 495,000 | 408,290 | ||||||||||
| 702,325 | ||||||||||||||
| REAL ESTATE INVESTMENT TRUST (REITS) – 2.7% | ||||||||||||||
| Diversified Healthcare Trust | 4.38 | 03/01/31 | 430,000 | 348,703 | ||||||||||
| Diversified Healthcare Trust | 4.75 | 02/15/28 | 445,000 | 394,101 | ||||||||||
| Office Properties Income Trust(1) | 9.00 | 03/31/29 | 245,000 | 239,070 | ||||||||||
| Office Properties Income Trust(1) | 9.00 | 09/30/29 | 505,000 | 427,156 | ||||||||||
| Uniti Group LP/Uniti Fiber Holdings, Inc./CSL Capital LLC(1) | 6.00 | 01/15/30 | 620,000 | 520,145 | ||||||||||
| Uniti Group LP/Uniti Group Finance 2019, Inc./CSL Capital LLC(1) | 6.50 | 02/15/29 | 995,000 | 857,735 | ||||||||||
| 2,786,910 | ||||||||||||||
| RETAIL – 5.8% | ||||||||||||||
| Fertitta Entertainment LLC/Fertitta Entertainment Finance Co., Inc.(1) | 6.75 | 01/15/30 | 1,095,000 | 996,664 | ||||||||||
| Foundation Building Materials, Inc.(1) | 6.00 | 03/01/29 | 355,000 | 314,051 | ||||||||||
| GPS Hospitality Holding Co. LLC/GPS FinCo., Inc.(1) | 7.00 | 08/15/28 | 350,000 | 217,389 | ||||||||||
| Guitar Center, Inc.(1) | 8.50 | 01/15/26 | 485,000 | 414,722 | ||||||||||
| LBM Acquisition LLC(1) | 6.25 | 01/15/29 | 635,000 | 586,343 | ||||||||||
| Liberty Interactive LLC | 8.25 | 02/01/30 | 445,000 | 228,412 | ||||||||||
| Liberty Interactive LLC | 8.50 | 07/15/29 | 255,000 | 136,647 | ||||||||||
| Michaels Cos, Inc.(1) | 7.88 | 05/01/29 | 1,000,000 | 532,368 | ||||||||||
| NMG Holding Co., Inc./Neiman Marcus Group LLC(1) | 8.50 | 10/01/28 | 960,000 | 976,903 | ||||||||||
| Park River Holdings, Inc.(1) | 5.63 | 02/01/29 | 305,000 | 266,719 | ||||||||||
| Park River Holdings, Inc.(1) | 6.75 | 08/01/29 | 255,000 | 227,859 | ||||||||||
| Staples, Inc.(1) | 12.75 | 01/15/30 | 735,847 | 585,635 | ||||||||||
| White Capital Buyer LLC(1) | 6.88 | 10/15/28 | 564,000 | 566,358 | ||||||||||
| 6,050,070 | ||||||||||||||
The accompanying notes are an integral part of these financial statements.
96
BONDBLOXX ETF TRUST
BondBloxx CCC Rated USD High Yield Corporate Bond ETF
Portfolio of Investments (Continued)
October 31, 2024
| Rate (%) | Maturity | Face Amount | Value | |||||||||||
| SOFTWARE – 5.8% | ||||||||||||||
| Alteryx, Inc.(1) | 8.75 | 03/15/28 | $ | 395,000 | $ | 404,072 | ||||||||
| AthenaHealth Group, Inc.(1) | 6.50 | 02/15/30 | 2,105,000 | 1,992,304 | ||||||||||
| Castle US Holding Corp.(1) | 9.50 | 02/15/28 | 240,000 | 109,200 | ||||||||||
| Cloud Software Group, Inc.(1) | 9.00 | 09/30/29 | 2,035,000 | 2,036,382 | ||||||||||
| Rackspace Finance LLC(1) | 3.50 | 05/15/28 | 285,000 | 168,271 | ||||||||||
| Rocket Software, Inc.(1) | 6.50 | 02/15/29 | 505,000 | 470,121 | ||||||||||
| Veritas US, Inc./Veritas Bermuda Ltd.(1) | 7.50 | 09/01/25 | 575,000 | 547,811 | ||||||||||
| West Technology Group LLC(1) | 8.50 | 04/10/27 | 340,000 | 286,604 | ||||||||||
| 6,014,765 | ||||||||||||||
| TELECOMMUNICATIONS – 10.8% | ||||||||||||||
| Altice Financing SA(1) | 5.00 | 01/15/28 | 815,000 | 690,049 | ||||||||||
| Altice Financing SA(1) | 5.75 | 08/15/29 | 1,395,000 | 1,145,687 | ||||||||||
| Altice Financing SA(1) | 9.63 | 07/15/27 | 255,000 | 248,463 | ||||||||||
| Altice France SA(1) | 5.13 | 01/15/29 | 175,000 | 131,254 | ||||||||||
| Altice France SA(1) | 5.13 | 07/15/29 | 830,000 | 621,743 | ||||||||||
| Altice France SA(1) | 5.50 | 01/15/28 | 370,000 | 287,527 | ||||||||||
| Altice France SA(1) | 5.50 | 10/15/29 | 710,000 | 532,417 | ||||||||||
| Altice France SA(1) | 8.13 | 02/01/27 | 620,000 | 513,977 | ||||||||||
| CommScope LLC(1) | 4.75 | 09/01/29 | 1,030,000 | 881,937 | ||||||||||
| CommScope LLC(1) | 6.00 | 03/01/26 | 1,230,000 | 1,202,273 | ||||||||||
| GoTo Group, Inc.(1) | 5.50 | 05/01/28 | 263,349 | 84,140 | ||||||||||
| Hughes Satellite Systems Corp. | 5.25 | 08/01/26 | 655,000 | 599,047 | ||||||||||
| Hughes Satellite Systems Corp. | 6.63 | 08/01/26 | 665,000 | 575,981 | ||||||||||
| Level 3 Financing, Inc.(1) | 3.63 | 01/15/29 | 265,000 | 200,029 | ||||||||||
| Level 3 Financing, Inc.(1) | 3.75 | 07/15/29 | 305,000 | 224,468 | ||||||||||
| Level 3 Financing, Inc.(1) | 3.88 | 10/15/30 | 320,000 | 244,797 | ||||||||||
| Level 3 Financing, Inc.(1) | 4.00 | 04/15/31 | 315,000 | 239,400 | ||||||||||
| Level 3 Financing, Inc.(1) | 4.25 | 07/01/28 | 310,000 | 259,237 | ||||||||||
| Level 3 Financing, Inc.(1) | 4.50 | 04/01/30 | 483,000 | 388,787 | ||||||||||
| Level 3 Financing, Inc.(1) | 4.88 | 06/15/29 | 420,000 | 361,200 | ||||||||||
| Level 3 Financing, Inc.(1) | 10.00 | 10/15/32 | 229,340 | 227,642 | ||||||||||
| Lumen Technologies, Inc.(1) | 4.50 | 01/15/29 | 225,000 | 175,737 | ||||||||||
| Lumen Technologies, Inc. | 7.60 | 09/15/39 | 275,000 | 202,558 | ||||||||||
| Lumen Technologies, Inc. | 7.65 | 03/15/42 | 220,000 | 159,599 | ||||||||||
| Lumen Technologies, Inc.(1) | 10.00 | 10/15/32 | 21,000 | 20,948 | ||||||||||
| Telesat Canada/Telesat LLC(1) | 4.88 | 06/01/27 | 250,000 | 110,231 | ||||||||||
| Telesat Canada/Telesat LLC(1) | 5.63 | 12/06/26 | 455,000 | 201,942 | ||||||||||
| Zayo Group Holdings, Inc.(1) | 6.13 | 03/01/28 | 945,000 | 812,305 | ||||||||||
| 11,343,375 | ||||||||||||||
| TRANSPORTATION – 0.2% | ||||||||||||||
| Carriage Purchaser, Inc.(1) | 7.88 | 10/15/29 | 265,000 | 249,963 | ||||||||||
| TOTAL CORPORATE BONDS (Cost - $98,358,583) | 101,362,488 | |||||||||||||
The accompanying notes are an integral part of these financial statements.
97
BONDBLOXX ETF TRUST
BondBloxx CCC Rated USD High Yield Corporate Bond ETF
Portfolio of Investments (Continued)
October 31, 2024
| Rate (%) | Maturity | Face Amount | Value | |||||||||||
| SHORT-TERM INVESTMENTS – 1.5% | ||||||||||||||
| TIME DEPOSITS – 1.5% | ||||||||||||||
| JP Morgan Chase, New York | 4.18 | 11/01/24 | $ | 1,527,222 | $ | 1,527,222 | ||||||||
| TOTAL SHORT-TERM INVESTMENTS (Cost - $1,527,222) | 1,527,222 | |||||||||||||
| TOTAL INVESTMENTS – 98.5% (Cost - $99,887,279) | $ | 102,891,231 | ||||||||||||
| OTHER ASSETS LESS LIABILITIES – 1.5% | 1,612,438 | |||||||||||||
| NET ASSETS – 100.0% | $ | 104,503,669 | ||||||||||||
| * | Non-income producing security. |
| (1) | Security was purchased pursuant to Rule 144A under the Securities Act of 1933 and may not be resold subject to that Rule except to qualified institutional buyers. The aggregate value of Rule 144A holdings at October 31, 2024, amounts to $94,193,072 and represents 90.1% of net assets. These securities have been deemed liquid under procedures approved by the Trust’s Board of Trustees. |
The accompanying notes are an integral part of these financial statements.
98
BONDBLOXX ETF TRUST
BondBloxx BBB Rated 1-5 Year Corporate Bond ETF
Portfolio of Investments
October 31, 2024
| Rate (%) | Maturity | Face Amount | Value | |||||||||||
| CORPORATE BONDS – 98.4% | ||||||||||||||
| ADVERTISING – 0.2% | ||||||||||||||
| Interpublic Group of Cos, Inc. | 4.65 | 10/01/28 | $ | 20,000 | $ | 19,849 | ||||||||
| Omnicom Group, Inc./Omnicom Capital, Inc. | 3.60 | 04/15/26 | 85,000 | 83,788 | ||||||||||
| 103,637 | ||||||||||||||
| AEROSPACE/DEFENSE – 3.1% | ||||||||||||||
| Boeing Co. | 2.20 | 02/04/26 | 315,000 | 303,491 | ||||||||||
| Boeing Co. | 2.70 | 02/01/27 | 65,000 | 61,359 | ||||||||||
| Boeing Co. | 2.75 | 02/01/26 | 85,000 | 82,443 | ||||||||||
| Boeing Co. | 3.10 | 05/01/26 | 35,000 | 33,896 | ||||||||||
| Boeing Co. | 3.20 | 03/01/29 | 100,000 | 91,436 | ||||||||||
| Boeing Co. | 3.25 | 02/01/28 | 35,000 | 32,877 | ||||||||||
| Boeing Co. | 5.04 | 05/01/27 | 105,000 | 104,615 | ||||||||||
| Boeing Co.(1) | 6.26 | 05/01/27 | 70,000 | 71,641 | ||||||||||
| Boeing Co.(1) | 6.30 | 05/01/29 | 100,000 | 103,664 | ||||||||||
| Embraer Netherlands Finance BV | 5.40 | 02/01/27 | 35,000 | 35,456 | ||||||||||
| HEICO Corp. | 5.25 | 08/01/28 | 40,000 | 40,609 | ||||||||||
| Howmet Aerospace, Inc. | 3.00 | 01/15/29 | 15,000 | 13,957 | ||||||||||
| Howmet Aerospace, Inc. | 5.90 | 02/01/27 | 70,000 | 71,720 | ||||||||||
| L3Harris Technologies, Inc. | 3.85 | 12/15/26 | 25,000 | 24,619 | ||||||||||
| L3Harris Technologies, Inc. | 4.40 | 06/15/28 | 55,000 | 54,353 | ||||||||||
| L3Harris Technologies, Inc. | 4.40 | 06/15/28 | 50,000 | 49,393 | ||||||||||
| L3Harris Technologies, Inc. | 5.05 | 06/01/29 | 45,000 | 45,378 | ||||||||||
| L3Harris Technologies, Inc. | 5.40 | 01/15/27 | 75,000 | 76,214 | ||||||||||
| Northrop Grumman Corp. | 3.20 | 02/01/27 | 40,000 | 38,848 | ||||||||||
| Northrop Grumman Corp. | 3.25 | 01/15/28 | 150,000 | 143,582 | ||||||||||
| RTX Corp. | 2.65 | 11/01/26 | 30,000 | 28,931 | ||||||||||
| RTX Corp. | 3.13 | 05/04/27 | 70,000 | 67,496 | ||||||||||
| RTX Corp. | 3.50 | 03/15/27 | 60,000 | 58,473 | ||||||||||
| RTX Corp. | 4.13 | 11/16/28 | 165,000 | 161,442 | ||||||||||
| RTX Corp. | 5.00 | 02/27/26 | 35,000 | 35,135 | ||||||||||
| RTX Corp. | 5.75 | 11/08/26 | 105,000 | 107,257 | ||||||||||
| RTX Corp. | 5.75 | 01/15/29 | 25,000 | 25,961 | ||||||||||
| 1,964,246 | ||||||||||||||
| AGRICULTURE – 1.5% | ||||||||||||||
| Altria Group, Inc. | 2.63 | 09/16/26 | 15,000 | 14,455 | ||||||||||
| Altria Group, Inc. | 4.40 | 02/14/26 | 75,000 | 74,646 | ||||||||||
| Altria Group, Inc. | 4.80 | 02/14/29 | 90,000 | 89,493 | ||||||||||
| Altria Group, Inc. | 6.20 | 11/01/28 | 55,000 | 57,549 | ||||||||||
| BAT Capital Corp. | 2.26 | 03/25/28 | 100,000 | 91,785 | ||||||||||
| BAT Capital Corp. | 3.22 | 09/06/26 | 35,000 | 34,034 | ||||||||||
| BAT Capital Corp. | 3.46 | 09/06/29 | 25,000 | 23,384 | ||||||||||
| BAT Capital Corp. | 3.56 | 08/15/27 | 125,000 | 121,207 | ||||||||||
| BAT Capital Corp. | 4.70 | 04/02/27 | 55,000 | 54,909 | ||||||||||
| BAT International Finance PLC | 1.67 | 03/25/26 | 120,000 | 114,932 | ||||||||||
| BAT International Finance PLC | 4.45 | 03/16/28 | 75,000 | 74,024 | ||||||||||
| BAT International Finance PLC | 5.93 | 02/02/29 | 55,000 | 56,980 | ||||||||||
| Bunge Ltd. Finance Corp. | 3.25 | 08/15/26 | 45,000 | 43,984 | ||||||||||
The accompanying notes are an integral part of these financial statements.
99
BONDBLOXX ETF TRUST
BondBloxx BBB Rated 1-5 Year Corporate Bond ETF
Portfolio of Investments (Continued)
October 31, 2024
| Rate (%) | Maturity | Face Amount | Value | |||||||||||
| AGRICULTURE – 1.5% (Continued) | ||||||||||||||
| Bunge Ltd. Finance Corp. | 3.75 | 09/25/27 | $ | 20,000 | $ | 19,564 | ||||||||
| Bunge Ltd. Finance Corp. | 4.20 | 09/17/29 | 55,000 | 53,491 | ||||||||||
| 924,437 | ||||||||||||||
| AIRLINES – 0.3% | ||||||||||||||
| American Airlines 2015-1 Class A Pass Through Trust | 3.38 | 05/01/27 | 13,748 | 13,136 | ||||||||||
| Delta Air Lines, Inc. | 7.38 | 01/15/26 | 55,000 | 56,348 | ||||||||||
| Southwest Airlines Co. | 5.13 | 06/15/27 | 103,000 | 103,748 | ||||||||||
| 173,232 | ||||||||||||||
| APPAREL – 0.2% | ||||||||||||||
| Tapestry, Inc. | 7.00 | 11/27/26 | 40,000 | 40,863 | ||||||||||
| Tapestry, Inc. | 7.05 | 11/27/25 | 25,000 | 25,356 | ||||||||||
| Tapestry, Inc. | 7.35 | 11/27/28 | 65,000 | 66,329 | ||||||||||
| 132,548 | ||||||||||||||
| AUTO MANUFACTURERS – 5.0% | ||||||||||||||
| Ford Motor Co. | 4.35 | 12/08/26 | 85,000 | 83,631 | ||||||||||
| Ford Motor Credit Co. LLC | 2.70 | 08/10/26 | 95,000 | 90,674 | ||||||||||
| Ford Motor Credit Co. LLC | 2.90 | 02/16/28 | 40,000 | 36,752 | ||||||||||
| Ford Motor Credit Co. LLC | 3.38 | 11/13/25 | 120,000 | 117,717 | ||||||||||
| Ford Motor Credit Co. LLC | 3.82 | 11/02/27 | 75,000 | 71,605 | ||||||||||
| Ford Motor Credit Co. LLC | 4.13 | 08/17/27 | 75,000 | 72,520 | ||||||||||
| Ford Motor Credit Co. LLC | 4.27 | 01/09/27 | 40,000 | 39,107 | ||||||||||
| Ford Motor Credit Co. LLC | 4.39 | 01/08/26 | 65,000 | 64,207 | ||||||||||
| Ford Motor Credit Co. LLC | 4.54 | 08/01/26 | 25,000 | 24,653 | ||||||||||
| Ford Motor Credit Co. LLC | 4.95 | 05/28/27 | 100,000 | 98,902 | ||||||||||
| Ford Motor Credit Co. LLC | 5.11 | 05/03/29 | 125,000 | 121,699 | ||||||||||
| Ford Motor Credit Co. LLC | 5.13 | 11/05/26 | 80,000 | 79,702 | ||||||||||
| Ford Motor Credit Co. LLC | 5.30 | 09/06/29 | 50,000 | 49,012 | ||||||||||
| Ford Motor Credit Co. LLC | 5.80 | 03/05/27 | 80,000 | 80,706 | ||||||||||
| Ford Motor Credit Co. LLC | 5.80 | 03/08/29 | 80,000 | 80,070 | ||||||||||
| Ford Motor Credit Co. LLC | 5.85 | 05/17/27 | 80,000 | 80,774 | ||||||||||
| Ford Motor Credit Co. LLC | 6.80 | 11/07/28 | 135,000 | 140,326 | ||||||||||
| Ford Motor Credit Co. LLC | 6.80 | 05/12/28 | 55,000 | 57,009 | ||||||||||
| Ford Motor Credit Co. LLC | 6.95 | 03/06/26 | 100,000 | 101,938 | ||||||||||
| Ford Motor Credit Co. LLC | 6.95 | 06/10/26 | 55,000 | 56,227 | ||||||||||
| Ford Motor Credit Co. LLC | 7.35 | 11/04/27 | 90,000 | 94,510 | ||||||||||
| General Motors Co. | 4.20 | 10/01/27 | 50,000 | 49,060 | ||||||||||
| General Motors Co. | 5.00 | 10/01/28 | 30,000 | 29,961 | ||||||||||
| General Motors Co. | 5.40 | 10/15/29 | 95,000 | 95,898 | ||||||||||
| General Motors Co. | 6.80 | 10/01/27 | 45,000 | 47,192 | ||||||||||
| General Motors Financial Co., Inc. | 1.25 | 01/08/26 | 75,000 | 71,873 | ||||||||||
| General Motors Financial Co., Inc. | 1.50 | 06/10/26 | 65,000 | 61,607 | ||||||||||
| General Motors Financial Co., Inc. | 2.35 | 02/26/27 | 40,000 | 37,810 | ||||||||||
| General Motors Financial Co., Inc. | 2.40 | 04/10/28 | 50,000 | 45,852 | ||||||||||
| General Motors Financial Co., Inc. | 2.40 | 10/15/28 | 30,000 | 27,133 | ||||||||||
| General Motors Financial Co., Inc. | 2.70 | 08/20/27 | 50,000 | 47,136 | ||||||||||
| General Motors Financial Co., Inc. | 4.00 | 10/06/26 | 55,000 | 54,194 | ||||||||||
| General Motors Financial Co., Inc. | 4.30 | 04/06/29 | 50,000 | 48,323 | ||||||||||
The accompanying notes are an integral part of these financial statements.
100
BONDBLOXX ETF TRUST
BondBloxx BBB Rated 1-5 Year Corporate Bond ETF
Portfolio of Investments (Continued)
October 31, 2024
| Rate (%) | Maturity | Face Amount | Value | |||||||||||
| AUTO MANUFACTURERS – 5.0% (Continued) | ||||||||||||||
| General Motors Financial Co., Inc. | 4.35 | 01/17/27 | $ | 70,000 | $ | 69,243 | ||||||||
| General Motors Financial Co., Inc. | 5.00 | 04/09/27 | 115,000 | 115,188 | ||||||||||
| General Motors Financial Co., Inc. | 5.25 | 03/01/26 | 85,000 | 85,255 | ||||||||||
| General Motors Financial Co., Inc. | 5.35 | 07/15/27 | 60,000 | 60,637 | ||||||||||
| General Motors Financial Co., Inc. | 5.40 | 04/06/26 | 110,000 | 110,860 | ||||||||||
| General Motors Financial Co., Inc. | 5.40 | 05/08/27 | 60,000 | 60,718 | ||||||||||
| General Motors Financial Co., Inc. | 5.55 | 07/15/29 | 70,000 | 70,968 | ||||||||||
| General Motors Financial Co., Inc. | 5.80 | 06/23/28 | 85,000 | 87,044 | ||||||||||
| General Motors Financial Co., Inc. | 5.80 | 01/07/29 | 155,000 | 158,605 | ||||||||||
| General Motors Financial Co., Inc. | 6.00 | 01/09/28 | 120,000 | 123,451 | ||||||||||
| 3,199,749 | ||||||||||||||
| AUTO PARTS & EQUIPMENT – 0.2% | ||||||||||||||
| Aptiv PLC/Aptiv Global Financing DAC | 4.65 | 09/13/29 | 35,000 | 34,072 | ||||||||||
| BorgWarner, Inc. | 2.65 | 07/01/27 | 55,000 | 52,208 | ||||||||||
| BorgWarner, Inc. | 4.95 | 08/15/29 | 40,000 | 39,857 | ||||||||||
| Lear Corp. | 3.80 | 09/15/27 | 30,000 | 29,118 | ||||||||||
| 155,255 | ||||||||||||||
| BANKS – 9.9% | ||||||||||||||
| Banco Bilbao Vizcaya Argentaria SA | 6.14 | 09/14/28 | 40,000 | 41,230 | ||||||||||
| Banco Santander SA | 5.18 | 11/19/25 | 80,000 | 79,991 | ||||||||||
| Bank of Montreal | 3.80 | 12/15/32 | 65,000 | 62,107 | ||||||||||
| Bank of Nova Scotia | 4.50 | 12/16/25 | 70,000 | 69,627 | ||||||||||
| Barclays PLC | 2.28 | 11/24/27 | 105,000 | 99,547 | ||||||||||
| Barclays PLC | 4.34 | 01/10/28 | 65,000 | 63,752 | ||||||||||
| Barclays PLC | 4.38 | 01/12/26 | 150,000 | 149,105 | ||||||||||
| Barclays PLC | 4.84 | 05/09/28 | 130,000 | 128,336 | ||||||||||
| Barclays PLC | 4.84 | 09/10/28 | 60,000 | 59,720 | ||||||||||
| Barclays PLC | 4.94 | 09/10/30 | 75,000 | 74,182 | ||||||||||
| Barclays PLC | 4.97 | 05/16/29 | 105,000 | 104,584 | ||||||||||
| Barclays PLC | 5.09 | 06/20/30 | 90,000 | 88,694 | ||||||||||
| Barclays PLC | 5.20 | 05/12/26 | 100,000 | 100,050 | ||||||||||
| Barclays PLC | 5.50 | 08/09/28 | 100,000 | 101,383 | ||||||||||
| Barclays PLC | 5.67 | 03/12/28 | 70,000 | 71,112 | ||||||||||
| Barclays PLC | 5.69 | 03/12/30 | 120,000 | 122,218 | ||||||||||
| Barclays PLC | 5.83 | 05/09/27 | 125,000 | 126,550 | ||||||||||
| Barclays PLC | 6.49 | 09/13/29 | 80,000 | 83,836 | ||||||||||
| Barclays PLC | 6.50 | 09/13/27 | 95,000 | 97,595 | ||||||||||
| Barclays PLC | 7.33 | 11/02/26 | 90,000 | 91,921 | ||||||||||
| Barclays PLC | 7.39 | 11/02/28 | 110,000 | 117,115 | ||||||||||
| Citigroup, Inc. | 4.13 | 07/25/28 | 115,000 | 112,210 | ||||||||||
| Citigroup, Inc. | 4.30 | 11/20/26 | 60,000 | 59,413 | ||||||||||
| Citigroup, Inc. | 4.45 | 09/29/27 | 225,000 | 222,070 | ||||||||||
| Citigroup, Inc. | 4.60 | 03/09/26 | 95,000 | 94,705 | ||||||||||
| Citizens Financial Group, Inc. | 2.85 | 07/27/26 | 20,000 | 19,277 | ||||||||||
| Citizens Financial Group, Inc. | 5.84 | 01/23/30 | 80,000 | 81,762 | ||||||||||
| Comerica, Inc. | 4.00 | 02/01/29 | 40,000 | 38,073 | ||||||||||
| Comerica, Inc. | 5.98 | 01/30/30 | 60,000 | 60,816 | ||||||||||
The accompanying notes are an integral part of these financial statements.
101
BONDBLOXX ETF TRUST
BondBloxx BBB Rated 1-5 Year Corporate Bond ETF
Portfolio of Investments (Continued)
October 31, 2024
| Rate (%) | Maturity | Face Amount | Value | |||||||||||
| BANKS – 9.9% (Continued) | ||||||||||||||
| Cooperatieve Rabobank UA | 3.75 | 07/21/26 | $ | 82,000 | $ | 80,231 | ||||||||
| Deutsche Bank AG/New York, NY | 2.13 | 11/24/26 | 125,000 | 121,085 | ||||||||||
| Deutsche Bank AG/New York, NY | 2.31 | 11/16/27 | 110,000 | 104,073 | ||||||||||
| Deutsche Bank AG/New York, NY | 2.55 | 01/07/28 | 80,000 | 75,652 | ||||||||||
| Deutsche Bank AG/New York, NY | 4.88 | 12/01/32 | 50,000 | 48,566 | ||||||||||
| Deutsche Bank AG/New York, NY | 5.00 | 09/11/30 | 75,000 | 73,892 | ||||||||||
| Deutsche Bank AG/New York, NY | 5.71 | 02/08/28 | 55,000 | 55,576 | ||||||||||
| Deutsche Bank AG/New York, NY | 6.72 | 01/18/29 | 90,000 | 93,837 | ||||||||||
| Deutsche Bank AG/New York, NY | 6.82 | 11/20/29 | 95,000 | 100,191 | ||||||||||
| Deutsche Bank AG/New York, NY | 7.15 | 07/13/27 | 74,000 | 76,423 | ||||||||||
| Discover Bank | 3.45 | 07/27/26 | 50,000 | 48,747 | ||||||||||
| Discover Bank | 4.65 | 09/13/28 | 55,000 | 54,085 | ||||||||||
| Fifth Third Bancorp | 1.71 | 11/01/27 | 30,000 | 28,247 | ||||||||||
| Fifth Third Bancorp | 2.55 | 05/05/27 | 35,000 | 33,235 | ||||||||||
| Fifth Third Bancorp | 3.95 | 03/14/28 | 35,000 | 34,048 | ||||||||||
| Fifth Third Bancorp | 4.77 | 07/28/30 | 70,000 | 68,922 | ||||||||||
| Fifth Third Bancorp | 4.90 | 09/06/30 | 30,000 | 29,698 | ||||||||||
| Fifth Third Bancorp | 6.34 | 07/27/29 | 90,000 | 93,980 | ||||||||||
| Fifth Third Bancorp | 6.36 | 10/27/28 | 55,000 | 57,071 | ||||||||||
| Fifth Third Bank, N.A. | 3.85 | 03/15/26 | 60,000 | 59,144 | ||||||||||
| Goldman Sachs Group, Inc. | 5.95 | 01/15/27 | 50,000 | 51,301 | ||||||||||
| HSBC Holdings PLC | 4.38 | 11/23/26 | 90,000 | 89,039 | ||||||||||
| Huntington Bancshares, Inc./OH | 4.44 | 08/04/28 | 35,000 | 34,583 | ||||||||||
| Huntington Bancshares, Inc./OH | 6.21 | 08/21/29 | 90,000 | 93,437 | ||||||||||
| KeyBank, N.A./Cleveland, OH | 3.40 | 05/20/26 | 30,000 | 29,179 | ||||||||||
| KeyBank, N.A./Cleveland, OH | 4.70 | 01/26/26 | 30,000 | 29,896 | ||||||||||
| KeyBank, N.A./Cleveland, OH | 5.85 | 11/15/27 | 70,000 | 71,744 | ||||||||||
| KeyCorp | 2.25 | 04/06/27 | 30,000 | 28,172 | ||||||||||
| KeyCorp | 2.55 | 10/01/29 | 45,000 | 40,087 | ||||||||||
| KeyCorp | 4.10 | 04/30/28 | 45,000 | 43,747 | ||||||||||
| Lloyds Banking Group PLC | 4.58 | 12/10/25 | 90,000 | 89,396 | ||||||||||
| Lloyds Banking Group PLC | 4.65 | 03/24/26 | 80,000 | 79,455 | ||||||||||
| M&T Bank Corp. | 4.55 | 08/16/28 | 30,000 | 29,663 | ||||||||||
| M&T Bank Corp. | 7.41 | 10/30/29 | 75,000 | 80,767 | ||||||||||
| Morgan Stanley | 3.95 | 04/23/27 | 115,000 | 112,948 | ||||||||||
| Morgan Stanley | 4.35 | 09/08/26 | 140,000 | 139,136 | ||||||||||
| Morgan Stanley | 5.00 | 11/24/25 | 120,000 | 120,354 | ||||||||||
| NatWest Group PLC | 6.48 | 06/01/34 | 55,000 | 56,949 | ||||||||||
| Regions Financial Corp. | 1.80 | 08/12/28 | 25,000 | 22,270 | ||||||||||
| Regions Financial Corp. | 5.72 | 06/06/30 | 55,000 | 55,855 | ||||||||||
| Santander Holdings USA, Inc. | 2.49 | 01/06/28 | 30,000 | 28,286 | ||||||||||
| Santander Holdings USA, Inc. | 3.24 | 10/05/26 | 90,000 | 86,984 | ||||||||||
| Santander Holdings USA, Inc. | 4.40 | 07/13/27 | 60,000 | 59,158 | ||||||||||
| Santander Holdings USA, Inc. | 5.35 | 09/06/30 | 50,000 | 49,520 | ||||||||||
| Santander Holdings USA, Inc. | 6.12 | 05/31/27 | 30,000 | 30,456 | ||||||||||
| Santander Holdings USA, Inc. | 6.17 | 01/09/30 | 45,000 | 46,085 | ||||||||||
| Santander Holdings USA, Inc. | 6.50 | 03/09/29 | 40,000 | 41,254 | ||||||||||
| Santander Holdings USA, Inc. | 6.57 | 06/12/29 | 75,000 | 77,838 | ||||||||||
The accompanying notes are an integral part of these financial statements.
102
BONDBLOXX ETF TRUST
BondBloxx BBB Rated 1-5 Year Corporate Bond ETF
Portfolio of Investments (Continued)
October 31, 2024
| Rate (%) | Maturity | Face Amount | Value | |||||||||||
| BANKS – 9.9% (Continued) | ||||||||||||||
| Santander UK Group Holdings PLC | 1.67 | 06/14/27 | $ | 55,000 | $ | 52,092 | ||||||||
| Santander UK Group Holdings PLC | 2.47 | 01/11/28 | 55,000 | 51,867 | ||||||||||
| Santander UK Group Holdings PLC | 3.82 | 11/03/28 | 65,000 | 62,671 | ||||||||||
| Santander UK Group Holdings PLC | 4.86 | 09/11/30 | 60,000 | 59,132 | ||||||||||
| Santander UK Group Holdings PLC | 6.53 | 01/10/29 | 80,000 | 83,213 | ||||||||||
| Santander UK Group Holdings PLC | 6.83 | 11/21/26 | 90,000 | 91,462 | ||||||||||
| Sumitomo Mitsui Financial Group, Inc. | 3.20 | 09/17/29 | 25,000 | 23,084 | ||||||||||
| Synchrony Bank | 5.63 | 08/23/27 | 55,000 | 55,438 | ||||||||||
| Synovus Bank/Columbus, GA | 5.63 | 02/15/28 | 25,000 | 24,879 | ||||||||||
| Toronto-Dominion Bank | 3.63 | 09/15/31 | 80,000 | 77,698 | ||||||||||
| Truist Financial Corp. | 3.88 | 03/19/29 | 35,000 | 33,365 | ||||||||||
| Zions Bancorp N.A. | 3.25 | 10/29/29 | 20,000 | 17,612 | ||||||||||
| 6,307,756 | ||||||||||||||
| BEVERAGES – 1.1% | ||||||||||||||
| Coca-Cola Consolidated, Inc. | 5.25 | 06/01/29 | 40,000 | 40,667 | ||||||||||
| Constellation Brands, Inc. | 3.15 | 08/01/29 | 45,000 | 41,747 | ||||||||||
| Constellation Brands, Inc. | 3.50 | 05/09/27 | 30,000 | 29,141 | ||||||||||
| Constellation Brands, Inc. | 3.60 | 02/15/28 | 105,000 | 101,224 | ||||||||||
| Constellation Brands, Inc. | 3.70 | 12/06/26 | 50,000 | 49,012 | ||||||||||
| Constellation Brands, Inc. | 4.35 | 05/09/27 | 30,000 | 29,741 | ||||||||||
| Constellation Brands, Inc. | 4.40 | 11/15/25 | 10,000 | 9,953 | ||||||||||
| Constellation Brands, Inc. | 4.65 | 11/15/28 | 10,000 | 9,925 | ||||||||||
| Constellation Brands, Inc. | 5.00 | 02/02/26 | 5,000 | 4,999 | ||||||||||
| Keurig Dr Pepper, Inc. | 3.40 | 11/15/25 | 50,000 | 49,364 | ||||||||||
| Keurig Dr Pepper, Inc. | 3.95 | 04/15/29 | 60,000 | 58,043 | ||||||||||
| Keurig Dr Pepper, Inc. | 4.60 | 05/25/28 | 70,000 | 69,705 | ||||||||||
| Keurig Dr Pepper, Inc. | 5.05 | 03/15/29 | 40,000 | 40,422 | ||||||||||
| Keurig Dr Pepper, Inc. | 5.10 | 03/15/27 | 30,000 | 30,332 | ||||||||||
| Molson Coors Beverage Co. | 3.00 | 07/15/26 | 120,000 | 116,809 | ||||||||||
| 681,084 | ||||||||||||||
| BIOTECHNOLOGY – 1.8% | ||||||||||||||
| Amgen, Inc. | 1.65 | 08/15/28 | 65,000 | 58,246 | ||||||||||
| Amgen, Inc. | 2.20 | 02/21/27 | 100,000 | 94,973 | ||||||||||
| Amgen, Inc. | 2.60 | 08/19/26 | 90,000 | 86,925 | ||||||||||
| Amgen, Inc. | 3.00 | 02/22/29 | 45,000 | 42,082 | ||||||||||
| Amgen, Inc. | 3.20 | 11/02/27 | 55,000 | 52,938 | ||||||||||
| Amgen, Inc. | 4.05 | 08/18/29 | 80,000 | 77,599 | ||||||||||
| Amgen, Inc. | 5.15 | 03/02/28 | 220,000 | 223,101 | ||||||||||
| Amgen, Inc. | 5.51 | 03/02/26 | 90,000 | 90,006 | ||||||||||
| Gilead Sciences, Inc. | 1.20 | 10/01/27 | 35,000 | 31,894 | ||||||||||
| Gilead Sciences, Inc. | 2.95 | 03/01/27 | 105,000 | 101,369 | ||||||||||
| Gilead Sciences, Inc. | 3.65 | 03/01/26 | 140,000 | 138,258 | ||||||||||
| Illumina, Inc. | 4.65 | 09/09/26 | 30,000 | 29,925 | ||||||||||
| Illumina, Inc. | 5.75 | 12/13/27 | 20,000 | 20,534 | ||||||||||
| Illumina, Inc. | 5.80 | 12/12/25 | 40,000 | 40,367 | ||||||||||
| Royalty Pharma PLC | 1.75 | 09/02/27 | 55,000 | 50,701 | ||||||||||
| Royalty Pharma PLC | 5.15 | 09/02/29 | 35,000 | 35,226 | ||||||||||
| 1,174,144 | ||||||||||||||
The accompanying notes are an integral part of these financial statements.
103
BONDBLOXX ETF TRUST
BondBloxx BBB Rated 1-5 Year Corporate Bond ETF
Portfolio of Investments (Continued)
October 31, 2024
| Rate (%) | Maturity | Face Amount | Value | |||||||||||
| BUILDING MATERIALS – 0.6% | ||||||||||||||
| Carrier Global Corp. | 2.49 | 02/15/27 | $ | 50,000 | $ | 47,819 | ||||||||
| CRH SMW Finance DAC | 5.20 | 05/21/29 | 50,000 | 50,719 | ||||||||||
| Fortune Brands Innovations, Inc. | 3.25 | 09/15/29 | 40,000 | 37,138 | ||||||||||
| Johnson Controls International PLC/Tyco Fire & Security Finance SCA | 5.50 | 04/19/29 | 40,000 | 41,108 | ||||||||||
| Lennox International, Inc. | 5.50 | 09/15/28 | 20,000 | 20,493 | ||||||||||
| Martin Marietta Materials, Inc. | 3.50 | 12/15/27 | 25,000 | 24,178 | ||||||||||
| Masco Corp. | 1.50 | 02/15/28 | 30,000 | 27,066 | ||||||||||
| Mohawk Industries, Inc. | 5.85 | 09/18/28 | 40,000 | 41,272 | ||||||||||
| Owens Corning | 5.50 | 06/15/27 | 30,000 | 30,592 | ||||||||||
| Trane Technologies Financing Ltd. | 3.80 | 03/21/29 | 65,000 | 62,800 | ||||||||||
| Trane Technologies Global Holding Co. Ltd. | 3.75 | 08/21/28 | 15,000 | 14,565 | ||||||||||
| 397,750 | ||||||||||||||
| CHEMICALS – 1.9% | ||||||||||||||
| Albemarle Corp. | 4.65 | 06/01/27 | 40,000 | 39,735 | ||||||||||
| Celanese US Holdings LLC | 6.17 | 07/15/27 | 100,000 | 102,288 | ||||||||||
| Celanese US Holdings LLC | 6.33 | 07/15/29 | 40,000 | 41,425 | ||||||||||
| Celanese US Holdings LLC | 6.35 | 11/15/28 | 85,000 | 88,013 | ||||||||||
| Dow Chemical Co. | 4.80 | 11/30/28 | 40,000 | 40,098 | ||||||||||
| DuPont de Nemours, Inc. | 4.49 | 11/15/25 | 120,000 | 119,661 | ||||||||||
| DuPont de Nemours, Inc. | 4.73 | 11/15/28 | 130,000 | 130,082 | ||||||||||
| Eastman Chemical Co. | 4.50 | 12/01/28 | 55,000 | 54,313 | ||||||||||
| Eastman Chemical Co. | 5.00 | 08/01/29 | 10,000 | 10,039 | ||||||||||
| FMC Corp. | 3.20 | 10/01/26 | 55,000 | 53,219 | ||||||||||
| FMC Corp. | 3.45 | 10/01/29 | 30,000 | 27,618 | ||||||||||
| FMC Corp. | 5.15 | 05/18/26 | 10,000 | 10,030 | ||||||||||
| Huntsman International LLC | 4.50 | 05/01/29 | 45,000 | 43,270 | ||||||||||
| LYB International Finance II BV | 3.50 | 03/02/27 | 30,000 | 29,141 | ||||||||||
| Mosaic Co. | 4.05 | 11/15/27 | 35,000 | 34,319 | ||||||||||
| Nutrien Ltd. | 4.20 | 04/01/29 | 55,000 | 53,727 | ||||||||||
| Nutrien Ltd. | 4.90 | 03/27/28 | 30,000 | 30,206 | ||||||||||
| Nutrien Ltd. | 5.95 | 11/07/25 | 30,000 | 30,429 | ||||||||||
| PPG Industries, Inc. | 1.20 | 03/15/26 | 45,000 | 42,872 | ||||||||||
| PPG Industries, Inc. | 3.75 | 03/15/28 | 40,000 | 38,862 | ||||||||||
| Rohm & Haas Co. | 7.85 | 07/15/29 | 35,000 | 38,913 | ||||||||||
| Sherwin-Williams Co. | 2.95 | 08/15/29 | 45,000 | 41,467 | ||||||||||
| Sherwin-Williams Co. | 3.45 | 06/01/27 | 90,000 | 87,417 | ||||||||||
| Westlake Corp. | 3.60 | 08/15/26 | 50,000 | 48,960 | ||||||||||
| 1,236,104 | ||||||||||||||
| COMMERCIAL SERVICES – 1.0% | ||||||||||||||
| Block Financial LLC | 2.50 | 07/15/28 | 25,000 | 22,856 | ||||||||||
| Equifax, Inc. | 4.80 | 09/15/29 | 25,000 | 24,783 | ||||||||||
| Equifax, Inc. | 5.10 | 12/15/27 | 65,000 | 65,564 | ||||||||||
| Equifax, Inc. | 5.10 | 06/01/28 | 40,000 | 40,270 | ||||||||||
| Global Payments, Inc. | 1.20 | 03/01/26 | 60,000 | 57,244 | ||||||||||
| Global Payments, Inc. | 2.15 | 01/15/27 | 40,000 | 37,802 | ||||||||||
| Global Payments, Inc. | 3.20 | 08/15/29 | 40,000 | 36,829 | ||||||||||
| Global Payments, Inc. | 4.80 | 04/01/26 | 50,000 | 49,924 | ||||||||||
The accompanying notes are an integral part of these financial statements.
104
BONDBLOXX ETF TRUST
BondBloxx BBB Rated 1-5 Year Corporate Bond ETF
Portfolio of Investments (Continued)
October 31, 2024
| Rate (%) | Maturity | Face Amount | Value | |||||||||||
| COMMERCIAL SERVICES – 1.0% (Continued) | ||||||||||||||
| Global Payments, Inc. | 4.95 | 08/15/27 | $ | 35,000 | $ | 35,150 | ||||||||
| Global Payments, Inc. | 5.30 | 08/15/29 | 65,000 | 65,563 | ||||||||||
| GXO Logistics, Inc. | 6.25 | 05/06/29 | 30,000 | 30,991 | ||||||||||
| Moody’s Corp. | 3.25 | 01/15/28 | 25,000 | 24,115 | ||||||||||
| Quanta Services, Inc. | 4.75 | 08/09/27 | 40,000 | 39,924 | ||||||||||
| RELX Capital, Inc. | 4.00 | 03/18/29 | 65,000 | 63,259 | ||||||||||
| Verisk Analytics, Inc. | 4.13 | 03/15/29 | 30,000 | 29,339 | ||||||||||
| 623,613 | ||||||||||||||
| COMPUTERS – 1.8% | ||||||||||||||
| CGI, Inc. | 1.45 | 09/14/26 | 30,000 | 28,221 | ||||||||||
| Dell International LLC/EMC Corp. | 4.90 | 10/01/26 | 115,000 | 115,348 | ||||||||||
| Dell International LLC/EMC Corp. | 5.25 | 02/01/28 | 53,000 | 53,857 | ||||||||||
| Dell International LLC/EMC Corp. | 5.30 | 10/01/29 | 100,000 | 101,662 | ||||||||||
| Dell International LLC/EMC Corp. | 6.02 | 06/15/26 | 146,000 | 148,465 | ||||||||||
| DXC Technology Co. | 1.80 | 09/15/26 | 30,000 | 28,221 | ||||||||||
| DXC Technology Co. | 2.38 | 09/15/28 | 50,000 | 44,534 | ||||||||||
| Fortinet, Inc. | 1.00 | 03/15/26 | 20,000 | 19,017 | ||||||||||
| Hewlett Packard Enterprise Co. | 1.75 | 04/01/26 | 100,000 | 95,827 | ||||||||||
| Hewlett Packard Enterprise Co. | 4.40 | 09/25/27 | 60,000 | 59,526 | ||||||||||
| Hewlett Packard Enterprise Co. | 4.45 | 09/25/26 | 60,000 | 59,742 | ||||||||||
| Hewlett Packard Enterprise Co. | 4.55 | 10/15/29 | 80,000 | 78,520 | ||||||||||
| Hewlett Packard Enterprise Co. | 5.25 | 07/01/28 | 40,000 | 40,517 | ||||||||||
| HP, Inc. | 3.00 | 06/17/27 | 130,000 | 124,685 | ||||||||||
| HP, Inc. | 4.00 | 04/15/29 | 75,000 | 72,410 | ||||||||||
| Kyndryl Holdings, Inc. | 2.05 | 10/15/26 | 40,000 | 37,863 | ||||||||||
| NetApp, Inc. | 2.38 | 06/22/27 | 35,000 | 33,073 | ||||||||||
| Western Digital Corp. | 2.85 | 02/01/29 | 25,000 | 22,166 | ||||||||||
| 1,163,654 | ||||||||||||||
| COSMETICS/PERSONAL CARE – 0.3% | ||||||||||||||
| Haleon US Capital LLC | 3.38 | 03/24/27 | 108,000 | 104,864 | ||||||||||
| Haleon US Capital LLC | 3.38 | 03/24/29 | 65,000 | 61,449 | ||||||||||
| 166,313 | ||||||||||||||
| DISTRIBUTION/WHOLESALE – 0.1% | ||||||||||||||
| LKQ Corp. | 5.75 | 06/15/28 | 45,000 | 45,878 | ||||||||||
| DIVERSIFIED FINANCIAL SERVICES – 6.2% | ||||||||||||||
| AerCap Ireland Capital DAC/AerCap Global Aviation Trust | 1.75 | 01/30/26 | 70,000 | 67,317 | ||||||||||
| AerCap Ireland Capital DAC/AerCap Global Aviation Trust | 2.45 | 10/29/26 | 225,000 | 214,787 | ||||||||||
| AerCap Ireland Capital DAC/AerCap Global Aviation Trust | 3.00 | 10/29/28 | 220,000 | 204,180 | ||||||||||
| AerCap Ireland Capital DAC/AerCap Global Aviation Trust | 3.65 | 07/21/27 | 50,000 | 48,525 | ||||||||||
| AerCap Ireland Capital DAC/AerCap Global Aviation Trust | 3.88 | 01/23/28 | 30,000 | 29,065 | ||||||||||
| AerCap Ireland Capital DAC/AerCap Global Aviation Trust | 4.45 | 04/03/26 | 30,000 | 29,789 | ||||||||||
| AerCap Ireland Capital DAC/AerCap Global Aviation Trust | 4.63 | 10/15/27 | 30,000 | 29,786 | ||||||||||
| AerCap Ireland Capital DAC/AerCap Global Aviation Trust | 4.63 | 09/10/29 | 75,000 | 73,458 | ||||||||||
| AerCap Ireland Capital DAC/AerCap Global Aviation Trust | 5.10 | 01/19/29 | 40,000 | 40,117 | ||||||||||
| AerCap Ireland Capital DAC/AerCap Global Aviation Trust | 5.75 | 06/06/28 | 45,000 | 46,172 | ||||||||||
| AerCap Ireland Capital DAC/AerCap Global Aviation Trust | 6.10 | 01/15/27 | 55,000 | 56,422 | ||||||||||
The accompanying notes are an integral part of these financial statements.
105
BONDBLOXX ETF TRUST
BondBloxx BBB Rated 1-5 Year Corporate Bond ETF
Portfolio of Investments (Continued)
October 31, 2024
| Rate (%) | Maturity | Face Amount | Value | |||||||||||
| DIVERSIFIED FINANCIAL SERVICES – 6.2% (Continued) | ||||||||||||||
| AerCap Ireland Capital DAC/AerCap Global Aviation Trust | 6.45 | 04/15/27 | $ | 115,000 | $ | 119,089 | ||||||||
| Air Lease Corp. | 1.88 | 08/15/26 | 90,000 | 85,537 | ||||||||||
| Air Lease Corp. | 2.10 | 09/01/28 | 40,000 | 36,039 | ||||||||||
| Air Lease Corp. | 2.20 | 01/15/27 | 25,000 | 23,644 | ||||||||||
| Air Lease Corp. | 2.88 | 01/15/26 | 100,000 | 97,652 | ||||||||||
| Air Lease Corp. | 3.25 | 10/01/29 | 20,000 | 18,471 | ||||||||||
| Air Lease Corp. | 3.63 | 04/01/27 | 30,000 | 29,267 | ||||||||||
| Air Lease Corp. | 3.63 | 12/01/27 | 25,000 | 24,149 | ||||||||||
| Air Lease Corp. | 3.75 | 06/01/26 | 30,000 | 29,497 | ||||||||||
| Air Lease Corp. | 4.63 | 10/01/28 | 10,000 | 9,899 | ||||||||||
| Air Lease Corp. | 5.10 | 03/01/29 | 25,000 | 25,169 | ||||||||||
| Air Lease Corp. | 5.30 | 06/25/26 | 40,000 | 40,351 | ||||||||||
| Air Lease Corp. | 5.30 | 02/01/28 | 40,000 | 40,563 | ||||||||||
| Air Lease Corp. | 5.85 | 12/15/27 | 70,000 | 72,068 | ||||||||||
| Aircastle Ltd. | 4.25 | 06/15/26 | 40,000 | 39,486 | ||||||||||
| Ally Financial, Inc. | 2.20 | 11/02/28 | 50,000 | 44,462 | ||||||||||
| Ally Financial, Inc. | 4.75 | 06/09/27 | 40,000 | 39,743 | ||||||||||
| Ally Financial, Inc. | 6.85 | 01/03/30 | 40,000 | 41,609 | ||||||||||
| Ally Financial, Inc. | 6.99 | 06/13/29 | 50,000 | 52,213 | ||||||||||
| Ally Financial, Inc. | 7.10 | 11/15/27 | 45,000 | 47,373 | ||||||||||
| Ares Management Corp. | 6.38 | 11/10/28 | 35,000 | 36,866 | ||||||||||
| BGC Group, Inc. | 6.60 | 06/10/29 | 25,000 | 25,415 | ||||||||||
| Capital One Financial Corp. | 1.88 | 11/02/27 | 80,000 | 75,451 | ||||||||||
| Capital One Financial Corp. | 3.27 | 03/01/30 | 75,000 | 69,536 | ||||||||||
| Capital One Financial Corp. | 3.65 | 05/11/27 | 80,000 | 78,019 | ||||||||||
| Capital One Financial Corp. | 3.75 | 07/28/26 | 100,000 | 97,897 | ||||||||||
| Capital One Financial Corp. | 3.75 | 03/09/27 | 90,000 | 87,964 | ||||||||||
| Capital One Financial Corp. | 3.80 | 01/31/28 | 80,000 | 77,362 | ||||||||||
| Capital One Financial Corp. | 4.93 | 05/10/28 | 70,000 | 70,103 | ||||||||||
| Capital One Financial Corp. | 5.25 | 07/26/30 | 50,000 | 49,991 | ||||||||||
| Capital One Financial Corp. | 5.46 | 07/26/30 | 70,000 | 70,631 | ||||||||||
| Capital One Financial Corp. | 5.47 | 02/01/29 | 45,000 | 45,564 | ||||||||||
| Capital One Financial Corp. | 5.70 | 02/01/30 | 55,000 | 56,091 | ||||||||||
| Capital One Financial Corp. | 6.31 | 06/08/29 | 110,000 | 114,289 | ||||||||||
| Capital One Financial Corp. | 7.15 | 10/29/27 | 40,000 | 41,738 | ||||||||||
| Discover Financial Services | 4.10 | 02/09/27 | 60,000 | 59,001 | ||||||||||
| Discover Financial Services | 4.50 | 01/30/26 | 40,000 | 39,793 | ||||||||||
| Enact Holdings, Inc. | 6.25 | 05/28/29 | 45,000 | 45,881 | ||||||||||
| Jefferies Financial Group, Inc. | 4.85 | 01/15/27 | 50,000 | 49,991 | ||||||||||
| Jefferies Financial Group, Inc. | 5.88 | 07/21/28 | 60,000 | 61,665 | ||||||||||
| Lazard Group LLC | 4.38 | 03/11/29 | 65,000 | 63,539 | ||||||||||
| LPL Holdings, Inc. | 5.70 | 05/20/27 | 15,000 | 15,236 | ||||||||||
| LPL Holdings, Inc. | 6.75 | 11/17/28 | 65,000 | 68,544 | ||||||||||
| Nasdaq, Inc. | 3.85 | 06/30/26 | 35,000 | 34,524 | ||||||||||
| Nasdaq, Inc. | 5.35 | 06/28/28 | 50,000 | 51,055 | ||||||||||
| Nomura Holdings, Inc. | 1.65 | 07/14/26 | 60,000 | 56,786 | ||||||||||
| Nomura Holdings, Inc. | 2.17 | 07/14/28 | 50,000 | 45,095 | ||||||||||
| Nomura Holdings, Inc. | 2.33 | 01/22/27 | 80,000 | 75,596 | ||||||||||
The accompanying notes are an integral part of these financial statements.
106
BONDBLOXX ETF TRUST
BondBloxx BBB Rated 1-5 Year Corporate Bond ETF
Portfolio of Investments (Continued)
October 31, 2024
| Rate (%) | Maturity | Face Amount | Value | |||||||||||
| DIVERSIFIED FINANCIAL SERVICES – 6.2% (Continued) | ||||||||||||||
| Nomura Holdings, Inc. | 5.39 | 07/06/27 | $ | 30,000 | $ | 30,284 | ||||||||
| Nomura Holdings, Inc. | 5.59 | 07/02/27 | 15,000 | 15,224 | ||||||||||
| Nomura Holdings, Inc. | 5.61 | 07/06/29 | 50,000 | 51,103 | ||||||||||
| Nomura Holdings, Inc. | 5.71 | 01/09/26 | 50,000 | 50,381 | ||||||||||
| Nomura Holdings, Inc. | 5.84 | 01/18/28 | 30,000 | 30,698 | ||||||||||
| Nomura Holdings, Inc. | 6.07 | 07/12/28 | 75,000 | 77,558 | ||||||||||
| ORIX Corp. | 3.70 | 07/18/27 | 35,000 | 33,993 | ||||||||||
| Radian Group, Inc. | 6.20 | 05/15/29 | 30,000 | 30,778 | ||||||||||
| Synchrony Financial | 3.70 | 08/04/26 | 30,000 | 29,274 | ||||||||||
| Synchrony Financial | 3.95 | 12/01/27 | 40,000 | 38,438 | ||||||||||
| Synchrony Financial | 5.15 | 03/19/29 | 50,000 | 49,242 | ||||||||||
| Synchrony Financial | 5.94 | 08/02/30 | 40,000 | 40,611 | ||||||||||
| Western Union Co. | 1.35 | 03/15/26 | 25,000 | 23,780 | ||||||||||
| 3,920,886 | ||||||||||||||
| ELECTRIC – 7.4% | ||||||||||||||
| AEP Texas, Inc. | 5.45 | 05/15/29 | 85,000 | 86,785 | ||||||||||
| AES Corp. | 1.38 | 01/15/26 | 35,000 | 33,531 | ||||||||||
| AES Corp. | 5.45 | 06/01/28 | 75,000 | 75,724 | ||||||||||
| Algonquin Power & Utilities Corp.(2) | 5.37 | 06/15/26 | 85,000 | 85,510 | ||||||||||
| Ameren Corp. | 1.95 | 03/15/27 | 10,000 | 9,386 | ||||||||||
| Ameren Corp. | 5.00 | 01/15/29 | 60,000 | 60,346 | ||||||||||
| Ameren Corp. | 5.70 | 12/01/26 | 35,000 | 35,641 | ||||||||||
| American Electric Power Co., Inc. | 3.20 | 11/13/27 | 10,000 | 9,585 | ||||||||||
| American Electric Power Co., Inc. | 3.88 | 02/15/62 | 20,000 | 18,907 | ||||||||||
| American Electric Power Co., Inc. | 4.30 | 12/01/28 | 15,000 | 14,736 | ||||||||||
| American Electric Power Co., Inc. | 5.20 | 01/15/29 | 25,000 | 25,334 | ||||||||||
| American Electric Power Co., Inc. | 5.75 | 11/01/27 | 55,000 | 56,631 | ||||||||||
| Avangrid, Inc. | 3.80 | 06/01/29 | 40,000 | 38,198 | ||||||||||
| CenterPoint Energy, Inc. | 1.45 | 06/01/26 | 30,000 | 28,516 | ||||||||||
| CenterPoint Energy, Inc. | 5.40 | 06/01/29 | 40,000 | 40,742 | ||||||||||
| Cleco Corporate Holdings LLC | 3.74 | 05/01/26 | 25,000 | 24,485 | ||||||||||
| Constellation Energy Generation LLC | 5.60 | 03/01/28 | 40,000 | 41,066 | ||||||||||
| Dominion Energy, Inc. | 1.45 | 04/15/26 | 25,000 | 23,846 | ||||||||||
| DTE Energy Co. | 2.85 | 10/01/26 | 25,000 | 24,167 | ||||||||||
| DTE Energy Co. | 4.88 | 06/01/28 | 20,000 | 20,038 | ||||||||||
| DTE Energy Co. | 4.95 | 07/01/27 | 80,000 | 80,449 | ||||||||||
| DTE Energy Co. | 5.10 | 03/01/29 | 100,000 | 100,805 | ||||||||||
| Duke Energy Corp. | 2.65 | 09/01/26 | 110,000 | 106,189 | ||||||||||
| Duke Energy Corp. | 3.15 | 08/15/27 | 75,000 | 72,004 | ||||||||||
| Duke Energy Corp. | 3.40 | 06/15/29 | 30,000 | 28,206 | ||||||||||
| Duke Energy Corp. | 4.30 | 03/15/28 | 85,000 | 83,813 | ||||||||||
| Duke Energy Corp. | 4.85 | 01/05/27 | 30,000 | 30,155 | ||||||||||
| Duke Energy Corp. | 4.85 | 01/05/29 | 10,000 | 10,012 | ||||||||||
| Duke Energy Corp. | 5.00 | 12/08/25 | 45,000 | 45,105 | ||||||||||
| Duke Energy Corp. | 5.00 | 12/08/27 | 10,000 | 10,077 | ||||||||||
| Edison International | 4.13 | 03/15/28 | 15,000 | 14,647 | ||||||||||
| Edison International | 5.25 | 11/15/28 | 80,000 | 80,631 | ||||||||||
| Edison International | 5.75 | 06/15/27 | 40,000 | 40,830 | ||||||||||
The accompanying notes are an integral part of these financial statements.
107
BONDBLOXX ETF TRUST
BondBloxx BBB Rated 1-5 Year Corporate Bond ETF
Portfolio of Investments (Continued)
October 31, 2024
| Rate (%) | Maturity | Face Amount | Value | |||||||||||
| ELECTRIC – 7.4% (Continued) | ||||||||||||||
| Emera US Finance LP | 3.55 | 06/15/26 | $ | 40,000 | $ | 39,096 | ||||||||
| Enel Americas SA | 4.00 | 10/25/26 | 30,000 | 29,428 | ||||||||||
| Enel Chile SA | 4.88 | 06/12/28 | 65,000 | 64,390 | ||||||||||
| Entergy Corp. | 1.90 | 06/15/28 | 35,000 | 31,659 | ||||||||||
| Entergy Corp. | 2.95 | 09/01/26 | 55,000 | 53,301 | ||||||||||
| Evergy, Inc. | 2.90 | 09/15/29 | 40,000 | 36,499 | ||||||||||
| Eversource Energy | 2.90 | 03/01/27 | 65,000 | 62,342 | ||||||||||
| Eversource Energy | 4.25 | 04/01/29 | 30,000 | 29,254 | ||||||||||
| Eversource Energy | 5.45 | 03/01/28 | 95,000 | 96,931 | ||||||||||
| Eversource Energy | 5.95 | 02/01/29 | 45,000 | 46,734 | ||||||||||
| Exelon Corp. | 2.75 | 03/15/27 | 10,000 | 9,574 | ||||||||||
| Exelon Corp. | 3.40 | 04/15/26 | 30,000 | 29,441 | ||||||||||
| Exelon Corp. | 5.15 | 03/15/28 | 115,000 | 116,275 | ||||||||||
| Exelon Corp. | 5.15 | 03/15/29 | 20,000 | 20,269 | ||||||||||
| FirstEnergy Corp. | 3.90 | 07/15/27 | 90,000 | 87,907 | ||||||||||
| Fortis, Inc./Canada | 3.06 | 10/04/26 | 60,000 | 58,115 | ||||||||||
| Interstate Power & Light Co. | 4.10 | 09/26/28 | 25,000 | 24,402 | ||||||||||
| ITC Holdings Corp. | 3.35 | 11/15/27 | 25,000 | 24,055 | ||||||||||
| National Grid PLC | 5.60 | 06/12/28 | 45,000 | 46,102 | ||||||||||
| NextEra Energy Capital Holdings, Inc. | 1.88 | 01/15/27 | 90,000 | 84,680 | ||||||||||
| NextEra Energy Capital Holdings, Inc. | 1.90 | 06/15/28 | 85,000 | 76,949 | ||||||||||
| NextEra Energy Capital Holdings, Inc. | 3.50 | 04/01/29 | 65,000 | 61,607 | ||||||||||
| NextEra Energy Capital Holdings, Inc. | 3.55 | 05/01/27 | 90,000 | 87,732 | ||||||||||
| NextEra Energy Capital Holdings, Inc. | 3.80 | 03/15/82 | 35,000 | 33,313 | ||||||||||
| NextEra Energy Capital Holdings, Inc. | 4.63 | 07/15/27 | 65,000 | 65,030 | ||||||||||
| NextEra Energy Capital Holdings, Inc. | 4.80 | 12/01/77 | 75,000 | 71,946 | ||||||||||
| NextEra Energy Capital Holdings, Inc. | 4.90 | 02/28/28 | 65,000 | 65,296 | ||||||||||
| NextEra Energy Capital Holdings, Inc. | 4.90 | 03/15/29 | 35,000 | 35,150 | ||||||||||
| NextEra Energy Capital Holdings, Inc. | 4.95 | 01/29/26 | 40,000 | 40,138 | ||||||||||
| NextEra Energy Capital Holdings, Inc. | 5.65 | 05/01/79 | 20,000 | 19,835 | ||||||||||
| NextEra Energy Capital Holdings, Inc. | 6.70 | 09/01/54 | 30,000 | 30,840 | ||||||||||
| Pacific Gas & Electric Co. | 2.10 | 08/01/27 | 75,000 | 69,724 | ||||||||||
| Pacific Gas & Electric Co. | 3.00 | 06/15/28 | 70,000 | 65,609 | ||||||||||
| Pacific Gas & Electric Co. | 3.15 | 01/01/26 | 145,000 | 141,889 | ||||||||||
| Pacific Gas & Electric Co. | 3.30 | 12/01/27 | 35,000 | 33,389 | ||||||||||
| Pacific Gas & Electric Co. | 3.75 | 07/01/28 | 35,000 | 33,613 | ||||||||||
| Pacific Gas & Electric Co. | 5.55 | 05/15/29 | 75,000 | 76,435 | ||||||||||
| Pacific Gas & Electric Co. | 6.10 | 01/15/29 | 30,000 | 31,161 | ||||||||||
| PPL Capital Funding, Inc. | 3.10 | 05/15/26 | 40,000 | 38,982 | ||||||||||
| Public Service Enterprise Group, Inc. | 5.20 | 04/01/29 | 50,000 | 50,764 | ||||||||||
| Public Service Enterprise Group, Inc. | 5.85 | 11/15/27 | 35,000 | 36,089 | ||||||||||
| Public Service Enterprise Group, Inc. | 5.88 | 10/15/28 | 40,000 | 41,521 | ||||||||||
| Sempra | 3.25 | 06/15/27 | 40,000 | 38,440 | ||||||||||
| Sempra | 3.40 | 02/01/28 | 70,000 | 66,969 | ||||||||||
| Sempra | 3.70 | 04/01/29 | 25,000 | 23,769 | ||||||||||
| Sempra | 4.13 | 04/01/52 | 60,000 | 56,997 | ||||||||||
| Sempra | 5.40 | 08/01/26 | 35,000 | 35,376 | ||||||||||
| Sempra | 6.88 | 10/01/54 | 60,000 | 61,140 | ||||||||||
The accompanying notes are an integral part of these financial statements.
108
BONDBLOXX ETF TRUST
BondBloxx BBB Rated 1-5 Year Corporate Bond ETF
Portfolio of Investments (Continued)
October 31, 2024
| Rate (%) | Maturity | Face Amount | Value | |||||||||||
| ELECTRIC – 7.4% (Continued) | ||||||||||||||
| Southern Co. | 3.25 | 07/01/26 | $ | 115,000 | $ | 112,472 | ||||||||
| Southern Co. | 3.75 | 09/15/51 | 30,000 | 28,906 | ||||||||||
| Southern Co. | 4.00 | 01/15/51 | 50,000 | 49,034 | ||||||||||
| Southern Co. | 4.85 | 06/15/28 | 35,000 | 35,285 | ||||||||||
| Southern Co. | 5.11 | 08/01/27 | 85,000 | 85,641 | ||||||||||
| Southern Co. | 5.50 | 03/15/29 | 60,000 | 61,733 | ||||||||||
| Southern Power Co. | 4.15 | 12/01/25 | 60,000 | 59,531 | ||||||||||
| Southwestern Electric Power Co. | 1.65 | 03/15/26 | 40,000 | 38,390 | ||||||||||
| Southwestern Electric Power Co. | 4.10 | 09/15/28 | 30,000 | 29,286 | ||||||||||
| WEC Energy Group, Inc. | 1.38 | 10/15/27 | 80,000 | 72,914 | ||||||||||
| WEC Energy Group, Inc. | 2.20 | 12/15/28 | 15,000 | 13,590 | ||||||||||
| WEC Energy Group, Inc. | 4.75 | 01/09/26 | 55,000 | 55,056 | ||||||||||
| WEC Energy Group, Inc. | 5.60 | 09/12/26 | 10,000 | 10,163 | ||||||||||
| Xcel Energy, Inc. | 1.75 | 03/15/27 | 80,000 | 74,810 | ||||||||||
| Xcel Energy, Inc. | 3.35 | 12/01/26 | 15,000 | 14,580 | ||||||||||
| Xcel Energy, Inc. | 4.00 | 06/15/28 | 10,000 | 9,719 | ||||||||||
| 4,687,364 | ||||||||||||||
| ELECTRONICS – 0.9% | ||||||||||||||
| Amphenol Corp. | 4.35 | 06/01/29 | 30,000 | 29,553 | ||||||||||
| Amphenol Corp. | 5.05 | 04/05/27 | 35,000 | 35,370 | ||||||||||
| Arrow Electronics, Inc. | 3.88 | 01/12/28 | 25,000 | 24,145 | ||||||||||
| Arrow Electronics, Inc. | 5.15 | 08/21/29 | 35,000 | 34,828 | ||||||||||
| Avnet, Inc. | 4.63 | 04/15/26 | 55,000 | 54,660 | ||||||||||
| Avnet, Inc. | 6.25 | 03/15/28 | 10,000 | 10,328 | ||||||||||
| Flex Ltd. | 3.75 | 02/01/26 | 40,000 | 39,366 | ||||||||||
| Flex Ltd. | 4.88 | 06/15/29 | 35,000 | 34,559 | ||||||||||
| Fortive Corp. | 3.15 | 06/15/26 | 45,000 | 43,836 | ||||||||||
| Jabil, Inc. | 1.70 | 04/15/26 | 30,000 | 28,616 | ||||||||||
| Jabil, Inc. | 3.95 | 01/12/28 | 30,000 | 29,101 | ||||||||||
| Jabil, Inc. | 4.25 | 05/15/27 | 30,000 | 29,559 | ||||||||||
| Keysight Technologies, Inc. | 3.00 | 10/30/29 | 25,000 | 22,840 | ||||||||||
| Keysight Technologies, Inc. | 4.60 | 04/06/27 | 35,000 | 34,999 | ||||||||||
| TD SYNNEX Corp. | 1.75 | 08/09/26 | 50,000 | 47,341 | ||||||||||
| TD SYNNEX Corp. | 2.38 | 08/09/28 | 30,000 | 27,295 | ||||||||||
| Trimble, Inc. | 4.90 | 06/15/28 | 40,000 | 40,020 | ||||||||||
| Vontier Corp. | 1.80 | 04/01/26 | 40,000 | 38,195 | ||||||||||
| 604,611 | ||||||||||||||
| ENGINEERING & CONSTRUCTION – 0.1% | ||||||||||||||
| Jacobs Engineering Group, Inc. | 6.35 | 08/18/28 | 30,000 | 31,293 | ||||||||||
| MasTec, Inc. | 5.90 | 06/15/29 | 35,000 | 35,822 | ||||||||||
| 67,115 | ||||||||||||||
| ENTERTAINMENT – 0.7% | ||||||||||||||
| Warnermedia Holdings, Inc. | 3.76 | 03/15/27 | 215,000 | 207,055 | ||||||||||
| Warnermedia Holdings, Inc. | 4.05 | 03/15/29 | 100,000 | 93,457 | ||||||||||
| Warnermedia Holdings, Inc. | 6.41 | 03/15/26 | 130,000 | 130,110 | ||||||||||
| 430,622 | ||||||||||||||
The accompanying notes are an integral part of these financial statements.
109
BONDBLOXX ETF TRUST
BondBloxx BBB Rated 1-5 Year Corporate Bond ETF
Portfolio of Investments (Continued)
October 31, 2024
| Rate (%) | Maturity | Face Amount | Value | |||||||||||
| ENVIRONMENTAL CONTROL – 0.5% | ||||||||||||||
| Republic Services, Inc. | 2.90 | 07/01/26 | $ | 25,000 | $ | 24,364 | ||||||||
| Republic Services, Inc. | 3.38 | 11/15/27 | 20,000 | 19,339 | ||||||||||
| Republic Services, Inc. | 3.95 | 05/15/28 | 75,000 | 73,327 | ||||||||||
| Republic Services, Inc. | 4.88 | 04/01/29 | 50,000 | 50,300 | ||||||||||
| Veralto Corp. | 5.35 | 09/18/28 | 50,000 | 50,928 | ||||||||||
| Veralto Corp. | 5.50 | 09/18/26 | 30,000 | 30,409 | ||||||||||
| Waste Connections, Inc. | 3.50 | 05/01/29 | 25,000 | 23,811 | ||||||||||
| Waste Connections, Inc. | 4.25 | 12/01/28 | 30,000 | 29,529 | ||||||||||
| 302,007 | ||||||||||||||
| FOOD – 3.1% | ||||||||||||||
| Ahold Finance USA LLC | 6.88 | 05/01/29 | 20,000 | 21,547 | ||||||||||
| Campbell Soup Co. | 4.15 | 03/15/28 | 60,000 | 58,905 | ||||||||||
| Campbell Soup Co. | 5.20 | 03/19/27 | 25,000 | 25,368 | ||||||||||
| Campbell Soup Co. | 5.20 | 03/21/29 | 35,000 | 35,487 | ||||||||||
| Conagra Brands, Inc. | 1.38 | 11/01/27 | 45,000 | 40,737 | ||||||||||
| Conagra Brands, Inc. | 4.60 | 11/01/25 | 85,000 | 84,806 | ||||||||||
| Conagra Brands, Inc. | 4.85 | 11/01/28 | 85,000 | 84,774 | ||||||||||
| Conagra Brands, Inc. | 5.30 | 10/01/26 | 15,000 | 15,156 | ||||||||||
| General Mills, Inc. | 3.20 | 02/10/27 | 25,000 | 24,216 | ||||||||||
| General Mills, Inc. | 4.20 | 04/17/28 | 105,000 | 103,279 | ||||||||||
| General Mills, Inc. | 4.70 | 01/30/27 | 40,000 | 40,037 | ||||||||||
| General Mills, Inc. | 5.24 | 11/18/25 | 40,000 | 39,974 | ||||||||||
| General Mills, Inc. | 5.50 | 10/17/28 | 10,000 | 10,269 | ||||||||||
| Ingredion, Inc. | 3.20 | 10/01/26 | 35,000 | 34,018 | ||||||||||
| J M Smucker Co. | 3.38 | 12/15/27 | 40,000 | 38,557 | ||||||||||
| J M Smucker Co. | 5.90 | 11/15/28 | 30,000 | 31,323 | ||||||||||
| JBS USA Holding Lux Sarl/JBS USA Food Co./JBS Lux Co. Sarl | 2.50 | 01/15/27 | 40,000 | 37,946 | ||||||||||
| JBS USA Holding Lux Sarl/JBS USA Food Co./JBS Lux Co. Sarl | 3.00 | 02/02/29 | 35,000 | 32,099 | ||||||||||
| JBS USA Holding Lux Sarl/JBS USA Food Co./JBS Lux Co. Sarl | 5.13 | 02/01/28 | 65,000 | 64,917 | ||||||||||
| Kellanova | 3.25 | 04/01/26 | 40,000 | 39,199 | ||||||||||
| Kellanova | 3.40 | 11/15/27 | 45,000 | 43,434 | ||||||||||
| Kellanova | 4.30 | 05/15/28 | 30,000 | 29,681 | ||||||||||
| Kraft Heinz Foods Co. | 3.00 | 06/01/26 | 115,000 | 111,962 | ||||||||||
| Kraft Heinz Foods Co. | 3.88 | 05/15/27 | 85,000 | 83,374 | ||||||||||
| Kroger Co. | 2.65 | 10/15/26 | 35,000 | 33,687 | ||||||||||
| Kroger Co. | 3.50 | 02/01/26 | 35,000 | 34,511 | ||||||||||
| Kroger Co. | 3.70 | 08/01/27 | 15,000 | 14,643 | ||||||||||
| Kroger Co. | 4.50 | 01/15/29 | 75,000 | 74,322 | ||||||||||
| Kroger Co. | 4.60 | 08/15/27 | 50,000 | 50,105 | ||||||||||
| Kroger Co. | 4.65 | 09/15/29 | 85,000 | 85,021 | ||||||||||
| Kroger Co. | 4.70 | 08/15/26 | 60,000 | 60,188 | ||||||||||
| McCormick & Co., Inc./MD | 0.90 | 02/15/26 | 40,000 | 38,096 | ||||||||||
| McCormick & Co., Inc./MD | 3.40 | 08/15/27 | 40,000 | 38,744 | ||||||||||
| Mondelez International, Inc. | 2.63 | 03/17/27 | 30,000 | 28,694 | ||||||||||
| Mondelez International, Inc. | 4.75 | 02/20/29 | 50,000 | 50,148 | ||||||||||
| Sysco Corp. | 3.25 | 07/15/27 | 20,000 | 19,283 | ||||||||||
| Sysco Corp. | 3.30 | 07/15/26 | 95,000 | 92,852 | ||||||||||
| Sysco Corp. | 5.75 | 01/17/29 | 15,000 | 15,540 | ||||||||||
The accompanying notes are an integral part of these financial statements.
110
BONDBLOXX ETF TRUST
BondBloxx BBB Rated 1-5 Year Corporate Bond ETF
Portfolio of Investments (Continued)
October 31, 2024
| Rate (%) | Maturity | Face Amount | Value | |||||||||||
| FOOD – 3.1% (Continued) | ||||||||||||||
| Tyson Foods, Inc. | 3.55 | 06/02/27 | $ | 75,000 | $ | 72,817 | ||||||||
| Tyson Foods, Inc. | 4.00 | 03/01/26 | 45,000 | 44,515 | ||||||||||
| Tyson Foods, Inc. | 4.35 | 03/01/29 | 85,000 | 82,928 | ||||||||||
| Tyson Foods, Inc. | 5.40 | 03/15/29 | 15,000 | 15,259 | ||||||||||
| 1,982,418 | ||||||||||||||
| FOREST PRODUCTS & PAPER – 0.3% | ||||||||||||||
| Suzano Austria GmbH | 2.50 | 09/15/28 | 25,000 | 22,616 | ||||||||||
| Suzano Austria GmbH | 6.00 | 01/15/29 | 105,000 | 106,420 | ||||||||||
| Suzano International Finance BV | 5.50 | 01/17/27 | 45,000 | 45,370 | ||||||||||
| 174,406 | ||||||||||||||
| GAS – 0.4% | ||||||||||||||
| National Fuel Gas Co. | 5.50 | 01/15/26 | 30,000 | 30,162 | ||||||||||
| NiSource, Inc. | 2.95 | 09/01/29 | 35,000 | 32,181 | ||||||||||
| NiSource, Inc. | 3.49 | 05/15/27 | 50,000 | 48,672 | ||||||||||
| NiSource, Inc. | 5.20 | 07/01/29 | 35,000 | 35,501 | ||||||||||
| NiSource, Inc. | 5.25 | 03/30/28 | 73,000 | 74,082 | ||||||||||
| Piedmont Natural Gas Co., Inc. | 3.50 | 06/01/29 | 45,000 | 42,702 | ||||||||||
| 263,300 | ||||||||||||||
| HAND/MACHINE TOOLS – 0.3% | ||||||||||||||
| Regal Rexnord Corp. | 6.05 | 02/15/26 | 80,000 | 80,838 | ||||||||||
| Regal Rexnord Corp. | 6.05 | 04/15/28 | 50,000 | 51,183 | ||||||||||
| Stanley Black & Decker, Inc. | 3.40 | 03/01/26 | 30,000 | 29,458 | ||||||||||
| Stanley Black & Decker, Inc. | 4.25 | 11/15/28 | 25,000 | 24,545 | ||||||||||
| 186,024 | ||||||||||||||
| HEALTHCARE-PRODUCTS – 1.6% | ||||||||||||||
| Agilent Technologies, Inc. | 2.75 | 09/15/29 | 30,000 | 27,326 | ||||||||||
| Agilent Technologies, Inc. | 4.20 | 09/09/27 | 35,000 | 34,623 | ||||||||||
| Baxter International, Inc. | 1.92 | 02/01/27 | 40,000 | 37,561 | ||||||||||
| Baxter International, Inc. | 2.27 | 12/01/28 | 120,000 | 108,080 | ||||||||||
| Baxter International, Inc. | 2.60 | 08/15/26 | 35,000 | 33,703 | ||||||||||
| Edwards Lifesciences Corp. | 4.30 | 06/15/28 | 35,000 | 34,393 | ||||||||||
| GE HealthCare Technologies, Inc. | 4.80 | 08/14/29 | 65,000 | 64,896 | ||||||||||
| GE HealthCare Technologies, Inc. | 5.60 | 11/15/25 | 80,000 | 80,678 | ||||||||||
| GE HealthCare Technologies, Inc. | 5.65 | 11/15/27 | 100,000 | 102,588 | ||||||||||
| Revvity, Inc. | 1.90 | 09/15/28 | 20,000 | 17,916 | ||||||||||
| Revvity, Inc. | 3.30 | 09/15/29 | 60,000 | 55,533 | ||||||||||
| Solventum Corp.(1) | 5.40 | 03/01/29 | 85,000 | 86,141 | ||||||||||
| Solventum Corp.(1) | 5.45 | 02/25/27 | 65,000 | 65,854 | ||||||||||
| Stryker Corp. | 3.38 | 11/01/25 | 110,000 | 108,816 | ||||||||||
| Stryker Corp. | 3.50 | 03/15/26 | 25,000 | 24,624 | ||||||||||
| Stryker Corp. | 4.25 | 09/11/29 | 40,000 | 39,214 | ||||||||||
| Stryker Corp. | 4.85 | 12/08/28 | 45,000 | 45,290 | ||||||||||
| Zimmer Biomet Holdings, Inc. | 3.05 | 01/15/26 | 50,000 | 48,997 | ||||||||||
| Zimmer Biomet Holdings, Inc. | 5.35 | 12/01/28 | 15,000 | 15,302 | ||||||||||
| 1,031,535 | ||||||||||||||
The accompanying notes are an integral part of these financial statements.
111
BONDBLOXX ETF TRUST
BondBloxx BBB Rated 1-5 Year Corporate Bond ETF
Portfolio of Investments (Continued)
October 31, 2024
| Rate (%) | Maturity | Face Amount | Value | |||||||||||
| HEALTHCARE-SERVICES – 4.0% | ||||||||||||||
| Centene Corp. | 2.45 | 07/15/28 | $ | 130,000 | $ | 117,066 | ||||||||
| Centene Corp. | 4.25 | 12/15/27 | 140,000 | 135,483 | ||||||||||
| Cigna Group | 1.25 | 03/15/26 | 40,000 | 38,155 | ||||||||||
| Cigna Group | 3.05 | 10/15/27 | 30,000 | 28,717 | ||||||||||
| Cigna Group | 3.40 | 03/01/27 | 65,000 | 63,134 | ||||||||||
| Cigna Group | 4.13 | 11/15/25 | 65,000 | 64,639 | ||||||||||
| Cigna Group | 4.38 | 10/15/28 | 205,000 | 201,399 | ||||||||||
| Cigna Group | 4.50 | 02/25/26 | 115,000 | 114,710 | ||||||||||
| Cigna Group | 5.00 | 05/15/29 | 90,000 | 90,503 | ||||||||||
| Elevance Health, Inc. | 1.50 | 03/15/26 | 50,000 | 47,900 | ||||||||||
| Elevance Health, Inc. | 2.88 | 09/15/29 | 45,000 | 41,104 | ||||||||||
| Elevance Health, Inc. | 3.65 | 12/01/27 | 70,000 | 67,992 | ||||||||||
| Elevance Health, Inc. | 4.10 | 03/01/28 | 85,000 | 83,371 | ||||||||||
| Elevance Health, Inc. | 4.90 | 02/08/26 | 40,000 | 39,911 | ||||||||||
| Elevance Health, Inc. | 5.15 | 06/15/29 | 45,000 | 45,549 | ||||||||||
| HCA, Inc. | 3.13 | 03/15/27 | 75,000 | 72,167 | ||||||||||
| HCA, Inc. | 3.38 | 03/15/29 | 30,000 | 28,141 | ||||||||||
| HCA, Inc. | 4.13 | 06/15/29 | 125,000 | 120,433 | ||||||||||
| HCA, Inc. | 4.50 | 02/15/27 | 60,000 | 59,527 | ||||||||||
| HCA, Inc. | 5.20 | 06/01/28 | 50,000 | 50,474 | ||||||||||
| HCA, Inc. | 5.25 | 06/15/26 | 100,000 | 100,393 | ||||||||||
| HCA, Inc. | 5.38 | 09/01/26 | 50,000 | 50,270 | ||||||||||
| HCA, Inc. | 5.63 | 09/01/28 | 70,000 | 71,420 | ||||||||||
| HCA, Inc. | 5.88 | 02/15/26 | 105,000 | 105,779 | ||||||||||
| HCA, Inc. | 5.88 | 02/01/29 | 70,000 | 72,016 | ||||||||||
| Humana, Inc. | 1.35 | 02/03/27 | 60,000 | 55,621 | ||||||||||
| Humana, Inc. | 3.13 | 08/15/29 | 30,000 | 27,550 | ||||||||||
| Humana, Inc. | 3.70 | 03/23/29 | 40,000 | 37,984 | ||||||||||
| Humana, Inc. | 3.95 | 03/15/27 | 30,000 | 29,373 | ||||||||||
| Humana, Inc. | 5.70 | 03/13/26 | 40,000 | 40,008 | ||||||||||
| Humana, Inc. | 5.75 | 03/01/28 | 40,000 | 40,870 | ||||||||||
| Humana, Inc. | 5.75 | 12/01/28 | 15,000 | 15,390 | ||||||||||
| Icon Investments Six DAC | 5.81 | 05/08/27 | 50,000 | 51,009 | ||||||||||
| Icon Investments Six DAC | 5.85 | 05/08/29 | 40,000 | 41,078 | ||||||||||
| IQVIA, Inc. | 5.70 | 05/15/28 | 30,000 | 30,651 | ||||||||||
| IQVIA, Inc. | 6.25 | 02/01/29 | 90,000 | 93,813 | ||||||||||
| Laboratory Corp. of America Holdings | 1.55 | 06/01/26 | 50,000 | 47,682 | ||||||||||
| Laboratory Corp. of America Holdings | 3.60 | 09/01/27 | 15,000 | 14,608 | ||||||||||
| Quest Diagnostics, Inc. | 3.45 | 06/01/26 | 30,000 | 29,426 | ||||||||||
| Quest Diagnostics, Inc. | 4.20 | 06/30/29 | 30,000 | 29,231 | ||||||||||
| Universal Health Services, Inc. | 1.65 | 09/01/26 | 45,000 | 42,398 | ||||||||||
| Universal Health Services, Inc. | 4.63 | 10/15/29 | 20,000 | 19,428 | ||||||||||
| 2,556,373 | ||||||||||||||
| HOME BUILDERS – 0.2% | ||||||||||||||
| DR Horton, Inc. | 1.30 | 10/15/26 | 55,000 | 51,656 | ||||||||||
| DR Horton, Inc. | 1.40 | 10/15/27 | 10,000 | 9,177 | ||||||||||
| Lennar Corp. | 4.75 | 11/29/27 | 45,000 | 45,027 | ||||||||||
| 105,860 | ||||||||||||||
The accompanying notes are an integral part of these financial statements.
112
BONDBLOXX ETF TRUST
BondBloxx BBB Rated 1-5 Year Corporate Bond ETF
Portfolio of Investments (Continued)
October 31, 2024
| Rate (%) | Maturity | Face Amount | Value | |||||||||||
| HOME FURNISHINGS – 0.1% | ||||||||||||||
| Leggett & Platt, Inc. | 3.50 | 11/15/27 | $ | 35,000 | $ | 33,222 | ||||||||
| Leggett & Platt, Inc. | 4.40 | 03/15/29 | 30,000 | 28,180 | ||||||||||
| Whirlpool Corp. | 4.75 | 02/26/29 | 30,000 | 29,688 | ||||||||||
| 91,090 | ||||||||||||||
| HOUSEHOLD PRODUCTS/WARES – 0.2% | ||||||||||||||
| Avery Dennison Corp. | 4.88 | 12/06/28 | 60,000 | 60,082 | ||||||||||
| Clorox Co. | 3.90 | 05/15/28 | 25,000 | 24,424 | ||||||||||
| Clorox Co. | 4.40 | 05/01/29 | 20,000 | 19,813 | ||||||||||
| 104,319 | ||||||||||||||
| INSURANCE – 2.6% | ||||||||||||||
| Aegon Ltd. | 5.50 | 04/11/48 | 55,000 | 54,494 | ||||||||||
| Allstate Corp. | 0.75 | 12/15/25 | 35,000 | 33,486 | ||||||||||
| Allstate Corp. | 3.28 | 12/15/26 | 35,000 | 34,088 | ||||||||||
| Allstate Corp. | 5.05 | 06/24/29 | 30,000 | 30,276 | ||||||||||
| American International Group, Inc. | 5.75 | 04/01/48 | 50,000 | 49,965 | ||||||||||
| American National Group, Inc. | 5.00 | 06/15/27 | 35,000 | 34,760 | ||||||||||
| American National Group, Inc. | 5.75 | 10/01/29 | 30,000 | 30,093 | ||||||||||
| Aon Corp. | 3.75 | 05/02/29 | 40,000 | 38,285 | ||||||||||
| Aon Corp./Aon Global Holdings PLC | 2.85 | 05/28/27 | 40,000 | 38,308 | ||||||||||
| Aon Global Ltd. | 3.88 | 12/15/25 | 35,000 | 34,680 | ||||||||||
| Aon North America, Inc. | 5.13 | 03/01/27 | 60,000 | 60,778 | ||||||||||
| Aon North America, Inc. | 5.15 | 03/01/29 | 85,000 | 85,972 | ||||||||||
| Arch Capital Finance LLC | 4.01 | 12/15/26 | 25,000 | 24,604 | ||||||||||
| Athene Holding Ltd. | 4.13 | 01/12/28 | 55,000 | 53,525 | ||||||||||
| Brighthouse Financial, Inc. | 3.70 | 06/22/27 | 45,000 | 43,584 | ||||||||||
| CNA Financial Corp. | 3.45 | 08/15/27 | 10,000 | 9,678 | ||||||||||
| CNA Financial Corp. | 3.90 | 05/01/29 | 35,000 | 33,751 | ||||||||||
| CNA Financial Corp. | 4.50 | 03/01/26 | 40,000 | 39,822 | ||||||||||
| CNO Financial Group, Inc. | 5.25 | 05/30/29 | 35,000 | 34,823 | ||||||||||
| Corebridge Financial, Inc. | 3.65 | 04/05/27 | 75,000 | 73,096 | ||||||||||
| Corebridge Financial, Inc. | 3.85 | 04/05/29 | 65,000 | 62,214 | ||||||||||
| Corebridge Financial, Inc. | 6.88 | 12/15/52 | 60,000 | 61,474 | ||||||||||
| Enstar Finance LLC | 5.50 | 01/15/42 | 20,000 | 18,849 | ||||||||||
| Enstar Group Ltd. | 4.95 | 06/01/29 | 35,000 | 34,572 | ||||||||||
| Equitable Holdings, Inc. | 4.35 | 04/20/28 | 80,000 | 78,480 | ||||||||||
| Essent Group Ltd. | 6.25 | 07/01/29 | 25,000 | 25,582 | ||||||||||
| F&G Annuities & Life, Inc. | 6.50 | 06/04/29 | 30,000 | 30,425 | ||||||||||
| Fairfax Financial Holdings Ltd. | 4.85 | 04/17/28 | 30,000 | 29,890 | ||||||||||
| Globe Life, Inc. | 4.55 | 09/15/28 | 25,000 | 24,686 | ||||||||||
| Hartford Financial Services Group, Inc. | 2.80 | 08/19/29 | 45,000 | 41,100 | ||||||||||
| Lincoln National Corp. | 3.80 | 03/01/28 | 25,000 | 24,211 | ||||||||||
| MGIC Investment Corp. | 5.25 | 08/15/28 | 40,000 | 39,425 | ||||||||||
| Old Republic International Corp. | 3.88 | 08/26/26 | 40,000 | 39,348 | ||||||||||
| Prudential Financial, Inc. | 4.50 | 09/15/47 | 40,000 | 39,014 | ||||||||||
| Prudential Financial, Inc. | 5.70 | 09/15/48 | 70,000 | 70,611 | ||||||||||
| Reinsurance Group of America, Inc. | 3.90 | 05/15/29 | 40,000 | 38,413 | ||||||||||
| Trinity Acquisition PLC | 4.40 | 03/15/26 | 30,000 | 29,808 | ||||||||||
The accompanying notes are an integral part of these financial statements.
113
BONDBLOXX ETF TRUST
BondBloxx BBB Rated 1-5 Year Corporate Bond ETF
Portfolio of Investments (Continued)
October 31, 2024
| Rate (%) | Maturity | Face Amount | Value | |||||||||||
| INSURANCE – 2.6% (Continued) | ||||||||||||||
| Willis North America, Inc. | 2.95 | 09/15/29 | $ | 40,000 | $ | 36,540 | ||||||||
| Willis North America, Inc. | 4.50 | 09/15/28 | 20,000 | 19,711 | ||||||||||
| Willis North America, Inc. | 4.65 | 06/15/27 | 65,000 | 64,808 | ||||||||||
| 1,647,229 | ||||||||||||||
| INTERNET – 1.0% | ||||||||||||||
| eBay, Inc. | 1.40 | 05/10/26 | 35,000 | 33,321 | ||||||||||
| eBay, Inc. | 3.60 | 06/05/27 | 60,000 | 58,674 | ||||||||||
| Expedia Group, Inc. | 3.80 | 02/15/28 | 50,000 | 48,435 | ||||||||||
| Expedia Group, Inc. | 4.63 | 08/01/27 | 30,000 | 29,895 | ||||||||||
| Expedia Group, Inc. | 5.00 | 02/15/26 | 85,000 | 85,164 | ||||||||||
| Netflix, Inc. | 4.38 | 11/15/26 | 70,000 | 69,913 | ||||||||||
| Netflix, Inc. | 4.88 | 04/15/28 | 95,000 | 95,585 | ||||||||||
| Netflix, Inc. | 5.88 | 11/15/28 | 118,000 | 123,300 | ||||||||||
| Netflix, Inc. | 6.38 | 05/15/29 | 40,000 | 42,758 | ||||||||||
| VeriSign, Inc. | 4.75 | 07/15/27 | 35,000 | 34,723 | ||||||||||
| 621,768 | ||||||||||||||
| INVESTMENT COMPANIES – 2.6% | ||||||||||||||
| Apollo Debt Solutions BDC(1) | 6.90 | 04/13/29 | 55,000 | 56,180 | ||||||||||
| Ares Capital Corp. | 2.15 | 07/15/26 | 58,000 | 55,044 | ||||||||||
| Ares Capital Corp. | 2.88 | 06/15/27 | 30,000 | 28,207 | ||||||||||
| Ares Capital Corp. | 2.88 | 06/15/28 | 65,000 | 59,356 | ||||||||||
| Ares Capital Corp. | 3.88 | 01/15/26 | 70,000 | 68,846 | ||||||||||
| Ares Capital Corp. | 5.88 | 03/01/29 | 75,000 | 75,564 | ||||||||||
| Ares Capital Corp. | 5.95 | 07/15/29 | 35,000 | 35,353 | ||||||||||
| Ares Capital Corp. | 7.00 | 01/15/27 | 55,000 | 56,845 | ||||||||||
| Ares Strategic Income Fund(1) | 6.35 | 08/15/29 | 45,000 | 45,359 | ||||||||||
| Blackstone Private Credit Fund | 2.63 | 12/15/26 | 65,000 | 61,259 | ||||||||||
| Blackstone Private Credit Fund | 3.25 | 03/15/27 | 60,000 | 56,868 | ||||||||||
| Blackstone Private Credit Fund | 4.00 | 01/15/29 | 35,000 | 32,988 | ||||||||||
| Blackstone Private Credit Fund(1) | 5.95 | 07/16/29 | 25,000 | 25,084 | ||||||||||
| Blackstone Private Credit Fund(1) | 7.30 | 11/27/28 | 45,000 | 47,218 | ||||||||||
| Blackstone Secured Lending Fund | 2.13 | 02/15/27 | 30,000 | 27,777 | ||||||||||
| Blackstone Secured Lending Fund | 2.75 | 09/16/26 | 50,000 | 47,651 | ||||||||||
| Blackstone Secured Lending Fund | 2.85 | 09/30/28 | 30,000 | 27,117 | ||||||||||
| Blackstone Secured Lending Fund | 3.63 | 01/15/26 | 60,000 | 58,681 | ||||||||||
| Blue Owl Capital Corp. | 2.63 | 01/15/27 | 25,000 | 23,404 | ||||||||||
| Blue Owl Capital Corp. | 2.88 | 06/11/28 | 55,000 | 49,697 | ||||||||||
| Blue Owl Capital Corp. | 3.40 | 07/15/26 | 55,000 | 52,996 | ||||||||||
| Blue Owl Capital Corp. | 4.25 | 01/15/26 | 30,000 | 29,552 | ||||||||||
| Blue Owl Capital Corp. | 5.95 | 03/15/29 | 40,000 | 40,159 | ||||||||||
| Blue Owl Credit Income Corp.(1) | 6.60 | 09/15/29 | 35,000 | 35,424 | ||||||||||
| Blue Owl Credit Income Corp. | 7.75 | 09/16/27 | 35,000 | 36,471 | ||||||||||
| Blue Owl Credit Income Corp. | 7.75 | 01/15/29 | 25,000 | 26,346 | ||||||||||
| Blue Owl Credit Income Corp. | 7.95 | 06/13/28 | 40,000 | 42,223 | ||||||||||
| Blue Owl Technology Finance Corp. II(1) | 6.75 | 04/04/29 | 45,000 | 44,806 | ||||||||||
| FS KKR Capital Corp. | 3.13 | 10/12/28 | 60,000 | 54,013 | ||||||||||
| FS KKR Capital Corp. | 3.25 | 07/15/27 | 25,000 | 23,528 | ||||||||||
The accompanying notes are an integral part of these financial statements.
114
BONDBLOXX ETF TRUST
BondBloxx BBB Rated 1-5 Year Corporate Bond ETF
Portfolio of Investments (Continued)
October 31, 2024
| Rate (%) | Maturity | Face Amount | Value | |||||||||||
| INVESTMENT COMPANIES – 2.6% (Continued) | ||||||||||||||
| FS KKR Capital Corp. | 3.40 | 01/15/26 | $ | 55,000 | $ | 53,535 | ||||||||
| FS KKR Capital Corp. | 6.88 | 08/15/29 | 35,000 | 36,062 | ||||||||||
| Goldman Sachs BDC, Inc. | 2.88 | 01/15/26 | 25,000 | 24,357 | ||||||||||
| Golub Capital BDC, Inc. | 2.50 | 08/24/26 | 30,000 | 28,427 | ||||||||||
| Golub Capital BDC, Inc. | 6.00 | 07/15/29 | 45,000 | 45,090 | ||||||||||
| Golub Capital Private Credit Fund(1) | 5.80 | 09/12/29 | 35,000 | 34,130 | ||||||||||
| HPS Corporate Lending Fund(1) | 6.75 | 01/30/29 | 25,000 | 25,514 | ||||||||||
| Main Street Capital Corp. | 3.00 | 07/14/26 | 25,000 | 23,887 | ||||||||||
| Sixth Street Lending Partners(1) | 6.50 | 03/11/29 | 45,000 | 45,351 | ||||||||||
| 1,640,369 | ||||||||||||||
| IRON/STEEL – 0.2% | ||||||||||||||
| ArcelorMittal SA | 4.25 | 07/16/29 | 40,000 | 39,024 | ||||||||||
| ArcelorMittal SA | 6.55 | 11/29/27 | 60,000 | 62,463 | ||||||||||
| 101,487 | ||||||||||||||
| LEISURE TIME – 0.1% | ||||||||||||||
| Polaris, Inc. | 6.95 | 03/15/29 | 60,000 | 63,353 | ||||||||||
| LODGING – 1.1% | ||||||||||||||
| Hyatt Hotels Corp. | 5.75 | 01/30/27 | 20,000 | 20,396 | ||||||||||
| Las Vegas Sands Corp. | 3.50 | 08/18/26 | 55,000 | 53,492 | ||||||||||
| Las Vegas Sands Corp. | 3.90 | 08/08/29 | 45,000 | 42,066 | ||||||||||
| Las Vegas Sands Corp. | 5.90 | 06/01/27 | 45,000 | 45,710 | ||||||||||
| Las Vegas Sands Corp. | 6.00 | 08/15/29 | 35,000 | 35,706 | ||||||||||
| Marriott International, Inc./MD | 3.13 | 06/15/26 | 20,000 | 19,534 | ||||||||||
| Marriott International, Inc./MD | 4.90 | 04/15/29 | 45,000 | 45,100 | ||||||||||
| Marriott International, Inc./MD | 5.00 | 10/15/27 | 155,000 | 156,650 | ||||||||||
| Marriott International, Inc./MD | 5.55 | 10/15/28 | 20,000 | 20,574 | ||||||||||
| Sands China Ltd. | 2.30 | 03/08/27 | 100,000 | 93,152 | ||||||||||
| Sands China Ltd. | 2.85 | 03/08/29 | 75,000 | 67,344 | ||||||||||
| Sands China Ltd. | 3.80 | 01/08/26 | 20,000 | 19,622 | ||||||||||
| Sands China Ltd. | 5.40 | 08/08/28 | 53,000 | 52,791 | ||||||||||
| 672,137 | ||||||||||||||
| MACHINERY-DIVERSIFIED – 0.9% | ||||||||||||||
| CNH Industrial Capital LLC | 1.45 | 07/15/26 | 55,000 | 51,991 | ||||||||||
| CNH Industrial Capital LLC | 1.88 | 01/15/26 | 20,000 | 19,322 | ||||||||||
| CNH Industrial Capital LLC | 4.55 | 04/10/28 | 40,000 | 39,705 | ||||||||||
| CNH Industrial Capital LLC | 5.10 | 04/20/29 | 25,000 | 25,206 | ||||||||||
| CNH Industrial Capital LLC | 5.50 | 01/12/29 | 35,000 | 35,813 | ||||||||||
| CNH Industrial NV | 3.85 | 11/15/27 | 25,000 | 24,490 | ||||||||||
| IDEX Corp. | 4.95 | 09/01/29 | 35,000 | 35,154 | ||||||||||
| Ingersoll Rand, Inc. | 5.18 | 06/15/29 | 50,000 | 50,739 | ||||||||||
| Ingersoll Rand, Inc. | 5.20 | 06/15/27 | 45,000 | 45,589 | ||||||||||
| Ingersoll Rand, Inc. | 5.40 | 08/14/28 | 25,000 | 25,566 | ||||||||||
| Otis Worldwide Corp. | 2.29 | 04/05/27 | 20,000 | 18,975 | ||||||||||
| Otis Worldwide Corp. | 5.25 | 08/16/28 | 50,000 | 50,902 | ||||||||||
| Westinghouse Air Brake Technologies Corp. | 3.45 | 11/15/26 | 65,000 | 63,410 | ||||||||||
| Westinghouse Air Brake Technologies Corp. | 4.70 | 09/15/28 | 60,000 | 59,730 | ||||||||||
The accompanying notes are an integral part of these financial statements.
115
BONDBLOXX ETF TRUST
BondBloxx BBB Rated 1-5 Year Corporate Bond ETF
Portfolio of Investments (Continued)
October 31, 2024
| Rate (%) | Maturity | Face Amount | Value | |||||||||||
| MACHINERY-DIVERSIFIED – 0.9% (Continued) | ||||||||||||||
| Xylem, Inc./NY | 1.95 | 01/30/28 | $ | 30,000 | $ | 27,664 | ||||||||
| Xylem, Inc./NY | 3.25 | 11/01/26 | 30,000 | 29,230 | ||||||||||
| 603,486 | ||||||||||||||
| MEDIA – 1.3% | ||||||||||||||
| Charter Communications Operating LLC/Charter Communications Operating Capital | 2.25 | 01/15/29 | 75,000 | 65,877 | ||||||||||
| Charter Communications Operating LLC/Charter Communications Operating Capital | 3.75 | 02/15/28 | 45,000 | 42,864 | ||||||||||
| Charter Communications Operating LLC/Charter Communications Operating Capital | 4.20 | 03/15/28 | 65,000 | 62,703 | ||||||||||
| Charter Communications Operating LLC/Charter Communications Operating Capital | 5.05 | 03/30/29 | 70,000 | 68,699 | ||||||||||
| Charter Communications Operating LLC/Charter Communications Operating Capital | 6.10 | 06/01/29 | 95,000 | 96,994 | ||||||||||
| Charter Communications Operating LLC/Charter Communications Operating Capital | 6.15 | 11/10/26 | 90,000 | 91,910 | ||||||||||
| Discovery Communications LLC | 3.95 | 03/20/28 | 135,000 | 127,441 | ||||||||||
| Discovery Communications LLC | 4.13 | 05/15/29 | 20,000 | 18,625 | ||||||||||
| FactSet Research Systems, Inc. | 2.90 | 03/01/27 | 30,000 | 28,778 | ||||||||||
| Fox Corp. | 4.71 | 01/25/29 | 115,000 | 114,532 | ||||||||||
| Paramount Global | 2.90 | 01/15/27 | 35,000 | 33,260 | ||||||||||
| Paramount Global | 3.38 | 02/15/28 | 40,000 | 37,197 | ||||||||||
| Paramount Global | 4.20 | 06/01/29 | 20,000 | 18,729 | ||||||||||
| Thomson Reuters Corp. | 3.35 | 05/15/26 | 20,000 | 19,603 | ||||||||||
| 827,212 | ||||||||||||||
| MINING – 0.2% | ||||||||||||||
| AngloGold Ashanti Holdings PLC | 3.38 | 11/01/28 | 60,000 | 55,443 | ||||||||||
| Newmont Corp. | 2.80 | 10/01/29 | 25,000 | 22,892 | ||||||||||
| Newmont Corp./Newcrest Finance Pty Ltd. | 5.30 | 03/15/26 | 65,000 | 65,598 | ||||||||||
| 143,933 | ||||||||||||||
| MISCELLANEOUS MANUFACTURER – 0.5% | ||||||||||||||
| Carlisle Cos, Inc. | 3.75 | 12/01/27 | 45,000 | 43,763 | ||||||||||
| Parker-Hannifin Corp. | 3.25 | 03/01/27 | 35,000 | 33,973 | ||||||||||
| Parker-Hannifin Corp. | 3.25 | 06/14/29 | 60,000 | 56,381 | ||||||||||
| Parker-Hannifin Corp. | 4.25 | 09/15/27 | 80,000 | 79,331 | ||||||||||
| Parker-Hannifin Corp. | 4.50 | 09/15/29 | 60,000 | 59,588 | ||||||||||
| Teledyne Technologies, Inc. | 2.25 | 04/01/28 | 40,000 | 36,908 | ||||||||||
| 309,944 | ||||||||||||||
| OFFICE/BUSINESS EQUIPMENT – 0.2% | ||||||||||||||
| CDW LLC/CDW Finance Corp. | 2.67 | 12/01/26 | 60,000 | 57,316 | ||||||||||
| CDW LLC/CDW Finance Corp. | 3.25 | 02/15/29 | 55,000 | 50,841 | ||||||||||
| CDW LLC/CDW Finance Corp. | 3.28 | 12/01/28 | 10,000 | 9,319 | ||||||||||
| CDW LLC/CDW Finance Corp. | 4.25 | 04/01/28 | 40,000 | 38,957 | ||||||||||
| 156,433 | ||||||||||||||
The accompanying notes are an integral part of these financial statements.
116
BONDBLOXX ETF TRUST
BondBloxx BBB Rated 1-5 Year Corporate Bond ETF
Portfolio of Investments (Continued)
October 31, 2024
| Rate (%) | Maturity | Face Amount | Value | |||||||||||
| OIL & GAS – 1.7% | ||||||||||||||
| Canadian Natural Resources Ltd. | 3.85 | 06/01/27 | $ | 65,000 | $ | 63,582 | ||||||||
| Continental Resources, Inc. | 4.38 | 01/15/28 | 60,000 | 58,233 | ||||||||||
| Coterra Energy, Inc. | 3.90 | 05/15/27 | 60,000 | 58,480 | ||||||||||
| Diamondback Energy, Inc. | 3.25 | 12/01/26 | 50,000 | 48,560 | ||||||||||
| Diamondback Energy, Inc. | 5.20 | 04/18/27 | 45,000 | 45,468 | ||||||||||
| EQT Corp. | 3.90 | 10/01/27 | 75,000 | 73,041 | ||||||||||
| EQT Corp. | 5.70 | 04/01/28 | 30,000 | 30,570 | ||||||||||
| Expand Energy Corp. | 5.38 | 02/01/29 | 40,000 | 39,415 | ||||||||||
| Hess Corp. | 4.30 | 04/01/27 | 60,000 | 59,388 | ||||||||||
| HF Sinclair Corp. | 5.88 | 04/01/26 | 60,000 | 60,553 | ||||||||||
| Marathon Oil Corp. | 4.40 | 07/15/27 | 65,000 | 64,456 | ||||||||||
| Marathon Oil Corp. | 5.30 | 04/01/29 | 25,000 | 25,448 | ||||||||||
| Marathon Petroleum Corp. | 5.13 | 12/15/26 | 45,000 | 45,283 | ||||||||||
| Occidental Petroleum Corp. | 5.00 | 08/01/27 | 50,000 | 49,987 | ||||||||||
| Occidental Petroleum Corp. | 5.20 | 08/01/29 | 75,000 | 74,786 | ||||||||||
| Occidental Petroleum Corp. | 5.55 | 03/15/26 | 45,000 | 45,282 | ||||||||||
| Occidental Petroleum Corp. | 6.38 | 09/01/28 | 30,000 | 31,088 | ||||||||||
| Ovintiv, Inc. | 5.65 | 05/15/28 | 30,000 | 30,426 | ||||||||||
| Phillips 66 | 1.30 | 02/15/26 | 10,000 | 9,586 | ||||||||||
| Phillips 66 | 3.90 | 03/15/28 | 15,000 | 14,601 | ||||||||||
| Phillips 66 Co. | 4.95 | 12/01/27 | 85,000 | 85,785 | ||||||||||
| Valero Energy Corp. | 4.35 | 06/01/28 | 55,000 | 54,265 | ||||||||||
| 1,068,283 | ||||||||||||||
| PACKAGING & CONTAINERS – 0.6% | ||||||||||||||
| Amcor Finance USA, Inc. | 3.63 | 04/28/26 | 20,000 | 19,642 | ||||||||||
| Amcor Group Finance PLC | 5.45 | 05/23/29 | 35,000 | 35,516 | ||||||||||
| Berry Global, Inc. | 1.57 | 01/15/26 | 85,000 | 81,596 | ||||||||||
| Packaging Corp. of America | 3.40 | 12/15/27 | 30,000 | 28,898 | ||||||||||
| Sonoco Products Co. | 4.60 | 09/01/29 | 40,000 | 39,019 | ||||||||||
| WRKCo, Inc. | 3.90 | 06/01/28 | 80,000 | 77,223 | ||||||||||
| WRKCo, Inc. | 4.00 | 03/15/28 | 10,000 | 9,726 | ||||||||||
| WRKCo, Inc. | 4.65 | 03/15/26 | 50,000 | 49,786 | ||||||||||
| WRKCo, Inc. | 4.90 | 03/15/29 | 20,000 | 19,955 | ||||||||||
| 361,361 | ||||||||||||||
| PHARMACEUTICALS – 2.9% | ||||||||||||||
| Becton Dickinson & Co. | 3.70 | 06/06/27 | 98,000 | 95,744 | ||||||||||
| Becton Dickinson & Co. | 4.69 | 02/13/28 | 50,000 | 49,995 | ||||||||||
| Becton Dickinson & Co. | 4.87 | 02/08/29 | 35,000 | 35,053 | ||||||||||
| Becton Dickinson & Co. | 5.08 | 06/07/29 | 45,000 | 45,515 | ||||||||||
| Cardinal Health, Inc. | 3.41 | 06/15/27 | 55,000 | 53,273 | ||||||||||
| Cardinal Health, Inc. | 5.13 | 02/15/29 | 50,000 | 50,492 | ||||||||||
| Cencora, Inc. | 3.45 | 12/15/27 | 50,000 | 48,280 | ||||||||||
| CVS Health Corp. | 1.30 | 08/21/27 | 140,000 | 126,897 | ||||||||||
| CVS Health Corp. | 2.88 | 06/01/26 | 95,000 | 92,060 | ||||||||||
| CVS Health Corp. | 3.00 | 08/15/26 | 50,000 | 48,399 | ||||||||||
| CVS Health Corp. | 3.25 | 08/15/29 | 95,000 | 87,302 | ||||||||||
| CVS Health Corp. | 3.63 | 04/01/27 | 40,000 | 38,847 | ||||||||||
The accompanying notes are an integral part of these financial statements.
117
BONDBLOXX ETF TRUST
BondBloxx BBB Rated 1-5 Year Corporate Bond ETF
Portfolio of Investments (Continued)
October 31, 2024
| Rate (%) | Maturity | Face Amount | Value | |||||||||||
| PHARMACEUTICALS – 2.9% (Continued) | ||||||||||||||
| CVS Health Corp. | 4.30 | 03/25/28 | $ | 305,000 | $ | 297,408 | ||||||||
| CVS Health Corp. | 5.00 | 02/20/26 | 90,000 | 90,066 | ||||||||||
| CVS Health Corp. | 5.00 | 01/30/29 | 60,000 | 59,812 | ||||||||||
| CVS Health Corp. | 5.40 | 06/01/29 | 70,000 | 70,715 | ||||||||||
| Mylan, Inc. | 4.55 | 04/15/28 | 50,000 | 49,013 | ||||||||||
| Shire Acquisitions Investments Ireland DAC | 3.20 | 09/23/26 | 84,000 | 82,049 | ||||||||||
| Takeda Pharmaceutical Co. Ltd. | 5.00 | 11/26/28 | 105,000 | 106,008 | ||||||||||
| Utah Acquisition Sub, Inc. | 3.95 | 06/15/26 | 108,000 | 106,234 | ||||||||||
| Viatris, Inc. | 2.30 | 06/22/27 | 30,000 | 27,986 | ||||||||||
| Zoetis, Inc. | 3.00 | 09/12/27 | 40,000 | 38,336 | ||||||||||
| Zoetis, Inc. | 3.90 | 08/20/28 | 25,000 | 24,353 | ||||||||||
| Zoetis, Inc. | 4.50 | 11/13/25 | 45,000 | 44,892 | ||||||||||
| Zoetis, Inc. | 5.40 | 11/14/25 | 44,000 | 44,282 | ||||||||||
| 1,813,011 | ||||||||||||||
| PIPELINES – 5.8% | ||||||||||||||
| Boardwalk Pipelines LP | 4.45 | 07/15/27 | 15,000 | 14,837 | ||||||||||
| Boardwalk Pipelines LP | 4.80 | 05/03/29 | 50,000 | 49,451 | ||||||||||
| Boardwalk Pipelines LP | 5.95 | 06/01/26 | 25,000 | 25,288 | ||||||||||
| Cheniere Corpus Christi Holdings LLC | 5.13 | 06/30/27 | 70,000 | 70,459 | ||||||||||
| Cheniere Energy Partners LP | 4.50 | 10/01/29 | 80,000 | 77,094 | ||||||||||
| Cheniere Energy, Inc. | 4.63 | 10/15/28 | 90,000 | 88,296 | ||||||||||
| DCP Midstream Operating LP | 5.13 | 05/15/29 | 40,000 | 40,280 | ||||||||||
| DCP Midstream Operating LP | 5.63 | 07/15/27 | 25,000 | 25,460 | ||||||||||
| Enbridge, Inc. | 3.70 | 07/15/27 | 20,000 | 19,502 | ||||||||||
| Enbridge, Inc. | 4.25 | 12/01/26 | 15,000 | 14,865 | ||||||||||
| Enbridge, Inc. | 5.25 | 04/05/27 | 55,000 | 55,733 | ||||||||||
| Enbridge, Inc. | 5.30 | 04/05/29 | 35,000 | 35,528 | ||||||||||
| Enbridge, Inc. | 5.90 | 11/15/26 | 20,000 | 20,445 | ||||||||||
| Enbridge, Inc. | 6.00 | 11/15/28 | 40,000 | 41,731 | ||||||||||
| Energy Transfer LP | 4.00 | 10/01/27 | 45,000 | 44,068 | ||||||||||
| Energy Transfer LP | 4.15 | 09/15/29 | 25,000 | 24,075 | ||||||||||
| Energy Transfer LP | 4.20 | 04/15/27 | 30,000 | 29,589 | ||||||||||
| Energy Transfer LP | 4.40 | 03/15/27 | 25,000 | 24,795 | ||||||||||
| Energy Transfer LP | 4.75 | 01/15/26 | 95,000 | 94,903 | ||||||||||
| Energy Transfer LP | 4.95 | 05/15/28 | 10,000 | 10,022 | ||||||||||
| Energy Transfer LP | 4.95 | 06/15/28 | 65,000 | 65,150 | ||||||||||
| Energy Transfer LP | 5.25 | 04/15/29 | 85,000 | 85,812 | ||||||||||
| Energy Transfer LP | 5.25 | 07/01/29 | 55,000 | 55,553 | ||||||||||
| Energy Transfer LP | 5.50 | 06/01/27 | 60,000 | 60,925 | ||||||||||
| Energy Transfer LP | 5.55 | 02/15/28 | 105,000 | 107,173 | ||||||||||
| Energy Transfer LP | 6.05 | 12/01/26 | 75,000 | 76,851 | ||||||||||
| Energy Transfer LP | 6.10 | 12/01/28 | 35,000 | 36,501 | ||||||||||
| Enterprise Products Operating LLC | 5.25 | 08/16/77 | 75,000 | 73,796 | ||||||||||
| Enterprise Products Operating LLC | 5.38 | 02/15/78 | 25,000 | 24,043 | ||||||||||
| Kinder Morgan, Inc. | 1.75 | 11/15/26 | 25,000 | 23,605 | ||||||||||
| Kinder Morgan, Inc. | 4.30 | 03/01/28 | 63,000 | 62,086 | ||||||||||
| Kinder Morgan, Inc. | 5.00 | 02/01/29 | 95,000 | 95,142 | ||||||||||
| Kinder Morgan, Inc. | 5.10 | 08/01/29 | 35,000 | 35,166 | ||||||||||
The accompanying notes are an integral part of these financial statements.
118
BONDBLOXX ETF TRUST
BondBloxx BBB Rated 1-5 Year Corporate Bond ETF
Portfolio of Investments (Continued)
October 31, 2024
| Rate (%) | Maturity | Face Amount | Value | |||||||||||
| PIPELINES – 5.8% (Continued) | ||||||||||||||
| MPLX LP | 1.75 | 03/01/26 | $ | 85,000 | $ | 81,634 | ||||||||
| MPLX LP | 4.00 | 03/15/28 | 60,000 | 58,406 | ||||||||||
| MPLX LP | 4.13 | 03/01/27 | 50,000 | 49,309 | ||||||||||
| MPLX LP | 4.25 | 12/01/27 | 115,000 | 113,142 | ||||||||||
| MPLX LP | 4.80 | 02/15/29 | 20,000 | 19,900 | ||||||||||
| ONEOK, Inc. | 3.40 | 09/01/29 | 20,000 | 18,649 | ||||||||||
| ONEOK, Inc. | 4.00 | 07/13/27 | 20,000 | 19,608 | ||||||||||
| ONEOK, Inc. | 4.25 | 09/24/27 | 65,000 | 64,198 | ||||||||||
| ONEOK, Inc. | 4.35 | 03/15/29 | 60,000 | 58,480 | ||||||||||
| ONEOK, Inc. | 4.40 | 10/15/29 | 35,000 | 34,126 | ||||||||||
| ONEOK, Inc. | 4.55 | 07/15/28 | 45,000 | 44,495 | ||||||||||
| ONEOK, Inc. | 5.00 | 03/01/26 | 40,000 | 40,029 | ||||||||||
| ONEOK, Inc. | 5.55 | 11/01/26 | 70,000 | 70,959 | ||||||||||
| ONEOK, Inc. | 5.65 | 11/01/28 | 45,000 | 46,210 | ||||||||||
| ONEOK, Inc. | 5.85 | 01/15/26 | 35,000 | 35,354 | ||||||||||
| Plains All American Pipeline LP/PAA Finance Corp. | 4.50 | 12/15/26 | 50,000 | 49,775 | ||||||||||
| Sabine Pass Liquefaction LLC | 4.20 | 03/15/28 | 120,000 | 117,576 | ||||||||||
| Sabine Pass Liquefaction LLC | 5.00 | 03/15/27 | 65,000 | 65,156 | ||||||||||
| Sabine Pass Liquefaction LLC | 5.88 | 06/30/26 | 80,000 | 80,906 | ||||||||||
| South Bow USA Infrastructure Holdings LLC(1) | 4.91 | 09/01/27 | 40,000 | 39,810 | ||||||||||
| South Bow USA Infrastructure Holdings LLC(1) | 5.03 | 10/01/29 | 50,000 | 49,226 | ||||||||||
| Spectra Energy Partners LP | 3.38 | 10/15/26 | 150,000 | 146,074 | ||||||||||
| Targa Resources Corp. | 5.20 | 07/01/27 | 45,000 | 45,533 | ||||||||||
| Targa Resources Corp. | 6.15 | 03/01/29 | 65,000 | 67,897 | ||||||||||
| Targa Resources Partners LP/Targa Resources Partners Finance Corp. | 5.00 | 01/15/28 | 45,000 | 44,841 | ||||||||||
| Targa Resources Partners LP/Targa Resources Partners Finance Corp. | 6.50 | 07/15/27 | 20,000 | 20,185 | ||||||||||
| Targa Resources Partners LP/Targa Resources Partners Finance Corp. | 6.88 | 01/15/29 | 55,000 | 56,288 | ||||||||||
| TC PipeLines LP | 3.90 | 05/25/27 | 25,000 | 24,393 | ||||||||||
| TransCanada PipeLines Ltd. | 4.25 | 05/15/28 | 105,000 | 103,004 | ||||||||||
| TransCanada PipeLines Ltd. | 4.88 | 01/15/26 | 35,000 | 34,966 | ||||||||||
| Transcontinental Gas Pipe Line Co. LLC | 7.85 | 02/01/26 | 60,000 | 61,733 | ||||||||||
| Western Midstream Operating LP | 6.35 | 01/15/29 | 35,000 | 36,436 | ||||||||||
| Williams Cos, Inc. | 3.75 | 06/15/27 | 135,000 | 131,812 | ||||||||||
| Williams Cos, Inc. | 4.90 | 03/15/29 | 70,000 | 69,937 | ||||||||||
| Williams Cos, Inc. | 5.30 | 08/15/28 | 35,000 | 35,548 | ||||||||||
| Williams Cos, Inc. | 5.40 | 03/02/26 | 35,000 | 35,235 | ||||||||||
| 3,679,054 | ||||||||||||||
| REAL ESTATE – 0.1% | ||||||||||||||
| CBRE Services, Inc. | 4.88 | 03/01/26 | 50,000 | 49,969 | ||||||||||
| CBRE Services, Inc. | 5.50 | 04/01/29 | 10,000 | 10,263 | ||||||||||
| 60,232 | ||||||||||||||
| REAL ESTATE INVESTMENT TRUST (REITS) – 4.9% | ||||||||||||||
| American Homes 4 Rent LP | 4.25 | 02/15/28 | 30,000 | 29,353 | ||||||||||
| American Tower Corp. | 1.45 | 09/15/26 | 40,000 | 37,679 | ||||||||||
| American Tower Corp. | 1.50 | 01/31/28 | 40,000 | 36,071 | ||||||||||
| American Tower Corp. | 1.60 | 04/15/26 | 40,000 | 38,203 | ||||||||||
| American Tower Corp. | 2.75 | 01/15/27 | 35,000 | 33,556 | ||||||||||
The accompanying notes are an integral part of these financial statements.
119
BONDBLOXX ETF TRUST
BondBloxx BBB Rated 1-5 Year Corporate Bond ETF
Portfolio of Investments (Continued)
October 31, 2024
| Rate (%) | Maturity | Face Amount | Value | |||||||||||
| REAL ESTATE INVESTMENT TRUST (REITS) – 4.9% (Continued) | ||||||||||||||
| American Tower Corp. | 3.38 | 10/15/26 | $ | 55,000 | $ | 53,672 | ||||||||
| American Tower Corp. | 3.55 | 07/15/27 | 40,000 | 38,756 | ||||||||||
| American Tower Corp. | 3.60 | 01/15/28 | 30,000 | 28,912 | ||||||||||
| American Tower Corp. | 3.65 | 03/15/27 | 30,000 | 29,262 | ||||||||||
| American Tower Corp. | 3.80 | 08/15/29 | 95,000 | 90,456 | ||||||||||
| American Tower Corp. | 3.95 | 03/15/29 | 40,000 | 38,497 | ||||||||||
| American Tower Corp. | 4.40 | 02/15/26 | 45,000 | 44,786 | ||||||||||
| American Tower Corp. | 5.20 | 02/15/29 | 35,000 | 35,392 | ||||||||||
| American Tower Corp. | 5.25 | 07/15/28 | 25,000 | 25,302 | ||||||||||
| American Tower Corp. | 5.50 | 03/15/28 | 70,000 | 71,353 | ||||||||||
| American Tower Corp. | 5.80 | 11/15/28 | 55,000 | 56,771 | ||||||||||
| Boston Properties LP | 2.75 | 10/01/26 | 55,000 | 52,716 | ||||||||||
| Boston Properties LP | 3.40 | 06/21/29 | 30,000 | 27,561 | ||||||||||
| Boston Properties LP | 3.65 | 02/01/26 | 50,000 | 49,076 | ||||||||||
| Boston Properties LP | 4.50 | 12/01/28 | 85,000 | 82,510 | ||||||||||
| Boston Properties LP | 6.75 | 12/01/27 | 60,000 | 62,602 | ||||||||||
| Brixmor Operating Partnership LP | 4.13 | 06/15/26 | 23,000 | 22,708 | ||||||||||
| Brixmor Operating Partnership LP | 4.13 | 05/15/29 | 60,000 | 57,661 | ||||||||||
| Crown Castle, Inc. | 1.05 | 07/15/26 | 70,000 | 65,740 | ||||||||||
| Crown Castle, Inc. | 2.90 | 03/15/27 | 45,000 | 43,073 | ||||||||||
| Crown Castle, Inc. | 3.65 | 09/01/27 | 45,000 | 43,577 | ||||||||||
| Crown Castle, Inc. | 3.70 | 06/15/26 | 45,000 | 44,200 | ||||||||||
| Crown Castle, Inc. | 3.80 | 02/15/28 | 35,000 | 33,830 | ||||||||||
| Crown Castle, Inc. | 4.00 | 03/01/27 | 30,000 | 29,477 | ||||||||||
| Crown Castle, Inc. | 4.30 | 02/15/29 | 25,000 | 24,315 | ||||||||||
| Crown Castle, Inc. | 4.45 | 02/15/26 | 45,000 | 44,785 | ||||||||||
| Crown Castle, Inc. | 4.80 | 09/01/28 | 30,000 | 29,845 | ||||||||||
| Crown Castle, Inc. | 4.90 | 09/01/29 | 30,000 | 29,789 | ||||||||||
| Crown Castle, Inc. | 5.00 | 01/11/28 | 100,000 | 100,136 | ||||||||||
| Crown Castle, Inc. | 5.60 | 06/01/29 | 55,000 | 56,419 | ||||||||||
| CubeSmart LP | 2.25 | 12/15/28 | 35,000 | 31,621 | ||||||||||
| Digital Realty Trust LP | 3.60 | 07/01/29 | 70,000 | 66,489 | ||||||||||
| Digital Realty Trust LP | 3.70 | 08/15/27 | 45,000 | 43,782 | ||||||||||
| Digital Realty Trust LP | 4.45 | 07/15/28 | 35,000 | 34,559 | ||||||||||
| Digital Realty Trust LP | 5.55 | 01/15/28 | 60,000 | 61,283 | ||||||||||
| EPR Properties | 3.75 | 08/15/29 | 30,000 | 27,635 | ||||||||||
| Equinix, Inc. | 1.45 | 05/15/26 | 25,000 | 23,835 | ||||||||||
| Equinix, Inc. | 1.55 | 03/15/28 | 115,000 | 103,748 | ||||||||||
| Equinix, Inc. | 2.90 | 11/18/26 | 15,000 | 14,495 | ||||||||||
| Essex Portfolio LP | 4.00 | 03/01/29 | 40,000 | 38,493 | ||||||||||
| Extra Space Storage LP | 3.50 | 07/01/26 | 35,000 | 34,312 | ||||||||||
| Extra Space Storage LP | 5.70 | 04/01/28 | 30,000 | 30,755 | ||||||||||
| GLP Capital LP/GLP Financing II, Inc. | 5.30 | 01/15/29 | 70,000 | 69,896 | ||||||||||
| GLP Capital LP/GLP Financing II, Inc. | 5.38 | 04/15/26 | 55,000 | 55,051 | ||||||||||
| GLP Capital LP/GLP Financing II, Inc. | 5.75 | 06/01/28 | 10,000 | 10,164 | ||||||||||
| Healthcare Realty Holdings LP | 3.50 | 08/01/26 | 45,000 | 43,968 | ||||||||||
| Healthcare Realty Holdings LP | 3.75 | 07/01/27 | 25,000 | 24,231 | ||||||||||
| Healthpeak OP LLC | 2.13 | 12/01/28 | 35,000 | 31,587 | ||||||||||
The accompanying notes are an integral part of these financial statements.
120
BONDBLOXX ETF TRUST
BondBloxx BBB Rated 1-5 Year Corporate Bond ETF
Portfolio of Investments (Continued)
October 31, 2024
| Rate (%) | Maturity | Face Amount | Value | |||||||||||
| REAL ESTATE INVESTMENT TRUST (REITS) – 4.9% (Continued) | ||||||||||||||
| Healthpeak OP LLC | 3.25 | 07/15/26 | $ | 35,000 | $ | 34,221 | ||||||||
| Healthpeak OP LLC | 3.50 | 07/15/29 | 40,000 | 37,664 | ||||||||||
| Invitation Homes Operating Partnership LP | 2.30 | 11/15/28 | 30,000 | 27,183 | ||||||||||
| Kimco Realty OP LLC | 2.80 | 10/01/26 | 25,000 | 24,127 | ||||||||||
| Omega Healthcare Investors, Inc. | 3.63 | 10/01/29 | 20,000 | 18,528 | ||||||||||
| Omega Healthcare Investors, Inc. | 4.50 | 04/01/27 | 30,000 | 29,634 | ||||||||||
| Omega Healthcare Investors, Inc. | 4.75 | 01/15/28 | 30,000 | 29,603 | ||||||||||
| Omega Healthcare Investors, Inc. | 5.25 | 01/15/26 | 45,000 | 45,030 | ||||||||||
| Piedmont Operating Partnership LP | 9.25 | 07/20/28 | 35,000 | 38,517 | ||||||||||
| Regency Centers LP | 3.60 | 02/01/27 | 35,000 | 34,101 | ||||||||||
| Sabra Health Care LP | 5.13 | 08/15/26 | 30,000 | 30,003 | ||||||||||
| Sun Communities Operating LP | 5.50 | 01/15/29 | 25,000 | 25,247 | ||||||||||
| Ventas Realty LP | 4.00 | 03/01/28 | 40,000 | 38,976 | ||||||||||
| Ventas Realty LP | 4.13 | 01/15/26 | 35,000 | 34,659 | ||||||||||
| Ventas Realty LP | 4.40 | 01/15/29 | 35,000 | 34,211 | ||||||||||
| VICI Properties LP | 4.75 | 02/15/28 | 75,000 | 74,360 | ||||||||||
| Welltower OP LLC | 2.05 | 01/15/29 | 25,000 | 22,447 | ||||||||||
| Welltower OP LLC | 2.70 | 02/15/27 | 30,000 | 28,887 | ||||||||||
| Welltower OP LLC | 4.13 | 03/15/29 | 35,000 | 34,127 | ||||||||||
| Welltower OP LLC | 4.25 | 04/01/26 | 50,000 | 49,676 | ||||||||||
| Welltower OP LLC | 4.25 | 04/15/28 | 35,000 | 34,449 | ||||||||||
| Weyerhaeuser Co. | 4.75 | 05/15/26 | 40,000 | 39,992 | ||||||||||
| 3,099,587 | ||||||||||||||
| RETAIL – 2.8% | ||||||||||||||
| AutoZone, Inc. | 3.75 | 06/01/27 | 35,000 | 34,241 | ||||||||||
| AutoZone, Inc. | 5.10 | 07/15/29 | 30,000 | 30,286 | ||||||||||
| AutoZone, Inc. | 6.25 | 11/01/28 | 35,000 | 36,833 | ||||||||||
| Best Buy Co., Inc. | 4.45 | 10/01/28 | 25,000 | 24,713 | ||||||||||
| Darden Restaurants, Inc. | 3.85 | 05/01/27 | 20,000 | 19,557 | ||||||||||
| Dollar General Corp. | 3.88 | 04/15/27 | 35,000 | 34,257 | ||||||||||
| Dollar General Corp. | 4.13 | 05/01/28 | 15,000 | 14,618 | ||||||||||
| Dollar General Corp. | 4.15 | 11/01/25 | 10,000 | 9,923 | ||||||||||
| Dollar General Corp. | 4.63 | 11/01/27 | 85,000 | 84,361 | ||||||||||
| Dollar General Corp. | 5.20 | 07/05/28 | 15,000 | 15,119 | ||||||||||
| Dollar Tree, Inc. | 4.20 | 05/15/28 | 75,000 | 72,863 | ||||||||||
| Genuine Parts Co. | 4.95 | 08/15/29 | 45,000 | 44,688 | ||||||||||
| Lowe’s Cos, Inc. | 1.30 | 04/15/28 | 55,000 | 49,146 | ||||||||||
| Lowe’s Cos, Inc. | 1.70 | 09/15/28 | 60,000 | 53,730 | ||||||||||
| Lowe’s Cos, Inc. | 2.50 | 04/15/26 | 38,000 | 36,953 | ||||||||||
| Lowe’s Cos, Inc. | 3.10 | 05/03/27 | 80,000 | 77,234 | ||||||||||
| Lowe’s Cos, Inc. | 3.35 | 04/01/27 | 30,000 | 29,149 | ||||||||||
| Lowe’s Cos, Inc. | 3.65 | 04/05/29 | 140,000 | 133,941 | ||||||||||
| Lowe’s Cos, Inc. | 4.80 | 04/01/26 | 75,000 | 75,175 | ||||||||||
| McDonald’s Corp. | 2.63 | 09/01/29 | 65,000 | 59,383 | ||||||||||
| McDonald’s Corp. | 3.50 | 03/01/27 | 30,000 | 29,311 | ||||||||||
| McDonald’s Corp. | 3.50 | 07/01/27 | 115,000 | 111,993 | ||||||||||
| McDonald’s Corp. | 3.70 | 01/30/26 | 115,000 | 113,810 | ||||||||||
| McDonald’s Corp. | 3.80 | 04/01/28 | 25,000 | 24,368 | ||||||||||
The accompanying notes are an integral part of these financial statements.
121
BONDBLOXX ETF TRUST
BondBloxx BBB Rated 1-5 Year Corporate Bond ETF
Portfolio of Investments (Continued)
October 31, 2024
| Rate (%) | Maturity | Face Amount | Value | |||||||||||
| RETAIL – 2.8% (Continued) | ||||||||||||||
| McDonald’s Corp. | 4.80 | 08/14/28 | $ | 15,000 | $ | 15,096 | ||||||||
| McDonald’s Corp. | 5.00 | 05/17/29 | 35,000 | 35,473 | ||||||||||
| O’Reilly Automotive, Inc. | 3.55 | 03/15/26 | 15,000 | 14,764 | ||||||||||
| O’Reilly Automotive, Inc. | 3.60 | 09/01/27 | 40,000 | 38,903 | ||||||||||
| O’Reilly Automotive, Inc. | 3.90 | 06/01/29 | 25,000 | 24,147 | ||||||||||
| O’Reilly Automotive, Inc. | 4.35 | 06/01/28 | 10,000 | 9,887 | ||||||||||
| O’Reilly Automotive, Inc. | 5.75 | 11/20/26 | 90,000 | 91,832 | ||||||||||
| Ross Stores, Inc. | 0.88 | 04/15/26 | 30,000 | 28,423 | ||||||||||
| Starbucks Corp. | 2.00 | 03/12/27 | 105,000 | 99,135 | ||||||||||
| Starbucks Corp. | 2.45 | 06/15/26 | 15,000 | 14,525 | ||||||||||
| Starbucks Corp. | 3.50 | 03/01/28 | 30,000 | 29,055 | ||||||||||
| Starbucks Corp. | 3.55 | 08/15/29 | 55,000 | 52,468 | ||||||||||
| Starbucks Corp. | 4.00 | 11/15/28 | 35,000 | 34,223 | ||||||||||
| Starbucks Corp. | 4.75 | 02/15/26 | 35,000 | 35,057 | ||||||||||
| Starbucks Corp. | 4.85 | 02/08/27 | 55,000 | 55,354 | ||||||||||
| 1,793,994 | ||||||||||||||
| SEMICONDUCTORS – 3.1% | ||||||||||||||
| Broadcom Corp./Broadcom Cayman Finance Ltd. | 3.50 | 01/15/28 | 65,000 | 62,588 | ||||||||||
| Broadcom Corp./Broadcom Cayman Finance Ltd. | 3.88 | 01/15/27 | 195,000 | 191,835 | ||||||||||
| Broadcom, Inc.(1) | 1.95 | 02/15/28 | 25,000 | 22,896 | ||||||||||
| Broadcom, Inc. | 3.15 | 11/15/25 | 70,000 | 68,894 | ||||||||||
| Broadcom, Inc. | 3.46 | 09/15/26 | 15,000 | 14,697 | ||||||||||
| Broadcom, Inc.(1) | 4.00 | 04/15/29 | 35,000 | 33,769 | ||||||||||
| Broadcom, Inc. | 4.11 | 09/15/28 | 110,000 | 107,550 | ||||||||||
| Broadcom, Inc. | 4.15 | 02/15/28 | 35,000 | 34,384 | ||||||||||
| Broadcom, Inc. | 4.75 | 04/15/29 | 100,000 | 99,715 | ||||||||||
| Broadcom, Inc. | 5.05 | 07/12/27 | 70,000 | 70,710 | ||||||||||
| Broadcom, Inc. | 5.05 | 07/12/29 | 125,000 | 126,112 | ||||||||||
| Intel Corp. | 1.60 | 08/12/28 | 50,000 | 44,047 | ||||||||||
| Intel Corp. | 2.60 | 05/19/26 | 55,000 | 53,154 | ||||||||||
| Intel Corp. | 3.15 | 05/11/27 | 50,000 | 47,928 | ||||||||||
| Intel Corp. | 3.75 | 03/25/27 | 65,000 | 63,284 | ||||||||||
| Intel Corp. | 3.75 | 08/05/27 | 70,000 | 67,916 | ||||||||||
| Intel Corp. | 4.00 | 08/05/29 | 70,000 | 66,815 | ||||||||||
| Intel Corp. | 4.88 | 02/10/26 | 100,000 | 100,013 | ||||||||||
| Intel Corp. | 4.88 | 02/10/28 | 100,000 | 99,605 | ||||||||||
| Marvell Technology, Inc. | 1.65 | 04/15/26 | 35,000 | 33,407 | ||||||||||
| Marvell Technology, Inc. | 2.45 | 04/15/28 | 40,000 | 36,886 | ||||||||||
| Marvell Technology, Inc. | 5.75 | 02/15/29 | 30,000 | 30,915 | ||||||||||
| Microchip Technology, Inc. | 5.05 | 03/15/29 | 75,000 | 75,275 | ||||||||||
| Micron Technology, Inc. | 4.19 | 02/15/27 | 105,000 | 103,666 | ||||||||||
| Micron Technology, Inc. | 4.98 | 02/06/26 | 20,000 | 20,061 | ||||||||||
| Micron Technology, Inc. | 5.33 | 02/06/29 | 40,000 | 40,493 | ||||||||||
| Micron Technology, Inc. | 5.38 | 04/15/28 | 10,000 | 10,144 | ||||||||||
| NXP BV/NXP Funding LLC | 5.55 | 12/01/28 | 35,000 | 35,787 | ||||||||||
| NXP BV/NXP Funding LLC/NXP USA, Inc. | 3.88 | 06/18/26 | 50,000 | 49,376 | ||||||||||
| NXP BV/NXP Funding LLC/NXP USA, Inc. | 4.30 | 06/18/29 | 60,000 | 58,388 | ||||||||||
The accompanying notes are an integral part of these financial statements.
122
BONDBLOXX ETF TRUST
BondBloxx BBB Rated 1-5 Year Corporate Bond ETF
Portfolio of Investments (Continued)
October 31, 2024
| Rate (%) | Maturity | Face Amount | Value | |||||||||||
| SEMICONDUCTORS – 3.1% (Continued) | ||||||||||||||
| NXP BV/NXP Funding LLC/NXP USA, Inc. | 4.40 | 06/01/27 | $ | 25,000 | $ | 24,868 | ||||||||
| Qorvo, Inc. | 4.38 | 10/15/29 | 40,000 | 37,739 | ||||||||||
| Skyworks Solutions, Inc. | 1.80 | 06/01/26 | 35,000 | 33,305 | ||||||||||
| 1,966,222 | ||||||||||||||
| SHIPBUILDING – 0.1% | ||||||||||||||
| Huntington Ingalls Industries, Inc. | 2.04 | 08/16/28 | 30,000 | 27,064 | ||||||||||
| Huntington Ingalls Industries, Inc. | 3.48 | 12/01/27 | 45,000 | 43,309 | ||||||||||
| 70,373 | ||||||||||||||
| SOFTWARE – 3.7% | ||||||||||||||
| Atlassian Corp. | 5.25 | 05/15/29 | 25,000 | 25,333 | ||||||||||
| Autodesk, Inc. | 3.50 | 06/15/27 | 25,000 | 24,346 | ||||||||||
| Broadridge Financial Solutions, Inc. | 3.40 | 06/27/26 | 20,000 | 19,565 | ||||||||||
| Concentrix Corp. | 6.60 | 08/02/28 | 45,000 | 45,631 | ||||||||||
| Concentrix Corp. | 6.65 | 08/02/26 | 50,000 | 50,957 | ||||||||||
| Fidelity National Information Services, Inc. | 1.15 | 03/01/26 | 65,000 | 61,982 | ||||||||||
| Fidelity National Information Services, Inc. | 1.65 | 03/01/28 | 60,000 | 54,361 | ||||||||||
| Fiserv, Inc. | 2.25 | 06/01/27 | 75,000 | 70,631 | ||||||||||
| Fiserv, Inc. | 3.20 | 07/01/26 | 105,000 | 102,536 | ||||||||||
| Fiserv, Inc. | 3.50 | 07/01/29 | 165,000 | 156,006 | ||||||||||
| Fiserv, Inc. | 4.20 | 10/01/28 | 70,000 | 68,548 | ||||||||||
| Fiserv, Inc. | 5.15 | 03/15/27 | 30,000 | 30,336 | ||||||||||
| Fiserv, Inc. | 5.38 | 08/21/28 | 45,000 | 45,901 | ||||||||||
| Fiserv, Inc. | 5.45 | 03/02/28 | 70,000 | 71,456 | ||||||||||
| Oracle Corp. | 1.65 | 03/25/26 | 185,000 | 177,305 | ||||||||||
| Oracle Corp. | 2.30 | 03/25/28 | 115,000 | 106,459 | ||||||||||
| Oracle Corp. | 2.65 | 07/15/26 | 160,000 | 154,799 | ||||||||||
| Oracle Corp. | 2.80 | 04/01/27 | 135,000 | 129,408 | ||||||||||
| Oracle Corp. | 3.25 | 11/15/27 | 150,000 | 144,138 | ||||||||||
| Oracle Corp. | 4.20 | 09/27/29 | 85,000 | 82,838 | ||||||||||
| Oracle Corp. | 4.50 | 05/06/28 | 75,000 | 74,622 | ||||||||||
| Oracle Corp. | 5.80 | 11/10/25 | 50,000 | 50,537 | ||||||||||
| Roper Technologies, Inc. | 1.40 | 09/15/27 | 65,000 | 59,739 | ||||||||||
| Roper Technologies, Inc. | 2.95 | 09/15/29 | 25,000 | 22,976 | ||||||||||
| Roper Technologies, Inc. | 3.80 | 12/15/26 | 35,000 | 34,493 | ||||||||||
| Roper Technologies, Inc. | 4.20 | 09/15/28 | 45,000 | 44,258 | ||||||||||
| Roper Technologies, Inc. | 4.50 | 10/15/29 | 25,000 | 24,629 | ||||||||||
| Take-Two Interactive Software, Inc. | 3.70 | 04/14/27 | 90,000 | 87,889 | ||||||||||
| Take-Two Interactive Software, Inc. | 4.95 | 03/28/28 | 30,000 | 30,115 | ||||||||||
| VMware LLC | 1.40 | 08/15/26 | 120,000 | 113,160 | ||||||||||
| VMware LLC | 1.80 | 08/15/28 | 75,000 | 67,197 | ||||||||||
| VMware LLC | 3.90 | 08/21/27 | 40,000 | 39,097 | ||||||||||
| VMware LLC | 4.65 | 05/15/27 | 10,000 | 9,975 | ||||||||||
| Workday, Inc. | 3.50 | 04/01/27 | 75,000 | 73,126 | ||||||||||
| Workday, Inc. | 3.70 | 04/01/29 | 25,000 | 23,975 | ||||||||||
| 2,378,324 | ||||||||||||||
The accompanying notes are an integral part of these financial statements.
123
BONDBLOXX ETF TRUST
BondBloxx BBB Rated 1-5 Year Corporate Bond ETF
Portfolio of Investments (Continued)
October 31, 2024
| Rate (%) | Maturity | Face Amount | Value | |||||||||||
| TELECOMMUNICATIONS – 5.9% | ||||||||||||||
| AT&T, Inc. | 1.65 | 02/01/28 | $ | 135,000 | $ | 122,691 | ||||||||
| AT&T, Inc. | 1.70 | 03/25/26 | 180,000 | 172,757 | ||||||||||
| AT&T, Inc. | 2.30 | 06/01/27 | 145,000 | 137,026 | ||||||||||
| AT&T, Inc. | 3.80 | 02/15/27 | 50,000 | 49,098 | ||||||||||
| AT&T, Inc. | 4.10 | 02/15/28 | 100,000 | 98,270 | ||||||||||
| AT&T, Inc. | 4.25 | 03/01/27 | 115,000 | 114,188 | ||||||||||
| AT&T, Inc. | 4.35 | 03/01/29 | 175,000 | 172,612 | ||||||||||
| AT&T, Inc. | 5.54 | 02/20/26 | 75,000 | 75,027 | ||||||||||
| British Telecommunications PLC | 5.13 | 12/04/28 | 50,000 | 50,488 | ||||||||||
| Juniper Networks, Inc. | 3.75 | 08/15/29 | 25,000 | 23,617 | ||||||||||
| Motorola Solutions, Inc. | 4.60 | 02/23/28 | 30,000 | 29,896 | ||||||||||
| Motorola Solutions, Inc. | 4.60 | 05/23/29 | 60,000 | 59,479 | ||||||||||
| Nokia OYJ | 4.38 | 06/12/27 | 25,000 | 24,546 | ||||||||||
| Rogers Communications, Inc. | 2.90 | 11/15/26 | 35,000 | 33,729 | ||||||||||
| Rogers Communications, Inc. | 3.20 | 03/15/27 | 85,000 | 81,957 | ||||||||||
| Rogers Communications, Inc. | 3.63 | 12/15/25 | 35,000 | 34,517 | ||||||||||
| Rogers Communications, Inc. | 5.00 | 02/15/29 | 70,000 | 70,079 | ||||||||||
| Sprint Capital Corp. | 6.88 | 11/15/28 | 155,000 | 166,346 | ||||||||||
| Sprint LLC | 7.63 | 03/01/26 | 85,000 | 87,243 | ||||||||||
| Telefonica Emisiones SA | 4.10 | 03/08/27 | 65,000 | 64,098 | ||||||||||
| TELUS Corp. | 2.80 | 02/16/27 | 50,000 | 47,763 | ||||||||||
| TELUS Corp. | 3.70 | 09/15/27 | 15,000 | 14,560 | ||||||||||
| T-Mobile USA, Inc. | 1.50 | 02/15/26 | 45,000 | 43,207 | ||||||||||
| T-Mobile USA, Inc. | 2.05 | 02/15/28 | 95,000 | 87,280 | ||||||||||
| T-Mobile USA, Inc. | 2.25 | 02/15/26 | 100,000 | 96,894 | ||||||||||
| T-Mobile USA, Inc. | 2.40 | 03/15/29 | 30,000 | 27,153 | ||||||||||
| T-Mobile USA, Inc. | 2.63 | 04/15/26 | 60,000 | 58,187 | ||||||||||
| T-Mobile USA, Inc. | 2.63 | 02/15/29 | 50,000 | 45,636 | ||||||||||
| T-Mobile USA, Inc. | 3.38 | 04/15/29 | 135,000 | 126,830 | ||||||||||
| T-Mobile USA, Inc. | 3.75 | 04/15/27 | 245,000 | 239,955 | ||||||||||
| T-Mobile USA, Inc. | 4.20 | 10/01/29 | 25,000 | 24,320 | ||||||||||
| T-Mobile USA, Inc. | 4.75 | 02/01/28 | 90,000 | 89,672 | ||||||||||
| T-Mobile USA, Inc. | 4.80 | 07/15/28 | 65,000 | 65,046 | ||||||||||
| T-Mobile USA, Inc. | 4.85 | 01/15/29 | 85,000 | 85,176 | ||||||||||
| T-Mobile USA, Inc. | 4.95 | 03/15/28 | 60,000 | 60,349 | ||||||||||
| T-Mobile USA, Inc. | 5.38 | 04/15/27 | 45,000 | 45,316 | ||||||||||
| Verizon Communications, Inc. | 0.85 | 11/20/25 | 75,000 | 72,165 | ||||||||||
| Verizon Communications, Inc. | 1.45 | 03/20/26 | 105,000 | 100,593 | ||||||||||
| Verizon Communications, Inc. | 2.10 | 03/22/28 | 145,000 | 133,209 | ||||||||||
| Verizon Communications, Inc. | 2.63 | 08/15/26 | 100,000 | 96,657 | ||||||||||
| Verizon Communications, Inc. | 3.00 | 03/22/27 | 35,000 | 33,745 | ||||||||||
| Verizon Communications, Inc. | 3.88 | 02/08/29 | 55,000 | 53,236 | ||||||||||
| Verizon Communications, Inc. | 4.13 | 03/16/27 | 175,000 | 172,982 | ||||||||||
| Verizon Communications, Inc. | 4.33 | 09/21/28 | 205,000 | 202,351 | ||||||||||
| Vodafone Group PLC | 4.38 | 05/30/28 | 30,000 | 29,953 | ||||||||||
| 3,719,899 | ||||||||||||||
The accompanying notes are an integral part of these financial statements.
124
BONDBLOXX ETF TRUST
BondBloxx BBB Rated 1-5 Year Corporate Bond ETF
Portfolio of Investments (Continued)
October 31, 2024
| Rate (%) | Maturity | Face Amount | Value | |||||||||||
| TOYS/GAMES/HOBBIES – 0.1% | ||||||||||||||
| Hasbro, Inc. | 3.55 | 11/19/26 | $ | 70,000 | $ | 68,209 | ||||||||
| TRANSPORTATION – 0.8% | ||||||||||||||
| BNSF Funding Trust I | 6.61 | 12/15/55 | 35,000 | 35,409 | ||||||||||
| Canadian Pacific Railway Co. | 1.75 | 12/02/26 | 70,000 | 66,072 | ||||||||||
| Canadian Pacific Railway Co. | 4.00 | 06/01/28 | 20,000 | 19,574 | ||||||||||
| CH Robinson Worldwide, Inc. | 4.20 | 04/15/28 | 45,000 | 44,088 | ||||||||||
| FedEx Corp. | 3.10 | 08/05/29 | 55,000 | 51,127 | ||||||||||
| FedEx Corp. | 3.25 | 04/01/26 | 50,000 | 49,031 | ||||||||||
| FedEx Corp. | 3.40 | 02/15/28 | 25,000 | 24,060 | ||||||||||
| JB Hunt Transport Services, Inc. | 3.88 | 03/01/26 | 40,000 | 39,537 | ||||||||||
| Kirby Corp. | 4.20 | 03/01/28 | 35,000 | 34,046 | ||||||||||
| Norfolk Southern Corp. | 2.90 | 06/15/26 | 30,000 | 29,204 | ||||||||||
| Norfolk Southern Corp. | 3.80 | 08/01/28 | 40,000 | 38,974 | ||||||||||
| Ryder System, Inc. | 5.25 | 06/01/28 | 25,000 | 25,321 | ||||||||||
| Ryder System, Inc. | 5.38 | 03/15/29 | 55,000 | 55,933 | ||||||||||
| Ryder System, Inc. | 5.65 | 03/01/28 | 20,000 | 20,524 | ||||||||||
| 532,900 | ||||||||||||||
| TRUCKING & LEASING – 0.0% | ||||||||||||||
| GATX Corp. | 4.70 | 04/01/29 | 25,000 | 24,816 | ||||||||||
| WATER – 0.2% | ||||||||||||||
| American Water Capital Corp. | 2.95 | 09/01/27 | 15,000 | 14,358 | ||||||||||
| American Water Capital Corp. | 3.45 | 06/01/29 | 40,000 | 37,836 | ||||||||||
| American Water Capital Corp. | 3.75 | 09/01/28 | 55,000 | 53,184 | ||||||||||
| Essential Utilities, Inc. | 4.80 | 08/15/27 | 25,000 | 25,011 | ||||||||||
| 130,389 | ||||||||||||||
| TOTAL CORPORATE BONDS (Cost - $62,024,488) | 62,511,335 | |||||||||||||
| SHORT-TERM INVESTMENTS – 0.3% | ||||||||||||||
| TIME DEPOSITS – 0.3% | ||||||||||||||
| JP Morgan Chase, New York | 4.18 | 11/01/24 | 165,894 | 165,894 | ||||||||||
| TOTAL SHORT-TERM INVESTMENTS (Cost - $165,894) | 165,894 | |||||||||||||
| TOTAL INVESTMENTS – 98.7% (Cost - $62,190,382) | $ | 62,677,229 | ||||||||||||
| OTHER ASSETS LESS LIABILITIES – 1.3% | 842,329 | |||||||||||||
| NET ASSETS – 100.0% | $ | 63,519,558 | ||||||||||||
| (1) | Security was purchased pursuant to Rule 144A under the Securities Act of 1933 and may not be resold subject to that Rule except to qualified institutional buyers. The aggregate value of Rule 144A holdings at October 31, 2024, amounts to $832,067 and represents 1.3% of net assets. These securities have been deemed liquid under procedures approved by the Trust’s Board of Trustees. |
| (2) | Includes step-up bonds that pay an initial coupon rate for the first period and then a higher coupon rate for the following periods. The rate reported is the rate in effect as of October 31, 2024. |
The accompanying notes are an integral part of these financial statements.
125
BONDBLOXX ETF TRUST
BondBloxx BBB Rated 5-10 Year Corporate Bond ETF
Portfolio of Investments
October 31, 2024
| Rate (%) | Maturity | Face Amount | Value | |||||||||||
| CORPORATE BONDS – 98.4% | ||||||||||||||
| ADVERTISING – 0.3% | ||||||||||||||
| Interpublic Group of Cos, Inc. | 4.75 | 03/30/30 | $ | 5,000 | $ | 4,949 | ||||||||
| Omnicom Group, Inc. | 2.45 | 04/30/30 | 10,000 | 8,805 | ||||||||||
| Omnicom Group, Inc. | 2.60 | 08/01/31 | 5,000 | 4,317 | ||||||||||
| Omnicom Group, Inc. | 4.20 | 06/01/30 | 5,000 | 4,836 | ||||||||||
| 22,907 | ||||||||||||||
| AEROSPACE/DEFENSE – 3.0% | ||||||||||||||
| Boeing Co. | 2.95 | 02/01/30 | 10,000 | 8,860 | ||||||||||
| Boeing Co. | 3.60 | 05/01/34 | 10,000 | 8,404 | ||||||||||
| Boeing Co. | 3.63 | 02/01/31 | 10,000 | 9,035 | ||||||||||
| Boeing Co. | 5.15 | 05/01/30 | 40,000 | 39,523 | ||||||||||
| Boeing Co.(1) | 6.39 | 05/01/31 | 5,000 | 5,233 | ||||||||||
| Boeing Co.(1) | 6.53 | 05/01/34 | 20,000 | 21,093 | ||||||||||
| General Electric Co. | 6.75 | 03/15/32 | 10,000 | 11,150 | ||||||||||
| HEICO Corp. | 5.35 | 08/01/33 | 5,000 | 5,046 | ||||||||||
| L3Harris Technologies, Inc. | 1.80 | 01/15/31 | 5,000 | 4,164 | ||||||||||
| L3Harris Technologies, Inc. | 5.25 | 06/01/31 | 5,000 | 5,072 | ||||||||||
| L3Harris Technologies, Inc. | 5.35 | 06/01/34 | 15,000 | 15,170 | ||||||||||
| L3Harris Technologies, Inc. | 5.40 | 07/31/33 | 10,000 | 10,151 | ||||||||||
| Northrop Grumman Corp. | 4.40 | 05/01/30 | 5,000 | 4,914 | ||||||||||
| Northrop Grumman Corp. | 4.70 | 03/15/33 | 10,000 | 9,821 | ||||||||||
| Northrop Grumman Corp. | 4.90 | 06/01/34 | 10,000 | 9,885 | ||||||||||
| RTX Corp. | 1.90 | 09/01/31 | 10,000 | 8,273 | ||||||||||
| RTX Corp. | 2.25 | 07/01/30 | 10,000 | 8,728 | ||||||||||
| RTX Corp. | 2.38 | 03/15/32 | 10,000 | 8,408 | ||||||||||
| RTX Corp. | 5.15 | 02/27/33 | 10,000 | 10,084 | ||||||||||
| RTX Corp. | 6.00 | 03/15/31 | 10,000 | 10,596 | ||||||||||
| RTX Corp. | 6.10 | 03/15/34 | 10,000 | 10,717 | ||||||||||
| 224,327 | ||||||||||||||
| AGRICULTURE – 1.2% | ||||||||||||||
| Altria Group, Inc. | 2.45 | 02/04/32 | 10,000 | 8,315 | ||||||||||
| Altria Group, Inc. | 3.40 | 05/06/30 | 5,000 | 4,614 | ||||||||||
| Altria Group, Inc. | 6.88 | 11/01/33 | 5,000 | 5,498 | ||||||||||
| BAT Capital Corp. | 2.73 | 03/25/31 | 10,000 | 8,714 | ||||||||||
| BAT Capital Corp. | 4.74 | 03/16/32 | 5,000 | 4,854 | ||||||||||
| BAT Capital Corp. | 4.91 | 04/02/30 | 5,000 | 4,952 | ||||||||||
| BAT Capital Corp. | 5.83 | 02/20/31 | 10,000 | 10,321 | ||||||||||
| BAT Capital Corp. | 6.00 | 02/20/34 | 5,000 | 5,174 | ||||||||||
| BAT Capital Corp. | 6.34 | 08/02/30 | 10,000 | 10,559 | ||||||||||
| BAT Capital Corp. | 6.42 | 08/02/33 | 10,000 | 10,651 | ||||||||||
| BAT Capital Corp. | 7.75 | 10/19/32 | 10,000 | 11,489 | ||||||||||
| Bunge Ltd. Finance Corp. | 2.75 | 05/14/31 | 5,000 | 4,385 | ||||||||||
| 89,526 | ||||||||||||||
| APPAREL – 0.3% | ||||||||||||||
| Tapestry, Inc. | 7.70 | 11/27/30 | 10,000 | 10,208 | ||||||||||
| Tapestry, Inc. | 7.85 | 11/27/33 | 15,000 | 15,322 | ||||||||||
| 25,530 | ||||||||||||||
The accompanying notes are an integral part of these financial statements.
126
BONDBLOXX ETF TRUST
BondBloxx BBB Rated 5-10 Year Corporate Bond ETF
Portfolio of Investments (Continued)
October 31, 2024
| Rate (%) | Maturity | Face Amount | Value | |||||||||||
| AUTO MANUFACTURERS – 2.9% | ||||||||||||||
| Ford Motor Co. | 3.25 | 02/12/32 | $ | 20,000 | $ | 16,752 | ||||||||
| Ford Motor Co. | 6.10 | 08/19/32 | 10,000 | 10,055 | ||||||||||
| Ford Motor Co. | 7.45 | 07/16/31 | 15,000 | 16,256 | ||||||||||
| Ford Motor Credit Co. LLC | 3.63 | 06/17/31 | 10,000 | 8,706 | ||||||||||
| Ford Motor Credit Co. LLC | 4.00 | 11/13/30 | 15,000 | 13,566 | ||||||||||
| Ford Motor Credit Co. LLC | 6.05 | 03/05/31 | 5,000 | 5,034 | ||||||||||
| Ford Motor Credit Co. LLC | 6.13 | 03/08/34 | 15,000 | 14,855 | ||||||||||
| Ford Motor Credit Co. LLC | 7.12 | 11/07/33 | 10,000 | 10,587 | ||||||||||
| Ford Motor Credit Co. LLC | 7.20 | 06/10/30 | 5,000 | 5,280 | ||||||||||
| Ford Motor Credit Co. LLC | 7.35 | 03/06/30 | 10,000 | 10,615 | ||||||||||
| General Motors Co. | 5.60 | 10/15/32 | 10,000 | 10,157 | ||||||||||
| General Motors Financial Co., Inc. | 2.35 | 01/08/31 | 10,000 | 8,424 | ||||||||||
| General Motors Financial Co., Inc. | 2.70 | 06/10/31 | 10,000 | 8,503 | ||||||||||
| General Motors Financial Co., Inc. | 3.10 | 01/12/32 | 10,000 | 8,602 | ||||||||||
| General Motors Financial Co., Inc. | 3.60 | 06/21/30 | 10,000 | 9,179 | ||||||||||
| General Motors Financial Co., Inc. | 5.60 | 06/18/31 | 5,000 | 5,043 | ||||||||||
| General Motors Financial Co., Inc. | 5.75 | 02/08/31 | 15,000 | 15,283 | ||||||||||
| General Motors Financial Co., Inc. | 5.85 | 04/06/30 | 10,000 | 10,257 | ||||||||||
| General Motors Financial Co., Inc. | 5.95 | 04/04/34 | 10,000 | 10,191 | ||||||||||
| General Motors Financial Co., Inc. | 6.10 | 01/07/34 | 10,000 | 10,279 | ||||||||||
| General Motors Financial Co., Inc. | 6.40 | 01/09/33 | 10,000 | 10,506 | ||||||||||
| 218,130 | ||||||||||||||
| AUTO PARTS & EQUIPMENT – 0.2% | ||||||||||||||
| Aptiv PLC/Aptiv Corp. | 3.25 | 03/01/32 | 5,000 | 4,350 | ||||||||||
| Aptiv PLC/Aptiv Global Financing DAC | 5.15 | 09/13/34 | 10,000 | 9,478 | ||||||||||
| 13,828 | ||||||||||||||
| BANKS – 8.1% | ||||||||||||||
| Banco Bilbao Vizcaya Argentaria SA | 6.03 | 03/13/35 | 5,000 | 5,143 | ||||||||||
| Banco Bilbao Vizcaya Argentaria SA | 7.88 | 11/15/34 | 5,000 | 5,603 | ||||||||||
| Banco Santander SA | 2.75 | 12/03/30 | 10,000 | 8,586 | ||||||||||
| Banco Santander SA | 3.23 | 11/22/32 | 15,000 | 12,965 | ||||||||||
| Banco Santander SA | 6.35 | 03/14/34 | 15,000 | 15,569 | ||||||||||
| Banco Santander SA | 6.92 | 08/08/33 | 10,000 | 10,770 | ||||||||||
| Bank of Montreal | 3.09 | 01/10/37 | 10,000 | 8,448 | ||||||||||
| Bank of Nova Scotia | 4.59 | 05/04/37 | 10,000 | 9,298 | ||||||||||
| Barclays PLC | 2.65 | 06/24/31 | 10,000 | 8,746 | ||||||||||
| Barclays PLC | 2.67 | 03/10/32 | 10,000 | 8,604 | ||||||||||
| Barclays PLC | 2.89 | 11/24/32 | 10,000 | 8,568 | ||||||||||
| Barclays PLC | 3.56 | 09/23/35 | 5,000 | 4,447 | ||||||||||
| Barclays PLC | 5.34 | 09/10/35 | 10,000 | 9,805 | ||||||||||
| Barclays PLC | 5.75 | 08/09/33 | 10,000 | 10,190 | ||||||||||
| Barclays PLC | 6.22 | 05/09/34 | 15,000 | 15,729 | ||||||||||
| Barclays PLC | 6.69 | 09/13/34 | 15,000 | 16,218 | ||||||||||
| Barclays PLC | 7.12 | 06/27/34 | 10,000 | 10,835 | ||||||||||
| Barclays PLC | 7.44 | 11/02/33 | 20,000 | 22,460 | ||||||||||
| Citigroup, Inc. | 5.83 | 02/13/35 | 20,000 | 20,182 | ||||||||||
| Citigroup, Inc. | 6.00 | 10/31/33 | 5,000 | 5,229 | ||||||||||
The accompanying notes are an integral part of these financial statements.
127
BONDBLOXX ETF TRUST
BondBloxx BBB Rated 5-10 Year Corporate Bond ETF
Portfolio of Investments (Continued)
October 31, 2024
| Rate (%) | Maturity | Face Amount | Value | |||||||||||
| BANKS – 8.1% (Continued) | ||||||||||||||
| Citigroup, Inc. | 6.17 | 05/25/34 | $ | 25,000 | $ | 25,928 | ||||||||
| Citigroup, Inc. | 6.63 | 06/15/32 | 10,000 | 10,797 | ||||||||||
| Citizens Financial Group, Inc. | 2.64 | 09/30/32 | 5,000 | 4,080 | ||||||||||
| Citizens Financial Group, Inc. | 3.25 | 04/30/30 | 10,000 | 9,075 | ||||||||||
| Citizens Financial Group, Inc. | 5.72 | 07/23/32 | 10,000 | 10,099 | ||||||||||
| Citizens Financial Group, Inc. | 6.65 | 04/25/35 | 5,000 | 5,341 | ||||||||||
| Deutsche Bank AG/New York, NY | 3.04 | 05/28/32 | 10,000 | 8,651 | ||||||||||
| Deutsche Bank AG/New York, NY | 3.55 | 09/18/31 | 15,000 | 13,613 | ||||||||||
| Deutsche Bank AG/New York, NY | 3.73 | 01/14/32 | 15,000 | 13,226 | ||||||||||
| Deutsche Bank AG/New York, NY | 3.74 | 01/07/33 | 10,000 | 8,610 | ||||||||||
| Deutsche Bank AG/New York, NY | 7.08 | 02/10/34 | 10,000 | 10,507 | ||||||||||
| Fifth Third Bancorp | 4.34 | 04/25/33 | 10,000 | 9,357 | ||||||||||
| Fifth Third Bancorp | 5.63 | 01/29/32 | 5,000 | 5,086 | ||||||||||
| Goldman Sachs Capital I | 6.35 | 02/15/34 | 5,000 | 5,246 | ||||||||||
| HSBC Holdings PLC | 4.76 | 03/29/33 | 20,000 | 19,158 | ||||||||||
| HSBC Holdings PLC | 6.55 | 06/20/34 | 15,000 | 15,927 | ||||||||||
| HSBC Holdings PLC | 7.40 | 11/13/34 | 15,000 | 16,759 | ||||||||||
| HSBC Holdings PLC | 8.11 | 11/03/33 | 15,000 | 17,312 | ||||||||||
| Huntington Bancshares, Inc./OH | 2.55 | 02/04/30 | 15,000 | 13,237 | ||||||||||
| Huntington Bancshares, Inc./OH | 5.71 | 02/02/35 | 10,000 | 10,126 | ||||||||||
| KeyBank, N.A./Cleveland, OH | 4.90 | 08/08/32 | 10,000 | 9,552 | ||||||||||
| KeyBank, N.A./Cleveland, OH | 5.00 | 01/26/33 | 10,000 | 9,661 | ||||||||||
| KeyCorp | 4.79 | 06/01/33 | 10,000 | 9,549 | ||||||||||
| KeyCorp | 6.40 | 03/06/35 | 5,000 | 5,276 | ||||||||||
| Lloyds Banking Group PLC | 7.95 | 11/15/33 | 5,000 | 5,671 | ||||||||||
| M&T Bank Corp. | 5.05 | 01/27/34 | 10,000 | 9,648 | ||||||||||
| M&T Bank Corp. | 6.08 | 03/13/32 | 5,000 | 5,173 | ||||||||||
| Mizuho Financial Group, Inc. | 2.56 | 09/13/31 | 5,000 | 4,214 | ||||||||||
| Morgan Stanley | 2.48 | 09/16/36 | 30,000 | 24,478 | ||||||||||
| Morgan Stanley | 5.30 | 04/20/37 | 20,000 | 19,609 | ||||||||||
| Morgan Stanley | 5.94 | 02/07/39 | 10,000 | 10,154 | ||||||||||
| Morgan Stanley | 5.95 | 01/19/38 | 15,000 | 15,264 | ||||||||||
| NatWest Group PLC | 3.03 | 11/28/35 | 10,000 | 8,701 | ||||||||||
| Santander Holdings USA, Inc. | 6.34 | 05/31/35 | 10,000 | 10,229 | ||||||||||
| Santander Holdings USA, Inc. | 7.66 | 11/09/31 | 5,000 | 5,486 | ||||||||||
| Santander UK Group Holdings PLC | 2.90 | 03/15/32 | 5,000 | 4,358 | ||||||||||
| Sumitomo Mitsui Financial Group, Inc. | 2.14 | 09/23/30 | 10,000 | 8,529 | ||||||||||
| Truist Financial Corp. | 4.92 | 07/28/33 | 5,000 | 4,771 | ||||||||||
| 619,853 | ||||||||||||||
| BEVERAGES – 0.8% | ||||||||||||||
| Coca-Cola Consolidated, Inc. | 5.45 | 06/01/34 | 5,000 | 5,087 | ||||||||||
| Constellation Brands, Inc. | 2.25 | 08/01/31 | 5,000 | 4,214 | ||||||||||
| Constellation Brands, Inc. | 2.88 | 05/01/30 | 10,000 | 8,998 | ||||||||||
| Constellation Brands, Inc. | 4.75 | 05/09/32 | 5,000 | 4,898 | ||||||||||
| Constellation Brands, Inc. | 4.90 | 05/01/33 | 5,000 | 4,903 | ||||||||||
| Keurig Dr Pepper, Inc. | 3.20 | 05/01/30 | 10,000 | 9,214 | ||||||||||
The accompanying notes are an integral part of these financial statements.
128
BONDBLOXX ETF TRUST
BondBloxx BBB Rated 5-10 Year Corporate Bond ETF
Portfolio of Investments (Continued)
October 31, 2024
| Rate (%) | Maturity | Face Amount | Value | |||||||||||
| BEVERAGES – 0.8% (Continued) | ||||||||||||||
| Keurig Dr Pepper, Inc. | 4.05 | 04/15/32 | $ | 10,000 | $ | 9,500 | ||||||||
| Keurig Dr Pepper, Inc. | 5.20 | 03/15/31 | 5,000 | 5,075 | ||||||||||
| Keurig Dr Pepper, Inc. | 5.30 | 03/15/34 | 5,000 | 5,065 | ||||||||||
| 56,954 | ||||||||||||||
| BIOTECHNOLOGY – 2.1% | ||||||||||||||
| Amgen, Inc. | 2.00 | 01/15/32 | 10,000 | 8,235 | ||||||||||
| Amgen, Inc. | 2.30 | 02/25/31 | 10,000 | 8,625 | ||||||||||
| Amgen, Inc. | 2.45 | 02/21/30 | 10,000 | 8,913 | ||||||||||
| Amgen, Inc. | 3.35 | 02/22/32 | 5,000 | 4,517 | ||||||||||
| Amgen, Inc. | 4.20 | 03/01/33 | 5,000 | 4,704 | ||||||||||
| Amgen, Inc. | 5.25 | 03/02/30 | 25,000 | 25,505 | ||||||||||
| Amgen, Inc. | 5.25 | 03/02/33 | 35,000 | 35,378 | ||||||||||
| Biogen, Inc. | 2.25 | 05/01/30 | 10,000 | 8,684 | ||||||||||
| Bio-Rad Laboratories, Inc. | 3.70 | 03/15/32 | 5,000 | 4,509 | ||||||||||
| Gilead Sciences, Inc. | 1.65 | 10/01/30 | 10,000 | 8,402 | ||||||||||
| Gilead Sciences, Inc. | 5.25 | 10/15/33 | 10,000 | 10,212 | ||||||||||
| Illumina, Inc. | 2.55 | 03/23/31 | 5,000 | 4,278 | ||||||||||
| Regeneron Pharmaceuticals, Inc. | 1.75 | 09/15/30 | 15,000 | 12,606 | ||||||||||
| Royalty Pharma PLC | 2.15 | 09/02/31 | 10,000 | 8,294 | ||||||||||
| Royalty Pharma PLC | 2.20 | 09/02/30 | 10,000 | 8,548 | ||||||||||
| 161,410 | ||||||||||||||
| BUILDING MATERIALS – 1.3% | ||||||||||||||
| Carrier Global Corp. | 2.70 | 02/15/31 | 5,000 | 4,391 | ||||||||||
| Carrier Global Corp. | 2.72 | 02/15/30 | 20,000 | 17,983 | ||||||||||
| Carrier Global Corp. | 5.90 | 03/15/34 | 10,000 | 10,514 | ||||||||||
| CRH America Finance, Inc. | 5.40 | 05/21/34 | 10,000 | 10,137 | ||||||||||
| Eagle Materials, Inc. | 2.50 | 07/01/31 | 5,000 | 4,323 | ||||||||||
| Fortune Brands Innovations, Inc. | 5.88 | 06/01/33 | 5,000 | 5,256 | ||||||||||
| Johnson Controls International PLC/Tyco Fire & Security Finance SCA | 1.75 | 09/15/30 | 5,000 | 4,224 | ||||||||||
| Johnson Controls International PLC/Tyco Fire & Security Finance SCA | 2.00 | 09/16/31 | 5,000 | 4,189 | ||||||||||
| Martin Marietta Materials, Inc. | 2.40 | 07/15/31 | 5,000 | 4,281 | ||||||||||
| Masco Corp. | 2.00 | 02/15/31 | 10,000 | 8,437 | ||||||||||
| Owens Corning | 5.70 | 06/15/34 | 5,000 | 5,147 | ||||||||||
| Trane Technologies Financing Ltd. | 5.10 | 06/13/34 | 10,000 | 10,121 | ||||||||||
| Trane Technologies Financing Ltd. | 5.25 | 03/03/33 | 5,000 | 5,108 | ||||||||||
| Vulcan Materials Co. | 3.50 | 06/01/30 | 5,000 | 4,658 | ||||||||||
| 98,769 | ||||||||||||||
| CHEMICALS – 1.5% | ||||||||||||||
| Albemarle Corp. | 5.05 | 06/01/32 | 5,000 | 4,868 | ||||||||||
| Celanese US Holdings LLC | 6.38 | 07/15/32 | 5,000 | 5,189 | ||||||||||
| Celanese US Holdings LLC | 6.55 | 11/15/30 | 10,000 | 10,485 | ||||||||||
| Celanese US Holdings LLC | 6.70 | 11/15/33 | 15,000 | 15,950 | ||||||||||
| CF Industries, Inc. | 5.15 | 03/15/34 | 5,000 | 4,907 | ||||||||||
| Dow Chemical Co. | 2.10 | 11/15/30 | 10,000 | 8,578 | ||||||||||
| Dow Chemical Co. | 5.15 | 02/15/34 | 5,000 | 4,977 | ||||||||||
| Dow Chemical Co. | 6.30 | 03/15/33 | 5,000 | 5,395 | ||||||||||
| Dow Chemical Co. | 7.38 | 11/01/29 | 5,000 | 5,537 | ||||||||||
The accompanying notes are an integral part of these financial statements.
129
BONDBLOXX ETF TRUST
BondBloxx BBB Rated 5-10 Year Corporate Bond ETF
Portfolio of Investments (Continued)
October 31, 2024
| Rate (%) | Maturity | Face Amount | Value | |||||||||||
| CHEMICALS – 1.5% (Continued) | ||||||||||||||
| Eastman Chemical Co. | 5.63 | 02/20/34 | $ | 5,000 | $ | 5,052 | ||||||||
| Eastman Chemical Co. | 5.75 | 03/08/33 | 10,000 | 10,262 | ||||||||||
| FMC Corp. | 5.65 | 05/18/33 | 5,000 | 5,037 | ||||||||||
| LYB International Finance III LLC | 5.50 | 03/01/34 | 5,000 | 5,026 | ||||||||||
| LYB International Finance III LLC | 5.63 | 05/15/33 | 5,000 | 5,136 | ||||||||||
| Nutrien Ltd. | 5.40 | 06/21/34 | 5,000 | 5,031 | ||||||||||
| Sherwin-Williams Co. | 2.20 | 03/15/32 | 15,000 | 12,551 | ||||||||||
| 113,981 | ||||||||||||||
| COMMERCIAL SERVICES – 1.0% | ||||||||||||||
| Block Financial LLC | 3.88 | 08/15/30 | 5,000 | 4,675 | ||||||||||
| Equifax, Inc. | 2.35 | 09/15/31 | 10,000 | 8,423 | ||||||||||
| Global Payments, Inc. | 2.90 | 05/15/30 | 10,000 | 8,939 | ||||||||||
| Global Payments, Inc. | 2.90 | 11/15/31 | 10,000 | 8,643 | ||||||||||
| Global Payments, Inc. | 5.40 | 08/15/32 | 5,000 | 5,031 | ||||||||||
| GXO Logistics, Inc. | 6.50 | 05/06/34 | 5,000 | 5,200 | ||||||||||
| Moody’s Corp. | 4.25 | 08/08/32 | 5,000 | 4,786 | ||||||||||
| Quanta Services, Inc. | 2.90 | 10/01/30 | 10,000 | 8,999 | ||||||||||
| Quanta Services, Inc. | 5.25 | 08/09/34 | 5,000 | 4,964 | ||||||||||
| RELX Capital, Inc. | 3.00 | 05/22/30 | 5,000 | 4,571 | ||||||||||
| Triton Container International Ltd./TAL International Container Corp. | 3.25 | 03/15/32 | 5,000 | 4,248 | ||||||||||
| Verisk Analytics, Inc. | 5.25 | 06/05/34 | 10,000 | 10,038 | ||||||||||
| 78,517 | ||||||||||||||
| COMPUTERS – 1.8% | ||||||||||||||
| Amdocs Ltd. | 2.54 | 06/15/30 | 10,000 | 8,744 | ||||||||||
| Booz Allen Hamilton, Inc. | 5.95 | 08/04/33 | 5,000 | 5,256 | ||||||||||
| Dell International LLC/EMC Corp. | 5.30 | 10/01/29 | 5,000 | 5,083 | ||||||||||
| Dell International LLC/EMC Corp. | 5.40 | 04/15/34 | 15,000 | 15,186 | ||||||||||
| Dell International LLC/EMC Corp. | 5.75 | 02/01/33 | 5,000 | 5,205 | ||||||||||
| Dell International LLC/EMC Corp. | 6.20 | 07/15/30 | 5,000 | 5,301 | ||||||||||
| Hewlett Packard Enterprise Co. | 4.85 | 10/15/31 | 10,000 | 9,806 | ||||||||||
| Hewlett Packard Enterprise Co. | 5.00 | 10/15/34 | 15,000 | 14,556 | ||||||||||
| HP, Inc. | 2.65 | 06/17/31 | 10,000 | 8,637 | ||||||||||
| HP, Inc. | 4.20 | 04/15/32 | 10,000 | 9,461 | ||||||||||
| HP, Inc. | 5.50 | 01/15/33 | 10,000 | 10,223 | ||||||||||
| Kyndryl Holdings, Inc. | 6.35 | 02/20/34 | 10,000 | 10,362 | ||||||||||
| Leidos, Inc. | 2.30 | 02/15/31 | 10,000 | 8,527 | ||||||||||
| Leidos, Inc. | 4.38 | 05/15/30 | 10,000 | 9,646 | ||||||||||
| Leidos, Inc. | 5.75 | 03/15/33 | 5,000 | 5,175 | ||||||||||
| NetApp, Inc. | 2.70 | 06/22/30 | 5,000 | 4,433 | ||||||||||
| Western Digital Corp. | 3.10 | 02/01/32 | 5,000 | 4,182 | ||||||||||
| 139,783 | ||||||||||||||
| COSMETICS/PERSONAL CARE – 0.2% | ||||||||||||||
| Haleon US Capital LLC | 3.63 | 03/24/32 | 20,000 | 18,326 | ||||||||||
The accompanying notes are an integral part of these financial statements.
130
BONDBLOXX ETF TRUST
BondBloxx BBB Rated 5-10 Year Corporate Bond ETF
Portfolio of Investments (Continued)
October 31, 2024
| Rate (%) | Maturity | Face Amount | Value | |||||||||||
| DISTRIBUTION/WHOLESALE – 0.1% | ||||||||||||||
| LKQ Corp. | 6.25 | 06/15/33 | $ | 5,000 | $ | 5,165 | ||||||||
| DIVERSIFIED FINANCIAL SERVICES – 4.6% | ||||||||||||||
| AerCap Ireland Capital DAC/AerCap Global Aviation Trust | 3.30 | 01/30/32 | 30,000 | 26,393 | ||||||||||
| AerCap Ireland Capital DAC/AerCap Global Aviation Trust | 3.40 | 10/29/33 | 15,000 | 12,877 | ||||||||||
| AerCap Ireland Capital DAC/AerCap Global Aviation Trust | 4.95 | 09/10/34 | 5,000 | 4,815 | ||||||||||
| AerCap Ireland Capital DAC/AerCap Global Aviation Trust | 5.30 | 01/19/34 | 10,000 | 9,937 | ||||||||||
| AerCap Ireland Capital DAC/AerCap Global Aviation Trust | 6.15 | 09/30/30 | 5,000 | 5,250 | ||||||||||
| AerCap Ireland Capital DAC/AerCap Global Aviation Trust | 6.95 | 03/10/55 | 5,000 | 5,154 | ||||||||||
| Air Lease Corp. | 2.88 | 01/15/32 | 5,000 | 4,292 | ||||||||||
| Air Lease Corp. | 3.13 | 12/01/30 | 10,000 | 8,952 | ||||||||||
| Air Lease Corp. | 5.20 | 07/15/31 | 10,000 | 9,967 | ||||||||||
| Ally Financial, Inc. | 6.18 | 07/26/35 | 5,000 | 4,996 | ||||||||||
| Ally Financial, Inc. | 8.00 | 11/01/31 | 10,000 | 11,155 | ||||||||||
| Ally Financial, Inc. | 8.00 | 11/01/31 | 15,000 | 16,695 | ||||||||||
| Blue Owl Finance LLC | 6.25 | 04/18/34 | 5,000 | 5,145 | ||||||||||
| Capital One Financial Corp. | 2.36 | 07/29/32 | 10,000 | 8,075 | ||||||||||
| Capital One Financial Corp. | 2.62 | 11/02/32 | 5,000 | 4,181 | ||||||||||
| Capital One Financial Corp. | 5.27 | 05/10/33 | 10,000 | 9,859 | ||||||||||
| Capital One Financial Corp. | 5.82 | 02/01/34 | 15,000 | 15,221 | ||||||||||
| Capital One Financial Corp. | 5.88 | 07/26/35 | 10,000 | 10,163 | ||||||||||
| Capital One Financial Corp. | 6.05 | 02/01/35 | 5,000 | 5,147 | ||||||||||
| Capital One Financial Corp. | 6.38 | 06/08/34 | 10,000 | 10,496 | ||||||||||
| Capital One Financial Corp. | 7.62 | 10/30/31 | 15,000 | 16,674 | ||||||||||
| CI Financial Corp. | 3.20 | 12/17/30 | 10,000 | 8,476 | ||||||||||
| Discover Financial Services | 6.70 | 11/29/32 | 10,000 | 10,764 | ||||||||||
| Discover Financial Services | 7.96 | 11/02/34 | 5,000 | 5,744 | ||||||||||
| Jefferies Financial Group, Inc. | 2.63 | 10/15/31 | 15,000 | 12,715 | ||||||||||
| Jefferies Financial Group, Inc. | 4.15 | 01/23/30 | 5,000 | 4,783 | ||||||||||
| Jefferies Financial Group, Inc. | 6.20 | 04/14/34 | 15,000 | 15,641 | ||||||||||
| Nasdaq, Inc. | 1.65 | 01/15/31 | 10,000 | 8,323 | ||||||||||
| Nasdaq, Inc. | 5.55 | 02/15/34 | 10,000 | 10,225 | ||||||||||
| Nomura Holdings, Inc. | 2.61 | 07/14/31 | 10,000 | 8,507 | ||||||||||
| Nomura Holdings, Inc. | 2.68 | 07/16/30 | 5,000 | 4,379 | ||||||||||
| Nomura Holdings, Inc. | 3.00 | 01/22/32 | 5,000 | 4,302 | ||||||||||
| Nomura Holdings, Inc. | 3.10 | 01/16/30 | 10,000 | 9,064 | ||||||||||
| Nomura Holdings, Inc. | 5.78 | 07/03/34 | 5,000 | 5,103 | ||||||||||
| Nomura Holdings, Inc. | 6.09 | 07/12/33 | 10,000 | 10,526 | ||||||||||
| Nomura Holdings, Inc. | 6.18 | 01/18/33 | 10,000 | 10,534 | ||||||||||
| Synchrony Financial | 2.88 | 10/28/31 | 10,000 | 8,349 | ||||||||||
| TPG Operating Group II LP | 5.88 | 03/05/34 | 5,000 | 5,179 | ||||||||||
| 348,058 | ||||||||||||||
| ELECTRIC – 6.6% | ||||||||||||||
| AEP Texas, Inc. | 2.10 | 07/01/30 | 10,000 | 8,621 | ||||||||||
| AEP Texas, Inc. | 4.70 | 05/15/32 | 10,000 | 9,756 | ||||||||||
| AES Corp. | 2.45 | 01/15/31 | 5,000 | 4,211 | ||||||||||
The accompanying notes are an integral part of these financial statements.
131
BONDBLOXX ETF TRUST
BondBloxx BBB Rated 5-10 Year Corporate Bond ETF
Portfolio of Investments (Continued)
October 31, 2024
| Rate (%) | Maturity | Face Amount | Value | |||||||||||
| ELECTRIC – 6.6% (Continued) | ||||||||||||||
| Ameren Corp. | 3.50 | 01/15/31 | $ | 5,000 | $ | 4,618 | ||||||||
| American Electric Power Co., Inc. | 5.63 | 03/01/33 | 10,000 | 10,219 | ||||||||||
| Arizona Public Service Co. | 5.55 | 08/01/33 | 5,000 | 5,079 | ||||||||||
| Constellation Energy Generation LLC | 5.80 | 03/01/33 | 5,000 | 5,194 | ||||||||||
| Dominion Energy, Inc. | 2.25 | 08/15/31 | 5,000 | 4,215 | ||||||||||
| Dominion Energy, Inc. | 3.38 | 04/01/30 | 10,000 | 9,261 | ||||||||||
| Dominion Energy, Inc. | 5.25 | 08/01/33 | 20,000 | 20,009 | ||||||||||
| Dominion Energy, Inc. | 5.38 | 11/15/32 | 5,000 | 5,089 | ||||||||||
| Dominion Energy, Inc. | 6.88 | 02/01/55 | 5,000 | 5,229 | ||||||||||
| Dominion Energy, Inc. | 7.00 | 06/01/54 | 5,000 | 5,332 | ||||||||||
| DTE Energy Co. | 5.85 | 06/01/34 | 5,000 | 5,196 | ||||||||||
| Duke Energy Corp. | 2.45 | 06/01/30 | 5,000 | 4,394 | ||||||||||
| Duke Energy Corp. | 2.55 | 06/15/31 | 5,000 | 4,301 | ||||||||||
| Duke Energy Corp. | 4.50 | 08/15/32 | 10,000 | 9,610 | ||||||||||
| Duke Energy Corp. | 5.45 | 06/15/34 | 5,000 | 5,059 | ||||||||||
| Duke Energy Corp. | 5.75 | 09/15/33 | 10,000 | 10,384 | ||||||||||
| Edison International | 6.95 | 11/15/29 | 5,000 | 5,408 | ||||||||||
| Entergy Corp. | 2.80 | 06/15/30 | 10,000 | 8,957 | ||||||||||
| Entergy Corp. | 7.13 | 12/01/54 | 10,000 | 10,251 | ||||||||||
| Eversource Energy | 3.38 | 03/01/32 | 10,000 | 8,891 | ||||||||||
| Eversource Energy | 5.13 | 05/15/33 | 10,000 | 9,867 | ||||||||||
| Eversource Energy | 5.50 | 01/01/34 | 5,000 | 5,045 | ||||||||||
| Eversource Energy | 5.85 | 04/15/31 | 5,000 | 5,182 | ||||||||||
| Eversource Energy | 5.95 | 07/15/34 | 5,000 | 5,198 | ||||||||||
| Exelon Corp. | 4.05 | 04/15/30 | 10,000 | 9,594 | ||||||||||
| Exelon Corp. | 5.30 | 03/15/33 | 10,000 | 10,146 | ||||||||||
| Exelon Corp. | 5.45 | 03/15/34 | 10,000 | 10,180 | ||||||||||
| FirstEnergy Corp. | 2.65 | 03/01/30 | 10,000 | 8,910 | ||||||||||
| National Grid PLC | 5.42 | 01/11/34 | 5,000 | 5,058 | ||||||||||
| National Grid PLC | 5.81 | 06/12/33 | 5,000 | 5,187 | ||||||||||
| NextEra Energy Capital Holdings, Inc. | 2.25 | 06/01/30 | 20,000 | 17,438 | ||||||||||
| NextEra Energy Capital Holdings, Inc. | 2.44 | 01/15/32 | 10,000 | 8,442 | ||||||||||
| NextEra Energy Capital Holdings, Inc. | 2.75 | 11/01/29 | 5,000 | 4,554 | ||||||||||
| NextEra Energy Capital Holdings, Inc. | 5.00 | 07/15/32 | 5,000 | 4,991 | ||||||||||
| NextEra Energy Capital Holdings, Inc. | 5.05 | 02/28/33 | 10,000 | 9,944 | ||||||||||
| NextEra Energy Capital Holdings, Inc. | 5.25 | 03/15/34 | 10,000 | 10,054 | ||||||||||
| NextEra Energy Capital Holdings, Inc. | 6.75 | 06/15/54 | 10,000 | 10,509 | ||||||||||
| Pacific Gas & Electric Co. | 2.50 | 02/01/31 | 20,000 | 17,161 | ||||||||||
| Pacific Gas & Electric Co. | 3.25 | 06/01/31 | 10,000 | 8,926 | ||||||||||
| Pacific Gas & Electric Co. | 4.55 | 07/01/30 | 25,000 | 24,280 | ||||||||||
| Pacific Gas & Electric Co. | 5.80 | 05/15/34 | 10,000 | 10,279 | ||||||||||
| Pacific Gas & Electric Co. | 6.15 | 01/15/33 | 5,000 | 5,234 | ||||||||||
| Pacific Gas & Electric Co. | 6.40 | 06/15/33 | 10,000 | 10,663 | ||||||||||
| Pacific Gas & Electric Co. | 6.95 | 03/15/34 | 5,000 | 5,553 | ||||||||||
| Progress Energy, Inc. | 7.75 | 03/01/31 | 10,000 | 11,439 | ||||||||||
| Public Service Enterprise Group, Inc. | 2.45 | 11/15/31 | 20,000 | 17,052 | ||||||||||
| Sempra | 5.50 | 08/01/33 | 5,000 | 5,105 | ||||||||||
| Sempra | 6.40 | 10/01/54 | 10,000 | 9,967 | ||||||||||
The accompanying notes are an integral part of these financial statements.
132
BONDBLOXX ETF TRUST
BondBloxx BBB Rated 5-10 Year Corporate Bond ETF
Portfolio of Investments (Continued)
October 31, 2024
| Rate (%) | Maturity | Face Amount | Value | |||||||||||
| ELECTRIC – 6.6% (Continued) | ||||||||||||||
| Southern Co. | 3.70 | 04/30/30 | $ | 10,000 | $ | 9,434 | ||||||||
| Southern Co. | 5.20 | 06/15/33 | 10,000 | 10,059 | ||||||||||
| Southern Co. | 5.70 | 03/15/34 | 10,000 | 10,408 | ||||||||||
| Wisconsin Power & Light Co. | 3.95 | 09/01/32 | 10,000 | 9,382 | ||||||||||
| Xcel Energy, Inc. | 3.40 | 06/01/30 | 10,000 | 9,228 | ||||||||||
| Xcel Energy, Inc. | 4.60 | 06/01/32 | 10,000 | 9,598 | ||||||||||
| Xcel Energy, Inc. | 5.45 | 08/15/33 | 5,000 | 5,049 | ||||||||||
| Xcel Energy, Inc. | 5.50 | 03/15/34 | 5,000 | 5,046 | ||||||||||
| 503,446 | ||||||||||||||
| ELECTRONICS – 0.9% | ||||||||||||||
| Allegion US Holding Co., Inc. | 5.41 | 07/01/32 | 5,000 | 5,069 | ||||||||||
| Amphenol Corp. | 2.20 | 09/15/31 | 5,000 | 4,212 | ||||||||||
| Amphenol Corp. | 2.80 | 02/15/30 | 5,000 | 4,529 | ||||||||||
| Amphenol Corp. | 5.25 | 04/05/34 | 10,000 | 10,145 | ||||||||||
| Arrow Electronics, Inc. | 5.88 | 04/10/34 | 5,000 | 5,067 | ||||||||||
| Flex Ltd. | 4.88 | 05/12/30 | 10,000 | 9,789 | ||||||||||
| Jabil, Inc. | 3.00 | 01/15/31 | 10,000 | 8,819 | ||||||||||
| TD SYNNEX Corp. | 6.10 | 04/12/34 | 10,000 | 10,345 | ||||||||||
| Trimble, Inc. | 6.10 | 03/15/33 | 5,000 | 5,270 | ||||||||||
| Vontier Corp. | 2.95 | 04/01/31 | 5,000 | 4,309 | ||||||||||
| 67,554 | ||||||||||||||
| ENTERTAINMENT – 0.6% | ||||||||||||||
| Warnermedia Holdings, Inc. | 4.28 | 03/15/32 | 50,000 | 43,884 | ||||||||||
| ENVIRONMENTAL CONTROL – 0.9% | ||||||||||||||
| Republic Services, Inc. | 1.45 | 02/15/31 | 10,000 | 8,187 | ||||||||||
| Republic Services, Inc. | 1.75 | 02/15/32 | 10,000 | 8,102 | ||||||||||
| Republic Services, Inc. | 2.30 | 03/01/30 | 5,000 | 4,429 | ||||||||||
| Republic Services, Inc. | 2.38 | 03/15/33 | 5,000 | 4,106 | ||||||||||
| Republic Services, Inc. | 5.00 | 12/15/33 | 5,000 | 4,999 | ||||||||||
| Republic Services, Inc. | 5.00 | 04/01/34 | 5,000 | 4,980 | ||||||||||
| Veralto Corp. | 5.45 | 09/18/33 | 5,000 | 5,076 | ||||||||||
| Waste Connections, Inc. | 2.20 | 01/15/32 | 10,000 | 8,349 | ||||||||||
| Waste Connections, Inc. | 3.20 | 06/01/32 | 10,000 | 8,882 | ||||||||||
| Waste Connections, Inc. | 4.20 | 01/15/33 | 5,000 | 4,711 | ||||||||||
| Waste Connections, Inc. | 5.00 | 03/01/34 | 5,000 | 4,965 | ||||||||||
| 66,786 | ||||||||||||||
| FOOD – 3.1% | ||||||||||||||
| Campbell Soup Co. | 5.40 | 03/21/34 | 15,000 | 15,174 | ||||||||||
| General Mills, Inc. | 2.88 | 04/15/30 | 5,000 | 4,521 | ||||||||||
| General Mills, Inc. | 4.95 | 03/29/33 | 10,000 | 9,938 | ||||||||||
| Ingredion, Inc. | 2.90 | 06/01/30 | 5,000 | 4,512 | ||||||||||
| J M Smucker Co. | 2.13 | 03/15/32 | 15,000 | 12,319 | ||||||||||
| J M Smucker Co. | 6.20 | 11/15/33 | 5,000 | 5,341 | ||||||||||
| JBS USA Holding Lux Sarl/JBS USA Food Co./JBS Lux Co. Sarl | 3.00 | 05/15/32 | 10,000 | 8,426 | ||||||||||
| JBS USA Holding Lux Sarl/JBS USA Food Co./JBS Lux Co. Sarl | 3.63 | 01/15/32 | 10,000 | 8,834 | ||||||||||
| JBS USA Holding Lux Sarl/JBS USA Food Co./JBS Lux Co. Sarl | 5.50 | 01/15/30 | 10,000 | 9,979 | ||||||||||
The accompanying notes are an integral part of these financial statements.
133
BONDBLOXX ETF TRUST
BondBloxx BBB Rated 5-10 Year Corporate Bond ETF
Portfolio of Investments (Continued)
October 31, 2024
| Rate (%) | Maturity | Face Amount | Value | |||||||||||
| FOOD – 3.1% (Continued) | ||||||||||||||
| JBS USA Holding Lux Sarl/JBS USA Food Co./JBS Lux Co. Sarl | 5.75 | 04/01/33 | $ | 18,000 | $ | 18,188 | ||||||||
| JBS USA Holding Lux Sarl/JBS USA Food Co./JBS Lux Co. Sarl(1) | 6.75 | 03/15/34 | 10,000 | 10,746 | ||||||||||
| Kellanova | 7.45 | 04/01/31 | 5,000 | 5,656 | ||||||||||
| Kraft Heinz Foods Co. | 3.75 | 04/01/30 | 5,000 | 4,759 | ||||||||||
| Kroger Co. | 2.20 | 05/01/30 | 5,000 | 4,355 | ||||||||||
| Kroger Co. | 4.90 | 09/15/31 | 15,000 | 14,970 | ||||||||||
| Kroger Co. | 5.00 | 09/15/34 | 15,000 | 14,755 | ||||||||||
| McCormick & Co., Inc./MD | 1.85 | 02/15/31 | 5,000 | 4,183 | ||||||||||
| McCormick & Co., Inc./MD | 4.95 | 04/15/33 | 10,000 | 9,938 | ||||||||||
| Mondelez International, Inc. | 1.88 | 10/15/32 | 10,000 | 8,125 | ||||||||||
| Mondelez International, Inc. | 2.75 | 04/13/30 | 5,000 | 4,519 | ||||||||||
| Mondelez International, Inc. | 3.00 | 03/17/32 | 10,000 | 8,848 | ||||||||||
| Pilgrim’s Pride Corp. | 3.50 | 03/01/32 | 10,000 | 8,763 | ||||||||||
| Pilgrim’s Pride Corp. | 4.25 | 04/15/31 | 10,000 | 9,298 | ||||||||||
| Pilgrim’s Pride Corp. | 6.25 | 07/01/33 | 10,000 | 10,377 | ||||||||||
| Sysco Corp. | 2.40 | 02/15/30 | 5,000 | 4,420 | ||||||||||
| Sysco Corp. | 5.95 | 04/01/30 | 10,000 | 10,483 | ||||||||||
| Tyson Foods, Inc. | 5.70 | 03/15/34 | 5,000 | 5,105 | ||||||||||
| 236,532 | ||||||||||||||
| FOREST PRODUCTS & PAPER – 0.4% | ||||||||||||||
| Suzano Austria GmbH | 3.13 | 01/15/32 | 5,000 | 4,204 | ||||||||||
| Suzano Austria GmbH | 3.75 | 01/15/31 | 15,000 | 13,385 | ||||||||||
| Suzano Austria GmbH | 5.00 | 01/15/30 | 10,000 | 9,724 | ||||||||||
| 27,313 | ||||||||||||||
| GAS – 0.6% | ||||||||||||||
| National Fuel Gas Co. | 2.95 | 03/01/31 | 5,000 | 4,334 | ||||||||||
| NiSource, Inc. | 1.70 | 02/15/31 | 10,000 | 8,259 | ||||||||||
| NiSource, Inc. | 3.60 | 05/01/30 | 5,000 | 4,681 | ||||||||||
| NiSource, Inc. | 5.35 | 04/01/34 | 5,000 | 5,023 | ||||||||||
| NiSource, Inc. | 6.95 | 11/30/54 | 5,000 | 5,146 | ||||||||||
| Southern Co. Gas Capital Corp. | 5.75 | 09/15/33 | 10,000 | 10,415 | ||||||||||
| Southwest Gas Corp. | 4.05 | 03/15/32 | 5,000 | 4,646 | ||||||||||
| 42,504 | ||||||||||||||
| HAND/MACHINE TOOLS – 0.3% | ||||||||||||||
| Regal Rexnord Corp. | 6.30 | 02/15/30 | 10,000 | 10,357 | ||||||||||
| Regal Rexnord Corp. | 6.40 | 04/15/33 | 5,000 | 5,216 | ||||||||||
| Stanley Black & Decker, Inc. | 2.30 | 03/15/30 | 5,000 | 4,371 | ||||||||||
| Stanley Black & Decker, Inc. | 3.00 | 05/15/32 | 5,000 | 4,369 | ||||||||||
| 24,313 | ||||||||||||||
| HEALTHCARE-PRODUCTS – 1.6% | ||||||||||||||
| Agilent Technologies, Inc. | 2.10 | 06/04/30 | 5,000 | 4,313 | ||||||||||
| Agilent Technologies, Inc. | 2.30 | 03/12/31 | 5,000 | 4,291 | ||||||||||
| Baxter International, Inc. | 1.73 | 04/01/31 | 5,000 | 4,105 | ||||||||||
| Baxter International, Inc. | 2.54 | 02/01/32 | 10,000 | 8,415 | ||||||||||
| Boston Scientific Corp. | 2.65 | 06/01/30 | 10,000 | 8,970 | ||||||||||
| DENTSPLY SIRONA, Inc. | 3.25 | 06/01/30 | 5,000 | 4,475 | ||||||||||
| GE HealthCare Technologies, Inc. | 5.86 | 03/15/30 | 15,000 | 15,676 | ||||||||||
The accompanying notes are an integral part of these financial statements.
134
BONDBLOXX ETF TRUST
BondBloxx BBB Rated 5-10 Year Corporate Bond ETF
Portfolio of Investments (Continued)
October 31, 2024
| Rate (%) | Maturity | Face Amount | Value | |||||||||||
| HEALTHCARE-PRODUCTS – 1.6% (Continued) | ||||||||||||||
| GE HealthCare Technologies, Inc. | 5.91 | 11/22/32 | $ | 10,000 | $ | 10,565 | ||||||||
| Revvity, Inc. | 2.25 | 09/15/31 | 5,000 | 4,155 | ||||||||||
| Smith & Nephew PLC | 2.03 | 10/14/30 | 15,000 | 12,655 | ||||||||||
| Smith & Nephew PLC | 5.40 | 03/20/34 | 5,000 | 5,023 | ||||||||||
| Solventum Corp.(1) | 5.45 | 03/13/31 | 10,000 | 10,084 | ||||||||||
| Solventum Corp.(1) | 5.60 | 03/23/34 | 15,000 | 15,125 | ||||||||||
| STERIS Irish FinCo UnLtd. Co. | 2.70 | 03/15/31 | 5,000 | 4,341 | ||||||||||
| Stryker Corp. | 1.95 | 06/15/30 | 5,000 | 4,302 | ||||||||||
| Zimmer Biomet Holdings, Inc. | 2.60 | 11/24/31 | 5,000 | 4,292 | ||||||||||
| 120,787 | ||||||||||||||
| HEALTHCARE-SERVICES – 4.4% | ||||||||||||||
| Centene Corp. | 2.50 | 03/01/31 | 15,000 | 12,553 | ||||||||||
| Centene Corp. | 2.63 | 08/01/31 | 10,000 | 8,322 | ||||||||||
| Centene Corp. | 3.00 | 10/15/30 | 20,000 | 17,347 | ||||||||||
| Centene Corp. | 3.38 | 02/15/30 | 20,000 | 17,931 | ||||||||||
| Centene Corp. | 4.63 | 12/15/29 | 30,000 | 28,698 | ||||||||||
| Cigna Group | 2.38 | 03/15/31 | 10,000 | 8,550 | ||||||||||
| Cigna Group | 2.40 | 03/15/30 | 15,000 | 13,219 | ||||||||||
| Cigna Group | 5.25 | 02/15/34 | 15,000 | 14,960 | ||||||||||
| Cigna Group | 5.40 | 03/15/33 | 10,000 | 10,126 | ||||||||||
| Elevance Health, Inc. | 2.25 | 05/15/30 | 5,000 | 4,358 | ||||||||||
| Elevance Health, Inc. | 2.55 | 03/15/31 | 5,000 | 4,337 | ||||||||||
| Elevance Health, Inc. | 4.10 | 05/15/32 | 10,000 | 9,391 | ||||||||||
| Elevance Health, Inc. | 4.75 | 02/15/33 | 10,000 | 9,715 | ||||||||||
| Elevance Health, Inc. | 5.38 | 06/15/34 | 5,000 | 5,051 | ||||||||||
| Elevance Health, Inc. | 5.50 | 10/15/32 | 10,000 | 10,235 | ||||||||||
| HCA, Inc. | 2.38 | 07/15/31 | 10,000 | 8,414 | ||||||||||
| HCA, Inc. | 3.50 | 09/01/30 | 20,000 | 18,351 | ||||||||||
| HCA, Inc. | 3.63 | 03/15/32 | 20,000 | 17,992 | ||||||||||
| HCA, Inc. | 5.45 | 04/01/31 | 10,000 | 10,113 | ||||||||||
| HCA, Inc. | 5.45 | 09/15/34 | 10,000 | 9,934 | ||||||||||
| HCA, Inc. | 5.50 | 06/01/33 | 10,000 | 10,046 | ||||||||||
| HCA, Inc. | 5.60 | 04/01/34 | 10,000 | 10,082 | ||||||||||
| Humana, Inc. | 2.15 | 02/03/32 | 5,000 | 4,040 | ||||||||||
| Humana, Inc. | 4.88 | 04/01/30 | 5,000 | 4,928 | ||||||||||
| Humana, Inc. | 5.38 | 04/15/31 | 10,000 | 10,017 | ||||||||||
| Humana, Inc. | 5.88 | 03/01/33 | 10,000 | 10,200 | ||||||||||
| Humana, Inc. | 5.95 | 03/15/34 | 5,000 | 5,135 | ||||||||||
| Icon Investments Six DAC | 6.00 | 05/08/34 | 5,000 | 5,123 | ||||||||||
| Laboratory Corp. of America Holdings | 2.70 | 06/01/31 | 10,000 | 8,701 | ||||||||||
| Laboratory Corp. of America Holdings | 2.95 | 12/01/29 | 5,000 | 4,551 | ||||||||||
| Quest Diagnostics, Inc. | 2.80 | 06/30/31 | 10,000 | 8,778 | ||||||||||
| Quest Diagnostics, Inc. | 2.95 | 06/30/30 | 5,000 | 4,519 | ||||||||||
| Quest Diagnostics, Inc. | 6.40 | 11/30/33 | 5,000 | 5,433 | ||||||||||
| Universal Health Services, Inc. | 2.65 | 10/15/30 | 5,000 | 4,323 | ||||||||||
| 335,473 | ||||||||||||||
The accompanying notes are an integral part of these financial statements.
135
BONDBLOXX ETF TRUST
BondBloxx BBB Rated 5-10 Year Corporate Bond ETF
Portfolio of Investments (Continued)
October 31, 2024
| Rate (%) | Maturity | Face Amount | Value | |||||||||||
| HOME BUILDERS – 0.1% | ||||||||||||||
| NVR, Inc. | 3.00 | 05/15/30 | $ | 5,000 | $ | 4,531 | ||||||||
| HOUSEHOLD PRODUCTS/WARES – 0.2% | ||||||||||||||
| Avery Dennison Corp. | 2.25 | 02/15/32 | 5,000 | 4,141 | ||||||||||
| Clorox Co. | 4.60 | 05/01/32 | 10,000 | 9,859 | ||||||||||
| 14,000 | ||||||||||||||
| INSURANCE – 3.3% | ||||||||||||||
| Allstate Corp. | 1.45 | 12/15/30 | 5,000 | 4,081 | ||||||||||
| Allstate Corp. | 5.25 | 03/30/33 | 5,000 | 5,042 | ||||||||||
| American International Group, Inc. | 5.13 | 03/27/33 | 5,000 | 5,002 | ||||||||||
| Aon Corp. | 2.80 | 05/15/30 | 15,000 | 13,452 | ||||||||||
| Aon Corp./Aon Global Holdings PLC | 5.35 | 02/28/33 | 5,000 | 5,066 | ||||||||||
| Aon North America, Inc. | 5.30 | 03/01/31 | 10,000 | 10,186 | ||||||||||
| Aon North America, Inc. | 5.45 | 03/01/34 | 10,000 | 10,165 | ||||||||||
| Assured Guaranty US Holdings, Inc. | 3.15 | 06/15/31 | 5,000 | 4,446 | ||||||||||
| Athene Holding Ltd. | 5.88 | 01/15/34 | 5,000 | 5,094 | ||||||||||
| Athene Holding Ltd. | 6.15 | 04/03/30 | 5,000 | 5,237 | ||||||||||
| Athene Holding Ltd. | 6.63 | 10/15/54 | 5,000 | 4,929 | ||||||||||
| Brighthouse Financial, Inc. | 5.63 | 05/15/30 | 5,000 | 5,114 | ||||||||||
| Brown & Brown, Inc. | 2.38 | 03/15/31 | 5,000 | 4,247 | ||||||||||
| Brown & Brown, Inc. | 4.20 | 03/17/32 | 10,000 | 9,319 | ||||||||||
| Brown & Brown, Inc. | 5.65 | 06/11/34 | 5,000 | 5,084 | ||||||||||
| CNA Financial Corp. | 5.50 | 06/15/33 | 10,000 | 10,174 | ||||||||||
| CNO Financial Group, Inc. | 6.45 | 06/15/34 | 5,000 | 5,152 | ||||||||||
| Corebridge Financial, Inc. | 3.90 | 04/05/32 | 15,000 | 13,727 | ||||||||||
| Corebridge Financial, Inc. | 6.38 | 09/15/54 | 10,000 | 9,987 | ||||||||||
| Enstar Group Ltd. | 3.10 | 09/01/31 | 10,000 | 8,464 | ||||||||||
| Fairfax Financial Holdings Ltd. | 4.63 | 04/29/30 | 5,000 | 4,893 | ||||||||||
| Fairfax Financial Holdings Ltd. | 5.63 | 08/16/32 | 10,000 | 10,157 | ||||||||||
| Fairfax Financial Holdings Ltd. | 6.00 | 12/07/33 | 10,000 | 10,267 | ||||||||||
| Fidelity National Financial, Inc. | 2.45 | 03/15/31 | 5,000 | 4,272 | ||||||||||
| Fidelity National Financial, Inc. | 3.40 | 06/15/30 | 5,000 | 4,539 | ||||||||||
| First American Financial Corp. | 2.40 | 08/15/31 | 5,000 | 4,092 | ||||||||||
| Lincoln National Corp. | 3.40 | 01/15/31 | 5,000 | 4,529 | ||||||||||
| Primerica, Inc. | 2.80 | 11/19/31 | 10,000 | 8,513 | ||||||||||
| Prudential Financial, Inc. | 3.70 | 10/01/50 | 5,000 | 4,543 | ||||||||||
| Prudential Financial, Inc. | 5.13 | 03/01/52 | 10,000 | 9,694 | ||||||||||
| Prudential Financial, Inc. | 6.00 | 09/01/52 | 10,000 | 10,164 | ||||||||||
| Prudential Financial, Inc. | 6.50 | 03/15/54 | 5,000 | 5,226 | ||||||||||
| Prudential Financial, Inc. | 6.75 | 03/01/53 | 10,000 | 10,650 | ||||||||||
| Reinsurance Group of America, Inc. | 3.15 | 06/15/30 | 5,000 | 4,546 | ||||||||||
| Willis North America, Inc. | 5.35 | 05/15/33 | 10,000 | 10,049 | ||||||||||
| 250,102 | ||||||||||||||
| INTERNET – 0.7% | ||||||||||||||
| eBay, Inc. | 2.70 | 03/11/30 | 10,000 | 9,000 | ||||||||||
| Expedia Group, Inc. | 3.25 | 02/15/30 | 15,000 | 13,875 | ||||||||||
| Uber Technologies, Inc. | 4.30 | 01/15/30 | 10,000 | 9,731 | ||||||||||
The accompanying notes are an integral part of these financial statements.
136
BONDBLOXX ETF TRUST
BondBloxx BBB Rated 5-10 Year Corporate Bond ETF
Portfolio of Investments (Continued)
October 31, 2024
| Rate (%) | Maturity | Face Amount | Value | |||||||||||
| INTERNET – 0.7% (Continued) | ||||||||||||||
| Uber Technologies, Inc. | 4.80 | 09/15/34 | $ | 10,000 | $ | 9,693 | ||||||||
| VeriSign, Inc. | 2.70 | 06/15/31 | 5,000 | 4,285 | ||||||||||
| Weibo Corp. | 3.38 | 07/08/30 | 5,000 | 4,491 | ||||||||||
| 51,075 | ||||||||||||||
| INVESTMENT COMPANIES – 0.4% | ||||||||||||||
| Apollo Debt Solutions BDC(1) | 6.70 | 07/29/31 | 5,000 | 5,069 | ||||||||||
| Ares Capital Corp. | 3.20 | 11/15/31 | 10,000 | 8,507 | ||||||||||
| Blackstone Private Credit Fund(1) | 6.25 | 01/25/31 | 5,000 | 5,057 | ||||||||||
| Blue Owl Credit Income Corp.(1) | 5.80 | 03/15/30 | 5,000 | 4,860 | ||||||||||
| Blue Owl Credit Income Corp. | 6.65 | 03/15/31 | 5,000 | 5,038 | ||||||||||
| HA Sustainable Infrastructure Capital, Inc.(1) | 6.38 | 07/01/34 | 5,000 | 4,977 | ||||||||||
| 33,508 | ||||||||||||||
| IRON/STEEL – 0.7% | ||||||||||||||
| ArcelorMittal SA | 6.00 | 06/17/34 | 10,000 | 10,274 | ||||||||||
| ArcelorMittal SA | 6.80 | 11/29/32 | 5,000 | 5,429 | ||||||||||
| Steel Dynamics, Inc. | 3.45 | 04/15/30 | 5,000 | 4,647 | ||||||||||
| Vale Overseas Ltd. | 3.75 | 07/08/30 | 10,000 | 9,320 | ||||||||||
| Vale Overseas Ltd. | 6.13 | 06/12/33 | 20,000 | 20,522 | ||||||||||
| Vale Overseas Ltd. | 8.25 | 01/17/34 | 5,000 | 6,041 | ||||||||||
| 56,233 | ||||||||||||||
| LEISURE TIME – 0.1% | ||||||||||||||
| Brunswick Corp./DE | 2.40 | 08/18/31 | 5,000 | 4,118 | ||||||||||
| LODGING – 0.7% | ||||||||||||||
| Choice Hotels International, Inc. | 5.85 | 08/01/34 | 5,000 | 5,027 | ||||||||||
| Las Vegas Sands Corp. | 6.20 | 08/15/34 | 5,000 | 5,095 | ||||||||||
| Marriott International, Inc./MD | 2.85 | 04/15/31 | 10,000 | 8,795 | ||||||||||
| Marriott International, Inc./MD | 3.50 | 10/15/32 | 15,000 | 13,348 | ||||||||||
| Marriott International, Inc./MD | 4.63 | 06/15/30 | 10,000 | 9,871 | ||||||||||
| Marriott International, Inc./MD | 5.30 | 05/15/34 | 5,000 | 5,005 | ||||||||||
| Sands China Ltd. | 3.25 | 08/08/31 | 5,000 | 4,333 | ||||||||||
| Sands China Ltd. | 4.38 | 06/18/30 | 5,000 | 4,713 | ||||||||||
| 56,187 | ||||||||||||||
| MACHINERY-DIVERSIFIED – 0.8% | ||||||||||||||
| AGCO Corp. | 5.80 | 03/21/34 | 5,000 | 5,094 | ||||||||||
| Flowserve Corp. | 2.80 | 01/15/32 | 5,000 | 4,248 | ||||||||||
| IDEX Corp. | 2.63 | 06/15/31 | 5,000 | 4,329 | ||||||||||
| Ingersoll Rand, Inc. | 5.45 | 06/15/34 | 10,000 | 10,207 | ||||||||||
| Ingersoll Rand, Inc. | 5.70 | 08/14/33 | 10,000 | 10,388 | ||||||||||
| Nordson Corp. | 5.80 | 09/15/33 | 5,000 | 5,239 | ||||||||||
| nVent Finance Sarl | 5.65 | 05/15/33 | 5,000 | 5,105 | ||||||||||
| Otis Worldwide Corp. | 2.57 | 02/15/30 | 10,000 | 8,919 | ||||||||||
| Westinghouse Air Brake Technologies Corp. | 5.61 | 03/11/34 | 5,000 | 5,143 | ||||||||||
| 58,672 | ||||||||||||||
The accompanying notes are an integral part of these financial statements.
137
BONDBLOXX ETF TRUST
BondBloxx BBB Rated 5-10 Year Corporate Bond ETF
Portfolio of Investments (Continued)
October 31, 2024
| Rate (%) | Maturity | Face Amount | Value | |||||||||||
| MEDIA – 1.4% | ||||||||||||||
| Charter Communications Operating LLC/Charter Communications Operating Capital | 2.30 | 02/01/32 | $ | 10,000 | $ | 7,900 | ||||||||
| Charter Communications Operating LLC/Charter Communications Operating Capital | 2.80 | 04/01/31 | 15,000 | 12,620 | ||||||||||
| Charter Communications Operating LLC/Charter Communications Operating Capital | 4.40 | 04/01/33 | 15,000 | 13,409 | ||||||||||
| Charter Communications Operating LLC/Charter Communications Operating Capital | 6.55 | 06/01/34 | 15,000 | 15,278 | ||||||||||
| Discovery Communications LLC | 3.63 | 05/15/30 | 5,000 | 4,431 | ||||||||||
| Fox Corp. | 3.50 | 04/08/30 | 5,000 | 4,653 | ||||||||||
| Fox Corp. | 6.50 | 10/13/33 | 15,000 | 15,979 | ||||||||||
| Paramount Global | 4.20 | 05/19/32 | 5,000 | 4,356 | ||||||||||
| Paramount Global | 4.95 | 01/15/31 | 10,000 | 9,291 | ||||||||||
| Paramount Global | 7.88 | 07/30/30 | 10,000 | 10,776 | ||||||||||
| Time Warner Cable Enterprises LLC | 8.38 | 07/15/33 | 5,000 | 5,619 | ||||||||||
| 104,312 | ||||||||||||||
| MINING – 0.4% | ||||||||||||||
| AngloGold Ashanti Holdings PLC | 3.75 | 10/01/30 | 5,000 | 4,546 | ||||||||||
| Freeport-McMoRan, Inc. | 4.63 | 08/01/30 | 5,000 | 4,880 | ||||||||||
| Newmont Corp. | 2.25 | 10/01/30 | 10,000 | 8,728 | ||||||||||
| Newmont Corp. | 2.60 | 07/15/32 | 5,000 | 4,285 | ||||||||||
| Newmont Corp./Newcrest Finance Pty Ltd. | 3.25 | 05/13/30 | 5,000 | 4,634 | ||||||||||
| Newmont Corp./Newcrest Finance Pty Ltd. | 5.35 | 03/15/34 | 5,000 | 5,093 | ||||||||||
| 32,166 | ||||||||||||||
| MISCELLANEOUS MANUFACTURER – 0.2% | ||||||||||||||
| Carlisle Cos, Inc. | 2.75 | 03/01/30 | 10,000 | 8,999 | ||||||||||
| Teledyne Technologies, Inc. | 2.75 | 04/01/31 | 5,000 | 4,421 | ||||||||||
| Textron, Inc. | 2.45 | 03/15/31 | 5,000 | 4,266 | ||||||||||
| 17,686 | ||||||||||||||
| OFFICE/BUSINESS EQUIPMENT – 0.2% | ||||||||||||||
| CDW LLC/CDW Finance Corp. | 3.57 | 12/01/31 | 5,000 | 4,488 | ||||||||||
| CDW LLC/CDW Finance Corp. | 5.55 | 08/22/34 | 10,000 | 9,947 | ||||||||||
| 14,435 | ||||||||||||||
| OIL & GAS – 3.0% | ||||||||||||||
| Cenovus Energy, Inc. | 2.65 | 01/15/32 | 5,000 | 4,201 | ||||||||||
| Coterra Energy, Inc. | 5.60 | 03/15/34 | 5,000 | 4,999 | ||||||||||
| Devon Energy Corp. | 4.50 | 01/15/30 | 5,000 | 4,841 | ||||||||||
| Devon Energy Corp. | 5.20 | 09/15/34 | 10,000 | 9,625 | ||||||||||
| Devon Energy Corp. | 7.88 | 09/30/31 | 5,000 | 5,694 | ||||||||||
| Diamondback Energy, Inc. | 3.13 | 03/24/31 | 10,000 | 8,911 | ||||||||||
| Diamondback Energy, Inc. | 3.50 | 12/01/29 | 5,000 | 4,670 | ||||||||||
| Diamondback Energy, Inc. | 5.15 | 01/30/30 | 5,000 | 5,030 | ||||||||||
| Diamondback Energy, Inc. | 5.40 | 04/18/34 | 10,000 | 9,983 | ||||||||||
| Diamondback Energy, Inc. | 6.25 | 03/15/33 | 15,000 | 15,814 | ||||||||||
| EQT Corp. | 7.00 | 02/01/30 | 10,000 | 10,699 | ||||||||||
| Expand Energy Corp. | 4.75 | 02/01/32 | 15,000 | 14,105 | ||||||||||
| Hess Corp. | 7.13 | 03/15/33 | 5,000 | 5,607 | ||||||||||
The accompanying notes are an integral part of these financial statements.
138
BONDBLOXX ETF TRUST
BondBloxx BBB Rated 5-10 Year Corporate Bond ETF
Portfolio of Investments (Continued)
October 31, 2024
| Rate (%) | Maturity | Face Amount | Value | |||||||||||
| OIL & GAS – 3.0% (Continued) | ||||||||||||||
| Hess Corp. | 7.30 | 08/15/31 | $ | 5,000 | $ | 5,602 | ||||||||
| Marathon Oil Corp. | 5.70 | 04/01/34 | 5,000 | 5,186 | ||||||||||
| Marathon Oil Corp. | 6.80 | 03/15/32 | 5,000 | 5,501 | ||||||||||
| Occidental Petroleum Corp. | 5.38 | 01/01/32 | 10,000 | 9,874 | ||||||||||
| Occidental Petroleum Corp. | 6.13 | 01/01/31 | 5,000 | 5,154 | ||||||||||
| Occidental Petroleum Corp. | 6.63 | 09/01/30 | 15,000 | 15,767 | ||||||||||
| Occidental Petroleum Corp. | 7.50 | 05/01/31 | 10,000 | 11,070 | ||||||||||
| Occidental Petroleum Corp. | 8.88 | 07/15/30 | 10,000 | 11,500 | ||||||||||
| Ovintiv, Inc. | 6.25 | 07/15/33 | 10,000 | 10,322 | ||||||||||
| Phillips 66 | 2.15 | 12/15/30 | 5,000 | 4,274 | ||||||||||
| Phillips 66 Co. | 3.15 | 12/15/29 | 10,000 | 9,220 | ||||||||||
| Phillips 66 Co. | 5.25 | 06/15/31 | 5,000 | 5,046 | ||||||||||
| Phillips 66 Co. | 5.30 | 06/30/33 | 10,000 | 10,033 | ||||||||||
| Valero Energy Corp. | 7.50 | 04/15/32 | 5,000 | 5,668 | ||||||||||
| Woodside Finance Ltd. | 5.10 | 09/12/34 | 10,000 | 9,689 | ||||||||||
| 228,085 | ||||||||||||||
| OIL & GAS SERVICES – 0.1% | ||||||||||||||
| Halliburton Co. | 2.92 | 03/01/30 | 5,000 | 4,534 | ||||||||||
| NOV, Inc. | 3.60 | 12/01/29 | 5,000 | 4,667 | ||||||||||
| 9,201 | ||||||||||||||
| PACKAGING & CONTAINERS – 0.7% | ||||||||||||||
| Amcor Finance USA, Inc. | 5.63 | 05/26/33 | 5,000 | 5,123 | ||||||||||
| Amcor Flexibles North America, Inc. | 2.69 | 05/25/31 | 10,000 | 8,662 | ||||||||||
| Berry Global, Inc.(1) | 5.65 | 01/15/34 | 10,000 | 10,002 | ||||||||||
| Smurfit Kappa Treasury ULC(1) | 5.20 | 01/15/30 | 10,000 | 10,100 | ||||||||||
| Smurfit Kappa Treasury ULC(1) | 5.44 | 04/03/34 | 10,000 | 10,060 | ||||||||||
| Sonoco Products Co. | 2.85 | 02/01/32 | 10,000 | 8,560 | ||||||||||
| WRKCo, Inc. | 3.00 | 06/15/33 | 5,000 | 4,246 | ||||||||||
| 56,753 | ||||||||||||||
| PHARMACEUTICALS – 2.5% | ||||||||||||||
| Becton Dickinson & Co. | 1.96 | 02/11/31 | 10,000 | 8,401 | ||||||||||
| Becton Dickinson & Co. | 2.82 | 05/20/30 | 5,000 | 4,499 | ||||||||||
| Becton Dickinson & Co. | 5.11 | 02/08/34 | 10,000 | 9,969 | ||||||||||
| Cardinal Health, Inc. | 5.45 | 02/15/34 | 5,000 | 5,091 | ||||||||||
| Cencora, Inc. | 2.70 | 03/15/31 | 5,000 | 4,377 | ||||||||||
| Cencora, Inc. | 2.80 | 05/15/30 | 5,000 | 4,496 | ||||||||||
| Cencora, Inc. | 5.13 | 02/15/34 | 10,000 | 9,947 | ||||||||||
| CVS Health Corp. | 1.75 | 08/21/30 | 10,000 | 8,249 | ||||||||||
| CVS Health Corp. | 1.88 | 02/28/31 | 15,000 | 12,201 | ||||||||||
| CVS Health Corp. | 2.13 | 09/15/31 | 10,000 | 8,115 | ||||||||||
| CVS Health Corp. | 3.75 | 04/01/30 | 10,000 | 9,281 | ||||||||||
| CVS Health Corp. | 5.13 | 02/21/30 | 15,000 | 14,904 | ||||||||||
| CVS Health Corp. | 5.25 | 01/30/31 | 10,000 | 9,933 | ||||||||||
| CVS Health Corp. | 5.25 | 02/21/33 | 15,000 | 14,737 | ||||||||||
| CVS Health Corp. | 5.30 | 06/01/33 | 10,000 | 9,819 | ||||||||||
| CVS Health Corp. | 5.70 | 06/01/34 | 10,000 | 10,050 | ||||||||||
| Takeda Pharmaceutical Co. Ltd. | 2.05 | 03/31/30 | 25,000 | 21,751 | ||||||||||
The accompanying notes are an integral part of these financial statements.
139
BONDBLOXX ETF TRUST
BondBloxx BBB Rated 5-10 Year Corporate Bond ETF
Portfolio of Investments (Continued)
October 31, 2024
| Rate (%) | Maturity | Face Amount | Value | |||||||||||
| PHARMACEUTICALS – 2.5% (Continued) | ||||||||||||||
| Takeda Pharmaceutical Co. Ltd. | 5.30 | 07/05/34 | $ | 5,000 | $ | 5,070 | ||||||||
| Viatris, Inc. | 2.70 | 06/22/30 | 10,000 | 8,684 | ||||||||||
| Zoetis, Inc. | 2.00 | 05/15/30 | 10,000 | 8,638 | ||||||||||
| Zoetis, Inc. | 5.60 | 11/16/32 | 5,000 | 5,197 | ||||||||||
| 193,409 | ||||||||||||||
| PIPELINES – 6.6% | ||||||||||||||
| Boardwalk Pipelines LP | 3.60 | 09/01/32 | 5,000 | 4,418 | ||||||||||
| Cheniere Corpus Christi Holdings LLC | 3.70 | 11/15/29 | 5,000 | 4,710 | ||||||||||
| Cheniere Energy Partners LP | 3.25 | 01/31/32 | 10,000 | 8,708 | ||||||||||
| Cheniere Energy Partners LP | 4.00 | 03/01/31 | 15,000 | 13,880 | ||||||||||
| Cheniere Energy Partners LP(1) | 5.75 | 08/15/34 | 10,000 | 10,116 | ||||||||||
| Cheniere Energy Partners LP | 5.95 | 06/30/33 | 10,000 | 10,290 | ||||||||||
| Cheniere Energy, Inc. | 5.65 | 04/15/34 | 15,000 | 15,089 | ||||||||||
| Enbridge, Inc. | 2.50 | 08/01/33 | 5,000 | 4,068 | ||||||||||
| Enbridge, Inc. | 5.63 | 04/05/34 | 15,000 | 15,244 | ||||||||||
| Enbridge, Inc. | 5.70 | 03/08/33 | 10,000 | 10,257 | ||||||||||
| Enbridge, Inc. | 6.20 | 11/15/30 | 15,000 | 15,925 | ||||||||||
| Enbridge, Inc. | 7.20 | 06/27/54 | 5,000 | 5,181 | ||||||||||
| Enbridge, Inc. | 7.38 | 03/15/55 | 15,000 | 15,468 | ||||||||||
| Energy Transfer LP | 3.75 | 05/15/30 | 15,000 | 14,003 | ||||||||||
| Energy Transfer LP | 5.55 | 05/15/34 | 15,000 | 15,072 | ||||||||||
| Energy Transfer LP | 5.75 | 02/15/33 | 10,000 | 10,213 | ||||||||||
| Energy Transfer LP | 6.40 | 12/01/30 | 10,000 | 10,616 | ||||||||||
| Energy Transfer LP | 6.55 | 12/01/33 | 15,000 | 16,103 | ||||||||||
| Kinder Morgan, Inc. | 2.00 | 02/15/31 | 10,000 | 8,424 | ||||||||||
| Kinder Morgan, Inc. | 4.80 | 02/01/33 | 20,000 | 19,257 | ||||||||||
| Kinder Morgan, Inc. | 5.20 | 06/01/33 | 10,000 | 9,846 | ||||||||||
| Kinder Morgan, Inc. | 5.40 | 02/01/34 | 5,000 | 4,986 | ||||||||||
| Kinder Morgan, Inc. | 7.75 | 01/15/32 | 5,000 | 5,729 | ||||||||||
| Kinder Morgan, Inc. | 7.80 | 08/01/31 | 5,000 | 5,713 | ||||||||||
| MPLX LP | 2.65 | 08/15/30 | 10,000 | 8,801 | ||||||||||
| MPLX LP | 4.95 | 09/01/32 | 10,000 | 9,757 | ||||||||||
| MPLX LP | 5.00 | 03/01/33 | 5,000 | 4,862 | ||||||||||
| MPLX LP | 5.50 | 06/01/34 | 20,000 | 19,958 | ||||||||||
| ONEOK, Inc. | 3.10 | 03/15/30 | 10,000 | 9,100 | ||||||||||
| ONEOK, Inc. | 4.75 | 10/15/31 | 15,000 | 14,664 | ||||||||||
| ONEOK, Inc. | 6.05 | 09/01/33 | 10,000 | 10,405 | ||||||||||
| ONEOK, Inc. | 6.10 | 11/15/32 | 5,000 | 5,255 | ||||||||||
| ONEOK, Inc. | 6.35 | 01/15/31 | 10,000 | 10,607 | ||||||||||
| Plains All American Pipeline LP/PAA Finance Corp. | 3.55 | 12/15/29 | 10,000 | 9,320 | ||||||||||
| Sabine Pass Liquefaction LLC | 4.50 | 05/15/30 | 15,000 | 14,595 | ||||||||||
| Targa Resources Corp. | 6.13 | 03/15/33 | 5,000 | 5,227 | ||||||||||
| Targa Resources Corp. | 6.50 | 03/30/34 | 10,000 | 10,735 | ||||||||||
| Targa Resources Partners LP/Targa Resources Partners Finance Corp. | 4.00 | 01/15/32 | 15,000 | 13,753 | ||||||||||
| Targa Resources Partners LP/Targa Resources Partners Finance Corp. | 4.88 | 02/01/31 | 10,000 | 9,720 | ||||||||||
The accompanying notes are an integral part of these financial statements.
140
BONDBLOXX ETF TRUST
BondBloxx BBB Rated 5-10 Year Corporate Bond ETF
Portfolio of Investments (Continued)
October 31, 2024
| Rate (%) | Maturity | Face Amount | Value | |||||||||||
| PIPELINES – 6.6% (Continued) | ||||||||||||||
| Targa Resources Partners LP/Targa Resources Partners Finance Corp. | 5.50 | 03/01/30 | $ | 10,000 | $ | 10,024 | ||||||||
| TransCanada PipeLines Ltd. | 4.10 | 04/15/30 | 5,000 | 4,785 | ||||||||||
| TransCanada PipeLines Ltd. | 4.63 | 03/01/34 | 15,000 | 14,198 | ||||||||||
| Transcontinental Gas Pipe Line Co. LLC | 3.25 | 05/15/30 | 10,000 | 9,140 | ||||||||||
| Western Midstream Operating LP | 4.05 | 02/01/30 | 10,000 | 9,401 | ||||||||||
| Western Midstream Operating LP | 6.15 | 04/01/33 | 10,000 | 10,341 | ||||||||||
| Williams Cos, Inc. | 2.60 | 03/15/31 | 10,000 | 8,662 | ||||||||||
| Williams Cos, Inc. | 3.50 | 11/15/30 | 5,000 | 4,609 | ||||||||||
| Williams Cos, Inc. | 4.65 | 08/15/32 | 10,000 | 9,661 | ||||||||||
| Williams Cos, Inc. | 5.15 | 03/15/34 | 5,000 | 4,924 | ||||||||||
| Williams Cos, Inc. | 5.65 | 03/15/33 | 10,000 | 10,248 | ||||||||||
| 506,068 | ||||||||||||||
| REAL ESTATE – 0.1% | ||||||||||||||
| CBRE Services, Inc. | 2.50 | 04/01/31 | 5,000 | 4,294 | ||||||||||
| CBRE Services, Inc. | 5.95 | 08/15/34 | 5,000 | 5,236 | ||||||||||
| 9,530 | ||||||||||||||
| REAL ESTATE INVESTMENT TRUSTS (REITS) – 6.7% | ||||||||||||||
| Alexandria Real Estate Equities, Inc. | 1.88 | 02/01/33 | 10,000 | 7,782 | ||||||||||
| Alexandria Real Estate Equities, Inc. | 2.00 | 05/18/32 | 5,000 | 4,030 | ||||||||||
| Alexandria Real Estate Equities, Inc. | 2.95 | 03/15/34 | 5,000 | 4,185 | ||||||||||
| Alexandria Real Estate Equities, Inc. | 3.38 | 08/15/31 | 10,000 | 9,074 | ||||||||||
| Alexandria Real Estate Equities, Inc. | 4.90 | 12/15/30 | 5,000 | 4,967 | ||||||||||
| American Assets Trust LP | 3.38 | 02/01/31 | 5,000 | 4,334 | ||||||||||
| American Homes 4 Rent LP | 3.63 | 04/15/32 | 10,000 | 9,035 | ||||||||||
| American Homes 4 Rent LP | 5.50 | 02/01/34 | 5,000 | 5,029 | ||||||||||
| American Tower Corp. | 1.88 | 10/15/30 | 10,000 | 8,406 | ||||||||||
| American Tower Corp. | 2.10 | 06/15/30 | 5,000 | 4,297 | ||||||||||
| American Tower Corp. | 2.90 | 01/15/30 | 10,000 | 9,056 | ||||||||||
| American Tower Corp. | 5.45 | 02/15/34 | 5,000 | 5,064 | ||||||||||
| American Tower Corp. | 5.55 | 07/15/33 | 10,000 | 10,189 | ||||||||||
| American Tower Corp. | 5.65 | 03/15/33 | 15,000 | 15,376 | ||||||||||
| American Tower Corp. | 5.90 | 11/15/33 | 5,000 | 5,214 | ||||||||||
| Boston Properties LP | 2.45 | 10/01/33 | 10,000 | 7,779 | ||||||||||
| Boston Properties LP | 2.55 | 04/01/32 | 10,000 | 8,156 | ||||||||||
| Boston Properties LP | 3.25 | 01/30/31 | 10,000 | 8,814 | ||||||||||
| Boston Properties LP | 6.50 | 01/15/34 | 10,000 | 10,585 | ||||||||||
| Brixmor Operating Partnership LP | 2.50 | 08/16/31 | 10,000 | 8,465 | ||||||||||
| Brixmor Operating Partnership LP | 4.05 | 07/01/30 | 5,000 | 4,737 | ||||||||||
| COPT Defense Properties LP | 2.75 | 04/15/31 | 5,000 | 4,275 | ||||||||||
| Crown Castle, Inc. | 2.10 | 04/01/31 | 10,000 | 8,334 | ||||||||||
| Crown Castle, Inc. | 2.25 | 01/15/31 | 10,000 | 8,464 | ||||||||||
| Crown Castle, Inc. | 2.50 | 07/15/31 | 10,000 | 8,474 | ||||||||||
| Crown Castle, Inc. | 3.30 | 07/01/30 | 10,000 | 9,118 | ||||||||||
| Crown Castle, Inc. | 5.10 | 05/01/33 | 5,000 | 4,932 | ||||||||||
| Crown Castle, Inc. | 5.80 | 03/01/34 | 5,000 | 5,141 | ||||||||||
| Equinix Europe 2 Financing Corp. LLC | 5.50 | 06/15/34 | 10,000 | 10,163 | ||||||||||
| Equinix, Inc. | 2.15 | 07/15/30 | 10,000 | 8,638 | ||||||||||
The accompanying notes are an integral part of these financial statements.
141
BONDBLOXX ETF TRUST
BondBloxx BBB Rated 5-10 Year Corporate Bond ETF
Portfolio of Investments (Continued)
October 31, 2024
| Rate (%) | Maturity | Face Amount | Value | |||||||||||
| REAL ESTATE INVESTMENT TRUSTS (REITS) – 6.7% (Continued) | ||||||||||||||
| Equinix, Inc. | 2.50 | 05/15/31 | $ | 5,000 | $ | 4,311 | ||||||||
| Equinix, Inc. | 3.20 | 11/18/29 | 10,000 | 9,244 | ||||||||||
| Equinix, Inc. | 3.90 | 04/15/32 | 10,000 | 9,336 | ||||||||||
| Essex Portfolio LP | 3.00 | 01/15/30 | 10,000 | 9,102 | ||||||||||
| Extra Space Storage LP | 2.40 | 10/15/31 | 5,000 | 4,186 | ||||||||||
| Extra Space Storage LP | 5.90 | 01/15/31 | 10,000 | 10,366 | ||||||||||
| GLP Capital LP/GLP Financing II, Inc. | 3.25 | 01/15/32 | 5,000 | 4,321 | ||||||||||
| GLP Capital LP/GLP Financing II, Inc. | 4.00 | 01/15/30 | 10,000 | 9,322 | ||||||||||
| GLP Capital LP/GLP Financing II, Inc. | 4.00 | 01/15/31 | 5,000 | 4,592 | ||||||||||
| GLP Capital LP/GLP Financing II, Inc. | 5.63 | 09/15/34 | 5,000 | 4,941 | ||||||||||
| Healthcare Realty Holdings LP | 2.00 | 03/15/31 | 5,000 | 4,108 | ||||||||||
| Healthcare Realty Holdings LP | 3.10 | 02/15/30 | 10,000 | 9,010 | ||||||||||
| Healthpeak OP LLC | 2.88 | 01/15/31 | 10,000 | 8,928 | ||||||||||
| Healthpeak OP LLC | 3.00 | 01/15/30 | 5,000 | 4,566 | ||||||||||
| Healthpeak OP LLC | 5.25 | 12/15/32 | 10,000 | 10,077 | ||||||||||
| Host Hotels & Resorts LP | 3.50 | 09/15/30 | 10,000 | 9,060 | ||||||||||
| Host Hotels & Resorts LP | 5.70 | 07/01/34 | 10,000 | 10,006 | ||||||||||
| Invitation Homes Operating Partnership LP | 2.00 | 08/15/31 | 5,000 | 4,099 | ||||||||||
| Invitation Homes Operating Partnership LP | 4.15 | 04/15/32 | 5,000 | 4,642 | ||||||||||
| Kimco Realty OP LLC | 3.20 | 04/01/32 | 5,000 | 4,427 | ||||||||||
| Kimco Realty OP LLC | 4.60 | 02/01/33 | 20,000 | 19,293 | ||||||||||
| NNN REIT, Inc. | 5.50 | 06/15/34 | 5,000 | 5,065 | ||||||||||
| Omega Healthcare Investors, Inc. | 3.25 | 04/15/33 | 5,000 | 4,204 | ||||||||||
| Omega Healthcare Investors, Inc. | 3.38 | 02/01/31 | 5,000 | 4,453 | ||||||||||
| Regency Centers LP | 3.70 | 06/15/30 | 5,000 | 4,695 | ||||||||||
| Sabra Health Care LP | 3.20 | 12/01/31 | 5,000 | 4,314 | ||||||||||
| Sun Communities Operating LP | 2.70 | 07/15/31 | 10,000 | 8,515 | ||||||||||
| UDR, Inc. | 3.00 | 08/15/31 | 5,000 | 4,439 | ||||||||||
| UDR, Inc. | 3.20 | 01/15/30 | 10,000 | 9,211 | ||||||||||
| Ventas Realty LP | 2.50 | 09/01/31 | 5,000 | 4,253 | ||||||||||
| Ventas Realty LP | 3.00 | 01/15/30 | 10,000 | 9,069 | ||||||||||
| Ventas Realty LP | 4.75 | 11/15/30 | 5,000 | 4,930 | ||||||||||
| VICI Properties LP | 4.95 | 02/15/30 | 10,000 | 9,825 | ||||||||||
| VICI Properties LP | 5.13 | 05/15/32 | 15,000 | 14,697 | ||||||||||
| Welltower OP LLC | 2.80 | 06/01/31 | 10,000 | 8,820 | ||||||||||
| Welltower OP LLC | 3.10 | 01/15/30 | 10,000 | 9,191 | ||||||||||
| Welltower OP LLC | 3.85 | 06/15/32 | 10,000 | 9,280 | ||||||||||
| Weyerhaeuser Co. | 4.00 | 04/15/30 | 15,000 | 14,368 | ||||||||||
| 509,379 | ||||||||||||||
| RETAIL – 3.1% | ||||||||||||||
| AutoNation, Inc. | 3.85 | 03/01/32 | 5,000 | 4,492 | ||||||||||
| AutoNation, Inc. | 4.75 | 06/01/30 | 5,000 | 4,878 | ||||||||||
| AutoZone, Inc. | 4.00 | 04/15/30 | 10,000 | 9,586 | ||||||||||
| AutoZone, Inc. | 4.75 | 08/01/32 | 10,000 | 9,759 | ||||||||||
| AutoZone, Inc. | 4.75 | 02/01/33 | 10,000 | 9,736 | ||||||||||
| Best Buy Co., Inc. | 1.95 | 10/01/30 | 10,000 | 8,504 | ||||||||||
| Darden Restaurants, Inc. | 6.30 | 10/10/33 | 5,000 | 5,277 | ||||||||||
| Dick’s Sporting Goods, Inc. | 3.15 | 01/15/32 | 5,000 | 4,388 | ||||||||||
The accompanying notes are an integral part of these financial statements.
142
BONDBLOXX ETF TRUST
BondBloxx BBB Rated 5-10 Year Corporate Bond ETF
Portfolio of Investments (Continued)
October 31, 2024
| Rate (%) | Maturity | Face Amount | Value | |||||||||||
| RETAIL – 3.1% (Continued) | ||||||||||||||
| Dollar General Corp. | 3.50 | 04/03/30 | $ | 10,000 | $ | 9,220 | ||||||||
| Dollar General Corp. | 5.00 | 11/01/32 | 10,000 | 9,648 | ||||||||||
| Dollar General Corp. | 5.45 | 07/05/33 | 5,000 | 4,957 | ||||||||||
| Dollar Tree, Inc. | 2.65 | 12/01/31 | 5,000 | 4,190 | ||||||||||
| Genuine Parts Co. | 2.75 | 02/01/32 | 5,000 | 4,250 | ||||||||||
| Lowe’s Cos, Inc. | 1.70 | 10/15/30 | 10,000 | 8,383 | ||||||||||
| Lowe’s Cos, Inc. | 2.63 | 04/01/31 | 15,000 | 13,156 | ||||||||||
| Lowe’s Cos, Inc. | 3.75 | 04/01/32 | 10,000 | 9,261 | ||||||||||
| Lowe’s Cos, Inc. | 4.50 | 04/15/30 | 10,000 | 9,867 | ||||||||||
| Lowe’s Cos, Inc. | 5.00 | 04/15/33 | 20,000 | 19,997 | ||||||||||
| Lowe’s Cos, Inc. | 5.15 | 07/01/33 | 5,000 | 5,059 | ||||||||||
| McDonald’s Corp. | 2.13 | 03/01/30 | 10,000 | 8,763 | ||||||||||
| McDonald’s Corp. | 3.60 | 07/01/30 | 10,000 | 9,429 | ||||||||||
| McDonald’s Corp. | 4.60 | 09/09/32 | 5,000 | 4,925 | ||||||||||
| McDonald’s Corp. | 5.20 | 05/17/34 | 5,000 | 5,105 | ||||||||||
| O’Reilly Automotive, Inc. | 4.20 | 04/01/30 | 5,000 | 4,833 | ||||||||||
| O’Reilly Automotive, Inc. | 4.70 | 06/15/32 | 5,000 | 4,893 | ||||||||||
| Starbucks Corp. | 2.25 | 03/12/30 | 10,000 | 8,819 | ||||||||||
| Starbucks Corp. | 2.55 | 11/15/30 | 10,000 | 8,800 | ||||||||||
| Starbucks Corp. | 3.00 | 02/14/32 | 15,000 | 13,286 | ||||||||||
| Starbucks Corp. | 4.80 | 02/15/33 | 5,000 | 4,971 | ||||||||||
| Tractor Supply Co. | 1.75 | 11/01/30 | 5,000 | 4,187 | ||||||||||
| Tractor Supply Co. | 5.25 | 05/15/33 | 5,000 | 5,033 | ||||||||||
| 237,652 | ||||||||||||||
| SEMICONDUCTORS – 4.4% | ||||||||||||||
| Broadcom, Inc.(1) | 2.45 | 02/15/31 | 20,000 | 17,281 | ||||||||||
| Broadcom, Inc.(1) | 2.60 | 02/15/33 | 10,000 | 8,301 | ||||||||||
| Broadcom, Inc.(1) | 3.42 | 04/15/33 | 20,000 | 17,654 | ||||||||||
| Broadcom, Inc.(1) | 3.47 | 04/15/34 | 25,000 | 21,830 | ||||||||||
| Broadcom, Inc. | 4.15 | 11/15/30 | 20,000 | 19,199 | ||||||||||
| Broadcom, Inc.(1) | 4.15 | 04/15/32 | 10,000 | 9,444 | ||||||||||
| Broadcom, Inc. | 4.30 | 11/15/32 | 20,000 | 19,025 | ||||||||||
| Broadcom, Inc. | 4.35 | 02/15/30 | 15,000 | 14,615 | ||||||||||
| Broadcom, Inc. | 4.80 | 10/15/34 | 15,000 | 14,504 | ||||||||||
| Broadcom, Inc. | 5.15 | 11/15/31 | 15,000 | 15,120 | ||||||||||
| Intel Corp. | 2.00 | 08/12/31 | 15,000 | 12,189 | ||||||||||
| Intel Corp. | 2.45 | 11/15/29 | 15,000 | 13,198 | ||||||||||
| Intel Corp. | 3.90 | 03/25/30 | 15,000 | 14,084 | ||||||||||
| Intel Corp. | 4.15 | 08/05/32 | 20,000 | 18,486 | ||||||||||
| Intel Corp. | 5.13 | 02/10/30 | 10,000 | 9,983 | ||||||||||
| Intel Corp. | 5.20 | 02/10/33 | 20,000 | 19,665 | ||||||||||
| Marvell Technology, Inc. | 2.95 | 04/15/31 | 5,000 | 4,418 | ||||||||||
| Marvell Technology, Inc. | 5.95 | 09/15/33 | 5,000 | 5,235 | ||||||||||
| Micron Technology, Inc. | 2.70 | 04/15/32 | 10,000 | 8,459 | ||||||||||
| Micron Technology, Inc. | 4.66 | 02/15/30 | 10,000 | 9,820 | ||||||||||
| Micron Technology, Inc. | 5.30 | 01/15/31 | 10,000 | 10,073 | ||||||||||
| Micron Technology, Inc. | 5.88 | 02/09/33 | 5,000 | 5,174 | ||||||||||
The accompanying notes are an integral part of these financial statements.
143
BONDBLOXX ETF TRUST
BondBloxx BBB Rated 5-10 Year Corporate Bond ETF
Portfolio of Investments (Continued)
October 31, 2024
| Rate (%) | Maturity | Face Amount | Value | |||||||||||
| SEMICONDUCTORS – 4.4% (Continued) | ||||||||||||||
| Micron Technology, Inc. | 5.88 | 09/15/33 | $ | 10,000 | $ | 10,363 | ||||||||
| Micron Technology, Inc. | 6.75 | 11/01/29 | 5,000 | 5,367 | ||||||||||
| NXP BV/NXP Funding LLC/NXP USA, Inc. | 2.50 | 05/11/31 | 10,000 | 8,558 | ||||||||||
| NXP BV/NXP Funding LLC/NXP USA, Inc. | 2.65 | 02/15/32 | 10,000 | 8,457 | ||||||||||
| NXP BV/NXP Funding LLC/NXP USA, Inc. | 3.40 | 05/01/30 | 10,000 | 9,223 | ||||||||||
| NXP BV/NXP Funding LLC/NXP USA, Inc. | 5.00 | 01/15/33 | 5,000 | 4,925 | ||||||||||
| 334,650 | ||||||||||||||
| SOFTWARE – 3.6% | ||||||||||||||
| Atlassian Corp. | 5.50 | 05/15/34 | 10,000 | 10,180 | ||||||||||
| Autodesk, Inc. | 2.40 | 12/15/31 | 10,000 | 8,509 | ||||||||||
| Broadridge Financial Solutions, Inc. | 2.60 | 05/01/31 | 5,000 | 4,317 | ||||||||||
| Broadridge Financial Solutions, Inc. | 2.90 | 12/01/29 | 10,000 | 9,082 | ||||||||||
| Concentrix Corp. | 6.85 | 08/02/33 | 5,000 | 5,042 | ||||||||||
| Electronic Arts, Inc. | 1.85 | 02/15/31 | 5,000 | 4,195 | ||||||||||
| Fidelity National Information Services, Inc. | 5.10 | 07/15/32 | 10,000 | 10,086 | ||||||||||
| Fiserv, Inc. | 2.65 | 06/01/30 | 10,000 | 8,895 | ||||||||||
| Fiserv, Inc. | 5.15 | 08/12/34 | 15,000 | 14,908 | ||||||||||
| Fiserv, Inc. | 5.60 | 03/02/33 | 10,000 | 10,284 | ||||||||||
| Fiserv, Inc. | 5.63 | 08/21/33 | 15,000 | 15,434 | ||||||||||
| Oracle Corp. | 2.88 | 03/25/31 | 25,000 | 22,165 | ||||||||||
| Oracle Corp. | 2.95 | 04/01/30 | 25,000 | 22,702 | ||||||||||
| Oracle Corp. | 4.30 | 07/08/34 | 10,000 | 9,339 | ||||||||||
| Oracle Corp. | 4.65 | 05/06/30 | 10,000 | 9,927 | ||||||||||
| Oracle Corp. | 4.70 | 09/27/34 | 10,000 | 9,627 | ||||||||||
| Oracle Corp. | 4.90 | 02/06/33 | 10,000 | 9,872 | ||||||||||
| Oracle Corp. | 6.15 | 11/09/29 | 15,000 | 15,867 | ||||||||||
| Oracle Corp. | 6.25 | 11/09/32 | 25,000 | 26,841 | ||||||||||
| Roper Technologies, Inc. | 1.75 | 02/15/31 | 10,000 | 8,272 | ||||||||||
| Roper Technologies, Inc. | 4.90 | 10/15/34 | 15,000 | 14,644 | ||||||||||
| Take-Two Interactive Software, Inc. | 4.00 | 04/14/32 | 5,000 | 4,677 | ||||||||||
| VMware LLC | 2.20 | 08/15/31 | 10,000 | 8,346 | ||||||||||
| VMware LLC | 4.70 | 05/15/30 | 5,000 | 4,915 | ||||||||||
| Workday, Inc. | 3.80 | 04/01/32 | 10,000 | 9,237 | ||||||||||
| 277,363 | ||||||||||||||
| TELECOMMUNICATIONS – 8.3% | ||||||||||||||
| AT&T, Inc. | 2.25 | 02/01/32 | 20,000 | 16,664 | ||||||||||
| AT&T, Inc. | 2.55 | 12/01/33 | 35,000 | 28,502 | ||||||||||
| AT&T, Inc. | 2.75 | 06/01/31 | 25,000 | 21,970 | ||||||||||
| AT&T, Inc. | 4.30 | 02/15/30 | 20,000 | 19,474 | ||||||||||
| AT&T, Inc. | 5.40 | 02/15/34 | 20,000 | 20,326 | ||||||||||
| Bell Telephone Co. of Canada or Bell Canada | 2.15 | 02/15/32 | 10,000 | 8,233 | ||||||||||
| Bell Telephone Co. of Canada or Bell Canada | 5.10 | 05/11/33 | 5,000 | 4,948 | ||||||||||
| Bell Telephone Co. of Canada or Bell Canada | 5.20 | 02/15/34 | 5,000 | 4,980 | ||||||||||
| British Telecommunications PLC | 9.63 | 12/15/30 | 25,000 | 30,771 | ||||||||||
| Deutsche Telekom International Finance BV | 8.75 | 06/15/30 | 25,000 | 29,428 | ||||||||||
| Deutsche Telekom International Finance BV | 9.25 | 06/01/32 | 5,000 | 6,274 | ||||||||||
| Koninklijke KPN NV | 8.38 | 10/01/30 | 5,000 | 5,856 | ||||||||||
The accompanying notes are an integral part of these financial statements.
144
BONDBLOXX ETF TRUST
BondBloxx BBB Rated 5-10 Year Corporate Bond ETF
Portfolio of Investments (Continued)
October 31, 2024
| Rate (%) | Maturity | Face Amount | Value | |||||||||||
| TELECOMMUNICATIONS – 8.3% (Continued) | ||||||||||||||
| Motorola Solutions, Inc. | 2.75 | 05/24/31 | $ | 10,000 | $ | 8,743 | ||||||||
| Motorola Solutions, Inc. | 5.40 | 04/15/34 | 10,000 | 10,138 | ||||||||||
| Motorola Solutions, Inc. | 5.60 | 06/01/32 | 10,000 | 10,317 | ||||||||||
| Orange SA | 9.00 | 03/01/31 | 20,000 | 24,190 | ||||||||||
| Rogers Communications, Inc. | 3.80 | 03/15/32 | 15,000 | 13,679 | ||||||||||
| Rogers Communications, Inc. | 5.30 | 02/15/34 | 10,000 | 9,923 | ||||||||||
| Sprint Capital Corp. | 8.75 | 03/15/32 | 20,000 | 24,191 | ||||||||||
| Telefonica Europe BV | 8.25 | 09/15/30 | 10,000 | 11,517 | ||||||||||
| TELUS Corp. | 3.40 | 05/13/32 | 5,000 | 4,464 | ||||||||||
| T-Mobile USA, Inc. | 2.25 | 11/15/31 | 10,000 | 8,397 | ||||||||||
| T-Mobile USA, Inc. | 2.55 | 02/15/31 | 15,000 | 13,049 | ||||||||||
| T-Mobile USA, Inc. | 2.70 | 03/15/32 | 10,000 | 8,575 | ||||||||||
| T-Mobile USA, Inc. | 2.88 | 02/15/31 | 10,000 | 8,862 | ||||||||||
| T-Mobile USA, Inc. | 3.50 | 04/15/31 | 20,000 | 18,359 | ||||||||||
| T-Mobile USA, Inc. | 3.88 | 04/15/30 | 55,000 | 52,275 | ||||||||||
| T-Mobile USA, Inc. | 5.05 | 07/15/33 | 20,000 | 19,919 | ||||||||||
| T-Mobile USA, Inc. | 5.15 | 04/15/34 | 15,000 | 14,990 | ||||||||||
| T-Mobile USA, Inc. | 5.20 | 01/15/33 | 10,000 | 10,060 | ||||||||||
| T-Mobile USA, Inc. | 5.75 | 01/15/34 | 10,000 | 10,426 | ||||||||||
| Verizon Communications, Inc. | 1.50 | 09/18/30 | 10,000 | 8,332 | ||||||||||
| Verizon Communications, Inc. | 1.68 | 10/30/30 | 10,000 | 8,319 | ||||||||||
| Verizon Communications, Inc. | 1.75 | 01/20/31 | 20,000 | 16,591 | ||||||||||
| Verizon Communications, Inc. | 2.36 | 03/15/32 | 35,000 | 29,236 | ||||||||||
| Verizon Communications, Inc. | 2.55 | 03/21/31 | 30,000 | 26,053 | ||||||||||
| Verizon Communications, Inc. | 3.15 | 03/22/30 | 10,000 | 9,187 | ||||||||||
| Verizon Communications, Inc. | 4.02 | 12/03/29 | 30,000 | 28,866 | ||||||||||
| Verizon Communications, Inc. | 4.50 | 08/10/33 | 20,000 | 19,044 | ||||||||||
| Verizon Communications, Inc. | 5.05 | 05/09/33 | 10,000 | 10,015 | ||||||||||
| 635,143 | ||||||||||||||
| TOYS/GAMES/HOBBIES – 0.2% | ||||||||||||||
| Hasbro, Inc. | 3.90 | 11/19/29 | 10,000 | 9,428 | ||||||||||
| Hasbro, Inc. | 6.05 | 05/14/34 | 5,000 | 5,113 | ||||||||||
| 14,541 | ||||||||||||||
| TRANSPORTATION – 0.7% | ||||||||||||||
| Canadian Pacific Railway Co. | 2.05 | 03/05/30 | 5,000 | 4,360 | ||||||||||
| Canadian Pacific Railway Co. | 2.45 | 12/02/31 | 10,000 | 8,624 | ||||||||||
| FedEx Corp. | 2.40 | 05/15/31 | 10,000 | 8,618 | ||||||||||
| FedEx Corp. | 4.25 | 05/15/30 | 10,000 | 9,739 | ||||||||||
| Norfolk Southern Corp. | 3.00 | 03/15/32 | 10,000 | 8,838 | ||||||||||
| Norfolk Southern Corp. | 5.05 | 08/01/30 | 10,000 | 10,146 | ||||||||||
| Ryder System, Inc. | 6.60 | 12/01/33 | 5,000 | 5,436 | ||||||||||
| 55,761 | ||||||||||||||
| TRUCKING & LEASING – 0.1% | ||||||||||||||
| GATX Corp. | 4.00 | 06/30/30 | 5,000 | 4,733 | ||||||||||
The accompanying notes are an integral part of these financial statements.
145
BONDBLOXX ETF TRUST
BondBloxx BBB Rated 5-10 Year Corporate Bond ETF
Portfolio of Investments (Continued)
October 31, 2024
| Rate (%) | Maturity | Face Amount | Value | |||||||||||
| WATER – 0.3% | ||||||||||||||
| American Water Capital Corp. | 2.80 | 05/01/30 | $ | 5,000 | $ | 4,515 | ||||||||
| American Water Capital Corp. | 4.45 | 06/01/32 | 10,000 | 9,748 | ||||||||||
| American Water Capital Corp. | 5.15 | 03/01/34 | 5,000 | 5,039 | ||||||||||
| Essential Utilities, Inc. | 5.38 | 01/15/34 | 5,000 | 5,043 | ||||||||||
| 24,345 | ||||||||||||||
| TOTAL CORPORATE BONDS (Cost - $7,506,755) | 7,497,294 | |||||||||||||
| SHORT-TERM INVESTMENTS – 0.5% | ||||||||||||||
| TIME DEPOSITS – 0.5% | ||||||||||||||
| Citibank, New York | 4.18 | 11/01/24 | 36,071 | 36,071 | ||||||||||
| TOTAL SHORT-TERM INVESTMENTS (Cost - $36,071) | 36,071 | |||||||||||||
| TOTAL INVESTMENTS – 98.9% (Cost - $7,542,826) | $ | 7,533,365 | ||||||||||||
| OTHER ASSETS LESS LIABILITIES – 1.1% | 83,117 | |||||||||||||
| NET ASSETS – 100.0% | $ | 7,616,482 | ||||||||||||
| (1) | Security was purchased pursuant to Rule 144A under the Securities Act of 1933 and may not be resold subject to that Rule except to qualified institutional buyers. The aggregate value of Rule 144A holdings at October 31, 2024, amounts to $197,032 and represents 2.6% of net assets. These securities have been deemed liquid under procedures approved by the Trust’s Board of Trustees. |
The accompanying notes are an integral part of these financial statements.
146
BONDBLOXX ETF TRUST
BondBloxx BBB Rated 10+ Year Corporate Bond ETF
Portfolio of Investments
October 31, 2024
| Rate (%) | Maturity | Face Amount | Value | |||||||||||
| CORPORATE BONDS – 98.0% | ||||||||||||||
| ADVERTISING – 0.2% | ||||||||||||||
| Interpublic Group of Cos, Inc. | 3.38 | 03/01/41 | $ | 5,000 | $ | 3,738 | ||||||||
| Interpublic Group of Cos, Inc. | 5.40 | 10/01/48 | 5,000 | 4,717 | ||||||||||
| Omnicom Group, Inc. | 5.30 | 11/01/34 | 5,000 | 5,018 | ||||||||||
| 13,473 | ||||||||||||||
| AEROSPACE/DEFENSE – 5.0% | ||||||||||||||
| Boeing Co. | 3.25 | 02/01/35 | 5,000 | 3,987 | ||||||||||
| Boeing Co. | 3.75 | 02/01/50 | 10,000 | 6,951 | ||||||||||
| Boeing Co. | 3.90 | 05/01/49 | 5,000 | 3,536 | ||||||||||
| Boeing Co. | 3.95 | 08/01/59 | 10,000 | 6,713 | ||||||||||
| Boeing Co. | 5.71 | 05/01/40 | 25,000 | 24,071 | ||||||||||
| Boeing Co. | 5.81 | 05/01/50 | 45,000 | 42,498 | ||||||||||
| Boeing Co. | 5.93 | 05/01/60 | 45,000 | 42,152 | ||||||||||
| Boeing Co.(1) | 6.86 | 05/01/54 | 15,000 | 16,114 | ||||||||||
| Boeing Co. | 6.88 | 03/15/39 | 5,000 | 5,298 | ||||||||||
| GE Capital International Funding Co. Unlimited Co. | 4.42 | 11/15/35 | 10,000 | 9,427 | ||||||||||
| General Electric Co. | 5.88 | 01/14/38 | 5,000 | 5,259 | ||||||||||
| General Electric Co. | 6.88 | 01/10/39 | 10,000 | 11,530 | ||||||||||
| Howmet Aerospace, Inc. | 5.95 | 02/01/37 | 5,000 | 5,274 | ||||||||||
| L3Harris Technologies, Inc. | 5.05 | 04/27/45 | 5,000 | 4,705 | ||||||||||
| L3Harris Technologies, Inc. | 5.50 | 08/15/54 | 5,000 | 4,989 | ||||||||||
| L3Harris Technologies, Inc. | 5.60 | 07/31/53 | 5,000 | 5,060 | ||||||||||
| Northrop Grumman Corp. | 4.03 | 10/15/47 | 10,000 | 8,133 | ||||||||||
| Northrop Grumman Corp. | 4.75 | 06/01/43 | 5,000 | 4,601 | ||||||||||
| Northrop Grumman Corp. | 4.95 | 03/15/53 | 10,000 | 9,330 | ||||||||||
| Northrop Grumman Corp. | 5.15 | 05/01/40 | 5,000 | 4,883 | ||||||||||
| Northrop Grumman Corp. | 5.20 | 06/01/54 | 15,000 | 14,548 | ||||||||||
| Northrop Grumman Corp. | 5.25 | 05/01/50 | 10,000 | 9,755 | ||||||||||
| RTX Corp. | 2.82 | 09/01/51 | 10,000 | 6,347 | ||||||||||
| RTX Corp. | 3.13 | 07/01/50 | 15,000 | 10,208 | ||||||||||
| RTX Corp. | 3.75 | 11/01/46 | 15,000 | 11,702 | ||||||||||
| RTX Corp. | 4.05 | 05/04/47 | 5,000 | 4,045 | ||||||||||
| RTX Corp. | 4.35 | 04/15/47 | 10,000 | 8,473 | ||||||||||
| RTX Corp. | 4.45 | 11/16/38 | 10,000 | 9,120 | ||||||||||
| RTX Corp. | 4.50 | 06/01/42 | 25,000 | 22,266 | ||||||||||
| RTX Corp. | 4.63 | 11/16/48 | 10,000 | 8,837 | ||||||||||
| RTX Corp. | 4.88 | 10/15/40 | 5,000 | 4,715 | ||||||||||
| RTX Corp. | 5.38 | 02/27/53 | 10,000 | 9,834 | ||||||||||
| RTX Corp. | 5.70 | 04/15/40 | 10,000 | 10,303 | ||||||||||
| RTX Corp. | 6.13 | 07/15/38 | 5,000 | 5,389 | ||||||||||
| RTX Corp. | 6.40 | 03/15/54 | 10,000 | 11,275 | ||||||||||
| 371,328 | ||||||||||||||
| AGRICULTURE – 2.5% | ||||||||||||||
| Altria Group, Inc. | 3.40 | 02/04/41 | 15,000 | 11,187 | ||||||||||
| Altria Group, Inc. | 3.70 | 02/04/51 | 10,000 | 7,035 | ||||||||||
| Altria Group, Inc. | 3.88 | 09/16/46 | 5,000 | 3,734 | ||||||||||
| Altria Group, Inc. | 4.25 | 08/09/42 | 5,000 | 4,106 | ||||||||||
The accompanying notes are an integral part of these financial statements.
147
BONDBLOXX ETF TRUST
BondBloxx BBB Rated 10+ Year Corporate Bond ETF
Portfolio of Investments (Continued)
October 31, 2024
| Rate (%) | Maturity | Face Amount | Value | |||||||||||
| AGRICULTURE – 2.5% (Continued) | ||||||||||||||
| Altria Group, Inc. | 4.45 | 05/06/50 | $ | 10,000 | $ | 8,029 | ||||||||
| Altria Group, Inc. | 4.50 | 05/02/43 | 5,000 | 4,217 | ||||||||||
| Altria Group, Inc. | 5.38 | 01/31/44 | 10,000 | 9,715 | ||||||||||
| Altria Group, Inc. | 5.80 | 02/14/39 | 15,000 | 15,250 | ||||||||||
| Altria Group, Inc. | 5.95 | 02/14/49 | 30,000 | 30,216 | ||||||||||
| BAT Capital Corp. | 4.39 | 08/15/37 | 25,000 | 21,806 | ||||||||||
| BAT Capital Corp. | 4.54 | 08/15/47 | 15,000 | 12,018 | ||||||||||
| BAT Capital Corp. | 4.76 | 09/06/49 | 15,000 | 12,335 | ||||||||||
| BAT Capital Corp. | 5.28 | 04/02/50 | 5,000 | 4,490 | ||||||||||
| BAT Capital Corp. | 7.08 | 08/02/43 | 5,000 | 5,463 | ||||||||||
| BAT Capital Corp. | 7.08 | 08/02/53 | 5,000 | 5,544 | ||||||||||
| Reynolds American, Inc. | 5.70 | 08/15/35 | 5,000 | 5,051 | ||||||||||
| Reynolds American, Inc. | 5.85 | 08/15/45 | 20,000 | 19,312 | ||||||||||
| Reynolds American, Inc. | 6.15 | 09/15/43 | 5,000 | 5,004 | ||||||||||
| 184,512 | ||||||||||||||
| AUTO MANUFACTURERS – 1.1% | ||||||||||||||
| Ford Motor Co. | 4.75 | 01/15/43 | 20,000 | 16,188 | ||||||||||
| Ford Motor Co. | 5.29 | 12/08/46 | 5,000 | 4,397 | ||||||||||
| General Motors Co. | 5.00 | 04/01/35 | 10,000 | 9,500 | ||||||||||
| General Motors Co. | 5.20 | 04/01/45 | 10,000 | 8,952 | ||||||||||
| General Motors Co. | 5.40 | 04/01/48 | 5,000 | 4,551 | ||||||||||
| General Motors Co. | 5.95 | 04/01/49 | 10,000 | 9,768 | ||||||||||
| General Motors Co. | 6.25 | 10/02/43 | 10,000 | 10,080 | ||||||||||
| General Motors Co. | 6.60 | 04/01/36 | 10,000 | 10,615 | ||||||||||
| General Motors Co. | 6.75 | 04/01/46 | 10,000 | 10,674 | ||||||||||
| 84,725 | ||||||||||||||
| AUTO PARTS & EQUIPMENT – 0.4% | ||||||||||||||
| Aptiv PLC | 3.10 | 12/01/51 | 10,000 | 6,068 | ||||||||||
| Aptiv PLC/Aptiv Corp. | 4.15 | 05/01/52 | 10,000 | 7,410 | ||||||||||
| Aptiv PLC/Aptiv Global Financing DAC | 5.75 | 09/13/54 | 5,000 | 4,594 | ||||||||||
| BorgWarner, Inc. | 4.38 | 03/15/45 | 5,000 | 4,098 | ||||||||||
| Lear Corp. | 5.25 | 05/15/49 | 5,000 | 4,477 | ||||||||||
| 26,647 | ||||||||||||||
| BANKS – 3.9% | ||||||||||||||
| Barclays PLC | 3.33 | 11/24/42 | 15,000 | 11,170 | ||||||||||
| Barclays PLC | 3.81 | 03/10/42 | 15,000 | 11,892 | ||||||||||
| Barclays PLC | 4.95 | 01/10/47 | 5,000 | 4,605 | ||||||||||
| Barclays PLC | 5.25 | 08/17/45 | 15,000 | 14,570 | ||||||||||
| Citigroup, Inc. | 4.75 | 05/18/46 | 15,000 | 13,399 | ||||||||||
| Citigroup, Inc. | 5.30 | 05/06/44 | 10,000 | 9,698 | ||||||||||
| Citigroup, Inc. | 6.13 | 08/25/36 | 5,000 | 5,222 | ||||||||||
| Citigroup, Inc. | 6.68 | 09/13/43 | 5,000 | 5,635 | ||||||||||
| Cooperatieve Rabobank UA | 5.25 | 08/04/45 | 5,000 | 4,957 | ||||||||||
| Cooperatieve Rabobank UA | 5.75 | 12/01/43 | 15,000 | 15,384 | ||||||||||
| Fifth Third Bancorp | 8.25 | 03/01/38 | 10,000 | 12,088 | ||||||||||
| Goldman Sachs Group, Inc. | 5.15 | 05/22/45 | 15,000 | 14,340 | ||||||||||
| Goldman Sachs Group, Inc. | 6.75 | 10/01/37 | 50,000 | 54,934 | ||||||||||
The accompanying notes are an integral part of these financial statements.
148
BONDBLOXX ETF TRUST
BondBloxx BBB Rated 10+ Year Corporate Bond ETF
Portfolio of Investments (Continued)
October 31, 2024
| Rate (%) | Maturity | Face Amount | Value | |||||||||||
| BANKS – 3.9% (Continued) | ||||||||||||||
| HSBC Holdings PLC | 5.25 | 03/14/44 | $ | 15,000 | $ | 14,255 | ||||||||
| HSBC Holdings PLC | 6.50 | 05/02/36 | 15,000 | 16,215 | ||||||||||
| HSBC Holdings PLC | 6.50 | 05/02/36 | 5,000 | 5,257 | ||||||||||
| HSBC Holdings PLC | 6.50 | 09/15/37 | 20,000 | 21,401 | ||||||||||
| HSBC Holdings PLC | 6.80 | 06/01/38 | 5,000 | 5,423 | ||||||||||
| Lloyds Banking Group PLC | 3.37 | 12/14/46 | 10,000 | 7,131 | ||||||||||
| Lloyds Banking Group PLC | 4.34 | 01/09/48 | 20,000 | 16,227 | ||||||||||
| Regions Bank/Birmingham AL | 6.45 | 06/26/37 | 5,000 | 5,178 | ||||||||||
| Sumitomo Mitsui Financial Group, Inc. | 2.93 | 09/17/41 | 10,000 | 7,390 | ||||||||||
| Sumitomo Mitsui Financial Group, Inc. | 5.84 | 07/09/44 | 10,000 | 10,395 | ||||||||||
| Sumitomo Mitsui Financial Group, Inc. | 6.18 | 07/13/43 | 5,000 | 5,494 | ||||||||||
| 292,260 | ||||||||||||||
| BEVERAGES – 0.9% | ||||||||||||||
| Constellation Brands, Inc. | 3.75 | 05/01/50 | 10,000 | 7,601 | ||||||||||
| Constellation Brands, Inc. | 4.50 | 05/09/47 | 5,000 | 4,304 | ||||||||||
| Constellation Brands, Inc. | 5.25 | 11/15/48 | 5,000 | 4,787 | ||||||||||
| Fomento Economico Mexicano SAB de CV | 3.50 | 01/16/50 | 10,000 | 7,503 | ||||||||||
| Keurig Dr Pepper, Inc. | 3.35 | 03/15/51 | 5,000 | 3,523 | ||||||||||
| Keurig Dr Pepper, Inc. | 3.80 | 05/01/50 | 10,000 | 7,679 | ||||||||||
| Keurig Dr Pepper, Inc. | 4.50 | 04/15/52 | 10,000 | 8,607 | ||||||||||
| Molson Coors Beverage Co. | 4.20 | 07/15/46 | 25,000 | 20,494 | ||||||||||
| 64,498 | ||||||||||||||
| BIOTECHNOLOGY – 4.7% | ||||||||||||||
| Amgen, Inc. | 2.80 | 08/15/41 | 15,000 | 10,829 | ||||||||||
| Amgen, Inc. | 3.00 | 01/15/52 | 10,000 | 6,685 | ||||||||||
| Amgen, Inc. | 3.15 | 02/21/40 | 10,000 | 7,625 | ||||||||||
| Amgen, Inc. | 3.38 | 02/21/50 | 10,000 | 7,243 | ||||||||||
| Amgen, Inc. | 4.40 | 05/01/45 | 10,000 | 8,542 | ||||||||||
| Amgen, Inc. | 4.40 | 02/22/62 | 10,000 | 8,116 | ||||||||||
| Amgen, Inc. | 4.56 | 06/15/48 | 20,000 | 17,314 | ||||||||||
| Amgen, Inc. | 4.66 | 06/15/51 | 30,000 | 26,263 | ||||||||||
| Amgen, Inc. | 4.88 | 03/01/53 | 15,000 | 13,453 | ||||||||||
| Amgen, Inc. | 5.15 | 11/15/41 | 5,000 | 4,803 | ||||||||||
| Amgen, Inc. | 5.60 | 03/02/43 | 30,000 | 30,114 | ||||||||||
| Amgen, Inc. | 5.65 | 03/02/53 | 35,000 | 35,260 | ||||||||||
| Amgen, Inc. | 5.75 | 03/02/63 | 25,000 | 25,055 | ||||||||||
| Baxalta, Inc. | 5.25 | 06/23/45 | 10,000 | 9,521 | ||||||||||
| Biogen, Inc. | 3.15 | 05/01/50 | 15,000 | 9,822 | ||||||||||
| Biogen, Inc. | 3.25 | 02/15/51 | 10,000 | 6,675 | ||||||||||
| Biogen, Inc. | 5.20 | 09/15/45 | 5,000 | 4,635 | ||||||||||
| Gilead Sciences, Inc. | 2.80 | 10/01/50 | 20,000 | 12,904 | ||||||||||
| Gilead Sciences, Inc. | 4.00 | 09/01/36 | 5,000 | 4,495 | ||||||||||
| Gilead Sciences, Inc. | 4.15 | 03/01/47 | 20,000 | 16,680 | ||||||||||
| Gilead Sciences, Inc. | 4.50 | 02/01/45 | 20,000 | 17,695 | ||||||||||
| Gilead Sciences, Inc. | 4.60 | 09/01/35 | 10,000 | 9,606 | ||||||||||
| Gilead Sciences, Inc. | 4.75 | 03/01/46 | 15,000 | 13,678 | ||||||||||
| Gilead Sciences, Inc. | 4.80 | 04/01/44 | 10,000 | 9,231 | ||||||||||
The accompanying notes are an integral part of these financial statements.
149
BONDBLOXX ETF TRUST
BondBloxx BBB Rated 10+ Year Corporate Bond ETF
Portfolio of Investments (Continued)
October 31, 2024
| Rate (%) | Maturity | Face Amount | Value | |||||||||||
| BIOTECHNOLOGY – 4.7% (Continued) | ||||||||||||||
| Gilead Sciences, Inc. | 5.55 | 10/15/53 | $ | 10,000 | $ | 10,247 | ||||||||
| Regeneron Pharmaceuticals, Inc. | 2.80 | 09/15/50 | 5,000 | 3,114 | ||||||||||
| Royalty Pharma PLC | 3.30 | 09/02/40 | 5,000 | 3,704 | ||||||||||
| Royalty Pharma PLC | 3.55 | 09/02/50 | 5,000 | 3,467 | ||||||||||
| Royalty Pharma PLC | 5.90 | 09/02/54 | 10,000 | 9,940 | ||||||||||
| 346,716 | ||||||||||||||
| BUILDING MATERIALS – 0.7% | ||||||||||||||
| Carrier Global Corp. | 3.38 | 04/05/40 | 5,000 | 3,940 | ||||||||||
| Carrier Global Corp. | 3.58 | 04/05/50 | 13,000 | 9,707 | ||||||||||
| Carrier Global Corp. | 6.20 | 03/15/54 | 8,000 | 8,794 | ||||||||||
| Martin Marietta Materials, Inc. | 3.20 | 07/15/51 | 10,000 | 6,850 | ||||||||||
| Owens Corning | 5.95 | 06/15/54 | 5,000 | 5,147 | ||||||||||
| Trane Technologies Global Holding Co. Ltd. | 5.75 | 06/15/43 | 5,000 | 5,202 | ||||||||||
| Vulcan Materials Co. | 4.50 | 06/15/47 | 10,000 | 8,602 | ||||||||||
| 48,242 | ||||||||||||||
| CHEMICALS – 2.8% | ||||||||||||||
| CF Industries, Inc. | 4.95 | 06/01/43 | 5,000 | 4,506 | ||||||||||
| CF Industries, Inc. | 5.38 | 03/15/44 | 5,000 | 4,711 | ||||||||||
| Dow Chemical Co. | 3.60 | 11/15/50 | 5,000 | 3,588 | ||||||||||
| Dow Chemical Co. | 4.38 | 11/15/42 | 15,000 | 12,655 | ||||||||||
| Dow Chemical Co. | 5.55 | 11/30/48 | 10,000 | 9,679 | ||||||||||
| Dow Chemical Co. | 5.60 | 02/15/54 | 10,000 | 9,813 | ||||||||||
| Dow Chemical Co. | 6.90 | 05/15/53 | 10,000 | 11,357 | ||||||||||
| Dow Chemical Co. | 9.40 | 05/15/39 | 5,000 | 6,689 | ||||||||||
| DuPont de Nemours, Inc. | 5.32 | 11/15/38 | 8,000 | 8,276 | ||||||||||
| DuPont de Nemours, Inc. | 5.42 | 11/15/48 | 20,000 | 20,942 | ||||||||||
| Eastman Chemical Co. | 4.65 | 10/15/44 | 5,000 | 4,300 | ||||||||||
| Eastman Chemical Co. | 4.80 | 09/01/42 | 5,000 | 4,452 | ||||||||||
| FMC Corp. | 6.38 | 05/18/53 | 5,000 | 5,199 | ||||||||||
| International Flavors & Fragrances, Inc. | 4.38 | 06/01/47 | 5,000 | 4,008 | ||||||||||
| International Flavors & Fragrances, Inc. | 5.00 | 09/26/48 | 5,000 | 4,441 | ||||||||||
| LYB International Finance BV | 4.88 | 03/15/44 | 5,000 | 4,430 | ||||||||||
| LYB International Finance BV | 5.25 | 07/15/43 | 5,000 | 4,644 | ||||||||||
| LYB International Finance III LLC | 3.38 | 10/01/40 | 10,000 | 7,545 | ||||||||||
| LYB International Finance III LLC | 3.80 | 10/01/60 | 5,000 | 3,443 | ||||||||||
| LYB International Finance III LLC | 4.20 | 10/15/49 | 10,000 | 7,814 | ||||||||||
| LYB International Finance III LLC | 4.20 | 05/01/50 | 10,000 | 7,797 | ||||||||||
| LyondellBasell Industries NV | 4.63 | 02/26/55 | 10,000 | 8,246 | ||||||||||
| Mosaic Co. | 5.63 | 11/15/43 | 5,000 | 4,820 | ||||||||||
| Nutrien Ltd. | 3.95 | 05/13/50 | 5,000 | 3,884 | ||||||||||
| Nutrien Ltd. | 5.80 | 03/27/53 | 10,000 | 10,211 | ||||||||||
| Sherwin-Williams Co. | 2.90 | 03/15/52 | 10,000 | 6,360 | ||||||||||
| Sherwin-Williams Co. | 3.30 | 05/15/50 | 5,000 | 3,479 | ||||||||||
| Sherwin-Williams Co. | 4.50 | 06/01/47 | 10,000 | 8,635 | ||||||||||
| Westlake Corp. | 3.13 | 08/15/51 | 5,000 | 3,215 | ||||||||||
| Westlake Corp. | 4.38 | 11/15/47 | 10,000 | 8,156 | ||||||||||
| 207,295 | ||||||||||||||
The accompanying notes are an integral part of these financial statements.
150
BONDBLOXX ETF TRUST
BondBloxx BBB Rated 10+ Year Corporate Bond ETF
Portfolio of Investments (Continued)
October 31, 2024
| Rate (%) | Maturity | Face Amount | Value | |||||||||||
| COMMERCIAL SERVICES – 0.4% | ||||||||||||||
| Global Payments, Inc. | 4.15 | 08/15/49 | $ | 10,000 | $ | 7,783 | ||||||||
| Global Payments, Inc. | 5.95 | 08/15/52 | 5,000 | 5,010 | ||||||||||
| Moody’s Corp. | 3.75 | 02/25/52 | 10,000 | 7,656 | ||||||||||
| Moody’s Corp. | 5.25 | 07/15/44 | 5,000 | 4,859 | ||||||||||
| Quanta Services, Inc. | 3.05 | 10/01/41 | 5,000 | 3,632 | ||||||||||
| 28,940 | ||||||||||||||
| COMPUTERS – 1.1% | ||||||||||||||
| Dell International LLC/EMC Corp. | 3.45 | 12/15/51 | 5,000 | 3,491 | ||||||||||
| Dell International LLC/EMC Corp. | 4.85 | 02/01/35 | 5,000 | 4,804 | ||||||||||
| Dell International LLC/EMC Corp. | 8.10 | 07/15/36 | 10,000 | 12,090 | ||||||||||
| Dell International LLC/EMC Corp. | 8.35 | 07/15/46 | 10,000 | 13,051 | ||||||||||
| Hewlett Packard Enterprise Co. | 5.60 | 10/15/54 | 10,000 | 9,628 | ||||||||||
| Hewlett Packard Enterprise Co. | 6.20 | 10/15/35 | 10,000 | 10,662 | ||||||||||
| Hewlett Packard Enterprise Co. | 6.35 | 10/15/45 | 10,000 | 10,647 | ||||||||||
| HP, Inc. | 6.00 | 09/15/41 | 10,000 | 10,344 | ||||||||||
| Kyndryl Holdings, Inc. | 4.10 | 10/15/41 | 5,000 | 3,940 | ||||||||||
| 78,657 | ||||||||||||||
| COSMETICS/PERSONAL CARE – 0.1% | ||||||||||||||
| Haleon US Capital LLC | 4.00 | 03/24/52 | 5,000 | 4,008 | ||||||||||
| DIVERSIFIED FINANCIAL SERVICES – 0.6% | ||||||||||||||
| AerCap Ireland Capital DAC/AerCap Global Aviation Trust | 3.85 | 10/29/41 | 15,000 | 12,015 | ||||||||||
| Ares Management Corp. | 5.60 | 10/11/54 | 5,000 | 4,861 | ||||||||||
| Jefferies Financial Group, Inc. | 6.25 | 01/15/36 | 5,000 | 5,204 | ||||||||||
| Nasdaq, Inc. | 2.50 | 12/21/40 | 10,000 | 6,821 | ||||||||||
| Nasdaq, Inc. | 5.95 | 08/15/53 | 10,000 | 10,401 | ||||||||||
| Nasdaq, Inc. | 6.10 | 06/28/63 | 5,000 | 5,234 | ||||||||||
| 44,536 | ||||||||||||||
| ELECTRIC – 4.9% | ||||||||||||||
| AEP Texas, Inc. | 5.25 | 05/15/52 | 5,000 | 4,679 | ||||||||||
| American Electric Power Co., Inc. | 6.95 | 12/15/54 | 5,000 | 5,236 | ||||||||||
| Appalachian Power Co. | 3.70 | 05/01/50 | 10,000 | 7,274 | ||||||||||
| Appalachian Power Co. | 7.00 | 04/01/38 | 10,000 | 11,355 | ||||||||||
| Arizona Public Service Co. | 4.35 | 11/15/45 | 5,000 | 4,175 | ||||||||||
| Constellation Energy Generation LLC | 5.75 | 03/15/54 | 10,000 | 10,080 | ||||||||||
| Constellation Energy Generation LLC | 6.25 | 10/01/39 | 5,000 | 5,332 | ||||||||||
| Constellation Energy Generation LLC | 6.50 | 10/01/53 | 10,000 | 10,995 | ||||||||||
| Dominion Energy, Inc. | 4.85 | 08/15/52 | 5,000 | 4,431 | ||||||||||
| Dominion Energy, Inc. | 4.90 | 08/01/41 | 5,000 | 4,576 | ||||||||||
| Dominion Energy, Inc. | 5.95 | 06/15/35 | 5,000 | 5,244 | ||||||||||
| Duke Energy Carolinas LLC | 6.10 | 06/01/37 | 5,000 | 5,285 | ||||||||||
| Duke Energy Corp. | 3.30 | 06/15/41 | 25,000 | 18,731 | ||||||||||
| Duke Energy Corp. | 3.50 | 06/15/51 | 10,000 | 7,049 | ||||||||||
| Duke Energy Corp. | 4.80 | 12/15/45 | 10,000 | 8,846 | ||||||||||
| Duke Energy Corp. | 5.00 | 08/15/52 | 15,000 | 13,514 | ||||||||||
| Duke Energy Corp. | 5.80 | 06/15/54 | 5,000 | 5,018 | ||||||||||
The accompanying notes are an integral part of these financial statements.
151
BONDBLOXX ETF TRUST
BondBloxx BBB Rated 10+ Year Corporate Bond ETF
Portfolio of Investments (Continued)
October 31, 2024
| Rate (%) | Maturity | Face Amount | Value | |||||||||||
| ELECTRIC – 4.9% (Continued) | ||||||||||||||
| Duke Energy Corp. | 6.10 | 09/15/53 | $ | 5,000 | $ | 5,225 | ||||||||
| Emera US Finance LP | 4.75 | 06/15/46 | 10,000 | 8,462 | ||||||||||
| Entergy Corp. | 3.75 | 06/15/50 | 5,000 | 3,688 | ||||||||||
| Eversource Energy | 3.45 | 01/15/50 | 10,000 | 7,155 | ||||||||||
| Exelon Corp. | 4.45 | 04/15/46 | 10,000 | 8,533 | ||||||||||
| Exelon Corp. | 4.70 | 04/15/50 | 5,000 | 4,387 | ||||||||||
| Exelon Corp. | 5.60 | 03/15/53 | 10,000 | 9,944 | ||||||||||
| Exelon Corp. | 5.63 | 06/15/35 | 10,000 | 10,285 | ||||||||||
| FirstEnergy Corp. | 3.40 | 03/01/50 | 5,000 | 3,513 | ||||||||||
| FirstEnergy Corp. | 4.85 | 07/15/47 | 5,000 | 4,403 | ||||||||||
| NextEra Energy Capital Holdings, Inc. | 3.00 | 01/15/52 | 10,000 | 6,490 | ||||||||||
| NextEra Energy Capital Holdings, Inc. | 5.25 | 02/28/53 | 5,000 | 4,758 | ||||||||||
| NextEra Energy Capital Holdings, Inc. | 5.55 | 03/15/54 | 10,000 | 9,939 | ||||||||||
| Oglethorpe Power Corp. | 4.50 | 04/01/47 | 5,000 | 4,211 | ||||||||||
| Oglethorpe Power Corp. | 5.05 | 10/01/48 | 5,000 | 4,548 | ||||||||||
| Pacific Gas & Electric Co. | 3.30 | 08/01/40 | 10,000 | 7,496 | ||||||||||
| Pacific Gas & Electric Co. | 3.50 | 08/01/50 | 10,000 | 6,975 | ||||||||||
| Pacific Gas & Electric Co. | 4.00 | 12/01/46 | 10,000 | 7,615 | ||||||||||
| Pacific Gas & Electric Co. | 4.50 | 07/01/40 | 20,000 | 17,350 | ||||||||||
| Pacific Gas & Electric Co. | 4.75 | 02/15/44 | 5,000 | 4,308 | ||||||||||
| Pacific Gas & Electric Co. | 4.95 | 07/01/50 | 20,000 | 17,557 | ||||||||||
| Pacific Gas & Electric Co. | 5.25 | 03/01/52 | 5,000 | 4,559 | ||||||||||
| Pacific Gas & Electric Co. | 6.70 | 04/01/53 | 10,000 | 10,987 | ||||||||||
| Pacific Gas & Electric Co. | 6.75 | 01/15/53 | 20,000 | 21,897 | ||||||||||
| Sempra | 3.80 | 02/01/38 | 15,000 | 12,599 | ||||||||||
| Sempra | 6.00 | 10/15/39 | 5,000 | 5,121 | ||||||||||
| Southern Co. | 4.40 | 07/01/46 | 20,000 | 16,985 | ||||||||||
| Southern Power Co. | 5.15 | 09/15/41 | 5,000 | 4,794 | ||||||||||
| 365,604 | ||||||||||||||
| ELECTRONICS – 0.2% | ||||||||||||||
| Amphenol Corp. | 5.00 | 01/15/35 | 10,000 | 9,941 | ||||||||||
| Fortive Corp. | 4.30 | 06/15/46 | 5,000 | 4,175 | ||||||||||
| 14,116 | ||||||||||||||
| ENTERTAINMENT – 1.2% | ||||||||||||||
| Warnermedia Holdings, Inc. | 5.05 | 03/15/42 | 40,000 | 31,985 | ||||||||||
| Warnermedia Holdings, Inc. | 5.14 | 03/15/52 | 60,000 | 45,237 | ||||||||||
| Warnermedia Holdings, Inc. | 5.39 | 03/15/62 | 20,000 | 14,979 | ||||||||||
| 92,201 | ||||||||||||||
| ENVIRONMENTAL CONTROL – 0.2% | ||||||||||||||
| Republic Services, Inc. | 5.20 | 11/15/34 | 5,000 | 5,064 | ||||||||||
| Waste Connections, Inc. | 2.95 | 01/15/52 | 5,000 | 3,268 | ||||||||||
| Waste Connections, Inc. | 3.05 | 04/01/50 | 5,000 | 3,374 | ||||||||||
| 11,706 | ||||||||||||||
The accompanying notes are an integral part of these financial statements.
152
BONDBLOXX ETF TRUST
BondBloxx BBB Rated 10+ Year Corporate Bond ETF
Portfolio of Investments (Continued)
October 31, 2024
| Rate (%) | Maturity | Face Amount | Value | |||||||||||
| FOOD – 3.5% | ||||||||||||||
| Campbell Soup Co. | 4.75 | 03/23/35 | $ | 10,000 | $ | 9,612 | ||||||||
| Campbell Soup Co. | 4.80 | 03/15/48 | 5,000 | 4,498 | ||||||||||
| Conagra Brands, Inc. | 5.30 | 11/01/38 | 10,000 | 9,633 | ||||||||||
| Conagra Brands, Inc. | 5.40 | 11/01/48 | 5,000 | 4,748 | ||||||||||
| General Mills, Inc. | 3.00 | 02/01/51 | 5,000 | 3,312 | ||||||||||
| J M Smucker Co. | 6.50 | 11/15/43 | 10,000 | 10,822 | ||||||||||
| J M Smucker Co. | 6.50 | 11/15/53 | 10,000 | 11,006 | ||||||||||
| JBS USA Holding Lux Sarl/JBS USA Food Co./JBS Lux Co. Sarl | 4.38 | 02/02/52 | 5,000 | 3,834 | ||||||||||
| JBS USA Holding Lux Sarl/JBS USA Food Co./JBS Lux Co. Sarl | 6.50 | 12/01/52 | 10,000 | 10,284 | ||||||||||
| JBS USA Holding Lux Sarl/JBS USA Food Co./JBS Lux Co. Sarl(1) | 7.25 | 11/15/53 | 10,000 | 11,245 | ||||||||||
| Kellanova | 4.50 | 04/01/46 | 5,000 | 4,367 | ||||||||||
| Kraft Heinz Foods Co. | 4.38 | 06/01/46 | 20,000 | 16,778 | ||||||||||
| Kraft Heinz Foods Co. | 4.88 | 10/01/49 | 5,000 | 4,468 | ||||||||||
| Kraft Heinz Foods Co. | 5.00 | 07/15/35 | 5,000 | 4,944 | ||||||||||
| Kraft Heinz Foods Co. | 5.00 | 06/04/42 | 15,000 | 13,948 | ||||||||||
| Kraft Heinz Foods Co. | 5.20 | 07/15/45 | 20,000 | 18,785 | ||||||||||
| Kraft Heinz Foods Co. | 5.50 | 06/01/50 | 5,000 | 4,898 | ||||||||||
| Kraft Heinz Foods Co. | 6.50 | 02/09/40 | 5,000 | 5,471 | ||||||||||
| Kraft Heinz Foods Co. | 6.88 | 01/26/39 | 5,000 | 5,636 | ||||||||||
| Kroger Co. | 3.95 | 01/15/50 | 10,000 | 7,742 | ||||||||||
| Kroger Co. | 4.45 | 02/01/47 | 10,000 | 8,407 | ||||||||||
| Kroger Co. | 4.65 | 01/15/48 | 10,000 | 8,676 | ||||||||||
| Kroger Co. | 5.50 | 09/15/54 | 15,000 | 14,592 | ||||||||||
| Kroger Co. | 5.65 | 09/15/64 | 10,000 | 9,734 | ||||||||||
| Mondelez International, Inc. | 2.63 | 09/04/50 | 10,000 | 6,122 | ||||||||||
| Sysco Corp. | 3.15 | 12/14/51 | 5,000 | 3,349 | ||||||||||
| Sysco Corp. | 3.30 | 02/15/50 | 5,000 | 3,514 | ||||||||||
| Sysco Corp. | 4.50 | 04/01/46 | 10,000 | 8,495 | ||||||||||
| Sysco Corp. | 6.60 | 04/01/50 | 10,000 | 11,234 | ||||||||||
| Tyson Foods, Inc. | 4.55 | 06/02/47 | 5,000 | 4,192 | ||||||||||
| Tyson Foods, Inc. | 5.10 | 09/28/48 | 20,000 | 18,232 | ||||||||||
| 262,578 | ||||||||||||||
| FOREST PRODUCTS & PAPER – 0.3% | ||||||||||||||
| International Paper Co. | 4.35 | 08/15/48 | 5,000 | 4,170 | ||||||||||
| International Paper Co. | 4.80 | 06/15/44 | 5,000 | 4,505 | ||||||||||
| International Paper Co. | 6.00 | 11/15/41 | 10,000 | 10,497 | ||||||||||
| 19,172 | ||||||||||||||
| GAS – 0.6% | ||||||||||||||
| NiSource, Inc. | 4.38 | 05/15/47 | 10,000 | 8,432 | ||||||||||
| NiSource, Inc. | 4.80 | 02/15/44 | 10,000 | 9,028 | ||||||||||
| NiSource, Inc. | 5.25 | 02/15/43 | 10,000 | 9,670 | ||||||||||
| Southern Co. Gas Capital Corp. | 3.95 | 10/01/46 | 5,000 | 3,936 | ||||||||||
| Southern Co. Gas Capital Corp. | 5.88 | 03/15/41 | 10,000 | 10,419 | ||||||||||
| 41,485 | ||||||||||||||
The accompanying notes are an integral part of these financial statements.
153
BONDBLOXX ETF TRUST
BondBloxx BBB Rated 10+ Year Corporate Bond ETF
Portfolio of Investments (Continued)
October 31, 2024
| Rate (%) | Maturity | Face Amount | Value | |||||||||||
| HAND/MACHINE TOOLS – 0.1% | ||||||||||||||
| Stanley Black & Decker, Inc. | 2.75 | 11/15/50 | $ | 10,000 | $ | 6,024 | ||||||||
| Stanley Black & Decker, Inc. | 4.85 | 11/15/48 | 5,000 | 4,519 | ||||||||||
| 10,543 | ||||||||||||||
| HEALTHCARE-PRODUCTS – 0.9% | ||||||||||||||
| Baxter International, Inc. | 3.13 | 12/01/51 | 10,000 | 6,449 | ||||||||||
| Boston Scientific Corp. | 4.70 | 03/01/49 | 5,000 | 4,597 | ||||||||||
| GE HealthCare Technologies, Inc. | 6.38 | 11/22/52 | 10,000 | 11,145 | ||||||||||
| Koninklijke Philips NV | 5.00 | 03/15/42 | 5,000 | 4,632 | ||||||||||
| Koninklijke Philips NV | 6.88 | 03/11/38 | 5,000 | 5,594 | ||||||||||
| Solventum Corp.(1) | 5.90 | 04/30/54 | 10,000 | 10,025 | ||||||||||
| Solventum Corp.(1) | 6.00 | 05/15/64 | 5,000 | 5,016 | ||||||||||
| STERIS Irish FinCo UnLtd. Co. | 3.75 | 03/15/51 | 5,000 | 3,668 | ||||||||||
| Stryker Corp. | 4.63 | 03/15/46 | 15,000 | 13,416 | ||||||||||
| 64,542 | ||||||||||||||
| HEALTHCARE-SERVICES – 4.5% | ||||||||||||||
| Aetna, Inc. | 3.88 | 08/15/47 | 5,000 | 3,697 | ||||||||||
| Aetna, Inc. | 4.13 | 11/15/42 | 5,000 | 3,986 | ||||||||||
| Aetna, Inc. | 4.50 | 05/15/42 | 5,000 | 4,233 | ||||||||||
| Aetna, Inc. | 6.63 | 06/15/36 | 5,000 | 5,410 | ||||||||||
| Aetna, Inc. | 6.75 | 12/15/37 | 5,000 | 5,435 | ||||||||||
| Cigna Group | 3.20 | 03/15/40 | 15,000 | 11,277 | ||||||||||
| Cigna Group | 3.40 | 03/15/50 | 10,000 | 6,900 | ||||||||||
| Cigna Group | 3.40 | 03/15/51 | 20,000 | 13,710 | ||||||||||
| Cigna Group | 4.80 | 08/15/38 | 10,000 | 9,267 | ||||||||||
| Cigna Group | 4.80 | 07/15/46 | 15,000 | 13,227 | ||||||||||
| Cigna Group | 4.90 | 12/15/48 | 35,000 | 31,060 | ||||||||||
| Elevance Health, Inc. | 3.60 | 03/15/51 | 10,000 | 7,247 | ||||||||||
| Elevance Health, Inc. | 3.70 | 09/15/49 | 10,000 | 7,416 | ||||||||||
| Elevance Health, Inc. | 4.38 | 12/01/47 | 20,000 | 16,616 | ||||||||||
| Elevance Health, Inc. | 4.55 | 05/15/52 | 10,000 | 8,417 | ||||||||||
| Elevance Health, Inc. | 4.63 | 05/15/42 | 5,000 | 4,421 | ||||||||||
| Elevance Health, Inc. | 4.65 | 01/15/43 | 5,000 | 4,445 | ||||||||||
| Elevance Health, Inc. | 4.65 | 08/15/44 | 10,000 | 8,807 | ||||||||||
| Elevance Health, Inc. | 5.10 | 01/15/44 | 10,000 | 9,328 | ||||||||||
| Elevance Health, Inc. | 5.13 | 02/15/53 | 10,000 | 9,226 | ||||||||||
| Elevance Health, Inc. | 5.65 | 06/15/54 | 5,000 | 4,982 | ||||||||||
| Elevance Health, Inc. | 5.70 | 02/15/55 | 10,000 | 10,063 | ||||||||||
| Elevance Health, Inc. | 5.85 | 11/01/64 | 10,000 | 10,111 | ||||||||||
| Elevance Health, Inc. | 6.10 | 10/15/52 | 5,000 | 5,259 | ||||||||||
| HCA, Inc. | 3.50 | 07/15/51 | 15,000 | 10,209 | ||||||||||
| HCA, Inc. | 4.63 | 03/15/52 | 15,000 | 12,335 | ||||||||||
| HCA, Inc. | 5.13 | 06/15/39 | 10,000 | 9,429 | ||||||||||
| HCA, Inc. | 5.25 | 06/15/49 | 10,000 | 9,070 | ||||||||||
| HCA, Inc. | 5.50 | 06/15/47 | 20,000 | 18,974 | ||||||||||
| HCA, Inc. | 5.90 | 06/01/53 | 15,000 | 14,850 | ||||||||||
| HCA, Inc. | 5.95 | 09/15/54 | 5,000 | 4,991 | ||||||||||
The accompanying notes are an integral part of these financial statements.
154
BONDBLOXX ETF TRUST
BondBloxx BBB Rated 10+ Year Corporate Bond ETF
Portfolio of Investments (Continued)
October 31, 2024
| Rate (%) | Maturity | Face Amount | Value | |||||||||||
| HEALTHCARE-SERVICES – 4.5% (Continued) | ||||||||||||||
| HCA, Inc. | 6.00 | 04/01/54 | $ | 5,000 | $ | 5,027 | ||||||||
| HCA, Inc. | 6.10 | 04/01/64 | 5,000 | 4,986 | ||||||||||
| Humana, Inc. | 3.95 | 08/15/49 | 5,000 | 3,723 | ||||||||||
| Humana, Inc. | 5.50 | 03/15/53 | 10,000 | 9,297 | ||||||||||
| Humana, Inc. | 5.75 | 04/15/54 | 10,000 | 9,631 | ||||||||||
| Laboratory Corp. of America Holdings | 4.70 | 02/01/45 | 5,000 | 4,416 | ||||||||||
| Quest Diagnostics, Inc. | 5.00 | 12/15/34 | 5,000 | 4,904 | ||||||||||
| 336,382 | ||||||||||||||
| HOME BUILDERS – 0.1% | ||||||||||||||
| MDC Holdings, Inc. | 6.00 | 01/15/43 | 5,000 | 5,132 | ||||||||||
| HOME FURNISHINGS – 0.1% | ||||||||||||||
| Whirlpool Corp. | 4.50 | 06/01/46 | 10,000 | 8,081 | ||||||||||
| HOUSEHOLD PRODUCTS/WARES – 0.1% | ||||||||||||||
| Church & Dwight Co., Inc. | 5.00 | 06/15/52 | 5,000 | 4,721 | ||||||||||
| INSURANCE – 3.5% | ||||||||||||||
| Allstate Corp. | 4.20 | 12/15/46 | 10,000 | 8,272 | ||||||||||
| Allstate Corp. | 5.55 | 05/09/35 | 5,000 | 5,126 | ||||||||||
| Allstate Corp. | 6.50 | 05/15/57 | 5,000 | 5,191 | ||||||||||
| American Financial Group, Inc./OH | 4.50 | 06/15/47 | 5,000 | 4,247 | ||||||||||
| American International Group, Inc. | 3.88 | 01/15/35 | 5,000 | 4,483 | ||||||||||
| American International Group, Inc. | 4.38 | 06/30/50 | 10,000 | 8,508 | ||||||||||
| American International Group, Inc. | 4.50 | 07/16/44 | 5,000 | 4,366 | ||||||||||
| American International Group, Inc. | 4.75 | 04/01/48 | 10,000 | 9,059 | ||||||||||
| American International Group, Inc. | 4.80 | 07/10/45 | 10,000 | 9,071 | ||||||||||
| Aon Corp./Aon Global Holdings PLC | 3.90 | 02/28/52 | 10,000 | 7,667 | ||||||||||
| Aon Global Ltd. | 4.60 | 06/14/44 | 5,000 | 4,387 | ||||||||||
| Aon North America, Inc. | 5.75 | 03/01/54 | 20,000 | 20,269 | ||||||||||
| Arch Capital Group Ltd. | 3.64 | 06/30/50 | 10,000 | 7,377 | ||||||||||
| Arthur J Gallagher & Co. | 3.50 | 05/20/51 | 10,000 | 7,048 | ||||||||||
| Arthur J Gallagher & Co. | 5.75 | 03/02/53 | 5,000 | 4,997 | ||||||||||
| Arthur J Gallagher & Co. | 6.75 | 02/15/54 | 5,000 | 5,678 | ||||||||||
| Athene Holding Ltd. | 3.45 | 05/15/52 | 15,000 | 9,926 | ||||||||||
| Athene Holding Ltd. | 6.25 | 04/01/54 | 5,000 | 5,141 | ||||||||||
| Brighthouse Financial, Inc. | 4.70 | 06/22/47 | 10,000 | 7,931 | ||||||||||
| Brown & Brown, Inc. | 4.95 | 03/17/52 | 5,000 | 4,384 | ||||||||||
| Corebridge Financial, Inc. | 4.40 | 04/05/52 | 10,000 | 8,222 | ||||||||||
| Equitable Holdings, Inc. | 5.00 | 04/20/48 | 10,000 | 9,200 | ||||||||||
| Everest Reinsurance Holdings, Inc. | 3.13 | 10/15/52 | 15,000 | 9,518 | ||||||||||
| Fairfax Financial Holdings Ltd.(1) | 6.10 | 03/15/55 | 10,000 | 10,101 | ||||||||||
| Fairfax Financial Holdings Ltd. | 6.35 | 03/22/54 | 5,000 | 5,210 | ||||||||||
| Hartford Financial Services Group, Inc. | 2.90 | 09/15/51 | 5,000 | 3,209 | ||||||||||
| Hartford Financial Services Group, Inc. | 3.60 | 08/19/49 | 10,000 | 7,471 | ||||||||||
| Lincoln National Corp. | 7.00 | 06/15/40 | 5,000 | 5,607 | ||||||||||
| Markel Group, Inc. | 3.45 | 05/07/52 | 5,000 | 3,400 | ||||||||||
The accompanying notes are an integral part of these financial statements.
155
BONDBLOXX ETF TRUST
BondBloxx BBB Rated 10+ Year Corporate Bond ETF
Portfolio of Investments (Continued)
October 31, 2024
| Rate (%) | Maturity | Face Amount | Value | |||||||||||
| INSURANCE – 3.5% (Continued) | ||||||||||||||
| Markel Group, Inc. | 4.15 | 09/17/50 | $ | 10,000 | $ | 7,763 | ||||||||
| Markel Group, Inc. | 5.00 | 04/05/46 | 5,000 | 4,468 | ||||||||||
| Markel Group, Inc. | 5.00 | 05/20/49 | 5,000 | 4,482 | ||||||||||
| MetLife, Inc. | 6.40 | 12/15/36 | 10,000 | 10,424 | ||||||||||
| MetLife, Inc. | 10.75 | 08/01/39 | 5,000 | 6,969 | ||||||||||
| Old Republic International Corp. | 3.85 | 06/11/51 | 5,000 | 3,620 | ||||||||||
| Unum Group | 4.13 | 06/15/51 | 5,000 | 3,801 | ||||||||||
| Willis North America, Inc. | 5.90 | 03/05/54 | 10,000 | 10,053 | ||||||||||
| 256,646 | ||||||||||||||
| INTERNET – 0.4% | ||||||||||||||
| eBay, Inc. | 3.65 | 05/10/51 | 5,000 | 3,665 | ||||||||||
| eBay, Inc. | 4.00 | 07/15/42 | 10,000 | 8,149 | ||||||||||
| Netflix, Inc. | 5.40 | 08/15/54 | 10,000 | 10,064 | ||||||||||
| Uber Technologies, Inc. | 5.35 | 09/15/54 | 10,000 | 9,513 | ||||||||||
| 31,391 | ||||||||||||||
| IRON/STEEL – 0.5% | ||||||||||||||
| ArcelorMittal SA | 6.35 | 06/17/54 | 5,000 | 4,993 | ||||||||||
| ArcelorMittal SA | 7.00 | 10/15/39 | 5,000 | 5,458 | ||||||||||
| Vale Overseas Ltd. | 6.40 | 06/28/54 | 10,000 | 10,039 | ||||||||||
| Vale Overseas Ltd. | 6.88 | 11/21/36 | 5,000 | 5,479 | ||||||||||
| Vale Overseas Ltd. | 6.88 | 11/10/39 | 8,000 | 8,702 | ||||||||||
| 34,671 | ||||||||||||||
| LODGING – 0.1% | ||||||||||||||
| Marriott International, Inc./MD | 5.35 | 03/15/35 | 10,000 | 9,956 | ||||||||||
| MACHINERY-DIVERSIFIED – 0.2% | ||||||||||||||
| Ingersoll Rand, Inc. | 5.70 | 06/15/54 | 5,000 | 5,139 | ||||||||||
| Otis Worldwide Corp. | 3.11 | 02/15/40 | 5,000 | 3,886 | ||||||||||
| Otis Worldwide Corp. | 3.36 | 02/15/50 | 10,000 | 7,216 | ||||||||||
| 16,241 | ||||||||||||||
| MEDIA – 4.5% | ||||||||||||||
| Charter Communications Operating LLC/Charter Communications Operating Capital | 3.50 | 06/01/41 | 15,000 | 10,261 | ||||||||||
| Charter Communications Operating LLC/Charter Communications Operating Capital | 3.50 | 03/01/42 | 5,000 | 3,384 | ||||||||||
| Charter Communications Operating LLC/Charter Communications Operating Capital | 3.70 | 04/01/51 | 10,000 | 6,264 | ||||||||||
| Charter Communications Operating LLC/Charter Communications Operating Capital | 3.85 | 04/01/61 | 10,000 | 6,014 | ||||||||||
| Charter Communications Operating LLC/Charter Communications Operating Capital | 3.90 | 06/01/52 | 25,000 | 16,110 | ||||||||||
| Charter Communications Operating LLC/Charter Communications Operating Capital | 3.95 | 06/30/62 | 15,000 | 9,101 | ||||||||||
| Charter Communications Operating LLC/Charter Communications Operating Capital | 4.40 | 12/01/61 | 15,000 | 9,991 | ||||||||||
| Charter Communications Operating LLC/Charter Communications Operating Capital | 4.80 | 03/01/50 | 25,000 | 18,791 | ||||||||||
The accompanying notes are an integral part of these financial statements.
156
BONDBLOXX ETF TRUST
BondBloxx BBB Rated 10+ Year Corporate Bond ETF
Portfolio of Investments (Continued)
October 31, 2024
| Rate (%) | Maturity | Face Amount | Value | |||||||||||
| MEDIA – 4.5% (Continued) | ||||||||||||||
| Charter Communications Operating LLC/Charter Communications Operating Capital | 5.13 | 07/01/49 | $ | 10,000 | $ | 7,861 | ||||||||
| Charter Communications Operating LLC/Charter Communications Operating Capital | 5.25 | 04/01/53 | 10,000 | 7,999 | ||||||||||
| Charter Communications Operating LLC/Charter Communications Operating Capital | 5.38 | 04/01/38 | 10,000 | 8,910 | ||||||||||
| Charter Communications Operating LLC/Charter Communications Operating Capital | 5.38 | 05/01/47 | 15,000 | 12,266 | ||||||||||
| Charter Communications Operating LLC/Charter Communications Operating Capital | 5.50 | 04/01/63 | 5,000 | 3,981 | ||||||||||
| Charter Communications Operating LLC/Charter Communications Operating Capital | 5.75 | 04/01/48 | 20,000 | 17,097 | ||||||||||
| Charter Communications Operating LLC/Charter Communications Operating Capital | 6.38 | 10/23/35 | 15,000 | 15,015 | ||||||||||
| Charter Communications Operating LLC/Charter Communications Operating Capital | 6.48 | 10/23/45 | 25,000 | 23,696 | ||||||||||
| Charter Communications Operating LLC/Charter Communications Operating Capital | 6.83 | 10/23/55 | 10,000 | 9,720 | ||||||||||
| Discovery Communications LLC | 4.00 | 09/15/55 | 10,000 | 6,520 | ||||||||||
| Discovery Communications LLC | 6.35 | 06/01/40 | 5,000 | 4,685 | ||||||||||
| Fox Corp. | 5.48 | 01/25/39 | 5,000 | 4,832 | ||||||||||
| Fox Corp. | 5.58 | 01/25/49 | 15,000 | 14,253 | ||||||||||
| Grupo Televisa SAB | 5.00 | 05/13/45 | 15,000 | 11,573 | ||||||||||
| Grupo Televisa SAB | 5.25 | 05/24/49 | 5,000 | 4,009 | ||||||||||
| Grupo Televisa SAB | 6.63 | 01/15/40 | 5,000 | 4,771 | ||||||||||
| Paramount Global | 4.38 | 03/15/43 | 15,000 | 10,792 | ||||||||||
| Paramount Global | 4.60 | 01/15/45 | 10,000 | 7,225 | ||||||||||
| Paramount Global | 4.90 | 08/15/44 | 10,000 | 7,442 | ||||||||||
| Paramount Global | 5.85 | 09/01/43 | 10,000 | 8,496 | ||||||||||
| Paramount Global | 6.88 | 04/30/36 | 5,000 | 5,004 | ||||||||||
| Time Warner Cable LLC | 4.50 | 09/15/42 | 5,000 | 3,734 | ||||||||||
| Time Warner Cable LLC | 5.50 | 09/01/41 | 10,000 | 8,451 | ||||||||||
| Time Warner Cable LLC | 5.88 | 11/15/40 | 10,000 | 8,843 | ||||||||||
| Time Warner Cable LLC | 6.55 | 05/01/37 | 20,000 | 19,223 | ||||||||||
| Time Warner Cable LLC | 6.75 | 06/15/39 | 15,000 | 14,644 | ||||||||||
| Time Warner Cable LLC | 7.30 | 07/01/38 | 5,000 | 5,109 | ||||||||||
| 336,067 | ||||||||||||||
| MINING – 1.4% | ||||||||||||||
| Barrick North America Finance LLC | 5.70 | 05/30/41 | 10,000 | 10,148 | ||||||||||
| Barrick North America Finance LLC | 5.75 | 05/01/43 | 10,000 | 10,226 | ||||||||||
| Freeport-McMoRan, Inc. | 5.40 | 11/14/34 | 5,000 | 5,009 | ||||||||||
| Freeport-McMoRan, Inc. | 5.45 | 03/15/43 | 15,000 | 14,415 | ||||||||||
| Newmont Corp. | 4.88 | 03/15/42 | 15,000 | 14,072 | ||||||||||
| Newmont Corp. | 5.88 | 04/01/35 | 10,000 | 10,535 | ||||||||||
| Southern Copper Corp. | 5.25 | 11/08/42 | 10,000 | 9,370 | ||||||||||
| Southern Copper Corp. | 5.88 | 04/23/45 | 10,000 | 10,051 | ||||||||||
| Southern Copper Corp. | 6.75 | 04/16/40 | 15,000 | 16,605 | ||||||||||
| 100,431 | ||||||||||||||
The accompanying notes are an integral part of these financial statements.
157
BONDBLOXX ETF TRUST
BondBloxx BBB Rated 10+ Year Corporate Bond ETF
Portfolio of Investments (Continued)
October 31, 2024
| Rate (%) | Maturity | Face Amount | Value | |||||||||||
| MISCELLANEOUS MANUFACTURER – 0.2% | ||||||||||||||
| Parker-Hannifin Corp. | 4.00 | 06/14/49 | $ | 5,000 | $ | 4,085 | ||||||||
| Parker-Hannifin Corp. | 4.10 | 03/01/47 | 5,000 | 4,101 | ||||||||||
| Parker-Hannifin Corp. | 4.45 | 11/21/44 | 10,000 | 8,810 | ||||||||||
| 16,996 | ||||||||||||||
| OIL & GAS – 4.0% | ||||||||||||||
| Apache Corp. | 5.10 | 09/01/40 | 10,000 | 8,659 | ||||||||||
| Canadian Natural Resources Ltd. | 4.95 | 06/01/47 | 10,000 | 8,819 | ||||||||||
| Canadian Natural Resources Ltd. | 6.25 | 03/15/38 | 5,000 | 5,195 | ||||||||||
| Cenovus Energy, Inc. | 3.75 | 02/15/52 | 10,000 | 7,129 | ||||||||||
| Cenovus Energy, Inc. | 6.75 | 11/15/39 | 5,000 | 5,459 | ||||||||||
| Continental Resources, Inc. | 4.90 | 06/01/44 | 5,000 | 4,143 | ||||||||||
| Devon Energy Corp. | 4.75 | 05/15/42 | 10,000 | 8,515 | ||||||||||
| Devon Energy Corp. | 5.60 | 07/15/41 | 15,000 | 14,217 | ||||||||||
| Devon Energy Corp. | 5.75 | 09/15/54 | 10,000 | 9,316 | ||||||||||
| Diamondback Energy, Inc. | 4.25 | 03/15/52 | 10,000 | 7,801 | ||||||||||
| Diamondback Energy, Inc. | 4.40 | 03/24/51 | 10,000 | 8,027 | ||||||||||
| Diamondback Energy, Inc. | 5.75 | 04/18/54 | 10,000 | 9,710 | ||||||||||
| Diamondback Energy, Inc. | 5.90 | 04/18/64 | 5,000 | 4,862 | ||||||||||
| Diamondback Energy, Inc. | 6.25 | 03/15/53 | 5,000 | 5,158 | ||||||||||
| Hess Corp. | 5.60 | 02/15/41 | 15,000 | 15,052 | ||||||||||
| Hess Corp. | 5.80 | 04/01/47 | 5,000 | 5,080 | ||||||||||
| Marathon Oil Corp. | 6.60 | 10/01/37 | 10,000 | 11,013 | ||||||||||
| Marathon Petroleum Corp. | 4.75 | 09/15/44 | 5,000 | 4,263 | ||||||||||
| Marathon Petroleum Corp. | 6.50 | 03/01/41 | 10,000 | 10,510 | ||||||||||
| Occidental Petroleum Corp. | 6.05 | 10/01/54 | 10,000 | 9,701 | ||||||||||
| Occidental Petroleum Corp. | 6.20 | 03/15/40 | 10,000 | 9,953 | ||||||||||
| Occidental Petroleum Corp. | 6.45 | 09/15/36 | 10,000 | 10,356 | ||||||||||
| Occidental Petroleum Corp. | 6.60 | 03/15/46 | 10,000 | 10,244 | ||||||||||
| Phillips 66 | 3.30 | 03/15/52 | 5,000 | 3,314 | ||||||||||
| Phillips 66 | 4.65 | 11/15/34 | 10,000 | 9,459 | ||||||||||
| Phillips 66 | 4.88 | 11/15/44 | 15,000 | 13,396 | ||||||||||
| Phillips 66 | 5.88 | 05/01/42 | 5,000 | 5,069 | ||||||||||
| Phillips 66 Co. | 4.90 | 10/01/46 | 10,000 | 8,743 | ||||||||||
| Phillips 66 Co. | 5.50 | 03/15/55 | 5,000 | 4,720 | ||||||||||
| Phillips 66 Co. | 5.65 | 06/15/54 | 5,000 | 4,850 | ||||||||||
| Suncor Energy, Inc. | 3.75 | 03/04/51 | 5,000 | 3,641 | ||||||||||
| Suncor Energy, Inc. | 5.95 | 12/01/34 | 5,000 | 5,242 | ||||||||||
| Suncor Energy, Inc. | 6.80 | 05/15/38 | 8,000 | 8,731 | ||||||||||
| Suncor Energy, Inc. | 6.85 | 06/01/39 | 10,000 | 10,988 | ||||||||||
| Valero Energy Corp. | 4.00 | 06/01/52 | 10,000 | 7,440 | ||||||||||
| Valero Energy Corp. | 4.90 | 03/15/45 | 5,000 | 4,512 | ||||||||||
| Valero Energy Corp. | 6.63 | 06/15/37 | 15,000 | 16,158 | ||||||||||
| 299,445 | ||||||||||||||
| OIL & GAS SERVICES – 0.8% | ||||||||||||||
| Halliburton Co. | 4.50 | 11/15/41 | 5,000 | 4,394 | ||||||||||
| Halliburton Co. | 4.75 | 08/01/43 | 10,000 | 8,911 | ||||||||||
| Halliburton Co. | 4.85 | 11/15/35 | 10,000 | 9,618 | ||||||||||
The accompanying notes are an integral part of these financial statements.
158
BONDBLOXX ETF TRUST
BondBloxx BBB Rated 10+ Year Corporate Bond ETF
Portfolio of Investments (Continued)
October 31, 2024
| Rate (%) | Maturity | Face Amount | Value | |||||||||||
| OIL & GAS SERVICES – 0.8% (Continued) | ||||||||||||||
| Halliburton Co. | 5.00 | 11/15/45 | $ | 20,000 | $ | 18,261 | ||||||||
| Halliburton Co. | 7.45 | 09/15/39 | 10,000 | 11,826 | ||||||||||
| NOV, Inc. | 3.95 | 12/01/42 | 5,000 | 3,802 | ||||||||||
| 56,812 | ||||||||||||||
| PACKAGING & CONTAINERS – 0.2% | ||||||||||||||
| Packaging Corp. of America | 3.05 | 10/01/51 | 10,000 | 6,617 | ||||||||||
| Smurfit Kappa Treasury ULC(1) | 5.78 | 04/03/54 | 5,000 | 5,066 | ||||||||||
| Sonoco Products Co. | 5.75 | 11/01/40 | 5,000 | 4,996 | ||||||||||
| 16,679 | ||||||||||||||
| PHARMACEUTICALS – 4.0% | ||||||||||||||
| Becton Dickinson & Co. | 3.79 | 05/20/50 | 10,000 | 7,667 | ||||||||||
| Becton Dickinson & Co. | 4.67 | 06/06/47 | 15,000 | 13,190 | ||||||||||
| Cencora, Inc. | 4.25 | 03/01/45 | 5,000 | 4,213 | ||||||||||
| Cencora, Inc. | 4.30 | 12/15/47 | 5,000 | 4,176 | ||||||||||
| CVS Health Corp. | 2.70 | 08/21/40 | 10,000 | 6,663 | ||||||||||
| CVS Health Corp. | 4.13 | 04/01/40 | 10,000 | 8,069 | ||||||||||
| CVS Health Corp. | 4.78 | 03/25/38 | 35,000 | 31,238 | ||||||||||
| CVS Health Corp. | 4.88 | 07/20/35 | 5,000 | 4,660 | ||||||||||
| CVS Health Corp. | 5.05 | 03/25/48 | 60,000 | 51,877 | ||||||||||
| CVS Health Corp. | 5.13 | 07/20/45 | 30,000 | 26,288 | ||||||||||
| CVS Health Corp. | 5.30 | 12/05/43 | 10,000 | 9,061 | ||||||||||
| CVS Health Corp. | 5.63 | 02/21/53 | 5,000 | 4,649 | ||||||||||
| CVS Health Corp. | 5.88 | 06/01/53 | 10,000 | 9,638 | ||||||||||
| CVS Health Corp. | 6.00 | 06/01/44 | 10,000 | 9,800 | ||||||||||
| CVS Health Corp. | 6.00 | 06/01/63 | 10,000 | 9,657 | ||||||||||
| CVS Health Corp. | 6.05 | 06/01/54 | 10,000 | 9,882 | ||||||||||
| Mylan, Inc. | 5.20 | 04/15/48 | 10,000 | 8,356 | ||||||||||
| Mylan, Inc. | 5.40 | 11/29/43 | 5,000 | 4,423 | ||||||||||
| Takeda Pharmaceutical Co. Ltd. | 3.03 | 07/09/40 | 20,000 | 14,989 | ||||||||||
| Takeda Pharmaceutical Co. Ltd. | 3.18 | 07/09/50 | 20,000 | 13,697 | ||||||||||
| Takeda Pharmaceutical Co. Ltd. | 3.38 | 07/09/60 | 10,000 | 6,658 | ||||||||||
| Utah Acquisition Sub, Inc. | 5.25 | 06/15/46 | 10,000 | 8,487 | ||||||||||
| Viatris, Inc. | 3.85 | 06/22/40 | 10,000 | 7,496 | ||||||||||
| Viatris, Inc. | 4.00 | 06/22/50 | 10,000 | 6,913 | ||||||||||
| Zoetis, Inc. | 4.70 | 02/01/43 | 15,000 | 13,645 | ||||||||||
| 295,392 | ||||||||||||||
| PIPELINES – 8.4% | ||||||||||||||
| Cheniere Corpus Christi Holdings LLC | 2.74 | 12/31/39 | 5,000 | 4,023 | ||||||||||
| Columbia Pipeline Group, Inc. | 5.80 | 06/01/45 | 5,000 | 4,957 | ||||||||||
| Eastern Energy Gas Holdings LLC | 5.65 | 10/15/54 | 10,000 | 9,831 | ||||||||||
| Enbridge Energy Partners LP | 5.50 | 09/15/40 | 5,000 | 4,858 | ||||||||||
| Enbridge Energy Partners LP | 7.38 | 10/15/45 | 5,000 | 5,801 | ||||||||||
| Enbridge, Inc. | 3.40 | 08/01/51 | 15,000 | 10,358 | ||||||||||
| Enbridge, Inc. | 4.50 | 06/10/44 | 5,000 | 4,235 | ||||||||||
| Enbridge, Inc. | 5.50 | 12/01/46 | 5,000 | 4,849 | ||||||||||
| Enbridge, Inc. | 6.70 | 11/15/53 | 15,000 | 16,781 | ||||||||||
| Energy Transfer LP | 4.90 | 03/15/35 | 5,000 | 4,770 | ||||||||||
The accompanying notes are an integral part of these financial statements.
159
BONDBLOXX ETF TRUST
BondBloxx BBB Rated 10+ Year Corporate Bond ETF
Portfolio of Investments (Continued)
October 31, 2024
| Rate (%) | Maturity | Face Amount | Value | |||||||||||
| PIPELINES – 8.4% (Continued) | ||||||||||||||
| Energy Transfer LP | 5.00 | 05/15/44 | $ | 10,000 | $ | 8,748 | ||||||||
| Energy Transfer LP | 5.00 | 05/15/50 | 10,000 | 8,672 | ||||||||||
| Energy Transfer LP | 5.15 | 03/15/45 | 5,000 | 4,460 | ||||||||||
| Energy Transfer LP | 5.35 | 05/15/45 | 5,000 | 4,573 | ||||||||||
| Energy Transfer LP | 5.40 | 10/01/47 | 10,000 | 9,131 | ||||||||||
| Energy Transfer LP | 5.95 | 05/15/54 | 20,000 | 19,726 | ||||||||||
| Energy Transfer LP | 6.00 | 06/15/48 | 15,000 | 14,784 | ||||||||||
| Energy Transfer LP | 6.05 | 06/01/41 | 5,000 | 5,011 | ||||||||||
| Energy Transfer LP | 6.05 | 09/01/54 | 10,000 | 9,998 | ||||||||||
| Energy Transfer LP | 6.13 | 12/15/45 | 10,000 | 9,991 | ||||||||||
| Energy Transfer LP | 6.25 | 04/15/49 | 15,000 | 15,252 | ||||||||||
| Energy Transfer LP | 6.50 | 02/01/42 | 5,000 | 5,248 | ||||||||||
| Energy Transfer LP | 7.50 | 07/01/38 | 10,000 | 11,479 | ||||||||||
| EnLink Midstream Partners LP | 5.45 | 06/01/47 | 5,000 | 4,557 | ||||||||||
| Kinder Morgan Energy Partners LP | 5.00 | 08/15/42 | 10,000 | 8,951 | ||||||||||
| Kinder Morgan Energy Partners LP | 5.00 | 03/01/43 | 5,000 | 4,443 | ||||||||||
| Kinder Morgan Energy Partners LP | 5.40 | 09/01/44 | 10,000 | 9,311 | ||||||||||
| Kinder Morgan Energy Partners LP | 5.50 | 03/01/44 | 5,000 | 4,721 | ||||||||||
| Kinder Morgan Energy Partners LP | 5.80 | 03/15/35 | 5,000 | 5,095 | ||||||||||
| Kinder Morgan Energy Partners LP | 6.50 | 09/01/39 | 10,000 | 10,559 | ||||||||||
| Kinder Morgan Energy Partners LP | 6.95 | 01/15/38 | 5,000 | 5,493 | ||||||||||
| Kinder Morgan, Inc. | 3.25 | 08/01/50 | 10,000 | 6,518 | ||||||||||
| Kinder Morgan, Inc. | 3.60 | 02/15/51 | 5,000 | 3,468 | ||||||||||
| Kinder Morgan, Inc. | 5.05 | 02/15/46 | 5,000 | 4,436 | ||||||||||
| Kinder Morgan, Inc. | 5.20 | 03/01/48 | 5,000 | 4,528 | ||||||||||
| Kinder Morgan, Inc. | 5.30 | 12/01/34 | 5,000 | 4,932 | ||||||||||
| Kinder Morgan, Inc. | 5.45 | 08/01/52 | 5,000 | 4,673 | ||||||||||
| Kinder Morgan, Inc. | 5.55 | 06/01/45 | 15,000 | 14,206 | ||||||||||
| Kinder Morgan, Inc. | 5.95 | 08/01/54 | 5,000 | 5,002 | ||||||||||
| MPLX LP | 4.50 | 04/15/38 | 10,000 | 8,868 | ||||||||||
| MPLX LP | 4.70 | 04/15/48 | 10,000 | 8,388 | ||||||||||
| MPLX LP | 4.90 | 04/15/58 | 5,000 | 4,155 | ||||||||||
| MPLX LP | 4.95 | 03/14/52 | 10,000 | 8,607 | ||||||||||
| MPLX LP | 5.20 | 03/01/47 | 10,000 | 9,064 | ||||||||||
| MPLX LP | 5.50 | 02/15/49 | 15,000 | 14,046 | ||||||||||
| MPLX LP | 5.65 | 03/01/53 | 5,000 | 4,766 | ||||||||||
| ONEOK Partners LP | 6.13 | 02/01/41 | 10,000 | 10,131 | ||||||||||
| ONEOK Partners LP | 6.65 | 10/01/36 | 5,000 | 5,419 | ||||||||||
| ONEOK Partners LP | 6.85 | 10/15/37 | 10,000 | 11,030 | ||||||||||
| ONEOK, Inc. | 4.20 | 10/03/47 | 10,000 | 7,697 | ||||||||||
| ONEOK, Inc. | 4.45 | 09/01/49 | 10,000 | 7,979 | ||||||||||
| ONEOK, Inc. | 4.85 | 02/01/49 | 5,000 | 4,258 | ||||||||||
| ONEOK, Inc. | 5.05 | 11/01/34 | 5,000 | 4,849 | ||||||||||
| ONEOK, Inc. | 5.15 | 10/15/43 | 5,000 | 4,566 | ||||||||||
| ONEOK, Inc. | 5.20 | 07/15/48 | 5,000 | 4,508 | ||||||||||
| ONEOK, Inc. | 5.70 | 11/01/54 | 10,000 | 9,647 | ||||||||||
| ONEOK, Inc. | 5.85 | 11/01/64 | 10,000 | 9,627 | ||||||||||
| ONEOK, Inc. | 6.63 | 09/01/53 | 10,000 | 10,771 | ||||||||||
The accompanying notes are an integral part of these financial statements.
160
BONDBLOXX ETF TRUST
BondBloxx BBB Rated 10+ Year Corporate Bond ETF
Portfolio of Investments (Continued)
October 31, 2024
| Rate (%) | Maturity | Face Amount | Value | |||||||||||
| PIPELINES – 8.4% (Continued) | ||||||||||||||
| Plains All American Pipeline LP/PAA Finance Corp. | 4.70 | 06/15/44 | $ | 5,000 | $ | 4,261 | ||||||||
| Plains All American Pipeline LP/PAA Finance Corp. | 6.65 | 01/15/37 | 10,000 | 10,713 | ||||||||||
| South Bow USA Infrastructure Holdings LLC(1) | 6.18 | 10/01/54 | 5,000 | 4,949 | ||||||||||
| Spectra Energy Partners LP | 4.50 | 03/15/45 | 5,000 | 4,169 | ||||||||||
| Targa Resources Corp. | 4.95 | 04/15/52 | 5,000 | 4,349 | ||||||||||
| Targa Resources Corp. | 5.50 | 02/15/35 | 5,000 | 4,989 | ||||||||||
| Targa Resources Corp. | 6.25 | 07/01/52 | 10,000 | 10,328 | ||||||||||
| Targa Resources Corp. | 6.50 | 02/15/53 | 5,000 | 5,373 | ||||||||||
| TransCanada PipeLines Ltd. | 4.75 | 05/15/38 | 10,000 | 9,229 | ||||||||||
| TransCanada PipeLines Ltd. | 5.10 | 03/15/49 | 10,000 | 9,469 | ||||||||||
| TransCanada PipeLines Ltd. | 6.20 | 10/15/37 | 10,000 | 10,515 | ||||||||||
| TransCanada PipeLines Ltd. | 7.63 | 01/15/39 | 15,000 | 17,677 | ||||||||||
| Transcontinental Gas Pipe Line Co. LLC | 4.60 | 03/15/48 | 5,000 | 4,282 | ||||||||||
| Western Midstream Operating LP | 5.25 | 02/01/50 | 5,000 | 4,361 | ||||||||||
| Western Midstream Operating LP | 5.30 | 03/01/48 | 10,000 | 8,709 | ||||||||||
| Western Midstream Operating LP | 5.45 | 11/15/34 | 5,000 | 4,883 | ||||||||||
| Western Midstream Operating LP | 5.45 | 04/01/44 | 5,000 | 4,527 | ||||||||||
| Williams Cos, Inc. | 3.50 | 10/15/51 | 5,000 | 3,496 | ||||||||||
| Williams Cos, Inc. | 4.90 | 01/15/45 | 5,000 | 4,446 | ||||||||||
| Williams Cos, Inc. | 5.10 | 09/15/45 | 10,000 | 9,168 | ||||||||||
| Williams Cos, Inc. | 5.30 | 08/15/52 | 20,000 | 18,743 | ||||||||||
| Williams Cos, Inc. | 5.40 | 03/04/44 | 5,000 | 4,751 | ||||||||||
| Williams Cos, Inc. | 6.30 | 04/15/40 | 10,000 | 10,546 | ||||||||||
| 620,738 | ||||||||||||||
| REAL ESTATE INVESTMENT TRUST (REITS) – 1.4% | ||||||||||||||
| Alexandria Real Estate Equities, Inc. | 3.00 | 05/18/51 | 5,000 | 3,187 | ||||||||||
| Alexandria Real Estate Equities, Inc. | 3.55 | 03/15/52 | 5,000 | 3,511 | ||||||||||
| Alexandria Real Estate Equities, Inc. | 4.00 | 02/01/50 | 10,000 | 7,704 | ||||||||||
| Alexandria Real Estate Equities, Inc. | 4.75 | 04/15/35 | 5,000 | 4,789 | ||||||||||
| Alexandria Real Estate Equities, Inc. | 5.15 | 04/15/53 | 5,000 | 4,594 | ||||||||||
| Alexandria Real Estate Equities, Inc. | 5.63 | 05/15/54 | 5,000 | 4,934 | ||||||||||
| American Tower Corp. | 3.10 | 06/15/50 | 10,000 | 6,668 | ||||||||||
| American Tower Corp. | 3.70 | 10/15/49 | 10,000 | 7,444 | ||||||||||
| Boston Properties LP | 5.75 | 01/15/35 | 5,000 | 4,952 | ||||||||||
| Crown Castle, Inc. | 2.90 | 04/01/41 | 10,000 | 7,130 | ||||||||||
| Crown Castle, Inc. | 3.25 | 01/15/51 | 5,000 | 3,399 | ||||||||||
| Crown Castle, Inc. | 4.15 | 07/01/50 | 5,000 | 3,968 | ||||||||||
| Equinix, Inc. | 2.95 | 09/15/51 | 5,000 | 3,178 | ||||||||||
| Equinix, Inc. | 3.00 | 07/15/50 | 5,000 | 3,283 | ||||||||||
| Federal Realty OP LP | 4.50 | 12/01/44 | 5,000 | 4,223 | ||||||||||
| Host Hotels & Resorts LP | 5.50 | 04/15/35 | 5,000 | 4,906 | ||||||||||
| Invitation Homes Operating Partnership LP | 4.88 | 02/01/35 | 5,000 | 4,783 | ||||||||||
| Kimco Realty OP LLC | 4.25 | 04/01/45 | 5,000 | 4,147 | ||||||||||
| Kimco Realty OP LLC | 4.85 | 03/01/35 | 5,000 | 4,806 | ||||||||||
| VICI Properties LP | 5.63 | 05/15/52 | 5,000 | 4,699 | ||||||||||
| VICI Properties LP | 6.13 | 04/01/54 | 5,000 | 5,037 | ||||||||||
| Welltower OP LLC | 4.95 | 09/01/48 | 5,000 | 4,649 | ||||||||||
| 105,991 | ||||||||||||||
The accompanying notes are an integral part of these financial statements.
161
BONDBLOXX ETF TRUST
BondBloxx BBB Rated 10+ Year Corporate Bond ETF
Portfolio of Investments (Continued)
October 31, 2024
| Rate (%) | Maturity | Face Amount | Value | |||||||||||
| RETAIL – 2.7% | ||||||||||||||
| Dick’s Sporting Goods, Inc. | 4.10 | 01/15/52 | $ | 5,000 | $ | 3,677 | ||||||||
| Lowe’s Cos, Inc. | 2.80 | 09/15/41 | 5,000 | 3,525 | ||||||||||
| Lowe’s Cos, Inc. | 3.00 | 10/15/50 | 10,000 | 6,453 | ||||||||||
| Lowe’s Cos, Inc. | 3.50 | 04/01/51 | 10,000 | 7,079 | ||||||||||
| Lowe’s Cos, Inc. | 3.70 | 04/15/46 | 10,000 | 7,584 | ||||||||||
| Lowe’s Cos, Inc. | 4.05 | 05/03/47 | 10,000 | 7,975 | ||||||||||
| Lowe’s Cos, Inc. | 4.25 | 04/01/52 | 5,000 | 4,032 | ||||||||||
| Lowe’s Cos, Inc. | 4.45 | 04/01/62 | 10,000 | 8,002 | ||||||||||
| Lowe’s Cos, Inc. | 4.55 | 04/05/49 | 5,000 | 4,261 | ||||||||||
| Lowe’s Cos, Inc. | 4.65 | 04/15/42 | 5,000 | 4,500 | ||||||||||
| Lowe’s Cos, Inc. | 5.63 | 04/15/53 | 15,000 | 14,873 | ||||||||||
| Lowe’s Cos, Inc. | 5.75 | 07/01/53 | 10,000 | 10,100 | ||||||||||
| Lowe’s Cos, Inc. | 5.80 | 09/15/62 | 5,000 | 5,013 | ||||||||||
| Lowe’s Cos, Inc. | 5.85 | 04/01/63 | 5,000 | 5,056 | ||||||||||
| McDonald’s Corp. | 3.63 | 05/01/43 | 5,000 | 3,938 | ||||||||||
| McDonald’s Corp. | 3.63 | 09/01/49 | 10,000 | 7,454 | ||||||||||
| McDonald’s Corp. | 3.70 | 02/15/42 | 5,000 | 4,001 | ||||||||||
| McDonald’s Corp. | 4.20 | 04/01/50 | 5,000 | 4,092 | ||||||||||
| McDonald’s Corp. | 4.45 | 03/01/47 | 5,000 | 4,324 | ||||||||||
| McDonald’s Corp. | 4.60 | 05/26/45 | 5,000 | 4,447 | ||||||||||
| McDonald’s Corp. | 4.70 | 12/09/35 | 5,000 | 4,853 | ||||||||||
| McDonald’s Corp. | 4.88 | 12/09/45 | 10,000 | 9,216 | ||||||||||
| McDonald’s Corp. | 5.15 | 09/09/52 | 10,000 | 9,475 | ||||||||||
| McDonald’s Corp. | 5.45 | 08/14/53 | 10,000 | 9,876 | ||||||||||
| McDonald’s Corp. | 6.30 | 10/15/37 | 10,000 | 10,940 | ||||||||||
| McDonald’s Corp. | 6.30 | 03/01/38 | 10,000 | 10,947 | ||||||||||
| Starbucks Corp. | 3.35 | 03/12/50 | 5,000 | 3,483 | ||||||||||
| Starbucks Corp. | 3.50 | 11/15/50 | 10,000 | 7,219 | ||||||||||
| Starbucks Corp. | 4.45 | 08/15/49 | 10,000 | 8,460 | ||||||||||
| Starbucks Corp. | 4.50 | 11/15/48 | 10,000 | 8,584 | ||||||||||
| 203,439 | ||||||||||||||
| SEMICONDUCTORS – 3.5% | ||||||||||||||
| Broadcom, Inc.(1) | 3.14 | 11/15/35 | 30,000 | 24,648 | ||||||||||
| Broadcom, Inc.(1) | 3.19 | 11/15/36 | 20,000 | 16,245 | ||||||||||
| Broadcom, Inc.(1) | 3.50 | 02/15/41 | 25,000 | 19,667 | ||||||||||
| Broadcom, Inc.(1) | 3.75 | 02/15/51 | 20,000 | 15,128 | ||||||||||
| Broadcom, Inc.(1) | 4.93 | 05/15/37 | 15,000 | 14,394 | ||||||||||
| Intel Corp. | 3.05 | 08/12/51 | 10,000 | 6,052 | ||||||||||
| Intel Corp. | 3.10 | 02/15/60 | 10,000 | 5,718 | ||||||||||
| Intel Corp. | 3.25 | 11/15/49 | 15,000 | 9,566 | ||||||||||
| Intel Corp. | 3.73 | 12/08/47 | 15,000 | 10,435 | ||||||||||
| Intel Corp. | 4.10 | 05/19/46 | 10,000 | 7,508 | ||||||||||
| Intel Corp. | 4.10 | 05/11/47 | 10,000 | 7,442 | ||||||||||
| Intel Corp. | 4.60 | 03/25/40 | 10,000 | 8,571 | ||||||||||
| Intel Corp. | 4.75 | 03/25/50 | 20,000 | 16,338 | ||||||||||
| Intel Corp. | 4.90 | 07/29/45 | 10,000 | 8,476 | ||||||||||
| Intel Corp. | 4.90 | 08/05/52 | 15,000 | 12,449 | ||||||||||
The accompanying notes are an integral part of these financial statements.
162
BONDBLOXX ETF TRUST
BondBloxx BBB Rated 10+ Year Corporate Bond ETF
Portfolio of Investments (Continued)
October 31, 2024
| Rate (%) | Maturity | Face Amount | Value | |||||||||||
| SEMICONDUCTORS – 3.5% (Continued) | ||||||||||||||
| Intel Corp. | 4.95 | 03/25/60 | $ | 10,000 | $ | 8,219 | ||||||||
| Intel Corp. | 5.05 | 08/05/62 | 10,000 | 8,324 | ||||||||||
| Intel Corp. | 5.60 | 02/21/54 | 10,000 | 9,273 | ||||||||||
| Intel Corp. | 5.63 | 02/10/43 | 10,000 | 9,525 | ||||||||||
| Intel Corp. | 5.70 | 02/10/53 | 15,000 | 14,030 | ||||||||||
| Intel Corp. | 5.90 | 02/10/63 | 10,000 | 9,483 | ||||||||||
| Micron Technology, Inc. | 3.37 | 11/01/41 | 5,000 | 3,720 | ||||||||||
| NXP BV/NXP Funding LLC/NXP USA, Inc. | 3.25 | 05/11/41 | 10,000 | 7,511 | ||||||||||
| NXP BV/NXP Funding LLC/NXP USA, Inc. | 3.25 | 11/30/51 | 5,000 | 3,356 | ||||||||||
| 256,078 | ||||||||||||||
| SOFTWARE – 4.3% | ||||||||||||||
| Electronic Arts, Inc. | 2.95 | 02/15/51 | 5,000 | 3,302 | ||||||||||
| Fidelity National Information Services, Inc. | 3.10 | 03/01/41 | 5,000 | 3,712 | ||||||||||
| Fiserv, Inc. | 4.40 | 07/01/49 | 15,000 | 12,700 | ||||||||||
| Oracle Corp. | 3.60 | 04/01/40 | 25,000 | 19,901 | ||||||||||
| Oracle Corp. | 3.60 | 04/01/50 | 40,000 | 28,846 | ||||||||||
| Oracle Corp. | 3.65 | 03/25/41 | 20,000 | 15,848 | ||||||||||
| Oracle Corp. | 3.80 | 11/15/37 | 15,000 | 12,731 | ||||||||||
| Oracle Corp. | 3.85 | 07/15/36 | 10,000 | 8,668 | ||||||||||
| Oracle Corp. | 3.85 | 04/01/60 | 25,000 | 17,756 | ||||||||||
| Oracle Corp. | 3.90 | 05/15/35 | 10,000 | 8,890 | ||||||||||
| Oracle Corp. | 3.95 | 03/25/51 | 25,000 | 19,075 | ||||||||||
| Oracle Corp. | 4.00 | 07/15/46 | 25,000 | 19,661 | ||||||||||
| Oracle Corp. | 4.00 | 11/15/47 | 20,000 | 15,591 | ||||||||||
| Oracle Corp. | 4.10 | 03/25/61 | 15,000 | 11,160 | ||||||||||
| Oracle Corp. | 4.13 | 05/15/45 | 15,000 | 12,092 | ||||||||||
| Oracle Corp. | 4.38 | 05/15/55 | 5,000 | 4,044 | ||||||||||
| Oracle Corp. | 4.50 | 07/08/44 | 10,000 | 8,581 | ||||||||||
| Oracle Corp. | 5.38 | 07/15/40 | 15,000 | 14,691 | ||||||||||
| Oracle Corp. | 5.38 | 09/27/54 | 10,000 | 9,524 | ||||||||||
| Oracle Corp. | 5.50 | 09/27/64 | 10,000 | 9,448 | ||||||||||
| Oracle Corp. | 5.55 | 02/06/53 | 15,000 | 14,673 | ||||||||||
| Oracle Corp. | 6.13 | 07/08/39 | 15,000 | 15,880 | ||||||||||
| Oracle Corp. | 6.50 | 04/15/38 | 10,000 | 10,929 | ||||||||||
| Oracle Corp. | 6.90 | 11/09/52 | 20,000 | 23,020 | ||||||||||
| 320,723 | ||||||||||||||
| TELECOMMUNICATIONS – 13.9% | ||||||||||||||
| AT&T, Inc. | 3.10 | 02/01/43 | 10,000 | 7,328 | ||||||||||
| AT&T, Inc. | 3.50 | 06/01/41 | 20,000 | 15,715 | ||||||||||
| AT&T, Inc. | 3.50 | 09/15/53 | 60,000 | 41,802 | ||||||||||
| AT&T, Inc. | 3.55 | 09/15/55 | 65,000 | 45,164 | ||||||||||
| AT&T, Inc. | 3.65 | 06/01/51 | 35,000 | 25,461 | ||||||||||
| AT&T, Inc. | 3.65 | 09/15/59 | 50,000 | 34,322 | ||||||||||
| AT&T, Inc. | 3.80 | 12/01/57 | 50,000 | 35,900 | ||||||||||
| AT&T, Inc. | 3.85 | 06/01/60 | 20,000 | 14,390 | ||||||||||
| AT&T, Inc. | 4.30 | 12/15/42 | 10,000 | 8,521 | ||||||||||
| AT&T, Inc. | 4.35 | 06/15/45 | 5,000 | 4,209 | ||||||||||
| AT&T, Inc. | 4.50 | 05/15/35 | 15,000 | 14,064 | ||||||||||
The accompanying notes are an integral part of these financial statements.
163
BONDBLOXX ETF TRUST
BondBloxx BBB Rated 10+ Year Corporate Bond ETF
Portfolio of Investments (Continued)
October 31, 2024
| Rate (%) | Maturity | Face Amount | Value | |||||||||||
| TELECOMMUNICATIONS – 13.9% (Continued) | ||||||||||||||
| AT&T, Inc. | 4.50 | 03/09/48 | $ | 10,000 | $ | 8,511 | ||||||||
| AT&T, Inc. | 4.55 | 03/09/49 | 5,000 | 4,298 | ||||||||||
| AT&T, Inc. | 4.75 | 05/15/46 | 10,000 | 8,904 | ||||||||||
| AT&T, Inc. | 4.85 | 03/01/39 | 10,000 | 9,398 | ||||||||||
| AT&T, Inc. | 4.90 | 08/15/37 | 5,000 | 4,777 | ||||||||||
| AT&T, Inc. | 5.15 | 11/15/46 | 5,000 | 4,695 | ||||||||||
| AT&T, Inc. | 5.15 | 02/15/50 | 10,000 | 9,311 | ||||||||||
| AT&T, Inc. | 5.25 | 03/01/37 | 15,000 | 14,842 | ||||||||||
| AT&T, Inc. | 5.35 | 09/01/40 | 10,000 | 9,822 | ||||||||||
| AT&T, Inc. | 5.55 | 08/15/41 | 5,000 | 4,973 | ||||||||||
| Bell Telephone Co. of Canada/Bell Canada | 3.65 | 03/17/51 | 10,000 | 7,261 | ||||||||||
| Bell Telephone Co. of Canada/Bell Canada | 3.65 | 08/15/52 | 5,000 | 3,642 | ||||||||||
| Bell Telephone Co. of Canada/Bell Canada | 4.30 | 07/29/49 | 5,000 | 4,088 | ||||||||||
| Bell Telephone Co. of Canada/Bell Canada | 4.46 | 04/01/48 | 10,000 | 8,419 | ||||||||||
| Bell Telephone Co. of Canada/Bell Canada | 5.55 | 02/15/54 | 5,000 | 4,941 | ||||||||||
| Corning, Inc. | 5.35 | 11/15/48 | 10,000 | 9,694 | ||||||||||
| Corning, Inc. | 5.45 | 11/15/79 | 15,000 | 14,059 | ||||||||||
| Nokia OYJ | 6.63 | 05/15/39 | 5,000 | 5,140 | ||||||||||
| Orange SA | 5.38 | 01/13/42 | 5,000 | 4,906 | ||||||||||
| Orange SA | 5.50 | 02/06/44 | 10,000 | 9,944 | ||||||||||
| Rogers Communications, Inc. | 3.70 | 11/15/49 | 15,000 | 10,900 | ||||||||||
| Rogers Communications, Inc. | 4.30 | 02/15/48 | 10,000 | 8,052 | ||||||||||
| Rogers Communications, Inc. | 4.35 | 05/01/49 | 5,000 | 4,061 | ||||||||||
| Rogers Communications, Inc. | 4.50 | 03/15/42 | 5,000 | 4,315 | ||||||||||
| Rogers Communications, Inc. | 4.50 | 03/15/43 | 5,000 | 4,261 | ||||||||||
| Rogers Communications, Inc. | 4.55 | 03/15/52 | 10,000 | 8,299 | ||||||||||
| Rogers Communications, Inc. | 5.00 | 03/15/44 | 10,000 | 9,100 | ||||||||||
| Rogers Communications, Inc. | 5.45 | 10/01/43 | 5,000 | 4,805 | ||||||||||
| Telefonica Emisiones SA | 4.67 | 03/06/38 | 10,000 | 9,041 | ||||||||||
| Telefonica Emisiones SA | 4.90 | 03/06/48 | 10,000 | 8,748 | ||||||||||
| Telefonica Emisiones SA | 5.21 | 03/08/47 | 20,000 | 18,213 | ||||||||||
| Telefonica Emisiones SA | 5.52 | 03/01/49 | 10,000 | 9,522 | ||||||||||
| Telefonica Emisiones SA | 7.05 | 06/20/36 | 10,000 | 11,158 | ||||||||||
| TELUS Corp. | 4.30 | 06/15/49 | 5,000 | 3,988 | ||||||||||
| TELUS Corp. | 4.60 | 11/16/48 | 5,000 | 4,227 | ||||||||||
| T-Mobile USA, Inc. | 3.00 | 02/15/41 | 20,000 | 14,706 | ||||||||||
| T-Mobile USA, Inc. | 3.30 | 02/15/51 | 20,000 | 13,790 | ||||||||||
| T-Mobile USA, Inc. | 3.40 | 10/15/52 | 25,000 | 17,418 | ||||||||||
| T-Mobile USA, Inc. | 3.60 | 11/15/60 | 15,000 | 10,341 | ||||||||||
| T-Mobile USA, Inc. | 4.38 | 04/15/40 | 10,000 | 8,849 | ||||||||||
| T-Mobile USA, Inc. | 4.50 | 04/15/50 | 25,000 | 21,230 | ||||||||||
| T-Mobile USA, Inc. | 4.70 | 01/15/35 | 5,000 | 4,816 | ||||||||||
| T-Mobile USA, Inc. | 5.25 | 06/15/55 | 5,000 | 4,742 | ||||||||||
| T-Mobile USA, Inc. | 5.50 | 01/15/55 | 10,000 | 9,854 | ||||||||||
| T-Mobile USA, Inc. | 5.65 | 01/15/53 | 20,000 | 20,064 | ||||||||||
| T-Mobile USA, Inc. | 5.75 | 01/15/54 | 10,000 | 10,149 | ||||||||||
| T-Mobile USA, Inc. | 5.80 | 09/15/62 | 5,000 | 5,052 | ||||||||||
| T-Mobile USA, Inc. | 6.00 | 06/15/54 | 5,000 | 5,260 | ||||||||||
The accompanying notes are an integral part of these financial statements.
164
BONDBLOXX ETF TRUST
BondBloxx BBB Rated 10+ Year Corporate Bond ETF
Portfolio of Investments (Continued)
October 31, 2024
| Rate (%) | Maturity | Face Amount | Value | |||||||||||
| TELECOMMUNICATIONS – 13.9% (Continued) | ||||||||||||||
| Verizon Communications, Inc. | 2.65 | 11/20/40 | $ | 25,000 | $ | 17,488 | ||||||||
| Verizon Communications, Inc. | 2.88 | 11/20/50 | 25,000 | 15,934 | ||||||||||
| Verizon Communications, Inc. | 2.99 | 10/30/56 | 30,000 | 18,590 | ||||||||||
| Verizon Communications, Inc. | 3.00 | 11/20/60 | 10,000 | 6,055 | ||||||||||
| Verizon Communications, Inc. | 3.40 | 03/22/41 | 35,000 | 27,125 | ||||||||||
| Verizon Communications, Inc. | 3.55 | 03/22/51 | 40,000 | 29,271 | ||||||||||
| Verizon Communications, Inc. | 3.70 | 03/22/61 | 30,000 | 21,343 | ||||||||||
| Verizon Communications, Inc. | 3.85 | 11/01/42 | 10,000 | 8,093 | ||||||||||
| Verizon Communications, Inc. | 3.88 | 03/01/52 | 10,000 | 7,682 | ||||||||||
| Verizon Communications, Inc. | 4.00 | 03/22/50 | 10,000 | 7,897 | ||||||||||
| Verizon Communications, Inc. | 4.13 | 08/15/46 | 10,000 | 8,164 | ||||||||||
| Verizon Communications, Inc. | 4.27 | 01/15/36 | 15,000 | 13,714 | ||||||||||
| Verizon Communications, Inc. | 4.40 | 11/01/34 | 25,000 | 23,493 | ||||||||||
| Verizon Communications, Inc.(1) | 4.78 | 02/15/35 | 10,000 | 9,640 | ||||||||||
| Verizon Communications, Inc. | 4.81 | 03/15/39 | 10,000 | 9,372 | ||||||||||
| Verizon Communications, Inc. | 4.86 | 08/21/46 | 30,000 | 27,596 | ||||||||||
| Verizon Communications, Inc. | 5.01 | 04/15/49 | 10,000 | 9,601 | ||||||||||
| Verizon Communications, Inc. | 5.01 | 08/21/54 | 5,000 | 4,605 | ||||||||||
| Verizon Communications, Inc. | 5.25 | 03/16/37 | 5,000 | 4,961 | ||||||||||
| Verizon Communications, Inc. | 5.50 | 02/23/54 | 5,000 | 4,975 | ||||||||||
| Vodafone Group PLC | 4.25 | 09/17/50 | 10,000 | 7,928 | ||||||||||
| Vodafone Group PLC | 4.38 | 02/19/43 | 5,000 | 4,377 | ||||||||||
| Vodafone Group PLC | 4.88 | 06/19/49 | 10,000 | 8,824 | ||||||||||
| Vodafone Group PLC | 5.00 | 05/30/38 | 5,000 | 4,793 | ||||||||||
| Vodafone Group PLC | 5.25 | 05/30/48 | 10,000 | 9,431 | ||||||||||
| Vodafone Group PLC | 5.63 | 02/10/53 | 10,000 | 9,732 | ||||||||||
| Vodafone Group PLC | 5.75 | 06/28/54 | 25,000 | 24,773 | ||||||||||
| Vodafone Group PLC | 5.75 | 02/10/63 | 5,000 | 4,817 | ||||||||||
| Vodafone Group PLC | 5.88 | 06/28/64 | 5,000 | 4,917 | ||||||||||
| Vodafone Group PLC | 6.15 | 02/27/37 | 10,000 | 10,657 | ||||||||||
| 1,029,310 | ||||||||||||||
| TOYS/GAMES/HOBBIES – 0.1% | ||||||||||||||
| Hasbro, Inc. | 6.35 | 03/15/40 | 5,000 | 5,199 | ||||||||||
| TRANSPORTATION – 2.2% | ||||||||||||||
| Canadian Pacific Railway Co. | 3.00 | 12/02/41 | 10,000 | 7,438 | ||||||||||
| Canadian Pacific Railway Co. | 3.10 | 12/02/51 | 15,000 | 10,159 | ||||||||||
| Canadian Pacific Railway Co. | 3.50 | 05/01/50 | 5,000 | 3,690 | ||||||||||
| Canadian Pacific Railway Co. | 4.80 | 08/01/45 | 5,000 | 4,557 | ||||||||||
| Canadian Pacific Railway Co. | 6.13 | 09/15/15 | 5,000 | 5,215 | ||||||||||
| FedEx Corp. | 3.25 | 05/15/41 | 10,000 | 7,449 | ||||||||||
| FedEx Corp. | 3.88 | 08/01/42 | 5,000 | 3,975 | ||||||||||
| FedEx Corp. | 4.05 | 02/15/48 | 10,000 | 7,924 | ||||||||||
| FedEx Corp. | 4.10 | 04/15/43 | 5,000 | 4,091 | ||||||||||
| FedEx Corp. | 4.10 | 02/01/45 | 5,000 | 4,015 | ||||||||||
| FedEx Corp. | 4.40 | 01/15/47 | 5,000 | 4,141 | ||||||||||
| FedEx Corp. | 4.55 | 04/01/46 | 10,000 | 8,501 | ||||||||||
| FedEx Corp. | 4.75 | 11/15/45 | 10,000 | 8,760 | ||||||||||
The accompanying notes are an integral part of these financial statements.
165
BONDBLOXX ETF TRUST
BondBloxx BBB Rated 10+ Year Corporate Bond ETF
Portfolio of Investments (Continued)
October 31, 2024
| Rate (%) | Maturity | Face Amount | Value | |||||||||||
| TRANSPORTATION – 2.2% (Continued) | ||||||||||||||
| FedEx Corp. | 4.95 | 10/17/48 | $ | 5,000 | $ | 4,495 | ||||||||
| FedEx Corp. | 5.10 | 01/15/44 | 5,000 | 4,661 | ||||||||||
| FedEx Corp. | 5.25 | 05/15/50 | 10,000 | 9,424 | ||||||||||
| Norfolk Southern Corp. | 3.16 | 05/15/55 | 10,000 | 6,580 | ||||||||||
| Norfolk Southern Corp. | 3.94 | 11/01/47 | 10,000 | 7,960 | ||||||||||
| Norfolk Southern Corp. | 4.10 | 05/15/21 | 10,000 | 7,193 | ||||||||||
| Norfolk Southern Corp. | 4.15 | 02/28/48 | 5,000 | 4,145 | ||||||||||
| Norfolk Southern Corp. | 4.45 | 06/15/45 | 10,000 | 8,730 | ||||||||||
| Norfolk Southern Corp. | 4.55 | 06/01/53 | 10,000 | 8,670 | ||||||||||
| Norfolk Southern Corp. | 4.84 | 10/01/41 | 10,000 | 9,366 | ||||||||||
| Norfolk Southern Corp. | 5.35 | 08/01/54 | 5,000 | 4,927 | ||||||||||
| Norfolk Southern Corp. | 5.95 | 03/15/64 | 5,000 | 5,294 | ||||||||||
| 161,360 | ||||||||||||||
| WATER – 0.6% | ||||||||||||||
| American Water Capital Corp. | 3.25 | 06/01/51 | 5,000 | 3,493 | ||||||||||
| American Water Capital Corp. | 3.45 | 05/01/50 | 10,000 | 7,288 | ||||||||||
| American Water Capital Corp. | 3.75 | 09/01/47 | 5,000 | 3,854 | ||||||||||
| American Water Capital Corp. | 4.20 | 09/01/48 | 15,000 | 12,486 | ||||||||||
| American Water Capital Corp. | 4.30 | 12/01/42 | 5,000 | 4,358 | ||||||||||
| American Water Capital Corp. | 6.59 | 10/15/37 | 5,000 | 5,635 | ||||||||||
| Essential Utilities, Inc. | 5.30 | 05/01/52 | 10,000 | 9,442 | ||||||||||
| 46,556 | ||||||||||||||
| TOTAL CORPORATE BONDS (Cost - $7,217,660) | 7,252,221 | |||||||||||||
| SHORT-TERM INVESTMENTS – 0.7% | ||||||||||||||
| TIME DEPOSITS – 0.7% | ||||||||||||||
| Citibank, New York | 4.18 | 11/01/24 | 55,118 | 55,118 | ||||||||||
| TOTAL SHORT-TERM INVESTMENTS (Cost - $55,118) | 55,118 | |||||||||||||
| TOTAL INVESTMENTS – 98.7% (Cost - $7,272,778) | $ | 7,307,339 | ||||||||||||
| OTHER ASSETS LESS LIABILITIES – 1.3% | 97,619 | |||||||||||||
| NET ASSETS – 100.0% | $ | 7,404,958 | ||||||||||||
| (1) | Security was purchased pursuant to Rule 144A under the Securities Act of 1933 and may not be resold subject to that Rule except to qualified institutional buyers. The aggregate value of Rule 144A holdings at October 31, 2024, amounts to $162,238 and represents 2.2% of net assets. These securities have been deemed liquid under procedures approved by the Trust’s Board of Trustees. |
The accompanying notes are an integral part of these financial statements.
166
BONDBLOXX ETF TRUST
BondBloxx JP Morgan USD Emerging Markets 1-10 Year Bond ETF
Portfolio of Investments
October 31, 2024
| Rate (%) | Maturity | Face Amount | Value | |||||||||||
| CORPORATE BONDS – 11.0% | ||||||||||||||
| BANKS – 0.3% | ||||||||||||||
| Banco Nacional de Comercio Exterior SNC/Cayman Islands(1) | 4.38 | 10/14/25 | $ | 200,000 | $ | 198,876 | ||||||||
| Banco Nacional de Panama(1) | 2.50 | 08/11/30 | 525,000 | 426,072 | ||||||||||
| 624,948 | ||||||||||||||
| CHEMICALS – 0.3% | ||||||||||||||
| CNAC HK Finbridge Co. Ltd.(1) | 3.00 | 09/22/30 | 200,000 | 179,165 | ||||||||||
| CNAC HK Finbridge Co. Ltd.(1) | 4.13 | 07/19/27 | 200,000 | 195,875 | ||||||||||
| CNAC HK Finbridge Co. Ltd.(1) | 5.13 | 03/14/28 | 500,000 | 500,358 | ||||||||||
| 875,398 | ||||||||||||||
| COMMERCIAL SERVICES – 0.3% | ||||||||||||||
| DP World Crescent Ltd.(1) | 3.88 | 07/18/29 | 200,000 | 191,562 | ||||||||||
| DP World Crescent Ltd.(1) | 4.85 | 09/26/28 | 200,000 | 199,900 | ||||||||||
| DP World Crescent Ltd.(1) | 5.50 | 09/13/33 | 400,000 | 408,125 | ||||||||||
| 799,587 | ||||||||||||||
| ELECTRIC – 1.1% | ||||||||||||||
| Comision Federal de Electricidad(1) | 4.69 | 05/15/29 | 200,000 | 190,500 | ||||||||||
| Eskom Holdings SOC Ltd.(1) | 6.35 | 08/10/28 | 650,000 | 651,219 | ||||||||||
| Perusahaan Perseroan Persero PT Perusahaan Listrik Negara(1) | 4.13 | 05/15/27 | 375,000 | 369,609 | ||||||||||
| Perusahaan Perseroan Persero PT Perusahaan Listrik Negara(1) | 5.45 | 05/21/28 | 200,000 | 203,187 | ||||||||||
| SPIC MTN Co. Ltd.(1) | 1.63 | 07/27/25 | 225,000 | 219,446 | ||||||||||
| State Grid Overseas Investment BVI Ltd.(1) | 1.63 | 08/05/30 | 425,000 | 364,646 | ||||||||||
| State Grid Overseas Investment BVI Ltd.(1) | 3.50 | 05/04/27 | 600,000 | 587,055 | ||||||||||
| Three Gorges Finance I Cayman Islands Ltd.(1) | 3.15 | 06/02/26 | 225,000 | 220,347 | ||||||||||
| 2,806,009 | ||||||||||||||
| INSURANCE – 0.2% | ||||||||||||||
| China Life Insurance Overseas Co. Ltd./Hong Kong(1) | 5.35 | 08/15/33 | 550,000 | 557,048 | ||||||||||
| INVESTMENT COMPANIES – 2.1% | ||||||||||||||
| Abu Dhabi Developmental Holding Co. PJSC(1) | 5.38 | 05/08/29 | 440,000 | 449,350 | ||||||||||
| Abu Dhabi Developmental Holding Co. PJSC(1) | 5.50 | 05/08/34 | 240,000 | 247,320 | ||||||||||
| Gaci First Investment Co.(1) | 4.75 | 02/14/30 | 200,000 | 197,125 | ||||||||||
| Gaci First Investment Co.(1) | 5.00 | 10/13/27 | 250,000 | 250,703 | ||||||||||
| Gaci First Investment Co.(1) | 5.00 | 01/29/29 | 250,000 | 249,844 | ||||||||||
| Gaci First Investment Co.(1) | 5.25 | 10/13/32 | 300,000 | 301,312 | ||||||||||
| Gaci First Investment Co.(1) | 5.25 | 01/29/34 | 450,000 | 449,437 | ||||||||||
| MDGH GMTN RSC Ltd.(1) | 2.50 | 05/21/26 | 275,000 | 265,705 | ||||||||||
| MDGH GMTN RSC Ltd.(1) | 2.88 | 11/07/29 | 225,000 | 206,157 | ||||||||||
| MDGH GMTN RSC Ltd.(1) | 2.88 | 05/21/30 | 200,000 | 181,750 | ||||||||||
| MDGH GMTN RSC Ltd.(1) | 3.38 | 03/28/32 | 200,000 | 181,938 | ||||||||||
| MDGH GMTN RSC Ltd.(1) | 4.38 | 11/22/33 | 200,000 | 190,000 | ||||||||||
| MDGH GMTN RSC Ltd.(1) | 5.50 | 04/28/33 | 200,000 | 206,000 | ||||||||||
| Mdgh Sukuk Ltd.(1) | 4.96 | 04/04/34 | 200,000 | 200,879 | ||||||||||
| Suci Second Investment Co.(1) | 4.38 | 09/10/27 | 300,000 | 296,159 | ||||||||||
| Suci Second Investment Co.(1) | 5.17 | 03/05/31 | 300,000 | 301,611 | ||||||||||
| Suci Second Investment Co.(1) | 6.00 | 10/25/28 | 800,000 | 832,500 | ||||||||||
| Suci Second Investment Co.(1) | 6.25 | 10/25/33 | 200,000 | 216,188 | ||||||||||
| 5,223,978 | ||||||||||||||
The accompanying notes are an integral part of these financial statements.
167
BONDBLOXX ETF TRUST
BondBloxx JP Morgan USD Emerging Markets 1-10 Year Bond ETF
Portfolio of Investments (Continued)
October 31, 2024
| Rate (%) | Maturity | Face Amount | Value | |||||||||||
| MINING – 0.6% | ||||||||||||||
| Corp. Nacional del Cobre de Chile(1) | 3.00 | 09/30/29 | $ | 325,000 | $ | 292,703 | ||||||||
| Corp. Nacional del Cobre de Chile(1) | 3.15 | 01/14/30 | 350,000 | 315,219 | ||||||||||
| Corp. Nacional del Cobre de Chile(1) | 3.63 | 08/01/27 | 425,000 | 410,524 | ||||||||||
| Corp. Nacional del Cobre de Chile(1) | 5.95 | 01/08/34 | 350,000 | 355,359 | ||||||||||
| Indonesia Asahan Aluminium PT/Mineral Industri Indonesia Persero PT(1) | 5.45 | 05/15/30 | 200,000 | 200,480 | ||||||||||
| 1,574,285 | ||||||||||||||
| OIL & GAS – 5.4% | ||||||||||||||
| Adnoc Murban Rsc Ltd.(1) | 4.25 | 09/11/29 | 220,000 | 214,087 | ||||||||||
| Adnoc Murban Rsc Ltd.(1) | 4.50 | 09/11/34 | 335,000 | 319,088 | ||||||||||
| Bapco Energies BSC Closed(1) | 7.50 | 10/25/27 | 525,000 | 543,703 | ||||||||||
| EDO Sukuk Ltd.(1) | 5.88 | 09/21/33 | 650,000 | 676,023 | ||||||||||
| Pertamina Persero PT(1) | 1.40 | 02/09/26 | 200,000 | 191,125 | ||||||||||
| Petroleos de Venezuela SA(1)(2) | 5.38 | 04/12/27 | 975,000 | 96,038 | ||||||||||
| Petroleos de Venezuela SA(1)(2) | 6.00 | 05/16/24 | 1,510,000 | 151,000 | ||||||||||
| Petroleos de Venezuela SA(1)(2) | 6.00 | 11/15/26 | 1,290,000 | 129,645 | ||||||||||
| Petroleos de Venezuela SA(1)(2) | 8.50 | 10/27/20 | 280,000 | 254,100 | ||||||||||
| Petroleos de Venezuela SA(1)(2) | 9.00 | 11/17/21 | 730,000 | 78,110 | ||||||||||
| Petroleos de Venezuela SA(1)(2) | 9.75 | 05/17/35 | 950,000 | 110,675 | ||||||||||
| Petroleos de Venezuela SA(1)(2) | 12.75 | 02/17/22 | 925,000 | 106,837 | ||||||||||
| Petroleos del Peru SA(1) | 4.75 | 06/19/32 | 550,000 | 422,125 | ||||||||||
| Petroleos Mexicanos | 4.50 | 01/23/26 | 175,000 | 170,548 | ||||||||||
| Petroleos Mexicanos | 5.35 | 02/12/28 | 400,000 | 373,276 | ||||||||||
| Petroleos Mexicanos | 5.95 | 01/28/31 | 750,000 | 646,875 | ||||||||||
| Petroleos Mexicanos | 6.49 | 01/23/27 | 250,000 | 247,097 | ||||||||||
| Petroleos Mexicanos | 6.50 | 03/13/27 | 800,000 | 785,112 | ||||||||||
| Petroleos Mexicanos | 6.50 | 01/23/29 | 300,000 | 282,327 | ||||||||||
| Petroleos Mexicanos | 6.70 | 02/16/32 | 1,300,000 | 1,156,597 | ||||||||||
| Petroleos Mexicanos | 6.84 | 01/23/30 | 400,000 | 369,100 | ||||||||||
| Petroleos Mexicanos | 6.88 | 08/04/26 | 500,000 | 500,000 | ||||||||||
| Petroleos Mexicanos | 8.75 | 06/02/29 | 300,000 | 303,844 | ||||||||||
| Petroleos Mexicanos | 10.00 | 02/07/33 | 325,000 | 343,817 | ||||||||||
| Petronas Capital Ltd.(1) | 2.48 | 01/28/32 | 875,000 | 741,799 | ||||||||||
| Petronas Capital Ltd.(1) | 3.50 | 04/21/30 | 1,450,000 | 1,354,612 | ||||||||||
| QatarEnergy(1) | 1.38 | 09/12/26 | 600,000 | 565,887 | ||||||||||
| QatarEnergy(1) | 2.25 | 07/12/31 | 1,100,000 | 947,375 | ||||||||||
| Sinopec Group Overseas Development 2017 Ltd.(1) | 3.63 | 04/12/27 | 250,000 | 245,215 | ||||||||||
| Sinopec Group Overseas Development 2018 Ltd.(1) | 1.45 | 01/08/26 | 450,000 | 433,492 | ||||||||||
| Sinopec Group Overseas Development 2018 Ltd.(1) | 2.30 | 01/08/31 | 225,000 | 198,614 | ||||||||||
| Sinopec Group Overseas Development 2018 Ltd.(1) | 2.70 | 05/13/30 | 475,000 | 435,200 | ||||||||||
| Sinopec Group Overseas Development 2018 Ltd.(1) | 2.95 | 11/12/29 | 250,000 | 233,650 | ||||||||||
| 13,626,993 | ||||||||||||||
| PIPELINES – 0.5% | ||||||||||||||
| Southern Gas Corridor CJSC(1) | 6.88 | 03/24/26 | 1,350,000 | 1,379,113 | ||||||||||
| TRANSPORTATION – 0.2% | ||||||||||||||
| Transnet SOC Ltd.(1) | 8.25 | 02/06/28 | 550,000 | 561,859 | ||||||||||
| TOTAL CORPORATE BONDS (Cost - $27,813,212) | 28,029,218 | |||||||||||||
The accompanying notes are an integral part of these financial statements.
168
BONDBLOXX ETF TRUST
BondBloxx JP Morgan USD Emerging Markets 1-10 Year Bond ETF
Portfolio of Investments (Continued)
October 31, 2024
| Rate (%) | Maturity | Face Amount | Value | |||||||||||
| GOVERNMENT AGENCIES AND OBLIGATIONS – 87.2% | ||||||||||||||
| GOVERNMENT AGENCIES – 3.3% | ||||||||||||||
| Bank Gospodarstwa Krajowego(1) | 5.38 | 05/22/33 | $ | 900,000 | $ | 895,694 | ||||||||
| Bank Gospodarstwa Krajowego(1) | 5.75 | 07/09/34 | 1,000,000 | 1,013,430 | ||||||||||
| Bank Gospodarstwa Krajowego(1) | 6.25 | 10/31/28 | 700,000 | 734,265 | ||||||||||
| China Development Bank(1) | 1.00 | 10/27/25 | 225,000 | 216,863 | ||||||||||
| Export-Import Bank of China(1) | 2.88 | 04/26/26 | 200,000 | 195,115 | ||||||||||
| Export-Import Bank of China(1) | 3.88 | 05/16/26 | 550,000 | 545,229 | ||||||||||
| Export-Import Bank of India(1) | 2.25 | 01/13/31 | 700,000 | 597,187 | ||||||||||
| Export-Import Bank of India(1) | 3.25 | 01/15/30 | 600,000 | 551,718 | ||||||||||
| Export-Import Bank of India(1) | 3.38 | 08/05/26 | 575,000 | 560,918 | ||||||||||
| Export-Import Bank of India(1) | 3.88 | 02/01/28 | 675,000 | 655,489 | ||||||||||
| Export-Import Bank of India(1) | 5.50 | 01/18/33 | 750,000 | 767,578 | ||||||||||
| Finance Department Government of Sharjah(1) | 6.50 | 11/23/32 | 200,000 | 211,313 | ||||||||||
| Magyar Export-Import Bank Zrt(1) | 6.13 | 12/04/27 | 850,000 | 867,531 | ||||||||||
| MFB Magyar Fejlesztesi Bank Zrt(1) | 6.50 | 06/29/28 | 725,000 | 747,203 | ||||||||||
| 8,559,533 | ||||||||||||||
| GOVERNMENT OBLIGATIONS – 83.9% | ||||||||||||||
| Abu Dhabi Government International Bond(1) | 1.63 | 06/02/28 | 400,000 | 362,502 | ||||||||||
| Abu Dhabi Government International Bond(1) | 1.70 | 03/02/31 | 300,000 | 252,834 | ||||||||||
| Abu Dhabi Government International Bond(1) | 1.88 | 09/15/31 | 350,000 | 293,685 | ||||||||||
| Abu Dhabi Government International Bond(1) | 2.50 | 09/30/29 | 850,000 | 776,955 | ||||||||||
| Abu Dhabi Government International Bond(1) | 3.13 | 05/03/26 | 650,000 | 636,682 | ||||||||||
| Abu Dhabi Government International Bond(1) | 3.13 | 10/11/27 | 800,000 | 771,808 | ||||||||||
| Abu Dhabi Government International Bond(1) | 3.13 | 04/16/30 | 626,000 | 583,902 | ||||||||||
| Abu Dhabi Government International Bond(1) | 4.88 | 04/30/29 | 350,000 | 355,906 | ||||||||||
| Abu Dhabi Government International Bond(1) | 5.00 | 04/30/34 | 300,000 | 306,188 | ||||||||||
| Angolan Government International Bond(1) | 8.00 | 11/26/29 | 1,250,000 | 1,148,437 | ||||||||||
| Angolan Government International Bond(1) | 8.25 | 05/09/28 | 1,150,000 | 1,099,544 | ||||||||||
| Angolan Government International Bond(1) | 8.75 | 04/14/32 | 1,200,000 | 1,089,696 | ||||||||||
| Argentine Republic Government International Bond(3) | 0.75 | 07/09/30 | 4,252,800 | 2,862,134 | ||||||||||
| Argentine Republic Government International Bond | 1.00 | 07/09/29 | 750,000 | 539,250 | ||||||||||
| Argentine Republic Government International Bond(3) | 3.50 | 07/09/41 | 3,000,000 | 1,545,000 | ||||||||||
| Argentine Republic Government International Bond(3) | 4.13 | 07/09/35 | 5,880,000 | 3,263,400 | ||||||||||
| Argentine Republic Government International Bond(3) | 5.00 | 01/09/38 | 3,285,000 | 1,967,715 | ||||||||||
| Bahrain Government International Bond(1) | 5.25 | 01/25/33 | 400,000 | 367,500 | ||||||||||
| Bahrain Government International Bond(1) | 5.45 | 09/16/32 | 700,000 | 655,634 | ||||||||||
| Bahrain Government International Bond(1) | 5.63 | 09/30/31 | 675,000 | 648,844 | ||||||||||
| Bahrain Government International Bond(1) | 5.63 | 05/18/34 | 550,000 | 511,671 | ||||||||||
| Bahrain Government International Bond(1) | 6.75 | 09/20/29 | 800,000 | 821,000 | ||||||||||
| Bahrain Government International Bond(1) | 7.00 | 01/26/26 | 725,000 | 734,063 | ||||||||||
| Bahrain Government International Bond(1) | 7.00 | 10/12/28 | 850,000 | 886,656 | ||||||||||
| Bahrain Government International Bond(1) | 7.38 | 05/14/30 | 475,000 | 502,284 | ||||||||||
| Bolivian Government International Bond(1) | 4.50 | 03/20/28 | 600,000 | 384,000 | ||||||||||
| Brazilian Government International Bond | 2.88 | 06/06/25 | 525,000 | 517,789 | ||||||||||
| Brazilian Government International Bond | 3.75 | 09/12/31 | 575,000 | 508,159 | ||||||||||
| Brazilian Government International Bond | 3.88 | 06/12/30 | 1,275,000 | 1,162,468 | ||||||||||
The accompanying notes are an integral part of these financial statements.
169
BONDBLOXX ETF TRUST
BondBloxx JP Morgan USD Emerging Markets 1-10 Year Bond ETF
Portfolio of Investments (Continued)
October 31, 2024
| Rate (%) | Maturity | Face Amount | Value | |||||||||||
| GOVERNMENT OBLIGATIONS – 83.9% (Continued) | ||||||||||||||
| Brazilian Government International Bond | 4.50 | 05/30/29 | $ | 950,000 | $ | 915,800 | ||||||||
| Brazilian Government International Bond | 4.63 | 01/13/28 | 1,000,000 | 992,285 | ||||||||||
| Brazilian Government International Bond | 6.00 | 04/07/26 | 950,000 | 963,252 | ||||||||||
| Brazilian Government International Bond | 6.00 | 10/20/33 | 900,000 | 894,150 | ||||||||||
| Brazilian Government International Bond | 6.13 | 01/22/32 | 600,000 | 605,100 | ||||||||||
| Brazilian Government International Bond | 6.13 | 03/15/34 | 825,000 | 819,233 | ||||||||||
| Brazilian Government International Bond | 6.25 | 03/18/31 | 775,000 | 790,663 | ||||||||||
| Brazilian Government International Bond | 8.25 | 01/20/34 | 575,000 | 665,131 | ||||||||||
| CBB International Sukuk Co. 7 SPC(1) | 6.88 | 10/05/25 | 675,000 | 684,703 | ||||||||||
| CBB International Sukuk Programme Co. W.L.L.(1) | 3.88 | 05/18/29 | 675,000 | 633,234 | ||||||||||
| CBB International Sukuk Programme Co. W.L.L.(1) | 3.95 | 09/16/27 | 600,000 | 576,563 | ||||||||||
| CBB International Sukuk Programme Co. W.L.L.(1) | 4.50 | 03/30/27 | 675,000 | 661,078 | ||||||||||
| CBB International Sukuk Programme Co. W.L.L.(1) | 6.00 | 02/12/31 | 550,000 | 564,609 | ||||||||||
| CBB International Sukuk Programme Co. W.L.L.(1) | 6.25 | 10/18/30 | 500,000 | 518,750 | ||||||||||
| Chile Government International Bond | 2.45 | 01/31/31 | 440,000 | 383,460 | ||||||||||
| Chile Government International Bond | 2.55 | 01/27/32 | 525,000 | 450,187 | ||||||||||
| Chile Government International Bond | 2.55 | 07/27/33 | 750,000 | 621,375 | ||||||||||
| Chile Government International Bond | 2.75 | 01/31/27 | 425,000 | 406,512 | ||||||||||
| Chile Government International Bond | 3.24 | 02/06/28 | 550,000 | 526,350 | ||||||||||
| Chile Government International Bond | 3.50 | 01/31/34 | 475,000 | 421,087 | ||||||||||
| Chile Government International Bond | 4.85 | 01/22/29 | 550,000 | 551,650 | ||||||||||
| China Government International Bond(1) | 0.55 | 10/21/25 | 500,000 | 481,793 | ||||||||||
| China Government International Bond(1) | 1.20 | 10/21/30 | 550,000 | 470,313 | ||||||||||
| China Government International Bond(1) | 1.25 | 10/26/26 | 500,000 | 473,318 | ||||||||||
| China Government International Bond(1) | 1.75 | 10/26/31 | 250,000 | 215,843 | ||||||||||
| China Government International Bond(1) | 2.13 | 12/03/29 | 625,000 | 572,675 | ||||||||||
| China Government International Bond(1) | 2.63 | 11/02/27 | 250,000 | 241,725 | ||||||||||
| China Government International Bond(1) | 3.50 | 10/19/28 | 200,000 | 196,185 | ||||||||||
| Colombia Government International Bond | 3.00 | 01/30/30 | 500,000 | 417,000 | ||||||||||
| Colombia Government International Bond | 3.13 | 04/15/31 | 1,085,000 | 866,372 | ||||||||||
| Colombia Government International Bond | 3.25 | 04/22/32 | 750,000 | 580,500 | ||||||||||
| Colombia Government International Bond | 3.88 | 04/25/27 | 825,000 | 791,175 | ||||||||||
| Colombia Government International Bond | 4.50 | 01/28/26 | 550,000 | 545,050 | ||||||||||
| Colombia Government International Bond | 4.50 | 03/15/29 | 950,000 | 883,500 | ||||||||||
| Colombia Government International Bond | 7.50 | 02/02/34 | 800,000 | 794,400 | ||||||||||
| Colombia Government International Bond | 8.00 | 04/20/33 | 800,000 | 823,600 | ||||||||||
| Costa Rica Government International Bond(1) | 6.13 | 02/19/31 | 756,000 | 771,120 | ||||||||||
| Costa Rica Government International Bond(1) | 6.55 | 04/03/34 | 1,000,000 | 1,041,563 | ||||||||||
| Dominican Republic International Bond(1) | 4.50 | 01/30/30 | 1,100,000 | 1,023,000 | ||||||||||
| Dominican Republic International Bond(1) | 4.88 | 09/23/32 | 1,650,000 | 1,509,750 | ||||||||||
| Dominican Republic International Bond(1) | 5.50 | 02/22/29 | 850,000 | 835,656 | ||||||||||
| Dominican Republic International Bond(1) | 5.95 | 01/25/27 | 875,000 | 878,063 | ||||||||||
| Dominican Republic International Bond(1) | 6.00 | 07/19/28 | 850,000 | 856,328 | ||||||||||
| Dominican Republic International Bond(1) | 6.00 | 02/22/33 | 975,000 | 961,350 | ||||||||||
| Dominican Republic International Bond(1) | 6.88 | 01/29/26 | 800,000 | 811,200 | ||||||||||
| Dominican Republic International Bond(1) | 7.05 | 02/03/31 | 700,000 | 731,707 | ||||||||||
| Ecuador Government International Bond(1) | ZCP | 07/31/30 | 800,000 | 439,000 | ||||||||||
| Ecuador Government International Bond(1)(3) | 5.50 | 07/31/35 | 4,950,000 | 2,752,200 | ||||||||||
The accompanying notes are an integral part of these financial statements.
170
BONDBLOXX ETF TRUST
BondBloxx JP Morgan USD Emerging Markets 1-10 Year Bond ETF
Portfolio of Investments (Continued)
October 31, 2024
| Rate (%) | Maturity | Face Amount | Value | |||||||||||
| GOVERNMENT OBLIGATIONS – 83.9% (Continued) | ||||||||||||||
| Ecuador Government International Bond(1)(3) | 6.90 | 07/31/30 | $ | 2,125,000 | $ | 1,469,438 | ||||||||
| Egypt Government International Bond(1) | 5.80 | 09/30/27 | 650,000 | 612,625 | ||||||||||
| Egypt Government International Bond(1) | 5.88 | 06/11/25 | 825,000 | 825,000 | ||||||||||
| Egypt Government International Bond(1) | 5.88 | 02/16/31 | 825,000 | 686,817 | ||||||||||
| Egypt Government International Bond(1) | 6.59 | 02/21/28 | 575,000 | 546,175 | ||||||||||
| Egypt Government International Bond(1) | 7.05 | 01/15/32 | 650,000 | 560,222 | ||||||||||
| Egypt Government International Bond(1) | 7.30 | 09/30/33 | 450,000 | 381,517 | ||||||||||
| Egypt Government International Bond(1) | 7.50 | 01/31/27 | 1,025,000 | 1,022,443 | ||||||||||
| Egypt Government International Bond(1) | 7.60 | 03/01/29 | 975,000 | 934,888 | ||||||||||
| Egypt Government International Bond(1) | 7.63 | 05/29/32 | 925,000 | 812,844 | ||||||||||
| Egyptian Financial Co. for Sovereign Taskeek(1) | 10.88 | 02/28/26 | 700,000 | 731,281 | ||||||||||
| El Salvador Government International Bond(1) | 9.25 | 04/17/30 | 575,000 | 572,125 | ||||||||||
| Ethiopia International Bond(1)(2) | 6.63 | 12/11/24 | 550,000 | 430,891 | ||||||||||
| Ghana Government International Bond(1)(3) | 5.00 | 07/03/29 | 1,892,850 | 1,630,217 | ||||||||||
| Ghana Government International Bond(1)(3) | 5.00 | 07/03/35 | 2,727,900 | 1,902,710 | ||||||||||
| Hazine Mustesarligi Varlik Kiralama AS(1) | 5.13 | 06/22/26 | 475,000 | 471,438 | ||||||||||
| Hazine Mustesarligi Varlik Kiralama AS(1) | 7.25 | 02/24/27 | 850,000 | 878,953 | ||||||||||
| Hazine Mustesarligi Varlik Kiralama AS(1) | 8.51 | 01/14/29 | 625,000 | 677,539 | ||||||||||
| Hazine Mustesarligi Varlik Kiralama AS(1) | 9.76 | 11/13/25 | 650,000 | 678,844 | ||||||||||
| Hungary Government International Bond(1) | 2.13 | 09/22/31 | 1,350,000 | 1,085,063 | ||||||||||
| Hungary Government International Bond(1) | 5.25 | 06/16/29 | 1,250,000 | 1,241,406 | ||||||||||
| Hungary Government International Bond(1) | 5.50 | 06/16/34 | 885,000 | 868,130 | ||||||||||
| Hungary Government International Bond(1) | 6.13 | 05/22/28 | 1,300,000 | 1,334,775 | ||||||||||
| Hungary Government International Bond(1) | 6.25 | 09/22/32 | 1,200,000 | 1,249,500 | ||||||||||
| Indonesia Government International Bond | 1.85 | 03/12/31 | 250,000 | 209,844 | ||||||||||
| Indonesia Government International Bond | 2.15 | 07/28/31 | 400,000 | 337,750 | ||||||||||
| Indonesia Government International Bond | 2.85 | 02/14/30 | 250,000 | 228,047 | ||||||||||
| Indonesia Government International Bond | 3.50 | 01/11/28 | 325,000 | 314,539 | ||||||||||
| Indonesia Government International Bond | 3.55 | 03/31/32 | 300,000 | 275,250 | ||||||||||
| Indonesia Government International Bond(1) | 3.85 | 07/18/27 | 200,000 | 197,125 | ||||||||||
| Indonesia Government International Bond | 3.85 | 10/15/30 | 475,000 | 452,289 | ||||||||||
| Indonesia Government International Bond | 4.10 | 04/24/28 | 200,000 | 197,062 | ||||||||||
| Indonesia Government International Bond(1) | 4.35 | 01/08/27 | 250,000 | 249,531 | ||||||||||
| Indonesia Government International Bond | 4.55 | 01/11/28 | 220,000 | 219,794 | ||||||||||
| Indonesia Government International Bond | 4.65 | 09/20/32 | 250,000 | 244,630 | ||||||||||
| Indonesia Government International Bond(1) | 4.75 | 01/08/26 | 500,000 | 501,938 | ||||||||||
| Indonesia Government International Bond | 4.75 | 02/11/29 | 225,000 | 225,511 | ||||||||||
| Indonesia Government International Bond | 4.75 | 09/10/34 | 225,000 | 220,710 | ||||||||||
| Indonesia Government International Bond | 4.85 | 01/11/33 | 200,000 | 197,750 | ||||||||||
| Iraq International Bond(1) | 5.80 | 01/15/28 | 382,813 | 369,773 | ||||||||||
| Ivory Coast Government International Bond(1) | 6.13 | 06/15/33 | 750,000 | 681,555 | ||||||||||
| Ivory Coast Government International Bond(1) | 7.63 | 01/30/33 | 725,000 | 721,455 | ||||||||||
| Jamaica Government International Bond | 6.75 | 04/28/28 | 755,000 | 784,822 | ||||||||||
| Jordan Government International Bond(1) | 5.75 | 01/31/27 | 800,000 | 787,000 | ||||||||||
| Jordan Government International Bond(1) | 5.85 | 07/07/30 | 700,000 | 663,908 | ||||||||||
| Jordan Government International Bond(1) | 6.13 | 01/29/26 | 600,000 | 598,688 | ||||||||||
| Jordan Government International Bond(1) | 7.50 | 01/13/29 | 825,000 | 838,406 | ||||||||||
| Kazakhstan Government International Bond(1) | 5.13 | 07/21/25 | 1,650,000 | 1,651,601 | ||||||||||
The accompanying notes are an integral part of these financial statements.
171
BONDBLOXX ETF TRUST
BondBloxx JP Morgan USD Emerging Markets 1-10 Year Bond ETF
Portfolio of Investments (Continued)
October 31, 2024
| Rate (%) | Maturity | Face Amount | Value | |||||||||||
| GOVERNMENT OBLIGATIONS – 83.9% (Continued) | ||||||||||||||
| KSA Sukuk Ltd.(1) | 2.25 | 05/17/31 | $ | 575,000 | $ | 491,266 | ||||||||
| KSA Sukuk Ltd.(1) | 2.97 | 10/29/29 | 375,000 | 346,055 | ||||||||||
| KSA Sukuk Ltd.(1) | 3.63 | 04/20/27 | 1,000,000 | 980,312 | ||||||||||
| KSA Sukuk Ltd.(1) | 4.27 | 05/22/29 | 600,000 | 591,375 | ||||||||||
| KSA Sukuk Ltd.(1) | 4.30 | 01/19/29 | 450,000 | 444,375 | ||||||||||
| KSA Sukuk Ltd.(1) | 4.51 | 05/22/33 | 400,000 | 388,625 | ||||||||||
| KSA Sukuk Ltd.(1) | 5.25 | 06/04/27 | 200,000 | 203,001 | ||||||||||
| KSA Sukuk Ltd.(1) | 5.25 | 06/04/30 | 200,000 | 203,313 | ||||||||||
| KSA Sukuk Ltd.(1) | 5.25 | 06/04/34 | 450,000 | 456,609 | ||||||||||
| KSA Sukuk Ltd.(1) | 5.27 | 10/25/28 | 525,000 | 537,797 | ||||||||||
| Kuwait International Government Bond(1) | 3.50 | 03/20/27 | 3,050,000 | 2,999,294 | ||||||||||
| Latvia Government International Bond(1) | 5.13 | 07/30/34 | 750,000 | 747,143 | ||||||||||
| Lebanon Government International Bond(1)(2) | 6.00 | 01/27/23 | 600,000 | 51,000 | ||||||||||
| Lebanon Government International Bond(1)(2) | 6.10 | 10/04/22 | 1,700,000 | 144,500 | ||||||||||
| Lebanon Government International Bond(1)(2) | 6.65 | 02/26/30 | 1,600,000 | 136,000 | ||||||||||
| Lebanon Government International Bond(1)(2) | 6.85 | 03/23/27 | 1,450,000 | 123,250 | ||||||||||
| Lebanon Government International Bond(1)(2) | 8.25 | 04/12/21 | 1,200,000 | 102,000 | ||||||||||
| Malaysia Sukuk Global Bhd(1) | 3.18 | 04/27/26 | 650,000 | 637,813 | ||||||||||
| Mexico Government International Bond | 2.66 | 05/24/31 | 625,000 | 520,508 | ||||||||||
| Mexico Government International Bond | 3.25 | 04/16/30 | 450,000 | 400,950 | ||||||||||
| Mexico Government International Bond | 3.50 | 02/12/34 | 500,000 | 407,969 | ||||||||||
| Mexico Government International Bond | 3.75 | 01/11/28 | 325,000 | 312,711 | ||||||||||
| Mexico Government International Bond | 4.13 | 01/21/26 | 325,000 | 323,070 | ||||||||||
| Mexico Government International Bond | 4.15 | 03/28/27 | 425,000 | 418,758 | ||||||||||
| Mexico Government International Bond | 4.50 | 04/22/29 | 650,000 | 629,687 | ||||||||||
| Mexico Government International Bond | 4.75 | 04/27/32 | 300,000 | 279,844 | ||||||||||
| Mexico Government International Bond | 4.88 | 05/19/33 | 475,000 | 437,950 | ||||||||||
| Mexico Government International Bond | 5.00 | 05/07/29 | 180,000 | 176,962 | ||||||||||
| Mexico Government International Bond | 5.40 | 02/09/28 | 150,000 | 150,891 | ||||||||||
| Mexico Government International Bond | 6.75 | 09/27/34 | 400,000 | 417,750 | ||||||||||
| Mexico Government International Bond | 8.30 | 08/15/31 | 300,000 | 353,906 | ||||||||||
| Morocco Government International Bond(1) | 3.00 | 12/15/32 | 600,000 | 497,063 | ||||||||||
| Morocco Government International Bond(1) | 5.95 | 03/08/28 | 730,000 | 741,680 | ||||||||||
| Morocco Government International Bond(1) | 6.50 | 09/08/33 | 900,000 | 947,813 | ||||||||||
| Nigeria Government International Bond(1) | 6.13 | 09/28/28 | 1,000,000 | 905,625 | ||||||||||
| Nigeria Government International Bond(1) | 6.50 | 11/28/27 | 1,050,000 | 994,219 | ||||||||||
| Nigeria Government International Bond(1) | 7.14 | 02/23/30 | 750,000 | 679,219 | ||||||||||
| Nigeria Government International Bond(1) | 7.38 | 09/28/33 | 1,000,000 | 847,805 | ||||||||||
| Nigeria Government International Bond(1) | 7.63 | 11/21/25 | 650,000 | 650,203 | ||||||||||
| Nigeria Government International Bond(1) | 7.88 | 02/16/32 | 1,125,000 | 1,014,258 | ||||||||||
| Nigeria Government International Bond(1) | 8.38 | 03/24/29 | 725,000 | 700,655 | ||||||||||
| Nigeria Government International Bond(1) | 8.75 | 01/21/31 | 600,000 | 575,352 | ||||||||||
| Oman Government International Bond(1) | 4.75 | 06/15/26 | 1,275,000 | 1,263,034 | ||||||||||
| Oman Government International Bond(1) | 5.38 | 03/08/27 | 925,000 | 928,180 | ||||||||||
| Oman Government International Bond(1) | 5.63 | 01/17/28 | 1,275,000 | 1,282,969 | ||||||||||
| Oman Government International Bond(1) | 6.00 | 08/01/29 | 925,000 | 948,111 | ||||||||||
| Oman Government International Bond(1) | 6.25 | 01/25/31 | 950,000 | 991,859 | ||||||||||
| Oman Government International Bond(1) | 6.75 | 10/28/27 | 825,000 | 859,547 | ||||||||||
The accompanying notes are an integral part of these financial statements.
172
BONDBLOXX ETF TRUST
BondBloxx JP Morgan USD Emerging Markets 1-10 Year Bond ETF
Portfolio of Investments (Continued)
October 31, 2024
| Rate (%) | Maturity | Face Amount | Value | |||||||||||
| GOVERNMENT OBLIGATIONS – 83.9% (Continued) | ||||||||||||||
| Oman Government International Bond(1) | 7.38 | 10/28/32 | $ | 650,000 | $ | 728,000 | ||||||||
| Oman Sovereign Sukuk Co.(1) | 4.88 | 06/15/30 | 1,000,000 | 1,007,813 | ||||||||||
| Oman Sovereign Sukuk Co.(1) | 5.93 | 10/31/25 | 650,000 | 656,906 | ||||||||||
| Pakistan Global Sukuk Programme Co. Ltd.(1) | 7.95 | 01/31/29 | 775,000 | 723,898 | ||||||||||
| Pakistan Government International Bond(1) | 6.00 | 04/08/26 | 775,000 | 729,469 | ||||||||||
| Pakistan Government International Bond(1) | 6.88 | 12/05/27 | 1,075,000 | 976,234 | ||||||||||
| Pakistan Government International Bond(1) | 7.38 | 04/08/31 | 825,000 | 700,219 | ||||||||||
| Panama Government International Bond | 2.25 | 09/29/32 | 1,000,000 | 734,750 | ||||||||||
| Panama Government International Bond | 3.16 | 01/23/30 | 725,000 | 625,352 | ||||||||||
| Panama Government International Bond | 3.30 | 01/19/33 | 450,000 | 355,387 | ||||||||||
| Panama Government International Bond | 3.88 | 03/17/28 | 500,000 | 470,500 | ||||||||||
| Panama Government International Bond | 7.50 | 03/01/31 | 425,000 | 447,525 | ||||||||||
| Paraguay Government International Bond(1) | 4.95 | 04/28/31 | 650,000 | 634,359 | ||||||||||
| Perusahaan Penerbit SBSN Indonesia III(1) | 1.50 | 06/09/26 | 250,000 | 238,509 | ||||||||||
| Perusahaan Penerbit SBSN Indonesia III(1) | 2.55 | 06/09/31 | 250,000 | 217,950 | ||||||||||
| Perusahaan Penerbit SBSN Indonesia III(1) | 2.80 | 06/23/30 | 200,000 | 180,032 | ||||||||||
| Perusahaan Penerbit SBSN Indonesia III(1) | 4.15 | 03/29/27 | 350,000 | 346,937 | ||||||||||
| Perusahaan Penerbit SBSN Indonesia III(1) | 4.40 | 06/06/27 | 550,000 | 549,656 | ||||||||||
| Perusahaan Penerbit SBSN Indonesia III(1) | 4.40 | 03/01/28 | 325,000 | 322,988 | ||||||||||
| Perusahaan Penerbit SBSN Indonesia III(1) | 4.45 | 02/20/29 | 400,000 | 396,310 | ||||||||||
| Perusahaan Penerbit SBSN Indonesia III(1) | 4.55 | 03/29/26 | 325,000 | 326,016 | ||||||||||
| Perusahaan Penerbit SBSN Indonesia III(1) | 4.70 | 06/06/32 | 500,000 | 494,215 | ||||||||||
| Perusahaan Penerbit SBSN Indonesia III(1) | 5.20 | 07/02/34 | 200,000 | 202,775 | ||||||||||
| Perusahaan Penerbit SBSN Indonesia III(1) | 5.40 | 11/15/28 | 200,000 | 205,170 | ||||||||||
| Perusahaan Penerbit SBSN Indonesia III(1) | 5.60 | 11/15/33 | 200,000 | 209,486 | ||||||||||
| Peruvian Government International Bond | 1.86 | 12/01/32 | 505,000 | 393,111 | ||||||||||
| Peruvian Government International Bond | 2.78 | 01/23/31 | 1,625,000 | 1,413,750 | ||||||||||
| Peruvian Government International Bond | 3.00 | 01/15/34 | 1,165,000 | 961,489 | ||||||||||
| Peruvian Government International Bond | 8.75 | 11/21/33 | 1,090,000 | 1,336,953 | ||||||||||
| Philippine Government International Bond | 1.65 | 06/10/31 | 450,000 | 370,406 | ||||||||||
| Philippine Government International Bond | 2.46 | 05/05/30 | 375,000 | 335,039 | ||||||||||
| Philippine Government International Bond | 3.00 | 02/01/28 | 850,000 | 807,766 | ||||||||||
| Philippine Government International Bond | 3.75 | 01/14/29 | 450,000 | 435,656 | ||||||||||
| Philippine Government International Bond | 5.00 | 07/17/33 | 530,000 | 532,153 | ||||||||||
| Philippine Government International Bond | 5.25 | 05/14/34 | 400,000 | 407,500 | ||||||||||
| Philippine Government International Bond | 5.50 | 03/30/26 | 375,000 | 380,409 | ||||||||||
| Philippine Government International Bond | 6.38 | 01/15/32 | 350,000 | 382,375 | ||||||||||
| Philippine Government International Bond | 6.38 | 10/23/34 | 725,000 | 802,258 | ||||||||||
| Philippine Government International Bond | 7.75 | 01/14/31 | 700,000 | 812,000 | ||||||||||
| Philippine Government International Bond | 9.50 | 02/02/30 | 850,000 | 1,034,875 | ||||||||||
| Qatar Government International Bond(1) | 3.25 | 06/02/26 | 1,150,000 | 1,129,516 | ||||||||||
| Qatar Government International Bond(1) | 3.75 | 04/16/30 | 1,000,000 | 967,188 | ||||||||||
| Qatar Government International Bond(1) | 4.00 | 03/14/29 | 1,450,000 | 1,428,703 | ||||||||||
| Qatar Government International Bond(1) | 4.50 | 04/23/28 | 850,000 | 853,719 | ||||||||||
| Qatar Government International Bond(1) | 4.63 | 05/29/29 | 400,000 | 404,875 | ||||||||||
| Qatar Government International Bond(1) | 4.75 | 05/29/34 | 400,000 | 406,250 | ||||||||||
| Qatar Government International Bond(1) | 9.75 | 06/15/30 | 475,000 | 603,547 | ||||||||||
| Republic of Azerbaijan International Bond(1) | 3.50 | 09/01/32 | 650,000 | 565,500 | ||||||||||
The accompanying notes are an integral part of these financial statements.
173
BONDBLOXX ETF TRUST
BondBloxx JP Morgan USD Emerging Markets 1-10 Year Bond ETF
Portfolio of Investments (Continued)
October 31, 2024
| Rate (%) | Maturity | Face Amount | Value | |||||||||||
| GOVERNMENT OBLIGATIONS – 83.9% (Continued) | ||||||||||||||
| Republic of Kenya Government International Bond(1) | 6.30 | 01/23/34 | $ | 700,000 | $ | 568,750 | ||||||||
| Republic of Kenya Government International Bond(1) | 7.25 | 02/28/28 | 600,000 | 575,784 | ||||||||||
| Republic of Kenya Government International Bond(1) | 8.00 | 05/22/32 | 700,000 | 645,750 | ||||||||||
| Republic of Kenya Government International Bond(1) | 9.75 | 02/16/31 | 1,025,000 | 1,034,292 | ||||||||||
| Republic of Poland Government International Bond | 3.25 | 04/06/26 | 920,000 | 904,470 | ||||||||||
| Republic of Poland Government International Bond | 4.63 | 03/18/29 | 865,000 | 867,279 | ||||||||||
| Republic of Poland Government International Bond | 4.88 | 10/04/33 | 1,435,000 | 1,415,556 | ||||||||||
| Republic of Poland Government International Bond | 5.13 | 09/18/34 | 1,725,000 | 1,709,104 | ||||||||||
| Republic of Poland Government International Bond | 5.50 | 11/16/27 | 865,000 | 892,282 | ||||||||||
| Republic of Poland Government International Bond | 5.75 | 11/16/32 | 875,000 | 914,305 | ||||||||||
| Republic of South Africa Government International Bond | 4.30 | 10/12/28 | 1,190,000 | 1,126,781 | ||||||||||
| Republic of South Africa Government International Bond | 4.85 | 09/27/27 | 650,000 | 637,406 | ||||||||||
| Republic of South Africa Government International Bond | 4.85 | 09/30/29 | 1,200,000 | 1,133,250 | ||||||||||
| Republic of South Africa Government International Bond | 4.88 | 04/14/26 | 800,000 | 792,500 | ||||||||||
| Republic of South Africa Government International Bond | 5.88 | 09/16/25 | 1,045,000 | 1,047,482 | ||||||||||
| Republic of South Africa Government International Bond | 5.88 | 06/22/30 | 825,000 | 806,437 | ||||||||||
| Republic of South Africa Government International Bond | 5.88 | 04/20/32 | 725,000 | 694,187 | ||||||||||
| Romanian Government International Bond(1) | 3.00 | 02/27/27 | 900,000 | 857,250 | ||||||||||
| Romanian Government International Bond(1) | 3.00 | 02/14/31 | 830,000 | 704,463 | ||||||||||
| Romanian Government International Bond(1) | 3.63 | 03/27/32 | 710,000 | 611,266 | ||||||||||
| Romanian Government International Bond(1) | 5.25 | 11/25/27 | 630,000 | 627,638 | ||||||||||
| Romanian Government International Bond(1) | 5.88 | 01/30/29 | 1,300,000 | 1,309,344 | ||||||||||
| Romanian Government International Bond(1) | 6.00 | 05/25/34 | 750,000 | 733,050 | ||||||||||
| Romanian Government International Bond(1) | 6.38 | 01/30/34 | 1,200,000 | 1,200,750 | ||||||||||
| Romanian Government International Bond(1) | 6.63 | 02/17/28 | 1,050,000 | 1,084,781 | ||||||||||
| Romanian Government International Bond(1) | 7.13 | 01/17/33 | 1,060,000 | 1,123,931 | ||||||||||
| ROP Sukuk Trust(1) | 5.05 | 06/06/29 | 450,000 | 456,750 | ||||||||||
| Saudi Government International Bond(1) | 2.25 | 02/02/33 | 650,000 | 527,313 | ||||||||||
| Saudi Government International Bond(1) | 2.50 | 02/03/27 | 275,000 | 262,969 | ||||||||||
| Saudi Government International Bond(1) | 2.75 | 02/03/32 | 225,000 | 196,102 | ||||||||||
| Saudi Government International Bond(1) | 2.90 | 10/22/25 | 350,000 | 343,649 | ||||||||||
| Saudi Government International Bond(1) | 3.25 | 10/26/26 | 1,050,000 | 1,024,406 | ||||||||||
| Saudi Government International Bond(1) | 3.25 | 10/22/30 | 300,000 | 275,813 | ||||||||||
| Saudi Government International Bond(1) | 3.63 | 03/04/28 | 1,275,000 | 1,235,953 | ||||||||||
| Saudi Government International Bond(1) | 4.38 | 04/16/29 | 850,000 | 840,437 | ||||||||||
| Saudi Government International Bond(1) | 4.50 | 04/17/30 | 500,000 | 492,969 | ||||||||||
| Saudi Government International Bond(1) | 4.75 | 01/18/28 | 475,000 | 478,414 | ||||||||||
| Saudi Government International Bond(1) | 4.75 | 01/16/30 | 700,000 | 697,156 | ||||||||||
| Saudi Government International Bond(1) | 4.88 | 07/18/33 | 675,000 | 669,727 | ||||||||||
| Saudi Government International Bond(1) | 5.00 | 01/16/34 | 775,000 | 771,609 | ||||||||||
| Saudi Government International Bond(1) | 5.50 | 10/25/32 | 500,000 | 517,344 | ||||||||||
| Senegal Government International Bond(1) | 6.25 | 05/23/33 | 625,000 | 517,797 | ||||||||||
| Serbia International Bond(1) | 2.13 | 12/01/30 | 900,000 | 747,000 | ||||||||||
| Serbia International Bond(1) | 6.00 | 06/12/34 | 1,000,000 | 1,003,125 | ||||||||||
| Serbia International Bond(1) | 6.50 | 09/26/33 | 550,000 | 575,781 | ||||||||||
| Sharjah Sukuk Program Ltd.(1) | 2.94 | 06/10/27 | 225,000 | 212,840 | ||||||||||
| Sharjah Sukuk Program Ltd.(1) | 3.23 | 10/23/29 | 200,000 | 182,695 | ||||||||||
| Sharjah Sukuk Program Ltd.(1) | 3.85 | 04/03/26 | 200,000 | 196,602 | ||||||||||
The accompanying notes are an integral part of these financial statements.
174
BONDBLOXX ETF TRUST
BondBloxx JP Morgan USD Emerging Markets 1-10 Year Bond ETF
Portfolio of Investments (Continued)
October 31, 2024
| Rate (%) | Maturity | Face Amount | Value | |||||||||||
| GOVERNMENT OBLIGATIONS – 83.9% (Continued) | ||||||||||||||
| Sharjah Sukuk Program Ltd.(1) | 4.23 | 03/14/28 | $ | 450,000 | $ | 438,192 | ||||||||
| Sri Lanka Government International Bond(1)(2) | 5.75 | 04/18/23 | 825,000 | 507,375 | ||||||||||
| Sri Lanka Government International Bond(1)(2) | 6.20 | 05/11/27 | 1,000,000 | 626,250 | ||||||||||
| Sri Lanka Government International Bond(1)(2) | 6.75 | 04/18/28 | 825,000 | 522,844 | ||||||||||
| Sri Lanka Government International Bond(1)(2) | 6.83 | 07/18/26 | 700,000 | 439,691 | ||||||||||
| Sri Lanka Government International Bond(1)(2) | 6.85 | 03/14/24 | 600,000 | 369,000 | ||||||||||
| Sri Lanka Government International Bond(1)(2) | 6.85 | 11/03/25 | 1,000,000 | 635,000 | ||||||||||
| Sri Lanka Government International Bond(1)(2) | 7.55 | 03/28/30 | 1,375,000 | 862,812 | ||||||||||
| Sri Lanka Government International Bond(1)(2) | 7.85 | 03/14/29 | 450,000 | 283,923 | ||||||||||
| Trinidad & Tobago Government International Bond(1) | 4.50 | 08/04/26 | 600,000 | 587,100 | ||||||||||
| Turkiye Government International Bond | 4.25 | 04/14/26 | 325,000 | 321,344 | ||||||||||
| Turkiye Government International Bond | 4.75 | 01/26/26 | 450,000 | 449,297 | ||||||||||
| Turkiye Government International Bond | 4.88 | 10/09/26 | 750,000 | 744,844 | ||||||||||
| Turkiye Government International Bond | 5.13 | 02/17/28 | 440,000 | 430,787 | ||||||||||
| Turkiye Government International Bond | 5.25 | 03/13/30 | 825,000 | 778,800 | ||||||||||
| Turkiye Government International Bond | 5.88 | 06/26/31 | 300,000 | 284,812 | ||||||||||
| Turkiye Government International Bond | 5.95 | 01/15/31 | 600,000 | 573,000 | ||||||||||
| Turkiye Government International Bond | 6.00 | 03/25/27 | 850,000 | 861,422 | ||||||||||
| Turkiye Government International Bond | 6.13 | 10/24/28 | 650,000 | 653,859 | ||||||||||
| Turkiye Government International Bond | 6.38 | 10/14/25 | 500,000 | 507,312 | ||||||||||
| Turkiye Government International Bond | 6.50 | 09/20/33 | 500,000 | 482,500 | ||||||||||
| Turkiye Government International Bond | 7.13 | 07/17/32 | 500,000 | 502,030 | ||||||||||
| Turkiye Government International Bond | 7.63 | 04/26/29 | 625,000 | 655,078 | ||||||||||
| Turkiye Government International Bond | 7.63 | 05/15/34 | 650,000 | 671,734 | ||||||||||
| Turkiye Government International Bond | 8.00 | 02/14/34 | 315,000 | 339,609 | ||||||||||
| Turkiye Government International Bond | 8.60 | 09/24/27 | 425,000 | 459,000 | ||||||||||
| Turkiye Government International Bond | 9.13 | 07/13/30 | 600,000 | 670,875 | ||||||||||
| Turkiye Government International Bond | 9.38 | 03/14/29 | 450,000 | 502,312 | ||||||||||
| Turkiye Government International Bond | 9.38 | 01/19/33 | 600,000 | 686,625 | ||||||||||
| Turkiye Government International Bond | 9.88 | 01/15/28 | 725,000 | 810,867 | ||||||||||
| Turkiye Government International Bond | 11.88 | 01/15/30 | 325,000 | 412,242 | ||||||||||
| UAE Government International Bond(1) | 2.00 | 10/19/31 | 225,000 | 191,039 | ||||||||||
| UAE Government International Bond(1) | 4.05 | 07/07/32 | 450,000 | 433,688 | ||||||||||
| UAE Government International Bond(1) | 4.86 | 07/02/34 | 200,000 | 202,000 | ||||||||||
| UAE Government International Bond(1) | 4.92 | 09/25/33 | 400,000 | 405,625 | ||||||||||
| Ukraine Government International Bond(1)(3) | ZCP | 02/01/34 | 1,270,663 | 470,463 | ||||||||||
| Ukraine Government International Bond(1)(3) | 1.75 | 02/01/29 | 748,432 | 450,743 | ||||||||||
| Ukraine Government International Bond(1)(3) | 1.75 | 02/01/34 | 2,077,647 | 981,169 | ||||||||||
| Uruguay Government International Bond | 4.38 | 10/27/27 | 925,000 | 922,977 | ||||||||||
| Uruguay Government International Bond | 4.38 | 01/23/31 | 1,420,000 | 1,400,031 | ||||||||||
| Uruguay Government International Bond | 5.75 | 10/28/34 | 1,400,000 | 1,478,312 | ||||||||||
| Venezuela Government International Bond(1)(2) | 6.00 | 12/09/20 | 360,000 | 43,380 | ||||||||||
| Venezuela Government International Bond(1)(2) | 7.65 | 04/21/25 | 390,000 | 53,625 | ||||||||||
| Venezuela Government International Bond(1)(2) | 7.75 | 10/13/19 | 750,000 | 95,250 | ||||||||||
| Venezuela Government International Bond(1)(2) | 8.25 | 10/13/24 | 800,000 | 110,000 | ||||||||||
| Venezuela Government International Bond(1)(2) | 9.00 | 05/07/23 | 680,000 | 93,160 | ||||||||||
| Venezuela Government International Bond(2) | 9.25 | 09/15/27 | 1,115,000 | 175,612 | ||||||||||
| Venezuela Government International Bond(1)(2) | 9.25 | 05/07/28 | 635,000 | 95,250 | ||||||||||
| Venezuela Government International Bond(2) | 9.38 | 01/13/34 | 365,000 | 60,407 | ||||||||||
The accompanying notes are an integral part of these financial statements.
175
BONDBLOXX ETF TRUST
BondBloxx JP Morgan USD Emerging Markets 1-10 Year Bond ETF
Portfolio of Investments (Continued)
October 31, 2024
| Rate (%) | Maturity | Face Amount | Value | |||||||||||
| GOVERNMENT OBLIGATIONS – 83.9% (Continued) | ||||||||||||||
| Venezuela Government International Bond(1)(2) | 11.75 | 10/21/26 | $ | 1,125,000 | $ | 180,000 | ||||||||
| Venezuela Government International Bond(1)(2) | 11.95 | 08/05/31 | 1,465,000 | 234,400 | ||||||||||
| Venezuela Government International Bond(1)(2) | 12.75 | 08/23/22 | 900,000 | 144,450 | ||||||||||
| Zambia Government International Bond(1)(3) | 5.75 | 06/30/33 | 809,516 | 711,401 | ||||||||||
| 213,674,910 | ||||||||||||||
| TOTAL GOVERNMENT AGENCIES AND OBLIGATIONS (Cost - $211,620,440) | 222,234,443 | |||||||||||||
| SHORT-TERM INVESTMENTS – 0.4% | ||||||||||||||
| TIME DEPOSITS – 0.4% | ||||||||||||||
| Citibank, London | 2.09 | 11/01/24 | EUR | 1,004 | 1,090 | |||||||||
| Royal Bank of Canada, Toronto | 4.18 | 11/01/24 | 974,471 | 974,471 | ||||||||||
| TOTAL SHORT-TERM INVESTMENTS (Cost - $975,561) | 975,561 | |||||||||||||
| TOTAL INVESTMENTS – 98.6% (Cost - $240,409,213) | $ | 251,239,222 | ||||||||||||
| OTHER ASSETS LESS LIABILITIES – 1.4% | 3,617,108 | |||||||||||||
| NET ASSETS – 100.0% | $ | 254,856,330 | ||||||||||||
| ZCP | Indicates a zero coupon rate. |
| EUR | Euro. |
| (1) | Security was purchased pursuant to Regulation S under the Securities Act of 1933 and may not be resold subject to that Regulation except to qualified institutional buyers. The aggregate value of Regulation S holdings at October 31, 2024, amounts to $166,456,386 and represents 65.3% of net assets. These securities have been deemed liquid under procedures approved by the Trust’s Board of Trustees. |
| (2) | Defaulted security. Security has not paid its last interest payment and/or interest is not being accrued. |
| (3) | Includes step-up bonds that pay an initial coupon rate for the first period and then a higher coupon rate for the following periods. The rate reported is the rate in effect as of October 31, 2024. |
The accompanying notes are an integral part of these financial statements.
176
BONDBLOXX ETF TRUST
BondBloxx JP Morgan USD Emerging Markets 1-10 Year Bond ETF
Portfolio of Investments (Continued)
October 31, 2024
COUNTRY DIVERSIFICATION
BondBloxx JP Morgan USD Emerging Markets 1-10 Year Bond ETF invested, as a percentage of net assets, in the following countries as of October 31, 2024:
| Country | Percent of Net Assets | |||
| Angola | 1.3 | % | ||
| Argentina | 4.0 | % | ||
| Azerbaijan | 0.8 | % | ||
| Bahrain | 3.7 | % | ||
| Bolivia | 0.2 | % | ||
| Brazil | 3.5 | % | ||
| Chile | 1.9 | % | ||
| China | 2.8 | % | ||
| Colombia | 2.2 | % | ||
| Costa Rica | 0.7 | % | ||
| Dominican Republic | 3.0 | % | ||
| Ecuador | 1.8 | % | ||
| Egypt | 2.8 | % | ||
| El Salvador | 0.2 | % | ||
| Ethiopia | 0.2 | % | ||
| Ghana | 1.4 | % | ||
| Hong Kong | 0.2 | % | ||
| Hungary | 2.9 | % | ||
| India | 1.2 | % | ||
| Indonesia | 3.4 | % | ||
| Iraq | 0.1 | % | ||
| Ivory Coast | 0.6 | % | ||
| Jamaica | 0.3 | % | ||
| Jordan | 1.1 | % | ||
| Kazakhstan | 0.6 | % | ||
| Kenya | 1.1 | % | ||
| Kuwait | 1.2 | % | ||
| Latvia | 0.3 | % | ||
| Lebanon | 0.2 | % | ||
| Country | Percent of Net Assets | |||
| Malaysia | 1.1 | % | ||
| Mexico | 4.1 | % | ||
| Morocco | 0.9 | % | ||
| Nigeria | 2.5 | % | ||
| Oman | 3.7 | % | ||
| Pakistan | 1.2 | % | ||
| Panama | 1.2 | % | ||
| Paraguay | 0.2 | % | ||
| Peru | 1.8 | % | ||
| Philippines | 2.7 | % | ||
| Poland | 3.7 | % | ||
| Qatar | 2.9 | % | ||
| Romania | 3.2 | % | ||
| Saudi Arabia | 6.3 | % | ||
| Senegal | 0.2 | % | ||
| Serbia | 0.9 | % | ||
| South Africa | 2.9 | % | ||
| Sri Lanka | 1.7 | % | ||
| Trinidad And Tobago | 0.2 | % | ||
| Turkey | 5.7 | % | ||
| Ukraine | 0.7 | % | ||
| United Arab Emirates | 4.0 | % | ||
| Uruguay | 1.5 | % | ||
| Venezuela | 0.9 | % | ||
| Zambia | 0.3 | % | ||
| Other* | 1.8 | % | ||
| 100.0 | % | |||
| * | Includes cash and any non-equity securities and net other assets (liabilities). |
The accompanying notes are an integral part of these financial statements.
177
BONDBLOXX ETF TRUST
BondBloxx Bloomberg Six Month Target Duration US Treasury ETF
Portfolio of Investments
October 31, 2024
| Rate (%) | Maturity | Face Amount | Value | |||||||||||
| SHORT-TERM INVESTMENTS – 105.6% | ||||||||||||||
| GOVERNMENT OBLIGATIONS – 99.4% | ||||||||||||||
| U.S. Treasury Bill | ZCP | 11/07/24 | $ | 11,291,200 | $ | 11,282,443 | ||||||||
| U.S. Treasury Bill | ZCP | 11/14/24 | 13,545,200 | 13,522,554 | ||||||||||
| U.S. Treasury Bill | ZCP | 11/19/24 | 11,578,000 | 11,551,214 | ||||||||||
| U.S. Treasury Bill | ZCP | 11/21/24 | 15,423,200 | 15,383,763 | ||||||||||
| U.S. Treasury Bill | ZCP | 11/26/24 | 6,054,400 | 6,035,081 | ||||||||||
| U.S. Treasury Bill | ZCP | 11/29/24 | 31,838,800 | 31,725,051 | ||||||||||
| U.S. Treasury Bill | ZCP | 12/05/24 | 11,041,400 | 10,993,459 | ||||||||||
| U.S. Treasury Bill | ZCP | 12/12/24 | 9,061,200 | 9,013,933 | ||||||||||
| U.S. Treasury Bill | ZCP | 12/26/24 | 50,479,500 | 50,127,684 | ||||||||||
| U.S. Treasury Bill | ZCP | 01/02/25 | 16,170,000 | 16,044,463 | ||||||||||
| U.S. Treasury Bill | ZCP | 01/14/25 | 7,418,900 | 7,351,143 | ||||||||||
| U.S. Treasury Bill | ZCP | 01/23/25 | 50,813,700 | 50,294,431 | ||||||||||
| U.S. Treasury Bill | ZCP | 01/30/25 | 7,188,000 | 7,108,323 | ||||||||||
| U.S. Treasury Bill | ZCP | 02/11/25 | 8,000,000 | 7,899,589 | ||||||||||
| U.S. Treasury Bill | ZCP | 02/20/25 | 40,317,900 | 39,768,207 | ||||||||||
| U.S. Treasury Bill | ZCP | 03/20/25 | 41,464,500 | 40,765,375 | ||||||||||
| U.S. Treasury Bill | ZCP | 04/03/25 | 7,627,100 | 7,485,944 | ||||||||||
| U.S. Treasury Bill | ZCP | 04/17/25 | 64,796,500 | 63,498,410 | ||||||||||
| U.S. Treasury Bill | ZCP | 05/15/25 | 83,507,500 | 81,603,435 | ||||||||||
| U.S. Treasury Bill | ZCP | 06/12/25 | 84,420,400 | 82,245,872 | ||||||||||
| U.S. Treasury Bill | ZCP | 07/10/25 | 84,410,000 | 81,975,134 | ||||||||||
| U.S. Treasury Bill | ZCP | 08/07/25 | 84,427,200 | 81,721,174 | ||||||||||
| U.S. Treasury Bill | ZCP | 09/04/25 | 83,307,000 | 80,367,156 | ||||||||||
| U.S. Treasury Bill | ZCP | 10/02/25 | 45,000,000 | 43,290,621 | ||||||||||
| U.S. Treasury Bill | ZCP | 10/30/25 | 46,000,000 | 44,108,554 | ||||||||||
| TOTAL GOVERNMENT OBLIGATIONS (Cost - $894,453,969) | 895,163,013 | |||||||||||||
| TIME DEPOSITS – 6.2% | ||||||||||||||
| Sumitomo Mitsui Trust Bank, London | 4.18 | 11/01/24 | 55,418,634 | 55,418,634 | ||||||||||
| TOTAL TIME DEPOSITS (Cost - $55,418,634) | 55,418,634 | |||||||||||||
| TOTAL SHORT-TERM INVESTMENTS (Cost - $949,872,603) | 950,581,647 | |||||||||||||
| TOTAL INVESTMENTS – 105.6% (Cost - $949,872,603) | $ | 950,581,647 | ||||||||||||
| OTHER ASSETS LESS LIABILITIES – (5.6)% | (50,638,847 | ) | ||||||||||||
| NET ASSETS – 100.0% | $ | 899,942,800 | ||||||||||||
| ZCP | Indicates a zero coupon rate. |
The accompanying notes are an integral part of these financial statements.
178
BONDBLOXX ETF TRUST
BondBloxx Bloomberg One Year Target Duration US Treasury ETF
Portfolio of Investments
October 31, 2024
| Rate (%) | Maturity | Face Amount | Value | |||||||||||
| GOVERNMENT OBLIGATIONS – 98.8% | ||||||||||||||
| U.S. Treasury Bond | 6.88 | 08/15/25 | $ | 786,200 | $ | 804,212 | ||||||||
| U.S. Treasury Note | 0.25 | 05/31/25 | 11,429,200 | 11,157,533 | ||||||||||
| U.S. Treasury Note | 0.25 | 06/30/25 | 11,198,400 | 10,899,411 | ||||||||||
| U.S. Treasury Note | 0.25 | 07/31/25 | 12,047,500 | 11,685,369 | ||||||||||
| U.S. Treasury Note | 0.25 | 08/31/25 | 12,611,800 | 12,189,108 | ||||||||||
| U.S. Treasury Note | 0.25 | 09/30/25 | 13,447,800 | 12,959,004 | ||||||||||
| U.S. Treasury Note | 0.25 | 10/31/25 | 12,070,500 | 11,595,224 | ||||||||||
| U.S. Treasury Note | 0.38 | 04/30/25 | 181,300 | 177,713 | ||||||||||
| U.S. Treasury Note | 0.38 | 11/30/25 | 11,548,200 | 11,072,288 | ||||||||||
| U.S. Treasury Note | 0.38 | 12/31/25 | 10,849,300 | 10,372,736 | ||||||||||
| U.S. Treasury Note | 0.38 | 01/31/26 | 11,478,900 | 10,943,293 | ||||||||||
| U.S. Treasury Note | 0.50 | 02/28/26 | 11,197,600 | 10,658,497 | ||||||||||
| U.S. Treasury Note | 0.75 | 03/31/26 | 11,183,000 | 10,653,773 | ||||||||||
| U.S. Treasury Note | 0.75 | 04/30/26 | 9,000,000 | 8,551,231 | ||||||||||
| U.S. Treasury Note | 1.63 | 02/15/26 | 10,391,500 | 10,053,979 | ||||||||||
| U.S. Treasury Note | 1.63 | 05/15/26 | 9,500,000 | 9,138,740 | ||||||||||
| U.S. Treasury Note | 2.00 | 08/15/25 | 14,484,300 | 14,218,660 | ||||||||||
| U.S. Treasury Note | 2.13 | 05/15/25 | 14,083,100 | 13,911,462 | ||||||||||
| U.S. Treasury Note | 2.25 | 11/15/25 | 12,960,300 | 12,689,197 | ||||||||||
| U.S. Treasury Note | 2.25 | 03/31/26 | 5,350,400 | 5,207,026 | ||||||||||
| U.S. Treasury Note | 2.38 | 04/30/26 | 3,000,000 | 2,921,426 | ||||||||||
| U.S. Treasury Note | 2.50 | 02/28/26 | 5,598,800 | 5,475,451 | ||||||||||
| U.S. Treasury Note | 2.63 | 12/31/25 | 4,862,800 | 4,772,667 | ||||||||||
| U.S. Treasury Note | 2.63 | 01/31/26 | 3,589,900 | 3,519,785 | ||||||||||
| U.S. Treasury Note | 2.75 | 05/15/25 | 12,361,600 | 12,251,263 | ||||||||||
| U.S. Treasury Note | 2.75 | 06/30/25 | 4,401,400 | 4,356,956 | ||||||||||
| U.S. Treasury Note | 2.75 | 08/31/25 | 5,180,000 | 5,111,203 | ||||||||||
| U.S. Treasury Note | 2.88 | 04/30/25 | 397,700 | 394,678 | ||||||||||
| U.S. Treasury Note | 2.88 | 05/31/25 | 5,698,500 | 5,648,527 | ||||||||||
| U.S. Treasury Note | 2.88 | 06/15/25 | 11,352,100 | 11,250,109 | ||||||||||
| U.S. Treasury Note | 2.88 | 07/31/25 | 4,426,400 | 4,378,764 | ||||||||||
| U.S. Treasury Note | 2.88 | 11/30/25 | 5,219,700 | 5,140,997 | ||||||||||
| U.S. Treasury Note | 3.00 | 07/15/25 | 11,537,200 | 11,435,348 | ||||||||||
| U.S. Treasury Note | 3.00 | 09/30/25 | 4,872,700 | 4,815,217 | ||||||||||
| U.S. Treasury Note | 3.00 | 10/31/25 | 4,301,400 | 4,246,960 | ||||||||||
| U.S. Treasury Note | 3.13 | 08/15/25 | 11,451,300 | 11,340,589 | ||||||||||
| U.S. Treasury Note | 3.50 | 09/15/25 | 9,650,000 | 9,582,337 | ||||||||||
| U.S. Treasury Note | 3.63 | 05/15/26 | 7,500,000 | 7,434,961 | ||||||||||
| U.S. Treasury Note | 3.75 | 04/15/26 | 7,773,700 | 7,723,748 | ||||||||||
| U.S. Treasury Note | 3.88 | 01/15/26 | 8,174,400 | 8,138,956 | ||||||||||
| U.S. Treasury Note | 4.00 | 12/15/25 | 8,828,600 | 8,801,011 | ||||||||||
| U.S. Treasury Note | 4.00 | 02/15/26 | 7,985,300 | 7,962,062 | ||||||||||
| U.S. Treasury Note | 4.25 | 05/31/25 | 11,555,500 | 11,542,861 | ||||||||||
| U.S. Treasury Note | 4.25 | 10/15/25 | 7,904,000 | 7,900,758 | ||||||||||
| U.S. Treasury Note | 4.25 | 12/31/25 | 11,099,400 | 11,093,764 | ||||||||||
| U.S. Treasury Note | 4.25 | 01/31/26 | 13,517,100 | 13,515,780 | ||||||||||
| U.S. Treasury Note | 4.50 | 11/15/25 | 7,855,500 | 7,870,076 | ||||||||||
The accompanying notes are an integral part of these financial statements.
179
BONDBLOXX ETF TRUST
BondBloxx Bloomberg One Year Target Duration US Treasury ETF
Portfolio of Investments (Continued)
October 31, 2024
| Rate (%) | Maturity | Face Amount | Value | |||||||||||
| GOVERNMENT OBLIGATIONS – 98.8% (Continued) | ||||||||||||||
| U.S. Treasury Note | 4.50 | 03/31/26 | $ | 13,194,100 | $ | 13,241,001 | ||||||||
| U.S. Treasury Note | 4.63 | 06/30/25 | 11,031,600 | 11,048,406 | ||||||||||
| U.S. Treasury Note | 4.63 | 02/28/26 | 13,061,400 | 13,120,840 | ||||||||||
| U.S. Treasury Note | 4.63 | 03/15/26 | 8,002,900 | 8,044,009 | ||||||||||
| U.S. Treasury Note | 4.75 | 07/31/25 | 10,539,700 | 10,567,490 | ||||||||||
| U.S. Treasury Note | 4.88 | 11/30/25 | 10,248,000 | 10,307,246 | ||||||||||
| U.S. Treasury Note | 4.88 | 04/30/26 | 13,224,700 | 13,349,715 | ||||||||||
| U.S. Treasury Note | 4.88 | 05/31/26 | 12,600,000 | 12,725,508 | ||||||||||
| U.S. Treasury Note | 5.00 | 08/31/25 | 12,733,600 | 12,794,035 | ||||||||||
| U.S. Treasury Note | 5.00 | 09/30/25 | 13,033,600 | 13,106,405 | ||||||||||
| U.S. Treasury Note | 5.00 | 10/31/25 | 11,111,000 | 11,183,916 | ||||||||||
| TOTAL GOVERNMENT OBLIGATIONS (Cost - $526,340,514) | 527,053,281 | |||||||||||||
| SHORT-TERM INVESTMENTS – 0.3% | ||||||||||||||
| TIME DEPOSITS – 0.3% | ||||||||||||||
| Citibank, New York | 4.18 | 11/01/24 | 1,526,693 | 1,526,693 | ||||||||||
| TOTAL SHORT-TERM INVESTMENTS (Cost - $1,526,693) | 1,526,693 | |||||||||||||
| TOTAL INVESTMENTS – 99.1% (Cost - $527,867,207) | $ | 528,579,974 | ||||||||||||
| OTHER ASSETS LESS LIABILITIES – 0.9% | 4,664,712 | |||||||||||||
| NET ASSETS – 100.0% | $ | 533,244,686 | ||||||||||||
The accompanying notes are an integral part of these financial statements.
180
BONDBLOXX ETF TRUST
BondBloxx Bloomberg Two Year Target Duration US Treasury ETF
Portfolio of Investments
October 31, 2024
| Rate (%) | Maturity | Face Amount | Value | |||||||||||
| GOVERNMENT OBLIGATIONS – 98.9% | ||||||||||||||
| U.S. Treasury Bond | 6.50 | 11/15/26 | $ | 153,000 | $ | 160,853 | ||||||||
| U.S. Treasury Bond | 6.63 | 02/15/27 | 126,400 | 133,826 | ||||||||||
| U.S. Treasury Note | 0.38 | 11/30/25 | 1,714,100 | 1,643,460 | ||||||||||
| U.S. Treasury Note | 0.38 | 12/31/25 | 1,572,000 | 1,502,949 | ||||||||||
| U.S. Treasury Note | 0.38 | 01/31/26 | 2,169,200 | 2,067,985 | ||||||||||
| U.S. Treasury Note | 0.38 | 07/31/27 | 1,800,900 | 1,626,789 | ||||||||||
| U.S. Treasury Note | 0.38 | 09/30/27 | 1,913,400 | 1,717,800 | ||||||||||
| U.S. Treasury Note | 0.50 | 02/28/26 | 1,950,200 | 1,856,308 | ||||||||||
| U.S. Treasury Note | 0.50 | 04/30/27 | 1,344,400 | 1,229,653 | ||||||||||
| U.S. Treasury Note | 0.50 | 05/31/27 | 1,373,300 | 1,252,171 | ||||||||||
| U.S. Treasury Note | 0.50 | 06/30/27 | 1,645,600 | 1,496,210 | ||||||||||
| U.S. Treasury Note | 0.50 | 08/31/27 | 1,617,300 | 1,462,014 | ||||||||||
| U.S. Treasury Note | 0.50 | 10/31/27 | 1,913,500 | 1,719,310 | ||||||||||
| U.S. Treasury Note | 0.63 | 07/31/26 | 2,187,900 | 2,057,908 | ||||||||||
| U.S. Treasury Note | 0.63 | 03/31/27 | 1,034,200 | 951,908 | ||||||||||
| U.S. Treasury Note | 0.63 | 11/30/27 | 2,150,000 | 1,933,404 | ||||||||||
| U.S. Treasury Note | 0.75 | 03/31/26 | 1,670,700 | 1,591,635 | ||||||||||
| U.S. Treasury Note | 0.75 | 04/30/26 | 2,529,500 | 2,403,371 | ||||||||||
| U.S. Treasury Note | 0.75 | 05/31/26 | 1,925,200 | 1,824,240 | ||||||||||
| U.S. Treasury Note | 0.75 | 08/31/26 | 2,504,300 | 2,354,727 | ||||||||||
| U.S. Treasury Note | 0.88 | 06/30/26 | 2,414,200 | 2,286,559 | ||||||||||
| U.S. Treasury Note | 0.88 | 09/30/26 | 2,356,400 | 2,215,384 | ||||||||||
| U.S. Treasury Note | 1.13 | 10/31/26 | 2,276,600 | 2,145,562 | ||||||||||
| U.S. Treasury Note | 1.13 | 02/28/27 | 665,200 | 621,260 | ||||||||||
| U.S. Treasury Note | 1.25 | 11/30/26 | 2,655,000 | 2,502,960 | ||||||||||
| U.S. Treasury Note | 1.25 | 12/31/26 | 2,254,100 | 2,121,143 | ||||||||||
| U.S. Treasury Note | 1.38 | 08/31/26 | 1,099,800 | 1,046,206 | ||||||||||
| U.S. Treasury Note | 1.50 | 08/15/26 | 2,227,200 | 2,125,888 | ||||||||||
| U.S. Treasury Note | 1.50 | 01/31/27 | 3,141,600 | 2,965,376 | ||||||||||
| U.S. Treasury Note | 1.63 | 02/15/26 | 2,322,400 | 2,246,967 | ||||||||||
| U.S. Treasury Note | 1.63 | 05/15/26 | 2,315,000 | 2,226,967 | ||||||||||
| U.S. Treasury Note | 1.63 | 09/30/26 | 468,600 | 447,138 | ||||||||||
| U.S. Treasury Note | 1.63 | 10/31/26 | 1,071,600 | 1,020,385 | ||||||||||
| U.S. Treasury Note | 1.63 | 11/30/26 | 774,200 | 735,702 | ||||||||||
| U.S. Treasury Note | 1.75 | 12/31/26 | 958,400 | 911,715 | ||||||||||
| U.S. Treasury Note | 1.88 | 06/30/26 | 1,000,600 | 963,879 | ||||||||||
| U.S. Treasury Note | 1.88 | 07/31/26 | 1,066,000 | 1,024,880 | ||||||||||
| U.S. Treasury Note | 1.88 | 02/28/27 | 2,217,500 | 2,107,145 | ||||||||||
| U.S. Treasury Note | 2.00 | 11/15/26 | 1,603,400 | 1,537,197 | ||||||||||
| U.S. Treasury Note | 2.13 | 05/31/26 | 894,400 | 866,363 | ||||||||||
| U.S. Treasury Note | 2.25 | 11/15/25 | 1,977,600 | 1,936,233 | ||||||||||
| U.S. Treasury Note | 2.25 | 03/31/26 | 1,008,600 | 981,573 | ||||||||||
| U.S. Treasury Note | 2.25 | 02/15/27 | 1,934,500 | 1,855,306 | ||||||||||
| U.S. Treasury Note | 2.25 | 08/15/27 | 1,697,800 | 1,614,435 | ||||||||||
| U.S. Treasury Note | 2.25 | 11/15/27 | 1,751,300 | 1,657,783 | ||||||||||
| U.S. Treasury Note | 2.38 | 04/30/26 | 422,200 | 411,142 | ||||||||||
| U.S. Treasury Note | 2.38 | 05/15/27 | 2,475,500 | 2,371,645 | ||||||||||
| U.S. Treasury Note | 2.50 | 02/28/26 | 1,250,000 | 1,222,461 | ||||||||||
The accompanying notes are an integral part of these financial statements.
181
BONDBLOXX ETF TRUST
BondBloxx Bloomberg Two Year Target Duration US Treasury ETF
Portfolio of Investments (Continued)
October 31, 2024
| Rate (%) | Maturity | Face Amount | Value | |||||||||||
| GOVERNMENT OBLIGATIONS – 98.9% (Continued) | ||||||||||||||
| U.S. Treasury Note | 2.50 | 03/31/27 | $ | 2,351,700 | $ | 2,265,716 | ||||||||
| U.S. Treasury Note | 2.63 | 12/31/25 | 731,000 | 717,451 | ||||||||||
| U.S. Treasury Note | 2.63 | 01/31/26 | 756,600 | 741,823 | ||||||||||
| U.S. Treasury Note | 2.63 | 05/31/27 | 2,164,300 | 2,085,506 | ||||||||||
| U.S. Treasury Note | 2.75 | 04/30/27 | 2,381,400 | 2,304,377 | ||||||||||
| U.S. Treasury Note | 2.75 | 07/31/27 | 2,217,200 | 2,138,299 | ||||||||||
| U.S. Treasury Note | 2.88 | 11/30/25 | 270,000 | 265,929 | ||||||||||
| U.S. Treasury Note | 3.13 | 08/31/27 | 1,800,900 | 1,753,064 | ||||||||||
| U.S. Treasury Note | 3.25 | 06/30/27 | 2,198,400 | 2,150,653 | ||||||||||
| U.S. Treasury Note | 3.38 | 09/15/27 | 2,370,200 | 2,323,444 | ||||||||||
| U.S. Treasury Note | 3.63 | 05/15/26 | 1,213,900 | 1,203,373 | ||||||||||
| U.S. Treasury Note | 3.75 | 04/15/26 | 1,443,200 | 1,433,926 | ||||||||||
| U.S. Treasury Note | 3.75 | 08/15/27 | 2,375,100 | 2,351,906 | ||||||||||
| U.S. Treasury Note | 3.88 | 01/15/26 | 1,344,600 | 1,338,770 | ||||||||||
| U.S. Treasury Note | 3.88 | 10/15/27 | 1,700,000 | 1,688,512 | ||||||||||
| U.S. Treasury Note | 3.88 | 11/30/27 | 1,806,200 | 1,793,077 | ||||||||||
| U.S. Treasury Note | 3.88 | 12/31/27 | 1,878,800 | 1,865,003 | ||||||||||
| U.S. Treasury Note | 4.00 | 12/15/25 | 1,099,600 | 1,096,164 | ||||||||||
| U.S. Treasury Note | 4.00 | 02/15/26 | 1,591,000 | 1,586,370 | ||||||||||
| U.S. Treasury Note | 4.00 | 01/15/27 | 2,282,100 | 2,275,414 | ||||||||||
| U.S. Treasury Note | 4.13 | 06/15/26 | 1,380,100 | 1,378,348 | ||||||||||
| U.S. Treasury Note | 4.13 | 02/15/27 | 2,381,400 | 2,380,563 | ||||||||||
| U.S. Treasury Note | 4.13 | 09/30/27 | 1,861,100 | 1,861,754 | ||||||||||
| U.S. Treasury Note | 4.13 | 10/31/27 | 2,020,600 | 2,020,995 | ||||||||||
| U.S. Treasury Note | 4.25 | 12/31/25 | 1,773,400 | 1,772,499 | ||||||||||
| U.S. Treasury Note | 4.25 | 01/31/26 | 753,500 | 753,426 | ||||||||||
| U.S. Treasury Note | 4.25 | 03/15/27 | 2,465,700 | 2,472,635 | ||||||||||
| U.S. Treasury Note | 4.38 | 08/15/26 | 1,437,600 | 1,442,486 | ||||||||||
| U.S. Treasury Note | 4.38 | 12/15/26 | 2,125,700 | 2,135,498 | ||||||||||
| U.S. Treasury Note | 4.38 | 07/15/27 | 2,253,400 | 2,267,572 | ||||||||||
| U.S. Treasury Note | 4.50 | 11/15/25 | 132,900 | 133,147 | ||||||||||
| U.S. Treasury Note | 4.50 | 03/31/26 | 1,394,900 | 1,399,858 | ||||||||||
| U.S. Treasury Note | 4.50 | 07/15/26 | 1,981,300 | 1,991,245 | ||||||||||
| U.S. Treasury Note | 4.50 | 04/15/27 | 2,388,200 | 2,408,537 | ||||||||||
| U.S. Treasury Note | 4.50 | 05/15/27 | 2,280,000 | 2,299,950 | ||||||||||
| U.S. Treasury Note | 4.63 | 02/28/26 | 1,262,400 | 1,268,145 | ||||||||||
| U.S. Treasury Note | 4.63 | 03/15/26 | 1,553,600 | 1,561,580 | ||||||||||
| U.S. Treasury Note | 4.63 | 09/15/26 | 1,801,400 | 1,816,107 | ||||||||||
| U.S. Treasury Note | 4.63 | 10/15/26 | 1,923,000 | 1,939,601 | ||||||||||
| U.S. Treasury Note | 4.63 | 11/15/26 | 2,020,400 | 2,038,631 | ||||||||||
| U.S. Treasury Note | 4.63 | 06/15/27 | 1,718,600 | 1,740,015 | ||||||||||
| U.S. Treasury Note | 4.88 | 11/30/25 | 1,773,400 | 1,783,652 | ||||||||||
| U.S. Treasury Note | 4.88 | 04/30/26 | 964,400 | 973,517 | ||||||||||
| U.S. Treasury Note | 4.88 | 05/31/26 | 508,800 | 513,868 | ||||||||||
| TOTAL GOVERNMENT OBLIGATIONS (Cost - $148,483,247) | 148,888,181 | |||||||||||||
The accompanying notes are an integral part of these financial statements.
182
BONDBLOXX ETF TRUST
BondBloxx Bloomberg Two Year Target Duration US Treasury ETF
Portfolio of Investments (Continued)
October 31, 2024
| Rate (%) | Maturity | Face Amount | Value | |||||||||||
| SHORT-TERM INVESTMENTS – 0.3% | ||||||||||||||
| TIME DEPOSITS – 0.3% | ||||||||||||||
| JP Morgan Chase, New York | 4.18 | 11/01/24 | $ | 417,354 | $ | 417,354 | ||||||||
| TOTAL SHORT-TERM INVESTMENTS (Cost - $417,354) | 417,354 | |||||||||||||
| TOTAL INVESTMENTS – 99.2% (Cost - $148,900,601) | $ | 149,305,535 | ||||||||||||
| OTHER ASSETS LESS LIABILITIES – 0.8% | 1,223,294 | |||||||||||||
| NET ASSETS – 100.0% | $ | 150,528,829 | ||||||||||||
The accompanying notes are an integral part of these financial statements.
183
BONDBLOXX ETF TRUST
BondBloxx Bloomberg Three Year Target Duration US Treasury ETF
Portfolio of Investments
October 31, 2024
| Rate (%) | Maturity | Face Amount | Value | |||||||||||
| GOVERNMENT OBLIGATIONS – 98.7% | ||||||||||||||
| U.S. Treasury Bond | 5.25 | 11/15/28 | $ | 201,000 | $ | 209,346 | ||||||||
| U.S. Treasury Note | 0.38 | 07/31/27 | 1,393,200 | 1,258,506 | ||||||||||
| U.S. Treasury Note | 0.38 | 09/30/27 | 1,700,700 | 1,526,843 | ||||||||||
| U.S. Treasury Note | 0.50 | 04/30/27 | 1,129,900 | 1,033,461 | ||||||||||
| U.S. Treasury Note | 0.50 | 05/31/27 | 1,188,800 | 1,083,944 | ||||||||||
| U.S. Treasury Note | 0.50 | 06/30/27 | 1,026,800 | 933,586 | ||||||||||
| U.S. Treasury Note | 0.50 | 08/31/27 | 1,288,700 | 1,164,965 | ||||||||||
| U.S. Treasury Note | 0.50 | 10/31/27 | 1,475,000 | 1,325,311 | ||||||||||
| U.S. Treasury Note | 0.63 | 03/31/27 | 799,400 | 735,791 | ||||||||||
| U.S. Treasury Note | 0.63 | 11/30/27 | 1,560,800 | 1,403,562 | ||||||||||
| U.S. Treasury Note | 0.63 | 12/31/27 | 1,722,400 | 1,544,508 | ||||||||||
| U.S. Treasury Note | 0.75 | 01/31/28 | 1,949,700 | 1,750,389 | ||||||||||
| U.S. Treasury Note | 1.00 | 07/31/28 | 2,024,900 | 1,805,167 | ||||||||||
| U.S. Treasury Note | 1.13 | 02/28/27 | 592,100 | 552,989 | ||||||||||
| U.S. Treasury Note | 1.13 | 02/29/28 | 1,928,400 | 1,748,968 | ||||||||||
| U.S. Treasury Note | 1.13 | 08/31/28 | 1,869,100 | 1,670,216 | ||||||||||
| U.S. Treasury Note | 1.25 | 11/30/26 | 1,805,000 | 1,701,636 | ||||||||||
| U.S. Treasury Note | 1.25 | 12/31/26 | 1,965,400 | 1,849,472 | ||||||||||
| U.S. Treasury Note | 1.25 | 03/31/28 | 1,785,500 | 1,622,294 | ||||||||||
| U.S. Treasury Note | 1.25 | 04/30/28 | 1,948,300 | 1,766,408 | ||||||||||
| U.S. Treasury Note | 1.25 | 05/31/28 | 1,886,600 | 1,706,341 | ||||||||||
| U.S. Treasury Note | 1.25 | 06/30/28 | 2,107,100 | 1,901,082 | ||||||||||
| U.S. Treasury Note | 1.25 | 09/30/28 | 1,973,600 | 1,768,222 | ||||||||||
| U.S. Treasury Note | 1.38 | 10/31/28 | 1,212,700 | 1,089,488 | ||||||||||
| U.S. Treasury Note | 1.38 | 12/31/28 | 1,600,000 | 1,431,437 | ||||||||||
| U.S. Treasury Note | 1.50 | 01/31/27 | 2,950,600 | 2,785,090 | ||||||||||
| U.S. Treasury Note | 1.50 | 11/30/28 | 1,317,500 | 1,187,191 | ||||||||||
| U.S. Treasury Note | 1.63 | 11/30/26 | 113,000 | 107,381 | ||||||||||
| U.S. Treasury Note | 1.75 | 12/31/26 | 453,600 | 431,505 | ||||||||||
| U.S. Treasury Note | 1.88 | 02/28/27 | 1,701,400 | 1,616,729 | ||||||||||
| U.S. Treasury Note | 2.25 | 02/15/27 | 922,600 | 884,831 | ||||||||||
| U.S. Treasury Note | 2.25 | 08/15/27 | 1,269,000 | 1,206,690 | ||||||||||
| U.S. Treasury Note | 2.25 | 11/15/27 | 1,267,600 | 1,199,912 | ||||||||||
| U.S. Treasury Note | 2.38 | 05/15/27 | 1,532,000 | 1,467,728 | ||||||||||
| U.S. Treasury Note | 2.50 | 03/31/27 | 1,543,000 | 1,486,584 | ||||||||||
| U.S. Treasury Note | 2.63 | 05/31/27 | 1,718,600 | 1,656,032 | ||||||||||
| U.S. Treasury Note | 2.63 | 02/15/29 | 1,700,000 | 1,598,332 | ||||||||||
| U.S. Treasury Note | 2.75 | 04/30/27 | 1,743,500 | 1,687,109 | ||||||||||
| U.S. Treasury Note | 2.75 | 07/31/27 | 1,315,700 | 1,268,880 | ||||||||||
| U.S. Treasury Note | 2.75 | 02/15/28 | 1,782,400 | 1,706,648 | ||||||||||
| U.S. Treasury Note | 2.88 | 05/15/28 | 1,703,700 | 1,632,624 | ||||||||||
| U.S. Treasury Note | 2.88 | 08/15/28 | 1,897,500 | 1,812,928 | ||||||||||
| U.S. Treasury Note | 3.13 | 08/31/27 | 1,496,300 | 1,456,554 | ||||||||||
| U.S. Treasury Note | 3.13 | 11/15/28 | 1,584,200 | 1,523,740 | ||||||||||
| U.S. Treasury Note | 3.25 | 06/30/27 | 1,167,400 | 1,142,045 | ||||||||||
| U.S. Treasury Note | 3.38 | 09/15/27 | 900,000 | 882,246 | ||||||||||
| U.S. Treasury Note | 3.50 | 01/31/28 | 1,127,600 | 1,106,017 | ||||||||||
| U.S. Treasury Note | 3.50 | 04/30/28 | 1,479,200 | 1,448,518 | ||||||||||
The accompanying notes are an integral part of these financial statements.
184
BONDBLOXX ETF TRUST
BondBloxx Bloomberg Three Year Target Duration US Treasury ETF
Portfolio of Investments (Continued)
October 31, 2024
| Rate (%) | Maturity | Face Amount | Value | |||||||||||
| GOVERNMENT OBLIGATIONS – 98.7% (Continued) | ||||||||||||||
| U.S. Treasury Note | 3.63 | 03/31/28 | $ | 1,071,900 | $ | 1,054,733 | ||||||||
| U.S. Treasury Note | 3.63 | 05/31/28 | 1,201,900 | 1,181,242 | ||||||||||
| U.S. Treasury Note | 3.75 | 08/15/27 | 912,400 | 903,490 | ||||||||||
| U.S. Treasury Note | 3.75 | 12/31/28 | 1,727,700 | 1,700,570 | ||||||||||
| U.S. Treasury Note | 3.88 | 11/30/27 | 1,334,800 | 1,325,102 | ||||||||||
| U.S. Treasury Note | 3.88 | 12/31/27 | 1,492,400 | 1,481,440 | ||||||||||
| U.S. Treasury Note | 4.00 | 01/15/27 | 858,600 | 856,085 | ||||||||||
| U.S. Treasury Note | 4.00 | 02/29/28 | 1,108,800 | 1,104,166 | ||||||||||
| U.S. Treasury Note | 4.00 | 06/30/28 | 1,334,000 | 1,327,590 | ||||||||||
| U.S. Treasury Note | 4.00 | 01/31/29 | 1,721,900 | 1,711,138 | ||||||||||
| U.S. Treasury Note | 4.13 | 02/15/27 | 946,200 | 945,867 | ||||||||||
| U.S. Treasury Note | 4.13 | 09/30/27 | 1,226,600 | 1,227,031 | ||||||||||
| U.S. Treasury Note | 4.13 | 10/31/27 | 1,378,600 | 1,378,869 | ||||||||||
| U.S. Treasury Note | 4.13 | 07/31/28 | 1,331,700 | 1,330,295 | ||||||||||
| U.S. Treasury Note | 4.13 | 03/31/29 | 1,900,000 | 1,897,477 | ||||||||||
| U.S. Treasury Note | 4.25 | 03/15/27 | 1,061,100 | 1,064,084 | ||||||||||
| U.S. Treasury Note | 4.25 | 02/28/29 | 1,849,800 | 1,856,592 | ||||||||||
| U.S. Treasury Note | 4.38 | 12/15/26 | 150,700 | 151,395 | ||||||||||
| U.S. Treasury Note | 4.38 | 07/15/27 | 1,386,800 | 1,395,522 | ||||||||||
| U.S. Treasury Note | 4.38 | 08/31/28 | 1,278,700 | 1,288,290 | ||||||||||
| U.S. Treasury Note | 4.38 | 11/30/28 | 1,478,700 | 1,490,368 | ||||||||||
| U.S. Treasury Note | 4.50 | 04/15/27 | 1,286,300 | 1,297,254 | ||||||||||
| U.S. Treasury Note | 4.50 | 05/15/27 | 1,331,500 | 1,343,151 | ||||||||||
| U.S. Treasury Note | 4.63 | 06/15/27 | 900,400 | 911,620 | ||||||||||
| U.S. Treasury Note | 4.63 | 09/30/28 | 1,535,000 | 1,560,603 | ||||||||||
| U.S. Treasury Note | 4.88 | 10/31/28 | 1,717,600 | 1,762,352 | ||||||||||
| TOTAL GOVERNMENT OBLIGATIONS (Cost - $99,630,214) | 99,425,572 | |||||||||||||
| SHORT-TERM INVESTMENTS – 0.3% | ||||||||||||||
| TIME DEPOSITS – 0.3% | ||||||||||||||
| ANZ National Bank, London | 4.18 | 11/01/24 | 315,277 | 315,277 | ||||||||||
| TOTAL SHORT-TERM INVESTMENTS (Cost - $315,277) | 315,277 | |||||||||||||
| TOTAL INVESTMENTS – 99.0% (Cost - $99,945,491) | $ | 99,740,849 | ||||||||||||
| OTHER ASSETS LESS LIABILITIES – 1.0% | 984,885 | |||||||||||||
| NET ASSETS – 100.0% | $ | 100,725,734 | ||||||||||||
The accompanying notes are an integral part of these financial statements.
185
BONDBLOXX ETF TRUST
BondBloxx Bloomberg Five Year Target Duration US Treasury ETF
Portfolio of Investments
October 31, 2024
| Rate (%) | Maturity | Face Amount | Value | |||||||||||
| GOVERNMENT OBLIGATIONS – 98.9% | ||||||||||||||
| U.S. Treasury Bond | 5.38 | 02/15/31 | $ | 703,800 | $ | 751,224 | ||||||||
| U.S. Treasury Note | 0.63 | 05/15/30 | 6,022,800 | 4,972,104 | ||||||||||
| U.S. Treasury Note | 0.63 | 08/15/30 | 7,365,500 | 6,025,900 | ||||||||||
| U.S. Treasury Note | 0.88 | 11/15/30 | 7,881,100 | 6,507,449 | ||||||||||
| U.S. Treasury Note | 1.13 | 02/15/31 | 7,000,000 | 5,834,063 | ||||||||||
| U.S. Treasury Note | 1.50 | 02/15/30 | 2,353,200 | 2,056,476 | ||||||||||
| U.S. Treasury Note | 1.63 | 08/15/29 | 1,755,300 | 1,566,537 | ||||||||||
| U.S. Treasury Note | 1.75 | 01/31/29 | 2,132,900 | 1,933,941 | ||||||||||
| U.S. Treasury Note | 1.75 | 11/15/29 | 1,358,800 | 1,213,844 | ||||||||||
| U.S. Treasury Note | 1.88 | 02/28/29 | 2,028,900 | 1,846,616 | ||||||||||
| U.S. Treasury Note | 2.38 | 03/31/29 | 1,850,300 | 1,717,960 | ||||||||||
| U.S. Treasury Note | 2.38 | 05/15/29 | 1,935,100 | 1,794,201 | ||||||||||
| U.S. Treasury Note | 2.63 | 02/15/29 | 53,900 | 50,677 | ||||||||||
| U.S. Treasury Note | 2.63 | 07/31/29 | 1,408,000 | 1,315,765 | ||||||||||
| U.S. Treasury Note | 2.75 | 05/31/29 | 1,830,700 | 1,723,432 | ||||||||||
| U.S. Treasury Note | 2.88 | 04/30/29 | 1,730,100 | 1,639,540 | ||||||||||
| U.S. Treasury Note | 3.13 | 08/31/29 | 1,583,400 | 1,512,023 | ||||||||||
| U.S. Treasury Note | 3.25 | 06/30/29 | 1,606,300 | 1,544,307 | ||||||||||
| U.S. Treasury Note | 3.50 | 09/30/29 | 2,840,700 | 2,759,807 | ||||||||||
| U.S. Treasury Note | 3.50 | 01/31/30 | 1,506,100 | 1,458,681 | ||||||||||
| U.S. Treasury Note | 3.50 | 04/30/30 | 1,715,400 | 1,658,644 | ||||||||||
| U.S. Treasury Note | 3.63 | 08/31/29 | 2,907,400 | 2,842,551 | ||||||||||
| U.S. Treasury Note | 3.63 | 03/31/30 | 1,414,600 | 1,376,914 | ||||||||||
| U.S. Treasury Note | 3.75 | 05/31/30 | 1,592,800 | 1,558,766 | ||||||||||
| U.S. Treasury Note | 3.75 | 06/30/30 | 1,578,700 | 1,544,289 | ||||||||||
| U.S. Treasury Note | 3.75 | 12/31/30 | 2,755,400 | 2,687,699 | ||||||||||
| U.S. Treasury Note | 3.75 | 08/31/31 | 2,600,000 | 2,527,281 | ||||||||||
| U.S. Treasury Note | 3.88 | 09/30/29 | 1,506,600 | 1,487,238 | ||||||||||
| U.S. Treasury Note | 3.88 | 11/30/29 | 1,380,600 | 1,362,372 | ||||||||||
| U.S. Treasury Note | 3.88 | 12/31/29 | 1,436,600 | 1,417,015 | ||||||||||
| U.S. Treasury Note | 4.00 | 07/31/29 | 2,707,600 | 2,690,255 | ||||||||||
| U.S. Treasury Note | 4.00 | 10/31/29 | 1,404,500 | 1,394,076 | ||||||||||
| U.S. Treasury Note | 4.00 | 02/28/30 | 1,447,700 | 1,436,107 | ||||||||||
| U.S. Treasury Note | 4.00 | 07/31/30 | 2,375,600 | 2,353,050 | ||||||||||
| U.S. Treasury Note | 4.00 | 01/31/31 | 2,969,900 | 2,936,025 | ||||||||||
| U.S. Treasury Note | 4.13 | 03/31/29 | 156,000 | 155,793 | ||||||||||
| U.S. Treasury Note | 4.13 | 10/31/29 | 2,750,000 | 2,747,529 | ||||||||||
| U.S. Treasury Note | 4.13 | 08/31/30 | 2,809,200 | 2,798,995 | ||||||||||
| U.S. Treasury Note | 4.13 | 03/31/31 | 3,370,200 | 3,352,822 | ||||||||||
| U.S. Treasury Note | 4.13 | 07/31/31 | 3,331,300 | 3,312,301 | ||||||||||
| U.S. Treasury Note | 4.25 | 06/30/29 | 3,190,300 | 3,202,014 | ||||||||||
| U.S. Treasury Note | 4.25 | 02/28/31 | 2,955,900 | 2,961,904 | ||||||||||
| U.S. Treasury Note | 4.25 | 06/30/31 | 3,142,100 | 3,146,764 | ||||||||||
| U.S. Treasury Note | 4.38 | 11/30/30 | 2,843,000 | 2,868,987 | ||||||||||
| U.S. Treasury Note | 4.50 | 05/31/29 | 2,879,200 | 2,921,263 | ||||||||||
| U.S. Treasury Note | 4.63 | 04/30/29 | 2,808,000 | 2,862,076 | ||||||||||
| U.S. Treasury Note | 4.63 | 09/30/30 | 2,741,700 | 2,802,960 | ||||||||||
| U.S. Treasury Note | 4.63 | 04/30/31 | 3,466,000 | 3,545,610 | ||||||||||
The accompanying notes are an integral part of these financial statements.
186
BONDBLOXX ETF TRUST
BondBloxx Bloomberg Five Year Target Duration US Treasury ETF
Portfolio of Investments (Continued)
October 31, 2024
| Rate (%) | Maturity | Face Amount | Value | |||||||||||
| GOVERNMENT OBLIGATIONS – 98.9% (Continued) | ||||||||||||||
| U.S. Treasury Note | 4.63 | 05/31/31 | $ | 3,406,000 | $ | 3,483,433 | ||||||||
| U.S. Treasury Note | 4.88 | 10/31/30 | 2,841,600 | 2,942,943 | ||||||||||
| TOTAL GOVERNMENT OBLIGATIONS (Cost - $121,124,516) | 120,602,223 | |||||||||||||
| SHORT-TERM INVESTMENTS – 0.3% | ||||||||||||||
| TIME DEPOSITS – 0.3% | ||||||||||||||
| Sumitomo Mitsui Trust Bank, London | 4.18 | 11/01/24 | 372,366 | 372,366 | ||||||||||
| TOTAL SHORT-TERM INVESTMENTS (Cost - $372,366) | 372,366 | |||||||||||||
| TOTAL INVESTMENTS – 99.2% (Cost - $121,496,882) | $ | 120,974,589 | ||||||||||||
| OTHER ASSETS LESS LIABILITIES – 0.8% | 1,029,120 | |||||||||||||
| NET ASSETS – 100.0% | $ | 122,003,709 | ||||||||||||
The accompanying notes are an integral part of these financial statements.
187
BONDBLOXX ETF TRUST
BondBloxx Bloomberg Seven Year Target Duration US Treasury ETF
Portfolio of Investments
October 31, 2024
| Rate (%) | Maturity | Face Amount | Value | |||||||||||
| GOVERNMENT OBLIGATIONS – 98.5% | ||||||||||||||
| U.S. Treasury Bond | 4.50 | 02/15/36 | $ | 932,000 | $ | 956,902 | ||||||||
| U.S. Treasury Note | 0.63 | 05/15/30 | 1,563,100 | 1,290,412 | ||||||||||
| U.S. Treasury Note | 0.63 | 08/15/30 | 2,049,400 | 1,676,665 | ||||||||||
| U.S. Treasury Note | 0.88 | 11/15/30 | 2,403,400 | 1,984,495 | ||||||||||
| U.S. Treasury Note | 1.13 | 02/15/31 | 2,578,100 | 2,148,685 | ||||||||||
| U.S. Treasury Note | 1.25 | 08/15/31 | 2,690,600 | 2,222,267 | ||||||||||
| U.S. Treasury Note | 1.38 | 11/15/31 | 2,359,700 | 1,952,283 | ||||||||||
| U.S. Treasury Note | 1.63 | 05/15/31 | 2,330,300 | 1,987,855 | ||||||||||
| U.S. Treasury Note | 1.88 | 02/15/32 | 2,137,600 | 1,822,638 | ||||||||||
| U.S. Treasury Note | 2.75 | 08/15/32 | 2,616,600 | 2,358,620 | ||||||||||
| U.S. Treasury Note | 2.88 | 05/15/32 | 2,070,700 | 1,888,867 | ||||||||||
| U.S. Treasury Note | 3.38 | 05/15/33 | 9,209,000 | 8,629,121 | ||||||||||
| U.S. Treasury Note | 3.50 | 02/15/33 | 9,453,200 | 8,956,907 | ||||||||||
| U.S. Treasury Note | 3.63 | 09/30/31 | 640,000 | 617,250 | ||||||||||
| U.S. Treasury Note | 3.75 | 06/30/30 | 32,200 | 31,498 | ||||||||||
| U.S. Treasury Note | 3.75 | 12/31/30 | 913,000 | 890,567 | ||||||||||
| U.S. Treasury Note | 3.75 | 08/31/31 | 398,000 | 386,868 | ||||||||||
| U.S. Treasury Note | 3.88 | 08/15/33 | 10,579,600 | 10,276,263 | ||||||||||
| U.S. Treasury Note | 3.88 | 08/15/34 | 11,722,500 | 11,342,435 | ||||||||||
| U.S. Treasury Note | 4.00 | 07/31/30 | 998,700 | 989,220 | ||||||||||
| U.S. Treasury Note | 4.00 | 01/31/31 | 834,000 | 824,487 | ||||||||||
| U.S. Treasury Note | 4.00 | 02/15/34 | 11,722,800 | 11,472,775 | ||||||||||
| U.S. Treasury Note | 4.13 | 08/31/30 | 833,600 | 830,572 | ||||||||||
| U.S. Treasury Note | 4.13 | 03/31/31 | 1,035,600 | 1,030,260 | ||||||||||
| U.S. Treasury Note | 4.13 | 07/31/31 | 451,100 | 448,527 | ||||||||||
| U.S. Treasury Note | 4.13 | 11/15/32 | 2,038,600 | 2,023,470 | ||||||||||
| U.S. Treasury Note | 4.25 | 02/28/31 | 986,500 | 988,504 | ||||||||||
| U.S. Treasury Note | 4.25 | 06/30/31 | 948,800 | 950,208 | ||||||||||
| U.S. Treasury Note | 4.38 | 11/30/30 | 1,087,100 | 1,097,037 | ||||||||||
| U.S. Treasury Note | 4.38 | 05/15/34 | 11,591,800 | 11,677,833 | ||||||||||
| U.S. Treasury Note | 4.50 | 11/15/33 | 11,147,900 | 11,336,892 | ||||||||||
| U.S. Treasury Note | 4.63 | 09/30/30 | 834,700 | 853,350 | ||||||||||
| U.S. Treasury Note | 4.63 | 04/30/31 | 933,400 | 954,839 | ||||||||||
| U.S. Treasury Note | 4.63 | 05/31/31 | 1,014,700 | 1,037,769 | ||||||||||
| U.S. Treasury Note | 4.88 | 10/31/30 | 178,400 | 184,763 | ||||||||||
| TOTAL GOVERNMENT OBLIGATIONS (Cost - $108,562,804) | 108,121,104 | |||||||||||||
| SHORT-TERM INVESTMENTS – 0.1% | ||||||||||||||
| TIME DEPOSITS – 0.1% | ||||||||||||||
| Citibank, New York | 4.18 | 11/01/24 | 153,808 | 153,808 | ||||||||||
| TOTAL SHORT-TERM INVESTMENTS (Cost - $153,808) | 153,808 | |||||||||||||
| TOTAL INVESTMENTS – 98.6% (Cost - $108,716,612) | $ | 108,274,912 | ||||||||||||
| OTHER ASSETS LESS LIABILITIES – 1.4% | 1,556,307 | |||||||||||||
| NET ASSETS – 100.0% | $ | 109,831,219 | ||||||||||||
The accompanying notes are an integral part of these financial statements.
188
BONDBLOXX ETF TRUST
BondBloxx Bloomberg Ten Year Target Duration US Treasury ETF
Portfolio of Investments
October 31, 2024
| Rate (%) | Maturity | Face Amount | Value | |||||||||||
| GOVERNMENT OBLIGATIONS – 98.4% | ||||||||||||||
| U.S. Treasury Bond | 1.13 | 05/15/40 | $ | 4,165,900 | $ | 2,601,735 | ||||||||
| U.S. Treasury Bond | 1.13 | 08/15/40 | 4,500,000 | 2,783,672 | ||||||||||
| U.S. Treasury Bond | 1.38 | 11/15/40 | 5,367,100 | 3,446,684 | ||||||||||
| U.S. Treasury Bond | 1.75 | 08/15/41 | 6,564,400 | 4,406,866 | ||||||||||
| U.S. Treasury Bond | 1.88 | 02/15/41 | 8,611,800 | 5,981,837 | ||||||||||
| U.S. Treasury Bond | 2.00 | 11/15/41 | 4,906,200 | 3,417,092 | ||||||||||
| U.S. Treasury Bond | 2.25 | 05/15/41 | 9,436,800 | 6,937,522 | ||||||||||
| U.S. Treasury Bond | 2.38 | 02/15/42 | 6,926,300 | 5,105,982 | ||||||||||
| U.S. Treasury Bond | 2.75 | 08/15/42 | 1,882,500 | 1,465,409 | ||||||||||
| U.S. Treasury Bond | 2.75 | 11/15/42 | 2,188,000 | 1,696,213 | ||||||||||
| U.S. Treasury Bond | 2.88 | 05/15/43 | 4,019,800 | 3,155,543 | ||||||||||
| U.S. Treasury Bond | 3.00 | 05/15/42 | 3,315,500 | 2,692,808 | ||||||||||
| U.S. Treasury Bond | 3.13 | 11/15/41 | 1,477,400 | 1,235,707 | ||||||||||
| U.S. Treasury Bond | 3.13 | 02/15/42 | 3,417,700 | 2,842,565 | ||||||||||
| U.S. Treasury Bond | 3.13 | 02/15/43 | 3,110,400 | 2,549,799 | ||||||||||
| U.S. Treasury Bond | 3.25 | 05/15/42 | 8,001,300 | 6,736,094 | ||||||||||
| U.S. Treasury Bond | 3.38 | 08/15/42 | 4,506,700 | 3,853,228 | ||||||||||
| U.S. Treasury Bond | 3.38 | 05/15/44 | 1,014,400 | 853,285 | ||||||||||
| U.S. Treasury Bond | 3.50 | 02/15/39 | 863,800 | 784,371 | ||||||||||
| U.S. Treasury Bond | 3.63 | 08/15/43 | 4,491,400 | 3,944,011 | ||||||||||
| U.S. Treasury Bond | 3.63 | 02/15/44 | 3,824,800 | 3,344,011 | ||||||||||
| U.S. Treasury Bond | 3.75 | 08/15/41 | 1,628,700 | 1,487,843 | ||||||||||
| U.S. Treasury Bond | 3.75 | 11/15/43 | 2,648,500 | 2,363,165 | ||||||||||
| U.S. Treasury Bond | 3.88 | 08/15/40 | 1,734,600 | 1,622,122 | ||||||||||
| U.S. Treasury Bond | 3.88 | 02/15/43 | 7,244,800 | 6,627,860 | ||||||||||
| U.S. Treasury Bond | 3.88 | 05/15/43 | 4,519,600 | 4,123,429 | ||||||||||
| U.S. Treasury Bond | 4.00 | 11/15/42 | 5,167,400 | 4,820,215 | ||||||||||
| U.S. Treasury Bond | 4.13 | 08/15/44 | 204,800 | 192,320 | ||||||||||
| U.S. Treasury Bond | 4.25 | 05/15/39 | 1,523,800 | 1,499,038 | ||||||||||
| U.S. Treasury Bond | 4.25 | 11/15/40 | 1,492,700 | 1,458,531 | ||||||||||
| U.S. Treasury Bond | 4.38 | 02/15/38 | 620,000 | 622,906 | ||||||||||
| U.S. Treasury Bond | 4.38 | 11/15/39 | 1,554,000 | 1,545,744 | ||||||||||
| U.S. Treasury Bond | 4.38 | 05/15/40 | 1,649,000 | 1,638,050 | ||||||||||
| U.S. Treasury Bond | 4.38 | 05/15/41 | 795,200 | 787,310 | ||||||||||
| U.S. Treasury Bond | 4.38 | 08/15/43 | 5,813,100 | 5,670,952 | ||||||||||
| U.S. Treasury Bond | 4.50 | 02/15/36 | 762,700 | 783,078 | ||||||||||
| U.S. Treasury Bond | 4.50 | 05/15/38 | 759,700 | 771,986 | ||||||||||
| U.S. Treasury Bond | 4.50 | 08/15/39 | 1,460,400 | 1,473,635 | ||||||||||
| U.S. Treasury Bond | 4.50 | 02/15/44 | 2,645,100 | 2,617,409 | ||||||||||
| U.S. Treasury Bond | 4.63 | 02/15/40 | 1,653,800 | 1,688,943 | ||||||||||
| U.S. Treasury Bond | 4.63 | 05/15/44 | 870,400 | 874,888 | ||||||||||
| U.S. Treasury Bond | 4.75 | 02/15/41 | 2,030,600 | 2,101,512 | ||||||||||
| U.S. Treasury Bond | 4.75 | 11/15/43 | 5,820,900 | 5,959,601 | ||||||||||
| U.S. Treasury Bond | 5.00 | 05/15/37 | 921,600 | 984,528 | ||||||||||
| U.S. Treasury Note | 1.13 | 02/15/31 | 179,500 | 149,602 | ||||||||||
| U.S. Treasury Note | 1.25 | 08/15/31 | 9,608,000 | 7,935,607 | ||||||||||
| U.S. Treasury Note | 1.38 | 11/15/31 | 9,537,900 | 7,891,122 | ||||||||||
| U.S. Treasury Note | 1.63 | 05/15/31 | 9,483,000 | 8,089,444 | ||||||||||
The accompanying notes are an integral part of these financial statements.
189
BONDBLOXX ETF TRUST
BondBloxx Bloomberg Ten Year Target Duration US Treasury ETF
Portfolio of Investments (Continued)
October 31, 2024
| Rate (%) | Maturity | Face Amount | Value | |||||||||||
| GOVERNMENT OBLIGATIONS – 98.4% (Continued) | ||||||||||||||
| U.S. Treasury Note | 1.88 | 02/15/32 | $ | 8,659,500 | $ | 7,383,577 | ||||||||
| U.S. Treasury Note | 2.75 | 08/15/32 | 8,779,600 | 7,913,986 | ||||||||||
| U.S. Treasury Note | 2.88 | 05/15/32 | 8,360,900 | 7,626,708 | ||||||||||
| U.S. Treasury Note | 3.38 | 05/15/33 | 7,813,800 | 7,321,775 | ||||||||||
| U.S. Treasury Note | 3.50 | 02/15/33 | 8,320,000 | 7,883,200 | ||||||||||
| U.S. Treasury Note | 3.88 | 08/15/33 | 8,484,600 | 8,241,331 | ||||||||||
| U.S. Treasury Note | 3.88 | 08/15/34 | 6,022,800 | 5,827,530 | ||||||||||
| U.S. Treasury Note | 4.00 | 02/15/34 | 8,919,700 | 8,729,460 | ||||||||||
| U.S. Treasury Note | 4.13 | 11/15/32 | 8,271,100 | 8,209,713 | ||||||||||
| U.S. Treasury Note | 4.38 | 05/15/34 | 8,863,200 | 8,928,982 | ||||||||||
| U.S. Treasury Note | 4.50 | 11/15/33 | 8,469,700 | 8,613,288 | ||||||||||
| TOTAL GOVERNMENT OBLIGATIONS (Cost - $232,005,251) | 232,294,824 | |||||||||||||
| SHORT-TERM INVESTMENTS – 0.3% | ||||||||||||||
| TIME DEPOSITS – 0.3% | ||||||||||||||
| Sumitomo Mitsui Trust Bank, London | 4.18 | 11/01/24 | 628,936 | 628,936 | ||||||||||
| TOTAL SHORT-TERM INVESTMENTS (Cost - $628,936) | 628,936 | |||||||||||||
| TOTAL INVESTMENTS – 98.7% (Cost - $232,634,187) | $ | 232,923,760 | ||||||||||||
| OTHER ASSETS LESS LIABILITIES – 1.3% | 3,120,017 | |||||||||||||
| NET ASSETS – 100.0% | $ | 236,043,777 | ||||||||||||
The accompanying notes are an integral part of these financial statements.
190
BONDBLOXX ETF TRUST
BondBloxx Bloomberg Twenty Year Target Duration US Treasury ETF
Portfolio of Investments
October 31, 2024
| Rate (%) | Maturity | Face Amount | Value | |||||||||||
| GOVERNMENT OBLIGATIONS – 98.4% | ||||||||||||||
| U.S. Treasury Bond | 1.25 | 05/15/50 | $ | 3,072,600 | $ | 1,544,702 | ||||||||
| U.S. Treasury Bond | 1.38 | 08/15/50 | 2,931,000 | 1,516,335 | ||||||||||
| U.S. Treasury Bond | 1.63 | 11/15/50 | 2,524,500 | 1,395,970 | ||||||||||
| U.S. Treasury Bond | 1.88 | 02/15/51 | 3,068,400 | 1,808,918 | ||||||||||
| U.S. Treasury Bond | 1.88 | 11/15/51 | 2,790,200 | 1,634,011 | ||||||||||
| U.S. Treasury Bond | 2.00 | 02/15/50 | 2,157,400 | 1,324,104 | ||||||||||
| U.S. Treasury Bond | 2.00 | 08/15/51 | 3,057,400 | 1,852,116 | ||||||||||
| U.S. Treasury Bond | 2.25 | 08/15/46 | 1,121,300 | 755,739 | ||||||||||
| U.S. Treasury Bond | 2.25 | 08/15/49 | 1,822,300 | 1,188,624 | ||||||||||
| U.S. Treasury Bond | 2.25 | 02/15/52 | 2,560,500 | 1,644,521 | ||||||||||
| U.S. Treasury Bond | 2.38 | 11/15/49 | 1,540,700 | 1,032,028 | ||||||||||
| U.S. Treasury Bond | 2.38 | 05/15/51 | 3,082,300 | 2,049,007 | ||||||||||
| U.S. Treasury Bond | 2.88 | 05/15/49 | 1,552,000 | 1,155,997 | ||||||||||
| U.S. Treasury Bond | 2.88 | 05/15/52 | 2,401,300 | 1,774,711 | ||||||||||
| U.S. Treasury Bond | 3.00 | 02/15/49 | 90,000 | 68,688 | ||||||||||
| U.S. Treasury Bond | 3.00 | 08/15/52 | 2,329,100 | 1,767,023 | ||||||||||
| U.S. Treasury Bond | 3.63 | 02/15/53 | 2,384,000 | 2,046,329 | ||||||||||
| U.S. Treasury Bond | 3.63 | 05/15/53 | 2,322,500 | 1,995,354 | ||||||||||
| U.S. Treasury Bond | 4.00 | 11/15/52 | 108,200 | 99,426 | ||||||||||
| U.S. Treasury Bond | 4.13 | 08/15/53 | 2,415,600 | 2,270,475 | ||||||||||
| U.S. Treasury Bond | 4.25 | 02/15/54 | 2,828,200 | 2,719,491 | ||||||||||
| U.S. Treasury Bond | 4.25 | 08/15/54 | 2,776,000 | 2,671,466 | ||||||||||
| U.S. Treasury Strip | ZCP | 11/15/44 | 682,600 | 271,853 | ||||||||||
| U.S. Treasury Strip | ZCP | 02/15/45 | 918,900 | 361,476 | ||||||||||
| U.S. Treasury Strip | ZCP | 08/15/45 | 670,700 | 258,534 | ||||||||||
| U.S. Treasury Strip | ZCP | 02/15/46 | 1,210,500 | 455,498 | ||||||||||
| U.S. Treasury Strip | ZCP | 08/15/46 | 1,281,400 | 471,440 | ||||||||||
| U.S. Treasury Strip | ZCP | 05/15/47 | 502,000 | 178,485 | ||||||||||
| U.S. Treasury Strip | ZCP | 08/15/47 | 1,304,900 | 459,722 | ||||||||||
| U.S. Treasury Strip | ZCP | 11/15/47 | 987,700 | 343,804 | ||||||||||
| U.S. Treasury Strip | ZCP | 02/15/48 | 1,499,200 | 515,291 | ||||||||||
| U.S. Treasury Strip | ZCP | 08/15/48 | 2,059,200 | 693,170 | ||||||||||
| U.S. Treasury Strip | ZCP | 02/15/49 | 2,917,200 | 962,733 | ||||||||||
| U.S. Treasury Strip | ZCP | 05/15/49 | 3,292,400 | 1,077,554 | ||||||||||
| U.S. Treasury Strip | ZCP | 02/15/50 | 2,122,400 | 677,012 | ||||||||||
| U.S. Treasury Strip | ZCP | 05/15/50 | 1,764,100 | 560,860 | ||||||||||
| U.S. Treasury Strip | ZCP | 08/15/50 | 2,028,900 | 634,982 | ||||||||||
| U.S. Treasury Strip | ZCP | 11/15/50 | 2,538,200 | 787,139 | ||||||||||
| U.S. Treasury Strip | ZCP | 02/15/51 | 2,395,800 | 736,708 | ||||||||||
| U.S. Treasury Strip | ZCP | 05/15/51 | 2,024,400 | 619,024 | ||||||||||
| U.S. Treasury Strip | ZCP | 08/15/51 | 2,050,100 | 619,835 | ||||||||||
| U.S. Treasury Strip | ZCP | 11/15/51 | 2,834,600 | 849,716 | ||||||||||
| U.S. Treasury Strip | ZCP | 02/15/52 | 3,005,400 | 894,106 | ||||||||||
| U.S. Treasury Strip | ZCP | 08/15/52 | 3,963,900 | 1,164,860 | ||||||||||
| U.S. Treasury Strip | ZCP | 11/15/52 | 530,000 | 157,033 | ||||||||||
| U.S. Treasury Strip | ZCP | 02/15/53 | 1,900,000 | 554,266 | ||||||||||
| U.S. Treasury Strip | ZCP | 05/15/53 | 6,228,000 | 1,802,471 | ||||||||||
The accompanying notes are an integral part of these financial statements.
191
BONDBLOXX ETF TRUST
BondBloxx Bloomberg Twenty Year Target Duration US Treasury ETF
Portfolio of Investments (Continued)
October 31, 2024
| Rate (%) | Maturity | Face Amount | Value | |||||||||||
| GOVERNMENT OBLIGATIONS – 98.4% (Continued) | ||||||||||||||
| U.S. Treasury Strip | ZCP | 11/15/53 | $ | 900,000 | $ | 260,842 | ||||||||
| U.S. Treasury Strip | ZCP | 02/15/54 | 1,769,100 | 504,297 | ||||||||||
| TOTAL GOVERNMENT OBLIGATIONS (Cost - $53,364,426) | 51,187,746 | |||||||||||||
| SHORT-TERM INVESTMENTS – 0.1% | ||||||||||||||
| TIME DEPOSITS – 0.1% | ||||||||||||||
| Citibank, New York | 4.18 | 11/01/24 | 34,347 | 34,347 | ||||||||||
| TOTAL SHORT-TERM INVESTMENTS (Cost - $34,347) | 34,347 | |||||||||||||
| TOTAL INVESTMENTS – 98.5% (Cost - $53,398,773) | $ | 51,222,093 | ||||||||||||
| OTHER ASSETS LESS LIABILITIES – 1.5% | 790,217 | |||||||||||||
| NET ASSETS – 100.0% | $ | 52,012,310 | ||||||||||||
ZCP Indicates a zero coupon rate.
The accompanying notes are an integral part of these financial statements.
192
BONDBLOXX ETF TRUST
BondBloxx IR+M Tax-Aware Short Duration ETF
Portfolio of Investments
October 31, 2024
| Rate (%) | Maturity | Face Amount | Value | |||||||||||
| ASSET-BACKED SECURITIES – 7.8% | ||||||||||||||
| Aimco CLO 14 Ltd. 2021-14A Class A (CME Term SOFR 3 Month + 1.25%)(1) | 5.87 | 04/20/34 | $ | 300,000 | $ | 300,451 | ||||||||
| AIMCO CLO 2017-AA Class AR (CME Term SOFR 3 Month + 1.31%)(1) | 5.93 | 04/20/34 | 411,000 | 411,474 | ||||||||||
| Apidos CLO XL Ltd. 2022-40A Class AR (CME Term SOFR 3 Month + 1.35%)(1) | 6.01 | 07/15/37 | 440,000 | 441,103 | ||||||||||
| Apidos CLO XLVII Ltd. 2024-47A Class A1 (CME Term SOFR 3 Month + 1.50%)(1) | 6.12 | 04/26/37 | 500,000 | 501,581 | ||||||||||
| Avis Budget Rental Car Funding AESOP LLC 2024-2A Class A(1) | 5.13 | 10/20/28 | 250,000 | 250,973 | ||||||||||
| CCG Receivables Trust 2023-2 Class A2(1) | 6.28 | 04/14/32 | 89,076 | 90,409 | ||||||||||
| CIFC Funding 2015-III Ltd. 2015-3A Class AR (CME Term SOFR 3 Month + 1.13%)(1) | 5.75 | 04/19/29 | 108,001 | 108,184 | ||||||||||
| CIFC Funding 2018-III Ltd. 2018-3A Class A (CME Term SOFR 3 Month + 1.36%)(1) | 5.99 | 07/18/31 | 205,203 | 205,780 | ||||||||||
| CIFC Funding 2021-IV Ltd. 2021-4A Class AR (CME Term SOFR 3 Month + 1.36%)(1) | 6.53 | 07/23/37 | 359,000 | 359,164 | ||||||||||
| DB Master Finance LLC 2017-1A Class A2II(1) | 4.03 | 11/20/47 | 140,250 | 135,996 | ||||||||||
| DB Master Finance LLC 2021-1A Class A2I(1) | 2.05 | 11/20/51 | 291,750 | 274,524 | ||||||||||
| DB Master Finance LLC 2021-1A Class A2II(1) | 2.49 | 11/20/51 | 194,500 | 175,875 | ||||||||||
| Domino’s Pizza Master Issuer LLC 2018-1A Class A2I(1) | 4.12 | 07/25/48 | 213,188 | 211,401 | ||||||||||
| Domino’s Pizza Master Issuer LLC 2021-1A Class A2I(1) | 2.66 | 04/25/51 | 413,313 | 374,476 | ||||||||||
| Elmwood CLO 30 Ltd. 2024-6A Class A (CME Term SOFR 3 Month + 1.43%)(1) | 6.73 | 07/17/37 | 450,000 | 452,528 | ||||||||||
| Elmwood CLO 31 Ltd. 2024-7A Class A1 (CME Term SOFR 3 Month + 1.35%)(1) | 6.19 | 07/17/37 | 325,000 | 325,558 | ||||||||||
| Elmwood CLO I Ltd. 2019-1A Class A1RR (CME Term SOFR 3 Month + 1.52%)(1) | 6.14 | 04/20/37 | 650,000 | 652,542 | ||||||||||
| LCM XVIII LP 18A Class A1R (CME Term SOFR 3 Month + 1.28%)(1) | 5.90 | 04/20/31 | 184,651 | 185,048 | ||||||||||
| NextGear Floorplan Master Owner Trust 2023-1A Class A2(1) | 5.74 | 03/15/28 | 100,000 | 101,340 | ||||||||||
| Palmer Square CLO 2022-4 Ltd. 2022-4A Class A1R (CME Term SOFR 3 Month + 1.35%)(1) | ZCP | 10/20/37 | 500,000 | 500,002 | ||||||||||
| PFS Financing Corp. 2022-D Class A(1) | 4.27 | 08/15/27 | 100,000 | 99,577 | ||||||||||
| Planet Fitness Master Issuer LLC 2022-1A Class A2I(1) | 3.25 | 12/05/51 | 254,475 | 243,360 | ||||||||||
| SERVPRO Master Issuer LLC 2019-1A Class A2(1) | 3.88 | 10/25/49 | 356,250 | 345,403 | ||||||||||
| TCI-Flatiron CLO 2016-1 Ltd. 2016-1A Class AR3 (CME Term SOFR 3 Month + 1.10%)(1) | 5.75 | 01/17/32 | 131,852 | 131,918 | ||||||||||
| Tricon Residential Trust 2023-SFR1 Class A(1) | 5.10 | 07/17/40 | 99,908 | 98,946 | ||||||||||
| Tricon Residential Trust 2023-SFR2 Class A(1) | 5.00 | 12/17/40 | 395,529 | 393,294 | ||||||||||
| Wendy’s Funding LLC 2019-1A Class A2I(1) | 3.78 | 06/15/49 | 446,218 | 435,672 | ||||||||||
| Wheels Fleet Lease Funding 1 LLC 2023-1A Class A(1) | 5.80 | 04/18/38 | 435,111 | 437,395 | ||||||||||
| TOTAL ASSET-BACKED SECURITIES (Cost - $8,202,791) | 8,243,974 | |||||||||||||
| COLLATERALIZED MORTGAGE OBLIGATIONS – 8.3% | ||||||||||||||
| BX Commercial Mortgage Trust 2021-VOLT Class A (CME Term SOFR 1 Month + 0.81%)(1) | 5.62 | 09/15/36 | 625,000 | 621,795 | ||||||||||
| BX Commercial Mortgage Trust 2024-XL4 Class A (CME Term SOFR 1 Month + 1.44%)(1) | 6.25 | 02/15/39 | 563,765 | 565,764 | ||||||||||
| BX Commercial Mortgage Trust 2024-XL5 Class A (CME Term SOFR 1 Month + 1.39%)(1) | 6.20 | 03/15/41 | 221,896 | 222,398 | ||||||||||
| BX Trust 2022-CLS Class A(1) | 5.76 | 10/13/27 | 221,000 | 219,956 | ||||||||||
| BX Trust 2024-BIO Class A (CME Term SOFR 1 Month + 1.64%)(1) | 6.45 | 02/15/41 | 361,000 | 362,511 | ||||||||||
The accompanying notes are an integral part of these financial statements.
193
BONDBLOXX ETF TRUST
BondBloxx IR+M Tax-Aware Short Duration ETF
Portfolio of Investments (Continued)
October 31, 2024
| Rate (%) | Maturity | Face Amount | Value | |||||||||||
| COLLATERALIZED MORTGAGE OBLIGATIONS – 8.3% (Continued) | ||||||||||||||
| BX Trust 2024-CNYN Class A (CME Term SOFR 1 Month + 1.44%)(1) | 6.25 | 04/15/41 | $ | 356,067 | $ | 356,571 | ||||||||
| Citigroup Commercial Mortgage Trust 2016-GC37 Class A3 | 3.05 | 04/10/49 | 87,633 | 85,830 | ||||||||||
| COMM Mortgage Trust 2015-CR23 Class A4 | 3.50 | 05/10/48 | 130,000 | 129,073 | ||||||||||
| COMM Mortgage Trust 2015-CR27 Class A4 | 3.61 | 10/10/48 | 350,000 | 345,144 | ||||||||||
| COMM Mortgage Trust 2015-LC19 Class A4 | 3.18 | 02/10/48 | 715,000 | 712,448 | ||||||||||
| Fashion Show Mall LLC 2024-SHOW Class A(1) | 5.27 | 10/10/41 | 500,000 | 491,891 | ||||||||||
| GS Mortgage Securities Corp. Trust 2023-SHIP Class A(1) | 4.32 | 09/10/38 | 165,000 | 162,561 | ||||||||||
| GS Mortgage Securities Trust 2016-GS2 Class A4 | 3.05 | 05/10/49 | 85,000 | 82,728 | ||||||||||
| J.P. Morgan BB Commercial Mortgage Securities Trust 2015-C28 2015-C28 Class A4 | 3.23 | 10/15/48 | 575,000 | 571,192 | ||||||||||
| J.P. Morgan BB Commercial Mortgage Securities Trust 2015-C33 2015-C33 Class A4 | 3.77 | 12/15/48 | 607,000 | 599,017 | ||||||||||
| JP Morgan Mortgage Trust 2024-9 Class A6A(1) | 5.00 | 02/25/55 | 429,563 | 423,575 | ||||||||||
| KIND Commercial Mortgage Trust 2024-1 Class A (CME Term SOFR 1 Month + 1.89%)(1) | 6.69 | 08/15/41 | 367,000 | 368,167 | ||||||||||
| Morgan Stanley Bank of America Merrill Lynch Trust 2015-C24 Class A3 | 3.48 | 05/15/48 | 123,846 | 122,804 | ||||||||||
| Morgan Stanley Bank of America Merrill Lynch Trust 2015-C24 Class A4 | 3.73 | 05/15/48 | 523,000 | 517,398 | ||||||||||
| Morgan Stanley Bank of America Merrill Lynch Trust 2015-C25 Class A4 | 3.37 | 10/15/48 | 50,000 | 49,425 | ||||||||||
| Morgan Stanley Bank of America Merrill Lynch Trust 2016-C32 Class A4 | 3.72 | 12/15/49 | 393,000 | 380,885 | ||||||||||
| Sequoia Mortgage Trust 2024-7 Class A11(1) | 6.00 | 08/25/54 | 206,079 | 206,194 | ||||||||||
| UBS Commercial Mortgage Trust 2019-C16 Class ASB | 3.46 | 04/15/52 | 309,378 | 300,082 | ||||||||||
| Wells Fargo Commercial Mortgage Trust 2015-C29 Class A4 | 3.64 | 06/15/48 | 522,000 | 517,371 | ||||||||||
| Wells Fargo Commercial Mortgage Trust 2015-C31 Class A4 | 3.70 | 11/15/48 | 90,000 | 88,874 | ||||||||||
| Wells Fargo Commercial Mortgage Trust 2015-LC22 Class A4 | 3.84 | 09/15/58 | 300,000 | 296,559 | ||||||||||
| TOTAL COLLATERALIZED MORTGAGE OBLIGATIONS (Cost - $8,744,210) | 8,800,213 | |||||||||||||
| CORPORATE BONDS – 18.1% | ||||||||||||||
| AIRLINES – 0.2% | ||||||||||||||
| Delta Air Lines 2020-1 Class AA Pass Through Trust | 2.00 | 06/10/28 | 282,266 | 262,575 | ||||||||||
| APPAREL – 0.1% | ||||||||||||||
| William Carter Co.(1) | 5.63 | 03/15/27 | 91,000 | 90,548 | ||||||||||
| AUTO MANUFACTURERS – 0.4% | ||||||||||||||
| Ford Motor Credit Co. LLC | 2.70 | 08/10/26 | 400,000 | 381,886 | ||||||||||
| AUTO PARTS & EQUIPMENT – 0.2% | ||||||||||||||
| Dana, Inc. | 5.63 | 06/15/28 | 262,000 | 254,539 | ||||||||||
| BANKS – 4.0% | ||||||||||||||
| Bank of America Corp.(2) | 4.38 | - | 350,000 | 337,996 | ||||||||||
| Bank of New York Mellon Corp.(2) | 4.70 | - | 319,000 | 317,111 | ||||||||||
| Barclays PLC | 5.83 | 05/09/27 | 200,000 | 202,454 | ||||||||||
| Citigroup, Inc.(2) | 4.00 | - | 350,000 | 341,466 | ||||||||||
| Depository Trust & Clearing Corp.(1),(2) | 3.38 | - | 500,000 | 479,048 | ||||||||||
| HSBC Holdings PLC | 5.89 | 08/14/27 | 200,000 | 203,635 | ||||||||||
| JPMorgan Chase & Co. | 1.58 | 04/22/27 | 183,000 | 174,653 | ||||||||||
| Morgan Stanley | 0.99 | 12/10/26 | 164,000 | 157,110 | ||||||||||
| Northern Trust Corp.(2) | 4.60 | - | 384,000 | 381,324 | ||||||||||
| PNC Financial Services Group, Inc.(2) | 6.00 | - | 400,000 | 401,437 | ||||||||||
| Truist Financial Corp. | 4.26 | 07/28/26 | 77,000 | 76,542 | ||||||||||
The accompanying notes are an integral part of these financial statements.
194
BONDBLOXX ETF TRUST
BondBloxx IR+M Tax-Aware Short Duration ETF
Portfolio of Investments (Continued)
October 31, 2024
| Rate (%) | Maturity | Face Amount | Value | |||||||||||
| BANKS – 4.0% (Continued) | ||||||||||||||
| Truist Financial Corp.(2) | 4.95 | - | $ | 334,000 | $ | 330,950 | ||||||||
| US Bancorp(2) | 3.70 | - | 500,000 | 469,879 | ||||||||||
| Wells Fargo & Co.(2) | 3.90 | - | 349,000 | 338,219 | ||||||||||
| 4,211,824 | ||||||||||||||
| CHEMICALS – 0.2% | ||||||||||||||
| Methanex Corp. | 5.13 | 10/15/27 | 175,000 | 170,456 | ||||||||||
| COMMERCIAL SERVICES – 1.0% | ||||||||||||||
| Ashtead Capital, Inc.(1) | 4.00 | 05/01/28 | 200,000 | 192,802 | ||||||||||
| Brink’s Co.(1) | 4.63 | 10/15/27 | 214,000 | 208,770 | ||||||||||
| Element Fleet Management Corp.(1) | 5.64 | 03/13/27 | 314,000 | 318,413 | ||||||||||
| Triton Container International Ltd.(1) | 2.05 | 04/15/26 | 344,000 | 328,214 | ||||||||||
| 1,048,199 | ||||||||||||||
| COMPUTERS – 0.6% | ||||||||||||||
| Genpact Luxembourg Sarl/Genpact USA, Inc. | 1.75 | 04/10/26 | 233,000 | 222,781 | ||||||||||
| Seagate HDD Cayman | 4.75 | 01/01/25 | 89,000 | 88,759 | ||||||||||
| Western Digital Corp. | 4.75 | 02/15/26 | 290,000 | 286,782 | ||||||||||
| 598,322 | ||||||||||||||
| COSMETICS/PERSONAL CARE – 0.1% | ||||||||||||||
| Coty, Inc.(1) | 5.00 | 04/15/26 | 91,000 | 90,608 | ||||||||||
| DIVERSIFIED FINANCIAL SERVICES – 1.8% | ||||||||||||||
| American Express Co.(2) | 3.55 | - | 380,000 | 360,638 | ||||||||||
| Aviation Capital Group LLC(1) | 1.95 | 01/30/26 | 291,000 | 279,586 | ||||||||||
| Charles Schwab Corp.(2) | 5.38 | - | 360,000 | 359,040 | ||||||||||
| GGAM Finance Ltd.(1) | 7.75 | 05/15/26 | 268,000 | 272,879 | ||||||||||
| Navient Corp. | 5.00 | 03/15/27 | 171,000 | 168,253 | ||||||||||
| Navient Corp. | 6.75 | 06/15/26 | 95,000 | 96,888 | ||||||||||
| OneMain Finance Corp. | 3.50 | 01/15/27 | 316,000 | 301,816 | ||||||||||
| United Wholesale Mortgage LLC(1) | 5.50 | 11/15/25 | 91,000 | 90,605 | ||||||||||
| 1,929,705 | ||||||||||||||
| ELECTRIC – 0.2% | ||||||||||||||
| NextEra Energy Operating Partners LP(1) | 3.88 | 10/15/26 | 262,000 | 252,782 | ||||||||||
| ENTERTAINMENT – 0.4% | ||||||||||||||
| Warnermedia Holdings, Inc. | 3.76 | 03/15/27 | 442,000 | 425,755 | ||||||||||
| ENVIRONMENTAL CONTROL – 0.1% | ||||||||||||||
| GFL Environmental, Inc.(1) | 5.13 | 12/15/26 | 92,000 | 91,164 | ||||||||||
| HOME BUILDERS – 0.2% | ||||||||||||||
| Tri Pointe Homes, Inc. | 5.25 | 06/01/27 | 240,000 | 237,670 | ||||||||||
The accompanying notes are an integral part of these financial statements.
195
BONDBLOXX ETF TRUST
BondBloxx IR+M Tax-Aware Short Duration ETF
Portfolio of Investments (Continued)
October 31, 2024
| Rate (%) | Maturity | Face Amount | Value | |||||||||||
| INSURANCE – 1.4% | ||||||||||||||
| Athene Global Funding(1) | 1.73 | 10/02/26 | $ | 359,000 | $ | 338,468 | ||||||||
| F&G Global Funding(1) | 1.75 | 06/30/26 | 398,000 | 375,772 | ||||||||||
| MetLife, Inc.(2) | 3.85 | - | 369,000 | 362,013 | ||||||||||
| SBL Holdings, Inc.(1) | 5.13 | 11/13/26 | 415,000 | 406,709 | ||||||||||
| 1,482,962 | ||||||||||||||
| INVESTMENT COMPANIES – 1.6% | ||||||||||||||
| Antares Holdings LP(1) | 3.95 | 07/15/26 | 500,000 | 483,030 | ||||||||||
| Barings BDC, Inc. | 3.30 | 11/23/26 | 99,000 | 94,138 | ||||||||||
| Blue Owl Technology Finance Corp.(1) | 3.75 | 06/17/26 | 268,000 | 257,078 | ||||||||||
| Golub Capital BDC, Inc. | 2.50 | 08/24/26 | 280,000 | 265,393 | ||||||||||
| HPS Corporate Lending Fund(1) | 6.75 | 01/30/29 | 227,000 | 231,672 | ||||||||||
| Oaktree Specialty Lending Corp. | 2.70 | 01/15/27 | 197,000 | 184,185 | ||||||||||
| Sixth Street Lending Partners(1) | 6.50 | 03/11/29 | 220,000 | 221,959 | ||||||||||
| 1,737,455 | ||||||||||||||
| IRON/STEEL – 0.1% | ||||||||||||||
| Mineral Resources Ltd.(1) | 8.13 | 05/01/27 | 93,000 | 93,746 | ||||||||||
| LEISURE TIME – 0.3% | ||||||||||||||
| Royal Caribbean Cruises Ltd.(1) | 5.50 | 08/31/26 | 291,000 | 291,510 | ||||||||||
| MEDIA – 0.3% | ||||||||||||||
| CCO Holdings LLC/CCO Holdings Capital Corp.(1) | 5.13 | 05/01/27 | 207,000 | 202,845 | ||||||||||
| CCO Holdings LLC/CCO Holdings Capital Corp.(1) | 5.50 | 05/01/26 | 91,000 | 90,767 | ||||||||||
| 293,612 | ||||||||||||||
| MINING – 0.2% | ||||||||||||||
| Novelis Corp.(1) | 3.25 | 11/15/26 | 191,000 | 183,903 | ||||||||||
| OIL & GAS – 0.2% | ||||||||||||||
| Civitas Resources, Inc.(1) | 5.00 | 10/15/26 | 245,000 | 240,820 | ||||||||||
| PACKAGING & CONTAINERS – 0.3% | ||||||||||||||
| Berry Global, Inc.(1) | 4.50 | 02/15/26 | 320,000 | 315,987 | ||||||||||
| PHARMACEUTICALS – 1.0% | ||||||||||||||
| CVS Pass-Through Trust(1) | 5.77 | 01/10/33 | 229,196 | 228,113 | ||||||||||
| CVS Pass-Through Trust(1) | 5.93 | 01/10/34 | 347,103 | 348,344 | ||||||||||
| CVS Pass-Through Trust | 6.04 | 12/10/28 | 287,406 | 290,490 | ||||||||||
| CVS Pass-Through Trust | 6.94 | 01/10/30 | 175,563 | 180,688 | ||||||||||
| 1,047,635 | ||||||||||||||
| PIPELINES – 0.4% | ||||||||||||||
| Antero Midstream Partners LP/Antero Midstream Finance Corp.(1) | 5.75 | 03/01/27 | 333,000 | 332,631 | ||||||||||
| Buckeye Partners LP | 3.95 | 12/01/26 | 142,000 | 136,637 | ||||||||||
| 469,268 | ||||||||||||||
| PRIVATE EQUITY – 0.3% | ||||||||||||||
| Hercules Capital, Inc. | 2.63 | 09/16/26 | 288,000 | 273,019 | ||||||||||
The accompanying notes are an integral part of these financial statements.
196
BONDBLOXX ETF TRUST
BondBloxx IR+M Tax-Aware Short Duration ETF
Portfolio of Investments (Continued)
October 31, 2024
| Rate (%) | Maturity | Face Amount | Value | |||||||||||
| REAL ESTATE INVESTMENT TRUSTS (REITS) – 1.6% | ||||||||||||||
| Boston Properties LP | 2.75 | 10/01/26 | $ | 420,000 | $ | 402,784 | ||||||||
| EPR Properties | 4.75 | 12/15/26 | 445,000 | 441,192 | ||||||||||
| SBA Communications Corp. | 3.88 | 02/15/27 | 298,000 | 288,618 | ||||||||||
| Starwood Property Trust, Inc.(1) | 4.38 | 01/15/27 | 212,000 | 204,525 | ||||||||||
| VICI Properties LP | 4.38 | 05/15/25 | 381,000 | 379,432 | ||||||||||
| 1,716,551 | ||||||||||||||
| RETAIL – 0.9% | ||||||||||||||
| Academy Ltd.(1) | 6.00 | 11/15/27 | 291,000 | 290,448 | ||||||||||
| Bath & Body Works, Inc. | 6.69 | 01/15/27 | 161,000 | 164,950 | ||||||||||
| Beacon Roofing Supply, Inc.(1) | 4.50 | 11/15/26 | 242,000 | 237,400 | ||||||||||
| Lithia Motors, Inc.(1) | 4.63 | 12/15/27 | 287,000 | 278,712 | ||||||||||
| 971,510 | ||||||||||||||
| TOTAL CORPORATE BONDS (Cost - $18,978,489) | 19,164,011 | |||||||||||||
| MUNICIPAL BONDS – 64.2% | ||||||||||||||
| ALABAMA – 4.2% | ||||||||||||||
| Black Belt Energy Gas District, Revenue Bonds | 4.00 | 10/01/52 | 1,125,000 | 1,130,079 | ||||||||||
| Black Belt Energy Gas District, Series A-1, Revenue Bonds | 4.00 | 10/01/49 | 750,000 | 754,540 | ||||||||||
| Houston County Health Care Authority, Revenue Bonds | 5.00 | 10/01/25 | 1,000,000 | 1,010,390 | ||||||||||
| Southeast Energy Authority A Cooperative District, Series A, Revenue Bonds | 5.25 | 01/01/54 | 655,000 | 693,488 | ||||||||||
| Southeast Energy Authority A Cooperative District, Series B, Revenue Bonds | 4.00 | 06/01/29 | 700,000 | 704,859 | ||||||||||
| 4,293,356 | ||||||||||||||
| ARIZONA – 0.6% | ||||||||||||||
| Town of Prescott Valley, Series A, Revenue Bonds | 5.00 | 01/01/25 | 625,000 | 626,436 | ||||||||||
| CONNECTICUT – 0.4% | ||||||||||||||
| City of New Haven, Series A, General Obligation | 5.00 | 08/01/25 | 375,000 | 378,568 | ||||||||||
| FLORIDA – 2.0% | ||||||||||||||
| County of Miami-Dade, Series A, General Obligation | 5.00 | 07/01/28 | 175,000 | 180,861 | ||||||||||
| County of Okeechobee, Revenue Bonds | 3.80 | 07/01/39 | 550,000 | 554,904 | ||||||||||
| Hillsborough County School Board, Certificate Participation | 5.00 | 07/01/26 | 600,000 | 605,638 | ||||||||||
| Pinellas County School Board, Series A, Certificate Participation | 5.00 | 07/01/25 | 450,000 | 455,080 | ||||||||||
| School District of Broward County, Series B, Certificate Participation | 5.00 | 07/01/30 | 325,000 | 327,754 | ||||||||||
| 2,124,237 | ||||||||||||||
| GEORGIA – 1.0% | ||||||||||||||
| Development Authority of Burke County, Revenue Bonds | 3.70 | 10/01/32 | 685,000 | 698,275 | ||||||||||
| Main Street Natural Gas, Inc., Series A, Revenue Bonds | 4.00 | 07/01/52 | 290,000 | 293,467 | ||||||||||
| 991,742 | ||||||||||||||
| HAWAII – 0.2% | ||||||||||||||
| City & County of Honolulu, General Obligation | 5.00 | 03/01/25 | 185,000 | 186,038 | ||||||||||
| ILLINOIS – 14.5% | ||||||||||||||
| Chicago O’Hare International Airport, Revenue Bonds | 5.00 | 01/01/26 | 375,000 | 375,893 | ||||||||||
| City of Chicago Waterworks Revenue, Series A-1, Revenue Bonds | 5.00 | 11/01/30 | 325,000 | 335,550 | ||||||||||
The accompanying notes are an integral part of these financial statements.
197
BONDBLOXX ETF TRUST
BondBloxx IR+M Tax-Aware Short Duration ETF
Portfolio of Investments (Continued)
October 31, 2024
| Rate (%) | Maturity | Face Amount | Value | |||||||||||
| ILLINOIS – 14.5% (Continued) | ||||||||||||||
| City of Chicago, Series A, General Obligation | 5.00 | 01/01/28 | $ | 450,000 | $ | 470,668 | ||||||||
| City of Mount Vernon, General Obligation | 4.00 | 12/15/27 | 905,000 | 925,134 | ||||||||||
| Cook County School District No. 171 Sunnybrook, General Obligation | 5.00 | 12/01/27 | 465,000 | 490,878 | ||||||||||
| Cook County School District No. 25 Arlington Heights, General Obligation | 5.00 | 12/15/26 | 330,000 | 344,592 | ||||||||||
| Cook County School District No. 81 Schiller Park, General Obligation | 4.00 | 12/01/24 | 440,000 | 440,077 | ||||||||||
| County of Cook Sales Tax Revenue, Series B, Revenue Bonds | 5.00 | 11/15/25 | 925,000 | 942,888 | ||||||||||
| DuPage County Community Unit School District No. 200 Wheaton-Warrenville, General Obligation | 5.00 | 10/01/25 | 815,000 | 828,259 | ||||||||||
| Illinois Development Finance Authority, Revenue Bonds | ZCP | 07/15/25 | 675,000 | 658,550 | ||||||||||
| Illinois Finance Authority, Revenue Bonds | 5.00 | 04/01/26 | 300,000 | 305,952 | ||||||||||
| Illinois Finance Authority, Revenue Bonds | 5.00 | 04/01/27 | 305,000 | 316,597 | ||||||||||
| Illinois Finance Authority, Series A, Revenue Bonds | 5.00 | 05/15/32 | 460,000 | 481,232 | ||||||||||
| Illinois Housing Development Authority, Revenue Bonds | 5.00 | 10/01/27 | 700,000 | 721,579 | ||||||||||
| Lee County Community Unit School District No. 272, General Obligation | 4.00 | 01/01/33 | 765,000 | 770,035 | ||||||||||
| Macon County School District No. 61 Decatur, Series C, General Obligation | 4.00 | 01/01/29 | 710,000 | 720,434 | ||||||||||
| Madison County Community Unit School District No. 7 Edwardsville, Series C, Revenue Bonds | 5.00 | 12/01/26 | 290,000 | 297,487 | ||||||||||
| Madison-Macoupin Etc. Counties Community College District No. 536, General Obligation | 4.00 | 05/01/29 | 1,000,000 | 1,014,840 | ||||||||||
| Metropolitan Water Reclamation District of Greater Chicago, Series A, General Obligation | 5.00 | 12/01/29 | 180,000 | 187,012 | ||||||||||
| Northern Illinois Municipal Power Agency, Series A, Revenue Bonds | 5.00 | 12/01/30 | 430,000 | 445,501 | ||||||||||
| Peoria & Fulton Counties Community Unit School District No. 327, Series A, General Obligation | 5.00 | 12/01/27 | 435,000 | 455,032 | ||||||||||
| Peoria Public Building Commission, Series A, Revenue Bonds | 4.00 | 12/01/26 | 350,000 | 354,679 | ||||||||||
| Sales Tax Securitization Corp., Series C, Revenue Bonds | 5.50 | 01/01/33 | 1,000,000 | 1,084,900 | ||||||||||
| Sangamon Logan & Menard Counties Community Unit School Distributors No. 15 Williamsville, Series B, General Obligation | 5.00 | 12/01/32 | 650,000 | 687,378 | ||||||||||
| State of Illinois, Series D, General Obligation | 5.00 | 11/01/26 | 1,200,000 | 1,240,644 | ||||||||||
| Village of Mundelein, General Obligation | 4.00 | 12/15/33 | 460,000 | 464,179 | ||||||||||
| 15,359,970 | ||||||||||||||
| INDIANA – 4.9% | ||||||||||||||
| Carmel Local Public Improvement Bond Bank, Revenue Bonds | 5.00 | 06/01/28 | 345,000 | 356,353 | ||||||||||
| County of St Joseph, Series A, Revenue Bonds | 5.00 | 04/01/26 | 1,180,000 | 1,201,119 | ||||||||||
| Hamilton Southeastern Schools, Series A, General Obligation | 5.00 | 06/30/25 | 1,000,000 | 1,009,925 | ||||||||||
| Indiana Finance Authority, Revenue Bonds | 5.00 | 10/01/28 | 420,000 | 435,667 | ||||||||||
| Indiana Finance Authority, Series A, Revenue Bonds | 5.00 | 07/01/28 | 520,000 | 544,596 | ||||||||||
| Indiana Municipal Power Agency, Series A, Revenue Bonds | 5.00 | 01/01/27 | 1,025,000 | 1,027,702 | ||||||||||
| South Bend Redevelopment Authority, Revenue Bonds | 5.00 | 08/01/28 | 610,000 | 644,674 | ||||||||||
| 5,220,036 | ||||||||||||||
| IOWA – 0.8% | ||||||||||||||
| Iowa Finance Authority, Series E, Revenue Bonds | 5.00 | 08/15/26 | 350,000 | 356,691 | ||||||||||
| PEFA, Inc., Revenue Bonds | 5.00 | 09/01/49 | 550,000 | 562,743 | ||||||||||
| 919,434 | ||||||||||||||
The accompanying notes are an integral part of these financial statements.
198
BONDBLOXX ETF TRUST
BondBloxx IR+M Tax-Aware Short Duration ETF
Portfolio of Investments (Continued)
October 31, 2024
| Rate (%) | Maturity | Face Amount | Value | |||||||||||
| KENTUCKY – 1.9% | ||||||||||||||
| Kentucky Asset Liability Commission, Revenue Bonds | 5.00 | 09/01/27 | $ | 875,000 | $ | 886,339 | ||||||||
| Kentucky Public Energy Authority, Series C, Revenue Bonds | 4.00 | 02/01/50 | 310,000 | 312,569 | ||||||||||
| Kentucky Turnpike Authority, Series A, Revenue Bonds | 5.00 | 07/01/25 | 550,000 | 556,500 | ||||||||||
| Louisville/Jefferson County Metropolitan Government, Revenue Bonds | 5.00 | 10/01/29 | 350,000 | 358,748 | ||||||||||
| 2,114,156 | ||||||||||||||
| LOUISIANA – 0.5% | ||||||||||||||
| Louisiana Housing Corp., Series B, Revenue Bonds | 3.75 | 02/01/28 | 540,000 | 544,756 | ||||||||||
| MARYLAND – 0.5% | ||||||||||||||
| Maryland Health & Higher Educational Facilities Authority, Revenue Bonds | 5.25 | 06/01/28 | 500,000 | 525,302 | ||||||||||
| MASSACHUSETTS – 1.0% | ||||||||||||||
| Massachusetts Development Finance Agency, Revenue Bonds | 5.00 | 07/01/25 | 1,000,000 | 1,010,230 | ||||||||||
| MICHIGAN – 2.3% | ||||||||||||||
| City of Saginaw Water Supply System Revenue, Revenue Bonds | 4.00 | 07/01/25 | 215,000 | 216,263 | ||||||||||
| Michigan Finance Authority, Revenue Bonds | 5.00 | 11/15/25 | 1,205,000 | 1,226,816 | ||||||||||
| Michigan State Housing Development Authority, Series D, Revenue Bonds | 3.05 | 06/01/26 | 965,000 | 956,422 | ||||||||||
| 2,399,501 | ||||||||||||||
| MISSOURI – 0.8% | ||||||||||||||
| Health & Educational Facilities Authority of the State of Missouri, Revenue Bonds | 5.00 | 10/01/25 | 875,000 | 887,172 | ||||||||||
| NEVADA – 0.1% | ||||||||||||||
| County of Clark, Series A, General Obligation | 5.00 | 07/01/27 | 155,000 | 156,877 | ||||||||||
| NEW JERSEY – 3.7% | ||||||||||||||
| City of Newark, Series A, General Obligation | 5.00 | 07/15/25 | 390,000 | 393,664 | ||||||||||
| New Jersey Health Care Facilities Financing Authority, Revenue Bonds | 5.00 | 07/01/42 | 950,000 | 959,154 | ||||||||||
| New Jersey Housing & Mortgage Finance Agency, Series K, Revenue Bonds | 3.60 | 10/01/27 | 710,000 | 718,912 | ||||||||||
| New Jersey Transportation Trust Fund Authority, Revenue Bonds | 5.00 | 06/15/27 | 970,000 | 996,529 | ||||||||||
| New Jersey Transportation Trust Fund Authority, Revenue Bonds | 5.00 | 06/15/30 | 550,000 | 563,257 | ||||||||||
| New Jersey Transportation Trust Fund Authority, Series AA, Revenue Bonds | 5.00 | 06/15/26 | 300,000 | 308,375 | ||||||||||
| 3,939,891 | ||||||||||||||
| NEW YORK – 4.1% | ||||||||||||||
| Metropolitan Transportation Authority, Series C-1, Revenue Bonds | 5.00 | 11/15/30 | 330,000 | 338,225 | ||||||||||
| New York City Housing Development Corp., Revenue Bonds | 3.63 | 11/01/63 | 1,000,000 | 1,010,756 | ||||||||||
| New York City Municipal Water Finance Authority, Series FF, Revenue Bonds | 5.00 | 06/15/28 | 265,000 | 267,998 | ||||||||||
| New York City Transitional Finance Authority Future Tax Secured Revenue, Revenue Bonds | 4.00 | 05/01/31 | 1,100,000 | 1,109,112 | ||||||||||
| New York City Transitional Finance Authority Future Tax Secured Revenue, Series F-3, Revenue Bonds | 5.00 | 02/01/29 | 1,055,000 | 1,077,274 | ||||||||||
| New York State Dormitory Authority, Series A, Revenue Bonds | 5.00 | 03/15/32 | 355,000 | 365,658 | ||||||||||
| Troy Capital Resource Corp., Revenue Bonds | 5.00 | 09/01/25 | 360,000 | 364,580 | ||||||||||
| 4,533,603 | ||||||||||||||
The accompanying notes are an integral part of these financial statements.
199
BONDBLOXX ETF TRUST
BondBloxx IR+M Tax-Aware Short Duration ETF
Portfolio of Investments (Continued)
October 31, 2024
| Rate (%) | Maturity | Face Amount | Value | |||||||||||
| NORTH CAROLINA – 1.2% | ||||||||||||||
| North Carolina Housing Finance Agency, Revenue Bonds | 3.20 | 07/01/56 | $ | 1,275,000 | $ | 1,264,401 | ||||||||
| OHIO – 0.9% | ||||||||||||||
| Franklin County Convention Facilities Authority, Revenue Bonds | 5.00 | 12/01/26 | 990,000 | 992,689 | ||||||||||
| OKLAHOMA – 0.7% | ||||||||||||||
| Coweta Public Works Authority, Series A, Revenue Bonds | 4.00 | 08/01/27 | 505,000 | 509,857 | ||||||||||
| Oklahoma Municipal Power Authority, Series B, Revenue Bonds | 5.00 | 01/01/25 | 170,000 | 170,333 | ||||||||||
| 680,190 | ||||||||||||||
| OREGON – 1.0% | ||||||||||||||
| Oregon State Lottery, Series D, Revenue Bonds | 5.00 | 04/01/27 | 520,000 | 524,093 | ||||||||||
| State of Oregon, General Obligation | 3.90 | 06/01/39 | 500,000 | 500,000 | ||||||||||
| 1,024,093 | ||||||||||||||
| PENNSYLVANIA – 2.9% | ||||||||||||||
| City of Scranton, General Obligation | 5.00 | 09/01/29 | 515,000 | 531,167 | ||||||||||
| Pennsylvania Turnpike Commission Oil Franchise Tax Revenue, Series B, Revenue Bonds | 5.00 | 12/01/28 | 500,000 | 520,083 | ||||||||||
| Philadelphia Authority for Industrial Development, Revenue Bonds | 5.00 | 12/01/27 | 650,000 | 661,982 | ||||||||||
| Philadelphia Gas Works Co., Revenue Bonds | 5.00 | 10/01/30 | 325,000 | 335,317 | ||||||||||
| Sports & Exhibition Authority of Pittsburgh & Allegheny County, Series B, Revenue Bonds | 4.00 | 02/01/26 | 1,100,000 | 1,112,128 | ||||||||||
| 3,160,677 | ||||||||||||||
| RHODE ISLAND – 0.6% | ||||||||||||||
| Rhode Island Commerce Corp., Revenue Bonds | 5.00 | 07/01/31 | 445,000 | 453,317 | ||||||||||
| Rhode Island Commerce Corp., Series B, Revenue Bonds | 5.00 | 06/15/27 | 250,000 | 257,720 | ||||||||||
| 711,037 | ||||||||||||||
| SOUTH CAROLINA – 1.2% | ||||||||||||||
| Dillon County School Facilities Corp., Certificate Participation | 5.00 | 12/01/30 | 300,000 | 321,733 | ||||||||||
| South Carolina Jobs-Economic Development Authority, Revenue Bonds | 5.00 | 05/01/33 | 900,000 | 940,350 | ||||||||||
| 1,262,083 | ||||||||||||||
| TENNESSEE – 1.6% | ||||||||||||||
| Chattanooga Health Educational & Housing Facility Board, Revenue Bonds | 3.80 | 12/01/29 | 1,000,000 | 1,010,985 | ||||||||||
| Tennergy Corp., Revenue Bonds | 5.00 | 10/01/54 | 600,000 | 638,089 | ||||||||||
| 1,649,074 | ||||||||||||||
| TEXAS – 3.1% | ||||||||||||||
| Capital Area Housing Finance Corp., Revenue Bonds | 3.48 | 08/01/39 | 280,000 | 279,548 | ||||||||||
| City of Dallas Hotel Occupancy Tax Revenue, Revenue Bonds | 4.00 | 08/15/28 | 550,000 | 554,336 | ||||||||||
| City of Dallas Housing Finance Corp., Revenue Bonds | 5.00 | 08/01/27 | 600,000 | 617,213 | ||||||||||
| City of Round Rock, Series A, General Obligation | 4.00 | 08/15/25 | 200,000 | 201,308 | ||||||||||
| Lower Colorado River Authority, Revenue Bonds | 5.00 | 05/15/25 | 165,000 | 166,457 | ||||||||||
| Metropolitan Transit Authority of Harris County Sales & Use Tax Revenue, Series A, Revenue Bonds | 5.00 | 11/01/27 | 165,000 | 171,801 | ||||||||||
| North East Independent School District, General Obligation | 3.75 | 08/01/49 | 1,110,000 | 1,122,534 | ||||||||||
| 3,113,197 | ||||||||||||||
The accompanying notes are an integral part of these financial statements.
200
BONDBLOXX ETF TRUST
BondBloxx IR+M Tax-Aware Short Duration ETF
Portfolio of Investments (Continued)
October 31, 2024
| Rate (%) | Maturity | Face Amount | Value | |||||||||||
| VIRGINIA – 0.5% | ||||||||||||||
| Louisa Industrial Development Authority, Revenue Bonds | 3.80 | 11/01/35 | $ | 550,000 | $ | 560,028 | ||||||||
| WASHINGTON – 3.8% | ||||||||||||||
| King County School District No. 411 Issaquah, General Obligation | 4.00 | 12/01/31 | 1,775,000 | 1,788,415 | ||||||||||
| Pend Oreille County Public Utility District No. 1 Box Canyon, Revenue Bonds | 5.00 | 01/01/33 | 970,000 | 1,009,633 | ||||||||||
| Port of Tacoma, Series A, General Obligation | 5.00 | 12/01/27 | 605,000 | 630,185 | ||||||||||
| Washington Higher Education Facilities Authority, Revenue Bonds | 5.00 | 05/01/31 | 500,000 | 518,184 | ||||||||||
| 3,946,417 | ||||||||||||||
| WEST VIRGINIA – 1.0% | ||||||||||||||
| West Virginia Housing Development Fund, Series A, Revenue Bonds | 3.25 | 11/01/27 | 1,100,000 | 1,100,612 | ||||||||||
| WISCONSIN – 2.2% | ||||||||||||||
| Public Finance Authority, Revenue Bonds | 5.00 | 06/01/26 | 330,000 | 335,979 | ||||||||||
| State of Wisconsin, Series 1, General Obligation | 5.00 | 11/01/25 | 750,000 | 756,280 | ||||||||||
| Wisconsin Housing & Economic Development Authority, Revenue Bonds | 5.00 | 08/01/58 | 600,000 | 617,110 | ||||||||||
| Wisconsin Housing & Economic Development Authority, Series I, Revenue Bonds | 5.00 | 11/01/58 | 600,000 | 622,463 | ||||||||||
| 2,331,832 | ||||||||||||||
| TOTAL MUNICIPAL BONDS (Cost - $67,941,727) | 68,007,635 | |||||||||||||
| SHORT-TERM INVESTMENTS – 1.0% | ||||||||||||||
| TIME DEPOSITS – 1.0% | ||||||||||||||
| JP Morgan Chase, New York | 4.18 | 11/01/24 | 1,110,139 | 1,110,139 | ||||||||||
| TOTAL SHORT-TERM INVESTMENTS (Cost - $1,110,139) | 1,110,139 | |||||||||||||
| TOTAL INVESTMENTS – 99.4% (Cost - $104,977,356) | $ | 105,325,972 | ||||||||||||
| OTHER ASSETS LESS LIABILITIES – 0.6% | 592,849 | |||||||||||||
| NET ASSETS – 100.0% | $ | 105,918,821 | ||||||||||||
| SOFR | Secured Overnight Financing Rate |
| ZCP | Indicates a zero coupon rate. |
| (1) | Security was purchased pursuant to Rule 144A under the Securities Act of 1933 and may not be resold subject to that Rule except to qualified institutional buyers. The aggregate value of Rule 144A holdings at October 31, 2024, amounts to $20,595,215 and represents 19.4% of net assets. These securities have been deemed liquid under procedures approved by the Trust’s Board of Trustees. |
| (2) | Security is perpetual in nature and has no stated maturity date. |
The accompanying notes are an integral part of these financial statements.
201
BONDBLOXX ETF TRUST
Statements of Assets and Liabilities
October 31, 2024
BondBloxx USD High Yield Bond Industrial Sector ETF | BondBloxx USD High Yield Bond | BondBloxx USD High Yield Bond Healthcare Sector ETF | BondBloxx USD High Yield Bond Financial & REIT | BondBloxx USD High Yield Bond Energy Sector ETF | ||||||||||||||||
| ASSETS: | ||||||||||||||||||||
| Investments in securities, at value | $ | 81,633,477 | $ | 107,203,111 | $ | 47,249,138 | $ | 57,253,227 | $ | 13,575,245 | ||||||||||
| Cash | 5,001 | 7,539 | - | - | - | |||||||||||||||
| Receivable for investments sold | 20,528 | 1,590,655 | 199,137 | 2,138,831 | 630,030 | |||||||||||||||
| Interest income receivable | 1,308,006 | 1,861,760 | 680,977 | 936,241 | 248,840 | |||||||||||||||
| TOTAL ASSETS | 82,967,012 | 110,663,065 | 48,129,252 | 60,328,299 | 14,454,115 | |||||||||||||||
| LIABILITIES: | ||||||||||||||||||||
| Payable for investments purchased | 948,968 | 2,702,225 | 600,354 | 2,089,718 | 775,533 | |||||||||||||||
| Management fees payable (Note 3) | 23,912 | 31,615 | 14,025 | 17,189 | 4,125 | |||||||||||||||
| TOTAL LIABILITIES | 972,880 | 2,733,840 | 614,379 | 2,106,907 | 779,658 | |||||||||||||||
| NET ASSETS | $ | 81,994,132 | $ | 107,929,225 | $ | 47,514,873 | $ | 58,221,392 | $ | 13,674,457 | ||||||||||
| COMPONENTS OF NET ASSETS | ||||||||||||||||||||
| Paid-in capital | 81,307,579 | 106,245,782 | 47,337,553 | 56,702,769 | 13,836,166 | |||||||||||||||
| Total distributable earnings/(accumulated loss) | 686,553 | 1,683,443 | 177,320 | 1,518,623 | (161,709 | ) | ||||||||||||||
| NET ASSETS | $ | 81,994,132 | $ | 107,929,225 | $ | 47,514,873 | $ | 58,221,392 | $ | 13,674,457 | ||||||||||
| Shares outstanding | 2,150,000 | 3,100,000 | 1,350,000 | 1,550,000 | 352,500 | |||||||||||||||
| Net asset value, offering and redemption price per share | $ | 38.14 | $ | 34.82 | $ | 35.20 | $ | 37.56 | $ | 38.79 | ||||||||||
| Investment in securities, at cost | $ | 81,183,136 | $ | 105,659,351 | $ | 46,796,565 | $ | 55,846,316 | $ | 13,648,190 | ||||||||||
The accompanying notes are an integral part of these financial statements.
202
BONDBLOXX ETF TRUST
Statements of Assets and Liabilities (Continued)
October 31, 2024
BondBloxx USD High Yield Bond Consumer Cyclicals Sector ETF | BondBloxx USD High Yield Bond Consumer Non-Cyclicals | BondBloxx USD High Yield Bond Sector Rotation ETF | BondBloxx BB Rated USD High Yield Corporate Bond ETF | BondBloxx B Rated USD High Yield Corporate Bond ETF | ||||||||||||||||
| ASSETS: | ||||||||||||||||||||
| Investments in securities, at value | $ | 70,728,664 | $ | 30,556,131 | $ | 28,192,601 | (a) | $ | 60,322,699 | $ | 17,725,146 | |||||||||
| Cash | - | 2,494 | - | - | - | |||||||||||||||
| Receivable for investments sold | 1,280,900 | 797,033 | - | 911,560 | 352,954 | |||||||||||||||
| Interest income receivable | 1,123,717 | 399,344 | - | 885,001 | 308,488 | |||||||||||||||
| Due from the Adviser | - | - | 57,256 | - | - | |||||||||||||||
| TOTAL ASSETS | 73,133,281 | 31,755,002 | 28,249,857 | 62,119,260 | 18,386,588 | |||||||||||||||
| LIABILITIES: | ||||||||||||||||||||
| Payable for investments purchased | 1,782,187 | 1,284,816 | - | 1,435,666 | 552,486 | |||||||||||||||
| Management fees payable (Note 3) | 20,695 | 8,795 | - | 10,285 | 4,377 | |||||||||||||||
| Administration fees payable (Note 3) | - | - | 8,905 | - | - | |||||||||||||||
| Audit fees payable | - | - | 35,494 | - | - | |||||||||||||||
| Legal fees payable | - | - | 33,681 | - | - | |||||||||||||||
| TOTAL LIABILITIES | 1,802,882 | 1,293,611 | 78,080 | 1,445,951 | 556,863 | |||||||||||||||
| NET ASSETS | $ | 71,330,399 | $ | 30,461,391 | $ | 28,171,777 | $ | 60,673,309 | $ | 17,829,725 | ||||||||||
| COMPONENTS OF NET ASSETS | ||||||||||||||||||||
| Paid-in capital | 70,620,544 | 30,264,667 | 86,704,856 | 59,921,841 | 17,747,049 | |||||||||||||||
| Total distributable earnings/(accumulated loss) | 709,855 | 196,724 | (58,533,079 | ) | 751,468 | 82,676 | ||||||||||||||
| NET ASSETS | $ | 71,330,399 | $ | 30,461,391 | $ | 28,171,777 | $ | 60,673,309 | $ | 17,829,725 | ||||||||||
| Shares outstanding | 1,900,000 | 800,000 | 1,860,000 | 1,500,000 | 450,000 | |||||||||||||||
| Net asset value, offering and redemption price per share | $ | 37.54 | $ | 38.08 | $ | 15.15 | $ | 40.45 | $ | 39.62 | ||||||||||
| Investment in securities, at cost | $ | 70,189,217 | $ | 30,406,182 | $ | 27,479,299 | $ | 59,089,745 | $ | 17,382,182 | ||||||||||
| (a) | For the BondBloxx USD High Yield Bond Sector Rotation ETF, $28,154,797 (cost $27,441,495) is invested in affiliated investment companies of the BondBloxx ETF Trust. |
The accompanying notes are an integral part of these financial statements.
203
BONDBLOXX ETF TRUST
Statements of Assets and Liabilities (Continued)
October 31, 2024
BondBloxx CCC Rated | BondBloxx BBB Rated 1-5 Year Corporate Bond ETF | BondBloxx BBB Rated 5-10 Year Corporate | BondBloxx BBB Rated 10+ Year Corporate Bond ETF | BondBloxx JP Morgan USD Emerging | ||||||||||||||||
| ASSETS: | ||||||||||||||||||||
| Investments in securities, at value | $ | 102,891,231 | $ | 62,677,229 | $ | 7,533,365 | $ | 7,307,339 | $ | 251,239,222 | ||||||||||
| Cash | 882 | - | - | - | - | |||||||||||||||
| Receivable for investments sold | 440,940 | 1,173,076 | 82,915 | 78,654 | 3,642,717 | |||||||||||||||
| Interest income receivable | 2,114,964 | 714,193 | 89,341 | 101,727 | 3,041,142 | |||||||||||||||
| TOTAL ASSETS | 105,448,017 | 64,564,498 | 7,705,621 | 7,487,720 | 257,923,081 | |||||||||||||||
| LIABILITIES: | ||||||||||||||||||||
| Due to custodian | - | - | - | - | 7,000 | |||||||||||||||
| Payable for investments purchased | 910,103 | 1,035,020 | 87,899 | 81,549 | 2,997,226 | |||||||||||||||
| Management fees payable (Note 3) | 34,245 | 9,920 | 1,240 | 1,213 | 62,525 | |||||||||||||||
| TOTAL LIABILITIES | 944,348 | 1,044,940 | 89,139 | 82,762 | 3,066,751 | |||||||||||||||
| NET ASSETS | $ | 104,503,669 | $ | 63,519,558 | $ | 7,616,482 | $ | 7,404,958 | $ | 254,856,330 | ||||||||||
| COMPONENTS OF NET ASSETS | ||||||||||||||||||||
| Paid-in capital | 102,093,175 | 62,740,120 | 7,595,425 | 7,328,975 | 243,018,850 | |||||||||||||||
| Total distributable earnings/(accumulated loss) | 2,410,494 | 779,438 | 21,057 | 75,983 | 11,837,480 | |||||||||||||||
| NET ASSETS | $ | 104,503,669 | $ | 63,519,558 | $ | 7,616,482 | $ | 7,404,958 | $ | 254,856,330 | ||||||||||
| Shares outstanding | 2,650,000 | 1,250,000 | 150,000 | 150,000 | 6,050,000 | |||||||||||||||
| Net asset value, offering and redemption price per share | $ | 39.44 | $ | 50.82 | $ | 50.78 | $ | 49.37 | $ | 42.13 | ||||||||||
| Investment in securities, at cost | $ | 99,887,279 | $ | 62,190,382 | $ | 7,542,826 | $ | 7,272,778 | $ | 240,409,213 | ||||||||||
| Foreign currency, at cost | $ | - | $ | - | $ | - | $ | - | $ | 1,090 | ||||||||||
The accompanying notes are an integral part of these financial statements.
204
BONDBLOXX ETF TRUST
Statements of Assets and Liabilities (Continued)
October 31, 2024
BondBloxx Six Month Target Duration US | BondBloxx One Year Target Duration US | BondBloxx Two Year Target Duration US | BondBloxx Three Year Target Duration US | BondBloxx Five Year Target Duration US | ||||||||||||||||
| ASSETS: | ||||||||||||||||||||
| Investments in securities, at value | $ | 950,581,647 | $ | 528,579,974 | $ | 149,305,535 | $ | 99,740,849 | $ | 120,974,589 | ||||||||||
| Receivable for investments sold | 44,505,707 | 42,937,563 | 6,043,788 | 7,919,545 | 12,659,067 | |||||||||||||||
| Receivable for shares created | 3,021,678 | 994,886 | 1,974,172 | 491,358 | - | |||||||||||||||
| Interest income receivable | - | 3,662,916 | 959,659 | 606,406 | 850,633 | |||||||||||||||
| TOTAL ASSETS | 998,109,032 | 576,175,339 | 158,283,154 | 108,758,158 | 134,484,289 | |||||||||||||||
| LIABILITIES: | ||||||||||||||||||||
| Due to custodian | 1,708 | - | - | - | - | |||||||||||||||
| Payable for investments purchased | 98,141,138 | 42,916,775 | 7,748,081 | 8,028,559 | 12,475,429 | |||||||||||||||
| Management fees payable (Note 3) | 23,386 | 13,878 | 6,244 | 3,865 | 5,151 | |||||||||||||||
| TOTAL LIABILITIES | 98,166,232 | 42,930,653 | 7,754,325 | 8,032,424 | 12,480,580 | |||||||||||||||
| NET ASSETS | $ | 899,942,800 | $ | 533,244,686 | $ | 150,528,829 | $ | 100,725,734 | $ | 122,003,709 | ||||||||||
| COMPONENTS OF NET ASSETS | ||||||||||||||||||||
| Paid-in capital | 896,514,424 | 533,405,681 | 150,830,770 | 101,268,294 | 123,622,544 | |||||||||||||||
| Total distributable earnings/(accumulated loss) | 3,428,376 | (160,995 | ) | (301,941 | ) | (542,560 | ) | (1,618,835 | ) | |||||||||||
| NET ASSETS | $ | 899,942,800 | $ | 533,244,686 | $ | 150,528,829 | $ | 100,725,734 | $ | 122,003,709 | ||||||||||
| Shares outstanding | 17,870,000 | 10,720,000 | 3,050,000 | 2,050,000 | 2,510,000 | |||||||||||||||
| Net asset value, offering and redemption price per share | $ | 50.36 | $ | 49.74 | $ | 49.35 | $ | 49.13 | $ | 48.61 | ||||||||||
| Investment in securities, at cost | $ | 949,872,603 | $ | 527,867,207 | $ | 148,900,601 | $ | 99,945,491 | $ | 121,496,882 | ||||||||||
The accompanying notes are an integral part of these financial statements.
205
BONDBLOXX ETF TRUST
Statements of Assets and Liabilities (Continued)
October 31, 2024
BondBloxx Seven Year Target Duration US Treasury ETF | BondBloxx Ten Year Target Duration US Treasury ETF | BondBloxx Bloomberg Twenty Year Target Duration US Treasury ETF | BondBloxx IR+M | |||||||||||||
| ASSETS: | ||||||||||||||||
| Investments in securities, at value | $ | 108,274,912 | $ | 232,923,760 | $ | 51,222,093 | $ | 105,325,972 | ||||||||
| Receivable for investments sold | 5,834,440 | 11,203,089 | 10,451,590 | - | ||||||||||||
| Receivable for shares created | - | 925,678 | 1,238,382 | - | ||||||||||||
| Interest income receivable | 1,237,409 | 2,766,844 | 379,374 | 1,248,924 | ||||||||||||
| TOTAL ASSETS | 115,346,761 | 247,819,371 | 63,291,439 | 106,574,896 | ||||||||||||
| LIABILITIES: | ||||||||||||||||
| Due to custodian | - | - | - | 127,111 | ||||||||||||
| Payable for investments purchased | 5,510,333 | 11,760,472 | 11,272,922 | 500,000 | ||||||||||||
| Management fees payable (Note 3) | 5,209 | 15,122 | 6,207 | 28,964 | ||||||||||||
| TOTAL LIABILITIES | 5,515,542 | 11,775,594 | 11,279,129 | 656,075 | ||||||||||||
| NET ASSETS | $ | 109,831,219 | $ | 236,043,777 | $ | 52,012,310 | $ | 105,918,821 | ||||||||
| COMPONENTS OF NET ASSETS | ||||||||||||||||
| Paid-in capital | 111,197,201 | 236,958,583 | 59,445,905 | 105,341,747 | ||||||||||||
| Total distributable earnings/(accumulated loss) | (1,365,982 | ) | (914,806 | ) | (7,433,595 | ) | 577,074 | |||||||||
| NET ASSETS | $ | 109,831,219 | $ | 236,043,777 | $ | 52,012,310 | $ | 105,918,821 | ||||||||
| Shares outstanding | 2,320,000 | 5,100,000 | 1,260,000 | 2,100,000 | ||||||||||||
| Net asset value, offering and redemption price per share | $ | 47.34 | $ | 46.28 | $ | 41.28 | $ | 50.44 | ||||||||
| Investment in securities, at cost | $ | 108,716,612 | $ | 232,634,187 | $ | 53,398,773 | $ | 104,977,356 | ||||||||
The accompanying notes are an integral part of these financial statements.
206
BONDBLOXX ETF TRUST
Statements of Operations
For the Year Ended October 31, 2024
BondBloxx USD High Yield Bond | BondBloxx USD High Yield Bond | BondBloxx USD High Yield Bond Healthcare Sector ETF | BondBloxx USD High Yield Bond Financial & REIT | BondBloxx USD High Yield Bond | ||||||||||||||||
| INVESTMENT INCOME: | ||||||||||||||||||||
| Interest income | $ | 4,518,173 | $ | 3,919,696 | $ | 2,644,416 | $ | 3,326,003 | $ | 2,985,589 | ||||||||||
| Total income | 4,518,173 | 3,919,696 | 2,644,416 | 3,326,003 | 2,985,589 | |||||||||||||||
| EXPENSES: | ||||||||||||||||||||
| Management fees (Note 3) | 212,994 | 154,408 | 122,514 | 151,449 | 146,768 | |||||||||||||||
| Total Expenses | 212,994 | 154,408 | 122,514 | 151,449 | 146,768 | |||||||||||||||
| NET INVESTMENT INCOME/(LOSS) | 4,305,179 | 3,765,288 | 2,521,902 | 3,174,554 | 2,838,821 | |||||||||||||||
| NET REALIZED AND UNREALIZED GAIN/(LOSS) ON INVESTMENTS: | ||||||||||||||||||||
| Net realized gain/(loss) on: | ||||||||||||||||||||
| Investments in securities | (111,725 | ) | (481,419 | ) | 38,011 | 14,356 | 12,939 | |||||||||||||
| Unaffiliated in-kind redemptions | 1,157,632 | 19,854 | 1,419,171 | 365,836 | 1,444,177 | |||||||||||||||
| Net realized gain/(loss) | 1,045,907 | (461,565 | ) | 1,457,182 | 380,192 | 1,457,116 | ||||||||||||||
| Change in unrealized appreciation/(depreciation) on: | ||||||||||||||||||||
| Investments in securities | 2,191,941 | 2,982,979 | 1,270,042 | 2,360,059 | 415,664 | |||||||||||||||
| Change in unrealized appreciation/(depreciation) | 2,191,941 | 2,982,979 | 1,270,042 | 2,360,059 | 415,664 | |||||||||||||||
| Net Realized and Unrealized Gain/(Loss) on Investments | 3,237,848 | 2,521,414 | 2,727,224 | 2,740,251 | 1,872,780 | |||||||||||||||
| Net Increase/(Decrease) in Net Assets Resulting from Operations | $ | 7,543,027 | $ | 6,286,702 | $ | 5,249,126 | $ | 5,914,805 | $ | 4,711,601 | ||||||||||
The accompanying notes are an integral part of these financial statements.
207
BONDBLOXX ETF TRUST
Statements of Operations (Continued)
For the Year Ended October 31, 2024
BondBloxx USD High Yield Bond Sector ETF | BondBloxx USD High Yield Bond | BondBloxx USD High Yield Bond | BondBloxx BB Rated USD High Yield Corporate Bond ETF | BondBloxx B Rated USD High Yield Corporate Bond ETF | ||||||||||||||||
| INVESTMENT INCOME: | ||||||||||||||||||||
| Interest income | $ | 3,310,988 | $ | 926,925 | $ | 12,813 | $ | 3,731,432 | $ | 1,190,238 | ||||||||||
| Affiliated dividend income | - | - | 2,372,060 | - | - | |||||||||||||||
| Total income | 3,310,988 | 926,925 | 2,384,873 | 3,731,432 | 1,190,238 | |||||||||||||||
| EXPENSES: | ||||||||||||||||||||
| Management fees (Note 3) | 159,415 | 47,416 | 146,487 | 112,703 | 43,879 | |||||||||||||||
| Administration fees (Note 3) | - | - | 39,874 | - | - | |||||||||||||||
| Audit fees | - | - | 18,499 | - | - | |||||||||||||||
| Legal fees | - | - | 30,001 | - | - | |||||||||||||||
| Shareholder reporting fees | - | - | 4,499 | - | - | |||||||||||||||
| Other expenses | - | - | 5,000 | - | - | |||||||||||||||
| Total Expenses | 159,415 | 47,416 | 244,360 | 112,703 | 43,879 | |||||||||||||||
| Fee waiver and expense reimbursement | - | - | (179,149 | ) | - | - | ||||||||||||||
| Net Expenses | 159,415 | 47,416 | 65,211 | 112,703 | 43,879 | |||||||||||||||
| NET INVESTMENT INCOME/(LOSS) | 3,151,573 | 879,509 | 2,319,662 | 3,618,729 | 1,146,359 | |||||||||||||||
| NET REALIZED AND UNREALIZED GAIN/(LOSS) ON INVESTMENTS: | ||||||||||||||||||||
| Net realized gain/(loss) on: | ||||||||||||||||||||
| Unaffiliated investments in securities | (105,428 | ) | (32,146 | ) | 3,542 | (66,191 | ) | (124,812 | ) | |||||||||||
| Affiliated investments in securities | - | - | 16,708 | - | - | |||||||||||||||
| Unaffiliated in-kind redemptions | 707,853 | - | - | - | - | |||||||||||||||
| Affiliated in-kind redemptions | - | - | 294,338 | - | - | |||||||||||||||
| Net realized gain/(loss) | 602,425 | (32,146 | ) | 314,588 | (66,191 | ) | (124,812 | ) | ||||||||||||
| Change in unrealized appreciation/(depreciation) on: | ||||||||||||||||||||
| Unaffiliated investments in securities | 1,251,658 | 682,035 | - | 3,645,457 | 958,463 | |||||||||||||||
| Affiliated investments in securities | - | - | 1,506,932 | - | - | |||||||||||||||
| Change in unrealized appreciation/(depreciation) | 1,251,658 | 682,035 | 1,506,932 | 3,645,457 | 958,463 | |||||||||||||||
| Net Realized and Unrealized Gain/(Loss) on Investments | 1,854,083 | 649,889 | 1,821,520 | 3,579,266 | 833,651 | |||||||||||||||
| Net Increase/(Decrease) in Net Assets Resulting from Operations | $ | 5,005,656 | $ | 1,529,398 | $ | 4,141,182 | $ | 7,197,995 | $ | 1,980,010 | ||||||||||
The accompanying notes are an integral part of these financial statements.
208
BONDBLOXX ETF TRUST
Statements of Operations (Continued)
For the Period Ended October 31, 2024
BondBloxx CCC Rated Bond ETF | BondBloxx BBB Rated 1-5 Year Corporate Bond ETF(1) | BondBloxx BBB Rated 5-10 Year Corporate Bond ETF(1) | BondBloxx BBB Rated 10+ Year Corporate Bond ETF(1) | BondBloxx JP Morgan USD Emerging Bond ETF | ||||||||||||||||
| INVESTMENT INCOME: | ||||||||||||||||||||
| Interest income | $ | 6,452,024 | $ | 1,223,821 | $ | 213,667 | $ | 258,342 | $ | 14,393,006 | ||||||||||
| Other income | - | - | - | - | 346 | |||||||||||||||
| Total income | 6,452,024 | 1,223,821 | 213,667 | 258,342 | 14,393,352 | |||||||||||||||
| EXPENSES: | ||||||||||||||||||||
| Management fees (Note 3) | 215,565 | 44,090 | 7,747 | 8,512 | 632,132 | |||||||||||||||
| Total Expenses | 215,565 | 44,090 | 7,747 | 8,512 | 632,132 | |||||||||||||||
| NET INVESTMENT INCOME/(LOSS) | 6,236,459 | 1,179,731 | 205,920 | 249,830 | 13,761,220 | |||||||||||||||
| NET REALIZED AND UNREALIZED GAIN/(LOSS) ON INVESTMENTS: | ||||||||||||||||||||
| Net realized gain/(loss) on: | ||||||||||||||||||||
| Investments in securities | (1,209,970 | ) | 32,225 | (1,872 | ) | 6,237 | 704,576 | |||||||||||||
| Unaffiliated in-kind redemptions | 352,005 | - | - | - | 959,396 | |||||||||||||||
| Foreign currency transactions | - | - | - | - | 7 | |||||||||||||||
| Net realized gain/(loss) | (857,965 | ) | 32,225 | (1,872 | ) | 6,237 | 1,663,979 | |||||||||||||
| Change in unrealized appreciation/(depreciation) on: | ||||||||||||||||||||
| Investments in securities | 4,123,310 | 486,847 | (9,461 | ) | 34,561 | 16,280,697 | ||||||||||||||
| Foreign currency transactions | - | - | - | - | 6 | |||||||||||||||
| Change in unrealized appreciation/(depreciation) | 4,123,310 | 486,847 | (9,461 | ) | 34,561 | 16,280,703 | ||||||||||||||
| Net Realized and Unrealized Gain/(Loss) on Investments | 3,265,345 | 519,072 | (11,333 | ) | 40,798 | 17,944,682 | ||||||||||||||
| Net Increase/(Decrease) in Net Assets Resulting from Operations | $ | 9,501,804 | $ | 1,698,803 | $ | 194,587 | $ | 290,628 | $ | 31,705,902 | ||||||||||
| (1) | Fund commenced operations on January 23, 2024. |
The accompanying notes are an integral part of these financial statements.
209
BONDBLOXX ETF TRUST
Statements of Operations (Continued)
For the Year Ended October 31, 2024
BondBloxx Six Month Target Duration US | BondBloxx One Year Target Duration US | BondBloxx Two Year Target Duration US | BondBloxx Three Year Target Duration US | BondBloxx Five Year Target Duration US | ||||||||||||||||
| INVESTMENT INCOME: | ||||||||||||||||||||
| Interest income | $ | 55,836,325 | $ | 25,763,704 | $ | 5,280,128 | $ | 2,361,709 | $ | 3,201,514 | ||||||||||
| Total income | 55,836,325 | 25,763,704 | 5,280,128 | 2,361,709 | 3,201,514 | |||||||||||||||
| EXPENSES: | ||||||||||||||||||||
| Management fees (Note 3) | 327,014 | 146,987 | 57,663 | 26,600 | 39,253 | |||||||||||||||
| Other expenses | - | - | - | 50 | - | |||||||||||||||
| Total Expenses | 327,014 | 146,987 | 57,663 | 26,650 | 39,253 | |||||||||||||||
| NET INVESTMENT INCOME/(LOSS) | 55,509,311 | 25,616,717 | 5,222,465 | 2,335,059 | 3,162,261 | |||||||||||||||
| NET REALIZED AND UNREALIZED GAIN/(LOSS) ON INVESTMENTS: | ||||||||||||||||||||
| Net realized gain/(loss) on: | ||||||||||||||||||||
| Investments in securities | (163,143 | ) | (1,833,477 | ) | (546,196 | ) | (279,685 | ) | (738,401 | ) | ||||||||||
| Unaffiliated in-kind redemptions | 1,274,281 | 1,009,850 | 180,705 | 33,632 | 306,938 | |||||||||||||||
| Net realized gain/(loss) | 1,111,138 | (823,627 | ) | (365,491 | ) | (246,053 | ) | (431,463 | ) | |||||||||||
| Change in unrealized appreciation/(depreciation) on: | ||||||||||||||||||||
| Investments in securities | 1,135,352 | 1,992,594 | 1,635,022 | 371,980 | 1,008,714 | |||||||||||||||
| Change in unrealized appreciation/(depreciation) | 1,135,352 | 1,992,594 | 1,635,022 | 371,980 | 1,008,714 | |||||||||||||||
| Net Realized and Unrealized Gain/(Loss) on Investments | 2,246,490 | 1,168,967 | 1,269,531 | 125,927 | 577,251 | |||||||||||||||
| Net Increase/(Decrease) in Net Assets Resulting from Operations | $ | 57,755,801 | $ | 26,785,684 | $ | 6,491,996 | $ | 2,460,986 | $ | 3,739,512 | ||||||||||
The accompanying notes are an integral part of these financial statements.
210
BONDBLOXX ETF TRUST
Statements of Operations (Continued)
For the Period Ended October 31, 2024
BondBloxx Seven Year Target Duration US | BondBloxx Ten Year Target Duration US | BondBloxx Bloomberg Twenty Year Target Duration US Treasury ETF | BondBloxx | |||||||||||||
| INVESTMENT INCOME: | ||||||||||||||||
| Interest income | $ | 4,937,224 | $ | 6,869,038 | $ | 1,466,558 | $ | 1,692,959 | ||||||||
| Total income | 4,937,224 | 6,869,038 | 1,466,558 | 1,692,959 | ||||||||||||
| EXPENSES: | ||||||||||||||||
| Management fees (Note 3) | 57,999 | 119,832 | 41,882 | 143,453 | ||||||||||||
| Total Expenses | 57,999 | 119,832 | 41,882 | 143,453 | ||||||||||||
| NET INVESTMENT INCOME/(LOSS) | 4,879,225 | 6,749,206 | 1,424,676 | 1,549,506 | ||||||||||||
| NET REALIZED AND UNREALIZED GAIN/(LOSS) ON INVESTMENTS: | ||||||||||||||||
| Net realized gain/(loss) on: | ||||||||||||||||
| Investments in securities | (762,284 | ) | (631,311 | ) | (3,032,123 | ) | (79,673 | ) | ||||||||
| Unaffiliated in-kind redemptions | 2,343,413 | 1,368,124 | 1,050,115 | - | ||||||||||||
| Net realized gain/(loss) | 1,581,129 | 736,813 | (1,982,008 | ) | (79,673 | ) | ||||||||||
| Change in unrealized appreciation/(depreciation) on: | ||||||||||||||||
| Investments in securities | 1,725,277 | 3,397,988 | 2,757,832 | 348,616 | ||||||||||||
| Change in unrealized appreciation/(depreciation) | 1,725,277 | 3,397,988 | 2,757,832 | 348,616 | ||||||||||||
| Net Realized and Unrealized Gain/(Loss) on Investments | 3,306,406 | 4,134,801 | 775,824 | 268,943 | ||||||||||||
| Net Increase/(Decrease) in Net Assets Resulting from Operations | $ | 8,185,631 | $ | 10,884,007 | $ | 2,200,500 | $ | 1,818,449 | ||||||||
| (2) | Fund commenced operations on March 12, 2024. |
The accompanying notes are an integral part of these financial statements.
211
BONDBLOXX ETF TRUST
Statements of Changes in Net Assets
BondBloxx USD High Yield Bond Industrial Sector ETF | BondBloxx USD High Yield Bond | |||||||||||||||
| For the Year Ended October 31, 2024 | For the Year Ended October 31, 2023 | For the Year Ended October 31, 2024 | For the Year Ended October 31, 2023 | |||||||||||||
| OPERATIONS: | ||||||||||||||||
| Net investment income/(loss) | $ | 4,305,179 | $ | 1,295,469 | $ | 3,765,288 | $ | 985,587 | ||||||||
| Net realized gain/(loss) on investments | 1,045,907 | (262,560 | ) | (461,565 | ) | (285,345 | ) | |||||||||
| Net change in unrealized appreciation/(depreciation) on investments | 2,191,941 | (1,326,269 | ) | 2,982,979 | (950,315 | ) | ||||||||||
| Net increase/(decrease) in net assets resulting from operations | 7,543,027 | (293,360 | ) | 6,286,702 | (250,073 | ) | ||||||||||
| DISTRIBUTIONS TO SHAREHOLDERS: | ||||||||||||||||
| Distributions from distributable earnings | (4,150,759 | ) | (1,039,987 | ) | (3,279,475 | ) | (773,573 | ) | ||||||||
| CAPITAL TRANSACTIONS: | ||||||||||||||||
| Proceeds from shares sold | 64,498,700 | 42,210,745 | 77,171,915 | 28,696,710 | ||||||||||||
| Cost of shares redeemed | (26,741,290 | ) | (3,607,670 | ) | (1,644,690 | ) | (1,757,155 | ) | ||||||||
| Net increase/(decrease) in net assets from capital transactions | 37,757,410 | 38,603,075 | 75,527,225 | 26,939,555 | ||||||||||||
| Increase/(decrease) in net assets | 41,149,678 | 37,269,728 | 78,534,452 | 25,915,909 | ||||||||||||
| NET ASSETS: | ||||||||||||||||
| Beginning of year | 40,844,454 | 3,574,726 | 29,394,773 | 3,478,864 | ||||||||||||
| End of year | $ | 81,994,132 | $ | 40,844,454 | $ | 107,929,225 | $ | 29,394,773 | ||||||||
| CHANGES IN SHARES OUTSTANDING: | ||||||||||||||||
| Shares outstanding, beginning of year | 1,150,000 | 100,000 | 900,000 | 100,000 | ||||||||||||
| Shares sold | 1,700,000 | 1,150,000 | 2,250,000 | 850,000 | ||||||||||||
| Shares redeemed | (700,000 | ) | (100,000 | ) | (50,000 | ) | (50,000 | ) | ||||||||
| Shares outstanding, end of year | 2,150,000 | 1,150,000 | 3,100,000 | 900,000 | ||||||||||||
The accompanying notes are an integral part of these financial statements.
212
BONDBLOXX ETF TRUST
Statements of Changes in Net Assets (Continued)
BondBloxx USD High Yield Bond Healthcare Sector ETF | BondBloxx USD High Yield Bond Financial & REIT Sector ETF | |||||||||||||||
| For the Year Ended October 31, 2024 | For the Year Ended October 31, 2023 | For the Year Ended October 31, 2024 | For the Year Ended October 31, 2023 | |||||||||||||
| OPERATIONS: | ||||||||||||||||
| Net investment income/(loss) | $ | 2,521,902 | $ | 475,101 | $ | 3,174,554 | $ | 873,684 | ||||||||
| Net realized gain/(loss) on investments | 1,457,182 | (630,266 | ) | 380,192 | (342,114 | ) | ||||||||||
| Net change in unrealized appreciation/(depreciation) on investments | 1,270,042 | 6,287 | 2,360,059 | (504,288 | ) | |||||||||||
| Net increase/(decrease) in net assets resulting from operations | 5,249,126 | (148,878 | ) | 5,914,805 | 27,282 | |||||||||||
| DISTRIBUTIONS TO SHAREHOLDERS: | ||||||||||||||||
| Distributions from distributable earnings | (2,329,068 | ) | (462,631 | ) | (3,043,682 | ) | (689,760 | ) | ||||||||
| CAPITAL TRANSACTIONS: | ||||||||||||||||
| Proceeds from shares sold | 63,690,200 | 9,936,130 | 31,621,560 | 28,367,350 | ||||||||||||
| Cost of shares redeemed | (30,083,830 | ) | (6,495,240 | ) | (5,676,945 | ) | (1,798,040 | ) | ||||||||
| Net increase/(decrease) in net assets from capital transactions | 33,606,370 | 3,440,890 | 25,944,615 | 26,569,310 | ||||||||||||
| Increase/(decrease) in net assets | 36,526,428 | 2,829,381 | 28,815,738 | 25,906,832 | ||||||||||||
| NET ASSETS: | ||||||||||||||||
| Beginning of year | 10,988,445 | 8,159,064 | 29,405,654 | 3,498,822 | ||||||||||||
| End of year | $ | 47,514,873 | $ | 10,988,445 | $ | 58,221,392 | $ | 29,405,654 | ||||||||
| CHANGES IN SHARES OUTSTANDING: | ||||||||||||||||
| Shares outstanding, beginning of year | 350,000 | 250,000 | 850,000 | 100,000 | ||||||||||||
| Shares sold | 1,850,000 | 300,000 | 850,000 | 800,000 | ||||||||||||
| Shares redeemed | (850,000 | ) | (200,000 | ) | (150,000 | ) | (50,000 | ) | ||||||||
| Shares outstanding, end of year | 1,350,000 | 350,000 | 1,550,000 | 850,000 | ||||||||||||
The accompanying notes are an integral part of these financial statements.
213
BONDBLOXX ETF TRUST
Statements of Changes in Net Assets (Continued)
BondBloxx USD High Yield Bond Energy Sector ETF | BondBloxx USD High Yield Bond Consumer Cyclicals Sector ETF | |||||||||||||||
| For the Year Ended October 31, 2024 | For the Year Ended October 31, 2023 | For the Year Ended October 31, 2024 | For the Year Ended October 31, 2023 | |||||||||||||
| OPERATIONS: | ||||||||||||||||
| Net investment income/(loss) | $ | 2,838,821 | $ | 690,177 | $ | 3,151,573 | $ | 927,686 | ||||||||
| Net realized gain/(loss) on investments | 1,457,116 | (286,942 | ) | 602,425 | (578,968 | ) | ||||||||||
| Net change in unrealized appreciation/(depreciation) on investments | 415,664 | (86,272 | ) | 1,251,658 | 110,662 | |||||||||||
| Net increase/(decrease) in net assets resulting from operations | 4,711,601 | 316,963 | 5,005,656 | 459,380 | ||||||||||||
| DISTRIBUTIONS TO SHAREHOLDERS: | ||||||||||||||||
| Distributions from distributable earnings | (2,889,467 | ) | (606,084 | ) | (2,907,383 | ) | (826,902 | ) | ||||||||
| CAPITAL TRANSACTIONS: | ||||||||||||||||
| Proceeds from shares sold | 60,260,735 | 20,703,110 | 59,638,510 | 21,363,810 | ||||||||||||
| Cost of shares redeemed | (68,923,500 | ) | (7,414,975 | ) | (13,121,760 | ) | (5,206,265 | ) | ||||||||
| Net increase/(decrease) in net assets from capital transactions | (8,662,765 | ) | 13,288,135 | 46,516,750 | 16,157,545 | |||||||||||
| Increase/(decrease) in net assets | (6,840,631 | ) | 12,999,014 | 48,615,023 | 15,790,023 | |||||||||||
| NET ASSETS: | ||||||||||||||||
| Beginning of year | 20,515,088 | 7,516,074 | 22,715,376 | 6,925,353 | ||||||||||||
| End of year | $ | 13,674,457 | $ | 20,515,088 | $ | 71,330,399 | $ | 22,715,376 | ||||||||
| CHANGES IN SHARES OUTSTANDING: | ||||||||||||||||
| Shares outstanding, beginning of year | 552,500 | 202,500 | 650,000 | 200,000 | ||||||||||||
| Shares sold | 1,550,000 | 550,000 | 1,600,000 | 600,000 | ||||||||||||
| Shares redeemed | (1,750,000 | ) | (200,000 | ) | (350,000 | ) | (150,000 | ) | ||||||||
| Shares outstanding, end of year | 352,500 | 552,500 | 1,900,000 | 650,000 | ||||||||||||
The accompanying notes are an integral part of these financial statements.
214
BONDBLOXX ETF TRUST
Statements of Changes in Net Assets (Continued)
BondBloxx USD High Yield Bond Consumer Non-Cyclicals Sector ETF | BondBloxx USD High Yield Bond Sector Rotation ETF(1) | |||||||||||||||||||
| For the Year Ended October 31, 2024 | For the Year Ended | For the Year Ended October 31, 2024 | For the Period Ended | For the Year Ended | ||||||||||||||||
| OPERATIONS: | ||||||||||||||||||||
| Net investment income/(loss) | $ | 879,509 | $ | 375,069 | $ | 2,319,662 | $ | 584,020 | $ | 2,101,410 | ||||||||||
| Net realized gain/(loss) on investments | (32,146 | ) | (360,001 | ) | 314,588 | (515,545 | ) | (2,145,701 | ) | |||||||||||
| Net change in unrealized appreciation/ (depreciation) on investments | 682,035 | 64,831 | 1,506,932 | (429,061 | ) | 2,220,850 | ||||||||||||||
| Net increase/(decrease) in net assets resulting from operations | 1,529,398 | 79,899 | 4,141,182 | (360,586 | ) | 2,176,559 | ||||||||||||||
| DISTRIBUTIONS TO SHAREHOLDERS: | ||||||||||||||||||||
| Distributions from distributable earnings | (788,908 | ) | (339,571 | ) | (2,374,535 | ) | (533,623 | ) | (2,101,410 | ) | ||||||||||
| Return of capital | - | - | - | - | (60,985 | ) | ||||||||||||||
| Total distributions | (788,908 | ) | (339,571 | ) | (2,374,535 | ) | (533,623 | ) | (2,162,395 | ) | ||||||||||
| CAPITAL TRANSACTIONS: | ||||||||||||||||||||
| Proceeds from shares sold | 19,078,280 | 9,148,635 | 10,186,841 | 4,410,006 | 26,591,706 | |||||||||||||||
| Cost of shares redeemed | - | (3,594,970 | ) | (12,349,493 | ) | (1,268,145 | ) | (34,058,196 | ) | |||||||||||
| Net increase/(decrease) in net assets from capital transactions | 19,078,280 | 5,553,665 | (2,162,652 | ) | 3,141,861 | (7,466,490 | ) | |||||||||||||
| Increase/(decrease) in net assets | 19,818,770 | 5,293,993 | (396,005 | ) | 2,247,652 | (7,452,326 | ) | |||||||||||||
| NET ASSETS: | ||||||||||||||||||||
| Beginning of period | 10,642,621 | 5,348,628 | 28,567,782 | 26,320,130 | 33,772,456 | |||||||||||||||
| End of period | $ | 30,461,391 | $ | 10,642,621 | $ | 28,171,777 | $ | 28,567,782 | $ | 26,320,130 | ||||||||||
| CHANGES IN SHARES OUTSTANDING: | ||||||||||||||||||||
| Shares outstanding, beginning of period | 300,000 | 150,000 | 2,010,000 | 1,800,000 | 2,300,000 | |||||||||||||||
| Shares sold | 500,000 | 250,000 | 680,000 | 300,000 | 1,800,000 | |||||||||||||||
| Shares redeemed | - | (100,000 | ) | (830,000 | ) | (90,000 | ) | (2,300,000 | ) | |||||||||||
| Shares outstanding, end of period | 800,000 | 300,000 | 1,860,000 | 2,010,000 | 1,800,000 | |||||||||||||||
| (1) | The Fund acquired the assets and liabilities of a predecessor ETF (the “Predecessor ETF”), a series of the NexPoint Funds I at the close of business on September 15, 2023. As a result of the reorganization, the Fund is the accounting successor of the Predecessor ETF. Financial information above for the periods prior to September 16, 2023, reflect the performance of the Predecessor ETF. | |
| (2) | Fiscal year end changed from June 30, 2023 to October 31, 2023. |
The accompanying notes are an integral part of these financial statements.
215
BONDBLOXX ETF TRUST
Statements of Changes in Net Assets (Continued)
BondBloxx BB Rated USD High Yield Corporate Bond ETF | BondBloxx B Rated USD High Yield Corporate Bond ETF | |||||||||||||||
| For the Year Ended October 31, 2024 | For the Year Ended October 31, 2023 | For the Year Ended October 31, 2024 | For the Year Ended October 31, 2023 | |||||||||||||
| OPERATIONS: | ||||||||||||||||
| Net investment income/(loss) | $ | 3,618,729 | $ | 2,999,857 | $ | 1,146,359 | $ | 961,330 | ||||||||
| Net realized gain/(loss) on investments | (66,191 | ) | (839,618 | ) | (124,812 | ) | (201,007 | ) | ||||||||
| Net change in unrealized appreciation/(depreciation) on investments | 3,645,457 | (515,770 | ) | 958,463 | (194,628 | ) | ||||||||||
| Net increase/(decrease) in net assets resulting from operations | 7,197,995 | 1,644,469 | 1,980,010 | 565,695 | ||||||||||||
| DISTRIBUTIONS TO SHAREHOLDERS: | ||||||||||||||||
| Distributions from distributable earnings | (3,592,728 | ) | (2,930,252 | ) | (1,130,858 | ) | (948,646 | ) | ||||||||
| CAPITAL TRANSACTIONS: | ||||||||||||||||
| Proceeds from shares sold | 7,993,265 | 17,507,495 | 3,927,365 | 1,919,410 | ||||||||||||
| Cost of shares redeemed | - | (9,528,265 | ) | - | - | |||||||||||
| Net increase/(decrease) in net assets from capital transactions | 7,993,265 | 7,979,230 | 3,927,365 | 1,919,410 | ||||||||||||
| Increase/(decrease) in net assets | 11,598,532 | 6,693,447 | 4,776,517 | 1,536,459 | ||||||||||||
| NET ASSETS: | ||||||||||||||||
| Beginning of year | 49,074,777 | 42,381,330 | 13,053,208 | 11,516,749 | ||||||||||||
| End of year | $ | 60,673,309 | $ | 49,074,777 | $ | 17,829,725 | $ | 13,053,208 | ||||||||
| CHANGES IN SHARES OUTSTANDING: | ||||||||||||||||
| Shares outstanding, beginning of year | 1,300,000 | 1,100,000 | 350,000 | 300,000 | ||||||||||||
| Shares sold | 200,000 | 450,000 | 100,000 | 50,000 | ||||||||||||
| Shares redeemed | - | (250,000 | ) | - | - | |||||||||||
| Shares outstanding, end of year | 1,500,000 | 1,300,000 | 450,000 | 350,000 | ||||||||||||
The accompanying notes are an integral part of these financial statements.
216
BONDBLOXX ETF TRUST
Statements of Changes in Net Assets (Continued)
BondBloxx CCC Rated USD High Yield Corporate Bond ETF | BondBloxx BBB Rated 1-5 Year Corporate Bond ETF | BondBloxx BBB Rated 5-10 Year Corporate Bond ETF | BondBloxx BBB Rated 10+ Year Corporate Bond ETF | |||||||||||||||||
| For the Year Ended October 31, 2024 | For the Year Ended October 31, 2023 | For the Period Ended October 31, 2024(2) | For the Period Ended 2024(2) | For the Period Ended | ||||||||||||||||
| OPERATIONS: | ||||||||||||||||||||
| Net investment income/(loss) | $ | 6,236,459 | $ | 1,229,308 | $ | 1,179,731 | $ | 205,920 | $ | 249,830 | ||||||||||
| Net realized gain/(loss) on investments | (857,965 | ) | (375,809 | ) | 32,225 | (1,872 | ) | 6,237 | ||||||||||||
| Net change in unrealized appreciation/ (depreciation) on investments | 4,123,310 | (458,130 | ) | 486,847 | (9,461 | ) | 34,561 | |||||||||||||
| Net increase/(decrease) in net assets resulting from operations | 9,501,804 | 395,369 | 1,698,803 | 194,587 | 290,628 | |||||||||||||||
| DISTRIBUTIONS TO SHAREHOLDERS: | ||||||||||||||||||||
| Distributions from distributable earnings | (5,483,094 | ) | (1,187,914 | ) | (919,365 | ) | (173,530 | ) | (214,645 | ) | ||||||||||
| CAPITAL TRANSACTIONS: | ||||||||||||||||||||
| Proceeds from shares sold | 86,475,075 | 12,914,935 | 62,740,120 | 7,595,425 | 7,328,975 | |||||||||||||||
| Cost of shares redeemed | (5,670,525 | ) | (3,690,915 | ) | - | - | - | |||||||||||||
| Net increase/(decrease) in net assets from capital transactions | 80,804,550 | 9,224,020 | 62,740,120 | 7,595,425 | 7,328,975 | |||||||||||||||
| Increase/(decrease) in net assets | 84,823,260 | 8,431,475 | 63,519,558 | 7,616,482 | 7,404,958 | |||||||||||||||
| NET ASSETS: | ||||||||||||||||||||
| Beginning of period | 19,680,409 | 11,248,934 | - | - | - | |||||||||||||||
| End of period | $ | 104,503,669 | $ | 19,680,409 | $ | 63,519,558 | $ | 7,616,482 | $ | 7,404,958 | ||||||||||
| CHANGES IN SHARES OUTSTANDING: | ||||||||||||||||||||
| Shares outstanding, beginning of period | 550,000 | 300,000 | - | - | - | |||||||||||||||
| Shares sold | 2,250,000 | 350,000 | 1,250,000 | 150,000 | 150,000 | |||||||||||||||
| Shares redeemed | (150,000 | ) | (100,000 | ) | - | - | - | |||||||||||||
| Shares outstanding, end of period | 2,650,000 | 550,000 | 1,250,000 | 150,000 | 150,000 | |||||||||||||||
| (2) | Funds commenced operations on January 23, 2024. |
The accompanying notes are an integral part of these financial statements.
217
BONDBLOXX ETF TRUST
Statements of Changes in Net Assets (Continued)
BondBloxx JP Morgan USD Emerging Markets 1-10 Year Bond ETF | BondBloxx Bloomberg Six Month Target Duration US Treasury ETF | |||||||||||||||
| For the Year Ended October 31, 2024 | For the Year Ended October 31, 2023 | For the Year Ended October 31, 2024 | For the Year Ended October 31, 2023 | |||||||||||||
| OPERATIONS: | ||||||||||||||||
| Net investment income/(loss) | $ | 13,761,220 | $ | 11,497,350 | $ | 55,509,311 | $ | 23,925,782 | ||||||||
| Net realized gain/(loss) on investments | 1,663,979 | (782,104 | ) | 1,111,138 | (879,120 | ) | ||||||||||
| Net change in unrealized appreciation/(depreciation) on investments | 16,280,703 | 3,614,479 | 1,135,352 | (360,110 | ) | |||||||||||
| Net increase/(decrease) in net assets resulting from operations | 31,705,902 | 14,329,725 | 57,755,801 | 22,686,552 | ||||||||||||
| DISTRIBUTIONS TO SHAREHOLDERS: | ||||||||||||||||
| Distributions from distributable earnings | (13,454,640 | ) | (11,393,515 | ) | (56,714,301 | ) | (19,195,046 | ) | ||||||||
| CAPITAL TRANSACTIONS: | ||||||||||||||||
| Proceeds from shares sold | 75,504,760 | 11,771,310 | 641,133,646 | 1,561,833,583 | ||||||||||||
| Cost of shares redeemed | (22,318,460 | ) | - | (839,117,347 | ) | (518,534,699 | ) | |||||||||
| Net increase/(decrease) in net assets from capital transactions | 53,186,300 | 11,771,310 | (197,983,701 | ) | 1,043,298,884 | |||||||||||
| Increase/(decrease) in net assets | 71,437,562 | 14,707,520 | (196,942,201 | ) | 1,046,790,390 | |||||||||||
| NET ASSETS: | ||||||||||||||||
| Beginning of year | 183,418,768 | 168,711,248 | 1,096,885,001 | 50,094,611 | ||||||||||||
| End of year | $ | 254,856,330 | $ | 183,418,768 | $ | 899,942,800 | $ | 1,096,885,001 | ||||||||
| CHANGES IN SHARES OUTSTANDING: | ||||||||||||||||
| Shares outstanding, beginning of year | 4,750,000 | 4,450,000 | 21,810,000 | 1,000,000 | ||||||||||||
| Shares sold | 1,850,000 | 300,000 | 12,760,000 | 31,150,000 | ||||||||||||
| Shares redeemed | (550,000 | ) | - | (16,700,000 | ) | (10,340,000 | ) | |||||||||
| Shares outstanding, end of year | 6,050,000 | 4,750,000 | 17,870,000 | 21,810,000 | ||||||||||||
The accompanying notes are an integral part of these financial statements.
218
BONDBLOXX ETF TRUST
Statements of Changes in Net Assets (Continued)
BondBloxx Bloomberg One Year Target Duration US Treasury ETF | BondBloxx Bloomberg Two Year Target Duration US Treasury ETF | |||||||||||||||
| For the Year Ended October 31, 2024 | For the Year Ended October 31, 2023 | For the Year Ended October 31, 2024 | For the Year Ended October 31, 2023 | |||||||||||||
| OPERATIONS: | ||||||||||||||||
| Net investment income/(loss) | $ | 25,616,717 | $ | 14,467,927 | $ | 5,222,465 | $ | 3,451,090 | ||||||||
| Net realized gain/(loss) on investments | (823,627 | ) | (4,456,879 | ) | (365,491 | ) | (847,127 | ) | ||||||||
| Net change in unrealized appreciation/(depreciation) on investments | 1,992,594 | (1,080,182 | ) | 1,635,022 | (828,781 | ) | ||||||||||
| Net increase/(decrease) in net assets resulting from operations | 26,785,684 | 8,930,866 | 6,491,996 | 1,775,182 | ||||||||||||
| DISTRIBUTIONS TO SHAREHOLDERS: | ||||||||||||||||
| Distributions from distributable earnings | (25,788,925 | ) | (11,946,611 | ) | (5,054,888 | ) | (3,191,299 | ) | ||||||||
| CAPITAL TRANSACTIONS: | ||||||||||||||||
| Proceeds from shares sold | 364,720,110 | 1,328,686,554 | 84,523,977 | 144,785,822 | ||||||||||||
| Cost of shares redeemed | (359,698,756 | ) | (837,868,625 | ) | (40,461,786 | ) | (74,962,851 | ) | ||||||||
| Net increase/(decrease) in net assets from capital transactions | 5,021,354 | 490,817,929 | 44,062,191 | 69,822,971 | ||||||||||||
| Increase/(decrease) in net assets | 6,018,113 | 487,802,184 | 45,499,299 | 68,406,854 | ||||||||||||
| NET ASSETS: | ||||||||||||||||
| Beginning of year | 527,226,573 | 39,424,389 | 105,029,530 | 36,622,676 | ||||||||||||
| End of year | $ | 533,244,686 | $ | 527,226,573 | $ | 150,528,829 | $ | 105,029,530 | ||||||||
| CHANGES IN SHARES OUTSTANDING: | ||||||||||||||||
| Shares outstanding, beginning of year | 10,600,000 | 790,000 | 2,150,000 | 740,000 | ||||||||||||
| Shares sold | 7,350,000 | 26,690,000 | 1,720,000 | 2,930,000 | ||||||||||||
| Shares redeemed | (7,230,000 | ) | (16,880,000 | ) | (820,000 | ) | (1,520,000 | ) | ||||||||
| Shares outstanding, end of year | 10,720,000 | 10,600,000 | 3,050,000 | 2,150,000 | ||||||||||||
The accompanying notes are an integral part of these financial statements.
219
BONDBLOXX ETF TRUST
Statements of Changes in Net Assets (Continued)
BondBloxx Bloomberg Three Year Target Duration US Treasury ETF | BondBloxx Bloomberg Five Year Target Duration US Treasury ETF | |||||||||||||||
| For the Year Ended October 31, 2024 | For the Year Ended October 31, 2023 | For the Year Ended October 31, 2024 | For the Year Ended October 31, 2023 | |||||||||||||
| OPERATIONS: | ||||||||||||||||
| Net investment income/(loss) | $ | 2,335,059 | $ | 987,174 | $ | 3,162,261 | $ | 1,224,437 | ||||||||
| Net realized gain/(loss) on investments | (246,053 | ) | (326,389 | ) | (431,463 | ) | (742,194 | ) | ||||||||
| Net change in unrealized appreciation/(depreciation) on investments | 371,980 | (288,445 | ) | 1,008,714 | (947,289 | ) | ||||||||||
| Net increase/(decrease) in net assets resulting from operations | 2,460,986 | 372,340 | 3,739,512 | (465,046 | ) | |||||||||||
| DISTRIBUTIONS TO SHAREHOLDERS: | ||||||||||||||||
| Distributions from distributable earnings | (2,091,424 | ) | (987,439 | ) | (2,880,621 | ) | (1,188,187 | ) | ||||||||
| CAPITAL TRANSACTIONS: | ||||||||||||||||
| Proceeds from shares sold | 74,850,057 | 14,840,962 | 95,850,308 | 21,336,190 | ||||||||||||
| Cost of shares redeemed | (3,414,716 | ) | (5,451,076 | ) | (11,238,815 | ) | (3,475,903 | ) | ||||||||
| Net increase/(decrease) in net assets from capital transactions | 71,435,341 | 9,389,886 | 84,611,493 | 17,860,287 | ||||||||||||
| Increase/(decrease) in net assets | 71,804,903 | 8,774,787 | 85,470,384 | 16,207,054 | ||||||||||||
| NET ASSETS: | ||||||||||||||||
| Beginning of year | 28,920,831 | 20,146,044 | 36,533,325 | 20,326,271 | ||||||||||||
| End of year | $ | 100,725,734 | $ | 28,920,831 | $ | 122,003,709 | $ | 36,533,325 | ||||||||
| CHANGES IN SHARES OUTSTANDING: | ||||||||||||||||
| Shares outstanding, beginning of year | 600,000 | 410,000 | 780,000 | 420,000 | ||||||||||||
| Shares sold | 1,520,000 | 300,000 | 1,960,000 | 430,000 | ||||||||||||
| Shares redeemed | (70,000 | ) | (110,000 | ) | (230,000 | ) | (70,000 | ) | ||||||||
| Shares outstanding, end of year | 2,050,000 | 600,000 | 2,510,000 | 780,000 | ||||||||||||
The accompanying notes are an integral part of these financial statements.
220
BONDBLOXX ETF TRUST
Statements of Changes in Net Assets (Continued)
BondBloxx Bloomberg Seven Year Target Duration US Treasury ETF | BondBloxx Bloomberg Ten Year Target Duration US Treasury ETF | |||||||||||||||
| For the Year Ended October 31, 2024 | For the Year Ended October 31, 2023 | For the Year Ended October 31, 2024 | For the Year Ended October 31, 2023 | |||||||||||||
| OPERATIONS: | ||||||||||||||||
| Net investment income/(loss) | $ | 4,879,225 | $ | 937,698 | $ | 6,749,206 | $ | 967,010 | ||||||||
| Net realized gain/(loss) on investments | 1,581,129 | (495,159 | ) | 736,813 | (1,342,079 | ) | ||||||||||
| Net change in unrealized appreciation/(depreciation) on investments | 1,725,277 | (1,400,117 | ) | 3,397,988 | (1,910,985 | ) | ||||||||||
| Net increase/(decrease) in net assets resulting from operations | 8,185,631 | (957,578 | ) | 10,884,007 | (2,286,054 | ) | ||||||||||
| DISTRIBUTIONS TO SHAREHOLDERS: | ||||||||||||||||
| Distributions from distributable earnings | (4,558,289 | ) | (923,627 | ) | (6,063,656 | ) | (896,889 | ) | ||||||||
| CAPITAL TRANSACTIONS: | ||||||||||||||||
| Proceeds from shares sold | 115,311,800 | 35,499,443 | 223,876,177 | 25,726,389 | ||||||||||||
| Cost of shares redeemed | (62,758,450 | ) | (499,667 | ) | (35,263,199 | ) | - | |||||||||
| Net increase/(decrease) in net assets from capital transactions | 52,553,350 | 34,999,776 | 188,612,978 | 25,726,389 | ||||||||||||
| Increase/(decrease) in net assets | 56,180,692 | 33,118,571 | 193,433,329 | 22,543,446 | ||||||||||||
| NET ASSETS: | ||||||||||||||||
| Beginning of year | 53,650,527 | 20,531,956 | 42,610,448 | 20,067,002 | ||||||||||||
| End of year | $ | 109,831,219 | $ | 53,650,527 | $ | 236,043,777 | $ | 42,610,448 | ||||||||
| CHANGES IN SHARES OUTSTANDING: | ||||||||||||||||
| Shares outstanding, beginning of year | 1,190,000 | 430,000 | 990,000 | 430,000 | ||||||||||||
| Shares sold | 2,440,000 | 770,000 | 4,870,000 | 560,000 | ||||||||||||
| Shares redeemed | (1,310,000 | ) | (10,000 | ) | (760,000 | ) | - | |||||||||
| Shares outstanding, end of year | 2,320,000 | 1,190,000 | 5,100,000 | 990,000 | ||||||||||||
The accompanying notes are an integral part of these financial statements.
221
BONDBLOXX ETF TRUST
Statements of Changes in Net Assets (Continued)
BondBloxx Bloomberg Twenty Year Target Duration US Treasury ETF | BondBloxx IR+M | |||||||||||
| For the Year Ended October 31, 2024 | For the Year Ended October 31, 2023 | For the Period Ended October 31, 2024(4) | ||||||||||
| OPERATIONS: | ||||||||||||
| Net investment income/(loss) | $ | 1,424,676 | $ | 949,626 | $ | 1,549,506 | ||||||
| Net realized gain/(loss) on investments | (1,982,008 | ) | (2,604,799 | ) | (79,673 | ) | ||||||
| Net change in unrealized appreciation/(depreciation) on investments | 2,757,832 | (2,773,615 | ) | 348,616 | ||||||||
| Net increase/(decrease) in net assets resulting from operations | 2,200,500 | (4,428,788 | ) | 1,818,449 | ||||||||
| DISTRIBUTIONS TO SHAREHOLDERS: | ||||||||||||
| Distributions from distributable earnings | (1,309,183 | ) | (948,088 | ) | (1,241,375 | ) | ||||||
| CAPITAL TRANSACTIONS: | ||||||||||||
| Proceeds from shares sold | 45,412,326 | 22,835,539 | 105,341,747 | |||||||||
| Cost of shares redeemed | (17,380,827 | ) | (15,756,925 | ) | - | |||||||
| Net increase/(decrease) in net assets from capital transactions | 28,031,499 | 7,078,614 | 105,341,747 | |||||||||
| Increase/(decrease) in net assets | 28,922,816 | 1,701,738 | 105,918,821 | |||||||||
| NET ASSETS: | ||||||||||||
| Beginning of period | 23,089,494 | 21,387,756 | - | |||||||||
| End of period | $ | 52,012,310 | $ | 23,089,494 | $ | 105,918,821 | ||||||
| CHANGES IN SHARES OUTSTANDING: | ||||||||||||
| Shares outstanding, beginning of period | 630,000 | 490,000 | - | |||||||||
| Shares sold | 1,040,000 | 490,000 | 2,100,000 | |||||||||
| Shares redeemed | (410,000 | ) | (350,000 | ) | - | |||||||
| Shares outstanding, end of period | 1,260,000 | 630,000 | 2,100,000 | |||||||||
| (4) | Fund commenced operations on March 12, 2024. |
The accompanying notes are an integral part of these financial statements.
222
BONDBLOXX ETF TRUST
Financial Highlights
For a share outstanding throughout the period presented.
BondBloxx USD High Yield Bond Industrial Sector ETF | ||||||||||||
For the Year Ended | For the Year Ended | For the Period Ended October 31, 2022(1) | ||||||||||
| Net Asset Value, beginning of period | $ | 35.52 | $ | 35.75 | $ | 39.89 | ||||||
| Income/(loss) from operations: | ||||||||||||
| Net investment income/(loss)(2) | 2.67 | 2.65 | 1.55 | |||||||||
| Net realized and unrealized gain/(loss) on investments | 2.62 | (0.59 | ) | (4.25 | ) | |||||||
| Total income/(loss) from operations | 5.29 | 2.06 | (2.70 | ) | ||||||||
| Distributions to shareholders: | ||||||||||||
| Net investment income | (2.67 | ) | (2.29 | ) | (1.44 | ) | ||||||
| Total distributions | (2.67 | ) | (2.29 | ) | (1.44 | ) | ||||||
| Net Asset Value, end of period | $ | 38.14 | $ | 35.52 | $ | 35.75 | ||||||
| Market Value, end of period | $ | 38.09 | $ | 35.60 | $ | 35.71 | ||||||
| Total Return at Net Asset Value(3) | 15.31 | % | 5.77 | % | (6.81 | )% | ||||||
| Total Return at Market Value(4) | 14.88 | % | 6.12 | % | (6.88 | )% | ||||||
| Net Assets, end of period (millions) | $ | 82.0 | $ | 40.8 | $ | 3.6 | ||||||
| Ratios to average net assets: | ||||||||||||
| Expenses | 0.35 | % | 0.35 | % | 0.35 | %(7) | ||||||
| Net investment income/(loss)(5) | 7.07 | % | 7.23 | % | 5.87 | %(7) | ||||||
| Portfolio turnover rate(6) | 23 | % | 21 | % | 9 | % | ||||||
| (1) | The Fund commenced operations on February 15, 2022. Shares of XHYI were listed on the NYSE Arca, Inc. on February 17, 2022. |
| (2) | Based on average daily shares outstanding. |
| (3) | Net asset value total return is calculated assuming an initial investment made at the net asset value at the beginning of the period, reinvestment of all distributions at net asset value during the period, and redemption at net asset value on the last day of the period. Net asset value total return includes adjustments in accordance with United States generally accepted accounting principles (“GAAP”) and as such, the net asset value for financial reporting purposes and the returns based upon those net asset values may differ from the net asset value and returns for shareholder transactions. Total return calculated for a period of less than one year is not annualized. |
| (4) | Market price total return is calculated assuming an initial investment made at the market price at the beginning of the period, reinvestment of all distributions at net asset value during the period and sale at the market price on the last day of the period. Total return calculated for a period of less than one year is not annualized. |
| (5) | Net investment income/(loss) represents income earned by the Fund from its underlying investments less expenses incurred by the Fund during the period. |
| (6) | Portfolio turnover rate is not annualized and excludes the value of portfolio securities received or delivered as a result of in-kind creations or redemptions of the Fund’s capital shares. |
| (7) | Annualized. |
The accompanying notes are an integral part of these financial statements.
223
BONDBLOXX ETF TRUST
Financial Highlights (Continued)
For a share outstanding throughout the period presented.
BondBloxx USD High Yield Bond Telecom, Media & Technology Sector ETF | ||||||||||||
For the Year Ended | For the Year Ended | For the Period Ended October 31, 2022(1) | ||||||||||
| Net Asset Value, beginning of period | $ | 32.66 | $ | 34.79 | $ | 39.65 | ||||||
| Income/(loss) from operations: | ||||||||||||
| Net investment income/(loss)(2) | 2.92 | 2.92 | 1.54 | |||||||||
| Net realized and unrealized gain/(loss) on investments | 2.09 | (2.60 | ) | (5.05 | ) | |||||||
| Total income/(loss) from operations | 5.01 | 0.32 | (3.51 | ) | ||||||||
| Distributions to shareholders: | ||||||||||||
| Net investment income | (2.85 | ) | (2.45 | ) | (1.35 | ) | ||||||
| Total distributions | (2.85 | ) | (2.45 | ) | (1.35 | ) | ||||||
| Net Asset Value, end of period | $ | 34.82 | $ | 32.66 | $ | 34.79 | ||||||
| Market Value, end of period | $ | 34.89 | $ | 32.77 | $ | 34.73 | ||||||
| Total Return at Net Asset Value(3) | 16.02 | % | 0.89 | % | (8.96 | )% | ||||||
| Total Return at Market Value(4) | 15.84 | % | 1.39 | % | (9.03 | )% | ||||||
| Net Assets, end of period (millions) | $ | 107.9 | $ | 29.4 | $ | 3.5 | ||||||
| Ratios to average net assets: | ||||||||||||
| Expenses | 0.35 | % | 0.35 | % | 0.35 | %(7) | ||||||
| Net investment income/(loss)(5) | 8.53 | % | 8.60 | % | 5.93 | %(7) | ||||||
| Portfolio turnover rate(6) | 28 | % | 14 | % | 13 | % | ||||||
| (1) | The Fund commenced operations on February 15, 2022. Shares of XHYT were listed on the NYSE Arca, Inc. on February 17, 2022. |
| (2) | Based on average daily shares outstanding. |
| (3) | Net asset value total return is calculated assuming an initial investment made at the net asset value at the beginning of the period, reinvestment of all distributions at net asset value during the period, and redemption at net asset value on the last day of the period. Net asset value total return includes adjustments in accordance with GAAP and as such, the net asset value for financial reporting purposes and the returns based upon those net asset values may differ from the net asset value and returns for shareholder transactions. Total return calculated for a period of less than one year is not annualized. |
| (4) | Market price total return is calculated assuming an initial investment made at the market price at the beginning of the period, reinvestment of all distributions at net asset value during the period and sale at the market price on the last day of the period. Total return calculated for a period of less than one year is not annualized. |
| (5) | Net investment income/(loss) represents income earned by the Fund from its underlying investments less expenses incurred by the Fund during the period. |
| (6) | Portfolio turnover rate is not annualized and excludes the value of portfolio securities received or delivered as a result of in-kind creations or redemptions of the Fund’s capital shares. |
| (7) | Annualized. |
The accompanying notes are an integral part of these financial statements.
224
BONDBLOXX ETF TRUST
Financial Highlights (Continued)
For a share outstanding throughout the period presented.
BondBloxx USD High Yield Bond Healthcare Sector ETF | ||||||||||||
For the Year Ended | For the Year Ended | For the Period Ended October 31, 2022(1) | ||||||||||
| Net Asset Value, beginning of period | $ | 31.40 | $ | 32.64 | $ | 39.84 | ||||||
| Income/(loss) from operations: | ||||||||||||
| Net investment income/(loss)(2) | 2.52 | 2.70 | 1.62 | |||||||||
| Net realized and unrealized gain/(loss) on investments | 3.74 | (0.94 | ) | (7.58 | ) | |||||||
| Total income/(loss) from operations | 6.26 | 1.76 | (5.96 | ) | ||||||||
| Distributions to shareholders: | ||||||||||||
| Net investment income | (2.46 | ) | (3.00 | ) | (1.24 | ) | ||||||
| Total distributions | (2.46 | ) | (3.00 | ) | (1.24 | ) | ||||||
| Net Asset Value, end of period | $ | 35.20 | $ | 31.40 | $ | 32.64 | ||||||
| Market Value, end of period | $ | 35.15 | $ | 31.49 | $ | 32.52 | ||||||
| Total Return at Net Asset Value(3) | 20.50 | % | 5.36 | % | (15.19 | )% | ||||||
| Total Return at Market Value(4) | 19.96 | % | 6.03 | % | (15.47 | )% | ||||||
| Net Assets, end of period (millions) | $ | 47.5 | $ | 11.0 | $ | 8.2 | ||||||
| Ratios to average net assets: | ||||||||||||
| Expenses | 0.35 | % | 0.35 | % | 0.35 | %(7) | ||||||
| Net investment income/(loss)(5) | 7.20 | % | 8.23 | % | 6.39 | %(7) | ||||||
| Portfolio turnover rate(6) | 22 | % | 18 | % | 37 | % | ||||||
| (1) | The Fund commenced operations on February 15, 2022. Shares of XHYH were listed on the NYSE Arca, Inc. on February 17, 2022. |
| (2) | Based on average daily shares outstanding. |
| (3) | Net asset value total return is calculated assuming an initial investment made at the net asset value at the beginning of the period, reinvestment of all distributions at net asset value during the period, and redemption at net asset value on the last day of the period. Net asset value total return includes adjustments in accordance with GAAP and as such, the net asset value for financial reporting purposes and the returns based upon those net asset values may differ from the net asset value and returns for shareholder transactions. Total return calculated for a period of less than one year is not annualized. |
| (4) | Market price total return is calculated assuming an initial investment made at the market price at the beginning of the period, reinvestment of all distributions at net asset value during the period and sale at the market price on the last day of the period. Total return calculated for a period of less than one year is not annualized. |
| (5) | Net investment income/(loss) represents income earned by the Fund from its underlying investments less expenses incurred by the Fund during the period. |
| (6) | Portfolio turnover rate is not annualized and excludes the value of portfolio securities received or delivered as a result of in-kind creations or redemptions of the Fund’s capital shares. |
| (7) | Annualized. |
The accompanying notes are an integral part of these financial statements.
225
BONDBLOXX ETF TRUST
Financial Highlights (Continued)
For a share outstanding throughout the period presented.
BondBloxx USD High Yield Bond Financial & REIT Sector ETF | ||||||||||||
For the Year Ended | For the Year Ended | For the Period Ended October 31, 2022(1) | ||||||||||
| Net Asset Value, beginning of period | $ | 34.59 | $ | 34.99 | $ | 39.74 | ||||||
| Income/(loss) from operations: | ||||||||||||
| Net investment income/(loss)(2) | 2.72 | 2.74 | 1.46 | |||||||||
| Net realized and unrealized gain/(loss) on investments | 2.96 | (0.70 | ) | (4.86 | ) | |||||||
| Total income/(loss) from operations | 5.68 | 2.04 | (3.40 | ) | ||||||||
| Distributions to shareholders: | ||||||||||||
| Net investment income | (2.71 | ) | (2.44 | ) | (1.35 | ) | ||||||
| Total distributions | (2.71 | ) | (2.44 | ) | (1.35 | ) | ||||||
| Net Asset Value, end of period | $ | 37.56 | $ | 34.59 | $ | 34.99 | ||||||
| Market Value, end of period | $ | 37.47 | $ | 34.68 | $ | 34.99 | ||||||
| Total Return at Net Asset Value(3) | 16.89 | % | 5.91 | % | (8.65 | )% | ||||||
| Total Return at Market Value(4) | 16.29 | % | 6.17 | % | (8.72 | )% | ||||||
| Net Assets, end of period (millions) | $ | 58.2 | $ | 29.4 | $ | 3.5 | ||||||
| Ratios to average net assets: | ||||||||||||
| Expenses | 0.35 | % | 0.35 | % | 0.35 | %(7) | ||||||
| Net investment income/(loss)(5) | 7.34 | % | 7.71 | % | 5.57 | %(7) | ||||||
| Portfolio turnover rate(6) | 43 | % | 32 | % | 21 | % | ||||||
| (1) | The Fund commenced operations on February 15, 2022. Shares of XHYF were listed on the NYSE Arca, Inc. on February 17, 2022. |
| (2) | Based on average daily shares outstanding. |
| (3) | Net asset value total return is calculated assuming an initial investment made at the net asset value at the beginning of the period, reinvestment of all distributions at net asset value during the period, and redemption at net asset value on the last day of the period. Net asset value total return includes adjustments in accordance with GAAP and as such, the net asset value for financial reporting purposes and the returns based upon those net asset values may differ from the net asset value and returns for shareholder transactions. Total return calculated for a period of less than one year is not annualized. |
| (4) | Market price total return is calculated assuming an initial investment made at the market price at the beginning of the period, reinvestment of all distributions at net asset value during the period and sale at the market price on the last day of the period. Total return calculated for a period of less than one year is not annualized. |
| (5) | Net investment income/(loss) represents income earned by the Fund from its underlying investments less expenses incurred by the Fund during the period. |
| (6) | Portfolio turnover rate is not annualized and excludes the value of portfolio securities received or delivered as a result of in-kind creations or redemptions of the Fund’s capital shares. |
| (7) | Annualized. |
The accompanying notes are an integral part of these financial statements.
226
BONDBLOXX ETF TRUST
Financial Highlights (Continued)
For a share outstanding throughout the period presented.
BondBloxx USD High Yield Bond Energy Sector ETF | ||||||||||||
For the Year Ended | For the Year Ended | For the Period Ended October 31, 2022(1) | ||||||||||
| Net Asset Value, beginning of period | $ | 37.13 | $ | 37.12 | $ | 39.62 | ||||||
| Income/(loss) from operations: | ||||||||||||
| Net investment income/(loss)(2) | 2.64 | 2.58 | 1.62 | |||||||||
| Net realized and unrealized gain/(loss) on investments | 1.83 | (0.14 | ) | (2.74 | ) | |||||||
| Total income/(loss) from operations | 4.47 | 2.44 | (1.12 | ) | ||||||||
| Distributions to shareholders: | ||||||||||||
| Net investment income | (2.81 | ) | (2.43 | ) | (1.38 | ) | ||||||
| Total distributions | (2.81 | ) | (2.43 | ) | (1.38 | ) | ||||||
| Net Asset Value, end of period | $ | 38.79 | $ | 37.13 | $ | 37.12 | ||||||
| Market Value, end of period | $ | 38.79 | $ | 37.23 | $ | 36.97 | ||||||
| Total Return at Net Asset Value(3) | 12.32 | % | 6.73 | % | (2.84 | )% | ||||||
| Total Return at Market Value(4) | 11.99 | % | 7.43 | % | (3.19 | )% | ||||||
| Net Assets, end of period (millions) | $ | 13.7 | $ | 20.5 | $ | 7.5 | ||||||
| Ratios to average net assets: | ||||||||||||
| Expenses | 0.35 | % | 0.35 | % | 0.35 | %(7) | ||||||
| Net investment income/(loss)(5) | 6.77 | % | 6.85 | % | 6.03 | %(7) | ||||||
| Portfolio turnover rate(6) | 41 | % | 37 | % | 21 | % | ||||||
| (1) | The Fund commenced operations on February 15, 2022. Shares of XHYE were listed on the NYSE Arca, Inc. on February 17, 2022. |
| (2) | Based on average daily shares outstanding. |
| (3) | Net asset value total return is calculated assuming an initial investment made at the net asset value at the beginning of the period, reinvestment of all distributions at net asset value during the period, and redemption at net asset value on the last day of the period. Net asset value total return includes adjustments in accordance with GAAP and as such, the net asset value for financial reporting purposes and the returns based upon those net asset values may differ from the net asset value and returns for shareholder transactions. Total return calculated for a period of less than one year is not annualized. |
| (4) | Market price total return is calculated assuming an initial investment made at the market price at the beginning of the period, reinvestment of all distributions at net asset value during the period and sale at the market price on the last day of the period. Total return calculated for a period of less than one year is not annualized. |
| (5) | Net investment income/(loss) represents income earned by the Fund from its underlying investments less expenses incurred by the Fund during the period. |
| (6) | Portfolio turnover rate is not annualized and excludes the value of portfolio securities received or delivered as a result of in-kind creations or redemptions of the Fund’s capital shares. |
| (7) | Annualized. |
The accompanying notes are an integral part of these financial statements.
227
BONDBLOXX ETF TRUST
Financial Highlights (Continued)
For a share outstanding throughout the period presented.
BondBloxx USD High Yield Bond Consumer Cyclicals Sector ETF | ||||||||||||
For the Year Ended | For the Year Ended | For the Period Ended October 31, 2022(1) | ||||||||||
| Net Asset Value, beginning of period | $ | 34.95 | $ | 34.63 | $ | 39.87 | ||||||
| Income/(loss) from operations: | ||||||||||||
| Net investment income/(loss)(2) | 2.59 | 2.70 | 1.57 | |||||||||
| Net realized and unrealized gain/(loss) on investments | 2.55 | 0.02 | (5.49 | ) | ||||||||
| Total income/(loss) from operations | 5.14 | 2.72 | (3.92 | ) | ||||||||
| Distributions to shareholders: | ||||||||||||
| Net investment income | (2.55 | ) | (2.40 | ) | (1.32 | ) | ||||||
| Total distributions | (2.55 | ) | (2.40 | ) | (1.32 | ) | ||||||
| Net Asset Value, end of period | $ | 37.54 | $ | 34.95 | $ | 34.63 | ||||||
| Market Value, end of period | $ | 37.47 | $ | 35.03 | $ | 34.45 | ||||||
| Total Return at Net Asset Value(3) | 15.09 | % | 7.98 | % | (9.96 | )% | ||||||
| Total Return at Market Value(4) | 14.60 | % | 8.77 | % | (10.54 | )% | ||||||
| Net Assets, end of period (millions) | $ | 71.3 | $ | 22.7 | $ | 6.9 | ||||||
| Ratios to average net assets: | ||||||||||||
| Expenses | 0.35 | % | 0.35 | % | 0.35 | %(7) | ||||||
| Net investment income/(loss)(5) | 6.92 | % | 7.53 | % | 6.05 | %(7) | ||||||
| Portfolio turnover rate(6) | 37 | % | 24 | % | 12 | % | ||||||
| (1) | The Fund commenced operations on February 15, 2022. Shares of XHYC were listed on the NYSE Arca, Inc. on February 17, 2022. |
| (2) | Based on average daily shares outstanding. |
| (3) | Net asset value total return is calculated assuming an initial investment made at the net asset value at the beginning of the period, reinvestment of all distributions at net asset value during the period, and redemption at net asset value on the last day of the period. Net asset value total return includes adjustments in accordance with GAAP and as such, the net asset value for financial reporting purposes and the returns based upon those net asset values may differ from the net asset value and returns for shareholder transactions. Total return calculated for a period of less than one year is not annualized. |
| (4) | Market price total return is calculated assuming an initial investment made at the market price at the beginning of the period, reinvestment of all distributions at net asset value during the period and sale at the market price on the last day of the period. Total return calculated for a period of less than one year is not annualized. |
| (5) | Net investment income/(loss) represents income earned by the Fund from its underlying investments less expenses incurred by the Fund during the period. |
| (6) | Portfolio turnover rate is not annualized and excludes the value of portfolio securities received or delivered as a result of in-kind creations or redemptions of the Fund’s capital shares. |
| (7) | Annualized. |
The accompanying notes are an integral part of these financial statements.
228
BONDBLOXX ETF TRUST
Financial Highlights (Continued)
For a share outstanding throughout the period presented.
BondBloxx USD High Yield Bond Consumer Non-Cyclicals Sector ETF | ||||||||||||
For the Year Ended | For the Year Ended | For the Period Ended October 31, 2022(1) | ||||||||||
| Net Asset Value, beginning of period | $ | 35.48 | $ | 35.66 | $ | 39.80 | ||||||
| Income/(loss) from operations: | ||||||||||||
| Net investment income/(loss)(2) | 2.45 | 2.31 | 1.44 | |||||||||
| Net realized and unrealized gain/(loss) on investments | 2.58 | (0.40 | ) | (4.33 | ) | |||||||
| Total income/(loss) from operations | 5.03 | 1.91 | (2.89 | ) | ||||||||
| Distributions to shareholders: | ||||||||||||
| Net investment income | (2.43 | ) | (2.09 | ) | (1.25 | ) | ||||||
| Total distributions | (2.43 | ) | (2.09 | ) | (1.25 | ) | ||||||
| Net Asset Value, end of period | $ | 38.08 | $ | 35.48 | $ | 35.66 | ||||||
| Market Value, end of period | $ | 38.09 | $ | 35.62 | $ | 35.62 | ||||||
| Total Return at Net Asset Value(3) | 14.54 | % | 5.40 | % | (7.32 | )% | ||||||
| Total Return at Market Value(4) | 14.10 | % | 5.92 | % | (7.55 | )% | ||||||
| Net Assets, end of period (millions) | $ | 30.5 | $ | 10.6 | $ | 5.3 | ||||||
| Ratios to average net assets: | ||||||||||||
| Expenses | 0.35 | % | 0.35 | % | 0.35 | %(7) | ||||||
| Net investment income/(loss)(5) | 6.49 | % | 6.34 | % | 5.47 | %(7) | ||||||
| Portfolio turnover rate(6) | 34 | % | 15 | % | 25 | % | ||||||
| (1) | The Fund commenced operations on February 15, 2022. Shares of XHYD were listed on the NYSE Arca, Inc. on February 17, 2022. |
| (2) | Based on average daily shares outstanding. |
| (3) | Net asset value total return is calculated assuming an initial investment made at the net asset value at the beginning of the period, reinvestment of all distributions at net asset value during the period, and redemption at net asset value on the last day of the period. Net asset value total return includes adjustments in accordance with GAAP and as such, the net asset value for financial reporting purposes and the returns based upon those net asset values may differ from the net asset value and returns for shareholder transactions. Total return calculated for a period of less than one year is not annualized. |
| (4) | Market price total return is calculated assuming an initial investment made at the market price at the beginning of the period, reinvestment of all distributions at net asset value during the period and sale at the market price on the last day of the period. Total return calculated for a period of less than one year is not annualized. |
| (5) | Net investment income/(loss) represents income earned by the Fund from its underlying investments less expenses incurred by the Fund during the period. |
| (6) | Portfolio turnover rate is not annualized and excludes the value of portfolio securities received or delivered as a result of in-kind creations or redemptions of the Fund’s capital shares. |
| (7) | Annualized. |
The accompanying notes are an integral part of these financial statements.
229
BONDBLOXX ETF TRUST
Financial Highlights (Continued)
For a share outstanding throughout the period presented.
| BondBloxx USD High Yield Bond Sector Rotation ETF(8) | ||||||||||||||||||||||||
| For the Year Ended October 31, 2024 | For the Period Ended October 31, 2023(9) | For the Year Ended June 30, 2023 | For the 2022 | For the Year Ended June 30, 2021 | For the June 30, 2020 | |||||||||||||||||||
| Net Asset Value, beginning of period | $ | 14.21 | $ | 14.62 | $ | 14.68 | $ | 16.15 | $ | 15.72 | $ | 17.55 | ||||||||||||
| Income/(loss) from operations: | ||||||||||||||||||||||||
| Net investment income/(loss)(2) | 1.06 | 0.28 | 1.06 | 0.43 | 0.43 | 0.71 | ||||||||||||||||||
| Net realized and unrealized gain/(loss) on investments | 0.97 | (0.44 | ) | 0.00 | (10) | (1.38 | ) | 0.36 | (1.85 | ) | ||||||||||||||
| Total income/(loss) from operations | 2.03 | (0.16 | ) | 1.06 | (0.95 | ) | 0.79 | (1.14 | ) | |||||||||||||||
| Distributions to shareholders: | ||||||||||||||||||||||||
| Net investment income | (1.09 | ) | (0.25 | ) | (1.09 | ) | (0.52 | ) | (0.36 | ) | (0.67 | ) | ||||||||||||
| Return of capital | - | - | (0.03 | ) | (0.00 | )(10) | - | (0.02 | ) | |||||||||||||||
| Total distributions | (1.09 | ) | (0.25 | ) | (1.12 | ) | (0.52 | ) | (0.36 | ) | (0.69 | ) | ||||||||||||
| Net Asset Value, end of period | $ | 15.15 | $ | 14.21 | $ | 14.62 | $ | 14.68 | $ | 16.15 | $ | 15.72 | ||||||||||||
| Market Value, end of period | $ | 15.17 | $ | 14.16 | $ | 14.66 | $ | 14.72 | $ | 16.14 | $ | 15.75 | ||||||||||||
| Total Return at Net Asset Value(3) | 14.75 | % | (1.14 | )% | 7.44 | % | (6.07 | )% | 5.08 | % | (6.69 | )% | ||||||||||||
| Total Return at Market Value(4) | 15.31 | % | (1.70 | )% | 7.44 | % | (5.76 | )% | 4.82 | % | (6.45 | )% | ||||||||||||
| Net Assets, end of period (millions) | $ | 28.2 | $ | 28.6 | $ | 26.3 | $ | 33.8 | $ | 43.6 | $ | 77.0 | ||||||||||||
| Ratios to average net assets: | ||||||||||||||||||||||||
| Gross operating expenses | 0.75 | %(11) | 0.90 | %(7)(11) | 1.31 | % | 0.76 | % | 1.36 | % | 1.12 | % | ||||||||||||
| Excluded from Expense Cap - Expedited settlement facility fees | - | % | - | % | - | % | 0.01 | % | 0.11 | % | 0.19 | % | ||||||||||||
| Total operating expenses (net of waiver/reimbursement, if applicable, but gross of all other operating expenses) | 0.20 | %(11) | 0.41 | %(7)(11) | 0.55 | % | 0.56 | % | 0.66 | % | 0.75 | % | ||||||||||||
| Net investment income/(loss)(5) | 7.13 | % | 5.80 | %(7) | 7.18 | % | 2.73 | % | 2.68 | % | 4.13 | % | ||||||||||||
| Portfolio turnover rate(6) | 25 | % | 107 | %(12) | 123 | % | 157 | % | 215 | % | 344 | % | ||||||||||||
| (2) | Based on average daily shares outstanding. |
| (3) | Net asset value total return is calculated assuming an initial investment made at the net asset value at the beginning of the period, reinvestment of all distributions at net asset value during the period, and redemption at net asset value on the last day of the period. Net asset value total return includes adjustments in accordance with GAAP and as such, the net asset value for financial reporting purposes and the returns based upon those net asset values may differ from the net asset value and returns for shareholder transactions. Total return calculated for a period of less than one year is not annualized. |
| (4) | Market price total return is calculated assuming an initial investment made at the market price at the beginning of the period, reinvestment of all distributions at net asset value during the period and sale at the market price on the last day of the period. Total return calculated for a period of less than one year is not annualized. |
| (5) | Net investment income/(loss) represents income earned by the Fund from its underlying investments less expenses incurred by the Fund during the period. |
| (6) | Portfolio turnover rate is not annualized and excludes the value of portfolio securities received or delivered as a result of in-kind creations or redemptions of the Fund’s capital shares. |
| (7) | Annualized. |
| (8) | The Fund acquired the assets and liabilities of the Predecessor ETF, a series of the NexPoint Funds I, at the close of business on September 15, 2023. As a result of the reorganization, the Fund is the accounting successor of the Predecessor ETF. Financial information above for the periods prior to September 16, 2023, reflect the performance of the Predecessor ETF. Prior to September 16, 2023, the Predecessor ETF had a different investment adviser, had a different investment objective and policies, and was a passively-managed fund that sought to track the performance of the Markit iBoxx USD Liquid Leveraged Loan Index. |
| (9) | Fiscal year end changed from June 30, 2023 to October 31, 2023. |
| (10) | Amount represents less than $0.005 per share. |
| (11) | Does not include expenses of the affiliated investment companies in which the fund invests. |
| (12) | Portfolio turnover rate related to the change in investment strategy and re-balancing is 107%. |
The accompanying notes are an integral part of these financial statements.
230
BONDBLOXX ETF TRUST
Financial Highlights (Continued)
For a share outstanding throughout the period presented.
BondBloxx BB Rated USD High Yield Corporate Bond ETF | ||||||||||||
For the Year Ended | For the Year Ended | For the Period Ended October 31, 2022(13) | ||||||||||
| Net Asset Value, beginning of period | $ | 37.75 | $ | 38.53 | $ | 40.17 | ||||||
| Income/(loss) from operations: | ||||||||||||
| Net investment income/(loss)(2) | 2.57 | 2.48 | 1.04 | |||||||||
| Net realized and unrealized gain/(loss) on investments | 2.69 | (0.82 | ) | (1.87 | ) | |||||||
| Total income/(loss) from operations | 5.26 | 1.66 | (0.83 | ) | ||||||||
| Distributions to shareholders: | ||||||||||||
| Net investment income | (2.56 | ) | (2.44 | ) | (0.81 | ) | ||||||
| Total distributions | (2.56 | ) | (2.44 | ) | (0.81 | ) | ||||||
| Net Asset Value, end of period | $ | 40.45 | $ | 37.75 | $ | 38.53 | ||||||
| Market Value, end of period | $ | 40.53 | $ | 37.86 | $ | 38.47 | ||||||
| Total Return at Net Asset Value(3) | 14.26 | % | 4.33 | % | (2.07 | )% | ||||||
| Total Return at Market Value(4) | 14.13 | % | 4.78 | % | (5.57 | )% | ||||||
| Net Assets, end of period (millions) | $ | 60.7 | $ | 49.1 | $ | 42.4 | ||||||
| Ratios to average net assets: | ||||||||||||
| Expenses | 0.20 | % | 0.20 | % | 0.20 | %(7) | ||||||
| Net investment income/(loss)(5) | 6.42 | % | 6.40 | % | 6.03 | %(7) | ||||||
| Portfolio turnover rate(6) | 39 | % | 29 | % | 13 | % | ||||||
| (2) | Based on average daily shares outstanding. |
| (3) | Net asset value total return is calculated assuming an initial investment made at the net asset value at the beginning of the period, reinvestment of all distributions at net asset value during the period, and redemption at net asset value on the last day of the period. Net asset value total return includes adjustments in accordance with GAAP and as such, the net asset value for financial reporting purposes and the returns based upon those net asset values may differ from the net asset value and returns for shareholder transactions. Total return calculated for a period of less than one year is not annualized. |
| (4) | Market price total return is calculated assuming an initial investment made at the market price at the beginning of the period, reinvestment of all distributions at net asset value during the period and sale at the market price on the last day of the period. Total return calculated for a period of less than one year is not annualized. |
| (5) | Net investment income/(loss) represents income earned by the Fund from its underlying investments less expenses incurred by the Fund during the period. |
| (6) | Portfolio turnover rate is not annualized and excludes the value of portfolio securities received or delivered as a result of in-kind creations or redemptions of the Fund’s capital shares. |
| (7) | Annualized. |
| (13) | The Fund commenced operations on May 24, 2022. Shares of XBB were listed on the NYSE Arca, Inc. on May 26, 2022. |
The accompanying notes are an integral part of these financial statements.
231
BONDBLOXX ETF TRUST
Financial Highlights (Continued)
For a share outstanding throughout the period presented.
BondBloxx B Rated USD High Yield | ||||||||||||
For the Year Ended | For the Year Ended | For the Period Ended October 31, 2022(13) | ||||||||||
| Net Asset Value, beginning of period | $ | 37.29 | $ | 38.39 | $ | 40.08 | ||||||
| Income/(loss) from operations: | ||||||||||||
| Net investment income/(loss)(2) | 3.08 | 3.13 | 1.35 | |||||||||
| Net realized and unrealized gain/(loss) on investments | 2.34 | (1.11 | ) | (1.94 | ) | |||||||
| Total income/(loss) from operations | 5.42 | 2.02 | (0.59 | ) | ||||||||
| Distributions to shareholders: | ||||||||||||
| Net investment income | (3.09 | ) | (3.12 | ) | (1.10 | ) | ||||||
| Total distributions | (3.09 | ) | (3.12 | ) | (1.10 | ) | ||||||
| Net Asset Value, end of period | $ | 39.62 | $ | 37.29 | $ | 38.39 | ||||||
| Market Value, end of period | $ | 39.66 | $ | 37.39 | $ | 38.33 | ||||||
| Total Return at Net Asset Value(3) | 14.98 | % | 5.35 | % | (1.45 | )% | ||||||
| Total Return at Market Value(4) | 14.76 | % | 5.77 | % | (5.16 | )% | ||||||
| Net Assets, end of period (millions) | $ | 17.8 | $ | 13.1 | $ | 11.5 | ||||||
| Ratios to average net assets: | ||||||||||||
| Expenses | 0.30 | % | 0.30 | % | 0.30 | %(7) | ||||||
| Net investment income/(loss)(5) | 7.84 | % | 8.15 | % | 7.87 | %(7) | ||||||
| Portfolio turnover rate(6) | 55 | % | 31 | % | 8 | % | ||||||
| (2) | Based on average daily shares outstanding. |
| (3) | Net asset value total return is calculated assuming an initial investment made at the net asset value at the beginning of the period, reinvestment of all distributions at net asset value during the period, and redemption at net asset value on the last day of the period. Net asset value total return includes adjustments in accordance with GAAP and as such, the net asset value for financial reporting purposes and the returns based upon those net asset values may differ from the net asset value and returns for shareholder transactions. Total return calculated for a period of less than one year is not annualized. |
| (4) | Market price total return is calculated assuming an initial investment made at the market price at the beginning of the period, reinvestment of all distributions at net asset value during the period and sale at the market price on the last day of the period. Total return calculated for a period of less than one year is not annualized. |
| (5) | Net investment income/(loss) represents income earned by the Fund from its underlying investments less expenses incurred by the Fund during the period. |
| (6) | Portfolio turnover rate is not annualized and excludes the value of portfolio securities received or delivered as a result of in-kind creations or redemptions of the Fund’s capital shares. |
| (7) | Annualized. |
| (13) | The Fund commenced operations on May 24, 2022. Shares of XB were listed on the NYSE Arca, Inc. on May 26, 2022. |
The accompanying notes are an integral part of these financial statements.
232
BONDBLOXX ETF TRUST
Financial Highlights (Continued)
For a share outstanding throughout the period presented.
BondBloxx CCC Rated USD High Yield | ||||||||||||
For the Year Ended | For the Year Ended October 31, 2023 | For the Period Ended October 31, 2022(13) | ||||||||||
| Net Asset Value, beginning of period | $ | 35.78 | $ | 37.50 | $ | 40.00 | ||||||
| Income/(loss) from operations: | ||||||||||||
| Net investment income/(loss)(2) | 4.44 | 4.56 | 1.99 | |||||||||
| Net realized and unrealized gain/(loss) on investments | 3.42 | (1.77 | ) | (3.01 | ) | |||||||
| Total income/(loss) from operations | 7.86 | 2.79 | (1.02 | ) | ||||||||
| Distributions to shareholders: | ||||||||||||
| Net investment income | (4.20 | ) | (4.51 | ) | (1.48 | ) | ||||||
| Total distributions | (4.20 | ) | (4.51 | ) | (1.48 | ) | ||||||
| Net Asset Value, end of period | $ | 39.44 | $ | 35.78 | $ | 37.50 | ||||||
| Market Value, end of period | $ | 39.49 | $ | 35.83 | $ | 37.45 | ||||||
| Total Return at Net Asset Value(3) | 23.14 | % | 7.66 | % | (2.59 | )% | ||||||
| Total Return at Market Value(4) | 23.07 | % | 7.91 | % | (5.63 | )% | ||||||
| Net Assets, end of period (millions) | $ | 104.5 | $ | 19.7 | $ | 11.2 | ||||||
| Ratios to average net assets: | ||||||||||||
| Expenses | 0.40 | % | 0.40 | % | 0.40 | %(7) | ||||||
| Net investment income/(loss)(5) | 11.57 | % | 12.21 | % | 11.58 | %(7) | ||||||
| Portfolio turnover rate(6) | 49 | % | 25 | % | 12 | % | ||||||
| (2) | Based on average daily shares outstanding. |
| (3) | Net asset value total return is calculated assuming an initial investment made at the net asset value at the beginning of the period, reinvestment of all distributions at net asset value during the period, and redemption at net asset value on the last day of the period. Net asset value total return includes adjustments in accordance with GAAP and as such, the net asset value for financial reporting purposes and the returns based upon those net asset values may differ from the net asset value and returns for shareholder transactions. Total return calculated for a period of less than one year is not annualized. |
| (4) | Market price total return is calculated assuming an initial investment made at the market price at the beginning of the period, reinvestment of all distributions at net asset value during the period and sale at the market price on the last day of the period. Total return calculated for a period of less than one year is not annualized. |
| (5) | Net investment income/(loss) represents income earned by the Fund from its underlying investments less expenses incurred by the Fund during the period. |
| (6) | Portfolio turnover rate is not annualized and excludes the value of portfolio securities received or delivered as a result of in-kind creations or redemptions of the Fund’s capital shares. |
| (7) | Annualized. |
| (13) | The Fund commenced operations on May 24, 2022. Shares of XCCC were listed on the NYSE Arca, Inc. on May 26, 2022. |
The accompanying notes are an integral part of these financial statements.
233
BONDBLOXX ETF TRUST
Financial Highlights (Continued)
For a share outstanding throughout the period presented.
BondBloxx BBB Rated 1-5 Year Corporate | BondBloxx BBB Rated 5-10 Year Corporate | BondBloxx BBB Rated 10+ Year Corporate | ||||||||||
For the Period Ended | For the Period Ended | For the Period Ended | ||||||||||
| Net Asset Value, beginning of period | $ | 50.15 | $ | 50.02 | $ | 49.54 | ||||||
| Income/(loss) from operations: | ||||||||||||
| Net investment income/(loss)(2) | 2.00 | 1.98 | 2.15 | |||||||||
| Net realized and unrealized gain/(loss) on investments | 0.21 | 0.46 | (0.52 | ) | ||||||||
| Total income/(loss) from operations | 2.21 | 2.44 | 1.63 | |||||||||
| Distributions to shareholders: | ||||||||||||
| Net investment income | (1.54 | ) | (1.68 | ) | (1.80 | ) | ||||||
| Total distributions | (1.54 | ) | (1.68 | ) | (1.80 | ) | ||||||
| Net Asset Value, end of period | $ | 50.82 | $ | 50.78 | $ | 49.37 | ||||||
| Market Value, end of period | $ | 50.83 | $ | 50.72 | $ | 49.26 | ||||||
| Total Return at Net Asset Value(3) | 4.47 | % | 4.96 | % | 3.37 | % | ||||||
| Total Return at Market Value(4) | 4.31 | % | 4.48 | % | 2.50 | % | ||||||
| Net Assets, end of period (millions) | $ | 63.5 | $ | 7.6 | $ | 7.4 | ||||||
| Ratios to average net assets: | ||||||||||||
| Expenses | 0.19 | %(7) | 0.19 | %(7) | 0.19 | %(7) | ||||||
| Net investment income/(loss)(5) | 5.07 | %(7) | 5.03 | %(7) | 5.56 | %(7) | ||||||
| Portfolio turnover rate(6) | 21 | % | 27 | % | 25 | % | ||||||
| (2) | Based on average daily shares outstanding. |
| (3) | Net asset value total return is calculated assuming an initial investment made at the net asset value at the beginning of the period, reinvestment of all distributions at net asset value during the period, and redemption at net asset value on the last day of the period. Net asset value total return includes adjustments in accordance with GAAP and as such, the net asset value for financial reporting purposes and the returns based upon those net asset values may differ from the net asset value and returns for shareholder transactions. Total return calculated for a period of less than one year is not annualized. |
| (4) | Market price total return is calculated assuming an initial investment made at the market price at the beginning of the period, reinvestment of all distributions at net asset value during the period and sale at the market price on the last day of the period. Total return calculated for a period of less than one year is not annualized. |
| (5) | Net investment income/(loss) represents income earned by the Fund from its underlying investments less expenses incurred by the Fund during the period. |
| (6) | Portfolio turnover rate is not annualized and excludes the value of portfolio securities received or delivered as a result of in-kind creations or redemptions of the Fund’s capital shares. |
| (7) | Annualized. |
| (14) | The Funds commenced operations on January 23, 2024. Shares of BBBS, BBBI and BBBL were listed on the NYSE Arca, Inc. on January 25, 2024. |
The accompanying notes are an integral part of these financial statements.
234
BONDBLOXX ETF TRUST
Financial Highlights (Continued)
For a share outstanding throughout the period presented.
BondBloxx JP Morgan USD Emerging Markets 1-10 Year Bond ETF | ||||||||||||
For the Year Ended | For the Year Ended October 31, 2023 | For the Period Ended October 31, 2022(15) | ||||||||||
| Net Asset Value, beginning of period | $ | 38.61 | $ | 37.91 | $ | 40.00 | ||||||
| Income/(loss) from operations: | ||||||||||||
| Net investment income/(loss)(2) | 2.60 | 2.52 | 0.83 | |||||||||
| Net realized and unrealized gain/(loss) on investments | 3.50 | 0.68 | (2.32 | ) | ||||||||
| Total income/(loss) from operations | 6.10 | 3.20 | (1.49 | ) | ||||||||
| Distributions to shareholders: | ||||||||||||
| Net investment income | (2.58 | ) | (2.50 | ) | (0.60 | ) | ||||||
| Total distributions | (2.58 | ) | (2.50 | ) | (0.60 | ) | ||||||
| Net Asset Value, end of period | $ | 42.13 | $ | 38.61 | $ | 37.91 | ||||||
| Market Value, end of period | $ | 42.14 | $ | 38.61 | $ | 37.67 | ||||||
| Total Return at Net Asset Value(3) | 16.21 | % | 8.50 | % | (3.78 | )% | ||||||
| Total Return at Market Value(4) | 16.22 | % | 9.17 | % | (4.32 | )% | ||||||
| Net Assets, end of period (millions) | $ | 254.9 | $ | 183.4 | $ | 168.7 | ||||||
| Ratios to average net assets: | ||||||||||||
| Expenses | 0.29 | % | 0.29 | % | 0.29 | %(7) | ||||||
| Net investment income/(loss)(5) | 6.31 | % | 6.37 | % | 6.09 | %(7) | ||||||
| Portfolio turnover rate(6) | 22 | % | 23 | % | 9 | % | ||||||
| (2) | Based on average daily shares outstanding. |
| (3) | Net asset value total return is calculated assuming an initial investment made at the net asset value at the beginning of the period, reinvestment of all distributions at net asset value during the period, and redemption at net asset value on the last day of the period. Net asset value total return includes adjustments in accordance with GAAP and as such, the net asset value for financial reporting purposes and the returns based upon those net asset values may differ from the net asset value and returns for shareholder transactions. Total return calculated for a period of less than one year is not annualized. |
| (4) | Market price total return is calculated assuming an initial investment made at the market price at the beginning of the period, reinvestment of all distributions at net asset value during the period and sale at the market price on the last day of the period. Total return calculated for a period of less than one year is not annualized. |
| (5) | Net investment income/(loss) represents income earned by the Fund from its underlying investments less expenses incurred by the Fund during the period. |
| (6) | Portfolio turnover rate is not annualized and excludes the value of portfolio securities received or delivered as a result of in-kind creations or redemptions of the Fund’s capital shares. |
| (7) | Annualized. |
| (15) | The Fund commenced operations on June 28, 2022. Shares of XEMD were listed on the Cboe BZX, Inc. on June 30, 2022. |
The accompanying notes are an integral part of these financial statements.
235
BONDBLOXX ETF TRUST
Financial Highlights (Continued)
For a share outstanding throughout the period presented.
BondBloxx Bloomberg Six Month Target Duration US Treasury ETF | ||||||||||||
For the Year Ended | For the Year Ended October 31, 2023 | For the Period Ended October 31, 2022(16) | ||||||||||
| Net Asset Value, beginning of period | $ | 50.29 | $ | 50.09 | $ | 50.00 | ||||||
| Income/(loss) from operations: | ||||||||||||
| Net investment income/(loss)(2) | 2.55 | 2.53 | 0.25 | |||||||||
| Net realized and unrealized gain/(loss) on investments | 0.10 | (0.30 | ) | (0.16 | ) | |||||||
| Total income/(loss) from operations | 2.65 | 2.23 | 0.09 | |||||||||
| Distributions to shareholders: | ||||||||||||
| Net investment income | (2.58 | ) | (2.03 | ) | - | |||||||
| Total distributions | (2.58 | ) | (2.03 | ) | - | |||||||
| Net Asset Value, end of period | $ | 50.36 | $ | 50.29 | $ | 50.09 | ||||||
| Market Value, end of period | $ | 50.36 | $ | 50.31 | $ | 50.13 | ||||||
| Total Return at Net Asset Value(3) | 5.41 | % | 4.55 | % | 0.18 | % | ||||||
| Total Return at Market Value(4) | 5.36 | % | 4.50 | % | 0.22 | % | ||||||
| Net Assets, end of period (millions) | $ | 899.9 | $ | 1,096.9 | $ | 50.1 | ||||||
| Ratios to average net assets: | ||||||||||||
| Expenses | 0.03 | % | 0.03 | % | 0.03 | %(7) | ||||||
| Net investment income/(loss)(5) | 5.09 | % | 5.02 | % | 3.53 | %(7) | ||||||
| Portfolio turnover rate(6) | - | % | - | % | 24 | % | ||||||
| (2) | Based on average daily shares outstanding. |
| (3) | Net asset value total return is calculated assuming an initial investment made at the net asset value at the beginning of the period, reinvestment of all distributions at net asset value during the period, and redemption at net asset value on the last day of the period. Net asset value total return includes adjustments in accordance with GAAP and as such, the net asset value for financial reporting purposes and the returns based upon those net asset values may differ from the net asset value and returns for shareholder transactions. Total return calculated for a period of less than one year is not annualized. |
| (4) | Market price total return is calculated assuming an initial investment made at the market price at the beginning of the period, reinvestment of all distributions at net asset value during the period and sale at the market price on the last day of the period. Total return calculated for a period of less than one year is not annualized. |
| (5) | Net investment income/(loss) represents income earned by the Fund from its underlying investments less expenses incurred by the Fund during the period. |
| (6) | Portfolio turnover rate is not annualized and excludes the value of portfolio securities received or delivered as a result of in-kind creations or redemptions of the Fund’s capital shares. |
| (7) | Annualized. |
| (16) | The Fund commenced operations on September 13, 2022. Shares of XHLF were listed on the NYSE Arca, Inc. on September 15, 2022. |
The accompanying notes are an integral part of these financial statements.
236
BONDBLOXX ETF TRUST
Financial Highlights (Continued)
For a share outstanding throughout the period presented.
BondBloxx Bloomberg One Year Target Duration US Treasury ETF | ||||||||||||
For the Year Ended | For the Year Ended October 31, 2023 | For the Period Ended October 31, 2022(16) | ||||||||||
| Net Asset Value, beginning of period | $ | 49.74 | $ | 49.90 | $ | 50.00 | ||||||
| Income/(loss) from operations: | ||||||||||||
| Net investment income/(loss)(2) | 2.59 | 2.51 | 0.27 | |||||||||
| Net realized and unrealized gain/(loss) on investments | 0.08 | (0.56 | ) | (0.37 | ) | |||||||
| Total income/(loss) from operations | 2.67 | 1.95 | (0.10 | ) | ||||||||
| Distributions to shareholders: | ||||||||||||
| Net investment income | (2.67 | ) | (2.11 | ) | - | |||||||
| Total distributions | (2.67 | ) | (2.11 | ) | - | |||||||
| Net Asset Value, end of period | $ | 49.74 | $ | 49.74 | $ | 49.90 | ||||||
| Market Value, end of period | $ | 49.74 | $ | 49.76 | $ | 49.91 | ||||||
| Total Return at Net Asset Value(3) | 5.52 | % | 4.01 | % | (0.20 | )% | ||||||
| Total Return at Market Value(4) | 5.47 | % | 4.02 | % | (0.14 | )% | ||||||
| Net Assets, end of period (millions) | $ | 533.2 | $ | 527.2 | $ | 39.4 | ||||||
| Ratios to average net assets: | ||||||||||||
| Expenses | 0.03 | % | 0.03 | % | 0.03 | %(7) | ||||||
| Net investment income/(loss)(5) | 5.23 | % | 5.00 | % | 3.83 | %(7) | ||||||
| Portfolio turnover rate(6) | 66 | % | 85 | % | 19 | % | ||||||
| (2) | Based on average daily shares outstanding. |
| (3) | Net asset value total return is calculated assuming an initial investment made at the net asset value at the beginning of the period, reinvestment of all distributions at net asset value during the period, and redemption at net asset value on the last day of the period. Net asset value total return includes adjustments in accordance with GAAP and as such, the net asset value for financial reporting purposes and the returns based upon those net asset values may differ from the net asset value and returns for shareholder transactions. Total return calculated for a period of less than one year is not annualized. |
| (4) | Market price total return is calculated assuming an initial investment made at the market price at the beginning of the period, reinvestment of all distributions at net asset value during the period and sale at the market price on the last day of the period. Total return calculated for a period of less than one year is not annualized. |
| (5) | Net investment income/(loss) represents income earned by the Fund from its underlying investments less expenses incurred by the Fund during the period. |
| (6) | Portfolio turnover rate is not annualized and excludes the value of portfolio securities received or delivered as a result of in-kind creations or redemptions of the Fund’s capital shares. |
| (7) | Annualized. |
| (16) | The Fund commenced operations on September 13, 2022. Shares of XONE were listed on the NYSE Arca, Inc. on September 15, 2022. |
The accompanying notes are an integral part of these financial statements.
237
BONDBLOXX ETF TRUST
Financial Highlights (Continued)
For a share outstanding throughout the period presented.
BondBloxx Bloomberg Two Year Target Duration US Treasury ETF | ||||||||||||
For the Year Ended | For the Year Ended October 31, 2023 | For the Period Ended October 31, 2022(16) | ||||||||||
| Net Asset Value, beginning of period | $ | 48.85 | $ | 49.49 | $ | 49.94 | ||||||
| Income/(loss) from operations: | ||||||||||||
| Net investment income/(loss)(2) | 2.23 | 2.09 | 0.26 | |||||||||
| Net realized and unrealized gain/(loss) on investments | 0.54 | (0.75 | ) | (0.71 | ) | |||||||
| Total income/(loss) from operations | 2.77 | 1.34 | (0.45 | ) | ||||||||
| Distributions to shareholders: | ||||||||||||
| Net investment income | (2.27 | ) | (1.98 | ) | - | |||||||
| Total distributions | (2.27 | ) | (1.98 | ) | - | |||||||
| Net Asset Value, end of period | $ | 49.35 | $ | 48.85 | $ | 49.49 | ||||||
| Market Value, end of period | $ | 49.37 | $ | 48.87 | $ | 49.48 | ||||||
| Total Return at Net Asset Value(3) | 5.79 | % | 2.76 | % | (0.90 | )% | ||||||
| Total Return at Market Value(4) | 5.79 | % | 2.82 | % | (0.74 | )% | ||||||
| Net Assets, end of period (millions) | $ | 150.5 | $ | 105.0 | $ | 36.6 | ||||||
| Ratios to average net assets: | ||||||||||||
| Expenses | 0.05 | % | 0.05 | % | 0.05 | %(7) | ||||||
| Net investment income/(loss)(5) | 4.53 | % | 4.21 | % | 3.74 | %(7) | ||||||
| Portfolio turnover rate(6) | 66 | % | 68 | % | 12 | % | ||||||
| (2) | Based on average daily shares outstanding. |
| (3) | Net asset value total return is calculated assuming an initial investment made at the net asset value at the beginning of the period, reinvestment of all distributions at net asset value during the period, and redemption at net asset value on the last day of the period. Net asset value total return includes adjustments in accordance with GAAP and as such, the net asset value for financial reporting purposes and the returns based upon those net asset values may differ from the net asset value and returns for shareholder transactions. Total return calculated for a period of less than one year is not annualized. |
| (4) | Market price total return is calculated assuming an initial investment made at the market price at the beginning of the period, reinvestment of all distributions at net asset value during the period and sale at the market price on the last day of the period. Total return calculated for a period of less than one year is not annualized. |
| (5) | Net investment income/(loss) represents income earned by the Fund from its underlying investments less expenses incurred by the Fund during the period. |
| (6) | Portfolio turnover rate is not annualized and excludes the value of portfolio securities received or delivered as a result of in-kind creations or redemptions of the Fund’s capital shares. |
| (7) | Annualized. |
| (16) | The Fund commenced operations on September 13, 2022. Shares of XTWO were listed on the NYSE Arca, Inc. on September 15, 2022. |
The accompanying notes are an integral part of these financial statements.
238
BONDBLOXX ETF TRUST
Financial Highlights (Continued)
For a share outstanding throughout the period presented.
BondBloxx Bloomberg Three Year Target Duration US Treasury ETF | ||||||||||||
For the Year Ended | For the Year Ended October 31, 2023 | For the Period Ended October 31, 2022(16) | ||||||||||
| Net Asset Value, beginning of period | $ | 48.20 | $ | 49.14 | $ | 49.86 | ||||||
| Income/(loss) from operations: | ||||||||||||
| Net investment income/(loss)(2) | 2.16 | 1.99 | 0.28 | |||||||||
| Net realized and unrealized gain/(loss) on investments | 0.83 | (0.92 | ) | (1.00 | ) | |||||||
| Total income/(loss) from operations | 2.99 | 1.07 | (0.72 | ) | ||||||||
| Distributions to shareholders: | ||||||||||||
| Net investment income | (2.06 | ) | (2.01 | ) | - | |||||||
| Total distributions | (2.06 | ) | (2.01 | ) | - | |||||||
| Net Asset Value, end of period | $ | 49.13 | $ | 48.20 | $ | 49.14 | ||||||
| Market Value, end of period | $ | 49.11 | $ | 48.21 | $ | 49.12 | ||||||
| Total Return at Net Asset Value(3) | 6.30 | % | 2.18 | % | (1.44 | )% | ||||||
| Total Return at Market Value(4) | 6.24 | % | 2.24 | % | (1.25 | )% | ||||||
| Net Assets, end of period (millions) | $ | 100.7 | $ | 28.9 | $ | 20.1 | ||||||
| Ratios to average net assets: | ||||||||||||
| Expenses | 0.05 | % | 0.05 | % | 0.05 | %(7) | ||||||
| Net investment income/(loss)(5) | 4.39 | % | 4.05 | % | 3.99 | %(7) | ||||||
| Portfolio turnover rate(6) | 72 | % | 80 | % | 20 | % | ||||||
| (2) | Based on average daily shares outstanding. |
| (3) | Net asset value total return is calculated assuming an initial investment made at the net asset value at the beginning of the period, reinvestment of all distributions at net asset value during the period, and redemption at net asset value on the last day of the period. Net asset value total return includes adjustments in accordance with GAAP and as such, the net asset value for financial reporting purposes and the returns based upon those net asset values may differ from the net asset value and returns for shareholder transactions. Total return calculated for a period of less than one year is not annualized. |
| (4) | Market price total return is calculated assuming an initial investment made at the market price at the beginning of the period, reinvestment of all distributions at net asset value during the period and sale at the market price on the last day of the period. Total return calculated for a period of less than one year is not annualized. |
| (5) | Net investment income/(loss) represents income earned by the Fund from its underlying investments less expenses incurred by the Fund during the period. |
| (6) | Portfolio turnover rate is not annualized and excludes the value of portfolio securities received or delivered as a result of in-kind creations or redemptions of the Fund’s capital shares. |
| (7) | Annualized. |
| (16) | The Fund commenced operations on September 13, 2022. Shares of XTRE were listed on the NYSE Arca, Inc. on September 15, 2022. |
The accompanying notes are an integral part of these financial statements.
239
BONDBLOXX ETF TRUST
Financial Highlights (Continued)
For a share outstanding throughout the period presented.
BondBloxx Bloomberg Five Year Target Duration US Treasury ETF | ||||||||||||
For the Year Ended 2024 | For the Year Ended October 31, 2023 | For the Period Ended October 31, 2022(16) | ||||||||||
| Net Asset Value, beginning of period | $ | 46.84 | $ | 48.40 | $ | 49.77 | ||||||
| Income/(loss) from operations: | ||||||||||||
| Net investment income/(loss)(2) | 1.97 | 1.83 | 0.24 | |||||||||
| Net realized and unrealized gain/(loss) on investments | 1.68 | (1.56 | ) | (1.61 | ) | |||||||
| Total income/(loss) from operations | 3.65 | 0.27 | (1.37 | ) | ||||||||
| Distributions to shareholders: | ||||||||||||
| Net investment income | (1.88 | ) | (1.83 | ) | - | |||||||
| Total distributions | (1.88 | ) | (1.83 | ) | - | |||||||
| Net Asset Value, end of period | $ | 48.61 | $ | 46.84 | $ | 48.40 | ||||||
| Market Value, end of period | $ | 48.62 | $ | 46.86 | $ | 48.36 | ||||||
| Total Return at Net Asset Value(3) | 7.88 | % | 0.46 | % | (2.75 | )% | ||||||
| Total Return at Market Value(4) | 7.85 | % | 0.59 | % | (2.50 | )% | ||||||
| Net Assets, end of period (millions) | $ | 122.0 | $ | 36.5 | $ | 20.3 | ||||||
| Ratios to average net assets: | ||||||||||||
| Expenses | 0.05 | % | 0.05 | % | 0.05 | %(7) | ||||||
| Net investment income/(loss)(5) | 4.03 | % | 3.73 | % | 3.49 | %(7) | ||||||
| Portfolio turnover rate(6) | 95 | % | 88 | % | 8 | % | ||||||
| (2) | Based on average daily shares outstanding. |
| (3) | Net asset value total return is calculated assuming an initial investment made at the net asset value at the beginning of the period, reinvestment of all distributions at net asset value during the period, and redemption at net asset value on the last day of the period. Net asset value total return includes adjustments in accordance with GAAP and as such, the net asset value for financial reporting purposes and the returns based upon those net asset values may differ from the net asset value and returns for shareholder transactions. Total return calculated for a period of less than one year is not annualized. |
| (4) | Market price total return is calculated assuming an initial investment made at the market price at the beginning of the period, reinvestment of all distributions at net asset value during the period and sale at the market price on the last day of the period. Total return calculated for a period of less than one year is not annualized. |
| (5) | Net investment income/(loss) represents income earned by the Fund from its underlying investments less expenses incurred by the Fund during the period. |
| (6) | Portfolio turnover rate is not annualized and excludes the value of portfolio securities received or delivered as a result of in-kind creations or redemptions of the Fund’s capital shares. |
| (7) | Annualized. |
| (16) | The Fund commenced operations on September 13, 2022. Shares of XFIV were listed on the NYSE Arca, Inc. on September 15, 2022. |
The accompanying notes are an integral part of these financial statements.
240
BONDBLOXX ETF TRUST
Financial Highlights (Continued)
For a share outstanding throughout the period presented.
BondBloxx Bloomberg Seven Year Target Duration US Treasury ETF | ||||||||||||
For the Year Ended | For the Year Ended October 31, 2023 | For the Period Ended October 31, 2022(16) | ||||||||||
| Net Asset Value, beginning of period | $ | 45.08 | $ | 47.75 | $ | 49.70 | ||||||
| Income/(loss) from operations: | ||||||||||||
| Net investment income/(loss)(2) | 2.00 | 1.77 | 0.23 | |||||||||
| Net realized and unrealized gain/(loss) on investments | 2.10 | (2.66 | ) | (2.18 | ) | |||||||
| Total income/(loss) from operations | 4.10 | (0.89 | ) | (1.95 | ) | |||||||
| Distributions to shareholders: | ||||||||||||
| Net investment income | (1.84 | ) | (1.78 | ) | - | |||||||
| Total distributions | (1.84 | ) | (1.78 | ) | - | |||||||
| Net Asset Value, end of period | $ | 47.34 | $ | 45.08 | $ | 47.75 | ||||||
| Market Value, end of period | $ | 47.32 | $ | 45.13 | $ | 47.68 | ||||||
| Total Return at Net Asset Value(3) | 9.15 | % | (2.04 | )% | (3.92 | )% | ||||||
| Total Return at Market Value(4) | 8.98 | % | (1.79 | )% | (3.75 | )% | ||||||
| Net Assets, end of period (millions) | $ | 109.8 | $ | 53.7 | $ | 20.5 | ||||||
| Ratios to average net assets: | ||||||||||||
| Expenses | 0.05 | % | 0.05 | % | 0.05 | %(7) | ||||||
| Net investment income/(loss)(5) | 4.21 | % | 3.65 | % | 3.45 | %(7) | ||||||
| Portfolio turnover rate(6) | 71 | % | 64 | % | 19 | % | ||||||
| (2) | Based on average daily shares outstanding. |
| (3) | Net asset value total return is calculated assuming an initial investment made at the net asset value at the beginning of the period, reinvestment of all distributions at net asset value during the period, and redemption at net asset value on the last day of the period. Net asset value total return includes adjustments in accordance with GAAP and as such, the net asset value for financial reporting purposes and the returns based upon those net asset values may differ from the net asset value and returns for shareholder transactions. Total return calculated for a period of less than one year is not annualized. |
| (4) | Market price total return is calculated assuming an initial investment made at the market price at the beginning of the period, reinvestment of all distributions at net asset value during the period and sale at the market price on the last day of the period. Total return calculated for a period of less than one year is not annualized. |
| (5) | Net investment income/(loss) represents income earned by the Fund from its underlying investments less expenses incurred by the Fund during the period. |
| (6) | Portfolio turnover rate is not annualized and excludes the value of portfolio securities received or delivered as a result of in-kind creations or redemptions of the Fund’s capital shares. |
| (7) | Annualized. |
| (16) | The Fund commenced operations on September 13, 2022. Shares of XSVN were listed on the NYSE Arca, Inc. on September 15, 2022. |
The accompanying notes are an integral part of these financial statements.
241
BONDBLOXX ETF TRUST
Financial Highlights (Continued)
For a share outstanding throughout the period presented.
BondBloxx Bloomberg Ten Year Target Duration US Treasury ETF | ||||||||||||
For the Year Ended | For the Year Ended October 31, 2023 | For the Period Ended October 31, 2022(16) | ||||||||||
| Net Asset Value, beginning of period | $ | 43.04 | $ | 46.67 | $ | 49.74 | ||||||
| Income/(loss) from operations: | ||||||||||||
| Net investment income/(loss)(2) | 1.98 | 1.81 | 0.23 | |||||||||
| Net realized and unrealized gain/(loss) on investments | 3.11 | (3.64 | ) | (3.30 | ) | |||||||
| Total income/(loss) from operations | 5.09 | (1.83 | ) | (3.07 | ) | |||||||
| Distributions to shareholders: | ||||||||||||
| Net investment income | (1.85 | ) | (1.80 | ) | - | |||||||
| Total distributions | (1.85 | ) | (1.80 | ) | - | |||||||
| Net Asset Value, end of period | $ | 46.28 | $ | 43.04 | $ | 46.67 | ||||||
| Market Value, end of period | $ | 46.27 | $ | 43.09 | $ | 46.60 | ||||||
| Total Return at Net Asset Value(3) | 11.91 | % | (4.23 | )% | (6.17 | )% | ||||||
| Total Return at Market Value(4) | 11.76 | % | (3.98 | )% | (6.03 | )% | ||||||
| Net Assets, end of period (millions) | $ | 236.0 | $ | 42.6 | $ | 20.1 | ||||||
| Ratios to average net assets: | ||||||||||||
| Expenses | 0.075 | % | 0.075 | % | 0.075 | %(7) | ||||||
| Net investment income/(loss)(5) | 4.22 | % | 3.82 | % | 3.44 | %(7) | ||||||
| Portfolio turnover rate(6) | 40 | % | 84 | % | 12 | % | ||||||
| (2) | Based on average daily shares outstanding. |
| (3) | Net asset value total return is calculated assuming an initial investment made at the net asset value at the beginning of the period, reinvestment of all distributions at net asset value during the period, and redemption at net asset value on the last day of the period. Net asset value total return includes adjustments in accordance with GAAP and as such, the net asset value for financial reporting purposes and the returns based upon those net asset values may differ from the net asset value and returns for shareholder transactions. Total return calculated for a period of less than one year is not annualized. |
| (4) | Market price total return is calculated assuming an initial investment made at the market price at the beginning of the period, reinvestment of all distributions at net asset value during the period and sale at the market price on the last day of the period. Total return calculated for a period of less than one year is not annualized. |
| (5) | Net investment income/(loss) represents income earned by the Fund from its underlying investments less expenses incurred by the Fund during the period. |
| (6) | Portfolio turnover rate is not annualized and excludes the value of portfolio securities received or delivered as a result of in-kind creations or redemptions of the Fund’s capital shares. |
| (7) | Annualized. |
| (16) | The Fund commenced operations on September 13, 2022. Shares of XTEN were listed on the NYSE Arca, Inc. on September 15, 2022. |
The accompanying notes are an integral part of these financial statements.
242
BONDBLOXX ETF TRUST
Financial Highlights (Continued)
For a share outstanding throughout the period presented.
BondBloxx Bloomberg Twenty Year Target Duration US Treasury ETF | ||||||||||||
For the Year Ended | For the Year Ended October 31, 2023 | For the 2022(16) | ||||||||||
| Net Asset Value, beginning of period | $ | 36.65 | $ | 43.65 | $ | 49.78 | ||||||
| Income/(loss) from operations: | ||||||||||||
| Net investment income/(loss)(2) | 1.81 | 1.74 | 0.23 | |||||||||
| Net realized and unrealized gain/(loss) on investments | 4.61 | (6.98 | ) | (6.36 | ) | |||||||
| Total income/(loss) from operations | 6.42 | (5.24 | ) | (6.13 | ) | |||||||
| Distributions to shareholders: | ||||||||||||
| Net investment income | (1.79 | ) | (1.76 | ) | - | |||||||
| Total distributions | (1.79 | ) | (1.76 | ) | - | |||||||
| Net Asset Value, end of period | $ | 41.28 | $ | 36.65 | $ | 43.65 | ||||||
| Market Value, end of period | $ | 41.23 | $ | 36.74 | $ | 43.62 | ||||||
| Total Return at Net Asset Value(3) | 17.56 | % | (12.73 | )% | (12.31 | )% | ||||||
| Total Return at Market Value(4) | 17.13 | % | (12.45 | )% | (12.66 | )% | ||||||
| Net Assets, end of period (millions) | $ | 52.0 | $ | 23.1 | $ | 21.4 | ||||||
| Ratios to average net assets: | ||||||||||||
| Expenses | 0.125 | % | 0.125 | % | 0.125 | %(7) | ||||||
| Net investment income/(loss)(5) | 4.25 | % | 3.81 | % | 3.54 | %(7) | ||||||
| Portfolio turnover rate(6) | 151 | % | 93 | % | 45 | % | ||||||
| (2) | Based on average daily shares outstanding. |
| (3) | Net asset value total return is calculated assuming an initial investment made at the net asset value at the beginning of the period, reinvestment of all distributions at net asset value during the period, and redemption at net asset value on the last day of the period. Net asset value total return includes adjustments in accordance with GAAP and as such, the net asset value for financial reporting purposes and the returns based upon those net asset values may differ from the net asset value and returns for shareholder transactions. Total return calculated for a period of less than one year is not annualized. |
| (4) | Market price total return is calculated assuming an initial investment made at the market price at the beginning of the period, reinvestment of all distributions at net asset value during the period and sale at the market price on the last day of the period. Total return calculated for a period of less than one year is not annualized. |
| (5) | Net investment income/(loss) represents income earned by the Fund from its underlying investments less expenses incurred by the Fund during the period. |
| (6) | Portfolio turnover rate is not annualized and excludes the value of portfolio securities received or delivered as a result of in-kind creations or redemptions of the Fund’s capital shares. |
| (7) | Annualized. |
| (16) | The Fund commenced operations on September 13, 2022. Shares of XTWY were listed on the NYSE Arca, Inc. on September 15, 2022. |
The accompanying notes are an integral part of these financial statements.
243
BONDBLOXX ETF TRUST
Financial Highlights (Continued)
For a share outstanding throughout the period presented.
BondBloxx IR+M ETF | ||||
For the Period Ended | ||||
| Net Asset Value, beginning of period | $ | 50.00 | ||
| Income/(loss) from operations: | ||||
| Net investment income/(loss)(2) | 1.21 | |||
| Net realized and unrealized gain/(loss) on investments | 0.15 | |||
| Total income/(loss) from operations | 1.36 | |||
| Distributions to shareholders: | ||||
| Net investment income | (0.92 | ) | ||
| Total distributions | (0.92 | ) | ||
| Net Asset Value, end of period | $ | 50.44 | ||
| Market Value, end of period | $ | 50.44 | ||
| Total Return at Net Asset Value(3) | 2.75 | % | ||
| Total Return at Market Value(4) | 2.93 | % | ||
| Net Assets, end of period (millions) | $ | 105.9 | ||
| Ratios to average net assets: | ||||
| Expenses | 0.35 | %(7) | ||
| Net investment income/(loss)(5) | 3.73 | %(7) | ||
| Portfolio turnover rate(6) | 18 | % | ||
| (2) | Based on average daily shares outstanding. |
| (3) | Net asset value total return is calculated assuming an initial investment made at the net asset value at the beginning of the period, reinvestment of all distributions at net asset value during the period, and redemption at net asset value on the last day of the period. Net asset value total return includes adjustments in accordance with GAAP and as such, the net asset value for financial reporting purposes and the returns based upon those net asset values may differ from the net asset value and returns for shareholder transactions. Total return calculated for a period of less than one year is not annualized. |
| (4) | Market price total return is calculated assuming an initial investment made at the market price at the beginning of the period, reinvestment of all distributions at net asset value during the period and sale at the market price on the last day of the period. Total return calculated for a period of less than one year is not annualized. |
| (5) | Net investment income/(loss) represents income earned by the Fund from its underlying investments less expenses incurred by the Fund during the period. |
| (6) | Portfolio turnover rate is not annualized and excludes the value of portfolio securities received or delivered as a result of in-kind creations or redemptions of the Fund’s capital shares. |
| (7) | Annualized. |
| (17) | The Fund commenced operations on March 12, 2024. Shares of TAXX were listed on the NYSE Arca, Inc. on March 14, 2024. |
The accompanying notes are an integral part of these financial statements.
244
BONDBLOXX ETF TRUST
Notes to the Financial Statements
October 31, 2024
1. ORGANIZATION
The BondBloxx ETF Trust (the “Trust”) is a Delaware statutory trust organized on August 17, 2021 and is authorized to issue multiple series or portfolios. The Trust is an open-end management investment company, registered under the Investment Company Act of 1940, as amended (the “1940 Act”). The Trust’s shares are registered under the Securities Act of 1933, as amended. The Trust currently consists of Bond shares of twenty-four separate active series: BondBloxx USD High Yield Bond Industrial Sector ETF, BondBloxx USD High Yield Bond Telecom, Media & Technology Sector ETF, BondBloxx USD High Yield Bond Healthcare Sector ETF, BondBloxx USD High Yield Bond Financial & REIT Sector ETF, BondBloxx USD High Yield Bond Energy Sector ETF, BondBloxx USD High Yield Bond Consumer Cyclicals Sector ETF, BondBloxx USD High Yield Bond Consumer Non-Cyclicals Sector ETF, BondBloxx USD High Yield Bond Sector Rotation ETF, BondBloxx BB Rated USD High Yield Corporate Bond ETF, BondBloxx B Rated USD High Yield Corporate Bond ETF, BondBloxx CCC Rated USD High Yield Corporate Bond ETF, BondBloxx BBB Rated 1-5 Year Corporate Bond ETF, BondBloxx BBB Rated 5-10 Year Corporate Bond ETF, BondBloxx BBB Rated 10+ Year Corporate Bond ETF, BondBloxx JP Morgan USD Emerging Markets 1-10 Year Bond ETF, BondBloxx Bloomberg Six Month Target Duration US Treasury ETF, BondBloxx Bloomberg One Year Target Duration US Treasury ETF, BondBloxx Bloomberg Two Year Target Duration US Treasury ETF, BondBloxx Bloomberg Three Year Target Duration US Treasury ETF, BondBloxx Bloomberg Five Year Target Duration US Treasury ETF, BondBloxx Bloomberg Seven Year Target Duration US Treasury ETF, BondBloxx Bloomberg Ten Year Target Duration US Treasury ETF, BondBloxx Bloomberg Twenty Year Target Duration US Treasury ETF and BondBloxx IR+M Tax-Aware Short Duration ETF (each, a “Fund” and collectively, the “Funds”). Each series operates as an exchange-traded fund (“ETF”). The Funds are classified as “non-diversified” under the 1940 Act.
Each Fund is managed by BondBloxx Investment Management Corporation (“BIM” or “Adviser”) and generally seeks to track the investment results of each Index (the “Index”). The following table details the Index and commencement of operations of each Fund. Each Index models the performance of the bonds of issuers within a particular sector or group of sectors.
| Fund Name | Actual Index | Commencement of Operations | ||
| BondBloxx USD High Yield Bond Industrial Sector ETF | ICE Diversified US Cash Pay High Yield Core Industrial Index | February 15, 2022 | ||
| BondBloxx USD High Yield Bond Telecom, Media & Technology Sector ETF | ICE Diversified US Cash Pay High Yield Telecom, Media & Technology Index | February 15, 2022 | ||
| BondBloxx USD High Yield Bond Healthcare Sector ETF | ICE Diversified US Cash Pay High Yield Healthcare Index | February 15, 2022 | ||
| BondBloxx USD High Yield Bond Financial & REIT Sector ETF | ICE Diversified US Cash Pay High Yield Financial & REIT Index | February 15, 2022 | ||
| BondBloxx USD High Yield Bond Energy Sector ETF | ICE Diversified US Cash Pay High Yield Energy Index | February 15, 2022 | ||
| BondBloxx USD High Yield Bond Consumer Cyclicals Sector ETF | ICE Diversified US Cash Pay High Yield Consumer Cyclical Index | February 15, 2022 | ||
| BondBloxx USD High Yield Bond Consumer Non-Cyclicals Sector ETF | ICE Diversified US Cash Pay High Yield Consumer Non-Cyclical Index | February 15, 2022 | ||
| BondBloxx USD High Yield Bond Sector Rotation ETF | N/A | September 16, 2023* | ||
| BondBloxx BB Rated USD High Yield Corporate Bond ETF | ICE BofA BB US Cash Pay High Yield Constrained Index | May 24, 2022 | ||
| BondBloxx B Rated USD High Yield Corporate Bond ETF | ICE BofA Single-B US Cash Pay High Yield Constrained Index | May 24, 2022 |
245
BONDBLOXX ETF TRUST
Notes to the Financial Statements (Continued)
October 31, 2024
| Fund Name | Actual Index | Commencement of Operations | ||
| BondBloxx CCC Rated USD High Yield Corporate Bond ETF | ICE CCC US Cash Pay High Yield Constrained Index | May 24, 2022 | ||
| BondBloxx BBB Rated 1-5 Year Corporate Bond ETF | Bloomberg US Corporate BBB 1-5 Year Index | January 23, 2024 | ||
| BondBloxx BBB Rated 5-10 Year Corporate Bond ETF | Bloomberg US Corporate BBB 5-10 Year Index | January 23, 2024 | ||
| BondBloxx BBB Rated 10+ Year Corporate Bond ETF | Bloomberg US Corporate BBB 10+ Year Index | January 23, 2024 | ||
| BondBloxx JP Morgan USD Emerging Markets 1-10 Year Bond ETF | J.P. Morgan EMBI Global Diversified Liquid 1-10 Year Maturity Index | June 28, 2022 | ||
| BondBloxx Bloomberg Six Month Target Duration US Treasury ETF | Bloomberg US Treasury Six Month Duration Index | September 13, 2022 | ||
| BondBloxx Bloomberg One Year Target Duration US Treasury ETF | Bloomberg US Treasury One Year Duration Index | September 13, 2022 | ||
| BondBloxx Bloomberg Two Year Target Duration US Treasury ETF | Bloomberg US Treasury Two Year Duration Index | September 13, 2022 | ||
| BondBloxx Bloomberg Three Year Target Duration US Treasury ETF | Bloomberg US Treasury Three Year Duration Index | September 13, 2022 | ||
| BondBloxx Bloomberg Five Year Target Duration US Treasury ETF | Bloomberg US Treasury Five Year Duration Index | September 13, 2022 | ||
| BondBloxx Bloomberg Seven Year Target Duration US Treasury ETF | Bloomberg US Treasury Seven Year Duration Index | September 13, 2022 | ||
| BondBloxx Bloomberg Ten Year Target Duration US Treasury ETF | Bloomberg US Treasury Ten Year Duration Index | September 13, 2022 | ||
| BondBloxx Bloomberg Twenty Year Target Duration US Treasury ETF | Bloomberg US Treasury Twenty Year Duration Index | September 13, 2022 | ||
| BondBloxx IR+M Tax-Aware Short Duration ETF | N/A | March 12, 2024 |
| * | Represents the date the Predecessor ETF to BondBloxx USD High Yield Bond Sector Rotation ETF merged into the BondBloxx ETF Trust. |
2. SUMMARY OF SIGNIFICANT ACCOUNTING POLICIES
Basis of Presentation
The following is a summary of significant accounting policies consistently followed by the Funds. These policies are in conformity with accounting principles generally accepted in the United States of America. Management has determined that each Fund is an investment company in accordance with the Financial Accounting Standards Board (“FASB”) Accounting Standards Codification (“ASC”) Topic 946, “Financial Services – Investment Companies,” for the purpose of financial reporting.
246
BONDBLOXX ETF TRUST
Notes to the Financial Statements (Continued)
October 31, 2024
Security transactions and Income recognition
Security transactions are recorded on a trade date basis. The specific identification method is used for determining realized gains or losses for financial statements and income tax purposes. Interest income is recognized on an accrual basis. Discounts and premiums on securities purchased are accreted and amortized using the effective yield method and included in interest income. Securities purchased or sold on a when-issued or delayed-delivery basis may be settled beyond a standard settlement period for the security after the trade date.
Foreign Currency Translation
The market values of foreign securities, currency holdings and other assets and liabilities denominated in foreign currencies are translated into U.S. dollars based on the current exchange rates each business day. Purchases and sales of securities and income and expense items denominated in foreign currencies, if any, are translated into U.S. dollars at the exchange rate in effect on the transaction date. The Funds do not separately report the effects of changes in foreign exchange rates from changes in market prices on securities held. Such changes are included in net realized gain (loss) and net change in unrealized appreciation (depreciation) from investments on the Statements of Operations. The Funds may invest in foreign currency-denominated securities and may engage in foreign currency transactions either on a spot (cash) basis at the rate prevailing in the currency exchange market at the time or through a forward foreign currency contract. Realized foreign exchange gains (losses) arising from sales of spot foreign currencies, currency gains (losses) realized between the trade and settlement dates on securities transactions and the difference between the recorded amounts of dividends, interest, and foreign withholding taxes and the U.S. dollar equivalent of the amounts actually received or paid are included in net realized gain (loss) on foreign currency transactions on the Statements of Operations. Net unrealized foreign exchange gains (losses) arising from changes in foreign exchange rates on foreign denominated assets and liabilities other than investments in securities held at the end of the reporting period are included in net change in unrealized appreciation (depreciation) on foreign currency transactions on the Statements of Operations.
Use of Estimates
The preparation of financial statements in conformity with GAAP requires management to make estimates and assumptions that affect the reported amounts of assets and liabilities and disclosure of contingent assets and liabilities at the date of the financial statements and the reported amounts of increases and decreases in net assets from operations during the reporting period. Actual results could differ from those estimates and such differences could be material.
Cash
Cash includes non-restricted cash held with a financial institution.
Investment Valuation
The Net Asset Value per share (“NAV”) of each Fund normally is determined once daily Monday through Friday, generally as of the regularly scheduled close of business of the New York Stock Exchange (“NYSE”) (normally 4:00 p.m., Eastern time) on each day that the NYSE is open for trading, based on prices of the Fund’s assets at the time of closing, provided that (i) any Fund assets or liabilities denominated in currencies other than the U.S. dollar are translated into U.S. dollars at the prevailing market rates on the date of valuation as quoted by one or more data service providers and (ii) U.S. fixed-income assets may be valued as of the announced closing time for trading in fixed-income instruments in a particular market or exchange.
Pursuant to Rule 2a-5 under the 1940 Act, each Fund has designated the Adviser as the “valuation designee” with respect to the fair valuation of each of the Fund’s portfolio securities. Fair valued securities are those for which market quotations were not readily available, including in circumstances under which it was determined by the Adviser that prices received were not reflective of their market values.
247
BONDBLOXX ETF TRUST
Notes to the Financial Statements (Continued)
October 31, 2024
The NAV of each Fund is calculated by dividing the value of the net assets of the Fund (i.e., the value of its total assets less total liabilities) by the total number of outstanding shares of the Fund, generally rounded to the nearest cent.
The value of the securities and other assets and liabilities held by each Fund are determined pursuant to valuation policies and procedures approved by the Board of Trustees (the “Board” or “Trustees”) and administered by BIM. BIM serves as the Funds’ valuation designee for purposes of compliance with the Rule 2a-5 under the 1940 Act.
Each Fund values fixed-income portfolio securities at the midpoint between the bid and ask prices, or at current market price quotations provided by dealers, or at prices (including evaluated prices) supplied by the Fund’s approved independent third-party pricing services, each in accordance with valuation policies and procedures approved by the Board. Pricing services may use matrix pricing or valuation models that utilize certain inputs and assumptions to derive values. Pricing services generally value fixed-income securities assuming orderly transactions of an institutional round lot size, but the Fund may hold or transact in such securities in smaller odd lot sizes. Odd lots often trade at lower prices than institutional round lots. An amortized cost method of valuation may be used with respect to debt obligations with sixty days or less remaining to maturity unless BIM determines in good faith that such method does not represent fair value.
Shares of underlying ETFs are valued at their most recent closing price on an exchange.
Generally, trading in non-U.S. securities and money market instruments is substantially completed each day at various times prior to the close of business on the NYSE. The values of such securities used in computing the NAV of the Fund are determined as of such times.
When market quotations are not readily available or are believed by BIM to be unreliable, each Fund’s investments are valued at fair value. Fair value determinations are made by BIM in accordance with policies and procedures approved by the Board. BIM may conclude that a market quotation is not readily available or is unreliable if a security or other asset or liability does not have a price source due to its lack of trading or other reasons, if a market quotation differs significantly from recent price quotations or otherwise no longer appears to reflect fair value, where the security or other asset or liability is thinly traded, when there is a significant event subsequent to the most recent market quotation, or if the trading market on which a security is listed is suspended or closed and no appropriate alternative trading market is available. A “significant event” is deemed to occur if BIM determines, in its reasonable business judgment prior to or at the time of pricing the Fund’s assets or liabilities, that the event is likely to cause a material change to the closing market price of one or more assets or liabilities held by the Fund.
Fair value represents a good faith approximation of the value of an asset or liability. The fair value of an asset or liability held by a Fund is the amount the Fund might reasonably expect to receive from the current sale of that asset or the cost to extinguish that liability in an arm’s-length transaction. Valuing a Fund’s investments using fair value pricing, in the absence of readily available and reliable market quotations, may result in prices that are based on subjective judgments, which may lead to prices that may differ materially from current market valuations and that may not be the prices at which those investments could have been sold during the period in which the particular fair values were used. Use of fair value prices and certain current market valuations could result in a difference between the prices used to calculate a Fund’s NAV and the prices used by the Index, which, in turn, could result in a difference between the Fund’s performance and the performance of the Index.
Various inputs are used in determining the value of the Funds’ investments. The three levels defined by the hierarchy are as follows:
| ■ | Level 1 – Quoted prices in active markets or exchanges for identical assets and liabilities. |
| ■ | Level 2 – Significant other observable inputs, which may include, but are not limited to, quoted prices for similar assets or liabilities in markets that are active, quoted prices for identical or similar assets or liabilities in markets that are not active, inputs other than quoted prices that are observable for the assets or liabilities (such as interest rates, yield curves, volatilities, prepayment speeds, loss severities, credit risks and default rates) or other market corroborated inputs. |
248
BONDBLOXX ETF TRUST
Notes to the Financial Statements (Continued)
October 31, 2024
| ■ | Level 3 – Significant unobservable inputs based on the best information available in the circumstances, to the extent observable inputs are not available, which may include assumptions made by BIM used in determining the fair value of investments. |
The inputs or methodology used for valuing assets and liabilities are not necessarily an indication of the risk associated with investing in those assets and liabilities.
The following table summarizes the valuation of the Funds’ fair value hierarchy levels as of October 31, 2024:
BondBloxx USD High Yield Bond Industrial Sector ETF
| Assets | Level 1 | Level 2 | Level 3 | Total | ||||||||||||
| Corporate Bonds | $ | - | $ | 80,342,203 | $ | - | $ | 80,342,203 | ||||||||
| Time Deposits | - | 1,291,274 | - | 1,291,274 | ||||||||||||
| Total Investments | $ | - | $ | 81,633,477 | $ | - | $ | 81,633,477 | ||||||||
BondBloxx USD High Yield Bond Telecom, Media & Technology Sector ETF
| Assets | Level 1 | Level 2 | Level 3 | Total | ||||||||||||
| Common Stocks | $ | 307 | $ | - | $ | - | $ | 307 | ||||||||
| Corporate Bonds | - | 105,106,446 | - | 105,106,446 | ||||||||||||
| Time Deposits | - | 2,096,358 | - | 2,096,358 | ||||||||||||
| Total Investments | $ | 307 | $ | 107,202,804 | $ | - | $ | 107,203,111 | ||||||||
BondBloxx USD High Yield Bond Healthcare Sector ETF
| Assets | Level 1 | Level 2 | Level 3 | Total | ||||||||||||
| Corporate Bonds | $ | - | $ | 46,609,338 | $ | - | $ | 46,609,338 | ||||||||
| Time Deposits | - | 639,800 | - | 639,800 | ||||||||||||
| Total Investments | $ | - | $ | 47,249,138 | $ | - | $ | 47,249,138 | ||||||||
BondBloxx USD High Yield Bond Financial & REIT Sector ETF
| Assets | Level 1 | Level 2 | Level 3 | Total | ||||||||||||
| Corporate Bonds | $ | - | $ | 56,893,702 | $ | - | $ | 56,893,702 | ||||||||
| Time Deposits | - | 359,525 | - | 359,525 | ||||||||||||
| Total Investments | $ | - | $ | 57,253,227 | $ | - | $ | 57,253,227 | ||||||||
BondBloxx USD High Yield Bond Energy Sector ETF
| Assets | Level 1 | Level 2 | Level 3 | Total | ||||||||||||
| Corporate Bonds | $ | - | $ | 13,318,706 | $ | - | $ | 13,318,706 | ||||||||
| Time Deposits | - | 256,539 | - | 256,539 | ||||||||||||
| Total Investments | $ | - | $ | 13,575,245 | $ | - | $ | 13,575,245 | ||||||||
249
BONDBLOXX ETF TRUST
Notes to the Financial Statements (Continued)
October 31, 2024
BondBloxx USD High Yield Bond Consumer Cyclicals Sector ETF
| Assets | Level 1 | Level 2 | Level 3 | Total | ||||||||||||
| Corporate Bonds | $ | - | $ | 70,026,788 | $ | - | $ | 70,026,788 | ||||||||
| Time Deposits | - | 701,876 | - | 701,876 | ||||||||||||
| Total Investments | $ | - | $ | 70,728,664 | $ | - | $ | 70,728,664 | ||||||||
BondBloxx USD High Yield Bond Consumer Non-Cyclicals Sector ETF
| Assets | Level 1 | Level 2 | Level 3 | Total | ||||||||||||
| Corporate Bonds | $ | - | $ | 29,719,681 | $ | - | $ | 29,719,681 | ||||||||
| Time Deposits | - | 836,450 | - | 836,450 | ||||||||||||
| Total Investments | $ | - | $ | 30,556,131 | $ | - | $ | 30,556,131 | ||||||||
BondBloxx USD High Yield Bond Sector Rotation ETF
| Assets | Level 1 | Level 2 | Level 3 | Total | ||||||||||||
| Exchange-Traded Funds | $ | 28,154,797 | $ | - | $ | - | $ | 28,154,797 | ||||||||
| Time Deposits | - | 37,804 | - | 37,804 | ||||||||||||
| Total Investments | $ | 28,154,797 | $ | 37,804 | $ | - | $ | 28,192,601 | ||||||||
BondBloxx BB Rated USD High Yield Corporate Bond ETF
| Assets | Level 1 | Level 2 | Level 3 | Total | ||||||||||||
| Corporate Bonds | $ | - | $ | 59,375,282 | $ | - | $ | 59,375,282 | ||||||||
| Time Deposits | - | 947,417 | - | 947,417 | ||||||||||||
| Total Investments | $ | - | $ | 60,322,699 | $ | - | $ | 60,322,699 | ||||||||
BondBloxx B Rated USD High Yield Corporate Bond ETF
| Assets | Level 1 | Level 2 | Level 3 | Total | ||||||||||||
| Corporate Bonds | $ | - | $ | 17,459,407 | $ | - | $ | 17,459,407 | ||||||||
| Time Deposits | - | 265,739 | - | 265,739 | ||||||||||||
| Total Investments | $ | - | $ | 17,725,146 | $ | - | $ | 17,725,146 | ||||||||
BondBloxx CCC Rated USD High Yield Corporate Bond ETF
| Assets | Level 1 | Level 2 | Level 3 | Total | ||||||||||||
| Common Stocks | $ | 1,521 | $ | - | $ | - | $ | 1,521 | ||||||||
| Corporate Bonds | - | 101,362,488 | - | 101,362,488 | ||||||||||||
| Time Deposits | - | 1,527,222 | - | 1,527,222 | ||||||||||||
| Total Investments | $ | 1,521 | $ | 102,889,710 | $ | - | $ | 102,891,231 | ||||||||
BondBloxx BBB Rated 1-5 Year Corporate Bond ETF
| Assets | Level 1 | Level 2 | Level 3 | Total | ||||||||||||
| Corporate Bonds | $ | - | $ | 62,511,335 | $ | - | $ | 62,511,335 | ||||||||
| Time Deposits | - | 165,894 | - | 165,894 | ||||||||||||
| Total Investments | $ | - | $ | 62,677,229 | $ | - | $ | 62,677,229 | ||||||||
250
BONDBLOXX ETF TRUST
Notes to the Financial Statements (Continued)
October 31, 2024
BondBloxx BBB Rated 5-10 Year Corporate Bond ETF
| Assets | Level 1 | Level 2 | Level 3 | Total | ||||||||||||
| Corporate Bonds | $ | - | $ | 7,497,294 | $ | - | $ | 7,497,294 | ||||||||
| Time Deposits | - | 36,071 | - | 36,071 | ||||||||||||
| Total Investments | $ | - | $ | 7,533,365 | $ | - | $ | 7,533,365 | ||||||||
BondBloxx BBB Rated 10+ Year Corporate Bond ETF
| Assets | Level 1 | Level 2 | Level 3 | Total | ||||||||||||
| Corporate Bonds | $ | - | $ | 7,252,221 | $ | - | $ | 7,252,221 | ||||||||
| Time Deposits | - | 55,118 | - | 55,118 | ||||||||||||
| Total Investments | $ | - | $ | 7,307,339 | $ | - | $ | 7,307,339 | ||||||||
BondBloxx JP Morgan USD Emerging Markets 1-10 Year Bond ETF
| Assets | Level 1 | Level 2 | Level 3 | Total | ||||||||||||
| Corporate Bonds | $ | - | $ | 28,029,218 | $ | - | $ | 28,029,218 | ||||||||
| Government Agencies and Obligations | - | 222,234,443 | - | 222,234,443 | ||||||||||||
| Time Deposits | - | 975,561 | - | 975,561 | ||||||||||||
| Total Investments | $ | - | $ | 251,239,222 | $ | - | $ | 251,239,222 | ||||||||
BondBloxx Bloomberg Six Month Target Duration US Treasury ETF
| Assets | Level 1 | Level 2 | Level 3 | Total | ||||||||||||
| Government Obligations | $ | - | $ | 895,163,013 | $ | - | $ | 895,163,013 | ||||||||
| Time Deposits | - | 55,418,634 | - | 55,418,634 | ||||||||||||
| Total Investments | $ | - | $ | 950,581,647 | $ | - | $ | 950,581,647 | ||||||||
BondBloxx Bloomberg One Year Target Duration US Treasury ETF
| Assets | Level 1 | Level 2 | Level 3 | Total | ||||||||||||
| Government Obligations | $ | - | $ | 527,053,281 | $ | - | $ | 527,053,281 | ||||||||
| Time Deposits | - | 1,526,693 | - | 1,526,693 | ||||||||||||
| Total Investments | $ | - | $ | 528,579,974 | $ | - | $ | 528,579,974 | ||||||||
BondBloxx Bloomberg Two Year Target Duration US Treasury ETF
| Assets | Level 1 | Level 2 | Level 3 | Total | ||||||||||||
| Government Obligations | $ | - | $ | 148,888,181 | $ | - | $ | 148,888,181 | ||||||||
| Time Deposits | - | 417,354 | - | 417,354 | ||||||||||||
| Total Investments | $ | - | $ | 149,305,535 | $ | - | $ | 149,305,535 | ||||||||
BondBloxx Bloomberg Three Year Target Duration US Treasury ETF
| Assets | Level 1 | Level 2 | Level 3 | Total | ||||||||||||
| Government Obligations | $ | - | $ | 99,425,572 | $ | - | $ | 99,425,572 | ||||||||
| Time Deposits | - | 315,277 | - | 315,277 | ||||||||||||
| Total Investments | $ | - | $ | 99,740,849 | $ | - | $ | 99,740,849 | ||||||||
251
BONDBLOXX ETF TRUST
Notes to the Financial Statements (Continued)
October 31, 2024
BondBloxx Bloomberg Five Year Target Duration US Treasury ETF
| Assets | Level 1 | Level 2 | Level 3 | Total | ||||||||||||
| Government Obligations | $ | - | $ | 120,602,223 | $ | - | $ | 120,602,223 | ||||||||
| Time Deposits | - | 372,366 | - | 372,366 | ||||||||||||
| Total Investments | $ | - | $ | 120,974,589 | $ | - | $ | 120,974,589 | ||||||||
BondBloxx Bloomberg Seven Year Target Duration US Treasury ETF
| Assets | Level 1 | Level 2 | Level 3 | Total | ||||||||||||
| Government Obligations | $ | - | $ | 108,121,104 | $ | - | $ | 108,121,104 | ||||||||
| Time Deposits | - | 153,808 | - | 153,808 | ||||||||||||
| Total Investments | $ | - | $ | 108,274,912 | $ | - | $ | 108,274,912 | ||||||||
BondBloxx Bloomberg Ten Year Target Duration US Treasury ETF
| Assets | Level 1 | Level 2 | Level 3 | Total | ||||||||||||
| Government Obligations | $ | - | $ | 232,294,824 | $ | - | $ | 232,294,824 | ||||||||
| Time Deposits | - | 628,936 | - | 628,936 | ||||||||||||
| Total Investments | $ | - | $ | 232,923,760 | $ | - | $ | 232,923,760 | ||||||||
BondBloxx Bloomberg Twenty Year Target Duration US Treasury ETF
| Assets | Level 1 | Level 2 | Level 3 | Total | ||||||||||||
| Government Obligations | $ | - | $ | 51,187,746 | $ | - | $ | 51,187,746 | ||||||||
| Time Deposits | - | 34,347 | - | 34,347 | ||||||||||||
| Total Investments | $ | - | $ | 51,222,093 | $ | - | $ | 51,222,093 | ||||||||
BondBloxx IR+M Tax-Aware Short Duration ETF
| Assets | Level 1 | Level 2 | Level 3 | Total | ||||||||||||
| Asset-Backed Securities | $ | - | $ | 8,243,974 | $ | - | $ | 8,243,974 | ||||||||
| Collateralized Mortgage Obligations | - | 8,800,213 | - | 8,800,213 | ||||||||||||
| Corporate Bonds | - | 19,164,011 | - | 19,164,011 | ||||||||||||
| Municipal Bonds | - | 68,007,635 | - | 68,007,635 | ||||||||||||
| Time Deposits | - | 1,110,139 | - | 1,110,139 | ||||||||||||
| Total Investments | $ | - | $ | 105,325,972 | $ | - | $ | 105,325,972 | ||||||||
Bonds
Each Fund, except HYSA, invests a substantial portion of its assets in U.S. dollar-denominated bonds. A bond is an interest-bearing security issued by a U.S. or non-U.S. company, or U.S. or non-U.S. governmental unit. The issuer of a bond has a contractual obligation to pay interest at a stated rate on specific dates and to repay principal (the bond’s face value) periodically or on a specified maturity date. Bonds generally are used by corporations and governments to borrow money from investors.
Perpetual Bonds are fixed income securities with no maturity date but pay a coupon in perpetuity (with no specified ending or maturity date). Unlike typical fixed income securities, there is no obligation for perpetual bonds to repay principal. The coupon payments, however, are mandatory. While perpetual bonds have no maturity date, they may have a callable date in
252
BONDBLOXX ETF TRUST
Notes to the Financial Statements (Continued)
October 31, 2024
which the perpetuity is eliminated and the issuer may return the principal received on the specified call date. Additionally, a perpetual bond may have additional features, such as interest rate increases at periodic dates or an increase as of a predetermined point in the future.
Restricted Investments are subject to legal or contractual restrictions on resale and may generally be sold privately, but may be required to be registered or exempted from such registration before being sold to the public. Private placement securities are generally considered to be restricted except for those securities traded between qualified institutional investors under the provisions of Rule 144A of the Securities Act of 1933. Restricted investments held by the Funds as of October 31, 2024, as applicable, are disclosed in the Notes to Portfolios of Investments.
Securities Issued by U.S. Government Agencies or Government-Sponsored Enterprises are obligations of and, in certain cases, guaranteed by, the U.S. Government, its agencies or instrumentalities. Some U.S. Government securities, such as Treasury bills, notes and bonds, and securities guaranteed by the Government National Mortgage Association, are supported by the full faith and credit of the U.S. Government; others, such as those of the Federal Home Loan Banks, are supported by the right of the issuer to borrow from the U.S. Department of the Treasury (the “U.S. Treasury”); and others, such as those of the Federal National Mortgage Association (“FNMA” or “Fannie Mae”), are supported by the discretionary authority of the U.S. Government to purchase the agency’s obligations. U.S. Government securities may include zero coupon securities which do not distribute interest on a current basis and tend to be subject to a greater risk than interest-paying securities of similar maturities.
Government-related guarantors (i.e., not backed by the full faith and credit of the U.S. Government) include FNMA and the Federal Home Loan Mortgage Corporation (“FHLMC” or “Freddie Mac”). FNMA is a government-sponsored corporation. FNMA purchases conventional (i.e., not insured or guaranteed by any government agency) residential mortgages from a list of approved seller/servicers which include state and federally chartered savings and loan associations, mutual savings banks, commercial banks and credit unions and mortgage bankers. Pass-through securities issued by FNMA are guaranteed as to timely payment of principal and interest by FNMA, but are not backed by the full faith and credit of the U.S. Government. FHLMC issues Participation Certificates (“PCs”), which are pass-through securities, each representing an undivided interest in a pool of residential mortgages. FHLMC guarantees the timely payment of interest and ultimate collection of principal, but PCs are not backed by the full faith and credit of the U.S. Government.
In June 2019, FNMA and FHLMC started issuing Uniform Mortgage Backed Securities in place of their current offerings of TBA-eligible securities (the “Single Security Initiative”). The Single Security Initiative seeks to support the overall liquidity of the TBA market and aligns the characteristics of FNMA and FHLMC certificates. The effects that the Single Security Initiative may have on the market for TBA and other mortgage-backed securities are uncertain.
Roll-timing strategies can be used where a Fund seeks to extend the expiration or maturity of a position, such as a TBA security on an underlying asset, by closing out the position before expiration and opening a new position with respect to substantially the same underlying asset with a later expiration date. TBA securities purchased or sold are reflected on the Statements of Assets and Liabilities as an asset or liability, respectively. Recently finalized FINRA rules include mandatory margin requirements for the TBA market that require the Funds to post collateral in connection with their TBA transactions.
There is no similar requirement applicable to the Funds’ TBA counterparties. The required collateralization of TBA trades could increase the cost of TBA transactions to the Funds and impose added operational complexity.
Separate Trading of Registered Interest and Principal of Securities (“STRIPS”) are U.S. Treasury fixed income securities in which the principal is separated, or stripped, from the interest and each takes the form of zero coupon securities. A STRIP is sold at a significant discount to face value and offers no interest payments; rather, investors receive payment at maturity. Zero coupon securities do not distribute interest on a current basis and tend to be subject to greater risk than interest-paying securities.
253
BONDBLOXX ETF TRUST
Notes to the Financial Statements (Continued)
October 31, 2024
Defaulted Securities
Certain Funds may hold defaulted securities or other securities which were placed in non-accrual status as the collection of a portion or all of the interest has been deemed to be uncollectible. Debt obligations may be placed on non-accrual status and the related interest income, amortization or accretion may be reduced or stopped entirely. Additionally, current income accruals and interest receivables may be written off when it becomes probable that the interest will not be collected, and the amount of uncollectible interest can be reasonably estimated. A debt obligation is removed from non-accrual status when the issuer resumes interest payments or when collectability of interest is probable.
Time Deposits
The Funds place excess cash balances into overnight time deposits with one or more eligible deposit institutions that meet credit and risk standards approved by the Funds. These are classified as short-term investments in the Funds’ Portfolio of Investments.
Reclassification
GAAP requires that certain components of net assets be adjusted to reflect permanent differences between financial and tax reporting. These reclassifications have no effect on net assets or the NAV per Share.
Distribution of Income and Gains
The Funds intend to declare and make distributions of net investment income monthly. Distributions of net realized capital gains earned by the Funds, if any, are distributed at least annually. Distributions from income and capital gains are determined in accordance with federal income tax regulations, which may differ from GAAP.
Organizational and Offering Costs
The Adviser has agreed to bear all organizational and offering expenses for the Funds.
3. INVESTMENT ADVISORY AND OTHER AGREEMENTS
Investment Adviser
The Adviser furnishes investment management services to the Funds pursuant to an Investment Advisory Agreement with the Trust’s Board on behalf of each Fund, subject to the supervision and direction of the Board. The Adviser is registered with the SEC as an investment adviser under the Investment Advisers Act of 1940, as amended, as of date of these financial statements.
Pursuant to the Investment Advisory Agreement between BIM and the Trust (entered into on behalf of each Fund other than HYSA), BIM is responsible for substantially all expenses of the Funds, except the management fees, interest expenses, taxes, expenses incurred with respect to the acquisition and disposition of portfolio securities and the execution of portfolio transactions, including brokerage commissions, distribution fees or expenses, litigation expenses and any extraordinary expenses (as determined by a majority of the Trustees who are not “interested persons” of the Trust). With respect to HYSA, the Fund pays the adviser a fee based on a percentage of the Fund’s average daily net assets at the annual rate of 0.45%. Pursuant to an expenses limitation agreement with BIM, BIM has contractually agreed to waive fees and/or reimburse operating expenses (other than interest, brokerage, taxes, extraordinary expenses and non-affiliated acquired fund fees and expenses) so that the ratio of HYSA’s net total annual operating expenses will not exceed 0.55% through the anniversary of the listing date of the Fund in 2026, subject to recapture as described below (the “Fee Waiver”). The Fee Waiver may be terminated prior to the anniversary of the listing date of the Fund in 2026 only upon written agreement of the Trust and BIM. The Fee Waiver may be modified by BIM to decrease the Fund’s net total annual operating expenses at any time. BIM is
254
BONDBLOXX ETF TRUST
Notes to the Financial Statements (Continued)
October 31, 2024
also permitted to recapture amounts waived and/or reimbursed within two years after the fiscal year in which BIM waived fees and/or reimbursed expenses if the Fund’s net total annual operating expenses have fallen to a level below the expense limit described above. In no case will BIM recapture any amount that would result, on any particular business day of the Fund, in the Fund’s expense ratio exceeding both (1) the expense cap in place at the time such amounts were waived and (2) the Fund’s current expense cap. Affiliated acquired fund fees incurred by HYSA are also waived by BIM in addition to the expense limitation on Fund expenses. During the period ended October 31, 2024, BIM waived $179,149 of expenses, which includes $113,829 of affiliated acquired fund fees. Affiliated acquired fund fees are not recoupable by BIM in future fiscal periods pursuant to the terms of the expense limitation agreement.
BIM does not intend to recoup amounts identified through October 31, 2024, that are permitted to be recouped in accordance with the preceding paragraph.
As of October 31, 2024, pursuant to the above, fees previously waiver and reimbursed by the Investment Adviser that may be subject to possible future reimbursement to the Investment Advisor were as follows for HYSA:
| Expiring Fiscal Year Ending October 31, 2025 | Expiring Fiscal Year Ending October 31, 2026 | |||||
| $ | 35,673 | $ | 65,320 | |||
For its investment advisory services to the Funds, BIM will be paid a management fee from each Fund based on a percentage of each Fund’s average daily net assets, at the annual rates set forth below:
| Fund | Management Fee | |
| BondBloxx USD High Yield Bond Industrial Sector ETF | 0.35% | |
| BondBloxx USD High Yield Bond Telecom, Media & Technology Sector ETF | 0.35% | |
| BondBloxx USD High Yield Bond Healthcare Sector ETF | 0.35% | |
| BondBloxx USD High Yield Bond Financial & REIT Sector ETF | 0.35% | |
| BondBloxx USD High Yield Bond Energy Sector ETF | 0.35% | |
| BondBloxx USD High Yield Bond Consumer Cyclicals Sector ETF | 0.35% | |
| BondBloxx USD High Yield Bond Consumer Non-Cyclicals Sector ETF | 0.35% | |
| BondBloxx USD High Yield Bond Sector Rotation ETF | 0.45% | |
| BondBloxx BB Rated USD High Yield Corporate Bond ETF | 0.20% | |
| BondBloxx B Rated USD High Yield Corporate Bond ETF | 0.30% | |
| BondBloxx CCC Rated USD High Yield Corporate Bond ETF | 0.40% | |
| BondBloxx BBB Rated 1-5 Year Corporate Bond ETF | 0.19% | |
| BondBloxx BBB Rated 5-10 Year Corporate Bond ETF | 0.19% | |
| BondBloxx BBB Rated 10+ Year Corporate Bond ETF | 0.19% | |
| BondBloxx JP Morgan USD Emerging Markets 1-10 Year Bond ETF | 0.29% | |
| BondBloxx Bloomberg Six Month Target Duration US Treasury ETF | 0.03% | |
| BondBloxx Bloomberg One Year Target Duration US Treasury ETF | 0.03% | |
| BondBloxx Bloomberg Two Year Target Duration US Treasury ETF | 0.05% | |
| BondBloxx Bloomberg Three Year Target Duration US Treasury ETF | 0.05% | |
| BondBloxx Bloomberg Five Year Target Duration US Treasury ETF | 0.05% | |
| BondBloxx Bloomberg Seven Year Target Duration US Treasury ETF | 0.05% | |
| BondBloxx Bloomberg Ten Year Target Duration US Treasury ETF | 0.075% | |
| BondBloxx Bloomberg Twenty Year Target Duration US Treasury ETF | 0.125% | |
| BondBloxx IR+M Tax-Aware Short Duration ETF | 0.35% |
255
BONDBLOXX ETF TRUST
Notes to the Financial Statements (Continued)
October 31, 2024
BIM may from time to time voluntarily waive and/or reimburse fees or expenses in order to limit total annual fund operating expenses (excluding acquired fund fees and expenses, if any). Any such voluntary waiver or reimbursement may be eliminated by BIM at any time. Any waivers/reimbursements are not subject to recoupment by the Adviser.
Pursuant to the sub-advisory agreement with Delaware Investments Fund Advisers (“Delaware”), a series of Macquarie Investment Management Business Trust, Delaware acts as sub-adviser to HYSA. BIM compensates Delaware for its sub-advisory services out of its management fee.
Pursuant to the sub-advisory agreement with Income Research + Management (“IR+M” or “Sub-Adviser”), a Massachusetts Business Trust, IR+M acts as sub-adviser to TAXX. IR+M is responsible for the day-to-day portfolio management of the Fund as Sub-Adviser. IR+M specializes in managing U.S. fixed income portfolios for institutional and private clients, as well as managing several U.S. fixed income private investment funds and collective investment trusts for qualified investors. For its services, IR+M is paid a fee by BIM.
Other Service Providers
Brown Brothers Harriman & Co. (“BBH”) is the Trust administrator, fund accountant, transfer and dividend agent and custodian. BBH is primarily in the business of providing custody, administrative, fund accounting and transfer agent services to retail and institutional mutual funds.
Foreside Fund Services, LLC (the “Distributor”) is the distributor for the shares of the Trust. The Distributor is a registered broker-dealer and member of the Financial Industry Regulatory Authority, Inc. (“FINRA”).
ACA Group provides the Trust with a Chief Compliance Officer.
Ropes & Gray LLP is counsel to the Trust.
Cohen & Company, Ltd. serves as the Trust’s independent registered public accounting firm. The independent registered public accounting firm is responsible for auditing the annual financial statements of the Funds.
4. PURCHASE AND SALE OF FUND SHARES
The Funds will offer, issue and redeem shares (“Shares”) at NAV only in aggregations of a specified number of Shares (each a “Creation Unit”). The Funds may issue and redeem Creation Units of its Shares only to certain authorized participants that have entered into agreements with the Distributor (“Authorized Participants”) in exchange for a designated basket of portfolio investments (including any portion of such investments for which cash may be substituted) (“Deposit Instruments”), together with the deposit of a specified cash payment (“Cash Component”). Shares of the Funds will be listed and trade on NYSE Arca, Inc. or Cboe BZX (the “Exchanges”), the national securities exchanges. Shares of the Funds will be traded in the secondary market and elsewhere at market prices that may be at, above or below the Funds’ NAV. Shares will be redeemable only in Creation Units by Authorized Participants, and, generally, in exchange for securities in-kind and/or a cash amount. Creation Units typically are large blocks of a specified number of shares or multiples thereof. In the event of liquidation of a Fund, the Trust may lower the number of shares in a Creation Unit.
Shares may be issued in advance of receipt of Deposit Instruments, subject to various conditions, including a requirement that the Authorized Participant maintain with the Trust a cash deposit marked to the market value of the omitted Deposit Instruments. These cash deposits may earn interest which may be used to offset certain expenses paid by BIM. Transaction fees and other costs associated with creations or redemptions that include cash may be higher than the transaction fees and other costs associated with in-kind creations or redemptions. In all cases, conditions with respect to creations and redemptions of Shares and fees will be limited in accordance with the requirements of Securities and Exchange Commission (“SEC”) rules and regulations applicable to management investment companies offering redeemable securities.
256
BONDBLOXX ETF TRUST
Notes to the Financial Statements (Continued)
October 31, 2024
5. INVESTMENT TRANSACTIONS
The cost of purchases and the proceeds from sales of investment securities (excluding in-kind subscriptions and redemptions, US government securities and short-term investments) for the year or period ended October 31, 2024 were as follows:
| Purchases | Sales | |||||||
| BondBloxx USD High Yield Bond Industrial Sector ETF | $ | 13,831,198 | $ | 13,827,339 | ||||
| BondBloxx USD High Yield Bond Telecom, Media & Technology Sector ETF | 12,395,219 | 12,365,347 | ||||||
| BondBloxx USD High Yield Bond Healthcare Sector ETF | 7,923,927 | 7,374,005 | ||||||
| BondBloxx USD High Yield Bond Financial & REIT Sector ETF | 18,224,044 | 18,737,696 | ||||||
| BondBloxx USD High Yield Bond Energy Sector ETF | 15,857,035 | 16,182,357 | ||||||
| BondBloxx USD High Yield Bond Consumer Cyclicals Sector ETF | 16,721,490 | 16,316,306 | ||||||
| BondBloxx USD High Yield Bond Consumer Non-Cyclicals Sector ETF | 5,313,660 | 4,663,400 | ||||||
| BondBloxx USD High Yield Bond Sector Rotation ETF | 7,916,457 | 7,880,885 | ||||||
| BondBloxx BB Rated USD High Yield Corporate Bond ETF | 21,464,050 | 21,627,716 | ||||||
| BondBloxx B Rated USD High Yield Corporate Bond ETF | 7,831,571 | 7,893,696 | ||||||
| BondBloxx CCC Rated USD High Yield Corporate Bond ETF | 25,726,583 | 26,431,995 | ||||||
| BondBloxx BBB Rated 1-5 Year Corporate Bond ETF | 8,437,299 | 6,710,549 | ||||||
| BondBloxx BBB Rated 5-10 Year Corporate Bond ETF | 1,507,394 | 1,392,630 | ||||||
| BondBloxx BBB Rated 10+ Year Corporate Bond ETF | 1,392,248 | 1,412,966 | ||||||
| BondBloxx JP Morgan USD Emerging Markets 1-10 Year Bond ETF | 47,657,400 | 47,765,024 | ||||||
| BondBloxx IR+M Tax-Aware Short Duration ETF | 113,191,971 | 11,400,923 | ||||||
The cost of purchases and the proceeds from sales of US government securities (excluding in-kind subscriptions and redemptions, investment securities and short-term investments) for the year ended October 31, 2024 were as follows:
| Purchases | Sales | |||||||
| BondBloxx Bloomberg One Year Target Duration US Treasury ETF | $ | 453,738,183 | $ | 277,292,326 | ||||
| BondBloxx Bloomberg Two Year Target Duration US Treasury ETF | 74,407,160 | 76,611,534 | ||||||
| BondBloxx Bloomberg Three Year Target Duration US Treasury ETF | 38,155,367 | 39,525,606 | ||||||
| BondBloxx Bloomberg Five Year Target Duration US Treasury ETF | 73,249,305 | 73,918,239 | ||||||
| BondBloxx Bloomberg Seven Year Target Duration US Treasury ETF | 80,217,909 | 81,680,672 | ||||||
| BondBloxx Bloomberg Ten Year Target Duration US Treasury ETF | 62,232,675 | 63,290,421 | ||||||
| BondBloxx Bloomberg Twenty Year Target Duration US Treasury ETF | 48,826,328 | 49,425,342 | ||||||
257
BONDBLOXX ETF TRUST
Notes to the Financial Statements (Continued)
October 31, 2024
For the year or period ended October 31, 2024, the costs of in-kind subscriptions and the proceeds from in-kind redemptions were as follows:
| Purchases | Sales | |||||||
| BondBloxx USD High Yield Bond Industrial Sector ETF | $ | 62,885,695 | $ | 26,267,666 | ||||
| BondBloxx USD High Yield Bond Telecom, Media & Technology Sector ETF | 74,534,063 | 1,605,199 | ||||||
| BondBloxx USD High Yield Bond Healthcare Sector ETF | 61,521,124 | 29,414,728 | ||||||
| BondBloxx USD High Yield Bond Financial & REIT Sector ETF | 30,765,859 | 5,343,768 | ||||||
| BondBloxx USD High Yield Bond Energy Sector ETF | 58,017,140 | 66,507,322 | ||||||
| BondBloxx USD High Yield Bond Consumer Cyclicals Sector ETF | 57,871,509 | 12,561,407 | ||||||
| BondBloxx USD High Yield Bond Consumer Non-Cyclicals Sector ETF | 17,895,529 | - | ||||||
| BondBloxx USD High Yield Bond Sector Rotation ETF | 10,175,159 | 12,344,064 | ||||||
| BondBloxx BB Rated USD High Yield Corporate Bond ETF | 7,491,520 | - | ||||||
| BondBloxx B Rated USD High Yield Corporate Bond ETF | 3,785,819 | - | ||||||
| BondBloxx CCC Rated USD High Yield Corporate Bond ETF | 83,241,746 | 5,220,268 | ||||||
| BondBloxx BBB Rated 1-5 Year Corporate Bond ETF | 60,533,248 | - | ||||||
| BondBloxx BBB Rated 5-10 Year Corporate Bond ETF | 7,365,198 | - | ||||||
| BondBloxx BBB Rated 10+ Year Corporate Bond ETF | 7,217,360 | - | ||||||
| BondBloxx JP Morgan USD Emerging Markets 1-10 Year Bond ETF | 72,079,924 | 20,692,709 | ||||||
| BondBloxx Bloomberg Six Month Target Duration US Treasury ETF | 633,853,760 | 833,993,916 | ||||||
| BondBloxx Bloomberg One Year Target Duration US Treasury ETF | 361,667,845 | 357,040,582 | ||||||
| BondBloxx Bloomberg Two Year Target Duration US Treasury ETF | 83,834,954 | 40,139,943 | ||||||
| BondBloxx Bloomberg Three Year Target Duration US Treasury ETF | 74,285,192 | 3,366,332 | ||||||
| BondBloxx Bloomberg Five Year Target Duration US Treasury ETF | 95,000,055 | 11,133,829 | ||||||
| BondBloxx Bloomberg Seven Year Target Duration US Treasury ETF | 114,233,744 | 62,044,817 | ||||||
| BondBloxx Bloomberg Ten Year Target Duration US Treasury ETF | 220,615,128 | 34,832,292 | ||||||
| BondBloxx Bloomberg Twenty Year Target Duration US Treasury ETF | 44,800,420 | 17,226,087 | ||||||
6. AFFILIATE TRANSACTIONS
Investments in issuers considered to be affiliates of the fund during the period ended October 31, 2024 for purposes of Section 2(a)(3) of the Investment Company Act of 1940, as amended, were as follows:
258
BONDBLOXX ETF TRUST
Notes to the Financial Statements (Continued)
October 31, 2024
BondBloxx USD High Yield Bond Sector Rotation ETF
| Affiliated Investment Company | Value as of October 31, 2023 | Purchases | Realized Gain (Loss) on Investment Securities | Change in Unrealized Appreciation (Depreciation) of Investment Securities | Sales | Value as of | Dividends | Shares as of October 31, 2024 | ||||||||||||||||||||||||
| BondBloxx USD High Yield Bond Consumer Cyclicals Sector ETF | $ | 4,568,276 | $ | 2,539,225 | $ | 86,029 | $ | 217,930 | $ | (3,851,302 | ) | $ | 3,560,158 | $ | 305,455 | 95,009 | ||||||||||||||||
| BondBloxx USD High Yield Bond Consumer Non-Cyclicals Sector ETF | 3,449,049 | 1,332,019 | 81,853 | 142,579 | (2,496,736 | ) | 2,508,764 | 189,724 | 65,861 | |||||||||||||||||||||||
| BondBloxx USD High Yield Bond Energy Sector ETF | 3,857,082 | 1,150,431 | 53,040 | 109,089 | (2,339,851 | ) | 2,829,791 | 242,969 | 72,954 | |||||||||||||||||||||||
| BondBloxx USD High Yield Bond Financial & REIT Sector ETF | 2,280,404 | 3,539,099 | 57,576 | 137,330 | (2,065,103 | ) | 3,949,306 | 282,819 | 105,400 | |||||||||||||||||||||||
| BondBloxx USD High Yield Bond Healthcare Sector ETF | 1,705,318 | 2,594,720 | 84,415 | 171,436 | (1,763,980 | ) | 2,791,909 | 221,716 | 79,437 | |||||||||||||||||||||||
| BondBloxx USD High Yield Bond Industrial Sector ETF | 7,371,542 | 2,635,896 | 90,526 | 407,351 | (3,713,111 | ) | 6,792,204 | 577,930 | 178,340 | |||||||||||||||||||||||
| BondBloxx USD High Yield Bond Telecom, Media & Technology Sector ETF | 5,238,481 | 4,300,226 | (142,393 | ) | 321,217 | (3,994,866 | ) | 5,722,665 | 551,447 | 164,000 | ||||||||||||||||||||||
| $ | 28,470,152 | $ | 18,091,616 | $ | 311,046 | $ | 1,506,932 | $ | (20,224,949 | ) | $ | 28,154,797 | $ | 2,372,060 | 761,001 | |||||||||||||||||
7. FEDERAL INCOME TAXES
The Funds intend to qualify as a “regulated investment company” under Subchapter M of the Internal Revenue Code of 1986, as amended. If so qualified, the Funds will not be subject to federal income tax to the extent they distribute substantially all of their net investment income and net capital gains to their shareholders. Management of the Funds is required to determine whether a tax position taken by the Funds is more likely than not to be sustained upon examination by the applicable taxing authority. Management of the Funds has reviewed tax positions taken in the tax periods that remain subject to examination by all major tax jurisdictions, including federal, and has concluded that no provision for unrecognized tax benefits or expenses is required in these financial statements. The Funds recognize interest and penalties, if any, related to unrecognized tax benefits as income tax expense on the Statements of Operations. During the year or period ended October 31, 2024, the Funds did not incur any interest or penalties.
259
BONDBLOXX ETF TRUST
Notes to the Financial Statements (Continued)
October 31, 2024
At October 31, 2024, the cost of investments and net unrealized appreciation (depreciation) for federal income tax purposes was as follows:
| Cost | Gross Appreciation | Gross Depreciation | Net Unrealized Appreciation (Depreciation) | |||||||||||||
| BondBloxx USD High Yield Bond Industrial Sector ETF | $ | 81,183,730 | $ | 847,457 | $ | (397,710 | ) | $ | 449,747 | |||||||
| BondBloxx USD High Yield Bond Telecom, Media & Technology Sector ETF | 105,675,320 | 2,008,451 | (480,660 | ) | 1,527,791 | |||||||||||
| BondBloxx USD High Yield Bond Healthcare Sector ETF | 46,801,341 | 740,746 | (292,949 | ) | 447,797 | |||||||||||
| BondBloxx USD High Yield Bond Financial & REIT Sector ETF | 55,857,870 | 1,539,557 | (144,200 | ) | 1,395,357 | |||||||||||
| BondBloxx USD High Yield Bond Energy Sector ETF | 13,648,289 | 52,008 | (125,052 | ) | (73,044 | ) | ||||||||||
| BondBloxx USD High Yield Bond Consumer Cyclicals Sector ETF | 70,192,633 | 952,933 | (416,902 | ) | 536,031 | |||||||||||
| BondBloxx USD High Yield Bond Consumer Non-Cyclicals Sector ETF | 30,408,297 | 281,547 | (133,713 | ) | 147,834 | |||||||||||
| BondBloxx USD High Yield Bond Sector Rotation ETF | 27,483,025 | 713,302 | (3,726 | ) | 709,576 | |||||||||||
| BondBloxx BB Rated USD High Yield Corporate Bond ETF | 59,090,261 | 1,388,822 | (156,384 | ) | 1,232,438 | |||||||||||
| BondBloxx B Rated USD High Yield Corporate Bond ETF | 17,384,260 | 451,182 | (110,296 | ) | 340,886 | |||||||||||
| BondBloxx CCC Rated USD High Yield Corporate Bond ETF | 99,919,475 | 4,302,102 | (1,330,346 | ) | 2,971,756 | |||||||||||
| BondBloxx BBB Rated 1-5 Year Corporate Bond ETF | 62,192,233 | 556,956 | (71,960 | ) | 484,996 | |||||||||||
| BondBloxx BBB Rated 5-10 Year Corporate Bond ETF | 7,542,911 | 44,404 | (53,950 | ) | (9,546 | ) | ||||||||||
| BondBloxx BBB Rated 10+ Year Corporate Bond ETF | 7,273,587 | 85,155 | (51,403 | ) | 33,752 | |||||||||||
| BondBloxx JP Morgan USD Emerging Markets 1-10 Year Bond ETF | 240,435,470 | 12,671,322 | (1,867,570 | ) | 10,803,752 | |||||||||||
| BondBloxx Bloomberg Six Month Target Duration US Treasury ETF | 949,872,603 | 944,376 | (235,332 | ) | 709,044 | |||||||||||
| BondBloxx Bloomberg One Year Target Duration US Treasury ETF | 527,867,207 | 1,059,917 | (347,150 | ) | 712,767 | |||||||||||
| BondBloxx Bloomberg Two Year Target Duration US Treasury ETF | 148,900,601 | 576,936 | (172,002 | ) | 404,934 | |||||||||||
| BondBloxx Bloomberg Three Year Target Duration US Treasury ETF | 99,949,181 | 93,548 | (301,880 | ) | (208,332 | ) | ||||||||||
| BondBloxx Bloomberg Five Year Target Duration US Treasury ETF | 121,498,152 | 141,763 | (665,326 | ) | (523,563 | ) | ||||||||||
| BondBloxx Bloomberg Seven Year Target Duration US Treasury ETF | 108,744,289 | 300,939 | (770,316 | ) | (469,377 | ) | ||||||||||
| BondBloxx Bloomberg Ten Year Target Duration US Treasury ETF | 232,638,039 | 826,841 | (541,120 | ) | 285,721 | |||||||||||
| BondBloxx Bloomberg Twenty Year Target Duration US Treasury ETF | 53,598,724 | 2,605 | (2,379,236 | ) | (2,376,631 | ) | ||||||||||
| BondBloxx IR+M Tax-Aware Short Duration ETF | 104,977,356 | 512,953 | (164,337 | ) | 348,616 | |||||||||||
The differences between book-basis and tax-basis components of unrealized appreciation/(depreciation) are primarily attributable to tax deferral of losses on wash sales for tax purposes.
260
BONDBLOXX ETF TRUST
Notes to the Financial Statements (Continued)
October 31, 2024
At October 31, 2024, the components of distributable earnings/loss on tax basis were as follows:
Undistributed Income | Undistributed Long-term Capital Gains | Accumulated Capital Gains/ (Losses) | Net Unrealized Appreciation/ (Depreciation) | Total Earnings/ (Losses) | ||||||||||||||||
| BondBloxx USD High Yield Bond Industrial Sector ETF | $ | 430,908 | $ | - | $ | (194,102 | ) | $ | 449,747 | $ | 686,553 | |||||||||
| BondBloxx USD High Yield Bond Telecom, Media & Technology Sector ETF | 716,771 | - | (561,119 | ) | 1,527,791 | 1,683,443 | ||||||||||||||
| BondBloxx USD High Yield Bond Healthcare Sector ETF | 269,072 | - | (539,549 | ) | 447,797 | 177,320 | ||||||||||||||
| BondBloxx USD High Yield Bond Financial & REIT Sector ETF | 332,744 | - | (209,478 | ) | 1,395,357 | 1,518,623 | ||||||||||||||
| BondBloxx USD High Yield Bond Energy Sector ETF | 71,623 | - | (160,288 | ) | (73,044 | ) | (161,709 | ) | ||||||||||||
| BondBloxx USD High Yield Bond Consumer Cyclicals Sector ETF | 384,720 | - | (210,896 | ) | 536,031 | 709,855 | ||||||||||||||
| BondBloxx USD High Yield Bond Consumer Non-Cyclicals Sector ETF | 151,653 | - | (102,763 | ) | 147,834 | 196,724 | ||||||||||||||
| BondBloxx USD High Yield Bond Sector Rotation ETF | - | - | (59,242,655 | ) | 709,576 | (58,533,079 | ) | |||||||||||||
| BondBloxx BB Rated USD High Yield Corporate Bond ETF | 322,605 | - | (803,575 | ) | 1,232,438 | 751,468 | ||||||||||||||
| BondBloxx B Rated USD High Yield Corporate Bond ETF | 108,419 | - | (366,629 | ) | 340,886 | 82,676 | ||||||||||||||
| BondBloxx CCC Rated USD High Yield Corporate Bond ETF | 917,196 | - | (1,478,458 | ) | 2,971,756 | 2,410,494 | ||||||||||||||
| BondBloxx BBB Rated 1-5 Year Corporate Bond ETF | 294,442 | - | - | 484,996 | 779,438 | |||||||||||||||
| BondBloxx BBB Rated 5-10 Year Corporate Bond ETF | 32,390 | - | (1,787 | ) | (9,546 | ) | 21,057 | |||||||||||||
| BondBloxx BBB Rated 10+ Year Corporate Bond ETF | 42,231 | - | - | 33,752 | 75,983 | |||||||||||||||
| BondBloxx JP Morgan USD Emerging Markets 1-10 Year Bond ETF | 1,537,513 | - | (503,821 | ) | 10,803,788 | 11,837,480 | ||||||||||||||
| BondBloxx Bloomberg Six Month Target Duration US Treasury ETF | 3,649,843 | - | (930,511 | ) | 709,044 | 3,428,376 | ||||||||||||||
| BondBloxx Bloomberg One Year Target Duration US Treasury ETF | 2,524,650 | - | (3,398,412 | ) | 712,767 | (160,995 | ) | |||||||||||||
| BondBloxx Bloomberg Two Year Target Duration US Treasury ETF | 593,632 | - | (1,300,507 | ) | 404,934 | (301,941 | ) | |||||||||||||
| BondBloxx Bloomberg Three Year Target Duration US Treasury ETF | 342,871 | - | (677,099 | ) | (208,332 | ) | (542,560 | ) | ||||||||||||
| BondBloxx Bloomberg Five Year Target Duration US Treasury ETF | 405,565 | - | (1,500,837 | ) | (523,563 | ) | (1,618,835 | ) | ||||||||||||
| BondBloxx Bloomberg Seven Year Target Duration US Treasury ETF | 421,884 | - | (1,318,489 | ) | (469,377 | ) | (1,365,982 | ) | ||||||||||||
| BondBloxx Bloomberg Ten Year Target Duration US Treasury ETF | 840,938 | - | (2,041,465 | ) | 285,721 | (914,806 | ) | |||||||||||||
| BondBloxx Bloomberg Twenty Year Target Duration US Treasury ETF | 210,213 | - | (5,267,177 | ) | (2,376,631 | ) | (7,433,595 | ) | ||||||||||||
| BondBloxx IR+M Tax-Aware Short Duration ETF | 309,975 | - | (81,517 | ) | 348,616 | 577,074 | ||||||||||||||
261
BONDBLOXX ETF TRUST
Notes to the Financial Statements (Continued)
October 31, 2024
At October 31, 2024, the effect of permanent book/tax reclassifications primarily related to in-kind transactions resulted in increase/(decrease) to the components of net assets as follows:
Total Distributable Earnings | Paid-in Capital | |||||||
| BondBloxx USD High Yield Bond Industrial Sector ETF | $ | (1,152,224 | ) | $ | 1,152,224 | |||
| BondBloxx USD High Yield Bond Telecom, Media & Technology Sector ETF | (19,854 | ) | 19,854 | |||||
| BondBloxx USD High Yield Bond Healthcare Sector ETF | (1,417,377 | ) | 1,417,377 | |||||
| BondBloxx USD High Yield Bond Financial & REIT Sector ETF | (358,772 | ) | 358,772 | |||||
| BondBloxx USD High Yield Bond Energy Sector ETF | (1,440,143 | ) | 1,440,143 | |||||
| BondBloxx USD High Yield Bond Consumer Cyclicals Sector ETF | (706,223 | ) | 706,223 | |||||
| BondBloxx USD High Yield Bond Consumer Non-Cyclicals Sector ETF | - | - | ||||||
| BondBloxx USD High Yield Bond Sector Rotation ETF | (279,746 | ) | 279,746 | |||||
| BondBloxx BB Rated USD High Yield Corporate Bond ETF | - | - | ||||||
| BondBloxx B Rated USD High Yield Corporate Bond ETF | - | - | ||||||
| BondBloxx CCC Rated USD High Yield Corporate Bond ETF | (339,404 | ) | 339,404 | |||||
| BondBloxx BBB Rated 1-5 Year Corporate Bond ETF | - | - | ||||||
| BondBloxx BBB Rated 5-10 Year Corporate Bond ETF | - | - | ||||||
| BondBloxx BBB Rated 10+ Year Corporate Bond ETF | - | - | ||||||
| BondBloxx JP Morgan USD Emerging Markets 1-10 Year Bond ETF | (954,565 | ) | 954,565 | |||||
| BondBloxx Bloomberg Six Month Target Duration US Treasury ETF | (1,269,060 | ) | 1,269,060 | |||||
| BondBloxx Bloomberg One Year Target Duration US Treasury ETF | (1,001,506 | ) | 1,001,506 | |||||
| BondBloxx Bloomberg Two Year Target Duration US Treasury ETF | (180,705 | ) | 180,705 | |||||
| BondBloxx Bloomberg Three Year Target Duration US Treasury ETF | (33,632 | ) | 33,632 | |||||
| BondBloxx Bloomberg Five Year Target Duration US Treasury ETF | (303,219 | ) | 303,219 | |||||
| BondBloxx Bloomberg Seven Year Target Duration US Treasury ETF | (2,324,299 | ) | 2,324,299 | |||||
| BondBloxx Bloomberg Ten Year Target Duration US Treasury ETF | (1,368,124 | ) | 1,368,124 | |||||
| BondBloxx Bloomberg Twenty Year Target Duration US Treasury ETF | (991,116 | ) | 991,116 | |||||
| BondBloxx IR+M Tax-Aware Short Duration ETF | - | - | ||||||
The tax character of distributions paid during the period indicated was as follow:
Year Ended October 31, 2024 | Year Ended October 31, 2023 | |||||||||||||||
Ordinary Income* | Long-Term Capital Gain | Ordinary Income* | Long-Term Capital Gain | |||||||||||||
| BondBloxx USD High Yield Bond Industrial Sector ETF | $ | 4,150,759 | $ | - | $ | 1,039,987 | $ | - | ||||||||
| BondBloxx USD High Yield Bond Telecom, Media & Technology Sector ETF | 3,279,475 | - | 773,573 | - | ||||||||||||
| BondBloxx USD High Yield Bond Healthcare Sector ETF | 2,329,068 | - | 462,631 | - | ||||||||||||
| BondBloxx USD High Yield Bond Financial & REIT Sector ETF | 3,043,682 | - | 689,760 | - | ||||||||||||
| BondBloxx USD High Yield Bond Energy Sector ETF | 2,889,467 | - | 606,084 | - | ||||||||||||
| BondBloxx USD High Yield Bond Consumer Cyclicals Sector ETF | 2,907,383 | - | 826,902 | - | ||||||||||||
| BondBloxx USD High Yield Bond Consumer Non-Cyclicals Sector ETF | 788,908 | - | 339,571 | - | ||||||||||||
262
BONDBLOXX ETF TRUST
Notes to the Financial Statements (Continued)
October 31, 2024
Year Ended October 31, 2024 | Period Ended October 31, 2023 | Year Ended June 30, 2023 | ||||||||||||||||||||||||||
Ordinary Income* | Long-Term Capital Gain | Ordinary Income* | Long-Term Capital Gain | Ordinary Income* | Long-Term Capital Gain | Return of Capital | ||||||||||||||||||||||
| BondBloxx USD High Yield Bond Sector Rotation ETF^ | $ | 2,374,535 | $ | - | $ | 533,623 | $ | - | $ | 2,101,410 | $ | - | $ | 60,985 | ||||||||||||||
Year/Period Ended October 31, 2024 | Year/Period Ended October 31, 2023 | |||||||||||||||
Ordinary Income* | Long-Term Capital Gain | Ordinary Income* | Long-Term Capital Gain | |||||||||||||
| BondBloxx BB Rated USD High Yield Corporate Bond ETF | $ | 3,592,728 | $ | - | $ | 2,930,252 | $ | - | ||||||||
| BondBloxx B Rated USD High Yield Corporate Bond ETF | 1,130,858 | - | 948,646 | - | ||||||||||||
| BondBloxx CCC Rated USD High Yield Corporate Bond ETF | 5,483,094 | - | 1,187,914 | - | ||||||||||||
| BondBloxx BBB Rated 1-5 Year Corporate Bond ETF | 919,365 | - | - | - | ||||||||||||
| BondBloxx BBB Rated 5-10 Year Corporate Bond ETF | 173,530 | - | - | - | ||||||||||||
| BondBloxx BBB Rated 10+ Year Corporate Bond ETF | 214,645 | - | - | - | ||||||||||||
| BondBloxx JP Morgan USD Emerging Markets 1-10 Year Bond ETF | 13,454,640 | - | 11,393,515 | - | ||||||||||||
| BondBloxx Bloomberg Six Month Target Duration US Treasury ETF | 56,714,301 | - | 19,195,046 | - | ||||||||||||
| BondBloxx Bloomberg One Year Target Duration US Treasury ETF | 25,788,925 | - | 11,946,611 | - | ||||||||||||
| BondBloxx Bloomberg Two Year Target Duration US Treasury ETF | 5,054,888 | - | 3,191,299 | - | ||||||||||||
| BondBloxx Bloomberg Three Year Target Duration US Treasury ETF | 2,091,424 | - | 987,439 | - | ||||||||||||
| BondBloxx Bloomberg Five Year Target Duration US Treasury ETF | 2,880,621 | - | 1,188,187 | - | ||||||||||||
| BondBloxx Bloomberg Seven Year Target Duration US Treasury ETF | 4,558,289 | - | 923,627 | - | ||||||||||||
| BondBloxx Bloomberg Ten Year Target Duration US Treasury ETF | 6,063,656 | - | 896,889 | - | ||||||||||||
| BondBloxx Bloomberg Twenty Year Target Duration US Treasury ETF | 1,309,183 | - | 948,088 | - | ||||||||||||
| BondBloxx IR+M Tax-Aware Short Duration ETF | 1,241,375 | - | - | - | ||||||||||||
| ^ | Fiscal year end changed from June 30, 2023 to October 31, 2023. | |
| * | For tax purpose short-term capital gain distributions are considered ordinary income distributions. |
At October 31, 2024, for Federal income tax purposes, the Funds have capital loss carryforwards available as shown in the table below, to the extent provided by regulations, to offset future capital gains for an unlimited period. To the extent that these capital loss carryforwards are used to offset future capital gains, it is probable that the capital gains so offset will not be distributed to shareholders.
263
BONDBLOXX ETF TRUST
Notes to the Financial Statements (Continued)
October 31, 2024
As of October 31, 2024, the Funds had the following net capital loss carryforwards remaining:
| Short-Term | Long-Term | Total Amount | ||||||||||
| BondBloxx USD High Yield Bond Industrial Sector ETF | $ | 75,223 | $ | 118,879 | $ | 194,102 | ||||||
| BondBloxx USD High Yield Bond Telecom, Media & Technology Sector ETF | 281,570 | 279,549 | 561,119 | |||||||||
| BondBloxx USD High Yield Bond Healthcare Sector ETF | 424,378 | 115,171 | 539,549 | |||||||||
| BondBloxx USD High Yield Bond Financial & REIT Sector ETF | 115,710 | 93,768 | 209,478 | |||||||||
| BondBloxx USD High Yield Bond Energy Sector ETF | 9,876 | 150,412 | 160,288 | |||||||||
| BondBloxx USD High Yield Bond Consumer Cyclicals Sector ETF | 94,042 | 116,854 | 210,896 | |||||||||
| BondBloxx USD High Yield Bond Consumer Non-Cyclicals Sector ETF | 47,001 | 55,762 | 102,763 | |||||||||
| BondBloxx USD High Yield Bond Sector Rotation ETF | 31,496,616 | 27,746,039 | 59,242,655 | |||||||||
| BondBloxx BB Rated USD High Yield Corporate Bond ETF | 599,583 | 203,992 | 803,575 | |||||||||
| BondBloxx B Rated USD High Yield Corporate Bond ETF | 230,611 | 136,018 | 366,629 | |||||||||
| BondBloxx CCC Rated USD High Yield Corporate Bond ETF | 1,109,389 | 369,069 | 1,478,458 | |||||||||
| BondBloxx BBB Rated 1-5 Year Corporate Bond ETF | - | - | - | |||||||||
| BondBloxx BBB Rated 5-10 Year Corporate Bond ETF | 1,787 | - | 1,787 | |||||||||
| BondBloxx BBB Rated 10+ Year Corporate Bond ETF | - | - | - | |||||||||
| BondBloxx JP Morgan USD Emerging Markets 1-10 Year Bond ETF | 419,976 | 83,845 | 503,821 | |||||||||
| BondBloxx Bloomberg Six Month Target Duration US Treasury ETF | 927,937 | 2,574 | 930,511 | |||||||||
| BondBloxx Bloomberg One Year Target Duration US Treasury ETF | 3,363,835 | 34,577 | 3,398,412 | |||||||||
| BondBloxx Bloomberg Two Year Target Duration US Treasury ETF | 868,868 | 431,639 | 1,300,507 | |||||||||
| BondBloxx Bloomberg Three Year Target Duration US Treasury ETF | 511,548 | 165,551 | 677,099 | |||||||||
| BondBloxx Bloomberg Five Year Target Duration US Treasury ETF | 1,046,336 | 454,501 | 1,500,837 | |||||||||
| BondBloxx Bloomberg Seven Year Target Duration US Treasury ETF | 670,418 | 648,071 | 1,318,489 | |||||||||
| BondBloxx Bloomberg Ten Year Target Duration US Treasury ETF | 1,266,815 | 774,650 | 2,041,465 | |||||||||
| BondBloxx Bloomberg Twenty Year Target Duration US Treasury ETF | 3,914,178 | 1,352,999 | 5,267,177 | |||||||||
| BondBloxx IR+M Tax-Aware Short Duration ETF | 81,517 | - | 81,517 | |||||||||
During the year ended October 31, 2024, the following Funds utilized capital loss carryforwards:
| Short-Term | Long-Term | Total Amount | ||||||||||
| BondBloxx USD High Yield Bond Healthcare Sector ETF | $ | 98,047 | $ | - | $ | 98,047 | ||||||
| BondBloxx USD High Yield Bond Financial & REIT Sector ETF | 16,644 | 10,977 | 27,621 | |||||||||
| BondBloxx USD High Yield Bond Energy Sector ETF | 42,447 | - | 42,447 | |||||||||
| BondBloxx USD High Yield Bond Sector Rotation ETF | 33,105 | - | 33,105 | |||||||||
| BondBloxx BB Rated USD High Yield Corporate Bond ETF | 13,692 | - | 13,692 | |||||||||
| BondBloxx JP Morgan USD Emerging Markets 1-10 Year Bond ETF | 412,255 | 117,547 | 529,802 | |||||||||
8. RELATED PARTIES
At October 31, 2024, certain officers and Trustees of the Trust are also officers or employees of the Adviser or affiliated with the Distributor.
9. INDEMNIFICATIONS
In the normal course of business, the Trust, on behalf of the Funds, enters into contracts with third-party service providers that contain a variety of representations and warranties and that provide general indemnifications. Additionally, under the Trust organizational documents, the officers and Trustees are indemnified against certain liabilities arising out of the performance
264
BONDBLOXX ETF TRUST
Notes to the Financial Statements (Continued)
October 31, 2024
of their duties to the Trust. The Funds’ maximum exposure under these arrangements is unknown, as it involves possible future claims that may or may not be made against the Funds. The Adviser is of the view that the risk of loss to the Funds in connection with the Funds’ indemnification obligations is remote; however, there can be no assurance that such obligations will not result in material liabilities that adversely affect the Funds.
10. INVESTMENT RISKS (Unaudited)
A discussion of some of the principal risks associated with an investment in a Fund is contained in each Fund’s Prospectus. An investment in a Fund should be made with an understanding that the value of the Fund’s portfolio securities may fluctuate in accordance with changes in the financial condition of the issuers of the portfolio securities, the value of bonds in general, and other factors that affect the market.
High Yield Bonds Risk. Bonds that are rated below investment-grade (sometimes referred to as “junk bonds,” which may include those bonds rated below “BBB-” by S&P Global Ratings and Fitch, or below “Baa3” by Moody’s), or similar bonds that are unrated, may be deemed speculative, may involve greater levels of risk than higher-rated bonds of similar maturity and may be more likely to default.
U.S. Treasury Obligations Risk. U.S. Treasury obligations may differ from other securities in their interest rates, maturities, times of issuance and other characteristics and may provide relatively lower returns than those of other securities. Similar to other issuers, changes to the financial condition or credit rating of the U.S. Government may cause the value of the Fund’s U.S. Treasury obligations to decline.
U.S. Government Obligations Risk. While U.S. Treasury obligations are backed by the “full faith and credit” of the U.S. Government, such securities are nonetheless subject to credit risk (i.e., the risk that the U.S. Government may be, or be perceived to be, unable or unwilling to honor its financial obligations, such as making payments). Securities issued or guaranteed by federal agencies or authorities and U.S. Government-sponsored instrumentalities or enterprises may or may not be backed by the full faith and credit of the U.S. Government.
Emerging Markets Risks. Investments in emerging market issuers are subject to a greater risk of loss than investments in issuers located or operating in more developed markets. This is due to, among other things, the potential for greater market volatility, lower trading volume, higher levels of inflation, political and economic instability, greater risk of a market shutdown and more governmental limitations on foreign investments in emerging market countries than are typically found in more developed markets. Companies in many emerging markets are not subject to the same degree of regulatory requirements, accounting standards or auditor oversight as companies in more developed countries, and as a result, information about the securities in which the Fund invests may be less reliable or complete. Moreover, emerging markets often have less reliable securities valuations and greater risks associated with custody of securities than developed markets. There may be significant obstacles to obtaining information necessary for investigations into or litigation against companies and shareholders may have limited legal remedies. The Fund is not actively managed and does not select investments based on investor protection considerations. In addition, emerging markets often have greater risk of capital controls through such measures as taxes or interest rate control than developed markets. Certain emerging market countries may also lack the infrastructure necessary to attract large amounts of foreign trade and investment. Local securities markets in emerging market countries may trade a small number of securities and may be unable to respond effectively to changes in trading volume, potentially making prompt liquidation of holdings difficult or impossible at times. Settlement procedures in emerging market countries are frequently less developed and reliable than those in the U.S. (and other developed countries). In addition, significant delays may occur in certain markets in registering the transfer of securities. There could be additional impacts on the value of the Fund as a result of sustainability risks, in particular those caused by environmental changes related to climate change, social issues (including relating to labor rights) and governance risk (including but not limited to risks around board independence, ownership and control, or audit and tax management). Additionally, disclosures or third-party data coverage associated with sustainability risks is generally less available or transparent in these markets.
265
BONDBLOXX ETF TRUST
Notes to the Financial Statements (Continued)
October 31, 2024
Municipal Bond Risk. Municipal securities risks include the possibility that the issuer may be unable to pay interest or repay principal on a timely basis or at all, the relative lack of information about certain issuers of municipal securities, and the possibility of future legislative changes which could affect the market for and value of municipal securities. In addition, state or local political or economic conditions and developments can adversely affect the securities issued by state and local governments. The value of the municipal securities owned by the Fund also may be adversely affected by future changes in U.S. federal, state or local tax laws.
Municipal Bond Market Liquidity Risk. From time to time, inventories of municipal securities held by brokers and dealers may decrease, lessening their ability to make a market in these securities. Any reduction in market making capacity has the potential to decrease the Fund’s ability to buy or sell municipal securities, and increase price volatility and trading costs, particularly during periods of economic or market stress. As a result, the Fund may be forced to accept a lower price to sell a municipal security, to sell other securities to raise cash, or to give up an investment opportunity, any of which could have a negative effect on performance.
Tax Risk. From time to time, the U.S. Government and the U.S. Congress consider changes in U.S. federal tax law that could limit or eliminate the U.S. federal income tax exemption for municipal bond income, which would in effect reduce the after-tax returns received by shareholders from the Fund by increasing taxes on distributions from the Fund. In such event, the Fund’s NAV could also decline as yields on municipal bonds, which are typically lower than those on taxable bonds, would be expected to increase to approximately the yield of comparable taxable bonds. Actions or anticipated actions affecting the tax-exempt status of municipal bonds could also result in significant shareholder redemptions of Fund shares as investors anticipate adverse effects on the Fund or seek higher yields to offset the potential loss of the tax deduction. As a result, the Fund would be required to maintain higher levels of cash to meet the redemptions, which would negatively affect the Fund’s yield.
Tax Aware Risk. Tax aware risk is the possibility that the use of investment practices that seek to maximize after tax return may not minimize tax consequences. Economic developments or unforeseeable investor redemptions may also reduce returns without any corresponding increase in tax efficiency.
Alternative Minimum Tax Risk. Although the interest received from municipal securities is generally exempt from federal income tax, the Fund may invest in municipal securities subject to the federal alternative minimum tax on individuals. For tax years beginning after December 31, 2022, interest on the bonds may affect the corporate alternative minimum tax for certain corporations. Accordingly, investment in the Fund could cause shareholders to be subject to the federal alternative minimum tax.
Interest Rate Risk. During periods of very low or negative interest rates, the Fund may be unable to maintain positive returns or pay dividends to Fund shareholders. Very low or negative interest rates may magnify interest rate risk. Changing interest rates, including rates that fall below zero, may have unpredictable effects on markets, result in heightened market volatility and detract from the Fund’s performance to the extent the Fund is exposed to such interest rates. Additionally, under certain market conditions in which interest rates are low and the market prices for portfolio securities have increased, the Fund may have a very low, or even negative yield. A low or negative yield would cause the Fund to lose money in certain conditions and over certain time periods. The U.S. government and the U.S. Federal Reserve, as well as certain foreign governments and central banks, have from time to time taken steps to support financial markets. The U.S. government and the U.S. Federal Reserve may, conversely, reduce market support activities, including by taking action intended to increase certain interest rates. This and other government intervention may not work as intended, particularly if the efforts are perceived by investors as being unlikely to achieve the desired results. Changes in government activities in this regard, such as changes in interest rate policy, can negatively affect financial markets generally, increase market volatility and reduce the value and liquidity of securities in which the Fund invests.
Concentration Risk. The Funds may be susceptible to an increased risk of loss, including losses due to adverse events that affect the Funds’ investments more than the market as a whole, to the extent that the Funds’ investments are concentrated in the securities of a particular issuer or issuers, sector, sub-sector, market segment, market, industry, group of industries,
266
BONDBLOXX ETF TRUST
Notes to the Financial Statements (Continued)
October 31, 2024
country, group of countries, region or asset class. The Funds may be more adversely affected by the underperformance of those securities, may experience increased price volatility and may be more susceptible to adverse economic, market, political or regulatory occurrences affecting those securities and/or other assets than a fund that does not concentrate its investments.
Inflation Risk. Inflation is a sustained rise in overall price levels. Moderate inflation is associated with economic growth, while high inflation can signal an overheated economy. Inflation risk is the risk that the value of assets or income from investments will be less in the future as inflation decreases the value of money (i.e., as inflation increases, the values of the Fund’s assets can decline). Inflation poses a “stealth” threat to investors because it reduces savings and investment returns. Central banks, such as the U.S. Federal Reserve, generally attempt to control inflation by regulating the pace of economic activity. They typically attempt to affect economic activity by raising and lowering short-term interest rates. At times, governments may attempt to manage inflation through fiscal policy, such as by raising taxes or reducing spending, thereby reducing economic activity; conversely, governments can attempt to combat deflation with tax cuts and increased spending designed to stimulate economic activity. Inflation rates may change frequently and significantly as a result of various factors, including unexpected shifts in the domestic or global economy and changes in economic policies, and the Fund’s investments may not keep pace with inflation, which may result in losses to Fund shareholders. This risk is greater for fixed-income instruments with longer maturities.
Affiliated ETF Risk. The Adviser receives advisory fees from the Underlying Funds. It is possible that a conflict of interest among the Fund and the Underlying Funds could affect how the Adviser fulfills its fiduciary duties to the Fund and the Underlying Funds. The Adviser may have an incentive to take into account the effect on an Underlying Fund in which the Fund may invest in determining whether, and under what circumstances, to purchase or sell shares in that Underlying Fund. In addition, the fees payable to the Adviser by certain of the Underlying Funds may be higher than the fee payable by the Fund. However, the Adviser has a fiduciary duty to act in the Fund’s best interests when selecting the Underlying Funds.
Market Risk. The Fund could lose money over short periods due to short-term market movements and over longer periods during more prolonged market downturns. Local, regional or global events such as war, acts of terrorism, the spread of infectious illness or other public health issues, recessions, the advent of significant inflation, or other events could have a significant impact on the Fund and its investments and could result in increased premiums or discounts to the Fund’s NAV.
Market Trading Risk. The Fund faces numerous market trading risks, including the potential lack of an active market for Fund shares or the Fund’s underlying portfolio securities, losses from trading in secondary markets, periods of high volatility and disruptions in the creation/redemption process. Any of these factors, among others, may lead to the Fund’s shares trading at a premium or discount to NAV. Accordingly, if a shareholder purchases Fund shares at a time when the market price is at a premium to the NAV, or sells shares at a time when the market price is at a discount to the NAV, the shareholder may sustain losses.
Investment in the Underlying Funds Risk. The Fund invests a substantial portion of its assets in the Underlying Funds. Accordingly, the Fund’s investment performance will be directly related to the performance of the Underlying Funds, and the Fund is subject to the risk factors associated with the investments of the Underlying Funds and will be affected by the investment policies and practices of the Underlying Funds in direct proportion to the amount of assets allocated to each. To the extent the Fund is exposed more heavily to one or more particular Sectors, its performance will be especially sensitive to risks associated with those Sectors.
A strategy used by the Underlying Funds may fail to produce the intended results. If the Fund has allocated a higher portion of its net assets to a particular Underlying Fund, it may be more susceptible to adverse developments affecting that Underlying Fund and may be more susceptible to losses because of these developments. The Fund’s ability to achieve its investment objective will depend on the ability of the Underlying Funds to achieve their investment objectives. There can be no assurance that the investment objective of any Underlying Fund can be achieved. With respect to the Underlying Funds, which are all designed to track an index, the price and movement of an ETF designed to track an index may not track the index and may result in a loss. In addition, ETFs may trade at a price above (premium) or below (discount) their net asset value, especially
267
BONDBLOXX ETF TRUST
Notes to the Financial Statements (Continued)
October 31, 2024
during periods of significant market volatility or stress, causing investors to pay significantly more or less than the value of the ETF’s underlying portfolio. Certain ETFs traded on exchanges may be thinly traded and experience large spreads between the “ask” price quoted by a seller and the “bid” price offered by a buyer.
The Fund’s NAV will change with changes in the value of the Underlying Funds and other investments based on their market valuations. The Fund’s market price may deviate from value of the Fund’s underlying holdings, particularly in times of market stress, and as a result, investors may pay more or receive less than the underlying value of the Fund’s shares bought or sold. An investment in the Fund will entail more costs and expenses than a direct investment in the Underlying Funds.
ETF and Other Investment Company Risk. The Fund may invest in shares of other investment companies and ETFs, including the affiliated Underlying Funds. Shareholders bear both their proportionate share of the Fund’s expenses and similar expenses of the underlying investment company or ETF when the Fund invests in shares of another investment company or ETF. The Fund is subject to the risks associated with the ETF or investment company’s investments. The price and movement of an ETF designed to track an index may not track the index and may result in a loss. In addition, ETFs may trade at a price above (premium) or below (discount) their net asset value, especially during periods of significant market volatility or stress, causing investors to pay significantly more or less than the value of the ETF’s underlying portfolio. Certain ETFs traded on exchanges may be thinly traded and experience large spreads between the “ask” price quoted by a seller and the “bid” price offered by a buyer.
Mortgage-Related and Asset-Backed Securities Risk. Mortgage-related and asset-backed securities represent interests in “pools” of mortgages or other assets, including consumer loans or receivables held in trust. These mortgage-related or asset-backed securities are subject to credit risk, interest rate risk, “prepayment risk” (the risk that borrowers will repay a loan more quickly in periods of falling interest rates) and “extension risk” (the risk that borrowers will repay a loan more slowly in periods of rising interest rates). If the Fund invests in mortgage-related or asset-backed securities that are subordinated to other interests in the same mortgage or asset pool, the Fund may only receive payments after the pool’s obligations to other investors have been satisfied. An unexpectedly high rate of defaults on the mortgages held by a mortgage pool may limit substantially the pool’s ability to make payments of principal or interest to the Fund, reducing the values of those securities or in some cases rendering them worthless. Uniform Mortgage-Backed Securities, which generally align the characteristics of Fannie Mae and Freddie Mac certificates, are a recent innovation and the effect they may have on the market for mortgage-related securities is uncertain.
Collateralized Loan Obligations (“CLO”) Risk. The risks of investing in CLOs include both the economic risks of the underlying loans combined with the risks associated with the CLO structure governing the priority of payments. The degree of such risk will generally correspond to the specific tranche in which the Fund is invested. The Fund intends to invest primarily in the rated debt tranches of CLOs; however, any such ratings do not constitute a guarantee, may be downgraded, and in stressed market environments it is possible that even senior CLO tranches could experience losses due to actual defaults, increased sensitivity to defaults due to collateral default and the disappearance of the subordinated/equity tranches, market anticipation of defaults, as well as negative market sentiment with respect to CLO securities as an asset class. The Sub-Adviser may not be able to accurately predict how specific CLOs or the portfolio of underlying loans for such CLOs will react to changes or stresses in the market, including changes in interest rates. The most common risks associated with investing in CLOs are liquidity risk, interest rate risk, credit risk, prepayment risk, and the risk of default of the underlying asset, among others.
Commercial Mortgage-Backed Securities Risk (“CMBS”). CMBS are not backed by the full faith and credit of the U.S. government and are subject to risk of default on the underlying mortgages, particularly during periods of economic downturn. CMBS issued by non-agency issuers may offer higher yields than those issued by government entities, but also may be subject to greater volatility than government issues. CMBS are subject to a greater degree of prepayment and extension risk than many other forms of fixed-income securities and therefore react differently to changes in interest rates than other bonds, and the prices of CMBS may reflect adverse economic and market conditions.
268
BONDBLOXX ETF TRUST
Notes to the Financial Statements (Continued)
October 31, 2024
Non-Diversification Risk. The Funds are classified as “non-diversified” funds under the 1940 Act. Accordingly, a Fund may invest a greater portion of its assets in the securities of a single issuer than if it were a “diversified” fund. To the extent that a Fund invests a higher percentage of its assets in the securities of a single issuer, the Fund is subject to a higher degree of risk associated with and developments affecting that issuer than a fund that invests more widely.
LIBOR Transition Risk. The risk related to the anticipated discontinuation of the London Interbank Offered Rate (“LIBOR”) by the end of 2021. On November 30, 2020, the administrator of LIBOR announced a delay in the phase out of a majority of the U.S. dollar LIBOR publications until June 30, 2023, and the remainder of LIBOR publications are expected to end at the end of 2021. Certain instruments held by the Funds may rely in some fashion upon LIBOR. Although the transition process away from LIBOR has become increasingly well-defined in advance of the anticipated discontinuation date, there remains uncertainty regarding the nature of any replacement rate, and any potential effects of the transition away from LIBOR on the Funds or on certain instruments in which the Funds invest can be difficult to ascertain. The transition process may involve, among other things, increased volatility or illiquidity in markets for instruments that currently rely on LIBOR, and may result in a reduction in value of certain instruments held by the Funds.
Russian Invasion of Ukraine. Russia launched a large-scale invasion of Ukraine on February 24, 2022. The extent and duration of the military action, resulting sanctions and resulting future market disruptions in the region are impossible to predict, but could be significant. Any such disruptions caused by Russian military action or other actions (e.g., cyberattacks and espionage) or resulting actual and threatened responses to such activity, including purchasing and financing restrictions, sanctions, tariffs or cyberattacks on Russian entities or individuals could have a severe adverse effect on the region, including significant negative impacts on the economy and the markets for certain securities and commodities, such as oil and natural gas, as well as other sectors. How long such military action and related events will last cannot be predicted. These and any related events could have significant impact on Fund performance and the value of an investment in the Fund.
11. NEW ACCOUNTING PRONOUNCEMENTS
In June 2022, the FASB issued ASU 2022-03, “Fair Value Measurement (Topic 820): Fair Value Measurement of Equity Securities Subject to Contractual Sale Restrictions.” The ASU clarifies that a contractual restriction on the sale of an equity security is not considered part of the unit of account of the equity security and, therefore, is not considered in measuring the fair value. The amendments also require additional disclosures related to equity securities subject to contractual sale restrictions. The ASU is effective for fiscal years beginning after December 15, 2023 and interim periods within those fiscal years. Management is evaluating the implications of this guidance to future financial statements.
12. SUBSEQUENT EVENTS
Management has evaluated the need for disclosure and/or adjustments resulting from subsequent events through the date the financial statements were issued. Based on this evaluation, no adjustments were required to the financial statements.
269
BONDBLOXX ETF TRUST
Report of Independent Registered Public Accounting Firm
To the Shareholders and Board of Trustees of
BondBloxx ETF Trust
Opinion on the Financial Statements
We have audited the accompanying statements of assets and liabilities, including the portfolios of investments, of BondBloxx ETF Trust comprising the funds listed below (the “Funds”) as of October 31, 2024, the related statements of operations and changes in net assets, and the financial highlights for each of the periods indicated below, and the related notes (collectively referred to as the “financial statements”). In our opinion, the financial statements present fairly, in all material respects, the financial position of each of the Funds as of October 31, 2024, the results of their operations, the changes in net assets, and the financial highlights for each of the periods indicated below in conformity with accounting principles generally accepted in the United States of America.
| Fund Name | Statements of Operations | Statements of Changes in Net Assets | Financial Highlights | |||
BondBloxx USD High Yield Bond Industrial Sector ETF,
BondBloxx USD High Yield Bond Telecom, Media & Technology Sector ETF,
BondBloxx USD High Yield Bond Healthcare Sector ETF,
BondBloxx USD High Yield Bond Financial & REIT Sector ETF,
BondBloxx USD High Yield Bond Energy Sector ETF,
BondBloxx USD High Yield Bond Consumer Cyclicals Sector ETF,
BondBloxx USD High Yield Bond Consumer Non-Cyclicals Sector ETF | For the year ended October 31, 2024 | For the years ended October 31, 2024 and 2023 | For the years ended October 31, 2024, 2023, and for the period from February 15, 2022 (commencement of operations) through October 31, 2022 | |||
BondBloxx B Rated USD High Yield Corporate Bond ETF,
BondBloxx BB Rated USD High Yield Corporate Bond ETF,
BondBloxx CCC Rated USD High Yield Corporate Bond ETF | For the year ended October 31, 2024 | For the years ended October 31, 2024 and 2023 | For the years ended October 31, 2024, 2023, and for the period from May 24, 2022 (commencement of operations) through October 31, 2022 | |||
| BondBloxx JP Morgan USD Emerging Markets 1-10 Year Bond ETF | For the year ended October 31, 2024 | For the years ended October 31, 2024 and 2023 | For the years ended October 31, 2024, 2023, and for the period from June 28, 2022 (commencement of operations) through October 31, 2022 |
270
BONDBLOXX ETF TRUST
Report of Independent Registered Public Accounting Firm (Continued)
| Fund Name | Statements of Operations | Statements of Changes in Net Assets | Financial Highlights | |||
BondBloxx Bloomberg Six Month Target Duration US Treasury ETF,
BondBloxx Bloomberg One Year Target Duration US Treasury ETF,
BondBloxx Bloomberg Two Year Target Duration US Treasury ETF,
BondBloxx Bloomberg Three Year Target Duration US Treasury ETF,
BondBloxx Bloomberg Five Year Target Duration US Treasury ETF,
BondBloxx Bloomberg Seven Year Target Duration US Treasury ETF,
BondBloxx Bloomberg Ten Year Target Duration US Treasury ETF,
BondBloxx Bloomberg Twenty Year Target Duration US Treasury ETF | For the year ended October 31, 2024 | For the years ended October 31, 2024 and 2023 | For the years ended October 31, 2024, 2023, and for the period from September 13, 2022 (commencement of operations) through October 31, 2022 | |||
| BondBloxx USD High Yield Bond Sector Rotation ETF | For the year ended October 31, 2024 | For the year ended October 31, 2024, the period July 1, 2023 through October 31, 2023, and for the year ended June 30, 2023 | For the year ended October 31, 2024, for the period July 1, 2023 through October 31, 2023, and for the years ended June 30, 2023, 2022, 2021, and 2020 | |||
| BondBloxx IR+M Tax-Aware Short Duration ETF | For the period March 12, 2024 (commencement of operations) through October 31, 2024
| |||||
BondBloxx BBB Rated 1-5 Year Corporate Bond ETF,
BondBloxx BBB Rated 5-10 Year Corporate Bond ETF,
BondBloxx BBB Rated 10+ Year Corporate Bond ETF | For the period January 23, 2024 (commencement of operations) through October 31, 2024 | |||||
Basis for Opinion
These financial statements are the responsibility of the Funds’ management. Our responsibility is to express an opinion on the Funds’ financial statements based on our audits. We are a public accounting firm registered with the Public Company Accounting Oversight Board (United States) (“PCAOB”) and are required to be independent with respect to the Funds in accordance with the U.S. federal securities laws and the applicable rules and regulations of the Securities and Exchange Commission and the PCAOB.
We conducted our audits in accordance with the standards of the PCAOB. Those standards require that we plan and perform the audit to obtain reasonable assurance about whether the financial statements are free of material misstatement whether due to error or fraud.
271
BONDBLOXX ETF TRUST
Report of Independent Registered Public Accounting Firm (Continued)
Our audits included performing procedures to assess the risks of material misstatement of the financial statements, whether due to error or fraud, and performing procedures that respond to those risks. Such procedures included examining, on a test basis, evidence regarding the amounts and disclosures in the financial statements. Our procedures included confirmation of securities owned as of October 31, 2024, by correspondence with the custodian and brokers; when replies were not received from brokers, we performed other auditing procedures. Our audits also included evaluating the accounting principles used and significant estimates made by management, as well as evaluating the overall presentation of the financial statements. We believe that our audits provide a reasonable basis for our opinion.
We have served as auditor of one or more of the Funds within BondBloxx ETF Trust since 2020.

COHEN & COMPANY, LTD.
Cleveland, Ohio
December 23, 2024
272
BONDBLOXX ETF TRUST
Supplemental Information (Unaudited)
Quarterly Portfolio Schedule. BondBloxx ETF Trust files their complete schedules of portfolio holdings with the SEC for the first and third quarters of each fiscal year to date on Form N-PORT. The Forms N-PORT will be available on the SEC’s website at www.sec.gov. In addition, the Funds’ full portfolio holdings are updated daily and available on the Funds’ website at https://bondbloxxetf.com/.
Proxy Voting Policy. Information with respect to how proxies relating to the Funds’ portfolio securities were voted during the 12-month period ended June 30 will be available: (i) without charge, upon request, by calling (800) 896-5089 or through the Funds’ website at https://bondbloxxetf.com/; and (ii) on the SEC’s website at www.sec.gov.
Proxy Voting Record. BIM, as an adviser to a 1940 Act Funds, is required to comply with Rule 30b1-4 under the 1940 Act (the “Proxy Rule”), that requires investment companies to file annual report Form N-PX. The adviser must provide the Fund Administrator with the voting records in order to comply with this filing. On an annual basis, following the end of the 12-month period ending June 30, the Adviser will furnish to the Trust’s administrator a full record detailing all how the Adviser voted all Trust proxies for the prior 12-month period.
Premium/Discount Information. Information about the difference between daily market values on the secondary market for shares of the Funds in BondBloxx ETF Trust and such Funds’ net asset value can be found on our website, https://bondbloxxetf.com/.
Code of Ethics. The Trust and the Adviser have each adopted codes of ethics pursuant to Rule 17j-1 of the 1940 Act. Each code of ethics may be examined at the office of the SEC in Washington, D.C. or on the Internet at the SEC’s website at www.sec.gov.
Tax Information
Form 1099-DIV and other year-end tax information provide shareholders with actual calendar year amounts that should be included in their tax returns. Shareholders should consult their tax advisors. The Funds designate the following amounts or, if subsequently determined to be different, the maximum allowable for its year/period ended October 31, 2024.
Qualified Dividend Income* | Dividends Received Deduction* | Qualified Interest Income | |||||||
| BondBloxx Bloomberg Six Month Target Duration US Treasury ETF | 0.00% | 0.00% | 100.00% | ||||||
| BondBloxx Bloomberg One Year Target Duration US Treasury ETF | 0.00% | 0.00% | 100.00% | ||||||
| BondBloxx Bloomberg Two Year Target Duration US Treasury ETF | 0.00% | 0.00% | 100.00% | ||||||
| BondBloxx Bloomberg Three Year Target Duration US Treasury ETF | 0.00% | 0.00% | 100.00% | ||||||
| BondBloxx Bloomberg Five Year Target Duration US Treasury ETF | 0.00% | 0.00% | 100.00% | ||||||
| BondBloxx Bloomberg Seven Year Target Duration US Treasury ETF | 0.00% | 0.00% | 100.00% | ||||||
| BondBloxx Bloomberg Ten Year Target Duration US Treasury ETF | 0.00% | 0.00% | 100.00% | ||||||
| BondBloxx Bloomberg Twenty Year Target Duration US Treasury ETF | 0.00% | 0.00% | 100.00% |
| * | The above percentage is based on ordinary income dividends paid to shareholders during the Funds’ fiscal year/period. |
273
BONDBLOXX ETF TRUST
Board Approval of Investment Advisory Agreement (Unaudited)
BondBloxx IR+M Tax-Aware ETF for California Residents
BondBloxx IR+M Tax-Aware ETF for Massachusetts Residents
BondBloxx IR+M Tax-Aware ETF for New York Residents
Under Section 15(c) of the Investment Company Act of 1940, as amended (the “1940 Act”), the Trust’s Board of Trustees (the “Board”), including a majority of the Trustees who are not “interested persons” (as that term is defined in the 1940 Act) (the “Independent Trustees”) of BondBloxx ETF Trust (the “Trust,” and each series thereof, a “Fund”), is required to consider and approve the Investment Advisory Agreement between the Trust and BondBloxx Investment Management Corporation (the “Adviser” or “BondBloxx”) (the “Advisory Agreement”), as well as any sub-advisory agreements with respect to the applicable Funds. In considering these agreements, the Board, including all of the Independent Trustees, assess the Adviser’s and a sub-adviser’s, as applicable, proposed services to the Funds, including investment management; oversight of the Funds’ service providers, as applicable; risk management and oversight; legal and compliance services; and ability to comply with applicable legal and regulatory requirements.
At a meeting held on May 23, 2024 (the “May Meeting”), the Board, including a majority of the Independent Trustees, considered and approved the Advisory Agreement with respect to the BondBloxx IR+M Tax-Aware ETF for California Residents, BondBloxx IR+M Tax-Aware ETF for Massachusetts Residents and BondBloxx IR+M Tax-Aware ETF for New York Residents (the “State Tax-Aware ETFs”) for an initial two-year period. In addition, the Board approved the Investment Sub-Advisory Agreement among the Trust, on behalf of the State Tax-Aware ETFs, BondBloxx and Income Research + Management (the “Sub-Adviser” or “IR+M”), for an initial two-year period (the “Sub-Advisory Agreement,” and together with the Advisory Agreement, the “Agreements”).
General Information
The following information summarizes the Board’s considerations associated with its review of the Agreements. In connection with the Trustees’ deliberations, BondBloxx furnished information to the Trustees necessary for a majority of the Independent Trustees to make the determination that the Agreements were in the best interests of the State Tax-Aware ETFs and their shareholders. Prior to voting, the Independent Trustees reviewed the Agreements with management and their independent legal counsel and received materials from such counsel discussing the legal standards for their consideration of the proposed entering into of the Agreements.
Advisory Agreement
In approving the Advisory Agreement, the Board, including the Independent Trustees, considered various factors, including: (1) the nature, extent and quality of the services to be provided to the State Tax-Aware ETFs by BondBloxx; (2) BondBloxx’s proposed compensation under the Advisory Agreement; (3) the estimated expenses of the State Tax-Aware ETFs; (4) the estimated costs of services to be provided to the State Tax-Aware ETFs and the anticipated profits to be realized by BondBloxx from its management of the State Tax-Aware ETFs; (5) the potential for economies of scale and the sharing of any economies of scale with the State Tax-Aware ETFs’ shareholders; (6) the fees paid by and services provided to other active municipal exchange-traded funds (“ETFs”); and (7) other potential benefits to BondBloxx from its relationships with the State Tax-Aware ETFs. The material factors and conclusions that formed the basis for the Board, including the Independent Trustees, to approve the Advisory Agreement are discussed below.
Nature, Extent and Quality of Services to be Provided. In considering the nature, extent and quality of the services to be provided by BondBloxx under the Advisory Agreement, the Board reviewed information provided by BondBloxx relating to its operations and personnel. The Board considered the level and depth of knowledge and professional experience and qualifications of BondBloxx’s personnel. The Board also took into account the systems and resources that BondBloxx intended to devote to investment management, oversight of the Sub-Adviser, and legal and compliance. The Board noted that IR+M will be responsible for managing the day-to-day investment operations of the State Tax-Aware ETFs and the Adviser will be responsible for administering the State Tax-Aware ETFs. Based on the foregoing, the Board concluded that it was satisfied with the nature, extent and quality of the services to be provided to the State Tax-Aware ETFs by BondBloxx under the Advisory Agreement.
274
BONDBLOXX ETF TRUST
Board Approval of Investment Advisory Agreement (Unaudited) (Continued)
BondBloxx IR+M Tax-Aware ETF for California Residents
BondBloxx IR+M Tax-Aware ETF for Massachusetts Residents
BondBloxx IR+M Tax-Aware ETF for New York Residents
Performance. The Board took into account that BondBloxx does not currently manage any accounts or funds with similar investment objectives and policies and does not operate any affiliated advisory entities. The Board took into consideration the professional experience and investment capabilities of the individuals who are expected to serve as portfolio managers to the State Tax-Aware ETFs, including individuals from the Sub-Adviser. In addition, the Board considered BondBloxx’s investment philosophy and portfolio construction process and the systems and tools BondBloxx and the Sub-Adviser are expected to use in managing the State Tax-Aware ETFs in accordance with its investment objective and investment strategies. Based on the foregoing, the Board concluded that BondBloxx is qualified to manage the State Tax-Aware ETFs’ assets in accordance with each State Tax-Aware ETF’s investment objective and investment strategies.
Proposed Compensation and Estimated Expenses. The Board considered the proposed compensation that each State Tax-Aware ETF is required to pay to BondBloxx under the Advisory Agreement and the estimated expense ratios of each State Tax-Aware ETF. The Board took into account that under the Advisory Agreement, BondBloxx is responsible for paying substantially all of each State Tax-Aware ETF’s operating expenses with some exceptions and that this expense structure effectively limits each Fund’s expenses to the level of its respective advisory fee. The Board also took into account the sub-advisory fees payable by the Adviser to the Sub-Adviser. In addition, the Board took into account the expense ratios of other actively-managed municipal ETFs relative to the estimated expense ratios of the State Tax-Aware ETFs. Based on the foregoing, the Board concluded that each State Tax-Aware ETF’s advisory fee is reasonable in view of the services to be received by the State Tax-Aware ETFs from BondBloxx and the other factors considered.
Costs of Services, Anticipated Profitability and Fall-out Benefits. The Board considered the estimated cost of services to be provided and the profits to be realized by BondBloxx in connection with its provision of services to the State Tax-Aware ETFs pursuant to the Advisory Agreement. The Board noted potential benefits to BondBloxx that could accrue as a result of managing the State Tax-Aware ETFs, including potential reputational benefits. Based upon the foregoing, the Board concluded that BondBloxx’s anticipated profitability from its relationship with the State Tax-Aware ETFs was reasonable.
Potential Economies of Scale. The Board considered the initial levels of investor seed capital[, as applicable,] and the Adviser’s expectations concerning each State Tax-Aware ETF’s asset growth in the first year of operations and beyond. The Board noted the competitive environment in which each State Tax-Aware ETF will operate. The Board considered the effect of potential future asset growth on each Fund’s performance and expenses. The Board noted that if each Fund’s assets increase over time, then each Fund might realize other economies of scale to the extent its assets increase proportionally more than certain Fund operating expenses. Based on the foregoing, the Board concluded that the amount and structure of the proposed compensation to be paid by each State Tax-Aware ETF to BondBloxx is appropriate.
Sub-Advisory Agreement
Pursuant to an exemption obtained by the Trust and BondBloxx, which permits BondBloxx, on behalf of the Funds and subject to the approval of the Board, including a majority of the Independent Trustees, to hire, and to modify any existing or future sub-advisory agreement with, unaffiliated sub-advisers and affiliated sub-advisers. BondBloxx has the ultimate responsibility for overseeing the Funds’ sub-advisers and recommending their hiring, termination and replacement, subject to oversight by the Board. The exemption also contains relief from certain disclosure obligations with regard to sub-advisory fees.
In determining whether to approve the entering into of the Sub-Advisory Agreement, the Adviser and IR+M furnished information necessary for a majority of the Independent Trustees to make the determination that the entering into of the Sub-Advisory Agreement was in the best interests of the State Tax-Aware ETFs and their shareholders. Prior to voting, the Independent Trustees reviewed the proposed entering into of the Sub-Advisory Agreement with management and their independent legal counsel and received materials from such counsel discussing the legal standards for their consideration of the proposed entering into of the Sub- Advisory Agreement.
275
BONDBLOXX ETF TRUST
Board Approval of Investment Advisory Agreement (Unaudited) (Continued)
BondBloxx IR+M Tax-Aware ETF for California Residents
BondBloxx IR+M Tax-Aware ETF for Massachusetts Residents
BondBloxx IR+M Tax-Aware ETF for New York Residents
In approving the Sub-Advisory Agreement, the Board, including the Independent Trustees, considered various factors, including: (1) the nature, extent and quality of the services to be provided to the State Tax-Aware ETFs by IR+M; (2) the Adviser’s and IR+M’s proposed compensation under the Advisory Agreement and Sub-Advisory Agreement, respectively; (3) the estimated expenses of the State Tax-Aware ETFs; (4) the estimated costs of services to be provided to the State Tax-Aware ETFs by IR+M and the anticipated profits to be realized by IR+M from its management of the State Tax-Aware ETFs; (5) the potential for economies of scale and the sharing of any economies of scale with the State Tax-Aware ETFs’ shareholders; (6) the fees paid by and services provided to other actively-managed municipal ETFs; and (7) other potential benefits to IR+M from its relationships with the State Tax-Aware ETFs. The material factors and conclusions that formed the basis for the Board, including the Independent Trustees, to approve the Sub-Advisory Agreement are discussed below.
Nature, Extent and Quality of Services to be Provided. In considering the nature, extent and quality of the services to be provided by IR+M under the Sub-Advisory Agreement, the Board reviewed information provided by IR+M relating to its operations and personnel. The Board considered the level and depth of knowledge and professional experience and qualifications of IR+M’s personnel. The Board also took into account the systems and resources that IR+M intended to devote to investment management and legal and compliance services. The Board noted that the Sub-Adviser will be responsible for managing the day-to-day investment operations of the State Tax-Aware ETFs and BondBloxx will be responsible for administering the State Tax-Aware ETFs. Based on the foregoing, the Board concluded that it was satisfied with the nature, extent and quality of the services to be provided to the State Tax-Aware ETFs by the Sub-Adviser under the Sub-Advisory Agreement.
Performance. The Board took into consideration the professional experience and investment capabilities of the individuals from the Sub-Adviser who are expected to serve as portfolio managers to the State Tax-Aware ETFs. In addition, the Board considered the Sub-Adviser’s investment philosophy and portfolio construction process and the systems and tools the Sub-Adviser is expected to use in managing the State Tax-Aware ETFs in accordance with each State Tax-Aware ETF’s respective investment objectives and investment strategies. Based on the foregoing, the Board concluded that the Sub-Adviser is qualified to manage each State Tax-Aware ETF’s assets in accordance with each State Tax-Aware ETF’s investment objective and investment strategies.
Proposed Compensation and Estimated Expenses. The Board considered the proposed compensation payable by the Adviser to IR+M under the Sub-Advisory Agreement and the estimated expense ratios of the State Tax-Aware ETFs. The Board took into account that under the Sub-Advisory Agreement, IR+M will bear all expenses in connection with the performance of its services under the Sub-Advisory Agreement, excluding any Fund expenses as set forth in the Prospectus of each Fund. Based on the foregoing, the Board concluded that each State Tax-Aware ETF’s proposed compensation is reasonable in view of the services to be received by the State Tax-Aware ETFs from the Sub-Adviser and the other factors considered.
Costs of Services, Anticipated Profitability and Fall-out Benefits. The Board considered the estimated cost of services to be provided and the profits to be realized by the Sub-Adviser in connection with its provision of services to the State Tax-Aware ETFs pursuant to the Sub-Advisory Agreement. The Board noted potential benefits to the Sub-Adviser that could accrue as a result of managing the State Tax-Aware ETFs, including potential reputational benefits. Based upon the foregoing, the Board concluded that IR+M’s anticipated profitability from its relationship with the State Tax-Aware ETFs was reasonable.
Potential Economies of Scale. The Board considered the initial levels of investor seed capital and the Adviser’s and Sub-Adviser’s expectations concerning the State Tax-Aware ETFs’ asset growth in the first year of operations and beyond. The Board noted the competitive environment in which the State Tax-Aware ETFs will operate. The Board considered the effect of potential future asset growth on the State Tax-Aware ETFs. The Board noted that if the State Tax-Aware ETFs’ assets increase over time, the State Tax-Aware ETFs might realize other economies of scale to the extent its assets increase proportionally more than certain Fund operating expenses. Based on the foregoing, the Board concluded that the amount and structure of the proposed compensation payable to IR+M is reasonable.
276
BONDBLOXX ETF TRUST
Board Approval of Investment Advisory Agreement (Unaudited) (Continued)
BondBloxx IR+M Tax-Aware ETF for California Residents
BondBloxx IR+M Tax-Aware ETF for Massachusetts Residents
BondBloxx IR+M Tax-Aware ETF for New York Residents
Conclusion
The Board, including the Independent Trustees, did not identify any single factor as controlling, and each Trustee may have attributed different weight to various factors. Based on a review of the factors described above, as well as such other factors as deemed appropriate by the Board, the Board, including a majority of the Independent Trustees, determined that terms of Agreements, including the compensation payable to BondBloxx under the Advisory Agreement and the compensation payable to IR+M under the Sub-Advisory Agreement, were in the best interests of each State Tax-Aware ETF and its shareholders. Accordingly, the Board, including a majority of the Independent Trustees, voted to approve the Agreements, each for an initial two-year period.
277
BONDBLOXX ETF TRUST
General Information (Unaudited)
Investment Adviser
BondBloxx Investment Management Corporation
700 Larkspur Landing Circle, Suite 250
Larkspur, CA 94939
Administrator, Fund Accountant, Transfer and Dividend Agent and Custodian
Brown Brothers Harriman & Co.
50 Post Office Square
Boston, MA 02110
Distributor
Foreside Fund Services, LLC
Three Canal Plaza, Suite 100
Portland, ME 04101
Chief Compliance Officer
ACA Group
480 East Swedesford Road, Suite 220
Wayne, PA 19087
Independent Registered Public Accounting Firm
Cohen & Company, Ltd.
1350 Euclid Avenue, Suite 800
Cleveland, OH 44115
Legal Counsel
Ropes & Gray LLP
3 Embarcadero Center
San Francisco, CA 94111
278
![]()
This report is intended for the Funds’ shareholders. It may not be distributed to prospective investors unless it is preceded or accompanied by the current prospectus.
BondBloxx Investment Management Corporation | bondbloxxetf.com | 800.896.5089
Item 8. Changes in and Disagreements with Accountants for Open-End Management Investment Companies.
There were no changes in and/or disagreements with Accountants during the period covered by this report.
Item 9. Proxy Disclosures for Open-End Management Companies.
There were no matters submitted to a vote of shareholders during the period covered by this report.
Item 10. Remuneration Paid to Directors, Officers, and Others of Open-End Management Companies.
The aggregate renumeration paid to all Trustees is included within the financial statements under Item 7 of this Form N-CSR.
Item 11. Statement Regarding Basis for Approval of Investment Advisory Contract.
The basis for approval of the Investment Advisory Contracts is included within the financial statements under Item 7 of this Form N-CSR.
Item 12. Disclosure of Proxy Voting Policies and Procedures for Closed-End Management Investment Companies.
Not applicable.
Item 13. Portfolio Managers of Closed-End Management Investment Companies.
Not applicable.
Item 14. Purchases of Equity Securities by Closed-End Management Investment Company and Affiliated Purchasers.
Not applicable.
Item 15. Submission of Matters to a Vote of Security Holders.
There have been no material changes to the procedures by which the shareholders may recommend nominees to the Registrant’s board of directors, where those changes were implemented after the Registrant last provided disclosure in response to the requirements of Item 407(c)(2)(iv) of Regulation S-K (as required by Item 22(b)(15) of Schedule 14A (17 CFR 240.14a-101)), or this Item.
Item 16. Controls and Procedures.
| (a) | The Registrant’s principal executive and financial officers have concluded that the Registrant’s disclosure controls and procedures (as defined in Rule 30a-3(c) under the Investment Company Act of 1940, as amended (the “1940 Act”)) are effective, as of a date within 90 days of the filing date of this report, based on their evaluation of these controls and procedures required by Rule 30a-3(b) under the 1940 Act and Rules 13a-15(b) or 15d-15(b) under the Securities Exchange Act of 1934, as amended (the “Exchange Act”). | |
| (b) | There were no changes in the Registrant’s internal control over financial reporting (as defined in Rule 30a-3(d) under the 1940 Act) that occurred during the Registrant’s period covered by this report, that have materially affected, or are reasonably likely to materially affect, the Registrant’s internal control over financial reporting. |
Item 17. Disclosure of Securities Lending Activities for Closed-End Management Investment Companies.
Not applicable.
Item 18. Recovery of Erroneously Awarded Compensation.
Not applicable.
Item 19. Exhibits.
| (a)(1) | Not applicable. | |
| (a)(2) | Not applicable. | |
| (a)(3) | Certifications required by Rule 30a-2(a) under the 1940 Act and Section 302 of the Sarbanes-Oxley Act of 2002 are filed as Exhibit 13(a)(2) to this Form N-CSR. | |
| (a)(4) | Not Applicable. | |
| (a)(5) | There has been no change to the Registrant’s independent public accountant during the reporting period. | |
| (b) | Certifications required by Rule 30a-2(b) under the 1940 Act and Section 906 of the Sarbanes-Oxley Act of 2002 are furnished as Exhibit 13(b) to this Form N-CSR. |
SIGNATURES
Pursuant to the requirements of the Securities Exchange Act of 1934 and the Investment Company Act of 1940, the Registrant has duly caused this Report to be signed on its behalf by the undersigned, thereunto duly authorized.
BondBloxx ETF Trust
| By: | /s/ Joanna Gallegos | |
| Joanna Gallegos | ||
| Principal Executive Officer | ||
| BondBloxx ETF Trust | ||
| Date: | December 27, 2024 |
Pursuant to the requirements of the Securities Exchange Act of 1934 and the Investment Company Act of 1940, this report has been signed below by the following persons on behalf of the Registrant and in the capacities and on the dates indicated.
| By: | /s/ Joanna Gallegos | |
| Joanna Gallegos | ||
| Principal Executive Officer | ||
| BondBloxx ETF Trust | ||
| Date: | December 27, 2024 |
BondBloxx ETF Trust
| By: | /s/ Tony Kelly | |
| Tony Kelly | ||
Chief Financial Officer, Chief Accounting Officer, Vice President and Treasurer | ||
| BondBloxx ETF Trust | ||
| Date: | December 27, 2024 |