CHESTNUT STREET EXCHANGE FUND
(A California Limited Partnership)
INVESTMENT ADVISER’S REPORT
(Unaudited)
Summary
After a very turbulent year with many historic records being broken, the U.S. market finished in the positive territory with the S&P 500® Index gaining 18.40% for the year. 2020 started on an upbeat with signs of real economic growth through reported earnings and the signing of the U.S.-China Phase 1 trade deal. In March, Covid-19 crossed the European borders and in a matter of weeks all indices went into a free fall as countries implemented strict lockdown measures. Central banks and governments were quick to step in through monetary and fiscal easing to maintain liquidity and help struggling businesses and individuals. After hitting its lowest point in mid-March, the S&P 500® Index has since been on the rise, reaching all-time highs at the end of the year. In November, Joe Biden was elected to become the 46th U.S. President with the Democrats also winning the House and Senate. Development was made on the Covid-19 vaccine front with several pharmaceutical companies reporting encouraging test results which gave a boost to the previously underperforming value and cyclical sectors. Information technology and consumer discretionary sectors gained the most for the period as these sectors benefited from the work-from-home environment and the rise in the use of technology and digitalization. Despite recovering some of its loss in the final months of the year, the energy sector declined significantly during 2020 due to weakened demand and conflicts between the Organization of the Petroleum Exporting Countries and Russia on price and supply.
Performance Attribution
The portfolio underperformed its benchmark index, the S&P 500® Index during the year.
During the year, selection in information technology and positioning within the financials and consumer discretionary sectors were the largest detractors from relative performance. In contrast, a lack of exposure to utilities and real estate, and an underweight to consumer staples were the largest contributors to returns.
In information technology, a large overweight to Intel Corporation and an underweight to Apple were the largest detractors from relative performance. In financials, an overweight to banks with the Fund`s holdings in Wells Fargo & Company and JPMorgan Chase & Co. weighed on returns. Lastly, in consumer discretionary, an underweight to the internet & direct marketing retail sub-sector further detracted from relative performance.
Conversely, a lack of exposure to the defensive utilities and real estate sectors, and an underweight to consumer staples were the largest contributors to performance. These sectors lagged the broader market as they were less impacted by the market recovery efforts and the factor rotation from positive Covid-19 vaccine news in November.
Outlook
After a fateful year that seemed to pack a decade of market and economic activity into 12 months, we look to 2021 with optimism and a positive outlook for U.S. equities. Despite the recent flare-up in the Covid-19 pandemic, we ultimately believe that corporate earnings in the U.S. will be higher in 2021 than in 2020. While we cannot predict when the U.S. economy will return to normal, we do believe that ongoing policy support and vaccine deployment will create a bridge to a post-pandemic economy. Furthermore, we believe that a number of factors, explained below, will support stronger-than-expected corporate earnings and economic growth.
CHESTNUT STREET EXCHANGE FUND
(A California Limited Partnership)
INVESTMENT ADVISER’S REPORT (Continued)
(Unaudited)
| Portfolio Review (concluded) |
In our view, higher earnings in the U.S. start with management teams’ maniacal focus on managing costs. Remote work has afforded companies important opportunities to evaluate and reassess their businesses and operating structures. Workflow automation tools allow companies to find efficiencies, lower costs and increase productivity. We predict travel budgets will be reduced and 50-60% of all leases will expire in a year and come back at much lower rates. We believe these dynamics will all provide important margin tailwinds going forward in which management teams will take advantage.
On the demand side, the range for gross domestic product (GDP) estimates this year is very wide: between 2.7% and 6.1% GDP growth. We think demand is going to be stronger. We’ve done some work on demographics, specifically focused on the millennial cohort of the population and home ownership. Home ownership is back to 67% as an increase in the population aged 24-39 supports new home sales. Debt obligations are also low, meaning homeowners have significant room to borrow against their new houses. We believe the combination of new household formation, new home purchases and the ability to take on debt will provide another tailwind to GDP growth over the next few years.
Finally, given the profound monetary stimulus here in the U.S. and negative rates in countries like Germany, we continue to believe rates and inflation will remain structurally lower for longer. This dynamic remains critical to our outlook and belief that as earnings move higher in 2021, low discount rates will continue to support higher price multiples.
Any opinions expressed are those of BlackRock as of the date of this report and are subject to change based on changes in market or economic conditions. The performance data represents past performance and the principal value and investment return will fluctuate so that an investor’s shares, when redeemed may be worth more or less than their original cost. Past performance is not a guarantee of future results. Please call (866) 311-7541 for the most recent month-end performance. In addition, the data does not reflect the deduction of taxes that a shareholder would pay on distributions or redemption of Fund shares. There is no guarantee that forecasts made herein will come to pass. The comments should not be construed as a recommendation for any individual holdings or market sectors. Information and opinions are derived from proprietary and non-proprietary sources deemed by BlackRock to be reliable. We cannot guarantee the accuracy of such information, assure its completeness, or warrant that such information will not be changed without notice. Reliance upon information in this report is at the sole discretion of the reader.
CHESTNUT STREET EXCHANGE FUND
(A California Limited Partnership)
PERFORMANCE COMPARISON
December 31, 2020
(Unaudited)
Comparison of Change in Value of $10,000 Investment in Chestnut Street
Exchange Fund(1) vs. S&P 500® Index and Dow Jones Industrial AverageTM Index(2)
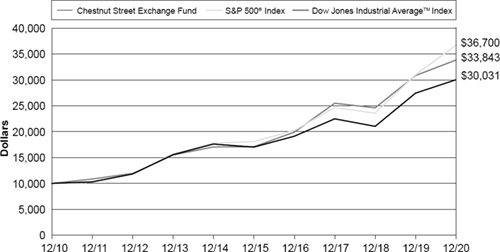
The performance data represents past performance and the principal value and investment return will fluctuate so that an investor’s shares, when redeemed, may be worth more or less than their original cost. Past performance is no guarantee of future results. Current performance may be higher or lower than the return shown. Please call (866) 311-7541 for the most recent month-end performance.
The performance quoted reflects fee waivers in effect and would have been lower in their absence. In addition, the data does not reflect the deduction of taxes that a shareholder would pay on distributions or redemption of Fund shares.
For the Periods Ended December 31, 2020
| | | | Average Annual Total Returns | |
| | | 1 Year | | | 5 Year | | | 10 Year | | | Since Inception(3) | |
| Chestnut Street Exchange Fund | | | 9.39 | % | | | 12.04 | % | | | 11.62 | % | | | 11.06 | % |
| | | 18.40 | % | | | 15.22 | % | | | 13.88 | % | | | 11.51 | % |
Dow Jones Industrial AverageTM Index | | | 9.72 | % | | | 14.65 | % | | | 12.97 | % | | | 11.49 | % |
| (1) | The chart assumes hypothetical $10,000 initial investment in the Fund made on December 31, 2010 and reflects Fund expenses. Investors should note that the Fund is a managed fund while the indices are unmanaged, do not incur expenses and are not available for investment. The Fund’s gross and net expense ratios for the fiscal year ended December 31, 2020 were 0.83% and 0.81%, respectively. |
| (2) | Results of index performance are presented for general comparative purposes. |
| (3) | Cumulative since inception total returns were 10,004.31%, 11,992.49% and 11,891.02% for the Chestnut Street Exchange Fund, the S&P 500® Index and the Dow Jones Industrial Average™ Index, respectively, for the period December 29, 1976 (inception date of the Fund) to December 31, 2020. |
BlackRock Capital ManageMent, Inc.
CHESTNUT STREET EXCHANGE FUND
(A California Limited Partnership)
FUND EXPENSE EXAMPLE
(Unaudited)
As a shareholder of the Fund, you incur ongoing costs, including management fees and other Fund expenses. The example is intended to help you understand your ongoing costs (in dollars) of investing in the Fund and to compare these costs with the ongoing costs of investing in other mutual funds.
The example is based on an investment of $1,000 invested at the beginning of the six-month period from July 1, 2020 through December 31, 2020, and held for the entire period.
Actual Expenses
The first line of the accompanying table provides information about actual account values and actual expenses. You may use the information in this line, together with the amount you invested, to estimate the expenses that you paid over the period. Simply divide your account value by $1,000 (for example, an $8,600 account value divided by $1,000 = 8.6), then multiply the result by the number in the first line under the heading entitled ‘’Expenses Paid During Six Months Ended December 31, 2020’’ to estimate the expenses you paid on your account during this period.
Hypothetical Example for Comparison Purposes
The second line of the accompanying table provides information about hypothetical account values and hypothetical expenses based on the Fund’s actual expense ratio and an assumed rate of return of 5% per year before expenses, which is not your Fund’s actual return. The hypothetical account values and expenses may not be used to estimate the actual ending account balance or expenses you paid for the period. You may use this information to compare the ongoing costs of investing in the Fund and other funds. To do so, compare this 5% hypothetical example with the 5% hypothetical examples that appear in the shareholder reports of other funds.
Please note that the expenses shown in the accompanying table are meant to highlight your ongoing costs only and do not reflect any transactional costs. Therefore, the second line of the accompanying table is useful in comparing ongoing costs only, and will not help you determine the relative total costs of owning different funds. In addition, if these transactional costs were included, your costs would have been higher.
| | | Beginning Account Value July 1, 2020 | | | Ending Account Value December 31, 2020 | | | Expenses Paid During Six Months Ended December 31, 2020* | |
| | $ | 1,000.00 | | | $ | 1,187.70 | | | $ | 4.07 | |
| | | | | | | | | | | | |
(5% return before expenses) | | $ | 1,000.00 | | | $ | 1,021.42 | | | $ | 3.76 | |
| * | Expenses are equal to the Fund’s annualized six-month expense ratio of 0.74%, multiplied by the average account value over the period, multiplied by the number of days (184) in the most recent fiscal half-year, then divided by 366 to reflect the one-half year period. The Fund’s ending account value on the first line of the table is based on the actual total return of 18.77% for the six-month period ended December 31, 2020. |
| † | Hypothetical expenses are based on the Fund’s actual annualized six-month expense ratio and an assumed rate of return of 5% per year before expenses. |
CHESTNUT STREET EXCHANGE FUND
(A California Limited Partnership)
PORTFOLIO HOLDINGS SUMMARY TABLE
December 31, 2020
(Unaudited)
| Security Type/Industry | | % of Net
Assets | | | Value | |
| COMMON STOCK | | | | | | | | |
| Technology | | | 20.4 | % | | $ | 42,853,356 | |
| Financial | | | 17.8 | % | | | 37,246,585 | |
| Consumer Cyclicals | | | 15.8 | % | | | 33,101,402 | |
| Healthcare | | | 13.1 | % | | | 27,454,386 | |
| Basics | | | 8.2 | % | | | 17,088,137 | |
| Transportation | | | 8.0 | % | | | 16,823,343 | |
| Retail | | | 5.4 | % | | | 11,313,236 | |
| Capital Equiment | | | 4.3 | % | | | 8,947,165 | |
| Staples | | | 3.9 | % | | | 8,212,470 | |
| Energy | | | 2.0 | % | | | 4,105,760 | |
| Other Assets in Excess of Liabilities | | | 1.1 | % | | | 2,295,466 | |
| Net Assets | | | 100.0 | % | | $ | 209,441,306 | |
CHESTNUT STREET EXCHANGE FUND
(A California Limited Partnership)
SCHEDULE OF INVESTMENTS
December 31, 2020
| | | Shares | | | Value | |
| COMMON STOCKS: 98.9% | | | | | | | | |
| BASICS: 8.2% | | | | | | | | |
| Air Products and Chemicals, Inc. | | | 50,413 | | | $ | 13,773,839 | |
| Cabot Corp. | | | 73,848 | | | | 3,314,298 | |
| | | | | | | | 17,088,137 | |
| CAPITAL EQUIPMENT: 4.3% | | | | | | | | |
| Emerson Electric Co. | | | 98,453 | | | | 7,912,668 | |
| General Electric Co. | | | 92,425 | | | | 998,190 | |
| Westinghouse Air Brake Technologies Corp. | | | 496 | | | | 36,307 | |
| | | | | | | | 8,947,165 | |
| CONSUMER CYCLICALS: 15.8% | | | | | | | | |
| 3M Co. | | | 23,636 | | | | 4,131,336 | |
| Comcast Corp. Class A | | | 202,741 | | | | 10,623,628 | |
| NIKE, Inc. | | | 21,213 | | | | 3,001,003 | |
| ViacomCBS, Inc. Class B | | | 51,024 | | | | 1,901,154 | |
| Walt Disney Co. | | | 74,204 | | | | 13,444,281 | |
| | | | | | | | 33,101,402 | |
| ENERGY: 2.0% | | | | | | | | |
| Exxon Mobil Corp. | | | 62,101 | | | | 2,559,803 | |
| Schlumberger Ltd. ^ | | | 70,818 | | | | 1,545,957 | |
| | | | | | | | 4,105,760 | |
| FINANCIAL: 17.8% | | | | | | | | |
| Bank of America Corp. | | | 48,170 | | | | 1,460,033 | |
| JPMorgan Chase & Co. | | | 103,170 | | | | 13,109,812 | |
| Moody’s Corp. | | | 70,949 | | | | 20,592,238 | |
| Wells Fargo & Co. | | | 69,069 | | | | 2,084,502 | |
| | | | | | | | 37,246,585 | |
| HEALTHCARE: 13.1% | | | | | | | | |
| Abbott Laboratories | | | 112,356 | | | | 12,301,858 | |
| Johnson & Johnson | | | 57,829 | | | | 9,101,128 | |
| Merck & Co., Inc. | | | 73,978 | | | | 6,051,400 | |
| | | | | | | | 27,454,386 | |
| | | Shares | | | Value | |
| RETAIL: 5.4% | | | | | | |
| Amazon.com, Inc.* | | | 1,021 | | | $ | 3,325,326 | |
| Home Depot, Inc. | | | 20,117 | | | | 5,343,478 | |
| Walmart, Inc. | | | 18,345 | | | | 2,644,432 | |
| | | | | | | | 11,313,236 | |
| STAPLES: 3.9% | | | | | | | | |
| Altria Group, Inc. | | | 15,436 | | | | 632,876 | |
| Kraft Heinz Co. | | | 3,607 | | | | 125,019 | |
| Mondelez International, Inc. | | | 10,720 | | | | 626,798 | |
| PepsiCo, Inc. | | | 37,423 | | | | 5,549,831 | |
| Philip Morris International, Inc. | | | 15,436 | | | | 1,277,946 | |
| | | | | | | | 8,212,470 | |
| TECHNOLOGY: 20.4% | | | | | | | | |
| Alphabet, Inc. Class A* | | | 2,601 | | | | 4,558,617 | |
| Apple, Inc. | | | 65,616 | | | | 8,706,587 | |
| Check Point Software Technologies Ltd. *^ | | | 38,990 | | | | 5,182,161 | |
| Cisco Systems, Inc. | | | 24,194 | | | | 1,082,682 | |
| Intel Corp. | | | 193,794 | | | | 9,654,817 | |
| Microsoft Corp. | | | 43,766 | | | | 9,734,434 | |
| Oracle Corp. | | | 60,814 | | | | 3,934,058 | |
| | | | | | | | 42,853,356 | |
| TRANSPORTATION: 8.0% | | | | | | | | |
| Union Pacific Corp. | | | 80,796 | | | | 16,823,343 | |
| | | | | | | | | |
| Total Common Stocks | | | | | | | | |
| (Cost: $24,746,433) | | | | | | | 207,145,840 | |
See Accompanying Notes to Financial Statements.
CHESTNUT STREET EXCHANGE FUND
(A California Limited Partnership)
SCHEDULE OF INVESTMENTS (Continued)
December 31, 2020
| | | Shares | | | Value | |
| TOTAL INVESTMENT IN SECURITIES | | | | | | | | |
| (Cost: $24,746,433) | | | 98.9 | % | | $ | 207,145,840 | |
| Other assets | | | 3.5 | % | | | 7,334,109 | |
| Other liabilities | | | -2.4 | % | | | (5,038,643 | ) |
| NET ASSETS | | | | | | | | |
| (Applicable to 243,536 partnership shares outstanding) | | | 100.0 | % | | $ | 209,441,306 | |
| Net Asset Value Per Share | | | | | | $ | 860.00 | |
| | | | | | | | | |
| Net assets applicable to shares owned by: | | | | | | | | |
| Limited partners (243,493 shares) | | | | | | $ | 209,404,326 | |
| Managing general partners (43 shares) | | | | | | | 36,980 | |
| NET ASSETS | | | | | | $ | 209,441,306 | |
See Accompanying Notes to Financial Statements.
CHESTNUT STREET EXCHANGE FUND
(A California Limited Partnership)
SCHEDULE OF INVESTMENTS (Concluded)
December 31, 2020
Fair Value Measurements. The inputs and valuation techniques used to measure fair value of the Fund’s investments are summarized into three levels as described in the hierarchy below:
| • Level 1 — | quoted prices in active markets for identical securities |
| • Level 2 — | other significant observable inputs (including quoted prices for identical securities in inactive markets and for similar securities, interest rates, prepayment speeds, credit risk, etc.) |
| • Level 3 — | significant unobservable inputs (including the Fund’s own assumptions in determining the fair value of investments) |
The inputs or methodology used for valuing securities are not necessarily an indication of the risk associated with investing in those securities.
The following is a summary of inputs used, as of December 31, 2020, in valuing the Fund’s investments carried at value:
| | | Total Value at December 31, 2020 | | | Level 1 Quoted Prices | | | Level 2 Significant Observable Inputs | | | Level 3 Significant Unobservable Inputs | |
| Investments in Common Stocks* | | $ | 207,145,840 | | | $ | 207,145,840 | | | $ | — | | | $ | — | |
| * | See details of industry breakout in the Schedule of Investments. |
At the end of each calendar quarter, management evaluates the classification of Levels 1, 2 and 3 assets and liabilities. Various factors are considered, such as changes in liquidity from the prior reporting period; whether or not a broker is willing to execute at the quoted price; the depth and consistency of prices from third party pricing services; and the existence of contemporaneous, observable trades in the market. Additionally, management evaluates the classification of Level 1 and Level 2 assets and liabilities on a quarterly basis for changes in listings or delistings on national exchanges.
For fair valuations using significant unobservable inputs, U.S. generally accepted accounting principles (“U.S. GAAP”) require the Fund to present a reconciliation of the beginning to ending balances for reported market values that presents changes attributable to total realized and unrealized gains or losses, purchase and sales, and transfers in and out of Level 3 during the period. A reconciliation of Level 3 investments is presented only when the Fund had an amount of Level 3 investments at the end of the reporting period that was meaningful in relation to its net assets. The amounts and reasons for all transfers in and out of each Level within the three-tier hierarchy are disclosed when the Fund had an amount of total transfers during the reporting period that was meaningful in relation to its net assets as of the end of the reporting period.
See Accompanying Notes to Financial Statements.
CHESTNUT STREET EXCHANGE FUND
(A California Limited Partnership)
STATEMENT OF ASSETS & LIABILITIES
December 31, 2020
| Assets | | | |
| Investments in securities, at value (cost $24,746,433) | | $ | 207,145,840 | |
| Cash | | | 2,804,234 | |
| Dividends receivable | | | 221,008 | |
| Interest receivable | | | 94 | |
| Receivable for investments sold | | | 4,294,752 | |
| Prepaid expenses | | | 14,021 | |
| Total assets | | | 214,479,949 | |
| | | | | |
| Liabilities | | | | |
| Payable for distributions | | | 493,171 | |
| Payable for Fund shares redeemed | | | 4,384,301 | |
| Accrued advisory fees | | | 46,362 | |
| Accrued administration and accounting fees | | | 31,043 | |
| Accrued partners’ compensation | | | 11,753 | |
| Accrued expenses and other liabilities | | | 72,013 | |
| Total liabilities | | | 5,038,643 | |
| Net Assets | | $ | 209,441,306 | |
| | | | | |
| Net Assets consisted of: | | | | |
| Other capital - paid-in or reinvested | | $ | 27,041,681 | |
| Distributable earnings | | | 182,399,625 | |
| Net Assets (Applicable to 243,536 partnership shares outstanding) | | $ | 209,441,306 | |
Net Asset Value offering and redemption price per share
(209,441,306 / 243,536 shares) | | $ | 860.00 | |
| | | | | |
| Net Assets applicable to shares owned by: | | | | |
| Limited partners (243,493 shares) | | $ | 209,404,326 | |
| Managing general partners (43 shares) | | | 36,980 | |
| Net Assets (243,536 shares) | | $ | 209,441,306 | |
See Accompanying Notes to Financial Statements.
CHESTNUT STREET EXCHANGE FUND
(A California Limited Partnership)
STATEMENT OF OPERATIONS
Year Ended December 31, 2020
| Investment Income | | | | | | |
| Dividends | | |
| | | $ | 3,974,761 | |
| Interest | | |
| | | | 2,803 | |
| Total investment income | | |
| | | | 3,977,564 | |
| Expenses | | |
| | | | | |
| Investment advisory services (Note C) | | |
| | | | 537,556 | |
| Legal fees (Note C) | | |
| | | | 383,492 | |
| Administration and accounting fees (Note C) | | |
| | | | 252,869 | |
| Managing general partners’ compensation, officer’s salary and expenses (Note C) | | |
| | | | 75,684 | |
| Transfer agent fees | | |
| | | | 226,326 | |
| Printing | | |
| | | | 8,208 | |
| Compliance fees | | |
| | | | 64,803 | |
| Custodian fees | | |
| | | | 26,991 | |
| Audit fees | | |
|
| | | 21,000 | |
| Insurance | | |
| | | | 24,662 | |
| Miscellaneous | | |
| | | | 1,038 | |
| Total expenses | | |
| | | | 1,622,629 | |
| | |
| | | | (36,000 | ) |
| | |
| | | | 1,586,629 | |
| | |
| | | | 2,390,935 | |
| | | | | | | | | |
| Net realized and unrealized gain on investments | | |
| | | | | |
| Net realized gain on sale of investment securities | | |
| | | | — | |
| Tax expense from realized capital gains | | |
| | | | — | |
| Net realized gain from securities transactions: distributed on redemption of partnership shares | | | | | | | 7,141,895 | |
| Net realized gain from securities litigation | | | | | | | 569 | |
| Unrealized appreciation on investments | | | | | | | | |
| Beginning of year | | $ | 173,796,300 | | | | | |
| End of year | | | 182,399,407 | | | | | |
| Net change in unrealized appreciation | | | | | | | 8,603,107 | |
| Net realized and unrealized gain from investments | | | | | | | 15,745,571 | |
| Net increase in net assets resulting from operations | | | | | | $ | 18,136,506 | |
See Accompanying Notes to Financial Statements.
CHESTNUT STREET EXCHANGE FUND
(A California Limited Partnership)
STATEMENTS OF CHANGES IN NET ASSETS
| | | Year Ended | | | Year Ended | |
| | | December 31, | | | December 31, | |
| | | 2020 | | | 2019 | |
| Increase in net assets | | | | | | | | |
| Operations: | | | | | | | | |
| Net investment income | | $ | 2,390,935 | | | $ | 3,046,993 | |
| Net realized gain from securities transactions, for federal income tax purposes net gain is $0 and $1,631,673, respectively | | | — | | | | 1,631,673 | |
| Tax expense from realized capital gains | | | — | | | | (280,737 | ) |
| Excess of market value over book value of securities distributed upon redemption of partnership shares | | | 7,141,895 | | | | 9,429,646 | |
| Net realized gain from securities litigation | | | 569 | | | | — | |
| Net change in unrealized appreciation on investments | | | 8,603,107 | | | | 35,317,760 | |
| Net increase in net assets resulting from operations | | | 18,136,506 | | | | 49,145,335 | |
| Distributions to partners from: | | | | | | | | |
| Total distributable earnings | | | (2,391,567 | ) | | | (3,046,321 | ) |
| Capital share transactions: | | | | | | | | |
| Net asset value of 288(1) and 303(2) shares issued in lieu of cash distributions, respectively | | | 216,127 | | | | 225,607 | |
| Cost of 9,293(3) and 13,019(4) shares repurchased, respectively | | | (7,598,420 | ) | | | (9,621,984 | ) |
| Net decrease in net assets from capital share transactions | | | (7,382,293 | ) | | | (9,396,377 | ) |
| Total net increase in net assets | | | 8,362,646 | | | | 36,702,637 | |
| Net assets: | | | | | | | | |
| Beginning of year | | | 201,078,660 | | | | 164,376,023 | |
| End of year | | $ | 209,441,306 | | | $ | 201,078,660 | |
(1) Includes 288 Limited partners’ shares and 0 Managing general partners’ shares.
(2) Includes 303 Limited partners’ shares and 0 Managing general partners’ shares.
(3) Includes 9,293 Limited partners’ shares and 0 Managing general partners’ shares.
(4) Includes 12,969 Limited partners’ shares and 50 Managing general partners’ shares.
See Accompanying Notes to Financial Statements.
CHESTNUT STREET EXCHANGE FUND
(A California Limited Partnership)
FINANCIAL HIGHLIGHTS
(For a Share of the Fund Outstanding Throughout Each Year)
| | | Year Ended December 31, | |
| | | 2020 | | | 2019 | | | 2018 | | | 2017 | | | 2016 | |
| | | | | | | | | | | | | | | | |
| Net Asset Value, Beginning of Year | | $ | 796.22 | | | $ | 619.69 | | | $ | 674.84 | | | $ | 580.36 | | | $ | 529.81 | |
| | | | | | | | | | | | | | | | | | | | | |
| Income From Investment Operations: | | | | | | | | | | | | | | | | | | | | |
| Net investment income | | | 9.51 | | | | 11.82 | | | | 11.77 | | | | 10.94 | | | | 10.94 | |
| Net gain (loss) on securities (both realized and unrealized) | | | 63.81 | | | | 176.53 | | | | (55.15 | ) | | | 94.44 | | | | 50.12 | |
| Total from Investment Operations | | | 73.32 | | | | 188.35 | | | | (43.38 | ) | | | 105.38 | | | | 61.06 | |
| Less Distributions: | | | | | | | | | | | | | | | | | | | | |
| From net investment income | | | (9.54 | ) | | | (11.82 | ) | | | (11.77 | ) | | | (10.90 | ) | | | (10.98 | ) |
| Capital Contribution from Investment Advisor | | | — | | | | — | | | | — | | | | — | | | | 0.47 | * |
| Net Asset Value, End of Year | | $ | 860.00 | | | $ | 796.22 | | | $ | 619.69 | | | $ | 674.84 | | | $ | 580.36 | |
| Total Return | | | 9.39 | % | | | 30.66 | % | | | (6.43 | )% | | | 18.37 | % | | | 11.72 | %* |
| Ratios/Supplemental Data: | | | | | | | | | | | | | | | | | | | | |
| Net Assets, End of Year (000’s) | | $ | 209,441 | | | $ | 201,079 | | | $ | 164,376 | | | $ | 200,532 | | | $ | 201,003 | |
| Ratios to average net assets: | | | | | | | | | | | | | | | | | | | | |
| Expenses | | | | | | | | | | | | | | | | | | | | |
| Including waivers | | | 0.81 | % | | | 0.66 | % | | | 0.58 | % | | | 0.59 | % | | | 0.58 | % |
| Excluding waivers | | | 0.83 | % | | | 0.68 | % | | | 0.59 | % | | | 0.61 | % | | | 0.60 | % |
| Net investment income | | | 1.26 | % | | | 1.62 | % | | | 1.69 | % | | | 1.74 | % | | | 1.98 | % |
| Portfolio Turnover Rate | | | 0.00 | % | | | 0.89 | % | | | 0.94 | % | | | 0.00 | % | | | 2.60 | % |
| * | During the year ended December 31, 2016, the Advisor reimbursed the Fund $172,892 as a result of a trading error, which otherwise would have reduced Total Return by 0.09%. |
See Accompanying Notes to Financial Statements.
CHESTNUT STREET EXCHANGE FUND
(A California Limited Partnership)
NOTES TO FINANCIAL STATEMENTS
December 31, 2020
Chestnut Street Exchange Fund (the “Fund”), a California Limited Partnership, is registered under the Investment Company Act of 1940, as amended, as a diversified open-end investment management company. The Fund’s investment objective is to seek long- term growth of capital and, secondarily, current income. Effective January 1, 1998, the Fund changed its status for tax purposes from a partnership to a regulated investment company. The change resulted from the enactment of the “Publicly Traded Partnership” rules to the Internal Revenue Code in 1987 which first applied to the Fund after 1997. The Fund is an investment company and therefore follows the investment company accounting and reporting guidance of the Financial Accounting Standards Board (“FASB”) Accounting Standards Codification Topic 946, Financial Services – Investment Companies.
| (B) | SIGNIFICANT ACCOUNTING PRINCIPLES |
The preparation of financial statements in conformity with accounting principles generally accepted in the United States of America requires management to make estimates and assumptions that affect the reported amounts of assets and liabilities and disclosure of contingent assets and liabilities at the date of the financial statements and the reported amounts of increases and decreases in net assets from operations during the reporting period. Actual results could differ from those estimates. The following is a summary of significant accounting policies followed by the Fund in the preparation of its financial statements.
Security Valuations
Securities listed or traded on an exchange are valued generally at the last sales price as of the close of the customary trading session on the exchange where the security is principally traded, or lacking any sales on a particular day, valued at the closing bid price on that day. Each security reported on the NASDAQ Stock Market, Inc. is valued at the NASDAQ Official Close Price. Securities for which market quotations are not readily available or are believed to be unreliable are valued at fair value as determined in good faith using methods approved by the Managing General Partners. Short-term obligations having 60 days or less to maturity are valued at amortized cost which approximates market value.
Securities Transactions and Investment Income
Securities transactions are accounted for on a trade date basis. Realized gains and losses on sales and redemptions in-kind are computed on the basis of specific identification for both financial reporting and income tax purposes. For securities exchanged into the Fund at the Fund’s inception in 1976, the cost for financial reporting purposes is the value of those securities as used in the exchange. The cost, for income tax purposes, of securities exchanged into the Fund is the tax basis of the individual investor. Interest income is recorded on the accrual basis. Dividend income is recorded on the ex-dividend date. Non-cash dividends included in dividend income are recorded at fair value of the security received.
Distributions
Distributions from net investment income are paid quarterly and recorded on the ex-dividend date. Distributions of capital gains, if any, are paid annually and recorded on the ex-dividend date.
Federal Income Taxes
The Fund intends to comply with the requirements of the Internal Revenue Code necessary to qualify as a regulated investment company and, as such, will not be subject to federal income taxes on otherwise taxable income which is distributed to shareholders. The Fund currently intends to retain all of its net long-term capital gains and pay the income tax at the applicable corporate income tax rate. The Fund may change this policy at any time and distribute up to all of its net long-term gains to shareholders.
For the year 2019, the Fund did not distribute net long-term capital gains, but retained gains of $1,336,845 and has paid the tax at the corporate income tax rate of 21% (in the amount of $280,737). For the year 2020, the Fund did not distribute net long-term capital gains, and has retained no gains. As such, the Fund did not pay any tax at the corporate income tax rate.
During the year ended December 31, 2020, the Fund did not utilize any capital loss carryover from prior years and has no capital loss carryover as of December 31, 2020.
Management has analyzed the Fund’s tax positions taken on federal income tax returns for all open tax years (December 31, 2017—2020) and has concluded that no provision for federal income tax is required in the Fund’s financial statements. The Fund’s federal and state income and federal excise tax returns for tax years for which the applicable statutes of limitations have not expired are subject to examination by the Internal Revenue Service and state departments of revenue.
At December 31, 2020, the federal tax cost, aggregate gross unrealized appreciation and depreciation of securities held by the Fund were as follows:
| Federal tax cost | | $ | 24,746,433 | |
| Gross unrealized appreciation | | | 182,400,959 | |
| Gross unrealized depreciation | | | (1,552 | ) |
| Net unrealized appreciation | | $ | 182,399,407 | |
The difference between book basis and tax basis of investments is attributable to the use of the individual partners’ tax basis for those securities contributed to the Fund at its inception, as required by law.
COVID 19
In early 2020, an outbreak of a novel strain of coronavirus (COVID-19) emerged globally. This coronavirus has resulted in closing international borders, enhanced health screenings, healthcare service preparation and delivery, quarantines, cancellations, disruptions to supply chains and customer activity, as well as general public concern and uncertainty. The impact of this outbreak has negatively affected the worldwide economy, as well as the economies of individual countries, the financial health of individual companies and the market in general in significant and unforeseen ways. The future impact of COVID-19 is currently unknown, and it may exacerbate other risks that apply to the Fund, including political, social and economic risks. Any such impact could adversely affect the Fund’s performance, the performance of the securities in which the Fund invests and may lead to losses on your investment in the Fund. The ultimate impact of COVID-19 on the financial performance of the Fund’s investments is not reasonably estimable at this time.
| (C) | INVESTMENT ADVISORY FEES, OTHER SERVICES AND TRANSACTIONS WITH AFFILIATES |
BlackRock Capital Management, Inc. (“BCM” or the “Adviser”), a wholly owned subsidiary of BlackRock Institutional Management, Inc., serves as Investment Adviser to the Fund pursuant to an advisory agreement dated September 29, 2006 as amended November 1, 2014 (“Advisory Agreement”). All BlackRock entities named are subsidiaries of BlackRock, Inc.
The Advisory Agreement provides for a fee, computed daily and paid monthly at the annual rate of 0.32% of the first $100,000,000 of the Fund’s net assets, plus 0.24% of the next $100,000,000 of the Fund’s net assets, plus 0.26% of the Fund’s net assets exceeding $200,000,000, which is reduced by an annual charge of $36,000 that is charged ratably against monthly payments. For the year ended December 31, 2020, this fee reduction equaled $36,000.
Effective April 18, 2020, U.S. Bancorp Fund Services, doing business as U.S. Bank Global Fund Services, serves as the Fund’s administrator, accounting agent, transfer agent and dividend disbursing agent. U.S. Bank, NA serves as the Fund’s custodian. Prior to April 18, 2020, BNY Mellon Investment Servicing (US) Inc. served as the Fund’s transfer and dividend disbursing agent and The Bank of New York Mellon served as the Fund’s administrator, accounting agent and custodian.
The Managing General Partners each receive a fixed fee as compensation for their services, fees for attending Board meetings and reimbursement of expenses incurred attending Board meetings. In addition, the Chairman, President, Chief Financial Officer and Chief Compliance Officer receive additional payments for overseeing the Fund’s activities, plus reimbursements of related expenses. For the year ended December 31, 2020, payments to or for the Managing General Partners, Chairman, President, Chief Financial Officer and Chief Compliance Officer amounted to $140,487.
Legal fees amounting to $383,492 for the year ended December 31, 2020 were paid to Faegre Drinker Biddle & Reath LLP. A partner of the law firm is the Secretary of the Fund.
| (D) | INVESTMENT TRANSACTIONS |
There were no purchases or sales of investment securities (excluding short-term obligations and redemptions in-kind) for the year ended December 31, 2020.
| (E) | DISTRIBUTIONS TO SHAREHOLDERS |
Net investment income and capital gain distributions are determined in accordance with federal income tax regulations, which may differ from accounting principles generally accepted in the United States of America. The primary difference applicable to the Fund’s distributions is the requirement to pass through 40% of its aggregate expenses to the partners of the Fund. This is required because the Fund has fewer than 500 partners and does not continuously offer shares. The partners have treated this pass-through of expenses as a distribution of net investment income and a corresponding miscellaneous itemized deduction of investment expense, however, in tax years 2019 through 2025, as a result of the Tax Cuts and Jobs Act of 2017, the investment expenses are no longer deductible.
The tax character of distributions paid during 2020 and 2019 were as follows:
| | | 2020 | | | 2019 | |
| Ordinary income | | $ | 2,391,567 | | | $ | 3,544,567 | |
| Investment expense | | | — | | | | (498,246 | ) |
| Distributed to partners | | $ | 2,391,567 | | | $ | 3,046,321 | |
For federal income tax purposes, distributions of net investment income and short-term capital gains are treated as ordinary income dividends.
| (F) | IN-KIND DISTRIBUTION OF SECURITIES |
During the year ended December 31, 2020, the Fund distributed portfolio securities in lieu of cash for most shareholder redemptions. The value of these redemptions in portfolio securities and cash redemptions were as follows:
| | | Value of the Redemptions | | | Net Realized Gain Included in Redemptions | | | Fund Shares Redeemed | |
| Portfolio Securities | | $ | 7,404,376 | * | | $ | 7,141,895 | | | | 9,293 | |
| Cash | | | 194,044 | | | | — | | | | — | |
| | | $ | 7,598,420 | | | $ | 7,141,895 | | | | 9,293 | |
| * | Includes $805 in cash redeemed. |
Net realized gains from these in-kind transactions are not taxable to the Fund. Such gains are not distributed to shareholders and will be reclassified to paid-in capital at the Fund’s fiscal year end. These transactions were completed following guidelines approved by the Managing General Partners.
In the ordinary course of business, the Fund enters into contracts that contain a variety of indemnifications. The Fund’s maximum exposure under these arrangements is dependent on claims that may be made against the Fund in the future, and therefore, cannot be estimated. However, based on experience, the risk of material loss for such claims is considered remote.
At December 31, 2020, the components of distributable earnings on a tax basis were as follows:
Undistributed net investment income | | $ | 218 | |
| | | — | |
Net unrealized appreciation on investments | | | 182,399,407 | |
| | | $ | 182,399,625 | |
On December 31, 2020, distributable earnings were decreased by $7,141,895 and additional paid in capital was increased by $7,141,895 due to permanent book and tax treatment of realized gains and losses attributable to redemptions in kind and differences in book and tax cost of securities described in note B. Net assets of the Fund were unaffected by this change.
Management has evaluated the impact of all subsequent events on the Fund through the date the financial statements were issued and determined that there were no subsequent events requiring disclosure.
CHESTNUT STREET EXCHANGE FUND
(A California Limited Partnership)
REPORT OF INDEPENDENT REGISTERED PUBLIC ACCOUNTING FIRM
To the Partners of Chestnut Street Exchange Fund
Opinion on the Financial Statements
We have audited the accompanying statement of assets and liabilities of Chestnut Street Exchange Fund (the “Fund”), including the schedule of investments, as of December 31, 2020, and the related statement of operations for the year then ended, the statements of changes in net assets for each of the years in the two-year period then ended and the financial highlights for each of the years in the five-year period then ended, and the related notes (collectively referred to as the “financial statements”). In our opinion, the financial statements present fairly, in all material respects, the financial position of the Fund as of December 31, 2020, and the results of its operations for the year then ended, the changes in its net assets for each of the years in the two-year period then ended and its financial highlights for each of the years in the five-year period then ended, in conformity with accounting principles generally accepted in the United States of America.
Basis for Opinion
These financial statements are the responsibility of the Fund’s management. Our responsibility is to express an opinion on the Fund’s financial statements based on our audits. We are a public accounting firm registered with the Public Company Accounting Oversight Board (United States) (“PCAOB”) and are required to be independent with respect to the Fund in accordance with the U.S. federal securities law and the applicable rules and regulations of the Securities and Exchange Commission and the PCAOB.
We conducted our audits in accordance with the standards of the PCAOB. Those standards require that we plan and perform the audits to obtain reasonable assurance about whether the financial statements are free of material misstatement, whether due to error or fraud. The Fund is not required to have, nor were we engaged to perform, an audit of its internal control over financial reporting. As part of our audits, we are required to obtain an understanding of internal control over financial reporting but not for the purpose of expressing an opinion on the effectiveness of the Fund’s internal control over financial reporting. Accordingly, we express no such opinion.
Our audits included performing procedures to assess the risk of material misstatement of the financial statements, whether due to error or fraud, and performing procedures that respond to those risks. Such procedures included examining, on a test basis, evidence regarding the amounts and disclosures in the financial statements. Our procedures included confirmation of securities owned as of December 31, 2020 by correspondence with the custodian. Our audits also included evaluating the accounting principles used and significant estimates made by management, as well as evaluating the overall presentation of the financial statements. We believe that our audits provide a reasonable basis for our opinion.

BBD, LLP
We have served as the auditor of the Chestnut Street Exchange Fund since 2003.
Philadelphia, Pennsylvania
February 23, 2021
CHESTNUT STREET EXCHANGE FUND
(A California Limited Partnership)
ADDITIONAL INFORMATION
(Unaudited)
Annual Approval Investment Advisory Agreement
At a meeting held on October 28, 2020, the Managing General Partners of the Chestnut Street Exchange Fund (the “Fund”), including a majority of the Independent Managing General Partners, approved the continuation of the investment advisory agreement with BlackRock Capital Management, Inc. (“BCM”) with respect to the Fund for an additional one year period. Pursuant to relief granted by the U.S. Securities and Exchange Commission in light of the COVID-19 pandemic (the “Order”) and a determination by the Managing General Partners that reliance on the Order was appropriate due to circumstances related to the current or potential effects of COVID-19m the meeting was held by video and telephone conference. In connection with this approval, the Managing General Partners considered, with the assistance of independent counsel, their legal responsibilities and reviewed the nature and quality of services provided to the Fund and BCM’s experience and qualifications. The Managing General Partners reviewed and considered BCM’s reports and presentations that included among other things: (1) a comparison of the advisory fee and expenses of the Fund to that of the BlackRock Funds Exchange Portfolio (the “BlackRock Portfolio”), the other exchange portfolio managed by BCM; (2) a comparison of the performance of the Fund to the BlackRock Portfolio, its benchmark (S&P 500® Index) as well as the Dow Jones Industrial Average™; (3) compensation or possible benefits to BCM arising from its relationship with the Fund; (4) a discussion of the current business activities of BCM; (5) information about the services provided to the Fund, the experience and qualifications of the personnel that are involved in the management of the Fund and how they are compensated; (6) a description of the procedures for determining that the Fund receives best execution and for allocating portfolio opportunities among the Fund and other advisory clients of BCM; (7) the nature of BCM’s internal controls to monitor portfolio compliance and an independent auditor’s report on its examination of BlackRock’s description of its systems related to asset management, recordkeeping and reporting services; (8) the costs of the services provided and BCM’s profits with respect to the Fund; and (9) BlackRock’s financial information. Since the Fund is closed to new investors, economies of scale were not considered relevant.
The Managing General Partners considered the scope and quality of services provided by the Adviser, particularly the qualifications and capabilities of the personnel responsible for providing services to the Fund. On the basis of this evaluation, the Managing General Partners concluded that the nature, quality and extent of services provided by BCM were satisfactory. The Managing General Partners also considered the Fund’s performance as compared to its benchmark, the S&P 500® Index, the BlackRock Portfolio and the Dow Jones Industrial Average™ for the year-to-date, 1-, 3-, 5- and 10-year periods ended June 30, 2020. The Managing General Partners also considered the advisory fee and expenses of the Fund as compared to the BlackRock Portfolio and the Adviser’s profitability information.
After further discussion, the Managing General Partners concluded that BCM had the capabilities, resources and personnel necessary to manage the Fund. The Managing General Partners considered the services provided by BCM and the fees paid by the Fund in relation to the BlackRock Portfolio’s fees, as well as the Fund’s performance and other information presented and discussed, and the Managing General Partners concluded that the advisory fees paid by the Fund are reasonable and fair.
CHESTNUT STREET EXCHANGE FUND
(A California Limited Partnership)
LIQUIDITY RISK MANAGEMENT PROGRAM
(Unaudited)
The Fund adopted a Liquidity Risk Management Program (the “Program”) pursuant to Rule 22e-4 under the Investment Company Act of 1940 Act, as amended (the “Liquidity Rule”). The Program seeks to assess, manage and review the Fund’s Liquidity Risk. “Liquidity Risk” is defined as the risk that the Fund could not meet requests to redeem shares issued by the Fund without significant dilution of remaining investors’ interests in the Fund.
The Fund’s Board of Managing General Partners appointed the Vigilant Compliance, LLC to be the administrator of the Program (the “Program Administrator”). Among other things, the Liquidity Rule requires that the Program Administrator provide a written report to the Board on an annual basis that addresses the operation of the Program and assesses the adequacy and effectiveness of its implementation, including the operation of the Highly Liquidity Investment Minimum (“HLIM”) established for the Fund, if any, and any material changes to the Program (the “Report”). On October 28, 2020, the Board received the first annual Report concerning the operation of the Program for the period from December 1, 2019 through September 30, 2020 (the “Program Reporting Period”). The Report summarized the operation of the Program and the information and factors considered by the Program Administrator in assessing whether the Program had been adequately and effectively implemented. There were no material changes to the Program during the Program Reporting Period and the Fund was not required to set a HLIM. The Report concluded that the Program continues to be an effective tool in seeking to ensure the Fund’s compliance with the Liquidity Rule.
CHESTNUT STREET EXCHANGE FUND
(A California Limited Partnership)
ADDITIONAL INFORMATION
(Unaudited)
Proxy Voting
Policies and procedures that the Fund uses to determine how to vote proxies relating to portfolio securities as well as information regarding how the Fund voted proxies relating to portfolio securities for the most recent 12-month period ended June 30 are available without charge, upon request, by calling (866) 311-7541 and on the Securities and Exchange Commission’s (“SEC”) website at http://www.sec.gov.
Quarterly Portfolio Schedule
The Fund files a complete schedule of portfolio holdings with the SEC for the first and third fiscal quarters of each fiscal year (quarters ended March 31 and September 30) on Part F of Form N-PORT. The Fund’s Part F of Form N-PORT is available on the SEC website at http://www.sec.gov.
Tax Information
As required by the Internal Revenue Code, 100% of ordinary income dividends paid for the year ended December 31, 2020 have been designated as: 1) qualified for the reduced tax rate under The Job and Growth Relief Reconciliation Act of 2003, and 2) eligible for the dividend received deduction for corporate shareholders.
CHESTNUT STREET EXCHANGE FUND
(A California Limited Partnership)
INFORMATION ON THE MANAGING GENERAL
PARTNERS AND OFFICERS OF THE FUND
(Unaudited)
The list below provides certain information about the identity and business experience of the Managing General Partners and officers of the Fund. The Fund’s Statement of Additional Information includes additional information about the Fund’s Managing General Partners, which may be obtained from the Fund free of charge by calling 1-866-311-7541.
TERM OF OFFICE: The Fund’s partnership agreement provides that each Managing General Partner holds office until the earliest of (a) the election of his or her successor; or (b) the date a Managing General Partner dies, resigns, becomes insane, is adjudicated as bankrupt or is removed by a majority of the partners. The officers of the Fund are elected by the Managing General Partners and each officer holds office for one year or until he or she shall resign or be removed or until his or her successor is elected and qualified.
| Name, Address, and Age | | Position with the Fund and Length of Time Served | | Principal Occupations During Past 5 Years and Current Affiliations | | Number of Portfolios in Fund Complex(1) Overseen by Managing General Partners | | Other Directorship(2) Held by Managing General Partner During Past 5 Years |
| | | | | | | | | |
| Disinterested Managing General Partners | | | |
| | | | | | | | | |
Gordon L. Keen, Jr.
Gateway Corporate Center,
Suite 216
223 Wilmington West
Chester Pike
Chadds Ford, PA 19317
Age: 76 | | Managing General Partner since 2006 | | Senior Vice President, Law & Corporate Department, Airgas, Inc. (Radnor, PA-based distributor of industrial, medical and specialty gases, and welding and safety equipment and supplies) from January 1992 to January 2006. | | 1 | | None |
| | | | | | | | | |
Langhorne B. Smith
Gateway Corporate Center,
Suite 216
223 Wilmington West
Chester Pike
Chadds Ford, PA 19317
Age: 84 | | Managing General Partner since 1997 | | Retired. President and Director, The Sandridge Corporation (private investment company); Director, Claneil Enterprises, Inc. (private investment company from 1981 to 2002). | | 1 | | None |
| | | | | | | | | |
David R. Wilmerding, Jr.
Gateway Corporate Center,
Suite 216
223 Wilmington West
Chester Pike
Chadds Ford, PA 19317
Age: 85 | | Managing General Partner since 1976; Chairman of the Managing General Partners since 2006 | | Retired. Chairman, Wilmerding & Associates (investment advisers) from February 1989 to 2006. | | 1 | | Director, Beaver Management Corporation |
CHESTNUT STREET EXCHANGE FUND
(A California Limited Partnership)
INFORMATION ON THE MANAGING GENERAL
PARTNERS AND OFFICERS OF THE FUND (Continued)
(Unaudited)
| Name, Address, and Age | | Position with the Fund and Length of Time Served | | Principal Occupations During Past 5 Years and Current Affiliations | | Number of Portfolios in Fund Complex(1) Overseen by Managing General Partners | | Other Directorship(2) Held by Managing General Partner During Past 5 Years |
| | | | | | | | | |
| Officers | | | | | | | | |
| | | | | | | | | |
Terry Wettergreen
Vigilant Compliance LLC
Gateway Corporate Center,
Suite 216
223 Wilmington West
Chester Pike
Chadds Ford, PA 19317
Age: 70 | | President and Chief Compliance Officer since January 1, 2018 | | Director, Vigilant Compliance LLC since October 2016; Chief Compliance Officer, Westport Advisers LLC and Westport Asset Management Inc. from 1996-2016; Treasurer, Chief Financial Officer, Vice President and Secretary, The Westport Funds 1998-2016. | | N/A | | N/A |
| | | | | | | | | |
John Boyle, CPA, MBA
Vigilant Compliance LLC
Gateway Corporate Center,
Suite 216
223 Wilmington West
Chester Pike
Chadds Ford, PA 19317
Age: 67 | | Chief Financial Officer since 2012 | | Director, Vigilant Compliance LLC since 2006. | | N/A | | N/A |
| | | | | | | | | |
Michael P. Malloy
Faegre Drinker Biddle & Reath LLP
One Logan Square
Suite 2000
Philadelphia, PA 19103
Age: 61 | | Secretary since 2001 | | Partner in the law firm of Faegre Drinker Biddle & Reath LLP. | | N/A | | N/A |
| (1) | The Fund Complex includes all registered investment companies that are advised by BlackRock Capital Management, Inc. or one of its affiliates. |
| (2) | Directorships of companies required to report to the Securities and Exchange Commission under the Securities Exchange Act of 1934, as amended (i.e., “public companies”) or other investment companies registered under the 1940 Act. |
CHESTNUT STREET EXCHANGE FUND
(A California Limited Partnership)
Privacy Notice
Chestnut Street Exchange Fund is committed to protecting the security and confidentiality of the personal information of our partners. We provide you with this notice to inform you about our practices with respect to personal information.
We collect nonpublic personal information about you from the following sources:
| • | Information we receive from you; and |
| • | Information about your transactions with us or others |
We do not disclose any nonpublic personal information about you to anyone, except as permitted by law. If you decide to close your account we will adhere to the privacy policies and practices as described in this notice.
We restrict access to your personal and account information to those employees of U.S. Bank Global Fund Services and the Fund’s Chief Financial Officer who need to know that information to provide services to you. We maintain physical, electronic and procedural safeguards to guard your nonpublic personal information.
[INTENTIONALLY LEFT BLANK]
[INTENTIONALLY LEFT BLANK]
[INTENTIONALLY LEFT BLANK]
MANAGING GENERAL PARTNERS
Gordon L. Keen, Jr.
Langhorne B. Smith
David R. Wilmerding, Jr.
INVESTMENT ADVISER
BlackRock Capital Management, Inc.
100 Bellevue Parkway
Wilmington, Delaware 19809
ADMINISTRATOR*
U.S. Bank Global Fund Services
615 East Michigan Street
Milwaukee, Wisconsin 53202
TRANSFER AGENT*
U.S. Bank Global Fund Services
615 East Michigan Street
Milwaukee, Wisconsin 53202
* Effective as of April 18, 2020

Annual Report
December 31, 2020
Chestnut Street Exchange
Fund
223 Wilmington West Chester
Pike Chadds Ford, PA 19137
1-866-311-7541
(b) Not applicable.
The registrant’s board of managing general partners has determined that the registrant has at least one “audit committee financial expert” serving on its audit committee. Langhorne B. Smith is the “audit committee financial expert” and is “independent” as each term is defined in Item 3 of Form N‑CSR.
Not applicable.
Not applicable.
Not applicable.
Not applicable.
There have been no material changes to the procedures by which shareholders may recommend nominees to the registrant’s board of managing general partners.
Not applicable.
Pursuant to the requirements of the Securities Exchange Act of 1934 and the Investment Company Act of 1940, the registrant has duly caused this report to be signed on its behalf by the undersigned, thereunto duly authorized.
Pursuant to the requirements of the Securities Exchange Act of 1934 and the Investment Company Act of 1940, this report has been signed below by the following persons on behalf of the registrant and in the capacities and on the dates indicated.