Frederick C. Teufel, Jr.
CHESTNUT STREET EXCHANGE FUND
(A California Limited Partnership)
(Unaudited)
February 4, 2022
Fellow Partner:
Enclosed is the Annual Report of Chestnut Street Exchange Fund for the year ended December 31, 2021.
Our Fund earned $10.66 per share of net investment income for a share outstanding throughout 2021, compared to $9.51 per share earned in 2020. Dividend income was decreased by $289,970 from the same period in 2020. Expenses were decreased in 2021.
After providing for the December 2021 distribution, the net asset value per partnership share at December 31, 2021 was $1,024.81. The net asset value at September 30, 2021, the date of our last report, was $948.23.
Commentary on market conditions and a comparison of our Fund’s performance to the Standard & Poor’s 500 Index® and the Dow Jones Industrial AverageTM Index will be found in the accompanying Investment Adviser’s Report.
Your comments or questions concerning Chestnut Street Exchange Fund are welcomed.
| Yours sincerely, |
|  |
| |
| David R. Wilmerding, Jr. |
CHESTNUT STREET EXCHANGE FUND
(A California Limited Partnership)
INVESTMENT ADVISER’S REPORT
(Unaudited)
Summary
After a volatile 2020 and against the backdrop of a global pandemic, U.S. equity markets posted very strong returns in 2021, with the S&P 500 Index® (“S&P 500”) gaining 28.71% for the year. Other indices also had exceptional years, with the Dow Jones Industrial AverageTM Index gaining 20.95% and the MSCI All Cap World Index gaining 19.02%.
All four quarters of earnings surprised Wall Street on the upside, leading to year-over-year earnings growth of over 40% for the average company in the S&P 500. This occurred even as two new COVID-19 variants circled the globe and disrupted commerce at every turn (Delta in the middle of the year, and Omicron as the year ended). Inflation hit levels not recorded in decades as supply chain issues caused by COVID-19, weather, and politics snarled global trade, while raw material costs soared. Energy and real estate were the top performing sectors of the year, as both had been laggards of the 2020 rally and benefitted from pent-up demand and lower supply. The financial sector also outperformed, as fewer than expected loan write-offs led to higher releases of loan loss reserves and buoyed earnings. Information technology stocks were the only other outperforming sector, as the continued transition to cloud computing drove higher earnings and price multiples across much of the sector. Utilities and consumer staples, the two worst performing sectors, still had returns in the high teens respectively, as 2021’s market rally was more broad-based than 2020’s.
Performance Attribution
The portfolio returned 20.54% during the year, underperforming its benchmark index, the S&P 500, which returned 28.71% during the same period.
During the year, in the communication services, healthcare, information technology and materials sectors, both security selection and sector weightings were detractors to relative performance. The overweight of Comcast Corporation and the Walt Disney Company and underweight of Alphabet, Inc. resulted in the most significant underperformance in any one sector (communication services). The Fund’s healthcare sector performance also lagged despite outperformance of medical device maker Abbott Laboratories, which could not compensate for the underperformance of both Johnson & Johnson and Merck & Co. Inc., the latter of which disappointed with its lack of progress on a COVID-19 vaccine. The Fund’s additional underweight of the information technology sector and lack of real estate exposure also contributed to underperformance during the year.
On the positive side, the Fund did outperform in the consumer discretionary sector and slightly in the financial sector. The Home Depot, Inc. was a positive contributor to performance in the consumer discretionary sector, as the country’s largest home improvement retailer continued its strong growth despite the end of most lockdowns. Moody’s Corporation performed in line with the financial sector, while the underperformance of JPMorgan Chase & Co. was offset by outperformance from smaller weightings in Bank of America Corporation and Wells Fargo & Company. The Fund’s underweighting of both the consumer staples and utilities sectors also contributed positively to relative performance.
CHESTNUT STREET EXCHANGE FUND
(A California Limited Partnership)
INVESTMENT ADVISER’S REPORT (Continued)
(Unaudited)
| Portfolio Review (concluded) |
Outlook
After the sharp rally in company revenues and earnings in 2021, we would not expect similar high growth in the coming year. We believe that equity markets now face headwinds that were not in place one year ago.
These begin with central banks, primarily the Federal Reserve and the European Central Bank, tapering their asset purchases and raising interest rates. Monetary policy that has been an accommodative tailwind for equity markets over the last 18 months will likely become more restrictive in the coming year as assets begin to roll off central bank balance sheets and fixed income possibly becomes a more attractive asset class as interest rates rise. Supply chain and worker shortage issues remain an impediment for most companies as well. In addition, markets remain at elevated valuation levels (though lower than a year ago), even after four quarters of results that leave broad S&P 500 earnings levels 20% higher than in 2019.
That being said, we believe the consumer continues to remain a strong driver of the U.S. economy and companies are still focused on restocking depleted inventory, which may result in continued high demand for some length of time – certainly a positive for revenues and earnings going forward. While we wouldn’t expect equities to match their exceptional 2021 performance, our hope is that earnings continue to outstrip expectations, leading to both rising stock prices and lower stock multiples as 2022 progresses.
Any opinions expressed are those of Mitchell Sinkler & Starr as of the date of this report and are subject to change based on changes in market or economic conditions. The performance data represents past performance and the principal value and investment return will fluctuate so that an investor’s shares, when redeemed may be worth more or less than their original cost. Past performance is not a guarantee of future results. Please call 1-866-311-7541 for the most recent month-end performance. In addition, the data does not reflect the deduction of taxes that a shareholder would pay on distributions or redemption of Fund shares. There is no guarantee that forecasts made herein will come to pass. The comments should not be construed as a recommendation for any individual holdings or market sectors. Information and opinions are derived from proprietary and non-proprietary sources deemed by Mitchell Sinkler & Starr to be reliable. We cannot guarantee the accuracy of such information, assure its completeness, or warrant that such information will not be changed without notice. Reliance upon information in this report is at the sole discretion of the reader.
CHESTNUT STREET EXCHANGE FUND
(A California Limited Partnership)
PERFORMANCE COMPARISON
December 31, 2021
(Unaudited)
Comparison of Change in Value of $10,000 Investment in Chestnut Street
Exchange Fund(1) vs. S&P 500® Index and Dow Jones Industrial AverageTM Index(2)
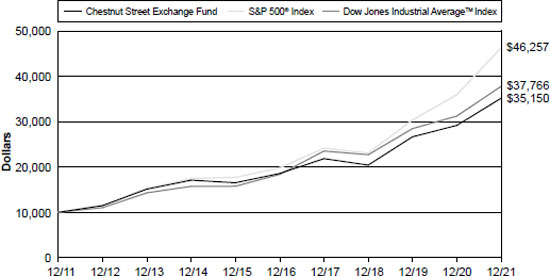
The performance data represents past performance and the principal value and investment return will fluctuate so that an investor’s shares, when redeemed, may be worth more or less than their original cost. Past performance is no guarantee of future results. Current performance may be higher or lower than the return shown. Please call (866) 311-7541 for the most recent month-end performance.
The performance quoted reflects fee waivers in effect and would have been lower in their absence. In addition, the data does not reflect the deduction of taxes that a shareholder would pay on distributions or redemption of Fund shares.
For the Years Ended December 31, 2021
| Average Annual Total Returns |
| 1 Year | | 5 Year | | 10 Year | | Since
Inception(3) |
Chestnut Street Exchange Fund | 20.54% | | 13.62% | | 13.39% | | 11.26% |
S&P 500® Index | 28.71% | | 18.47% | | 16.55% | | 11.87% |
Dow Jones Industrial AverageTM Index | 20.95% | | 15.51% | | 14.21% | | 11.69% |
| (1) | The chart assumes hypothetical $10,000 initial investment in the Fund made on December 31, 2011 and reflects Fund expenses. Investors should note that the Fund is a managed fund while the indices are unmanaged, do not incur expenses and are not available for investment. The Fund’s gross and net expense ratios for the fiscal year ended December 31, 2021 were 0.57% and 0.56%, respectively. |
| (2) | Results of index performance are presented for general comparative purposes. |
| (3) | Cumulative since inception total returns were 12,079.64%, 15,463.69% and 14,403.67% for the Chestnut Street Exchange Fund, the S&P 500® Index and the Dow Jones Industrial Average™ Index, respectively, for the period December 29, 1976 (inception date of the Fund) to December 31, 2021. |
CHESTNUT STREET EXCHANGE FUND
(A California Limited Partnership)
FUND EXPENSE EXAMPLE
(Unaudited)
As a shareholder of the Fund, you incur ongoing costs, including management fees and other Fund expenses. The example is intended to help you understand your ongoing costs (in dollars) of investing in the Fund and to compare these costs with the ongoing costs of investing in other mutual funds.
The example is based on an investment of $1,000 invested at the beginning of the six-month period from July 1, 2021 through December 31, 2021, and held for the entire period.
Actual Expenses
The first line of the accompanying table provides information about actual account values and actual expenses. You may use the information in this line, together with the amount you invested, to estimate the expenses that you paid over the period. Simply divide your account value by $1,000 (for example, an $8,600 account value divided by $1,000 = 8.6), then multiply the result by the number in the first line under the heading entitled ‘’Expenses Paid During Six Months Ended December 31, 2021’’ to estimate the expenses you paid on your account during this period.
Hypothetical Example for Comparison Purposes
The second line of the accompanying table provides information about hypothetical account values and hypothetical expenses based on the Fund’s actual expense ratio and an assumed rate of return of 5% per year before expenses, which is not your Fund’s actual return. The hypothetical account values and expenses may not be used to estimate the actual ending account balance or expenses you paid for the period. You may use this information to compare the ongoing costs of investing in the Fund and other funds. To do so, compare this 5% hypothetical example with the 5% hypothetical examples that appear in the shareholder reports of other funds.
Please note that the expenses shown in the accompanying table are meant to highlight your ongoing costs only and do not reflect any transactional costs. Therefore, the second line of the accompanying table is useful in comparing ongoing costs only, and will not help you determine the relative total costs of owning different funds. In addition, if these transactional costs were included, your costs would have been higher.
| Beginning
Account Value
July 1, 2021 | | Ending
Account Value
December 31, 2021 | | Expenses
Paid During
Six Months Ended
December 31, 2021* |
Actual | $ 1,000.00 | | $ 1,065.20 | | $2.65 |
Hypothetical † | | | | | |
(5% return before expenses) | $ 1,000.00 | | $ 1,022.62 | | $2.60 |
| * | Expenses are equal to the Fund’s annualized six-month expense ratio of 0.51%, multiplied by the average account value over the period, multiplied by the number of days in the most recent fiscal half-year (181), then divided by 365 to reflect the one-half year period. The Fund’s ending account value on the first line of the table is based on the actual total return of 6.52% for the six-month period ended December 31, 2021. |
| † | Hypothetical expenses are based on the Fund’s actual annualized six-month expense ratio and an assumed rate of return of 5% per year before expenses. |
CHESTNUT STREET EXCHANGE FUND
(A California Limited Partnership)
PORTFOLIO HOLDINGS SUMMARY TABLE
December 31, 2021
(Unaudited)
Security Type/Industry | | % of Net
Assets | | | Value | |
| | | | | | | | | |
COMMON STOCK | | | | | | | | |
Media & Entertainment | | | 12.6 | % | | $ | 26,998,450 | |
Software & Services | | | 10.1 | % | | | 21,551,967 | |
Diversified Financials | | | 9.4 | % | | | 20,051,205 | |
Banks | | | 8.7 | % | | | 18,581,553 | |
Transportation | | | 8.1 | % | | | 17,263,502 | |
Materials | | | 8.0 | % | | | 17,096,704 | |
Health Care Equipment & Services | | | 6.5 | % | | | 13,871,757 | |
Pharmaceuticals & Biotechnology | | | 6.5 | % | | | 13,849,631 | |
Capital Goods | | | 6.0 | % | | | 12,710,218 | |
Technology, Hardware & Equipment | | | 5.4 | % | | | 11,566,072 | |
Retailing | | | 4.8 | % | | | 10,314,999 | |
Semiconductors | | | 4.1 | % | | | 8,755,103 | |
Food, Beverage & Tobacco | | | 3.9 | % | | | 8,368,241 | |
Energy | | | 2.3 | % | | | 5,008,135 | |
Consumer Durables & Apparel | | | 1.5 | % | | | 3,101,562 | |
Food & Staples Retailing | | | 1.1 | % | | | 2,328,641 | |
Other Assets in Excess of Liabilities | | | 1.0 | % | | | 2,108,848 | |
Net Assets | | | 100.0 | % | | $ | 213,526,588 | |
CHESTNUT STREET EXCHANGE FUND
(A California Limited Partnership)
SCHEDULE OF INVESTMENTS
December 31, 2021
| | | Shares | | | Value | |
| | | | | | | | | |
| COMMON STOCKS: 99.0% | | | | | | | | |
| BANKS: 8.7% | | | | | | | | |
| Bank of America Corp. | | | 42,257 | | | $ | 1,880,014 | |
| JPMorgan Chase & Co. | | | 87,492 | | | | 13,854,358 | |
| Wells Fargo & Co. | | | 59,341 | | | | 2,847,181 | |
| | | | | | | | 18,581,553 | |
| CAPITAL GOODS: 6.0% | | | | | | | | |
| 3M Co. | | | 20,735 | | | | 3,683,158 | |
| Emerson Electric Co. | | | 86,366 | | | | 8,029,447 | |
| General Electric Co. | | | 10,135 | | | | 957,453 | |
| Westinghouse Air Brake Technologies Corp. | | | 436 | | | | 40,160 | |
| | | | | | | | 12,710,218 | |
| | | | | | | | | |
| CONSUMER DURABLES & APPAREL: 1.5% | | | | | | | | |
| NIKE, Inc. | | | 18,609 | | | | 3,101,562 | |
| | | | | | | | 3,101,562 | |
| | | | | | | | | |
| DIVERSIFIED FINANCIALS: 9.4% | | | | | | | | |
| Moody’s Corp. | | | 51,337 | | | | 20,051,205 | |
| | | | | | | | 20,051,205 | |
| | | | | | | | | |
| ENERGY: 2.3% | | | | | | | | |
| Exxon Mobil Corp. | | | 51,438 | | | | 3,147,491 | |
| Schlumberger Ltd. ^ | | | 62,125 | | | | 1,860,644 | |
| | | | | | | | 5,008,135 | |
| | | | | | | | | |
| FOOD & STAPLES RETAILING: 1.1% | | | | | | | | |
| Walmart, Inc. | | | 16,094 | | | | 2,328,641 | |
| | | | | | | | 2,328,641 | |
| | | | | | | | | |
| FOOD, BEVERAGE & TOBACCO: 3.9% | | | | | | |
| Altria Group, Inc. | | | 13,542 | | | | 641,755 | |
| Kraft Heinz Co. | | | 3,165 | | | | 113,624 | |
| Mondelez International, Inc. | | | 9,405 | | | | 623,646 | |
| PepsiCo, Inc. | | | 32,829 | | | | 5,702,726 | |
| Philip Morris International, Inc. | | | 13,542 | | | | 1,286,490 | |
| | | | | | | | 8,368,241 | |
| HEALTH CARE EQUIPMENT & SERVICES: 6.5% | | | | | | | | |
| Abbott Laboratories | | | 98,563 | | | | 13,871,757 | |
| | | | | | | | 13,871,757 | |
| | | | | | | | | |
| MATERIALS: 8.0% | | | | | | | | |
| Air Products and Chemicals, Inc. | | | 44,225 | | | | 13,455,899 | |
| Cabot Corp. | | | 64,783 | | | | 3,640,805 | |
| | | | | | | | 17,096,704 | |
| | | | | | | | | |
| MEDIA & ENTERTAINMENT: 12.6% | | | | | | | | |
| Alphabet, Inc. Class A* | | | 2,283 | | | | 6,613,942 | |
| Comcast Corp. Class A | | | 177,851 | | | | 8,951,241 | |
| Walt Disney Co. * | | | 65,094 | | | | 10,082,410 | |
| ViacomCBS, Inc. Class B | | | 44,760 | | | | 1,350,857 | |
| | | | | | | | 26,998,450 | |
| PHARMACEUTICALS & BIOTECHNOLOGY: 6.5% | | | | | | | | |
| Johnson & Johnson | | | 50,730 | | | | 8,678,381 | |
| Merck & Co., Inc. | | | 64,896 | | | | 4,973,629 | |
| Organon & Co. | | | 6,490 | | | | 197,621 | |
| | | | | | | | 13,849,631 | |
| | | | | | | | | |
| RETAILING: 4.8% | | | | | | | | |
| Amazon.com, Inc.* | | | 897 | | | | 2,990,903 | |
| Home Depot, Inc. | | | 17,648 | | | | 7,324,096 | |
| | | | | | | 10,314,999 | |
See Accompanying Notes to Financial Statements.
CHESTNUT STREET EXCHANGE FUND
(A California Limited Partnership)
SCHEDULE OF INVESTMENTS (Continued)
December 31, 2021
| | | Shares | | | Value | |
| | | | | | | | | |
| SEMICONDUCTORS: 4.1% | | | | | | | | |
| Intel Corp. | | | 170,002 | | | $ | 8,755,103 | |
| | | | | | | | 8,755,103 | |
| SOFTWARE & SERVICES: 10.1% | | | | | | | | |
| Check Point Software Technologies Ltd. *^ | | | 34,204 | | | | 3,986,818 | |
| Microsoft Corp. | | | 38,394 | | | | 12,912,670 | |
| Oracle Corp. | | | 53,348 | | | | 4,652,479 | |
| | | | | | | | 21,551,967 | |
| | | | | | | | | |
| TECHNOLOGY, HARDWARE & EQUIPMENT: 5.4% | | | | | | | | |
| Apple, Inc. | | | 57,561 | | | | 10,221,107 | |
| Cisco Systems, Inc. | | | 21,224 | | | | 1,344,965 | |
| | | | | | | | 11,566,072 | |
| | | | | | | | | |
| TRANSPORTATION: 8.1% | | | | | | | | |
| Union Pacific Corp. | | | 68,525 | | | | 17,263,502 | |
| | | | | | | | 17,263,502 | |
| Total Common Stocks | | | | | | | | |
| (Cost: $21,759,911) | | | | | | | 211,417,740 | |
| | | | | | | | | |
| TOTAL INVESTMENT IN SECURITIES | | | | | | | | |
| (Cost: $21,759,911) | | | 99.0 | % | | | 211,417,740 | |
| Other assets | | | 1.4 | % | | | 2,984,576 | |
| Other liabilities | | | (0.4 | )% | | | (875,728 | ) |
| NET ASSETS | | | | | | | | |
| (Applicable to 208,357 partnership shares outstanding) | | | 100.0 | % | | $ | 213,526,588 | |
| Net Asset Value Per Share | | | | | | $ | 1,024.81 | |
| | | | | | | | | |
| Net assets applicable to shares owned by: | | | | | | | | |
Limited partners
(208,314 shares) | | | | | | $ | 213,482,521 | |
Managing general partners
(43 shares) | | | | | | | 44,067 | |
| NET ASSETS | | | | | | $ | 213,526,588 | |
| * | Non-Income Producing |
| ^ | Foreign Issued Security |
For purposes of this report, the securities in the portfolio have been organized by their respective Global Industry Classification Standard (GICS®) code. GICS® was developed by and/or is the exclusive property of MSCI, Inc. and Standard & Poor Financial Services LLC (“S&P”). GICS is a service mark of MSCI and S&P and has been licensed for use by U.S. Bank Global Fund Services.
See Accompanying Notes to Financial Statements.
CHESTNUT STREET EXCHANGE FUND
(A California Limited Partnership)
SCHEDULE OF INVESTMENTS (Concluded)
December 31, 2021
Fair Value Measurements. The inputs and valuation techniques used to measure fair value of the Fund’s investments are summarized into three levels as described in the hierarchy below:
| ● Level 1 — | quoted prices in active markets for identical securities |
| ● Level 2 — | other significant observable inputs (including quoted prices for identical securities in inactive markets and for similar securities, interest rates, prepayment speeds, credit risk, etc.) |
| ● Level 3 — | significant unobservable inputs (including the Fund’s own assumptions in determining the fair value of investments) |
The inputs or methodology used for valuing securities are not necessarily an indication of the risk associated with investing in those securities.
The following is a summary of inputs used, as of December 31, 2021, in valuing the Fund’s investments carried at value:
| | | Total Value at
December 31,
2021 | | | Level 1
Quoted
Prices | | | Level 2
Significant
Observable
Inputs | | | Level 3
Significant
Unobservable
Inputs | |
| Investments in Common Stocks* | | $ | 211,417,740 | | | $ | 211,417,740 | | | $ | — | | | $ | — | |
| | | | | | | | | | | | | | | | | |
* See details of industry breakout in the Schedule of Investments.
At the end of each calendar quarter, management evaluates the classification of Levels 1, 2 and 3 assets and liabilities. Various factors are considered, such as changes in liquidity from the prior reporting period; whether or not a broker is willing to execute at the quoted price; the depth and consistency of prices from third party pricing services; and the existence of contemporaneous, observable trades in the market. Additionally, management evaluates the classification of Level 1 and Level 2 assets and liabilities on a quarterly basis for changes in listings or delistings on national exchanges.
For fair valuations using significant unobservable inputs, U.S. generally accepted accounting principles (“U.S. GAAP”) require the Fund to present a reconciliation of the beginning to ending balances for reported market values that presents changes attributable to total realized and unrealized gains or losses, purchase and sales, and transfers in and out of Level 3 during the period. A reconciliation of Level 3 investments is presented only when the Fund had an amount of Level 3 investments at the end of the reporting period that was meaningful in relation to its net assets. The amounts and reasons for all transfers in and out of each Level within the three-tier hierarchy are disclosed when the Fund had an amount of total transfers during the reporting period that was meaningful in relation to its net assets as of the end of the reporting period.
See Accompanying Notes to Financial Statements.
CHESTNUT STREET EXCHANGE FUND
(A California Limited Partnership)
STATEMENT OF ASSETS & LIABILITIES
December 31, 2021
| Assets | | | |
| Investments in securities, at value (cost $21,759,911) | | $ | 211,417,740 | |
| Cash | | | 2,751,333 | |
| Dividends receivable | | | 216,289 | |
| Interest receivable | | | 60 | |
| Prepaid expenses | | | 16,894 | |
| Total assets | | | 214,402,316 | |
| | | | | |
| Liabilities | | | | |
| Payable for distributions | | | 713,394 | |
| Accrued advisory fees | | | 62,673 | |
| Accrued administration and accounting fees | | | 34,760 | |
| Accrued partners’ compensation | | | 11,746 | |
| Accrued expenses and other liabilities | | | 53,155 | |
| Total liabilities | | | 875,728 | |
| Net Assets | | $ | 213,526,588 | |
| | | | | |
| Net Assets consisted of: | | | | |
| Other capital - paid-in or reinvested | | $ | 23,868,474 | |
| Distributable earnings | | | 189,658,114 | |
| Net Assets (Applicable to 208,357 partnership shares outstanding) | | $ | 213,526,588 | |
Net Asset Value offering and redemption price per share
(213,526,588 / 208,357 shares) | | $ | 1,024.81 | |
| | | | | |
| Net Assets applicable to shares owned by: | | | | |
| Limited partners (208,314 shares) | | $ | 213,482,521 | |
| Managing general partners (43 shares) | | | 44,067 | |
| Net Assets (208,357 shares) | | $ | 213,526,588 | |
See Accompanying Notes to Financial Statements.
CHESTNUT STREET EXCHANGE FUND
(A California Limited Partnership)
STATEMENT OF OPERATIONS
Year Ended December 31, 2021
| Investment Income | | | | | | |
| Dividends | | | | | | $ | 3,684,791 | |
| Interest | | | | | | | 707 | |
| Total investment income | | | | | | | 3,685,498 | |
| Expenses | | | | | | | | |
| Investment advisory services (Note C) | | | | | | | 407,166 | |
| Legal fees (Note C) | | | | | | | 350,523 | |
| Administration and accounting fees (Note C) | | | | | | | 204,360 | |
| Officer’s salary and expenses | | | | | | | 88,943 | |
| Transfer agent fees | | | | | | | 48,219 | |
| Managing general partners’ compensation (Note C) | | | | | | | 46,993 | |
| Printing | | | | | | | 23,648 | |
| Miscellaneous | | | | | | | 24,596 | |
| Custodian fees | | | | | | | 23,276 | |
| Insurance | | | | | | | 21,904 | |
| Audit fees | | | | | | | 21,000 | |
| Total expenses | | | | | | | 1,260,628 | |
| Advisory fees waived | | | | | | | (17,556 | ) |
| Total expense, net | | | | | | | 1,243,072 | |
| Net investment income | | | | | | | 2,442,426 | |
| | | | | | | | | |
| Net realized and unrealized gain on investments | | | | | | | | |
| Net realized gain from securities transactions: distributed on redemption of partnership shares | | | | | | | 30,452,689 | |
| Net realized gain from securities litigation | | | | | | | 4,314 | |
| Unrealized appreciation on investments | | | | | | | | |
| Beginning of year | | $ | 182,399,407 | | | |
| |
| End of year | | | 189,657,829 | | | |
| |
| Net change in unrealized appreciation | | | | | | | 7,258,422 | |
| Net realized and unrealized gain from investments | | | | | | | 37,715,425 | |
| Net increase in net assets resulting from operations | | | | | | $ | 40,157,851 | |
See Accompanying Notes to Financial Statements.
CHESTNUT STREET EXCHANGE FUND
(A California Limited Partnership)
STATEMENTS OF CHANGES IN NET ASSETS
| | | Year Ended
December 31,
2021 | | | Year Ended
December 31,
2020 | |
| Increase in net assets | | | | | | | | |
| Operations: | | | | | | | | |
| Net investment income | | $ | 2,442,426 | | | $ | 2,390,935 | |
| Net realized gain from securities transactions: distributed on redemption of partnership shares | | | 30,452,689 | | | | 7,141,895 | |
| Net realized gain from securities litigation | | | 4,314 | | | | 569 | |
| Net change in unrealized appreciation on investments | | | 7,258,422 | | | | 8,603,107 | |
| Net increase in net assets resulting from operations | | | 40,157,851 | | | | 18,136,506 | |
| Distributions to partners from: | | | | | | | | |
| Total distributable earnings | | | (2,446,673 | ) | | | (2,391,567 | ) |
| Capital share transactions: | | | | | | | | |
| Net asset value of 204(1) and 288(2) shares issued in lieu of cash distributions, respectively | | | 196,328 | | | | 216,127 | |
| Cost of 35,383(3) and 9,293(4) shares repurchased, respectively | | | (33,822,224 | ) | | | (7,598,420 | ) |
| Net decrease in net assets from capital share transactions | | | (33,625,896 | ) | | | (7,382,293 | ) |
| Total net increase in net assets | | | 4,085,282 | | | | 8,362,646 | |
| Net assets: | | | | | | | | |
| Beginning of year | | | 209,441,306 | | | | 201,078,660 | |
| End of year | | $ | 213,526,588 | | | $ | 209,441,306 | |
(1) Includes 204 Limited partners’ shares and 0 Managing general partners’ shares.
(2) Includes 288 Limited partners’ shares and 0 Managing general partners’ shares.
(3) Includes 35,383 Limited partners’ shares and 0 Managing general partners’ shares.
(4) Includes 9,293 Limited partners’ shares and 0 Managing general partners’ shares.
See Accompanying Notes to Financial Statements.
CHESTNUT STREET EXCHANGE FUND
(A California Limited Partnership)
FINANCIAL HIGHLIGHTS
(For a Share of the Fund Outstanding Throughout Each Year)
| | | Year Ended December 31, | |
| | | 2021 | | | 2020 | | | 2019 | | | 2018 | | | 2017 | |
| | | | | | | | | | | | | | | | |
| Net Asset Value, Beginning of Year | | $ | 860.00 | | | $ | 796.22 | | | $ | 619.69 | | | $ | 674.84 | | | $ | 580.36 | |
| | | | | | | | | | | | | | | | | | | | | |
| Income From Investment Operations: | | | | | | | | | | | | | | | | | | | | |
| Net investment income(a) | | | 10.66 | | | | 9.51 | | | | 11.82 | | | | 11.77 | | | | 10.94 | |
| Net gain (loss) on securities | | | | | | | | | | | | | | | | | | | | |
| (both realized and unrealized) | | | 165.24 | | | | 63.81 | | | | 176.53 | | | | (55.15 | ) | | | 94.44 | |
| Total from Investment Operations | | | 175.90 | | | | 73.32 | | | | 188.35 | | | | (43.38 | ) | | | 105.38 | |
| | | | | | | | | | | | | | | | | | | | | |
| Less Distributions: | | | | | | | | | | | | | | | | | | | | |
| From net investment income | | | (11.09 | ) | | | (9.54 | ) | | | (11.82 | ) | | | (11.77 | ) | | | (10.90 | ) |
| | | | | | | | | | | | | | | | | | | | | |
| Net Asset Value, End of Year | | $ | 1,024.81 | | | $ | 860.00 | | | $ | 796.22 | | | $ | 619.69 | | | $ | 674.84 | |
| | | | | | | | | | | | | | | | | | | | | |
| Total Return | | | 20.54 | % | | | 9.39 | % | | | 30.66 | % | | | (6.43 | )% | | | 18.37 | % |
| | | | | | | | | | | | | | | | | | | | | |
| Ratios/Supplemental Data: | | | | | | | | | | | | | | | | | | | | |
| Net Assets, End of Year (000’s) | | $ | 213,527 | | | $ | 209,441 | | | $ | 201,079 | | | $ | 164,376 | | | $ | 200,532 | |
| Ratios to average net assets: | | | | | | | | | | | | | | | | | | | | |
| Expenses | | | | | | | | | | | | | | | | | | | | |
| Including waivers | | | 0.56 | % | | | 0.81 | % | | | 0.66 | % | | | 0.58 | % | | | 0.59 | % |
| Excluding waivers | | | 0.57 | % | | | 0.83 | % | | | 0.68 | % | | | 0.59 | % | | | 0.61 | % |
| Net investment income | | | 1.11 | % | | | 1.26 | % | | | 1.62 | % | | | 1.69 | % | | | 1.74 | % |
| Portfolio Turnover Rate | | | 0.00 | % | | | 0.00 | % | | | 0.89 | % | | | 0.94 | % | | | 0.00 | % |
(a) Net investment income per share is based on average shares outstanding.
See Accompanying Notes to Financial Statements.
CHESTNUT STREET EXCHANGE FUND
(A California Limited Partnership)
NOTES TO FINANCIAL STATEMENTS
December 31, 2021
Chestnut Street Exchange Fund (the “Fund”), a California Limited Partnership, is registered under the Investment Company Act of 1940, as amended, as a diversified open-end investment management company. The Fund’s investment objective is to seek long- term growth of capital and, secondarily, current income. Effective January 1, 1998, the Fund changed its status for tax purposes from a partnership to a regulated investment company. The change resulted from the enactment of the “Publicly Traded Partnership” rules to the Internal Revenue Code in 1987 which first applied to the Fund after 1997. The Fund is an investment company and therefore follows the investment company accounting and reporting guidance of the Financial Accounting Standards Board (“FASB”) Accounting Standards Codification Topic 946, Financial Services - Investment Companies.
| (B) | SIGNIFICANT ACCOUNTING PRINCIPLES |
The preparation of financial statements in conformity with accounting principles generally accepted in the United States of America requires management to make estimates and assumptions that affect the reported amounts of assets and liabilities and disclosure of contingent assets and liabilities at the date of the financial statements and the reported amounts of increases and decreases in net assets from operations during the reporting period. Actual results could differ from those estimates. The following is a summary of significant accounting policies followed by the Fund in the preparation of its financial statements.
Security Valuations
Securities listed or traded on an exchange are valued generally at the last sales price as of the close of the customary trading session on the exchange where the security is principally traded, or lacking any sales on a particular day, valued at the closing bid price on that day. Each security reported on the NASDAQ Stock Market, Inc. is valued at the NASDAQ Official Close Price. Securities for which market quotations are not readily available or are believed to be unreliable are valued at fair value as determined in good faith using methods approved by the Managing General Partners. Short-term obligations having 60 days or less to maturity are valued at amortized cost which approximates market value.
Securities Transactions and Investment Income
Securities transactions are accounted for on a trade date basis. Realized gains and losses on sales and redemptions in-kind are computed on the basis of specific identification for both financial reporting and income tax purposes. For securities exchanged into the Fund at the Fund’s inception in 1976, the cost for financial reporting purposes is the value of those securities as used in the exchange. The cost, for income tax purposes, of securities exchanged into the Fund is the tax basis of the individual investor. Interest income is recorded on the accrual basis. Dividend income is recorded on the ex-dividend date. Non-cash dividends included in dividend income are recorded at fair value of the security received.
Distributions
Distributions from net investment income are paid quarterly and recorded on the ex-dividend date. Distributions of capital gains, if any, are paid annually and recorded on the ex-dividend date.
Federal Income Taxes
The Fund intends to comply with the requirements of the Internal Revenue Code necessary to qualify as a regulated investment company and, as such, will not be subject to federal income taxes on otherwise taxable income which is distributed to shareholders. The Fund currently intends to retain all of its net long-term capital gains and pay the income tax at the applicable corporate income tax rate. The Fund may change this policy at any time and distribute up to all of its net long-term gains to shareholders.
For the years 2020 and 2021, the Fund did not distribute net long-term capital gains, and has retained no gains. As such, the Fund did not pay any tax at the corporate income tax at the rate.
During the year ended December 31, 2021, the Fund utilized no capital loss carryover from prior years and has no capital loss carryover as of December 31, 2021.
Management has analyzed the Fund’s tax positions taken on federal income tax returns for all open tax years (December 31, 2018—2021) and has concluded that no provision for federal income tax is required in the Fund’s financial statements, except as noted above. The Fund’s federal and state income and federal excise tax returns for tax years for which the applicable statutes of limitations have not expired are subject to examination by the Internal Revenue Service and state departments of revenue.
At December 31, 2021, the federal tax cost, aggregate gross unrealized appreciation and depreciation of securities held by the Fund were as follows:
| Federal tax cost | | $ | 21,759,911 | |
| Gross unrealized appreciation | | | 189,657,829 | |
| Gross unrealized depreciation | | | — | |
| Net unrealized appreciation | | $ | 189,657,829 | |
The difference between book basis and tax basis of investments is attributable to the use of the individual partners’ tax basis for those securities contributed to the Fund at its inception, as required by law.
COVID 19
In early 2020, an outbreak of a novel strain of coronavirus (COVID-19) emerged globally. This coronavirus has resulted in closing international borders, enhanced health screenings, healthcare service preparation and delivery, quarantines, cancellations, disruptions to supply chains and customer activity, as well as general public concern and uncertainty. The impact of this outbreak has negatively affected the worldwide economy, as well as the economies of individual countries, the financial health of individual companies and the market in general in significant and unforeseen ways. Although vaccines for COVID-19 are becoming more widely available, the future impact of COVID-19 is currently unknown, and the pace of recovery may vary from market to market, which may exacerbate other risks that apply to the Fund, including political, social and economic risks. Any such impact could adversely affect the Fund’s performance, the performance of the securities in which the Fund invests and may lead to losses on your investment in the Fund. The ultimate impact of COVID-19 on the financial performance of the Fund’s investments is not reasonably estimable at this time.
Recent Accounting Pronouncements
In December 2020, the SEC adopted a new rule providing a framework for fund valuation practices (“Rule 2a-5”). Rule 2a-5 establishes requirements for determining fair value in good faith for purposes of the Investment Company Act of 1940, as amended (the “1940 Act”). Rule 2a-5 will permit fund boards to designate certain parties to perform fair value determinations, subject to board oversight and certain other conditions. Rule 2a-5 also defines when market quotations are “readily available” for purposes of the 1940 Act and the threshold for determining whether a fund must fair value a security. In connection with Rule 2a-5, the SEC also adopted related recordkeeping requirements and is rescinding previously issued guidance, including with respect to the role of a board in determining fair value and the accounting and auditing of fund investments. The Funds will be required to comply with the rules by September 8, 2022. Management is currently assessing the potential impact of the new rules on the Fund’s financial statements.
| (C) | INVESTMENT ADVISORY FEES, OTHER SERVICES AND TRANSACTIONS WITH AFFILIATES |
Effective June 28, 2021 Mitchell Sinkler & Starr, Inc., serves as the Fund’s investment adviser pursuant to an advisory agreement dated December 31, 2021 (the “Investment Advisory Agreement”). Prior to June 28, 2021, BlackRock Capital Management, Inc., a wholly owned subsidiary of BlackRock Institutional Management, Inc. served as the Fund’s investment advisor.
Effective June 28, 2021, the Investment Advisory Agreement provides for a fee, computed daily and paid monthly at the annual rate of 0.10% of the Fund’s average daily net assets. Prior to June 28, 2021, the Fund’s prior investment advisory agreement with BlackRock Capital Management, Inc. provided for a fee, computed daily and paid monthly at the annual rate of 0.32% of the first $100,000,000 of the Fund’s net assets, plus 0.24% of the next $100,000,000 of the Fund’s net assets, plus 0.26% of the Fund’s net assets exceeding $200,000,000, which was reduced by an annual charge of $36,000 that was charged ratably against monthly payments. For the year ended December 31, 2021, this fee reduction equaled $17,556.
U.S. Bancorp Fund Services, doing business as U.S. Bank Global Fund Services serves as the Fund’s administrator, accounting agent, transfer agent and dividend disbursing agent. U.S. Bank, NA serves as the Fund’s custodian.
The Managing General Partners each receive a fixed fee as compensation for their services, fees for attending Board meetings and reimbursement of expenses incurred attending Board meetings. In addition, the Chairman, President, Chief Financial Officer and Chief Compliance Officer receive additional payments for overseeing the Fund’s activities, plus reimbursements of related expenses. For the year ended December 31, 2021, payments to or for the Managing General Partners, Chairman, President, Chief Financial Officer and Chief Compliance Officer amounted to $135,936.
Legal fees amounting to $350,523 for the year ended December 31, 2021 were paid to Faegre Drinker Biddle & Reath LLP. A partner of the law firm is the Secretary of the Fund.
| (D) | INVESTMENT TRANSACTIONS |
There were no purchases and sales of investment securities (excluding short-term obligations and redemptions in-kind) for the year ended December 31, 2021.
| (E) | DISTRIBUTIONS TO SHAREHOLDERS |
Net investment income and capital gain distributions are determined in accordance with federal income tax regulations, which may differ from accounting principles generally accepted in the United States of America. The primary difference applicable to the Fund’s distributions is the requirement to pass through 40% of its aggregate expenses to the partners of the Fund. This is required because the Fund has fewer than 500 partners and does not continuously offer shares. The partners have treated this pass-through of expenses as a distribution of net investment income and a corresponding miscellaneous itemized deduction of investment expense, however, in tax years 2019 through 2025, as a result of the Tax Cuts and Jobs Act of 2017, the investment expenses are no longer deductible.
The tax character of distributions paid during 2021 and 2020 were as follows:
| | | 2021 | | | 2020 | |
| Ordinary income | | $ | 2,446,673 |
| | $ | 2,391,567 | |
| Distributed to partners | | $ | 2,446,673 |
| | $ | 2,391,567 | |
For federal income tax purposes, distributions of net investment income and short-term capital gains are treated as ordinary income dividends.
| (F) | IN-KIND DISTRIBUTION OF SECURITIES |
During the year ended December 31, 2021, the Fund distributed portfolio securities in lieu of cash for most shareholder redemptions. The value of these redemptions in portfolio securities and cash redemptions were as follows:
| | | Value of the Redemptions | | | Net Realized Gain Included in Redemptions | | | Fund Shares Redeemed | |
| Portfolio Securities | | $ | 33,821,253 | * | | $ | 30,452,689 | | | | 35,383 | |
| Cash | | | 971 | | | | — | | | | — | |
| | | $ | 33,822,224 | | | $ | 30,452,689 | | | | 35,383 | |
| * | Includes $382,047 in cash redeemed. |
Net realized gains from these in-kind transactions are not taxable to the Fund. Such gains are not distributed to shareholders and will be reclassified to paid-in capital at the Fund’s fiscal year end. These transactions were completed following guidelines approved by the Managing General Partners.
In the ordinary course of business, the Fund enters into contracts that contain a variety of indemnifications. The Fund’s maximum exposure under these arrangements is dependent on claims that may be made against the Fund in the future, and therefore, cannot be estimated. However, based on experience, the risk of material loss for such claims is considered remote.
At December 31, 2021, the components of distributable earnings on a tax basis were as follows:
| Undistributed net investment income | | $ | — | |
| Net realized gain | | | 285 | |
| Net unrealized appreciation on investments | | | 189,657,829 | |
| | | $ | 189,658,114 | |
On December 31, 2021, distributable earnings were decreased by $30,452,689 and additional paid in capital was increased by $30,452,689 due to permanent book and tax treatment of realized gains and losses attributable to redemptions in kind and differences in book and tax cost of securities described in note B. Net assets of the Fund were unaffected by this change.
Management has evaluated the impact of all subsequent events on the Fund through the date the financial statements were issued and determined that there were no subsequent events requiring disclosure.
CHESTNUT STREET EXCHANGE FUND
(A California Limited Partnership)
REPORT OF INDEPENDENT REGISTERED PUBLIC ACCOUNTING FIRM
To the Partners of Chestnut Street Exchange Fund
Opinion on the Financial Statements
We have audited the accompanying statement of assets and liabilities of Chestnut Street Exchange Fund (the “Fund”), including the schedule of investments, as of December 31, 2021, and the related statement of operations for the year then ended, the statements of changes in net assets for each of the years in the two-year period then ended and the financial highlights for each of the years in the five-year period then ended, and the related notes (collectively referred to as the “financial statements”). In our opinion, the financial statements present fairly, in all material respects, the financial position of the Fund as of December 31, 2021, and the results of its operations for the year then ended, the changes in its net assets for each of the years in the two-year period then ended and its financial highlights for each of the years in the five-year period then ended, in conformity with accounting principles generally accepted in the United States of America.
Basis for Opinion
These financial statements are the responsibility of the Fund’s management. Our responsibility is to express an opinion on the Fund’s financial statements based on our audits. We are a public accounting firm registered with the Public Company Accounting Oversight Board (United States) (“PCAOB”) and are required to be independent with respect to the Fund in accordance with the U.S. federal securities law and the applicable rules and regulations of the Securities and Exchange Commission and the PCAOB.
We conducted our audits in accordance with the standards of the PCAOB. Those standards require that we plan and perform the audits to obtain reasonable assurance about whether the financial statements are free of material misstatement, whether due to error or fraud. The Fund is not required to have, nor were we engaged to perform, an audit of its internal control over financial reporting. As part of our audits we are required to obtain an understanding of internal control over financial reporting but not for the purpose of expressing an opinion on the effectiveness of the Fund’s internal control over financial reporting. Accordingly, we express no such opinion.
Our audits included performing procedures to assess the risk of material misstatement of the financial statements, whether due to error or fraud, and performing procedures that respond to those risks. Such procedures included examining, on a test basis, evidence regarding the amounts and disclosures in the financial statements. Our procedures included confirmation of securities owned as of December 31, 2021 by correspondence with the custodian. Our audits also included evaluating the accounting principles used and significant estimates made by management, as well as evaluating the overall presentation of the financial statements. We believe that our audits provide a reasonable basis for our opinion.

BBD, LLP
We have served as the auditor of the Chestnut Street Exchange Fund since 2003.
Philadelphia, Pennsylvania
February 18, 2022
CHESTNUT STREET EXCHANGE FUND
(A California Limited Partnership)
LIQUIDITY RISK MANAGEMENT PROGRAM
(Unaudited)
The Fund adopted a Liquidity Risk Management Program (the “Program”) pursuant to Rule 22e-4 under the Investment Company Act of 1940 Act, as amended (the “Liquidity Rule”). The Program seeks to assess, manage and review the Fund’s Liquidity Risk. “Liquidity Risk” is defined as the risk that the Fund could not meet requests to redeem shares issued by the Fund without significant dilution of remaining investors’ interests in the Fund.
The Fund’s Board of Managing General Partners appointed the Vigilant Compliance, LLC to be the administrator of the Program (the “Program Administrator”). Among other things, the Liquidity Rule requires that the Program Administrator provide a written report to the Board on an annual basis that addresses the operation of the Program and assesses the adequacy and effectiveness of its implementation, including the operation of the Highly Liquidity Investment Minimum (“HLIM”) established for the Fund, if any, and any material changes to the Program (the “Report”). On October 27, 2021, the Board received the annual Report concerning the operation of the Program for the period from October 1, 2020 through September 30, 2021 (the “Program Reporting Period”). The Report summarized the operation of the Program and the information and factors considered by the Program Administrator in assessing whether the Program had been adequately and effectively implemented. There were no material changes to the Program during the Program Reporting Period and the Fund was not required to set a HLIM. The Report concluded that the Program continues to be an effective tool in seeking to ensure the Fund’s compliance with the Liquidity Rule.
CHESTNUT STREET EXCHANGE FUND
(A California Limited Partnership)
ADDITIONAL INFORMATION
(Unaudited)
Proxy Voting
Policies and procedures that the Fund uses to determine how to vote proxies relating to portfolio securities as well as information regarding how the Fund voted proxies relating to portfolio securities for the most recent 12-month period ended June 30 are available without charge, upon request, by calling (866) 311-7541 and on the Securities and Exchange Commission’s (“SEC”) website at http://www.sec.gov.
Quarterly Portfolio Schedule
The Fund files a complete schedule of portfolio holdings with the SEC for the first and third fiscal quarters of each fiscal year (quarters ended March 31 and September 30) on Part F of Form N-PORT. The Fund’s Part F of Form N-PORT is available on the SEC website at http://www.sec.gov.
Tax Information
As required by the Internal Revenue Code, 100% of ordinary income dividends paid for the year ended December 31, 2021 have been designated as: 1) qualified for the reduced tax rate under The Job and Growth Relief Reconciliation Act of 2003, and 2) eligible for the dividend received deduction for corporate shareholders.
CHESTNUT STREET EXCHANGE FUND
(A California Limited Partnership)
INFORMATION ON THE MANAGING GENERAL
PARTNERS AND OFFICERS OF THE FUND
(Unaudited)
The list below provides certain information about the identity and business experience of the Managing General Partners and officers of the Fund. The Fund’s Statement of Additional Information includes additional information about the Fund’s Managing General Partners, which may be obtained from the Fund free of charge by calling 1-866-311-7541.
TERM OF OFFICE: The Fund’s partnership agreement provides that each Managing General Partner holds office until the earliest of (a) the election of his or her successor; or (b) the date a Managing General Partner dies, resigns, becomes insane, is adjudicated as bankrupt or is removed by a majority of the partners. The officers of the Fund are elected by the Managing General Partners and each officer holds office for one year or until he or she shall resign or be removed or until his or her successor is elected and qualified.
Name, Address, and Age | | Position with
the Fund and
Length of
Time Served | | Principal Occupations During Past
5 Years and Current Affiliations | | Number of
Portfolios in
Fund Complex(1)
Overseen by
Managing
General
Partners | | Other
Directorship(2)
Held by
Managing
General Partner
During Past 5
Years |
| | | | | | | | |
Disinterested Managing General Partners |
|
Gordon L. Keen, Jr.
Gateway Corporate Center,
Suite 216
223 Wilmington West
Chester Pike, Suite 216
Chadds Ford, PA 19317
Age: 74 | | Managing General Partner since 2006 | | Senior Vice President, Law & Corporate Department, Airgas, Inc. (Radnor, PA-based distributor of industrial, medical and specialty gases, and welding and safety equipment and supplies) from January 1992 to January 2006. | | 1 | | None |
| | | | | | | | |
Langhorne B. Smith
Gateway Corporate Center, Suite 216
223 Wilmington West
Chester Pike, Suite 216
Chadds Ford, PA 19317 Age: 83 | | Managing General Partner since 1997 | | Retired. President and Director, The Sandridge Corporation (private investment company); Director, Claneil Enterprises, Inc. (private investment company from 1981 to 2002). | | 1 | | None |
| | | | | | | | |
David R. Wilmerding, Jr.
Gateway Corporate Center,
Suite 216
223 Wilmington West
Chester Pike, Suite 216
Chadds Ford, PA 19317
Age: 84 | | Managing General Partner since 1976; Chairman of the Managing General Partners since 2006 | | Retired. Chairman, Wilmerding & Associates (investment advisers) from February 1989 to 2006. | | 1 | | Director, Beaver
Management
Corporation |
CHESTNUT STREET EXCHANGE FUND
(A California Limited Partnership)
INFORMATION ON THE MANAGING GENERAL
PARTNERS AND OFFICERS OF THE FUND (Continued)
(Unaudited)
| Name, Address, and Age | | Position with
the Fund and
Length of
Time Served | | Principal Occupations During Past
5 Years and Current Affiliations | | Number of
Portfolios in
Fund Complex(1)
Overseen by
Managing
General Partners | | Other
Directorship(2)
Held by
Managing
General Partner
During Past
5 Years |
| | | | | | | | | |
| Officers | | | | | | | | |
| | | | | | | | | |
Frederick C. Teufel, Jr. Vigilant Compliance LLC Gateway Corporate Center, Suite 216 223 Wilmington West Chester Pike, Suite 216 Chadds Ford, PA 19317 Age: 62 | | President and Chief Compliance Officer since January 26, 2022 | | Director, Vigilant Compliance LLC since September 2020. Professor of Accounting, Saint Joseph’s University, 2014 to 2020. Principal, The Vanguard Group of Investment Companies, 1990 to 2014. Director, Business Assurance, Price Waterhouse 1983 to 1990. | | N/A | | N/A |
| | | | | | | | | |
John Boyle, MBA Vigilant Compliance LLC Gateway Corporate Center, Suite 216 223 Wilmington West Chester Pike, Suite 216 Chadds Ford, PA 19317 Age: 67 | | Chief Financial Officer since 2012 | | Director, Vigilant Compliance LLC since 2006. | | N/A | | N/A |
| | | | | | | | | |
Michael P. Malloy Faegre Drinker Biddle & Reath LLP One Logan Square Suite 2000 Philadelphia, PA 19103 Age: 61 | | Secretary since 2001 | | Partner in the law firm of Faegre Drinker Biddle & Reath LLP. | | N/A | | N/A |
| (1) | The Fund Complex includes all registered investment companies that are advised by Mitchell Sinkler & Starr, Inc. |
| (2) | Directorships of companies required to report to the Securities and Exchange Commission under the Securities Exchange Act of 1934, as amended (i.e., “public companies”) or other investment companies registered under the 1940 Act. |
CHESTNUT STREET EXCHANGE FUND
(A California Limited Partnership)
Privacy Notice
Chestnut Street Exchange Fund is committed to protecting the security and confidentiality of the personal information of our partners. We provide you with this notice to inform you about our practices with respect to personal information.
We collect nonpublic personal information about you from the following sources:
● Information we receive from you; and
● Information about your transactions with us or others
We do not disclose any nonpublic personal information about you to anyone, except as permitted by law. If you decide to close your account we will adhere to the privacy policies and practices as described in this notice.
We restrict access to your personal and account information to those employees of U.S. Bank Global Fund Services and the Fund’s Chief Financial Officer who need to know that information to provide services to you. We maintain physical, electronic and procedural safeguards to guard your nonpublic personal information.
[INTENTIONALLY LEFT BLANK]
[INTENTIONALLY LEFT BLANK]
[INTENTIONALLY LEFT BLANK]
|
| |
| |
| |
| |
MANAGING GENERAL PARTNERS
Gordon L. Keen, Jr.
Langhorne B. Smith
David R. Wilmerding, Jr. |
|
| |
| |
| |
| |
INVESTMENT ADVISER
Mitchell Sinkler & Starr, Inc.
Two Penn Center Plaza, Suite 1320
Philadelphia, PA 19102 |
|
| |
| |
| |
| |
ADMINISTRATOR
U.S. Bank Global Fund Services
615 East Michigan Street
Milwaukee, Wisconsin 53202 |
|
| |
| |
| |
| |
TRANSFER AGENT
U.S. Bank Global Fund Services
615 East Michigan Street
Milwaukee, Wisconsin 53202 |
| |
| |
| |
| |
|
|
|
|
| |
| |
| |
| |
 |
| |
| |
| |
| |
|
Annual Report
December 31, 2021 |
| |
| |
| |
| |
|
Chestnut Street Exchange
Fund |
| |
| |
| |
|
223 Wilmington West Chester Pike, Suite 216
Chadds Ford, PA 19137
1-866-311-7541 |
|
The registrant’s board of managing general partners has determined that the registrant has at least one “audit committee financial expert” serving on its audit committee. Langhorne B. Smith is the “audit committee financial expert” and is “independent” as each term is defined in Item 3 of Form N‑CSR.
Not applicable.
Not applicable.
Not applicable.
Not applicable.
There have been no material changes to the procedures by which shareholders may recommend nominees to the registrant’s board of managing general partners.
Not applicable.
Pursuant to the requirements of the Securities Exchange Act of 1934 and the Investment Company Act of 1940, the registrant has duly caused this report to be signed on its behalf by the undersigned, thereunto duly authorized.
Frederick C. Teufel, Jr., President & Chief Compliance Officer
Pursuant to the requirements of the Securities Exchange Act of 1934 and the Investment Company Act of 1940, this report has been signed below by the following persons on behalf of the registrant and in the capacities and on the dates indicated.
Frederick C. Teufel, Jr., President & Chief Compliance Officer
Frederick C. Teufel, Jr., Chief Financial Officer