UNITED STATES
SECURITIES AND EXCHANGE COMMISSION
Washington, D.C. 20549
FORMN-CSR
CERTIFIED SHAREHOLDER REPORT OF REGISTERED MANAGEMENT
INVESTMENT COMPANIES
Investment Company Act file number 811-02631
Chestnut Street Exchange Fund
(Exact name of registrant as specified in charter)
301 Bellevue Parkway
Wilmington, DE 19809
(Address of principal executive offices) (Zip code)
Terry Wettergreen
Chestnut Street Exchange Fund
301 Bellevue Parkway
Wilmington, DE 19809
(Name and address of agent for service)
Registrant’s telephone number, including area code: (610)558-1750
Date of fiscal year end: December 31
Date of reporting period: December 31, 2019
FormN-CSR is to be used by management investment companies to file reports with the Commission not later than 10 days after the transmission to stockholders of any report that is required to be transmitted to stockholders under Rule30e-1 under the Investment Company Act of 1940 (17 CFR270.30e-1). The Commission may use the information provided on FormN-CSR in its regulatory, disclosure review, inspection, and policymaking roles.
A registrant is required to disclose the information specified by FormN-CSR, and the Commission will make this information public. A registrant is not required to respond to the collection of information contained inForm N-CSR unless the Form displays a currently valid Office of Management and Budget (“OMB”) control number. Please direct comments concerning the accuracy of the information collection burden estimate and any suggestions for reducing the burden to Secretary, Securities and Exchange Commission, 450 Fifth Street, NW, Washington, DC 20549-0609. The OMB has reviewed this collection of information under the clearance requirements of 44 U.S.C. § 3507.
Item 1. Reports to Stockholders.
The Report to Shareholders is attached herewith.
CHESTNUT STREET EXCHANGE FUND
(A California Limited Partnership)
(Unaudited)
David R. Wilmerding, Jr.
Chairman
January 13, 2020
Fellow Partner:
Enclosed is the Annual Report of Chestnut Street Exchange Fund for the year ended December 31, 2019.
Our Fund earned $11.82 per share of net investment income for a share outstanding throughout 2019, compared to $11.77 per share earned in 2018. Dividend income in 2019 was decreased by $59,622 from 2018. Expenses were increased in 2019.
In 2019, the Fund realized long-term capital gains (federal income tax basis) in the amount of $5.29 per share and paid the capital gains tax on your behalf. It is our policy, effective when the Fund adopted regulated investment company status for federal income tax purposes as of January 1, 1998, not to make cash distributions of capital gains. Instead, the gains have been allocated to partners of record at year-end, together with a tax credit representing the federal tax on the gains paid by the Fund. The tax basis of a partner’s interest in the Fund is increased by the retained capital gain and reduced by the tax credit. Although capital gains must still be reported as income in a partner’s federal income tax return, the federal tax credit will reduce any income tax due.
Form 2439 providing information on the amount of the gain and the amount of the tax paid by the Fund for income tax purposes will be mailed to you by March 31, 2020. Form 2439 will report net realized capital gains, and the tax paid by the Fund which can be used as a credit against your own income tax.
After providing for the December 2019 distribution, the net asset value per partnership share at December 31, 2019 was $796.22. The net asset value at September 30, 2019, the date of our last report, was $730.43.
Commentary on market conditions and a comparison of our Fund’s performance to the Standard & Poor’s 500 Index® and the Dow Jones Industrial AverageTM will be found in the accompanying Investment Adviser’s Report.
Your comments or questions concerning Chestnut Street Exchange Fund are welcomed.
Yours sincerely,

David R. Wilmerding, Jr.
Beginning on January 1, 2021, as permitted by regulations adopted by the Securities and Exchange Commission, paper copies of the Fund’s shareholder reports like this one may no longer be sent by mail, unless you specifically request paper copies of the reports from the Fund or from your financial intermediary, such as a broker-dealer or bank. Instead, the reports will be made available on a website, and you will be notified by mail each time a report is posted and provided with a website link to access the report.
If you already elected to receive shareholder reports electronically, you will not be affected by this change and you need not take any action. You may elect to receive shareholder reports and other communications from the Fund or your financial intermediary electronically by contacting the Fund at 1-800-852-4750 or by contacting your financial intermediary.
You may elect to receive all future reports in paper free of charge. You can inform the Fund or your financial intermediary that you wish to continue receiving paper copies of your shareholder reports by contacting the Fund at 1-800-852-4750 or by contacting your financial intermediary. Your election to receive reports in paper will apply to the Fund and all funds you hold with your financial intermediary.
CHESTNUT STREET EXCHANGE FUND
(A California Limited Partnership)
INVESTMENT ADVISER’S REPORT
(Unaudited)
| | |
| |
Portfolio Review | | Annual 2019 |
Summary
U.S. equities significantly surged during the year with the S&P 500® Index returning 31.49% in 2019. During the year, the primary market drivers were ongoing U.S.-China trade tensions and the U.S. Federal Reserve’s (the “Fed”) shift to a dovish stance on monetary policy. Trade tensions eased considerably during the fourth quarter, as the year ended with the finalization of a phase-one trade deal signed by President Trump on the 15th of January. Under the agreement, the U.S. will halve existing tariffs on approximately $120 billion of Chinese imports and cancel the next round of tariffs on consumer goods. In return, China will ramp up imports of American agriculture products, manufactured goods, and energy products and services. With respect to monetary policy, the Fed took a sharp U-turn after four rate hikes in 2018 and cut rates three times in 2019 to stimulate growth and ease investor sentiment amidst a slowing global economy. Other notable fundamental drivers that led U.S. equities higher during the year included a strong labor market with steady growth in non-farm payrolls and historically low unemployment, a resilient consumer base, and corporate earnings that outperformed expectations. All sectors were positive for the year, with information technology and communication services being the best performing sectors.
Performance Attribution
During 2019, the portfolio underperformed its benchmark, the S&P 500® Index, net of fees.
The largest detractors from relative performance were security selection in the information technology and industrials sectors as well as an allocation to cash. In contrast, additive stock selection within financials and materials, and an underweight to consumer discretionary were the largest contributors.
In information technology, selection in the software industry and an underweight to the technology hardware, storage and peripherals industry detracted from performance. Within software, an off-benchmark position in Check Point Software Technologies, underweight to Microsoft and overweight to Oracle Corporation hurt relative results. Additionally, an underweight to Apple, a key technology hardware name, weighed on relative performance. In industrials, selection within industrials conglomerates, specifically an overweight to 3M, detracted from relative performance. Lastly, the portfolio’s allocation to cash was detractive as the benchmark posted strong returns over the period.
Within financials, selection in the capital markets industry, driven by an overweight to Moody’s Corporation, was the largest contributor to relative performance. In addition, a lack of exposure to the diversified financial services industry also proved advantageous as the sub-sector underperformed. In materials, security selection within the chemicals industry, driven by an overweight to Air Products and Chemicals Inc., drove returns. Lastly, within consumer discretionary, an underweight to Amazon, within the internet & direct marketing retail industry, contributed to relative performance.
2
CHESTNUT STREET EXCHANGE FUND
(A California Limited Partnership)
INVESTMENT ADVISER’S REPORT (Continued)
(Unaudited)
Portfolio Review (concluded)
Outlook
As we begin to construct our outlook for 2020, it behooves us to revisit what happened in 2019. We all painfully remember the violent sell-off in the fourth quarter of 2018 when the S&P 500® Index fell more than-15%, finishing the year down -4.5%. Earnings grew more than 5% during that year, meaning that multiples contracted between 1 and 1.5 points in 2018. The key opportunity at the start of 2019 was that interest rates had risen 75 basis points*, giving investors an opportunity to hedge growth exposure by owning low volatility stocks like REITs and tower companies, both of which did well last year. Meanwhile, earnings growth for 2019 was only expected to be lower than in 2018, which in fact meant zero earnings growth and 2% stock buybacks. Last year, investors also saw a pick-up in volatility, starting with soft economic data during the last four months of 2018 which allowed the Federal Reserve to reverse policy on January 4th. Markets recovered quickly as economic data steadily improved until early in the summer when the numbers started to decline, and market pundits started talking about a recession. In fact, the trade fight with China, drove many parts of the U.S. industrial economy into a recession last year. The Fed then stepped in to stabilize the repo market in the third quarter and effectively re-started quantitative easing. With quantitative easing, M2** money supply grew from 3% to 7% in the fourth quarter, and stocks rallied 9% with year-to-date laggards running to catch-up.
So, what does this mean for 2020? First, we think earnings and organic growth will be higher than last year and in line with nominal gross domestic product (“GDP”). The key question, however, is what happens to multiples given they were up 2.5 percentage points last year. We do not expect multiple expansion from here but we do think business models that continue to deliver strong fundamentals can compound with earnings. Last year was a low rate and low inflation environment. This has been the regime in place consistently for the last five years. In our opinion, the risk today is that the U.S. dollar weakens, inflation increases (which is what the Fed and European Central Bank want), Treasuries sell off, and we switch from lower for longer to a cyclical expansion with faster GDP growth and higher rates. This is why we focus our process on portfolio construction, remain steadfast in our diversification and always monitor the correlation of our bets.
Any opinions expressed are those of BlackRock as of the date of this report and are subject to change based on changes in market or economic conditions. The performance data represents past performance and the principal value and investment return will fluctuate so that an investor’s shares, when redeemed may be worth more or less than their original cost. Past performance is not a guarantee of future results. Please call (800)852-4750 for the most recentmonth-end performance. In addition, the data does not reflect the deduction of taxes that a shareholder would pay on distributions or redemption of Fund shares. There is no guarantee that forecasts made herein will come to pass. The comments should not be construed as a recommendation for any individual holdings or market sectors. Information and opinions are derived from proprietary andnon-proprietary sources deemed by BlackRock to be reliable. We cannot guarantee the accuracy of such information, assure its completeness, or warrant that such information will not be changed without notice. Reliance upon information in this report is at the sole discretion of the reader.
| * | A basis point equals .01%. |
| ** | The statistic that central bankers watch as an indicator for money supply and future inflation as it is more comprehensive than just liquid money (i.e. M1) which just includes cash and checking deposits. |
3
CHESTNUT STREET EXCHANGE FUND
(A California Limited Partnership)
INVESTMENT ADVISER’S REPORT(Concluded)
(Unaudited)
PERFORMANCE COMPARISON
Comparison of Change in Value of $10,000 Investment in Chestnut Street
Exchange Fund(1) vs. S&P 500® Index and Dow Jones Industrial AverageTM Index(2)
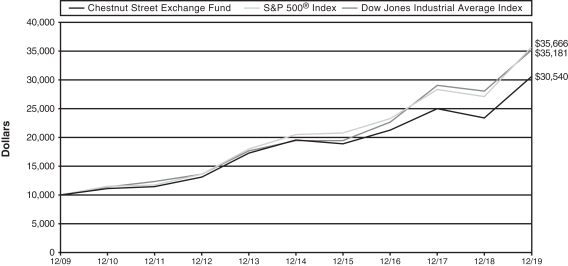
The performance data represents past performance and the principal value and investment return will fluctuate so that an investor’s shares, when redeemed, may be worth more or less than their original cost. Past performance is no guarantee of future results. Current performance may be higher or lower than the return shown. Please call(800) 852-4750 for the most recentmonth-end performance.
The performance quoted reflects fee waivers in effect and would have been lower in their absence. In addition, the data does not reflect the deduction of taxes that a shareholder would pay on distributions or redemption of Fund shares.
For the Periods Ended December 31, 2019
| | | | | | | | | | | | | | | | |
| | | Average Annual Total Returns | |
| | | 1 Year | | | 5 Year | | | 10 Year | | | Since
Inception(3) | |
Chestnut Street Exchange Fund | | | 30.66% | | | | 9.24% | | | | 11.81% | | | | 11.10% | |
S&P 500® Index | | | 31.49% | | | | 11.70% | | | | 13.56% | | | | 11.36% | |
Dow Jones Industrial AverageTM Index | | | 25.34% | | | | 12.59% | | | | 13.40% | | | | 11.57% | |
| (1) | The chart assumes hypothetical $10,000 initial investment in the Fund made on December 31, 2009 and reflects Fund expenses. Investors should note that the Fund is a managed fund while the indices are unmanaged, do not incur expenses and are not available for investment.The Fund’s gross and net expense ratios for the fiscal year ended December 31, 2019 were 0.68% and 0.66%, respectively. |
| (2) | Results of index performance are presented for general comparative purposes. |
| (3) | Cumulative since inception total returns were 9,134.72%, 10,114.54% and 10,963.40% for the Chestnut Street Exchange Fund, the S&P 500® Index and the Dow Jones Industrial Average™ Index, respectively, for the period December 29, 1976 (inception date of the Fund) to December 31, 2019. |
BLACKROCK CAPITAL MANAGEMENT, INC.
4
CHESTNUT STREET EXCHANGE FUND
(A California Limited Partnership)
Fund Expense Example
(Unaudited)
As a shareholder of the Fund, you incur ongoing costs, including management fees and other Fund expenses. The example is intended to help you understand your ongoing costs (in dollars) of investing in the Fund and to compare these costs with the ongoing costs of investing in other mutual funds.
The example is based on an investment of $1,000 invested at the beginning of thesix-month period from July 1, 2019 through December 31, 2019, and held for the entire period.
Actual Expenses
The first line of the accompanying table provides information about actual account values and actual expenses. You may use the information in this line, together with the amount you invested, to estimate the expenses that you paid over the period. Simply divide your account value by $1,000 (for example, an $8,600 account value divided by $1,000 = 8.6), then multiply the result by the number in the first line under the heading entitled “Expenses Paid During Six Months Ended December 31, 2019” to estimate the expenses you paid on your account during this period.
Hypothetical Example for Comparison Purposes
The second line of the accompanying table provides information about hypothetical account values and hypothetical expenses based on the Fund’s actual expense ratio and an assumed rate of return of 5% per year before expenses, which is not your Fund’s actual return. The hypothetical account values and expenses may not be used to estimate the actual ending account balance or expenses you paid for the period. You may use this information to compare the ongoing costs of investing in the Fund and other funds. To do so, compare this 5% hypothetical example with the 5% hypothetical examples that appear in the shareholder reports of other funds.
Please note that the expenses shown in the accompanying table are meant to highlight your ongoing costs only and do not reflect any transactional costs. Therefore, the second line of the accompanying table is useful in comparing ongoing costs only, and will not help you determine the relative total costs of owning different funds. In addition, if these transactional costs were included, your costs would have been higher.
Chestnut Street Exchange Fund
| | | | | | | | | | | | |
| | | Beginning
Account Value
July 1, 2019 | | | Ending
Account Value
December 31, 2019 | | | Expenses Paid
During Six
Months Ended
December 31, 2019* | |
Actual | | $ | 1,000.00 | | | $ | 1,102.80 | | | $ | 3.92 | |
Hypothetical†
(5% return before expenses) | | $ | 1,000.00 | | | $ | 1,021.48 | | | $ | 3.77 | |
| * | Expenses are equal to the Fund’s annualizedsix-month expense ratio of 0.74%, multiplied by the average account value over the period, multiplied by the number of days (184) in the most recent fiscal half-year, then divided by 365 to reflect theone-half year period. The Fund’s ending account value on the first line of the table is based on the actual total return of 10.28% for thesix-month period ended December 31, 2019. |
| † | Hypothetical expenses are based on the Fund’s actual annualizedsix-month expense ratio and an assumed rate of return of 5% per year before expenses. |
5
CHESTNUT STREET EXCHANGE FUND
(A California Limited Partnership)
PORTFOLIO HOLDINGS SUMMARY TABLE
December 31, 2019
(Unaudited)
| | | | | | | | |
Security Type/Industry | | % of Net
Assets | | | Value | |
| | |
COMMON STOCK | | | | | | | | |
Financial | | | 22.6 | % | | | $45,454,744 | |
Technology | | | 17.7 | | | | 35,509,857 | |
Consumer Cyclicals | | | 14.1 | | | | 28,360,148 | |
Health Care | | | 12.4 | | | | 24,923,057 | |
Transportation | | | 8.2 | | | | 16,467,619 | |
Basics | | | 7.6 | | | | 15,355,808 | |
Capital Equipment | | | 4.6 | | | | 9,188,158 | |
Retail | | | 4.2 | | | | 8,459,915 | |
Staples | | | 3.9 | | | | 7,904,812 | |
Energy | | | 3.6 | | | | 7,180,292 | |
Other Assets in Excess of Liabilities | | | 1.1 | | | | 2,274,250 | |
| | | | | | | | |
| | |
Net Assets | | | 100.0 | % | | $ | 201,078,660 | |
| | | | | | | | |
6
CHESTNUT STREET EXCHANGE FUND
(A California Limited Partnership)
SCHEDULE OF INVESTMENTS
December 31, 2019
| | | | | | | | |
| | | Shares | | | Value | |
COMMON STOCKS—98.9% | |
BASICS—7.6% | |
Air Products & Chemicals, Inc. | | | 50,413 | | | $ | 11,846,551 | |
Cabot Corp. | | | 73,848 | | | | 3,509,257 | |
| | | | | | | | |
| |
| | | | 15,355,808 | |
| | | | | | | | |
CAPITAL EQUIPMENT—4.6% | |
Emerson Electric Co. | | | 106,453 | | | | 8,118,106 | |
General Electric Co. | | | 92,425 | | | | 1,031,463 | |
Westinghouse Air Brake Technologies Corp. | | | 496 | | | | 38,589 | |
| | | | | | | | |
| |
| | | | 9,188,158 | |
| | | | | | | | |
CONSUMER CYCLICALS—14.1% | |
3M Co. | | | 23,636 | | | | 4,169,863 | |
Comcast Corp.,—Class A | | | 202,741 | | | | 9,117,263 | |
NIKE, Inc.,—Class B | | | 21,213 | | | | 2,149,089 | |
ViacomCBS, Inc.,—Class B | | | 51,024 | | | | 2,141,477 | |
Walt Disney Co. (The) | | | 74,552 | | | | 10,782,456 | |
| | | | | | | | |
| |
| | | | 28,360,148 | |
| | | | | | | | |
ENERGY—3.6% | |
Exxon Mobil Corp. | | | 62,101 | | | | 4,333,408 | |
Schlumberger, Ltd. | | | 70,818 | | | | 2,846,884 | |
| | | | | | | | |
| |
| | | | 7,180,292 | |
| | | | | | | | |
FINANCIAL—22.6% | |
Bank of America Corp. | | | 48,170 | | | | 1,696,547 | |
JPMorgan Chase & Co. | | | 107,818 | | | | 15,029,829 | |
Moody’s Corp. | | | 70,949 | | | | 16,844,002 | |
Wells Fargo & Co. | | | 220,899 | | | | 11,884,366 | |
| | | | | | | | |
| |
| | | | 45,454,744 | |
| | | | | | | | |
HEALTH CARE—12.4% | |
Abbott Laboratories | | | 112,356 | | | | 9,759,242 | |
Johnson & Johnson | | | 57,829 | | | | 8,435,516 | |
Merck & Co., Inc. | | | 73,978 | | | | 6,728,299 | |
| | | | | | | | |
| |
| | | | 24,923,057 | |
| | | | | | | | |
| | | | | | | | |
| | | Shares | | | Value | |
RETAIL—4.2% | |
Amazon.com Inc.* | | | 1,021 | | | $ | 1,886,645 | |
Home Depot, Inc. | | | 20,117 | | | | 4,393,150 | |
Walmart, Inc. | | | 18,345 | | | | 2,180,120 | |
| | | | | | | | |
| |
| | | | 8,459,915 | |
| | | | | | | | |
STAPLES—3.9% | |
Altria Group, Inc. | | | 15,436 | | | | 770,411 | |
Kraft Heinz Co. (The) | | | 3,607 | | | | 115,893 | |
Mondelez International, Inc.,—Class A | | | 10,720 | | | | 590,458 | |
PepsiCo, Inc. | | | 37,423 | | | | 5,114,601 | |
Philip Morris International, Inc. | | | 15,436 | | | | 1,313,449 | |
| | | | | | | | |
| |
| | | | 7,904,812 | |
| | | | | | | | |
TECHNOLOGY—17.7% | |
Alphabet Inc.,—Class A* | | | 2,601 | | | | 3,483,753 | |
Apple, Inc. | | | 16,404 | | | | 4,817,035 | |
Check Point Software Technologies Ltd.* | | | 38,990 | | | | 4,326,330 | |
Cisco Systems, Inc. | | | 24,194 | | | | 1,160,344 | |
Intel Corp. | | | 193,794 | | | | 11,598,571 | |
Microsoft Corp. | | | 43,766 | | | | 6,901,898 | |
Oracle Corp. | | | 60,814 | | | | 3,221,926 | |
| | | | | | | | |
| |
| | | | 35,509,857 | |
| | | | | | | | |
TRANSPORTATION—8.2% | |
Union Pacific Corp. | | | 91,087 | | | | 16,467,619 | |
| | | | | | | | |
Total Common Stocks
(Cost: $25,008,110) | | | | | | | 198,804,410 | |
| | | | | | | | |
|
TOTAL INVESTMENTS IN SECURITIES | |
(Cost: $25,008,110) | | | 98.9 | % | | $ | 198,804,410 | |
Other assets in excess of liabililties | | | 1.1 | % | | | 2,274,250 | |
| | | | | | | | |
| | |
NET ASSETS | | | 100.0 | % | | $ | 201,078,660 | |
| | | | | | | | |
See Accompanying Notes to Financial Statements.
7
CHESTNUT STREET EXCHANGE FUND
(A California Limited Partnership)
SCHEDULE OF INVESTMENTS (Concluded)
December 31, 2019
Fair Value Measurements.The inputs and valuation techniques used to measure fair value of the Fund’s investments are summarized into three levels as described in the hierarchy below:
| | | | | | |
| | | |
| • | | Level 1 | | — | | quoted prices in active markets for identical securities |
| | | |
| • | | Level 2 | | — | | other significant observable inputs (including quoted prices for identical securities in inactive markets and for similar securities, interest rates, prepayment speeds, credit risk, etc.) |
| | | |
| • | | Level 3 | | — | | significant unobservable inputs (including the Fund’s own assumptions in determining the fair value of investments) |
The inputs or methodology used for valuing securities are not necessarily an indication of the risk associated with investing in those securities.
The following is a summary of inputs used, as of December 31, 2019, in valuing the Fund’s investments carried at value:
| | | | | | | | | | | | | | | | |
| | | Total
Value at
12/31/19 | | | Level 1
Quoted
Prices | | | Level 2
Significant
Observable
Inputs | | | Level 3
Significant
Unobservable
Inputs | |
Investments in Common Stocks* | | $ | 198,804,410 | | | $ | 198,804,410 | | | $ | — | | | $ | — | |
| | | | | | | | | | | | | | | | |
| * | See details of industry breakout in the Schedule of Investments. |
At the end of each calendar quarter, management evaluates the classification of Levels 1, 2 and 3 assets and liabilities. Various factors are considered, such as changes in liquidity from the prior reporting period; whether or not a broker is willing to execute at the quoted price; the depth and consistency of prices from third party pricing services; and the existence of contemporaneous, observable trades in the market. Additionally, management evaluates the classification of Level 1 and Level 2 assets and liabilities on a quarterly basis for changes in listings or delistings on national exchanges.
For fair valuations using significant unobservable inputs, U.S. generally accepted accounting principles (“U.S. GAAP”) require the Fund to present a reconciliation of the beginning to ending balances for reported market values that presents changes attributable to total realized and unrealized gains or losses, purchase and sales, and transfers in and out of Level 3 during the period. A reconciliation of Level 3 investments is presented only when the Fund had an amount of Level 3 investments at the end of the reporting period that was meaningful in relation to its net assets. The amounts and reasons for all transfers in and out of each Level within the three-tier hierarchy are disclosed when the Fund had an amount of total transfers during the reporting period that was meaningful in relation to its net assets as of the end of the reporting period.
For the year ended December 31, 2019, there were no transfers among Levels 1, 2 and 3 for the Fund.
See Accompanying Notes to Financial Statements.
8
CHESTNUT STREET EXCHANGE FUND
(A California Limited Partnership)
Statement of Assets and Liabilities
December 31, 2019
| | | | |
Assets | | | | |
Investments in securities, at value (cost $25,008,110) | | $ | 198,804,410 | |
Cash | | | 3,254,969 | |
Dividends receivable | | | 302,531 | |
Interest receivable | | | 268 | |
Prepaid expenses | | | 15,933 | |
| | | | |
| |
Total assets | | | 202,378,111 | |
| | | | |
| |
Liabilities | | | | |
Payables for: | | | | |
Accrued tax expense | | | 280,737 | |
Distributions | | | 888,993 | |
Advisory fees | | | 44,498 | |
Administration and accounting fees | | | 14,857 | |
Custodian fees | | | 14,928 | |
Transfer agent fees | | | 3,797 | |
Accrued expenses and other liabilities | | | 51,641 | |
| | | | |
| |
Total liabilities | | | 1,299,451 | |
| | | | |
| |
Net Assets | | $ | 201,078,660 | |
| | | | |
| |
Net Assets consisted of: | | | | |
Other capital —paid-in or reinvested | | $ | 27,282,079 | |
Distributable earnings | | | 173,796,581 | |
| | | | |
| |
Net Assets (Applicable to 252,541 partnership shares outstanding) | | $ | 201,078,660 | |
| | | | |
| |
Net Asset Value offering and redemption price per share ($201,078,660 / 252,541 shares) | | $ | 796.22 | |
| | | | |
| |
Net assets applicable to shares owned by: | | | | |
Limited partners (252,498 shares) | | $ | 201,044,533 | |
Managing general partners (43 shares)* | | | 34,127 | |
| | | | |
| |
Total net assets (252,541 shares) | | $ | 201,078,660 | |
| | | | |
| * | Net asset value per share does not recompute due to rounding. |
See Accompanying Notes to Financial Statements.
9
CHESTNUT STREET EXCHANGE FUND
(A California Limited Partnership)
Statement of Operations
Year Ended December 31, 2019
| | | | | | | | |
Investment income | | | | | |
Dividends | | | $ | 4,292,607 | |
| | | | | |
Expenses | | | | | |
Investment advisory services (Note C) | | | | 531,591 | |
Legal fees (Note C) | | | | 332,675 | |
Administration and accounting fees (Note C) | | | | 168,881 | |
Managing general partners’ compensation, officer’s salary and expenses (Note C) | | | | 102,133 | |
Transfer agent fees | | | | 42,521 | |
Printing | | | | 19,277 | |
Custodian fees | | | | 25,210 | |
Audit fees | | | | 21,000 | |
Insurance | | | | 17,095 | |
Miscellaneous | | | | 21,231 | |
| | | | | |
Total expenses | | | | 1,281,614 | |
| | | | | | | | |
Advisory fees waived | | | | (36,000 | ) |
| | | | | | | | |
Total expense, net | | | | 1,245,614 | |
| | | | | | | | |
Net investment income | | | | 3,046,993 | |
| | | | | |
Net realized and unrealized gain on investments | | | | | |
Net realized gain on sale of investment securities | | | | 1,631,673 | |
Tax expense from realized capital gains | | | | (280,737 | ) |
Net realized gain from securities transactions: distributed on redemption of partnership shares | | | | 9,429,646 | |
Unrealized appreciation on investments | | | | | |
Beginning of year | | $ | 138,478,540 | | | | | |
End of year | | | 173,796,300 | | | | | |
| | | | | | | | |
Net change in unrealized appreciation | | | | 35,317,760 | |
| | | | | | | | |
Net realized and unrealized gain from investments | | | | 46,098,342 | |
| | | | | | | | |
Net increase in net assets resulting from operations | | | $ | 49,145,335 | |
| | | | | |
Statements of Changes in Net Assets
Years Ended December 31,
| | | | | | | | |
| | | 2019 | | | 2018 | |
Increase /(decrease) in net assets
Operations: | |
Net investment income | | $ | 3,046,993 | | | $ | 3,246,798 | |
Net realized gain/(loss) from securities transactions, for federal income tax purposes net gain/(loss) is $1,631,673 and ($294,828) | | | 1,631,673 | | | | (294,828 | ) |
Tax expense from realized capital gains | | | (280,737 | ) | | | — | |
Excess of market value over book value of securities distributed upon redemption of partnership shares | | | 9,429,646 | | | | 20,223,948 | |
Net unrealized change in unrealized appreciation (depreciation) on investments | | | 35,317,760 | | | | (35,168,344 | ) |
| | | | | | | | |
Increase (decrease) in net assets resulting from operations | | | 49,145,335 | | | | (11,992,426 | ) |
| | | | | | | | |
Distributions to partners from: | |
Total distributable earnings | | | (3,046,321 | ) | | | (3,247,179 | ) |
| | | | | | | | |
Capital share transactions: | |
Net asset value of 303(1) and 488(2) shares issued in lieu of cash distributions | | | 225,607 | | | | 320,035 | |
Cost of 13,019(3) and 32,386(4) shares repurchased | | | (9,621,984 | ) | | | (21,236,783 | ) |
| | | | | | | | |
Decrease in net assets from capital share transactions | | | (9,396,377 | ) | | | (20,916,748 | ) |
| | | | | | | | |
Total increase/(decrease) in net assets | | | 36,702,637 | | | | (36,156,353 | ) |
| | | | | | | | |
Net assets: | |
Beginning of year | | | 164,376,023 | | | | 200,532,376 | |
| | | | | | | | |
End of year | | $ | 201,078,660 | | | $ | 164,376,023 | |
| | | | | | | | |
| (1) | Includes 303 Limited partners shares and 0 Managing general partners shares. |
| (2) | Includes 488 Limited partners shares and 0 Managing general partners shares. |
| (3) | Includes 12,969 Limited partners shares and 50 Managing general partners shares. |
| (4) | Includes 32,386 Limited partners shares and 0 Managing general partners shares. |
See Accompanying Notes to Financial Statements.
10
CHESTNUT STREET EXCHANGE FUND
(A California Limited Partnership)
FINANCIAL HIGHLIGHTS
(For a Share of the Fund Outstanding Throughout Each Year)
| | | | | | | | | | | | | | | | | | | | |
| | | Years Ended December 31, | |
| | | 2019 | | | 2018 | | | 2017 | | | 2016 | | | 2015 | |
| | | | | |
Net Asset Value, Beginning of Year | | $ | 619.69 | | | $ | 674.84 | | | $ | 580.36 | | | $ | 529.81 | | | $ | 559.24 | |
| | | | | | | | | | | | | | | | | | | | |
| | | | | |
Income From Investment Operations: | | | | | | | | | | | | | | | | | | | | |
Net investment income | | | 11.82 | | | | 11.77 | | | | 10.94 | | | | 10.94 | | | | 10.52 | |
Net gain (loss) on securities
(both realized and unrealized) | | | 176.53 | | | | (55.15 | ) | | | 94.44 | | | | 50.12 | | | | (29.43 | ) |
| | | | | | | | | | | | | | | | | | | | |
| | | | | |
Total from investment operations | | | 188.35 | | | | (43.38 | ) | | | 105.38 | | | | 61.06 | | | | (18.91 | ) |
| | | | | | | | | | | | | | | | | | | | |
| | | | | |
Less Distributions: | | | | | | | | | | | | | | | | | | | | |
From net investment income | | | (11.82 | ) | | | (11.77 | ) | | | (10.90 | ) | | | (10.98 | ) | | | (10.52 | ) |
| | | | | | | | | | | | | | | | | | | | |
| | | | | |
Capital Contribution from Investment Advisor | | | — | | | | — | | | | — | | | | 0.47 | * | | | — | |
| | | | | | | | | | | | | | | | | | | | |
| | | | | |
Net Asset Value,
End of Year | | $ | 796.22 | | | $ | 619.69 | | | $ | 674.84 | | | $ | 580.36 | | | $ | 529.81 | |
| | | | | | | | | | | | | | | | | | | | |
| | | | | |
Total Return | | | 30.66 | % | | | (6.43 | )% | | | 18.37 | % | | | 11.72 | %* | | | (3.42 | )% |
| | | | | | | | | | | | | | | | | | | | |
| | | | | |
Ratios/Supplemental Data: | | | | | | | | | | | | | | | | | | | | |
Net Assets, End of
Year (000’s) | | $ | 201,079 | | | $ | 164,376 | | | $ | 200,532 | | | $ | 201,003 | | | $ | 202,329 | |
Ratios to average net assets: | | | | | | | | | | | | | | | | | | | | |
Expenses | | | | | | | | | | | | | | | | | | | | |
Including waivers | | | 0.66 | % | | | 0.58 | % | | | 0.59 | % | | | 0.58 | % | | | 0.54 | % |
Excluding waivers | | | 0.68 | % | | | 0.59 | % | | | 0.61 | % | | | 0.60 | % | | | 0.56 | % |
Net investment income | | | 1.62 | % | | | 1.69 | % | | | 1.74 | % | | | 1.98 | % | | | 1.93 | % |
Portfolio Turnover Rate | | | 0.89 | % | | | 0.94 | % | | | — | % | | | 2.60 | % | | | 0.02 | % |
| * | During the year ended December 31, 2016, the Advisor reimbursed the Fund $172,892 as a result of a trading error, which otherwise would have reduced Total Return by 0.09%. |
See Accompanying Notes to Financial Statements.
11
CHESTNUT STREET EXCHANGE FUND
(A California Limited Partnership)
NOTES TO FINANCIAL STATEMENTS
December 31, 2019
Chestnut Street Exchange Fund (the “Fund”), a California Limited Partnership, is registered under the Investment Company Act of 1940, as amended, as a diversifiedopen-end investment management company. The Fund’s investment objective is to seek long-term growth of capital and, secondarily, current income. Effective January 1, 1998, the Fund changed its status for tax purposes from a partnership to a regulated investment company. The change resulted from the enactment of the “Publicly Traded Partnership” rules to the Internal Revenue Code in 1987 which first applied to the Fund after 1997.
| (B) | SIGNIFICANT ACCOUNTING PRINCIPLES |
The preparation of financial statements in conformity with accounting principles generally accepted in the United States of America requires management to make estimates and assumptions that affect the reported amounts of assets and liabilities and disclosure of contingent assets and liabilities at the date of the financial statements and the reported amounts of increases and decreases in net assets from operations during the reporting period. Actual results could differ from those estimates. The following is a summary of significant accounting policies followed by the Fund in the preparation of its financial statements.
Security Valuations
Securities listed or traded on an exchange are valued generally at the last sales price as of the close of the customary trading session on the exchange where the security is principally traded, or lacking any sales on a particular day, valued at the closing bid price on that day. Each security reported on the NASDAQ Stock Market, Inc. is valued at the NASDAQ Official Close Price. Securities for which market quotations are not readily available or are believed to be unreliable are valued at fair value as determined in good faith using methods approved by the Managing General Partners. Short-term obligations having 60 days or less to maturity are valued at amortized cost which approximates market value.
Securities Transactions and Investment Income
Securities transactions are accounted for on a trade date basis. Realized gains and losses on sales and redemptionsin-kind are computed on the basis of specific identification for both financial reporting and income tax purposes. For securities exchanged into the Fund at the Fund’s inception in 1976, the cost for financial reporting purposes is the value of those securities as used in the exchange. The cost, for income tax purposes, of securities exchanged into the Fund is the tax basis of the individual investor. Interest income is recorded on the accrual basis. Dividend income is recorded on theex-dividend date.
12
Distributions
Distributions from net investment income are paid quarterly and recorded on theex-dividend date. Distributions of capital gains, if any, are paid annually and recorded on theex-dividend date.
Federal Income Taxes
The Fund intends to comply with the requirements of the Internal Revenue Code necessary to qualify as a regulated investment company and, as such, will not be subject to federal income taxes on otherwise taxable income which is distributed to shareholders. The Fund currently intends to retain all of its net long-term capital gains and pay the income tax at the applicable corporate income tax rate. The Fund may change this policy at any time and distribute up to all of its net long-term gains to shareholders.
For the year 2019, the Fund did not distribute net long-term capital gains, but has retained gains of $1,336,845 and has paid the tax at the corporate income tax at the rate of 21% (in the amount of $280,737). The partners of record as of December 31, 2019 are entitled to a proportionate credit of the tax payment and the tax basis of their shares has been increased by the amount of undistributed gains less the tax paid by the Fund.
During the year ended December 31, 2019, the Fund utilized $294,828 of its capital loss carryover from prior years and has no capital loss carryover as of December 31, 2019.
Management has analyzed the Fund’s tax positions taken on federal income tax returns for all open tax years (December 31, 2016—2019) and has concluded that no provision for federal income tax is required in the Fund’s financial statements, except as noted above. The Fund’s federal and state income and federal excise tax returns for tax years for which the applicable statutes of limitations have not expired are subject to examination by the Internal Revenue Service and state departments of revenue.
At December 31, 2019, the federal tax cost, aggregate gross unrealized appreciation and depreciation of securities held by the Fund were as follows:
| | | | |
Federal tax cost | | $ | 23,531,169 | |
| | | | |
| |
Gross unrealized appreciation | | | 175,273,241 | |
Gross unrealized depreciation | | | — | |
| | | | |
| |
Net unrealized appreciation | | $ | 175,273,241 | |
| | | | |
The difference between book basis and tax basis of investments is attributable to the use of the individual partners’ tax basis for those securities contributed to the Fund at its inception, as required by law.
Recent Accounting Pronouncements
In August 2018, the Financial Accounting Standards Board issued Accounting Standards Update 2018-13 “Changes to the Disclosure Requirements for Fair Value Measurement” which modifies disclosure requirements for fair value measurements. The guidance is effective for fiscal years beginning after December 15, 2019 and for interim periods within those fiscal years. Management has adopted these amendments and there was no significant impact to the accompanying notes.
| (C) | INVESTMENT ADVISORY FEES, OTHER SERVICES AND TRANSACTIONS WITH AFFILIATES |
BlackRock Capital Management, Inc. (“BCM” or the “Adviser”), a wholly owned subsidiary of BlackRock Institutional Management, Inc., serves as Investment Adviser to the Fund pursuant to an advisory
agreement dated September 29, 2006 as amended November 1, 2014 (“Advisory Agreement”). All BlackRock entities named are subsidiaries of BlackRock, Inc.
13
The Advisory Agreement provides for a fee, computed daily and paid monthly at the annual rate of 0.32% of the first $100,000,000 of the Fund’s net assets, plus 0.24% of the next $100,000,000 of the Fund’s net assets, plus 0.26% of the Fund’s net assets exceeding $200,000,000, which is reduced by an annual charge of $36,000 that is charged ratably against monthly payments. For the year ended December 31, 2019, this fee reduction equaled $36,000.
BNY Mellon Investment Servicing (US) Inc. serves as the Fund’s transfer and dividend disbursing agent.
The Bank of New York Mellon serves as the Fund’s administrator, accounting agent and custodian.
The Managing General Partners each receive a fixed fee as compensation for their services, fees for attending Board meetings and reimbursement of expenses incurred attending Board meetings. In addition, the Chairman, President, Chief Financial Officer and Chief Compliance Officer receive additional payments for overseeing the Fund’s activities, plus reimbursements of related expenses. For the year ended December 31, 2019, payments to or for the Managing General Partners amounted to $102,133.
Legal fees amounting to $332,675 for the year ended December 31, 2019 were paid to Faegre Drinker Biddle & Reath LLP. A partner of the law firm is the Secretary of the Fund.
| (D) | INVESTMENT TRANSACTIONS |
Purchases and sales of investment securities (excluding short-term obligations and redemptionsin-kind) were $2,003,292 and $1,646,021 respectively, for the year ended December 31, 2019.
| (E) | DISTRIBUTIONS TO SHAREHOLDERS |
Net investment income and capital gain distributions are determined in accordance with federal income tax regulations, which may differ from accounting principles generally accepted in the United States of America. The primary difference applicable to the Fund’s distributions is the requirement to pass through 40% of its aggregate expenses to the partners of the Fund. This is required because the Fund has fewer than 500 partners and does not continuously offer shares. The partners have treated this pass-through of expenses as a distribution of net investment income and a corresponding miscellaneous itemized deduction of investment expense, however, in tax years 2019 through 2025, as a result of the Tax Cuts and Jobs Act of 2017, the investment expenses are no longer deductible.
The tax character of distributions paid during 2019 and 2018 were as follows:
| | | | | | | | |
| | | 2019 | | | 2018 | |
Ordinary income | | $ | 3,544,567 | | | $ | 3,689,351 | |
Investment expense | | | (498,246 | ) | | | (442,172 | ) |
| | | | | | | | |
Distributed to partners | | $ | 3,046,321 | | | $ | 3,247,179 | |
| | | | | | | | |
For federal income tax purposes, distributions of net investment income and short-term capital gains are treated as ordinary income dividends.
14
| (F) | IN-KIND DISTRIBUTION OF SECURITIES |
During the year ended December 31, 2019, the Fund distributed portfolio securities in lieu of cash for most shareholder redemptions. The value of these redemptions in portfolio securities and cash redemptions were as follows:
| | | | | | | | | | | | |
| | | Value of the
Redemptions | | | Net Realized
Gain Included
In Redemptions | | | Fund
Shares
Redeemed | |
Portfolio Securities | | $ | 9,620,881 | * | | $ | 9,429,646 | | | | 13,019 | |
Cash | | | 1,103 | | | | — | | | | — | |
| | | | | | | | | | | | |
| | $ | 9,621,984 | | | $ | 9,429,646 | | | | 13,019 | |
| | | | | | | | | | | | |
| | * | Includes $734 in cash redeemed. |
Net realized gains from these in-kind transactions are not taxable to the Fund. Such gains are not distributed to shareholders and will be reclassified topaid-in capital at the Fund’s fiscal year end. These transactions were completed following guidelines approved by the Managing General Partners.
In the ordinary course of business, the Fund enters into contracts that contain a variety of indemnifications. The Fund’s maximum exposure under these arrangements is dependent on claims that may be made against the Fund in the future, and therefore, cannot be estimated. However, based on experience, the risk of material loss for such claims is considered remote.
At December 31, 2019, the components of distributable earnings on a tax basis were as follows:
| | | | |
Undistributed net investment income | | $ | 281 | |
Other timing differences | | | (1,476,941 | ) |
Net unrealized appreciation of investments | | | 175,273,241 | |
| | | | |
| | $ | 173,796,581 | |
| | | | |
On December 31, 2019, distributable earnings were decreased by $10,485,754, and additional paid in capital was increased by $10,485,754 due to permanent book and tax treatment of realized gains and losses attributable to redemptions in kind, long term capital gains that were retained by the Fund (and corresponding income tax paid on such gains) and the differences in book and tax cost of securities described in note B. Net assets of the Fund were unaffected by this change.
Management has evaluated the impact of all subsequent events on the Fund through the date the financial statements were issued, and determined that there were no subsequent events requiring disclosure.
15
REPORT OF INDEPENDENT REGISTERED PUBLIC ACCOUNTING FIRM
To the Partners of
Chestnut Street Exchange Fund
Opinion on the Financial Statements
We have audited the accompanying statement of assets and liabilities of Chestnut Street Exchange Fund (the “Fund”), including the schedule of investments, as of December 31, 2019, and the related statement of operations for the year then ended, the statements of changes in net assets for each of the years in the two-year period then ended and the financial highlights for each of the years in the five-year period then ended, and the related notes (collectively referred to as the “financial statements”). In our opinion, the financial statements present fairly, in all material respects, the financial position of the Fund as of December 31, 2019, and the results of its operations for the year then ended, the changes in its net assets for each of the years in the two-year period then ended and its financial highlights for each of the years in the five-year period then ended, in conformity with accounting principles generally accepted in the United States of America.
Basis for Opinion
These financial statements are the responsibility of the Fund’s management. Our responsibility is to express an opinion on the Fund’s financial statements based on our audits. We are a public accounting firm registered with the Public Company Accounting Oversight Board (United States) (“PCAOB”) and are required to be independent with respect to the Fund in accordance with the U.S. federal securities law and the applicable rules and regulations of the Securities and Exchange Commission and the PCAOB.
We conducted our audits in accordance with the standards of the PCAOB. Those standards require that we plan and perform the audit to obtain reasonable assurance about whether the financial statements are free of material misstatement, whether due to error or fraud. The Fund is not required to have, nor were we engaged to perform, an audit of its internal control over financial reporting. As part of our audit we are required to obtain an understanding of internal control over financial reporting but not for the purpose of expressing an opinion on the effectiveness of the Fund’s internal control over financial reporting. Accordingly, we express no such opinion.
Our audits included performing procedures to assess the risk of material misstatement of the financial statements, whether due to error or fraud, and performing procedures that respond to those risks. Such procedures included examining, on a test basis, evidence regarding the amounts and disclosures in the financial statements. Our procedures included confirmation of securities owned as of December 31, 2019 by correspondence with the custodian. Our audits also included evaluating the accounting principles used and significant estimates made by management, as well as evaluating the overall presentation of the financial statements. We believe that our audits provide a reasonable basis for our opinion.

BBD, LLP
We have served as the auditor of the Chestnut Street Exchange Fund since 2003.
Philadelphia, Pennsylvania
February 20, 2020
16
CHESTNUT STREET EXCHANGE FUND
(A California Limited Partnership)
Additional Information (Unaudited)
Annual Approval Investment Advisory Agreement
At a meeting held on October 30, 2019, the Managing General Partners of the Chestnut Street Exchange Fund (the “Fund”), including a majority of the Independent Managing General Partners, approved the continuation of the investment advisory agreement with BlackRock Capital Management, Inc. (“BCM”) with respect to the Fund for an additional one year period. In connection with this approval, the Managing General Partners considered, with the assistance of independent counsel, their legal responsibilities and reviewed the nature and quality of services provided to the Fund and BCM’s experience and qualifications. The Managing General Partners reviewed and considered BCM’s reports and presentations that included among other things: (1) a comparison of the advisory fee and expenses of the Fund to that of the BlackRock Funds Exchange Portfolio (the “BlackRock Portfolio”), the other exchange portfolio managed by BCM; (2) a comparison of the performance of the Fund to the BlackRock Portfolio, its benchmark (S&P 500® Index) as well as the Dow Jones Industrial Average™; (3) compensation or possible benefits to BCM arising from its relationship with the Fund; (4) a discussion of the current business activities of BCM; (5) information about the services provided to the Fund, the experience and qualifications of the personnel that are involved in the management of the Fund and how they are compensated; (6) a description of the procedures for determining that the Fund receives best execution and for allocating portfolio opportunities among the Fund and other advisory clients of BCM; (7) the nature of BCM’s internal controls to monitor portfolio compliance and an independent auditor’s report on its examination of BlackRock’s description of its systems related to asset management, recordkeeping and reporting services; (8) the costs of the services provided and BCM’s profits with respect to the Fund; and (9) BlackRock’s financial information. Since the Fund is closed to new investors, economies of scale were not considered relevant.
The Managing General Partners considered the scope and quality of services provided by the Adviser, particularly the qualifications and capabilities of the personnel responsible for providing services to the Fund. On the basis of this evaluation, the Managing General Partners concluded that the nature, quality and extent of services provided by BCM were satisfactory. The Managing General Partners also considered the Fund’s performance as compared to its benchmark, the S&P 500® Index, the BlackRock Portfolio and the Dow Jones Industrial Average™ for theyear-to-date,1-,3-,5- and10-year periods ended June 30, 2018. The Managing General Partners also considered the advisory fee and expenses of the Fund as compared to the BlackRock Portfolio and the Adviser’s profitability information.
After further discussion, the Managing General Partners concluded that BCM had the capabilities, resources and personnel necessary to manage the Fund. The Managing General Partners considered the services provided by BCM and the fees paid by the Fund in relation to the BlackRock Portfolio’s fees, as well as the Fund’s performance and other information presented and discussed, and the Managing General Partners concluded that the advisory fees paid by the Fund are reasonable and fair.
17
CHESTNUT STREET EXCHANGE FUND
(A California Limited Partnership)
Additional Information (Unaudited)
Proxy Voting
Policies and procedures that the Fund uses to determine how to vote proxies relating to portfolio securities as well as information regarding how the Fund voted proxies relating to portfolio securities for the most recent12-month period ended June 30 are available without charge, upon request, by calling(800) 852-4750 and on the Securities and Exchange Commission’s (“SEC”) website athttp://www.sec.gov.
Quarterly Portfolio Schedule
The Fund files a complete schedule of portfolio holdings with the SEC for the first and third fiscal quarters of each fiscal year (quarters ended March 31 and September 30) on FormN-Q (or as an exhibit to its report on Form N-Q’s successor form, Form N-PORT). The Fund’s FormN-Q is, and its successor form, Form N-PORT will be, available on the SEC website athttp://www.sec.gov.
Tax Information
As required by the Internal Revenue Code, 100% of ordinary income dividends paid for the year ended December 31, 2019 have been designated as: 1) qualified for the reduced tax rate under The Job and Growth Relief Reconciliation Act of 2003, and 2) eligible for the dividend received deduction for corporate shareholders.
18
CHESTNUT STREET EXCHANGE FUND
(A California Limited Partnership)
INFORMATION ON THE MANAGING GENERAL
PARTNERS AND OFFICERS OF THE FUND
(Unaudited)
The list below provides certain information about the identity and business experience of the Managing General Partners and officers of the Fund. The Fund’s Statement of Additional Information includes additional information about the Fund’s Managing General Partners, which may be obtained from the Fund free of charge by calling1-800-852-4750.
TERM OF OFFICE:The Fund’s partnership agreement provides that each Managing General Partner holds office until the earliest of (a) the election of his or her successor; or (b) the date a Managing General Partner dies, resigns, becomes insane, is adjudicated as bankrupt or is removed by a majority of the partners. The officers of the Fund are elected by the Managing General Partners and each officer holds office for one year or until he or she shall resign or be removed or until his or her successor is elected and qualified.
| | | | | | | | |
Name, Address, and Age | | Position with
the Fund and
Length of
Time Served | | Principal
Occupations During
Past 5 Years and
Current Affiliations | | Number of Portfolios
in Fund
Complex(1)
Overseen by
Managing
General Partners | | Other Directorship(2) Held by
Managing General Partner During Past 5 Years |
| | | | |
| Disinterested Managing General Partners | | | | | | | | |
Gordon L. Keen, Jr.
The Bank of New York Mellon
301 Bellevue Parkway
Wilmington, DE 19809
Age: 74 | | Managing General Partner since 2006 | | Senior Vice President, Law & Corporate Department, Airgas, Inc. (Radnor, PA-based distributor of industrial, medical and specialty gases, and welding and safety equipment and supplies) from January 1992 to January 2006. | | 1 | | None |
| | | | |
Langhorne B. Smith
The Bank of New York Mellon
301 Bellevue Parkway
Wilmington, DE 19809
Age: 83 | | Managing General Partner since 1997 | | Retired. President and Director, The Sandridge Corporation (private investment company); Director, Claneil Enterprises, Inc. (private investment company from 1981 to 2002). | | 1 | | None |
| | | | |
David R. Wilmerding, Jr.
The Bank of New York Mellon
301 Bellevue Parkway
Wilmington, DE 19809
Age: 84 | | Managing General Partner since 1976; Chairman of the Managing General Partners since 2006 | | Retired. Chairman, Wilmerding & Associates (investment advisers) from February 1989 to 2006. | | 1 | | Director, Beaver Management Corporation |
19
| | | | | | | | |
Name, Address, and Age | | Position with
the Fund and
Length of
Time Served | | Principal
Occupations During
Past 5 Years and
Current Affiliations | | Number of Portfolios
in Fund
Complex(1)
Overseen by
Managing
General Partners | | Other Directorship(2) Held by
Managing General Partner During Past 5 Years |
| | | | |
| Officers | | | | | | | | |
Terry Wettergreen Vigilant Compliance LLC Gateway Corporate Center, Suite 216 223 Wilmington West Chester Pike Chadds Ford, PA 19317 Age: 69 | | President and Chief Compliance Officer since January 1, 2018 | | Director, Vigilant Compliance LLC since October 2016; Chief Compliance Officer, Westport Advisers LLC and Westport Asset Management Inc. from 1996-2016; Treasurer, Chief Financial Officer, Vice President and Secretary, The Westport Funds 1998-2016. | | N/A | | N/A |
| | | | |
John Boyle, CPA, MBA
Vigilant Compliance LLC Gateway Corporate Center, Suite 216 223 Wilmington West Chester Pike Chadds Ford, PA 19317 Age: 66 | | Chief Financial Officer since 2012 | | Director, Vigilant Compliance LLC since 2006. | | N/A | | N/A |
| | | | |
Michael P. Malloy
Faegre Drinker Biddle &
Reath LLP
One Logan Square
Suite 2000
Philadelphia, PA 19103
Age: 60 | | Secretary since 2001 | | Partner in the law firm of Faegre Drinker Biddle & Reath LLP. | | N/A | | N/A |
| (1) | The Fund Complex includes all registered investment companies that are advised by BlackRock Capital Management, Inc. or one of its affiliates. |
| (2) | Directorships of companies required to report to the Securities and Exchange Commission under the Securities Exchange Act of 1934, as amended (i.e., “public companies”) or other investment companies registered under the 1940 Act. |
20
CHESTNUT STREET EXCHANGE FUND
Privacy Notice
Chestnut Street Exchange Fund is committed to protecting the security and confidentiality of the personal information of our partners. We provide you with this notice to inform you about our practices with respect to personal information.
We collect nonpublic personal information about you from the following sources:
| • | | Information we receive from you; and |
| • | | Information about your transactions with us or others |
We do not disclose any nonpublic personal information about you to anyone, except as permitted by law. If you decide to close your account we will adhere to the privacy policies and practices as described in this notice.
We restrict access to your personal and account information to those employees of BNY Mellon Investment Servicing Inc. and the Fund’s Chief Financial Officer who need to know that information to provide services to you. We maintain physical, electronic and procedural safeguards to guard your nonpublic personal information.
21
MANAGING GENERAL PARTNERS
Gordon L. Keen, Jr.
Langhorne B. Smith
David R. Wilmerding, Jr.
INVESTMENT ADVISER
BlackRock Capital Management, Inc.
100 Bellevue Parkway
Wilmington, Delaware 19809
ADMINISTRATOR
The Bank of New York Mellon
301 Bellevue Parkway
Wilmington, Delaware 19809
TRANSFER AGENT
BNY Mellon Investment
Servicing (US) Inc.
4400 Computer Drive,
Westborough, MA 01581
(800) 852-4750

Annual Report
December 31, 2019
Chestnut Street Exchange Fund
301 Bellevue Parkway
Wilmington, Delaware 19809
(800) 852-4750
Item 2. Code of Ethics.
| | (a) | The registrant, as of the end of the period covered by this report, has adopted a code of ethics that applies to the registrant’s principal executive officer, principal financial officer, principal accounting officer or controller, or persons performing similar functions, regardless of whether these individuals are employed by the registrant or a third party. |
| | (c) | There have been no amendments, during the period covered by this report, to a provision of the code of ethics that applies to the registrant’s principal executive officer, principal financial officer, principal accounting officer or controller, or persons performing similar functions, regardless of whether these individuals are employed by the registrant or a third party, and that relates to any element of the code of ethics description. |
| | (d) | The registrant has not granted any waivers, including an implicit waiver, from a provision of the code of ethics that applies to the registrant’s principal executive officer, principal financial officer, principal accounting officer or controller, or persons performing similar functions, regardless of whether these individuals are employed by the registrant or a third party, that relates to one or more of the items set forth in paragraph (b) of this item’s instructions. |
| | (f) | A copy of the Codes of Ethics is available as provided in Item 13(a)(1) of this report. |
Item 3. Audit Committee Financial Expert.
The registrant’s board of managing general partners has determined that the registrant has at least one “audit committee financial expert” (as defined in Item 3 of FormN-CSR) serving on its audit committee. Langhorne B. Smith is the “audit committee financial expert” and is “independent” (as each item is defined in Item 3 ofForm N-CSR).
Item 4. Principal Accountant Fees and Services.
Audit Fees
| | (a) | The aggregate fees billed for each of the last two fiscal years for professional services rendered by the principal accountant for the audit of the registrant’s annual financial statements or services that are normally provided by the accountant in connection with statutory and regulatory filings or engagements for those fiscal years are $21,000 for 2019 and $21,000 for 2018. |
Audit-Related Fees
| (b) | The aggregate fees billed in each of the last two fiscal years for assurance and related services by the principal accountant that are reasonably related to the performance of the audit of the registrant’s financial statements and are not reported under paragraph (a) of this Item are $0 for 2019 and $0 for 2018. |
Tax Fees
| | (c) | The aggregate fees billed in each of the last two fiscal years for professional services rendered by the principal accountant for tax compliance, tax advice, and tax planning are $0 for 2019 and $0 for 2018. |
All Other Fees
| | (d) | The aggregate fees billed in each of the last two fiscal years for products and services provided by the principal accountant, other than the services reported in paragraphs (a) through (c) of this Item are $0 for 2019 and $0 for 2018. |
| | (e)(1) | Disclose the audit committee’spre-approval policies and procedures described in paragraph (c)(7) of Rule2-01 of RegulationS-X. |
The Audit Committee does not havepre-approved policies and procedures. Instead, the Audit Committee approves on acase-by-case basis each audit ornon-audit service before the accountant is engaged by the Registrant.
| | (e)(2) | No services described in paragraph (b) through (d) were approved by the Audit Committee pursuant to the “de minimis” exception of Rule2-01(c)(7)(i)(c) of RegulationS-X. |
| | (f) | The percentage of hours expended on the principal accountant’s engagement to audit the registrant’s financial statements for the most recent fiscal year that were attributed to work performed by persons other than the principal accountant’s full-time, permanent employees was less than fifty percent. |
| | (g) | The aggregatenon-audit fees billed by the registrant’s accountant for services rendered to the registrant, and rendered to the registrant’s investment adviser (not including anysub-adviser whose role is primarily portfolio management and is subcontracted with or overseen by another |
| | investment adviser), and any entity controlling, controlled by, or under common control with the adviser that provides ongoing services to the registrant for each of the last two fiscal years of the registrant was $ 0 for 2018 and $0 for 2019. |
Item 5. Audit Committee of Listed Registrants.
Not applicable.
Item 6. Investments.
| (a) | Schedule of Investments in securities of unaffiliated issuers as of the close of the reporting period is included as part of the report to shareholders filed under Item 1 of this form. |
| Item 7. | Disclosure of Proxy Voting Policies and Procedures forClosed-End Management Investment Companies. |
Not applicable.
Item 8. Portfolio Managers ofClosed-End Management Investment Companies.
Not applicable.
| Item 9. | Purchases of Equity Securities byClosed-End Management Investment Company and Affiliated Purchasers. |
Not applicable.
Item 10. Submission of Matters to a Vote of Security Holders.
There have been no material changes to the procedures by which shareholders may recommend nominees to the registrant’s board of managing general partners.
Item 11. Controls and Procedures.
| | (a) | The registrant’s principal executive and principal financial officers, or persons performing similar functions, have concluded that the registrant’s disclosure controls and procedures (as defined in Rule30a-3(c) under the Investment Company Act of 1940, as amended (the “1940 Act”) (17 CFR270.30a-3(c))) are effective, as of a date within 90 days of the filing date of the report that includes the disclosure required by this paragraph, based on their evaluation of these controls and procedures required by Rule30a-3(b) under the 1940 Act (17 CFR270.30a-3(b)) and Rules13a-15(b) or15d-15(b) under the Securities Exchange Act of 1934, as amended (17 CFR240.13a-15(b) or240.15d-15(b)). |
| | (b) | There were no changes in the registrant’s internal control over financial reporting (as defined in Rule30a-3(d) under the 1940 Act (17 CFR270.30a-3(d))) that occurred during the registrant’s last fiscal quarter that has materially affected, or is reasonably likely to materially affect, the registrant’s internal control over financial reporting. |
Item 12. Disclosure of Securities Lending Activities forClosed-End Management Investment Companies.
Not applicable.
Item 13. Exhibits.
| (a)(1) | Code of ethics, or any amendment thereto, that is the subject of disclosure required by Item 2 is attached hereto. |
| (a)(2) | Certifications pursuant to Rule30a-2(a) under the 1940 Act and Section 302 of the Sarbanes-Oxley Act of 2002 are attached hereto. |
| (b) | Certifications pursuant to Rule30a-2(b) under the 1940 Act and Section 906 of the Sarbanes-Oxley Act of 2002 are attached hereto. |
SIGNATURES
Pursuant to the requirements of the Securities Exchange Act of 1934 and the Investment Company Act of 1940, the registrant has duly caused this report to be signed on its behalf by the undersigned, thereunto duly authorized.
| | |
| (Registrant) Chestnut Street Exchange Fund |
| |
| By (Signature and Title)* | | /s/ Terry Wettergreen |
| | Terry Wettergreen, President & Chief Compliance Officer |
| | (principal executive officer) |
Pursuant to the requirements of the Securities Exchange Act of 1934 and the Investment Company Act of 1940, this report has been signed below by the following persons on behalf of the registrant and in the capacities and on the dates indicated.
| | |
| By (Signature and Title)* | | /s/ Terry Wettergreen |
| | Terry Wettergreen, President & Chief Compliance Officer |
| | (principal executive officer) |
| | |
| By (Signature and Title)* | | /s/ John Boyle |
| | John Boyle, Chief Financial Officer |
| | (principal financial officer) |
* Print the name and title of each signing officer under his or her signature.