0000202032 aimgs:C000001325Member oef:WithoutSalesLoadMember 2015-01-01 2024-12-31 0000202032 aimgs:C000217950Member aimgs:GovernmentNationalMortgageAssociationTBA55006202054Member 2024-12-31
UNITED STATES
SECURITIES AND EXCHANGE COMMISSION
Washington, D.C. 20549
FORM N-CSR
CERTIFIED SHAREHOLDER REPORT OF REGISTERED MANAGEMENT INVESTMENT COMPANIES
Investment Company Act file number
AIM Growth Series (Invesco Growth Series)
(Exact name of registrant as specified in charter)
11 Greenway Plaza, Suite 1000 Houston, Texas 77046
(Address of principal executive offices) (Zip code)
Glenn Brightman, Principal Executive Officer
11 Greenway Plaza, Suite 1000
Houston, Texas 77046
(Name and address of agent for service)
Registrant's telephone number, including area code:
Date of reporting period:
Item 1. Reports to Stockholders.
(a) The Registrant's annual report transmitted to shareholders pursuant to Rule 30e-1 under the Investment Company Act of 1940, as amended (the "Act") is as follows:
Invesco Active Allocation Fund
Class A: OAAAX
ANNUAL SHAREHOLDER REPORT | December 31, 2024
This annual shareholder report contains important information about Invesco Active Allocation Fund (the “Fund”) for the period January 1, 2024 to December 31, 2024. You can find additional information about the Fund at invesco.com/reports. You can also request this information by contacting us at (800) 959-4246.
What Were The Fund Costs For The Last Year ?
(Based on a hypothetical $10,000 investment)
| Fund (Class) | Costs of a $10,000 investment | Costs paid as a percentage
of a $10,000 investment |
Invesco Active Allocation Fund
(Class A) | $48 | 0.46%† |
† | Reflects fee waivers and/or expense reimbursements, without which expenses would have been higher. |
How Did The Fund Perform During The Period?
• During the fiscal year ended December 31, 2024, global risk assets outperformed defensive assets driven by a favorable macroeconomic environment, the beginning of a global monetary policy easing cycle and greater clarity with respect to fiscal policy following the conclusion of many major elections globally. These macroeconomic tailwinds supported global equity prices, particularly within the US, as well as the continuation of credit spreads tightening to cycle lows within investment grade, high yield and emerging market debt markets. Given this backdrop, an underweight to equities and overweight to fixed income assets was a headwind to Fund performance, as were certain factor tilts within equities, as well as allocations within fixed income to core and US Treasury bonds.
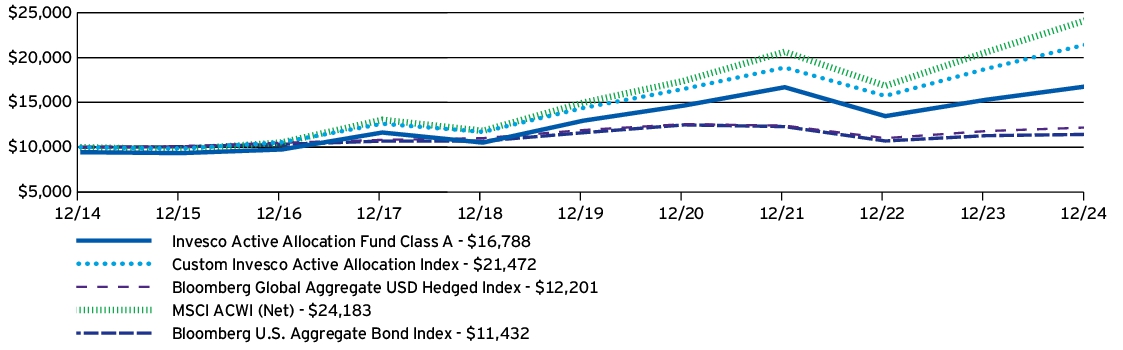
• For the fiscal year ended December 31, 2024, Class A shares of the Fund, excluding sales charge, returned 9.77%. For the same time period, the Custom Invesco Active Allocation Index returned 14.63%.
What contributed to performance?
Exposure to growth equities and the quality factor | The Fund's exposure to high quality securities (commonly referred to as 'growth' stocks) was rewarded with exposures within both the US large- and mid-cap space, as well as exposure internationally.
Exposure to high yield and floating rate credit | The Fund's exposure to high yield was beneficial as credit spreads continued to tighten, supported by resilient corporate fundamentals and strong investor demand for higher-coupon bond offerings. Floating rate exposure was rewarded as well, with the securities benefiting from an increasing interest rate environment, compared to their fixed-rate peers.
What detracted from performance?
Cyclical factor exposure within equities | Exposure to the small size and value factors was a detractor from Fund performance over the time period, as more defensive equity factors such as quality continued to be in demand led by US megacap technology stocks and strong momentum in investor demand for thematic artificial intelligence stocks.
Exposure to core and US Treasury bonds | The Fund's exposure to core and US Treasury bonds was a headwind, as long and moderate duration, as well as higher-grade fixed income, suffered compared to shorter duration, more credit sensitive counterparts. This was due to interest rates moving higher and the steepening of the yield curve that transpired significantly in the second half of the year.
How Has The Fund Historically Performed?
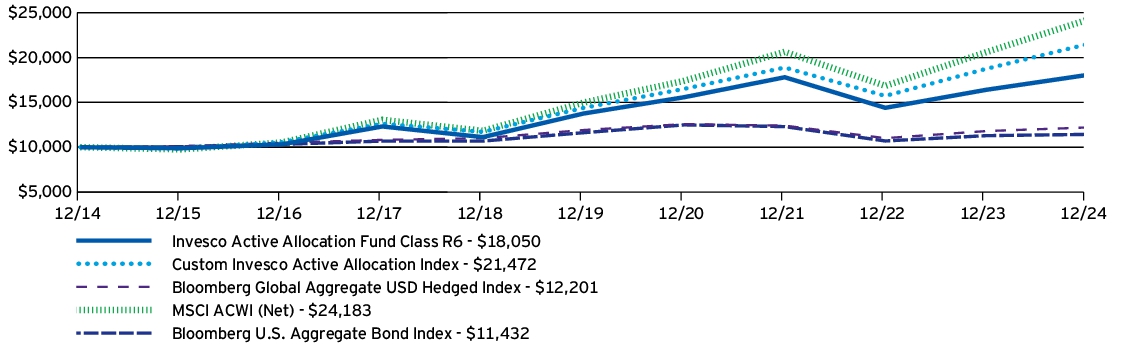
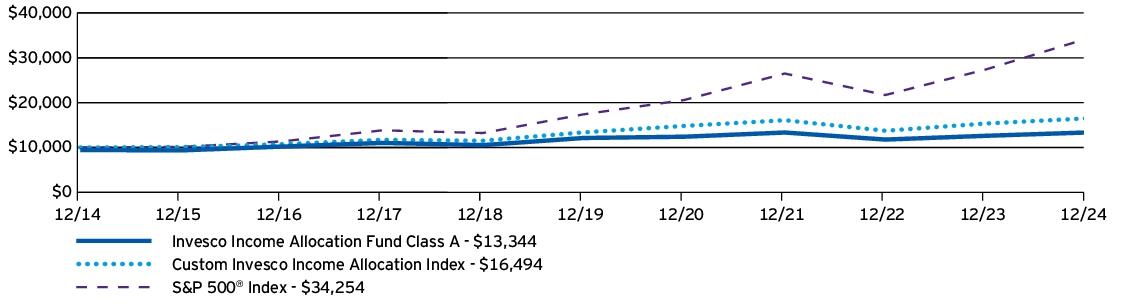
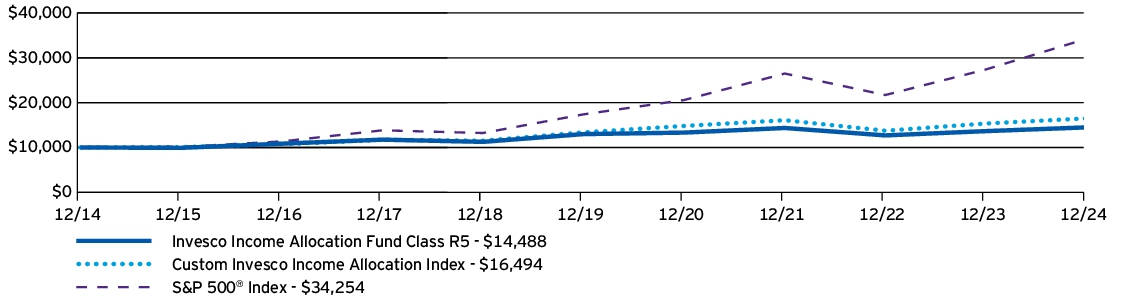
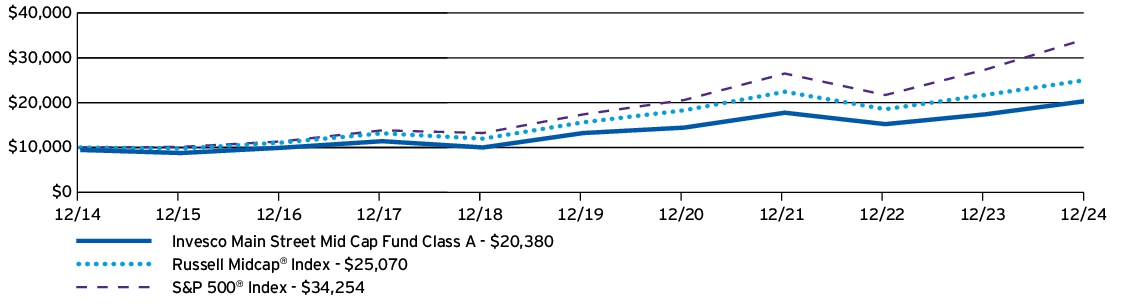
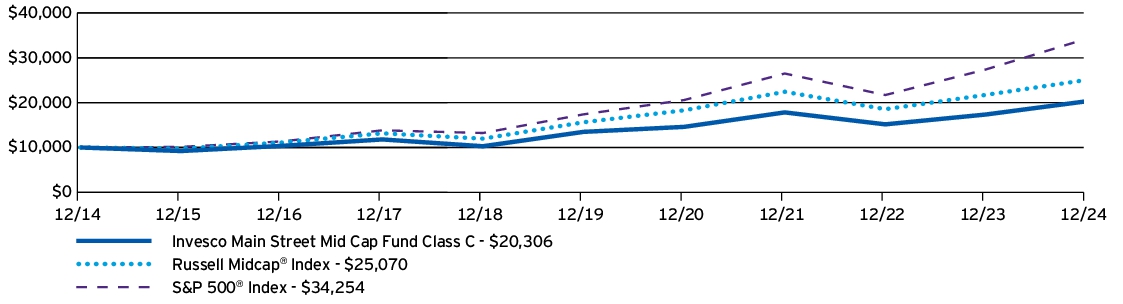
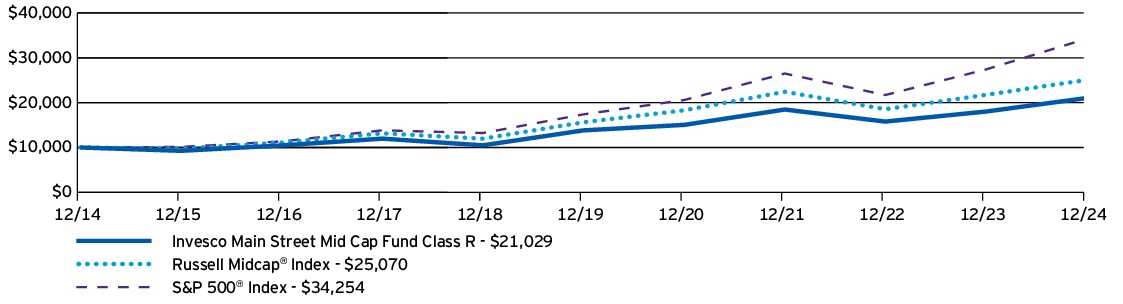
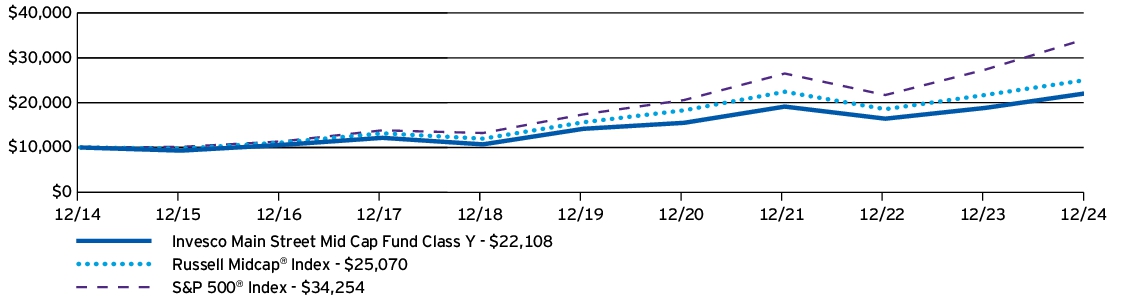
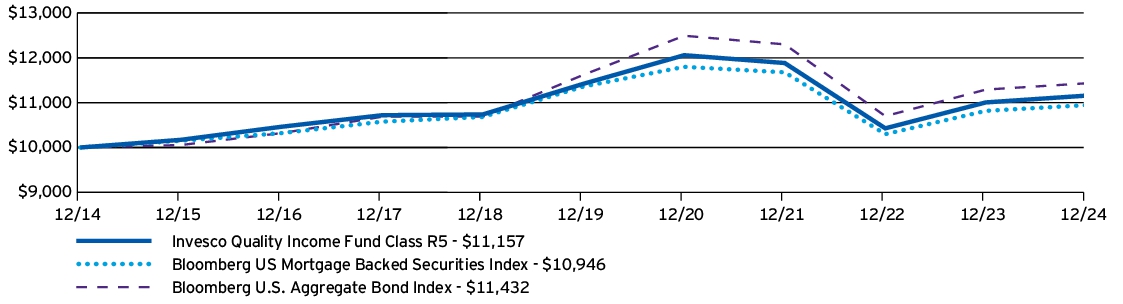
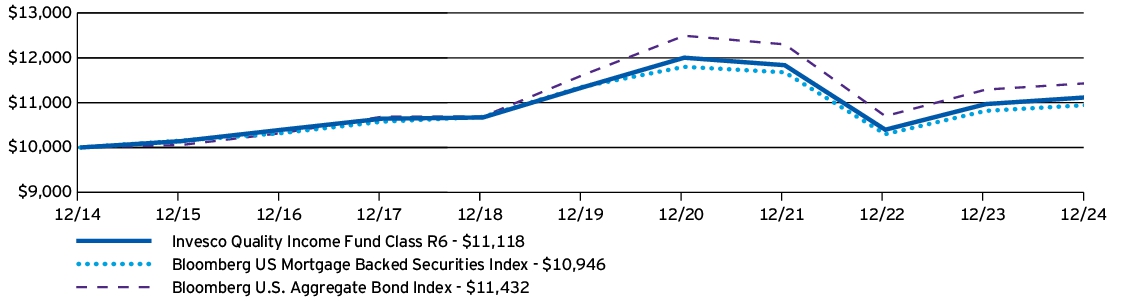
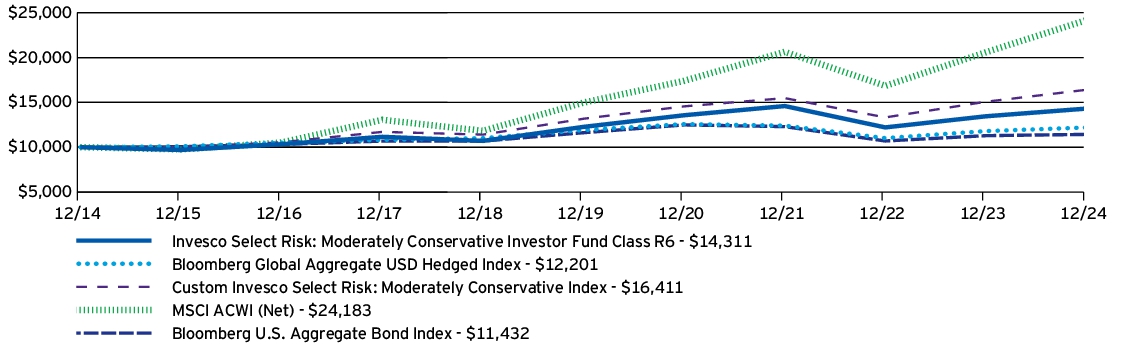
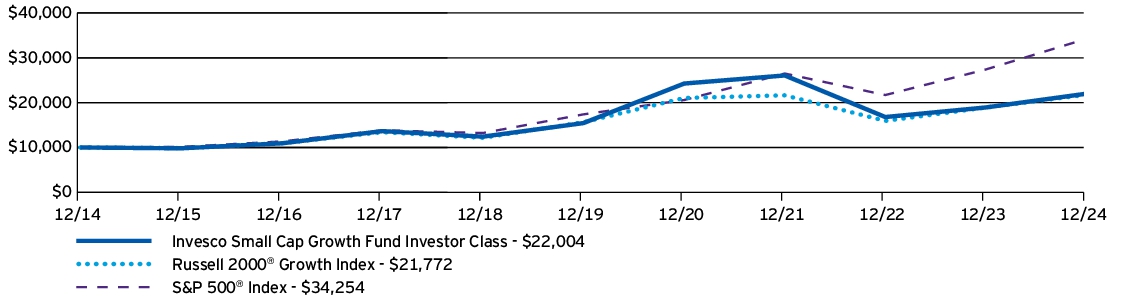
Growth of $10,000 Investment
| AVERAGE ANNUAL TOTAL RETURNS | 1 Year | 5 Years | 10 Years |
| Invesco Active Allocation Fund (Class A) —including sales charge | 3.75% | 4.12% | 5.32% |
| Invesco Active Allocation Fund (Class A) —excluding sales charge | 9.77% | 5.30% | 5.91% |
| Custom Invesco Active Allocation Index | 14.63% | 8.34% | 7.94% |
| Bloomberg Global Aggregate USD Hedged Index | 3.40% | 0.48% | 2.01% |
| MSCI ACWI (Net) | 17.49% | 10.06% | 9.23% |
| Bloomberg U.S. Aggregate Bond Index | 1.25% | (0.33)% | 1.35% |
The Custom Invesco Active Allocation Index is composed of 80% MSCI ACWI (Net) and 20% Bloomberg Global Aggregate USD Hedged Index.
Effective after the close of business on May 24, 2019, Class A shares of Oppenheimer Portfolio Series: Active Allocation Fund (the predecessor fund), were reorganized into Class A shares of the Fund. Returns shown above for periods ending on or prior to May 24, 2019 are those of Class A shares of the predecessor fund. Share class returns will differ from the predecessor fund because of different expenses.
Effective April 26, 2024, the Fund changed its broad-based securities market benchmark from the Bloomberg Global Aggregate USD Hedged Index to the Bloomberg U.S. Aggregate Bond Index to reflect that the Bloomberg U.S. Aggregate Bond Index can be considered more broadly representative of the overall applicable securities market.
The performance data quoted represents past performance and cannot guarantee future results; current performance may be lower or higher. Please visit invesco.com/performance for more recent performance information.
Performance figures do not reflect deduction of taxes a shareholder would pay on Fund distributions or sale of Fund shares.
What Are Key Statistics About The Fund?
(as of December 31, 2024)
| Fund net assets | $1,899,296,008 |
| Total number of portfolio holdings | 27 |
| Total advisory fees paid | $1,648,323 |
| Portfolio turnover rate | 43% |
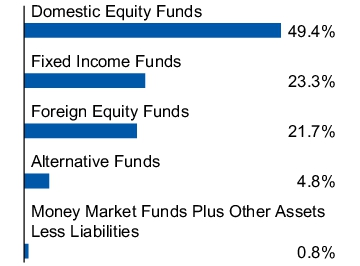
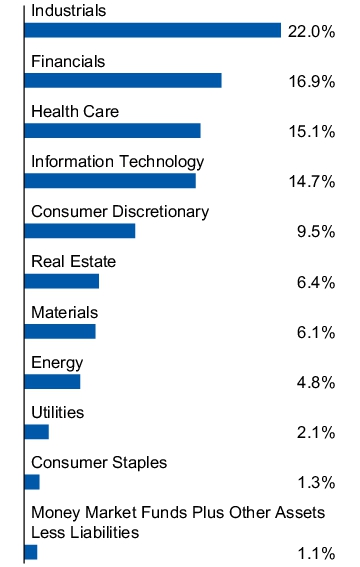
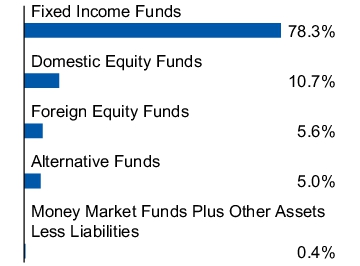
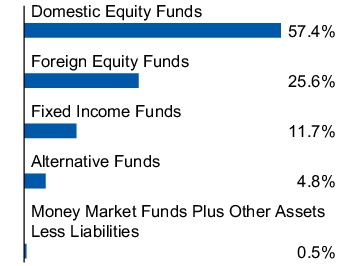
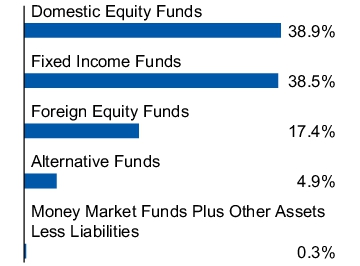
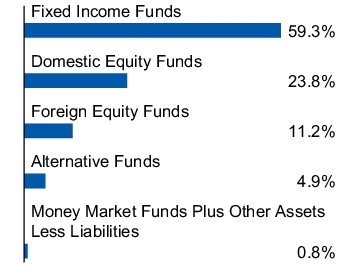
What Comprised The Fund's Holdings?
(as of December 31, 2024)
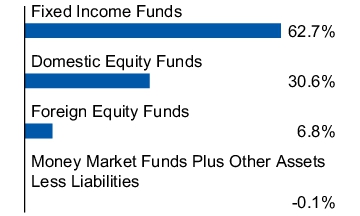
Asset allocation
(% of net assets)
Where Can I Find More Information?
You can find more information about the Fund, including the Fund's prospectus, financial information, and holdings at invesco.com/reports. Additionally, the Fund's proxy voting information can be found at invesco.com/proxy-voting.
What Should I Know About Delivery Of Important Regulatory Documents?
To reduce Fund expenses, only one copy of most shareholder documents may be mailed to shareholders with multiple accounts at the same address (Householding). Mailing of your shareholder documents may be householded indefinitely unless you instruct us otherwise. If you do not want the mailing of these documents to be combined with those for other members of your household, please contact Invesco Investment Services, Inc. at (800) 959-4246 or contact your financial institution. We will begin sending you individual copies for each account within 30 days after receiving your request.
For additional information, please scan the QR code at the left to navigate to additional material at invesco.com/reports.
Invesco Active Allocation Fund
Class C: OAACX
ANNUAL SHAREHOLDER REPORT | December 31, 2024
This annual shareholder report contains important information about Invesco Active Allocation Fund (the “Fund”) for the period January 1, 2024 to December 31, 2024. You can find additional information about the Fund at invesco.com/reports. You can also request this information by contacting us at (800) 959-4246.
What Were The Fund Costs For The Last Year ?
(Based on a hypothetical $10,000 investment)
| Fund (Class) | Costs of a $10,000 investment | Costs paid as a percentage
of a $10,000 investment |
Invesco Active Allocation Fund
(Class C) | $127 | 1.22%† |
† | Reflects fee waivers and/or expense reimbursements, without which expenses would have been higher. |
How Did The Fund Perform During The Period?
• During the fiscal year ended December 31, 2024, global risk assets outperformed defensive assets driven by a favorable macroeconomic environment, the beginning of a global monetary policy easing cycle and greater clarity with respect to fiscal policy following the conclusion of many major elections globally. These macroeconomic tailwinds supported global equity prices, particularly within the US, as well as the continuation of credit spreads tightening to cycle lows within investment grade, high yield and emerging market debt markets. Given this backdrop, an underweight to equities and overweight to fixed income assets was a headwind to Fund performance, as were certain factor tilts within equities, as well as allocations within fixed income to core and US Treasury bonds.
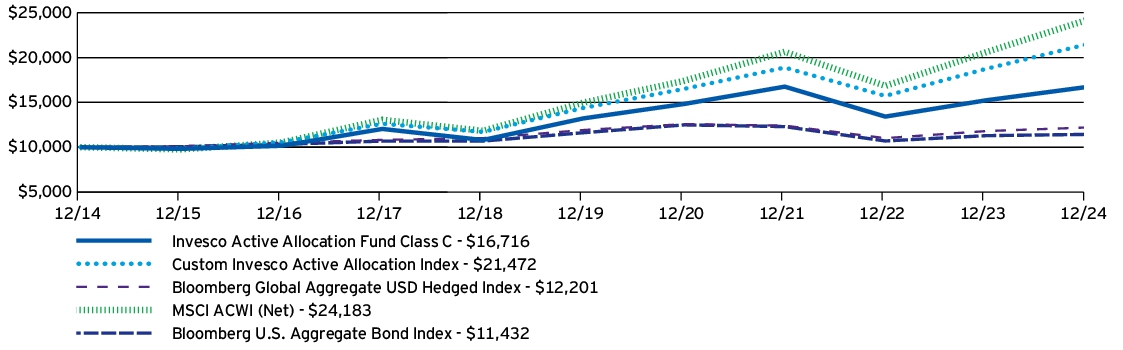
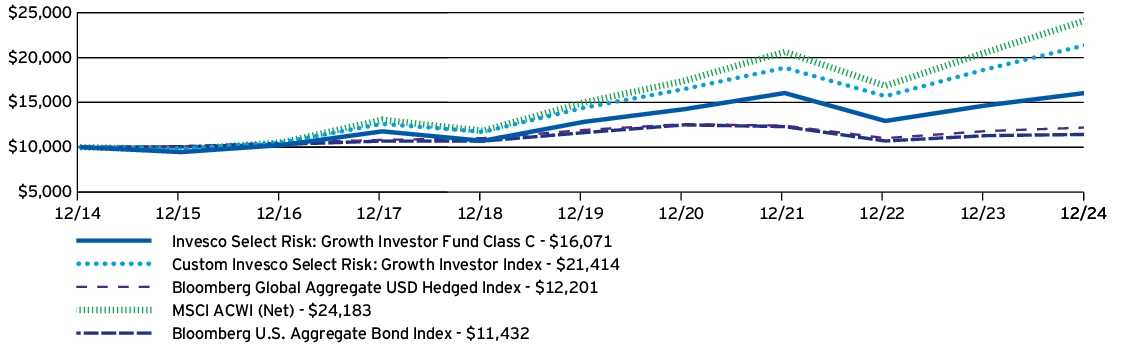
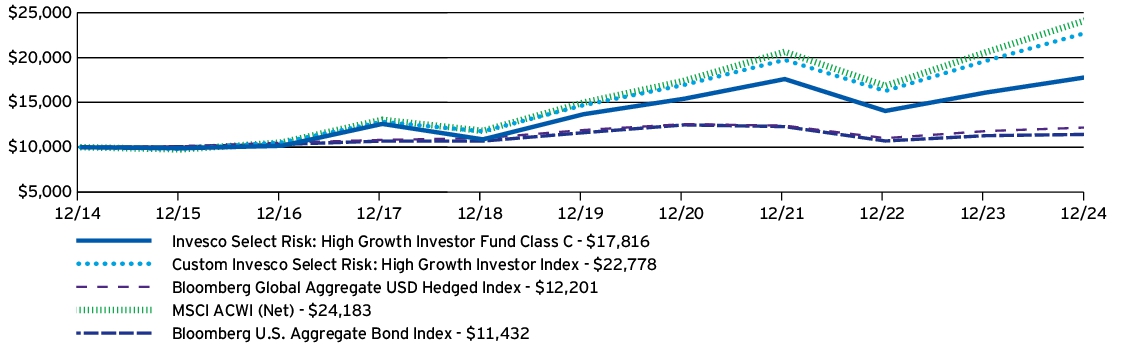
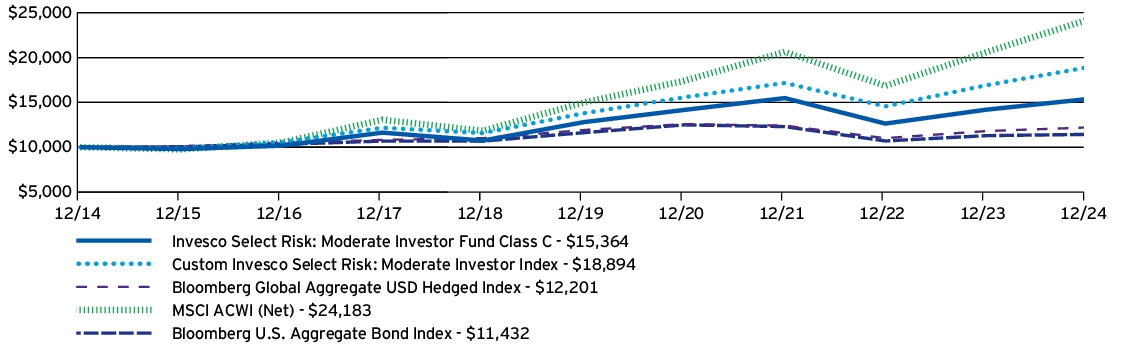
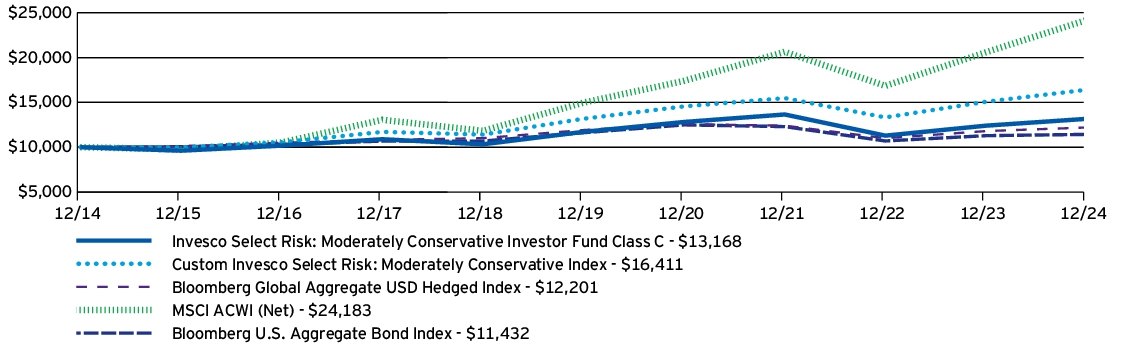
• For the fiscal year ended December 31, 2024, Class C shares of the Fund, excluding sales charge, returned 9.00%. For the same time period, the Custom Invesco Active Allocation Index returned 14.63%.
What contributed to performance?
Exposure to growth equities and the quality factor | The Fund's exposure to high quality securities (commonly referred to as 'growth' stocks) was rewarded with exposures within both the US large- and mid-cap space, as well as exposure internationally.
Exposure to high yield and floating rate credit | The Fund's exposure to high yield was beneficial as credit spreads continued to tighten, supported by resilient corporate fundamentals and strong investor demand for higher-coupon bond offerings. Floating rate exposure was rewarded as well, with the securities benefiting from an increasing interest rate environment, compared to their fixed-rate peers.
What detracted from performance?
Cyclical factor exposure within equities | Exposure to the small size and value factors was a detractor from Fund performance over the time period, as more defensive equity factors such as quality continued to be in demand led by US megacap technology stocks and strong momentum in investor demand for thematic artificial intelligence stocks.
Exposure to core and US Treasury bonds | The Fund's exposure to core and US Treasury bonds was a headwind, as long and moderate duration, as well as higher-grade fixed income, suffered compared to shorter duration, more credit sensitive counterparts. This was due to interest rates moving higher and the steepening of the yield curve that transpired significantly in the second half of the year.
How Has The Fund Historically Performed?
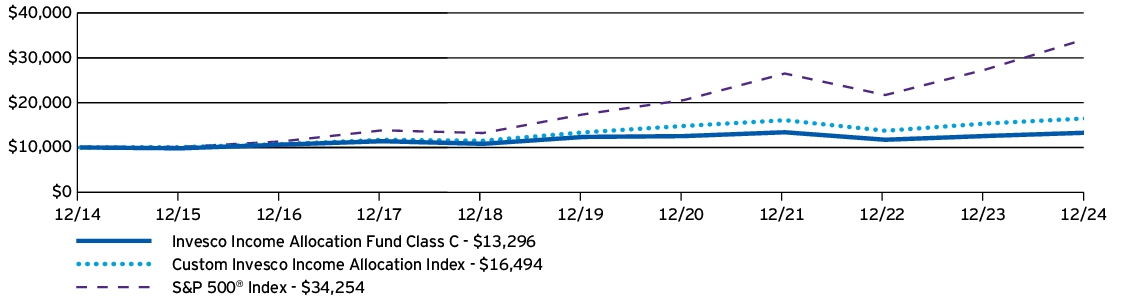
Growth of $10,000 Investment
| AVERAGE ANNUAL TOTAL RETURNS | 1 Year | 5 Years | 10 Years |
| Invesco Active Allocation Fund (Class C) —including sales charge | 8.00% | 4.51% | 5.27% |
| Invesco Active Allocation Fund (Class C) —excluding sales charge | 9.00% | 4.51% | 5.27% |
| Custom Invesco Active Allocation Index | 14.63% | 8.34% | 7.94% |
| Bloomberg Global Aggregate USD Hedged Index | 3.40% | 0.48% | 2.01% |
| MSCI ACWI (Net) | 17.49% | 10.06% | 9.23% |
| Bloomberg U.S. Aggregate Bond Index | 1.25% | (0.33)% | 1.35% |
The Custom Invesco Active Allocation Index is composed of 80% MSCI ACWI (Net) and 20% Bloomberg Global Aggregate USD Hedged Index.
Effective after the close of business on May 24, 2019, Class C shares of Oppenheimer Portfolio Series: Active Allocation Fund (the predecessor fund), were reorganized into Class C shares of the Fund. Returns shown above for periods ending on or prior to May 24, 2019 are those of Class C shares of the predecessor fund. Share class returns will differ from the predecessor fund because of different expenses.
Effective April 26, 2024, the Fund changed its broad-based securities market benchmark from the Bloomberg Global Aggregate USD Hedged Index to the Bloomberg U.S. Aggregate Bond Index to reflect that the Bloomberg U.S. Aggregate Bond Index can be considered more broadly representative of the overall applicable securities market.
The performance data quoted represents past performance and cannot guarantee future results; current performance may be lower or higher. Please visit invesco.com/performance for more recent performance information.
Performance figures do not reflect deduction of taxes a shareholder would pay on Fund distributions or sale of Fund shares.
What Are Key Statistics About The Fund?
(as of December 31, 2024)
| Fund net assets | $1,899,296,008 |
| Total number of portfolio holdings | 27 |
| Total advisory fees paid | $1,648,323 |
| Portfolio turnover rate | 43% |
What Comprised The Fund's Holdings?
(as of December 31, 2024)
Asset allocation
(% of net assets)
Where Can I Find More Information?
You can find more information about the Fund, including the Fund's prospectus, financial information, and holdings at invesco.com/reports. Additionally, the Fund's proxy voting information can be found at invesco.com/proxy-voting.
What Should I Know About Delivery Of Important Regulatory Documents?
To reduce Fund expenses, only one copy of most shareholder documents may be mailed to shareholders with multiple accounts at the same address (Householding). Mailing of your shareholder documents may be householded indefinitely unless you instruct us otherwise. If you do not want the mailing of these documents to be combined with those for other members of your household, please contact Invesco Investment Services, Inc. at (800) 959-4246 or contact your financial institution. We will begin sending you individual copies for each account within 30 days after receiving your request.
For additional information, please scan the QR code at the left to navigate to additional material at invesco.com/reports.
Invesco Active Allocation Fund
Class R: OAANX
ANNUAL SHAREHOLDER REPORT | December 31, 2024
This annual shareholder report contains important information about Invesco Active Allocation Fund (the “Fund”) for the period January 1, 2024 to December 31, 2024. You can find additional information about the Fund at invesco.com/reports. You can also request this information by contacting us at (800) 959-4246.
What Were The Fund Costs For The Last Year ?
(Based on a hypothetical $10,000 investment)
| Fund (Class) | Costs of a $10,000 investment | Costs paid as a percentage
of a $10,000 investment |
Invesco Active Allocation Fund
(Class R) | $75 | 0.72%† |
† | Reflects fee waivers and/or expense reimbursements, without which expenses would have been higher. |
How Did The Fund Perform During The Period?
• During the fiscal year ended December 31, 2024, global risk assets outperformed defensive assets driven by a favorable macroeconomic environment, the beginning of a global monetary policy easing cycle and greater clarity with respect to fiscal policy following the conclusion of many major elections globally. These macroeconomic tailwinds supported global equity prices, particularly within the US, as well as the continuation of credit spreads tightening to cycle lows within investment grade, high yield and emerging market debt markets. Given this backdrop, an underweight to equities and overweight to fixed income assets was a headwind to Fund performance, as were certain factor tilts within equities, as well as allocations within fixed income to core and US Treasury bonds.
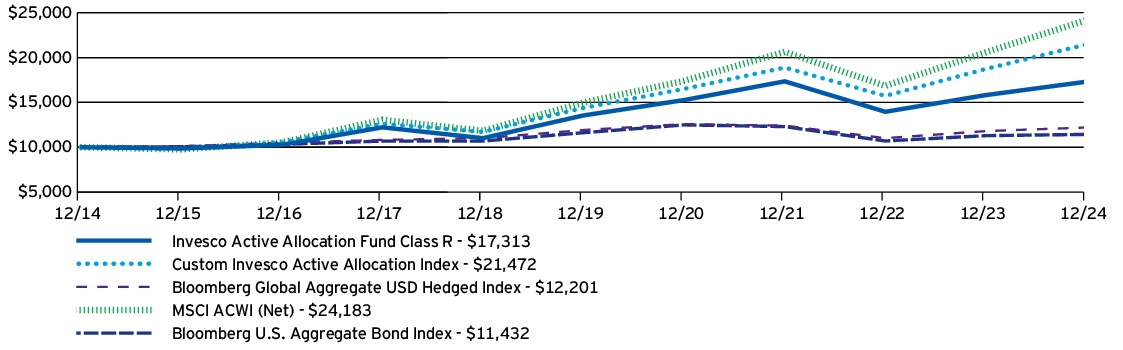
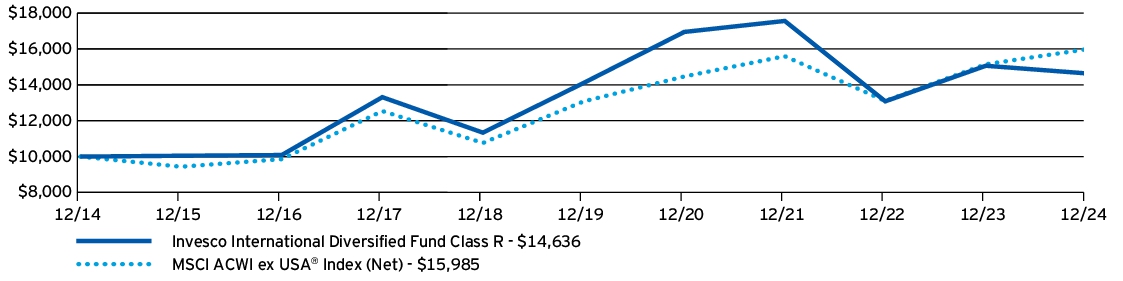
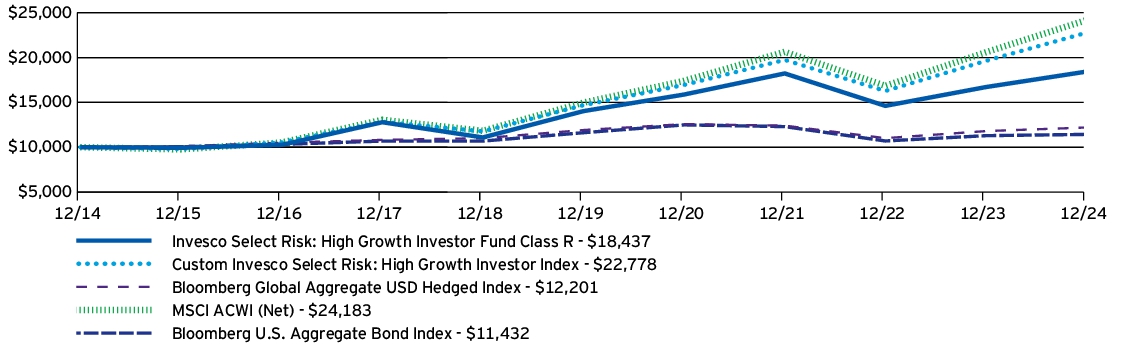
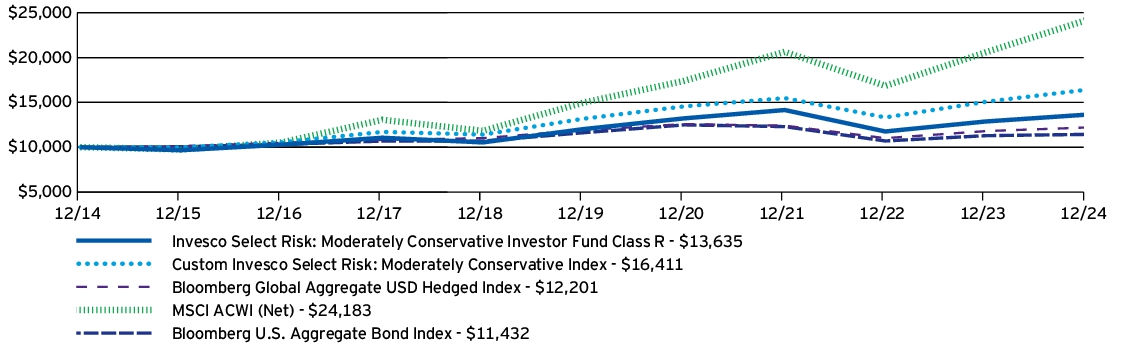
• For the fiscal year ended December 31, 2024, Class R shares of the Fund returned 9.48%. For the same time period, the Custom Invesco Active Allocation Index returned 14.63%.
What contributed to performance?
Exposure to growth equities and the quality factor | The Fund's exposure to high quality securities (commonly referred to as 'growth' stocks) was rewarded with exposures within both the US large- and mid-cap space, as well as exposure internationally.
Exposure to high yield and floating rate credit | The Fund's exposure to high yield was beneficial as credit spreads continued to tighten, supported by resilient corporate fundamentals and strong investor demand for higher-coupon bond offerings. Floating rate exposure was rewarded as well, with the securities benefiting from an increasing interest rate environment, compared to their fixed-rate peers.
What detracted from performance?
Cyclical factor exposure within equities | Exposure to the small size and value factors was a detractor from Fund performance over the time period, as more defensive equity factors such as quality continued to be in demand led by US megacap technology stocks and strong momentum in investor demand for thematic artificial intelligence stocks.
Exposure to core and US Treasury bonds | The Fund's exposure to core and US Treasury bonds was a headwind, as long and moderate duration, as well as higher-grade fixed income, suffered compared to shorter duration, more credit sensitive counterparts. This was due to interest rates moving higher and the steepening of the yield curve that transpired significantly in the second half of the year.
How Has The Fund Historically Performed?
Growth of $10,000 Investment
| AVERAGE ANNUAL TOTAL RETURNS | 1 Year | 5 Years | 10 Years |
| Invesco Active Allocation Fund (Class R) | 9.48% | 5.03% | 5.64% |
| Custom Invesco Active Allocation Index | 14.63% | 8.34% | 7.94% |
| Bloomberg Global Aggregate USD Hedged Index | 3.40% | 0.48% | 2.01% |
| MSCI ACWI (Net) | 17.49% | 10.06% | 9.23% |
| Bloomberg U.S. Aggregate Bond Index | 1.25% | (0.33)% | 1.35% |
The Custom Invesco Active Allocation Index is composed of 80% MSCI ACWI (Net) and 20% Bloomberg Global Aggregate USD Hedged Index.
Effective after the close of business on May 24, 2019, Class R shares of Oppenheimer Portfolio Series: Active Allocation Fund (the predecessor fund), were reorganized into Class R shares of the Fund. Returns shown above for periods ending on or prior to May 24, 2019 are those of Class R shares of the predecessor fund. Share class returns will differ from the predecessor fund because of different expenses.
Effective April 26, 2024, the Fund changed its broad-based securities market benchmark from the Bloomberg Global Aggregate USD Hedged Index to the Bloomberg U.S. Aggregate Bond Index to reflect that the Bloomberg U.S. Aggregate Bond Index can be considered more broadly representative of the overall applicable securities market.
The performance data quoted represents past performance and cannot guarantee future results; current performance may be lower or higher. Please visit invesco.com/performance for more recent performance information.
Performance figures do not reflect deduction of taxes a shareholder would pay on Fund distributions or sale of Fund shares.
What Are Key Statistics About The Fund?
(as of December 31, 2024)
| Fund net assets | $1,899,296,008 |
| Total number of portfolio holdings | 27 |
| Total advisory fees paid | $1,648,323 |
| Portfolio turnover rate | 43% |
What Comprised The Fund's Holdings?
(as of December 31, 2024)
Asset allocation
(% of net assets)
Where Can I Find More Information?
You can find more information about the Fund, including the Fund's prospectus, financial information, and holdings at invesco.com/reports. Additionally, the Fund's proxy voting information can be found at invesco.com/proxy-voting.
What Should I Know About Delivery Of Important Regulatory Documents?
To reduce Fund expenses, only one copy of most shareholder documents may be mailed to shareholders with multiple accounts at the same address (Householding). Mailing of your shareholder documents may be householded indefinitely unless you instruct us otherwise. If you do not want the mailing of these documents to be combined with those for other members of your household, please contact Invesco Investment Services, Inc. at (800) 959-4246 or contact your financial institution. We will begin sending you individual copies for each account within 30 days after receiving your request.
For additional information, please scan the QR code at the left to navigate to additional material at invesco.com/reports.
Invesco Active Allocation Fund
Class Y: OAAYX
ANNUAL SHAREHOLDER REPORT | December 31, 2024
This annual shareholder report contains important information about Invesco Active Allocation Fund (the “Fund”) for the period January 1, 2024 to December 31, 2024. You can find additional information about the Fund at invesco.com/reports. You can also request this information by contacting us at (800) 959-4246.
What Were The Fund Costs For The Last Year ?
(Based on a hypothetical $10,000 investment)
| Fund (Class) | Costs of a $10,000 investment | Costs paid as a percentage
of a $10,000 investment |
Invesco Active Allocation Fund
(Class Y) | $23 | 0.22%† |
† | Reflects fee waivers and/or expense reimbursements, without which expenses would have been higher. |
How Did The Fund Perform During The Period?
• During the fiscal year ended December 31, 2024, global risk assets outperformed defensive assets driven by a favorable macroeconomic environment, the beginning of a global monetary policy easing cycle and greater clarity with respect to fiscal policy following the conclusion of many major elections globally. These macroeconomic tailwinds supported global equity prices, particularly within the US, as well as the continuation of credit spreads tightening to cycle lows within investment grade, high yield and emerging market debt markets. Given this backdrop, an underweight to equities and overweight to fixed income assets was a headwind to Fund performance, as were certain factor tilts within equities, as well as allocations within fixed income to core and US Treasury bonds.
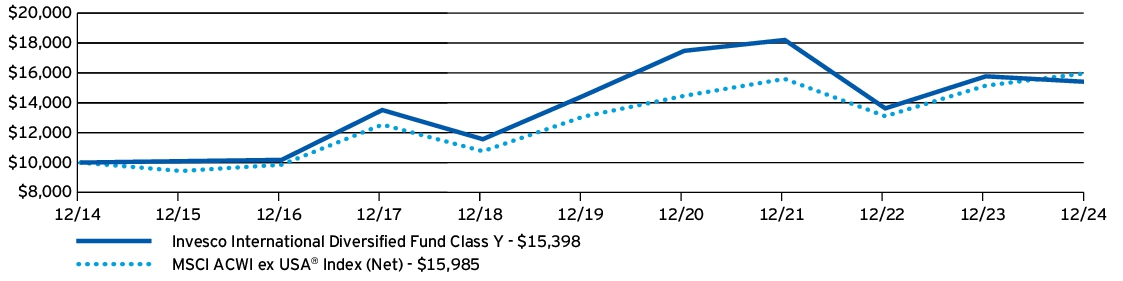
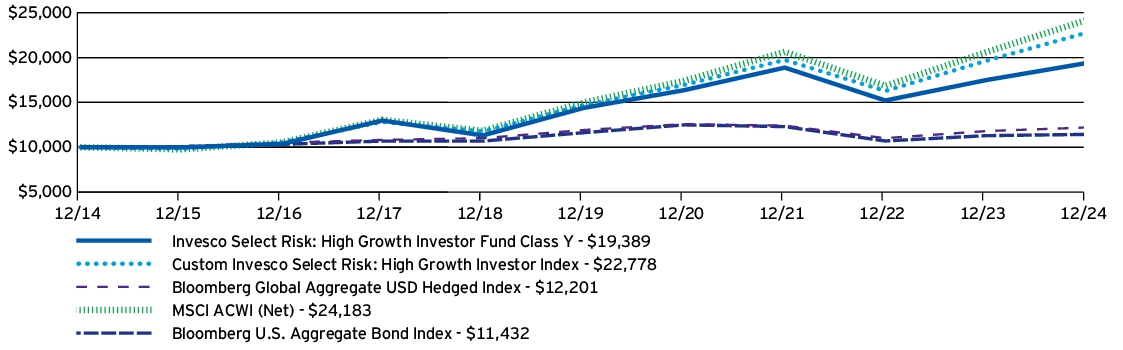
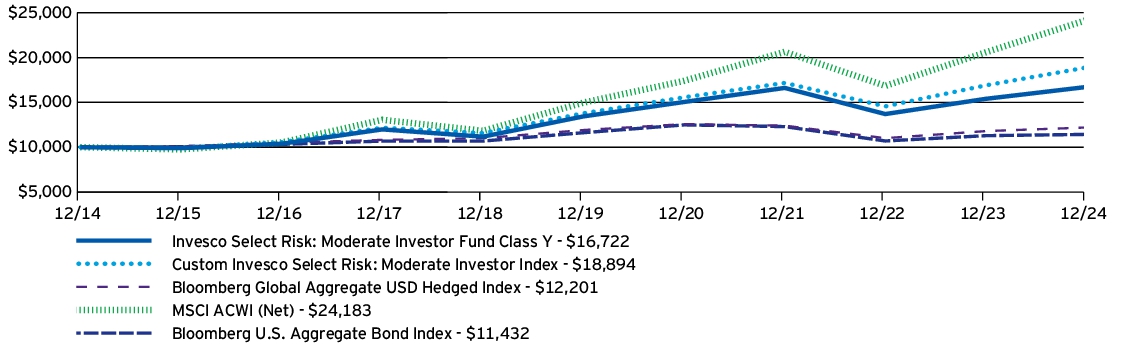
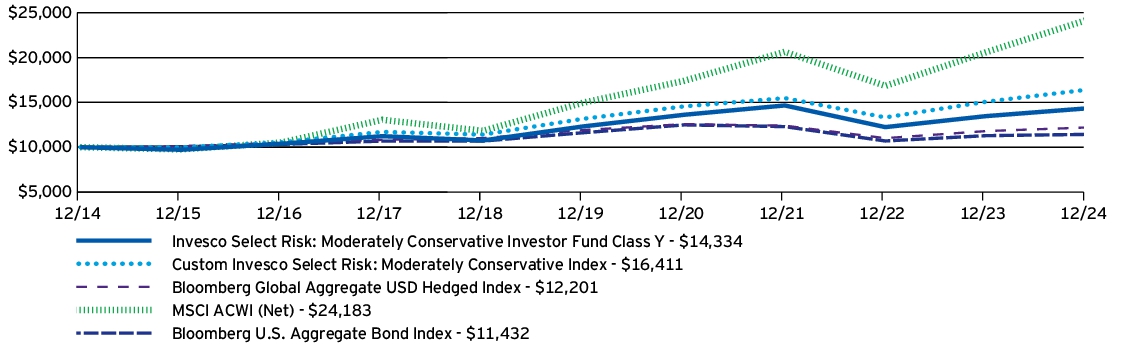
• For the fiscal year ended December 31, 2024, Class Y shares of the Fund returned 10.00%. For the same time period, the Custom Invesco Active Allocation Index returned 14.63%.
What contributed to performance?
Exposure to growth equities and the quality factor | The Fund's exposure to high quality securities (commonly referred to as 'growth' stocks) was rewarded with exposures within both the US large- and mid-cap space, as well as exposure internationally.
Exposure to high yield and floating rate credit | The Fund's exposure to high yield was beneficial as credit spreads continued to tighten, supported by resilient corporate fundamentals and strong investor demand for higher-coupon bond offerings. Floating rate exposure was rewarded as well, with the securities benefiting from an increasing interest rate environment, compared to their fixed-rate peers.
What detracted from performance?
Cyclical factor exposure within equities | Exposure to the small size and value factors was a detractor from Fund performance over the time period, as more defensive equity factors such as quality continued to be in demand led by US megacap technology stocks and strong momentum in investor demand for thematic artificial intelligence stocks.
Exposure to core and US Treasury bonds | The Fund's exposure to core and US Treasury bonds was a headwind, as long and moderate duration, as well as higher-grade fixed income, suffered compared to shorter duration, more credit sensitive counterparts. This was due to interest rates moving higher and the steepening of the yield curve that transpired significantly in the second half of the year.
How Has The Fund Historically Performed?
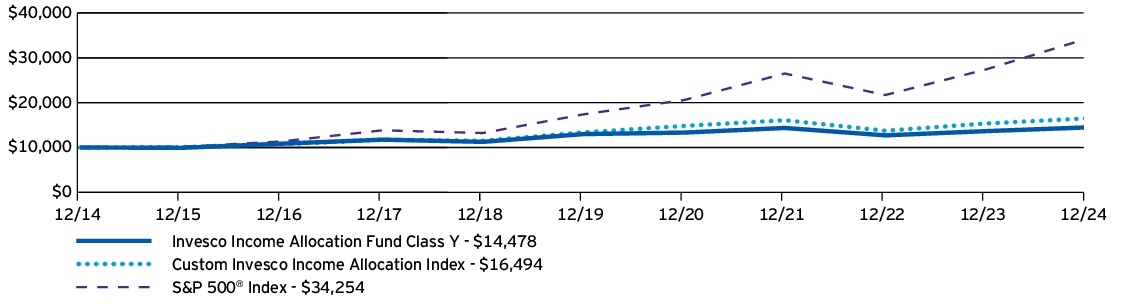
Growth of $10,000 Investment
| AVERAGE ANNUAL TOTAL RETURNS | 1 Year | 5 Years | 10 Years |
| Invesco Active Allocation Fund (Class Y) | 10.00% | 5.55% | 6.17% |
| Custom Invesco Active Allocation Index | 14.63% | 8.34% | 7.94% |
| Bloomberg Global Aggregate USD Hedged Index | 3.40% | 0.48% | 2.01% |
| MSCI ACWI (Net) | 17.49% | 10.06% | 9.23% |
| Bloomberg U.S. Aggregate Bond Index | 1.25% | (0.33)% | 1.35% |
The Custom Invesco Active Allocation Index is composed of 80% MSCI ACWI (Net) and 20% Bloomberg Global Aggregate USD Hedged Index.
Effective after the close of business on May 24, 2019, Class Y shares of Oppenheimer Portfolio Series: Active Allocation Fund (the predecessor fund), were reorganized into Class Y shares of the Fund. Returns shown above for periods ending on or prior to May 24, 2019 are those of Class Y shares of the predecessor fund. Share class returns will differ from the predecessor fund because of different expenses.
Effective April 26, 2024, the Fund changed its broad-based securities market benchmark from the Bloomberg Global Aggregate USD Hedged Index to the Bloomberg U.S. Aggregate Bond Index to reflect that the Bloomberg U.S. Aggregate Bond Index can be considered more broadly representative of the overall applicable securities market.
The performance data quoted represents past performance and cannot guarantee future results; current performance may be lower or higher. Please visit invesco.com/performance for more recent performance information.
Performance figures do not reflect deduction of taxes a shareholder would pay on Fund distributions or sale of Fund shares.
What Are Key Statistics About The Fund?
(as of December 31, 2024)
| Fund net assets | $1,899,296,008 |
| Total number of portfolio holdings | 27 |
| Total advisory fees paid | $1,648,323 |
| Portfolio turnover rate | 43% |
What Comprised The Fund's Holdings?
(as of December 31, 2024)
Asset allocation
(% of net assets)
Where Can I Find More Information?
You can find more information about the Fund, including the Fund's prospectus, financial information, and holdings at invesco.com/reports. Additionally, the Fund's proxy voting information can be found at invesco.com/proxy-voting.
What Should I Know About Delivery Of Important Regulatory Documents?
To reduce Fund expenses, only one copy of most shareholder documents may be mailed to shareholders with multiple accounts at the same address (Householding). Mailing of your shareholder documents may be householded indefinitely unless you instruct us otherwise. If you do not want the mailing of these documents to be combined with those for other members of your household, please contact Invesco Investment Services, Inc. at (800) 959-4246 or contact your financial institution. We will begin sending you individual copies for each account within 30 days after receiving your request.
For additional information, please scan the QR code at the left to navigate to additional material at invesco.com/reports.
Invesco Active Allocation Fund
Class R5: PAAJX
ANNUAL SHAREHOLDER REPORT | December 31, 2024
This annual shareholder report contains important information about Invesco Active Allocation Fund (the “Fund”) for the period January 1, 2024 to December 31, 2024. You can find additional information about the Fund at invesco.com/reports. You can also request this information by contacting us at (800) 959-4246.
This report describes changes to the Fund that occurred during the reporting period.
What Were The Fund Costs For The Last Year ?
(Based on a hypothetical $10,000 investment)
| Fund (Class) | Costs of a $10,000 investment | Costs paid as a percentage
of a $10,000 investment |
Invesco Active Allocation Fund
(Class R5) | $18 | 0.17% |
How Did The Fund Perform During The Period?
• During the fiscal year ended December 31, 2024, global risk assets outperformed defensive assets driven by a favorable macroeconomic environment, the beginning of a global monetary policy easing cycle and greater clarity with respect to fiscal policy following the conclusion of many major elections globally. These macroeconomic tailwinds supported global equity prices, particularly within the US, as well as the continuation of credit spreads tightening to cycle lows within investment grade, high yield and emerging market debt markets. Given this backdrop, an underweight to equities and overweight to fixed income assets was a headwind to Fund performance, as were certain factor tilts within equities, as well as allocations within fixed income to core and US Treasury bonds.
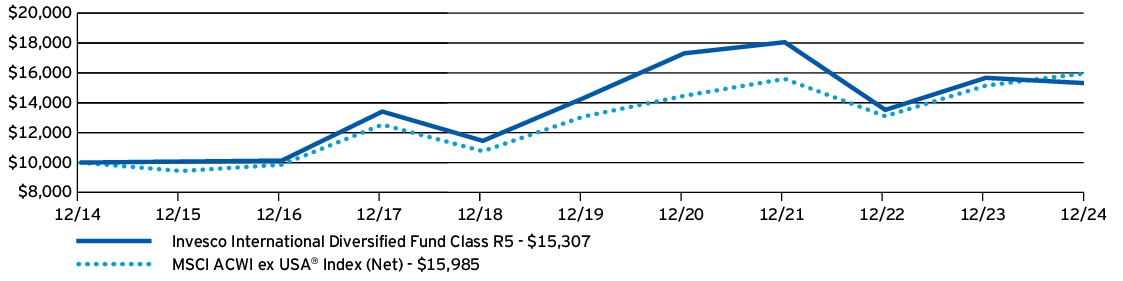
• For the fiscal year ended December 31, 2024, Class R5 shares of the Fund returned 10.05%. For the same time period, the Custom Invesco Active Allocation Index returned 14.63%.
What contributed to performance?
Exposure to growth equities and the quality factor | The Fund's exposure to high quality securities (commonly referred to as 'growth' stocks) was rewarded with exposures within both the US large- and mid-cap space, as well as exposure internationally.
Exposure to high yield and floating rate credit | The Fund's exposure to high yield was beneficial as credit spreads continued to tighten, supported by resilient corporate fundamentals and strong investor demand for higher-coupon bond offerings. Floating rate exposure was rewarded as well, with the securities benefiting from an increasing interest rate environment, compared to their fixed-rate peers.
What detracted from performance?
Cyclical factor exposure within equities | Exposure to the small size and value factors was a detractor from Fund performance over the time period, as more defensive equity factors such as quality continued to be in demand led by US megacap technology stocks and strong momentum in investor demand for thematic artificial intelligence stocks.
Exposure to core and US Treasury bonds | The Fund's exposure to core and US Treasury bonds was a headwind, as long and moderate duration, as well as higher-grade fixed income, suffered compared to shorter duration, more credit sensitive counterparts. This was due to interest rates moving higher and the steepening of the yield curve that transpired significantly in the second half of the year.
How Has The Fund Historically Performed?
Growth of $10,000 Investment
| AVERAGE ANNUAL TOTAL RETURNS | 1 Year | 5 Years | 10 Years |
| Invesco Active Allocation Fund (Class R5) | 10.05% | 5.58% | 6.07% |
| Custom Invesco Active Allocation Index | 14.63% | 8.34% | 7.94% |
| Bloomberg Global Aggregate USD Hedged Index | 3.40% | 0.48% | 2.01% |
| MSCI ACWI (Net) | 17.49% | 10.06% | 9.23% |
| Bloomberg U.S. Aggregate Bond Index | 1.25% | (0.33)% | 1.35% |
The Custom Invesco Active Allocation Index is composed of 80% MSCI ACWI (Net) and 20% Bloomberg Global Aggregate USD Hedged Index.
Class R5 shares incepted on May 24, 2019. Performance shown on and prior to that date is that of Oppenheimer Portfolio Series: Active Allocation Fund's (the predecessor fund) Class A shares at net asset value and includes 12b-1 fees applicable to Class A shares. Share class returns will differ from the predecessor fund because of different expenses.
Effective April 26, 2024, the Fund changed its broad-based securities market benchmark from the Bloomberg Global Aggregate USD Hedged Index to the Bloomberg U.S. Aggregate Bond Index to reflect that the Bloomberg U.S. Aggregate Bond Index can be considered more broadly representative of the overall applicable securities market.
The performance data quoted represents past performance and cannot guarantee future results; current performance may be lower or higher. Please visit invesco.com/performance for more recent performance information.
Performance figures do not reflect deduction of taxes a shareholder would pay on Fund distributions or sale of Fund shares.
What Are Key Statistics About The Fund?
(as of December 31, 2024)
| Fund net assets | $1,899,296,008 |
| Total number of portfolio holdings | 27 |
| Total advisory fees paid | $1,648,323 |
| Portfolio turnover rate | 43% |
What Comprised The Fund's Holdings?
(as of December 31, 2024)
Asset allocation
(% of net assets)
How Has The Fund Changed Over The Past Year?
This is a summary of certain changes to the Fund since December 31, 2023. For more complete information, you may review the Fund's prospectus, which is available at invesco.com/reports or upon request at (800) 959-4246.
Effective after the close of business on September 30, 2024, the Fund has limited public sales of its Class R5 shares to certain investors who were previously invested in Class R5 shares of the Fund.
Where Can I Find More Information?
You can find more information about the Fund, including the Fund's prospectus, financial information, and holdings at invesco.com/reports. Additionally, the Fund's proxy voting information can be found at invesco.com/proxy-voting.
What Should I Know About Delivery Of Important Regulatory Documents?
To reduce Fund expenses, only one copy of most shareholder documents may be mailed to shareholders with multiple accounts at the same address (Householding). Mailing of your shareholder documents may be householded indefinitely unless you instruct us otherwise. If you do not want the mailing of these documents to be combined with those for other members of your household, please contact Invesco Investment Services, Inc. at (800) 959-4246 or contact your financial institution. We will begin sending you individual copies for each account within 30 days after receiving your request.
For additional information, please scan the QR code at the left to navigate to additional material at invesco.com/reports.
Invesco Active Allocation Fund
Class R6: PAAQX
ANNUAL SHAREHOLDER REPORT | December 31, 2024
This annual shareholder report contains important information about Invesco Active Allocation Fund (the “Fund”) for the period January 1, 2024 to December 31, 2024. You can find additional information about the Fund at invesco.com/reports. You can also request this information by contacting us at (800) 959-4246.
What Were The Fund Costs For The Last Year ?
(Based on a hypothetical $10,000 investment)
| Fund (Class) | Costs of a $10,000 investment | Costs paid as a percentage
of a $10,000 investment |
Invesco Active Allocation Fund
(Class R6) | $16 | 0.15% |
How Did The Fund Perform During The Period?
• During the fiscal year ended December 31, 2024, global risk assets outperformed defensive assets driven by a favorable macroeconomic environment, the beginning of a global monetary policy easing cycle and greater clarity with respect to fiscal policy following the conclusion of many major elections globally. These macroeconomic tailwinds supported global equity prices, particularly within the US, as well as the continuation of credit spreads tightening to cycle lows within investment grade, high yield and emerging market debt markets. Given this backdrop, an underweight to equities and overweight to fixed income assets was a headwind to Fund performance, as were certain factor tilts within equities, as well as allocations within fixed income to core and US Treasury bonds.
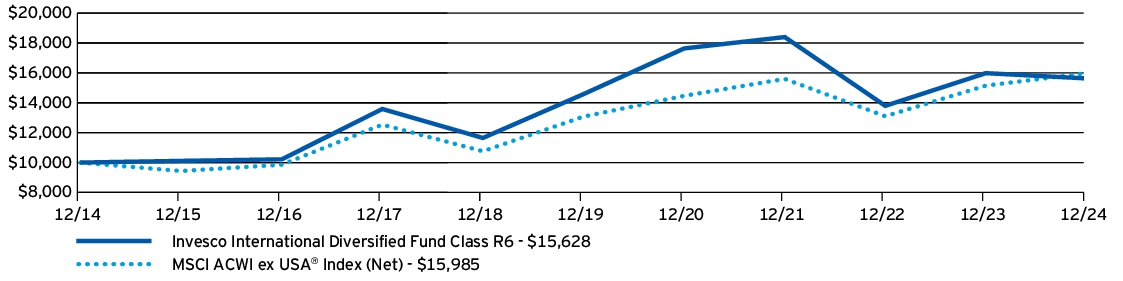
• For the fiscal year ended December 31, 2024, Class R6 shares of the Fund returned 10.08%. For the same time period, the Custom Invesco Active Allocation Index returned 14.63%.
What contributed to performance?
Exposure to growth equities and the quality factor | The Fund's exposure to high quality securities (commonly referred to as 'growth' stocks) was rewarded with exposures within both the US large- and mid-cap space, as well as exposure internationally.
Exposure to high yield and floating rate credit | The Fund's exposure to high yield was beneficial as credit spreads continued to tighten, supported by resilient corporate fundamentals and strong investor demand for higher-coupon bond offerings. Floating rate exposure was rewarded as well, with the securities benefiting from an increasing interest rate environment, compared to their fixed-rate peers.
What detracted from performance?
Cyclical factor exposure within equities | Exposure to the small size and value factors was a detractor from Fund performance over the time period, as more defensive equity factors such as quality continued to be in demand led by US megacap technology stocks and strong momentum in investor demand for thematic artificial intelligence stocks.
Exposure to core and US Treasury bonds | The Fund's exposure to core and US Treasury bonds was a headwind, as long and moderate duration, as well as higher-grade fixed income, suffered compared to shorter duration, more credit sensitive counterparts. This was due to interest rates moving higher and the steepening of the yield curve that transpired significantly in the second half of the year.
How Has The Fund Historically Performed?
Growth of $10,000 Investment
| AVERAGE ANNUAL TOTAL RETURNS | 1 Year | 5 Years | 10 Years |
| Invesco Active Allocation Fund (Class R6) | 10.08% | 5.59% | 6.08% |
| Custom Invesco Active Allocation Index | 14.63% | 8.34% | 7.94% |
| Bloomberg Global Aggregate USD Hedged Index | 3.40% | 0.48% | 2.01% |
| MSCI ACWI (Net) | 17.49% | 10.06% | 9.23% |
| Bloomberg U.S. Aggregate Bond Index | 1.25% | (0.33)% | 1.35% |
The Custom Invesco Active Allocation Index is composed of 80% MSCI ACWI (Net) and 20% Bloomberg Global Aggregate USD Hedged Index.
Class R6 shares incepted on May 24, 2019. Performance shown on and prior to that date is that of Oppenheimer Portfolio Series: Active Allocation Fund's (the predecessor fund) Class A shares at net asset value and includes 12b-1 fees applicable to Class A shares. Share class returns will differ from the predecessor fund because of different expenses.
Effective April 26, 2024, the Fund changed its broad-based securities market benchmark from the Bloomberg Global Aggregate USD Hedged Index to the Bloomberg U.S. Aggregate Bond Index to reflect that the Bloomberg U.S. Aggregate Bond Index can be considered more broadly representative of the overall applicable securities market.
The performance data quoted represents past performance and cannot guarantee future results; current performance may be lower or higher. Please visit invesco.com/performance for more recent performance information.
Performance figures do not reflect deduction of taxes a shareholder would pay on Fund distributions or sale of Fund shares.
What Are Key Statistics About The Fund?
(as of December 31, 2024)
| Fund net assets | $1,899,296,008 |
| Total number of portfolio holdings | 27 |
| Total advisory fees paid | $1,648,323 |
| Portfolio turnover rate | 43% |
What Comprised The Fund's Holdings?
(as of December 31, 2024)
Asset allocation
(% of net assets)
Where Can I Find More Information?
You can find more information about the Fund, including the Fund's prospectus, financial information, and holdings at invesco.com/reports. Additionally, the Fund's proxy voting information can be found at invesco.com/proxy-voting.
What Should I Know About Delivery Of Important Regulatory Documents?
To reduce Fund expenses, only one copy of most shareholder documents may be mailed to shareholders with multiple accounts at the same address (Householding). Mailing of your shareholder documents may be householded indefinitely unless you instruct us otherwise. If you do not want the mailing of these documents to be combined with those for other members of your household, please contact Invesco Investment Services, Inc. at (800) 959-4246 or contact your financial institution. We will begin sending you individual copies for each account within 30 days after receiving your request.
For additional information, please scan the QR code at the left to navigate to additional material at invesco.com/reports.
Invesco Convertible Securities Fund
Class A: CNSAX
ANNUAL SHAREHOLDER REPORT | December 31, 2024
This annual shareholder report contains important information about Invesco Convertible Securities Fund (the “Fund”) for the period January 1, 2024 to December 31, 2024. You can find additional information about the Fund at invesco.com/reports. You can also request this information by contacting us at (800) 959-4246.
What Were The Fund Costs For The Last Year ?
(Based on a hypothetical $10,000 investment)
| Fund (Class) | Costs of a $10,000 investment | Costs paid as a percentage
of a $10,000 investment |
Invesco Convertible Securities Fund
(Class A) | $101 | 0.96%† |
† | Reflects fee waivers and/or expense reimbursements, without which expenses would have been higher. |
How Did The Fund Perform During The Period?
• During the fiscal year ended December 31, 2024, the Fund performed favorably. Stronger than anticipated economic growth alongside a continuing, albeit bumpy, disinflation trend created a favorable backdrop for equity and credit markets. Convertibles fared well in this environment, supported by strong equity performance.
• For the fiscal year ended December 31, 2024, Class A shares of the Fund, excluding sales charge, returned 9.74%. For the same time period, the ICE BofA US Convertible Index returned 11.14%.
What contributed to performance?
BrightSpring Health Services, Inc. | BrightSpring Health Services offers a home and community-based health care services platform. The company posted strong revenue growth alongside improving sentiment for the sector.
Insmed, Inc. | Insmed is a biopharmaceutical company. The company benefited from positive clinical results in May, bolstering equity performance.
What detracted from performance?
Rocket Lab USA, Inc. | An underweight position to Rocket Lab hurt the Fund after the spacecraft and satellite company posted stronger than expected earnings in the third quarter. We sold the holding during the fiscal year.
Uber Technologies, Inc. | An overweight position to Uber detracted from relative performance as the ride hailing service saw mixed performance over the year. We sold the holding during the fiscal year.
How Has The Fund Historically Performed?
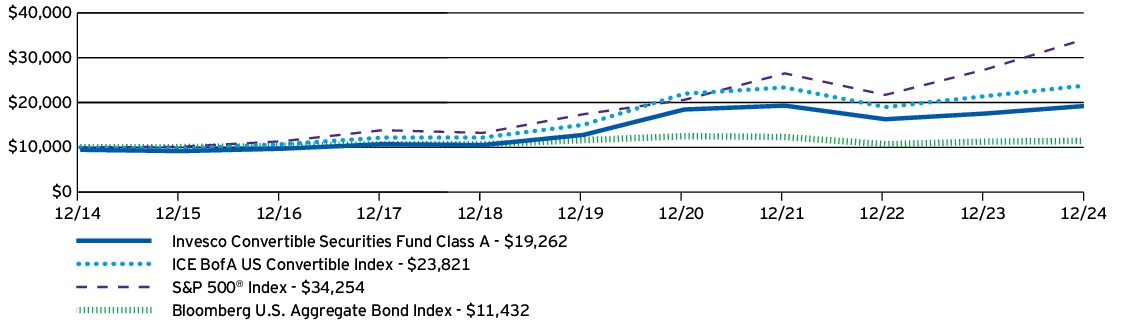
Growth of $10,000 Investment
| AVERAGE ANNUAL TOTAL RETURNS | 1 Year | 5 Years | 10 Years |
| Invesco Convertible Securities Fund (Class A) —including sales charge | 3.69% | 7.34% | 6.77% |
| Invesco Convertible Securities Fund (Class A) —excluding sales charge | 9.74% | 8.55% | 7.38% |
| ICE BofA US Convertible Index | 11.14% | 9.66% | 9.07% |
| S&P 500® Index | 25.02% | 14.53% | 13.10% |
| Bloomberg U.S. Aggregate Bond Index | 1.25% | (0.33)% | 1.35% |
Prior to July 1, 2022, index returns reflect no deduction for fees, expenses or taxes. Effective July 1, 2022, index returns reflect no deduction for taxes, but include transaction costs, which may be higher or lower than the actual transaction costs incurred by the Fund.
Effective April 26, 2024, the Fund changed its broad-based securities market benchmark from the ICE BofA US Convertible Index to the S&P 500® Index and Bloomberg U.S. Aggregate Bond Index to reflect that the S&P 500® Index and the Bloomberg U.S. Aggregate Bond Index can be considered more broadly representative of the overall applicable securities markets.
The performance data quoted represents past performance and cannot guarantee future results; current performance may be lower or higher. Please visit invesco.com/performance for more recent performance information.
Performance figures do not reflect deduction of taxes a shareholder would pay on Fund distributions or sale of Fund shares.
What Are Key Statistics About The Fund?
(as of December 31, 2024)
| Fund net assets | $739,282,669 |
| Total number of portfolio holdings | 173 |
| Total advisory fees paid | $3,991,359 |
| Portfolio turnover rate | 87% |
What Comprised The Fund's Holdings?
(as of December 31, 2024)
Top ten holdings*
(% of net assets)
| Wells Fargo & Co., Class A, Series L, Conv. Pfd., 7.50%, | 2.97% |
| Bank of America Corp., Series L, Conv. Pfd., 7.25%, | 2.94% |
| Boeing Co. (The), Conv. Pfd., 6.00%, 10/15/2027 | 2.39% |
| Coinbase Global, Inc., Conv., 0.25%, 04/01/2030 | 2.25% |
| Southern Co. (The), Conv., 4.50%, 06/15/2027 | 1.57% |
| Rivian Automotive, Inc., Conv., 4.63%, 03/15/2029 | 1.53% |
| Uber Technologies, Inc., Series 2028, Conv., 0.88%, 12/01/2028 | 1.48% |
| Live Nation Entertainment, Inc., Conv., 3.13%, 01/15/2029 | 1.38% |
| Akamai Technologies, Inc., Conv., 0.38%, 09/01/2027 | 1.38% |
| Welltower OP LLC, Conv., 3.13%, 07/15/2029 | 1.33% |
| * Excluding money market fund holdings, if any. | |
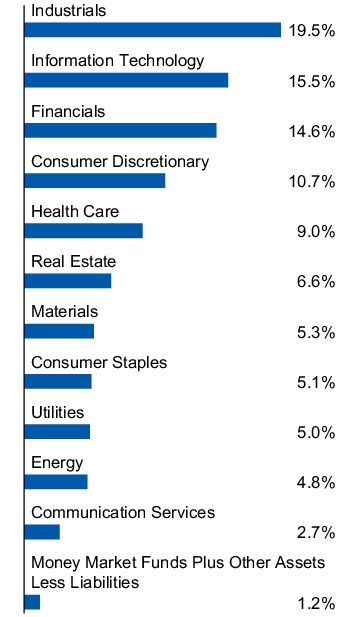
Sector allocation
(% of net assets)
Where Can I Find More Information?
You can find more information about the Fund, including the Fund's prospectus, financial information, and holdings at invesco.com/reports. Additionally, the Fund's proxy voting information can be found at invesco.com/proxy-voting.
What Should I Know About Delivery Of Important Regulatory Documents?
To reduce Fund expenses, only one copy of most shareholder documents may be mailed to shareholders with multiple accounts at the same address (Householding). Mailing of your shareholder documents may be householded indefinitely unless you instruct us otherwise. If you do not want the mailing of these documents to be combined with those for other members of your household, please contact Invesco Investment Services, Inc. at (800) 959-4246 or contact your financial institution. We will begin sending you individual copies for each account within 30 days after receiving your request.
For additional information, please scan the QR code at the left to navigate to additional material at invesco.com/reports.
Invesco Convertible Securities Fund
Class C: CNSCX
ANNUAL SHAREHOLDER REPORT | December 31, 2024
This annual shareholder report contains important information about Invesco Convertible Securities Fund (the “Fund”) for the period January 1, 2024 to December 31, 2024. You can find additional information about the Fund at invesco.com/reports. You can also request this information by contacting us at (800) 959-4246.
What Were The Fund Costs For The Last Year ?
(Based on a hypothetical $10,000 investment)
| Fund (Class) | Costs of a $10,000 investment | Costs paid as a percentage
of a $10,000 investment |
Invesco Convertible Securities Fund
(Class C) | $178 | 1.70%† |
† | Reflects fee waivers and/or expense reimbursements, without which expenses would have been higher. |
How Did The Fund Perform During The Period?
• During the fiscal year ended December 31, 2024, the Fund performed favorably. Stronger than anticipated economic growth alongside a continuing, albeit bumpy, disinflation trend created a favorable backdrop for equity and credit markets. Convertibles fared well in this environment, supported by strong equity performance.
• For the fiscal year ended December 31, 2024, Class C shares of the Fund, excluding sales charge, returned 8.86%. For the same time period, the ICE BofA US Convertible Index returned 11.14%.
What contributed to performance?
BrightSpring Health Services, Inc. | BrightSpring Health Services offers a home and community-based health care services platform. The company posted strong revenue growth alongside improving sentiment for the sector.
Insmed, Inc. | Insmed is a biopharmaceutical company. The company benefited from positive clinical results in May, bolstering equity performance.
What detracted from performance?
Rocket Lab USA, Inc. | An underweight position to Rocket Lab hurt the Fund after the spacecraft and satellite company posted stronger than expected earnings in the third quarter. We sold the holding during the fiscal year.
Uber Technologies, Inc. | An overweight position to Uber detracted from relative performance as the ride hailing service saw mixed performance over the year. We sold the holding during the fiscal year.
How Has The Fund Historically Performed?
Growth of $10,000 Investment
| AVERAGE ANNUAL TOTAL RETURNS | 1 Year | 5 Years | 10 Years |
| Invesco Convertible Securities Fund (Class C) —including sales charge | 7.86% | 7.75% | 6.76% |
| Invesco Convertible Securities Fund (Class C) —excluding sales charge | 8.86% | 7.75% | 6.76% |
| ICE BofA US Convertible Index | 11.14% | 9.66% | 9.07% |
| S&P 500® Index | 25.02% | 14.53% | 13.10% |
| Bloomberg U.S. Aggregate Bond Index | 1.25% | (0.33)% | 1.35% |
Prior to July 1, 2022, index returns reflect no deduction for fees, expenses or taxes. Effective July 1, 2022, index returns reflect no deduction for taxes, but include transaction costs, which may be higher or lower than the actual transaction costs incurred by the Fund.
Effective April 26, 2024, the Fund changed its broad-based securities market benchmark from the ICE BofA US Convertible Index to the S&P 500® Index and Bloomberg U.S. Aggregate Bond Index to reflect that the S&P 500® Index and the Bloomberg U.S. Aggregate Bond Index can be considered more broadly representative of the overall applicable securities markets.
The performance data quoted represents past performance and cannot guarantee future results; current performance may be lower or higher. Please visit invesco.com/performance for more recent performance information.
Performance figures do not reflect deduction of taxes a shareholder would pay on Fund distributions or sale of Fund shares.
What Are Key Statistics About The Fund?
(as of December 31, 2024)
| Fund net assets | $739,282,669 |
| Total number of portfolio holdings | 173 |
| Total advisory fees paid | $3,991,359 |
| Portfolio turnover rate | 87% |
What Comprised The Fund's Holdings?
(as of December 31, 2024)
Top ten holdings*
(% of net assets)
| Wells Fargo & Co., Class A, Series L, Conv. Pfd., 7.50%, | 2.97% |
| Bank of America Corp., Series L, Conv. Pfd., 7.25%, | 2.94% |
| Boeing Co. (The), Conv. Pfd., 6.00%, 10/15/2027 | 2.39% |
| Coinbase Global, Inc., Conv., 0.25%, 04/01/2030 | 2.25% |
| Southern Co. (The), Conv., 4.50%, 06/15/2027 | 1.57% |
| Rivian Automotive, Inc., Conv., 4.63%, 03/15/2029 | 1.53% |
| Uber Technologies, Inc., Series 2028, Conv., 0.88%, 12/01/2028 | 1.48% |
| Live Nation Entertainment, Inc., Conv., 3.13%, 01/15/2029 | 1.38% |
| Akamai Technologies, Inc., Conv., 0.38%, 09/01/2027 | 1.38% |
| Welltower OP LLC, Conv., 3.13%, 07/15/2029 | 1.33% |
| * Excluding money market fund holdings, if any. | |
Sector allocation
(% of net assets)
Where Can I Find More Information?
You can find more information about the Fund, including the Fund's prospectus, financial information, and holdings at invesco.com/reports. Additionally, the Fund's proxy voting information can be found at invesco.com/proxy-voting.
What Should I Know About Delivery Of Important Regulatory Documents?
To reduce Fund expenses, only one copy of most shareholder documents may be mailed to shareholders with multiple accounts at the same address (Householding). Mailing of your shareholder documents may be householded indefinitely unless you instruct us otherwise. If you do not want the mailing of these documents to be combined with those for other members of your household, please contact Invesco Investment Services, Inc. at (800) 959-4246 or contact your financial institution. We will begin sending you individual copies for each account within 30 days after receiving your request.
For additional information, please scan the QR code at the left to navigate to additional material at invesco.com/reports.
Invesco Convertible Securities Fund
Class Y: CNSDX
ANNUAL SHAREHOLDER REPORT | December 31, 2024
This annual shareholder report contains important information about Invesco Convertible Securities Fund (the “Fund”) for the period January 1, 2024 to December 31, 2024. You can find additional information about the Fund at invesco.com/reports. You can also request this information by contacting us at (800) 959-4246.
What Were The Fund Costs For The Last Year ?
(Based on a hypothetical $10,000 investment)
| Fund (Class) | Costs of a $10,000 investment | Costs paid as a percentage
of a $10,000 investment |
Invesco Convertible Securities Fund
(Class Y) | $75 | 0.71%† |
† | Reflects fee waivers and/or expense reimbursements, without which expenses would have been higher. |
How Did The Fund Perform During The Period?
• During the fiscal year ended December 31, 2024, the Fund performed favorably. Stronger than anticipated economic growth alongside a continuing, albeit bumpy, disinflation trend created a favorable backdrop for equity and credit markets. Convertibles fared well in this environment, supported by strong equity performance.
• For the fiscal year ended December 31, 2024, Class Y shares of the Fund returned 9.95%. For the same time period, the ICE BofA US Convertible Index returned 11.14%.
What contributed to performance?
BrightSpring Health Services, Inc. | BrightSpring Health Services offers a home and community-based health care services platform. The company posted strong revenue growth alongside improving sentiment for the sector.
Insmed, Inc. | Insmed is a biopharmaceutical company. The company benefited from positive clinical results in May, bolstering equity performance.
What detracted from performance?
Rocket Lab USA, Inc. | An underweight position to Rocket Lab hurt the Fund after the spacecraft and satellite company posted stronger than expected earnings in the third quarter. We sold the holding during the fiscal year.
Uber Technologies, Inc. | An overweight position to Uber detracted from relative performance as the ride hailing service saw mixed performance over the year. We sold the holding during the fiscal year.
How Has The Fund Historically Performed?
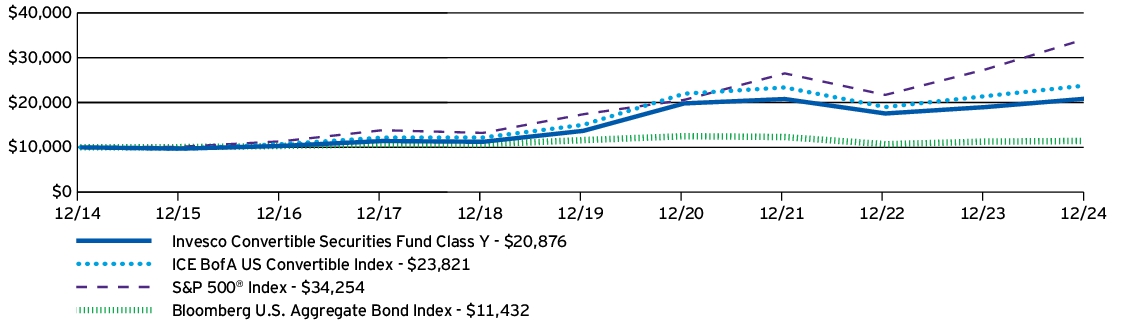
Growth of $10,000 Investment
| AVERAGE ANNUAL TOTAL RETURNS | 1 Year | 5 Years | 10 Years |
| Invesco Convertible Securities Fund (Class Y) | 9.95% | 8.82% | 7.64% |
| ICE BofA US Convertible Index | 11.14% | 9.66% | 9.07% |
| S&P 500® Index | 25.02% | 14.53% | 13.10% |
| Bloomberg U.S. Aggregate Bond Index | 1.25% | (0.33)% | 1.35% |
Prior to July 1, 2022, index returns reflect no deduction for fees, expenses or taxes. Effective July 1, 2022, index returns reflect no deduction for taxes, but include transaction costs, which may be higher or lower than the actual transaction costs incurred by the Fund.
Effective April 26, 2024, the Fund changed its broad-based securities market benchmark from the ICE BofA US Convertible Index to the S&P 500® Index and Bloomberg U.S. Aggregate Bond Index to reflect that the S&P 500® Index and the Bloomberg U.S. Aggregate Bond Index can be considered more broadly representative of the overall applicable securities markets.
The performance data quoted represents past performance and cannot guarantee future results; current performance may be lower or higher. Please visit invesco.com/performance for more recent performance information.
Performance figures do not reflect deduction of taxes a shareholder would pay on Fund distributions or sale of Fund shares.
What Are Key Statistics About The Fund?
(as of December 31, 2024)
| Fund net assets | $739,282,669 |
| Total number of portfolio holdings | 173 |
| Total advisory fees paid | $3,991,359 |
| Portfolio turnover rate | 87% |
What Comprised The Fund's Holdings?
(as of December 31, 2024)
Top ten holdings*
(% of net assets)
| Wells Fargo & Co., Class A, Series L, Conv. Pfd., 7.50%, | 2.97% |
| Bank of America Corp., Series L, Conv. Pfd., 7.25%, | 2.94% |
| Boeing Co. (The), Conv. Pfd., 6.00%, 10/15/2027 | 2.39% |
| Coinbase Global, Inc., Conv., 0.25%, 04/01/2030 | 2.25% |
| Southern Co. (The), Conv., 4.50%, 06/15/2027 | 1.57% |
| Rivian Automotive, Inc., Conv., 4.63%, 03/15/2029 | 1.53% |
| Uber Technologies, Inc., Series 2028, Conv., 0.88%, 12/01/2028 | 1.48% |
| Live Nation Entertainment, Inc., Conv., 3.13%, 01/15/2029 | 1.38% |
| Akamai Technologies, Inc., Conv., 0.38%, 09/01/2027 | 1.38% |
| Welltower OP LLC, Conv., 3.13%, 07/15/2029 | 1.33% |
| * Excluding money market fund holdings, if any. | |
Sector allocation
(% of net assets)
Where Can I Find More Information?
You can find more information about the Fund, including the Fund's prospectus, financial information, and holdings at invesco.com/reports. Additionally, the Fund's proxy voting information can be found at invesco.com/proxy-voting.
What Should I Know About Delivery Of Important Regulatory Documents?
To reduce Fund expenses, only one copy of most shareholder documents may be mailed to shareholders with multiple accounts at the same address (Householding). Mailing of your shareholder documents may be householded indefinitely unless you instruct us otherwise. If you do not want the mailing of these documents to be combined with those for other members of your household, please contact Invesco Investment Services, Inc. at (800) 959-4246 or contact your financial institution. We will begin sending you individual copies for each account within 30 days after receiving your request.
For additional information, please scan the QR code at the left to navigate to additional material at invesco.com/reports.
Invesco Convertible Securities Fund
Class R5: CNSIX
ANNUAL SHAREHOLDER REPORT | December 31, 2024
This annual shareholder report contains important information about Invesco Convertible Securities Fund (the “Fund”) for the period January 1, 2024 to December 31, 2024. You can find additional information about the Fund at invesco.com/reports. You can also request this information by contacting us at (800) 959-4246.
This report describes changes to the Fund that occurred during the reporting period.
What Were The Fund Costs For The Last Year ?
(Based on a hypothetical $10,000 investment)
| Fund (Class) | Costs of a $10,000 investment | Costs paid as a percentage
of a $10,000 investment |
Invesco Convertible Securities Fund
(Class R5) | $70 | 0.67%† |
† | Reflects fee waivers and/or expense reimbursements, without which expenses would have been higher. |
How Did The Fund Perform During The Period?
• During the fiscal year ended December 31, 2024, the Fund performed favorably. Stronger than anticipated economic growth alongside a continuing, albeit bumpy, disinflation trend created a favorable backdrop for equity and credit markets. Convertibles fared well in this environment, supported by strong equity performance.
• For the fiscal year ended December 31, 2024, Class R5 shares of the Fund returned 10.01%. For the same time period, the ICE BofA US Convertible Index returned 11.14%.
What contributed to performance?
BrightSpring Health Services, Inc. | BrightSpring Health Services offers a home and community-based health care services platform. The company posted strong revenue growth alongside improving sentiment for the sector.
Insmed, Inc. | Insmed is a biopharmaceutical company. The company benefited from positive clinical results in May, bolstering equity performance.
What detracted from performance?
Rocket Lab USA, Inc. | An underweight position to Rocket Lab hurt the Fund after the spacecraft and satellite company posted stronger than expected earnings in the third quarter. We sold the holding during the fiscal year.
Uber Technologies, Inc. | An overweight position to Uber detracted from relative performance as the ride hailing service saw mixed performance over the year. We sold the holding during the fiscal year.
How Has The Fund Historically Performed?
Growth of $10,000 Investment
| AVERAGE ANNUAL TOTAL RETURNS | 1 Year | 5 Years | 10 Years |
| Invesco Convertible Securities Fund (Class R5) | 10.01% | 8.84% | 7.67% |
| ICE BofA US Convertible Index | 11.14% | 9.66% | 9.07% |
| S&P 500® Index | 25.02% | 14.53% | 13.10% |
| Bloomberg U.S. Aggregate Bond Index | 1.25% | (0.33)% | 1.35% |
Prior to July 1, 2022, index returns reflect no deduction for fees, expenses or taxes. Effective July 1, 2022, index returns reflect no deduction for taxes, but include transaction costs, which may be higher or lower than the actual transaction costs incurred by the Fund.
Effective April 26, 2024, the Fund changed its broad-based securities market benchmark from the ICE BofA US Convertible Index to the S&P 500® Index and Bloomberg U.S. Aggregate Bond Index to reflect that the S&P 500® Index and the Bloomberg U.S. Aggregate Bond Index can be considered more broadly representative of the overall applicable securities markets.
The performance data quoted represents past performance and cannot guarantee future results; current performance may be lower or higher. Please visit invesco.com/performance for more recent performance information.
Performance figures do not reflect deduction of taxes a shareholder would pay on Fund distributions or sale of Fund shares.
What Are Key Statistics About The Fund?
(as of December 31, 2024)
| Fund net assets | $739,282,669 |
| Total number of portfolio holdings | 173 |
| Total advisory fees paid | $3,991,359 |
| Portfolio turnover rate | 87% |
What Comprised The Fund's Holdings?
(as of December 31, 2024)
Top ten holdings*
(% of net assets)
| Wells Fargo & Co., Class A, Series L, Conv. Pfd., 7.50%, | 2.97% |
| Bank of America Corp., Series L, Conv. Pfd., 7.25%, | 2.94% |
| Boeing Co. (The), Conv. Pfd., 6.00%, 10/15/2027 | 2.39% |
| Coinbase Global, Inc., Conv., 0.25%, 04/01/2030 | 2.25% |
| Southern Co. (The), Conv., 4.50%, 06/15/2027 | 1.57% |
| Rivian Automotive, Inc., Conv., 4.63%, 03/15/2029 | 1.53% |
| Uber Technologies, Inc., Series 2028, Conv., 0.88%, 12/01/2028 | 1.48% |
| Live Nation Entertainment, Inc., Conv., 3.13%, 01/15/2029 | 1.38% |
| Akamai Technologies, Inc., Conv., 0.38%, 09/01/2027 | 1.38% |
| Welltower OP LLC, Conv., 3.13%, 07/15/2029 | 1.33% |
| * Excluding money market fund holdings, if any. | |
Sector allocation
(% of net assets)
How Has The Fund Changed Over The Past Year?
This is a summary of certain changes to the Fund since December 31, 2023. For more complete information, you may review the Fund's prospectus, which is available at invesco.com/reports or upon request at (800) 959-4246.
Effective after the close of business on September 30, 2024, the Fund has limited public sales of its Class R5 shares to certain investors who were previously invested in Class R5 shares of the Fund.
Where Can I Find More Information?
You can find more information about the Fund, including the Fund's prospectus, financial information, and holdings at invesco.com/reports. Additionally, the Fund's proxy voting information can be found at invesco.com/proxy-voting.
What Should I Know About Delivery Of Important Regulatory Documents?
To reduce Fund expenses, only one copy of most shareholder documents may be mailed to shareholders with multiple accounts at the same address (Householding). Mailing of your shareholder documents may be householded indefinitely unless you instruct us otherwise. If you do not want the mailing of these documents to be combined with those for other members of your household, please contact Invesco Investment Services, Inc. at (800) 959-4246 or contact your financial institution. We will begin sending you individual copies for each account within 30 days after receiving your request.
For additional information, please scan the QR code at the left to navigate to additional material at invesco.com/reports.
Invesco Convertible Securities Fund
Class R6: CNSFX
ANNUAL SHAREHOLDER REPORT | December 31, 2024
This annual shareholder report contains important information about Invesco Convertible Securities Fund (the “Fund”) for the period January 1, 2024 to December 31, 2024. You can find additional information about the Fund at invesco.com/reports. You can also request this information by contacting us at (800) 959-4246.
What Were The Fund Costs For The Last Year ?
(Based on a hypothetical $10,000 investment)
| Fund (Class) | Costs of a $10,000 investment | Costs paid as a percentage
of a $10,000 investment |
Invesco Convertible Securities Fund
(Class R6) | $63 | 0.60%† |
† | Reflects fee waivers and/or expense reimbursements, without which expenses would have been higher. |
How Did The Fund Perform During The Period?
• During the fiscal year ended December 31, 2024, the Fund performed favorably. Stronger than anticipated economic growth alongside a continuing, albeit bumpy, disinflation trend created a favorable backdrop for equity and credit markets. Convertibles fared well in this environment, supported by strong equity performance.
• For the fiscal year ended December 31, 2024, Class R6 shares of the Fund returned 10.08%. For the same time period, the ICE BofA US Convertible Index returned 11.14%.
What contributed to performance?
BrightSpring Health Services, Inc. | BrightSpring Health Services offers a home and community-based health care services platform. The company posted strong revenue growth alongside improving sentiment for the sector.
Insmed, Inc. | Insmed is a biopharmaceutical company. The company benefited from positive clinical results in May, bolstering equity performance.
What detracted from performance?
Rocket Lab USA, Inc. | An underweight position to Rocket Lab hurt the Fund after the spacecraft and satellite company posted stronger than expected earnings in the third quarter. We sold the holding during the fiscal year.
Uber Technologies, Inc. | An overweight position to Uber detracted from relative performance as the ride hailing service saw mixed performance over the year. We sold the holding during the fiscal year.
How Has The Fund Historically Performed?
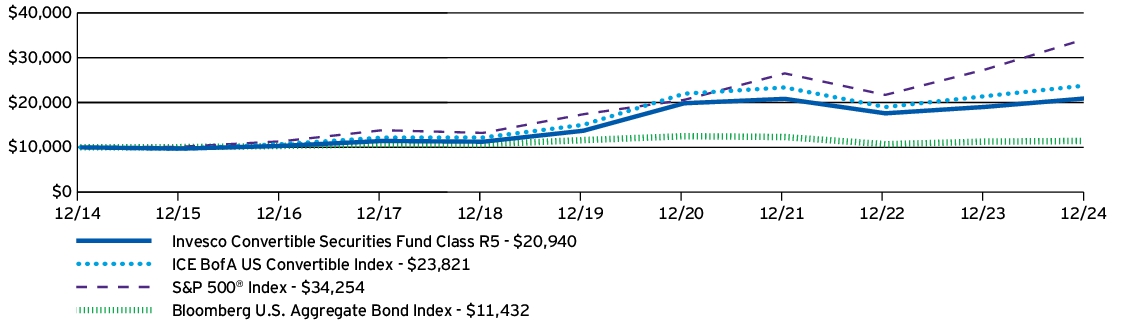
Growth of $10,000 Investment
| AVERAGE ANNUAL TOTAL RETURNS | 1 Year | 5 Years | 10 Years |
| Invesco Convertible Securities Fund (Class R6) | 10.08% | 8.93% | 7.76% |
| ICE BofA US Convertible Index | 11.14% | 9.66% | 9.07% |
| S&P 500® Index | 25.02% | 14.53% | 13.10% |
| Bloomberg U.S. Aggregate Bond Index | 1.25% | (0.33)% | 1.35% |
Prior to July 1, 2022, index returns reflect no deduction for fees, expenses or taxes. Effective July 1, 2022, index returns reflect no deduction for taxes, but include transaction costs, which may be higher or lower than the actual transaction costs incurred by the Fund.
Effective April 26, 2024, the Fund changed its broad-based securities market benchmark from the ICE BofA US Convertible Index to the S&P 500® Index and Bloomberg U.S. Aggregate Bond Index to reflect that the S&P 500® Index and the Bloomberg U.S. Aggregate Bond Index can be considered more broadly representative of the overall applicable securities markets.
The performance data quoted represents past performance and cannot guarantee future results; current performance may be lower or higher. Please visit invesco.com/performance for more recent performance information.
Performance figures do not reflect deduction of taxes a shareholder would pay on Fund distributions or sale of Fund shares.
What Are Key Statistics About The Fund?
(as of December 31, 2024)
| Fund net assets | $739,282,669 |
| Total number of portfolio holdings | 173 |
| Total advisory fees paid | $3,991,359 |
| Portfolio turnover rate | 87% |
What Comprised The Fund's Holdings?
(as of December 31, 2024)
Top ten holdings*
(% of net assets)
| Wells Fargo & Co., Class A, Series L, Conv. Pfd., 7.50%, | 2.97% |
| Bank of America Corp., Series L, Conv. Pfd., 7.25%, | 2.94% |
| Boeing Co. (The), Conv. Pfd., 6.00%, 10/15/2027 | 2.39% |
| Coinbase Global, Inc., Conv., 0.25%, 04/01/2030 | 2.25% |
| Southern Co. (The), Conv., 4.50%, 06/15/2027 | 1.57% |
| Rivian Automotive, Inc., Conv., 4.63%, 03/15/2029 | 1.53% |
| Uber Technologies, Inc., Series 2028, Conv., 0.88%, 12/01/2028 | 1.48% |
| Live Nation Entertainment, Inc., Conv., 3.13%, 01/15/2029 | 1.38% |
| Akamai Technologies, Inc., Conv., 0.38%, 09/01/2027 | 1.38% |
| Welltower OP LLC, Conv., 3.13%, 07/15/2029 | 1.33% |
| * Excluding money market fund holdings, if any. | |
Sector allocation
(% of net assets)
Where Can I Find More Information?
You can find more information about the Fund, including the Fund's prospectus, financial information, and holdings at invesco.com/reports. Additionally, the Fund's proxy voting information can be found at invesco.com/proxy-voting.
What Should I Know About Delivery Of Important Regulatory Documents?
To reduce Fund expenses, only one copy of most shareholder documents may be mailed to shareholders with multiple accounts at the same address (Householding). Mailing of your shareholder documents may be householded indefinitely unless you instruct us otherwise. If you do not want the mailing of these documents to be combined with those for other members of your household, please contact Invesco Investment Services, Inc. at (800) 959-4246 or contact your financial institution. We will begin sending you individual copies for each account within 30 days after receiving your request.
For additional information, please scan the QR code at the left to navigate to additional material at invesco.com/reports.
Invesco Income Advantage International Fund
Class A: GTNDX
ANNUAL SHAREHOLDER REPORT | December 31, 2024
This annual shareholder report contains important information about Invesco Income Advantage International Fund (the “Fund”) for the period January 1, 2024 to December 31, 2024. You can find additional information about the Fund at invesco.com/reports. You can also request this information by contacting us at (800) 959-4246.
This report describes changes to the Fund that occurred during the reporting period.
What Were The Fund Costs For The Last Year ?
(Based on a hypothetical $10,000 investment)
| Fund (Class) | Costs of a $10,000 investment | Costs paid as a percentage
of a $10,000 investment |
Invesco Income Advantage International Fund
(Class A) | $129 | 1.25%† |
† | Reflects fee waivers and/or expense reimbursements, without which expenses would have been higher. |
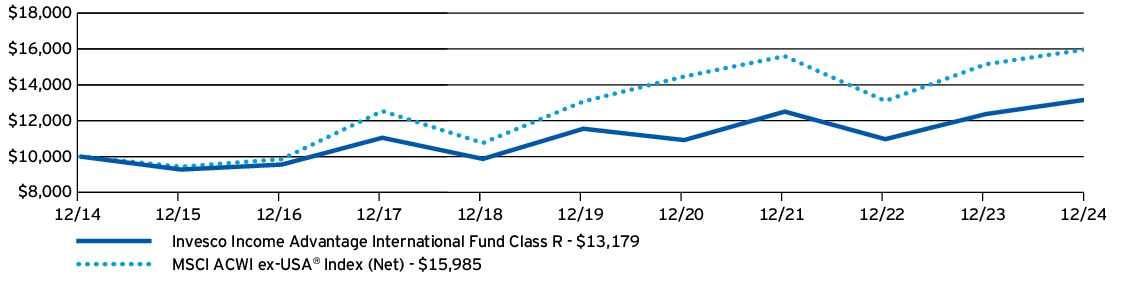
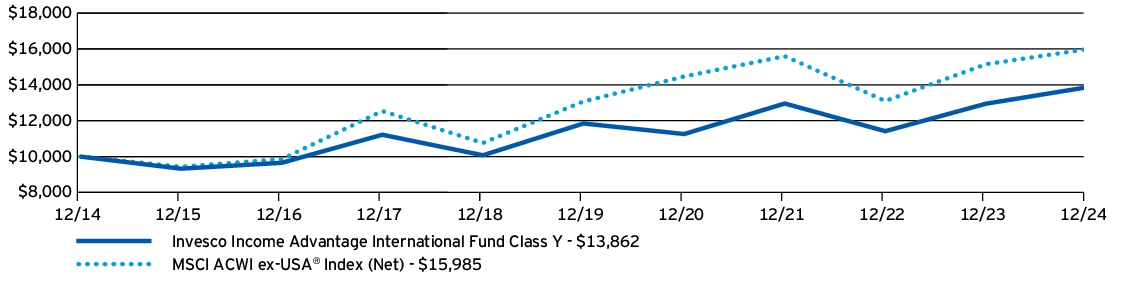
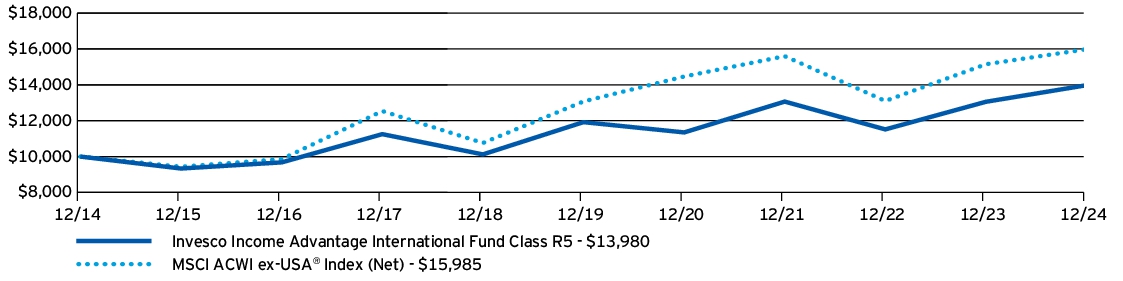
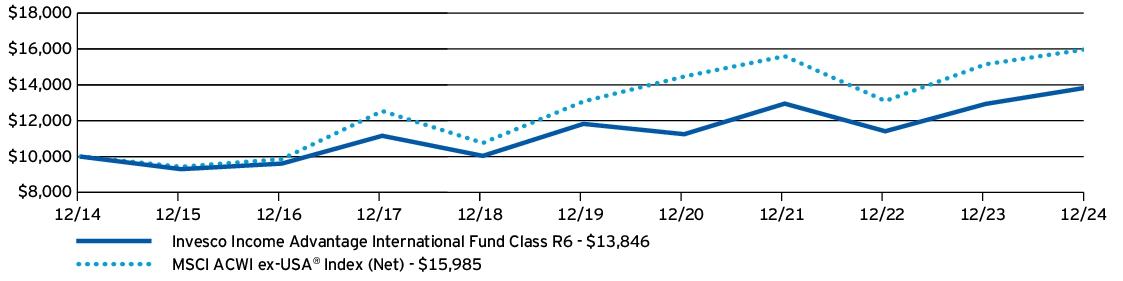
How Did The Fund Perform During The Period?
• During the fiscal year ended December 31, 2024, international equities experienced a mixed but generally positive performance that contained periods of volatility. This included a sharp sell-off in early August and another large drawdown in October, in response to a strengthening US dollar. The fiscal year ended with another drawdown in December due to geopolitical tensions and wavering global central bank policy.
• For the fiscal year ended December 31, 2024, Class A shares of the Fund, excluding sales charge, returned 6.80%. For the same time period, the MSCI ACWI ex-USA® Index (Net) returned 5.53%.
What contributed to performance?
Options-Based Income Exposure | The defensive and income-producing options and cash/cash equivalent components of the Fund's investments in equity-linked notes helped mitigate heightened market volatility and drawdowns relative to the MSCI ACWI ex-USA® Index (Net). Equity-linked notes are comprised primarily of returns attributable to coupon income received from selling embedded options and returns attributable to price changes in referenced equities, and cash or cash equivalents.
Passive Index Security Exposure | The Fund’s low tracking error to the MSCI ACWI ex-USA Index® contributed to the Fund's performance during the period.
What detracted from performance?
Detractors | There were no detractors during the fiscal year.
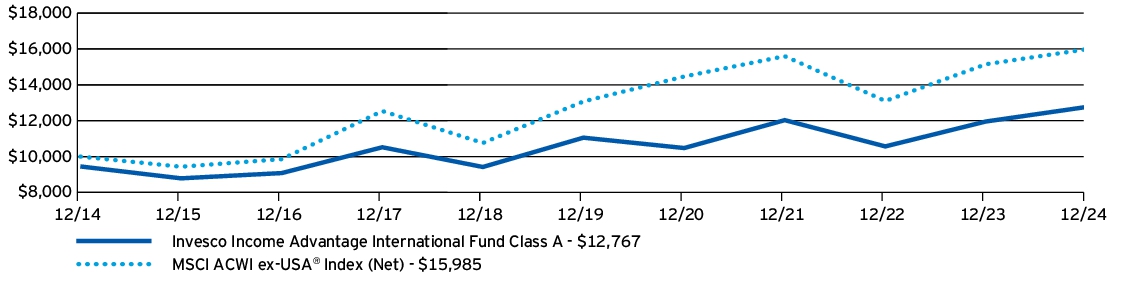
How Has The Fund Historically Performed?
Growth of $10,000 Investment
| AVERAGE ANNUAL TOTAL RETURNS | 1 Year | 5 Years | 10 Years |
| Invesco Income Advantage International Fund (Class A) —including sales charge | 0.94% | 1.76% | 2.47% |
| Invesco Income Advantage International Fund (Class A) —excluding sales charge | 6.80% | 2.93% | 3.06% |
| MSCI ACWI ex-USA® Index (Net) | 5.53% | 4.10% | 4.80% |
The performance data quoted represents past performance and cannot guarantee future results; current performance may be lower or higher. Please visit invesco.com/performance for more recent performance information.
Performance figures do not reflect deduction of taxes a shareholder would pay on Fund distributions or sale of Fund shares.
What Are Key Statistics About The Fund?
(as of December 31, 2024)
| Fund net assets | $55,651,265 |
| Total number of portfolio holdings | 1,271 |
| Total advisory fees paid | $168,609 |
| Portfolio turnover rate | 72% |
What Comprised The Fund's Holdings?
(as of December 31, 2024)
Top ten holdings*
(% of net assets)
| iShares Core MSCI Emerging Markets ETF | 4.48% |
| Royal Bank of Canada (MSCI EAFE Index), 142.71%, 02/03/2025 | 1.21% |
| Novartis AG | 1.17% |
| Deutsche Telekom AG | 1.04% |
| Novo Nordisk A/S, Class B | 1.03% |
| Canadian Imperial Bank of Commerce (MSCI EAFE Index), 132.75%, 01/21/2025 | 1.03% |
| Roche Holding AG | 0.96% |
| J.P. Morgan Structured Products B.V. (MSCI EAFE Index) , 01/03/2025 | 0.93% |
| Tencent Holdings Ltd. | 0.82% |
| Taiwan Semiconductor Manufacturing Co. Ltd. | 0.74% |
| * Excluding money market fund holdings, if any. | |
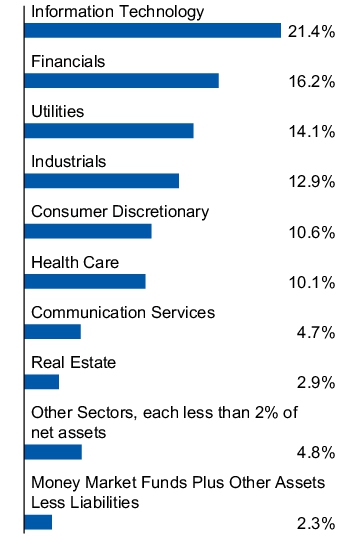
Sector allocation
(% of net assets)
How Has The Fund Changed Over The Past Year?
This is a summary of certain changes to the Fund since December 31, 2023. For more complete information, you may review the Fund's prospectus, which is available at invesco.com/reports or upon request at (800) 959-4246.
At a meeting held December 11, 2024, the Board of Trustees approved a Plan of Liquidation and Dissolution, which authorizes the termination, liquidation and dissolution of the Fund. In order to effect such liquidation, the Fund will be closed to investments by new accounts after the close of business on January 17, 2025. The Fund will be liquidated on or about March 20, 2025.
Where Can I Find More Information?
You can find more information about the Fund, including the Fund's prospectus, financial information, and holdings at invesco.com/reports. Additionally, the Fund's proxy voting information can be found at invesco.com/proxy-voting.
What Should I Know About Delivery Of Important Regulatory Documents?
To reduce Fund expenses, only one copy of most shareholder documents may be mailed to shareholders with multiple accounts at the same address (Householding). Mailing of your shareholder documents may be householded indefinitely unless you instruct us otherwise. If you do not want the mailing of these documents to be combined with those for other members of your household, please contact Invesco Investment Services, Inc. at (800) 959-4246 or contact your financial institution. We will begin sending you individual copies for each account within 30 days after receiving your request.
For additional information, please scan the QR code at the left to navigate to additional material at invesco.com/reports.
Invesco Income Advantage International Fund
Class C: GNDCX
ANNUAL SHAREHOLDER REPORT | December 31, 2024
This annual shareholder report contains important information about Invesco Income Advantage International Fund (the “Fund”) for the period January 1, 2024 to December 31, 2024. You can find additional information about the Fund at invesco.com/reports. You can also request this information by contacting us at (800) 959-4246.
This report describes changes to the Fund that occurred during the reporting period.
What Were The Fund Costs For The Last Year ?
(Based on a hypothetical $10,000 investment)
| Fund (Class) | Costs of a $10,000 investment | Costs paid as a percentage
of a $10,000 investment |
Invesco Income Advantage International Fund
(Class C) | $206 | 2.00%† |
† | Reflects fee waivers and/or expense reimbursements, without which expenses would have been higher. |
How Did The Fund Perform During The Period?
• During the fiscal year ended December 31, 2024, international equities experienced a mixed but generally positive performance that contained periods of volatility. This included a sharp sell-off in early August and another large drawdown in October, in response to a strengthening US dollar. The fiscal year ended with another drawdown in December due to geopolitical tensions and wavering global central bank policy.
• For the fiscal year ended December 31, 2024, Class C shares of the Fund, excluding sales charge, returned 6.00%. For the same time period, the MSCI ACWI ex-USA® Index (Net) returned 5.53%.
What contributed to performance?
Options-Based Income Exposure | The defensive and income-producing options and cash/cash equivalent components of the Fund's investments in equity-linked notes helped mitigate heightened market volatility and drawdowns relative to the MSCI ACWI ex-USA® Index (Net). Equity-linked notes are comprised primarily of returns attributable to coupon income received from selling embedded options and returns attributable to price changes in referenced equities, and cash or cash equivalents.
Passive Index Security Exposure | The Fund’s low tracking error to the MSCI ACWI ex-USA Index® contributed to the Fund's performance during the period.
What detracted from performance?
Detractors | There were no detractors during the fiscal year.
How Has The Fund Historically Performed?
Growth of $10,000 Investment
| AVERAGE ANNUAL TOTAL RETURNS | 1 Year | 5 Years | 10 Years |
| Invesco Income Advantage International Fund (Class C) —including sales charge | 5.01% | 2.18% | 2.44% |
| Invesco Income Advantage International Fund (Class C) —excluding sales charge | 6.00% | 2.18% | 2.44% |
| MSCI ACWI ex-USA® Index (Net) | 5.53% | 4.10% | 4.80% |
The performance data quoted represents past performance and cannot guarantee future results; current performance may be lower or higher. Please visit invesco.com/performance for more recent performance information.
Performance figures do not reflect deduction of taxes a shareholder would pay on Fund distributions or sale of Fund shares.
What Are Key Statistics About The Fund?
(as of December 31, 2024)
| Fund net assets | $55,651,265 |
| Total number of portfolio holdings | 1,271 |
| Total advisory fees paid | $168,609 |
| Portfolio turnover rate | 72% |
What Comprised The Fund's Holdings?
(as of December 31, 2024)
Top ten holdings*
(% of net assets)
| iShares Core MSCI Emerging Markets ETF | 4.48% |
| Royal Bank of Canada (MSCI EAFE Index), 142.71%, 02/03/2025 | 1.21% |
| Novartis AG | 1.17% |
| Deutsche Telekom AG | 1.04% |
| Novo Nordisk A/S, Class B | 1.03% |
| Canadian Imperial Bank of Commerce (MSCI EAFE Index), 132.75%, 01/21/2025 | 1.03% |
| Roche Holding AG | 0.96% |
| J.P. Morgan Structured Products B.V. (MSCI EAFE Index) , 01/03/2025 | 0.93% |
| Tencent Holdings Ltd. | 0.82% |
| Taiwan Semiconductor Manufacturing Co. Ltd. | 0.74% |
| * Excluding money market fund holdings, if any. | |
Sector allocation
(% of net assets)
How Has The Fund Changed Over The Past Year?
This is a summary of certain changes to the Fund since December 31, 2023. For more complete information, you may review the Fund's prospectus, which is available at invesco.com/reports or upon request at (800) 959-4246.
At a meeting held December 11, 2024, the Board of Trustees approved a Plan of Liquidation and Dissolution, which authorizes the termination, liquidation and dissolution of the Fund. In order to effect such liquidation, the Fund will be closed to investments by new accounts after the close of business on January 17, 2025. The Fund will be liquidated on or about March 20, 2025.
Where Can I Find More Information?
You can find more information about the Fund, including the Fund's prospectus, financial information, and holdings at invesco.com/reports. Additionally, the Fund's proxy voting information can be found at invesco.com/proxy-voting.
What Should I Know About Delivery Of Important Regulatory Documents?
To reduce Fund expenses, only one copy of most shareholder documents may be mailed to shareholders with multiple accounts at the same address (Householding). Mailing of your shareholder documents may be householded indefinitely unless you instruct us otherwise. If you do not want the mailing of these documents to be combined with those for other members of your household, please contact Invesco Investment Services, Inc. at (800) 959-4246 or contact your financial institution. We will begin sending you individual copies for each account within 30 days after receiving your request.
For additional information, please scan the QR code at the left to navigate to additional material at invesco.com/reports.
Invesco Income Advantage International Fund
Class R: GTNRX
ANNUAL SHAREHOLDER REPORT | December 31, 2024
This annual shareholder report contains important information about Invesco Income Advantage International Fund (the “Fund”) for the period January 1, 2024 to December 31, 2024. You can find additional information about the Fund at invesco.com/reports. You can also request this information by contacting us at (800) 959-4246.
This report describes changes to the Fund that occurred during the reporting period.
What Were The Fund Costs For The Last Year ?
(Based on a hypothetical $10,000 investment)
| Fund (Class) | Costs of a $10,000 investment | Costs paid as a percentage
of a $10,000 investment |
Invesco Income Advantage International Fund
(Class R) | $155 | 1.50%† |
† | Reflects fee waivers and/or expense reimbursements, without which expenses would have been higher. |
How Did The Fund Perform During The Period?
• During the fiscal year ended December 31, 2024, international equities experienced a mixed but generally positive performance that contained periods of volatility. This included a sharp sell-off in early August and another large drawdown in October, in response to a strengthening US dollar. The fiscal year ended with another drawdown in December due to geopolitical tensions and wavering global central bank policy.
• For the fiscal year ended December 31, 2024, Class R shares of the Fund returned 6.54%. For the same time period, the MSCI ACWI ex-USA® Index (Net) returned 5.53%.
What contributed to performance?
Options-Based Income Exposure | The defensive and income-producing options and cash/cash equivalent components of the Fund's investments in equity-linked notes helped mitigate heightened market volatility and drawdowns relative to the MSCI ACWI ex-USA® Index (Net). Equity-linked notes are comprised primarily of returns attributable to coupon income received from selling embedded options and returns attributable to price changes in referenced equities, and cash or cash equivalents.
Passive Index Security Exposure | The Fund’s low tracking error to the MSCI ACWI ex-USA Index® contributed to the Fund's performance during the period.
What detracted from performance?
Detractors | There were no detractors during the fiscal year.
How Has The Fund Historically Performed?
Growth of $10,000 Investment
| AVERAGE ANNUAL TOTAL RETURNS | 1 Year | 5 Years | 10 Years |
| Invesco Income Advantage International Fund (Class R) | 6.54% | 2.67% | 2.80% |
| MSCI ACWI ex-USA® Index (Net) | 5.53% | 4.10% | 4.80% |
The performance data quoted represents past performance and cannot guarantee future results; current performance may be lower or higher. Please visit invesco.com/performance for more recent performance information.
Performance figures do not reflect deduction of taxes a shareholder would pay on Fund distributions or sale of Fund shares.
What Are Key Statistics About The Fund?
(as of December 31, 2024)
| Fund net assets | $55,651,265 |
| Total number of portfolio holdings | 1,271 |
| Total advisory fees paid | $168,609 |
| Portfolio turnover rate | 72% |
What Comprised The Fund's Holdings?
(as of December 31, 2024)
Top ten holdings*
(% of net assets)
| iShares Core MSCI Emerging Markets ETF | 4.48% |
| Royal Bank of Canada (MSCI EAFE Index), 142.71%, 02/03/2025 | 1.21% |
| Novartis AG | 1.17% |
| Deutsche Telekom AG | 1.04% |
| Novo Nordisk A/S, Class B | 1.03% |
| Canadian Imperial Bank of Commerce (MSCI EAFE Index), 132.75%, 01/21/2025 | 1.03% |
| Roche Holding AG | 0.96% |
| J.P. Morgan Structured Products B.V. (MSCI EAFE Index) , 01/03/2025 | 0.93% |
| Tencent Holdings Ltd. | 0.82% |
| Taiwan Semiconductor Manufacturing Co. Ltd. | 0.74% |
| * Excluding money market fund holdings, if any. | |
Sector allocation
(% of net assets)
How Has The Fund Changed Over The Past Year?
This is a summary of certain changes to the Fund since December 31, 2023. For more complete information, you may review the Fund's prospectus, which is available at invesco.com/reports or upon request at (800) 959-4246.
At a meeting held December 11, 2024, the Board of Trustees approved a Plan of Liquidation and Dissolution, which authorizes the termination, liquidation and dissolution of the Fund. In order to effect such liquidation, the Fund will be closed to investments by new accounts after the close of business on January 17, 2025. The Fund will be liquidated on or about March 20, 2025.
Where Can I Find More Information?
You can find more information about the Fund, including the Fund's prospectus, financial information, and holdings at invesco.com/reports. Additionally, the Fund's proxy voting information can be found at invesco.com/proxy-voting.
What Should I Know About Delivery Of Important Regulatory Documents?
To reduce Fund expenses, only one copy of most shareholder documents may be mailed to shareholders with multiple accounts at the same address (Householding). Mailing of your shareholder documents may be householded indefinitely unless you instruct us otherwise. If you do not want the mailing of these documents to be combined with those for other members of your household, please contact Invesco Investment Services, Inc. at (800) 959-4246 or contact your financial institution. We will begin sending you individual copies for each account within 30 days after receiving your request.
For additional information, please scan the QR code at the left to navigate to additional material at invesco.com/reports.
Invesco Income Advantage International Fund
Class Y: GTNYX
ANNUAL SHAREHOLDER REPORT | December 31, 2024
This annual shareholder report contains important information about Invesco Income Advantage International Fund (the “Fund”) for the period January 1, 2024 to December 31, 2024. You can find additional information about the Fund at invesco.com/reports. You can also request this information by contacting us at (800) 959-4246.
This report describes changes to the Fund that occurred during the reporting period.
What Were The Fund Costs For The Last Year ?
(Based on a hypothetical $10,000 investment)
| Fund (Class) | Costs of a $10,000 investment | Costs paid as a percentage
of a $10,000 investment |
Invesco Income Advantage International Fund
(Class Y) | $104 | 1.00%† |
† | Reflects fee waivers and/or expense reimbursements, without which expenses would have been higher. |
How Did The Fund Perform During The Period?
• During the fiscal year ended December 31, 2024, international equities experienced a mixed but generally positive performance that contained periods of volatility. This included a sharp sell-off in early August and another large drawdown in October, in response to a strengthening US dollar. The fiscal year ended with another drawdown in December due to geopolitical tensions and wavering global central bank policy.
• For the fiscal year ended December 31, 2024, Class Y shares of the Fund returned 7.08%. For the same time period, the MSCI ACWI ex-USA® Index (Net) returned 5.53%.
What contributed to performance?
Options-Based Income Exposure | The defensive and income-producing options and cash/cash equivalent components of the Fund's investments in equity-linked notes helped mitigate heightened market volatility and drawdowns relative to the MSCI ACWI ex-USA® Index (Net). Equity-linked notes are comprised primarily of returns attributable to coupon income received from selling embedded options and returns attributable to price changes in referenced equities, and cash or cash equivalents.
Passive Index Security Exposure | The Fund’s low tracking error to the MSCI ACWI ex-USA Index® contributed to the Fund's performance during the period.
What detracted from performance?
Detractors | There were no detractors during the fiscal year.
How Has The Fund Historically Performed?
Growth of $10,000 Investment
| AVERAGE ANNUAL TOTAL RETURNS | 1 Year | 5 Years | 10 Years |
| Invesco Income Advantage International Fund (Class Y) | 7.08% | 3.19% | 3.32% |
| MSCI ACWI ex-USA® Index (Net) | 5.53% | 4.10% | 4.80% |
The performance data quoted represents past performance and cannot guarantee future results; current performance may be lower or higher. Please visit invesco.com/performance for more recent performance information.
Performance figures do not reflect deduction of taxes a shareholder would pay on Fund distributions or sale of Fund shares.
What Are Key Statistics About The Fund?
(as of December 31, 2024)
| Fund net assets | $55,651,265 |
| Total number of portfolio holdings | 1,271 |
| Total advisory fees paid | $168,609 |
| Portfolio turnover rate | 72% |
What Comprised The Fund's Holdings?
(as of December 31, 2024)
Top ten holdings*
(% of net assets)
| iShares Core MSCI Emerging Markets ETF | 4.48% |
| Royal Bank of Canada (MSCI EAFE Index), 142.71%, 02/03/2025 | 1.21% |
| Novartis AG | 1.17% |
| Deutsche Telekom AG | 1.04% |
| Novo Nordisk A/S, Class B | 1.03% |
| Canadian Imperial Bank of Commerce (MSCI EAFE Index), 132.75%, 01/21/2025 | 1.03% |
| Roche Holding AG | 0.96% |
| J.P. Morgan Structured Products B.V. (MSCI EAFE Index) , 01/03/2025 | 0.93% |
| Tencent Holdings Ltd. | 0.82% |
| Taiwan Semiconductor Manufacturing Co. Ltd. | 0.74% |
| * Excluding money market fund holdings, if any. | |
Sector allocation
(% of net assets)
How Has The Fund Changed Over The Past Year?
This is a summary of certain changes to the Fund since December 31, 2023. For more complete information, you may review the Fund's prospectus, which is available at invesco.com/reports or upon request at (800) 959-4246.
At a meeting held December 11, 2024, the Board of Trustees approved a Plan of Liquidation and Dissolution, which authorizes the termination, liquidation and dissolution of the Fund. In order to effect such liquidation, the Fund will be closed to investments by new accounts after the close of business on January 17, 2025. The Fund will be liquidated on or about March 20, 2025.
Where Can I Find More Information?
You can find more information about the Fund, including the Fund's prospectus, financial information, and holdings at invesco.com/reports. Additionally, the Fund's proxy voting information can be found at invesco.com/proxy-voting.
What Should I Know About Delivery Of Important Regulatory Documents?
To reduce Fund expenses, only one copy of most shareholder documents may be mailed to shareholders with multiple accounts at the same address (Householding). Mailing of your shareholder documents may be householded indefinitely unless you instruct us otherwise. If you do not want the mailing of these documents to be combined with those for other members of your household, please contact Invesco Investment Services, Inc. at (800) 959-4246 or contact your financial institution. We will begin sending you individual copies for each account within 30 days after receiving your request.
For additional information, please scan the QR code at the left to navigate to additional material at invesco.com/reports.
Invesco Income Advantage International Fund
Class R5: GNDIX
ANNUAL SHAREHOLDER REPORT | December 31, 2024
This annual shareholder report contains important information about Invesco Income Advantage International Fund (the “Fund”) for the period January 1, 2024 to December 31, 2024. You can find additional information about the Fund at invesco.com/reports. You can also request this information by contacting us at (800) 959-4246.
This report describes changes to the Fund that occurred during the reporting period.
What Were The Fund Costs For The Last Year ?
(Based on a hypothetical $10,000 investment)
| Fund (Class) | Costs of a $10,000 investment | Costs paid as a percentage
of a $10,000 investment |
Invesco Income Advantage International Fund
(Class R5) | $104 | 1.00%† |
† | Reflects fee waivers and/or expense reimbursements, without which expenses would have been higher. |
How Did The Fund Perform During The Period?
• During the fiscal year ended December 31, 2024, international equities experienced a mixed but generally positive performance that contained periods of volatility. This included a sharp sell-off in early August and another large drawdown in October, in response to a strengthening US dollar. The fiscal year ended with another drawdown in December due to geopolitical tensions and wavering global central bank policy.
• For the fiscal year ended December 31, 2024, Class R5 shares of the Fund returned 7.09%. For the same time period, the MSCI ACWI ex-USA® Index (Net) returned 5.53%.
What contributed to performance?
Options-Based Income Exposure | The defensive and income-producing options and cash/cash equivalent components of the Fund's investments in equity-linked notes helped mitigate heightened market volatility and drawdowns relative to the MSCI ACWI ex-USA® Index (Net). Equity-linked notes are comprised primarily of returns attributable to coupon income received from selling embedded options and returns attributable to price changes in referenced equities, and cash or cash equivalents.
Passive Index Security Exposure | The Fund’s low tracking error to the MSCI ACWI ex-USA Index® contributed to the Fund's performance during the period.
What detracted from performance?
Detractors | There were no detractors during the fiscal year.
How Has The Fund Historically Performed?
Growth of $10,000 Investment
| AVERAGE ANNUAL TOTAL RETURNS | 1 Year | 5 Years | 10 Years |
| Invesco Income Advantage International Fund (Class R5) | 7.09% | 3.24% | 3.41% |
| MSCI ACWI ex-USA® Index (Net) | 5.53% | 4.10% | 4.80% |
The performance data quoted represents past performance and cannot guarantee future results; current performance may be lower or higher. Please visit invesco.com/performance for more recent performance information.
Performance figures do not reflect deduction of taxes a shareholder would pay on Fund distributions or sale of Fund shares.
What Are Key Statistics About The Fund?
(as of December 31, 2024)
| Fund net assets | $55,651,265 |
| Total number of portfolio holdings | 1,271 |
| Total advisory fees paid | $168,609 |
| Portfolio turnover rate | 72% |
What Comprised The Fund's Holdings?
(as of December 31, 2024)
Top ten holdings*
(% of net assets)
| iShares Core MSCI Emerging Markets ETF | 4.48% |
| Royal Bank of Canada (MSCI EAFE Index), 142.71%, 02/03/2025 | 1.21% |
| Novartis AG | 1.17% |
| Deutsche Telekom AG | 1.04% |
| Novo Nordisk A/S, Class B | 1.03% |
| Canadian Imperial Bank of Commerce (MSCI EAFE Index), 132.75%, 01/21/2025 | 1.03% |
| Roche Holding AG | 0.96% |
| J.P. Morgan Structured Products B.V. (MSCI EAFE Index) , 01/03/2025 | 0.93% |
| Tencent Holdings Ltd. | 0.82% |
| Taiwan Semiconductor Manufacturing Co. Ltd. | 0.74% |
| * Excluding money market fund holdings, if any. | |
Sector allocation
(% of net assets)
How Has The Fund Changed Over The Past Year?
This is a summary of certain changes to the Fund since December 31, 2023. For more complete information, you may review the Fund's prospectus, which is available at invesco.com/reports or upon request at (800) 959-4246.
At a meeting held December 11, 2024, the Board of Trustees approved a Plan of Liquidation and Dissolution, which authorizes the termination, liquidation and dissolution of the Fund. In order to effect such liquidation, the Fund will be closed to investments by new accounts after the close of business on January 17, 2025. The Fund will be liquidated on or about March 20, 2025.
Effective after the close of business on September 30, 2024, the Fund has limited public sales of its Class R5 shares to certain investors who were previously invested in Class R5 shares of the Fund.
Where Can I Find More Information?
You can find more information about the Fund, including the Fund's prospectus, financial information, and holdings at invesco.com/reports. Additionally, the Fund's proxy voting information can be found at invesco.com/proxy-voting.
What Should I Know About Delivery Of Important Regulatory Documents?
To reduce Fund expenses, only one copy of most shareholder documents may be mailed to shareholders with multiple accounts at the same address (Householding). Mailing of your shareholder documents may be householded indefinitely unless you instruct us otherwise. If you do not want the mailing of these documents to be combined with those for other members of your household, please contact Invesco Investment Services, Inc. at (800) 959-4246 or contact your financial institution. We will begin sending you individual copies for each account within 30 days after receiving your request.
For additional information, please scan the QR code at the left to navigate to additional material at invesco.com/reports.
Invesco Income Advantage International Fund
Class R6: GNDSX
ANNUAL SHAREHOLDER REPORT | December 31, 2024
This annual shareholder report contains important information about Invesco Income Advantage International Fund (the “Fund”) for the period January 1, 2024 to December 31, 2024. You can find additional information about the Fund at invesco.com/reports. You can also request this information by contacting us at (800) 959-4246.
This report describes changes to the Fund that occurred during the reporting period.
What Were The Fund Costs For The Last Year ?
(Based on a hypothetical $10,000 investment)
| Fund (Class) | Costs of a $10,000 investment | Costs paid as a percentage
of a $10,000 investment |
Invesco Income Advantage International Fund
(Class R6) | $104 | 1.00%† |
† | Reflects fee waivers and/or expense reimbursements, without which expenses would have been higher. |
How Did The Fund Perform During The Period?
• During the fiscal year ended December 31, 2024, international equities experienced a mixed but generally positive performance that contained periods of volatility. This included a sharp sell-off in early August and another large drawdown in October, in response to a strengthening US dollar. The fiscal year ended with another drawdown in December due to geopolitical tensions and wavering global central bank policy.
• For the fiscal year ended December 31, 2024, Class R6 shares of the Fund returned 7.00%. For the same time period, the MSCI ACWI ex-USA® Index (Net) returned 5.53%.
What contributed to performance?
Options-Based Income Exposure | The defensive and income-producing options and cash/cash equivalent components of the Fund's investments in equity-linked notes helped mitigate heightened market volatility and drawdowns relative to the MSCI ACWI ex-USA® Index (Net). Equity-linked notes are comprised primarily of returns attributable to coupon income received from selling embedded options and returns attributable to price changes in referenced equities, and cash or cash equivalents.
Passive Index Security Exposure | The Fund’s low tracking error to the MSCI ACWI ex-USA Index® contributed to the Fund's performance during the period.
What detracted from performance?
Detractors | There were no detractors during the fiscal year.
How Has The Fund Historically Performed?
Growth of $10,000 Investment
| AVERAGE ANNUAL TOTAL RETURNS | 1 Year | 5 Years | 10 Years |
| Invesco Income Advantage International Fund (Class R6) | 7.00% | 3.21% | 3.31% |
| MSCI ACWI ex-USA® Index (Net) | 5.53% | 4.10% | 4.80% |
Class R6 shares incepted on April 4, 2017. Performance shown prior to that date is that of Class A shares at net asset value and includes the 12b-1 fees applicable to Class A shares. Class R6 shares' returns of the Fund will be different from Class A shares' returns of the Fund as they have different expenses.
The performance data quoted represents past performance and cannot guarantee future results; current performance may be lower or higher. Please visit invesco.com/performance for more recent performance information.
Performance figures do not reflect deduction of taxes a shareholder would pay on Fund distributions or sale of Fund shares.
What Are Key Statistics About The Fund?
(as of December 31, 2024)
| Fund net assets | $55,651,265 |
| Total number of portfolio holdings | 1,271 |
| Total advisory fees paid | $168,609 |
| Portfolio turnover rate | 72% |
What Comprised The Fund's Holdings?
(as of December 31, 2024)
Top ten holdings*
(% of net assets)
| iShares Core MSCI Emerging Markets ETF | 4.48% |
| Royal Bank of Canada (MSCI EAFE Index), 142.71%, 02/03/2025 | 1.21% |
| Novartis AG | 1.17% |
| Deutsche Telekom AG | 1.04% |
| Novo Nordisk A/S, Class B | 1.03% |
| Canadian Imperial Bank of Commerce (MSCI EAFE Index), 132.75%, 01/21/2025 | 1.03% |
| Roche Holding AG | 0.96% |
| J.P. Morgan Structured Products B.V. (MSCI EAFE Index) , 01/03/2025 | 0.93% |
| Tencent Holdings Ltd. | 0.82% |
| Taiwan Semiconductor Manufacturing Co. Ltd. | 0.74% |
| * Excluding money market fund holdings, if any. | |
Sector allocation
(% of net assets)
How Has The Fund Changed Over The Past Year?
This is a summary of certain changes to the Fund since December 31, 2023. For more complete information, you may review the Fund's prospectus, which is available at invesco.com/reports or upon request at (800) 959-4246.
At a meeting held December 11, 2024, the Board of Trustees approved a Plan of Liquidation and Dissolution, which authorizes the termination, liquidation and dissolution of the Fund. In order to effect such liquidation, the Fund will be closed to investments by new accounts after the close of business on January 17, 2025. The Fund will be liquidated on or about March 20, 2025.
Where Can I Find More Information?
You can find more information about the Fund, including the Fund's prospectus, financial information, and holdings at invesco.com/reports. Additionally, the Fund's proxy voting information can be found at invesco.com/proxy-voting.
What Should I Know About Delivery Of Important Regulatory Documents?
To reduce Fund expenses, only one copy of most shareholder documents may be mailed to shareholders with multiple accounts at the same address (Householding). Mailing of your shareholder documents may be householded indefinitely unless you instruct us otherwise. If you do not want the mailing of these documents to be combined with those for other members of your household, please contact Invesco Investment Services, Inc. at (800) 959-4246 or contact your financial institution. We will begin sending you individual copies for each account within 30 days after receiving your request.
For additional information, please scan the QR code at the left to navigate to additional material at invesco.com/reports.
Invesco Income Allocation Fund
Class A: ALAAX
ANNUAL SHAREHOLDER REPORT | December 31, 2024
This annual shareholder report contains important information about Invesco Income Allocation Fund (the “Fund”) for the period January 1, 2024 to December 31, 2024. You can find additional information about the Fund at invesco.com/reports. You can also request this information by contacting us at (800) 959-4246.
What Were The Fund Costs For The Last Year ?
(Based on a hypothetical $10,000 investment)
| Fund (Class) | Costs of a $10,000 investment | Costs paid as a percentage
of a $10,000 investment |
Invesco Income Allocation Fund
(Class A) | $48 | 0.47% |
How Did The Fund Perform During The Period?
• During the fiscal year ended December 31, 2024, global risk assets outperformed defensive assets driven by a favorable macroeconomic environment, the beginning of a global monetary policy easing cycle and greater clarity with respect to fiscal policy following the conclusion of many major elections globally. These macroeconomic tailwinds supported global equity prices, particularly within the US, as well as the continuation of credit spreads tightening to cycle lows within investment grade, high yield and emerging market debt markets. Given this backdrop, an underweight to equities was a headwind to Fund performance, as were certain factor tilts within equities, as well as allocations within fixed income to core and core-plus bonds.
• For the fiscal year ended December 31, 2024, Class A shares of the Fund, excluding sales charge, returned 5.84%. For the same time period, the Custom Invesco Income Allocation Index returned 7.46%.
What contributed to performance?
Exposure to growth equities and the quality factor | The Fund's exposure to high quality securities (commonly referred to as 'growth' stocks) was rewarded with exposures within both the US large- and mid-cap space, as well as exposure internationally.
Exposure to high yield and floating rate credit | The Fund's exposure to high yield was beneficial as credit spreads continued to tighten, supported by resilient corporate fundamentals and strong investor demand for higher-coupon bond offerings. Floating rate exposure was rewarded as well, with the securities benefiting from an increasing interest rate environment, compared to their fixed-rate peers.
What detracted from performance?
Cyclical factor exposure within equities | Exposure to the small size and value factors was a detractor from Fund performance over the time period, as more defensive equity factors such as quality continued to be in demand led by US megacap technology stocks and strong momentum in investor demand for thematic artificial intelligence stocks.
Exposure to core and core-plus bonds | The Fund's exposure to core and core-plus bonds was a headwind, as long and moderate duration, as well as higher-grade fixed income, suffered compared to shorter duration, more credit sensitive counterparts. This was due to interest rates moving higher and the steepening of the yield curve that transpired significantly in the second half of the year.
How Has The Fund Historically Performed?
Growth of $10,000 Investment
| AVERAGE ANNUAL TOTAL RETURNS | 1 Year | 5 Years | 10 Years |
| Invesco Income Allocation Fund (Class A) —including sales charge | 0.06% | 0.79% | 2.93% |
| Invesco Income Allocation Fund (Class A) —excluding sales charge | 5.84% | 1.94% | 3.51% |
| Custom Invesco Income Allocation Index | 7.46% | 4.29% | 5.13% |
| S&P 500® Index | 25.02% | 14.53% | 13.10% |
The Custom Invesco Income Allocation Index is composed of the following indexes: S&P 500® Index, MSCI EAFE® Index (Net), FTSE NAREIT Equity REITs Index and Bloomberg U.S. Universal Index. The composition of the index may change based on the Fund’s target asset allocation. Therefore, the current composition of the index does not reflect its historical composition and will likely be altered in the future to better reflect the Fund’s objective.
The performance data quoted represents past performance and cannot guarantee future results; current performance may be lower or higher. Please visit invesco.com/performance for more recent performance information.
Performance figures do not reflect deduction of taxes a shareholder would pay on Fund distributions or sale of Fund shares.
What Are Key Statistics About The Fund?
(as of December 31, 2024)
| Fund net assets | $333,014,762 |
| Total number of portfolio holdings | 19 |
| Total advisory fees paid | $0 |
| Portfolio turnover rate | 86% |
What Comprised The Fund's Holdings?
(as of December 31, 2024)
Asset allocation
(% of net assets)
Where Can I Find More Information?
You can find more information about the Fund, including the Fund's prospectus, financial information, and holdings at invesco.com/reports. Additionally, the Fund's proxy voting information can be found at invesco.com/proxy-voting.
What Should I Know About Delivery Of Important Regulatory Documents?
To reduce Fund expenses, only one copy of most shareholder documents may be mailed to shareholders with multiple accounts at the same address (Householding). Mailing of your shareholder documents may be householded indefinitely unless you instruct us otherwise. If you do not want the mailing of these documents to be combined with those for other members of your household, please contact Invesco Investment Services, Inc. at (800) 959-4246 or contact your financial institution. We will begin sending you individual copies for each account within 30 days after receiving your request.
For additional information, please scan the QR code at the left to navigate to additional material at invesco.com/reports.
Invesco Income Allocation Fund
Class C: CLIAX
ANNUAL SHAREHOLDER REPORT | December 31, 2024
This annual shareholder report contains important information about Invesco Income Allocation Fund (the “Fund”) for the period January 1, 2024 to December 31, 2024. You can find additional information about the Fund at invesco.com/reports. You can also request this information by contacting us at (800) 959-4246.
What Were The Fund Costs For The Last Year ?
(Based on a hypothetical $10,000 investment)
| Fund (Class) | Costs of a $10,000 investment | Costs paid as a percentage
of a $10,000 investment |
Invesco Income Allocation Fund
(Class C) | $125 | 1.22% |
How Did The Fund Perform During The Period?
• During the fiscal year ended December 31, 2024, global risk assets outperformed defensive assets driven by a favorable macroeconomic environment, the beginning of a global monetary policy easing cycle and greater clarity with respect to fiscal policy following the conclusion of many major elections globally. These macroeconomic tailwinds supported global equity prices, particularly within the US, as well as the continuation of credit spreads tightening to cycle lows within investment grade, high yield and emerging market debt markets. Given this backdrop, an underweight to equities was a headwind to Fund performance, as were certain factor tilts within equities, as well as allocations within fixed income to core and core-plus bonds.
• For the fiscal year ended December 31, 2024, Class C shares of the Fund, excluding sales charge, returned 5.04%. For the same time period, the Custom Invesco Income Allocation Index returned 7.46%.
What contributed to performance?
Exposure to growth equities and the quality factor | The Fund's exposure to high quality securities (commonly referred to as 'growth' stocks) was rewarded with exposures within both the US large- and mid-cap space, as well as exposure internationally.
Exposure to high yield and floating rate credit | The Fund's exposure to high yield was beneficial as credit spreads continued to tighten, supported by resilient corporate fundamentals and strong investor demand for higher-coupon bond offerings. Floating rate exposure was rewarded as well, with the securities benefiting from an increasing interest rate environment, compared to their fixed-rate peers.
What detracted from performance?
Cyclical factor exposure within equities | Exposure to the small size and value factors was a detractor from Fund performance over the time period, as more defensive equity factors such as quality continued to be in demand led by US megacap technology stocks and strong momentum in investor demand for thematic artificial intelligence stocks.
Exposure to core and core-plus bonds | The Fund's exposure to core and core-plus bonds was a headwind, as long and moderate duration, as well as higher-grade fixed income, suffered compared to shorter duration, more credit sensitive counterparts. This was due to interest rates moving higher and the steepening of the yield curve that transpired significantly in the second half of the year.
How Has The Fund Historically Performed?
Growth of $10,000 Investment
| AVERAGE ANNUAL TOTAL RETURNS | 1 Year | 5 Years | 10 Years |
| Invesco Income Allocation Fund (Class C) —including sales charge | 4.04% | 1.20% | 2.89% |
| Invesco Income Allocation Fund (Class C) —excluding sales charge | 5.04% | 1.20% | 2.89% |
| Custom Invesco Income Allocation Index | 7.46% | 4.29% | 5.13% |
| S&P 500® Index | 25.02% | 14.53% | 13.10% |
The Custom Invesco Income Allocation Index is composed of the following indexes: S&P 500® Index, MSCI EAFE® Index (Net), FTSE NAREIT Equity REITs Index and Bloomberg U.S. Universal Index. The composition of the index may change based on the Fund’s target asset allocation. Therefore, the current composition of the index does not reflect its historical composition and will likely be altered in the future to better reflect the Fund’s objective.
The performance data quoted represents past performance and cannot guarantee future results; current performance may be lower or higher. Please visit invesco.com/performance for more recent performance information.
Performance figures do not reflect deduction of taxes a shareholder would pay on Fund distributions or sale of Fund shares.
What Are Key Statistics About The Fund?
(as of December 31, 2024)
| Fund net assets | $333,014,762 |
| Total number of portfolio holdings | 19 |
| Total advisory fees paid | $0 |
| Portfolio turnover rate | 86% |
What Comprised The Fund's Holdings?
(as of December 31, 2024)
Asset allocation
(% of net assets)
Where Can I Find More Information?
You can find more information about the Fund, including the Fund's prospectus, financial information, and holdings at invesco.com/reports. Additionally, the Fund's proxy voting information can be found at invesco.com/proxy-voting.
What Should I Know About Delivery Of Important Regulatory Documents?
To reduce Fund expenses, only one copy of most shareholder documents may be mailed to shareholders with multiple accounts at the same address (Householding). Mailing of your shareholder documents may be householded indefinitely unless you instruct us otherwise. If you do not want the mailing of these documents to be combined with those for other members of your household, please contact Invesco Investment Services, Inc. at (800) 959-4246 or contact your financial institution. We will begin sending you individual copies for each account within 30 days after receiving your request.
For additional information, please scan the QR code at the left to navigate to additional material at invesco.com/reports.
Invesco Income Allocation Fund
Class R: RLIAX
ANNUAL SHAREHOLDER REPORT | December 31, 2024
This annual shareholder report contains important information about Invesco Income Allocation Fund (the “Fund”) for the period January 1, 2024 to December 31, 2024. You can find additional information about the Fund at invesco.com/reports. You can also request this information by contacting us at (800) 959-4246.
What Were The Fund Costs For The Last Year ?
(Based on a hypothetical $10,000 investment)
| Fund (Class) | Costs of a $10,000 investment | Costs paid as a percentage
of a $10,000 investment |
Invesco Income Allocation Fund
(Class R) | $74 | 0.72% |
How Did The Fund Perform During The Period?
• During the fiscal year ended December 31, 2024, global risk assets outperformed defensive assets driven by a favorable macroeconomic environment, the beginning of a global monetary policy easing cycle and greater clarity with respect to fiscal policy following the conclusion of many major elections globally. These macroeconomic tailwinds supported global equity prices, particularly within the US, as well as the continuation of credit spreads tightening to cycle lows within investment grade, high yield and emerging market debt markets. Given this backdrop, an underweight to equities was a headwind to Fund performance, as were certain factor tilts within equities, as well as allocations within fixed income to core and core-plus bonds.
• For the fiscal year ended December 31, 2024, Class R shares of the Fund returned 5.57%. For the same time period, the Custom Invesco Income Allocation Index returned 7.46%.
What contributed to performance?
Exposure to growth equities and the quality factor | The Fund's exposure to high quality securities (commonly referred to as 'growth' stocks) was rewarded with exposures within both the US large- and mid-cap space, as well as exposure internationally.
Exposure to high yield and floating rate credit | The Fund's exposure to high yield was beneficial as credit spreads continued to tighten, supported by resilient corporate fundamentals and strong investor demand for higher-coupon bond offerings. Floating rate exposure was rewarded as well, with the securities benefiting from an increasing interest rate environment, compared to their fixed-rate peers.
What detracted from performance?
Cyclical factor exposure within equities | Exposure to the small size and value factors was a detractor from Fund performance over the time period, as more defensive equity factors such as quality continued to be in demand led by US megacap technology stocks and strong momentum in investor demand for thematic artificial intelligence stocks.
Exposure to core and core-plus bonds | The Fund's exposure to core and core-plus bonds was a headwind, as long and moderate duration, as well as higher-grade fixed income, suffered compared to shorter duration, more credit sensitive counterparts. This was due to interest rates moving higher and the steepening of the yield curve that transpired significantly in the second half of the year.
How Has The Fund Historically Performed?
Growth of $10,000 Investment
| AVERAGE ANNUAL TOTAL RETURNS | 1 Year | 5 Years | 10 Years |
| Invesco Income Allocation Fund (Class R) | 5.57% | 1.69% | 3.25% |
| Custom Invesco Income Allocation Index | 7.46% | 4.29% | 5.13% |
| S&P 500® Index | 25.02% | 14.53% | 13.10% |
The Custom Invesco Income Allocation Index is composed of the following indexes: S&P 500® Index, MSCI EAFE® Index (Net), FTSE NAREIT Equity REITs Index and Bloomberg U.S. Universal Index. The composition of the index may change based on the Fund’s target asset allocation. Therefore, the current composition of the index does not reflect its historical composition and will likely be altered in the future to better reflect the Fund’s objective.
The performance data quoted represents past performance and cannot guarantee future results; current performance may be lower or higher. Please visit invesco.com/performance for more recent performance information.
Performance figures do not reflect deduction of taxes a shareholder would pay on Fund distributions or sale of Fund shares.
What Are Key Statistics About The Fund?
(as of December 31, 2024)
| Fund net assets | $333,014,762 |
| Total number of portfolio holdings | 19 |
| Total advisory fees paid | $0 |
| Portfolio turnover rate | 86% |
What Comprised The Fund's Holdings?
(as of December 31, 2024)
Asset allocation
(% of net assets)
Where Can I Find More Information?
You can find more information about the Fund, including the Fund's prospectus, financial information, and holdings at invesco.com/reports. Additionally, the Fund's proxy voting information can be found at invesco.com/proxy-voting.
What Should I Know About Delivery Of Important Regulatory Documents?
To reduce Fund expenses, only one copy of most shareholder documents may be mailed to shareholders with multiple accounts at the same address (Householding). Mailing of your shareholder documents may be householded indefinitely unless you instruct us otherwise. If you do not want the mailing of these documents to be combined with those for other members of your household, please contact Invesco Investment Services, Inc. at (800) 959-4246 or contact your financial institution. We will begin sending you individual copies for each account within 30 days after receiving your request.
For additional information, please scan the QR code at the left to navigate to additional material at invesco.com/reports.
Invesco Income Allocation Fund
Class Y: ALAYX
ANNUAL SHAREHOLDER REPORT | December 31, 2024
This annual shareholder report contains important information about Invesco Income Allocation Fund (the “Fund”) for the period January 1, 2024 to December 31, 2024. You can find additional information about the Fund at invesco.com/reports. You can also request this information by contacting us at (800) 959-4246.
What Were The Fund Costs For The Last Year ?
(Based on a hypothetical $10,000 investment)
| Fund (Class) | Costs of a $10,000 investment | Costs paid as a percentage
of a $10,000 investment |
Invesco Income Allocation Fund
(Class Y) | $23 | 0.22% |
How Did The Fund Perform During The Period?
• During the fiscal year ended December 31, 2024, global risk assets outperformed defensive assets driven by a favorable macroeconomic environment, the beginning of a global monetary policy easing cycle and greater clarity with respect to fiscal policy following the conclusion of many major elections globally. These macroeconomic tailwinds supported global equity prices, particularly within the US, as well as the continuation of credit spreads tightening to cycle lows within investment grade, high yield and emerging market debt markets. Given this backdrop, an underweight to equities was a headwind to Fund performance, as were certain factor tilts within equities, as well as allocations within fixed income to core and core-plus bonds.
• For the fiscal year ended December 31, 2024, Class Y shares of the Fund returned 6.11%. For the same time period, the Custom Invesco Income Allocation Index returned 7.46%.
What contributed to performance?
Exposure to growth equities and the quality factor | The Fund's exposure to high quality securities (commonly referred to as 'growth' stocks) was rewarded with exposures within both the US large- and mid-cap space, as well as exposure internationally.
Exposure to high yield and floating rate credit | The Fund's exposure to high yield was beneficial as credit spreads continued to tighten, supported by resilient corporate fundamentals and strong investor demand for higher-coupon bond offerings. Floating rate exposure was rewarded as well, with the securities benefiting from an increasing interest rate environment, compared to their fixed-rate peers.
What detracted from performance?
Cyclical factor exposure within equities | Exposure to the small size and value factors was a detractor from Fund performance over the time period, as more defensive equity factors such as quality continued to be in demand led by US megacap technology stocks and strong momentum in investor demand for thematic artificial intelligence stocks.
Exposure to core and core-plus bonds | The Fund's exposure to core and core-plus bonds was a headwind, as long and moderate duration, as well as higher-grade fixed income, suffered compared to shorter duration, more credit sensitive counterparts. This was due to interest rates moving higher and the steepening of the yield curve that transpired significantly in the second half of the year.
How Has The Fund Historically Performed?
Growth of $10,000 Investment
| AVERAGE ANNUAL TOTAL RETURNS | 1 Year | 5 Years | 10 Years |
| Invesco Income Allocation Fund (Class Y) | 6.11% | 2.20% | 3.77% |
| Custom Invesco Income Allocation Index | 7.46% | 4.29% | 5.13% |
| S&P 500® Index | 25.02% | 14.53% | 13.10% |
The Custom Invesco Income Allocation Index is composed of the following indexes: S&P 500® Index, MSCI EAFE® Index (Net), FTSE NAREIT Equity REITs Index and Bloomberg U.S. Universal Index. The composition of the index may change based on the Fund’s target asset allocation. Therefore, the current composition of the index does not reflect its historical composition and will likely be altered in the future to better reflect the Fund’s objective.
The performance data quoted represents past performance and cannot guarantee future results; current performance may be lower or higher. Please visit invesco.com/performance for more recent performance information.
Performance figures do not reflect deduction of taxes a shareholder would pay on Fund distributions or sale of Fund shares.
What Are Key Statistics About The Fund?
(as of December 31, 2024)
| Fund net assets | $333,014,762 |
| Total number of portfolio holdings | 19 |
| Total advisory fees paid | $0 |
| Portfolio turnover rate | 86% |
What Comprised The Fund's Holdings?
(as of December 31, 2024)
Asset allocation
(% of net assets)
Where Can I Find More Information?
You can find more information about the Fund, including the Fund's prospectus, financial information, and holdings at invesco.com/reports. Additionally, the Fund's proxy voting information can be found at invesco.com/proxy-voting.
What Should I Know About Delivery Of Important Regulatory Documents?
To reduce Fund expenses, only one copy of most shareholder documents may be mailed to shareholders with multiple accounts at the same address (Householding). Mailing of your shareholder documents may be householded indefinitely unless you instruct us otherwise. If you do not want the mailing of these documents to be combined with those for other members of your household, please contact Invesco Investment Services, Inc. at (800) 959-4246 or contact your financial institution. We will begin sending you individual copies for each account within 30 days after receiving your request.
For additional information, please scan the QR code at the left to navigate to additional material at invesco.com/reports.
Invesco Income Allocation Fund
Class R5: ILAAX
ANNUAL SHAREHOLDER REPORT | December 31, 2024
This annual shareholder report contains important information about Invesco Income Allocation Fund (the “Fund”) for the period January 1, 2024 to December 31, 2024. You can find additional information about the Fund at invesco.com/reports. You can also request this information by contacting us at (800) 959-4246.
This report describes changes to the Fund that occurred during the reporting period.
What Were The Fund Costs For The Last Year ?
(Based on a hypothetical $10,000 investment)
| Fund (Class) | Costs of a $10,000 investment | Costs paid as a percentage
of a $10,000 investment |
Invesco Income Allocation Fund
(Class R5) | $19 | 0.18% |
How Did The Fund Perform During The Period?
• During the fiscal year ended December 31, 2024, global risk assets outperformed defensive assets driven by a favorable macroeconomic environment, the beginning of a global monetary policy easing cycle and greater clarity with respect to fiscal policy following the conclusion of many major elections globally. These macroeconomic tailwinds supported global equity prices, particularly within the US, as well as the continuation of credit spreads tightening to cycle lows within investment grade, high yield and emerging market debt markets. Given this backdrop, an underweight to equities was a headwind to Fund performance, as were certain factor tilts within equities, as well as allocations within fixed income to core and core-plus bonds.
• For the fiscal year ended December 31, 2024, Class R5 shares of the Fund returned 6.14%. For the same time period, the Custom Invesco Income Allocation Index returned 7.46%.
What contributed to performance?
Exposure to growth equities and the quality factor | The Fund's exposure to high quality securities (commonly referred to as 'growth' stocks) was rewarded with exposures within both the US large- and mid-cap space, as well as exposure internationally.
Exposure to high yield and floating rate credit | The Fund's exposure to high yield was beneficial as credit spreads continued to tighten, supported by resilient corporate fundamentals and strong investor demand for higher-coupon bond offerings. Floating rate exposure was rewarded as well, with the securities benefiting from an increasing interest rate environment, compared to their fixed-rate peers.
What detracted from performance?
Cyclical factor exposure within equities | Exposure to the small size and value factors was a detractor from Fund performance over the time period, as more defensive equity factors such as quality continued to be in demand led by US megacap technology stocks and strong momentum in investor demand for thematic artificial intelligence stocks.
Exposure to core and core-plus bonds | The Fund's exposure to core and core-plus bonds was a headwind, as long and moderate duration, as well as higher-grade fixed income, suffered compared to shorter duration, more credit sensitive counterparts. This was due to interest rates moving higher and the steepening of the yield curve that transpired significantly in the second half of the year.
How Has The Fund Historically Performed?
Growth of $10,000 Investment
| AVERAGE ANNUAL TOTAL RETURNS | 1 Year | 5 Years | 10 Years |
| Invesco Income Allocation Fund (Class R5) | 6.14% | 2.22% | 3.78% |
| Custom Invesco Income Allocation Index | 7.46% | 4.29% | 5.13% |
| S&P 500® Index | 25.02% | 14.53% | 13.10% |
The Custom Invesco Income Allocation Index is composed of the following indexes: S&P 500® Index, MSCI EAFE® Index (Net), FTSE NAREIT Equity REITs Index and Bloomberg U.S. Universal Index. The composition of the index may change based on the Fund’s target asset allocation. Therefore, the current composition of the index does not reflect its historical composition and will likely be altered in the future to better reflect the Fund’s objective.
The performance data quoted represents past performance and cannot guarantee future results; current performance may be lower or higher. Please visit invesco.com/performance for more recent performance information.
Performance figures do not reflect deduction of taxes a shareholder would pay on Fund distributions or sale of Fund shares.
What Are Key Statistics About The Fund?
(as of December 31, 2024)
| Fund net assets | $333,014,762 |
| Total number of portfolio holdings | 19 |
| Total advisory fees paid | $0 |
| Portfolio turnover rate | 86% |
What Comprised The Fund's Holdings?
(as of December 31, 2024)
Asset allocation
(% of net assets)
How Has The Fund Changed Over The Past Year?
This is a summary of certain changes to the Fund since December 31, 2023. For more complete information, you may review the Fund's prospectus, which is available at invesco.com/reports or upon request at (800) 959-4246.
Effective after the close of business on September 30, 2024, the Fund has limited public sales of its Class R5 shares to certain investors who were previously invested in Class R5 shares of the Fund.
Where Can I Find More Information?
You can find more information about the Fund, including the Fund's prospectus, financial information, and holdings at invesco.com/reports. Additionally, the Fund's proxy voting information can be found at invesco.com/proxy-voting.
What Should I Know About Delivery Of Important Regulatory Documents?
To reduce Fund expenses, only one copy of most shareholder documents may be mailed to shareholders with multiple accounts at the same address (Householding). Mailing of your shareholder documents may be householded indefinitely unless you instruct us otherwise. If you do not want the mailing of these documents to be combined with those for other members of your household, please contact Invesco Investment Services, Inc. at (800) 959-4246 or contact your financial institution. We will begin sending you individual copies for each account within 30 days after receiving your request.
For additional information, please scan the QR code at the left to navigate to additional material at invesco.com/reports.
Invesco Income Allocation Fund
Class R6: IIASX
ANNUAL SHAREHOLDER REPORT | December 31, 2024
This annual shareholder report contains important information about Invesco Income Allocation Fund (the “Fund”) for the period January 1, 2024 to December 31, 2024. You can find additional information about the Fund at invesco.com/reports. You can also request this information by contacting us at (800) 959-4246.
What Were The Fund Costs For The Last Year ?
(Based on a hypothetical $10,000 investment)
| Fund (Class) | Costs of a $10,000 investment | Costs paid as a percentage
of a $10,000 investment |
Invesco Income Allocation Fund
(Class R6) | $9 | 0.09% |
How Did The Fund Perform During The Period?
• During the fiscal year ended December 31, 2024, global risk assets outperformed defensive assets driven by a favorable macroeconomic environment, the beginning of a global monetary policy easing cycle and greater clarity with respect to fiscal policy following the conclusion of many major elections globally. These macroeconomic tailwinds supported global equity prices, particularly within the US, as well as the continuation of credit spreads tightening to cycle lows within investment grade, high yield and emerging market debt markets. Given this backdrop, an underweight to equities was a headwind to Fund performance, as were certain factor tilts within equities, as well as allocations within fixed income to core and core-plus bonds.
• For the fiscal year ended December 31, 2024, Class R6 shares of the Fund returned 6.14%. For the same time period, the Custom Invesco Income Allocation Index returned 7.46%.
What contributed to performance?
Exposure to growth equities and the quality factor | The Fund's exposure to high quality securities (commonly referred to as 'growth' stocks) was rewarded with exposures within both the US large- and mid-cap space, as well as exposure internationally.
Exposure to high yield and floating rate credit | The Fund's exposure to high yield was beneficial as credit spreads continued to tighten, supported by resilient corporate fundamentals and strong investor demand for higher-coupon bond offerings. Floating rate exposure was rewarded as well, with the securities benefiting from an increasing interest rate environment, compared to their fixed-rate peers.
What detracted from performance?
Cyclical factor exposure within equities | Exposure to the small size and value factors was a detractor from Fund performance over the time period, as more defensive equity factors such as quality continued to be in demand led by US megacap technology stocks and strong momentum in investor demand for thematic artificial intelligence stocks.
Exposure to core and core-plus bonds | The Fund's exposure to core and core-plus bonds was a headwind, as long and moderate duration, as well as higher-grade fixed income, suffered compared to shorter duration, more credit sensitive counterparts. This was due to interest rates moving higher and the steepening of the yield curve that transpired significantly in the second half of the year.
How Has The Fund Historically Performed?
Growth of $10,000 Investment
| AVERAGE ANNUAL TOTAL RETURNS | 1 Year | 5 Years | 10 Years |
| Invesco Income Allocation Fund (Class R6) | 6.14% | 2.24% | 3.72% |
| Custom Invesco Income Allocation Index | 7.46% | 4.29% | 5.13% |
| S&P 500® Index | 25.02% | 14.53% | 13.10% |
The Custom Invesco Income Allocation Index is composed of the following indexes: S&P 500® Index, MSCI EAFE® Index (Net), FTSE NAREIT Equity REITs Index and Bloomberg U.S. Universal Index. The composition of the index may change based on the Fund’s target asset allocation. Therefore, the current composition of the index does not reflect its historical composition and will likely be altered in the future to better reflect the Fund’s objective.
Class R6 shares incepted on April 4, 2017. Performance shown prior to that date is that of Class A shares at net asset value and includes the 12b-1 fees applicable to Class A shares. Class R6 shares' returns of the Fund will be different from Class A shares' returns of the Fund as they have different expenses.
The performance data quoted represents past performance and cannot guarantee future results; current performance may be lower or higher. Please visit invesco.com/performance for more recent performance information.
Performance figures do not reflect deduction of taxes a shareholder would pay on Fund distributions or sale of Fund shares.
What Are Key Statistics About The Fund?
(as of December 31, 2024)
| Fund net assets | $333,014,762 |
| Total number of portfolio holdings | 19 |
| Total advisory fees paid | $0 |
| Portfolio turnover rate | 86% |
What Comprised The Fund's Holdings?
(as of December 31, 2024)
Asset allocation
(% of net assets)
Where Can I Find More Information?
You can find more information about the Fund, including the Fund's prospectus, financial information, and holdings at invesco.com/reports. Additionally, the Fund's proxy voting information can be found at invesco.com/proxy-voting.
What Should I Know About Delivery Of Important Regulatory Documents?
To reduce Fund expenses, only one copy of most shareholder documents may be mailed to shareholders with multiple accounts at the same address (Householding). Mailing of your shareholder documents may be householded indefinitely unless you instruct us otherwise. If you do not want the mailing of these documents to be combined with those for other members of your household, please contact Invesco Investment Services, Inc. at (800) 959-4246 or contact your financial institution. We will begin sending you individual copies for each account within 30 days after receiving your request.
For additional information, please scan the QR code at the left to navigate to additional material at invesco.com/reports.
Invesco International Diversified Fund
Class A: OIDAX
ANNUAL SHAREHOLDER REPORT | December 31, 2024
This annual shareholder report contains important information about Invesco International Diversified Fund (the “Fund”) for the period January 1, 2024 to December 31, 2024. You can find additional information about the Fund at invesco.com/reports. You can also request this information by contacting us at (800) 959-4246.
What Were The Fund Costs For The Last Year ?
(Based on a hypothetical $10,000 investment)
| Fund (Class) | Costs of a $10,000 investment | Costs paid as a percentage
of a $10,000 investment |
Invesco International Diversified Fund
(Class A) | $44 | 0.45% |
How Did The Fund Perform During The Period?
• Broad-based equity markets rose during the fiscal year ended December 31, 2024. In the US, enthusiasm around artificial intelligence led to market concentration in megacap technology and to outperformance relative to non-US equities. The turn in the interest rate cycle also caused high quality segments to underperform the wider market. Outside of the US, emerging markets (EM) outperformed developed markets as news of fiscal stimulus by the Chinese government drove better sentiment towards the EM asset class. In this environment, our portfolio, with its high-quality bias, underperformed its broad-based market index.
• For the fiscal year ended December 31, 2024, Class A shares of the Fund, excluding sales charge, returned (2.53)%. For the same time period, the MSCI ACWI ex USA® Index (Net) returned 5.53%.
What contributed to performance?
Sectors | Fund's stock selection and underweight allocation to the materials sector contributed positively to relative performance. Stock selection and an overweight allocation to consumer discretionary sector also contributed positively.
Underlying Funds | As of the fiscal year end, the Fund’s portfolio consisted of four underlying mutual funds, one of which contributed to the Fund's absolute returns. Invesco EQV International Equity Fund returned 0.70%, contributing 0.18% to the Fund's absolute return during the period.
What detracted from performance?
Sectors | The Fund's underperformance compared to the MSCI ACWI ex USA® Index (Net) was driven by stock selection in financials and industrials sectors. The Fund's underweight allocation to financials sector also detracted from relative results.
Underlying Funds | Three of the four underlying mutual funds held in the portfolio detracted from the Fund's absolute returns during the fiscal period. Invesco International Small-Mid Company Fund returned (6.08)% and detracted 1.83% from absolute return, Invesco Oppenheimer International Growth Fund returned (1.40)% and detracted 0.28% from absolute return and Invesco Developing Markets Fund returned (0.97)% and detracted 0.22% from absolute return.
How Has The Fund Historically Performed?
Growth of $10,000 Investment
| AVERAGE ANNUAL TOTAL RETURNS | 1 Year | 5 Years | 10 Years |
| Invesco International Diversified Fund (Class A) —including sales charge | (7.90)% | (0.11)% | 3.56% |
| Invesco International Diversified Fund (Class A) —excluding sales charge | (2.53)% | 1.02% | 4.15% |
| MSCI ACWI ex USA® Index (Net) | 5.53% | 4.10% | 4.80% |
Effective after the close of business on May 24, 2019, Class A shares of Oppenheimer International Diversified Fund (the predecessor fund), were reorganized into Class A shares of the Fund. Returns shown above for periods ending on or prior to May 24, 2019 are those of Class A shares of the predecessor fund. Share class returns will differ from the predecessor fund because of different expenses.
The performance data quoted represents past performance and cannot guarantee future results; current performance may be lower or higher. Please visit invesco.com/performance for more recent performance information.
Performance figures do not reflect deduction of taxes a shareholder would pay on Fund distributions or sale of Fund shares.
What Are Key Statistics About The Fund?
(as of December 31, 2024)
| Fund net assets | $1,566,249,789 |
| Total number of portfolio holdings | 4 |
| Total advisory fees paid | $0 |
| Portfolio turnover rate | 8% |
What Comprised The Fund's Holdings?
(as of December 31, 2024)
Portfolio composition
(% of total investments)
| Invesco International Small-Mid Company Fund, Class R6 | 30.10% |
| Invesco EQV International Equity Fund, Class R6 | 25.06 |
| Invesco Oppenheimer International Growth Fund, Class R6 | 24.88 |
| Invesco Developing Markets Fund, Class R6 | 19.96 |
Where Can I Find More Information?
You can find more information about the Fund, including the Fund's prospectus, financial information, and holdings at invesco.com/reports. Additionally, the Fund's proxy voting information can be found at invesco.com/proxy-voting.
What Should I Know About Delivery Of Important Regulatory Documents?
To reduce Fund expenses, only one copy of most shareholder documents may be mailed to shareholders with multiple accounts at the same address (Householding). Mailing of your shareholder documents may be householded indefinitely unless you instruct us otherwise. If you do not want the mailing of these documents to be combined with those for other members of your household, please contact Invesco Investment Services, Inc. at (800) 959-4246 or contact your financial institution. We will begin sending you individual copies for each account within 30 days after receiving your request.
For additional information, please scan the QR code at the left to navigate to additional material at invesco.com/reports.
Invesco International Diversified Fund
Class C: OIDCX
ANNUAL SHAREHOLDER REPORT | December 31, 2024
This annual shareholder report contains important information about Invesco International Diversified Fund (the “Fund”) for the period January 1, 2024 to December 31, 2024. You can find additional information about the Fund at invesco.com/reports. You can also request this information by contacting us at (800) 959-4246.
What Were The Fund Costs For The Last Year ?
(Based on a hypothetical $10,000 investment)
| Fund (Class) | Costs of a $10,000 investment | Costs paid as a percentage
of a $10,000 investment |
Invesco International Diversified Fund
(Class C) | $118 | 1.20% |
How Did The Fund Perform During The Period?
• Broad-based equity markets rose during the fiscal year ended December 31, 2024. In the US, enthusiasm around artificial intelligence led to market concentration in megacap technology and to outperformance relative to non-US equities. The turn in the interest rate cycle also caused high quality segments to underperform the wider market. Outside of the US, emerging markets (EM) outperformed developed markets as news of fiscal stimulus by the Chinese government drove better sentiment towards the EM asset class. In this environment, our portfolio, with its high-quality bias, underperformed its broad-based market index.
• For the fiscal year ended December 31, 2024, Class C shares of the Fund, excluding sales charge, returned (3.27)%. For the same time period, the MSCI ACWI ex USA® Index (Net) returned 5.53%.
What contributed to performance?
Sectors | Fund's stock selection and underweight allocation to the materials sector contributed positively to relative performance. Stock selection and an overweight allocation to consumer discretionary sector also contributed positively.
Underlying Funds | As of the fiscal year end, the Fund’s portfolio consisted of four underlying mutual funds, one of which contributed to the Fund's absolute returns. Invesco EQV International Equity Fund returned 0.70%, contributing 0.18% to the Fund's absolute return during the period.
What detracted from performance?
Sectors | The Fund's underperformance compared to the MSCI ACWI ex USA® Index (Net) was driven by stock selection in financials and industrials sectors. The Fund's underweight allocation to financials sector also detracted from relative results.
Underlying Funds | Three of the four underlying mutual funds held in the portfolio detracted from the Fund's absolute returns during the fiscal period. Invesco International Small-Mid Company Fund returned (6.08)% and detracted 1.83% from absolute return, Invesco Oppenheimer International Growth Fund returned (1.40)% and detracted 0.28% from absolute return and Invesco Developing Markets Fund returned (0.97)% and detracted 0.22% from absolute return.
How Has The Fund Historically Performed?
Growth of $10,000 Investment
| AVERAGE ANNUAL TOTAL RETURNS | 1 Year | 5 Years | 10 Years |
| Invesco International Diversified Fund (Class C) —including sales charge | (4.20)% | 0.26% | 3.52% |
| Invesco International Diversified Fund (Class C) —excluding sales charge | (3.27)% | 0.26% | 3.52% |
| MSCI ACWI ex USA® Index (Net) | 5.53% | 4.10% | 4.80% |
Effective after the close of business on May 24, 2019, Class C shares of Oppenheimer International Diversified Fund (the predecessor fund), were reorganized into Class C shares of the Fund. Returns shown above for periods ending on or prior to May 24, 2019 are those of Class C shares of the predecessor fund. Share class returns will differ from the predecessor fund because of different expenses.
The performance data quoted represents past performance and cannot guarantee future results; current performance may be lower or higher. Please visit invesco.com/performance for more recent performance information.
Performance figures do not reflect deduction of taxes a shareholder would pay on Fund distributions or sale of Fund shares.
What Are Key Statistics About The Fund?
(as of December 31, 2024)
| Fund net assets | $1,566,249,789 |
| Total number of portfolio holdings | 4 |
| Total advisory fees paid | $0 |
| Portfolio turnover rate | 8% |
What Comprised The Fund's Holdings?
(as of December 31, 2024)
Portfolio composition
(% of total investments)
| Invesco International Small-Mid Company Fund, Class R6 | 30.10% |
| Invesco EQV International Equity Fund, Class R6 | 25.06 |
| Invesco Oppenheimer International Growth Fund, Class R6 | 24.88 |
| Invesco Developing Markets Fund, Class R6 | 19.96 |
Where Can I Find More Information?
You can find more information about the Fund, including the Fund's prospectus, financial information, and holdings at invesco.com/reports. Additionally, the Fund's proxy voting information can be found at invesco.com/proxy-voting.
What Should I Know About Delivery Of Important Regulatory Documents?
To reduce Fund expenses, only one copy of most shareholder documents may be mailed to shareholders with multiple accounts at the same address (Householding). Mailing of your shareholder documents may be householded indefinitely unless you instruct us otherwise. If you do not want the mailing of these documents to be combined with those for other members of your household, please contact Invesco Investment Services, Inc. at (800) 959-4246 or contact your financial institution. We will begin sending you individual copies for each account within 30 days after receiving your request.
For additional information, please scan the QR code at the left to navigate to additional material at invesco.com/reports.
Invesco International Diversified Fund
Class R: OIDNX
ANNUAL SHAREHOLDER REPORT | December 31, 2024
This annual shareholder report contains important information about Invesco International Diversified Fund (the “Fund”) for the period January 1, 2024 to December 31, 2024. You can find additional information about the Fund at invesco.com/reports. You can also request this information by contacting us at (800) 959-4246.
What Were The Fund Costs For The Last Year ?
(Based on a hypothetical $10,000 investment)
| Fund (Class) | Costs of a $10,000 investment | Costs paid as a percentage
of a $10,000 investment |
Invesco International Diversified Fund
(Class R) | $69 | 0.70% |
How Did The Fund Perform During The Period?
• Broad-based equity markets rose during the fiscal year ended December 31, 2024. In the US, enthusiasm around artificial intelligence led to market concentration in megacap technology and to outperformance relative to non-US equities. The turn in the interest rate cycle also caused high quality segments to underperform the wider market. Outside of the US, emerging markets (EM) outperformed developed markets as news of fiscal stimulus by the Chinese government drove better sentiment towards the EM asset class. In this environment, our portfolio, with its high-quality bias, underperformed its broad-based market index.
• For the fiscal year ended December 31, 2024, Class R shares of the Fund returned (2.83)%. For the same time period, the MSCI ACWI ex USA® Index (Net) returned 5.53%.
What contributed to performance?
Sectors | Fund's stock selection and underweight allocation to the materials sector contributed positively to relative performance. Stock selection and an overweight allocation to consumer discretionary sector also contributed positively.
Underlying Funds | As of the fiscal year end, the Fund’s portfolio consisted of four underlying mutual funds, one of which contributed to the Fund's absolute returns. Invesco EQV International Equity Fund returned 0.70%, contributing 0.18% to the Fund's absolute return during the period.
What detracted from performance?
Sectors | The Fund's underperformance compared to the MSCI ACWI ex USA® Index (Net) was driven by stock selection in financials and industrials sectors. The Fund's underweight allocation to financials sector also detracted from relative results.
Underlying Funds | Three of the four underlying mutual funds held in the portfolio detracted from the Fund's absolute returns during the fiscal period. Invesco International Small-Mid Company Fund returned (6.08)% and detracted 1.83% from absolute return, Invesco Oppenheimer International Growth Fund returned (1.40)% and detracted 0.28% from absolute return and Invesco Developing Markets Fund returned (0.97)% and detracted 0.22% from absolute return.
How Has The Fund Historically Performed?
Growth of $10,000 Investment
| AVERAGE ANNUAL TOTAL RETURNS | 1 Year | 5 Years | 10 Years |
| Invesco International Diversified Fund (Class R) | (2.83)% | 0.75% | 3.88% |
| MSCI ACWI ex USA® Index (Net) | 5.53% | 4.10% | 4.80% |
Effective after the close of business on May 24, 2019, Class R shares of Oppenheimer International Diversified Fund (the predecessor fund), were reorganized into Class R shares of the Fund. Returns shown above for periods ending on or prior to May 24, 2019 are those of Class R shares of the predecessor fund. Share class returns will differ from the predecessor fund because of different expenses.
The performance data quoted represents past performance and cannot guarantee future results; current performance may be lower or higher. Please visit invesco.com/performance for more recent performance information.
Performance figures do not reflect deduction of taxes a shareholder would pay on Fund distributions or sale of Fund shares.
What Are Key Statistics About The Fund?
(as of December 31, 2024)
| Fund net assets | $1,566,249,789 |
| Total number of portfolio holdings | 4 |
| Total advisory fees paid | $0 |
| Portfolio turnover rate | 8% |
What Comprised The Fund's Holdings?
(as of December 31, 2024)
Portfolio composition
(% of total investments)
| Invesco International Small-Mid Company Fund, Class R6 | 30.10% |
| Invesco EQV International Equity Fund, Class R6 | 25.06 |
| Invesco Oppenheimer International Growth Fund, Class R6 | 24.88 |
| Invesco Developing Markets Fund, Class R6 | 19.96 |
Where Can I Find More Information?
You can find more information about the Fund, including the Fund's prospectus, financial information, and holdings at invesco.com/reports. Additionally, the Fund's proxy voting information can be found at invesco.com/proxy-voting.
What Should I Know About Delivery Of Important Regulatory Documents?
To reduce Fund expenses, only one copy of most shareholder documents may be mailed to shareholders with multiple accounts at the same address (Householding). Mailing of your shareholder documents may be householded indefinitely unless you instruct us otherwise. If you do not want the mailing of these documents to be combined with those for other members of your household, please contact Invesco Investment Services, Inc. at (800) 959-4246 or contact your financial institution. We will begin sending you individual copies for each account within 30 days after receiving your request.
For additional information, please scan the QR code at the left to navigate to additional material at invesco.com/reports.
Invesco International Diversified Fund
Class Y: OIDYX
ANNUAL SHAREHOLDER REPORT | December 31, 2024
This annual shareholder report contains important information about Invesco International Diversified Fund (the “Fund”) for the period January 1, 2024 to December 31, 2024. You can find additional information about the Fund at invesco.com/reports. You can also request this information by contacting us at (800) 959-4246.
What Were The Fund Costs For The Last Year ?
(Based on a hypothetical $10,000 investment)
| Fund (Class) | Costs of a $10,000 investment | Costs paid as a percentage
of a $10,000 investment |
Invesco International Diversified Fund
(Class Y) | $20 | 0.20% |
How Did The Fund Perform During The Period?
• Broad-based equity markets rose during the fiscal year ended December 31, 2024. In the US, enthusiasm around artificial intelligence led to market concentration in megacap technology and to outperformance relative to non-US equities. The turn in the interest rate cycle also caused high quality segments to underperform the wider market. Outside of the US, emerging markets (EM) outperformed developed markets as news of fiscal stimulus by the Chinese government drove better sentiment towards the EM asset class. In this environment, our portfolio, with its high-quality bias, underperformed its broad-based market index.
• For the fiscal year ended December 31, 2024, Class Y shares of the Fund returned (2.35)%. For the same time period, the MSCI ACWI ex USA® Index (Net) returned 5.53%.
What contributed to performance?
Sectors | Fund's stock selection and underweight allocation to the materials sector contributed positively to relative performance. Stock selection and an overweight allocation to consumer discretionary sector also contributed positively.
Underlying Funds | As of the fiscal year end, the Fund’s portfolio consisted of four underlying mutual funds, one of which contributed to the Fund's absolute returns. Invesco EQV International Equity Fund returned 0.70%, contributing 0.18% to the Fund's absolute return during the period.
What detracted from performance?
Sectors | The Fund's underperformance compared to the MSCI ACWI ex USA® Index (Net) was driven by stock selection in financials and industrials sectors. The Fund's underweight allocation to financials sector also detracted from relative results.
Underlying Funds | Three of the four underlying mutual funds held in the portfolio detracted from the Fund's absolute returns during the fiscal period. Invesco International Small-Mid Company Fund returned (6.08)% and detracted 1.83% from absolute return, Invesco Oppenheimer International Growth Fund returned (1.40)% and detracted 0.28% from absolute return and Invesco Developing Markets Fund returned (0.97)% and detracted 0.22% from absolute return.
How Has The Fund Historically Performed?
Growth of $10,000 Investment
| AVERAGE ANNUAL TOTAL RETURNS | 1 Year | 5 Years | 10 Years |
| Invesco International Diversified Fund (Class Y) | (2.35)% | 1.26% | 4.41% |
| MSCI ACWI ex USA® Index (Net) | 5.53% | 4.10% | 4.80% |
Effective after the close of business on May 24, 2019, Class Y shares of Oppenheimer International Diversified Fund (the predecessor fund), were reorganized into Class Y shares of the Fund. Returns shown above for periods ending on or prior to May 24, 2019 are those of Class Y shares of the predecessor fund. Share class returns will differ from the predecessor fund because of different expenses.
The performance data quoted represents past performance and cannot guarantee future results; current performance may be lower or higher. Please visit invesco.com/performance for more recent performance information.
Performance figures do not reflect deduction of taxes a shareholder would pay on Fund distributions or sale of Fund shares.
What Are Key Statistics About The Fund?
(as of December 31, 2024)
| Fund net assets | $1,566,249,789 |
| Total number of portfolio holdings | 4 |
| Total advisory fees paid | $0 |
| Portfolio turnover rate | 8% |
What Comprised The Fund's Holdings?
(as of December 31, 2024)
Portfolio composition
(% of total investments)
| Invesco International Small-Mid Company Fund, Class R6 | 30.10% |
| Invesco EQV International Equity Fund, Class R6 | 25.06 |
| Invesco Oppenheimer International Growth Fund, Class R6 | 24.88 |
| Invesco Developing Markets Fund, Class R6 | 19.96 |
Where Can I Find More Information?
You can find more information about the Fund, including the Fund's prospectus, financial information, and holdings at invesco.com/reports. Additionally, the Fund's proxy voting information can be found at invesco.com/proxy-voting.
What Should I Know About Delivery Of Important Regulatory Documents?
To reduce Fund expenses, only one copy of most shareholder documents may be mailed to shareholders with multiple accounts at the same address (Householding). Mailing of your shareholder documents may be householded indefinitely unless you instruct us otherwise. If you do not want the mailing of these documents to be combined with those for other members of your household, please contact Invesco Investment Services, Inc. at (800) 959-4246 or contact your financial institution. We will begin sending you individual copies for each account within 30 days after receiving your request.
For additional information, please scan the QR code at the left to navigate to additional material at invesco.com/reports.
Invesco International Diversified Fund
Class R5: INDFX
ANNUAL SHAREHOLDER REPORT | December 31, 2024
This annual shareholder report contains important information about Invesco International Diversified Fund (the “Fund”) for the period January 1, 2024 to December 31, 2024. You can find additional information about the Fund at invesco.com/reports. You can also request this information by contacting us at (800) 959-4246.
This report describes changes to the Fund that occurred during the reporting period.
What Were The Fund Costs For The Last Year ?
(Based on a hypothetical $10,000 investment)
| Fund (Class) | Costs of a $10,000 investment | Costs paid as a percentage
of a $10,000 investment |
Invesco International Diversified Fund
(Class R5) | $13 | 0.13% |
How Did The Fund Perform During The Period?
• Broad-based equity markets rose during the fiscal year ended December 31, 2024. In the US, enthusiasm around artificial intelligence led to market concentration in megacap technology and to outperformance relative to non-US equities. The turn in the interest rate cycle also caused high quality segments to underperform the wider market. Outside of the US, emerging markets (EM) outperformed developed markets as news of fiscal stimulus by the Chinese government drove better sentiment towards the EM asset class. In this environment, our portfolio, with its high-quality bias, underperformed its broad-based market index.
• For the fiscal year ended December 31, 2024, Class R5 shares of the Fund returned (2.31)%. For the same time period, the MSCI ACWI ex USA® Index (Net) returned 5.53%.
What contributed to performance?
Sectors | Fund's stock selection and underweight allocation to the materials sector contributed positively to relative performance. Stock selection and an overweight allocation to consumer discretionary sector also contributed positively.
Underlying Funds | As of the fiscal year end, the Fund’s portfolio consisted of four underlying mutual funds, one of which contributed to the Fund's absolute returns. Invesco EQV International Equity Fund returned 0.70%, contributing 0.18% to the Fund's absolute return during the period.
What detracted from performance?
Sectors | The Fund's underperformance compared to the MSCI ACWI ex USA® Index (Net) was driven by stock selection in financials and industrials sectors. The Fund's underweight allocation to financials sector also detracted from relative results.
Underlying Funds | Three of the four underlying mutual funds held in the portfolio detracted from the Fund's absolute returns during the fiscal period. Invesco International Small-Mid Company Fund returned (6.08)% and detracted 1.83% from absolute return, Invesco Oppenheimer International Growth Fund returned (1.40)% and detracted 0.28% from absolute return and Invesco Developing Markets Fund returned (0.97)% and detracted 0.22% from absolute return.
How Has The Fund Historically Performed?
Growth of $10,000 Investment
| AVERAGE ANNUAL TOTAL RETURNS | 1 Year | 5 Years | 10 Years |
| Invesco International Diversified Fund (Class R5) | (2.31)% | 1.36% | 4.35% |
| MSCI ACWI ex USA® Index (Net) | 5.53% | 4.10% | 4.80% |
Class R5 shares incepted on May 24, 2019. Performance shown on and prior to that date is that of Oppenheimer International Diversified Fund's (the predecessor fund) Class A shares at net asset value and includes 12b-1 fees applicable to Class A shares. Share class returns will differ from the predecessor fund because of different expenses.
The performance data quoted represents past performance and cannot guarantee future results; current performance may be lower or higher. Please visit invesco.com/performance for more recent performance information.
Performance figures do not reflect deduction of taxes a shareholder would pay on Fund distributions or sale of Fund shares.
What Are Key Statistics About The Fund?
(as of December 31, 2024)
| Fund net assets | $1,566,249,789 |
| Total number of portfolio holdings | 4 |
| Total advisory fees paid | $0 |
| Portfolio turnover rate | 8% |
What Comprised The Fund's Holdings?
(as of December 31, 2024)
Portfolio composition
(% of total investments)
| Invesco International Small-Mid Company Fund, Class R6 | 30.10% |
| Invesco EQV International Equity Fund, Class R6 | 25.06 |
| Invesco Oppenheimer International Growth Fund, Class R6 | 24.88 |
| Invesco Developing Markets Fund, Class R6 | 19.96 |
How Has The Fund Changed Over The Past Year?
This is a summary of certain changes to the Fund since December 31, 2023. For more complete information, you may review the Fund's prospectus, which is available at invesco.com/reports or upon request at (800) 959-4246.
Effective after the close of business on September 30, 2024, the Fund has limited public sales of its Class R5 shares to certain investors who were previously invested in Class R5 shares of the Fund.
Where Can I Find More Information?
You can find more information about the Fund, including the Fund's prospectus, financial information, and holdings at invesco.com/reports. Additionally, the Fund's proxy voting information can be found at invesco.com/proxy-voting.
What Should I Know About Delivery Of Important Regulatory Documents?
To reduce Fund expenses, only one copy of most shareholder documents may be mailed to shareholders with multiple accounts at the same address (Householding). Mailing of your shareholder documents may be householded indefinitely unless you instruct us otherwise. If you do not want the mailing of these documents to be combined with those for other members of your household, please contact Invesco Investment Services, Inc. at (800) 959-4246 or contact your financial institution. We will begin sending you individual copies for each account within 30 days after receiving your request.
For additional information, please scan the QR code at the left to navigate to additional material at invesco.com/reports.
Invesco International Diversified Fund
Class R6: OIDIX
ANNUAL SHAREHOLDER REPORT | December 31, 2024
This annual shareholder report contains important information about Invesco International Diversified Fund (the “Fund”) for the period January 1, 2024 to December 31, 2024. You can find additional information about the Fund at invesco.com/reports. You can also request this information by contacting us at (800) 959-4246.
What Were The Fund Costs For The Last Year ?
(Based on a hypothetical $10,000 investment)
| Fund (Class) | Costs of a $10,000 investment | Costs paid as a percentage
of a $10,000 investment |
Invesco International Diversified Fund
(Class R6) | $6 | 0.06% |
How Did The Fund Perform During The Period?
• Broad-based equity markets rose during the fiscal year ended December 31, 2024. In the US, enthusiasm around artificial intelligence led to market concentration in megacap technology and to outperformance relative to non-US equities. The turn in the interest rate cycle also caused high quality segments to underperform the wider market. Outside of the US, emerging markets (EM) outperformed developed markets as news of fiscal stimulus by the Chinese government drove better sentiment towards the EM asset class. In this environment, our portfolio, with its high-quality bias, underperformed its broad-based market index.
• For the fiscal year ended December 31, 2024, Class R6 shares of the Fund returned (2.21)%. For the same time period, the MSCI ACWI ex USA® Index (Net) returned 5.53%.
What contributed to performance?
Sectors | Fund's stock selection and underweight allocation to the materials sector contributed positively to relative performance. Stock selection and an overweight allocation to consumer discretionary sector also contributed positively.
Underlying Funds | As of the fiscal year end, the Fund’s portfolio consisted of four underlying mutual funds, one of which contributed to the Fund's absolute returns. Invesco EQV International Equity Fund returned 0.70%, contributing 0.18% to the Fund's absolute return during the period.
What detracted from performance?
Sectors | The Fund's underperformance compared to the MSCI ACWI ex USA® Index (Net) was driven by stock selection in financials and industrials sectors. The Fund's underweight allocation to financials sector also detracted from relative results.
Underlying Funds | Three of the four underlying mutual funds held in the portfolio detracted from the Fund's absolute returns during the fiscal period. Invesco International Small-Mid Company Fund returned (6.08)% and detracted 1.83% from absolute return, Invesco Oppenheimer International Growth Fund returned (1.40)% and detracted 0.28% from absolute return and Invesco Developing Markets Fund returned (0.97)% and detracted 0.22% from absolute return.
How Has The Fund Historically Performed?
Growth of $10,000 Investment
| AVERAGE ANNUAL TOTAL RETURNS | 1 Year | 5 Years | 10 Years |
| Invesco International Diversified Fund (Class R6) | (2.21)% | 1.40% | 4.57% |
| MSCI ACWI ex USA® Index (Net) | 5.53% | 4.10% | 4.80% |
Effective after the close of business on May 24, 2019, Class I shares of Oppenheimer International Diversified Fund (the predecessor fund), were reorganized into Class R6 shares of the Fund. Returns shown above for periods ending on or prior to May 24, 2019 are those of Class I shares of the predecessor fund. Share class returns will differ from the predecessor fund because of different expenses.
The performance data quoted represents past performance and cannot guarantee future results; current performance may be lower or higher. Please visit invesco.com/performance for more recent performance information.
Performance figures do not reflect deduction of taxes a shareholder would pay on Fund distributions or sale of Fund shares.
What Are Key Statistics About The Fund?
(as of December 31, 2024)
| Fund net assets | $1,566,249,789 |
| Total number of portfolio holdings | 4 |
| Total advisory fees paid | $0 |
| Portfolio turnover rate | 8% |
What Comprised The Fund's Holdings?
(as of December 31, 2024)
Portfolio composition
(% of total investments)
| Invesco International Small-Mid Company Fund, Class R6 | 30.10% |
| Invesco EQV International Equity Fund, Class R6 | 25.06 |
| Invesco Oppenheimer International Growth Fund, Class R6 | 24.88 |
| Invesco Developing Markets Fund, Class R6 | 19.96 |
Where Can I Find More Information?
You can find more information about the Fund, including the Fund's prospectus, financial information, and holdings at invesco.com/reports. Additionally, the Fund's proxy voting information can be found at invesco.com/proxy-voting.
What Should I Know About Delivery Of Important Regulatory Documents?
To reduce Fund expenses, only one copy of most shareholder documents may be mailed to shareholders with multiple accounts at the same address (Householding). Mailing of your shareholder documents may be householded indefinitely unless you instruct us otherwise. If you do not want the mailing of these documents to be combined with those for other members of your household, please contact Invesco Investment Services, Inc. at (800) 959-4246 or contact your financial institution. We will begin sending you individual copies for each account within 30 days after receiving your request.
For additional information, please scan the QR code at the left to navigate to additional material at invesco.com/reports.
Invesco Main Street Mid Cap Fund®
Class A: OPMSX
ANNUAL SHAREHOLDER REPORT | December 31, 2024
This annual shareholder report contains important information about Invesco Main Street Mid Cap Fund® (the “Fund”) for the period January 1, 2024 to December 31, 2024. You can find additional information about the Fund at invesco.com/reports. You can also request this information by contacting us at (800) 959-4246.
What Were The Fund Costs For The Last Year ?
(Based on a hypothetical $10,000 investment)
| Fund (Class) | Costs of a $10,000 investment | Costs paid as a percentage
of a $10,000 investment |
Invesco Main Street Mid Cap Fund®
(Class A) | $114 | 1.05%† |
† | Reflects fee waivers and/or expense reimbursements, without which expenses would have been higher. |
How Did The Fund Perform During The Period?
• During the fiscal year ended December 31, 2024, US equity markets posted strong gains as the US economy remained resilient. Data suggested the US Federal Reserve (the Fed) may have achieved its fabled soft landing, as moderating inflation, strong consumer spending and low unemployment provided support. The Fed cut the federal funds rate several times over the period, but suggested less aggressive easing in 2025 should robust economic growth and lingering inflation continue. The Fund outperformed its benchmark mainly as a result of stock selection in the industrials, health care and materials sectors. Weaker stock selection in the financials, energy and utilities sectors partially offset these results.
• For the fiscal year ended December 31, 2024, Class A shares of the Fund, excluding sales charge, returned 17.07%. For the same time period, the Russell Midcap® Index returned 15.34%.
What contributed to performance?
Howmet Aerospace, Inc. | Howmet Aerospace outperformed as it reported results that showed strength in its commercial aerospace business despite challenges in the global aerospace supply chain. Profit margins and cashflow exceeded apparent investor expectations and the company raised its dividend and increased its share repurchase program.
Astera Labs, Inc. | Astera Labs makes connectivity chips for cloud and artificial intelligence data centers. The firm reported revenue growth that exceeded expectations while providing guidance that was interpreted optimistically, including news about expected new products and customer wins.
What detracted from performance?
MongoDB, Inc. | MongoDB is a document database that stores and manages data for a variety of applications such as customer relationship management and health care systems. MongoDB has gained share in the large database software market but underperformed during the period as it reported underwhelming results that saw slower than expected new customer additions and growth within its installed customer base.
Acadia Healthcare Company, Inc. | Acadia Healthcare underperformed as its operation of acute behavioral healthcare facilities was subject to negative media about its admissions and operating practices, leading to a decline in patient referrals. We sold the holding during the fiscal year.
How Has The Fund Historically Performed?
Growth of $10,000 Investment
| AVERAGE ANNUAL TOTAL RETURNS | 1 Year | 5 Years | 10 Years |
| Invesco Main Street Mid Cap Fund® (Class A) —including sales charge | 10.61% | 7.81% | 7.38% |
| Invesco Main Street Mid Cap Fund® (Class A) —excluding sales charge | 17.07% | 9.04% | 7.99% |
| Russell Midcap® Index | 15.34% | 9.92% | 9.63% |
| S&P 500® Index | 25.02% | 14.53% | 13.10% |
Effective after the close of business on May 24, 2019, Class A shares of Oppenheimer Main Street Mid Cap Fund® (the predecessor fund), were reorganized into Class A shares of the Fund. Returns shown above for periods ending on or prior to May 24, 2019 are those of Class A shares of the predecessor fund. Share class returns will differ from the predecessor fund because of different expenses.
Effective April 26, 2024, the Fund changed its broad-based securities market benchmark from the Russell Midcap® Index to the S&P 500® Index to reflect that the S&P 500® Index can be considered more broadly representative of the overall applicable securities market.
The performance data quoted represents past performance and cannot guarantee future results; current performance may be lower or higher. Please visit invesco.com/performance for more recent performance information.
Performance figures do not reflect deduction of taxes a shareholder would pay on Fund distributions or sale of Fund shares.
What Are Key Statistics About The Fund?
(as of December 31, 2024)
| Fund net assets | $2,534,755,572 |
| Total number of portfolio holdings | 97 |
| Total advisory fees paid | $15,464,860 |
| Portfolio turnover rate | 40% |
What Comprised The Fund's Holdings?
(as of December 31, 2024)
Top ten holdings*
(% of net assets)
| Trade Desk, Inc. (The), Class A | 1.88% |
| Royal Caribbean Cruises Ltd. | 1.87% |
| Raymond James Financial, Inc. | 1.74% |
| Wyndham Hotels & Resorts, Inc. | 1.66% |
| M&T Bank Corp. | 1.65% |
| Cheniere Energy, Inc. | 1.61% |
| Howmet Aerospace, Inc. | 1.49% |
| Expand Energy Corp. | 1.44% |
| CMS Energy Corp. | 1.40% |
| American International Group, Inc. | 1.40% |
| * Excluding money market fund holdings, if any. | |
Sector allocation
(% of net assets)
Where Can I Find More Information?
You can find more information about the Fund, including the Fund's prospectus, financial information, and holdings at invesco.com/reports. Additionally, the Fund's proxy voting information can be found at invesco.com/proxy-voting.
What Should I Know About Delivery Of Important Regulatory Documents?
To reduce Fund expenses, only one copy of most shareholder documents may be mailed to shareholders with multiple accounts at the same address (Householding). Mailing of your shareholder documents may be householded indefinitely unless you instruct us otherwise. If you do not want the mailing of these documents to be combined with those for other members of your household, please contact Invesco Investment Services, Inc. at (800) 959-4246 or contact your financial institution. We will begin sending you individual copies for each account within 30 days after receiving your request.
For additional information, please scan the QR code at the left to navigate to additional material at invesco.com/reports.
Invesco Main Street Mid Cap Fund®
Class C: OPMCX
ANNUAL SHAREHOLDER REPORT | December 31, 2024
This annual shareholder report contains important information about Invesco Main Street Mid Cap Fund® (the “Fund”) for the period January 1, 2024 to December 31, 2024. You can find additional information about the Fund at invesco.com/reports. You can also request this information by contacting us at (800) 959-4246.
What Were The Fund Costs For The Last Year ?
(Based on a hypothetical $10,000 investment)
| Fund (Class) | Costs of a $10,000 investment | Costs paid as a percentage
of a $10,000 investment |
Invesco Main Street Mid Cap Fund®
(Class C) | $196 | 1.81%† |
† | Reflects fee waivers and/or expense reimbursements, without which expenses would have been higher. |
How Did The Fund Perform During The Period?
• During the fiscal year ended December 31, 2024, US equity markets posted strong gains as the US economy remained resilient. Data suggested the US Federal Reserve (the Fed) may have achieved its fabled soft landing, as moderating inflation, strong consumer spending and low unemployment provided support. The Fed cut the federal funds rate several times over the period, but suggested less aggressive easing in 2025 should robust economic growth and lingering inflation continue. The Fund outperformed its benchmark mainly as a result of stock selection in the industrials, health care and materials sectors. Weaker stock selection in the financials, energy and utilities sectors partially offset these results.
• For the fiscal year ended December 31, 2024, Class C shares of the Fund, excluding sales charge, returned 16.21%. For the same time period, the Russell Midcap® Index returned 15.34%.
What contributed to performance?
Howmet Aerospace, Inc. | Howmet Aerospace outperformed as it reported results that showed strength in its commercial aerospace business despite challenges in the global aerospace supply chain. Profit margins and cashflow exceeded apparent investor expectations and the company raised its dividend and increased its share repurchase program.
Astera Labs, Inc. | Astera Labs makes connectivity chips for cloud and artificial intelligence data centers. The firm reported revenue growth that exceeded expectations while providing guidance that was interpreted optimistically, including news about expected new products and customer wins.
What detracted from performance?
MongoDB, Inc. | MongoDB is a document database that stores and manages data for a variety of applications such as customer relationship management and health care systems. MongoDB has gained share in the large database software market but underperformed during the period as it reported underwhelming results that saw slower than expected new customer additions and growth within its installed customer base.
Acadia Healthcare Company, Inc. | Acadia Healthcare underperformed as its operation of acute behavioral healthcare facilities was subject to negative media about its admissions and operating practices, leading to a decline in patient referrals. We sold the holding during the fiscal year.
How Has The Fund Historically Performed?
Growth of $10,000 Investment
| AVERAGE ANNUAL TOTAL RETURNS | 1 Year | 5 Years | 10 Years |
| Invesco Main Street Mid Cap Fund® (Class C) —including sales charge | 15.21% | 8.22% | 7.34% |
| Invesco Main Street Mid Cap Fund® (Class C) —excluding sales charge | 16.21% | 8.22% | 7.34% |
| Russell Midcap® Index | 15.34% | 9.92% | 9.63% |
| S&P 500® Index | 25.02% | 14.53% | 13.10% |
Effective after the close of business on May 24, 2019, Class C shares of Oppenheimer Main Street Mid Cap Fund® (the predecessor fund), were reorganized into Class C shares of the Fund. Returns shown above for periods ending on or prior to May 24, 2019 are those of Class C shares of the predecessor fund. Share class returns will differ from the predecessor fund because of different expenses.
Effective April 26, 2024, the Fund changed its broad-based securities market benchmark from the Russell Midcap® Index to the S&P 500® Index to reflect that the S&P 500® Index can be considered more broadly representative of the overall applicable securities market.
The performance data quoted represents past performance and cannot guarantee future results; current performance may be lower or higher. Please visit invesco.com/performance for more recent performance information.
Performance figures do not reflect deduction of taxes a shareholder would pay on Fund distributions or sale of Fund shares.
What Are Key Statistics About The Fund?
(as of December 31, 2024)
| Fund net assets | $2,534,755,572 |
| Total number of portfolio holdings | 97 |
| Total advisory fees paid | $15,464,860 |
| Portfolio turnover rate | 40% |
What Comprised The Fund's Holdings?
(as of December 31, 2024)
Top ten holdings*
(% of net assets)
| Trade Desk, Inc. (The), Class A | 1.88% |
| Royal Caribbean Cruises Ltd. | 1.87% |
| Raymond James Financial, Inc. | 1.74% |
| Wyndham Hotels & Resorts, Inc. | 1.66% |
| M&T Bank Corp. | 1.65% |
| Cheniere Energy, Inc. | 1.61% |
| Howmet Aerospace, Inc. | 1.49% |
| Expand Energy Corp. | 1.44% |
| CMS Energy Corp. | 1.40% |
| American International Group, Inc. | 1.40% |
| * Excluding money market fund holdings, if any. | |
Sector allocation
(% of net assets)
Where Can I Find More Information?
You can find more information about the Fund, including the Fund's prospectus, financial information, and holdings at invesco.com/reports. Additionally, the Fund's proxy voting information can be found at invesco.com/proxy-voting.
What Should I Know About Delivery Of Important Regulatory Documents?
To reduce Fund expenses, only one copy of most shareholder documents may be mailed to shareholders with multiple accounts at the same address (Householding). Mailing of your shareholder documents may be householded indefinitely unless you instruct us otherwise. If you do not want the mailing of these documents to be combined with those for other members of your household, please contact Invesco Investment Services, Inc. at (800) 959-4246 or contact your financial institution. We will begin sending you individual copies for each account within 30 days after receiving your request.
For additional information, please scan the QR code at the left to navigate to additional material at invesco.com/reports.
Invesco Main Street Mid Cap Fund®
Class R: OPMNX
ANNUAL SHAREHOLDER REPORT | December 31, 2024
This annual shareholder report contains important information about Invesco Main Street Mid Cap Fund® (the “Fund”) for the period January 1, 2024 to December 31, 2024. You can find additional information about the Fund at invesco.com/reports. You can also request this information by contacting us at (800) 959-4246.
What Were The Fund Costs For The Last Year ?
(Based on a hypothetical $10,000 investment)
| Fund (Class) | Costs of a $10,000 investment | Costs paid as a percentage
of a $10,000 investment |
Invesco Main Street Mid Cap Fund®
(Class R) | $142 | 1.31%† |
† | Reflects fee waivers and/or expense reimbursements, without which expenses would have been higher. |
How Did The Fund Perform During The Period?
• During the fiscal year ended December 31, 2024, US equity markets posted strong gains as the US economy remained resilient. Data suggested the US Federal Reserve (the Fed) may have achieved its fabled soft landing, as moderating inflation, strong consumer spending and low unemployment provided support. The Fed cut the federal funds rate several times over the period, but suggested less aggressive easing in 2025 should robust economic growth and lingering inflation continue. The Fund outperformed its benchmark mainly as a result of stock selection in the industrials, health care and materials sectors. Weaker stock selection in the financials, energy and utilities sectors partially offset these results.
• For the fiscal year ended December 31, 2024, Class R shares of the Fund returned 16.74%. For the same time period, the Russell Midcap® Index returned 15.34%.
What contributed to performance?
Howmet Aerospace, Inc. | Howmet Aerospace outperformed as it reported results that showed strength in its commercial aerospace business despite challenges in the global aerospace supply chain. Profit margins and cashflow exceeded apparent investor expectations and the company raised its dividend and increased its share repurchase program.
Astera Labs, Inc. | Astera Labs makes connectivity chips for cloud and artificial intelligence data centers. The firm reported revenue growth that exceeded expectations while providing guidance that was interpreted optimistically, including news about expected new products and customer wins.
What detracted from performance?
MongoDB, Inc. | MongoDB is a document database that stores and manages data for a variety of applications such as customer relationship management and health care systems. MongoDB has gained share in the large database software market but underperformed during the period as it reported underwhelming results that saw slower than expected new customer additions and growth within its installed customer base.
Acadia Healthcare Company, Inc. | Acadia Healthcare underperformed as its operation of acute behavioral healthcare facilities was subject to negative media about its admissions and operating practices, leading to a decline in patient referrals. We sold the holding during the fiscal year.
How Has The Fund Historically Performed?
Growth of $10,000 Investment
| AVERAGE ANNUAL TOTAL RETURNS | 1 Year | 5 Years | 10 Years |
| Invesco Main Street Mid Cap Fund® (Class R) | 16.74% | 8.76% | 7.72% |
| Russell Midcap® Index | 15.34% | 9.92% | 9.63% |
| S&P 500® Index | 25.02% | 14.53% | 13.10% |
Effective after the close of business on May 24, 2019, Class R shares of Oppenheimer Main Street Mid Cap Fund® (the predecessor fund), were reorganized into Class R shares of the Fund. Returns shown above for periods ending on or prior to May 24, 2019 are those of Class R shares of the predecessor fund. Share class returns will differ from the predecessor fund because of different expenses.
Effective April 26, 2024, the Fund changed its broad-based securities market benchmark from the Russell Midcap® Index to the S&P 500® Index to reflect that the S&P 500® Index can be considered more broadly representative of the overall applicable securities market.
The performance data quoted represents past performance and cannot guarantee future results; current performance may be lower or higher. Please visit invesco.com/performance for more recent performance information.
Performance figures do not reflect deduction of taxes a shareholder would pay on Fund distributions or sale of Fund shares.
What Are Key Statistics About The Fund?
(as of December 31, 2024)
| Fund net assets | $2,534,755,572 |
| Total number of portfolio holdings | 97 |
| Total advisory fees paid | $15,464,860 |
| Portfolio turnover rate | 40% |
What Comprised The Fund's Holdings?
(as of December 31, 2024)
Top ten holdings*
(% of net assets)
| Trade Desk, Inc. (The), Class A | 1.88% |
| Royal Caribbean Cruises Ltd. | 1.87% |
| Raymond James Financial, Inc. | 1.74% |
| Wyndham Hotels & Resorts, Inc. | 1.66% |
| M&T Bank Corp. | 1.65% |
| Cheniere Energy, Inc. | 1.61% |
| Howmet Aerospace, Inc. | 1.49% |
| Expand Energy Corp. | 1.44% |
| CMS Energy Corp. | 1.40% |
| American International Group, Inc. | 1.40% |
| * Excluding money market fund holdings, if any. | |
Sector allocation
(% of net assets)
Where Can I Find More Information?
You can find more information about the Fund, including the Fund's prospectus, financial information, and holdings at invesco.com/reports. Additionally, the Fund's proxy voting information can be found at invesco.com/proxy-voting.
What Should I Know About Delivery Of Important Regulatory Documents?
To reduce Fund expenses, only one copy of most shareholder documents may be mailed to shareholders with multiple accounts at the same address (Householding). Mailing of your shareholder documents may be householded indefinitely unless you instruct us otherwise. If you do not want the mailing of these documents to be combined with those for other members of your household, please contact Invesco Investment Services, Inc. at (800) 959-4246 or contact your financial institution. We will begin sending you individual copies for each account within 30 days after receiving your request.
For additional information, please scan the QR code at the left to navigate to additional material at invesco.com/reports.
Invesco Main Street Mid Cap Fund®
Class Y: OPMYX
ANNUAL SHAREHOLDER REPORT | December 31, 2024
This annual shareholder report contains important information about Invesco Main Street Mid Cap Fund® (the “Fund”) for the period January 1, 2024 to December 31, 2024. You can find additional information about the Fund at invesco.com/reports. You can also request this information by contacting us at (800) 959-4246.
What Were The Fund Costs For The Last Year ?
(Based on a hypothetical $10,000 investment)
| Fund (Class) | Costs of a $10,000 investment | Costs paid as a percentage
of a $10,000 investment |
Invesco Main Street Mid Cap Fund®
(Class Y) | $88 | 0.81%† |
† | Reflects fee waivers and/or expense reimbursements, without which expenses would have been higher. |
How Did The Fund Perform During The Period?
• During the fiscal year ended December 31, 2024, US equity markets posted strong gains as the US economy remained resilient. Data suggested the US Federal Reserve (the Fed) may have achieved its fabled soft landing, as moderating inflation, strong consumer spending and low unemployment provided support. The Fed cut the federal funds rate several times over the period, but suggested less aggressive easing in 2025 should robust economic growth and lingering inflation continue. The Fund outperformed its benchmark mainly as a result of stock selection in the industrials, health care and materials sectors. Weaker stock selection in the financials, energy and utilities sectors partially offset these results.
• For the fiscal year ended December 31, 2024, Class Y shares of the Fund returned 17.32%. For the same time period, the Russell Midcap® Index returned 15.34%.
What contributed to performance?
Howmet Aerospace, Inc. | Howmet Aerospace outperformed as it reported results that showed strength in its commercial aerospace business despite challenges in the global aerospace supply chain. Profit margins and cashflow exceeded apparent investor expectations and the company raised its dividend and increased its share repurchase program.
Astera Labs, Inc. | Astera Labs makes connectivity chips for cloud and artificial intelligence data centers. The firm reported revenue growth that exceeded expectations while providing guidance that was interpreted optimistically, including news about expected new products and customer wins.
What detracted from performance?
MongoDB, Inc. | MongoDB is a document database that stores and manages data for a variety of applications such as customer relationship management and health care systems. MongoDB has gained share in the large database software market but underperformed during the period as it reported underwhelming results that saw slower than expected new customer additions and growth within its installed customer base.
Acadia Healthcare Company, Inc. | Acadia Healthcare underperformed as its operation of acute behavioral healthcare facilities was subject to negative media about its admissions and operating practices, leading to a decline in patient referrals. We sold the holding during the fiscal year.
How Has The Fund Historically Performed?
Growth of $10,000 Investment
| AVERAGE ANNUAL TOTAL RETURNS | 1 Year | 5 Years | 10 Years |
| Invesco Main Street Mid Cap Fund® (Class Y) | 17.32% | 9.31% | 8.26% |
| Russell Midcap® Index | 15.34% | 9.92% | 9.63% |
| S&P 500® Index | 25.02% | 14.53% | 13.10% |
Effective after the close of business on May 24, 2019, Class Y shares of Oppenheimer Main Street Mid Cap Fund® (the predecessor fund), were reorganized into Class Y shares of the Fund. Returns shown above for periods ending on or prior to May 24, 2019 are those of Class Y shares of the predecessor fund. Share class returns will differ from the predecessor fund because of different expenses.
Effective April 26, 2024, the Fund changed its broad-based securities market benchmark from the Russell Midcap® Index to the S&P 500® Index to reflect that the S&P 500® Index can be considered more broadly representative of the overall applicable securities market.
The performance data quoted represents past performance and cannot guarantee future results; current performance may be lower or higher. Please visit invesco.com/performance for more recent performance information.
Performance figures do not reflect deduction of taxes a shareholder would pay on Fund distributions or sale of Fund shares.
What Are Key Statistics About The Fund?
(as of December 31, 2024)
| Fund net assets | $2,534,755,572 |
| Total number of portfolio holdings | 97 |
| Total advisory fees paid | $15,464,860 |
| Portfolio turnover rate | 40% |
What Comprised The Fund's Holdings?
(as of December 31, 2024)
Top ten holdings*
(% of net assets)
| Trade Desk, Inc. (The), Class A | 1.88% |
| Royal Caribbean Cruises Ltd. | 1.87% |
| Raymond James Financial, Inc. | 1.74% |
| Wyndham Hotels & Resorts, Inc. | 1.66% |
| M&T Bank Corp. | 1.65% |
| Cheniere Energy, Inc. | 1.61% |
| Howmet Aerospace, Inc. | 1.49% |
| Expand Energy Corp. | 1.44% |
| CMS Energy Corp. | 1.40% |
| American International Group, Inc. | 1.40% |
| * Excluding money market fund holdings, if any. | |
Sector allocation
(% of net assets)
Where Can I Find More Information?
You can find more information about the Fund, including the Fund's prospectus, financial information, and holdings at invesco.com/reports. Additionally, the Fund's proxy voting information can be found at invesco.com/proxy-voting.
What Should I Know About Delivery Of Important Regulatory Documents?
To reduce Fund expenses, only one copy of most shareholder documents may be mailed to shareholders with multiple accounts at the same address (Householding). Mailing of your shareholder documents may be householded indefinitely unless you instruct us otherwise. If you do not want the mailing of these documents to be combined with those for other members of your household, please contact Invesco Investment Services, Inc. at (800) 959-4246 or contact your financial institution. We will begin sending you individual copies for each account within 30 days after receiving your request.
For additional information, please scan the QR code at the left to navigate to additional material at invesco.com/reports.
Invesco Main Street Mid Cap Fund®
Class R5: MSMJX
ANNUAL SHAREHOLDER REPORT | December 31, 2024
This annual shareholder report contains important information about Invesco Main Street Mid Cap Fund® (the “Fund”) for the period January 1, 2024 to December 31, 2024. You can find additional information about the Fund at invesco.com/reports. You can also request this information by contacting us at (800) 959-4246.
This report describes changes to the Fund that occurred during the reporting period.
What Were The Fund Costs For The Last Year ?
(Based on a hypothetical $10,000 investment)
| Fund (Class) | Costs of a $10,000 investment | Costs paid as a percentage
of a $10,000 investment |
Invesco Main Street Mid Cap Fund®
(Class R5) | $83 | 0.76% |
How Did The Fund Perform During The Period?
• During the fiscal year ended December 31, 2024, US equity markets posted strong gains as the US economy remained resilient. Data suggested the US Federal Reserve (the Fed) may have achieved its fabled soft landing, as moderating inflation, strong consumer spending and low unemployment provided support. The Fed cut the federal funds rate several times over the period, but suggested less aggressive easing in 2025 should robust economic growth and lingering inflation continue. The Fund outperformed its benchmark mainly as a result of stock selection in the industrials, health care and materials sectors. Weaker stock selection in the financials, energy and utilities sectors partially offset these results.
• For the fiscal year ended December 31, 2024, Class R5 shares of the Fund returned 17.37%. For the same time period, the Russell Midcap® Index returned 15.34%.
What contributed to performance?
Howmet Aerospace, Inc. | Howmet Aerospace outperformed as it reported results that showed strength in its commercial aerospace business despite challenges in the global aerospace supply chain. Profit margins and cashflow exceeded apparent investor expectations and the company raised its dividend and increased its share repurchase program.
Astera Labs, Inc. | Astera Labs makes connectivity chips for cloud and artificial intelligence data centers. The firm reported revenue growth that exceeded expectations while providing guidance that was interpreted optimistically, including news about expected new products and customer wins.
What detracted from performance?
MongoDB, Inc. | MongoDB is a document database that stores and manages data for a variety of applications such as customer relationship management and health care systems. MongoDB has gained share in the large database software market but underperformed during the period as it reported underwhelming results that saw slower than expected new customer additions and growth within its installed customer base.
Acadia Healthcare Company, Inc. | Acadia Healthcare underperformed as its operation of acute behavioral healthcare facilities was subject to negative media about its admissions and operating practices, leading to a decline in patient referrals. We sold the holding during the fiscal year.
How Has The Fund Historically Performed?
Growth of $10,000 Investment
| AVERAGE ANNUAL TOTAL RETURNS | 1 Year | 5 Years | 10 Years |
| Invesco Main Street Mid Cap Fund® (Class R5) | 17.37% | 9.40% | 8.19% |
| Russell Midcap® Index | 15.34% | 9.92% | 9.63% |
| S&P 500® Index | 25.02% | 14.53% | 13.10% |
Class R5 shares incepted on May 24, 2019. Performance shown on and prior to that date is that of Oppenheimer Main Street Mid Cap Fund®'s (the predecessor fund) Class A shares at net asset value and includes 12b-1 fees applicable to Class A shares. Share class returns will differ from the predecessor fund because of different expenses.
Effective February 28, 2024, the Fund changed its broad-based securities market benchmark from the Russell Midcap® Index to the S&P 500® Index to reflect that the S&P 500® Index can be considered more broadly representative of the overall applicable securities market.
The performance data quoted represents past performance and cannot guarantee future results; current performance may be lower or higher. Please visit invesco.com/performance for more recent performance information.
Performance figures do not reflect deduction of taxes a shareholder would pay on Fund distributions or sale of Fund shares.
What Are Key Statistics About The Fund?
(as of December 31, 2024)
| Fund net assets | $2,534,755,572 |
| Total number of portfolio holdings | 97 |
| Total advisory fees paid | $15,464,860 |
| Portfolio turnover rate | 40% |
What Comprised The Fund's Holdings?
(as of December 31, 2024)
Top ten holdings*
(% of net assets)
| Trade Desk, Inc. (The), Class A | 1.88% |
| Royal Caribbean Cruises Ltd. | 1.87% |
| Raymond James Financial, Inc. | 1.74% |
| Wyndham Hotels & Resorts, Inc. | 1.66% |
| M&T Bank Corp. | 1.65% |
| Cheniere Energy, Inc. | 1.61% |
| Howmet Aerospace, Inc. | 1.49% |
| Expand Energy Corp. | 1.44% |
| CMS Energy Corp. | 1.40% |
| American International Group, Inc. | 1.40% |
| * Excluding money market fund holdings, if any. | |
Sector allocation
(% of net assets)
How Has The Fund Changed Over The Past Year?
This is a summary of certain changes to the Fund since December 31, 2023. For more complete information, you may review the Fund's prospectus, which is available at invesco.com/reports or upon request at (800) 959-4246.
Effective after the close of business on September 30, 2024, the Fund has limited public sales of its Class R5 shares to certain investors who were previously invested in Class R5 shares of the Fund.
Where Can I Find More Information?
You can find more information about the Fund, including the Fund's prospectus, financial information, and holdings at invesco.com/reports. Additionally, the Fund's proxy voting information can be found at invesco.com/proxy-voting.
What Should I Know About Delivery Of Important Regulatory Documents?
To reduce Fund expenses, only one copy of most shareholder documents may be mailed to shareholders with multiple accounts at the same address (Householding). Mailing of your shareholder documents may be householded indefinitely unless you instruct us otherwise. If you do not want the mailing of these documents to be combined with those for other members of your household, please contact Invesco Investment Services, Inc. at (800) 959-4246 or contact your financial institution. We will begin sending you individual copies for each account within 30 days after receiving your request.
For additional information, please scan the QR code at the left to navigate to additional material at invesco.com/reports.
Invesco Main Street Mid Cap Fund®
Class R6: OPMIX
ANNUAL SHAREHOLDER REPORT | December 31, 2024
This annual shareholder report contains important information about Invesco Main Street Mid Cap Fund® (the “Fund”) for the period January 1, 2024 to December 31, 2024. You can find additional information about the Fund at invesco.com/reports. You can also request this information by contacting us at (800) 959-4246.
What Were The Fund Costs For The Last Year ?
(Based on a hypothetical $10,000 investment)
| Fund (Class) | Costs of a $10,000 investment | Costs paid as a percentage
of a $10,000 investment |
Invesco Main Street Mid Cap Fund®
(Class R6) | $75 | 0.69% |
How Did The Fund Perform During The Period?
• During the fiscal year ended December 31, 2024, US equity markets posted strong gains as the US economy remained resilient. Data suggested the US Federal Reserve (the Fed) may have achieved its fabled soft landing, as moderating inflation, strong consumer spending and low unemployment provided support. The Fed cut the federal funds rate several times over the period, but suggested less aggressive easing in 2025 should robust economic growth and lingering inflation continue. The Fund outperformed its benchmark mainly as a result of stock selection in the industrials, health care and materials sectors. Weaker stock selection in the financials, energy and utilities sectors partially offset these results.
• For the fiscal year ended December 31, 2024, Class R6 shares of the Fund returned 17.48%. For the same time period, the Russell Midcap® Index returned 15.34%.
What contributed to performance?
Howmet Aerospace, Inc. | Howmet Aerospace outperformed as it reported results that showed strength in its commercial aerospace business despite challenges in the global aerospace supply chain. Profit margins and cashflow exceeded apparent investor expectations and the company raised its dividend and increased its share repurchase program.
Astera Labs, Inc. | Astera Labs makes connectivity chips for cloud and artificial intelligence data centers. The firm reported revenue growth that exceeded expectations while providing guidance that was interpreted optimistically, including news about expected new products and customer wins.
What detracted from performance?
MongoDB, Inc. | MongoDB is a document database that stores and manages data for a variety of applications such as customer relationship management and health care systems. MongoDB has gained share in the large database software market but underperformed during the period as it reported underwhelming results that saw slower than expected new customer additions and growth within its installed customer base.
Acadia Healthcare Company, Inc. | Acadia Healthcare underperformed as its operation of acute behavioral healthcare facilities was subject to negative media about its admissions and operating practices, leading to a decline in patient referrals. We sold the holding during the fiscal year.
How Has The Fund Historically Performed?
Growth of $10,000 Investment
| AVERAGE ANNUAL TOTAL RETURNS | 1 Year | 5 Years | 10 Years |
| Invesco Main Street Mid Cap Fund® (Class R6) | 17.48% | 9.46% | 8.43% |
| Russell Midcap® Index | 15.34% | 9.92% | 9.63% |
| S&P 500® Index | 25.02% | 14.53% | 13.10% |
Effective after the close of business on May 24, 2019, Class I shares of Oppenheimer Main Street Mid Cap Fund® (the predecessor fund), were reorganized into Class R6 shares of the Fund. Returns shown above for periods ending on or prior to May 24, 2019 are those of Class I shares of the predecessor fund. Share class returns will differ from the predecessor fund because of different expenses.
Effective April 26, 2024, the Fund changed its broad-based securities market benchmark from the Russell Midcap® Index to the S&P 500® Index to reflect that the S&P 500® Index can be considered more broadly representative of the overall applicable securities market.
The performance data quoted represents past performance and cannot guarantee future results; current performance may be lower or higher. Please visit invesco.com/performance for more recent performance information.
Performance figures do not reflect deduction of taxes a shareholder would pay on Fund distributions or sale of Fund shares.
What Are Key Statistics About The Fund?
(as of December 31, 2024)
| Fund net assets | $2,534,755,572 |
| Total number of portfolio holdings | 97 |
| Total advisory fees paid | $15,464,860 |
| Portfolio turnover rate | 40% |
What Comprised The Fund's Holdings?
(as of December 31, 2024)
Top ten holdings*
(% of net assets)
| Trade Desk, Inc. (The), Class A | 1.88% |
| Royal Caribbean Cruises Ltd. | 1.87% |
| Raymond James Financial, Inc. | 1.74% |
| Wyndham Hotels & Resorts, Inc. | 1.66% |
| M&T Bank Corp. | 1.65% |
| Cheniere Energy, Inc. | 1.61% |
| Howmet Aerospace, Inc. | 1.49% |
| Expand Energy Corp. | 1.44% |
| CMS Energy Corp. | 1.40% |
| American International Group, Inc. | 1.40% |
| * Excluding money market fund holdings, if any. | |
Sector allocation
(% of net assets)
Where Can I Find More Information?
You can find more information about the Fund, including the Fund's prospectus, financial information, and holdings at invesco.com/reports. Additionally, the Fund's proxy voting information can be found at invesco.com/proxy-voting.
What Should I Know About Delivery Of Important Regulatory Documents?
To reduce Fund expenses, only one copy of most shareholder documents may be mailed to shareholders with multiple accounts at the same address (Householding). Mailing of your shareholder documents may be householded indefinitely unless you instruct us otherwise. If you do not want the mailing of these documents to be combined with those for other members of your household, please contact Invesco Investment Services, Inc. at (800) 959-4246 or contact your financial institution. We will begin sending you individual copies for each account within 30 days after receiving your request.
For additional information, please scan the QR code at the left to navigate to additional material at invesco.com/reports.
Invesco Main Street Small Cap Fund®
Class A: OSCAX
ANNUAL SHAREHOLDER REPORT | December 31, 2024
This annual shareholder report contains important information about Invesco Main Street Small Cap Fund® (the “Fund”) for the period January 1, 2024 to December 31, 2024. You can find additional information about the Fund at invesco.com/reports. You can also request this information by contacting us at (800) 959-4246.
What Were The Fund Costs For The Last Year ?
(Based on a hypothetical $10,000 investment)
| Fund (Class) | Costs of a $10,000 investment | Costs paid as a percentage
of a $10,000 investment |
Invesco Main Street Small Cap Fund®
(Class A) | $116 | 1.09% |
How Did The Fund Perform During The Period?
• During the fiscal year ended December 31, 2024, US equity markets posted strong gains as the US economy remained resilient. Data suggested the US Federal Reserve (the Fed) may have achieved its fabled soft landing, as moderating inflation, strong consumer spending and low unemployment provided support. The Fed cut the federal funds rate several times over the period, but suggested less aggressive easing in 2025 should robust economic growth and lingering inflation continue. The Fund outperformed its benchmark mainly as a result of stock selection in the health care, consumer discretionary and materials sectors. Weaker stock selection in the information technology, communication services and industrials sectors partially offset these results.
• For the fiscal year ended December 31, 2024, Class A shares of the Fund, excluding sales charge, returned 12.43%. For the same time period, the Russell 2000® Index returned 11.54%.
What contributed to performance?
ADMA Biologics, Inc. | ADMA, a biopharmaceutical company developing specialty plasma-derived biologics, outperformed as demand outpaced supply while the company appeared to remain on track to expand its manufacturing yields and supply next year.
Tenet Healthcare Corporation | Tenet outperformed as it reported strong results during the period driven by revenue growth in its ambulatory surgery centers (ASC) and hospitals. The company announced that it expects to expand the footprint of its ASCs, which have higher profit margins, as more procedures move from acute care hospitals into ASCs. We sold the holding during the fiscal year.
What detracted from performance?
Atkore, Inc. | Atkore underperformed as it reported underwhelming earnings during the period that included weaker-than-expected sales in high density polyethylene (HDPE) power and telecommunications business, while pricing in some product lines was adverseley affected by an increase in steel conduit imported from Mexico.
Acadia Healthcare Company, Inc. | Acadia Healthcare underperformed as its operation of acute behavioral healthcare facilities was subject to negative media about its admissions and operating practices, leading to a decline in patient referrals. We sold the holding during the fiscal year.
How Has The Fund Historically Performed?
Growth of $10,000 Investment
| AVERAGE ANNUAL TOTAL RETURNS | 1 Year | 5 Years | 10 Years |
| Invesco Main Street Small Cap Fund® (Class A) —including sales charge | 6.25% | 8.86% | 7.97% |
| Invesco Main Street Small Cap Fund® (Class A) —excluding sales charge | 12.43% | 10.09% | 8.57% |
| Russell 2000® Index | 11.54% | 7.40% | 7.82% |
| S&P 500® Index | 25.02% | 14.53% | 13.10% |
Effective after the close of business on May 24, 2019, Class A shares of Oppenheimer Main Street Small Cap Fund® (the predecessor fund), were reorganized into Class A shares of the Fund. Returns shown above for periods ending on or prior to May 24, 2019 are those of Class A shares of the predecessor fund. Share class returns will differ from the predecessor fund because of different expenses.
Effective April 26, 2024, the Fund changed its broad-based securities market benchmark from the Russell 2000® Index to the S&P 500® Index to reflect that the S&P 500® Index can be considered more broadly representative of the overall applicable securities market.
The performance data quoted represents past performance and cannot guarantee future results; current performance may be lower or higher. Please visit invesco.com/performance for more recent performance information.
Performance figures do not reflect deduction of taxes a shareholder would pay on Fund distributions or sale of Fund shares.
What Are Key Statistics About The Fund?
(as of December 31, 2024)
| Fund net assets | $2,026,502,716 |
| Total number of portfolio holdings | 103 |
| Total advisory fees paid | $12,105,559 |
| Portfolio turnover rate | 41% |
What Comprised The Fund's Holdings?
(as of December 31, 2024)
Top ten holdings*
(% of net assets)
| Wintrust Financial Corp. | 1.82% |
| Summit Materials, Inc., Class A | 1.77% |
| Zurn Elkay Water Solutions Corp. | 1.77% |
| AutoNation, Inc. | 1.76% |
| ESAB Corp. | 1.65% |
| ADMA Biologics, Inc. | 1.63% |
| MACOM Technology Solutions Holdings, Inc. | 1.59% |
| PennyMac Financial Services, Inc. | 1.59% |
| Itron, Inc. | 1.58% |
| Allison Transmission Holdings, Inc. | 1.56% |
| * Excluding money market fund holdings, if any. | |
Sector allocation
(% of net assets)
Where Can I Find More Information?
You can find more information about the Fund, including the Fund's prospectus, financial information, and holdings at invesco.com/reports. Additionally, the Fund's proxy voting information can be found at invesco.com/proxy-voting.
What Should I Know About Delivery Of Important Regulatory Documents?
To reduce Fund expenses, only one copy of most shareholder documents may be mailed to shareholders with multiple accounts at the same address (Householding). Mailing of your shareholder documents may be householded indefinitely unless you instruct us otherwise. If you do not want the mailing of these documents to be combined with those for other members of your household, please contact Invesco Investment Services, Inc. at (800) 959-4246 or contact your financial institution. We will begin sending you individual copies for each account within 30 days after receiving your request.
For additional information, please scan the QR code at the left to navigate to additional material at invesco.com/reports.
Invesco Main Street Small Cap Fund®
Class C: OSCCX
ANNUAL SHAREHOLDER REPORT | December 31, 2024
This annual shareholder report contains important information about Invesco Main Street Small Cap Fund® (the “Fund”) for the period January 1, 2024 to December 31, 2024. You can find additional information about the Fund at invesco.com/reports. You can also request this information by contacting us at (800) 959-4246.
What Were The Fund Costs For The Last Year ?
(Based on a hypothetical $10,000 investment)
| Fund (Class) | Costs of a $10,000 investment | Costs paid as a percentage
of a $10,000 investment |
Invesco Main Street Small Cap Fund®
(Class C) | $195 | 1.84% |
How Did The Fund Perform During The Period?
• During the fiscal year ended December 31, 2024, US equity markets posted strong gains as the US economy remained resilient. Data suggested the US Federal Reserve (the Fed) may have achieved its fabled soft landing, as moderating inflation, strong consumer spending and low unemployment provided support. The Fed cut the federal funds rate several times over the period, but suggested less aggressive easing in 2025 should robust economic growth and lingering inflation continue. The Fund outperformed its benchmark mainly as a result of stock selection in the health care, consumer discretionary and materials sectors. Weaker stock selection in the information technology, communication services and industrials sectors partially offset these results.
• For the fiscal year ended December 31, 2024, Class C shares of the Fund, excluding sales charge, returned 11.61%. For the same time period, the Russell 2000® Index returned 11.54%.
What contributed to performance?
ADMA Biologics, Inc. | ADMA, a biopharmaceutical company developing specialty plasma-derived biologics, outperformed as demand outpaced supply while the company appeared to remain on track to expand its manufacturing yields and supply next year.
Tenet Healthcare Corporation | Tenet outperformed as it reported strong results during the period driven by revenue growth in its ambulatory surgery centers (ASC) and hospitals. The company announced that it expects to expand the footprint of its ASCs, which have higher profit margins, as more procedures move from acute care hospitals into ASCs. We sold the holding during the fiscal year.
What detracted from performance?
Atkore, Inc. | Atkore underperformed as it reported underwhelming earnings during the period that included weaker-than-expected sales in high density polyethylene (HDPE) power and telecommunications business, while pricing in some product lines was adverseley affected by an increase in steel conduit imported from Mexico.
Acadia Healthcare Company, Inc. | Acadia Healthcare underperformed as its operation of acute behavioral healthcare facilities was subject to negative media about its admissions and operating practices, leading to a decline in patient referrals. We sold the holding during the fiscal year.
How Has The Fund Historically Performed?
Growth of $10,000 Investment
| AVERAGE ANNUAL TOTAL RETURNS | 1 Year | 5 Years | 10 Years |
| Invesco Main Street Small Cap Fund® (Class C) —including sales charge | 10.61% | 9.27% | 7.92% |
| Invesco Main Street Small Cap Fund® (Class C) —excluding sales charge | 11.61% | 9.27% | 7.92% |
| Russell 2000® Index | 11.54% | 7.40% | 7.82% |
| S&P 500® Index | 25.02% | 14.53% | 13.10% |
Effective after the close of business on May 24, 2019, Class C shares of Oppenheimer Main Street Small Cap Fund® (the predecessor fund), were reorganized into Class C shares of the Fund. Returns shown above for periods ending on or prior to May 24, 2019 are those of Class C shares of the predecessor fund. Share class returns will differ from the predecessor fund because of different expenses.
Effective April 26, 2024, the Fund changed its broad-based securities market benchmark from the Russell 2000® Index to the S&P 500® Index to reflect that the S&P 500® Index can be considered more broadly representative of the overall applicable securities market.
The performance data quoted represents past performance and cannot guarantee future results; current performance may be lower or higher. Please visit invesco.com/performance for more recent performance information.
Performance figures do not reflect deduction of taxes a shareholder would pay on Fund distributions or sale of Fund shares.
What Are Key Statistics About The Fund?
(as of December 31, 2024)
| Fund net assets | $2,026,502,716 |
| Total number of portfolio holdings | 103 |
| Total advisory fees paid | $12,105,559 |
| Portfolio turnover rate | 41% |
What Comprised The Fund's Holdings?
(as of December 31, 2024)
Top ten holdings*
(% of net assets)
| Wintrust Financial Corp. | 1.82% |
| Summit Materials, Inc., Class A | 1.77% |
| Zurn Elkay Water Solutions Corp. | 1.77% |
| AutoNation, Inc. | 1.76% |
| ESAB Corp. | 1.65% |
| ADMA Biologics, Inc. | 1.63% |
| MACOM Technology Solutions Holdings, Inc. | 1.59% |
| PennyMac Financial Services, Inc. | 1.59% |
| Itron, Inc. | 1.58% |
| Allison Transmission Holdings, Inc. | 1.56% |
| * Excluding money market fund holdings, if any. | |
Sector allocation
(% of net assets)
Where Can I Find More Information?
You can find more information about the Fund, including the Fund's prospectus, financial information, and holdings at invesco.com/reports. Additionally, the Fund's proxy voting information can be found at invesco.com/proxy-voting.
What Should I Know About Delivery Of Important Regulatory Documents?
To reduce Fund expenses, only one copy of most shareholder documents may be mailed to shareholders with multiple accounts at the same address (Householding). Mailing of your shareholder documents may be householded indefinitely unless you instruct us otherwise. If you do not want the mailing of these documents to be combined with those for other members of your household, please contact Invesco Investment Services, Inc. at (800) 959-4246 or contact your financial institution. We will begin sending you individual copies for each account within 30 days after receiving your request.
For additional information, please scan the QR code at the left to navigate to additional material at invesco.com/reports.
Invesco Main Street Small Cap Fund®
Class R: OSCNX
ANNUAL SHAREHOLDER REPORT | December 31, 2024
This annual shareholder report contains important information about Invesco Main Street Small Cap Fund® (the “Fund”) for the period January 1, 2024 to December 31, 2024. You can find additional information about the Fund at invesco.com/reports. You can also request this information by contacting us at (800) 959-4246.
What Were The Fund Costs For The Last Year ?
(Based on a hypothetical $10,000 investment)
| Fund (Class) | Costs of a $10,000 investment | Costs paid as a percentage
of a $10,000 investment |
Invesco Main Street Small Cap Fund®
(Class R) | $142 | 1.34% |
How Did The Fund Perform During The Period?
• During the fiscal year ended December 31, 2024, US equity markets posted strong gains as the US economy remained resilient. Data suggested the US Federal Reserve (the Fed) may have achieved its fabled soft landing, as moderating inflation, strong consumer spending and low unemployment provided support. The Fed cut the federal funds rate several times over the period, but suggested less aggressive easing in 2025 should robust economic growth and lingering inflation continue. The Fund outperformed its benchmark mainly as a result of stock selection in the health care, consumer discretionary and materials sectors. Weaker stock selection in the information technology, communication services and industrials sectors partially offset these results.
• For the fiscal year ended December 31, 2024, Class R shares of the Fund returned 12.18%. For the same time period, the Russell 2000® Index returned 11.54%.
What contributed to performance?
ADMA Biologics, Inc. | ADMA, a biopharmaceutical company developing specialty plasma-derived biologics, outperformed as demand outpaced supply while the company appeared to remain on track to expand its manufacturing yields and supply next year.
Tenet Healthcare Corporation | Tenet outperformed as it reported strong results during the period driven by revenue growth in its ambulatory surgery centers (ASC) and hospitals. The company announced that it expects to expand the footprint of its ASCs, which have higher profit margins, as more procedures move from acute care hospitals into ASCs. We sold the holding during the fiscal year.
What detracted from performance?
Atkore, Inc. | Atkore underperformed as it reported underwhelming earnings during the period that included weaker-than-expected sales in high density polyethylene (HDPE) power and telecommunications business, while pricing in some product lines was adverseley affected by an increase in steel conduit imported from Mexico.
Acadia Healthcare Company, Inc. | Acadia Healthcare underperformed as its operation of acute behavioral healthcare facilities was subject to negative media about its admissions and operating practices, leading to a decline in patient referrals. We sold the holding during the fiscal year.
How Has The Fund Historically Performed?
Growth of $10,000 Investment
| AVERAGE ANNUAL TOTAL RETURNS | 1 Year | 5 Years | 10 Years |
| Invesco Main Street Small Cap Fund® (Class R) | 12.18% | 9.80% | 8.29% |
| Russell 2000® Index | 11.54% | 7.40% | 7.82% |
| S&P 500® Index | 25.02% | 14.53% | 13.10% |
Effective after the close of business on May 24, 2019, Class R shares of Oppenheimer Main Street Small Cap Fund® (the predecessor fund), were reorganized into Class R shares of the Fund. Returns shown above for periods ending on or prior to May 24, 2019 are those of Class R shares of the predecessor fund. Share class returns will differ from the predecessor fund because of different expenses.
Effective April 26, 2024, the Fund changed its broad-based securities market benchmark from the Russell 2000® Index to the S&P 500® Index to reflect that the S&P 500® Index can be considered more broadly representative of the overall applicable securities market.
The performance data quoted represents past performance and cannot guarantee future results; current performance may be lower or higher. Please visit invesco.com/performance for more recent performance information.
Performance figures do not reflect deduction of taxes a shareholder would pay on Fund distributions or sale of Fund shares.
What Are Key Statistics About The Fund?
(as of December 31, 2024)
| Fund net assets | $2,026,502,716 |
| Total number of portfolio holdings | 103 |
| Total advisory fees paid | $12,105,559 |
| Portfolio turnover rate | 41% |
What Comprised The Fund's Holdings?
(as of December 31, 2024)
Top ten holdings*
(% of net assets)
| Wintrust Financial Corp. | 1.82% |
| Summit Materials, Inc., Class A | 1.77% |
| Zurn Elkay Water Solutions Corp. | 1.77% |
| AutoNation, Inc. | 1.76% |
| ESAB Corp. | 1.65% |
| ADMA Biologics, Inc. | 1.63% |
| MACOM Technology Solutions Holdings, Inc. | 1.59% |
| PennyMac Financial Services, Inc. | 1.59% |
| Itron, Inc. | 1.58% |
| Allison Transmission Holdings, Inc. | 1.56% |
| * Excluding money market fund holdings, if any. | |
Sector allocation
(% of net assets)
Where Can I Find More Information?
You can find more information about the Fund, including the Fund's prospectus, financial information, and holdings at invesco.com/reports. Additionally, the Fund's proxy voting information can be found at invesco.com/proxy-voting.
What Should I Know About Delivery Of Important Regulatory Documents?
To reduce Fund expenses, only one copy of most shareholder documents may be mailed to shareholders with multiple accounts at the same address (Householding). Mailing of your shareholder documents may be householded indefinitely unless you instruct us otherwise. If you do not want the mailing of these documents to be combined with those for other members of your household, please contact Invesco Investment Services, Inc. at (800) 959-4246 or contact your financial institution. We will begin sending you individual copies for each account within 30 days after receiving your request.
For additional information, please scan the QR code at the left to navigate to additional material at invesco.com/reports.
Invesco Main Street Small Cap Fund®
Class Y: OSCYX
ANNUAL SHAREHOLDER REPORT | December 31, 2024
This annual shareholder report contains important information about Invesco Main Street Small Cap Fund® (the “Fund”) for the period January 1, 2024 to December 31, 2024. You can find additional information about the Fund at invesco.com/reports. You can also request this information by contacting us at (800) 959-4246.
What Were The Fund Costs For The Last Year ?
(Based on a hypothetical $10,000 investment)
| Fund (Class) | Costs of a $10,000 investment | Costs paid as a percentage
of a $10,000 investment |
Invesco Main Street Small Cap Fund®
(Class Y) | $89 | 0.84% |
How Did The Fund Perform During The Period?
• During the fiscal year ended December 31, 2024, US equity markets posted strong gains as the US economy remained resilient. Data suggested the US Federal Reserve (the Fed) may have achieved its fabled soft landing, as moderating inflation, strong consumer spending and low unemployment provided support. The Fed cut the federal funds rate several times over the period, but suggested less aggressive easing in 2025 should robust economic growth and lingering inflation continue. The Fund outperformed its benchmark mainly as a result of stock selection in the health care, consumer discretionary and materials sectors. Weaker stock selection in the information technology, communication services and industrials sectors partially offset these results.
• For the fiscal year ended December 31, 2024, Class Y shares of the Fund returned 12.75%. For the same time period, the Russell 2000® Index returned 11.54%.
What contributed to performance?
ADMA Biologics, Inc. | ADMA, a biopharmaceutical company developing specialty plasma-derived biologics, outperformed as demand outpaced supply while the company appeared to remain on track to expand its manufacturing yields and supply next year.
Tenet Healthcare Corporation | Tenet outperformed as it reported strong results during the period driven by revenue growth in its ambulatory surgery centers (ASC) and hospitals. The company announced that it expects to expand the footprint of its ASCs, which have higher profit margins, as more procedures move from acute care hospitals into ASCs. We sold the holding during the fiscal year.
What detracted from performance?
Atkore, Inc. | Atkore underperformed as it reported underwhelming earnings during the period that included weaker-than-expected sales in high density polyethylene (HDPE) power and telecommunications business, while pricing in some product lines was adverseley affected by an increase in steel conduit imported from Mexico.
Acadia Healthcare Company, Inc. | Acadia Healthcare underperformed as its operation of acute behavioral healthcare facilities was subject to negative media about its admissions and operating practices, leading to a decline in patient referrals. We sold the holding during the fiscal year.
How Has The Fund Historically Performed?
Growth of $10,000 Investment
| AVERAGE ANNUAL TOTAL RETURNS | 1 Year | 5 Years | 10 Years |
| Invesco Main Street Small Cap Fund® (Class Y) | 12.75% | 10.38% | 8.88% |
| Russell 2000® Index | 11.54% | 7.40% | 7.82% |
| S&P 500® Index | 25.02% | 14.53% | 13.10% |
Effective after the close of business on May 24, 2019, Class Y shares of Oppenheimer Main Street Small Cap Fund® (the predecessor fund), were reorganized into Class Y shares of the Fund. Returns shown above for periods ending on or prior to May 24, 2019 are those of Class Y shares of the predecessor fund. Share class returns will differ from the predecessor fund because of different expenses.
Effective April 26, 2024, the Fund changed its broad-based securities market benchmark from the Russell 2000® Index to the S&P 500® Index to reflect that the S&P 500® Index can be considered more broadly representative of the overall applicable securities market.
The performance data quoted represents past performance and cannot guarantee future results; current performance may be lower or higher. Please visit invesco.com/performance for more recent performance information.
Performance figures do not reflect deduction of taxes a shareholder would pay on Fund distributions or sale of Fund shares.
What Are Key Statistics About The Fund?
(as of December 31, 2024)
| Fund net assets | $2,026,502,716 |
| Total number of portfolio holdings | 103 |
| Total advisory fees paid | $12,105,559 |
| Portfolio turnover rate | 41% |
What Comprised The Fund's Holdings?
(as of December 31, 2024)
Top ten holdings*
(% of net assets)
| Wintrust Financial Corp. | 1.82% |
| Summit Materials, Inc., Class A | 1.77% |
| Zurn Elkay Water Solutions Corp. | 1.77% |
| AutoNation, Inc. | 1.76% |
| ESAB Corp. | 1.65% |
| ADMA Biologics, Inc. | 1.63% |
| MACOM Technology Solutions Holdings, Inc. | 1.59% |
| PennyMac Financial Services, Inc. | 1.59% |
| Itron, Inc. | 1.58% |
| Allison Transmission Holdings, Inc. | 1.56% |
| * Excluding money market fund holdings, if any. | |
Sector allocation
(% of net assets)
Where Can I Find More Information?
You can find more information about the Fund, including the Fund's prospectus, financial information, and holdings at invesco.com/reports. Additionally, the Fund's proxy voting information can be found at invesco.com/proxy-voting.
What Should I Know About Delivery Of Important Regulatory Documents?
To reduce Fund expenses, only one copy of most shareholder documents may be mailed to shareholders with multiple accounts at the same address (Householding). Mailing of your shareholder documents may be householded indefinitely unless you instruct us otherwise. If you do not want the mailing of these documents to be combined with those for other members of your household, please contact Invesco Investment Services, Inc. at (800) 959-4246 or contact your financial institution. We will begin sending you individual copies for each account within 30 days after receiving your request.
For additional information, please scan the QR code at the left to navigate to additional material at invesco.com/reports.
Invesco Main Street Small Cap Fund®
Class R5: MNSQX
ANNUAL SHAREHOLDER REPORT | December 31, 2024
This annual shareholder report contains important information about Invesco Main Street Small Cap Fund® (the “Fund”) for the period January 1, 2024 to December 31, 2024. You can find additional information about the Fund at invesco.com/reports. You can also request this information by contacting us at (800) 959-4246.
This report describes changes to the Fund that occurred during the reporting period.
What Were The Fund Costs For The Last Year ?
(Based on a hypothetical $10,000 investment)
| Fund (Class) | Costs of a $10,000 investment | Costs paid as a percentage
of a $10,000 investment |
Invesco Main Street Small Cap Fund®
(Class R5) | $82 | 0.77% |
How Did The Fund Perform During The Period?
• During the fiscal year ended December 31, 2024, US equity markets posted strong gains as the US economy remained resilient. Data suggested the US Federal Reserve (the Fed) may have achieved its fabled soft landing, as moderating inflation, strong consumer spending and low unemployment provided support. The Fed cut the federal funds rate several times over the period, but suggested less aggressive easing in 2025 should robust economic growth and lingering inflation continue. The Fund outperformed its benchmark mainly as a result of stock selection in the health care, consumer discretionary and materials sectors. Weaker stock selection in the information technology, communication services and industrials sectors partially offset these results.
• For the fiscal year ended December 31, 2024, Class R5 shares of the Fund returned 12.77%. For the same time period, the Russell 2000® Index returned 11.54%.
What contributed to performance?
ADMA Biologics, Inc. | ADMA, a biopharmaceutical company developing specialty plasma-derived biologics, outperformed as demand outpaced supply while the company appeared to remain on track to expand its manufacturing yields and supply next year.
Tenet Healthcare Corporation | Tenet outperformed as it reported strong results during the period driven by revenue growth in its ambulatory surgery centers (ASC) and hospitals. The company announced that it expects to expand the footprint of its ASCs, which have higher profit margins, as more procedures move from acute care hospitals into ASCs. We sold the holding during the fiscal year.
What detracted from performance?
Atkore, Inc. | Atkore underperformed as it reported underwhelming earnings during the period that included weaker-than-expected sales in high density polyethylene (HDPE) power and telecommunications business, while pricing in some product lines was adverseley affected by an increase in steel conduit imported from Mexico.
Acadia Healthcare Company, Inc. | Acadia Healthcare underperformed as its operation of acute behavioral healthcare facilities was subject to negative media about its admissions and operating practices, leading to a decline in patient referrals. We sold the holding during the fiscal year.
How Has The Fund Historically Performed?
Growth of $10,000 Investment
| AVERAGE ANNUAL TOTAL RETURNS | 1 Year | 5 Years | 10 Years |
| Invesco Main Street Small Cap Fund® (Class R5) | 12.77% | 10.48% | 8.78% |
| Russell 2000® Index | 11.54% | 7.40% | 7.82% |
| S&P 500® Index | 25.02% | 14.53% | 13.10% |
Class R5 shares incepted on May 24, 2019. Performance shown on and prior to that date is that of Oppenheimer Main Street Small Cap Fund®'s (the predecessor fund) Class A shares at net asset value and includes 12b-1 fees applicable to Class A shares. Share class returns will differ from the predecessor fund because of different expenses.
Effective February 28, 2024, the Fund changed its broad-based securities market benchmark from the Russell 2000® Index to the S&P 500® Index to reflect that the S&P 500® Index can be considered more broadly representative of the overall applicable securities market.
The performance data quoted represents past performance and cannot guarantee future results; current performance may be lower or higher. Please visit invesco.com/performance for more recent performance information.
Performance figures do not reflect deduction of taxes a shareholder would pay on Fund distributions or sale of Fund shares.
What Are Key Statistics About The Fund?
(as of December 31, 2024)
| Fund net assets | $2,026,502,716 |
| Total number of portfolio holdings | 103 |
| Total advisory fees paid | $12,105,559 |
| Portfolio turnover rate | 41% |
What Comprised The Fund's Holdings?
(as of December 31, 2024)
Top ten holdings*
(% of net assets)
| Wintrust Financial Corp. | 1.82% |
| Summit Materials, Inc., Class A | 1.77% |
| Zurn Elkay Water Solutions Corp. | 1.77% |
| AutoNation, Inc. | 1.76% |
| ESAB Corp. | 1.65% |
| ADMA Biologics, Inc. | 1.63% |
| MACOM Technology Solutions Holdings, Inc. | 1.59% |
| PennyMac Financial Services, Inc. | 1.59% |
| Itron, Inc. | 1.58% |
| Allison Transmission Holdings, Inc. | 1.56% |
| * Excluding money market fund holdings, if any. | |
Sector allocation
(% of net assets)
How Has The Fund Changed Over The Past Year?
This is a summary of certain changes to the Fund since December 31, 2023. For more complete information, you may review the Fund's prospectus, which is available at invesco.com/reports or upon request at (800) 959-4246.
Effective after the close of business on September 30, 2024, the Fund has limited public sales of its Class R5 shares to certain investors who were previously invested in Class R5 shares of the Fund.
Where Can I Find More Information?
You can find more information about the Fund, including the Fund's prospectus, financial information, and holdings at invesco.com/reports. Additionally, the Fund's proxy voting information can be found at invesco.com/proxy-voting.
What Should I Know About Delivery Of Important Regulatory Documents?
To reduce Fund expenses, only one copy of most shareholder documents may be mailed to shareholders with multiple accounts at the same address (Householding). Mailing of your shareholder documents may be householded indefinitely unless you instruct us otherwise. If you do not want the mailing of these documents to be combined with those for other members of your household, please contact Invesco Investment Services, Inc. at (800) 959-4246 or contact your financial institution. We will begin sending you individual copies for each account within 30 days after receiving your request.
For additional information, please scan the QR code at the left to navigate to additional material at invesco.com/reports.
Invesco Main Street Small Cap Fund®
Class R6: OSSIX
ANNUAL SHAREHOLDER REPORT | December 31, 2024
This annual shareholder report contains important information about Invesco Main Street Small Cap Fund® (the “Fund”) for the period January 1, 2024 to December 31, 2024. You can find additional information about the Fund at invesco.com/reports. You can also request this information by contacting us at (800) 959-4246.
What Were The Fund Costs For The Last Year ?
(Based on a hypothetical $10,000 investment)
| Fund (Class) | Costs of a $10,000 investment | Costs paid as a percentage
of a $10,000 investment |
Invesco Main Street Small Cap Fund®
(Class R6) | $75 | 0.70% |
How Did The Fund Perform During The Period?
• During the fiscal year ended December 31, 2024, US equity markets posted strong gains as the US economy remained resilient. Data suggested the US Federal Reserve (the Fed) may have achieved its fabled soft landing, as moderating inflation, strong consumer spending and low unemployment provided support. The Fed cut the federal funds rate several times over the period, but suggested less aggressive easing in 2025 should robust economic growth and lingering inflation continue. The Fund outperformed its benchmark mainly as a result of stock selection in the health care, consumer discretionary and materials sectors. Weaker stock selection in the information technology, communication services and industrials sectors partially offset these results.
• For the fiscal year ended December 31, 2024, Class R6 shares of the Fund returned 12.88%. For the same time period, the Russell 2000® Index returned 11.54%.
What contributed to performance?
ADMA Biologics, Inc. | ADMA, a biopharmaceutical company developing specialty plasma-derived biologics, outperformed as demand outpaced supply while the company appeared to remain on track to expand its manufacturing yields and supply next year.
Tenet Healthcare Corporation | Tenet outperformed as it reported strong results during the period driven by revenue growth in its ambulatory surgery centers (ASC) and hospitals. The company announced that it expects to expand the footprint of its ASCs, which have higher profit margins, as more procedures move from acute care hospitals into ASCs. We sold the holding during the fiscal year.
What detracted from performance?
Atkore, Inc. | Atkore underperformed as it reported underwhelming earnings during the period that included weaker-than-expected sales in high density polyethylene (HDPE) power and telecommunications business, while pricing in some product lines was adverseley affected by an increase in steel conduit imported from Mexico.
Acadia Healthcare Company, Inc. | Acadia Healthcare underperformed as its operation of acute behavioral healthcare facilities was subject to negative media about its admissions and operating practices, leading to a decline in patient referrals. We sold the holding during the fiscal year.
How Has The Fund Historically Performed?
Growth of $10,000 Investment
| AVERAGE ANNUAL TOTAL RETURNS | 1 Year | 5 Years | 10 Years |
| Invesco Main Street Small Cap Fund® (Class R6) | 12.88% | 10.53% | 9.03% |
| Russell 2000® Index | 11.54% | 7.40% | 7.82% |
| S&P 500® Index | 25.02% | 14.53% | 13.10% |
Effective after the close of business on May 24, 2019, Class I shares of Oppenheimer Main Street Small Cap Fund® (the predecessor fund), were reorganized into Class R6 shares of the Fund. Returns shown above for periods ending on or prior to May 24, 2019 are those of Class I shares of the predecessor fund. Share class returns will differ from the predecessor fund because of different expenses.
Effective April 26, 2024, the Fund changed its broad-based securities market benchmark from the Russell 2000® Index to the S&P 500® Index to reflect that the S&P 500® Index can be considered more broadly representative of the overall applicable securities market.
The performance data quoted represents past performance and cannot guarantee future results; current performance may be lower or higher. Please visit invesco.com/performance for more recent performance information.
Performance figures do not reflect deduction of taxes a shareholder would pay on Fund distributions or sale of Fund shares.
What Are Key Statistics About The Fund?
(as of December 31, 2024)
| Fund net assets | $2,026,502,716 |
| Total number of portfolio holdings | 103 |
| Total advisory fees paid | $12,105,559 |
| Portfolio turnover rate | 41% |
What Comprised The Fund's Holdings?
(as of December 31, 2024)
Top ten holdings*
(% of net assets)
| Wintrust Financial Corp. | 1.82% |
| Summit Materials, Inc., Class A | 1.77% |
| Zurn Elkay Water Solutions Corp. | 1.77% |
| AutoNation, Inc. | 1.76% |
| ESAB Corp. | 1.65% |
| ADMA Biologics, Inc. | 1.63% |
| MACOM Technology Solutions Holdings, Inc. | 1.59% |
| PennyMac Financial Services, Inc. | 1.59% |
| Itron, Inc. | 1.58% |
| Allison Transmission Holdings, Inc. | 1.56% |
| * Excluding money market fund holdings, if any. | |
Sector allocation
(% of net assets)
Where Can I Find More Information?
You can find more information about the Fund, including the Fund's prospectus, financial information, and holdings at invesco.com/reports. Additionally, the Fund's proxy voting information can be found at invesco.com/proxy-voting.
What Should I Know About Delivery Of Important Regulatory Documents?
To reduce Fund expenses, only one copy of most shareholder documents may be mailed to shareholders with multiple accounts at the same address (Householding). Mailing of your shareholder documents may be householded indefinitely unless you instruct us otherwise. If you do not want the mailing of these documents to be combined with those for other members of your household, please contact Invesco Investment Services, Inc. at (800) 959-4246 or contact your financial institution. We will begin sending you individual copies for each account within 30 days after receiving your request.
For additional information, please scan the QR code at the left to navigate to additional material at invesco.com/reports.
Invesco Quality Income Fund
Class A: VKMGX
ANNUAL SHAREHOLDER REPORT | December 31, 2024
This annual shareholder report contains important information about Invesco Quality Income Fund (the “Fund”) for the period January 1, 2024 to December 31, 2024. You can find additional information about the Fund at invesco.com/reports. You can also request this information by contacting us at (800) 959-4246.
What Were The Fund Costs For The Last Year ?
(Based on a hypothetical $10,000 investment)
| Fund (Class) | Costs of a $10,000 investment | Costs paid as a percentage
of a $10,000 investment |
Invesco Quality Income Fund
(Class A) | $90 | 0.90%† |
† | Reflects fee waivers and/or expense reimbursements, without which expenses would have been higher. |
How Did The Fund Perform During The Period?
• The Fund generated a positive return in 2024, despite longer term Treasury yields increasing by 25 to 75 basis points across the yield curve. This shows the advantage of a bond market where yields were materially higher than they had been in many years, providing cushion against rising interest rates. Non-Treasury sectors of the bond market performed well this year as economic growth and employment performed better than many forecasted at the start of the year.
• For the fiscal year ended December 31, 2024, Class A shares of the Fund, excluding sales charge, returned 0.98%. For the same time period, the Bloomberg US Mortgage Backed Securities Index returned 1.20%.
What contributed to performance?
Agency mortgage-backed securities (MBS) | During 2024, the agency mortgage market, in which the Fund invested the majority of its assets, performed better than US Treasury securities, given the significant yield advantage enjoyed by agency MBS versus Treasuries. The Fund's positioning in higher coupon agency MBS was a positive contributor.
Non-agency MBS, asset-backed securities (ABS) | Non-agency MBS and ABS performed well this year due to attractive starting yields and relatively strong economic performance in 2024, which caused market participants to bid up these assets relative to US Treasuries.
What detracted from performance?
Commercial mortgage-backed securities (CMBS) | CMBS yield spreads increased relative to Treasuries during the year, due to continued challenges in the commercial property market.
How Has The Fund Historically Performed?
Growth of $10,000 Investment
| AVERAGE ANNUAL TOTAL RETURNS | 1 Year | 5 Years | 10 Years |
| Invesco Quality Income Fund (Class A) —including sales charge | (3.36)% | (1.59)% | 0.35% |
| Invesco Quality Income Fund (Class A) —excluding sales charge | 0.98% | (0.73)% | 0.78% |
| Bloomberg US Mortgage Backed Securities Index | 1.20% | (0.74)% | 0.91% |
| Bloomberg U.S. Aggregate Bond Index | 1.25% | (0.33)% | 1.35% |
Effective April 26, 2024, the Fund changed its broad-based securities market benchmark from the Bloomberg US Mortgage Backed Securities Index to the Bloomberg U.S. Aggregate Bond Index to reflect that the Bloomberg U.S. Aggregate Bond Index can be considered more broadly representative of the overall applicable securities market.
The performance data quoted represents past performance and cannot guarantee future results; current performance may be lower or higher. Please visit invesco.com/performance for more recent performance information.
Performance figures do not reflect deduction of taxes a shareholder would pay on Fund distributions or sale of Fund shares.
What Are Key Statistics About The Fund?
(as of December 31, 2024)
| Fund net assets | $530,702,034 |
| Total number of portfolio holdings | 686 |
| Total advisory fees paid | $2,415,423 |
| Portfolio turnover rate | 331% |
What Comprised The Fund's Holdings?
(as of December 31, 2024)
Top ten holdings*
(% of net assets)
| Uniform Mortgage-Backed Securities, TBA, 6.00%, 01/01/2055 | 4.24% |
| Government National Mortgage Association, TBA, 2.50%, 01/01/2055 | 4.01% |
| Government National Mortgage Association, TBA, 5.50%, 06/20/2054 | 3.23% |
| Uniform Mortgage-Backed Securities, TBA, 3.00%, 01/01/2055 | 3.18% |
| Federal Home Loan Mortgage Corp., 2.50%, 10/01/2051 | 2.72% |
| Government National Mortgage Association, TBA, 3.00%, 01/01/2055 | 2.69% |
| Government National Mortgage Association, TBA, 5.00%, 01/01/2055 | 2.16% |
| Federal Home Loan Mortgage Corp., 5.50%, 11/01/2052 | 2.10% |
| Federal Home Loan Mortgage Corp., 2.00%, 05/01/2051 | 2.03% |
| Federal Home Loan Mortgage Corp., 2.50%, 04/01/2052 | 1.98% |
| * Excluding money market fund holdings, if any. | |
Security type allocation
(% of total investments)
Where Can I Find More Information?
You can find more information about the Fund, including the Fund's prospectus, financial information, and holdings at invesco.com/reports. Additionally, the Fund's proxy voting information can be found at invesco.com/proxy-voting.
What Should I Know About Delivery Of Important Regulatory Documents?
To reduce Fund expenses, only one copy of most shareholder documents may be mailed to shareholders with multiple accounts at the same address (Householding). Mailing of your shareholder documents may be householded indefinitely unless you instruct us otherwise. If you do not want the mailing of these documents to be combined with those for other members of your household, please contact Invesco Investment Services, Inc. at (800) 959-4246 or contact your financial institution. We will begin sending you individual copies for each account within 30 days after receiving your request.
For additional information, please scan the QR code at the left to navigate to additional material at invesco.com/reports.
Invesco Quality Income Fund
Class C: VUSCX
ANNUAL SHAREHOLDER REPORT | December 31, 2024
This annual shareholder report contains important information about Invesco Quality Income Fund (the “Fund”) for the period January 1, 2024 to December 31, 2024. You can find additional information about the Fund at invesco.com/reports. You can also request this information by contacting us at (800) 959-4246.
What Were The Fund Costs For The Last Year ?
(Based on a hypothetical $10,000 investment)
| Fund (Class) | Costs of a $10,000 investment | Costs paid as a percentage
of a $10,000 investment |
Invesco Quality Income Fund
(Class C) | $166 | 1.66%† |
† | Reflects fee waivers and/or expense reimbursements, without which expenses would have been higher. |
How Did The Fund Perform During The Period?
• The Fund generated a positive return in 2024, despite longer term Treasury yields increasing by 25 to 75 basis points across the yield curve. This shows the advantage of a bond market where yields were materially higher than they had been in many years, providing cushion against rising interest rates. Non-Treasury sectors of the bond market performed well this year as economic growth and employment performed better than many forecasted at the start of the year.
• For the fiscal year ended December 31, 2024, Class C shares of the Fund, excluding sales charge, returned 0.20%. For the same time period, the Bloomberg US Mortgage Backed Securities Index returned 1.20%.
What contributed to performance?
Agency mortgage-backed securities (MBS) | During 2024, the agency mortgage market, in which the Fund invested the majority of its assets, performed better than US Treasury securities, given the significant yield advantage enjoyed by agency MBS versus Treasuries. The Fund's positioning in higher coupon agency MBS was a positive contributor.
Non-agency MBS, asset-backed securities (ABS) | Non-agency MBS and ABS performed well this year due to attractive starting yields and relatively strong economic performance in 2024, which caused market participants to bid up these assets relative to US Treasuries.
What detracted from performance?
Commercial mortgage-backed securities (CMBS) | CMBS yield spreads increased relative to Treasuries during the year, due to continued challenges in the commercial property market.
How Has The Fund Historically Performed?
Growth of $10,000 Investment
| AVERAGE ANNUAL TOTAL RETURNS | 1 Year | 5 Years | 10 Years |
| Invesco Quality Income Fund (Class C) —including sales charge | (0.77)% | (1.47)% | 0.18% |
| Invesco Quality Income Fund (Class C) —excluding sales charge | 0.20% | (1.47)% | 0.18% |
| Bloomberg US Mortgage Backed Securities Index | 1.20% | (0.74)% | 0.91% |
| Bloomberg U.S. Aggregate Bond Index | 1.25% | (0.33)% | 1.35% |
Effective April 26, 2024, the Fund changed its broad-based securities market benchmark from the Bloomberg US Mortgage Backed Securities Index to the Bloomberg U.S. Aggregate Bond Index to reflect that the Bloomberg U.S. Aggregate Bond Index can be considered more broadly representative of the overall applicable securities market.
The performance data quoted represents past performance and cannot guarantee future results; current performance may be lower or higher. Please visit invesco.com/performance for more recent performance information.
Performance figures do not reflect deduction of taxes a shareholder would pay on Fund distributions or sale of Fund shares.
What Are Key Statistics About The Fund?
(as of December 31, 2024)
| Fund net assets | $530,702,034 |
| Total number of portfolio holdings | 686 |
| Total advisory fees paid | $2,415,423 |
| Portfolio turnover rate | 331% |
What Comprised The Fund's Holdings?
(as of December 31, 2024)
Top ten holdings*
(% of net assets)
| Uniform Mortgage-Backed Securities, TBA, 6.00%, 01/01/2055 | 4.24% |
| Government National Mortgage Association, TBA, 2.50%, 01/01/2055 | 4.01% |
| Government National Mortgage Association, TBA, 5.50%, 06/20/2054 | 3.23% |
| Uniform Mortgage-Backed Securities, TBA, 3.00%, 01/01/2055 | 3.18% |
| Federal Home Loan Mortgage Corp., 2.50%, 10/01/2051 | 2.72% |
| Government National Mortgage Association, TBA, 3.00%, 01/01/2055 | 2.69% |
| Government National Mortgage Association, TBA, 5.00%, 01/01/2055 | 2.16% |
| Federal Home Loan Mortgage Corp., 5.50%, 11/01/2052 | 2.10% |
| Federal Home Loan Mortgage Corp., 2.00%, 05/01/2051 | 2.03% |
| Federal Home Loan Mortgage Corp., 2.50%, 04/01/2052 | 1.98% |
| * Excluding money market fund holdings, if any. | |
Security type allocation
(% of total investments)
Where Can I Find More Information?
You can find more information about the Fund, including the Fund's prospectus, financial information, and holdings at invesco.com/reports. Additionally, the Fund's proxy voting information can be found at invesco.com/proxy-voting.
What Should I Know About Delivery Of Important Regulatory Documents?
To reduce Fund expenses, only one copy of most shareholder documents may be mailed to shareholders with multiple accounts at the same address (Householding). Mailing of your shareholder documents may be householded indefinitely unless you instruct us otherwise. If you do not want the mailing of these documents to be combined with those for other members of your household, please contact Invesco Investment Services, Inc. at (800) 959-4246 or contact your financial institution. We will begin sending you individual copies for each account within 30 days after receiving your request.
For additional information, please scan the QR code at the left to navigate to additional material at invesco.com/reports.
Invesco Quality Income Fund
Class R: VUSRX
ANNUAL SHAREHOLDER REPORT | December 31, 2024
This annual shareholder report contains important information about Invesco Quality Income Fund (the “Fund”) for the period January 1, 2024 to December 31, 2024. You can find additional information about the Fund at invesco.com/reports. You can also request this information by contacting us at (800) 959-4246.
What Were The Fund Costs For The Last Year ?
(Based on a hypothetical $10,000 investment)
| Fund (Class) | Costs of a $10,000 investment | Costs paid as a percentage
of a $10,000 investment |
Invesco Quality Income Fund
(Class R) | $116 | 1.16%† |
† | Reflects fee waivers and/or expense reimbursements, without which expenses would have been higher. |
How Did The Fund Perform During The Period?
• The Fund generated a positive return in 2024, despite longer term Treasury yields increasing by 25 to 75 basis points across the yield curve. This shows the advantage of a bond market where yields were materially higher than they had been in many years, providing cushion against rising interest rates. Non-Treasury sectors of the bond market performed well this year as economic growth and employment performed better than many forecasted at the start of the year.
• For the fiscal year ended December 31, 2024, Class R shares of the Fund returned 0.72%. For the same time period, the Bloomberg US Mortgage Backed Securities Index returned 1.20%.
What contributed to performance?
Agency mortgage-backed securities (MBS) | During 2024, the agency mortgage market, in which the Fund invested the majority of its assets, performed better than US Treasury securities, given the significant yield advantage enjoyed by agency MBS versus Treasuries. The Fund's positioning in higher coupon agency MBS was a positive contributor.
Non-agency MBS, asset-backed securities (ABS) | Non-agency MBS and ABS performed well this year due to attractive starting yields and relatively strong economic performance in 2024, which caused market participants to bid up these assets relative to US Treasuries.
What detracted from performance?
Commercial mortgage-backed securities (CMBS) | CMBS yield spreads increased relative to Treasuries during the year, due to continued challenges in the commercial property market.
How Has The Fund Historically Performed?
Growth of $10,000 Investment
| AVERAGE ANNUAL TOTAL RETURNS | 1 Year | 5 Years | 10 Years |
| Invesco Quality Income Fund (Class R) | 0.72% | (1.02)% | 0.51% |
| Bloomberg US Mortgage Backed Securities Index | 1.20% | (0.74)% | 0.91% |
| Bloomberg U.S. Aggregate Bond Index | 1.25% | (0.33)% | 1.35% |
Class R shares incepted on May 15, 2020. Performance shown prior to that date is that of Class A shares at net asset value and includes the 12b-1 fees applicable to Class A shares. Class R shares' returns of the Fund will be different from Class A shares' returns of the Fund as they have different expenses.
Effective April 26, 2024, the Fund changed its broad-based securities market benchmark from the Bloomberg US Mortgage Backed Securities Index to the Bloomberg U.S. Aggregate Bond Index to reflect that the Bloomberg U.S. Aggregate Bond Index can be considered more broadly representative of the overall applicable securities market.
The performance data quoted represents past performance and cannot guarantee future results; current performance may be lower or higher. Please visit invesco.com/performance for more recent performance information.
Performance figures do not reflect deduction of taxes a shareholder would pay on Fund distributions or sale of Fund shares.
What Are Key Statistics About The Fund?
(as of December 31, 2024)
| Fund net assets | $530,702,034 |
| Total number of portfolio holdings | 686 |
| Total advisory fees paid | $2,415,423 |
| Portfolio turnover rate | 331% |
What Comprised The Fund's Holdings?
(as of December 31, 2024)
Top ten holdings*
(% of net assets)
| Uniform Mortgage-Backed Securities, TBA, 6.00%, 01/01/2055 | 4.24% |
| Government National Mortgage Association, TBA, 2.50%, 01/01/2055 | 4.01% |
| Government National Mortgage Association, TBA, 5.50%, 06/20/2054 | 3.23% |
| Uniform Mortgage-Backed Securities, TBA, 3.00%, 01/01/2055 | 3.18% |
| Federal Home Loan Mortgage Corp., 2.50%, 10/01/2051 | 2.72% |
| Government National Mortgage Association, TBA, 3.00%, 01/01/2055 | 2.69% |
| Government National Mortgage Association, TBA, 5.00%, 01/01/2055 | 2.16% |
| Federal Home Loan Mortgage Corp., 5.50%, 11/01/2052 | 2.10% |
| Federal Home Loan Mortgage Corp., 2.00%, 05/01/2051 | 2.03% |
| Federal Home Loan Mortgage Corp., 2.50%, 04/01/2052 | 1.98% |
| * Excluding money market fund holdings, if any. | |
Security type allocation
(% of total investments)
Where Can I Find More Information?
You can find more information about the Fund, including the Fund's prospectus, financial information, and holdings at invesco.com/reports. Additionally, the Fund's proxy voting information can be found at invesco.com/proxy-voting.
What Should I Know About Delivery Of Important Regulatory Documents?
To reduce Fund expenses, only one copy of most shareholder documents may be mailed to shareholders with multiple accounts at the same address (Householding). Mailing of your shareholder documents may be householded indefinitely unless you instruct us otherwise. If you do not want the mailing of these documents to be combined with those for other members of your household, please contact Invesco Investment Services, Inc. at (800) 959-4246 or contact your financial institution. We will begin sending you individual copies for each account within 30 days after receiving your request.
For additional information, please scan the QR code at the left to navigate to additional material at invesco.com/reports.
Invesco Quality Income Fund
Class Y: VUSIX
ANNUAL SHAREHOLDER REPORT | December 31, 2024
This annual shareholder report contains important information about Invesco Quality Income Fund (the “Fund”) for the period January 1, 2024 to December 31, 2024. You can find additional information about the Fund at invesco.com/reports. You can also request this information by contacting us at (800) 959-4246.
What Were The Fund Costs For The Last Year ?
(Based on a hypothetical $10,000 investment)
| Fund (Class) | Costs of a $10,000 investment | Costs paid as a percentage
of a $10,000 investment |
Invesco Quality Income Fund
(Class Y) | $66 | 0.66%† |
† | Reflects fee waivers and/or expense reimbursements, without which expenses would have been higher. |
How Did The Fund Perform During The Period?
• The Fund generated a positive return in 2024, despite longer term Treasury yields increasing by 25 to 75 basis points across the yield curve. This shows the advantage of a bond market where yields were materially higher than they had been in many years, providing cushion against rising interest rates. Non-Treasury sectors of the bond market performed well this year as economic growth and employment performed better than many forecasted at the start of the year.
• For the fiscal year ended December 31, 2024, Class Y shares of the Fund returned 1.23%. For the same time period, the Bloomberg US Mortgage Backed Securities Index returned 1.20%.
What contributed to performance?
Agency mortgage-backed securities (MBS) | During 2024, the agency mortgage market, in which the Fund invested the majority of its assets, performed better than US Treasury securities, given the significant yield advantage enjoyed by agency MBS versus Treasuries. The Fund's positioning in higher coupon agency MBS was a positive contributor.
Non-agency MBS, asset-backed securities (ABS) | Non-agency MBS and ABS performed well this year due to attractive starting yields and relatively strong economic performance in 2024, which caused market participants to bid up these assets relative to US Treasuries.
What detracted from performance?
Commercial mortgage-backed securities (CMBS) | CMBS yield spreads increased relative to Treasuries during the year, due to continued challenges in the commercial property market.
How Has The Fund Historically Performed?
Growth of $10,000 Investment
| AVERAGE ANNUAL TOTAL RETURNS | 1 Year | 5 Years | 10 Years |
| Invesco Quality Income Fund (Class Y) | 1.23% | (0.51)% | 1.03% |
| Bloomberg US Mortgage Backed Securities Index | 1.20% | (0.74)% | 0.91% |
| Bloomberg U.S. Aggregate Bond Index | 1.25% | (0.33)% | 1.35% |
Effective April 26, 2024, the Fund changed its broad-based securities market benchmark from the Bloomberg US Mortgage Backed Securities Index to the Bloomberg U.S. Aggregate Bond Index to reflect that the Bloomberg U.S. Aggregate Bond Index can be considered more broadly representative of the overall applicable securities market.
The performance data quoted represents past performance and cannot guarantee future results; current performance may be lower or higher. Please visit invesco.com/performance for more recent performance information.
Performance figures do not reflect deduction of taxes a shareholder would pay on Fund distributions or sale of Fund shares.
What Are Key Statistics About The Fund?
(as of December 31, 2024)
| Fund net assets | $530,702,034 |
| Total number of portfolio holdings | 686 |
| Total advisory fees paid | $2,415,423 |
| Portfolio turnover rate | 331% |
What Comprised The Fund's Holdings?
(as of December 31, 2024)
Top ten holdings*
(% of net assets)
| Uniform Mortgage-Backed Securities, TBA, 6.00%, 01/01/2055 | 4.24% |
| Government National Mortgage Association, TBA, 2.50%, 01/01/2055 | 4.01% |
| Government National Mortgage Association, TBA, 5.50%, 06/20/2054 | 3.23% |
| Uniform Mortgage-Backed Securities, TBA, 3.00%, 01/01/2055 | 3.18% |
| Federal Home Loan Mortgage Corp., 2.50%, 10/01/2051 | 2.72% |
| Government National Mortgage Association, TBA, 3.00%, 01/01/2055 | 2.69% |
| Government National Mortgage Association, TBA, 5.00%, 01/01/2055 | 2.16% |
| Federal Home Loan Mortgage Corp., 5.50%, 11/01/2052 | 2.10% |
| Federal Home Loan Mortgage Corp., 2.00%, 05/01/2051 | 2.03% |
| Federal Home Loan Mortgage Corp., 2.50%, 04/01/2052 | 1.98% |
| * Excluding money market fund holdings, if any. | |
Security type allocation
(% of total investments)
Where Can I Find More Information?
You can find more information about the Fund, including the Fund's prospectus, financial information, and holdings at invesco.com/reports. Additionally, the Fund's proxy voting information can be found at invesco.com/proxy-voting.
What Should I Know About Delivery Of Important Regulatory Documents?
To reduce Fund expenses, only one copy of most shareholder documents may be mailed to shareholders with multiple accounts at the same address (Householding). Mailing of your shareholder documents may be householded indefinitely unless you instruct us otherwise. If you do not want the mailing of these documents to be combined with those for other members of your household, please contact Invesco Investment Services, Inc. at (800) 959-4246 or contact your financial institution. We will begin sending you individual copies for each account within 30 days after receiving your request.
For additional information, please scan the QR code at the left to navigate to additional material at invesco.com/reports.
Invesco Quality Income Fund
Class R5: VUSJX
ANNUAL SHAREHOLDER REPORT | December 31, 2024
This annual shareholder report contains important information about Invesco Quality Income Fund (the “Fund”) for the period January 1, 2024 to December 31, 2024. You can find additional information about the Fund at invesco.com/reports. You can also request this information by contacting us at (800) 959-4246.
This report describes changes to the Fund that occurred during the reporting period.
What Were The Fund Costs For The Last Year ?
(Based on a hypothetical $10,000 investment)
| Fund (Class) | Costs of a $10,000 investment | Costs paid as a percentage
of a $10,000 investment |
Invesco Quality Income Fund
(Class R5) | $61 | 0.61% |
How Did The Fund Perform During The Period?
• The Fund generated a positive return in 2024, despite longer term Treasury yields increasing by 25 to 75 basis points across the yield curve. This shows the advantage of a bond market where yields were materially higher than they had been in many years, providing cushion against rising interest rates. Non-Treasury sectors of the bond market performed well this year as economic growth and employment performed better than many forecasted at the start of the year.
• For the fiscal year ended December 31, 2024, Class R5 shares of the Fund returned 1.38%. For the same time period, the Bloomberg US Mortgage Backed Securities Index returned 1.20%.
What contributed to performance?
Agency mortgage-backed securities (MBS) | During 2024, the agency mortgage market, in which the Fund invested the majority of its assets, performed better than US Treasury securities, given the significant yield advantage enjoyed by agency MBS versus Treasuries. The Fund's positioning in higher coupon agency MBS was a positive contributor.
Non-agency MBS, asset-backed securities (ABS) | Non-agency MBS and ABS performed well this year due to attractive starting yields and relatively strong economic performance in 2024, which caused market participants to bid up these assets relative to US Treasuries.
What detracted from performance?
Commercial mortgage-backed securities (CMBS) | CMBS yield spreads increased relative to Treasuries during the year, due to continued challenges in the commercial property market.
How Has The Fund Historically Performed?
Growth of $10,000 Investment
| AVERAGE ANNUAL TOTAL RETURNS | 1 Year | 5 Years | 10 Years |
| Invesco Quality Income Fund (Class R5) | 1.38% | (0.47)% | 1.10% |
| Bloomberg US Mortgage Backed Securities Index | 1.20% | (0.74)% | 0.91% |
| Bloomberg U.S. Aggregate Bond Index | 1.25% | (0.33)% | 1.35% |
Effective April 26, 2024, the Fund changed its broad-based securities market benchmark from the Bloomberg US Mortgage Backed Securities Index to the Bloomberg U.S. Aggregate Bond Index to reflect that the Bloomberg U.S. Aggregate Bond Index can be considered more broadly representative of the overall applicable securities market.
The performance data quoted represents past performance and cannot guarantee future results; current performance may be lower or higher. Please visit invesco.com/performance for more recent performance information.
Performance figures do not reflect deduction of taxes a shareholder would pay on Fund distributions or sale of Fund shares.
What Are Key Statistics About The Fund?
(as of December 31, 2024)
| Fund net assets | $530,702,034 |
| Total number of portfolio holdings | 686 |
| Total advisory fees paid | $2,415,423 |
| Portfolio turnover rate | 331% |
What Comprised The Fund's Holdings?
(as of December 31, 2024)
Top ten holdings*
(% of net assets)
| Uniform Mortgage-Backed Securities, TBA, 6.00%, 01/01/2055 | 4.24% |
| Government National Mortgage Association, TBA, 2.50%, 01/01/2055 | 4.01% |
| Government National Mortgage Association, TBA, 5.50%, 06/20/2054 | 3.23% |
| Uniform Mortgage-Backed Securities, TBA, 3.00%, 01/01/2055 | 3.18% |
| Federal Home Loan Mortgage Corp., 2.50%, 10/01/2051 | 2.72% |
| Government National Mortgage Association, TBA, 3.00%, 01/01/2055 | 2.69% |
| Government National Mortgage Association, TBA, 5.00%, 01/01/2055 | 2.16% |
| Federal Home Loan Mortgage Corp., 5.50%, 11/01/2052 | 2.10% |
| Federal Home Loan Mortgage Corp., 2.00%, 05/01/2051 | 2.03% |
| Federal Home Loan Mortgage Corp., 2.50%, 04/01/2052 | 1.98% |
| * Excluding money market fund holdings, if any. | |
Security type allocation
(% of total investments)
How Has The Fund Changed Over The Past Year?
This is a summary of certain changes to the Fund since December 31, 2023. For more complete information, you may review the Fund's prospectus, which is available at invesco.com/reports or upon request at (800) 959-4246.
Effective after the close of business on September 30, 2024, the Fund has limited public sales of its Class R5 shares to certain investors who were previously invested in Class R5 shares of the Fund.
Where Can I Find More Information?
You can find more information about the Fund, including the Fund's prospectus, financial information, and holdings at invesco.com/reports. Additionally, the Fund's proxy voting information can be found at invesco.com/proxy-voting.
What Should I Know About Delivery Of Important Regulatory Documents?
To reduce Fund expenses, only one copy of most shareholder documents may be mailed to shareholders with multiple accounts at the same address (Householding). Mailing of your shareholder documents may be householded indefinitely unless you instruct us otherwise. If you do not want the mailing of these documents to be combined with those for other members of your household, please contact Invesco Investment Services, Inc. at (800) 959-4246 or contact your financial institution. We will begin sending you individual copies for each account within 30 days after receiving your request.
For additional information, please scan the QR code at the left to navigate to additional material at invesco.com/reports.
Invesco Quality Income Fund
Class R6: VUSSX
ANNUAL SHAREHOLDER REPORT | December 31, 2024
This annual shareholder report contains important information about Invesco Quality Income Fund (the “Fund”) for the period January 1, 2024 to December 31, 2024. You can find additional information about the Fund at invesco.com/reports. You can also request this information by contacting us at (800) 959-4246.
What Were The Fund Costs For The Last Year ?
(Based on a hypothetical $10,000 investment)
| Fund (Class) | Costs of a $10,000 investment | Costs paid as a percentage
of a $10,000 investment |
Invesco Quality Income Fund
(Class R6) | $54 | 0.54% |
How Did The Fund Perform During The Period?
• The Fund generated a positive return in 2024, despite longer term Treasury yields increasing by 25 to 75 basis points across the yield curve. This shows the advantage of a bond market where yields were materially higher than they had been in many years, providing cushion against rising interest rates. Non-Treasury sectors of the bond market performed well this year as economic growth and employment performed better than many forecasted at the start of the year.
• For the fiscal year ended December 31, 2024, Class R6 shares of the Fund returned 1.35%. For the same time period, the Bloomberg US Mortgage Backed Securities Index returned 1.20%.
What contributed to performance?
Agency mortgage-backed securities (MBS) | During 2024, the agency mortgage market, in which the Fund invested the majority of its assets, performed better than US Treasury securities, given the significant yield advantage enjoyed by agency MBS versus Treasuries. The Fund's positioning in higher coupon agency MBS was a positive contributor.
Non-agency MBS, asset-backed securities (ABS) | Non-agency MBS and ABS performed well this year due to attractive starting yields and relatively strong economic performance in 2024, which caused market participants to bid up these assets relative to US Treasuries.
What detracted from performance?
Commercial mortgage-backed securities (CMBS) | CMBS yield spreads increased relative to Treasuries during the year, due to continued challenges in the commercial property market.
How Has The Fund Historically Performed?
Growth of $10,000 Investment
| AVERAGE ANNUAL TOTAL RETURNS | 1 Year | 5 Years | 10 Years |
| Invesco Quality Income Fund (Class R6) | 1.35% | (0.41)% | 1.07% |
| Bloomberg US Mortgage Backed Securities Index | 1.20% | (0.74)% | 0.91% |
| Bloomberg U.S. Aggregate Bond Index | 1.25% | (0.33)% | 1.35% |
Class R6 shares incepted on April 4, 2017. Performance shown prior to that date is that of Class A shares at net asset value and includes the 12b-1 fees applicable to Class A shares. Class R6 shares' returns of the Fund will be different from Class A shares' returns of the Fund as they have different expenses.
Effective April 26, 2024, the Fund changed its broad-based securities market benchmark from the Bloomberg US Mortgage Backed Securities Index to the Bloomberg U.S. Aggregate Bond Index to reflect that the Bloomberg U.S. Aggregate Bond Index can be considered more broadly representative of the overall applicable securities market.
The performance data quoted represents past performance and cannot guarantee future results; current performance may be lower or higher. Please visit invesco.com/performance for more recent performance information.
Performance figures do not reflect deduction of taxes a shareholder would pay on Fund distributions or sale of Fund shares.
What Are Key Statistics About The Fund?
(as of December 31, 2024)
| Fund net assets | $530,702,034 |
| Total number of portfolio holdings | 686 |
| Total advisory fees paid | $2,415,423 |
| Portfolio turnover rate | 331% |
What Comprised The Fund's Holdings?
(as of December 31, 2024)
Top ten holdings*
(% of net assets)
| Uniform Mortgage-Backed Securities, TBA, 6.00%, 01/01/2055 | 4.24% |
| Government National Mortgage Association, TBA, 2.50%, 01/01/2055 | 4.01% |
| Government National Mortgage Association, TBA, 5.50%, 06/20/2054 | 3.23% |
| Uniform Mortgage-Backed Securities, TBA, 3.00%, 01/01/2055 | 3.18% |
| Federal Home Loan Mortgage Corp., 2.50%, 10/01/2051 | 2.72% |
| Government National Mortgage Association, TBA, 3.00%, 01/01/2055 | 2.69% |
| Government National Mortgage Association, TBA, 5.00%, 01/01/2055 | 2.16% |
| Federal Home Loan Mortgage Corp., 5.50%, 11/01/2052 | 2.10% |
| Federal Home Loan Mortgage Corp., 2.00%, 05/01/2051 | 2.03% |
| Federal Home Loan Mortgage Corp., 2.50%, 04/01/2052 | 1.98% |
| * Excluding money market fund holdings, if any. | |
Security type allocation
(% of total investments)
Where Can I Find More Information?
You can find more information about the Fund, including the Fund's prospectus, financial information, and holdings at invesco.com/reports. Additionally, the Fund's proxy voting information can be found at invesco.com/proxy-voting.
What Should I Know About Delivery Of Important Regulatory Documents?
To reduce Fund expenses, only one copy of most shareholder documents may be mailed to shareholders with multiple accounts at the same address (Householding). Mailing of your shareholder documents may be householded indefinitely unless you instruct us otherwise. If you do not want the mailing of these documents to be combined with those for other members of your household, please contact Invesco Investment Services, Inc. at (800) 959-4246 or contact your financial institution. We will begin sending you individual copies for each account within 30 days after receiving your request.
For additional information, please scan the QR code at the left to navigate to additional material at invesco.com/reports.
Invesco Select Risk: Conservative Investor Fund
Class A: OACIX
ANNUAL SHAREHOLDER REPORT | December 31, 2024
This annual shareholder report contains important information about Invesco Select Risk: Conservative Investor Fund (the “Fund”) for the period January 1, 2024 to December 31, 2024. You can find additional information about the Fund at invesco.com/reports. You can also request this information by contacting us at (800) 959-4246.
What Were The Fund Costs For The Last Year ?
(Based on a hypothetical $10,000 investment)
| Fund (Class) | Costs of a $10,000 investment | Costs paid as a percentage
of a $10,000 investment |
Invesco Select Risk: Conservative Investor Fund
(Class A) | $43 | 0.42%† |
† | Reflects fee waivers and/or expense reimbursements, without which expenses would have been higher. |
How Did The Fund Perform During The Period?
• During the fiscal year ended December 31, 2024, global risk assets outperformed defensive assets driven by a favorable macroeconomic environment, the beginning of a global monetary policy easing cycle and greater clarity with respect to fiscal policy following the conclusion of many major elections globally. These macroeconomic tailwinds supported global equity prices, particularly within the US, as well as the continuation of credit spreads tightening to cycle lows within investment grade, high yield and emerging market debt markets. Given this backdrop, an underweight to equities was a headwind to Fund performance, as were factor tilts within equities, as well as allocations within fixed income to core and US Treasury bonds.
• For the fiscal year ended December 31, 2024, Class A shares of the Fund, excluding sales charge, returned 4.41%. For the same time period, the Custom Invesco Select Risk: Conservative Investor Index returned 6.17%.
What contributed to performance?
Manager selection within fixed income | Manager selection within fixed income was a contributor to Fund performance, driven by the Invesco Core Bond Fund, Invesco Core Plus Bond Fund and Invesco Variable Rate Investment Grade ETF.
Exposure to high yield and floating rate credit | The Fund's exposure to high yield was beneficial as credit spreads continued to tighten, supported by resilient corporate fundamentals and strong investor demand for higher-coupon bond offerings. Floating rate exposure was rewarded as well, with the securities benefiting from an increasing interest rate environment, compared to their fixed-rate peers.
What detracted from performance?
Cyclical factor exposure within equities | Exposure to the small size and value factors was a detractor from Fund performance over the time period, as more defensive equity factors such as quality continued to be in demand led by US megacap technology stocks and strong momentum in investor demand for thematic artificial intelligence stocks.
Exposure to core and US Treasury bonds | The Fund's exposure to core and US Treasury bonds was a headwind, as long and moderate duration, as well as higher-grade fixed income, suffered compared to shorter duration, more credit sensitive counterparts. This was due to interest rates moving higher and the steepening of the yield curve that transpired significantly in the second half of the year.
How Has The Fund Historically Performed?
Growth of $10,000 Investment
| AVERAGE ANNUAL TOTAL RETURNS | 1 Year | 5 Years | 10 Years |
| Invesco Select Risk: Conservative Investor Fund (Class A) —including sales charge | (1.29)% | 0.05% | 2.03% |
| Invesco Select Risk: Conservative Investor Fund (Class A) —excluding sales charge | 4.41% | 1.19% | 2.61% |
| Custom Invesco Select Risk: Conservative Investor Index | 6.17% | 2.57% | 3.60% |
| Bloomberg Global Aggregate USD Hedged Index | 3.40% | 0.48% | 2.01% |
| MSCI ACWI (Net) | 17.49% | 10.06% | 9.23% |
| Bloomberg U.S. Aggregate Bond Index | 1.25% | (0.33)% | 1.35% |
The Custom Invesco Select Risk: Conservative Investor Index is composed of 20% MSCI ACWI (Net) and 80% Bloomberg Global Aggregate USD Hedged Index.
Effective after the close of business on May 24, 2019, Class A shares of Oppenheimer Portfolio Series: Conservative Investor Fund (the predecessor fund), were reorganized into Class A shares of the Fund. Returns shown above for periods ending on or prior to May 24, 2019 are those of Class A shares of the predecessor fund. Share class returns will differ from the predecessor fund because of different expenses.
Effective April 26, 2024, the Fund changed its broad-based securities market benchmark from the Bloomberg Global Aggregate USD Hedged Index to the Bloomberg U.S. Aggregate Bond Index to reflect that the Bloomberg U.S. Aggregate Bond Index can be considered more broadly representative of the overall applicable securities market.
The performance data quoted represents past performance and cannot guarantee future results; current performance may be lower or higher. Please visit invesco.com/performance for more recent performance information.
Performance figures do not reflect deduction of taxes a shareholder would pay on Fund distributions or sale of Fund shares.
What Are Key Statistics About The Fund?
(as of December 31, 2024)
| Fund net assets | $362,862,940 |
| Total number of portfolio holdings | 25 |
| Total advisory fees paid | $0 |
| Portfolio turnover rate | 51% |
What Comprised The Fund's Holdings?
(as of December 31, 2024)
Asset allocation
(% of net assets)
Where Can I Find More Information?
You can find more information about the Fund, including the Fund's prospectus, financial information, and holdings at invesco.com/reports. Additionally, the Fund's proxy voting information can be found at invesco.com/proxy-voting.
What Should I Know About Delivery Of Important Regulatory Documents?
To reduce Fund expenses, only one copy of most shareholder documents may be mailed to shareholders with multiple accounts at the same address (Householding). Mailing of your shareholder documents may be householded indefinitely unless you instruct us otherwise. If you do not want the mailing of these documents to be combined with those for other members of your household, please contact Invesco Investment Services, Inc. at (800) 959-4246 or contact your financial institution. We will begin sending you individual copies for each account within 30 days after receiving your request.
For additional information, please scan the QR code at the left to navigate to additional material at invesco.com/reports.
Invesco Select Risk: Conservative Investor Fund
Class C: OCCIX
ANNUAL SHAREHOLDER REPORT | December 31, 2024
This annual shareholder report contains important information about Invesco Select Risk: Conservative Investor Fund (the “Fund”) for the period January 1, 2024 to December 31, 2024. You can find additional information about the Fund at invesco.com/reports. You can also request this information by contacting us at (800) 959-4246.
What Were The Fund Costs For The Last Year ?
(Based on a hypothetical $10,000 investment)
| Fund (Class) | Costs of a $10,000 investment | Costs paid as a percentage
of a $10,000 investment |
Invesco Select Risk: Conservative Investor Fund
(Class C) | $120 | 1.18%† |
† | Reflects fee waivers and/or expense reimbursements, without which expenses would have been higher. |
How Did The Fund Perform During The Period?
• During the fiscal year ended December 31, 2024, global risk assets outperformed defensive assets driven by a favorable macroeconomic environment, the beginning of a global monetary policy easing cycle and greater clarity with respect to fiscal policy following the conclusion of many major elections globally. These macroeconomic tailwinds supported global equity prices, particularly within the US, as well as the continuation of credit spreads tightening to cycle lows within investment grade, high yield and emerging market debt markets. Given this backdrop, an underweight to equities was a headwind to Fund performance, as were factor tilts within equities, as well as allocations within fixed income to core and US Treasury bonds.
• For the fiscal year ended December 31, 2024, Class C shares of the Fund, excluding sales charge, returned 3.57%. For the same time period, the Custom Invesco Select Risk: Conservative Investor Index returned 6.17%.
What contributed to performance?
Manager selection within fixed income | Manager selection within fixed income was a contributor to Fund performance, driven by the Invesco Core Bond Fund, Invesco Core Plus Bond Fund and Invesco Variable Rate Investment Grade ETF.
Exposure to high yield and floating rate credit | The Fund's exposure to high yield was beneficial as credit spreads continued to tighten, supported by resilient corporate fundamentals and strong investor demand for higher-coupon bond offerings. Floating rate exposure was rewarded as well, with the securities benefiting from an increasing interest rate environment, compared to their fixed-rate peers.
What detracted from performance?
Cyclical factor exposure within equities | Exposure to the small size and value factors was a detractor from Fund performance over the time period, as more defensive equity factors such as quality continued to be in demand led by US megacap technology stocks and strong momentum in investor demand for thematic artificial intelligence stocks.
Exposure to core and US Treasury bonds | The Fund's exposure to core and US Treasury bonds was a headwind, as long and moderate duration, as well as higher-grade fixed income, suffered compared to shorter duration, more credit sensitive counterparts. This was due to interest rates moving higher and the steepening of the yield curve that transpired significantly in the second half of the year.
How Has The Fund Historically Performed?
Growth of $10,000 Investment
| AVERAGE ANNUAL TOTAL RETURNS | 1 Year | 5 Years | 10 Years |
| Invesco Select Risk: Conservative Investor Fund (Class C) —including sales charge | 2.57% | 0.44% | 1.99% |
| Invesco Select Risk: Conservative Investor Fund (Class C) —excluding sales charge | 3.57% | 0.44% | 1.99% |
| Custom Invesco Select Risk: Conservative Investor Index | 6.17% | 2.57% | 3.60% |
| Bloomberg Global Aggregate USD Hedged Index | 3.40% | 0.48% | 2.01% |
| MSCI ACWI (Net) | 17.49% | 10.06% | 9.23% |
| Bloomberg U.S. Aggregate Bond Index | 1.25% | (0.33)% | 1.35% |
The Custom Invesco Select Risk: Conservative Investor Index is composed of 20% MSCI ACWI (Net) and 80% Bloomberg Global Aggregate USD Hedged Index.
Effective after the close of business on May 24, 2019, Class C shares of Oppenheimer Portfolio Series: Conservative Investor Fund (the predecessor fund), were reorganized into Class C shares of the Fund. Returns shown above for periods ending on or prior to May 24, 2019 are those of Class C shares of the predecessor fund. Share class returns will differ from the predecessor fund because of different expenses.
Effective April 26, 2024, the Fund changed its broad-based securities market benchmark from the Bloomberg Global Aggregate USD Hedged Index to the Bloomberg U.S. Aggregate Bond Index to reflect that the Bloomberg U.S. Aggregate Bond Index can be considered more broadly representative of the overall applicable securities market.
The performance data quoted represents past performance and cannot guarantee future results; current performance may be lower or higher. Please visit invesco.com/performance for more recent performance information.
Performance figures do not reflect deduction of taxes a shareholder would pay on Fund distributions or sale of Fund shares.
What Are Key Statistics About The Fund?
(as of December 31, 2024)
| Fund net assets | $362,862,940 |
| Total number of portfolio holdings | 25 |
| Total advisory fees paid | $0 |
| Portfolio turnover rate | 51% |
What Comprised The Fund's Holdings?
(as of December 31, 2024)
Asset allocation
(% of net assets)
Where Can I Find More Information?
You can find more information about the Fund, including the Fund's prospectus, financial information, and holdings at invesco.com/reports. Additionally, the Fund's proxy voting information can be found at invesco.com/proxy-voting.
What Should I Know About Delivery Of Important Regulatory Documents?
To reduce Fund expenses, only one copy of most shareholder documents may be mailed to shareholders with multiple accounts at the same address (Householding). Mailing of your shareholder documents may be householded indefinitely unless you instruct us otherwise. If you do not want the mailing of these documents to be combined with those for other members of your household, please contact Invesco Investment Services, Inc. at (800) 959-4246 or contact your financial institution. We will begin sending you individual copies for each account within 30 days after receiving your request.
For additional information, please scan the QR code at the left to navigate to additional material at invesco.com/reports.
Invesco Select Risk: Conservative Investor Fund
Class R: ONCIX
ANNUAL SHAREHOLDER REPORT | December 31, 2024
This annual shareholder report contains important information about Invesco Select Risk: Conservative Investor Fund (the “Fund”) for the period January 1, 2024 to December 31, 2024. You can find additional information about the Fund at invesco.com/reports. You can also request this information by contacting us at (800) 959-4246.
What Were The Fund Costs For The Last Year ?
(Based on a hypothetical $10,000 investment)
| Fund (Class) | Costs of a $10,000 investment | Costs paid as a percentage
of a $10,000 investment |
Invesco Select Risk: Conservative Investor Fund
(Class R) | $69 | 0.68%† |
† | Reflects fee waivers and/or expense reimbursements, without which expenses would have been higher. |
How Did The Fund Perform During The Period?
• During the fiscal year ended December 31, 2024, global risk assets outperformed defensive assets driven by a favorable macroeconomic environment, the beginning of a global monetary policy easing cycle and greater clarity with respect to fiscal policy following the conclusion of many major elections globally. These macroeconomic tailwinds supported global equity prices, particularly within the US, as well as the continuation of credit spreads tightening to cycle lows within investment grade, high yield and emerging market debt markets. Given this backdrop, an underweight to equities was a headwind to Fund performance, as were factor tilts within equities, as well as allocations within fixed income to core and US Treasury bonds.
• For the fiscal year ended December 31, 2024, Class R shares of the Fund returned 4.00%. For the same time period, the Custom Invesco Select Risk: Conservative Investor Index returned 6.17%.
What contributed to performance?
Manager selection within fixed income | Manager selection within fixed income was a contributor to Fund performance, driven by the Invesco Core Bond Fund, Invesco Core Plus Bond Fund and Invesco Variable Rate Investment Grade ETF.
Exposure to high yield and floating rate credit | The Fund's exposure to high yield was beneficial as credit spreads continued to tighten, supported by resilient corporate fundamentals and strong investor demand for higher-coupon bond offerings. Floating rate exposure was rewarded as well, with the securities benefiting from an increasing interest rate environment, compared to their fixed-rate peers.
What detracted from performance?
Cyclical factor exposure within equities | Exposure to the small size and value factors was a detractor from Fund performance over the time period, as more defensive equity factors such as quality continued to be in demand led by US megacap technology stocks and strong momentum in investor demand for thematic artificial intelligence stocks.
Exposure to core and US Treasury bonds | The Fund's exposure to core and US Treasury bonds was a headwind, as long and moderate duration, as well as higher-grade fixed income, suffered compared to shorter duration, more credit sensitive counterparts. This was due to interest rates moving higher and the steepening of the yield curve that transpired significantly in the second half of the year.
How Has The Fund Historically Performed?
Growth of $10,000 Investment
| AVERAGE ANNUAL TOTAL RETURNS | 1 Year | 5 Years | 10 Years |
| Invesco Select Risk: Conservative Investor Fund (Class R) | 4.00% | 0.92% | 2.35% |
| Custom Invesco Select Risk: Conservative Investor Index | 6.17% | 2.57% | 3.60% |
| Bloomberg Global Aggregate USD Hedged Index | 3.40% | 0.48% | 2.01% |
| MSCI ACWI (Net) | 17.49% | 10.06% | 9.23% |
| Bloomberg U.S. Aggregate Bond Index | 1.25% | (0.33)% | 1.35% |
The Custom Invesco Select Risk: Conservative Investor Index is composed of 20% MSCI ACWI (Net) and 80% Bloomberg Global Aggregate USD Hedged Index.
Effective after the close of business on May 24, 2019, Class R shares of Oppenheimer Portfolio Series: Conservative Investor Fund (the predecessor fund), were reorganized into Class R shares of the Fund. Returns shown above for periods ending on or prior to May 24, 2019 are those of Class R shares of the predecessor fund. Share class returns will differ from the predecessor fund because of different expenses.
Effective April 26, 2024, the Fund changed its broad-based securities market benchmark from the Bloomberg Global Aggregate USD Hedged Index to the Bloomberg U.S. Aggregate Bond Index to reflect that the Bloomberg U.S. Aggregate Bond Index can be considered more broadly representative of the overall applicable securities market.
The performance data quoted represents past performance and cannot guarantee future results; current performance may be lower or higher. Please visit invesco.com/performance for more recent performance information.
Performance figures do not reflect deduction of taxes a shareholder would pay on Fund distributions or sale of Fund shares.
What Are Key Statistics About The Fund?
(as of December 31, 2024)
| Fund net assets | $362,862,940 |
| Total number of portfolio holdings | 25 |
| Total advisory fees paid | $0 |
| Portfolio turnover rate | 51% |
What Comprised The Fund's Holdings?
(as of December 31, 2024)
Asset allocation
(% of net assets)
Where Can I Find More Information?
You can find more information about the Fund, including the Fund's prospectus, financial information, and holdings at invesco.com/reports. Additionally, the Fund's proxy voting information can be found at invesco.com/proxy-voting.
What Should I Know About Delivery Of Important Regulatory Documents?
To reduce Fund expenses, only one copy of most shareholder documents may be mailed to shareholders with multiple accounts at the same address (Householding). Mailing of your shareholder documents may be householded indefinitely unless you instruct us otherwise. If you do not want the mailing of these documents to be combined with those for other members of your household, please contact Invesco Investment Services, Inc. at (800) 959-4246 or contact your financial institution. We will begin sending you individual copies for each account within 30 days after receiving your request.
For additional information, please scan the QR code at the left to navigate to additional material at invesco.com/reports.
Invesco Select Risk: Conservative Investor Fund
Class Y: OYCIX
ANNUAL SHAREHOLDER REPORT | December 31, 2024
This annual shareholder report contains important information about Invesco Select Risk: Conservative Investor Fund (the “Fund”) for the period January 1, 2024 to December 31, 2024. You can find additional information about the Fund at invesco.com/reports. You can also request this information by contacting us at (800) 959-4246.
What Were The Fund Costs For The Last Year ?
(Based on a hypothetical $10,000 investment)
| Fund (Class) | Costs of a $10,000 investment | Costs paid as a percentage
of a $10,000 investment |
Invesco Select Risk: Conservative Investor Fund
(Class Y) | $18 | 0.18%† |
† | Reflects fee waivers and/or expense reimbursements, without which expenses would have been higher. |
How Did The Fund Perform During The Period?
• During the fiscal year ended December 31, 2024, global risk assets outperformed defensive assets driven by a favorable macroeconomic environment, the beginning of a global monetary policy easing cycle and greater clarity with respect to fiscal policy following the conclusion of many major elections globally. These macroeconomic tailwinds supported global equity prices, particularly within the US, as well as the continuation of credit spreads tightening to cycle lows within investment grade, high yield and emerging market debt markets. Given this backdrop, an underweight to equities was a headwind to Fund performance, as were factor tilts within equities, as well as allocations within fixed income to core and US Treasury bonds.
• For the fiscal year ended December 31, 2024, Class Y shares of the Fund returned 4.64%. For the same time period, the Custom Invesco Select Risk: Conservative Investor Index returned 6.17%.
What contributed to performance?
Manager selection within fixed income | Manager selection within fixed income was a contributor to Fund performance, driven by the Invesco Core Bond Fund, Invesco Core Plus Bond Fund and Invesco Variable Rate Investment Grade ETF.
Exposure to high yield and floating rate credit | The Fund's exposure to high yield was beneficial as credit spreads continued to tighten, supported by resilient corporate fundamentals and strong investor demand for higher-coupon bond offerings. Floating rate exposure was rewarded as well, with the securities benefiting from an increasing interest rate environment, compared to their fixed-rate peers.
What detracted from performance?
Cyclical factor exposure within equities | Exposure to the small size and value factors was a detractor from Fund performance over the time period, as more defensive equity factors such as quality continued to be in demand led by US megacap technology stocks and strong momentum in investor demand for thematic artificial intelligence stocks.
Exposure to core and US Treasury bonds | The Fund's exposure to core and US Treasury bonds was a headwind, as long and moderate duration, as well as higher-grade fixed income, suffered compared to shorter duration, more credit sensitive counterparts. This was due to interest rates moving higher and the steepening of the yield curve that transpired significantly in the second half of the year.
How Has The Fund Historically Performed?
Growth of $10,000 Investment
| AVERAGE ANNUAL TOTAL RETURNS | 1 Year | 5 Years | 10 Years |
| Invesco Select Risk: Conservative Investor Fund (Class Y) | 4.64% | 1.45% | 2.86% |
| Custom Invesco Select Risk: Conservative Investor Index | 6.17% | 2.57% | 3.60% |
| Bloomberg Global Aggregate USD Hedged Index | 3.40% | 0.48% | 2.01% |
| MSCI ACWI (Net) | 17.49% | 10.06% | 9.23% |
| Bloomberg U.S. Aggregate Bond Index | 1.25% | (0.33)% | 1.35% |
The Custom Invesco Select Risk: Conservative Investor Index is composed of 20% MSCI ACWI (Net) and 80% Bloomberg Global Aggregate USD Hedged Index.
Effective after the close of business on May 24, 2019, Class Y shares of Oppenheimer Portfolio Series: Conservative Investor Fund (the predecessor fund), were reorganized into Class Y shares of the Fund. Returns shown above for periods ending on or prior to May 24, 2019 are those of Class Y shares of the predecessor fund. Share class returns will differ from the predecessor fund because of different expenses.
Effective April 26, 2024, the Fund changed its broad-based securities market benchmark from the Bloomberg Global Aggregate USD Hedged Index to the Bloomberg U.S. Aggregate Bond Index to reflect that the Bloomberg U.S. Aggregate Bond Index can be considered more broadly representative of the overall applicable securities market.
The performance data quoted represents past performance and cannot guarantee future results; current performance may be lower or higher. Please visit invesco.com/performance for more recent performance information.
Performance figures do not reflect deduction of taxes a shareholder would pay on Fund distributions or sale of Fund shares.
What Are Key Statistics About The Fund?
(as of December 31, 2024)
| Fund net assets | $362,862,940 |
| Total number of portfolio holdings | 25 |
| Total advisory fees paid | $0 |
| Portfolio turnover rate | 51% |
What Comprised The Fund's Holdings?
(as of December 31, 2024)
Asset allocation
(% of net assets)
Where Can I Find More Information?
You can find more information about the Fund, including the Fund's prospectus, financial information, and holdings at invesco.com/reports. Additionally, the Fund's proxy voting information can be found at invesco.com/proxy-voting.
What Should I Know About Delivery Of Important Regulatory Documents?
To reduce Fund expenses, only one copy of most shareholder documents may be mailed to shareholders with multiple accounts at the same address (Householding). Mailing of your shareholder documents may be householded indefinitely unless you instruct us otherwise. If you do not want the mailing of these documents to be combined with those for other members of your household, please contact Invesco Investment Services, Inc. at (800) 959-4246 or contact your financial institution. We will begin sending you individual copies for each account within 30 days after receiving your request.
For additional information, please scan the QR code at the left to navigate to additional material at invesco.com/reports.
Invesco Select Risk: Conservative Investor Fund
Class R5: PXCIX
ANNUAL SHAREHOLDER REPORT | December 31, 2024
This annual shareholder report contains important information about Invesco Select Risk: Conservative Investor Fund (the “Fund”) for the period January 1, 2024 to December 31, 2024. You can find additional information about the Fund at invesco.com/reports. You can also request this information by contacting us at (800) 959-4246.
This report describes changes to the Fund that occurred during the reporting period.
What Were The Fund Costs For The Last Year ?
(Based on a hypothetical $10,000 investment)
| Fund (Class) | Costs of a $10,000 investment | Costs paid as a percentage
of a $10,000 investment |
Invesco Select Risk: Conservative Investor Fund
(Class R5) | $10 | 0.10% |
How Did The Fund Perform During The Period?
• During the fiscal year ended December 31, 2024, global risk assets outperformed defensive assets driven by a favorable macroeconomic environment, the beginning of a global monetary policy easing cycle and greater clarity with respect to fiscal policy following the conclusion of many major elections globally. These macroeconomic tailwinds supported global equity prices, particularly within the US, as well as the continuation of credit spreads tightening to cycle lows within investment grade, high yield and emerging market debt markets. Given this backdrop, an underweight to equities was a headwind to Fund performance, as were factor tilts within equities, as well as allocations within fixed income to core and US Treasury bonds.
• For the fiscal year ended December 31, 2024, Class R5 shares of the Fund returned 4.62%. For the same time period, the Custom Invesco Select Risk: Conservative Investor Index returned 6.17%.
What contributed to performance?
Manager selection within fixed income | Manager selection within fixed income was a contributor to Fund performance, driven by the Invesco Core Bond Fund, Invesco Core Plus Bond Fund and Invesco Variable Rate Investment Grade ETF.
Exposure to high yield and floating rate credit | The Fund's exposure to high yield was beneficial as credit spreads continued to tighten, supported by resilient corporate fundamentals and strong investor demand for higher-coupon bond offerings. Floating rate exposure was rewarded as well, with the securities benefiting from an increasing interest rate environment, compared to their fixed-rate peers.
What detracted from performance?
Cyclical factor exposure within equities | Exposure to the small size and value factors was a detractor from Fund performance over the time period, as more defensive equity factors such as quality continued to be in demand led by US megacap technology stocks and strong momentum in investor demand for thematic artificial intelligence stocks.
Exposure to core and US Treasury bonds | The Fund's exposure to core and US Treasury bonds was a headwind, as long and moderate duration, as well as higher-grade fixed income, suffered compared to shorter duration, more credit sensitive counterparts. This was due to interest rates moving higher and the steepening of the yield curve that transpired significantly in the second half of the year.
How Has The Fund Historically Performed?
Growth of $10,000 Investment
| AVERAGE ANNUAL TOTAL RETURNS | 1 Year | 5 Years | 10 Years |
| Invesco Select Risk: Conservative Investor Fund (Class R5) | 4.62% | 1.50% | 2.79% |
| Custom Invesco Select Risk: Conservative Investor Index | 6.17% | 2.57% | 3.60% |
| Bloomberg Global Aggregate USD Hedged Index | 3.40% | 0.48% | 2.01% |
| MSCI ACWI (Net) | 17.49% | 10.06% | 9.23% |
| Bloomberg U.S. Aggregate Bond Index | 1.25% | (0.33)% | 1.35% |
The Custom Invesco Select Risk: Conservative Investor Index is composed of 20% MSCI ACWI (Net) and 80% Bloomberg Global Aggregate USD Hedged Index.
Class R5 shares incepted on May 24, 2019. Performance shown on and prior to that date is that of Oppenheimer Portfolio Series: Conservative Investor Fund's (the predecessor fund) Class A shares at net asset value and includes 12b-1 fees applicable to Class A shares. Share class returns will differ from the predecessor fund because of different expenses.
Effective April 26, 2024, the Fund changed its broad-based securities market benchmark from the Bloomberg Global Aggregate USD Hedged Index to the Bloomberg U.S. Aggregate Bond Index to reflect that the Bloomberg U.S. Aggregate Bond Index can be considered more broadly representative of the overall applicable securities market.
The performance data quoted represents past performance and cannot guarantee future results; current performance may be lower or higher. Please visit invesco.com/performance for more recent performance information.
Performance figures do not reflect deduction of taxes a shareholder would pay on Fund distributions or sale of Fund shares.
What Are Key Statistics About The Fund?
(as of December 31, 2024)
| Fund net assets | $362,862,940 |
| Total number of portfolio holdings | 25 |
| Total advisory fees paid | $0 |
| Portfolio turnover rate | 51% |
What Comprised The Fund's Holdings?
(as of December 31, 2024)
Asset allocation
(% of net assets)
How Has The Fund Changed Over The Past Year?
This is a summary of certain changes to the Fund since December 31, 2023. For more complete information, you may review the Fund's prospectus, which is available at invesco.com/reports or upon request at (800) 959-4246.
Effective after the close of business on September 30, 2024, the Fund has limited public sales of its Class R5 shares to certain investors who were previously invested in Class R5 shares of the Fund.
Where Can I Find More Information?
You can find more information about the Fund, including the Fund's prospectus, financial information, and holdings at invesco.com/reports. Additionally, the Fund's proxy voting information can be found at invesco.com/proxy-voting.
What Should I Know About Delivery Of Important Regulatory Documents?
To reduce Fund expenses, only one copy of most shareholder documents may be mailed to shareholders with multiple accounts at the same address (Householding). Mailing of your shareholder documents may be householded indefinitely unless you instruct us otherwise. If you do not want the mailing of these documents to be combined with those for other members of your household, please contact Invesco Investment Services, Inc. at (800) 959-4246 or contact your financial institution. We will begin sending you individual copies for each account within 30 days after receiving your request.
For additional information, please scan the QR code at the left to navigate to additional material at invesco.com/reports.
Invesco Select Risk: Conservative Investor Fund
Class R6: PXCCX
ANNUAL SHAREHOLDER REPORT | December 31, 2024
This annual shareholder report contains important information about Invesco Select Risk: Conservative Investor Fund (the “Fund”) for the period January 1, 2024 to December 31, 2024. You can find additional information about the Fund at invesco.com/reports. You can also request this information by contacting us at (800) 959-4246.
What Were The Fund Costs For The Last Year ?
(Based on a hypothetical $10,000 investment)
| Fund (Class) | Costs of a $10,000 investment | Costs paid as a percentage
of a $10,000 investment |
Invesco Select Risk: Conservative Investor Fund
(Class R6) | $7 | 0.07% |
How Did The Fund Perform During The Period?
• During the fiscal year ended December 31, 2024, global risk assets outperformed defensive assets driven by a favorable macroeconomic environment, the beginning of a global monetary policy easing cycle and greater clarity with respect to fiscal policy following the conclusion of many major elections globally. These macroeconomic tailwinds supported global equity prices, particularly within the US, as well as the continuation of credit spreads tightening to cycle lows within investment grade, high yield and emerging market debt markets. Given this backdrop, an underweight to equities was a headwind to Fund performance, as were factor tilts within equities, as well as allocations within fixed income to core and US Treasury bonds.
• For the fiscal year ended December 31, 2024, Class R6 shares of the Fund returned 4.65%. For the same time period, the Custom Invesco Select Risk: Conservative Investor Index returned 6.17%.
What contributed to performance?
Manager selection within fixed income | Manager selection within fixed income was a contributor to Fund performance, driven by the Invesco Core Bond Fund, Invesco Core Plus Bond Fund and Invesco Variable Rate Investment Grade ETF.
Exposure to high yield and floating rate credit | The Fund's exposure to high yield was beneficial as credit spreads continued to tighten, supported by resilient corporate fundamentals and strong investor demand for higher-coupon bond offerings. Floating rate exposure was rewarded as well, with the securities benefiting from an increasing interest rate environment, compared to their fixed-rate peers.
What detracted from performance?
Cyclical factor exposure within equities | Exposure to the small size and value factors was a detractor from Fund performance over the time period, as more defensive equity factors such as quality continued to be in demand led by US megacap technology stocks and strong momentum in investor demand for thematic artificial intelligence stocks.
Exposure to core and US Treasury bonds | The Fund's exposure to core and US Treasury bonds was a headwind, as long and moderate duration, as well as higher-grade fixed income, suffered compared to shorter duration, more credit sensitive counterparts. This was due to interest rates moving higher and the steepening of the yield curve that transpired significantly in the second half of the year.
How Has The Fund Historically Performed?
Growth of $10,000 Investment
| AVERAGE ANNUAL TOTAL RETURNS | 1 Year | 5 Years | 10 Years |
| Invesco Select Risk: Conservative Investor Fund (Class R6) | 4.65% | 1.50% | 2.79% |
| Custom Invesco Select Risk: Conservative Investor Index | 6.17% | 2.57% | 3.60% |
| Bloomberg Global Aggregate USD Hedged Index | 3.40% | 0.48% | 2.01% |
| MSCI ACWI (Net) | 17.49% | 10.06% | 9.23% |
| Bloomberg U.S. Aggregate Bond Index | 1.25% | (0.33)% | 1.35% |
The Custom Invesco Select Risk: Conservative Investor Index is composed of 20% MSCI ACWI (Net) and 80% Bloomberg Global Aggregate USD Hedged Index.
Class R6 shares incepted on May 24, 2019. Performance shown on and prior to that date is that of Oppenheimer Portfolio Series: Conservative Investor Fund's (the predecessor fund) Class A shares at net asset value and includes 12b-1 fees applicable to Class A shares. Share class returns will differ from the predecessor fund because of different expenses.
Effective April 26, 2024, the Fund changed its broad-based securities market benchmark from the Bloomberg Global Aggregate USD Hedged Index to the Bloomberg U.S. Aggregate Bond Index to reflect that the Bloomberg U.S. Aggregate Bond Index can be considered more broadly representative of the overall applicable securities market.
The performance data quoted represents past performance and cannot guarantee future results; current performance may be lower or higher. Please visit invesco.com/performance for more recent performance information.
Performance figures do not reflect deduction of taxes a shareholder would pay on Fund distributions or sale of Fund shares.
What Are Key Statistics About The Fund?
(as of December 31, 2024)
| Fund net assets | $362,862,940 |
| Total number of portfolio holdings | 25 |
| Total advisory fees paid | $0 |
| Portfolio turnover rate | 51% |
What Comprised The Fund's Holdings?
(as of December 31, 2024)
Asset allocation
(% of net assets)
Where Can I Find More Information?
You can find more information about the Fund, including the Fund's prospectus, financial information, and holdings at invesco.com/reports. Additionally, the Fund's proxy voting information can be found at invesco.com/proxy-voting.
What Should I Know About Delivery Of Important Regulatory Documents?
To reduce Fund expenses, only one copy of most shareholder documents may be mailed to shareholders with multiple accounts at the same address (Householding). Mailing of your shareholder documents may be householded indefinitely unless you instruct us otherwise. If you do not want the mailing of these documents to be combined with those for other members of your household, please contact Invesco Investment Services, Inc. at (800) 959-4246 or contact your financial institution. We will begin sending you individual copies for each account within 30 days after receiving your request.
For additional information, please scan the QR code at the left to navigate to additional material at invesco.com/reports.
Invesco Select Risk: Growth Investor Fund
Class A: AADAX
ANNUAL SHAREHOLDER REPORT | December 31, 2024
This annual shareholder report contains important information about Invesco Select Risk: Growth Investor Fund (the “Fund”) for the period January 1, 2024 to December 31, 2024. You can find additional information about the Fund at invesco.com/reports. You can also request this information by contacting us at (800) 959-4246.
What Were The Fund Costs For The Last Year ?
(Based on a hypothetical $10,000 investment)
| Fund (Class) | Costs of a $10,000 investment | Costs paid as a percentage
of a $10,000 investment |
Invesco Select Risk: Growth Investor Fund
(Class A) | $47 | 0.45% |
How Did The Fund Perform During The Period?
• During the fiscal year ended December 31, 2024, global risk assets outperformed defensive assets driven by a favorable macroeconomic environment, the beginning of a global monetary policy easing cycle and greater clarity with respect to fiscal policy following the conclusion of many major elections globally. These macroeconomic tailwinds supported global equity prices, particularly within the US, as well as the continuation of credit spreads tightening to cycle lows within investment grade, high yield and emerging market debt markets. Given this backdrop, an underweight to equities and overweight to fixed income were headwinds to Fund performance, as were factor tilts within equities, as well as allocations within fixed income to core and US Treasury bonds.
• For the fiscal year ended December 31, 2024, Class A shares of the Fund, excluding sales charge, returned 9.63%. For the same time period, the Custom Invesco Select Risk: Growth Investor Index returned 14.58%.
What contributed to performance?
Manager selection within fixed income | Manager selection within fixed income was a contributor to Fund performance, driven by the Invesco Core Bond Fund, Invesco Core Plus Bond Fund and Invesco Variable Rate Investment Grade ETF.
Exposure to high yield and floating rate credit | The Fund's exposure to high yield was beneficial as credit spreads continued to tighten, supported by resilient corporate fundamentals and strong investor demand for higher-coupon bond offerings. Floating rate exposure was rewarded as well, with the securities benefiting from an increasing interest rate environment, compared to their fixed-rate peers.
What detracted from performance?
Cyclical factor exposure within equities | Exposure to the small size and value factors was a detractor from Fund performance over the time period, as more defensive equity factors such as quality continued to be in demand led by US megacap technology stocks and strong momentum in investor demand for thematic artificial intelligence stocks.
Exposure to core and US Treasury bonds | The Fund's exposure to core and US Treasury bonds was a headwind, as long and moderate duration, as well as higher-grade fixed income, suffered compared to shorter duration, more credit sensitive counterparts. This was due to interest rates moving higher and the steepening of the yield curve that transpired significantly in the second half of the year.
How Has The Fund Historically Performed?
Growth of $10,000 Investment
| AVERAGE ANNUAL TOTAL RETURNS | 1 Year | 5 Years | 10 Years |
| Invesco Select Risk: Growth Investor Fund (Class A) —including sales charge | 3.57% | 3.92% | 4.90% |
| Invesco Select Risk: Growth Investor Fund (Class A) —excluding sales charge | 9.63% | 5.10% | 5.50% |
| Custom Invesco Select Risk: Growth Investor Index | 14.58% | 8.27% | 7.91% |
| Bloomberg Global Aggregate USD Hedged Index | 3.40% | 0.48% | 2.01% |
| MSCI ACWI (Net) | 17.49% | 10.06% | 9.23% |
| Bloomberg U.S. Aggregate Bond Index | 1.25% | (0.33)% | 1.35% |
The Custom Invesco Select Risk: Growth Investor Index is composed of 80% MSCI ACWI (Net) and 20% Bloomberg Global Aggregate USD Hedged Index.
Effective April 26, 2024, the Fund changed its broad-based securities market benchmark from the Bloomberg Global Aggregate USD Hedged Index to the Bloomberg U.S. Aggregate Bond Index to reflect that the Bloomberg U.S. Aggregate Bond Index can be considered more broadly representative of the overall applicable securities market.
The performance data quoted represents past performance and cannot guarantee future results; current performance may be lower or higher. Please visit invesco.com/performance for more recent performance information.
Performance figures do not reflect deduction of taxes a shareholder would pay on Fund distributions or sale of Fund shares.
What Are Key Statistics About The Fund?
(as of December 31, 2024)
| Fund net assets | $970,810,752 |
| Total number of portfolio holdings | 27 |
| Total advisory fees paid | $0 |
| Portfolio turnover rate | 42% |
What Comprised The Fund's Holdings?
(as of December 31, 2024)
Asset allocation
(% of net assets)
Where Can I Find More Information?
You can find more information about the Fund, including the Fund's prospectus, financial information, and holdings at invesco.com/reports. Additionally, the Fund's proxy voting information can be found at invesco.com/proxy-voting.
What Should I Know About Delivery Of Important Regulatory Documents?
To reduce Fund expenses, only one copy of most shareholder documents may be mailed to shareholders with multiple accounts at the same address (Householding). Mailing of your shareholder documents may be householded indefinitely unless you instruct us otherwise. If you do not want the mailing of these documents to be combined with those for other members of your household, please contact Invesco Investment Services, Inc. at (800) 959-4246 or contact your financial institution. We will begin sending you individual copies for each account within 30 days after receiving your request.
For additional information, please scan the QR code at the left to navigate to additional material at invesco.com/reports.
Invesco Select Risk: Growth Investor Fund
Class C: AADCX
ANNUAL SHAREHOLDER REPORT | December 31, 2024
This annual shareholder report contains important information about Invesco Select Risk: Growth Investor Fund (the “Fund”) for the period January 1, 2024 to December 31, 2024. You can find additional information about the Fund at invesco.com/reports. You can also request this information by contacting us at (800) 959-4246.
What Were The Fund Costs For The Last Year ?
(Based on a hypothetical $10,000 investment)
| Fund (Class) | Costs of a $10,000 investment | Costs paid as a percentage
of a $10,000 investment |
Invesco Select Risk: Growth Investor Fund
(Class C) | $125 | 1.20% |
How Did The Fund Perform During The Period?
• During the fiscal year ended December 31, 2024, global risk assets outperformed defensive assets driven by a favorable macroeconomic environment, the beginning of a global monetary policy easing cycle and greater clarity with respect to fiscal policy following the conclusion of many major elections globally. These macroeconomic tailwinds supported global equity prices, particularly within the US, as well as the continuation of credit spreads tightening to cycle lows within investment grade, high yield and emerging market debt markets. Given this backdrop, an underweight to equities and overweight to fixed income were headwinds to Fund performance, as were factor tilts within equities, as well as allocations within fixed income to core and US Treasury bonds.
• For the fiscal year ended December 31, 2024, Class C shares of the Fund, excluding sales charge, returned 8.81%. For the same time period, the Custom Invesco Select Risk: Growth Investor Index returned 14.58%.
What contributed to performance?
Manager selection within fixed income | Manager selection within fixed income was a contributor to Fund performance, driven by the Invesco Core Bond Fund, Invesco Core Plus Bond Fund and Invesco Variable Rate Investment Grade ETF.
Exposure to high yield and floating rate credit | The Fund's exposure to high yield was beneficial as credit spreads continued to tighten, supported by resilient corporate fundamentals and strong investor demand for higher-coupon bond offerings. Floating rate exposure was rewarded as well, with the securities benefiting from an increasing interest rate environment, compared to their fixed-rate peers.
What detracted from performance?
Cyclical factor exposure within equities | Exposure to the small size and value factors was a detractor from Fund performance over the time period, as more defensive equity factors such as quality continued to be in demand led by US megacap technology stocks and strong momentum in investor demand for thematic artificial intelligence stocks.
Exposure to core and US Treasury bonds | The Fund's exposure to core and US Treasury bonds was a headwind, as long and moderate duration, as well as higher-grade fixed income, suffered compared to shorter duration, more credit sensitive counterparts. This was due to interest rates moving higher and the steepening of the yield curve that transpired significantly in the second half of the year.
How Has The Fund Historically Performed?
Growth of $10,000 Investment
| AVERAGE ANNUAL TOTAL RETURNS | 1 Year | 5 Years | 10 Years |
| Invesco Select Risk: Growth Investor Fund (Class C) —including sales charge | 7.81% | 4.32% | 4.86% |
| Invesco Select Risk: Growth Investor Fund (Class C) —excluding sales charge | 8.81% | 4.32% | 4.86% |
| Custom Invesco Select Risk: Growth Investor Index | 14.58% | 8.27% | 7.91% |
| Bloomberg Global Aggregate USD Hedged Index | 3.40% | 0.48% | 2.01% |
| MSCI ACWI (Net) | 17.49% | 10.06% | 9.23% |
| Bloomberg U.S. Aggregate Bond Index | 1.25% | (0.33)% | 1.35% |
The Custom Invesco Select Risk: Growth Investor Index is composed of 80% MSCI ACWI (Net) and 20% Bloomberg Global Aggregate USD Hedged Index.
Effective April 26, 2024, the Fund changed its broad-based securities market benchmark from the Bloomberg Global Aggregate USD Hedged Index to the Bloomberg U.S. Aggregate Bond Index to reflect that the Bloomberg U.S. Aggregate Bond Index can be considered more broadly representative of the overall applicable securities market.
The performance data quoted represents past performance and cannot guarantee future results; current performance may be lower or higher. Please visit invesco.com/performance for more recent performance information.
Performance figures do not reflect deduction of taxes a shareholder would pay on Fund distributions or sale of Fund shares.
What Are Key Statistics About The Fund?
(as of December 31, 2024)
| Fund net assets | $970,810,752 |
| Total number of portfolio holdings | 27 |
| Total advisory fees paid | $0 |
| Portfolio turnover rate | 42% |
What Comprised The Fund's Holdings?
(as of December 31, 2024)
Asset allocation
(% of net assets)
Where Can I Find More Information?
You can find more information about the Fund, including the Fund's prospectus, financial information, and holdings at invesco.com/reports. Additionally, the Fund's proxy voting information can be found at invesco.com/proxy-voting.
What Should I Know About Delivery Of Important Regulatory Documents?
To reduce Fund expenses, only one copy of most shareholder documents may be mailed to shareholders with multiple accounts at the same address (Householding). Mailing of your shareholder documents may be householded indefinitely unless you instruct us otherwise. If you do not want the mailing of these documents to be combined with those for other members of your household, please contact Invesco Investment Services, Inc. at (800) 959-4246 or contact your financial institution. We will begin sending you individual copies for each account within 30 days after receiving your request.
For additional information, please scan the QR code at the left to navigate to additional material at invesco.com/reports.
Invesco Select Risk: Growth Investor Fund
Class R: AADRX
ANNUAL SHAREHOLDER REPORT | December 31, 2024
This annual shareholder report contains important information about Invesco Select Risk: Growth Investor Fund (the “Fund”) for the period January 1, 2024 to December 31, 2024. You can find additional information about the Fund at invesco.com/reports. You can also request this information by contacting us at (800) 959-4246.
What Were The Fund Costs For The Last Year ?
(Based on a hypothetical $10,000 investment)
| Fund (Class) | Costs of a $10,000 investment | Costs paid as a percentage
of a $10,000 investment |
Invesco Select Risk: Growth Investor Fund
(Class R) | $73 | 0.70% |
How Did The Fund Perform During The Period?
• During the fiscal year ended December 31, 2024, global risk assets outperformed defensive assets driven by a favorable macroeconomic environment, the beginning of a global monetary policy easing cycle and greater clarity with respect to fiscal policy following the conclusion of many major elections globally. These macroeconomic tailwinds supported global equity prices, particularly within the US, as well as the continuation of credit spreads tightening to cycle lows within investment grade, high yield and emerging market debt markets. Given this backdrop, an underweight to equities and overweight to fixed income were headwinds to Fund performance, as were factor tilts within equities, as well as allocations within fixed income to core and US Treasury bonds.
• For the fiscal year ended December 31, 2024, Class R shares of the Fund returned 9.32%. For the same time period, the Custom Invesco Select Risk: Growth Investor Index returned 14.58%.
What contributed to performance?
Manager selection within fixed income | Manager selection within fixed income was a contributor to Fund performance, driven by the Invesco Core Bond Fund, Invesco Core Plus Bond Fund and Invesco Variable Rate Investment Grade ETF.
Exposure to high yield and floating rate credit | The Fund's exposure to high yield was beneficial as credit spreads continued to tighten, supported by resilient corporate fundamentals and strong investor demand for higher-coupon bond offerings. Floating rate exposure was rewarded as well, with the securities benefiting from an increasing interest rate environment, compared to their fixed-rate peers.
What detracted from performance?
Cyclical factor exposure within equities | Exposure to the small size and value factors was a detractor from Fund performance over the time period, as more defensive equity factors such as quality continued to be in demand led by US megacap technology stocks and strong momentum in investor demand for thematic artificial intelligence stocks.
Exposure to core and US Treasury bonds | The Fund's exposure to core and US Treasury bonds was a headwind, as long and moderate duration, as well as higher-grade fixed income, suffered compared to shorter duration, more credit sensitive counterparts. This was due to interest rates moving higher and the steepening of the yield curve that transpired significantly in the second half of the year.
How Has The Fund Historically Performed?
Growth of $10,000 Investment
| AVERAGE ANNUAL TOTAL RETURNS | 1 Year | 5 Years | 10 Years |
| Invesco Select Risk: Growth Investor Fund (Class R) | 9.32% | 4.84% | 5.23% |
| Custom Invesco Select Risk: Growth Investor Index | 14.58% | 8.27% | 7.91% |
| Bloomberg Global Aggregate USD Hedged Index | 3.40% | 0.48% | 2.01% |
| MSCI ACWI (Net) | 17.49% | 10.06% | 9.23% |
| Bloomberg U.S. Aggregate Bond Index | 1.25% | (0.33)% | 1.35% |
The Custom Invesco Select Risk: Growth Investor Index is composed of 80% MSCI ACWI (Net) and 20% Bloomberg Global Aggregate USD Hedged Index.
Effective April 26, 2024, the Fund changed its broad-based securities market benchmark from the Bloomberg Global Aggregate USD Hedged Index to the Bloomberg U.S. Aggregate Bond Index to reflect that the Bloomberg U.S. Aggregate Bond Index can be considered more broadly representative of the overall applicable securities market.
The performance data quoted represents past performance and cannot guarantee future results; current performance may be lower or higher. Please visit invesco.com/performance for more recent performance information.
Performance figures do not reflect deduction of taxes a shareholder would pay on Fund distributions or sale of Fund shares.
What Are Key Statistics About The Fund?
(as of December 31, 2024)
| Fund net assets | $970,810,752 |
| Total number of portfolio holdings | 27 |
| Total advisory fees paid | $0 |
| Portfolio turnover rate | 42% |
What Comprised The Fund's Holdings?
(as of December 31, 2024)
Asset allocation
(% of net assets)
Where Can I Find More Information?
You can find more information about the Fund, including the Fund's prospectus, financial information, and holdings at invesco.com/reports. Additionally, the Fund's proxy voting information can be found at invesco.com/proxy-voting.
What Should I Know About Delivery Of Important Regulatory Documents?
To reduce Fund expenses, only one copy of most shareholder documents may be mailed to shareholders with multiple accounts at the same address (Householding). Mailing of your shareholder documents may be householded indefinitely unless you instruct us otherwise. If you do not want the mailing of these documents to be combined with those for other members of your household, please contact Invesco Investment Services, Inc. at (800) 959-4246 or contact your financial institution. We will begin sending you individual copies for each account within 30 days after receiving your request.
For additional information, please scan the QR code at the left to navigate to additional material at invesco.com/reports.
Invesco Select Risk: Growth Investor Fund
Class S: AADSX
ANNUAL SHAREHOLDER REPORT | December 31, 2024
This annual shareholder report contains important information about Invesco Select Risk: Growth Investor Fund (the “Fund”) for the period January 1, 2024 to December 31, 2024. You can find additional information about the Fund at invesco.com/reports. You can also request this information by contacting us at (800) 959-4246.
What Were The Fund Costs For The Last Year ?
(Based on a hypothetical $10,000 investment)
| Fund (Class) | Costs of a $10,000 investment | Costs paid as a percentage
of a $10,000 investment |
Invesco Select Risk: Growth Investor Fund
(Class S) | $37 | 0.35% |
How Did The Fund Perform During The Period?
• During the fiscal year ended December 31, 2024, global risk assets outperformed defensive assets driven by a favorable macroeconomic environment, the beginning of a global monetary policy easing cycle and greater clarity with respect to fiscal policy following the conclusion of many major elections globally. These macroeconomic tailwinds supported global equity prices, particularly within the US, as well as the continuation of credit spreads tightening to cycle lows within investment grade, high yield and emerging market debt markets. Given this backdrop, an underweight to equities and overweight to fixed income were headwinds to Fund performance, as were factor tilts within equities, as well as allocations within fixed income to core and US Treasury bonds.
• For the fiscal year ended December 31, 2024, Class S shares of the Fund returned 9.78%. For the same time period, the Custom Invesco Select Risk: Growth Investor Index returned 14.58%.
What contributed to performance?
Manager selection within fixed income | Manager selection within fixed income was a contributor to Fund performance, driven by the Invesco Core Bond Fund, Invesco Core Plus Bond Fund and Invesco Variable Rate Investment Grade ETF.
Exposure to high yield and floating rate credit | The Fund's exposure to high yield was beneficial as credit spreads continued to tighten, supported by resilient corporate fundamentals and strong investor demand for higher-coupon bond offerings. Floating rate exposure was rewarded as well, with the securities benefiting from an increasing interest rate environment, compared to their fixed-rate peers.
What detracted from performance?
Cyclical factor exposure within equities | Exposure to the small size and value factors was a detractor from Fund performance over the time period, as more defensive equity factors such as quality continued to be in demand led by US megacap technology stocks and strong momentum in investor demand for thematic artificial intelligence stocks.
Exposure to core and US Treasury bonds | The Fund's exposure to core and US Treasury bonds was a headwind, as long and moderate duration, as well as higher-grade fixed income, suffered compared to shorter duration, more credit sensitive counterparts. This was due to interest rates moving higher and the steepening of the yield curve that transpired significantly in the second half of the year.
How Has The Fund Historically Performed?
Growth of $10,000 Investment
| AVERAGE ANNUAL TOTAL RETURNS | 1 Year | 5 Years | 10 Years |
| Invesco Select Risk: Growth Investor Fund (Class S) | 9.78% | 5.21% | 5.61% |
| Custom Invesco Select Risk: Growth Investor Index | 14.58% | 8.27% | 7.91% |
| Bloomberg Global Aggregate USD Hedged Index | 3.40% | 0.48% | 2.01% |
| MSCI ACWI (Net) | 17.49% | 10.06% | 9.23% |
| Bloomberg U.S. Aggregate Bond Index | 1.25% | (0.33)% | 1.35% |
The Custom Invesco Select Risk: Growth Investor Index is composed of 80% MSCI ACWI (Net) and 20% Bloomberg Global Aggregate USD Hedged Index.
Effective April 26, 2024, the Fund changed its broad-based securities market benchmark from the Bloomberg Global Aggregate USD Hedged Index to the Bloomberg U.S. Aggregate Bond Index to reflect that the Bloomberg U.S. Aggregate Bond Index can be considered more broadly representative of the overall applicable securities market.
The performance data quoted represents past performance and cannot guarantee future results; current performance may be lower or higher. Please visit invesco.com/performance for more recent performance information.
Performance figures do not reflect deduction of taxes a shareholder would pay on Fund distributions or sale of Fund shares.
What Are Key Statistics About The Fund?
(as of December 31, 2024)
| Fund net assets | $970,810,752 |
| Total number of portfolio holdings | 27 |
| Total advisory fees paid | $0 |
| Portfolio turnover rate | 42% |
What Comprised The Fund's Holdings?
(as of December 31, 2024)
Asset allocation
(% of net assets)
Where Can I Find More Information?
You can find more information about the Fund, including the Fund's prospectus, financial information, and holdings at invesco.com/reports. Additionally, the Fund's proxy voting information can be found at invesco.com/proxy-voting.
What Should I Know About Delivery Of Important Regulatory Documents?
To reduce Fund expenses, only one copy of most shareholder documents may be mailed to shareholders with multiple accounts at the same address (Householding). Mailing of your shareholder documents may be householded indefinitely unless you instruct us otherwise. If you do not want the mailing of these documents to be combined with those for other members of your household, please contact Invesco Investment Services, Inc. at (800) 959-4246 or contact your financial institution. We will begin sending you individual copies for each account within 30 days after receiving your request.
For additional information, please scan the QR code at the left to navigate to additional material at invesco.com/reports.
Invesco Select Risk: Growth Investor Fund
Class Y: AADYX
ANNUAL SHAREHOLDER REPORT | December 31, 2024
This annual shareholder report contains important information about Invesco Select Risk: Growth Investor Fund (the “Fund”) for the period January 1, 2024 to December 31, 2024. You can find additional information about the Fund at invesco.com/reports. You can also request this information by contacting us at (800) 959-4246.
What Were The Fund Costs For The Last Year ?
(Based on a hypothetical $10,000 investment)
| Fund (Class) | Costs of a $10,000 investment | Costs paid as a percentage
of a $10,000 investment |
Invesco Select Risk: Growth Investor Fund
(Class Y) | $21 | 0.20% |
How Did The Fund Perform During The Period?
• During the fiscal year ended December 31, 2024, global risk assets outperformed defensive assets driven by a favorable macroeconomic environment, the beginning of a global monetary policy easing cycle and greater clarity with respect to fiscal policy following the conclusion of many major elections globally. These macroeconomic tailwinds supported global equity prices, particularly within the US, as well as the continuation of credit spreads tightening to cycle lows within investment grade, high yield and emerging market debt markets. Given this backdrop, an underweight to equities and overweight to fixed income were headwinds to Fund performance, as were factor tilts within equities, as well as allocations within fixed income to core and US Treasury bonds.
• For the fiscal year ended December 31, 2024, Class Y shares of the Fund returned 9.81%. For the same time period, the Custom Invesco Select Risk: Growth Investor Index returned 14.58%.
What contributed to performance?
Manager selection within fixed income | Manager selection within fixed income was a contributor to Fund performance, driven by the Invesco Core Bond Fund, Invesco Core Plus Bond Fund and Invesco Variable Rate Investment Grade ETF.
Exposure to high yield and floating rate credit | The Fund's exposure to high yield was beneficial as credit spreads continued to tighten, supported by resilient corporate fundamentals and strong investor demand for higher-coupon bond offerings. Floating rate exposure was rewarded as well, with the securities benefiting from an increasing interest rate environment, compared to their fixed-rate peers.
What detracted from performance?
Cyclical factor exposure within equities | Exposure to the small size and value factors was a detractor from Fund performance over the time period, as more defensive equity factors such as quality continued to be in demand led by US megacap technology stocks and strong momentum in investor demand for thematic artificial intelligence stocks.
Exposure to core and US Treasury bonds | The Fund's exposure to core and US Treasury bonds was a headwind, as long and moderate duration, as well as higher-grade fixed income, suffered compared to shorter duration, more credit sensitive counterparts. This was due to interest rates moving higher and the steepening of the yield curve that transpired significantly in the second half of the year.
How Has The Fund Historically Performed?
Growth of $10,000 Investment
| AVERAGE ANNUAL TOTAL RETURNS | 1 Year | 5 Years | 10 Years |
| Invesco Select Risk: Growth Investor Fund (Class Y) | 9.81% | 5.36% | 5.76% |
| Custom Invesco Select Risk: Growth Investor Index | 14.58% | 8.27% | 7.91% |
| Bloomberg Global Aggregate USD Hedged Index | 3.40% | 0.48% | 2.01% |
| MSCI ACWI (Net) | 17.49% | 10.06% | 9.23% |
| Bloomberg U.S. Aggregate Bond Index | 1.25% | (0.33)% | 1.35% |
The Custom Invesco Select Risk: Growth Investor Index is composed of 80% MSCI ACWI (Net) and 20% Bloomberg Global Aggregate USD Hedged Index.
Effective April 26, 2024, the Fund changed its broad-based securities market benchmark from the Bloomberg Global Aggregate USD Hedged Index to the Bloomberg U.S. Aggregate Bond Index to reflect that the Bloomberg U.S. Aggregate Bond Index can be considered more broadly representative of the overall applicable securities market.
The performance data quoted represents past performance and cannot guarantee future results; current performance may be lower or higher. Please visit invesco.com/performance for more recent performance information.
Performance figures do not reflect deduction of taxes a shareholder would pay on Fund distributions or sale of Fund shares.
What Are Key Statistics About The Fund?
(as of December 31, 2024)
| Fund net assets | $970,810,752 |
| Total number of portfolio holdings | 27 |
| Total advisory fees paid | $0 |
| Portfolio turnover rate | 42% |
What Comprised The Fund's Holdings?
(as of December 31, 2024)
Asset allocation
(% of net assets)
Where Can I Find More Information?
You can find more information about the Fund, including the Fund's prospectus, financial information, and holdings at invesco.com/reports. Additionally, the Fund's proxy voting information can be found at invesco.com/proxy-voting.
What Should I Know About Delivery Of Important Regulatory Documents?
To reduce Fund expenses, only one copy of most shareholder documents may be mailed to shareholders with multiple accounts at the same address (Householding). Mailing of your shareholder documents may be householded indefinitely unless you instruct us otherwise. If you do not want the mailing of these documents to be combined with those for other members of your household, please contact Invesco Investment Services, Inc. at (800) 959-4246 or contact your financial institution. We will begin sending you individual copies for each account within 30 days after receiving your request.
For additional information, please scan the QR code at the left to navigate to additional material at invesco.com/reports.
Invesco Select Risk: Growth Investor Fund
Class R5: AADIX
ANNUAL SHAREHOLDER REPORT | December 31, 2024
This annual shareholder report contains important information about Invesco Select Risk: Growth Investor Fund (the “Fund”) for the period January 1, 2024 to December 31, 2024. You can find additional information about the Fund at invesco.com/reports. You can also request this information by contacting us at (800) 959-4246.
This report describes changes to the Fund that occurred during the reporting period.
What Were The Fund Costs For The Last Year ?
(Based on a hypothetical $10,000 investment)
| Fund (Class) | Costs of a $10,000 investment | Costs paid as a percentage
of a $10,000 investment |
Invesco Select Risk: Growth Investor Fund
(Class R5) | $17 | 0.16% |
How Did The Fund Perform During The Period?
• During the fiscal year ended December 31, 2024, global risk assets outperformed defensive assets driven by a favorable macroeconomic environment, the beginning of a global monetary policy easing cycle and greater clarity with respect to fiscal policy following the conclusion of many major elections globally. These macroeconomic tailwinds supported global equity prices, particularly within the US, as well as the continuation of credit spreads tightening to cycle lows within investment grade, high yield and emerging market debt markets. Given this backdrop, an underweight to equities and overweight to fixed income were headwinds to Fund performance, as were factor tilts within equities, as well as allocations within fixed income to core and US Treasury bonds.
• For the fiscal year ended December 31, 2024, Class R5 shares of the Fund returned 9.87%. For the same time period, the Custom Invesco Select Risk: Growth Investor Index returned 14.58%.
What contributed to performance?
Manager selection within fixed income | Manager selection within fixed income was a contributor to Fund performance, driven by the Invesco Core Bond Fund, Invesco Core Plus Bond Fund and Invesco Variable Rate Investment Grade ETF.
Exposure to high yield and floating rate credit | The Fund's exposure to high yield was beneficial as credit spreads continued to tighten, supported by resilient corporate fundamentals and strong investor demand for higher-coupon bond offerings. Floating rate exposure was rewarded as well, with the securities benefiting from an increasing interest rate environment, compared to their fixed-rate peers.
What detracted from performance?
Cyclical factor exposure within equities | Exposure to the small size and value factors was a detractor from Fund performance over the time period, as more defensive equity factors such as quality continued to be in demand led by US megacap technology stocks and strong momentum in investor demand for thematic artificial intelligence stocks.
Exposure to core and US Treasury bonds | The Fund's exposure to core and US Treasury bonds was a headwind, as long and moderate duration, as well as higher-grade fixed income, suffered compared to shorter duration, more credit sensitive counterparts. This was due to interest rates moving higher and the steepening of the yield curve that transpired significantly in the second half of the year.
How Has The Fund Historically Performed?
Growth of $10,000 Investment
| AVERAGE ANNUAL TOTAL RETURNS | 1 Year | 5 Years | 10 Years |
| Invesco Select Risk: Growth Investor Fund (Class R5) | 9.87% | 5.41% | 5.84% |
| Custom Invesco Select Risk: Growth Investor Index | 14.58% | 8.27% | 7.91% |
| Bloomberg Global Aggregate USD Hedged Index | 3.40% | 0.48% | 2.01% |
| MSCI ACWI (Net) | 17.49% | 10.06% | 9.23% |
| Bloomberg U.S. Aggregate Bond Index | 1.25% | (0.33)% | 1.35% |
The Custom Invesco Select Risk: Growth Investor Index is composed of 80% MSCI ACWI (Net) and 20% Bloomberg Global Aggregate USD Hedged Index.
Effective April 26, 2024, the Fund changed its broad-based securities market benchmark from the Bloomberg Global Aggregate USD Hedged Index to the Bloomberg U.S. Aggregate Bond Index to reflect that the Bloomberg U.S. Aggregate Bond Index can be considered more broadly representative of the overall applicable securities market.
The performance data quoted represents past performance and cannot guarantee future results; current performance may be lower or higher. Please visit invesco.com/performance for more recent performance information.
Performance figures do not reflect deduction of taxes a shareholder would pay on Fund distributions or sale of Fund shares.
What Are Key Statistics About The Fund?
(as of December 31, 2024)
| Fund net assets | $970,810,752 |
| Total number of portfolio holdings | 27 |
| Total advisory fees paid | $0 |
| Portfolio turnover rate | 42% |
What Comprised The Fund's Holdings?
(as of December 31, 2024)
Asset allocation
(% of net assets)
How Has The Fund Changed Over The Past Year?
This is a summary of certain changes to the Fund since December 31, 2023. For more complete information, you may review the Fund's prospectus, which is available at invesco.com/reports or upon request at (800) 959-4246.
Effective after the close of business on September 30, 2024, the Fund has limited public sales of its Class R5 shares to certain investors who were previously invested in Class R5 shares of the Fund.
Where Can I Find More Information?
You can find more information about the Fund, including the Fund's prospectus, financial information, and holdings at invesco.com/reports. Additionally, the Fund's proxy voting information can be found at invesco.com/proxy-voting.
What Should I Know About Delivery Of Important Regulatory Documents?
To reduce Fund expenses, only one copy of most shareholder documents may be mailed to shareholders with multiple accounts at the same address (Householding). Mailing of your shareholder documents may be householded indefinitely unless you instruct us otherwise. If you do not want the mailing of these documents to be combined with those for other members of your household, please contact Invesco Investment Services, Inc. at (800) 959-4246 or contact your financial institution. We will begin sending you individual copies for each account within 30 days after receiving your request.
For additional information, please scan the QR code at the left to navigate to additional material at invesco.com/reports.
Invesco Select Risk: Growth Investor Fund
Class R6: AAESX
ANNUAL SHAREHOLDER REPORT | December 31, 2024
This annual shareholder report contains important information about Invesco Select Risk: Growth Investor Fund (the “Fund”) for the period January 1, 2024 to December 31, 2024. You can find additional information about the Fund at invesco.com/reports. You can also request this information by contacting us at (800) 959-4246.
What Were The Fund Costs For The Last Year ?
(Based on a hypothetical $10,000 investment)
| Fund (Class) | Costs of a $10,000 investment | Costs paid as a percentage
of a $10,000 investment |
Invesco Select Risk: Growth Investor Fund
(Class R6) | $9 | 0.09% |
How Did The Fund Perform During The Period?
• During the fiscal year ended December 31, 2024, global risk assets outperformed defensive assets driven by a favorable macroeconomic environment, the beginning of a global monetary policy easing cycle and greater clarity with respect to fiscal policy following the conclusion of many major elections globally. These macroeconomic tailwinds supported global equity prices, particularly within the US, as well as the continuation of credit spreads tightening to cycle lows within investment grade, high yield and emerging market debt markets. Given this backdrop, an underweight to equities and overweight to fixed income were headwinds to Fund performance, as were factor tilts within equities, as well as allocations within fixed income to core and US Treasury bonds.
• For the fiscal year ended December 31, 2024, Class R6 shares of the Fund returned 10.02%. For the same time period, the Custom Invesco Select Risk: Growth Investor Index returned 14.58%.
What contributed to performance?
Manager selection within fixed income | Manager selection within fixed income was a contributor to Fund performance, driven by the Invesco Core Bond Fund, Invesco Core Plus Bond Fund and Invesco Variable Rate Investment Grade ETF.
Exposure to high yield and floating rate credit | The Fund's exposure to high yield was beneficial as credit spreads continued to tighten, supported by resilient corporate fundamentals and strong investor demand for higher-coupon bond offerings. Floating rate exposure was rewarded as well, with the securities benefiting from an increasing interest rate environment, compared to their fixed-rate peers.
What detracted from performance?
Cyclical factor exposure within equities | Exposure to the small size and value factors was a detractor from Fund performance over the time period, as more defensive equity factors such as quality continued to be in demand led by US megacap technology stocks and strong momentum in investor demand for thematic artificial intelligence stocks.
Exposure to core and US Treasury bonds | The Fund's exposure to core and US Treasury bonds was a headwind, as long and moderate duration, as well as higher-grade fixed income, suffered compared to shorter duration, more credit sensitive counterparts. This was due to interest rates moving higher and the steepening of the yield curve that transpired significantly in the second half of the year.
How Has The Fund Historically Performed?
Growth of $10,000 Investment
| AVERAGE ANNUAL TOTAL RETURNS | 1 Year | 5 Years | 10 Years |
| Invesco Select Risk: Growth Investor Fund (Class R6) | 10.02% | 5.47% | 5.78% |
| Custom Invesco Select Risk: Growth Investor Index | 14.58% | 8.27% | 7.91% |
| Bloomberg Global Aggregate USD Hedged Index | 3.40% | 0.48% | 2.01% |
| MSCI ACWI (Net) | 17.49% | 10.06% | 9.23% |
| Bloomberg U.S. Aggregate Bond Index | 1.25% | (0.33)% | 1.35% |
The Custom Invesco Select Risk: Growth Investor Index is composed of 80% MSCI ACWI (Net) and 20% Bloomberg Global Aggregate USD Hedged Index.
Class R6 shares incepted on April 4, 2017. Performance shown prior to that date is that of Class A shares at net asset value and includes the 12b-1 fees applicable to Class A shares. Class R6 shares' returns of the Fund will be different from Class A shares' returns of the Fund as they have different expenses.
Effective April 26, 2024, the Fund changed its broad-based securities market benchmark from the Bloomberg Global Aggregate USD Hedged Index to the Bloomberg U.S. Aggregate Bond Index to reflect that the Bloomberg U.S. Aggregate Bond Index can be considered more broadly representative of the overall applicable securities market.
The performance data quoted represents past performance and cannot guarantee future results; current performance may be lower or higher. Please visit invesco.com/performance for more recent performance information.
Performance figures do not reflect deduction of taxes a shareholder would pay on Fund distributions or sale of Fund shares.
What Are Key Statistics About The Fund?
(as of December 31, 2024)
| Fund net assets | $970,810,752 |
| Total number of portfolio holdings | 27 |
| Total advisory fees paid | $0 |
| Portfolio turnover rate | 42% |
What Comprised The Fund's Holdings?
(as of December 31, 2024)
Asset allocation
(% of net assets)
Where Can I Find More Information?
You can find more information about the Fund, including the Fund's prospectus, financial information, and holdings at invesco.com/reports. Additionally, the Fund's proxy voting information can be found at invesco.com/proxy-voting.
What Should I Know About Delivery Of Important Regulatory Documents?
To reduce Fund expenses, only one copy of most shareholder documents may be mailed to shareholders with multiple accounts at the same address (Householding). Mailing of your shareholder documents may be householded indefinitely unless you instruct us otherwise. If you do not want the mailing of these documents to be combined with those for other members of your household, please contact Invesco Investment Services, Inc. at (800) 959-4246 or contact your financial institution. We will begin sending you individual copies for each account within 30 days after receiving your request.
For additional information, please scan the QR code at the left to navigate to additional material at invesco.com/reports.
Invesco Select Risk: High Growth Investor Fund
Class A: OAAIX
ANNUAL SHAREHOLDER REPORT | December 31, 2024
This annual shareholder report contains important information about Invesco Select Risk: High Growth Investor Fund (the “Fund”) for the period January 1, 2024 to December 31, 2024. You can find additional information about the Fund at invesco.com/reports. You can also request this information by contacting us at (800) 959-4246.
What Were The Fund Costs For The Last Year ?
(Based on a hypothetical $10,000 investment)
| Fund (Class) | Costs of a $10,000 investment | Costs paid as a percentage
of a $10,000 investment |
Invesco Select Risk: High Growth Investor Fund
(Class A) | $40 | 0.38%† |
† | Reflects fee waivers and/or expense reimbursements, without which expenses would have been higher. |
How Did The Fund Perform During The Period?
• During the fiscal year ended December 31, 2024, global risk assets outperformed defensive assets driven by a favorable macroeconomic environment, the beginning of a global monetary policy easing cycle and greater clarity with respect to fiscal policy following the conclusion of many major elections globally. These macroeconomic tailwinds supported global equity prices, particularly within the US, as well as the continuation of credit spreads tightening to cycle lows within investment grade, high yield and emerging market debt markets. Given this backdrop, an underweight to equities and overweights to fixed income and alternatives were headwinds to Fund performance, as were factor tilts within equities, as well as allocations within fixed income to core bonds.
• For the fiscal year ended December 31, 2024, Class A shares of the Fund, excluding sales charge, returned 10.68%. For the same time period, the Custom Invesco Select Risk: High Growth Investor Index returned 16.03%.
What contributed to performance?
Manager selection within fixed income | Manager selection within fixed income was a contributor to Fund performance, driven by the Invesco Core Bond Fund, Invesco Core Plus Bond Fund and Invesco Variable Rate Investment Grade ETF.
Exposure to high yield and floating rate credit | The Fund's exposure to high yield was beneficial as credit spreads continued to tighten, supported by resilient corporate fundamentals and strong investor demand for higher-coupon bond offerings. Floating rate exposure was rewarded as well, with the securities benefiting from an increasing interest rate environment, compared to their fixed-rate peers.
What detracted from performance?
Cyclical factor exposure within equities | Exposure to the small size and value factors was a detractor from Fund performance over the time period, as more defensive equity factors such as quality continued to be in demand led by US megacap technology stocks and strong momentum in investor demand for thematic artificial intelligence stocks.
Underweight equities, overweight alternatives and fixed income | The Fund's underweight to equity risk in favor of exposure to alternatives and fixed income was a headwind as equities outperformed. Exposures to alternative asset classes including Invesco Global Real Estate Income Fund and Invesco Macro Allocation Strategy Fund were the most significant detractors.
How Has The Fund Historically Performed?
Growth of $10,000 Investment
| AVERAGE ANNUAL TOTAL RETURNS | 1 Year | 5 Years | 10 Years |
| Invesco Select Risk: High Growth Investor Fund (Class A) —including sales charge | 4.59% | 4.72% | 5.99% |
| Invesco Select Risk: High Growth Investor Fund (Class A) —excluding sales charge | 10.68% | 5.91% | 6.59% |
| Custom Invesco Select Risk: High Growth Investor Index | 16.03% | 9.18% | 8.58% |
| Bloomberg Global Aggregate USD Hedged Index | 3.40% | 0.48% | 2.01% |
| MSCI ACWI (Net) | 17.49% | 10.06% | 9.23% |
| Bloomberg U.S. Aggregate Bond Index | 1.25% | (0.33)% | 1.35% |
The Custom Invesco Select Risk: High Growth Investor Index is composed of 90% MSCI ACWI (Net) and 10% Bloomberg Global Aggregate USD Hedged Index.
Effective after the close of business on May 24, 2019, Class A shares of Oppenheimer Portfolio Series: Growth Investor Fund (the predecessor fund), were reorganized into Class A shares of the Fund. Returns shown above for periods ending on or prior to May 24, 2019 are those of Class A shares of the predecessor fund. Share class returns will differ from the predecessor fund because of different expenses.
Effective April 26, 2024, the Fund changed its broad-based securities market benchmark from the Bloomberg Global Aggregate USD Hedged Index to the Bloomberg U.S. Aggregate Bond Index to reflect that the Bloomberg U.S. Aggregate Bond Index can be considered more broadly representative of the overall applicable securities market.
The performance data quoted represents past performance and cannot guarantee future results; current performance may be lower or higher. Please visit invesco.com/performance for more recent performance information.
Performance figures do not reflect deduction of taxes a shareholder would pay on Fund distributions or sale of Fund shares.
What Are Key Statistics About The Fund?
(as of December 31, 2024)
| Fund net assets | $820,347,041 |
| Total number of portfolio holdings | 27 |
| Total advisory fees paid | $0 |
| Portfolio turnover rate | 41% |
What Comprised The Fund's Holdings?
(as of December 31, 2024)
Asset allocation
(% of net assets)
Where Can I Find More Information?
You can find more information about the Fund, including the Fund's prospectus, financial information, and holdings at invesco.com/reports. Additionally, the Fund's proxy voting information can be found at invesco.com/proxy-voting.
What Should I Know About Delivery Of Important Regulatory Documents?
To reduce Fund expenses, only one copy of most shareholder documents may be mailed to shareholders with multiple accounts at the same address (Householding). Mailing of your shareholder documents may be householded indefinitely unless you instruct us otherwise. If you do not want the mailing of these documents to be combined with those for other members of your household, please contact Invesco Investment Services, Inc. at (800) 959-4246 or contact your financial institution. We will begin sending you individual copies for each account within 30 days after receiving your request.
For additional information, please scan the QR code at the left to navigate to additional material at invesco.com/reports.
Invesco Select Risk: High Growth Investor Fund
Class C: OCAIX
ANNUAL SHAREHOLDER REPORT | December 31, 2024
This annual shareholder report contains important information about Invesco Select Risk: High Growth Investor Fund (the “Fund”) for the period January 1, 2024 to December 31, 2024. You can find additional information about the Fund at invesco.com/reports. You can also request this information by contacting us at (800) 959-4246.
What Were The Fund Costs For The Last Year ?
(Based on a hypothetical $10,000 investment)
| Fund (Class) | Costs of a $10,000 investment | Costs paid as a percentage
of a $10,000 investment |
Invesco Select Risk: High Growth Investor Fund
(Class C) | $120 | 1.14%† |
† | Reflects fee waivers and/or expense reimbursements, without which expenses would have been higher. |
How Did The Fund Perform During The Period?
• During the fiscal year ended December 31, 2024, global risk assets outperformed defensive assets driven by a favorable macroeconomic environment, the beginning of a global monetary policy easing cycle and greater clarity with respect to fiscal policy following the conclusion of many major elections globally. These macroeconomic tailwinds supported global equity prices, particularly within the US, as well as the continuation of credit spreads tightening to cycle lows within investment grade, high yield and emerging market debt markets. Given this backdrop, an underweight to equities and overweights to fixed income and alternatives were headwinds to Fund performance, as were factor tilts within equities, as well as allocations within fixed income to core bonds.
• For the fiscal year ended December 31, 2024, Class C shares of the Fund, excluding sales charge, returned 9.85%. For the same time period, the Custom Invesco Select Risk: High Growth Investor Index returned 16.03%.
What contributed to performance?
Manager selection within fixed income | Manager selection within fixed income was a contributor to Fund performance, driven by the Invesco Core Bond Fund, Invesco Core Plus Bond Fund and Invesco Variable Rate Investment Grade ETF.
Exposure to high yield and floating rate credit | The Fund's exposure to high yield was beneficial as credit spreads continued to tighten, supported by resilient corporate fundamentals and strong investor demand for higher-coupon bond offerings. Floating rate exposure was rewarded as well, with the securities benefiting from an increasing interest rate environment, compared to their fixed-rate peers.
What detracted from performance?
Cyclical factor exposure within equities | Exposure to the small size and value factors was a detractor from Fund performance over the time period, as more defensive equity factors such as quality continued to be in demand led by US megacap technology stocks and strong momentum in investor demand for thematic artificial intelligence stocks.
Underweight equities, overweight alternatives and fixed income | The Fund's underweight to equity risk in favor of exposure to alternatives and fixed income was a headwind as equities outperformed. Exposures to alternative asset classes including Invesco Global Real Estate Income Fund and Invesco Macro Allocation Strategy Fund were the most significant detractors.
How Has The Fund Historically Performed?
Growth of $10,000 Investment
| AVERAGE ANNUAL TOTAL RETURNS | 1 Year | 5 Years | 10 Years |
| Invesco Select Risk: High Growth Investor Fund (Class C) —including sales charge | 8.85% | 5.10% | 5.94% |
| Invesco Select Risk: High Growth Investor Fund (Class C) —excluding sales charge | 9.85% | 5.10% | 5.94% |
| Custom Invesco Select Risk: High Growth Investor Index | 16.03% | 9.18% | 8.58% |
| Bloomberg Global Aggregate USD Hedged Index | 3.40% | 0.48% | 2.01% |
| MSCI ACWI (Net) | 17.49% | 10.06% | 9.23% |
| Bloomberg U.S. Aggregate Bond Index | 1.25% | (0.33)% | 1.35% |
The Custom Invesco Select Risk: High Growth Investor Index is composed of 90% MSCI ACWI (Net) and 10% Bloomberg Global Aggregate USD Hedged Index.
Effective after the close of business on May 24, 2019, Class C shares of Oppenheimer Portfolio Series: Growth Investor Fund (the predecessor fund), were reorganized into Class C shares of the Fund. Returns shown above for periods ending on or prior to May 24, 2019 are those of Class C shares of the predecessor fund. Share class returns will differ from the predecessor fund because of different expenses.
Effective April 26, 2024, the Fund changed its broad-based securities market benchmark from the Bloomberg Global Aggregate USD Hedged Index to the Bloomberg U.S. Aggregate Bond Index to reflect that the Bloomberg U.S. Aggregate Bond Index can be considered more broadly representative of the overall applicable securities market.
The performance data quoted represents past performance and cannot guarantee future results; current performance may be lower or higher. Please visit invesco.com/performance for more recent performance information.
Performance figures do not reflect deduction of taxes a shareholder would pay on Fund distributions or sale of Fund shares.
What Are Key Statistics About The Fund?
(as of December 31, 2024)
| Fund net assets | $820,347,041 |
| Total number of portfolio holdings | 27 |
| Total advisory fees paid | $0 |
| Portfolio turnover rate | 41% |
What Comprised The Fund's Holdings?
(as of December 31, 2024)
Asset allocation
(% of net assets)
Where Can I Find More Information?
You can find more information about the Fund, including the Fund's prospectus, financial information, and holdings at invesco.com/reports. Additionally, the Fund's proxy voting information can be found at invesco.com/proxy-voting.
What Should I Know About Delivery Of Important Regulatory Documents?
To reduce Fund expenses, only one copy of most shareholder documents may be mailed to shareholders with multiple accounts at the same address (Householding). Mailing of your shareholder documents may be householded indefinitely unless you instruct us otherwise. If you do not want the mailing of these documents to be combined with those for other members of your household, please contact Invesco Investment Services, Inc. at (800) 959-4246 or contact your financial institution. We will begin sending you individual copies for each account within 30 days after receiving your request.
For additional information, please scan the QR code at the left to navigate to additional material at invesco.com/reports.
Invesco Select Risk: High Growth Investor Fund
Class R: ONAIX
ANNUAL SHAREHOLDER REPORT | December 31, 2024
This annual shareholder report contains important information about Invesco Select Risk: High Growth Investor Fund (the “Fund”) for the period January 1, 2024 to December 31, 2024. You can find additional information about the Fund at invesco.com/reports. You can also request this information by contacting us at (800) 959-4246.
What Were The Fund Costs For The Last Year ?
(Based on a hypothetical $10,000 investment)
| Fund (Class) | Costs of a $10,000 investment | Costs paid as a percentage
of a $10,000 investment |
Invesco Select Risk: High Growth Investor Fund
(Class R) | $67 | 0.64%† |
† | Reflects fee waivers and/or expense reimbursements, without which expenses would have been higher. |
How Did The Fund Perform During The Period?
• During the fiscal year ended December 31, 2024, global risk assets outperformed defensive assets driven by a favorable macroeconomic environment, the beginning of a global monetary policy easing cycle and greater clarity with respect to fiscal policy following the conclusion of many major elections globally. These macroeconomic tailwinds supported global equity prices, particularly within the US, as well as the continuation of credit spreads tightening to cycle lows within investment grade, high yield and emerging market debt markets. Given this backdrop, an underweight to equities and overweights to fixed income and alternatives were headwinds to Fund performance, as were factor tilts within equities, as well as allocations within fixed income to core bonds.
• For the fiscal year ended December 31, 2024, Class R shares of the Fund returned 10.34%. For the same time period, the Custom Invesco Select Risk: High Growth Investor Index returned 16.03%.
What contributed to performance?
Manager selection within fixed income | Manager selection within fixed income was a contributor to Fund performance, driven by the Invesco Core Bond Fund, Invesco Core Plus Bond Fund and Invesco Variable Rate Investment Grade ETF.
Exposure to high yield and floating rate credit | The Fund's exposure to high yield was beneficial as credit spreads continued to tighten, supported by resilient corporate fundamentals and strong investor demand for higher-coupon bond offerings. Floating rate exposure was rewarded as well, with the securities benefiting from an increasing interest rate environment, compared to their fixed-rate peers.
What detracted from performance?
Cyclical factor exposure within equities | Exposure to the small size and value factors was a detractor from Fund performance over the time period, as more defensive equity factors such as quality continued to be in demand led by US megacap technology stocks and strong momentum in investor demand for thematic artificial intelligence stocks.
Underweight equities, overweight alternatives and fixed income | The Fund's underweight to equity risk in favor of exposure to alternatives and fixed income was a headwind as equities outperformed. Exposures to alternative asset classes including Invesco Global Real Estate Income Fund and Invesco Macro Allocation Strategy Fund were the most significant detractors.
How Has The Fund Historically Performed?
Growth of $10,000 Investment
| AVERAGE ANNUAL TOTAL RETURNS | 1 Year | 5 Years | 10 Years |
| Invesco Select Risk: High Growth Investor Fund (Class R) | 10.34% | 5.62% | 6.31% |
| Custom Invesco Select Risk: High Growth Investor Index | 16.03% | 9.18% | 8.58% |
| Bloomberg Global Aggregate USD Hedged Index | 3.40% | 0.48% | 2.01% |
| MSCI ACWI (Net) | 17.49% | 10.06% | 9.23% |
| Bloomberg U.S. Aggregate Bond Index | 1.25% | (0.33)% | 1.35% |
The Custom Invesco Select Risk: High Growth Investor Index is composed of 90% MSCI ACWI (Net) and 10% Bloomberg Global Aggregate USD Hedged Index.
Effective after the close of business on May 24, 2019, Class R shares of Oppenheimer Portfolio Series: Growth Investor Fund (the predecessor fund), were reorganized into Class R shares of the Fund. Returns shown above for periods ending on or prior to May 24, 2019 are those of Class R shares of the predecessor fund. Share class returns will differ from the predecessor fund because of different expenses.
Effective April 26, 2024, the Fund changed its broad-based securities market benchmark from the Bloomberg Global Aggregate USD Hedged Index to the Bloomberg U.S. Aggregate Bond Index to reflect that the Bloomberg U.S. Aggregate Bond Index can be considered more broadly representative of the overall applicable securities market.
The performance data quoted represents past performance and cannot guarantee future results; current performance may be lower or higher. Please visit invesco.com/performance for more recent performance information.
Performance figures do not reflect deduction of taxes a shareholder would pay on Fund distributions or sale of Fund shares.
What Are Key Statistics About The Fund?
(as of December 31, 2024)
| Fund net assets | $820,347,041 |
| Total number of portfolio holdings | 27 |
| Total advisory fees paid | $0 |
| Portfolio turnover rate | 41% |
What Comprised The Fund's Holdings?
(as of December 31, 2024)
Asset allocation
(% of net assets)
Where Can I Find More Information?
You can find more information about the Fund, including the Fund's prospectus, financial information, and holdings at invesco.com/reports. Additionally, the Fund's proxy voting information can be found at invesco.com/proxy-voting.
What Should I Know About Delivery Of Important Regulatory Documents?
To reduce Fund expenses, only one copy of most shareholder documents may be mailed to shareholders with multiple accounts at the same address (Householding). Mailing of your shareholder documents may be householded indefinitely unless you instruct us otherwise. If you do not want the mailing of these documents to be combined with those for other members of your household, please contact Invesco Investment Services, Inc. at (800) 959-4246 or contact your financial institution. We will begin sending you individual copies for each account within 30 days after receiving your request.
For additional information, please scan the QR code at the left to navigate to additional material at invesco.com/reports.
Invesco Select Risk: High Growth Investor Fund
Class Y: OYAIX
ANNUAL SHAREHOLDER REPORT | December 31, 2024
This annual shareholder report contains important information about Invesco Select Risk: High Growth Investor Fund (the “Fund”) for the period January 1, 2024 to December 31, 2024. You can find additional information about the Fund at invesco.com/reports. You can also request this information by contacting us at (800) 959-4246.
What Were The Fund Costs For The Last Year ?
(Based on a hypothetical $10,000 investment)
| Fund (Class) | Costs of a $10,000 investment | Costs paid as a percentage
of a $10,000 investment |
Invesco Select Risk: High Growth Investor Fund
(Class Y) | $15 | 0.14%† |
† | Reflects fee waivers and/or expense reimbursements, without which expenses would have been higher. |
How Did The Fund Perform During The Period?
• During the fiscal year ended December 31, 2024, global risk assets outperformed defensive assets driven by a favorable macroeconomic environment, the beginning of a global monetary policy easing cycle and greater clarity with respect to fiscal policy following the conclusion of many major elections globally. These macroeconomic tailwinds supported global equity prices, particularly within the US, as well as the continuation of credit spreads tightening to cycle lows within investment grade, high yield and emerging market debt markets. Given this backdrop, an underweight to equities and overweights to fixed income and alternatives were headwinds to Fund performance, as were factor tilts within equities, as well as allocations within fixed income to core bonds.
• For the fiscal year ended December 31, 2024, Class Y shares of the Fund returned 10.92%. For the same time period, the Custom Invesco Select Risk: High Growth Investor Index returned 16.03%.
What contributed to performance?
Manager selection within fixed income | Manager selection within fixed income was a contributor to Fund performance, driven by the Invesco Core Bond Fund, Invesco Core Plus Bond Fund and Invesco Variable Rate Investment Grade ETF.
Exposure to high yield and floating rate credit | The Fund's exposure to high yield was beneficial as credit spreads continued to tighten, supported by resilient corporate fundamentals and strong investor demand for higher-coupon bond offerings. Floating rate exposure was rewarded as well, with the securities benefiting from an increasing interest rate environment, compared to their fixed-rate peers.
What detracted from performance?
Cyclical factor exposure within equities | Exposure to the small size and value factors was a detractor from Fund performance over the time period, as more defensive equity factors such as quality continued to be in demand led by US megacap technology stocks and strong momentum in investor demand for thematic artificial intelligence stocks.
Underweight equities, overweight alternatives and fixed income | The Fund's underweight to equity risk in favor of exposure to alternatives and fixed income was a headwind as equities outperformed. Exposures to alternative asset classes including Invesco Global Real Estate Income Fund and Invesco Macro Allocation Strategy Fund were the most significant detractors.
How Has The Fund Historically Performed?
Growth of $10,000 Investment
| AVERAGE ANNUAL TOTAL RETURNS | 1 Year | 5 Years | 10 Years |
| Invesco Select Risk: High Growth Investor Fund (Class Y) | 10.92% | 6.17% | 6.85% |
| Custom Invesco Select Risk: High Growth Investor Index | 16.03% | 9.18% | 8.58% |
| Bloomberg Global Aggregate USD Hedged Index | 3.40% | 0.48% | 2.01% |
| MSCI ACWI (Net) | 17.49% | 10.06% | 9.23% |
| Bloomberg U.S. Aggregate Bond Index | 1.25% | (0.33)% | 1.35% |
The Custom Invesco Select Risk: High Growth Investor Index is composed of 90% MSCI ACWI (Net) and 10% Bloomberg Global Aggregate USD Hedged Index.
Effective after the close of business on May 24, 2019, Class Y shares of Oppenheimer Portfolio Series: Growth Investor Fund (the predecessor fund), were reorganized into Class Y shares of the Fund. Returns shown above for periods ending on or prior to May 24, 2019 are those of Class Y shares of the predecessor fund. Share class returns will differ from the predecessor fund because of different expenses.
Effective April 26, 2024, the Fund changed its broad-based securities market benchmark from the Bloomberg Global Aggregate USD Hedged Index to the Bloomberg U.S. Aggregate Bond Index to reflect that the Bloomberg U.S. Aggregate Bond Index can be considered more broadly representative of the overall applicable securities market.
The performance data quoted represents past performance and cannot guarantee future results; current performance may be lower or higher. Please visit invesco.com/performance for more recent performance information.
Performance figures do not reflect deduction of taxes a shareholder would pay on Fund distributions or sale of Fund shares.
What Are Key Statistics About The Fund?
(as of December 31, 2024)
| Fund net assets | $820,347,041 |
| Total number of portfolio holdings | 27 |
| Total advisory fees paid | $0 |
| Portfolio turnover rate | 41% |
What Comprised The Fund's Holdings?
(as of December 31, 2024)
Asset allocation
(% of net assets)
Where Can I Find More Information?
You can find more information about the Fund, including the Fund's prospectus, financial information, and holdings at invesco.com/reports. Additionally, the Fund's proxy voting information can be found at invesco.com/proxy-voting.
What Should I Know About Delivery Of Important Regulatory Documents?
To reduce Fund expenses, only one copy of most shareholder documents may be mailed to shareholders with multiple accounts at the same address (Householding). Mailing of your shareholder documents may be householded indefinitely unless you instruct us otherwise. If you do not want the mailing of these documents to be combined with those for other members of your household, please contact Invesco Investment Services, Inc. at (800) 959-4246 or contact your financial institution. We will begin sending you individual copies for each account within 30 days after receiving your request.
For additional information, please scan the QR code at the left to navigate to additional material at invesco.com/reports.
Invesco Select Risk: High Growth Investor Fund
Class R5: PXQIX
ANNUAL SHAREHOLDER REPORT | December 31, 2024
This annual shareholder report contains important information about Invesco Select Risk: High Growth Investor Fund (the “Fund”) for the period January 1, 2024 to December 31, 2024. You can find additional information about the Fund at invesco.com/reports. You can also request this information by contacting us at (800) 959-4246.
This report describes changes to the Fund that occurred during the reporting period.
What Were The Fund Costs For The Last Year ?
(Based on a hypothetical $10,000 investment)
| Fund (Class) | Costs of a $10,000 investment | Costs paid as a percentage
of a $10,000 investment |
Invesco Select Risk: High Growth Investor Fund
(Class R5) | $7 | 0.07% |
How Did The Fund Perform During The Period?
• During the fiscal year ended December 31, 2024, global risk assets outperformed defensive assets driven by a favorable macroeconomic environment, the beginning of a global monetary policy easing cycle and greater clarity with respect to fiscal policy following the conclusion of many major elections globally. These macroeconomic tailwinds supported global equity prices, particularly within the US, as well as the continuation of credit spreads tightening to cycle lows within investment grade, high yield and emerging market debt markets. Given this backdrop, an underweight to equities and overweights to fixed income and alternatives were headwinds to Fund performance, as were factor tilts within equities, as well as allocations within fixed income to core bonds.
• For the fiscal year ended December 31, 2024, Class R5 shares of the Fund returned 11.03%. For the same time period, the Custom Invesco Select Risk: High Growth Investor Index returned 16.03%.
What contributed to performance?
Manager selection within fixed income | Manager selection within fixed income was a contributor to Fund performance, driven by the Invesco Core Bond Fund, Invesco Core Plus Bond Fund and Invesco Variable Rate Investment Grade ETF.
Exposure to high yield and floating rate credit | The Fund's exposure to high yield was beneficial as credit spreads continued to tighten, supported by resilient corporate fundamentals and strong investor demand for higher-coupon bond offerings. Floating rate exposure was rewarded as well, with the securities benefiting from an increasing interest rate environment, compared to their fixed-rate peers.
What detracted from performance?
Cyclical factor exposure within equities | Exposure to the small size and value factors was a detractor from Fund performance over the time period, as more defensive equity factors such as quality continued to be in demand led by US megacap technology stocks and strong momentum in investor demand for thematic artificial intelligence stocks.
Underweight equities, overweight alternatives and fixed income | The Fund's underweight to equity risk in favor of exposure to alternatives and fixed income was a headwind as equities outperformed. Exposures to alternative asset classes including Invesco Global Real Estate Income Fund and Invesco Macro Allocation Strategy Fund were the most significant detractors.
How Has The Fund Historically Performed?
Growth of $10,000 Investment
| AVERAGE ANNUAL TOTAL RETURNS | 1 Year | 5 Years | 10 Years |
| Invesco Select Risk: High Growth Investor Fund (Class R5) | 11.03% | 6.25% | 6.78% |
| Custom Invesco Select Risk: High Growth Investor Index | 16.03% | 9.18% | 8.58% |
| Bloomberg Global Aggregate USD Hedged Index | 3.40% | 0.48% | 2.01% |
| MSCI ACWI (Net) | 17.49% | 10.06% | 9.23% |
| Bloomberg U.S. Aggregate Bond Index | 1.25% | (0.33)% | 1.35% |
The Custom Invesco Select Risk: High Growth Investor Index is composed of 90% MSCI ACWI (Net) and 10% Bloomberg Global Aggregate USD Hedged Index.
Class R5 shares incepted on May 24, 2019. Performance shown on and prior to that date is that of Oppenheimer Portfolio Series: Growth Investor Fund's (the predecessor fund) Class A shares at net asset value and includes 12b-1 fees applicable to Class A shares. Share class returns will differ from the predecessor fund because of different expenses.
Effective April 26, 2024, the Fund changed its broad-based securities market benchmark from the Bloomberg Global Aggregate USD Hedged Index to the Bloomberg U.S. Aggregate Bond Index to reflect that the Bloomberg U.S. Aggregate Bond Index can be considered more broadly representative of the overall applicable securities market.
The performance data quoted represents past performance and cannot guarantee future results; current performance may be lower or higher. Please visit invesco.com/performance for more recent performance information.
Performance figures do not reflect deduction of taxes a shareholder would pay on Fund distributions or sale of Fund shares.
What Are Key Statistics About The Fund?
(as of December 31, 2024)
| Fund net assets | $820,347,041 |
| Total number of portfolio holdings | 27 |
| Total advisory fees paid | $0 |
| Portfolio turnover rate | 41% |
What Comprised The Fund's Holdings?
(as of December 31, 2024)
Asset allocation
(% of net assets)
How Has The Fund Changed Over The Past Year?
This is a summary of certain changes to the Fund since December 31, 2023. For more complete information, you may review the Fund's prospectus, which is available at invesco.com/reports or upon request at (800) 959-4246.
Effective after the close of business on September 30, 2024, the Fund has limited public sales of its Class R5 shares to certain investors who were previously invested in Class R5 shares of the Fund.
Where Can I Find More Information?
You can find more information about the Fund, including the Fund's prospectus, financial information, and holdings at invesco.com/reports. Additionally, the Fund's proxy voting information can be found at invesco.com/proxy-voting.
What Should I Know About Delivery Of Important Regulatory Documents?
To reduce Fund expenses, only one copy of most shareholder documents may be mailed to shareholders with multiple accounts at the same address (Householding). Mailing of your shareholder documents may be householded indefinitely unless you instruct us otherwise. If you do not want the mailing of these documents to be combined with those for other members of your household, please contact Invesco Investment Services, Inc. at (800) 959-4246 or contact your financial institution. We will begin sending you individual copies for each account within 30 days after receiving your request.
For additional information, please scan the QR code at the left to navigate to additional material at invesco.com/reports.
Invesco Select Risk: High Growth Investor Fund
Class R6: PXGGX
ANNUAL SHAREHOLDER REPORT | December 31, 2024
This annual shareholder report contains important information about Invesco Select Risk: High Growth Investor Fund (the “Fund”) for the period January 1, 2024 to December 31, 2024. You can find additional information about the Fund at invesco.com/reports. You can also request this information by contacting us at (800) 959-4246.
What Were The Fund Costs For The Last Year ?
(Based on a hypothetical $10,000 investment)
| Fund (Class) | Costs of a $10,000 investment | Costs paid as a percentage
of a $10,000 investment |
Invesco Select Risk: High Growth Investor Fund
(Class R6) | $6 | 0.06% |
How Did The Fund Perform During The Period?
• During the fiscal year ended December 31, 2024, global risk assets outperformed defensive assets driven by a favorable macroeconomic environment, the beginning of a global monetary policy easing cycle and greater clarity with respect to fiscal policy following the conclusion of many major elections globally. These macroeconomic tailwinds supported global equity prices, particularly within the US, as well as the continuation of credit spreads tightening to cycle lows within investment grade, high yield and emerging market debt markets. Given this backdrop, an underweight to equities and overweights to fixed income and alternatives were headwinds to Fund performance, as were factor tilts within equities, as well as allocations within fixed income to core bonds.
• For the fiscal year ended December 31, 2024, Class R6 shares of the Fund returned 11.05%. For the same time period, the Custom Invesco Select Risk: High Growth Investor Index returned 16.03%.
What contributed to performance?
Manager selection within fixed income | Manager selection within fixed income was a contributor to Fund performance, driven by the Invesco Core Bond Fund, Invesco Core Plus Bond Fund and Invesco Variable Rate Investment Grade ETF.
Exposure to high yield and floating rate credit | The Fund's exposure to high yield was beneficial as credit spreads continued to tighten, supported by resilient corporate fundamentals and strong investor demand for higher-coupon bond offerings. Floating rate exposure was rewarded as well, with the securities benefiting from an increasing interest rate environment, compared to their fixed-rate peers.
What detracted from performance?
Cyclical factor exposure within equities | Exposure to the small size and value factors was a detractor from Fund performance over the time period, as more defensive equity factors such as quality continued to be in demand led by US megacap technology stocks and strong momentum in investor demand for thematic artificial intelligence stocks.
Underweight equities, overweight alternatives and fixed income | The Fund's underweight to equity risk in favor of exposure to alternatives and fixed income was a headwind as equities outperformed. Exposures to alternative asset classes including Invesco Global Real Estate Income Fund and Invesco Macro Allocation Strategy Fund were the most significant detractors.
How Has The Fund Historically Performed?
Growth of $10,000 Investment
| AVERAGE ANNUAL TOTAL RETURNS | 1 Year | 5 Years | 10 Years |
| Invesco Select Risk: High Growth Investor Fund (Class R6) | 11.05% | 6.25% | 6.79% |
| Custom Invesco Select Risk: High Growth Investor Index | 16.03% | 9.18% | 8.58% |
| Bloomberg Global Aggregate USD Hedged Index | 3.40% | 0.48% | 2.01% |
| MSCI ACWI (Net) | 17.49% | 10.06% | 9.23% |
| Bloomberg U.S. Aggregate Bond Index | 1.25% | (0.33)% | 1.35% |
The Custom Invesco Select Risk: High Growth Investor Index is composed of 90% MSCI ACWI (Net) and 10% Bloomberg Global Aggregate USD Hedged Index.
Class R6 shares incepted on May 24, 2019. Performance shown on and prior to that date is that of Oppenheimer Portfolio Series: Growth Investor Fund's (the predecessor fund) Class A shares at net asset value and includes 12b-1 fees applicable to Class A shares. Share class returns will differ from the predecessor fund because of different expenses.
Effective April 26, 2024, the Fund changed its broad-based securities market benchmark from the Bloomberg Global Aggregate USD Hedged Index to the Bloomberg U.S. Aggregate Bond Index to reflect that the Bloomberg U.S. Aggregate Bond Index can be considered more broadly representative of the overall applicable securities market.
The performance data quoted represents past performance and cannot guarantee future results; current performance may be lower or higher. Please visit invesco.com/performance for more recent performance information.
Performance figures do not reflect deduction of taxes a shareholder would pay on Fund distributions or sale of Fund shares.
What Are Key Statistics About The Fund?
(as of December 31, 2024)
| Fund net assets | $820,347,041 |
| Total number of portfolio holdings | 27 |
| Total advisory fees paid | $0 |
| Portfolio turnover rate | 41% |
What Comprised The Fund's Holdings?
(as of December 31, 2024)
Asset allocation
(% of net assets)
Where Can I Find More Information?
You can find more information about the Fund, including the Fund's prospectus, financial information, and holdings at invesco.com/reports. Additionally, the Fund's proxy voting information can be found at invesco.com/proxy-voting.
What Should I Know About Delivery Of Important Regulatory Documents?
To reduce Fund expenses, only one copy of most shareholder documents may be mailed to shareholders with multiple accounts at the same address (Householding). Mailing of your shareholder documents may be householded indefinitely unless you instruct us otherwise. If you do not want the mailing of these documents to be combined with those for other members of your household, please contact Invesco Investment Services, Inc. at (800) 959-4246 or contact your financial institution. We will begin sending you individual copies for each account within 30 days after receiving your request.
For additional information, please scan the QR code at the left to navigate to additional material at invesco.com/reports.
Invesco Select Risk: Moderate Investor Fund
Class A: OAMIX
ANNUAL SHAREHOLDER REPORT | December 31, 2024
This annual shareholder report contains important information about Invesco Select Risk: Moderate Investor Fund (the “Fund”) for the period January 1, 2024 to December 31, 2024. You can find additional information about the Fund at invesco.com/reports. You can also request this information by contacting us at (800) 959-4246.
What Were The Fund Costs For The Last Year ?
(Based on a hypothetical $10,000 investment)
| Fund (Class) | Costs of a $10,000 investment | Costs paid as a percentage
of a $10,000 investment |
Invesco Select Risk: Moderate Investor Fund
(Class A) | $37 | 0.36%† |
† | Reflects fee waivers and/or expense reimbursements, without which expenses would have been higher. |
How Did The Fund Perform During The Period?
• During the fiscal year ended December 31, 2024, global risk assets outperformed defensive assets driven by a favorable macroeconomic environment, the beginning of a global monetary policy easing cycle and greater clarity with respect to fiscal policy following the conclusion of many major elections globally. These macroeconomic tailwinds supported global equity prices, particularly within the US, as well as the continuation of credit spreads tightening to cycle lows within investment grade, high yield and emerging market debt markets. Given this backdrop, an underweight to equities was a headwind to Fund performance, as were factor tilts within equities, as well as allocations within fixed income to core and US Treasury bonds.
• For the fiscal year ended December 31, 2024, Class A shares of the Fund, excluding sales charge, returned 8.21%. For the same time period, the Custom Invesco Select Risk: Moderate Investor Index returned 11.78%.
What contributed to performance?
Manager selection within fixed income | Manager selection within fixed income was a contributor to Fund performance, driven by the Invesco Core Bond Fund, Invesco Core Plus Bond Fund and Invesco Variable Rate Investment Grade ETF.
Exposure to high yield and floating rate credit | The Fund's exposure to high yield was beneficial as credit spreads continued to tighten, supported by resilient corporate fundamentals and strong investor demand for higher-coupon bond offerings. Floating rate exposure was rewarded as well, with the securities benefiting from an increasing interest rate environment, compared to their fixed-rate peers.
What detracted from performance?
Cyclical factor exposure within equities | Exposure to the small size and value factors was a detractor from Fund performance over the time period, as more defensive equity factors such as quality continued to be in demand led by US megacap technology stocks and strong momentum in investor demand for thematic artificial intelligence stocks.
Exposure to core and US Treasury bonds | The Fund's exposure to core and US Treasury bonds was a headwind, as long and moderate duration, as well as higher-grade fixed income, suffered compared to shorter duration, more credit sensitive counterparts. This was due to interest rates moving higher and the steepening of the yield curve that transpired significantly in the second half of the year.
How Has The Fund Historically Performed?
Growth of $10,000 Investment
| AVERAGE ANNUAL TOTAL RETURNS | 1 Year | 5 Years | 10 Years |
| Invesco Select Risk: Moderate Investor Fund (Class A) —including sales charge | 2.25% | 3.03% | 4.43% |
| Invesco Select Risk: Moderate Investor Fund (Class A) —excluding sales charge | 8.21% | 4.21% | 5.02% |
| Custom Invesco Select Risk: Moderate Investor Index | 11.78% | 6.51% | 6.57% |
| Bloomberg Global Aggregate USD Hedged Index | 3.40% | 0.48% | 2.01% |
| MSCI ACWI (Net) | 17.49% | 10.06% | 9.23% |
| Bloomberg U.S. Aggregate Bond Index | 1.25% | (0.33)% | 1.35% |
The Custom Invesco Select Risk: Moderate Investor Index is composed of 60% MSCI ACWI (Net) and 40% Bloomberg Global Aggregate USD Hedged Index.
Effective after the close of business on May 24, 2019, Class A shares of Oppenheimer Portfolio Series: Moderate Investor Fund (the predecessor fund), were reorganized into Class A shares of the Fund. Returns shown above for periods ending on or prior to May 24, 2019 are those of Class A shares of the predecessor fund. Share class returns will differ from the predecessor fund because of different expenses.
Effective April 26, 2024, the Fund changed its broad-based securities market benchmark from the Bloomberg Global Aggregate USD Hedged Index to the Bloomberg U.S. Aggregate Bond Index to reflect that the Bloomberg U.S. Aggregate Bond Index can be considered more broadly representative of the overall applicable securities market.
The performance data quoted represents past performance and cannot guarantee future results; current performance may be lower or higher. Please visit invesco.com/performance for more recent performance information.
Performance figures do not reflect deduction of taxes a shareholder would pay on Fund distributions or sale of Fund shares.
What Are Key Statistics About The Fund?
(as of December 31, 2024)
| Fund net assets | $1,790,439,701 |
| Total number of portfolio holdings | 27 |
| Total advisory fees paid | $0 |
| Portfolio turnover rate | 42% |
What Comprised The Fund's Holdings?
(as of December 31, 2024)
Asset allocation
(% of net assets)
Where Can I Find More Information?
You can find more information about the Fund, including the Fund's prospectus, financial information, and holdings at invesco.com/reports. Additionally, the Fund's proxy voting information can be found at invesco.com/proxy-voting.
What Should I Know About Delivery Of Important Regulatory Documents?
To reduce Fund expenses, only one copy of most shareholder documents may be mailed to shareholders with multiple accounts at the same address (Householding). Mailing of your shareholder documents may be householded indefinitely unless you instruct us otherwise. If you do not want the mailing of these documents to be combined with those for other members of your household, please contact Invesco Investment Services, Inc. at (800) 959-4246 or contact your financial institution. We will begin sending you individual copies for each account within 30 days after receiving your request.
For additional information, please scan the QR code at the left to navigate to additional material at invesco.com/reports.
Invesco Select Risk: Moderate Investor Fund
Class C: OCMIX
ANNUAL SHAREHOLDER REPORT | December 31, 2024
This annual shareholder report contains important information about Invesco Select Risk: Moderate Investor Fund (the “Fund”) for the period January 1, 2024 to December 31, 2024. You can find additional information about the Fund at invesco.com/reports. You can also request this information by contacting us at (800) 959-4246.
What Were The Fund Costs For The Last Year ?
(Based on a hypothetical $10,000 investment)
| Fund (Class) | Costs of a $10,000 investment | Costs paid as a percentage
of a $10,000 investment |
Invesco Select Risk: Moderate Investor Fund
(Class C) | $116 | 1.12%† |
† | Reflects fee waivers and/or expense reimbursements, without which expenses would have been higher. |
How Did The Fund Perform During The Period?
• During the fiscal year ended December 31, 2024, global risk assets outperformed defensive assets driven by a favorable macroeconomic environment, the beginning of a global monetary policy easing cycle and greater clarity with respect to fiscal policy following the conclusion of many major elections globally. These macroeconomic tailwinds supported global equity prices, particularly within the US, as well as the continuation of credit spreads tightening to cycle lows within investment grade, high yield and emerging market debt markets. Given this backdrop, an underweight to equities was a headwind to Fund performance, as were factor tilts within equities, as well as allocations within fixed income to core and US Treasury bonds.
• For the fiscal year ended December 31, 2024, Class C shares of the Fund, excluding sales charge, returned 7.46%. For the same time period, the Custom Invesco Select Risk: Moderate Investor Index returned 11.78%.
What contributed to performance?
Manager selection within fixed income | Manager selection within fixed income was a contributor to Fund performance, driven by the Invesco Core Bond Fund, Invesco Core Plus Bond Fund and Invesco Variable Rate Investment Grade ETF.
Exposure to high yield and floating rate credit | The Fund's exposure to high yield was beneficial as credit spreads continued to tighten, supported by resilient corporate fundamentals and strong investor demand for higher-coupon bond offerings. Floating rate exposure was rewarded as well, with the securities benefiting from an increasing interest rate environment, compared to their fixed-rate peers.
What detracted from performance?
Cyclical factor exposure within equities | Exposure to the small size and value factors was a detractor from Fund performance over the time period, as more defensive equity factors such as quality continued to be in demand led by US megacap technology stocks and strong momentum in investor demand for thematic artificial intelligence stocks.
Exposure to core and US Treasury bonds | The Fund's exposure to core and US Treasury bonds was a headwind, as long and moderate duration, as well as higher-grade fixed income, suffered compared to shorter duration, more credit sensitive counterparts. This was due to interest rates moving higher and the steepening of the yield curve that transpired significantly in the second half of the year.
How Has The Fund Historically Performed?
Growth of $10,000 Investment
| AVERAGE ANNUAL TOTAL RETURNS | 1 Year | 5 Years | 10 Years |
| Invesco Select Risk: Moderate Investor Fund (Class C) —including sales charge | 6.46% | 3.40% | 4.39% |
| Invesco Select Risk: Moderate Investor Fund (Class C) —excluding sales charge | 7.46% | 3.40% | 4.39% |
| Custom Invesco Select Risk: Moderate Investor Index | 11.78% | 6.51% | 6.57% |
| Bloomberg Global Aggregate USD Hedged Index | 3.40% | 0.48% | 2.01% |
| MSCI ACWI (Net) | 17.49% | 10.06% | 9.23% |
| Bloomberg U.S. Aggregate Bond Index | 1.25% | (0.33)% | 1.35% |
The Custom Invesco Select Risk: Moderate Investor Index is composed of 60% MSCI ACWI (Net) and 40% Bloomberg Global Aggregate USD Hedged Index.
Effective after the close of business on May 24, 2019, Class C shares of Oppenheimer Portfolio Series: Moderate Investor Fund (the predecessor fund), were reorganized into Class C shares of the Fund. Returns shown above for periods ending on or prior to May 24, 2019 are those of Class C shares of the predecessor fund. Share class returns will differ from the predecessor fund because of different expenses.
Effective April 26, 2024, the Fund changed its broad-based securities market benchmark from the Bloomberg Global Aggregate USD Hedged Index to the Bloomberg U.S. Aggregate Bond Index to reflect that the Bloomberg U.S. Aggregate Bond Index can be considered more broadly representative of the overall applicable securities market.
The performance data quoted represents past performance and cannot guarantee future results; current performance may be lower or higher. Please visit invesco.com/performance for more recent performance information.
Performance figures do not reflect deduction of taxes a shareholder would pay on Fund distributions or sale of Fund shares.
What Are Key Statistics About The Fund?
(as of December 31, 2024)
| Fund net assets | $1,790,439,701 |
| Total number of portfolio holdings | 27 |
| Total advisory fees paid | $0 |
| Portfolio turnover rate | 42% |
What Comprised The Fund's Holdings?
(as of December 31, 2024)
Asset allocation
(% of net assets)
Where Can I Find More Information?
You can find more information about the Fund, including the Fund's prospectus, financial information, and holdings at invesco.com/reports. Additionally, the Fund's proxy voting information can be found at invesco.com/proxy-voting.
What Should I Know About Delivery Of Important Regulatory Documents?
To reduce Fund expenses, only one copy of most shareholder documents may be mailed to shareholders with multiple accounts at the same address (Householding). Mailing of your shareholder documents may be householded indefinitely unless you instruct us otherwise. If you do not want the mailing of these documents to be combined with those for other members of your household, please contact Invesco Investment Services, Inc. at (800) 959-4246 or contact your financial institution. We will begin sending you individual copies for each account within 30 days after receiving your request.
For additional information, please scan the QR code at the left to navigate to additional material at invesco.com/reports.
Invesco Select Risk: Moderate Investor Fund
Class R: ONMIX
ANNUAL SHAREHOLDER REPORT | December 31, 2024
This annual shareholder report contains important information about Invesco Select Risk: Moderate Investor Fund (the “Fund”) for the period January 1, 2024 to December 31, 2024. You can find additional information about the Fund at invesco.com/reports. You can also request this information by contacting us at (800) 959-4246.
What Were The Fund Costs For The Last Year ?
(Based on a hypothetical $10,000 investment)
| Fund (Class) | Costs of a $10,000 investment | Costs paid as a percentage
of a $10,000 investment |
Invesco Select Risk: Moderate Investor Fund
(Class R) | $64 | 0.62%† |
† | Reflects fee waivers and/or expense reimbursements, without which expenses would have been higher. |
How Did The Fund Perform During The Period?
• During the fiscal year ended December 31, 2024, global risk assets outperformed defensive assets driven by a favorable macroeconomic environment, the beginning of a global monetary policy easing cycle and greater clarity with respect to fiscal policy following the conclusion of many major elections globally. These macroeconomic tailwinds supported global equity prices, particularly within the US, as well as the continuation of credit spreads tightening to cycle lows within investment grade, high yield and emerging market debt markets. Given this backdrop, an underweight to equities was a headwind to Fund performance, as were factor tilts within equities, as well as allocations within fixed income to core and US Treasury bonds.
• For the fiscal year ended December 31, 2024, Class R shares of the Fund returned 8.01%. For the same time period, the Custom Invesco Select Risk: Moderate Investor Index returned 11.78%.
What contributed to performance?
Manager selection within fixed income | Manager selection within fixed income was a contributor to Fund performance, driven by the Invesco Core Bond Fund, Invesco Core Plus Bond Fund and Invesco Variable Rate Investment Grade ETF.
Exposure to high yield and floating rate credit | The Fund's exposure to high yield was beneficial as credit spreads continued to tighten, supported by resilient corporate fundamentals and strong investor demand for higher-coupon bond offerings. Floating rate exposure was rewarded as well, with the securities benefiting from an increasing interest rate environment, compared to their fixed-rate peers.
What detracted from performance?
Cyclical factor exposure within equities | Exposure to the small size and value factors was a detractor from Fund performance over the time period, as more defensive equity factors such as quality continued to be in demand led by US megacap technology stocks and strong momentum in investor demand for thematic artificial intelligence stocks.
Exposure to core and US Treasury bonds | The Fund's exposure to core and US Treasury bonds was a headwind, as long and moderate duration, as well as higher-grade fixed income, suffered compared to shorter duration, more credit sensitive counterparts. This was due to interest rates moving higher and the steepening of the yield curve that transpired significantly in the second half of the year.
How Has The Fund Historically Performed?
Growth of $10,000 Investment
| AVERAGE ANNUAL TOTAL RETURNS | 1 Year | 5 Years | 10 Years |
| Invesco Select Risk: Moderate Investor Fund (Class R) | 8.01% | 3.93% | 4.75% |
| Custom Invesco Select Risk: Moderate Investor Index | 11.78% | 6.51% | 6.57% |
| Bloomberg Global Aggregate USD Hedged Index | 3.40% | 0.48% | 2.01% |
| MSCI ACWI (Net) | 17.49% | 10.06% | 9.23% |
| Bloomberg U.S. Aggregate Bond Index | 1.25% | (0.33)% | 1.35% |
The Custom Invesco Select Risk: Moderate Investor Index is composed of 60% MSCI ACWI (Net) and 40% Bloomberg Global Aggregate USD Hedged Index.
Effective after the close of business on May 24, 2019, Class R shares of Oppenheimer Portfolio Series: Moderate Investor Fund (the predecessor fund), were reorganized into Class R shares of the Fund. Returns shown above for periods ending on or prior to May 24, 2019 are those of Class R shares of the predecessor fund. Share class returns will differ from the predecessor fund because of different expenses.
Effective April 26, 2024, the Fund changed its broad-based securities market benchmark from the Bloomberg Global Aggregate USD Hedged Index to the Bloomberg U.S. Aggregate Bond Index to reflect that the Bloomberg U.S. Aggregate Bond Index can be considered more broadly representative of the overall applicable securities market.
The performance data quoted represents past performance and cannot guarantee future results; current performance may be lower or higher. Please visit invesco.com/performance for more recent performance information.
Performance figures do not reflect deduction of taxes a shareholder would pay on Fund distributions or sale of Fund shares.
What Are Key Statistics About The Fund?
(as of December 31, 2024)
| Fund net assets | $1,790,439,701 |
| Total number of portfolio holdings | 27 |
| Total advisory fees paid | $0 |
| Portfolio turnover rate | 42% |
What Comprised The Fund's Holdings?
(as of December 31, 2024)
Asset allocation
(% of net assets)
Where Can I Find More Information?
You can find more information about the Fund, including the Fund's prospectus, financial information, and holdings at invesco.com/reports. Additionally, the Fund's proxy voting information can be found at invesco.com/proxy-voting.
What Should I Know About Delivery Of Important Regulatory Documents?
To reduce Fund expenses, only one copy of most shareholder documents may be mailed to shareholders with multiple accounts at the same address (Householding). Mailing of your shareholder documents may be householded indefinitely unless you instruct us otherwise. If you do not want the mailing of these documents to be combined with those for other members of your household, please contact Invesco Investment Services, Inc. at (800) 959-4246 or contact your financial institution. We will begin sending you individual copies for each account within 30 days after receiving your request.
For additional information, please scan the QR code at the left to navigate to additional material at invesco.com/reports.
Invesco Select Risk: Moderate Investor Fund
Class S: PXMSX
ANNUAL SHAREHOLDER REPORT | December 31, 2024
This annual shareholder report contains important information about Invesco Select Risk: Moderate Investor Fund (the “Fund”) for the period January 1, 2024 to December 31, 2024. You can find additional information about the Fund at invesco.com/reports. You can also request this information by contacting us at (800) 959-4246.
What Were The Fund Costs For The Last Year ?
(Based on a hypothetical $10,000 investment)
| Fund (Class) | Costs of a $10,000 investment | Costs paid as a percentage
of a $10,000 investment |
Invesco Select Risk: Moderate Investor Fund
(Class S) | $28 | 0.27%† |
† | Reflects fee waivers and/or expense reimbursements, without which expenses would have been higher. |
How Did The Fund Perform During The Period?
• During the fiscal year ended December 31, 2024, global risk assets outperformed defensive assets driven by a favorable macroeconomic environment, the beginning of a global monetary policy easing cycle and greater clarity with respect to fiscal policy following the conclusion of many major elections globally. These macroeconomic tailwinds supported global equity prices, particularly within the US, as well as the continuation of credit spreads tightening to cycle lows within investment grade, high yield and emerging market debt markets. Given this backdrop, an underweight to equities was a headwind to Fund performance, as were factor tilts within equities, as well as allocations within fixed income to core and US Treasury bonds.
• For the fiscal year ended December 31, 2024, Class S shares of the Fund returned 8.41%. For the same time period, the Custom Invesco Select Risk: Moderate Investor Index returned 11.78%.
What contributed to performance?
Manager selection within fixed income | Manager selection within fixed income was a contributor to Fund performance, driven by the Invesco Core Bond Fund, Invesco Core Plus Bond Fund and Invesco Variable Rate Investment Grade ETF.
Exposure to high yield and floating rate credit | The Fund's exposure to high yield was beneficial as credit spreads continued to tighten, supported by resilient corporate fundamentals and strong investor demand for higher-coupon bond offerings. Floating rate exposure was rewarded as well, with the securities benefiting from an increasing interest rate environment, compared to their fixed-rate peers.
What detracted from performance?
Cyclical factor exposure within equities | Exposure to the small size and value factors was a detractor from Fund performance over the time period, as more defensive equity factors such as quality continued to be in demand led by US megacap technology stocks and strong momentum in investor demand for thematic artificial intelligence stocks.
Exposure to core and US Treasury bonds | The Fund's exposure to core and US Treasury bonds was a headwind, as long and moderate duration, as well as higher-grade fixed income, suffered compared to shorter duration, more credit sensitive counterparts. This was due to interest rates moving higher and the steepening of the yield curve that transpired significantly in the second half of the year.
How Has The Fund Historically Performed?
Growth of $10,000 Investment
| AVERAGE ANNUAL TOTAL RETURNS | 1 Year | 5 Years | 10 Years |
| Invesco Select Risk: Moderate Investor Fund (Class S) | 8.41% | 4.31% | 5.07% |
| Custom Invesco Select Risk: Moderate Investor Index | 11.78% | 6.51% | 6.57% |
| Bloomberg Global Aggregate USD Hedged Index | 3.40% | 0.48% | 2.01% |
| MSCI ACWI (Net) | 17.49% | 10.06% | 9.23% |
| Bloomberg U.S. Aggregate Bond Index | 1.25% | (0.33)% | 1.35% |
The Custom Invesco Select Risk: Moderate Investor Index is composed of 60% MSCI ACWI (Net) and 40% Bloomberg Global Aggregate USD Hedged Index.
Class S shares incepted on May 15, 2020. Performance shown on and prior to that date is that of Oppenheimer Portfolio Series: Moderate Investor Fund's (the predecessor fund) Class A shares at net asset value and includes 12b-1 fees applicable to Class A shares. Share class returns will differ from the predecessor fund because of different expenses.
Effective April 26, 2024, the Fund changed its broad-based securities market benchmark from the Bloomberg Global Aggregate USD Hedged Index to the Bloomberg U.S. Aggregate Bond Index to reflect that the Bloomberg U.S. Aggregate Bond Index can be considered more broadly representative of the overall applicable securities market.
The performance data quoted represents past performance and cannot guarantee future results; current performance may be lower or higher. Please visit invesco.com/performance for more recent performance information.
Performance figures do not reflect deduction of taxes a shareholder would pay on Fund distributions or sale of Fund shares.
What Are Key Statistics About The Fund?
(as of December 31, 2024)
| Fund net assets | $1,790,439,701 |
| Total number of portfolio holdings | 27 |
| Total advisory fees paid | $0 |
| Portfolio turnover rate | 42% |
What Comprised The Fund's Holdings?
(as of December 31, 2024)
Asset allocation
(% of net assets)
Where Can I Find More Information?
You can find more information about the Fund, including the Fund's prospectus, financial information, and holdings at invesco.com/reports. Additionally, the Fund's proxy voting information can be found at invesco.com/proxy-voting.
What Should I Know About Delivery Of Important Regulatory Documents?
To reduce Fund expenses, only one copy of most shareholder documents may be mailed to shareholders with multiple accounts at the same address (Householding). Mailing of your shareholder documents may be householded indefinitely unless you instruct us otherwise. If you do not want the mailing of these documents to be combined with those for other members of your household, please contact Invesco Investment Services, Inc. at (800) 959-4246 or contact your financial institution. We will begin sending you individual copies for each account within 30 days after receiving your request.
For additional information, please scan the QR code at the left to navigate to additional material at invesco.com/reports.
Invesco Select Risk: Moderate Investor Fund
Class Y: OYMIX
ANNUAL SHAREHOLDER REPORT | December 31, 2024
This annual shareholder report contains important information about Invesco Select Risk: Moderate Investor Fund (the “Fund”) for the period January 1, 2024 to December 31, 2024. You can find additional information about the Fund at invesco.com/reports. You can also request this information by contacting us at (800) 959-4246.
What Were The Fund Costs For The Last Year ?
(Based on a hypothetical $10,000 investment)
| Fund (Class) | Costs of a $10,000 investment | Costs paid as a percentage
of a $10,000 investment |
Invesco Select Risk: Moderate Investor Fund
(Class Y) | $13 | 0.12%† |
† | Reflects fee waivers and/or expense reimbursements, without which expenses would have been higher. |
How Did The Fund Perform During The Period?
• During the fiscal year ended December 31, 2024, global risk assets outperformed defensive assets driven by a favorable macroeconomic environment, the beginning of a global monetary policy easing cycle and greater clarity with respect to fiscal policy following the conclusion of many major elections globally. These macroeconomic tailwinds supported global equity prices, particularly within the US, as well as the continuation of credit spreads tightening to cycle lows within investment grade, high yield and emerging market debt markets. Given this backdrop, an underweight to equities was a headwind to Fund performance, as were factor tilts within equities, as well as allocations within fixed income to core and US Treasury bonds.
• For the fiscal year ended December 31, 2024, Class Y shares of the Fund returned 8.50%. For the same time period, the Custom Invesco Select Risk: Moderate Investor Index returned 11.78%.
What contributed to performance?
Manager selection within fixed income | Manager selection within fixed income was a contributor to Fund performance, driven by the Invesco Core Bond Fund, Invesco Core Plus Bond Fund and Invesco Variable Rate Investment Grade ETF.
Exposure to high yield and floating rate credit | The Fund's exposure to high yield was beneficial as credit spreads continued to tighten, supported by resilient corporate fundamentals and strong investor demand for higher-coupon bond offerings. Floating rate exposure was rewarded as well, with the securities benefiting from an increasing interest rate environment, compared to their fixed-rate peers.
What detracted from performance?
Cyclical factor exposure within equities | Exposure to the small size and value factors was a detractor from Fund performance over the time period, as more defensive equity factors such as quality continued to be in demand led by US megacap technology stocks and strong momentum in investor demand for thematic artificial intelligence stocks.
Exposure to core and US Treasury bonds | The Fund's exposure to core and US Treasury bonds was a headwind, as long and moderate duration, as well as higher-grade fixed income, suffered compared to shorter duration, more credit sensitive counterparts. This was due to interest rates moving higher and the steepening of the yield curve that transpired significantly in the second half of the year.
How Has The Fund Historically Performed?
Growth of $10,000 Investment
| AVERAGE ANNUAL TOTAL RETURNS | 1 Year | 5 Years | 10 Years |
| Invesco Select Risk: Moderate Investor Fund (Class Y) | 8.50% | 4.47% | 5.28% |
| Custom Invesco Select Risk: Moderate Investor Index | 11.78% | 6.51% | 6.57% |
| Bloomberg Global Aggregate USD Hedged Index | 3.40% | 0.48% | 2.01% |
| MSCI ACWI (Net) | 17.49% | 10.06% | 9.23% |
| Bloomberg U.S. Aggregate Bond Index | 1.25% | (0.33)% | 1.35% |
The Custom Invesco Select Risk: Moderate Investor Index is composed of 60% MSCI ACWI (Net) and 40% Bloomberg Global Aggregate USD Hedged Index.
Effective after the close of business on May 24, 2019, Class Y shares of Oppenheimer Portfolio Series: Moderate Investor Fund (the predecessor fund), were reorganized into Class Y shares of the Fund. Returns shown above for periods ending on or prior to May 24, 2019 are those of Class Y shares of the predecessor fund. Share class returns will differ from the predecessor fund because of different expenses.
Effective April 26, 2024, the Fund changed its broad-based securities market benchmark from the Bloomberg Global Aggregate USD Hedged Index to the Bloomberg U.S. Aggregate Bond Index to reflect that the Bloomberg U.S. Aggregate Bond Index can be considered more broadly representative of the overall applicable securities market.
The performance data quoted represents past performance and cannot guarantee future results; current performance may be lower or higher. Please visit invesco.com/performance for more recent performance information.
Performance figures do not reflect deduction of taxes a shareholder would pay on Fund distributions or sale of Fund shares.
What Are Key Statistics About The Fund?
(as of December 31, 2024)
| Fund net assets | $1,790,439,701 |
| Total number of portfolio holdings | 27 |
| Total advisory fees paid | $0 |
| Portfolio turnover rate | 42% |
What Comprised The Fund's Holdings?
(as of December 31, 2024)
Asset allocation
(% of net assets)
Where Can I Find More Information?
You can find more information about the Fund, including the Fund's prospectus, financial information, and holdings at invesco.com/reports. Additionally, the Fund's proxy voting information can be found at invesco.com/proxy-voting.
What Should I Know About Delivery Of Important Regulatory Documents?
To reduce Fund expenses, only one copy of most shareholder documents may be mailed to shareholders with multiple accounts at the same address (Householding). Mailing of your shareholder documents may be householded indefinitely unless you instruct us otherwise. If you do not want the mailing of these documents to be combined with those for other members of your household, please contact Invesco Investment Services, Inc. at (800) 959-4246 or contact your financial institution. We will begin sending you individual copies for each account within 30 days after receiving your request.
For additional information, please scan the QR code at the left to navigate to additional material at invesco.com/reports.
Invesco Select Risk: Moderate Investor Fund
Class R5: PXMQX
ANNUAL SHAREHOLDER REPORT | December 31, 2024
This annual shareholder report contains important information about Invesco Select Risk: Moderate Investor Fund (the “Fund”) for the period January 1, 2024 to December 31, 2024. You can find additional information about the Fund at invesco.com/reports. You can also request this information by contacting us at (800) 959-4246.
This report describes changes to the Fund that occurred during the reporting period.
What Were The Fund Costs For The Last Year ?
(Based on a hypothetical $10,000 investment)
| Fund (Class) | Costs of a $10,000 investment | Costs paid as a percentage
of a $10,000 investment |
Invesco Select Risk: Moderate Investor Fund
(Class R5) | $13 | 0.12% |
How Did The Fund Perform During The Period?
• During the fiscal year ended December 31, 2024, global risk assets outperformed defensive assets driven by a favorable macroeconomic environment, the beginning of a global monetary policy easing cycle and greater clarity with respect to fiscal policy following the conclusion of many major elections globally. These macroeconomic tailwinds supported global equity prices, particularly within the US, as well as the continuation of credit spreads tightening to cycle lows within investment grade, high yield and emerging market debt markets. Given this backdrop, an underweight to equities was a headwind to Fund performance, as were factor tilts within equities, as well as allocations within fixed income to core and US Treasury bonds.
• For the fiscal year ended December 31, 2024, Class R5 shares of the Fund returned 8.58%. For the same time period, the Custom Invesco Select Risk: Moderate Investor Index returned 11.78%.
What contributed to performance?
Manager selection within fixed income | Manager selection within fixed income was a contributor to Fund performance, driven by the Invesco Core Bond Fund, Invesco Core Plus Bond Fund and Invesco Variable Rate Investment Grade ETF.
Exposure to high yield and floating rate credit | The Fund's exposure to high yield was beneficial as credit spreads continued to tighten, supported by resilient corporate fundamentals and strong investor demand for higher-coupon bond offerings. Floating rate exposure was rewarded as well, with the securities benefiting from an increasing interest rate environment, compared to their fixed-rate peers.
What detracted from performance?
Cyclical factor exposure within equities | Exposure to the small size and value factors was a detractor from Fund performance over the time period, as more defensive equity factors such as quality continued to be in demand led by US megacap technology stocks and strong momentum in investor demand for thematic artificial intelligence stocks.
Exposure to core and US Treasury bonds | The Fund's exposure to core and US Treasury bonds was a headwind, as long and moderate duration, as well as higher-grade fixed income, suffered compared to shorter duration, more credit sensitive counterparts. This was due to interest rates moving higher and the steepening of the yield curve that transpired significantly in the second half of the year.
How Has The Fund Historically Performed?
Growth of $10,000 Investment
| AVERAGE ANNUAL TOTAL RETURNS | 1 Year | 5 Years | 10 Years |
| Invesco Select Risk: Moderate Investor Fund (Class R5) | 8.58% | 4.54% | 5.21% |
| Custom Invesco Select Risk: Moderate Investor Index | 11.78% | 6.51% | 6.57% |
| Bloomberg Global Aggregate USD Hedged Index | 3.40% | 0.48% | 2.01% |
| MSCI ACWI (Net) | 17.49% | 10.06% | 9.23% |
| Bloomberg U.S. Aggregate Bond Index | 1.25% | (0.33)% | 1.35% |
The Custom Invesco Select Risk: Moderate Investor Index is composed of 60% MSCI ACWI (Net) and 40% Bloomberg Global Aggregate USD Hedged Index.
Class R5 shares incepted on May 24, 2019. Performance shown on and prior to that date is that of Oppenheimer Portfolio Series: Moderate Investor Fund's (the predecessor fund) Class A shares at net asset value and includes 12b-1 fees applicable to Class A shares. Share class returns will differ from the predecessor fund because of different expenses.
Effective April 26, 2024, the Fund changed its broad-based securities market benchmark from the Bloomberg Global Aggregate USD Hedged Index to the Bloomberg U.S. Aggregate Bond Index to reflect that the Bloomberg U.S. Aggregate Bond Index can be considered more broadly representative of the overall applicable securities market.
The performance data quoted represents past performance and cannot guarantee future results; current performance may be lower or higher. Please visit invesco.com/performance for more recent performance information.
Performance figures do not reflect deduction of taxes a shareholder would pay on Fund distributions or sale of Fund shares.
What Are Key Statistics About The Fund?
(as of December 31, 2024)
| Fund net assets | $1,790,439,701 |
| Total number of portfolio holdings | 27 |
| Total advisory fees paid | $0 |
| Portfolio turnover rate | 42% |
What Comprised The Fund's Holdings?
(as of December 31, 2024)
Asset allocation
(% of net assets)
How Has The Fund Changed Over The Past Year?
This is a summary of certain changes to the Fund since December 31, 2023. For more complete information, you may review the Fund's prospectus, which is available at invesco.com/reports or upon request at (800) 959-4246.
Effective after the close of business on September 30, 2024, the Fund has limited public sales of its Class R5 shares to certain investors who were previously invested in Class R5 shares of the Fund.
The Fund's net expense ratio increased from the prior fiscal year end as a result of a change in operating expenses.
Where Can I Find More Information?
You can find more information about the Fund, including the Fund's prospectus, financial information, and holdings at invesco.com/reports. Additionally, the Fund's proxy voting information can be found at invesco.com/proxy-voting.
What Should I Know About Delivery Of Important Regulatory Documents?
To reduce Fund expenses, only one copy of most shareholder documents may be mailed to shareholders with multiple accounts at the same address (Householding). Mailing of your shareholder documents may be householded indefinitely unless you instruct us otherwise. If you do not want the mailing of these documents to be combined with those for other members of your household, please contact Invesco Investment Services, Inc. at (800) 959-4246 or contact your financial institution. We will begin sending you individual copies for each account within 30 days after receiving your request.
For additional information, please scan the QR code at the left to navigate to additional material at invesco.com/reports.
Invesco Select Risk: Moderate Investor Fund
Class R6: PXMMX
ANNUAL SHAREHOLDER REPORT | December 31, 2024
This annual shareholder report contains important information about Invesco Select Risk: Moderate Investor Fund (the “Fund”) for the period January 1, 2024 to December 31, 2024. You can find additional information about the Fund at invesco.com/reports. You can also request this information by contacting us at (800) 959-4246.
What Were The Fund Costs For The Last Year ?
(Based on a hypothetical $10,000 investment)
| Fund (Class) | Costs of a $10,000 investment | Costs paid as a percentage
of a $10,000 investment |
Invesco Select Risk: Moderate Investor Fund
(Class R6) | $5 | 0.05% |
How Did The Fund Perform During The Period?
• During the fiscal year ended December 31, 2024, global risk assets outperformed defensive assets driven by a favorable macroeconomic environment, the beginning of a global monetary policy easing cycle and greater clarity with respect to fiscal policy following the conclusion of many major elections globally. These macroeconomic tailwinds supported global equity prices, particularly within the US, as well as the continuation of credit spreads tightening to cycle lows within investment grade, high yield and emerging market debt markets. Given this backdrop, an underweight to equities was a headwind to Fund performance, as were factor tilts within equities, as well as allocations within fixed income to core and US Treasury bonds.
• For the fiscal year ended December 31, 2024, Class R6 shares of the Fund returned 8.66%. For the same time period, the Custom Invesco Select Risk: Moderate Investor Index returned 11.78%.
What contributed to performance?
Manager selection within fixed income | Manager selection within fixed income was a contributor to Fund performance, driven by the Invesco Core Bond Fund, Invesco Core Plus Bond Fund and Invesco Variable Rate Investment Grade ETF.
Exposure to high yield and floating rate credit | The Fund's exposure to high yield was beneficial as credit spreads continued to tighten, supported by resilient corporate fundamentals and strong investor demand for higher-coupon bond offerings. Floating rate exposure was rewarded as well, with the securities benefiting from an increasing interest rate environment, compared to their fixed-rate peers.
What detracted from performance?
Cyclical factor exposure within equities | Exposure to the small size and value factors was a detractor from Fund performance over the time period, as more defensive equity factors such as quality continued to be in demand led by US megacap technology stocks and strong momentum in investor demand for thematic artificial intelligence stocks.
Exposure to core and US Treasury bonds | The Fund's exposure to core and US Treasury bonds was a headwind, as long and moderate duration, as well as higher-grade fixed income, suffered compared to shorter duration, more credit sensitive counterparts. This was due to interest rates moving higher and the steepening of the yield curve that transpired significantly in the second half of the year.
How Has The Fund Historically Performed?
Growth of $10,000 Investment
| AVERAGE ANNUAL TOTAL RETURNS | 1 Year | 5 Years | 10 Years |
| Invesco Select Risk: Moderate Investor Fund (Class R6) | 8.66% | 4.56% | 5.22% |
| Custom Invesco Select Risk: Moderate Investor Index | 11.78% | 6.51% | 6.57% |
| Bloomberg Global Aggregate USD Hedged Index | 3.40% | 0.48% | 2.01% |
| MSCI ACWI (Net) | 17.49% | 10.06% | 9.23% |
| Bloomberg U.S. Aggregate Bond Index | 1.25% | (0.33)% | 1.35% |
The Custom Invesco Select Risk: Moderate Investor Index is composed of 60% MSCI ACWI (Net) and 40% Bloomberg Global Aggregate USD Hedged Index.
Class R6 shares incepted on May 24, 2019. Performance shown on and prior to that date is that of Oppenheimer Portfolio Series: Moderate Investor Fund's (the predecessor fund) Class A shares at net asset value and includes 12b-1 fees applicable to Class A shares. Share class returns will differ from the predecessor fund because of different expenses.
Effective April 26, 2024, the Fund changed its broad-based securities market benchmark from the Bloomberg Global Aggregate USD Hedged Index to the Bloomberg U.S. Aggregate Bond Index to reflect that the Bloomberg U.S. Aggregate Bond Index can be considered more broadly representative of the overall applicable securities market.
The performance data quoted represents past performance and cannot guarantee future results; current performance may be lower or higher. Please visit invesco.com/performance for more recent performance information.
Performance figures do not reflect deduction of taxes a shareholder would pay on Fund distributions or sale of Fund shares.
What Are Key Statistics About The Fund?
(as of December 31, 2024)
| Fund net assets | $1,790,439,701 |
| Total number of portfolio holdings | 27 |
| Total advisory fees paid | $0 |
| Portfolio turnover rate | 42% |
What Comprised The Fund's Holdings?
(as of December 31, 2024)
Asset allocation
(% of net assets)
Where Can I Find More Information?
You can find more information about the Fund, including the Fund's prospectus, financial information, and holdings at invesco.com/reports. Additionally, the Fund's proxy voting information can be found at invesco.com/proxy-voting.
What Should I Know About Delivery Of Important Regulatory Documents?
To reduce Fund expenses, only one copy of most shareholder documents may be mailed to shareholders with multiple accounts at the same address (Householding). Mailing of your shareholder documents may be householded indefinitely unless you instruct us otherwise. If you do not want the mailing of these documents to be combined with those for other members of your household, please contact Invesco Investment Services, Inc. at (800) 959-4246 or contact your financial institution. We will begin sending you individual copies for each account within 30 days after receiving your request.
For additional information, please scan the QR code at the left to navigate to additional material at invesco.com/reports.
Invesco Select Risk: Moderately Conservative Investor Fund
Class A: CAAMX
ANNUAL SHAREHOLDER REPORT | December 31, 2024
This annual shareholder report contains important information about Invesco Select Risk: Moderately Conservative Investor Fund (the “Fund”) for the period January 1, 2024 to December 31, 2024. You can find additional information about the Fund at invesco.com/reports. You can also request this information by contacting us at (800) 959-4246.
What Were The Fund Costs For The Last Year ?
(Based on a hypothetical $10,000 investment)
| Fund (Class) | Costs of a $10,000 investment | Costs paid as a percentage
of a $10,000 investment |
Invesco Select Risk: Moderately Conservative Investor Fund
(Class A) | $48 | 0.47% |
How Did The Fund Perform During The Period?
• During the fiscal year ended December 31, 2024, global risk assets outperformed defensive assets driven by a favorable macroeconomic environment, the beginning of a global monetary policy easing cycle and greater clarity with respect to fiscal policy following the conclusion of many major elections globally. These macroeconomic tailwinds supported global equity prices, particularly within the US, as well as the continuation of credit spreads tightening to cycle lows within investment grade, high yield and emerging market debt markets. Given this backdrop, an underweight to equities was a headwind to Fund performance, as were factor tilts within equities, as well as allocations within fixed income to core and US Treasury bonds.
• For the fiscal year ended December 31, 2024, Class A shares of the Fund, excluding sales charge, returned 6.17%. For the same time period, the Custom Invesco Select Risk: Moderately Conservative Index returned 8.89%.
What contributed to performance?
Manager selection within fixed income | Manager selection within fixed income was a contributor to Fund performance, driven by the Invesco Core Bond Fund, Invesco Core Plus Bond Fund and Invesco Variable Rate Investment Grade ETF.
Exposure to high yield and floating rate credit | The Fund's exposure to high yield was beneficial as credit spreads continued to tighten, supported by resilient corporate fundamentals and strong investor demand for higher-coupon bond offerings. Floating rate exposure was rewarded as well, with the securities benefiting from an increasing interest rate environment, compared to their fixed-rate peers.
What detracted from performance?
Cyclical factor exposure within equities | Exposure to the small size and value factors was a detractor from Fund performance over the time period, as more defensive equity factors such as quality continued to be in demand led by US megacap technology stocks and strong momentum in investor demand for thematic artificial intelligence stocks.
Exposure to core and US Treasury bonds | The Fund's exposure to core and US Treasury bonds was a headwind, as long and moderate duration, as well as higher-grade fixed income, suffered compared to shorter duration, more credit sensitive counterparts. This was due to interest rates moving higher and the steepening of the yield curve that transpired significantly in the second half of the year.
How Has The Fund Historically Performed?
Growth of $10,000 Investment
| AVERAGE ANNUAL TOTAL RETURNS | 1 Year | 5 Years | 10 Years |
| Invesco Select Risk: Moderately Conservative Investor Fund (Class A) —including sales charge | 0.30% | 1.65% | 2.83% |
| Invesco Select Risk: Moderately Conservative Investor Fund (Class A) —excluding sales charge | 6.17% | 2.81% | 3.41% |
| Custom Invesco Select Risk: Moderately Conservative Index | 8.89% | 4.49% | 5.08% |
| Bloomberg Global Aggregate USD Hedged Index | 3.40% | 0.48% | 2.01% |
| MSCI ACWI (Net) | 17.49% | 10.06% | 9.23% |
| Bloomberg U.S. Aggregate Bond Index | 1.25% | (0.33)% | 1.35% |
The Custom Invesco Select Risk: Moderately Conservative Index is composed of 40% MSCI ACWI (Net) and 60% Bloomberg Global Aggregate USD Hedged Index.
Effective April 26, 2024, the Fund changed its broad-based securities market benchmark from the Bloomberg Global Aggregate USD Hedged Index to the Bloomberg U.S. Aggregate Bond Index to reflect that the Bloomberg U.S. Aggregate Bond Index can be considered more broadly representative of the overall applicable securities market.
The performance data quoted represents past performance and cannot guarantee future results; current performance may be lower or higher. Please visit invesco.com/performance for more recent performance information.
Performance figures do not reflect deduction of taxes a shareholder would pay on Fund distributions or sale of Fund shares.
What Are Key Statistics About The Fund?
(as of December 31, 2024)
| Fund net assets | $270,729,040 |
| Total number of portfolio holdings | 25 |
| Total advisory fees paid | $0 |
| Portfolio turnover rate | 49% |
What Comprised The Fund's Holdings?
(as of December 31, 2024)
Asset allocation
(% of net assets)
Where Can I Find More Information?
You can find more information about the Fund, including the Fund's prospectus, financial information, and holdings at invesco.com/reports. Additionally, the Fund's proxy voting information can be found at invesco.com/proxy-voting.
What Should I Know About Delivery Of Important Regulatory Documents?
To reduce Fund expenses, only one copy of most shareholder documents may be mailed to shareholders with multiple accounts at the same address (Householding). Mailing of your shareholder documents may be householded indefinitely unless you instruct us otherwise. If you do not want the mailing of these documents to be combined with those for other members of your household, please contact Invesco Investment Services, Inc. at (800) 959-4246 or contact your financial institution. We will begin sending you individual copies for each account within 30 days after receiving your request.
For additional information, please scan the QR code at the left to navigate to additional material at invesco.com/reports.
Invesco Select Risk: Moderately Conservative Investor Fund
Class C: CACMX
ANNUAL SHAREHOLDER REPORT | December 31, 2024
This annual shareholder report contains important information about Invesco Select Risk: Moderately Conservative Investor Fund (the “Fund”) for the period January 1, 2024 to December 31, 2024. You can find additional information about the Fund at invesco.com/reports. You can also request this information by contacting us at (800) 959-4246.
What Were The Fund Costs For The Last Year ?
(Based on a hypothetical $10,000 investment)
| Fund (Class) | Costs of a $10,000 investment | Costs paid as a percentage
of a $10,000 investment |
Invesco Select Risk: Moderately Conservative Investor Fund
(Class C) | $125 | 1.22% |
How Did The Fund Perform During The Period?
• During the fiscal year ended December 31, 2024, global risk assets outperformed defensive assets driven by a favorable macroeconomic environment, the beginning of a global monetary policy easing cycle and greater clarity with respect to fiscal policy following the conclusion of many major elections globally. These macroeconomic tailwinds supported global equity prices, particularly within the US, as well as the continuation of credit spreads tightening to cycle lows within investment grade, high yield and emerging market debt markets. Given this backdrop, an underweight to equities was a headwind to Fund performance, as were factor tilts within equities, as well as allocations within fixed income to core and US Treasury bonds.
• For the fiscal year ended December 31, 2024, Class C shares of the Fund, excluding sales charge, returned 5.42%. For the same time period, the Custom Invesco Select Risk: Moderately Conservative Index returned 8.89%.
What contributed to performance?
Manager selection within fixed income | Manager selection within fixed income was a contributor to Fund performance, driven by the Invesco Core Bond Fund, Invesco Core Plus Bond Fund and Invesco Variable Rate Investment Grade ETF.
Exposure to high yield and floating rate credit | The Fund's exposure to high yield was beneficial as credit spreads continued to tighten, supported by resilient corporate fundamentals and strong investor demand for higher-coupon bond offerings. Floating rate exposure was rewarded as well, with the securities benefiting from an increasing interest rate environment, compared to their fixed-rate peers.
What detracted from performance?
Cyclical factor exposure within equities | Exposure to the small size and value factors was a detractor from Fund performance over the time period, as more defensive equity factors such as quality continued to be in demand led by US megacap technology stocks and strong momentum in investor demand for thematic artificial intelligence stocks.
Exposure to core and US Treasury bonds | The Fund's exposure to core and US Treasury bonds was a headwind, as long and moderate duration, as well as higher-grade fixed income, suffered compared to shorter duration, more credit sensitive counterparts. This was due to interest rates moving higher and the steepening of the yield curve that transpired significantly in the second half of the year.
How Has The Fund Historically Performed?
Growth of $10,000 Investment
| AVERAGE ANNUAL TOTAL RETURNS | 1 Year | 5 Years | 10 Years |
| Invesco Select Risk: Moderately Conservative Investor Fund (Class C) —including sales charge | 4.42% | 2.04% | 2.79% |
| Invesco Select Risk: Moderately Conservative Investor Fund (Class C) —excluding sales charge | 5.42% | 2.04% | 2.79% |
| Custom Invesco Select Risk: Moderately Conservative Index | 8.89% | 4.49% | 5.08% |
| Bloomberg Global Aggregate USD Hedged Index | 3.40% | 0.48% | 2.01% |
| MSCI ACWI (Net) | 17.49% | 10.06% | 9.23% |
| Bloomberg U.S. Aggregate Bond Index | 1.25% | (0.33)% | 1.35% |
The Custom Invesco Select Risk: Moderately Conservative Index is composed of 40% MSCI ACWI (Net) and 60% Bloomberg Global Aggregate USD Hedged Index.
Effective April 26, 2024, the Fund changed its broad-based securities market benchmark from the Bloomberg Global Aggregate USD Hedged Index to the Bloomberg U.S. Aggregate Bond Index to reflect that the Bloomberg U.S. Aggregate Bond Index can be considered more broadly representative of the overall applicable securities market.
The performance data quoted represents past performance and cannot guarantee future results; current performance may be lower or higher. Please visit invesco.com/performance for more recent performance information.
Performance figures do not reflect deduction of taxes a shareholder would pay on Fund distributions or sale of Fund shares.
What Are Key Statistics About The Fund?
(as of December 31, 2024)
| Fund net assets | $270,729,040 |
| Total number of portfolio holdings | 25 |
| Total advisory fees paid | $0 |
| Portfolio turnover rate | 49% |
What Comprised The Fund's Holdings?
(as of December 31, 2024)
Asset allocation
(% of net assets)
Where Can I Find More Information?
You can find more information about the Fund, including the Fund's prospectus, financial information, and holdings at invesco.com/reports. Additionally, the Fund's proxy voting information can be found at invesco.com/proxy-voting.
What Should I Know About Delivery Of Important Regulatory Documents?
To reduce Fund expenses, only one copy of most shareholder documents may be mailed to shareholders with multiple accounts at the same address (Householding). Mailing of your shareholder documents may be householded indefinitely unless you instruct us otherwise. If you do not want the mailing of these documents to be combined with those for other members of your household, please contact Invesco Investment Services, Inc. at (800) 959-4246 or contact your financial institution. We will begin sending you individual copies for each account within 30 days after receiving your request.
For additional information, please scan the QR code at the left to navigate to additional material at invesco.com/reports.
Invesco Select Risk: Moderately Conservative Investor Fund
Class R: CMARX
ANNUAL SHAREHOLDER REPORT | December 31, 2024
This annual shareholder report contains important information about Invesco Select Risk: Moderately Conservative Investor Fund (the “Fund”) for the period January 1, 2024 to December 31, 2024. You can find additional information about the Fund at invesco.com/reports. You can also request this information by contacting us at (800) 959-4246.
What Were The Fund Costs For The Last Year ?
(Based on a hypothetical $10,000 investment)
| Fund (Class) | Costs of a $10,000 investment | Costs paid as a percentage
of a $10,000 investment |
Invesco Select Risk: Moderately Conservative Investor Fund
(Class R) | $74 | 0.72% |
How Did The Fund Perform During The Period?
• During the fiscal year ended December 31, 2024, global risk assets outperformed defensive assets driven by a favorable macroeconomic environment, the beginning of a global monetary policy easing cycle and greater clarity with respect to fiscal policy following the conclusion of many major elections globally. These macroeconomic tailwinds supported global equity prices, particularly within the US, as well as the continuation of credit spreads tightening to cycle lows within investment grade, high yield and emerging market debt markets. Given this backdrop, an underweight to equities was a headwind to Fund performance, as were factor tilts within equities, as well as allocations within fixed income to core and US Treasury bonds.
• For the fiscal year ended December 31, 2024, Class R shares of the Fund returned 5.92%. For the same time period, the Custom Invesco Select Risk: Moderately Conservative Index returned 8.89%.
What contributed to performance?
Manager selection within fixed income | Manager selection within fixed income was a contributor to Fund performance, driven by the Invesco Core Bond Fund, Invesco Core Plus Bond Fund and Invesco Variable Rate Investment Grade ETF.
Exposure to high yield and floating rate credit | The Fund's exposure to high yield was beneficial as credit spreads continued to tighten, supported by resilient corporate fundamentals and strong investor demand for higher-coupon bond offerings. Floating rate exposure was rewarded as well, with the securities benefiting from an increasing interest rate environment, compared to their fixed-rate peers.
What detracted from performance?
Cyclical factor exposure within equities | Exposure to the small size and value factors was a detractor from Fund performance over the time period, as more defensive equity factors such as quality continued to be in demand led by US megacap technology stocks and strong momentum in investor demand for thematic artificial intelligence stocks.
Exposure to core and US Treasury bonds | The Fund's exposure to core and US Treasury bonds was a headwind, as long and moderate duration, as well as higher-grade fixed income, suffered compared to shorter duration, more credit sensitive counterparts. This was due to interest rates moving higher and the steepening of the yield curve that transpired significantly in the second half of the year.
How Has The Fund Historically Performed?
Growth of $10,000 Investment
| AVERAGE ANNUAL TOTAL RETURNS | 1 Year | 5 Years | 10 Years |
| Invesco Select Risk: Moderately Conservative Investor Fund (Class R) | 5.92% | 2.56% | 3.15% |
| Custom Invesco Select Risk: Moderately Conservative Index | 8.89% | 4.49% | 5.08% |
| Bloomberg Global Aggregate USD Hedged Index | 3.40% | 0.48% | 2.01% |
| MSCI ACWI (Net) | 17.49% | 10.06% | 9.23% |
| Bloomberg U.S. Aggregate Bond Index | 1.25% | (0.33)% | 1.35% |
The Custom Invesco Select Risk: Moderately Conservative Index is composed of 40% MSCI ACWI (Net) and 60% Bloomberg Global Aggregate USD Hedged Index.
Effective April 26, 2024, the Fund changed its broad-based securities market benchmark from the Bloomberg Global Aggregate USD Hedged Index to the Bloomberg U.S. Aggregate Bond Index to reflect that the Bloomberg U.S. Aggregate Bond Index can be considered more broadly representative of the overall applicable securities market.
The performance data quoted represents past performance and cannot guarantee future results; current performance may be lower or higher. Please visit invesco.com/performance for more recent performance information.
Performance figures do not reflect deduction of taxes a shareholder would pay on Fund distributions or sale of Fund shares.
What Are Key Statistics About The Fund?
(as of December 31, 2024)
| Fund net assets | $270,729,040 |
| Total number of portfolio holdings | 25 |
| Total advisory fees paid | $0 |
| Portfolio turnover rate | 49% |
What Comprised The Fund's Holdings?
(as of December 31, 2024)
Asset allocation
(% of net assets)
Where Can I Find More Information?
You can find more information about the Fund, including the Fund's prospectus, financial information, and holdings at invesco.com/reports. Additionally, the Fund's proxy voting information can be found at invesco.com/proxy-voting.
What Should I Know About Delivery Of Important Regulatory Documents?
To reduce Fund expenses, only one copy of most shareholder documents may be mailed to shareholders with multiple accounts at the same address (Householding). Mailing of your shareholder documents may be householded indefinitely unless you instruct us otherwise. If you do not want the mailing of these documents to be combined with those for other members of your household, please contact Invesco Investment Services, Inc. at (800) 959-4246 or contact your financial institution. We will begin sending you individual copies for each account within 30 days after receiving your request.
For additional information, please scan the QR code at the left to navigate to additional material at invesco.com/reports.
Invesco Select Risk: Moderately Conservative Investor Fund
Class S: CMASX
ANNUAL SHAREHOLDER REPORT | December 31, 2024
This annual shareholder report contains important information about Invesco Select Risk: Moderately Conservative Investor Fund (the “Fund”) for the period January 1, 2024 to December 31, 2024. You can find additional information about the Fund at invesco.com/reports. You can also request this information by contacting us at (800) 959-4246.
What Were The Fund Costs For The Last Year ?
(Based on a hypothetical $10,000 investment)
| Fund (Class) | Costs of a $10,000 investment | Costs paid as a percentage
of a $10,000 investment |
Invesco Select Risk: Moderately Conservative Investor Fund
(Class S) | $38 | 0.37% |
How Did The Fund Perform During The Period?
• During the fiscal year ended December 31, 2024, global risk assets outperformed defensive assets driven by a favorable macroeconomic environment, the beginning of a global monetary policy easing cycle and greater clarity with respect to fiscal policy following the conclusion of many major elections globally. These macroeconomic tailwinds supported global equity prices, particularly within the US, as well as the continuation of credit spreads tightening to cycle lows within investment grade, high yield and emerging market debt markets. Given this backdrop, an underweight to equities was a headwind to Fund performance, as were factor tilts within equities, as well as allocations within fixed income to core and US Treasury bonds.
• For the fiscal year ended December 31, 2024, Class S shares of the Fund returned 6.27%. For the same time period, the Custom Invesco Select Risk: Moderately Conservative Index returned 8.89%.
What contributed to performance?
Manager selection within fixed income | Manager selection within fixed income was a contributor to Fund performance, driven by the Invesco Core Bond Fund, Invesco Core Plus Bond Fund and Invesco Variable Rate Investment Grade ETF.
Exposure to high yield and floating rate credit | The Fund's exposure to high yield was beneficial as credit spreads continued to tighten, supported by resilient corporate fundamentals and strong investor demand for higher-coupon bond offerings. Floating rate exposure was rewarded as well, with the securities benefiting from an increasing interest rate environment, compared to their fixed-rate peers.
What detracted from performance?
Cyclical factor exposure within equities | Exposure to the small size and value factors was a detractor from Fund performance over the time period, as more defensive equity factors such as quality continued to be in demand led by US megacap technology stocks and strong momentum in investor demand for thematic artificial intelligence stocks.
Exposure to core and US Treasury bonds | The Fund's exposure to core and US Treasury bonds was a headwind, as long and moderate duration, as well as higher-grade fixed income, suffered compared to shorter duration, more credit sensitive counterparts. This was due to interest rates moving higher and the steepening of the yield curve that transpired significantly in the second half of the year.
How Has The Fund Historically Performed?
Growth of $10,000 Investment
| AVERAGE ANNUAL TOTAL RETURNS | 1 Year | 5 Years | 10 Years |
| Invesco Select Risk: Moderately Conservative Investor Fund (Class S) | 6.27% | 2.91% | 3.51% |
| Custom Invesco Select Risk: Moderately Conservative Index | 8.89% | 4.49% | 5.08% |
| Bloomberg Global Aggregate USD Hedged Index | 3.40% | 0.48% | 2.01% |
| MSCI ACWI (Net) | 17.49% | 10.06% | 9.23% |
| Bloomberg U.S. Aggregate Bond Index | 1.25% | (0.33)% | 1.35% |
The Custom Invesco Select Risk: Moderately Conservative Index is composed of 40% MSCI ACWI (Net) and 60% Bloomberg Global Aggregate USD Hedged Index.
Effective April 26, 2024, the Fund changed its broad-based securities market benchmark from the Bloomberg Global Aggregate USD Hedged Index to the Bloomberg U.S. Aggregate Bond Index to reflect that the Bloomberg U.S. Aggregate Bond Index can be considered more broadly representative of the overall applicable securities market.
The performance data quoted represents past performance and cannot guarantee future results; current performance may be lower or higher. Please visit invesco.com/performance for more recent performance information.
Performance figures do not reflect deduction of taxes a shareholder would pay on Fund distributions or sale of Fund shares.
What Are Key Statistics About The Fund?
(as of December 31, 2024)
| Fund net assets | $270,729,040 |
| Total number of portfolio holdings | 25 |
| Total advisory fees paid | $0 |
| Portfolio turnover rate | 49% |
What Comprised The Fund's Holdings?
(as of December 31, 2024)
Asset allocation
(% of net assets)
Where Can I Find More Information?
You can find more information about the Fund, including the Fund's prospectus, financial information, and holdings at invesco.com/reports. Additionally, the Fund's proxy voting information can be found at invesco.com/proxy-voting.
What Should I Know About Delivery Of Important Regulatory Documents?
To reduce Fund expenses, only one copy of most shareholder documents may be mailed to shareholders with multiple accounts at the same address (Householding). Mailing of your shareholder documents may be householded indefinitely unless you instruct us otherwise. If you do not want the mailing of these documents to be combined with those for other members of your household, please contact Invesco Investment Services, Inc. at (800) 959-4246 or contact your financial institution. We will begin sending you individual copies for each account within 30 days after receiving your request.
For additional information, please scan the QR code at the left to navigate to additional material at invesco.com/reports.
Invesco Select Risk: Moderately Conservative Investor Fund
Class Y: CAAYX
ANNUAL SHAREHOLDER REPORT | December 31, 2024
This annual shareholder report contains important information about Invesco Select Risk: Moderately Conservative Investor Fund (the “Fund”) for the period January 1, 2024 to December 31, 2024. You can find additional information about the Fund at invesco.com/reports. You can also request this information by contacting us at (800) 959-4246.
What Were The Fund Costs For The Last Year ?
(Based on a hypothetical $10,000 investment)
| Fund (Class) | Costs of a $10,000 investment | Costs paid as a percentage
of a $10,000 investment |
Invesco Select Risk: Moderately Conservative Investor Fund
(Class Y) | $23 | 0.22% |
How Did The Fund Perform During The Period?
• During the fiscal year ended December 31, 2024, global risk assets outperformed defensive assets driven by a favorable macroeconomic environment, the beginning of a global monetary policy easing cycle and greater clarity with respect to fiscal policy following the conclusion of many major elections globally. These macroeconomic tailwinds supported global equity prices, particularly within the US, as well as the continuation of credit spreads tightening to cycle lows within investment grade, high yield and emerging market debt markets. Given this backdrop, an underweight to equities was a headwind to Fund performance, as were factor tilts within equities, as well as allocations within fixed income to core and US Treasury bonds.
• For the fiscal year ended December 31, 2024, Class Y shares of the Fund returned 6.44%. For the same time period, the Custom Invesco Select Risk: Moderately Conservative Index returned 8.89%.
What contributed to performance?
Manager selection within fixed income | Manager selection within fixed income was a contributor to Fund performance, driven by the Invesco Core Bond Fund, Invesco Core Plus Bond Fund and Invesco Variable Rate Investment Grade ETF.
Exposure to high yield and floating rate credit | The Fund's exposure to high yield was beneficial as credit spreads continued to tighten, supported by resilient corporate fundamentals and strong investor demand for higher-coupon bond offerings. Floating rate exposure was rewarded as well, with the securities benefiting from an increasing interest rate environment, compared to their fixed-rate peers.
What detracted from performance?
Cyclical factor exposure within equities | Exposure to the small size and value factors was a detractor from Fund performance over the time period, as more defensive equity factors such as quality continued to be in demand led by US megacap technology stocks and strong momentum in investor demand for thematic artificial intelligence stocks.
Exposure to core and US Treasury bonds | The Fund's exposure to core and US Treasury bonds was a headwind, as long and moderate duration, as well as higher-grade fixed income, suffered compared to shorter duration, more credit sensitive counterparts. This was due to interest rates moving higher and the steepening of the yield curve that transpired significantly in the second half of the year.
How Has The Fund Historically Performed?
Growth of $10,000 Investment
| AVERAGE ANNUAL TOTAL RETURNS | 1 Year | 5 Years | 10 Years |
| Invesco Select Risk: Moderately Conservative Investor Fund (Class Y) | 6.44% | 3.07% | 3.67% |
| Custom Invesco Select Risk: Moderately Conservative Index | 8.89% | 4.49% | 5.08% |
| Bloomberg Global Aggregate USD Hedged Index | 3.40% | 0.48% | 2.01% |
| MSCI ACWI (Net) | 17.49% | 10.06% | 9.23% |
| Bloomberg U.S. Aggregate Bond Index | 1.25% | (0.33)% | 1.35% |
The Custom Invesco Select Risk: Moderately Conservative Index is composed of 40% MSCI ACWI (Net) and 60% Bloomberg Global Aggregate USD Hedged Index.
Effective April 26, 2024, the Fund changed its broad-based securities market benchmark from the Bloomberg Global Aggregate USD Hedged Index to the Bloomberg U.S. Aggregate Bond Index to reflect that the Bloomberg U.S. Aggregate Bond Index can be considered more broadly representative of the overall applicable securities market.
The performance data quoted represents past performance and cannot guarantee future results; current performance may be lower or higher. Please visit invesco.com/performance for more recent performance information.
Performance figures do not reflect deduction of taxes a shareholder would pay on Fund distributions or sale of Fund shares.
What Are Key Statistics About The Fund?
(as of December 31, 2024)
| Fund net assets | $270,729,040 |
| Total number of portfolio holdings | 25 |
| Total advisory fees paid | $0 |
| Portfolio turnover rate | 49% |
What Comprised The Fund's Holdings?
(as of December 31, 2024)
Asset allocation
(% of net assets)
Where Can I Find More Information?
You can find more information about the Fund, including the Fund's prospectus, financial information, and holdings at invesco.com/reports. Additionally, the Fund's proxy voting information can be found at invesco.com/proxy-voting.
What Should I Know About Delivery Of Important Regulatory Documents?
To reduce Fund expenses, only one copy of most shareholder documents may be mailed to shareholders with multiple accounts at the same address (Householding). Mailing of your shareholder documents may be householded indefinitely unless you instruct us otherwise. If you do not want the mailing of these documents to be combined with those for other members of your household, please contact Invesco Investment Services, Inc. at (800) 959-4246 or contact your financial institution. We will begin sending you individual copies for each account within 30 days after receiving your request.
For additional information, please scan the QR code at the left to navigate to additional material at invesco.com/reports.
Invesco Select Risk: Moderately Conservative Investor Fund
Class R5: CMAIX
ANNUAL SHAREHOLDER REPORT | December 31, 2024
This annual shareholder report contains important information about Invesco Select Risk: Moderately Conservative Investor Fund (the “Fund”) for the period January 1, 2024 to December 31, 2024. You can find additional information about the Fund at invesco.com/reports. You can also request this information by contacting us at (800) 959-4246.
This report describes changes to the Fund that occurred during the reporting period.
What Were The Fund Costs For The Last Year ?
(Based on a hypothetical $10,000 investment)
| Fund (Class) | Costs of a $10,000 investment | Costs paid as a percentage
of a $10,000 investment |
Invesco Select Risk: Moderately Conservative Investor Fund
(Class R5) | $20 | 0.19% |
How Did The Fund Perform During The Period?
• During the fiscal year ended December 31, 2024, global risk assets outperformed defensive assets driven by a favorable macroeconomic environment, the beginning of a global monetary policy easing cycle and greater clarity with respect to fiscal policy following the conclusion of many major elections globally. These macroeconomic tailwinds supported global equity prices, particularly within the US, as well as the continuation of credit spreads tightening to cycle lows within investment grade, high yield and emerging market debt markets. Given this backdrop, an underweight to equities was a headwind to Fund performance, as were factor tilts within equities, as well as allocations within fixed income to core and US Treasury bonds.
• For the fiscal year ended December 31, 2024, Class R5 shares of the Fund returned 6.35%. For the same time period, the Custom Invesco Select Risk: Moderately Conservative Index returned 8.89%.
What contributed to performance?
Manager selection within fixed income | Manager selection within fixed income was a contributor to Fund performance, driven by the Invesco Core Bond Fund, Invesco Core Plus Bond Fund and Invesco Variable Rate Investment Grade ETF.
Exposure to high yield and floating rate credit | The Fund's exposure to high yield was beneficial as credit spreads continued to tighten, supported by resilient corporate fundamentals and strong investor demand for higher-coupon bond offerings. Floating rate exposure was rewarded as well, with the securities benefiting from an increasing interest rate environment, compared to their fixed-rate peers.
What detracted from performance?
Cyclical factor exposure within equities | Exposure to the small size and value factors was a detractor from Fund performance over the time period, as more defensive equity factors such as quality continued to be in demand led by US megacap technology stocks and strong momentum in investor demand for thematic artificial intelligence stocks.
Exposure to core and US Treasury bonds | The Fund's exposure to core and US Treasury bonds was a headwind, as long and moderate duration, as well as higher-grade fixed income, suffered compared to shorter duration, more credit sensitive counterparts. This was due to interest rates moving higher and the steepening of the yield curve that transpired significantly in the second half of the year.
How Has The Fund Historically Performed?
Growth of $10,000 Investment
| AVERAGE ANNUAL TOTAL RETURNS | 1 Year | 5 Years | 10 Years |
| Invesco Select Risk: Moderately Conservative Investor Fund (Class R5) | 6.35% | 3.10% | 3.70% |
| Custom Invesco Select Risk: Moderately Conservative Index | 8.89% | 4.49% | 5.08% |
| Bloomberg Global Aggregate USD Hedged Index | 3.40% | 0.48% | 2.01% |
| MSCI ACWI (Net) | 17.49% | 10.06% | 9.23% |
| Bloomberg U.S. Aggregate Bond Index | 1.25% | (0.33)% | 1.35% |
The Custom Invesco Select Risk: Moderately Conservative Index is composed of 40% MSCI ACWI (Net) and 60% Bloomberg Global Aggregate USD Hedged Index.
Effective April 26, 2024, the Fund changed its broad-based securities market benchmark from the Bloomberg Global Aggregate USD Hedged Index to the Bloomberg U.S. Aggregate Bond Index to reflect that the Bloomberg U.S. Aggregate Bond Index can be considered more broadly representative of the overall applicable securities market.
The performance data quoted represents past performance and cannot guarantee future results; current performance may be lower or higher. Please visit invesco.com/performance for more recent performance information.
Performance figures do not reflect deduction of taxes a shareholder would pay on Fund distributions or sale of Fund shares.
What Are Key Statistics About The Fund?
(as of December 31, 2024)
| Fund net assets | $270,729,040 |
| Total number of portfolio holdings | 25 |
| Total advisory fees paid | $0 |
| Portfolio turnover rate | 49% |
What Comprised The Fund's Holdings?
(as of December 31, 2024)
Asset allocation
(% of net assets)
How Has The Fund Changed Over The Past Year?
This is a summary of certain changes to the Fund since December 31, 2023. For more complete information, you may review the Fund's prospectus, which is available at invesco.com/reports or upon request at (800) 959-4246.
Effective after the close of business on September 30, 2024, the Fund has limited public sales of its Class R5 shares to certain investors who were previously invested in Class R5 shares of the Fund.
The Fund's net expense ratio increased from the prior fiscal year end as a result of a change in operating expenses.
Where Can I Find More Information?
You can find more information about the Fund, including the Fund's prospectus, financial information, and holdings at invesco.com/reports. Additionally, the Fund's proxy voting information can be found at invesco.com/proxy-voting.
What Should I Know About Delivery Of Important Regulatory Documents?
To reduce Fund expenses, only one copy of most shareholder documents may be mailed to shareholders with multiple accounts at the same address (Householding). Mailing of your shareholder documents may be householded indefinitely unless you instruct us otherwise. If you do not want the mailing of these documents to be combined with those for other members of your household, please contact Invesco Investment Services, Inc. at (800) 959-4246 or contact your financial institution. We will begin sending you individual copies for each account within 30 days after receiving your request.
For additional information, please scan the QR code at the left to navigate to additional material at invesco.com/reports.
Invesco Select Risk: Moderately Conservative Investor Fund
Class R6: CNSSX
ANNUAL SHAREHOLDER REPORT | December 31, 2024
This annual shareholder report contains important information about Invesco Select Risk: Moderately Conservative Investor Fund (the “Fund”) for the period January 1, 2024 to December 31, 2024. You can find additional information about the Fund at invesco.com/reports. You can also request this information by contacting us at (800) 959-4246.
What Were The Fund Costs For The Last Year ?
(Based on a hypothetical $10,000 investment)
| Fund (Class) | Costs of a $10,000 investment | Costs paid as a percentage
of a $10,000 investment |
Invesco Select Risk: Moderately Conservative Investor Fund
(Class R6) | $12 | 0.12% |
How Did The Fund Perform During The Period?
• During the fiscal year ended December 31, 2024, global risk assets outperformed defensive assets driven by a favorable macroeconomic environment, the beginning of a global monetary policy easing cycle and greater clarity with respect to fiscal policy following the conclusion of many major elections globally. These macroeconomic tailwinds supported global equity prices, particularly within the US, as well as the continuation of credit spreads tightening to cycle lows within investment grade, high yield and emerging market debt markets. Given this backdrop, an underweight to equities was a headwind to Fund performance, as were factor tilts within equities, as well as allocations within fixed income to core and US Treasury bonds.
• For the fiscal year ended December 31, 2024, Class R6 shares of the Fund returned 6.42%. For the same time period, the Custom Invesco Select Risk: Moderately Conservative Index returned 8.89%.
What contributed to performance?
Manager selection within fixed income | Manager selection within fixed income was a contributor to Fund performance, driven by the Invesco Core Bond Fund, Invesco Core Plus Bond Fund and Invesco Variable Rate Investment Grade ETF.
Exposure to high yield and floating rate credit | The Fund's exposure to high yield was beneficial as credit spreads continued to tighten, supported by resilient corporate fundamentals and strong investor demand for higher-coupon bond offerings. Floating rate exposure was rewarded as well, with the securities benefiting from an increasing interest rate environment, compared to their fixed-rate peers.
What detracted from performance?
Cyclical factor exposure within equities | Exposure to the small size and value factors was a detractor from Fund performance over the time period, as more defensive equity factors such as quality continued to be in demand led by US megacap technology stocks and strong momentum in investor demand for thematic artificial intelligence stocks.
Exposure to core and US Treasury bonds | The Fund's exposure to core and US Treasury bonds was a headwind, as long and moderate duration, as well as higher-grade fixed income, suffered compared to shorter duration, more credit sensitive counterparts. This was due to interest rates moving higher and the steepening of the yield curve that transpired significantly in the second half of the year.
How Has The Fund Historically Performed?
Growth of $10,000 Investment
| AVERAGE ANNUAL TOTAL RETURNS | 1 Year | 5 Years | 10 Years |
| Invesco Select Risk: Moderately Conservative Investor Fund (Class R6) | 6.42% | 3.14% | 3.65% |
| Custom Invesco Select Risk: Moderately Conservative Index | 8.89% | 4.49% | 5.08% |
| Bloomberg Global Aggregate USD Hedged Index | 3.40% | 0.48% | 2.01% |
| MSCI ACWI (Net) | 17.49% | 10.06% | 9.23% |
| Bloomberg U.S. Aggregate Bond Index | 1.25% | (0.33)% | 1.35% |
The Custom Invesco Select Risk: Moderately Conservative Index is composed of 40% MSCI ACWI (Net) and 60% Bloomberg Global Aggregate USD Hedged Index.
Class R6 shares incepted on April 4, 2017. Performance shown prior to that date is that of Class A shares at net asset value and includes the 12b-1 fees applicable to Class A shares. Class R6 shares' returns of the Fund will be different from Class A shares' returns of the Fund as they have different expenses.
Effective April 26, 2024, the Fund changed its broad-based securities market benchmark from the Bloomberg Global Aggregate USD Hedged Index to the Bloomberg U.S. Aggregate Bond Index to reflect that the Bloomberg U.S. Aggregate Bond Index can be considered more broadly representative of the overall applicable securities market.
The performance data quoted represents past performance and cannot guarantee future results; current performance may be lower or higher. Please visit invesco.com/performance for more recent performance information.
Performance figures do not reflect deduction of taxes a shareholder would pay on Fund distributions or sale of Fund shares.
What Are Key Statistics About The Fund?
(as of December 31, 2024)
| Fund net assets | $270,729,040 |
| Total number of portfolio holdings | 25 |
| Total advisory fees paid | $0 |
| Portfolio turnover rate | 49% |
What Comprised The Fund's Holdings?
(as of December 31, 2024)
Asset allocation
(% of net assets)
Where Can I Find More Information?
You can find more information about the Fund, including the Fund's prospectus, financial information, and holdings at invesco.com/reports. Additionally, the Fund's proxy voting information can be found at invesco.com/proxy-voting.
What Should I Know About Delivery Of Important Regulatory Documents?
To reduce Fund expenses, only one copy of most shareholder documents may be mailed to shareholders with multiple accounts at the same address (Householding). Mailing of your shareholder documents may be householded indefinitely unless you instruct us otherwise. If you do not want the mailing of these documents to be combined with those for other members of your household, please contact Invesco Investment Services, Inc. at (800) 959-4246 or contact your financial institution. We will begin sending you individual copies for each account within 30 days after receiving your request.
For additional information, please scan the QR code at the left to navigate to additional material at invesco.com/reports.
Invesco Small Cap Growth Fund
Class A: GTSAX
ANNUAL SHAREHOLDER REPORT | December 31, 2024
This annual shareholder report contains important information about Invesco Small Cap Growth Fund (the “Fund”) for the period January 1, 2024 to December 31, 2024. You can find additional information about the Fund at invesco.com/reports. You can also request this information by contacting us at (800) 959-4246.
What Were The Fund Costs For The Last Year ?
(Based on a hypothetical $10,000 investment)
| Fund (Class) | Costs of a $10,000 investment | Costs paid as a percentage
of a $10,000 investment |
Invesco Small Cap Growth Fund
(Class A) | $126 | 1.17% |
How Did The Fund Perform During The Period?
• During the fiscal year ended December 31, 2024, US small cap equities saw improved performance as the US Federal Reserve began easing monetary policy. The Fund outperformed the Russell 2000® Growth Index primarily due to strong stock selection in the health care, consumer discretionary, utilities, financials and energy sectors. An underweight exposure in the health care sector and an overweight exposure in the information technology sector was also beneficial. These results were partially offset by weaker stock selection in the information technology, consumer staples and industrials sectors.
• For the fiscal year ended December 31, 2024, Class A shares of the Fund, excluding sales charge, returned 16.19%. For the same time period, the Russell 2000® Growth Index returned 15.15%.
What contributed to performance?
Natera, Inc. | Natera makes genetic diagnostics and monitoring tests for oncology, organ health and pre-natal testing. The company benefited from momentum in its cancer diagnostic business and effective execution in its pre-natal testing business. We sold the holding during the fiscal year.
Astera Labs, Inc. | Astera Labs provides semiconductor-based connectivity solutions. The company's performance was driven by strong demand for its connectivity solutions in the artificial intelligence and cloud sectors.
Glaukos Corp. | Glaukos makes treatments and diagnostics for glaucoma and other eye disorders. The company reported better than expected revenue and raised guidance due to momentum in its treatment for intraocular pressure.
What detracted from performance?
PACS Group, Inc. | PACS Group is a holding company focused on post-acute health care, assisted living and skilled nursing care services. Operational challenges affected the company’s recent financial results, which we believe caused the stock to sell off.
DoubleVerify Holdings, Inc. | DoubleVerify provides systems to monitor and analyze the effectiveness of digital advertising and e-commerce. The company has experienced headwinds from lower advertisement spending by several major customers. We sold the holding during the fiscal year.
iRhythm Technologies, Inc. | iRhythm Technologies, maker of cardiac rhythm monitoring devices, suffered from regulatory delays. We sold the holding during the fiscal year.
How Has The Fund Historically Performed?
Growth of $10,000 Investment
| AVERAGE ANNUAL TOTAL RETURNS | 1 Year | 5 Years | 10 Years |
| Invesco Small Cap Growth Fund (Class A) —including sales charge | 9.80% | 6.07% | 7.56% |
| Invesco Small Cap Growth Fund (Class A) —excluding sales charge | 16.19% | 7.27% | 8.17% |
| Russell 2000® Growth Index | 15.15% | 6.86% | 8.09% |
| S&P 500® Index | 25.02% | 14.53% | 13.10% |
The performance data quoted represents past performance and cannot guarantee future results; current performance may be lower or higher. Please visit invesco.com/performance for more recent performance information.
Performance figures do not reflect deduction of taxes a shareholder would pay on Fund distributions or sale of Fund shares.
What Are Key Statistics About The Fund?
(as of December 31, 2024)
| Fund net assets | $1,989,930,409 |
| Total number of portfolio holdings | 118 |
| Total advisory fees paid | $14,071,713 |
| Portfolio turnover rate | 55% |
What Comprised The Fund's Holdings?
(as of December 31, 2024)
Top ten holdings*
(% of net assets)
| Astera Labs, Inc. | 1.93% |
| Q2 Holdings, Inc. | 1.49% |
| AAON, Inc. | 1.47% |
| Jefferies Financial Group, Inc. | 1.45% |
| Coherent Corp. | 1.43% |
| TMX Group Ltd. | 1.41% |
| Talen Energy Corp. | 1.34% |
| Clean Harbors, Inc. | 1.33% |
| Glaukos Corp. | 1.31% |
| Pegasystems, Inc. | 1.31% |
| * Excluding money market fund holdings, if any. | |
Sector allocation
(% of net assets)
Where Can I Find More Information?
You can find more information about the Fund, including the Fund's prospectus, financial information, and holdings at invesco.com/reports. Additionally, the Fund's proxy voting information can be found at invesco.com/proxy-voting.
What Should I Know About Delivery Of Important Regulatory Documents?
To reduce Fund expenses, only one copy of most shareholder documents may be mailed to shareholders with multiple accounts at the same address (Householding). Mailing of your shareholder documents may be householded indefinitely unless you instruct us otherwise. If you do not want the mailing of these documents to be combined with those for other members of your household, please contact Invesco Investment Services, Inc. at (800) 959-4246 or contact your financial institution. We will begin sending you individual copies for each account within 30 days after receiving your request.
For additional information, please scan the QR code at the left to navigate to additional material at invesco.com/reports.
Invesco Small Cap Growth Fund
Class C: GTSDX
ANNUAL SHAREHOLDER REPORT | December 31, 2024
This annual shareholder report contains important information about Invesco Small Cap Growth Fund (the “Fund”) for the period January 1, 2024 to December 31, 2024. You can find additional information about the Fund at invesco.com/reports. You can also request this information by contacting us at (800) 959-4246.
What Were The Fund Costs For The Last Year ?
(Based on a hypothetical $10,000 investment)
| Fund (Class) | Costs of a $10,000 investment | Costs paid as a percentage
of a $10,000 investment |
Invesco Small Cap Growth Fund
(Class C) | $198 | 1.84% |
How Did The Fund Perform During The Period?
• During the fiscal year ended December 31, 2024, US small cap equities saw improved performance as the US Federal Reserve began easing monetary policy. The Fund outperformed the Russell 2000® Growth Index primarily due to strong stock selection in the health care, consumer discretionary, utilities, financials and energy sectors. An underweight exposure in the health care sector and an overweight exposure in the information technology sector was also beneficial. These results were partially offset by weaker stock selection in the information technology, consumer staples and industrials sectors.
• For the fiscal year ended December 31, 2024, Class C shares of the Fund, excluding sales charge, returned 15.37%. For the same time period, the Russell 2000® Growth Index returned 15.15%.
What contributed to performance?
Natera, Inc. | Natera makes genetic diagnostics and monitoring tests for oncology, organ health and pre-natal testing. The company benefited from momentum in its cancer diagnostic business and effective execution in its pre-natal testing business. We sold the holding during the fiscal year.
Astera Labs, Inc. | Astera Labs provides semiconductor-based connectivity solutions. The company's performance was driven by strong demand for its connectivity solutions in the artificial intelligence and cloud sectors.
Glaukos Corp. | Glaukos makes treatments and diagnostics for glaucoma and other eye disorders. The company reported better than expected revenue and raised guidance due to momentum in its treatment for intraocular pressure.
What detracted from performance?
PACS Group, Inc. | PACS Group is a holding company focused on post-acute health care, assisted living and skilled nursing care services. Operational challenges affected the company’s recent financial results, which we believe caused the stock to sell off.
DoubleVerify Holdings, Inc. | DoubleVerify provides systems to monitor and analyze the effectiveness of digital advertising and e-commerce. The company has experienced headwinds from lower advertisement spending by several major customers. We sold the holding during the fiscal year.
iRhythm Technologies, Inc. | iRhythm Technologies, maker of cardiac rhythm monitoring devices, suffered from regulatory delays. We sold the holding during the fiscal year.
How Has The Fund Historically Performed?
Growth of $10,000 Investment
| AVERAGE ANNUAL TOTAL RETURNS | 1 Year | 5 Years | 10 Years |
| Invesco Small Cap Growth Fund (Class C) —including sales charge | 14.37% | 6.51% | 7.53% |
| Invesco Small Cap Growth Fund (Class C) —excluding sales charge | 15.37% | 6.51% | 7.53% |
| Russell 2000® Growth Index | 15.15% | 6.86% | 8.09% |
| S&P 500® Index | 25.02% | 14.53% | 13.10% |
The performance data quoted represents past performance and cannot guarantee future results; current performance may be lower or higher. Please visit invesco.com/performance for more recent performance information.
Performance figures do not reflect deduction of taxes a shareholder would pay on Fund distributions or sale of Fund shares.
What Are Key Statistics About The Fund?
(as of December 31, 2024)
| Fund net assets | $1,989,930,409 |
| Total number of portfolio holdings | 118 |
| Total advisory fees paid | $14,071,713 |
| Portfolio turnover rate | 55% |
What Comprised The Fund's Holdings?
(as of December 31, 2024)
Top ten holdings*
(% of net assets)
| Astera Labs, Inc. | 1.93% |
| Q2 Holdings, Inc. | 1.49% |
| AAON, Inc. | 1.47% |
| Jefferies Financial Group, Inc. | 1.45% |
| Coherent Corp. | 1.43% |
| TMX Group Ltd. | 1.41% |
| Talen Energy Corp. | 1.34% |
| Clean Harbors, Inc. | 1.33% |
| Glaukos Corp. | 1.31% |
| Pegasystems, Inc. | 1.31% |
| * Excluding money market fund holdings, if any. | |
Sector allocation
(% of net assets)
Where Can I Find More Information?
You can find more information about the Fund, including the Fund's prospectus, financial information, and holdings at invesco.com/reports. Additionally, the Fund's proxy voting information can be found at invesco.com/proxy-voting.
What Should I Know About Delivery Of Important Regulatory Documents?
To reduce Fund expenses, only one copy of most shareholder documents may be mailed to shareholders with multiple accounts at the same address (Householding). Mailing of your shareholder documents may be householded indefinitely unless you instruct us otherwise. If you do not want the mailing of these documents to be combined with those for other members of your household, please contact Invesco Investment Services, Inc. at (800) 959-4246 or contact your financial institution. We will begin sending you individual copies for each account within 30 days after receiving your request.
For additional information, please scan the QR code at the left to navigate to additional material at invesco.com/reports.
Invesco Small Cap Growth Fund
Class R: GTSRX
ANNUAL SHAREHOLDER REPORT | December 31, 2024
This annual shareholder report contains important information about Invesco Small Cap Growth Fund (the “Fund”) for the period January 1, 2024 to December 31, 2024. You can find additional information about the Fund at invesco.com/reports. You can also request this information by contacting us at (800) 959-4246.
What Were The Fund Costs For The Last Year ?
(Based on a hypothetical $10,000 investment)
| Fund (Class) | Costs of a $10,000 investment | Costs paid as a percentage
of a $10,000 investment |
Invesco Small Cap Growth Fund
(Class R) | $153 | 1.42% |
How Did The Fund Perform During The Period?
• During the fiscal year ended December 31, 2024, US small cap equities saw improved performance as the US Federal Reserve began easing monetary policy. The Fund outperformed the Russell 2000® Growth Index primarily due to strong stock selection in the health care, consumer discretionary, utilities, financials and energy sectors. An underweight exposure in the health care sector and an overweight exposure in the information technology sector was also beneficial. These results were partially offset by weaker stock selection in the information technology, consumer staples and industrials sectors.
• For the fiscal year ended December 31, 2024, Class R shares of the Fund returned 15.88%. For the same time period, the Russell 2000® Growth Index returned 15.15%.
What contributed to performance?
Natera, Inc. | Natera makes genetic diagnostics and monitoring tests for oncology, organ health and pre-natal testing. The company benefited from momentum in its cancer diagnostic business and effective execution in its pre-natal testing business. We sold the holding during the fiscal year.
Astera Labs, Inc. | Astera Labs provides semiconductor-based connectivity solutions. The company's performance was driven by strong demand for its connectivity solutions in the artificial intelligence and cloud sectors.
Glaukos Corp. | Glaukos makes treatments and diagnostics for glaucoma and other eye disorders. The company reported better than expected revenue and raised guidance due to momentum in its treatment for intraocular pressure.
What detracted from performance?
PACS Group, Inc. | PACS Group is a holding company focused on post-acute health care, assisted living and skilled nursing care services. Operational challenges affected the company’s recent financial results, which we believe caused the stock to sell off.
DoubleVerify Holdings, Inc. | DoubleVerify provides systems to monitor and analyze the effectiveness of digital advertising and e-commerce. The company has experienced headwinds from lower advertisement spending by several major customers. We sold the holding during the fiscal year.
iRhythm Technologies, Inc. | iRhythm Technologies, maker of cardiac rhythm monitoring devices, suffered from regulatory delays. We sold the holding during the fiscal year.
How Has The Fund Historically Performed?
Growth of $10,000 Investment
| AVERAGE ANNUAL TOTAL RETURNS | 1 Year | 5 Years | 10 Years |
| Invesco Small Cap Growth Fund (Class R) | 15.88% | 7.00% | 7.89% |
| Russell 2000® Growth Index | 15.15% | 6.86% | 8.09% |
| S&P 500® Index | 25.02% | 14.53% | 13.10% |
The performance data quoted represents past performance and cannot guarantee future results; current performance may be lower or higher. Please visit invesco.com/performance for more recent performance information.
Performance figures do not reflect deduction of taxes a shareholder would pay on Fund distributions or sale of Fund shares.
What Are Key Statistics About The Fund?
(as of December 31, 2024)
| Fund net assets | $1,989,930,409 |
| Total number of portfolio holdings | 118 |
| Total advisory fees paid | $14,071,713 |
| Portfolio turnover rate | 55% |
What Comprised The Fund's Holdings?
(as of December 31, 2024)
Top ten holdings*
(% of net assets)
| Astera Labs, Inc. | 1.93% |
| Q2 Holdings, Inc. | 1.49% |
| AAON, Inc. | 1.47% |
| Jefferies Financial Group, Inc. | 1.45% |
| Coherent Corp. | 1.43% |
| TMX Group Ltd. | 1.41% |
| Talen Energy Corp. | 1.34% |
| Clean Harbors, Inc. | 1.33% |
| Glaukos Corp. | 1.31% |
| Pegasystems, Inc. | 1.31% |
| * Excluding money market fund holdings, if any. | |
Sector allocation
(% of net assets)
Where Can I Find More Information?
You can find more information about the Fund, including the Fund's prospectus, financial information, and holdings at invesco.com/reports. Additionally, the Fund's proxy voting information can be found at invesco.com/proxy-voting.
What Should I Know About Delivery Of Important Regulatory Documents?
To reduce Fund expenses, only one copy of most shareholder documents may be mailed to shareholders with multiple accounts at the same address (Householding). Mailing of your shareholder documents may be householded indefinitely unless you instruct us otherwise. If you do not want the mailing of these documents to be combined with those for other members of your household, please contact Invesco Investment Services, Inc. at (800) 959-4246 or contact your financial institution. We will begin sending you individual copies for each account within 30 days after receiving your request.
For additional information, please scan the QR code at the left to navigate to additional material at invesco.com/reports.
Invesco Small Cap Growth Fund
Class Y: GTSYX
ANNUAL SHAREHOLDER REPORT | December 31, 2024
This annual shareholder report contains important information about Invesco Small Cap Growth Fund (the “Fund”) for the period January 1, 2024 to December 31, 2024. You can find additional information about the Fund at invesco.com/reports. You can also request this information by contacting us at (800) 959-4246.
What Were The Fund Costs For The Last Year ?
(Based on a hypothetical $10,000 investment)
| Fund (Class) | Costs of a $10,000 investment | Costs paid as a percentage
of a $10,000 investment |
Invesco Small Cap Growth Fund
(Class Y) | $100 | 0.92% |
How Did The Fund Perform During The Period?
• During the fiscal year ended December 31, 2024, US small cap equities saw improved performance as the US Federal Reserve began easing monetary policy. The Fund outperformed the Russell 2000® Growth Index primarily due to strong stock selection in the health care, consumer discretionary, utilities, financials and energy sectors. An underweight exposure in the health care sector and an overweight exposure in the information technology sector was also beneficial. These results were partially offset by weaker stock selection in the information technology, consumer staples and industrials sectors.
• For the fiscal year ended December 31, 2024, Class Y shares of the Fund returned 16.49%. For the same time period, the Russell 2000® Growth Index returned 15.15%.
What contributed to performance?
Natera, Inc. | Natera makes genetic diagnostics and monitoring tests for oncology, organ health and pre-natal testing. The company benefited from momentum in its cancer diagnostic business and effective execution in its pre-natal testing business. We sold the holding during the fiscal year.
Astera Labs, Inc. | Astera Labs provides semiconductor-based connectivity solutions. The company's performance was driven by strong demand for its connectivity solutions in the artificial intelligence and cloud sectors.
Glaukos Corp. | Glaukos makes treatments and diagnostics for glaucoma and other eye disorders. The company reported better than expected revenue and raised guidance due to momentum in its treatment for intraocular pressure.
What detracted from performance?
PACS Group, Inc. | PACS Group is a holding company focused on post-acute health care, assisted living and skilled nursing care services. Operational challenges affected the company’s recent financial results, which we believe caused the stock to sell off.
DoubleVerify Holdings, Inc. | DoubleVerify provides systems to monitor and analyze the effectiveness of digital advertising and e-commerce. The company has experienced headwinds from lower advertisement spending by several major customers. We sold the holding during the fiscal year.
iRhythm Technologies, Inc. | iRhythm Technologies, maker of cardiac rhythm monitoring devices, suffered from regulatory delays. We sold the holding during the fiscal year.
How Has The Fund Historically Performed?
Growth of $10,000 Investment
| AVERAGE ANNUAL TOTAL RETURNS | 1 Year | 5 Years | 10 Years |
| Invesco Small Cap Growth Fund (Class Y) | 16.49% | 7.54% | 8.43% |
| Russell 2000® Growth Index | 15.15% | 6.86% | 8.09% |
| S&P 500® Index | 25.02% | 14.53% | 13.10% |
The performance data quoted represents past performance and cannot guarantee future results; current performance may be lower or higher. Please visit invesco.com/performance for more recent performance information.
Performance figures do not reflect deduction of taxes a shareholder would pay on Fund distributions or sale of Fund shares.
What Are Key Statistics About The Fund?
(as of December 31, 2024)
| Fund net assets | $1,989,930,409 |
| Total number of portfolio holdings | 118 |
| Total advisory fees paid | $14,071,713 |
| Portfolio turnover rate | 55% |
What Comprised The Fund's Holdings?
(as of December 31, 2024)
Top ten holdings*
(% of net assets)
| Astera Labs, Inc. | 1.93% |
| Q2 Holdings, Inc. | 1.49% |
| AAON, Inc. | 1.47% |
| Jefferies Financial Group, Inc. | 1.45% |
| Coherent Corp. | 1.43% |
| TMX Group Ltd. | 1.41% |
| Talen Energy Corp. | 1.34% |
| Clean Harbors, Inc. | 1.33% |
| Glaukos Corp. | 1.31% |
| Pegasystems, Inc. | 1.31% |
| * Excluding money market fund holdings, if any. | |
Sector allocation
(% of net assets)
Where Can I Find More Information?
You can find more information about the Fund, including the Fund's prospectus, financial information, and holdings at invesco.com/reports. Additionally, the Fund's proxy voting information can be found at invesco.com/proxy-voting.
What Should I Know About Delivery Of Important Regulatory Documents?
To reduce Fund expenses, only one copy of most shareholder documents may be mailed to shareholders with multiple accounts at the same address (Householding). Mailing of your shareholder documents may be householded indefinitely unless you instruct us otherwise. If you do not want the mailing of these documents to be combined with those for other members of your household, please contact Invesco Investment Services, Inc. at (800) 959-4246 or contact your financial institution. We will begin sending you individual copies for each account within 30 days after receiving your request.
For additional information, please scan the QR code at the left to navigate to additional material at invesco.com/reports.
Invesco Small Cap Growth Fund
Investor Class: GTSIX
ANNUAL SHAREHOLDER REPORT | December 31, 2024
This annual shareholder report contains important information about Invesco Small Cap Growth Fund (the “Fund”) for the period January 1, 2024 to December 31, 2024. You can find additional information about the Fund at invesco.com/reports. You can also request this information by contacting us at (800) 959-4246.
What Were The Fund Costs For The Last Year ?
(Based on a hypothetical $10,000 investment)
| Fund (Class) | Costs of a $10,000 investment | Costs paid as a percentage
of a $10,000 investment |
Invesco Small Cap Growth Fund
(Investor Class) | $123 | 1.14% |
How Did The Fund Perform During The Period?
• During the fiscal year ended December 31, 2024, US small cap equities saw improved performance as the US Federal Reserve began easing monetary policy. The Fund outperformed the Russell 2000® Growth Index primarily due to strong stock selection in the health care, consumer discretionary, utilities, financials and energy sectors. An underweight exposure in the health care sector and an overweight exposure in the information technology sector was also beneficial. These results were partially offset by weaker stock selection in the information technology, consumer staples and industrials sectors.
• For the fiscal year ended December 31, 2024, Investor Class shares of the Fund returned 16.24%. For the same time period, the Russell 2000® Growth Index returned 15.15%.
What contributed to performance?
Natera, Inc. | Natera makes genetic diagnostics and monitoring tests for oncology, organ health and pre-natal testing. The company benefited from momentum in its cancer diagnostic business and effective execution in its pre-natal testing business. We sold the holding during the fiscal year.
Astera Labs, Inc. | Astera Labs provides semiconductor-based connectivity solutions. The company's performance was driven by strong demand for its connectivity solutions in the artificial intelligence and cloud sectors.
Glaukos Corp. | Glaukos makes treatments and diagnostics for glaucoma and other eye disorders. The company reported better than expected revenue and raised guidance due to momentum in its treatment for intraocular pressure.
What detracted from performance?
PACS Group, Inc. | PACS Group is a holding company focused on post-acute health care, assisted living and skilled nursing care services. Operational challenges affected the company’s recent financial results, which we believe caused the stock to sell off.
DoubleVerify Holdings, Inc. | DoubleVerify provides systems to monitor and analyze the effectiveness of digital advertising and e-commerce. The company has experienced headwinds from lower advertisement spending by several major customers. We sold the holding during the fiscal year.
iRhythm Technologies, Inc. | iRhythm Technologies, maker of cardiac rhythm monitoring devices, suffered from regulatory delays. We sold the holding during the fiscal year.
How Has The Fund Historically Performed?
Growth of $10,000 Investment
| AVERAGE ANNUAL TOTAL RETURNS | 1 Year | 5 Years | 10 Years |
| Invesco Small Cap Growth Fund (Investor Class) | 16.24% | 7.34% | 8.21% |
| Russell 2000® Growth Index | 15.15% | 6.86% | 8.09% |
| S&P 500® Index | 25.02% | 14.53% | 13.10% |
The performance data quoted represents past performance and cannot guarantee future results; current performance may be lower or higher. Please visit invesco.com/performance for more recent performance information.
Performance figures do not reflect deduction of taxes a shareholder would pay on Fund distributions or sale of Fund shares.
What Are Key Statistics About The Fund?
(as of December 31, 2024)
| Fund net assets | $1,989,930,409 |
| Total number of portfolio holdings | 118 |
| Total advisory fees paid | $14,071,713 |
| Portfolio turnover rate | 55% |
What Comprised The Fund's Holdings?
(as of December 31, 2024)
Top ten holdings*
(% of net assets)
| Astera Labs, Inc. | 1.93% |
| Q2 Holdings, Inc. | 1.49% |
| AAON, Inc. | 1.47% |
| Jefferies Financial Group, Inc. | 1.45% |
| Coherent Corp. | 1.43% |
| TMX Group Ltd. | 1.41% |
| Talen Energy Corp. | 1.34% |
| Clean Harbors, Inc. | 1.33% |
| Glaukos Corp. | 1.31% |
| Pegasystems, Inc. | 1.31% |
| * Excluding money market fund holdings, if any. | |
Sector allocation
(% of net assets)
Where Can I Find More Information?
You can find more information about the Fund, including the Fund's prospectus, financial information, and holdings at invesco.com/reports. Additionally, the Fund's proxy voting information can be found at invesco.com/proxy-voting.
What Should I Know About Delivery Of Important Regulatory Documents?
To reduce Fund expenses, only one copy of most shareholder documents may be mailed to shareholders with multiple accounts at the same address (Householding). Mailing of your shareholder documents may be householded indefinitely unless you instruct us otherwise. If you do not want the mailing of these documents to be combined with those for other members of your household, please contact Invesco Investment Services, Inc. at (800) 959-4246 or contact your financial institution. We will begin sending you individual copies for each account within 30 days after receiving your request.
For additional information, please scan the QR code at the left to navigate to additional material at invesco.com/reports.
Invesco Small Cap Growth Fund
Class R5: GTSVX
ANNUAL SHAREHOLDER REPORT | December 31, 2024
This annual shareholder report contains important information about Invesco Small Cap Growth Fund (the “Fund”) for the period January 1, 2024 to December 31, 2024. You can find additional information about the Fund at invesco.com/reports. You can also request this information by contacting us at (800) 959-4246.
What Were The Fund Costs For The Last Year ?
(Based on a hypothetical $10,000 investment)
| Fund (Class) | Costs of a $10,000 investment | Costs paid as a percentage
of a $10,000 investment |
Invesco Small Cap Growth Fund
(Class R5) | $89 | 0.82% |
How Did The Fund Perform During The Period?
• During the fiscal year ended December 31, 2024, US small cap equities saw improved performance as the US Federal Reserve began easing monetary policy. The Fund outperformed the Russell 2000® Growth Index primarily due to strong stock selection in the health care, consumer discretionary, utilities, financials and energy sectors. An underweight exposure in the health care sector and an overweight exposure in the information technology sector was also beneficial. These results were partially offset by weaker stock selection in the information technology, consumer staples and industrials sectors.
• For the fiscal year ended December 31, 2024, Class R5 shares of the Fund returned 16.61%. For the same time period, the Russell 2000® Growth Index returned 15.15%.
What contributed to performance?
Natera, Inc. | Natera makes genetic diagnostics and monitoring tests for oncology, organ health and pre-natal testing. The company benefited from momentum in its cancer diagnostic business and effective execution in its pre-natal testing business. We sold the holding during the fiscal year.
Astera Labs, Inc. | Astera Labs provides semiconductor-based connectivity solutions. The company's performance was driven by strong demand for its connectivity solutions in the artificial intelligence and cloud sectors.
Glaukos Corp. | Glaukos makes treatments and diagnostics for glaucoma and other eye disorders. The company reported better than expected revenue and raised guidance due to momentum in its treatment for intraocular pressure.
What detracted from performance?
PACS Group, Inc. | PACS Group is a holding company focused on post-acute health care, assisted living and skilled nursing care services. Operational challenges affected the company’s recent financial results, which we believe caused the stock to sell off.
DoubleVerify Holdings, Inc. | DoubleVerify provides systems to monitor and analyze the effectiveness of digital advertising and e-commerce. The company has experienced headwinds from lower advertisement spending by several major customers. We sold the holding during the fiscal year.
iRhythm Technologies, Inc. | iRhythm Technologies, maker of cardiac rhythm monitoring devices, suffered from regulatory delays. We sold the holding during the fiscal year.
How Has The Fund Historically Performed?
Growth of $10,000 Investment
| AVERAGE ANNUAL TOTAL RETURNS | 1 Year | 5 Years | 10 Years |
| Invesco Small Cap Growth Fund (Class R5) | 16.61% | 7.65% | 8.56% |
| Russell 2000® Growth Index | 15.15% | 6.86% | 8.09% |
| S&P 500® Index | 25.02% | 14.53% | 13.10% |
The performance data quoted represents past performance and cannot guarantee future results; current performance may be lower or higher. Please visit invesco.com/performance for more recent performance information.
Performance figures do not reflect deduction of taxes a shareholder would pay on Fund distributions or sale of Fund shares.
What Are Key Statistics About The Fund?
(as of December 31, 2024)
| Fund net assets | $1,989,930,409 |
| Total number of portfolio holdings | 118 |
| Total advisory fees paid | $14,071,713 |
| Portfolio turnover rate | 55% |
What Comprised The Fund's Holdings?
(as of December 31, 2024)
Top ten holdings*
(% of net assets)
| Astera Labs, Inc. | 1.93% |
| Q2 Holdings, Inc. | 1.49% |
| AAON, Inc. | 1.47% |
| Jefferies Financial Group, Inc. | 1.45% |
| Coherent Corp. | 1.43% |
| TMX Group Ltd. | 1.41% |
| Talen Energy Corp. | 1.34% |
| Clean Harbors, Inc. | 1.33% |
| Glaukos Corp. | 1.31% |
| Pegasystems, Inc. | 1.31% |
| * Excluding money market fund holdings, if any. | |
Sector allocation
(% of net assets)
Where Can I Find More Information?
You can find more information about the Fund, including the Fund's prospectus, financial information, and holdings at invesco.com/reports. Additionally, the Fund's proxy voting information can be found at invesco.com/proxy-voting.
What Should I Know About Delivery Of Important Regulatory Documents?
To reduce Fund expenses, only one copy of most shareholder documents may be mailed to shareholders with multiple accounts at the same address (Householding). Mailing of your shareholder documents may be householded indefinitely unless you instruct us otherwise. If you do not want the mailing of these documents to be combined with those for other members of your household, please contact Invesco Investment Services, Inc. at (800) 959-4246 or contact your financial institution. We will begin sending you individual copies for each account within 30 days after receiving your request.
For additional information, please scan the QR code at the left to navigate to additional material at invesco.com/reports.
Invesco Small Cap Growth Fund
Class R6: GTSFX
ANNUAL SHAREHOLDER REPORT | December 31, 2024
This annual shareholder report contains important information about Invesco Small Cap Growth Fund (the “Fund”) for the period January 1, 2024 to December 31, 2024. You can find additional information about the Fund at invesco.com/reports. You can also request this information by contacting us at (800) 959-4246.
What Were The Fund Costs For The Last Year ?
(Based on a hypothetical $10,000 investment)
| Fund (Class) | Costs of a $10,000 investment | Costs paid as a percentage
of a $10,000 investment |
Invesco Small Cap Growth Fund
(Class R6) | $82 | 0.76% |
How Did The Fund Perform During The Period?
• During the fiscal year ended December 31, 2024, US small cap equities saw improved performance as the US Federal Reserve began easing monetary policy. The Fund outperformed the Russell 2000® Growth Index primarily due to strong stock selection in the health care, consumer discretionary, utilities, financials and energy sectors. An underweight exposure in the health care sector and an overweight exposure in the information technology sector was also beneficial. These results were partially offset by weaker stock selection in the information technology, consumer staples and industrials sectors.
• For the fiscal year ended December 31, 2024, Class R6 shares of the Fund returned 16.66%. For the same time period, the Russell 2000® Growth Index returned 15.15%.
What contributed to performance?
Natera, Inc. | Natera makes genetic diagnostics and monitoring tests for oncology, organ health and pre-natal testing. The company benefited from momentum in its cancer diagnostic business and effective execution in its pre-natal testing business. We sold the holding during the fiscal year.
Astera Labs, Inc. | Astera Labs provides semiconductor-based connectivity solutions. The company's performance was driven by strong demand for its connectivity solutions in the artificial intelligence and cloud sectors.
Glaukos Corp. | Glaukos makes treatments and diagnostics for glaucoma and other eye disorders. The company reported better than expected revenue and raised guidance due to momentum in its treatment for intraocular pressure.
What detracted from performance?
PACS Group, Inc. | PACS Group is a holding company focused on post-acute health care, assisted living and skilled nursing care services. Operational challenges affected the company’s recent financial results, which we believe caused the stock to sell off.
DoubleVerify Holdings, Inc. | DoubleVerify provides systems to monitor and analyze the effectiveness of digital advertising and e-commerce. The company has experienced headwinds from lower advertisement spending by several major customers. We sold the holding during the fiscal year.
iRhythm Technologies, Inc. | iRhythm Technologies, maker of cardiac rhythm monitoring devices, suffered from regulatory delays. We sold the holding during the fiscal year.
How Has The Fund Historically Performed?
Growth of $10,000 Investment
| AVERAGE ANNUAL TOTAL RETURNS | 1 Year | 5 Years | 10 Years |
| Invesco Small Cap Growth Fund (Class R6) | 16.66% | 7.73% | 8.65% |
| Russell 2000® Growth Index | 15.15% | 6.86% | 8.09% |
| S&P 500® Index | 25.02% | 14.53% | 13.10% |
The performance data quoted represents past performance and cannot guarantee future results; current performance may be lower or higher. Please visit invesco.com/performance for more recent performance information.
Performance figures do not reflect deduction of taxes a shareholder would pay on Fund distributions or sale of Fund shares.
What Are Key Statistics About The Fund?
(as of December 31, 2024)
| Fund net assets | $1,989,930,409 |
| Total number of portfolio holdings | 118 |
| Total advisory fees paid | $14,071,713 |
| Portfolio turnover rate | 55% |
What Comprised The Fund's Holdings?
(as of December 31, 2024)
Top ten holdings*
(% of net assets)
| Astera Labs, Inc. | 1.93% |
| Q2 Holdings, Inc. | 1.49% |
| AAON, Inc. | 1.47% |
| Jefferies Financial Group, Inc. | 1.45% |
| Coherent Corp. | 1.43% |
| TMX Group Ltd. | 1.41% |
| Talen Energy Corp. | 1.34% |
| Clean Harbors, Inc. | 1.33% |
| Glaukos Corp. | 1.31% |
| Pegasystems, Inc. | 1.31% |
| * Excluding money market fund holdings, if any. | |
Sector allocation
(% of net assets)
Where Can I Find More Information?
You can find more information about the Fund, including the Fund's prospectus, financial information, and holdings at invesco.com/reports. Additionally, the Fund's proxy voting information can be found at invesco.com/proxy-voting.
What Should I Know About Delivery Of Important Regulatory Documents?
To reduce Fund expenses, only one copy of most shareholder documents may be mailed to shareholders with multiple accounts at the same address (Householding). Mailing of your shareholder documents may be householded indefinitely unless you instruct us otherwise. If you do not want the mailing of these documents to be combined with those for other members of your household, please contact Invesco Investment Services, Inc. at (800) 959-4246 or contact your financial institution. We will begin sending you individual copies for each account within 30 days after receiving your request.
For additional information, please scan the QR code at the left to navigate to additional material at invesco.com/reports.
The Registrant has adopted a Code of Ethics (the "Code") that applies to the Registrant's Principal Executive Officer ("PEO") and Principal Financial Officer ("PFO"). This Code is filed as an exhibit to this report on Form N-CSR under Item 19(a)(1). No substantive amendments to this Code were made during the reporting period. The Code was revised to include PEOs and PFOs of certain Invesco exchange traded funds, previously covered by a separate code of ethics. There were no waivers for the fiscal year ended December 31, 2024.
Item 3. Audit Committee Financial Expert.
The Board of Trustees has determined that the Registrant has at least one audit committee financial expert serving on its Audit Committee. The Audit Committee financial expert is Anthony J. LaCava, Jr. Anthony J. LaCava, Jr. is "independent" within the meaning of that term as used in Form N-CSR.
Item 4. Principal Accountant Fees and Services.
(a) to (d)
Fees Billed by PwC Related to the Registrant
PricewaterhouseCoopers LLP (“PwC”), the Registrant’s independent registered public accounting firm, billed the Registrant aggregate fees for services rendered to the Registrant for the last two fiscal years as shown in the following table. The Audit Committee pre-approved all audit and non-audit services provided to the Registrant.
| | | |
| Fees Billed by PwC for Services Rendered to the Registrant for Fiscal Year Ended 2024 | Fees Billed by PwC for Services Rendered to the Registrant for Fiscal Year Ended 2023 |
| | |
Audit Fees | $ 391,243 | $ 365,666 |
Audit-Related Fees | $ 0 | $ 0 |
Tax Fees(1) | $ 227,101 | $ 252,121 |
All Other Fees | $ 0 | $ 0 |
Total Fees | $ 618,344 | $ 617,787 |
(1) | Tax Fees for the fiscal years ended 2024 and 2023 includes fees billed for preparation of U.S. Tax Returns and Taxable Income calculations, including excise tax and year-to-date estimates for various book-to-tax differences. |
Fees Billed by PwC Related to Invesco and Affiliates
PwC billed Invesco Advisers, Inc. (“Invesco”), the Registrant’s investment adviser, and any entity controlling, controlled by or under common control with Invesco that provides ongoing services to the Registrant (“Affiliates”) aggregate fees for pre-approved non-audit services rendered to Invesco and Affiliates for the last two fiscal years as shown in the following table. The Audit Committee pre-approved all non-audit services provided to Invesco and Affiliates that were required to be pre-approved.
| | | |
| Fees Billed for Non- Audit Services Rendered to Invesco and Affiliates for Fiscal Year Ended 2024 That Were Required to be Pre-Approved by the Registrant’s Audit Committee | Fees Billed for Non- Audit Services Rendered to Invesco and Affiliates for Fiscal Year Ended 2023 That Were Required to be Pre-Approved by the Registrant’s Audit Committee |
Audit-Related Fees(1) | $ 1,141,000 | $ 1,094,000 |
Tax Fees | $ 0 | $ 0 |
All Other Fees | $ 0 | $ 0 |
Total Fees | $ 1,141,000 | $ 1,094,000 |
(1) Audit-Related Fees for the fiscal years ended 2024 and 2023 include fees billed related to reviewing controls at a service organization.
(e)(1)
PRE-APPROVAL OF AUDIT AND NON-AUDIT SERVICES
POLICIES AND PROCEDURES
As adopted by the Audit Committees
of the Invesco Funds (the “Funds”)
Last Amended March 29, 2017
I. | Statement of Principles |
The Audit Committees (the “Audit Committee”) of the Boards of Trustees of the Funds (the “Board”) have adopted these policies and procedures (the “Procedures”) with respect to the pre-approval of audit and non-audit services to be provided by the Funds’ independent auditor (the “Auditor”) to the Funds, and to the Funds’ investment adviser(s) and any entity controlling, controlled by, or under common control with the investment adviser(s) that provides ongoing services to the Funds (collectively, “Service Affiliates”).
Under Section 202 of the Sarbanes-Oxley Act of 2002, all audit and non-audit services provided to the Funds by the Auditor must be preapproved by the Audit Committee. Rule 2-01 of Regulation S-X requires that the Audit Committee also pre-approve a Service Affiliate’s engagement of the Auditor for non-audit services if the engagement relates directly to the operations and financial reporting of the Funds (a “Service Affiliate’s Covered Engagement”).
These Procedures set forth the procedures and the conditions pursuant to which the Audit Committee may pre-approve audit and non-audit services for the Funds and a Service Affiliate’s Covered Engagement pursuant to rules and regulations of the Securities and Exchange Commission (“SEC”) and other organizations and regulatory bodies applicable to the Funds (“Applicable Rules”).1 They address both general pre-approvals without consideration of specific case-by-case services (“general pre-approvals”) and pre-approvals on a case-by-case basis (“specific pre-approvals”). Any services requiring pre-approval that are not within the scope of general pre-approvals hereunder are subject to specific pre-approval. These Procedures also address the delegation by the Audit Committee of pre-approval authority to the Audit Committee Chair or Vice Chair.
II. | Pre-Approval of Fund Audit Services |
The annual Fund audit services engagement, including terms and fees, is subject to specific pre-approval by the Audit Committee. Audit services include the annual financial statement audit and other procedures required to be performed by an independent auditor to be able to form an opinion on the Funds’ financial statements. The Audit Committee will receive, review and consider sufficient information concerning a proposed Fund audit engagement to make a reasonable evaluation of the Auditor’s qualifications and independence. The Audit Committee will oversee the Fund audit services engagement as necessary, including approving any changes in terms, audit scope, conditions and fees.
In addition to approving the Fund audit services engagement at least annually and specifically approving any changes, the Audit Committee may generally or specifically pre-approve engagements for other audit services, which are those services that only an independent auditor reasonably can provide. Other audit services may include services associated with SEC registration statements, periodic reports and other documents filed with the SEC.
III. | General and Specific Pre-Approval of Non-Audit Fund Services |
The Audit Committee will consider, at least annually, the list of General Pre-Approved Non-Audit Services which list may be terminated or modified at any time by the Audit Committee. To inform the Audit Committee’s review and approval of General Pre-Approved Non-Audit Services, the Funds’ Treasurer (or his or her designee) and Auditor shall provide such information regarding independence or other matters as the Audit Committee may request.
Any services or fee ranges that are not within the scope of General Pre-Approved Non-Audit Services have not received general pre-approval and require specific pre-approval. Each request for specific pre-approval by the Audit Committee for services to be provided by the Auditor to the Funds must be submitted to the Audit Committee by the Funds’ Treasurer (or his or her designee) and must include detailed information about the services to be provided, the fees or fee ranges to be charged, and other relevant information sufficient to allow the Audit Committee to consider whether to pre-approve such engagement, including evaluating whether the provision of such services will impair the independence of the Auditor and is otherwise consistent with Applicable Rules.
IV. | Non-Audit Service Types |
The Audit Committee may provide either general or specific pre-approval of audit-related, tax or other services, each as described in more detail below.
“Audit-related services” are assurance and related services that are reasonably related to the performance of the audit or review of the Fund’s financial statements or that are traditionally performed by an independent auditor. Audit-related services include, among others, accounting consultations related to accounting, financial reporting or disclosure matters not classified as “Audit services”; assistance with understanding and implementing new accounting and financial reporting guidance from rulemaking authorities; services related to mergers, acquisitions or dispositions; compliance with ratings agency requirements and interfund lending activities; and assistance with internal control reporting requirements.
“Tax services” include, but are not limited to, the review and signing of the Funds’ federal tax returns, the review of required distributions by the Funds and consultations regarding tax matters such as the tax treatment of new investments or the impact of new regulations. The Audit Committee will not approve proposed services of the Auditor which the Audit Committee believes are to be provided in connection with a service or transaction initially recommended by the Auditor, the sole business purpose of which may be tax avoidance and the tax treatment of which may not be supported in the Internal Revenue Code and related regulations. The Audit Committee will consult with the Funds’ Treasurer (or his or her designee) and may consult with outside counsel or advisers as necessary to ensure the consistency of tax services rendered by the Auditor with the foregoing policy. The Auditor shall not represent any Fund or any Service Affiliate before a tax court, district court or federal court of claims.
Each request to provide tax services under either the general or specific pre-approval of the Audit Committee will include a description from the Auditor in writing of (i) the scope of the service, the fee structure for the engagement, and any side letter or other amendment to the engagement letter, or any other agreement (whether oral, written, or otherwise) between the Auditor and the Funds, relating to the service; and (ii) any compensation arrangement or other agreement, such as a referral agreement, a referral fee or fee-sharing arrangement, between the Auditor (or an affiliate of the Auditor) and any person (other than the Funds or Service Affiliates receiving the services) with respect to the promoting, marketing, or recommending of a transaction covered by the service. The Auditor will also discuss with the Audit Committee the potential effects of the services on the independence of the Auditor, and document the substance of its discussion with the Audit Committee.
The Audit Committee may pre-approve other non-audit services so long as the Audit Committee believes that the service will not impair the independence of the Auditor. Appendix I includes a list of services that the Auditor is prohibited from performing by the SEC rules. Appendix I also includes a list of services that would impair the Auditor’s independence unless the Audit Committee reasonably concludes that the results of the services will not be subject to audit procedures during an audit of the Funds’ financial statements.
V. | Pre-Approval of Service Affiliate’s Covered Engagements |
Rule 2-01 of Regulation S-X requires that the Audit Committee pre-approve a Service Affiliate’s engagement of the Auditor for non-audit services if the engagement relates directly to the operations and financial reporting of the Funds, defined above as a “Service Affiliate’s Covered Engagement”.
The Audit Committee may provide either general or specific pre-approval of any Service Affiliate’s Covered Engagement, including for audit-related, tax or other services, as described above, if the Audit Committee believes that the provision of the services to a Service Affiliate will not impair the independence of the Auditor with respect to the Funds. Any Service Affiliate’s Covered Engagements that are not within the scope of General Pre-Approved Non-Audit Services have not received general pre-approval and require specific pre-approval.
Each request for specific pre-approval by the Audit Committee of a Service Affiliate’s Covered Engagement must be submitted to the Audit Committee by the Funds’ Treasurer (or his or her designee) and must include detailed information about the services to be provided, the fees or fee ranges to be charged, a description of the current status of the pre-approval process involving other audit committees in the Invesco investment company complex (as defined in Rule 2-201 of Regulation S-X) with respect to the proposed engagement, and other relevant information sufficient to allow the Audit Committee to consider whether the provision of such services will impair the independence of the Auditor from the Funds. Additionally, the Funds’ Treasurer (or his or her designee) and the Auditor will provide the Audit Committee with a statement that the proposed engagement requires pre-approval by the Audit Committee, the proposed engagement, in their view, will not impair the independence of the Auditor and is consistent with Applicable Rules, and the description of the proposed engagement provided to the Audit Committee is consistent with that presented to or approved by the Invesco audit committee.
Information about all Service Affiliate engagements of the Auditor for non-audit services, whether or not subject to pre-approval by the Audit Committee, shall be provided to the Audit Committee at least quarterly, to allow the Audit Committee to consider whether the provision of such services is compatible with maintaining the Auditor’s independence from the Funds. The Funds’ Treasurer and Auditor shall provide the Audit Committee with sufficiently detailed information about the scope of services provided and the fees for such services, to ensure that the Audit Committee can adequately consider whether the provision of such services is compatible with maintaining the Auditor’s independence from the Fund.
VI. | Pre-Approved Fee Levels or Established Amounts |
Pre-approved fee levels or ranges for audit and non-audit services to be provided by the Auditor to the Funds, and for a Service Affiliate’s Covered Engagement, under general pre-approval or specific pre-approval will be set periodically by the Audit Committee. Any proposed fees exceeding 110% of the maximum pre-approved fee levels or ranges for such services or engagements will be promptly presented to the Audit Committee and will require specific pre-approval by the Audit Committee before payment of any additional fees is made.
The Audit Committee hereby delegates, subject to the dollar limitations set forth below, specific authority to its Chair, or in his or her absence, Vice Chair, to pre-approve audit and non-audit services proposed to be provided by the Auditor to the Funds and/or a Service Affiliate’s Covered Engagement, between Audit Committee meetings. Such delegation does not preclude the Chair or Vice Chair from declining, on a case-by-case basis, to exercise his or her delegated authority and instead convening the Audit Committee to consider and pre-approve any proposed services or engagements.
Notwithstanding the foregoing, the Audit Committee must pre-approve: (a) any non-audit services to be provided to the Funds for which the fees are estimated to exceed $500,000; (b) any Service Affiliate’s Covered Engagement for which the fees are estimated to exceed $500,000; or (c) any cost increase to any previously approved service or engagement that exceeds the greater of $250,000 or 50% of the previously approved fees up to a maximum increase of $500,000.
VIII. | Compliance with Procedures |
Notwithstanding anything herein to the contrary, failure to pre-approve any services or engagements that are not required to be pre-approved pursuant to the de minimis exception provided for in Rule 2-01(c)(7)(i)(C) of Regulation S-X shall not constitute a violation of these Procedures. The Audit Committee has designated the Funds’ Treasurer to ensure services and engagements are pre-approved in compliance with these Procedures. The Funds’ Treasurer will immediately report to the Chair of the Audit Committee, or the Vice Chair in his or her absence, any breach of these Procedures that comes to the attention of the Funds’ Treasurer or any services or engagements that are not required to be pre-approved pursuant to the de minimis exception provided for in Rule 2-01(c)(7)(i)(C) of Regulation S-X.
On at least an annual basis, the Auditor will provide the Audit Committee with a summary of all non-audit services provided to any entity in the investment company complex (as defined in section 2-01(f)(14) of Regulation S-X, including the Funds and Service Affiliates) that were not pre-approved, including the nature of services provided and the associated fees.
IX. | Amendments to Procedures |
All material amendments to these Procedures must be approved in advance by the Audit Committee. Non-material amendments to these Procedures may be made by the Legal and Compliance Departments and will be reported to the Audit Committee at the next regularly scheduled meeting of the Audit Committee.
Appendix I
Non-Audit Services That May Impair the Auditor’s Independence
The Auditor is not independent if, at any point during the audit and professional engagement, the Auditor provides the following non-audit services:
· | Broker-dealer, investment adviser, or investment banking services; |
· | Expert services unrelated to the audit; |
· | Any service or product provided for a contingent fee or a commission; |
· | Services related to marketing, planning, or opining in favor of the tax treatment of confidential transactions or aggressive tax position transactions, a significant purpose of which is tax avoidance; |
· | Tax services for persons in financial reporting oversight roles at the Fund; and |
· | Any other service that the Public Company Oversight Board determines by regulation is impermissible. |
An Auditor is not independent if, at any point during the audit and professional engagement, the Auditor provides the following non-audit services unless it is reasonable to conclude that the results of the services will not be subject to audit procedures during an audit of the Funds’ financial statements:
· | Bookkeeping or other services related to the accounting records or financial statements of the audit client; |
· | Financial information systems design and implementation; |
· | Appraisal or valuation services, fairness opinions, or contribution-in-kind reports; |
· | Internal audit outsourcing services. |
(e)(2) There were no amounts that were pre-approved by the Audit Committee pursuant to the de minimis exception under Rule 2-01 of Regulation S-X.
(f) Not applicable.
(g) In addition to the amounts shown in the tables above, PwC billed Invesco and Invesco Affiliates aggregate fees of $6,489,000 for the fiscal year ended December 31, 2024 and $6,510,000 for the fiscal year ended December 31, 2023. In total, PwC billed the Registrant, Invesco and Invesco Affiliates aggregate non-audit fees of $7,857,101 for the fiscal year ended December 31, 2024 and $7,856,121 for the fiscal year ended December 31, 2023.
PwC provided audit services to the Investment Company complex of approximately $35 million.
(h) The Audit Committee also has considered whether the provision of non-audit services that were rendered to Invesco and Invesco Affiliates that were not required to be pre-approved pursuant to SEC regulations, if any, is compatible with maintaining PwC’s independence.
(i) Not applicable.
(j) Not applicable.
1 | Applicable Rules include, for example, New York Stock Exchange (“NYSE”) rules applicable to closed-end funds managed by Invesco and listed on NYSE. |
Item 5. Audit Committee of Listed Registrants.
(a) Investments in securities of unaffiliated issuers is filed under Item 7 of this Form N-CSR.
(b) Not applicable.
Item 7. Financial Statements and Financial Highlights for Open-End Management Investment Companies.
Annual Financial Statements and Other InformationDecember 31, 2024
Invesco Active Allocation Fund
A: OAAAX ■ C: OAACX ■ R: OAANX ■ Y: OAAYX ■ R5: PAAJX ■ R6: PAAQX
| |
| |
| |
| Notes to Financial Statements |
| Report of Independent Registered Public Accounting Firm |
| |
| Other Information Required in Form N-CSR (Items 8-11) |
Schedule of Investments
Invesco Active Allocation Fund |
Schedule of Investments in Affiliated Issuers–99.61%(a) |
| | | | | Change in
Unrealized
Appreciation
(Depreciation) | | | | |
|
Invesco Global Real Estate | | | | | | | | | |
Invesco Macro Allocation Strategy Fund, Class R6 | | | | | | | | | |
| | | | | | | | | |
Domestic Equity Funds–49.44% |
Invesco Discovery Mid Cap Growth Fund, Class R6 | | | | | | | | | |
Invesco Main Street Small Cap Fund, Class R6 | | | | | | | | | |
Invesco NASDAQ 100 ETF(c) | | | | | | | | | |
Invesco Russell 1000® Dynamic Multifactor ETF | | | | | | | | | |
Invesco S&P 500® Low Volatility ETF | | | | | | | | | |
Invesco S&P 500® Pure Growth ETF | | | | | | | | | |
Invesco S&P 500® Pure Value ETF | | | | | | | | | |
Invesco Value Opportunities Fund, Class R6 | | | | | | | | | |
Total Domestic Equity Funds | | | | | | | | | |
Fixed Income Funds–23.28% |
Invesco Core Bond Fund, Class R6 | | | | | | | | | |
Invesco Core Plus Bond Fund, Class R6 | | | | | | | | | |
Invesco Emerging Markets Sovereign Debt ETF | | | | | | | | | |
Invesco Equal Weight 0-30 Year Treasury ETF | | | | | | | | | |
Invesco Floating Rate ESG | | | | | | | | | |
Invesco High Yield Fund, Class R6 | | | | | | | | | |
Invesco Income Fund, Class R6 | | | | | | | | | |
Invesco International Bond | | | | | | | | | |
Invesco Senior Floating Rate | | | | | | | | | |
Invesco Taxable Municipal Bond ETF | | | | | | | | | |
| | | | | | | | | |
| | | | | | | | | |
International and Global Equity Funds–21.75% |
Invesco EQV Emerging Markets All Cap Fund, Class R6 | | | | | | | | | |
Invesco Developing Markets Fund, Class R6 | | | | | | | | | |
Invesco FTSE RAFI Developed Markets ex-U.S. ETF | | | | | | | | | |
Invesco Global Fund, Class R6 | | | | | | | | | |
Invesco Global Infrastructure Fund, Class R6 | | | | | | | | | |
See accompanying Notes to Financial Statements which are an integral part of the financial statements.
2
Invesco Active Allocation Fund
Invesco Active Allocation Fund (continued) |
Schedule of Investments in Affiliated Issuers–99.61%(a) |
| | | | | Change in Unrealized Appreciation (Depreciation) | | | | |
Invesco International Developed Dynamic | | | | | | | | | |
Invesco International Small-Mid Company Fund, Class R6 | | | | | | | | | |
Invesco Oppenheimer International Growth Fund, Class R6 | | | | | | | | | |
Invesco S&P Emerging Markets Low Volatility ETF | | | | | | | | | |
Invesco S&P International Developed Low Volatility ETF | | | | | | | | | |
Total International and Global Equity Funds | | | | | | | | | |
|
Invesco Government & Agency Portfolio, Institutional Class, | | | | | | | | | |
Invesco Liquid Assets Portfolio, Institutional | | | | | | | | | |
Invesco Treasury Portfolio, Institutional Class, | | | | | | | | | |
| | | | | | | | | |
TOTAL INVESTMENTS IN AFFILIATED ISSUERS (excluding investments purchased with cash collateral from securities on loan)
(Cost $1,619,682,028) | | | | | | | | | |
|
Investments Purchased with Cash Collateral from Securities on Loan | | | | | | | | | |
|
Invesco Private Government | | | | | | | | | |
Invesco Private Prime Fund, | | | | | | | | | |
Total Investments Purchased with Cash Collateral from Securities on Loan
(Cost $10,384,389) | | | | | | | | | |
TOTAL INVESTMENTS IN AFFILIATED ISSUERS (Cost $1,630,066,417) | | | | | | | | | |
OTHER ASSETS LESS LIABILITIES | | | | | | | | | |
| | | | | | | | | |
Investment Abbreviations:
See accompanying Notes to Financial Statements which are an integral part of the financial statements.
3
Invesco Active Allocation Fund
Notes to Schedule of Investments:
| Each underlying fund and the Fund are affiliated by either having the same investment adviser or an investment adviser under common control with the Fund’s investment adviser. |
| Includes return of capital distribution. |
| All or a portion of this security was out on loan at December 31, 2024. |
| The rate shown is the 7-day SEC standardized yield as of December 31, 2024. |
| The security has been segregated to satisfy the commitment to return the cash collateral received in securities lending transactions upon the borrower’s return of the securities loaned. See Note 1J. |
| Represents the income earned on the investment of cash collateral, which is included in securities lending income on the Statement of Operations. Does not include rebates and fees paid to lending agent or premiums received from borrowers, if any. |
| Includes capital gains distributions from affiliated underlying funds as follows: |
| |
Invesco Discovery Mid Cap Growth Fund | |
| |
Invesco Global Infrastructure Fund | |
Invesco International Small-Mid Company Fund | |
Invesco Main Street Small Cap Fund | |
Invesco Oppenheimer International Growth Fund | |
Invesco Value Opportunities Fund | |
Open Futures Contracts(a) |
| | | | | Unrealized Appreciation (Depreciation) |
|
| | | | | |
|
U.S. Treasury 10 Year Notes | | | | | |
Subtotal—Long Futures Contracts | | |
| | | | | |
|
MSCI Emerging Markets Index | | | | | |
| | | | | |
| | | | | |
| | | | | |
| | | | | |
Subtotal—Short Futures Contracts | | |
| | |
| Futures contracts collateralized by $3,894,905 cash held with Merrill Lynch International, the futures commission merchant. |
Open Forward Foreign Currency Contracts |
| | | Unrealized
Appreciation
(Depreciation) |
| |
| | | | | | |
| | | | | | |
| | | | | | |
| | | | | | |
| | | | | | |
| | | | | | |
| Goldman Sachs International | | | | | |
| Goldman Sachs International | | | | | |
| Goldman Sachs International | | | | | |
| J.P. Morgan Chase Bank, N.A. | | | | | |
| Merrill Lynch International | | | | | |
| | | | | | |
| |
See accompanying Notes to Financial Statements which are an integral part of the financial statements.
4
Invesco Active Allocation Fund
Open Forward Foreign Currency Contracts—(continued) |
| | | Unrealized Appreciation (Depreciation) |
| |
| | | | | | |
| | | | | | |
| | | | | | |
| | | | | | |
| | | | | | |
| | | | | | |
| | | | | | |
| | | | | | |
| Goldman Sachs International | | | | | |
| Goldman Sachs International | | | | | |
| Goldman Sachs International | | | | | |
| Goldman Sachs International | | | | | |
| Merrill Lynch International | | | | | |
| Merrill Lynch International | | | | | |
| Merrill Lynch International | | | | | |
| Standard Chartered Bank PLC | | | | | |
| | | | | | |
| | | | | | |
| |
Total Forward Foreign Currency Contracts | |
Open Centrally Cleared Credit Default Swap Agreements(a) |
| | | | | | | Upfront
Payments Paid
(Received) | | Unrealized
Appreciation
(Depreciation) |
|
Markit CDX North America High Yield Index, Series 42, Version 1 | | | | | | | | | | |
|
Markit CDX North America Investment Grade Index, Series 42, Version 1 | | | | | | | | | | |
Total Centrally Cleared Credit Default Swap Agreements | | | | | | |
| Centrally cleared swap agreements collateralized by $1,657,723 cash held with J.P. Morgan Chase Bank, N.A. |
| Implied credit spreads represent the current level, as of December 31, 2024, at which protection could be bought or sold given the terms of the existing credit default swap agreement and serve as an indicator of the current status of the payment/performance risk of the credit default swap agreement. An implied credit spread that has widened or increased since entry into the initial agreement may indicate a deteriorating credit profile and increased risk of default for the reference entity. A declining or narrowing spread may indicate an improving credit profile or decreased risk of default for the reference entity. Alternatively, credit spreads may increase or decrease reflecting the general tolerance for risk in the credit markets generally. |
See accompanying Notes to Financial Statements which are an integral part of the financial statements.
5
Invesco Active Allocation Fund
See accompanying Notes to Financial Statements which are an integral part of the financial statements.
6
Invesco Active Allocation Fund
Statement of Assets and Liabilities
| |
Investments in affiliated underlying funds, at value
(Cost $1,630,066,417)* | |
| |
Variation margin receivable — futures contracts | |
Unrealized appreciation on forward foreign currency contracts outstanding | |
| |
Cash collateral — exchange-traded futures contracts | |
Cash collateral — centrally cleared swap agreements | |
Cash collateral — OTC Derivatives | |
| |
| |
| |
Dividends - affiliated underlying funds | |
Investment for trustee deferred compensation and retirement plans | |
| |
| |
| |
| |
Variation margin payable — centrally cleared swap agreements | |
Unrealized depreciation on forward foreign currency contracts outstanding | |
| |
Investments purchased - affiliated underlying funds | |
| |
Collateral upon return of securities loaned | |
Accrued fees to affiliates | |
Accrued trustees’ and officers’ fees and benefits | |
Accrued other operating expenses | |
Trustee deferred compensation and retirement plans | |
| |
Net assets applicable to shares outstanding | |
| |
Shares of beneficial interest | |
| |
| |
|
| |
| |
| |
| |
| |
| |
Shares outstanding, no par value, with an unlimited number of shares authorized: |
| |
| |
| |
| |
| |
| |
| |
Net asset value per share | |
Maximum offering price per share
(Net asset value of $13.57 ÷ 94.50%) | |
| |
Net asset value and offering price per share | |
| |
Net asset value and offering price per share | |
| |
Net asset value and offering price per share | |
| |
Net asset value and offering price per share | |
| |
Net asset value and offering price per share | |
| At December 31, 2024, securities with an aggregate value of $9,697,699 were on loan to brokers. |
See accompanying Notes to Financial Statements which are an integral part of the financial statements.
7
Invesco Active Allocation Fund
Statement of Operations
For the year ended December 31, 2024
| |
Dividends from affiliated underlying funds (includes net securities lending income of $100,546) | |
| |
| |
| |
| |
Administrative services fees | |
| |
| |
| |
| |
| |
Transfer agent fees — A, C, R and Y | |
| |
| |
Trustees’ and officers’ fees and benefits | |
Registration and filing fees | |
| |
Professional services fees | |
| |
| |
Less: Fees waived and/or expense offset arrangement(s) | |
| |
| |
Realized and unrealized gain from: | |
Net realized gain (loss) from: | |
Affiliated underlying fund shares | |
| |
Forward foreign currency contracts | |
| |
| |
Capital gain distributions from affiliated underlying fund shares | |
| |
Change in net unrealized appreciation (depreciation) of: | |
Affiliated underlying fund shares | |
| |
Forward foreign currency contracts | |
| |
| |
| |
Net realized and unrealized gain | |
Net increase in net assets resulting from operations | |
See accompanying Notes to Financial Statements which are an integral part of the financial statements.
8
Invesco Active Allocation Fund
Statement of Changes in Net Assets
For the years ended December 31, 2024 and 2023
| | |
| | |
| | |
| | |
Change in net unrealized appreciation | | |
Net increase in net assets resulting from operations | | |
Distributions to shareholders from distributable earnings: | | |
| | |
| | |
| | |
| | |
| | |
| | |
Total distributions from distributable earnings | | |
| | |
| | |
| | |
| | |
| | |
| | |
| | |
Net increase (decrease) in net assets resulting from share transactions | | |
Net increase (decrease) in net assets | | |
| | |
| | |
| | |
See accompanying Notes to Financial Statements which are an integral part of the financial statements.
9
Invesco Active Allocation Fund
Financial Highlights
The following schedule presents financial highlights for a share of the Fund outstanding throughout the periods indicated.
| Net asset
value,
beginning
of period | | Net gains
(losses)
on securities
(both
realized and
unrealized) | Total from
investment
operations | Dividends
from net
investment
income | Distributions
from net
realized
gains | | Net asset
value, end
of period | | Net assets,
end of period
(000’s omitted) | Ratio of
expenses
to average
net assets
with fee waivers
and/or
expenses
| Ratio of
expenses
to average net
assets without
fee waivers
and/or
expenses
absorbed
| Ratio of net
investment
income
(loss)
to average
net assets | |
|
| | | | | | | | | | | | | | |
| | | | | | | | | | | | | | |
| | | | | | | | | | | | | | |
| | | | | | | | | | | | | | |
| | | | | | | | | | | | | | |
|
| | | | | | | | | | | | | | |
| | | | | | | | | | | | | | |
| | | | | | | | | | | | | | |
| | | | | | | | | | | | | | |
| | | | | | | | | | | | | | |
|
| | | | | | | | | | | | | | |
| | | | | | | | | | | | | | |
| | | | | | | | | | | | | | |
| | | | | | | | | | | | | | |
| | | | | | | | | | | | | | |
|
| | | | | | | | | | | | | | |
| | | | | | | | | | | | | | |
| | | | | | | | | | | | | | |
| | | | | | | | | | | | | | |
| | | | | | | | | | | | | | |
|
| | | | | | | | | | | | | | |
| | | | | | | | | | | | | | |
| | | | | | | | | | | | | | |
| | | | | | | | | | | | | | |
| | | | | | | | | | | | | | |
|
| | | | | | | | | | | | | | |
| | | | | | | | | | | | | | |
| | | | | | | | | | | | | | |
| | | | | | | | | | | | | | |
| | | | | | | | | | | | | | |
| Calculated using average shares outstanding. |
| Includes adjustments in accordance with accounting principles generally accepted in the United States of America and as such, the net asset value for financial reporting purposes and the returns based upon those net asset values may differ from the net asset value and returns for shareholder transactions. Does not include sales charges and is not annualized for periods less than one year, if applicable. |
| In addition to the fees and expenses which the Fund bears directly, the Fund indirectly bears a pro rata share of the fees and expenses of the underlying funds in which the Fund invests. Because the underlying funds have varied expenses and fee levels and the Fund may own different proportions at different times, the amount of fees and expenses incurred indirectly by the Fund will vary. Estimated underlying fund expenses are not expenses that are incurred directly by the Fund. They are expenses that are incurred directly by the underlying funds and are deducted from the value of the funds the Fund invests in. The effect of the estimated underlying fund expenses that the Fund bears indirectly is included in the Fund’s total return. Estimated acquired fund fees from underlying funds was 0.52%, 0.52%, 0.53%, 0.53% and 0.63% for the years ended December 31, 2024, 2023, 2022, 2021 and 2020, respectively. |
| Portfolio turnover is calculated at the fund level and is not annualized for periods less than one year, if applicable. |
| The total return, ratios of expenses to average net assets and ratio of net investment income to average net assets reflect actual 12b-1 fees of 0.24% for the years ended December 31, 2024, 2023, 2022, 2021 and 2020, respectively. |
See accompanying Notes to Financial Statements which are an integral part of the financial statements.
10
Invesco Active Allocation Fund
Notes to Financial Statements
NOTE 1—Significant Accounting Policies
Invesco Active Allocation Fund (the “Fund”) is a series portfolio of AIM Growth Series (Invesco Growth Series) (the “Trust”). The Trust is a Delaware statutory trust registered under the Investment Company Act of 1940, as amended (the “1940 Act”), as an open-end series management investment company authorized to issue an unlimited number of shares of beneficial interest. Information presented in these financial statements pertains only to the Fund. Matters affecting the Fund or each class will be voted on exclusively by the shareholders of the Fund or each class.
The Fund’s investment objective is to seek total return.
The Fund is a “fund of funds”, in that it invests in other mutual funds advised by Invesco Advisers, Inc. (the “Adviser” or “Invesco”) and exchange-traded funds ("ETFs") and other pooled investment vehicles advised by Invesco Capital Management LLC (“Invesco Capital”) or mutual funds, ETFs and other pooled investment vehicles advised by unaffiliated advisers (“underlying funds”). Invesco and Invesco Capital are affiliates of each other as they are indirect, wholly-owned subsidiaries of Invesco Ltd. Invesco may change the Fund’s asset class allocations, the underlying funds or the target weightings in the underlying funds without shareholder approval or notice to shareholders. The underlying funds may engage in a number of investment techniques and practices, which involve certain risks. Each underlying fund’s accounting policies are outlined in the underlying fund’s financial statements and are publicly available.
The Fund currently consists of six different classes of shares: Class A, Class C, Class R, Class Y, Class R5 and Class R6. Class Y shares are available only to certain investors. Class A shares are sold with a front-end sales charge unless certain waiver criteria are met. Under certain circumstances, load waived shares may be subject to contingent deferred sales charges ("CDSC"). Class C shares are sold with a CDSC. Class R, Class Y, Class R5 and Class R6 shares are sold at net asset value. Class C shares held for eight years after purchase are eligible for automatic conversion into Class A shares of the same Fund (the "Conversion Feature"). The automatic conversion pursuant to the Conversion Feature will generally occur at the end of the month following the eighth anniversary after a purchase of Class C shares.
Effective after the close of business on September 30, 2024, Class R5 shares are closed to new investors.
The Fund is an investment company and accordingly follows the investment company accounting and reporting guidance in accordance with Financial Accounting Standards Board Accounting Standards Codification Topic 946, Financial Services – Investment Companies.
The following is a summary of the significant accounting policies followed by the Fund in the preparation of its financial statements.
A.
Security Valuations — Securities of investment companies listed or traded on an exchange are generally valued at the trade price or official closing price that day as of the close of the exchange where the security is principally traded, or lacking any trades or official closing price on a particular day, the security may be valued at the closing bid price on that day. Securities of investment companies that are not exchange-traded (e.g., open-end mutual funds) are valued using such company’s end-of-business-day net asset value per share. Securities in the underlying funds, including restricted securities, are valued in accordance with the valuation policy of such fund. The policies of the underlying funds affiliated with the Fund, as a result of having the same investment adviser, are set forth below.
A security listed or traded on an exchange is generally valued at its trade price or official closing price that day as of the close of the exchange where the security is principally traded, or lacking any trades or official closing price on a particular day, the security may be valued at the closing bid or ask price on that day. Securities traded in the over-the-counter market are valued based on prices furnished by independent pricing services or market makers. When such securities are valued using prices provided by an independent pricing service they may be considered fair valued. Futures contracts are valued at the daily settlement price set by an exchange on which they are principally traded. Where a final settlement price exists, exchange-traded options are valued at the final settlement price from the exchange where the option principally trades. Where a final settlement price does not exist, exchange-traded options are valued at the mean between the last bid and ask price generally from the exchange where the option principally trades.
Variable rate senior loan interests are fair valued using quotes provided by an independent pricing service. Quotes provided by the pricing service may reflect appropriate factors such as ratings, tranche type, industry, company performance, spread, individual trading characteristics, institution-size trading in similar groups of securities and other market data.
Securities of investment companies that are not exchange-traded (e.g., open-end mutual funds) are valued using such company’s end-of-business-day net asset value per share.
Deposits, other obligations of U.S. and non-U.S. banks and financial institutions are valued at their daily account value.
Fixed income securities (including convertible debt securities) generally are valued on the basis of prices provided by independent pricing services. Prices provided by the pricing service may be determined without exclusive reliance on quoted prices, and may reflect appropriate factors such as institution-size trading in similar groups of securities, developments related to specific securities, dividend rate (for unlisted equities), yield (for debt obligations), quality, type of issue, coupon rate (for debt obligations), maturity (for debt obligations), individual trading characteristics and other market data. Pricing services generally value debt obligations assuming orderly transactions of institutional round lot size, but a fund may hold or transact in the same securities in smaller, odd lot sizes. Odd lots often trade at lower prices than institutional round lots, and their value may be adjusted accordingly. Debt obligations are subject to interest rate and credit risks. In addition, all debt obligations involve some risk of default with respect to interest and/or principal payments.
Swap agreements are fair valued using an evaluated quote, if available, provided by an independent pricing service. Evaluated quotes provided by the pricing service are valued based on a model which may include end-of-day net present values, spreads, ratings, industry, company performance and returns of referenced assets. Centrally cleared swap agreements are valued at the daily settlement price determined by the relevant exchange or clearinghouse.
Foreign securities’ (including foreign exchange contracts) prices are converted into U.S. dollar amounts using the applicable exchange rates as of the close of the New York Stock Exchange (“NYSE”). If market quotations are available and reliable for foreign exchange-traded equity securities, the securities will be valued at the market quotations. The Adviser may use various pricing services to obtain market quotations as well as fair value prices. Because trading hours for certain foreign securities end before the close of the NYSE, closing market quotations may become not representative of market value in the Adviser’s judgment (“unreliable”). If, between the time trading ends on a particular security and the close of the customary trading session on the NYSE, a significant event occurs that makes the closing price of the security unreliable, the Adviser may fair value the security. If the event is likely to have affected the closing price of the security, the security will be valued at fair value in good faith in accordance with Board- approved policies and related Adviser procedures (“Valuation Procedures”). Adjustments to closing prices to reflect fair value may also be based on a screening process of an independent pricing service to indicate the degree of certainty, based on historical data, that the closing price in the principal market where a foreign security trades is not the current value as of the close of the NYSE. Foreign securities’ prices meeting the degree of certainty that the price is not reflective of current value will be priced at the indication of fair value from the independent pricing service. Multiple factors may be considered by the independent pricing service in determining adjustments to reflect fair value and may include information relating to sector indices, American Depositary Receipts and domestic and foreign index futures. Foreign securities may have additional risks including exchange rate changes, potential for sharply devalued currencies and high inflation, political and economic upheaval, the relative lack of issuer information, relatively low market liquidity and the potential lack of strict financial and accounting controls and standards.
Unlisted securities will be valued using prices provided by independent pricing services or by another method that the Adviser, in its judgment, believes better reflects the security’s fair value in accordance with the Valuation Procedures.
Non-traded rights and warrants shall be valued at intrinsic value if the terms of the rights and warrants are available, specifically the subscription or exercise price and the ratio. Intrinsic value is calculated as the daily market closing price of the security to be received less the subscription price, which is then adjusted by
11
Invesco Active Allocation Fund
the exercise ratio. In the case of warrants, an option pricing model supplied by an independent pricing service may be used based on market data such as volatility, stock price and interest rate from the independent pricing service and strike price and exercise period from verified terms.
Securities for which market prices are not provided by any of the above methods may be valued based upon quotes furnished by independent sources. The mean between the last bid and ask prices may be used to value debt obligations, including corporate loans.
Securities for which market quotations are not readily available are fair valued by the Adviser in accordance with the Valuation Procedures. If a fair value price provided by a pricing service is unreliable, the Adviser will fair value the security using the Valuation Procedures. Issuer specific events, market trends, bid/ask quotes of brokers and information providers and other market data may be reviewed in the course of making a good faith determination of a security’s fair value.
The Fund may invest in securities that are subject to interest rate risk, meaning the risk that the prices will generally fall as interest rates rise and, conversely, the prices will generally rise as interest rates fall. Specific securities differ in their sensitivity to changes in interest rates depending on their individual characteristics. Changes in interest rates may result in increased market volatility, which may affect the value and/or liquidity of certain Fund investments.
Valuations change in response to many factors including the historical and prospective earnings of the issuer, the value of the issuer’s assets, general market conditions which are not specifically related to the particular issuer, such as real or perceived adverse economic conditions, changes in the general outlook for revenues or corporate earnings, changes in interest or currency rates, regional or global instability, natural or environmental disasters, widespread disease or other public health issues, war, acts of terrorism, significant governmental actions or adverse investor sentiment generally and market liquidity. Because of the inherent uncertainties of valuation, the values reflected in the financial statements may materially differ from the value received upon actual sale of those investments.
The price the Fund could receive upon the sale of any investment may differ from the Adviser’s valuation of the investment, particularly for securities that are valued using a fair valuation technique. When fair valuation techniques are applied, the Adviser uses available information, including both observable and unobservable inputs and assumptions, to determine a methodology that will result in a valuation that the Adviser believes approximates market value. Fund securities that are fair valued may be subject to greater fluctuation in their value from one day to the next than would be the case if market quotations were used. Because of the inherent uncertainties of valuation, and the degree of subjectivity in such decisions, the Fund could realize a greater or lesser than expected gain or loss upon the sale of the investment.
B.
Securities Transactions and Investment Income — Securities transactions are accounted for on a trade date basis. Realized gains or losses on sales are computed on the basis of specific identification of the securities sold. Distributions from ordinary income from underlying funds, if any, are recorded as dividend income on the ex-dividend date. Distributions from gains from underlying funds, if any, are recorded as realized gains on the ex-dividend date. The following policies are followed by the underlying funds: Interest income (net of withholding tax, if any) is recorded on an accrual basis from settlement date and includes coupon interest and amortization of premium and accretion of discount on debt securities as applicable. Pay-in-kind interest income and non-cash dividend income received in the form of securities in lieu of cash are recorded at the fair value of the securities received. Paydown gains and losses on mortgage and asset-backed securities are recorded as adjustments to interest income.
The Fund may periodically participate in litigation related to the Fund’s investments. As such, the Fund may receive proceeds from litigation settlements. Any proceeds received are included in the Statement of Operations as realized gain (loss) for investments no longer held and as unrealized gain (loss) for investments still held.
The Fund allocates income and realized and unrealized capital gains and losses to a class based on the relative net assets of each class.
C.
Country Determination — For the purposes of making investment selection decisions and presentation in the Schedule of Investments, the investment adviser may determine the country in which an issuer is located and/or credit risk exposure based on various factors. These factors include the laws of the country under which the issuer is organized, where the issuer maintains a principal office, the country in which the issuer derives 50% or more of its total revenues, the country that has the primary market for the issuer’s securities and its "country of risk" as determined by a third party service provider, as well as other criteria. Among the other criteria that may be evaluated for making this determination are the country in which the issuer maintains 50% or more of its assets, the type of security, financial guarantees and enhancements, the nature of the collateral and the sponsor organization. Country of issuer and/or credit risk exposure has been determined to be the United States of America, unless otherwise noted.
D.
Distributions – Distributions from net investment income and net realized capital gain, if any, are generally declared and paid annually and recorded on the ex-dividend date. The Fund may elect to treat a portion of the proceeds from redemptions as distributions for federal income tax purposes.
E.
Federal Income Taxes – The Fund intends to comply with the requirements of Subchapter M of the Internal Revenue Code of 1986, as amended (the “Internal Revenue Code”), necessary to qualify as a regulated investment company and to distribute substantially all of the Fund’s taxable earnings to shareholders. As such, the Fund will not be subject to federal income taxes on otherwise taxable income (including net realized capital gain) that is distributed to shareholders. Therefore, no provision for federal income taxes is recorded in the financial statements.
The Fund recognizes the tax benefits of uncertain tax positions only when the position is more likely than not to be sustained. Management has analyzed the Fund’s uncertain tax positions and concluded that no liability for unrecognized tax benefits should be recorded related to uncertain tax positions. Management is not aware of any tax positions for which it is reasonably possible that the total amounts of unrecognized tax benefits will change materially in the next 12 months.
The Fund files tax returns in the U.S. Federal jurisdiction and certain other jurisdictions. Generally, the Fund is subject to examinations by such taxing authorities for up to three years after the filing of the return for the tax period.
F.
Expenses – Expenses included in the accompanying financial statements reflect the expenses of the Fund and do not include any expenses of the underlying funds. The effects of the underlying funds expenses are included in the realized and unrealized gain/loss on the investments in the underlying funds. Estimated expenses of the underlying funds are discussed further within the Financial Highlights.
Fees provided for under the Rule 12b-1 plan of a particular class of the Fund and which are directly attributable to that class are charged to the operations of such class. Transfer agency fees and expenses and other shareholder recordkeeping fees and expenses attributable to Class R5 and Class R6 are allocated based on relative net assets of Class R5 and Class R6. Transfer agency fees and expenses and other shareholder recordkeeping fees and expenses relating to all other classes are allocated among those classes based on relative net assets. All other expenses are allocated among the classes based on relative net assets.
G.
Accounting Estimates – The preparation of financial statements in conformity with accounting principles generally accepted in the United States of America (“GAAP”) requires management to make estimates and assumptions that affect the reported amounts of assets and liabilities at the date of the financial statements and the reported amounts of revenues and expenses during the reporting period including estimates and assumptions related to taxation. Actual results could differ from those estimates by a significant amount. In addition, the Fund monitors for material events or transactions that may occur or become known after the period-end date and before the date the financial statements are released to print.
H.
Indemnifications – Under the Trust’s organizational documents, each Trustee, officer, employee or other agent of the Trust is indemnified against certain liabilities that may arise out of the performance of their duties to the Fund. Additionally, in the normal course of business, the Fund enters into contracts, including the Fund’s servicing agreements, that contain a variety of indemnification clauses. The Fund’s maximum exposure under these arrangements is unknown as this would involve future claims that may be made against the Fund that have not yet occurred. The risk of material loss as a result of such indemnification claims is considered remote.
I.
Segment Reporting — In November 2023, the FASB issued Accounting Standards Update 2023-07, Segment Reporting (Topic 280): Improvements to Reportable Segment Disclosures (“ASU 2023-07”), with the intent of improving reportable segment disclosure requirements, primarily through enhanced disclosures about significant segment expenses, allowing financial statement users to better understand the components of a segment’s profit or loss and assess potential future cash flows for each reportable segment and the entity as a whole thereby enabling better understanding of how an entity’s segments impact
12
Invesco Active Allocation Fund
overall performance. The Fund represents a single operating segment. Subject to the oversight and, when applicable, approval of the Board of Trustees, the Fund’s Adviser acts as the Fund’s chief operating decision maker (“CODM”), assessing performance and making decisions about resource allocation within the Fund. The CODM monitors the operating results as a whole and the Fund’s long-term strategic asset allocation is determined in accordance with the terms of its prospectus based on a defined investment strategy. The financial information provided to and reviewed by the CODM is consistent with that presented in the Fund’s financial statements. Adoption of the new standard impacted the Fund’s financial statement note disclosures only and did not affect the Fund’s financial position or the results of its operations.
J.
Securities Lending – The Fund may lend portfolio securities having a market value up to one-third of the Fund’s total assets. Such loans are secured by collateral equal to no less than the market value of the loaned securities determined daily by the securities lending provider. Such collateral will be cash or debt securities issued or guaranteed by the U.S. Government or any of its sponsored agencies. Cash collateral received in connection with these loans is invested in short-term money market instruments or affiliated, unregistered investment companies that comply with Rule 2a-7 under the 1940 Act and money market funds (collectively, "affiliated money market funds") and is shown as such on the Schedule of Investments. The Fund bears the risk of loss with respect to the investment of collateral. It is the Fund’s policy to obtain additional collateral from or return excess collateral to the borrower by the end of the next business day, following the valuation date of the securities loaned. Therefore, the value of the collateral held may be temporarily less than the value of the securities on loan. When loaning securities, the Fund retains certain benefits of owning the securities, including the economic equivalent of dividends or interest generated by the security. Lending securities entails a risk of loss to the Fund if, and to the extent that, the market value of the securities loaned were to increase and the borrower did not increase the collateral accordingly, and the borrower failed to return the securities. The securities loaned are subject to termination at the option of the borrower or the Fund. Upon termination, the borrower will return to the Fund the securities loaned and the Fund will return the collateral. Upon the failure of the borrower to return the securities, collateral may be liquidated and the securities may be purchased on the open market to replace the loaned securities. The Fund could experience delays and costs in gaining access to the collateral and the securities may lose value during the delay which could result in potential losses to the Fund. Some of these losses may be indemnified by the lending agent. The Fund bears the risk of any deficiency in the amount of the collateral available for return to the borrower due to any loss on the collateral invested. Dividends received on cash collateral investments for securities lending transactions, which are net of compensation to counterparties, are included in Dividends from affiliated underlying funds on the Statement of Operations. The aggregate value of securities out on loan, if any, is shown as a footnote on the Statement of Assets and Liabilities.
The Adviser serves as an affiliated securities lending agent for the Fund. The Bank of New York Mellon also serves as a securities lending agent. To the extent the Fund utilizes the Adviser as an affiliated securities lending agent, the Fund conducts its securities lending in accordance with, and in reliance upon, no-action letters issued by the SEC staff that provide guidance on how an affiliate may act as a direct agent lender and receive compensation for those services in a manner consistent with the federal securities laws. For the year ended December 31, 2024, the Fund paid the Adviser $4,196 in fees for securities lending agent services. Fees paid to the Adviser for securities lending agent services, if any, are included in Dividends from affiliated underlying funds on the Statement of Operations.
K.
Foreign Currency Translations — Foreign currency is valued at the close of the NYSE based on quotations posted by banks and major currency dealers. Portfolio securities and other assets and liabilities denominated in foreign currencies are translated into U.S. dollar amounts at the date of valuation. Purchases and sales of portfolio securities (net of foreign taxes withheld on disposition) and income items denominated in foreign currencies are translated into U.S. dollar amounts on the respective dates of such transactions. The Fund does not separately account for the portion of the results of operations resulting from changes in foreign exchange rates on investments and the fluctuations arising from changes in market prices of securities held. The combined results of changes in foreign exchange rates and the fluctuation of market prices on investments (net of estimated foreign tax withholding) are included with the net realized and unrealized gain or loss from investments in the Statement of Operations. Reported net realized foreign currency gains or losses arise from (1) sales of foreign currencies, (2) currency gains or losses realized between the trade and settlement dates on securities transactions, and (3) the difference between the amounts of dividends, interest, and foreign withholding taxes recorded on the Fund’s books and the U.S. dollar equivalent of the amounts actually received or paid. Net unrealized foreign currency gains and losses arise from changes in the fair values of assets and liabilities, other than investments in securities at fiscal period end, resulting from changes in exchange rates.
The Fund may invest in foreign securities, which may be subject to foreign taxes on income, gains on investments or currency repatriation, a portion of which may be recoverable. Foreign taxes, if any, are recorded based on the tax regulations and rates that exist in the foreign markets in which the Fund invests and are shown in the Statement of Operations.
The performance of the Fund may be materially affected positively or negatively by foreign currency strength or weakness relative to the U.S. dollar. Currency rates in foreign countries may fluctuate for a number of reasons, including changes in interest rates, political, economic, or social instability and development, and imposition of currency controls. Currency controls in certain foreign jurisdictions may cause the Fund to experience significant delays in its ability to repatriate its assets in U.S. dollars at quoted spot rates, and it is possible that the Fund’s ability to convert certain foreign currencies into U.S. dollars may be limited and may occur at discounts to quoted rates. As a result, the value of the Fund’s assets and liabilities denominated in such currencies that would ultimately be realized could differ from those reported on the Statement of Assets and Liabilities. Certain foreign companies may be subject to sanctions, embargoes, or other governmental actions that may limit the ability to invest in, receive, hold, or sell the securities of such companies, all of which affect the market and/or credit risk of the investments. Because of the inherent uncertainties of valuation, the values reflected in the financial statements may materially differ from the value received upon actual sale of those investments.
L.
Forward Foreign Currency Contracts — The Fund may engage in foreign currency transactions either on a spot (i.e. for prompt delivery and settlement) basis, or through forward foreign currency contracts, to manage or minimize currency or exchange rate risk.
The Fund may also enter into forward foreign currency contracts for the purchase or sale of a security denominated in a foreign currency in order to “lock in” the U.S. dollar price of that security, or the Fund may also enter into forward foreign currency contracts that do not provide for physical exchange of the two currencies on the settlement date, but instead are settled by a single cash payment calculated as the difference between the agreed upon exchange rate and the spot rate at settlement based upon an agreed upon notional amount (non-deliverable forwards).
A forward foreign currency contract is an obligation between two parties (“Counterparties”) to purchase or sell a specific currency for an agreed-upon price at a future date. The use of forward foreign currency contracts for hedging does not eliminate fluctuations in the price of the underlying securities the Fund owns or intends to acquire but establishes a rate of exchange in advance. Fluctuations in the value of these contracts are measured by the difference in the contract date and reporting date exchange rates and are recorded as unrealized appreciation (depreciation) until the contracts are closed. When the contracts are closed, realized gains (losses) are recorded. Realized and unrealized gains (losses) on the contracts are included in the Statement of Operations. The primary risks associated with forward foreign currency contracts include failure of the Counterparty to meet the terms of the contract and the value of the foreign currency changing unfavorably. These risks may be in excess of the amounts reflected in the Statement of Assets and Liabilities.
M.
Futures Contracts — The Fund may enter into futures contracts to manage exposure to interest rate, equity and market price movements and/or currency risks. A futures contract is an agreement between Counterparties to purchase or sell a specified underlying security, currency or commodity (or delivery of a cash settlement price, in the case of an index future) for a fixed price at a future date. The Fund currently invests only in exchange-traded futures and they are standardized as to maturity date and underlying instrument or asset. Initial margin deposits required upon entering into futures contracts are satisfied by the segregation of specific securities or cash as collateral at the futures commission merchant (broker). During the period the futures contracts are open, changes in the value of the contracts are recognized as unrealized gains or losses by recalculating the value of the contracts on a daily basis. Subsequent or variation margin payments are received or made depending upon whether unrealized gains or losses are incurred. These amounts are reflected as receivables or payables on the
13
Invesco Active Allocation Fund
Statement of Assets and Liabilities. When the contracts are closed or expire, the Fund recognizes a realized gain or loss equal to the difference between the proceeds from, or cost of, the closing transaction and the Fund’s basis in the contract. The net realized gain (loss) and the change in unrealized gain (loss) on futures contracts held during the period is included on the Statement of Operations. The primary risks associated with futures contracts are market risk and the absence of a liquid secondary market. If the Fund were unable to liquidate a futures contract and/or enter into an offsetting closing transaction, the Fund would continue to be subject to market risk with respect to the value of the contracts and continue to be required to maintain the margin deposits on the futures contracts. Futures contracts have minimal Counterparty risk since the exchange’s clearinghouse, as Counterparty to all exchange-traded futures, guarantees the futures against default. Risks may exceed amounts recognized in the Statement of Assets and Liabilities.
N.
Swap Agreements — The Fund may enter into various swap transactions, including interest rate, total return, index, currency and credit default swap contracts (“CDS”) for investment purposes or to manage interest rate, currency or credit risk. Such transactions are agreements between Counterparties. A swap agreement may be negotiated bilaterally and traded over-the-counter (“OTC”) between two parties (“uncleared/ OTC”) or, in some instances, must be transacted through a future commission merchant (“FCM”) and cleared through a clearinghouse that serves as a central Counterparty (“centrally cleared swap”). These agreements may contain among other conditions, events of default and termination events, and various covenants and representations such as provisions that require the Fund to maintain a pre-determined level of net assets, and/ or provide limits regarding the decline of the Fund’s net asset value ("NAV") per share over specific periods of time. If the Fund were to trigger such provisions and have open derivative positions at that time, the Counterparty may be able to terminate such agreement and request immediate payment in an amount equal to the net liability positions, if any.
Interest rate, total return, index, and currency swap agreements are two-party contracts entered into primarily to exchange the returns (or differentials in rates of returns) earned or realized on particular predetermined investments or instruments. The gross returns to be exchanged or “swapped” between the parties are calculated with respect to a notional amount, i.e., the return on or increase in value of a particular dollar amount invested at a particular interest rate or return of an underlying asset, in a particular foreign currency, or in a “basket” of securities representing a particular index.
In a centrally cleared swap, the Fund’s ultimate Counterparty is a central clearinghouse. The Fund initially will enter into centrally cleared swaps through an executing broker. When a fund enters into a centrally cleared swap, it must deliver to the central Counterparty (via the FCM) an amount referred to as “initial margin.” Initial margin requirements are determined by the central Counterparty, but an FCM may require additional initial margin above the amount required by the central Counterparty. Initial margin deposits required upon entering into centrally cleared swaps are satisfied by cash or securities as collateral at the FCM. Securities deposited as initial margin are designated on the Schedule of Investments and cash deposited is recorded on the Statement of Assets and Liabilities. During the term of a cleared swap agreement, a “variation margin” amount may be required to be paid by the Fund or may be received by the Fund, based on the daily change in price of the underlying reference instrument subject to the swap agreement and is recorded as a receivable or payable for variation margin in the Statement of Assets and Liabilities until the centrally cleared swap is terminated at which time a realized gain or loss is recorded.
A CDS is an agreement between Counterparties to exchange the credit risk of an issuer. A buyer of a CDS is said to buy protection by paying a fixed payment over the life of the agreement and in some situations an upfront payment to the seller of the CDS. If a defined credit event occurs (such as payment default or bankruptcy), the Fund as a protection buyer would cease paying its fixed payment, the Fund would deliver eligible bonds issued by the reference entity to the seller, and the seller would pay the full notional value, or the “par value”, of the referenced obligation to the Fund. A seller of a CDS is said to sell protection and thus would receive a fixed payment over the life of the agreement and an upfront payment, if applicable. If a credit event occurs, the Fund as a protection seller would cease to receive the fixed payment stream, the Fund would pay the buyer “par value” or the full notional value of the referenced obligation, and the Fund would receive the eligible bonds issued by the reference entity. In turn, these bonds may be sold in order to realize a recovery value. Alternatively, the seller of the CDS and its Counterparty may agree to net the notional amount and the market value of the bonds and make a cash payment equal to the difference to the buyer of protection. If no credit event occurs, the Fund receives the fixed payment over the life of the agreement. As the seller, the Fund would effectively add leverage to its portfolio because, in addition to its total net assets, the Fund would be subject to investment exposure on the notional amount of the CDS. In connection with these agreements, cash and securities may be identified as collateral in accordance with the terms of the respective swap agreements to provide assets of value and recourse in the event of default under the swap agreement or bankruptcy/insolvency of a party to the swap agreement. If a Counterparty becomes bankrupt or otherwise fails to perform its obligations due to financial difficulties, the Fund may experience significant delays in obtaining any recovery in a bankruptcy or other reorganization proceeding. The Fund may obtain only limited recovery or may obtain no recovery in such circumstances. The Fund’s maximum risk of loss from Counterparty risk, either as the protection seller or as the protection buyer, is the value of the contract. The risk may be mitigated by having a master netting arrangement between the Fund and the Counterparty and by the designation of collateral by the Counterparty to cover the Fund’s exposure to the Counterparty.
Implied credit spreads represent the current level at which protection could be bought or sold given the terms of the existing CDS contract and serve as an indicator of the current status of the payment/performance risk of the CDS. An implied spread that has widened or increased since entry into the initial contract may indicate a deteriorating credit profile and increased risk of default for the reference entity. A declining or narrowing spread may indicate an improving credit profile or decreased risk of default for the reference entity. Alternatively, credit spreads may increase or decrease reflecting the general tolerance for risk in the credit markets.
An interest rate swap is an agreement between Counterparties pursuant to which the parties exchange a floating rate payment for a fixed rate payment based on a specified notional amount.
Changes in the value of centrally cleared and OTC swap agreements are recognized as unrealized gains (losses) in the Statement of Operations by “marking to market” on a daily basis to reflect the value of the swap agreement at the end of each trading day. Payments received or paid at the beginning of the agreement are reflected as such on the Statement of Assets and Liabilities and may be referred to as upfront payments. The Fund accrues for the fixed payment stream and amortizes upfront payments, if any, on swap agreements on a daily basis with the net amount, recorded as a component of realized gain (loss) on the Statement of Operations. A liquidation payment received or made at the termination of a swap agreement is recorded as realized gain (loss) on the Statement of Operations. Cash held as collateral is recorded as deposits with brokers on the Statement of Assets and Liabilities. Entering into these agreements involves, to varying degrees, lack of liquidity and elements of credit, market, and Counterparty risk in excess of amounts recognized on the Statement of Assets and Liabilities. Such risks involve the possibility that a swap is difficult to sell or liquidate; the Counterparty does not honor its obligations under the agreement and unfavorable interest rates and market fluctuations, which could result in the Fund accruing additional expenses. It is possible that developments in the swaps market, including potential government regulation, could adversely affect the Fund’s ability to terminate existing swap agreements or to realize amounts to be received under such agreements. Additionally, an International Swaps and Derivatives Association Master Agreement (“ISDA Master Agreement”) includes credit related contingent features which allow Counterparties to OTC derivatives to terminate derivative contracts prior to maturity in the event that, for example, the Fund’s net assets decline by a stated percentage or the Fund fails to meet the terms of its ISDA Master Agreements, which would cause the Fund to accelerate payment of any net liability owed to the Counterparty. A short position in a security poses more risk than holding the same security long. As there is no limit on how much the price of the security can increase, the Fund’s exposure is unlimited.
Notional amounts of each individual credit default swap agreement outstanding as of December 31, 2024, if any, for which the Fund is the seller of protection are disclosed in the open swap agreements table. These potential amounts would be partially offset by any recovery values of the respective referenced obligations, upfront payments received upon entering into the agreement, or net amounts received from the settlement of buy protection credit default swap agreements entered into by the Fund for the same referenced entity or entities.
O.
Leverage Risk — Leverage exists when the Fund can lose more than it originally invests because it purchases or sells an instrument or enters into a transaction without investing an amount equal to the full economic exposure of the instrument or transaction.
14
Invesco Active Allocation Fund
P.
Other Risks - Certain of the underlying funds are non-diversified and can invest a greater portion of their assets in the obligations or securities of a small number of issuers or any single issuer than a diversified fund can. A change in the value of one or a few issuers’ securities will therefore affect the value of an underlying fund more than would occur in a diversified fund.
Investments in ETFs generally present the same primary risks as an investment in a conventional mutual fund that has the same investment objective, strategy and policies. Investments in ETFs further involve the same risks associated with a direct investment in the types of securities, commodities and/or currencies included in the indices the ETFs are designed to replicate. In addition, shares of an ETF may trade at a market price that is higher or lower than their net asset value and an active trading market in such shares may not develop or continue. Moreover, trading of an ETF’s shares may be halted if the listing exchange’s officials deem such action to be appropriate, the shares are de-listed from the exchange, or the activation of market-wide “circuit breakers” (which are tied to large decreases in stock prices) halts stock trading generally.
Emerging markets (also referred to as developing markets) are generally subject to greater market volatility, political, social and economic instability, uncertain trading markets and more governmental limitations on foreign investment than more developed markets. In addition, companies operating in emerging markets may be subject to lower trading volume and greater price fluctuations than companies in more developed markets. Such countries’ economies may be more dependent on relatively few industries or investors that may be highly vulnerable to local and global changes. Companies in emerging market countries generally may be subject to less stringent regulatory, disclosure, financial reporting, accounting, auditing and recordkeeping standards than companies in more developed countries. As a result, information, including financial information, about such companies may be less available and reliable, which can impede an underlying Fund’s ability to evaluate such companies. Securities law and the enforcement of systems of taxation in many emerging market countries may change quickly and unpredictably, and the ability to bring and enforce actions (including bankruptcy, confiscatory taxation, expropriation, nationalization of a company’s assets, restrictions on foreign ownership of local companies, restrictions on withdrawing assets from the country, protectionist measures and practices such as share blocking), or to obtain information needed to pursue or enforce such actions, may be limited. In addition, the ability of foreign entities to participate in privatization programs of certain developing or emerging market countries may be limited by local law. Investments in emerging market securities may be subject to additional transaction costs, delays in settlement procedures, unexpected market closures, and lack of timely information.
NOTE 2—Advisory Fees and Other Fees Paid to Affiliates
The Trust has entered into a master investment advisory agreement with the Adviser. Under the terms of the investment advisory agreement, the Fund accrues daily and pays monthly an advisory fee to the Adviser based on the annual rate of the Fund’s average daily net assets as follows:
| The advisory fee paid by the Fund shall be reduced by any amounts paid by the Fund under the administrative services agreement with the Adviser. |
For the year ended December 31, 2024, the effective advisory fee rate incurred by the Fund was 0.09%.
Under the terms of a master sub-advisory agreement between the Adviser and each of Invesco Asset Management Deutschland GmbH, Invesco Asset Management Limited, Invesco Asset Management (Japan) Limited, Invesco Hong Kong Limited, Invesco Senior Secured Management, Inc. and Invesco Canada Ltd. and a separate sub-advisory agreement with Invesco Capital Management LLC (collectively, the "Affiliated Sub-Advisers") the Adviser, not the Fund, will pay 40% of the fees paid to the Adviser to any such Affiliated Sub-Adviser(s) that provide(s) discretionary investment management services to the Fund based on the percentage of assets allocated to such Affiliated Sub-Adviser(s). Invesco has also entered into a sub-advisory agreement with OppenheimerFunds, Inc. to provide discretionary management services to the Fund.
The Adviser has agreed, for an indefinite period, to waive advisory fees and/or reimburse expenses of all shares to the extent necessary to limit total annual fund operating expenses after fee waiver and/or expense reimbursement (excluding certain items discussed below) of Class A, Class C, Class R, Class Y, Class R5 and Class R6 shares to 1.50%, 2.25%, 1.75%, 1.25%, 1.25% and 1.25%, respectively, of the Fund’s average daily net assets (the “boundary limits”). In determining the Adviser’s obligation to waive advisory fees and/or reimburse expenses, the following expenses are not taken into account, and could cause the total annual fund operating expenses after fee waiver and/or expense reimbursement to exceed the numbers reflected above: (1) interest; (2) taxes; (3) dividend expense on short sales; (4) extraordinary or non-routine items, including litigation expenses; and (5) expenses that the Fund has incurred but did not actually pay because of an expense offset arrangement. Acquired Fund Fees and Expenses are not operating expenses of the Fund directly, but are fees and expenses, including management fees, of the investment companies in which the Fund invests. As a result, the total annual fund operating expenses after fee waiver and/or expense reimbursement may exceed the boundary limits above. Invesco may amend and/or terminate these boundary limits at any time in its sole discretion and will inform the Board of Trustees of any such changes. The Adviser did not waive fees and/or reimburse expenses during the period under these boundary limits.
Further, the Adviser has contractually agreed, through at least August 31, 2026, to waive the advisory fee payable by the Fund in an amount equal to 100% of the net advisory fees the Adviser receives from the affiliated money market funds on investments by the Fund of uninvested cash (excluding investments of cash collateral from securities lending) in such affiliated money market funds.
For the year ended December 31, 2024, the Adviser waived advisory fees of $10,566.
The Trust has entered into a master administrative services agreement with Invesco pursuant to which the Fund has agreed to pay Invesco for certain administrative costs incurred in providing accounting services to the Fund. For the year ended December 31, 2024, expenses incurred under the agreement are shown in the Statement of Operations as Administrative services fees. Invesco has entered into a sub-administration agreement whereby State Street Bank and Trust Company (“SSB”) serves as fund accountant and provides certain administrative services to the Fund. Pursuant to a custody agreement with the Trust on behalf of the Fund, SSB also serves as the Fund’s custodian.
The Trust has entered into a transfer agency and service agreement with Invesco Investment Services, Inc. (“IIS”) pursuant to which the Fund has agreed to pay IIS a fee for providing transfer agency and shareholder services to the Fund and reimburse IIS for certain expenses incurred by IIS in the course of providing such services. IIS may make payments to intermediaries that provide omnibus account services, sub-accounting services and/or networking services. All fees payable by IIS to intermediaries that provide omnibus account services or sub-accounting services are charged back to the Fund, subject to certain limitations approved by the Trust’s Board of Trustees. For the year ended December 31, 2024, expenses incurred under the agreement are shown in the Statement of Operations as Transfer agent fees.
The Trust has entered into master distribution agreements with Invesco Distributors, Inc. (“IDI”) to serve as the distributor for the Class A, Class C, Class R, Class Y, Class R5 and Class R6 shares of the Fund. The Trust has adopted plans pursuant to Rule 12b-1 under the 1940 Act with respect to the Fund’s Class A, Class C and Class R shares (collectively, the “Plans”). The Fund, pursuant to the Class A Plan, reimburses IDI for its allocated share of expenses incurred for the period, up to a maximum annual rate of 0.25% of the average daily net assets of Class A shares. The Fund, pursuant to the Class C and Class R Plans, pays IDI compensation at the annual rate of 1.00% of the average daily net assets of Class C shares and 0.50% of the average daily net assets of Class R shares. The fees are accrued daily and paid monthly. Of the Plans payments, up to 0.25% of the average daily net assets of each class of shares may be paid to furnish continuing personal shareholder services to customers who purchase and own shares of such classes. Any amounts not paid as a service fee under the Plans would constitute an asset-based sales charge. Rules of the Financial Industry Regulatory Authority (“FINRA”) impose a cap on the total sales charges, including asset-based sales charges, that may be paid by any class of shares of the Fund. For the year ended December 31, 2024, expenses incurred under the Plans are shown in the Statement of Operations as Distribution fees.
15
Invesco Active Allocation Fund
Front-end sales commissions and CDSC (collectively, the “sales charges”) are not recorded as expenses of the Fund. Front-end sales commissions are deducted from proceeds from the sales of Fund shares prior to investment in Class A shares of the Fund. CDSC are deducted from redemption proceeds prior to remittance to the shareholder. During the year ended December 31, 2024, IDI advised the Fund that IDI retained $160,055 in front-end sales commissions from the sale of Class A shares and $5,712 and $4,179 from Class A and Class C shares, respectively, for CDSC imposed upon redemptions by shareholders.
The underlying Invesco Funds pay no distribution fees for Class R6 shares and the Funds pay no sales loads or other similar compensation to IDI for acquiring underlying fund shares.
Certain officers and trustees of the Trust are officers and directors of the Adviser, IIS and/or IDI.
NOTE 3—Additional Valuation Information
GAAP defines fair value as the price that would be received to sell an asset or paid to transfer a liability in an orderly transaction between market participants at the measurement date, under current market conditions. GAAP establishes a hierarchy that prioritizes the inputs to valuation methods, giving the highest priority to readily available unadjusted quoted prices in an active market for identical assets (Level 1) and the lowest priority to significant unobservable inputs (Level 3), generally when market prices are not readily available. Based on the valuation inputs, the securities or other investments are tiered into one of three levels. Changes in valuation methods may result in transfers in or out of an investment’s assigned level:
Level 1 – Prices are determined using quoted prices in an active market for identical assets.
Level 2 – Prices are determined using other significant observable inputs. Observable inputs are inputs that other market participants may use in pricing a security. These may include quoted prices for similar securities, interest rates, prepayment speeds, credit risk, yield curves, loss severities, default rates, discount rates, volatilities and others. When significant events cause market movements to occur after the close of the relevant foreign securities markets, foreign securities may be fair valued utilizing an independent pricing service.
Level 3 – Prices are determined using significant unobservable inputs. In situations where quoted prices or observable inputs are unavailable (for example, when there is little or no market activity for an investment at the end of the period), unobservable inputs may be used. Unobservable inputs reflect the Adviser’s assumptions about the factors market participants would use in determining fair value of the securities or instruments and would be based on the best available information.
The following is a summary of the tiered valuation input levels, as of December 31, 2024. The level assigned to the securities valuations may not be an indication of the risk or liquidity associated with investing in those securities. Because of the inherent uncertainties of valuation, the values reflected in the financial statements may materially differ from the value received upon actual sale of those investments.
| | | | |
Investments in Securities | | | | |
| | | | |
| | | | |
Total Investments in Securities | | | | |
Other Investments - Assets* | | | | |
| | | | |
Forward Foreign Currency Contracts | | | | |
| | | | |
| | | | |
Other Investments - Liabilities* | | | | |
| | | | |
Forward Foreign Currency Contracts | | | | |
| | | | |
| | | | |
| | | | |
| | | | |
| Unrealized appreciation (depreciation). |
NOTE 4—Derivative Investments
The Fund may enter into an International Swaps and Derivatives Association Master Agreement (“ISDA Master Agreement”) under which a fund may trade OTC derivatives. An OTC transaction entered into under an ISDA Master Agreement typically involves a collateral posting arrangement, payment netting provisions and close-out netting provisions. These netting provisions allow for reduction of credit risk through netting of contractual obligations. The enforceability of the netting provisions of the ISDA Master Agreement depends on the governing law of the ISDA Master Agreement, among other factors.
For financial reporting purposes, the Fund does not offset OTC derivative assets or liabilities that are subject to ISDA Master Agreements in the Statement of Assets and Liabilities.
16
Invesco Active Allocation Fund
Value of Derivative Investments at Period-End
The table below summarizes the value of the Fund’s derivative investments, detailed by primary risk exposure, held as of December 31, 2024:
| |
| | | | |
Unrealized appreciation on futures contracts —Exchange-Traded(a) | | | | |
Unrealized appreciation on swap agreements — Centrally Cleared(a) | | | | |
Unrealized appreciation on forward foreign currency contracts outstanding | | | | |
| | | | |
Derivatives not subject to master netting agreements | | | | |
Total Derivative Assets subject to master netting agreements | | | | |
| |
| | | | | |
Unrealized depreciation on futures contracts —Exchange-Traded(a) | | | | | |
Unrealized depreciation on swap agreements — Centrally Cleared(a) | | | | | |
Unrealized depreciation on forward foreign currency contracts outstanding | | | | | |
Total Derivative Liabilities | | | | | |
Derivatives not subject to master netting agreements | | | | | |
Total Derivative Liabilities subject to master netting agreements | | | | | |
| The daily variation margin receivable (payable) at period-end is recorded in the Statement of Assets and Liabilities. |
Offsetting Assets and Liabilities
The table below reflects the Fund’s exposure to Counterparties subject to either an ISDA Master Agreement or other agreement for OTC derivative transactions as of December 31, 2024.
| Financial
Derivative
Assets | Financial
Derivative
Liabilities | | Collateral
(Received)/Pledged | |
| Forward Foreign
Currency Contracts | Forward Foreign
Currency Contracts | | | | |
| | | | | | |
| | | | | | |
| | | | | | |
| | | | | | |
Goldman Sachs International | | | | | | |
J.P. Morgan Chase Bank, N.A. | | | | | | |
Merrill Lynch International | | | | | | |
Standard Chartered Bank PLC | | | | | | |
| | | | | | |
| | | | | | |
Effect of Derivative Investments for the year ended December 31, 2024
The table below summarizes the gains (losses) on derivative investments, detailed by primary risk exposure, recognized in earnings during the period:
| Location of Gain (Loss) on
Statement of Operations |
| | | | | |
| | | | | |
Forward foreign currency contracts | | | | | |
| | | | | |
| | | | | |
Change in Net Unrealized Appreciation (Depreciation): | | | | | |
Forward foreign currency contracts | | | | | |
| | | | | |
| | | | | |
| | | | | |
17
Invesco Active Allocation Fund
The table below summarizes the average notional value of derivatives held during the period.
| Forward
Foreign Currency
Contracts | | |
| | | |
| | | |
NOTE 5—Expense Offset Arrangement(s)
The expense offset arrangement is comprised of transfer agency credits which result from balances in demand deposit accounts used by the transfer agent for clearing shareholder transactions. For the year ended December 31, 2024, the Fund received credits from this arrangement, which resulted in the reduction of the Fund’s total expenses of $110,804.
NOTE 6—Trustees’ and Officers’ Fees and Benefits
Trustees’ and Officers’ Fees and Benefits include amounts accrued by the Fund to pay remuneration to certain Trustees and Officers of the Fund. Trustees have the option to defer compensation payable by the Fund, and Trustees’ and Officers’ Fees and Benefits also include amounts accrued by the Fund to fund such deferred compensation amounts. Those Trustees who defer compensation have the option to select various Invesco Funds in which their deferral accounts shall be deemed to be invested. Finally, certain current Trustees were eligible to participate in a retirement plan that provided for benefits to be paid upon retirement to Trustees over a period of time based on the number of years of service. The Fund may have certain former Trustees who also participate in a retirement plan and receive benefits under such plan. Trustees’ and Officers’ Fees and Benefits include amounts accrued by the Fund to fund such retirement benefits. Obligations under the deferred compensation and retirement plans represent unsecured claims against the general assets of the Fund.
The Fund is permitted to temporarily carry a negative or overdrawn balance in its account with SSB, the custodian bank. Such balances, if any at period-end, are shown in the Statement of Assets and Liabilities under the payable caption Amount due custodian. To compensate the custodian bank for such overdrafts, the overdrawn Fund may either (1) leave funds as a compensating balance in the account so the custodian bank can be compensated by earning the additional interest; or (2) compensate by paying the custodian bank at a rate agreed upon by the custodian bank and Invesco, not to exceed the contractually agreed upon rate.
NOTE 8—Distributions to Shareholders and Tax Components of Net Assets
Tax Character of Distributions to Shareholders Paid During the Fiscal Years Ended December 31, 2024 and 2023: |
| | |
| | |
| | |
| | |
| Includes short-term capital gain distributions, if any. |
Tax Components of Net Assets at Period-End: |
| |
Undistributed ordinary income | |
Undistributed long-term capital gain | |
Net unrealized appreciation — investments | |
Net unrealized appreciation (depreciation) — foreign currencies | |
Temporary book/tax differences | |
Shares of beneficial interest | |
| |
The difference between book-basis and tax-basis unrealized appreciation (depreciation) is due to differences in the timing of recognition of gains and losses on investments for tax and book purposes. The Fund’s net unrealized appreciation (depreciation) difference is attributable primarily to wash sales, derivative instruments and partnerships.
The temporary book/tax differences are a result of timing differences between book and tax recognition of income and/or expenses. The Fund’s temporary book/tax differences are the result of the trustee deferral of compensation and retirement plan benefits.
Capital loss carryforward is calculated and reported as of a specific date. Results of transactions and other activity after that date may affect the amount of capital loss carryforward actually available for the Fund to utilize. The ability to utilize capital loss carryforward in the future may be limited under the Internal Revenue Code and related regulations based on the results of future transactions.
The Fund does not have a capital loss carryforward as of December 31, 2024.
NOTE 9—Investment Transactions
The aggregate amount of investment securities (other than short-term securities, U.S. Government obligations and money market funds, if any) purchased and sold by the Fund during the year ended December 31, 2024 was $833,665,788 and $955,667,372, respectively. As of December 31, 2024, the aggregate cost of
18
Invesco Active Allocation Fund
investments, including any derivatives, on a tax basis listed below includes the adjustments for financial reporting purposes as of the most recently completed federal income tax reporting period-end:
Unrealized Appreciation (Depreciation) of Investments on a Tax Basis |
Aggregate unrealized appreciation of investments | |
Aggregate unrealized (depreciation) of investments | |
Net unrealized appreciation of investments | |
Cost of investments for tax purposes is $1,636,393,170.
NOTE 10—Reclassification of Permanent Differences
Primarily as a result of differing book/tax treatment of foreign currency transactions, distributions and derivative instruments, on December 31, 2024, undistributed net investment income was increased by $1,737,624 and undistributed net realized gain was decreased by $1,737,624. This reclassification had no effect on the net assets or the distributable earnings of the Fund.
NOTE 11—Share Information
| Summary of Share Activity |
| Year ended
December 31, 2024 | Year ended
December 31, 2023 |
| | | | |
| | | | |
| | | | |
| | | | |
| | | | |
| | | | |
| | | | |
| | | | |
Issued as reinvestment of dividends: | | | | |
| | | | |
| | | | |
| | | | |
| | | | |
| | | | |
| | | | |
Automatic conversion of Class C shares to Class A shares: | | | | |
| | | | |
| | | | |
| | | | |
| | | | |
| | | | |
| | | | |
| | | | |
| | | | |
| | | | |
Net increase (decrease) in share activity | | | | |
19
Invesco Active Allocation Fund
Report of Independent Registered Public Accounting Firm
To the Board of Trustees of AIM Growth Series (Invesco Growth Series) and Shareholders of Invesco Active Allocation Fund
Opinion on the Financial Statements
We have audited the accompanying statement of assets and liabilities, including the schedule of investments, of Invesco Active Allocation Fund (one of the funds constituting AIM Growth Series (Invesco Growth Series), referred to hereafter as the "Fund") as of December 31, 2024, the related statement of operations for the year ended December 31, 2024, the statement of changes in net assets for each of the two years in the period ended December 31, 2024, including the related notes, and the financial highlights for each of the five years in the period ended December 31, 2024 (collectively referred to as the "financial statements"). In our opinion, the financial statements present fairly, in all material respects, the financial position of the Fund as of December 31, 2024, the results of its operations for the year then ended, the changes in its net assets for each of the two years in the period ended December 31, 2024 and the financial highlights for each of the five years in the period ended December 31, 2024 in conformity with accounting principles generally accepted in the United States of America.
These financial statements are the responsibility of the Fund’s management. Our responsibility is to express an opinion on the Fund’s financial statements based on our audits. We are a public accounting firm registered with the Public Company Accounting Oversight Board (United States) (PCAOB) and are required to be independent with respect to the Fund in accordance with the U.S. federal securities laws and the applicable rules and regulations of the Securities and Exchange Commission and the PCAOB.
We conducted our audits of these financial statements in accordance with the standards of the PCAOB. Those standards require that we plan and perform the audit to obtain reasonable assurance about whether the financial statements are free of material misstatement, whether due to error or fraud.
Our audits included performing procedures to assess the risks of material misstatement of the financial statements, whether due to error or fraud, and performing procedures that respond to those risks. Such procedures included examining, on a test basis, evidence regarding the amounts and disclosures in the financial statements. Our audits also included evaluating the accounting principles used and significant estimates made by management, as well as evaluating the overall presentation of the financial statements. Our procedures included confirmation of securities owned as of December 31, 2024 by correspondence with the custodian, transfer agent and brokers. We believe that our audits provide a reasonable basis for our opinion.
/s/PricewaterhouseCoopers LLP
February 20, 2025
We have served as the auditor of one or more of the investment companies in the Invesco group of investment companies since at least 1995. We have not been able to determine the specific year we began serving as auditor.
20
Invesco Active Allocation Fund
Tax Information
Form 1099-DIV, Form 1042-S and other year–end tax information provide shareholders with actual calendar year amounts that should be included in their tax returns. Shareholders should consult their tax advisers.
The following distribution information is being provided as required by the Internal Revenue Code or to meet a specific state’s requirement.
The Fund designates the following amounts or, if subsequently determined to be different, the maximum amount allowable for its fiscal year ended December 31, 2024:
Federal and State Income Tax | |
Long-Term Capital Gain Distributions | |
Qualified Dividend Income* | |
Corporate Dividends Received Deduction* | |
U.S. Treasury Obligations* | |
Qualified Business Income* | |
Business Interest Income* | |
*
The above percentages are based on ordinary income dividends paid to shareholders during the Fund’s fiscal year.
Non-Resident Alien Shareholders | |
Short-Term Capital Gain Distributions | |
21
Invesco Active Allocation Fund
Other Information Required in Form N-CSR (Items 8-11)
Changes in and Disagreements with Accountants for Open-End Management Investment Companies
Proxy Disclosures for Open-End Management Investment Companies
Remuneration Paid to Directors, Officers, and Others of Open-End Management Investment Companies
The aggregate remuneration paid to directors, officers and others is disclosed within the financial statements.
Statement Regarding Basis for Approval of Investment Advisory Contracts
22
Invesco Active Allocation Fund
SEC file number(s): 811-02699 and 002-57526
Invesco Distributors, Inc.
O-OPSAA-NCSR
Annual Financial Statements and Other InformationDecember 31, 2024
Invesco Convertible Securities Fund
A: CNSAX ■ C: CNSCX ■ Y: CNSDX ■ R5: CNSIX ■ R6: CNSFX
| |
| |
| |
| Notes to Financial Statements |
| Report of Independent Registered Public Accounting Firm |
| |
| Other Information Required in Form N-CSR (Items 8-11) |
Schedule of Investments(a)
| | |
U.S. Dollar Denominated Bonds & Notes–82.64% |
Aerospace & Defense–1.11% |
Axon Enterprise, Inc., Conv., 0.50%, 12/15/2027 | | | |
| | | |
| | | |
|
Burlington Stores, Inc., Conv., 1.25%, 12/15/2027 | | | |
Application Software–8.05% |
Bentley Systems, Inc., Conv., 0.13%, 01/15/2026 | | | |
BILL Holdings, Inc., Conv., 0.00%, | | | |
BlackLine, Inc., Conv., 1.00%, | | | |
| | | |
Confluent, Inc., Conv., 0.00%, | | | |
Core Scientific, Inc., Conv., 0.00%, | | | |
Datadog, Inc., Conv., 0.00%, | | | |
Dropbox, Inc., Conv., 0.00%, | | | |
Five9, Inc., Conv., 1.00%, | | | |
Guidewire Software, Inc., Conv., | | | |
HubSpot, Inc., Conv., 0.38%, 06/01/2025 | | | |
| | |
Conv.,
0.00%, 06/04/2027(b)(c)(d) | | | |
0.00%, 12/01/2027(b)(c)(d) | | | |
MicroStrategy, Inc., Conv., 0.00%, | | | |
| | |
| | | |
| | | |
Riot Platforms, Inc., Conv., 0.75%, | | | |
TeraWulf, Inc., Conv., 2.75%, | | | |
Tyler Technologies, Inc., Conv., 0.25%, 03/15/2026 | | | |
Unity Software, Inc., Conv., 0.00%, | | | |
Workiva, Inc., Conv., 1.25%, 08/15/2028 | | | |
| | | |
Automobile Manufacturers–3.26% |
Ford Motor Co., Conv., 0.00%, | | | |
| | |
Automobile Manufacturers–(continued) |
Ford Motor Credit Co. LLC, 7.35%, 11/04/2027 | | | |
Rivian Automotive, Inc., Conv., 4.63%, 03/15/2029 | | | |
Winnebago Industries, Inc., Conv., | | | |
| | | |
|
Alnylam Pharmaceuticals, Inc., Conv., 1.00%, 09/15/2027 | | | |
Cytokinetics, Inc., Conv., 3.50%, 07/01/2027 | | | |
Exact Sciences Corp., Conv., 2.00%, | | | |
Halozyme Therapeutics, Inc., Conv., 1.00%, 08/15/2028 | | | |
Insmed, Inc., Conv., 0.75%, 06/01/2028 | | | |
Ionis Pharmaceuticals, Inc., Conv., 1.75%, 06/15/2028 | | | |
Jazz Investments I Ltd., Conv., | | | |
Sarepta Therapeutics, Inc., Conv., 1.25%, 09/15/2027 | | | |
| | | |
|
Alibaba Group Holding Ltd. (China), Conv., 0.50%, 06/01/2029(b)(d) | | | |
Etsy, Inc., Conv., 0.13%, 10/01/2026 | | | |
JD.com, Inc. (China), Conv., 0.25%, | | | |
| | | |
|
Liberty Broadband Corp., Conv., | | | |
|
DraftKings Holdings, Inc., Conv., | | | |
Communications Equipment–1.02% |
Lumentum Holdings, Inc., Conv., 1.50%, 12/15/2029 | | | |
Construction & Engineering–1.13% |
Fluor Corp., Conv., 1.13%, 08/15/2029 | | | |
Granite Construction, Inc., Conv., | | | |
| | | |
|
SoFi Technologies, Inc., Conv., 1.25%, | | | |
Upstart Holdings, Inc., Conv., 1.00%, | | | |
| | | |
See accompanying Notes to Financial Statements which are an integral part of the financial statements.
2
Invesco Convertible Securities Fund
| | |
Diversified Financial Services–0.68% |
AerCap Ireland Capital DAC/AerCap Global Aviation Trust (Ireland), 6.50%, 07/15/2025 | | | |
Diversified Metals & Mining–0.33% |
MP Materials Corp., Conv., 3.00%, | | | |
|
Digital Realty Trust, L.P., Conv., | | | |
|
Alliant Energy Corp., Conv., 3.88%, 03/15/2026 | | | |
Duke Energy Corp., Conv., 4.13%, 04/15/2026 | | | |
Evergy, Inc., Conv., 4.50%, 12/15/2027 | | | |
FirstEnergy Corp., Conv., 4.00%, 05/01/2026 | | | |
NextEra Energy Capital Holdings, Inc., Conv., 3.00%, 03/01/2027(b) | | | |
NRG Energy, Inc., Conv., 2.75%, | | | |
PG&E Corp., Conv., 4.25%, 12/01/2027 | | | |
PPL Capital Funding, Inc., Conv., 2.88%, 03/15/2028 | | | |
Southern Co. (The), Conv., 4.50%, | | | |
Vistra Operations Co. LLC, 5.63%, | | | |
| | | |
Electrical Components & Equipment–0.25% |
Sunrun, Inc., Conv., 4.00%, | | | |
Electronic Components–0.36% |
Vishay Intertechnology, Inc., Conv., 2.25%, 09/15/2030 | | | |
Electronic Equipment & Instruments–0.81% |
Advanced Energy Industries, Inc., Conv., 2.50%, 09/15/2028 | | | |
Itron, Inc., Conv., 1.38%, | | | |
| | | |
Environmental & Facilities Services–0.44% |
Tetra Tech, Inc., Conv., 2.25%, 08/15/2028 | | | |
Financial Exchanges & Data–2.25% |
Coinbase Global, Inc., Conv., 0.25%, | | | |
|
Chefs’ Warehouse, Inc. (The), Conv., 2.38%, 12/15/2028 | | | |
|
| | | |
| | |
Health Care Equipment–2.89% |
CONMED Corp., Conv., 2.25%, 06/15/2027 | | | |
DexCom, Inc., Conv., 0.38%, 05/15/2028 | | | |
Enovis Corp., Conv., 3.88%, 10/15/2028 | | | |
Insulet Corp., Conv., 0.38%, 09/01/2026 | | | |
Integer Holdings Corp., Conv., 2.13%, 02/15/2028 | | | |
iRhythm Technologies, Inc., Conv., | | | |
Tandem Diabetes Care, Inc., Series 2024, Conv., 1.50%, | | | |
TransMedics Group, Inc., Conv., 1.50%, 06/01/2028 | | | |
| | | |
|
Ventas Realty L.P., Conv., 3.75%, 06/01/2026 | | | |
Welltower OP LLC, Conv., 3.13%, | | | |
| | | |
Health Care Supplies–1.41% |
Haemonetics Corp., Conv., 2.50%, | | | |
Lantheus Holdings, Inc., Conv., 2.63%, 12/15/2027 | | | |
Merit Medical Systems, Inc., Conv., | | | |
| | | |
Health Care Technology–0.12% |
Evolent Health, Inc., Conv., 3.50%, 12/01/2029 | | | |
Heavy Electrical Equipment–0.33% |
Bloom Energy Corp., Conv., 3.00%, 06/01/2028 | | | |
|
Meritage Homes Corp., Conv., 1.75%, | | | |
Homefurnishing Retail–0.90% |
Wayfair, Inc., Conv., 3.25%, 09/15/2027 | | | |
Hotels, Resorts & Cruise Lines–2.45% |
| | |
| | | |
| | | |
| | |
| | | |
Conv., 0.00%, 02/15/2026(c) | | | |
Marriott Vacations Worldwide Corp., Conv., 3.25%, 12/15/2027 | | | |
| | | |
|
Spectrum Brands, Inc., Conv., 3.38%, | | | |
See accompanying Notes to Financial Statements which are an integral part of the financial statements.
3
Invesco Convertible Securities Fund
| | |
Housewares & Specialties–0.54% |
Newell Brands, Inc., 6.38%, 05/15/2030 | | | |
Industrial Machinery & Supplies & Components–0.30% |
Middleby Corp. (The), Conv., 1.00%, 09/01/2025 | | | |
|
Rexford Industrial Realty L.P., Conv., | | | |
Integrated Oil & Gas–0.54% |
Occidental Petroleum Corp., 5.88%, 09/01/2025 | | | |
Interactive Media & Services–2.02% |
Match Group Holdings II LLC, 5.00%, | | | |
| | |
| | | |
| | | |
| | | |
Internet Services & Infrastructure–3.29% |
Akamai Technologies, Inc., | | |
| | | |
| | | |
DigitalOcean Holdings, Inc., Conv., | | | |
| | |
| | | |
| | | |
| | | |
|
| | |
| | | |
| | | |
| | | |
Life Sciences Tools & Services–0.62% |
Repligen Corp., Conv., 1.00%, 12/15/2028 | | | |
|
Starwood Property Trust, Inc., Conv., 6.75%, 07/15/2027 | | | |
Movies & Entertainment–2.18% |
Cinemark Holdings, Inc., Conv., 4.50%, 08/15/2025 | | | |
Liberty Media Corp.-Liberty Formula One, Conv., 2.25%, 08/15/2027 | | | |
Live Nation Entertainment, Inc., Conv., 3.13%, 01/15/2029 | | | |
| | | |
|
CenterPoint Energy, Inc., Conv., 4.25%, 08/15/2026 | | | |
| | |
Multi-Utilities–(continued) |
CMS Energy Corp., Conv., 3.38%, 05/01/2028 | | | |
| | |
| | | |
| | | |
| | | |
Oil & Gas Exploration & Production–0.29% |
Northern Oil and Gas, Inc., Conv., 3.63%, 04/15/2029 | | | |
Oil & Gas Refining & Marketing–0.52% |
Sunoco L.P., 7.00%, 05/01/2029(b) | | | |
Oil & Gas Storage & Transportation–0.41% |
Energy Transfer L.P., 4.75%, 01/15/2026 | | | |
Packaged Foods & Meats–0.70% |
Freshpet, Inc., Conv., 3.00%, 04/01/2028 | | | |
Post Holdings, Inc., Conv., 2.50%, 08/15/2027 | | | |
| | | |
|
American Airlines Group, Inc., Conv., 6.50%, 07/01/2025 | | | |
American Airlines, Inc./AAdvantage Loyalty IP Ltd., 5.75%, | | | |
| | |
| | | |
| | | |
Southwest Airlines Co., Conv., 1.25%, 05/01/2025 | | | |
| | | |
Passenger Ground Transportation–2.52% |
Lyft, Inc., Conv., 0.63%, | | | |
| | |
| | | |
Series 2028, Conv., 0.88%, 12/01/2028 | | | |
| | | |
|
Amphastar Pharmaceuticals, Inc., Conv., 2.00%, 03/15/2029 | | | |
Renewable Electricity–0.51% |
NextEra Energy Partners L.P., Conv., | | | |
Research & Consulting Services–0.64% |
Parsons Corp., Conv., 2.63%, | | | |
Semiconductor Materials & Equipment–0.72% |
MKS Instruments, Inc., Conv., 1.25%, | | | |
See accompanying Notes to Financial Statements which are an integral part of the financial statements.
4
Invesco Convertible Securities Fund
| | |
|
Impinj, Inc., Conv., 1.13%, 05/15/2027 | | | |
MACOM Technology Solutions Holdings, Inc., Conv., 0.00%, | | | |
Microchip Technology, Inc., Conv., | | | |
| | |
| | | |
| | | |
Synaptics, Inc., Conv., 0.75%, | | | |
Wolfspeed, Inc., Conv., 1.75%, 05/01/2026 | | | |
| | | |
|
ArcelorMittal S.A. (Luxembourg), 6.55%, 11/29/2027 | | | |
|
Progress Software Corp., Conv., | | | |
Varonis Systems, Inc., Conv., 1.00%, | | | |
Zscaler, Inc., Conv., 0.13%, 07/01/2025 | | | |
| | | |
Technology Hardware, Storage & Peripherals–2.12% |
Seagate HDD Cayman, Conv., 3.50%, 06/01/2028 | | | |
Super Micro Computer, Inc., Conv., | | | |
Western Digital Corp., Conv., 3.00%, 11/15/2028 | | | |
| | | |
Trading Companies & Distributors–0.44% |
Air Lease Corp., Series D, 6.00%(e)(f) | | | |
Transaction & Payment Processing Services–3.70% |
| | |
| | | |
| | | |
| | |
Conv., 0.00%, 05/01/2026(c) | | | |
| | | |
Global Payments, Inc., Conv., 1.50%, | | | |
Shift4 Payments, Inc., Conv., 0.50%, 08/01/2027 | | | |
| | | |
|
American Water Capital Corp., Conv., 3.63%, 06/15/2026 | | | |
Total U.S. Dollar Denominated Bonds & Notes (Cost $578,171,666) | |
| | |
|
Aerospace & Defense–2.39% |
Boeing Co. (The), 6.00%, Conv. Pfd. | | |
Asset Management & Custody Banks–0.63% |
Ares Management Corp., 6.75%, Series B, Conv. Pfd. | | |
|
Bank of America Corp., 7.25%, Series L, Conv. Pfd. | | |
Wells Fargo & Co., 7.50%, Class A, Series L, Conv. Pfd. | | |
| | | |
Diversified Financial Services–1.30% |
Apollo Global Management, Inc., 6.75%, Conv. Pfd. | | |
|
NextEra Energy, Inc., 7.30%, Conv. Pfd. | | |
PG&E Corp., 6.00%, Series A, Conv. Pfd. | | |
| | | |
Health Care Services–0.15% |
BrightSpring Health Services, Inc., 6.75%, Conv. Pfd. | | |
Industrial Machinery & Supplies & Components–0.60% |
Chart Industries, Inc., 6.75%, Series B, Conv. Pfd. | | |
Specialty Chemicals–0.71% |
Albemarle Corp., 7.25%, Conv. Pfd. | | |
Technology Hardware, Storage & Peripherals–1.10% |
Hewlett Packard Enterprise Co., 7.63%, Conv. Pfd. | | |
Total Preferred Stocks (Cost $94,853,388) | |
|
Invesco Government & Agency Portfolio, Institutional Class, 4.42%(g)(h) | | |
Invesco Treasury Portfolio, Institutional | | |
Total Money Market Funds (Cost $14,361,199) | |
|
|
| |
TOTAL INVESTMENTS IN SECURITIES–99.61% (Cost $698,172,468) | |
OTHER ASSETS LESS LIABILITIES—0.39% | |
| |
See accompanying Notes to Financial Statements which are an integral part of the financial statements.
5
Invesco Convertible Securities Fund
Investment Abbreviations:
Notes to Schedule of Investments:
| Industry and/or sector classifications used in this report are generally according to the Global Industry Classification Standard, which was developed by and is the exclusive property and a service mark of MSCI Inc. and Standard & Poor’s. |
| Security purchased or received in a transaction exempt from registration under the Securities Act of 1933, as amended (the “1933 Act”). The security may be resold pursuant to an exemption from registration under the 1933 Act, typically to qualified institutional buyers. The aggregate value of these securities at December 31, 2024 was $242,341,867, which represented 32.78% of the Fund’s Net Assets. |
| Zero coupon bond issued at a discount. |
| Security has an irrevocable call by the issuer or mandatory put by the holder. Maturity date reflects such call or put. |
| Security issued at a fixed rate for a specific period of time, after which it will convert to a variable rate. |
| Perpetual bond with no specified maturity date. |
| Affiliated holding. Affiliated holdings are investments in entities which are under common ownership or control of Invesco Ltd. or are investments in entities in which the Fund owns 5% or more of the outstanding voting securities. The table below shows the Fund’s transactions in, and earnings from, its investments in affiliates for the fiscal year ended December 31, 2024. |
| | | | Change in
Unrealized
Appreciation | | | |
Investments in Affiliated Money Market Funds: | | | | | | | |
Invesco Government & Agency Portfolio, Institutional Class | | | | | | | |
Invesco Liquid Assets Portfolio, Institutional Class | | | | | | | |
Invesco Treasury Portfolio, Institutional Class | | | | | | | |
| | | | | | | |
| The rate shown is the 7-day SEC standardized yield as of December 31, 2024. |
| The table below details options purchased. |
Open Exchange-Traded Equity Options Purchased |
| | | | | | |
|
| | | | | | | | |
| | | | | | | | |
Energy Select Sector SPDR Fund | | | | | | | | |
| | | | | | | | |
Royal Caribbean Cruises Ltd. | | | | | | | | |
| | | | | | | | |
Total Exchange-Traded Equity Options Purchased | | | | | | |
| Notional Value is calculated by multiplying the Number of Contracts by the Exercise Price by the multiplier. |
Open Exchange-Traded Index Options Purchased |
| | | | | | |
|
| | | | | | | | |
| Notional Value is calculated by multiplying the Number of Contracts by the Exercise Price by the multiplier. |
Open Exchange-Traded Equity Options Written |
| | | | | | |
|
MicroStrategy Incorporated | | | | | | | | |
| Notional Value is calculated by multiplying the Number of Contracts by the Exercise Price by the multiplier. |
See accompanying Notes to Financial Statements which are an integral part of the financial statements.
6
Invesco Convertible Securities Fund
|
| |
| —Standard & Poor’s Depositary Receipt |
| |
See accompanying Notes to Financial Statements which are an integral part of the financial statements.
7
Invesco Convertible Securities Fund
Statement of Assets and Liabilities
| |
Investments in unaffiliated securities, at value
(Cost $683,811,269) | |
Investments in affiliated money market funds, at value (Cost $14,361,199) | |
| |
| |
| |
| |
| |
Investment for trustee deferred compensation and retirement plans | |
| |
| |
| |
| |
Options written, at value (premiums received $315,290) | |
| |
| |
Accrued fees to affiliates | |
Accrued other operating expenses | |
Trustee deferred compensation and retirement plans | |
| |
Net assets applicable to shares outstanding | |
| |
Shares of beneficial interest | |
| |
| |
|
| |
| |
| |
| |
| |
Shares outstanding, no par value, with an unlimited number of shares authorized: |
| |
| |
| |
| |
| |
| |
Net asset value per share | |
Maximum offering price per share
(Net asset value of $23.87 ÷ 94.50%) | |
| |
Net asset value and offering price per share | |
| |
Net asset value and offering price per share | |
| |
Net asset value and offering price per share | |
| |
Net asset value and offering price per share | |
See accompanying Notes to Financial Statements which are an integral part of the financial statements.
8
Invesco Convertible Securities Fund
Statement of Operations
For the year ended December 31, 2024
| |
| |
| |
Dividends from affiliated money market funds | |
| |
| |
| |
Administrative services fees | |
| |
| |
| |
| |
Transfer agent fees — A, C and Y | |
| |
| |
Trustees’ and officers’ fees and benefits | |
Registration and filing fees | |
| |
Professional services fees | |
| |
| |
Less: Fees waived and/or expense offset arrangement(s) | |
| |
| |
Realized and unrealized gain (loss) from: | |
Net realized gain (loss) from: | |
Unaffiliated investment securities | |
Affiliated investment securities | |
| |
| |
Change in net unrealized appreciation (depreciation) of: | |
Unaffiliated investment securities | |
| |
| |
Net realized and unrealized gain | |
Net increase in net assets resulting from operations | |
See accompanying Notes to Financial Statements which are an integral part of the financial statements.
9
Invesco Convertible Securities Fund
Statement of Changes in Net Assets
For the years ended December 31, 2024 and 2023
| | |
| | |
| | |
| | |
Change in net unrealized appreciation (depreciation) | | |
Net increase in net assets resulting from operations | | |
Distributions to shareholders from distributable earnings: | | |
| | |
| | |
| | |
| | |
| | |
Total distributions from distributable earnings | | |
| | |
| | |
| | |
| | |
| | |
| | |
Net increase (decrease) in net assets resulting from share transactions | | |
Net increase (decrease) in net assets | | |
| | |
| | |
| | |
See accompanying Notes to Financial Statements which are an integral part of the financial statements.
10
Invesco Convertible Securities Fund
Financial Highlights
The following schedule presents financial highlights for a share of the Fund outstanding throughout the periods indicated.
| Net asset
value,
beginning
of period | | Net gains
(losses)
on securities
(both
realized and
unrealized) | Total from
investment
operations | Dividends
from net
investment
income | Distributions
from net
realized
gains | | Net asset
value, end
of period | | Net assets,
end of period
(000’s omitted) | Ratio of
expenses
to average
net assets
with fee waivers
and/or
expenses
absorbed | Ratio of
expenses
to average net
assets without
fee waivers
and/or
expenses
absorbed
| Ratio of net
investment
income
(loss)
to average
net assets | |
|
| | | | | | | | | | | | | | |
| | | | | | | | | | | | | | |
| | | | | | | | | | | | | | |
| | | | | | | | | | | | | | |
| | | | | | | | | | | | | | |
|
| | | | | | | | | | | | | | |
| | | | | | | | | | | | | | |
| | | | | | | | | | | | | | |
| | | | | | | | | | | | | | |
| | | | | | | | | | | | | | |
|
| | | | | | | | | | | | | | |
| | | | | | | | | | | | | | |
| | | | | | | | | | | | | | |
| | | | | | | | | | | | | | |
| | | | | | | | | | | | | | |
|
| | | | | | | | | | | | | | |
| | | | | | | | | | | | | | |
| | | | | | | | | | | | | | |
| | | | | | | | | | | | | | |
| | | | | | | | | | | | | | |
|
| | | | | | | | | | | | | | |
| | | | | | | | | | | | | | |
| | | | | | | | | | | | | | |
| | | | | | | | | | | | | | |
| | | | | | | | | | | | | | |
| Calculated using average shares outstanding. |
| Includes adjustments in accordance with accounting principles generally accepted in the United States of America and as such, the net asset value for financial reporting purposes and the returns based upon those net asset values may differ from the net asset value and returns for shareholder transactions. Does not include sales charges and is not annualized for periods less than one year, if applicable. |
| Portfolio turnover is calculated at the fund level and is not annualized for periods less than one year, if applicable. |
| The total return, ratios of expenses to average net assets and ratio of net investment income to average net assets reflect actual 12b-1 fees of 0.99% for Class C shares. |
| The total return, ratios of expenses to average net assets and ratio of net investment income to average net assets reflect actual 12b-1 fees of 0.98% for the years ended December 31, 2023 and 2022, respectively. |
| The total return, ratios of expenses to average net assets and ratio of net investment income to average net assets reflect actual 12b-1 fees of 0.97% for Class C shares. |
See accompanying Notes to Financial Statements which are an integral part of the financial statements.
11
Invesco Convertible Securities Fund
Notes to Financial Statements
NOTE 1—Significant Accounting Policies
Invesco Convertible Securities Fund (the “Fund”) is a series portfolio of AIM Growth Series (Invesco Growth Series) (the “Trust”). The Trust is a Delaware statutory trust registered under the Investment Company Act of 1940, as amended (the “1940 Act”), as an open-end series management investment company authorized to issue an unlimited number of shares of beneficial interest. Information presented in these financial statements pertains only to the Fund. Matters affecting the Fund or each class will be voted on exclusively by the shareholders of the Fund or each class.
The Fund’s investment objective is total return through growth of capital and current income.
The Fund currently consists of five different classes of shares: Class A, Class C, Class Y, Class R5 and Class R6. Class Y shares are available only to certain investors. Class A shares are sold with a front-end sales charge unless certain waiver criteria are met. Under certain circumstances, load waived shares may be subject to contingent deferred sales charges ("CDSC"). Class C shares are sold with a CDSC. Class Y, Class R5 and Class R6 shares are sold at net asset value. Class C shares held for eight years after purchase are eligible for automatic conversion into Class A shares of the same Fund (the "Conversion Feature"). The automatic conversion pursuant to the Conversion Feature will generally occur at the end of the month following the eighth anniversary after a purchase of Class C shares.
Effective after the close of business on September 30, 2024, Class R5 shares are closed to new investors.
The Fund is an investment company and accordingly follows the investment company accounting and reporting guidance in accordance with Financial Accounting Standards Board Accounting Standards Codification Topic 946, Financial Services – Investment Companies.
The following is a summary of the significant accounting policies followed by the Fund in the preparation of its financial statements.
A.
Security Valuations – Securities, including restricted securities, are valued according to the following policy.
Fixed income securities (including convertible debt securities) generally are valued on the basis of prices provided by independent pricing services. Prices provided by the pricing service may be determined without exclusive reliance on quoted prices, and may reflect appropriate factors such as institution-size trading in similar groups of securities, developments related to specific securities, dividend rate (for unlisted equities), yield (for debt obligations), quality, type of issue, coupon rate (for debt obligations), maturity (for debt obligations), individual trading characteristics and other market data. Pricing services generally value debt obligations assuming orderly transactions of institutional round lot size, but a fund may hold or transact in the same securities in smaller, odd lot sizes. Odd lots often trade at lower prices than institutional round lots, and their value may be adjusted accordingly. Debt obligations are subject to interest rate and credit risks. In addition, all debt obligations involve some risk of default with respect to interest and/or principal payments.
A security listed or traded on an exchange is generally valued at its trade price or official closing price that day as of the close of the exchange where the security is principally traded, or lacking any trades or official closing price on a particular day, the security may be valued at the closing bid or ask price on that day. Securities traded in the over-the-counter market are valued based on prices furnished by independent pricing services or market makers. When such securities are valued using prices provided by an independent pricing service they may be considered fair valued. Futures contracts are valued at the daily settlement price set by an exchange on which they are principally traded. Where a final settlement price exists, exchange-traded options are valued at the final settlement price from the exchange where the option principally trades. Where a final settlement price does not exist, exchange-traded options are valued at the mean between the last bid and ask price generally from the exchange where the option principally trades.
Securities of investment companies that are not exchange-traded (e.g., open-end mutual funds) are valued using such company’s end-of-business-day net asset value per share.
Deposits, other obligations of U.S. and non-U.S. banks and financial institutions are valued at their daily account value.
Foreign securities’ (including foreign exchange contracts) prices are converted into U.S. dollar amounts using the applicable exchange rates as of the close of the New York Stock Exchange (“NYSE”). If market quotations are available and reliable for foreign exchange-traded equity securities, the securities will be valued at the market quotations. Invesco Advisers, Inc. (the “Adviser” or “Invesco”) may use various pricing services to obtain market quotations as well as fair value prices. Because trading hours for certain foreign securities end before the close of the NYSE, closing market quotations may become not representative of market value in the Adviser’s judgment (“unreliable”). If, between the time trading ends on a particular security and the close of the customary trading session on the NYSE, a significant event occurs that makes the closing price of the security unreliable, the Adviser may fair value the security. If the event is likely to have affected the closing price of the security, the security will be valued at fair value in good faith in accordance with Board- approved policies and related Adviser procedures (“Valuation Procedures”). Adjustments to closing prices to reflect fair value may also be based on a screening process of an independent pricing service to indicate the degree of certainty, based on historical data, that the closing price in the principal market where a foreign security trades is not the current value as of the close of the NYSE. Foreign securities’ prices meeting the degree of certainty that the price is not reflective of current value will be priced at the indication of fair value from the independent pricing service. Multiple factors may be considered by the independent pricing service in determining adjustments to reflect fair value and may include information relating to sector indices, American Depositary Receipts and domestic and foreign index futures. Foreign securities may have additional risks including exchange rate changes, potential for sharply devalued currencies and high inflation, political and economic upheaval, the relative lack of issuer information, relatively low market liquidity and the potential lack of strict financial and accounting controls and standards.
Unlisted securities will be valued using prices provided by independent pricing services or by another method that the Adviser, in its judgment, believes better reflects the security’s fair value in accordance with the Valuation Procedures.
Non-traded rights and warrants shall be valued at intrinsic value if the terms of the rights and warrants are available, specifically the subscription or exercise price and the ratio. Intrinsic value is calculated as the daily market closing price of the security to be received less the subscription price, which is then adjusted by the exercise ratio. In the case of warrants, an option pricing model supplied by an independent pricing service may be used based on market data such as volatility, stock price and interest rate from the independent pricing service and strike price and exercise period from verified terms.
Securities for which market prices are not provided by any of the above methods may be valued based upon quotes furnished by independent sources. The mean between the last bid and ask prices may be used to value debt obligations, including corporate loans.
Securities for which market quotations are not readily available are fair valued by the Adviser in accordance with the Valuation Procedures. If a fair value price provided by a pricing service is unreliable, the Adviser will fair value the security using the Valuation Procedures. Issuer specific events, market trends, bid/ask quotes of brokers and information providers and other market data may be reviewed in the course of making a good faith determination of a security’s fair value.
The Fund may invest in securities that are subject to interest rate risk, meaning the risk that the prices will generally fall as interest rates rise and, conversely, the prices will generally rise as interest rates fall. Specific securities differ in their sensitivity to changes in interest rates depending on their individual characteristics. Changes in interest rates may result in increased market volatility, which may affect the value and/or liquidity of certain Fund investments.
Valuations change in response to many factors including the historical and prospective earnings of the issuer, the value of the issuer’s assets, general market conditions which are not specifically related to the particular issuer, such as real or perceived adverse economic conditions, changes in the general outlook for revenues or corporate earnings, changes in interest or currency rates, regional or global instability, natural or environmental disasters, widespread disease or other public health issues, war, acts of terrorism, significant governmental actions or adverse investor sentiment generally and market liquidity. Because of the inherent uncertainties of valuation, the values reflected in the financial statements may materially differ from the value received upon actual sale of those investments.
12
Invesco Convertible Securities Fund
The price the Fund could receive upon the sale of any investment may differ from the Adviser’s valuation of the investment, particularly for securities that are valued using a fair valuation technique. When fair valuation techniques are applied, the Adviser uses available information, including both observable and unobservable inputs and assumptions, to determine a methodology that will result in a valuation that the Adviser believes approximates market value. Fund securities that are fair valued may be subject to greater fluctuation in their value from one day to the next than would be the case if market quotations were used. Because of the inherent uncertainties of valuation, and the degree of subjectivity in such decisions, the Fund could realize a greater or lesser than expected gain or loss upon the sale of the investment.
B.
Securities Transactions and Investment Income – Securities transactions are accounted for on a trade date basis. Realized gains or losses on sales are computed on the basis of specific identification of the securities sold. Interest income (net of withholding tax, if any) is recorded on an accrual basis from settlement date and includes coupon interest and amortization of premium and accretion of discount on debt securities as applicable. Pay-in-kind interest income and non-cash dividend income received in the form of securities in lieu of cash are recorded at the fair value of the securities received. Paydown gains and losses on mortgage and asset-backed securities are recorded as adjustments to interest income. Dividend income (net of withholding tax, if any) is recorded on the ex-dividend date.
The Fund may periodically participate in litigation related to Fund investments. As such, the Fund may receive proceeds from litigation settlements. Any proceeds received are included in the Statement of Operations as realized gain (loss) for investments no longer held and as unrealized gain (loss) for investments still held.
Brokerage commissions and mark ups are considered transaction costs and are recorded as an increase to the cost basis of securities purchased and/or a reduction of proceeds on a sale of securities. Such transaction costs are included in the determination of net realized and unrealized gain (loss) from investment securities reported in the Statement of Operations and the Statement of Changes in Net Assets and the net realized and unrealized gains (losses) on securities per share in the Financial Highlights. Transaction costs are included in the calculation of the Fund’s net asset value and, accordingly, they reduce the Fund’s total returns. These transaction costs are not considered operating expenses and are not reflected in net investment income reported in the Statement of Operations and the Statement of Changes in Net Assets, or the net investment income per share and the ratios of expenses and net investment income reported in the Financial Highlights, nor are they limited by any expense limitation arrangements between the Fund and the investment adviser.
The Fund allocates income and realized and unrealized capital gains and losses to a class based on the relative net assets of each class.
C.
Country Determination — For the purposes of making investment selection decisions and presentation in the Schedule of Investments, the investment adviser may determine the country in which an issuer is located and/or credit risk exposure based on various factors. These factors include the laws of the country under which the issuer is organized, where the issuer maintains a principal office, the country in which the issuer derives 50% or more of its total revenues, the country that has the primary market for the issuer’s securities and its "country of risk" as determined by a third party service provider, as well as other criteria. Among the other criteria that may be evaluated for making this determination are the country in which the issuer maintains 50% or more of its assets, the type of security, financial guarantees and enhancements, the nature of the collateral and the sponsor organization. Country of issuer and/or credit risk exposure has been determined to be the United States of America, unless otherwise noted.
D.
Distributions - Distributions from net investment income, if any, are declared and paid quarterly and are recorded on the ex-dividend date. Distributions from net realized capital gain, if any, are generally declared and paid annually and recorded on the ex-dividend date. The Fund may elect to treat a portion of the proceeds from redemptions as distributions for federal income tax purposes.
E.
Federal Income Taxes – The Fund intends to comply with the requirements of Subchapter M of the Internal Revenue Code of 1986, as amended (the “Internal Revenue Code”), necessary to qualify as a regulated investment company and to distribute substantially all of the Fund’s taxable earnings to shareholders. As such, the Fund will not be subject to federal income taxes on otherwise taxable income (including net realized capital gain) that is distributed to shareholders. Therefore, no provision for federal income taxes is recorded in the financial statements.
The Fund recognizes the tax benefits of uncertain tax positions only when the position is more likely than not to be sustained. Management has analyzed the Fund’s uncertain tax positions and concluded that no liability for unrecognized tax benefits should be recorded related to uncertain tax positions. Management is not aware of any tax positions for which it is reasonably possible that the total amounts of unrecognized tax benefits will change materially in the next 12 months.
The Fund files tax returns in the U.S. Federal jurisdiction and certain other jurisdictions. Generally, the Fund is subject to examinations by such taxing authorities for up to three years after the filing of the return for the tax period.
F.
Expenses – Fees provided for under the Rule 12b-1 plan of a particular class of the Fund are charged to the operations of such class. Transfer agency fees and expenses and other shareholder recordkeeping fees and expenses attributable to Class R5 and Class R6 are allocated based on relative net assets of Class R5 and Class R6. Sub-accounting fees attributable to Class R5 are charged to the operations of the class. Transfer agency fees and expenses and other shareholder recordkeeping fees and expenses relating to all other classes are allocated among those classes based on relative net assets. All other expenses are allocated among the classes based on relative net assets.
G.
Accounting Estimates – The preparation of financial statements in conformity with accounting principles generally accepted in the United States of America (“GAAP”) requires management to make estimates and assumptions that affect the reported amounts of assets and liabilities at the date of the financial statements and the reported amounts of revenues and expenses during the reporting period including estimates and assumptions related to taxation. Actual results could differ from those estimates by a significant amount. In addition, the Fund monitors for material events or transactions that may occur or become known after the period-end date and before the date the financial statements are released to print.
H.
Indemnifications – Under the Trust’s organizational documents, each Trustee, officer, employee or other agent of the Trust is indemnified against certain liabilities that may arise out of the performance of their duties to the Fund. Additionally, in the normal course of business, the Fund enters into contracts, including the Fund’s servicing agreements, that contain a variety of indemnification clauses. The Fund’s maximum exposure under these arrangements is unknown as this would involve future claims that may be made against the Fund that have not yet occurred. The risk of material loss as a result of such indemnification claims is considered remote.
I.
Segment Reporting — In November 2023, the FASB issued Accounting Standards Update 2023-07, Segment Reporting (Topic 280): Improvements to Reportable Segment Disclosures (“ASU 2023-07”), with the intent of improving reportable segment disclosure requirements, primarily through enhanced disclosures about significant segment expenses, allowing financial statement users to better understand the components of a segment’s profit or loss and assess potential future cash flows for each reportable segment and the entity as a whole thereby enabling better understanding of how an entity’s segments impact overall performance. The Fund represents a single operating segment. Subject to the oversight and, when applicable, approval of the Board of Trustees, the Fund’s Adviser acts as the Fund’s chief operating decision maker (“CODM”), assessing performance and making decisions about resource allocation within the Fund. The CODM monitors the operating results as a whole and the Fund’s long-term strategic asset allocation is determined in accordance with the terms of its prospectus based on a defined investment strategy. The financial information provided to and reviewed by the CODM is consistent with that presented in the Fund’s financial statements. Adoption of the new standard impacted the Fund’s financial statement note disclosures only and did not affect the Fund’s financial position or the results of its operations.
J.
Other Risks - Fluctuations in the federal funds and equivalent foreign rates or other changes to monetary policy or regulatory actions may expose fixed income markets to heightened volatility, perhaps suddenly and to a significant degree, and to reduced liquidity for certain fixed income investments, particularly those with longer maturities, when rates increase. Such changes and resulting increased volatility may adversely impact the Fund, including its operations, universe of potential investment options, and return potential. It is difficult to predict the impact of interest rate changes on various markets. In addition, decreases in fixed income dealer market-making capacity may also potentially lead to heightened volatility and reduced liquidity in the fixed income markets. As a result, the value of
13
Invesco Convertible Securities Fund
the Fund’s investments and share price may decline. Changes in central bank policies and other governmental actions and political events within the U.S. and abroad may also, among other things, affect investor and consumer expectations and confidence in the financial markets. This could result in higher than normal redemptions by shareholders, which could potentially increase the Fund’s portfolio turnover rate and transaction costs.
The market values of convertible securities are affected by market interest rates, the risk of actual issuer default on interest or principal payments and the value of the underlying common stock into which the convertible security may be converted. Additionally, a convertible security is subject to the same types of market and issuer risks as apply to the underlying common stock. In addition, certain convertible securities are subject to involuntary conversions and may undergo principal write-downs upon the occurrence of certain triggering events, and, as a result, are subject to an increased risk of loss. Convertible securities may be rated below investment grade.
Preferred securities are subject to issuer-specific and market risks applicable generally to equity securities. Preferred securities also may be subordinated to bonds or other debt instruments, subjecting them to a greater risk of non-payment, may be less liquid than many other securities, such as common stocks, and generally offer no voting rights with respect to the issuer.
NOTE 2—Advisory Fees and Other Fees Paid to Affiliates
The Trust has entered into a master investment advisory agreement with the Adviser. Under the terms of the investment advisory agreement, the Fund accrues daily and pays monthly an advisory fee to the Adviser based on the annual rate of the Fund’s average daily net assets as follows:
For the year ended December 31, 2024, the effective advisory fee rate incurred by the Fund was 0.52%.
Under the terms of a master sub-advisory agreement between the Adviser and each of Invesco Asset Management Deutschland GmbH, Invesco Asset Management Limited, Invesco Asset Management (Japan) Limited, Invesco Hong Kong Limited, Invesco Senior Secured Management, Inc. and Invesco Canada Ltd. and a separate sub-advisory agreement with Invesco Capital Management LLC (collectively, the "Affiliated Sub-Advisers") the Adviser, not the Fund, will pay 40% of the fees paid to the Adviser to any such Affiliated Sub-Adviser(s) that provide(s) discretionary investment management services to the Fund based on the percentage of assets allocated to such Affiliated Sub-Adviser(s).
The Adviser has agreed, for an indefinite period, to waive advisory fees and/or reimburse expenses of all shares to the extent necessary to limit total annual fund operating expenses after fee waiver and/or expense reimbursement (excluding certain items discussed below) of Class A, Class C, Class Y, Class R5 and Class R6 shares to 1.50%, 2.25%, 1.25%, 1.25% and 1.25%, respectively, of the Fund’s average daily net assets (the “boundary limits”). In determining the Adviser’s obligation to waive advisory fees and/or reimburse expenses, the following expenses are not taken into account, and could cause the total annual fund operating expenses after fee waiver and/or expense reimbursement to exceed the numbers reflected above: (1) interest; (2) taxes; (3) dividend expense on short sales; (4) extraordinary or non-routine items, including litigation expenses; and (5) expenses that the Fund has incurred but did not actually pay because of an expense offset arrangement. Invesco may amend and/or terminate these boundary limits at any time in its sole discretion and will inform the Board of Trustees of any such changes. The Adviser did not waive fees and/or reimburse expenses during the period under these boundary limits.
Further, the Adviser has contractually agreed, through at least August 31, 2026, to waive the advisory fee payable by the Fund in an amount equal to 100% of the net advisory fees the Adviser receives from the affiliated money market funds on investments by the Fund of uninvested cash in such affiliated money market funds.
For the year ended December 31, 2024, the Adviser waived advisory fees of $40,619.
The Trust has entered into a master administrative services agreement with Invesco pursuant to which the Fund has agreed to pay Invesco for certain administrative costs incurred in providing accounting services to the Fund. For the year ended December 31, 2024, expenses incurred under the agreement are shown in the Statement of Operations as Administrative services fees. Invesco has entered into a sub-administration agreement whereby State Street Bank and Trust Company (“SSB”) serves as fund accountant and provides certain administrative services to the Fund. Pursuant to a custody agreement with the Trust on behalf of the Fund, SSB also serves as the Fund’s custodian.
The Trust has entered into a transfer agency and service agreement with Invesco Investment Services, Inc. (“IIS”) pursuant to which the Fund has agreed to pay IIS a fee for providing transfer agency and shareholder services to the Fund and reimburse IIS for certain expenses incurred by IIS in the course of providing such services. IIS may make payments to intermediaries that provide omnibus account services, sub-accounting services and/or networking services. All fees payable by IIS to intermediaries that provide omnibus account services or sub-accounting services are charged back to the Fund, subject to certain limitations approved by the Trust’s Board of Trustees. For the year ended December 31, 2024, expenses incurred under the agreement are shown in the Statement of Operations as Transfer agent fees.
The Trust has entered into master distribution agreements with Invesco Distributors, Inc. (“IDI”) to serve as the distributor for the Class A, Class C, Class Y, Class R5 and Class R6 shares of the Fund. The Trust has adopted distribution and service plans pursuant to Rule 12b-1 under the 1940 Act with respect to the Fund’s Class A and Class C shares (collectively, the “Plans”). The Fund, pursuant to the Plans, reimburses IDI for its allocated share of expenses incurred for the period, up to a maximum annual rate of 0.25% of the average daily net assets of Class A shares and up to 1.00% of the average daily net assets of Class C shares. The fees are accrued daily and paid monthly. Of the Plans payments, up to 0.25% of the average daily net assets of each class of shares may be paid to furnish continuing personal shareholder services to customers who purchase and own shares of such classes. Any amounts not paid as a service fee under the Plans would constitute an asset-based sales charge. Rules of the Financial Industry Regulatory Authority (“FINRA”) impose a cap on the total sales charges, including asset-based sales charges, that may be paid by any class of shares of the Fund. For the year ended December 31, 2024, expenses incurred under the Plans are shown in the Statement of Operations as Distribution fees.
Front-end sales commissions and CDSC (collectively, the “sales charges”) are not recorded as expenses of the Fund. Front-end sales commissions are deducted from proceeds from the sales of Fund shares prior to investment in Class A shares of the Fund. CDSC are deducted from redemption proceeds prior to remittance to the shareholder. During the year ended December 31, 2024, IDI advised the Fund that IDI retained $34,894 in front-end sales commissions from the sale of Class A shares and $2,475 and $298 from Class A and Class C shares, respectively, for CDSC imposed upon redemptions by shareholders.
Certain officers and trustees of the Trust are officers and directors of the Adviser, IIS and/or IDI.
NOTE 3—Additional Valuation Information
GAAP defines fair value as the price that would be received to sell an asset or paid to transfer a liability in an orderly transaction between market participants at the measurement date, under current market conditions. GAAP establishes a hierarchy that prioritizes the inputs to valuation methods, giving the highest priority to readily available unadjusted quoted prices in an active market for identical assets (Level 1) and the lowest priority to significant unobservable inputs (Level 3), generally when
14
Invesco Convertible Securities Fund
market prices are not readily available. Based on the valuation inputs, the securities or other investments are tiered into one of three levels. Changes in valuation methods may result in transfers in or out of an investment’s assigned level:
Level 1 – Prices are determined using quoted prices in an active market for identical assets.
Level 2 – Prices are determined using other significant observable inputs. Observable inputs are inputs that other market participants may use in pricing a security. These may include quoted prices for similar securities, interest rates, prepayment speeds, credit risk, yield curves, loss severities, default rates, discount rates, volatilities and others. When significant events cause market movements to occur after the close of the relevant foreign securities markets, foreign securities may be fair valued utilizing an independent pricing service.
Level 3 – Prices are determined using significant unobservable inputs. In situations where quoted prices or observable inputs are unavailable (for example, when there is little or no market activity for an investment at the end of the period), unobservable inputs may be used. Unobservable inputs reflect the Adviser’s assumptions about the factors market participants would use in determining fair value of the securities or instruments and would be based on the best available information.
The following is a summary of the tiered valuation input levels, as of December 31, 2024. The level assigned to the securities valuations may not be an indication of the risk or liquidity associated with investing in those securities. Because of the inherent uncertainties of valuation, the values reflected in the financial statements may materially differ from the value received upon actual sale of those investments.
| | | | |
Investments in Securities | | | | |
U.S. Dollar Denominated Bonds & Notes | | | | |
| | | | |
| | | | |
| | | | |
Total Investments in Securities | | | | |
Other Investments - Liabilities* | | | | |
| | | | |
| | | | |
| Options written are shown at value. |
NOTE 4—Derivative Investments
The Fund may enter into an International Swaps and Derivatives Association Master Agreement (“ISDA Master Agreement”) under which a fund may trade OTC derivatives. An OTC transaction entered into under an ISDA Master Agreement typically involves a collateral posting arrangement, payment netting provisions and close-out netting provisions. These netting provisions allow for reduction of credit risk through netting of contractual obligations. The enforceability of the netting provisions of the ISDA Master Agreement depends on the governing law of the ISDA Master Agreement, among other factors.
For financial reporting purposes, the Fund does not offset OTC derivative assets or liabilities that are subject to ISDA Master Agreements in the Statement of Assets and Liabilities.
Value of Derivative Investments at Period-End
The table below summarizes the value of the Fund’s derivative investments, detailed by primary risk exposure, held as of December 31, 2024:
| |
| |
Options purchased, at value — Exchange-Traded(a) | |
Derivatives not subject to master netting agreements | |
Total Derivative Assets subject to master netting agreements | |
| |
| |
Options written, at value — Exchange-Traded | |
Derivatives not subject to master netting agreements | |
Total Derivative Liabilities subject to master netting agreements | |
| Options purchased, at value as reported in the Schedule of Investments. |
Effect of Derivative Investments for the year ended December 31, 2024
The table below summarizes the gains (losses) on derivative investments, detailed by primary risk exposure, recognized in earnings during the period:
| Location of Gain (Loss) on
Statement of Operations |
| |
| |
| |
| |
15
Invesco Convertible Securities Fund
| Location of Gain (Loss) on Statement of Operations |
| |
Change in Net Unrealized Appreciation (Depreciation): | |
| |
| |
| |
| Options purchased are included in the net realized gain (loss) from investment securities and the change in net unrealized appreciation (depreciation) of investment securities. |
The table below summarizes the average notional value of derivatives held during the period.
NOTE 5—Expense Offset Arrangement(s)
The expense offset arrangement is comprised of transfer agency credits which result from balances in demand deposit accounts used by the transfer agent for clearing shareholder transactions. For the year ended December 31, 2024, the Fund received credits from this arrangement, which resulted in the reduction of the Fund’s total expenses of $12,635.
NOTE 6—Trustees’ and Officers’ Fees and Benefits
Trustees’ and Officers’ Fees and Benefits include amounts accrued by the Fund to pay remuneration to certain Trustees and Officers of the Fund. Trustees have the option to defer compensation payable by the Fund, and Trustees’ and Officers’ Fees and Benefits also include amounts accrued by the Fund to fund such deferred compensation amounts. Those Trustees who defer compensation have the option to select various Invesco Funds in which their deferral accounts shall be deemed to be invested. Finally, certain current Trustees were eligible to participate in a retirement plan that provided for benefits to be paid upon retirement to Trustees over a period of time based on the number of years of service. The Fund may have certain former Trustees who also participate in a retirement plan and receive benefits under such plan. Trustees’ and Officers’ Fees and Benefits include amounts accrued by the Fund to fund such retirement benefits. Obligations under the deferred compensation and retirement plans represent unsecured claims against the general assets of the Fund.
The Fund is permitted to temporarily carry a negative or overdrawn balance in its account with SSB, the custodian bank. Such balances, if any at period-end, are shown in the Statement of Assets and Liabilities under the payable caption Amount due custodian. To compensate the custodian bank for such overdrafts, the overdrawn Fund may either (1) leave funds as a compensating balance in the account so the custodian bank can be compensated by earning the additional interest; or (2) compensate by paying the custodian bank at a rate agreed upon by the custodian bank and Invesco, not to exceed the contractually agreed upon rate.
NOTE 8—Distributions to Shareholders and Tax Components of Net Assets
Tax Character of Distributions to Shareholders Paid During the Fiscal Years Ended December 31, 2024 and 2023: |
| | |
| | |
| Includes short-term capital gain distributions, if any. |
Tax Components of Net Assets at Period-End: |
| |
Undistributed ordinary income | |
Undistributed long-term capital gain | |
Net unrealized appreciation — investments | |
Temporary book/tax differences | |
Shares of beneficial interest | |
| |
The difference between book-basis and tax-basis unrealized appreciation (depreciation) is due to differences in the timing of recognition of gains and losses on investments for tax and book purposes. The Fund’s net unrealized appreciation (depreciation) difference is attributable primarily to wash sales, amortization and accretion on debt securities, deemed dividends and derivative instruments.
The temporary book/tax differences are a result of timing differences between book and tax recognition of income and/or expenses. The Fund’s temporary book/tax differences are the result of the trustee deferral of compensation and retirement plan benefits.
Capital loss carryforward is calculated and reported as of a specific date. Results of transactions and other activity after that date may affect the amount of capital loss carryforward actually available for the Fund to utilize. The ability to utilize capital loss carryforward in the future may be limited under the Internal Revenue Code and related regulations based on the results of future transactions.
The Fund does not have a capital loss carryforward as of December 31, 2024.
16
Invesco Convertible Securities Fund
NOTE 9—Investment Transactions
The aggregate amount of investment securities (other than short-term securities, U.S. Government obligations and money market funds, if any) purchased and sold by the Fund during the year ended December 31, 2024 was $640,967,252 and $793,406,407, respectively. As of December 31, 2024, the aggregate cost of investments, including any derivatives, on a tax basis listed below includes the adjustments for financial reporting purposes as of the most recently completed federal income tax reporting period-end:
Unrealized Appreciation (Depreciation) of Investments on a Tax Basis |
Aggregate unrealized appreciation of investments | |
Aggregate unrealized (depreciation) of investments | |
Net unrealized appreciation of investments | |
Cost of investments for tax purposes is $697,719,012.
NOTE 10—Reclassification of Permanent Differences
Primarily as a result of differing book/tax treatment of deemed dividends, amortization and accretion on debt securities and contingent payment debt instruments, on December 31, 2024, undistributed net investment income was increased by $3,812,874 and undistributed net realized gain was decreased by $3,812,874. This reclassification had no effect on the net assets or the distributable earnings of the Fund.
NOTE 11—Share Information
| Summary of Share Activity |
| | Year ended
December 31, 2023 |
| | | | |
| | | | |
| | | | |
| | | | |
| | | | |
| | | | |
| | | | |
Issued as reinvestment of dividends: | | | | |
| | | | |
| | | | |
| | | | |
| | | | |
| | | | |
Automatic conversion of Class C shares to Class A shares: | | | | |
| | | | |
| | | | |
| | | | |
| | | | |
| | | | |
| | | | |
| | | | |
| | | | |
Net increase (decrease) in share activity | | | | |
| There are entities that are record owners of more than 5% of the outstanding shares of the Fund and in the aggregate own 40% of the outstanding shares of the Fund. IDI has an agreement with these entities to sell Fund shares. The Fund, Invesco and/or Invesco affiliates may make payments to these entities, which are considered to be related to the Fund, for providing services to the Fund, Invesco and/or Invesco affiliates including but not limited to services such as securities brokerage, distribution, third party record keeping and account servicing. The Fund has no knowledge as to whether all or any portion of the shares owned of record by these entities are also owned beneficially. |
17
Invesco Convertible Securities Fund
Report of Independent Registered Public Accounting Firm
To the Board of Trustees of AIM Growth Series (Invesco Growth Series) and Shareholders of Invesco Convertible Securities Fund
Opinion on the Financial Statements
We have audited the accompanying statement of assets and liabilities, including the schedule of investments, of Invesco Convertible Securities Fund (one of the funds constituting AIM Growth Series (Invesco Growth Series), referred to hereafter as the "Fund") as of December 31, 2024, the related statement of operations for the year ended December 31, 2024, the statement of changes in net assets for each of the two years in the period ended December 31, 2024, including the related notes, and the financial highlights for each of the five years in the period ended December 31, 2024 (collectively referred to as the "financial statements"). In our opinion, the financial statements present fairly, in all material respects, the financial position of the Fund as of December 31, 2024, the results of its operations for the year then ended, the changes in its net assets for each of the two years in the period ended December 31, 2024 and the financial highlights for each of the five years in the period ended December 31, 2024 in conformity with accounting principles generally accepted in the United States of America.
These financial statements are the responsibility of the Fund’s management. Our responsibility is to express an opinion on the Fund’s financial statements based on our audits. We are a public accounting firm registered with the Public Company Accounting Oversight Board (United States) (PCAOB) and are required to be independent with respect to the Fund in accordance with the U.S. federal securities laws and the applicable rules and regulations of the Securities and Exchange Commission and the PCAOB.
We conducted our audits of these financial statements in accordance with the standards of the PCAOB. Those standards require that we plan and perform the audit to obtain reasonable assurance about whether the financial statements are free of material misstatement, whether due to error or fraud.
Our audits included performing procedures to assess the risks of material misstatement of the financial statements, whether due to error or fraud, and performing procedures that respond to those risks. Such procedures included examining, on a test basis, evidence regarding the amounts and disclosures in the financial statements. Our audits also included evaluating the accounting principles used and significant estimates made by management, as well as evaluating the overall presentation of the financial statements. Our procedures included confirmation of securities owned as of December 31, 2024 by correspondence with the custodian, transfer agent, and broker. We believe that our audits provide a reasonable basis for our opinion.
/s/PricewaterhouseCoopers LLP
February 20, 2025
We have served as the auditor of one or more of the investment companies in the Invesco group of investment companies since at least 1995. We have not been able to determine the specific year we began serving as auditor.
18
Invesco Convertible Securities Fund
Tax Information
Form 1099-DIV, Form 1042-S and other year–end tax information provide shareholders with actual calendar year amounts that should be included in their tax returns. Shareholders should consult their tax advisers.
The following distribution information is being provided as required by the Internal Revenue Code or to meet a specific state’s requirement.
The Fund designates the following amounts or, if subsequently determined to be different, the maximum amount allowable for its fiscal year ended December 31, 2024:
Federal and State Income Tax | |
Qualified Dividend Income* | |
Corporate Dividends Received Deduction* | |
U.S. Treasury Obligations* | |
Qualified Business Income* | |
Business Interest Income* | |
*
The above percentages are based on ordinary income dividends paid to shareholders during the Fund’s fiscal year.
Non-Resident Alien Shareholders | |
Short-Term Capital Gain Distributions | |
19
Invesco Convertible Securities Fund
Other Information Required in Form N-CSR (Items 8-11)
Changes in and Disagreements with Accountants for Open-End Management Investment Companies
Proxy Disclosures for Open-End Management Investment Companies
Remuneration Paid to Directors, Officers, and Others of Open-End Management Investment Companies
The aggregate remuneration paid to directors, officers and others is disclosed within the financial statements.
Statement Regarding Basis for Approval of Investment Advisory Contracts
20
Invesco Convertible Securities Fund
SEC file number(s): 811-02699 and 002-57526
Invesco Distributors, Inc.
MS-CSEC-NCSR
Annual Financial Statements and Other InformationDecember 31, 2024
Invesco Income Advantage International Fund
A: GTNDX ■ C: GNDCX ■ R: GTNRX ■ Y: GTNYX ■ R5: GNDIX ■ R6:GNDSX
| |
| |
| |
| Notes to Financial Statements |
| Report of Independent Registered Public Accounting Firm |
| |
| Other Information Required in Form N-CSR (Items 8-11) |
| | |
Common Stocks & Other Equity Interests–69.79% |
|
| | |
| | |
| | |
| | |
| | |
| | |
| | |
| | |
| | |
| | |
| | |
| | |
Commonwealth Bank of Australia | | |
| | |
| | |
| | |
| | |
| | |
| | |
| | |
| | |
| | |
Harvey Norman Holdings Ltd. | | |
| | |
James Hardie Industries PLC, CDI(a) | | |
| | |
| | |
| | |
| | |
National Australia Bank Ltd. | | |
Northern Star Resources Ltd. | | |
| | |
| | |
| | |
| | |
| | |
| | |
| | |
| | |
| | |
| | |
| | |
| | |
| | |
| | |
| | |
| | |
| | |
| | |
| | |
Treasury Wine Estates Ltd. | | |
| | |
Washington H Soul Pattinson & Co. Ltd. | | |
| | |
|
| | |
| | |
| | |
Woodside Energy Group Ltd. | | |
| | |
| | | |
|
| | |
| | |
| | |
| | |
Raiffeisen Bank International AG | | |
| | |
Vienna Insurance Group AG Wiener Versicherung Gruppe | | |
| | |
| | |
| | | |
|
| | |
Anheuser-Busch InBev S.A./N.V. | | |
| | |
| | |
| | |
Groupe Bruxelles Lambert N.V. | | |
| | |
| | |
| | |
| | |
| | |
| | |
| | | |
|
| | |
B3 S.A. - Brasil, Bolsa, Balcao | | |
Banco Bradesco S.A., Preference Shares | | |
| | |
Centrais Eletricas Brasileiras S.A. | | |
Cia Energetica de Minas Gerais, Preference Shares | | |
| | |
Gerdau S.A., Preference Shares | | |
Itau Unibanco Holding S.A., Preference Shares | | |
Itausa S.A., Preference Shares | | |
Metalurgica Gerdau S.A., Preference Shares | | |
| | |
Petroleo Brasileiro S.A., Preference Shares | | |
| | |
| | |
| | |
| | | |
See accompanying Notes to Financial Statements which are an integral part of the financial statements.
2
Invesco Income Advantage International Fund
| | |
|
| | |
|
| | |
Algonquin Power & Utilities Corp. | | |
Alimentation Couche-Tard, Inc. | | |
| | |
| | |
| | |
| | |
| | |
Bank of Nova Scotia (The) | | |
| | |
| | |
Brookfield Asset Management Ltd., Class A | | |
| | |
| | |
| | |
Canadian Imperial Bank of Commerce | | |
Canadian National Railway Co. | | |
Canadian Natural Resources Ltd. | | |
Canadian Pacific Kansas City Ltd. | | |
Canadian Tire Corp. Ltd., Class A | | |
Canadian Utilities Ltd., Class A | | |
CCL Industries, Inc., Class B | | |
| | |
| | |
Constellation Software, Inc. | | |
| | |
| | |
| | |
Fairfax Financial Holdings Ltd. | | |
Finning International, Inc. | | |
| | |
| | |
| | |
| | |
| | |
| | |
| | |
| | |
| | |
| | |
Ivanhoe Mines Ltd., Class A(a) | | |
| | |
| | |
| | |
| | |
Magna International, Inc. | | |
| | |
| | |
| | |
| | |
| | |
| | |
| | |
| | |
| | |
| | |
|
| | |
Restaurant Brands International, Inc. | | |
| | |
Rogers Communications, Inc., Class B | | |
| | |
| | |
Shopify, Inc., Class A(a) | | |
| | |
| | |
| | |
| | |
Teck Resources Ltd., Class B | | |
| | |
| | |
| | |
Toronto-Dominion Bank (The) | | |
| | |
West Fraser Timber Co. Ltd. | | |
Wheaton Precious Metals Corp. | | |
| | |
| | | |
|
| | |
| | |
| | | |
|
Agricultural Bank of China Ltd., H Shares | | |
| | |
Alibaba Group Holding Ltd. | | |
| | |
| | |
Bank of China Ltd., H Shares | | |
Bank of Communications Co. Ltd., H Shares | | |
| | |
| | |
BOC Hong Kong (Holdings) Ltd. | | |
Brilliance China Automotive Holdings Ltd. | | |
| | |
China CITIC Bank Corp. Ltd., H Shares | | |
China Coal Energy Co. Ltd., H Shares | | |
China Construction Bank Corp., H Shares | | |
China Hongqiao Group Ltd. | | |
China Life Insurance Co. Ltd., H Shares | | |
China Mengniu Dairy Co. Ltd. | | |
China Merchants Bank Co. Ltd., H Shares | | |
China Minsheng Banking Corp. Ltd., H Shares | | |
China National Building Material Co. Ltd., H Shares | | |
China Overseas Land & Investment Ltd. | | |
China Pacific Insurance (Group) Co. Ltd., H Shares | | |
China Petroleum & Chemical Corp., H Shares | | |
China Taiping Insurance Holdings Co. Ltd. | | |
China Tower Corp. Ltd., H Shares(b) | | |
| | |
COSCO SHIPPING Holdings Co. Ltd., H Shares | | |
CSPC Pharmaceutical Group Ltd. | | |
See accompanying Notes to Financial Statements which are an integral part of the financial statements.
3
Invesco Income Advantage International Fund
| | |
|
| | |
| | |
Geely Automobile Holdings Ltd. | | |
Great Wall Motor Co. Ltd. | | |
Industrial & Commercial Bank of China Ltd., H Shares | | |
| | |
| | |
| | |
Kuaishou Technology(a)(b) | | |
Li Auto, Inc., A Shares(a) | | |
| | |
| | |
New China Life Insurance Co. Ltd., H Shares | | |
New Oriental Education & Technology Group, Inc. | | |
| | |
PetroChina Co. Ltd., H Shares | | |
Ping An Insurance (Group) Co. of China Ltd., H Shares | | |
Pop Mart International Group Ltd.(b) | | |
Postal Savings Bank of China Co. Ltd., H | | |
| | |
Qifu Technology, Inc., ADR | | |
Sino Biopharmaceutical Ltd. | | |
Sinopharm Group Co. Ltd., H Shares | | |
Smoore International Holdings Ltd.(b) | | |
| | |
Tencent Music Entertainment Group, ADR | | |
Topsports International Holdings Ltd.(b) | | |
| | |
Vipshop Holdings Ltd., ADR | | |
| | |
Wharf (Holdings) Ltd. (The) | | |
Wilmar International Ltd. | | |
Xinyi Glass Holdings Ltd. | | |
Yangzijiang Shipbuilding Holdings Ltd. | | |
| | |
Zhejiang Expressway Co. Ltd., H Shares | | |
Zijin Mining Group Co. Ltd., H Shares | | |
ZTO Express (Cayman), Inc., ADR | | |
| | | |
|
Bancolombia S.A., Preference Shares | | |
|
| | |
|
A.P. Moller - Maersk A/S, Class B | | |
| | |
Ascendis Pharma A/S, ADR(a) | | |
| | |
| | |
| | |
| | |
| | |
| | |
| | |
|
| | |
| | |
| | |
| | |
Novo Nordisk A/S, Class B | | |
Novonesis (Novozymes) B, Class B | | |
| | |
| | |
| | |
| | |
Vestas Wind Systems A/S(a) | | |
| | | |
|
| | |
| | |
| | |
| | |
| | |
| | |
| | |
| | |
| | |
| | |
| | |
| | |
| | |
| | | |
|
| | |
| | |
| | |
| | |
| | |
| | |
| | |
| | |
| | |
| | |
| | |
| | |
| | |
| | |
| | |
| | |
| | |
| | |
Cie Generale des Etablissements Michelin S.C.A. | | |
| | |
| | |
| | |
| | |
| | |
| | |
| | |
| | |
| | |
See accompanying Notes to Financial Statements which are an integral part of the financial statements.
4
Invesco Income Advantage International Fund
| | |
|
| | |
| | |
| | |
| | |
Hermes International S.C.A. | | |
| | |
| | |
| | |
| | |
| | |
La Francaise des Jeux SACA(b) | | |
| | |
| | |
| | |
LVMH Moet Hennessy Louis Vuitton SE | | |
| | |
| | |
| | |
| | |
| | |
| | |
| | |
| | |
| | |
| | |
| | |
| | |
| | |
| | |
| | |
| | |
| | |
| | |
Unibail-Rodamco-Westfield SE | | |
| | |
Veolia Environnement S.A. | | |
| | |
| | |
| | |
| | |
| | | |
|
| | |
| | |
| | |
| | |
Bayerische Motoren Werke AG | | |
| | |
| | |
| | |
Carl Zeiss Meditec AG, BR | | |
| | |
| | |
| | |
| | |
| | |
| | |
| | |
|
| | |
| | |
| | |
Dr. Ing. h.c. F. Porsche AG, Preference | | |
DWS Group GmbH & Co. KGaA(b) | | |
| | |
| | |
Fraport AG Frankfurt Airport Services | | |
Fresenius Medical Care AG | | |
Fresenius SE & Co. KGaA(a) | | |
FUCHS SE, Preference Shares | | |
| | |
| | |
| | |
Henkel AG & Co. KGaA, Preference Shares | | |
| | |
| | |
| | |
| | |
| | |
| | |
| | |
| | |
| | |
Muenchener Rueckversicherungs-Gesellschaft AG in Muenchen, Class R | | |
| | |
Porsche Automobil Holding SE, Preference Shares | | |
| | |
| | |
| | |
| | |
| | |
Sartorius AG, Preference Shares | | |
| | |
| | |
Siemens Energy AG, Class A(a) | | |
Siemens Healthineers AG(b) | | |
| | |
| | |
| | |
| | |
| | |
Volkswagen AG, Preference Shares | | |
| | |
| | |
| | |
| | | |
|
Alpha Services and Holdings S.A. | | |
Eurobank Ergasias Services and Holdings S.A. | | |
Hellenic Telecommunications Organization S.A. | | |
| | |
See accompanying Notes to Financial Statements which are an integral part of the financial statements.
5
Invesco Income Advantage International Fund
| | |
|
National Bank of Greece S.A. | | |
| | | |
|
Millicom International Cellular S.A., SDR(a) | | |
|
| | |
| | |
Cathay Pacific Airways Ltd. | | |
| | |
CK Hutchison Holdings Ltd. | | |
CK Infrastructure Holdings Ltd. | | |
| | |
DFI Retail Group Holdings Ltd. | | |
| | |
Hang Lung Properties Ltd. | | |
| | |
Henderson Land Development Co. Ltd. | | |
HK Electric Investments & HK Electric Investments Ltd. | | |
| | |
Hong Kong & China Gas Co. Ltd. (The) | | |
Hong Kong Exchanges & Clearing Ltd. | | |
Hongkong Land Holdings Ltd. | | |
Jardine Matheson Holdings Ltd. | | |
| | |
| | |
| | |
Melco Resorts & Entertainment Ltd., ADR(a) | | |
| | |
New World Development Co. Ltd. | | |
| | |
Power Assets Holdings Ltd. | | |
| | |
| | |
Sun Hung Kai Properties Ltd. | | |
Swire Pacific Ltd., Class A | | |
Techtronic Industries Co. Ltd. | | |
| | |
Wharf Real Estate Investment Co. Ltd. | | |
| | | |
|
| | |
|
Dr. Reddy’s Laboratories Ltd., ADR | | |
| | |
| | |
| | |
| | |
| | |
| | |
| | |
OLA Electric Mobility Ltd.(a) | | |
One 97 Communications Ltd. | | |
| | |
| | |
Sun Pharmaceutical Industries Ltd. | | |
| | |
|
| | |
Tata Consultancy Services Ltd. | | |
Tata Power Co. Ltd. (The) | | |
| | |
| | | |
|
PT Astra International Tbk | | |
| | |
PT Indofood Sukses Makmur Tbk | | |
PT Telkom Indonesia (Persero) Tbk | | |
| | |
| | | |
|
| | |
| | |
Bank of Ireland Group PLC | | |
Flutter Entertainment PLC(a) | | |
| | |
| | |
| | |
| | | |
|
| | |
| | |
Bank Leumi le-Israel B.M. | | |
Check Point Software Technologies Ltd.(a) | | |
| | |
| | |
Israel Discount Bank Ltd., Class A | | |
Mizrahi Tefahot Bank Ltd. | | |
| | |
Teva Pharmaceutical Industries Ltd., ADR(a) | | |
| | |
| | | |
|
| | |
| | |
Assicurazioni Generali S.p.A. | | |
| | |
| | |
| | |
| | |
| | |
Davide Campari-Milano N.V. | | |
| | |
| | |
| | |
| | |
FinecoBank Banca Fineco S.p.A. | | |
| | |
Infrastrutture Wireless Italiane S.p.A.(b) | | |
| | |
| | |
| | |
See accompanying Notes to Financial Statements which are an integral part of the financial statements.
6
Invesco Income Advantage International Fund
| | |
|
Mediobanca Banca di Credito Finanziario S.p.A. | | |
| | |
| | |
| | |
| | |
| | |
| | |
Recordati Industria Chimica e Farmaceutica S.p.A. | | |
Ryanair Holdings PLC, ADR | | |
| | |
| | |
| | |
| | |
| | | |
|
| | |
| | |
| | |
| | |
| | |
| | |
| | |
| | |
| | |
Asahi Group Holdings Ltd. | | |
| | |
| | |
| | |
| | |
Bandai Namco Holdings, Inc. | | |
| | |
| | |
Canon Marketing Japan, Inc. | | |
| | |
| | |
Central Japan Railway Co. | | |
| | |
Chubu Electric Power Co., Inc. | | |
Chugai Pharmaceutical Co. Ltd. | | |
Concordia Financial Group Ltd. | | |
| | |
Dai Nippon Printing Co. Ltd. | | |
| | |
Dai-ichi Life Holdings, Inc. | | |
| | |
| | |
Daito Trust Construction Co. Ltd. | | |
Daiwa House Industry Co. Ltd. | | |
Daiwa Securities Group, Inc. | | |
| | |
| | |
| | |
| | |
| | |
| | |
| | |
| | |
|
| | |
| | |
| | |
| | |
| | |
Fukuoka Financial Group, Inc. | | |
GMO Payment Gateway, Inc. | | |
Hakuhodo DY Holdings, Inc. | | |
| | |
Hankyu Hanshin Holdings, Inc. | | |
| | |
| | |
Hitachi Construction Machinery Co. Ltd. | | |
| | |
| | |
| | |
| | |
| | |
| | |
| | |
| | |
Iida Group Holdings Co. Ltd. | | |
| | |
Isetan Mitsukoshi Holdings Ltd. | | |
| | |
| | |
| | |
Japan Exchange Group, Inc. | | |
| | |
Japan Post Holdings Co. Ltd. | | |
Japan Post Insurance Co. Ltd. | | |
Japan Real Estate Investment Corp. | | |
| | |
| | |
| | |
Kansai Electric Power Co., Inc. (The) | | |
| | |
Kawasaki Heavy Industries Ltd. | | |
| | |
| | |
Keisei Electric Railway Co. Ltd. | | |
| | |
| | |
Kintetsu Group Holdings Co. Ltd. | | |
| | |
| | |
Koito Manufacturing Co. Ltd. | | |
| | |
| | |
| | |
| | |
| | |
Kurita Water Industries Ltd. | | |
| | |
| | |
Kyushu Electric Power Co., Inc. | | |
| | |
| | |
See accompanying Notes to Financial Statements which are an integral part of the financial statements.
7
Invesco Income Advantage International Fund
| | |
|
| | |
| | |
| | |
| | |
| | |
| | |
| | |
McDonald’s Holdings Co. (Japan) Ltd. | | |
| | |
| | |
| | |
| | |
Mitsubishi Chemical Group Corp. | | |
| | |
Mitsubishi Electric Corp. | | |
Mitsubishi Estate Co. Ltd. | | |
Mitsubishi Gas Chemical Co., Inc. | | |
Mitsubishi HC Capital, Inc. | | |
Mitsubishi Heavy Industries Ltd. | | |
| | |
Mitsubishi UFJ Financial Group, Inc. | | |
| | |
| | |
| | |
| | |
Mizuho Financial Group, Inc. | | |
| | |
MS&AD Insurance Group Holdings, Inc. | | |
Murata Manufacturing Co. Ltd. | | |
| | |
| | |
| | |
| | |
| | |
| | |
| | |
Nippon Building Fund, Inc. | | |
Nippon Express Holdings, Inc. | | |
Nippon Paint Holdings Co. Ltd. | | |
Nippon Prologis REIT, Inc. | | |
Nippon Sanso Holdings Corp. | | |
| | |
Nippon Telegraph & Telephone Corp. | | |
| | |
| | |
| | |
Nisshin Seifun Group, Inc. | | |
Nissin Foods Holdings Co. Ltd. | | |
| | |
| | |
| | |
| | |
Nomura Real Estate Holdings, Inc. | | |
Nomura Real Estate Master Fund, Inc. | | |
Nomura Research Institute Ltd. | | |
| | |
| | |
| | |
| | |
|
Odakyu Electric Railway Co. Ltd. | | |
| | |
| | |
| | |
Ono Pharmaceutical Co. Ltd. | | |
| | |
| | |
| | |
| | |
| | |
Pan Pacific International Holdings Corp. | | |
| | |
| | |
Recruit Holdings Co. Ltd. | | |
Renesas Electronics Corp. | | |
| | |
| | |
| | |
| | |
| | |
| | |
Santen Pharmaceutical Co. Ltd. | | |
| | |
| | |
Sega Sammy Holdings, Inc. | | |
| | |
| | |
Sekisui Chemical Co. Ltd. | | |
| | |
Seven & i Holdings Co. Ltd. | | |
| | |
| | |
| | |
| | |
| | |
| | |
Shin-Etsu Chemical Co. Ltd. | | |
| | |
| | |
| | |
| | |
| | |
| | |
| | |
| | |
Square Enix Holdings Co. Ltd. | | |
Stanley Electric Co. Ltd. | | |
| | |
| | |
Sumitomo Chemical Co. Ltd. | | |
| | |
Sumitomo Electric Industries Ltd. | | |
Sumitomo Heavy Industries Ltd. | | |
Sumitomo Metal Mining Co. Ltd. | | |
Sumitomo Mitsui Financial Group, Inc. | | |
Sumitomo Mitsui Trust Group, Inc. | | |
Sumitomo Realty & Development Co. Ltd. | | |
| | |
See accompanying Notes to Financial Statements which are an integral part of the financial statements.
8
Invesco Income Advantage International Fund
| | |
|
Suntory Beverage & Food Ltd. | | |
| | |
| | |
| | |
| | |
Takeda Pharmaceutical Co. Ltd. | | |
| | |
| | |
| | |
| | |
Tohoku Electric Power Co., Inc. | | |
Tokio Marine Holdings, Inc. | | |
| | |
Tokyo Electric Power Co. Holdings, Inc.(a) | | |
| | |
| | |
| | |
| | |
Tokyu Fudosan Holdings Corp. | | |
| | |
| | |
| | |
| | |
| | |
| | |
| | |
| | |
| | |
| | |
| | |
| | |
| | |
| | |
| | |
| | |
| | |
| | |
| | |
| | |
| | |
| | | |
|
Hikma Pharmaceuticals PLC | | |
|
Kuwait Finance House K.S.C.P. | | |
Mobile Telecommunications Co. K.S.C.P. | | |
National Bank of Kuwait S.A.K.P. | | |
| | | |
|
| | |
| | |
| | |
| | | |
|
Galaxy Entertainment Group Ltd. | | |
| | |
|
| | |
| | |
| | | |
|
| | |
| | |
| | |
| | |
| | |
| | |
| | |
| | | |
|
America Movil S.A.B. de C.V., Class B | | |
Arca Continental S.A.B. de C.V. | | |
CEMEX S.A.B. de C.V., Series CPO | | |
Coca-Cola FEMSA S.A.B. de C.V., Series CPO | | |
Fibra Uno Administracion S.A. de C.V. | | |
Fomento Economico Mexicano S.A.B. de C.V., Series CPO | | |
| | |
Grupo Mexico S.A.B. de C.V., Class B | | |
Wal-Mart de Mexico S.A.B. de C.V., Series V | | |
| | | |
|
ABN AMRO Bank N.V., CVA(b) | | |
| | |
| | |
| | |
| | |
| | |
| | |
| | |
BE Semiconductor Industries N.V. | | |
| | |
| | |
| | |
| | |
| | |
| | |
| | |
| | |
Koninklijke Ahold Delhaize N.V. | | |
| | |
Koninklijke Philips N.V.(a) | | |
| | |
| | |
| | |
| | |
| | |
Universal Music Group N.V. | | |
| | |
| | | |
|
Auckland International Airport Ltd. | | |
See accompanying Notes to Financial Statements which are an integral part of the financial statements.
9
Invesco Income Advantage International Fund
| | |
|
Fisher & Paykel Healthcare Corp. Ltd. | | |
| | |
| | |
| | |
| | | |
|
| | |
| | |
| | |
Gjensidige Forsikring ASA | | |
| | |
| | |
| | |
| | |
| | |
| | |
| | |
| | |
| | |
| | | |
|
| | |
|
International Container Terminal Services, Inc. | | |
|
| | |
| | |
| | | |
|
| | |
| | |
Jeronimo Martins SGPS S.A. | | |
| | | |
|
| | |
| | |
Qatar Electricity and Water Co. Q.P.S.C. | | |
Qatar National Bank Q.P.S.C. | | |
| | | |
|
| | |
X5 Retail Group N.V., GDR(a)(b)(c) | | |
| | | |
|
| | |
| | |
Al Rajhi Co. for Cooperative Insurance(a) | | |
| | |
Saudi Arabian Mining Co.(a) | | |
| | |
Saudi Basic Industries Corp. | | |
| | |
| | |
|
Saudi National Bank (The) | | |
| | |
| | | |
|
| | |
CapitaLand Integrated Commercial Trust | | |
CapitaLand Investment Ltd. | | |
| | |
| | |
| | |
Jardine Cycle & Carriage Ltd. | | |
| | |
Oversea-Chinese Banking Corp. Ltd. | | |
| | |
| | |
| | |
| | |
Singapore Technologies Engineering Ltd. | | |
Singapore Telecommunications Ltd. | | |
| | |
United Overseas Bank Ltd. | | |
| | | |
|
| | |
| | |
| | |
Capitec Bank Holdings Ltd. | | |
| | |
| | |
Foschini Group Ltd. (The) | | |
| | |
Growthpoint Properties Ltd. | | |
Harmony Gold Mining Co. Ltd. | | |
| | |
Life Healthcare Group Holdings Ltd. | | |
| | |
| | |
| | |
| | |
| | |
| | |
| | |
| | |
| | |
| | |
| | | |
|
| | |
| | |
| | |
| | |
| | |
| | |
Doosan Enerbility Co. Ltd.(a) | | |
| | |
| | |
See accompanying Notes to Financial Statements which are an integral part of the financial statements.
10
Invesco Income Advantage International Fund
| | |
|
Ecopro Materials Co. Ltd.(a) | | |
Hana Financial Group, Inc. | | |
Hankook Tire & Technology Co. Ltd. | | |
| | |
| | |
HD Hyundai Heavy Industries Co. Ltd.(a) | | |
HD Korea Shipbuilding & Offshore Engineering | | |
| | |
| | |
| | |
| | |
| | |
| | |
| | |
| | |
| | |
| | |
Korea Aerospace Industries Ltd. | | |
Korea Electric Power Corp.(a) | | |
| | |
Korean Air Lines Co. Ltd. | | |
| | |
| | |
Kumho Petrochemical Co. Ltd. | | |
| | |
| | |
| | |
| | |
| | |
LG Energy Solution Ltd.(a) | | |
| | |
| | |
| | |
Meritz Financial Group, Inc. | | |
Mirae Asset Securities Co. Ltd. | | |
| | |
| | |
| | |
| | |
| | |
Samsung Biologics Co. Ltd.(a)(b) | | |
| | |
| | |
Samsung Electro-Mechanics Co. Ltd. | | |
Samsung Electronics Co. Ltd. | | |
Samsung Fire & Marine Insurance Co. Ltd. | | |
Samsung Heavy Industries Co. Ltd.(a) | | |
Samsung Life Insurance Co. Ltd. | | |
| | |
| | |
Shinhan Financial Group Co. Ltd. | | |
SK Biopharmaceuticals Co. Ltd.(a) | | |
SK Bioscience Co. Ltd.(a) | | |
| | |
SK Innovation Co. Ltd.(a) | | |
| | |
| | |
| | |
|
| | |
| | |
Woori Financial Group, Inc. | | |
| | |
| | | |
|
| | |
ACS Actividades de Construccion y Servicios S.A. | | |
| | |
| | |
Banco Bilbao Vizcaya Argentaria S.A. | | |
| | |
| | |
| | |
| | |
| | |
| | |
| | |
| | |
| | |
| | |
| | |
Industria de Diseno Textil S.A. | | |
| | |
Merlin Properties SOCIMI S.A. | | |
| | |
| | |
| | |
| | | |
|
| | |
| | |
| | |
| | |
| | |
| | |
| | |
| | |
| | |
Fastighets AB Balder, Class B(a) | | |
| | |
H & M Hennes & Mauritz AB, Class B | | |
| | |
| | |
| | |
Industrivarden AB, Class C | | |
| | |
Investment AB Latour, Class B | | |
| | |
| | |
L E Lundbergforetagen AB, Class B | | |
| | |
NIBE Industrier AB, Class B | | |
| | |
| | |
| | |
See accompanying Notes to Financial Statements which are an integral part of the financial statements.
11
Invesco Income Advantage International Fund
| | |
|
| | |
Skandinaviska Enskilda Banken AB, Class A | | |
| | |
| | |
Spotify Technology S.A.(a) | | |
| | |
Svenska Cellulosa AB S.C.A., Class B | | |
Svenska Handelsbanken AB, Class A | | |
| | |
Swedish Orphan Biovitrum AB, Class B(a) | | |
| | |
Telefonaktiebolaget LM Ericsson, Class B | | |
| | |
| | |
| | |
| | | |
|
| | |
| | |
| | |
Banque Cantonale Vaudoise | | |
| | |
| | |
| | |
Chocoladefabriken Lindt & Spruengli AG, PC | | |
Cie Financiere Richemont S.A. | | |
| | |
| | |
| | |
| | |
| | |
Galderma Group AG, Class A(a) | | |
| | |
| | |
| | |
| | |
Kuehne + Nagel International AG, Class R | | |
Logitech International S.A., Class R | | |
| | |
| | |
| | |
Partners Group Holding AG | | |
| | |
| | |
| | |
| | |
| | |
| | |
Sonova Holding AG, Class A | | |
| | |
| | |
| | |
Swatch Group AG (The), BR | | |
| | |
| | |
| | |
| | |
| | |
|
| | |
| | |
Zurich Insurance Group AG | | |
| | | |
|
| | |
Catcher Technology Co. Ltd. | | |
Cathay Financial Holding Co. Ltd. | | |
Chang Hwa Commercial Bank Ltd. | | |
| | |
| | |
Chunghwa Telecom Co. Ltd. | | |
| | |
CTBC Financial Holding Co. Ltd. | | |
| | |
E.Sun Financial Holding Co. Ltd. | | |
| | |
Far Eastern New Century Corp. | | |
Far EasTone Telecommunications Co. Ltd. | | |
First Financial Holding Co. Ltd. | | |
Fortune Electric Co. Ltd. | | |
Fubon Financial Holding Co. Ltd. | | |
Hon Hai Precision Industry Co. Ltd. | | |
Hua Nan Financial Holdings Co. Ltd. | | |
International Games System Co. Ltd. | | |
KGI Financial Holding Co. Ltd. | | |
| | |
Mega Financial Holding Co. Ltd. | | |
Novatek Microelectronics Corp. | | |
| | |
| | |
| | |
Powertech Technology, Inc. | | |
President Chain Store Corp. | | |
| | |
SinoPac Financial Holdings Co. Ltd. | | |
Taiwan Cooperative Financial Holding Co. Ltd. | | |
| | |
Taiwan Semiconductor Manufacturing Co. Ltd. | | |
Uni-President Enterprises Corp. | | |
Voltronic Power Technology Corp. | | |
| | |
| | |
Yuanta Financial Holding Co. Ltd. | | |
| | | |
|
Advanced Info Service PCL, NVDR | | |
Airports of Thailand PCL, NVDR | | |
| | |
Delta Electronics Thailand PCL, NVDR | | |
Gulf Energy Development PCL, NVDR | | |
| | |
PTT Exploration & Production PCL, NVDR | | |
| | |
| | |
| | | |
See accompanying Notes to Financial Statements which are an integral part of the financial statements.
12
Invesco Income Advantage International Fund
| | |
|
| | |
| | |
| | |
Turkiye Is Bankasi A.S., Class C | | |
Turkiye Petrol Rafinerileri A.S. | | |
Yapi ve Kredi Bankasi A.S. | | |
| | | |
United Arab Emirates–0.15% |
Abu Dhabi Commercial Bank PJSC | | |
| | |
| | |
| | |
International Holding Co. PJSC(a) | | |
| | | |
|
| | |
| | |
| | |
| | |
| | |
Associated British Foods PLC | | |
| | |
| | |
| | |
B&M European Value Retail S.A. | | |
| | |
| | |
| | |
| | |
Berkeley Group Holdings PLC (The) | | |
British American Tobacco PLC | | |
British Land Co. PLC (The) | | |
| | |
| | |
| | |
| | |
Coca-Cola Europacific Partners PLC | | |
| | |
| | |
| | |
| | |
| | |
| | |
Direct Line Insurance Group PLC | | |
| | |
| | |
| | |
| | |
| | |
| | |
| | |
| | |
| | |
| | |
| | |
| | |
| | |
| | |
United Kingdom–(continued) |
InterContinental Hotels Group PLC | | |
Intermediate Capital Group PLC | | |
International Consolidated Airlines Group S.A. | | |
| | |
| | |
| | |
| | |
| | |
Just Eat Takeaway.com N.V.(a)(b) | | |
| | |
Land Securities Group PLC | | |
Legal & General Group PLC | | |
| | |
London Stock Exchange Group PLC | | |
| | |
| | |
Marks & Spencer Group PLC | | |
| | |
| | |
| | |
| | |
| | |
| | |
| | |
Phoenix Group Holdings PLC | | |
Reckitt Benckiser Group PLC | | |
| | |
| | |
| | |
Rolls-Royce Holdings PLC(a) | | |
| | |
| | |
| | |
| | |
| | |
| | |
| | |
| | |
| | |
| | |
| | |
| | |
| | |
| | |
| | |
| | |
United Utilities Group PLC | | |
| | |
| | |
| | |
| | |
| | |
| | | |
|
| | |
| | |
Atlassian Corp., Class A(a) | | |
See accompanying Notes to Financial Statements which are an integral part of the financial statements.
13
Invesco Income Advantage International Fund
| | |
United States–(continued) |
| | |
| | |
| | |
Ferguson Enterprises, Inc. | | |
| | |
| | |
| | |
| | |
| | |
| | |
| | |
| | |
| | |
| | |
| | |
| | |
| | |
| | |
| | | |
|
First Quantum Minerals Ltd.(a) | | |
Total Common Stocks & Other Equity Interests (Cost $34,852,016) | |
| | |
Equity Linked Notes–5.55% |
|
Bank of Montreal (MSCI EAFE Index), | | | |
Canadian Imperial Bank of Commerce (MSCI EAFE Index), 132.75%, | | | |
Royal Bank of Canada (MSCI EAFE Index), | | | |
Royal Bank of Canada (MSCI Emerging Markets Index), 150.00%, | | | |
Toronto-Dominion Bank (The) (MSCI EAFE Index), 148.00%, 01/13/2025(b) | | | |
| | | |
|
BNPP Issuance B.V. (MSCI Emerging Markets Index), 141.82%, | | | |
| | |
|
Mizuho Markets Cayman L.P. (MSCI Emerging Markets Index), 131.00%, | | | |
|
Citigroup Global Markets Holdings, Inc. (MSCI Emerging Markets Index), | | | |
J.P. Morgan Structured Products B.V. (MSCI EAFE Index), 01/03/2025 | | | |
J.P. Morgan Structured Products B.V. (MSCI Emerging Markets Index), 01/03/2025 | | | |
| | | |
Total Equity Linked Notes (Cost $3,241,000) | |
| | |
Exchange-Traded Funds–4.48% |
|
iShares Core MSCI Emerging Markets ETF(d) (Cost $2,440,931) | | |
Money Market Funds–20.73% |
Invesco Government & Agency Portfolio, Institutional Class, 4.42%(e)(f) | | |
Invesco Treasury Portfolio, Institutional Class, | | |
Total Money Market Funds (Cost $11,535,217) | |
TOTAL INVESTMENTS IN SECURITIES (excluding Investments purchased with cash collateral from securities on loan)-100.55% (Cost $52,069,164) | | | |
Investments Purchased with Cash Collateral from Securities on Loan |
|
Invesco Private Government Fund, | | |
Invesco Private Prime Fund, 4.53%(e)(f)(g) | | |
Total Investments Purchased with Cash Collateral from Securities on Loan (Cost $2,525,934) | |
TOTAL INVESTMENTS IN SECURITIES—105.09% (Cost $54,595,098) | |
OTHER ASSETS LESS LIABILITIES–(5.09)% | |
| |
Investment Abbreviations:
| – American Depositary Receipt |
| |
| – CREST Depository Interest |
| – Certificates of Ordinary Participation |
| |
| |
| – Global Depositary Receipt |
| – Non-Voting Depositary Receipt |
| – Participation Certificate |
| – Real Estate Investment Trust |
| – Swedish Depository Receipt |
See accompanying Notes to Financial Statements which are an integral part of the financial statements.
14
Invesco Income Advantage International Fund
Notes to Schedule of Investments:
| Non-income producing security. |
| Security purchased or received in a transaction exempt from registration under the Securities Act of 1933, as amended (the “1933 Act”). The security may be resold pursuant to an exemption from registration under the 1933 Act, typically to qualified institutional buyers. The aggregate value of these securities at December 31, 2024 was $2,992,279, which represented 5.38% of the Fund’s Net Assets. |
| Security valued using significant unobservable inputs (Level 3). See Note 3. |
| All or a portion of this security was out on loan at December 31, 2024. |
| Affiliated holding. Affiliated holdings are investments in entities which are under common ownership or control of Invesco Ltd. or are investments in entities in which the Fund owns 5% or more of the outstanding voting securities. The table below shows the Fund’s transactions in, and earnings from, its investments in affiliates for the fiscal year ended December 31, 2024. |
| | | | Change in
Unrealized
Appreciation
(Depreciation) | | | |
Investments in Affiliated Money Market Funds: | | | | | | | |
Invesco Government & Agency Portfolio, Institutional Class | | | | | | | |
Invesco Liquid Assets Portfolio, Institutional Class | | | | | | | |
Invesco Treasury Portfolio, Institutional Class | | | | | | | |
Investments Purchased with Cash Collateral from Securities on Loan: | | | | | | | |
Invesco Private Government Fund | | | | | | | |
Invesco Private Prime Fund | | | | | | | |
| | | | | | | |
| Represents the income earned on the investment of cash collateral, which is included in securities lending income on the Statement of Operations. Does not include rebates and fees paid to lending agent or premiums received from borrowers, if any. |
| The rate shown is the 7-day SEC standardized yield as of December 31, 2024. |
| The security has been segregated to satisfy the commitment to return the cash collateral received in securities lending transactions upon the borrower’s return of the securities loaned. See Note 1K. |
Open Futures Contracts(a) |
| | | | | Unrealized Appreciation (Depreciation) |
|
MSCI Emerging Markets Index | | | | | |
| Futures contracts collateralized by $46,310 cash held with Merrill Lynch International, the futures commission merchant. |
See accompanying Notes to Financial Statements which are an integral part of the financial statements.
15
Invesco Income Advantage International Fund
Statement of Assets and Liabilities
| |
Investments in unaffiliated securities, at value
(Cost $40,533,947)* | |
Investments in affiliated money market funds, at value (Cost $14,061,151) | |
| |
Variation margin receivable — futures contracts | |
| |
Cash collateral — exchange-traded futures contracts | |
| |
Foreign currencies, at value (Cost $214,140) | |
| |
| |
| |
| |
Investment for trustee deferred compensation and retirement plans | |
| |
| |
| |
| |
| |
| |
| |
Collateral upon return of securities loaned | |
Accrued fees to affiliates | |
Accrued other operating expenses | |
Trustee deferred compensation and retirement plans | |
| |
Net assets applicable to shares outstanding | |
| |
Shares of beneficial interest | |
Distributable earnings (loss) | |
| |
|
| |
| |
| |
| |
| |
| |
Shares outstanding, no par value, with an unlimited number of shares authorized: |
| |
| |
| |
| |
| |
| |
| |
Net asset value per share | |
Maximum offering price per share
(Net asset value of $12.19 ÷ 94.50%) | |
| |
Net asset value and offering price per share | |
| |
Net asset value and offering price per share | |
| |
Net asset value and offering price per share | |
| |
Net asset value and offering price per share | |
| |
Net asset value and offering price per share | |
| At December 31, 2024, security with a value of $2,470,006 was on loan to brokers. |
See accompanying Notes to Financial Statements which are an integral part of the financial statements.
16
Invesco Income Advantage International Fund
Statement of Operations
For the year ended December 31, 2024
| |
Interest (net of foreign withholding taxes of $144) | |
Dividends (net of foreign withholding taxes of $157,228) | |
Dividends from affiliated money market funds (includes net securities lending income of $681) | |
| |
| |
| |
Administrative services fees | |
| |
| |
| |
| |
| |
Transfer agent fees — A, C, R and Y | |
| |
| |
Trustees’ and officers’ fees and benefits | |
Registration and filing fees | |
| |
Professional services fees | |
| |
| |
Less: Fees waived, expenses reimbursed and/or expense offset arrangement(s) | |
| |
| |
Realized and unrealized gain (loss) from: | |
Net realized gain (loss) from: | |
Unaffiliated investment securities (net of foreign taxes of $187) | |
Affiliated investment securities | |
| |
Forward foreign currency contracts | |
| |
| |
Change in net unrealized appreciation (depreciation) of: | |
Unaffiliated investment securities (net of foreign taxes of $2,910) | |
Affiliated investment securities | |
| |
| |
| |
Net realized and unrealized gain (loss) | |
Net increase in net assets resulting from operations | |
See accompanying Notes to Financial Statements which are an integral part of the financial statements.
17
Invesco Income Advantage International Fund
Statement of Changes in Net Assets
For the years ended December 31, 2024 and 2023
| | |
| | |
| | |
| | |
Change in net unrealized appreciation (depreciation) | | |
Net increase in net assets resulting from operations | | |
Distributions to shareholders from distributable earnings: | | |
| | |
| | |
| | |
| | |
| | |
| | |
Total distributions from distributable earnings | | |
| | |
| | |
| | |
| | |
| | |
| | |
| | |
Net increase (decrease) in net assets resulting from share transactions | | |
Net increase (decrease) in net assets | | |
| | |
| | |
| | |
See accompanying Notes to Financial Statements which are an integral part of the financial statements.
18
Invesco Income Advantage International Fund
Financial Highlights
The following schedule presents financial highlights for a share of the Fund outstanding throughout the periods indicated.
| Net asset
value,
beginning
of period | | Net gains
(losses)
on securities
(both
realized and
unrealized) | Total from
investment
operations | Dividends
from net
investment
income | | | Net asset
value, end
of period | | Net assets,
end of period
(000’s omitted) | Ratio of
expenses
to average
net assets
with fee waivers
and/or
expenses
absorbed | Ratio of
expenses
to average net
assets without
fee waivers
and/or
expenses
absorbed
| Ratio of net
investment
income
to average
net assets | |
|
| | | | | | | | | | | | | | |
| | | | | | | | | | | | | | |
| | | | | | | | | | | | | | |
| | | | | | | | | | | | | | |
| | | | | | | | | | | | | | |
|
| | | | | | | | | | | | | | |
| | | | | | | | | | | | | | |
| | | | | | | | | | | | | | |
| | | | | | | | | | | | | | |
| | | | | | | | | | | | | | |
|
| | | | | | | | | | | | | | |
| | | | | | | | | | | | | | |
| | | | | | | | | | | | | | |
| | | | | | | | | | | | | | |
| | | | | | | | | | | | | | |
|
| | | | | | | | | | | | | | |
| | | | | | | | | | | | | | |
| | | | | | | | | | | | | | |
| | | | | | | | | | | | | | |
| | | | | | | | | | | | | | |
|
| | | | | | | | | | | | | | |
| | | | | | | | | | | | | | |
| | | | | | | | | | | | | | |
| | | | | | | | | | | | | | |
| | | | | | | | | | | | | | |
|
| | | | | | | | | | | | | | |
| | | | | | | | | | | | | | |
| | | | | | | | | | | | | | |
| | | | | | | | | | | | | | |
| | | | | | | | | | | | | | |
| Calculated using average shares outstanding. |
| Includes adjustments in accordance with accounting principles generally accepted in the United States of America and as such, the net asset value for financial reporting purposes and the returns based upon those net asset values may differ from the net asset value and returns for shareholder transactions. Does not include sales charges and is not annualized for periods less than one year, if applicable. |
| Portfolio turnover is calculated at the fund level and is not annualized for periods less than one year, if applicable. |
See accompanying Notes to Financial Statements which are an integral part of the financial statements.
19
Invesco Income Advantage International Fund
Notes to Financial Statements
NOTE 1—Significant Accounting Policies
Invesco Income Advantage International Fund (the “Fund”) is a series portfolio of AIM Growth Series (Invesco Growth Series) (the “Trust”). The Trust is a Delaware statutory trust registered under the Investment Company Act of 1940, as amended (the “1940 Act”), as an open-end series management investment company authorized to issue an unlimited number of shares of beneficial interest. Information presented in these financial statements pertains only to the Fund. Matters affecting the Fund or each class will be voted on exclusively by the shareholders of the Fund or each class.
The Fund’s investment objective is income and long-term growth of capital.
The Fund currently consists of six different classes of shares: Class A, Class C, Class R, Class Y, Class R5 and Class R6. Class Y shares are available only to certain investors. Class A shares are sold with a front-end sales charge unless certain waiver criteria are met. Under certain circumstances, load waived shares may be subject to contingent deferred sales charges ("CDSC"). Class C shares are sold with a CDSC. Class R, Class Y, Class R5 and Class R6 shares are sold at net asset value. Class C shares held for eight years after purchase are eligible for automatic conversion into Class A shares of the same Fund (the "Conversion Feature"). The automatic conversion pursuant to the Conversion Feature will generally occur at the end of the month following the eighth anniversary after a purchase of Class C shares.
Effective after the close of business on September 30, 2024, Class R5 shares are closed to new investors.
The Fund is an investment company and accordingly follows the investment company accounting and reporting guidance in accordance with Financial Accounting Standards Board Accounting Standards Codification Topic 946, Financial Services – Investment Companies.
The following is a summary of the significant accounting policies followed by the Fund in the preparation of its financial statements.
A.
Security Valuations — Securities, including restricted securities, are valued according to the following policy.
A security listed or traded on an exchange is generally valued at its trade price or official closing price that day as of the close of the exchange where the security is principally traded, or lacking any trades or official closing price on a particular day, the security may be valued at the closing bid or ask price on that day. Securities traded in the over-the-counter market are valued based on prices furnished by independent pricing services or market makers. When such securities are valued using prices provided by an independent pricing service they may be considered fair valued. Futures contracts are valued at the daily settlement price set by an exchange on which they are principally traded. Where a final settlement price exists, exchange-traded options are valued at the final settlement price from the exchange where the option principally trades. Where a final settlement price does not exist, exchange-traded options are valued at the mean between the last bid and ask price generally from the exchange where the option principally trades.
Securities of investment companies that are not exchange-traded (e.g., open-end mutual funds) are valued using such company’s end-of-business-day net asset value per share.
Deposits, other obligations of U.S. and non-U.S. banks and financial institutions are valued at their daily account value.
Fixed income securities (including convertible debt securities) generally are valued on the basis of prices provided by independent pricing services. Prices provided by the pricing service may be determined without exclusive reliance on quoted prices, and may reflect appropriate factors such as institution-size trading in similar groups of securities, developments related to specific securities, dividend rate (for unlisted equities), yield (for debt obligations), quality, type of issue, coupon rate (for debt obligations), maturity (for debt obligations), individual trading characteristics and other market data. Pricing services generally value debt obligations assuming orderly transactions of institutional round lot size, but a fund may hold or transact in the same securities in smaller, odd lot sizes. Odd lots often trade at lower prices than institutional round lots, and their value may be adjusted accordingly. Debt obligations are subject to interest rate and credit risks. In addition, all debt obligations involve some risk of default with respect to interest and/or principal payments.
Foreign securities’ (including foreign exchange contracts) prices are converted into U.S. dollar amounts using the applicable exchange rates as of the close of the New York Stock Exchange (“NYSE”). If market quotations are available and reliable for foreign exchange-traded equity securities, the securities will be valued at the market quotations. Invesco Advisers, Inc. (the “Adviser” or “Invesco”) may use various pricing services to obtain market quotations as well as fair value prices. Because trading hours for certain foreign securities end before the close of the NYSE, closing market quotations may become not representative of market value in the Adviser’s judgment (“unreliable”). If, between the time trading ends on a particular security and the close of the customary trading session on the NYSE, a significant event occurs that makes the closing price of the security unreliable, the Adviser may fair value the security. If the event is likely to have affected the closing price of the security, the security will be valued at fair value in good faith in accordance with Board- approved policies and related Adviser procedures (“Valuation Procedures”). Adjustments to closing prices to reflect fair value may also be based on a screening process of an independent pricing service to indicate the degree of certainty, based on historical data, that the closing price in the principal market where a foreign security trades is not the current value as of the close of the NYSE. Foreign securities’ prices meeting the degree of certainty that the price is not reflective of current value will be priced at the indication of fair value from the independent pricing service. Multiple factors may be considered by the independent pricing service in determining adjustments to reflect fair value and may include information relating to sector indices, American Depositary Receipts and domestic and foreign index futures. Foreign securities may have additional risks including exchange rate changes, potential for sharply devalued currencies and high inflation, political and economic upheaval, the relative lack of issuer information, relatively low market liquidity and the potential lack of strict financial and accounting controls and standards.
Equity-linked notes are valued using an independent pricing service provider whose calculations are based on various data points that are included in the trade terms.
Unlisted securities will be valued using prices provided by independent pricing services or by another method that the Adviser, in its judgment, believes better reflects the security’s fair value in accordance with the Valuation Procedures.
Non-traded rights and warrants shall be valued at intrinsic value if the terms of the rights and warrants are available, specifically the subscription or exercise price and the ratio. Intrinsic value is calculated as the daily market closing price of the security to be received less the subscription price, which is then adjusted by the exercise ratio. In the case of warrants, an option pricing model supplied by an independent pricing service may be used based on market data such as volatility, stock price and interest rate from the independent pricing service and strike price and exercise period from verified terms.
Securities for which market prices are not provided by any of the above methods may be valued based upon quotes furnished by independent sources. The mean between the last bid and ask prices may be used to value debt obligations, including corporate loans.
Securities for which market quotations are not readily available are fair valued by the Adviser in accordance with the Valuation Procedures. If a fair value price provided by a pricing service is unreliable, the Adviser will fair value the security using the Valuation Procedures. Issuer specific events, market trends, bid/ask quotes of brokers and information providers and other market data may be reviewed in the course of making a good faith determination of a security’s fair value.
The Fund may invest in securities that are subject to interest rate risk, meaning the risk that the prices will generally fall as interest rates rise and, conversely, the prices will generally rise as interest rates fall. Specific securities differ in their sensitivity to changes in interest rates depending on their individual characteristics. Changes in interest rates may result in increased market volatility, which may affect the value and/or liquidity of certain Fund investments.
Valuations change in response to many factors including the historical and prospective earnings of the issuer, the value of the issuer’s assets, general market conditions which are not specifically related to the particular issuer, such as real or perceived adverse economic conditions, changes in the general outlook for revenues or corporate earnings, changes in interest or currency rates, regional or global instability, natural or environmental disasters, widespread disease or
20
Invesco Income Advantage International Fund
other public health issues, war, acts of terrorism, significant governmental actions or adverse investor sentiment generally and market liquidity. Because of the inherent uncertainties of valuation, the values reflected in the financial statements may materially differ from the value received upon actual sale of those investments.
The price the Fund could receive upon the sale of any investment may differ from the Adviser’s valuation of the investment, particularly for securities that are valued using a fair valuation technique. When fair valuation techniques are applied, the Adviser uses available information, including both observable and unobservable inputs and assumptions, to determine a methodology that will result in a valuation that the Adviser believes approximates market value. Fund securities that are fair valued may be subject to greater fluctuation in their value from one day to the next than would be the case if market quotations were used. Because of the inherent uncertainties of valuation, and the degree of subjectivity in such decisions, the Fund could realize a greater or lesser than expected gain or loss upon the sale of the investment.
B.
Securities Transactions and Investment Income — Securities transactions are accounted for on a trade date basis. Realized gains or losses on sales are computed on the basis of specific identification of the securities sold. Interest income (net of withholding tax, if any) is recorded on an accrual basis from settlement date and includes coupon interest and amortization of premium and accretion of discount on debt securities as applicable. Pay-in-kind interest income and non-cash dividend income received in the form of securities in lieu of cash are recorded at the fair value of the securities received. Dividend income (net of withholding tax, if any) is recorded on the ex-dividend date.
The Fund may periodically participate in litigation related to Fund investments. As such, the Fund may receive proceeds from litigation settlements. Any proceeds received are included in the Statement of Operations as realized gain (loss) for investments no longer held and as unrealized gain (loss) for investments still held.
Brokerage commissions and mark ups are considered transaction costs and are recorded as an increase to the cost basis of securities purchased and/or a reduction of proceeds on a sale of securities. Such transaction costs are included in the determination of net realized and unrealized gain (loss) from investment securities reported in the Statement of Operations and the Statement of Changes in Net Assets and the net realized and unrealized gains (losses) on securities per share in the Financial Highlights. Transaction costs are included in the calculation of the Fund’s net asset value and, accordingly, they reduce the Fund’s total returns. These transaction costs are not considered operating expenses and are not reflected in net investment income reported in the Statement of Operations and the Statement of Changes in Net Assets, or the net investment income per share and the ratios of expenses and net investment income reported in the Financial Highlights, nor are they limited by any expense limitation arrangements between the Fund and the investment adviser.
The Fund allocates income and realized and unrealized capital gains and losses to a class based on the relative net assets of each class.
C.
Country Determination — For the purposes of making investment selection decisions and presentation in the Schedule of Investments, the investment adviser may determine the country in which an issuer is located and/or credit risk exposure based on various factors. These factors include the laws of the country under which the issuer is organized, where the issuer maintains a principal office, the country in which the issuer derives 50% or more of its total revenues, the country that has the primary market for the issuer’s securities and its "country of risk" as determined by a third party service provider, as well as other criteria. Among the other criteria that may be evaluated for making this determination are the country in which the issuer maintains 50% or more of its assets, the type of security, financial guarantees and enhancements, the nature of the collateral and the sponsor organization. Country of issuer and/or credit risk exposure has been determined to be the United States of America, unless otherwise noted.
D.
Distributions – Distributions from net investment income, if any, are declared and paid monthly. Distributions from net realized capital gain, if any, are generally declared and paid annually and recorded on the ex-dividend date. The Fund may elect to treat a portion of the proceeds from redemptions as distributions for federal income tax purposes.
E.
Federal Income Taxes – The Fund intends to comply with the requirements of Subchapter M of the Internal Revenue Code of 1986, as amended (the “Internal Revenue Code”), necessary to qualify as a regulated investment company and to distribute substantially all of the Fund’s taxable earnings to shareholders. As such, the Fund will not be subject to federal income taxes on otherwise taxable income (including net realized capital gain) that is distributed to shareholders. Therefore, no provision for federal income taxes is recorded in the financial statements.
The Fund recognizes the tax benefits of uncertain tax positions only when the position is more likely than not to be sustained. Management has analyzed the Fund’s uncertain tax positions and concluded that no liability for unrecognized tax benefits should be recorded related to uncertain tax positions. Management is not aware of any tax positions for which it is reasonably possible that the total amounts of unrecognized tax benefits will change materially in the next 12 months.
The Fund files tax returns in the U.S. Federal jurisdiction and certain other jurisdictions. Generally, the Fund is subject to examinations by such taxing authorities for up to three years after the filing of the return for the tax period.
F.
Expenses – Fees provided for under the Rule 12b-1 plan of a particular class of the Fund are charged to the operations of such class. Transfer agency fees and expenses and other shareholder recordkeeping fees and expenses attributable to Class R5 and Class R6 are allocated based on relative net assets of Class R5 and Class R6. Sub-accounting fees attributable to Class R5 are charged to the operations of the class. Transfer agency fees and expenses and other shareholder recordkeeping fees and expenses relating to all other classes are allocated among those classes based on relative net assets. All other expenses are allocated among the classes based on relative net assets.
G.
Accounting Estimates – The preparation of financial statements in conformity with accounting principles generally accepted in the United States of America (“GAAP”) requires management to make estimates and assumptions that affect the reported amounts of assets and liabilities at the date of the financial statements and the reported amounts of revenues and expenses during the reporting period including estimates and assumptions related to taxation. Actual results could differ from those estimates by a significant amount. In addition, the Fund monitors for material events or transactions that may occur or become known after the period-end date and before the date the financial statements are released to print.
H.
Indemnifications – Under the Trust’s organizational documents, each Trustee, officer, employee or other agent of the Trust is indemnified against certain liabilities that may arise out of the performance of their duties to the Fund. Additionally, in the normal course of business, the Fund enters into contracts, including the Fund’s servicing agreements, that contain a variety of indemnification clauses. The Fund’s maximum exposure under these arrangements is unknown as this would involve future claims that may be made against the Fund that have not yet occurred. The risk of material loss as a result of such indemnification claims is considered remote.
I.
Segment Reporting — In November 2023, the FASB issued Accounting Standards Update 2023-07, Segment Reporting (Topic 280): Improvements to Reportable Segment Disclosures (“ASU 2023-07”), with the intent of improving reportable segment disclosure requirements, primarily through enhanced disclosures about significant segment expenses, allowing financial statement users to better understand the components of a segment’s profit or loss and assess potential future cash flows for each reportable segment and the entity as a whole thereby enabling better understanding of how an entity’s segments impact overall performance. The Fund represents a single operating segment. Subject to the oversight and, when applicable, approval of the Board of Trustees, the Fund’s Adviser acts as the Fund’s chief operating decision maker (“CODM”), assessing performance and making decisions about resource allocation within the Fund. The CODM monitors the operating results as a whole and the Fund’s long-term strategic asset allocation is determined in accordance with the terms of its prospectus based on a defined investment strategy. The financial information provided to and reviewed by the CODM is consistent with that presented in the Fund’s financial statements. Adoption of the new standard impacted the Fund’s financial statement note disclosures only and did not affect the Fund’s financial position or the results of its operations.
J.
Equity-Linked Notes – The Fund may invest in Equity-Linked Notes (ELNs). ELNs are hybrid derivative-type instruments, in a single note form, that are specially designed to combine the characteristics of one or more reference securities (such as a single stock, an exchange traded fund, or an index or basket of securities (underlying securities)) and one or more related equity derivatives, such as put or call options, or a combination thereof. Unlike a direct investment in
21
Invesco Income Advantage International Fund
equity securities, ELNs have a maturity date, potentially increasing the Fund’s turnover rate, transaction costs and tax liability. Upon the maturity of an ELN, the Fund generally receives an interest coupon payment and the par value of the note plus or minus a return based on the performance of the underlying securities and the related equity derivatives. If the underlying securities have depreciated in value or if their price appreciates or depreciates outside of a preset range, depending on the type of ELN, the Fund may receive only the principal amount of the note or less than the principal amount of the note, or may even lose the entire principal invested in the ELN. Investments in ELNs possess the risks associated with the underlying securities, such as management risk, market risk and, as applicable, foreign securities and currency risks. In addition, as a note, ELNs are also subject to certain debt securities risks, such as interest rate and credit risk. An investment in an ELN also bears the risk that the ELN issuer will default or become bankrupt. In such an event, the Fund may have difficulty being repaid, or fail to be repaid, the principal amount of, or income from, its investment. As the holder of an ELN, the Fund generally has no rights to the underlying securities, including no voting rights or rights to receive dividends.
ELNs utilized by the Fund may involve synthetic exposure to options that can create economic leverage risk which, depending on the performance of the underlying securities, could magnify or otherwise increase investment losses to the Fund and result in losses on the ELN that exceed the losses on the underlying securities. The economic leverage associated with investments in ELNs is distinguishable from indebtedness leverage in that it does not expose the Fund to losing more than the principal amount of the ELN. Should the prices of the underlying securities move in an unexpected manner, the Fund may not achieve the anticipated benefits of its ELN investments, and it may realize losses, which could be significant and could include the Fund’s entire principal investment. In addition, investments in ELNs allow for enhanced yield but are subject to limited upside appreciation potential based on movements of the underlying securities. Investing in ELNs may be more costly to the Fund than if the Fund had invested in the underlying securities directly.
K.
Securities Lending – The Fund may lend portfolio securities having a market value up to one-third of the Fund’s total assets. Such loans are secured by collateral equal to no less than the market value of the loaned securities determined daily by the securities lending provider. Such collateral will be cash or debt securities issued or guaranteed by the U.S. Government or any of its sponsored agencies. Cash collateral received in connection with these loans is invested in short-term money market instruments or affiliated, unregistered investment companies that comply with Rule 2a-7 under the 1940 Act and money market funds (collectively, "affiliated money market funds") and is shown as such on the Schedule of Investments. The Fund bears the risk of loss with respect to the investment of collateral. It is the Fund’s policy to obtain additional collateral from or return excess collateral to the borrower by the end of the next business day, following the valuation date of the securities loaned. Therefore, the value of the collateral held may be temporarily less than the value of the securities on loan. When loaning securities, the Fund retains certain benefits of owning the securities, including the economic equivalent of dividends or interest generated by the security. Lending securities entails a risk of loss to the Fund if, and to the extent that, the market value of the securities loaned were to increase and the borrower did not increase the collateral accordingly, and the borrower failed to return the securities. The securities loaned are subject to termination at the option of the borrower or the Fund. Upon termination, the borrower will return to the Fund the securities loaned and the Fund will return the collateral. Upon the failure of the borrower to return the securities, collateral may be liquidated and the securities may be purchased on the open market to replace the loaned securities. The Fund could experience delays and costs in gaining access to the collateral and the securities may lose value during the delay which could result in potential losses to the Fund. Some of these losses may be indemnified by the lending agent. The Fund bears the risk of any deficiency in the amount of the collateral available for return to the borrower due to any loss on the collateral invested. Dividends received on cash collateral investments for securities lending transactions, which are net of compensation to counterparties, are included in Dividends from affiliated money market funds on the Statement of Operations. The aggregate value of securities out on loan, if any, is shown as a footnote on the Statement of Assets and Liabilities.
The Adviser serves as an affiliated securities lending agent for the Fund. The Bank of New York Mellon also serves as a securities lending agent. To the extent the Fund utilizes the Adviser as an affiliated securities lending agent, the Fund conducts its securities lending in accordance with, and in reliance upon, no-action letters issued by the SEC staff that provide guidance on how an affiliate may act as a direct agent lender and receive compensation for those services in a manner consistent with the federal securities laws. For the year ended December 31, 2024, the Fund paid the Adviser fees for securities lending agent services, which were less than $500. Fees paid to the Adviser for securities lending agent services, if any, are included in Dividends from affiliated money market funds on the Statement of Operations.
L.
Foreign Currency Translations — Foreign currency is valued at the close of the NYSE based on quotations posted by banks and major currency dealers. Portfolio securities and other assets and liabilities denominated in foreign currencies are translated into U.S. dollar amounts at the date of valuation. Purchases and sales of portfolio securities (net of foreign taxes withheld on disposition) and income items denominated in foreign currencies are translated into U.S. dollar amounts on the respective dates of such transactions. The Fund does not separately account for the portion of the results of operations resulting from changes in foreign exchange rates on investments and the fluctuations arising from changes in market prices of securities held. The combined results of changes in foreign exchange rates and the fluctuation of market prices on investments (net of estimated foreign tax withholding) are included with the net realized and unrealized gain or loss from investments in the Statement of Operations. Reported net realized foreign currency gains or losses arise from (1) sales of foreign currencies, (2) currency gains or losses realized between the trade and settlement dates on securities transactions, and (3) the difference between the amounts of dividends, interest, and foreign withholding taxes recorded on the Fund’s books and the U.S. dollar equivalent of the amounts actually received or paid. Net unrealized foreign currency gains and losses arise from changes in the fair values of assets and liabilities, other than investments in securities at fiscal period end, resulting from changes in exchange rates.
The Fund may invest in foreign securities, which may be subject to foreign taxes on income, gains on investments or currency repatriation, a portion of which may be recoverable. Foreign taxes, if any, are recorded based on the tax regulations and rates that exist in the foreign markets in which the Fund invests and are shown in the Statement of Operations.
The performance of the Fund may be materially affected positively or negatively by foreign currency strength or weakness relative to the U.S. dollar. Currency rates in foreign countries may fluctuate for a number of reasons, including changes in interest rates, political, economic, or social instability and development, and imposition of currency controls. Currency controls in certain foreign jurisdictions may cause the Fund to experience significant delays in its ability to repatriate its assets in U.S. dollars at quoted spot rates, and it is possible that the Fund’s ability to convert certain foreign currencies into U.S. dollars may be limited and may occur at discounts to quoted rates. As a result, the value of the Fund’s assets and liabilities denominated in such currencies that would ultimately be realized could differ from those reported on the Statement of Assets and Liabilities. Certain foreign companies may be subject to sanctions, embargoes, or other governmental actions that may limit the ability to invest in, receive, hold, or sell the securities of such companies, all of which affect the market and/or credit risk of the investments. Because of the inherent uncertainties of valuation, the values reflected in the financial statements may materially differ from the value received upon actual sale of those investments.
M.
Forward Foreign Currency Contracts — The Fund may engage in foreign currency transactions either on a spot (i.e. for prompt delivery and settlement) basis, or through forward foreign currency contracts, to manage or minimize currency or exchange rate risk.
The Fund may also enter into forward foreign currency contracts for the purchase or sale of a security denominated in a foreign currency in order to “lock in” the U.S. dollar price of that security, or the Fund may also enter into forward foreign currency contracts that do not provide for physical exchange of the two currencies on the settlement date, but instead are settled by a single cash payment calculated as the difference between the agreed upon exchange rate and the spot rate at settlement based upon an agreed upon notional amount (non-deliverable forwards).
A forward foreign currency contract is an obligation between two parties (“Counterparties”) to purchase or sell a specific currency for an agreed-upon price at a future date. The use of forward foreign currency contracts for hedging does not eliminate fluctuations in the price of the underlying securities the Fund owns or intends to acquire but establishes a rate of exchange in advance. Fluctuations in the value of these contracts are measured by the difference in the contract date and reporting date exchange rates and are recorded as unrealized appreciation (depreciation) until the contracts are closed. When the contracts are closed,
22
Invesco Income Advantage International Fund
realized gains (losses) are recorded. Realized and unrealized gains (losses) on the contracts are included in the Statement of Operations. The primary risks associated with forward foreign currency contracts include failure of the Counterparty to meet the terms of the contract and the value of the foreign currency changing unfavorably. These risks may be in excess of the amounts reflected in the Statement of Assets and Liabilities.
N.
Futures Contracts — The Fund may enter into futures contracts to manage exposure to interest rate, equity and market price movements and/or currency risks. A futures contract is an agreement between Counterparties to purchase or sell a specified underlying security, currency or commodity (or delivery of a cash settlement price, in the case of an index future) for a fixed price at a future date. The Fund currently invests only in exchange-traded futures and they are standardized as to maturity date and underlying instrument or asset. Initial margin deposits required upon entering into futures contracts are satisfied by the segregation of specific securities or cash as collateral at the futures commission merchant (broker). During the period the futures contracts are open, changes in the value of the contracts are recognized as unrealized gains or losses by recalculating the value of the contracts on a daily basis. Subsequent or variation margin payments are received or made depending upon whether unrealized gains or losses are incurred. These amounts are reflected as receivables or payables on the Statement of Assets and Liabilities. When the contracts are closed or expire, the Fund recognizes a realized gain or loss equal to the difference between the proceeds from, or cost of, the closing transaction and the Fund’s basis in the contract. The net realized gain (loss) and the change in unrealized gain (loss) on futures contracts held during the period is included on the Statement of Operations. The primary risks associated with futures contracts are market risk and the absence of a liquid secondary market. If the Fund were unable to liquidate a futures contract and/or enter into an offsetting closing transaction, the Fund would continue to be subject to market risk with respect to the value of the contracts and continue to be required to maintain the margin deposits on the futures contracts. Futures contracts have minimal Counterparty risk since the exchange’s clearinghouse, as Counterparty to all exchange-traded futures, guarantees the futures against default. Risks may exceed amounts recognized in the Statement of Assets and Liabilities.
O.
Leverage Risk — Leverage exists when the Fund can lose more than it originally invests because it purchases or sells an instrument or enters into a transaction without investing an amount equal to the full economic exposure of the instrument or transaction.
P.
Other Risks - Active trading of portfolio securities may result in added expenses, a lower return and increased tax liability.
Investments in companies located or operating in Greater China (normally considered to be the geographical area that includes mainland China, Hong Kong, Macau and Taiwan) involve risks and considerations not typically associated with investments in the U.S. and other Western nations, such as greater government control over the economy; political, legal and regulatory uncertainty; nationalization, expropriation, or confiscation of property; lack of willingness or ability of the Chinese government to support the economies and markets of the Greater China region; difficulty in obtaining information necessary for investigations into and/or litigation against Chinese companies, as well as in obtaining and/or enforcing judgments; lack of publicly available information; limited legal remedies for shareholders; alteration or discontinuation of economic reforms; military conflicts and the risk of war, either internal or with other countries; public health emergencies resulting in market closures, travel restrictions, quarantines or other interventions; inflation, currency fluctuations and fluctuations in inflation and interest rates that may have negative effects on the economy and securities markets of Greater China; and Greater China’s dependency on the economies of other Asian countries, many of which are developing countries. Events in any one country within Greater China may impact the other countries in the region or Greater China as a whole.
The level of development of the economies of countries in the Asia Pacific region varies greatly. Furthermore, since the economies of the countries in the region are largely intertwined, if an economic recession is experienced by any of these countries, it will likely adversely impact the economic performance of other countries in the region. In addition, export growth continues to be a major driver of China’s rapid economic growth. As a result, a reduction in spending on Chinese products and services, the institution of tariffs, sanctions, capital controls, embargoes, trade wars or other trade barriers, or a downturn in any of the economies of China’s key trading partners may have an adverse impact on the Chinese economy. The current political climate has intensified concerns about a potential trade war between China and the U.S., as each country has recently imposed tariffs on the other country’s products. Further, actions by the U.S. government, such as delisting of certain Chinese companies from U.S. securities exchanges or otherwise restricting their operations in the U.S., may negatively impact the value of such securities held by the Fund.
Certain securities issued by companies located or operating in Greater China, such as China A-shares, are subject to trading restrictions and suspensions, quota limitations and sudden changes in those limitations, and operational, clearing and settlement risks. Significant portions of the Chinese securities markets may become rapidly illiquid, as Chinese issuers have the ability to suspend the trading of their equity securities, and have shown a willingness to exercise that option in response to market volatility and other events. The liquidity of Chinese securities may shrink or disappear suddenly and without warning as a result of adverse economic, market or political events, or adverse investor perceptions, whether or not accurate.
The Fund’s Japanese investments may be adversely affected by protectionist trade policies, slow economic activity worldwide, dependence on exports and international trade, increasing competition from Asia’s other low-cost emerging economies, political and social instability, regional and global conflicts and natural disasters, as well as by commodity markets fluctuations related to Japan’s limited natural resource supply. The Japanese economy also faces several other concerns, including a financial system with large levels of nonperforming loans, over-leveraged corporate balance sheets, extensive cross-ownership by major corporations, a changing corporate governance structure, and large government deficits.
Emerging markets (also referred to as developing markets) are generally subject to greater market volatility, political, social and economic instability, uncertain trading markets and more governmental limitations on foreign investment than more developed markets. In addition, companies operating in emerging markets may be subject to lower trading volume and greater price fluctuations than companies in more developed markets. Such countries’ economies may be more dependent on relatively few industries or investors that may be highly vulnerable to local and global changes. Companies in emerging market countries generally may be subject to less stringent regulatory, disclosure, financial reporting, accounting, auditing and recordkeeping standards than companies in more developed countries. As a result, information, including financial information, about such companies may be less available and reliable, which can impede the Fund’s ability to evaluate such companies. Securities law and the enforcement of systems of taxation in many emerging market countries may change quickly and unpredictably, and the ability to bring and enforce actions (including bankruptcy, confiscatory taxation, expropriation, nationalization of a company’s assets, restrictions on foreign ownership of local companies, restrictions on withdrawing assets from the country, protectionist measures and practices such as share blocking), or to obtain information needed to pursue or enforce such actions, may be limited. In addition, the ability of foreign entities to participate in privatization programs of certain developing or emerging market countries may be limited by local law. Investments in emerging market securities may be subject to additional transaction costs, delays in settlement procedures, unexpected market closures, and lack of timely information.
23
Invesco Income Advantage International Fund
NOTE 2—Advisory Fees and Other Fees Paid to Affiliates
The Trust has entered into a master investment advisory agreement with the Adviser. Under the terms of the investment advisory agreement, the Fund accrues daily and pays monthly an advisory fee to the Adviser based on the annual rate of the Fund’s average daily net assets as follows:
For the year ended December 31, 2024, the effective advisory fee rate incurred by the Fund was 0.75%.
Under the terms of a master sub-advisory agreement between the Adviser and each of Invesco Asset Management Deutschland GmbH, Invesco Asset Management Limited, Invesco Asset Management (Japan) Limited, Invesco Hong Kong Limited, Invesco Senior Secured Management, Inc. and Invesco Canada Ltd. (collectively, the "Affiliated Sub-Advisers") the Adviser, not the Fund, will pay 40% of the fees paid to the Adviser to any such Affiliated Sub-Adviser(s) that provide(s) discretionary investment management services to the Fund based on the percentage of assets allocated to such Affiliated Sub-Adviser(s).
Effective May 1, 2024, the Adviser has contractually agreed, through at least April 30, 2026, to waive advisory fees and/or reimburse expenses of all shares to the extent necessary to limit total annual fund operating expenses after fee waiver and/or expense reimbursement (excluding certain items discussed below) of Class A, Class C, Class R, Class Y, Class R5 and Class R6 shares to 1.28%, 2.03%, 1.53%, 1.03%, 1.03% and 1.03%, respectively, of the Fund’s average daily net assets (the "expense limits"). Prior to May 1, 2024, the Adviser had contractually agreed, to waive advisory fees and/or reimburse expenses of all shares to the extent necessary to limit total annual fund operating expenses after fee waiver and/or expense reimbursement (excluding certain items discussed below) of Class A, Class C, Class R, Class Y, Class R5 and Class R6 shares to shares to 1.23%, 1.98%, 1.48%, 0.98%, 0.98% and 0.98% respectively, of the Fund’s average daily net assets. In determining the Adviser’s obligation to waive advisory fees and/or reimburse expenses, the following expenses are not taken into account, and could cause the total annual fund operating expenses after fee waiver and/or expense reimbursement to exceed the numbers reflected above: (1) interest; (2) taxes; (3) dividend expense on short sales; (4) extraordinary or non-routine items, including litigation expenses; and (5) expenses that the Fund has incurred but did not actually pay because of an expense offset arrangement. Unless Invesco continues the fee waiver agreement, it will terminate on April 30, 2026. During its term, the fee waiver agreement cannot be terminated or amended to increase the expense limits or reduce the advisory fee waiver without approval of the Board of Trustees. To the extent that the annualized expense ratio does not exceed the expense limits,the Adviser will retain its ability to be reimbursed for such fee waivers or reimbursements prior to the end of each fiscal year.
Further, the Adviser has contractually agreed, through at least August 31, 2026, to waive the advisory fee payable by the Fund in an amount equal to 100% of the net advisory fees the Adviser receives from the affiliated money market funds on investments by the Fund of uninvested cash (excluding investments of cash collateral from securities lending) in such affiliated money market funds.
For the year ended December 31, 2024, the Adviser waived advisory fees of $163,406 and reimbursed class level expenses of $95,665, $1,694, $3,401, $8,899, $456 and $3 of Class A, Class C, Class R, Class Y, Class R5 and Class R6 shares, respectively.
The Trust has entered into a master administrative services agreement with Invesco pursuant to which the Fund has agreed to pay Invesco for certain administrative costs incurred in providing accounting services to the Fund. For the year ended December 31, 2024, expenses incurred under the agreement are shown in the Statement of Operations as Administrative services fees. Invesco has entered into a sub-administration agreement whereby State Street Bank and Trust Company (“SSB”) serves as fund accountant and provides certain administrative services to the Fund. Pursuant to a custody agreement with the Trust on behalf of the Fund, SSB also serves as the Fund’s custodian.
The Trust has entered into a transfer agency and service agreement with Invesco Investment Services, Inc. (“IIS”) pursuant to which the Fund has agreed to pay IIS a fee for providing transfer agency and shareholder services to the Fund and reimburse IIS for certain expenses incurred by IIS in the course of providing such services. IIS may make payments to intermediaries that provide omnibus account services, sub-accounting services and/or networking services. All fees payable by IIS to intermediaries that provide omnibus account services or sub-accounting services are charged back to the Fund, subject to certain limitations approved by the Trust’s Board of Trustees. For the year ended December 31, 2024, expenses incurred under the agreement are shown in the Statement of Operations as Transfer agent fees.
The Trust has entered into master distribution agreements with Invesco Distributors, Inc. (“IDI”) to serve as the distributor for the Class A, Class C, Class R, Class Y, Class R5 and Class R6 shares of the Fund. The Trust has adopted plans pursuant to Rule 12b-1 under the 1940 Act with respect to the Fund’s Class A, Class C and Class R shares (collectively, the “Plans”). The Fund, pursuant to the Plans, pays IDI compensation at the annual rate of 0.25% of the Fund’s average daily net assets of Class A shares, 1.00% of the average daily net assets of Class C shares and 0.50% of the average daily net assets of Class R shares. The fees are accrued daily and paid monthly. Of the Plans payments, up to 0.25% of the average daily net assets of each class of shares may be paid to furnish continuing personal shareholder services to customers who purchase and own shares of such classes. Any amounts not paid as a service fee under the Plans would constitute an asset-based sales charge. Rules of the Financial Industry Regulatory Authority (“FINRA”) impose a cap on the total sales charges, including asset-based sales charges, that may be paid by any class of shares of the Fund. For the year ended December 31, 2024, expenses incurred under the Plans are shown in the Statement of Operations as Distribution fees.
Front-end sales commissions and CDSC (collectively, the “sales charges”) are not recorded as expenses of the Fund. Front-end sales commissions are deducted from proceeds from the sales of Fund shares prior to investment in Class A shares of the Fund. CDSC are deducted from redemption proceeds prior to remittance to the shareholder. During the year ended December 31, 2024, IDI advised the Fund that IDI retained $3,080 in front-end sales commissions from the sale of Class A shares and $72 and $7 from Class A and Class C shares, respectively, for CDSC imposed upon redemptions by shareholders.
Certain officers and trustees of the Trust are officers and directors of the Adviser, IIS and/or IDI.
NOTE 3—Additional Valuation Information
GAAP defines fair value as the price that would be received to sell an asset or paid to transfer a liability in an orderly transaction between market participants at the measurement date, under current market conditions. GAAP establishes a hierarchy that prioritizes the inputs to valuation methods, giving the highest priority to readily available unadjusted quoted prices in an active market for identical assets (Level 1) and the lowest priority to significant unobservable inputs (Level 3), generally when market prices are not readily available. Based on the valuation inputs, the securities or other investments are tiered into one of three levels. Changes in valuation methods may result in transfers in or out of an investment’s assigned level:
Level 1 – Prices are determined using quoted prices in an active market for identical assets.
Level 2 – Prices are determined using other significant observable inputs. Observable inputs are inputs that other market participants may use in pricing a security. These may include quoted prices for similar securities, interest rates, prepayment speeds, credit risk, yield curves, loss severities, default rates, discount
24
Invesco Income Advantage International Fund
rates, volatilities and others. When significant events cause market movements to occur after the close of the relevant foreign securities markets, foreign securities may be fair valued utilizing an independent pricing service.
Level 3 – Prices are determined using significant unobservable inputs. In situations where quoted prices or observable inputs are unavailable (for example, when there is little or no market activity for an investment at the end of the period), unobservable inputs may be used. Unobservable inputs reflect the Adviser’s assumptions about the factors market participants would use in determining fair value of the securities or instruments and would be based on the best available information.
The following is a summary of the tiered valuation input levels, as of December 31, 2024. The level assigned to the securities valuations may not be an indication of the risk or liquidity associated with investing in those securities. Because of the inherent uncertainties of valuation, the values reflected in the financial statements may materially differ from the value received upon actual sale of those investments.
| | | | |
Investments in Securities | | | | |
| | | | |
| | | | |
| | | | |
| | | | |
| | | | |
| | | | |
| | | | |
| | | | |
| | | | |
| | | | |
| | | | |
| | | | |
| | | | |
| | | | |
| | | | |
| | | | |
| | | | |
| | | | |
| | | | |
| | | | |
| | | | |
| | | | |
| | | | |
| | | | |
| | | | |
| | | | |
| | | | |
| | | | |
| | | | |
| | | | |
| | | | |
| | | | |
| | | | |
| | | | |
| | | | |
| | | | |
| | | | |
| | | | |
| | | | |
| | | | |
| | | | |
| | | | |
| | | | |
| | | | |
| | | | |
| | | | |
| | | | |
| | | | |
| | | | |
| | | | |
| | | | |
25
Invesco Income Advantage International Fund
| | | | |
| | | | |
| | | | |
| | | | |
| | | | |
Total Investments in Securities | | | | |
Other Investments - Liabilities* | | | | |
| | | | |
| | | | |
| Unrealized appreciation (depreciation). |
NOTE 4—Derivative Investments
The Fund may enter into an International Swaps and Derivatives Association Master Agreement (“ISDA Master Agreement”) under which a fund may trade OTC derivatives. An OTC transaction entered into under an ISDA Master Agreement typically involves a collateral posting arrangement, payment netting provisions and close-out netting provisions. These netting provisions allow for reduction of credit risk through netting of contractual obligations. The enforceability of the netting provisions of the ISDA Master Agreement depends on the governing law of the ISDA Master Agreement, among other factors.
For financial reporting purposes, the Fund does not offset OTC derivative assets or liabilities that are subject to ISDA Master Agreements in the Statement of Assets and Liabilities.
Value of Derivative Investments at Period-End
The table below summarizes the value of the Fund’s derivative investments, detailed by primary risk exposure, held as of December 31, 2024:
| |
| |
Unrealized depreciation on futures contracts —Exchange-Traded(a) | |
Derivatives not subject to master netting agreements | |
Total Derivative Liabilities subject to master netting agreements | |
| The daily variation margin receivable (payable) at period-end is recorded in the Statement of Assets and Liabilities. |
Effect of Derivative Investments for the year ended December 31, 2024
The table below summarizes the gains (losses) on derivative investments, detailed by primary risk exposure, recognized in earnings during the period:
| Location of Gain (Loss) on
Statement of Operations |
| | | |
| | | |
Forward foreign currency contracts | | | |
| | | |
Change in Net Unrealized Appreciation (Depreciation): | | | |
| | | |
| | | |
The table below summarizes the average notional value of derivatives held during the period.
| Forward
Foreign Currency
Contracts | |
| | |
| | |
NOTE 5—Expense Offset Arrangement(s)
The expense offset arrangement is comprised of transfer agency credits which result from balances in demand deposit accounts used by the transfer agent for clearing shareholder transactions. For the year ended December 31, 2024, the Fund received credits from this arrangement, which resulted in the reduction of the Fund’s total expenses of $5,528.
NOTE 6—Trustees’ and Officers’ Fees and Benefits
Trustees’ and Officers’ Fees and Benefits include amounts accrued by the Fund to pay remuneration to certain Trustees and Officers of the Fund. Trustees have the option to defer compensation payable by the Fund, and Trustees’ and Officers’ Fees and Benefits also include amounts accrued by the Fund to fund such deferred compensation amounts. Those Trustees who defer compensation have the option to select various Invesco Funds in which their deferral accounts shall be deemed to be invested. Finally, certain current Trustees were eligible to participate in a retirement plan that provided for benefits to be paid upon retirement to Trustees over a period of time based on the number of years of service. The Fund may have certain former Trustees who also participate in a retirement plan and receive benefits under
26
Invesco Income Advantage International Fund
such plan. Trustees’ and Officers’ Fees and Benefits include amounts accrued by the Fund to fund such retirement benefits. Obligations under the deferred compensation and retirement plans represent unsecured claims against the general assets of the Fund.
The Fund is permitted to temporarily carry a negative or overdrawn balance in its account with SSB, the custodian bank. Such balances, if any at period-end, are shown in the Statement of Assets and Liabilities under the payable caption Amount due custodian. To compensate the custodian bank for such overdrafts, the overdrawn Fund may either (1) leave funds as a compensating balance in the account so the custodian bank can be compensated by earning the additional interest; or (2) compensate by paying the custodian bank at a rate agreed upon by the custodian bank and Invesco, not to exceed the contractually agreed upon rate.
NOTE 8—Distributions to Shareholders and Tax Components of Net Assets
Tax Character of Distributions to Shareholders Paid During the Fiscal Years Ended December 31, 2024 and 2023: |
| | |
| | |
| Includes short-term capital gain distributions, if any. |
Tax Components of Net Assets at Period-End: |
| |
Undistributed ordinary income | |
Net unrealized appreciation — investments | |
Net unrealized appreciation (depreciation) — foreign currencies | |
Temporary book/tax differences | |
Capital loss carryforward | |
Shares of beneficial interest | |
| |
The difference between book-basis and tax-basis unrealized appreciation (depreciation) is due to differences in the timing of recognition of gains and losses on investments for tax and book purposes. The Fund’s net unrealized appreciation (depreciation) difference is attributable primarily to wash sales and passive foreign investment companies.
The temporary book/tax differences are a result of timing differences between book and tax recognition of income and/or expenses. The Fund’s temporary book/tax differences are the result of the trustee deferral of compensation and retirement plan benefits.
Capital loss carryforward is calculated and reported as of a specific date. Results of transactions and other activity after that date may affect the amount of capital loss carryforward actually available for the Fund to utilize. The ability to utilize capital loss carryforward in the future may be limited under the Internal Revenue Code and related regulations based on the results of future transactions.
The Fund has a capital loss carryforward as of December 31, 2024, as follows:
Capital Loss Carryforward* |
| | | |
Not subject to expiration | | | |
*
Capital loss carryforward is reduced for limitations, if any, to the extent required by the Internal Revenue Code and may be further limited depending upon a variety of factors, including the realization of net unrealized gains or losses as of the date of any reorganization.
NOTE 9—Investment Transactions
The aggregate amount of investment securities (other than short-term securities, U.S. Government obligations and money market funds, if any) purchased and sold by the Fund during the year ended December 31, 2024 was $33,284,879 and $30,290,406, respectively. As of December 31, 2024, the aggregate cost of investments, including any derivatives, on a tax basis listed below includes the adjustments for financial reporting purposes as of the most recently completed federal income tax reporting period-end:
Unrealized Appreciation (Depreciation) of Investments on a Tax Basis |
Aggregate unrealized appreciation of investments | |
Aggregate unrealized (depreciation) of investments | |
Net unrealized appreciation of investments | |
Cost of investments for tax purposes is $55,281,114.
NOTE 10—Reclassification of Permanent Differences
Primarily as a result of differing book/tax treatment of passive foreign investment companies and foreign currency transactions, on December 31, 2024, undistributed net investment income was increased by $294,454 and undistributed net realized gain (loss) was decreased by $294,454. This reclassification had no effect on the net assets or the distributable earnings (loss) of the Fund.
27
Invesco Income Advantage International Fund
NOTE 11—Share Information
| Summary of Share Activity |
| | Year ended
December 31, 2023 |
| | | | |
| | | | |
| | | | |
| | | | |
| | | | |
| | | | |
| | | | |
| | | | |
Issued as reinvestment of dividends: | | | | |
| | | | |
| | | | |
| | | | |
| | | | |
| | | | |
| | | | |
Automatic conversion of Class C shares to Class A shares: | | | | |
| | | | |
| | | | |
| | | | |
| | | | |
| | | | |
| | | | |
| | | | |
| | | | |
| | | | |
Net increase (decrease) in share activity | | | | |
| There are entities that are record owners of more than 5% of the outstanding shares of the Fund and in the aggregate own 18% of the outstanding shares of the Fund. IDI has an agreement with these entities to sell Fund shares. The Fund, Invesco and/or Invesco affiliates may make payments to these entities, which are considered to be related to the Fund, for providing services to the Fund, Invesco and/or Invesco affiliates including but not limited to services such as securities brokerage, distribution, third party record keeping and account servicing. The Fund has no knowledge as to whether all or any portion of the shares owned of record by these entities are also owned beneficially. |
At a meeting held December 11, 2024, the Board of Trustees approved a Plan of Liquidation and Dissolution, which authorizes the termination, liquidation and dissolution of the Fund. In order to effect such liquidation, the Fund will be closed to investments by new accounts after the close of business on January 17, 2025. The Fund will be liquidated on or about March 20, 2025.
28
Invesco Income Advantage International Fund
Report of Independent Registered Public Accounting Firm
To the Board of Trustees of AIM Growth Series (Invesco Growth Series) and Shareholders of Invesco Income Advantage International Fund
Opinion on the Financial Statements
We have audited the accompanying statement of assets and liabilities, including the schedule of investments, of Invesco Income Advantage International Fund (one of the funds constituting AIM Growth Series (Invesco Growth Series), referred to hereafter as the "Fund") as of December 31, 2024, the related statement of operations for the year ended December 31, 2024, the statement of changes in net assets for each of the two years in the period ended December 31, 2024, including the related notes, and the financial highlights for each of the five years in the period ended December 31, 2024 (collectively referred to as the "financial statements"). In our opinion, the financial statements present fairly, in all material respects, the financial position of the Fund as of December 31, 2024, the results of its operations for the year then ended, the changes in its net assets for each of the two years in the period ended December 31, 2024 and the financial highlights for each of the five years in the period ended December 31, 2024 in conformity with accounting principles generally accepted in the United States of America.
These financial statements are the responsibility of the Fund’s management. Our responsibility is to express an opinion on the Fund’s financial statements based on our audits. We are a public accounting firm registered with the Public Company Accounting Oversight Board (United States) (PCAOB) and are required to be independent with respect to the Fund in accordance with the U.S. federal securities laws and the applicable rules and regulations of the Securities and Exchange Commission and the PCAOB.
We conducted our audits of these financial statements in accordance with the standards of the PCAOB. Those standards require that we plan and perform the audit to obtain reasonable assurance about whether the financial statements are free of material misstatement, whether due to error or fraud.
Our audits included performing procedures to assess the risks of material misstatement of the financial statements, whether due to error or fraud, and performing procedures that respond to those risks. Such procedures included examining, on a test basis, evidence regarding the amounts and disclosures in the financial statements. Our audits also included evaluating the accounting principles used and significant estimates made by management, as well as evaluating the overall presentation of the financial statements. Our procedures included confirmation of securities owned as of December 31, 2024 by correspondence with the custodian, transfer agent and brokers. We believe that our audits provide a reasonable basis for our opinion.
/s/PricewaterhouseCoopers LLP
February 20, 2025
We have served as the auditor of one or more of the investment companies in the Invesco group of investment companies since at least 1995. We have not been able to determine the specific year we began serving as auditor.
29
Invesco Income Advantage International Fund
Tax Information
Form 1099-DIV, Form 1042-S and other year–end tax information provide shareholders with actual calendar year amounts that should be included in their tax returns. Shareholders should consult their tax advisers.
The following distribution information is being provided as required by the Internal Revenue Code or to meet a specific state’s requirement.
The Fund designates the following amounts or, if subsequently determined to be different, the maximum amount allowable for its fiscal year ended December 31, 2024:
Federal and State Income Tax | | |
Qualified Dividend Income* | | |
Corporate Dividends Received Deduction* | | |
U.S. Treasury Obligations* | | |
Qualified Business Income* | | |
Business Interest Income* | | |
| | |
| | |
*
The above percentages are based on ordinary income dividends paid to shareholders during the Fund’s fiscal year.
30
Invesco Income Advantage International Fund
Other Information Required in Form N-CSR (Items 8-11)
Changes in and Disagreements with Accountants for Open-End Management Investment Companies
Proxy Disclosures for Open-End Management Investment Companies
Remuneration Paid to Directors, Officers, and Others of Open-End Management Investment Companies
The aggregate remuneration paid to directors, officers and others is disclosed within the financial statements.
Statement Regarding Basis for Approval of Investment Advisory Contracts
31
Invesco Income Advantage International Fund
SEC file number(s): 811-02699 and 002-57526
Invesco Distributors, Inc.
GLVEY-NCSR
Annual Financial Statements and Other InformationDecember 31, 2024
Invesco Income Allocation Fund
A: ALAAX ■ C: CLIAX ■ R: RLIAX ■ Y: ALAYX ■ R5: ILAAX ■ R6: IIASX
| |
| |
| |
| Notes to Financial Statements |
| Report of Independent Registered Public Accounting Firm |
| |
| Other Information Required in Form N-CSR (Items 8-11) |
Schedule of Investments
Invesco Income Allocation Fund |
Schedule of Investments in Affiliated and Unaffiliated Issuers–100.05% |
| | | | | Change in
Unrealized
Appreciation
(Depreciation) | | | | |
|
Invesco Global Real Estate Income | | | | | | | | | |
Invesco Multi-Asset Income Fund, Class R6 | | | | | | | | | |
| | | | | | | | | |
Domestic Equity Funds–30.64% |
Invesco Dividend Income Fund, Class R6 | | | | | | | | | |
Invesco Income Advantage U.S. Fund, Class R6 | | | | | | | | | |
Invesco Main Street Small Cap Fund, Class R6 | | | | | | | | | |
| | | | | | | | | |
Invesco QQQ Income Advantage ETF | | | | | | | | | |
Invesco Russell 1000® Dynamic Multifactor ETF | | | | | | | | | |
Invesco S&P 500 Equal Weight Income Advantage ETF | | | | | | | | | |
Invesco S&P 500® High Dividend Low Volatility ETF | | | | | | | | | |
Invesco S&P 500® Pure Value ETF(b) | | | | | | | | | |
Invesco Value Opportunities Fund, Class R6 | | | | | | | | | |
Total Domestic Equity Funds | | | | | | | | | |
Fixed Income Funds–62.65% |
Invesco Core Bond Fund, Class R6 | | | | | | | | | |
Invesco Core Plus Bond Fund, Class R6 | | | | | | | | | |
Invesco Corporate Bond Fund, Class R6 | | | | | | | | | |
Invesco Equal Weight 0-30 Year Treasury ETF | | | | | | | | | |
Invesco Floating Rate ESG Fund, | | | | | | | | | |
Invesco High Yield Fund, Class R6 | | | | | | | | | |
Invesco Income Fund, Class R6 | | | | | | | | | |
Invesco International Bond Fund, | | | | | | | | | |
Invesco Taxable Municipal Bond ETF | | | | | | | | | |
Invesco Variable Rate Investment Grade ETF | | | | | | | | | |
| | | | | | | | | |
International and Global Equity Funds–6.76% |
Invesco FTSE RAFI Developed Markets ex-U.S. ETF | | | | | | | | | |
Invesco S&P Emerging Markets Low Volatility ETF | | | | | | | | | |
Invesco S&P International Developed Low Volatility ETF | | | | | | | | | |
iShares Global Infrastructure ETF(c) | | | | | | | | | |
Total International and Global Equity Funds | | | | | | | | | |
|
Invesco Government & Agency Portfolio, Institutional Class, | | | | | | | | | |
See accompanying Notes to Financial Statements which are an integral part of the financial statements.
2
Invesco Income Allocation Fund
Invesco Income Allocation Fund (continued) |
Schedule of Investments in Affiliated and Unaffiliated Issuers–100.05% |
| | | | | Change in Unrealized Appreciation (Depreciation) | | | | |
Money Market Funds–(continued) |
Invesco Liquid Assets Portfolio, | | | | | | | | | |
Invesco Treasury Portfolio, Institutional Class, 4.38%(d) | | | | | | | | | |
| | | | | | | | | |
TOTAL INVESTMENTS IN AFFILIATED AND UNAFFILIATED ISSUERS (excluding investments purchased with cash collateral from securities on loan)
(Cost $320,864,785) | | | | | | | | | |
|
Investments Purchased with Cash Collateral from Securities on Loan | | | | | | | | | |
|
Invesco Private Government Fund, | | | | | | | | | |
Invesco Private Prime Fund, | | | | | | | | | |
Total Investments Purchased with Cash Collateral from Securities on Loan
(Cost $2,069,240) | | | | | | | | | |
TOTAL INVESTMENTS IN AFFILIATED AND UNAFFILIATED ISSUERS (Cost $322,934,025) | | | | | | | | | |
OTHER ASSETS LESS LIABILITIES | | | | | | | | | |
| | | | | | | | | |
Investment Abbreviations:
Notes to Schedule of Investments:
| Includes return of capital distribution. |
| All or a portion of this security was out on loan at December 31, 2024. |
| Not affiliated with Invesco Advisers, Inc. |
| The rate shown is the 7-day SEC standardized yield as of December 31, 2024. |
| The security has been segregated to satisfy the commitment to return the cash collateral received in securities lending transactions upon the borrower’s return of the securities loaned. See Note 1I. |
| Represents the income earned on the investment of cash collateral, which is included in securities lending income on the Statement of Operations. Does not include rebates and fees paid to lending agent or premiums received from borrowers, if any. |
| Includes capital gains distributions from affiliated underlying funds as follows: |
| |
Invesco Dividend Income Fund | |
Invesco Main Street Small Cap Fund | |
Invesco Value Opportunities Fund | |
See accompanying Notes to Financial Statements which are an integral part of the financial statements.
3
Invesco Income Allocation Fund
Statement of Assets and Liabilities
| |
Investments in affiliated underlying funds, at value
(Cost $322,934,025)* | |
| |
| |
Dividends - affiliated underlying funds | |
Investment for trustee deferred compensation and retirement plans | |
| |
| |
| |
| |
Investments purchased - affiliated underlying funds | |
| |
| |
Collateral upon return of securities loaned | |
Accrued fees to affiliates | |
Accrued other operating expenses | |
Trustee deferred compensation and retirement plans | |
| |
Net assets applicable to shares outstanding | |
| |
Shares of beneficial interest | |
Distributable earnings (loss) | |
| |
|
| |
| |
| |
| |
| |
| |
Shares outstanding, no par value, with an unlimited number of shares authorized: |
| |
| |
| |
| |
| |
| |
| |
Net asset value per share | |
Maximum offering price per share
(Net asset value of $10.54 ÷ 94.50%) | |
| |
Net asset value and offering price per share | |
| |
Net asset value and offering price per share | |
| |
Net asset value and offering price per share | |
| |
Net asset value and offering price per share | |
| |
Net asset value and offering price per share | |
| At December 31, 2024, securities with an aggregate value of $2,032,270 were on loan to brokers. |
See accompanying Notes to Financial Statements which are an integral part of the financial statements.
4
Invesco Income Allocation Fund
Statement of Operations
For the year ended December 31, 2024
| |
Dividends from affiliated underlying funds (includes net securities lending income of $81,242) | |
| |
| |
| |
Administrative services fees | |
| |
| |
| |
| |
| |
Transfer agent fees — A, C, R and Y | |
| |
Trustees’ and officers’ fees and benefits | |
Registration and filing fees | |
| |
Professional services fees | |
| |
| |
Less: Expense offset arrangement(s) | |
| |
| |
Realized and unrealized gain (loss) from: | |
Net realized gain (loss) from: | |
Affiliated underlying fund shares | |
Unaffiliated underlying fund shares | |
Capital gain distributions from affiliated underlying fund shares | |
| |
Change in net unrealized appreciation (depreciation) of: | |
Affiliated underlying fund shares | |
Unaffiliated underlying fund shares | |
| |
Net realized and unrealized gain | |
Net increase in net assets resulting from operations | |
See accompanying Notes to Financial Statements which are an integral part of the financial statements.
5
Invesco Income Allocation Fund
Statement of Changes in Net Assets
For the years ended December 31, 2024 and 2023
| | |
| | |
| | |
| | |
Change in net unrealized appreciation | | |
Net increase in net assets resulting from operations | | |
Distributions to shareholders from distributable earnings: | | |
| | |
| | |
| | |
| | |
| | |
| | |
Total distributions from distributable earnings | | |
| | |
| | |
| | |
| | |
| | |
| | |
| | |
Net increase (decrease) in net assets resulting from share transactions | | |
Net increase (decrease) in net assets | | |
| | |
| | |
| | |
See accompanying Notes to Financial Statements which are an integral part of the financial statements.
6
Invesco Income Allocation Fund
Financial Highlights
The following schedule presents financial highlights for a share of the Fund outstanding throughout the periods indicated.
| Net asset
value,
beginning
of period | | Net gains
(losses)
on securities
(both
realized and
unrealized) | Total from
investment
operations | Dividends
from net
investment
income | Distributions
from net
realized
gains | | Net asset
value, end
of period | | Net assets,
end of period
(000’s omitted) | Ratio of
expenses
to average
net assets
with fee waivers
and/or
expenses
| Ratio of
expenses
to average net
assets without
fee waivers
and/or
expenses
absorbed
| Ratio of net
investment
income
to average
net assets | |
|
| | | | | | | | | | | | | | |
| | | | | | | | | | | | | | |
| | | | | | | | | | | | | | |
| | | | | | | | | | | | | | |
| | | | | | | | | | | | | | |
|
| | | | | | | | | | | | | | |
| | | | | | | | | | | | | | |
| | | | | | | | | | | | | | |
| | | | | | | | | | | | | | |
| | | | | | | | | | | | | | |
|
| | | | | | | | | | | | | | |
| | | | | | | | | | | | | | |
| | | | | | | | | | | | | | |
| | | | | | | | | | | | | | |
| | | | | | | | | | | | | | |
|
| | | | | | | | | | | | | | |
| | | | | | | | | | | | | | |
| | | | | | | | | | | | | | |
| | | | | | | | | | | | | | |
| | | | | | | | | | | | | | |
|
| | | | | | | | | | | | | | |
| | | | | | | | | | | | | | |
| | | | | | | | | | | | | | |
| | | | | | | | | | | | | | |
| | | | | | | | | | | | | | |
|
| | | | | | | | | | | | | | |
| | | | | | | | | | | | | | |
| | | | | | | | | | | | | | |
| | | | | | | | | | | | | | |
| | | | | | | | | | | | | | |
| Calculated using average shares outstanding. |
| Includes adjustments in accordance with accounting principles generally accepted in the United States of America and as such, the net asset value for financial reporting purposes and the returns based upon those net asset values may differ from the net asset value and returns for shareholder transactions. Does not include sales charges and is not annualized for periods less than one year, if applicable. |
| In addition to the fees and expenses which the Fund bears directly; the Fund indirectly bears a pro rata share of the fees and expenses of the underlying funds in which the Fund invests. Because the underlying funds have varied expenses and fee levels and the Fund may own different proportions at different times, the amount of fees and expenses incurred indirectly by the Fund will vary. Estimated underlying fund expenses are not expenses that are incurred directly by the Fund. They are expenses that are incurred directly by the underlying funds and are deducted from the value of the funds your Fund invests in. The effect of the estimated underlying fund expenses that you bear indirectly is included in your Fund’s total return. Estimated acquired fund fees from underlying funds were 0.45%, 0.46%, 0.45%, 0.45% and 0.51% for the years ended December 31, 2024, 2023, 2022, 2021 and 2020, respectively. |
| Portfolio turnover is calculated at the fund level and is not annualized for periods less than one year, if applicable. |
See accompanying Notes to Financial Statements which are an integral part of the financial statements.
7
Invesco Income Allocation Fund
Notes to Financial Statements
NOTE 1—Significant Accounting Policies
Invesco Income Allocation Fund (the “Fund”) is a series portfolio of AIM Growth Series (Invesco Growth Series) (the “Trust”). The Trust is a Delaware statutory trust registered under the Investment Company Act of 1940, as amended (the “1940 Act”), as an open-end series management investment company authorized to issue an unlimited number of shares of beneficial interest. Information presented in these financial statements pertains only to the Fund. Matters affecting the Fund or each class will be voted on exclusively by the shareholders of the Fund or each class.
The Fund’s investment objective is current income and, secondarily, growth of capital.
The Fund is a "fund of funds", in that it invests in other mutual funds advised by Invesco Advisers, Inc. (the "Adviser" or "Invesco") and exchange-traded funds ("ETFs") and other pooled investment vehicles advised by Invesco Capital Management LLC ("Invesco Capital") or mutual funds, ETFs and other pooled investment vehicles advised by unaffiliated advisers ("underlying funds"). Invesco and Invesco Capital are affiliates of each other as they are indirect, wholly-owned subsidiaries of Invesco Ltd. Invesco may change the Fund’s asset class allocations, the underlying funds or the target weightings in the underlying funds without shareholder approval or notice to shareholders. The underlying funds may engage in a number of investment techniques and practices, which involve certain risks. Each underlying fund’s accounting policies are outlined in the underlying fund’s financial statements and are publicly available.
The Fund currently consists of six different classes of shares: Class A, Class C, Class R, Class Y, Class R5 and Class R6. Class Y shares are available only to certain investors. Class A shares are sold with a front-end sales charge unless certain waiver criteria are met. Under certain circumstances, load waived shares may be subject to contingent deferred sales charges ("CDSC"). Class C shares are sold with a CDSC. Class R, Class Y, Class R5 and Class R6 shares are sold at net asset value. Class C shares held for eight years after purchase are eligible for automatic conversion into Class A shares of the same Fund (the "Conversion Feature"). The automatic conversion pursuant to the Conversion Feature will generally occur at the end of the month following the eighth anniversary after a purchase of Class C shares.
Effective after the close of business on September 30, 2024, Class R5 shares are closed to new investors.
The Fund is an investment company and accordingly follows the investment company accounting and reporting guidance in accordance with Financial Accounting Standards Board Accounting Standards Codification Topic 946, Financial Services – Investment Companies.
The following is a summary of the significant accounting policies followed by the Fund in the preparation of its financial statements.
A.
Security Valuations — Securities of investment companies listed or traded on an exchange are generally valued at the trade price or official closing price that day as of the close of the exchange where the security is principally traded, or lacking any trades or official closing price on a particular day, the security may be valued at the closing bid price on that day. Securities of investment companies that are not exchange-traded (e.g., open-end mutual funds) are valued using such company’s end-of-business-day net asset value per share. Securities in the underlying funds, including restricted securities, are valued in accordance with the valuation policy of such fund. The policies of the underlying funds affiliated with the Fund, as a result of having the same investment adviser, are set forth below.
A security listed or traded on an exchange is generally valued at its trade price or official closing price that day as of the close of the exchange where the security is principally traded, or lacking any trades or official closing price on a particular day, the security may be valued at the closing bid or ask price on that day. Securities traded in the over-the-counter market are valued based on prices furnished by independent pricing services or market makers. When such securities are valued using prices provided by an independent pricing service they may be considered fair valued. Futures contracts are valued at the daily settlement price set by an exchange on which they are principally traded. Where a final settlement price exists, exchange-traded options are valued at the final settlement price from the exchange where the option principally trades. Where a final settlement price does not exist, exchange-traded options are valued at the mean between the last bid and ask price generally from the exchange where the option principally trades.
Variable rate senior loan interests are fair valued using quotes provided by an independent pricing service. Quotes provided by the pricing service may reflect appropriate factors such as ratings, tranche type, industry, company performance, spread, individual trading characteristics, institution-size trading in similar groups of securities and other market data.
Securities of investment companies that are not exchange-traded (e.g., open-end mutual funds) are valued using such company’s end-of-business-day net asset value per share.
Deposits, other obligations of U.S. and non-U.S. banks and financial institutions are valued at their daily account value.
Fixed income securities (including convertible debt securities) generally are valued on the basis of prices provided by independent pricing services. Prices provided by the pricing service may be determined without exclusive reliance on quoted prices, and may reflect appropriate factors such as institution-size trading in similar groups of securities, developments related to specific securities, dividend rate (for unlisted equities), yield (for debt obligations), quality, type of issue, coupon rate (for debt obligations), maturity (for debt obligations), individual trading characteristics and other market data. Pricing services generally value debt obligations assuming orderly transactions of institutional round lot size, but a fund may hold or transact in the same securities in smaller, odd lot sizes. Odd lots often trade at lower prices than institutional round lots, and their value may be adjusted accordingly. Debt obligations are subject to interest rate and credit risks. In addition, all debt obligations involve some risk of default with respect to interest and/or principal payments.
Swap agreements are fair valued using an evaluated quote, if available, provided by an independent pricing service. Evaluated quotes provided by the pricing service are valued based on a model which may include end-of-day net present values, spreads, ratings, industry, company performance and returns of referenced assets. Centrally cleared swap agreements are valued at the daily settlement price determined by the relevant exchange or clearinghouse.
Foreign securities’ (including foreign exchange contracts) prices are converted into U.S. dollar amounts using the applicable exchange rates as of the close of the New York Stock Exchange (“NYSE”). If market quotations are available and reliable for foreign exchange-traded equity securities, the securities will be valued at the market quotations. The Adviser may use various pricing services to obtain market quotations as well as fair value prices. Because trading hours for certain foreign securities end before the close of the NYSE, closing market quotations may become not representative of market value in the Adviser’s judgment (“unreliable”). If, between the time trading ends on a particular security and the close of the customary trading session on the NYSE, a significant event occurs that makes the closing price of the security unreliable, the Adviser may fair value the security. If the event is likely to have affected the closing price of the security, the security will be valued at fair value in good faith in accordance with Board- approved policies and related Adviser procedures (“Valuation Procedures”). Adjustments to closing prices to reflect fair value may also be based on a screening process of an independent pricing service to indicate the degree of certainty, based on historical data, that the closing price in the principal market where a foreign security trades is not the current value as of the close of the NYSE. Foreign securities’ prices meeting the degree of certainty that the price is not reflective of current value will be priced at the indication of fair value from the independent pricing service. Multiple factors may be considered by the independent pricing service in determining adjustments to reflect fair value and may include information relating to sector indices, American Depositary Receipts and domestic and foreign index futures. Foreign securities may have additional risks including exchange rate changes, potential for sharply devalued currencies and high inflation, political and economic upheaval, the relative lack of issuer information, relatively low market liquidity and the potential lack of strict financial and accounting controls and standards.
Unlisted securities will be valued using prices provided by independent pricing services or by another method that the Adviser, in its judgment, believes better reflects the security’s fair value in accordance with the Valuation Procedures.
Non-traded rights and warrants shall be valued at intrinsic value if the terms of the rights and warrants are available, specifically the subscription or exercise price and the ratio. Intrinsic value is calculated as the daily market closing price of the security to be received less the subscription price, which is then adjusted by
8
Invesco Income Allocation Fund
the exercise ratio. In the case of warrants, an option pricing model supplied by an independent pricing service may be used based on market data such as volatility, stock price and interest rate from the independent pricing service and strike price and exercise period from verified terms.
Securities for which market prices are not provided by any of the above methods may be valued based upon quotes furnished by independent sources. The mean between the last bid and ask prices may be used to value debt obligations, including corporate loans.
Securities for which market quotations are not readily available are fair valued by the Adviser in accordance with the Valuation Procedures. If a fair value price provided by a pricing service is unreliable, the Adviser will fair value the security using the Valuation Procedures. Issuer specific events, market trends, bid/ask quotes of brokers and information providers and other market data may be reviewed in the course of making a good faith determination of a security’s fair value.
The Fund may invest in securities that are subject to interest rate risk, meaning the risk that the prices will generally fall as interest rates rise and, conversely, the prices will generally rise as interest rates fall. Specific securities differ in their sensitivity to changes in interest rates depending on their individual characteristics. Changes in interest rates may result in increased market volatility, which may affect the value and/or liquidity of certain Fund investments.
Valuations change in response to many factors including the historical and prospective earnings of the issuer, the value of the issuer’s assets, general market conditions which are not specifically related to the particular issuer, such as real or perceived adverse economic conditions, changes in the general outlook for revenues or corporate earnings, changes in interest or currency rates, regional or global instability, natural or environmental disasters, widespread disease or other public health issues, war, acts of terrorism, significant governmental actions or adverse investor sentiment generally and market liquidity. Because of the inherent uncertainties of valuation, the values reflected in the financial statements may materially differ from the value received upon actual sale of those investments.
The price the Fund could receive upon the sale of any investment may differ from the Adviser’s valuation of the investment, particularly for securities that are valued using a fair valuation technique. When fair valuation techniques are applied, the Adviser uses available information, including both observable and unobservable inputs and assumptions, to determine a methodology that will result in a valuation that the Adviser believes approximates market value. Fund securities that are fair valued may be subject to greater fluctuation in their value from one day to the next than would be the case if market quotations were used. Because of the inherent uncertainties of valuation, and the degree of subjectivity in such decisions, the Fund could realize a greater or lesser than expected gain or loss upon the sale of the investment.
B.
Securities Transactions and Investment Income — Securities transactions are accounted for on a trade date basis. Realized gains or losses on sales are computed on the basis of specific identification of the securities sold. Distributions from ordinary income from underlying funds, if any, are recorded as dividend income on the ex-dividend date. Distributions from gains from underlying funds, if any, are recorded as realized gains on the ex-dividend date. The following policies are followed by the underlying funds: Interest income (net of withholding tax, if any) is recorded on an accrual basis from settlement date and includes coupon interest and amortization of premium and accretion of discount on debt securities as applicable. Pay-in-kind interest income and non-cash dividend income received in the form of securities in lieu of cash are recorded at the fair value of the securities received. Paydown gains and losses on mortgage and asset-backed securities are recorded as adjustments to interest income.
The Fund may periodically participate in litigation related to the Fund’s investments. As such, the Fund may receive proceeds from litigation settlements. Any proceeds received are included in the Statement of Operations as realized gain (loss) for investments no longer held and as unrealized gain (loss) for investments still held.
The Fund allocates income and realized and unrealized capital gains and losses to a class based on the relative net assets of each class.
C.
Distributions – Distributions from net investment income, if any, are declared and paid monthly. Distributions from net realized capital gain, if any, are generally declared and paid annually and recorded on the ex-dividend date. The Fund may elect to treat a portion of the proceeds from redemptions as distributions for federal income tax purposes.
D.
Federal Income Taxes – The Fund intends to comply with the requirements of Subchapter M of the Internal Revenue Code of 1986, as amended (the “Internal Revenue Code”), necessary to qualify as a regulated investment company and to distribute substantially all of the Fund’s taxable earnings to shareholders. As such, the Fund will not be subject to federal income taxes on otherwise taxable income (including net realized capital gain) that is distributed to shareholders. Therefore, no provision for federal income taxes is recorded in the financial statements.
The Fund recognizes the tax benefits of uncertain tax positions only when the position is more likely than not to be sustained. Management has analyzed the Fund’s uncertain tax positions and concluded that no liability for unrecognized tax benefits should be recorded related to uncertain tax positions. Management is not aware of any tax positions for which it is reasonably possible that the total amounts of unrecognized tax benefits will change materially in the next 12 months.
The Fund files tax returns in the U.S. Federal jurisdiction and certain other jurisdictions. Generally, the Fund is subject to examinations by such taxing authorities for up to three years after the filing of the return for the tax period.
E.
Expenses – Expenses included in the accompanying financial statements reflect the expenses of the Fund and do not include any expenses of the underlying funds. The effects of the underlying funds expenses are included in the realized and unrealized gain/loss on the investments in the underlying funds. Estimated expenses of the underlying funds are discussed further within the Financial Highlights.
Fees provided for under the Rule 12b-1 plan of a particular class of the Fund and which are directly attributable to that class are charged to the operations of such class. Transfer agency fees and expenses and other shareholder recordkeeping fees and expenses attributable to Class R5 and Class R6 are allocated based on relative net assets of Class R5 and Class R6. Transfer agency fees and expenses and other shareholder recordkeeping fees and expenses relating to all other classes are allocated among those classes based on relative net assets. All other expenses are allocated among the classes based on relative net assets.
F.
Accounting Estimates – The preparation of financial statements in conformity with accounting principles generally accepted in the United States of America (“GAAP”) requires management to make estimates and assumptions that affect the reported amounts of assets and liabilities at the date of the financial statements and the reported amounts of revenues and expenses during the reporting period including estimates and assumptions related to taxation. Actual results could differ from those estimates by a significant amount. In addition, the Fund monitors for material events or transactions that may occur or become known after the period-end date and before the date the financial statements are released to print.
G.
Indemnifications – Under the Trust’s organizational documents, each Trustee, officer, employee or other agent of the Trust is indemnified against certain liabilities that may arise out of the performance of their duties to the Fund. Additionally, in the normal course of business, the Fund enters into contracts, including the Fund’s servicing agreements, that contain a variety of indemnification clauses. The Fund’s maximum exposure under these arrangements is unknown as this would involve future claims that may be made against the Fund that have not yet occurred. The risk of material loss as a result of such indemnification claims is considered remote.
H.
Segment Reporting — In November 2023, the FASB issued Accounting Standards Update 2023-07, Segment Reporting (Topic 280): Improvements to Reportable Segment Disclosures (“ASU 2023-07”), with the intent of improving reportable segment disclosure requirements, primarily through enhanced disclosures about significant segment expenses, allowing financial statement users to better understand the components of a segment’s profit or loss and assess potential future cash flows for each reportable segment and the entity as a whole thereby enabling better understanding of how an entity’s segments impact overall performance. The Fund represents a single operating segment. Subject to the oversight and, when applicable, approval of the Board of Trustees, the Fund’s Adviser acts as the Fund’s chief operating decision maker (“CODM”), assessing performance and making decisions about resource allocation within the Fund. The CODM monitors the operating results as a whole and the Fund’s long-term strategic asset allocation is determined in accordance with the terms of its prospectus based on a defined investment strategy. The financial information provided to and reviewed by the CODM is consistent with that presented in the Fund’s financial statements. Adoption of the new standard impacted the Fund’s financial statement note disclosures only and did not affect the Fund’s financial position or the results of its operations.
9
Invesco Income Allocation Fund
I.
Securities Lending – The Fund may lend portfolio securities having a market value up to one-third of the Fund’s total assets. Such loans are secured by collateral equal to no less than the market value of the loaned securities determined daily by the securities lending provider. Such collateral will be cash or debt securities issued or guaranteed by the U.S. Government or any of its sponsored agencies. Cash collateral received in connection with these loans is invested in short-term money market instruments or affiliated, unregistered investment companies that comply with Rule 2a-7 under the 1940 Act and money market funds (collectively, "affiliated money market funds") and is shown as such on the Schedule of Investments. The Fund bears the risk of loss with respect to the investment of collateral. It is the Fund’s policy to obtain additional collateral from or return excess collateral to the borrower by the end of the next business day, following the valuation date of the securities loaned. Therefore, the value of the collateral held may be temporarily less than the value of the securities on loan. When loaning securities, the Fund retains certain benefits of owning the securities, including the economic equivalent of dividends or interest generated by the security. Lending securities entails a risk of loss to the Fund if, and to the extent that, the market value of the securities loaned were to increase and the borrower did not increase the collateral accordingly, and the borrower failed to return the securities. The securities loaned are subject to termination at the option of the borrower or the Fund. Upon termination, the borrower will return to the Fund the securities loaned and the Fund will return the collateral. Upon the failure of the borrower to return the securities, collateral may be liquidated and the securities may be purchased on the open market to replace the loaned securities. The Fund could experience delays and costs in gaining access to the collateral and the securities may lose value during the delay which could result in potential losses to the Fund. Some of these losses may be indemnified by the lending agent. The Fund bears the risk of any deficiency in the amount of the collateral available for return to the borrower due to any loss on the collateral invested. Dividends received on cash collateral investments for securities lending transactions, which are net of compensation to counterparties, are included in Dividends from affiliated underlying funds on the Statement of Operations. The aggregate value of securities out on loan, if any, is shown as a footnote on the Statement of Assets and Liabilities.
The Adviser serves as an affiliated securities lending agent for the Fund. The Bank of New York Mellon also serves as a securities lending agent. To the extent the Fund utilizes the Adviser as an affiliated securities lending agent, the Fund conducts its securities lending in accordance with, and in reliance upon, no-action letters issued by the SEC staff that provide guidance on how an affiliate may act as a direct agent lender and receive compensation for those services in a manner consistent with the federal securities laws. For the year ended December 31, 2024, the Fund paid the Adviser $4,387 in fees for securities lending agent services. Fees paid to the Adviser for securities lending agent services, if any, are included in Dividends from affiliated underlying funds on the Statement of Operations.
J.
Other Risks - Certain of the underlying funds are non-diversified and can invest a greater portion of their assets in the obligations or securities of a small number of issuers or any single issuer than a diversified fund can. A change in the value of one or a few issuers’ securities will therefore affect the value of an underlying fund more than would occur in a diversified fund.
Investments in ETFs generally present the same primary risks as an investment in a conventional mutual fund that has the same investment objective, strategy and policies. Investments in ETFs further involve the same risks associated with a direct investment in the types of securities, commodities and/or currencies included in the indices the ETFs are designed to replicate. In addition, shares of an ETF may trade at a market price that is higher or lower than their net asset value and an active trading market in such shares may not develop or continue. Moreover, trading of an ETF’s shares may be halted if the listing exchange’s officials deem such action to be appropriate, the shares are de-listed from the exchange, or the activation of market-wide “circuit breakers” (which are tied to large decreases in stock prices) halts stock trading generally.
NOTE 2—Advisory Fees and Other Fees Paid to Affiliates
The Trust has entered into a master investment advisory agreement with the Adviser. Under the terms of the investment advisory agreement, the Fund does not pay an advisory fee. However, the Fund pays advisory fees to the Adviser indirectly as a shareholder of the underlying funds.
Under the terms of a master sub-advisory agreement between the Adviser and each of Invesco Asset Management Deutschland GmbH, Invesco Asset Management Limited, Invesco Asset Management (Japan) Limited, Invesco Hong Kong Limited, Invesco Senior Secured Management, Inc. and Invesco Canada Ltd. (collectively, the "Affiliated Sub-Advisers") the Adviser, not the Fund, will pay 40% of the fees paid to the Adviser to any such Affiliated Sub-Adviser(s) that provide(s) discretionary investment management services to the Fund based on the percentage of assets allocated to such Affiliated Sub-Adviser(s).
The Adviser has agreed, for an indefinite period, to reimburse expenses of all shares to the extent necessary to limit total annual fund operating expenses after expense reimbursement (excluding certain items discussed below) of Class A, Class C, Class R, Class Y, Class R5 and Class R6 shares to 1.50%, 2.25%, 1.75%, 1.25%, 1.25% and 1.25%, respectively, of the Fund’s average daily net assets (the “boundary limits”). In determining the Adviser’s obligation to reimburse expenses, the following expenses are not taken into account, and could cause the total annual fund operating expenses after expense reimbursement to exceed the numbers reflected above: (1) interest; (2) taxes; (3) dividend expense on short sales; (4) extraordinary or non-routine items, including litigation expenses; and (5) expenses that the Fund has incurred but did not actually pay because of an expense offset arrangement. Acquired Fund Fees and Expenses are not operating expenses of the Fund directly, but are fees and expenses, including management fees, of the investment companies in which the Fund invests. As a result, the total annual fund operating expenses after expense reimbursement may exceed the boundary limits above. Invesco may amend and/or terminate these boundary limits at any time in its sole discretion and will inform the Board of Trustees of any such changes. The Adviser did not reimburse expenses during the period under these boundary limits.
The Trust has entered into a master administrative services agreement with Invesco pursuant to which the Fund has agreed to pay Invesco for certain administrative costs incurred in providing accounting services to the Fund. For the year ended December 31, 2024, expenses incurred under the agreement are shown in the Statement of Operations as Administrative services fees. Invesco has entered into a sub-administration agreement whereby State Street Bank and Trust Company (“SSB”) serves as fund accountant and provides certain administrative services to the Fund. Pursuant to a custody agreement with the Trust on behalf of the Fund, SSB also serves as the Fund’s custodian.
The Trust has entered into a transfer agency and service agreement with Invesco Investment Services, Inc. (“IIS”) pursuant to which the Fund has agreed to pay IIS a fee for providing transfer agency and shareholder services to the Fund and reimburse IIS for certain expenses incurred by IIS in the course of providing such services. IIS may make payments to intermediaries that provide omnibus account services, sub-accounting services and/or networking services. All fees payable by IIS to intermediaries that provide omnibus account services or sub-accounting services are charged back to the Fund, subject to certain limitations approved by the Trust’s Board of Trustees. For the year ended December 31, 2024, expenses incurred under the agreement are shown in the Statement of Operations as Transfer agent fees.
The Trust has entered into master distribution agreements with Invesco Distributors, Inc. (“IDI”) to serve as the distributor for the Class A, Class C, Class R, Class Y, Class R5 and Class R6 shares of the Fund. The Trust has adopted plans pursuant to Rule 12b-1 under the 1940 Act with respect to the Fund’s Class A, Class C and Class R shares (collectively, the “Plans”). The Fund, pursuant to the Plans, pays IDI compensation at the annual rate of 0.25% of the Fund’s average daily net assets of Class A shares, 1.00% of the average daily net assets of Class C shares and 0.50% of the average daily net assets of Class R shares. The fees are accrued daily and paid monthly. Of the Plans payments, up to 0.25% of the average daily net assets of each class of shares may be paid to furnish continuing personal shareholder services to customers who purchase and own shares of such classes. Any amounts not paid as a service fee under the Plans would constitute an asset-based sales charge. Rules of the Financial Industry Regulatory Authority (“FINRA”) impose a cap on the total sales charges, including asset-based sales charges, that may be paid by any class of shares of the Fund. For the year ended December 31, 2024, expenses incurred under the Plans are shown in the Statement of Operations as Distribution fees.
Front-end sales commissions and CDSC (collectively, the “sales charges”) are not recorded as expenses of the Fund. Front-end sales commissions are deducted from proceeds from the sales of Fund shares prior to investment in Class A shares of the Fund. CDSC are deducted from redemption proceeds prior to remittance to the shareholder. During the year ended December 31, 2024, IDI advised the Fund that IDI retained $24,121 in front-end sales commissions from the sale of Class A shares and $16,327 and $134 from Class A and Class C shares, respectively, for CDSC imposed upon redemptions by shareholders.
10
Invesco Income Allocation Fund
The underlying Invesco Funds pay no distribution fees for Class R6 shares and the Funds pay no sales loads or other similar compensation to IDI for acquiring underlying fund shares.
Certain officers and trustees of the Trust are officers and directors of the Adviser, IIS and/or IDI.
NOTE 3—Additional Valuation Information
GAAP defines fair value as the price that would be received to sell an asset or paid to transfer a liability in an orderly transaction between market participants at the measurement date, under current market conditions. GAAP establishes a hierarchy that prioritizes the inputs to valuation methods, giving the highest priority to readily available unadjusted quoted prices in an active market for identical assets (Level 1) and the lowest priority to significant unobservable inputs (Level 3), generally when market prices are not readily available. Based on the valuation inputs, the securities or other investments are tiered into one of three levels. Changes in valuation methods may result in transfers in or out of an investment’s assigned level:
Level 1 – Prices are determined using quoted prices in an active market for identical assets.
Level 2 – Prices are determined using other significant observable inputs. Observable inputs are inputs that other market participants may use in pricing a security. These may include quoted prices for similar securities, interest rates, prepayment speeds, credit risk, yield curves, loss severities, default rates, discount rates, volatilities and others. When significant events cause market movements to occur after the close of the relevant foreign securities markets, foreign securities may be fair valued utilizing an independent pricing service.
Level 3 – Prices are determined using significant unobservable inputs. In situations where quoted prices or observable inputs are unavailable (for example, when there is little or no market activity for an investment at the end of the period), unobservable inputs may be used. Unobservable inputs reflect the Adviser’s assumptions about the factors market participants would use in determining fair value of the securities or instruments and would be based on the best available information.
The following is a summary of the tiered valuation input levels, as of December 31, 2024. The level assigned to the securities valuations may not be an indication of the risk or liquidity associated with investing in those securities. Because of the inherent uncertainties of valuation, the values reflected in the financial statements may materially differ from the value received upon actual sale of those investments.
| | | | |
Investments in Securities | | | | |
| | | | |
| | | | |
| | | | |
NOTE 4—Expense Offset Arrangement(s)
The expense offset arrangement is comprised of transfer agency credits which result from balances in demand deposit accounts used by the transfer agent for clearing shareholder transactions. For the year ended December 31, 2024, the Fund received credits from this arrangement, which resulted in the reduction of the Fund’s total expenses of $5,059.
NOTE 5—Trustees’ and Officers’ Fees and Benefits
Trustees’ and Officers’ Fees and Benefits include amounts accrued by the Fund to pay remuneration to certain Trustees and Officers of the Fund. Trustees have the option to defer compensation payable by the Fund, and Trustees’ and Officers’ Fees and Benefits also include amounts accrued by the Fund to fund such deferred compensation amounts. Those Trustees who defer compensation have the option to select various Invesco Funds in which their deferral accounts shall be deemed to be invested. Finally, certain current Trustees were eligible to participate in a retirement plan that provided for benefits to be paid upon retirement to Trustees over a period of time based on the number of years of service. The Fund may have certain former Trustees who also participate in a retirement plan and receive benefits under such plan. Trustees’ and Officers’ Fees and Benefits include amounts accrued by the Fund to fund such retirement benefits. Obligations under the deferred compensation and retirement plans represent unsecured claims against the general assets of the Fund.
The Fund is permitted to temporarily carry a negative or overdrawn balance in its account with SSB, the custodian bank. Such balances, if any at period-end, are shown in the Statement of Assets and Liabilities under the payable caption Amount due custodian. To compensate the custodian bank for such overdrafts, the overdrawn Fund may either (1) leave funds as a compensating balance in the account so the custodian bank can be compensated by earning the additional interest; or (2) compensate by paying the custodian bank at a rate agreed upon by the custodian bank and Invesco, not to exceed the contractually agreed upon rate.
NOTE 7—Distributions to Shareholders and Tax Components of Net Assets
Tax Character of Distributions to Shareholders Paid During the Fiscal Years Ended December 31, 2024 and 2023: |
| | |
| | |
| Includes short-term capital gain distributions, if any. |
Tax Components of Net Assets at Period-End: |
| |
Undistributed ordinary income | |
Net unrealized appreciation — investments | |
Temporary book/tax differences | |
Capital loss carryforward | |
Shares of beneficial interest | |
| |
11
Invesco Income Allocation Fund
The difference between book-basis and tax-basis unrealized appreciation (depreciation) is due to differences in the timing of recognition of gains and losses on investments for tax and book purposes. The Fund’s net unrealized appreciation (depreciation) difference is attributable primarily to wash sales.
The temporary book/tax differences are a result of timing differences between book and tax recognition of income and/or expenses. The Fund’s temporary book/tax differences are the result of the trustee deferral of compensation and retirement plan benefits.
Capital loss carryforward is calculated and reported as of a specific date. Results of transactions and other activity after that date may affect the amount of capital loss carryforward actually available for the Fund to utilize. The ability to utilize capital loss carryforward in the future may be limited under the Internal Revenue Code and related regulations based on the results of future transactions.
The Fund has a capital loss carryforward as of December 31, 2024, as follows:
Capital Loss Carryforward* |
| | | |
Not subject to expiration | | | |
*
Capital loss carryforward is reduced for limitations, if any, to the extent required by the Internal Revenue Code and may be further limited depending upon a variety of factors, including the realization of net unrealized gains or losses as of the date of any reorganization.
NOTE 8—Investment Transactions
The aggregate amount of investment securities (other than short-term securities, U.S. Government obligations and money market funds, if any) purchased and sold by the Fund during the year ended December 31, 2024 was $301,777,070 and $352,394,238, respectively. As of December 31, 2024, the aggregate cost of investments, including any derivatives, on a tax basis listed below includes the adjustments for financial reporting purposes as of the most recently completed federal income tax reporting period-end:
Unrealized Appreciation (Depreciation) of Investments on a Tax Basis |
Aggregate unrealized appreciation of investments | |
Aggregate unrealized (depreciation) of investments | |
Net unrealized appreciation of investments | |
Cost of investments for tax purposes is $326,161,313.
NOTE 9—Reclassification of Permanent Differences
Primarily as a result of differing book/tax treatment of partnerships and distributions, on December 31, 2024, undistributed net investment income was increased by $56,537 and undistributed net realized gain (loss) was decreased by $56,537. This reclassification had no effect on the net assets or the distributable earnings (loss) of the Fund.
NOTE 10—Share Information
| Summary of Share Activity |
| | Year ended
December 31, 2023 |
| | | | |
| | | | |
| | | | |
| | | | |
| | | | |
| | | | |
| | | | |
| | | | |
Issued as reinvestment of dividends: | | | | |
| | | | |
| | | | |
| | | | |
| | | | |
| | | | |
| | | | |
Automatic conversion of Class C shares to Class A shares: | | | | |
| | | | |
| | | | |
12
Invesco Income Allocation Fund
| Summary of Share Activity |
| Year ended December 31, 2024(a) | Year ended December 31, 2023 |
| | | | |
| | | | |
| | | | |
| | | | |
| | | | |
| | | | |
| | | | |
| | | | |
Net increase (decrease) in share activity | | | | |
| There are entities that are record owners of more than 5% of the outstanding shares of the Fund and in the aggregate own 54% of the outstanding shares of the Fund. IDI has an agreement with these entities to sell Fund shares. The Fund, Invesco and/or Invesco affiliates may make payments to these entities, which are considered to be related to the Fund, for providing services to the Fund, Invesco and/or Invesco affiliates including but not limited to services such as securities brokerage, distribution, third party record keeping and account servicing. The Fund has no knowledge as to whether all or any portion of the shares owned of record by these entities are also owned beneficially. |
13
Invesco Income Allocation Fund
Report of Independent Registered Public Accounting Firm
To the Board of Trustees of AIM Growth Series (Invesco Growth Series) and Shareholders of Invesco Income Allocation Fund
Opinion on the Financial Statements
We have audited the accompanying statement of assets and liabilities, including the schedule of investments, of Invesco Income Allocation Fund (one of the funds constituting AIM Growth Series (Invesco Growth Series), referred to hereafter as the "Fund") as of December 31, 2024, the related statement of operations for the year ended December 31, 2024, the statement of changes in net assets for each of the two years in the period ended December 31, 2024, including the related notes, and the financial highlights for each of the five years in the period ended December 31, 2024 (collectively referred to as the "financial statements"). In our opinion, the financial statements present fairly, in all material respects, the financial position of the Fund as of December 31, 2024, the results of its operations for the year then ended, the changes in its net assets for each of the two years in the period ended December 31, 2024 and the financial highlights for each of the five years in the period ended December 31, 2024 in conformity with accounting principles generally accepted in the United States of America.
These financial statements are the responsibility of the Fund’s management. Our responsibility is to express an opinion on the Fund’s financial statements based on our audits. We are a public accounting firm registered with the Public Company Accounting Oversight Board (United States) (PCAOB) and are required to be independent with respect to the Fund in accordance with the U.S. federal securities laws and the applicable rules and regulations of the Securities and Exchange Commission and the PCAOB.
We conducted our audits of these financial statements in accordance with the standards of the PCAOB. Those standards require that we plan and perform the audit to obtain reasonable assurance about whether the financial statements are free of material misstatement, whether due to error or fraud.
Our audits included performing procedures to assess the risks of material misstatement of the financial statements, whether due to error or fraud, and performing procedures that respond to those risks. Such procedures included examining, on a test basis, evidence regarding the amounts and disclosures in the financial statements. Our audits also included evaluating the accounting principles used and significant estimates made by management, as well as evaluating the overall presentation of the financial statements. Our procedures included confirmation of securities owned as of December 31, 2024 by correspondence with the custodian, transfer agent and broker. We believe that our audits provide a reasonable basis for our opinion.
/s/PricewaterhouseCoopers LLP
February 20, 2025
We have served as the auditor of one or more of the investment companies in the Invesco group of investment companies since at least 1995. We have not been able to determine the specific year we began serving as auditor.
14
Invesco Income Allocation Fund
Tax Information
Form 1099-DIV, Form 1042-S and other year–end tax information provide shareholders with actual calendar year amounts that should be included in their tax returns. Shareholders should consult their tax advisers.
The following distribution information is being provided as required by the Internal Revenue Code or to meet a specific state’s requirement.
The Fund designates the following amounts or, if subsequently determined to be different, the maximum amount allowable for its fiscal year ended December 31, 2024:
Federal and State Income Tax | |
Qualified Dividend Income* | |
Corporate Dividends Received Deduction* | |
U.S. Treasury Obligations* | |
Qualified Business Income* | |
Business Interest Income* | |
*
The above percentages are based on ordinary income dividends paid to shareholders during the Fund’s fiscal year.
15
Invesco Income Allocation Fund
Other Information Required in Form N-CSR (Items 8-11)
Changes in and Disagreements with Accountants for Open-End Management Investment Companies
Proxy Disclosures for Open-End Management Investment Companies
Remuneration Paid to Directors, Officers, and Others of Open-End Management Investment Companies
The aggregate remuneration paid to directors, officers and others is disclosed within the financial statements.
Statement Regarding Basis for Approval of Investment Advisory Contracts
16
Invesco Income Allocation Fund
SEC file number(s): 811-02699 and 002-57526
Invesco Distributors, Inc.
INCAL-NCSR
Annual Financial Statements and Other InformationDecember 31, 2024
Invesco International Diversified Fund
A: OIDAX ■ C: OIDCX ■ R: OIDNX ■ Y: OIDYX ■ R5: INDFX ■ R6: OIDIX
| |
| |
| |
| Notes to Financial Statements |
| Report of Independent Registered Public Accounting Firm |
| |
| Other Information Required in Form N-CSR (Items 8-11) |
Schedule of Investments
Invesco International Diversified Fund |
Schedule of Investments in Affiliated Issuers–99.47%(a) |
| | | | | Change in
Unrealized
Appreciation
(Depreciation) | | | | |
International and Global Equity Funds–99.47% |
Invesco Developing Markets Fund, Class R6 | | | | | | | | | |
Invesco EQV International Equity Fund, Class R6 | | | | | | | | | |
Invesco International Small-Mid Company Fund, Class R6 | | | | | | | | | |
Invesco Oppenheimer International Growth Fund, Class R6 | | | | | | | | | |
TOTAL INVESTMENTS IN AFFILIATED ISSUERS (Cost $1,088,979,394) | | | | | | | | | |
OTHER ASSETS LESS LIABILITIES | | | | | | | | | |
| | | | | | | | | |
Notes to Schedule of Investments:
| Each underlying fund and the Fund are affiliated by either having the same investment adviser or an investment adviser under common control with the Fund’s investment adviser. |
| Includes capital gains distributions from affiliated underlying funds as follows: |
| |
Invesco EQV International Equity Fund | |
Invesco International Small-Mid Company Fund | |
Invesco Oppenheimer International Growth Fund | |
See accompanying Notes to Financial Statements which are an integral part of the financial statements.
2
Invesco International Diversified Fund
Statement of Assets and Liabilities
| |
Investments in affiliated underlying funds, at value
(Cost $1,088,979,394) | |
| |
| |
| |
| |
Investment for trustee deferred compensation and retirement plans | |
| |
| |
| |
| |
| |
Accrued fees to affiliates | |
Accrued trustees’ and officers’ fees and benefits | |
Accrued other operating expenses | |
Trustee deferred compensation and retirement plans | |
| |
Net assets applicable to shares outstanding | |
| |
Shares of beneficial interest | |
| |
| |
|
| |
| |
| |
| |
| |
| |
Shares outstanding, no par value, with an unlimited number of shares authorized: |
| |
| |
| |
| |
| |
| |
| |
Net asset value per share | |
Maximum offering price per share
(Net asset value of $14.98 ÷ 94.50%) | |
| |
Net asset value and offering price per share | |
| |
Net asset value and offering price per share | |
| |
Net asset value and offering price per share | |
| |
Net asset value and offering price per share | |
| |
Net asset value and offering price per share | |
See accompanying Notes to Financial Statements which are an integral part of the financial statements.
3
Invesco International Diversified Fund
Statement of Operations
For the year ended December 31, 2024
| |
Dividends from affiliated underlying funds | |
| |
| |
| |
| |
| |
| |
Transfer agent fees — A, C, R and Y | |
| |
| |
Trustees’ and officers’ fees and benefits | |
Registration and filing fees | |
| |
Professional services fees | |
| |
| |
Less: Expense offset arrangement(s) | |
| |
| |
Realized and unrealized gain (loss) from: | |
| |
Affiliated underlying fund shares | |
Capital gain distributions from affiliated underlying fund shares | |
| |
Change in net unrealized appreciation (depreciation) of affiliated underlying fund shares | |
Net realized and unrealized gain (loss) | |
Net increase (decrease) in net assets resulting from operations | |
See accompanying Notes to Financial Statements which are an integral part of the financial statements.
4
Invesco International Diversified Fund
Statement of Changes in Net Assets
For the years ended December 31, 2024 and 2023
| | |
| | |
| | |
| | |
Change in net unrealized appreciation (depreciation) | | |
Net increase (decrease) in net assets resulting from operations | | |
Distributions to shareholders from distributable earnings: | | |
| | |
| | |
| | |
| | |
| | |
| | |
Total distributions from distributable earnings | | |
| | |
| | |
| | |
| | |
| | |
| | |
| | |
Net increase (decrease) in net assets resulting from share transactions | | |
Net increase (decrease) in net assets | | |
| | |
| | |
| | |
See accompanying Notes to Financial Statements which are an integral part of the financial statements.
5
Invesco International Diversified Fund
Financial Highlights
The following schedule presents financial highlights for a share of the Fund outstanding throughout the periods indicated.
| Net asset
value,
beginning
of period | | Net gains
(losses)
on securities
(both
realized and
unrealized) | Total from
investment
operations | Dividends
from net
investment
income | Distributions
from net
realized
gains | | Net asset
value, end
of period | | Net assets,
end of period
(000’s omitted) | Ratio of
expenses
to average
net assets
with fee waivers
and/or
expenses
| Ratio of
expenses
to average net
assets without
fee waivers
and/or
expenses
absorbed
| Ratio of net
investment
income
(loss)
to average
net assets | |
|
| | | | | | | | | | | | | | |
| | | | | | | | | | | | | | |
| | | | | | | | | | | | | | |
| | | | | | | | | | | | | | |
| | | | | | | | | | | | | | |
|
| | | | | | | | | | | | | | |
| | | | | | | | | | | | | | |
| | | | | | | | | | | | | | |
| | | | | | | | | | | | | | |
| | | | | | | | | | | | | | |
|
| | | | | | | | | | | | | | |
| | | | | | | | | | | | | | |
| | | | | | | | | | | | | | |
| | | | | | | | | | | | | | |
| | | | | | | | | | | | | | |
|
| | | | | | | | | | | | | | |
| | | | | | | | | | | | | | |
| | | | | | | | | | | | | | |
| | | | | | | | | | | | | | |
| | | | | | | | | | | | | | |
|
| | | | | | | | | | | | | | |
| | | | | | | | | | | | | | |
| | | | | | | | | | | | | | |
| | | | | | | | | | | | | | |
| | | | | | | | | | | | | | |
|
| | | | | | | | | | | | | | |
| | | | | | | | | | | | | | |
| | | | | | | | | | | | | | |
| | | | | | | | | | | | | | |
| | | | | | | | | | | | | | |
| Calculated using average shares outstanding. |
| Includes adjustments in accordance with accounting principles generally accepted in the United States of America and as such, the net asset value for financial reporting purposes and the returns based upon those net asset values may differ from the net asset value and returns for shareholder transactions. Does not include sales charges and is not annualized for periods less than one year, if applicable. |
| In addition to the fees and expenses which the Fund bears directly, the Fund indirectly bears a pro rata share of the fees and expenses of the underlying funds in which the Fund invests. Because the underlying funds have varied expenses and fee levels and the Fund may own different proportions at different times, the amount of fees and expenses incurred indirectly by the Fund will vary. Estimated underlying fund expenses are not expenses that are incurred directly by the Fund. They are expenses that are incurred directly by the underlying funds and are deducted from the value of the funds the Fund invests in. The effect of the estimated underlying fund expenses that the Fund bears indirectly is included in the Fund’s total return. Estimated acquired fund fees from underlying funds were 0.87%, 0.87%, 0.83%, 0.82% and 0.81% for the years ended December 31, 2024, 2023, 2022, 2021 and 2020, respectively. |
| Portfolio turnover is calculated at the fund level and is not annualized for periods less than one year, if applicable. For the year ended ended December 31, 2020, the portfolio turnover calculation excludes the value of securities purchased of $103,226,025 and sold of $86,850,094 in the effort to realign the Fund’s portfolio holdings after the reorganization of Invesco International Allocation Fund into the Fund. |
See accompanying Notes to Financial Statements which are an integral part of the financial statements.
6
Invesco International Diversified Fund
Notes to Financial Statements
NOTE 1—Significant Accounting Policies
Invesco International Diversified Fund (the “Fund”) is a series portfolio of AIM Growth Series (Invesco Growth Series) (the “Trust”). The Trust is a Delaware statutory trust registered under the Investment Company Act of 1940, as amended (the “1940 Act”), as an open-end series management investment company authorized to issue an unlimited number of shares of beneficial interest. Information presented in these financial statements pertains only to the Fund. Matters affecting the Fund or each class will be voted on exclusively by the shareholders of the Fund or each class.
The Fund’s investment objective is to seek capital appreciation.
The Fund is a "fund of funds", in that it invests in other mutual funds ("underlying funds") advised by Invesco Advisers, Inc. (the "Adviser" or "Invesco"). The Adviser may change the Fund’s asset class allocations, the underlying funds or the target weightings in the underlying funds without shareholder approval or notice to shareholders. The underlying funds may engage in a number of investment techniques and practices, which involve certain risks. Each underlying fund’s accounting policies are outlined in the underlying fund’s financial statements and are publicly available.
The Fund currently consists of six different classes of shares: Class A, Class C, Class R, Class Y, Class R5 and Class R6. Class Y shares are available only to certain investors. Class A shares are sold with a front-end sales charge unless certain waiver criteria are met. Under certain circumstances, load waived shares may be subject to contingent deferred sales charges ("CDSC"). Class C shares are sold with a CDSC. Class R, Class Y, Class R5 and Class R6 shares are sold at net asset value. Class C shares held for eight years after purchase are eligible for automatic conversion into Class A shares of the same Fund (the "Conversion Feature"). The automatic conversion pursuant to the Conversion Feature will generally occur at the end of the month following the eighth anniversary after a purchase of Class C shares.
Effective after the close of business on September 30, 2024, Class R5 shares are closed to new investors.
The Fund is an investment company and accordingly follows the investment company accounting and reporting guidance in accordance with Financial Accounting Standards Board Accounting Standards Codification Topic 946, Financial Services – Investment Companies.
The following is a summary of the significant accounting policies followed by the Fund in the preparation of its financial statements.
A.
Security Valuations — Securities of investment companies listed or traded on an exchange are generally valued at the trade price or official closing price that day as of the close of the exchange where the security is principally traded, or lacking any trades or official closing price on a particular day, the security may be valued at the closing bid price on that day. Securities of investment companies that are not exchange-traded (e.g., open-end mutual funds) are valued using such company’s end-of-business-day net asset value per share. Securities in the underlying funds, including restricted securities, are valued in accordance with the valuation policy of such fund. The policies of the underlying funds affiliated with the Fund, as a result of having the same investment adviser, are set forth below.
A security listed or traded on an exchange is generally valued at its trade price or official closing price that day as of the close of the exchange where the security is principally traded, or lacking any trades or official closing price on a particular day, the security may be valued at the closing bid or ask price on that day. Securities traded in the over-the-counter market are valued based on prices furnished by independent pricing services or market makers. When such securities are valued using prices provided by an independent pricing service they may be considered fair valued. Futures contracts are valued at the daily settlement price set by an exchange on which they are principally traded. Where a final settlement price exists, exchange-traded options are valued at the final settlement price from the exchange where the option principally trades. Where a final settlement price does not exist, exchange-traded options are valued at the mean between the last bid and ask price generally from the exchange where the option principally trades.
Securities of investment companies that are not exchange-traded (e.g., open-end mutual funds) are valued using such company’s end-of-business-day net asset value per share.
Deposits, other obligations of U.S. and non-U.S. banks and financial institutions are valued at their daily account value.
Fixed income securities (including convertible debt securities) generally are valued on the basis of prices provided by independent pricing services. Prices provided by the pricing service may be determined without exclusive reliance on quoted prices, and may reflect appropriate factors such as institution-size trading in similar groups of securities, developments related to specific securities, dividend rate (for unlisted equities), yield (for debt obligations), quality, type of issue, coupon rate (for debt obligations), maturity (for debt obligations), individual trading characteristics and other market data. Pricing services generally value debt obligations assuming orderly transactions of institutional round lot size, but a fund may hold or transact in the same securities in smaller, odd lot sizes. Odd lots often trade at lower prices than institutional round lots, and their value may be adjusted accordingly. Debt obligations are subject to interest rate and credit risks. In addition, all debt obligations involve some risk of default with respect to interest and/or principal payments.
Foreign securities’ (including foreign exchange contracts) prices are converted into U.S. dollar amounts using the applicable exchange rates as of the close of the New York Stock Exchange (“NYSE”). If market quotations are available and reliable for foreign exchange-traded equity securities, the securities will be valued at the market quotations. The Adviser may use various pricing services to obtain market quotations as well as fair value prices. Because trading hours for certain foreign securities end before the close of the NYSE, closing market quotations may become not representative of market value in the Adviser’s judgment (“unreliable”). If, between the time trading ends on a particular security and the close of the customary trading session on the NYSE, a significant event occurs that makes the closing price of the security unreliable, the Adviser may fair value the security. If the event is likely to have affected the closing price of the security, the security will be valued at fair value in good faith in accordance with Board- approved policies and related Adviser procedures (“Valuation Procedures”). Adjustments to closing prices to reflect fair value may also be based on a screening process of an independent pricing service to indicate the degree of certainty, based on historical data, that the closing price in the principal market where a foreign security trades is not the current value as of the close of the NYSE. Foreign securities’ prices meeting the degree of certainty that the price is not reflective of current value will be priced at the indication of fair value from the independent pricing service. Multiple factors may be considered by the independent pricing service in determining adjustments to reflect fair value and may include information relating to sector indices, American Depositary Receipts and domestic and foreign index futures. Foreign securities may have additional risks including exchange rate changes, potential for sharply devalued currencies and high inflation, political and economic upheaval, the relative lack of issuer information, relatively low market liquidity and the potential lack of strict financial and accounting controls and standards.
Unlisted securities will be valued using prices provided by independent pricing services or by another method that the Adviser, in its judgment, believes better reflects the security’s fair value in accordance with the Valuation Procedures.
Non-traded rights and warrants shall be valued at intrinsic value if the terms of the rights and warrants are available, specifically the subscription or exercise price and the ratio. Intrinsic value is calculated as the daily market closing price of the security to be received less the subscription price, which is then adjusted by the exercise ratio. In the case of warrants, an option pricing model supplied by an independent pricing service may be used based on market data such as volatility, stock price and interest rate from the independent pricing service and strike price and exercise period from verified terms.
Securities for which market prices are not provided by any of the above methods may be valued based upon quotes furnished by independent sources. The mean between the last bid and ask prices may be used to value debt obligations, including corporate loans.
Securities for which market quotations are not readily available are fair valued by the Adviser in accordance with the Valuation Procedures. If a fair value price provided by a pricing service is unreliable, the Adviser will fair value the security using the Valuation Procedures. Issuer specific events, market trends, bid/ask quotes of brokers and information providers and other market data may be reviewed in the course of making a good faith determination of a security’s fair value.
7
Invesco International Diversified Fund
The Fund may invest in securities that are subject to interest rate risk, meaning the risk that the prices will generally fall as interest rates rise and, conversely, the prices will generally rise as interest rates fall. Specific securities differ in their sensitivity to changes in interest rates depending on their individual characteristics. Changes in interest rates may result in increased market volatility, which may affect the value and/or liquidity of certain Fund investments.
Valuations change in response to many factors including the historical and prospective earnings of the issuer, the value of the issuer’s assets, general market conditions which are not specifically related to the particular issuer, such as real or perceived adverse economic conditions, changes in the general outlook for revenues or corporate earnings, changes in interest or currency rates, regional or global instability, natural or environmental disasters, widespread disease or other public health issues, war, acts of terrorism, significant governmental actions or adverse investor sentiment generally and market liquidity. Because of the inherent uncertainties of valuation, the values reflected in the financial statements may materially differ from the value received upon actual sale of those investments.
The price the Fund could receive upon the sale of any investment may differ from the Adviser’s valuation of the investment, particularly for securities that are valued using a fair valuation technique. When fair valuation techniques are applied, the Adviser uses available information, including both observable and unobservable inputs and assumptions, to determine a methodology that will result in a valuation that the Adviser believes approximates market value. Fund securities that are fair valued may be subject to greater fluctuation in their value from one day to the next than would be the case if market quotations were used. Because of the inherent uncertainties of valuation, and the degree of subjectivity in such decisions, the Fund could realize a greater or lesser than expected gain or loss upon the sale of the investment.
B.
Securities Transactions and Investment Income — Securities transactions are accounted for on a trade date basis. Realized gains or losses on sales are computed on the basis of specific identification of the securities sold. Distributions from ordinary income from underlying funds, if any, are recorded as dividend income on the ex-dividend date. Distributions from gains from underlying funds, if any, are recorded as realized gains on the ex-dividend date. The following policies are followed by the underlying funds: Interest income (net of withholding tax, if any) is recorded on an accrual basis from settlement date and includes coupon interest and amortization of premium and accretion of discount on debt securities as applicable. Pay-in-kind interest income and non-cash dividend income received in the form of securities in lieu of cash are recorded at the fair value of the securities received. Paydown gains and losses on mortgage and asset-backed securities are recorded as adjustments to interest income.
The Fund may periodically participate in litigation related to the Fund’s investments. As such, the Fund may receive proceeds from litigation settlements. Any proceeds received are included in the Statement of Operations as realized gain (loss) for investments no longer held and as unrealized gain (loss) for investments still held.
The Fund allocates income and realized and unrealized capital gains and losses to a class based on the relative net assets of each class.
C.
Country Determination — For the purposes of making investment selection decisions and presentation in the Schedule of Investments, the investment adviser may determine the country in which an issuer is located and/or credit risk exposure based on various factors. These factors include the laws of the country under which the issuer is organized, where the issuer maintains a principal office, the country in which the issuer derives 50% or more of its total revenues, the country that has the primary market for the issuer’s securities and its "country of risk" as determined by a third party service provider, as well as other criteria. Among the other criteria that may be evaluated for making this determination are the country in which the issuer maintains 50% or more of its assets, the type of security, financial guarantees and enhancements, the nature of the collateral and the sponsor organization. Country of issuer and/or credit risk exposure has been determined to be the United States of America, unless otherwise noted.
D.
Distributions – Distributions from net investment income and net realized capital gain, if any, are generally declared and paid annually and recorded on the ex-dividend date. The Fund may elect to treat a portion of the proceeds from redemptions as distributions for federal income tax purposes.
E.
Federal Income Taxes – The Fund intends to comply with the requirements of Subchapter M of the Internal Revenue Code of 1986, as amended (the “Internal Revenue Code”), necessary to qualify as a regulated investment company and to distribute substantially all of the Fund’s taxable earnings to shareholders. As such, the Fund will not be subject to federal income taxes on otherwise taxable income (including net realized capital gain) that is distributed to shareholders. Therefore, no provision for federal income taxes is recorded in the financial statements.
The Fund recognizes the tax benefits of uncertain tax positions only when the position is more likely than not to be sustained. Management has analyzed the Fund’s uncertain tax positions and concluded that no liability for unrecognized tax benefits should be recorded related to uncertain tax positions. Management is not aware of any tax positions for which it is reasonably possible that the total amounts of unrecognized tax benefits will change materially in the next 12 months.
The Fund files tax returns in the U.S. Federal jurisdiction and certain other jurisdictions. Generally, the Fund is subject to examinations by such taxing authorities for up to three years after the filing of the return for the tax period.
F.
Expenses – Expenses included in the accompanying financial statements reflect the expenses of the Fund and do not include any expenses of the underlying funds. The effects of the underlying funds expenses are included in the realized and unrealized gain/loss on the investments in the underlying funds. Estimated expenses of the underlying funds are discussed further within the Financial Highlights.
Fees provided for under the Rule 12b-1 plan of a particular class of the Fund and which are directly attributable to that class are charged to the operations of such class. Transfer agency fees and expenses and other shareholder recordkeeping fees and expenses attributable to Class R5 and Class R6 are allocated based on relative net assets of Class R5 and Class R6. Transfer agency fees and expenses and other shareholder recordkeeping fees and expenses relating to all other classes are allocated among those classes based on relative net assets. All other expenses are allocated among the classes based on relative net assets.
G.
Accounting Estimates – The preparation of financial statements in conformity with accounting principles generally accepted in the United States of America (“GAAP”) requires management to make estimates and assumptions that affect the reported amounts of assets and liabilities at the date of the financial statements and the reported amounts of revenues and expenses during the reporting period including estimates and assumptions related to taxation. Actual results could differ from those estimates by a significant amount. In addition, the Fund monitors for material events or transactions that may occur or become known after the period-end date and before the date the financial statements are released to print.
H.
Indemnifications – Under the Trust’s organizational documents, each Trustee, officer, employee or other agent of the Trust is indemnified against certain liabilities that may arise out of the performance of their duties to the Fund. Additionally, in the normal course of business, the Fund enters into contracts, including the Fund’s servicing agreements, that contain a variety of indemnification clauses. The Fund’s maximum exposure under these arrangements is unknown as this would involve future claims that may be made against the Fund that have not yet occurred. The risk of material loss as a result of such indemnification claims is considered remote.
I.
Segment Reporting — In November 2023, the FASB issued Accounting Standards Update 2023-07, Segment Reporting (Topic 280): Improvements to Reportable Segment Disclosures (“ASU 2023-07”), with the intent of improving reportable segment disclosure requirements, primarily through enhanced disclosures about significant segment expenses, allowing financial statement users to better understand the components of a segment’s profit or loss and assess potential future cash flows for each reportable segment and the entity as a whole thereby enabling better understanding of how an entity’s segments impact overall performance. The Fund represents a single operating segment. Subject to the oversight and, when applicable, approval of the Board of Trustees, the Fund’s Adviser acts as the Fund’s chief operating decision maker (“CODM”), assessing performance and making decisions about resource allocation within the Fund. The CODM monitors the operating results as a whole and the Fund’s long-term strategic asset allocation is determined in accordance with the terms of its prospectus based on a defined investment strategy. The financial information provided to and reviewed by the CODM is consistent with that presented in the Fund’s financial statements. Adoption of the new standard impacted the Fund’s financial statement note disclosures only and did not affect the Fund’s financial position or the results of its operations.
J.
Other Risks - Emerging markets (also referred to as developing markets) are generally subject to greater market volatility, political, social and economic
8
Invesco International Diversified Fund
instability, uncertain trading markets and more governmental limitations on foreign investment than more developed markets. In addition, companies operating in emerging markets may be subject to lower trading volume and greater price fluctuations than companies in more developed markets. Such countries’ economies may be more dependent on relatively few industries or investors that may be highly vulnerable to local and global changes. Companies in emerging market countries generally may be subject to less stringent regulatory, disclosure, financial reporting, accounting, auditing and recordkeeping standards than companies in more developed countries. As a result, information, including financial information, about such companies may be less available and reliable, which can impede an underlying Fund’s ability to evaluate such companies. Securities law and the enforcement of systems of taxation in many emerging market countries may change quickly and unpredictably, and the ability to bring and enforce actions (including bankruptcy, confiscatory taxation, expropriation, nationalization of a company’s assets, restrictions on foreign ownership of local companies, restrictions on withdrawing assets from the country, protectionist measures and practices such as share blocking), or to obtain information needed to pursue or enforce such actions, may be limited. In addition, the ability of foreign entities to participate in privatization programs of certain developing or emerging market countries may be limited by local law. Investments in emerging market securities may be subject to additional transaction costs, delays in settlement procedures, unexpected market closures, and lack of timely information.
Investments in companies located or operating in Greater China (normally considered to be the geographical area that includes mainland China, Hong Kong, Macau and Taiwan) involve risks and considerations not typically associated with investments in the U.S. and other Western nations, such as greater government control over the economy; political, legal and regulatory uncertainty; nationalization, expropriation, or confiscation of property; lack of willingness or ability of the Chinese government to support the economies and markets of the Greater China region; difficulty in obtaining information necessary for investigations into and/or litigation against Chinese companies, as well as in obtaining and/or enforcing judgments; lack of publicly available information; limited legal remedies for shareholders; alteration or discontinuation of economic reforms; military conflicts and the risk of war, either internal or with other countries; public health emergencies resulting in market closures, travel restrictions, quarantines or other interventions; inflation, currency fluctuations and fluctuations in inflation and interest rates that may have negative effects on the economy and securities markets of Greater China; and Greater China’s dependency on the economies of other Asian countries, many of which are developing countries. Events in any one country within Greater China may impact the other countries in the region or Greater China as a whole.
The level of development of the economies of countries in the Asia Pacific region varies greatly. Furthermore, since the economies of the countries in the region are largely intertwined, if an economic recession is experienced by any of these countries, it will likely adversely impact the economic performance of other countries in the region. In addition, export growth continues to be a major driver of China’s rapid economic growth. As a result, a reduction in spending on Chinese products and services, the institution of tariffs, sanctions, capital controls, embargoes, trade wars or other trade barriers, or a downturn in any of the economies of China’s key trading partners may have an adverse impact on the Chinese economy. The current political climate has intensified concerns about a potential trade war between China and the U.S., as each country has recently imposed tariffs on the other country’s products. Further, actions by the U.S. government, such as delisting of certain Chinese companies from U.S. securities exchanges or otherwise restricting their operations in the U.S., may negatively impact the value of such securities held by the underlying Fund.
Certain securities issued by companies located or operating in Greater China, such as China A-shares, are subject to trading restrictions and suspensions, quota limitations and sudden changes in those limitations, and operational, clearing and settlement risks. Significant portions of the Chinese securities markets may become rapidly illiquid, as Chinese issuers have the ability to suspend the trading of their equity securities, and have shown a willingness to exercise that option in response to market volatility and other events. The liquidity of Chinese securities may shrink or disappear suddenly and without warning as a result of adverse economic, market or political events, or adverse investor perceptions, whether or not accurate.
NOTE 2—Advisory Fees and Other Fees Paid to Affiliates
The Trust has entered into a master investment advisory agreement with the Adviser. Under the terms of the investment advisory agreement, the Fund does not pay an advisory fee. However, the Fund pays advisory fees to the Adviser indirectly as a shareholder of the underlying funds.
Under the terms of a master sub-advisory agreement between the Adviser and each of Invesco Asset Management Deutschland GmbH, Invesco Asset Management Limited, Invesco Asset Management (Japan) Limited, Invesco Hong Kong Limited, Invesco Senior Secured Management, Inc. and Invesco Canada Ltd. and a separate sub-advisory agreement with Invesco Capital Management LLC (collectively, the "Affiliated Sub-Advisers") the Adviser, not the Fund, will pay 40% of the fees paid to the Adviser to any such Affiliated Sub-Adviser(s) that provide(s) discretionary investment management services to the Fund based on the percentage of assets allocated to such Affiliated Sub-Adviser(s). Invesco has also entered into a sub-advisory agreement with OppenheimerFunds, Inc. to provide discretionary management services to the Fund.
The Adviser has agreed, for an indefinite period, to reimburse expenses of all shares to the extent necessary to limit total annual fund operating expenses after expense reimbursement (excluding certain items discussed below) of Class A, Class C, Class R, Class Y, Class R5 and Class R6 shares to 2.25%, 3.00%, 2.50%, 2.00%, 2.00% and 2.00%, respectively, of the Fund’s average daily net assets (the “boundary limits”). In determining the Adviser’s obligation to reimburse expenses, the following expenses are not taken into account, and could cause the total annual fund operating expenses after expense reimbursement to exceed the numbers reflected above: (1) interest; (2) taxes; (3) dividend expense on short sales; (4) extraordinary or non-routine items, including litigation expenses; and (5) expenses that the Fund has incurred but did not actually pay because of an expense offset arrangement. Acquired Fund Fees and Expenses are not operating expenses of the Fund directly, but are fees and expenses, including management fees, of the investment companies in which the Fund invests. As a result, the total annual fund operating expenses after expense reimbursement may exceed the boundary limits above. Invesco may amend and/or terminate these boundary limits at any time in its sole discretion and will inform the Board of Trustees of any such changes. The Adviser did not reimburse expenses during the period under these boundary limits.
The Trust has entered into a master administrative services agreement with Invesco pursuant to which the Fund has agreed to pay Invesco for certain administrative costs incurred in providing accounting services to the Fund. For the year ended December 31, 2024, expenses incurred under the agreement are shown in the Statement of Operations as Administrative services fees. Invesco has entered into a sub-administration agreement whereby State Street Bank and Trust Company (“SSB”) serves as fund accountant and provides certain administrative services to the Fund. Pursuant to a custody agreement with the Trust on behalf of the Fund, SSB also serves as the Fund’s custodian.
The Trust has entered into a transfer agency and service agreement with Invesco Investment Services, Inc. (“IIS”) pursuant to which the Fund has agreed to pay IIS a fee for providing transfer agency and shareholder services to the Fund and reimburse IIS for certain expenses incurred by IIS in the course of providing such services. IIS may make payments to intermediaries that provide omnibus account services, sub-accounting services and/or networking services. All fees payable by IIS to intermediaries that provide omnibus account services or sub-accounting services are charged back to the Fund, subject to certain limitations approved by the Trust’s Board of Trustees. For the year ended December 31, 2024, expenses incurred under the agreement are shown in the Statement of Operations as Transfer agent fees.
The Trust has entered into master distribution agreements with Invesco Distributors, Inc. (“IDI”) to serve as the distributor for the Class A, Class C, Class R, Class Y, Class R5 and Class R6 shares of the Fund. The Trust has adopted plans pursuant to Rule 12b-1 under the 1940 Act with respect to the Fund’s Class A, Class C and Class R shares (collectively, the “Plans”). The Fund, pursuant to the Class A Plan, reimburses IDI for its allocated share of expenses incurred for the period, up to a maximum annual rate of 0.25% of the average daily net assets of Class A shares. The Fund, pursuant to the Class C and Class R Plans, pays IDI compensation at the annual rate of 1.00% of the average daily net assets of Class C shares and 0.50% of the average daily net assets of Class R shares. The fees are accrued daily and paid monthly. Of the Plans payments, up to 0.25% of the average daily net assets of each class of shares may be paid to furnish continuing personal shareholder services to customers who purchase and own shares of such classes. Any amounts not paid as a service fee under the Plans would constitute an asset-based sales charge. Rules of
9
Invesco International Diversified Fund
the Financial Industry Regulatory Authority (“FINRA”) impose a cap on the total sales charges, including asset-based sales charges, that may be paid by any class of shares of the Fund. For the year ended December 31, 2024, expenses incurred under the Plans are shown in the Statement of Operations as Distribution fees.
Front-end sales commissions and CDSC (collectively, the “sales charges”) are not recorded as expenses of the Fund. Front-end sales commissions are deducted from proceeds from the sales of Fund shares prior to investment in Class A shares of the Fund. CDSC are deducted from redemption proceeds prior to remittance to the shareholder. During the year ended December 31, 2024, IDI advised the Fund that IDI retained $59,338 in front-end sales commissions from the sale of Class A shares and $1,580 and $1,706 from Class A and Class C shares, respectively, for CDSC imposed upon redemptions by shareholders.
Certain officers and trustees of the Trust are officers and directors of the Adviser, IIS and/or IDI.
NOTE 3—Additional Valuation Information
GAAP defines fair value as the price that would be received to sell an asset or paid to transfer a liability in an orderly transaction between market participants at the measurement date, under current market conditions. GAAP establishes a hierarchy that prioritizes the inputs to valuation methods, giving the highest priority to readily available unadjusted quoted prices in an active market for identical assets (Level 1) and the lowest priority to significant unobservable inputs (Level 3), generally when market prices are not readily available. Based on the valuation inputs, the securities or other investments are tiered into one of three levels. Changes in valuation methods may result in transfers in or out of an investment’s assigned level:
Level 1 — Prices are determined using quoted prices in an active market for identical assets.
Level 2 — Prices are determined using other significant observable inputs. Observable inputs are inputs that other market participants may use in pricing a security. These may include quoted prices for similar securities, interest rates, prepayment speeds, credit risk, yield curves, loss severities, default rates, discount rates, volatilities and others. When significant events cause market movements to occur after the close of the relevant foreign securities markets, foreign securities may be fair valued utilizing an independent pricing service.
Level 3 — Prices are determined using significant unobservable inputs. In situations where quoted prices or observable inputs are unavailable (for example, when there is little or no market activity for an investment at the end of the period), unobservable inputs may be used. Unobservable inputs reflect the Adviser’s assumptions about the factors market participants would use in determining fair value of the securities or instruments and would be based on the best available information.
As of December 31, 2024, all of the securities in this Fund were valued based on Level 1 inputs (see the Schedule of Investments for security categories). The level assigned to the securities valuations may not be an indication of the risk or liquidity associated with investing in those securities. Because of the inherent uncertainties of valuation, the values reflected in the financial statements may materially differ from the value received upon actual sale of those investments.
NOTE 4—Expense Offset Arrangement(s)
The expense offset arrangement is comprised of transfer agency credits which result from balances in demand deposit accounts used by the transfer agent for clearing shareholder transactions. For the year ended December 31, 2024, the Fund received credits from this arrangement, which resulted in the reduction of the Fund’s total expenses of $77,234.
NOTE 5—Trustees’ and Officers’ Fees and Benefits
Trustees’ and Officers’ Fees and Benefits include amounts accrued by the Fund to pay remuneration to certain Trustees and Officers of the Fund. Trustees have the option to defer compensation payable by the Fund, and Trustees’ and Officers’ Fees and Benefits also include amounts accrued by the Fund to fund such deferred compensation amounts. Those Trustees who defer compensation have the option to select various Invesco Funds in which their deferral accounts shall be deemed to be invested. Finally, certain current Trustees were eligible to participate in a retirement plan that provided for benefits to be paid upon retirement to Trustees over a period of time based on the number of years of service. The Fund may have certain former Trustees who also participate in a retirement plan and receive benefits under such plan. Trustees’ and Officers’ Fees and Benefits include amounts accrued by the Fund to fund such retirement benefits. Obligations under the deferred compensation and retirement plans represent unsecured claims against the general assets of the Fund.
The Fund is permitted to temporarily carry a negative or overdrawn balance in its account with SSB, the custodian bank. Such balances, if any at period-end, are shown in the Statement of Assets and Liabilities under the payable caption Amount due custodian. To compensate the custodian bank for such overdrafts, the overdrawn Fund may either (1) leave funds as a compensating balance in the account so the custodian bank can be compensated by earning the additional interest; or (2) compensate by paying the custodian bank at a rate agreed upon by the custodian bank and Invesco, not to exceed the contractually agreed upon rate.
NOTE 7—Distributions to Shareholders and Tax Components of Net Assets
Tax Character of Distributions to Shareholders Paid During the Fiscal Years Ended December 31, 2024 and 2023: |
| | |
| | |
| | |
| | |
| Includes short-term capital gain distributions, if any. |
10
Invesco International Diversified Fund
Tax Components of Net Assets at Period-End: |
| |
Undistributed ordinary income | |
Undistributed long-term capital gain | |
Net unrealized appreciation — investments | |
Temporary book/tax differences | |
Capital loss carryforward | |
Shares of beneficial interest | |
| |
The difference between book-basis and tax-basis unrealized appreciation (depreciation) is due to differences in the timing of recognition of gains and losses on investments for tax and book purposes. The Fund’s net unrealized appreciation (depreciation) difference is attributable primarily to wash sales.
The temporary book/tax differences are a result of timing differences between book and tax recognition of income and/or expenses. The Fund’s temporary book/tax differences are the result of the trustee deferral of compensation and retirement plan benefits.
Capital loss carryforward is calculated and reported as of a specific date. Results of transactions and other activity after that date may affect the amount of capital loss carryforward actually available for the Fund to utilize. The ability to utilize capital loss carryforward in the future may be limited under the Internal Revenue Code and related regulations based on the results of future transactions.
The Fund has a capital loss carryforward as of December 31, 2024, as follows:
Capital Loss Carryforward* |
| | | |
Not subject to expiration | | | |
*
Capital loss carryforward is reduced for limitations, if any, to the extent required by the Internal Revenue Code and may be further limited depending upon a variety of factors, including the realization of net unrealized gains or losses as of the date of any reorganization.
NOTE 8—Investment Transactions
The aggregate amount of investment securities (other than short-term securities, U.S. Government obligations and money market funds, if any) purchased and sold by the Fund during the year ended December 31, 2024 was $144,787,003 and $553,596,824, respectively. As of December 31, 2024, the aggregate cost of investments, including any derivatives, on a tax basis listed below includes the adjustments for financial reporting purposes as of the most recently completed federal income tax reporting period-end:
Unrealized Appreciation (Depreciation) of Investments on a Tax Basis |
Aggregate unrealized appreciation of investments | |
Aggregate unrealized (depreciation) of investments | |
Net unrealized appreciation of investments | |
Cost of investments for tax purposes is $1,141,223,895.
NOTE 9—Reclassification of Permanent Differences
Primarily as a result of differing book/tax treatment of equalization and distributions, on December 31, 2024, undistributed net investment income was increased by $5,941,159, undistributed net realized gain was decreased by $13,725,158 and shares of beneficial interest was increased by $7,783,999. This reclassification had no effect on the net assets of the Fund.
NOTE 10—Share Information
| Summary of Share Activity |
| | Year ended
December 31, 2023 |
| | | | |
| | | | |
| | | | |
| | | | |
| | | | |
| | | | |
| | | | |
Issued as reinvestment of dividends: | | | | |
| | | | |
| | | | |
| | | | |
| | | | |
| | | | |
| | | | |
11
Invesco International Diversified Fund
| Summary of Share Activity |
| Year ended December 31, 2024(a) | Year ended December 31, 2023 |
| | | | |
Automatic conversion of Class C shares to Class A shares: | | | | |
| | | | |
| | | | |
| | | | |
| | | | |
| | | | |
| | | | |
| | | | |
| | | | |
Net increase (decrease) in share activity | | | | |
| There are entities that are record owners of more than 5% of the outstanding shares of the Fund and in the aggregate own 31% of the outstanding shares of the Fund. IDI has an agreement with these entities to sell Fund shares. The Fund, Invesco and/or Invesco affiliates may make payments to these entities, which are considered to be related to the Fund, for providing services to the Fund, Invesco and/or Invesco affiliates including but not limited to services such as securities brokerage, distribution, third party record keeping and account servicing. The Fund has no knowledge as to whether all or any portion of the shares owned of record by these entities are also owned beneficially. |
12
Invesco International Diversified Fund
Report of Independent Registered Public Accounting Firm
To the Board of Trustees of AIM Growth Series (Invesco Growth Series) and Shareholders of Invesco International Diversified Fund
Opinion on the Financial Statements
We have audited the accompanying statement of assets and liabilities, including the schedule of investments, of Invesco International Diversified Fund (one of the funds constituting AIM Growth Series (Invesco Growth Series), referred to hereafter as the "Fund") as of December 31, 2024, the related statement of operations for the year ended December 31, 2024, the statement of changes in net assets for each of the two years in the period ended December 31, 2024, including the related notes, and the financial highlights for each of the five years in the period ended December 31, 2024 (collectively referred to as the "financial statements"). In our opinion, the financial statements present fairly, in all material respects, the financial position of the Fund as of December 31, 2024, the results of its operations for the year then ended, the changes in its net assets for each of the two years in the period ended December 31, 2024 and the financial highlights for each of the five years in the period ended December 31, 2024 in conformity with accounting principles generally accepted in the United States of America.
These financial statements are the responsibility of the Fund’s management. Our responsibility is to express an opinion on the Fund’s financial statements based on our audits. We are a public accounting firm registered with the Public Company Accounting Oversight Board (United States) (PCAOB) and are required to be independent with respect to the Fund in accordance with the U.S. federal securities laws and the applicable rules and regulations of the Securities and Exchange Commission and the PCAOB.
We conducted our audits of these financial statements in accordance with the standards of the PCAOB. Those standards require that we plan and perform the audit to obtain reasonable assurance about whether the financial statements are free of material misstatement, whether due to error or fraud.
Our audits included performing procedures to assess the risks of material misstatement of the financial statements, whether due to error or fraud, and performing procedures that respond to those risks. Such procedures included examining, on a test basis, evidence regarding the amounts and disclosures in the financial statements. Our audits also included evaluating the accounting principles used and significant estimates made by management, as well as evaluating the overall presentation of the financial statements. Our procedures included confirmation of securities owned as of December 31, 2024 by correspondence with the transfer agent. We believe that our audits provide a reasonable basis for our opinion.
/s/PricewaterhouseCoopers LLP
February 20, 2025
We have served as the auditor of one or more of the investment companies in the Invesco group of investment companies since at least 1995. We have not been able to determine the specific year we began serving as auditor.
13
Invesco International Diversified Fund
Tax Information
Form 1099-DIV, Form 1042-S and other year–end tax information provide shareholders with actual calendar year amounts that should be included in their tax returns. Shareholders should consult their tax advisers.
The following distribution information is being provided as required by the Internal Revenue Code or to meet a specific state’s requirement.
The Fund designates the following amounts or, if subsequently determined to be different, the maximum amount allowable for its fiscal year ended December 31, 2024:
Federal and State Income Tax | |
Long-Term Capital Gain Distributions | |
Qualified Dividend Income* | |
Corporate Dividends Received Deduction* | |
U.S. Treasury Obligations* | |
Qualified Business Income* | |
Business Interest Income* | |
*
The above percentages are based on ordinary income dividends paid to shareholders during the Fund’s fiscal year.
14
Invesco International Diversified Fund
Other Information Required in Form N-CSR (Items 8-11)
Changes in and Disagreements with Accountants for Open-End Management Investment Companies
Proxy Disclosures for Open-End Management Investment Companies
Remuneration Paid to Directors, Officers, and Others of Open-End Management Investment Companies
The aggregate remuneration paid to directors, officers and others is disclosed within the financial statements.
Statement Regarding Basis for Approval of Investment Advisory Contracts
15
Invesco International Diversified Fund
SEC file number(s): 811-02699 and 002-57526
Invesco Distributors, Inc.
O-IDIV-NCSR
Annual Financial Statements and Other InformationDecember 31, 2024
Invesco Main Street Mid Cap Fund®
A: OPMSX ■ C: OPMCX ■ R: OPMNX ■ Y: OPMYX ■ R5: MSMJX ■ R6: OPMIX
| |
| |
| |
| Notes to Financial Statements |
| Report of Independent Registered Public Accounting Firm |
| |
| Other Information Required in Form N-CSR (Items 8-11) |
Schedule of Investments(a)
| | |
Common Stocks & Other Equity Interests–98.89% |
|
Trade Desk, Inc. (The), Class A(b) | | |
Aerospace & Defense–2.81% |
| | |
| | |
| | | |
|
Burlington Stores, Inc.(b) | | |
Application Software–6.43% |
| | |
Informatica, Inc., Class A(b)(c) | | |
Manhattan Associates, Inc.(b) | | |
| | |
Tyler Technologies, Inc.(b) | | |
Unity Software, Inc.(b)(c) | | |
| | | |
Asset Management & Custody Banks–1.04% |
Blue Owl Capital, Inc.(c) | | |
Automotive Parts & Equipment–0.66% |
| | |
|
Ascendis Pharma A/S, ADR (Denmark)(b) | | |
| | |
| | | |
|
| | |
Fortune Brands Innovations, Inc. | | |
Johnson Controls International PLC | | |
| | | |
Cargo Ground Transportation–0.85% |
J.B. Hunt Transport Services, Inc. | | |
Communications Equipment–1.38% |
| | |
Construction & Engineering–0.72% |
WillScot Holdings Corp.(b)(c) | | |
Construction Machinery & Heavy Transportation Equipment– 1.29% |
Allison Transmission Holdings, Inc. | | |
|
Discover Financial Services | | |
Consumer Staples Merchandise Retail–1.27% |
BJ’s Wholesale Club Holdings, Inc.(b)(c) | | |
Distillers & Vintners–0.74% |
Constellation Brands, Inc., Class A | | |
Diversified Financial Services–1.33% |
| | |
| | |
|
| | |
Electrical Components & Equipment–4.17% |
| | |
| | |
Rockwell Automation, Inc. | | |
Vertiv Holdings Co., Class A | | |
| | | |
Electronic Equipment & Instruments–0.99% |
Keysight Technologies, Inc.(b) | | |
Environmental & Facilities Services–0.71% |
Casella Waste Systems, Inc., Class A(b)(c) | | |
Fertilizers & Agricultural Chemicals–1.10% |
| | |
Financial Exchanges & Data–0.89% |
Cboe Global Markets, Inc. | | |
|
| | |
|
| | |
Health Care Distributors–0.83% |
| | |
Health Care Equipment–1.02% |
Zimmer Biomet Holdings, Inc. | | |
Health Care Facilities–2.13% |
| | |
Tenet Healthcare Corp.(b) | | |
| | | |
Health Care Supplies–0.98% |
Cooper Cos., Inc. (The)(b) | | |
|
| | |
| | |
| | | |
Hotels, Resorts & Cruise Lines–3.53% |
Royal Caribbean Cruises Ltd. | | |
Wyndham Hotels & Resorts, Inc. | | |
| | | |
Human Resource & Employment Services–2.13% |
| | |
Paylocity Holding Corp.(b) | | |
| | | |
Independent Power Producers & Energy Traders–1.00% |
| | |
Industrial Machinery & Supplies & Components–2.18% |
Lincoln Electric Holdings, Inc. | | |
See accompanying Notes to Financial Statements which are an integral part of the financial statements.
2
Invesco Main Street Mid Cap Fund®
| | |
Industrial Machinery & Supplies & Components–(continued) |
| | |
| | | |
|
First Industrial Realty Trust, Inc. | | |
|
Arthur J. Gallagher & Co. | | |
Interactive Media & Services–0.85% |
Pinterest, Inc., Class A(b) | | |
Internet Services & Infrastructure–1.86% |
| | |
Snowflake, Inc., Class A(b) | | |
| | | |
Investment Banking & Brokerage–1.74% |
Raymond James Financial, Inc. | | |
Life Sciences Tools & Services–1.57% |
| | |
Lonza Group AG (Switzerland) | | |
| | | |
Metal, Glass & Plastic Containers–0.85% |
| | |
Multi-Family Residential REITs–0.95% |
Mid-America Apartment Communities, Inc. | | |
Multi-line Insurance–1.40% |
American International Group, Inc. | | |
|
| | |
| | |
| | | |
Oil & Gas Exploration & Production–3.20% |
| | |
| | |
Permian Resources Corp.(c) | | |
| | | |
Oil & Gas Storage & Transportation–1.61% |
| | |
Other Specialized REITs–1.23% |
Lamar Advertising Co., Class A(c) | | |
Paper & Plastic Packaging Products & Materials–1.03% |
| | |
Personal Care Products–1.79% |
| | |
Estee Lauder Cos., Inc. (The), Class A | | |
| | | |
|
Intra-Cellular Therapies, Inc.(b) | | |
Property & Casualty Insurance–1.32% |
Hartford Financial Services Group, Inc. (The) | | |
| | |
|
Citizens Financial Group, Inc. | | |
| | |
Wintrust Financial Corp.(c) | | |
| | | |
|
Reinsurance Group of America, Inc. | | |
Research & Consulting Services–2.03% |
CACI International, Inc., Class A(b) | | |
| | |
| | | |
|
Dutch Bros, Inc., Class A(b)(c) | | |
| | |
| | | |
|
| | |
Semiconductor Materials & Equipment–0.69% |
| | |
|
| | |
| | |
Microchip Technology, Inc. | | |
| | | |
Single-Family Residential REITs–1.12% |
American Homes 4 Rent, Class A | | |
Specialty Chemicals–1.58% |
| | |
| | |
| | | |
|
| | |
|
GitLab, Inc., Class A(b)(c) | | |
Telecom Tower REITs–0.62% |
SBA Communications Corp., Class A | | |
Trading Companies & Distributors–0.48% |
| | |
Total Common Stocks & Other Equity Interests (Cost $1,841,005,158) | |
|
Invesco Government & Agency Portfolio, Institutional Class, 4.42%(d)(e) | | |
Invesco Treasury Portfolio, Institutional | | |
Total Money Market Funds (Cost $24,109,889) | |
TOTAL INVESTMENTS IN SECURITIES (excluding investments purchased with cash collateral from securities on loan)-99.84% (Cost $1,865,115,047) | | | |
See accompanying Notes to Financial Statements which are an integral part of the financial statements.
3
Invesco Main Street Mid Cap Fund®
| | |
Investments Purchased with Cash Collateral from Securities on Loan |
|
Invesco Private Government Fund, | | |
Invesco Private Prime Fund, 4.53%(d)(e)(f) | | |
Total Investments Purchased with Cash Collateral from Securities on Loan (Cost $85,990,890) | |
TOTAL INVESTMENTS IN SECURITIES–103.23% (Cost $1,951,105,937) | |
OTHER ASSETS LESS LIABILITIES—(3.23)% | |
| |
Investment Abbreviations:
| – American Depositary Receipt |
| – Real Estate Investment Trust |
Notes to Schedule of Investments:
| Industry and/or sector classifications used in this report are generally according to the Global Industry Classification Standard, which was developed by and is the exclusive property and a service mark of MSCI Inc. and Standard & Poor’s. |
| Non-income producing security. |
| All or a portion of this security was out on loan at December 31, 2024. |
| Affiliated holding. Affiliated holdings are investments in entities which are under common ownership or control of Invesco Ltd. or are investments in entities in which the Fund owns 5% or more of the outstanding voting securities. The table below shows the Fund’s transactions in, and earnings from, its investments in affiliates for the fiscal year ended December 31, 2024. |
| | | | Change in
Unrealized
Appreciation
(Depreciation) | | | |
Investments in Affiliated Money Market Funds: | | | | | | | |
Invesco Government & Agency Portfolio, Institutional Class | | | | | | | |
Invesco Liquid Assets Portfolio, Institutional Class | | | | | | | |
Invesco Treasury Portfolio, Institutional Class | | | | | | | |
Investments Purchased with Cash Collateral from Securities on Loan: | | | | | | | |
Invesco Private Government Fund | | | | | | | |
Invesco Private Prime Fund | | | | | | | |
| | | | | | | |
| Represents the income earned on the investment of cash collateral, which is included in securities lending income on the Statement of Operations. Does not include rebates and fees paid to lending agent or premiums received from borrowers, if any. |
| The rate shown is the 7-day SEC standardized yield as of December 31, 2024. |
| The security has been segregated to satisfy the commitment to return the cash collateral received in securities lending transactions upon the borrower’s return of the securities loaned. See Note 1J. |
See accompanying Notes to Financial Statements which are an integral part of the financial statements.
4
Invesco Main Street Mid Cap Fund®
Statement of Assets and Liabilities
| |
Investments in unaffiliated securities, at value
(Cost $1,841,005,158)* | |
Investments in affiliated money market funds, at value (Cost $110,100,779) | |
| |
Foreign currencies, at value (Cost $148) | |
| |
| |
| |
Investment for trustee deferred compensation and retirement plans | |
| |
| |
| |
| |
| |
Collateral upon return of securities loaned | |
Accrued fees to affiliates | |
Accrued other operating expenses | |
Trustee deferred compensation and retirement plans | |
| |
Net assets applicable to shares outstanding | |
| |
Shares of beneficial interest | |
| |
| |
|
| |
| |
| |
| |
| |
| |
Shares outstanding, no par value, with an unlimited number of shares authorized: |
| |
| |
| |
| |
| |
| |
| |
Net asset value per share | |
Maximum offering price per share
(Net asset value of $28.77 ÷ 94.50%) | |
| |
Net asset value and offering price per share | |
| |
Net asset value and offering price per share | |
| |
Net asset value and offering price per share | |
| |
Net asset value and offering price per share | |
| |
Net asset value and offering price per share | |
| At December 31, 2024, securities with an aggregate value of $81,854,745 were on loan to brokers. |
See accompanying Notes to Financial Statements which are an integral part of the financial statements.
5
Invesco Main Street Mid Cap Fund®
Statement of Operations
For the year ended December 31, 2024
| |
Dividends (net of foreign withholding taxes of $9,040) | |
Dividends from affiliated money market funds (includes net securities lending income of $506,375) | |
| |
| |
| |
Administrative services fees | |
| |
| |
| |
| |
| |
Transfer agent fees — A, C, R and Y | |
| |
| |
Trustees’ and officers’ fees and benefits | |
Registration and filing fees | |
| |
Professional services fees | |
| |
| |
Less: Fees waived and/or expense offset arrangement(s) | |
| |
| |
Realized and unrealized gain (loss) from: | |
Net realized gain (loss) from: | |
Unaffiliated investment securities | |
Affiliated investment securities | |
| |
| |
Change in net unrealized appreciation (depreciation) of: | |
Unaffiliated investment securities | |
Affiliated investment securities | |
| |
| |
Net realized and unrealized gain | |
Net increase in net assets resulting from operations | |
See accompanying Notes to Financial Statements which are an integral part of the financial statements.
6
Invesco Main Street Mid Cap Fund®
Statement of Changes in Net Assets
For the years ended December 31, 2024 and 2023
| | |
| | |
| | |
| | |
Change in net unrealized appreciation | | |
Net increase in net assets resulting from operations | | |
Distributions to shareholders from distributable earnings: | | |
| | |
| | |
| | |
| | |
| | |
| | |
Total distributions from distributable earnings | | |
| | |
| | |
| | |
| | |
| | |
| | |
| | |
Net increase (decrease) in net assets resulting from share transactions | | |
Net increase in net assets | | |
| | |
| | |
| | |
See accompanying Notes to Financial Statements which are an integral part of the financial statements.
7
Invesco Main Street Mid Cap Fund®
Financial Highlights
The following schedule presents financial highlights for a share of the Fund outstanding throughout the periods indicated.
| Net asset
value,
beginning
of period | | Net gains
(losses)
on securities
(both
realized and
unrealized) | Total from
investment
operations | Dividends
from net
investment
income | Distributions
from net
realized
gains | | Net asset
value, end
of period | | Net assets,
end of period
(000’s omitted) | Ratio of
expenses
to average
net assets
with fee waivers
and/or
expenses
absorbed | Ratio of
expenses
to average net
assets without
fee waivers
and/or
expenses
absorbed
| Ratio of net
investment
income
(loss)
to average
net assets | |
|
| | | | | | | | | | | | | | |
| | | | | | | | | | | | | | |
| | | | | | | | | | | | | | |
| | | | | | | | | | | | | | |
| | | | | | | | | | | | | | |
|
| | | | | | | | | | | | | | |
| | | | | | | | | | | | | | |
| | | | | | | | | | | | | | |
| | | | | | | | | | | | | | |
| | | | | | | | | | | | | | |
|
| | | | | | | | | | | | | | |
| | | | | | | | | | | | | | |
| | | | | | | | | | | | | | |
| | | | | | | | | | | | | | |
| | | | | | | | | | | | | | |
|
| | | | | | | | | | | | | | |
| | | | | | | | | | | | | | |
| | | | | | | | | | | | | | |
| | | | | | | | | | | | | | |
| | | | | | | | | | | | | | |
|
| | | | | | | | | | | | | | |
| | | | | | | | | | | | | | |
| | | | | | | | | | | | | | |
| | | | | | | | | | | | | | |
| | | | | | | | | | | | | | |
|
| | | | | | | | | | | | | | |
| | | | | | | | | | | | | | |
| | | | | | | | | | | | | | |
| | | | | | | | | | | | | | |
| | | | | | | | | | | | | | |
| Calculated using average shares outstanding. |
| Includes adjustments in accordance with accounting principles generally accepted in the United States of America and as such, the net asset value for financial reporting purposes and the returns based upon those net asset values may differ from the net asset value and returns for shareholder transactions. Does not include sales charges and is not annualized for periods less than one year, if applicable. |
| Portfolio turnover is calculated at the fund level and is not annualized for periods less than one year, if applicable. For the year ended December 31, 2021, the portfolio turnover calculation excludes the value of securities purchased of $96,615,194 in connection with the acquisition of Invesco Endeavor Fund into the Fund. For the year ended December 31, 2020, the portfolio turnover calculation excludes the value of securities purchased of $654,478,527 in connection with the acquisition of Invesco Mid Cap Core Equity Fund into the Fund. |
| The total return, ratio of expenses to average net assets and ratio of net investment income to average net assets reflect actual 12b-1 fees of 0.24% for the year ended December 31, 2024, 2023, 2022 and 2020, respectively. |
See accompanying Notes to Financial Statements which are an integral part of the financial statements.
8
Invesco Main Street Mid Cap Fund®
Notes to Financial Statements
NOTE 1—Significant Accounting Policies
Invesco Main Street Mid Cap Fund® (the “Fund”) is a series portfolio of AIM Growth Series (Invesco Growth Series) (the “Trust”). The Trust is a Delaware statutory trust registered under the Investment Company Act of 1940, as amended (the “1940 Act”), as an open-end series management investment company authorized to issue an unlimited number of shares of beneficial interest. Information presented in these financial statements pertains only to the Fund. Matters affecting the Fund or each class will be voted on exclusively by the shareholders of the Fund or each class.
The Fund’s investment objective is to seek capital appreciation.
The Fund currently consists of six different classes of shares: Class A, Class C, Class R, Class Y, Class R5 and Class R6. Class Y shares are available only to certain investors. Class A shares are sold with a front-end sales charge unless certain waiver criteria are met. Under certain circumstances, load waived shares may be subject to contingent deferred sales charges ("CDSC"). Class C shares are sold with a CDSC. Class R, Class Y, Class R5 and Class R6 shares are sold at net asset value. Class C shares held for eight years after purchase are eligible for automatic conversion into Class A shares of the same Fund (the "Conversion Feature"). The automatic conversion pursuant to the Conversion Feature will generally occur at the end of the month following the eighth anniversary after a purchase of Class C shares.
Effective after the close of business on September 30, 2024, Class R5 shares are closed to new investors.
The Fund is an investment company and accordingly follows the investment company accounting and reporting guidance in accordance with Financial Accounting Standards Board Accounting Standards Codification Topic 946, Financial Services – Investment Companies.
The following is a summary of the significant accounting policies followed by the Fund in the preparation of its financial statements.
A.
Security Valuations — Securities, including restricted securities, are valued according to the following policy.
A security listed or traded on an exchange is generally valued at its trade price or official closing price that day as of the close of the exchange where the security is principally traded, or lacking any trades or official closing price on a particular day, the security may be valued at the closing bid or ask price on that day. Securities traded in the over-the-counter market are valued based on prices furnished by independent pricing services or market makers. When such securities are valued using prices provided by an independent pricing service they may be considered fair valued. Futures contracts are valued at the daily settlement price set by an exchange on which they are principally traded. Where a final settlement price exists, exchange-traded options are valued at the final settlement price from the exchange where the option principally trades. Where a final settlement price does not exist, exchange-traded options are valued at the mean between the last bid and ask price generally from the exchange where the option principally trades.
Securities of investment companies that are not exchange-traded (e.g., open-end mutual funds) are valued using such company’s end-of-business-day net asset value per share.
Deposits, other obligations of U.S. and non-U.S. banks and financial institutions are valued at their daily account value.
Fixed income securities (including convertible debt securities) generally are valued on the basis of prices provided by independent pricing services. Prices provided by the pricing service may be determined without exclusive reliance on quoted prices, and may reflect appropriate factors such as institution-size trading in similar groups of securities, developments related to specific securities, dividend rate (for unlisted equities), yield (for debt obligations), quality, type of issue, coupon rate (for debt obligations), maturity (for debt obligations), individual trading characteristics and other market data. Pricing services generally value debt obligations assuming orderly transactions of institutional round lot size, but a fund may hold or transact in the same securities in smaller, odd lot sizes. Odd lots often trade at lower prices than institutional round lots, and their value may be adjusted accordingly. Debt obligations are subject to interest rate and credit risks. In addition, all debt obligations involve some risk of default with respect to interest and/or principal payments.
Foreign securities’ (including foreign exchange contracts) prices are converted into U.S. dollar amounts using the applicable exchange rates as of the close of the New York Stock Exchange (“NYSE”). If market quotations are available and reliable for foreign exchange-traded equity securities, the securities will be valued at the market quotations. Invesco Advisers, Inc. (the “Adviser” or “Invesco”) may use various pricing services to obtain market quotations as well as fair value prices. Because trading hours for certain foreign securities end before the close of the NYSE, closing market quotations may become not representative of market value in the Adviser’s judgment (“unreliable”). If, between the time trading ends on a particular security and the close of the customary trading session on the NYSE, a significant event occurs that makes the closing price of the security unreliable, the Adviser may fair value the security. If the event is likely to have affected the closing price of the security, the security will be valued at fair value in good faith in accordance with Board- approved policies and related Adviser procedures (“Valuation Procedures”). Adjustments to closing prices to reflect fair value may also be based on a screening process of an independent pricing service to indicate the degree of certainty, based on historical data, that the closing price in the principal market where a foreign security trades is not the current value as of the close of the NYSE. Foreign securities’ prices meeting the degree of certainty that the price is not reflective of current value will be priced at the indication of fair value from the independent pricing service. Multiple factors may be considered by the independent pricing service in determining adjustments to reflect fair value and may include information relating to sector indices, American Depositary Receipts and domestic and foreign index futures. Foreign securities may have additional risks including exchange rate changes, potential for sharply devalued currencies and high inflation, political and economic upheaval, the relative lack of issuer information, relatively low market liquidity and the potential lack of strict financial and accounting controls and standards.
Unlisted securities will be valued using prices provided by independent pricing services or by another method that the Adviser, in its judgment, believes better reflects the security’s fair value in accordance with the Valuation Procedures.
Non-traded rights and warrants shall be valued at intrinsic value if the terms of the rights and warrants are available, specifically the subscription or exercise price and the ratio. Intrinsic value is calculated as the daily market closing price of the security to be received less the subscription price, which is then adjusted by the exercise ratio. In the case of warrants, an option pricing model supplied by an independent pricing service may be used based on market data such as volatility, stock price and interest rate from the independent pricing service and strike price and exercise period from verified terms.
Securities for which market prices are not provided by any of the above methods may be valued based upon quotes furnished by independent sources. The mean between the last bid and ask prices may be used to value debt obligations, including corporate loans.
Securities for which market quotations are not readily available are fair valued by the Adviser in accordance with the Valuation Procedures. If a fair value price provided by a pricing service is unreliable, the Adviser will fair value the security using the Valuation Procedures. Issuer specific events, market trends, bid/ask quotes of brokers and information providers and other market data may be reviewed in the course of making a good faith determination of a security’s fair value.
The Fund may invest in securities that are subject to interest rate risk, meaning the risk that the prices will generally fall as interest rates rise and, conversely, the prices will generally rise as interest rates fall. Specific securities differ in their sensitivity to changes in interest rates depending on their individual characteristics. Changes in interest rates may result in increased market volatility, which may affect the value and/or liquidity of certain Fund investments.
Valuations change in response to many factors including the historical and prospective earnings of the issuer, the value of the issuer’s assets, general market conditions which are not specifically related to the particular issuer, such as real or perceived adverse economic conditions, changes in the general outlook for revenues or corporate earnings, changes in interest or currency rates, regional or global instability, natural or environmental disasters, widespread disease or other public health issues, war, acts of terrorism, significant governmental actions or adverse investor sentiment generally and market liquidity. Because of the inherent uncertainties of valuation, the values reflected in the financial statements may materially differ from the value received upon actual sale of those investments.
9
Invesco Main Street Mid Cap Fund®
The price the Fund could receive upon the sale of any investment may differ from the Adviser’s valuation of the investment, particularly for securities that are valued using a fair valuation technique. When fair valuation techniques are applied, the Adviser uses available information, including both observable and unobservable inputs and assumptions, to determine a methodology that will result in a valuation that the Adviser believes approximates market value. Fund securities that are fair valued may be subject to greater fluctuation in their value from one day to the next than would be the case if market quotations were used. Because of the inherent uncertainties of valuation, and the degree of subjectivity in such decisions, the Fund could realize a greater or lesser than expected gain or loss upon the sale of the investment.
B.
Securities Transactions and Investment Income – Securities transactions are accounted for on a trade date basis. Realized gains or losses on sales are computed on the basis of specific identification of the securities sold. Interest income (net of withholding tax, if any) is recorded on an accrual basis from settlement date and includes coupon interest and amortization of premium and accretion of discount on debt securities as applicable. Pay-in-kind interest income and non-cash dividend income received in the form of securities in lieu of cash are recorded at the fair value of the securities received. Dividend income (net of withholding tax, if any) is recorded on the ex-dividend date.
The Fund may periodically participate in litigation related to Fund investments. As such, the Fund may receive proceeds from litigation settlements. Any proceeds received are included in the Statement of Operations as realized gain (loss) for investments no longer held and as unrealized gain (loss) for investments still held.
Brokerage commissions and mark ups are considered transaction costs and are recorded as an increase to the cost basis of securities purchased and/or a reduction of proceeds on a sale of securities. Such transaction costs are included in the determination of net realized and unrealized gain (loss) from investment securities reported in the Statement of Operations and the Statement of Changes in Net Assets and the net realized and unrealized gains (losses) on securities per share in the Financial Highlights. Transaction costs are included in the calculation of the Fund’s net asset value and, accordingly, they reduce the Fund’s total returns. These transaction costs are not considered operating expenses and are not reflected in net investment income reported in the Statement of Operations and the Statement of Changes in Net Assets, or the net investment income per share and the ratios of expenses and net investment income reported in the Financial Highlights, nor are they limited by any expense limitation arrangements between the Fund and the investment adviser.
The Fund allocates income and realized and unrealized capital gains and losses to a class based on the relative net assets of each class.
The Fund recharacterizes distributions received from REIT investments based on information provided by the REIT into the following categories: ordinary income, long-term and short-term capital gains, and return of capital. If information is not available on a timely basis from the REIT, the recharacterization will be based on available information which may include the previous year’s allocation. If new or additional information becomes available from the REIT at a later date, a recharacterization will be made in the following year. The Fund records as dividend income the amount recharacterized as ordinary income and as realized gain the amount recharacterized as capital gain in the Statement of Operations, and the amount recharacterized as return of capital as a reduction of the cost of the related investment. These recharacterizations are reflected in the accompanying financial statements.
C.
Country Determination — For the purposes of making investment selection decisions and presentation in the Schedule of Investments, the investment adviser may determine the country in which an issuer is located and/or credit risk exposure based on various factors. These factors include the laws of the country under which the issuer is organized, where the issuer maintains a principal office, the country in which the issuer derives 50% or more of its total revenues, the country that has the primary market for the issuer’s securities and its "country of risk" as determined by a third party service provider, as well as other criteria. Among the other criteria that may be evaluated for making this determination are the country in which the issuer maintains 50% or more of its assets, the type of security, financial guarantees and enhancements, the nature of the collateral and the sponsor organization. Country of issuer and/or credit risk exposure has been determined to be the United States of America, unless otherwise noted.
D.
Distributions – Distributions from net investment income and net realized capital gain, if any, are generally declared and paid annually and recorded on the ex-dividend date. The Fund may elect to treat a portion of the proceeds from redemptions as distributions for federal income tax purposes.
E.
Federal Income Taxes – The Fund intends to comply with the requirements of Subchapter M of the Internal Revenue Code of 1986, as amended (the “Internal Revenue Code”), necessary to qualify as a regulated investment company and to distribute substantially all of the Fund’s taxable earnings to shareholders. As such, the Fund will not be subject to federal income taxes on otherwise taxable income (including net realized capital gain) that is distributed to shareholders. Therefore, no provision for federal income taxes is recorded in the financial statements.
The Fund recognizes the tax benefits of uncertain tax positions only when the position is more likely than not to be sustained. Management has analyzed the Fund’s uncertain tax positions and concluded that no liability for unrecognized tax benefits should be recorded related to uncertain tax positions. Management is not aware of any tax positions for which it is reasonably possible that the total amounts of unrecognized tax benefits will change materially in the next 12 months.
The Fund files tax returns in the U.S. Federal jurisdiction and certain other jurisdictions. Generally, the Fund is subject to examinations by such taxing authorities for up to three years after the filing of the return for the tax period.
F.
Expenses – Fees provided for under the Rule 12b-1 plan of a particular class of the Fund are charged to the operations of such class. Transfer agency fees and expenses and other shareholder recordkeeping fees and expenses attributable to Class R5 and Class R6 are allocated based on relative net assets of Class R5 and Class R6. Sub-accounting fees attributable to Class R5 are charged to the operations of the class. Transfer agency fees and expenses and other shareholder recordkeeping fees and expenses relating to all other classes are allocated among those classes based on relative net assets. All other expenses are allocated among the classes based on relative net assets.
G.
Accounting Estimates – The preparation of financial statements in conformity with accounting principles generally accepted in the United States of America (“GAAP”) requires management to make estimates and assumptions that affect the reported amounts of assets and liabilities at the date of the financial statements and the reported amounts of revenues and expenses during the reporting period including estimates and assumptions related to taxation. Actual results could differ from those estimates by a significant amount. In addition, the Fund monitors for material events or transactions that may occur or become known after the period-end date and before the date the financial statements are released to print.
H.
Indemnifications – Under the Trust’s organizational documents, each Trustee, officer, employee or other agent of the Trust is indemnified against certain liabilities that may arise out of the performance of their duties to the Fund. Additionally, in the normal course of business, the Fund enters into contracts, including the Fund’s servicing agreements, that contain a variety of indemnification clauses. The Fund’s maximum exposure under these arrangements is unknown as this would involve future claims that may be made against the Fund that have not yet occurred. The risk of material loss as a result of such indemnification claims is considered remote.
I.
Segment Reporting — In November 2023, the FASB issued Accounting Standards Update 2023-07, Segment Reporting (Topic 280): Improvements to Reportable Segment Disclosures (“ASU 2023-07”), with the intent of improving reportable segment disclosure requirements, primarily through enhanced disclosures about significant segment expenses, allowing financial statement users to better understand the components of a segment’s profit or loss and assess potential future cash flows for each reportable segment and the entity as a whole thereby enabling better understanding of how an entity’s segments impact overall performance. The Fund represents a single operating segment. Subject to the oversight and, when applicable, approval of the Board of Trustees, the Fund’s Adviser acts as the Fund’s chief operating decision maker (“CODM”), assessing performance and making decisions about resource allocation within the Fund. The CODM monitors the operating results as a whole and the Fund’s long-term strategic asset allocation is determined in accordance with the terms of its prospectus based on a defined investment strategy. The financial information provided to and reviewed by the CODM is consistent with that presented in the Fund’s financial statements. Adoption of the new standard impacted the Fund’s financial statement note disclosures only and did not affect the Fund’s financial position or the results of its operations.
J.
Securities Lending – The Fund may lend portfolio securities having a market value up to one-third of the Fund’s total assets. Such loans are secured by
10
Invesco Main Street Mid Cap Fund®
collateral equal to no less than the market value of the loaned securities determined daily by the securities lending provider. Such collateral will be cash or debt securities issued or guaranteed by the U.S. Government or any of its sponsored agencies. Cash collateral received in connection with these loans is invested in short-term money market instruments or affiliated, unregistered investment companies that comply with Rule 2a-7 under the 1940 Act and money market funds (collectively, "affiliated money market funds") and is shown as such on the Schedule of Investments. The Fund bears the risk of loss with respect to the investment of collateral. It is the Fund’s policy to obtain additional collateral from or return excess collateral to the borrower by the end of the next business day, following the valuation date of the securities loaned. Therefore, the value of the collateral held may be temporarily less than the value of the securities on loan. When loaning securities, the Fund retains certain benefits of owning the securities, including the economic equivalent of dividends or interest generated by the security. Lending securities entails a risk of loss to the Fund if, and to the extent that, the market value of the securities loaned were to increase and the borrower did not increase the collateral accordingly, and the borrower failed to return the securities. The securities loaned are subject to termination at the option of the borrower or the Fund. Upon termination, the borrower will return to the Fund the securities loaned and the Fund will return the collateral. Upon the failure of the borrower to return the securities, collateral may be liquidated and the securities may be purchased on the open market to replace the loaned securities. The Fund could experience delays and costs in gaining access to the collateral and the securities may lose value during the delay which could result in potential losses to the Fund. Some of these losses may be indemnified by the lending agent. The Fund bears the risk of any deficiency in the amount of the collateral available for return to the borrower due to any loss on the collateral invested. Dividends received on cash collateral investments for securities lending transactions, which are net of compensation to counterparties, are included in Dividends from affiliated money market funds on the Statement of Operations. The aggregate value of securities out on loan, if any, is shown as a footnote on the Statement of Assets and Liabilities.
The Adviser serves as an affiliated securities lending agent for the Fund. The Bank of New York Mellon also serves as a securities lending agent. To the extent the Fund utilizes the Adviser as an affiliated securities lending agent, the Fund conducts its securities lending in accordance with, and in reliance upon, no-action letters issued by the SEC staff that provide guidance on how an affiliate may act as a direct agent lender and receive compensation for those services in a manner consistent with the federal securities laws. For the year ended December 31, 2024, the Fund paid the Adviser $41,164 in fees for securities lending agent services. Fees paid to the Adviser for securities lending agent services, if any, are included in Dividends from affiliated money market funds on the Statement of Operations.
K.
Foreign Currency Translations — Foreign currency is valued at the close of the NYSE based on quotations posted by banks and major currency dealers. Portfolio securities and other assets and liabilities denominated in foreign currencies are translated into U.S. dollar amounts at the date of valuation. Purchases and sales of portfolio securities (net of foreign taxes withheld on disposition) and income items denominated in foreign currencies are translated into U.S. dollar amounts on the respective dates of such transactions. The Fund does not separately account for the portion of the results of operations resulting from changes in foreign exchange rates on investments and the fluctuations arising from changes in market prices of securities held. The combined results of changes in foreign exchange rates and the fluctuation of market prices on investments (net of estimated foreign tax withholding) are included with the net realized and unrealized gain or loss from investments in the Statement of Operations. Reported net realized foreign currency gains or losses arise from (1) sales of foreign currencies, (2) currency gains or losses realized between the trade and settlement dates on securities transactions, and (3) the difference between the amounts of dividends, interest, and foreign withholding taxes recorded on the Fund’s books and the U.S. dollar equivalent of the amounts actually received or paid. Net unrealized foreign currency gains and losses arise from changes in the fair values of assets and liabilities, other than investments in securities at fiscal period end, resulting from changes in exchange rates.
The Fund may invest in foreign securities, which may be subject to foreign taxes on income, gains on investments or currency repatriation, a portion of which may be recoverable. Foreign taxes, if any, are recorded based on the tax regulations and rates that exist in the foreign markets in which the Fund invests and are shown in the Statement of Operations.
The performance of the Fund may be materially affected positively or negatively by foreign currency strength or weakness relative to the U.S. dollar. Currency rates in foreign countries may fluctuate for a number of reasons, including changes in interest rates, political, economic, or social instability and development, and imposition of currency controls. Currency controls in certain foreign jurisdictions may cause the Fund to experience significant delays in its ability to repatriate its assets in U.S. dollars at quoted spot rates, and it is possible that the Fund’s ability to convert certain foreign currencies into U.S. dollars may be limited and may occur at discounts to quoted rates. As a result, the value of the Fund’s assets and liabilities denominated in such currencies that would ultimately be realized could differ from those reported on the Statement of Assets and Liabilities. Certain foreign companies may be subject to sanctions, embargoes, or other governmental actions that may limit the ability to invest in, receive, hold, or sell the securities of such companies, all of which affect the market and/or credit risk of the investments. Because of the inherent uncertainties of valuation, the values reflected in the financial statements may materially differ from the value received upon actual sale of those investments.
L.
Forward Foreign Currency Contracts — The Fund may engage in foreign currency transactions either on a spot (i.e. for prompt delivery and settlement) basis, or through forward foreign currency contracts, to manage or minimize currency or exchange rate risk.
The Fund may also enter into forward foreign currency contracts for the purchase or sale of a security denominated in a foreign currency in order to “lock in” the U.S. dollar price of that security, or the Fund may also enter into forward foreign currency contracts that do not provide for physical exchange of the two currencies on the settlement date, but instead are settled by a single cash payment calculated as the difference between the agreed upon exchange rate and the spot rate at settlement based upon an agreed upon notional amount (non-deliverable forwards).
A forward foreign currency contract is an obligation between two parties (“Counterparties”) to purchase or sell a specific currency for an agreed-upon price at a future date. The use of forward foreign currency contracts for hedging does not eliminate fluctuations in the price of the underlying securities the Fund owns or intends to acquire but establishes a rate of exchange in advance. Fluctuations in the value of these contracts are measured by the difference in the contract date and reporting date exchange rates and are recorded as unrealized appreciation (depreciation) until the contracts are closed. When the contracts are closed, realized gains (losses) are recorded. Realized and unrealized gains (losses) on the contracts are included in the Statement of Operations. The primary risks associated with forward foreign currency contracts include failure of the Counterparty to meet the terms of the contract and the value of the foreign currency changing unfavorably. These risks may be in excess of the amounts reflected in the Statement of Assets and Liabilities.
11
Invesco Main Street Mid Cap Fund®
NOTE 2—Advisory Fees and Other Fees Paid to Affiliates
The Trust has entered into a master investment advisory agreement with the Adviser. Under the terms of the investment advisory agreement, the Fund accrues daily and pays monthly an advisory fee to the Adviser based on the annual rate of the Fund’s average daily net assets as follows:
| The advisory fee paid by the Fund shall be reduced by any amounts paid by the Fund under the administrative services agreement with the Adviser. |
For the year ended December 31, 2024, the effective advisory fee rate incurred by the Fund was 0.62%.
Under the terms of a master sub-advisory agreement between the Adviser and each of Invesco Asset Management Deutschland GmbH, Invesco Asset Management Limited, Invesco Asset Management (Japan) Limited, Invesco Hong Kong Limited, Invesco Senior Secured Management, Inc. and Invesco Canada Ltd. and a separate sub-advisory agreement with Invesco Capital Management LLC (collectively, the "Affiliated Sub-Advisers") the Adviser, not the Fund, will pay 40% of the fees paid to the Adviser to any such Affiliated Sub-Adviser(s) that provide(s) discretionary investment management services to the Fund based on the percentage of assets allocated to such Affiliated Sub-Adviser(s). Invesco has also entered into a sub-advisory agreement with OppenheimerFunds, Inc. to provide discretionary management services to the Fund.
The Adviser has agreed, for an indefinite period, to waive advisory fees and/or reimburse expenses of all shares to the extent necessary to limit total annual fund operating expenses after fee waiver and/or expense reimbursement (excluding certain items discussed below) of Class A, Class C, Class R, Class Y, Class R5 and Class R6 shares to 2.00%, 2.75%, 2.25%, 1.75%, 1.75% and 1.75%, respectively, of the Fund’s average daily net assets (the “boundary limits”). In determining the Adviser’s obligation to waive advisory fees and/or reimburse expenses, the following expenses are not taken into account, and could cause the total annual fund operating expenses after fee waiver and/or expense reimbursement to exceed the numbers reflected above: (1) interest; (2) taxes; (3) dividend expense on short sales; (4) extraordinary or non-routine items, including litigation expenses; and (5) expenses that the Fund has incurred but did not actually pay because of an expense offset arrangement. Invesco may amend and/or terminate these boundary limits at any time in its sole discretion and will inform the Board of Trustees of any such changes. The Adviser did not waive fees and/or reimburse expenses during the period under these boundary limits.
Further, the Adviser has contractually agreed, through at least August 31, 2026, to waive the advisory fee payable by the Fund in an amount equal to 100% of the net advisory fees the Adviser receives from the affiliated money market funds on investments by the Fund of uninvested cash (excluding investments of cash collateral from securities lending) in such affiliated money market funds.
For the year ended December 31, 2024, the Adviser waived advisory fees of $18,320.
The Trust has entered into a master administrative services agreement with Invesco pursuant to which the Fund has agreed to pay Invesco for certain administrative costs incurred in providing accounting services to the Fund. For the year ended December 31, 2024, expenses incurred under the agreement are shown in the Statement of Operations as Administrative services fees. Invesco has entered into a sub-administration agreement whereby State Street Bank and Trust Company (“SSB”) serves as fund accountant and provides certain administrative services to the Fund. Pursuant to a custody agreement with the Trust on behalf of the Fund, SSB also serves as the Fund’s custodian.
The Trust has entered into a transfer agency and service agreement with Invesco Investment Services, Inc. (“IIS”) pursuant to which the Fund has agreed to pay IIS a fee for providing transfer agency and shareholder services to the Fund and reimburse IIS for certain expenses incurred by IIS in the course of providing such services. IIS may make payments to intermediaries that provide omnibus account services, sub-accounting services and/or networking services. All fees payable by IIS to intermediaries that provide omnibus account services or sub-accounting services are charged back to the Fund, subject to certain limitations approved by the Trust’s Board of Trustees. For the year ended December 31, 2024, expenses incurred under the agreement are shown in the Statement of Operations as Transfer agent fees.
The Trust has entered into master distribution agreements with Invesco Distributors, Inc. (“IDI”) to serve as the distributor for the Class A, Class C, Class R, Class Y, Class R5 and Class R6 shares of the Fund. The Trust has adopted plans pursuant to Rule 12b-1 under the 1940 Act with respect to the Fund’s Class A, Class C and Class R shares (collectively, the “Plans”). The Fund, pursuant to the Class A Plan, reimburses IDI for its allocated share of expenses incurred for the period, up to a maximum annual rate of 0.25% of the average daily net assets of Class A shares. The Fund, pursuant to the Class C and Class R Plans, pays IDI compensation at the annual rate of 1.00% of the average daily net assets of Class C shares and 0.50% of the average daily net assets of Class R shares. The fees are accrued daily and paid monthly. Of the Plans payments, up to 0.25% of the average daily net assets of each class of shares may be paid to furnish continuing personal shareholder services to customers who purchase and own shares of such classes. Any amounts not paid as a service fee under the Plans would constitute an asset-based sales charge. Rules of the Financial Industry Regulatory Authority (“FINRA”) impose a cap on the total sales charges, including asset-based sales charges, that may be paid by any class of shares of the Fund. For the year ended December 31, 2024, expenses incurred under the Plans are shown in the Statement of Operations as Distribution fees.
Front-end sales commissions and CDSC (collectively, the “sales charges”) are not recorded as expenses of the Fund. Front-end sales commissions are deducted from proceeds from the sales of Fund shares prior to investment in Class A shares of the Fund. CDSC are deducted from redemption proceeds prior to remittance to the shareholder. During the year ended December 31, 2024, IDI advised the Fund that IDI retained $106,591 in front-end sales commissions from the sale of Class A shares and $416 and $1,357 from Class A and Class C shares, respectively, for CDSC imposed upon redemptions by shareholders.
For the year ended December 31, 2024, the Fund incurred $59,314 in brokerage commissions with Invesco Capital Markets, Inc., an affiliate of the Adviser and IDI, for portfolio transactions executed on behalf of the Fund.
Certain officers and trustees of the Trust are officers and directors of the Adviser, IIS and/or IDI.
NOTE 3—Additional Valuation Information
GAAP defines fair value as the price that would be received to sell an asset or paid to transfer a liability in an orderly transaction between market participants at the measurement date, under current market conditions. GAAP establishes a hierarchy that prioritizes the inputs to valuation methods, giving the highest priority to readily available unadjusted quoted prices in an active market for identical assets (Level 1) and the lowest priority to significant unobservable inputs (Level 3), generally when market prices are not readily available. Based on the valuation inputs, the securities or other investments are tiered into one of three levels. Changes in valuation methods may result in transfers in or out of an investment’s assigned level:
Level 1 – Prices are determined using quoted prices in an active market for identical assets.
Level 2 – Prices are determined using other significant observable inputs. Observable inputs are inputs that other market participants may use in pricing a security. These may include quoted prices for similar securities, interest rates, prepayment speeds, credit risk, yield curves, loss severities, default rates, discount rates, volatilities and others. When significant events cause market movements to occur after the close of the relevant foreign securities markets, foreign securities may be fair valued utilizing an independent pricing service.
12
Invesco Main Street Mid Cap Fund®
Level 3 – Prices are determined using significant unobservable inputs. In situations where quoted prices or observable inputs are unavailable (for example, when there is little or no market activity for an investment at the end of the period), unobservable inputs may be used. Unobservable inputs reflect the Adviser’s assumptions about the factors market participants would use in determining fair value of the securities or instruments and would be based on the best available information.
The following is a summary of the tiered valuation input levels, as of December 31, 2024. The level assigned to the securities valuations may not be an indication of the risk or liquidity associated with investing in those securities. Because of the inherent uncertainties of valuation, the values reflected in the financial statements may materially differ from the value received upon actual sale of those investments.
| | | | |
Investments in Securities | | | | |
Common Stocks & Other Equity Interests | | | | |
| | | | |
| | | | |
NOTE 4—Expense Offset Arrangement(s)
The expense offset arrangement is comprised of transfer agency credits which result from balances in demand deposit accounts used by the transfer agent for clearing shareholder transactions. For the year ended December 31, 2024, the Fund received credits from this arrangement, which resulted in the reduction of the Fund’s total expenses of $120,575.
NOTE 5—Trustees’ and Officers’ Fees and Benefits
Trustees’ and Officers’ Fees and Benefits include amounts accrued by the Fund to pay remuneration to certain Trustees and Officers of the Fund. Trustees have the option to defer compensation payable by the Fund, and Trustees’ and Officers’ Fees and Benefits also include amounts accrued by the Fund to fund such deferred compensation amounts. Those Trustees who defer compensation have the option to select various Invesco Funds in which their deferral accounts shall be deemed to be invested. Finally, certain current Trustees were eligible to participate in a retirement plan that provided for benefits to be paid upon retirement to Trustees over a period of time based on the number of years of service. The Fund may have certain former Trustees who also participate in a retirement plan and receive benefits under such plan. Trustees’ and Officers’ Fees and Benefits include amounts accrued by the Fund to fund such retirement benefits. Obligations under the deferred compensation and retirement plans represent unsecured claims against the general assets of the Fund.
The Fund is permitted to temporarily carry a negative or overdrawn balance in its account with SSB, the custodian bank. Such balances, if any at period-end, are shown in the Statement of Assets and Liabilities under the payable caption Amount due custodian. To compensate the custodian bank for such overdrafts, the overdrawn Fund may either (1) leave funds as a compensating balance in the account so the custodian bank can be compensated by earning the additional interest; or (2) compensate by paying the custodian bank at a rate agreed upon by the custodian bank and Invesco, not to exceed the contractually agreed upon rate.
NOTE 7—Distributions to Shareholders and Tax Components of Net Assets
Tax Character of Distributions to Shareholders Paid During the Fiscal Years Ended December 31, 2024 and 2023: |
| | |
| | |
| | |
| | |
| Includes short-term capital gain distributions, if any. |
Tax Components of Net Assets at Period-End: |
| |
Undistributed ordinary income | |
Undistributed long-term capital gain | |
Net unrealized appreciation — investments | |
Net unrealized appreciation (depreciation) — foreign currencies | |
Temporary book/tax differences | |
Shares of beneficial interest | |
| |
The difference between book-basis and tax-basis unrealized appreciation (depreciation) is due to differences in the timing of recognition of gains and losses on investments for tax and book purposes. The Fund’s net unrealized appreciation (depreciation) difference is attributable primarily to wash sales.
The temporary book/tax differences are a result of timing differences between book and tax recognition of income and/or expenses. The Fund’s temporary book/tax differences are the result of the trustee deferral of compensation and retirement plan benefits.
Capital loss carryforward is calculated and reported as of a specific date. Results of transactions and other activity after that date may affect the amount of capital loss carryforward actually available for the Fund to utilize. The ability to utilize capital loss carryforward in the future may be limited under the Internal Revenue Code and related regulations based on the results of future transactions.
The Fund does not have a capital loss carryforward as of December 31, 2024.
13
Invesco Main Street Mid Cap Fund®
NOTE 8—Investment Transactions
The aggregate amount of investment securities (other than short-term securities, U.S. Government obligations and money market funds, if any) purchased and sold by the Fund during the year ended December 31, 2024 was $1,003,294,855 and $1,259,248,085, respectively. As of December 31, 2024, the aggregate cost of investments, including any derivatives, on a tax basis listed below includes the adjustments for financial reporting purposes as of the most recently completed federal income tax reporting period-end:
Unrealized Appreciation (Depreciation) of Investments on a Tax Basis |
Aggregate unrealized appreciation of investments | |
Aggregate unrealized (depreciation) of investments | |
Net unrealized appreciation of investments | |
Cost of investments for tax purposes is $1,951,308,384.
NOTE 9—Reclassification of Permanent Differences
Primarily as a result of differing book/tax treatment of equalization, on December 31, 2024, undistributed net investment income was increased by $123, undistributed net realized gain was decreased by $10,137,123 and shares of beneficial interest was increased by $10,137,000. This reclassification had no effect on the net assets of the Fund.
NOTE 10—Share Information
| Summary of Share Activity |
| | Year ended
December 31, 2023 |
| | | | |
| | | | |
| | | | |
| | | | |
| | | | |
| | | | |
| | | | |
| | | | |
Issued as reinvestment of dividends: | | | | |
| | | | |
| | | | |
| | | | |
| | | | |
| | | | |
| | | | |
Automatic conversion of Class C shares to Class A shares: | | | | |
| | | | |
| | | | |
| | | | |
| | | | |
| | | | |
| | | | |
| | | | |
| | | | |
| | | | |
Net increase (decrease) in share activity | | | | |
| There are entities that are record owners of more than 5% of the outstanding shares of the Fund and in the aggregate own 18% of the outstanding shares of the Fund. IDI has an agreement with these entities to sell Fund shares. The Fund, Invesco and/or Invesco affiliates may make payments to these entities, which are considered to be related to the Fund, for providing services to the Fund, Invesco and/or Invesco affiliates including but not limited to services such as securities brokerage, distribution, third party record keeping and account servicing. The Fund has no knowledge as to whether all or any portion of the shares owned of record by these entities are also owned beneficially. |
14
Invesco Main Street Mid Cap Fund®
Report of Independent Registered Public Accounting Firm
To the Board of Trustees of AIM Growth Series (Invesco Growth Series) and Shareholders of Invesco Main Street Mid Cap Fund®
Opinion on the Financial Statements
We have audited the accompanying statement of assets and liabilities, including the schedule of investments, of Invesco Main Street Mid Cap Fund® (one of the funds constituting AIM Growth Series (Invesco Growth Series), referred to hereafter as the "Fund") as of December 31, 2024, the related statement of operations for the year ended December 31, 2024, the statement of changes in net assets for each of the two years in the period ended December 31, 2024, including the related notes, and the financial highlights for each of the five years in the period ended December 31, 2024 (collectively referred to as the "financial statements"). In our opinion, the financial statements present fairly, in all material respects, the financial position of the Fund as of December 31, 2024, the results of its operations for the year then ended, the changes in its net assets for each of the two years in the period ended December 31, 2024 and the financial highlights for each of the five years in the period ended December 31, 2024 in conformity with accounting principles generally accepted in the United States of America.
These financial statements are the responsibility of the Fund’s management. Our responsibility is to express an opinion on the Fund’s financial statements based on our audits. We are a public accounting firm registered with the Public Company Accounting Oversight Board (United States) (PCAOB) and are required to be independent with respect to the Fund in accordance with the U.S. federal securities laws and the applicable rules and regulations of the Securities and Exchange Commission and the PCAOB.
We conducted our audits of these financial statements in accordance with the standards of the PCAOB. Those standards require that we plan and perform the audit to obtain reasonable assurance about whether the financial statements are free of material misstatement, whether due to error or fraud.
Our audits included performing procedures to assess the risks of material misstatement of the financial statements, whether due to error or fraud, and performing procedures that respond to those risks. Such procedures included examining, on a test basis, evidence regarding the amounts and disclosures in the financial statements. Our audits also included evaluating the accounting principles used and significant estimates made by management, as well as evaluating the overall presentation of the financial statements. Our procedures included confirmation of securities owned as of December 31, 2024 by correspondence with the custodian, transfer agent and broker. We believe that our audits provide a reasonable basis for our opinion.
/s/PricewaterhouseCoopers LLP
February 20, 2025
We have served as the auditor of one or more of the investment companies in the Invesco group of investment companies since at least 1995. We have not been able to determine the specific year we began serving as auditor.
15
Invesco Main Street Mid Cap Fund®
Tax Information
Form 1099-DIV, Form 1042-S and other year–end tax information provide shareholders with actual calendar year amounts that should be included in their tax returns. Shareholders should consult their tax advisers.
The following distribution information is being provided as required by the Internal Revenue Code or to meet a specific state’s requirement.
The Fund designates the following amounts or, if subsequently determined to be different, the maximum amount allowable for its fiscal year ended December 31, 2024:
Federal and State Income Tax | |
Long-Term Capital Gain Distributions | |
Qualified Dividend Income* | |
Corporate Dividends Received Deduction* | |
U.S. Treasury Obligations* | |
Qualified Business Income* | |
Business Interest Income* | |
*
The above percentages are based on ordinary income dividends paid to shareholders during the Fund’s fiscal year.
Non-Resident Alien Shareholders | |
Short-Term Capital Gain Distributions | |
16
Invesco Main Street Mid Cap Fund®
Other Information Required in Form N-CSR (Items 8-11)
Changes in and Disagreements with Accountants for Open-End Management Investment Companies
Proxy Disclosures for Open-End Management Investment Companies
Remuneration Paid to Directors, Officers, and Others of Open-End Management Investment Companies
The aggregate remuneration paid to directors, officers and others is disclosed within the financial statements.
Statement Regarding Basis for Approval of Investment Advisory Contracts
17
Invesco Main Street Mid Cap Fund®
SEC file number(s): 811-02699 and 002-57526
Invesco Distributors, Inc.
O-MSM-NCSR
Annual Financial Statements and Other InformationDecember 31, 2024
Invesco Main Street Small Cap Fund®
A: OSCAX ■ C: OSCCX ■ R: OSCNX ■ Y: OSCYX ■ R5: MNSQX ■ R6: OSSIX
| |
| |
| |
| Notes to Financial Statements |
| Report of Independent Registered Public Accounting Firm |
| |
| Other Information Required in Form N-CSR (Items 8-11) |
Schedule of Investments(a)
| | |
Common Stocks & Other Equity Interests–98.85% |
Aerospace & Defense–0.92% |
| | |
Air Freight & Logistics–1.43% |
| | |
|
| | |
| | |
| | | |
Application Software–2.69% |
Informatica, Inc., Class A(b) | | |
MARA Holdings, Inc.(b)(c) | | |
| | |
Unity Software, Inc.(b)(c) | | |
| | | |
Asset Management & Custody Banks–1.90% |
DigitalBridge Group, Inc. | | |
Federated Hermes, Inc., Class B | | |
| | | |
Automotive Parts & Equipment–2.50% |
| | |
| | |
| | | |
|
| | |
|
| | |
Ascendis Pharma A/S, ADR (Denmark)(b) | | |
BridgeBio Pharma, Inc.(b) | | |
| | |
Merus N.V. (Netherlands)(b) | | |
Twist Bioscience Corp.(b) | | |
Ultragenyx Pharmaceutical, Inc.(b) | | |
| | | |
|
Hayward Holdings, Inc.(b) | | |
Zurn Elkay Water Solutions Corp.(c) | | |
| | | |
Commercial & Residential Mortgage Finance–1.59% |
PennyMac Financial Services, Inc. | | |
Construction & Engineering–0.75% |
WillScot Holdings Corp.(b) | | |
Construction Machinery & Heavy Transportation Equipment– 3.24% |
Allison Transmission Holdings, Inc. | | |
Atmus Filtration Technologies, Inc. | | |
| | |
| | | |
| | |
Construction Materials–1.77% |
Summit Materials, Inc., Class A(b) | | |
|
Bank of N.T. Butterfield & Son Ltd. (The) (Bermuda) | | |
|
Essential Properties Realty Trust, Inc. | | |
|
| | |
|
Portland General Electric Co. | | |
Electrical Components & Equipment–1.51% |
| | |
| | |
| | | |
Electronic Components–2.02% |
| | |
Vishay Intertechnology, Inc.(c) | | |
| | | |
Electronic Equipment & Instruments–1.58% |
| | |
Environmental & Facilities Services–2.65% |
| | |
Casella Waste Systems, Inc., Class A(b) | | |
| | | |
|
| | |
|
Chesapeake Utilities Corp. | | |
Health Care Equipment–2.35% |
Inspire Medical Systems, Inc.(b)(c) | | |
Integer Holdings Corp.(b)(c) | | |
TransMedics Group, Inc.(b)(c) | | |
| | | |
Health Care Facilities–1.44% |
| | |
Surgery Partners, Inc.(b)(c) | | |
| | | |
Health Care Services–2.14% |
| | |
BrightSpring Health Services, Inc.(b)(c) | | |
Guardant Health, Inc.(b)(c) | | |
| | | |
|
| | |
Hotel & Resort REITs–1.54% |
DiamondRock Hospitality Co. | | |
See accompanying Notes to Financial Statements which are an integral part of the financial statements.
2
Invesco Main Street Small Cap Fund®
| | |
Human Resource & Employment Services–3.22% |
| | |
| | |
| | |
| | | |
Industrial Machinery & Supplies & Components–4.07% |
| | |
| | |
Gates Industrial Corp. PLC(b) | | |
| | | |
|
| | |
Investment Banking & Brokerage–1.39% |
| | |
| | |
| | | |
IT Consulting & Other Services–1.04% |
| | |
Life Sciences Tools & Services–1.62% |
BioLife Solutions, Inc.(b)(c) | | |
| | |
| | | |
Metal, Glass & Plastic Containers–1.25% |
| | |
|
| | |
Oil & Gas Exploration & Production–3.59% |
| | |
CNX Resources Corp.(b)(c) | | |
Northern Oil and Gas, Inc.(c) | | |
| | | |
Other Specialized REITs–2.83% |
Four Corners Property Trust, Inc.(c) | | |
| | |
| | | |
Personal Care Products–1.32% |
| | |
|
Collegium Pharmaceutical, Inc.(b)(c) | | |
Intra-Cellular Therapies, Inc.(b) | | |
Structure Therapeutics, Inc., ADR(b)(c) | | |
| | | |
Property & Casualty Insurance–1.79% |
Definity Financial Corp. (Canada) | | |
Skyward Specialty Insurance Group, | | |
| | | |
|
Berkshire Hills Bancorp, Inc. | | |
| | |
Columbia Banking System, Inc. | | |
| | |
Regional Banks–(continued) |
OceanFirst Financial Corp. | | |
Pacific Premier Bancorp, Inc. | | |
United Community Banks, Inc. | | |
| | |
| | |
| | |
| | | |
Research & Consulting Services–0.77% |
CACI International, Inc., Class A(b) | | |
|
Dutch Bros, Inc., Class A(b) | | |
| | |
| | | |
Semiconductor Materials & Equipment–0.99% |
| | |
|
Allegro MicroSystems, Inc.(b)(c) | | |
Lattice Semiconductor Corp.(b)(c) | | |
MACOM Technology Solutions Holdings, | | |
Silicon Laboratories, Inc.(b)(c) | | |
| | | |
|
| | |
| | |
| | | |
|
| | |
Progress Software Corp.(c) | | |
| | | |
Trading Companies & Distributors–0.94% |
| | |
Transaction & Payment Processing Services–0.41% |
Marqeta, Inc., Class A(b) | | |
Total Common Stocks & Other Equity Interests (Cost $1,491,642,999) | |
|
Invesco Government & Agency Portfolio, Institutional Class, 4.42%(d)(e) | | |
Invesco Treasury Portfolio, Institutional | | |
Total Money Market Funds (Cost $21,302,167) | |
TOTAL INVESTMENTS IN SECURITIES (excluding investments purchased with cash collateral from securities on loan)-99.90% (Cost $1,512,945,166) | | | |
Investments Purchased with Cash Collateral from Securities on Loan |
Money Market Funds–12.69% |
Invesco Private Government Fund, | | |
See accompanying Notes to Financial Statements which are an integral part of the financial statements.
3
Invesco Main Street Small Cap Fund®
| | |
Money Market Funds–(continued) |
Invesco Private Prime Fund, | | |
Total Investments Purchased with Cash Collateral from Securities on Loan (Cost $257,164,958) | |
TOTAL INVESTMENTS IN SECURITIES–112.59% (Cost $1,770,110,124) | |
OTHER ASSETS LESS LIABILITIES—(12.59)% | |
| |
Investment Abbreviations:
| – American Depositary Receipt |
| – Real Estate Investment Trust |
Notes to Schedule of Investments:
| Industry and/or sector classifications used in this report are generally according to the Global Industry Classification Standard, which was developed by and is the exclusive property and a service mark of MSCI Inc. and Standard & Poor’s. |
| Non-income producing security. |
| All or a portion of this security was out on loan at December 31, 2024. |
| Affiliated holding. Affiliated holdings are investments in entities which are under common ownership or control of Invesco Ltd. or are investments in entities in which the Fund owns 5% or more of the outstanding voting securities. The table below shows the Fund’s transactions in, and earnings from, its investments in affiliates for the fiscal year ended December 31, 2024. |
| | | | Change in
Unrealized
Appreciation
(Depreciation) | | | |
Investments in Affiliated Money Market Funds: | | | | | | | |
Invesco Government & Agency Portfolio, Institutional Class | | | | | | | |
Invesco Liquid Assets Portfolio, Institutional Class | | | | | | | |
Invesco Treasury Portfolio, Institutional Class | | | | | | | |
Investments Purchased with Cash Collateral from Securities on Loan: | | | | | | | |
Invesco Private Government Fund | | | | | | | |
Invesco Private Prime Fund | | | | | | | |
| | | | | | | |
| Represents the income earned on the investment of cash collateral, which is included in securities lending income on the Statement of Operations. Does not include rebates and fees paid to lending agent or premiums received from borrowers, if any. |
| The rate shown is the 7-day SEC standardized yield as of December 31, 2024. |
| The security has been segregated to satisfy the commitment to return the cash collateral received in securities lending transactions upon the borrower’s return of the securities loaned. See Note 1J. |
See accompanying Notes to Financial Statements which are an integral part of the financial statements.
4
Invesco Main Street Small Cap Fund®
Statement of Assets and Liabilities
| |
Investments in unaffiliated securities, at value
(Cost $1,491,642,999)* | |
Investments in affiliated money market funds, at value (Cost $278,467,125) | |
| |
Foreign currencies, at value (Cost $57,308) | |
| |
| |
| |
Investment for trustee deferred compensation and retirement plans | |
| |
| |
| |
| |
| |
| |
Collateral upon return of securities loaned | |
Accrued fees to affiliates | |
Accrued other operating expenses | |
Trustee deferred compensation and retirement plans | |
| |
Net assets applicable to shares outstanding | |
| |
Shares of beneficial interest | |
| |
| |
|
| |
| |
| |
| |
| |
| |
Shares outstanding, no par value, with an unlimited number of shares authorized: |
| |
| |
| |
| |
| |
| |
| |
Net asset value per share | |
Maximum offering price per share
(Net asset value of $21.93 ÷ 94.50%) | |
| |
Net asset value and offering price per share | |
| |
Net asset value and offering price per share | |
| |
Net asset value and offering price per share | |
| |
Net asset value and offering price per share | |
| |
Net asset value and offering price per share | |
| At December 31, 2024, securities with an aggregate value of $248,542,046 were on loan to brokers. |
See accompanying Notes to Financial Statements which are an integral part of the financial statements.
5
Invesco Main Street Small Cap Fund®
Statement of Operations
For the year ended December 31, 2024
| |
Dividends (net of foreign withholding taxes of $39,900) | |
Dividends from affiliated money market funds (includes net securities lending income of $405,376) | |
| |
| |
| |
Administrative services fees | |
| |
| |
| |
| |
| |
Transfer agent fees — A, C, R and Y | |
| |
| |
Trustees’ and officers’ fees and benefits | |
Registration and filing fees | |
| |
Professional services fees | |
| |
| |
Less: Fees waived and/or expense offset arrangement(s) | |
| |
| |
Realized and unrealized gain (loss) from: | |
| |
Unaffiliated investment securities | |
Affiliated investment securities | |
| |
| |
Change in net unrealized appreciation (depreciation) of: | |
Unaffiliated investment securities | |
Affiliated investment securities | |
| |
| |
Net realized and unrealized gain | |
Net increase in net assets resulting from operations | |
See accompanying Notes to Financial Statements which are an integral part of the financial statements.
6
Invesco Main Street Small Cap Fund®
Statement of Changes in Net Assets
For the years ended December 31, 2024 and 2023
| | |
| | |
| | |
| | |
Change in net unrealized appreciation | | |
Net increase in net assets resulting from operations | | |
Distributions to shareholders from distributable earnings: | | |
| | |
| | |
| | |
| | |
| | |
| | |
Total distributions from distributable earnings | | |
| | |
| | |
| | |
| | |
| | |
| | |
| | |
Net increase in net assets resulting from share transactions | | |
Net increase in net assets | | |
| | |
| | |
| | |
See accompanying Notes to Financial Statements which are an integral part of the financial statements.
7
Invesco Main Street Small Cap Fund®
Financial Highlights
The following schedule presents financial highlights for a share of the Fund outstanding throughout the periods indicated.
| Net asset
value,
beginning
of period | | Net gains
(losses)
on securities
(both
realized and
unrealized) | Total from
investment
operations | Dividends
from net
investment
income | Distributions
from net
realized
gains | | | Net asset
value, end
of period | | Net assets,
end of period
(000’s omitted) | Ratio of
expenses
to average
net assets
with fee waivers
and/or
expenses
absorbed | Ratio of
expenses
to average net
assets without
fee waivers
and/or
expenses
absorbed
| Ratio of net
investment
income
(loss)
to average
net assets | |
|
| | | | | | | | | | | | | | | |
| | | | | | | | | | | | | | | |
| | | | | | | | | | | | | | | |
| | | | | | | | | | | | | | | |
| | | | | | | | | | | | | | | |
|
| | | | | | | | | | | | | | | |
| | | | | | | | | | | | | | | |
| | | | | | | | | | | | | | | |
| | | | | | | | | | | | | | | |
| | | | | | | | | | | | | | | |
|
| | | | | | | | | | | | | | | |
| | | | | | | | | | | | | | | |
| | | | | | | | | | | | | | | |
| | | | | | | | | | | | | | | |
| | | | | | | | | | | | | | | |
|
| | | | | | | | | | | | | | | |
| | | | | | | | | | | | | | | |
| | | | | | | | | | | | | | | |
| | | | | | | | | | | | | | | |
| | | | | | | | | | | | | | | |
|
| | | | | | | | | | | | | | | |
| | | | | | | | | | | | | | | |
| | | | | | | | | | | | | | | |
| | | | | | | | | | | | | | | |
| | | | | | | | | | | | | | | |
|
| | | | | | | | | | | | | | | |
| | | | | | | | | | | | | | | |
| | | | | | | | | | | | | | | |
| | | | | | | | | | | | | | | |
| | | | | | | | | | | | | | | |
| Calculated using average shares outstanding. |
| Includes adjustments in accordance with accounting principles generally accepted in the United States of America and as such, the net asset value for financial reporting purposes and the returns based upon those net asset values may differ from the net asset value and returns for shareholder transactions. Does not include sales charges and is not annualized for periods less than one year, if applicable. |
| Portfolio turnover is calculated at the fund level and is not annualized for periods less than one year, if applicable. For the year ended December 31, 2021, the portfolio turnover calculation excludes the value of securities purchased of $205,907,350 in connection with the acquisition of Invesco Select Companies Fund into the Fund. |
| The total return, ratio of expenses to average net assets and ratio of net investment income to average net assets reflect actual 12b-1 fees of 0.24% for the year ended December 31, 2020. |
See accompanying Notes to Financial Statements which are an integral part of the financial statements.
8
Invesco Main Street Small Cap Fund®
Notes to Financial Statements
NOTE 1—Significant Accounting Policies
Invesco Main Street Small Cap Fund® (the “Fund”) is a series portfolio of AIM Growth Series (Invesco Growth Series) (the “Trust”). The Trust is a Delaware statutory trust registered under the Investment Company Act of 1940, as amended (the “1940 Act”), as an open-end series management investment company authorized to issue an unlimited number of shares of beneficial interest. Information presented in these financial statements pertains only to the Fund. Matters affecting the Fund or each class will be voted on exclusively by the shareholders of the Fund or each class.
The Fund’s investment objective is to seek capital appreciation.
The Fund currently consists of six different classes of shares: Class A, Class C, Class R, Class Y, Class R5 and Class R6. Class Y shares are available only to certain investors. Class A shares are sold with a front-end sales charge unless certain waiver criteria are met. Under certain circumstances, load waived shares may be subject to contingent deferred sales charges ("CDSC"). Class C shares are sold with a CDSC. Class R, Class Y, Class R5 and Class R6 shares are sold at net asset value. Class C shares held for eight years after purchase are eligible for automatic conversion into Class A shares of the same Fund (the "Conversion Feature"). The automatic conversion pursuant to the Conversion Feature will generally occur at the end of the month following the eighth anniversary after a purchase of Class C shares.
Effective after the close of business on September 30, 2024, Class R5 shares are closed to new investors.
The Fund is an investment company and accordingly follows the investment company accounting and reporting guidance in accordance with Financial Accounting Standards Board Accounting Standards Codification Topic 946, Financial Services – Investment Companies.
The following is a summary of the significant accounting policies followed by the Fund in the preparation of its financial statements.
A.
Security Valuations — Securities, including restricted securities, are valued according to the following policy.
A security listed or traded on an exchange is generally valued at its trade price or official closing price that day as of the close of the exchange where the security is principally traded, or lacking any trades or official closing price on a particular day, the security may be valued at the closing bid or ask price on that day. Securities traded in the over-the-counter market are valued based on prices furnished by independent pricing services or market makers. When such securities are valued using prices provided by an independent pricing service they may be considered fair valued. Futures contracts are valued at the daily settlement price set by an exchange on which they are principally traded. Where a final settlement price exists, exchange-traded options are valued at the final settlement price from the exchange where the option principally trades. Where a final settlement price does not exist, exchange-traded options are valued at the mean between the last bid and ask price generally from the exchange where the option principally trades.
Securities of investment companies that are not exchange-traded (e.g., open-end mutual funds) are valued using such company’s end-of-business-day net asset value per share.
Deposits, other obligations of U.S. and non-U.S. banks and financial institutions are valued at their daily account value.
Fixed income securities (including convertible debt securities) generally are valued on the basis of prices provided by independent pricing services. Prices provided by the pricing service may be determined without exclusive reliance on quoted prices, and may reflect appropriate factors such as institution-size trading in similar groups of securities, developments related to specific securities, dividend rate (for unlisted equities), yield (for debt obligations), quality, type of issue, coupon rate (for debt obligations), maturity (for debt obligations), individual trading characteristics and other market data. Pricing services generally value debt obligations assuming orderly transactions of institutional round lot size, but a fund may hold or transact in the same securities in smaller, odd lot sizes. Odd lots often trade at lower prices than institutional round lots, and their value may be adjusted accordingly. Debt obligations are subject to interest rate and credit risks. In addition, all debt obligations involve some risk of default with respect to interest and/or principal payments.
Foreign securities’ (including foreign exchange contracts) prices are converted into U.S. dollar amounts using the applicable exchange rates as of the close of the New York Stock Exchange (“NYSE”). If market quotations are available and reliable for foreign exchange-traded equity securities, the securities will be valued at the market quotations. Invesco Advisers, Inc. (the “Adviser” or “Invesco”) may use various pricing services to obtain market quotations as well as fair value prices. Because trading hours for certain foreign securities end before the close of the NYSE, closing market quotations may become not representative of market value in the Adviser’s judgment (“unreliable”). If, between the time trading ends on a particular security and the close of the customary trading session on the NYSE, a significant event occurs that makes the closing price of the security unreliable, the Adviser may fair value the security. If the event is likely to have affected the closing price of the security, the security will be valued at fair value in good faith in accordance with Board- approved policies and related Adviser procedures (“Valuation Procedures”). Adjustments to closing prices to reflect fair value may also be based on a screening process of an independent pricing service to indicate the degree of certainty, based on historical data, that the closing price in the principal market where a foreign security trades is not the current value as of the close of the NYSE. Foreign securities’ prices meeting the degree of certainty that the price is not reflective of current value will be priced at the indication of fair value from the independent pricing service. Multiple factors may be considered by the independent pricing service in determining adjustments to reflect fair value and may include information relating to sector indices, American Depositary Receipts and domestic and foreign index futures. Foreign securities may have additional risks including exchange rate changes, potential for sharply devalued currencies and high inflation, political and economic upheaval, the relative lack of issuer information, relatively low market liquidity and the potential lack of strict financial and accounting controls and standards.
Unlisted securities will be valued using prices provided by independent pricing services or by another method that the Adviser, in its judgment, believes better reflects the security’s fair value in accordance with the Valuation Procedures.
Non-traded rights and warrants shall be valued at intrinsic value if the terms of the rights and warrants are available, specifically the subscription or exercise price and the ratio. Intrinsic value is calculated as the daily market closing price of the security to be received less the subscription price, which is then adjusted by the exercise ratio. In the case of warrants, an option pricing model supplied by an independent pricing service may be used based on market data such as volatility, stock price and interest rate from the independent pricing service and strike price and exercise period from verified terms.
Securities for which market prices are not provided by any of the above methods may be valued based upon quotes furnished by independent sources. The mean between the last bid and ask prices may be used to value debt obligations, including corporate loans.
Securities for which market quotations are not readily available are fair valued by the Adviser in accordance with the Valuation Procedures. If a fair value price provided by a pricing service is unreliable, the Adviser will fair value the security using the Valuation Procedures. Issuer specific events, market trends, bid/ask quotes of brokers and information providers and other market data may be reviewed in the course of making a good faith determination of a security’s fair value.
The Fund may invest in securities that are subject to interest rate risk, meaning the risk that the prices will generally fall as interest rates rise and, conversely, the prices will generally rise as interest rates fall. Specific securities differ in their sensitivity to changes in interest rates depending on their individual characteristics. Changes in interest rates may result in increased market volatility, which may affect the value and/or liquidity of certain Fund investments.
Valuations change in response to many factors including the historical and prospective earnings of the issuer, the value of the issuer’s assets, general market conditions which are not specifically related to the particular issuer, such as real or perceived adverse economic conditions, changes in the general outlook for revenues or corporate earnings, changes in interest or currency rates, regional or global instability, natural or environmental disasters, widespread disease or other public health issues, war, acts of terrorism, significant governmental actions or adverse investor sentiment generally and market liquidity. Because of the inherent uncertainties of valuation, the values reflected in the financial statements may materially differ from the value received upon actual sale of those investments.
9
Invesco Main Street Small Cap Fund®
The price the Fund could receive upon the sale of any investment may differ from the Adviser’s valuation of the investment, particularly for securities that are valued using a fair valuation technique. When fair valuation techniques are applied, the Adviser uses available information, including both observable and unobservable inputs and assumptions, to determine a methodology that will result in a valuation that the Adviser believes approximates market value. Fund securities that are fair valued may be subject to greater fluctuation in their value from one day to the next than would be the case if market quotations were used. Because of the inherent uncertainties of valuation, and the degree of subjectivity in such decisions, the Fund could realize a greater or lesser than expected gain or loss upon the sale of the investment.
B.
Securities Transactions and Investment Income – Securities transactions are accounted for on a trade date basis. Realized gains or losses on sales are computed on the basis of specific identification of the securities sold. Interest income (net of withholding tax, if any) is recorded on an accrual basis from settlement date and includes coupon interest and amortization of premium and accretion of discount on debt securities as applicable. Pay-in-kind interest income and non-cash dividend income received in the form of securities in lieu of cash are recorded at the fair value of the securities received. Dividend income (net of withholding tax, if any) is recorded on the ex-dividend date.
The Fund may periodically participate in litigation related to Fund investments. As such, the Fund may receive proceeds from litigation settlements. Any proceeds received are included in the Statement of Operations as realized gain (loss) for investments no longer held and as unrealized gain (loss) for investments still held.
Brokerage commissions and mark ups are considered transaction costs and are recorded as an increase to the cost basis of securities purchased and/or a reduction of proceeds on a sale of securities. Such transaction costs are included in the determination of net realized and unrealized gain (loss) from investment securities reported in the Statement of Operations and the Statement of Changes in Net Assets and the net realized and unrealized gains (losses) on securities per share in the Financial Highlights. Transaction costs are included in the calculation of the Fund’s net asset value and, accordingly, they reduce the Fund’s total returns. These transaction costs are not considered operating expenses and are not reflected in net investment income reported in the Statement of Operations and the Statement of Changes in Net Assets, or the net investment income per share and the ratios of expenses and net investment income reported in the Financial Highlights, nor are they limited by any expense limitation arrangements between the Fund and the investment adviser.
The Fund allocates income and realized and unrealized capital gains and losses to a class based on the relative net assets of each class.
The Fund recharacterizes distributions received from REIT investments based on information provided by the REIT into the following categories: ordinary income, long-term and short-term capital gains, and return of capital. If information is not available on a timely basis from the REIT, the recharacterization will be based on available information which may include the previous year’s allocation. If new or additional information becomes available from the REIT at a later date, a recharacterization will be made in the following year. The Fund records as dividend income the amount recharacterized as ordinary income and as realized gain the amount recharacterized as capital gain in the Statement of Operations, and the amount recharacterized as return of capital as a reduction of the cost of the related investment. These recharacterizations are reflected in the accompanying financial statements.
C.
Country Determination — For the purposes of making investment selection decisions and presentation in the Schedule of Investments, the investment adviser may determine the country in which an issuer is located and/or credit risk exposure based on various factors. These factors include the laws of the country under which the issuer is organized, where the issuer maintains a principal office, the country in which the issuer derives 50% or more of its total revenues, the country that has the primary market for the issuer’s securities and its "country of risk" as determined by a third party service provider, as well as other criteria. Among the other criteria that may be evaluated for making this determination are the country in which the issuer maintains 50% or more of its assets, the type of security, financial guarantees and enhancements, the nature of the collateral and the sponsor organization. Country of issuer and/or credit risk exposure has been determined to be the United States of America, unless otherwise noted.
D.
Distributions – Distributions from net investment income and net realized capital gain, if any, are generally declared and paid annually and recorded on the ex-dividend date. The Fund may elect to treat a portion of the proceeds from redemptions as distributions for federal income tax purposes.
E.
Federal Income Taxes – The Fund intends to comply with the requirements of Subchapter M of the Internal Revenue Code of 1986, as amended (the “Internal Revenue Code”), necessary to qualify as a regulated investment company and to distribute substantially all of the Fund’s taxable earnings to shareholders. As such, the Fund will not be subject to federal income taxes on otherwise taxable income (including net realized capital gain) that is distributed to shareholders. Therefore, no provision for federal income taxes is recorded in the financial statements.
The Fund recognizes the tax benefits of uncertain tax positions only when the position is more likely than not to be sustained. Management has analyzed the Fund’s uncertain tax positions and concluded that no liability for unrecognized tax benefits should be recorded related to uncertain tax positions. Management is not aware of any tax positions for which it is reasonably possible that the total amounts of unrecognized tax benefits will change materially in the next 12 months.
The Fund files tax returns in the U.S. Federal jurisdiction and certain other jurisdictions. Generally, the Fund is subject to examinations by such taxing authorities for up to three years after the filing of the return for the tax period.
F.
Expenses – Fees provided for under the Rule 12b-1 plan of a particular class of the Fund are charged to the operations of such class. Transfer agency fees and expenses and other shareholder recordkeeping fees and expenses attributable to Class R5 and Class R6 are allocated based on relative net assets of Class R5 and Class R6. Sub-accounting fees attributable to Class R5 are charged to the operations of the class. Transfer agency fees and expenses and other shareholder recordkeeping fees and expenses relating to all other classes are allocated among those classes based on relative net assets. All other expenses are allocated among the classes based on relative net assets.
G.
Accounting Estimates – The preparation of financial statements in conformity with accounting principles generally accepted in the United States of America (“GAAP”) requires management to make estimates and assumptions that affect the reported amounts of assets and liabilities at the date of the financial statements and the reported amounts of revenues and expenses during the reporting period including estimates and assumptions related to taxation. Actual results could differ from those estimates by a significant amount. In addition, the Fund monitors for material events or transactions that may occur or become known after the period-end date and before the date the financial statements are released to print.
H.
Indemnifications – Under the Trust’s organizational documents, each Trustee, officer, employee or other agent of the Trust is indemnified against certain liabilities that may arise out of the performance of their duties to the Fund. Additionally, in the normal course of business, the Fund enters into contracts, including the Fund’s servicing agreements, that contain a variety of indemnification clauses. The Fund’s maximum exposure under these arrangements is unknown as this would involve future claims that may be made against the Fund that have not yet occurred. The risk of material loss as a result of such indemnification claims is considered remote.
I.
Segment Reporting — In November 2023, the FASB issued Accounting Standards Update 2023-07, Segment Reporting (Topic 280): Improvements to Reportable Segment Disclosures (“ASU 2023-07”), with the intent of improving reportable segment disclosure requirements, primarily through enhanced disclosures about significant segment expenses, allowing financial statement users to better understand the components of a segment’s profit or loss and assess potential future cash flows for each reportable segment and the entity as a whole thereby enabling better understanding of how an entity’s segments impact overall performance. The Fund represents a single operating segment. Subject to the oversight and, when applicable, approval of the Board of Trustees, the Fund’s Adviser acts as the Fund’s chief operating decision maker (“CODM”), assessing performance and making decisions about resource allocation within the Fund. The CODM monitors the operating results as a whole and the Fund’s long-term strategic asset allocation is determined in accordance with the terms of its prospectus based on a defined investment strategy. The financial information provided to and reviewed by the CODM is consistent with that presented in the Fund’s financial statements. Adoption of the new standard impacted the Fund’s financial statement note disclosures only and did not affect the Fund’s financial position or the results of its operations.
J.
Securities Lending – The Fund may lend portfolio securities having a market value up to one-third of the Fund’s total assets. Such loans are secured by
10
Invesco Main Street Small Cap Fund®
collateral equal to no less than the market value of the loaned securities determined daily by the securities lending provider. Such collateral will be cash or debt securities issued or guaranteed by the U.S. Government or any of its sponsored agencies. Cash collateral received in connection with these loans is invested in short-term money market instruments or affiliated, unregistered investment companies that comply with Rule 2a-7 under the 1940 Act and money market funds (collectively, "affiliated money market funds") and is shown as such on the Schedule of Investments. The Fund bears the risk of loss with respect to the investment of collateral. It is the Fund’s policy to obtain additional collateral from or return excess collateral to the borrower by the end of the next business day, following the valuation date of the securities loaned. Therefore, the value of the collateral held may be temporarily less than the value of the securities on loan. When loaning securities, the Fund retains certain benefits of owning the securities, including the economic equivalent of dividends or interest generated by the security. Lending securities entails a risk of loss to the Fund if, and to the extent that, the market value of the securities loaned were to increase and the borrower did not increase the collateral accordingly, and the borrower failed to return the securities. The securities loaned are subject to termination at the option of the borrower or the Fund. Upon termination, the borrower will return to the Fund the securities loaned and the Fund will return the collateral. Upon the failure of the borrower to return the securities, collateral may be liquidated and the securities may be purchased on the open market to replace the loaned securities. The Fund could experience delays and costs in gaining access to the collateral and the securities may lose value during the delay which could result in potential losses to the Fund. Some of these losses may be indemnified by the lending agent. The Fund bears the risk of any deficiency in the amount of the collateral available for return to the borrower due to any loss on the collateral invested. Dividends received on cash collateral investments for securities lending transactions, which are net of compensation to counterparties, are included in Dividends from affiliated money market funds on the Statement of Operations. The aggregate value of securities out on loan, if any, is shown as a footnote on the Statement of Assets and Liabilities.
The Adviser serves as an affiliated securities lending agent for the Fund. The Bank of New York Mellon also serves as a securities lending agent. To the extent the Fund utilizes the Adviser as an affiliated securities lending agent, the Fund conducts its securities lending in accordance with, and in reliance upon, no-action letters issued by the SEC staff that provide guidance on how an affiliate may act as a direct agent lender and receive compensation for those services in a manner consistent with the federal securities laws. For the year ended December 31, 2024, the Fund paid the Adviser $26,931 in fees for securities lending agent services. Fees paid to the Adviser for securities lending agent services, if any, are included in Dividends from affiliated money market funds on the Statement of Operations.
K.
Foreign Currency Translations — Foreign currency is valued at the close of the NYSE based on quotations posted by banks and major currency dealers. Portfolio securities and other assets and liabilities denominated in foreign currencies are translated into U.S. dollar amounts at the date of valuation. Purchases and sales of portfolio securities (net of foreign taxes withheld on disposition) and income items denominated in foreign currencies are translated into U.S. dollar amounts on the respective dates of such transactions. The Fund does not separately account for the portion of the results of operations resulting from changes in foreign exchange rates on investments and the fluctuations arising from changes in market prices of securities held. The combined results of changes in foreign exchange rates and the fluctuation of market prices on investments (net of estimated foreign tax withholding) are included with the net realized and unrealized gain or loss from investments in the Statement of Operations. Reported net realized foreign currency gains or losses arise from (1) sales of foreign currencies, (2) currency gains or losses realized between the trade and settlement dates on securities transactions, and (3) the difference between the amounts of dividends, interest, and foreign withholding taxes recorded on the Fund’s books and the U.S. dollar equivalent of the amounts actually received or paid. Net unrealized foreign currency gains and losses arise from changes in the fair values of assets and liabilities, other than investments in securities at fiscal period end, resulting from changes in exchange rates.
The Fund may invest in foreign securities, which may be subject to foreign taxes on income, gains on investments or currency repatriation, a portion of which may be recoverable. Foreign taxes, if any, are recorded based on the tax regulations and rates that exist in the foreign markets in which the Fund invests and are shown in the Statement of Operations.
The performance of the Fund may be materially affected positively or negatively by foreign currency strength or weakness relative to the U.S. dollar. Currency rates in foreign countries may fluctuate for a number of reasons, including changes in interest rates, political, economic, or social instability and development, and imposition of currency controls. Currency controls in certain foreign jurisdictions may cause the Fund to experience significant delays in its ability to repatriate its assets in U.S. dollars at quoted spot rates, and it is possible that the Fund’s ability to convert certain foreign currencies into U.S. dollars may be limited and may occur at discounts to quoted rates. As a result, the value of the Fund’s assets and liabilities denominated in such currencies that would ultimately be realized could differ from those reported on the Statement of Assets and Liabilities. Certain foreign companies may be subject to sanctions, embargoes, or other governmental actions that may limit the ability to invest in, receive, hold, or sell the securities of such companies, all of which affect the market and/or credit risk of the investments. Because of the inherent uncertainties of valuation, the values reflected in the financial statements may materially differ from the value received upon actual sale of those investments.
L.
Forward Foreign Currency Contracts — The Fund may engage in foreign currency transactions either on a spot (i.e. for prompt delivery and settlement) basis, or through forward foreign currency contracts, to manage or minimize currency or exchange rate risk.
The Fund may also enter into forward foreign currency contracts for the purchase or sale of a security denominated in a foreign currency in order to “lock in” the U.S. dollar price of that security, or the Fund may also enter into forward foreign currency contracts that do not provide for physical exchange of the two currencies on the settlement date, but instead are settled by a single cash payment calculated as the difference between the agreed upon exchange rate and the spot rate at settlement based upon an agreed upon notional amount (non-deliverable forwards).
A forward foreign currency contract is an obligation between two parties (“Counterparties”) to purchase or sell a specific currency for an agreed-upon price at a future date. The use of forward foreign currency contracts for hedging does not eliminate fluctuations in the price of the underlying securities the Fund owns or intends to acquire but establishes a rate of exchange in advance. Fluctuations in the value of these contracts are measured by the difference in the contract date and reporting date exchange rates and are recorded as unrealized appreciation (depreciation) until the contracts are closed. When the contracts are closed, realized gains (losses) are recorded. Realized and unrealized gains (losses) on the contracts are included in the Statement of Operations. The primary risks associated with forward foreign currency contracts include failure of the Counterparty to meet the terms of the contract and the value of the foreign currency changing unfavorably. These risks may be in excess of the amounts reflected in the Statement of Assets and Liabilities.
11
Invesco Main Street Small Cap Fund®
NOTE 2—Advisory Fees and Other Fees Paid to Affiliates
The Trust has entered into a master investment advisory agreement with the Adviser. Under the terms of the investment advisory agreement, the Fund accrues daily and pays monthly an advisory fee to the Adviser based on the annual rate of the Fund’s average daily net assets as follows:
| The advisory fee paid by the Fund shall be reduced by any amounts paid by the Fund under the administrative services agreement with the Adviser. |
For the year ended December 31, 2024, the effective advisory fee rate incurred by the Fund was 0.63%.
Under the terms of a master sub-advisory agreement between the Adviser and each of Invesco Asset Management Deutschland GmbH, Invesco Asset Management Limited, Invesco Asset Management (Japan) Limited, Invesco Hong Kong Limited, Invesco Senior Secured Management, Inc. and Invesco Canada Ltd. and a separate sub-advisory agreement with Invesco Capital Management LLC (collectively, the "Affiliated Sub-Advisers") the Adviser, not the Fund, will pay 40% of the fees paid to the Adviser to any such Affiliated Sub-Adviser(s) that provide(s) discretionary investment management services to the Fund based on the percentage of assets allocated to such Affiliated Sub-Adviser(s). Invesco has also entered into a sub-advisory agreement with OppenheimerFunds, Inc. to provide discretionary management services to the Fund.
The Adviser has agreed, for an indefinite period, to waive advisory fees and/or reimburse expenses of all shares to the extent necessary to limit total annual fund operating expenses after fee waiver and/or expense reimbursement (excluding certain items discussed below) of Class A, Class C, Class R, Class Y, Class R5 and Class R6 shares to 2.00%, 2.75%, 2.25%, 1.75%, 1.75% and 1.75%, respectively, of the Fund’s average daily net assets (the “boundary limits”). In determining the Adviser’s obligation to waive advisory fees and/or reimburse expenses, the following expenses are not taken into account, and could cause the total annual fund operating expenses after fee waiver and/or expense reimbursement to exceed the numbers reflected above: (1) interest; (2) taxes; (3) dividend expense on short sales; (4) extraordinary or non-routine items, including litigation expenses; and (5) expenses that the Fund has incurred but did not actually pay because of an expense offset arrangement. Invesco may amend and/or terminate these boundary limits at any time in its sole discretion and will inform the Board of Trustees of any such changes. The Adviser did not waive fees and/or reimburse expenses during the period under these boundary limits.
Further, the Adviser has contractually agreed, through at least August 31, 2026, to waive the advisory fee payable by the Fund in an amount equal to 100% of the net advisory fees the Adviser receives from the affiliated money market funds on investments by the Fund of uninvested cash (excluding investments of cash collateral from securities lending) in such affiliated money market funds.
For the year ended December 31, 2024, the Adviser waived advisory fees of $35,864.
The Trust has entered into a master administrative services agreement with Invesco pursuant to which the Fund has agreed to pay Invesco for certain administrative costs incurred in providing accounting services to the Fund. For the year ended December 31, 2024, expenses incurred under the agreement are shown in the Statement of Operations as Administrative services fees. Invesco has entered into a sub-administration agreement whereby State Street Bank and Trust Company (“SSB”) serves as fund accountant and provides certain administrative services to the Fund. Pursuant to a custody agreement with the Trust on behalf of the Fund, SSB also serves as the Fund’s custodian.
The Trust has entered into a transfer agency and service agreement with Invesco Investment Services, Inc. (“IIS”) pursuant to which the Fund has agreed to pay IIS a fee for providing transfer agency and shareholder services to the Fund and reimburse IIS for certain expenses incurred by IIS in the course of providing such services. IIS may make payments to intermediaries that provide omnibus account services, sub-accounting services and/or networking services. All fees payable by IIS to intermediaries that provide omnibus account services or sub-accounting services are charged back to the Fund, subject to certain limitations approved by the Trust’s Board of Trustees. For the year ended December 31, 2024, expenses incurred under the agreement are shown in the Statement of Operations as Transfer agent fees.
The Trust has entered into master distribution agreements with Invesco Distributors, Inc. (“IDI”) to serve as the distributor for the Class A, Class C, Class R, Class Y, Class R5 and Class R6 shares of the Fund. The Trust has adopted plans pursuant to Rule 12b-1 under the 1940 Act with respect to the Fund’s Class A, Class C and Class R shares (collectively, the “Plans”). The Fund, pursuant to the Class A Plan, reimburses IDI for its allocated share of expenses incurred for the period, up to a maximum annual rate of 0.25% of the average daily net assets of Class A shares. The Fund, pursuant to the Class C and Class R Plans, pays IDI compensation at the annual rate of 1.00% of the average daily net assets of Class C shares and 0.50% of the average daily net assets of Class R shares. The fees are accrued daily and paid monthly. Of the Plans payments, up to 0.25% of the average daily net assets of each class of shares may be paid to furnish continuing personal shareholder services to customers who purchase and own shares of such classes. Any amounts not paid as a service fee under the Plans would constitute an asset-based sales charge. Rules of the Financial Industry Regulatory Authority (“FINRA”) impose a cap on the total sales charges, including asset-based sales charges, that may be paid by any class of shares of the Fund. For the year ended December 31, 2024, expenses incurred under the Plans are shown in the Statement of Operations as Distribution fees.
Front-end sales commissions and CDSC (collectively, the “sales charges”) are not recorded as expenses of the Fund. Front-end sales commissions are deducted from proceeds from the sales of Fund shares prior to investment in Class A shares of the Fund. CDSC are deducted from redemption proceeds prior to remittance to the shareholder. During the year ended December 31, 2024, IDI advised the Fund that IDI retained $92,367 in front-end sales commissions from the sale of Class A shares and $704 and $1,555 from Class A and Class C shares, respectively, for CDSC imposed upon redemptions by shareholders.
For the year ended December 31, 2024, the Fund incurred $18,164 in brokerage commissions with Invesco Capital Markets, Inc., an affiliate of the Adviser and IDI, for portfolio transactions executed on behalf of the Fund.
Certain officers and trustees of the Trust are officers and directors of the Adviser, IIS and/or IDI.
NOTE 3—Additional Valuation Information
GAAP defines fair value as the price that would be received to sell an asset or paid to transfer a liability in an orderly transaction between market participants at the measurement date, under current market conditions. GAAP establishes a hierarchy that prioritizes the inputs to valuation methods, giving the highest priority to readily available unadjusted quoted prices in an active market for identical assets (Level 1) and the lowest priority to significant unobservable inputs (Level 3), generally when market prices are not readily available. Based on the valuation inputs, the securities or other investments are tiered into one of three levels. Changes in valuation methods may result in transfers in or out of an investment’s assigned level:
Level 1 – Prices are determined using quoted prices in an active market for identical assets.
Level 2 – Prices are determined using other significant observable inputs. Observable inputs are inputs that other market participants may use in pricing a security. These may include quoted prices for similar securities, interest rates, prepayment speeds, credit risk, yield curves, loss severities, default rates, discount rates, volatilities and others. When significant events cause market movements to occur after the close of the relevant foreign securities markets, foreign securities may be fair valued utilizing an independent pricing service.
12
Invesco Main Street Small Cap Fund®
Level 3 – Prices are determined using significant unobservable inputs. In situations where quoted prices or observable inputs are unavailable (for example, when there is little or no market activity for an investment at the end of the period), unobservable inputs may be used. Unobservable inputs reflect the Adviser’s assumptions about the factors market participants would use in determining fair value of the securities or instruments and would be based on the best available information.
The following is a summary of the tiered valuation input levels, as of December 31, 2024. The level assigned to the securities valuations may not be an indication of the risk or liquidity associated with investing in those securities. Because of the inherent uncertainties of valuation, the values reflected in the financial statements may materially differ from the value received upon actual sale of those investments.
| | | | |
Investments in Securities | | | | |
Common Stocks & Other Equity Interests | | | | |
| | | | |
| | | | |
NOTE 4—Expense Offset Arrangement(s)
The expense offset arrangement is comprised of transfer agency credits which result from balances in demand deposit accounts used by the transfer agent for clearing shareholder transactions. For the year ended December 31, 2024, the Fund received credits from this arrangement, which resulted in the reduction of the Fund’s total expenses of $44,322.
NOTE 5—Trustees’ and Officers’ Fees and Benefits
Trustees’ and Officers’ Fees and Benefits include amounts accrued by the Fund to pay remuneration to certain Trustees and Officers of the Fund. Trustees have the option to defer compensation payable by the Fund, and Trustees’ and Officers’ Fees and Benefits also include amounts accrued by the Fund to fund such deferred compensation amounts. Those Trustees who defer compensation have the option to select various Invesco Funds in which their deferral accounts shall be deemed to be invested. Finally, certain current Trustees were eligible to participate in a retirement plan that provided for benefits to be paid upon retirement to Trustees over a period of time based on the number of years of service. The Fund may have certain former Trustees who also participate in a retirement plan and receive benefits under such plan. Trustees’ and Officers’ Fees and Benefits include amounts accrued by the Fund to fund such retirement benefits. Obligations under the deferred compensation and retirement plans represent unsecured claims against the general assets of the Fund.
The Fund is permitted to temporarily carry a negative or overdrawn balance in its account with SSB, the custodian bank. Such balances, if any at period-end, are shown in the Statement of Assets and Liabilities under the payable caption Amount due custodian. To compensate the custodian bank for such overdrafts, the overdrawn Fund may either (1) leave funds as a compensating balance in the account so the custodian bank can be compensated by earning the additional interest; or (2) compensate by paying the custodian bank at a rate agreed upon by the custodian bank and Invesco, not to exceed the contractually agreed upon rate.
NOTE 7—Distributions to Shareholders and Tax Components of Net Assets
Tax Character of Distributions to Shareholders Paid During the Fiscal Years Ended December 31, 2024 and 2023: |
| | |
| | |
| | |
| | |
| Includes short-term capital gain distributions, if any. |
Tax Components of Net Assets at Period-End: |
| |
Undistributed ordinary income | |
Undistributed long-term capital gain | |
Net unrealized appreciation — investments | |
Net unrealized appreciation — foreign currencies | |
Temporary book/tax differences | |
Shares of beneficial interest | |
| |
The difference between book-basis and tax-basis unrealized appreciation (depreciation) is due to differences in the timing of recognition of gains and losses on investments for tax and book purposes. The Fund’s net unrealized appreciation (depreciation) difference is attributable primarily to wash sales.
The temporary book/tax differences are a result of timing differences between book and tax recognition of income and/or expenses. The Fund’s temporary book/tax differences are the result of the trustee deferral of compensation and retirement plan benefits.
Capital loss carryforward is calculated and reported as of a specific date. Results of transactions and other activity after that date may affect the amount of capital loss carryforward actually available for the Fund to utilize. The ability to utilize capital loss carryforward in the future may be limited under the Internal Revenue Code and related regulations based on the results of future transactions.
The Fund does not have a capital loss carryforward as of December 31, 2024.
13
Invesco Main Street Small Cap Fund®
NOTE 8—Investment Transactions
The aggregate amount of investment securities (other than short-term securities, U.S. Government obligations and money market funds, if any) purchased and sold by the Fund during the year ended December 31, 2024 was $871,300,256 and $783,962,194, respectively. As of December 31, 2024, the aggregate cost of investments, including any derivatives, on a tax basis listed below includes the adjustments for financial reporting purposes as of the most recently completed federal income tax reporting period-end:
Unrealized Appreciation (Depreciation) of Investments on a Tax Basis |
Aggregate unrealized appreciation of investments | |
Aggregate unrealized (depreciation) of investments | |
Net unrealized appreciation of investments | |
Cost of investments for tax purposes is $1,776,432,344.
NOTE 9—Reclassification of Permanent Differences
Primarily as a result of differing book/tax treatment of equalization, on December 31, 2024, undistributed net investment income was increased by $217,633, undistributed net realized gain was decreased by $8,638,653 and shares of beneficial interest was increased by $8,421,020. This reclassification had no effect on the net assets of the Fund.
NOTE 10—Share Information
| Summary of Share Activity |
| | Year ended
December 31, 2023 |
| | | | |
| | | | |
| | | | |
| | | | |
| | | | |
| | | | |
| | | | |
| | | | |
Issued as reinvestment of dividends: | | | | |
| | | | |
| | | | |
| | | | |
| | | | |
| | | | |
| | | | |
Automatic conversion of Class C shares to Class A shares: | | | | |
| | | | |
| | | | |
| | | | |
| | | | |
| | | | |
| | | | |
| | | | |
| | | | |
| | | | |
Net increase in share activity | | | | |
| There are entities that are record owners of more than 5% of the outstanding shares of the Fund and in the aggregate own 41% of the outstanding shares of the Fund. IDI has an agreement with these entities to sell Fund shares. The Fund, Invesco and/or Invesco affiliates may make payments to these entities, which are considered to be related to the Fund, for providing services to the Fund, Invesco and/or Invesco affiliates including but not limited to services such as securities brokerage, distribution, third party record keeping and account servicing. The Fund has no knowledge as to whether all or any portion of the shares owned of record by these entities are also owned beneficially. |
| In addition, 9% of the outstanding shares of the Fund are owned by the Adviser or an affiliate of the Adviser. |
14
Invesco Main Street Small Cap Fund®
Report of Independent Registered Public Accounting Firm
To the Board of Trustees of AIM Growth Series (Invesco Growth Series) and Shareholders of Invesco Main Street Small Cap Fund®
Opinion on the Financial Statements
We have audited the accompanying statement of assets and liabilities, including the schedule of investments, of Invesco Main Street Small Cap Fund® (one of the funds constituting AIM Growth Series (Invesco Growth Series), referred to hereafter as the "Fund") as of December 31, 2024, the related statement of operations for the year ended December 31, 2024, the statement of changes in net assets for each of the two years in the period ended December 31, 2024, including the related notes, and the financial highlights for each of the five years in the period ended December 31, 2024 (collectively referred to as the "financial statements"). In our opinion, the financial statements present fairly, in all material respects, the financial position of the Fund as of December 31, 2024, the results of its operations for the year then ended, the changes in its net assets for each of the two years in the period ended December 31, 2024 and the financial highlights for each of the five years in the period ended December 31, 2024 in conformity with accounting principles generally accepted in the United States of America.
These financial statements are the responsibility of the Fund’s management. Our responsibility is to express an opinion on the Fund’s financial statements based on our audits. We are a public accounting firm registered with the Public Company Accounting Oversight Board (United States) (PCAOB) and are required to be independent with respect to the Fund in accordance with the U.S. federal securities laws and the applicable rules and regulations of the Securities and Exchange Commission and the PCAOB.
We conducted our audits of these financial statements in accordance with the standards of the PCAOB. Those standards require that we plan and perform the audit to obtain reasonable assurance about whether the financial statements are free of material misstatement, whether due to error or fraud.
Our audits included performing procedures to assess the risks of material misstatement of the financial statements, whether due to error or fraud, and performing procedures that respond to those risks. Such procedures included examining, on a test basis, evidence regarding the amounts and disclosures in the financial statements. Our audits also included evaluating the accounting principles used and significant estimates made by management, as well as evaluating the overall presentation of the financial statements. Our procedures included confirmation of securities owned as of December 31, 2024 by correspondence with the custodian, transfer agent and brokers. We believe that our audits provide a reasonable basis for our opinion.
/s/PricewaterhouseCoopers LLP
February 20, 2025
We have served as the auditor of one or more of the investment companies in the Invesco group of investment companies since at least 1995. We have not been able to determine the specific year we began serving as auditor.
15
Invesco Main Street Small Cap Fund®
Tax Information
Form 1099-DIV, Form 1042-S and other year–end tax information provide shareholders with actual calendar year amounts that should be included in their tax returns. Shareholders should consult their tax advisers.
The following distribution information is being provided as required by the Internal Revenue Code or to meet a specific state’s requirement.
The Fund designates the following amounts or, if subsequently determined to be different, the maximum amount allowable for its fiscal year ended December 31, 2024:
Federal and State Income Tax | |
Long-Term Capital Gain Distributions | |
Qualified Dividend Income* | |
Corporate Dividends Received Deduction* | |
U.S. Treasury Obligations* | |
Qualified Business Income* | |
Business Interest Income* | |
*
The above percentages are based on ordinary income dividends paid to shareholders during the Fund’s fiscal year.
16
Invesco Main Street Small Cap Fund®
Other Information Required in Form N-CSR (Items 8-11)
Changes in and Disagreements with Accountants for Open-End Management Investment Companies
Proxy Disclosures for Open-End Management Investment Companies
Remuneration Paid to Directors, Officers, and Others of Open-End Management Investment Companies
The aggregate remuneration paid to directors, officers and others is disclosed within the financial statements.
Statement Regarding Basis for Approval of Investment Advisory Contracts
17
Invesco Main Street Small Cap Fund®
SEC file number(s): 811-02699 and 002-57526
Invesco Distributors, Inc.
O-MSS-NCSR
Annual Financial Statements and Other InformationDecember 31, 2024
Invesco Quality Income Fund
A: VKMGX ■ C: VUSCX ■ R: VUSRX ■ Y: VUSIX ■ R5: VUSJX ■ R6: VUSSX
| |
| |
| |
| Notes to Financial Statements |
| Report of Independent Registered Public Accounting Firm |
| |
| |
| Other Information Required in Form N-CSR (Items 8-11) |
| | |
U.S. Government Sponsored Agency Mortgage-Backed Securities–110.56% |
Collateralized Mortgage Obligations–5.04% |
Fannie Mae Grantor Trust, Series 1999-T2, Class A1,
| | | |
Fannie Mae Interest STRIPS, | | |
| | | |
| | | |
| | | |
| | | |
| | | |
| | | |
| | | |
| | |
| | | |
| | | |
| | | |
5.68% (30 Day Average SOFR + 1.11%), 12/25/2031 to | | | |
5.71% (30 Day Average SOFR + 1.11%), 03/18/2032 to | | | |
5.18% (30 Day Average SOFR + 0.61%), 08/25/2032 to | | | |
5.21% (30 Day Average SOFR + | | | |
5.08% (30 Day Average SOFR + 0.51%), 03/25/2033 to | | | |
5.02% (30 Day Average SOFR + | | | |
5.03% (30 Day Average SOFR + 0.46%), 08/25/2035 to | | | |
7.39% (24.57% - (3.67 x (30 Day Average SOFR + 0.11%))), | | | |
7.03% (24.20% - (3.67 x (30 Day Average SOFR + 0.11%))), | | | |
7.03% (24.20% - (3.67 x (30 Day Average SOFR + 0.11%))), | | | |
5.62% (30 Day Average SOFR + | | | |
5.13% (30 Day Average SOFR + | | | |
| | | |
| | | |
| | |
Collateralized Mortgage Obligations–(continued) |
| | | |
| | | |
| | | |
| | | |
2.02% (6.70% - (30 Day Average SOFR + 0.11%)), 10/25/2031 to | | | |
3.22% (7.90% - (30 Day Average SOFR + 0.11%)), | | | |
3.19% (7.90% - (30 Day Average SOFR + 0.11%)), | | | |
3.27% (7.95% - (30 Day Average SOFR + 0.11%)), | | | |
3.29% (8.00% - (30 Day Average SOFR + 0.11%)), | | | |
3.42% (8.10% - (30 Day Average SOFR + 0.11%)), 03/25/2032 to | | | |
2.32% (7.00% - (30 Day Average SOFR + 0.11%)), 04/25/2032 to | | | |
3.12% (7.80% - (30 Day Average SOFR + 0.11%)), | | | |
3.32% (8.00% - (30 Day Average SOFR + 0.11%)), 07/25/2032 to | | | |
3.39% (8.10% - (30 Day Average SOFR + 0.11%)), | | | |
3.57% (8.25% - (30 Day Average SOFR + 0.11%)), 02/25/2033 to | | | |
| | | |
1.37% (6.05% - (30 Day Average SOFR + 0.11%)), 03/25/2035 to | | | |
2.07% (6.75% - (30 Day Average SOFR + 0.11%)), | | | |
1.92% (6.60% - (30 Day Average SOFR + 0.11%)), | | | |
| | | |
1.87% (6.55% - (30 Day Average SOFR + 0.11%)), | | | |
1.47% (6.15% - (30 Day Average SOFR + 0.11%)), | | | |
| | | |
| | | |
See accompanying Notes to Financial Statements which are an integral part of the financial statements.
2
Invesco Quality Income Fund
| | |
Collateralized Mortgage Obligations–(continued) |
1.22% (5.90% - (30 Day Average SOFR + 0.11%)), | | | |
| | | |
Freddie Mac Multifamily Structured Pass-Through Ctfs., | | |
Series K051, Class X1, IO,
| | | |
Series K734, Class X1, IO,
| | | |
Series K735, Class X1, IO,
| | | |
Series K093, Class X1, IO,
| | | |
Series Q004, Class AFL,
5.49% (12 mo. MTA Rate + | | | |
| | |
3.50%, 11/15/2025 to 05/15/2032 | | | |
| | | |
| | | |
| | | |
6.50%, 08/15/2028 to 03/15/2032 | | | |
5.31% (30 Day Average SOFR + 0.71%), 01/15/2029 to | | | |
6.00%, 01/15/2029 to 04/15/2029 | | | |
5.06% (30 Day Average SOFR + | | | |
5.70% (30 Day Average SOFR + | | | |
5.11% (30 Day Average SOFR + 0.51%), 06/15/2029 to | | | |
5.36% (30 Day Average SOFR + | | | |
| | | |
5.66% (30 Day Average SOFR + | | | |
5.21% (30 Day Average SOFR + 0.61%), 02/15/2032 to | | | |
5.71% (30 Day Average SOFR + 1.11%), 02/15/2032 to | | | |
5.26% (30 Day Average SOFR + 0.66%), 03/15/2032 to | | | |
7.47% (24.75% - (3.67 x (30 Day Average SOFR + 0.11%))), | | | |
5.01% (30 Day Average SOFR + | | | |
5.16% (30 Day Average SOFR + | | | |
| | | |
5.47% (30 Day Average SOFR + | | | |
| | |
Collateralized Mortgage Obligations–(continued) |
IO,
2.94% (7.65% - (30 Day Average SOFR + 0.11%)), | | | |
| | | |
3.99% (8.70% - (30 Day Average SOFR + 0.11%)), | | | |
3.39% (8.10% - (30 Day Average SOFR + 0.11%)), 06/15/2029 to | | | |
1.99% (6.70% - (30 Day Average SOFR + 0.11%)), | | | |
2.04% (6.75% - (30 Day Average SOFR + 0.11%)), | | | |
2.01% (6.72% - (30 Day Average SOFR + 0.11%)), | | | |
2.29% (7.00% - (30 Day Average SOFR + 0.11%)), | | | |
1.29% (6.00% - (30 Day Average SOFR + 0.11%)), | | | |
1.36% (6.07% - (30 Day Average SOFR + 0.11%)), | | | |
| | | |
1.54% (6.25% - (30 Day Average SOFR + 0.11%)), | | | |
1.39% (6.10% - (30 Day Average SOFR + 0.11%)), | | | |
Freddie Mac Seasoned Loans Structured Transaction, Series 2019-1, Class A2,
3.50%, 05/25/2029 | | | |
| | |
| | | |
| | | |
| | | |
| | | |
| | | |
| | | |
| | | |
| | | |
5.21% (30 Day Average SOFR +
| | | |
Freddie Mac Structured Pass-Through Ctfs., Series T-54, Class 2A,
6.50%, 02/25/2043 | | | |
Freddie Mac Whole Loan Securities Trust, Series 2015-SC02, Class 1A,
3.00%, 09/25/2045 | | | |
| | | |
See accompanying Notes to Financial Statements which are an integral part of the financial statements.
3
Invesco Quality Income Fund
| | |
Federal Home Loan Mortgage Corp. (FHLMC)–30.48% |
6.50%, 07/01/2028 to 04/01/2034 | | | |
6.00%, 03/01/2029 to 10/01/2029 | | | |
2.50%, 02/01/2031 to 04/01/2052 | | | |
8.50%, 03/01/2031 to 08/01/2031 | | | |
7.00%, 10/01/2031 to 10/01/2037 | | | |
7.50%, 01/01/2032 to 08/01/2037 | | | |
3.00%, 02/01/2032 to 05/01/2050 | | | |
| | | |
5.50%, 12/01/2036 to 05/01/2053 | | | |
5.00%, 01/01/2037 to 07/01/2052 | | | |
4.50%, 05/01/2038 to 07/01/2052 | | | |
5.35%, 07/01/2038 to 10/17/2038 | | | |
| | | |
| | | |
4.00%, 06/01/2042 to 07/01/2049 | | | |
3.50%, 09/01/2045 to 05/01/2050 | | | |
2.00%, 05/01/2051 to 01/01/2052 | | | |
ARM,
4.63% (1 yr. U.S. Treasury Yield Curve Rate + 2.16%), | | | |
| | | |
Federal National Mortgage Association (FNMA)–43.70% |
5.50%, 03/01/2025 to 04/01/2038 | | | |
4.50%, 07/01/2025 to 07/01/2044 | | | |
6.50%, 01/01/2027 to 11/01/2038 | | | |
7.50%, 02/01/2027 to 08/01/2037 | | | |
5.00%, 06/01/2027 to 01/01/2053 | | | |
6.00%, 05/01/2028 to 10/01/2053 | | | |
3.00%, 02/01/2029 to 01/01/2052 | | | |
7.00%, 04/01/2029 to 01/01/2036 | | | |
| | | |
| | | |
| | | |
| | | |
3.50%, 11/01/2034 to 05/01/2050 | | | |
2.50%, 03/01/2035 to 11/01/2051 | | | |
| | |
Federal National Mortgage Association (FNMA)–(continued) |
2.00%, 09/01/2035 to 03/01/2052 | | | |
| | | |
4.00%, 02/01/2042 to 03/01/2050 | | | |
ARM,
6.11% (1 yr. Refinitiv USD IBOR Consumer Cash Fallbacks + | | | |
| | | |
Government National Mortgage Association (GNMA)–21.56% |
3.00%, 12/16/2025 to 02/20/2050 | | | |
7.00%, 12/15/2027 to 01/20/2030 | | | |
6.50%, 03/15/2028 to 10/15/2028 | | | |
6.00%, 06/15/2028 to 04/20/2029 | | | |
7.50%, 06/15/2028 to 08/15/2028 | | | |
5.50%, 05/15/2033 to 10/15/2034 | | | |
| | | |
| | | |
| | | |
| | | |
| | | |
| | | |
3.50%, 05/20/2046 to 06/20/2050 | | | |
4.00%, 02/20/2048 to 03/20/2050 | | | |
IO,
2.14% (6.65% - (1 mo. Term SOFR + 0.11%)), | | | |
| | | |
1.69% (6.20% - (1 mo. Term SOFR + 0.11%)), | | | |
| | | |
| | | |
| | | |
| | | |
| | | |
| | | |
| | | |
| | | |
Series 2020-137, Class A,
1.50%, 04/16/2062 | | | |
| | | |
See accompanying Notes to Financial Statements which are an integral part of the financial statements.
4
Invesco Quality Income Fund
| | |
Uniform Mortgage-Backed Securities–9.78% |
| | | |
| | | |
| | | |
| | | |
| | | |
| | | |
Total U.S. Government Sponsored Agency Mortgage-Backed Securities (Cost $657,801,189) | |
|
Asset-Backed Securities–5.12% |
Adjustable Rate Mortgage Trust, Series 2005-7, Class 2A21, | | | |
Agate Bay Mortgage Trust, Series 2015-2, Class B1, 3.62%, | | | |
Banc of America Funding Trust, Series 2006-A, Class 1A1, | | | |
Bank, Series 2017-BNK5, Class AS, 3.62%, 06/15/2060 | | | |
Bear Stearns Adjustable Rate Mortgage Trust, Series 2005-1, Class 2A1, 2.16%, | | | |
Benchmark Mortgage Trust, Series 2018-B1, Class XA, IO, | | | |
CD Mortgage Trust, Series 2017- CD6, Class XA, IO, 0.89%, | | | |
Chase Mortgage Finance Corp., | | |
Series 2016-2, Class M4, 3.75%, | | | |
Series 2016-SH1, Class M3, | | | |
Chase Mortgage Finance Trust, | | |
Series 2005-A1, Class 3A1, | | | |
Series 2007-A2, Class 2A1, | | | |
Series 2007-A2, Class 2A4, | | | |
Citigroup Commercial Mortgage Trust, Series 2017-C4, Class XA, IO, | | | |
Citigroup Mortgage Loan Trust, Inc., | | |
Series 2004-UST1, Class A4, | | | |
Series 2005-11, Class A2A, 7.23% (1 yr. U.S. Treasury Yield Curve Rate + 2.40%), | | | |
Series 2006-AR2, Class 1A2, | | | |
COMM Mortgage Trust, Series 2015-CR24, Class XA, IO, | | | |
Commonbond Student Loan Trust, Series 2018-CGS, Class A1, | | | |
| | |
|
Countrywide Home Loans Mortgage Pass-Through Trust, Series 2004-29, Class 1A1, 4.99% (1 mo. Term SOFR + | | | |
Credit Suisse Mortgage Capital Trust, Series 2013-7, Class B1, 3.55%, | | | |
Credit Suisse Mortgage Loan Trust, Series 2015-1, Class A9, 3.50%, | | | |
CSFB Mortgage-Backed Pass-Through Ctfs., Series 2004-AR5, Class 5A1, 6.20%, | | | |
Deutsche Mortgage Securities, Inc. Re-REMIC Trust Ctfs., Series 2007-WM1, Class A1, | | | |
Galton Funding Mortgage Trust, Series 2018-1, Class A33, | | | |
GSAA Home Equity Trust, Series 2007-7, Class A4, 4.99% (1 mo. Term SOFR + 0.65%), | | | |
| | |
Series 2004-12, Class 3A6, | | | |
Series 2005-AR4, Class 6A1, | | | |
JP Morgan Mortgage Trust, | | |
Series 2005-A1, Class 3A1, | | | |
Series 2014-1, Class 1A17, | | | |
Series 2017-5, Class A1, 5.21%, | | | |
Series 2019-INV2, Class A15, | | | |
JP Morgan Trust, Series 2015-3, Class A3, 3.50%, | | | |
Luminent Mortgage Trust, Series 2006-1, Class A1, 5.17% (1 mo. Term SOFR + 0.83%), | | | |
MASTR Adjustable Rate Mortgages Trust, Series 2004-13, Class 2A2, 6.90%, | | | |
Merrill Lynch Mortgage Investors Trust, | | |
Series 2005-3, Class 3A, 2.39%, | | | |
Series 2005-A, Class A1, 4.91% (1 mo. Term SOFR + 0.57%), | | | |
Morgan Stanley Capital I Trust, Series 2017-HR2, Class XA, IO, | | | |
Residential Accredit Loans, Inc. Trust, Series 2006-QS13, Class 1A8, 6.00%, 09/25/2036 | | | |
Sapphire Aviation Finance II Ltd., Series 2020-1A, Class B, 4.34%, | | | |
See accompanying Notes to Financial Statements which are an integral part of the financial statements.
5
Invesco Quality Income Fund
| | |
|
Shellpoint Asset Funding Trust, Series 2013-1, Class A3, 3.75%, | | | |
Structured Adjustable Rate Mortgage Loan Trust, | | |
Series 2004-13, Class A2, 4.75% (1 mo. Term SOFR + 0.41%), | | | |
Series 2004-20, Class 3A1, | | | |
Structured Asset Sec Mortgage Pass-Through Ctfs., Series 2002-21A, Class B1II, | | | |
UBS Commercial Mortgage Trust, Series 2017-C5, Class XA, IO, | | | |
| | |
Series 1999-3, Class IO, 0.00%, | | | |
Series 2001-3, Class IO, 0.00%, | | | |
Series 2002-2, Class IO, 0.00%, | | | |
Series 2002-3, Class IO, 0.18%, | | | |
Series 2003-1, Class IO, 0.01%, | | | |
Verus Securitization Trust, | | |
Series 2019-INV3, Class A2, | | | |
Series 2023-INV3, Class A3, | | | |
WaMu Mortgage Pass-Through Ctfs. Trust, | | |
Series 2003-AR10, Class A7, | | | |
Series 2007-HY2, Class 2A1, | | | |
Wells Fargo Commercial Mortgage Trust, Series 2017-C42, Class XA, | | | |
Zaxby’s Funding LLC, Series 2021- 1A, Class A2, 3.24%, | | | |
Total Asset-Backed Securities (Cost $30,486,147) | |
|
|
ING US Funding LLC, 4.75% (SOFR + | | | |
Macquarie Bank Ltd. (Australia), 4.76% (SOFR + 0.39%), | | | |
Swedbank AB (Sweden), 4.74% (SOFR + 0.36%), | | | |
UBS AG (Switzerland), 4.97% (SOFR + 0.37%), 05/01/2025(e)(g) | | | |
| | | |
| | |
Diversified Financial Services–1.13% |
JP Morgan Securities LLC, 4.77% (SOFR + 0.39%), | | | |
Total Commercial Paper (Cost $20,000,000) | |
Certificates of Deposit–3.39% |
|
Bank of Nova Scotia (Canada), 4.97% (SOFR + 0.35%), 10/17/2025(e) | | | |
Mitsubishi UFJ Trust & Banking Corp. (Japan), 4.65% (SOFR + 0.34%), | | | |
| | | |
|
Standard Chartered Bank (United Kingdom), 4.67% (SOFR + | | | |
Total Certificates of Deposit (Cost $18,000,000) | |
|
Agency Credit Risk Transfer Notes–2.72% |
Fannie Mae Connecticut Avenue Securities, Series 2023-R02, Class 1M2, 7.92% (30 Day Average SOFR + 3.35%), | | | |
| | |
Series 2022-DNA4, Class M1, STACR®, 7.92% (30 Day Average SOFR + 3.35%), 05/25/2042(e)(g) | | | |
Series 2022-HQA3, Class M1, STACR®, 6.87% (30 Day Average SOFR + 2.30%), 08/25/2042(e)(g) | | | |
Total Agency Credit Risk Transfer Notes (Cost $13,972,825) | |
U.S. Treasury Securities–0.17% |
U.S. Treasury Bills–0.17% |
4.45% - 4.78%, 01/30/2025
| | | |
| | |
|
Invesco Government & Agency Portfolio, Institutional Class, 4.42%(j)(k) (Cost $5,675,101) | | |
TOTAL INVESTMENTS IN SECURITIES–126.80% (Cost $746,814,966) | |
OTHER ASSETS LESS LIABILITIES—(26.80)% | |
| |
See accompanying Notes to Financial Statements which are an integral part of the financial statements.
6
Invesco Quality Income Fund
Investment Abbreviations:
| – Adjustable Rate Mortgage |
| |
| |
| |
| – Moving Treasury Average |
| |
| – Real Estate Mortgage Investment Conduits |
| – Secured Overnight Financing Rate |
| – Structured Agency Credit Risk |
| – Separately Traded Registered Interest and Principal Security |
| |
| |
Notes to Schedule of Investments:
| Interest rate is redetermined periodically based on the cash flows generated by the pool of assets backing the security, less any applicable fees. The rate shown is the rate in effect on December 31, 2024. |
| Interest only security. Principal amount shown is the notional principal and does not reflect the maturity value of the security. |
| Zero coupon bond issued at a discount. |
| Interest only security. Principal amount shown is the notional principal and does not reflect the maturity value of the security. Interest rate is redetermined periodically based on the cash flows generated by the pool of assets backing the security, less any applicable fees. The rate shown is the rate in effect on December 31, 2024. |
| Interest or dividend rate is redetermined periodically. Rate shown is the rate in effect on December 31, 2024. |
| Security purchased on a forward commitment basis. This security is subject to dollar roll transactions. See Note 1J. |
| Security purchased or received in a transaction exempt from registration under the Securities Act of 1933, as amended (the “1933 Act”). The security may be resold pursuant to an exemption from registration under the 1933 Act, typically to qualified institutional buyers. The aggregate value of these securities at December 31, 2024 was $54,705,003, which represented 10.31% of the Fund’s Net Assets. |
| All or a portion of the value was pledged as collateral to cover margin requirements for open futures contracts. See Note 1I. |
| Security traded on a discount basis. The interest rate shown represents the discount rate at the time of purchase by the Fund. |
| Affiliated holding. Affiliated holdings are investments in entities which are under common ownership or control of Invesco Ltd. or are investments in entities in which the Fund owns 5% or more of the outstanding voting securities. The table below shows the Fund’s transactions in, and earnings from, its investments in affiliates for the fiscal year ended December 31, 2024. |
| | | | Change in
Unrealized
Appreciation | | | |
Investments in Affiliated Money Market Funds: | | | | | | | |
Invesco Government & Agency Portfolio, Institutional Class | | | | | | | |
| The rate shown is the 7-day SEC standardized yield as of December 31, 2024. |
|
| | | | | Unrealized Appreciation (Depreciation) |
|
U.S. Treasury 2 Year Notes | | | | | |
| | | | | |
|
U.S. Treasury 5 Year Notes | | | | | |
U.S. Treasury 10 Year Notes | | | | | |
U.S. Treasury 10 Year Ultra Notes | | | | | |
| | | | | |
U.S. Treasury Ultra Bonds | | | | | |
Subtotal—Short Futures Contracts | | |
| | |
See accompanying Notes to Financial Statements which are an integral part of the financial statements.
7
Invesco Quality Income Fund
Statement of Assets and Liabilities
| |
Investments in unaffiliated securities, at value
(Cost $741,139,865) | |
Investments in affiliated money market funds, at value (Cost $5,675,101) | |
| |
Variation margin receivable — futures contracts | |
| |
Cash collateral — TBA commitments | |
| |
| |
| |
| |
| |
| |
| |
| |
Investment for trustee deferred compensation and retirement plans | |
| |
| |
| |
| |
| |
| |
| |
Accrued fees to affiliates | |
Accrued other operating expenses | |
Trustee deferred compensation and retirement plans | |
| |
Net assets applicable to shares outstanding | |
| |
Shares of beneficial interest | |
Distributable earnings (loss) | |
| |
|
| |
| |
| |
| |
| |
| |
Shares outstanding, no par value, with an unlimited number of shares authorized: |
| |
| |
| |
| |
| |
| |
| |
Net asset value per share | |
Maximum offering price per share
(Net asset value of $9.53 ÷ 95.75%) | |
| |
Net asset value and offering price per share | |
| |
Net asset value and offering price per share | |
| |
Net asset value and offering price per share | |
| |
Net asset value and offering price per share | |
| |
Net asset value and offering price per share | |
See accompanying Notes to Financial Statements which are an integral part of the financial statements.
8
Invesco Quality Income Fund
Statement of Operations
For the year ended December 31, 2024
| |
| |
Dividends from affiliated money market funds | |
| |
| |
| |
Administrative services fees | |
| |
| |
| |
| |
| |
Transfer agent fees — A, C, R and Y | |
| |
| |
Trustees’ and officers’ fees and benefits | |
Registration and filing fees | |
| |
Professional services fees | |
| |
| |
Less: Fees waived and/or expense offset arrangement(s) | |
| |
| |
Realized and unrealized gain (loss) from: | |
Net realized gain (loss) from: | |
Unaffiliated investment securities | |
| |
| |
Change in net unrealized appreciation (depreciation) of: | |
Unaffiliated investment securities | |
| |
| |
Net realized and unrealized gain (loss) | |
Net increase in net assets resulting from operations | |
See accompanying Notes to Financial Statements which are an integral part of the financial statements.
9
Invesco Quality Income Fund
Statement of Changes in Net Assets
For the years ended December 31, 2024 and 2023
| | |
| | |
| | |
| | |
Change in net unrealized appreciation (depreciation) | | |
Net increase in net assets resulting from operations | | |
Distributions to shareholders from distributable earnings: | | |
| | |
| | |
| | |
| | |
| | |
| | |
Total distributions from distributable earnings | | |
| | |
| | |
| | |
| | |
| | |
| | |
| | |
Net increase (decrease) in net assets resulting from share transactions | | |
Net increase (decrease) in net assets | | |
| | |
| | |
| | |
See accompanying Notes to Financial Statements which are an integral part of the financial statements.
10
Invesco Quality Income Fund
Financial Highlights
The following schedule presents financial highlights for a share of the Fund outstanding throughout the periods indicated.
| Net asset
value,
beginning
of period | | Net gains
(losses)
on securities
(both
realized and
unrealized) | Total from
investment
operations | Dividends
from net
investment
income | Net asset
value, end
of period | | Net assets,
end of period
(000’s omitted) | Ratio of
expenses
to average
net assets
with fee waivers
and/or
expenses
absorbed | Ratio of
expenses
to average net
assets without
fee waivers
and/or
expenses
absorbed
| Ratio of net
investment
income
(loss)
to average
net assets | |
|
| | | | | | | | | | | | |
| | | | | | | | | | | | |
| | | | | | | | | | | | |
| | | | | | | | | | | | |
| | | | | | | | | | | | |
|
| | | | | | | | | | | | |
| | | | | | | | | | | | |
| | | | | | | | | | | | |
| | | | | | | | | | | | |
| | | | | | | | | | | | |
|
| | | | | | | | | | | | |
| | | | | | | | | | | | |
| | | | | | | | | | | | |
| | | | | | | | | | | | |
| | | | | | | | | | | | |
|
| | | | | | | | | | | | |
| | | | | | | | | | | | |
| | | | | | | | | | | | |
| | | | | | | | | | | | |
| | | | | | | | | | | | |
|
| | | | | | | | | | | | |
| | | | | | | | | | | | |
| | | | | | | | | | | | |
| | | | | | | | | | | | |
| | | | | | | | | | | | |
|
| | | | | | | | | | | | |
| | | | | | | | | | | | |
| | | | | | | | | | | | |
| | | | | | | | | | | | |
| | | | | | | | | | | | |
| Calculated using average shares outstanding. |
| Includes adjustments in accordance with accounting principles generally accepted in the United States of America and as such, the net asset value for financial reporting purposes and the returns based upon those net asset values may differ from the net asset value and returns for shareholder transactions. Does not include sales charges and is not annualized for periods less than one year, if applicable. |
| Portfolio turnover is calculated at the fund level and is not annualized for periods less than one year, if applicable. For the year ended December 31, 2020, the portfolio turnover calculation excludes the value of securities purchased of $1,606,141,382 in connection with the acquisition of Invesco Oppenheimer Limited-Term Government Fund into the Fund. |
| The total return, ratios of expenses to average net assets and ratio of net investment income to average net assets reflect actual 12b-1 fees of 0.24% for Class A for the years ended December 31, 2024, 2023, 2022, 2021 and 2020 respectively. |
| The total return, ratios of expenses to average net assets and ratio of net investment income to average net assets reflect actual 12b-1 fees of 0.99% for Class C shares for the years ended December 31, 2021 and 2020, respectively. |
| Commencement date of May 15, 2020. |
| |
See accompanying Notes to Financial Statements which are an integral part of the financial statements.
11
Invesco Quality Income Fund
Notes to Financial Statements
NOTE 1—Significant Accounting Policies
Invesco Quality Income Fund (the “Fund”) is a series portfolio of AIM Growth Series (Invesco Growth Series) (the “Trust”). The Trust is a Delaware statutory trust registered under the Investment Company Act of 1940, as amended (the “1940 Act”), as an open-end series management investment company authorized to issue an unlimited number of shares of beneficial interest. Information presented in these financial statements pertains only to the Fund. Matters affecting the Fund or each class will be voted on exclusively by the shareholders of the Fund or each class.
The Fund’s investment objective is to provide a high level of current income, with liquidity and safety of principal.
The Fund currently consists of six different classes of shares: Class A, Class C, Class R, Class Y, Class R5 and Class R6. Class Y shares are available only to certain investors. Class A shares are sold with a front-end sales charge unless certain waiver criteria are met. Under certain circumstances, load waived shares may be subject to contingent deferred sales charges ("CDSC"). Class C shares are sold with a CDSC. Class R, Class Y, Class R5 and Class R6 shares are sold at net asset value. Class C shares held for eight years after purchase are eligible for automatic conversion into Class A shares of the same Fund (the "Conversion Feature"). The automatic conversion pursuant to the Conversion Feature will generally occur at the end of the month following the eighth anniversary after a purchase of Class C shares.
Effective after the close of business on September 30, 2024, Class R5 shares are closed to new investors.
The Fund is an investment company and accordingly follows the investment company accounting and reporting guidance in accordance with Financial Accounting Standards Board Accounting Standards Codification Topic 946, Financial Services – Investment Companies.
The following is a summary of the significant accounting policies followed by the Fund in the preparation of its financial statements.
A.
Security Valuations – Securities, including restricted securities, are valued according to the following policy.
Fixed income securities (including convertible debt securities) generally are valued on the basis of prices provided by independent pricing services. Prices provided by the pricing service may be determined without exclusive reliance on quoted prices, and may reflect appropriate factors such as institution-size trading in similar groups of securities, developments related to specific securities, dividend rate (for unlisted equities), yield (for debt obligations), quality, type of issue, coupon rate (for debt obligations), maturity (for debt obligations), individual trading characteristics and other market data. Pricing services generally value debt obligations assuming orderly transactions of institutional round lot size, but a fund may hold or transact in the same securities in smaller, odd lot sizes. Odd lots often trade at lower prices than institutional round lots, and their value may be adjusted accordingly. Debt obligations are subject to interest rate and credit risks. In addition, all debt obligations involve some risk of default with respect to interest and/or principal payments.
A security listed or traded on an exchange is generally valued at its trade price or official closing price that day as of the close of the exchange where the security is principally traded, or lacking any trades or official closing price on a particular day, the security may be valued at the closing bid or ask price on that day. Securities traded in the over-the-counter market are valued based on prices furnished by independent pricing services or market makers. When such securities are valued using prices provided by an independent pricing service they may be considered fair valued. Futures contracts are valued at the daily settlement price set by an exchange on which they are principally traded. Where a final settlement price exists, exchange-traded options are valued at the final settlement price from the exchange where the option principally trades. Where a final settlement price does not exist, exchange-traded options are valued at the mean between the last bid and ask price generally from the exchange where the option principally trades.
Securities of investment companies that are not exchange-traded (e.g., open-end mutual funds) are valued using such company’s end-of-business-day net asset value per share.
Deposits, other obligations of U.S. and non-U.S. banks and financial institutions are valued at their daily account value.
Foreign securities’ (including foreign exchange contracts) prices are converted into U.S. dollar amounts using the applicable exchange rates as of the close of the New York Stock Exchange (“NYSE”). If market quotations are available and reliable for foreign exchange-traded equity securities, the securities will be valued at the market quotations. Invesco Advisers, Inc. (the “Adviser” or “Invesco”) may use various pricing services to obtain market quotations as well as fair value prices. Because trading hours for certain foreign securities end before the close of the NYSE, closing market quotations may become not representative of market value in the Adviser’s judgment (“unreliable”). If, between the time trading ends on a particular security and the close of the customary trading session on the NYSE, a significant event occurs that makes the closing price of the security unreliable, the Adviser may fair value the security. If the event is likely to have affected the closing price of the security, the security will be valued at fair value in good faith in accordance with Board- approved policies and related Adviser procedures (“Valuation Procedures”). Adjustments to closing prices to reflect fair value may also be based on a screening process of an independent pricing service to indicate the degree of certainty, based on historical data, that the closing price in the principal market where a foreign security trades is not the current value as of the close of the NYSE. Foreign securities’ prices meeting the degree of certainty that the price is not reflective of current value will be priced at the indication of fair value from the independent pricing service. Multiple factors may be considered by the independent pricing service in determining adjustments to reflect fair value and may include information relating to sector indices, American Depositary Receipts and domestic and foreign index futures. Foreign securities may have additional risks including exchange rate changes, potential for sharply devalued currencies and high inflation, political and economic upheaval, the relative lack of issuer information, relatively low market liquidity and the potential lack of strict financial and accounting controls and standards.
Unlisted securities will be valued using prices provided by independent pricing services or by another method that the Adviser, in its judgment, believes better reflects the security’s fair value in accordance with the Valuation Procedures.
Non-traded rights and warrants shall be valued at intrinsic value if the terms of the rights and warrants are available, specifically the subscription or exercise price and the ratio. Intrinsic value is calculated as the daily market closing price of the security to be received less the subscription price, which is then adjusted by the exercise ratio. In the case of warrants, an option pricing model supplied by an independent pricing service may be used based on market data such as volatility, stock price and interest rate from the independent pricing service and strike price and exercise period from verified terms.
Securities for which market prices are not provided by any of the above methods may be valued based upon quotes furnished by independent sources. The mean between the last bid and ask prices may be used to value debt obligations, including corporate loans.
Securities for which market quotations are not readily available are fair valued by the Adviser in accordance with the Valuation Procedures. If a fair value price provided by a pricing service is unreliable, the Adviser will fair value the security using the Valuation Procedures. Issuer specific events, market trends, bid/ask quotes of brokers and information providers and other market data may be reviewed in the course of making a good faith determination of a security’s fair value.
The Fund may invest in securities that are subject to interest rate risk, meaning the risk that the prices will generally fall as interest rates rise and, conversely, the prices will generally rise as interest rates fall. Specific securities differ in their sensitivity to changes in interest rates depending on their individual characteristics. Changes in interest rates may result in increased market volatility, which may affect the value and/or liquidity of certain Fund investments.
Valuations change in response to many factors including the historical and prospective earnings of the issuer, the value of the issuer’s assets, general market conditions which are not specifically related to the particular issuer, such as real or perceived adverse economic conditions, changes in the general outlook for revenues or corporate earnings, changes in interest or currency rates, regional or global instability, natural or environmental disasters, widespread disease or other public health issues, war, acts of terrorism, significant governmental actions or adverse investor sentiment generally and market liquidity. Because of the inherent uncertainties of valuation, the values reflected in the financial statements may materially differ from the value received upon actual sale of those investments.
12
Invesco Quality Income Fund
The price the Fund could receive upon the sale of any investment may differ from the Adviser’s valuation of the investment, particularly for securities that are valued using a fair valuation technique. When fair valuation techniques are applied, the Adviser uses available information, including both observable and unobservable inputs and assumptions, to determine a methodology that will result in a valuation that the Adviser believes approximates market value. Fund securities that are fair valued may be subject to greater fluctuation in their value from one day to the next than would be the case if market quotations were used. Because of the inherent uncertainties of valuation, and the degree of subjectivity in such decisions, the Fund could realize a greater or lesser than expected gain or loss upon the sale of the investment.
B.
Securities Transactions and Investment Income – Securities transactions are accounted for on a trade date basis. Realized gains or losses on sales are computed on the basis of specific identification of the securities sold. Interest income (net of withholding tax, if any) is recorded on an accrual basis from settlement date and includes coupon interest and amortization of premium and accretion of discount on debt securities as applicable. Pay-in-kind interest income and non-cash dividend income received in the form of securities in lieu of cash are recorded at the fair value of the securities received. Paydown gains and losses on mortgage and asset-backed securities are recorded as adjustments to interest income. Dividend income (net of withholding tax, if any) is recorded on the ex-dividend date.
The Fund may periodically participate in litigation related to Fund investments. As such, the Fund may receive proceeds from litigation settlements. Any proceeds received are included in the Statement of Operations as realized gain (loss) for investments no longer held and as unrealized gain (loss) for investments still held.
Brokerage commissions and mark ups are considered transaction costs and are recorded as an increase to the cost basis of securities purchased and/or a reduction of proceeds on a sale of securities. Such transaction costs are included in the determination of net realized and unrealized gain (loss) from investment securities reported in the Statement of Operations and the Statement of Changes in Net Assets and the net realized and unrealized gains (losses) on securities per share in the Financial Highlights. Transaction costs are included in the calculation of the Fund’s net asset value and, accordingly, they reduce the Fund’s total returns. These transaction costs are not considered operating expenses and are not reflected in net investment income reported in the Statement of Operations and the Statement of Changes in Net Assets, or the net investment income per share and the ratios of expenses and net investment income reported in the Financial Highlights, nor are they limited by any expense limitation arrangements between the Fund and the investment adviser.
The Fund allocates realized and unrealized capital gains and losses to a class based on the relative net assets of each class. The Fund allocates income to a class based on the relative value of the settled shares of each class.
C.
Distributions - Distributions from net investment income, if any, are declared daily and paid monthly. Distributions from net realized capital gain, if any, are generally declared and paid annually and recorded on the ex-dividend date.
D.
Federal Income Taxes – The Fund intends to comply with the requirements of Subchapter M of the Internal Revenue Code of 1986, as amended (the “Internal Revenue Code”), necessary to qualify as a regulated investment company and to distribute substantially all of the Fund’s taxable earnings to shareholders. As such, the Fund will not be subject to federal income taxes on otherwise taxable income (including net realized capital gain) that is distributed to shareholders. Therefore, no provision for federal income taxes is recorded in the financial statements.
The Fund recognizes the tax benefits of uncertain tax positions only when the position is more likely than not to be sustained. Management has analyzed the Fund’s uncertain tax positions and concluded that no liability for unrecognized tax benefits should be recorded related to uncertain tax positions. Management is not aware of any tax positions for which it is reasonably possible that the total amounts of unrecognized tax benefits will change materially in the next 12 months.
The Fund files tax returns in the U.S. Federal jurisdiction and certain other jurisdictions. Generally, the Fund is subject to examinations by such taxing authorities for up to three years after the filing of the return for the tax period.
E.
Expenses – Fees provided for under the Rule 12b-1 plan of a particular class of the Fund are charged to the operations of such class. Transfer agency fees and expenses and other shareholder recordkeeping fees and expenses attributable to Class R5 and Class R6 are allocated based on relative net assets of Class R5 and Class R6. Sub-accounting fees attributable to Class R5 are charged to the operations of the class. Transfer agency fees and expenses and other shareholder recordkeeping fees and expenses relating to all other classes are allocated among those classes based on relative net assets. All other expenses are allocated among the classes based on the relative value of settled shares.
F.
Accounting Estimates – The preparation of financial statements in conformity with accounting principles generally accepted in the United States of America (“GAAP”) requires management to make estimates and assumptions that affect the reported amounts of assets and liabilities at the date of the financial statements and the reported amounts of revenues and expenses during the reporting period including estimates and assumptions related to taxation. Actual results could differ from those estimates by a significant amount. In addition, the Fund monitors for material events or transactions that may occur or become known after the period-end date and before the date the financial statements are released to print.
G.
Indemnifications – Under the Trust’s organizational documents, each Trustee, officer, employee or other agent of the Trust is indemnified against certain liabilities that may arise out of the performance of their duties to the Fund. Additionally, in the normal course of business, the Fund enters into contracts, including the Fund’s servicing agreements, that contain a variety of indemnification clauses. The Fund’s maximum exposure under these arrangements is unknown as this would involve future claims that may be made against the Fund that have not yet occurred. The risk of material loss as a result of such indemnification claims is considered remote.
H.
Segment Reporting — In November 2023, the FASB issued Accounting Standards Update 2023-07, Segment Reporting (Topic 280): Improvements to Reportable Segment Disclosures (“ASU 2023-07”), with the intent of improving reportable segment disclosure requirements, primarily through enhanced disclosures about significant segment expenses, allowing financial statement users to better understand the components of a segment’s profit or loss and assess potential future cash flows for each reportable segment and the entity as a whole thereby enabling better understanding of how an entity’s segments impact overall performance. The Fund represents a single operating segment. Subject to the oversight and, when applicable, approval of the Board of Trustees, the Fund’s Adviser acts as the Fund’s chief operating decision maker (“CODM”), assessing performance and making decisions about resource allocation within the Fund. The CODM monitors the operating results as a whole and the Fund’s long-term strategic asset allocation is determined in accordance with the terms of its prospectus based on a defined investment strategy. The financial information provided to and reviewed by the CODM is consistent with that presented in the Fund’s financial statements. Adoption of the new standard impacted the Fund’s financial statement note disclosures only and did not affect the Fund’s financial position or the results of its operations.
I.
Futures Contracts — The Fund may enter into futures contracts to manage exposure to interest rate, equity and market price movements and/or currency risks. A futures contract is an agreement between two parties ("Counterparties") to purchase or sell a specified underlying security, currency or commodity (or delivery of a cash settlement price, in the case of an index future) for a fixed price at a future date. The Fund currently invests only in exchange-traded futures and they are standardized as to maturity date and underlying instrument or asset. Initial margin deposits required upon entering into futures contracts are satisfied by the segregation of specific securities or cash as collateral at the futures commission merchant (broker). During the period the futures contracts are open, changes in the value of the contracts are recognized as unrealized gains or losses by recalculating the value of the contracts on a daily basis. Subsequent or variation margin payments are received or made depending upon whether unrealized gains or losses are incurred. These amounts are reflected as receivables or payables on the Statement of Assets and Liabilities. When the contracts are closed or expire, the Fund recognizes a realized gain or loss equal to the difference between the proceeds from, or cost of, the closing transaction and the Fund’s basis in the contract. The net realized gain (loss) and the change in unrealized gain (loss) on futures contracts held during the period is included on the Statement of Operations. The primary risks associated with futures contracts are market risk and the absence of a liquid secondary market. If the Fund were unable to liquidate a futures contract and/or enter into an offsetting closing transaction, the Fund would continue to be subject to market risk with respect to the value of the contracts and continue to be required to maintain the margin deposits on the futures
13
Invesco Quality Income Fund
contracts. Futures contracts have minimal Counterparty risk since the exchange’s clearinghouse, as Counterparty to all exchange-traded futures, guarantees the futures against default. Risks may exceed amounts recognized in the Statement of Assets and Liabilities.
J.
Dollar Rolls and Forward Commitment Transactions - The Fund may enter into dollar roll transactions to enhance the Fund’s performance. The Fund executes its dollar roll transactions in the to be announced (“TBA”) market whereby the Fund makes a forward commitment to purchase a security and, instead of accepting delivery, the position is offset by the sale of the security with a simultaneous agreement to repurchase at a future date.
The Fund accounts for dollar roll transactions as purchases and sales and realizes gains and losses on these transactions. These transactions increase the Fund’s portfolio turnover rate.
Dollar roll transactions involve the risk that a Counterparty to the transaction may fail to complete the transaction. If this occurs, the Fund may lose the opportunity to purchase or sell the security at the agreed upon price. Dollar roll transactions also involve the risk that the value of the securities retained by the Fund may decline below the price of the securities that the Fund has sold but is obligated to purchase under the agreement.
K.
Leverage Risk — Leverage exists when the Fund can lose more than it originally invests because it purchases or sells an instrument or enters into a transaction without investing an amount equal to the full economic exposure of the instrument or transaction.
L.
Collateral —To the extent the Fund has designated or segregated a security as collateral and that security is subsequently sold, it is the Fund’s practice to replace such collateral no later than the next business day. This practice does not apply to securities pledged as collateral for securities lending transactions.
M.
Other Risks - Obligations of U.S. Government agencies and authorities receive varying levels of support and may not be backed by the full faith and credit of the U.S. Government, which could affect the Fund’s ability to recover should they default. No assurance can be given that the U.S. Government will provide financial support to its agencies and authorities if it is not obligated by law to do so.
Mortgage- and asset-backed securities, including collateralized debt obligations and collateralized mortgage obligations, are subject to prepayment or call risk, which is the risk that a borrower’s payments may be received earlier or later than expected due to changes in prepayment rates on underlying loans. This could result in the Fund reinvesting these early payments at lower interest rates, thereby reducing the Fund’s income. Mortgage- and asset-backed securities also are subject to extension risk, which is the risk that an unexpected rise in interest rates could reduce the rate of prepayments, causing the price of the mortgage- and asset-backed securities and the Fund’s share price to fall. An unexpectedly high rate of defaults on the mortgages held by a mortgage pool may adversely affect the value of mortgage-backed securities and could result in losses to the Fund. Privately-issued mortgage-backed securities and asset-backed securities may be less liquid than other types of securities and the Fund may be unable to sell these securities at the time or price it desires.
Active trading of portfolio securities may result in added expenses, a lower return and increased tax liability.
Fluctuations in the federal funds and equivalent foreign rates or other changes to monetary policy or regulatory actions may expose fixed income markets to heightened volatility, perhaps suddenly and to a significant degree, and to reduced liquidity for certain fixed income investments, particularly those with longer maturities, when rates increase. Such changes and resulting increased volatility may adversely impact the Fund, including its operations, universe of potential investment options, and return potential. It is difficult to predict the impact of interest rate changes on various markets. In addition, decreases in fixed income dealer market-making capacity may also potentially lead to heightened volatility and reduced liquidity in the fixed income markets. As a result, the value of the Fund’s investments and share price may decline. Changes in central bank policies and other governmental actions and political events within the U.S. and abroad may also, among other things, affect investor and consumer expectations and confidence in the financial markets. This could result in higher than normal redemptions by shareholders, which could potentially increase the Fund’s portfolio turnover rate and transaction costs.
NOTE 2—Advisory Fees and Other Fees Paid to Affiliates
The Trust has entered into a master investment advisory agreement with the Adviser. Under the terms of the investment advisory agreement, the Fund accrues daily and pays monthly an advisory fee to the Adviser based on the annual rate of the Fund’s average daily net assets as follows:
For the year ended December 31, 2024, the effective advisory fee rate incurred by the Fund was 0.43%.
Under the terms of a master sub-advisory agreement between the Adviser and each of Invesco Asset Management Deutschland GmbH, Invesco Asset Management Limited, Invesco Asset Management (Japan) Limited, Invesco Hong Kong Limited, Invesco Senior Secured Management, Inc. and Invesco Canada Ltd. and a separate sub-advisory agreement with Invesco Capital Management LLC (collectively, the "Affiliated Sub-Advisers") the Adviser, not the Fund, will pay 40% of the fees paid to the Adviser to any such Affiliated Sub-Adviser(s) that provide(s) discretionary investment management services to the Fund based on the percentage of assets allocated to such Affiliated Sub-Adviser(s).
The Adviser has agreed, for an indefinite period, to waive advisory fees and/or reimburse expenses of all shares to the extent necessary to limit total annual fund operating expenses after fee waiver and/or expense reimbursement (excluding certain items discussed below) of Class A, Class C, Class R, Class Y, Class R5 and Class R6 shares to 1.50%, 2.25%, 1.75%, 1.25%, 1.25% and 1.25%, respectively, of the Fund’s average daily net assets (the “boundary limits”). In determining the Adviser’s obligation to waive advisory fees and/or reimburse expenses, the following expenses are not taken into account, and could cause the total annual fund operating expenses after fee waiver and/or expense reimbursement to exceed the numbers reflected above: (1) interest; (2) taxes; (3) dividend expense on short sales; (4) extraordinary or non-routine items, including litigation expenses; and (5) expenses that the Fund has incurred but did not actually pay because of an expense offset arrangement. Invesco may amend and/or terminate these boundary limits at any time in its sole discretion and will inform the Board of Trustees of any such changes. The Adviser did not waive fees and/or reimburse expenses during the period under these boundary limits.
Further, the Adviser has contractually agreed, through at least August 31, 2026, to waive the advisory fee payable by the Fund in an amount equal to 100% of the net advisory fees the Adviser receives from the affiliated money market funds on investments by the Fund of uninvested cash in such affiliated money market funds.
For the year ended December 31, 2024, the Adviser waived advisory fees of $3,994.
The Trust has entered into a master administrative services agreement with Invesco pursuant to which the Fund has agreed to pay Invesco for certain administrative costs incurred in providing accounting services to the Fund. For the year ended December 31, 2024, expenses incurred under the agreement are shown in the Statement of Operations as Administrative services fees. Invesco has entered into a sub-administration agreement whereby State Street Bank and Trust Company
14
Invesco Quality Income Fund
(“SSB”) serves as fund accountant and provides certain administrative services to the Fund. Pursuant to a custody agreement with the Trust on behalf of the Fund, SSB also serves as the Fund’s custodian.
The Trust has entered into a transfer agency and service agreement with Invesco Investment Services, Inc. (“IIS”) pursuant to which the Fund has agreed to pay IIS a fee for providing transfer agency and shareholder services to the Fund and reimburse IIS for certain expenses incurred by IIS in the course of providing such services. IIS may make payments to intermediaries that provide omnibus account services, sub-accounting services and/or networking services. All fees payable by IIS to intermediaries that provide omnibus account services or sub-accounting services are charged back to the Fund, subject to certain limitations approved by the Trust’s Board of Trustees. For the year ended December 31, 2024, expenses incurred under the agreement are shown in the Statement of Operations as Transfer agent fees.
The Trust has entered into master distribution agreements with Invesco Distributors, Inc.(“IDI”) to serve as the distributor for the Class A, Class C, Class R, Class Y, Class R5 and Class R6 shares of the Fund. The Trust has adopted plans pursuant to Rule 12b-1 under the 1940 Act with respect to the Fund’s Class A, Class C and Class R shares (collectively the “Plans”). The Fund, pursuant to the Plans, reimburses IDI for its allocated share of expenses incurred for the period, up to a maximum annual rate of 0.25% of the average daily net assets of Class A shares and up to a maximum annual rate of 1.00% of the average daily net assets of Class C shares. The Fund pursuant to the Class R Plan, pays IDI compensation at the annual rate of 0.50% of the average daily net assets of Class R shares. The fees are accrued daily and paid monthly. Of the Plans payments, up to 0.25% of the average daily net assets of each class of shares may be paid to furnish continuing personal shareholder services to customers who purchase and own shares of such classes. Any amounts not paid as a service fee under the Plans would constitute an asset-based sales charge. Rules of the Financial Industry Regulatory Authority (“FINRA”) impose a cap on the total sales charges, including asset-based sales charges, that may be paid by any class of shares of the Fund. For the year ended December 31, 2024, expenses incurred under the Plans are shown in the Statement of Operations as Distribution fees.
Front-end sales commissions and CDSC (collectively, the “sales charges”) are not recorded as expenses of the Fund. Front-end sales commissions are deducted from proceeds from the sales of Fund shares prior to investment in Class A shares of the Fund. CDSC are deducted from redemption proceeds prior to remittance to the shareholder. During the year ended December 31, 2024, IDI advised the Fund that IDI retained $20,813 in front-end sales commissions from the sale of Class A shares and $1,979 and $1,981 from Class A and Class C shares, respectively, for CDSC imposed upon redemptions by shareholders.
Certain officers and trustees of the Trust are officers and directors of the Adviser, IIS and/or IDI.
NOTE 3—Additional Valuation Information
GAAP defines fair value as the price that would be received to sell an asset or paid to transfer a liability in an orderly transaction between market participants at the measurement date, under current market conditions. GAAP establishes a hierarchy that prioritizes the inputs to valuation methods, giving the highest priority to readily available unadjusted quoted prices in an active market for identical assets (Level 1) and the lowest priority to significant unobservable inputs (Level 3), generally when market prices are not readily available. Based on the valuation inputs, the securities or other investments are tiered into one of three levels. Changes in valuation methods may result in transfers in or out of an investment’s assigned level:
Level 1 – Prices are determined using quoted prices in an active market for identical assets.
Level 2 – Prices are determined using other significant observable inputs. Observable inputs are inputs that other market participants may use in pricing a security. These may include quoted prices for similar securities, interest rates, prepayment speeds, credit risk, yield curves, loss severities, default rates, discount rates, volatilities and others. When significant events cause market movements to occur after the close of the relevant foreign securities markets, foreign securities may be fair valued utilizing an independent pricing service.
Level 3 – Prices are determined using significant unobservable inputs. In situations where quoted prices or observable inputs are unavailable (for example, when there is little or no market activity for an investment at the end of the period), unobservable inputs may be used. Unobservable inputs reflect the Adviser’s assumptions about the factors market participants would use in determining fair value of the securities or instruments and would be based on the best available information.
The following is a summary of the tiered valuation input levels, as of December 31, 2024. The level assigned to the securities valuations may not be an indication of the risk or liquidity associated with investing in those securities. Because of the inherent uncertainties of valuation, the values reflected in the financial statements may materially differ from the value received upon actual sale of those investments.
| | | | |
Investments in Securities | | | | |
U.S. Government Sponsored Agency Mortgage-Backed Securities | | | | |
| | | | |
| | | | |
| | | | |
Agency Credit Risk Transfer Notes | | | | |
| | | | |
| | | | |
Total Investments in Securities | | | | |
Other Investments - Assets | | | | |
| | | | |
Other Investments - Liabilities* | | | | |
| | | | |
| | | | |
| | | | |
| Unrealized appreciation (depreciation). |
NOTE 4—Derivative Investments
The Fund may enter into an International Swaps and Derivatives Association Master Agreement (“ISDA Master Agreement”) under which a fund may trade OTC derivatives. An OTC transaction entered into under an ISDA Master Agreement typically involves a collateral posting arrangement, payment netting provisions and close-out netting provisions. These netting provisions allow for reduction of credit risk through netting of contractual obligations. The enforceability of the netting provisions of the ISDA Master Agreement depends on the governing law of the ISDA Master Agreement, among other factors.
15
Invesco Quality Income Fund
For financial reporting purposes, the Fund does not offset OTC derivative assets or liabilities that are subject to ISDA Master Agreements in the Statement of Assets and Liabilities.
Value of Derivative Investments at Period-End
The table below summarizes the value of the Fund’s derivative investments, detailed by primary risk exposure, held as of December 31, 2024:
| |
| |
Unrealized appreciation on futures contracts —Exchange-Traded(a) | |
Derivatives not subject to master netting agreements | |
Total Derivative Assets subject to master netting agreements | |
| |
| |
Unrealized depreciation on futures contracts —Exchange-Traded(a) | |
Derivatives not subject to master netting agreements | |
Total Derivative Liabilities subject to master netting agreements | |
| The daily variation margin receivable (payable) at period-end is recorded in the Statement of Assets and Liabilities. |
Effect of Derivative Investments for the year ended December 31, 2024
The table below summarizes the gains (losses) on derivative investments, detailed by primary risk exposure, recognized in earnings during the period:
| Location of Gain on
Statement of Operations |
| |
| |
| |
Change in Net Unrealized Appreciation: | |
| |
| |
The table below summarizes the average notional value of derivatives held during the period.
NOTE 5—Expense Offset Arrangement(s)
The expense offset arrangement is comprised of transfer agency credits which result from balances in demand deposit accounts used by the transfer agent for clearing shareholder transactions. For the year ended December 31, 2024, the Fund received credits from this arrangement, which resulted in the reduction of the Fund’s total expenses of $38,343.
NOTE 6—Trustees’ and Officers’ Fees and Benefits
Trustees’ and Officers’ Fees and Benefits include amounts accrued by the Fund to pay remuneration to certain Trustees and Officers of the Fund. Trustees have the option to defer compensation payable by the Fund, and Trustees’ and Officers’ Fees and Benefits also include amounts accrued by the Fund to fund such deferred compensation amounts. Those Trustees who defer compensation have the option to select various Invesco Funds in which their deferral accounts shall be deemed to be invested. Finally, certain current Trustees were eligible to participate in a retirement plan that provided for benefits to be paid upon retirement to Trustees over a period of time based on the number of years of service. The Fund may have certain former Trustees who also participate in a retirement plan and receive benefits under such plan. Trustees’ and Officers’ Fees and Benefits include amounts accrued by the Fund to fund such retirement benefits. Obligations under the deferred compensation and retirement plans represent unsecured claims against the general assets of the Fund.
The Fund may borrow for leveraging in an amount up to 5% of the Fund’s total assets (excluding the amount borrowed) at the time the borrowing is made. In doing so, the Fund is permitted to temporarily carry a negative or overdrawn balance in its account with SSB, the custodian bank. Such balances, if any at period end, are shown in the Statement of Assets and Liabilities under the payable caption Amount due custodian. To compensate the custodian bank for such overdrafts, the overdrawn Fund may either (1) leave funds as a compensating balance in the account so the custodian bank can be compensated by earning the additional interest; or (2) compensate by paying the custodian bank at a rate agreed upon by the custodian bank and Invesco, not to exceed the contractually agreed upon rate.
16
Invesco Quality Income Fund
NOTE 8—Distributions to Shareholders and Tax Components of Net Assets
Tax Character of Distributions to Shareholders Paid During the Fiscal Years Ended December 31, 2024 and 2023: |
| | |
| | |
| Includes short-term capital gain distributions, if any. |
Tax Components of Net Assets at Period-End: |
| |
Net unrealized appreciation (depreciation) — investments | |
Temporary book/tax differences | |
Capital loss carryforward | |
Shares of beneficial interest | |
| |
The difference between book-basis and tax-basis unrealized appreciation (depreciation) is due to differences in the timing of recognition of gains and losses on investments for tax and book purposes. The Fund’s net unrealized appreciation (depreciation) difference is attributable primarily to derivative instruments and wash sales.
The temporary book/tax differences are a result of timing differences between book and tax recognition of income and/or expenses. The Fund’s temporary book/tax differences are the result of the trustee deferral of compensation and retirement plan benefits.
Capital loss carryforward is calculated and reported as of a specific date. Results of transactions and other activity after that date may affect the amount of capital loss carryforward actually available for the Fund to utilize. The ability to utilize capital loss carryforward in the future may be limited under the Internal Revenue Code and related regulations based on the results of future transactions.
The Fund has a capital loss carryforward as of December 31, 2024, as follows:
Capital Loss Carryforward* |
| | | |
Not subject to expiration | | | |
*
Capital loss carryforward is reduced for limitations, if any, to the extent required by the Internal Revenue Code and may be further limited depending upon a variety of factors, including the realization of net unrealized gains or losses as of the date of any reorganization.
NOTE 9—Investment Transactions
The aggregate amount of investment securities (other than short-term securities, U.S. Government obligations and money market funds, if any) purchased and sold by the Fund during the year ended December 31, 2024 was $9,795,275 and $17,295,738, respectively. As of December 31, 2024, the aggregate cost of investments, including any derivatives, on a tax basis listed below includes the adjustments for financial reporting purposes as of the most recently completed federal income tax reporting period-end:
Unrealized Appreciation (Depreciation) of Investments on a Tax Basis |
Aggregate unrealized appreciation of investments | |
Aggregate unrealized (depreciation) of investments | |
Net unrealized appreciation (depreciation) of investments | |
Cost of investments for tax purposes is $747,367,074.
NOTE 10—Reclassification of Permanent Differences
Primarily as a result of differing book/tax treatment of dollar rolls and paydowns, on December 31, 2024, undistributed net investment income was increased by $2,266,321, undistributed net realized gain (loss) was decreased by $2,244,429 and shares of beneficial interest was decreased by $21,892. This reclassification had no effect on the net assets of the Fund.
NOTE 11—Share Information
| Summary of Share Activity |
| | Year ended
December 31, 2023 |
| | | | |
| | | | |
| | | | |
| | | | |
| | | | |
| | | | |
| | | | |
| | | | |
17
Invesco Quality Income Fund
| Summary of Share Activity |
| Year ended December 31, 2024(a) | Year ended December 31, 2023 |
| | | | |
Issued as reinvestment of dividends: | | | | |
| | | | |
| | | | |
| | | | |
| | | | |
| | | | |
| | | | |
Automatic conversion of Class C shares to Class A shares: | | | | |
| | | | |
| | | | |
| | | | |
| | | | |
| | | | |
| | | | |
| | | | |
| | | | |
| | | | |
Net increase (decrease) in share activity | | | | |
| There are entities that are record owners of more than 5% of the outstanding shares of the Fund and in the aggregate own 16% of the outstanding shares of the Fund. IDI has an agreement with these entities to sell Fund shares. The Fund, Invesco and/or Invesco affiliates may make payments to these entities, which are considered to be related to the Fund, for providing services to the Fund, Invesco and/or Invesco affiliates including but not limited to services such as securities brokerage, distribution, third party record keeping and account servicing. The Fund has no knowledge as to whether all or any portion of the shares owned of record by these entities are also owned beneficially. |
18
Invesco Quality Income Fund
Report of Independent Registered Public Accounting Firm
To the Board of Trustees of AIM Growth Series (Invesco Growth Series) and Shareholders of Invesco Quality Income Fund
Opinion on the Financial Statements
We have audited the accompanying statement of assets and liabilities, including the schedule of investments, of Invesco Quality Income Fund (one of the funds constituting AIM Growth Series (Invesco Growth Series), referred to hereafter as the "Fund") as of December 31, 2024, the related statement of operations for the year ended December 31, 2024, the statement of changes in net assets for each of the two years in the period ended December 31, 2024, including the related notes, and the financial highlights for each of the periods indicated therein (collectively referred to as the "financial statements"). In our opinion, the financial statements present fairly, in all material respects, the financial position of the Fund as of December 31, 2024, the results of its operations for the year then ended, the changes in its net assets for each of the two years in the period ended December 31, 2024 and the financial highlights for each of the periods indicated therein in conformity with accounting principles generally accepted in the United States of America.
These financial statements are the responsibility of the Fund’s management. Our responsibility is to express an opinion on the Fund’s financial statements based on our audits. We are a public accounting firm registered with the Public Company Accounting Oversight Board (United States) (PCAOB) and are required to be independent with respect to the Fund in accordance with the U.S. federal securities laws and the applicable rules and regulations of the Securities and Exchange Commission and the PCAOB.
We conducted our audits of these financial statements in accordance with the standards of the PCAOB. Those standards require that we plan and perform the audit to obtain reasonable assurance about whether the financial statements are free of material misstatement, whether due to error or fraud.
Our audits included performing procedures to assess the risks of material misstatement of the financial statements, whether due to error or fraud, and performing procedures that respond to those risks. Such procedures included examining, on a test basis, evidence regarding the amounts and disclosures in the financial statements. Our audits also included evaluating the accounting principles used and significant estimates made by management, as well as evaluating the overall presentation of the financial statements. Our procedures included confirmation of securities owned as of December 31, 2024 by correspondence with the custodian, transfer agent and brokers. We believe that our audits provide a reasonable basis for our opinion.
/s/PricewaterhouseCoopers LLP
February 20, 2025
We have served as the auditor of one or more of the investment companies in the Invesco group of investment companies since at least 1995. We have not been able to determine the specific year we began serving as auditor.
19
Invesco Quality Income Fund
Distribution Information
The following table sets forth on a per share basis the distribution that was paid in October 2024. Included in the table is a written statement of the sources of the distribution on a generally accepted accounting principles (“GAAP”) basis.
| | | Gain from
Sale of Securities | | |
| | | | | |
| | | | | |
| | | | | |
| | | | | |
| | | | | |
| | | | | |
Please note that the information in the preceding chart is for financial accounting purposes only. Shareholders should be aware that the tax treatment of distributions likely differs from GAAP treatment. Form 1099-DIV for the calendar year will report distributions for U.S. federal income tax purposes. This notice is sent to comply with certain U.S. Securities and Exchange Commission requirements.
20
Invesco Quality Income Fund
Tax Information
Form 1099-DIV, Form 1042-S and other year–end tax information provide shareholders with actual calendar year amounts that should be included in their tax returns. Shareholders should consult their tax advisers.
The following distribution information is being provided as required by the Internal Revenue Code or to meet a specific state’s requirement.
The Fund designates the following amounts or, if subsequently determined to be different, the maximum amount allowable for its fiscal year ended December 31, 2024:
Federal and State Income Tax | |
Qualified Dividend Income* | |
Corporate Dividends Received Deduction* | |
U.S. Treasury Obligations* | |
Qualified Business Income* | |
Business Interest Income* | |
*
The above percentages are based on ordinary income dividends paid to shareholders during the Fund’s fiscal year.
21
Invesco Quality Income Fund
Other Information Required in Form N-CSR (Items 8-11)
Changes in and Disagreements with Accountants for Open-End Management Investment Companies
Proxy Disclosures for Open-End Management Investment Companies
Remuneration Paid to Directors, Officers, and Others of Open-End Management Investment Companies
The aggregate remuneration paid to directors, officers and others is disclosed within the financial statements.
Statement Regarding Basis for Approval of Investment Advisory Contracts
22
Invesco Quality Income Fund
SEC file number(s): 811-02699 and 002-57526
Invesco Distributors, Inc.
VK-QINC-NCSR
Annual Financial Statements and Other InformationDecember 31, 2024
Invesco Select Risk: Conservative Investor Fund
A: OACIX ■ C: OCCIX ■ R: ONCIX ■ Y: OYCIX ■ R5: PXCIX ■ R6: PXCCX
| |
| |
| |
| Notes to Financial Statements |
| Report of Independent Registered Public Accounting Firm |
| |
| Other Information Required in Form N-CSR (Items 8-11) |
Schedule of Investments
Invesco Select Risk: Conservative Investor Fund |
Schedule of Investments in Affiliated Issuers–100.00%(a) |
| | | | | Change in
Unrealized
Appreciation
(Depreciation) | | | | |
|
Invesco Global Real Estate Income | | | | | | | | | |
Invesco Macro Allocation Strategy Fund, Class R6 | | | | | | | | | |
| | | | | | | | | |
Domestic Equity Funds–10.75% |
Invesco Discovery Mid Cap Growth Fund, Class R6 | | | | | | | | | |
Invesco Main Street Small Cap Fund, Class R6 | | | | | | | | | |
| | | | | | | | | |
Invesco Russell 1000® Dynamic Multifactor ETF | | | | | | | | | |
Invesco S&P 500® Low Volatility ETF | | | | | | | | | |
Invesco S&P 500® Pure Growth ETF | | | | | | | | | |
Invesco S&P 500® Pure Value ETF | | | | | | | | | |
Invesco Value Opportunities Fund, Class R6 | | | | | | | | | |
Total Domestic Equity Funds | | | | | | | | | |
Fixed Income Funds–78.31% |
Invesco Core Bond Fund, Class R6 | | | | | | | | | |
Invesco Core Plus Bond Fund, Class R6 | | | | | | | | | |
Invesco Emerging Markets Sovereign Debt ETF | | | | | | | | | |
Invesco Equal Weight 0-30 Year Treasury ETF | | | | | | | | | |
Invesco Floating Rate ESG Fund, | | | | | | | | | |
Invesco High Yield Fund, Class R6 | | | | | | | | | |
Invesco Income Fund, Class R6 | | | | | | | | | |
Invesco International Bond Fund, | | | | | | | | | |
Invesco Taxable Municipal Bond ETF | | | | | | | | | |
Invesco Variable Rate Investment Grade ETF | | | | | | | | | |
| | | | | | | | | |
International and Global Equity Funds–5.55% |
Invesco EQV Emerging Markets All Cap Fund, Class R6 | | | | | | | | | |
Invesco Developing Markets Fund, Class R6 | | | | | | | | | |
Invesco FTSE RAFI Developed Markets ex-U.S. ETF | | | | | | | | | |
Invesco Global Fund, Class R6 | | | | | | | | | |
Invesco Global Infrastructure Fund, Class R6 | | | | | | | | | |
Invesco International Developed Dynamic Multifactor ETF | | | | | | | | | |
Invesco International Small-Mid Company Fund, Class R6 | | | | | | | | | |
Invesco Oppenheimer International Growth Fund, Class R6 | | | | | | | | | |
Invesco S&P Emerging Markets Low Volatility ETF | | | | | | | | | |
Invesco S&P International Developed Low Volatility ETF | | | | | | | | | |
Total International and Global Equity Funds | | | | | | | | | |
See accompanying Notes to Financial Statements which are an integral part of the financial statements.
2
Invesco Select Risk: Conservative Investor Fund
Invesco Select Risk: Conservative Investor Fund (continued) |
Schedule of Investments in Affiliated Issuers–100.00%(a) |
| | | | | Change in Unrealized Appreciation (Depreciation) | | | | |
|
Invesco Government & Agency Portfolio, Institutional Class, | | | | | | | | | |
Invesco Liquid Assets Portfolio, | | | | | | | | | |
Invesco Treasury Portfolio, Institutional Class, 4.38%(c) | | | | | | | | | |
| | | | | | | | | |
TOTAL INVESTMENTS IN AFFILIATED ISSUERS (excluding investments purchased with cash collateral from securities on loan)
(Cost $371,175,308) | | | | | | | | | |
|
Investments Purchased with Cash Collateral from Securities on Loan | | | | | | | | | |
|
Invesco Private Government Fund, | | | | | | | | | |
Invesco Private Prime Fund, | | | | | | | | | |
Total Investments Purchased with Cash Collateral from Securities on Loan
(Cost $0) | | | | | | | | | |
TOTAL INVESTMENTS IN AFFILIATED ISSUERS (Cost $371,175,308) | | | | | | | | | |
OTHER ASSETS LESS LIABILITIES | | | | | | | | | |
| | | | | | | | | |
Investment Abbreviations:
Notes to Schedule of Investments:
| Each underlying fund and the Fund are affiliated by either having the same investment adviser or an investment adviser under common control with the Fund’s investment adviser. |
| Includes return of capital distribution. |
| The rate shown is the 7-day SEC standardized yield as of December 31, 2024. |
| The security has been segregated to satisfy the commitment to return the cash collateral received in securities lending transactions upon the borrower’s return of the securities loaned. See Note 1I. |
| Represents the income earned on the investment of cash collateral, which is included in securities lending income on the Statement of Operations. Does not include rebates and fees paid to lending agent or premiums received from borrowers, if any. |
| Includes capital gains distributions from affiliated underlying funds as follows: |
| |
Invesco Discovery Mid Cap Growth Fund | |
| |
Invesco Global Infrastructure Fund | |
Invesco International Small-Mid Company Fund | |
Invesco Main Street Small Cap Fund | |
Invesco Oppenheimer International Growth Fund | |
Invesco Value Opportunities Fund | |
See accompanying Notes to Financial Statements which are an integral part of the financial statements.
3
Invesco Select Risk: Conservative Investor Fund
Statement of Assets and Liabilities
| |
Investments in affiliated underlying funds, at value
(Cost $371,175,308) | |
| |
| |
| |
Dividends - affiliated underlying funds | |
Investment for trustee deferred compensation and retirement plans | |
| |
| |
| |
| |
Investments purchased - affiliated underlying funds | |
| |
Accrued fees to affiliates | |
Accrued trustees’ and officers’ fees and benefits | |
Accrued other operating expenses | |
Trustee deferred compensation and retirement plans | |
| |
Net assets applicable to shares outstanding | |
| |
Shares of beneficial interest | |
Distributable earnings (loss) | |
| |
|
| |
| |
| |
| |
| |
| |
Shares outstanding, no par value, with an unlimited number of shares authorized: |
| |
| |
| |
| |
| |
| |
| |
Net asset value per share | |
Maximum offering price per share
(Net asset value of $8.48 ÷ 94.50%) | |
| |
Net asset value and offering price per share | |
| |
Net asset value and offering price per share | |
| |
Net asset value and offering price per share | |
| |
Net asset value and offering price per share | |
| |
Net asset value and offering price per share | |
See accompanying Notes to Financial Statements which are an integral part of the financial statements.
4
Invesco Select Risk: Conservative Investor Fund
Statement of Operations
For the year ended December 31, 2024
| |
Dividends from affiliated underlying funds (includes net securities lending income of $3,812) | |
| |
| |
| |
| |
| |
| |
| |
| |
Transfer agent fees — A, C, R and Y | |
| |
| |
Trustees’ and officers’ fees and benefits | |
Registration and filing fees | |
| |
Professional services fees | |
| |
| |
Less: Expense offset arrangement(s) | |
| |
| |
Realized and unrealized gain (loss) from: | |
Net realized gain (loss) from: | |
Affiliated underlying fund shares | |
Capital gain distributions from affiliated underlying fund shares | |
| |
Change in net unrealized appreciation of affiliated underlying fund shares | |
Net realized and unrealized gain | |
Net increase in net assets resulting from operations | |
See accompanying Notes to Financial Statements which are an integral part of the financial statements.
5
Invesco Select Risk: Conservative Investor Fund
Statement of Changes in Net Assets
For the years ended December 31, 2024 and 2023
| | |
| | |
| | |
| | |
Change in net unrealized appreciation | | |
Net increase in net assets resulting from operations | | |
Distributions to shareholders from distributable earnings: | | |
| | |
| | |
| | |
| | |
| | |
| | |
Total distributions from distributable earnings | | |
| | |
| | |
| | |
| | |
| | |
| | |
| | |
Net increase (decrease) in net assets resulting from share transactions | | |
Net increase (decrease) in net assets | | |
| | |
| | |
| | |
See accompanying Notes to Financial Statements which are an integral part of the financial statements.
6
Invesco Select Risk: Conservative Investor Fund
Financial Highlights
The following schedule presents financial highlights for a share of the Fund outstanding throughout the periods indicated.
| Net asset
value,
beginning
of period | | Net gains
(losses)
on securities
(both
realized and
unrealized) | Total from
investment
operations | Dividends
from net
investment
income | Distributions
from net
realized
gains | | Net asset
value, end
of period | | Net assets,
end of period
(000’s omitted) | Ratio of
expenses
to average
net assets
with fee waivers
and/or
expenses
| Ratio of
expenses
to average net
assets without
fee waivers
and/or
expenses
absorbed
| Ratio of net
investment
income
to average
net assets | |
|
| | | | | | | | | | | | | | |
| | | | | | | | | | | | | | |
| | | | | | | | | | | | | | |
| | | | | | | | | | | | | | |
| | | | | | | | | | | | | | |
|
| | | | | | | | | | | | | | |
| | | | | | | | | | | | | | |
| | | | | | | | | | | | | | |
| | | | | | | | | | | | | | |
| | | | | | | | | | | | | | |
|
| | | | | | | | | | | | | | |
| | | | | | | | | | | | | | |
| | | | | | | | | | | | | | |
| | | | | | | | | | | | | | |
| | | | | | | | | | | | | | |
|
| | | | | | | | | | | | | | |
| | | | | | | | | | | | | | |
| | | | | | | | | | | | | | |
| | | | | | | | | | | | | | |
| | | | | | | | | | | | | | |
|
| | | | | | | | | | | | | | |
| | | | | | | | | | | | | | |
| | | | | | | | | | | | | | |
| | | | | | | | | | | | | | |
| | | | | | | | | | | | | | |
|
| | | | | | | | | | | | | | |
| | | | | | | | | | | | | | |
| | | | | | | | | | | | | | |
| | | | | | | | | | | | | | |
| | | | | | | | | | | | | | |
| Calculated using average shares outstanding. |
| Includes adjustments in accordance with accounting principles generally accepted in the United States of America and as such, the net asset value for financial reporting purposes and the returns based upon those net asset values may differ from the net asset value and returns for shareholder transactions. Does not include sales charges and is not annualized for periods less than one year, if applicable. |
| In addition to the fees and expenses which the Fund bears directly, the Fund indirectly bears a pro rata share of the fees and expenses of the underlying funds in which the Fund invests. Because the underlying funds have varied expenses and fee levels and the Fund may own different proportions at different times, the amount of fees and expenses incurred indirectly by the Fund will vary. Estimated underlying fund expenses are not expenses that are incurred directly by the Fund. They are expenses that are incurred directly by the underlying funds and are deducted from the value of the funds the Fund invests in. The effect of the estimated underlying fund expenses that the Fund bears indirectly is included in the Fund’s total return. Estimated acquired fund fees from underlying funds was 0.47%, 0.47%, 0.45%, 0.47% and 0.55% for the years ended December 31, 2024, 2023, 2022, 2021 and 2020, respectively. |
| Portfolio turnover is calculated at the fund level and is not annualized for periods less than one year, if applicable. |
| The total return, ratios of expenses to average net assets and ratio of net investment income (loss) to average net assets reflect actual 12b-1 fees of 0.24% for the years ended December 31, 2024, 2023, 2022, 2021 and 2020, respectively. |
See accompanying Notes to Financial Statements which are an integral part of the financial statements.
7
Invesco Select Risk: Conservative Investor Fund
Notes to Financial Statements
NOTE 1—Significant Accounting Policies
Invesco Select Risk: Conservative Investor Fund (the “Fund”) is a series portfolio of AIM Growth Series (Invesco Growth Series) (the “Trust”). The Trust is a Delaware statutory trust registered under the Investment Company Act of 1940, as amended (the “1940 Act”), as an open-end series management investment company authorized to issue an unlimited number of shares of beneficial interest. Information presented in these financial statements pertains only to the Fund. Matters affecting the Fund or each class will be voted on exclusively by the shareholders of the Fund or each class.
The Fund’s investment objective is to seek total return.
The Fund is a “fund of funds”, in that it invests in other mutual funds advised by Invesco Advisers, Inc. (the “Adviser” or “Invesco”) and exchange-traded funds ("ETFs") and other pooled investment vehicles advised by Invesco Capital Management LLC (“Invesco Capital”) or mutual funds, ETFs and other pooled investment vehicles advised by unaffiliated advisers (“underlying funds”). Invesco and Invesco Capital are affiliates of each other as they are indirect, wholly-owned subsidiaries of Invesco Ltd. Invesco may change the Fund’s asset class allocations, the underlying funds or the target weightings in the underlying funds without shareholder approval or notice to shareholders. The underlying funds may engage in a number of investment techniques and practices, which involve certain risks. Each underlying fund’s accounting policies are outlined in the underlying fund’s financial statements and are publicly available.
The Fund currently consists of six different classes of shares: Class A, Class C, Class R, Class Y, Class R5 and Class R6. Class Y shares are available only to certain investors. Class A shares are sold with a front-end sales charge unless certain waiver criteria are met. Under certain circumstances, load waived shares may be subject to contingent deferred sales charges ("CDSC"). Class C shares are sold with a CDSC. Class R, Class Y, Class R5 and Class R6 shares are sold at net asset value. Class C shares held for eight years after purchase are eligible for automatic conversion into Class A shares of the same Fund (the "Conversion Feature"). The automatic conversion pursuant to the Conversion Feature will generally occur at the end of the month following the eighth anniversary after a purchase of Class C shares.
Effective after the close of business on September 30, 2024, Class R5 shares are closed to new investors.
The Fund is an investment company and accordingly follows the investment company accounting and reporting guidance in accordance with Financial Accounting Standards Board Accounting Standards Codification Topic 946, Financial Services – Investment Companies.
The following is a summary of the significant accounting policies followed by the Fund in the preparation of its financial statements.
A.
Security Valuations — Securities of investment companies listed or traded on an exchange are generally valued at the trade price or official closing price that day as of the close of the exchange where the security is principally traded, or lacking any trades or official closing price on a particular day, the security may be valued at the closing bid price on that day. Securities of investment companies that are not exchange-traded (e.g., open-end mutual funds) are valued using such company’s end-of-business-day net asset value per share. Securities in the underlying funds, including restricted securities, are valued in accordance with the valuation policy of such fund. The policies of the underlying funds affiliated with the Fund, as a result of having the same investment adviser, are set forth below.
A security listed or traded on an exchange is generally valued at its trade price or official closing price that day as of the close of the exchange where the security is principally traded, or lacking any trades or official closing price on a particular day, the security may be valued at the closing bid or ask price on that day. Securities traded in the over-the-counter market are valued based on prices furnished by independent pricing services or market makers. When such securities are valued using prices provided by an independent pricing service they may be considered fair valued. Futures contracts are valued at the daily settlement price set by an exchange on which they are principally traded. Where a final settlement price exists, exchange-traded options are valued at the final settlement price from the exchange where the option principally trades. Where a final settlement price does not exist, exchange-traded options are valued at the mean between the last bid and ask price generally from the exchange where the option principally trades.
Variable rate senior loan interests are fair valued using quotes provided by an independent pricing service. Quotes provided by the pricing service may reflect appropriate factors such as ratings, tranche type, industry, company performance, spread, individual trading characteristics, institution-size trading in similar groups of securities and other market data.
Securities of investment companies that are not exchange-traded (e.g., open-end mutual funds) are valued using such company’s end-of-business-day net asset value per share.
Deposits, other obligations of U.S. and non-U.S. banks and financial institutions are valued at their daily account value.
Fixed income securities (including convertible debt securities) generally are valued on the basis of prices provided by independent pricing services. Prices provided by the pricing service may be determined without exclusive reliance on quoted prices, and may reflect appropriate factors such as institution-size trading in similar groups of securities, developments related to specific securities, dividend rate (for unlisted equities), yield (for debt obligations), quality, type of issue, coupon rate (for debt obligations), maturity (for debt obligations), individual trading characteristics and other market data. Pricing services generally value debt obligations assuming orderly transactions of institutional round lot size, but a fund may hold or transact in the same securities in smaller, odd lot sizes. Odd lots often trade at lower prices than institutional round lots, and their value may be adjusted accordingly. Debt obligations are subject to interest rate and credit risks. In addition, all debt obligations involve some risk of default with respect to interest and/or principal payments.
Swap agreements are fair valued using an evaluated quote, if available, provided by an independent pricing service. Evaluated quotes provided by the pricing service are valued based on a model which may include end-of-day net present values, spreads, ratings, industry, company performance and returns of referenced assets. Centrally cleared swap agreements are valued at the daily settlement price determined by the relevant exchange or clearinghouse.
Foreign securities’ (including foreign exchange contracts) prices are converted into U.S. dollar amounts using the applicable exchange rates as of the close of the New York Stock Exchange (“NYSE”). If market quotations are available and reliable for foreign exchange-traded equity securities, the securities will be valued at the market quotations. The Adviser may use various pricing services to obtain market quotations as well as fair value prices. Because trading hours for certain foreign securities end before the close of the NYSE, closing market quotations may become not representative of market value in the Adviser’s judgment (“unreliable”). If, between the time trading ends on a particular security and the close of the customary trading session on the NYSE, a significant event occurs that makes the closing price of the security unreliable, the Adviser may fair value the security. If the event is likely to have affected the closing price of the security, the security will be valued at fair value in good faith in accordance with Board- approved policies and related Adviser procedures (“Valuation Procedures”). Adjustments to closing prices to reflect fair value may also be based on a screening process of an independent pricing service to indicate the degree of certainty, based on historical data, that the closing price in the principal market where a foreign security trades is not the current value as of the close of the NYSE. Foreign securities’ prices meeting the degree of certainty that the price is not reflective of current value will be priced at the indication of fair value from the independent pricing service. Multiple factors may be considered by the independent pricing service in determining adjustments to reflect fair value and may include information relating to sector indices, American Depositary Receipts and domestic and foreign index futures. Foreign securities may have additional risks including exchange rate changes, potential for sharply devalued currencies and high inflation, political and economic upheaval, the relative lack of issuer information, relatively low market liquidity and the potential lack of strict financial and accounting controls and standards.
Unlisted securities will be valued using prices provided by independent pricing services or by another method that the Adviser, in its judgment, believes better reflects the security’s fair value in accordance with the Valuation Procedures.
Non-traded rights and warrants shall be valued at intrinsic value if the terms of the rights and warrants are available, specifically the subscription or exercise price and the ratio. Intrinsic value is calculated as the daily market closing price of the security to be received less the subscription price, which is then adjusted by
8
Invesco Select Risk: Conservative Investor Fund
the exercise ratio. In the case of warrants, an option pricing model supplied by an independent pricing service may be used based on market data such as volatility, stock price and interest rate from the independent pricing service and strike price and exercise period from verified terms.
Securities for which market prices are not provided by any of the above methods may be valued based upon quotes furnished by independent sources. The mean between the last bid and ask prices may be used to value debt obligations, including corporate loans.
Securities for which market quotations are not readily available are fair valued by the Adviser in accordance with the Valuation Procedures. If a fair value price provided by a pricing service is unreliable, the Adviser will fair value the security using the Valuation Procedures. Issuer specific events, market trends, bid/ask quotes of brokers and information providers and other market data may be reviewed in the course of making a good faith determination of a security’s fair value.
The Fund may invest in securities that are subject to interest rate risk, meaning the risk that the prices will generally fall as interest rates rise and, conversely, the prices will generally rise as interest rates fall. Specific securities differ in their sensitivity to changes in interest rates depending on their individual characteristics. Changes in interest rates may result in increased market volatility, which may affect the value and/or liquidity of certain Fund investments.
Valuations change in response to many factors including the historical and prospective earnings of the issuer, the value of the issuer’s assets, general market conditions which are not specifically related to the particular issuer, such as real or perceived adverse economic conditions, changes in the general outlook for revenues or corporate earnings, changes in interest or currency rates, regional or global instability, natural or environmental disasters, widespread disease or other public health issues, war, acts of terrorism, significant governmental actions or adverse investor sentiment generally and market liquidity. Because of the inherent uncertainties of valuation, the values reflected in the financial statements may materially differ from the value received upon actual sale of those investments.
The price the Fund could receive upon the sale of any investment may differ from the Adviser’s valuation of the investment, particularly for securities that are valued using a fair valuation technique. When fair valuation techniques are applied, the Adviser uses available information, including both observable and unobservable inputs and assumptions, to determine a methodology that will result in a valuation that the Adviser believes approximates market value. Fund securities that are fair valued may be subject to greater fluctuation in their value from one day to the next than would be the case if market quotations were used. Because of the inherent uncertainties of valuation, and the degree of subjectivity in such decisions, the Fund could realize a greater or lesser than expected gain or loss upon the sale of the investment.
B.
Securities Transactions and Investment Income — Securities transactions are accounted for on a trade date basis. Realized gains or losses on sales are computed on the basis of specific identification of the securities sold. Distributions from ordinary income from underlying funds, if any, are recorded as dividend income on the ex-dividend date. Distributions from gains from underlying funds, if any, are recorded as realized gains on the ex-dividend date. The following policies are followed by the underlying funds: Interest income (net of withholding tax, if any) is recorded on an accrual basis from settlement date and includes coupon interest and amortization of premium and accretion of discount on debt securities as applicable. Pay-in-kind interest income and non-cash dividend income received in the form of securities in lieu of cash are recorded at the fair value of the securities received. Paydown gains and losses on mortgage and asset-backed securities are recorded as adjustments to interest income.
The Fund may periodically participate in litigation related to the Fund’s investments. As such, the Fund may receive proceeds from litigation settlements. Any proceeds received are included in the Statement of Operations as realized gain (loss) for investments no longer held and as unrealized gain (loss) for investments still held.
The Fund allocates income and realized and unrealized capital gains and losses to a class based on the relative net assets of each class.
C.
Distributions – Distributions from net investment income and net realized capital gain, if any, are generally declared and paid annually and recorded on the ex-dividend date. The Fund may elect to treat a portion of the proceeds from redemptions as distributions for federal income tax purposes.
D.
Federal Income Taxes – The Fund intends to comply with the requirements of Subchapter M of the Internal Revenue Code of 1986, as amended (the “Internal Revenue Code”), necessary to qualify as a regulated investment company and to distribute substantially all of the Fund’s taxable earnings to shareholders. As such, the Fund will not be subject to federal income taxes on otherwise taxable income (including net realized capital gain) that is distributed to shareholders. Therefore, no provision for federal income taxes is recorded in the financial statements.
The Fund recognizes the tax benefits of uncertain tax positions only when the position is more likely than not to be sustained. Management has analyzed the Fund’s uncertain tax positions and concluded that no liability for unrecognized tax benefits should be recorded related to uncertain tax positions. Management is not aware of any tax positions for which it is reasonably possible that the total amounts of unrecognized tax benefits will change materially in the next 12 months.
The Fund files tax returns in the U.S. Federal jurisdiction and certain other jurisdictions. Generally, the Fund is subject to examinations by such taxing authorities for up to three years after the filing of the return for the tax period.
E.
Expenses – Expenses included in the accompanying financial statements reflect the expenses of the Fund and do not include any expenses of the underlying funds. The effects of the underlying funds expenses are included in the realized and unrealized gain/loss on the investments in the underlying funds. Estimated expenses of the underlying funds are discussed further within the Financial Highlights.
Fees provided for under the Rule 12b-1 plan of a particular class of the Fund and which are directly attributable to that class are charged to the operations of such class. Transfer agency fees and expenses and other shareholder recordkeeping fees and expenses attributable to Class R5 and Class R6 are allocated based on relative net assets of Class R5 and Class R6. Transfer agency fees and expenses and other shareholder recordkeeping fees and expenses relating to all other classes are allocated among those classes based on relative net assets. All other expenses are allocated among the classes based on relative net assets.
F.
Accounting Estimates – The preparation of financial statements in conformity with accounting principles generally accepted in the United States of America (“GAAP”) requires management to make estimates and assumptions that affect the reported amounts of assets and liabilities at the date of the financial statements and the reported amounts of revenues and expenses during the reporting period including estimates and assumptions related to taxation. Actual results could differ from those estimates by a significant amount. In addition, the Fund monitors for material events or transactions that may occur or become known after the period-end date and before the date the financial statements are released to print.
G.
Indemnifications – Under the Trust’s organizational documents, each Trustee, officer, employee or other agent of the Trust is indemnified against certain liabilities that may arise out of the performance of their duties to the Fund. Additionally, in the normal course of business, the Fund enters into contracts, including the Fund’s servicing agreements, that contain a variety of indemnification clauses. The Fund’s maximum exposure under these arrangements is unknown as this would involve future claims that may be made against the Fund that have not yet occurred. The risk of material loss as a result of such indemnification claims is considered remote.
H.
Segment Reporting — In November 2023, the FASB issued Accounting Standards Update 2023-07, Segment Reporting (Topic 280): Improvements to Reportable Segment Disclosures (“ASU 2023-07”), with the intent of improving reportable segment disclosure requirements, primarily through enhanced disclosures about significant segment expenses, allowing financial statement users to better understand the components of a segment’s profit or loss and assess potential future cash flows for each reportable segment and the entity as a whole thereby enabling better understanding of how an entity’s segments impact overall performance. The Fund represents a single operating segment. Subject to the oversight and, when applicable, approval of the Board of Trustees, the Fund’s Adviser acts as the Fund’s chief operating decision maker (“CODM”), assessing performance and making decisions about resource allocation within the Fund. The CODM monitors the operating results as a whole and the Fund’s long-term strategic asset allocation is determined in accordance with the terms of its prospectus based on a defined investment strategy. The financial information provided to and reviewed by the CODM is consistent with that presented in the Fund’s financial statements. Adoption of the new standard impacted the Fund’s financial statement note disclosures only and did not affect the Fund’s financial position or the results of its operations.
I.
Securities Lending – The Fund may lend portfolio securities having a market value up to one-third of the Fund’s total assets. Such loans are secured by
9
Invesco Select Risk: Conservative Investor Fund
collateral equal to no less than the market value of the loaned securities determined daily by the securities lending provider. Such collateral will be cash or debt securities issued or guaranteed by the U.S. Government or any of its sponsored agencies. Cash collateral received in connection with these loans is invested in short-term money market instruments or affiliated, unregistered investment companies that comply with Rule 2a-7 under the 1940 Act and money market funds (collectively, "affiliated money market funds") and is shown as such on the Schedule of Investments. The Fund bears the risk of loss with respect to the investment of collateral. It is the Fund’s policy to obtain additional collateral from or return excess collateral to the borrower by the end of the next business day, following the valuation date of the securities loaned. Therefore, the value of the collateral held may be temporarily less than the value of the securities on loan. When loaning securities, the Fund retains certain benefits of owning the securities, including the economic equivalent of dividends or interest generated by the security. Lending securities entails a risk of loss to the Fund if, and to the extent that, the market value of the securities loaned were to increase and the borrower did not increase the collateral accordingly, and the borrower failed to return the securities. The securities loaned are subject to termination at the option of the borrower or the Fund. Upon termination, the borrower will return to the Fund the securities loaned and the Fund will return the collateral. Upon the failure of the borrower to return the securities, collateral may be liquidated and the securities may be purchased on the open market to replace the loaned securities. The Fund could experience delays and costs in gaining access to the collateral and the securities may lose value during the delay which could result in potential losses to the Fund. Some of these losses may be indemnified by the lending agent. The Fund bears the risk of any deficiency in the amount of the collateral available for return to the borrower due to any loss on the collateral invested. Dividends received on cash collateral investments for securities lending transactions, which are net of compensation to counterparties, are included in Dividends from affiliated underlying funds on the Statement of Operations. The aggregate value of securities out on loan, if any, is shown as a footnote on the Statement of Assets and Liabilities.
The Adviser serves as an affiliated securities lending agent for the Fund. The Bank of New York Mellon also serves as a securities lending agent. To the extent the Fund utilizes the Adviser as an affiliated securities lending agent, the Fund conducts its securities lending in accordance with, and in reliance upon, no-action letters issued by the SEC staff that provide guidance on how an affiliate may act as a direct agent lender and receive compensation for those services in a manner consistent with the federal securities laws. For the year ended December 31, 2024, the Fund paid the Adviser fees for securities lending agent services, which were less than $500. Fees paid to the Adviser for securities lending agent services, if any, are included in Dividends from affiliated underlying funds on the Statement of Operations.
J.
Other Risks - Certain of the underlying funds are non-diversified and can invest a greater portion of their assets in the obligations or securities of a small number of issuers or any single issuer than a diversified fund can. A change in the value of one or a few issuers’ securities will therefore affect the value of an underlying fund more than would occur in a diversified fund.
Investments in ETFs generally present the same primary risks as an investment in a conventional mutual fund that has the same investment objective, strategy and policies. Investments in ETFs further involve the same risks associated with a direct investment in the types of securities, commodities and/or currencies included in the indices the ETFs are designed to replicate. In addition, shares of an ETF may trade at a market price that is higher or lower than their net asset value and an active trading market in such shares may not develop or continue. Moreover, trading of an ETF’s shares may be halted if the listing exchange’s officials deem such action to be appropriate, the shares are de-listed from the exchange, or the activation of market-wide “circuit breakers” (which are tied to large decreases in stock prices) halts stock trading generally.
NOTE 2—Advisory Fees and Other Fees Paid to Affiliates
The Trust has entered into a master investment advisory agreement with the Adviser. Under the terms of the investment advisory agreement, the Fund does not pay an advisory fee. However, the Fund pays advisory fees to the Adviser indirectly as a shareholder of the underlying funds.
Under the terms of a master sub-advisory agreement between the Adviser and each of Invesco Asset Management Deutschland GmbH, Invesco Asset Management Limited, Invesco Asset Management (Japan) Limited, Invesco Hong Kong Limited, Invesco Senior Secured Management, Inc. and Invesco Canada Ltd. and a separate sub-advisory agreement with Invesco Capital Management LLC (collectively, the "Affiliated Sub-Advisers") the Adviser, not the Fund, will pay 40% of the fees paid to the Adviser to any such Affiliated Sub-Adviser(s) that provide(s) discretionary investment management services to the Fund based on the percentage of assets allocated to such Affiliated Sub-Adviser(s). Invesco has also entered into a sub-advisory agreement with OppenheimerFunds, Inc. to provide discretionary management services to the Fund.
The Adviser has contractually agreed, through at least April 30, 2026, to reimburse expenses of all shares to the extent necessary to limit total annual fund operating expenses after expense reimbursement (excluding certain items discussed below) of Class A, Class C, Class R, Class Y, Class R5 and Class R6 shares to 0.50%, 1.25%, 0.75%, 0.25%, 0.25%, and 0.25%, respectively, of the Fund’s average daily net assets (the “expense limits”). In determining the Adviser’s obligation to reimburse expenses, the following expenses are not taken into account, and could cause the total annual fund operating expenses after expense reimbursement to exceed the numbers reflected above: (1) interest; (2) taxes; (3) dividend expense on short sales; (4) extraordinary or non-routine items, litigation expenses; and (5) expenses that the Fund has incurred but did not actually pay because of an expense offset arrangement. Unless Invesco continues the expense reimbursement agreement, it will terminate on April 30, 2026. During its term, the expense reimbursement agreement cannot be terminated or amended to increase the expense limits or reduce the expense reimbursement without approval of the Board of Trustees. The Adviser did not reimburse expenses during the period under these expense limits.
The Trust has entered into a master administrative services agreement with Invesco pursuant to which the Fund has agreed to pay Invesco for certain administrative costs incurred in providing accounting services to the Fund. For the year ended December 31, 2024, expenses incurred under the agreement are shown in the Statement of Operations as Administrative services fees. Invesco has entered into a sub-administration agreement whereby State Street Bank and Trust Company (“SSB”) serves as fund accountant and provides certain administrative services to the Fund. Pursuant to a custody agreement with the Trust on behalf of the Fund, SSB also serves as the Fund’s custodian.
The Trust has entered into a transfer agency and service agreement with Invesco Investment Services, Inc. (“IIS”) pursuant to which the Fund has agreed to pay IIS a fee for providing transfer agency and shareholder services to the Fund and reimburse IIS for certain expenses incurred by IIS in the course of providing such services. IIS may make payments to intermediaries that provide omnibus account services, sub-accounting services and/or networking services. All fees payable by IIS to intermediaries that provide omnibus account services or sub-accounting services are charged back to the Fund, subject to certain limitations approved by the Trust’s Board of Trustees. For the year ended December 31, 2024, expenses incurred under the agreement are shown in the Statement of Operations as Transfer agent fees.
The Trust has entered into master distribution agreements with Invesco Distributors, Inc. (“IDI”) to serve as the distributor for the Class A, Class C, Class R, Class Y, Class R5 and Class R6 shares of the Fund. The Trust has adopted plans pursuant to Rule 12b-1 under the 1940 Act with respect to the Fund’s Class A, Class C and Class R shares (collectively, the “Plans”). The Fund, pursuant to the Class A Plan, reimburses IDI for its allocated share of expenses incurred for the period, up to a maximum annual rate of 0.25% of the average daily net assets of Class A shares. The Fund, pursuant to the Class C and Class R Plans, pays IDI compensation at the annual rate of 1.00% of the average daily net assets of Class C shares and 0.50% of the average daily net assets of Class R shares. The fees are accrued daily and paid monthly. Of the Plans payments, up to 0.25% of the average daily net assets of each class of shares may be paid to furnish continuing personal shareholder services to customers who purchase and own shares of such classes. Any amounts not paid as a service fee under the Plans would constitute an asset-based sales charge. Rules of the Financial Industry Regulatory Authority (“FINRA”) impose a cap on the total sales charges, including asset-based sales charges, that may be paid by any class of shares of the Fund. For the year ended December 31, 2024, expenses incurred under the Plans are shown in the Statement of Operations as Distribution fees.
Front-end sales commissions and CDSC (collectively, the “sales charges”) are not recorded as expenses of the Fund. Front-end sales commissions are deducted from proceeds from the sales of Fund shares prior to investment in Class A shares of the Fund. CDSC are deducted from redemption proceeds prior to remittance to the
10
Invesco Select Risk: Conservative Investor Fund
shareholder. During the year ended December 31, 2024, IDI advised the Fund that IDI retained $25,504 in front-end sales commissions from the sale of Class A shares and $13,313 and $2,372 from Class A and Class C shares, respectively, for CDSC imposed upon redemptions by shareholders.
The underlying Invesco Funds pay no distribution fees for Class R6 shares and the Funds pay no sales loads or other similar compensation to IDI for acquiring underlying fund shares.
Certain officers and trustees of the Trust are officers and directors of the Adviser, IIS and/or IDI.
NOTE 3—Additional Valuation Information
GAAP defines fair value as the price that would be received to sell an asset or paid to transfer a liability in an orderly transaction between market participants at the measurement date, under current market conditions. GAAP establishes a hierarchy that prioritizes the inputs to valuation methods, giving the highest priority to readily available unadjusted quoted prices in an active market for identical assets (Level 1) and the lowest priority to significant unobservable inputs (Level 3), generally when market prices are not readily available. Based on the valuation inputs, the securities or other investments are tiered into one of three levels. Changes in valuation methods may result in transfers in or out of an investment’s assigned level:
Level 1 — Prices are determined using quoted prices in an active market for identical assets.
Level 2 — Prices are determined using other significant observable inputs. Observable inputs are inputs that other market participants may use in pricing a security. These may include quoted prices for similar securities, interest rates, prepayment speeds, credit risk, yield curves, loss severities, default rates, discount rates, volatilities and others. When significant events cause market movements to occur after the close of the relevant foreign securities markets, foreign securities may be fair valued utilizing an independent pricing service.
Level 3 — Prices are determined using significant unobservable inputs. In situations where quoted prices or observable inputs are unavailable (for example, when there is little or no market activity for an investment at the end of the period), unobservable inputs may be used. Unobservable inputs reflect the Adviser’s assumptions about the factors market participants would use in determining fair value of the securities or instruments and would be based on the best available information.
As of December 31, 2024, all of the securities in this Fund were valued based on Level 1 inputs (see the Schedule of Investments for security categories). The level assigned to the securities valuations may not be an indication of the risk or liquidity associated with investing in those securities. Because of the inherent uncertainties of valuation, the values reflected in the financial statements may materially differ from the value received upon actual sale of those investments.
NOTE 4—Expense Offset Arrangement(s)
The expense offset arrangement is comprised of transfer agency credits which result from balances in demand deposit accounts used by the transfer agent for clearing shareholder transactions. For the year ended December 31, 2024, the Fund received credits from this arrangement, which resulted in the reduction of the Fund’s total expenses of $21,697.
NOTE 5—Trustees’ and Officers’ Fees and Benefits
Trustees’ and Officers’ Fees and Benefits include amounts accrued by the Fund to pay remuneration to certain Trustees and Officers of the Fund. Trustees have the option to defer compensation payable by the Fund, and Trustees’ and Officers’ Fees and Benefits also include amounts accrued by the Fund to fund such deferred compensation amounts. Those Trustees who defer compensation have the option to select various Invesco Funds in which their deferral accounts shall be deemed to be invested. Finally, certain current Trustees were eligible to participate in a retirement plan that provided for benefits to be paid upon retirement to Trustees over a period of time based on the number of years of service. The Fund may have certain former Trustees who also participate in a retirement plan and receive benefits under such plan. Trustees’ and Officers’ Fees and Benefits include amounts accrued by the Fund to fund such retirement benefits. Obligations under the deferred compensation and retirement plans represent unsecured claims against the general assets of the Fund.
The Fund is permitted to temporarily carry a negative or overdrawn balance in its account with SSB, the custodian bank. Such balances, if any at period-end, are shown in the Statement of Assets and Liabilities under the payable caption Amount due custodian. To compensate the custodian bank for such overdrafts, the overdrawn Fund may either (1) leave funds as a compensating balance in the account so the custodian bank can be compensated by earning the additional interest; or (2) compensate by paying the custodian bank at a rate agreed upon by the custodian bank and Invesco, not to exceed the contractually agreed upon rate.
NOTE 7—Distributions to Shareholders and Tax Components of Net Assets
Tax Character of Distributions to Shareholders Paid During the Fiscal Years Ended December 31, 2024 and 2023: |
| | |
| | |
| Includes short-term capital gain distributions, if any. |
Tax Components of Net Assets at Period-End: |
| |
Undistributed ordinary income | |
Net unrealized appreciation (depreciation) — investments | |
Temporary book/tax differences | |
Capital loss carryforward | |
Shares of beneficial interest | |
| |
The difference between book-basis and tax-basis unrealized appreciation (depreciation) is due to differences in the timing of recognition of gains and losses on investments for tax and book purposes. The Fund’s net unrealized appreciation (depreciation) difference is attributable primarily to wash sales.
The temporary book/tax differences are a result of timing differences between book and tax recognition of income and/or expenses. The Fund’s temporary book/tax differences are the result of the trustee deferral of compensation and retirement plan benefits.
11
Invesco Select Risk: Conservative Investor Fund
Capital loss carryforward is calculated and reported as of a specific date. Results of transactions and other activity after that date may affect the amount of capital loss carryforward actually available for the Fund to utilize. The ability to utilize capital loss carryforward in the future may be limited under the Internal Revenue Code and related regulations based on the results of future transactions.
The Fund has a capital loss carryforward as of December 31, 2024, as follows:
Capital Loss Carryforward* |
| | | |
Not subject to expiration | | | |
*
Capital loss carryforward is reduced for limitations, if any, to the extent required by the Internal Revenue Code and may be further limited depending upon a variety of factors, including the realization of net unrealized gains or losses as of the date of any reorganization.
NOTE 8—Investment Transactions
The aggregate amount of investment securities (other than short-term securities, U.S. Government obligations and money market funds, if any) purchased and sold by the Fund during the year ended December 31, 2024 was $186,369,461 and $195,426,037, respectively. As of December 31, 2024, the aggregate cost of investments, including any derivatives, on a tax basis listed below includes the adjustments for financial reporting purposes as of the most recently completed federal income tax reporting period-end:
Unrealized Appreciation (Depreciation) of Investments on a Tax Basis |
Aggregate unrealized appreciation of investments | |
Aggregate unrealized (depreciation) of investments | |
Net unrealized appreciation (depreciation) of investments | |
Cost of investments for tax purposes is $375,315,202.
NOTE 9—Reclassification of Permanent Differences
Primarily as a result of differing book/tax treatment of partnerships and distributions, on December 31, 2024, undistributed net investment income was increased by $36,268 and undistributed net realized gain (loss) was decreased by $36,268. This reclassification had no effect on the net assets or the distributable earnings (loss) of the Fund.
NOTE 10—Share Information
| Summary of Share Activity |
| | Year ended
December 31, 2023 |
| | | | |
| | | | |
| | | | |
| | | | |
| | | | |
| | | | |
| | | | |
| | | | |
Issued as reinvestment of dividends: | | | | |
| | | | |
| | | | |
| | | | |
| | | | |
| | | | |
| | | | |
Automatic conversion of Class C shares to Class A shares: | | | | |
| | | | |
| | | | |
12
Invesco Select Risk: Conservative Investor Fund
| Summary of Share Activity |
| Year ended December 31, 2024(a) | Year ended December 31, 2023 |
| | | | |
| | | | |
| | | | |
| | | | |
| | | | |
| | | | |
| | | | |
| | | | |
Net increase (decrease) in share activity | | | | |
| There is an entity that is a record owner of more than 5% of the outstanding shares of the Fund and owns 16% of the outstanding shares of the Fund. IDI has an agreement with this entity to sell Fund shares. The Fund, Invesco and/or Invesco affiliates may make payments to this entity, which is considered to be related to the Fund, for providing services to the Fund, Invesco and/or Invesco affiliates including but not limited to services such as, securities brokerage, distribution, third party record keeping and account servicing. The Fund has no knowledge as to whether all or any portion of the shares owned of record by this entity are also |
13
Invesco Select Risk: Conservative Investor Fund
Report of Independent Registered Public Accounting Firm
To the Board of Trustees of AIM Growth Series (Invesco Growth Series) and Shareholders of Invesco Select Risk: Conservative Investor Fund
Opinion on the Financial Statements
We have audited the accompanying statement of assets and liabilities, including the schedule of investments, of Invesco Select Risk: Conservative Investor Fund (one of the funds constituting AIM Growth Series (Invesco Growth Series), referred to hereafter as the "Fund") as of December 31, 2024, the related statement of operations for the year ended December 31, 2024, the statement of changes in net assets for each of the two years in the period ended December 31, 2024, including the related notes, and the financial highlights for each of the five years in the period ended December 31, 2024 (collectively referred to as the "financial statements"). In our opinion, the financial statements present fairly, in all material respects, the financial position of the Fund as of December 31, 2024, the results of its operations for the year then ended, the changes in its net assets for each of the two years in the period ended December 31, 2024 and the financial highlights for each of the five years in the period ended December 31, 2024 in conformity with accounting principles generally accepted in the United States of America.
These financial statements are the responsibility of the Fund’s management. Our responsibility is to express an opinion on the Fund’s financial statements based on our audits. We are a public accounting firm registered with the Public Company Accounting Oversight Board (United States) (PCAOB) and are required to be independent with respect to the Fund in accordance with the U.S. federal securities laws and the applicable rules and regulations of the Securities and Exchange Commission and the PCAOB.
We conducted our audits of these financial statements in accordance with the standards of the PCAOB. Those standards require that we plan and perform the audit to obtain reasonable assurance about whether the financial statements are free of material misstatement, whether due to error or fraud.
Our audits included performing procedures to assess the risks of material misstatement of the financial statements, whether due to error or fraud, and performing procedures that respond to those risks. Such procedures included examining, on a test basis, evidence regarding the amounts and disclosures in the financial statements. Our audits also included evaluating the accounting principles used and significant estimates made by management, as well as evaluating the overall presentation of the financial statements. Our procedures included confirmation of securities owned as of December 31, 2024 by correspondence with the custodian and transfer agent. We believe that our audits provide a reasonable basis for our opinion.
/s/PricewaterhouseCoopers LLP
February 20, 2025
We have served as the auditor of one or more of the investment companies in the Invesco group of investment companies since at least 1995. We have not been able to determine the specific year we began serving as auditor.
14
Invesco Select Risk: Conservative Investor Fund
Tax Information
Form 1099-DIV, Form 1042-S and other year–end tax information provide shareholders with actual calendar year amounts that should be included in their tax returns. Shareholders should consult their tax advisers.
The following distribution information is being provided as required by the Internal Revenue Code or to meet a specific state’s requirement.
The Fund designates the following amounts or, if subsequently determined to be different, the maximum amount allowable for its fiscal year ended December 31, 2024:
Federal and State Income Tax | |
Qualified Dividend Income* | |
Corporate Dividends Received Deduction* | |
U.S. Treasury Obligations* | |
Qualified Business Income* | |
Business Interest Income* | |
*
The above percentages are based on ordinary income dividends paid to shareholders during the Fund’s fiscal year.
15
Invesco Select Risk: Conservative Investor Fund
Other Information Required in Form N-CSR (Items 8-11)
Changes in and Disagreements with Accountants for Open-End Management Investment Companies
Proxy Disclosures for Open-End Management Investment Companies
Remuneration Paid to Directors, Officers, and Others of Open-End Management Investment Companies
The aggregate remuneration paid to directors, officers and others is disclosed within the financial statements.
Statement Regarding Basis for Approval of Investment Advisory Contracts
16
Invesco Select Risk: Conservative Investor Fund
SEC file number(s): 811-02699 and 002-57526
Invesco Distributors, Inc.
O-OPSCI-NCSR
Annual Financial Statements and Other InformationDecember 31, 2024
Invesco Select Risk: Growth Investor Fund
A: AADAX ■ C: AADCX ■ R: AADRX ■ S: AADSX ■ Y: AADYX ■ R5: AADIX ■ R6: AAESX
| |
| |
| |
| Notes to Financial Statements |
| Report of Independent Registered Public Accounting Firm |
| |
| Other Information Required in Form N-CSR (Items 8-11) |
Schedule of Investments
Invesco Select Risk: Growth Investor Fund |
Schedule of Investments in Affiliated Issuers–100.03%(a) |
| | | | | Change in
Unrealized
Appreciation
(Depreciation) | | | | |
|
Invesco Global Real Estate | | | | | | | | | |
Invesco Macro Allocation Strategy Fund, Class R6 | | | | | | | | | |
| | | | | | | | | |
Domestic Equity Funds–49.82% |
Invesco Discovery Mid Cap Growth Fund, Class R6 | | | | | | | | | |
Invesco Main Street Small Cap Fund, Class R6 | | | | | | | | | |
Invesco NASDAQ 100 ETF(c) | | | | | | | | | |
Invesco Russell 1000® Dynamic Multifactor ETF | | | | | | | | | |
Invesco S&P 500® Low Volatility ETF | | | | | | | | | |
Invesco S&P 500® Pure Growth ETF | | | | | | | | | |
Invesco S&P 500® Pure Value | | | | | | | | | |
Invesco Value Opportunities Fund, Class R6 | | | | | | | | | |
Total Domestic Equity Funds | | | | | | | | | |
Fixed Income Funds–23.16% |
Invesco Core Bond Fund, Class R6 | | | | | | | | | |
Invesco Core Plus Bond Fund, Class R6 | | | | | | | | | |
Invesco Emerging Markets Sovereign Debt ETF | | | | | | | | | |
Invesco Equal Weight 0-30 Year Treasury ETF | | | | | | | | | |
Invesco Floating Rate ESG Fund, | | | | | | | | | |
Invesco High Yield Fund, Class R6 | | | | | | | | | |
Invesco Income Fund, Class R6 | | | | | | | | | |
Invesco International Bond | | | | | | | | | |
Invesco Senior Floating Rate | | | | | | | | | |
Invesco Taxable Municipal Bond ETF | | | | | | | | | |
Invesco Variable Rate Investment Grade ETF | | | | | | | | | |
| | | | | | | | | |
International and Global Equity Funds–21.74% |
Invesco EQV Emerging Markets All Cap Fund, Class R6 | | | | | | | | | |
Invesco Developing Markets Fund, Class R6 | | | | | | | | | |
Invesco FTSE RAFI Developed | | | | | | | | | |
Invesco Global Fund, Class R6 | | | | | | | | | |
Invesco Global Infrastructure Fund, Class R6 | | | | | | | | | |
Invesco International Developed Dynamic Multifactor ETF(c) | | | | | | | | | |
Invesco International Small-Mid Company Fund, Class R6 | | | | | | | | | |
Invesco Oppenheimer International Growth Fund, Class R6 | | | | | | | | | |
See accompanying Notes to Financial Statements which are an integral part of the financial statements.
2
Invesco Select Risk: Growth Investor Fund
Invesco Select Risk: Growth Investor Fund (continued) |
Schedule of Investments in Affiliated Issuers–100.03%(a) |
| | | | | Change in Unrealized Appreciation (Depreciation) | | | | |
Invesco S&P Emerging Markets Low Volatility ETF | | | | | | | | | |
Invesco S&P International Developed Low Volatility ETF | | | | | | | | | |
Total International and Global Equity Funds | | | | | | | | | |
|
Invesco Government & Agency Portfolio, Institutional Class, | | | | | | | | | |
Invesco Liquid Assets Portfolio, | | | | | | | | | |
Invesco Treasury Portfolio, Institutional Class, 4.38%(d) | | | | | | | | | |
| | | | | | | | | |
TOTAL INVESTMENTS IN AFFILIATED ISSUERS (excluding investments purchased with cash collateral from securities on loan)
(Cost $875,678,452) | | | | | | | | | |
|
Investments Purchased with Cash Collateral from Securities on Loan | | | | | | | | | |
|
Invesco Private Government | | | | | | | | | |
Invesco Private Prime Fund, | | | | | | | | | |
Total Investments Purchased with Cash Collateral from Securities on Loan
(Cost $9,634,115) | | | | | | | | | |
TOTAL INVESTMENTS IN AFFILIATED ISSUERS (Cost $885,312,567) | | | | | | | | | |
OTHER ASSETS LESS LIABILITIES | | | | | | | | | |
| | | | | | | | | |
Investment Abbreviations:
Notes to Schedule of Investments:
| Each underlying fund and the Fund are affiliated by either having the same investment adviser or an investment adviser under common control with the Fund’s investment adviser. |
| Includes return of capital distribution. |
| All or a portion of this security was out on loan at December 31, 2024. |
| The rate shown is the 7-day SEC standardized yield as of December 31, 2024. |
| The security has been segregated to satisfy the commitment to return the cash collateral received in securities lending transactions upon the borrower’s return of the securities loaned. See Note 1I. |
| Represents the income earned on the investment of cash collateral, which is included in securities lending income on the Statement of Operations. Does not include rebates and fees paid to lending agent or premiums received from borrowers, if any. |
| Includes capital gains distributions from affiliated underlying funds as follows: |
| |
Invesco Discovery Mid Cap Growth Fund | |
| |
Invesco Global Infrastructure Fund | |
Invesco International Small-Mid Company Fund | |
Invesco Main Street Small Cap Fund | |
Invesco Oppenheimer International Growth Fund | |
Invesco Value Opportunities Fund | |
See accompanying Notes to Financial Statements which are an integral part of the financial statements.
3
Invesco Select Risk: Growth Investor Fund
Statement of Assets and Liabilities
| |
Investments in affiliated underlying funds, at value
(Cost $885,312,567)* | |
| |
| |
| |
Dividends - affiliated underlying funds | |
Investment for trustee deferred compensation and retirement plans | |
| |
| |
| |
| |
Investments purchased - affiliated underlying funds | |
| |
Collateral upon return of securities loaned | |
Accrued fees to affiliates | |
Accrued other operating expenses | |
Trustee deferred compensation and retirement plans | |
| |
Net assets applicable to shares outstanding | |
| |
Shares of beneficial interest | |
| |
| |
|
| |
| |
| |
| |
| |
| |
| |
Shares outstanding, no par value, with an unlimited number of shares authorized: |
| |
| |
| |
| |
| |
| |
| |
| |
Net asset value per share | |
Maximum offering price per share
(Net asset value of $15.04 ÷ 94.50%) | |
| |
Net asset value and offering price per share | |
| |
Net asset value and offering price per share | |
| |
Net asset value and offering price per share | |
| |
Net asset value and offering price per share | |
| |
Net asset value and offering price per share | |
| |
Net asset value and offering price per share | |
| At December 31, 2024, securities with an aggregate value of $9,371,880 were on loan to brokers. |
See accompanying Notes to Financial Statements which are an integral part of the financial statements.
4
Invesco Select Risk: Growth Investor Fund
Statement of Operations
For the year ended December 31, 2024
| |
Dividends from affiliated underlying funds (includes net securities lending income of $92,709) | |
| |
| |
| |
Administrative services fees | |
| |
| |
| |
| |
| |
| |
Transfer agent fees — A, C, R, S and Y | |
| |
| |
Trustees’ and officers’ fees and benefits | |
Registration and filing fees | |
| |
Professional services fees | |
| |
| |
Less: Expense offset arrangement(s) | |
| |
| |
Realized and unrealized gain from: | |
| |
Affiliated underlying fund shares | |
Capital gain distributions from affiliated underlying fund shares | |
| |
Change in net unrealized appreciation of affiliated underlying fund shares | |
Net realized and unrealized gain | |
Net increase in net assets resulting from operations | |
See accompanying Notes to Financial Statements which are an integral part of the financial statements.
5
Invesco Select Risk: Growth Investor Fund
Statement of Changes in Net Assets
For the years ended December 31, 2024 and 2023
| | |
| | |
| | |
| | |
Change in net unrealized appreciation | | |
Net increase in net assets resulting from operations | | |
Distributions to shareholders from distributable earnings: | | |
| | |
| | |
| | |
| | |
| | |
| | |
| | |
Total distributions from distributable earnings | | |
| | |
| | |
| | |
| | |
| | |
| | |
| | |
| | |
Net increase (decrease) in net assets resulting from share transactions | | |
Net increase in net assets | | |
| | |
| | |
| | |
See accompanying Notes to Financial Statements which are an integral part of the financial statements.
6
Invesco Select Risk: Growth Investor Fund
Financial Highlights
The following schedule presents financial highlights for a share of the Fund outstanding throughout the periods indicated.
| Net asset
value,
beginning
of period | | Net gains
(losses)
on securities
(both
realized and
unrealized) | Total from
investment
operations | Dividends
from net
investment
income | Distributions
from net
realized
gains | | Net asset
value, end
of period | | Net assets,
end of period
(000’s omitted) | Ratio of
expenses
to average
net assets
with fee waivers
and/or
expenses
| Ratio of
expenses
to average net
assets without
fee waivers
and/or
expenses
absorbed
| Ratio of net
investment
income
to average
| |
|
| | | | | | | | | | | | | | |
| | | | | | | | | | | | | | |
| | | | | | | | | | | | | | |
| | | | | | | | | | | | | | |
| | | | | | | | | | | | | | |
|
| | | | | | | | | | | | | | |
| | | | | | | | | | | | | | |
| | | | | | | | | | | | | | |
| | | | | | | | | | | | | | |
| | | | | | | | | | | | | | |
|
| | | | | | | | | | | | | | |
| | | | | | | | | | | | | | |
| | | | | | | | | | | | | | |
| | | | | | | | | | | | | | |
| | | | | | | | | | | | | | |
|
| | | | | | | | | | | | | | |
| | | | | | | | | | | | | | |
| | | | | | | | | | | | | | |
| | | | | | | | | | | | | | |
| | | | | | | | | | | | | | |
|
| | | | | | | | | | | | | | |
| | | | | | | | | | | | | | |
| | | | | | | | | | | | | | |
| | | | | | | | | | | | | | |
| | | | | | | | | | | | | | |
|
| | | | | | | | | | | | | | |
| | | | | | | | | | | | | | |
| | | | | | | | | | | | | | |
| | | | | | | | | | | | | | |
| | | | | | | | | | | | | | |
|
| | | | | | | | | | | | | | |
| | | | | | | | | | | | | | |
| | | | | | | | | | | | | | |
| | | | | | | | | | | | | | |
| | | | | | | | | | | | | | |
| Calculated using average shares outstanding. |
| Net investment income (loss) is affected by the timing of the declaration of dividends by the underlying funds in which the Fund invests. Ratio of net investment income (loss) does not include net investment income of the underlying funds in which the Fund invests. |
| Includes adjustments in accordance with accounting principles generally accepted in the United States of America and as such, the net asset value for financial reporting purposes and the returns based upon those net asset values may differ from the net asset value and returns for shareholder transactions. Does not include sales charges and is not annualized for periods less than one year, if applicable. |
| In addition to the fees and expenses which the Fund bears directly, the Fund indirectly bears a pro rata share of the fees and expenses of the underlying funds in which the Fund invests. Because the underlying funds have varied expenses and fee levels and the Fund may own different proportions at different times, the amount of fees and expenses incurred indirectly by the Fund will vary. Estimated underlying fund expenses are not expenses that are incurred directly by the Fund. They are expenses that are incurred directly by the underlying funds and are deducted from the value of the funds the Fund invests in. The effect of the estimated underlying fund expenses that the Fund bears indirectly is included in the Fund’s total return. Estimated acquired fund fees from underlying funds were 0.52%, 0.52%, 0.54%, 0.54% and 0.58% for the years ended December 31, 2024, 2023, 2022, 2021, and 2020, respectively. |
| Portfolio turnover is calculated at the fund level and is not annualized for periods less than one year, if applicable. |
See accompanying Notes to Financial Statements which are an integral part of the financial statements.
7
Invesco Select Risk: Growth Investor Fund
Notes to Financial Statements
NOTE 1—Significant Accounting Policies
Invesco Select Risk: Growth Investor Fund (the “Fund”) is a series portfolio of AIM Growth Series (Invesco Growth Series) (the “Trust”). The Trust is a Delaware statutory trust registered under the Investment Company Act of 1940, as amended (the “1940 Act”), as an open-end series management investment company authorized to issue an unlimited number of shares of beneficial interest. Information presented in these financial statements pertains only to the Fund. Matters affecting the Fund or each class will be voted on exclusively by the shareholders of the Fund or each class.
The Fund’s investment objective is long-term growth of capital consistent with a higher level of risk relative to the broad stock market.
The Fund is a "fund of funds", in that it invests in other mutual funds advised by Invesco Advisers, Inc. (the "Adviser" or "Invesco") and exchange-traded funds ("ETFs") and other pooled investment vehicles advised by Invesco Capital Management LLC ("Invesco Capital") or mutual funds, ETFs and other pooled investment vehicles advised by unaffiliated advisers ("underlying funds"). Invesco and Invesco Capital are affiliates of each other as they are indirect, wholly-owned subsidiaries of Invesco Ltd. Invesco may change the Fund’s asset class allocations, the underlying funds or the target weightings in the underlying funds without shareholder approval or notice to shareholders. The underlying funds may engage in a number of investment techniques and practices, which involve certain risks. Each underlying fund’s accounting policies are outlined in the underlying fund’s financial statements and are publicly available.
The Fund currently consists of seven different classes of shares: Class A, Class C, Class R, Class S, Class Y, Class R5 and Class R6. Class Y shares are available only to certain investors. Class A shares are sold with a front-end sales charge unless certain waiver criteria are met. Under certain circumstances, load waived shares may be subject to contingent deferred sales charges (“CDSC”). Class C shares are sold with a CDSC. Class R, Class S, Class Y, Class R5 and Class R6 shares are sold at net asset value. Class C shares held for eight years after purchase are eligible for automatic conversion into Class A shares of the same Fund (the "Conversion Feature"). The automatic conversion pursuant to the Conversion Feature will generally occur at the end of the month following the eighth anniversary after a purchase of Class C shares.
Effective after the close of business on September 30, 2024, Class R5 shares are closed to new investors.
The Fund is an investment company and accordingly follows the investment company accounting and reporting guidance in accordance with Financial Accounting Standards Board Accounting Standards Codification Topic 946, Financial Services – Investment Companies.
The following is a summary of the significant accounting policies followed by the Fund in the preparation of its financial statements.
A.
Security Valuations — Securities of investment companies listed or traded on an exchange are generally valued at the trade price or official closing price that day as of the close of the exchange where the security is principally traded, or lacking any trades or official closing price on a particular day, the security may be valued at the closing bid price on that day. Securities of investment companies that are not exchange-traded (e.g., open-end mutual funds) are valued using such company’s end-of-business-day net asset value per share. Securities in the underlying funds, including restricted securities, are valued in accordance with the valuation policy of such fund. The policies of the underlying funds affiliated with the Fund, as a result of having the same investment adviser, are set forth below.
A security listed or traded on an exchange is generally valued at its trade price or official closing price that day as of the close of the exchange where the security is principally traded, or lacking any trades or official closing price on a particular day, the security may be valued at the closing bid or ask price on that day. Securities traded in the over-the-counter market are valued based on prices furnished by independent pricing services or market makers. When such securities are valued using prices provided by an independent pricing service they may be considered fair valued. Futures contracts are valued at the daily settlement price set by an exchange on which they are principally traded. Where a final settlement price exists, exchange-traded options are valued at the final settlement price from the exchange where the option principally trades. Where a final settlement price does not exist, exchange-traded options are valued at the mean between the last bid and ask price generally from the exchange where the option principally trades.
Variable rate senior loan interests are fair valued using quotes provided by an independent pricing service. Quotes provided by the pricing service may reflect appropriate factors such as ratings, tranche type, industry, company performance, spread, individual trading characteristics, institution-size trading in similar groups of securities and other market data.
Securities of investment companies that are not exchange-traded (e.g., open-end mutual funds) are valued using such company’s end-of-business-day net asset value per share.
Deposits, other obligations of U.S. and non-U.S. banks and financial institutions are valued at their daily account value.
Fixed income securities (including convertible debt securities) generally are valued on the basis of prices provided by independent pricing services. Prices provided by the pricing service may be determined without exclusive reliance on quoted prices, and may reflect appropriate factors such as institution-size trading in similar groups of securities, developments related to specific securities, dividend rate (for unlisted equities), yield (for debt obligations), quality, type of issue, coupon rate (for debt obligations), maturity (for debt obligations), individual trading characteristics and other market data. Pricing services generally value debt obligations assuming orderly transactions of institutional round lot size, but a fund may hold or transact in the same securities in smaller, odd lot sizes. Odd lots often trade at lower prices than institutional round lots, and their value may be adjusted accordingly. Debt obligations are subject to interest rate and credit risks. In addition, all debt obligations involve some risk of default with respect to interest and/or principal payments.
Swap agreements are fair valued using an evaluated quote, if available, provided by an independent pricing service. Evaluated quotes provided by the pricing service are valued based on a model which may include end-of-day net present values, spreads, ratings, industry, company performance and returns of referenced assets. Centrally cleared swap agreements are valued at the daily settlement price determined by the relevant exchange or clearinghouse.
Foreign securities’ (including foreign exchange contracts) prices are converted into U.S. dollar amounts using the applicable exchange rates as of the close of the New York Stock Exchange (“NYSE”). If market quotations are available and reliable for foreign exchange-traded equity securities, the securities will be valued at the market quotations. The Adviser may use various pricing services to obtain market quotations as well as fair value prices. Because trading hours for certain foreign securities end before the close of the NYSE, closing market quotations may become not representative of market value in the Adviser’s judgment (“unreliable”). If, between the time trading ends on a particular security and the close of the customary trading session on the NYSE, a significant event occurs that makes the closing price of the security unreliable, the Adviser may fair value the security. If the event is likely to have affected the closing price of the security, the security will be valued at fair value in good faith in accordance with Board- approved policies and related Adviser procedures (“Valuation Procedures”). Adjustments to closing prices to reflect fair value may also be based on a screening process of an independent pricing service to indicate the degree of certainty, based on historical data, that the closing price in the principal market where a foreign security trades is not the current value as of the close of the NYSE. Foreign securities’ prices meeting the degree of certainty that the price is not reflective of current value will be priced at the indication of fair value from the independent pricing service. Multiple factors may be considered by the independent pricing service in determining adjustments to reflect fair value and may include information relating to sector indices, American Depositary Receipts and domestic and foreign index futures. Foreign securities may have additional risks including exchange rate changes, potential for sharply devalued currencies and high inflation, political and economic upheaval, the relative lack of issuer information, relatively low market liquidity and the potential lack of strict financial and accounting controls and standards.
Unlisted securities will be valued using prices provided by independent pricing services or by another method that the Adviser, in its judgment, believes better reflects the security’s fair value in accordance with the Valuation Procedures.
8
Invesco Select Risk: Growth Investor Fund
Non-traded rights and warrants shall be valued at intrinsic value if the terms of the rights and warrants are available, specifically the subscription or exercise price and the ratio. Intrinsic value is calculated as the daily market closing price of the security to be received less the subscription price, which is then adjusted by the exercise ratio. In the case of warrants, an option pricing model supplied by an independent pricing service may be used based on market data such as volatility, stock price and interest rate from the independent pricing service and strike price and exercise period from verified terms.
Securities for which market prices are not provided by any of the above methods may be valued based upon quotes furnished by independent sources. The mean between the last bid and ask prices may be used to value debt obligations, including corporate loans.
Securities for which market quotations are not readily available are fair valued by the Adviser in accordance with the Valuation Procedures. If a fair value price provided by a pricing service is unreliable, the Adviser will fair value the security using the Valuation Procedures. Issuer specific events, market trends, bid/ask quotes of brokers and information providers and other market data may be reviewed in the course of making a good faith determination of a security’s fair value.
The Fund may invest in securities that are subject to interest rate risk, meaning the risk that the prices will generally fall as interest rates rise and, conversely, the prices will generally rise as interest rates fall. Specific securities differ in their sensitivity to changes in interest rates depending on their individual characteristics. Changes in interest rates may result in increased market volatility, which may affect the value and/or liquidity of certain Fund investments.
Valuations change in response to many factors including the historical and prospective earnings of the issuer, the value of the issuer’s assets, general market conditions which are not specifically related to the particular issuer, such as real or perceived adverse economic conditions, changes in the general outlook for revenues or corporate earnings, changes in interest or currency rates, regional or global instability, natural or environmental disasters, widespread disease or other public health issues, war, acts of terrorism, significant governmental actions or adverse investor sentiment generally and market liquidity. Because of the inherent uncertainties of valuation, the values reflected in the financial statements may materially differ from the value received upon actual sale of those investments.
The price the Fund could receive upon the sale of any investment may differ from the Adviser’s valuation of the investment, particularly for securities that are valued using a fair valuation technique. When fair valuation techniques are applied, the Adviser uses available information, including both observable and unobservable inputs and assumptions, to determine a methodology that will result in a valuation that the Adviser believes approximates market value. Fund securities that are fair valued may be subject to greater fluctuation in their value from one day to the next than would be the case if market quotations were used. Because of the inherent uncertainties of valuation, and the degree of subjectivity in such decisions, the Fund could realize a greater or lesser than expected gain or loss upon the sale of the investment.
B.
Securities Transactions and Investment Income — Securities transactions are accounted for on a trade date basis. Realized gains or losses on sales are computed on the basis of specific identification of the securities sold. Distributions from ordinary income from underlying funds, if any, are recorded as dividend income on the ex-dividend date. Distributions from gains from underlying funds, if any, are recorded as realized gains on the ex-dividend date. The following policies are followed by the underlying funds: Interest income (net of withholding tax, if any) is recorded on an accrual basis from settlement date and includes coupon interest and amortization of premium and accretion of discount on debt securities as applicable. Pay-in-kind interest income and non-cash dividend income received in the form of securities in lieu of cash are recorded at the fair value of the securities received. Paydown gains and losses on mortgage and asset-backed securities are recorded as adjustments to interest income.
The Fund may periodically participate in litigation related to the Fund’s investments. As such, the Fund may receive proceeds from litigation settlements. Any proceeds received are included in the Statement of Operations as realized gain (loss) for investments no longer held and as unrealized gain (loss) for investments still held.
The Fund allocates income and realized and unrealized capital gains and losses to a class based on the relative net assets of each class.
C.
Distributions – Distributions from net investment income and net realized capital gain, if any, are generally declared and paid annually and recorded on the ex-dividend date. The Fund may elect to treat a portion of the proceeds from redemptions as distributions for federal income tax purposes.
D.
Federal Income Taxes – The Fund intends to comply with the requirements of Subchapter M of the Internal Revenue Code of 1986, as amended (the “Internal Revenue Code”), necessary to qualify as a regulated investment company and to distribute substantially all of the Fund’s taxable earnings to shareholders. As such, the Fund will not be subject to federal income taxes on otherwise taxable income (including net realized capital gain) that is distributed to shareholders. Therefore, no provision for federal income taxes is recorded in the financial statements.
The Fund recognizes the tax benefits of uncertain tax positions only when the position is more likely than not to be sustained. Management has analyzed the Fund’s uncertain tax positions and concluded that no liability for unrecognized tax benefits should be recorded related to uncertain tax positions. Management is not aware of any tax positions for which it is reasonably possible that the total amounts of unrecognized tax benefits will change materially in the next 12 months.
The Fund files tax returns in the U.S. Federal jurisdiction and certain other jurisdictions. Generally, the Fund is subject to examinations by such taxing authorities for up to three years after the filing of the return for the tax period.
E.
Expenses – Expenses included in the accompanying financial statements reflect the expenses of the Fund and do not include any expenses of the underlying funds. The effects of the underlying funds expenses are included in the realized and unrealized gain/loss on the investments in the underlying funds. Estimated expenses of the underlying funds are discussed further within the Financial Highlights.
Fees provided for under the Rule 12b-1 plan of a particular class of the Fund and which are directly attributable to that class are charged to the operations of such class. Transfer agency fees and expenses and other shareholder recordkeeping fees and expenses attributable to Class R5 and Class R6 are allocated based on relative net assets of Class R5 and Class R6. Transfer agency fees and expenses and other shareholder recordkeeping fees and expenses relating to all other classes are allocated among those classes based on relative net assets. All other expenses are allocated among the classes based on relative net assets.
F.
Accounting Estimates – The preparation of financial statements in conformity with accounting principles generally accepted in the United States of America (“GAAP”) requires management to make estimates and assumptions that affect the reported amounts of assets and liabilities at the date of the financial statements and the reported amounts of revenues and expenses during the reporting period including estimates and assumptions related to taxation. Actual results could differ from those estimates by a significant amount. In addition, the Fund monitors for material events or transactions that may occur or become known after the period-end date and before the date the financial statements are released to print.
G.
Indemnifications – Under the Trust’s organizational documents, each Trustee, officer, employee or other agent of the Trust is indemnified against certain liabilities that may arise out of the performance of their duties to the Fund. Additionally, in the normal course of business, the Fund enters into contracts, including the Fund’s servicing agreements, that contain a variety of indemnification clauses. The Fund’s maximum exposure under these arrangements is unknown as this would involve future claims that may be made against the Fund that have not yet occurred. The risk of material loss as a result of such indemnification claims is considered remote.
H.
Segment Reporting — In November 2023, the FASB issued Accounting Standards Update 2023-07, Segment Reporting (Topic 280): Improvements to Reportable Segment Disclosures (“ASU 2023-07”), with the intent of improving reportable segment disclosure requirements, primarily through enhanced disclosures about significant segment expenses, allowing financial statement users to better understand the components of a segment’s profit or loss and assess potential future cash flows for each reportable segment and the entity as a whole thereby enabling better understanding of how an entity’s segments impact overall performance. The Fund represents a single operating segment. Subject to the oversight and, when applicable, approval of the Board of Trustees, the Fund’s Adviser acts as the Fund’s chief operating decision maker (“CODM”), assessing performance and making decisions about resource allocation within the Fund. The CODM monitors the operating results as a whole and the Fund’s long-term strategic asset allocation is determined in accordance with the terms of its prospectus based on a defined investment strategy. The financial information provided to and reviewed by the CODM is consistent with that presented in the Fund’s financial
9
Invesco Select Risk: Growth Investor Fund
statements. Adoption of the new standard impacted the Fund’s financial statement note disclosures only and did not affect the Fund’s financial position or the results of its operations.
I.
Securities Lending – The Fund may lend portfolio securities having a market value up to one-third of the Fund’s total assets. Such loans are secured by collateral equal to no less than the market value of the loaned securities determined daily by the securities lending provider. Such collateral will be cash or debt securities issued or guaranteed by the U.S. Government or any of its sponsored agencies. Cash collateral received in connection with these loans is invested in short-term money market instruments or affiliated, unregistered investment companies that comply with Rule 2a-7 under the 1940 Act and money market funds (collectively, "affiliated money market funds") and is shown as such on the Schedule of Investments. The Fund bears the risk of loss with respect to the investment of collateral. It is the Fund’s policy to obtain additional collateral from or return excess collateral to the borrower by the end of the next business day, following the valuation date of the securities loaned. Therefore, the value of the collateral held may be temporarily less than the value of the securities on loan. When loaning securities, the Fund retains certain benefits of owning the securities, including the economic equivalent of dividends or interest generated by the security. Lending securities entails a risk of loss to the Fund if, and to the extent that, the market value of the securities loaned were to increase and the borrower did not increase the collateral accordingly, and the borrower failed to return the securities. The securities loaned are subject to termination at the option of the borrower or the Fund. Upon termination, the borrower will return to the Fund the securities loaned and the Fund will return the collateral. Upon the failure of the borrower to return the securities, collateral may be liquidated and the securities may be purchased on the open market to replace the loaned securities. The Fund could experience delays and costs in gaining access to the collateral and the securities may lose value during the delay which could result in potential losses to the Fund. Some of these losses may be indemnified by the lending agent. The Fund bears the risk of any deficiency in the amount of the collateral available for return to the borrower due to any loss on the collateral invested. Dividends received on cash collateral investments for securities lending transactions, which are net of compensation to counterparties, are included in Dividends from affiliated underlying funds on the Statement of Operations. The aggregate value of securities out on loan, if any, is shown as a footnote on the Statement of Assets and Liabilities.
The Adviser serves as an affiliated securities lending agent for the Fund. The Bank of New York Mellon also serves as a securities lending agent. To the extent the Fund utilizes the Adviser as an affiliated securities lending agent, the Fund conducts its securities lending in accordance with, and in reliance upon, no-action letters issued by the SEC staff that provide guidance on how an affiliate may act as a direct agent lender and receive compensation for those services in a manner consistent with the federal securities laws. For the year ended December 31, 2024, the Fund paid the Adviser $2,276 in fees for securities lending agent services. Fees paid to the Adviser for securities lending agent services, if any, are included in Dividends from affiliated underlying funds on the Statement of Operations.
J.
Other Risks - Certain of the underlying funds are non-diversified and can invest a greater portion of their assets in the obligations or securities of a small number of issuers or any single issuer than a diversified fund can. A change in the value of one or a few issuers’ securities will therefore affect the value of an underlying fund more than would occur in a diversified fund.
Investments in ETFs generally present the same primary risks as an investment in a conventional mutual fund that has the same investment objective, strategy and policies. Investments in ETFs further involve the same risks associated with a direct investment in the types of securities, commodities and/or currencies included in the indices the ETFs are designed to replicate. In addition, shares of an ETF may trade at a market price that is higher or lower than their net asset value and an active trading market in such shares may not develop or continue. Moreover, trading of an ETF’s shares may be halted if the listing exchange’s officials deem such action to be appropriate, the shares are de-listed from the exchange, or the activation of market-wide “circuit breakers” (which are tied to large decreases in stock prices) halts stock trading generally.
Emerging markets (also referred to as developing markets) are generally subject to greater market volatility, political, social and economic instability, uncertain trading markets and more governmental limitations on foreign investment than more developed markets. In addition, companies operating in emerging markets may be subject to lower trading volume and greater price fluctuations than companies in more developed markets. Such countries’ economies may be more dependent on relatively few industries or investors that may be highly vulnerable to local and global changes. Companies in emerging market countries generally may be subject to less stringent regulatory, disclosure, financial reporting, accounting, auditing and recordkeeping standards than companies in more developed countries. As a result, information, including financial information, about such companies may be less available and reliable, which can impede an underlying Fund’s ability to evaluate such companies. Securities law and the enforcement of systems of taxation in many emerging market countries may change quickly and unpredictably, and the ability to bring and enforce actions (including bankruptcy, confiscatory taxation, expropriation, nationalization of a company’s assets, restrictions on foreign ownership of local companies, restrictions on withdrawing assets from the country, protectionist measures and practices such as share blocking), or to obtain information needed to pursue or enforce such actions, may be limited. In addition, the ability of foreign entities to participate in privatization programs of certain developing or emerging market countries may be limited by local law. Investments in emerging market securities may be subject to additional transaction costs, delays in settlement procedures, unexpected market closures, and lack of timely information.
NOTE 2—Advisory Fees and Other Fees Paid to Affiliates
The Trust has entered into a master investment advisory agreement with the Adviser. Under the terms of the investment advisory agreement, the Fund does not pay an advisory fee. However, the Fund pays advisory fees to the Adviser indirectly as a shareholder of the underlying funds.
Under the terms of a master sub-advisory agreement between the Adviser and each of Invesco Asset Management Deutschland GmbH, Invesco Asset Management Limited, Invesco Asset Management (Japan) Limited, Invesco Hong Kong Limited, Invesco Senior Secured Management, Inc. and Invesco Canada Ltd. (collectively, the "Affiliated Sub-Advisers") the Adviser, not the Fund, will pay 40% of the fees paid to the Adviser to any such Affiliated Sub-Adviser(s) that provide(s) discretionary investment management services to the Fund based on the percentage of assets allocated to such Affiliated Sub-Adviser(s).
The Adviser has agreed, for an indefinite period, to reimburse expenses of all shares to the extent necessary to limit total annual fund operating expenses after expense reimbursement (excluding certain items discussed below) of Class A, Class C, Class R, Class S, Class Y, Class R5 and Class R6 shares to 2.00%, 2.75%, 2.25%, 1.90%, 1.75%, 1.75% and 1.75%, respectively, of the Fund’s average daily net assets (the “boundary limits”). In determining the Adviser’s obligation to reimburse expenses, the following expenses are not taken into account, and could cause the total annual fund operating expenses after expense reimbursement to exceed the numbers reflected above: (1) interest; (2) taxes; (3) dividend expense on short sales; (4) extraordinary or non-routine items, including litigation expenses; and (5) expenses that the Fund has incurred but did not actually pay because of an expense offset arrangement. Acquired Fund Fees and Expenses are not operating expenses of the Fund directly, but are fees and expenses, including management fees, of the investment companies in which the Fund invests. As a result, the total annual fund operating expenses after expense reimbursement may exceed the boundary limits above. Invesco may amend and/or terminate these boundary limits at any time in its sole discretion and will inform the Board of Trustees of any such changes. The Adviser did not reimburse expenses during the period under these boundary limits.
The Trust has entered into a master administrative services agreement with Invesco pursuant to which the Fund has agreed to pay Invesco for certain administrative costs incurred in providing accounting services to the Fund. For the year ended December 31, 2024, expenses incurred under the agreement are shown in the Statement of Operations as Administrative services fees. Invesco has entered into a sub-administration agreement whereby State Street Bank and Trust Company (“SSB”) serves as fund accountant and provides certain administrative services to the Fund. Pursuant to a custody agreement with the Trust on behalf of the Fund, SSB also serves as the Fund’s custodian.
The Trust has entered into a transfer agency and service agreement with Invesco Investment Services, Inc. (“IIS”) pursuant to which the Fund has agreed to pay IIS a fee for providing transfer agency and shareholder services to the Fund and reimburse IIS for certain expenses incurred by IIS in the course of providing such services.
10
Invesco Select Risk: Growth Investor Fund
IIS may make payments to intermediaries that provide omnibus account services, sub-accounting services and/or networking services. All fees payable by IIS to intermediaries that provide omnibus account services or sub-accounting services are charged back to the Fund, subject to certain limitations approved by the Trust’s Board of Trustees. For the year ended December 31, 2024, expenses incurred under the agreement are shown in the Statement of Operations as Transfer agent fees.
The Trust has entered into master distribution agreements with Invesco Distributors, Inc. (“IDI”) to serve as the distributor for the Class A, Class C, Class R, Class S, Class Y, Class R5 and Class R6 shares of the Fund. The Trust has adopted plans pursuant to Rule 12b-1 under the 1940 Act with respect to the Fund’s Class A, Class C, Class R and Class S shares (collectively, the “Plans”). The Fund, pursuant to the Plans, pays IDI compensation at the annual rate of 0.25% of the Fund’s average daily net assets of Class A shares, 1.00% of the average daily net assets of Class C shares, 0.50% of the average daily net assets of Class R shares and 0.15% of the average daily net assets of Class S shares. The fees are accrued daily and paid monthly. Of the Plans payments, up to 0.25% of the average daily net assets of Class A, Class C and Class R shares and 0.15% of the average daily net assets of Class S shares may be paid to furnish continuing personal shareholder services to customers who purchase and own shares of such classes. Any amounts not paid as a service fee under the Plans would constitute an asset-based sales charge. Rules of the Financial Industry Regulatory Authority (“FINRA”) impose a cap on the total sales charges, including asset-based sales charges, that may be paid by any class of shares of the Fund. For the year ended December 31, 2024, expenses incurred under the Plans are shown in the Statement of Operations as Distribution fees.
Front-end sales commissions and CDSC (collectively, the “sales charges”) are not recorded as expenses of the Fund. Front-end sales commissions are deducted from proceeds from the sales of Fund shares prior to investment in Class A shares of the Fund. CDSC are deducted from redemption proceeds prior to remittance to the shareholder. During the year ended December 31, 2024, IDI advised the Fund that IDI retained $114,063 in front-end sales commissions from the sale of Class A shares and $23,271 and $1,500 from Class A and Class C shares, respectively, for CDSC imposed upon redemptions by shareholders.
Certain officers and trustees of the Trust are officers and directors of the Adviser, IIS and/or IDI.
NOTE 3—Additional Valuation Information
GAAP defines fair value as the price that would be received to sell an asset or paid to transfer a liability in an orderly transaction between market participants at the measurement date, under current market conditions. GAAP establishes a hierarchy that prioritizes the inputs to valuation methods, giving the highest priority to readily available unadjusted quoted prices in an active market for identical assets (Level 1) and the lowest priority to significant unobservable inputs (Level 3), generally when market prices are not readily available. Based on the valuation inputs, the securities or other investments are tiered into one of three levels. Changes in valuation methods may result in transfers in or out of an investment’s assigned level:
Level 1 – Prices are determined using quoted prices in an active market for identical assets.
Level 2 – Prices are determined using other significant observable inputs. Observable inputs are inputs that other market participants may use in pricing a security. These may include quoted prices for similar securities, interest rates, prepayment speeds, credit risk, yield curves, loss severities, default rates, discount rates, volatilities and others. When significant events cause market movements to occur after the close of the relevant foreign securities markets, foreign securities may be fair valued utilizing an independent pricing service.
Level 3 – Prices are determined using significant unobservable inputs. In situations where quoted prices or observable inputs are unavailable (for example, when there is little or no market activity for an investment at the end of the period), unobservable inputs may be used. Unobservable inputs reflect the Adviser’s assumptions about the factors market participants would use in determining fair value of the securities or instruments and would be based on the best available information.
The following is a summary of the tiered valuation input levels, as of December 31, 2024. The level assigned to the securities valuations may not be an indication of the risk or liquidity associated with investing in those securities. Because of the inherent uncertainties of valuation, the values reflected in the financial statements may materially differ from the value received upon actual sale of those investments.
| | | | |
Investments in Securities | | | | |
| | | | |
| | | | |
| | | | |
NOTE 4—Expense Offset Arrangement(s)
The expense offset arrangement is comprised of transfer agency credits which result from balances in demand deposit accounts used by the transfer agent for clearing shareholder transactions. For the year ended December 31, 2024, the Fund received credits from this arrangement, which resulted in the reduction of the Fund’s total expenses of $47,911.
NOTE 5—Trustees’ and Officers’ Fees and Benefits
Trustees’ and Officers’ Fees and Benefits include amounts accrued by the Fund to pay remuneration to certain Trustees and Officers of the Fund. Trustees have the option to defer compensation payable by the Fund, and Trustees’ and Officers’ Fees and Benefits also include amounts accrued by the Fund to fund such deferred compensation amounts. Those Trustees who defer compensation have the option to select various Invesco Funds in which their deferral accounts shall be deemed to be invested. Finally, certain current Trustees were eligible to participate in a retirement plan that provided for benefits to be paid upon retirement to Trustees over a period of time based on the number of years of service. The Fund may have certain former Trustees who also participate in a retirement plan and receive benefits under such plan. Trustees’ and Officers’ Fees and Benefits include amounts accrued by the Fund to fund such retirement benefits. Obligations under the deferred compensation and retirement plans represent unsecured claims against the general assets of the Fund.
The Fund is permitted to temporarily carry a negative or overdrawn balance in its account with SSB, the custodian bank. Such balances, if any at period-end, are shown in the Statement of Assets and Liabilities under the payable caption Amount due custodian. To compensate the custodian bank for such overdrafts, the overdrawn Fund may either (1) leave funds as a compensating balance in the account so the custodian bank can be compensated by earning the additional interest; or (2) compensate by paying the custodian bank at a rate agreed upon by the custodian bank and Invesco, not to exceed the contractually agreed upon rate.
11
Invesco Select Risk: Growth Investor Fund
NOTE 7—Distributions to Shareholders and Tax Components of Net Assets
Tax Character of Distributions to Shareholders Paid During the Fiscal Years Ended December 31, 2024 and 2023: |
| | |
| | |
| | |
| | |
| Includes short-term capital gain distributions, if any. |
Tax Components of Net Assets at Period-End: |
| |
Undistributed ordinary income | |
Undistributed long-term capital gain | |
Net unrealized appreciation — investments | |
Temporary book/tax differences | |
Shares of beneficial interest | |
| |
The difference between book-basis and tax-basis unrealized appreciation (depreciation) is due to differences in the timing of recognition of gains and losses on investments for tax and book purposes. The Fund’s net unrealized appreciation (depreciation) difference is attributable primarily to wash sales.
The temporary book/tax differences are a result of timing differences between book and tax recognition of income and/or expenses. The Fund’s temporary book/tax differences are the result of the trustee deferral of compensation and retirement plan benefits.
Capital loss carryforward is calculated and reported as of a specific date. Results of transactions and other activity after that date may affect the amount of capital loss carryforward actually available for the Fund to utilize. The ability to utilize capital loss carryforward in the future may be limited under the Internal Revenue Code and related regulations based on the results of future transactions.
The Fund does not have a capital loss carryforward as of December 31, 2024.
NOTE 8—Investment Transactions
The aggregate amount of investment securities (other than short-term securities, U.S. Government obligations and money market funds, if any) purchased and sold by the Fund during the year ended December 31, 2024 was $406,264,771 and $439,606,796, respectively. As of December 31, 2024, the aggregate cost of investments, including any derivatives, on a tax basis listed below includes the adjustments for financial reporting purposes as of the most recently completed federal income tax reporting period-end:
Unrealized Appreciation (Depreciation) of Investments on a Tax Basis |
Aggregate unrealized appreciation of investments | |
Aggregate unrealized (depreciation) of investments | |
Net unrealized appreciation of investments | |
Cost of investments for tax purposes is $893,717,532.
NOTE 9—Reclassification of Permanent Differences
Primarily as a result of differing book/tax treatment of distributions, on December 31, 2024, undistributed net investment income was increased by $527,648 and undistributed net realized gain was decreased by $527,648. This reclassification had no effect on the net assets or the distributable earnings of the Fund.
NOTE 10—Share Information
| Summary of Share Activity |
| | Year ended
December 31, 2023 |
| | | | |
| | | | |
| | | | |
| | | | |
| | | | |
| | | | |
| | | | |
| | | | |
| | | | |
12
Invesco Select Risk: Growth Investor Fund
| Summary of Share Activity |
| Year ended December 31, 2024(a) | Year ended December 31, 2023 |
| | | | |
Issued as reinvestment of dividends: | | | | |
| | | | |
| | | | |
| | | | |
| | | | |
| | | | |
| | | | |
| | | | |
Automatic conversion of Class C shares to Class A shares: | | | | |
| | | | |
| | | | |
| | | | |
| | | | |
| | | | |
| | | | |
| | | | |
| | | | |
| | | | |
| | | | |
Net increase (decrease) in share activity | | | | |
| There are entities that are record owners of more than 5% of the outstanding shares of the Fund and in the aggregate own 34% of the outstanding shares of the Fund. The Fund and the Fund’s principal underwriter or adviser, are parties to participation agreements with these entities whereby these entities sell units of interest in separate accounts funding variable products that are invested in the Fund. The Fund, Invesco and/or Invesco affiliates may make payments to these entities, which are considered to be related to the Fund, for providing services to the Fund, Invesco and/or Invesco affiliates including but not limited to services such as, securities brokerage, third party record keeping and account servicing and administrative services. The Fund has no knowledge as to whether all or any portion of the shares owned of record by these entities are also owned beneficially. |
13
Invesco Select Risk: Growth Investor Fund
Report of Independent Registered Public Accounting Firm
To the Board of Trustees of AIM Growth Series (Invesco Growth Series) and Shareholders of Invesco Select Risk: Growth Investor Fund
Opinion on the Financial Statements
We have audited the accompanying statement of assets and liabilities, including the schedule of investments, of Invesco Select Risk: Growth Investor Fund (one of the funds constituting AIM Growth Series (Invesco Growth Series), referred to hereafter as the "Fund") as of December 31, 2024, the related statement of operations for the year ended December 31, 2024, the statement of changes in net assets for each of the two years in the period ended December 31, 2024, including the related notes, and the financial highlights for each of the five years in the period ended December 31, 2024 (collectively referred to as the "financial statements"). In our opinion, the financial statements present fairly, in all material respects, the financial position of the Fund as of December 31, 2024, the results of its operations for the year then ended, the changes in its net assets for each of the two years in the period ended December 31, 2024 and the financial highlights for each of the five years in the period ended December 31, 2024 in conformity with accounting principles generally accepted in the United States of America.
These financial statements are the responsibility of the Fund’s management. Our responsibility is to express an opinion on the Fund’s financial statements based on our audits. We are a public accounting firm registered with the Public Company Accounting Oversight Board (United States) (PCAOB) and are required to be independent with respect to the Fund in accordance with the U.S. federal securities laws and the applicable rules and regulations of the Securities and Exchange Commission and the PCAOB.
We conducted our audits of these financial statements in accordance with the standards of the PCAOB. Those standards require that we plan and perform the audit to obtain reasonable assurance about whether the financial statements are free of material misstatement, whether due to error or fraud.
Our audits included performing procedures to assess the risks of material misstatement of the financial statements, whether due to error or fraud, and performing procedures that respond to those risks. Such procedures included examining, on a test basis, evidence regarding the amounts and disclosures in the financial statements. Our audits also included evaluating the accounting principles used and significant estimates made by management, as well as evaluating the overall presentation of the financial statements. Our procedures included confirmation of securities owned as of December 31, 2024 by correspondence with the custodian, transfer agent and broker. We believe that our audits provide a reasonable basis for our opinion.
/s/PricewaterhouseCoopers LLP
February 20, 2025
We have served as the auditor of one or more of the investment companies in the Invesco group of investment companies since at least 1995. We have not been able to determine the specific year we began serving as auditor.
14
Invesco Select Risk: Growth Investor Fund
Tax Information
Form 1099-DIV, Form 1042-S and other year–end tax information provide shareholders with actual calendar year amounts that should be included in their tax returns. Shareholders should consult their tax advisers.
The following distribution information is being provided as required by the Internal Revenue Code or to meet a specific state’s requirement.
The Fund designates the following amounts or, if subsequently determined to be different, the maximum amount allowable for its fiscal year ended December 31, 2024:
Federal and State Income Tax | |
Long-Term Capital Gain Distributions | |
Qualified Dividend Income* | |
Corporate Dividends Received Deduction* | |
U.S. Treasury Obligations* | |
Qualified Business Income* | |
Business Interest Income* | |
*
The above percentages are based on ordinary income dividends paid to shareholders during the Fund’s fiscal year.
Non-Resident Alien Shareholders | |
Short-Term Capital Gain Distributions | |
15
Invesco Select Risk: Growth Investor Fund
Other Information Required in Form N-CSR (Items 8-11)
Changes in and Disagreements with Accountants for Open-End Management Investment Companies
Proxy Disclosures for Open-End Management Investment Companies
Remuneration Paid to Directors, Officers, and Others of Open-End Management Investment Companies
The aggregate remuneration paid to directors, officers and others is disclosed within the financial statements.
Statement Regarding Basis for Approval of Investment Advisory Contracts
16
Invesco Select Risk: Growth Investor Fund
SEC file number(s): 811-02699 and 002-57526
Invesco Distributors, Inc.
GAL-NCSR
Annual Financial Statements and Other InformationDecember 31, 2024
Invesco Select Risk: High Growth Investor Fund
A: OAAIX ■ C: OCAIX ■ R: ONAIX ■ Y: OYAIX ■ R5: PXQIX ■ R6: PXGGX
| |
| |
| |
| Notes to Financial Statements |
| Report of Independent Registered Public Accounting Firm |
| |
| Other Information Required in Form N-CSR (Items 8-11) |
Schedule of Investments
Invesco Select Risk: High Growth Investor Fund |
Schedule of Investments in Affiliated Issuers–100.02%(a) |
| | | | | Change in
Unrealized
Appreciation
(Depreciation) | | | | |
|
Invesco Global Real Estate Income | | | | | | | | | |
Invesco Macro Allocation Strategy Fund, Class R6 | | | | | | | | | |
| | | | | | | | | |
Domestic Equity Funds–57.35% |
Invesco Discovery Mid Cap Growth Fund, Class R6 | | | | | | | | | |
Invesco Main Street Small Cap Fund, Class R6 | | | | | | | | | |
| | | | | | | | | |
Invesco Russell 1000® Dynamic Multifactor ETF | | | | | | | | | |
Invesco S&P 500® Low Volatility ETF | | | | | | | | | |
Invesco S&P 500® Pure Growth ETF | | | | | | | | | |
Invesco S&P 500® Pure Value ETF(c) | | | | | | | | | |
Invesco Value Opportunities Fund, Class R6 | | | | | | | | | |
Total Domestic Equity Funds | | | | | | | | | |
Fixed Income Funds–11.73% |
Invesco Core Bond Fund, Class R6 | | | | | | | | | |
Invesco Core Plus Bond Fund, Class R6 | | | | | | | | | |
Invesco Emerging Markets Sovereign Debt ETF | | | | | | | | | |
Invesco Equal Weight 0-30 Year Treasury ETF | | | | | | | | | |
Invesco Floating Rate ESG Fund, | | | | | | | | | |
Invesco High Yield Fund, Class R6 | | | | | | | | | |
Invesco Senior Floating Rate Fund, | | | | | | | | | |
Invesco Variable Rate Investment Grade ETF | | | | | | | | | |
| | | | | | | | | |
International and Global Equity Funds–25.59% |
Invesco EQV Emerging Markets All Cap Fund, Class R6 | | | | | | | | | |
Invesco Developing Markets Fund, Class R6 | | | | | | | | | |
Invesco FTSE RAFI Developed Markets ex-U.S. ETF | | | | | | | | | |
Invesco Global Fund, Class R6 | | | | | | | | | |
Invesco Global Infrastructure Fund, Class R6 | | | | | | | | | |
Invesco International Developed Dynamic Multifactor ETF | | | | | | | | | |
Invesco International Small-Mid Company Fund, Class R6 | | | | | | | | | |
Invesco Oppenheimer International Growth Fund, Class R6 | | | | | | | | | |
Invesco S&P Emerging Markets Low Volatility ETF | | | | | | | | | |
Invesco S&P International Developed Low Volatility ETF | | | | | | | | | |
Total International and Global Equity Funds | | | | | | | | | |
|
Invesco Government & Agency Portfolio, Institutional Class, | | | | | | | | | |
See accompanying Notes to Financial Statements which are an integral part of the financial statements.
2
Invesco Select Risk: High Growth Investor Fund
Invesco Select Risk: High Growth Investor Fund (continued) |
Schedule of Investments in Affiliated Issuers–100.02%(a) |
| | | | | Change in Unrealized Appreciation (Depreciation) | | | | |
Money Market Funds–(continued) |
Invesco Liquid Assets Portfolio, | | | | | | | | | |
Invesco Treasury Portfolio, Institutional | | | | | | | | | |
| | | | | | | | | |
TOTAL INVESTMENTS IN AFFILIATED ISSUERS (excluding investments purchased with cash collateral from securities on loan)
(Cost $680,732,246) | | | | | | | | | |
|
Investments Purchased with Cash Collateral from Securities on Loan | | | | | | | | | |
|
Invesco Private Government Fund, | | | | | | | | | |
Invesco Private Prime Fund, | | | | | | | | | |
Total Investments Purchased with Cash Collateral from Securities on Loan
(Cost $1,231,487) | | | | | | | | | |
TOTAL INVESTMENTS IN AFFILIATED ISSUERS (Cost $681,963,733) | | | | | | | | | |
OTHER ASSETS LESS LIABILITIES | | | | | | | | | |
| | | | | | | | | |
Investment Abbreviations:
Notes to Schedule of Investments:
| Each underlying fund and the Fund are affiliated by either having the same investment adviser or an investment adviser under common control with the Fund’s investment adviser. |
| Includes return of capital distribution. |
| All or a portion of this security was out on loan at December 31, 2024. |
| The rate shown is the 7-day SEC standardized yield as of December 31, 2024. |
| The security has been segregated to satisfy the commitment to return the cash collateral received in securities lending transactions upon the borrower’s return of the securities loaned. See Note 1I. |
| Represents the income earned on the investment of cash collateral, which is included in securities lending income on the Statement of Operations. Does not include rebates and fees paid to lending agent or premiums received from borrowers, if any. |
| Includes capital gains distributions from affiliated underlying funds as follows: |
| |
Invesco Discovery Mid Cap Growth Fund | |
| |
Invesco Global Infrastructure Fund | |
Invesco International Small-Mid Company Fund | |
Invesco Main Street Small Cap Fund | |
Invesco Oppenheimer International Growth Fund | |
Invesco Value Opportunities Fund | |
See accompanying Notes to Financial Statements which are an integral part of the financial statements.
3
Invesco Select Risk: High Growth Investor Fund
Statement of Assets and Liabilities
| |
Investments in affiliated underlying funds, at value
(Cost $681,963,733)* | |
| |
Dividends - affiliated underlying funds | |
| |
Investment for trustee deferred compensation and retirement plans | |
| |
| |
| |
| |
Investments purchased - affiliated underlying funds | |
| |
| |
Collateral upon return of securities loaned | |
Accrued fees to affiliates | |
Accrued trustees’ and officers’ fees and benefits | |
Accrued other operating expenses | |
Trustee deferred compensation and retirement plans | |
| |
Net assets applicable to shares outstanding | |
| |
Shares of beneficial interest | |
| |
| |
|
| |
| |
| |
| |
| |
| |
Shares outstanding, no par value, with an unlimited number of shares authorized: |
| |
| |
| |
| |
| |
| |
| |
Net asset value per share | |
Maximum offering price per share
(Net asset value of $14.19 ÷ 94.50%) | |
| |
Net asset value and offering price per share | |
| |
Net asset value and offering price per share | |
| |
Net asset value and offering price per share | |
| |
Net asset value and offering price per share | |
| |
Net asset value and offering price per share | |
| At December 31, 2024, security with a value of $847,974 was on loan to brokers. |
See accompanying Notes to Financial Statements which are an integral part of the financial statements.
4
Invesco Select Risk: High Growth Investor Fund
Statement of Operations
For the year ended December 31, 2024
| |
Dividends from affiliated underlying funds (includes net securities lending income of $22,942) | |
| |
| |
| |
| |
| |
| |
| |
| |
Transfer agent fees— A, C, R and Y | |
| |
| |
Trustees’ and officers’ fees and benefits | |
Registration and filing fees | |
| |
Professional services fees | |
| |
| |
Less: Expense offset arrangement(s) | |
| |
| |
Realized and unrealized gain (loss) from: | |
Net realized gain (loss) from: | |
Affiliated underlying fund shares | |
| |
Capital gain distributions from affiliated underlying fund shares | |
| |
Change in net unrealized appreciation (depreciation) of: | |
Affiliated underlying fund shares | |
| |
| |
Net realized and unrealized gain | |
Net increase in net assets resulting from operations | |
See accompanying Notes to Financial Statements which are an integral part of the financial statements.
5
Invesco Select Risk: High Growth Investor Fund
Statement of Changes in Net Assets
For the years ended December 31, 2024 and 2023
| | |
| | |
| | |
| | |
Change in net unrealized appreciation | | |
Net increase in net assets resulting from operations | | |
Distributions to shareholders from distributable earnings: | | |
| | |
| | |
| | |
| | |
| | |
| | |
Total distributions from distributable earnings | | |
| | |
| | |
| | |
| | |
| | |
| | |
| | |
Net increase (decrease) in net assets resulting from share transactions | | |
Net increase in net assets | | |
| | |
| | |
| | |
See accompanying Notes to Financial Statements which are an integral part of the financial statements.
6
Invesco Select Risk: High Growth Investor Fund
Financial Highlights
The following schedule presents financial highlights for a share of the Fund outstanding throughout the periods indicated.
| Net asset
value,
beginning
of period | | Net gains
(losses)
on securities
(both
realized and
unrealized) | Total from
investment
operations | Dividends
from net
investment
income | Distributions
from net
realized
gains | | Net asset
value, end
of period | | Net assets,
end of period
(000’s omitted) | Ratio of
expenses
to average
net assets
with fee waivers
and/or
expenses
| Ratio of
expenses
to average net
assets without
fee waivers
and/or
expenses
absorbed
| Ratio of net
investment
income
(loss)
to average
net assets | |
|
| | | | | | | | | | | | | | |
| | | | | | | | | | | | | | |
| | | | | | | | | | | | | | |
| | | | | | | | | | | | | | |
| | | | | | | | | | | | | | |
|
| | | | | | | | | | | | | | |
| | | | | | | | | | | | | | |
| | | | | | | | | | | | | | |
| | | | | | | | | | | | | | |
| | | | | | | | | | | | | | |
|
| | | | | | | | | | | | | | |
| | | | | | | | | | | | | | |
| | | | | | | | | | | | | | |
| | | | | | | | | | | | | | |
| | | | | | | | | | | | | | |
|
| | | | | | | | | | | | | | |
| | | | | | | | | | | | | | |
| | | | | | | | | | | | | | |
| | | | | | | | | | | | | | |
| | | | | | | | | | | | | | |
|
| | | | | | | | | | | | | | |
| | | | | | | | | | | | | | |
| | | | | | | | | | | | | | |
| | | | | | | | | | | | | | |
| | | | | | | | | | | | | | |
|
| | | | | | | | | | | | | | |
| | | | | | | | | | | | | | |
| | | | | | | | | | | | | | |
| | | | | | | | | | | | | | |
| | | | | | | | | | | | | | |
| Calculated using average shares outstanding. |
| Includes adjustments in accordance with accounting principles generally accepted in the United States of America and as such, the net asset value for financial reporting purposes and the returns based upon those net asset values may differ from the net asset value and returns for shareholder transactions. Does not include sales charges and is not annualized for periods less than one year, if applicable. |
| In addition to the fees and expenses which the Fund bears directly, the Fund indirectly bears a pro rata share of the fees and expenses of the underlying funds in which the Fund invests. Because the underlying funds have varied expenses and fee levels and the Fund may own different proportions at different times, the amount of fees and expenses incurred indirectly by the Fund will vary. Estimated underlying fund expenses are not expenses that are incurred directly by the Fund. They are expenses that are incurred directly by the underlying funds and are deducted from the value of the funds the Fund invests in. The effect of the estimated underlying fund expenses that the Fund bears indirectly is included in the Fund’s total return. Estimated acquired fund fees from underlying funds was 0.53%, 0.53%, 0.55%, 0.55% and 0.64% for the years ended December 31, 2024, 2023, 2022, 2021 and 2020, respectively. |
| Portfolio turnover is calculated at the fund level and is not annualized for periods less than one year, if applicable. |
| The total return, ratios of expenses to average net assets and ratio of net investment income (loss) to average net assets reflect actual 12b-1 fees of 0.24% for the years ended December 31, 2024, 2023, 2022, 2021 and 2020, respectively. |
See accompanying Notes to Financial Statements which are an integral part of the financial statements.
7
Invesco Select Risk: High Growth Investor Fund
Notes to Financial Statements
NOTE 1—Significant Accounting Policies
Invesco Select Risk: High Growth Investor Fund (the “Fund”) is a series portfolio of AIM Growth Series (Invesco Growth Series) (the “Trust”). The Trust is a Delaware statutory trust registered under the Investment Company Act of 1940, as amended (the “1940 Act”), as an open-end series management investment company authorized to issue an unlimited number of shares of beneficial interest. Information presented in these financial statements pertains only to the Fund. Matters affecting the Fund or each class will be voted on exclusively by the shareholders of the Fund or each class.
The Fund’s investment objective is to seek total return.
The Fund is a “fund of funds”, in that it invests in other mutual funds advised by Invesco Advisers, Inc. (the “Adviser” or “Invesco”) and exchange-traded funds ("ETFs") and other pooled investment vehicles advised by Invesco Capital Management LLC (“Invesco Capital”) or mutual funds, ETFs and other pooled investment vehicles advised by unaffiliated advisers (“underlying funds”). Invesco and Invesco Capital are affiliates of each other as they are indirect, wholly-owned subsidiaries of Invesco Ltd. Invesco may change the Fund’s asset class allocations, the underlying funds or the target weightings in the underlying funds without shareholder approval or notice to shareholders. The underlying funds may engage in a number of investment techniques and practices, which involve certain risks. Each underlying fund’s accounting policies are outlined in the underlying fund’s financial statements and are publicly available.
The Fund currently consists of six different classes of shares: Class A, Class C, Class R, Class Y, Class R5 and Class R6. Class Y shares are available only to certain investors. Class A shares are sold with a front-end sales charge unless certain waiver criteria are met. Under certain circumstances, load waived shares may be subject to contingent deferred sales charges ("CDSC"). Class C shares are sold with a CDSC. Class R, Class Y, Class R5 and Class R6 shares are sold at net asset value. Class C shares held for eight years after purchase are eligible for automatic conversion into Class A shares of the same Fund (the "Conversion Feature"). The automatic conversion pursuant to the Conversion Feature will generally occur at the end of the month following the eighth anniversary after a purchase of Class C shares.
Effective after the close of business on September 30, 2024, Class R5 shares are closed to new investors.
The Fund is an investment company and accordingly follows the investment company accounting and reporting guidance in accordance with Financial Accounting Standards Board Accounting Standards Codification Topic 946, Financial Services – Investment Companies.
The following is a summary of the significant accounting policies followed by the Fund in the preparation of its financial statements.
A.
Security Valuations — Securities of investment companies listed or traded on an exchange are generally valued at the trade price or official closing price that day as of the close of the exchange where the security is principally traded, or lacking any trades or official closing price on a particular day, the security may be valued at the closing bid price on that day. Securities of investment companies that are not exchange-traded (e.g., open-end mutual funds) are valued using such company’s end-of-business-day net asset value per share. Securities in the underlying funds, including restricted securities, are valued in accordance with the valuation policy of such fund. The policies of the underlying funds affiliated with the Fund, as a result of having the same investment adviser, are set forth below.
A security listed or traded on an exchange is generally valued at its trade price or official closing price that day as of the close of the exchange where the security is principally traded, or lacking any trades or official closing price on a particular day, the security may be valued at the closing bid or ask price on that day. Securities traded in the over-the-counter market are valued based on prices furnished by independent pricing services or market makers. When such securities are valued using prices provided by an independent pricing service they may be considered fair valued. Futures contracts are valued at the daily settlement price set by an exchange on which they are principally traded. Where a final settlement price exists, exchange-traded options are valued at the final settlement price from the exchange where the option principally trades. Where a final settlement price does not exist, exchange-traded options are valued at the mean between the last bid and ask price generally from the exchange where the option principally trades.
Variable rate senior loan interests are fair valued using quotes provided by an independent pricing service. Quotes provided by the pricing service may reflect appropriate factors such as ratings, tranche type, industry, company performance, spread, individual trading characteristics, institution-size trading in similar groups of securities and other market data.
Securities of investment companies that are not exchange-traded (e.g., open-end mutual funds) are valued using such company’s end-of-business-day net asset value per share.
Deposits, other obligations of U.S. and non-U.S. banks and financial institutions are valued at their daily account value.
Fixed income securities (including convertible debt securities) generally are valued on the basis of prices provided by independent pricing services. Prices provided by the pricing service may be determined without exclusive reliance on quoted prices, and may reflect appropriate factors such as institution-size trading in similar groups of securities, developments related to specific securities, dividend rate (for unlisted equities), yield (for debt obligations), quality, type of issue, coupon rate (for debt obligations), maturity (for debt obligations), individual trading characteristics and other market data. Pricing services generally value debt obligations assuming orderly transactions of institutional round lot size, but a fund may hold or transact in the same securities in smaller, odd lot sizes. Odd lots often trade at lower prices than institutional round lots, and their value may be adjusted accordingly. Debt obligations are subject to interest rate and credit risks. In addition, all debt obligations involve some risk of default with respect to interest and/or principal payments.
Swap agreements are fair valued using an evaluated quote, if available, provided by an independent pricing service. Evaluated quotes provided by the pricing service are valued based on a model which may include end-of-day net present values, spreads, ratings, industry, company performance and returns of referenced assets. Centrally cleared swap agreements are valued at the daily settlement price determined by the relevant exchange or clearinghouse.
Foreign securities’ (including foreign exchange contracts) prices are converted into U.S. dollar amounts using the applicable exchange rates as of the close of the New York Stock Exchange (“NYSE”). If market quotations are available and reliable for foreign exchange-traded equity securities, the securities will be valued at the market quotations. The Adviser may use various pricing services to obtain market quotations as well as fair value prices. Because trading hours for certain foreign securities end before the close of the NYSE, closing market quotations may become not representative of market value in the Adviser’s judgment (“unreliable”). If, between the time trading ends on a particular security and the close of the customary trading session on the NYSE, a significant event occurs that makes the closing price of the security unreliable, the Adviser may fair value the security. If the event is likely to have affected the closing price of the security, the security will be valued at fair value in good faith in accordance with Board- approved policies and related Adviser procedures (“Valuation Procedures”). Adjustments to closing prices to reflect fair value may also be based on a screening process of an independent pricing service to indicate the degree of certainty, based on historical data, that the closing price in the principal market where a foreign security trades is not the current value as of the close of the NYSE. Foreign securities’ prices meeting the degree of certainty that the price is not reflective of current value will be priced at the indication of fair value from the independent pricing service. Multiple factors may be considered by the independent pricing service in determining adjustments to reflect fair value and may include information relating to sector indices, American Depositary Receipts and domestic and foreign index futures. Foreign securities may have additional risks including exchange rate changes, potential for sharply devalued currencies and high inflation, political and economic upheaval, the relative lack of issuer information, relatively low market liquidity and the potential lack of strict financial and accounting controls and standards.
Unlisted securities will be valued using prices provided by independent pricing services or by another method that the Adviser, in its judgment, believes better reflects the security’s fair value in accordance with the Valuation Procedures.
Non-traded rights and warrants shall be valued at intrinsic value if the terms of the rights and warrants are available, specifically the subscription or exercise price and the ratio. Intrinsic value is calculated as the daily market closing price of the security to be received less the subscription price, which is then adjusted by
8
Invesco Select Risk: High Growth Investor Fund
the exercise ratio. In the case of warrants, an option pricing model supplied by an independent pricing service may be used based on market data such as volatility, stock price and interest rate from the independent pricing service and strike price and exercise period from verified terms.
Securities for which market prices are not provided by any of the above methods may be valued based upon quotes furnished by independent sources. The mean between the last bid and ask prices may be used to value debt obligations, including corporate loans.
Securities for which market quotations are not readily available are fair valued by the Adviser in accordance with the Valuation Procedures. If a fair value price provided by a pricing service is unreliable, the Adviser will fair value the security using the Valuation Procedures. Issuer specific events, market trends, bid/ask quotes of brokers and information providers and other market data may be reviewed in the course of making a good faith determination of a security’s fair value.
The Fund may invest in securities that are subject to interest rate risk, meaning the risk that the prices will generally fall as interest rates rise and, conversely, the prices will generally rise as interest rates fall. Specific securities differ in their sensitivity to changes in interest rates depending on their individual characteristics. Changes in interest rates may result in increased market volatility, which may affect the value and/or liquidity of certain Fund investments.
Valuations change in response to many factors including the historical and prospective earnings of the issuer, the value of the issuer’s assets, general market conditions which are not specifically related to the particular issuer, such as real or perceived adverse economic conditions, changes in the general outlook for revenues or corporate earnings, changes in interest or currency rates, regional or global instability, natural or environmental disasters, widespread disease or other public health issues, war, acts of terrorism, significant governmental actions or adverse investor sentiment generally and market liquidity. Because of the inherent uncertainties of valuation, the values reflected in the financial statements may materially differ from the value received upon actual sale of those investments.
The price the Fund could receive upon the sale of any investment may differ from the Adviser’s valuation of the investment, particularly for securities that are valued using a fair valuation technique. When fair valuation techniques are applied, the Adviser uses available information, including both observable and unobservable inputs and assumptions, to determine a methodology that will result in a valuation that the Adviser believes approximates market value. Fund securities that are fair valued may be subject to greater fluctuation in their value from one day to the next than would be the case if market quotations were used. Because of the inherent uncertainties of valuation, and the degree of subjectivity in such decisions, the Fund could realize a greater or lesser than expected gain or loss upon the sale of the investment.
B.
Securities Transactions and Investment Income — Securities transactions are accounted for on a trade date basis. Realized gains or losses on sales are computed on the basis of specific identification of the securities sold. Distributions from ordinary income from underlying funds, if any, are recorded as dividend income on the ex-dividend date. Distributions from gains from underlying funds, if any, are recorded as realized gains on the ex-dividend date. The following policies are followed by the underlying funds: Interest income (net of withholding tax, if any) is recorded on an accrual basis from settlement date and includes coupon interest and amortization of premium and accretion of discount on debt securities as applicable. Pay-in-kind interest income and non-cash dividend income received in the form of securities in lieu of cash are recorded at the fair value of the securities received. Paydown gains and losses on mortgage and asset-backed securities are recorded as adjustments to interest income.
The Fund may periodically participate in litigation related to the Fund’s investments. As such, the Fund may receive proceeds from litigation settlements. Any proceeds received are included in the Statement of Operations as realized gain (loss) for investments no longer held and as unrealized gain (loss) for investments still held.
The Fund allocates income and realized and unrealized capital gains and losses to a class based on the relative net assets of each class.
C.
Distributions – Distributions from net investment income and net realized capital gain, if any, are generally declared and paid annually and recorded on the ex-dividend date. The Fund may elect to treat a portion of the proceeds from redemptions as distributions for federal income tax purposes.
D.
Federal Income Taxes – The Fund intends to comply with the requirements of Subchapter M of the Internal Revenue Code of 1986, as amended (the “Internal Revenue Code”), necessary to qualify as a regulated investment company and to distribute substantially all of the Fund’s taxable earnings to shareholders. As such, the Fund will not be subject to federal income taxes on otherwise taxable income (including net realized capital gain) that is distributed to shareholders. Therefore, no provision for federal income taxes is recorded in the financial statements.
The Fund recognizes the tax benefits of uncertain tax positions only when the position is more likely than not to be sustained. Management has analyzed the Fund’s uncertain tax positions and concluded that no liability for unrecognized tax benefits should be recorded related to uncertain tax positions. Management is not aware of any tax positions for which it is reasonably possible that the total amounts of unrecognized tax benefits will change materially in the next 12 months.
The Fund files tax returns in the U.S. Federal jurisdiction and certain other jurisdictions. Generally, the Fund is subject to examinations by such taxing authorities for up to three years after the filing of the return for the tax period.
E.
Expenses – Expenses included in the accompanying financial statements reflect the expenses of the Fund and do not include any expenses of the underlying funds. The effects of the underlying funds expenses are included in the realized and unrealized gain/loss on the investments in the underlying funds. Estimated expenses of the underlying funds are discussed further within the Financial Highlights.
Fees provided for under the Rule 12b-1 plan of a particular class of the Fund and which are directly attributable to that class are charged to the operations of such class. Transfer agency fees and expenses and other shareholder recordkeeping fees and expenses attributable to Class R5 and Class R6 are allocated based on relative net assets of Class R5 and Class R6. Transfer agency fees and expenses and other shareholder recordkeeping fees and expenses relating to all other classes are allocated among those classes based on relative net assets. All other expenses are allocated among the classes based on relative net assets.
F.
Accounting Estimates – The preparation of financial statements in conformity with accounting principles generally accepted in the United States of America (“GAAP”) requires management to make estimates and assumptions that affect the reported amounts of assets and liabilities at the date of the financial statements and the reported amounts of revenues and expenses during the reporting period including estimates and assumptions related to taxation. Actual results could differ from those estimates by a significant amount. In addition, the Fund monitors for material events or transactions that may occur or become known after the period-end date and before the date the financial statements are released to print.
G.
Indemnifications – Under the Trust’s organizational documents, each Trustee, officer, employee or other agent of the Trust is indemnified against certain liabilities that may arise out of the performance of their duties to the Fund. Additionally, in the normal course of business, the Fund enters into contracts, including the Fund’s servicing agreements, that contain a variety of indemnification clauses. The Fund’s maximum exposure under these arrangements is unknown as this would involve future claims that may be made against the Fund that have not yet occurred. The risk of material loss as a result of such indemnification claims is considered remote.
H.
Segment Reporting — In November 2023, the FASB issued Accounting Standards Update 2023-07, Segment Reporting (Topic 280): Improvements to Reportable Segment Disclosures (“ASU 2023-07”), with the intent of improving reportable segment disclosure requirements, primarily through enhanced disclosures about significant segment expenses, allowing financial statement users to better understand the components of a segment’s profit or loss and assess potential future cash flows for each reportable segment and the entity as a whole thereby enabling better understanding of how an entity’s segments impact overall performance. The Fund represents a single operating segment. Subject to the oversight and, when applicable, approval of the Board of Trustees, the Fund’s Adviser acts as the Fund’s chief operating decision maker (“CODM”), assessing performance and making decisions about resource allocation within the Fund. The CODM monitors the operating results as a whole and the Fund’s long-term strategic asset allocation is determined in accordance with the terms of its prospectus based on a defined investment strategy. The financial information provided to and reviewed by the CODM is consistent with that presented in the Fund’s financial statements. Adoption of the new standard impacted the Fund’s financial statement note disclosures only and did not affect the Fund’s financial position or the results of its operations.
I.
Securities Lending – The Fund may lend portfolio securities having a market value up to one-third of the Fund’s total assets. Such loans are secured by
9
Invesco Select Risk: High Growth Investor Fund
collateral equal to no less than the market value of the loaned securities determined daily by the securities lending provider. Such collateral will be cash or debt securities issued or guaranteed by the U.S. Government or any of its sponsored agencies. Cash collateral received in connection with these loans is invested in short-term money market instruments or affiliated, unregistered investment companies that comply with Rule 2a-7 under the 1940 Act and money market funds (collectively, "affiliated money market funds") and is shown as such on the Schedule of Investments. The Fund bears the risk of loss with respect to the investment of collateral. It is the Fund’s policy to obtain additional collateral from or return excess collateral to the borrower by the end of the next business day, following the valuation date of the securities loaned. Therefore, the value of the collateral held may be temporarily less than the value of the securities on loan. When loaning securities, the Fund retains certain benefits of owning the securities, including the economic equivalent of dividends or interest generated by the security. Lending securities entails a risk of loss to the Fund if, and to the extent that, the market value of the securities loaned were to increase and the borrower did not increase the collateral accordingly, and the borrower failed to return the securities. The securities loaned are subject to termination at the option of the borrower or the Fund. Upon termination, the borrower will return to the Fund the securities loaned and the Fund will return the collateral. Upon the failure of the borrower to return the securities, collateral may be liquidated and the securities may be purchased on the open market to replace the loaned securities. The Fund could experience delays and costs in gaining access to the collateral and the securities may lose value during the delay which could result in potential losses to the Fund. Some of these losses may be indemnified by the lending agent. The Fund bears the risk of any deficiency in the amount of the collateral available for return to the borrower due to any loss on the collateral invested. Dividends received on cash collateral investments for securities lending transactions, which are net of compensation to counterparties, are included in Dividends from affiliated underlying funds on the Statement of Operations. The aggregate value of securities out on loan, if any, is shown as a footnote on the Statement of Assets and Liabilities.
The Adviser serves as an affiliated securities lending agent for the Fund. The Bank of New York Mellon also serves as a securities lending agent. To the extent the Fund utilizes the Adviser as an affiliated securities lending agent, the Fund conducts its securities lending in accordance with, and in reliance upon, no-action letters issued by the SEC staff that provide guidance on how an affiliate may act as a direct agent lender and receive compensation for those services in a manner consistent with the federal securities laws. For the year ended December 31, 2024, the Fund paid the Adviser $1,878 in fees for securities lending agent services. Fees paid to the Adviser for securities lending agent services, if any, are included in Dividends from affiliated underlying funds on the Statement of Operations.
J.
Foreign Currency Translations — Foreign currency is valued at the close of the NYSE based on quotations posted by banks and major currency dealers. Portfolio securities and other assets and liabilities denominated in foreign currencies are translated into U.S. dollar amounts at the date of valuation. Purchases and sales of portfolio securities (net of foreign taxes withheld on disposition) and income items denominated in foreign currencies are translated into U.S. dollar amounts on the respective dates of such transactions. The Fund does not separately account for the portion of the results of operations resulting from changes in foreign exchange rates on investments and the fluctuations arising from changes in market prices of securities held. The combined results of changes in foreign exchange rates and the fluctuation of market prices on investments (net of estimated foreign tax withholding) are included with the net realized and unrealized gain or loss from investments in the Statement of Operations. Reported net realized foreign currency gains or losses arise from (1) sales of foreign currencies, (2) currency gains or losses realized between the trade and settlement dates on securities transactions, and (3) the difference between the amounts of dividends, interest, and foreign withholding taxes recorded on the Fund’s books and the U.S. dollar equivalent of the amounts actually received or paid. Net unrealized foreign currency gains and losses arise from changes in the fair values of assets and liabilities, other than investments in securities at fiscal period end, resulting from changes in exchange rates.
The Fund may invest in foreign securities, which may be subject to foreign taxes on income, gains on investments or currency repatriation, a portion of which may be recoverable. Foreign taxes, if any, are recorded based on the tax regulations and rates that exist in the foreign markets in which the Fund invests and are shown in the Statement of Operations.
The performance of the Fund may be materially affected positively or negatively by foreign currency strength or weakness relative to the U.S. dollar. Currency rates in foreign countries may fluctuate for a number of reasons, including changes in interest rates, political, economic, or social instability and development, and imposition of currency controls. Currency controls in certain foreign jurisdictions may cause the Fund to experience significant delays in its ability to repatriate its assets in U.S. dollars at quoted spot rates, and it is possible that the Fund’s ability to convert certain foreign currencies into U.S. dollars may be limited and may occur at discounts to quoted rates. As a result, the value of the Fund’s assets and liabilities denominated in such currencies that would ultimately be realized could differ from those reported on the Statement of Assets and Liabilities. Certain foreign companies may be subject to sanctions, embargoes, or other governmental actions that may limit the ability to invest in, receive, hold, or sell the securities of such companies, all of which affect the market and/or credit risk of the investments. Because of the inherent uncertainties of valuation, the values reflected in the financial statements may materially differ from the value received upon actual sale of those investments.
K.
Forward Foreign Currency Contracts — The Fund may engage in foreign currency transactions either on a spot (i.e. for prompt delivery and settlement) basis, or through forward foreign currency contracts, to manage or minimize currency or exchange rate risk.
The Fund may also enter into forward foreign currency contracts for the purchase or sale of a security denominated in a foreign currency in order to “lock in” the U.S. dollar price of that security, or the Fund may also enter into forward foreign currency contracts that do not provide for physical exchange of the two currencies on the settlement date, but instead are settled by a single cash payment calculated as the difference between the agreed upon exchange rate and the spot rate at settlement based upon an agreed upon notional amount (non-deliverable forwards).
A forward foreign currency contract is an obligation between two parties (“Counterparties”) to purchase or sell a specific currency for an agreed-upon price at a future date. The use of forward foreign currency contracts for hedging does not eliminate fluctuations in the price of the underlying securities the Fund owns or intends to acquire but establishes a rate of exchange in advance. Fluctuations in the value of these contracts are measured by the difference in the contract date and reporting date exchange rates and are recorded as unrealized appreciation (depreciation) until the contracts are closed. When the contracts are closed, realized gains (losses) are recorded. Realized and unrealized gains (losses) on the contracts are included in the Statement of Operations. The primary risks associated with forward foreign currency contracts include failure of the Counterparty to meet the terms of the contract and the value of the foreign currency changing unfavorably. These risks may be in excess of the amounts reflected in the Statement of Assets and Liabilities.
L.
Other Risks - Certain of the underlying funds are non-diversified and can invest a greater portion of their assets in the obligations or securities of a small number of issuers or any single issuer than a diversified fund can. A change in the value of one or a few issuers’ securities will therefore affect the value of an underlying fund more than would occur in a diversified fund.
Investments in ETFs generally present the same primary risks as an investment in a conventional mutual fund that has the same investment objective, strategy and policies. Investments in ETFs further involve the same risks associated with a direct investment in the types of securities, commodities and/or currencies included in the indices the ETFs are designed to replicate. In addition, shares of an ETF may trade at a market price that is higher or lower than their net asset value and an active trading market in such shares may not develop or continue. Moreover, trading of an ETF’s shares may be halted if the listing exchange’s officials deem such action to be appropriate, the shares are de-listed from the exchange, or the activation of market-wide “circuit breakers” (which are tied to large decreases in stock prices) halts stock trading generally.
Emerging markets (also referred to as developing markets) are generally subject to greater market volatility, political, social and economic instability, uncertain trading markets and more governmental limitations on foreign investment than more developed markets. In addition, companies operating in emerging markets may be subject to lower trading volume and greater price fluctuations than companies in more developed markets. Such countries’ economies may be more dependent on relatively few industries or investors that may be highly vulnerable to local and global changes. Companies in emerging market countries generally may be subject to less stringent regulatory, disclosure, financial reporting, accounting, auditing and recordkeeping standards than companies in more developed
10
Invesco Select Risk: High Growth Investor Fund
countries. As a result, information, including financial information, about such companies may be less available and reliable, which can impede an underlying Fund’s ability to evaluate such companies. Securities law and the enforcement of systems of taxation in many emerging market countries may change quickly and unpredictably, and the ability to bring and enforce actions (including bankruptcy, confiscatory taxation, expropriation, nationalization of a company’s assets, restrictions on foreign ownership of local companies, restrictions on withdrawing assets from the country, protectionist measures and practices such as share blocking), or to obtain information needed to pursue or enforce such actions, may be limited. In addition, the ability of foreign entities to participate in privatization programs of certain developing or emerging market countries may be limited by local law. Investments in emerging market securities may be subject to additional transaction costs, delays in settlement procedures, unexpected market closures, and lack of timely information.
NOTE 2—Advisory Fees and Other Fees Paid to Affiliates
The Trust has entered into a master investment advisory agreement with the Adviser. Under the terms of the investment advisory agreement, the Fund does not pay an advisory fee. However, the Fund pays advisory fees to the Adviser indirectly as a shareholder of the underlying funds.
Under the terms of a master sub-advisory agreement between the Adviser and each of Invesco Asset Management Deutschland GmbH, Invesco Asset Management Limited, Invesco Asset Management (Japan) Limited, Invesco Hong Kong Limited, Invesco Senior Secured Management, Inc. and Invesco Canada Ltd. and a separate sub-advisory agreement with Invesco Capital Management LLC (collectively, the "Affiliated Sub-Advisers") the Adviser, not the Fund, will pay 40% of the fees paid to the Adviser to any such Affiliated Sub-Adviser(s) that provide(s) discretionary investment management services to the Fund based on the percentage of assets allocated to such Affiliated Sub-Adviser(s). Invesco has also entered into a sub-advisory agreement with OppenheimerFunds, Inc. to provide discretionary management services to the Fund.
The Adviser has contractually agreed, through at least April 30, 2026, to reimburse expenses of all shares to the extent necessary to limit total annual fund operating expenses after expense reimbursement (excluding certain items discussed below) of Class A, Class C, Class R, Class Y, Class R5 and Class R6 shares to 0.45%, 1.20%, 0.70%, 0.20%, 0.20%, and 0.20%, respectively, of the Fund’s average daily net assets (the “expense limits”). In determining the Adviser’s obligation to reimburse expenses, the following expenses are not taken into account, and could cause the total annual fund operating expenses after expense reimbursement to exceed the numbers reflected above: (1) interest; (2) taxes; (3) dividend expense on short sales; (4) extraordinary or non-routine items, litigation expenses; and (5) expenses that the Fund has incurred but did not actually pay because of an expense offset arrangement. Unless Invesco continues the expense reimbursement agreement, it will terminate on April 30, 2026. During its term, the expense reimbursement agreement cannot be terminated or amended to increase the expense limits or reduce the expense reimbursement without approval of the Board of Trustees.
The Trust has entered into a master administrative services agreement with Invesco pursuant to which the Fund has agreed to pay Invesco for certain administrative costs incurred in providing accounting services to the Fund. For the year ended December 31, 2024, expenses incurred under the agreement are shown in the Statement of Operations as Administrative services fees. Invesco has entered into a sub-administration agreement whereby State Street Bank and Trust Company (“SSB”) serves as fund accountant and provides certain administrative services to the Fund. Pursuant to a custody agreement with the Trust on behalf of the Fund, SSB also serves as the Fund’s custodian.
The Trust has entered into a transfer agency and service agreement with Invesco Investment Services, Inc. (“IIS”) pursuant to which the Fund has agreed to pay IIS a fee for providing transfer agency and shareholder services to the Fund and reimburse IIS for certain expenses incurred by IIS in the course of providing such services. IIS may make payments to intermediaries that provide omnibus account services, sub-accounting services and/or networking services. All fees payable by IIS to intermediaries that provide omnibus account services or sub-accounting services are charged back to the Fund, subject to certain limitations approved by the Trust’s Board of Trustees. For the year ended December 31, 2024, expenses incurred under the agreement are shown in the Statement of Operations as Transfer agent fees.
The Trust has entered into master distribution agreements with Invesco Distributors, Inc. (“IDI”) to serve as the distributor for the Class A, Class C, Class R, Class Y, Class R5 and Class R6 shares of the Fund. The Trust has adopted plans pursuant to Rule 12b-1 under the 1940 Act with respect to the Fund’s Class A, Class C and Class R shares (collectively, the “Plans”). The Fund, pursuant to the Class A Plan, reimburses IDI for its allocated share of expenses incurred for the period, up to a maximum annual rate of 0.25% of the average daily net assets of Class A shares. The Fund, pursuant to the Class C and Class R Plans, pays IDI compensation at the annual rate of 1.00% of the average daily net assets of Class C shares and 0.50% of the average daily net assets of Class R shares. The fees are accrued daily and paid monthly. Of the Plans payments, up to 0.25% of the average daily net assets of each class of shares may be paid to furnish continuing personal shareholder services to customers who purchase and own shares of such classes. Any amounts not paid as a service fee under the Plans would constitute an asset-based sales charge. Rules of the Financial Industry Regulatory Authority (“FINRA”) impose a cap on the total sales charges, including asset-based sales charges, that may be paid by any class of shares of the Fund. For the year ended December 31, 2024, expenses incurred under the Plans are shown in the Statement of Operations as Distribution fees.
Front-end sales commissions and CDSC (collectively, the “sales charges”) are not recorded as expenses of the Fund. Front-end sales commissions are deducted from proceeds from the sales of Fund shares prior to investment in Class A shares of the Fund. CDSC are deducted from redemption proceeds prior to remittance to the shareholder. During the year ended December 31, 2024, IDI advised the Fund that IDI retained $114,600 in front-end sales commissions from the sale of Class A shares and $7,169 and $3,508 from Class A and Class C shares, respectively, for CDSC imposed upon redemptions by shareholders.
The underlying Invesco Funds pay no distribution fees for Class R6 shares and the Funds pay no sales loads or other similar compensation to IDI for acquiring underlying fund shares.
Certain officers and trustees of the Trust are officers and directors of the Adviser, IIS and/or IDI.
NOTE 3—Additional Valuation Information
GAAP defines fair value as the price that would be received to sell an asset or paid to transfer a liability in an orderly transaction between market participants at the measurement date, under current market conditions. GAAP establishes a hierarchy that prioritizes the inputs to valuation methods, giving the highest priority to readily available unadjusted quoted prices in an active market for identical assets (Level 1) and the lowest priority to significant unobservable inputs (Level 3), generally when market prices are not readily available. Based on the valuation inputs, the securities or other investments are tiered into one of three levels. Changes in valuation methods may result in transfers in or out of an investment’s assigned level:
Level 1 – Prices are determined using quoted prices in an active market for identical assets.
Level 2 – Prices are determined using other significant observable inputs. Observable inputs are inputs that other market participants may use in pricing a security. These may include quoted prices for similar securities, interest rates, prepayment speeds, credit risk, yield curves, loss severities, default rates, discount rates, volatilities and others. When significant events cause market movements to occur after the close of the relevant foreign securities markets, foreign securities may be fair valued utilizing an independent pricing service.
Level 3 – Prices are determined using significant unobservable inputs. In situations where quoted prices or observable inputs are unavailable (for example, when there is little or no market activity for an investment at the end of the period), unobservable inputs may be used. Unobservable inputs reflect the Adviser’s assumptions about the factors market participants would use in determining fair value of the securities or instruments and would be based on the best available information.
The following is a summary of the tiered valuation input levels, as of December 31, 2024. The level assigned to the securities valuations may not be an indication of the risk or liquidity associated with investing in those securities. Because of the inherent uncertainties of valuation, the values reflected in the financial statements may materially differ from the value received upon actual sale of those investments.
11
Invesco Select Risk: High Growth Investor Fund
| | | | |
Investments in Securities | | | | |
| | | | |
| | | | |
| | | | |
NOTE 4—Expense Offset Arrangement(s)
The expense offset arrangement is comprised of transfer agency credits which result from balances in demand deposit accounts used by the transfer agent for clearing shareholder transactions. For the year ended December 31, 2024, the Fund received credits from this arrangement, which resulted in the reduction of the Fund’s total expenses of $57,979.
NOTE 5—Trustees’ and Officers’ Fees and Benefits
Trustees’ and Officers’ Fees and Benefits include amounts accrued by the Fund to pay remuneration to certain Trustees and Officers of the Fund. Trustees have the option to defer compensation payable by the Fund, and Trustees’ and Officers’ Fees and Benefits also include amounts accrued by the Fund to fund such deferred compensation amounts. Those Trustees who defer compensation have the option to select various Invesco Funds in which their deferral accounts shall be deemed to be invested. Finally, certain current Trustees were eligible to participate in a retirement plan that provided for benefits to be paid upon retirement to Trustees over a period of time based on the number of years of service. The Fund may have certain former Trustees who also participate in a retirement plan and receive benefits under such plan. Trustees’ and Officers’ Fees and Benefits include amounts accrued by the Fund to fund such retirement benefits. Obligations under the deferred compensation and retirement plans represent unsecured claims against the general assets of the Fund.
The Fund is permitted to temporarily carry a negative or overdrawn balance in its account with SSB, the custodian bank. Such balances, if any at period-end, are shown in the Statement of Assets and Liabilities under the payable caption Amount due custodian. To compensate the custodian bank for such overdrafts, the overdrawn Fund may either (1) leave funds as a compensating balance in the account so the custodian bank can be compensated by earning the additional interest; or (2) compensate by paying the custodian bank at a rate agreed upon by the custodian bank and Invesco, not to exceed the contractually agreed upon rate.
NOTE 7—Distributions to Shareholders and Tax Components of Net Assets
Tax Character of Distributions to Shareholders Paid During the Fiscal Years Ended December 31, 2024 and 2023: |
| | |
| | |
| | |
| | |
| Includes short-term capital gain distributions, if any. |
Tax Components of Net Assets at Period-End: |
| |
Undistributed ordinary income | |
Undistributed long-term capital gain | |
Net unrealized appreciation — investments | |
Net unrealized appreciation (depreciation) — foreign currencies | |
Temporary book/tax differences | |
Shares of beneficial interest | |
| |
The difference between book-basis and tax-basis unrealized appreciation (depreciation) is due to differences in the timing of recognition of gains and losses on investments for tax and book purposes. The Fund’s net unrealized appreciation (depreciation) difference is attributable primarily to wash sales.
The temporary book/tax differences are a result of timing differences between book and tax recognition of income and/or expenses. The Fund’s temporary book/tax differences are the result of the trustee deferral of compensation and retirement plan benefits.
Capital loss carryforward is calculated and reported as of a specific date. Results of transactions and other activity after that date may affect the amount of capital loss carryforward actually available for the Fund to utilize. The ability to utilize capital loss carryforward in the future may be limited under the Internal Revenue Code and related regulations based on the results of future transactions.
The Fund does not have a capital loss carryforward as of December 31, 2024.
NOTE 8—Investment Transactions
The aggregate amount of investment securities (other than short-term securities, U.S. Government obligations and money market funds, if any) purchased and sold by the Fund during the year ended December 31, 2024 was $331,194,345 and $359,806,327, respectively. As of December 31, 2024, the aggregate cost of investments, including any derivatives, on a tax basis listed below includes the adjustments for financial reporting purposes as of the most recently completed federal income tax reporting period-end:
Unrealized Appreciation (Depreciation) of Investments on a Tax Basis |
Aggregate unrealized appreciation of investments | |
Aggregate unrealized (depreciation) of investments | |
Net unrealized appreciation of investments | |
12
Invesco Select Risk: High Growth Investor Fund
Cost of investments for tax purposes is $684,299,884.
NOTE 9—Reclassification of Permanent Differences
Primarily as a result of differing book/tax treatment of distributions, on December 31, 2024, undistributed net investment income was increased by $725,632 and undistributed net realized gain was decreased by $725,632. This reclassification had no effect on the net assets or the distributable earnings of the Fund.
NOTE 10—Share Information
| Summary of Share Activity |
| Year ended
December 31, 2024 | Year ended
December 31, 2023 |
| | | | |
| | | | |
| | | | |
| | | | |
| | | | |
| | | | |
| | | | |
| | | | |
Issued as reinvestment of dividends: | | | | |
| | | | |
| | | | |
| | | | |
| | | | |
| | | | |
| | | | |
Automatic conversion of Class C shares to Class A shares: | | | | |
| | | | |
| | | | |
| | | | |
| | | | |
| | | | |
| | | | |
| | | | |
| | | | |
| | | | |
Net increase (decrease) in share activity | | | | |
13
Invesco Select Risk: High Growth Investor Fund
Report of Independent Registered Public Accounting Firm
To the Board of Trustees of AIM Growth Series (Invesco Growth Series) and Shareholders of Invesco Select Risk: High Growth Investor Fund
Opinion on the Financial Statements
We have audited the accompanying statement of assets and liabilities, including the schedule of investments, of Invesco Select Risk: High Growth Investor Fund (one of the funds constituting AIM Growth Series (Invesco Growth Series), referred to hereafter as the "Fund") as of December 31, 2024, the related statement of operations for the year ended December 31, 2024, the statement of changes in net assets for each of the two years in the period ended December 31, 2024, including the related notes, and the financial highlights for each of the five years in the period ended December 31, 2024 (collectively referred to as the "financial statements"). In our opinion, the financial statements present fairly, in all material respects, the financial position of the Fund as of December 31, 2024, the results of its operations for the year then ended, the changes in its net assets for each of the two years in the period ended December 31, 2024 and the financial highlights for each of the five years in the period ended December 31, 2024 in conformity with accounting principles generally accepted in the United States of America.
These financial statements are the responsibility of the Fund’s management. Our responsibility is to express an opinion on the Fund’s financial statements based on our audits. We are a public accounting firm registered with the Public Company Accounting Oversight Board (United States) (PCAOB) and are required to be independent with respect to the Fund in accordance with the U.S. federal securities laws and the applicable rules and regulations of the Securities and Exchange Commission and the PCAOB.
We conducted our audits of these financial statements in accordance with the standards of the PCAOB. Those standards require that we plan and perform the audit to obtain reasonable assurance about whether the financial statements are free of material misstatement, whether due to error or fraud.
Our audits included performing procedures to assess the risks of material misstatement of the financial statements, whether due to error or fraud, and performing procedures that respond to those risks. Such procedures included examining, on a test basis, evidence regarding the amounts and disclosures in the financial statements. Our audits also included evaluating the accounting principles used and significant estimates made by management, as well as evaluating the overall presentation of the financial statements. Our procedures included confirmation of securities owned as of December 31, 2024 by correspondence with the custodian, transfer agent and broker. We believe that our audits provide a reasonable basis for our opinion.
/s/PricewaterhouseCoopers LLP
February 20, 2025
We have served as the auditor of one or more of the investment companies in the Invesco group of investment companies since at least 1995. We have not been able to determine the specific year we began serving as auditor.
14
Invesco Select Risk: High Growth Investor Fund
Tax Information
Form 1099-DIV, Form 1042-S and other year–end tax information provide shareholders with actual calendar year amounts that should be included in their tax returns. Shareholders should consult their tax advisers.
The following distribution information is being provided as required by the Internal Revenue Code or to meet a specific state’s requirement.
The Fund designates the following amounts or, if subsequently determined to be different, the maximum amount allowable for its fiscal year ended December 31, 2024:
Federal and State Income Tax | |
Long-Term Capital Gain Distributions | |
Qualified Dividend Income* | |
Corporate Dividends Received Deduction* | |
U.S. Treasury Obligations* | |
Qualified Business Income* | |
Business Interest Income* | |
*
The above percentages are based on ordinary income dividends paid to shareholders during the Fund’s fiscal year.
Non-Resident Alien Shareholders | |
Short-Term Capital Gain Distributions | |
15
Invesco Select Risk: High Growth Investor Fund
Other Information Required in Form N-CSR (Items 8-11)
Changes in and Disagreements with Accountants for Open-End Management Investment Companies
Proxy Disclosures for Open-End Management Investment Companies
Remuneration Paid to Directors, Officers, and Others of Open-End Management Investment Companies
The aggregate remuneration paid to directors, officers and others is disclosed within the financial statements.
Statement Regarding Basis for Approval of Investment Advisory Contracts
16
Invesco Select Risk: High Growth Investor Fund
SEC file number(s): 811-02699 and 002-57526
Invesco Distributors, Inc.
O-OPSGI-NCSR
Annual Financial Statements and Other InformationDecember 31, 2024
Invesco Select Risk: Moderate Investor Fund
A: OAMIX ■ C: OCMIX ■ R: ONMIX ■ S: PXMSX ■ Y: OYMIX ■ R5: PXMQX ■ R6: PXMMX
| |
| |
| |
| Notes to Financial Statements |
| Report of Independent Registered Public Accounting Firm |
| |
| Other Information Required in Form N-CSR (Items 8-11) |
Schedule of Investments
Invesco Select Risk: Moderate Investor Fund |
Schedule of Investments in Affiliated Issuers–100.02%(a) |
| | | | | Change in
Unrealized
Appreciation
(Depreciation) | | | | |
|
Invesco Global Real Estate | | | | | | | | | |
Invesco Macro Allocation Strategy Fund, Class R6 | | | | | | | | | |
| | | | | | | | | |
Domestic Equity Funds–38.96% |
Invesco Discovery Mid Cap Growth Fund, Class R6 | | | | | | | | | |
Invesco Main Street Small Cap Fund, Class R6 | | | | | | | | | |
Invesco NASDAQ 100 ETF(c) | | | | | | | | | |
Invesco Russell 1000® Dynamic Multifactor ETF | | | | | | | | | |
Invesco S&P 500® Low Volatility ETF | | | | | | | | | |
Invesco S&P 500® Pure Growth ETF | | | | | | | | | |
| | | | | | | | | |
Invesco Value Opportunities Fund, Class R6 | | | | | | | | | |
Total Domestic Equity Funds | | | | | | | | | |
Fixed Income Funds–38.47% |
Invesco Core Bond Fund, Class R6 | | | | | | | | | |
Invesco Core Plus Bond Fund, Class R6 | | | | | | | | | |
Invesco Emerging Markets Sovereign Debt ETF | | | | | | | | | |
Invesco Equal Weight 0-30 Year Treasury ETF | | | | | | | | | |
Invesco Floating Rate ESG | | | | | | | | | |
Invesco High Yield Fund, Class R6 | | | | | | | | | |
Invesco Income Fund, Class R6 | | | | | | | | | |
Invesco International Bond | | | | | | | | | |
Invesco Taxable Municipal Bond ETF | | | | | | | | | |
Invesco Variable Rate Investment Grade ETF | | | | | | | | | |
| | | | | | | | | |
International and Global Equity Funds–17.43% |
Invesco EQV Emerging Markets All Cap Fund, Class R6 | | | | | | | | | |
Invesco Developing Markets Fund, Class R6 | | | | | | | | | |
Invesco FTSE RAFI Developed Markets ex-U.S. ETF | | | | | | | | | |
Invesco Global Fund, Class R6 | | | | | | | | | |
Invesco Global Infrastructure Fund, Class R6 | | | | | | | | | |
Invesco International Developed Dynamic | | | | | | | | | |
See accompanying Notes to Financial Statements which are an integral part of the financial statements.
2
Invesco Select Risk: Moderate Investor Fund
Invesco Select Risk: Moderate Investor Fund (continued) |
Schedule of Investments in Affiliated Issuers–100.02%(a) |
| | | | | Change in Unrealized Appreciation (Depreciation) | | | | |
Invesco International Small-Mid Company Fund, Class R6 | | | | | | | | | |
Invesco Oppenheimer International Growth Fund, Class R6 | | | | | | | | | |
Invesco S&P Emerging Markets Low Volatility ETF | | | | | | | | | |
Invesco S&P International Developed Low Volatility ETF | | | | | | | | | |
Total International and Global Equity Funds | | | | | | | | | |
|
Invesco Government & Agency Portfolio, Institutional Class, | | | | | | | | | |
Invesco Liquid Assets Portfolio, Institutional | | | | | | | | | |
Invesco Treasury Portfolio, Institutional Class, | | | | | | | | | |
| | | | | | | | | |
TOTAL INVESTMENTS IN AFFILIATED ISSUERS (excluding investments purchased with cash collateral from securities on loan)
(Cost $1,618,988,351) | | | | | | | | | |
|
Investments Purchased with Cash Collateral from Securities on Loan | | | | | | | | | |
|
Invesco Private Government | | | | | | | | | |
Invesco Private Prime Fund, | | | | | | | | | |
Total Investments Purchased with Cash Collateral from Securities on Loan
(Cost $316,257) | | | | | | | | | |
TOTAL INVESTMENTS IN AFFILIATED ISSUERS (Cost $1,619,304,608) | | | | | | | | | |
OTHER ASSETS LESS LIABILITIES | | | | | | | | | |
| | | | | | | | | |
Investment Abbreviations:
See accompanying Notes to Financial Statements which are an integral part of the financial statements.
3
Invesco Select Risk: Moderate Investor Fund
Notes to Schedule of Investments:
| Each underlying fund and the Fund are affiliated by either having the same investment adviser or an investment adviser under common control with the Fund’s investment adviser. |
| Includes return of capital distribution. |
| All or a portion of this security was out on loan at December 31, 2024. |
| The rate shown is the 7-day SEC standardized yield as of December 31, 2024. |
| The security has been segregated to satisfy the commitment to return the cash collateral received in securities lending transactions upon the borrower’s return of the securities loaned. See Note 1I. |
| Represents the income earned on the investment of cash collateral, which is included in securities lending income on the Statement of Operations. Does not include rebates and fees paid to lending agent or premiums received from borrowers, if any. |
| Includes capital gains distributions from affiliated underlying funds as follows: |
| |
Invesco Discovery Mid Cap Growth Fund | |
| |
Invesco Global Infrastructure Fund | |
Invesco International Small-Mid Company Fund | |
Invesco Main Street Small Cap Fund | |
Invesco Oppenheimer International Growth Fund | |
Invesco Value Opportunities Fund | |
See accompanying Notes to Financial Statements which are an integral part of the financial statements.
4
Invesco Select Risk: Moderate Investor Fund
Statement of Assets and Liabilities
| |
Investments in affiliated underlying funds, at value
(Cost $1,619,304,608)* | |
| |
| |
| |
Dividends - affiliated underlying funds | |
Investment for trustee deferred compensation and retirement plans | |
| |
| |
| |
| |
Investments purchased - affiliated underlying funds | |
| |
Collateral upon return of securities loaned | |
Accrued fees to affiliates | |
Accrued trustees’ and officers’ fees and benefits | |
Accrued other operating expenses | |
Trustee deferred compensation and retirement plans | |
| |
Net assets applicable to shares outstanding | |
| |
Shares of beneficial interest | |
| |
| |
|
| |
| |
| |
| |
| |
| |
| |
Shares outstanding, no par value, with an unlimited number of shares authorized: |
| |
| |
| |
| |
| |
| |
| |
| |
Net asset value per share | |
Maximum offering price per share
(Net asset value of $11.11 ÷ 94.50%) | |
| |
Net asset value and offering price per share | |
| |
Net asset value and offering price per share | |
| |
Net asset value and offering price per share | |
| |
Net asset value and offering price per share | |
| |
Net asset value and offering price per share | |
| |
Net asset value and offering price per share | |
| At December 31, 2024, securities with an aggregate value of $118,931 were on loan to brokers. |
See accompanying Notes to Financial Statements which are an integral part of the financial statements.
5
Invesco Select Risk: Moderate Investor Fund
Statement of Operations
For the year ended December 31, 2024
| |
Dividends from affiliated underlying funds (includes net securities lending income of $44,656) | |
| |
| |
| |
| |
| |
| |
| |
| |
| |
Transfer agent fees— A, C, R, S and Y | |
| |
| |
Trustees’ and officers’ fees and benefits | |
Registration and filing fees | |
| |
Professional services fees | |
| |
| |
Less: Expense offset arrangement(s) | |
| |
| |
Realized and unrealized gain (loss) from: | |
Net realized gain (loss) from: | |
Affiliated underlying fund shares | |
| |
Capital gain distributions from affiliated underlying fund shares | |
| |
Change in net unrealized appreciation (depreciation) of: | |
Affiliated underlying fund shares | |
| |
| |
Net realized and unrealized gain | |
Net increase in net assets resulting from operations | |
See accompanying Notes to Financial Statements which are an integral part of the financial statements.
6
Invesco Select Risk: Moderate Investor Fund
Statement of Changes in Net Assets
For the years ended December 31, 2024 and 2023
| | |
| | |
| | |
| | |
Change in net unrealized appreciation | | |
Net increase in net assets resulting from operations | | |
Distributions to shareholders from distributable earnings: | | |
| | |
| | |
| | |
| | |
| | |
| | |
| | |
Total distributions from distributable earnings | | |
| | |
| | |
| | |
| | |
| | |
| | |
| | |
| | |
Net increase (decrease) in net assets resulting from share transactions | | |
Net increase (decrease) in net assets | | |
| | |
| | |
| | |
See accompanying Notes to Financial Statements which are an integral part of the financial statements.
7
Invesco Select Risk: Moderate Investor Fund
Financial Highlights
The following schedule presents financial highlights for a share of the Fund outstanding throughout the periods indicated.
| Net asset
value,
beginning
of period | | Net gains
(losses)
on securities
(both
realized and
unrealized) | Total from
investment
operations | Dividends
from net
investment
income | Distributions
from net
realized
gains | | Net asset
value, end
of period | | Net assets,
end of period
(000’s omitted) | Ratio of
expenses
to average
net assets
with fee waivers
and/or
expenses
| Ratio of
expenses
to average net
assets without
fee waivers
and/or
expenses
absorbed
| Ratio of net
investment
income
to average
net assets | |
|
| | | | | | | | | | | | | | |
| | | | | | | | | | | | | | |
| | | | | | | | | | | | | | |
| | | | | | | | | | | | | | |
| | | | | | | | | | | | | | |
|
| | | | | | | | | | | | | | |
| | | | | | | | | | | | | | |
| | | | | | | | | | | | | | |
| | | | | | | | | | | | | | |
| | | | | | | | | | | | | | |
|
| | | | | | | | | | | | | | |
| | | | | | | | | | | | | | |
| | | | | | | | | | | | | | |
| | | | | | | | | | | | | | |
| | | | | | | | | | | | | | |
|
| | | | | | | | | | | | | | |
| | | | | | | | | | | | | | |
| | | | | | | | | | | | | | |
| | | | | | | | | | | | | | |
| | | | | | | | | | | | | | |
|
| | | | | | | | | | | | | | |
| | | | | | | | | | | | | | |
| | | | | | | | | | | | | | |
| | | | | | | | | | | | | | |
| | | | | | | | | | | | | | |
|
| | | | | | | | | | | | | | |
| | | | | | | | | | | | | | |
| | | | | | | | | | | | | | |
| | | | | | | | | | | | | | |
| | | | | | | | | | | | | | |
|
| | | | | | | | | | | | | | |
| | | | | | | | | | | | | | |
| | | | | | | | | | | | | | |
| | | | | | | | | | | | | | |
| | | | | | | | | | | | | | |
| Calculated using average shares outstanding. |
| Includes adjustments in accordance with accounting principles generally accepted in the United States of America and as such, the net asset value for financial reporting purposes and the returns based upon those net asset values may differ from the net asset value and returns for shareholder transactions. Does not include sales charges and is not annualized for periods less than one year, if applicable. |
| In addition to the fees and expenses which the Fund bears directly, the Fund indirectly bears a pro rata share of the fees and expenses of the underlying funds in which the Fund invests. Because the underlying funds have varied expenses and fee levels and the Fund may own different proportions at different times, the amount of fees and expenses incurred indirectly by the Fund will vary. Estimated underlying fund expenses are not expenses that are incurred directly by the Fund. They are expenses that are incurred directly by the underlying funds and are deducted from the value of the funds the Fund invests in. The effect of the estimated underlying fund expenses that the Fund bears indirectly is included in the Fund’s total return. Estimated acquired fund fees from underlying funds were 0.50%, 0.51%, 0.52%, 0.52% and 0.58% for the years ended December 31, 2024, 2023, 2022, 2021 and 2020, respectively. |
| Portfolio turnover is calculated at the fund level and is not annualized for periods less than one year, if applicable. For the year ended December 31, 2020, the portfolio turnover calculation excludes the value of securities purchased of $597,759,006 in connection with the acquisition of Invesco Moderate Allocation Fund into the Fund. |
| The total return, ratios of expenses to average net assets and ratio of net investment income (loss) to average net assets reflect actual 12b-1 fees of 0.24%, 0.24%, 0.24%, 0.24% and 0.23% for the years ended December 31, 2024, 2023, 2022, 2021 and 2020, respectively. |
| Commencement date of May 15, 2020. |
| |
See accompanying Notes to Financial Statements which are an integral part of the financial statements.
8
Invesco Select Risk: Moderate Investor Fund
Notes to Financial Statements
NOTE 1—Significant Accounting Policies
Invesco Select Risk: Moderate Investor Fund (the “Fund”) is a series portfolio of AIM Growth Series (Invesco Growth Series) (the “Trust”). The Trust is a Delaware statutory trust registered under the Investment Company Act of 1940, as amended (the “1940 Act”), as an open-end series management investment company authorized to issue an unlimited number of shares of beneficial interest. Information presented in these financial statements pertains only to the Fund. Matters affecting the Fund or each class will be voted on exclusively by the shareholders of the Fund or each class.
The Fund’s investment objective is to seek total return.
The Fund is a “fund of funds”, in that it invests in other mutual funds advised by Invesco Advisers, Inc. (the “Adviser” or “Invesco”) and exchange-traded funds ("ETFs") and other pooled investment vehicles advised by Invesco Capital Management LLC (“Invesco Capital”) or mutual funds, ETFs and other pooled investment vehicles advised by unaffiliated advisers (“underlying funds”). Invesco and Invesco Capital are affiliates of each other as they are indirect, wholly-owned subsidiaries of Invesco Ltd. Invesco may change the Fund’s asset class allocations, the underlying funds or the target weightings in the underlying funds without shareholder approval or notice to shareholders. The underlying funds may engage in a number of investment techniques and practices, which involve certain risks. Each underlying fund’s accounting policies are outlined in the underlying fund’s financial statements and are publicly available.
The Fund currently consists of seven different classes of shares: Class A, Class C, Class R, Class S, Class Y, Class R5 and Class R6. Class Y shares are available only to certain investors. Class A shares are sold with a front-end sales charge unless certain waiver criteria are met. Under certain circumstances, load waived shares may be subject to contingent deferred sales charges (“CDSC”). Class C shares are sold with a CDSC. Class R, Class S, Class Y, Class R5 and Class R6 shares are sold at net asset value. Class C shares held for eight years after purchase are eligible for automatic conversion into Class A shares of the same Fund (the "Conversion Feature"). The automatic conversion pursuant to the Conversion Feature will generally occur at the end of the month following the eighth anniversary after a purchase of Class C shares.
Effective after the close of business on September 30, 2024, Class R5 shares are closed to new investors.
The Fund is an investment company and accordingly follows the investment company accounting and reporting guidance in accordance with Financial Accounting Standards Board Accounting Standards Codification Topic 946, Financial Services – Investment Companies.
The following is a summary of the significant accounting policies followed by the Fund in the preparation of its financial statements.
A.
Security Valuations — Securities of investment companies listed or traded on an exchange are generally valued at the trade price or official closing price that day as of the close of the exchange where the security is principally traded, or lacking any trades or official closing price on a particular day, the security may be valued at the closing bid price on that day. Securities of investment companies that are not exchange-traded (e.g., open-end mutual funds) are valued using such company’s end-of-business-day net asset value per share. Securities in the underlying funds, including restricted securities, are valued in accordance with the valuation policy of such fund. The policies of the underlying funds affiliated with the Fund, as a result of having the same investment adviser, are set forth below.
A security listed or traded on an exchange is generally valued at its trade price or official closing price that day as of the close of the exchange where the security is principally traded, or lacking any trades or official closing price on a particular day, the security may be valued at the closing bid or ask price on that day. Securities traded in the over-the-counter market are valued based on prices furnished by independent pricing services or market makers. When such securities are valued using prices provided by an independent pricing service they may be considered fair valued. Futures contracts are valued at the daily settlement price set by an exchange on which they are principally traded. Where a final settlement price exists, exchange-traded options are valued at the final settlement price from the exchange where the option principally trades. Where a final settlement price does not exist, exchange-traded options are valued at the mean between the last bid and ask price generally from the exchange where the option principally trades.
Variable rate senior loan interests are fair valued using quotes provided by an independent pricing service. Quotes provided by the pricing service may reflect appropriate factors such as ratings, tranche type, industry, company performance, spread, individual trading characteristics, institution-size trading in similar groups of securities and other market data.
Securities of investment companies that are not exchange-traded (e.g., open-end mutual funds) are valued using such company’s end-of-business-day net asset value per share.
Deposits, other obligations of U.S. and non-U.S. banks and financial institutions are valued at their daily account value.
Fixed income securities (including convertible debt securities) generally are valued on the basis of prices provided by independent pricing services. Prices provided by the pricing service may be determined without exclusive reliance on quoted prices, and may reflect appropriate factors such as institution-size trading in similar groups of securities, developments related to specific securities, dividend rate (for unlisted equities), yield (for debt obligations), quality, type of issue, coupon rate (for debt obligations), maturity (for debt obligations), individual trading characteristics and other market data. Pricing services generally value debt obligations assuming orderly transactions of institutional round lot size, but a fund may hold or transact in the same securities in smaller, odd lot sizes. Odd lots often trade at lower prices than institutional round lots, and their value may be adjusted accordingly. Debt obligations are subject to interest rate and credit risks. In addition, all debt obligations involve some risk of default with respect to interest and/or principal payments.
Swap agreements are fair valued using an evaluated quote, if available, provided by an independent pricing service. Evaluated quotes provided by the pricing service are valued based on a model which may include end-of-day net present values, spreads, ratings, industry, company performance and returns of referenced assets. Centrally cleared swap agreements are valued at the daily settlement price determined by the relevant exchange or clearinghouse.
Foreign securities’ (including foreign exchange contracts) prices are converted into U.S. dollar amounts using the applicable exchange rates as of the close of the New York Stock Exchange (“NYSE”). If market quotations are available and reliable for foreign exchange-traded equity securities, the securities will be valued at the market quotations. The Adviser may use various pricing services to obtain market quotations as well as fair value prices. Because trading hours for certain foreign securities end before the close of the NYSE, closing market quotations may become not representative of market value in the Adviser’s judgment (“unreliable”). If, between the time trading ends on a particular security and the close of the customary trading session on the NYSE, a significant event occurs that makes the closing price of the security unreliable, the Adviser may fair value the security. If the event is likely to have affected the closing price of the security, the security will be valued at fair value in good faith in accordance with Board- approved policies and related Adviser procedures (“Valuation Procedures”). Adjustments to closing prices to reflect fair value may also be based on a screening process of an independent pricing service to indicate the degree of certainty, based on historical data, that the closing price in the principal market where a foreign security trades is not the current value as of the close of the NYSE. Foreign securities’ prices meeting the degree of certainty that the price is not reflective of current value will be priced at the indication of fair value from the independent pricing service. Multiple factors may be considered by the independent pricing service in determining adjustments to reflect fair value and may include information relating to sector indices, American Depositary Receipts and domestic and foreign index futures. Foreign securities may have additional risks including exchange rate changes, potential for sharply devalued currencies and high inflation, political and economic upheaval, the relative lack of issuer information, relatively low market liquidity and the potential lack of strict financial and accounting controls and standards.
Unlisted securities will be valued using prices provided by independent pricing services or by another method that the Adviser, in its judgment, believes better reflects the security’s fair value in accordance with the Valuation Procedures.
9
Invesco Select Risk: Moderate Investor Fund
Non-traded rights and warrants shall be valued at intrinsic value if the terms of the rights and warrants are available, specifically the subscription or exercise price and the ratio. Intrinsic value is calculated as the daily market closing price of the security to be received less the subscription price, which is then adjusted by the exercise ratio. In the case of warrants, an option pricing model supplied by an independent pricing service may be used based on market data such as volatility, stock price and interest rate from the independent pricing service and strike price and exercise period from verified terms.
Securities for which market prices are not provided by any of the above methods may be valued based upon quotes furnished by independent sources. The mean between the last bid and ask prices may be used to value debt obligations, including corporate loans.
Securities for which market quotations are not readily available are fair valued by the Adviser in accordance with the Valuation Procedures. If a fair value price provided by a pricing service is unreliable, the Adviser will fair value the security using the Valuation Procedures. Issuer specific events, market trends, bid/ask quotes of brokers and information providers and other market data may be reviewed in the course of making a good faith determination of a security’s fair value.
The Fund may invest in securities that are subject to interest rate risk, meaning the risk that the prices will generally fall as interest rates rise and, conversely, the prices will generally rise as interest rates fall. Specific securities differ in their sensitivity to changes in interest rates depending on their individual characteristics. Changes in interest rates may result in increased market volatility, which may affect the value and/or liquidity of certain Fund investments.
Valuations change in response to many factors including the historical and prospective earnings of the issuer, the value of the issuer’s assets, general market conditions which are not specifically related to the particular issuer, such as real or perceived adverse economic conditions, changes in the general outlook for revenues or corporate earnings, changes in interest or currency rates, regional or global instability, natural or environmental disasters, widespread disease or other public health issues, war, acts of terrorism, significant governmental actions or adverse investor sentiment generally and market liquidity. Because of the inherent uncertainties of valuation, the values reflected in the financial statements may materially differ from the value received upon actual sale of those investments.
The price the Fund could receive upon the sale of any investment may differ from the Adviser’s valuation of the investment, particularly for securities that are valued using a fair valuation technique. When fair valuation techniques are applied, the Adviser uses available information, including both observable and unobservable inputs and assumptions, to determine a methodology that will result in a valuation that the Adviser believes approximates market value. Fund securities that are fair valued may be subject to greater fluctuation in their value from one day to the next than would be the case if market quotations were used. Because of the inherent uncertainties of valuation, and the degree of subjectivity in such decisions, the Fund could realize a greater or lesser than expected gain or loss upon the sale of the investment.
B.
Securities Transactions and Investment Income — Securities transactions are accounted for on a trade date basis. Realized gains or losses on sales are computed on the basis of specific identification of the securities sold. Distributions from ordinary income from underlying funds, if any, are recorded as dividend income on the ex-dividend date. Distributions from gains from underlying funds, if any, are recorded as realized gains on the ex-dividend date. The following policies are followed by the underlying funds: Interest income (net of withholding tax, if any) is recorded on an accrual basis from settlement date and includes coupon interest and amortization of premium and accretion of discount on debt securities as applicable. Pay-in-kind interest income and non-cash dividend income received in the form of securities in lieu of cash are recorded at the fair value of the securities received. Paydown gains and losses on mortgage and asset-backed securities are recorded as adjustments to interest income.
The Fund may periodically participate in litigation related to the Fund’s investments. As such, the Fund may receive proceeds from litigation settlements. Any proceeds received are included in the Statement of Operations as realized gain (loss) for investments no longer held and as unrealized gain (loss) for investments still held.
The Fund allocates income and realized and unrealized capital gains and losses to a class based on the relative net assets of each class.
C.
Distributions – Distributions from net investment income and net realized capital gain, if any, are generally declared and paid annually and recorded on the ex-dividend date. The Fund may elect to treat a portion of the proceeds from redemptions as distributions for federal income tax purposes.
D.
Federal Income Taxes – The Fund intends to comply with the requirements of Subchapter M of the Internal Revenue Code of 1986, as amended (the “Internal Revenue Code”), necessary to qualify as a regulated investment company and to distribute substantially all of the Fund’s taxable earnings to shareholders. As such, the Fund will not be subject to federal income taxes on otherwise taxable income (including net realized capital gain) that is distributed to shareholders. Therefore, no provision for federal income taxes is recorded in the financial statements.
The Fund recognizes the tax benefits of uncertain tax positions only when the position is more likely than not to be sustained. Management has analyzed the Fund’s uncertain tax positions and concluded that no liability for unrecognized tax benefits should be recorded related to uncertain tax positions. Management is not aware of any tax positions for which it is reasonably possible that the total amounts of unrecognized tax benefits will change materially in the next 12 months.
The Fund files tax returns in the U.S. Federal jurisdiction and certain other jurisdictions. Generally, the Fund is subject to examinations by such taxing authorities for up to three years after the filing of the return for the tax period.
E.
Expenses – Expenses included in the accompanying financial statements reflect the expenses of the Fund and do not include any expenses of the underlying funds. The effects of the underlying funds expenses are included in the realized and unrealized gain/loss on the investments in the underlying funds. Estimated expenses of the underlying funds are discussed further within the Financial Highlights.
Fees provided for under the Rule 12b-1 plan of a particular class of the Fund and which are directly attributable to that class are charged to the operations of such class. Transfer agency fees and expenses and other shareholder recordkeeping fees and expenses attributable to Class R5 and Class R6 are allocated based on relative net assets of Class R5 and Class R6. Transfer agency fees and expenses and other shareholder recordkeeping fees and expenses relating to all other classes are allocated among those classes based on relative net assets. All other expenses are allocated among the classes based on relative net assets.
F.
Accounting Estimates – The preparation of financial statements in conformity with accounting principles generally accepted in the United States of America (“GAAP”) requires management to make estimates and assumptions that affect the reported amounts of assets and liabilities at the date of the financial statements and the reported amounts of revenues and expenses during the reporting period including estimates and assumptions related to taxation. Actual results could differ from those estimates by a significant amount. In addition, the Fund monitors for material events or transactions that may occur or become known after the period-end date and before the date the financial statements are released to print.
G.
Indemnifications – Under the Trust’s organizational documents, each Trustee, officer, employee or other agent of the Trust is indemnified against certain liabilities that may arise out of the performance of their duties to the Fund. Additionally, in the normal course of business, the Fund enters into contracts, including the Fund’s servicing agreements, that contain a variety of indemnification clauses. The Fund’s maximum exposure under these arrangements is unknown as this would involve future claims that may be made against the Fund that have not yet occurred. The risk of material loss as a result of such indemnification claims is considered remote.
H.
Segment Reporting — In November 2023, the FASB issued Accounting Standards Update 2023-07, Segment Reporting (Topic 280): Improvements to Reportable Segment Disclosures (“ASU 2023-07”), with the intent of improving reportable segment disclosure requirements, primarily through enhanced disclosures about significant segment expenses, allowing financial statement users to better understand the components of a segment’s profit or loss and assess potential future cash flows for each reportable segment and the entity as a whole thereby enabling better understanding of how an entity’s segments impact overall performance. The Fund represents a single operating segment. Subject to the oversight and, when applicable, approval of the Board of Trustees, the Fund’s Adviser acts as the Fund’s chief operating decision maker (“CODM”), assessing performance and making decisions about resource allocation within the Fund. The CODM monitors the operating results as a whole and the Fund’s long-term strategic asset allocation is determined in accordance with the terms of its prospectus based on a defined investment strategy. The financial information provided to and reviewed by the CODM is consistent with that presented in the Fund’s financial
10
Invesco Select Risk: Moderate Investor Fund
statements. Adoption of the new standard impacted the Fund’s financial statement note disclosures only and did not affect the Fund’s financial position or the results of its operations.
I.
Securities Lending – The Fund may lend portfolio securities having a market value up to one-third of the Fund’s total assets. Such loans are secured by collateral equal to no less than the market value of the loaned securities determined daily by the securities lending provider. Such collateral will be cash or debt securities issued or guaranteed by the U.S. Government or any of its sponsored agencies. Cash collateral received in connection with these loans is invested in short-term money market instruments or affiliated, unregistered investment companies that comply with Rule 2a-7 under the 1940 Act and money market funds (collectively, "affiliated money market funds") and is shown as such on the Schedule of Investments. The Fund bears the risk of loss with respect to the investment of collateral. It is the Fund’s policy to obtain additional collateral from or return excess collateral to the borrower by the end of the next business day, following the valuation date of the securities loaned. Therefore, the value of the collateral held may be temporarily less than the value of the securities on loan. When loaning securities, the Fund retains certain benefits of owning the securities, including the economic equivalent of dividends or interest generated by the security. Lending securities entails a risk of loss to the Fund if, and to the extent that, the market value of the securities loaned were to increase and the borrower did not increase the collateral accordingly, and the borrower failed to return the securities. The securities loaned are subject to termination at the option of the borrower or the Fund. Upon termination, the borrower will return to the Fund the securities loaned and the Fund will return the collateral. Upon the failure of the borrower to return the securities, collateral may be liquidated and the securities may be purchased on the open market to replace the loaned securities. The Fund could experience delays and costs in gaining access to the collateral and the securities may lose value during the delay which could result in potential losses to the Fund. Some of these losses may be indemnified by the lending agent. The Fund bears the risk of any deficiency in the amount of the collateral available for return to the borrower due to any loss on the collateral invested. Dividends received on cash collateral investments for securities lending transactions, which are net of compensation to counterparties, are included in Dividends from affiliated underlying funds on the Statement of Operations. The aggregate value of securities out on loan, if any, is shown as a footnote on the Statement of Assets and Liabilities.
The Adviser serves as an affiliated securities lending agent for the Fund. The Bank of New York Mellon also serves as a securities lending agent. To the extent the Fund utilizes the Adviser as an affiliated securities lending agent, the Fund conducts its securities lending in accordance with, and in reliance upon, no-action letters issued by the SEC staff that provide guidance on how an affiliate may act as a direct agent lender and receive compensation for those services in a manner consistent with the federal securities laws. For the year ended December 31, 2024, the Fund paid the Adviser $1,938 in fees for securities lending agent services. Fees paid to the Adviser for securities lending agent services, if any, are included in Dividends from affiliated underlying funds on the Statement of Operations.
J.
Foreign Currency Translations — Foreign currency is valued at the close of the NYSE based on quotations posted by banks and major currency dealers. Portfolio securities and other assets and liabilities denominated in foreign currencies are translated into U.S. dollar amounts at the date of valuation. Purchases and sales of portfolio securities (net of foreign taxes withheld on disposition) and income items denominated in foreign currencies are translated into U.S. dollar amounts on the respective dates of such transactions. The Fund does not separately account for the portion of the results of operations resulting from changes in foreign exchange rates on investments and the fluctuations arising from changes in market prices of securities held. The combined results of changes in foreign exchange rates and the fluctuation of market prices on investments (net of estimated foreign tax withholding) are included with the net realized and unrealized gain or loss from investments in the Statement of Operations. Reported net realized foreign currency gains or losses arise from (1) sales of foreign currencies, (2) currency gains or losses realized between the trade and settlement dates on securities transactions, and (3) the difference between the amounts of dividends, interest, and foreign withholding taxes recorded on the Fund’s books and the U.S. dollar equivalent of the amounts actually received or paid. Net unrealized foreign currency gains and losses arise from changes in the fair values of assets and liabilities, other than investments in securities at fiscal period end, resulting from changes in exchange rates.
The Fund may invest in foreign securities, which may be subject to foreign taxes on income, gains on investments or currency repatriation, a portion of which may be recoverable. Foreign taxes, if any, are recorded based on the tax regulations and rates that exist in the foreign markets in which the Fund invests and are shown in the Statement of Operations.
The performance of the Fund may be materially affected positively or negatively by foreign currency strength or weakness relative to the U.S. dollar. Currency rates in foreign countries may fluctuate for a number of reasons, including changes in interest rates, political, economic, or social instability and development, and imposition of currency controls. Currency controls in certain foreign jurisdictions may cause the Fund to experience significant delays in its ability to repatriate its assets in U.S. dollars at quoted spot rates, and it is possible that the Fund’s ability to convert certain foreign currencies into U.S. dollars may be limited and may occur at discounts to quoted rates. As a result, the value of the Fund’s assets and liabilities denominated in such currencies that would ultimately be realized could differ from those reported on the Statement of Assets and Liabilities. Certain foreign companies may be subject to sanctions, embargoes, or other governmental actions that may limit the ability to invest in, receive, hold, or sell the securities of such companies, all of which affect the market and/or credit risk of the investments. Because of the inherent uncertainties of valuation, the values reflected in the financial statements may materially differ from the value received upon actual sale of those investments.
K.
Forward Foreign Currency Contracts — The Fund may engage in foreign currency transactions either on a spot (i.e. for prompt delivery and settlement) basis, or through forward foreign currency contracts, to manage or minimize currency or exchange rate risk.
The Fund may also enter into forward foreign currency contracts for the purchase or sale of a security denominated in a foreign currency in order to “lock in” the U.S. dollar price of that security, or the Fund may also enter into forward foreign currency contracts that do not provide for physical exchange of the two currencies on the settlement date, but instead are settled by a single cash payment calculated as the difference between the agreed upon exchange rate and the spot rate at settlement based upon an agreed upon notional amount (non-deliverable forwards).
A forward foreign currency contract is an obligation between two parties (“Counterparties”) to purchase or sell a specific currency for an agreed-upon price at a future date. The use of forward foreign currency contracts for hedging does not eliminate fluctuations in the price of the underlying securities the Fund owns or intends to acquire but establishes a rate of exchange in advance. Fluctuations in the value of these contracts are measured by the difference in the contract date and reporting date exchange rates and are recorded as unrealized appreciation (depreciation) until the contracts are closed. When the contracts are closed, realized gains (losses) are recorded. Realized and unrealized gains (losses) on the contracts are included in the Statement of Operations. The primary risks associated with forward foreign currency contracts include failure of the Counterparty to meet the terms of the contract and the value of the foreign currency changing unfavorably. These risks may be in excess of the amounts reflected in the Statement of Assets and Liabilities.
L.
Other Risks - Certain of the underlying funds are non-diversified and can invest a greater portion of their assets in the obligations or securities of a small number of issuers or any single issuer than a diversified fund can. A change in the value of one or a few issuers’ securities will therefore affect the value of an underlying fund more than would occur in a diversified fund.
Investments in ETFs generally present the same primary risks as an investment in a conventional mutual fund that has the same investment objective, strategy and policies. Investments in ETFs further involve the same risks associated with a direct investment in the types of securities, commodities and/or currencies included in the indices the ETFs are designed to replicate. In addition, shares of an ETF may trade at a market price that is higher or lower than their net asset value and an active trading market in such shares may not develop or continue. Moreover, trading of an ETF’s shares may be halted if the listing exchange’s officials deem such action to be appropriate, the shares are de-listed from the exchange, or the activation of market-wide “circuit breakers” (which are tied to large decreases in stock prices) halts stock trading generally.
Emerging markets (also referred to as developing markets) are generally subject to greater market volatility, political, social and economic instability, uncertain trading markets and more governmental limitations on foreign investment than more developed markets. In addition, companies operating in emerging markets
11
Invesco Select Risk: Moderate Investor Fund
may be subject to lower trading volume and greater price fluctuations than companies in more developed markets. Such countries’ economies may be more dependent on relatively few industries or investors that may be highly vulnerable to local and global changes. Companies in emerging market countries generally may be subject to less stringent regulatory, disclosure, financial reporting, accounting, auditing and recordkeeping standards than companies in more developed countries. As a result, information, including financial information, about such companies may be less available and reliable, which can impede an underlying Fund’s ability to evaluate such companies. Securities law and the enforcement of systems of taxation in many emerging market countries may change quickly and unpredictably, and the ability to bring and enforce actions (including bankruptcy, confiscatory taxation, expropriation, nationalization of a company’s assets, restrictions on foreign ownership of local companies, restrictions on withdrawing assets from the country, protectionist measures and practices such as share blocking), or to obtain information needed to pursue or enforce such actions, may be limited. In addition, the ability of foreign entities to participate in privatization programs of certain developing or emerging market countries may be limited by local law. Investments in emerging market securities may be subject to additional transaction costs, delays in settlement procedures, unexpected market closures, and lack of timely information.
NOTE 2—Advisory Fees and Other Fees Paid to Affiliates
The Trust has entered into a master investment advisory agreement with the Adviser. Under the terms of the investment advisory agreement, the Fund does not pay an advisory fee. However, the Fund pays advisory fees to the Adviser indirectly as a shareholder of the underlying funds.
Under the terms of a master sub-advisory agreement between the Adviser and each of Invesco Asset Management Deutschland GmbH, Invesco Asset Management Limited, Invesco Asset Management (Japan) Limited, Invesco Hong Kong Limited, Invesco Senior Secured Management, Inc. and Invesco Canada Ltd. and a separate sub-advisory agreement with Invesco Capital Management LLC (collectively, the "Affiliated Sub-Advisers") the Adviser, not the Fund, will pay 40% of the fees paid to the Adviser to any such Affiliated Sub-Adviser(s) that provide(s) discretionary investment management services to the Fund based on the percentage of assets allocated to such Affiliated Sub-Adviser(s). Invesco has also entered into a sub-advisory agreement with OppenheimerFunds, Inc. to provide discretionary management services to the Fund.
The Adviser has contractually agreed, through at least April 30, 2026, to reimburse expenses of all shares to the extent necessary to limit total annual fund operating expenses after expense reimbursement (excluding certain items discussed below) of Class A, Class C, Class R, Class S, Class Y, Class R5 and Class R6 shares to 0.47%, 1.22%, 0.72%, 0.37%, 0.22%, 0.22% and 0.22%, respectively, of the Fund’s average daily net assets (the “expense limits”). In determining the Adviser’s obligation to reimburse expenses, the following expenses are not taken into account, and could cause total annual fund operating expenses after expense reimbursement to exceed the numbers reflected above: (1) interest; (2) taxes; (3) dividend expenses on short sales; (4) extraordinary or non-routine items, including litigation expenses; and (5) expenses that the Fund has incurred but did not actually pay because of an expense offset arrangement. Unless Invesco continues the expense reimbursement agreement, it will terminate on April 30, 2026. During its term, the expense reimbursement agreement cannot be terminated or amended to increase the expense limits or reduce the expense reimbursement without approval of the Board of Trustees. The Adviser did not reimburse expenses during the period under these expense limits.
The Trust has entered into a master administrative services agreement with Invesco pursuant to which the Fund has agreed to pay Invesco for certain administrative costs incurred in providing accounting services to the Fund. For the year ended December 31, 2024, expenses incurred under the agreement are shown in the Statement of Operations as Administrative services fees. Invesco has entered into a sub-administration agreement whereby State Street Bank and Trust Company (“SSB”) serves as fund accountant and provides certain administrative services to the Fund. Pursuant to a custody agreement with the Trust on behalf of the Fund, SSB also serves as the Fund’s custodian.
The Trust has entered into a transfer agency and service agreement with Invesco Investment Services, Inc. (“IIS”) pursuant to which the Fund has agreed to pay IIS a fee for providing transfer agency and shareholder services to the Fund and reimburse IIS for certain expenses incurred by IIS in the course of providing such services. IIS may make payments to intermediaries that provide omnibus account services, sub-accounting services and/or networking services. All fees payable by IIS to intermediaries that provide omnibus account services or sub-accounting services are charged back to the Fund, subject to certain limitations approved by the Trust’s Board of Trustees. For the year ended December 31, 2024, expenses incurred under the agreement are shown in the Statement of Operations as Transfer agent fees.
The Trust has entered into master distribution agreements with Invesco Distributors, Inc. (“IDI”) to serve as the distributor for the Class A, Class C, Class R, Class S, Class Y, Class R5 and Class R6 shares of the Fund. The Trust has adopted plans pursuant to Rule 12b-1 under the 1940 Act with respect to the Fund’s Class A, Class C, Class R and Class S shares (collectively, the “Plans”). The Fund, pursuant to the Class A Plan, reimburses IDI for its allocated share of expenses incurred for the period, up to a maximum annual rate of 0.25% of the average daily net assets of Class A shares. The Fund pursuant to the Class C, Class R and Class S Plans, pays IDI compensation at the annual rate of 1.00% of the average daily net assets of Class C shares, 0.50% of the average daily net assets of Class R shares and 0.15% of the average daily net assets of Class S shares. The fees are accrued daily and paid monthly. Of the Plans payments, up to 0.25% of the average daily net assets of Class A, Class C and Class R shares and 0.15% of the average daily net assets of Class S shares may be paid to furnish continuing personal shareholder services to customers who purchase and own shares of such classes. Any amounts not paid as a service fee under the Plans would constitute an asset-based sales charge. Rules of the Financial Industry Regulatory Authority (“FINRA”) impose a cap on the total sales charges, including asset-based sales charges, that may be paid by any class of shares of the Fund. For the year ended December 31, 2024, expenses incurred under the Plans are shown in the Statement of Operations as Distribution fees.
Front-end sales commissions and CDSC (collectively, the “sales charges”) are not recorded as expenses of the Fund. Front-end sales commissions are deducted from proceeds from the sales of Fund shares prior to investment in Class A shares of the Fund. CDSC are deducted from redemption proceeds prior to remittance to the shareholder. During the year ended December 31, 2024, IDI advised the Fund that IDI retained $183,242 in front-end sales commissions from the sale of Class A shares and $35,826 and $8,211 from Class A and Class C shares, respectively, for CDSC imposed upon redemptions by shareholders.
The underlying Invesco Funds pay no distribution fees for Class R6 shares and the Funds pay no sales loads or other similar compensation to IDI for acquiring underlying fund shares.
Certain officers and trustees of the Trust are officers and directors of the Adviser, IIS and/or IDI.
NOTE 3—Additional Valuation Information
GAAP defines fair value as the price that would be received to sell an asset or paid to transfer a liability in an orderly transaction between market participants at the measurement date, under current market conditions. GAAP establishes a hierarchy that prioritizes the inputs to valuation methods, giving the highest priority to readily available unadjusted quoted prices in an active market for identical assets (Level 1) and the lowest priority to significant unobservable inputs (Level 3), generally when market prices are not readily available. Based on the valuation inputs, the securities or other investments are tiered into one of three levels. Changes in valuation methods may result in transfers in or out of an investment’s assigned level:
Level 1 – Prices are determined using quoted prices in an active market for identical assets.
Level 2 – Prices are determined using other significant observable inputs. Observable inputs are inputs that other market participants may use in pricing a security. These may include quoted prices for similar securities, interest rates, prepayment speeds, credit risk, yield curves, loss severities, default rates, discount rates, volatilities and others. When significant events cause market movements to occur after the close of the relevant foreign securities markets, foreign securities may be fair valued utilizing an independent pricing service.
Level 3 – Prices are determined using significant unobservable inputs. In situations where quoted prices or observable inputs are unavailable (for example, when there is little or no market activity for an investment at the end of the period), unobservable inputs may be used. Unobservable inputs reflect the Adviser’s
12
Invesco Select Risk: Moderate Investor Fund
assumptions about the factors market participants would use in determining fair value of the securities or instruments and would be based on the best available information.
The following is a summary of the tiered valuation input levels, as of December 31, 2024. The level assigned to the securities valuations may not be an indication of the risk or liquidity associated with investing in those securities. Because of the inherent uncertainties of valuation, the values reflected in the financial statements may materially differ from the value received upon actual sale of those investments.
| | | | |
Investments in Securities | | | | |
| | | | |
| | | | |
| | | | |
NOTE 4—Expense Offset Arrangement(s)
The expense offset arrangement is comprised of transfer agency credits which result from balances in demand deposit accounts used by the transfer agent for clearing shareholder transactions. For the year ended December 31, 2024, the Fund received credits from this arrangement, which resulted in the reduction of the Fund’s total expenses of $99,628.
NOTE 5—Trustees’ and Officers’ Fees and Benefits
Trustees’ and Officers’ Fees and Benefits include amounts accrued by the Fund to pay remuneration to certain Trustees and Officers of the Fund. Trustees have the option to defer compensation payable by the Fund, and Trustees’ and Officers’ Fees and Benefits also include amounts accrued by the Fund to fund such deferred compensation amounts. Those Trustees who defer compensation have the option to select various Invesco Funds in which their deferral accounts shall be deemed to be invested. Finally, certain current Trustees were eligible to participate in a retirement plan that provided for benefits to be paid upon retirement to Trustees over a period of time based on the number of years of service. The Fund may have certain former Trustees who also participate in a retirement plan and receive benefits under such plan. Trustees’ and Officers’ Fees and Benefits include amounts accrued by the Fund to fund such retirement benefits. Obligations under the deferred compensation and retirement plans represent unsecured claims against the general assets of the Fund.
The Fund is permitted to temporarily carry a negative or overdrawn balance in its account with SSB, the custodian bank. Such balances, if any at period-end, are shown in the Statement of Assets and Liabilities under the payable caption Amount due custodian. To compensate the custodian bank for such overdrafts, the overdrawn Fund may either (1) leave funds as a compensating balance in the account so the custodian bank can be compensated by earning the additional interest; or (2) compensate by paying the custodian bank at a rate agreed upon by the custodian bank and Invesco, not to exceed the contractually agreed upon rate.
NOTE 7—Distributions to Shareholders and Tax Components of Net Assets
Tax Character of Distributions to Shareholders Paid During the Fiscal Years Ended December 31, 2024 and 2023: |
| | |
| | |
| Includes short-term capital gain distributions, if any. |
Tax Components of Net Assets at Period-End: |
| |
Undistributed ordinary income | |
Undistributed long-term capital gain | |
Net unrealized appreciation — investments | |
Temporary book/tax differences | |
Shares of beneficial interest | |
| |
The difference between book-basis and tax-basis unrealized appreciation (depreciation) is due to differences in the timing of recognition of gains and losses on investments for tax and book purposes. The Fund’s net unrealized appreciation (depreciation) difference is attributable primarily to wash sales.
The temporary book/tax differences are a result of timing differences between book and tax recognition of income and/or expenses. The Fund’s temporary book/tax differences are the result of the trustee deferral of compensation and retirement plan benefits.
Capital loss carryforward is calculated and reported as of a specific date. Results of transactions and other activity after that date may affect the amount of capital loss carryforward actually available for the Fund to utilize. The ability to utilize capital loss carryforward in the future may be limited under the Internal Revenue Code and related regulations based on the results of future transactions.
The Fund does not have a capital loss carryforward as of December 31, 2024.
NOTE 8—Investment Transactions
The aggregate amount of investment securities (other than short-term securities, U.S. Government obligations and money market funds, if any) purchased and sold by the Fund during the year ended December 31, 2024 was $753,020,213 and $830,873,562, respectively. As of December 31, 2024, the aggregate cost of
13
Invesco Select Risk: Moderate Investor Fund
investments, including any derivatives, on a tax basis listed below includes the adjustments for financial reporting purposes as of the most recently completed federal income tax reporting period-end:
Unrealized Appreciation (Depreciation) of Investments on a Tax Basis |
Aggregate unrealized appreciation of investments | |
Aggregate unrealized (depreciation) of investments | |
Net unrealized appreciation of investments | |
Cost of investments for tax purposes is $1,629,293,392.
NOTE 9—Reclassification of Permanent Differences
Primarily as a result of differing book/tax treatment of distributions, on December 31, 2024, undistributed net investment income was increased by $729,541 and undistributed net realized gain was decreased by $729,541. This reclassification had no effect on the net assets or the distributable earnings of the Fund.
NOTE 10—Share Information
| Summary of Share Activity |
| | Year ended
December 31, 2023 |
| | | | |
| | | | |
| | | | |
| | | | |
| | | | |
| | | | |
| | | | |
| | | | |
| | | | |
Issued as reinvestment of dividends: | | | | |
| | | | |
| | | | |
| | | | |
| | | | |
| | | | |
| | | | |
| | | | |
Automatic conversion of Class C shares to Class A shares: | | | | |
| | | | |
| | | | |
| | | | |
| | | | |
| | | | |
| | | | |
| | | | |
| | | | |
| | | | |
| | | | |
Net increase (decrease) in share activity | | | | |
| There is an entity that is a record owner of more than 5% of the outstanding shares of the Fund and owns 10% of the outstanding shares of the Fund. IDI has an agreement with this entity to sell Fund shares. The Fund, Invesco and/or Invesco affiliates may make payments to this entity, which is considered to be related to the Fund, for providing services to the Fund, Invesco and/or Invesco affiliates including but not limited to services such as, securities brokerage, distribution, third party record keeping and account servicing. The Fund has no knowledge as to whether all or any portion of the shares owned of record by this entity are also |
14
Invesco Select Risk: Moderate Investor Fund
Report of Independent Registered Public Accounting Firm
To the Board of Trustees of AIM Growth Series (Invesco Growth Series) and Shareholders of Invesco Select Risk: Moderate Investor Fund
Opinion on the Financial Statements
We have audited the accompanying statement of assets and liabilities, including the schedule of investments, of Invesco Select Risk: Moderate Investor Fund (one of the funds constituting AIM Growth Series (Invesco Growth Series), referred to hereafter as the "Fund") as of December 31, 2024, the related statement of operations for the year ended December 31, 2024, the statement of changes in net assets for each of the two years in the period ended December 31, 2024, including the related notes, and the financial highlights for each of the periods indicated therein (collectively referred to as the "financial statements"). In our opinion, the financial statements present fairly, in all material respects, the financial position of the Fund as of December 31, 2024, the results of its operations for the year then ended, the changes in its net assets for each of the two years in the period ended December 31, 2024 and the financial highlights for each of the periods indicated therein in conformity with accounting principles generally accepted in the United States of America.
These financial statements are the responsibility of the Fund’s management. Our responsibility is to express an opinion on the Fund’s financial statements based on our audits. We are a public accounting firm registered with the Public Company Accounting Oversight Board (United States) (PCAOB) and are required to be independent with respect to the Fund in accordance with the U.S. federal securities laws and the applicable rules and regulations of the Securities and Exchange Commission and the PCAOB.
We conducted our audits of these financial statements in accordance with the standards of the PCAOB. Those standards require that we plan and perform the audit to obtain reasonable assurance about whether the financial statements are free of material misstatement, whether due to error or fraud.
Our audits included performing procedures to assess the risks of material misstatement of the financial statements, whether due to error or fraud, and performing procedures that respond to those risks. Such procedures included examining, on a test basis, evidence regarding the amounts and disclosures in the financial statements. Our audits also included evaluating the accounting principles used and significant estimates made by management, as well as evaluating the overall presentation of the financial statements. Our procedures included confirmation of securities owned as of December 31, 2024 by correspondence with the custodian, transfer agent and broker. We believe that our audits provide a reasonable basis for our opinion.
/s/PricewaterhouseCoopers LLP
February 20, 2025
We have served as the auditor of one or more of the investment companies in the Invesco group of investment companies since at least 1995. We have not been able to determine the specific year we began serving as auditor.
15
Invesco Select Risk: Moderate Investor Fund
Tax Information
Form 1099-DIV, Form 1042-S and other year–end tax information provide shareholders with actual calendar year amounts that should be included in their tax returns. Shareholders should consult their tax advisers.
The following distribution information is being provided as required by the Internal Revenue Code or to meet a specific state’s requirement.
The Fund designates the following amounts or, if subsequently determined to be different, the maximum amount allowable for its fiscal year ended December 31, 2024:
Federal and State Income Tax | |
Qualified Dividend Income* | |
Corporate Dividends Received Deduction* | |
U.S. Treasury Obligations* | |
Qualified Business Income* | |
Business Interest Income* | |
*
The above percentages are based on ordinary income dividends paid to shareholders during the Fund’s fiscal year.
16
Invesco Select Risk: Moderate Investor Fund
Other Information Required in Form N-CSR (Items 8-11)
Changes in and Disagreements with Accountants for Open-End Management Investment Companies
Proxy Disclosures for Open-End Management Investment Companies
Remuneration Paid to Directors, Officers, and Others of Open-End Management Investment Companies
The aggregate remuneration paid to directors, officers and others is disclosed within the financial statements.
Statement Regarding Basis for Approval of Investment Advisory Contracts
17
Invesco Select Risk: Moderate Investor Fund
SEC file number(s): 811-02699 and 002-57526
Invesco Distributors, Inc.
O-OPSMI-NCSR
Annual Financial Statements and Other InformationDecember 31, 2024
Invesco Select Risk: Moderately Conservative Investor Fund
A: CAAMX ■ C: CACMX ■ R: CMARX ■ S: CMASX ■ Y: CAAYX ■ R5: CMAIX ■ R6: CNSSX
| |
| |
| |
| Notes to Financial Statements |
| Report of Independent Registered Public Accounting Firm |
| |
| Other Information Required in Form N-CSR (Items 8-11) |
Schedule of Investments
Invesco Select Risk: Moderately Conservative Investor Fund |
Schedule of Investments in Affiliated Issuers–100.05%(a) |
| | | | | Change in
Unrealized
Appreciation
(Depreciation) | | | | |
|
Invesco Global Real Estate Income | | | | | | | | | |
Invesco Macro Allocation Strategy Fund, Class R6 | | | | | | | | | |
| | | | | | | | | |
Domestic Equity Funds–23.80% |
Invesco Discovery Mid Cap Growth Fund, Class R6 | | | | | | | | | |
Invesco Main Street Small Cap Fund, Class R6 | | | | | | | | | |
| | | | | | | | | |
Invesco Russell 1000® Dynamic Multifactor ETF | | | | | | | | | |
Invesco S&P 500® Low Volatility ETF | | | | | | | | | |
Invesco S&P 500® Pure Growth ETF | | | | | | | | | |
Invesco S&P 500® Pure Value ETF | | | | | | | | | |
Invesco Value Opportunities Fund, Class R6 | | | | | | | | | |
Total Domestic Equity Funds | | | | | | | | | |
Fixed Income Funds–59.33% |
Invesco Core Bond Fund, Class R6 | | | | | | | | | |
Invesco Core Plus Bond Fund, Class R6 | | | | | | | | | |
Invesco Emerging Markets Sovereign Debt ETF | | | | | | | | | |
Invesco Equal Weight 0-30 Year Treasury ETF | | | | | | | | | |
Invesco Floating Rate ESG Fund, | | | | | | | | | |
Invesco High Yield Fund, Class R6 | | | | | | | | | |
Invesco Income Fund, Class R6 | | | | | | | | | |
Invesco International Bond Fund, | | | | | | | | | |
Invesco Senior Floating Rate Fund, | | | | | | | | | |
Invesco Taxable Municipal Bond ETF | | | | | | | | | |
Invesco Variable Rate Investment Grade ETF | | | | | | | | | |
| | | | | | | | | |
International and Global Equity Funds–11.16% |
Invesco EQV Emerging Markets All Cap Fund, Class R6 | | | | | | | | | |
Invesco Developing Markets Fund, Class R6 | | | | | | | | | |
Invesco FTSE RAFI Developed Markets ex-U.S. ETF | | | | | | | | | |
Invesco Global Fund, Class R6 | | | | | | | | | |
Invesco Global Infrastructure Fund, Class R6 | | | | | | | | | |
Invesco International Developed Dynamic Multifactor ETF | | | | | | | | | |
Invesco International Small-Mid Company Fund, Class R6 | | | | | | | | | |
Invesco Oppenheimer International Growth Fund, Class R6 | | | | | | | | | |
Invesco S&P Emerging Markets Low Volatility ETF | | | | | | | | | |
Invesco S&P International Developed Low Volatility ETF | | | | | | | | | |
Total International and Global Equity Funds | | | | | | | | | |
See accompanying Notes to Financial Statements which are an integral part of the financial statements.
2
Invesco Select Risk: Moderately Conservative Investor Fund
Invesco Select Risk: Moderately Conservative Investor Fund (continued) |
Schedule of Investments in Affiliated Issuers–100.05%(a) |
| | | | | Change in Unrealized Appreciation (Depreciation) | | | | |
|
Invesco Government & Agency Portfolio, Institutional Class, | | | | | | | | | |
Invesco Liquid Assets Portfolio, | | | | | | | | | |
Invesco Treasury Portfolio, Institutional Class, 4.38%(c) | | | | | | | | | |
| | | | | | | | | |
TOTAL INVESTMENTS IN AFFILIATED ISSUERS (excluding investments purchased with cash collateral from securities on loan)
(Cost $258,808,363) | | | | | | | | | |
|
Investments Purchased with Cash Collateral from Securities on Loan | | | | | | | | | |
|
Invesco Private Government Fund, | | | | | | | | | |
Invesco Private Prime Fund, | | | | | | | | | |
Total Investments Purchased with Cash Collateral from Securities on Loan
(Cost $0) | | | | | | | | | |
TOTAL INVESTMENTS IN AFFILIATED ISSUERS (Cost $258,808,363) | | | | | | | | | |
OTHER ASSETS LESS LIABILITIES | | | | | | | | | |
| | | | | | | | | |
Investment Abbreviations:
Notes to Schedule of Investments:
| Each underlying fund and the Fund are affiliated by either having the same investment adviser or an investment adviser under common control with the Fund’s investment adviser. |
| Includes return of capital distribution. |
| The rate shown is the 7-day SEC standardized yield as of December 31, 2024. |
| The security has been segregated to satisfy the commitment to return the cash collateral received in securities lending transactions upon the borrower’s return of the securities loaned. See Note 1I. |
| Represents the income earned on the investment of cash collateral, which is included in securities lending income on the Statement of Operations. Does not include rebates and fees paid to lending agent or premiums received from borrowers, if any. |
| Includes capital gains distributions from affiliated underlying funds as follows: |
| |
Invesco Discovery Mid Cap Growth Fund | |
| |
Invesco Global Infrastructure Fund | |
Invesco International Small-Mid Company Fund | |
Invesco Main Street Small Cap Fund | |
Invesco Oppenheimer International Growth Fund | |
Invesco Value Opportunities Fund | |
See accompanying Notes to Financial Statements which are an integral part of the financial statements.
3
Invesco Select Risk: Moderately Conservative Investor Fund
Statement of Assets and Liabilities
| |
Investments in affiliated underlying funds, at value
(Cost $258,808,363) | |
| |
| |
| |
Dividends - affiliated underlying funds | |
Investment for trustee deferred compensation and retirement plans | |
| |
| |
| |
| |
Investments purchased - affiliated underlying funds | |
| |
Accrued fees to affiliates | |
Accrued other operating expenses | |
Trustee deferred compensation and retirement plans | |
| |
Net assets applicable to shares outstanding | |
| |
Shares of beneficial interest | |
Distributable earnings (loss) | |
| |
|
| |
| |
| |
| |
| |
| |
| |
Shares outstanding, no par value, with an unlimited number of shares authorized: |
| |
| |
| |
| |
| |
| |
| |
| |
Net asset value per share | |
Maximum offering price per share
(Net asset value of $10.63 ÷ 94.50%) | |
| |
Net asset value and offering price per share | |
| |
Net asset value and offering price per share | |
| |
Net asset value and offering price per share | |
| |
Net asset value and offering price per share | |
| |
Net asset value and offering price per share | |
| |
Net asset value and offering price per share | |
See accompanying Notes to Financial Statements which are an integral part of the financial statements.
4
Invesco Select Risk: Moderately Conservative Investor Fund
Statement of Operations
For the year ended December 31, 2024
| |
Dividends from affiliated underlying funds (includes net securities lending income of $1,216) | |
| |
| |
| |
Administrative services fees | |
| |
| |
| |
| |
| |
| |
Transfer agent fees — A, C, R, S and Y | |
| |
| |
Trustees’ and officers’ fees and benefits | |
Registration and filing fees | |
| |
Professional services fees | |
| |
| |
Less: Expense offset arrangement(s) | |
| |
| |
Realized and unrealized gain from: | |
Net realized gain (loss) from: | |
Affiliated underlying fund shares | |
Capital gain distributions from affiliated underlying fund shares | |
| |
Change in net unrealized appreciation of affiliated underlying fund shares | |
Net realized and unrealized gain | |
Net increase in net assets resulting from operations | |
See accompanying Notes to Financial Statements which are an integral part of the financial statements.
5
Invesco Select Risk: Moderately Conservative Investor Fund
Statement of Changes in Net Assets
For the years ended December 31, 2024 and 2023
| | |
| | |
| | |
| | |
Change in net unrealized appreciation | | |
Net increase in net assets resulting from operations | | |
Distributions to shareholders from distributable earnings: | | |
| | |
| | |
| | |
| | |
| | |
| | |
| | |
Total distributions from distributable earnings | | |
| | |
| | |
| | |
| | |
| | |
| | |
| | |
| | |
Net increase (decrease) in net assets resulting from share transactions | | |
Net increase (decrease) in net assets | | |
| | |
| | |
| | |
See accompanying Notes to Financial Statements which are an integral part of the financial statements.
6
Invesco Select Risk: Moderately Conservative Investor Fund
Financial Highlights
The following schedule presents financial highlights for a share of the Fund outstanding throughout the periods indicated.
| Net asset
value,
beginning
of period | | Net gains
(losses)
on securities
(both
realized and
unrealized) | Total from
investment
operations | Dividends
from net
investment
income | Distributions
from net
realized
gains | | | Net asset
value, end
of period | | Net assets,
end of period
(000’s omitted) | Ratio of
expenses
to average
net assets
with fee waivers
and/or
expenses
| Ratio of
expenses
to average net
assets without
fee waivers
and/or
expenses
absorbed
| Ratio of net
investment
income
to average
net assets | |
|
| | | | | | | | | | | | | | | |
| | | | | | | | | | | | | | | |
| | | | | | | | | | | | | | | |
| | | | | | | | | | | | | | | |
| | | | | | | | | | | | | | | |
|
| | | | | | | | | | | | | | | |
| | | | | | | | | | | | | | | |
| | | | | | | | | | | | | | | |
| | | | | | | | | | | | | | | |
| | | | | | | | | | | | | | | |
|
| | | | | | | | | | | | | | | |
| | | | | | | | | | | | | | | |
| | | | | | | | | | | | | | | |
| | | | | | | | | | | | | | | |
| | | | | | | | | | | | | | | |
|
| | | | | | | | | | | | | | | |
| | | | | | | | | | | | | | | |
| | | | | | | | | | | | | | | |
| | | | | | | | | | | | | | | |
| | | | | | | | | | | | | | | |
|
| | | | | | | | | | | | | | | |
| | | | | | | | | | | | | | | |
| | | | | | | | | | | | | | | |
| | | | | | | | | | | | | | | |
| | | | | | | | | | | | | | | |
|
| | | | | | | | | | | | | | | |
| | | | | | | | | | | | | | | |
| | | | | | | | | | | | | | | |
| | | | | | | | | | | | | | | |
| | | | | | | | | | | | | | | |
|
| | | | | | | | | | | | | | | |
| | | | | | | | | | | | | | | |
| | | | | | | | | | | | | | | |
| | | | | | | | | | | | | | | |
| | | | | | | | | | | | | | | |
| Calculated using average shares outstanding. |
| Net investment income (loss) is affected by the timing of the declaration of dividends by the underlying funds in which the Fund invests. Ratio of net investment income (loss) does not include net investment income of the underlying funds in which the Fund invests. |
| Includes adjustments in accordance with accounting principles generally accepted in the United States of America and as such, the net asset value for financial reporting purposes and the returns based upon those net asset values may differ from the net asset value and returns for shareholder transactions. Does not include sales charges and is not annualized for periods less than one year, if applicable. |
| In addition to the fees and expenses which the Fund bears directly, the Fund indirectly bears a pro rata share of the fees and expenses of the underlying funds in which the Fund invests. Because the underlying funds have varied expenses and fee levels and the Fund may own different proportions at different times, the amount of fees and expenses incurred indirectly by the Fund will vary. Estimated underlying fund expenses are not expenses that are incurred directly by the Fund. They are expenses that are incurred directly by the underlying funds and are deducted from the value of the funds the Fund invests in. The effect of the estimated underlying fund expenses that the Fund bears indirectly is included in the Fund’s total return. Estimated acquired fund fees from underlying funds were 0.48%, 0.49%, 0.49%, 0.49% and 0.51% for the years ended December 31, 2024, 2023, 2022, 2021 and 2020, respectively. |
| Portfolio turnover is calculated at the fund level and is not annualized for periods less than one year, if applicable. |
See accompanying Notes to Financial Statements which are an integral part of the financial statements.
7
Invesco Select Risk: Moderately Conservative Investor Fund
Notes to Financial Statements
NOTE 1—Significant Accounting Policies
Invesco Select Risk: Moderately Conservative Investor Fund (the “Fund”) is a series portfolio of AIM Growth Series (Invesco Growth Series) (the “Trust”). The Trust is a Delaware statutory trust registered under the Investment Company Act of 1940, as amended (the “1940 Act”), as an open-end series management investment company authorized to issue an unlimited number of shares of beneficial interest. Information presented in these financial statements pertains only to the Fund. Matters affecting the Fund or each class will be voted on exclusively by the shareholders of the Fund or each class.
The Fund’s investment objective is total return consistent with a lower level of risk relative to the broad stock market.
The Fund is a "fund of funds", in that it invests in other mutual funds advised by Invesco Advisers, Inc. (the "Adviser" or "Invesco") and exchange-traded funds ("ETFs") and other pooled investment vehicles advised by Invesco Capital Management LLC ("Invesco Capital") or mutual funds, ETFs and other pooled investment vehicles advised by unaffiliated advisers ("underlying funds"). Invesco and Invesco Capital are affiliates of each other as they are indirect, wholly-owned subsidiaries of Invesco Ltd. Invesco may change the Fund’s asset class allocations, the underlying funds or the target weightings in the underlying funds without shareholder approval or notice to shareholders. The underlying funds may engage in a number of investment techniques and practices, which involve certain risks. Each underlying fund’s accounting policies are outlined in the underlying fund’s financial statements and are publicly available.
The Fund currently consists of seven different classes of shares: Class A, Class C, Class R, Class S, Class Y, Class R5 and Class R6. Class Y shares are available only to certain investors. Class A shares are sold with a front-end sales charge unless certain waiver criteria are met. Under certain circumstances, load waived shares may be subject to contingent deferred sales charges (“CDSC”). Class C shares are sold with a CDSC. Class R, Class S, Class Y, Class R5 and Class R6 shares are sold at net asset value. Class C shares held for eight years after purchase are eligible for automatic conversion into Class A shares of the same Fund (the "Conversion Feature"). The automatic conversion pursuant to the Conversion Feature will generally occur at the end of the month following the eighth anniversary after a purchase of Class C shares.
Effective after the close of business on September 30, 2024, Class R5 shares are closed to new investors.
The Fund is an investment company and accordingly follows the investment company accounting and reporting guidance in accordance with Financial Accounting Standards Board Accounting Standards Codification Topic 946, Financial Services – Investment Companies.
The following is a summary of the significant accounting policies followed by the Fund in the preparation of its financial statements.
A.
Security Valuations — Securities of investment companies listed or traded on an exchange are generally valued at the trade price or official closing price that day as of the close of the exchange where the security is principally traded, or lacking any trades or official closing price on a particular day, the security may be valued at the closing bid price on that day. Securities of investment companies that are not exchange-traded (e.g., open-end mutual funds) are valued using such company’s end-of-business-day net asset value per share. Securities in the underlying funds, including restricted securities, are valued in accordance with the valuation policy of such fund. The policies of the underlying funds affiliated with the Fund, as a result of having the same investment adviser, are set forth below.
A security listed or traded on an exchange is generally valued at its trade price or official closing price that day as of the close of the exchange where the security is principally traded, or lacking any trades or official closing price on a particular day, the security may be valued at the closing bid or ask price on that day. Securities traded in the over-the-counter market are valued based on prices furnished by independent pricing services or market makers. When such securities are valued using prices provided by an independent pricing service they may be considered fair valued. Futures contracts are valued at the daily settlement price set by an exchange on which they are principally traded. Where a final settlement price exists, exchange-traded options are valued at the final settlement price from the exchange where the option principally trades. Where a final settlement price does not exist, exchange-traded options are valued at the mean between the last bid and ask price generally from the exchange where the option principally trades.
Variable rate senior loan interests are fair valued using quotes provided by an independent pricing service. Quotes provided by the pricing service may reflect appropriate factors such as ratings, tranche type, industry, company performance, spread, individual trading characteristics, institution-size trading in similar groups of securities and other market data.
Securities of investment companies that are not exchange-traded (e.g., open-end mutual funds) are valued using such company’s end-of-business-day net asset value per share.
Deposits, other obligations of U.S. and non-U.S. banks and financial institutions are valued at their daily account value.
Fixed income securities (including convertible debt securities) generally are valued on the basis of prices provided by independent pricing services. Prices provided by the pricing service may be determined without exclusive reliance on quoted prices, and may reflect appropriate factors such as institution-size trading in similar groups of securities, developments related to specific securities, dividend rate (for unlisted equities), yield (for debt obligations), quality, type of issue, coupon rate (for debt obligations), maturity (for debt obligations), individual trading characteristics and other market data. Pricing services generally value debt obligations assuming orderly transactions of institutional round lot size, but a fund may hold or transact in the same securities in smaller, odd lot sizes. Odd lots often trade at lower prices than institutional round lots, and their value may be adjusted accordingly. Debt obligations are subject to interest rate and credit risks. In addition, all debt obligations involve some risk of default with respect to interest and/or principal payments.
Swap agreements are fair valued using an evaluated quote, if available, provided by an independent pricing service. Evaluated quotes provided by the pricing service are valued based on a model which may include end-of-day net present values, spreads, ratings, industry, company performance and returns of referenced assets. Centrally cleared swap agreements are valued at the daily settlement price determined by the relevant exchange or clearinghouse.
Foreign securities’ (including foreign exchange contracts) prices are converted into U.S. dollar amounts using the applicable exchange rates as of the close of the New York Stock Exchange (“NYSE”). If market quotations are available and reliable for foreign exchange-traded equity securities, the securities will be valued at the market quotations. The Adviser may use various pricing services to obtain market quotations as well as fair value prices. Because trading hours for certain foreign securities end before the close of the NYSE, closing market quotations may become not representative of market value in the Adviser’s judgment (“unreliable”). If, between the time trading ends on a particular security and the close of the customary trading session on the NYSE, a significant event occurs that makes the closing price of the security unreliable, the Adviser may fair value the security. If the event is likely to have affected the closing price of the security, the security will be valued at fair value in good faith in accordance with Board- approved policies and related Adviser procedures (“Valuation Procedures”). Adjustments to closing prices to reflect fair value may also be based on a screening process of an independent pricing service to indicate the degree of certainty, based on historical data, that the closing price in the principal market where a foreign security trades is not the current value as of the close of the NYSE. Foreign securities’ prices meeting the degree of certainty that the price is not reflective of current value will be priced at the indication of fair value from the independent pricing service. Multiple factors may be considered by the independent pricing service in determining adjustments to reflect fair value and may include information relating to sector indices, American Depositary Receipts and domestic and foreign index futures. Foreign securities may have additional risks including exchange rate changes, potential for sharply devalued currencies and high inflation, political and economic upheaval, the relative lack of issuer information, relatively low market liquidity and the potential lack of strict financial and accounting controls and standards.
Unlisted securities will be valued using prices provided by independent pricing services or by another method that the Adviser, in its judgment, believes better reflects the security’s fair value in accordance with the Valuation Procedures.
8
Invesco Select Risk: Moderately Conservative Investor Fund
Non-traded rights and warrants shall be valued at intrinsic value if the terms of the rights and warrants are available, specifically the subscription or exercise price and the ratio. Intrinsic value is calculated as the daily market closing price of the security to be received less the subscription price, which is then adjusted by the exercise ratio. In the case of warrants, an option pricing model supplied by an independent pricing service may be used based on market data such as volatility, stock price and interest rate from the independent pricing service and strike price and exercise period from verified terms.
Securities for which market prices are not provided by any of the above methods may be valued based upon quotes furnished by independent sources. The mean between the last bid and ask prices may be used to value debt obligations, including corporate loans.
Securities for which market quotations are not readily available are fair valued by the Adviser in accordance with the Valuation Procedures. If a fair value price provided by a pricing service is unreliable, the Adviser will fair value the security using the Valuation Procedures. Issuer specific events, market trends, bid/ask quotes of brokers and information providers and other market data may be reviewed in the course of making a good faith determination of a security’s fair value.
The Fund may invest in securities that are subject to interest rate risk, meaning the risk that the prices will generally fall as interest rates rise and, conversely, the prices will generally rise as interest rates fall. Specific securities differ in their sensitivity to changes in interest rates depending on their individual characteristics. Changes in interest rates may result in increased market volatility, which may affect the value and/or liquidity of certain Fund investments.
Valuations change in response to many factors including the historical and prospective earnings of the issuer, the value of the issuer’s assets, general market conditions which are not specifically related to the particular issuer, such as real or perceived adverse economic conditions, changes in the general outlook for revenues or corporate earnings, changes in interest or currency rates, regional or global instability, natural or environmental disasters, widespread disease or other public health issues, war, acts of terrorism, significant governmental actions or adverse investor sentiment generally and market liquidity. Because of the inherent uncertainties of valuation, the values reflected in the financial statements may materially differ from the value received upon actual sale of those investments.
The price the Fund could receive upon the sale of any investment may differ from the Adviser’s valuation of the investment, particularly for securities that are valued using a fair valuation technique. When fair valuation techniques are applied, the Adviser uses available information, including both observable and unobservable inputs and assumptions, to determine a methodology that will result in a valuation that the Adviser believes approximates market value. Fund securities that are fair valued may be subject to greater fluctuation in their value from one day to the next than would be the case if market quotations were used. Because of the inherent uncertainties of valuation, and the degree of subjectivity in such decisions, the Fund could realize a greater or lesser than expected gain or loss upon the sale of the investment.
B.
Securities Transactions and Investment Income — Securities transactions are accounted for on a trade date basis. Realized gains or losses on sales are computed on the basis of specific identification of the securities sold. Distributions from ordinary income from underlying funds, if any, are recorded as dividend income on the ex-dividend date. Distributions from gains from underlying funds, if any, are recorded as realized gains on the ex-dividend date. The following policies are followed by the underlying funds: Interest income (net of withholding tax, if any) is recorded on an accrual basis from settlement date and includes coupon interest and amortization of premium and accretion of discount on debt securities as applicable. Pay-in-kind interest income and non-cash dividend income received in the form of securities in lieu of cash are recorded at the fair value of the securities received. Paydown gains and losses on mortgage and asset-backed securities are recorded as adjustments to interest income.
The Fund may periodically participate in litigation related to the Fund’s investments. As such, the Fund may receive proceeds from litigation settlements. Any proceeds received are included in the Statement of Operations as realized gain (loss) for investments no longer held and as unrealized gain (loss) for investments still held.
The Fund allocates income and realized and unrealized capital gains and losses to a class based on the relative net assets of each class.
C.
Distributions - Distributions from net investment income, if any, are declared and paid quarterly and are recorded on the ex-dividend date. Distributions from net realized capital gain, if any, are generally declared and paid annually and recorded on the ex-dividend date. The Fund may elect to treat a portion of the proceeds from redemptions as distributions for federal income tax purposes.
D.
Federal Income Taxes – The Fund intends to comply with the requirements of Subchapter M of the Internal Revenue Code of 1986, as amended (the “Internal Revenue Code”), necessary to qualify as a regulated investment company and to distribute substantially all of the Fund’s taxable earnings to shareholders. As such, the Fund will not be subject to federal income taxes on otherwise taxable income (including net realized capital gain) that is distributed to shareholders. Therefore, no provision for federal income taxes is recorded in the financial statements.
The Fund recognizes the tax benefits of uncertain tax positions only when the position is more likely than not to be sustained. Management has analyzed the Fund’s uncertain tax positions and concluded that no liability for unrecognized tax benefits should be recorded related to uncertain tax positions. Management is not aware of any tax positions for which it is reasonably possible that the total amounts of unrecognized tax benefits will change materially in the next 12 months.
The Fund files tax returns in the U.S. Federal jurisdiction and certain other jurisdictions. Generally, the Fund is subject to examinations by such taxing authorities for up to three years after the filing of the return for the tax period.
E.
Expenses – Expenses included in the accompanying financial statements reflect the expenses of the Fund and do not include any expenses of the underlying funds. The effects of the underlying funds expenses are included in the realized and unrealized gain/loss on the investments in the underlying funds. Estimated expenses of the underlying funds are discussed further within the Financial Highlights.
Fees provided for under the Rule 12b-1 plan of a particular class of the Fund and which are directly attributable to that class are charged to the operations of such class. Transfer agency fees and expenses and other shareholder recordkeeping fees and expenses attributable to Class R5 and Class R6 are allocated based on relative net assets of Class R5 and Class R6. Transfer agency fees and expenses and other shareholder recordkeeping fees and expenses relating to all other classes are allocated among those classes based on relative net assets. All other expenses are allocated among the classes based on relative net assets.
F.
Accounting Estimates – The preparation of financial statements in conformity with accounting principles generally accepted in the United States of America (“GAAP”) requires management to make estimates and assumptions that affect the reported amounts of assets and liabilities at the date of the financial statements and the reported amounts of revenues and expenses during the reporting period including estimates and assumptions related to taxation. Actual results could differ from those estimates by a significant amount. In addition, the Fund monitors for material events or transactions that may occur or become known after the period-end date and before the date the financial statements are released to print.
G.
Indemnifications – Under the Trust’s organizational documents, each Trustee, officer, employee or other agent of the Trust is indemnified against certain liabilities that may arise out of the performance of their duties to the Fund. Additionally, in the normal course of business, the Fund enters into contracts, including the Fund’s servicing agreements, that contain a variety of indemnification clauses. The Fund’s maximum exposure under these arrangements is unknown as this would involve future claims that may be made against the Fund that have not yet occurred. The risk of material loss as a result of such indemnification claims is considered remote.
H.
Segment Reporting — In November 2023, the FASB issued Accounting Standards Update 2023-07, Segment Reporting (Topic 280): Improvements to Reportable Segment Disclosures (“ASU 2023-07”), with the intent of improving reportable segment disclosure requirements, primarily through enhanced disclosures about significant segment expenses, allowing financial statement users to better understand the components of a segment’s profit or loss and assess potential future cash flows for each reportable segment and the entity as a whole thereby enabling better understanding of how an entity’s segments impact overall performance. The Fund represents a single operating segment. Subject to the oversight and, when applicable, approval of the Board of Trustees, the Fund’s Adviser acts as the Fund’s chief operating decision maker (“CODM”), assessing performance and making decisions about resource allocation within the Fund. The CODM monitors the operating results as a whole and the Fund’s long-term strategic asset allocation is determined in accordance with the terms of its prospectus based on a defined investment strategy. The financial information provided to and reviewed by the CODM is consistent with that presented in the Fund’s financial
9
Invesco Select Risk: Moderately Conservative Investor Fund
statements. Adoption of the new standard impacted the Fund’s financial statement note disclosures only and did not affect the Fund’s financial position or the results of its operations.
I.
Securities Lending – The Fund may lend portfolio securities having a market value up to one-third of the Fund’s total assets. Such loans are secured by collateral equal to no less than the market value of the loaned securities determined daily by the securities lending provider. Such collateral will be cash or debt securities issued or guaranteed by the U.S. Government or any of its sponsored agencies. Cash collateral received in connection with these loans is invested in short-term money market instruments or affiliated, unregistered investment companies that comply with Rule 2a-7 under the 1940 Act and money market funds (collectively, "affiliated money market funds") and is shown as such on the Schedule of Investments. The Fund bears the risk of loss with respect to the investment of collateral. It is the Fund’s policy to obtain additional collateral from or return excess collateral to the borrower by the end of the next business day, following the valuation date of the securities loaned. Therefore, the value of the collateral held may be temporarily less than the value of the securities on loan. When loaning securities, the Fund retains certain benefits of owning the securities, including the economic equivalent of dividends or interest generated by the security. Lending securities entails a risk of loss to the Fund if, and to the extent that, the market value of the securities loaned were to increase and the borrower did not increase the collateral accordingly, and the borrower failed to return the securities. The securities loaned are subject to termination at the option of the borrower or the Fund. Upon termination, the borrower will return to the Fund the securities loaned and the Fund will return the collateral. Upon the failure of the borrower to return the securities, collateral may be liquidated and the securities may be purchased on the open market to replace the loaned securities. The Fund could experience delays and costs in gaining access to the collateral and the securities may lose value during the delay which could result in potential losses to the Fund. Some of these losses may be indemnified by the lending agent. The Fund bears the risk of any deficiency in the amount of the collateral available for return to the borrower due to any loss on the collateral invested. Dividends received on cash collateral investments for securities lending transactions, which are net of compensation to counterparties, are included in Dividends from affiliated underlying funds on the Statement of Operations. The aggregate value of securities out on loan, if any, is shown as a footnote on the Statement of Assets and Liabilities.
The Adviser serves as an affiliated securities lending agent for the Fund. The Bank of New York Mellon also serves as a securities lending agent. To the extent the Fund utilizes the Adviser as an affiliated securities lending agent, the Fund conducts its securities lending in accordance with, and in reliance upon, no-action letters issued by the SEC staff that provide guidance on how an affiliate may act as a direct agent lender and receive compensation for those services in a manner consistent with the federal securities laws. For the year ended December 31, 2024, there were no securities lending transactions with the Adviser. Fees paid to the Adviser for securities lending agent services, if any, are included in Dividends from affiliated underlying funds on the Statement of Operations.
J.
Other Risks - Certain of the underlying funds are non-diversified and can invest a greater portion of their assets in the obligations or securities of a small number of issuers or any single issuer than a diversified fund can. A change in the value of one or a few issuers’ securities will therefore affect the value of an underlying fund more than would occur in a diversified fund.
Investments in ETFs generally present the same primary risks as an investment in a conventional mutual fund that has the same investment objective, strategy and policies. Investments in ETFs further involve the same risks associated with a direct investment in the types of securities, commodities and/or currencies included in the indices the ETFs are designed to replicate. In addition, shares of an ETF may trade at a market price that is higher or lower than their net asset value and an active trading market in such shares may not develop or continue. Moreover, trading of an ETF’s shares may be halted if the listing exchange’s officials deem such action to be appropriate, the shares are de-listed from the exchange, or the activation of market-wide “circuit breakers” (which are tied to large decreases in stock prices) halts stock trading generally.
Emerging markets (also referred to as developing markets) are generally subject to greater market volatility, political, social and economic instability, uncertain trading markets and more governmental limitations on foreign investment than more developed markets. In addition, companies operating in emerging markets may be subject to lower trading volume and greater price fluctuations than companies in more developed markets. Such countries’ economies may be more dependent on relatively few industries or investors that may be highly vulnerable to local and global changes. Companies in emerging market countries generally may be subject to less stringent regulatory, disclosure, financial reporting, accounting, auditing and recordkeeping standards than companies in more developed countries. As a result, information, including financial information, about such companies may be less available and reliable, which can impede an underlying Fund’s ability to evaluate such companies. Securities law and the enforcement of systems of taxation in many emerging market countries may change quickly and unpredictably, and the ability to bring and enforce actions (including bankruptcy, confiscatory taxation, expropriation, nationalization of a company’s assets, restrictions on foreign ownership of local companies, restrictions on withdrawing assets from the country, protectionist measures and practices such as share blocking), or to obtain information needed to pursue or enforce such actions, may be limited. In addition, the ability of foreign entities to participate in privatization programs of certain developing or emerging market countries may be limited by local law. Investments in emerging market securities may be subject to additional transaction costs, delays in settlement procedures, unexpected market closures, and lack of timely information.
NOTE 2—Advisory Fees and Other Fees Paid to Affiliates
The Trust has entered into a master investment advisory agreement with the Adviser. Under the terms of the investment advisory agreement, the Fund does not pay an advisory fee. However, the Fund pays advisory fees to the Adviser indirectly as a shareholder of the underlying funds.
Under the terms of a master sub-advisory agreement between the Adviser and each of Invesco Asset Management Deutschland GmbH, Invesco Asset Management Limited, Invesco Asset Management (Japan) Limited, Invesco Hong Kong Limited, Invesco Senior Secured Management, Inc. and Invesco Canada Ltd. (collectively, the "Affiliated Sub-Advisers") the Adviser, not the Fund, will pay 40% of the fees paid to the Adviser to any such Affiliated Sub-Adviser(s) that provide(s) discretionary investment management services to the Fund based on the percentage of assets allocated to such Affiliated Sub-Adviser(s).
The Adviser has agreed, for an indefinite period, to reimburse expenses of all shares to the extent necessary to limit total annual fund operating expenses after expense reimbursement (excluding certain items discussed below) of Class A, Class C, Class R, Class S, Class Y, Class R5 and Class R6 shares to 1.50%, 2.25%, 1.75%, 1.40%, 1.25%, 1.25% and 1.25%, respectively, of the Fund’s average daily net assets (the “boundary limits”). In determining the Adviser’s obligation to reimburse expenses, the following expenses are not taken into account, and could cause the total annual fund operating expenses after expense reimbursement to exceed the numbers reflected above: (1) interest; (2) taxes; (3) dividend expense on short sales; (4) extraordinary or non-routine items, including litigation expenses; and (5) expenses that the Fund has incurred but did not actually pay because of an expense offset arrangement. Acquired Fund Fees and Expenses are not operating expenses of the Fund directly, but are fees and expenses, including management fees, of the investment companies in which the Fund invests. As a result, the total annual fund operating expenses after expense reimbursement may exceed the boundary limits above. Invesco may amend and/or terminate these boundary limits at any time in its sole discretion and will inform the Board of Trustees of any such changes. The Adviser did not reimburse expenses during the period under these boundary limits.
The Trust has entered into a master administrative services agreement with Invesco pursuant to which the Fund has agreed to pay Invesco for certain administrative costs incurred in providing accounting services to the Fund. For the year ended December 31, 2024, expenses incurred under the agreement are shown in the Statement of Operations as Administrative services fees. Invesco has entered into a sub-administration agreement whereby State Street Bank and Trust Company (“SSB”) serves as fund accountant and provides certain administrative services to the Fund. Pursuant to a custody agreement with the Trust on behalf of the Fund, SSB also serves as the Fund’s custodian.
The Trust has entered into a transfer agency and service agreement with Invesco Investment Services, Inc. (“IIS”) pursuant to which the Fund has agreed to pay IIS a fee for providing transfer agency and shareholder services to the Fund and reimburse IIS for certain expenses incurred by IIS in the course of providing such services. IIS may make payments to intermediaries that provide omnibus account services, sub-accounting services and/or networking services. All fees payable by IIS to
10
Invesco Select Risk: Moderately Conservative Investor Fund
intermediaries that provide omnibus account services or sub-accounting services are charged back to the Fund, subject to certain limitations approved by the Trust’s Board of Trustees. For the year ended December 31, 2024, expenses incurred under the agreement are shown in the Statement of Operations as Transfer agent fees.
The Trust has entered into master distribution agreements with Invesco Distributors, Inc. (“IDI”) to serve as the distributor for the Class A, Class C, Class R, Class S, Class Y, Class R5 and Class R6 shares of the Fund. The Trust has adopted plans pursuant to Rule 12b-1 under the 1940 Act with respect to the Fund’s Class A, Class C, Class R and Class S shares (collectively, the “Plans”). The Fund, pursuant to the Plans, pays IDI compensation at the annual rate of 0.25% of the Fund’s average daily net assets of Class A shares, 1.00% of the average daily net assets of Class C shares, 0.50% of the average daily net assets of Class R shares and 0.15% of the average daily net assets of Class S shares. The fees are accrued daily and paid monthly. Of the Plans payments, up to 0.25% of the average daily net assets of Class A, Class C and Class R shares and 0.15% of the average daily net assets of Class S shares may be paid to furnish continuing personal shareholder services to customers who purchase and own shares of such classes. Any amounts not paid as a service fee under the Plans would constitute an asset-based sales charge. Rules of the Financial Industry Regulatory Authority (“FINRA”) impose a cap on the total sales charges, including asset-based sales charges, that may be paid by any class of shares of the Fund. For the year ended December 31, 2024, expenses incurred under the Plans are shown in the Statement of Operations as Distribution fees.
Front-end sales commissions and CDSC (collectively, the “sales charges”) are not recorded as expenses of the Fund. Front-end sales commissions are deducted from proceeds from the sales of Fund shares prior to investment in Class A shares of the Fund. CDSC are deducted from redemption proceeds prior to remittance to the shareholder. During the year ended December 31, 2024, IDI advised the Fund that IDI retained $27,481 in front-end sales commissions from the sale of Class A shares and $9,967 and $2,031 from Class A and Class C shares, respectively, for CDSC imposed upon redemptions by shareholders.
The underlying Invesco Funds pay no distribution fees for Class R6 shares and the Funds pay no sales loads or other similar compensation to IDI for acquiring underlying fund shares.
Certain officers and trustees of the Trust are officers and directors of the Adviser, IIS and/or IDI.
NOTE 3—Additional Valuation Information
GAAP defines fair value as the price that would be received to sell an asset or paid to transfer a liability in an orderly transaction between market participants at the measurement date, under current market conditions. GAAP establishes a hierarchy that prioritizes the inputs to valuation methods, giving the highest priority to readily available unadjusted quoted prices in an active market for identical assets (Level 1) and the lowest priority to significant unobservable inputs (Level 3), generally when market prices are not readily available. Based on the valuation inputs, the securities or other investments are tiered into one of three levels. Changes in valuation methods may result in transfers in or out of an investment’s assigned level:
Level 1 — Prices are determined using quoted prices in an active market for identical assets.
Level 2 — Prices are determined using other significant observable inputs. Observable inputs are inputs that other market participants may use in pricing a security. These may include quoted prices for similar securities, interest rates, prepayment speeds, credit risk, yield curves, loss severities, default rates, discount rates, volatilities and others. When significant events cause market movements to occur after the close of the relevant foreign securities markets, foreign securities may be fair valued utilizing an independent pricing service.
Level 3 — Prices are determined using significant unobservable inputs. In situations where quoted prices or observable inputs are unavailable (for example, when there is little or no market activity for an investment at the end of the period), unobservable inputs may be used. Unobservable inputs reflect the Adviser’s assumptions about the factors market participants would use in determining fair value of the securities or instruments and would be based on the best available information.
As of December 31, 2024, all of the securities in this Fund were valued based on Level 1 inputs (see the Schedule of Investments for security categories). The level assigned to the securities valuations may not be an indication of the risk or liquidity associated with investing in those securities. Because of the inherent uncertainties of valuation, the values reflected in the financial statements may materially differ from the value received upon actual sale of those investments.
NOTE 4—Expense Offset Arrangement(s)
The expense offset arrangement is comprised of transfer agency credits which result from balances in demand deposit accounts used by the transfer agent for clearing shareholder transactions. For the year ended December 31, 2024, the Fund received credits from this arrangement, which resulted in the reduction of the Fund’s total expenses of $10,392.
NOTE 5—Trustees’ and Officers’ Fees and Benefits
Trustees’ and Officers’ Fees and Benefits include amounts accrued by the Fund to pay remuneration to certain Trustees and Officers of the Fund. Trustees have the option to defer compensation payable by the Fund, and Trustees’ and Officers’ Fees and Benefits also include amounts accrued by the Fund to fund such deferred compensation amounts. Those Trustees who defer compensation have the option to select various Invesco Funds in which their deferral accounts shall be deemed to be invested. Finally, certain current Trustees were eligible to participate in a retirement plan that provided for benefits to be paid upon retirement to Trustees over a period of time based on the number of years of service. The Fund may have certain former Trustees who also participate in a retirement plan and receive benefits under such plan. Trustees’ and Officers’ Fees and Benefits include amounts accrued by the Fund to fund such retirement benefits. Obligations under the deferred compensation and retirement plans represent unsecured claims against the general assets of the Fund.
The Fund is permitted to temporarily carry a negative or overdrawn balance in its account with SSB, the custodian bank. Such balances, if any at period-end, are shown in the Statement of Assets and Liabilities under the payable caption Amount due custodian. To compensate the custodian bank for such overdrafts, the overdrawn Fund may either (1) leave funds as a compensating balance in the account so the custodian bank can be compensated by earning the additional interest; or (2) compensate by paying the custodian bank at a rate agreed upon by the custodian bank and Invesco, not to exceed the contractually agreed upon rate.
NOTE 7—Distributions to Shareholders and Tax Components of Net Assets
Tax Character of Distributions to Shareholders Paid During the Fiscal Years Ended December 31, 2024 and 2023: |
| | |
| | |
| Includes short-term capital gain distributions, if any. |
11
Invesco Select Risk: Moderately Conservative Investor Fund
Tax Components of Net Assets at Period-End: |
| |
Undistributed ordinary income | |
Net unrealized appreciation — investments | |
Temporary book/tax differences | |
Capital loss carryforward | |
Shares of beneficial interest | |
| |
The difference between book-basis and tax-basis unrealized appreciation (depreciation) is due to differences in the timing of recognition of gains and losses on investments for tax and book purposes. The Fund’s net unrealized appreciation (depreciation) difference is attributable primarily to wash sales.
The temporary book/tax differences are a result of timing differences between book and tax recognition of income and/or expenses. The Fund’s temporary book/tax differences are the result of the trustee deferral of compensation and retirement plan benefits.
Capital loss carryforward is calculated and reported as of a specific date. Results of transactions and other activity after that date may affect the amount of capital loss carryforward actually available for the Fund to utilize. The ability to utilize capital loss carryforward in the future may be limited under the Internal Revenue Code and related regulations based on the results of future transactions.
The Fund has a capital loss carryforward as of December 31, 2024, as follows:
Capital Loss Carryforward* |
| | | |
Not subject to expiration | | | |
*
Capital loss carryforward is reduced for limitations, if any, to the extent required by the Internal Revenue Code and may be further limited depending upon a variety of factors, including the realization of net unrealized gains or losses as of the date of any reorganization.
NOTE 8—Investment Transactions
The aggregate amount of investment securities (other than short-term securities, U.S. Government obligations and money market funds, if any) purchased and sold by the Fund during the year ended December 31, 2024 was $135,433,362 and $151,392,116, respectively. As of December 31, 2024, the aggregate cost of investments, including any derivatives, on a tax basis listed below includes the adjustments for financial reporting purposes as of the most recently completed federal income tax reporting period-end:
Unrealized Appreciation (Depreciation) of Investments on a Tax Basis |
Aggregate unrealized appreciation of investments | |
Aggregate unrealized (depreciation) of investments | |
Net unrealized appreciation of investments | |
Cost of investments for tax purposes is $265,313,199.
NOTE 9—Reclassification of Permanent Differences
Primarily as a result of differing book/tax treatment of distributions, on December 31, 2024, undistributed net investment income was increased by $66,813 and undistributed net realized gain (loss) was decreased by $66,813. This reclassification had no effect on the net assets or the distributable earnings (loss) of the Fund.
NOTE 10—Share Information
| Summary of Share Activity |
| | Year ended
December 31, 2023 |
| | | | |
| | | | |
| | | | |
| | | | |
| | | | |
| | | | |
| | | | |
| | | | |
| | | | |
Issued as reinvestment of dividends: | | | | |
| | | | |
| | | | |
| | | | |
| | | | |
| | | | |
| | | | |
| | | | |
12
Invesco Select Risk: Moderately Conservative Investor Fund
| Summary of Share Activity |
| Year ended December 31, 2024(a) | Year ended December 31, 2023 |
| | | | |
Automatic conversion of Class C shares to Class A shares: | | | | |
| | | | |
| | | | |
| | | | |
| | | | |
| | | | |
| | | | |
| | | | |
| | | | |
| | | | |
| | | | |
Net increase (decrease) in share activity | | | | |
| There are entities that are record owners of more than 5% of the outstanding shares of the Fund and in the aggregate own 35% of the outstanding shares of the Fund. IDI has an agreement with these entities to sell Fund shares. The Fund, Invesco and/or Invesco affiliates may make payments to these entities, which are considered to be related to the Fund, for providing services to the Fund, Invesco and/or Invesco affiliates including but not limited to services such as securities brokerage, distribution, third party record keeping and account servicing. The Fund has no knowledge as to whether all or any portion of the shares owned of record by these entities are also owned beneficially. |
13
Invesco Select Risk: Moderately Conservative Investor Fund
Report of Independent Registered Public Accounting Firm
To the Board of Trustees of AIM Growth Series (Invesco Growth Series) and Shareholders of Invesco Select Risk: Moderately Conservative Investor Fund
Opinion on the Financial Statements
We have audited the accompanying statement of assets and liabilities, including the schedule of investments, of Invesco Select Risk: Moderately Conservative Investor Fund (one of the funds constituting AIM Growth Series (Invesco Growth Series), referred to hereafter as the "Fund") as of December 31, 2024, the related statement of operations for the year ended December 31, 2024, the statement of changes in net assets for each of the two years in the period ended December 31, 2024, including the related notes, and the financial highlights for each of the five years in the period ended December 31, 2024 (collectively referred to as the "financial statements"). In our opinion, the financial statements present fairly, in all material respects, the financial position of the Fund as of December 31, 2024, the results of its operations for the year then ended, the changes in its net assets for each of the two years in the period ended December 31, 2024 and the financial highlights for each of the five years in the period ended December 31, 2024 in conformity with accounting principles generally accepted in the United States of America.
These financial statements are the responsibility of the Fund’s management. Our responsibility is to express an opinion on the Fund’s financial statements based on our audits. We are a public accounting firm registered with the Public Company Accounting Oversight Board (United States) (PCAOB) and are required to be independent with respect to the Fund in accordance with the U.S. federal securities laws and the applicable rules and regulations of the Securities and Exchange Commission and the PCAOB.
We conducted our audits of these financial statements in accordance with the standards of the PCAOB. Those standards require that we plan and perform the audit to obtain reasonable assurance about whether the financial statements are free of material misstatement, whether due to error or fraud.
Our audits included performing procedures to assess the risks of material misstatement of the financial statements, whether due to error or fraud, and performing procedures that respond to those risks. Such procedures included examining, on a test basis, evidence regarding the amounts and disclosures in the financial statements. Our audits also included evaluating the accounting principles used and significant estimates made by management, as well as evaluating the overall presentation of the financial statements. Our procedures included confirmation of securities owned as of December 31, 2024 by correspondence with the custodian and transfer agent. We believe that our audits provide a reasonable basis for our opinion.
/s/PricewaterhouseCoopers LLP
February 20, 2025
We have served as the auditor of one or more of the investment companies in the Invesco group of investment companies since at least 1995. We have not been able to determine the specific year we began serving as auditor.
14
Invesco Select Risk: Moderately Conservative Investor Fund
Tax Information
Form 1099-DIV, Form 1042-S and other year–end tax information provide shareholders with actual calendar year amounts that should be included in their tax returns. Shareholders should consult their tax advisers.
The following distribution information is being provided as required by the Internal Revenue Code or to meet a specific state’s requirement.
The Fund designates the following amounts or, if subsequently determined to be different, the maximum amount allowable for its fiscal year ended December 31, 2024:
Federal and State Income Tax | |
Qualified Dividend Income* | |
Corporate Dividends Received Deduction* | |
U.S. Treasury Obligations* | |
Qualified Business Income* | |
Business Interest Income* | |
*
The above percentages are based on ordinary income dividends paid to shareholders during the Fund’s fiscal year.
15
Invesco Select Risk: Moderately Conservative Investor Fund
Other Information Required in Form N-CSR (Items 8-11)
Changes in and Disagreements with Accountants for Open-End Management Investment Companies
Proxy Disclosures for Open-End Management Investment Companies
Remuneration Paid to Directors, Officers, and Others of Open-End Management Investment Companies
The aggregate remuneration paid to directors, officers and others is disclosed within the financial statements.
Statement Regarding Basis for Approval of Investment Advisory Contracts
16
Invesco Select Risk: Moderately Conservative Investor Fund
SEC file number(s): 811-02699 and 002-57526
Invesco Distributors, Inc.
CAL-NCSR
Annual Financial Statements and Other InformationDecember 31, 2024
Invesco Small Cap Growth Fund
A: GTSAX ■ C: GTSDX ■ R: GTSRX ■ Y: GTSYX ■ Investor: GTSIX ■ R5: GTSVX ■ R6: GTSFX
| |
| |
| |
| Notes to Financial Statements |
| Report of Independent Registered Public Accounting Firm |
| |
| Other Information Required in Form N-CSR (Items 8-11) |
Schedule of Investments(a)
| | |
Common Stocks & Other Equity Interests–98.17% |
Aerospace & Defense–1.13% |
Loar Holdings, Inc.(b)(c) | | |
| | |
| | | |
|
Boot Barn Holdings, Inc.(b)(c) | | |
Application Software–12.10% |
| | |
| | |
| | |
Braze, Inc., Class A(b)(c) | | |
Cellebrite DI Ltd. (Israel)(b) | | |
Clearwater Analytics Holdings, Inc., | | |
Descartes Systems Group, Inc. (The) | | |
| | |
| | |
| | |
Procore Technologies, Inc.(b) | | |
| | |
| | |
| | |
| | | |
Asset Management & Custody Banks–2.03% |
Hamilton Lane, Inc., Class A | | |
StepStone Group, Inc., Class A | | |
| | | |
Automotive Parts & Equipment–0.96% |
Modine Manufacturing Co.(b) | | |
|
| | |
|
| | |
Ascendis Pharma A/S, ADR (Denmark)(b) | | |
Blueprint Medicines Corp.(b) | | |
Madrigal Pharmaceuticals, Inc.(b)(c) | | |
Twist Bioscience Corp.(b) | | |
| | |
| | |
Viking Therapeutics, Inc.(b)(c) | | |
| | | |
|
Ollie’s Bargain Outlet Holdings, Inc.(b)(c) | | |
|
| | |
| | |
Zurn Elkay Water Solutions Corp.(c) | | |
| | | |
| | |
Cargo Ground Transportation–0.98% |
| | |
Commercial & Residential Mortgage Finance–0.95% |
PennyMac Financial Services, Inc. | | |
Communications Equipment–1.40% |
| | |
Lumentum Holdings, Inc.(b) | | |
| | | |
Construction & Engineering–3.92% |
Comfort Systems USA, Inc. | | |
Construction Partners, Inc., Class A(b) | | |
Everus Construction Group, Inc.(b) | | |
Sterling Infrastructure, Inc.(b) | | |
| | | |
Construction Machinery & Heavy Transportation Equipment– 1.01% |
| | |
Construction Materials–1.03% |
| | |
|
Bright Horizons Family Solutions, | | |
| | |
| | | |
Electrical Components & Equipment–1.72% |
Hammond Power Solutions Inc. (Canada) | | |
| | |
| | | |
Electronic Components–1.43% |
| | |
Electronic Equipment & Instruments–1.49% |
| | |
PAR Technology Corp.(b)(c) | | |
| | | |
Electronic Manufacturing Services–1.40% |
Celestica, Inc. (Canada)(b) | | |
| | |
| | | |
Environmental & Facilities Services–1.33% |
| | |
Financial Exchanges & Data–1.41% |
| | |
|
| | |
Health Care Equipment–3.28% |
| | |
Inspire Medical Systems, Inc.(b)(c) | | |
Integer Holdings Corp.(b)(c) | | |
See accompanying Notes to Financial Statements which are an integral part of the financial statements.
2
Invesco Small Cap Growth Fund
| | |
Health Care Equipment–(continued) |
TransMedics Group, Inc.(b)(c) | | |
| | | |
Health Care Facilities–2.58% |
| | |
| | |
Tenet Healthcare Corp.(b) | | |
| | | |
Health Care Supplies–2.42% |
Lantheus Holdings, Inc.(b)(c) | | |
Merit Medical Systems, Inc.(b) | | |
UFP Technologies, Inc.(b)(c) | | |
| | | |
|
Cavco Industries, Inc.(b)(c) | | |
Homefurnishing Retail–0.77% |
| | |
Hotels, Resorts & Cruise Lines–1.33% |
| | |
Wyndham Hotels & Resorts, Inc. | | |
| | | |
Household Appliances–0.69% |
| | |
Independent Power Producers & Energy Traders–1.34% |
| | |
Industrial Machinery & Supplies & Components–2.72% |
| | |
| | |
| | |
| | | |
|
EastGroup Properties, Inc. | | |
| | |
| | | |
Internet Services & Infrastructure–0.73% |
DigitalOcean Holdings, Inc.(b)(c) | | |
Investment Banking & Brokerage–2.50% |
Jefferies Financial Group, Inc. | | |
| | |
| | | |
Life Sciences Tools & Services–2.40% |
BioLife Solutions, Inc.(b)(c) | | |
| | |
| | |
| | | |
Managed Health Care–0.88% |
| | |
Oil & Gas Equipment & Services–1.38% |
TechnipFMC PLC (United Kingdom) | | |
| | |
Oil & Gas Equipment & Services–(continued) |
Weatherford International PLC | | |
| | | |
Oil & Gas Exploration & Production–1.14% |
| | |
| | |
| | | |
Packaged Foods & Meats–2.30% |
| | |
| | |
| | | |
Personal Care Products–0.88% |
| | |
|
Intra-Cellular Therapies, Inc.(b) | | |
Prestige Consumer Healthcare, Inc.(b) | | |
| | | |
|
Bancorp, Inc. (The)(b)(c) | | |
Western Alliance Bancorporation(c) | | |
| | | |
Research & Consulting Services–0.83% |
| | |
|
Shake Shack, Inc., Class A(b) | | |
Sweetgreen, Inc., Class A(b)(c) | | |
| | |
| | |
| | | |
|
| | |
| | |
MACOM Technology Solutions Holdings, | | |
| | |
Tower Semiconductor Ltd. (Israel)(b) | | |
| | | |
Specialty Chemicals–1.13% |
| | |
|
| | |
Carpenter Technology Corp. | | |
| | | |
|
CyberArk Software Ltd.(b) | | |
| | |
SentinelOne, Inc., Class A(b) | | |
Varonis Systems, Inc.(b)(c) | | |
| | | |
Trading Companies & Distributors–2.21% |
Applied Industrial Technologies, Inc. | | |
| | |
See accompanying Notes to Financial Statements which are an integral part of the financial statements.
3
Invesco Small Cap Growth Fund
| | |
Trading Companies & Distributors–(continued) |
SiteOne Landscape Supply, Inc.(b)(c) | | |
| | | |
Total Common Stocks & Other Equity Interests (Cost $1,463,793,108) | |
|
Invesco Government & Agency Portfolio, Institutional Class, 4.42%(d)(e) | | |
Invesco Treasury Portfolio, Institutional | | |
Total Money Market Funds (Cost $38,864,728) | |
TOTAL INVESTMENTS IN SECURITIES (excluding investments purchased with cash collateral from securities on loan)-100.12% (Cost $1,502,657,836) | | | |
| | |
Investments Purchased with Cash Collateral from Securities on Loan |
|
Invesco Private Government Fund, | | |
Invesco Private Prime Fund, | | |
Total Investments Purchased with Cash Collateral from Securities on Loan (Cost $181,648,235) | |
TOTAL INVESTMENTS IN SECURITIES–109.25% (Cost $1,684,306,071) | |
OTHER ASSETS LESS LIABILITIES—(9.25)% | |
| |
Investment Abbreviations:
| – American Depositary Receipt |
| – Real Estate Investment Trust |
Notes to Schedule of Investments:
| Industry and/or sector classifications used in this report are generally according to the Global Industry Classification Standard, which was developed by and is the exclusive property and a service mark of MSCI Inc. and Standard & Poor’s. |
| Non-income producing security. |
| All or a portion of this security was out on loan at December 31, 2024. |
| Affiliated holding. Affiliated holdings are investments in entities which are under common ownership or control of Invesco Ltd. or are investments in entities in which the Fund owns 5% or more of the outstanding voting securities. The table below shows the Fund’s transactions in, and earnings from, its investments in affiliates for the fiscal year ended December 31, 2024. |
| | | | Change in
Unrealized
Appreciation
(Depreciation) | | | |
Investments in Affiliated Money Market Funds: | | | | | | | |
Invesco Government & Agency Portfolio, Institutional Class | | | | | | | |
Invesco Liquid Assets Portfolio, Institutional Class | | | | | | | |
Invesco Treasury Portfolio, Institutional Class | | | | | | | |
Investments Purchased with Cash Collateral from Securities on Loan: | | | | | | | |
Invesco Private Government Fund | | | | | | | |
Invesco Private Prime Fund | | | | | | | |
| | | | | | | |
| Represents the income earned on the investment of cash collateral, which is included in securities lending income on the Statement of Operations. Does not include rebates and fees paid to lending agent or premiums received from borrowers, if any. |
| The rate shown is the 7-day SEC standardized yield as of December 31, 2024. |
| The security has been segregated to satisfy the commitment to return the cash collateral received in securities lending transactions upon the borrower’s return of the securities loaned. See Note 1J. |
See accompanying Notes to Financial Statements which are an integral part of the financial statements.
4
Invesco Small Cap Growth Fund
Statement of Assets and Liabilities
| |
Investments in unaffiliated securities, at value
(Cost $1,463,793,108)* | |
Investments in affiliated money market funds, at value (Cost $220,512,963) | |
| |
Foreign currencies, at value (Cost $24,902) | |
| |
| |
| |
Investment for trustee deferred compensation and retirement plans | |
| |
| |
| |
| |
| |
Collateral upon return of securities loaned | |
Accrued fees to affiliates | |
Accrued other operating expenses | |
Trustee deferred compensation and retirement plans | |
| |
Net assets applicable to shares outstanding | |
| |
Shares of beneficial interest | |
| |
| |
|
| |
| |
| |
| |
| |
| |
| |
Shares outstanding, no par value, with an unlimited number of shares authorized: |
| |
| |
| |
| |
| |
| |
| |
| |
Net asset value per share | |
Maximum offering price per share
(Net asset value of $29.57 ÷ 94.50%) | |
| |
Net asset value and offering price per share | |
| |
Net asset value and offering price per share | |
| |
Net asset value and offering price per share | |
| |
Net asset value and offering price per share | |
| |
Net asset value and offering price per share | |
| |
Net asset value and offering price per share | |
| At December 31, 2024, securities with an aggregate value of $172,078,188 were on loan to brokers. |
See accompanying Notes to Financial Statements which are an integral part of the financial statements.
5
Invesco Small Cap Growth Fund
Statement of Operations
For the year ended December 31, 2024
| |
Dividends (net of foreign withholding taxes of $82,644) | |
Dividends from affiliated money market funds (includes net securities lending income of $328,973) | |
| |
| |
| |
Administrative services fees | |
| |
| |
| |
| |
| |
| |
Transfer agent fees — A, C, R, Y and Investor | |
| |
| |
Trustees’ and officers’ fees and benefits | |
Registration and filing fees | |
| |
Professional services fees | |
| |
| |
Less: Fees waived and/or expense offset arrangement(s) | |
| |
Net investment income (loss) | |
Realized and unrealized gain (loss) from: | |
Net realized gain (loss) from: | |
Unaffiliated investment securities | |
Affiliated investment securities | |
| |
| |
Change in net unrealized appreciation (depreciation) of: | |
Unaffiliated investment securities | |
Affiliated investment securities | |
| |
| |
Net realized and unrealized gain | |
Net increase in net assets resulting from operations | |
See accompanying Notes to Financial Statements which are an integral part of the financial statements.
6
Invesco Small Cap Growth Fund
Statement of Changes in Net Assets
For the years ended December 31, 2024 and 2023
| | |
| | |
Net investment income (loss) | | |
| | |
Change in net unrealized appreciation | | |
Net increase in net assets resulting from operations | | |
| | |
| | |
| | |
| | |
| | |
| | |
| | |
| | |
Net increase (decrease) in net assets resulting from share transactions | | |
Net increase (decrease) in net assets | | |
| | |
| | |
| | |
See accompanying Notes to Financial Statements which are an integral part of the financial statements.
7
Invesco Small Cap Growth Fund
Financial Highlights
The following schedule presents financial highlights for a share of the Fund outstanding throughout the periods indicated.
| Net asset
value,
beginning
of period | | Net gains
(losses)
on securities
(both
realized and
unrealized) | Total from
investment
operations | Distributions
from net
realized
gains | Net asset
value, end
of period | | Net assets,
end of period
(000’s omitted) | Ratio of
expenses
to average
net assets
with fee waivers
and/or
expenses
absorbed | Ratio of
expenses
to average net
assets without
fee waivers
and/or
expenses
absorbed
| Ratio of net
investment
income
(loss)
to average
net assets | |
|
| | | | | | | | | | | | |
| | | | | | | | | | | | |
| | | | | | | | | | | | |
| | | | | | | | | | | | |
| | | | | | | | | | | | |
|
| | | | | | | | | | | | |
| | | | | | | | | | | | |
| | | | | | | | | | | | |
| | | | | | | | | | | | |
| | | | | | | | | | | | |
|
| | | | | | | | | | | | |
| | | | | | | | | | | | |
| | | | | | | | | | | | |
| | | | | | | | | | | | |
| | | | | | | | | | | | |
|
| | | | | | | | | | | | |
| | | | | | | | | | | | |
| | | | | | | | | | | | |
| | | | | | | | | | | | |
| | | | | | | | | | | | |
|
| | | | | | | | | | | | |
| | | | | | | | | | | | |
| | | | | | | | | | | | |
| | | | | | | | | | | | |
| | | | | | | | | | | | |
|
| | | | | | | | | | | | |
| | | | | | | | | | | | |
| | | | | | | | | | | | |
| | | | | | | | | | | | |
| | | | | | | | | | | | |
|
| | | | | | | | | | | | |
| | | | | | | | | | | | |
| | | | | | | | | | | | |
| | | | | | | | | | | | |
| | | | | | | | | | | | |
| Based on average shares outstanding. |
| Includes adjustments in accordance with accounting principles generally accepted in the United States of America and as such, the net asset value for financial reporting purposes and the returns based upon those net asset values may differ from the net asset value and returns for shareholder transactions. Does not include sales charges and is not annualized for periods less than one year, if applicable. |
| Portfolio turnover is calculated at the fund level and is not annualized for periods less than one year, if applicable. |
| The total return, ratios of expenses to average net assets and ratio of net investment income to average net assets reflect actual 12b-1 fees of 0.92%, 0.95%, 0.97% and 0.97% for Class C for the years ended December 31, 2024, 2023, 2021 and 2020, respectively. |
| The total return, ratios of expenses to average net assets and ratio of net investment income to average net assets reflect actual 12b-1 fees of 0.22%, 0.18%, 0.22%, 0.16% and 0.17% for Investor Class for the years ended December 31, 2024, 2023, 2022, 2021 and 2020, respectively. |
See accompanying Notes to Financial Statements which are an integral part of the financial statements.
8
Invesco Small Cap Growth Fund
Notes to Financial Statements
NOTE 1—Significant Accounting Policies
Invesco Small Cap Growth Fund (the “Fund”) is a series portfolio of AIM Growth Series (Invesco Growth Series) (the “Trust”). The Trust is a Delaware statutory trust registered under the Investment Company Act of 1940, as amended (the “1940 Act”), as an open-end series management investment company authorized to issue an unlimited number of shares of beneficial interest. Information presented in these financial statements pertains only to the Fund. Matters affecting the Fund or each class will be voted on exclusively by the shareholders of the Fund or each class.
The Fund’s investment objective is long-term growth of capital.
The Fund currently consists of seven different classes of shares: Class A, Class C, Class R, Class Y, Investor Class, Class R5 and Class R6. Class Y and Investor Class shares are available only to certain investors. Class A shares are sold with a front-end sales charge unless certain waiver criteria are met. Under certain circumstances, load waived shares may be subject to contingent deferred sales charges ("CDSC"). Class C shares are sold with a CDSC. Class R, Class Y, Investor Class, Class R5 and Class R6 shares are sold at net asset value. Class C shares held for eight years after purchase are eligible for automatic conversion into Class A shares of the same Fund (the "Conversion Feature"). The automatic conversion pursuant to the Conversion Feature will generally occur at the end of the month following the eighth anniversary after a purchase of Class C shares.
The Fund’s shares are offered on a limited basis to certain investors.
The Fund is an investment company and accordingly follows the investment company accounting and reporting guidance in accordance with Financial Accounting Standards Board Accounting Standards Codification Topic 946, Financial Services – Investment Companies.
The following is a summary of the significant accounting policies followed by the Fund in the preparation of its financial statements.
A.
Security Valuations — Securities, including restricted securities, are valued according to the following policy.
A security listed or traded on an exchange is generally valued at its trade price or official closing price that day as of the close of the exchange where the security is principally traded, or lacking any trades or official closing price on a particular day, the security may be valued at the closing bid or ask price on that day. Securities traded in the over-the-counter market are valued based on prices furnished by independent pricing services or market makers. When such securities are valued using prices provided by an independent pricing service they may be considered fair valued. Futures contracts are valued at the daily settlement price set by an exchange on which they are principally traded. Where a final settlement price exists, exchange-traded options are valued at the final settlement price from the exchange where the option principally trades. Where a final settlement price does not exist, exchange-traded options are valued at the mean between the last bid and ask price generally from the exchange where the option principally trades.
Securities of investment companies that are not exchange-traded (e.g., open-end mutual funds) are valued using such company’s end-of-business-day net asset value per share.
Deposits, other obligations of U.S. and non-U.S. banks and financial institutions are valued at their daily account value.
Fixed income securities (including convertible debt securities) generally are valued on the basis of prices provided by independent pricing services. Prices provided by the pricing service may be determined without exclusive reliance on quoted prices, and may reflect appropriate factors such as institution-size trading in similar groups of securities, developments related to specific securities, dividend rate (for unlisted equities), yield (for debt obligations), quality, type of issue, coupon rate (for debt obligations), maturity (for debt obligations), individual trading characteristics and other market data. Pricing services generally value debt obligations assuming orderly transactions of institutional round lot size, but a fund may hold or transact in the same securities in smaller, odd lot sizes. Odd lots often trade at lower prices than institutional round lots, and their value may be adjusted accordingly. Debt obligations are subject to interest rate and credit risks. In addition, all debt obligations involve some risk of default with respect to interest and/or principal payments.
Foreign securities’ (including foreign exchange contracts) prices are converted into U.S. dollar amounts using the applicable exchange rates as of the close of the New York Stock Exchange (“NYSE”). If market quotations are available and reliable for foreign exchange-traded equity securities, the securities will be valued at the market quotations. Invesco Advisers, Inc. (the “Adviser” or “Invesco”) may use various pricing services to obtain market quotations as well as fair value prices. Because trading hours for certain foreign securities end before the close of the NYSE, closing market quotations may become not representative of market value in the Adviser’s judgment (“unreliable”). If, between the time trading ends on a particular security and the close of the customary trading session on the NYSE, a significant event occurs that makes the closing price of the security unreliable, the Adviser may fair value the security. If the event is likely to have affected the closing price of the security, the security will be valued at fair value in good faith in accordance with Board- approved policies and related Adviser procedures (“Valuation Procedures”). Adjustments to closing prices to reflect fair value may also be based on a screening process of an independent pricing service to indicate the degree of certainty, based on historical data, that the closing price in the principal market where a foreign security trades is not the current value as of the close of the NYSE. Foreign securities’ prices meeting the degree of certainty that the price is not reflective of current value will be priced at the indication of fair value from the independent pricing service. Multiple factors may be considered by the independent pricing service in determining adjustments to reflect fair value and may include information relating to sector indices, American Depositary Receipts and domestic and foreign index futures. Foreign securities may have additional risks including exchange rate changes, potential for sharply devalued currencies and high inflation, political and economic upheaval, the relative lack of issuer information, relatively low market liquidity and the potential lack of strict financial and accounting controls and standards.
Unlisted securities will be valued using prices provided by independent pricing services or by another method that the Adviser, in its judgment, believes better reflects the security’s fair value in accordance with the Valuation Procedures.
Non-traded rights and warrants shall be valued at intrinsic value if the terms of the rights and warrants are available, specifically the subscription or exercise price and the ratio. Intrinsic value is calculated as the daily market closing price of the security to be received less the subscription price, which is then adjusted by the exercise ratio. In the case of warrants, an option pricing model supplied by an independent pricing service may be used based on market data such as volatility, stock price and interest rate from the independent pricing service and strike price and exercise period from verified terms.
Securities for which market prices are not provided by any of the above methods may be valued based upon quotes furnished by independent sources. The mean between the last bid and ask prices may be used to value debt obligations, including corporate loans.
Securities for which market quotations are not readily available are fair valued by the Adviser in accordance with the Valuation Procedures. If a fair value price provided by a pricing service is unreliable, the Adviser will fair value the security using the Valuation Procedures. Issuer specific events, market trends, bid/ask quotes of brokers and information providers and other market data may be reviewed in the course of making a good faith determination of a security’s fair value.
The Fund may invest in securities that are subject to interest rate risk, meaning the risk that the prices will generally fall as interest rates rise and, conversely, the prices will generally rise as interest rates fall. Specific securities differ in their sensitivity to changes in interest rates depending on their individual characteristics. Changes in interest rates may result in increased market volatility, which may affect the value and/or liquidity of certain Fund investments.
Valuations change in response to many factors including the historical and prospective earnings of the issuer, the value of the issuer’s assets, general market conditions which are not specifically related to the particular issuer, such as real or perceived adverse economic conditions, changes in the general outlook for revenues or corporate earnings, changes in interest or currency rates, regional or global instability, natural or environmental disasters, widespread disease or other public health issues, war, acts of terrorism, significant governmental actions or adverse investor sentiment generally and market liquidity. Because of the inherent uncertainties of valuation, the values reflected in the financial statements may materially differ from the value received upon actual sale of those investments.
9
Invesco Small Cap Growth Fund
The price the Fund could receive upon the sale of any investment may differ from the Adviser’s valuation of the investment, particularly for securities that are valued using a fair valuation technique. When fair valuation techniques are applied, the Adviser uses available information, including both observable and unobservable inputs and assumptions, to determine a methodology that will result in a valuation that the Adviser believes approximates market value. Fund securities that are fair valued may be subject to greater fluctuation in their value from one day to the next than would be the case if market quotations were used. Because of the inherent uncertainties of valuation, and the degree of subjectivity in such decisions, the Fund could realize a greater or lesser than expected gain or loss upon the sale of the investment.
B.
Securities Transactions and Investment Income — Securities transactions are accounted for on a trade date basis. Realized gains or losses on sales are computed on the basis of specific identification of the securities sold. Interest income (net of withholding tax, if any) is recorded on an accrual basis from settlement date and includes coupon interest and amortization of premium and accretion of discount on debt securities as applicable. Pay-in-kind interest income and non-cash dividend income received in the form of securities in lieu of cash are recorded at the fair value of the securities received. Dividend income (net of withholding tax, if any) is recorded on the ex-dividend date.
The Fund may periodically participate in litigation related to Fund investments. As such, the Fund may receive proceeds from litigation settlements. Any proceeds received are included in the Statement of Operations as realized gain (loss) for investments no longer held and as unrealized gain (loss) for investments still held.
Brokerage commissions and mark ups are considered transaction costs and are recorded as an increase to the cost basis of securities purchased and/or a reduction of proceeds on a sale of securities. Such transaction costs are included in the determination of net realized and unrealized gain (loss) from investment securities reported in the Statement of Operations and the Statement of Changes in Net Assets and the net realized and unrealized gains (losses) on securities per share in the Financial Highlights. Transaction costs are included in the calculation of the Fund’s net asset value and, accordingly, they reduce the Fund’s total returns. These transaction costs are not considered operating expenses and are not reflected in net investment income reported in the Statement of Operations and the Statement of Changes in Net Assets, or the net investment income per share and the ratios of expenses and net investment income reported in the Financial Highlights, nor are they limited by any expense limitation arrangements between the Fund and the investment adviser.
The Fund allocates income and realized and unrealized capital gains and losses to a class based on the relative net assets of each class.
C.
Country Determination — For the purposes of making investment selection decisions and presentation in the Schedule of Investments, the investment adviser may determine the country in which an issuer is located and/or credit risk exposure based on various factors. These factors include the laws of the country under which the issuer is organized, where the issuer maintains a principal office, the country in which the issuer derives 50% or more of its total revenues, the country that has the primary market for the issuer’s securities and its "country of risk" as determined by a third party service provider, as well as other criteria. Among the other criteria that may be evaluated for making this determination are the country in which the issuer maintains 50% or more of its assets, the type of security, financial guarantees and enhancements, the nature of the collateral and the sponsor organization. Country of issuer and/or credit risk exposure has been determined to be the United States of America, unless otherwise noted.
D.
Distributions – Distributions from net investment income and net realized capital gain, if any, are generally declared and paid annually and recorded on the ex-dividend date. The Fund may elect to treat a portion of the proceeds from redemptions as distributions for federal income tax purposes.
E.
Federal Income Taxes – The Fund intends to comply with the requirements of Subchapter M of the Internal Revenue Code of 1986, as amended (the “Internal Revenue Code”), necessary to qualify as a regulated investment company and to distribute substantially all of the Fund’s taxable earnings to shareholders. As such, the Fund will not be subject to federal income taxes on otherwise taxable income (including net realized capital gain) that is distributed to shareholders. Therefore, no provision for federal income taxes is recorded in the financial statements.
The Fund recognizes the tax benefits of uncertain tax positions only when the position is more likely than not to be sustained. Management has analyzed the Fund’s uncertain tax positions and concluded that no liability for unrecognized tax benefits should be recorded related to uncertain tax positions. Management is not aware of any tax positions for which it is reasonably possible that the total amounts of unrecognized tax benefits will change materially in the next 12 months.
The Fund files tax returns in the U.S. Federal jurisdiction and certain other jurisdictions. Generally, the Fund is subject to examinations by such taxing authorities for up to three years after the filing of the return for the tax period.
F.
Expenses – Fees provided for under the Rule 12b-1 plan of a particular class of the Fund are charged to the operations of such class. Transfer agency fees and expenses and other shareholder recordkeeping fees and expenses attributable to Class R5 and Class R6 are allocated based on relative net assets of Class R5 and Class R6. Sub-accounting fees attributable to Class R5 are charged to the operations of the class. Transfer agency fees and expenses and other shareholder recordkeeping fees and expenses relating to all other classes are allocated among those classes based on relative net assets. All other expenses are allocated among the classes based on relative net assets.
G.
Accounting Estimates – The preparation of financial statements in conformity with accounting principles generally accepted in the United States of America (“GAAP”) requires management to make estimates and assumptions that affect the reported amounts of assets and liabilities at the date of the financial statements and the reported amounts of revenues and expenses during the reporting period including estimates and assumptions related to taxation. Actual results could differ from those estimates by a significant amount. In addition, the Fund monitors for material events or transactions that may occur or become known after the period-end date and before the date the financial statements are released to print.
H.
Indemnifications – Under the Trust’s organizational documents, each Trustee, officer, employee or other agent of the Trust is indemnified against certain liabilities that may arise out of the performance of their duties to the Fund. Additionally, in the normal course of business, the Fund enters into contracts, including the Fund’s servicing agreements, that contain a variety of indemnification clauses. The Fund’s maximum exposure under these arrangements is unknown as this would involve future claims that may be made against the Fund that have not yet occurred. The risk of material loss as a result of such indemnification claims is considered remote.
I.
Segment Reporting — In November 2023, the FASB issued Accounting Standards Update 2023-07, Segment Reporting (Topic 280): Improvements to Reportable Segment Disclosures (“ASU 2023-07”), with the intent of improving reportable segment disclosure requirements, primarily through enhanced disclosures about significant segment expenses, allowing financial statement users to better understand the components of a segment’s profit or loss and assess potential future cash flows for each reportable segment and the entity as a whole thereby enabling better understanding of how an entity’s segments impact overall performance. The Fund represents a single operating segment. Subject to the oversight and, when applicable, approval of the Board of Trustees, the Fund’s Adviser acts as the Fund’s chief operating decision maker (“CODM”), assessing performance and making decisions about resource allocation within the Fund. The CODM monitors the operating results as a whole and the Fund’s long-term strategic asset allocation is determined in accordance with the terms of its prospectus based on a defined investment strategy. The financial information provided to and reviewed by the CODM is consistent with that presented in the Fund’s financial statements. Adoption of the new standard impacted the Fund’s financial statement note disclosures only and did not affect the Fund’s financial position or the results of its operations.
J.
Securities Lending – The Fund may lend portfolio securities having a market value up to one-third of the Fund’s total assets. Such loans are secured by collateral equal to no less than the market value of the loaned securities determined daily by the securities lending provider. Such collateral will be cash or debt securities issued or guaranteed by the U.S. Government or any of its sponsored agencies. Cash collateral received in connection with these loans is invested in short-term money market instruments or affiliated, unregistered investment companies that comply with Rule 2a-7 under the 1940 Act and money market funds (collectively, "affiliated money market funds") and is shown as such on the Schedule of Investments. The Fund bears the risk of loss with respect to the investment of collateral. It is the Fund’s policy to obtain additional collateral from or return excess collateral to the borrower by the end of the next business day, following the valuation date of the securities loaned. Therefore, the value of the collateral held may be temporarily less than the value of the securities on loan. When
10
Invesco Small Cap Growth Fund
loaning securities, the Fund retains certain benefits of owning the securities, including the economic equivalent of dividends or interest generated by the security. Lending securities entails a risk of loss to the Fund if, and to the extent that, the market value of the securities loaned were to increase and the borrower did not increase the collateral accordingly, and the borrower failed to return the securities. The securities loaned are subject to termination at the option of the borrower or the Fund. Upon termination, the borrower will return to the Fund the securities loaned and the Fund will return the collateral. Upon the failure of the borrower to return the securities, collateral may be liquidated and the securities may be purchased on the open market to replace the loaned securities. The Fund could experience delays and costs in gaining access to the collateral and the securities may lose value during the delay which could result in potential losses to the Fund. Some of these losses may be indemnified by the lending agent. The Fund bears the risk of any deficiency in the amount of the collateral available for return to the borrower due to any loss on the collateral invested. Dividends received on cash collateral investments for securities lending transactions, which are net of compensation to counterparties, are included in Dividends from affiliated money market funds on the Statement of Operations. The aggregate value of securities out on loan, if any, is shown as a footnote on the Statement of Assets and Liabilities.
The Adviser serves as an affiliated securities lending agent for the Fund. The Bank of New York Mellon also serves as a securities lending agent. To the extent the Fund utilizes the Adviser as an affiliated securities lending agent, the Fund conducts its securities lending in accordance with, and in reliance upon, no-action letters issued by the SEC staff that provide guidance on how an affiliate may act as a direct agent lender and receive compensation for those services in a manner consistent with the federal securities laws. For the year ended December 31, 2024, the Fund paid the Adviser $20,265 in fees for securities lending agent services. Fees paid to the Adviser for securities lending agent services, if any, are included in Dividends from affiliated money market funds on the Statement of Operations.
NOTE 2—Advisory Fees and Other Fees Paid to Affiliates
The Trust has entered into a master investment advisory agreement with the Adviser. Under the terms of the investment advisory agreement, the Fund accrues daily and pays monthly an advisory fee to the Adviser based on the annual rate of the Fund’s average daily net assets as follows:
For the year ended December 31, 2024, the effective advisory fee rate incurred by the Fund was 0.69%.
Under the terms of a master sub-advisory agreement between the Adviser and each of Invesco Asset Management Deutschland GmbH, Invesco Asset Management Limited, Invesco Asset Management (Japan) Limited, Invesco Hong Kong Limited, Invesco Senior Secured Management, Inc. and Invesco Canada Ltd. and a separate sub-advisory agreement with Invesco Capital Management LLC (collectively, the "Affiliated Sub-Advisers") the Adviser, not the Fund, will pay 40% of the fees paid to the Adviser to any such Affiliated Sub-Adviser(s) that provide(s) discretionary investment management services to the Fund based on the percentage of assets allocated to such Affiliated Sub-Adviser(s).
The Adviser has agreed, for an indefinite period, to waive advisory fees and/or reimburse expenses of all shares to the extent necessary to limit total annual fund operating expenses after fee waiver and/or expense reimbursement (excluding certain items discussed below) of Class A, Class C, Class R, Class Y, Investor Class, Class R5 and Class R6 shares to 2.00%, 2.75%, 2.25%, 1.75%, 2.00%, 1.75% and 1.75%, respectively, of the Fund’s average daily net assets (the “boundary limits”). In determining the Adviser’s obligation to waive advisory fees and/or reimburse expenses, the following expenses are not taken into account, and could cause the total annual fund operating expenses after fee waiver and/or expense reimbursement to exceed the numbers reflected above: (1) interest; (2) taxes; (3) dividend expense on short sales; (4) extraordinary or non-routine items, including litigation expenses; and (5) expenses that the Fund has incurred but did not actually pay because of an expense offset arrangement. Invesco may amend and/or terminate these boundary limits at any time in its sole discretion and will inform the Board of Trustees of any such changes. The Adviser did not waive fees and/or reimburse expenses during the period under these boundary limits.
Further, the Adviser has contractually agreed, through at least August 31, 2026, to waive the advisory fee payable by the Fund in an amount equal to 100% of the net advisory fees the Adviser receives from the affiliated money market funds on investments by the Fund of uninvested cash (excluding investments of cash collateral from securities lending) in such affiliated money market funds.
For the year ended December 31, 2024, the Adviser waived advisory fees of $26,809.
The Trust has entered into a master administrative services agreement with Invesco pursuant to which the Fund has agreed to pay Invesco for certain administrative costs incurred in providing accounting services to the Fund. For the year ended December 31, 2024, expenses incurred under the agreement are shown in the Statement of Operations as Administrative services fees. Invesco has entered into a sub-administration agreement whereby State Street Bank and Trust Company (“SSB”) serves as fund accountant and provides certain administrative services to the Fund. Pursuant to a custody agreement with the Trust on behalf of the Fund, SSB also serves as the Fund’s custodian.
The Trust has entered into a transfer agency and service agreement with Invesco Investment Services, Inc. (“IIS”) pursuant to which the Fund has agreed to pay IIS a fee for providing transfer agency and shareholder services to the Fund and reimburse IIS for certain expenses incurred by IIS in the course of providing such services. IIS may make payments to intermediaries that provide omnibus account services, sub-accounting services and/or networking services. All fees payable by IIS to intermediaries that provide omnibus account services or sub-accounting services are charged back to the Fund, subject to certain limitations approved by the Trust’s Board of Trustees. For the year ended December 31, 2024, expenses incurred under the agreement are shown in the Statement of Operations as Transfer agent fees.
The Trust has entered into master distribution agreements with Invesco Distributors, Inc.(“IDI”) to serve as the distributor for the Class A, Class C, Class R, Class Y and Class R6 shares of the Fund. The Trust has adopted plans pursuant to Rule 12b-1 under the 1940 Act with respect to the Fund’s Class A, Class C and Class R shares (collectively the “Plans”). The Fund, pursuant to the Plans, reimburses IDI for its allocated share of expenses incurred for the period, up to a maximum annual rate of 0.25% of the average daily net assets of Class A shares and up to a maximum annual rate of 1.00% of the average daily net assets of Class C shares and up to a maximum annual rate of 0.25% of the average daily net assets of Investor Class shares. The Fund pursuant to the Class R Plan, pays IDI compensation at the annual rate of 0.50% of the average daily net assets of Class R shares. The fees are accrued daily and paid monthly. Of the Plans payments, up to 0.25% of the average daily net assets of each class of shares may be paid to furnish continuing personal shareholder services to customers who purchase and own shares of such classes. Any amounts not paid as a service fee under the Plans would constitute an asset-based sales charge. Rules of the Financial Industry Regulatory Authority (“FINRA”) impose a cap on the total sales charges, including asset-based sales charges, that may be paid by any class of shares of the Fund. For the year ended December 31, 2024, expenses incurred under the Plans are shown in the Statement of Operations as Distribution fees.
Front-end sales commissions and CDSC (collectively, the “sales charges”) are not recorded as expenses of the Fund. Front-end sales commissions are deducted from proceeds from the sales of Fund shares prior to investment in Class A shares of the Fund. CDSC are deducted from redemption proceeds prior to remittance to the shareholder. During the year ended December 31, 2024, IDI advised the Fund that IDI retained $21,557 in front-end sales commissions from the sale of Class A shares and $69 and $165 from Class A and Class C shares, respectively, for CDSC imposed upon redemptions by shareholders.
For the year ended December 31, 2024, the Fund incurred $144,079 in brokerage commissions with Invesco Capital Markets, Inc., an affiliate of the Adviser and IDI, for portfolio transactions executed on behalf of the Fund.
11
Invesco Small Cap Growth Fund
Certain officers and trustees of the Trust are officers and directors of the Adviser, IIS and/or IDI.
NOTE 3—Additional Valuation Information
GAAP defines fair value as the price that would be received to sell an asset or paid to transfer a liability in an orderly transaction between market participants at the measurement date, under current market conditions. GAAP establishes a hierarchy that prioritizes the inputs to valuation methods, giving the highest priority to readily available unadjusted quoted prices in an active market for identical assets (Level 1) and the lowest priority to significant unobservable inputs (Level 3), generally when market prices are not readily available. Based on the valuation inputs, the securities or other investments are tiered into one of three levels. Changes in valuation methods may result in transfers in or out of an investment’s assigned level:
Level 1 – Prices are determined using quoted prices in an active market for identical assets.
Level 2 – Prices are determined using other significant observable inputs. Observable inputs are inputs that other market participants may use in pricing a security. These may include quoted prices for similar securities, interest rates, prepayment speeds, credit risk, yield curves, loss severities, default rates, discount rates, volatilities and others. When significant events cause market movements to occur after the close of the relevant foreign securities markets, foreign securities may be fair valued utilizing an independent pricing service.
Level 3 – Prices are determined using significant unobservable inputs. In situations where quoted prices or observable inputs are unavailable (for example, when there is little or no market activity for an investment at the end of the period), unobservable inputs may be used. Unobservable inputs reflect the Adviser’s assumptions about the factors market participants would use in determining fair value of the securities or instruments and would be based on the best available information.
The following is a summary of the tiered valuation input levels, as of December 31, 2024. The level assigned to the securities valuations may not be an indication of the risk or liquidity associated with investing in those securities. Because of the inherent uncertainties of valuation, the values reflected in the financial statements may materially differ from the value received upon actual sale of those investments.
| | | | |
Investments in Securities | | | | |
Common Stocks & Other Equity Interests | | | | |
| | | | |
| | | | |
NOTE 4—Expense Offset Arrangement(s)
The expense offset arrangement is comprised of transfer agency credits which result from balances in demand deposit accounts used by the transfer agent for clearing shareholder transactions. For the year ended December 31, 2024, the Fund received credits from this arrangement, which resulted in the reduction of the Fund’s total expenses of $416.
NOTE 5—Trustees’ and Officers’ Fees and Benefits
Trustees’ and Officers’ Fees and Benefits include amounts accrued by the Fund to pay remuneration to certain Trustees and Officers of the Fund. Trustees have the option to defer compensation payable by the Fund, and Trustees’ and Officers’ Fees and Benefits also include amounts accrued by the Fund to fund such deferred compensation amounts. Those Trustees who defer compensation have the option to select various Invesco Funds in which their deferral accounts shall be deemed to be invested. Finally, certain current Trustees were eligible to participate in a retirement plan that provided for benefits to be paid upon retirement to Trustees over a period of time based on the number of years of service. The Fund may have certain former Trustees who also participate in a retirement plan and receive benefits under such plan. Trustees’ and Officers’ Fees and Benefits include amounts accrued by the Fund to fund such retirement benefits. Obligations under the deferred compensation and retirement plans represent unsecured claims against the general assets of the Fund.
The Fund is permitted to temporarily carry a negative or overdrawn balance in its account with SSB, the custodian bank. Such balances, if any at period-end, are shown in the Statement of Assets and Liabilities under the payable caption Amount due custodian. To compensate the custodian bank for such overdrafts, the overdrawn Fund may either (1) leave funds as a compensating balance in the account so the custodian bank can be compensated by earning the additional interest; or (2) compensate by paying the custodian bank at a rate agreed upon by the custodian bank and Invesco, not to exceed the contractually agreed upon rate.
NOTE 7—Distributions to Shareholders and Tax Components of Net Assets
Tax Components of Net Assets at Period-End: |
| |
Net unrealized appreciation — investments | |
Net unrealized appreciation — foreign currencies | |
Temporary book/tax differences | |
Capital loss carryforward | |
Shares of beneficial interest | |
| |
The difference between book-basis and tax-basis unrealized appreciation (depreciation) is due to differences in the timing of recognition of gains and losses on investments for tax and book purposes. The Fund’s net unrealized appreciation (depreciation) difference is attributable primarily to passive foreign investment companies.
The temporary book/tax differences are a result of timing differences between book and tax recognition of income and/or expenses. The Fund’s temporary book/tax differences are the result of the trustee deferral of compensation and retirement plan benefits.
Capital loss carryforward is calculated and reported as of a specific date. Results of transactions and other activity after that date may affect the amount of capital loss carryforward actually available for the Fund to utilize. The ability to utilize capital loss carryforward in the future may be limited under the Internal Revenue Code and related regulations based on the results of future transactions.
12
Invesco Small Cap Growth Fund
The Fund has a capital loss carryforward as of December 31, 2024, as follows:
Capital Loss Carryforward* |
| | | |
Not subject to expiration | | | |
*
Capital loss carryforward is reduced for limitations, if any, to the extent required by the Internal Revenue Code and may be further limited depending upon a variety of factors, including the realization of net unrealized gains or losses as of the date of any reorganization.
NOTE 8—Investment Transactions
The aggregate amount of investment securities (other than short-term securities, U.S. Government obligations and money market funds, if any) purchased and sold by the Fund during the year ended December 31, 2024 was $1,110,798,770 and $1,570,944,256, respectively. As of December 31, 2024, the aggregate cost of investments, including any derivatives, on a tax basis listed below includes the adjustments for financial reporting purposes as of the most recently completed federal income tax reporting period-end:
Unrealized Appreciation (Depreciation) of Investments on a Tax Basis |
Aggregate unrealized appreciation of investments | |
Aggregate unrealized (depreciation) of investments | |
Net unrealized appreciation of investments | |
Cost of investments for tax purposes is $1,690,312,846.
NOTE 9—Reclassification of Permanent Differences
Primarily as a result of differing book/tax treatment of net operating losses, on December 31, 2024, undistributed net investment income (loss) was increased by $3,309,206, undistributed net realized gain (loss) was decreased by $132,813 and shares of beneficial interest was decreased by $3,176,393. This reclassification had no effect on the net assets of the Fund.
NOTE 10—Share Information
| Summary of Share Activity |
| | Year ended
December 31, 2023 |
| | | | |
| | | | |
| | | | |
| | | | |
| | | | |
| | | | |
| | | | |
| | | | |
| | | | |
Automatic conversion of Class C shares to Class A shares: | | | | |
| | | | |
| | | | |
| | | | |
| | | | |
| | | | |
| | | | |
| | | | |
| | | | |
| | | | |
| | | | |
Net increase (decrease) in share activity | | | | |
| There are entities that are record owners of more than 5% of the outstanding shares of the Fund and in the aggregate own 25% of the outstanding shares of the Fund. IDI has an agreement with these entities to sell Fund shares. The Fund, Invesco and/or Invesco affiliates may make payments to these entities, which are considered to be related to the Fund, for providing services to the Fund, Invesco and/or Invesco affiliates including but not limited to services such as securities brokerage, distribution, third party record keeping and account servicing. The Fund has no knowledge as to whether all or any portion of the shares owned of record by these entities are also owned beneficially. |
13
Invesco Small Cap Growth Fund
Report of Independent Registered Public Accounting Firm
To the Board of Trustees of AIM Growth Series (Invesco Growth Series) and Shareholders of Invesco Small Cap Growth Fund
Opinion on the Financial Statements
We have audited the accompanying statement of assets and liabilities, including the schedule of investments, of Invesco Small Cap Growth Fund (one of the funds constituting AIM Growth Series (Invesco Growth Series), referred to hereafter as the "Fund") as of December 31, 2024, the related statement of operations for the year ended December 31, 2024, the statement of changes in net assets for each of the two years in the period ended December 31, 2024, including the related notes, and the financial highlights for each of the five years in the period ended December 31, 2024 (collectively referred to as the "financial statements"). In our opinion, the financial statements present fairly, in all material respects, the financial position of the Fund as of December 31, 2024, the results of its operations for the year then ended, the changes in its net assets for each of the two years in the period ended December 31, 2024 and the financial highlights for each of the five years in the period ended December 31, 2024 in conformity with accounting principles generally accepted in the United States of America.
These financial statements are the responsibility of the Fund’s management. Our responsibility is to express an opinion on the Fund’s financial statements based on our audits. We are a public accounting firm registered with the Public Company Accounting Oversight Board (United States) (PCAOB) and are required to be independent with respect to the Fund in accordance with the U.S. federal securities laws and the applicable rules and regulations of the Securities and Exchange Commission and the PCAOB.
We conducted our audits of these financial statements in accordance with the standards of the PCAOB. Those standards require that we plan and perform the audit to obtain reasonable assurance about whether the financial statements are free of material misstatement, whether due to error or fraud.
Our audits included performing procedures to assess the risks of material misstatement of the financial statements, whether due to error or fraud, and performing procedures that respond to those risks. Such procedures included examining, on a test basis, evidence regarding the amounts and disclosures in the financial statements. Our audits also included evaluating the accounting principles used and significant estimates made by management, as well as evaluating the overall presentation of the financial statements. Our procedures included confirmation of securities owned as of December 31, 2024 by correspondence with the custodian, transfer agent and broker. We believe that our audits provide a reasonable basis for our opinion.
/s/PricewaterhouseCoopers LLP
February 20, 2025
We have served as the auditor of one or more of the investment companies in the Invesco group of investment companies since at least 1995. We have not been able to determine the specific year we began serving as auditor.
14
Invesco Small Cap Growth Fund
Tax Information
Form 1099-DIV, Form 1042-S and other year–end tax information provide shareholders with actual calendar year amounts that should be included in their tax returns. Shareholders should consult their tax advisers.
The following distribution information is being provided as required by the Internal Revenue Code or to meet a specific state’s requirement.
The Fund designates the following amounts or, if subsequently determined to be different, the maximum amount allowable for its fiscal year ended December 31, 2024:
Federal and State Income Tax | |
Qualified Dividend Income* | |
Corporate Dividends Received Deduction* | |
U.S. Treasury Obligations* | |
Qualified Business Income* | |
Business Interest Income* | |
*
The above percentages are based on ordinary income dividends paid to shareholders during the Fund’s fiscal year.
15
Invesco Small Cap Growth Fund
Other Information Required in Form N-CSR (Items 8-11)
Changes in and Disagreements with Accountants for Open-End Management Investment Companies
Proxy Disclosures for Open-End Management Investment Companies
Remuneration Paid to Directors, Officers, and Others of Open-End Management Investment Companies
The aggregate remuneration paid to directors, officers and others is disclosed within the financial statements.
Statement Regarding Basis for Approval of Investment Advisory Contracts
16
Invesco Small Cap Growth Fund
SEC file number(s): 811-02699 and 002-57526
Invesco Distributors, Inc.
SCG-NCSR
Item 8. Changes in and Disagreements with Accountants for Open-End Management Investment Companies.
Item 9. Proxy Disclosures for Open-End Management Investment Companies.
Item 10. Remuneration Paid to Directors, Officers, and Others for Open-End Management Investment Companies.
This information is filed under Item 7 of this Form N-CSR.
Item 11. Statement Regarding Basis for Approval of Investment Advisory Contract.
Item 12. Disclosure of Proxy Voting Policies and Procedures for Closed-End Management Investment Companies.
Item 13. Portfolio Managers of Closed-End Management Investment Companies.
Item 14. Purchases of Equity Securities by Closed-End Management Investment Company and Affiliated Purchasers.
Item 15. Submission of Matters to a Vote of Security Holders.
Item 16. Controls and Procedures.
(a) As of a date within 90 days of the filing date of this report, an evaluation was performed under the supervision and with the participation of the officers of the Registrant, including the PEO and PFO, to assess the effectiveness of the Registrant's disclosure controls and procedures, as that term is defined in Rule 30a-3(c) under the Act. Based on that evaluation, the Registrant's officers, including the PEO and PFO, concluded that the Registrant's disclosure controls and procedures were reasonably designed to ensure: (1) that information required to be disclosed by the Registrant on Form N-CSR is recorded, processed, summarized and reported within the time periods specified by the rules and forms of the Securities and Exchange Commission; and (2) that material information relating to the Registrant is made known to the PEO and PFO as appropriate to allow timely decisions regarding required disclosure.
(b) There have been no changes in the Registrant's internal control over financial reporting (as defined in Rule 30a-3(d) under the Act) that occurred during the period covered by this report that have materially affected, or are reasonably likely to materially affect, the Registrant's internal control over financial reporting.
Item 17. Disclosure of Securities Lending Activity for Closed-End Management Investment Companies.
Item 18. Recovery of Erroneously Awarded Compensation.
SIGNATURES
Pursuant to the requirements of the Securities Exchange Act of 1934 and the Investment Company Act of 1940, the Registrant has duly caused this report to be signed on its behalf by the undersigned, thereunto duly authorized.
(Registrant) AIM Growth Series (Invesco Growth Series)
By: /s/ Glenn Brightman .
Name: Glenn Brightman
Title:Principal Executive Officer
Date: February 28, 2025
Pursuant to the requirements of the Securities Exchange Act of 1934 and the Investment Company Act of 1940, this report has been signed below by the following persons on behalf of the Registrant and in the capacities and on the dates indicated.
By: /s/ Glenn Brightman ..
Name:Glenn Brightman
Title:Principal Executive Officer
Date: February 28, 2025
By: /s/ Adrien Deberghes ____
Name:Adrien Deberghes
Title:Principal Financial Officer
Date:February 28, 2025