UNITED STATES
SECURITIES AND EXCHANGE COMMISSION
WASHINGTON, D. C. 20549
FORM N-CSR
Investment Company Act file number: 811-02671
Deutsche DWS Municipal Trust
(Exact Name of Registrant as Specified in Charter)
875 Third Avenue
New York, NY 10022-6225
(Address of Principal Executive Offices) (Zip Code)
Registrant’s Telephone Number, including Area Code: (212) 454-4500
Diane Kenneally
100 Summer Street
Boston, MA 02110
(Name and Address of Agent for Service)
| Date of fiscal year end: | 5/31 |
| | |
| Date of reporting period: | 5/31/2023 |
| ITEM 1. | REPORT TO STOCKHOLDERS |
| | |
| | (a) |
May 31, 2023
Annual Report
to Shareholders
DWS Strategic High Yield Tax-Free Fund
This report must be preceded or accompanied by a prospectus. To obtain a summary prospectus, if available, or prospectus for any of our funds, refer to the Account Management Resources information provided in the back of this booklet. We advise you to consider the Fund’s objectives, risks, charges and expenses carefully before investing. The summary prospectus and prospectus contain this and other important information about the Fund. Please read the prospectus carefully before you invest.
The brand DWS represents DWS Group GmbH & Co. KGaA and any of its subsidiaries such as DWS Distributors, Inc. which offers investment products or DWS Investment Management Americas, Inc. and RREEF America L.L.C. which offer advisory services.
NOT FDIC/NCUA INSURED NO BANK GUARANTEE MAY LOSE VALUE
NOT A DEPOSIT NOT INSURED BY ANY FEDERAL GOVERNMENT AGENCY
| | DWS Strategic High Yield Tax-Free Fund |
Bond investments are subject to interest-rate, credit, liquidity and market risks to varying degrees. When interest rates rise, bond prices generally fall. Credit risk refers to the ability of an issuer to make timely payments of principal and interest. Investments in lower-quality (“junk bonds” ) and non-rated securities present greater risk of loss than investments in higher-quality securities. Municipal securities are subject to the risk that litigation, legislation or other political events, local business or economic conditions or the bankruptcy of the issuer could have a significant effect on an issuer’s ability to make payments of principal and/or interest. The market for municipal bonds may be less liquid than for taxable bonds and there may be less information available on the financial condition of issuers of municipal securities than for public corporations. The Fund invests in inverse floaters, which are derivatives that involve leverage and could magnify the Fund’s gains or losses. Although the Fund seeks income that is exempt from federal income taxes, a portion of the Fund’s distributions may be subject to federal, state and local taxes, including the alternative minimum tax. Please read the prospectus for details.
War, terrorism, sanctions, economic uncertainty, trade disputes, public health crises, natural disasters, climate change and related geopolitical events have led and, in the future, may lead to significant disruptions in U.S. and world economies and markets, which may lead to increased market volatility and may have significant adverse effects on the Fund and its investments.
DWS Strategic High Yield Tax-Free Fund | | |
Letter to Shareholders
Dear Shareholder:
This past year can be described as one where there were major structural disruptions and challenges impacting financial markets: record high inflation; end of ultra-loose monetary policy; impact of slower growth in China; ongoing political attacks on global trade; demographic change profoundly affecting more and more countries; and finally, the Ukraine conflict, the future course of which continues to be highly unpredictable.
It is therefore apparent that there will be no lack of challenges for investors in 2023. With looming recession concerns in the U.S. and Europe, we believe the prospects for equity returns will be challenging in 2023. Further, aggressive tightening by the Federal Reserve and international monetary authorities has increased pressure on banks and their ability to lend, and also negatively impacted the performance of fixed income securities. Inflation continues to remain above monetary authority targets, however there is early evidence that rate hikes by the Federal Reserve are beginning to take effect and cool the pace of rising prices.
Consequently, we believe that it is important for investors to diversify their investments given the level of volatility in markets. Balanced portfolios can help mitigate the negative impact of unexpected economic, geopolitical, and market events. While investment objectives are unique to each investor, we do believe there may be benefits to owning corporate and government bonds given their potential for yield as well as holding equities for their ability to counter the negative effects of persistent inflation.
In our view, these factors of market volatility, unpredictable economic events, and complex geo-political forces strongly underscore the value add of active portfolio management. The partnership between our portfolio managers and our CIO Office — which synthesizes the views of more than 900 DWS economists, analysts and investment professionals around the world — makes an important difference in making strategic and tactical decisions for the DWS Funds. Thank you for your trust. For ongoing updates to our market and economic outlook, please visit the “Insights” section of dws.com.
Best regards,
Hepsen Uzcan
President, DWS Funds
Assumptions, estimates and opinions contained in this document constitute our judgment as of the date of the document and are subject to change without notice. Any projections are based on a number of assumptions as to market conditions and there can be no guarantee that any projected results will be achieved. Past performance is not a guarantee of future results.
| | DWS Strategic High Yield Tax-Free Fund |
Portfolio Management Review(Unaudited)
Market Overview and Fund Performance
All performance information below is historical and does not guarantee future results. Returns shown are for Class A shares, unadjusted for sales charges. Investment return and principal fluctuate, so your shares may be worth more or less when redeemed. Current performance may differ from performance data shown. Please visit dws.com for the most recent month-end performance of all share classes. Fund performance includes reinvestment of all distributions. Unadjusted returns do not reflect sales charges and would have been lower if they had. Please refer to pages 10 through 12 for more complete performance information.
DWS Strategic High Yield Tax-Free Fund posted a return of –3.27% for the 12-month period ended May 31, 2023. The overall investment grade municipal bond market, as measured by the unmanaged Bloomberg Municipal Bond Index, delivered a total return of 0.49% for the same period. The average fund in the Morningstar High Yield Muni category returned –2.96% for the 12 months.
Along with the broader fixed-income market, municipal bonds experienced significant volatility for much of the 12 months ended May 31, 2023.
Entering the period, the U.S. Federal Reserve (Fed) had already begun to tighten monetary policy in the face of persistently high inflation by raising its benchmark overnight lending rate and ending its program of bond purchases aimed at keeping longer-term borrowing costs low. The Fed would implement a series of sharp rate hikes that brought the fed funds
Investment Process
The Fund can buy many types of municipal securities of all maturities. These may include revenue bonds (which are backed by revenues from a particular source) and general obligation bonds (which are typically backed by the issuer’s ability to levy taxes).
The Fund’s management team seeks to hold municipal bonds that appear to offer the best opportunity to meet the Fund’s objective of providing a high level of income exempt from regular federal income tax. In selecting securities, the managers typically weigh a number of factors against each other, from economic outlooks and possible interest rate movements to changes in supply and demand within the municipal bond market. Although portfolio management may adjust the Fund’s duration (a measure of sensitivity to interest rates) over a wider range, they generally intend to keep it similar to that of the Bloomberg Municipal Bond Index, generally between five and nine years.
DWS Strategic High Yield Tax-Free Fund | | |
target to a range of 4.25% to 4.50% by the end of 2022, its highest level since the fall of 2007. U.S. consumer price inflation peaked at 9.1% in June of 2022 before receding slightly over the remainder of the year.
Entering 2023, as inflation showed signs of moderating markets became increasingly optimistic that the Fed and other leading central banks were poised to stop raising interest rates. January saw Treasury yields ease off their recent highs on the outlook for easier monetary policy. On February 1, the Fed raised rates by a comparatively moderate 25 points, to a target range of 4.50% to 4.75%.
March saw the failure of a handful of U.S. banks and the collapse of European giant Credit Suisse raise the prospect of a financial crisis. Municipal yields plummeted along with Treasury yields as the market factored in increased recession risks and anticipated an end to the Fed’s rate hiking cycle. At its March 2023 meeting the Fed raised the fed funds target by a quarter-point to a range of 4.75%–5.0%. The rate hike was well-received by financial markets as a signal that the central bank believed the financial system remained on generally sound footing.
“Along with the broader fixed-income market, municipal bonds experienced significant volatility for much of the 12 months ended May 31, 2023.”
While new issue supply was significantly lower relative to the prior 12 months, municipal market prices were generally pressured by outflows from tax-free mutual funds and ETFs. Demand from separately managed accounts continued to support high quality issues with maturities below 10 years. For the 12 months, higher quality issues in the AAA and AA ratings categories led municipal market performance as recession fears weighed on credit sentiment broadly.
For the 12 months ended May 31, 2023, the two-year municipal bond yield went from 1.83% to 3.08%, the 10-year from 2.47% to 2.65%, and the 30-year from 2.81% to 3.55% (source: Thomson Reuters).
| | DWS Strategic High Yield Tax-Free Fund |
AAA Municipal Bond Yield Curve (as of 5/31/23 and 5/31/22)
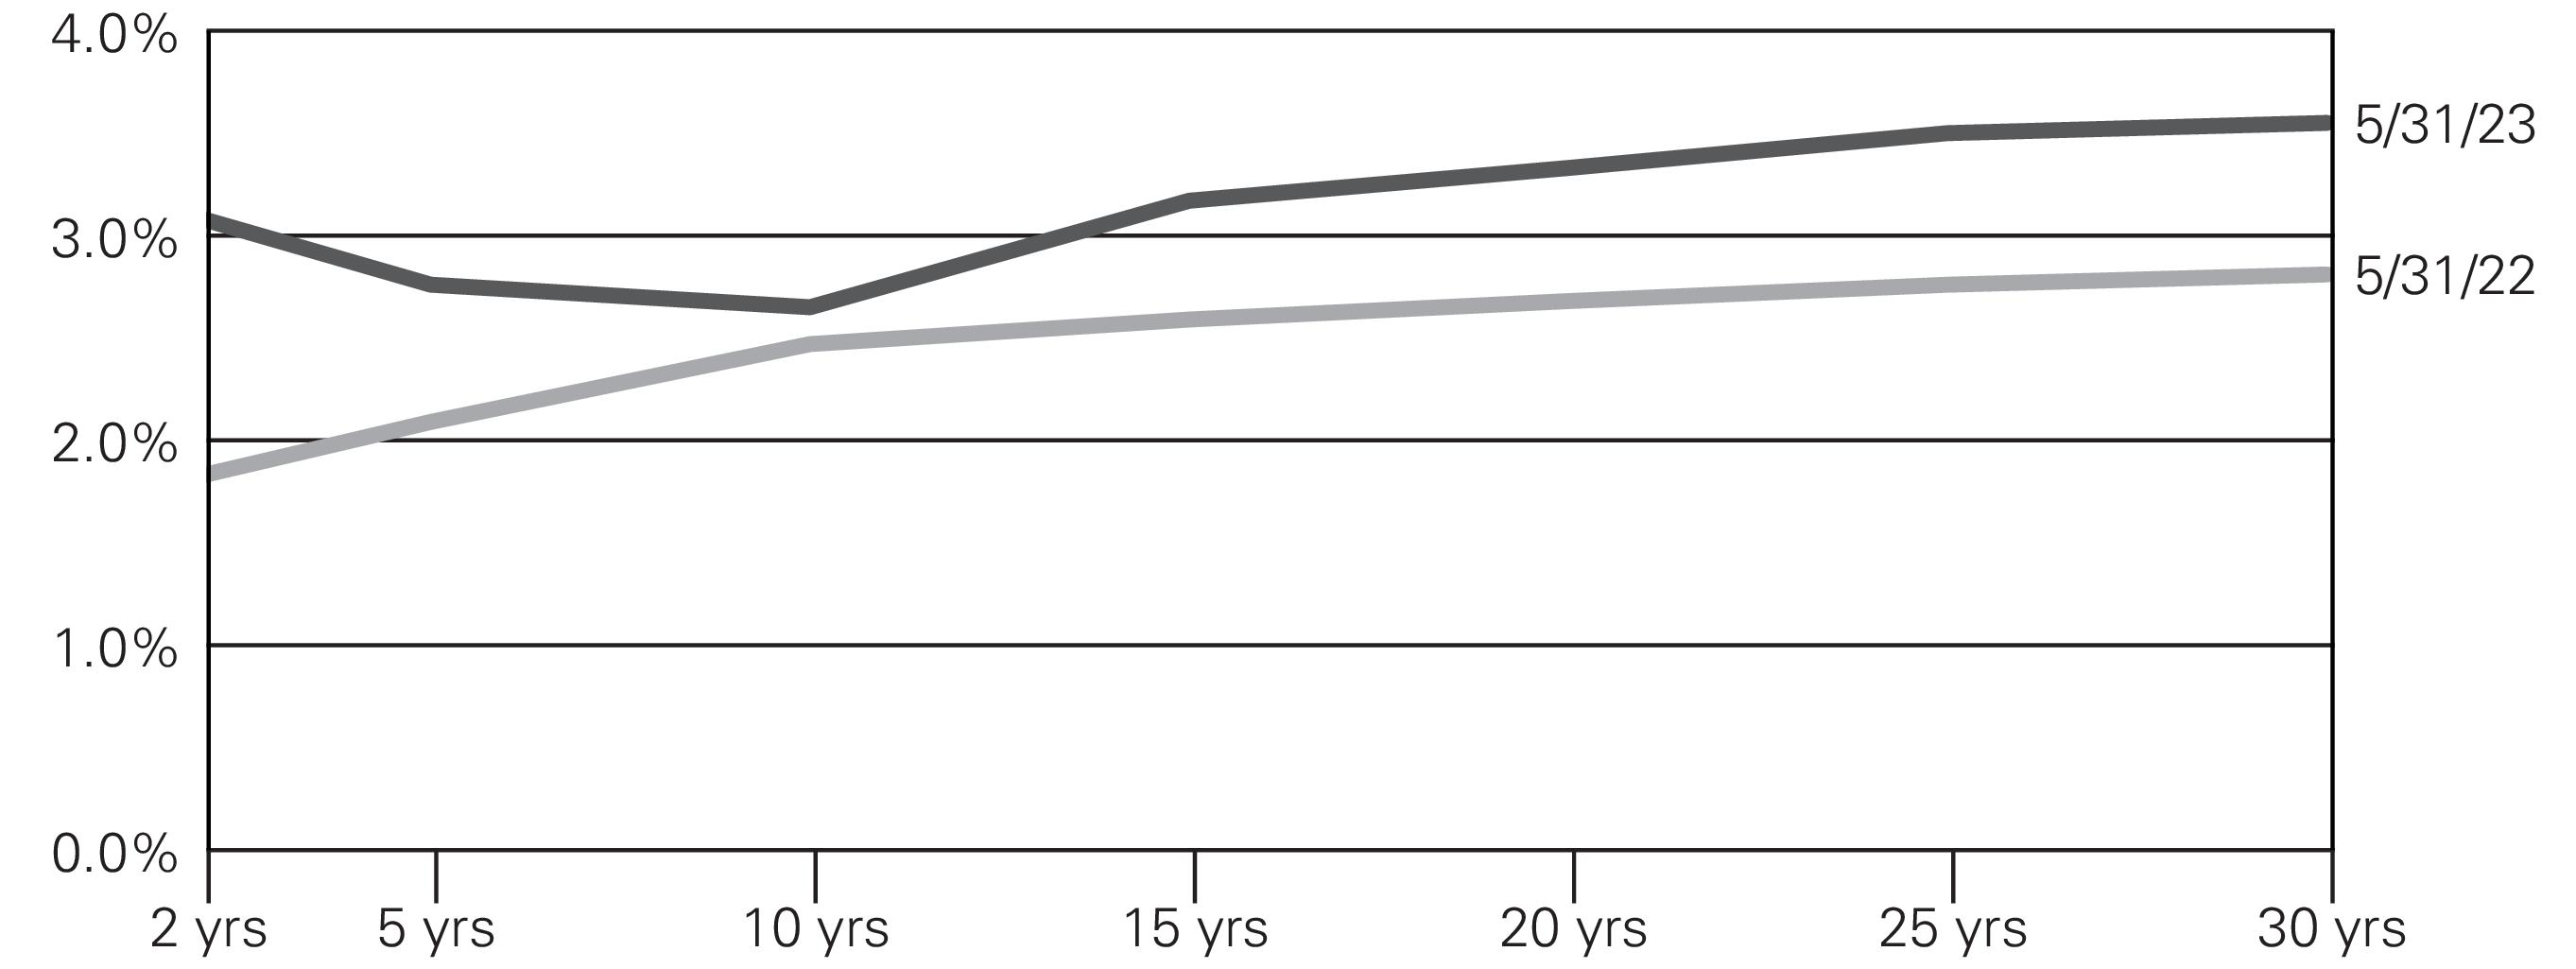
Source: Refinitiv TM3 as of 5/31/23.
Chart is for illustrative purposes only and does not represent any DWS product.
Positive and Negative Contributors to Fund Performance
The Fund’s stance with respect to credit quality detracted from performance vs. the benchmark. During the period we were overweight issues rated BBB, the lowest investment grade category, and had out-of-benchmark exposure to below-investment grade issues. This positioning weighed on performance as higher quality bonds outperformed within the municipal market.
In sector terms, overweight exposures to senior living, housing, corporate industrial development, and healthcare issues detracted from performance. Positive contributors included exposure to Illinois general obligation bonds and a short U.S. Treasury futures position to manage portfolio duration.
The Fund’s positioning with respect to duration and corresponding interest rate sensitivity detracted from performance relative to the benchmark.
Specifically, the Fund held an above-benchmark duration stance in order to align with its peer group, which weighed on performance as interest rates rose over the period.
Outlook and Positioning
As of May 31, 2023, in our view longer maturity municipal yields offer the best value versus U.S. Treasuries of all the places on the curve, with the 30-year municipal yield at 92% of Treasuries. With the 10-year municipal yield only 73% of the comparable Treasury yield, due partly to strong retail interest in shorter maturities, we believe a focus on longer maturity
DWS Strategic High Yield Tax-Free Fund | | |
municipal issues is warranted. Credit spreads for lower investment grade bonds look compelling in certain sectors when considering that credit fundamentals generally remain sound in our view.
The Fund has been selling longer bonds that are priced closer to par, while investing in the 15- to 20-year part of the curve with a premium coupon structure. The Fund is focusing purchases mainly on new issues which are coming to market at wider spreads. We continue to be active in tax loss swapping and improving the book yield of the portfolio.
Portfolio Management Team
Matthew J. Caggiano, CFA, Head of Investment Strategy Fixed Income
Portfolio Manager of the Fund. Began managing the Fund in 2021.
—Joined DWS in 1989.
—Co-Head of Municipal Bond Department.
—BS, Pennsylvania State University; MS, Boston College.
Chad H. Farrington, CFA, Head of Investment Strategy Fixed Income
Portfolio Manager of the Fund. Began managing the Fund in 2018.
—Joined DWS in 2018 with 20 years of industry experience; previously, worked as Portfolio Manager, Head of Municipal Research, and Senior Credit Analyst at Columbia Threadneedle.
—Co-Head of Municipal Bond Department.
—BS, Montana State University.
Michael J. Generazo, Senior Portfolio Manager Fixed Income
Portfolio Manager of the Fund. Began managing the Fund 2018.
—Joined DWS in 1999.
—BS, Bryant College; MBA, Suffolk University.
The views expressed reflect those of the portfolio management team only through the end of the period of the report as stated on the cover. The management team’s views are subject to change at any time based on market and other conditions and should not be construed as a recommendation. Past performance is no guarantee of future results. Current and future portfolio holdings are subject to risk.
Terms to Know
The Bloomberg Municipal Bond Index covers the USD-denominated long- term tax exempt bond market. The index has four main sectors: state and local general obligation bonds, revenue bonds, insured bonds, and pre-refunded bonds.
Index returns do not reflect fees or expenses and it is not possible to invest directly into an index.
The Morningstar High Yield Muni category consists of funds that invest at least 50% of their assets in high-income municipal securities that are not rated or that are rated at a level of BBB and below.
| | DWS Strategic High Yield Tax-Free Fund |
The yield curve is a graphic representation of how yields on bonds of different maturities compare. Normally, yield curves slant upward, as bonds with longer maturities typically offer higher yields than short-term bonds.
Duration, which is expressed in years, measures the sensitivity of the price of a bond or bond fund to a change in interest rates.
Contribution and detraction incorporate both an investment’s total return and its weighting in the Fund.
Overweight means that a fund holds a higher weighting in a given sector or security than its benchmark index. Underweight means that a fund holds a lower weighting.
Credit quality is the ability of an issuer of fixed-income securities to repay interest and principal in a timely manner. Credit quality is measured using credit ratings, i.e., assessments of the creditworthiness of a borrower such as a corporation, a municipality or a sovereign country by a credit ratings agency. Letter grades of “BBB” and above indicate that the rated borrower is considered “investment grade” by a particular ratings agency.
Credit spread refers to the excess yield offered by a lower quality bond relative to a higher quality bond of comparable maturity. When spreads widen, yield differences are increasing between the bonds being compared. When spreads narrow, the opposite is true.
DWS Strategic High Yield Tax-Free Fund | | |
Performance SummaryMay 31, 2023 (Unaudited)
| | | |
Average Annual Total Returns as of 5/31/23 |
Unadjusted for Sales Charge | | | |
Adjusted for the Maximum Sales Charge
(max 2.75% load) | | | |
Bloomberg Municipal Bond Index† | | | |
| | | |
Average Annual Total Returns as of 5/31/23 |
Unadjusted for Sales Charge | | | |
Adjusted for the Maximum Sales Charge
(max 1.00% CDSC) | | | |
Bloomberg Municipal Bond Index† | | | |
| | | |
Average Annual Total Returns as of 5/31/23 |
| | | |
Bloomberg Municipal Bond Index† | | | |
| | | |
Average Annual Total Returns as of 5/31/23 |
| | | |
Bloomberg Municipal Bond Index† | | | |
Performance in the Average Annual Total Returns table above and the Growth of an Assumed $10,000 Investment line graph that follows is historical and does not guarantee future results. Investment return and principal fluctuate, so your shares may be worth more or less when redeemed. Current performance may differ from performance data shown. Please visit dws.com for the Fund’s most recent month-end performance. Fund performance includes reinvestment of all distributions. Unadjusted returns do not reflect sales charges and would have been lower if they had.
The gross expense ratios of the Fund, as stated in the fee table of the prospectus dated October 1, 2022 are 0.90%, 1.66%, 0.74% and 0.68% for Class A, Class C, Class S and Institutional Class shares, respectively, and may differ from the expense ratios disclosed in the Financial Highlights tables in this report.
Index returns do not reflect any fees or expenses and it is not possible to invest directly into an index.
Performance figures do not reflect the deduction of taxes that a shareholder would pay on fund distributions or the redemption of fund shares.
| | DWS Strategic High Yield Tax-Free Fund |
A portion of the Fund’s distributions may be subject to federal, state and local taxes and the alternative minimum tax.
Generally accepted accounting principles require adjustments to be made to the net assets of the Fund at period end for financial reporting purposes only, and as such, the total return based on the unadjusted net asset value per share may differ from the total return reported in the financial highlights.
Growth of an Assumed $10,000 Investment
(Adjusted for Maximum Sales Charge)
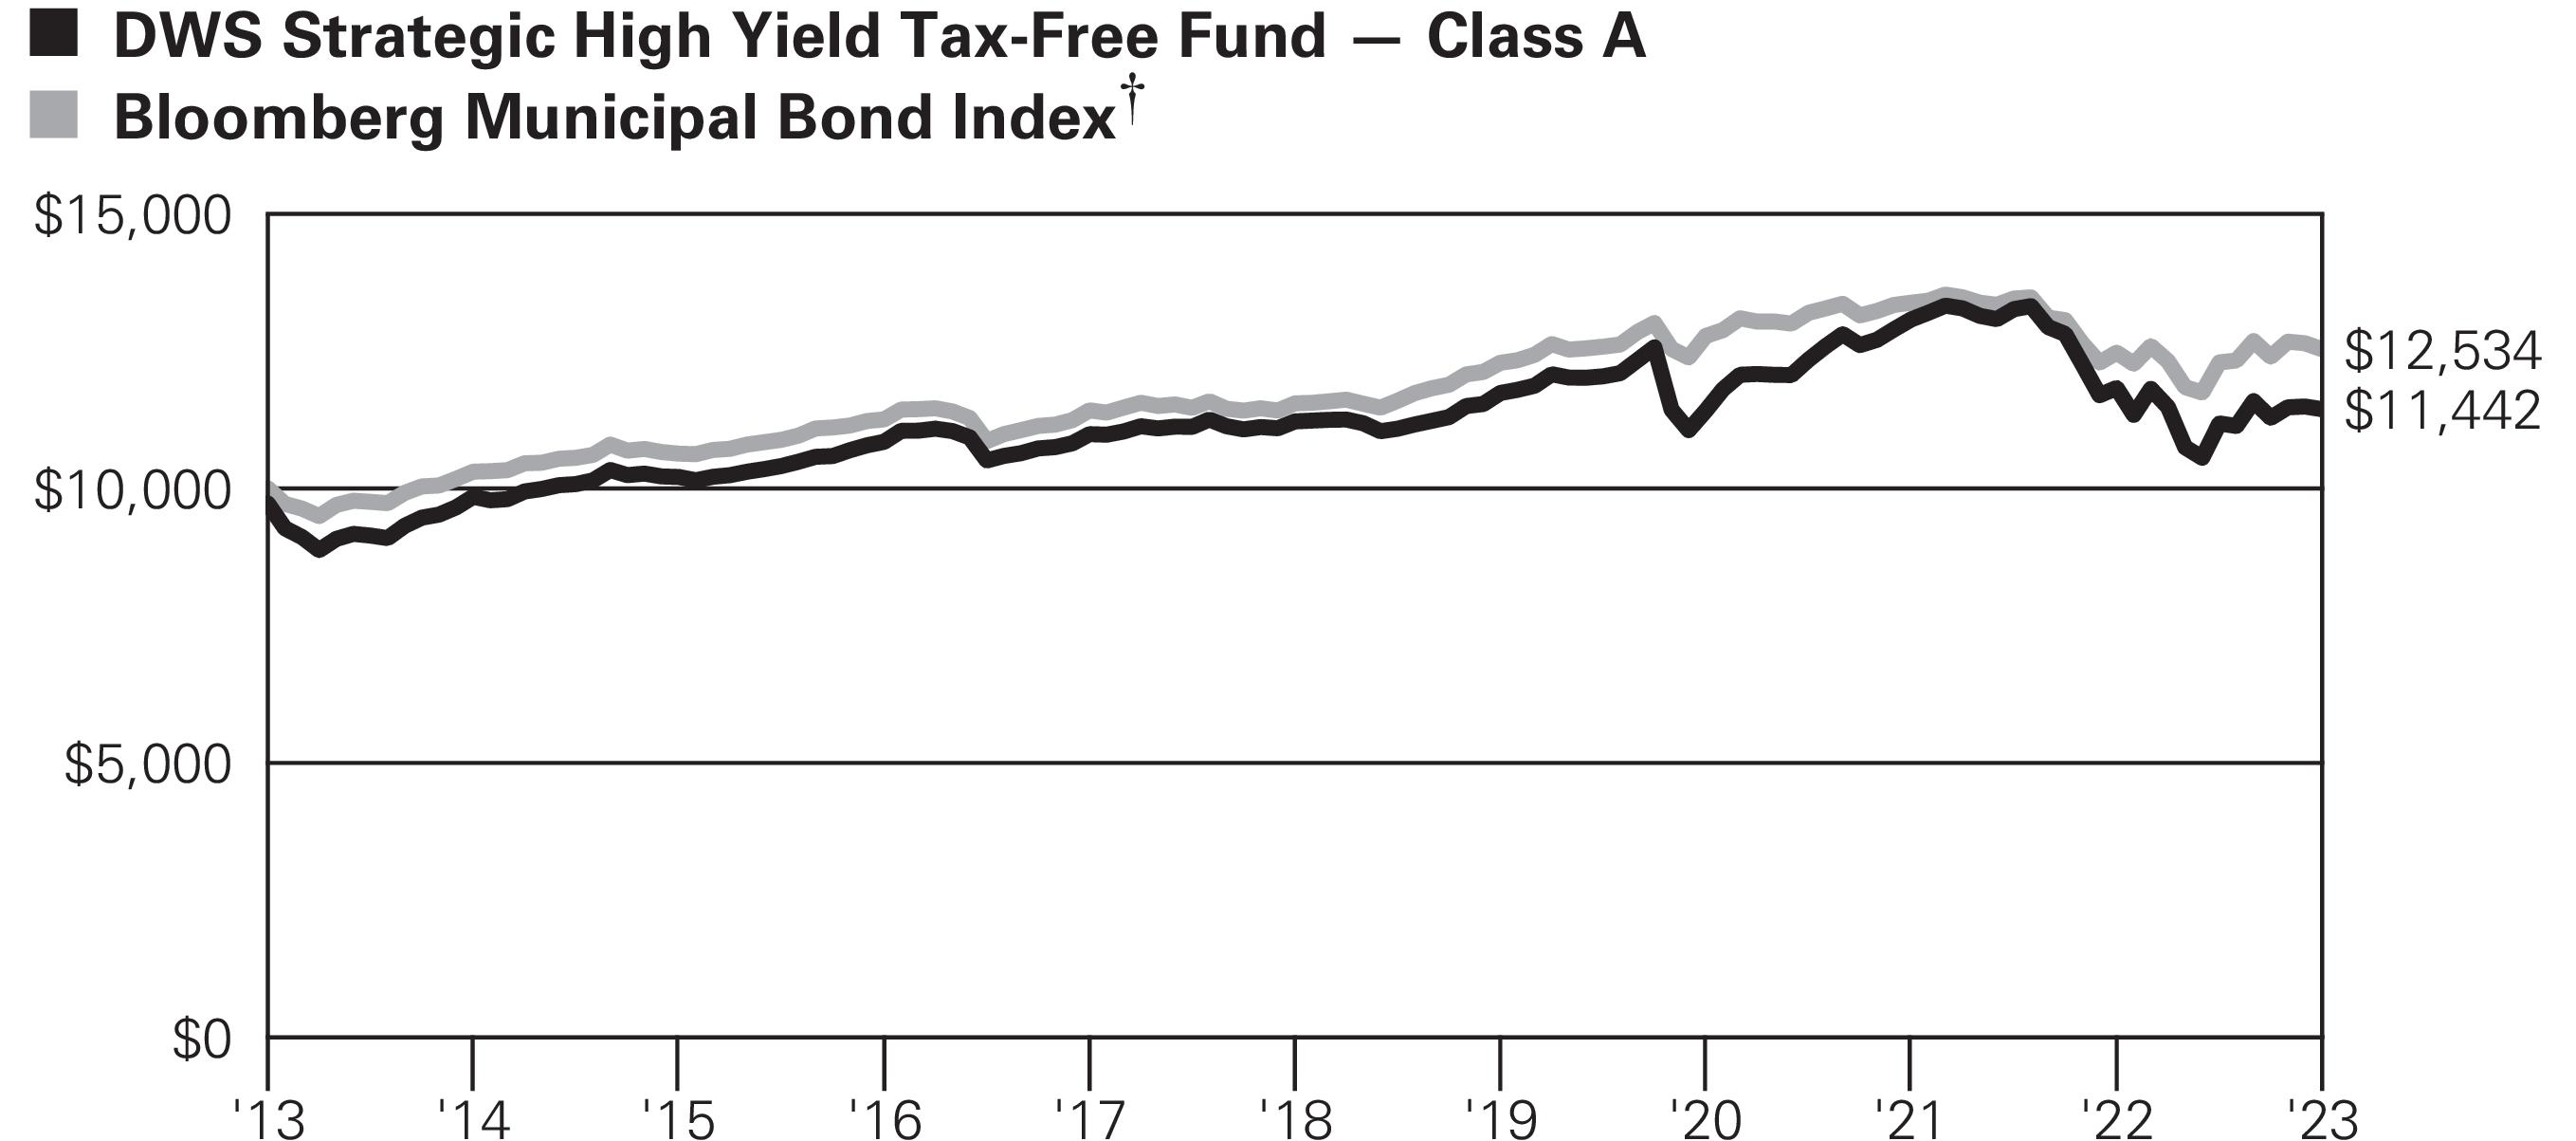 Yearly periods ended May 31
The Fund’s growth of an assumed $10,000 investment is adjusted for the maximum sales charge of 2.75%. This results in a net initial investment of $9,725.
The growth of $10,000 is cumulative.
Performance of other share classes will vary based on the sales charges and the fee structure of those classes.
| Bloomberg Municipal Bond Index covers the USD-denominated long-term tax exempt bond market. The index has four main sectors: state and local general obligation bonds, revenue bonds, insured bonds, and pre-refunded bonds. |
DWS Strategic High Yield Tax-Free Fund | | |
| | | | |
|
| | | | |
| | | | |
Distribution Information as of 5/31/23 |
Income Dividends, Twelve Months | | | | |
Capital Gain Distributions | | | | |
| | | | |
| | | | |
| | | | |
Current Annualized Distribution Rate‡‡ | | | | |
| The SEC yield is net investment income per share earned over the month ended May 31, 2023, shown as an annualized percentage of the maximum offering price per share on the last day of the period. The SEC yield is computed in accordance with a standardized method prescribed by the Securities and Exchange Commission. The SEC yields would have been 3.80% and 3.17% for Class A and Class C shares, respectively, had certain expenses not been reduced. Tax equivalent yield is based on the Fund’s yield and a marginal income tax rate of 40.8%. Current annualized distribution rate is the latest monthly dividend shown as an annualized percentage of net asset value on May 31, 2023. Distribution rate simply measures the level of dividends and is not a complete measure of performance. The current annualized distribution rates would have been 4.08% and 3.28% for Class A and Class C shares, respectively, had certain expenses not been reduced. Yields and distribution rates are historical, not guaranteed and will fluctuate. |
| | DWS Strategic High Yield Tax-Free Fund |
Portfolio Summary(Unaudited)
Asset Allocation (As a % of Investment Portfolio excluding Open-End Investment Companies) | | |
| | |
| | |
Variable Rate Demand Notes | | |
| | |
Escrow to Maturity/Prerefunded Bonds | | |
| | |
Variable Rate Demand Preferred Shares | | |
| | |
Interest Rate Sensitivity | | |
| | |
| | |
Effective maturity is the weighted average of the maturity date of bonds held by the Fund taking into consideration any available maturity shortening features.
Modified duration is an approximate measure of a fund’s sensitivity to movements in interest rates based on the current interest rate environment.
Quality (As a % of Investment Portfolio excluding Open-End Investment Companies) | | |
| | |
| | |
| | |
| | |
| | |
| | |
| | |
| | |
| | |
The quality ratings represent the higher of Moody’s Investors Service, Inc. (“Moody’s” ), Fitch Ratings, Inc. (“Fitch” ) or S&P Global Ratings (“S&P” ) credit ratings. The ratings of Moody’s, Fitch and S&P represent their opinions as to the quality of the securities they rate. Credit quality measures a bond issuer’s ability to repay interest and principal in a timely manner. Ratings are relative and subjective and are not absolute standards of quality. Credit quality does not remove market risk and is subject to change.
Top Five State Allocations (As a % of Investment Portfolio excluding Open-End Investment Companies) | | |
| | |
| | |
| | |
| | |
| | |
DWS Strategic High Yield Tax-Free Fund | | |
Portfolio holdings and characteristics are subject to change.
For more complete details about the Fund’s investment portfolio, see page 15. A quarterly Fact Sheet is available on dws.com or upon request. Please see the Account Management Resources section on page 72 for contact information.
| | DWS Strategic High Yield Tax-Free Fund |
Investment Portfolioas of May 31, 2023
| | |
Municipal Investments 97.1% | |
| |
Alabama, Black Belt Energy Gas District Gas Project Revenue, Series B, 5.25% (a), 12/1/2053, GTY: Royal Bank of Canada, LIQ: Royal Bank of Canada | | | |
Alabama, Black Belt Energy Gas District Prepay Revenue, Series A, 5.25% (a), 1/1/2054, GTY: Goldman Sachs Group, INC. | | | |
Jefferson County, AL, Sewer Revenue, Series C, 0%–6.9%, 10/1/2050 (b), INS: AGMC | | | |
| | | |
| |
Arizona, State Health Facilities Authority Revenue, Banner Health, Series B, MUNIPSA + 0.25%, 3.66% (a), 1/1/2046 | | | |
Arizona, State Industrial Development Authority, Education Facility Revenue, Odyssey Preparatory Academy Project, 144A, 5.0%, 7/1/2049 | | | |
Arizona, State Industrial Development Authority, Education Revenue, BASIS School Projects: | | | |
Series G, 144A, 5.0%, 7/1/2047 | | | |
Series D, 144A, 5.0%, 7/1/2051 | | | |
Series G, 144A, 5.0%, 7/1/2051 | | | |
Series A, 144A, 5.25%, 7/1/2047 | | | |
Maricopa County, AZ, Industrial Development Authority, Education Revenue, Benjamin Franklin Charter School Project, Series A, 144A, 6.0%, 7/1/2052 | | | |
Phoenix, AZ, Civic Improvement Corp., Rental Car Facility Revenue, Series A, 4.0%, 7/1/2045 | | | |
Phoenix, AZ, Industrial Development Authority, Student Housing Revenue, Downtown Phoenix Student Housing LLC, Series A, 5.0%, 7/1/2037 | | | |
Pima County, AZ, Industrial Development Authority, Education Revenue, American Leadership Academy Project: | | | |
Series 2022, 144A, 4.0%, 6/15/2057 | | | |
| | | |
| | | |
| | | |
The accompanying notes are an integral part of the financial statements.
DWS Strategic High Yield Tax-Free Fund | | |
| | |
| |
California, CSCDA Community Improvement Authority, Essential Housing Revenue, Series A, 144A, 5.0%, 7/1/2051 | | | |
California, Golden State Tobacco Securitization Corp., Tobacco Settlement Revenue, Series B-1, 3.85%, 6/1/2050 | | | |
California, Morongo Band of Mission Indians Revenue, Series B, 144A, 5.0%, 10/1/2042 | | | |
California, M-S-R Energy Authority, Series B, 7.0%, 11/1/2034, GTY: Citigroup Global Markets | | | |
California, Municipal Finance Authority, Barlow Respiratory hospital obligated Group, Series A, 4.0%, 9/1/2040 | | | |
California, River Islands Public Financing Authority, Special Tax, Community Facilities District No. 2019-1, Phase 2 Public Improvements: | | | |
| | | |
| | | |
California, State General Obligation, Various Purposes, Series C-3, 2.45% (c), 6/7/2023, LOC: U.S. Bank NA | | | |
California, State Public Finance Authority Revenue, ENSO Village Project: | | | |
Series A, 144A, 5.0%, 11/15/2046 | | | |
Series A, 144A, 5.0%, 11/15/2051 | | | |
Long Beach, CA, Bond Finance Authority, Natural Gas Purchase Revenue, Series A, 5.25%, 11/15/2023, GTY: Merrill Lynch & Co. | | | |
Long Beach, CA, Carnival Cruise Terminal Financing, 144A, 7.282%, 11/1/2030, GTY: Carnival Corp. | | | |
Los Angeles, CA, Department of Airports Revenue, Series A, AMT, 5.0%, 5/15/2037 | | | |
Nuveen California Quality Municipal Income Fund: | | | |
Series 7, 144A, 3.48% (c), 6/7/2023 | | | |
Series 1-1362, 144A, 3.5% (c), 6/7/2023 | | | |
Riverside County, CA, General Obligation, Series 2021 B-2, 3.0%, 6/1/2048 | | | |
San Bernardino County, CA, Flood Control District, 2.7% (c), 6/7/2023, LOC: Bank of America NA | | | |
| | | |
| |
Colorado, Aurora Highlands Community Authority Board, Special Tax Revenue, Series A, 5.75%, 12/1/2051 | | | |
Colorado, Brighton Crossing Metropolitan District No. 6 Ltd., Series A, 5.0%, 12/1/2050 | | | |
The accompanying notes are an integral part of the financial statements.
| | DWS Strategic High Yield Tax-Free Fund |
| | |
Colorado, Broadway Park North Metropolitan District No. 2: | | | |
| | | |
| | | |
Colorado, Broadway Station Metropolitan District No. 3, Series B, 0%–7.5%, 12/1/2049 (b) | | | |
Colorado, General Obligation, Series A, 144A, 5.0%, 12/1/2051 | | | |
Colorado, North Range Metropolitan District No. 3, Series A, 5.25%, 12/1/2050 | | | |
Colorado, Public Energy Authority, Natural Gas Purchased Revenue, 6.25%, 11/15/2028, GTY: Merrill Lynch & Co. | | | |
Colorado, Trails At Crowfoot Metropolitan District No. 3, Series A, 5.0%, 12/1/2049 | | | |
Denver, CO, Convention Center Hotel Authority Revenue: | | | |
| | | |
| | | |
Denver, CO, Urban Renewal Authority, Tax Increment Revenue, 9th Urban Redevelopment Area, Series A, 144A, 5.25%, 12/1/2039 | | | |
Douglas County, CO, Rampart Range Metropolitan District No. 5: | | | |
| | | |
Series 2021, 4.0%, 12/1/2051 | | | |
| | | |
| |
Connecticut, Steel Point Infrastructure Improvement District Special Obligation Revenue, Steelpointe Harbor Project: | | | |
| | | |
| | | |
| | | |
District of Columbia 0.8% | |
District of Columbia, Latin American Montessori Bilingual Public Charter School, 5.0%, 6/1/2050 | | | |
District of Columbia, Two Rivers Public Charter School, Inc., 5.0%, 6/1/2050 | | | |
| | | |
| |
Charlotte County, FL, Industrial Development Authority, Utility System Revenue, Town & Country Utilities Project, Series A, 144A, AMT, 4.0%, 10/1/2051, GTY: Babcock Ranch IRR LLC | | | |
The accompanying notes are an integral part of the financial statements.
DWS Strategic High Yield Tax-Free Fund | | |
| | |
Collier County, FL, Industrial Development Authority, Continuing Care Community Revenue, Arlington of Naples Project, Series A, 144A, 8.125%, 5/15/2044* (d) | | | |
Collier County,FL, State Educational Facilities Authority Revenue, Ave Maria University Inc., 5.25%, 6/1/2038 | | | |
Florida, Capital Project Finance Authority, Student Housing Revenue, Loan Program: | | | |
Series A-1, 5.0%, 10/1/2032 | | | |
Series A-1, 5.0%, 10/1/2033 | | | |
Series A-1, 5.0%, 10/1/2034 | | | |
Series A-1, 5.0%, 10/1/2035 | | | |
Florida, Capital Projects Finance Authority, Student Housing Revenue, Capital Projects Loan Program, Series A-2, 4.0%, 10/1/2024 | | | |
Florida, Capital Trust Agency, Educational Facilities Authority, Charter Educational Foundation Project, Series A, 144A, 5.375%, 6/15/2048 | | | |
Florida, Capital Trust Agency, Educational Growth Fund LLC, Charter School Portfolio Project, Series A-1, 144A, 5.0%, 7/1/2056 | | | |
Florida, Development Finance Corp., Educational Facilities Revenue, Mater Academy Projects, Series A, 5.0%, 6/15/2050 | | | |
Florida, Development Finance Corp., Brightline Florida Passenger Rail Expansion Project, Series A, 144A, AMT, 7.25% (a), 7/1/2057 | | | |
Florida, Development Finance Corp., Educational Facilities Revenue, River City Science Academy Project: | | | |
Series A-1, 5.0%, 7/1/2042 | | | |
| | | |
Series A-1, 5.0%, 7/1/2051 | | | |
| | | |
Series A-1, 5.0%, 2/1/2057 | | | |
| | | |
Florida, Development Finance Corp., Surface Transportation Facilities Revenue, Brightline Passenger Rail Project, Series B, 144A, AMT, 7.375%, 1/1/2049 | | | |
Florida, Development Finance Corp., Surface Transportation Facilities Revenue, Virgin Trains USA Passenger Rail Project, Series A, 144A, AMT, 6.5% (a), 1/1/2049 | | | |
Florida, State Development Finance Corp., Learning Gate Community School Project: | | | |
Series A, 5.0%, 2/15/2038 | | | |
Series A, 5.0%, 2/15/2048 | | | |
The accompanying notes are an integral part of the financial statements.
| | DWS Strategic High Yield Tax-Free Fund |
| | |
Florida, State Development Finance Corp., Senior Living Revenue, The Cabana at Jensen Dunes Project: | | | |
Series A, 144A, 5.0%, 11/15/2056 | | | |
Series A, 144A, 5.25%, 11/15/2056 | | | |
Florida, State Higher Educational Facilities Financial Authority Revenue, Florida Institute of Technology: | | | |
Series A, 4.0%, 10/1/2044 | | | |
| | | |
Florida, State Higher Educational Facilities Financial Authority Revenue, Jacksonville University Project, Series A-1, 144A, 4.75%, 6/1/2038 | | | |
Florida, State Mid-Bay Bridge Authority, Series A, 5.0%, 10/1/2035 | | | |
Florida, Village Community Development District No. 12, Special Assessment Revenue: | | | |
| | | |
| | | |
Florida, Village Community Development District No. 13, Special Assessment Revenue, Series 2021, 3.25%, 5/1/2052 | | | |
Florida, Village Community Development District No. 14, 5.5%, 5/1/2053 | | | |
Greater Orlando, FL, Aviation Authority Airport Facilities Revenue, Series A, AMT, 4.0%, 10/1/2052 | | | |
Jacksonville, FL, Educational Facilities Revenue, Jacksonville University Project, Series B, 144A, 5.0%, 6/1/2053 | | | |
Lake County, FL, Educational Facilities Revenue, Imagine South Lake Charter School Project: | | | |
Series A, 144A, 5.0%, 1/15/2049 | | | |
Series A, 144A, 5.0%, 1/15/2054 | | | |
Miami-Dade County, FL, Seaport Revenue: | | | |
Series B-1, AMT, 4.0%, 10/1/2046 | | | |
Series A, AMT, 5.0%, 10/1/2040 | | | |
Orange County, FL, Health Facilities Authority, The Nemours Foundation, Series C-2, 3.25% (c), 6/7/2023, LOC: TD Bank NA | | | |
Osceola County, FL, Transportation Revenue: | | | |
Series A-2, Zero Coupon, 10/1/2049 | | | |
Series A-2, Zero Coupon, 10/1/2051 | | | |
Series A-2, Zero Coupon, 10/1/2054 | | | |
The accompanying notes are an integral part of the financial statements.
DWS Strategic High Yield Tax-Free Fund | | |
| | |
Seminole County, FL, Industrial Development Authority, Legacy Pointe At UCF Project: | | | |
Series A, 5.25%, 11/15/2039 | | | |
Series A, 5.5%, 11/15/2049 | | | |
| | | |
| |
George L Smith II, GA, Congress Center Authority, Convention Center Hotel First Tier, Series A, 4.0%, 1/1/2054 | | | |
George L Smith II, GA, Congress Center Authority, Convention Center Hotel Second Tier, Series B, 144A, 5.0%, 1/1/2054 | | | |
Georgia, Main Street Natural Gas, Inc., Gas Supply Revenue, Series B, 5.0% (a), 7/1/2053, GTY: Royal Bank of Canada | | | |
Georgia, Tender Option Bond Trust Receipts, Series 2018-XF0709, 144A, 144A, 1.96% (c), 6/7/2023, LIQ: JPMorgan Chase Bank NA | | | |
| | | |
| |
Chicago, IL, Board of Education: | | | |
Series B, 4.0%, 12/1/2035 | | | |
Series A, 5.0%, 12/1/2033 | | | |
Series H, 5.0%, 12/1/2046 | | | |
Chicago, IL, General Obligation: | | | |
| | | |
| | | |
Chicago, IL, O’Hare International Airport, Special Facility Revenue, AMT, 5.0%, 7/1/2048 | | | |
Chicago, IL, Transit Authority, Sales Tax Receipts Revenue, Second Lien, Series A, 4.0%, 12/1/2050 | | | |
Illinois, Housing Development Authority Revenue: | | | |
| | | |
Series 2022-E, 5.25%, 10/1/2052 | | | |
Illinois, State Finance Authority Revenue, Friendship Village of Schaumburg, 5.125%, 2/15/2045* (d) | | | |
Illinois, State General Obligation: | | | |
| | | |
| | | |
Series A, 5.0%, 12/1/2042 | | | |
Series B, 5.25%, 5/1/2041 | | | |
Series B, 5.25%, 5/1/2042 | | | |
Series B, 5.25%, 5/1/2043 | | | |
The accompanying notes are an integral part of the financial statements.
| | DWS Strategic High Yield Tax-Free Fund |
| | |
| | | |
| | | |
| | | |
| |
Indiana, State Finance Authority Revenue, Educational Facilities, Rock Creek Community Academy Inc., Project: | | | |
Series A, 144A, 5.875%, 7/1/2038 | | | |
Series A, 144A, 6.125%, 7/1/2048 | | | |
Indiana, State Housing & Community Development Authority, Single Family Mortgage Revenue, Series C-1, 5.0%, 7/1/2053 | | | |
| | | |
| |
Iowa, Finance Authority, Educational Facility Revenue, Holy Family Catholic School Project, 3.9% (c), 6/1/2023, LOC: U.S. Bank NA | | | |
Iowa, State Higher Education Loan Authority Revenue, Private College Facility, Des Moines University Project, 4.0%, 10/1/2045 | | | |
Iowa, State Student Loan Liquidity Corp., Senior Revenue, Series B, AMT, 3.0%, 12/1/2039 | | | |
Iowa, Tobacco Settlement Authority Revenue: | | | |
Series B-2, Zero Coupon, 6/1/2065 | | | |
Series B-1, 4.0%, 6/1/2049 | | | |
| | | |
| |
Wyandotte County, KS, Unified Government, Legends Apartments Garage & West Lawn Project, 4.5%, 6/1/2040 | | | |
| |
Kentucky, State Economic Development Finance Authority, Owensboro Health, Inc., Obligated Group, Series A, 5.0%, 6/1/2045 | | | |
| |
Louisiana, Public Facilities Authority Revenue, Ochsner Clinic Foundation Project, Prerefunded, 5.0%, 5/15/2047 | | | |
| |
Maryland, State Health & Higher Educational Facilities Authority Revenue, Greater Baltimore Medical Center, Series A, 3.0%, 7/1/2046 | | | |
The accompanying notes are an integral part of the financial statements.
DWS Strategic High Yield Tax-Free Fund | | |
| | |
| |
Massachusetts, Educational Financing Authority, Issue M, Series B, AMT, 2.0%, 7/1/2037 | | | |
Massachusetts, State Department of Transportation, Metropolitan Highway Systems Revenue, Series A-2, 3.55% (c), 6/7/2023, LOC: TD Bank NA | | | |
Massachusetts, State Development Finance Agency Revenue, Springfield College: | | | |
| | | |
| | | |
Massachusetts, State Development Financing Agency, College of the Holy Cross, Series A, 4.0% (c), 6/1/2023, LOC: Bank of America NA | | | |
Massachusetts, State Educational Financing Authority, Series B, AMT, 3.0%, 7/1/2035 | | | |
Massachusetts, State Health & Educational Facilities Authority Revenue, Series J-2, 3.2% (c), 6/7/2023 | | | |
| | | |
| |
Kentwood, MI, Economic Development Corp., Holland Home Obligated Group, Series 2022, 4.0%, 11/15/2043 | | | |
Michigan, Finance Authority Higher Facilities, Ltd. Obligation Revenue, Kettering University Project: | | | |
| | | |
| | | |
Michigan, State Finance Authority Revenue, Detroit Water & Sewer Department, Series C, 5.0%, 7/1/2035 | | | |
Michigan, State Finance Authority Revenue, Tobacco Settlement Revenue: | | | |
“1", Series A, 4.0%, 6/1/2049 | | | |
Series A-2, 5.0%, 6/1/2040 | | | |
Michigan, State University Revenue, Series 2000-A, 3.95% (c), 6/7/2023, SPA: Northern Trust Company | | | |
| | | |
| |
Duluth, MN, Economic Development Authority, Health Care Facilities Revenue, Essentia Health Obligated Group, Series A, 5.0%, 2/15/2048 | | | |
Minnesota, State Housing Finance Agency, Series I, 5.0%, 7/1/2053 | | | |
The accompanying notes are an integral part of the financial statements.
| | DWS Strategic High Yield Tax-Free Fund |
| | |
Minnesota, State Office of Higher Education Revenue: | | | |
| | | |
| | | |
| | | |
| |
Kansas City, MO, Land Clearance Redevelopment Authority Project Revenue, Convention Center Hotel Project, Series A, 144A, 6.25%, 4/15/2049 | | | |
Missouri, State Health & Educational Facilities Authority Revenue, Medical Research, Lutheran Senior Services: | | | |
| | | |
| | | |
St. Louis, MO, Industrial Development Authority Financing Revenue, Ballpark Village Development Project, Series A, 4.75%, 11/15/2047 | | | |
| | | |
| |
Nevada, Tahoe Douglas Visitors Authority, Stateline Revenue: | | | |
| | | |
| | | |
| | | |
Reno, NV, Sales Tax Revenue, Transportation Rail Access, Series C, 144A, Zero Coupon, 7/1/2058 | | | |
| | | |
| |
New Hampshire, State Health & Educational Facilities Authority Revenue, Hillside Village: | | | |
Series A, 144A, 6.125%, 7/1/2037* (d) | | | |
Series A, 144A, 6.25%, 7/1/2042* (d) | | | |
| | | |
| |
New Jersey, State Covid-19 General Obligation Emergency Bonds, Series A, 4.0%, 6/1/2031 | | | |
New Jersey, State Economic Development Authority Revenue, Series SSS, 5.25%, 6/15/2038 (e) | | | |
New Jersey, State Economic Development Authority Revenue, Black Horse EHT Urban Renewal LLC Project, Series A, 144A, 5.0%, 10/1/2039 | | | |
New Jersey, State Economic Development Authority Revenue, White Horse HMT Urban Renewal LLC Project, 144A, 5.0%, 1/1/2040 | | | |
The accompanying notes are an integral part of the financial statements.
DWS Strategic High Yield Tax-Free Fund | | |
| | |
New Jersey, State Economic Development Authority, Special Facilities Revenue, Continental Airlines, Inc. Project, Series B, AMT, 5.625%, 11/15/2030 | | | |
New Jersey, State Higher Education Assistance Authority, Student Loan Revenue: | | | |
Series B, AMT, 2.5%, 12/1/2040 | | | |
Series B, AMT, 3.25%, 12/1/2039 | | | |
Series B, AMT, 3.5%, 12/1/2039 | | | |
Series C, AMT, 5.0%, 12/1/2053 | | | |
New Jersey, State Housing & Mortgage Finance Agency, Single Family Housing Revenue, Series I, 5.0%, 10/1/2053 | | | |
New Jersey, Transportation Trust Fund Authority, Series BB, 4.0%, 6/15/2040 | | | |
| | | |
| |
New Mexico, State Mortgage Finance Authority, “I” , Series D, 3.25%, 7/1/2044 | | | |
| |
Buffalo & Erie County, NY, Industrial Land Development Corp., D’Youville College Project: | | | |
Series A, 4.0%, 11/1/2040 | | | |
Series A, 4.0%, 11/1/2050 | | | |
Dutchess County, NY, Local Development Corp., Bard College Project, Series A, 144A, 5.0%, 7/1/2051 | | | |
Monroe County, NY, Industrial Development Corp. Revenue, St. Ann’s Community Project, 5.0%, 1/1/2050 | | | |
New York, Brooklyn Arena Local Development Corp., Pilot Revenue, Barclays Center Project, Series A, 4.0%, 7/15/2035, INS: AGMC | | | |
New York, Metropolitan Transportation Authority Revenue: | | | |
Series 2012-G1, 4.0% (c), 6/1/2023, LOC: Barclays Bank PLC | | | |
Series E-1, 4.0% (c), 6/1/2023, LOC: Barclays Bank PLC | | | |
New York, Metropolitan Transportation Authority Revenue, Green Bond, Series D-2, 4.0%, 11/15/2048 | | | |
New York, State Dormitory Authority Revenues, Non-State Supported Debt, The New School: | | | |
| | | |
| | | |
New York, State Transportation Development Corp., Special Facilities Revenue, John F. Kennedy International Airport Project: | | | |
AMT, 3.0%, 8/1/2031, GTY: American Airlines Group, Inc. | | | |
The accompanying notes are an integral part of the financial statements.
| | DWS Strategic High Yield Tax-Free Fund |
| | |
| | | |
| | | |
| | | |
| | | |
| | | |
New York City, NY, General Obligation, Series E-1, 5.0%, 4/1/2041 | | | |
New York City, NY, Housing Development Corp., Multi-Family Housing Revenue: | | | |
Series E-1, 2.8%, 11/1/2034 | | | |
Series E-1, 3.0%, 11/1/2039 | | | |
New York City, NY, Municipal Water Finance Authority, Water & Sewer Systems Revenue, Series EE-2, 3.95% (c), 6/1/2023, LIQ: State Street B&T Co. | | | |
New York Counties, NY, Tobacco Trust IV, Series F, Zero Coupon, 6/1/2060 | | | |
New York, NY, General Obligation, Series L-4, 3.95% (c), 6/1/2023, LOC: U.S. Bank NA | | | |
Orange County, NY, Senior Care Revenue, Industrial Development Agency, The Glen Arden Project, Series A, 5.7%, 1/1/2028* (d) | | | |
| | | |
| |
North Carolina, Charlotte-Mecklenburg Hospital Authority, Atrium Health Obligated Group, Series E, 3.95% (c), 6/1/2023, LOC: Royal Bank of Canada | | | |
North Carolina, State Housing Finance Agency, Series 42, 4.0%, 1/1/2050 | | | |
| | | |
| |
Buckeye, OH, Tobacco Settlement Financing Authority, “2” , Series B-2, 5.0%, 6/1/2055 | | | |
Columbus, OH, Regional Airport Authority, Capital Funding Revenue, Oasbo Expanded Asset, 3.4% (c), 6/7/2023, LOC: U.S. Bank NA | | | |
Hamilton County, OH, Health Care Revenue, Life Enriching Communities Project: | | | |
| | | |
| | | |
Ohio, Akron, Bath & Copley Joint Township Hospital District Revenue, 5.25%, 11/15/2046 | | | |
The accompanying notes are an integral part of the financial statements.
DWS Strategic High Yield Tax-Free Fund | | |
| | |
Ohio, State Air Quality Development Authority, Exempt Facilities Revenue, Pratt Paper LLC Project: | | | |
144A, AMT, 4.25%, 1/15/2038, GTY: Pratt Industries, Inc. | | | |
144A, AMT, 4.5%, 1/15/2048, GTY: Pratt Industries, Inc. | | | |
Ohio, State Hospital Revenue, Aultman Health Foundation, 144A, 5.0%, 12/1/2048 | | | |
| | | |
| |
Oklahoma, State Development Finance Authority, Health System Revenue, OU Medicine Project: | | | |
Series B, 5.25%, 8/15/2048 | | | |
Series A, 5.5%, 8/15/2041 | | | |
Series A, 5.5%, 8/15/2044 | | | |
| | | |
| |
Oregon, State Facilities Authority Revenue, Peacehealth Systems, Series B, 3.9% (c), 6/1/2023, LOC: TD Bank NA | | | |
| |
Chester County, PA, Industrial Development Authority, Special Obligation Revenue, Woodlands at Graystone Neighborhood Improvement Project, 144A, 5.125%, 3/1/2048 | | | |
Lancaster County, PA, Hospital Authority, Brethren Village Project: | | | |
| | | |
| | | |
Pennsylvania, Higher Education Assistance Agency Education Loan Revenue, Series A, AMT, 2.45%, 6/1/2041 | | | |
Pennsylvania, State Economic Development Financing Authority Revenue, UPMC Obligated Group, Series A-2, 4.0%, 5/15/2043 | | | |
Pennsylvania, State Housing Finance Agency, Single Family Mortgage Revenue, Series 132A, 3.5%, 4/1/2051 | | | |
Pennsylvania, State Turnpike Commission Revenue: | | | |
Series A, 4.0%, 12/1/2044 | | | |
Series A, 4.0%, 12/1/2046 | | | |
The accompanying notes are an integral part of the financial statements.
| | DWS Strategic High Yield Tax-Free Fund |
| | |
Series A-1, 5.0%, 12/1/2041 | | | |
Philadelphia, PA, Authority For Industrial Development, Charter School Revenue, Philadelphia Electrical and Technology Charter High School Project, Series A, 4.0%, 6/1/2056 | | | |
| | | |
| |
South Carolina, Public Service Authority Revenue, Series A, 4.0%, 12/1/2055 | | | |
South Carolina, State Public Service Authority Revenue: | | | |
Series B, 4.0%, 12/1/2047 | | | |
Series A, 4.0%, 12/1/2052 | | | |
| | | |
| |
Lincon County, SD, Economic Development Revenue, Augustana College Association Project, Series A, 4.0%, 8/1/2056 | | | |
South Dakota, State Health & Educational Facilities Authority, Sioux Vy Hospital & Health Revenue, Series B, 3.55% (c), 6/7/2023, LOC: U.S. Bank NA | | | |
| | | |
| |
Metropolitan Nashville, TN, Airport Authority Revenue: | | | |
Series B, AMT, 4.0%, 7/1/2049 | | | |
Series B, AMT, 4.0%, 7/1/2054 | | | |
Nashville & Davidson County, TN, Metropolitan Development & Housing Agency, Tax Increment Revenue, Fifth Broadway Development District, 144A, 5.125%, 6/1/2036 | | | |
Nashville & Davidson County, TN, Metropolitan Government Health & Education Facilities Board Revenue, Blakeford At Green Hills Corp., Series A, 4.0%, 11/1/2055 | | | |
Tennessee, New Memphis Arena Public Building Authority, City of Memphis Project, 0%–4.0%, 4/1/2031 (b) | | | |
Tennessee, State Energy Acquisition Corporation Revenue, Series A, 5.0% (a), 5/1/2052, GTY: Goldman Sachs Group, INC. | | | |
| | | |
| |
Central Texas, Regional Mobility Authority Revenue, Capital Appreciation: | | | |
| | | |
The accompanying notes are an integral part of the financial statements.
DWS Strategic High Yield Tax-Free Fund | | |
| | |
| | | |
Clifton, TX, Higher Education Finance Corp., Education Revenue, Series D, 6.125%, 8/15/2048 | | | |
Greater Texas, Cultural Education Facilities Finance Corp. Lease Revenue, Epicenter Multipurpose Facilities Project, Series A, 4.0%, 3/1/2050 | | | |
Matagorda County, TX, Navigation District No. 1, Pollution Control Revenue, AEP Texas Central Co. Project, Series A, 4.4%, 5/1/2030, INS: AMBAC | | | |
Newark, TX, Higher Education Finance Corp., Texas Revenue, Abilene Christian University Project, Series A, 4.0%, 4/1/2057 | | | |
San Antonio, TX, Education Facilities Corp. Higher Education Revenue, Hallmark University Project: | | | |
Series A, 5.0%, 10/1/2041 | | | |
Series A, 5.0%, 10/1/2051 | | | |
Tarrant County, TX, Cultural Education Facilities Finance Corp., Hospital Revenue, Methodist Hospitals of Dallas Project, Series A, 3.9% (c), 6/1/2023, LOC: TD Bank NA | | | |
Temple, TX, Tax Increment, Reinvestment Zone No. 1: | | | |
Series A, 4.0%, 8/1/2039, INS: BAM | | | |
Series A, 4.0%, 8/1/2041, INS: BAM | | | |
| | | |
Texas, Industrial Development Corp. Revenue, Energy Transfer LP, 4.05% (a), 11/1/2050 | | | |
Texas, New Hope Cultural Education Facilities Finance Corp., Educational Revenue, Cumberland Academy Project, Series A, 144A, 5.0%, 8/15/2050 | | | |
Texas, New Hope Cultural Education Facilities Finance Corp., Retirement Facilities Revenue, Westminster Project, 4.0%, 11/1/2049 | | | |
Texas, New Hope Cultural Education Facilities Finance Corp., Senior Living Revenue, Bridgemoor Plano Project, Series A, 7.25%, 12/1/2053* (d) | | | |
Texas, Private Activity Bond, Surface Transportation Corp. Revenue, Senior Lien Revenue, Infrastructure Group LLC, I-635 Managed Lanes Project: | | | |
Series A, 4.0%, 6/30/2038 | | | |
Series A, 4.0%, 12/31/2038 | | | |
Series A, 4.0%, 6/30/2039 | | | |
Series A, 4.0%, 6/30/2040 | | | |
The accompanying notes are an integral part of the financial statements.
| | DWS Strategic High Yield Tax-Free Fund |
| | |
Texas, State Municipal Gas Acquisition & Supply Corp. I, Gas Supply Revenue, Series D, 6.25%, 12/15/2026, GTY: Merrill Lynch & Co. | | | |
Texas, State Private Activity Bond, Surface Transportation Corp. Revenue, Senior Lien, North Tarrant Express Mobility Partners Segments LLC, Series A, AMT, 6.75%, 6/30/2043 | | | |
| | | |
| |
Utah, Infrastructure Agency Telecommunication Revenue: | | | |
Series A, 4.0%, 10/15/2036 | | | |
Series A, 4.0%, 10/15/2041 | | | |
Series 2019, 4.0%, 10/15/2042 | | | |
Utah, State Charter School Finance Authority, St. George Campus Project, Series A, 144A, 5.0%, 6/15/2052 | | | |
Utah, State Charter School Financing Authority Revenue, Freedom Academy Foundation Project, 144A, 5.375%, 6/15/2048 | | | |
| | | |
| |
Vermont, State Educational & Health Buildings Financing Agency Revenue, St Michael’s College Inc., 144A, 5.5%, 10/1/2043 | | | |
| |
Prince William County, VA, Industrial Development Authority, Residential Care Facilities, Westminster at Lake Ridge: | | | |
| | | |
| | | |
Roanoke County, VA, Economic Development Authority, RSDL Care Facilities Revenue, Richfield Living: | | | |
Series 2020, 5.0%, 9/1/2050* (d) | | | |
Series A, 5.375%, 9/1/2054* (d) | | | |
Virginia, Marquis Community Development Authority Revenue: | | | |
| | | |
Series B, 5.625%, 9/1/2041 (d) (f) | | | |
144A, 7.5%, 9/1/2045 (d) (f) | | | |
Virginia, Peninsula Town Center, Community Development Authority Revenue, Special Obligation: | | | |
| | | |
| | | |
Virginia, Small Business Financing Authority Revenue, 95 Express Lanes LLC Project, AMT, 4.0%, 1/1/2048 | | | |
The accompanying notes are an integral part of the financial statements.
DWS Strategic High Yield Tax-Free Fund | | |
| | |
Virginia, Small Business Financing Authority Revenue, Elizabeth River Crossings OpCo LLC, AMT, 4.0%, 1/1/2038 | | | |
Virginia, Small Business Financing Authority, Elizabeth River Crossings OPCO LLC Project, AMT, 4.0%, 1/1/2039 | | | |
Virginia, Small Business Financing Authority, Private Activity Revenue, Transform 66 P3 Project, AMT, 5.0%, 12/31/2049 | | | |
| | | |
| |
Washington, State Convention Center Public Facilities District: | | | |
| | | |
| | | |
| | | |
Washington, State Higher Educational Facilities Authority, Seattle University Project, 4.0%, 5/1/2050 | | | |
Washington, State Housing Finance Commission, Non-Profit Housing Revenue, Rockwood Retirement Communities Project, Series A, 144A, Prerefunded, 7.375%, 1/1/2044 | | | |
Washington, State Housing Finance Commission, The Hearthstone Project: | | | |
Series A, 144A, 5.0%, 7/1/2038 | | | |
Series A, 144A, 5.0%, 7/1/2048 | | | |
Series A, 144A, 5.0%, 7/1/2053 | | | |
| | | |
| |
Wisconsin, Health Educational Facilities Authority, Covenant Communities, Inc. Project: | | | |
Series A-1, 5.0%, 7/1/2043 | | | |
| | | |
| | | |
Wisconsin, Public Finance Authority Educational Facility Revenue, Noorba College of Osteopathic Media Project, Series B, 144A, 6.5%, 6/1/2045 | | | |
Wisconsin, Public Finance Authority, Education Revenue, Mountain Island Charter School Ltd.: | | | |
| | | |
| | | |
Wisconsin, Public Finance Authority, Education Revenue, North Carolina Leadership Academy, Series A, 144A, 5.0%, 6/15/2049 | | | |
The accompanying notes are an integral part of the financial statements.
| | DWS Strategic High Yield Tax-Free Fund |
| | |
Wisconsin, Public Finance Authority, Green Bond, Fargo Moorhead, AMT, 4.0%, 3/31/2056 | | | |
Wisconsin, Public Finance Authority, Hospital Revenue, Carson Valley Medical Center, Series A, 4.0%, 12/1/2051 | | | |
Wisconsin, Public Finance Authority, Pollution Control Revenue, Duke Energy Progress Project, Series A, 3.7% (a), 10/1/2046 | | | |
Wisconsin, Public Finance Authority, Roseman University of Health Sciences Project: | | | |
| | | |
144A, Prerefunded, 4.0%, 4/1/2042 | | | |
| | | |
144A, Prerefunded, 4.0%, 4/1/2052 | | | |
Wisconsin, Public Finance Authority, Senior Living Community First Mortgage Revenue, Cedars Obligated Group: | | | |
| | | |
| | | |
Wisconsin, Public Finance Authority, Wisconsin Hotel Revenue, Senior Lien Grand Hyatt San Antonio Hotel, Series B, 144A, 6.0%, 2/1/2062 | | | |
Wisconsin, State Health & Educational Facilities Authority Revenue, Froedtert Health Inc., Obligated Group, Series A, 4.0%, 4/1/2039 | | | |
Wisconsin, State Health & Educational Facilities Authority Revenue, Marshfield Clinic Health System, Inc., Series A, 4.0% (c), 6/1/2023, LOC: Barclays Bank PLC | | | |
| | | |
| |
Guam, Antonio B. Won Pat International Airport Authority: | | | |
Series C, AMT, 6.25%, 10/1/2034 | | | |
Series C, AMT, Prerefunded, 6.25%, 10/1/2034 | | | |
Guam, Government Waterworks Authority, Water & Wastewater System Revenue, Series A, 5.0%, 1/1/2050 | | | |
Guam, International Airport Authority Revenue: | | | |
Series C, AMT, 6.375%, 10/1/2043 | | | |
Series C, AMT, Prerefunded, 6.375%, 10/1/2043 | | | |
| | | |
| |
Puerto Rico, Commonwealth Aqueduct and Sewer Authority, Series A, 144A, 4.0%, 7/1/2042 | | | |
Puerto Rico, General Obligation: | | | |
Series A, Zero Coupon, 7/1/2024 | | | |
Series A, Zero Coupon, 7/1/2033 | | | |
The accompanying notes are an integral part of the financial statements.
DWS Strategic High Yield Tax-Free Fund | | |
| | |
Series A1, 4.0%, 7/1/2033 | | | |
Series A1, 4.0%, 7/1/2035 | | | |
Series A1, 4.0%, 7/1/2037 | | | |
Series A1, 4.0%, 7/1/2041 | | | |
Series A1, 5.25%, 7/1/2023 | | | |
Series A1, 5.375%, 7/1/2025 | | | |
Series A1, 5.625%, 7/1/2027 | | | |
Series A1, 5.75%, 7/1/2031 | | | |
Puerto Rico, Sales Tax Financing Corp., Sales Tax Revenue: | | | |
Series A-1, 4.75%, 7/1/2053 | | | |
Series A-1, 5.0%, 7/1/2058 | | | |
Puerto Rico, The Childrens Trust Fund, Tobacco Settlement Revenue, Series A, Zero Coupon, 5/15/2057 | | | |
| | | |
| |
Freddie Mac Multi-Family ML Certificates, “A-CA” , Series 2021-ML10, 2.046%, 6/25/2038 | | | |
Total Municipal Investments (Cost $557,024,119) | |
| |
| |
Grand Canyon University, 5.125%, 10/1/2028 (Cost $2,165,000) | | | |
Government & Agency Obligations 0.2% | |
U.S. Treasury Obligations | |
U.S. Treasury Bills, 4.719% (g), 10/5/2023 (h) (Cost $983,483) | | | |
| | |
Closed-End Investment Companies 0.4% | |
Nuveen Quality Municipal Income Fund (Cost $2,515,604) | | | |
Open-End Investment Companies 0.0% | |
BlackRock Liquidity Funds MuniCash Portfolio, Institutional Shares, 3.26% (i) (Cost $147,056) | | | |
The accompanying notes are an integral part of the financial statements.
| | DWS Strategic High Yield Tax-Free Fund |
| | | |
Total Investment Portfolio (Cost $562,835,262) | | |
Other Assets and Liabilities, Net | | |
| | |
| Non-income producing security. |
| Variable or floating rate security. These securities are shown at their current rate as of May 31, 2023. For securities based on a published reference rate and spread, the reference rate and spread are indicated within the description above. Certain variable rate securities are not based on a published reference rate and spread but adjust periodically based on current market conditions, prepayment of underlying positions and/or other variables. Securities with a floor or ceiling feature are disclosed at the inherent rate, where applicable. |
| Security is a “step-up” bond where the coupon increases or steps-up at a predetermined date. The range of rates shown is the current coupon rate through the final coupon rate, date shown is the final maturity date. |
| Variable rate demand notes and variable rate demand preferred shares are securities whose interest rates are reset periodically (usually daily mode or weekly mode) by remarketing agents based on current market levels, and are not directly set as a fixed spread to a reference rate. These securities may be redeemed at par by the holder through a put or tender feature, and are shown at their current rates as of May 31, 2023. Date shown reflects the earlier of demand date or stated maturity date. |
| Defaulted security or security for which income has been deemed uncollectible. |
| When-issued or delayed delivery securities included. |
| Security currently paying partial interest. The rate shown represents 50% of the original coupon rate. |
| Annualized yield at time of purchase; not a coupon rate. |
| At May 31, 2023, this security has been pledged, in whole or in part, to cover initial margin requirements for open futures contracts. |
| Current yield; not a coupon rate. |
144A: Security exempt from registration under Rule 144A of the Securities Act of 1933. These securities may be resold in transactions exempt from registration, normally to qualified institutional buyers. |
AGMC: Assured Guaranty Municipal Corp. |
AMBAC: Ambac Financial Group, Inc. |
AMT: Subject to alternative minimum tax. |
BAM: Build America Mutual |
CBOT: Chicago Board of Trade |
|
|
|
|
MUNIPSA: SIFMA Municipal Swap Index Yield |
Prerefunded: Bonds which are prerefunded are collateralized usually by U.S. Treasury securities which are held in escrow and used to pay principal and interest on tax-exempt issues and to retire the bonds in full at the earliest refunding date. |
The accompanying notes are an integral part of the financial statements.
DWS Strategic High Yield Tax-Free Fund | | |
SIFMA: Securities Industry and Financial Markets Association |
SPA: Standby Bond Purchase Agreement |
At May 31, 2023, open futures contracts sold were as follows:
| | | | | | Unrealized
Depreciation ($) |
| | | | | | |
Currency Abbreviation(s)
For information on the Fund’s policy and additional disclosures regarding futures contracts, please refer to the Derivatives section of Note B in the accompanying Notes to Financial Statements.
Fair Value Measurements
Various inputs are used in determining the value of the Fund’s investments. These inputs are summarized in three broad levels. Level 1 includes quoted prices in active markets for identical securities. Level 2 includes other significant observable inputs (including quoted prices for similar securities, interest rates, prepayment speeds and credit risk). Level 3 includes significant unobservable inputs (including the Fund’s own assumptions in determining the fair value of investments). The level assigned to the securities valuations may not be an indication of the risk or liquidity associated with investing in those securities.
The following is a summary of the inputs used as of May 31, 2023 in valuing the Fund’s investments. For information on the Fund’s policy regarding the valuation of investments, please refer to the Security Valuation section of Note A in the accompanying Notes to Financial Statements.
| | | | |
Municipal Investments (a) | | | | |
| | | | |
Government & Agency Obligations | | | | |
Closed-End Investment Companies | | | | |
Open-End Investment Companies | | | | |
| | | | |
| See Investment Portfolio for additional detailed categorizations. |
| Derivatives include unrealized appreciation (depreciation) on open futures contracts. |
The accompanying notes are an integral part of the financial statements.
| | DWS Strategic High Yield Tax-Free Fund |
Statement of Assets and Liabilities
as of May 31, 2023
| |
Investment in securities, at value (cost $562,835,262) | |
Receivable for investments sold | |
Receivable for Fund shares sold | |
| |
| |
| |
| |
| |
Payable for investments purchased | |
Payable for investments purchased — when-issued/delayed delivery securities | |
Payable for Fund shares redeemed | |
Payable for variation margin on futures contracts | |
| |
| |
| |
Other accrued expenses and payables | |
| |
| |
| |
Distributable earnings (loss) | |
| |
| |
The accompanying notes are an integral part of the financial statements.
DWS Strategic High Yield Tax-Free Fund | | |
Statement of Assets and Liabilities as of May 31, 2023 (continued)
| |
| |
Net Asset Value and redemption price per share
($136,671,231 ÷ 13,350,189 outstanding shares of beneficial interest,
$.01 par value, unlimited shares authorized) | |
Maximum offering price per share (100 ÷ 97.25 of $10.24) | |
| |
Net Asset Value, offering and redemption price
(subject to contingent deferred sales charge) per share
($6,311,162 ÷ 615,827 outstanding shares of beneficial interest, $.01 par value, unlimited shares authorized) | |
| |
Net Asset Value, offering and redemption price per share
($267,934,358 ÷ 26,149,256 outstanding shares of beneficial interest, $.01 par value, unlimited shares authorized) | |
| |
Net Asset Value, offering and redemption price per share
($109,132,471 ÷ 10,647,047 outstanding shares of beneficial interest, $.01 par value, unlimited shares authorized) | |
The accompanying notes are an integral part of the financial statements.
| | DWS Strategic High Yield Tax-Free Fund |
Statement of Operations
for the year ended May 31, 2023
| |
| |
| |
| |
| |
| |
| |
| |
| |
Distribution and service fees | |
| |
| |
| |
| |
Trustees' fees and expenses | |
Interest expense and fees on floating rate notes issued | |
| |
Total expenses before expense reductions | |
| |
Total expenses after expense reductions | |
| |
Realized and Unrealized Gain (Loss) | |
Net realized gain (loss) from: | |
| |
| |
| |
Change in net unrealized appreciation (depreciation) on: | |
| |
| |
| |
| |
Net increase (decrease) in net assets resulting from operations | |
The accompanying notes are an integral part of the financial statements.
DWS Strategic High Yield Tax-Free Fund | | |
Statements of Changes in Net Assets
| |
Increase (Decrease) in Net Assets | | |
| | |
| | |
| | |
Change in net unrealized appreciation
(depreciation) | | |
Net increase (decrease) in net assets resulting from operations | | |
Distributions to shareholders: | | |
| | |
| | |
| | |
| | |
| | |
| | |
Proceeds from shares sold | | |
Reinvestment of distributions | | |
Payments for shares redeemed | | |
Net increase (decrease) in net assets from Fund share transactions | | |
Increase (decrease) in net assets | | |
Net assets at beginning of period | | |
Net assets at end of period | | |
The accompanying notes are an integral part of the financial statements.
| | DWS Strategic High Yield Tax-Free Fund |
Financial Highlights
DWS Strategic High Yield Tax-Free Fund — Class A |
| |
| | | | | |
|
Net asset value, beginning of period | | | | | |
Income (loss) from investment operations: | | | | | |
| | | | | |
Net realized and unrealized gain (loss) | | | | | |
Total from investment operations | | | | | |
| | | | | |
| | | | | |
| | | | | |
| | | | | |
Net asset value, end of period | | | | | |
| | | | | |
Ratios to Average Net Assets and Supplemental Data |
Net assets, end of period ($ millions) | | | | | |
Ratio of expenses before expense reductions (including interest expense) (%)c | | | | | |
Ratio of expenses after expense reductions (including interest expense) (%)c | | | | | |
Ratio of expenses after expense reductions (excluding interest expense) (%) | | | | | |
Ratio of net investment income (%) | | | | | |
Portfolio turnover rate (%) | | | | | |
| Total return does not reflect the effect of any sales charges. |
| Total return would have been lower had certain expenses not been reduced. |
| Interest expense represents interest and fees on short-term floating rate notes issued in conjunction with inverse floating rate securities. Interest income from such transactions is included in income from investment operations. |
| Amount is less than $.005. |
The accompanying notes are an integral part of the financial statements.
DWS Strategic High Yield Tax-Free Fund | | |
DWS Strategic High Yield Tax-Free Fund — Class C |
| |
| | | | | |
|
Net asset value, beginning of period | | | | | |
Income (loss) from investment operations: | | | | | |
| | | | | |
Net realized and unrealized gain (loss) | | | | | |
Total from investment operations | | | | | |
| | | | | |
| | | | | |
| | | | | |
| | | | | |
Net asset value, end of period | | | | | |
| | | | | |
Ratios to Average Net Assets and Supplemental Data |
Net assets, end of period ($ millions) | | | | | |
Ratio of expenses before expense reductions (including interest expense) (%)c | | | | | |
Ratio of expenses after expense reductions (including interest expense) (%)c | | | | | |
Ratio of expenses after expense reductions (excluding interest expense) (%) | | | | | |
Ratio of net investment income (%) | | | | | |
Portfolio turnover rate (%) | | | | | |
| Total return does not reflect the effect of any sales charges. |
| Total return would have been lower had certain expenses not been reduced. |
| Interest expense represents interest and fees on short-term floating rate notes issued in conjunction with inverse floating rate securities. Interest income from such transactions is included in income from investment operations. |
| Amount is less than $.005. |
The accompanying notes are an integral part of the financial statements.
| | DWS Strategic High Yield Tax-Free Fund |
DWS Strategic High Yield Tax-Free Fund — Class S |
| |
| | | | | |
|
Net asset value, beginning of period | | | | | |
Income (loss) from investment operations: | | | | | |
| | | | | |
Net realized and unrealized gain (loss) | | | | | |
Total from investment operations | | | | | |
| | | | | |
| | | | | |
| | | | | |
| | | | | |
Net asset value, end of period | | | | | |
| | | | | |
Ratios to Average Net Assets and Supplemental Data |
Net assets, end of period ($ millions) | | | | | |
Ratio of expenses before expense reductions (including interest expense) (%)b | | | | | |
Ratio of expenses after expense reductions (including interest expense) (%)b | | | | | |
Ratio of expenses after expense reductions (excluding interest expense) (%) | | | | | |
Ratio of net investment income (%) | | | | | |
Portfolio turnover rate (%) | | | | | |
| Total return would have been lower had certain expenses not been reduced. |
| Interest expense represents interest and fees on short-term floating rate notes issued in conjunction with inverse floating rate securities. Interest income from such transactions is included in income from investment operations. |
| Amount is less than $.005. |
The accompanying notes are an integral part of the financial statements.
DWS Strategic High Yield Tax-Free Fund | | |
DWS Strategic High Yield Tax-Free Fund — Institutional Class |
| |
| | | | | |
|
Net asset value, beginning of period | | | | | |
Income (loss) from investment operations: | | | | | |
| | | | | |
Net realized and unrealized gain (loss) | | | | | |
Total from investment operations | | | | | |
| | | | | |
| | | | | |
| | | | | |
| | | | | |
Net asset value, end of period | | | | | |
| | | | | |
Ratios to Average Net Assets and Supplemental Data |
Net assets, end of period ($ millions) | | | | | |
Ratio of expenses before expense reductions (including interest expense) (%)b | | | | | |
Ratio of expenses after expense reductions (including interest expense) (%)b | | | | | |
Ratio of expenses after expense reductions (excluding interest expense) (%) | | | | | |
Ratio of net investment income (%) | | | | | |
Portfolio turnover rate (%) | | | | | |
| Total return would have been lower had certain expenses not been reduced. |
| Interest expense represents interest and fees on short-term floating rate notes issued in conjunction with inverse floating rate securities. Interest income from such transactions is included in income from investment operations. |
| Amount is less than $.005. |
The accompanying notes are an integral part of the financial statements.
| | DWS Strategic High Yield Tax-Free Fund |
Notes to Financial Statements
A.
Organization and Significant Accounting Policies
DWS Strategic High Yield Tax-Free Fund (the “Fund” ) is a diversified series of Deutsche DWS Municipal Trust (the “Trust” ), which is registered under the Investment Company Act of 1940, as amended (the “1940 Act” ), as an open-end management investment company organized as a Massachusetts business trust.
The Fund offers multiple classes of shares which provide investors with different purchase options. Class A shares are subject to an initial sales charge. Class C shares are not subject to an initial sales charge but are subject to higher ongoing expenses than Class A shares and a contingent deferred sales charge payable upon certain redemptions within one year of purchase. Class C shares automatically convert to Class A shares in the same fund after 8 years, provided that the Fund or the financial intermediary through which the shareholder purchased the Class C shares has records verifying that the Class C shares have been held for at least 8 years. Class S shares are not subject to initial or contingent deferred sales charges and are available through certain intermediary relationships with financial services firms, or can be purchased by establishing an account directly with the Fund’s transfer agent. Institutional Class shares are not subject to initial or contingent deferred sales charges and are generally available only to qualified institutions.
Investment income, realized and unrealized gains and losses, and certain fund-level expenses and expense reductions, if any, are borne pro rata on the basis of relative net assets by the holders of all classes of shares, except that each class bears certain expenses unique to that class such as distribution and service fees, services to shareholders and certain other class-specific expenses. Differences in class-level expenses may result in payment of different per share dividends by class. All shares of the Fund have equal rights with respect to voting subject to class-specific arrangements.
The Fund’s financial statements are prepared in accordance with accounting principles generally accepted in the United States of America (“U.S. GAAP” ) which require the use of management estimates. Actual results could differ from those estimates. The Fund qualifies as an investment company under Topic 946 of Accounting Standards Codification of U.S. GAAP. The policies described below are followed consistently by the Fund in the preparation of its financial statements.
Security Valuation. Investments are stated at value determined as of the close of regular trading on the New York Stock Exchange on each day the exchange is open for trading.
DWS Strategic High Yield Tax-Free Fund | | |
The Fund’s Board has designated DWS Investment Management Americas, Inc. (the “Advisor” ) as the valuation designee for the Fund pursuant to Rule 2a-5 under the 1940 Act. The Advisor’s Pricing Committee (the “Pricing Committee” ) typically values securities using readily available market quotations or prices supplied by independent pricing services (which are considered fair values under Rule 2a-5). The Advisor has adopted fair valuation procedures that provide methodologies for fair valuing securities.
Various inputs are used in determining the value of the Fund’s investments. These inputs are summarized in three broad levels. Level 1 includes quoted prices in active markets for identical securities. Level 2 includes other significant observable inputs (including quoted prices for similar securities, interest rates, prepayment speeds and credit risk). Level 3 includes significant unobservable inputs (including the Fund’s own assumptions in determining the fair value of investments). The level assigned to the securities valuations may not be an indication of the risk or liquidity associated with investing in those securities.
Municipal debt securities are valued at prices supplied by independent pricing services approved by the Pricing Committee, whose valuations are intended to reflect the mean between the bid and asked prices. Such services may use various pricing techniques which take into account appropriate factors such as yield, quality, coupon rate, maturity, type of issue, trading characteristics and other data, as well as broker quotes. If the pricing services are unable to provide valuations, the securities are valued at the mean of the most recent bid and asked quotations or evaluated prices, as applicable, obtained from broker-dealers. These securities are generally categorized as Level 2.
Other debt securities are valued at prices supplied by independent pricing services approved by the Pricing Committee. Such services may use various pricing techniques which take into account appropriate factors such as yield, quality, coupon rate, maturity, type of issue, trading characteristics, prepayment speeds and other data, as well as broker quotes. If the pricing services are unable to provide valuations, debt securities are valued at the average of the most recent reliable bid quotations or evaluated prices, as applicable, obtained from broker-dealers. These securities are generally categorized as Level 2.
Closed-end investment companies are valued at the most recent sale price or official closing price reported on the exchange (U.S. or foreign) or over-the-counter market on which they trade. Closed-end investment companies for which no sales are reported are valued at the calculated mean between the most recent bid and asked quotations on the relevant market or, if a mean cannot be determined, at the most recent bid quotation. Closed-end investment companies are generally categorized as Level 1.
| | DWS Strategic High Yield Tax-Free Fund |
Investments in open-end investment companies are valued at their net asset value each business day and are categorized as Level 1.
Futures contracts are generally valued at the settlement prices established each day on the exchange on which they are traded and are categorized as Level 1.
Securities and other assets for which market quotations are not readily available or for which the above valuation procedures are deemed not to reflect fair value are valued in a manner that is intended to reflect their fair value as determined in accordance with procedures approved by the Pricing Committee and are generally categorized as Level 3. In accordance with the Fund’s valuation procedures, factors considered in determining value may include, but are not limited to, the type of the security; the size of the holding; the initial cost of the security; the existence of any contractual restrictions on the security’s disposition; the price and extent of public trading in similar securities of the issuer or of comparable companies; quotations or evaluated prices from broker-dealers and/or pricing services; information obtained from the issuer, analysts, and/or the appropriate stock exchange (for exchange-traded securities); an analysis of the company’s or issuer’s financial statements; an evaluation of the forces that influence the issuer and the market(s) in which the security is purchased and sold; and with respect to debt securities, the maturity, coupon, creditworthiness, currency denomination and the movement of the market in which the security is normally traded. The value determined under these procedures may differ from published values for the same securities.
Disclosure about the classification of fair value measurements is included in a table following the Fund’s Investment Portfolio.
Inverse Floaters. The Fund invests in inverse floaters. Inverse floaters are debt instruments with a weekly floating rate of interest that bears an inverse relationship to changes in the short-term interest rate market. Inverse floaters are created by depositing a fixed-rate long-term municipal bond into a special purpose Tender Option Bond trust (the “TOB Trust” ). In turn the TOB Trust issues a short-term floating rate note and an inverse floater. The short-term floating rate note is issued in a face amount equal to some fraction of the underlying bond’s par amount and is sold to a third party, usually a tax-exempt money market fund. The Fund receives the proceeds from the sale of the short-term floating rate note and uses the cash proceeds to make additional investments. The short-term floating rate note represents leverage to the Fund. The Fund, as the holder of the inverse floater, has full exposure to any increase or decrease in the value of the underlying bond. The income stream from the underlying bond in the TOB Trust is divided between the floating rate note and the inverse floater. The inverse floater earns all of the interest from the underlying long-term fixed-rate bond less the amount of interest paid on the floating
DWS Strategic High Yield Tax-Free Fund | | |
rate note and the expenses of the TOB Trust. The floating rate notes issued by the TOB Trust are valued at cost, which approximates fair value.
By holding the inverse floater, the Fund has the right to collapse the TOB Trust by causing the holders of the floating rate instrument to tender their notes at par and have the broker transfer the underlying bond to the Fund. The floating rate note holder can also elect to tender the note for redemption at par at each reset date. The Fund accounts for these transactions as a form of secured borrowing, by reflecting the value of the underlying bond in the investments of the Fund and the amount owed to the floating rate note holder as a liability under the caption “Payable for floating rate notes issued” in the Statement of Assets and Liabilities. Income earned on the underlying bond is included in interest income, and interest paid on the floaters and the expenses of the TOB Trust are included in “Interest expense and fees on floating rate notes issued” in the Statement of Operations. The weighted average outstanding daily balance of the floating rate notes issued during the year ended May 31, 2023 was approximately $8,762,329, with a weighted average interest rate of 2.40%.
The Fund may enter into shortfall and forbearance agreements by which the Fund agrees to reimburse the TOB Trust, in certain circumstances, for the difference between the liquidation value of the underlying bond held by the TOB Trust and the liquidation value of the floating rate notes plus any shortfalls in interest cash flows. This could potentially expose the Fund to losses in excess of the value of the Fund’s inverse floater investments. In addition, the value of inverse floaters may decrease significantly when interest rates increase. The market for inverse floaters may be more volatile and less liquid than other municipal bonds of comparable maturity. The TOB Trust could be terminated outside of the Fund’s control, resulting in a reduction of leverage and disposal of portfolio investments at inopportune times and prices. Investments in inverse floaters generally involve greater risk than in an investment in fixed-rate bonds.
As of May 31, 2023, the Fund did not hold inverse floaters.
When-Issued/Delayed Delivery Securities. The Fund may purchase or sell securities with delivery or payment to occur at a later date beyond the normal settlement period. At the time the Fund enters into a commitment to purchase or sell a security, the transaction is recorded and the value of the transaction is reflected in the net asset value. The price of such security and the date when the security will be delivered and paid for are fixed at the time the transaction is negotiated. The value of the security may vary with market fluctuations.
Certain risks may arise upon entering into when-issued or delayed delivery transactions from the potential inability of counterparties to meet the terms of their contracts or if the issuer does not issue the securities due
| | DWS Strategic High Yield Tax-Free Fund |
to political, economic, or other factors. Additionally, losses may arise due to changes in the value of the underlying securities.
Federal Income Taxes. The Fund’s policy is to comply with the requirements of the Internal Revenue Code of 1986, as amended, which are applicable to regulated investment companies, and to distribute all of its taxable and tax-exempt income to its shareholders.
At May 31, 2023, the Fund had net tax basis capital loss carryforwards of approximately $126,662,000, including short-term losses ($110,372,000) and long-term losses ($16,290,000), which may be applied against realized net taxable capital gains indefinitely.
The Fund has reviewed the tax positions for the open tax years as of May 31, 2023 and has determined that no provision for income tax and/or uncertain tax positions is required in the Fund’s financial statements. The Fund’s federal tax returns for the prior three fiscal years remain open subject to examination by the Internal Revenue Service.
Distribution of Income and Gains. Net investment income of the Fund is declared as a daily dividend and distributed to shareholders monthly. Net realized gains from investment transactions, in excess of available capital loss carryforwards, would be taxable to the Fund if not distributed, and, therefore, will be distributed to shareholders at least annually. The Fund may also make additional distributions for tax purposes if necessary.
The timing and characterization of certain income and capital gain distributions are determined annually in accordance with federal tax regulations which may differ from accounting principles generally accepted in the United States of America. These differences primarily relate to certain securities sold at a loss, investments in derivatives, accretion of market discount on debt securities, premium amortization on debt securities, interest income on defaulted securities and income related to restructuring of certain securities. As a result, net investment income (loss) and net realized gain (loss) on investment transactions for a reporting period may differ significantly from distributions during such period. Accordingly, the Fund may periodically make reclassifications among certain of its capital accounts without impacting the net asset value of the Fund.
At May 31, 2023, the Fund’s components of distributable earnings (accumulated losses) on a net tax basis were as follows:
Undistributed tax-exempt income | |
Undistributed ordinary income* | |
Capital loss carryforwards | |
Net unrealized appreciation (depreciation) on investments | |
DWS Strategic High Yield Tax-Free Fund | | |
At May 31, 2023, the aggregate cost of investments for federal income tax purposes was $560,094,427. The net unrealized depreciation for all investments based on tax cost was $50,151,913. This consisted of aggregate gross unrealized appreciation for all investments for which there was an excess of value over tax cost of $13,021,342 and aggregate gross unrealized depreciation for all investments for which there was an excess of tax cost over value of $63,173,255.
In addition, the tax character of distributions paid to shareholders by the Fund is summarized as follows:
| |
| | |
Distributions from tax-exempt income | | |
Distributions from ordinary income* | | |
| For tax purposes, short-term capital gain distributions are considered ordinary income distributions. |
Expenses. Expenses of the Trust arising in connection with a specific fund are allocated to that fund. Other Trust expenses which cannot be directly attributed to a fund are apportioned among the funds in the Trust based upon the relative net assets or other appropriate measures.
Contingencies. In the normal course of business, the Fund may enter into contracts with service providers that contain general indemnification clauses. The Fund’s maximum exposure under these arrangements is unknown, as this would involve future claims that may be made against the Fund that have not yet been made. However, based on experience, the Fund expects the risk of loss to be remote.
Other. Investment transactions are accounted for on a trade date plus one basis for daily net asset value calculations. However, for financial reporting purposes, investment transactions are reported on trade date. Interest income is recorded on the accrual basis. Realized gains and losses from investment transactions are recorded on an identified cost basis. All premiums and discounts are amortized/accreted for financial reporting purposes, with the exception of securities in default of principal.
A futures contract is an agreement between a buyer or seller and an established futures exchange or its clearinghouse in which the buyer or seller agrees to take or make a delivery of a specific amount of a financial instrument at a specified price on a specific date (settlement date). For the year ended May 31, 2023, the Fund used futures contracts as a means to manage the duration of the investment portfolio.
Upon entering into a futures contract, the Fund is required to deposit with a financial intermediary cash or securities (“initial margin” ) in an amount
| | DWS Strategic High Yield Tax-Free Fund |
equal to a certain percentage of the face value indicated in the futures contract. Subsequent payments (“variation margin” ) are made or received by the Fund dependent upon the daily fluctuations in the value and are recorded for financial reporting purposes as unrealized gains or losses by the Fund. Gains or losses are realized when the contract expires or is closed. Since all futures contracts are exchange-traded, counterparty risk is minimized as the exchange’s clearinghouse acts as the counterparty, and guarantees the futures against default.
Certain risks may arise upon entering into futures contracts, including the risk that an illiquid market will limit the Fund’s ability to close out a futures contract prior to the settlement date and the risk that the futures contract is not well correlated with the security, index or currency to which it relates. Risk of loss may exceed amounts recognized in the Statement of Assets and Liabilities.
A summary of the open futures contracts as of May 31, 2023, is included in a table following the Fund’s Investment Portfolio. For the year ended May 31, 2023, the investment in futures contracts sold had a total notional value generally indicative of a range from approximately $25,044,000 to $58,775,000.
The following table summarizes the value of the Fund’s derivative instruments held as of May 31, 2023 and the related location in the accompanying Statement of Assets and Liabilities, presented by primary underlying risk exposure:
| |
Interest Rate Contracts (a) | |
The above derivative is located in the following Statement of Assets and Liabilities account: |
| Includes cumulative depreciation of futures contracts as disclosed in the Investment Portfolio. Unsettled variation margin is disclosed separately within the Statement of Assets and Liabilities. |
Additionally, the amount of unrealized and realized gains and losses on derivative instruments recognized in Fund earnings during the year ended May 31, 2023 and the related location in the accompanying Statement of Operations is summarized in the following tables by primary underlying risk exposure:
| |
Interest Rate Contracts (a) | |
The above derivative is located in the following Statement of Operations account: |
| Net realized gain (loss) from futures contracts |
DWS Strategic High Yield Tax-Free Fund | | |
Change in Net Unrealized Appreciation (Depreciation) | |
Interest Rate Contracts (a) | |
The above derivative is located in the following Statement of Operations account: |
| Change in net unrealized appreciation (depreciation) on futures contracts |
C.
Purchases and Sales of Securities
During the year ended May 31, 2023, purchases and sales of investment securities (excluding short-term investments) aggregated $408,993,976 and $611,501,348, respectively.
Management Agreement. Under the Investment Management Agreement with DWS Investment Management Americas, Inc. (“DIMA” or the “Advisor” ), an indirect, wholly owned subsidiary of DWS Group GmbH & Co. KGaA (“DWS Group” ), the Advisor directs the investments of the Fund in accordance with its investment objectives, policies and restrictions. The Advisor determines the securities, instruments and other contracts relating to investments to be purchased, sold or entered into by the Fund.
Under the Investment Management Agreement with the Advisor, the Fund pays a monthly management fee based on the average daily net assets of the Fund, computed and accrued daily and payable monthly, at the following annual rates:
First $300 million of the Fund’s average daily net assets | |
Next $200 million of such net assets | |
Next $500 million of such net assets | |
Next $500 million of such net assets | |
Next $500 million of such net assets | |
Over $2 billion of such net assets | |
Accordingly, for the year ended May 31, 2023, the fee pursuant to the Investment Management Agreement was equivalent to an annual rate (exclusive of any applicable waivers/reimbursements) of 0.427% of the Fund’s average daily net assets.
For the period from June 1, 2022 through September 30, 2023, the Advisor has contractually agreed to waive its fees and/or reimburse certain operating expenses of the Fund to the extent necessary to maintain the total annual operating expenses (excluding certain expenses
| | DWS Strategic High Yield Tax-Free Fund |
such as extraordinary expenses, taxes, brokerage, interest expense and acquired fund fees and expenses) of each class as follows:
For the year ended May 31, 2023, fees waived and/or expenses reimbursed for each class are as follows:
Administration Fee. Pursuant to an Administrative Services Agreement, DIMA provides most administrative services to the Fund. For all services provided under the Administrative Services Agreement, the Fund pays the Advisor an annual fee (“Administration Fee” ) of 0.097% of the Fund’s average daily net assets, computed and accrued daily and payable monthly. For the year ended May 31, 2023, the Administration Fee was $562,022, of which $43,265 is unpaid.
Service Provider Fees. DWS Service Company (“DSC” ), an affiliate of the Advisor, is the transfer agent, dividend-paying agent and shareholder service agent for the Fund. Pursuant to a sub-transfer agency agreement between DSC and SS&C GIDS, Inc. (“SS&C” ) (name changed from DST Systems, Inc. effective January 1, 2023), DSC has delegated certain transfer agent, dividend-paying agent and shareholder service agent functions to SS&C. DSC compensates SS&C out of the shareholder servicing fee it receives from the Fund. For the year ended May 31, 2023, the amounts charged to the Fund by DSC were as follows:
In addition, for the year ended May 31, 2023, the amounts charged to the Fund for recordkeeping and other administrative services provided by
DWS Strategic High Yield Tax-Free Fund | | |
unaffiliated third parties, included in the Statement of Operations under “Services to shareholders,” were as follows:
Distribution and Service Fees. Under the Fund’s Class C 12b-1 Plan, DWS Distributors, Inc. (“DDI” ), an affiliate of the Advisor, receives a fee (“Distribution Fee” ) of 0.75% of the average daily net assets of Class C shares. In accordance with the Fund’s Underwriting and Distribution Services Agreement, DDI enters into related selling group agreements with various firms at various rates for sales of Class C shares. For the year ended May 31, 2023, the Distribution Fee was as follows:
In addition, DDI provides information and administrative services for a fee (“Service Fee” ) to Class A and C shareholders at an annual rate of up to 0.25% of the average daily net assets for each such class. DDI in turn has various agreements with financial services firms that provide these services and pays these fees based upon the assets of shareholder accounts the firms service. For the year ended May 31, 2023, the Service Fee was as follows:
Underwriting Agreement and Contingent Deferred Sales Charge. DDI is the principal underwriter for the Fund. Underwriting commissions paid in connection with the distribution of Class A shares for the year ended May 31, 2023 aggregated $1,816.
In addition, DDI receives any contingent deferred sales charge (“CDSC” ) from Class C share redemptions occurring within one year of purchase. There is no such charge upon redemption of any share appreciation or reinvested dividends. The CDSC is 1% of the value of the shares redeemed for Class C. For the year ended May 31, 2023, the CDSC for
| | DWS Strategic High Yield Tax-Free Fund |
Class C shares aggregated $712. A deferred sales charge of up to 1% is assessed on certain redemptions of Class A shares. For the year ended May 31, 2023, DDI received $16,486 for Class A shares.
Other Service Fees. Under an agreement with the Fund, DIMA is compensated for providing regulatory filing services to the Fund. For the year ended May 31, 2023, the amount charged to the Fund by DIMA included in the Statement of Operations under “Reports to shareholders” aggregated $1,570, of which $781 is unpaid.
Trustees’ Fees and Expenses. The Fund paid retainer fees to each Trustee not affiliated with the Advisor, plus specified amounts to the Board Chairperson and to each committee Chairperson.
Transactions with Affiliates. The Fund may purchase securities from, or sell securities to, an affiliated fund provided the affiliation is solely due to having a common investment adviser, common officers or common trustees. During the year ended May 31, 2023, the Fund engaged in securities purchases of $164,585,000 and securities sales of $164,650,000 with a net gain (loss) on securities sales of $0, with affiliated funds in compliance with Rule 17a-7 under the 1940 Act.
E.
Investing in High-Yield Debt Securities
High-yield debt securities or junk bonds are generally regarded as speculative with respect to the issuer’s continuing ability to meet principal and interest payments. The Fund’s performance could be hurt if an issuer of a debt security suffers an adverse change in financial condition that results in the issuer not making timely payments of interest or principal, a security downgrade or an inability to meet a financial obligation. High-yield debt securities’ total return and yield may generally be expected to fluctuate more than the total return and yield of investment-grade debt securities. A real or perceived economic downturn or an increase in market interest rates could cause a decline in the value of high-yield debt securities, result in increased redemptions and/or result in increased portfolio turnover, which could result in a decline in net asset value of the Fund, reduce liquidity for certain investments and/or increase costs. High-yield debt securities are often thinly traded and can be more difficult to sell and value accurately than investment-grade debt securities as there may be no established secondary market. Investments in high yield debt securities could increase liquidity risk for the Fund. In addition, the market for high-yield debt securities can experience sudden and sharp volatility which is generally associated more with investments in stocks.
The Fund and other affiliated funds (the “Participants” ) share in a $375 million revolving credit facility provided by a syndication of banks. The Fund may borrow for temporary or emergency purposes, including
DWS Strategic High Yield Tax-Free Fund | | |
the meeting of redemption requests that otherwise might require the untimely disposition of securities. The Participants are charged an annual commitment fee, which is allocated based on net assets, among each of the Participants. Interest is calculated at a daily fluctuating rate per annum equal to the sum of 0.10% plus the higher of the Federal Funds Effective Rate and the Overnight Bank Funding Rate, plus 1.25%. The Fund may borrow up to a maximum of 33 percent of its net assets under the agreement. The Fund had no outstanding loans at May 31, 2023.
G.
Fund Share Transactions
The following table summarizes share and dollar activity in the Fund:
| | |
| | | | |
|
| | | | |
| | | | |
| | | | |
| | | | |
| | | | |
Shares issued to shareholders in reinvestment of distributions |
| | | | |
| | | | |
| | | | |
| | | | |
| | | | |
|
| | | | |
| | | | |
| | | | |
| | | | |
| | | | |
| | DWS Strategic High Yield Tax-Free Fund |
DWS Strategic High Yield Tax-Free Fund | | |
Report of Independent Registered Public Accounting Firm
To the Board of Trustees of Deutsche DWS Municipal Trust and Shareholders of DWS Strategic High Yield Tax-Free Fund:
Opinion on the Financial Statements
We have audited the accompanying statement of assets and liabilities of DWS Strategic High Yield Tax-Free Fund (the “Fund” ) (one of the funds constituting Deutsche DWS Municipal Trust) (the “Trust” ), including the investment portfolio, as of May 31, 2023, and the related statement of operations for the year then ended, the statements of changes in net assets for each of the two years in the period then ended, the financial highlights for each of the five years in the period then ended and the related notes (collectively referred to as the “financial statements” ). In our opinion, the financial statements present fairly, in all material respects, the financial position of the Fund (one of the funds constituting Deutsche DWS Municipal Trust) at May 31, 2023, the results of its operations for the year then ended, the changes in its net assets for each of the two years in the period then ended, and its financial highlights for each of the five years in the period then ended, in conformity with U.S. generally accepted accounting principles.
Basis for Opinion
These financial statements are the responsibility of the Trust’s management. Our responsibility is to express an opinion on the Fund’s financial statements based on our audits. We are a public accounting firm registered with the Public Company Accounting Oversight Board (United States) (“PCAOB” ) and are required to be independent with respect to the Trust in accordance with the U.S. federal securities laws and the applicable rules and regulations of the Securities and Exchange Commission and the PCAOB.
We conducted our audits in accordance with the standards of the PCAOB. Those standards require that we plan and perform the audit to obtain reasonable assurance about whether the financial statements are free of material misstatement, whether due to error or fraud. The Trust is not required to have, nor were we engaged to perform, an audit of the Trust’s internal control over financial reporting. As part of our audits, we are required to obtain an understanding of internal control over financial reporting, but not for the purpose of expressing an opinion on the effectiveness of the Trust’s internal control over financial reporting. Accordingly, we express no such opinion.
| | DWS Strategic High Yield Tax-Free Fund |
Our audits included performing procedures to assess the risks of material misstatement of the financial statements, whether due to error or fraud, and performing procedures that respond to those risks. Such procedures included examining, on a test basis, evidence regarding the amounts and disclosures in the financial statements. Our procedures included confirmation of securities owned as of May 31, 2023, by correspondence with the custodian, brokers, and others; when replies were not received from brokers and others, we performed other auditing procedures. Our audits also included evaluating the accounting principles used and significant estimates made by management, as well as evaluating the overall presentation of the financial statements. We believe that our audits provide a reasonable basis for our opinion.
We have served as the auditor of one or more investment companies in the DWS family of funds since at least 1979, but we are unable to determine the specific year.
Boston, Massachusetts
July 24, 2023
DWS Strategic High Yield Tax-Free Fund | | |
Other Information (Unaudited)
Regulatory Update — Tailored Shareholder Report
Effective January 24, 2023, the SEC amended the rules for mutual fund and exchange-traded fund (“ETF” ) annual and semi-annual shareholder reports. The amended rules apply to mutual funds and ETFs that are registered on Form N-1A (i.e., open-end funds) and implement a new streamlined disclosure framework requiring “concise and visually engaging” shareholder reports highlighting key information, including a simplified expense presentation, performance information, portfolio holdings and certain fund statistics. The amended rules seek to simplify shareholder reporting by consolidating investor friendly data in one report and moving other data to Form N-CSR, creating a layered disclosure framework. Certain information from the Fund’s current shareholder reports, including the Fund’s investment portfolio, financial statements and financial highlights, will move to Form N-CSR. This information must be available online, delivered free of charge upon request and filed on a semiannual basis on Form N-CSR. Notably, the amended rules will require mutual funds and ETFs to prepare separate individual shareholder reports for each fund share class. The amendments also include a revised definition of “appropriate broad-based securities market index” that will affect performance presentations in the new streamlined reports and mutual fund and ETF prospectuses. The amended rules and related form amendments have a compliance date of July 24, 2024. At this time, management is evaluating the impact of the amended rules and form amendments on the content of the Fund’s current shareholder reports.
| | DWS Strategic High Yield Tax-Free Fund |
Information About Your Fund’s Expenses
As an investor of the Fund, you incur two types of costs: ongoing expenses and transaction costs. Ongoing expenses include management fees, distribution and service (12b-1) fees and other Fund expenses. Examples of transaction costs include sales charges (loads) and account maintenance fees, which are not shown in this section. The following tables are intended to help you understand your ongoing expenses (in dollars) of investing in the Fund and to help you compare these expenses
with the ongoing expenses of investing in other mutual funds. In the most recent six-month period, the Fund limited these expenses for Class A, Class C and Class S shares; had it not done so, expenses would have
been higher. The example in the table is based on an investment of $1,000 invested at the beginning of the six-month period and held for the entire period (December 1, 2022 to May 31, 2023).
The tables illustrate your Fund’s expenses in two ways:
—
Actual Fund Return. This helps you estimate the actual dollar amount of ongoing expenses (but not transaction costs) paid on a $1,000 investment in the Fund using the Fund’s actual return during the period. To estimate the expenses you paid over the period, simply divide your account value by $1,000 (for example, an $8,600 account value divided by $1,000 = 8.6), then multiply the result by the number in the “Expenses Paid per $1,000” line under the share class you hold.
—
Hypothetical 5% Fund Return. This helps you to compare your Fund’s ongoing expenses (but not transaction costs) with those of other mutual funds using the Fund’s actual expense ratio and a hypothetical rate of return of 5% per year before expenses. Examples using a 5% hypothetical fund return may be found in the shareholder reports of other mutual funds. The hypothetical account values and expenses may not be used to estimate the actual ending account balance or expenses you paid for the period.
Please note that the expenses shown in these tables are meant to highlight your ongoing expenses only and do not reflect any transaction costs. The “Expenses Paid per $1,000” line of the tables is useful in comparing ongoing expenses only and will not help you determine the
relative total expense of owning different funds. Subject to certain exceptions, an account maintenance fee of $20.00 assessed once per calendar year for Classes A, C and S shares may apply for accounts with balances less than $10,000. This fee is not included in these tables. If it was, the estimate of expenses paid for Classes A, C and S shares during the period would be higher, and account value during the period would be lower, by this amount.
DWS Strategic High Yield Tax-Free Fund | | |
Expenses and Value of a $1,000 Investment
for the six months ended May 31, 2023 (Unaudited)
| | | | |
Beginning Account Value 12/1/22 | | | | |
Ending Account Value 5/31/23 | | | | |
Expenses Paid per $1,000* | | | | |
Hypothetical 5% Fund Return | | | | |
Beginning Account Value 12/1/22 | | | | |
Ending Account Value 5/31/23 | | | | |
Expenses Paid per $1,000* | | | | |
| Expenses are equal to the Fund’s annualized expense ratio for each share class, multiplied by the average account value over the period, multiplied by 182 (the number of days in the most recent six-month period), then divided by 365. |
Annualized Expense Ratios | | | | |
DWS Strategic High Yield Tax-Free Fund† | | | | |
| Includes interest expense and fees on short-term floating rate notes issued in conjunction with inverse floating rate securities of 0.02% for each class. |
For more information, please refer to the Fund’s prospectus.
For an analysis of the fees associated with an investment in the Fund or similar funds, please refer to tools.finra.org/fund_analyzer/.
Tax Information (Unaudited)
Of the dividends paid from net investment income for the taxable year ended May 31, 2023, 95% are designated as exempt interest dividends for federal income tax purposes.
Please consult a tax advisor if you have questions about federal or state income tax laws, or on how to prepare your tax returns. If you have specific questions about your account, please call (800) 728-3337.
| | DWS Strategic High Yield Tax-Free Fund |
Liquidity Risk Management
In accordance with Rule 22e-4 (the “Liquidity Rule” ) under the Investment Company Act of 1940 (the “1940 Act” ), your Fund has adopted a liquidity risk management program (the “Program” ), and the Board has designated DWS Investment Management Americas, Inc. (“DIMA” ) as Program administrator. The Program is designed to assess and manage your Fund’s liquidity risk (the risk that the Fund would be unable to meet requests to redeem shares of the Fund without significant dilution of remaining investors’ interests in the Fund). DIMA has designated a committee (the “Committee” ) composed of personnel from multiple departments within DIMA and its affiliates that is responsible for the implementation and ongoing administration of the Program, which includes assessing the Fund’s liquidity risk under both normal and reasonably foreseeable stressed conditions. Under the Program, every investment held by the Fund is classified on a daily basis into one of four liquidity categories based on estimations of the investment’s ability to be sold during designated timeframes in current market conditions without significantly changing the investment’s market value.
In February 2023, as required by the Program and the Liquidity Rule, DIMA provided the Board with an annual written report (the “Report” ) addressing the operation of the Program and assessing the adequacy and effectiveness of its implementation during the period from December 1, 2021 through November 30, 2022 (the “Reporting Period” ). During the Reporting Period, your Fund was predominately invested in highly liquid investments (investments that the Fund anticipates can be converted to cash within three business days or less in current market conditions without significantly changing their market value). As a result, your Fund is not required to adopt, and has not adopted, a “Highly Liquid Investment Minimum” as defined in the Liquidity Rule. During the Reporting Period, the Fund did not approach the 15% limit imposed by the Liquidity Rule on holdings in illiquid investments (investments that cannot be sold or disposed of in seven days or less in current market conditions without the sale of the investment significantly changing the market value of the investment). Your Fund did not experience any issues meeting investor redemptions at any time during the Reporting Period. In the Report, DIMA stated that it believes the Program has operated adequately and effectively to manage the Fund’s liquidity risk during the Reporting Period. DIMA also reported that there were no material changes made to the Program during the Reporting Period.
DWS Strategic High Yield Tax-Free Fund | | |
Advisory Agreement Board Considerations and Fee Evaluation
The Board of Trustees (hereinafter referred to as the “Board” or “Trustees” ) approved the renewal of DWS Strategic High Yield Tax-Free Fund’s (the “Fund” ) investment management agreement (the “Agreement” ) with DWS Investment Management Americas, Inc. (“DIMA” ) in September 2022.
In terms of the process that the Board followed prior to approving the Agreement, shareholders should know that:
—
During the entire process, all of the Fund’s Trustees were independent of DIMA and its affiliates (the “Independent Trustees” ).
—
The Board met frequently during the past year to discuss fund matters and dedicated a substantial amount of time to contract review matters. Over the course of several months, the Board reviewed extensive materials received from DIMA, independent third parties and independent counsel. These materials included an analysis of the Fund’s performance, fees and expenses, and profitability from a fee consultant retained by the Fund’s Independent Trustees (the “Fee Consultant” ).
—
The Board also received extensive information throughout the year regarding performance of the Fund.
—
The Independent Trustees regularly met privately with counsel to discuss contract review and other matters. In addition, the Independent Trustees were advised by the Fee Consultant in the course of their review of the Fund’s contractual arrangements and considered a comprehensive report prepared by the Fee Consultant in connection with their deliberations.
—
In connection with reviewing the Agreement, the Board also reviewed the terms of the Fund’s Rule 12b-1 plan, distribution agreement, administrative services agreement, transfer agency agreement and other material service agreements.
In connection with the contract review process, the Board considered the factors discussed below, among others. The Board also considered that DIMA and its predecessors have managed the Fund since its inception, and the Board believes that a long-term relationship with a capable, conscientious advisor is in the best interests of the Fund. The Board considered, generally, that shareholders chose to invest or remain invested in the Fund knowing that DIMA managed the Fund. DIMA is part of DWS Group GmbH & Co. KGaA (“DWS Group” ). DWS Group is a global asset management business that offers a wide range of investing expertise and resources, including research capabilities in many countries throughout the world. In 2018, approximately 20% of DWS Group’s
���
| | DWS Strategic High Yield Tax-Free Fund |
shares were sold in an initial public offering, with Deutsche Bank AG owning the remaining shares.
As part of the contract review process, the Board carefully considered the fees and expenses of each DWS fund overseen by the Board in light of the fund’s performance. In many cases, this led to the negotiation and implementation of expense caps.
While shareholders may focus primarily on fund performance and fees, the Fund’s Board considers these and many other factors, including the quality and integrity of DIMA’s personnel and administrative support services provided by DIMA, such as back-office operations, fund valuations, and compliance policies and procedures.
Nature, Quality and Extent of Services. The Board considered the terms of the Agreement, including the scope of advisory services provided under the Agreement. The Board noted that, under the Agreement, DIMA provides portfolio management services to the Fund and that, pursuant to a separate administrative services agreement, DIMA provides administrative services to the Fund. The Board considered the experience and skills of senior management and investment personnel and the resources made available to such personnel. The Board also considered the risks to DIMA in sponsoring or managing the Fund, including financial, operational and reputational risks, the potential economic impact to DIMA from such risks and DIMA’s approach to addressing such risks. The Board reviewed the Fund’s performance over short-term and long-term periods and compared those returns to various agreed-upon performance measures, including market index(es) and a peer universe compiled using information supplied by Morningstar Direct (“Morningstar” ), an independent fund data service. The Board also noted that it has put into place a process of identifying “Funds in Review” (e.g., funds performing poorly relative to a peer universe), and receives additional reporting from DIMA regarding such funds and, where appropriate, DIMA’s plans to address underperformance. The Board believes this process is an effective manner of identifying and addressing underperforming funds. Based on the information provided, the Board noted that, for the one-, three- and five-year periods ended December 31, 2021, the Fund’s performance (Class A shares) was in the 2nd quartile, 3rd quartile and 4th quartile, respectively, of the applicable Morningstar universe (the 1st quartile being the best performers and the 4th quartile being the worst performers). The Board also observed that the Fund has outperformed its benchmark in the one-, three- and five-year periods ended December 31, 2021.
Fees and Expenses. The Board considered the Fund’s investment management fee schedule, operating expenses and total expense ratios, and comparative information provided by Broadridge Financial Solutions, Inc. (“Broadridge” ) and the Fee Consultant regarding investment management fee rates paid to other investment advisors by similar funds
DWS Strategic High Yield Tax-Free Fund | | |
(1st quartile being the most favorable and 4th quartile being the least favorable). With respect to management fees paid to other investment advisors by similar funds, the Board noted that the contractual fee rates paid by the Fund, which include a 0.097% fee paid to DIMA under the Fund’s administrative services agreement, were higher than the median (3rd quartile) of the applicable Broadridge peer group (based on Broadridge data provided as of December 31, 2021). The Board noted that the Fund’s Class A shares total (net) operating expenses (excluding 12b-1 fees) were expected to be higher than the median (3rd quartile) of the applicable Broadridge expense universe (based on Broadridge data provided as of December 31, 2021, and analyzing Broadridge expense universe Class A (net) expenses less any applicable 12b-1 fees) (“Broadridge Universe Expenses” ). The Board also reviewed data comparing each other operational share class’s total (net) operating expenses to the applicable Broadridge Universe Expenses. The Board noted that the expense limitations agreed to by DIMA were expected to help the Fund’s total (net) operating expenses remain competitive. The Board considered the Fund’s management fee rate as compared to fees charged by DIMA to comparable DWS U.S. registered funds (“DWS Funds” ) and considered differences between the Fund and the comparable DWS Funds. The information requested by the Board as part of its review of fees and expenses also included information about institutional accounts (including any sub-advised funds and accounts) and funds offered primarily to European investors (“DWS Europe Funds” ) managed by DWS Group. The Board noted that DIMA indicated that DWS Group does not manage any institutional accounts or DWS Europe Funds comparable to the Fund.
On the basis of the information provided, the Board concluded that management fees were reasonable and appropriate in light of the nature, quality and extent of services provided by DIMA.
Profitability. The Board reviewed detailed information regarding revenues received by DIMA under the Agreement. The Board considered the estimated costs to DIMA, and pre-tax profits realized by DIMA, from advising the DWS Funds, as well as estimates of the pre-tax profits attributable to managing the Fund in particular. The Board also received information regarding the estimated enterprise-wide profitability of DIMA and its affiliates with respect to all fund services in totality and by fund. The Board and the Fee Consultant reviewed DIMA’s methodology in allocating its costs to the management of the Fund. Based on the information provided, the Board concluded that the pre-tax profits realized by DIMA in connection with the management of the Fund were not unreasonable. The Board also reviewed certain publicly available information regarding the profitability of certain similar investment management firms. The Board noted that, while information regarding the profitability of such firms is limited (and in some cases is not necessarily
| | DWS Strategic High Yield Tax-Free Fund |
prepared on a comparable basis), DIMA and its affiliates’ overall profitability with respect to the DWS Funds (after taking into account distribution and other services provided to the funds by DIMA and its affiliates) was lower than the overall profitability levels of most comparable firms for which such data was available.
Economies of Scale. The Board considered whether there are economies of scale with respect to the management of the Fund and whether the Fund benefits from any economies of scale. The Board noted that the Fund’s investment management fee schedule includes fee breakpoints. The Board concluded that the Fund’s fee schedule represents an appropriate sharing between the Fund and DIMA of such economies of scale as may exist in the management of the Fund at current asset levels.
Other Benefits to DIMA and Its Affiliates. The Board also considered the character and amount of other incidental or “fall-out” benefits received by DIMA and its affiliates, including any fees received by DIMA for administrative services provided to the Fund, any fees received by an affiliate of DIMA for transfer agency services provided to the Fund and any fees received by an affiliate of DIMA for distribution services. The Board also considered benefits to DIMA related to brokerage and soft-dollar allocations, including allocating brokerage to pay for research generated by parties other than the executing broker dealers, which pertain primarily to funds investing in equity securities. In addition, the Board considered the incidental public relations benefits to DIMA related to DWS Funds advertising and cross-selling opportunities among DIMA products and services. The Board considered these benefits in reaching its conclusion that the Fund’s management fees were reasonable.
Compliance. The Board considered the significant attention and resources dedicated by DIMA to its compliance processes in recent years. The Board noted in particular (i) the experience, seniority and time commitment of the individuals serving as DIMA’s and the Fund’s chief compliance officers and (ii) the substantial commitment of resources by DIMA and its affiliates to compliance matters, including the retention of compliance personnel.
Based on all of the information considered and the conclusions reached, the Board determined that the continuation of the Agreement is in the best interests of the Fund. In making this determination, the Board did not give particular weight to any single factor identified above. The Board considered these factors over the course of numerous meetings, certain of which were in executive session with only the Independent Trustees and counsel present. It is possible that individual Independent Trustees may have weighed these factors differently in reaching their individual decisions to approve the continuation of the Agreement.
DWS Strategic High Yield Tax-Free Fund | | |
Board Members and Officers
The following table presents certain information regarding the Board Members and Officers of the Trust/Corporation. Each Board Member’s year of birth is set forth in parentheses after his or her name. Unless otherwise noted, (i) each Board Member has engaged in the principal occupation(s) noted in the table for at least the most recent five years, although not necessarily in the same capacity; and (ii) the address of each Independent Board Member is c/o Keith R. Fox, DWS Funds Board Chair, c/o Thomas R. Hiller, Ropes & Gray LLP, Prudential Tower, 800 Boylston
Street, Boston, MA 02199-3600. Except as otherwise noted below, the term of office for each Board Member is until the election and qualification of a successor, or until such Board Member sooner dies, resigns, is removed or as otherwise provided in the governing documents of the Trust/Corporation. Because the Fund does not hold an annual meeting of shareholders, each Board Member will hold office for an indeterminate period.
The Board Members may also serve in similar capacities with other funds in the fund complex. The number of funds in the DWS fund complex shown in the table below includes all registered open- and closed-end funds (including all of their portfolios) advised by the Advisor and any registered funds that have an investment advisor that is an affiliated person of the Advisor.
Independent Board Members/Independent Advisory Board Members
Name, Year of
Birth, Position
with the Trust/
Corporation
and Length of
| Business Experience and Directorships
During the Past Five Years | Number of
Funds in
DWS Fund
Complex
Overseen | Other
Directorships
Held by Board
Member |
Keith R. Fox, CFA (1954) Chairperson since 2017, and Board Member since 1996 | Managing General Partner, Exeter Capital Partners (a series of private investment funds) (since 1986). Former Chairman, National Association of Small Business Investment Companies; Former Directorships: ICI Mutual Insurance Company; BoxTop Media Inc. (advertising); Sun Capital Advisers Trust (mutual funds); Progressive International Corporation (kitchen goods designer and distributor) | | |
| | DWS Strategic High Yield Tax-Free Fund |
Name, Year of Birth, Position with the Trust/ Corporation and Length of Time Served1 | Business Experience and Directorships During the Past Five Years | Number of Funds in DWS Fund Complex Overseen | Other Directorships Held by Board Member |
John W. Ballantine (1946) Board Member since 1999 | Retired; formerly, Executive Vice President and Chief Risk Management Officer, First Chicago NBD Corporation/The First National Bank of Chicago (1996–1998); Executive Vice President and Head of International Banking (1995–1996); Not-for-Profit Directorships: Window to the World Communications (public media); Life Director of Harris Theater for Music and Dance (Chicago); Life Director of Hubbard Street Dance Chicago; Former Directorships: Director and Chairman of the Board, Healthways, Inc.2 (population wellbeing and wellness services) (2003–2014); Stockwell Capital Investments PLC (private equity); Enron Corporation; FNB Corporation; Tokheim Corporation; First Oak Brook Bancshares, Inc.; Oak Brook Bank; Portland General Electric2 (utility company (2003–2021); and Prisma Energy International; Former Not-for-Profit Directorships: Public Radio International; Palm Beach Civic Assn. | | |
Dawn-Marie Driscoll (1946) Board Member since 1987 | Emeritus Advisory Board and former Executive Fellow, Hoffman Center for Business Ethics, Bentley University; formerly: Partner, Palmer & Dodge (law firm) (1988–1990); Vice President of Corporate Affairs and General Counsel, Filene’s (retail) (1978–1988); Directorships: Trustee and former Chairman of the Board, Southwest Florida Community Foundation (charitable organization); Former Directorships: ICI Mutual Insurance Company (2007–2015); Sun Capital Advisers Trust (mutual funds) (2007–2012), Investment Company Institute (audit, executive, nominating committees) and Independent Directors Council (governance, executive committees) | | |
DWS Strategic High Yield Tax-Free Fund | | |
Name, Year of Birth, Position with the Trust/ Corporation and Length of Time Served1 | Business Experience and Directorships During the Past Five Years | Number of Funds in DWS Fund Complex Overseen | Other Directorships Held by Board Member |
Richard J. Herring (1946) Board Member since 1990 | Jacob Safra Professor of International Banking and Professor of Finance, The Wharton School, University of Pennsylvania (since July 1972); formerly: Director, The Wharton Financial Institutions Center (1994–2020); Vice Dean and Director, Wharton Undergraduate Division (1995–2000) and Director, The Lauder Institute of International Management Studies (2000–2006); Member FDIC Systemic Risk Advisory Committee since 2011, member Systemic Risk Council since 2012 and member of the Advisory Board at the Yale Program on Financial Stability since 2013; Former Directorships: Co-Chair of the Shadow Financial Regulatory Committee (2003–2015), Executive Director of The Financial Economists Roundtable (2008–2015), Director of The Thai Capital Fund (2007–2013), Director of The Aberdeen Singapore Fund (2007–2018), Director, The Aberdeen Japan Fund (2007-2021) and Nonexecutive Director of Barclays Bank DE (2010–2018) | | |
Chad D. Perry (1972) Board Member or Advisory Board Member | Executive Vice President, and General Counsel, RLJ Lodging Trust.2 (Since 2023); formerly: Executive Vice President, General Counsel and Secretary, Tanger Factory Outlet Centers, Inc.2 (2011-2023); Executive Vice President and Deputy General Counsel, LPL Financial Holdings Inc.2 (2006–2011); Senior Corporate Counsel, EMC Corporation (2005–2006); Associate, Ropes & Gray LLP (1997–2005) | | Director - Great Elm Capital Corp. (business development company) (since 2022) |
Rebecca W. Rimel (1951) Board Member since 1995 | Formerly: Executive Vice President, The Glenmede Trust Company (investment trust and wealth management) (1983–2004); Board Member, Investor Education (charitable organization) (2004–2005); Former Directorships: Trustee, Executive Committee, Philadelphia Chamber of Commerce (2001–2007); Director, Viasys Health Care2 (January 2007–June 2007); Trustee, Thomas Jefferson Foundation (charitable organization) (1994–2012); President, Chief Executive Officer and Director (1994–2020) and Senior Advisor (2020-2021), The Pew Charitable Trusts (charitable organization); Director, BioTelemetry Inc.2 (acquired by Royal Philips in 2021) (healthcare) (2009–2021); Director, Becton Dickinson and Company2 (medical technology company) (2012-2022) | | Director, The Bridgespan Group (nonprofit organization) (since October 2020) |
| | DWS Strategic High Yield Tax-Free Fund |
Name, Year of Birth, Position with the Trust/ Corporation and Length of Time Served1 | Business Experience and Directorships During the Past Five Years | Number of Funds in DWS Fund Complex Overseen | Other Directorships Held by Board Member |
Catherine Schrand (1964) Board Member since 2021 | Celia Z. Moh Professor of Accounting (since 2016) and Professor of Accounting (since 1994); Directorships: Director, the Jacobs Levy Center, The Wharton School, University of Pennsylvania (since 2023); Former positions: Vice Dean, Wharton Doctoral Programs, The Wharton School, University of Pennsylvania (2016–2019) | | |
William N. Searcy, Jr. (1946) Board Member since 1993 | Private investor since October 2003; formerly: Pension & Savings Trust Officer, Sprint Corporation2 (telecommunications) (November 1989–September 2003); Former Directorships: Trustee, Sun Capital Advisers Trust (mutual funds) (1998–2012) | | |
Officers5
Name, Year of Birth, Position
with the Trust/Corporation
and Length of Time Served6 | Business Experience and Directorships During the
Past Five Years |
Hepsen Uzcan7 (1974) President and Chief Executive Officer, 2017–present | Fund Administration (Head since 2017), DWS; Secretary, DWS USA Corporation (2018–present); Assistant Secretary, DWS Distributors, Inc. (2018–present); Director and Vice President, DWS Service Company (2018–present); Assistant Secretary, DWS Investment Management Americas, Inc. (2018–present); Director and President, DB Investment Managers, Inc. (2018–present); President and Chief Executive Officer, The European Equity Fund, Inc., The New Germany Fund, Inc. and The Central and Eastern Europe Fund, Inc. (2017–present); formerly: Vice President for the Deutsche funds (2016–2017); Assistant Secretary for the DWS funds (2013–2019); Assistant Secretary, The European Equity Fund, Inc., The New Germany Fund, Inc. and The Central and Eastern Europe Fund, Inc. (2013–2020); Directorships: Interested Director, The European Equity Fund, Inc., The New Germany Fund, Inc. and The Central and Eastern Europe Fund, Inc. (since June 25, 2020); ICI Mutual Insurance Company (since October 16, 2020); and Episcopalian Charities of New York (2018–present) |
John Millette8 (1962) Vice President and Secretary, 1999–present | Legal (Associate General Counsel), DWS; Chief Legal Officer, DWS Investment Management Americas, Inc. (2015–present); Director and Vice President, DWS Trust Company (2016–present); Secretary, DBX ETF Trust (2020–present); Vice President, DBX Advisors LLC (2021–present); Secretary, The European Equity Fund, Inc., The New Germany Fund, Inc. and The Central and Eastern Europe Fund, Inc. 2011–present); formerly: Secretary, Deutsche Investment Management Americas Inc. (2015–2017); and Assistant Secretary, DBX ETF Trust (2019–2020) |
Ciara Crawford9 (1984) Assistant Secretary, 2019–present | Fund Administration (Specialist), DWS (2015–present); formerly, Legal Assistant at Accelerated Tax Solutions |
DWS Strategic High Yield Tax-Free Fund | | |
Name, Year of Birth, Position with the Trust/Corporation and Length of Time Served6 | Business Experience and Directorships During the Past Five Years |
Diane Kenneally8 (1966) Chief Financial Officer and Treasurer, 2018–present | Fund Administration Treasurer’s Office (Co-Head since 2018), DWS; Treasurer, Chief Financial Officer and Controller, DBX ETF Trust (2019–present); Treasurer and Chief Financial Officer, The European Equity Fund, Inc., The New Germany Fund, Inc. and The Central and Eastern Europe Fund, Inc. (2018–present); formerly: Assistant Treasurer for the DWS funds (2007–2018) |
Paul Antosca8 (1957) Assistant Treasurer, 2007–present | Fund Administration Tax (Head), DWS; and Assistant Treasurer, DBX ETF Trust (2019–present) |
Sheila Cadogan8 (1966) Assistant Treasurer, 2017–present | Fund Administration Treasurer’s Office (Co-Head since 2018), DWS; Director and Vice President, DWS Trust Company (2018–present); Assistant Treasurer, DBX ETF Trust (2019–present); Assistant Treasurer, The European Equity Fund, Inc., The New Germany Fund, Inc. and The Central and Eastern Europe Fund, Inc. (2018–present) |
Scott D. Hogan8 (1970) Chief Compliance Officer, 2016–present | Anti-Financial Crime & Compliance US (Senior Team Lead), DWS; Chief Compliance Officer, The European Equity Fund, Inc., The New Germany Fund, Inc. and The Central and Eastern Europe Fund, Inc. (2016–present) |
Caroline Pearson8 (1962) Chief Legal Officer, 2010–present | Legal (Senior Team Lead), DWS; Assistant Secretary, DBX ETF Trust (2020–present); Chief Legal Officer, DBX Advisors LLC (2020–present); Chief Legal Officer, The European Equity Fund, Inc., The New Germany Fund, Inc. and The Central and Eastern Europe Fund, Inc. (2012–present); formerly: Secretary, Deutsche AM Distributors, Inc. (2002–2017); Secretary, Deutsche AM Service Company (2010–2017); and Chief Legal Officer, DBX Strategic Advisors LLC (2020–2021) |
Christian Rijs7 (1980) Anti-Money Laundering
Compliance Officer,
since 2021 | Senior Team Lead Anti-Financial Crime and Compliance, DWS; AML Officer, DWS Trust Company (since November 2, 2021); AML Officer, DBX ETF Trust (since October 21, 2021); AML Officer, The European Equity Fund, Inc., The New Germany Fund, Inc. and The Central and Eastern Europe Fund, Inc. (since November 12, 2021); formerly: DWS UK & Ireland Head of Anti-Financial Crime and MLRO |
| The length of time served represents the year in which the Board Member joined the board of one or more DWS funds currently overseen by the Board. |
| A publicly held company with securities registered pursuant to Section 12 of the Securities Exchange Act of 1934. |
| Mr. Perry is an Advisory Board Member of Deutsche DWS Asset Allocation Trust, Deutsche DWS Equity 500 Index Portfolio, Deutsche DWS Global/International Fund, Inc., Deutsche DWS Income Trust, Deutsche DWS Institutional Funds, Deutsche DWS International Fund, Inc., Deutsche DWS Investment Trust, Deutsche DWS Investments VIT Funds, Deutsche DWS Money Market Trust, Deutsche DWS Municipal Trust, Deutsche DWS Portfolio Trust, Deutsche DWS Securities Trust, Deutsche DWS Tax Free Trust, Deutsche DWS Variable Series I and Government Cash Management Portfolio. Mr. Perry is a Board Member of each other Trust. |
| Mr. Perry oversees 21 funds in the DWS Fund Complex as a Board Member of various Trusts. Mr. Perry is an Advisory Board Member of various Trusts/Corporations comprised of 48 funds in the DWS Fund Complex. |
| | DWS Strategic High Yield Tax-Free Fund |
| As a result of their respective positions held with the Advisor or its affiliates, these individuals are considered “interested persons” of the Advisor within the meaning of the 1940 Act. Interested persons receive no compensation from the Fund. |
| The length of time served represents the year in which the officer was first elected in such capacity for one or more DWS funds. |
| Address: 875 Third Avenue, New York, NY 10022. |
| Address: 100 Summer Street, Boston, MA 02110. |
| Address: 5201 Gate Parkway, Jacksonville, FL 32256. |
Certain officers hold similar positions for other investment companies for which DIMA or an affiliate serves as the Advisor.
The Fund’s Statement of Additional Information (“SAI” ) includes additional information about the Board Members. The SAI is available, without charge, upon request. If you would like to request a copy of the SAI, you may do so by calling the following toll-free number: (800) 728-3337.
DWS Strategic High Yield Tax-Free Fund | | |
Account Management Resources
| The automated telephone system allows you to access personalized account information and obtain information on other DWS funds using either your voice or your telephone keypad. Certain account types within Classes A, C and S also have the ability to purchase, exchange or redeem shares using this system. |
For more information, contact your financial representative. You may also access our automated telephone system or speak with a Shareholder Service representative by calling: (800) 728-3337 |
| dws.com View your account transactions and balances, trade shares, monitor your asset allocation, subscribe to fund and account updates by e-mail, and change your address, 24 hours a day. |
Obtain prospectuses and applications, news about DWS funds, insight from DWS economists and investment specialists and access to DWS fund account information. |
| DWS PO Box 219151 Kansas City, MO 64121-9151 |
| The Fund’s policies and procedures for voting proxies for portfolio securities and information about how the Fund voted proxies related to its portfolio securities during the most recent 12-month period ended June 30 are available on our Web site — dws.com/en-us/resources/proxy-voting — or on the SEC’s Web site — sec.gov. To obtain a written copy of the Fund’s policies and procedures without charge, upon request, call us toll free at (800) 728-3337. |
| Following the Fund’s fiscal first and third quarter-end, a complete portfolio holdings listing is posted on dws.com and is available free of charge by contacting your financial intermediary or, if you are a direct investor, by calling (800) 728-3337. In addition, the portfolio holdings listing is filed with the SEC on the Fund’s Form N-PORT and will be available on the SEC’s Web site at sec.gov. Additional portfolio holdings for the Fund are also posted on dws.com from time to time. Please see the Fund’s current prospectus for more information. |
| If you have questions, comments or complaints, contact: DWS Distributors, Inc. 222 South Riverside Plaza Chicago, IL 60606-5808 (800) 621-1148 |
| | DWS Strategic High Yield Tax-Free Fund |
| DWS Investment Management Americas, Inc. (“DIMA” or the “Advisor” ), which is part of the DWS Group GmbH & Co. KGaA (“DWS Group” ), is the investment advisor for the Fund. DIMA and its predecessors have more than 90 years of experience managing mutual funds and DIMA provides a full range of investment advisory services to both institutional and retail clients. DIMA is an indirect, wholly owned subsidiary of DWS Group. |
| DWS Group is a global organization that offers a wide range of investing expertise and resources, including hundreds of portfolio managers and analysts and an office network that reaches the world’s major investment centers. This well-resourced global investment platform brings together a wide variety of experience and investment insight across industries, regions, asset classes and investing styles. |
DWS Strategic High Yield Tax-Free Fund | | |
222 South Riverside Plaza
Chicago, IL 60606-5808
DSHYTFF-2
(R-027921-13 7/23)
| | |
| | (b) Not applicable |
| | |
| ITEM 2. | CODE OF ETHICS |
| | |
| | As of the end of the period covered by this report, the registrant has adopted a code of ethics, as defined in Item 2 of Form N-CSR that applies to its Principal Executive Officer and Principal Financial Officer. There have been no amendments to, or waivers from, a provision of the code of ethics during the period covered by this report that would require disclosure under Item 2. A copy of the code of ethics is filed as an exhibit to this Form N-CSR. |
| | |
| ITEM 3. | AUDIT COMMITTEE FINANCIAL EXPERT |
| | |
| | The fund’s audit committee is comprised solely of trustees who are "independent" (as such term has been defined by the Securities and Exchange Commission ("SEC") in regulations implementing Section 407 of the Sarbanes-Oxley Act (the "Regulations")). The fund’s Board of Trustees has determined that there are several "audit committee financial experts" (as such term has been defined by the Regulations) serving on the fund’s audit committee including Ms. Catherine Schrand, the chair of the fund’s audit committee. An “audit committee financial expert” is not an “expert” for any purpose, including for purposes of Section 11 of the Securities Act of 1933 and the designation or identification of a person as an “audit committee financial expert” does not impose on such person any duties, obligations or liability that are greater than the duties, obligations and liability imposed on such person as a member of the audit committee and board of directors in the absence of such designation or identification. |
| | |
| ITEM 4. | PRINCIPAL ACCOUNTANT FEES AND SERVICES |
| | |
DWS strategic high yield tax-free Fund
form n-csr disclosure re: AUDIT FEES
The following table shows the amount of fees that Ernst & Young LLP (“EY”), the Fund’s Independent Registered Public Accounting Firm, billed to the Fund during the Fund’s last two fiscal years. The Audit Committee approved in advance all audit services and non-audit services that EY provided to the Fund.
Services that the Fund’s Independent Registered Public Accounting Firm Billed to the Fund
Fiscal Year
Ended
May 31, | Audit Fees Billed to Fund | Audit-Related
Fees Billed to Fund | Tax Fees Billed to Fund | All
Other Fees Billed to Fund |
| 2023 | $53,136 | $0 | $7,880 | $0 |
| 2022 | $55,933 | $0 | $7,880 | $0 |
The above “Tax Fees” were billed for professional services rendered for tax preparation.
Services that the Fund’s Independent Registered Public Accounting Firm Billed to the Adviser and Affiliated Fund Service Providers
The following table shows the amount of fees billed by EY to DWS Investment Management Americas, Inc. (“DIMA” or the “Adviser”), and any entity controlling, controlled by or under common control with DIMA (“Control Affiliate”) that provides ongoing services to the Fund (“Affiliated Fund Service Provider”), for engagements directly related to the Fund’s operations and financial reporting, during the Fund’s last two fiscal years.
Fiscal Year
Ended
May 31, | Audit-Related
Fees Billed to Adviser and Affiliated Fund Service Providers | Tax Fees Billed to Adviser and Affiliated Fund Service Providers | All
Other Fees Billed to Adviser and Affiliated Fund Service Providers |
| 2023 | $0 | $572,355 | $0 |
| 2022 | $0 | $429,517 | $0 |
The above “Tax Fees” were billed in connection with tax compliance services and agreed upon procedures.
Non-Audit Services
The following table shows the amount of fees that EY billed during the Fund’s last two fiscal years for non-audit services. The Audit Committee pre-approved all non-audit services that EY provided to the Adviser and any Affiliated Fund Service Provider that related directly to the Fund’s operations and financial reporting. The Audit Committee requested and received information from EY about any non-audit services that EY rendered during the Fund’s last fiscal year to the Adviser and any Affiliated Fund Service Provider. The Committee considered this information in evaluating EY’s independence.
Fiscal Year
Ended
May 31, | Total
Non-Audit Fees Billed to Fund
(A) | Total Non-Audit Fees billed to Adviser and Affiliated Fund Service Providers (engagements related directly to the operations and financial reporting of the Fund)
(B) | Total Non-Audit Fees billed to Adviser and Affiliated Fund Service Providers (all other engagements)
(C) | Total of
(A), (B) and (C) |
| 2023 | $7,880 | $572,355 | $0 | $580,235 |
| 2022 | $7,880 | $429,517 | $0 | $437,397 |
All other engagement fees were billed for services in connection with agreed upon procedures and tax compliance for DIMA and other related entities.
Audit Committee Pre-Approval Policies and Procedures. Generally, each Fund’s Audit Committee must pre approve (i) all services to be performed for a Fund by a Fund’s Independent Registered Public Accounting Firm and (ii) all non-audit services to be performed by a Fund’s Independent Registered Public Accounting Firm for the DIMA Entities with respect to operations and financial reporting of the Fund, except that the Chairperson or Vice Chairperson of each Fund’s Audit Committee may grant the pre-approval for non-audit services described in items (i) and (ii) above for non-prohibited services for engagements of less than $100,000. All such delegated pre approvals shall be presented to each Fund’s Audit Committee no later than the next Audit Committee meeting.
There were no amounts that were approved by the Audit Committee pursuant to the de minimis exception under Rule 2-01 of Regulation S-X.
According to the registrant’s principal Independent Registered Public Accounting Firm, substantially all of the principal Independent Registered Public Accounting Firm's hours spent on auditing the registrant's financial statements were attributed to work performed by full-time permanent employees of the principal Independent Registered Public Accounting Firm.
***
In connection with the audit of the 2022 and 2023 financial statements, the Fund entered into an engagement letter with EY. The terms of the engagement letter required by EY, and agreed to by the Audit Committee, include a provision mandating the use of mediation and arbitration to resolve any controversy or claim between the parties arising out of or relating to the engagement letter or services provided thereunder.
***
Pursuant to PCAOB Rule 3526, EY is required to describe in writing to the Fund’s Audit Committee, on at least an annual basis, all relationships between EY, or any of its affiliates, and the DWS Funds, including the Fund, or persons in financial reporting oversight roles at the DWS Funds that, as of the date of the communication, may reasonably be thought to bear on EY’s independence. Pursuant to PCAOB Rule 3526, EY has reported the matters set forth below that may reasonably be thought to bear on EY’s independence. With respect to each reported matter in the aggregate, EY advised the Audit Committee that, after careful consideration of the facts and circumstances and the applicable independence rules, it concluded that the matters do not and will not impair EY’s ability to exercise objective and impartial judgement in connection with the audits of the financial statements for the Fund and a reasonable investor with knowledge of all relevant facts and circumstances would conclude that EY has been and is capable of exercising objective and impartial judgment on all issues encompassed within EY’s audit engagements. EY also confirmed to the Audit Committee that it can continue to act as the Independent Registered Public Accounting Firm for the Fund.
| · | EY advised the Fund’s Audit Committee that various covered persons within EY and EY’s affiliates held investments in, or had other financial relationships with, entities within the DWS Funds “investment company complex” (as defined in Regulation S-X) (the “DWS Funds Complex”). EY informed the Audit Committee that these investments and financial relationships were inconsistent with Rule 2-01(c)(1) of Regulation S-X. EY reported that all breaches have been resolved and that none of the breaches involved any professionals who were part of the audit engagement team for the Fund or in the position to influence the audit engagement team for the Fund. |
| | |
| ITEM 5. | AUDIT COMMITTEE OF LISTED REGISTRANTS |
| | |
| | Not applicable |
| | |
| ITEM 6. | INVESTMENTS |
| | |
| | Not applicable |
| | |
| ITEM 7. | DISCLOSURE OF PROXY VOTING POLICIES AND PROCEDURES FOR CLOSED-END MANAGEMENT INVESTMENT COMPANIES |
| | |
| | Not applicable |
| | |
| ITEM 8. | PORTFOLIO MANAGERS OF CLOSED-END MANAGEMENT INVESTMENT COMPANIES |
| | |
| | Not applicable |
| | |
| ITEM 9. | PURCHASES OF EQUITY SECURITIES BY CLOSED-END MANAGEMENT INVESTMENT COMPANY AND AFFILIATED PURCHASERS |
| | |
| | Not applicable |
| | |
| ITEM 10. | SUBMISSION OF MATTERS TO A VOTE OF SECURITY HOLDERS |
| | |
| | There were no material changes to the procedures by which shareholders may recommend nominees to the Fund’s Board. The primary function of the Nominating and Governance Committee is to identify and recommend individuals for membership on the Board and oversee the administration of the Board Governance Guidelines. Shareholders may recommend candidates for Board positions by forwarding their correspondence by U.S. mail or courier service to Keith R. Fox, DWS Funds Board Chair, c/o Thomas R. Hiller, Ropes & Gray LLP, Prudential Tower, 800 Boylston Street, Boston, MA 02199-3600. |
| | |
| ITEM 11. | CONTROLS AND PROCEDURES |
| | |
| | (a) | The Chief Executive and Financial Officers concluded that the Registrant’s Disclosure Controls and Procedures are effective based on the evaluation of the Disclosure Controls and Procedures as of a date within 90 days of the filing date of this report. |
| | |
| | (b) | There have been no changes in the registrant’s internal control over financial reporting that occurred during the period covered by this report that has materially affected, or is reasonably likely to materially affect, the registrant’s internal controls over financial reporting. |
| | |
| ITEM 12. | Disclosure of Securities Lending Activities for Closed-End Management Investment Companies |
| | |
| | Not applicable |
| | |
| ITEM 13. | EXHIBITS |
| | |
| | (a)(1) | Code of Ethics pursuant to Item 2 of Form N-CSR is filed and attached hereto as EX-99.CODE ETH. |
| | |
| | (a)(2) | Certification pursuant to Rule 30a-2(a) under the Investment Company Act of 1940 (17 CFR 270.30a-2(a)) is filed and attached hereto as Exhibit 99.CERT. |
| | |
| | (b) | Certification pursuant to Rule 30a-2(b) under the Investment Company Act of 1940 (17 CFR 270.30a-2(b)) is furnished and attached hereto as Exhibit 99.906CERT. |
SIGNATURES
Pursuant to the requirements of the Securities Exchange Act of 1934 and the Investment Company Act of 1940, the registrant has duly caused this report to be signed on its behalf by the undersigned, thereunto duly authorized.
| Registrant: | DWS Strategic High Yield Tax-Free Fund, a series of Deutsche DWS Municipal Trust |
| | |
| | |
| By: | /s/Hepsen Uzcan Hepsen Uzcan President |
| | |
| Date: | 7/28/2023 |
Pursuant to the requirements of the Securities Exchange Act of 1934 and the Investment Company Act of 1940, this report has been signed below by the following persons on behalf of the registrant and in the capacities and on the dates indicated.
| By: | /s/Hepsen Uzcan Hepsen Uzcan President |
| | |
| Date: | 7/28/2023 |
| | |
| | |
| | |
| By: | /s/Diane Kenneally Diane Kenneally Chief Financial Officer and Treasurer |
| | |
| Date: | 7/28/2023 |
| | |