UNITED STATES
SECURITIES AND EXCHANGE COMMISSION
WASHINGTON, D. C. 20549
FORM N-CSR
Investment Company Act file number: 811-02671
Deutsche DWS Municipal Trust
(Exact Name of Registrant as Specified in Charter)
875 Third Avenue
New York, NY 10022-6225
(Address of Principal Executive Offices) (Zip Code)
Registrant’s Telephone Number, including Area Code: (212) 454-4500
Diane Kenneally
100 Summer Street
Boston, MA 02110
(Name and Address of Agent for Service)
| Date of fiscal year end: | 5/31 |
| | |
| Date of reporting period: | 5/31/2024 |
| Item 1. | Reports to Stockholders. |
| | |
| | (a) |
0000203142 dws:DWSIndexBloombergMunicipalBondIndex18751BroadBasedIndexMember 2023-05-31
DWS Strategic High Yield Tax-Free Fund
Annual Shareholder Report—May 31, 2024
This annual shareholder report contains important information about DWS Strategic High Yield Tax-Free Fund ("the Fund") for the period June 1, 2023 to May 31, 2024. You can find additional information about the Fund on the Fund's website at www.dws.com/mutualreports. You can also request this information by contacting us at (800) 728-3337.
This report describes changes to the Fund that occurred during the reporting period.
What were the Fund costs for the last year?
(Based on a hypothetical $10,000 investment)
| Cost of a $10,000 investment | Costs paid as a percentage of a $10,000 investment |
|---|
| Class A | $86 | 0.83% |
Gross expense ratio as of the latest prospectus: 0.95%. See prospectus for any contractual or voluntary waivers; without a waiver, costs would have been higher.
How did the Fund perform last year and what affected its performance?
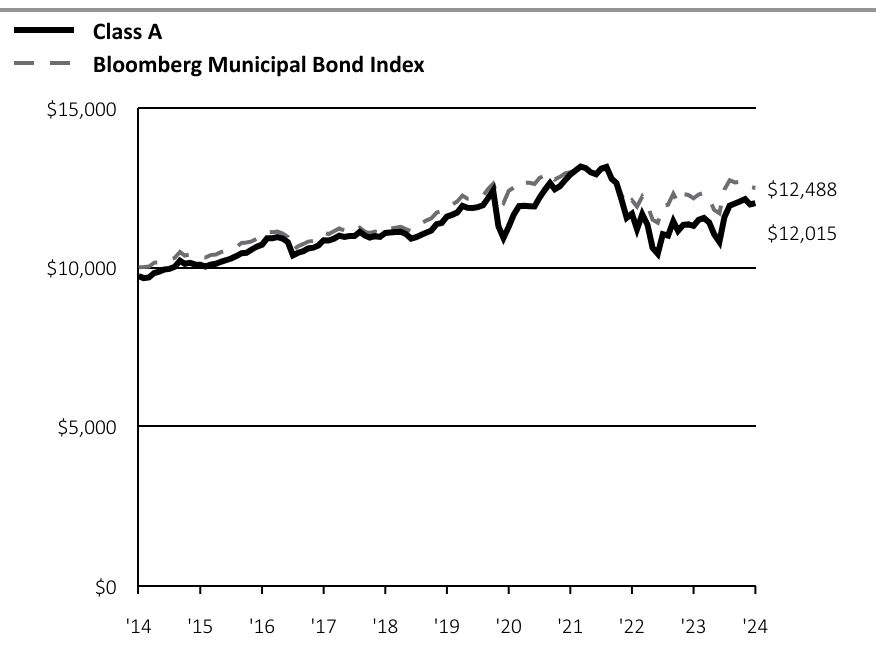
Class A shares of the Fund returned 6.33% (unadjusted for sales charges) for the period ended May 31, 2024. The Fund's index, the Bloomberg Municipal Bond Index, returned 2.67% for the same period.
Municipal market prices were pressured over the period by higher U.S. Treasury yields and greater-than-expected new issue supply. Lower quality issues in the BBB and high yield rating categories led municipal market performance as recession fears eased, supporting credit sentiment broadly. In addition, high yield prices benefited from very low new issuance. While yield increases were more muted than for U.S. Treasuries, the municipal curve finished higher along its length for the 12 months.
The Fund was overweight issues rated BBB and below investment grade, supporting returns as lower quality segments of the municipal market outperformed. In sector terms, overweight allocations to senior living, tobacco, and healthcare bonds aided performance. The Fund’s tilt toward longer maturities proved beneficial to performance as the higher income offered by these issues more than offset the negative impact on prices as the municipal yield curve moved higher.
While there were no material detractors, the Fund had exposure to a small number of distressed bonds and education-related issues that weighed marginally on relative performance.
Cumulative Growth of an Assumed $10,000Investment
(Adjusted for Maximum Sales Charge)
Bloomberg Municipal Bond Index is a market value-weighted index of investment-grade municipal bonds with maturities of one year or more.
Index returns do not reflect any fees or expenses and it is not possible to invest directly into an index.
| Class A | Bloomberg Municipal Bond Index |
|---|
| '14 | $9,725 | $10,000 |
| '14 | $9,661 | $10,009 |
| '14 | $9,682 | $10,026 |
| '14 | $9,820 | $10,148 |
| '14 | $9,864 | $10,158 |
| '14 | $9,932 | $10,228 |
| '14 | $9,952 | $10,245 |
| '14 | $10,019 | $10,297 |
| '15 | $10,206 | $10,480 |
| '15 | $10,113 | $10,371 |
| '15 | $10,141 | $10,401 |
| '15 | $10,090 | $10,347 |
| '15 | $10,080 | $10,318 |
| '15 | $10,021 | $10,309 |
| '15 | $10,083 | $10,384 |
| '15 | $10,113 | $10,404 |
| '15 | $10,175 | $10,479 |
| '15 | $10,222 | $10,521 |
| '15 | $10,277 | $10,563 |
| '15 | $10,355 | $10,637 |
| '16 | $10,443 | $10,764 |
| '16 | $10,456 | $10,781 |
| '16 | $10,561 | $10,815 |
| '16 | $10,650 | $10,894 |
| '16 | $10,712 | $10,924 |
| '16 | $10,911 | $11,098 |
| '16 | $10,913 | $11,105 |
| '16 | $10,949 | $11,120 |
| '16 | $10,905 | $11,064 |
| '16 | $10,792 | $10,948 |
| '16 | $10,377 | $10,540 |
| '16 | $10,459 | $10,663 |
| '17 | $10,508 | $10,734 |
| '17 | $10,593 | $10,808 |
| '17 | $10,617 | $10,832 |
| '17 | $10,686 | $10,910 |
| '17 | $10,850 | $11,083 |
| '17 | $10,840 | $11,044 |
| '17 | $10,899 | $11,133 |
| '17 | $10,993 | $11,218 |
| '17 | $10,953 | $11,161 |
| '17 | $10,985 | $11,188 |
| '17 | $10,982 | $11,128 |
| '17 | $11,114 | $11,244 |
| '18 | $10,993 | $11,112 |
| '18 | $10,936 | $11,079 |
| '18 | $10,978 | $11,120 |
| '18 | $10,956 | $11,080 |
| '18 | $11,080 | $11,207 |
| '18 | $11,094 | $11,216 |
| '18 | $11,108 | $11,244 |
| '18 | $11,113 | $11,273 |
| '18 | $11,045 | $11,200 |
| '18 | $10,903 | $11,131 |
| '18 | $10,948 | $11,254 |
| '18 | $11,024 | $11,388 |
| '19 | $11,090 | $11,475 |
| '19 | $11,157 | $11,536 |
| '19 | $11,355 | $11,718 |
| '19 | $11,392 | $11,762 |
| '19 | $11,591 | $11,925 |
| '19 | $11,647 | $11,969 |
| '19 | $11,721 | $12,065 |
| '19 | $11,928 | $12,255 |
| '19 | $11,868 | $12,157 |
| '19 | $11,865 | $12,179 |
| '19 | $11,890 | $12,209 |
| '19 | $11,947 | $12,247 |
| '20 | $12,179 | $12,467 |
| '20 | $12,412 | $12,627 |
| '20 | $11,290 | $12,169 |
| '20 | $10,921 | $12,017 |
| '20 | $11,273 | $12,399 |
| '20 | $11,655 | $12,501 |
| '20 | $11,919 | $12,712 |
| '20 | $11,932 | $12,652 |
| '20 | $11,917 | $12,655 |
| '20 | $11,912 | $12,617 |
| '20 | $12,188 | $12,807 |
| '20 | $12,431 | $12,885 |
| '21 | $12,649 | $12,967 |
| '21 | $12,451 | $12,761 |
| '21 | $12,547 | $12,840 |
| '21 | $12,736 | $12,947 |
| '21 | $12,914 | $12,986 |
| '21 | $13,033 | $13,022 |
| '21 | $13,162 | $13,130 |
| '21 | $13,112 | $13,082 |
| '21 | $12,978 | $12,987 |
| '21 | $12,918 | $12,949 |
| '21 | $13,099 | $13,059 |
| '21 | $13,153 | $13,081 |
| '22 | $12,776 | $12,722 |
| '22 | $12,651 | $12,677 |
| '22 | $12,106 | $12,266 |
| '22 | $11,550 | $11,927 |
| '22 | $11,681 | $12,104 |
| '22 | $11,196 | $11,906 |
| '22 | $11,666 | $12,220 |
| '22 | $11,337 | $11,952 |
| '22 | $10,614 | $11,494 |
| '22 | $10,425 | $11,398 |
| '22 | $11,043 | $11,931 |
| '22 | $10,997 | $11,965 |
| '23 | $11,445 | $12,309 |
| '23 | $11,144 | $12,031 |
| '23 | $11,333 | $12,298 |
| '23 | $11,347 | $12,270 |
| '23 | $11,299 | $12,163 |
| '23 | $11,491 | $12,285 |
| '23 | $11,551 | $12,334 |
| '23 | $11,411 | $12,156 |
| '23 | $11,037 | $11,800 |
| '23 | $10,797 | $11,699 |
| '23 | $11,579 | $12,442 |
| '23 | $11,938 | $12,731 |
| '24 | $12,001 | $12,666 |
| '24 | $12,065 | $12,683 |
| '24 | $12,140 | $12,682 |
| '24 | $11,973 | $12,525 |
| '24 | $12,015 | $12,488 |
Yearly periods ended May 31
The Fund's growth of an assumed $10,000 investment is adjusted for the maximum sales charge of 2.75%. This results in a net initial invesment of $9,725.
Average Annual Total Returns
| Class/Index | 1-Year | 5-Year | 10-Year |
|---|
| Class A Unadjusted for Sales Charge | 6.33% | 0.72% | 2.14% |
| Class A Adjusted for the Maximum Sales Charge (max 2.75% load) | 3.41% | 0.16% | 1.85% |
| Bloomberg Municipal Bond Index | 2.67% | 0.93% | 2.25% |
Performance shown is historical. The Fund's past performance is not a good predictor or guarantee of the Fund's future performance. Investment return and principal fluctuate, so your shares may be worth more or less when redeemed. Current performance may be lower or higher than the performance data quoted. The performance graph and returns table do not reflect the deduction of taxes that a shareholder would pay on Fund distributions or the redemption of Fund shares. Please visit dws.com/en-us/products/mutual-funds for the Fund’s most recent month-end performance. Fund performance includes reinvestment of all distributions. Unadjusted returns do not reflect sales charges and would have been lower if they had reflected sales charges.
| Net Assets ($) | 479,336,252 |
| Number of Portfolio Holdings | 310 |
| Portfolio Turnover Rate (%) | 58 |
| Total Net Advisory Fees Paid ($) | 2,033,647 |
| Modified Duration to Worst | 8.7 years |
Modified duration to worst is the measure of sensitivity of the prices of bonds held by the Fund to a change in interest rates, computed using each bond's nearest call or maturity date.
What did the Fund invest in?
Holdings-based data is subject to change.
The quality ratings represent the higher of Moody’s Investors Service, Inc. (“Moody’s”), Fitch Ratings, Inc. (“Fitch”) or S&P Global Ratings (“S&P”) credit ratings. The ratings of Moody’s, Fitch and S&P represent their opinions as to the quality of the securities they rate. Credit quality measures a bond issuer’s ability to repay interest and principal in a timely manner. Ratings are relative and subjective and are not absolute standards of quality. Credit quality does not remove market risk and is subject to change.
| Asset Type | % of Net Assets |
| Revenue Bonds | 87% |
| General Obligation Bonds | 5% |
| Variable Rate Demand Notes | 5% |
| Other | 1% |
| Lease Obligations | 0% |
| Escrow To Maturity/prerefunded Bonds | 0% |
| Other Assets and Liabilities, Net | 2% |
| Total | 100% |
| Credit Rating | % of Net Assets |
| AAA | 2% |
| AA | 12% |
| A | 12% |
| BBB | 19% |
| BB | 11% |
| Not Rated | 37% |
| Total | 93% |
This is a summary of certain changes of the Fund since June 1, 2023. For more information, review the Fund's current prospectus at www.dws.com/mutualreports, or call (800) 728-3337.
Effective October 1, 2023, the Fund’s contractual cap on total annual operating expense for Class A shares changed from 0.85% to 0.82%. The cap excludes certain expenses such as extraordinary expenses, taxes, brokerage, interest expense and acquired fund fees and expenses.
Effective October 1, 2023, the Fund eliminated its investment limitation on high yield debt securities (i.e., debt securities rated BB/Ba and below) of 50% of total assets. The Fund may currently invest without limit in high yield debt securities. The Fund generally intends to invest approximately 50% - 65% in high yield debt securities.
If you wish to view additional information about the Fund, including, but not limited to, its prospectus, quarterly holdings, Board fee evaluation reports, and financial statements and other information, please visit www.dws.com/mutualreports. For information about the Fund's proxy voting policies and procedures and how the Fund voted proxies related to its portfolio securities, please visit dws.com/en-us/resources/proxy-voting. This additional information is also available free of charge by contacting us at (800) 728-3337.
In order to reduce the amount of mail you receive and to help reduce expenses, we generally send a single copy of any shareholder report and prospectus to each household. If you do not want the mailing of these documents to be combined with those for other members of your household, please contact your financial representative or call DWS toll free at (800) 728-3337.
Bond investments are subject to interest-rate, credit, liquidity, and market risks to varying degrees. When interest rates rise, bond prices generally fall. Credit risk refers to the ability of an issuer to make timely payments of principal and interest. Investments in lower-quality (“junk bonds”) and non-rated securities present greater risk of loss than investments in higher-quality securities. Municipal securities are subject to the risk that litigation, legislation or other political events, local business or economic conditions or the bankruptcy of the issuer could have a significant effect on an issuer’s ability to make payments of principal and/or interest. The market for municipal bonds may be less liquid than for taxable bonds and there may be less information available on the financial condition of issuers of municipal securities than for public corporations. The Fund invests in inverse floaters, which are derivatives that involve leverage and could magnify the Fund's gains or losses. Although the Fund seeks income that is exempt from federal income taxes, a portion of the Fund’s distributions may be subject to federal, state and local taxes, including the alternative minimum tax. Please read the prospectus for details.
This report must be preceded or accompanied by a prospectus. We advise you to consider the Fund's objectives, risks, charges, and expenses carefully before investing. The prospectus contains this and other important information about the Fund, which can be requested by calling (800) 728-3337, contacting your financial representative, or visit www.dws.com/mutualreports to view or download a prospectus. Please read the prospectus carefully before you invest.
The brand DWS represents DWS Group GmbH & Co. KGaA and any of its subsidiaries such as DWS Distributors, Inc., which offers investment products, or DWS Investment Management Americas, Inc. and RREEF America L.L.C., which offer advisory services.
©2024 DWS Group GmbH&Co. KGaA. All rights reserved
DSHYTFF-TSRA-A
R-101128-1 (7/24)
DWS Strategic High Yield Tax-Free Fund
Annual Shareholder Report—May 31, 2024
This annual shareholder report contains important information about DWS Strategic High Yield Tax-Free Fund ("the Fund") for the period June 1, 2023 to May 31, 2024. You can find additional information about the Fund on the Fund's website at www.dws.com/mutualreports. You can also request this information by contacting us at (800) 728-3337.
This report describes changes to the Fund that occurred during the reporting period.
What were the Fund costs for the last year?
(Based on a hypothetical $10,000 investment)
| Cost of a $10,000 investment | Costs paid as a percentage of a $10,000 investment |
|---|
| Class S | $60 | 0.58% |
Gross expense ratio as of the latest prospectus: 0.74%. See prospectus for any contractual or voluntary waivers; without a waiver, costs would have been higher.
How did the Fund perform last year and what affected its performance?
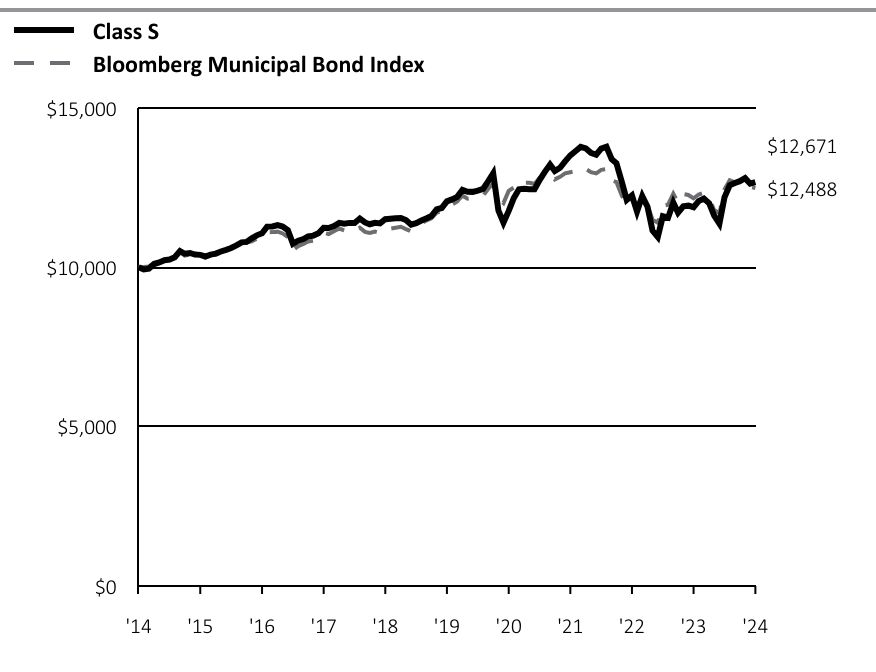
Class S shares of the Fund returned 6.60% for the period ended May 31, 2024. The Fund's index, the Bloomberg Municipal Bond Index, returned 2.67% for the same period.
Municipal market prices were pressured over the period by higher U.S. Treasury yields and greater-than-expected new issue supply. Lower quality issues in the BBB and high yield rating categories led municipal market performance as recession fears eased, supporting credit sentiment broadly. In addition, high yield prices benefited from very low new issuance. While yield increases were more muted than for U.S. Treasuries, the municipal curve finished higher along its length for the 12 months.
The Fund was overweight issues rated BBB and below investment grade, supporting returns as lower quality segments of the municipal market outperformed. In sector terms, overweight allocations to senior living, tobacco, and healthcare bonds aided performance. The Fund’s tilt toward longer maturities proved beneficial to performance as the higher income offered by these issues more than offset the negative impact on prices as the municipal yield curve moved higher.
While there were no material detractors, the Fund had exposure to a small number of distressed bonds and education-related issues that weighed marginally on relative performance.
Cumulative Growth of an Assumed $10,000Investment
Bloomberg Municipal Bond Index is a market value-weighted index of investment-grade municipal bonds with maturities of one year or more.
Index returns do not reflect any fees or expenses and it is not possible to invest directly into an index.
| Class S | Bloomberg Municipal Bond Index |
|---|
| '14 | $10,000 | $10,000 |
| '14 | $9,936 | $10,009 |
| '14 | $9,960 | $10,026 |
| '14 | $10,104 | $10,148 |
| '14 | $10,152 | $10,158 |
| '14 | $10,224 | $10,228 |
| '14 | $10,246 | $10,245 |
| '14 | $10,318 | $10,297 |
| '15 | $10,513 | $10,480 |
| '15 | $10,427 | $10,371 |
| '15 | $10,450 | $10,401 |
| '15 | $10,399 | $10,347 |
| '15 | $10,391 | $10,318 |
| '15 | $10,341 | $10,309 |
| '15 | $10,399 | $10,384 |
| '15 | $10,431 | $10,404 |
| '15 | $10,498 | $10,479 |
| '15 | $10,548 | $10,521 |
| '15 | $10,607 | $10,563 |
| '15 | $10,690 | $10,637 |
| '16 | $10,784 | $10,764 |
| '16 | $10,799 | $10,781 |
| '16 | $10,910 | $10,815 |
| '16 | $11,004 | $10,894 |
| '16 | $11,071 | $10,924 |
| '16 | $11,278 | $11,098 |
| '16 | $11,283 | $11,105 |
| '16 | $11,322 | $11,120 |
| '16 | $11,279 | $11,064 |
| '16 | $11,165 | $10,948 |
| '16 | $10,738 | $10,540 |
| '16 | $10,834 | $10,663 |
| '17 | $10,887 | $10,734 |
| '17 | $10,969 | $10,808 |
| '17 | $10,996 | $10,832 |
| '17 | $11,069 | $10,910 |
| '17 | $11,242 | $11,083 |
| '17 | $11,234 | $11,044 |
| '17 | $11,298 | $11,133 |
| '17 | $11,397 | $11,218 |
| '17 | $11,368 | $11,161 |
| '17 | $11,394 | $11,188 |
| '17 | $11,393 | $11,128 |
| '17 | $11,532 | $11,244 |
| '18 | $11,409 | $11,112 |
| '18 | $11,352 | $11,079 |
| '18 | $11,398 | $11,120 |
| '18 | $11,378 | $11,080 |
| '18 | $11,509 | $11,207 |
| '18 | $11,526 | $11,216 |
| '18 | $11,543 | $11,244 |
| '18 | $11,551 | $11,273 |
| '18 | $11,483 | $11,200 |
| '18 | $11,337 | $11,131 |
| '18 | $11,387 | $11,254 |
| '18 | $11,469 | $11,388 |
| '19 | $11,540 | $11,475 |
| '19 | $11,611 | $11,536 |
| '19 | $11,820 | $11,718 |
| '19 | $11,861 | $11,762 |
| '19 | $12,070 | $11,925 |
| '19 | $12,131 | $11,969 |
| '19 | $12,211 | $12,065 |
| '19 | $12,429 | $12,255 |
| '19 | $12,369 | $12,157 |
| '19 | $12,368 | $12,179 |
| '19 | $12,407 | $12,209 |
| '19 | $12,459 | $12,247 |
| '20 | $12,704 | $12,467 |
| '20 | $12,949 | $12,627 |
| '20 | $11,782 | $12,169 |
| '20 | $11,400 | $12,017 |
| '20 | $11,769 | $12,399 |
| '20 | $12,170 | $12,501 |
| '20 | $12,448 | $12,712 |
| '20 | $12,464 | $12,652 |
| '20 | $12,451 | $12,655 |
| '20 | $12,449 | $12,617 |
| '20 | $12,740 | $12,807 |
| '20 | $12,996 | $12,885 |
| '21 | $13,226 | $12,967 |
| '21 | $13,022 | $12,761 |
| '21 | $13,125 | $12,840 |
| '21 | $13,325 | $12,947 |
| '21 | $13,515 | $12,986 |
| '21 | $13,642 | $13,022 |
| '21 | $13,779 | $13,130 |
| '21 | $13,730 | $13,082 |
| '21 | $13,593 | $12,987 |
| '21 | $13,533 | $12,949 |
| '21 | $13,725 | $13,059 |
| '21 | $13,784 | $13,081 |
| '22 | $13,393 | $12,722 |
| '22 | $13,265 | $12,677 |
| '22 | $12,697 | $12,266 |
| '22 | $12,117 | $11,927 |
| '22 | $12,256 | $12,104 |
| '22 | $11,750 | $11,906 |
| '22 | $12,234 | $12,220 |
| '22 | $11,904 | $11,952 |
| '22 | $11,148 | $11,494 |
| '22 | $10,952 | $11,398 |
| '22 | $11,603 | $11,931 |
| '22 | $11,557 | $11,965 |
| '23 | $12,029 | $12,309 |
| '23 | $11,716 | $12,031 |
| '23 | $11,917 | $12,298 |
| '23 | $11,935 | $12,270 |
| '23 | $11,887 | $12,163 |
| '23 | $12,079 | $12,285 |
| '23 | $12,157 | $12,334 |
| '23 | $12,013 | $12,156 |
| '23 | $11,622 | $11,800 |
| '23 | $11,372 | $11,699 |
| '23 | $12,196 | $12,442 |
| '23 | $12,576 | $12,731 |
| '24 | $12,646 | $12,666 |
| '24 | $12,704 | $12,683 |
| '24 | $12,798 | $12,682 |
| '24 | $12,624 | $12,525 |
| '24 | $12,671 | $12,488 |
Yearly periods ended May 31
Average Annual Total Returns
| Class/Index | 1-Year | 5-Year | 10-Year |
|---|
| Class S No Sales Charge | 6.60% | 0.98% | 2.40% |
| Bloomberg Municipal Bond Index | 2.67% | 0.93% | 2.25% |
Performance shown is historical. The Fund's past performance is not a good predictor or guarantee of the Fund's future performance. Investment return and principal fluctuate, so your shares may be worth more or less when redeemed. Current performance may be lower or higher than the performance data quoted. The performance graph and returns table do not reflect the deduction of taxes that a shareholder would pay on Fund distributions or the redemption of Fund shares. Please visit dws.com/en-us/products/mutual-funds for the Fund’s most recent month-end performance. Fund performance includes reinvestment of all distributions.
| Net Assets ($) | 479,336,252 |
| Number of Portfolio Holdings | 310 |
| Portfolio Turnover Rate (%) | 58 |
| Total Net Advisory Fees Paid ($) | 2,033,647 |
| Modified Duration to Worst | 8.7 years |
Modified duration to worst is the measure of sensitivity of the prices of bonds held by the Fund to a change in interest rates, computed using each bond's nearest call or maturity date.
What did the Fund invest in?
Holdings-based data is subject to change.
The quality ratings represent the higher of Moody’s Investors Service, Inc. (“Moody’s”), Fitch Ratings, Inc. (“Fitch”) or S&P Global Ratings (“S&P”) credit ratings. The ratings of Moody’s, Fitch and S&P represent their opinions as to the quality of the securities they rate. Credit quality measures a bond issuer’s ability to repay interest and principal in a timely manner. Ratings are relative and subjective and are not absolute standards of quality. Credit quality does not remove market risk and is subject to change.
| Asset Type | % of Net Assets |
| Revenue Bonds | 87% |
| General Obligation Bonds | 5% |
| Variable Rate Demand Notes | 5% |
| Other | 1% |
| Lease Obligations | 0% |
| Escrow To Maturity/prerefunded Bonds | 0% |
| Other Assets and Liabilities, Net | 2% |
| Total | 100% |
| Credit Rating | % of Net Assets |
| AAA | 2% |
| AA | 12% |
| A | 12% |
| BBB | 19% |
| BB | 11% |
| Not Rated | 37% |
| Total | 93% |
This is a summary of certain changes of the Fund since June 1, 2023. For more information, review the Fund's current prospectus at www.dws.com/mutualreports, or call (800) 728-3337.
Effective October 1, 2023, the Fund’s contractual cap on total annual operating expense for Class S shares changed from 0.60% to 0.57%. The cap excludes certain expenses such as extraordinary expenses, taxes, brokerage, interest expense and acquired fund fees and expenses.
Effective October 1, 2023, the Fund eliminated its investment limitation on high yield debt securities (i.e., debt securities rated BB/Ba and below) of 50% of total assets. The Fund may currently invest without limit in high yield debt securities. The Fund generally intends to invest approximately 50% - 65% in high yield debt securities.
If you wish to view additional information about the Fund, including, but not limited to, its prospectus, quarterly holdings, Board fee evaluation reports, and financial statements and other information, please visit www.dws.com/mutualreports. For information about the Fund's proxy voting policies and procedures and how the Fund voted proxies related to its portfolio securities, please visit dws.com/en-us/resources/proxy-voting. This additional information is also available free of charge by contacting us at (800) 728-3337.
In order to reduce the amount of mail you receive and to help reduce expenses, we generally send a single copy of any shareholder report and prospectus to each household. If you do not want the mailing of these documents to be combined with those for other members of your household, please contact your financial representative or call DWS toll free at (800) 728-3337.
Bond investments are subject to interest-rate, credit, liquidity, and market risks to varying degrees. When interest rates rise, bond prices generally fall. Credit risk refers to the ability of an issuer to make timely payments of principal and interest. Investments in lower-quality (“junk bonds”) and non-rated securities present greater risk of loss than investments in higher-quality securities. Municipal securities are subject to the risk that litigation, legislation or other political events, local business or economic conditions or the bankruptcy of the issuer could have a significant effect on an issuer’s ability to make payments of principal and/or interest. The market for municipal bonds may be less liquid than for taxable bonds and there may be less information available on the financial condition of issuers of municipal securities than for public corporations. The Fund invests in inverse floaters, which are derivatives that involve leverage and could magnify the Fund's gains or losses. Although the Fund seeks income that is exempt from federal income taxes, a portion of the Fund’s distributions may be subject to federal, state and local taxes, including the alternative minimum tax. Please read the prospectus for details.
This report must be preceded or accompanied by a prospectus. We advise you to consider the Fund's objectives, risks, charges, and expenses carefully before investing. The prospectus contains this and other important information about the Fund, which can be requested by calling (800) 728-3337, contacting your financial representative, or visit www.dws.com/mutualreports to view or download a prospectus. Please read the prospectus carefully before you invest.
The brand DWS represents DWS Group GmbH & Co. KGaA and any of its subsidiaries such as DWS Distributors, Inc., which offers investment products, or DWS Investment Management Americas, Inc. and RREEF America L.L.C., which offer advisory services.
©2024 DWS Group GmbH&Co. KGaA. All rights reserved
DSHYTFF-TSRA-S
R-101128-1 (7/24)
DWS Strategic High Yield Tax-Free Fund
Annual Shareholder Report—May 31, 2024
This annual shareholder report contains important information about DWS Strategic High Yield Tax-Free Fund ("the Fund") for the period June 1, 2023 to May 31, 2024. You can find additional information about the Fund on the Fund's website at www.dws.com/mutualreports. You can also request this information by contacting us at (800) 728-3337.
This report describes changes to the Fund that occurred during the reporting period.
What were the Fund costs for the last year?
(Based on a hypothetical $10,000 investment)
| Cost of a $10,000 investment | Costs paid as a percentage of a $10,000 investment |
|---|
| Class C | $162 | 1.58% |
Gross expense ratio as of the latest prospectus: 1.71%. See prospectus for any contractual or voluntary waivers; without a waiver, costs would have been higher.
How did the Fund perform last year and what affected its performance?
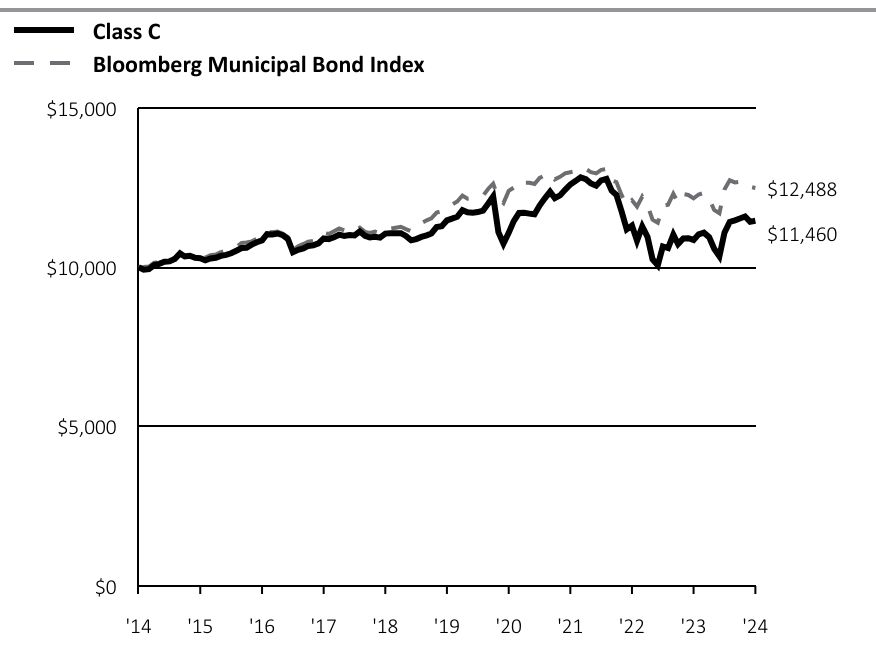
Class C shares of the Fund returned 5.53% (unadjusted for sales charges) for the period ended May 31, 2024. The Fund's index, the Bloomberg Municipal Bond Index, returned 2.67% for the same period.
Municipal market prices were pressured over the period by higher U.S. Treasury yields and greater-than-expected new issue supply. Lower quality issues in the BBB and high yield rating categories led municipal market performance as recession fears eased, supporting credit sentiment broadly. In addition, high yield prices benefited from very low new issuance. While yield increases were more muted than for U.S. Treasuries, the municipal curve finished higher along its length for the 12 months.
The Fund was overweight issues rated BBB and below investment grade, supporting returns as lower quality segments of the municipal market outperformed. In sector terms, overweight allocations to senior living, tobacco, and healthcare bonds aided performance. The Fund’s tilt toward longer maturities proved beneficial to performance as the higher income offered by these issues more than offset the negative impact on prices as the municipal yield curve moved higher.
While there were no material detractors, the Fund had exposure to a small number of distressed bonds and education-related issues that weighed marginally on relative performance.
Cumulative Growth of an Assumed $10,000Investment
Bloomberg Municipal Bond Index is a market value-weighted index of investment-grade municipal bonds with maturities of one year or more.
Index returns do not reflect any fees or expenses and it is not possible to invest directly into an index.
| Class C | Bloomberg Municipal Bond Index |
|---|
| '14 | $10,000 | $10,000 |
| '14 | $9,928 | $10,009 |
| '14 | $9,943 | $10,026 |
| '14 | $10,071 | $10,148 |
| '14 | $10,110 | $10,158 |
| '14 | $10,173 | $10,228 |
| '14 | $10,187 | $10,245 |
| '14 | $10,258 | $10,297 |
| '15 | $10,434 | $10,480 |
| '15 | $10,342 | $10,371 |
| '15 | $10,364 | $10,401 |
| '15 | $10,297 | $10,347 |
| '15 | $10,288 | $10,318 |
| '15 | $10,222 | $10,309 |
| '15 | $10,279 | $10,384 |
| '15 | $10,302 | $10,404 |
| '15 | $10,359 | $10,479 |
| '15 | $10,392 | $10,521 |
| '15 | $10,442 | $10,563 |
| '15 | $10,522 | $10,637 |
| '16 | $10,606 | $10,764 |
| '16 | $10,613 | $10,781 |
| '16 | $10,712 | $10,815 |
| '16 | $10,787 | $10,894 |
| '16 | $10,844 | $10,924 |
| '16 | $11,046 | $11,098 |
| '16 | $11,033 | $11,105 |
| '16 | $11,062 | $11,120 |
| '16 | $11,011 | $11,064 |
| '16 | $10,890 | $10,948 |
| '16 | $10,473 | $10,540 |
| '16 | $10,549 | $10,663 |
| '17 | $10,592 | $10,734 |
| '17 | $10,672 | $10,808 |
| '17 | $10,689 | $10,832 |
| '17 | $10,752 | $10,910 |
| '17 | $10,910 | $11,083 |
| '17 | $10,884 | $11,044 |
| '17 | $10,946 | $11,133 |
| '17 | $11,024 | $11,218 |
| '17 | $10,986 | $11,161 |
| '17 | $11,011 | $11,188 |
| '17 | $11,001 | $11,128 |
| '17 | $11,126 | $11,244 |
| '18 | $10,989 | $11,112 |
| '18 | $10,935 | $11,079 |
| '18 | $10,961 | $11,120 |
| '18 | $10,932 | $11,080 |
| '18 | $11,058 | $11,207 |
| '18 | $11,066 | $11,216 |
| '18 | $11,072 | $11,244 |
| '18 | $11,071 | $11,273 |
| '18 | $10,987 | $11,200 |
| '18 | $10,847 | $11,131 |
| '18 | $10,886 | $11,254 |
| '18 | $10,955 | $11,388 |
| '19 | $11,003 | $11,475 |
| '19 | $11,063 | $11,536 |
| '19 | $11,262 | $11,718 |
| '19 | $11,292 | $11,762 |
| '19 | $11,472 | $11,925 |
| '19 | $11,530 | $11,969 |
| '19 | $11,587 | $12,065 |
| '19 | $11,793 | $12,255 |
| '19 | $11,727 | $12,157 |
| '19 | $11,716 | $12,179 |
| '19 | $11,734 | $12,209 |
| '19 | $11,782 | $12,247 |
| '20 | $12,003 | $12,467 |
| '20 | $12,225 | $12,627 |
| '20 | $11,103 | $12,169 |
| '20 | $10,744 | $12,017 |
| '20 | $11,083 | $12,399 |
| '20 | $11,451 | $12,501 |
| '20 | $11,703 | $12,712 |
| '20 | $11,709 | $12,652 |
| '20 | $11,686 | $12,655 |
| '20 | $11,664 | $12,617 |
| '20 | $11,937 | $12,807 |
| '20 | $12,167 | $12,885 |
| '21 | $12,371 | $12,967 |
| '21 | $12,171 | $12,761 |
| '21 | $12,257 | $12,840 |
| '21 | $12,433 | $12,947 |
| '21 | $12,599 | $12,986 |
| '21 | $12,707 | $13,022 |
| '21 | $12,824 | $13,130 |
| '21 | $12,768 | $13,082 |
| '21 | $12,630 | $12,987 |
| '21 | $12,564 | $12,949 |
| '21 | $12,731 | $13,059 |
| '21 | $12,776 | $13,081 |
| '22 | $12,402 | $12,722 |
| '22 | $12,274 | $12,677 |
| '22 | $11,748 | $12,266 |
| '22 | $11,192 | $11,927 |
| '22 | $11,311 | $12,104 |
| '22 | $10,835 | $11,906 |
| '22 | $11,282 | $12,220 |
| '22 | $10,958 | $11,952 |
| '22 | $10,253 | $11,494 |
| '22 | $10,064 | $11,398 |
| '22 | $10,654 | $11,931 |
| '22 | $10,603 | $11,965 |
| '23 | $11,027 | $12,309 |
| '23 | $10,731 | $12,031 |
| '23 | $10,906 | $12,298 |
| '23 | $10,913 | $12,270 |
| '23 | $10,859 | $12,163 |
| '23 | $11,037 | $12,285 |
| '23 | $11,088 | $12,334 |
| '23 | $10,947 | $12,156 |
| '23 | $10,582 | $11,800 |
| '23 | $10,345 | $11,699 |
| '23 | $11,087 | $12,442 |
| '23 | $11,423 | $12,731 |
| '24 | $11,476 | $12,666 |
| '24 | $11,531 | $12,683 |
| '24 | $11,595 | $12,682 |
| '24 | $11,428 | $12,525 |
| '24 | $11,460 | $12,488 |
Yearly periods ended May 31
Average Annual Total Returns
| Class/Index | 1-Year | 5-Year | 10-Year |
|---|
| Class C Unadjusted for Sales Charge | 5.53% | | 1.37% |
| Class C Adjusted for the Maximum Sales Charge (max 1.00% CDSC) | 4.53% | -0.02% | 1.37% |
| Bloomberg Municipal Bond Index | 2.67% | 0.93% | 2.25% |
Performance shown is historical. The Fund's past performance is not a good predictor or guarantee of the Fund's future performance. Investment return and principal fluctuate, so your shares may be worth more or less when redeemed. Current performance may be lower or higher than the performance data quoted. The performance graph and returns table do not reflect the deduction of taxes that a shareholder would pay on Fund distributions or the redemption of Fund shares. Please visit dws.com/en-us/products/mutual-funds for the Fund’s most recent month-end performance. Fund performance includes reinvestment of all distributions.
| Net Assets ($) | 479,336,252 |
| Number of Portfolio Holdings | 310 |
| Portfolio Turnover Rate (%) | 58 |
| Total Net Advisory Fees Paid ($) | 2,033,647 |
| Modified Duration to Worst | 8.7 years |
Modified duration to worst is the measure of sensitivity of the prices of bonds held by the Fund to a change in interest rates, computed using each bond's nearest call or maturity date.
What did the Fund invest in?
Holdings-based data is subject to change.
The quality ratings represent the higher of Moody’s Investors Service, Inc. (“Moody’s”), Fitch Ratings, Inc. (“Fitch”) or S&P Global Ratings (“S&P”) credit ratings. The ratings of Moody’s, Fitch and S&P represent their opinions as to the quality of the securities they rate. Credit quality measures a bond issuer’s ability to repay interest and principal in a timely manner. Ratings are relative and subjective and are not absolute standards of quality. Credit quality does not remove market risk and is subject to change.
| Asset Type | % of Net Assets |
| Revenue Bonds | 87% |
| General Obligation Bonds | 5% |
| Variable Rate Demand Notes | 5% |
| Other | 1% |
| Lease Obligations | 0% |
| Escrow To Maturity/prerefunded Bonds | 0% |
| Other Assets and Liabilities, Net | 2% |
| Total | 100% |
| Credit Rating | % of Net Assets |
| AAA | 2% |
| AA | 12% |
| A | 12% |
| BBB | 19% |
| BB | 11% |
| Not Rated | 37% |
| Total | 93% |
This is a summary of certain changes of the Fund since June 1, 2023. For more information, review the Fund's current prospectus at www.dws.com/mutualreports, or call (800) 728-3337.
Effective October 1, 2023, the Fund’s contractual cap on total annual operating expense for Class C shares changed from 1.60% to 1.57%. The cap excludes certain expenses such as extraordinary expenses, taxes, brokerage, interest expense and acquired fund fees and expenses.
Effective October 1, 2023, the Fund eliminated its investment limitation on high yield debt securities (i.e., debt securities rated BB/Ba and below) of 50% of total assets. The Fund may currently invest without limit in high yield debt securities. The Fund generally intends to invest approximately 50% - 65% in high yield debt securities.
If you wish to view additional information about the Fund, including, but not limited to, its prospectus, quarterly holdings, Board fee evaluation reports, and financial statements and other information, please visit www.dws.com/mutualreports. For information about the Fund's proxy voting policies and procedures and how the Fund voted proxies related to its portfolio securities, please visit dws.com/en-us/resources/proxy-voting. This additional information is also available free of charge by contacting us at (800) 728-3337.
In order to reduce the amount of mail you receive and to help reduce expenses, we generally send a single copy of any shareholder report and prospectus to each household. If you do not want the mailing of these documents to be combined with those for other members of your household, please contact your financial representative or call DWS toll free at (800) 728-3337.
Bond investments are subject to interest-rate, credit, liquidity, and market risks to varying degrees. When interest rates rise, bond prices generally fall. Credit risk refers to the ability of an issuer to make timely payments of principal and interest. Investments in lower-quality (“junk bonds”) and non-rated securities present greater risk of loss than investments in higher-quality securities. Municipal securities are subject to the risk that litigation, legislation or other political events, local business or economic conditions or the bankruptcy of the issuer could have a significant effect on an issuer’s ability to make payments of principal and/or interest. The market for municipal bonds may be less liquid than for taxable bonds and there may be less information available on the financial condition of issuers of municipal securities than for public corporations. The Fund invests in inverse floaters, which are derivatives that involve leverage and could magnify the Fund's gains or losses. Although the Fund seeks income that is exempt from federal income taxes, a portion of the Fund’s distributions may be subject to federal, state and local taxes, including the alternative minimum tax. Please read the prospectus for details.
This report must be preceded or accompanied by a prospectus. We advise you to consider the Fund's objectives, risks, charges, and expenses carefully before investing. The prospectus contains this and other important information about the Fund, which can be requested by calling (800) 728-3337, contacting your financial representative, or visit www.dws.com/mutualreports to view or download a prospectus. Please read the prospectus carefully before you invest.
The brand DWS represents DWS Group GmbH & Co. KGaA and any of its subsidiaries such as DWS Distributors, Inc., which offers investment products, or DWS Investment Management Americas, Inc. and RREEF America L.L.C., which offer advisory services.
©2024 DWS Group GmbH&Co. KGaA. All rights reserved
DSHYTFF-TSRA-C
R-101128-1 (7/24)
DWS Strategic High Yield Tax-Free Fund
Institutional Class: NOTIX
Annual Shareholder Report—May 31, 2024
This annual shareholder report contains important information about DWS Strategic High Yield Tax-Free Fund ("the Fund") for the period June 1, 2023 to May 31, 2024. You can find additional information about the Fund on the Fund's website at www.dws.com/mutualreports. You can also request this information by contacting us at (800) 728-3337.
This report describes changes to the Fund that occurred during the reporting period.
What were the Fund costs for the last year?
(Based on a hypothetical $10,000 investment)
| Cost of a $10,000 investment | Costs paid as a percentage of a $10,000 investment |
|---|
| Institutional Class | $60 | 0.58% |
Gross expense ratio as of the latest prospectus: 0.69%. See prospectus for any contractual or voluntary waivers; without a waiver, costs would have been higher.
How did the Fund perform last year and what affected its performance?
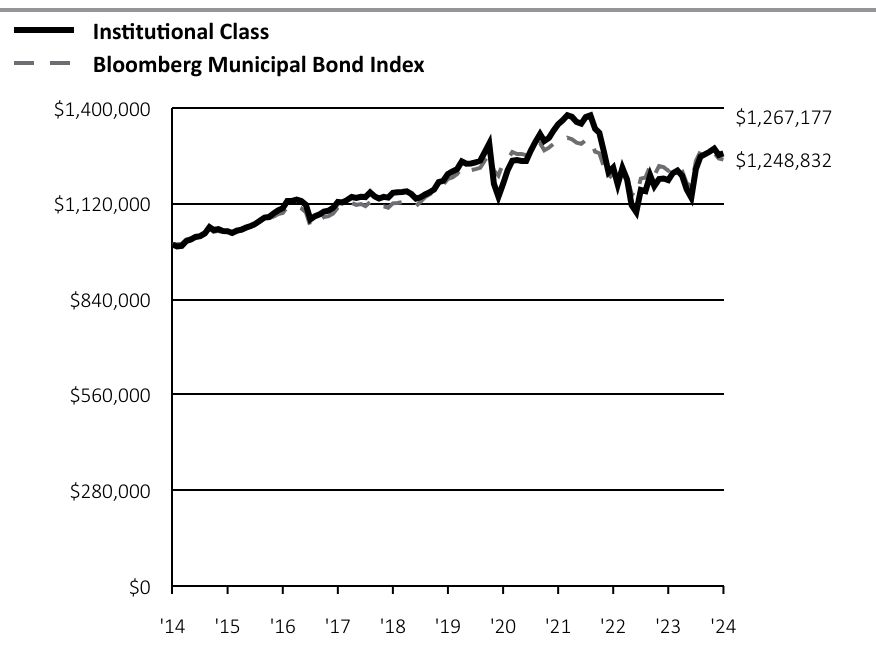
Institutional Class shares of the Fund returned 6.61% for the period ended May 31, 2024. The Fund's index, the Bloomberg Municipal Bond Index, returned 2.67% for the same period.
Municipal market prices were pressured over the period by higher U.S. Treasury yields and greater-than-expected new issue supply. Lower quality issues in the BBB and high yield rating categories led municipal market performance as recession fears eased, supporting credit sentiment broadly. In addition, high yield prices benefited from very low new issuance. While yield increases were more muted than for U.S. Treasuries, the municipal curve finished higher along its length for the 12 months.
The Fund was overweight issues rated BBB and below investment grade, supporting returns as lower quality segments of the municipal market outperformed. In sector terms, overweight allocations to senior living, tobacco, and healthcare bonds aided performance. The Fund’s tilt toward longer maturities proved beneficial to performance as the higher income offered by these issues more than offset the negative impact on prices as the municipal yield curve moved higher.
While there were no material detractors, the Fund had exposure to a small number of distressed bonds and education-related issues that weighed marginally on relative performance.
Cumulative Growth of an Assumed $1,000,000Investment
Bloomberg Municipal Bond Index is a market value-weighted index of investment-grade municipal bonds with maturities of one year or more.
Index returns do not reflect any fees or expenses and it is not possible to invest directly into an index.
| Institutional Class | Bloomberg Municipal Bond Index |
|---|
| '14 | $1,000,000 | $1,000,000 |
| '14 | $994,419 | $1,000,866 |
| '14 | $995,991 | $1,002,631 |
| '14 | $1,010,413 | $1,014,769 |
| '14 | $1,015,196 | $1,015,801 |
| '14 | $1,022,395 | $1,022,766 |
| '14 | $1,024,656 | $1,024,535 |
| '14 | $1,032,604 | $1,029,704 |
| '15 | $1,051,268 | $1,047,954 |
| '15 | $1,042,707 | $1,037,144 |
| '15 | $1,044,978 | $1,040,139 |
| '15 | $1,039,936 | $1,034,682 |
| '15 | $1,039,113 | $1,031,824 |
| '15 | $1,034,047 | $1,030,884 |
| '15 | $1,040,664 | $1,038,351 |
| '15 | $1,043,830 | $1,040,390 |
| '15 | $1,049,562 | $1,047,927 |
| '15 | $1,054,556 | $1,052,093 |
| '15 | $1,060,412 | $1,056,276 |
| '15 | $1,069,523 | $1,063,697 |
| '16 | $1,078,883 | $1,076,389 |
| '16 | $1,080,467 | $1,078,082 |
| '16 | $1,091,529 | $1,081,497 |
| '16 | $1,100,011 | $1,089,449 |
| '16 | $1,106,735 | $1,092,396 |
| '16 | $1,127,448 | $1,109,774 |
| '16 | $1,127,916 | $1,110,452 |
| '16 | $1,131,831 | $1,111,950 |
| '16 | $1,127,607 | $1,106,400 |
| '16 | $1,116,293 | $1,094,793 |
| '16 | $1,073,607 | $1,053,962 |
| '16 | $1,083,212 | $1,066,336 |
| '17 | $1,088,512 | $1,073,366 |
| '17 | $1,096,692 | $1,080,819 |
| '17 | $1,099,374 | $1,083,165 |
| '17 | $1,107,642 | $1,091,024 |
| '17 | $1,124,918 | $1,108,339 |
| '17 | $1,123,186 | $1,104,364 |
| '17 | $1,130,457 | $1,113,299 |
| '17 | $1,139,442 | $1,121,771 |
| '17 | $1,136,549 | $1,116,068 |
| '17 | $1,140,111 | $1,118,792 |
| '17 | $1,139,071 | $1,112,801 |
| '17 | $1,152,981 | $1,124,432 |
| '18 | $1,140,692 | $1,111,194 |
| '18 | $1,135,022 | $1,107,874 |
| '18 | $1,139,604 | $1,111,963 |
| '18 | $1,137,593 | $1,107,995 |
| '18 | $1,151,634 | $1,120,683 |
| '18 | $1,153,378 | $1,121,640 |
| '18 | $1,154,153 | $1,124,362 |
| '18 | $1,155,906 | $1,127,250 |
| '18 | $1,148,095 | $1,119,952 |
| '18 | $1,134,530 | $1,113,055 |
| '18 | $1,138,510 | $1,125,375 |
| '18 | $1,146,712 | $1,138,849 |
| '19 | $1,153,782 | $1,147,458 |
| '19 | $1,160,928 | $1,153,602 |
| '19 | $1,182,823 | $1,171,838 |
| '19 | $1,186,931 | $1,176,242 |
| '19 | $1,206,865 | $1,192,458 |
| '19 | $1,213,979 | $1,196,861 |
| '19 | $1,220,892 | $1,206,507 |
| '19 | $1,243,716 | $1,225,538 |
| '19 | $1,236,733 | $1,215,714 |
| '19 | $1,237,659 | $1,217,893 |
| '19 | $1,240,563 | $1,220,939 |
| '19 | $1,245,739 | $1,224,667 |
| '20 | $1,271,249 | $1,246,670 |
| '20 | $1,295,783 | $1,262,746 |
| '20 | $1,178,044 | $1,216,943 |
| '20 | $1,139,868 | $1,201,670 |
| '20 | $1,177,825 | $1,239,897 |
| '20 | $1,217,919 | $1,250,102 |
| '20 | $1,245,662 | $1,271,157 |
| '20 | $1,247,341 | $1,265,193 |
| '20 | $1,245,012 | $1,265,461 |
| '20 | $1,244,770 | $1,261,660 |
| '20 | $1,274,902 | $1,280,699 |
| '20 | $1,300,540 | $1,288,501 |
| '21 | $1,323,577 | $1,296,712 |
| '21 | $1,303,207 | $1,276,109 |
| '21 | $1,312,406 | $1,283,979 |
| '21 | $1,333,461 | $1,294,749 |
| '21 | $1,352,423 | $1,298,612 |
| '21 | $1,364,105 | $1,302,178 |
| '21 | $1,378,900 | $1,312,978 |
| '21 | $1,373,986 | $1,308,160 |
| '21 | $1,359,195 | $1,298,719 |
| '21 | $1,354,303 | $1,294,922 |
| '21 | $1,373,459 | $1,305,946 |
| '21 | $1,378,310 | $1,308,053 |
| '22 | $1,339,185 | $1,272,248 |
| '22 | $1,327,452 | $1,267,690 |
| '22 | $1,270,644 | $1,226,595 |
| '22 | $1,211,564 | $1,192,668 |
| '22 | $1,225,509 | $1,210,385 |
| '22 | $1,176,062 | $1,190,561 |
| '22 | $1,224,459 | $1,222,018 |
| '22 | $1,190,303 | $1,195,236 |
| '22 | $1,115,850 | $1,149,362 |
| '22 | $1,095,111 | $1,139,803 |
| '22 | $1,160,241 | $1,193,116 |
| '22 | $1,156,782 | $1,196,532 |
| '23 | $1,202,911 | $1,230,903 |
| '23 | $1,171,543 | $1,203,070 |
| '23 | $1,191,649 | $1,229,763 |
| '23 | $1,193,469 | $1,226,954 |
| '23 | $1,188,647 | $1,216,322 |
| '23 | $1,209,045 | $1,228,506 |
| '23 | $1,216,808 | $1,233,366 |
| '23 | $1,201,240 | $1,215,610 |
| '23 | $1,162,193 | $1,179,982 |
| '23 | $1,137,227 | $1,169,941 |
| '23 | $1,220,890 | $1,244,210 |
| '23 | $1,257,724 | $1,273,128 |
| '24 | $1,264,711 | $1,266,626 |
| '24 | $1,271,716 | $1,268,253 |
| '24 | $1,281,057 | $1,268,213 |
| '24 | $1,262,521 | $1,252,506 |
| '24 | $1,267,177 | $1,248,832 |
Yearly periods ended May 31
Average Annual Total Returns
| Class/Index | 1-Year | 5-Year | 10-Year |
|---|
| Institutional Class No Sales Charge | 6.61% | 0.98% | 2.40% |
| Bloomberg Municipal Bond Index | 2.67% | 0.93% | 2.25% |
Performance shown is historical. The Fund's past performance is not a good predictor or guarantee of the Fund's future performance. Investment return and principal fluctuate, so your shares may be worth more or less when redeemed. Current performance may be lower or higher than the performance data quoted. The performance graph and returns table do not reflect the deduction of taxes that a shareholder would pay on Fund distributions or the redemption of Fund shares. Please visit dws.com/en-us/products/mutual-funds for the Fund’s most recent month-end performance. Fund performance includes reinvestment of all distributions.
| Net Assets ($) | 479,336,252 |
| Number of Portfolio Holdings | 310 |
| Portfolio Turnover Rate (%) | 58 |
| Total Net Advisory Fees Paid ($) | 2,033,647 |
| Modified Duration to Worst | 8.7 years |
Modified duration to worst is the measure of sensitivity of the prices of bonds held by the Fund to a change in interest rates, computed using each bond's nearest call or maturity date.
What did the Fund invest in?
Holdings-based data is subject to change.
The quality ratings represent the higher of Moody’s Investors Service, Inc. (“Moody’s”), Fitch Ratings, Inc. (“Fitch”) or S&P Global Ratings (“S&P”) credit ratings. The ratings of Moody’s, Fitch and S&P represent their opinions as to the quality of the securities they rate. Credit quality measures a bond issuer’s ability to repay interest and principal in a timely manner. Ratings are relative and subjective and are not absolute standards of quality. Credit quality does not remove market risk and is subject to change.
| Asset Type | % of Net Assets |
| Revenue Bonds | 87% |
| General Obligation Bonds | 5% |
| Variable Rate Demand Notes | 5% |
| Other | 1% |
| Lease Obligations | 0% |
| Escrow To Maturity/prerefunded Bonds | 0% |
| Other Assets and Liabilities, Net | 2% |
| Total | 100% |
| Credit Rating | % of Net Assets |
| AAA | 2% |
| AA | 12% |
| A | 12% |
| BBB | 19% |
| BB | 11% |
| Not Rated | 37% |
| Total | 93% |
This is a summary of certain changes of the Fund since June 1, 2023. For more information, review the Fund's current prospectus at www.dws.com/mutualreports, or call (800) 728-3337.
Effective October 1, 2023, the Fund’s contractual cap on total annual operating expense for Institutional Class shares changed from 0.60% to 0.57%. The cap excludes certain expenses such as extraordinary expenses, taxes, brokerage, interest expense and acquired fund fees and expenses.
Effective October 1, 2023, the Fund eliminated its investment limitation on high yield debt securities (i.e., debt securities rated BB/Ba and below) of 50% of total assets. The Fund may currently invest without limit in high yield debt securities. The Fund generally intends to invest approximately 50% - 65% in high yield debt securities.
If you wish to view additional information about the Fund, including, but not limited to, its prospectus, quarterly holdings, Board fee evaluation reports, and financial statements and other information, please visit www.dws.com/mutualreports. For information about the Fund's proxy voting policies and procedures and how the Fund voted proxies related to its portfolio securities, please visit dws.com/en-us/resources/proxy-voting. This additional information is also available free of charge by contacting us at (800) 728-3337.
In order to reduce the amount of mail you receive and to help reduce expenses, we generally send a single copy of any shareholder report and prospectus to each household. If you do not want the mailing of these documents to be combined with those for other members of your household, please contact your financial representative or call DWS toll free at (800) 728-3337.
Bond investments are subject to interest-rate, credit, liquidity, and market risks to varying degrees. When interest rates rise, bond prices generally fall. Credit risk refers to the ability of an issuer to make timely payments of principal and interest. Investments in lower-quality (“junk bonds”) and non-rated securities present greater risk of loss than investments in higher-quality securities. Municipal securities are subject to the risk that litigation, legislation or other political events, local business or economic conditions or the bankruptcy of the issuer could have a significant effect on an issuer’s ability to make payments of principal and/or interest. The market for municipal bonds may be less liquid than for taxable bonds and there may be less information available on the financial condition of issuers of municipal securities than for public corporations. The Fund invests in inverse floaters, which are derivatives that involve leverage and could magnify the Fund's gains or losses. Although the Fund seeks income that is exempt from federal income taxes, a portion of the Fund’s distributions may be subject to federal, state and local taxes, including the alternative minimum tax. Please read the prospectus for details.
This report must be preceded or accompanied by a prospectus. We advise you to consider the Fund's objectives, risks, charges, and expenses carefully before investing. The prospectus contains this and other important information about the Fund, which can be requested by calling (800) 728-3337, contacting your financial representative, or visit www.dws.com/mutualreports to view or download a prospectus. Please read the prospectus carefully before you invest.
The brand DWS represents DWS Group GmbH & Co. KGaA and any of its subsidiaries such as DWS Distributors, Inc., which offers investment products, or DWS Investment Management Americas, Inc. and RREEF America L.L.C., which offer advisory services.
©2024 DWS Group GmbH&Co. KGaA. All rights reserved
DSHYTFF-TSRA-I
R-101128-1 (7/24)
| | |
| | (b) Not applicable |
| | |
| Item 2. | Code of Ethics. |
| | |
| | As of the end of the period covered by this report, the registrant has adopted a code of ethics, as defined in Item 2 of Form N-CSR that applies to its Principal Executive Officer and Principal Financial Officer. There have been no amendments to, or waivers from, a provision of the code of ethics during the period covered by this report that would require disclosure under Item 2. A copy of the code of ethics is filed as an exhibit to this Form N-CSR. |
| | |
| Item 3. | Audit Committee Financial Expert. |
| | |
| | The fund’s audit committee is comprised solely of trustees who are "independent" (as such term has been defined by the Securities and Exchange Commission ("SEC") in regulations implementing Section 407 of the Sarbanes-Oxley Act (the "Regulations")). The fund’s Board of Trustees has determined that there are several "audit committee financial experts" (as such term has been defined by the Regulations) serving on the fund’s audit committee including Ms. Catherine Schrand, the chair of the fund’s audit committee. An “audit committee financial expert” is not an “expert” for any purpose, including for purposes of Section 11 of the Securities Act of 1933 and the designation or identification of a person as an “audit committee financial expert” does not impose on such person any duties, obligations or liability that are greater than the duties, obligations and liability imposed on such person as a member of the audit committee and board of directors in the absence of such designation or identification. |
| | |
| Item 4. | Principal Accountant Fees and Services. |
| | |
DWS strategic high yield tax free Fund
form n-csr disclosure re: AUDIT FEES
The following table shows the amount of fees that Ernst & Young LLP (“EY”), the Fund’s Independent Registered Public Accounting Firm, billed to the Fund during the Fund’s last two fiscal years. The Audit Committee approved in advance all audit services and non-audit services that EY provided to the Fund.
Services that the Fund’s Independent Registered Public Accounting Firm Billed to the Fund
Fiscal Year
Ended
May 31, | Audit Fees Billed to Fund | Audit-Related
Fees Billed to Fund | Tax Fees Billed to Fund | All
Other Fees Billed to Fund |
| 2024 | $53,136 | $0 | $7,629 | $0 |
| 2023 | $53,136 | $0 | $7,880 | $0 |
The above “Tax Fees” were billed for professional services rendered for tax preparation.
Services that the Fund’s Independent Registered Public Accounting Firm Billed to the Adviser and Affiliated Fund Service Providers
The following table shows the amount of fees billed by EY to DWS Investment Management Americas, Inc. (“DIMA” or the “Adviser”), and any entity controlling, controlled by or under common control with DIMA (“Control Affiliate”) that provides ongoing services to the Fund (“Affiliated Fund Service Provider”), for engagements directly related to the Fund’s operations and financial reporting, during the Fund’s last two fiscal years.
Fiscal Year
Ended
May 31, | Audit-Related
Fees Billed to Adviser and Affiliated Fund Service Providers | Tax Fees Billed to Adviser and Affiliated Fund Service Providers | All
Other Fees Billed to Adviser and Affiliated Fund Service Providers |
| 2024 | $0 | $0 | $0 |
| 2023 | $0 | $572,355 | $0 |
The above “Tax Fees” were billed in connection with tax compliance services and agreed upon procedures.
Non-Audit Services
The following table shows the amount of fees that EY billed during the Fund’s last two fiscal years for non-audit services. The Audit Committee pre-approved all non-audit services that EY provided to the Adviser and any Affiliated Fund Service Provider that related directly to the Fund’s operations and financial reporting. The Audit Committee requested and received information from EY about any non-audit services that EY rendered during the Fund’s last fiscal year to the Adviser and any Affiliated Fund Service Provider. The Committee considered this information in evaluating EY’s independence.
Fiscal Year
Ended
May 31, | Total
Non-Audit Fees Billed to Fund
(A) | Total Non-Audit Fees billed to Adviser and Affiliated Fund Service Providers (engagements related directly to the operations and financial reporting of the Fund)
(B) | Total Non-Audit Fees billed to Adviser and Affiliated Fund Service Providers (all other engagements)
(C) | Total of
(A), (B) and (C) |
| 2024 | $7,629 | $0 | $0 | $7,629 |
| 2023 | $7,880 | $572,355 | $0 | $580,235 |
All other engagement fees were billed for services in connection with agreed upon procedures and tax compliance for DIMA and other related entities.
Audit Committee Pre-Approval Policies and Procedures. Generally, each Fund’s Audit Committee must pre approve (i) all services to be performed for a Fund by a Fund’s Independent Registered Public Accounting Firm and (ii) all non-audit services to be performed by a Fund’s Independent Registered Public Accounting Firm for the DIMA Entities with respect to operations and financial reporting of the Fund, except that the Chairperson or Vice Chairperson of each Fund’s Audit Committee may grant the pre-approval for non-audit services described in items (i) and (ii) above for non-prohibited services for engagements of less than $100,000. All such delegated pre approvals shall be presented to each Fund’s Audit Committee no later than the next Audit Committee meeting.
There were no amounts that were approved by the Audit Committee pursuant to the de minimis exception under Rule 2-01 of Regulation S-X.
According to the registrant’s principal Independent Registered Public Accounting Firm, substantially all of the principal Independent Registered Public Accounting Firm's hours spent on auditing the registrant's financial statements were attributed to work performed by full-time permanent employees of the principal Independent Registered Public Accounting Firm and (i) and (j) are not applicable.
***
In connection with the audit of the 2023 and 2024 financial statements, the Fund entered into an engagement letter with EY. The terms of the engagement letter required by EY, and agreed to by the Audit Committee, include a provision mandating the use of mediation and arbitration to resolve any controversy or claim between the parties arising out of or relating to the engagement letter or services provided thereunder.
***
| | |
| Item 5. | Audit Committee of Listed Registrants |
| | |
| | Not applicable |
| | |
| Item 6. | Investments. |
| | |
| | Not applicable |
| | |
| Item 7. | Financial Statements and Financial Highlights for Open-End Management Investment Companies. |
| | |
May 31, 2024
Annual Financial Statements and Other Information
DWS Strategic High Yield Tax-Free Fund
The brand DWS represents DWS Group GmbH & Co. KGaA and any of its subsidiaries such as DWS Distributors, Inc. which offers investment products or DWS Investment Management Americas, Inc. and RREEF America L.L.C. which offer advisory services.
| | DWS Strategic High Yield Tax-Free Fund |
Investment Portfolioas of May 31, 2024
| | |
Municipal Investments 96.2% | |
| |
Alabama, Black Belt Energy Gas District, Gas Project Revenue, Series D-1, 5.5% (a), 6/1/2049, GTY: Goldman Sachs Group, Inc. | | | |
Jefferson County, AL, Sewer Revenue, 5.5%, 10/1/2053 | | | |
| | | |
| |
Arizona, State Health Facilities Authority Revenue, Banner Health Obligated Group: | | | |
Series B, MUNIPSA + 0.25%, 3.61% (a), 1/1/2046 | | | |
Series B, Prerefunded, MUNIPSA + 0.25%, 3.61% (a), 1/1/2046 | | | |
Arizona, State Industrial Development Authority, Education Facility Revenue, Odyssey Preparatory Academy Project, 144A, 5.0%, 7/1/2049 | | | |
Arizona, State Industrial Development Authority, Education Revenue, BASIS School Projects: | | | |
Series G, 144A, 5.0%, 7/1/2047 | | | |
Series D, 144A, 5.0%, 7/1/2051 | | | |
Series G, 144A, 5.0%, 7/1/2051 | | | |
Series A, 144A, 5.25%, 7/1/2047 | | | |
Maricopa County, AZ, Industrial Development Authority, Education Revenue, Benjamin Franklin Charter School Project, Series A, 144A, 6.0%, 7/1/2052 | | | |
Phoenix, AZ, Industrial Development Authority, Student Housing Revenue, Downtown Phoenix Student Housing LLC, Series A, 5.0%, 7/1/2037 | | | |
Pima County, AZ, Industrial Development Authority, Education Revenue, American Leadership Academy Project: | | | |
Series 2022, 144A, 4.0%, 6/15/2057 | | | |
| | | |
| | | |
| | | |
| |
California, Community Housing Agency, Essential Housing Revenue, Verdant at Green Valley Project, Series A, 144A, 5.0%, 8/1/2049 | | | |
The accompanying notes are an integral part of the financial statements.
DWS Strategic High Yield Tax-Free Fund | | |
| | |
California, CSCDA Community Improvement Authority, Essential Housing Revenue: | | | |
Series A-1, 144A, 3.5%, 10/1/2046 | | | |
Series A, 144A, 5.0%, 7/1/2051 | | | |
California, Golden State Tobacco Securitization Corp., Tobacco Settlement Revenue: | | | |
Series B-2, Zero Coupon, 6/1/2066 | | | |
Series B-1, 3.85%, 6/1/2050 | | | |
California, Morongo Band of Mission Indians Revenue, Series B, 144A, 5.0%, 10/1/2042 | | | |
California, M-S-R Energy Authority, Series B, 7.0%, 11/1/2034, GTY: Citigroup Global Markets | | | |
California, Municipal Finance Authority, Barlow Respiratory Hospital Obligated Group, Series A, 4.0%, 9/1/2040 | | | |
California, River Islands Public Financing Authority, Special Tax, Community Facilities District No. 2019-1, Phase 2 Public Improvements: | | | |
| | | |
| | | |
California, State Municipal Finance Authority Revenue, Catalyst Impact Fund 1 LLC, “II” , 144A, 7.0%, 1/1/2039 | | | |
California, State Public Finance Authority Revenue, ENSO Village Project, Series A, 144A, 5.0%, 11/15/2046 | | | |
California, Statewide Communities Development Authority Revenue, Loma Linda University Medical Center, Series A, 5.5%, 12/1/2054 | | | |
California, Statewide Communities Development Authority, Multi-Family Housing Revenue, Foxwood Apartments Project, Series J, 3.13% (b), 6/7/2024, LOC: Wells Fargo Bank NA | | | |
California, University of California Revenue, Series Z-2, 5.37% (b), 6/7/2024 | | | |
Long Beach, CA, Carnival Cruise Terminal Financing, 144A, 7.282%, 11/1/2030, GTY: Carnival Corp. | | | |
Los Angeles, CA, Department of Airports Revenue, Series A, AMT, 5.0%, 5/15/2037 | | | |
| | | |
| |
Colorado, Aurora Highlands Community Authority Board, Special Tax Revenue, Series A, 5.75%, 12/1/2051 | | | |
Colorado, Broadway Station Metropolitan District No. 3, Series B, 0%–7.5% 12/1/2049 (c) | | | |
Colorado, North Range Metropolitan District No. 3, Series A, 5.25%, 12/1/2050 | | | |
Colorado, Public Energy Authority, Natural Gas Purchased Revenue, 6.25%, 11/15/2028, GTY: Merrill Lynch & Co. | | | |
The accompanying notes are an integral part of the financial statements.
| | DWS Strategic High Yield Tax-Free Fund |
| | |
Colorado, State Health Facilities Authority, Hospital Revenue, CommonSpirit Health Obligation Group, Series A-1, 4.0%, 8/1/2037 | | | |
Colorado, Sterling Ranch Community Authority Board Revenue, Metropolitan District No. 4 Subdistrict A, Series A, 6.5%, 12/1/2054 | | | |
Colorado, Trails At Crowfoot Metropolitan District No. 3, Series A, 5.0%, 12/1/2049 | | | |
Denver City & County, CO, Airport System Revenue: | | | |
Series B, AMT, 5.5%, 11/15/2040 | | | |
Series B, AMT, 5.5%, 11/15/2042 | | | |
Series B, AMT, 5.5%, 11/15/2043 | | | |
Denver, CO, Convention Center Hotel Authority Revenue: | | | |
| | | |
| | | |
Denver, CO, Urban Renewal Authority, Tax Increment Revenue, 9th Urban Redevelopment Area, Series A, 144A, 5.25%, 12/1/2039 | | | |
Douglas County, CO, Rampart Range Metropolitan District No. 5: | | | |
| | | |
| | | |
| | | |
District of Columbia 2.3% | |
District of Columbia, Latin American Montessori Bilingual Public Charter School, 5.0%, 6/1/2050 | | | |
District of Columbia, Two Rivers Public Charter School, Inc., 5.0%, 6/1/2040 | | | |
Metropolitan Washington, DC, Airport Authority, Dulles Toll Road Revenue: | | | |
Series B, 3.0%, 10/1/2050, INS: AGMC | | | |
Series B, 5.0%, 10/1/2047 | | | |
| | | |
| |
Charlotte County, FL, Industrial Development Authority, Utility System Revenue, Town & Country Utilities Project, Series A, 144A, AMT, 4.0%, 10/1/2051, GTY: Babcock Ranch IRR LLC | | | |
Collier County, FL, Industrial Development Authority, Continuing Care Community Revenue, Arlington of Naples Project, Series A, 144A, 8.125%, 5/15/2044 * (d) | | | |
Collier County, FL, State Educational Facilities Authority Revenue, Ave Maria University Inc., 5.25%, 6/1/2038 | | | |
The accompanying notes are an integral part of the financial statements.
DWS Strategic High Yield Tax-Free Fund | | |
| | |
Florida, Capital Project Finance Authority, Student Housing Revenue, Loan Program: | | | |
Series A-1, 5.0%, 10/1/2032 | | | |
Series A-1, 5.0%, 10/1/2033 | | | |
Series A-1, 5.0%, 10/1/2034 | | | |
Series A-1, 5.0%, 10/1/2035 | | | |
Florida, Capital Projects Finance Authority Revenue, Provident Group - Continuum Properties LLC: | | | |
Series A-1, 5.0%, 11/1/2053 | | | |
Series A-1, 5.0%, 11/1/2058 | | | |
Florida, Capital Trust Agency, Educational Facilities Authority, Charter Educational Foundation Project, Series A, 144A, 5.375%, 6/15/2048 | | | |
Florida, Capital Trust Agency, Educational Growth Fund LLC, Charter School Portfolio Project, Series A-1, 144A, 5.0%, 7/1/2056 | | | |
Florida, Capital Trust Agency, Southeastern University Obligated Group Project: | | | |
Series A, 144A, 6.25%, 5/1/2048 | | | |
Series A, 144A, 6.375%, 5/1/2053 | | | |
Florida, Development Finance Corp., AAF Operations Holdings LLC, 144A, AMT, 12.0% (a), 7/15/2032 | | | |
Florida, Development Finance Corp., Brightline Trains Florida LLC, AMT, 5.5%, 7/1/2053 | | | |
Florida, Development Finance Corp., Educational Facilities Revenue, River City Science Academy Project: | | | |
Series A-1, 5.0%, 7/1/2042 | | | |
| | | |
Series A-1, 5.0%, 7/1/2051 | | | |
| | | |
Series A-1, 5.0%, 2/1/2057 | | | |
| | | |
Florida, State Development Finance Corp., Learning Gate Community School Project: | | | |
Series A, 5.0%, 2/15/2038 | | | |
Series A, 5.0%, 2/15/2048 | | | |
Florida, State Development Finance Corp., Senior Living Revenue, The Cabana at Jensen Dunes Project: | | | |
Series A, 144A, 5.0%, 11/15/2056 | | | |
Series A, 144A, 5.25%, 11/15/2056 | | | |
Florida, State Higher Educational Facilities Financial Authority Revenue, Florida Institute of Technology: | | | |
| | | |
| | | |
The accompanying notes are an integral part of the financial statements.
| | DWS Strategic High Yield Tax-Free Fund |
| | |
Florida, State Higher Educational Facilities Financial Authority Revenue, Jacksonville University Project, Series A-1, 144A, 4.75%, 6/1/2038 | | | |
Florida, Village Community Development District No. 12, Special Assessment Revenue: | | | |
| | | |
| | | |
Florida, Village Community Development District No. 13, Special Assessment Revenue, 3.25%, 5/1/2052 | | | |
Florida, Village Community Development District No. 14, 5.5%, 5/1/2053 | | | |
Florida, Village Community Development District No. 15, Special Assessment Revenue, 144A, 5.25%, 5/1/2054 | | | |
Jacksonville, FL, Educational Facilities Revenue, Jacksonville University Project, Series B, 144A, 5.0%, 6/1/2053 | | | |
Lake County, FL, Educational Facilities Revenue, Imagine South Lake Charter School Project, Series A, 144A, 5.0%, 1/15/2054 | | | |
Miami-Dade County, FL, Seaport Revenue, Series A, AMT, 5.0%, 10/1/2040 | | | |
Osceola County, FL, Transportation Revenue: | | | |
Series A2, Zero Coupon, 10/1/2049 | | | |
Series A2, Zero Coupon, 10/1/2051 | | | |
Series A2, Zero Coupon, 10/1/2054 | | | |
Palm Beach County, FL, Health Facilities Authority Revenue, Lifespace Communities, Inc. Obligated Group: | | | |
Series C, 7.5%, 5/15/2053 | | | |
Series C, 7.625%, 5/15/2058 | | | |
Seminole County, FL, Industrial Development Authority, Legacy Pointe At UCF Project: | | | |
Series A, 5.25%, 11/15/2039 | | | |
Series A, 5.5%, 11/15/2049 | | | |
| | | |
| |
George L Smith II, GA, Congress Center Authority, Convention Center Hotel First Tier, Series A, 4.0%, 1/1/2054 | | | |
George L Smith II, GA, Congress Center Authority, Convention Center Hotel Second Tier, Series B, 144A, 5.0%, 1/1/2054 | | | |
Georgia, Main Street Natural Gas, Inc., Gas Supply Revenue, Series B, 5.0% (a), 7/1/2053, GTY: Royal Bank of Canada | | | |
| | | |
The accompanying notes are an integral part of the financial statements.
DWS Strategic High Yield Tax-Free Fund | | |
| | |
| |
Chicago, IL, Board of Education: | | | |
Series B, 4.0%, 12/1/2035 | | | |
Series A, 5.0%, 12/1/2033 | | | |
Series A, 6.0%, 12/1/2049 | | | |
Chicago, IL, General Obligation: | | | |
| | | |
| | | |
Illinois, Finance Authority Revenue, The Carle Foundation, Series C, 3.37% (b), 6/7/2024, LOC: Barclays Bank PLC | | | |
Illinois, Housing Development Authority Revenue: | | | |
| | | |
Series E, 5.25%, 10/1/2052 | | | |
Illinois, State Finance Authority Revenue, Friendship Village of Schaumburg, 5.125%, 2/15/2045 * (d) | | | |
Illinois, State General Obligation: | | | |
| | | |
Series A, 5.0%, 12/1/2042 | | | |
| | | |
| | | |
| | | |
| |
Indiana, State Finance Authority Revenue, Educational Facilities, Rock Creek Community Academy Inc., Project, Series A, 144A, 6.125%, 7/1/2048 | | | |
Indiana, State Housing & Community Development Authority, Single Family Mortgage Revenue, Series C-1, 5.0%, 7/1/2053 | | | |
Indianapolis, IN, Local Public Improvement Bond Bank, Airport Authority Project: | | | |
| | | |
Series E, 6.125%, 3/1/2057 | | | |
Series F, 7.75%, 3/1/2067 | | | |
| | | |
| |
Iowa, State Finance Authority Revenue, Lifespace Communities, Inc. Obligated Group, Series B, 7.5%, 5/15/2053 | | | |
Iowa, State Higher Education Loan Authority Revenue, Des Moines University Project, 4.0%, 10/1/2050 | | | |
Iowa, State Student Loan Liquidity Corp., Senior Revenue, Series B, AMT, 3.0%, 12/1/2039 | | | |
The accompanying notes are an integral part of the financial statements.
| | DWS Strategic High Yield Tax-Free Fund |
| | |
Iowa, Tobacco Settlement Authority Revenue: | | | |
“2", Series B-2, Zero Coupon, 6/1/2065 | | | |
“2", Series B1, 4.0%, 6/1/2049 | | | |
| | | |
| |
Wyandotte County, KS, Unified Government, Legends Apartments Garage & West Lawn Project, 4.5%, 6/1/2040 | | | |
| |
Kentucky, State Economic Development Finance Authority, Owensboro Health, Inc., Obligated Group, Series A, 5.25%, 6/1/2041 | | | |
Louisville & Jefferson County, KY, Metropolitan Government Health System Revenue, Norton Healthcare, Inc., Series B, 4.05% (b), 6/3/2024, LOC: PNC Bank NA | | | |
| | | |
| |
Louisiana, Public Facilities Authority Revenue, Ochsner Clinic Foundation Project, Prerefunded, 5.0%, 5/15/2047 | | | |
Louisiana, State Gasoline & Fuels Tax Revenue, Series A-2, 4.0% (b), 6/3/2024, LOC: Toronto-Dominion Bank | | | |
| | | |
| |
Maryland, State Community Development Administration, Series B, 5.35% (b), 6/7/2024, SPA: TD Bank NA | | | |
| |
Massachusetts, Educational Financing Authority Education Loan Revenue, Series B, AMT, 2.0%, 7/1/2037 | | | |
Massachusetts, State Department of Transportation, Metropolitan Highway Systems Revenue, Series A-2, 3.25% (b), 6/7/2024, LOC: TD Bank NA | | | |
Massachusetts, State Development Finance Agency Revenue, Springfield College, Series A, 4.0%, 6/1/2056 | | | |
Massachusetts, State Development Financing Agency, College of the Holy Cross, Series A, 3.95% (b), 6/3/2024, LOC: Bank of America NA | | | |
Massachusetts, State Educational Financing Authority: | | | |
Series B, AMT, 3.0%, 7/1/2035 | | | |
Series B, AMT, 4.25%, 7/1/2044 | | | |
The accompanying notes are an integral part of the financial statements.
DWS Strategic High Yield Tax-Free Fund | | |
| | |
Massachusetts, State Health & Educational Facilities Authority Revenue, Baystate Medical Center: | | | |
Series J-2-R, 4.0% (b), 6/3/2024, LOC: TD Bank NA | | | |
Series K, 4.0% (b), 6/3/2024, LOC: TD Bank NA | | | |
| | | |
| |
Kentwood, MI, Economic Development Corp., Holland Home Obligated Group, Series 2022, 4.0%, 11/15/2043 | | | |
Michigan, Finance Authority Higher Facilities, Ltd. Obligation Revenue, Kettering University Project: | | | |
| | | |
| | | |
Michigan, State Finance Authority Revenue, Detroit Water & Sewer Department, Series C, 5.0%, 7/1/2035 | | | |
Michigan, State Finance Authority Revenue, Tobacco Settlement Revenue: | | | |
“1", Series A, 4.0%, 6/1/2049 | | | |
Series A2, 5.0%, 6/1/2040 | | | |
| | | |
| |
Minnesota, State Housing Finance Agency, Series I, 5.0%, 7/1/2053 | | | |
Minnesota, State Office of Higher Education Revenue, AMT, 2.65%, 11/1/2038 | | | |
| | | |
| |
Kansas City, MO, Land Clearance Redevelopment Authority Project Revenue, Convention Center Hotel Project, Series A, 144A, 6.25%, 4/15/2049 | | | |
Missouri, State Health & Educational Facilities Authority Revenue, Medical Research, Lutheran Senior Services: | | | |
| | | |
| | | |
Missouri, State Health & Educational Facilities Authority Revenue, St Louis University: | | | |
Series B-1, 3.95% (b), 6/3/2024, LOC: Barclays Bank PLC | | | |
Series B, 4.1% (b), 6/3/2024, LOC: U.S. Bank NA | | | |
The accompanying notes are an integral part of the financial statements.
| | DWS Strategic High Yield Tax-Free Fund |
| | |
Nodaway County, MO, Industrial Development Authority, Educational Facilities Revenue, North West Foundation, Inc., 3.32% (b), 6/7/2024, LOC: U.S. Bank NA | | | |
St. Louis, MO, Industrial Development Authority Financing Revenue, Ballpark Village Development Project, Series A, 4.75%, 11/15/2047 | | | |
| | | |
| |
Nevada, Tahoe Douglas Visitors Authority, Stateline Revenue: | | | |
| | | |
| | | |
| | | |
Reno, NV, Sales Tax Revenue, Transportation Rail Access, Series C, 144A, Zero Coupon, 7/1/2058 | | | |
| | | |
| |
New Hampshire, State Health & Educational Facilities Authority Revenue, Hillside Village: | | | |
Series A, 144A, 6.125%, 7/1/2037 * (d) | | | |
Series A, 144A, 6.25%, 7/1/2042 * (d) | | | |
| | | |
| |
New Jersey, State Covid-19 General Obligation Emergency Bonds, Series A, 4.0%, 6/1/2031 | | | |
New Jersey, State Economic Development Authority Revenue, Series SSS, 5.25%, 6/15/2038 | | | |
New Jersey, State Economic Development Authority Revenue, Black Horse EHT Urban Renewal LLC Project, Series A, 144A, 5.0%, 10/1/2039 * (d) | | | |
New Jersey, State Economic Development Authority Revenue, White Horse HMT Urban Renewal LLC Project, 144A, 5.0%, 1/1/2040 * (d) | | | |
New Jersey, State Economic Development Authority, Special Facilities Revenue, Continental Airlines, Inc. Project, Series B, AMT, 5.625%, 11/15/2030 | | | |
New Jersey, State Higher Education Assistance Authority, Student Loan Revenue: | | | |
Series B, AMT, 3.25%, 12/1/2039 | | | |
Series B, AMT, 3.5%, 12/1/2039 | | | |
Series B, AMT, 4.25%, 12/1/2045 | | | |
Series C, AMT, 5.0%, 12/1/2053 | | | |
The accompanying notes are an integral part of the financial statements.
DWS Strategic High Yield Tax-Free Fund | | |
| | |
New Jersey, State Housing & Mortgage Finance Agency, Single Family Housing Revenue, Series I, 5.0%, 10/1/2053 | | | |
New Jersey, Transportation Trust Fund Authority, Series BB, 4.0%, 6/15/2040 | | | |
| | | |
| |
New Mexico, State Mortgage Finance Authority, “I” , Series D, 3.25%, 7/1/2044 | | | |
| |
Buffalo & Erie County, NY, Industrial Land Development Corp., D’Youville College Project: | | | |
Series A, 4.0%, 11/1/2040 | | | |
Series A, 4.0%, 11/1/2050 | | | |
Monroe County, NY, Industrial Development Corp. Revenue, St. Ann’s Community Project, 5.0%, 1/1/2050 | | | |
New York, Metropolitan Transportation Authority Revenue: | | | |
Series G-1, 3.41% (b), 6/7/2024, LOC: TD Bank NA | | | |
Series 2012-G1, 4.0% (b), 6/3/2024, LOC: Barclays Bank PLC | | | |
Series E-1, 4.0% (b), 6/3/2024, LOC: Barclays Bank PLC | | | |
New York, State Dormitory Authority Revenues, Non-State Supported Debt, The New School: | | | |
| | | |
| | | |
New York, State Transportation Development Corp., Special Facilities Revenue, Delta Air Lines, Inc., LaGuardia Airport C&D Redevelopment, AMT, 5.625%, 4/1/2040 | | | |
New York, State Transportation Development Corp., Special Facilities Revenue, John F. Kennedy International Airport Project: | | | |
AMT, 3.0%, 8/1/2031, GTY: American Airlines Group, Inc. | | | |
| | | |
| | | |
| | | |
| | | |
New York, Triborough Bridge & Tunnel Authority Revenue: | | | |
Series B, 4.0% (b), 6/3/2024, LOC: TD Bank NA | | | |
Series B-4C, 4.15% (b), 6/3/2024, LOC: U.S. Bank NA | | | |
| | | |
| | | |
| | | |
The accompanying notes are an integral part of the financial statements.
| | DWS Strategic High Yield Tax-Free Fund |
| | |
New York City, NY, Housing Development Corp., Multi-Family Housing Revenue: | | | |
Series E-1, 2.8%, 11/1/2034 | | | |
Series E-1, 3.0%, 11/1/2039 | | | |
New York Counties, NY, Tobacco Trust IV, Series F, Zero Coupon, 6/1/2060 | | | |
Orange County, NY, Senior Care Revenue, Industrial Development Agency, The Glen Arden Project, Series A, 5.7%, 1/1/2028 * (d) | | | |
Westchester County, NY, Local Development Corp., Health Care Corp. Obligated Group Revenue, 5.75%, 11/1/2053, INS: AGMC | | | |
| | | |
| |
North Carolina, State Education Assistance Authority Revenue, Series A, AMT, 5.0%, 6/1/2043 | | | |
North Carolina, State Housing Finance Agency, Series 42, 4.0%, 1/1/2050 | | | |
| | | |
| |
City of Grand Forks, ND, Altru Health System Obligated Group Revenue, Series A, 5.0%, 12/1/2053, INS: AGMC | | | |
| |
Buckeye, OH, Tobacco Settlement Financing Authority: | | | |
“2", Series B-3, Zero Coupon, 6/1/2057 | | | |
“2", Series B-2, 5.0%, 6/1/2055 | | | |
Hamilton County, OH, Health Care Revenue, Life Enriching Communities Project: | | | |
| | | |
| | | |
Series A, 5.75%, 1/1/2053 | | | |
Ohio, Akron, Bath & Copley Joint Township Hospital District Revenue, 5.25%, 11/15/2046 | | | |
Ohio, State Hospital Revenue, Aultman Health Foundation, 144A, 5.0%, 12/1/2048 | | | |
| | | |
| |
Oklahoma, State Development Finance Authority, Health System Revenue, OU Medicine Project: | | | |
Series B, 5.25%, 8/15/2048 | | | |
The accompanying notes are an integral part of the financial statements.
DWS Strategic High Yield Tax-Free Fund | | |
| | |
Series A, 5.5%, 8/15/2041 | | | |
Series A, 5.5%, 8/15/2044 | | | |
| | | |
| |
Chester County, PA, Industrial Development Authority, Special Obligation Revenue, Woodlands at Graystone Neighborhood Improvement Project, 144A, 5.125%, 3/1/2048 | | | |
Lancaster County, PA, Hospital Authority, Brethren Village Project: | | | |
| | | |
| | | |
Pennsylvania, Higher Education Assistance Agency Education Loan Revenue: | | | |
Series A, AMT, 2.45%, 6/1/2041 | | | |
| | | |
Pennsylvania, State Economic Development Financing Authority Revenue, UPMC Obligated Group, Series A-2, 4.0%, 5/15/2043 | | | |
Pennsylvania, State Housing Finance Agency, Single Family Mortgage Revenue: | | | |
Series 132A, 3.5%, 4/1/2051 | | | |
Series 145A, 6.0%, 10/1/2054 (e) | | | |
Pennsylvania, State Turnpike Commission Revenue, Series A-1, 5.0%, 12/1/2041 | | | |
Philadelphia, PA, Authority For Industrial Development, Philadelphia Electrical and Technology Charter High School Project, Series A, 4.0%, 6/1/2051 | | | |
| | | |
| |
Rhode Island, Student Loan Authority Revenue, Series A, AMT, 4.125%, 12/1/2043 | | | |
| |
South Carolina, Public Service Authority Revenue, Series A, 4.0%, 12/1/2055 | | | |
South Carolina, State Jobs-Economic Development Authority Revenue, Novant Health Obligated Group, Series A, 5.5%, 11/1/2054 | | | |
South Carolina, State Public Service Authority Revenue: | | | |
Series B, 4.0%, 12/1/2047 | | | |
Series A, 4.0%, 12/1/2052 | | | |
| | | |
The accompanying notes are an integral part of the financial statements.
| | DWS Strategic High Yield Tax-Free Fund |
| | |
| |
Lincon County, SD, Economic Development Revenue, Augustana College Association Project, Series A, 4.0%, 8/1/2056 | | | |
| |
Greeneville, TN, Health & Educational Facilities Board Hospital Revenue, Series B, 3.35% (b), 6/7/2024, LOC: U.S. Bank NA | | | |
Metropolitan Nashville, TN, Airport Authority Revenue: | | | |
Series B, AMT, 4.0%, 7/1/2049 | | | |
Series B, AMT, 4.0%, 7/1/2054 | | | |
Nashville & Davidson County, TN, Metropolitan Development & Housing Agency, Tax Increment Revenue, Fifth Broadway Development District, 144A, 5.125%, 6/1/2036 | | | |
Nashville & Davidson County, TN, Metropolitan Government Health & Education Facilities Board Revenue, Blakeford At Green Hills Corp., Series A, 4.0%, 11/1/2055 | | | |
Tennessee, New Memphis Arena Public Building Authority, City of Memphis Project, 0%–4.0% 4/1/2031 (c) | | | |
Tennessee, State Energy Acquisition Corporation Revenue, Series A, 5.0% (a), 5/1/2052, GTY: Goldman Sachs Group, Inc. | | | |
| | | |
| |
Central Texas, Regional Mobility Authority Revenue, Capital Appreciation: | | | |
| | | |
| | | |
Clifton, TX, Higher Education Finance Corp., Education Revenue, Series D, 6.125%, 8/15/2048 | | | |
Dallas, TX, Kay Bailey Hutchison Convention Center Project, Senior Lien, Special Tax, 144A, 6.0% (a), 8/15/2053 | | | |
Harris County, TX, Industrial Development Corp. Revenue, Energy Transfer LP, 4.05% (a), 11/1/2050 | | | |
Matagorda County, TX, Navigation District No. 1, Pollution Control Revenue, AEP Texas Central Co. Project, Series A, 4.4%, 5/1/2030, INS: AMBAC | | | |
Newark, TX, Higher Education Finance Corp., Texas Revenue, Abilene Christian University Project, Series A, 4.0%, 4/1/2057 | | | |
The accompanying notes are an integral part of the financial statements.
DWS Strategic High Yield Tax-Free Fund | | |
| | |
San Antonio, TX, Education Facilities Corp., Higher Education Revenue, Hallmark University Project: | | | |
Series A, 5.0%, 10/1/2041 | | | |
Series A, 5.0%, 10/1/2051 | | | |
Tarrant County, TX, Cultural Education Facilities Finance Corp., Christus Health Obligated Group, Series C-2, 3.43% (b), 6/7/2024, LOC: Bank of NY Mellon | | | |
Temple, TX, Tax Increment, Reinvestment Zone No. 1: | | | |
Series A, 4.0%, 8/1/2039, INS: BAM | | | |
Series A, 4.0%, 8/1/2041, INS: BAM | | | |
| | | |
Texas, New Hope Cultural Education Facilities Finance Corp. Revenue, Bridgemoor Plano Project: | | | |
Series A-2, Zero Coupon, 12/31/2030 | | | |
Series A-1, 7.25%, 12/31/2030 | | | |
Texas, New Hope Cultural Education Facilities Finance Corp., Educational Revenue, Cumberland Academy Project, Series A, 144A, 5.0%, 8/15/2050 | | | |
Texas, Private Activity Bond, Surface Transportation Corp. Revenue, North Tarrant Express, AMT, 5.5%, 12/31/2058 | | | |
Texas, State Municipal Gas Acquisition & Supply Corp. I, Gas Supply Revenue, Series D, 6.25%, 12/15/2026, GTY: Merrill Lynch & Co. | | | |
| | | |
| |
Utah, Infrastructure Agency Telecommunication Revenue: | | | |
Series A, 4.0%, 10/15/2036 | | | |
Series A, 4.0%, 10/15/2041 | | | |
Series A, 4.0%, 10/15/2042 | | | |
Utah, State Charter School Financing Authority Revenue, Freedom Academy Foundation Project, 144A, 5.375%, 6/15/2048 | | | |
| | | |
| |
Vermont, State Educational & Health Buildings Financing Agency Revenue, Landmark College Project, Series A, 4.01% (b), 6/3/2024, LOC: TD Bank NA | | | |
Vermont, State Educational & Health Buildings Financing Agency Revenue, St Michael’s College Inc., 144A, 5.5%, 10/1/2043 | | | |
| | | |
The accompanying notes are an integral part of the financial statements.
| | DWS Strategic High Yield Tax-Free Fund |
| | |
| |
Prince William County, VA, Industrial Development Authority, Residential Care Facilities, Westminster at Lake Ridge: | | | |
| | | |
| | | |
Roanoke County, VA, Economic Development Authority Revenue, Richfield Living, Series A, 5.25%, 9/1/2049 | | | |
Roanoke County, VA, Economic Development Authority, RSDL Care Facilities Revenue, Richfield Living, Series A, 5.375%, 9/1/2054 | | | |
Virginia, Marquis Community Development Authority Revenue: | | | |
| | | |
Series B, 5.625%, 9/1/2041 (d) (f) | | | |
144A, 7.5%, 9/1/2045 (d) (f) | | | |
Virginia, Peninsula Town Center, Community Development Authority Revenue, Special Obligation: | | | |
| | | |
| | | |
Virginia, Small Business Financing Authority Revenue, 95 Express Lanes LLC Project, AMT, 4.0%, 1/1/2048 | | | |
Virginia, Small Business Financing Authority Revenue, Elizabeth River Crossings OpCo LLC, AMT, 4.0%, 1/1/2038 | | | |
Virginia, Small Business Financing Authority, Elizabeth River Crossings OPCO LLC Project, AMT, 4.0%, 1/1/2039 | | | |
Virginia, Small Business Financing Authority, Private Activity Revenue, Transform 66 P3 Project, AMT, 5.0%, 12/31/2049 | | | |
Virginia Beach, VA, State Beach Development Authority Residential Care Facility, Westminster-Canterbury on Chesapeake Bay Obligated Group, Series B-3, 5.375%, 9/1/2029 | | | |
| | | |
| |
Skagit County, WA, Public Hospital District No. 1 Revenue, 5.5%, 12/1/2054 | | | |
Washington, State Convention Center Public Facilities District: | | | |
Series B, 3.0%, 7/1/2048, INS: AGMC | | | |
| | | |
The accompanying notes are an integral part of the financial statements.
DWS Strategic High Yield Tax-Free Fund | | |
| | |
Washington, State Housing Finance Commission, Emerald Heights: | | | |
Series B-2, 4.0%, 7/1/2026 | | | |
Series B-1, 4.75%, 7/1/2027 | | | |
Washington, State Housing Finance Commission, Panorama Project, 3.35% (b), 6/7/2024, LOC: Wells Fargo Bank NA | | | |
Washington, State Housing Finance Commission, The Hearthstone Project: | | | |
Series A, 144A, 5.0%, 7/1/2038 | | | |
Series A, 144A, 5.0%, 7/1/2048 | | | |
Series A, 144A, 5.0%, 7/1/2053 | | | |
| | | |
| |
Wisconsin, Health Educational Facilities Authority, Covenant Communities, Inc. Project: | | | |
Series A-1, 5.0%, 7/1/2043 | | | |
| | | |
| | | |
Wisconsin, Public Finance Authority Educational Facility Revenue, Noorba College of Osteopathic Media Project, Series B, 144A, 6.5%, 6/1/2045 | | | |
Wisconsin, Public Finance Authority, Education Revenue, Mountain Island Charter School Ltd.: | | | |
| | | |
| | | |
Wisconsin, Public Finance Authority, Education Revenue, North Carolina Leadership Academy, Series A, 144A, 5.0%, 6/15/2049 | | | |
Wisconsin, Public Finance Authority, Fargo-Moorhead Metropolitan Area Flood Risk Management Project, AMT, 4.0%, 9/30/2051 | | | |
Wisconsin, Public Finance Authority, Hospital Revenue, Carson Valley Medical Center, Series A, 144A, 4.0%, 12/1/2051 | | | |
Wisconsin, Public Finance Authority, Pollution Control Revenue, Duke Energy Progress Project, Series A-2, 3.7% (a), 10/1/2046 | | | |
Wisconsin, Public Finance Authority, Roseman University of Health Sciences Project: | | | |
| | | |
144A, Prerefunded, 4.0%, 4/1/2042 | | | |
144A, Prerefunded, 4.0%, 4/1/2052 | | | |
The accompanying notes are an integral part of the financial statements.
| | DWS Strategic High Yield Tax-Free Fund |
| | |
Wisconsin, Public Finance Authority, Senior Living Community First Mortgage Revenue, Cedars Obligated Group: | | | |
| | | |
| | | |
Wisconsin, Public Finance Authority, Wisconsin Hotel Revenue, Senior Lien Grand Hyatt San Antonio Hotel, Series B, 144A, 6.0%, 2/1/2062 | | | |
Wisconsin, Public Financing Authority, Retirement Facilities Revenue, Southminster, Inc., 144A, 5.0%, 10/1/2053 | | | |
Wisconsin, State Health & Educational Facilities Authority Revenue, Froedtert Health Inc., Obligated Group, Series A, 4.0%, 4/1/2039 | | | |
Wisconsin, State Health & Educational Facilities Authority Revenue, Marshfield Clinic Health System, Inc., Series A, 4.0% (b), 6/3/2024, LOC: Barclays Bank Plc | | | |
| | | |
| |
Guam, Government Waterworks Authority, Water & Wastewater System Revenue, Series A, 5.0%, 1/1/2050 | | | |
| |
Puerto Rico, Commonwealth Aqueduct and Sewer Authority, Series A, 144A, 4.0%, 7/1/2042 | | | |
Puerto Rico, General Obligation: | | | |
Series A, Zero Coupon, 7/1/2024 | | | |
Series A, Zero Coupon, 7/1/2033 | | | |
Series A1, 4.0%, 7/1/2033 | | | |
Series A1, 4.0%, 7/1/2035 | | | |
Series A1, 4.0%, 7/1/2037 | | | |
Series A1, 4.0%, 7/1/2041 | | | |
Series A1, 5.375%, 7/1/2025 | | | |
Series A1, 5.625%, 7/1/2027 | | | |
Series A1, 5.75%, 7/1/2031 | | | |
Puerto Rico, Sales Tax Financing Corp., Sales Tax Revenue: | | | |
Series A-1, 4.75%, 7/1/2053 | | | |
Series A-1, 5.0%, 7/1/2058 | | | |
Puerto Rico, The Childrens Trust Fund, Tobacco Settlement Revenue, Series A, Zero Coupon, 5/15/2057 | | | |
| | | |
The accompanying notes are an integral part of the financial statements.
DWS Strategic High Yield Tax-Free Fund | | |
| | |
| |
Freddie Mac Multi-Family ML Certificates, “A-CA” , Series 2021-ML10, 2.046%, 6/25/2038 | | | |
Total Municipal Investments (Cost $493,462,121) | |
| |
| |
| | | |
| | | |
| | | |
Total Corporate Bonds (Cost $5,051,812) | |
| | |
Closed-End Investment Companies 1.0% | |
Nuveen Quality Municipal Income Fund (Cost $5,256,881) | | | |
Open-End Investment Companies 0.0% | |
BlackRock Liquidity Funds MuniCash Portfolio, Institutional Shares, 3.23% (g) (Cost $8,584) | | | |
| | | |
Total Investment Portfolio (Cost $503,779,398) | | |
Other Assets and Liabilities, Net | | |
| | |
| Non-income producing security. |
| Variable or floating rate security. These securities are shown at their current rate as of May 31, 2024. For securities based on a published reference rate and spread, the reference rate and spread are indicated within the description above. Certain variable rate securities are not based on a published reference rate and spread but adjust periodically based on current market conditions, prepayment of underlying positions and/or other variables. Securities with a floor or ceiling feature are disclosed at the inherent rate, where applicable. |
| Variable rate demand notes are securities whose interest rates are reset periodically (usually daily mode or weekly mode) by remarketing agents based on current market levels, and are not directly set as a fixed spread to a reference rate. These securities may be redeemed at par by the holder through a put or tender feature, and are shown at their current rates as of May 31, 2024. Date shown reflects the earlier of demand date or stated maturity date. |
The accompanying notes are an integral part of the financial statements.
| | DWS Strategic High Yield Tax-Free Fund |
| Security is a “step-up” bond where the coupon increases or steps-up at a predetermined date. The range of rates shown is the current coupon rate through the final coupon rate, date shown is the final maturity date. |
| Defaulted security or security for which income has been deemed uncollectible. |
| When-issued or delayed delivery securities included. |
| Security currently paying partial interest. The rate shown represents 50% of the original coupon rate. |
| Current yield; not a coupon rate. |
144A: Security exempt from registration under Rule 144A of the Securities Act of 1933. These securities may be resold in transactions exempt from registration, normally to qualified institutional buyers. |
AGMC: Assured Guaranty Municipal Corp. |
AMBAC: Ambac Financial Group, Inc. |
AMT: Subject to alternative minimum tax. |
BAM: Build America Mutual |
|
|
|
MUNIPSA: SIFMA Municipal Swap Index Yield |
Prerefunded: Bonds which are prerefunded are collateralized usually by U.S. Treasury securities which are held in escrow and used to pay principal and interest on tax-exempt issues and to retire the bonds in full at the earliest refunding date. |
SIFMA: Securities Industry and Financial Markets Association |
SPA: Standby Bond Purchase Agreement |
Various inputs are used in determining the value of the Fund’s investments. These inputs are summarized in three broad levels. Level 1 includes quoted prices in active markets for identical securities. Level 2 includes other significant observable inputs (including quoted prices for similar securities, interest rates, prepayment speeds and credit risk). Level 3 includes significant unobservable inputs (including the Fund’s own assumptions in determining the fair value of investments). The level assigned to the securities valuations may not be an indication of the risk or liquidity associated with investing in those securities.
The following is a summary of the inputs used as of May 31, 2024 in valuing the Fund’s investments. For information on the Fund’s policy regarding the valuation of investments, please refer to the Security Valuation section of Note A in the accompanying Notes to Financial Statements.
| | | | |
Municipal Investments (a) | | | | |
| | | | |
Closed-End Investment Companies | | | | |
Open-End Investment Companies | | | | |
| | | | |
| See Investment Portfolio for additional detailed categorizations. |
The accompanying notes are an integral part of the financial statements.
DWS Strategic High Yield Tax-Free Fund | | |
Statement of Assets and Liabilities
| |
Investment in securities, at value (cost $503,779,398) | |
Receivable for investments sold | |
Receivable for Fund shares sold | |
| |
| |
| |
| |
| |
Payable for investments purchased — when-issued/delayed-delivery securities | |
Payable for Fund shares redeemed | |
| |
| |
| |
Other accrued expenses and payables | |
| |
| |
| |
Distributable earnings (loss) | |
| |
| |
The accompanying notes are an integral part of the financial statements.
| | DWS Strategic High Yield Tax-Free Fund |
Statement of Assets and Liabilities as of May 31, 2024 (continued)
| |
| |
Net Asset Value and redemption price per share
($145,007,687 ÷ 13,874,656 outstanding shares of beneficial interest,
$.01 par value, unlimited shares authorized) | |
Maximum offering price per share (100 ÷ 97.25 of $10.45) | |
| |
Net Asset Value, offering and redemption price
(subject to contingent deferred sales charge) per share
($4,122,439 ÷ 394,035 outstanding shares of beneficial interest, $.01 par value, unlimited shares authorized) | |
| |
Net Asset Value, offering and redemption price per share
($232,976,209 ÷ 22,273,313 outstanding shares of beneficial interest, $.01 par value, unlimited shares authorized) | |
| |
Net Asset Value, offering and redemption price per share
($97,229,917 ÷ 9,292,434 outstanding shares of beneficial interest, $.01 par value, unlimited shares authorized) | |
The accompanying notes are an integral part of the financial statements.
DWS Strategic High Yield Tax-Free Fund | | |
Statement of Operations
for the year ended May 31, 2024
| |
| |
| |
| |
| |
| |
| |
| |
| |
Distribution and service fees | |
| |
| |
| |
| |
Trustees' fees and expenses | |
| |
Total expenses before expense reductions | |
| |
Total expenses after expense reductions | |
| |
Realized and Unrealized Gain (Loss) | |
Net realized gain (loss) from: | |
| |
| |
| |
Change in net unrealized appreciation (depreciation) on: | |
| |
| |
| |
| |
Net increase (decrease) in net assets resulting from operations | |
The accompanying notes are an integral part of the financial statements.
| | DWS Strategic High Yield Tax-Free Fund |
Statements of Changes in Net Assets
| |
Increase (Decrease) in Net Assets | | |
| | |
| | |
| | |
Change in net unrealized appreciation
(depreciation) | | |
Net increase (decrease) in net assets resulting from operations | | |
Distributions to shareholders: | | |
| | |
| | |
| | |
| | |
| | |
| | |
Proceeds from shares sold | | |
Reinvestment of distributions | | |
Payments for shares redeemed | | |
Net increase (decrease) in net assets from Fund share transactions | | |
Increase (decrease) in net assets | | |
Net assets at beginning of period | | |
Net assets at end of period | | |
The accompanying notes are an integral part of the financial statements.
DWS Strategic High Yield Tax-Free Fund | | |
Financial Highlights
DWS Strategic High Yield Tax-Free Fund — Class A |
| |
| | | | | |
|
Net asset value, beginning of period | | | | | |
Income (loss) from investment operations: | | | | | |
| | | | | |
Net realized and unrealized gain (loss) | | | | | |
Total from investment operations | | | | | |
| | | | | |
| | | | | |
| | | | | |
| | | | | |
Net asset value, end of period | | | | | |
| | | | | |
Ratios to Average Net Assets and Supplemental Data |
Net assets, end of period ($ millions) | | | | | |
Ratio of expenses before expense reductions (including interest expense) (%) | | | | | |
Ratio of expenses after expense reductions (including interest expense) (%) | | | | | |
Ratio of expenses after expense reductions (excluding interest expense) (%) | | | | | |
Ratio of net investment income (%) | | | | | |
Portfolio turnover rate (%) | | | | | |
| Total return does not reflect the effect of any sales charges. |
| Total return would have been lower had certain expenses not been reduced. |
| Interest expense represents interest and fees on short-term floating rate notes issued in conjunction with inverse floating rate securities. Interest income from such transactions is included in income from investment operations. |
| Amount is less than $.005. |
The accompanying notes are an integral part of the financial statements.
| | DWS Strategic High Yield Tax-Free Fund |
DWS Strategic High Yield Tax-Free Fund — Class C |
| |
| | | | | |
|
Net asset value, beginning of period | | | | | |
Income (loss) from investment operations: | | | | | |
| | | | | |
Net realized and unrealized gain (loss) | | | | | |
Total from investment operations | | | | | |
| | | | | |
| | | | | |
| | | | | |
| | | | | |
Net asset value, end of period | | | | | |
| | | | | |
Ratios to Average Net Assets and Supplemental Data |
Net assets, end of period ($ millions) | | | | | |
Ratio of expenses before expense reductions (including interest expense) (%) | | | | | |
Ratio of expenses after expense reductions (including interest expense) (%) | | | | | |
Ratio of expenses after expense reductions (excluding interest expense) (%) | | | | | |
Ratio of net investment income (%) | | | | | |
Portfolio turnover rate (%) | | | | | |
| Total return does not reflect the effect of any sales charges. |
| Total return would have been lower had certain expenses not been reduced. |
| Interest expense represents interest and fees on short-term floating rate notes issued in conjunction with inverse floating rate securities. Interest income from such transactions is included in income from investment operations. |
| Amount is less than $.005. |
The accompanying notes are an integral part of the financial statements.
DWS Strategic High Yield Tax-Free Fund | | |
DWS Strategic High Yield Tax-Free Fund — Class S |
| |
| | | | | |
|
Net asset value, beginning of period | | | | | |
Income (loss) from investment operations: | | | | | |
| | | | | |
Net realized and unrealized gain (loss) | | | | | |
Total from investment operations | | | | | |
| | | | | |
| | | | | |
| | | | | |
| | | | | |
Net asset value, end of period | | | | | |
| | | | | |
Ratios to Average Net Assets and Supplemental Data |
Net assets, end of period ($ millions) | | | | | |
Ratio of expenses before expense reductions (including interest expense) (%) | | | | | |
Ratio of expenses after expense reductions (including interest expense) (%) | | | | | |
Ratio of expenses after expense reductions (excluding interest expense) (%) | | | | | |
Ratio of net investment income (%) | | | | | |
Portfolio turnover rate (%) | | | | | |
| Total return would have been lower had certain expenses not been reduced. |
| Interest expense represents interest and fees on short-term floating rate notes issued in conjunction with inverse floating rate securities. Interest income from such transactions is included in income from investment operations. |
| Amount is less than $.005. |
The accompanying notes are an integral part of the financial statements.
| | DWS Strategic High Yield Tax-Free Fund |
DWS Strategic High Yield Tax-Free Fund — Institutional Class |
| |
| | | | | |
|
Net asset value, beginning of period | | | | | |
Income (loss) from investment operations: | | | | | |
| | | | | |
Net realized and unrealized gain (loss) | | | | | |
Total from investment operations | | | | | |
| | | | | |
| | | | | |
| | | | | |
| | | | | |
Net asset value, end of period | | | | | |
| | | | | |
Ratios to Average Net Assets and Supplemental Data |
Net assets, end of period ($ millions) | | | | | |
Ratio of expenses before expense reductions (including interest expense) (%) | | | | | |
Ratio of expenses after expense reductions (including interest expense) (%) | | | | | |
Ratio of expenses after expense reductions (excluding interest expense) (%) | | | | | |
Ratio of net investment income (%) | | | | | |
Portfolio turnover rate (%) | | | | | |
| Total return would have been lower had certain expenses not been reduced. |
| Interest expense represents interest and fees on short-term floating rate notes issued in conjunction with inverse floating rate securities. Interest income from such transactions is included in income from investment operations. |
| Amount is less than $.005. |
The accompanying notes are an integral part of the financial statements.
DWS Strategic High Yield Tax-Free Fund | | |
Notes to Financial Statements
A.
Organization and Significant Accounting Policies
DWS Strategic High Yield Tax-Free Fund (the “Fund” ) is a diversified series of Deutsche DWS Municipal Trust (the “Trust” ), which is registered under the Investment Company Act of 1940, as amended (the “1940 Act” ), as an open-end management investment company organized as a Massachusetts business trust.
The Fund offers multiple classes of shares which provide investors with different purchase options. Class A shares are subject to an initial sales charge. Class C shares are not subject to an initial sales charge but are subject to higher ongoing expenses than Class A shares and a contingent deferred sales charge payable upon certain redemptions within one year of purchase. Class C shares automatically convert to Class A shares in the same fund after 8 years, provided that the Fund or the financial intermediary through which the shareholder purchased the Class C shares has records verifying that the Class C shares have been held for at least 8 years. Class S shares are not subject to initial or contingent deferred sales charges and are available through certain intermediary relationships with financial services firms, or can be purchased by establishing an account directly with the Fund’s transfer agent. Institutional Class shares are not subject to initial or contingent deferred sales charges and are generally available only to qualified institutions.
Investment income, realized and unrealized gains and losses, and certain fund-level expenses and expense reductions, if any, are borne pro rata on the basis of relative net assets by the holders of all classes of shares, except that each class bears certain expenses unique to that class such as distribution and service fees, services to shareholders and certain other class-specific expenses. Differences in class-level expenses may result in payment of different per share dividends by class. All shares of the Fund have equal rights with respect to voting subject to class-specific arrangements.
The Fund’s financial statements are prepared in accordance with accounting principles generally accepted in the United States of America (“U.S. GAAP” ) which require the use of management estimates. Actual results could differ from those estimates. The Fund qualifies as an investment company under Topic 946 of Accounting Standards Codification of U.S. GAAP. The policies described below are followed consistently by the Fund in the preparation of its financial statements.
Security Valuation. Investments are stated at value determined as of the close of regular trading on the New York Stock Exchange on each day the exchange is open for trading.
The Fund’s Board has designated DWS Investment Management Americas, Inc. (the “Advisor” ) as the valuation designee for the Fund pursuant to Rule 2a-5 under the 1940 Act. The Advisor’s Pricing
| | DWS Strategic High Yield Tax-Free Fund |
Committee (the “Pricing Committee” ) typically values securities using readily available market quotations or prices supplied by independent pricing services (which are considered fair values under Rule 2a-5). The Advisor has adopted fair valuation procedures that provide methodologies for fair valuing securities.
Various inputs are used in determining the value of the Fund’s investments. These inputs are summarized in three broad levels. Level 1 includes quoted prices in active markets for identical securities. Level 2 includes other significant observable inputs (including quoted prices for similar securities, interest rates, prepayment speeds and credit risk). Level 3 includes significant unobservable inputs (including the Fund’s own assumptions in determining the fair value of investments). The level assigned to the securities valuations may not be an indication of the risk or liquidity associated with investing in those securities.
Municipal debt securities are valued at prices supplied by independent pricing services approved by the Pricing Committee, whose valuations are intended to reflect the mean between the bid and asked prices. Such services may use various pricing techniques which take into account appropriate factors such as yield, quality, coupon rate, maturity, type of issue, trading characteristics and other data, as well as broker quotes. If the pricing services are unable to provide valuations, the securities are valued at the mean of the most recent bid and asked quotations or evaluated prices, as applicable, obtained from broker-dealers. These securities are generally categorized as Level 2.
Other debt securities are valued at prices supplied by independent pricing services approved by the Pricing Committee. Such services may use various pricing techniques which take into account appropriate factors such as yield, quality, coupon rate, maturity, type of issue, trading characteristics, prepayment speeds and other data, as well as broker quotes. If the pricing services are unable to provide valuations, debt securities are valued at the average of the most recent reliable bid quotations or evaluated prices, as applicable, obtained from broker-dealers. These securities are generally categorized as Level 2.
Closed-end investment companies are valued at the most recent sale price or official closing price reported on the exchange (U.S. or foreign) or over-the-counter market on which they trade. Closed-end investment companies for which no sales are reported are valued at the calculated mean between the most recent bid and asked quotations on the relevant market or, if a mean cannot be determined, at the most recent bid quotation. Closed-end investment companies are generally categorized as Level 1.
Investments in open-end investment companies are valued at their net asset value each business day and are categorized as Level 1.
DWS Strategic High Yield Tax-Free Fund | | |
Futures contracts are generally valued at the settlement prices established each day on the exchange on which they are traded and are categorized as Level 1.
Securities and other assets for which market quotations are not readily available or for which the above valuation procedures are deemed not to reflect fair value are valued in a manner that is intended to reflect their fair value as determined in accordance with procedures approved by the Pricing Committee and are generally categorized as Level 3. In accordance with the Fund’s valuation procedures, factors considered in determining value may include, but are not limited to, the type of the security; the size of the holding; the initial cost of the security; the existence of any contractual restrictions on the security’s disposition; the price and extent of public trading in similar securities of the issuer or of comparable companies; quotations or evaluated prices from broker-dealers and/or pricing services; information obtained from the issuer, analysts, and/or the appropriate stock exchange (for exchange-traded securities); an analysis of the company’s or issuer’s financial statements; an evaluation of the forces that influence the issuer and the market(s) in which the security is purchased and sold; and with respect to debt securities, the maturity, coupon, creditworthiness, currency denomination and the movement of the market in which the security is normally traded. The value determined under these procedures may differ from published values for the same securities.
Disclosure about the classification of fair value measurements is included in a table following the Fund’s Investment Portfolio.
Inverse Floaters. The Fund may invest in inverse floaters. Inverse floaters are debt instruments with a weekly floating rate of interest that bears an inverse relationship to changes in short-term market interest rates. Inverse floaters are created by depositing a fixed-rate long-term municipal bond into a special purpose Tender Option Bond Trust (the “TOB Trust” ). In turn the TOB Trust issues a short-term floating rate note and an inverse floater. The short-term floating rate note is issued in a face amount equal to some fraction of the underlying bond’s par amount and is sold to a third party, usually a tax-exempt money market fund. The Fund receives the proceeds from the sale of the short-term floating rate note and uses the cash proceeds to make additional investments. The short-term floating rate note represents leverage to the Fund. The Fund, as the holder of the inverse floater, has full exposure to any increase or decrease in the value of the underlying bond. The income stream from the underlying bond in the TOB Trust is divided between the floating rate note and the inverse floater. The inverse floater earns all of the interest from the underlying long-term fixed-rate bond less the amount of interest paid on the floating rate note and the expenses of the TOB Trust. The floating rate notes issued by the TOB Trust are valued at cost, which approximates fair value.
By holding the inverse floater, the Fund has the right to collapse the TOB Trust by causing the holders of the floating rate instrument to tender their
| | DWS Strategic High Yield Tax-Free Fund |
notes at par and have the broker transfer the underlying bond to the Fund. The floating rate note holder can also elect to tender the note for redemption at par at each reset date. The Fund accounts for these transactions, if any, as a form of secured borrowing, by reflecting the value of the underlying bond in the investments of the Fund and the amount owed to the floating rate note holder as a liability under the caption “Payable for floating rate notes issued” in the Statement of Assets and Liabilities. Income earned on the underlying bond is included in interest income, and interest paid on the floaters and the expenses of the TOB Trust are included in “Interest expense and fees on floating rate notes issued” in the Statement of Operations.
The Fund may enter into shortfall and forbearance agreements by which the Fund agrees to reimburse the TOB Trust, in certain circumstances, for the difference between the liquidation value of the underlying bond held by the TOB Trust and the liquidation value of the floating rate notes plus any shortfalls in interest cash flows. This could potentially expose the Fund to losses in excess of the value of the Fund’s inverse floater investments. In addition, the value of inverse floaters may decrease significantly when interest rates increase. The market for inverse floaters may be more volatile and less liquid than other municipal bonds of comparable maturity. The TOB Trust could be terminated outside of the Fund’s control, resulting in a reduction of leverage and disposal of portfolio investments at inopportune times and prices. Investments in inverse floaters generally involve greater risk than in an investment in fixed-rate bonds.
The Fund did not invest in inverse floaters during the period.
When-Issued, Delayed-Delivery Securities. The Fund may purchase or sell securities with delivery or payment to occur at a later date beyond the normal settlement period. At the time the Fund enters into a commitment to purchase or sell a security, the transaction is recorded and the value of the transaction is reflected in the net asset value. The price of such security and the date when the security will be delivered and paid for are fixed at the time the transaction is negotiated. The value of the security may vary with market fluctuations.
Certain risks may arise upon entering into when-issued, delayed-delivery transactions from the potential inability of counterparties to meet the terms of their contracts or if the issuer does not issue the securities due to political, economic or other factors. Additionally, losses may arise due to changes in the value of the underlying securities.
Federal Income Taxes. The Fund’s policy is to comply with the requirements of the Internal Revenue Code of 1986, as amended, which are applicable to regulated investment companies, and to distribute all of its taxable and tax-exempt income to its shareholders.
At May 31, 2024, the Fund had net tax basis capital loss carryforwards of $139,010,070, including short-term losses ($111,601,119) and long-term
DWS Strategic High Yield Tax-Free Fund | | |
losses ($27,408,951), which may be applied against realized net taxable capital gains indefinitely.
The Fund has reviewed the tax positions for the open tax years as of May 31, 2024 and has determined that no provision for income tax and/or uncertain tax positions is required in the Fund’s financial statements. The Fund’s federal tax returns for the prior three fiscal years remain open subject to examination by the Internal Revenue Service.
Distribution of Income and Gains. Net investment income of the Fund is declared as a daily dividend and distributed to shareholders monthly. Net realized gains from investment transactions, in excess of available capital loss carryforwards, would be taxable to the Fund if not distributed, and, therefore, will be distributed to shareholders at least annually. The Fund may also make additional distributions for tax purposes if necessary.
The timing and characterization of certain income and capital gain distributions are determined annually in accordance with federal tax regulations which may differ from accounting principles generally accepted in the United States of America. These differences primarily relate to certain securities sold at a loss, accretion of market discount on debt securities, premium amortization on debt securities and interest income on defaulted securities. As a result, net investment income (loss) and net realized gain (loss) on investment transactions for a reporting period may differ significantly from distributions during such period. Accordingly, the Fund may periodically make reclassifications among certain of its capital accounts without impacting the net asset value of the Fund.
At May 31, 2024, the Fund’s components of distributable earnings (accumulated losses) on a net tax basis were as follows:
Undistributed tax-exempt income | |
Undistributed ordinary income* | |
Capital loss carryforwards | |
Net unrealized appreciation (depreciation) on investments | |
At May 31, 2024, the aggregate cost of investments for federal income tax purposes was $500,902,641. The net unrealized depreciation for all investments based on tax cost was $30,393,742. This consisted of aggregate gross unrealized appreciation for all investments for which there was an excess of value over tax cost of $17,395,044 and aggregate gross unrealized depreciation for all investments for which there was an excess of tax cost over value of $47,788,786.
| | DWS Strategic High Yield Tax-Free Fund |
In addition, the tax character of distributions paid to shareholders by the Fund is summarized as follows:
| |
| | |
Distributions from tax-exempt income | | |
Distributions from ordinary income* | | |
| For tax purposes, short-term capital gain distributions are considered ordinary income distributions. |
Expenses. Expenses of the Trust arising in connection with a specific fund are allocated to that fund. Other Trust expenses which cannot be directly attributed to a fund are apportioned among the funds in the Trust based upon the relative net assets or other appropriate measures.
Contingencies. In the normal course of business, the Fund may enter into contracts with service providers that contain general indemnification clauses. The Fund’s maximum exposure under these arrangements is unknown, as this would involve future claims that may be made against the Fund that have not yet been made. However, based on experience, the Fund expects the risk of loss to be remote.
Other. Investment transactions are accounted for on a trade date plus one basis for daily net asset value calculations. However, for financial reporting purposes, investment transactions are reported on trade date. Interest income is recorded on the accrual basis. Realized gains and losses from investment transactions are recorded on an identified cost basis. All premiums and discounts are amortized/accreted for financial reporting purposes, with the exception of securities in default of principal.
A futures contract is an agreement between a buyer or seller and an established futures exchange or its clearinghouse in which the buyer or seller agrees to take or make a delivery of a specific amount of a financial instrument at a specified price on a specific date (settlement date). For the year ended May 31, 2024, the Fund used futures contracts as a means to manage the duration of the investment portfolio.
Upon entering into a futures contract, the Fund is required to deposit with a financial intermediary cash or securities (“initial margin” ) in an amount equal to a certain percentage of the face value indicated in the futures contract. Subsequent payments (“variation margin” ) are made or received by the Fund dependent upon the daily fluctuations in the value and are recorded for financial reporting purposes as unrealized gains or losses by the Fund. Gains or losses are realized when the contract expires or is closed. Since all futures contracts are exchange-traded, counterparty risk is minimized as the exchange’s clearinghouse acts as the counterparty, and guarantees the futures against default.
DWS Strategic High Yield Tax-Free Fund | | |
Certain risks may arise upon entering into futures contracts, including the risk that an illiquid market will limit the Fund’s ability to close out a futures contract prior to the settlement date and the risk that the futures contract is not well correlated with the security, index or currency to which it relates. Risk of loss may exceed amounts recognized in the Statement of Assets and Liabilities.
There were no open futures contracts as of May 31, 2024. For the year ended May 31, 2024, the investment in futures contracts sold had a total notional value generally indicative of a range from $0 to approximately $25,669,000.
The amount of unrealized and realized gains and losses on derivative instruments recognized in Fund earnings during the year ended May 31, 2024 and the related location in the accompanying Statement of Operations is summarized in the following tables by primary underlying risk exposure:
| |
Interest Rate Contracts (a) | |
The above derivative is located in the following Statement of Operations account: |
| Net realized gain (loss) from futures contracts |
Change in Net Unrealized Appreciation (Depreciation) | |
Interest Rate Contracts (a) | |
The above derivative is located in the following Statement of Operations account: |
| Change in net unrealized appreciation (depreciation) on futures contracts |
C.
Purchases and Sales of Securities
During the year ended May 31, 2024, purchases and sales of investment securities (excluding short-term investments) aggregated $274,658,791 and $320,976,400, respectively.
Management Agreement. Under the Investment Management Agreement with DWS Investment Management Americas, Inc. (“DIMA” or the “Advisor” ), an indirect, wholly owned subsidiary of DWS Group GmbH & Co. KGaA (“DWS Group” ), the Advisor directs the investments of the Fund in accordance with its investment objectives, policies and restrictions. The Advisor determines the securities, instruments and other contracts relating to investments to be purchased, sold or entered into by the Fund.
Under the Investment Management Agreement with the Advisor, the Fund pays a monthly management fee based on the average daily net
| | DWS Strategic High Yield Tax-Free Fund |
assets of the Fund, computed and accrued daily and payable monthly, at the following annual rates:
First $300 million of the Fund’s average daily net assets | |
Next $200 million of such net assets | |
Next $500 million of such net assets | |
Next $500 million of such net assets | |
Next $500 million of such net assets | |
Over $2 billion of such net assets | |
Accordingly, for the year ended May 31, 2024, the fee pursuant to the Investment Management Agreement was equivalent to an annual rate (exclusive of any applicable waivers/reimbursements) of 0.436% of the Fund’s average daily net assets.
For the period from June 1, 2023 through September 30, 2023, the Advisor had contractually agreed to waive its fees and/or reimburse certain operating expenses of the Fund to the extent necessary to maintain the total annual operating expenses (excluding certain expenses such as extraordinary expenses, taxes, brokerage, interest expense and acquired fund fees and expenses) of each class as follows:
Effective October 1, 2023 through September 30, 2024, the Advisor has contractually agreed to waive its fees and/or reimburse certain operating expenses of the Fund to the extent necessary to maintain the total annual operating expenses (excluding certain expenses such as extraordinary expenses, taxes, brokerage, interest expense and acquired fund fees and expenses) of each class as follows:
DWS Strategic High Yield Tax-Free Fund | | |
For the year ended May 31, 2024, fees waived and/or expenses reimbursed for each class are as follows:
Administration Fee. Pursuant to an Administrative Services Agreement, DIMA provides most administrative services to the Fund. For all services provided under the Administrative Services Agreement, the Fund pays the Advisor an annual fee (“Administration Fee” ) of 0.097% of the Fund’s average daily net assets, computed and accrued daily and payable monthly. For the year ended May 31, 2024, the Administration Fee was $463,854, of which $39,689 is unpaid.
Service Provider Fees. DWS Service Company (“DSC” ), an affiliate of the Advisor, is the transfer agent, dividend-paying agent and shareholder service agent for the Fund. Pursuant to a sub-transfer agency agreement between DSC and SS&C GIDS, Inc. (“SS&C” ), DSC has delegated certain transfer agent, dividend-paying agent and shareholder service agent functions to SS&C. DSC compensates SS&C out of the shareholder servicing fee it receives from the Fund. For the year ended May 31, 2024, the amounts charged to the Fund by DSC were as follows:
In addition, for the year ended May 31, 2024, the amounts charged to the Fund for recordkeeping and other administrative services provided by
| | DWS Strategic High Yield Tax-Free Fund |
unaffiliated third parties, included in the Statement of Operations under “Services to shareholders,” were as follows:
Distribution and Service Fees. Under the Fund’s Class C 12b-1 Plan, DWS Distributors, Inc. (“DDI” ), an affiliate of the Advisor, receives a fee (“Distribution Fee” ) of 0.75% of the average daily net assets of Class C shares. In accordance with the Fund’s Underwriting and Distribution Services Agreement, DDI enters into related selling group agreements with various firms at various rates for sales of Class C shares. For the year ended May 31, 2024, the Distribution Fee was as follows:
In addition, DDI provides information and administrative services for a fee (“Service Fee” ) to Class A and C shareholders at an annual rate of up to 0.25% of the average daily net assets for each such class. DDI in turn has various agreements with financial services firms that provide these services and pays these fees based upon the assets of shareholder accounts the firms service. For the year ended May 31, 2024, the Service Fee was as follows:
Underwriting Agreement and Contingent Deferred Sales Charge. DDI is the principal underwriter for the Fund. Underwriting commissions paid in connection with the distribution of Class A shares for the year ended May 31, 2024 aggregated $2,566.
In addition, DDI receives any contingent deferred sales charge (“CDSC” ) from Class C share redemptions occurring within one year of purchase. There is no such charge upon redemption of any share appreciation or reinvested dividends. The CDSC is 1% of the value of the shares redeemed for Class C. For the year ended May 31, 2024, the CDSC for Class C shares aggregated $343. A deferred sales charge of up to 1% is assessed on certain redemptions of Class A shares.
DWS Strategic High Yield Tax-Free Fund | | |
Other Service Fees. Under an agreement with the Fund, DIMA is compensated for providing regulatory filing services to the Fund. For the year ended May 31, 2024, the amount charged to the Fund by DIMA included in the Statement of Operations under “Reports to shareholders” aggregated $1,518, of which $669 is unpaid.
Trustees’ Fees and Expenses. The Fund paid retainer fees to each Trustee not affiliated with the Advisor, plus specified amounts to the Board Chairperson and to each committee Chairperson.
Transactions with Affiliates. The Fund may purchase securities from, or sell securities to, an affiliated fund provided the affiliation is solely due to having a common investment adviser, common officers or common trustees. During the year ended May 31, 2024, the Fund engaged in securities purchases of $115,120,000 and securities sales of $123,515,000 with a net gain (loss) on securities sales of $0, with affiliated funds in compliance with Rule 17a-7 under the 1940 Act.
E.
Investing in High-Yield Debt Securities
High-yield debt securities or junk bonds are generally regarded as speculative with respect to the issuer’s continuing ability to meet principal and interest payments. The Fund’s performance could be hurt if an issuer of a debt security suffers an adverse change in financial condition that results in the issuer not making timely payments of interest or principal, a security downgrade or an inability to meet a financial obligation. High-yield debt securities’ total return and yield may generally be expected to fluctuate more than the total return and yield of investment-grade debt securities. A real or perceived economic downturn or an increase in market interest rates could cause a decline in the value of high-yield debt securities, result in increased redemptions and/or result in increased portfolio turnover, which could result in a decline in net asset value of the Fund, reduce liquidity for certain investments and/or increase costs. High-yield debt securities are often thinly traded and can be more difficult to sell and value accurately than investment-grade debt securities as there may be no established secondary market. Investments in high yield debt securities could increase liquidity risk for the Fund. In addition, the market for high-yield debt securities can experience sudden and sharp volatility which is generally associated more with investments in stocks.
The Fund and other affiliated funds (the “Participants” ) share in a $345 million revolving credit facility provided by a syndication of banks. The Fund may borrow for temporary or emergency purposes, including the meeting of redemption requests that otherwise might require the untimely disposition of securities. The Participants are charged an annual commitment fee, which is allocated based on net assets, among each of the Participants. Interest is calculated at a daily fluctuating rate per annum equal to the sum of 0.10% plus the higher of the Federal Funds Effective
| | DWS Strategic High Yield Tax-Free Fund |
Rate and the Overnight Bank Funding Rate, plus 1.25%. The Fund may borrow up to a maximum of 33 percent of its net assets under the agreement. The Fund had no outstanding loans at May 31, 2024.
G.
Fund Share Transactions
The following table summarizes share and dollar activity in the Fund:
| | |
| | | | |
|
| | | | |
| | | | |
| | | | |
| | | | |
| | | | |
Shares issued to shareholders in reinvestment of distributions |
| | | | |
| | | | |
| | | | |
| | | | |
| | | | |
|
| | | | |
| | | | |
| | | | |
| | | | |
| | | | |
|
| | | | |
| | | | |
| | | | |
| | | | |
| | | | |
DWS Strategic High Yield Tax-Free Fund | | |
Report of Independent Registered Public Accounting Firm
To the Board of Trustees of Deutsche DWS Municipal Trust and Shareholders of DWS Strategic High Yield Tax-Free Fund:
Opinion on the Financial Statements
We have audited the accompanying statement of assets and liabilities of DWS Strategic High Yield Tax-Free Fund (the “Fund” ) (one of the funds constituting Deutsche DWS Municipal Trust) (the “Trust” ), including the investment portfolio, as of May 31, 2024, and the related statement of operations for the year then ended, the statements of changes in net assets for each of the two years in the period then ended, the financial highlights for each of the five years in the period then ended and the related notes (collectively referred to as the “financial statements” ). In our opinion, the financial statements present fairly, in all material respects, the financial position of the Fund (one of the funds constituting Deutsche DWS Municipal Trust) at May 31, 2024, the results of its operations for the year then ended, the changes in its net assets for each of the two years in the period then ended, and its financial highlights for each of the five years in the period then ended, in conformity with U.S. generally accepted accounting principles.
These financial statements are the responsibility of the Trust’s management. Our responsibility is to express an opinion on the Fund’s financial statements based on our audits. We are a public accounting firm registered with the Public Company Accounting Oversight Board (United States) (“PCAOB” ) and are required to be independent with respect to the Trust in accordance with the U.S. federal securities laws and the applicable rules and regulations of the Securities and Exchange Commission and the PCAOB.
We conducted our audits in accordance with the standards of the PCAOB. Those standards require that we plan and perform the audit to obtain reasonable assurance about whether the financial statements are free of material misstatement, whether due to error or fraud. The Trust is not required to have, nor were we engaged to perform, an audit of the Trust’s internal control over financial reporting. As part of our audits, we are required to obtain an understanding of internal control over financial reporting, but not for the purpose of expressing an opinion on the effectiveness of the Trust’s internal control over financial reporting. Accordingly, we express no such opinion.
| | DWS Strategic High Yield Tax-Free Fund |
Our audits included performing procedures to assess the risks of material misstatement of the financial statements, whether due to error or fraud, and performing procedures that respond to those risks. Such procedures included examining, on a test basis, evidence regarding the amounts and disclosures in the financial statements. Our procedures included confirmation of securities owned as of May 31, 2024, by correspondence with the custodian, brokers, and others; when replies were not received from brokers and others, we performed other auditing procedures. Our audits also included evaluating the accounting principles used and significant estimates made by management, as well as evaluating the overall presentation of the financial statements. We believe that our audits provide a reasonable basis for our opinion.
We have served as the auditor of one or more investment companies in the DWS family of funds since at least 1979, but we are unable to determine the specific year.
July 23, 2024
DWS Strategic High Yield Tax-Free Fund | | |
Tax Information (Unaudited)
Of the dividends paid from net investment income for the taxable year ended May 31, 2024, 95% are designated as exempt interest dividends for federal income tax purposes.
Please consult a tax advisor if you have questions about federal or state income tax laws, or on how to prepare your tax returns. If you have specific questions about your account, please call (800) 728-3337.
| | DWS Strategic High Yield Tax-Free Fund |
Advisory Agreement Board Considerations and Fee Evaluation
The Board of Trustees (hereinafter referred to as the “Board” or “Trustees” ) approved the renewal of DWS Strategic High Yield Tax-Free Fund’s (the “Fund” ) investment management agreement (the “Agreement” ) with DWS Investment Management Americas, Inc. (“DIMA” ) in September 2023.
In terms of the process that the Board followed prior to approving the Agreement, shareholders should know that:
—
During the entire process, all of the Fund’s Trustees were independent of DIMA and its affiliates (the “Independent Trustees” ).
—
The Board met frequently during the past year to discuss fund matters and dedicated a substantial amount of time to contract review matters. Over the course of several months, the Board reviewed extensive materials received from DIMA, independent third parties and independent counsel. These materials included an analysis of the Fund’s performance, fees and expenses, profitability, economies of scale, and fall-out benefits from a fee consultant retained by the Fund’s Independent Trustees (the “Fee Consultant” ).
—
The Board also received extensive information throughout the year regarding performance of the Fund.
—
The Independent Trustees regularly met privately with counsel to discuss contract review and other matters. In addition, the Independent Trustees were advised by the Fee Consultant as part of their review of the Fund’s contractual arrangements and considered a comprehensive report prepared by the Fee Consultant in connection with their deliberations.
—
In connection with reviewing the Agreement, the Board also reviewed the terms of the Fund’s Rule 12b-1 plan, distribution agreement, administrative services agreement, transfer agency agreement and other material service agreements.
In connection with the contract review process, the Board considered the factors discussed below, among others. The Board also considered that DIMA and its predecessors have managed the Fund since its inception, and the Board believes that a long-term relationship with a capable, conscientious advisor is in the best interests of the Fund. The Board considered, generally, that shareholders chose to invest or remain invested in the Fund knowing that DIMA managed the Fund. DIMA is part of DWS Group GmbH & Co. KGaA (“DWS Group” ). DWS Group is a global asset management business that offers a wide range of investing expertise and resources, including research capabilities in many countries
DWS Strategic High Yield Tax-Free Fund | | |
throughout the world. DWS Group is majority-owned by Deutsche Bank AG, with approximately 20% of its shares publicly traded.
As part of the contract review process, the Board carefully considered the fees and expenses of each DWS fund overseen by the Board in light of the fund’s performance. In many cases, this led to the negotiation and implementation of expense caps.
While shareholders may focus primarily on fund performance and fees, the Fund’s Board considers these and many other factors, including the quality and integrity of DIMA’s personnel and administrative support services provided by DIMA, such as back-office operations, fund valuations, and compliance policies and procedures.
Nature, Quality and Extent of Services. The Board considered the terms of the Agreement, including the scope of advisory services provided under the Agreement. The Board noted that, under the Agreement, DIMA provides portfolio management services to the Fund and that, pursuant to a separate administrative services agreement, DIMA provides administrative services to the Fund. The Board considered the experience and skills of senior management and investment personnel and the resources made available to such personnel. The Board also considered the risks to DIMA in sponsoring or managing the Fund, including financial, operational and reputational risks, the potential economic impact to DIMA from such risks and DIMA’s approach to addressing such risks. The Board reviewed the Fund’s performance over short-term and long-term periods and compared those returns to various agreed-upon performance measures, including market index(es) and a peer universe compiled using information supplied by Morningstar Direct (“Morningstar” ), an independent fund data service. The Board also noted that it has put into place a process of identifying “Funds in Review” (e.g., funds performing poorly relative to a peer universe), and receives additional reporting from DIMA regarding such funds and, where appropriate, DIMA’s plans to address underperformance. The Board believes this process is an effective manner of identifying and addressing underperforming funds. Based on the information provided, the Board noted that, for the one-, three- and five-year periods ended December 31, 2022, the Fund’s performance (Class A shares) was in the 4th quartile of the applicable Morningstar universe (the 1st quartile being the best performers and the 4th quartile being the worst performers). The Board also observed that the Fund has underperformed its benchmark in the one-, three- and five-year periods ended December 31, 2022. The Board noted the disappointing investment performance of the Fund in recent periods and continued to discuss with senior management of DIMA the factors contributing to such underperformance and actions being taken to improve performance. The Board noted certain changes to the Fund’s strategy to permit expanded investment in high yield debt securities. The Board observed that the Fund had experienced improved relative performance during the first eight
| | DWS Strategic High Yield Tax-Free Fund |
months of 2023. The Board recognized the efforts by DIMA in recent years to enhance its investment platform and improve long-term performance across the DWS fund complex.
Fees and Expenses. The Board considered the Fund’s investment management fee schedule, operating expenses and total expense ratios, and comparative information provided by Broadridge Financial Solutions, Inc. (“Broadridge” ) and the Fee Consultant regarding investment management fee rates paid to other investment advisors by similar funds (1st quartile being the most favorable and 4th quartile being the least favorable). With respect to management fees paid to other investment advisors by similar funds, the Board noted that the contractual fee rates paid by the Fund, which include a 0.097% fee paid to DIMA under the Fund’s administrative services agreement, were higher than the median (3rd quartile) of the applicable Broadridge peer group (based on Broadridge data provided as of December 31, 2022). The Board noted that the Fund’s Class A shares total (net) operating expenses (excluding 12b-1 fees) were expected to be lower than the median (2nd quartile) of the applicable Broadridge expense universe (based on Broadridge data provided as of December 31, 2022, and analyzing Broadridge expense universe Class A (net) expenses less any applicable 12b-1 fees) (“Broadridge Universe Expenses” ). The Board also reviewed data comparing each other operational share class’s total (net) operating expenses to the applicable Broadridge Universe Expenses. The Board noted that the expense limitations agreed to by DIMA were expected to help the Fund’s total (net) operating expenses remain competitive. The Board considered the Fund’s management fee rate as compared to fees charged by DIMA to comparable DWS U.S. registered funds (“DWS Funds” ) and considered differences between the Fund and the comparable DWS Funds. The information requested by the Board as part of its review of fees and expenses also included information about institutional accounts (including any sub-advised funds and accounts) and funds offered primarily to European investors (“DWS Europe Funds” ) managed by DWS Group. The Board noted that DIMA indicated that DWS Group does not manage any institutional accounts or DWS Europe Funds comparable to the Fund.
On the basis of the information provided, the Board concluded that management fees were reasonable and appropriate in light of the nature, quality and extent of services provided by DIMA.
Profitability. The Board reviewed detailed information regarding revenues received by DIMA under the Agreement. The Board considered the estimated costs to DIMA, and pre-tax profits realized by DIMA, from advising the DWS Funds, as well as estimates of the pre-tax profits attributable to managing the Fund in particular. The Board also received information regarding the estimated enterprise-wide profitability of DIMA
DWS Strategic High Yield Tax-Free Fund | | |
and its affiliates with respect to all fund services in totality and by fund. The Board and the Fee Consultant reviewed DIMA’s methodology in allocating its costs to the management of the Fund. Based on the information provided, the Board concluded that the pre-tax profits realized by DIMA in connection with the management of the Fund were not unreasonable. The Board also reviewed certain publicly available information regarding the profitability of certain similar investment management firms. The Board noted that, while information regarding the profitability of such firms is limited (and in some cases is not necessarily prepared on a comparable basis), DIMA and its affiliates’ overall profitability with respect to the DWS Funds (after taking into account distribution and other services provided to the funds by DIMA and its affiliates) was lower than the overall profitability levels of most comparable firms for which such data was available.
Economies of Scale. The Board considered whether there are economies of scale with respect to the management of the Fund and whether the Fund benefits from any economies of scale. The Board noted that the Fund’s investment management fee schedule includes fee breakpoints. The Board concluded that the Fund’s fee schedule represents an appropriate sharing between the Fund and DIMA of such economies of scale as may exist in the management of the Fund at current asset levels.
Other Benefits to DIMA and Its Affiliates. The Board also considered the character and amount of other incidental or “fall-out” benefits received by DIMA and its affiliates, including any fees received by DIMA for administrative services provided to the Fund, any fees received by an affiliate of DIMA for transfer agency services provided to the Fund and any fees received by an affiliate of DIMA for distribution services. The Board also considered benefits to DIMA related to brokerage and soft-dollar allocations, including allocating brokerage to pay for research generated by parties other than the executing broker dealers, which pertain primarily to funds investing in equity securities. In addition, the Board considered the incidental public relations benefits to DIMA related to DWS Funds advertising and cross-selling opportunities among DIMA products and services. The Board considered these benefits in reaching its conclusion that the Fund’s management fees were reasonable.
Compliance. The Board considered the significant attention and resources dedicated by DIMA to its compliance processes in recent years. The Board noted in particular (i) the experience, seniority and time commitment of the individuals serving as DIMA’s and the Fund’s chief compliance officers; (ii) the substantial commitment of resources by DIMA and its affiliates to compliance matters, including the retention of compliance personnel; and (iii) ongoing efforts to enhance the compliance program.
Based on all of the information considered and the conclusions reached, the Board determined that the continuation of the Agreement is in the
| | DWS Strategic High Yield Tax-Free Fund |
best interests of the Fund. In making this determination, the Board did not give particular weight to any single factor identified above. The Board considered these factors over the course of numerous meetings, certain of which were in executive session with only the Independent Trustees and counsel present. It is possible that individual Independent Trustees may have weighed these factors differently in reaching their individual decisions to approve the continuation of the Agreement.
DWS Strategic High Yield Tax-Free Fund | | |
| | |
| Item 8. | Changes in and Disagreements with Accountants for Open-End Management Investment Companies. |
| | |
| | Not applicable |
| | |
| Item 9. | Proxy Disclosures for Open-End Management Investment Companies. |
| | |
| | Not applicable |
| | |
| Item 10. | Remuneration Paid to Directors, Officers, and Others of Open-End Management Investment Companies. |
| | |
| | See Item 7 |
| | |
| Item 11. | Statement Regarding Basis for Approval of Investment Advisory Contract. |
| | |
| | See Item 7 |
| | |
| Item 12. | Disclosure of Proxy Voting Policies and Procedures for Closed-End Management Investment Companies. |
| | |
| | Not applicable |
| | |
| Item 13. | Portfolio Managers of Closed-End Management Investment Companies. |
| | |
| | Not applicable |
| | |
| Item 14. | Purchases of Equity Securities by Closed-End Management Investment Company and Affiliated Purchasers. |
| | |
| | Not applicable |
| | |
| Item 15. | Submission of Matters to a Vote of Security. |
| | |
| | There were no material changes to the procedures by which shareholders may recommend nominees to the Fund’s Board. The primary function of the Nominating and Governance Committee is to identify and recommend individuals for membership on the Board and oversee the administration of the Board Governance Guidelines. Shareholders may recommend candidates for Board positions by forwarding their correspondence by U.S. mail or courier service to Keith R. Fox, DWS Funds Board Chair, c/o Thomas R. Hiller, Ropes & Gray LLP, Prudential Tower, 800 Boylston Street, Boston, MA 02199-3600. |
| | |
| Item 16. | Controls and Procedures. |
| | |
| | (a) | The Chief Executive and Financial Officers concluded that the Registrant’s Disclosure Controls and Procedures are effective based on the evaluation of the Disclosure Controls and Procedures as of a date within 90 days of the filing date of this report. |
| | |
| | (b) | There have been no changes in the registrant’s internal control over financial reporting that occurred during the period covered by this report that has materially affected, or is reasonably likely to materially affect, the registrant’s internal controls over financial reporting. |
| | |
| | |
| Item 17. | Disclosure of Securities Lending Activities for Closed-End Management Investment Companies. |
| | |
| | Not applicable |
| | |
| | |
| Item 18. | Recovery of Erroneously Awarded Compensation. |
| | |
| | Not applicable |
| | |
| Item 19. | Exhibits |
| | |
| | (a)(1) | Code of Ethics pursuant to Item 2 of Form N-CSR is filed and attached hereto as EX-99.CODE ETH. |
| | |
| | (a)(2) | Certification pursuant to Rule 30a-2(a) under the Investment Company Act of 1940 (17 CFR 270.30a-2(a)) is filed and attached hereto as Exhibit 99.CERT. |
| | |
| | (b) | Certification pursuant to Rule 30a-2(b) under the Investment Company Act of 1940 (17 CFR 270.30a-2(b)) is furnished and attached hereto as Exhibit 99.906CERT. |
SIGNATURES
Pursuant to the requirements of the Securities Exchange Act of 1934 and the Investment Company Act of 1940, the registrant has duly caused this report to be signed on its behalf by the undersigned, thereunto duly authorized.
| Registrant: | DWS Strategic High Yield Tax-Free Fund, a series of Deutsche DWS Municipal Trust |
| | |
| | |
| By: | /s/Hepsen Uzcan Hepsen Uzcan Principal Executive Officer |
| | |
| Date: | 7/30/2024 |
Pursuant to the requirements of the Securities Exchange Act of 1934 and the Investment Company Act of 1940, this report has been signed below by the following persons on behalf of the registrant and in the capacities and on the dates indicated.
| By: | /s/Hepsen Uzcan Hepsen Uzcan Principal Executive Officer |
| | |
| Date: | 7/30/2024 |
| | |
| | |
| | |
| By: | /s/Diane Kenneally Diane Kenneally Principal Financial Officer |
| | |
| Date: | 7/30/2024 |
| | |