UNITED STATES
SECURITIES AND EXCHANGE COMMISSION
WASHINGTON, D. C. 20549
FORM N-CSR
CERTIFIED SHAREHOLDER REPORT OF REGISTERED MANAGEMENT INVESTMENT COMPANIES
Investment Company Act file number: 811-02671
Deutsche DWS Municipal Trust
(Exact Name of Registrant as Specified in Charter)
875 Third Avenue
New York, NY 10022-6225
(Address of Principal Executive Offices) (Zip Code)
Registrant’s Telephone Number, including Area Code: (212) 454-4500
Diane Kenneally
100 Summer Street
Boston, MA 02110
(Name and Address of Agent for Service)
| Date of fiscal year end: | 5/31 |
| Date of reporting period: | 5/31/2024 |
| Item 1. | Reports to Stockholders. |
| (a) |
DWS Managed Municipal Bond Fund
Class C: SMLCX
Annual Shareholder Report—May 31, 2024

This annual shareholder report contains important information about DWS Managed Municipal Bond Fund ("the Fund") for the period June 1, 2023 to May 31, 2024. You can find additional information about the Fund on the Fund's website at www.dws.com/mutualreports. You can also request this information by contacting us at (800) 728-3337.
This report describes changes to the Fund that occurred during the reporting period.
What were the Fund costs for the last year?
(Based on a hypothetical $10,000 investment)
| Cost of a $10,000 investment | Costs paid as a percentage of a $10,000 investment | |
|---|---|---|
| Class C | $155 | 1.52% |
Gross expense ratio as of the latest prospectus: 1.58%. See prospectus for any contractual or voluntary waivers; without a waiver, costs would have been higher.
How did the Fund perform last year and what affected its performance?
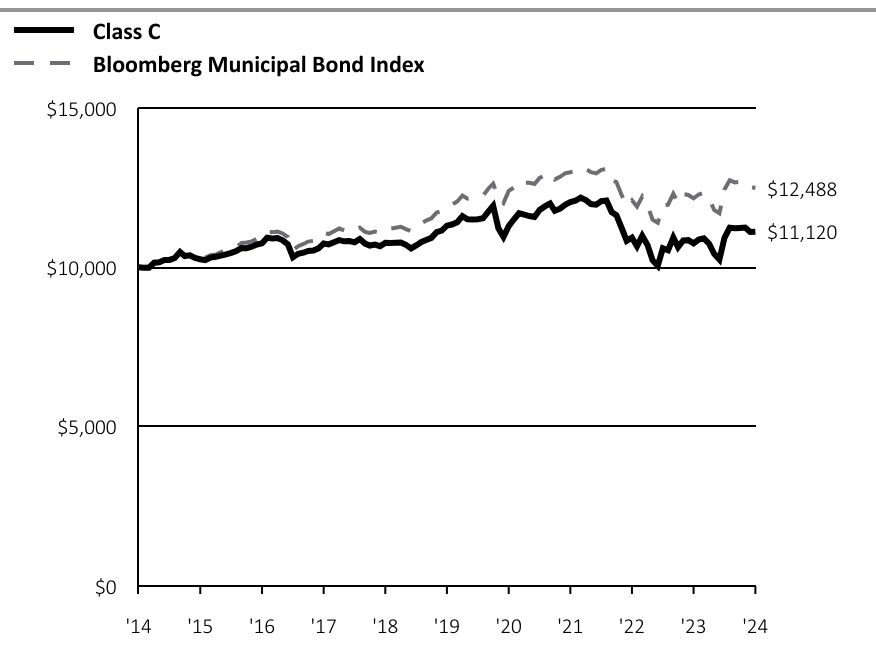
Class C shares of the Fund returned 3.40% (unadjusted for sales charges) for the period ended May 31, 2024. The Fund's index, the Bloomberg Municipal Bond Index, returned 2.67% for the same period.
Municipal market prices were pressured over the period by higher U.S. Treasury yields and greater-than-expected new issue supply. Lower quality issues in the BBB and high yield rating categories led municipal market performance as recession fears eased, supporting credit sentiment broadly. In addition, high yield prices benefited from very low new issuance. While yield increases were more muted than for U.S. Treasuries, the municipal curve finished higher along its length for the 12 months.
The Fund was overweight issues rated BBB and below investment grade, supporting returns as lower quality segments of the municipal market outperformed. The Fund’s tilt toward longer maturities proved beneficial to performance as the higher income offered by these issues more than offset the negative impact on prices as the municipal yield curve moved higher. In sector terms, overweight allocations to continuing care retirement community, charter school, prepaid gas, and toll facility bonds aided performance.
While there were no material detractors, the Fund’s underweight to general obligation issues weighed marginally on relative performance.
Fund Performance
Cumulative Growth of an Assumed $10,000Investment
Bloomberg Municipal Bond Index is a market value-weighted index of investment-grade municipal bonds with maturities of one year or more.
Index returns do not reflect any fees or expenses and it is not possible to invest directly into an index.
| Class C | Bloomberg Municipal Bond Index | |
|---|---|---|
| '14 | $10,000 | $10,000 |
| '14 | $9,984 | $10,009 |
| '14 | $9,988 | $10,026 |
| '14 | $10,144 | $10,148 |
| '14 | $10,160 | $10,158 |
| '14 | $10,229 | $10,228 |
| '14 | $10,233 | $10,245 |
| '14 | $10,295 | $10,297 |
| '15 | $10,483 | $10,480 |
| '15 | $10,354 | $10,371 |
| '15 | $10,379 | $10,401 |
| '15 | $10,294 | $10,347 |
| '15 | $10,253 | $10,318 |
| '15 | $10,224 | $10,309 |
| '15 | $10,305 | $10,384 |
| '15 | $10,330 | $10,404 |
| '15 | $10,368 | $10,479 |
| '15 | $10,405 | $10,521 |
| '15 | $10,453 | $10,563 |
| '15 | $10,514 | $10,637 |
| '16 | $10,607 | $10,764 |
| '16 | $10,600 | $10,781 |
| '16 | $10,647 | $10,815 |
| '16 | $10,718 | $10,894 |
| '16 | $10,754 | $10,924 |
| '16 | $10,927 | $11,098 |
| '16 | $10,905 | $11,105 |
| '16 | $10,917 | $11,120 |
| '16 | $10,848 | $11,064 |
| '16 | $10,720 | $10,948 |
| '16 | $10,317 | $10,540 |
| '16 | $10,424 | $10,663 |
| '17 | $10,458 | $10,734 |
| '17 | $10,516 | $10,808 |
| '17 | $10,527 | $10,832 |
| '17 | $10,596 | $10,910 |
| '17 | $10,746 | $11,083 |
| '17 | $10,720 | $11,044 |
| '17 | $10,788 | $11,133 |
| '17 | $10,855 | $11,218 |
| '17 | $10,816 | $11,161 |
| '17 | $10,824 | $11,188 |
| '17 | $10,785 | $11,128 |
| '17 | $10,892 | $11,244 |
| '18 | $10,745 | $11,112 |
| '18 | $10,683 | $11,079 |
| '18 | $10,715 | $11,120 |
| '18 | $10,664 | $11,080 |
| '18 | $10,768 | $11,207 |
| '18 | $10,765 | $11,216 |
| '18 | $10,773 | $11,244 |
| '18 | $10,781 | $11,273 |
| '18 | $10,706 | $11,200 |
| '18 | $10,593 | $11,131 |
| '18 | $10,688 | $11,254 |
| '18 | $10,795 | $11,388 |
| '19 | $10,865 | $11,475 |
| '19 | $10,925 | $11,536 |
| '19 | $11,105 | $11,718 |
| '19 | $11,152 | $11,762 |
| '19 | $11,308 | $11,925 |
| '19 | $11,343 | $11,969 |
| '19 | $11,413 | $12,065 |
| '19 | $11,607 | $12,255 |
| '19 | $11,505 | $12,157 |
| '19 | $11,501 | $12,179 |
| '19 | $11,510 | $12,209 |
| '19 | $11,538 | $12,247 |
| '20 | $11,745 | $12,467 |
| '20 | $11,928 | $12,627 |
| '20 | $11,224 | $12,169 |
| '20 | $10,957 | $12,017 |
| '20 | $11,292 | $12,399 |
| '20 | $11,501 | $12,501 |
| '20 | $11,697 | $12,712 |
| '20 | $11,653 | $12,652 |
| '20 | $11,610 | $12,655 |
| '20 | $11,578 | $12,617 |
| '20 | $11,800 | $12,807 |
| '20 | $11,912 | $12,885 |
| '21 | $12,006 | $12,967 |
| '21 | $11,772 | $12,761 |
| '21 | $11,842 | $12,840 |
| '21 | $11,964 | $12,947 |
| '21 | $12,045 | $12,986 |
| '21 | $12,089 | $13,022 |
| '21 | $12,184 | $13,130 |
| '21 | $12,111 | $13,082 |
| '21 | $11,987 | $12,987 |
| '21 | $11,966 | $12,949 |
| '21 | $12,075 | $13,059 |
| '21 | $12,095 | $13,081 |
| '22 | $11,733 | $12,722 |
| '22 | $11,635 | $12,677 |
| '22 | $11,234 | $12,266 |
| '22 | $10,833 | $11,927 |
| '22 | $10,932 | $12,104 |
| '22 | $10,663 | $11,906 |
| '22 | $10,987 | $12,220 |
| '22 | $10,703 | $11,952 |
| '22 | $10,221 | $11,494 |
| '22 | $10,044 | $11,398 |
| '22 | $10,599 | $11,931 |
| '22 | $10,536 | $11,965 |
| '23 | $10,933 | $12,309 |
| '23 | $10,635 | $12,031 |
| '23 | $10,845 | $12,298 |
| '23 | $10,853 | $12,270 |
| '23 | $10,754 | $12,163 |
| '23 | $10,872 | $12,285 |
| '23 | $10,908 | $12,334 |
| '23 | $10,741 | $12,156 |
| '23 | $10,424 | $11,800 |
| '23 | $10,244 | $11,699 |
| '23 | $10,926 | $12,442 |
| '23 | $11,241 | $12,731 |
| '24 | $11,225 | $12,666 |
| '24 | $11,237 | $12,683 |
| '24 | $11,248 | $12,682 |
| '24 | $11,108 | $12,525 |
| '24 | $11,120 | $12,488 |
Yearly periods ended May 31
Average Annual Total Returns
| Class/Index | 1-Year | 5-Year | 10-Year |
|---|---|---|---|
| Class C Unadjusted for Sales Charge | 3.40% | - 0.34% | 1.07% |
| Class C Adjusted for the Maximum Sales Charge (max 1.00% CDSC) | 2.40% | -0.34% | 1.07% |
| Bloomberg Municipal Bond Index | 2.67% | 0.93% | 2.25% |
Performance shown is historical. The Fund's past performance is not a good predictor or guarantee of the Fund's future performance. Investment return and principal fluctuate, so your shares may be worth more or less when redeemed. Current performance may be lower or higher than the performance data quoted. The performance graph and returns table do not reflect the deduction of taxes that a shareholder would pay on Fund distributions or the redemption of Fund shares. Please visit dws.com/en-us/products/mutual-funds for the Fund’s most recent month-end performance. Fund performance includes reinvestment of all distributions.
Key Fund Statistics
| Net Assets ($) | 1,956,316,161 |
| Number of Portfolio Holdings | 408 |
| Portfolio Turnover Rate (%) | 40 |
| Total Net Advisory Fees Paid ($) | 6,951,078 |
| Modified Duration to Worst | 6.9 years |
Modified duration to worst is the measure of sensitivity of the prices of bonds held by the Fund to a change in interest rates, computed using each bond's nearest call or maturity date.
What did the Fund invest in?
Holdings-based data is subject to change.
The quality ratings represent the higher of Moody’s Investors Service, Inc. (“Moody’s”), Fitch Ratings, Inc. (“Fitch”) or S&P Global Ratings (“S&P”) credit ratings. The ratings of Moody’s, Fitch and S&P represent their opinions as to the quality of the securities they rate. Credit quality measures a bond issuer’s ability to repay interest and principal in a timely manner. Ratings are relative and subjective and are not absolute standards of quality. Credit quality does not remove market risk and is subject to change.
Asset Allocation
| Asset Type | % of Net Assets |
| Revenue Bonds | 79% |
| General Obligation Bonds | 10% |
| Lease Obligations | 6% |
| Escrow To Maturity/prerefunded Bonds | 3% |
| Variable Rate Demand Notes | 1% |
| Other | 1% |
| Variable Rate Demand Preferred Shares | 0% |
| Other Assets and Liabilities, Net | 0% |
| Total | 100% |
Credit Quality
| Credit Rating | % of Net Assets |
| AAA | 12% |
| AA | 28% |
| A | 33% |
| BBB | 15% |
| BB | 3% |
| Not Rated | 9% |
| Total | 100% |
Material Fund Changes
This is a summary of certain changes of the Fund since June 1, 2023. For more information, review the Fund's current prospectus at www.dws.com/mutualreports, or call (800) 728-3337.
Effective October 1, 2023, the Fund’s contractual cap on total annual operating expense for Class C shares changed from 1.53% to 1.50%. The cap excludes certain expenses such as extraordinary expenses, taxes, brokerage, interest expense and acquired fund fees and expenses.
Additional Information
If you wish to view additional information about the Fund, including, but not limited to, its prospectus, quarterly holdings, Board fee evaluation reports, and financial statements and other information, please visit www.dws.com/mutualreports. For information about the Fund's proxy voting policies and procedures and how the Fund voted proxies related to its portfolio securities, please visit dws.com/en-us/resources/proxy-voting. This additional information is also available free of charge by contacting us at (800) 728-3337.
Householding
In order to reduce the amount of mail you receive and to help reduce expenses, we generally send a single copy of any shareholder report and prospectus to each household. If you do not want the mailing of these documents to be combined with those for other members of your household, please contact your financial representative or call DWS toll free at (800) 728-3337.
Bond investments are subject to interest-rate, credit, liquidity, and market risks to varying degrees. When interest rates rise, bond prices generally fall. Credit risk refers to the ability of an issuer to make timely payments of principal and interest. Investments in lower-quality (“junk bonds”) and non-rated securities present greater risk of loss than investments in higher-quality securities. Municipal securities are subject to the risk that litigation, legislation or other political events, local business or economic conditions or the bankruptcy of the issuer could have a significant effect on an issuer’s ability to make payments of principal and/or interest. The market for municipal bonds may be less liquid than for taxable bonds and there may be less information available on the financial condition of issuers of municipal securities than for public corporations. The Fund invests in inverse floaters, which are derivatives that involve leverage and could magnify the Fund's gains or losses. Although the Fund seeks income that is exempt from federal income taxes, a portion of the Fund’s distributions may be subject to federal, state, and local taxes, including the alternative minimum tax. Please read the prospectus for details.
This report must be preceded or accompanied by a prospectus. We advise you to consider the Fund's objectives, risks, charges, and expenses carefully before investing. The prospectus contains this and other important information about the Fund, which can be requested by calling (800) 728-3337, contacting your financial representative, or visit www.dws.com/mutualreports to view or download a prospectus. Please read the prospectus carefully before you invest.
The brand DWS represents DWS Group GmbH & Co. KGaA and any of its subsidiaries such as DWS Distributors, Inc., which offers investment products, or DWS Investment Management Americas, Inc. and RREEF America L.L.C., which offer advisory services.
©2024 DWS Group GmbH&Co. KGaA. All rights reserved
DMMBF-TSRA-C
R-101127-1 (7/24)
DWS Managed Municipal Bond Fund
Class S: SCMBX
Annual Shareholder Report—May 31, 2024

This annual shareholder report contains important information about DWS Managed Municipal Bond Fund ("the Fund") for the period June 1, 2023 to May 31, 2024. You can find additional information about the Fund on the Fund's website at www.dws.com/mutualreports. You can also request this information by contacting us at (800) 728-3337.
This report describes changes to the Fund that occurred during the reporting period.
What were the Fund costs for the last year?
(Based on a hypothetical $10,000 investment)
| Cost of a $10,000 investment | Costs paid as a percentage of a $10,000 investment | |
|---|---|---|
| Class S | $52 | 0.51% |
Gross expense ratio as of the latest prospectus: 0.62%. See prospectus for any contractual or voluntary waivers; without a waiver, costs would have been higher.
How did the Fund perform last year and what affected its performance?
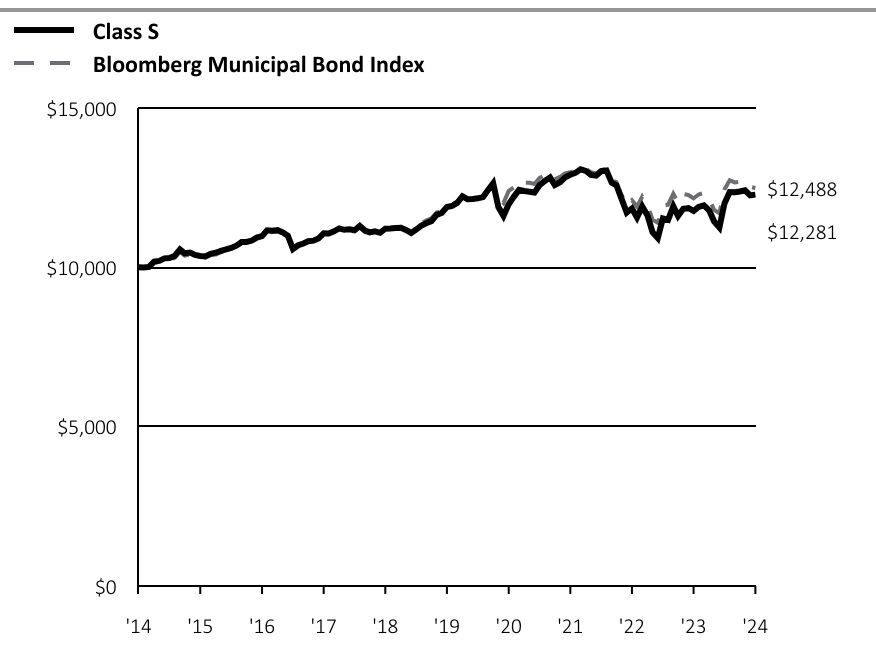
Class S shares of the Fund returned 4.31% for the period ended May 31, 2024. The Fund's index, the Bloomberg Municipal Bond Index, returned 2.67% for the same period.
Municipal market prices were pressured over the period by higher U.S. Treasury yields and greater-than-expected new issue supply. Lower quality issues in the BBB and high yield rating categories led municipal market performance as recession fears eased, supporting credit sentiment broadly. In addition, high yield prices benefited from very low new issuance. While yield increases were more muted than for U.S. Treasuries, the municipal curve finished higher along its length for the 12 months.
The Fund was overweight issues rated BBB and below investment grade, supporting returns as lower quality segments of the municipal market outperformed. The Fund’s tilt toward longer maturities proved beneficial to performance as the higher income offered by these issues more than offset the negative impact on prices as the municipal yield curve moved higher. In sector terms, overweight allocations to continuing care retirement community, charter school, prepaid gas, and toll facility bonds aided performance.
While there were no material detractors, the Fund’s underweight to general obligation issues weighed marginally on relative performance.
Fund Performance
Cumulative Growth of an Assumed $10,000Investment
Bloomberg Municipal Bond Index is a market value-weighted index of investment-grade municipal bonds with maturities of one year or more.
Index returns do not reflect any fees or expenses and it is not possible to invest directly into an index.
| Class S | Bloomberg Municipal Bond Index | |
|---|---|---|
| '14 | $10,000 | $10,000 |
| '14 | $9,992 | $10,009 |
| '14 | $10,015 | $10,026 |
| '14 | $10,180 | $10,148 |
| '14 | $10,203 | $10,158 |
| '14 | $10,281 | $10,228 |
| '14 | $10,294 | $10,245 |
| '14 | $10,365 | $10,297 |
| '15 | $10,563 | $10,480 |
| '15 | $10,441 | $10,371 |
| '15 | $10,464 | $10,401 |
| '15 | $10,387 | $10,347 |
| '15 | $10,355 | $10,318 |
| '15 | $10,345 | $10,309 |
| '15 | $10,424 | $10,384 |
| '15 | $10,459 | $10,404 |
| '15 | $10,517 | $10,479 |
| '15 | $10,563 | $10,521 |
| '15 | $10,609 | $10,563 |
| '15 | $10,680 | $10,637 |
| '16 | $10,795 | $10,764 |
| '16 | $10,795 | $10,781 |
| '16 | $10,841 | $10,815 |
| '16 | $10,934 | $10,894 |
| '16 | $10,979 | $10,924 |
| '16 | $11,164 | $11,098 |
| '16 | $11,151 | $11,105 |
| '16 | $11,172 | $11,120 |
| '16 | $11,099 | $11,064 |
| '16 | $10,990 | $10,948 |
| '16 | $10,574 | $10,540 |
| '16 | $10,693 | $10,663 |
| '17 | $10,748 | $10,734 |
| '17 | $10,817 | $10,808 |
| '17 | $10,836 | $10,832 |
| '17 | $10,904 | $10,910 |
| '17 | $11,068 | $11,083 |
| '17 | $11,063 | $11,044 |
| '17 | $11,129 | $11,133 |
| '17 | $11,220 | $11,218 |
| '17 | $11,177 | $11,161 |
| '17 | $11,195 | $11,188 |
| '17 | $11,164 | $11,128 |
| '17 | $11,296 | $11,244 |
| '18 | $11,153 | $11,112 |
| '18 | $11,098 | $11,079 |
| '18 | $11,128 | $11,120 |
| '18 | $11,084 | $11,080 |
| '18 | $11,213 | $11,207 |
| '18 | $11,219 | $11,216 |
| '18 | $11,237 | $11,244 |
| '18 | $11,243 | $11,273 |
| '18 | $11,173 | $11,200 |
| '18 | $11,078 | $11,131 |
| '18 | $11,186 | $11,254 |
| '18 | $11,308 | $11,388 |
| '19 | $11,390 | $11,475 |
| '19 | $11,449 | $11,536 |
| '19 | $11,648 | $11,718 |
| '19 | $11,706 | $11,762 |
| '19 | $11,893 | $11,925 |
| '19 | $11,926 | $11,969 |
| '19 | $12,024 | $12,065 |
| '19 | $12,225 | $12,255 |
| '19 | $12,140 | $12,157 |
| '19 | $12,146 | $12,179 |
| '19 | $12,165 | $12,209 |
| '19 | $12,205 | $12,247 |
| '20 | $12,434 | $12,467 |
| '20 | $12,638 | $12,627 |
| '20 | $11,890 | $12,169 |
| '20 | $11,616 | $12,017 |
| '20 | $11,980 | $12,399 |
| '20 | $12,212 | $12,501 |
| '20 | $12,430 | $12,712 |
| '20 | $12,394 | $12,652 |
| '20 | $12,372 | $12,655 |
| '20 | $12,348 | $12,617 |
| '20 | $12,581 | $12,807 |
| '20 | $12,711 | $12,885 |
| '21 | $12,823 | $12,967 |
| '21 | $12,583 | $12,761 |
| '21 | $12,669 | $12,840 |
| '21 | $12,822 | $12,947 |
| '21 | $12,906 | $12,986 |
| '21 | $12,964 | $13,022 |
| '21 | $13,077 | $13,130 |
| '21 | $13,024 | $13,082 |
| '21 | $12,901 | $12,987 |
| '21 | $12,876 | $12,949 |
| '21 | $13,017 | $13,059 |
| '21 | $13,036 | $13,081 |
| '22 | $12,657 | $12,722 |
| '22 | $12,576 | $12,677 |
| '22 | $12,139 | $12,266 |
| '22 | $11,717 | $11,927 |
| '22 | $11,848 | $12,104 |
| '22 | $11,566 | $11,906 |
| '22 | $11,912 | $12,220 |
| '22 | $11,630 | $11,952 |
| '22 | $11,102 | $11,494 |
| '22 | $10,919 | $11,398 |
| '22 | $11,532 | $11,931 |
| '22 | $11,488 | $11,965 |
| '23 | $11,915 | $12,309 |
| '23 | $11,614 | $12,031 |
| '23 | $11,838 | $12,298 |
| '23 | $11,857 | $12,270 |
| '23 | $11,773 | $12,163 |
| '23 | $11,897 | $12,285 |
| '23 | $11,947 | $12,334 |
| '23 | $11,789 | $12,156 |
| '23 | $11,437 | $11,800 |
| '23 | $11,249 | $11,699 |
| '23 | $12,006 | $12,442 |
| '23 | $12,363 | $12,731 |
| '24 | $12,356 | $12,666 |
| '24 | $12,379 | $12,683 |
| '24 | $12,417 | $12,682 |
| '24 | $12,258 | $12,525 |
| '24 | $12,281 | $12,488 |
Yearly periods ended May 31
Average Annual Total Returns
| Class/Index | 1-Year | 5-Year | 10-Year |
|---|---|---|---|
| Class S No Sales Charge | 4.31% | 0.64% | 2.08% |
| Bloomberg Municipal Bond Index | 2.67% | 0.93% | 2.25% |
Performance shown is historical. The Fund's past performance is not a good predictor or guarantee of the Fund's future performance. Investment return and principal fluctuate, so your shares may be worth more or less when redeemed. Current performance may be lower or higher than the performance data quoted. The performance graph and returns table do not reflect the deduction of taxes that a shareholder would pay on Fund distributions or the redemption of Fund shares. Please visit dws.com/en-us/products/mutual-funds for the Fund’s most recent month-end performance. Fund performance includes reinvestment of all distributions.
Key Fund Statistics
| Net Assets ($) | 1,956,316,161 |
| Number of Portfolio Holdings | 408 |
| Portfolio Turnover Rate (%) | 40 |
| Total Net Advisory Fees Paid ($) | 6,951,078 |
| Modified Duration to Worst | 6.9 years |
Modified duration to worst is the measure of sensitivity of the prices of bonds held by the Fund to a change in interest rates, computed using each bond's nearest call or maturity date.
What did the Fund invest in?
Holdings-based data is subject to change.
The quality ratings represent the higher of Moody’s Investors Service, Inc. (“Moody’s”), Fitch Ratings, Inc. (“Fitch”) or S&P Global Ratings (“S&P”) credit ratings. The ratings of Moody’s, Fitch and S&P represent their opinions as to the quality of the securities they rate. Credit quality measures a bond issuer’s ability to repay interest and principal in a timely manner. Ratings are relative and subjective and are not absolute standards of quality. Credit quality does not remove market risk and is subject to change.
Asset Allocation
| Asset Type | % of Net Assets |
| Revenue Bonds | 79% |
| General Obligation Bonds | 10% |
| Lease Obligations | 6% |
| Escrow To Maturity/prerefunded Bonds | 3% |
| Variable Rate Demand Notes | 1% |
| Other | 1% |
| Variable Rate Demand Preferred Shares | 0% |
| Other Assets and Liabilities, Net | 0% |
| Total | 100% |
Credit Quality
| Credit Rating | % of Net Assets |
| AAA | 12% |
| AA | 28% |
| A | 33% |
| BBB | 15% |
| BB | 3% |
| Not Rated | 9% |
| Total | 100% |
Material Fund Changes
This is a summary of certain changes of the Fund since June 1, 2023. For more information, review the Fund's current prospectus at www.dws.com/mutualreports, or call (800) 728-3337.
Effective October 1, 2023, the Fund’s contractual cap on total annual operating expense for Class S shares changed from 0.53% to 0.50%. The cap excludes certain expenses such as extraordinary expenses, taxes, brokerage, interest expense and acquired fund fees and expenses.
Additional Information
If you wish to view additional information about the Fund, including, but not limited to, its prospectus, quarterly holdings, Board fee evaluation reports, and financial statements and other information, please visit www.dws.com/mutualreports. For information about the Fund's proxy voting policies and procedures and how the Fund voted proxies related to its portfolio securities, please visit dws.com/en-us/resources/proxy-voting. This additional information is also available free of charge by contacting us at (800) 728-3337.
Householding
In order to reduce the amount of mail you receive and to help reduce expenses, we generally send a single copy of any shareholder report and prospectus to each household. If you do not want the mailing of these documents to be combined with those for other members of your household, please contact your financial representative or call DWS toll free at (800) 728-3337.
Bond investments are subject to interest-rate, credit, liquidity, and market risks to varying degrees. When interest rates rise, bond prices generally fall. Credit risk refers to the ability of an issuer to make timely payments of principal and interest. Investments in lower-quality (“junk bonds”) and non-rated securities present greater risk of loss than investments in higher-quality securities. Municipal securities are subject to the risk that litigation, legislation or other political events, local business or economic conditions or the bankruptcy of the issuer could have a significant effect on an issuer’s ability to make payments of principal and/or interest. The market for municipal bonds may be less liquid than for taxable bonds and there may be less information available on the financial condition of issuers of municipal securities than for public corporations. The Fund invests in inverse floaters, which are derivatives that involve leverage and could magnify the Fund's gains or losses. Although the Fund seeks income that is exempt from federal income taxes, a portion of the Fund’s distributions may be subject to federal, state, and local taxes, including the alternative minimum tax. Please read the prospectus for details.
This report must be preceded or accompanied by a prospectus. We advise you to consider the Fund's objectives, risks, charges, and expenses carefully before investing. The prospectus contains this and other important information about the Fund, which can be requested by calling (800) 728-3337, contacting your financial representative, or visit www.dws.com/mutualreports to view or download a prospectus. Please read the prospectus carefully before you invest.
The brand DWS represents DWS Group GmbH & Co. KGaA and any of its subsidiaries such as DWS Distributors, Inc., which offers investment products, or DWS Investment Management Americas, Inc. and RREEF America L.L.C., which offer advisory services.
©2024 DWS Group GmbH&Co. KGaA. All rights reserved
DMMBF-TSRA-S
R-101127-1 (7/24)
DWS Managed Municipal Bond Fund
Class A: SMLAX
Annual Shareholder Report—May 31, 2024

This annual shareholder report contains important information about DWS Managed Municipal Bond Fund ("the Fund") for the period June 1, 2023 to May 31, 2024. You can find additional information about the Fund on the Fund's website at www.dws.com/mutualreports. You can also request this information by contacting us at (800) 728-3337.
This report describes changes to the Fund that occurred during the reporting period.
What were the Fund costs for the last year?
(Based on a hypothetical $10,000 investment)
| Cost of a $10,000 investment | Costs paid as a percentage of a $10,000 investment | |
|---|---|---|
| Class A | $78 | 0.76% |
Gross expense ratio as of the latest prospectus: 0.78%. See prospectus for any contractual or voluntary waivers; without a waiver, costs would have been higher.
How did the Fund perform last year and what affected its performance?
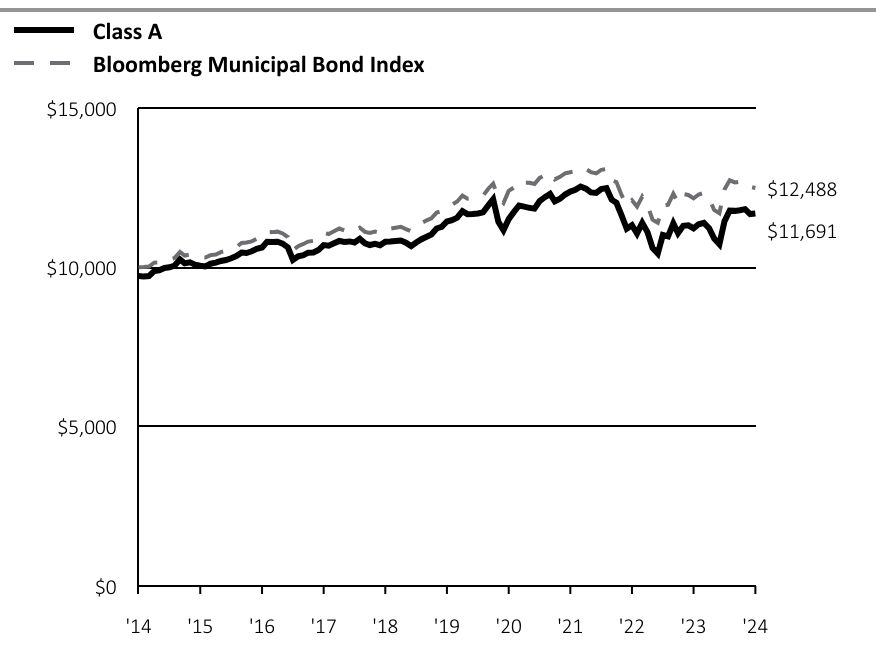
Class A shares of the Fund returned 4.18% (unadjusted for sales charges) for the period ended May 31, 2024. The Fund's index, the Bloomberg Municipal Bond Index, returned 2.67% for the same period.
Municipal market prices were pressured over the period by higher U.S. Treasury yields and greater-than-expected new issue supply. Lower quality issues in the BBB and high yield rating categories led municipal market performance as recession fears eased, supporting credit sentiment broadly. In addition, high yield prices benefited from very low new issuance. While yield increases were more muted than for U.S. Treasuries, the municipal curve finished higher along its length for the 12 months.
The Fund was overweight issues rated BBB and below investment grade, supporting returns as lower quality segments of the municipal market outperformed. The Fund’s tilt toward longer maturities proved beneficial to performance as the higher income offered by these issues more than offset the negative impact on prices as the municipal yield curve moved higher. In sector terms, overweight allocations to continuing care retirement community, charter school, prepaid gas, and toll facility bonds aided performance.
While there were no material detractors, the Fund’s underweight to general obligation issues weighed marginally on relative performance.
Fund Performance
Cumulative Growth of an Assumed $10,000Investment
(Adjusted for Maximum Sales Charge)
Bloomberg Municipal Bond Index is a market value-weighted index of investment-grade municipal bonds with maturities of one year or more.
Index returns do not reflect any fees or expenses and it is not possible to invest directly into an index.
| Class A | Bloomberg Municipal Bond Index | |
|---|---|---|
| '14 | $9,725 | $10,000 |
| '14 | $9,715 | $10,009 |
| '14 | $9,726 | $10,026 |
| '14 | $9,885 | $10,148 |
| '14 | $9,906 | $10,158 |
| '14 | $9,980 | $10,228 |
| '14 | $10,001 | $10,245 |
| '14 | $10,057 | $10,297 |
| '15 | $10,248 | $10,480 |
| '15 | $10,128 | $10,371 |
| '15 | $10,159 | $10,401 |
| '15 | $10,083 | $10,347 |
| '15 | $10,050 | $10,318 |
| '15 | $10,027 | $10,309 |
| '15 | $10,114 | $10,384 |
| '15 | $10,145 | $10,404 |
| '15 | $10,199 | $10,479 |
| '15 | $10,231 | $10,521 |
| '15 | $10,286 | $10,563 |
| '15 | $10,353 | $10,637 |
| '16 | $10,462 | $10,764 |
| '16 | $10,450 | $10,781 |
| '16 | $10,504 | $10,815 |
| '16 | $10,581 | $10,894 |
| '16 | $10,623 | $10,924 |
| '16 | $10,801 | $11,098 |
| '16 | $10,797 | $11,105 |
| '16 | $10,805 | $11,120 |
| '16 | $10,744 | $11,064 |
| '16 | $10,625 | $10,948 |
| '16 | $10,231 | $10,540 |
| '16 | $10,345 | $10,663 |
| '17 | $10,385 | $10,734 |
| '17 | $10,461 | $10,808 |
| '17 | $10,467 | $10,832 |
| '17 | $10,542 | $10,910 |
| '17 | $10,699 | $11,083 |
| '17 | $10,681 | $11,044 |
| '17 | $10,755 | $11,133 |
| '17 | $10,829 | $11,218 |
| '17 | $10,797 | $11,161 |
| '17 | $10,813 | $11,188 |
| '17 | $10,781 | $11,128 |
| '17 | $10,894 | $11,244 |
| '18 | $10,755 | $11,112 |
| '18 | $10,700 | $11,079 |
| '18 | $10,739 | $11,120 |
| '18 | $10,695 | $11,080 |
| '18 | $10,806 | $11,207 |
| '18 | $10,810 | $11,216 |
| '18 | $10,825 | $11,244 |
| '18 | $10,841 | $11,273 |
| '18 | $10,772 | $11,200 |
| '18 | $10,666 | $11,131 |
| '18 | $10,780 | $11,254 |
| '18 | $10,883 | $11,388 |
| '19 | $10,961 | $11,475 |
| '19 | $11,028 | $11,536 |
| '19 | $11,218 | $11,718 |
| '19 | $11,272 | $11,762 |
| '19 | $11,438 | $11,925 |
| '19 | $11,481 | $11,969 |
| '19 | $11,560 | $12,065 |
| '19 | $11,764 | $12,255 |
| '19 | $11,668 | $12,157 |
| '19 | $11,672 | $12,179 |
| '19 | $11,688 | $12,209 |
| '19 | $11,725 | $12,247 |
| '20 | $11,943 | $12,467 |
| '20 | $12,137 | $12,627 |
| '20 | $11,428 | $12,169 |
| '20 | $11,164 | $12,017 |
| '20 | $11,512 | $12,399 |
| '20 | $11,732 | $12,501 |
| '20 | $11,940 | $12,712 |
| '20 | $11,904 | $12,652 |
| '20 | $11,868 | $12,655 |
| '20 | $11,843 | $12,617 |
| '20 | $12,078 | $12,807 |
| '20 | $12,201 | $12,885 |
| '21 | $12,305 | $12,967 |
| '21 | $12,073 | $12,761 |
| '21 | $12,153 | $12,840 |
| '21 | $12,285 | $12,947 |
| '21 | $12,377 | $12,986 |
| '21 | $12,431 | $13,022 |
| '21 | $12,536 | $13,130 |
| '21 | $12,470 | $13,082 |
| '21 | $12,350 | $12,987 |
| '21 | $12,337 | $12,949 |
| '21 | $12,457 | $13,059 |
| '21 | $12,485 | $13,081 |
| '22 | $12,120 | $12,722 |
| '22 | $12,026 | $12,677 |
| '22 | $11,619 | $12,266 |
| '22 | $11,211 | $11,927 |
| '22 | $11,321 | $12,104 |
| '22 | $11,063 | $11,906 |
| '22 | $11,392 | $12,220 |
| '22 | $11,105 | $11,952 |
| '22 | $10,611 | $11,494 |
| '22 | $10,434 | $11,398 |
| '22 | $11,018 | $11,931 |
| '22 | $10,974 | $11,965 |
| '23 | $11,379 | $12,309 |
| '23 | $11,075 | $12,031 |
| '23 | $11,302 | $12,298 |
| '23 | $11,318 | $12,270 |
| '23 | $11,222 | $12,163 |
| '23 | $11,352 | $12,285 |
| '23 | $11,397 | $12,334 |
| '23 | $11,229 | $12,156 |
| '23 | $10,905 | $11,800 |
| '23 | $10,724 | $11,699 |
| '23 | $11,444 | $12,442 |
| '23 | $11,782 | $12,731 |
| '24 | $11,772 | $12,666 |
| '24 | $11,792 | $12,683 |
| '24 | $11,826 | $12,682 |
| '24 | $11,671 | $12,525 |
| '24 | $11,691 | $12,488 |
Yearly periods ended May 31
The Fund's growth of an assumed $10,000 investment is adjusted for the maximum sales charge of 2.75%. This results in a net initial invesment of $9,725.
Average Annual Total Returns
| Class/Index | 1-Year | 5-Year | 10-Year |
|---|---|---|---|
| Class A Unadjusted for Sales Charge | 4.18% | 0.44% | 1.86% |
| Class A Adjusted for the Maximum Sales Charge (max 2.75% load) | 1.32% | -0.12% | 1.57% |
| Bloomberg Municipal Bond Index | 2.67% | 0.93% | 2.25% |
Performance shown is historical. The Fund's past performance is not a good predictor or guarantee of the Fund's future performance. Investment return and principal fluctuate, so your shares may be worth more or less when redeemed. Current performance may be lower or higher than the performance data quoted. The performance graph and returns table do not reflect the deduction of taxes that a shareholder would pay on Fund distributions or the redemption of Fund shares. Please visit dws.com/en-us/products/mutual-funds for the Fund’s most recent month-end performance. Fund performance includes reinvestment of all distributions. Unadjusted returns do not reflect sales charges and would have been lower if they had reflected sales charges.
Key Fund Statistics
| Net Assets ($) | 1,956,316,161 |
| Number of Portfolio Holdings | 408 |
| Portfolio Turnover Rate (%) | 40 |
| Total Net Advisory Fees Paid ($) | 6,951,078 |
| Modified Duration to Worst | 6.9 years |
Modified duration to worst is the measure of sensitivity of the prices of bonds held by the Fund to a change in interest rates, computed using each bond's nearest call or maturity date.
What did the Fund invest in?
Holdings-based data is subject to change.
The quality ratings represent the higher of Moody’s Investors Service, Inc. (“Moody’s”), Fitch Ratings, Inc. (“Fitch”) or S&P Global Ratings (“S&P”) credit ratings. The ratings of Moody’s, Fitch and S&P represent their opinions as to the quality of the securities they rate. Credit quality measures a bond issuer’s ability to repay interest and principal in a timely manner. Ratings are relative and subjective and are not absolute standards of quality. Credit quality does not remove market risk and is subject to change.
Asset Allocation
| Asset Type | % of Net Assets |
| Revenue Bonds | 79% |
| General Obligation Bonds | 10% |
| Lease Obligations | 6% |
| Escrow To Maturity/prerefunded Bonds | 3% |
| Variable Rate Demand Notes | 1% |
| Other | 1% |
| Variable Rate Demand Preferred Shares | 0% |
| Other Assets and Liabilities, Net | 0% |
| Total | 100% |
Credit Quality
| Credit Rating | % of Net Assets |
| AAA | 12% |
| AA | 28% |
| A | 33% |
| BBB | 15% |
| BB | 3% |
| Not Rated | 9% |
| Total | 100% |
Material Fund Changes
This is a summary of certain changes of the Fund since June 1, 2023. For more information, review the Fund's current prospectus at www.dws.com/mutualreports, or call (800) 728-3337.
Effective October 1, 2023, the Fund’s contractual cap on total annual operating expense for Class A shares changed from 0.78% to 0.75%. The cap excludes certain expenses such as extraordinary expenses, taxes, brokerage, interest expense and acquired fund fees and expenses.
Additional Information
If you wish to view additional information about the Fund, including, but not limited to, its prospectus, quarterly holdings, Board fee evaluation reports, and financial statements and other information, please visit www.dws.com/mutualreports. For information about the Fund's proxy voting policies and procedures and how the Fund voted proxies related to its portfolio securities, please visit dws.com/en-us/resources/proxy-voting. This additional information is also available free of charge by contacting us at (800) 728-3337.
Householding
In order to reduce the amount of mail you receive and to help reduce expenses, we generally send a single copy of any shareholder report and prospectus to each household. If you do not want the mailing of these documents to be combined with those for other members of your household, please contact your financial representative or call DWS toll free at (800) 728-3337.
Bond investments are subject to interest-rate, credit, liquidity, and market risks to varying degrees. When interest rates rise, bond prices generally fall. Credit risk refers to the ability of an issuer to make timely payments of principal and interest. Investments in lower-quality (“junk bonds”) and non-rated securities present greater risk of loss than investments in higher-quality securities. Municipal securities are subject to the risk that litigation, legislation or other political events, local business or economic conditions or the bankruptcy of the issuer could have a significant effect on an issuer’s ability to make payments of principal and/or interest. The market for municipal bonds may be less liquid than for taxable bonds and there may be less information available on the financial condition of issuers of municipal securities than for public corporations. The Fund invests in inverse floaters, which are derivatives that involve leverage and could magnify the Fund's gains or losses. Although the Fund seeks income that is exempt from federal income taxes, a portion of the Fund’s distributions may be subject to federal, state, and local taxes, including the alternative minimum tax. Please read the prospectus for details.
This report must be preceded or accompanied by a prospectus. We advise you to consider the Fund's objectives, risks, charges, and expenses carefully before investing. The prospectus contains this and other important information about the Fund, which can be requested by calling (800) 728-3337, contacting your financial representative, or visit www.dws.com/mutualreports to view or download a prospectus. Please read the prospectus carefully before you invest.
The brand DWS represents DWS Group GmbH & Co. KGaA and any of its subsidiaries such as DWS Distributors, Inc., which offers investment products, or DWS Investment Management Americas, Inc. and RREEF America L.L.C., which offer advisory services.
©2024 DWS Group GmbH&Co. KGaA. All rights reserved
DMMBF-TSRA-A
R-101127-1 (7/24)
DWS Managed Municipal Bond Fund
Institutional Class: SMLIX
Annual Shareholder Report—May 31, 2024

This annual shareholder report contains important information about DWS Managed Municipal Bond Fund ("the Fund") for the period June 1, 2023 to May 31, 2024. You can find additional information about the Fund on the Fund's website at www.dws.com/mutualreports. You can also request this information by contacting us at (800) 728-3337.
This report describes changes to the Fund that occurred during the reporting period.
What were the Fund costs for the last year?
(Based on a hypothetical $10,000 investment)
| Cost of a $10,000 investment | Costs paid as a percentage of a $10,000 investment | |
|---|---|---|
| Institutional Class | $53 | 0.52% |
Gross expense ratio as of the latest prospectus: 0.56%. See prospectus for any contractual or voluntary waivers; without a waiver, costs would have been higher.
How did the Fund perform last year and what affected its performance?
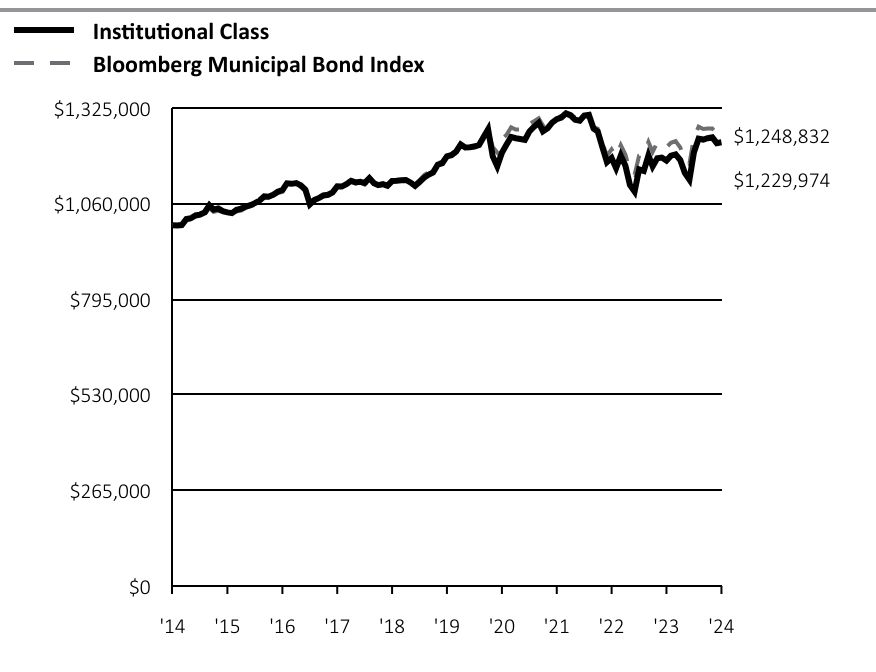
Institutional Class shares of the Fund returned 4.31% for the period ended May 31, 2024. The Fund's index, the Bloomberg Municipal Bond Index, returned 2.67% for the same period.
Municipal market prices were pressured over the period by higher U.S. Treasury yields and greater-than-expected new issue supply. Lower quality issues in the BBB and high yield rating categories led municipal market performance as recession fears eased, supporting credit sentiment broadly. In addition, high yield prices benefited from very low new issuance. While yield increases were more muted than for U.S. Treasuries, the municipal curve finished higher along its length for the 12 months.
The Fund was overweight issues rated BBB and below investment grade, supporting returns as lower quality segments of the municipal market outperformed. The Fund’s tilt toward longer maturities proved beneficial to performance as the higher income offered by these issues more than offset the negative impact on prices as the municipal yield curve moved higher. In sector terms, overweight allocations to continuing care retirement community, charter school, prepaid gas, and toll facility bonds aided performance.
While there were no material detractors, the Fund’s underweight to general obligation issues weighed marginally on relative performance.
Fund Performance
Cumulative Growth of an Assumed $1,000,000Investment
Bloomberg Municipal Bond Index is a market value-weighted index of investment-grade municipal bonds with maturities of one year or more.
Index returns do not reflect any fees or expenses and it is not possible to invest directly into an index.
| Institutional Class | Bloomberg Municipal Bond Index | |
|---|---|---|
| '14 | $1,000,000 | $1,000,000 |
| '14 | $999,183 | $1,000,866 |
| '14 | $1,000,511 | $1,002,631 |
| '14 | $1,017,007 | $1,014,769 |
| '14 | $1,019,398 | $1,015,801 |
| '14 | $1,027,205 | $1,022,766 |
| '14 | $1,029,582 | $1,024,535 |
| '14 | $1,035,606 | $1,029,704 |
| '15 | $1,055,497 | $1,047,954 |
| '15 | $1,043,319 | $1,037,144 |
| '15 | $1,046,685 | $1,040,139 |
| '15 | $1,038,999 | $1,034,682 |
| '15 | $1,035,749 | $1,031,824 |
| '15 | $1,033,627 | $1,030,884 |
| '15 | $1,042,717 | $1,038,351 |
| '15 | $1,046,183 | $1,040,390 |
| '15 | $1,051,963 | $1,047,927 |
| '15 | $1,055,482 | $1,052,093 |
| '15 | $1,061,328 | $1,056,276 |
| '15 | $1,068,449 | $1,063,697 |
| '16 | $1,079,969 | $1,076,389 |
| '16 | $1,078,926 | $1,078,082 |
| '16 | $1,084,729 | $1,081,497 |
| '16 | $1,092,852 | $1,089,449 |
| '16 | $1,097,436 | $1,092,396 |
| '16 | $1,116,033 | $1,109,774 |
| '16 | $1,114,752 | $1,110,452 |
| '16 | $1,116,968 | $1,111,950 |
| '16 | $1,110,890 | $1,106,400 |
| '16 | $1,098,823 | $1,094,793 |
| '16 | $1,058,267 | $1,053,962 |
| '16 | $1,070,192 | $1,066,336 |
| '17 | $1,075,748 | $1,073,366 |
| '17 | $1,082,579 | $1,080,819 |
| '17 | $1,084,545 | $1,083,165 |
| '17 | $1,091,348 | $1,091,024 |
| '17 | $1,107,733 | $1,108,339 |
| '17 | $1,107,263 | $1,104,364 |
| '17 | $1,113,974 | $1,113,299 |
| '17 | $1,123,059 | $1,121,771 |
| '17 | $1,118,819 | $1,116,068 |
| '17 | $1,120,616 | $1,118,792 |
| '17 | $1,117,540 | $1,112,801 |
| '17 | $1,130,785 | $1,124,432 |
| '18 | $1,116,524 | $1,111,194 |
| '18 | $1,110,984 | $1,107,874 |
| '18 | $1,113,982 | $1,111,963 |
| '18 | $1,109,550 | $1,107,995 |
| '18 | $1,122,503 | $1,120,683 |
| '18 | $1,123,084 | $1,121,640 |
| '18 | $1,124,966 | $1,124,362 |
| '18 | $1,125,602 | $1,127,250 |
| '18 | $1,118,668 | $1,119,952 |
| '18 | $1,109,184 | $1,113,055 |
| '18 | $1,119,988 | $1,125,375 |
| '18 | $1,132,195 | $1,138,849 |
| '19 | $1,140,530 | $1,147,458 |
| '19 | $1,146,422 | $1,153,602 |
| '19 | $1,167,597 | $1,171,838 |
| '19 | $1,172,139 | $1,176,242 |
| '19 | $1,190,844 | $1,192,458 |
| '19 | $1,194,186 | $1,196,861 |
| '19 | $1,203,944 | $1,206,507 |
| '19 | $1,224,111 | $1,225,538 |
| '19 | $1,215,676 | $1,215,714 |
| '19 | $1,216,338 | $1,217,893 |
| '19 | $1,218,310 | $1,220,939 |
| '19 | $1,222,355 | $1,224,667 |
| '20 | $1,245,343 | $1,246,670 |
| '20 | $1,265,767 | $1,262,746 |
| '20 | $1,190,762 | $1,216,943 |
| '20 | $1,163,320 | $1,201,670 |
| '20 | $1,201,056 | $1,239,897 |
| '20 | $1,222,954 | $1,250,102 |
| '20 | $1,244,840 | $1,271,157 |
| '20 | $1,241,263 | $1,265,193 |
| '20 | $1,239,051 | $1,265,461 |
| '20 | $1,236,649 | $1,261,660 |
| '20 | $1,260,017 | $1,280,699 |
| '20 | $1,273,088 | $1,288,501 |
| '21 | $1,284,250 | $1,296,712 |
| '21 | $1,260,264 | $1,276,109 |
| '21 | $1,268,862 | $1,283,979 |
| '21 | $1,284,231 | $1,294,749 |
| '21 | $1,294,105 | $1,298,612 |
| '21 | $1,298,580 | $1,302,178 |
| '21 | $1,309,847 | $1,312,978 |
| '21 | $1,304,535 | $1,308,160 |
| '21 | $1,292,300 | $1,298,719 |
| '21 | $1,289,752 | $1,294,922 |
| '21 | $1,303,908 | $1,305,946 |
| '21 | $1,305,781 | $1,308,053 |
| '22 | $1,267,817 | $1,272,248 |
| '22 | $1,259,611 | $1,267,690 |
| '22 | $1,215,850 | $1,226,595 |
| '22 | $1,174,889 | $1,192,668 |
| '22 | $1,186,595 | $1,210,385 |
| '22 | $1,158,365 | $1,190,561 |
| '22 | $1,193,104 | $1,222,018 |
| '22 | $1,164,727 | $1,195,236 |
| '22 | $1,111,839 | $1,149,362 |
| '22 | $1,093,494 | $1,139,803 |
| '22 | $1,154,924 | $1,193,116 |
| '22 | $1,150,514 | $1,196,532 |
| '23 | $1,193,295 | $1,230,903 |
| '23 | $1,163,110 | $1,203,070 |
| '23 | $1,185,590 | $1,229,763 |
| '23 | $1,187,531 | $1,226,954 |
| '23 | $1,179,130 | $1,216,322 |
| '23 | $1,193,000 | $1,228,506 |
| '23 | $1,196,490 | $1,233,366 |
| '23 | $1,180,654 | $1,215,610 |
| '23 | $1,145,382 | $1,179,982 |
| '23 | $1,126,540 | $1,169,941 |
| '23 | $1,202,472 | $1,244,210 |
| '23 | $1,239,785 | $1,273,128 |
| '24 | $1,237,504 | $1,266,626 |
| '24 | $1,241,364 | $1,268,253 |
| '24 | $1,243,648 | $1,268,213 |
| '24 | $1,227,647 | $1,252,506 |
| '24 | $1,229,974 | $1,248,832 |
Yearly periods ended May 31
Average Annual Total Returns
| Class/Index | 1-Year | 5-Year | 10-Year |
|---|---|---|---|
| Institutional Class No Sales Charge | 4.31% | 0.65% | 2.09% |
| Bloomberg Municipal Bond Index | 2.67% | 0.93% | 2.25% |
Performance shown is historical. The Fund's past performance is not a good predictor or guarantee of the Fund's future performance. Investment return and principal fluctuate, so your shares may be worth more or less when redeemed. Current performance may be lower or higher than the performance data quoted. The performance graph and returns table do not reflect the deduction of taxes that a shareholder would pay on Fund distributions or the redemption of Fund shares. Please visit dws.com/en-us/products/mutual-funds for the Fund’s most recent month-end performance. Fund performance includes reinvestment of all distributions.
Key Fund Statistics
| Net Assets ($) | 1,956,316,161 |
| Number of Portfolio Holdings | 408 |
| Portfolio Turnover Rate (%) | 40 |
| Total Net Advisory Fees Paid ($) | 6,951,078 |
| Modified Duration to Worst | 6.9 years |
Modified duration to worst is the measure of sensitivity of the prices of bonds held by the Fund to a change in interest rates, computed using each bond's nearest call or maturity date.
What did the Fund invest in?
Holdings-based data is subject to change.
The quality ratings represent the higher of Moody’s Investors Service, Inc. (“Moody’s”), Fitch Ratings, Inc. (“Fitch”) or S&P Global Ratings (“S&P”) credit ratings. The ratings of Moody’s, Fitch and S&P represent their opinions as to the quality of the securities they rate. Credit quality measures a bond issuer’s ability to repay interest and principal in a timely manner. Ratings are relative and subjective and are not absolute standards of quality. Credit quality does not remove market risk and is subject to change.
Asset Allocation
| Asset Type | % of Net Assets |
| Revenue Bonds | 79% |
| General Obligation Bonds | 10% |
| Lease Obligations | 6% |
| Escrow To Maturity/prerefunded Bonds | 3% |
| Variable Rate Demand Notes | 1% |
| Other | 1% |
| Variable Rate Demand Preferred Shares | 0% |
| Other Assets and Liabilities, Net | 0% |
| Total | 100% |
Credit Quality
| Credit Rating | % of Net Assets |
| AAA | 12% |
| AA | 28% |
| A | 33% |
| BBB | 15% |
| BB | 3% |
| Not Rated | 9% |
| Total | 100% |
Material Fund Changes
This is a summary of certain changes of the Fund since June 1, 2023. For more information, review the Fund's current prospectus at www.dws.com/mutualreports, or call (800) 728-3337.
Effective October 1, 2023, the Fund’s contractual cap on total annual operating expense for Institutional Class shares changed from 0.53% to 0.50%. The cap excludes certain expenses such as extraordinary expenses, taxes, brokerage, interest expense and acquired fund fees and expenses.
Additional Information
If you wish to view additional information about the Fund, including, but not limited to, its prospectus, quarterly holdings, Board fee evaluation reports, and financial statements and other information, please visit www.dws.com/mutualreports. For information about the Fund's proxy voting policies and procedures and how the Fund voted proxies related to its portfolio securities, please visit dws.com/en-us/resources/proxy-voting. This additional information is also available free of charge by contacting us at (800) 728-3337.
Householding
In order to reduce the amount of mail you receive and to help reduce expenses, we generally send a single copy of any shareholder report and prospectus to each household. If you do not want the mailing of these documents to be combined with those for other members of your household, please contact your financial representative or call DWS toll free at (800) 728-3337.
Bond investments are subject to interest-rate, credit, liquidity, and market risks to varying degrees. When interest rates rise, bond prices generally fall. Credit risk refers to the ability of an issuer to make timely payments of principal and interest. Investments in lower-quality (“junk bonds”) and non-rated securities present greater risk of loss than investments in higher-quality securities. Municipal securities are subject to the risk that litigation, legislation or other political events, local business or economic conditions or the bankruptcy of the issuer could have a significant effect on an issuer’s ability to make payments of principal and/or interest. The market for municipal bonds may be less liquid than for taxable bonds and there may be less information available on the financial condition of issuers of municipal securities than for public corporations. The Fund invests in inverse floaters, which are derivatives that involve leverage and could magnify the Fund's gains or losses. Although the Fund seeks income that is exempt from federal income taxes, a portion of the Fund’s distributions may be subject to federal, state, and local taxes, including the alternative minimum tax. Please read the prospectus for details.
This report must be preceded or accompanied by a prospectus. We advise you to consider the Fund's objectives, risks, charges, and expenses carefully before investing. The prospectus contains this and other important information about the Fund, which can be requested by calling (800) 728-3337, contacting your financial representative, or visit www.dws.com/mutualreports to view or download a prospectus. Please read the prospectus carefully before you invest.
The brand DWS represents DWS Group GmbH & Co. KGaA and any of its subsidiaries such as DWS Distributors, Inc., which offers investment products, or DWS Investment Management Americas, Inc. and RREEF America L.L.C., which offer advisory services.
©2024 DWS Group GmbH&Co. KGaA. All rights reserved
DMMBF-TSRA-I
R-101127-1 (7/24)
| (b) Not applicable | |
| Item 2. | Code of Ethics. |
As of the end of the period covered by this report, the registrant has adopted a code of ethics, as defined in Item 2 of Form N-CSR that applies to its Principal Executive Officer and Principal Financial Officer.
There have been no amendments to, or waivers from, a provision of the code of ethics during the period covered by this report that would require disclosure under Item 2.
A copy of the code of ethics is filed as an exhibit to this Form N-CSR. | |
| Item 3. | Audit Committee Financial Expert. |
| The fund’s audit committee is comprised solely of trustees who are "independent" (as such term has been defined by the Securities and Exchange Commission ("SEC") in regulations implementing Section 407 of the Sarbanes-Oxley Act (the "Regulations")). The fund’s Board of Trustees has determined that there are several "audit committee financial experts" (as such term has been defined by the Regulations) serving on the fund’s audit committee including Ms. Catherine Schrand, the chair of the fund’s audit committee. An “audit committee financial expert” is not an “expert” for any purpose, including for purposes of Section 11 of the Securities Act of 1933 and the designation or identification of a person as an “audit committee financial expert” does not impose on such person any duties, obligations or liability that are greater than the duties, obligations and liability imposed on such person as a member of the audit committee and board of directors in the absence of such designation or identification. | |
| Item 4. | Principal Accountant Fees and Services. |
DWS Managed Municipal Bond Fund
form n-csr disclosure re: AUDIT FEES
The following table shows the amount of fees that Ernst & Young LLP (“EY”), the Fund’s Independent Registered Public Accounting Firm, billed to the Fund during the Fund’s last two fiscal years. The Audit Committee approved in advance all audit services and non-audit services that EY provided to the Fund.
Services that the Fund’s Independent Registered Public Accounting Firm Billed to the Fund
| Fiscal Year Ended May 31, | Audit Fees Billed to Fund | Audit-Related Fees Billed to Fund | Tax Fees Billed to Fund | All Other Fees Billed to Fund |
| 2024 | $53,136 | $0 | $7,629 | $0 |
| 2023 | $53,136 | $0 | $7,880 | $0 |
The above “Tax Fees” were billed for professional services rendered for tax preparation.
Services that the Fund’s Independent Registered Public Accounting Firm Billed to the Adviser and Affiliated Fund Service Providers
The following table shows the amount of fees billed by EY to DWS Investment Management Americas, Inc. (“DIMA” or the “Adviser”), and any entity controlling, controlled by or under common control with DIMA (“Control Affiliate”) that provides ongoing services to the Fund (“Affiliated Fund Service Provider”), for engagements directly related to the Fund’s operations and financial reporting, during the Fund’s last two fiscal years.
| Fiscal Year Ended May 31, | Audit-Related Fees Billed to Adviser and Affiliated Fund Service Providers | Tax Fees Billed to Adviser and Affiliated Fund Service Providers | All Other Fees Billed to Adviser and Affiliated Fund Service Providers |
| 2024 | $0 | $0 | $0 |
| 2023 | $0 | $572,355 | $0 |
The above “Tax Fees” were billed in connection with tax compliance services and agreed upon procedures.
Non-Audit Services
The following table shows the amount of fees that EY billed during the Fund’s last two fiscal years for non-audit services. The Audit Committee pre-approved all non-audit services that EY provided to the Adviser and any Affiliated Fund Service Provider that related directly to the Fund’s operations and financial reporting. The Audit Committee requested and received information from EY about any non-audit services that EY rendered during the Fund’s last fiscal year to the Adviser and any Affiliated Fund Service Provider. The Committee considered this information in evaluating EY’s independence.
| Fiscal Year Ended May 31, | Total Non-Audit Fees Billed to Fund (A) | Total Non-Audit Fees billed to Adviser and Affiliated Fund Service Providers (engagements related directly to the operations and financial reporting of the Fund) (B) | Total Non-Audit Fees billed to Adviser and Affiliated Fund Service Providers (all other engagements) (C) | Total of (A), (B) and (C) |
| 2024 | $7,629 | $0 | $0 | $7,629 |
| 2023 | $7,880 | $572,355 | $0 | $580,235 |
All other engagement fees were billed for services in connection with agreed upon procedures and tax compliance for DIMA and other related entities.
Audit Committee Pre-Approval Policies and Procedures. Generally, each Fund’s Audit Committee must pre approve (i) all services to be performed for a Fund by a Fund’s Independent Registered Public Accounting Firm and (ii) all non-audit services to be performed by a Fund’s Independent Registered Public Accounting Firm for the DIMA Entities with respect to operations and financial reporting of the Fund, except that the Chairperson or Vice Chairperson of each Fund’s Audit Committee may grant the pre-approval for non-audit services described in items (i) and (ii) above for non-prohibited services for engagements of less than $100,000. All such delegated pre approvals shall be presented to each Fund’s Audit Committee no later than the next Audit Committee meeting.
There were no amounts that were approved by the Audit Committee pursuant to the de minimis exception under Rule 2-01 of Regulation S-X.
According to the registrant’s principal Independent Registered Public Accounting Firm, substantially all of the principal Independent Registered Public Accounting Firm's hours spent on auditing the registrant's financial statements were attributed to work performed by full-time permanent employees of the principal Independent Registered Public Accounting Firm and (i) and (j) are not applicable.
***
In connection with the audit of the 2023 and 2024 financial statements, the Fund entered into an engagement letter with EY. The terms of the engagement letter required by EY, and agreed to by the Audit Committee, include a provision mandating the use of mediation and arbitration to resolve any controversy or claim between the parties arising out of or relating to the engagement letter or services provided thereunder.
***
| Item 5. | Audit Committee of Listed Registrants |
| Not applicable | |
| Item 6. | Investments. |
| Not applicable | |
| Item 7. | Financial Statements and Financial Highlights for Open-End Management Investment Companies. |


3 | |
26 | |
28 | |
29 | |
30 | |
34 | |
45 | |
47 | |
48 |
2 | | | DWS Managed Municipal Bond Fund |
Principal Amount ($) | Value ($) | ||
Municipal Investments 98.8% | |||
Alabama 0.6% | |||
Alabama, Black Belt Energy Gas District, Gas Project Revenue, Series D-1, 5.5% (a), 6/1/2049, GTY: Goldman Sachs Group, Inc. | 3,000,000 | 3,167,187 | |
Jefferson County, AL, Sewer Revenue, 5.5%, 10/1/2053 | 4,170,000 | 4,499,659 | |
Southeast Alabama, Energy Authority Commodity Supply Revenue Project 4, Series A, 4.0% (a), 11/1/2051, GTY: Goldman Sachs Group, Inc. | 5,000,000 | 4,949,292 | |
12,616,138 | |||
Alaska 0.1% | |||
Alaska, Northern Tobacco Securitization Corp., Tobacco Settlement Revenue, “1” , Series A, 4.0%, 6/1/2050 | 2,045,000 | 1,800,721 | |
Arizona 1.8% | |||
Arizona, Salt Verde Financial Corp., Gas Revenue: | |||
5.0%, 12/1/2032, GTY: Citigroup, Inc. | 1,600,000 | 1,664,495 | |
5.0%, 12/1/2037, GTY: Citigroup, Inc. | 8,405,000 | 8,927,314 | |
Arizona, State Health Facilities Authority Revenue, Banner Health Obligated Group: | |||
Series B, MUNIPSA + 0.25%, 3.61% (a), 1/1/2046 | 1,220,000 | 1,205,726 | |
Series B, Prerefunded, MUNIPSA + 0.25%, 3.61% (a), 1/1/2046 | 230,000 | 230,219 | |
Arizona, State Industrial Development Authority, Education Facility Revenue, Odyssey Preparatory Academy Project, 144A, 5.0%, 7/1/2049 | 5,490,000 | 4,931,977 | |
Maricopa County, AZ, Industrial Development Authority, Education Revenue, Legacy Traditional Schools Project, Series B, 144A, 5.0%, 7/1/2049 | 4,560,000 | 4,371,208 | |
Maricopa County, AZ, Industrial Development Authority, Hospital Revenue: | |||
Series D, 5.0%, 12/1/2043 (b) | 2,150,000 | 2,246,599 | |
Series D, 5.0%, 12/1/2044 (b) | 2,750,000 | 2,862,522 | |
Series D, 5.0%, 12/1/2045 (b) | 2,200,000 | 2,286,211 | |
Pima County, AZ, Industrial Development Authority, Education Revenue, American Leadership Academy Project: | |||
Series 2022, 144A, 4.0%, 6/15/2057 | 6,495,000 | 4,875,716 | |
144A, 5.0%, 6/15/2049 | 1,445,000 | 1,343,766 | |
144A, 5.0%, 6/15/2052 | 1,410,000 | 1,311,649 | |
36,257,402 | |||
DWS Managed Municipal Bond Fund | | | 3 |
Principal Amount ($) | Value ($) | ||
California 6.0% | |||
California, Golden State Tobacco Securitization Corp., Tobacco Settlement Revenue, Series A, Prerefunded, 5.0%, 6/1/2040 | 11,765,000 | 11,965,183 | |
California, Housing Finance Agency, Municipal Certificates: | |||
“A", Series A, 3.25%, 8/20/2036 | 8,318,917 | 7,496,629 | |
“A", Series 2021-1, 3.5%, 11/20/2035 | 5,317,298 | 4,965,436 | |
“A", Series 2021-2, 3.75%, 3/25/2035 | 10,390,919 | 9,988,071 | |
California, Morongo Band of Mission Indians Revenue, Series B, 144A, 5.0%, 10/1/2042 | 2,395,000 | 2,401,298 | |
California, M-S-R Energy Authority, Series B, 7.0%, 11/1/2034, GTY: Citigroup Global Markets | 15,315,000 | 18,454,907 | |
California, Municipal Finance Authority, Barlow Respiratory Hospital Obligated Group, Series A, 4.0%, 9/1/2040 | 6,975,000 | 6,180,019 | |
California, River Islands Public Financing Authority, Special Tax, Community Facilities District No. 2019-1, Phase 2 Public Improvements: | |||
3.875%, 9/1/2049 | 1,560,000 | 1,227,665 | |
4.0%, 9/1/2046 | 2,265,000 | 1,881,487 | |
California, State Municipal Finance Authority Revenue, Catalyst Impact Fund 1 LLC, “II” , 144A, 7.0%, 1/1/2039 | 4,365,000 | 4,578,738 | |
California, State Municipal Finance Authority Revenue, LAX Integrated Express Solutions LLC, LINXS Apartment Project, Series A, AMT, 5.0%, 12/31/2043 | 3,110,000 | 3,117,726 | |
California, State Public Finance Authority Revenue, ENSO Village Project, Series A, 144A, 5.0%, 11/15/2046 | 675,000 | 614,761 | |
California, State Public Works Board, Lease Revenue: | |||
Series C, 5.0%, 8/1/2032 | 3,600,000 | 4,003,124 | |
Series C, 5.0%, 8/1/2033 | 3,765,000 | 4,183,593 | |
California, State University Revenue, Series A, 5.0%, 11/1/2038 | 7,410,000 | 7,552,151 | |
California, Statewide Communities Development Authority, Multi-Family Housing Revenue, Foxwood Apartments Project, Series J, 3.13% (c), 6/7/2024, LOC: Wells Fargo Bank NA | 200,000 | 200,000 | |
California, University of California Revenue, Series Z-2, 5.37% (c), 6/7/2024 | 3,300,000 | 3,300,000 | |
Los Angeles, CA, Department of Airports Revenue: | |||
Series B, AMT, 5.0%, 5/15/2030 | 5,715,000 | 5,935,581 | |
Series C, AMT, 5.0%, 5/15/2031 | 3,910,000 | 4,031,886 | |
4 | | | DWS Managed Municipal Bond Fund |
Principal Amount ($) | Value ($) | ||
Nuveen California Quality Municipal Income Fund: | |||
Series 7, 144A, AMT, 3.43% (c), 6/7/2024, LIQ: Royal Bank of Canada | 900,000 | 900,000 | |
Series 1-1362, 144A, AMT, 3.45% (c), 6/7/2024, LIQ: Societe Generale | 400,000 | 400,000 | |
Sacramento County, CA, Airport System Revenue, Series C, AMT, 5.0%, 7/1/2030 | 13,690,000 | 14,167,332 | |
117,545,587 | |||
Colorado 4.2% | |||
Colorado, Bridge & Tunnel Enterprise Revenue, Series A, 5.5%, 12/1/2054, INS: AGMC | 3,000,000 | 3,336,160 | |
Colorado, North Range Metropolitan District No. 3, Series A, 5.25%, 12/1/2050 | 3,333,000 | 3,279,641 | |
Colorado, Public Energy Authority, Natural Gas Purchase Revenue, 6.5%, 11/15/2038, GTY: Merrill Lynch & Co. | 30,000,000 | 35,939,229 | |
Colorado, State Health Facilities Authority, Hospital Revenue, CommonSpirit Health Obligation Group, Series A-1, 4.0%, 8/1/2044 | 4,000,000 | 3,754,253 | |
Colorado, Trails At Crowfoot Metropolitan District No. 3, Series A, 5.0%, 12/1/2049 | 1,000,000 | 933,466 | |
Denver City & County, CO, Airport System Revenue: | |||
Series A, AMT, 5.0%, 12/1/2029 | 7,985,000 | 8,301,251 | |
Series A, AMT, 5.0%, 12/1/2031 | 5,250,000 | 5,458,885 | |
Series B, AMT, 5.5%, 11/15/2040 | 1,835,000 | 2,036,828 | |
Series B, AMT, 5.5%, 11/15/2042 | 1,665,000 | 1,834,293 | |
Series B, AMT, 5.5%, 11/15/2043 | 1,665,000 | 1,826,792 | |
Series A, AMT, 5.5%, 11/15/2053 | 4,000,000 | 4,283,105 | |
Series D, AMT, 5.75%, 11/15/2045 | 3,280,000 | 3,640,696 | |
Denver, CO, Urban Renewal Authority, Tax Increment Revenue, 9th Urban Redevelopment Area, Series A, 144A, 5.25%, 12/1/2039 | 4,755,000 | 4,762,152 | |
Douglas County, CO, Rampart Range Metropolitan District No. 5: | |||
4.0%, 12/1/2041 | 940,000 | 777,526 | |
4.0%, 12/1/2051 | 3,510,000 | 2,609,370 | |
82,773,647 | |||
District of Columbia 1.3% | |||
District of Columbia, General Obligation, Series A, 5.0%, 6/1/2033 | 7,500,000 | 7,590,857 | |
District of Columbia, Latin American Montessori Bilingual Public Charter School, 5.0%, 6/1/2050 | 4,810,000 | 4,530,076 | |
District of Columbia, Two Rivers Public Charter School, Inc., 5.0%, 6/1/2050 | 2,155,000 | 1,891,004 | |
DWS Managed Municipal Bond Fund | | | 5 |
Principal Amount ($) | Value ($) | ||
Metropolitan Washington, DC, Airport Authority, Dulles Toll Road Revenue, Series B, 3.0%, 10/1/2050, INS: AGMC | 3,265,000 | 2,374,629 | |
Metropolitan Washington, DC, Airports Authority System Revenue, Series A, AMT, 5.0%, 10/1/2031 | 5,355,000 | 5,460,312 | |
Washington, DC, Convention & Sports Authority, Dedicated Tax Revenue: | |||
Series A, 5.0%, 10/1/2029 | 1,455,000 | 1,521,818 | |
Series A, 5.0%, 10/1/2030 | 1,455,000 | 1,521,643 | |
24,890,339 | |||
Florida 8.3% | |||
Broward County, FL, Airport System Revenue: | |||
Series A, AMT, 4.0%, 10/1/2044 | 2,140,000 | 1,997,846 | |
Series A, AMT, 4.0%, 10/1/2049 | 3,425,000 | 3,083,413 | |
Charlotte County, FL, Industrial Development Authority, Utility System Revenue, Town & Country Utilities Project, Series A, 144A, AMT, 4.0%, 10/1/2051, GTY: Babcock Ranch IRR LLC | 1,560,000 | 1,275,118 | |
Collier County, FL, State Educational Facilities Authority Revenue, Ave Maria University Inc., 5.25%, 6/1/2038 | 4,685,000 | 4,676,893 | |
Florida, Capital Project Finance Authority, Student Housing Revenue, Loan Program: | |||
Series A-1, 5.0%, 10/1/2032 | 540,000 | 550,069 | |
Series A-1, 5.0%, 10/1/2033 | 540,000 | 548,825 | |
Series A-1, 5.0%, 10/1/2034 | 545,000 | 552,342 | |
Series A-1, 5.0%, 10/1/2035 | 270,000 | 273,434 | |
Florida, Capital Projects Finance Authority Revenue, Provident Group - Continuum Properties LLC: | |||
Series A-1, 5.0%, 11/1/2053 | 785,000 | 757,536 | |
Series A-1, 5.0%, 11/1/2058 | 1,255,000 | 1,195,522 | |
Florida, Capital Trust Agency, Educational Growth Fund LLC, Charter School Portfolio Project, Series A-1, 144A, 5.0%, 7/1/2056 | 3,570,000 | 3,302,234 | |
Florida, Capital Trust Agency, Southeastern University Obligated Group Project: | |||
Series A, 144A, 6.25%, 5/1/2048 | 2,500,000 | 2,523,607 | |
Series A, 144A, 6.375%, 5/1/2053 | 1,000,000 | 1,012,456 | |
Florida, Development Finance Corp., Educational Facilities Revenue, Mater Academy Projects: | |||
Series A, 5.0%, 6/15/2047 | 6,600,000 | 6,606,262 | |
Series A, 5.0%, 6/15/2050 | 5,170,000 | 5,132,667 | |
Series A, 5.0%, 6/15/2052 | 1,980,000 | 1,954,702 | |
Series A, 5.0%, 6/15/2056 | 3,210,000 | 3,129,549 | |
6 | | | DWS Managed Municipal Bond Fund |
Principal Amount ($) | Value ($) | ||
Florida, Development Finance Corp., AAF Operations Holdings LLC, 144A, AMT, 12.0% (a), 7/15/2032 | 5,555,000 | 5,777,200 | |
Florida, Development Finance Corp., Brightline Trains Florida LLC, AMT, 5.5%, 7/1/2053 | 5,000,000 | 5,203,314 | |
Florida, Development Finance Corp., Educational Facilities Revenue, River City Science Academy Project: | |||
Series A-1, 5.0%, 7/1/2042 | 280,000 | 283,219 | |
Series B, 5.0%, 7/1/2042 | 295,000 | 298,392 | |
Series A-1, 5.0%, 7/1/2051 | 255,000 | 250,979 | |
Series B, 5.0%, 7/1/2051 | 420,000 | 413,377 | |
Series A-1, 5.0%, 2/1/2057 | 370,000 | 359,500 | |
Series B, 5.0%, 7/1/2057 | 440,000 | 427,465 | |
Florida, Higher Educational Facilities Financing Authority Revenue, Rollins College Project, Series A, 4.0%, 12/1/2050 | 15,000,000 | 13,649,439 | |
Florida, Jacksonville Electric Authority, Electric System Revenue, Series B, 4.0%, 10/1/2037 | 1,500,000 | 1,480,960 | |
Florida, State Development Finance Corp., Senior Living Revenue, The Cabana at Jensen Dunes Project, Series A, 144A, 5.25%, 11/15/2056 | 15,000,000 | 11,451,489 | |
Florida, State Higher Educational Facilities Financial Authority Revenue, Florida Institute of Technology, 4.0%, 10/1/2044 | 1,000,000 | 834,768 | |
Florida, State Higher Educational Facilities Financial Authority Revenue, Jacksonville University Project, Series A-1, 144A, 4.75%, 6/1/2038 | 2,150,000 | 2,067,046 | |
Florida, State Housing Finance Corp. Revenue, Series 1, 3.5%, 7/1/2051 | 1,830,000 | 1,789,485 | |
Florida, Village Community Development District No. 12, Special Assessment Revenue: | |||
4.25%, 5/1/2043 | 8,185,000 | 7,769,442 | |
4.375%, 5/1/2050 | 6,850,000 | 6,422,651 | |
Florida, Village Community Development District No. 13, Special Assessment Revenue, 3.25%, 5/1/2052 | 2,235,000 | 1,681,559 | |
Florida, Village Community Development District No. 14, 5.5%, 5/1/2053 | 6,500,000 | 6,710,352 | |
Florida, Village Community Development District No. 15, Special Assessment Revenue, 144A, 5.25%, 5/1/2054 | 2,160,000 | 2,205,135 | |
Jacksonville, FL, Educational Facilities Revenue, Jacksonville University Project, Series B, 144A, 5.0%, 6/1/2053 | 3,250,000 | 2,946,139 | |
Miami-Dade County, FL, Seaport Revenue: | |||
Series B1, AMT, 4.0%, 10/1/2046 | 6,430,000 | 5,793,380 | |
Series A, AMT, 5.0%, 10/1/2047 | 14,235,000 | 14,817,855 | |
DWS Managed Municipal Bond Fund | | | 7 |
Principal Amount ($) | Value ($) | ||
Orange County, FL, Health Facilities Authority, The Nemours Foundation, Series C-2, 3.33% (c), 6/7/2024, LOC: TD Bank NA | 300,000 | 300,000 | |
Orange County, FL, School Board, Certificates of Participation, Series C, Prerefunded, 5.0%, 8/1/2033 | 16,610,000 | 17,081,561 | |
Palm Beach County, FL, Health Facilities Authority Revenue, Lifespace Communities, Inc. Obligated Group: | |||
Series C, 7.5%, 5/15/2053 | 685,000 | 748,759 | |
Series C, 7.625%, 5/15/2058 | 905,000 | 990,046 | |
Tampa, FL, The University of Tampa Project, Series A, 4.0%, 4/1/2050 | 13,380,000 | 12,349,369 | |
162,675,356 | |||
Georgia 2.7% | |||
Cobb County, GA, Kennestone Hospital Authority, Revenue Anticipation Certificates, Wellstar Health System, Inc. Project, Series A, 4.0%, 4/1/2052 | 3,825,000 | 3,554,844 | |
Columbia County, GA, Hospital Authority Revenue, WellStar Health System Obligated Group: | |||
Series A, 5.125%, 4/1/2048 | 1,875,000 | 1,977,213 | |
Series A, 5.75%, 4/1/2053 | 2,000,000 | 2,218,363 | |
Fulton County, GA, Development Authority Hospital Revenue, Revenue Anticipation Certificates, Wellstar Health System, Series A, 5.0%, 4/1/2042 | 3,155,000 | 3,199,753 | |
George L Smith II, GA, Congress Center Authority, Convention Center Hotel First Tier, Series A, 4.0%, 1/1/2054 | 815,000 | 696,439 | |
George L Smith II, GA, Congress Center Authority, Convention Center Hotel Second Tier, Series B, 144A, 5.0%, 1/1/2054 | 4,255,000 | 3,792,187 | |
Georgia, Main Street Natural Gas, Inc., Gas Project Revenue: | |||
Series A, 4.0% (a), 7/1/2052, GTY: Royal Bank of Canada | 10,920,000 | 10,901,070 | |
Series C, 5.0% (a), 9/1/2053, GTY: Royal Bank of Canada | 5,765,000 | 6,056,463 | |
Series A, 5.5%, 9/15/2027, GTY: Merrill Lynch & Co. | 5,000,000 | 5,123,979 | |
Series A, 5.5%, 9/15/2028, GTY: Merrill Lynch & Co. | 5,000,000 | 5,158,111 | |
Georgia, Main Street Natural Gas, Inc., Gas Supply Revenue, Series B, 5.0% (a), 7/1/2053, GTY: Royal Bank of Canada | 4,750,000 | 4,992,816 | |
8 | | | DWS Managed Municipal Bond Fund |
Principal Amount ($) | Value ($) | ||
Georgia, Municipal Electric Authority Revenue, Project One, Series A, 5.0%, 1/1/2035 | 2,995,000 | 3,005,709 | |
Monroe County, GA, Development Authority, Pollution Control Revenue, Georgia Power Co. Plant Scherer Project, Series 2, 3.875% (a), 10/1/2048 | 1,250,000 | 1,252,755 | |
51,929,702 | |||
Illinois 7.0% | |||
Chicago, IL, Board of Education, Series A, 5.0%, 12/1/2034 | 810,000 | 833,633 | |
Chicago, IL, General Obligation, Series A, 6.0%, 1/1/2038 | 2,290,000 | 2,380,541 | |
Chicago, IL, O’Hare International Airport Revenue, Series A, AMT, 5.5%, 1/1/2053, INS: AGMC | 6,395,000 | 6,746,405 | |
Chicago, IL, Transit Authority, Sales Tax Receipts Revenue: | |||
Series A, 5.0%, 12/1/2045 | 3,700,000 | 3,765,195 | |
Series A, 5.0%, 12/1/2057 | 5,000,000 | 5,119,008 | |
Chicago, IL, Transit Authority, Sales Tax Receipts Revenue, Second Lien: | |||
Series A, 4.0%, 12/1/2050 | 3,730,000 | 3,367,549 | |
Series A, 5.0%, 12/1/2052 | 15,000,000 | 15,453,437 | |
Illinois, Housing Development Authority Revenue, Series N, 6.25%, 4/1/2054 | 6,975,000 | 7,641,602 | |
Illinois, Metropolitan Pier & Exposition Authority, Dedicated State Tax Revenue, Capital Appreciation-McCormick, Series A, Zero Coupon, 6/15/2038, INS: NATL | 17,305,000 | 9,266,864 | |
Illinois, Regional Transportation Authority, Series B, 5.75%, 6/1/2033, INS: NATL | 7,000,000 | 7,888,692 | |
Illinois, State Development Finance Authority, American College Surgeons, 3.4% (c), 6/7/2024, LOC: Northern Trust Company | 346,000 | 346,000 | |
Illinois, State Finance Authority Revenue, Edward Elmhurst Obligated Group: | |||
Series A, Prerefunded, 5.0%, 1/1/2036 | 2,970,000 | 3,080,049 | |
Series A, Prerefunded, 5.0%, 1/1/2037 | 3,965,000 | 4,111,917 | |
Illinois, State Finance Authority Revenue, Friendship Village of Schaumburg, 5.125%, 2/15/2045 * (d) | 9,825,000 | 2,259,750 | |
Illinois, State General Obligation: | |||
5.0%, 11/1/2034 | 3,500,000 | 3,568,505 | |
5.0%, 1/1/2035 | 6,875,000 | 6,961,890 | |
Series A, 5.0%, 5/1/2040 | 3,000,000 | 3,089,917 | |
Series A, 5.0%, 12/1/2042 | 5,955,000 | 6,065,780 | |
Series A, 5.0%, 5/1/2043 | 2,000,000 | 2,048,032 | |
Series A, 5.25%, 12/1/2030 | 6,500,000 | 6,793,093 | |
DWS Managed Municipal Bond Fund | | | 9 |
Principal Amount ($) | Value ($) | ||
Series B, 5.25%, 5/1/2041 | 5,625,000 | 6,077,158 | |
Series B, 5.25%, 5/1/2042 | 6,375,000 | 6,855,442 | |
Series B, 5.25%, 5/1/2043 | 3,000,000 | 3,213,211 | |
Series C, 5.25%, 10/1/2046 | 6,000,000 | 6,378,417 | |
5.5%, 5/1/2039 | 7,665,000 | 8,300,445 | |
5.75%, 5/1/2045 | 4,205,000 | 4,545,220 | |
136,157,752 | |||
Indiana 2.5% | |||
Indiana, State Finance Authority Revenue, BHI Senior Living Obligated Group, 5.0%, 11/15/2053 | 20,635,000 | 20,046,038 | |
Indiana, State Finance Authority Revenue, Stadium Project, Series A, 5.25%, 2/1/2031 | 2,595,000 | 2,635,920 | |
Indiana, State Finance Authority, CWA Authority, Inc. Project Revenue: | |||
Series A, 5.0%, 10/1/2042 (b) | 1,000,000 | 1,087,188 | |
Series A, 5.0%, 10/1/2043 (b) | 1,000,000 | 1,082,364 | |
Series A, 5.0%, 10/1/2044 (b) | 1,000,000 | 1,077,922 | |
Series A, 5.0%, 10/1/2045 (b) | 1,000,000 | 1,074,541 | |
Indiana, State Housing & Community Development Authority, Single Family Mortgage Revenue, Series C-1, 5.0%, 7/1/2053 | 1,735,000 | 1,750,015 | |
Indianapolis, IN, Local Public Improvement Bond Bank, Airport Authority Project: | |||
Series G-1, 5.0%, 1/1/2053 | 9,000,000 | 9,460,435 | |
Series G-1, 5.25%, 1/1/2048 | 4,100,000 | 4,404,677 | |
Series E, 6.0%, 3/1/2053 | 3,570,000 | 3,871,611 | |
Series E, 6.125%, 3/1/2057 | 1,780,000 | 1,930,696 | |
48,421,407 | |||
Iowa 1.3% | |||
Iowa, Higher Education Loan Authority, Des Moines University Project, 5.375%, 10/1/2052 | 2,265,000 | 2,315,857 | |
Iowa, PEFA, Inc., Gas Project Revenue, 5.0% (a), 9/1/2049, GTY: Goldman Sachs Group, Inc. | 10,000,000 | 10,178,529 | |
Iowa, State Finance Authority Revenue, Lifespace Communities, Inc. Obligated Group, Series B, 7.5%, 5/15/2053 | 910,000 | 994,701 | |
Iowa, State Higher Education Loan Authority Revenue, Des Moines University Project, 4.0%, 10/1/2050 | 12,905,000 | 10,909,571 | |
Iowa, Tobacco Settlement Authority Revenue, “2” , Series B1, 4.0%, 6/1/2049 | 485,000 | 472,044 | |
24,870,702 | |||
10 | | | DWS Managed Municipal Bond Fund |
Principal Amount ($) | Value ($) | ||
Kentucky 0.5% | |||
Louisville & Jefferson County, KY, Metro Government Hospital Revenue, UOFL Health Project, Series A, 5.0%, 5/15/2052 | 10,275,000 | 10,590,061 | |
Louisiana 0.0% | |||
Louisiana, State Gasoline & Fuels Tax Revenue, Series A-2, 4.0% (c), 6/3/2024, LOC: Toronto-Dominion Bank | 175,000 | 175,000 | |
Maryland 0.4% | |||
Maryland, State Community Development Administration, Series B, 5.35% (c), 6/7/2024, SPA: TD Bank NA | 270,000 | 270,000 | |
Maryland, State Community Development Administration, Department of Housing & Community Development, Series C, 3.5%, 3/1/2050 | 2,000,000 | 1,957,906 | |
Maryland, State Economic Development Corp., Student Housing Revenue, Morgan State University Project, Series A, 5.75%, 7/1/2053 | 1,925,000 | 2,045,637 | |
Maryland, State Health & Higher Educational Facilities Authority Revenue, UPMC Obligated Group, Series B, 4.0%, 4/15/2045 | 3,510,000 | 3,343,235 | |
7,616,778 | |||
Massachusetts 0.1% | |||
Massachusetts, State Department of Transportation, Metropolitan Highway Systems Revenue, Series A-2, 3.25% (c), 6/7/2024, LOC: TD Bank NA | 100,000 | 100,000 | |
Massachusetts, State Development Finance Agency Revenue, Springfield College, Series A, 4.0%, 6/1/2056 | 1,105,000 | 880,410 | |
Massachusetts, State Development Finance Agency Revenue, UMass Memorial Healthcare, 5.0%, 7/1/2036 | 1,000,000 | 1,015,235 | |
Massachusetts, State Development Financing Agency, College of the Holy Cross, Series A, 3.95% (c), 6/3/2024, LOC: Bank of America NA | 100,000 | 100,000 | |
Massachusetts, State Health & Educational Facilities Authority Revenue, Baystate Medical Center, Series K, 4.0% (c), 6/3/2024, LOC: TD Bank NA | 500,000 | 500,000 | |
2,595,645 | |||
DWS Managed Municipal Bond Fund | | | 11 |
Principal Amount ($) | Value ($) | ||
Michigan 0.8% | |||
Michigan, State Finance Authority Revenue, Tobacco Settlement Revenue, “1” , Series A, 4.0%, 6/1/2049 | 10,740,000 | 9,558,353 | |
Michigan, Strategic Fund, 75 Improvement P3 Project, AMT, 5.0%, 6/30/2048 | 5,800,000 | 5,800,067 | |
15,358,420 | |||
Minnesota 0.3% | |||
Minnesota, State Trunk Highway, Series B, 4.0%, 8/1/2032 | 5,000,000 | 5,109,456 | |
Missouri 1.4% | |||
Missouri, State Health & Educational Facilities Authority Revenue, Lutheran Senior Services Projects, Series B, 5.0%, 2/1/2046 | 2,460,000 | 2,374,636 | |
Missouri, State Health & Educational Facilities Authority Revenue, Medical Research, Lutheran Senior Services: | |||
4.0%, 2/1/2042 | 2,640,000 | 2,321,258 | |
Series A, 5.0%, 2/1/2046 | 3,285,000 | 3,171,008 | |
Missouri, State Health & Educational Facilities Authority Revenue, Mercy Health, Series C, 4.0%, 11/15/2049 | 7,000,000 | 6,490,544 | |
Missouri, State Housing Development Commission, Single Family Mortgage Revenue, First Homeownership Loan Program: | |||
Series B, 4.0%, 5/1/2050 | 2,090,000 | 2,066,766 | |
Series C, 6.0%, 5/1/2053 | 10,145,000 | 10,983,356 | |
Nodaway County, MO, Industrial Development Authority, Educational Facilities Revenue, North West Foundation, Inc., 3.32% (c), 6/7/2024, LOC: U.S. Bank NA | 500,000 | 500,000 | |
27,907,568 | |||
Nevada 0.2% | |||
Reno, NV, Sales Tax Revenue, Transportation Rail Access, Series C, 144A, Zero Coupon, 7/1/2058 | 37,500,000 | 4,821,015 | |
New Jersey 4.1% | |||
New Jersey, State Covid-19 General Obligation Emergency Bonds, Series A, 4.0%, 6/1/2031 | 1,245,000 | 1,291,775 | |
New Jersey, State Economic Development Authority Revenue: | |||
Series SSS, 5.25%, 6/15/2038 | 1,600,000 | 1,800,588 | |
Series BBB, Prerefunded, 5.5%, 6/15/2030 | 16,440,000 | 17,254,388 | |
12 | | | DWS Managed Municipal Bond Fund |
Principal Amount ($) | Value ($) | ||
New Jersey, State Economic Development Authority Revenue, Private Activity, The Goethals Bridge Replacement Project, Series A, AMT, 5.0%, 1/1/2031, INS: AGMC | 4,000,000 | 4,006,760 | |
New Jersey, State Higher Education Assistance Authority, Student Loan Revenue: | |||
Series B, AMT, 4.25%, 12/1/2045 | 4,835,000 | 4,675,551 | |
Series C, AMT, 5.0%, 12/1/2053 | 2,520,000 | 2,413,602 | |
New Jersey, State Housing & Mortgage Finance Agency, Single Family Housing Revenue, Series I, 5.0%, 10/1/2053 | 2,490,000 | 2,537,270 | |
New Jersey, State Transportation Trust Fund Authority, Transportation Program, Series CC, 5.5%, 6/15/2050 | 4,500,000 | 4,885,860 | |
New Jersey, State Transportation Trust Fund Authority, Transportation Systems: | |||
Series AA, 4.0%, 6/15/2050 | 5,820,000 | 5,393,799 | |
Series A, 5.0%, 12/15/2034 | 9,280,000 | 9,762,904 | |
Series A, 5.0%, 12/15/2036 | 2,385,000 | 2,501,147 | |
Series BB, 5.25%, 6/15/2050 | 6,855,000 | 7,348,732 | |
New Jersey, Tobacco Settlement Financing Corp., Series A, 5.25%, 6/1/2046 | 7,900,000 | 8,137,680 | |
South Jersey, NJ, Transportation Authority System Revenue: | |||
Series A, 4.0%, 11/1/2050 | 2,000,000 | 1,794,967 | |
Series A, 5.0%, 11/1/2045 | 3,000,000 | 3,087,535 | |
Series A, 5.25%, 11/1/2052 | 3,200,000 | 3,360,467 | |
80,253,025 | |||
New Mexico 1.2% | |||
New Mexico, State Finance Authority Revenue, Public Project Revolving Fund: | |||
Series A, 4.0%, 6/1/2029 | 5,765,000 | 5,890,330 | |
Series A, 4.0%, 6/1/2030 | 5,795,000 | 5,894,468 | |
New Mexico, State Mortgage Finance Authority: | |||
Series A, 3.5%, 1/1/2051 | 2,660,000 | 2,598,516 | |
“I", Series D, 6.5%, 9/1/2054 | 6,345,000 | 6,925,092 | |
New Mexico, State Mortgage Finance Authority, Single Family Mortgage Revenue, “I” , Series D, 3.75%, 1/1/2050 | 2,395,000 | 2,354,946 | |
23,663,352 | |||
New York 13.9% | |||
New York, Genesee County Funding Corp., Rochester Regional Health Obligation, Series A, 5.25%, 12/1/2052 | 2,000,000 | 2,038,984 | |
DWS Managed Municipal Bond Fund | | | 13 |
Principal Amount ($) | Value ($) | ||
New York, Metropolitan Transportation Authority Revenue: | |||
Series 2012-G1, 4.0% (c), 6/3/2024, LOC: Barclays Bank PLC | 3,400,000 | 3,400,000 | |
Series E-1, 4.0% (c), 6/3/2024, LOC: Barclays Bank PLC | 7,090,000 | 7,090,000 | |
New York, Metropolitan Transportation Authority, Dedicated Tax Fund, Climate Board Certified Green Bond, Series B2, 5.0%, 11/15/2034 | 10,940,000 | 11,398,805 | |
New York, State Dormitory Authority Revenues, Non-State Supported Debt, The New School: | |||
Series A, 4.0%, 7/1/2047 | 1,000,000 | 912,779 | |
Series A, 4.0%, 7/1/2052 | 1,175,000 | 1,045,540 | |
New York, State Dormitory Authority, Personal Income Tax Revenue: | |||
Series B, 5.0%, 2/15/2035 | 14,990,000 | 15,088,754 | |
Series B, Prerefunded, 5.0%, 2/15/2035 | 10,000 | 10,081 | |
Series A, 5.0%, 2/15/2039 | 3,945,000 | 4,057,627 | |
Series A, Prerefunded, 5.0%, 2/15/2039 | 5,000 | 5,163 | |
New York, State Dormitory Authority, Sales Tax Revenue, Series A, 5.0%, 3/15/2036 | 5,000,000 | 5,262,179 | |
New York, State Liberty Development Corp. Revenue, Series A, 3.0%, 11/15/2051 | 3,500,000 | 2,555,322 | |
New York, State Transportation Development Corp., Special Facilities Revenue, Delta Air Lines, Inc., LaGuardia Airport C&D Redevelopment: | |||
Series A, AMT, 5.0%, 1/1/2031 | 2,050,000 | 2,114,883 | |
AMT, 5.0%, 10/1/2035 | 3,705,000 | 3,928,402 | |
AMT, 5.625%, 4/1/2040 | 5,160,000 | 5,629,445 | |
New York, State Transportation Development Corp., Special Facilities Revenue, John F. Kennedy International Airport Project: | |||
AMT, 3.0%, 8/1/2031, GTY: American Airlines Group, Inc. | 1,000,000 | 934,768 | |
AMT, 5.375%, 6/30/2060 | 12,495,000 | 12,958,638 | |
AMT, 6.0%, 6/30/2054 | 1,400,000 | 1,535,700 | |
New York, State Transportation Development Corp., Special Facilities Revenue, Terminal 4 John F. Kennedy, International Project, AMT, 5.0%, 12/1/2041 | 3,210,000 | 3,331,698 | |
New York, Triborough Bridge & Tunnel Authority Revenue: | |||
Series B, 4.0% (c), 6/3/2024, LOC: TD Bank NA | 200,000 | 200,000 | |
Series B-4C, 4.15% (c), 6/3/2024, LOC: U.S. Bank NA | 400,000 | 400,000 | |
New York, Triborough Bridge & Tunnel Authority Revenue, MTA Bridges & Tunnels: | |||
Series C, 3.0%, 11/15/2046 | 5,000,000 | 3,824,736 | |
14 | | | DWS Managed Municipal Bond Fund |
Principal Amount ($) | Value ($) | ||
Series A, 4.0%, 11/15/2054 | 5,000,000 | 4,705,642 | |
Series A, 5.0%, 11/15/2034 | 1,000,000 | 1,134,939 | |
Series A, 5.0%, 11/15/2035 | 1,250,000 | 1,416,783 | |
Series A, 5.0%, 11/15/2036 | 1,250,000 | 1,411,190 | |
Series A, 5.0%, 11/15/2049 | 5,155,000 | 5,401,917 | |
New York, TSASC, Inc., Series A, 5.0%, 6/1/2041 | 1,195,000 | 1,211,896 | |
New York City, NY, Municipal Water Finance Authority, Water & Sewer Systems Revenue: | |||
Series DD, 5.0%, 6/15/2036 | 6,000,000 | 6,002,231 | |
Series GG-1, 5.0%, 6/15/2050 | 10,000,000 | 10,454,835 | |
Series AA-1, 5.25%, 6/15/2052 | 7,500,000 | 8,106,742 | |
New York City, NY, Transitional Finance Authority Revenue, Future Tax Secured: | |||
Series E-1, 5.0%, 11/1/2041 | 23,490,000 | 25,623,754 | |
Series F-1, 5.0%, 2/1/2042 | 9,410,000 | 10,217,569 | |
Series F-1, 5.0%, 2/1/2044 | 5,000,000 | 5,384,771 | |
Series D-1, 5.25%, 11/1/2040 | 5,000,000 | 5,557,540 | |
Series D-1, 5.5%, 11/1/2045 | 15,000,000 | 16,682,770 | |
New York City, NY, Transitional Finance Authority, Building Aid Revenue, Series S3, 5.0%, 7/15/2031 | 4,000,000 | 4,200,626 | |
New York City, NY, Transitional Finance Authority, Building Aid Revenue, Fiscal 2018, Series S1, 5.0%, 7/15/2035 | 2,800,000 | 2,882,335 | |
New York, NY, General Obligation: | |||
Series B1, 5.0%, 12/1/2031 | 2,000,000 | 2,051,747 | |
Series E1, 5.0%, 4/1/2040 | 11,250,000 | 12,328,982 | |
Series B-1, 5.25%, 10/1/2047 | 3,000,000 | 3,257,629 | |
New York, NY, Municipal Water Finance Authority, Water & Sewer System Revenue, Series EE-2, 4.15% (c), 6/3/2024, LIQ: State Street B&T Co. | 1,300,000 | 1,300,000 | |
Port Authority of New York & New Jersey: | |||
Series 207, AMT, 5.0%, 9/15/2031 | 6,950,000 | 7,184,273 | |
Series 207, AMT, 5.0%, 9/15/2032 | 13,500,000 | 13,941,009 | |
Series 242, AMT, 5.0%, 12/1/2032 | 12,000,000 | 12,986,819 | |
Triborough, NY, Bridge & Tunnel Authority Sales Tax Revenue: | |||
Series A, 5.25%, 5/15/2052 | 8,000,000 | 8,641,838 | |
Series A, 5.25%, 5/15/2057 | 12,000,000 | 12,861,204 | |
272,672,545 | |||
North Carolina 0.7% | |||
North Carolina, Greater Asheville Regional Airport Authority Revenue: | |||
AMT, 5.25%, 7/1/2043, INS: AGMC | 1,165,000 | 1,250,958 | |
AMT, 5.25%, 7/1/2048, INS: AGMC | 2,250,000 | 2,374,761 | |
DWS Managed Municipal Bond Fund | | | 15 |
Principal Amount ($) | Value ($) | ||
North Carolina, State Education Assistance Authority Revenue, Series A, AMT, 5.0%, 6/1/2043 | 2,735,000 | 2,665,965 | |
North Carolina, State Housing Finance Agency: | |||
Series 42, 4.0%, 1/1/2050 | 3,475,000 | 3,439,730 | |
Series 52-A, 6.25%, 1/1/2055 | 3,000,000 | 3,232,403 | |
12,963,817 | |||
North Dakota 0.3% | |||
City of Grand Forks, ND, Altru Health System Obligated Group Revenue, Series A, 5.0%, 12/1/2053, INS: AGMC | 1,315,000 | 1,339,474 | |
North Dakota, State Housing Finance Agency, Mortagage Finance Program, Series E, 5.37% (c), 6/7/2024, SPA: Royal Bank of Canada | 5,000,000 | 5,000,000 | |
6,339,474 | |||
Ohio 2.8% | |||
Buckeye, OH, Tobacco Settlement Financing Authority: | |||
“1", Series A-2, 4.0%, 6/1/2048 | 9,975,000 | 8,884,337 | |
“2", Series B-2, 5.0%, 6/1/2055 | 6,000,000 | 5,376,236 | |
Columbus, OH, Regional Airport Authority, Capital Funding Revenue, Oasbo Expanded Asset, 3.35% (c), 6/7/2024, LOC: U.S. Bank NA | 445,000 | 445,000 | |
Hamilton County, OH, Health Care Revenue, Life Enriching Communities Project: | |||
5.0%, 1/1/2036 | 975,000 | 976,717 | |
5.0%, 1/1/2046 | 2,790,000 | 2,624,967 | |
Series A, 5.75%, 1/1/2053 | 2,860,000 | 2,943,681 | |
Ohio, Akron, Bath & Copley Joint Township Hospital District Revenue, 5.25%, 11/15/2046 | 7,380,000 | 7,441,261 | |
Ohio, Port of Greater Cincinnati Development Authority Revenue, Series B, 5.0%, 12/1/2053 | 1,305,000 | 1,362,152 | |
Ohio, State Hospital Revenue, Aultman Health Foundation: | |||
144A, 5.0%, 12/1/2038 | 7,750,000 | 7,262,651 | |
144A, 5.0%, 12/1/2048 | 7,500,000 | 6,641,248 | |
Ohio, State Housing Finance Agency, Residential Mortgage Revenue, Series B, 4.5%, 3/1/2050 | 3,065,000 | 3,063,063 | |
Ohio, State Housing Finance Agency, Residential Mortgage Revenue, First Time Homebuyer Program, 3.75%, 9/1/2050 | 2,710,000 | 2,656,662 | |
Ohio, State Turnpike Commission, Junior Lien, Infrastructure Projects, Series A, 5.0%, 2/15/2039 | 3,890,000 | 4,288,897 | |
53,966,872 | |||
16 | | | DWS Managed Municipal Bond Fund |
Principal Amount ($) | Value ($) | ||
Oklahoma 1.0% | |||
Oklahoma, State Development Finance Authority, Health System Revenue, OU Medicine Project: | |||
Series B, 5.25%, 8/15/2048 | 2,670,000 | 2,710,074 | |
Series A, 5.5%, 8/15/2041 | 3,020,000 | 3,037,764 | |
Series A, 5.5%, 8/15/2044 | 3,205,000 | 3,261,442 | |
Oklahoma, State Turnpike Authority Revenue: | |||
Series E, 4.0%, 1/1/2031 | 6,375,000 | 6,405,447 | |
5.5%, 1/1/2053 | 3,000,000 | 3,275,055 | |
18,689,782 | |||
Oregon 0.1% | |||
Oregon, State Facilities Authority Revenue, Peacehealth Systems, Series A, 4.1% (c), 6/3/2024, LOC: U.S. Bank NA | 1,300,000 | 1,300,000 | |
Pennsylvania 5.3% | |||
Franklin County, PA, Industrial Development Authority Revenue, Menno Haven, Inc. Project: | |||
5.0%, 12/1/2043 | 665,000 | 599,772 | |
5.0%, 12/1/2053 | 1,780,000 | 1,496,575 | |
Lancaster County, PA, Hospital Authority Revenue, University of Pennsylvania Health System Obligated Group, 5.0%, 8/15/2042 | 2,100,000 | 2,130,086 | |
Pennsylvania, Bucks County Water and Sewer Authority Revenue, Series A, 5.25%, 12/1/2047, INS: AGMC | 2,175,000 | 2,338,037 | |
Pennsylvania, Certificate of Participations, Series A, 5.0%, 7/1/2043 | 1,115,000 | 1,142,763 | |
Pennsylvania, Commonwealth Financing Authority Revenue, Series A, 5.0%, 6/1/2033 | 5,000,000 | 5,047,416 | |
Pennsylvania, Commonwealth Financing Authority, Tobacco Master Settlement Payment Revenue Bonds: | |||
5.0%, 6/1/2027 | 1,290,000 | 1,331,689 | |
5.0%, 6/1/2028 | 1,290,000 | 1,345,291 | |
5.0%, 6/1/2029 | 1,290,000 | 1,347,747 | |
5.0%, 6/1/2030 | 855,000 | 894,511 | |
5.0%, 6/1/2031 | 865,000 | 905,350 | |
Pennsylvania, Geisinger Authority Health System Revenue, Series A-2, 5.0%, 2/15/2034 | 3,000,000 | 3,083,976 | |
Pennsylvania, State Economic Development Financing Authority, The Penndot Major Bridges, AMT, 5.75%, 6/30/2048 | 10,000,000 | 10,826,355 | |
Pennsylvania, State General Obligation, Series D, 5.0%, 8/15/2032 | 5,000,000 | 5,069,888 | |
DWS Managed Municipal Bond Fund | | | 17 |
Principal Amount ($) | Value ($) | ||
Pennsylvania, State Housing Finance Agency, Single Family Mortgage Revenue: | |||
Series 136, 3.0%, 10/1/2051 | 4,389,099 | 4,257,480 | |
Series 132A, 3.5%, 4/1/2051 | 1,355,000 | 1,333,356 | |
Pennsylvania, State Turnpike Commission Revenue: | |||
Series B, 5.0%, 6/1/2033 | 12,000,000 | 12,286,517 | |
Series B-1, 5.0%, 6/1/2042 | 6,950,000 | 7,095,884 | |
Series A, 5.0%, 12/1/2044 | 15,335,000 | 15,888,422 | |
Series B, 5.25%, 12/1/2052 | 4,050,000 | 4,375,229 | |
Southeastern, PA, Transportation Authority Revenue, 5.25%, 6/1/2052 | 20,000,000 | 21,546,062 | |
104,342,406 | |||
South Carolina 2.5% | |||
Lexington County, SC, Health Services District, Lexington Medical Center, 5.0%, 11/1/2041 | 2,500,000 | 2,524,890 | |
South Carolina, Public Service Authority Revenue, Series A, 4.0%, 12/1/2055 | 4,000,000 | 3,520,616 | |
South Carolina, State Jobs-Economic Development Authority Revenue, Novant Health Obligated Group, Series A, 5.5%, 11/1/2054 | 2,500,000 | 2,716,647 | |
South Carolina, State Public Service Authority Revenue: | |||
Series B, 4.0%, 12/1/2047 | 7,270,000 | 6,689,182 | |
Series A, 4.0%, 12/1/2052 | 8,640,000 | 7,699,090 | |
Series A, 5.0%, 12/1/2033 | 4,400,000 | 4,449,227 | |
Series A, 5.0%, 12/1/2036 | 4,780,000 | 4,826,421 | |
South Carolina, State Transportation Infrastructure Bank Revenue, Series A, 5.0%, 10/1/2038 | 15,130,000 | 15,653,572 | |
48,079,645 | |||
Tennessee 1.1% | |||
Metropolitan Nashville, TN, Airport Authority Revenue: | |||
Series B, AMT, 4.0%, 7/1/2049 | 4,000,000 | 3,603,236 | |
Series B, AMT, 4.0%, 7/1/2054 | 10,045,000 | 8,815,014 | |
Series B, AMT, 5.5%, 7/1/2052 | 3,250,000 | 3,466,611 | |
Sevier County, TN, Public Building Authority, Local Government Public Improvement Bonds, Series B-1, 3.38% (c), 6/7/2024, LOC: Bank of America NA | 390,000 | 390,000 | |
Tennessee, State Energy Acquisition Corporation Revenue, Series A, 5.0% (a), 5/1/2052, GTY: Goldman Sachs Group, Inc. | 5,050,000 | 5,296,333 | |
21,571,194 | |||
Texas 13.7% | |||
Aubrey, TX, Independent School District, 4.0%, 2/15/2052 | 6,025,000 | 5,674,608 | |
18 | | | DWS Managed Municipal Bond Fund |
Principal Amount ($) | Value ($) | ||
Austin, TX, Independent School District, General Obligation, 5.25%, 8/1/2049 | 12,500,000 | 13,677,965 | |
Central Texas, Regional Mobility Authority Revenue, Senior Lien: | |||
Series A, Prerefunded, 5.0%, 1/1/2040 | 4,730,000 | 4,804,217 | |
Series E, 5.0%, 1/1/2045 | 1,500,000 | 1,556,746 | |
City of Corpus Christi, TX, Utility System Revenue, 5.0%, 7/15/2049 (b) | 3,335,000 | 3,542,189 | |
Clifton, TX, Higher Education Finance Corp., Education Revenue, Series D, 6.125%, 8/15/2048 | 11,465,000 | 11,639,282 | |
Dallas, TX, Kay Bailey Hutchison Convention Center Project, Senior Lien, Special Tax, 144A, 6.0% (a), 8/15/2053 | 9,050,000 | 9,124,642 | |
Harris County, TX, Industrial Development Corp. Revenue, Energy Transfer LP, 4.05% (a), 11/1/2050 | 5,100,000 | 5,084,756 | |
Harris County, TX, Toll Road Revenue, Series A, 5.25%, 8/15/2054 (b) | 10,000,000 | 10,895,794 | |
Houston, TX, Hotel Occupancy Tax & Special Revenue, Convention & Entertainment Facilities Department: | |||
5.0%, 9/1/2029 | 1,000,000 | 1,050,028 | |
5.0%, 9/1/2030 | 1,000,000 | 1,051,294 | |
5.0%, 9/1/2031 | 850,000 | 893,747 | |
Houston, TX, Utility Systems Revenue, First Lien, Series A, 5.0%, 11/15/2033 | 2,475,000 | 2,702,941 | |
Lower Colorado River, TX, Transmission Contract Authority Revenue, LCRA Transmission Services Corp. Project: | |||
5.0%, 5/15/2045 | 1,500,000 | 1,547,770 | |
5.0%, 5/15/2050 | 2,500,000 | 2,568,324 | |
Newark, TX, Higher Education Finance Corp., Texas Revenue, Abilene Christian University Project, Series A, 4.0%, 4/1/2057 | 15,000,000 | 12,774,086 | |
San Antonio, TX, Education Facilities Corp. Revenue, University of the Incarnate Word Project: | |||
Series A, 4.0%, 4/1/2046 | 1,525,000 | 1,245,454 | |
Series A, 4.0%, 4/1/2051 | 5,500,000 | 4,312,232 | |
Series A, 4.0%, 4/1/2054 | 785,000 | 605,663 | |
San Antonio, TX, Education Facilities Corp., Higher Education Revenue, Hallmark University Project: | |||
Series A, 5.0%, 10/1/2041 | 890,000 | 754,794 | |
Series A, 5.0%, 10/1/2051 | 1,580,000 | 1,248,457 | |
San Antonio, TX, Independent School District Revenue, 5.0%, 8/15/2047 | 10,000,000 | 10,647,924 | |
Tarrant County, TX, Cultural Education Facilities Finance Corp. Revenue, Christus Health Obligated Group, Series B, 5.0%, 7/1/2048 | 20,000,000 | 20,202,730 | |
DWS Managed Municipal Bond Fund | | | 19 |
Principal Amount ($) | Value ($) | ||
Tarrant County, TX, Cultural Education Facilities Finance Corp., Hospital Revenue, Baylor Scott & White Healthcare, Series D, 5.5%, 11/15/2047 | 8,550,000 | 9,333,222 | |
Texas, Lamar Consolidated Independent School District: | |||
5.0%, 2/15/2041 | 10,930,000 | 11,795,481 | |
5.0%, 2/15/2042 | 13,180,000 | 14,170,125 | |
5.0%, 2/15/2043 | 11,340,000 | 12,134,189 | |
Texas, New Hope Cultural Education Facilities Finance Corp. Revenue, Bridgemoor Plano Project: | |||
Series A-2, Zero Coupon, 12/31/2030 | 817,291 | 496,581 | |
Series A-1, 7.25%, 12/31/2030 | 4,605,000 | 4,580,921 | |
Texas, New Hope Cultural Education Facilities Finance Corp., Educational Revenue, Cumberland Academy Project, Series A, 144A, 5.0%, 8/15/2050 | 4,250,000 | 4,024,175 | |
Texas, Private Activity Bond, Surface Transportation Corp. Revenue, North Tarrant Express, AMT, 5.5%, 12/31/2058 | 6,250,000 | 6,676,226 | |
Texas, Private Activity Bond, Surface Transportation Corp. Revenue, Senior Lien, North Mobility Partners Segments 3 LLC: | |||
AMT, 5.5%, 6/30/2041 | 2,000,000 | 2,146,930 | |
AMT, 5.5%, 6/30/2042 | 1,700,000 | 1,821,558 | |
AMT, 5.5%, 6/30/2043 | 2,290,000 | 2,448,392 | |
Texas, SA Energy Acquisition Public Facility Corp., Gas Supply Revenue, 5.5%, 8/1/2025, GTY: Goldman Sachs Group, Inc. | 2,750,000 | 2,786,344 | |
Texas, State College Student Loan, Series A, AMT, 5.5%, 8/1/2028 | 5,620,000 | 5,788,972 | |
Texas, State Department of Housing & Community Affairs, Series C, 6.0%, 3/1/2054 | 7,985,000 | 8,657,846 | |
Texas, State Municipal Gas Acquisition & Supply Corp. I, Gas Supply Revenue, Series D, 6.25%, 12/15/2026, GTY: Merrill Lynch & Co. | 8,615,000 | 8,852,572 | |
Texas, State Transportation Commission, Turnpike Systems Revenue, Series C, 5.0%, 8/15/2034 | 14,410,000 | 14,440,960 | |
Texas, State Water Development Board Revenue, State Water Implementation Revenue Fund: | |||
Series B, 4.0%, 10/15/2033 | 20,000,000 | 20,272,514 | |
Series B, 4.0%, 10/15/2036 | 5,000,000 | 5,042,981 | |
Texas, Transmission Contract Authority Revenue, LCRA Transmission Services Corp. Project: | |||
Series A, 5.0%, 5/15/2040 | 1,000,000 | 1,077,603 | |
Series A, 5.0%, 5/15/2041 | 4,450,000 | 4,762,445 | |
268,915,680 | |||
20 | | | DWS Managed Municipal Bond Fund |
Principal Amount ($) | Value ($) | ||
Utah 2.0% | |||
Salt Lake City, UT, Airport Revenue: | |||
Series A, AMT, 4.0%, 7/1/2051 | 10,200,000 | 9,086,748 | |
Series A, AMT, 5.0%, 7/1/2032 | 5,000,000 | 5,166,333 | |
Series A, AMT, 5.0%, 7/1/2042 | 13,440,000 | 13,551,543 | |
Series A, AMT, 5.0%, 7/1/2043 | 3,850,000 | 3,899,259 | |
Series A, AMT, 5.0%, 7/1/2048 | 2,310,000 | 2,323,548 | |
Utah, State Housing Corp. Revenue, Series A, 6.5%, 1/1/2054 | 3,160,000 | 3,443,822 | |
Utah, State Telecommunication Open Infrastructure Agency Sales Tax and Telecommunications Revenue, 5.5%, 6/1/2040 | 1,400,000 | 1,552,051 | |
39,023,304 | |||
Virginia 2.0% | |||
Stafford County, VA, Economic Development Authority, Hospital Facilities Revenue, Mary Washington Healthcare: | |||
Series A, 5.0%, 10/1/2042 | 895,000 | 934,854 | |
Series A, 5.0%, 10/1/2047 | 3,035,000 | 3,125,372 | |
Series A, 5.0%, 10/1/2052 | 3,900,000 | 3,983,413 | |
Virginia, Peninsula Town Center, Community Development Authority Revenue, Special Obligation, 144A, 5.0%, 9/1/2045 | 3,700,000 | 3,396,024 | |
Virginia, Small Business Financing Authority Revenue, 95 Express Lanes LLC Project, AMT, 4.0%, 1/1/2048 | 4,010,000 | 3,560,631 | |
Virginia, Small Business Financing Authority, Elizabeth River Crossings OPCO LLC Project, AMT, 4.0%, 1/1/2039 | 4,275,000 | 4,121,808 | |
Virginia, Small Business Financing Authority, Private Activity Revenue, Transform 66 P3 Project: | |||
AMT, 5.0%, 12/31/2049 | 3,145,000 | 3,168,026 | |
AMT, 5.0%, 12/31/2052 | 8,640,000 | 8,686,080 | |
Virginia, State College Building Authority, Educational Facilities Revenue, Regent University Project, 4.0%, 6/1/2046 | 2,420,000 | 2,040,652 | |
Virginia, State Commonwealth Transportation Board Revenue, Series A, 5.0%, 5/15/2031 | 5,120,000 | 5,377,346 | |
Virginia Beach, VA, State Beach Development Authority Residential Care Facility, Westminster-Canterbury on Chesapeake Bay Obligated Group, Series B-3, 5.375%, 9/1/2029 | 1,070,000 | 1,109,366 | |
39,503,572 | |||
DWS Managed Municipal Bond Fund | | | 21 |
Principal Amount ($) | Value ($) | ||
Washington 3.8% | |||
King County, WA, School District No. 412 Shoreline, 5.0%, 12/1/2031 | 4,345,000 | 4,658,063 | |
Port of Seattle, WA, Revenue Bonds: | |||
Series C, AMT, 5.0%, 8/1/2032 | 9,200,000 | 9,787,139 | |
Series B, AMT, 5.5%, 8/1/2047 | 1,500,000 | 1,607,677 | |
Skagit County, WA, Public Hospital District No. 1 Revenue, 5.5%, 12/1/2054 | 1,575,000 | 1,652,076 | |
Spokane County, WA, School District No. 81, Series B, 4.0%, 12/1/2030 | 13,000,000 | 13,165,554 | |
Washington, State Convention Center Public Facilities District: | |||
Series B, 3.0%, 7/1/2048, INS: AGMC | 9,170,000 | 6,883,751 | |
Series B, 3.0%, 7/1/2058 | 4,630,000 | 3,060,240 | |
Washington, State Health Care Facilities Authority, CommonSpirit Health Obligation Group, Series A2, 5.0%, 8/1/2044 | 17,700,000 | 18,094,255 | |
Washington, State Higher Educational Facilities Authority, Gonzaga University Project, Series A, 3.0%, 4/1/2049 | 5,000,000 | 3,660,247 | |
Washington, State Higher Educational Facilities Authority, Seattle University Project, 4.0%, 5/1/2050 | 4,350,000 | 3,863,734 | |
Washington, State Housing Finance Commission, Non-Profit Housing Revenue, Rockwood Retirement Communities Project, 144A, 5.0%, 1/1/2055 | 9,010,000 | 7,305,277 | |
Washington, State Housing Finance Commission, Panorama Project, 3.35% (c), 6/7/2024, LOC: Wells Fargo Bank NA | 250,000 | 250,000 | |
73,988,013 | |||
West Virginia 2.0% | |||
West Virginia, Marshall University Revenue, Improvement & Refunding Bonds, Series A, 4.0%, 5/1/2050, INS: AGMC | 9,150,000 | 8,113,268 | |
West Virginia, State Economic Development Authority, Solid Waste Disposal Facility, Arch Resources Project, AMT, 4.125% (a), 7/1/2045 | 3,900,000 | 3,883,852 | |
West Virginia, State Hospital Finance Authority, State University Health System Obligated Group: | |||
Series A, 5.0%, 6/1/2042 | 10,085,000 | 10,285,322 | |
Series A, 5.0%, 6/1/2047 | 10,035,000 | 10,155,795 | |
West Virginia, State Parkways Authority, Senior Lien, Trunpike Toll Revenue, 4.0%, 6/1/2051 | 6,765,000 | 6,273,879 | |
38,712,116 | |||
22 | | | DWS Managed Municipal Bond Fund |
Principal Amount ($) | Value ($) | ||
Wisconsin 2.3% | |||
Wisconsin, Public Finance Authority Educational Facility Revenue, Noorba College of Osteopathic Media Project, Series B, 144A, 6.5%, 6/1/2045 | 10,000,000 | 8,655,440 | |
Wisconsin, Public Finance Authority, Fargo-Moorhead Metropolitan Area Flood Risk Management Project, AMT, 4.0%, 9/30/2051 | 8,000,000 | 6,579,245 | |
Wisconsin, Public Finance Authority, Roseman University of Health Sciences Project: | |||
144A, 4.0%, 4/1/2042 | 485,000 | 435,611 | |
144A, Prerefunded, 4.0%, 4/1/2042 | 10,000 | 10,511 | |
144A, Prerefunded, 4.0%, 4/1/2052 | 25,000 | 26,278 | |
Wisconsin, Public Finance Authority, Senior Living Community First Mortgage Revenue, Cedars Obligated Group: | |||
144A, 5.5%, 5/1/2039 | 1,235,000 | 1,090,146 | |
144A, 5.75%, 5/1/2054 | 3,860,000 | 3,254,266 | |
Wisconsin, Public Finance Authority, Wisconsin Hotel Revenue, Senior Lien Grand Hyatt San Antonio Hotel: | |||
Series A, 5.0%, 2/1/2062 | 8,750,000 | 8,545,395 | |
Series B, 144A, 6.0%, 2/1/2062 | 3,000,000 | 3,054,846 | |
Wisconsin, Public Financing Authority, Retirement Facilities Revenue, Southminster, Inc.: | |||
144A, 5.0%, 10/1/2043 | 1,560,000 | 1,469,526 | |
144A, 5.0%, 10/1/2048 | 11,840,000 | 10,741,068 | |
Wisconsin, State General Obligation, Series 1, 5.0%, 5/1/2035 (b) | 1,250,000 | 1,395,212 | |
45,257,544 | |||
Guam 0.1% | |||
Guam, Government Waterworks Authority, Water & Wastewater System Revenue, Series A, 5.0%, 1/1/2050 | 1,090,000 | 1,109,955 | |
Puerto Rico 0.4% | |||
Puerto Rico, General Obligation: | |||
Series A1, 4.0%, 7/1/2037 | 1,690,325 | 1,639,954 | |
Series A1, 4.0%, 7/1/2041 | 2,613,626 | 2,429,434 | |
Series A1, 4.0%, 7/1/2046 | 1,097,810 | 992,899 | |
Puerto Rico, Sales Tax Financing Corp., Sales Tax Revenue, Series A-1, Zero Coupon, 7/1/2046 | 10,000,000 | 3,203,028 | |
8,265,315 | |||
Total Municipal Investments (Cost $1,947,489,230) | 1,932,730,307 | ||
DWS Managed Municipal Bond Fund | | | 23 |
Principal Amount ($) | Value ($) | ||
Corporate Bonds 0.5% | |||
Consumer Discretionary | |||
Grand Canyon University, 5.125%, 10/1/2028 (Cost $10,835,000) | 10,835,000 | 9,733,947 | |
Shares | Value ($) | ||
Closed-End Investment Companies 0.7% | |||
Nuveen Quality Municipal Income Fund (Cost $15,107,323) | 1,244,000 | 13,982,560 | |
Open-End Investment Companies 0.0% | |||
BlackRock Liquidity Funds MuniCash Portfolio, Institutional Shares, 3.23% (e) (Cost $71,152) | 71,145 | 71,152 | |
% of Net Assets | Value ($) | ||
Total Investment Portfolio (Cost $1,973,502,705) | 100.0 | 1,956,517,966 | |
Other Assets and Liabilities, Net | (0.0 ) | (201,805 ) | |
Net Assets | 100.0 | 1,956,316,161 | |
* | Non-income producing security. |
(a) | Variable or floating rate security. These securities are shown at their current rate as of May 31, 2024. For securities based on a published reference rate and spread, the reference rate and spread are indicated within the description above. Certain variable rate securities are not based on a published reference rate and spread but adjust periodically based on current market conditions, prepayment of underlying positions and/or other variables. Securities with a floor or ceiling feature are disclosed at the inherent rate, where applicable. |
(b) | When-issued security. |
(c) | Variable rate demand notes and variable rate demand preferred shares are securities whose interest rates are reset periodically (usually daily mode or weekly mode) by remarketing agents based on current market levels, and are not directly set as a fixed spread to a reference rate. These securities may be redeemed at par by the holder through a put or tender feature, and are shown at their current rates as of May 31, 2024. Date shown reflects the earlier of demand date or stated maturity date. |
(d) | Defaulted security or security for which income has been deemed uncollectible. |
(e) | Current yield; not a coupon rate. |
144A: Security exempt from registration under Rule 144A of the Securities Act of 1933. These securities may be resold in transactions exempt from registration, normally to qualified institutional buyers. |
AGMC: Assured Guaranty Municipal Corp. |
AMT: Subject to alternative minimum tax. |
GTY: Guaranty Agreement |
INS: Insured |
24 | | | DWS Managed Municipal Bond Fund |
LIQ: Liquidity Facility |
LOC: Letter of Credit |
MUNIPSA: SIFMA Municipal Swap Index Yield |
NATL: National Public Finance Guarantee Corp. |
Prerefunded: Bonds which are prerefunded are collateralized usually by U.S. Treasury securities which are held in escrow and used to pay principal and interest on tax-exempt issues and to retire the bonds in full at the earliest refunding date. |
SIFMA: Securities Industry and Financial Markets Association |
SPA: Standby Bond Purchase Agreement |
Assets | Level 1 | Level 2 | Level 3 | Total |
Municipal Investments (a) | $— | $1,932,730,307 | $— | $1,932,730,307 |
Corporate Bonds | — | 9,733,947 | — | 9,733,947 |
Closed-End Investment Companies | 13,982,560 | — | — | 13,982,560 |
Open-End Investment Companies | 71,152 | — | — | 71,152 |
Total | $14,053,712 | $1,942,464,254 | $— | $1,956,517,966 |
(a) | See Investment Portfolio for additional detailed categorizations. |
DWS Managed Municipal Bond Fund | | | 25 |
Assets | |
Investment in securities, at value (cost $1,973,502,705) | $1,956,517,966 |
Receivable for investments sold | 3,536,956 |
Receivable for Fund shares sold | 42,426 |
Dividends receivable | 64,688 |
Interest receivable | 27,586,168 |
Other assets | 76,578 |
Total assets | 1,987,824,782 |
Liabilities | |
Payable for investments purchased — when-issued securities | 27,667,587 |
Payable for Fund shares redeemed | 1,563,047 |
Distributions payable | 767,247 |
Accrued management fee | 468,327 |
Accrued Trustees' fees | 22,690 |
Other accrued expenses and payables | 1,019,723 |
Total liabilities | 31,508,621 |
Net assets, at value | $1,956,316,161 |
Net Assets Consist of | |
Distributable earnings (loss) | (151,103,765 ) |
Paid-in capital | 2,107,419,926 |
Net assets, at value | $1,956,316,161 |
26 | | | DWS Managed Municipal Bond Fund |
Net Asset Value | |
Class A | |
Net Asset Value and redemption price per share ($751,879,221 ÷ 94,028,319 outstanding shares of beneficial interest, $.01 par value, unlimited number of shares authorized) | $8.00 |
Maximum offering price per share (100 ÷ 97.25 of $8.00) | $8.23 |
Class C | |
Net Asset Value, offering and redemption price (subject to contingent deferred sales charge) per share ($13,386,576 ÷ 1,674,342 outstanding shares of beneficial interest, $.01 par value, unlimited number of shares authorized) | $8.00 |
Class S | |
Net Asset Value, offering and redemption price per share ($1,032,727,001 ÷ 128,975,650 outstanding shares of beneficial interest, $.01 par value, unlimited number of shares authorized) | $8.01 |
Institutional Class | |
Net Asset Value, offering and redemption price per share ($158,323,363 ÷ 19,789,460 outstanding shares of beneficial interest, $.01 par value, unlimited number of shares authorized) | $8.00 |
DWS Managed Municipal Bond Fund | | | 27 |
Investment Income | |
Income: | |
Interest | $87,254,182 |
Dividends | 573,368 |
Total income | 87,827,550 |
Expenses: | |
Management fee | 6,951,078 |
Administration fee | 2,000,014 |
Services to shareholders | 2,425,412 |
Distribution and service fees | 2,065,082 |
Custodian fee | 1,322 |
Professional fees | 101,825 |
Reports to shareholders | 95,578 |
Registration fees | 137,463 |
Trustees' fees and expenses | 88,137 |
Interest expense and fees on floating rate notes issued | 88,092 |
Other | 131,828 |
Total expenses before expense reductions | 14,085,831 |
Expense reductions | (1,304,740 ) |
Total expenses after expense reductions | 12,781,091 |
Net investment income | 75,046,459 |
Realized and Unrealized Gain (Loss) | |
Net realized gain (loss) from investments | (32,661,046 ) |
Change in net unrealized appreciation (depreciation) on investments | 41,755,592 |
Net gain (loss) | 9,094,546 |
Net increase (decrease) in net assets resulting from operations | $84,141,005 |
28 | | | DWS Managed Municipal Bond Fund |
Years Ended May 31, | ||
Increase (Decrease) in Net Assets | 2024 | 2023 |
Operations: | ||
Net investment income | $75,046,459 | $81,706,783 |
Net realized gain (loss) | (32,661,046 ) | (68,435,634 ) |
Change in net unrealized appreciation (depreciation) | 41,755,592 | (46,368,590 ) |
Net increase (decrease) in net assets resulting from operations | 84,141,005 | (33,097,441 ) |
Distributions to shareholders: | ||
Class A | (27,377,432 ) | (29,684,441 ) |
Class C | (529,722 ) | (858,866 ) |
Class S | (40,052,204 ) | (42,993,611 ) |
Institutional Class | (6,560,032 ) | (9,304,945 ) |
Total distributions | (74,519,390 ) | (82,841,863 ) |
Fund share transactions: | ||
Proceeds from shares sold | 688,040,784 | 1,330,306,009 |
Reinvestment of distributions | 65,206,705 | 72,363,466 |
Payments for shares redeemed | (1,012,338,134 ) | (1,900,685,408 ) |
Net increase (decrease) in net assets from Fund share transactions | (259,090,645 ) | (498,015,933 ) |
Increase (decrease) in net assets | (249,469,030 ) | (613,955,237 ) |
Net assets at beginning of period | 2,205,785,191 | 2,819,740,428 |
Net assets at end of period | $1,956,316,161 | $2,205,785,191 |
DWS Managed Municipal Bond Fund | | | 29 |
DWS Managed Municipal Bond Fund — Class A | |||||
Years Ended May 31, | |||||
2024 | 2023 | 2022 | 2021 | 2020 | |
Selected Per Share Data | |||||
Net asset value, beginning of period | $7.95 | $8.29 | $9.39 | $8.98 | $9.21 |
Income (loss) from investment operations: | |||||
Net investment income | .27 | .26 | .24 | .25 | .28 |
Net realized and unrealized gain (loss) | .05 | (.33 ) | (1.02 ) | .41 | (.21 ) |
Total from investment operations | .32 | (.07 ) | (.78 ) | .66 | .07 |
Less distributions from: | |||||
Net investment income | (.27 ) | (.26 ) | (.24 ) | (.25 ) | (.28 ) |
Net realized gains | (.00 )* | (.01 ) | (.08 ) | (.00 )* | (.02 ) |
Total distributions | (.27 ) | (.27 ) | (.32 ) | (.25 ) | (.30 ) |
Net asset value, end of period | $8.00 | $7.95 | $8.29 | $9.39 | $8.98 |
Total Return (%)a | 4.18 b | (.88 ) | (8.53 ) | 7.52 | .64 |
Ratios to Average Net Assets and Supplemental Data | |||||
Net assets, end of period ($ millions) | 752 | 833 | 1,008 | 1,251 | 1,220 |
Ratio of expenses before expense reductions (including interest expense) (%)c | .78 | .78 | .76 | .76 | .76 |
Ratio of expenses after expense reductions (including interest expense) (%)c | .76 | .78 | .76 | .76 | .76 |
Ratio of expenses after expense reductions (excluding interest expense) (%) | .76 | .77 | .76 | .76 | .76 |
Ratio of net investment income (%) | 3.50 | 3.25 | 2.65 | 2.77 | 3.02 |
Portfolio turnover rate (%) | 40 | 60 | 39 | 29 | 35 |
a | Total return does not reflect the effect of any sales charges. |
b | Total return would have been lower had certain expenses not been reduced. |
c | Interest expense represents interest and fees on short-term floating rate notes issued in conjunction with inverse floating rate securities. Interest income from such transactions is included in income from investment operations. |
* | Amount is less than $.005. |
30 | | | DWS Managed Municipal Bond Fund |
DWS Managed Municipal Bond Fund — Class C | |||||
Years Ended May 31, | |||||
2024 | 2023 | 2022 | 2021 | 2020 | |
Selected Per Share Data | |||||
Net asset value, beginning of period | $7.95 | $8.29 | $9.39 | $8.98 | $9.21 |
Income (loss) from investment operations: | |||||
Net investment income | .21 | .20 | .17 | .18 | .20 |
Net realized and unrealized gain (loss) | .05 | (.33 ) | (1.02 ) | .41 | (.21 ) |
Total from investment operations | .26 | (.13 ) | (.85 ) | .59 | (.01 ) |
Less distributions from: | |||||
Net investment income | (.21 ) | (.20 ) | (.17 ) | (.18 ) | (.20 ) |
Net realized gains | (.00 )* | (.01 ) | (.08 ) | (.00 )* | (.02 ) |
Total distributions | (.21 ) | (.21 ) | (.25 ) | (.18 ) | (.22 ) |
Net asset value, end of period | $8.00 | $7.95 | $8.29 | $9.39 | $8.98 |
Total Return (%)a | 3.40 b | (1.63 )b | (9.24 )b | 6.67 | (.15 ) |
Ratios to Average Net Assets and Supplemental Data | |||||
Net assets, end of period ($ millions) | 13 | 27 | 43 | 65 | 124 |
Ratio of expenses before expense reductions (including interest expense) (%)c | 1.59 | 1.58 | 1.56 | 1.55 | 1.55 |
Ratio of expenses after expense reductions (including interest expense) (%)c | 1.52 | 1.54 | 1.54 | 1.55 | 1.55 |
Ratio of expenses after expense reductions (excluding interest expense) (%) | 1.51 | 1.53 | 1.54 | 1.55 | 1.55 |
Ratio of net investment income (%) | 2.73 | 2.48 | 1.87 | 1.99 | 2.23 |
Portfolio turnover rate (%) | 40 | 60 | 39 | 29 | 35 |
a | Total return does not reflect the effect of any sales charges. |
b | Total return would have been lower had certain expenses not been reduced. |
c | Interest expense represents interest and fees on short-term floating rate notes issued in conjunction with inverse floating rate securities. Interest income from such transactions is included in income from investment operations. |
* | Amount is less than $.005. |
DWS Managed Municipal Bond Fund | | | 31 |
DWS Managed Municipal Bond Fund — Class S | |||||
Years Ended May 31, | |||||
2024 | 2023 | 2022 | 2021 | 2020 | |
Selected Per Share Data | |||||
Net asset value, beginning of period | $7.97 | $8.31 | $9.40 | $8.99 | $9.23 |
Income (loss) from investment operations: | |||||
Net investment income | .29 | .28 | .26 | .27 | .29 |
Net realized and unrealized gain (loss) | .04 | (.33 ) | (1.01 ) | .41 | (.22 ) |
Total from investment operations | .33 | (.05 ) | (.75 ) | .68 | .07 |
Less distributions from: | |||||
Net investment income | (.29 ) | (.28 ) | (.26 ) | (.27 ) | (.29 ) |
Net realized gains | (.00 )* | (.01 ) | (.08 ) | (.00 )* | (.02 ) |
Total distributions | (.29 ) | (.29 ) | (.34 ) | (.27 ) | (.31 ) |
Net asset value, end of period | $8.01 | $7.97 | $8.31 | $9.40 | $8.99 |
Total Return (%)a | 4.31 | (.63 ) | (8.20 ) | 7.73 | .73 |
Ratios to Average Net Assets and Supplemental Data | |||||
Net assets, end of period ($ millions) | 1,033 | 1,133 | 1,393 | 1,898 | 2,041 |
Ratio of expenses before expense reductions (including interest expense) (%)b | .61 | .62 | .61 | .61 | .62 |
Ratio of expenses after expense reductions (including interest expense) (%)b | .51 | .54 | .54 | .55 | .56 |
Ratio of expenses after expense reductions (excluding interest expense) (%) | .51 | .53 | .54 | .55 | .56 |
Ratio of net investment income (%) | 3.75 | 3.48 | 2.87 | 2.98 | 3.22 |
Portfolio turnover rate (%) | 40 | 60 | 39 | 29 | 35 |
a | Total return would have been lower had certain expenses not been reduced. |
b | Interest expense represents interest and fees on short-term floating rate notes issued in conjunction with inverse floating rate securities. Interest income from such transactions is included in income from investment operations. |
* | Amount is less than $.005. |
32 | | | DWS Managed Municipal Bond Fund |
DWS Managed Municipal Bond Fund — Institutional Class | |||||
Years Ended May 31, | |||||
2024 | 2023 | 2022 | 2021 | 2020 | |
Selected Per Share Data | |||||
Net asset value, beginning of period | $7.96 | $8.30 | $9.40 | $8.99 | $9.22 |
Income (loss) from investment operations: | |||||
Net investment income | .29 | .28 | .26 | .27 | .30 |
Net realized and unrealized gain (loss) | .04 | (.33 ) | (1.02 ) | .41 | (.21 ) |
Total from investment operations | .33 | (.05 ) | (.76 ) | .68 | .09 |
Less distributions from: | |||||
Net investment income | (.29 ) | (.28 ) | (.26 ) | (.27 ) | (.30 ) |
Net realized gains | (.00 )* | (.01 ) | (.08 ) | (.00 )* | (.02 ) |
Total distributions | (.29 ) | (.29 ) | (.34 ) | (.27 ) | (.32 ) |
Net asset value, end of period | $8.00 | $7.96 | $8.30 | $9.40 | $8.99 |
Total Return (%) | 4.31 a | (.63 )a | (8.31 )a | 7.75 | .86 |
Ratios to Average Net Assets and Supplemental Data | |||||
Net assets, end of period ($ millions) | 158 | 213 | 375 | 557 | 484 |
Ratio of expenses before expense reductions (including interest expense) (%)b | .56 | .56 | .55 | .54 | .55 |
Ratio of expenses after expense reductions (including interest expense) (%)b | .52 | .54 | .53 | .54 | .55 |
Ratio of expenses after expense reductions (excluding interest expense) (%) | .51 | .53 | .53 | .54 | .55 |
Ratio of net investment income (%) | 3.74 | 3.48 | 2.87 | 2.99 | 3.22 |
Portfolio turnover rate (%) | 40 | 60 | 39 | 29 | 35 |
a | Total return would have been lower had certain expenses not been reduced. |
b | Interest expense represents interest and fees on short-term floating rate notes issued in conjunction with inverse floating rate securities. Interest income from such transactions is included in income from investment operations. |
* | Amount is less than $.005. |
DWS Managed Municipal Bond Fund | | | 33 |
34 | | | DWS Managed Municipal Bond Fund |
DWS Managed Municipal Bond Fund | | | 35 |
36 | | | DWS Managed Municipal Bond Fund |
DWS Managed Municipal Bond Fund | | | 37 |
Undistributed tax-exempt income | $5,479,033 |
Undistributed ordinary income* | $48,219 |
Capital loss carryforwards | $(140,829,732 ) |
Net unrealized appreciation (depreciation) on investments | $(14,026,976 ) |
38 | | | DWS Managed Municipal Bond Fund |
Years Ended May 31, | ||
2024 | 2023 | |
Distributions from tax-exempt income | $72,843,501 | $79,894,597 |
Distributions from ordinary income* | $1,675,889 | $2,947,266 |
* | For tax purposes, short-term capital gain distributions are considered ordinary income distributions. |
DWS Managed Municipal Bond Fund | | | 39 |
First $250 million of the Fund’s average daily net assets | .365% |
Next $750 million of such net assets | .345% |
Next $1.5 billion of such net assets | .325% |
Next $2.5 billion of such net assets | .315% |
Next $2.5 billion of such net assets | .295% |
Next $2.5 billion of such net assets | .275% |
Next $2.5 billion of such net assets | .255% |
Over $12.5 billion of such net assets | .235% |
Class A | .78% |
Class C | 1.53% |
Class S | .53% |
Institutional Class | .53% |
Class A | .75% | |
Class C | 1.50% | |
Class S | .50% | |
Institutional Class | .50% |
40 | | | DWS Managed Municipal Bond Fund |
Class A | $132,532 |
Class C | 14,017 |
Class S | 1,076,527 |
Institutional Class | 81,664 |
$1,304,740 |
Services to Shareholders | Total Aggregated | Unpaid at May 31, 2024 |
Class A | $86,781 | $14,305 |
Class C | 840 | 133 |
Class S | 194,103 | 31,993 |
Institutional Class | 774 | 131 |
$282,498 | $46,562 |
DWS Managed Municipal Bond Fund | | | 41 |
Sub-Recordkeeping | Total Aggregated |
Class A | $500,458 |
Class C | 22,336 |
Class S | 1,361,435 |
Institutional Class | 160,600 |
$2,044,829 |
Distribution Fee | Total Aggregated | Unpaid at May 31, 2024 |
Class C | $146,800 | $8,747 |
Service Fee | Total Aggregated | Unpaid at May 31, 2024 | Annual Rate |
Class A | $1,869,349 | $318,416 | .24% |
Class C | 48,933 | 4,721 | .25% |
$1,918,282 | $323,137 |
42 | | | DWS Managed Municipal Bond Fund |
DWS Managed Municipal Bond Fund | | | 43 |
Year Ended May 31, 2024 | Year Ended May 31, 2023 | |||
Shares | Dollars | Shares | Dollars | |
Shares sold | ||||
Class A | 3,726,211 | $29,769,178 | 4,978,580 | $39,730,479 |
Class C | 64,034 | 502,102 | 242,140 | 1,936,585 |
Class S | 80,178,546 | 612,200,693 | 141,221,995 | 1,154,765,412 |
Institutional Class | 5,741,691 | 45,568,811 | 16,748,765 | 133,873,533 |
$688,040,784 | $1,330,306,009 | |||
Shares issued to shareholders in reinvestment of distributions | ||||
Class A | 3,047,515 | $24,258,918 | 3,288,833 | $26,143,975 |
Class C | 63,242 | 502,514 | 101,438 | 806,304 |
Class S | 4,307,391 | 34,340,674 | 4,618,346 | 36,770,911 |
Institutional Class | 766,568 | 6,104,599 | 1,086,467 | 8,642,276 |
$65,206,705 | $72,363,466 | |||
Shares redeemed | ||||
Class A | (17,448,459 ) | $(138,715,132 ) | (25,132,235 ) | $(200,609,845 ) |
Class C | (1,821,754 ) | (14,446,117 ) | (2,206,815 ) | (17,577,414 ) |
Class S | (97,730,076 ) | (751,697,108 ) | (171,352,231 ) | (1,393,131,333 ) |
Institutional Class | (13,528,917 ) | (107,479,777 ) | (36,221,614 ) | (289,366,816 ) |
$(1,012,338,134 ) | $(1,900,685,408 ) | |||
Net increase (decrease) | ||||
Class A | (10,674,733 ) | $(84,687,036 ) | (16,864,822 ) | $(134,735,391 ) |
Class C | (1,694,478 ) | (13,441,501 ) | (1,863,237 ) | (14,834,525 ) |
Class S | (13,244,139 ) | (105,155,741 ) | (25,511,890 ) | (201,595,010 ) |
Institutional Class | (7,020,658 ) | (55,806,367 ) | (18,386,382 ) | (146,851,007 ) |
$(259,090,645 ) | $(498,015,933 ) | |||
44 | | | DWS Managed Municipal Bond Fund |
DWS Managed Municipal Bond Fund | | | 45 |

46 | | | DWS Managed Municipal Bond Fund |
DWS Managed Municipal Bond Fund | | | 47 |
48 | | | DWS Managed Municipal Bond Fund |
DWS Managed Municipal Bond Fund | | | 49 |
50 | | | DWS Managed Municipal Bond Fund |
DWS Managed Municipal Bond Fund | | | 51 |
52 | | | DWS Managed Municipal Bond Fund |
| Item 8. | Changes in and Disagreements with Accountants for Open-End Management Investment Companies. | |
| Not applicable | ||
| Item 9. | Proxy Disclosures for Open-End Management Investment Companies. | |
| Not applicable | ||
| Item 10. | Remuneration Paid to Directors, Officers, and Others of Open-End Management Investment Companies. | |
| See Item 7 | ||
| Item 11. | Statement Regarding Basis for Approval of Investment Advisory Contract. | |
| See Item 7 | ||
| Item 12. | Disclosure of Proxy Voting Policies and Procedures for Closed-End Management Investment Companies. | |
| Not applicable | ||
| Item 13. | Portfolio Managers of Closed-End Management Investment Companies. | |
| Not applicable | ||
| Item 14. | Purchases of Equity Securities by Closed-End Management Investment Company and Affiliated Purchasers. | |
| Not applicable | ||
| Item 15. | Submission of Matters to a Vote of Security. | |
| There were no material changes to the procedures by which shareholders may recommend nominees to the Fund’s Board. The primary function of the Nominating and Governance Committee is to identify and recommend individuals for membership on the Board and oversee the administration of the Board Governance Guidelines. Shareholders may recommend candidates for Board positions by forwarding their correspondence by U.S. mail or courier service to Keith R. Fox, DWS Funds Board Chair, c/o Thomas R. Hiller, Ropes & Gray LLP, Prudential Tower, 800 Boylston Street, Boston, MA 02199-3600. | ||
| Item 16. | Controls and Procedures. | |
| (a) | The Chief Executive and Financial Officers concluded that the Registrant’s Disclosure Controls and Procedures are effective based on the evaluation of the Disclosure Controls and Procedures as of a date within 90 days of the filing date of this report. | |
| (b) | There have been no changes in the registrant’s internal control over financial reporting that occurred during the period covered by this report that has materially affected, or is reasonably likely to materially affect, the registrant’s internal controls over financial reporting. | |
| Item 17. | Disclosure of Securities Lending Activities for Closed-End Management Investment Companies. | |
| Not applicable | ||
| Item 18. | Recovery of Erroneously Awarded Compensation. | |
| Not applicable | ||
| Item 19. | Exhibits | |
| (a)(1) | Code of Ethics pursuant to Item 2 of Form N-CSR is filed and attached hereto as EX-99.CODE ETH. | |
| (a)(2) | Certification pursuant to Rule 30a-2(a) under the Investment Company Act of 1940 (17 CFR 270.30a-2(a)) is filed and attached hereto as Exhibit 99.CERT. | |
| (b) | Certification pursuant to Rule 30a-2(b) under the Investment Company Act of 1940 (17 CFR 270.30a-2(b)) is furnished and attached hereto as Exhibit 99.906CERT. | |
SIGNATURES
Pursuant to the requirements of the Securities Exchange Act of 1934 and the Investment Company Act of 1940, the registrant has duly caused this report to be signed on its behalf by the undersigned, thereunto duly authorized.
| Registrant: | DWS Managed Municipal Bond Fund, a series of Deutsche DWS Municipal Trust |
| By: | /s/Hepsen Uzcan Hepsen Uzcan Principal Executive Officer |
| Date: | 7/30/2024 |
Pursuant to the requirements of the Securities Exchange Act of 1934 and the Investment Company Act of 1940, this report has been signed below by the following persons on behalf of the registrant and in the capacities and on the dates indicated.
| By: | /s/Hepsen Uzcan Hepsen Uzcan Principal Executive Officer |
| Date: | 7/30/2024 |
| By: | /s/Diane Kenneally Diane Kenneally Principal Financial Officer |
| Date: | 7/30/2024 |