UNITED STATES
SECURITIES AND EXCHANGE COMMISSION
Washington, D.C. 20549
FORM N-CSR
CERTIFIED SHAREHOLDER REPORT OF REGISTERED
MANAGEMENT INVESTMENT COMPANIES
Investment Company Act file number 811-2346
Fidelity Commonwealth Trust
(Exact name of registrant as specified in charter)
82 Devonshire St., Boston, Massachusetts 02109
(Address of principal executive offices) (Zip code)
Eric D. Roiter, Secretary
82 Devonshire St.
Boston, Massachusetts 02109
(Name and address of agent for service)
Registrant's telephone number, including area code: 617-563-7000
Date of fiscal year end: | November 30 |
| |
Date of reporting period: | November 30, 2004 |
Item 1. Reports to Stockholders
Fidelity®
Nasdaq Composite® Index Tracking Stock
Annual Report
November 30, 2004
(2_fidelity_logos) (Registered_Trademark)
Contents
Chairman's Message | <Click Here> | Ned Johnson's message to shareholders. |
Premium/Discount Analysis | <Click Here> | Information regarding the fund's NAV and market price. |
Performance | <Click Here> | How the fund has done over time. |
Management's Discussion | <Click Here> | The manager's review of fund performance, strategy and outlook. |
Shareholder Expense Example | <Click Here> | An example of shareholder expenses. |
Investment Changes | <Click Here> | A summary of major shifts in the fund's investments over the past six months. |
Investments | <Click Here> | A complete list of the fund's investments with their market values. |
Financial Statements | <Click Here> | Statements of assets and liabilities, operations, and changes in net assets,
as well as financial highlights. |
Notes | <Click Here> | Notes to the financial statements. |
Report of Independent Registered Public Accounting Firm | <Click Here> | |
Trustees and Officers | <Click Here> | |
Distributions | <Click Here> | |
Proxy Voting Results | <Click Here> | |
To view a fund's proxy voting guidelines and proxy voting record for the 12-month period ended June 30, visit www.fidelity.com/proxyvotingresults or visit the Securities and Exchange Commission's (SEC) web site at www.sec.gov. You may also call 1-800-FIDELITY to request a free copy of the proxy voting guidelines.
Nasdaq® and Nasdaq Composite® are trademarks of The Nasdaq Stock Market, Inc. (which with its Affiliates are the Corporations) and are licensed for use by Fidelity. The product has not been passed on by the Corporations as to its legality or suitability. The product is not issued, endorsed or sold by the Corporations. The Corporations make no warranties and bear no liability with respect to shares of the product.
Standard & Poor's, S&P and S&P 500 are registered service marks of The McGraw-Hill Companies, Inc. and have been licensed for use by Fidelity Distributors Corporation.
Other third party marks appearing herein are the property of their respective owners.
All other marks appearing herein are registered or unregistered trademarks or service marks of FMR Corp. or an affiliated company.
(Recycle graphic) This report is printed on recycled paper using soy-based inks.
Annual Report
This report and the financial statements contained herein are submitted for the general information of the shareholders of the fund. This report is not authorized for distribution to prospective investors in the fund unless preceded or accompanied by an effective prospectus.
A fund files its complete schedule of portfolio holdings with the SEC for the first and third quarters of each fiscal year on Form N-Q. Forms N-Q are available on the SEC's web site at http://www.sec.gov. A fund's Forms N-Q may be reviewed and copied at the SEC's Public Reference Room in Washington, DC. Information regarding the operation of the SEC's Public Reference Room may be obtained by calling 1-800-SEC-0330. For a complete list of a fund's portfolio holdings, view the most recent quarterly holdings report, semiannual report, or annual report on Fidelity's web site at http://www.fidelity.com/holdings.
NOT FDIC INSURED · MAY LOSE VALUE · NO BANK GUARANTEE
Neither the fund nor Fidelity Distributors Corporation is a bank.
Annual Report
Chairman's Message
(photo_of_Edward_C_Johnson_3d)
Dear Shareholder:
During the past year or so, much has been reported about the mutual fund industry, and much of it has been more critical than I believe is warranted. Allegations that some companies have been less than forthright with their shareholders have cast a shadow on the entire industry. I continue to find these reports disturbing, and assert that they do not create an accurate picture of the industry overall. Therefore, I would like to remind everyone where Fidelity stands on these issues. I will say two things specifically regarding allegations that some mutual fund companies were in violation of the Securities and Exchange Commission's forward pricing rules or were involved in so-called "market timing" activities.
First, Fidelity has no agreements that permit customers who buy fund shares after 4 p.m. to obtain the 4 p.m. price. This is not a new policy. This is not to say that someone could not deceive the company through fraudulent acts. However, we are extremely diligent in preventing fraud from occurring in this manner - and in every other. But I underscore again that Fidelity has no so-called "agreements" that sanction illegal practices.
Second, Fidelity continues to stand on record, as we have for years, in opposition to predatory short-term trading that adversely affects shareholders in a mutual fund. Back in the 1980s, we initiated a fee - which is returned to the fund and, therefore, to investors - - to discourage this activity. Further, we took the lead several years ago in developing a Fair Value Pricing Policy to prevent market timing on foreign securities in our funds. I am confident we will find other ways to make it more difficult for predatory traders to operate. However, this will only be achieved through close cooperation among regulators, legislators and the industry.
Yes, there have been unfortunate instances of unethical and illegal activity within the mutual fund industry from time to time. That is true of any industry. When this occurs, confessed or convicted offenders should be dealt with appropriately. But we are still concerned about the risk of over-regulation and the quick application of simplistic solutions to intricate problems. Every system can be improved, and we support and applaud well thought out improvements by regulators, legislators and industry representatives that achieve the common goal of building and protecting the value of investors' holdings.
For nearly 60 years, Fidelity has worked very hard to improve its products and service to justify your trust. When our family founded this company in 1946, we had only a few hundred customers. Today, we serve more than 18 million customers including individual investors and participants in retirement plans across America.
Let me close by saying that we do not take your trust in us for granted, and we realize that we must always work to improve all aspects of our service to you. In turn, we urge you to continue your active participation with your financial matters, so that your interests can be well served.
Best regards,
/s/Edward C. Johnson 3d
Edward C. Johnson 3d
Annual Report
Premium/Discount
Analysis (Unaudited)
Shares of Fidelity® Nasdaq Composite® Index Tracking Stock (the fund) are listed on the Nasdaq stock market and can be bought and sold on the secondary market at market prices. Although the market price is expected to approximate the fund's NAV, it is possible that the market price and NAV will vary significantly. The closing market price is the daily closing price as reported on the Nasdaq stock market.
Premiums or discounts are the differences (expressed as a basis point differential with 1 basis point equaling 1/100 of 1%) between the fund's NAV and closing market price. A premium indicates that the closing market price is trading above the NAV. A discount indicates that the closing market price is trading below the NAV. A discrepancy may exist with respect to the timing of when the NAV is calculated and the determination of the closing market price.
The chart below presents information about the differences between the fund's daily closing market price and the fund's NAV.
Period Ended November 30, 2004
From commencement of operations* | | | |
to November 30, 2004 | Closing Market Price
Below NAV | Closing Market Price Above
or Equal to NAV |
| Basis Point Differential | Number of
Days | % of Total
Days | Number of
Days | % of Total
Days |
| 0 - <25 | 168 | 56.38% | 121 | 40.60% |
| 25 - <50 | 7 | 2.34% | 2 | 0.68% |
| 50 - <75 | 0 | - | 0 | - |
| 75 - <100 | 0 | - | 0 | - |
| 100 or greater | 0 | - | 0 | - |
| Total | 175 | 58.72% | 123 | 41.28% |
* September 25, 2003
Annual Report
Performance: The Bottom Line
The fund's net asset value ("NAV") performance is based on the NAV calculated each business day. It is calculated in accordance with the standard formula for valuing mutual fund shares as of the close of regular trading hours on the Nasdaq stock market, normally 4:00 p.m. Eastern time (or NYSE if Nasdaq is closed). The fund's market price performance is based on the daily closing price of the shares of the fund on the Nasdaq stock market.
Cumulative total returns reflect performance over the period shown generally by adding one year's return - positive or negative - to the next year's return. NAV and closing market price average annual returns reflect the change in the value of an investment, assuming reinvestment of the fund's dividend income and capital gains (the profits earned upon the sale of securities that have grown in value), at NAV and Market Price, respectively, and assumes a constant rate of performance each year. The $10,000 table and the fund's returns do not reflect the deduction of taxes that a shareholder would pay on fund distributions or the redemption or selling of fund shares. How a fund did yesterday is no guarantee of how it will do tomorrow.
Cumulative Total Returns
Periods ended November 30, 2004 | Past 1
year | Life of
FundA |
Fidelity® Nasdaq Composite® Index Tracking Stock - NAV | 6.94% | 15.40% |
Fidelity Nasdaq Composite Index Tracking Stock - Market Price | 7.25% | 15.51% |
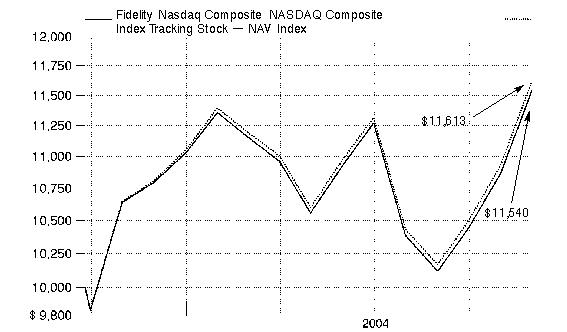
NASDAQ Composite® Index | 7.51% | 16.13% |
Average Annual Total Returns
Periods ended November 30, 2004 | Past 1
year | Life of
FundA |
Fidelity® Nasdaq Composite® Index Tracking Stock - NAV | 6.94% | 12.86% |
Fidelity Nasdaq Composite Index Tracking Stock - Market Price | 7.25% | 12.95% |
A From September 25, 2003.
Annual Report
$10,000 Over Life of Fund
Let's say hypothetically that $10,000 was invested in Fidelity® Nasdaq Composite Index Tracking Stock - NAV on September 25, 2003, when the fund started. The chart shows how the value of your investment would have changed, and also shows how the NASDAQ Composite® Index performed over the same period.
Annual Report
Management's Discussion of Fund Performance
Comments from Jacques Perold, who oversees the Fidelity® Nasdaq Composite® Index Tracking Stock's investment management personnel as President of Geode Capital Management, LLC
Despite surging oil prices, a struggling job market and four interest rate hikes in a five-month span, U.S. equity markets posted solid results for the 12-month period ending November 30, 2004, and were closing in on a second straight year in the black. There was great disparity in the market during the past year. For instance, value stocks trounced their growth counterparts during the period. To illustrate, the Russell 1000® Value Index shot up 19.67%, while the Russell 1000 Growth Index rose only 5.83%. Meanwhile, small- and mid-cap stocks vastly outperformed larger-cap stocks. Energy was the best-performing sector of the market, propelled by a spike in oil prices. Conversely, technology stocks dipped lower in response to a slowdown in corporate capital spending. For the 12-month period overall, the Standard & Poor's 500SM Index returned 12.86% - slightly above its historical average. Elsewhere, the Dow Jones Industrial AverageSM rose 8.87% and the tech-heavy NASDAQ Composite® Index advanced 7.51%.
For the 12-month period ending November 30, 2004, the fund's return at net asset value was 6.94%, trailing the NASDAQ® and the 7.25% return of the fund's market price. The fund's peer group average, the LipperSM Growth Funds Average, returned 9.52% during the same time frame. Software giant Microsoft had the greatest positive impact on results. Microsoft's stock rose steadily as the company continued to generate solid earnings growth. It also announced well-received plans to return part of its cash hoard to shareholders in the form of higher quarterly dividends and a special one-time year-end payment of $3 per share. Online auction house eBay benefited from increasing revenues generated overseas and additional use of fixed-price sales to complement its more traditional auction business. Intel, the world's leading maker of semiconductors, was the biggest detractor from performance, falling after announcing a second-quarter decline in profit margins and an increase in inventories. Another laggard was VERITAS, a leading data-storage software maker. Its stock price fell by more than a third in early July after the firm warned of lower earnings on disappointing sales in the United States.
The views expressed in this statement reflect those of the portfolio manager only through the end of the period of the report as stated on the cover and do not necessarily represent the views of Fidelity or any other person in the Fidelity organization. Any such views are subject to change at any time based upon market or other conditions and Fidelity disclaims any responsibility to update such views. These views may not be relied on as investment advice and, because investment decisions for a Fidelity fund are based on numerous factors, may not be relied on as an indication of trading intent on behalf of any Fidelity fund.
Annual Report
Shareholder Expense Example
As a shareholder of the Fund, you incur two types of costs: (1) transaction costs, and (2) ongoing costs, including management fees, distribution and/or service (12b-1) fees and other Fund expenses. This Example is intended to help you understand your ongoing costs (in dollars) of investing in the Fund and to compare these costs with the ongoing costs of investing in other mutual funds.
The Example is based on an investment of $1,000 invested at the beginning of the period and held for the entire period (June 1, 2004 to November 30, 2004).
Actual Expenses
The first line of the table below provides information about actual account values and actual expenses. You may use the information in this line, together with the amount you invested, to estimate the expenses that you paid over the period. Simply divide your account value by $1,000.00 (for example, an $8,600 account value divided by $1,000.00 = 8.6), then multiply the result by the number in the first line under the heading entitled "Expenses Paid During Period" to estimate the expenses you paid on your account during this period.
Hypothetical Example for Comparison Purposes
The second line of the table below provides information about hypothetical account values and hypothetical expenses based on the Fund's actual expense ratio and an assumed rate of return of 5% per year before expenses, which is not the Fund's actual return. The hypothetical account values and expenses may not be used to estimate the actual ending account balance or expenses you paid for the period. You may use this information to compare the ongoing costs of investing in the Fund and other funds. To do so, compare this 5% hypothetical example with the 5% hypothetical examples that appear in the shareholder reports of the other funds.
Please note that the expenses shown in the table are meant to highlight your ongoing costs only and do not reflect any transaction costs. Therefore, the second line of the table is useful in comparing ongoing costs only, and will not help you determine the relative total costs of owning different funds.
| Beginning
Account Value
June 1, 2004 | Ending
Account Value
November 30, 2004 | Expenses Paid
During Period*
June 1, 2004
to November 30, 2004 |
Actual | $ 1,000.00 | $ 1,056.30 | $ 1.54 |
Hypothetical (5% return per year before expenses) | $ 1,000.00 | $ 1,023.48 | $ 1.52 |
*Expenses are equal to the Fund's annualized expense ratio of .30%; multiplied by the average account value over the period, multiplied by 183/366 (to reflect the one-half year period).
Annual Report
Investment Changes
Top Ten Stocks as of November 30, 2004 |
| % of fund's
net assets | % of fund's net assets
6 months ago |
Microsoft Corp. | 9.2 | 9.5 |
Intel Corp. | 4.5 | 6.2 |
Cisco Systems, Inc. | 4.0 | 5.1 |
Dell, Inc. | 3.2 | 3.0 |
Amgen, Inc. | 2.4 | 2.3 |
eBay, Inc. | 2.4 | 1.9 |
QUALCOMM, Inc. | 2.1 | 1.8 |
Oracle Corp. | 2.1 | 2.0 |
Yahoo!, Inc. | 1.6 | 1.4 |
Comcast Corp. Class A | 1.3 | 1.3 |
| 32.8 | |
Market Sectors as of November 30, 2004 |
| % of fund's
net assets | % of fund's net assets
6 months ago |
Information Technology | 49.8 | 52.1 |
Consumer Discretionary | 13.8 | 12.9 |
Health Care | 12.9 | 13.5 |
Financials | 10.7 | 10.8 |
Industrials | 5.8 | 5.6 |
Telecommunication Services | 2.2 | 1.7 |
Consumer Staples | 1.6 | 1.4 |
Materials | 1.2 | 1.0 |
Energy | 0.6 | 0.4 |
Utilities | 0.2 | 0.2 |
Asset Allocation (% of fund's net assets) |
To match the NASDAQ Composite® Index, Fidelity Nasdaq Composite Index Tracking Stock seeks 100% investment exposure to stocks at all times.
Annual Report
Investments November 30, 2004
Showing Percentage of Net Assets
Common Stocks - 98.8% |
| Shares | | Value (Note 1) |
CONSUMER DISCRETIONARY - 13.8% |
Auto Components - 0.2% |
Aftermarket Technology Corp. (a) | 1,437 | | $ 25,033 |
China Automotive Systems, Inc. (a) | 1,017 | | 16,211 |
Decoma International, Inc. Class A (sub. vtg.) | 1,920 | | 21,710 |
Dura Automotive Systems, Inc. Class A (sub. vtg.) (a) | 1,489 | | 13,550 |
Exide Technologies (a) | 1,055 | | 13,135 |
GenTek, Inc. (a) | 400 | | 19,596 |
Gentex Corp. | 3,308 | | 106,915 |
Hayes Lemmerz International, Inc. (a) | 1,319 | | 10,051 |
Keystone Automotive Industries, Inc. (a) | 944 | | 22,118 |
LKQ Corp. | 1,089 | | 19,537 |
Quantum Fuel Systems Technologies Worldwide, Inc. (a) | 412 | | 2,559 |
R&B, Inc. (a) | 662 | | 16,550 |
Sports Resorts International, Inc. (a) | 2,825 | | 8,108 |
Strattec Security Corp. (a) | 256 | | 16,128 |
Tesma International, Inc. Class A (sub. vtg.) | 506 | | 17,258 |
| | 328,459 |
Automobiles - 0.0% |
Nissan Motor Co. Ltd. sponsored ADR | 1,406 | | 29,484 |
Distributors - 0.0% |
Source Interlink Companies, Inc. (a) | 1,652 | | 21,559 |
Hotels, Restaurants & Leisure - 1.8% |
AFC Enterprises, Inc. (a) | 1,100 | | 26,488 |
Ambassadors Group, Inc. | 517 | | 17,981 |
Ameristar Casinos, Inc. | 1,221 | | 49,145 |
Applebee's International, Inc. | 3,084 | | 79,259 |
BJ's Restaurants, Inc. (a) | 1,288 | | 19,268 |
Bob Evans Farms, Inc. | 1,413 | | 35,678 |
Buffalo Wild Wings, Inc. | 475 | | 15,737 |
California Pizza Kitchen, Inc. (a) | 848 | | 21,242 |
CBRL Group, Inc. | 1,832 | | 74,691 |
Churchill Downs, Inc. | 736 | | 34,187 |
Cosi, Inc. (a) | 2,462 | | 16,126 |
Ctrip.com International Ltd. ADR | 155 | | 7,491 |
Empire Resorts, Inc. (a) | 1,095 | | 11,782 |
International Speedway Corp. Class A | 1,104 | | 53,975 |
Isle of Capri Casinos, Inc. (a) | 1,413 | | 34,661 |
Lone Star Steakhouse & Saloon, Inc. | 928 | | 25,047 |
Magna Entertainment Corp. Class A (a) | 3,517 | | 21,102 |
Monarch Casino & Resort, Inc. (a) | 515 | | 17,984 |
MTR Gaming Group, Inc. (a) | 1,720 | | 17,303 |
Common Stocks - continued |
| Shares | | Value (Note 1) |
CONSUMER DISCRETIONARY - continued |
Hotels, Restaurants & Leisure - continued |
Multimedia Games, Inc. (a) | 1,166 | | $ 15,251 |
Navigant International, Inc. (a) | 1,024 | | 11,244 |
O'Charleys, Inc. (a) | 1,088 | | 20,672 |
P.F. Chang's China Bistro, Inc. (a) | 827 | | 46,510 |
Panera Bread Co. Class A (a) | 1,406 | | 56,156 |
Papa John's International, Inc. (a) | 864 | | 30,732 |
Penn National Gaming, Inc. (a) | 1,549 | | 81,741 |
Rare Hospitality International, Inc. (a) | 1,429 | | 42,813 |
Red Robin Gourmet Burgers, Inc. (a) | 848 | | 43,545 |
Ryan's Restaurant Group, Inc. (a) | 2,180 | | 33,289 |
Scientific Games Corp. Class A (a) | 3,646 | | 87,139 |
Shuffle Master, Inc. (a) | 1,034 | | 47,595 |
Smith & Wollensky Restaurant Group, Inc. (a) | 2,617 | | 12,143 |
Sonic Corp. (a) | 2,347 | | 68,462 |
Starbucks Corp. (a)(d) | 16,899 | | 950,738 |
Texas Roadhouse, Inc. Class A | 1,253 | | 31,826 |
The Cheesecake Factory, Inc. (a) | 2,174 | | 106,287 |
Wynn Resorts Ltd. (a) | 3,541 | | 205,697 |
| | 2,470,987 |
Household Durables - 0.5% |
Avatar Holdings, Inc. (a) | 544 | | 25,715 |
Bassett Furniture Industries, Inc. | 1,360 | | 26,806 |
Brillian Corp. (a) | 388 | | 1,195 |
California Coastal Communities, Inc. (a) | 798 | | 17,787 |
Craftmade International, Inc. | 720 | | 12,744 |
Dominion Homes, Inc. (a) | 560 | | 11,570 |
Dorel Industries, Inc. Class B (sub. vtg.) (a) | 1,104 | | 38,865 |
Flexsteel Industries, Inc. | 944 | | 16,529 |
Foamex International, Inc. (a) | 1,885 | | 7,672 |
Garmin Ltd. (d) | 4,473 | | 260,418 |
Helen of Troy Ltd. (a) | 1,141 | | 32,108 |
Hooker Furniture Corp. | 832 | | 19,427 |
Interface, Inc. Class A (a) | 3,081 | | 30,502 |
Kimball International, Inc. Class B | 1,517 | | 22,603 |
Lifetime Hoan Corp. | 488 | | 6,632 |
Palm Harbor Homes, Inc. (a) | 1,189 | | 18,560 |
Stanley Furniture Co., Inc. | 608 | | 27,968 |
Universal Electronics, Inc. (a) | 1,368 | | 24,966 |
| | 602,067 |
Common Stocks - continued |
| Shares | | Value (Note 1) |
CONSUMER DISCRETIONARY - continued |
Internet & Catalog Retail - 3.7% |
1-800 CONTACTS, Inc. (a) | 736 | | $ 15,081 |
1-800-FLOWERS.com, Inc. Class A (a) | 1,916 | | 15,903 |
Alloy, Inc. (a) | 2,681 | | 12,065 |
Amazon.com, Inc. (a)(d) | 17,028 | | 675,671 |
Audible, Inc. (a) | 840 | | 23,486 |
Blue Nile, Inc. | 731 | | 18,845 |
Coldwater Creek, Inc. (a) | 2,076 | | 54,391 |
Drugstore.com, Inc. (a) | 3,485 | | 11,326 |
eBay, Inc. (a)(d) | 27,800 | | 3,126,110 |
GSI Commerce, Inc. (a) | 1,980 | | 29,957 |
IAC/InterActiveCorp (a)(d) | 26,693 | | 659,050 |
Insight Enterprises, Inc. (a) | 2,312 | | 46,772 |
J. Jill Group, Inc. (a) | 1,112 | | 19,204 |
Netflix, Inc. (a)(d) | 2,177 | | 24,774 |
Overstock.com, Inc. (a) | 832 | | 59,288 |
PC Mall, Inc. (a) | 611 | | 14,847 |
Priceline.com, Inc. (a) | 1,640 | | 39,147 |
Provide Commerce, Inc. | 467 | | 16,018 |
Stamps.com, Inc. | 1,662 | | 25,711 |
ValueVision Media, Inc. Class A (a) | 1,732 | | 19,641 |
| | 4,907,287 |
Leisure Equipment & Products - 0.1% |
Arctic Cat, Inc. | 848 | | 22,650 |
Concord Camera Corp. (a) | 1,604 | | 4,235 |
JAKKS Pacific, Inc. (a) | 1,325 | | 24,672 |
Radica Games Ltd. | 2,288 | | 21,942 |
RC2 Corp. (a) | 944 | | 29,538 |
SCP Pool Corp. | 2,263 | | 71,352 |
| | 174,389 |
Media - 4.3% |
ACME Communications, Inc. (a) | 1,948 | | 11,454 |
Alliance Atlantis Communications, Inc. Class B (non-vtg.) (a) | 1,700 | | 44,222 |
Beasley Broadcast Group, Inc. Class A (a) | 1,008 | | 17,690 |
Cadmus Communications Corp. | 1,483 | | 20,586 |
Carmike Cinemas, Inc. | 656 | | 24,561 |
Central European Media Enterprises Ltd. Class A (a) | 959 | | 30,170 |
Charter Communications, Inc. Class A (a)(d) | 13,665 | | 29,516 |
Comcast Corp.: | | | |
Class A (a) | 57,262 | | 1,720,150 |
Class A (special) (a) | 35,741 | | 1,059,721 |
Common Stocks - continued |
| Shares | | Value (Note 1) |
CONSUMER DISCRETIONARY - continued |
Media - continued |
Crown Media Holdings, Inc. Class A (a) | 3,949 | | $ 34,988 |
Cumulus Media, Inc. Class A (a) | 2,184 | | 33,372 |
EchoStar Communications Corp. Class A | 9,283 | | 304,390 |
EMAK Worldwide, Inc. (a) | 1,085 | | 10,699 |
Emmis Communications Corp. Class A (a) | 2,072 | | 38,311 |
Fisher Communications, Inc. (a) | 400 | | 18,812 |
Gemstar-TV Guide International, Inc. (a) | 17,934 | | 97,740 |
Grey Global Group, Inc. | 48 | | 52,657 |
Harris Interactive, Inc. (a) | 2,921 | | 19,395 |
IMAX Corp. (a) | 1,695 | | 13,992 |
Insight Communications, Inc. Class A (a) | 2,585 | | 21,895 |
Knology, Inc. | 2,129 | | 7,324 |
Lakes Entertainment, Inc. (a) | 1,826 | | 25,473 |
Lamar Advertising Co. Class A (a) | 3,717 | | 146,598 |
Liberty Media International, Inc. Class A (a) | 5,881 | | 253,236 |
LodgeNet Entertainment Corp. (a) | 1,221 | | 18,828 |
MDC Partners, Inc. (a) | 980 | | 10,040 |
Mediacom Communications Corp. Class A (a) | 4,465 | | 23,307 |
Navarre Corp. (a) | 1,550 | | 26,397 |
New Frontier Media, Inc. (a) | 1,569 | | 12,693 |
NTL, Inc. (a) | 3,692 | | 256,889 |
Outdoor Channel Holdings, Inc. (a) | 1,000 | | 14,000 |
Pixar (a) | 2,184 | | 198,023 |
Private Media Group, Inc. (a)(d) | 4,801 | | 15,363 |
Radio One, Inc.: | | | |
Class A (a) | 992 | | 13,769 |
Class D (non-vtg.) (a) | 3,397 | | 47,388 |
Regent Communication, Inc. (a) | 2,793 | | 15,948 |
Reuters Group PLC sponsored ADR | 927 | | 40,862 |
Salem Communications Corp. Class A (a) | 848 | | 20,827 |
SBS Broadcasting SA (a) | 1,237 | | 42,590 |
Scholastic Corp. (a) | 1,565 | | 51,551 |
Sinclair Broadcast Group, Inc. Class A | 2,172 | | 15,660 |
Sirius Satellite Radio, Inc. (a)(d) | 52,034 | | 345,506 |
Spanish Broadcasting System, Inc. Class A (a) | 1,900 | | 20,311 |
TiVo, Inc. (a) | 3,177 | | 14,964 |
UnitedGlobalCom, Inc. Class A (a) | 17,017 | | 141,752 |
Value Line, Inc. | 448 | | 17,920 |
WPP Group PLC sponsored ADR | 909 | | 49,913 |
Common Stocks - continued |
| Shares | | Value (Note 1) |
CONSUMER DISCRETIONARY - continued |
Media - continued |
XM Satellite Radio Holdings, Inc. Class A (a) | 8,554 | | $ 315,728 |
Young Broadcasting, Inc. Class A (a) | 944 | | 9,213 |
| | 5,776,394 |
Multiline Retail - 0.5% |
Conn's, Inc. | 1,181 | | 20,939 |
Dollar Tree Stores, Inc. (a) | 4,830 | | 134,419 |
Fred's, Inc. Class A | 2,006 | | 34,764 |
Kmart Holding Corp. (a)(d) | 3,881 | | 399,083 |
Tuesday Morning Corp. (a) | 1,784 | | 59,746 |
| | 648,951 |
Specialty Retail - 2.4% |
AC Moore Arts & Crafts, Inc. (a) | 928 | | 26,717 |
America's Car Mart, Inc. (a) | 339 | | 12,441 |
American Eagle Outfitters, Inc. | 3,124 | | 130,489 |
bebe Stores, Inc. | 1,632 | | 59,209 |
Bed Bath & Beyond, Inc. (a) | 12,663 | | 505,608 |
Big 5 Sporting Goods Corp. | 1,136 | | 30,933 |
Brookstone Co., Inc. (a) | 1,178 | | 21,557 |
Cache, Inc. (a) | 734 | | 12,118 |
Casual Male Retail Group, Inc. (a) | 2,060 | | 8,899 |
Charlotte Russe Holding, Inc. (a) | 1,192 | | 13,887 |
Charming Shoppes, Inc. (a) | 5,503 | | 51,453 |
Cost Plus, Inc. (a) | 912 | | 28,983 |
Deb Shops, Inc. | 784 | | 19,326 |
Dress Barn, Inc. (a) | 1,405 | | 24,124 |
Electronics Boutique Holding Corp. (a) | 1,157 | | 45,065 |
Finish Line, Inc. Class A | 994 | | 18,290 |
Goody's Family Clothing, Inc. | 1,752 | | 17,064 |
Guitar Center, Inc. (a) | 1,024 | | 49,541 |
Gymboree Corp. (a) | 1,237 | | 14,584 |
Hibbett Sporting Goods, Inc. (a) | 1,104 | | 27,346 |
Hollywood Entertainment Corp. (a) | 2,617 | | 33,210 |
Hot Topic, Inc. (a) | 2,056 | | 33,657 |
Jos. A. Bank Clothiers, Inc. (a) | 540 | | 14,202 |
Kirkland's, Inc. (a) | 976 | | 9,370 |
Monro Muffler Brake, Inc. (a) | 816 | | 20,033 |
Movie Gallery, Inc. | 1,413 | | 24,629 |
O'Reilly Automotive, Inc. (a) | 2,216 | | 96,485 |
Pacific Sunwear of California, Inc. (a) | 2,996 | | 66,541 |
Party City Corp. (a) | 905 | | 11,575 |
Common Stocks - continued |
| Shares | | Value (Note 1) |
CONSUMER DISCRETIONARY - continued |
Specialty Retail - continued |
PETCO Animal Supplies, Inc. (a) | 2,360 | | $ 85,338 |
PETsMART, Inc. | 6,127 | | 209,972 |
Pomeroy IT Solutions, Inc. (a) | 1,021 | | 13,947 |
Rent-A-Center, Inc. (a) | 3,252 | | 82,893 |
Restoration Hardware, Inc. (a) | 2,172 | | 11,055 |
Ross Stores, Inc. | 6,036 | | 162,368 |
Select Comfort Corp. (a) | 1,445 | | 28,163 |
Sharper Image Corp. (a) | 704 | | 13,489 |
Shoe Carnival, Inc. (a) | 884 | | 11,527 |
Stage Stores, Inc. (a) | 816 | | 33,448 |
Staples, Inc. | 20,821 | | 664,398 |
Stein Mart, Inc. (a) | 1,291 | | 21,469 |
Steiner Leisure Ltd. (a) | 896 | | 24,120 |
TBC Corp. (a) | 1,072 | | 28,590 |
The Children's Place Retail Stores, Inc. (a) | 1,285 | | 40,683 |
The Pantry, Inc. (a) | 1,230 | | 33,850 |
Tractor Supply Co. (a) | 1,847 | | 58,587 |
Trans World Entertainment Corp. (a) | 2,389 | | 26,948 |
Tweeter Home Entertainment Group, Inc. (a) | 1,752 | | 11,230 |
Urban Outfitters, Inc. (a) | 3,354 | | 142,545 |
West Marine, Inc. (a) | 960 | | 22,176 |
Wet Seal, Inc. Class A (a) | 1,493 | | 2,478 |
Wilsons Leather Experts, Inc. (a) | 1,704 | | 8,520 |
| | 3,165,130 |
Textiles, Apparel & Luxury Goods - 0.3% |
Cherokee, Inc. | 700 | | 20,580 |
Columbia Sportswear Co. (a) | 1,656 | | 94,226 |
Deckers Outdoor Corp. (a) | 929 | | 40,430 |
Fossil, Inc. (a) | 3,108 | | 84,071 |
Haggar Corp. | 1,152 | | 25,459 |
K-Swiss, Inc. Class A | 1,120 | | 30,343 |
Oshkosh B'Gosh, Inc. Class A | 608 | | 12,464 |
Perry Ellis International, Inc. (a) | 528 | | 10,080 |
Quaker Fabric Corp. (a) | 2,220 | | 12,765 |
Steven Madden Ltd. (a) | 704 | | 13,277 |
Tandy Brands Accessories, Inc. | 1,080 | | 15,432 |
Warnaco Group, Inc. (a) | 1,944 | | 38,627 |
| | 397,754 |
TOTAL CONSUMER DISCRETIONARY | | 18,522,461 |
Common Stocks - continued |
| Shares | | Value (Note 1) |
CONSUMER STAPLES - 1.6% |
Beverages - 0.1% |
Coca-Cola Bottling Co. Consolidated | 336 | | $ 17,613 |
Hansen Natural Corp. (a) | 600 | | 20,280 |
MGP Ingredients, Inc. | 1,334 | | 12,460 |
Robert Mondavi Corp. Class A (a) | 512 | | 28,826 |
| | 79,179 |
Food & Staples Retailing - 1.1% |
Arden Group, Inc. Class A | 286 | | 28,243 |
Casey's General Stores, Inc. | 1,988 | | 38,508 |
Central European Distribution Corp. (a) | 792 | | 20,822 |
Costco Wholesale Corp. (d) | 19,421 | | 943,861 |
Fresh Brands, Inc. (a) | 1,192 | | 9,059 |
Ingles Markets, Inc. Class A | 1,873 | | 23,956 |
Nash-Finch Co. | 336 | | 12,469 |
NeighborCare, Inc. (a) | 1,768 | | 49,663 |
Pathmark Stores, Inc. (a) | 1,980 | | 10,910 |
Performance Food Group Co. (a) | 1,656 | | 43,453 |
Topps Co., Inc. | 2,044 | | 20,379 |
United Natural Foods, Inc. (a) | 1,604 | | 45,121 |
Whole Foods Market, Inc. | 2,566 | | 232,916 |
Wild Oats Markets, Inc. (a) | 1,684 | | 12,057 |
| | 1,491,417 |
Food Products - 0.2% |
Alico, Inc. | 262 | | 14,609 |
Bridgford Foods Corp. (a) | 2,028 | | 16,792 |
Cal-Maine Foods, Inc. | 1,186 | | 15,688 |
Farmer Brothers Co. | 800 | | 21,248 |
Gold Kist, Inc. Delaware | 2,080 | | 29,080 |
Hain Celestial Group, Inc. (a) | 1,549 | | 30,097 |
J&J Snack Foods Corp. (a) | 464 | | 21,780 |
Lancaster Colony Corp. | 1,205 | | 52,634 |
Lance, Inc. | 1,588 | | 29,600 |
Peet's Coffee & Tea, Inc. (a) | 688 | | 17,393 |
Sanderson Farms, Inc. | 840 | | 31,290 |
SunOpta, Inc. (a) | 3,052 | | 18,529 |
| | 298,740 |
Household Products - 0.0% |
Central Garden & Pet Co. Class A (a) | 704 | | 27,245 |
WD-40 Co. | 720 | | 21,031 |
| | 48,276 |
Common Stocks - continued |
| Shares | | Value (Note 1) |
CONSUMER STAPLES - continued |
Personal Products - 0.2% |
Chattem, Inc. (a) | 1,088 | | $ 39,407 |
Elizabeth Arden, Inc. (a) | 976 | | 22,253 |
Inter Parfums, Inc. | 991 | | 16,579 |
Mannatech, Inc. | 1,876 | | 43,148 |
Nature's Sunshine Products, Inc. | 1,462 | | 24,474 |
Reliv International, Inc. | 2,639 | | 21,561 |
USANA Health Sciences, Inc. (a) | 864 | | 25,669 |
| | 193,091 |
Tobacco - 0.0% |
Star Scientific, Inc. (a) | 3,450 | | 22,736 |
TOTAL CONSUMER STAPLES | | 2,133,439 |
ENERGY - 0.6% |
Energy Equipment & Services - 0.3% |
Cal Dive International, Inc. (a) | 1,429 | | 61,533 |
Dawson Geophysical Co. (a) | 1,110 | | 25,919 |
Global Industries Ltd. (a) | 4,946 | | 42,437 |
Gulfmark Offshore, Inc. (a) | 1,096 | | 22,808 |
Horizon Offshore, Inc. (a) | 3,229 | | 1,130 |
Hydril Co. (a) | 672 | | 31,524 |
Lufkin Industries, Inc. | 704 | | 28,343 |
Patterson-UTI Energy, Inc. | 6,088 | | 121,760 |
Seabulk International, Inc. (a) | 1,800 | | 21,456 |
Tesco Corp. (a) | 1,784 | | 18,367 |
Torch Offshore, Inc. (a) | 3,145 | | 6,224 |
| | 381,501 |
Oil & Gas - 0.3% |
APCO Argentina, Inc. | 481 | | 16,354 |
Atlas America, Inc. | 574 | | 18,219 |
ATP Oil & Gas Corp. (a) | 1,236 | | 17,613 |
Brigham Exploration Co. (a) | 2,341 | | 21,888 |
Canada Southern Petroleum Ltd. (ltd. vtg.) (a) | 1,265 | | 7,797 |
Clayton Williams Energy, Inc. (a) | 496 | | 11,353 |
Crosstex Energy, Inc. | 733 | | 29,518 |
Delta Petroleum Corp. (a) | 1,695 | | 26,662 |
Dorchester Minerals LP | 1,237 | | 29,874 |
Double Eagle Petroleum Co. (a) | 842 | | 16,891 |
Enterra Energy Trust | 1,156 | | 21,270 |
FX Energy, Inc. (a) | 3,253 | | 32,660 |
Common Stocks - continued |
| Shares | | Value (Note 1) |
ENERGY - continued |
Oil & Gas - continued |
Golar LNG Ltd. (Nasdaq) (a) | 2,437 | | $ 36,143 |
Ivanhoe Energy, Inc. (a) | 6,330 | | 16,386 |
Knightsbridge Tankers Ltd. (d) | 717 | | 27,848 |
Marine Petroleum Trust | 655 | | 18,897 |
Mission Resources Corp. (a) | 2,663 | | 16,537 |
Petroleum Development Corp. (a) | 889 | | 36,556 |
Syntroleum Corp. (a) | 2,835 | | 19,647 |
TC Pipelines LP | 672 | | 25,872 |
The Exploration Co. of Delaware, Inc. (a) | 2,761 | | 16,842 |
Top Tankers, Inc. | 856 | | 19,303 |
| | 484,130 |
TOTAL ENERGY | | 865,631 |
FINANCIALS - 10.7% |
Capital Markets - 1.1% |
American Capital Strategies Ltd. | 3,947 | | 126,067 |
Ameritrade Holding Corp. (a) | 15,791 | | 219,969 |
Calamos Asset Management, Inc. Class A | 644 | | 15,276 |
Gladstone Capital Corp. | 848 | | 20,801 |
Harris & Harris Group, Inc. (a) | 1,311 | | 19,350 |
Investors Financial Services Corp. | 2,693 | | 118,061 |
Knight Trading Group, Inc. (a) | 5,199 | | 59,321 |
MarketAxess Holdings, Inc. | 900 | | 17,640 |
MFC Bancorp Ltd. (a) | 960 | | 20,112 |
Northern Trust Corp. | 8,983 | | 422,560 |
Sanders Morris Harris Group, Inc. | 1,048 | | 15,982 |
SEI Investments Co. | 4,329 | | 169,307 |
T. Rowe Price Group, Inc. | 5,070 | | 299,941 |
TradeStation Group, Inc. (a) | 1,932 | | 14,335 |
| | 1,538,722 |
Commercial Banks - 5.8% |
1st Source Corp. | 1,088 | | 28,560 |
Alabama National Bancorp, Delaware | 642 | | 40,594 |
Alliance Financial Corp. | 627 | | 17,713 |
Amcore Financial, Inc. | 832 | | 27,065 |
American National Bankshares, Inc. | 876 | | 21,550 |
American River Bankshares | 768 | | 17,971 |
AmericanWest Bancorp (a) | 845 | | 17,745 |
Associated Banc-Corp. | 4,638 | | 154,121 |
Common Stocks - continued |
| Shares | | Value (Note 1) |
FINANCIALS - continued |
Commercial Banks - continued |
Banc Corp. (a) | 2,553 | | $ 20,067 |
BancFirst Corp. | 328 | | 23,285 |
BancTrust Financial Group, Inc. | 1,168 | | 24,878 |
Bank of Granite Corp. | 880 | | 19,096 |
Bank of the Ozarks, Inc. | 768 | | 27,379 |
Banner Corp. | 784 | | 25,888 |
BNC Bancorp | 1,168 | | 19,506 |
BOK Financial Corp. (a) | 2,324 | | 113,411 |
Boston Private Financial Holdings, Inc. | 880 | | 23,839 |
Capital Bank Corp. | 1,040 | | 17,316 |
Capital City Bank Group, Inc. | 464 | | 20,416 |
Capital Corp. of the West | 269 | | 13,851 |
Cascade Bancorp | 1,082 | | 23,588 |
Cascade Financial Corp. | 1,118 | | 21,264 |
Cathay General Bancorp | 2,078 | | 80,460 |
Center Bancorp, Inc. | 1,058 | | 13,627 |
Center Financial Corp., California | 38 | | 782 |
Central Coast Bancorp (a) | 968 | | 22,506 |
Century Bancorp, Inc. Class A (non-vtg.) | 528 | | 16,400 |
Chemical Financial Corp. | 944 | | 39,554 |
Chester Valley Bancorp, Inc. | 956 | | 20,438 |
Citizens Banking Corp. | 1,624 | | 57,002 |
City Holding Co. | 608 | | 22,447 |
CNB Financial Corp. | 1,305 | | 19,262 |
CoBiz, Inc. | 1,422 | | 31,284 |
Colony Bankcorp, Inc. | 846 | | 26,649 |
Columbia Bancorp | 592 | | 21,460 |
Columbia Bancorp, Oregon | 1,280 | | 24,640 |
Columbia Banking Systems, Inc. | 873 | | 22,165 |
Commerce Bancshares, Inc. | 3,030 | | 148,197 |
Community Bank of Northern Virginia | 632 | | 10,554 |
Community Banks, Inc. | 540 | | 15,833 |
Community Trust Bancorp, Inc. | 624 | | 20,892 |
Compass Bancshares, Inc. | 5,246 | | 244,254 |
CVB Financial Corp. | 1,979 | | 53,789 |
East West Bancorp, Inc. | 2,106 | | 87,336 |
Eastern Virgina Bankshares, Inc. | 889 | | 21,149 |
Farmers Capital Bank Corp. | 576 | | 21,888 |
Fidelity Southern Corp. | 1,248 | | 22,626 |
Fifth Third Bancorp | 23,624 | | 1,189,705 |
Financial Institutions, Inc. | 704 | | 17,952 |
Common Stocks - continued |
| Shares | | Value (Note 1) |
FINANCIALS - continued |
Commercial Banks - continued |
First Bancorp, North Carolina | 768 | | $ 21,750 |
First Charter Corp. | 1,349 | | 36,949 |
First Citizen Bancshares, Inc. | 320 | | 43,541 |
First Citizens Banc Corp. (d) | 784 | | 18,032 |
First Community Bancorp, California | 656 | | 27,565 |
First Community Bancshares, Inc. | 368 | | 13,108 |
First Financial Bancorp, Ohio | 2,084 | | 35,595 |
First Financial Bankshares, Inc. | 544 | | 23,664 |
First Financial Corp., Indiana | 576 | | 20,920 |
First Indiana Corp. | 992 | | 22,985 |
First M&F Corp. | 671 | | 22,814 |
First Mariner Bancorp, Inc. (a) | 928 | | 15,952 |
First Merchants Corp. | 624 | | 16,817 |
First Midwest Bancorp, Inc., Delaware | 1,928 | | 72,377 |
First Oak Brook Bancshares, Inc. | 624 | | 20,467 |
First of Long Island Corp. | 464 | | 22,796 |
First South Bancorp, Inc., Virginia | 768 | | 19,576 |
First United Corp. | 940 | | 19,129 |
FirstMerit Corp. | 3,076 | | 84,190 |
Flag Financial Corp. | 1,600 | | 22,800 |
FNB Corp., North Carolina | 976 | | 19,081 |
FNB Corp., Virginia | 624 | | 18,096 |
FNB Financial Services Corp. | 1,072 | | 22,512 |
Foothill Independent Bancorp | 1,034 | | 23,854 |
Frontier Financial Corp., Washington | 432 | | 17,220 |
Fulton Financial Corp. | 4,780 | | 107,072 |
GB&T Bancshares, Inc. | 800 | | 20,296 |
German American Bancorp | 1,008 | | 17,136 |
Glacier Bancorp, Inc. | 980 | | 33,918 |
Gold Banc Corp., Inc. | 1,739 | | 26,015 |
Great Southern Bancorp, Inc. | 571 | | 23,411 |
Greater Bay Bancorp | 2,104 | | 61,121 |
Greater Community Bancorp | 1,292 | | 19,122 |
Grupo Financiero Galicia SA sponsored ADR (a) | 1,938 | | 14,051 |
Hancock Holding Co. | 1,375 | | 46,750 |
Hanmi Financial Corp. | 1,025 | | 38,110 |
Harleysville National Corp., Pennsylvania | 856 | | 24,105 |
Heartland Financial USA, Inc. | 768 | | 16,950 |
Heritage Commerce Corp. (a) | 1,429 | | 27,951 |
Huntington Bancshares, Inc. | 9,623 | | 233,454 |
Independent Bank Corp., Massachusetts | 640 | | 22,118 |
Common Stocks - continued |
| Shares | | Value (Note 1) |
FINANCIALS - continued |
Commercial Banks - continued |
Independent Bank Corp., Michigan | 704 | | $ 21,190 |
Integra Bank Corp. | 880 | | 20,134 |
Interchange Financial Services Corp. | 816 | | 21,787 |
International Bancshares Corp. | 2,243 | | 88,711 |
Lakeland Bancorp, Inc. | 1,114 | | 20,219 |
LNB Bancorp, Inc. | 1,104 | | 22,113 |
LSB Bancshares, Inc. | 1,072 | | 18,063 |
Main Street Banks, Inc. | 704 | | 22,303 |
MB Financial, Inc. | 1,338 | | 56,464 |
MBT Financial Corp. | 1,088 | | 25,949 |
Mercantile Bankshares Corp. | 3,324 | | 171,186 |
Merchants Bancshares, Inc. | 815 | | 24,206 |
Mid-State Bancshares | 928 | | 27,692 |
Nara Bancorp, Inc. | 969 | | 20,116 |
National Bankshares, Inc. | 444 | | 22,959 |
National Penn Bancshares, Inc. | 1,240 | | 35,712 |
NBT Bancorp, Inc. | 1,333 | | 33,845 |
Northern States Financial Corp. | 770 | | 21,175 |
Old Point Financial Corp. | 681 | | 20,845 |
Omega Financial Corp. | 523 | | 18,467 |
Pacific Capital Bancorp | 1,542 | | 50,901 |
Pennrock Financial Services Corp. | 512 | | 20,731 |
Penns Woods Bancorp, Inc. | 497 | | 24,751 |
Peoples Bancorp, Inc. | 528 | | 16,542 |
Pinnacle Financial Partners, Inc. (a) | 1,038 | | 25,255 |
Popular, Inc. | 11,140 | | 295,210 |
Premierwest Bancorp (a) | 2,062 | | 22,909 |
PrivateBancorp, Inc. | 864 | | 29,756 |
Prosperity Bancshares, Inc. | 688 | | 19,512 |
Provident Bankshares Corp. | 1,262 | | 46,366 |
Republic Bancorp, Inc. | 2,896 | | 45,004 |
Republic Bancorp, Inc., Kentucky Class A | 1,008 | | 27,972 |
Republic First Bancorp, Inc. (a) | 1,411 | | 21,588 |
Riggs National Corp. | 1,248 | | 25,110 |
Royal Bancshares of Pennsylvania, Inc. Class A | 718 | | 20,822 |
Rurban Financial Corp. (a)(d) | 1,208 | | 16,984 |
S&T Bancorp, Inc. | 960 | | 35,242 |
Sandy Spring Bancorp, Inc. | 480 | | 17,434 |
SCBT Financial Corp. | 320 | | 11,834 |
Seacoast Banking Corp., Florida | 912 | | 20,082 |
Shore Bancshares, Inc. | 400 | | 12,744 |
Common Stocks - continued |
| Shares | | Value (Note 1) |
FINANCIALS - continued |
Commercial Banks - continued |
Sierra Bancorp | 900 | | $ 18,900 |
Signature Bank, New York | 1,067 | | 33,514 |
Silicon Valley Bancshares (a) | 1,429 | | 59,989 |
Simmons First National Corp. Class A | 800 | | 23,200 |
Sky Financial Group, Inc. | 3,908 | | 113,176 |
Slade's Ferry Bancorp | 171 | | 3,471 |
South Financial Group, Inc. | 3,250 | | 102,976 |
Southern Community Financial Corp. | 1,720 | | 18,920 |
Southwest Bancorp of Texas, Inc. | 2,442 | | 59,731 |
Southwest Bancorp, Inc., Oklahoma | 1,024 | | 27,494 |
State Financial Services Corp. Class A | 704 | | 20,768 |
Sterling Bancshares, Inc. | 2,060 | | 30,035 |
Sterling Financial Corp., Pennsylvania | 1,000 | | 29,290 |
Suffolk Bancorp | 416 | | 13,803 |
Summit Bancshares, Inc. | 672 | | 22,882 |
Sun Bancorp, Inc., New Jersey (a) | 672 | | 16,699 |
Susquehanna Bancshares, Inc., Pennsylvania | 1,709 | | 44,434 |
Taylor Capital Group, Inc. | 832 | | 28,721 |
Texas Capital Bancshares, Inc. (a) | 1,405 | | 28,971 |
Texas Regional Bancshares, Inc. Class A | 1,656 | | 58,887 |
Trico Bancshares | 1,056 | | 25,291 |
Trustco Bank Corp., New York | 3,177 | | 44,796 |
Trustmark Corp. | 1,880 | | 57,904 |
UCBH Holdings, Inc. | 1,700 | | 77,078 |
UMB Financial Corp. (a) | 624 | | 34,950 |
Umpqua Holdings Corp. | 2,197 | | 56,177 |
Union Bankshares Corp. | 464 | | 17,405 |
United Bankshares, Inc., West Virginia | 1,445 | | 55,300 |
United Community Banks, Inc., Georgia (a) | 1,540 | | 44,136 |
United Security Bancshares, Inc. | 496 | | 14,816 |
United Security Bancshares, California | 848 | | 21,107 |
Unizan Financial Corp. | 960 | | 24,749 |
Vail Banks, Inc. (d) | 1,381 | | 17,981 |
Virginia Financial Group, Inc. | 496 | | 16,988 |
Washington Trust Bancorp, Inc. | 736 | | 21,653 |
WesBanco, Inc. | 720 | | 22,759 |
West Bancorp., Inc. | 924 | | 16,022 |
West Coast Bancorp, Oregon | 848 | | 22,311 |
Westamerica Bancorp. | 1,365 | | 79,388 |
Westbank Corp. | 1,085 | | 19,986 |
Western Sierra Bancorp (a) | 648 | | 25,920 |
Common Stocks - continued |
| Shares | | Value (Note 1) |
FINANCIALS - continued |
Commercial Banks - continued |
Whitney Holding Corp. | 1,672 | | $ 77,146 |
Wilshire Bancorp, Inc. (a) | 548 | | 17,859 |
Wintrust Financial Corp. | 640 | | 38,298 |
Yadkin Valley Bank & Trust Co. | 1,280 | | 18,240 |
Yardville National Bancorp | 752 | | 25,049 |
Zions Bancorp | 3,765 | | 250,373 |
| | 7,824,752 |
Consumer Finance - 0.3% |
ACE Cash Express, Inc. (a) | 255 | | 6,802 |
Advanta Corp.: | | | |
Class A | 399 | | 8,930 |
Class B | 757 | | 18,077 |
Asta Funding, Inc. | 1,024 | | 22,487 |
Collegiate Funding Services, Inc. | 1,210 | | 15,609 |
CompuCredit Corp. (a) | 2,168 | | 51,967 |
Credit Acceptance Corp. (a) | 2,196 | | 54,351 |
Education Lending Group, Inc. (a) | 1,438 | | 20,218 |
First Cash Financial Services, Inc. (a) | 842 | | 21,926 |
QC Holdings, Inc. | 870 | | 15,077 |
United Panam Financial Corp. (a) | 848 | | 16,833 |
WFS Financial, Inc. (a) | 1,736 | | 80,776 |
World Acceptance Corp. (a) | 992 | | 25,584 |
| | 358,637 |
Diversified Financial Services - 0.1% |
Encore Capital Group, Inc. (a) | 1,502 | | 37,670 |
eSpeed, Inc. Class A (a) | 1,429 | | 15,991 |
First Albany Companies, Inc. | 1,121 | | 10,302 |
Instinet Group, Inc. (a) | 12,047 | | 72,162 |
Medallion Financial Corp. | 2,220 | | 20,846 |
| | 156,971 |
Insurance - 1.4% |
Alfa Corp. | 3,261 | | 49,404 |
American National Insurance Co. | 1,104 | | 112,222 |
American Physicians Capital, Inc. (a) | 608 | | 20,252 |
Arch Capital Group Ltd. (a) | 1,403 | | 54,647 |
Argonaut Group, Inc. (a) | 1,453 | | 28,886 |
Baldwin & Lyons, Inc. Class B | 832 | | 21,632 |
Ceres Group, Inc. (a) | 3,225 | | 16,125 |
Cincinnati Financial Corp. | 6,852 | | 306,970 |
Direct General Corp. | 720 | | 20,520 |
Common Stocks - continued |
| Shares | | Value (Note 1) |
FINANCIALS - continued |
Insurance - continued |
Donegal Group, Inc. Class A | 228 | | $ 4,902 |
EMC Insurance Group | 800 | | 17,368 |
Enstar Group, Inc. (a) | 207 | | 12,813 |
Erie Indemnity Co. Class A | 2,472 | | 128,989 |
FPIC Insurance Group, Inc. (a) | 864 | | 28,538 |
Harleysville Group, Inc. | 1,317 | | 31,661 |
Infinity Property & Casualty Corp. | 880 | | 32,560 |
IPC Holdings Ltd. | 2,024 | | 86,162 |
Kansas City Life Insurance Co. | 544 | | 26,895 |
Max Re Capital Ltd. | 1,912 | | 36,443 |
Millea Holdings, Inc. ADR | 641 | | 45,428 |
National Western Life Insurance Co. Class A (a) | 128 | | 20,760 |
Navigators Group, Inc. (a) | 480 | | 13,560 |
Ohio Casualty Corp. (a) | 2,648 | | 56,879 |
Philadelphia Consolidated Holding Corp. (a) | 896 | | 61,152 |
PMA Capital Corp. Class A (a) | 1,688 | | 16,796 |
Presidential Life Corp. | 1,533 | | 25,616 |
Quanta Capital Holdings Ltd. (a) | 2,300 | | 21,574 |
SAFECO Corp. | 5,538 | | 268,427 |
Safety Insurance Group, Inc. | 1,008 | | 27,720 |
Selective Insurance Group, Inc. | 1,121 | | 50,210 |
State Auto Financial Corp. | 1,720 | | 46,096 |
The Midland Co. (a) | 880 | | 27,984 |
Triad Guaranty, Inc. (a) | 592 | | 35,520 |
United Fire & Casualty Co. | 448 | | 29,837 |
Universal American Financial Corp. (a) | 2,617 | | 34,937 |
USI Holdings Corp. (a) | 2,052 | | 23,557 |
| | 1,843,042 |
Real Estate - 0.2% |
Capital Automotive (SBI) | 1,285 | | 43,317 |
Elbit Medical Imaging Ltd. (a) | 1,814 | | 17,795 |
Gladstone Commercial Corp. | 1,304 | | 21,829 |
Investors Real Estate Trust | 2,633 | | 27,804 |
Monmouth Real Estate Investment Corp. Class A | 2,628 | | 21,734 |
Price Legacy Corp. | 2,067 | | 39,480 |
Saxon Capital, Inc. | 1,777 | | 40,338 |
Tarragon Realty Investors, Inc. (a) | 1,192 | | 17,153 |
| | 229,450 |
Thrifts & Mortgage Finance - 1.8% |
Accredited Home Lenders Holding Co. (a) | 960 | | 41,232 |
Common Stocks - continued |
| Shares | | Value (Note 1) |
FINANCIALS - continued |
Thrifts & Mortgage Finance - continued |
Anchor BanCorp Wisconsin, Inc. | 992 | | $ 28,976 |
Bank Mutual Corp. | 2,975 | | 36,682 |
BankUnited Financial Corp. Class A (a) | 1,072 | | 32,953 |
Beverly Hills Bancorp, Inc. | 2,657 | | 26,331 |
Brookline Bancorp, Inc., Delaware | 2,180 | | 35,316 |
Camco Financial Corp. | 1,218 | | 18,550 |
Capitol Federal Financial | 2,693 | | 95,009 |
CFS Bancorp, Inc. | 1,277 | | 17,597 |
Charter Financial Corp. | 800 | | 32,728 |
Citizens First Bancorp, Inc. | 864 | | 22,507 |
Citizens South Banking Corp. | 1,509 | | 19,768 |
City Bank Lynnwood | 544 | | 20,966 |
Clifton Savings Bancorp, Inc. | 1,057 | | 13,635 |
Commercial Capital Bancorp, Inc. | 2,246 | | 53,590 |
Cooperative Bankshares, Inc. | 720 | | 19,872 |
Corus Bankshares, Inc. | 992 | | 48,281 |
Dime Community Bancorp, Inc. | 1,629 | | 29,892 |
E-Loan, Inc. (a) | 3,693 | | 9,971 |
ESB Financial Corp. | 1,570 | | 22,153 |
FFLC Bancorp, Inc. | 799 | | 26,071 |
Fidelity Bankshares, Inc. | 720 | | 29,542 |
First Busey Corp. | 912 | | 18,650 |
First Federal Bancshares of Arkansas, Inc. | 993 | | 21,618 |
First Financial Holdings, Inc. | 528 | | 17,287 |
First Financial Service Corp. | 736 | | 18,871 |
First Niagara Financial Group, Inc. | 3,959 | | 57,168 |
First Pactrust Bancorp, Inc. | 800 | | 20,720 |
First Place Financial Corp. | 944 | | 21,240 |
Flushing Financial Corp. | 976 | | 20,740 |
FMS Financial Corp. | 848 | | 15,111 |
Harbor Florida Bancshares, Inc. | 960 | | 33,696 |
Heritage Financial Corp., Washington | 998 | | 21,667 |
HMN Financial, Inc. | 751 | | 24,002 |
Horizon Financial Corp. | 1,205 | | 24,715 |
Hudson City Bancorp, Inc. | 8,109 | | 325,820 |
Hudson River Bancorp, Inc. | 1,184 | | 23,976 |
Independence Community Bank Corp. | 3,510 | | 149,105 |
KNBT Bancorp, Inc. | 1,259 | | 21,554 |
LSB Corp. | 1,057 | | 19,512 |
MAF Bancorp., Inc. | 1,565 | | 71,834 |
MASSBANK Corp. | 578 | | 21,444 |
Common Stocks - continued |
| Shares | | Value (Note 1) |
FINANCIALS - continued |
Thrifts & Mortgage Finance - continued |
MutualFirst Financial, Inc. | 864 | | $ 20,347 |
NASB Financial, Inc. | 544 | | 21,787 |
NetBank, Inc. | 2,204 | | 22,635 |
NewAlliance Bancshares, Inc. | 4,808 | | 72,264 |
NewMil Bancorp, Inc. | 752 | | 22,643 |
Northeast Pennsylvania Financial Corp. | 960 | | 16,310 |
Northwest Bancorp, Inc. | 1,736 | | 44,910 |
Pamrapo Bancorp, Inc. | 733 | | 17,592 |
Parkvale Financial Corp. | 816 | | 25,467 |
Partners Trust Financial Group, Inc. | 2,012 | | 22,514 |
People's Bank, Connecticut | 3,908 | | 155,382 |
Provident Bancorp, Inc., Delaware | 1,697 | | 22,502 |
PVF Capital Corp. | 294 | | 4,204 |
Riverview Bancorp, Inc. | 969 | | 20,873 |
Severn Bancorp, Inc. | 560 | | 22,372 |
Sound Federal Bancorp, Inc. | 1,407 | | 21,388 |
Sterling Financial Corp., Washington (a) | 942 | | 37,633 |
TierOne Corp. | 848 | | 21,039 |
Timberland Bancorp, Inc. | 837 | | 20,507 |
United Community Financial Corp., Ohio | 1,456 | | 16,729 |
Washington Federal, Inc. | 3,173 | | 85,576 |
Waypoint Financial Corp. | 1,189 | | 33,019 |
Willow Grove Bancorp, Inc. | 976 | | 17,597 |
| | 2,395,642 |
TOTAL FINANCIALS | | 14,347,216 |
HEALTH CARE - 12.9% |
Biotechnology - 7.2% |
Abgenix, Inc. (a) | 4,002 | | 40,620 |
AEterna Zentaris Laboratories, Inc. (a) | 3,264 | | 20,807 |
Affymetrix, Inc. (a) | 2,520 | | 85,554 |
Albany Molecular Research, Inc. (a) | 1,485 | | 15,919 |
Alexion Pharmaceuticals, Inc. (a) | 1,157 | | 23,927 |
Alkermes, Inc. (a) | 4,109 | | 56,663 |
Amgen, Inc. (a) | 53,096 | | 3,187,884 |
Amylin Pharmaceuticals, Inc. (a) | 4,137 | | 84,312 |
Angiotech Pharmaceuticals, Inc. (a) | 3,649 | | 67,476 |
Aphton Corp. (a) | 2,415 | | 7,970 |
Arena Pharmaceuticals, Inc. (a) | 2,044 | | 11,447 |
ARIAD Pharmaceuticals, Inc. (a) | 1,964 | | 11,332 |
Common Stocks - continued |
| Shares | | Value (Note 1) |
HEALTH CARE - continued |
Biotechnology - continued |
Array Biopharma, Inc. (a) | 1,043 | | $ 8,719 |
Avant Immunotherapeutics, Inc. (a) | 7,617 | | 14,091 |
Axonyx, Inc. (a) | 2,023 | | 14,889 |
Biogen Idec, Inc. (a) | 13,975 | | 820,053 |
BioMarin Pharmaceutical, Inc. (a) | 2,937 | | 15,654 |
Biopure Corp. Class A (a)(d) | 2,325 | | 1,186 |
Celgene Corp. (a) | 6,922 | | 189,801 |
Cell Genesys, Inc. (a) | 2,044 | | 15,003 |
Cell Therapeutics, Inc. (a)(d) | 2,837 | | 21,221 |
Cephalon, Inc. (a) | 2,296 | | 109,129 |
Cepheid, Inc. (a) | 2,568 | | 23,651 |
Chiron Corp. (a) | 8,087 | | 263,394 |
Ciphergen Biosystems, Inc. (a) | 1,461 | | 4,704 |
Corgentech, Inc. | 1,034 | | 18,819 |
Corixa Corp. (a) | 2,809 | | 10,534 |
Cubist Pharmaceuticals, Inc. (a) | 1,716 | | 20,592 |
CuraGen Corp. (a) | 3,177 | | 19,157 |
Curis, Inc. (a) | 2,737 | | 11,085 |
CV Therapeutics, Inc. (a) | 1,349 | | 29,246 |
Cytogen Corp. (a) | 1,020 | | 10,047 |
Cytokinetics, Inc. | 1,082 | | 9,305 |
deCODE genetics, Inc. (a) | 3,017 | | 19,611 |
Dendreon Corp. (a) | 2,405 | | 23,593 |
Digene Corp. (a) | 897 | | 21,692 |
Diversa Corp. (a) | 2,421 | | 20,506 |
DOV Pharmaceutical, Inc. (a) | 1,000 | | 18,510 |
Dyax Corp. (a) | 1,604 | | 12,720 |
Dynavax Technologies Corp. | 970 | | 6,809 |
Encysive Pharmaceuticals, Inc. (a) | 2,585 | | 28,047 |
Enzon Pharmaceuticals, Inc. (a) | 2,027 | | 27,446 |
Exact Sciences Corp. (a) | 1,016 | | 3,515 |
Exelixis, Inc. (a) | 3,677 | | 32,983 |
Eyetech Pharmaceuticals, Inc. | 1,597 | | 64,391 |
Gen-Probe, Inc. (a) | 2,064 | | 82,354 |
Genaera Corp. (a) | 3,056 | | 11,032 |
Gene Logic, Inc. (a) | 2,341 | | 7,889 |
Genelabs Technologies, Inc. (a) | 9,488 | | 6,736 |
Genencor International, Inc. (a) | 2,645 | | 42,849 |
Genitope Corp. | 944 | | 14,896 |
Genta, Inc. (a) | 3,437 | | 4,468 |
Genzyme Corp. - General Division (a) | 9,655 | | 540,777 |
Common Stocks - continued |
| Shares | | Value (Note 1) |
HEALTH CARE - continued |
Biotechnology - continued |
Geron Corp. (a) | 1,668 | | $ 11,593 |
Gilead Sciences, Inc. (a) | 18,126 | | 624,622 |
GTx, Inc. | 1,569 | | 21,025 |
Harvard Bioscience, Inc. (a) | 2,140 | | 8,496 |
Human Genome Sciences, Inc. (a) | 5,855 | | 64,405 |
ICOS Corp. (a) | 2,773 | | 66,968 |
ID Biomedical Corp. (a) | 1,836 | | 29,879 |
Idenix Pharmaceuticals, Inc. | 1,940 | | 28,033 |
Ilex Oncology, Inc. (a) | 1,864 | | 46,339 |
ImClone Systems, Inc. (a) | 3,372 | | 142,366 |
ImmunoGen, Inc. (a) | 2,633 | | 20,590 |
Immunomedics, Inc. (a) | 2,681 | | 7,534 |
Incyte Corp. (a) | 3,677 | | 37,763 |
Indevus Pharmaceuticals, Inc. (a) | 2,633 | | 18,194 |
InterMune, Inc. (a) | 1,541 | | 19,124 |
Introgen Therapeutics, Inc. (a)(d) | 1,688 | | 11,782 |
Invitrogen Corp. (a) | 2,120 | | 128,260 |
Isis Pharmaceuticals, Inc. (a) | 3,161 | | 14,920 |
Keryx Biopharmaceuticals, Inc. (a) | 1,264 | | 15,459 |
La Jolla Pharmaceutical Co. (a) | 2,301 | | 3,244 |
Lexicon Genetics, Inc. (a) | 3,549 | | 24,949 |
LifeCell Corp. (a) | 1,168 | | 12,077 |
Ligand Pharmaceuticals, Inc. Class B (a) | 3,381 | | 37,867 |
Luminex Corp. (a) | 1,980 | | 17,840 |
MannKind Corp. | 1,270 | | 19,939 |
Marshall Edwards, Inc. | 2,395 | | 21,699 |
Martek Biosciences (a) | 1,009 | | 39,220 |
Maxim Pharmaceuticals, Inc. (a) | 1,761 | | 5,125 |
Maxygen, Inc. (a) | 1,820 | | 18,364 |
Medarex, Inc. (a) | 3,997 | | 43,567 |
MedImmune, Inc. (a) | 10,540 | | 280,364 |
Memory Pharmaceuticals Corp. | 664 | | 4,150 |
Millennium Pharmaceuticals, Inc. (a) | 12,908 | | 162,899 |
Myogen, Inc. | 1,567 | | 12,787 |
Myriad Genetics, Inc. (a) | 1,517 | | 29,187 |
Nabi Biopharmaceuticals (a) | 2,376 | | 34,214 |
Nanogen, Inc. (a) | 1,562 | | 7,013 |
Neogen Corp. (a) | 960 | | 20,774 |
Neopharm, Inc. (a) | 1,168 | | 13,607 |
Neose Technologies, Inc. (a) | 1,429 | | 9,989 |
Neurochem, Inc. (a) | 1,455 | | 29,175 |
Common Stocks - continued |
| Shares | | Value (Note 1) |
HEALTH CARE - continued |
Biotechnology - continued |
Neurocrine Biosciences, Inc. (a) | 1,509 | | $ 69,414 |
Neurogen Corp. (a) | 1,980 | | 17,325 |
Northfield Laboratories, Inc. (a)(d) | 1,473 | | 27,545 |
Novavax, Inc. (a) | 1,868 | | 6,389 |
NPS Pharmaceuticals, Inc. (a) | 1,672 | | 29,946 |
Nuvelo, Inc. (a) | 1,381 | | 13,465 |
ONYX Pharmaceuticals, Inc. (a) | 1,553 | | 48,578 |
OraSure Technologies, Inc. (a) | 1,900 | | 13,604 |
Orchid BioSciences, Inc. (a) | 784 | | 8,397 |
Oscient Pharmaceuticals Corp. (a) | 2,988 | | 9,741 |
OSI Pharmaceuticals, Inc. (a) | 1,784 | | 84,883 |
Peregrine Pharmaceuticals, Inc. (a) | 7,380 | | 9,373 |
Pharmacopeia Drug Discovery, Inc. (a) | 664 | | 3,838 |
Pharmacyclics, Inc. (a) | 1,239 | | 12,910 |
Pharmion Corp. | 1,182 | | 50,046 |
PRAECIS Pharmaceuticals, Inc. (a) | 2,969 | | 6,265 |
Progenics Pharmaceuticals, Inc. (a) | 752 | | 11,242 |
Protein Design Labs, Inc. (a) | 4,281 | | 77,572 |
QIAGEN NV (a) | 5,919 | | 63,984 |
QLT, Inc. (a) | 4,036 | | 65,409 |
Regeneron Pharmaceuticals, Inc. (a) | 2,277 | | 20,994 |
Renovis, Inc. | 859 | | 12,456 |
Rigel Pharmaceuticals, Inc. (a) | 1,024 | | 25,620 |
Savient Pharmaceuticals, Inc. (a) | 3,549 | | 7,808 |
SciClone Pharmaceuticals, Inc. (a) | 2,044 | | 8,340 |
Seattle Genetics, Inc. (a) | 2,028 | | 13,851 |
Senomyx, Inc. | 1,630 | | 16,137 |
Sequenom, Inc. (a) | 3,869 | | 3,443 |
Serologicals Corp. (a) | 1,232 | | 28,755 |
Sirna Therapeutics, Inc. (a) | 2,022 | | 6,248 |
Stratagene Corp. (a) | 917 | | 6,290 |
Tanox, Inc. (a) | 2,072 | | 28,697 |
Targeted Genetics Corp. (a) | 5,774 | | 7,622 |
Techne Corp. (a) | 1,768 | | 65,681 |
Telik, Inc. (a) | 1,720 | | 32,869 |
Third Wave Technologies, Inc. (a) | 3,437 | | 27,702 |
Transkaryotic Therapies, Inc. (a) | 1,899 | | 43,316 |
Trimeris, Inc. (a) | 941 | | 11,678 |
United Therapeutics Corp. (a) | 944 | | 41,545 |
Vasogen, Inc. (a) | 1,762 | | 8,409 |
Vertex Pharmaceuticals, Inc. (a) | 3,677 | | 39,050 |
Common Stocks - continued |
| Shares | | Value (Note 1) |
HEALTH CARE - continued |
Biotechnology - continued |
Vicuron Pharmaceuticals, Inc. (a) | 2,632 | | $ 46,297 |
Vion Pharmaceuticals, Inc. (a) | 4,066 | | 19,273 |
XOMA Ltd. (a) | 3,485 | | 6,970 |
Zymogenetics, Inc. (a) | 2,196 | | 49,937 |
| | 9,609,331 |
Health Care Equipment & Supplies - 2.2% |
Abaxis, Inc. (a) | 1,200 | | 15,048 |
Abiomed, Inc. (a) | 2,092 | | 31,757 |
Advanced Neuromodulation Systems, Inc. (a) | 848 | | 30,613 |
Aksys Ltd. (a)(d) | 1,668 | | 11,025 |
Align Technology, Inc. (a) | 2,821 | | 29,818 |
American Medical Systems Holdings, Inc. (a) | 1,509 | | 57,583 |
Analogic Corp. | 544 | | 24,654 |
Anika Therapeutics, Inc. (a) | 1,319 | | 12,465 |
Animas Corp. | 768 | | 12,442 |
Arrow International, Inc. | 1,880 | | 56,851 |
Arthrocare Corp. (a) | 1,056 | | 31,965 |
Aspect Medical Systems, Inc. (a) | 1,272 | | 31,037 |
BioLase Technology, Inc. (d) | 1,108 | | 10,016 |
Biomet, Inc. | 10,764 | | 515,273 |
Biosite, Inc. (a) | 784 | | 43,661 |
BioVeris Corp. (a) | 1,050 | | 6,489 |
Bruker BioSciences Corp. (a) | 4,771 | | 21,994 |
Cardiac Science, Inc. (a) | 4,173 | | 8,847 |
Cardiodynamics International Corp. (a) | 3,081 | | 14,080 |
Closure Medical Corp. (a) | 752 | | 13,378 |
CNS., Inc. | 1,368 | | 16,512 |
Conceptus, Inc. (a) | 1,176 | | 10,502 |
CONMED Corp. (a) | 1,349 | | 39,081 |
CTI Molecular Imaging, Inc. (a) | 2,161 | | 28,914 |
Cyberonics, Inc. (a) | 1,008 | | 18,719 |
Cytyc Corp. (a) | 4,795 | | 128,698 |
Dade Behring Holdings, Inc. (a) | 1,640 | | 88,052 |
Datascope Corp. | 688 | | 27,582 |
DENTSPLY International, Inc. | 3,188 | | 167,721 |
Encore Medical Corp. (a) | 2,044 | | 12,867 |
Endocardial Solutions, Inc. (a) | 2,285 | | 25,980 |
Epix Pharmaceuticals, Inc. (a) | 1,024 | | 18,022 |
Exactech, Inc. (a) | 784 | | 14,771 |
Foxhollow Technologies, Inc. | 902 | | 23,362 |
Common Stocks - continued |
| Shares | | Value (Note 1) |
HEALTH CARE - continued |
Health Care Equipment & Supplies - continued |
Given Imaging Ltd. (a)(d) | 1,389 | | $ 46,268 |
Hologic, Inc. (a) | 1,200 | | 29,988 |
I-Flow Corp. (a) | 1,593 | | 32,704 |
ICU Medical, Inc. (a) | 704 | | 17,565 |
IDEXX Laboratories, Inc. (a) | 1,429 | | 73,736 |
Illumina, Inc. (a) | 2,618 | | 19,897 |
Immucor, Inc. (a) | 1,137 | | 36,555 |
INAMED Corp. (a) | 1,708 | | 91,634 |
Integra LifeSciences Holdings Corp. (a) | 1,157 | | 39,326 |
IntraLase Corp. | 1,034 | | 18,457 |
Intuitive Surgical, Inc. (a) | 1,293 | | 46,457 |
Kensey Nash Corp. (a) | 624 | | 19,506 |
Kyphon, Inc. (a) | 1,752 | | 42,153 |
Laserscope, Inc. (a) | 1,120 | | 36,422 |
Matthews International Corp. Class A | 1,397 | | 51,507 |
Merit Medical Systems, Inc. (a) | 1,065 | | 12,098 |
Micro Therapeutics, Inc. (a) | 2,633 | | 10,479 |
Molecular Devices Corp. (a) | 816 | | 17,160 |
Nutraceutical International Corp. (a) | 1,309 | | 20,983 |
NuVasive, Inc. | 985 | | 9,358 |
Ocular Sciences, Inc. (a) | 1,221 | | 58,991 |
Orthofix International NV (a) | 608 | | 23,062 |
Orthologic Corp. (a) | 2,793 | | 16,004 |
Orthovita, Inc. (a) | 3,341 | | 12,863 |
Palomar Medical Technologies, Inc. (a) | 844 | | 19,015 |
PolyMedica Corp. | 992 | | 35,266 |
Possis Medical, Inc. (a) | 960 | | 11,078 |
Quidel Corp. (a) | 2,108 | | 13,597 |
Regeneration Technologies, Inc. (a) | 1,320 | | 12,276 |
Respironics, Inc. (a) | 1,397 | | 77,366 |
SonoSight, Inc. (a) | 784 | | 23,402 |
Staar Surgical Co. (a) | 1,112 | | 6,594 |
Stereotaxis, Inc. | 1,830 | | 17,843 |
SurModics, Inc. (a) | 736 | | 22,154 |
Syneron Medical Ltd. | 919 | | 24,859 |
Synovis Life Technologies, Inc. (a) | 509 | | 6,032 |
Thoratec Corp. (a) | 2,517 | | 25,170 |
TriPath Imaging, Inc. (a) | 1,868 | | 13,412 |
Urologix, Inc. (a) | 832 | | 5,924 |
Utah Medical Products, Inc. | 640 | | 13,920 |
Varian, Inc. (a) | 1,413 | | 52,917 |
Common Stocks - continued |
| Shares | | Value (Note 1) |
HEALTH CARE - continued |
Health Care Equipment & Supplies - continued |
Vascular Solutions, Inc. (a) | 1,263 | | $ 13,085 |
Ventana Medical Systems, Inc. (a) | 752 | | 44,932 |
Vital Signs, Inc. | 656 | | 24,541 |
Wright Medical Group, Inc. (a) | 1,509 | | 39,913 |
Young Innovations, Inc. | 544 | | 17,375 |
Zoll Medical Corp. (a) | 448 | | 15,201 |
| | 2,918,824 |
Health Care Providers & Services - 1.9% |
Accredo Health, Inc. (a) | 2,072 | | 56,089 |
Advisory Board Co. (a) | 339 | | 12,079 |
Alderwoods Group, Inc. (a) | 2,617 | | 27,688 |
Allied Healthcare International, Inc. (a) | 915 | | 4,923 |
Allscripts Healthcare Solutions, Inc. (a) | 2,466 | | 24,290 |
Amedisys, Inc. (a) | 715 | | 23,538 |
America Service Group, Inc. (a) | 495 | | 12,400 |
American Healthways, Inc. (a) | 1,387 | | 46,256 |
AmSurg Corp. (a) | 1,416 | | 36,405 |
Andrx Corp. (a) | 3,324 | | 59,167 |
Cerner Corp. (a) | 1,581 | | 83,350 |
Computer Programs & Systems, Inc. | 656 | | 14,170 |
Corvel Corp. (a) | 480 | | 15,226 |
Cross Country Healthcare, Inc. (a) | 1,652 | | 29,323 |
D & K Healthcare Resources, Inc. | 961 | | 6,977 |
Dendrite International, Inc. (a) | 1,812 | | 30,931 |
Eclipsys Corp. (a) | 2,209 | | 42,965 |
eResearchTechnology, Inc. (a) | 2,227 | | 32,826 |
Express Scripts, Inc. (a) | 3,171 | | 228,185 |
First Health Group Corp. (a) | 3,781 | | 67,377 |
Genesis HealthCare Corp. (a) | 880 | | 28,380 |
Gentiva Health Services, Inc. (a) | 1,684 | | 28,039 |
HealthExtras, Inc. (a) | 1,836 | | 29,321 |
Henry Schein, Inc. (a) | 1,704 | | 111,067 |
ICON PLC sponsored ADR (a) | 560 | | 20,910 |
IDX Systems Corp. (a) | 1,301 | | 45,691 |
LabOne, Inc. (a) | 768 | | 23,155 |
LCA-Vision, Inc. | 636 | | 20,861 |
Lifeline Systems, Inc. (a) | 1,056 | | 28,565 |
LifePoint Hospitals, Inc. (a) | 1,597 | | 58,738 |
Lincare Holdings, Inc. (a) | 4,137 | | 159,647 |
Magellan Health Services, Inc. (a) | 1,166 | | 41,567 |
Common Stocks - continued |
| Shares | | Value (Note 1) |
HEALTH CARE - continued |
Health Care Providers & Services - continued |
Matria Healthcare, Inc. (a) | 880 | | $ 30,800 |
Medcath Corp. (a) | 1,384 | | 30,060 |
Merge Technologies, Inc. (a) | 765 | | 14,742 |
National Medical Health Card Systems, Inc. (a) | 508 | | 10,866 |
Odyssey Healthcare, Inc. (a) | 1,565 | | 20,893 |
Omnicell, Inc. (a) | 1,204 | | 12,943 |
Option Care, Inc. | 1,288 | | 22,179 |
PAREXEL International Corp. (a) | 1,309 | | 27,005 |
Patterson Companies, Inc. (a) | 5,610 | | 229,225 |
PDI, Inc. (a) | 672 | | 15,637 |
Per-Se Technologies, Inc. (a) | 1,505 | | 20,754 |
Pharmaceutical Product Development, Inc. (a) | 2,280 | | 96,011 |
PRA International | 906 | | 20,530 |
Priority Healthcare Corp. Class B (a) | 1,656 | | 34,610 |
PSS World Medical, Inc. (a) | 3,309 | | 41,409 |
Psychiatric Solutions, Inc. (a) | 942 | | 30,662 |
ResCare, Inc. (a) | 1,900 | | 28,500 |
SFBC International, Inc. (a) | 648 | | 25,162 |
Stewart Enterprises, Inc. Class A (a) | 5,583 | | 41,426 |
Sun Healthcare Group, Inc. (a) | 1,524 | | 11,430 |
Symbion, Inc. | 735 | | 14,083 |
TLC Vision Corp. (a) | 3,081 | | 36,085 |
TriZetto Group, Inc. (a) | 2,537 | | 17,962 |
United Surgical Partners International, Inc. (a) | 1,253 | | 49,456 |
VCA Antech, Inc. (a) | 3,536 | | 65,628 |
Ventiv Health, Inc. (a) | 1,720 | | 33,299 |
VistaCare, Inc. Class A (a) | 784 | | 13,324 |
Vital Images, Inc. (a) | 548 | | 8,872 |
VitalWorks, Inc. (a) | 2,793 | | 11,256 |
WebMD Corp. (a) | 13,188 | | 95,613 |
| | 2,560,528 |
Pharmaceuticals - 1.6% |
aaiPharma, Inc. (a)(d) | 1,265 | | 3,909 |
Able Laboratories, Inc. (a) | 752 | | 16,356 |
Acusphere, Inc. (d) | 2,301 | | 15,187 |
Adolor Corp. (a) | 1,445 | | 19,984 |
Advancis Pharmaceutical Corp. | 459 | | 1,198 |
American Pharmaceutical Partners, Inc. (a)(d) | 3,160 | | 93,947 |
Antigenics, Inc. (a) | 2,140 | | 20,159 |
Atherogenics, Inc. (a) | 1,832 | | 43,437 |
Common Stocks - continued |
| Shares | | Value (Note 1) |
HEALTH CARE - continued |
Pharmaceuticals - continued |
Axcan Pharma, Inc. (a) | 2,100 | | $ 37,026 |
Barrier Therapeutics, Inc. | 908 | | 15,145 |
Bone Care International, Inc. (a) | 1,096 | | 25,559 |
Connetics Corp. (a) | 1,477 | | 30,884 |
Cypress Bioscience, Inc. (a) | 1,643 | | 19,141 |
DepoMed, Inc. (a) | 3,286 | | 15,313 |
Discovery Laboratories, Inc. (a) | 2,060 | | 14,379 |
Discovery Partners International, Inc. (a) | 2,268 | | 10,433 |
Endo Pharmaceuticals Holdings, Inc. (a) | 5,038 | | 103,178 |
Eon Labs, Inc. (a) | 3,792 | | 102,232 |
First Horizon Pharmaceutical Corp. (a) | 1,716 | | 33,565 |
Flamel Technologies SA sponsored ADR (a) | 850 | | 17,842 |
Guilford Pharmaceuticals, Inc. (a) | 2,060 | | 11,618 |
Hollis-Eden Pharmaceuticals, Inc. (a) | 833 | | 8,447 |
Impax Laboratories, Inc. (a) | 2,408 | | 30,148 |
InKine Pharmaceutical, Inc. (a) | 3,097 | | 16,213 |
Inspire Pharmaceuticals, Inc. (a) | 1,525 | | 27,313 |
Kos Pharmaceuticals, Inc. (a) | 1,547 | | 65,856 |
Medicines Co. (a) | 2,104 | | 52,474 |
MGI Pharma, Inc. (a) | 2,794 | | 75,410 |
Nektar Therapeutics (a) | 3,011 | | 56,261 |
New River Pharmaceuticals, Inc. | 1,034 | | 16,182 |
NitroMed, Inc. (d) | 1,311 | | 27,400 |
Noven Pharmaceuticals, Inc. (a) | 1,232 | | 22,521 |
Novogen Ltd. sponsored ADR (a) | 354 | | 7,558 |
Pain Therapeutics, Inc. (a) | 2,338 | | 17,605 |
Penwest Pharmaceuticals Co. (a) | 893 | | 11,118 |
Perrigo Co. | 3,189 | | 57,530 |
Pharmos Corp. (a)(d) | 7,632 | | 30,528 |
Pozen, Inc. (a) | 1,304 | | 9,050 |
Salix Pharmaceuticals Ltd. (a) | 1,632 | | 24,725 |
Santarus, Inc. | 1,511 | | 14,732 |
Sepracor, Inc. (a) | 4,410 | | 196,289 |
Shire Pharmaceuticals Group PLC sponsored ADR | 1,946 | | 58,438 |
SuperGen, Inc. (a) | 2,044 | | 14,758 |
Taro Pharmaceutical Industries Ltd. (a) | 1,173 | | 34,768 |
Teva Pharmaceutical Industries Ltd. sponsored ADR | 18,606 | | 507,572 |
Theravance, Inc. | 1,730 | | 30,448 |
Vivus, Inc. (a) | 3,421 | | 20,115 |
Common Stocks - continued |
| Shares | | Value (Note 1) |
HEALTH CARE - continued |
Pharmaceuticals - continued |
Warner Chilcott PLC ADR | 212 | | $ 13,803 |
Zila, Inc. (a) | 3,853 | | 17,146 |
| | 2,114,900 |
TOTAL HEALTH CARE | | 17,203,583 |
INDUSTRIALS - 5.8% |
Aerospace & Defense - 0.3% |
Applied Signal Technology, Inc. | 720 | | 27,331 |
BE Aerospace, Inc. (a) | 2,905 | | 30,784 |
Ceradyne, Inc. (a) | 746 | | 36,852 |
Elbit Systems Ltd. (d) | 1,848 | | 41,451 |
Engineered Support Systems, Inc. | 976 | | 53,680 |
Innovative Solutions & Support, Inc. (a) | 615 | | 18,825 |
Invision Technologies, Inc. (a) | 864 | | 41,887 |
Kaman Corp. Class A | 1,620 | | 19,440 |
KVH Industries, Inc. (a) | 573 | | 5,787 |
Mercury Computer Systems, Inc.(a) | 1,040 | | 32,760 |
MTC Technologies, Inc. (a) | 704 | | 21,641 |
SI International, Inc. (a) | 643 | | 18,608 |
Sypris Solutions, Inc. | 1,040 | | 16,921 |
| | 365,967 |
Air Freight & Logistics - 0.5% |
C.H. Robinson Worldwide, Inc. | 3,356 | | 180,385 |
EGL, Inc. (a) | 2,152 | | 72,608 |
Expeditors International of Washington, Inc. | 4,539 | | 241,747 |
Forward Air Corp. (a) | 1,024 | | 47,462 |
Hub Group, Inc. Class A (a) | 453 | | 19,706 |
Pacer International, Inc. (a) | 1,672 | | 32,704 |
UTI Worldwide, Inc. | 1,088 | | 74,996 |
| | 669,608 |
Airlines - 0.3% |
FLYi, Inc. (a) | 2,373 | | 4,461 |
Frontier Airlines, Inc. (a) | 1,461 | | 17,138 |
JetBlue Airways Corp. (a)(d) | 4,121 | | 98,945 |
MAIR Holdings, Inc. (a) | 2,373 | | 21,832 |
Mesa Air Group, Inc. (a) | 1,752 | | 12,299 |
Northwest Airlines Corp. (a) | 4,285 | | 43,878 |
Republic Airways Holdings, Inc. | 1,063 | | 12,225 |
Common Stocks - continued |
| Shares | | Value (Note 1) |
INDUSTRIALS - continued |
Airlines - continued |
Ryanair Holdings PLC sponsored ADR (a) | 2,607 | | $ 102,064 |
SkyWest, Inc. | 2,616 | | 49,782 |
| | 362,624 |
Building Products - 0.1% |
Aaon, Inc. (a) | 832 | | 13,229 |
American Woodmark Corp. | 687 | | 27,638 |
Apogee Enterprises, Inc. | 1,652 | | 24,086 |
Quixote Corp. | 528 | | 11,067 |
Universal Forest Products, Inc. | 784 | | 33,837 |
| | 109,857 |
Commercial Services & Supplies - 2.3% |
Apollo Group, Inc. Class A (a) | 7,826 | | 623,732 |
Asset Acceptance Capital Corp. | 1,545 | | 31,842 |
Bright Horizons Family Solutions, Inc. (a) | 576 | | 36,144 |
Career Education Corp. (a) | 4,274 | | 166,259 |
Carlisle Holdings Ltd. (non-vtg.) | 3,225 | | 21,995 |
Casella Waste Systems, Inc. Class A (a) | 1,272 | | 19,220 |
Century Business Services, Inc. (a) | 5,042 | | 21,681 |
Charles River Associates, Inc. (a) | 512 | | 22,088 |
Cintas Corp. | 7,263 | | 324,801 |
Coinstar, Inc. (a) | 1,168 | | 30,391 |
Copart, Inc. (a) | 4,201 | | 90,742 |
Corinthian Colleges, Inc. (a) | 3,568 | | 62,172 |
Corporate Executive Board Co. | 1,820 | | 122,086 |
CoStar Group, Inc. (a) | 816 | | 35,741 |
DiamondCluster International, Inc. Class A (a) | 1,220 | | 14,921 |
Duratek, Inc. (a) | 873 | | 20,088 |
Educate, Inc. | 1,774 | | 23,417 |
Education Management Corp. (a) | 2,918 | | 96,703 |
Electro Rent Corp. | 1,752 | | 24,843 |
Exponent, Inc. (a) | 749 | | 20,815 |
FirstService Corp. (a) | 737 | | 23,783 |
G&K Services, Inc. Class A | 992 | | 40,751 |
General Binding Corp. (a) | 1,018 | | 13,570 |
Gevity HR, Inc. | 960 | | 17,002 |
Greg Manning Auctions, Inc. (a) | 1,285 | | 14,739 |
Healthcare Services Group, Inc. | 682 | | 14,145 |
Heidrick & Struggles International, Inc. (a) | 1,024 | | 35,226 |
Herman Miller, Inc. | 2,948 | | 72,412 |
Hudson Highland Group, Inc. (a) | 522 | | 14,256 |
Common Stocks - continued |
| Shares | | Value (Note 1) |
INDUSTRIALS - continued |
Commercial Services & Supplies - continued |
Huron Consulting Group, Inc. | 768 | | $ 16,243 |
ICT Group, Inc. (a) | 882 | | 7,541 |
Insurance Auto Auctions, Inc. (a) | 605 | | 13,425 |
Integrated Alarm Services Group, Inc. (a)(d) | 1,620 | | 6,820 |
Intersections, Inc. | 716 | | 12,888 |
Kelly Services, Inc. Class A (non-vtg.) | 1,640 | | 49,856 |
Kforce, Inc. (a) | 1,836 | | 21,995 |
Laureate Education, Inc. (a) | 1,864 | | 73,423 |
Layne Christensen Co. (a) | 473 | | 9,176 |
Learning Tree International, Inc. (a) | 1,056 | | 13,865 |
LECG Corp. | 768 | | 15,014 |
McGrath RentCorp. | 672 | | 28,399 |
Mobile Mini, Inc. (a) | 800 | | 24,232 |
Monster Worldwide, Inc. (a) | 4,830 | | 136,158 |
NCO Group, Inc. (a) | 1,189 | | 29,856 |
On Assignment, Inc. (a) | 1,797 | | 9,380 |
PICO Holdings, Inc. (a) | 579 | | 11,933 |
Portfolio Recovery Associates, Inc. (a) | 704 | | 26,400 |
PRG-Schultz International, Inc. (a) | 3,533 | | 19,078 |
Princeton Review, Inc. (a) | 2,204 | | 13,092 |
Resources Connection, Inc. (a) | 1,088 | | 49,352 |
School Specialty, Inc. (a) | 800 | | 30,400 |
SOURCECORP, Inc. (a) | 832 | | 13,836 |
Stericycle, Inc. (a) | 1,525 | | 63,730 |
Strayer Education, Inc. | 586 | | 62,983 |
Teletech Holdings, Inc. (a) | 3,565 | | 34,830 |
Tetra Tech, Inc. (a) | 2,328 | | 35,479 |
United Stationers, Inc. (a) | 1,301 | | 62,292 |
Vertrue, Inc. (a) | 576 | | 19,987 |
Waste Industries USA, Inc. | 1,800 | | 20,646 |
Waste Services, Inc. (a) | 2,579 | | 9,514 |
West Corp. (a) | 2,385 | | 82,616 |
| | 3,080,004 |
Construction & Engineering - 0.0% |
Insituform Technologies, Inc. Class A (a) | 1,189 | | 27,751 |
Washington Group International, Inc. (a) | 1,120 | | 43,680 |
| | 71,431 |
Electrical Equipment - 0.5% |
Active Power, Inc. (a) | 1,682 | | 7,653 |
American Power Conversion Corp. | 8,359 | | 176,709 |
Common Stocks - continued |
| Shares | | Value (Note 1) |
INDUSTRIALS - continued |
Electrical Equipment - continued |
American Superconductor Corp. (a) | 1,201 | | $ 16,629 |
Artesyn Technologies, Inc. (a) | 2,188 | | 20,830 |
Ballard Power Systems, Inc. (a) | 5,251 | | 35,023 |
Capstone Turbine Corp. (a) | 7,922 | | 14,814 |
Color Kinetics, Inc. | 868 | | 14,044 |
Deswell Industries, Inc. | 608 | | 14,987 |
Distributed Energy Systems Corp. (a) | 4,834 | | 12,955 |
Encore Wire Corp. (a) | 1,090 | | 14,688 |
Energy Conversion Devices, Inc. (a) | 1,064 | | 23,685 |
Franklin Electric Co., Inc. | 800 | | 32,528 |
FuelCell Energy, Inc. (a) | 2,184 | | 21,949 |
Genlyte Group, Inc. (a) | 528 | | 42,330 |
Hydrogenics Corp. (a) | 3,129 | | 16,226 |
II-VI, Inc. (a) | 752 | | 32,449 |
Intermagnetics General Corp. (a) | 1,152 | | 33,949 |
LSI Industries, Inc. | 1,534 | | 15,248 |
Medis Technologies Ltd. (a)(d) | 1,368 | | 22,230 |
Microvision, Inc. (a)(d) | 2,512 | | 19,116 |
Plug Power, Inc. (a) | 3,304 | | 19,527 |
Powell Industries, Inc. (a) | 816 | | 13,195 |
Power-One, Inc. (a) | 3,933 | | 36,144 |
Ultralife Batteries, Inc. (a) | 957 | | 14,393 |
Valence Technology, Inc. (a) | 4,141 | | 14,908 |
Vicor Corp. | 1,688 | | 18,349 |
Woodward Governor Co. | 512 | | 37,299 |
| | 741,857 |
Industrial Conglomerates - 0.0% |
Raven Industries, Inc. | 1,056 | | 22,672 |
Westaim Corp. (a) | 4,725 | | 12,191 |
| | 34,863 |
Machinery - 0.8% |
A.S.V., Inc. (a) | 736 | | 30,860 |
American Science & Engineering, Inc. (a) | 438 | | 16,188 |
Astec Industries, Inc. (a) | 1,381 | | 22,980 |
Bucyrus International, Inc. Class A | 604 | | 23,858 |
Commercial Vehicle Group, Inc. | 713 | | 13,975 |
CUNO, Inc. (a) | 752 | | 49,279 |
GSI Lumonics, Inc. (a) | 2,184 | | 21,491 |
Joy Global, Inc. | 2,408 | | 97,982 |
Lincoln Electric Holdings, Inc. | 1,640 | | 58,860 |
Common Stocks - continued |
| Shares | | Value (Note 1) |
INDUSTRIALS - continued |
Machinery - continued |
Middleby Corp. | 361 | | $ 20,729 |
Nordson Corp. (a) | 1,509 | | 57,433 |
PACCAR, Inc. | 7,391 | | 577,237 |
Pure Cycle Corp. (a) | 1,673 | | 12,882 |
Tecumseh Products Co. | 588 | | 25,754 |
Tecumseh Products Co. Class A (non-vtg.) | 560 | | 25,642 |
Volvo AB ADR | 457 | | 18,600 |
| | 1,073,750 |
Marine - 0.1% |
Alexander & Baldwin, Inc. | 1,541 | | 65,200 |
Stolt-Nielsen SA Class B sponsored ADR (a) | 790 | | 22,175 |
| | 87,375 |
Road & Rail - 0.7% |
AMERCO (a) | 751 | | 30,904 |
Arkansas Best Corp. | 1,088 | | 46,915 |
Covenant Transport, Inc. Class A (a) | 912 | | 17,529 |
Heartland Express, Inc. | 3,108 | | 68,252 |
J.B. Hunt Transport Services, Inc. | 3,236 | | 130,087 |
Knight Transportation, Inc. (a) | 2,419 | | 58,298 |
Landstar System, Inc. (a) | 1,184 | | 83,484 |
Marten Transport Ltd. (a) | 864 | | 18,965 |
Old Dominion Freight Lines, Inc. (a) | 960 | | 30,096 |
Overnite Corp. | 1,246 | | 44,034 |
P.A.M. Transportation Services, Inc. (a) | 688 | | 13,966 |
SCS Transportation, Inc. (a) | 976 | | 20,642 |
Swift Transportation Co., Inc. (a) | 3,525 | | 68,702 |
U.S. Xpress Enterprises, Inc. Class A (a) | 744 | | 19,344 |
USA Truck, Inc. (a) | 1,461 | | 18,102 |
USF Corp. | 1,237 | | 45,732 |
Werner Enterprises, Inc. | 3,788 | | 85,230 |
Yellow Roadway Corp. (a) | 2,028 | | 107,180 |
| | 907,462 |
Trading Companies & Distributors - 0.2% |
Aceto Corp. | 700 | | 11,900 |
Beacon Roofing Supply, Inc. | 1,096 | | 20,035 |
Fastenal Co. | 3,188 | | 194,978 |
Lawson Products, Inc. | 640 | | 31,264 |
Common Stocks - continued |
| Shares | | Value (Note 1) |
INDUSTRIALS - continued |
Trading Companies & Distributors - continued |
NuCo2, Inc. (a) | 670 | | $ 16,616 |
UAP Holding Corp. | 2,105 | | 34,417 |
| | 309,210 |
TOTAL INDUSTRIALS | | 7,814,008 |
INFORMATION TECHNOLOGY - 49.8% |
Communications Equipment - 9.3% |
3Com Corp. (a) | 16,199 | | 71,924 |
ADC Telecommunications, Inc. (a) | 36,669 | | 86,172 |
Adtran, Inc. | 3,253 | | 72,900 |
Advanced Fibre Communications, Inc. (a) | 3,653 | | 59,727 |
Airspan Networks, Inc. (a) | 1,625 | | 8,921 |
Alvarion Ltd. (a) | 2,825 | | 41,443 |
Anaren, Inc. (a) | 1,264 | | 16,981 |
Andrew Corp. (a) | 6,671 | | 94,728 |
Arris Group, Inc. (a) | 3,901 | | 22,197 |
Aspect Communications Corp. (a) | 3,406 | | 36,955 |
AudioCodes Ltd. (a) | 2,081 | | 30,591 |
Audiovox Corp. Class A (a) | 1,184 | | 17,701 |
Avanex Corp. (a) | 6,223 | | 19,291 |
Avici Systems, Inc. (a) | 1,295 | | 9,259 |
Avocent Corp. (a) | 1,944 | | 73,736 |
Bel Fuse, Inc. Class B | 399 | | 13,658 |
Black Box Corp. | 832 | | 35,510 |
C-COR.net Corp. (a) | 2,293 | | 20,522 |
Carrier Access Corp. (a) | 1,078 | | 9,734 |
Centillium Communications, Inc. (a) | 1,868 | | 4,707 |
CIENA Corp. (a) | 20,963 | | 53,456 |
Cisco Systems, Inc. (a) | 284,300 | | 5,319,253 |
Computer Network Technology Corp. (a) | 1,604 | | 9,143 |
Comtech Telecommunications Corp. (a) | 736 | | 23,169 |
Comverse Technology, Inc. (a) | 8,439 | | 179,498 |
CyberGuard Corp. (a) | 1,336 | | 8,243 |
Digi International, Inc. (a) | 2,060 | | 31,703 |
Ditech Communications Corp. (a) | 1,748 | | 27,548 |
Echelon Corp. (a) | 1,948 | | 14,727 |
ECI Telecom Ltd. (a) | 5,839 | | 48,464 |
ECtel Ltd. (a) | 371 | | 1,091 |
EFJ, Inc. (a) | 2,060 | | 16,645 |
Extreme Networks, Inc. (a) | 5,759 | | 39,334 |
Common Stocks - continued |
| Shares | | Value (Note 1) |
INFORMATION TECHNOLOGY - continued |
Communications Equipment - continued |
F5 Networks, Inc. (a) | 1,365 | | $ 58,763 |
FalconStor Software, Inc. (a)(d) | 2,713 | | 21,243 |
Finisar Corp. (a) | 10,335 | | 18,913 |
Foundry Networks, Inc. (a) | 5,602 | | 74,787 |
Glenayre Technologies, Inc. (a) | 3,440 | | 6,295 |
Harmonic, Inc. (a) | 3,485 | | 27,078 |
Inter-Tel, Inc. | 1,205 | | 34,126 |
InterDigital Communication Corp. (a) | 2,564 | | 52,177 |
Ixia (a) | 2,905 | | 40,961 |
JDS Uniphase Corp. (a) | 59,956 | | 190,061 |
Juniper Networks, Inc. (a) | 22,088 | | 608,083 |
MRV Communications, Inc. (a) | 6,207 | | 23,953 |
NETGEAR, Inc. (a) | 1,333 | | 21,861 |
Network Engines, Inc. (a) | 1,948 | | 4,539 |
NMS Communications Corp. (a) | 2,156 | | 13,773 |
Oplink Communications, Inc. (a) | 8,599 | | 17,628 |
Packeteer, Inc. (a) | 1,620 | | 21,060 |
Paradyne Networks, Inc. (a) | 5,324 | | 20,657 |
PC-Tel, Inc. (a) | 1,208 | | 9,749 |
Polycom, Inc. (a) | 4,233 | | 96,682 |
Powerwave Technologies, Inc. (a) | 3,597 | | 29,093 |
Proxim Corp. Class A (a) | 799 | | 3,284 |
Qiao Xing Universal Telephone, Inc. (a)(d) | 905 | | 8,334 |
QUALCOMM, Inc. | 68,200 | | 2,838,484 |
REMEC, Inc. (a) | 2,761 | | 16,649 |
Research In Motion Ltd. (a) | 7,882 | | 696,583 |
SafeNet, Inc. (a) | 1,036 | | 36,944 |
SCM Microsystems, Inc. (a) | 1,652 | | 5,633 |
SeaChange International, Inc. (a) | 1,409 | | 24,066 |
Sierra Wireless, Inc. (a) | 811 | | 15,318 |
SiRF Technology Holdings, Inc. | 1,848 | | 23,414 |
Sonus Networks, Inc. (a) | 9,700 | | 64,117 |
SpectraLink Corp. | 932 | | 13,654 |
Stratex Networks, Inc. (a) | 4,962 | | 10,222 |
Superior Essex, Inc. (a) | 730 | | 12,228 |
Sycamore Networks, Inc. (a) | 12,560 | | 47,100 |
Symmetricom, Inc. (a) | 2,617 | | 28,264 |
Tekelec (a) | 2,837 | | 66,414 |
Telefonaktiebolaget LM Ericsson ADR (a) | 7,151 | | 237,771 |
Tellabs, Inc. (a) | 18,143 | | 155,123 |
Terayon Communication Systems, Inc. (a) | 3,933 | | 7,827 |
Common Stocks - continued |
| Shares | | Value (Note 1) |
INFORMATION TECHNOLOGY - continued |
Communications Equipment - continued |
Tollgrade Communications, Inc. (a) | 756 | | $ 8,082 |
UTStarcom, Inc. (a) | 4,457 | | 87,090 |
Verso Technologies, Inc. (a) | 12,319 | | 9,978 |
ViaSat, Inc. (a) | 1,253 | | 26,150 |
Westell Technologies, Inc. Class A (a) | 2,389 | | 15,648 |
WJ Communications, Inc. (a) | 3,629 | | 12,302 |
Zhone Technologies, Inc. (a) | 3,945 | | 9,626 |
| | 12,390,718 |
Computers & Peripherals - 5.8% |
ActivCard Corp. (a) | 2,325 | | 18,507 |
Adaptec, Inc. (a) | 5,439 | | 42,424 |
Advanced Digital Information Corp. (a) | 2,945 | | 27,035 |
Apple Computer, Inc. (a) | 16,178 | | 1,084,735 |
Applied Films Corp. (a) | 544 | | 12,055 |
Avid Technology, Inc. (a) | 1,420 | | 81,039 |
Brocade Communications Systems, Inc. (a) | 11,532 | | 79,917 |
Concurrent Computer Corp. (a) | 3,709 | | 7,047 |
Cray, Inc. (a) | 3,193 | | 11,207 |
Creative Technology Ltd. (Nasdaq) | 3,629 | | 46,451 |
Dell, Inc. (a) | 105,000 | | 4,254,600 |
Dot Hill Systems Corp. (a) | 1,572 | | 10,375 |
Electronics for Imaging, Inc. (a) | 2,312 | | 38,680 |
Hutchinson Technology, Inc. (a) | 1,141 | | 37,391 |
InFocus Corp. (a) | 2,760 | | 18,492 |
Intergraph Corp. (a) | 1,960 | | 51,352 |
Komag, Inc. (a) | 1,189 | | 19,916 |
Logitech International SA sponsored ADR (a) | 297 | | 17,559 |
M-Systems Flash Disk Pioneers Ltd. (a) | 1,269 | | 20,126 |
McDATA Corp.: | | | |
Class A (a) | 3,509 | | 19,826 |
Class B (a) | 1,964 | | 10,527 |
Mobility Electronics, Inc. (a) | 1,445 | | 14,031 |
Neoware Systems, Inc. (a) | 792 | | 6,938 |
Network Appliance, Inc. (a) | 15,106 | | 455,597 |
Novatel Wireless, Inc. | 1,509 | | 31,780 |
palmOne, Inc. (a) | 2,070 | | 72,533 |
Pinnacle Systems, Inc. (a) | 3,081 | | 16,083 |
Presstek, Inc. (a) | 2,124 | | 22,684 |
QLogic Corp. (a) | 4,089 | | 140,621 |
Rimage Corp. (a) | 1,016 | | 15,453 |
Common Stocks - continued |
| Shares | | Value (Note 1) |
INFORMATION TECHNOLOGY - continued |
Computers & Peripherals - continued |
SanDisk Corp. (a) | 6,582 | | $ 148,622 |
SBS Technologies, Inc. (a) | 1,136 | | 14,836 |
Scitex Corp. Ltd. | 2,542 | | 11,286 |
SimpleTech, Inc. (a) | 2,172 | | 10,795 |
Stratasys, Inc. (a) | 402 | | 12,985 |
Sun Microsystems, Inc. (a) | 138,263 | | 767,360 |
Synaptics, Inc. (a) | 1,280 | | 49,152 |
Transact Technologies, Inc. (a) | 624 | | 13,946 |
Xybernaut Corp. (a) | 8,583 | | 10,300 |
| | 7,724,263 |
Electronic Equipment & Instruments - 2.1% |
Aeroflex, Inc. (a) | 2,921 | | 35,782 |
Agilysys, Inc. | 1,852 | | 30,614 |
Argon ST, Inc. (a) | 1,174 | | 30,360 |
BEI Technologies, Inc. | 912 | | 26,767 |
Bell Microproducts, Inc. (a) | 2,367 | | 20,238 |
Brightpoint, Inc. (a) | 913 | | 17,447 |
CDW Corp. | 3,485 | | 229,034 |
CellStar Corp. (a) | 946 | | 3,453 |
Cherokee International Corp. | 783 | | 6,710 |
Cogent, Inc. | 3,170 | | 106,417 |
Cognex Corp. | 1,928 | | 49,742 |
Coherent, Inc. (a) | 1,349 | | 38,973 |
CyberOptics Corp. (a) | 495 | | 6,960 |
Daktronics, Inc. (a) | 1,056 | | 27,372 |
DDi Corp. (a) | 865 | | 2,595 |
Digital Theater Systems, Inc. (a) | 401 | | 8,369 |
Dionex Corp. (a) | 928 | | 53,258 |
Electro Scientific Industries, Inc. (a) | 1,413 | | 27,440 |
Excel Technology, Inc. (a) | 672 | | 17,472 |
FARO Technologies, Inc. (a) | 736 | | 20,019 |
Flextronics International Ltd. (a) | 22,779 | | 326,879 |
FLIR Systems, Inc. (a) | 1,397 | | 78,721 |
Global Imaging Systems, Inc. (a) | 864 | | 32,331 |
Identix, Inc. (a) | 4,570 | | 36,240 |
INTAC International (a) | 778 | | 7,515 |
Itron, Inc. (a) | 928 | | 20,091 |
Lexar Media, Inc. (a) | 3,048 | | 24,049 |
Lipman Electronic Engineer Ltd. (Nasdaq) | 1,060 | | 30,040 |
Littelfuse, Inc. (a) | 1,072 | | 41,829 |
Common Stocks - continued |
| Shares | | Value (Note 1) |
INFORMATION TECHNOLOGY - continued |
Electronic Equipment & Instruments - continued |
M-Flex Electronix, Inc. | 1,199 | | $ 21,906 |
Magal Security Systems Ltd. | 405 | | 5,281 |
Mechanical Technology, Inc. (a) | 4,281 | | 23,631 |
Merix Corp. (a) | 928 | | 10,097 |
Methode Electronics, Inc. Class A | 1,688 | | 22,282 |
Metrologic Instruments, Inc. (a) | 1,550 | | 31,667 |
Molex, Inc. | 4,489 | | 123,762 |
Molex, Inc. Class A (non-vtg.) | 3,605 | | 87,565 |
MTS Systems Corp. | 1,157 | | 35,115 |
National Instruments Corp. | 3,300 | | 94,380 |
Newport Corp. (a) | 1,924 | | 23,742 |
NU Horizons Electronics Corp. (a) | 1,752 | | 14,543 |
Optimal Group, Inc. Class A (a) | 1,525 | | 16,623 |
Orbotech Ltd. (a) | 1,493 | | 28,307 |
OSI Systems, Inc. (a) | 752 | | 16,333 |
PC Connection, Inc. (a) | 1,461 | | 10,271 |
Pemstar, Inc. (a) | 3,293 | | 5,042 |
Photon Dynamics, Inc. (a) | 816 | | 17,993 |
Planar Systems, Inc. (a) | 689 | | 7,345 |
Plexus Corp. (a) | 2,132 | | 29,315 |
RadiSys Corp. (a) | 1,008 | | 14,203 |
Richardson Electronics Ltd. | 1,288 | | 14,361 |
Rofin-Sinar Technologies, Inc. (a) | 608 | | 23,712 |
Sanmina-SCI Corp. (a) | 22,840 | | 201,677 |
ScanSource, Inc. (a) | 560 | | 36,232 |
SpatiaLight, Inc. (a)(d) | 3,317 | | 29,753 |
Staktek Holdings, Inc. | 2,128 | | 9,087 |
Suntron Corp. (a) | 2,925 | | 9,653 |
Superconductor Technologies, Inc. (a) | 3,773 | | 3,169 |
Taser International, Inc. (a)(d) | 2,888 | | 79,247 |
Tech Data Corp. (a) | 2,376 | | 107,847 |
Thermogenesis Corp. (a) | 3,551 | | 21,555 |
Trimble Navigation Ltd. (a) | 2,235 | | 70,559 |
TTM Technologies, Inc. (a) | 1,892 | | 19,639 |
Universal Display Corp. (a) | 1,409 | | 13,738 |
Veeco Instruments, Inc. (a) | 1,413 | | 27,398 |
Viisage Technology, Inc. (a) | 2,332 | | 18,819 |
X-Rite, Inc. | 1,288 | | 19,204 |
Xyratex Ltd. | 1,732 | | 24,594 |
Common Stocks - continued |
| Shares | | Value (Note 1) |
INFORMATION TECHNOLOGY - continued |
Electronic Equipment & Instruments - continued |
Zomax, Inc. (a) | 2,485 | | $ 8,548 |
Zygo Corp. (a) | 1,073 | | 12,468 |
| | 2,747,380 |
Internet Software & Services - 3.5% |
Akamai Technologies, Inc. (a) | 5,695 | | 73,750 |
Aladdin Knowledge Systems Ltd. (a) | 571 | | 16,605 |
America Online Latin America, Inc. (a) | 15,633 | | 10,005 |
aQuantive, Inc. (a) | 2,953 | | 25,662 |
Ariba, Inc. (a) | 2,986 | | 49,269 |
Art Technology Group, Inc. (a) | 5,391 | | 5,984 |
AsiaInfo Holdings, Inc. (a) | 2,421 | | 14,526 |
Ask Jeeves, Inc. (a) | 2,396 | | 61,913 |
Autobytel, Inc. (a) | 1,868 | | 13,599 |
Bankrate, Inc. (a) | 1,077 | | 17,189 |
Blue Coat Systems, Inc. (a) | 420 | | 7,010 |
Chordiant Software, Inc. (a) | 3,837 | | 7,866 |
CMGI, Inc. (a) | 19,398 | | 29,679 |
CNET Networks, Inc. (a) | 6,410 | | 59,741 |
Corillian Corp. (a) | 1,616 | | 9,389 |
Digital Insight Corp. (a) | 1,549 | | 25,287 |
Digital River, Inc. (a) | 1,413 | | 59,233 |
Digitas, Inc. (a) | 4,361 | | 35,804 |
DoubleClick, Inc. (a) | 6,287 | | 47,153 |
EarthLink, Inc. (a) | 7,216 | | 78,221 |
eCollege.com (a) | 896 | | 10,528 |
Entrust, Inc. (a) | 3,709 | | 13,835 |
Equinix, Inc. (a) | 975 | | 37,908 |
FindWhat.com (a) | 1,008 | | 19,434 |
Google, Inc. Class A | 1,427 | | 261,141 |
Greenfield Online, Inc. | 691 | | 13,302 |
Homestore, Inc. (a) | 6,647 | | 17,282 |
InfoSpace, Inc. (a) | 1,493 | | 66,140 |
Internet Capital Group, Inc. (a) | 1,560 | | 10,717 |
Interwoven, Inc. (a) | 1,585 | | 15,375 |
iPass, Inc. (a) | 2,585 | | 16,777 |
IPIX Corp. (a) | 639 | | 4,154 |
iVillage, Inc. (a) | 4,250 | | 20,166 |
j2 Global Communications, Inc. (a) | 1,088 | | 37,917 |
Jupitermedia Corp. (a) | 1,806 | | 30,287 |
Keynote Systems, Inc. (a) | 1,368 | | 17,415 |
Common Stocks - continued |
| Shares | | Value (Note 1) |
INFORMATION TECHNOLOGY - continued |
Internet Software & Services - continued |
Kintera, Inc. | 1,740 | | $ 14,146 |
LivePerson, Inc. (a) | 2,445 | | 6,455 |
LookSmart Ltd. (a) | 5,122 | | 10,188 |
Mamma.com, Inc. (a) | 1,545 | | 10,830 |
Marketwatch.com, Inc. (a) | 1,043 | | 18,920 |
MatrixOne, Inc. (a) | 3,049 | | 20,154 |
NaviSite, Inc. (a) | 4,246 | | 9,596 |
Neoforma, Inc. (a) | 1,032 | | 7,668 |
Net2Phone, Inc. (a) | 2,252 | | 7,724 |
Netease.com, Inc. sponsored ADR (a) | 711 | | 37,626 |
NetRatings, Inc. (a) | 2,076 | | 41,520 |
NIC, Inc. (a) | 3,661 | | 16,822 |
Open Text Corp. (a) | 1,842 | | 34,310 |
Openwave Systems, Inc. (a) | 2,785 | | 36,706 |
PEC Solutions, Inc. (a) | 1,361 | | 19,313 |
RealNetworks, Inc. (a) | 7,572 | | 47,704 |
Register.com, Inc. (a) | 2,793 | | 16,255 |
Retek, Inc. (a) | 2,857 | | 17,428 |
S1 Corp. (a) | 4,045 | | 37,902 |
SAVVIS Communications Corp. (a) | 7,142 | | 6,071 |
SeeBeyond Technology Corp. (a) | 5,663 | | 17,895 |
Selectica, Inc. (a) | 3,389 | | 13,048 |
Shopping.Com Ltd. | 1,196 | | 36,623 |
Sina Corp. (a) | 2,072 | | 76,498 |
SkillSoft PLC sponsored ADR (a) | 3,949 | | 28,512 |
Sohu.com, Inc. (a) | 1,597 | | 27,069 |
SonicWALL, Inc. (a) | 3,805 | | 23,401 |
Stellent, Inc. (a) | 1,620 | | 12,717 |
Supportsoft, Inc. (a) | 1,684 | | 8,555 |
Terra Networks SA sponsored ADR | 2,463 | | 9,066 |
Tippingpoint Technologies, Inc. (a) | 490 | | 17,028 |
Tom Online, Inc. ADR | 317 | | 4,666 |
Travelzoo, Inc. (a)(d) | 814 | | 75,702 |
Tumbleweed Communications Corp. (a) | 2,252 | | 7,882 |
United Online, Inc. (a) | 2,708 | | 28,894 |
ValueClick, Inc. (a) | 3,709 | | 47,846 |
VeriSign, Inc. (a) | 10,875 | | 357,788 |
Vignette Corp. (a) | 12,996 | | 16,505 |
Vitria Technology, Inc. (a) | 2,505 | | 8,667 |
WebEx Communications, Inc. (a) | 1,912 | | 45,391 |
webMethods, Inc. (a) | 2,617 | | 16,068 |
Common Stocks - continued |
| Shares | | Value (Note 1) |
INFORMATION TECHNOLOGY - continued |
Internet Software & Services - continued |
Websense, Inc. (a) | 1,088 | | $ 52,289 |
Yahoo!, Inc. (a)(d) | 57,192 | | 2,151,563 |
Zix Corp. (a)(d) | 1,720 | | 7,878 |
| | 4,749,152 |
IT Services - 1.5% |
Acxiom Corp. | 3,653 | | 92,384 |
Answerthink, Inc. (a) | 1,793 | | 8,086 |
Carreker Corp. (a) | 1,399 | | 11,808 |
CheckFree Corp. (a) | 3,961 | | 146,755 |
Cognizant Technology Solutions Corp. Class A (a) | 5,514 | | 210,249 |
Corio, Inc. (a) | 4,625 | | 7,678 |
Covansys Corp. (a) | 1,343 | | 18,077 |
CSG Systems International, Inc. (a) | 2,536 | | 46,079 |
Elron Electronic Industries Ltd. (a) | 1,768 | | 25,689 |
Euronet Worldwide, Inc. (a) | 1,556 | | 38,278 |
Fiserv, Inc. (a) | 8,135 | | 313,279 |
Forrester Research, Inc. (a) | 1,264 | | 20,628 |
iGate Corp. (a) | 3,193 | | 12,772 |
Indus International, Inc. (a) | 5,471 | | 10,395 |
Infocrossing, Inc. (a) | 1,238 | | 20,798 |
Infosys Technologies Ltd. sponsored ADR (d) | 966 | | 69,475 |
infoUSA, Inc. (a) | 2,889 | | 31,808 |
Intrado, Inc. (a) | 816 | | 11,032 |
iPayment, Inc. (a) | 663 | | 25,486 |
Kanbay International, Inc. | 1,330 | | 38,211 |
Lightbridge, Inc. (a) | 1,688 | | 7,917 |
Lionbridge Technologies, Inc. (a) | 2,277 | | 12,546 |
ManTech International Corp. Class A (a) | 800 | | 19,152 |
Ness Technologies, Inc. | 1,287 | | 17,439 |
Paychex, Inc. | 16,181 | | 536,562 |
Pegasus Solutions, Inc. (a) | 1,320 | | 15,431 |
RightNow Technologies, Inc. | 1,180 | | 21,464 |
Sapient Corp. (a) | 6,538 | | 51,716 |
SM&A (a) | 1,192 | | 9,619 |
Sykes Enterprises, Inc. (a) | 2,505 | | 16,909 |
Syntel, Inc. | 1,752 | | 34,304 |
Telvent GIT SA | 1,475 | | 16,579 |
Tier Technologies, Inc. Class B (a) | 1,592 | | 14,057 |
Zanett, Inc. (a) | 3,965 | | 18,239 |
| | 1,950,901 |
Common Stocks - continued |
| Shares | | Value (Note 1) |
INFORMATION TECHNOLOGY - continued |
Office Electronics - 0.1% |
Zebra Technologies Corp. Class A (a) | 2,844 | | $ 142,996 |
Semiconductors & Semiconductor Equipment - 10.5% |
8X8, Inc. (a)(d) | 6,464 | | 23,852 |
Actel Corp. (a) | 1,072 | | 18,396 |
ADE Corp. (a) | 880 | | 16,245 |
Advanced Energy Industries, Inc. (a) | 1,597 | | 13,654 |
Alliance Semiconductor Corp. (a) | 2,729 | | 9,552 |
Altera Corp. (a) | 15,300 | | 347,004 |
AMIS Holdings, Inc. (a) | 2,885 | | 43,737 |
Amkor Technology, Inc. (a) | 7,523 | | 41,377 |
Applied Materials, Inc. (a) | 70,565 | | 1,174,202 |
Applied Micro Circuits Corp. (a) | 13,697 | | 50,405 |
ARM Holdings PLC sponsored ADR | 2,197 | | 12,809 |
Artisan Components, Inc. (a) | 1,040 | | 35,880 |
ASE Test Ltd. (a) | 4,726 | | 29,112 |
ASM International NV (Nasdaq) (a) | 1,072 | | 17,045 |
ASML Holding NV (NY Shares) (a) | 5,355 | | 81,664 |
Asyst Technologies, Inc. (a) | 1,941 | | 8,075 |
Atheros Communications, Inc. | 1,855 | | 20,757 |
ATI Technologies, Inc. (a) | 10,373 | | 199,509 |
Atmel Corp. (a) | 21,511 | | 76,364 |
ATMI, Inc. (a) | 1,397 | | 32,159 |
August Technology Corp. (a) | 513 | | 4,335 |
Axcelis Technologies, Inc. (a) | 4,898 | | 35,755 |
Broadcom Corp. Class A (a) | 10,651 | | 346,371 |
Brooks Automation, Inc. (a) | 1,800 | | 27,630 |
Cabot Microelectronics Corp. (a) | 1,056 | | 39,019 |
California Micro Devices Corp. (a) | 1,574 | | 13,694 |
Camtek Ltd. (a) | 3,200 | | 13,472 |
Ceva, Inc. (a) | 1,352 | | 10,843 |
ChipMOS TECHNOLOGIES Bermuda Ltd. (a) | 3,532 | | 19,567 |
Cirrus Logic, Inc. (a) | 4,417 | | 26,193 |
Cohu, Inc. | 960 | | 16,090 |
Conexant Systems, Inc. (a) | 19,810 | | 39,422 |
Credence Systems Corp. (a) | 4,453 | | 34,021 |
Cree, Inc. (a)(d) | 3,188 | | 114,067 |
Cymer, Inc. (a) | 1,549 | | 47,121 |
Diodes, Inc. (a) | 928 | | 23,079 |
DSP Group, Inc. (a) | 1,365 | | 30,276 |
DuPont Photomasks, Inc. (a) | 1,008 | | 26,591 |
EMCORE Corp. (a) | 1,192 | | 3,171 |
Common Stocks - continued |
| Shares | | Value (Note 1) |
INFORMATION TECHNOLOGY - continued |
Semiconductors & Semiconductor Equipment - continued |
Entegris, Inc. (a) | 3,129 | | $ 30,602 |
ESS Technology, Inc. (a) | 1,988 | | 14,015 |
Exar Corp. (a) | 1,860 | | 26,003 |
FEI Co. (a) | 1,549 | | 33,133 |
FormFactor, Inc. (a) | 1,397 | | 33,682 |
Genesis Microchip, Inc. (a) | 1,572 | | 25,639 |
Genus, Inc. (a) | 4,490 | | 7,813 |
Helix Technology Corp. | 1,309 | | 19,727 |
ICOS Vision Systems NV (a) | 611 | | 14,322 |
Integrated Circuit Systems, Inc. (a) | 2,948 | | 69,691 |
Integrated Device Technology, Inc. (a) | 4,783 | | 54,287 |
Integrated Silicon Solution, Inc. (a) | 1,604 | | 12,287 |
Intel Corp. | 269,700 | | 6,027,795 |
Intersil Corp. Class A | 5,963 | | 96,004 |
Intevac, Inc. (a) | 1,399 | | 9,863 |
IXYS Corp. (a) | 1,768 | | 16,425 |
KLA-Tencor Corp. (a) | 8,167 | | 368,005 |
Kopin Corp. (a) | 3,549 | | 14,409 |
Kulicke & Soffa Industries, Inc. (a) | 2,569 | | 19,216 |
Lam Research Corp. (a) | 5,602 | | 145,708 |
Lattice Semiconductor Corp. (a) | 5,247 | | 28,008 |
Leadis Technology, Inc. | 1,100 | | 10,692 |
Linear Technology Corp. | 12,508 | | 477,305 |
LTX Corp. (a) | 2,505 | | 17,886 |
Marvell Technology Group Ltd. (a) | 11,182 | | 358,495 |
Mattson Technology, Inc. (a) | 2,357 | | 22,038 |
Maxim Integrated Products, Inc. | 13,800 | | 565,248 |
Micrel, Inc. (a) | 4,230 | | 45,176 |
Microchip Technology, Inc. | 8,647 | | 243,672 |
Microsemi Corp. (a) | 2,634 | | 46,885 |
Mindspeed Technologies, Inc. (a) | 4,116 | | 10,290 |
MIPS Technologies, Inc. (a) | 2,112 | | 18,480 |
MKS Instruments, Inc. (a) | 2,408 | | 40,912 |
Monolithic System Technology, Inc. (a) | 1,636 | | 7,640 |
Nanometrics, Inc. (a) | 1,044 | | 16,986 |
Novellus Systems, Inc. (a) | 5,382 | | 144,991 |
NVE Corp. (a) | 218 | | 6,416 |
NVIDIA Corp. (a) | 7,199 | | 137,717 |
O2Micro International Ltd. (a) | 1,748 | | 21,151 |
Omnivision Technologies, Inc. (a) | 2,281 | | 40,693 |
ON Semiconductor Corp. (a) | 10,959 | | 40,000 |
Common Stocks - continued |
| Shares | | Value (Note 1) |
INFORMATION TECHNOLOGY - continued |
Semiconductors & Semiconductor Equipment - continued |
PDF Solutions, Inc. (a) | 1,457 | | $ 18,752 |
Pericom Semiconductor Corp. (a) | 1,556 | | 13,662 |
Photronics, Inc. (a) | 1,509 | | 28,430 |
Pixelworks, Inc. (a) | 1,988 | | 22,365 |
PLX Technology, Inc. (a) | 1,736 | | 15,641 |
PMC-Sierra, Inc. (a) | 7,507 | | 82,877 |
Portalplayer, Inc. | 940 | | 27,439 |
Power Integrations, Inc. (a) | 1,317 | | 25,984 |
Rambus, Inc. (a) | 4,265 | | 98,564 |
RF Micro Devices, Inc. (a) | 8,311 | | 57,845 |
Rudolph Technologies, Inc. (a) | 832 | | 13,312 |
Semitool, Inc. (a) | 1,868 | | 16,737 |
Semtech Corp. (a) | 3,252 | | 66,568 |
Sigmatel, Inc. (a) | 1,397 | | 49,985 |
Silicon Image, Inc. (a) | 3,501 | | 58,817 |
Silicon Laboratories, Inc. (a) | 2,168 | | 65,344 |
Silicon Storage Technology, Inc. (a) | 4,509 | | 31,383 |
Siliconix, Inc. (a) | 1,285 | | 47,532 |
Sipex Corp. (a) | 1,800 | | 9,900 |
Skyworks Solutions, Inc. (a) | 6,255 | | 62,112 |
Standard Microsystems Corp. (a) | 800 | | 19,664 |
Supertex, Inc. (a) | 752 | | 16,356 |
Tessera Technologies, Inc. | 1,661 | | 59,049 |
Therma-Wave, Inc. (a) | 2,067 | | 6,614 |
Tower Semicondutor Ltd. (a) | 4,634 | | 9,453 |
Transmeta Corp. (a)(d) | 6,903 | | 11,666 |
Transwitch Corp. (a) | 5,791 | | 7,065 |
Trident Microsystems, Inc. (a) | 995 | | 15,522 |
Tripath Technology, Inc. (a) | 2,713 | | 2,306 |
TriQuint Semiconductor, Inc. (a) | 6,711 | | 29,059 |
Ultratech, Inc. (a) | 1,104 | | 19,022 |
Varian Semiconductor Equipment Associates, Inc. (a) | 1,493 | | 53,031 |
Virage Logic Corp. (a) | 1,402 | | 21,072 |
Vitesse Semiconductor Corp. (a) | 9,372 | | 30,553 |
Volterra Semiconductor Corp. | 1,387 | | 29,280 |
White Electronic Designs Corp. (a) | 1,320 | | 8,844 |
Xilinx, Inc. | 14,754 | | 460,620 |
Zilog, Inc. (a) | 2,719 | | 17,809 |
Zoran Corp. (a) | 2,008 | | 23,795 |
| | 14,115,851 |
Common Stocks - continued |
| Shares | | Value (Note 1) |
INFORMATION TECHNOLOGY - continued |
Software - 17.0% |
Accelrys, Inc. (a) | 1,329 | | $ 8,320 |
Activision, Inc. (a) | 5,721 | | 89,934 |
Actuate Corp. (a) | 4,125 | | 9,776 |
Adobe Systems, Inc. | 9,914 | | 600,392 |
Advent Software, Inc. (a) | 1,597 | | 31,956 |
Agile Software Corp. (a) | 2,585 | | 21,611 |
Altiris, Inc. (a) | 1,157 | | 32,396 |
Ansys, Inc. (a) | 1,312 | | 40,265 |
Ascential Software Corp. (a) | 2,664 | | 36,417 |
Aspen Technology, Inc. (a) | 3,386 | | 19,537 |
Atari, Inc. (a) | 3,901 | | 8,855 |
Authentidate Holding Corp. (a) | 2,593 | | 17,995 |
Autodesk, Inc. | 4,782 | | 312,791 |
BEA Systems, Inc. (a) | 17,342 | | 140,123 |
Blackbaud, Inc. | 1,740 | | 21,750 |
Blackboard, Inc. | 1,056 | | 16,157 |
Borland Software Corp. (a) | 3,757 | | 43,919 |
Business Objects SA sponsored ADR (a) | 780 | | 18,158 |
Captaris, Inc. (a) | 2,905 | | 14,264 |
Catapult Communications Corp. (a) | 1,056 | | 28,660 |
CCC Information Services Group, Inc. (a) | 1,181 | | 24,683 |
Check Point Software Technologies Ltd. (a) | 10,540 | | 250,220 |
Chinadotcom Corp. Class A (a) | 4,554 | | 20,083 |
Citrix Systems, Inc. (a) | 7,071 | | 166,946 |
Cognos, Inc. (a) | 3,915 | | 152,744 |
Compuware Corp. (a) | 17,166 | | 99,048 |
Concord Communications, Inc. (a) | 1,057 | | 9,820 |
Concur Technologies, Inc. (a) | 1,604 | | 15,078 |
Convera Corp. Class A (a) | 2,921 | | 13,612 |
Creo, Inc. (a) | 2,617 | | 35,417 |
Digimarc Corp. (a) | 1,060 | | 9,763 |
E.piphany, Inc. (a) | 4,141 | | 18,717 |
Electronic Arts, Inc. (a) | 12,566 | | 614,477 |
Embarcadero Technologies, Inc. (a) | 1,505 | | 13,304 |
Epicor Software Corp. (a) | 2,161 | | 34,079 |
EPIQ Systems, Inc. (a) | 864 | | 12,951 |
Evolving Systems, Inc. (a) | 1,042 | | 3,720 |
FileNET Corp. (a) | 1,613 | | 43,245 |
Geac Computer Corp. Ltd. (a) | 2,656 | | 20,761 |
Hummingbird Ltd. (a) | 960 | | 23,070 |
Hyperion Solutions Corp. (a) | 1,581 | | 70,845 |
Common Stocks - continued |
| Shares | | Value (Note 1) |
INFORMATION TECHNOLOGY - continued |
Software - continued |
Informatica Corp. (a) | 3,981 | | $ 31,052 |
Intellisync Corp. (a)(d) | 2,825 | | 5,085 |
Internet Security Systems, Inc. (a) | 2,344 | | 56,748 |
InterVideo, Inc. | 648 | | 7,296 |
Intervoice, Inc. (a) | 1,807 | | 23,491 |
Intuit, Inc. (a) | 7,750 | | 324,260 |
Jack Henry & Associates, Inc. | 3,797 | | 73,206 |
JAMDAT Mobile, Inc. | 814 | | 18,624 |
JDA Software Group, Inc. (a) | 1,413 | | 18,539 |
Kronos, Inc. (a) | 1,293 | | 65,348 |
Lawson Software, Inc. (a) | 4,586 | | 28,341 |
Macromedia, Inc. (a) | 2,837 | | 80,940 |
Macrovision Corp. (a) | 2,136 | | 56,711 |
Magic Software Enterprises Ltd. (a) | 2,938 | | 9,989 |
Magma Design Automation, Inc. (a) | 1,509 | | 20,462 |
Manhattan Associates, Inc. (a) | 1,317 | | 32,003 |
Manugistics Group, Inc. (a) | 3,789 | | 10,420 |
MAPICS, Inc. (a) | 1,461 | | 14,201 |
Mentor Graphics Corp. (a) | 3,044 | | 38,202 |
Mercury Interactive Corp. (a) | 3,544 | | 161,642 |
Micromuse, Inc. (a) | 3,709 | | 19,502 |
MICROS Systems, Inc. (a) | 816 | | 59,870 |
Microsoft Corp. | 457,100 | | 12,254,817 |
MicroStrategy, Inc. Class A (a) | 592 | | 38,214 |
Motive, Inc. | 1,277 | | 16,282 |
MRO Software, Inc. (a) | 1,297 | | 16,666 |
Nassda Corp. (a) | 1,652 | | 7,071 |
NDS Group PLC sponsored ADR (a) | 783 | | 24,704 |
NetIQ Corp. (a) | 2,681 | | 32,896 |
NetScout Systems, Inc. (a) | 2,673 | | 20,235 |
Novell, Inc. (a) | 14,905 | | 90,921 |
Nuance Communications, Inc. (a) | 2,140 | | 9,245 |
NYFIX, Inc. (a) | 2,309 | | 14,755 |
Open Solutions, Inc. | 753 | | 19,917 |
OpenTV Corp. Class A (a) | 4,866 | | 19,561 |
Opnet Technologies, Inc. (a) | 1,117 | | 9,651 |
Opsware, Inc. (a) | 3,837 | | 26,283 |
Oracle Corp. (a) | 217,397 | | 2,752,246 |
PalmSource, Inc. (a) | 488 | | 7,730 |
Parametric Technology Corp. (a) | 12,932 | | 75,652 |
Pegasystems, Inc. (a) | 1,916 | | 13,910 |
Common Stocks - continued |
| Shares | | Value (Note 1) |
INFORMATION TECHNOLOGY - continued |
Software - continued |
PeopleSoft, Inc. (a) | 15,218 | | $ 359,297 |
Pervasive Software, Inc. (a) | 1,720 | | 6,863 |
Phase Forward, Inc. | 1,482 | | 12,167 |
Phoenix Technologies Ltd. (a) | 2,060 | | 16,707 |
Plato Learning, Inc. (a) | 1,636 | | 11,436 |
Portal Software, Inc. (a) | 2,044 | | 7,052 |
Progress Software Corp. (a) | 1,581 | | 35,889 |
QAD, Inc. | 1,748 | | 14,404 |
Quality Systems, Inc. (a) | 336 | | 20,634 |
Quest Software, Inc. (a) | 3,993 | | 61,812 |
RADWARE Ltd. (a) | 992 | | 25,207 |
Red Hat, Inc. (a) | 7,823 | | 113,277 |
Renaissance Learning, Inc. | 1,413 | | 27,214 |
Retalix Ltd. (a) | 848 | | 16,112 |
Roxio, Inc. (a) | 1,429 | | 13,375 |
RSA Security, Inc. (a) | 2,693 | | 56,957 |
ScanSoft, Inc. (a) | 6,060 | | 22,119 |
SCO Group, Inc. (a) | 833 | | 3,315 |
Secure Computing Corp. (a) | 1,700 | | 17,714 |
SERENA Software, Inc. (a) | 1,880 | | 39,198 |
Shanda Interactive Entertainment Ltd. ADR | 641 | | 25,736 |
Siebel Systems, Inc. (a) | 21,255 | | 214,250 |
Sonic Solutions, Inc. (a) | 1,040 | | 20,072 |
SPSS, Inc. (a) | 1,072 | | 17,141 |
SS&C Technologies, Inc. | 1,272 | | 28,480 |
Symantec Corp. (a) | 13,100 | | 835,911 |
Synopsys, Inc. (a) | 6,499 | | 114,577 |
Synplicity, Inc. (a) | 2,268 | | 12,746 |
Take-Two Interactive Software, Inc. (a) | 1,768 | | 61,792 |
TALX Corp. | 640 | | 18,816 |
THQ, Inc. (a) | 1,624 | | 34,851 |
TIBCO Software, Inc. (a) | 9,540 | | 109,710 |
Transaction Systems Architects, Inc. Class A (a) | 1,704 | | 34,966 |
Ulticom, Inc. (a) | 2,044 | | 36,690 |
Ultimate Software Group, Inc. (a) | 1,652 | | 21,096 |
VA Software Corp. (a) | 3,453 | | 8,529 |
Vastera, Inc. (a) | 2,389 | | 4,420 |
Verint Systems, Inc. (a) | 1,349 | | 55,498 |
Verisity Ltd. (a) | 1,144 | | 9,587 |
VERITAS Software Corp. (a) | 17,631 | | 386,119 |
Verity, Inc. (a) | 1,796 | | 24,623 |
Common Stocks - continued |
| Shares | | Value (Note 1) |
INFORMATION TECHNOLOGY - continued |
Software - continued |
Wind River Systems, Inc. (a) | 3,636 | | $ 43,996 |
Witness Systems, Inc. (a) | 1,541 | | 23,100 |
| | 22,796,002 |
TOTAL INFORMATION TECHNOLOGY | | 66,617,263 |
MATERIALS - 1.2% |
Chemicals - 0.4% |
A. Schulman, Inc. | 1,565 | | 33,569 |
Akzo Nobel NV sponsored ADR | 2,596 | | 107,448 |
Hawkins, Inc. | 1,509 | | 17,957 |
Headwaters, Inc. (a) | 1,482 | | 47,468 |
LESCO, Inc. (a) | 1,240 | | 14,880 |
Methanex Corp. | 5,425 | | 95,513 |
Sigma Aldrich Corp. | 2,693 | | 160,853 |
Symyx Technologies, Inc. (a) | 1,461 | | 46,065 |
| | 523,753 |
Containers & Packaging - 0.2% |
Anchor Glass Container Corp. | 1,097 | | 7,218 |
Caraustar Industries, Inc. (a) | 1,964 | | 31,601 |
Silgan Holdings, Inc. | 832 | | 45,178 |
Smurfit-Stone Container Corp. (a) | 10,295 | | 184,898 |
| | 268,895 |
Metals & Mining - 0.6% |
Aber Diamond Corp. (a) | 2,424 | | 93,367 |
Alliance Resource Partners LP | 576 | | 40,464 |
Anglo American PLC ADR | 1,295 | | 31,533 |
Century Aluminum Co. (a) | 1,260 | | 32,281 |
Commonwealth Industries, Inc. (a) | 2,346 | | 30,709 |
Durban Roodepoort Deep Ltd. sponsored ADR (a) | 7,316 | | 12,657 |
Gibraltar Industries, Inc. | 1,224 | | 29,486 |
Ivanhoe Mines Ltd. (a) | 10,684 | | 76,575 |
Metal Management, Inc. (a) | 748 | | 19,657 |
Metals USA, Inc. (a) | 861 | | 16,144 |
NN, Inc. | 1,128 | | 14,371 |
Novamerican Steel, Inc. (a) | 663 | | 25,857 |
Olympic Steel, Inc. (a) | 1,108 | | 29,916 |
Pan American Silver Corp. (a) | 2,276 | | 41,204 |
Randgold Resources Ltd. ADR (a) | 1,526 | | 19,350 |
Roanoke Electric Steel Corp. | 1,413 | | 25,420 |
Common Stocks - continued |
| Shares | | Value (Note 1) |
MATERIALS - continued |
Metals & Mining - continued |
Royal Gold, Inc. | 1,028 | | $ 18,216 |
Schnitzer Steel Industries, Inc. Class A | 816 | | 30,788 |
Silver Standard Resources, Inc. (a) | 1,633 | | 22,871 |
Steel Dynamics, Inc. | 2,100 | | 85,113 |
Steel Technologies, Inc. | 485 | | 14,201 |
Wheeling Pittsburgh Corp. (a) | 539 | | 19,717 |
| | 729,897 |
Paper & Forest Products - 0.0% |
Mercer International, Inc. (SBI) (a) | 2,505 | | 27,305 |
TOTAL MATERIALS | | 1,549,850 |
TELECOMMUNICATION SERVICES - 2.2% |
Diversified Telecommunication Services - 0.6% |
Broadwing Corp. (a) | 2,030 | | 13,479 |
Commonwealth Telephone Enterprises, Inc. (a) | 992 | | 48,271 |
CT Communications, Inc. | 1,176 | | 15,558 |
D&E Communications, Inc. | 1,313 | | 17,200 |
General Communications, Inc. Class A (a) | 2,437 | | 24,955 |
Global Crossing Ltd. (a) | 971 | | 14,614 |
Golden Telecom, Inc. | 1,502 | | 45,508 |
HickoryTech Corp. | 1,493 | | 15,871 |
ITC DeltaCom, Inc. (a) | 1,382 | | 2,363 |
Level 3 Communications, Inc. (a)(d) | 30,895 | | 106,588 |
MCI, Inc. | 13,200 | | 248,952 |
McLeodUSA, Inc. Class A (a) | 9,871 | | 2,566 |
North Pittsburgh Systems, Inc. | 1,056 | | 26,495 |
Primus Telecommunications Group, Inc. (a) | 3,177 | | 9,626 |
PTEK Holdings, Inc. (a) | 2,889 | | 30,421 |
Shenandoah Telecommunications Co. | 834 | | 24,661 |
SureWest Communications | 752 | | 21,409 |
Talk America Holdings, Inc. (a) | 1,461 | | 9,234 |
Teleglobe International Holdings Ltd. (a) | 786 | | 2,696 |
Telewest Global, Inc. (a) | 10,270 | | 150,353 |
Time Warner Telecom, Inc. Class A (a) | 2,469 | | 9,358 |
U.S. LEC Corp. Class A (a) | 3,176 | | 10,703 |
Warwick Valley Telephone Co. | 624 | | 14,027 |
| | 864,908 |
Wireless Telecommunication Services - 1.6% |
Aether Systems, Inc. (a) | 3,017 | | 11,223 |
Common Stocks - continued |
| Shares | | Value (Note 1) |
TELECOMMUNICATION SERVICES - continued |
Wireless Telecommunication Services - continued |
Alamosa Holdings, Inc. (a) | 4,671 | | $ 50,914 |
At Road, Inc. (a) | 2,161 | | 13,031 |
Centennial Communications Corp. Class A (a) | 4,285 | | 28,324 |
Dobson Communications Corp. Class A (a) | 3,902 | | 7,063 |
InPhonic, Inc. | 1,334 | | 34,030 |
Millicom International Cellular SA (a) | 4,222 | | 93,560 |
Nextel Communications, Inc. Class A (a) | 45,541 | | 1,296,097 |
Nextel Partners, Inc. Class A (a) | 7,668 | | 138,714 |
NII Holdings, Inc. (a) | 2,545 | | 110,097 |
SBA Communications Corp. Class A (a) | 2,376 | | 22,810 |
Telesystem International Wireless, Inc. (a) | 7,106 | | 82,567 |
TIM Hellas Telecommunications SA ADR | 658 | | 10,857 |
Ubiquitel, Inc. (a) | 5,034 | | 32,721 |
USA Mobility, Inc. (a) | 1,688 | | 61,376 |
Western Wireless Corp. Class A (a) | 3,108 | | 83,916 |
Wireless Facilities, Inc. (a) | 2,341 | | 19,383 |
| | 2,096,683 |
TOTAL TELECOMMUNICATION SERVICES | | 2,961,591 |
UTILITIES - 0.2% |
Electric Utilities - 0.1% |
MGE Energy, Inc. | 704 | | 24,260 |
Otter Tail Corp. | 1,701 | | 45,808 |
| | 70,068 |
Gas Utilities - 0.0% |
EnergySouth, Inc. | 700 | | 20,153 |
Inergy LP | 992 | | 29,085 |
| | 49,238 |
Multi-Utilities & Unregulated Power - 0.0% |
NorthWestern Energy Corp. (a) | 1,460 | | 37,449 |
Water Utilities - 0.1% |
Artesian Resources Corp. Class A | 688 | | 19,986 |
Connecticut Water Service, Inc. | 940 | | 26,160 |
Middlesex Water Co. | 1,230 | | 24,477 |
Common Stocks - continued |
| Shares | | Value (Note 1) |
UTILITIES - continued |
Water Utilities - continued |
Southwest Water Co. | 1,552 | | $ 21,123 |
York Water Co. | 1,020 | | 20,053 |
| | 111,799 |
TOTAL UTILITIES | | 268,554 |
TOTAL COMMON STOCKS (Cost $119,519,501) | 132,283,596 |
U.S. Treasury Obligations - 0.1% |
| Principal Amount | | |
U.S. Treasury Bills, yield at date of purchase 1.61% 1/6/05 (e)
(Cost $169,728) | | $ 170,000 | | 169,678 |
Money Market Funds - 6.0% |
| Shares | | |
Fidelity Cash Central Fund, 1.98% (b) | 14,311 | | 14,311 |
Fidelity Securities Lending Cash Central Fund, 2% (b)(c) | 7,941,984 | | 7,941,984 |
TOTAL MONEY MARKET FUNDS (Cost $7,956,295) | 7,956,295 |
TOTAL INVESTMENT PORTFOLIO - 104.9% (Cost $127,645,524) | | 140,409,569 |
NET OTHER ASSETS - (4.9)% | | (6,544,412) |
NET ASSETS - 100% | $ 133,865,157 |
Futures Contracts |
| Expiration Date | | Underlying Face Amount at Value | | Unrealized Appreciation/
(Depreciation) |
Purchased |
Equity Index Contracts |
50 Nasdaq 100 E-Mini Index Contracts | Dec. 2004 | | $ 1,573,000 | | $ 68,325 |
|
The face value of futures purchased as a percentage of net assets - 1.2% |
Legend |
(a) Non-income producing |
(b) Affiliated fund that is available only to investment companies and other accounts managed by Fidelity Investments. The rate quoted is the annualized seven-day yield of the fund at period end. A complete listing of the fund's holdings as of its most recent fiscal year end is available upon request. |
(c) Includes investment made with cash collateral received from securities on loan. |
(d) Security or a portion of the security is on loan at period end. |
(e) Security or a portion of the security was pledged to cover margin requirements for futures contracts. At the period end, the value of securities pledged amounted to $169,678. |
Income Tax Information |
The fund hereby designates approximately $382,000 as a capital gain dividend for the purpose of the dividend paid deduction. |
See accompanying notes which are an integral part of the financial statements.
Annual Report
Financial Statements
Statement of Assets and Liabilities
November 30, 2004 |
| | |
Assets | | |
Investment in securities, at value (including securities loaned of $7,729,006) (cost $127,645,524) - See accompanying schedule | | $ 140,409,569 |
Cash | | 34,586 |
Receivable for investments sold | | 13,255 |
Dividends receivable | | 1,451,741 |
Interest receivable | | 317 |
Prepaid expenses | | 528 |
Receivable from investment adviser for expense reductions | | 41,770 |
Other receivables | | 3,792 |
Total assets | | 141,955,558 |
| | |
Liabilities | | |
Payable for investments purchased | $ 19,802 | |
Accrued management fee | 26,321 | |
Distribution fees payable | 28,172 | |
Payable for daily variation on futures contracts | 4,500 | |
Other affiliated payables | 4,113 | |
Other payables and accrued expenses | 65,509 | |
Collateral on securities loaned, at value | 7,941,984 | |
Total liabilities | | 8,090,401 |
| | |
Net Assets | | $ 133,865,157 |
Net Assets consist of: | | |
Paid in capital | | $ 118,192,244 |
Undistributed net investment income | | 1,430,958 |
Accumulated undistributed net realized gain (loss) on investments and foreign currency transactions | | 1,409,586 |
Net unrealized appreciation (depreciation) on investments and assets and liabilities in foreign currencies | | 12,832,369 |
Net Assets, for 1,600,000 shares outstanding | | $ 133,865,157 |
Net Asset Value, offering price and redemption price per share ($133,865,157 ÷ 1,600,000 shares) | | $ 83.67 |
See accompanying notes which are an integral part of the financial statements.
Annual Report
Financial Statements - continued
Statement of Operations
Year ended November 30, 2004 |
| | |
Investment Income | | |
Dividends | | $ 615,697 |
Special Dividends | | 1,369,500 |
Interest | | 8,228 |
Security lending | | 28,024 |
Total income | | 2,021,449 |
| | |
Expenses | | |
Management fee | $ 310,612 | |
Transfer agent and custody fees | 98,855 | |
Distribution fees | 116,461 | |
Licensing fees | 64,700 | |
Accounting and security lending fees | 49,163 | |
Non-interested trustees' compensation | 707 | |
Audit | 73,002 | |
Legal | 4,148 | |
Miscellaneous | 8,126 | |
Total expenses before reductions | 725,774 | |
Expense reductions | (337,764) | 388,010 |
Net investment income (loss) | | 1,633,439 |
Realized and Unrealized Gain (Loss) Net realized gain (loss) on: | | |
Investment securities | 12,990,055 | |
Foreign currency transactions | 162 | |
Futures contracts | 29,734 | |
Total net realized gain (loss) | | 13,019,951 |
Change in net unrealized appreciation (depreciation) on: Investment securities | (99,016) | |
Assets and liabilities in foreign currencies | (1) | |
Futures contracts | 44,741 | |
Total change in net unrealized appreciation (depreciation) | | (54,276) |
Net gain (loss) | | 12,965,675 |
Net increase (decrease) in net assets resulting from operations | | $ 14,599,114 |
See accompanying notes which are an integral part of the financial statements.
Annual Report
Statement of Changes in Net Assets
| Year ended
November 30,
2004 | For the period
September 25, 2003
(commencement
of operations) to
November 30, 2003 |
Increase (Decrease) in Net Assets | | |
Operations | | |
Net investment income (loss) | $ 1,633,439 | $ 188,726 |
Net realized gain (loss) | 13,019,951 | 7,938,072 |
Change in net unrealized appreciation (depreciation) | (54,276) | 12,886,645 |
Net increase (decrease) in net assets resulting
from operations | 14,599,114 | 21,013,443 |
Distributions to shareholders from net investment income | (364,000) | - |
Share transactions
Proceeds from sales of shares | 30,916,600 | 414,333,000 |
Cost of shares redeemed | (91,710,000) | (254,923,000) |
Net increase (decrease) in net assets resulting from share transactions | (60,793,400) | 159,410,000 |
Total increase (decrease) in net assets | (46,558,286) | 180,423,443 |
| | |
Net Assets | | |
Beginning of period | 180,423,443 | - |
End of period (including undistributed net investment income of $1,430,958 and undistributed net investment income of $188,724, respectively) | $ 133,865,157 | $ 180,423,443 |
Other Information Shares | | |
Sold | 400,000 | 5,700,000 |
Redeemed | (1,100,000) | (3,400,000) |
Net increase (decrease) | (700,000) | 2,300,000 |
See accompanying notes which are an integral part of the financial statements.
Annual Report
Financial Highlights
Years ended November 30, | 2004 | 2003 F |
Selected Per-Share Data | | |
Net asset value, beginning of period | $ 78.44 | $ 72.69 |
Income from Investment Operations | | |
Net investment income (loss) D | 1.00 E | .06 |
Net realized and unrealized gain (loss) | 4.43 | 5.69 |
Total from investment operations | 5.43 | 5.75 |
Distributions from net investment income | (.20) | - |
Net asset value, end of period | $ 83.67 | $ 78.44 |
Total Return B, C | 6.94% | 7.91% |
Ratios to Average Net Assets G | | |
Expenses before expense reductions | .56% | .51% A |
Expenses net of voluntary waivers, if any | .30% | .30% A |
Expenses net of all reductions | .30% | .30% A |
Net investment income (loss) | 1.26% | .43% A |
Supplemental Data | | |
Net assets, end of period (000 omitted) | $ 133,865 | $ 180,423 |
Portfolio turnover rate H | 8% | 10% A |
A Annualized
B Total returns for periods of less than one year are not annualized.
C Total returns would have been lower had certain expenses not been reduced during the periods shown.
D Calculated based on average shares outstanding during the period.
E Investment income per share reflects a special dividend which amounted to $.83 per share.
F For the period September 25, 2003 (commencement of operations) to November 30, 2003.
G Expense ratios reflect operating expenses of the fund. Expenses before reductions do not reflect amounts reimbursed by the investment adviser or reductions from brokerage service arrangements or other expense offset arrangements and do not represent the amount paid by the fund during periods when reimbursements or reductions occur. Expense ratios before reductions for start-up periods may not be representative of longer-term operating periods. Expenses net of any voluntary waivers reflect expenses after reimbursement by the investment adviser but prior to reductions from brokerage service arrangements or other expense offset arrangements. Expenses net of all reductions represent the net expenses paid by the fund.
H Portfolio turnover rate excludes securities received or delivered in-kind.
See accompanying notes which are an integral part of the financial statements.
Annual Report
Notes to Financial Statements
For the period ended November 30, 2004
1. Significant Accounting Policies.
Fidelity Nasdaq Composite Index Tracking Stock (the fund) is an exchange-traded fund of Fidelity Commonwealth Trust (the trust) and is authorized to issue an unlimited number of shares. The trust is registered under the Investment Company Act of 1940, as amended (the 1940 Act), as an open-end management investment company organized as a Massachusetts business trust. The financial statements have been prepared in conformity with accounting principles generally accepted in the United States of America, which require management to make certain estimates and assumptions at the date of the financial statements. The following summarizes the significant accounting policies of the fund:
Security Valuation. Net asset value per share (NAV calculation) is calculated as of the close of regular trading hours on the Nasdaq stock market, normally 4:00 p.m. Eastern time. Equity securities, including restricted securities, for which market quotations are available are valued at the last sale price or official closing price (closing bid price or last evaluated quote if no sale has occurred) on the primary market or exchange on which they trade. If prices are not readily available or do not accurately reflect fair value for a security, or if a security's value has been materially affected by events occurring after the close of the exchange or market on which the security is principally traded, that security may be valued by another method that the Board of Trustees believes accurately reflects fair value. A security's valuation may differ depending on the method used for determining value. Price movements in futures contracts and ADRs, market and trading trends, the bid/ask quotes of brokers and off-exchange institutional trading may be reviewed in the course of making a good faith determination of a security's fair value. Short-term securities with remaining maturities of sixty days or less for which quotations are not readily available are valued on the basis of amortized cost. Investments in open-end investment companies are valued at their net asset value each business day.
Foreign Currency. The fund uses foreign currency contracts to facilitate transactions in foreign-denominated securities. Losses from these transactions may arise from changes in the value of the foreign currency or if the counterparties do not perform under the contracts' terms.
Foreign-denominated assets, including investment securities, and liabilities are translated into U.S. dollars at the exchange rate at period end. Purchases and sales of investment securities, income and dividends received and expenses denominated in foreign currencies are translated into U.S. dollars at the exchange rate in effect on the transaction date.
The effects of exchange rate fluctuations on investments are included with the net realized and unrealized gain (loss) on investment securities. Other foreign currency transactions resulting in realized and unrealized gain (loss) are disclosed separately.
Annual Report
Notes to Financial Statements - continued
1. Significant Accounting Policies - continued
Investment Transactions and Income. Security transactions are accounted for as of trade date. Gains and losses on securities sold are determined on the basis of identified cost and may include proceeds received from litigation. Dividend income is recorded on the ex-dividend date, except for certain dividends from foreign securities where the ex-dividend date may have passed, which are recorded as soon as the fund is informed of the ex-dividend date. Non-cash dividends included in dividend income, if any, are recorded at the fair market value of the securities received. Distributions received on securities that represent a return of capital or capital gain are recorded as a reduction of cost of investments and/or as a realized gain. The fund estimates the components of distributions received that may be considered return of capital distributions or capital gain distributions. Large, non-recurring dividends recognized by the fund are presented separately on the Statement of Operations as "Special Dividends" and the impact of these dividends to net investment income per share is presented in the Financial Highlights. Interest income is accrued as earned. Interest income includes coupon interest and amortization of premium and accretion of discount on debt securities. Investment income is recorded net of foreign taxes withheld where recovery of such taxes is uncertain.
Expenses. Most expenses of the trust can be directly attributed to a fund. Expenses which cannot be directly attributed are apportioned among the funds in the trust.
Income Tax Information and Distributions to Shareholders. Each year, the fund intends to qualify as a regulated investment company by distributing all of its taxable income and realized gains under Subchapter M of the Internal Revenue Code. As a result, no provision for income taxes is required in the accompanying financial statements. Realized gain or loss resulting from in-kind redemptions is not taxable to the fund and is not distributed to shareholders of the fund. Foreign taxes are provided for based on the fund's understanding of the tax rules and rates that exist in the foreign markets in which it invests.
Distributions are recorded on the ex-dividend date. Income and capital gain distributions are determined in accordance with income tax regulations, which may differ from generally accepted accounting principles. In addition, the fund will claim a portion of the payment made to redeeming shareholders as a distribution for income tax purposes.
Capital accounts within the financial statements are adjusted for permanent book-tax differences. These adjustments have no impact on net assets or the results of operations. Temporary book-tax differences will reverse in a subsequent period. Book-tax differences are primarily due to futures transactions and redemptions in kind.
Annual Report
1. Significant Accounting Policies - continued
Income Tax Information and Distributions to Shareholders - continued
The tax-basis components of distributable earnings and the federal tax cost as of period end were as follows:
Unrealized appreciation | $ 21,716,242 | |
Unrealized depreciation | (8,957,624) | |
Net unrealized appreciation (depreciation) | 12,758,618 | |
Undistributed ordinary income | 1,429,981 | |
Cost for federal income tax purposes | $ 127,650,951 | |
The tax character of distributions paid was as follows:
| November 30, 2004 | |
Ordinary Income | $ 364,000 | |
2. Operating Policies.
Repurchase Agreements. Fidelity Management & Research Company (FMR) has received an Exemptive Order from the Securities and Exchange Commission (the SEC) which permits the fund and other affiliated entities of FMR to transfer uninvested cash balances into joint trading accounts. These accounts are then invested in repurchase agreements that are collateralized by U.S. Treasury or Government obligations. The fund may also invest directly with institutions, in repurchase agreements that are collateralized by commercial paper obligations and corporate obligations. Collateral is held in segregated accounts with custodian banks and may be obtained in the event of a default of the counterparty. Collateral is marked-to-market daily and maintained at a value at least equal to the principal amount of the repurchase agreement (including accrued interest).
Futures Contracts. The fund may use futures contracts to manage its exposure to the stock market. Buying futures tends to increase the fund's exposure to the underlying instrument, while selling futures tends to decrease the fund's exposure to the underlying instrument or hedge other fund investments. Futures contracts involve, to varying degrees, risk of loss in excess of any futures variation margin reflected in the Statement of Assets and Liabilities. The underlying face amount at value of any open futures contracts at period end is shown in the Schedule of Investments under the caption "Futures Contracts." This amount reflects each contract's exposure to the underlying instrument at period end. Losses may arise from changes in the value of the underlying
Annual Report
Notes to Financial Statements - continued
2. Operating Policies - continued
Futures Contracts - continued
instruments or if the counter-parties do not perform under the contracts' terms. Gains (losses) are realized upon the expiration or closing of the futures contracts. Futures contracts are valued at the settlement price established each day by the board of trade or exchange on which they are traded.
3. Purchases and Sales of Investments.
Purchases and sales of securities, other than short-term securities, U.S. government securities and in-kind transactions, aggregated $10,301,929 and $9,857,788, respectively.
Securities received and delivered on an in-kind basis aggregated $30,905,146 and $91,668,126, respectively. Realized gain (loss) of $11,582,926 on securities delivered on an in-kind basis is included in the accompanying Statement of Operations as realized gain or loss on investment securities and is not taxable to the fund.
4. Fees and Other Transactions with Affiliates.
Management Fee. FMR and its affiliates provide the fund with investment management related services for which the fund pays a monthly management fee that is based on an annual rate of .24% of the fund's average net assets.
Sub-Adviser. Geode Capital Management, LLC (Geode), serves as sub-adviser for the fund. Geode provides discretionary investment advisory services to the fund and is paid by FMR for providing these services.
Distribution and Service Plan. In accordance with Rule 12b-1 of the 1940 Act, the fund has adopted a Distribution and Service Plan. The fund pays Fidelity Distributors Corporation (FDC), an affiliate of FMR, a distribution fee based on annual percentage of the fund's average net assets of up to .25%. In addition, FDC pays Nasdaq for marketing services provided to the fund. For the period, the distribution fees were equivalent to an annualized rate of .09% of average net assets. The total amounts paid to and retained by FDC were $116,461 and $0, respectively.
Accounting and Security Lending Fees. FSC maintains the fund's accounting records. The accounting fee is based on the level of average net assets for the month. Under a separate contract, FSC administers the security lending program. The security lending fee is based on the number and duration of lending transactions.
Licensing Fees. Under the terms of a license agreement, FMR pays Nasdaq an annual licensing fee for the use of the Nasdaq Composite Index. FMR has entered into a sub-license agreement with the fund whereby the fund pays FMR the amount of the license fee at the rate of up to .06% of the fund's average net assets.
Annual Report
4. Fees and Other Transactions with Affiliates - continued
Central Funds. The fund may invest in affiliated Central Funds managed by Fidelity Investments Money Management, Inc. (FIMM), an affiliate of FMR. The Central Funds are open-end investment companies available only to investment companies and other accounts managed by FMR and its affiliates. The Central Funds seek preservation of capital and current income and do not pay a management fee. Income distributions earned by the fund are recorded as income in the accompanying financial statements and totaled $5,600 for the period.
5. Security Lending.
The fund lends portfolio securities from time to time in order to earn additional income. The fund receives collateral (in the form of U.S. Treasury obligations, letters of credit and/or cash) against the loaned securities and maintains collateral in an amount not less than 100% of the market value of the loaned securities during the period of the loan. The market value of the loaned securities is determined at the close of business of the fund and any additional required collateral is delivered to the fund on the next business day. If the borrower defaults on its obligation to return the securities loaned because of insolvency or other reasons, a fund could experience delays and costs in recovering the securities loaned or in gaining access to the collateral. Cash collateral is invested in cash equivalents. The value of loaned securities and cash collateral at period end are disclosed on the fund's Statement of Assets and Liabilities.
6. Expense Reductions.
FMR has voluntarily agreed to reimburse the fund through October 1, 2006, to the extent annual operating expenses exceeded .30% of average net assets. Some expenses, for example interest expense, are excluded from this reimbursement. During the period, this reimbursement reduced the fund's expenses by $337,622.
In addition, through arrangements with the fund's custodian, credits realized as a result of uninvested cash balances were used to reduce the fund's expenses. During the period, these credits reduced the fund's custody expense by $142.
Annual Report
Notes to Financial Statements - continued
7. Share Transactions.
The fund issues and redeems shares at Net Asset Value only with certain authorized participants in large increments known as Creation Units. Purchases of Creation Units are made by tendering a basket of designated stocks to the fund and redemption proceeds are paid with a basket of securities from the fund's portfolio. The fund's shares are available in smaller increments to investors in the secondary market at market prices and may be subject to commissions. A transaction fee is charged by the shareholder servicing agent when authorized participants purchase or redeem Creation Units of the fund. The fee is charged to cover the costs associated with the issuance and redemption of Creation Units. During the period, transaction fees totaled $17,151.
Annual Report
Report of Independent Registered Public Accounting Firm
To the Trustees of Fidelity Commonwealth Trust and the Shareholders of Fidelity Nasdaq Composite Index Tracking Stock:
In our opinion, the accompanying statement of assets and liabilities, including the schedule of investments, and the related statements of operations and of changes in net assets and the financial highlights present fairly, in all material respects, the financial position of Fidelity Nasdaq Composite Index Tracking Stock (a fund of Fidelity Commonwealth Trust) at November 30, 2004 and the results of its operations, the changes in its net assets and the financial highlights for the periods indicated, in conformity with accounting principles generally accepted in the United States of America. These financial statements and financial highlights (hereafter referred to as "financial statements") are the responsibility of the Fidelity Nasdaq Composite Index Tracking Stock's management; our responsibility is to express an opinion on these financial statements based on our audits. We conducted our audits of these financial statements in accordance with the standards of the Public Company Accounting Oversight Board (United States). Those standards require that we plan and perform the audit to obtain reasonable assurance about whether the financial statements are free of material misstatement. An audit includes examining, on a test basis, evidence supporting the amounts and disclosures in the financial statements, assessing the accounting principles used and significant estimates made by management, and evaluating the overall financial statement presentation. We believe that our audits, which included confirmation of securities at November 30, 2004 by correspondence with the custodian and brokers, provide a reasonable basis for our opinion.
/s/PricewaterhouseCoopers LLP
PricewaterhouseCoopers LLP
Boston, Massachusetts
January 12, 2005
Annual Report
Trustees and Officers
The Trustees, Members of the Advisory Board, and executive officers of the trust and fund, as applicable, are listed below. The Board of Trustees governs the fund and is responsible for protecting the interests of shareholders. The Trustees are experienced executives who meet periodically throughout the year to oversee the fund's activities, review contractual arrangements with companies that provide services to the fund, and review the fund's performance. Except for William O. McCoy, Dennis J. Dirks, and Kenneth L. Wolfe each of the Trustees oversees 301 funds advised by FMR or an affiliate. Mr. McCoy oversees 303 funds advised by FMR or an affiliate. Mr. Dirks and Mr. Wolfe oversee 223 funds advised by FMR or an affiliate.
The Trustees hold office without limit in time except that (a) any Trustee may resign; (b) any Trustee may be removed by written instrument, signed by at least two-thirds of the number of Trustees prior to such removal; (c) any Trustee who requests to be retired or who has become incapacitated by illness or injury may be retired by written instrument signed by a majority of the other Trustees; and (d) any Trustee may be removed at any special meeting of shareholders by a two-thirds vote of the outstanding voting securities of the trust. In any event, each non-interested Trustee shall retire not later than the last day of the calendar year in which his or her 72nd birthday occurs. The executive officers and Advisory Board Members hold office without limit in time, except that any officer and Advisory Board Member may resign or may be removed by a vote of a majority of the Trustees at any regular meeting or any special meeting of the Trustees. Except as indicated, each individual has held the office shown or other offices in the same company for the past five years.
The fund's Statement of Additional Information (SAI) includes more information about the Trustees. To request a free copy, call Fidelity at 1-800-FIDELITY.
Interested Trustees*:
Correspondence intended for each Trustee who is an "interested person" (as defined in the 1940 Act) may be sent to Fidelity Investments, 82 Devonshire Street, Boston, Massachusetts 02109.
Name, Age; Principal Occupation |
Edward C. Johnson 3d (74)** |
| Year of Election or Appointment: 1974 Mr. Johnson is Chairman of the Board of Trustees. Mr. Johnson serves as Chief Executive Officer, Chairman, and a Director of FMR Corp.; a Director and Chairman of the Board and of the Executive Committee of FMR; Chairman and a Director of Fidelity Management & Research (Far East) Inc.; Chairman (1998) and a Director of Fidelity Investments Money Management, Inc.; and Chairman (2001) and a Director (2000) of FMR Co., Inc. |
Abigail P. Johnson (42)** |
| Year of Election or Appointment: 2001 Senior Vice President of Fidelity Nasdaq Composite Index Tracking Stock (2003). Ms. Johnson also serves as Senior Vice President of other Fidelity funds (2001). She is President and a Director of FMR (2001), Fidelity Investments Money Management, Inc. (2001), FMR Co., Inc. (2001), and a Director of FMR Corp. Previously, Ms. Johnson managed a number of Fidelity funds. |
Laura B. Cronin (50) |
| Year of Election or Appointment: 2003 Ms. Cronin is an Executive Vice President (2002) and Chief Financial Officer (2002) of FMR Corp. and is a member of the Fidelity Management Committee (2003). Previously, Ms. Cronin served as Vice President of Finance of FMR (1997-1999), and Chief Financial Officer of FMR (1999-2001), Fidelity Personal Investments (2001), and Fidelity Brokerage Company (2001-2002). |
Robert L. Reynolds (52) |
| Year of Election or Appointment: 2003 Mr. Reynolds is a Director (2003) and Chief Operating Officer (2002) of FMR Corp. and is the head of the Fidelity Management Committee (2003). He also serves on the Board at Fidelity Investments Canada, Ltd. (2000). Previously, Mr. Reynolds served as President of Fidelity Investments Institutional Retirement Group (1996-2000). |
* Trustees have been determined to be "Interested Trustees" by virtue of, among other things, their affiliation with the trust or various entities under common control with FMR.
** Edward C. Johnson 3d, Trustee, is Abigail P. Johnson's father.
Annual Report
Non-Interested Trustees:
Correspondence intended for each non-interested Trustee (that is, the Trustees other than the Interested Trustees) may be sent to Fidelity Investments, P.O. Box 55235, Boston, Massachusetts 02205-5235.
Name, Age; Principal Occupation |
Dennis J. Dirks (56) |
| Year of Election or Appointment: 2005 Trustee of Fidelity Commonwealth Trust. Mr. Dirks also serves as Trustee (2005) or Member of the Advisory Board (2004) of other investment companies advised by FMR. Prior to his retirement in May 2003, Mr. Dirks was Chief Operating Officer and a member of the Board of The Depository Trust & Clearing Corporation (DTCC) (1999-2003). He also served as President, Chief Operating Officer, and Board member of The Depository Trust Company (DTC) (1999-2003) and President and Board member of the National Securities Clearing Corporation (NSCC) (1999-2003). In addition, Mr. Dirks served as Chief Executive Officer and Board member of the Government Securities Clearing Corporation (2001-2003) and Chief Executive Officer and Board member of the Mortgage-Backed Securities Clearing Corporation (2001-2003). |
Robert M. Gates (61) |
| Year of Election or Appointment: 1997 Dr. Gates is Vice Chairman of the non-interested Trustees (2005). Dr. Gates is President of Texas A&M University (2002). He was Director of the Central Intelligence Agency (CIA) from 1991 to 1993. From 1989 to 1991, Dr. Gates served as Assistant to the President of the United States and Deputy National Security Advisor. Dr. Gates is a Director of NACCO Industries, Inc. (mining and manufacturing), Parker Drilling Co., Inc. (drilling and rental tools for the energy industry, 2001), and Brinker International (restaurant management, 2003). He also serves as a member of the Advisory Board of VoteHere.net (secure Internet voting, 2001). Previously, Dr. Gates served as a Director of LucasVarity PLC (automotive components and diesel engines), a Director of TRW Inc. (automotive, space, defense, and information technology), and Dean of the George Bush School of Government and Public Service at Texas A&M University (1999-2001). Dr. Gates also is a Trustee of the Forum for International Policy. |
George H. Heilmeier (68) |
| Year of Election or Appointment: 2004 Dr. Heilmeier is Chairman Emeritus of Telcordia Technologies (communication software and systems), where prior to his retirement,
he served as company Chairman and Chief Executive Officer. He currently serves on the Boards of Directors of The Mitre Corporation (systems engineering and information technology support for the government), INET Technologies Inc. (telecommunications network surveillance, 2001), Teletech Holdings (customer management services), and HRL Laboratories (private research and development, 2004). He is Chairman of the General Motors Technology Advisory Committee and a Life Fellow of the Institute of Electrical and Electronics Engineers (IEEE) (2000). Dr. Heilmeier is a member of the Defense Science Board and the National Security Agency Advisory Board. He is also a member of the National Academy of Engineering, the American Academy of Arts and Sciences, and the Board of Overseers of the School of Engineering and Applied Science of the University of Pennsylvania. Previously,
Dr. Heilmeier served as a Director of TRW Inc. (automotive, space, defense, and information technology, 1992-2002), Compaq (1994-2002), and Automatic Data Processing, Inc. (ADP) (technology-based business outsourcing, 1995-2002). |
Marie L. Knowles (58) |
| Year of Election or Appointment: 2001 Prior to Ms. Knowles' retirement in June 2000, she served as Executive Vice President and Chief Financial Officer of Atlantic Richfield Company (ARCO) (diversified energy, 1996-2000). From 1993 to 1996, she was a Senior Vice President of ARCO and President of ARCO Transportation Company. She served as a Director of ARCO from 1996 to 1998. She currently serves as a Director of Phelps Dodge Corporation (copper mining and manufacturing) and McKesson Corporation (healthcare service, 2002). Ms. Knowles is a Trustee of the Brookings Institution and the Catalina Island Conservancy and also serves as a member of the Advisory Board for the School of Engineering of the University of Southern California. |
Ned C. Lautenbach (60) |
| Year of Election or Appointment: 2000 Mr. Lautenbach has been a partner of Clayton, Dubilier & Rice, Inc. (private equity investment firm) since September 1998. Previously,
Mr. Lautenbach was with the International Business Machines Corporation (IBM) from 1968 until his retirement in 1998. He was most recently Senior Vice President and Group Executive of Worldwide Sales and Services. From 1993 to 1995, he was Chairman of IBM World Trade Corporation, and from 1994 to 1998 was a member of IBM's Corporate Executive Committee. Mr. Lautenbach serves as Co-Chairman and a Director of Covansys, Inc. (global provider of business and technology solutions, 2000). In addition, he is a Director of Italtel Holding S.p.A. (telecommunications (Milan, Italy), 2004) and Eaton Corporation (diversified industrial) as well as the Philharmonic Center for the Arts in Naples, Florida (1999). He also is a member of the Council on Foreign Relations. |
Marvin L. Mann (71) |
| Year of Election or Appointment: 1993 Mr. Mann is Chairman of the non-interested Trustees (2001). He is Chairman Emeritus of Lexmark International, Inc. (computer peripherals), where he served as CEO until April 1998, retired as Chairman May 1999, and remains a member of the Board. Prior to 1991, he held the positions of Vice President of International Business Machines Corporation (IBM) and President and General Manager of various IBM divisions and subsidiaries. He is a member of the Executive Committee of the Independent Director's Council of the Investment Company Institute. In addition, Mr. Mann is a member of the President's Cabinet at the University of Alabama and the Board of Visitors of the Culverhouse College of Commerce and Business Administration at the University of Alabama. |
William O. McCoy (71) |
| Year of Election or Appointment: 1997 Prior to his retirement in December 1994, Mr. McCoy was Vice Chairman of the Board of BellSouth Corporation (telecommunications) and President of BellSouth Enterprises. He is currently a Director of Liberty Corporation (holding company), Duke Realty Corporation (real estate), and Progress Energy, Inc. (electric utility). He is also a partner of Franklin Street Partners (private investment management firm) and a member of the Research Triangle Foundation Board. In addition, Mr. McCoy served as the Interim Chancellor (1999-2000) and a member of the Board of Visitors (1994-1998) for the University of North Carolina at Chapel Hill and currently serves on the Board of Directors of the University of North Carolina Health Care System and the Board of Visitors of the Kenan-Flagler Business School (University of North Carolina at Chapel Hill). He also served as Vice President of Finance for the University of North Carolina (16-school system, 1995-1998). |
Cornelia M. Small (60) |
| Year of Election or Appointment: 2005 Ms. Small is a member (2000) and Chairperson (2002) of the Investment Committee, and a member (2002) of the Board of Trustees of Smith College. Previously, she served as Chief Investment Officer (1999-2000), Director of Global Equity Investments (1996-1999),
and a member of the Board of Directors of Scudder, Stevens & Clark (1990-1997) and Scudder Kemper Investments (1997-1998). In addition, Ms. Small served as Co-Chair (2000-2003) of the Annual Fund
for the Fletcher School of Law and Diplomacy. |
William S. Stavropoulos (65) |
| Year of Election or Appointment: 2002 Mr. Stavropoulos is Chairman of the Board (2000), CEO (2002), a position he previously held from 1995-2000, Chairman of the Executive Committee (2000), and a Member of the Board of Directors of The Dow Chemical Company. Since joining The Dow Chemical Company in 1967, Mr. Stavropoulos served in numerous senior management positions, including President (1993-2000; 2002-2003). Currently, he is a Director of NCR Corporation (data warehousing and technology solutions), BellSouth Corporation (telecommunications), Chemical Financial Corporation, and Maersk Inc. (industrial conglomerate, 2002). He also serves as a member of the Board of Trustees of the American Enterprise Institute for Public Policy Research. In addition, Mr. Stavropoulos is a member of The Business Council, J.P. Morgan International Council and the University of Notre Dame Advisory Council for the College of Science. |
Kenneth L. Wolfe (65) |
| Year of Election or Appointment: 2005 Trustee of Fidelity Commonwealth Trust. Mr. Wolfe also serves as Trustee (2005) or Member of the Advisory Board (2004) of other investment companies advised by FMR. Prior to his retirement in 2001, Mr. Wolfe was Chairman and Chief Executive Officer of Hershey Foods Corporation (1993-2001). He currently serves as a member of the boards of Adelphia Communications Corporation (2003), Bausch & Lomb, Inc., and Revlon Inc. (2004). |
Advisory Board Member and Executive Officers:
Correspondence intended for each executive officer and Mr. Lynch may be sent to Fidelity Investments, 82 Devonshire Street, Boston, Massachusetts 02109.
Name, Age; Principal Occupation |
Peter S. Lynch (61) |
| Year of Election or Appointment: 2003 Member of the Advisory Board of Fidelity Commonwealth Trust. Vice Chairman and a Director of FMR, and Vice Chairman (2001) and a Director (2000) of FMR Co., Inc. Previously, Mr. Lynch served as a Trustee of the Fidelity funds (1990-2003). Prior to May 31, 1990, he was a Director of FMR and Executive Vice President of FMR (a position he held until March 31, 1991), Vice President of Fidelity® Magellan®(7)Fund and FMR Growth Group Leader, and Managing Director of FMR Corp. Mr. Lynch was also Vice President of Fidelity Investments Corporate Services. In addition, he serves as a Trustee of Boston College, Massachusetts Eye & Ear Infirmary, Historic Deerfield, John F. Kennedy Library, and the Museum of Fine Arts of Boston. |
Philip L. Bullen (45) |
| Year of Election or Appointment: 2003 Vice President of Fidelity Nasdaq Composite Index Tracking Stock.
Mr. Bullen also serves as Vice President of certain Equity Funds (2001) and certain High Income Funds (2001). He is Senior Vice President of FMR (2001) and FMR Co., Inc. (2001), President and a Director of Fidelity Management & Research (Far East) Inc. (2001), President
and a Director of Fidelity Management & Research (U.K.) Inc. (2002), and a Director of Strategic Advisers, Inc. (2002). Before joining Fidelity Investments, Mr. Bullen was President and Chief Investment Officer of Santander Global Advisors (1997-2000) and President and Chief Executive Officer of Boston's Baring Asset Management Inc. (1994-1997). |
Eric D. Roiter (56) |
| Year of Election or Appointment: 2003 Secretary of Fidelity Nasdaq Composite Index Tracking Stock. He also serves as Secretary of other Fidelity funds (1998); Vice President, General Counsel, and Clerk of FMR Co., Inc. (2001) and FMR (1998); Vice President and Clerk of FDC (1998); Assistant Clerk of Fidelity Management & Research (U.K.) Inc. (2001) and Fidelity Management & Research (Far East) Inc. (2001); and Assistant Secretary of Fidelity Investments Money Management, Inc. (2001). Prior to joining Fidelity, Mr. Roiter was with the law firm of Debevoise & Plimpton, as an associate (1981-1984) and as a partner (1985-1997), and served as an Assistant General Counsel of the U.S. Securities and Exchange Commission (1979-1981). Mr. Roiter is an Adjunct Member, Faculty of Law, at Boston College Law School (2003). |
Stuart Fross (45) |
| Year of Election or Appointment: 2003 Assistant Secretary of Fidelity Nasdaq Composite Index Tracking Stock. Mr. Fross also serves as Assistant Secretary of other Fidelity funds (2003) and is an employee of FMR. |
Christine Reynolds (46) |
| Year of Election or Appointment: 2004 President, Treasurer, and Anti-Money Laundering (AML) officer of Fidelity Nasdaq Composite Index Tracking Stock. Ms. Reynolds also serves as President, Treasurer, and AML officer of other Fidelity funds (2004) and is a Vice President (2003) and an employee (2002) of
FMR. Before joining Fidelity Investments, Ms. Reynolds worked at PricewaterhouseCoopers LLP (PwC) (1980-2002), where she was most recently an audit partner with PwC's investment management practice. |
Timothy F. Hayes (53) |
| Year of Election or Appointment: 2003 Chief Financial Officer of Fidelity Nasdaq Composite Index Tracking Stock. Mr. Hayes also serves as Chief Financial Officer of other Fidelity funds (2002). Recently he was appointed President of Fidelity Service Company (2003) where he also serves as a Director. Mr. Hayes also serves as President of Fidelity Investments Operations Group (FIOG, 2002), which includes Fidelity Pricing and Cash Management Services Group (FPCMS), where he was appointed President in 1998. Previously, Mr. Hayes served as Chief Financial Officer of Fidelity Investments Corporate Systems and Service Group (1998) and Fidelity Systems Company (1997-1998). |
Kenneth A. Rathgeber (57) |
| Year of Election or Appointment: 2004 Chief Compliance Officer of Fidelity Nasdaq Composite Index Tracking Stock. Mr. Rathgeber also serves as Chief Compliance Officer of other Fidelity funds (2004) and Executive Vice President of Risk Oversight for Fidelity Investments (2002). Previously, he served as Executive Vice President and Chief Operating Officer for Fidelity Investments Institutional Services Company, Inc. (1998-2002). |
John R. Hebble (46) |
| Year of Election or Appointment: 2003 Deputy Treasurer of Fidelity Nasdaq Composite Index Tracking Stock. Mr. Hebble also serves as Deputy Treasurer of other Fidelity funds (2003), and is an employee of FMR. Before joining Fidelity Investments, Mr. Hebble worked at Deutsche Asset Management where he served as Director of Fund Accounting (2002-2003) and Assistant Treasurer of the Scudder Funds (1998-2003). |
Kimberley H. Monasterio (40) |
| Year of Election or Appointment: 2004 Deputy Treasurer of Fidelity Nasdaq Composite Index Tracking Stock. Ms. Monasterio also serves as Deputy Treasurer of other Fidelity funds (2004) and is an employee of FMR (2004). Before joining Fidelity Investments, Ms. Monasterio served as Treasurer (2000-2004) and Chief Financial Officer (2002-2004) of the Franklin Templeton Funds and Senior Vice President of Franklin Templeton Services, LLC (2000-2004). |
John H. Costello (58) |
| Year of Election or Appointment: 2003 Assistant Treasurer of Fidelity Nasdaq Composite Index Tracking Stock. Mr. Costello also serves as Assistant Treasurer of other Fidelity funds and is an employee of FMR. |
Peter L. Lydecker (50) |
| Year of Election or Appointment: 2004 Assistant Treasurer of Fidelity Nasdaq Composite Index Tracking Stock. Mr. Lydecker also serves as Assistant Treasurer of other Fidelity funds (2004) and is an employee of FMR. |
Mark Osterheld (49) |
| Year of Election or Appointment: 2003 Assistant Treasurer of Fidelity Nasdaq Composite Index Tracking Stock. Mr. Osterheld also serves as Assistant Treasurer of other Fidelity funds (2002) and is an employee of FMR. |
Kenneth B. Robins (35) |
| Year of Election or Appointment: 2004 Assistant Treasurer of Fidelity Nasdaq Composite Index Tracking Stock. Mr. Robins also serves as Assistant Treasurer of other Fidelity funds (2004) and is an employee of FMR (2004). Before joining Fidelity Investments, Mr. Robins worked at KPMG LLP, where he was a partner in KPMG's department of professional practice (2002-2004) and a Senior Manager (1999-2000). In addition, Mr. Robins served as Assistant Chief Accountant, United States Securities and Exchange Commission (2000-2002). |
Thomas J. Simpson (46) |
| Year of Election or Appointment: 2003 Assistant Treasurer of Fidelity Nasdaq Composite Index Tracking Stock. Mr. Simpson is Assistant Treasurer of other Fidelity funds (2000) and an employee of FMR (1996). Prior to joining FMR, Mr. Simpson was Vice President and Fund Controller of Liberty Investment Services (1987-1995). |
Annual Report
Distributions
The fund designates 100% of the dividend distributed during the fiscal year as qualifying for the dividends-received deduction for corporate shareholders.
The fund designates 100% of the dividend distributed during the fiscal year as amounts which may be taken into account as a dividend for purposes of the maximum rate under section 1(h)(11) of the Internal Revenue Code.
A total of .14% of the dividends distributed during the fiscal year was derived from interest on U.S. Government securities which is generally exempt from state income tax.
The fund will notify shareholders in January 2005 of amounts for use in preparing 2004 income tax returns.
Annual Report
Proxy Voting Results
A special meeting of the fund's shareholders was held on November 17, 2004. The results of votes taken among shareholders on proposals before them are reported below. Each vote reported represents one dollar of net asset value held on the record date for the meeting.
PROPOSAL 1 |
To amend the Declaration of Trust to allow the Board of Trustees, if permitted by applicable law, to authorize fund mergers without shareholder approval. A |
| # of
Votes | % of
Votes |
Affirmative | 12,221,814,216.15 | 73.238 |
Against | 3,155,449,238.56 | 18.908 |
Abstain | 587,539,807.37 | 3.521 |
Broker
Non-Votes | 723,047,068.58 | 4.333 |
TOTAL | 16,687,850,330.66 | 100.000 |
PROPOSAL 2 |
To elect a Board of Trustees. A |
| # of
Votes | % of
Votes |
J. Michael Cook |
Affirmative | 15,841,707,644.41 | 94.930 |
Withheld | 846,142,686.25 | 5.070 |
TOTAL | 16,687,850,330.66 | 100.000 |
Ralph F. Cox |
Affirmative | 15,797,852,227.84 | 94.667 |
Withheld | 889,998,102.82 | 5.333 |
TOTAL | 16,687,850,330.66 | 100.000 |
Laura B. Cronin |
Affirmative | 15,839,639,342.73 | 94.917 |
Withheld | 848,210,987.93 | 5.083 |
TOTAL | 16,687,850,330.66 | 100.000 |
Dennis J. Dirks B |
Affirmative | 15,848,904,973.82 | 94.973 |
Withheld | 838,945,356.84 | 5.027 |
TOTAL | 16,687,850,330.66 | 100.000 |
| # of
Votes | % of
Votes |
Robert M. Gates |
Affirmative | 15,823,470,035.51 | 94.820 |
Withheld | 864,380,295.15 | 5.180 |
TOTAL | 16,687,850,330.66 | 100.000 |
George H. Heilmeier |
Affirmative | 15,839,665,226.61 | 94.917 |
Withheld | 848,185,104.05 | 5.083 |
TOTAL | 16,687,850,330.66 | 100.000 |
Abigail P. Johnson |
Affirmative | 15,781,077,913.19 | 94.566 |
Withheld | 906,772,417.47 | 5.434 |
TOTAL | 16,687,850,330.66 | 100.000 |
Edward C. Johnson 3d |
Affirmative | 15,754,759,829.98 | 94.409 |
Withheld | 933,090,500.68 | 5.591 |
TOTAL | 16,687,850,330.66 | 100.000 |
Donald J. Kirk |
Affirmative | 15,813,230,768.50 | 94.759 |
Withheld | 874,619,562.16 | 5.241 |
TOTAL | 16,687,850,330.66 | 100.000 |
Marie L. Knowles |
Affirmative | 15,851,883,968.67 | 94.991 |
Withheld | 835,966,361.99 | 5.009 |
TOTAL | 16,687,850,330.66 | 100.000 |
Ned C. Lautenbach |
Affirmative | 15,854,530,564.20 | 95.006 |
Withheld | 833,319,766.46 | 4.994 |
TOTAL | 16,687,850,330.66 | 100.000 |
Marvin L. Mann |
Affirmative | 15,816,737,319.52 | 94.780 |
Withheld | 871,113,011.14 | 5.220 |
TOTAL | 16,687,850,330.66 | 100.000 |
| # of
Votes | % of
Votes |
William O. McCoy |
Affirmative | 15,823,167,179.17 | 94.818 |
Withheld | 864,683,151.49 | 5.182 |
TOTAL | 16,687,850,330.66 | 100.000 |
Robert L. Reynolds |
Affirmative | 15,845,001,714.22 | 94.949 |
Withheld | 842,848,616.44 | 5.051 |
TOTAL | 16,687,850,330.66 | 100.000 |
Cornelia M. Small B |
Affirmative | 15,840,247,943.36 | 94.921 |
Withheld | 847,602,387.30 | 5.079 |
TOTAL | 16,687,850,330.66 | 100.000 |
William S. Stavropoulos |
Affirmative | 15,830,742,293.62 | 94.864 |
Withheld | 857,108,037.04 | 5.136 |
TOTAL | 16,687,850,330.66 | 100.000 |
A Denotes trust-wide proposals and voting results. B Effective January 1, 2005. |
Annual Report
Annual Report
Annual Report
Annual Report
Annual Report
Investment Adviser
Fidelity Management & Research Company
Boston, MA
Investment Sub-Advisers
FMR Co., Inc.
Geode Capital Management, LLC
General Distributor
Fidelity Distributors Corporation
Boston, MA
Transfer Agent
JPMorgan Chase Bank
New York, NY.
Shareholder Servicing Agent
Fidelity Service Company, Inc.
Boston, MA
Custodian
JPMorgan Chase Bank
New York, NY
The Fidelity Telephone Connection
1-800-FIDELITY
(Fidelity Investment logo)(registered trademark)
Corporate Headquarters
82 Devonshire St., Boston, MA 02109
www.fidelity.com
ETF-UANN-0105
1.795568.101
Fidelity®
Nasdaq Composite® Index
Fund
Annual Report
November 30, 2004
(2_fidelity_logos) (Registered_Trademark)
Contents
Chairman's Message | <Click Here> | Ned Johnson's message to shareholders. |
Performance | <Click Here> | How the fund has done over time. |
Management's Discussion | <Click Here> | The manager's review of fund performance, strategy and outlook. |
Shareholder Expense Example | <Click Here> | An example of shareholder expenses. |
Investment Changes | <Click Here> | A summary of major shifts in the fund's investments over the past six months. |
Investments | <Click Here> | A complete list of the fund's investments with their market values. |
Financial Statements | <Click Here> | Statements of assets and liabilities, operations, and changes in net assets,
as well as financial highlights. |
Notes | <Click Here> | Notes to the financial statements. |
Report of Independent Registered Public Accounting Firm | <Click Here> | |
Trustees and Officers | <Click Here> | |
Distributions | <Click Here> | |
Proxy Voting Results | <Click Here> | |
To view a fund's proxy voting guidelines and proxy voting record for the 12-month period ended June 30, visit www.fidelity.com/proxyvotingresults or visit the Securities and Exchange Commission's (SEC) web site at www.sec.gov. You may also call 1-800-544-8544 to request a free copy of the proxy voting guidelines.
Nasdaq® and Nasdaq Composite® are trademarks of The Nasdaq Stock Market, Inc. (which with its Affiliates are the Corporations) and are licensed for use by Fidelity. The product has not been passed on by the Corporations as to its legality or suitability. The product is not issued, endorsed or sold by the Corporations. The Corporations make no warranties and bear no liability with respect to shares of the product.
Standard & Poor's, S&P and S&P 500 are registered service marks of The McGraw-Hill Companies, Inc. and have been licensed for use by Fidelity Distributors Corporation.
Other third party marks appearing herein are the property of their respective owners.
All other marks appearing herein are registered or unregistered trademarks or service marks of FMR Corp. or an affiliated company.
(Recycle graphic) This report is printed on recycled paper using soy-based inks.
Annual Report
This report and the financial statements contained herein are submitted for the general information of the shareholders of the fund. This report is not authorized for distribution to prospective investors in the fund unless preceded or accompanied by an effective prospectus.
A fund files its complete schedule of portfolio holdings with the SEC for the first and third quarters of each fiscal year on Form N-Q. Forms N-Q are available on the SEC's web site at http://www.sec.gov. A fund's Forms N-Q may be reviewed and copied at the SEC's Public Reference Room in Washington, DC. Information regarding the operation of the SEC's Public Reference Room may be obtained by calling 1-800-SEC-0330. For a complete list of a fund's portfolio holdings, view the most recent quarterly holdings report, semiannual report, or annual report on Fidelity's web site at http://www.fidelity.com/holdings.
NOT FDIC INSURED · MAY LOSE VALUE · NO BANK GUARANTEE
Neither the fund nor Fidelity Distributors Corporation is a bank.
Annual Report
Chairman's Message
(photo_of_Edward_C_Johnson_3d)
Dear Shareholder:
During the past year or so, much has been reported about the mutual fund industry, and much of it has been more critical than I believe is warranted. Allegations that some companies have been less than forthright with their shareholders have cast a shadow on the entire industry. I continue to find these reports disturbing, and assert that they do not create an accurate picture of the industry overall. Therefore, I would like to remind everyone where Fidelity stands on these issues. I will say two things specifically regarding allegations that some mutual fund companies were in violation of the Securities and Exchange Commission's forward pricing rules or were involved in so-called "market timing" activities.
First, Fidelity has no agreements that permit customers who buy fund shares after 4 p.m. to obtain the 4 p.m. price. This is not a new policy. This is not to say that someone could not deceive the company through fraudulent acts. However, we are extremely diligent in preventing fraud from occurring in this manner - and in every other. But I underscore again that Fidelity has no so-called "agreements" that sanction illegal practices.
Second, Fidelity continues to stand on record, as we have for years, in opposition to predatory short-term trading that adversely affects shareholders in a mutual fund. Back in the 1980s, we initiated a fee - which is returned to the fund and, therefore, to investors - - to discourage this activity. Further, we took the lead several years ago in developing a Fair Value Pricing Policy to prevent market timing on foreign securities in our funds. I am confident we will find other ways to make it more difficult for predatory traders to operate. However, this will only be achieved through close cooperation among regulators, legislators and the industry.
Yes, there have been unfortunate instances of unethical and illegal activity within the mutual fund industry from time to time. That is true of any industry. When this occurs, confessed or convicted offenders should be dealt with appropriately. But we are still concerned about the risk of over-regulation and the quick application of simplistic solutions to intricate problems. Every system can be improved, and we support and applaud well thought out improvements by regulators, legislators and industry representatives that achieve the common goal of building and protecting the value of investors' holdings.
For nearly 60 years, Fidelity has worked very hard to improve its products and service to justify your trust. When our family founded this company in 1946, we had only a few hundred customers. Today, we serve more than 18 million customers including individual investors and participants in retirement plans across America.
Let me close by saying that we do not take your trust in us for granted, and we realize that we must always work to improve all aspects of our service to you. In turn, we urge you to continue your active participation with your financial matters, so that your interests can be well served.
Best regards,
/s/Edward C. Johnson 3d
Edward C. Johnson 3d
Annual Report
Performance: The Bottom Line
Average annual total return reflects the change in the value of an investment, assuming reinvestment of the fund's dividend income and capital gains (the profits earned upon the sale of securities that have grown in value) and assuming a constant rate of performance each year. The $10,000 table and the fund's returns do not reflect the deduction of taxes that a shareholder would pay on fund distributions or the redemption of fund shares. During periods of reimbursement by Fidelity, a fund's total return will be greater than it would be had the reimbursement not occurred. How a fund did yesterday is no guarantee of how it will do tomorrow.
Average Annual Total Returns
Periods ended November 30, 2004 | Past 1
year | Life of fundA |
Fidelity Nasdaq Composite Index Fund | 6.99% | 12.88% |
A From September 25, 2003.
$10,000 Over Life of Fund
Let's say hypothetically that $10,000 was invested in Fidelity Nasdaq Composite Index Fund on September 25, 2003, when the fund started. The chart shows how the value of your investment would have changed, and also shows how the NASDAQ Composite Index performed over the same period.
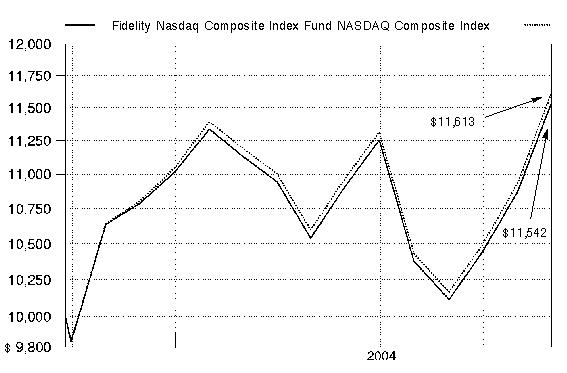
Annual Report
Management's Discussion of Fund Performance
Comments from Jacques Perold, who oversees the Fidelity® Nasdaq Composite® Index Fund's investment management personnel as President of Geode Capital Management, LLC
Despite surging oil prices, a struggling job market and four interest rate hikes in a five-month span, U.S. equity markets posted solid results for the 12-month period ending November 30, 2004, and were closing in on a second straight year in the black. There was great disparity in the market during the past year. For instance, value stocks trounced their growth counterparts during the period. To illustrate, the Russell 1000® Value Index shot up 19.67%, while the Russell 1000 Growth Index rose only 5.83%. Meanwhile, small- and mid-cap stocks vastly outperformed larger-cap stocks. Energy was the best-performing sector of the market, propelled by a spike in oil prices. Conversely, technology stocks dipped lower in response to a slowdown in corporate capital spending. For the 12-month period overall, the Standard & Poor's 500SM Index returned 12.86% - slightly above its historical average. Elsewhere, the Dow Jones Industrial AverageSM rose 8.87% and the tech-heavy NASDAQ Composite® Index advanced 7.51%.
For the 12-month period ending November 30, 2004, the fund gained 6.99%, roughly in line with the NASDAQ®. The fund's peer group average, the LipperSM Growth Funds Average, returned 9.52% during the same time frame. Software giant Microsoft had the greatest positive impact on results. Microsoft's stock rose steadily as the company continued to generate solid earnings growth. It also announced well-received plans to return part of
its cash hoard to shareholders in the form of higher quarterly dividends and a special one-time year-end payment of $3 per share. Online auction house eBay benefited from increasing revenues generated overseas and additional use of fixed-price sales to complement its more traditional auction business. Intel, the world's leading maker of semiconductors, was the biggest detractor from performance, falling after announcing a second-quarter decline in profit margins and an increase in inventories. Another laggard was VERITAS, a leading data-storage software maker. Its stock price fell by more than a third in early July after the firm warned of lower earnings on disappointing sales in the United States.
The views expressed in this statement reflect those of the portfolio manager only through the end of the period of the report as stated on the cover and do not necessarily represent the views of Fidelity or any other person in the Fidelity organization. Any such views are subject to change at any time based upon market or other conditions and Fidelity disclaims any responsibility to update such views. These views may not be relied on as investment advice and, because investment decisions for a Fidelity fund are based on numerous factors, may not be relied on as an indication of trading intent on behalf of any Fidelity fund.
Annual Report
Shareholder Expense Example
As a shareholder of the Fund, you incur two types of costs: (1) transaction costs, including redemption fees, and (2) ongoing costs, including management fees, distribution and/
or service (12b-1) fees and other Fund expenses. This Example is intended to help you understand your ongoing costs (in dollars) of investing in the Fund and to compare these costs with the ongoing costs of investing in other mutual funds.
The Example is based on an investment of $1,000 invested at the beginning of the period and held for the entire period (June 1, 2004 to November 30, 2004).
Actual Expenses
The first line of the table below provides information about actual account values and actual expenses. You may use the information in this line, together with the amount you invested, to estimate the expenses that you paid over the period. Simply divide your account value by $1,000.00 (for example, an $8,600 account value divided by $1,000.00 = 8.6), then multiply the result by the number in the first line under the heading entitled "Expenses Paid During Period" to estimate the expenses you paid on your account during this period. An annual index fund fee of $10 that is charged once a year may apply for certain accounts with a value of less than $10,000. This fee is not included in the table below. If it was, the estimate of expenses you paid during the period would be higher, and your ending account value lower, by this amount.
Hypothetical Example for Comparison Purposes
The second line of the table below provides information about hypothetical account values and hypothetical expenses based on the Fund's actual expense ratio and an assumed rate of return of 5% per year before expenses, which is not the Fund's actual return. The hypothetical account values and expenses may not be used to estimate the actual ending account balance or expenses you paid for the period. You may use this information to compare the ongoing costs of investing in the Fund and other funds. To do so, compare this 5% hypothetical example with the 5% hypothetical examples that appear in the shareholder reports of the other funds. An annual index fund fee of $10 that is charged once a year may apply for certain accounts with a value of less than $10,000. This fee is not included in the table below. If it was, the estimate of expenses you paid during the period would be higher, and your ending account value lower, by this amount.
Please note that the expenses shown in the table are meant to highlight your ongoing costs only and do not reflect any transaction costs. Therefore, the second line of the table is useful in comparing ongoing costs only, and will not help you determine the relative total costs of owning different funds. In addition, if these transactional costs were included, your costs would have been higher.
| Beginning
Account Value
June 1, 2004 | Ending
Account Value
November 30, 2004 | Expenses Paid
During Period*
June 1, 2004
to November 30, 2004 |
Actual | $ 1,000.00 | $ 1,057.70 | $ 2.31 |
Hypothetical (5% return per year before expenses) | $ 1,000.00 | $ 1,022.72 | $ 2.28 |
*Expenses are equal to the Fund's annualized expense ratio of .45%; multiplied by the average account value over the period, multiplied by 183/366 (to reflect the one-half year period).
Annual Report
Investment Changes
Top Ten Stocks as of November 30, 2004 |
| % of fund's
net assets | % of fund's net assets
6 months ago |
Microsoft Corp. | 9.1 | 9.3 |
Intel Corp. | 4.5 | 6.0 |
Cisco Systems, Inc. | 3.9 | 5.0 |
Dell, Inc. | 3.2 | 3.0 |
Amgen, Inc. | 2.4 | 2.3 |
eBay, Inc. | 2.3 | 1.9 |
QUALCOMM, Inc. | 2.1 | 1.8 |
Oracle Corp. | 2.1 | 1.9 |
Yahoo!, Inc. | 1.6 | 1.4 |
Comcast Corp. Class A | 1.3 | 1.3 |
| 32.5 | |
Market Sectors as of November 30, 2004 |
| % of fund's
net assets | % of fund's net assets
6 months ago |
Information Technology | 49.1 | 50.8 |
Consumer Discretionary | 13.7 | 12.7 |
Health Care | 12.7 | 13.2 |
Financials | 10.6 | 10.5 |
Industrials | 5.8 | 5.5 |
Telecommunication Services | 2.2 | 1.7 |
Consumer Staples | 1.5 | 1.4 |
Materials | 1.1 | 0.9 |
Energy | 0.7 | 0.5 |
Utilities | 0.2 | 0.1 |
Asset Allocation (% of fund's net assets) |
To match the NASDAQ Composite® Index, Fidelity Nasdaq Composite Index Fund seeks 100% investment exposure to stocks at all times.
Annual Report
Investments November 30, 2004
Showing Percentage of Net Assets
Common Stocks - 97.6% |
| Shares | | Value (Note 1) |
CONSUMER DISCRETIONARY - 13.7% |
Auto Components - 0.3% |
Aftermarket Technology Corp. (a) | 800 | | $ 13,936 |
China Automotive Systems, Inc. (a) | 1,032 | | 16,450 |
Decoma International, Inc. Class A (sub. vtg.) | 1,602 | | 18,114 |
Dura Automotive Systems, Inc. Class A (sub. vtg.) (a) | 661 | | 6,015 |
Exide Technologies (a) | 1,105 | | 13,757 |
GenTek, Inc. (a) | 300 | | 14,697 |
Gentex Corp. | 2,657 | | 85,874 |
Hayes Lemmerz International, Inc. (a) | 1,193 | | 9,091 |
Intier Automotive, Inc. Class A | 213 | | 6,374 |
Keystone Automotive Industries, Inc. (a) | 491 | | 11,504 |
LKQ Corp. | 796 | | 14,280 |
Noble International Ltd. | 308 | | 6,071 |
Quantum Fuel Systems Technologies Worldwide, Inc. (a) | 1,681 | | 10,439 |
R&B, Inc. (a) | 766 | | 19,150 |
Shiloh Industries, Inc. (a) | 545 | | 7,074 |
Sports Resorts International, Inc. (a) | 3,572 | | 10,252 |
Strattec Security Corp. (a) | 130 | | 8,190 |
Tesma International, Inc. Class A (sub. vtg.) | 627 | | 21,386 |
Wescast Industries, Inc. Class A (sub. vtg.) | 123 | | 3,340 |
| | 295,994 |
Automobiles - 0.0% |
Nissan Motor Co. Ltd. sponsored ADR | 770 | | 16,147 |
Distributors - 0.0% |
Noland Co. | 246 | | 10,583 |
Source Interlink Companies, Inc. (a) | 919 | | 11,993 |
| | 22,576 |
Hotels, Restaurants & Leisure - 1.9% |
AFC Enterprises, Inc. (a) | 1,055 | | 25,404 |
Ambassadors Group, Inc. | 369 | | 12,834 |
Ameristar Casinos, Inc. | 907 | | 36,507 |
Applebee's International, Inc. | 2,488 | | 63,942 |
BJ's Restaurants, Inc. (a) | 902 | | 13,494 |
Bob Evans Farms, Inc. | 1,216 | | 30,704 |
Buffalo Wild Wings, Inc. | 531 | | 17,592 |
California Pizza Kitchen, Inc. (a) | 768 | | 19,238 |
CBRL Group, Inc. | 1,617 | | 65,925 |
Churchill Downs, Inc. | 483 | | 22,435 |
Ctrip.com International Ltd. ADR | 360 | | 17,399 |
Empire Resorts, Inc. (a) | 676 | | 7,274 |
International Speedway Corp. Class A | 929 | | 45,419 |
Common Stocks - continued |
| Shares | | Value (Note 1) |
CONSUMER DISCRETIONARY - continued |
Hotels, Restaurants & Leisure - continued |
Isle of Capri Casinos, Inc. (a) | 1,198 | | $ 29,387 |
Lone Star Steakhouse & Saloon, Inc. | 829 | | 22,375 |
Magna Entertainment Corp. Class A (a) | 2,724 | | 16,344 |
McCormick & Schmick Seafood Restaurants | 397 | | 6,566 |
Monarch Casino & Resort, Inc. (a) | 237 | | 8,276 |
MTR Gaming Group, Inc. (a) | 1,009 | | 10,151 |
Multimedia Games, Inc. (a) | 948 | | 12,400 |
Navigant International, Inc. (a) | 541 | | 5,940 |
O'Charleys, Inc. (a) | 757 | | 14,383 |
P.F. Chang's China Bistro, Inc. (a) | 795 | | 44,711 |
Panera Bread Co. Class A (a) | 941 | | 37,584 |
Papa John's International, Inc. (a) | 403 | | 14,335 |
Penn National Gaming, Inc. (a) | 1,334 | | 70,395 |
Rare Hospitality International, Inc. (a) | 1,052 | | 31,518 |
Red Robin Gourmet Burgers, Inc. (a) | 451 | | 23,159 |
Ryan's Restaurant Group, Inc. (a) | 1,417 | | 21,638 |
Scientific Games Corp. Class A (a) | 2,873 | | 68,665 |
Shuffle Master, Inc. (a) | 823 | | 37,883 |
Smith & Wollensky Restaurant Group, Inc. (a) | 1,039 | | 4,821 |
Sonic Corp. (a) | 1,845 | | 53,819 |
Starbucks Corp. (a) | 12,747 | | 717,146 |
Sunterra Corp. (a) | 868 | | 9,574 |
Texas Roadhouse, Inc. Class A | 908 | | 23,063 |
The Cheesecake Factory, Inc. (a) | 1,620 | | 79,202 |
Wynn Resorts Ltd. (a) | 2,777 | | 161,316 |
| | 1,902,818 |
Household Durables - 0.4% |
Avatar Holdings, Inc. (a) | 197 | | 9,312 |
Bassett Furniture Industries, Inc. | 681 | | 13,423 |
Brillian Corp. (a) | 388 | | 1,195 |
California Coastal Communities, Inc. (a) | 409 | | 9,117 |
Craftmade International, Inc. | 649 | | 11,487 |
Dominion Homes, Inc. (a) | 396 | | 8,181 |
Dorel Industries, Inc. Class B (sub. vtg.) (a) | 886 | | 31,191 |
Flexsteel Industries, Inc. | 620 | | 10,856 |
Garmin Ltd. (d) | 3,420 | | 199,112 |
Helen of Troy Ltd. (a) | 913 | | 25,692 |
Hooker Furniture Corp. | 696 | | 16,252 |
Interface, Inc. Class A (a) | 2,168 | | 21,463 |
Kimball International, Inc. Class B | 805 | | 11,995 |
Common Stocks - continued |
| Shares | | Value (Note 1) |
CONSUMER DISCRETIONARY - continued |
Household Durables - continued |
Lifetime Hoan Corp. | 1,013 | | $ 13,767 |
Palm Harbor Homes, Inc. (a) | 739 | | 11,536 |
Stanley Furniture Co., Inc. | 312 | | 14,352 |
Universal Electronics, Inc. (a) | 813 | | 14,837 |
| | 423,768 |
Internet & Catalog Retail - 3.6% |
1-800 CONTACTS, Inc. (a) | 518 | | 10,614 |
1-800-FLOWERS.com, Inc. Class A (a) | 895 | | 7,429 |
Alloy, Inc. (a) | 1,976 | | 8,892 |
Amazon.com, Inc. (a) | 13,126 | | 520,840 |
Audible, Inc. (a) | 670 | | 18,733 |
Blue Nile, Inc. | 469 | | 12,091 |
Coldwater Creek, Inc. (a) | 1,231 | | 32,252 |
Drugstore.com, Inc. (a) | 2,140 | | 6,955 |
eBay, Inc. (a) | 21,163 | | 2,379,779 |
eCost.com, Inc. | 600 | | 11,580 |
GSI Commerce, Inc. (a) | 1,482 | | 22,423 |
IAC/InterActiveCorp (a) | 20,516 | | 506,540 |
Insight Enterprises, Inc. (a) | 1,623 | | 32,833 |
J. Jill Group, Inc. (a) | 641 | | 11,070 |
Netflix, Inc. (a)(d) | 1,475 | | 16,786 |
Overstock.com, Inc. (a) | 650 | | 46,319 |
PC Mall, Inc. (a) | 507 | | 12,320 |
PetMed Express, Inc. (a) | 710 | | 4,615 |
Priceline.com, Inc. (a) | 1,328 | | 31,699 |
Provide Commerce, Inc. | 585 | | 20,066 |
Stamps.com, Inc. | 989 | | 15,300 |
ValueVision Media, Inc. Class A (a) | 974 | | 11,045 |
| | 3,740,181 |
Leisure Equipment & Products - 0.1% |
Arctic Cat, Inc. | 607 | | 16,213 |
Concord Camera Corp. (a) | 341 | | 900 |
Escalade, Inc. | 749 | | 11,025 |
JAKKS Pacific, Inc. (a) | 1,033 | | 19,234 |
Radica Games Ltd. | 1,200 | | 11,508 |
RC2 Corp. (a) | 631 | | 19,744 |
SCP Pool Corp. | 1,758 | | 55,430 |
| | 134,054 |
Media - 4.2% |
ACME Communications, Inc. (a) | 1,400 | | 8,232 |
Common Stocks - continued |
| Shares | | Value (Note 1) |
CONSUMER DISCRETIONARY - continued |
Media - continued |
Alliance Atlantis Communications, Inc. Class B (non-vtg.) (a) | 1,269 | | $ 33,010 |
Beasley Broadcast Group, Inc. Class A (a) | 689 | | 12,092 |
Cadmus Communications Corp. | 937 | | 13,006 |
Carmike Cinemas, Inc. | 461 | | 17,260 |
Central European Media Enterprises Ltd. Class A (a) | 722 | | 22,714 |
Charter Communications, Inc. Class A (a)(d) | 9,505 | | 20,531 |
Comcast Corp.: | | | |
Class A (a) | 43,579 | | 1,309,113 |
Class A (special) (a) | 26,786 | | 794,205 |
Courier Corp. | 196 | | 9,914 |
Crown Media Holdings, Inc. Class A (a) | 2,664 | | 23,603 |
Cumulus Media, Inc. Class A (a) | 2,009 | | 30,698 |
EchoStar Communications Corp. Class A | 6,785 | | 222,480 |
Emmis Communications Corp. Class A (a) | 1,450 | | 26,811 |
Fisher Communications, Inc. (a) | 394 | | 18,530 |
Gemstar-TV Guide International, Inc. (a) | 13,818 | | 75,308 |
Global Sources Ltd. (a) | 990 | | 9,197 |
Grey Global Group, Inc. | 39 | | 42,784 |
Harris Interactive, Inc. (a) | 1,659 | | 11,016 |
IMAX Corp. (a) | 1,147 | | 9,468 |
Insight Communications, Inc. Class A (a) | 2,570 | | 21,768 |
Knology, Inc. | 1,452 | | 4,995 |
Lakes Entertainment, Inc. (a) | 998 | | 13,922 |
Lamar Advertising Co. Class A (a) | 2,768 | | 109,170 |
Liberty Media International, Inc. Class A (a) | 4,402 | | 189,550 |
LodgeNet Entertainment Corp. (a) | 799 | | 12,321 |
MDC Partners, Inc. (a) | 763 | | 7,817 |
Mediacom Communications Corp. Class A (a) | 3,456 | | 18,040 |
Navarre Corp. (a) | 871 | | 14,833 |
New Frontier Media, Inc. (a) | 1,084 | | 8,770 |
Nexstar Broadcasting Group, Inc. | 1,192 | | 9,953 |
NTL, Inc. (a) | 2,753 | | 191,554 |
Pixar (a) | 1,705 | | 154,592 |
Radio One, Inc.: | | | |
Class A (a) | 1,033 | | 14,338 |
Class D (non-vtg.) (a) | 2,352 | | 32,810 |
Regent Communication, Inc. (a) | 1,974 | | 11,272 |
Reuters Group PLC sponsored ADR | 707 | | 31,165 |
Salem Communications Corp. Class A (a) | 1,009 | | 24,781 |
SBS Broadcasting SA (a) | 925 | | 31,848 |
Scholastic Corp. (a) | 1,095 | | 36,069 |
Common Stocks - continued |
| Shares | | Value (Note 1) |
CONSUMER DISCRETIONARY - continued |
Media - continued |
Sinclair Broadcast Group, Inc. Class A | 2,015 | | $ 14,528 |
Sirius Satellite Radio, Inc. (a) | 40,875 | | 271,410 |
Spanish Broadcasting System, Inc. Class A (a) | 1,167 | | 12,475 |
TiVo, Inc. (a) | 2,475 | | 11,657 |
UnitedGlobalCom, Inc. Class A (a) | 12,931 | | 107,715 |
Value Line, Inc. | 422 | | 16,880 |
WPP Group PLC sponsored ADR | 641 | | 35,197 |
WPT Enterprises, Inc. | 792 | | 11,492 |
XM Satellite Radio Holdings, Inc. Class A (a) | 6,600 | | 243,606 |
Young Broadcasting, Inc. Class A (a) | 630 | | 6,149 |
| | 4,380,649 |
Multiline Retail - 0.5% |
Conn's, Inc. | 665 | | 11,790 |
Dollar Tree Stores, Inc. (a) | 3,584 | | 99,743 |
Fred's, Inc. Class A | 1,186 | | 20,553 |
Kmart Holding Corp. (a)(d) | 2,845 | | 292,551 |
The Bon-Ton Stores, Inc. | 984 | | 13,776 |
Tuesday Morning Corp. (a) | 1,287 | | 43,102 |
| | 481,515 |
Specialty Retail - 2.4% |
AC Moore Arts & Crafts, Inc. (a) | 1,063 | | 30,604 |
America's Car Mart, Inc. (a) | 379 | | 13,909 |
American Eagle Outfitters, Inc. | 2,409 | | 100,624 |
bebe Stores, Inc. | 1,192 | | 43,246 |
Bed Bath & Beyond, Inc. (a) | 9,773 | | 390,216 |
Big 5 Sporting Goods Corp. | 1,019 | | 27,747 |
Brookstone Co., Inc. (a) | 600 | | 10,980 |
Building Material Holding Corp. | 508 | | 18,517 |
Cache, Inc. (a) | 377 | | 6,224 |
Casual Male Retail Group, Inc. (a) | 1,489 | | 6,432 |
Charlotte Russe Holding, Inc. (a) | 658 | | 7,666 |
Charming Shoppes, Inc. (a) | 3,839 | | 35,895 |
Cost Plus, Inc. (a) | 788 | | 25,043 |
Deb Shops, Inc. | 763 | | 18,808 |
Dress Barn, Inc. (a) | 924 | | 15,865 |
Electronics Boutique Holding Corp. (a) | 801 | | 31,199 |
Finish Line, Inc. Class A | 1,016 | | 18,694 |
Gander Mountain Co. | 416 | | 5,458 |
Goody's Family Clothing, Inc. | 1,432 | | 13,948 |
Guitar Center, Inc. (a) | 727 | | 35,172 |
Common Stocks - continued |
| Shares | | Value (Note 1) |
CONSUMER DISCRETIONARY - continued |
Specialty Retail - continued |
Gymboree Corp. (a) | 738 | | $ 8,701 |
Hibbett Sporting Goods, Inc. (a) | 704 | | 17,438 |
Hollywood Entertainment Corp. (a) | 1,515 | | 19,225 |
Hot Topic, Inc. (a) | 1,563 | | 25,586 |
Jos. A. Bank Clothiers, Inc. (a) | 461 | | 12,124 |
Kirkland's, Inc. (a) | 622 | | 5,971 |
Monro Muffler Brake, Inc. (a) | 669 | | 16,424 |
Movie Gallery, Inc. | 1,335 | | 23,269 |
O'Reilly Automotive, Inc. (a) | 1,695 | | 73,800 |
Pacific Sunwear of California, Inc. (a) | 2,336 | | 51,883 |
Party City Corp. (a) | 552 | | 7,060 |
PETCO Animal Supplies, Inc. (a) | 1,834 | | 66,317 |
PETsMART, Inc. | 4,576 | | 156,820 |
Pomeroy IT Solutions, Inc. (a) | 627 | | 8,565 |
Rent-A-Center, Inc. (a) | 2,610 | | 66,529 |
Restoration Hardware, Inc. (a) | 1,275 | | 6,490 |
Ross Stores, Inc. | 4,580 | | 123,202 |
Select Comfort Corp. (a) | 1,096 | | 21,361 |
Sharper Image Corp. (a) | 608 | | 11,649 |
Shoe Carnival, Inc. (a) | 605 | | 7,889 |
Stage Stores, Inc. (a) | 511 | | 20,946 |
Staples, Inc. | 16,140 | | 515,027 |
Stein Mart, Inc. (a) | 1,359 | | 22,600 |
Steiner Leisure Ltd. (a) | 489 | | 13,164 |
TBC Corp. (a) | 632 | | 16,855 |
The Children's Place Retail Stores, Inc. (a) | 918 | | 29,064 |
The Pantry, Inc. (a) | 1,036 | | 28,511 |
Tractor Supply Co. (a) | 1,268 | | 40,221 |
Trans World Entertainment Corp. (a) | 1,445 | | 16,300 |
Tweeter Home Entertainment Group, Inc. (a) | 953 | | 6,109 |
Urban Outfitters, Inc. (a) | 2,554 | | 108,545 |
West Marine, Inc. (a) | 829 | | 19,150 |
Wet Seal, Inc. Class A (a) | 1,165 | | 1,934 |
Wilsons Leather Experts, Inc. (a) | 2,802 | | 14,010 |
| | 2,438,986 |
Textiles, Apparel & Luxury Goods - 0.3% |
Cherokee, Inc. | 583 | | 17,140 |
Columbia Sportswear Co. (a) | 1,249 | | 71,068 |
Deckers Outdoor Corp. (a) | 381 | | 16,581 |
Fossil, Inc. (a) | 2,251 | | 60,890 |
Common Stocks - continued |
| Shares | | Value (Note 1) |
CONSUMER DISCRETIONARY - continued |
Textiles, Apparel & Luxury Goods - continued |
Haggar Corp. | 814 | | $ 17,989 |
K-Swiss, Inc. Class A | 810 | | 21,945 |
Oshkosh B'Gosh, Inc. Class A | 639 | | 13,100 |
Perry Ellis International, Inc. (a) | 213 | | 4,066 |
Quaker Fabric Corp. (a) | 1,024 | | 5,888 |
Steven Madden Ltd. (a) | 480 | | 9,053 |
Tandy Brands Accessories, Inc. | 905 | | 12,932 |
Velcro Industries NV | 901 | | 11,263 |
Warnaco Group, Inc. (a) | 1,529 | | 30,381 |
Weyco Group, Inc. (a) | 303 | | 12,223 |
| | 304,519 |
TOTAL CONSUMER DISCRETIONARY | | 14,141,207 |
CONSUMER STAPLES - 1.5% |
Beverages - 0.1% |
Coca-Cola Bottling Co. Consolidated | 234 | | 12,266 |
MGP Ingredients, Inc. | 1,096 | | 10,237 |
Robert Mondavi Corp. Class A (a) | 392 | | 22,070 |
| | 44,573 |
Food & Staples Retailing - 1.1% |
Arden Group, Inc. Class A | 165 | | 16,294 |
Casey's General Stores, Inc. | 1,703 | | 32,987 |
Central European Distribution Corp. (a) | 519 | | 13,645 |
Costco Wholesale Corp. | 14,764 | | 717,530 |
Fresh Brands, Inc. (a) | 466 | | 3,542 |
Ingles Markets, Inc. Class A | 1,279 | | 16,358 |
Nash-Finch Co. | 339 | | 12,580 |
NeighborCare, Inc. (a) | 1,342 | | 37,697 |
Pathmark Stores, Inc. (a) | 1,698 | | 9,356 |
Performance Food Group Co. (a) | 1,331 | | 34,925 |
Topps Co., Inc. | 1,768 | | 17,627 |
United Natural Foods, Inc. (a) | 1,348 | | 37,919 |
Whole Foods Market, Inc. | 1,902 | | 172,645 |
Wild Oats Markets, Inc. (a) | 1,044 | | 7,475 |
| | 1,130,580 |
Food Products - 0.2% |
Alico, Inc. | 403 | | 22,471 |
Bridgford Foods Corp. (a) | 433 | | 3,585 |
Cal-Maine Foods, Inc. | 840 | | 11,112 |
Common Stocks - continued |
| Shares | | Value (Note 1) |
CONSUMER STAPLES - continued |
Food Products - continued |
Calavo Growers, Inc. | 1,103 | | $ 12,916 |
Farmer Brothers Co. | 654 | | 17,370 |
Gold Kist, Inc. Delaware | 1,500 | | 20,972 |
Hain Celestial Group, Inc. (a) | 942 | | 18,303 |
J&J Snack Foods Corp. (a) | 399 | | 18,729 |
John B. Sanfilippo & Son, Inc. | 308 | | 6,838 |
Lancaster Colony Corp. | 908 | | 39,661 |
Lance, Inc. | 1,018 | | 18,976 |
Peet's Coffee & Tea, Inc. (a) | 587 | | 14,839 |
Sanderson Farms, Inc. | 668 | | 24,883 |
SunOpta, Inc. (a) | 1,281 | | 7,777 |
| | 238,432 |
Household Products - 0.0% |
Central Garden & Pet Co. Class A (a) | 527 | | 20,395 |
WD-40 Co. | 667 | | 19,483 |
| | 39,878 |
Personal Products - 0.1% |
Chattem, Inc. (a) | 571 | | 20,682 |
Elizabeth Arden, Inc. (a) | 1,005 | | 22,914 |
Inter Parfums, Inc. | 544 | | 9,101 |
Mannatech, Inc. | 876 | | 20,148 |
Nature's Sunshine Products, Inc. | 995 | | 16,656 |
USANA Health Sciences, Inc. (a) | 727 | | 21,599 |
| | 111,100 |
Tobacco - 0.0% |
Star Scientific, Inc. (a)(d) | 3,889 | | 25,629 |
TOTAL CONSUMER STAPLES | | 1,590,192 |
ENERGY - 0.7% |
Energy Equipment & Services - 0.3% |
Cal Dive International, Inc. (a) | 1,236 | | 53,222 |
Global Industries Ltd. (a) | 3,345 | | 28,700 |
Gulf Island Fabrication, Inc. | 426 | | 9,061 |
Gulfmark Offshore, Inc. (a) | 656 | | 13,651 |
Horizon Offshore, Inc. (a) | 690 | | 242 |
Hydril Co. (a) | 678 | | 31,805 |
Lufkin Industries, Inc. | 263 | | 10,588 |
Matrix Service Co. (a) | 325 | | 2,421 |
Patterson-UTI Energy, Inc. | 5,259 | | 105,180 |
Common Stocks - continued |
| Shares | | Value (Note 1) |
ENERGY - continued |
Energy Equipment & Services - continued |
Seabulk International, Inc. (a) | 1,176 | | $ 14,018 |
Tesco Corp. (a) | 808 | | 8,319 |
Torch Offshore, Inc. (a) | 1,138 | | 2,252 |
| | 279,459 |
Oil & Gas - 0.4% |
APCO Argentina, Inc. | 353 | | 12,002 |
Atlas America, Inc. | 428 | | 13,585 |
ATP Oil & Gas Corp. (a) | 1,346 | | 19,181 |
Brigham Exploration Co. (a) | 2,496 | | 23,338 |
Clayton Williams Energy, Inc. (a) | 543 | | 12,429 |
Copano Energy LLC | 238 | | 5,879 |
Crosstex Energy LP | 394 | | 12,226 |
Crosstex Energy, Inc. | 671 | | 27,021 |
Delta Petroleum Corp. (a) | 1,660 | | 26,112 |
Dorchester Minerals LP | 602 | | 14,538 |
Enterra Energy Trust | 669 | | 12,310 |
FX Energy, Inc. (a) | 1,820 | | 18,273 |
Golar LNG Ltd. (Nasdaq) (a) | 2,090 | | 30,997 |
Ivanhoe Energy, Inc. (a) | 5,764 | | 14,921 |
Knightsbridge Tankers Ltd. | 576 | | 22,372 |
Marine Petroleum Trust | 541 | | 15,608 |
Mission Resources Corp. (a) | 1,676 | | 10,408 |
Petroleum Development Corp. (a) | 469 | | 19,285 |
Petroquest Energy, Inc. (a) | 2,202 | | 11,098 |
Resource America, Inc. Class A | 950 | | 27,959 |
Syntroleum Corp. (a) | 2,008 | | 13,915 |
TC Pipelines LP | 384 | | 14,784 |
The Exploration Co. of Delaware, Inc. (a) | 2,649 | | 16,159 |
Top Tankers, Inc. | 612 | | 13,801 |
| | 408,201 |
TOTAL ENERGY | | 687,660 |
FINANCIALS - 10.6% |
Capital Markets - 1.2% |
American Capital Strategies Ltd. | 2,858 | | 91,285 |
Ameritrade Holding Corp. (a) | 12,983 | | 180,853 |
Calamos Asset Management, Inc. Class A | 469 | | 11,125 |
Capital Southwest Corp. | 141 | | 11,111 |
Gladstone Capital Corp. | 658 | | 16,141 |
Common Stocks - continued |
| Shares | | Value (Note 1) |
FINANCIALS - continued |
Capital Markets - continued |
Harris & Harris Group, Inc. (a) | 1,045 | | $ 15,424 |
Investors Financial Services Corp. | 2,224 | | 97,500 |
Knight Trading Group, Inc. (a) | 3,926 | | 44,796 |
MarketAxess Holdings, Inc. | 650 | | 12,740 |
MFC Bancorp Ltd. (a) | 487 | | 10,203 |
Northern Trust Corp. | 7,100 | | 333,984 |
Sanders Morris Harris Group, Inc. | 903 | | 13,771 |
SEI Investments Co. | 3,312 | | 129,532 |
T. Rowe Price Group, Inc. | 3,865 | | 228,653 |
TradeStation Group, Inc. (a) | 1,353 | | 10,039 |
| | 1,207,157 |
Commercial Banks - 5.8% |
1st Source Corp. | 501 | | 13,151 |
ABC Bancorp | 818 | | 16,933 |
Alabama National Bancorp, Delaware | 384 | | 24,280 |
Alliance Financial Corp. | 376 | | 10,622 |
Amcore Financial, Inc. | 936 | | 30,448 |
American National Bankshares, Inc. | 549 | | 13,505 |
American River Bankshares | 538 | | 12,589 |
AmericanWest Bancorp (a) | 569 | | 11,949 |
Arrow Financial Corp. | 329 | | 10,564 |
Associated Banc-Corp. | 3,072 | | 102,083 |
Banc Corp. (a) | 804 | | 6,319 |
BancFirst Corp. | 180 | | 12,778 |
Bank of Granite Corp. | 778 | | 16,883 |
Bank of the Ozarks, Inc. | 400 | | 14,260 |
BNC Bancorp | 346 | | 5,778 |
BOK Financial Corp. (a) | 1,672 | | 81,594 |
Boston Private Financial Holdings, Inc. | 584 | | 15,821 |
Capital Bank Corp. | 729 | | 12,138 |
Capital City Bank Group, Inc. | 671 | | 29,524 |
Capital Corp. of the West | 434 | | 22,347 |
Cardinal Financial Corp. (a) | 1,972 | | 19,759 |
Cascade Bancorp | 616 | | 13,429 |
Cascade Financial Corp. | 809 | | 15,387 |
Cathay General Bancorp | 1,482 | | 57,383 |
Cavalry Bancorp, Inc. | 710 | | 15,115 |
Center Bancorp, Inc. | 525 | | 6,762 |
Center Financial Corp., California | 1,142 | | 23,514 |
Central Coast Bancorp (a) | 773 | | 17,972 |
Common Stocks - continued |
| Shares | | Value (Note 1) |
FINANCIALS - continued |
Commercial Banks - continued |
Century Bancorp, Inc. Class A (non-vtg.) | 318 | | $ 9,877 |
Chemical Financial Corp. | 648 | | 27,151 |
Chester Valley Bancorp, Inc. | 736 | | 15,735 |
Citizens Banking Corp. | 1,197 | | 42,015 |
City Holding Co. | 275 | | 10,153 |
CNB Financial Corp. | 587 | | 8,664 |
CoBiz, Inc. | 1,170 | | 25,740 |
Colony Bankcorp, Inc. | 620 | | 19,530 |
Columbia Bancorp | 413 | | 14,971 |
Columbia Bancorp, Oregon | 1,041 | | 20,039 |
Columbia Banking Systems, Inc. | 724 | | 18,382 |
Commerce Bancshares, Inc. | 1,996 | | 97,624 |
Commercial Bankshares, Inc. | 505 | | 19,064 |
Community Bank of Northern Virginia | 492 | | 8,216 |
Community Banks, Inc. | 418 | | 12,256 |
Community Trust Bancorp, Inc. | 348 | | 11,651 |
Compass Bancshares, Inc. | 3,580 | | 166,685 |
CVB Financial Corp. | 1,636 | | 44,466 |
East West Bancorp, Inc. | 1,533 | | 63,574 |
Eastern Virgina Bankshares, Inc. | 469 | | 11,158 |
Exchange National Bancshares, Inc. | 288 | | 8,358 |
Farmers Capital Bank Corp. | 357 | | 13,566 |
Fidelity Southern Corp. | 1,009 | | 18,293 |
Fifth Third Bancorp | 17,855 | | 899,178 |
Financial Institutions, Inc. | 425 | | 10,838 |
First Bancorp, North Carolina | 705 | | 19,966 |
First Charter Corp. | 1,343 | | 36,785 |
First Citizen Bancshares, Inc. | 209 | | 28,438 |
First Citizens Banc Corp. | 384 | | 8,832 |
First Community Bancorp, California | 408 | | 17,144 |
First Community Bancshares, Inc. | 357 | | 12,716 |
First Financial Bancorp, Ohio | 1,319 | | 22,529 |
First Financial Bankshares, Inc. | 311 | | 13,529 |
First Financial Corp., Indiana | 404 | | 14,673 |
First Indiana Corp. | 758 | | 17,563 |
First M&F Corp. | 549 | | 18,666 |
First Merchants Corp. | 459 | | 12,370 |
First Midwest Bancorp, Inc., Delaware | 1,260 | | 47,300 |
First Oak Brook Bancshares, Inc. | 529 | | 17,351 |
First of Long Island Corp. | 286 | | 14,051 |
First South Bancorp, Inc., Virginia | 528 | | 13,459 |
Common Stocks - continued |
| Shares | | Value (Note 1) |
FINANCIALS - continued |
Commercial Banks - continued |
First State Bancorp. | 465 | | $ 17,470 |
First United Corp. | 493 | | 10,033 |
Firstbank Corp., Michigan | 423 | | 12,457 |
FirstMerit Corp. | 2,562 | | 70,122 |
Flag Financial Corp. | 932 | | 13,281 |
FNB Corp., North Carolina | 602 | | 11,769 |
FNB Corp., Virginia | 559 | | 16,211 |
FNB Financial Services Corp. | 597 | | 12,537 |
Foothill Independent Bancorp | 638 | | 14,719 |
Frontier Financial Corp., Washington | 294 | | 11,719 |
Fulton Financial Corp. | 3,213 | | 71,971 |
GB&T Bancshares, Inc. | 498 | | 12,634 |
German American Bancorp | 686 | | 11,662 |
Glacier Bancorp, Inc. | 847 | | 29,315 |
Gold Banc Corp., Inc. | 957 | | 14,317 |
Great Southern Bancorp, Inc. | 418 | | 17,138 |
Greater Bay Bancorp | 1,571 | | 45,638 |
Greater Community Bancorp | 773 | | 11,440 |
Greene County Bancshares, Inc. | 456 | | 11,706 |
Grupo Financiero Galicia SA sponsored ADR (a) | 1,235 | | 8,954 |
Hancock Holding Co. | 882 | | 29,988 |
Hanmi Financial Corp. | 640 | | 23,795 |
Harleysville National Corp., Pennsylvania | 579 | | 16,305 |
Heartland Financial USA, Inc. | 717 | | 15,824 |
Heritage Commerce Corp. (a) | 1,051 | | 20,558 |
Huntington Bancshares, Inc. | 7,175 | | 174,066 |
IBERIABANK Corp. | 124 | | 8,010 |
Independent Bank Corp., Massachusetts | 515 | | 17,798 |
Independent Bank Corp., Michigan | 385 | | 11,589 |
Integra Bank Corp. | 485 | | 11,097 |
Interchange Financial Services Corp. | 462 | | 12,335 |
International Bancshares Corp. | 1,415 | | 55,963 |
Lakeland Bancorp, Inc. | 772 | | 14,012 |
Lakeland Financial Corp. | 382 | | 15,223 |
LNB Bancorp, Inc. | 836 | | 16,745 |
LSB Bancshares, Inc. | 666 | | 11,222 |
Macatawa Bank Corp. | 337 | | 10,265 |
Main Street Banks, Inc. | 516 | | 16,347 |
MainSource Financial Group, Inc. | 613 | | 15,080 |
MB Financial, Inc. | 851 | | 35,912 |
MBT Financial Corp. | 578 | | 13,785 |
Common Stocks - continued |
| Shares | | Value (Note 1) |
FINANCIALS - continued |
Commercial Banks - continued |
Mercantile Bank Corp. | 413 | | $ 16,850 |
Mercantile Bankshares Corp. | 2,229 | | 114,794 |
Merchants Bancshares, Inc. | 610 | | 18,117 |
Mid-State Bancshares | 481 | | 14,353 |
Midwest Banc Holdings, Inc. | 779 | | 17,979 |
Nara Bancorp, Inc. | 877 | | 18,207 |
National Bankshares, Inc. | 381 | | 19,702 |
National Penn Bancshares, Inc. | 1,245 | | 35,856 |
NBT Bancorp, Inc. | 1,162 | | 29,503 |
Northern States Financial Corp. | 462 | | 12,705 |
Oak Hill Financial, Inc. | 544 | | 20,721 |
Old Point Financial Corp. | 537 | | 16,438 |
Old Second Bancorp, Inc. | 796 | | 25,942 |
Omega Financial Corp. | 625 | | 22,069 |
Pacific Capital Bancorp | 1,321 | | 43,606 |
Pennrock Financial Services Corp. | 449 | | 18,180 |
Penns Woods Bancorp, Inc. | 301 | | 14,990 |
Peoples Bancorp, Inc. | 541 | | 16,950 |
Pinnacle Financial Partners, Inc. (a) | 510 | | 12,408 |
Popular, Inc. | 7,895 | | 209,218 |
Premierwest Bancorp (a) | 679 | | 7,544 |
PrivateBancorp, Inc. | 782 | | 26,932 |
Prosperity Bancshares, Inc. | 507 | | 14,379 |
Provident Bankshares Corp. | 1,078 | | 39,606 |
Republic Bancorp, Inc. | 2,132 | | 33,131 |
Republic Bancorp, Inc., Kentucky Class A | 592 | | 16,428 |
Republic First Bancorp, Inc. (a) | 973 | | 14,887 |
Riggs National Corp. | 803 | | 16,156 |
Royal Bancshares of Pennsylvania, Inc. Class A | 462 | | 13,398 |
Rurban Financial Corp. (a) | 723 | | 10,165 |
S&T Bancorp, Inc. | 901 | | 33,076 |
Sandy Spring Bancorp, Inc. | 279 | | 10,133 |
SCBT Financial Corp. | 432 | | 15,975 |
Seacoast Banking Corp., Florida | 720 | | 15,854 |
Security Bank Corp., Georgia | 370 | | 15,925 |
Shore Bancshares, Inc. | 507 | | 16,153 |
Sierra Bancorp | 727 | | 15,267 |
Signature Bank, New York | 906 | | 28,457 |
Silicon Valley Bancshares (a) | 1,013 | | 42,526 |
Simmons First National Corp. Class A | 562 | | 16,298 |
Sky Financial Group, Inc. | 3,225 | | 93,396 |
Common Stocks - continued |
| Shares | | Value (Note 1) |
FINANCIALS - continued |
Commercial Banks - continued |
Slade's Ferry Bancorp | 647 | | $ 13,134 |
South Financial Group, Inc. | 2,023 | | 64,099 |
Southern Community Financial Corp. | 910 | | 10,010 |
Southwest Bancorp of Texas, Inc. | 2,146 | | 52,491 |
Southwest Bancorp, Inc., Oklahoma | 811 | | 21,775 |
State Financial Services Corp. Class A | 495 | | 14,603 |
Sterling Bancshares, Inc. | 1,496 | | 21,812 |
Sterling Financial Corp., Pennsylvania | 587 | | 17,193 |
Suffolk Bancorp | 342 | | 11,348 |
Summit Bancshares, Inc. | 461 | | 15,697 |
Sun Bancorp, Inc., New Jersey (a) | 519 | | 12,897 |
Susquehanna Bancshares, Inc., Pennsylvania | 1,486 | | 38,636 |
Taylor Capital Group, Inc. | 570 | | 19,676 |
Texas Capital Bancshares, Inc. (a) | 793 | | 16,352 |
Texas Regional Bancshares, Inc. Class A | 1,424 | | 50,637 |
Trico Bancshares | 1,018 | | 24,381 |
Trustco Bank Corp., New York | 2,134 | | 30,089 |
Trustmark Corp. | 1,762 | | 54,270 |
UCBH Holdings, Inc. | 1,263 | | 57,264 |
UMB Financial Corp. (a) | 512 | | 28,677 |
Umpqua Holdings Corp. | 1,365 | | 34,903 |
Union Bankshares Corp. | 440 | | 16,504 |
United Bankshares, Inc., West Virginia | 1,231 | | 47,110 |
United Community Banks, Inc., Georgia (a) | 1,186 | | 33,991 |
United Financial Corp. | 468 | | 11,513 |
United Security Bancshares, Inc. | 450 | | 13,442 |
United Security Bancshares, California | 454 | | 11,300 |
Univest Corp. of Pennsylvania | 375 | | 17,659 |
Unizan Financial Corp. | 626 | | 16,138 |
Vail Banks, Inc. (d) | 945 | | 12,304 |
Virginia Commerce Bancorp, Inc. (a) | 737 | | 21,005 |
Virginia Financial Group, Inc. | 342 | | 11,714 |
Washington Trust Bancorp, Inc. | 617 | | 18,152 |
WesBanco, Inc. | 451 | | 14,256 |
West Bancorp., Inc. | 821 | | 14,236 |
West Coast Bancorp, Oregon | 748 | | 19,680 |
Westamerica Bancorp. | 801 | | 46,586 |
Westbank Corp. | 580 | | 10,684 |
Western Sierra Bancorp (a) | 411 | | 16,440 |
Whitney Holding Corp. | 955 | | 44,064 |
Wilshire Bancorp, Inc. (a) | 473 | | 15,415 |
Common Stocks - continued |
| Shares | | Value (Note 1) |
FINANCIALS - continued |
Commercial Banks - continued |
Wintrust Financial Corp. | 645 | | $ 38,597 |
Yadkin Valley Bank & Trust Co. | 667 | | 9,505 |
Yardville National Bancorp | 458 | | 15,256 |
Zions Bancorp | 2,620 | | 174,230 |
| | 5,970,454 |
Consumer Finance - 0.3% |
ACE Cash Express, Inc. (a) | 435 | | 11,604 |
Advanta Corp.: | | | |
Class A | 426 | | 9,534 |
Class B | 718 | | 17,146 |
Asta Funding, Inc. | 686 | | 15,065 |
Collegiate Funding Services, Inc. | 1,369 | | 17,660 |
CompuCredit Corp. (a) | 1,538 | | 36,866 |
Credit Acceptance Corp. (a) | 1,334 | | 33,017 |
Education Lending Group, Inc. (a) | 661 | | 9,294 |
First Cash Financial Services, Inc. (a) | 724 | | 18,853 |
QC Holdings, Inc. | 1,007 | | 17,451 |
United Panam Financial Corp. (a) | 805 | | 15,979 |
WFS Financial, Inc. (a) | 1,271 | | 59,140 |
World Acceptance Corp. (a) | 583 | | 15,036 |
| | 276,645 |
Diversified Financial Services - 0.1% |
California First National Bancorp | 627 | | 8,307 |
Encore Capital Group, Inc. (a) | 911 | | 22,848 |
eSpeed, Inc. Class A (a) | 879 | | 9,836 |
EuroBancshares, Inc. | 374 | | 7,626 |
First Albany Companies, Inc. | 714 | | 6,562 |
Instinet Group, Inc. (a) | 11,680 | | 69,963 |
Marlin Business Services Corp. | 759 | | 12,941 |
Medallion Financial Corp. | 1,687 | | 15,841 |
Newtek Business Services, Inc. (a) | 1,293 | | 5,308 |
| | 159,232 |
Insurance - 1.3% |
Affirmative Insurance Holdings, Inc. | 381 | | 6,370 |
Alfa Corp. | 2,654 | | 40,208 |
American National Insurance Co. | 763 | | 77,559 |
American Physicians Capital, Inc. (a) | 423 | | 14,090 |
Arch Capital Group Ltd. (a) | 835 | | 32,523 |
Argonaut Group, Inc. (a) | 707 | | 14,055 |
Baldwin & Lyons, Inc. Class B | 518 | | 13,468 |
Common Stocks - continued |
| Shares | | Value (Note 1) |
FINANCIALS - continued |
Insurance - continued |
Ceres Group, Inc. (a) | 1,684 | | $ 8,420 |
Cincinnati Financial Corp. | 5,423 | | 242,950 |
Direct General Corp. | 647 | | 18,440 |
Donegal Group, Inc. Class A | 627 | | 13,481 |
EMC Insurance Group | 582 | | 12,635 |
Enstar Group, Inc. (a) | 235 | | 14,547 |
Erie Indemnity Co. Class A | 1,866 | | 97,368 |
FPIC Insurance Group, Inc. (a) | 638 | | 21,073 |
Harleysville Group, Inc. | 974 | | 23,415 |
Infinity Property & Casualty Corp. | 709 | | 26,233 |
IPC Holdings Ltd. | 1,161 | | 49,424 |
Kansas City Life Insurance Co. | 310 | | 15,326 |
Max Re Capital Ltd. | 1,323 | | 25,216 |
Millea Holdings, Inc. ADR | 481 | | 34,088 |
National Western Life Insurance Co. Class A (a) | 73 | | 11,840 |
Navigators Group, Inc. (a) | 419 | | 11,837 |
Ohio Casualty Corp. (a) | 1,983 | | 42,595 |
Philadelphia Consolidated Holding Corp. (a) | 627 | | 42,793 |
PMA Capital Corp. Class A (a) | 1,857 | | 18,477 |
Presidential Life Corp. | 1,433 | | 23,945 |
Quanta Capital Holdings Ltd. (a) | 2,049 | | 19,220 |
SAFECO Corp. | 3,931 | | 190,536 |
Safety Insurance Group, Inc. | 813 | | 22,358 |
Selective Insurance Group, Inc. | 823 | | 36,862 |
State Auto Financial Corp. | 1,314 | | 35,215 |
The Midland Co. (a) | 738 | | 23,468 |
Triad Guaranty, Inc. (a) | 519 | | 31,140 |
United Fire & Casualty Co. | 332 | | 22,111 |
United National Group Ltd. Class A | 701 | | 12,443 |
Universal American Financial Corp. (a) | 1,700 | | 22,695 |
USI Holdings Corp. (a) | 1,690 | | 19,401 |
| | 1,387,825 |
Real Estate - 0.2% |
Capital Automotive (SBI) | 1,431 | | 48,239 |
Elbit Medical Imaging Ltd. (a) | 1,441 | | 14,136 |
Falcon Financial Investment Trust | 2,317 | | 16,103 |
Gladstone Commercial Corp. | 979 | | 16,388 |
Investors Real Estate Trust | 1,872 | | 19,768 |
Monmouth Real Estate Investment Corp. Class A | 2,165 | | 17,905 |
Price Legacy Corp. | 1,275 | | 24,353 |
Common Stocks - continued |
| Shares | | Value (Note 1) |
FINANCIALS - continued |
Real Estate - continued |
Saxon Capital, Inc. | 1,844 | | $ 41,859 |
Tarragon Realty Investors, Inc. (a) | 588 | | 8,461 |
ZipRealty, Inc. | 624 | | 10,539 |
| | 217,751 |
Thrifts & Mortgage Finance - 1.7% |
Accredited Home Lenders Holding Co. (a) | 644 | | 27,660 |
Anchor BanCorp Wisconsin, Inc. | 723 | | 21,119 |
Bank Mutual Corp. | 2,126 | | 26,214 |
BankUnited Financial Corp. Class A (a) | 773 | | 23,762 |
Beverly Hills Bancorp, Inc. | 1,968 | | 19,503 |
Brookline Bancorp, Inc., Delaware | 1,822 | | 29,516 |
Camco Financial Corp. | 727 | | 11,072 |
Capital Crossing Bank (a) | 282 | | 7,532 |
Capitol Federal Financial | 2,304 | | 81,285 |
CFS Bancorp, Inc. | 1,199 | | 16,522 |
Charter Financial Corp. | 864 | | 35,346 |
Citizens First Bancorp, Inc. | 720 | | 18,756 |
Citizens South Banking Corp. | 637 | | 8,345 |
City Bank Lynnwood | 482 | | 18,576 |
Clifton Savings Bancorp, Inc. | 1,352 | | 17,441 |
Coastal Financial Corp. | 1,070 | | 16,264 |
Commercial Capital Bancorp, Inc. | 1,875 | | 44,738 |
Corus Bankshares, Inc. | 695 | | 33,826 |
Dime Community Bancorp, Inc. | 1,218 | | 22,350 |
E-Loan, Inc. (a) | 2,671 | | 7,212 |
ESB Financial Corp. | 1,247 | | 17,595 |
FFLC Bancorp, Inc. | 504 | | 16,446 |
Fidelity Bankshares, Inc. | 418 | | 17,151 |
First Busey Corp. | 532 | | 10,879 |
First Defiance Financial Corp. | 519 | | 14,200 |
First Federal Bancshares of Arkansas, Inc. | 569 | | 12,387 |
First Financial Holdings, Inc. | 388 | | 12,703 |
First Financial Service Corp. | 216 | | 5,538 |
First Niagara Financial Group, Inc. | 2,512 | | 36,273 |
First Pactrust Bancorp, Inc. | 609 | | 15,773 |
First Place Financial Corp. | 477 | | 10,733 |
Flushing Financial Corp. | 759 | | 16,129 |
FMS Financial Corp. | 631 | | 11,244 |
Harbor Florida Bancshares, Inc. | 661 | | 23,201 |
Heritage Financial Corp., Washington | 686 | | 14,893 |
Common Stocks - continued |
| Shares | | Value (Note 1) |
FINANCIALS - continued |
Thrifts & Mortgage Finance - continued |
HMN Financial, Inc. | 448 | | $ 14,318 |
Horizon Financial Corp. | 760 | | 15,588 |
Hudson City Bancorp, Inc. | 5,843 | | 234,772 |
Hudson River Bancorp, Inc. | 832 | | 16,848 |
Independence Community Bank Corp. | 2,302 | | 97,789 |
ITLA Capital Corp. (a) | 89 | | 4,862 |
KNBT Bancorp, Inc. | 794 | | 13,593 |
LSB Corp. | 631 | | 11,648 |
MAF Bancorp., Inc. | 775 | | 35,573 |
MASSBANK Corp. | 367 | | 13,616 |
MutualFirst Financial, Inc. | 550 | | 12,953 |
NASB Financial, Inc. | 336 | | 13,457 |
NetBank, Inc. | 1,454 | | 14,933 |
NewAlliance Bancshares, Inc. | 3,646 | | 54,799 |
NewMil Bancorp, Inc. | 413 | | 12,435 |
Northeast Pennsylvania Financial Corp. | 744 | | 12,641 |
Northwest Bancorp, Inc. | 1,622 | | 41,961 |
OceanFirst Financial Corp. | 531 | | 13,466 |
Pamrapo Bancorp, Inc. | 749 | | 17,976 |
Partners Trust Financial Group, Inc. | 1,816 | | 20,321 |
Pennfed Financial Services, Inc. | 894 | | 15,359 |
People's Bank, Connecticut | 2,847 | | 113,197 |
Provident Bancorp, Inc., Delaware | 1,578 | | 20,924 |
Provident Financial Holdings, Inc. | 315 | | 9,198 |
PVF Capital Corp. | 455 | | 6,507 |
Riverview Bancorp, Inc. | 510 | | 10,986 |
Severn Bancorp, Inc. | 431 | | 17,218 |
Sound Federal Bancorp, Inc. | 1,315 | | 19,989 |
Sterling Financial Corp., Washington (a) | 581 | | 23,211 |
TierOne Corp. | 485 | | 12,033 |
Timberland Bancorp, Inc. | 556 | | 13,622 |
United Community Financial Corp., Ohio | 870 | | 9,996 |
Washington Federal, Inc. | 2,292 | | 61,815 |
Waypoint Financial Corp. | 950 | | 26,382 |
Willow Grove Bancorp, Inc. | 741 | | 13,360 |
WSFS Financial Corp. | 244 | | 14,945 |
| | 1,784,475 |
TOTAL FINANCIALS | | 11,003,539 |
Common Stocks - continued |
| Shares | | Value (Note 1) |
HEALTH CARE - 12.7% |
Biotechnology - 7.1% |
Abgenix, Inc. (a) | 2,859 | | $ 29,019 |
Acacia Research Corp. - CombiMatrix (a) | 1,427 | | 4,795 |
AEterna Zentaris Laboratories, Inc. (a) | 1,592 | | 10,148 |
Affymetrix, Inc. (a) | 2,111 | | 71,668 |
Albany Molecular Research, Inc. (a) | 747 | | 8,008 |
Alexion Pharmaceuticals, Inc. (a) | 1,001 | | 20,701 |
Alkermes, Inc. (a) | 3,610 | | 49,782 |
Amgen, Inc. (a) | 40,620 | | 2,438,825 |
Amylin Pharmaceuticals, Inc. (a) | 3,168 | | 64,564 |
Angiotech Pharmaceuticals, Inc. (a) | 2,712 | | 50,149 |
Aphton Corp. (a) | 1,970 | | 6,501 |
Arena Pharmaceuticals, Inc. (a) | 802 | | 4,491 |
ARIAD Pharmaceuticals, Inc. (a) | 1,982 | | 11,436 |
Array Biopharma, Inc. (a) | 1,496 | | 12,507 |
Avant Immunotherapeutics, Inc. (a) | 3,213 | | 5,944 |
Axonyx, Inc. (a) | 2,219 | | 16,332 |
Bioenvision, Inc. (a) | 1,026 | | 10,568 |
Biogen Idec, Inc. (a) | 10,645 | | 624,649 |
BioMarin Pharmaceutical, Inc. (a) | 1,690 | | 9,008 |
Biopure Corp. Class A (a) | 497 | | 253 |
Caliper Life Sciences, Inc. (a) | 1,195 | | 8,353 |
CancerVax Corp. | 1,246 | | 11,800 |
Celgene Corp. (a) | 5,141 | | 140,966 |
Cell Genesys, Inc. (a) | 1,539 | | 11,296 |
Cell Therapeutics, Inc. (a)(d) | 2,256 | | 16,875 |
Cephalon, Inc. (a) | 1,715 | | 81,514 |
Cepheid, Inc. (a) | 1,455 | | 13,401 |
Chiron Corp. (a) | 5,915 | | 192,652 |
Ciphergen Biosystems, Inc. (a) | 1,078 | | 3,471 |
Compugen Ltd. (a) | 1,757 | | 8,170 |
Corgentech, Inc. | 1,296 | | 23,587 |
Corixa Corp. (a) | 1,583 | | 5,936 |
Cubist Pharmaceuticals, Inc. (a) | 1,091 | | 13,092 |
CuraGen Corp. (a) | 1,634 | | 9,853 |
Curis, Inc. (a) | 1,951 | | 7,902 |
CV Therapeutics, Inc. (a) | 1,590 | | 34,471 |
Cytokinetics, Inc. | 1,078 | | 9,271 |
deCODE genetics, Inc. (a) | 1,985 | | 12,903 |
Dendreon Corp. (a) | 1,793 | | 17,589 |
Digene Corp. (a) | 715 | | 17,291 |
Diversa Corp. (a) | 1,093 | | 9,258 |
Common Stocks - continued |
| Shares | | Value (Note 1) |
HEALTH CARE - continued |
Biotechnology - continued |
DOV Pharmaceutical, Inc. (a) | 1,030 | | $ 19,065 |
Dyax Corp. (a) | 782 | | 6,201 |
Dynavax Technologies Corp. | 1,807 | | 12,685 |
Encysive Pharmaceuticals, Inc. (a) | 2,504 | | 27,168 |
Enzon Pharmaceuticals, Inc. (a) | 1,396 | | 18,902 |
Exact Sciences Corp. (a) | 1,230 | | 4,256 |
Exelixis, Inc. (a) | 2,435 | | 21,842 |
Eyetech Pharmaceuticals, Inc. | 1,283 | | 51,731 |
Forbes Medi-Tech, Inc. (a) | 1,040 | | 2,982 |
Gen-Probe, Inc. (a) | 1,632 | | 65,117 |
Genaera Corp. (a) | 2,470 | | 8,917 |
Gene Logic, Inc. (a) | 1,810 | | 6,100 |
Genelabs Technologies, Inc. (a) | 3,567 | | 2,533 |
Genencor International, Inc. (a) | 2,267 | | 36,725 |
Genitope Corp. | 1,205 | | 19,015 |
Genta, Inc. (a) | 2,036 | | 2,647 |
GenVec, Inc. (a) | 3,656 | | 7,093 |
Genzyme Corp. - General Division (a) | 7,347 | | 411,505 |
Geron Corp. (a) | 1,706 | | 11,857 |
Gilead Sciences, Inc. (a) | 13,540 | | 466,588 |
GTx, Inc. | 830 | | 11,122 |
Harvard Bioscience, Inc. (a) | 973 | | 3,863 |
Human Genome Sciences, Inc. (a) | 3,896 | | 42,856 |
ICOS Corp. (a) | 2,182 | | 52,695 |
ID Biomedical Corp. (a) | 1,335 | | 21,726 |
Idenix Pharmaceuticals, Inc. | 1,720 | | 24,854 |
Ilex Oncology, Inc. (a) | 1,420 | | 35,301 |
ImClone Systems, Inc. (a) | 2,530 | | 106,817 |
ImmunoGen, Inc. (a) | 2,035 | | 15,914 |
Immunomedics, Inc. (a) | 1,704 | | 4,788 |
Incyte Corp. (a) | 2,540 | | 26,086 |
Indevus Pharmaceuticals, Inc. (a) | 1,656 | | 11,443 |
InterMune, Inc. (a) | 1,181 | | 14,656 |
Introgen Therapeutics, Inc. (a)(d) | 1,380 | | 9,632 |
Invitrogen Corp. (a) | 1,656 | | 100,188 |
Isis Pharmaceuticals, Inc. (a) | 1,608 | | 7,590 |
Keryx Biopharmaceuticals, Inc. (a) | 1,032 | | 12,621 |
Kosan Biosciences, Inc. (a) | 755 | | 4,862 |
La Jolla Pharmaceutical Co. (a) | 1,785 | | 2,517 |
Lexicon Genetics, Inc. (a) | 2,296 | | 16,141 |
LifeCell Corp. (a) | 1,282 | | 13,256 |
Common Stocks - continued |
| Shares | | Value (Note 1) |
HEALTH CARE - continued |
Biotechnology - continued |
Ligand Pharmaceuticals, Inc. Class B (a) | 2,518 | | $ 28,202 |
Luminex Corp. (a) | 900 | | 8,109 |
MannKind Corp. | 1,236 | | 19,405 |
Marshall Edwards, Inc. | 1,945 | | 17,622 |
Martek Biosciences (a) | 979 | | 38,054 |
Maxim Pharmaceuticals, Inc. (a) | 725 | | 2,110 |
Maxygen, Inc. (a) | 939 | | 9,475 |
Medarex, Inc. (a) | 2,676 | | 29,168 |
MedImmune, Inc. (a) | 7,821 | | 208,039 |
Millennium Pharmaceuticals, Inc. (a) | 9,972 | | 125,847 |
Myogen, Inc. | 1,135 | | 9,262 |
Myriad Genetics, Inc. (a) | 1,095 | | 21,068 |
Nabi Biopharmaceuticals (a) | 1,796 | | 25,862 |
Nanogen, Inc. (a) | 940 | | 4,221 |
Neogen Corp. (a) | 709 | | 15,343 |
Neopharm, Inc. (a) | 731 | | 8,516 |
NeoRX Corp. (a) | 507 | | 887 |
Neose Technologies, Inc. (a) | 1,126 | | 7,871 |
Neurochem, Inc. (a) | 1,043 | | 20,914 |
Neurocrine Biosciences, Inc. (a) | 1,170 | | 53,820 |
Neurogen Corp. (a) | 1,639 | | 14,341 |
Northfield Laboratories, Inc. (a) | 914 | | 17,092 |
Novavax, Inc. (a) | 2,057 | | 7,035 |
NPS Pharmaceuticals, Inc. (a) | 1,233 | | 22,083 |
Nuvelo, Inc. (a) | 1,327 | | 12,938 |
ONYX Pharmaceuticals, Inc. (a) | 1,093 | | 34,189 |
OraSure Technologies, Inc. (a) | 1,286 | | 9,208 |
Orchid BioSciences, Inc. (a) | 1,015 | | 10,871 |
Oscient Pharmaceuticals Corp. (a) | 1,920 | | 6,259 |
OSI Pharmaceuticals, Inc. (a) | 1,395 | | 66,374 |
Peregrine Pharmaceuticals, Inc. (a) | 4,452 | | 5,654 |
Pharmacopeia Drug Discovery, Inc. (a) | 368 | | 2,127 |
Pharmacyclics, Inc. (a) | 1,146 | | 11,941 |
Pharmion Corp. | 1,001 | | 42,382 |
PRAECIS Pharmaceuticals, Inc. (a) | 1,768 | | 3,730 |
Progenics Pharmaceuticals, Inc. (a) | 554 | | 8,282 |
Protein Design Labs, Inc. (a) | 3,025 | | 54,813 |
QIAGEN NV (a) | 4,566 | | 49,358 |
QLT, Inc. (a) | 2,958 | | 47,939 |
Regeneron Pharmaceuticals, Inc. (a) | 1,881 | | 17,343 |
Renovis, Inc. | 1,133 | | 16,429 |
Common Stocks - continued |
| Shares | | Value (Note 1) |
HEALTH CARE - continued |
Biotechnology - continued |
Rigel Pharmaceuticals, Inc. (a) | 589 | | $ 14,737 |
Savient Pharmaceuticals, Inc. (a) | 2,981 | | 6,558 |
SciClone Pharmaceuticals, Inc. (a) | 1,927 | | 7,862 |
Seattle Genetics, Inc. (a) | 1,337 | | 9,132 |
Senomyx, Inc. | 987 | | 9,771 |
Sequenom, Inc. (a) | 1,742 | | 1,550 |
Serologicals Corp. (a) | 712 | | 16,618 |
Sirna Therapeutics, Inc. (a) | 2,265 | | 6,999 |
Stratagene Corp. (a) | 589 | | 4,040 |
Tanox, Inc. (a) | 1,465 | | 20,290 |
Targeted Genetics Corp. (a) | 5,047 | | 6,662 |
Techne Corp. (a) | 1,177 | | 43,726 |
Telik, Inc. (a) | 1,419 | | 27,117 |
Third Wave Technologies, Inc. (a) | 1,721 | | 13,871 |
Transkaryotic Therapies, Inc. (a) | 1,322 | | 30,155 |
Trimeris, Inc. (a) | 537 | | 6,664 |
United Therapeutics Corp. (a) | 769 | | 33,844 |
Vasogen, Inc. (a) | 1,722 | | 8,218 |
Vertex Pharmaceuticals, Inc. (a) | 2,749 | | 29,194 |
Vicuron Pharmaceuticals, Inc. (a) | 1,788 | | 31,451 |
Vion Pharmaceuticals, Inc. (a) | 2,003 | | 9,494 |
XOMA Ltd. (a) | 1,917 | | 3,834 |
Zymogenetics, Inc. (a) | 1,890 | | 42,979 |
| | 7,339,805 |
Health Care Equipment & Supplies - 2.1% |
Abaxis, Inc. (a) | 680 | | 8,527 |
Abiomed, Inc. (a) | 907 | | 13,768 |
Advanced Neuromodulation Systems, Inc. (a) | 762 | | 27,508 |
Aksys Ltd. (a)(d) | 1,303 | | 8,613 |
Align Technology, Inc. (a) | 2,037 | | 21,531 |
American Medical Systems Holdings, Inc. (a) | 1,075 | | 41,022 |
Analogic Corp. | 380 | | 17,222 |
Animas Corp. | 862 | | 13,964 |
Arrow International, Inc. | 1,354 | | 40,945 |
Arthrocare Corp. (a) | 596 | | 18,041 |
Aspect Medical Systems, Inc. (a) | 1,014 | | 24,742 |
BioLase Technology, Inc. (d) | 592 | | 5,352 |
Biomet, Inc. | 8,023 | | 384,061 |
Biosite, Inc. (a) | 581 | | 32,356 |
BioVeris Corp. (a) | 1,519 | | 9,387 |
Common Stocks - continued |
| Shares | | Value (Note 1) |
HEALTH CARE - continued |
Health Care Equipment & Supplies - continued |
Bruker BioSciences Corp. (a) | 2,094 | | $ 9,653 |
Candela Corp. (a) | 1,339 | | 13,095 |
Cardiac Science, Inc. (a) | 2,400 | | 5,088 |
Cardiodynamics International Corp. (a) | 1,574 | | 7,193 |
Closure Medical Corp. (a) | 589 | | 10,478 |
CNS., Inc. | 1,331 | | 16,065 |
Conceptus, Inc. (a) | 789 | | 7,046 |
CONMED Corp. (a) | 896 | | 25,957 |
CTI Molecular Imaging, Inc. (a) | 1,269 | | 16,979 |
Cyberonics, Inc. (a) | 756 | | 14,039 |
Cytyc Corp. (a) | 3,461 | | 92,893 |
Dade Behring Holdings, Inc. (a) | 1,328 | | 71,300 |
Datascope Corp. | 390 | | 15,635 |
DENTSPLY International, Inc. | 2,418 | | 127,211 |
Encore Medical Corp. (a) | 1,355 | | 8,530 |
Endocardial Solutions, Inc. (a) | 1,000 | | 11,370 |
Endologix, Inc. (a) | 1,944 | | 12,558 |
Epix Pharmaceuticals, Inc. (a) | 576 | | 10,138 |
Exactech, Inc. (a) | 534 | | 10,061 |
Foxhollow Technologies, Inc. | 653 | | 16,913 |
Given Imaging Ltd. (a) | 952 | | 31,711 |
Hologic, Inc. (a) | 735 | | 18,368 |
I-Flow Corp. (a) | 657 | | 13,488 |
ICU Medical, Inc. (a) | 375 | | 9,356 |
IDEXX Laboratories, Inc. (a) | 1,109 | | 57,224 |
Illumina, Inc. (a) | 1,642 | | 12,479 |
Immucor, Inc. (a) | 1,011 | | 32,504 |
INAMED Corp. (a) | 1,167 | | 62,610 |
Integra LifeSciences Holdings Corp. (a) | 979 | | 33,276 |
IntraLase Corp. | 1,053 | | 18,796 |
Intuitive Surgical, Inc. (a) | 1,183 | | 42,505 |
Kensey Nash Corp. (a) | 550 | | 17,193 |
Kyphon, Inc. (a) | 1,600 | | 38,496 |
Laserscope, Inc. (a) | 710 | | 23,089 |
Matrixx Initiatives, Inc. (a) | 372 | | 5,093 |
Matthews International Corp. Class A | 1,245 | | 45,903 |
Medical Action Industries, Inc. (a) | 947 | | 18,732 |
Meridian Bioscience, Inc. | 964 | | 15,954 |
Merit Medical Systems, Inc. (a) | 1,302 | | 14,791 |
Micro Therapeutics, Inc. (a) | 2,479 | | 9,866 |
Microtek Medical Holdings, Inc. (a) | 1,585 | | 6,467 |
Common Stocks - continued |
| Shares | | Value (Note 1) |
HEALTH CARE - continued |
Health Care Equipment & Supplies - continued |
Molecular Devices Corp. (a) | 603 | | $ 12,681 |
Nutraceutical International Corp. (a) | 719 | | 11,526 |
NuVasive, Inc. | 1,290 | | 12,255 |
Ocular Sciences, Inc. (a) | 828 | | 40,004 |
Orthofix International NV (a) | 477 | | 18,093 |
Orthologic Corp. (a) | 1,251 | | 7,168 |
Orthovita, Inc. (a) | 3,496 | | 13,460 |
Palomar Medical Technologies, Inc. (a) | 808 | | 18,204 |
PolyMedica Corp. | 1,048 | | 37,256 |
Possis Medical, Inc. (a) | 574 | | 6,624 |
Quidel Corp. (a) | 1,189 | | 7,669 |
Regeneration Technologies, Inc. (a) | 856 | | 7,961 |
Respironics, Inc. (a) | 1,189 | | 65,847 |
Sonic Innovations, Inc. (a) | 1,373 | | 5,588 |
SonoSight, Inc. (a) | 529 | | 15,791 |
Staar Surgical Co. (a) | 832 | | 4,934 |
Stereotaxis, Inc. | 1,010 | | 9,848 |
SurModics, Inc. (a) | 704 | | 21,190 |
Syneron Medical Ltd. | 692 | | 18,719 |
Synovis Life Technologies, Inc. (a) | 230 | | 2,726 |
Thoratec Corp. (a) | 1,495 | | 14,950 |
Trinity Biotech PLC sponsored ADR (a) | 605 | | 1,755 |
TriPath Imaging, Inc. (a) | 1,154 | | 8,286 |
Utah Medical Products, Inc. | 500 | | 10,875 |
Varian, Inc. (a) | 1,095 | | 41,008 |
Ventana Medical Systems, Inc. (a) | 671 | | 40,092 |
Vital Signs, Inc. | 457 | | 17,096 |
Vnus Medical Technologies, Inc. | 439 | | 6,664 |
Wright Medical Group, Inc. (a) | 1,176 | | 31,105 |
Young Innovations, Inc. | 390 | | 12,457 |
Zoll Medical Corp. (a) | 338 | | 11,468 |
| | 2,230,442 |
Health Care Providers & Services - 1.9% |
Accredo Health, Inc. (a) | 1,688 | | 45,694 |
Advisory Board Co. (a) | 571 | | 20,345 |
Alderwoods Group, Inc. (a) | 1,369 | | 14,484 |
Allied Healthcare International, Inc. (a) | 3,310 | | 17,808 |
Allscripts Healthcare Solutions, Inc. (a) | 1,788 | | 17,612 |
Amedisys, Inc. (a) | 479 | | 15,769 |
America Service Group, Inc. (a) | 530 | | 13,277 |
Common Stocks - continued |
| Shares | | Value (Note 1) |
HEALTH CARE - continued |
Health Care Providers & Services - continued |
American Healthways, Inc. (a) | 1,164 | | $ 38,819 |
AmSurg Corp. (a) | 897 | | 23,062 |
Andrx Corp. (a) | 2,280 | | 40,584 |
Bio-Reference Laboratories, Inc. (a) | 768 | | 12,611 |
Cedara Software Corp. (a) | 1,016 | | 9,681 |
Cerner Corp. (a) | 1,106 | | 58,308 |
Computer Programs & Systems, Inc. | 414 | | 8,942 |
Corvel Corp. (a) | 349 | | 11,070 |
Cross Country Healthcare, Inc. (a) | 928 | | 16,472 |
Curative Health Services, Inc. (a) | 666 | | 3,803 |
D & K Healthcare Resources, Inc. | 698 | | 5,067 |
Dendrite International, Inc. (a) | 1,280 | | 21,850 |
Eclipsys Corp. (a) | 1,688 | | 32,832 |
eResearchTechnology, Inc. (a) | 1,605 | | 23,658 |
Express Scripts, Inc. (a) | 2,362 | | 169,970 |
First Health Group Corp. (a) | 2,749 | | 48,987 |
Genesis HealthCare Corp. (a) | 620 | | 19,995 |
Gentiva Health Services, Inc. (a) | 964 | | 16,051 |
HealthExtras, Inc. (a) | 1,092 | | 17,439 |
Henry Schein, Inc. (a) | 1,307 | | 85,190 |
ICON PLC sponsored ADR (a) | 371 | | 13,853 |
IDX Systems Corp. (a) | 986 | | 34,628 |
IMPAC Medical Systems, Inc. (a) | 327 | | 5,477 |
LabOne, Inc. (a) | 447 | | 13,477 |
LCA-Vision, Inc. | 560 | | 18,368 |
Lifeline Systems, Inc. (a) | 712 | | 19,260 |
LifePoint Hospitals, Inc. (a) | 1,215 | | 44,688 |
Lincare Holdings, Inc. (a) | 3,119 | | 120,362 |
Magellan Health Services, Inc. (a) | 864 | | 30,801 |
Matria Healthcare, Inc. (a) | 380 | | 13,300 |
Medcath Corp. (a) | 731 | | 15,877 |
Merge Technologies, Inc. (a) | 516 | | 9,943 |
MIM Corp. | 895 | | 5,791 |
National Medical Health Card Systems, Inc. (a) | 330 | | 7,059 |
Odyssey Healthcare, Inc. (a) | 928 | | 12,389 |
Omnicell, Inc. (a) | 664 | | 7,138 |
Option Care, Inc. | 797 | | 13,724 |
PAREXEL International Corp. (a) | 1,314 | | 27,108 |
Patterson Companies, Inc. (a) | 4,238 | | 173,165 |
PDI, Inc. (a) | 594 | | 13,822 |
Per-Se Technologies, Inc. (a) | 866 | | 11,942 |
Common Stocks - continued |
| Shares | | Value (Note 1) |
HEALTH CARE - continued |
Health Care Providers & Services - continued |
Pharmaceutical Product Development, Inc. (a) | 1,801 | | $ 75,840 |
PRA International | 691 | | 15,658 |
Priority Healthcare Corp. Class B (a) | 1,190 | | 24,871 |
PSS World Medical, Inc. (a) | 1,950 | | 24,402 |
Psychiatric Solutions, Inc. (a) | 570 | | 18,554 |
QMed, Inc. (a) | 603 | | 6,965 |
Radiation Therapy Services, Inc. | 602 | | 8,880 |
ResCare, Inc. (a) | 930 | | 13,950 |
SFBC International, Inc. (a) | 543 | | 21,085 |
Stewart Enterprises, Inc. Class A (a) | 3,145 | | 23,336 |
Sun Healthcare Group, Inc. (a) | 1,059 | | 7,943 |
Symbion, Inc. | 887 | | 16,995 |
TLC Vision Corp. (a) | 2,012 | | 23,565 |
TriZetto Group, Inc. (a) | 1,531 | | 10,839 |
U.S. Physical Therapy, Inc. (a) | 574 | | 8,897 |
United Surgical Partners International, Inc. (a) | 897 | | 35,405 |
VCA Antech, Inc. (a) | 2,704 | | 50,186 |
Ventiv Health, Inc. (a) | 884 | | 17,114 |
VistaCare, Inc. Class A (a) | 323 | | 5,489 |
Vital Images, Inc. (a) | 671 | | 10,863 |
VitalWorks, Inc. (a) | 2,483 | | 10,006 |
WebMD Corp. (a) | 9,507 | | 68,926 |
| | 1,921,321 |
Pharmaceuticals - 1.6% |
aaiPharma, Inc. (a) | 572 | | 1,767 |
Able Laboratories, Inc. (a) | 666 | | 14,486 |
Acusphere, Inc. | 1,243 | | 8,204 |
Adolor Corp. (a) | 1,332 | | 18,422 |
Advancis Pharmaceutical Corp. | 1,591 | | 4,153 |
American Pharmaceutical Partners, Inc. (a)(d) | 2,304 | | 68,498 |
Antigenics, Inc. (a) | 2,149 | | 20,244 |
Atherogenics, Inc. (a) | 1,239 | | 29,377 |
Axcan Pharma, Inc. (a) | 1,329 | | 23,432 |
Barrier Therapeutics, Inc. | 1,043 | | 17,397 |
Bone Care International, Inc. (a) | 670 | | 15,624 |
Cardiome Pharma Corp. (a) | 1,301 | | 7,734 |
Columbia Laboratories, Inc. (a) | 1,899 | | 3,684 |
Connetics Corp. (a) | 1,261 | | 26,368 |
Cypress Bioscience, Inc. (a) | 1,387 | | 16,159 |
DepoMed, Inc. (a) | 1,263 | | 5,886 |
Common Stocks - continued |
| Shares | | Value (Note 1) |
HEALTH CARE - continued |
Pharmaceuticals - continued |
Discovery Laboratories, Inc. (a) | 1,297 | | $ 9,053 |
Discovery Partners International, Inc. (a) | 3,051 | | 14,035 |
Draxis Health, Inc. (a) | 1,236 | | 5,680 |
Durect Corp. (a) | 2,421 | | 5,423 |
Endo Pharmaceuticals Holdings, Inc. (a) | 4,383 | | 89,764 |
Eon Labs, Inc. (a) | 2,822 | | 76,081 |
First Horizon Pharmaceutical Corp. (a) | 1,418 | | 27,736 |
Flamel Technologies SA sponsored ADR (a) | 803 | | 16,855 |
Guilford Pharmaceuticals, Inc. (a) | 1,089 | | 6,142 |
Hi-Tech Pharmacal Co., Inc. (a) | 308 | | 5,036 |
Hollis-Eden Pharmaceuticals, Inc. (a) | 580 | | 5,881 |
Impax Laboratories, Inc. (a) | 1,941 | | 24,301 |
InKine Pharmaceutical, Inc. (a) | 1,715 | | 8,978 |
Inspire Pharmaceuticals, Inc. (a) | 1,281 | | 22,943 |
Ista Pharmaceuticals, Inc. (a) | 753 | | 7,538 |
Kos Pharmaceuticals, Inc. (a) | 1,217 | | 51,808 |
Medicines Co. (a) | 1,592 | | 39,704 |
MGI Pharma, Inc. (a) | 2,365 | | 63,831 |
Nektar Therapeutics (a) | 2,819 | | 52,673 |
New River Pharmaceuticals, Inc. | 664 | | 10,392 |
Nexmed, Inc. (a) | 672 | | 921 |
NitroMed, Inc. | 982 | | 20,524 |
Noven Pharmaceuticals, Inc. (a) | 899 | | 16,434 |
Novogen Ltd. sponsored ADR (a) | 97 | | 2,071 |
Pain Therapeutics, Inc. (a) | 1,553 | | 11,694 |
Penwest Pharmaceuticals Co. (a) | 793 | | 9,873 |
Perrigo Co. | 2,412 | | 43,512 |
Pharmos Corp. (a) | 2,311 | | 9,244 |
Pozen, Inc. (a) | 826 | | 5,732 |
Salix Pharmaceuticals Ltd. (a) | 1,011 | | 15,317 |
Santarus, Inc. | 1,330 | | 12,968 |
Sepracor, Inc. (a) | 3,316 | | 147,595 |
Shire Pharmaceuticals Group PLC sponsored ADR | 1,449 | | 43,513 |
SuperGen, Inc. (a) | 1,151 | | 8,310 |
Taro Pharmaceutical Industries Ltd. (a) | 783 | | 23,208 |
Teva Pharmaceutical Industries Ltd. sponsored ADR | 13,900 | | 379,192 |
Theravance, Inc. | 1,253 | | 22,053 |
Vivus, Inc. (a) | 2,040 | | 11,995 |
Common Stocks - continued |
| Shares | | Value (Note 1) |
HEALTH CARE - continued |
Pharmaceuticals - continued |
Warner Chilcott PLC ADR | 58 | | $ 3,776 |
Zila, Inc. (a) | 3,259 | | 14,503 |
| | 1,627,724 |
TOTAL HEALTH CARE | | 13,119,292 |
INDUSTRIALS - 5.8% |
Aerospace & Defense - 0.3% |
Applied Signal Technology, Inc. | 561 | | 21,296 |
BE Aerospace, Inc. (a) | 1,865 | | 19,763 |
Ceradyne, Inc. (a) | 577 | | 28,504 |
Elbit Systems Ltd. | 1,390 | | 31,178 |
Engineered Support Systems, Inc. | 738 | | 40,590 |
Essex Corp. (a) | 486 | | 8,568 |
Herley Industries, Inc. (a) | 746 | | 15,360 |
Innovative Solutions & Support, Inc. (a) | 378 | | 11,571 |
Invision Technologies, Inc. (a) | 538 | | 26,082 |
Kaman Corp. Class A | 987 | | 11,844 |
KVH Industries, Inc. (a) | 419 | | 4,232 |
Mercury Computer Systems, Inc. (a) | 1,018 | | 32,067 |
MTC Technologies, Inc. (a) | 622 | | 19,120 |
SI International, Inc. (a) | 431 | | 12,473 |
Sypris Solutions, Inc. | 676 | | 10,999 |
| | 293,647 |
Air Freight & Logistics - 0.5% |
C.H. Robinson Worldwide, Inc. | 2,651 | | 142,491 |
EGL, Inc. (a) | 1,477 | | 49,834 |
Expeditors International of Washington, Inc. | 3,291 | | 175,279 |
Forward Air Corp. (a) | 701 | | 32,491 |
Hub Group, Inc. Class A (a) | 426 | | 18,531 |
Pacer International, Inc. (a) | 1,088 | | 21,281 |
Park-Ohio Holdings Corp. (a) | 305 | | 6,856 |
UTI Worldwide, Inc. | 1,035 | | 71,343 |
| | 518,106 |
Airlines - 0.2% |
FLYi, Inc. (a) | 1,309 | | 2,461 |
Frontier Airlines, Inc. (a) | 1,453 | | 17,044 |
JetBlue Airways Corp. (a)(d) | 3,139 | | 75,367 |
MAIR Holdings, Inc. (a) | 1,544 | | 14,205 |
Mesa Air Group, Inc. (a) | 1,187 | | 8,333 |
Common Stocks - continued |
| Shares | | Value (Note 1) |
INDUSTRIALS - continued |
Airlines - continued |
Northwest Airlines Corp. (a) | 3,011 | | $ 30,833 |
Pinnacle Airlines Corp. | 841 | | 10,555 |
Republic Airways Holdings, Inc. | 683 | | 7,855 |
Ryanair Holdings PLC sponsored ADR (a) | 1,817 | | 71,136 |
SkyWest, Inc. | 1,780 | | 33,873 |
| | 271,662 |
Building Products - 0.1% |
Aaon, Inc. (a) | 568 | | 9,031 |
American Woodmark Corp. | 498 | | 20,035 |
Apogee Enterprises, Inc. | 1,220 | | 17,788 |
Quixote Corp. | 489 | | 10,249 |
Universal Forest Products, Inc. | 656 | | 28,313 |
| | 85,416 |
Commercial Services & Supplies - 2.3% |
51Job, Inc. ADR | 198 | | 7,049 |
Apollo Group, Inc. Class A (a) | 6,068 | | 483,620 |
Asset Acceptance Capital Corp. | 1,529 | | 31,513 |
Bright Horizons Family Solutions, Inc. (a) | 428 | | 26,857 |
Career Education Corp. (a) | 3,166 | | 123,157 |
Carlisle Holdings Ltd. (non-vtg.) | 1,707 | | 11,642 |
Casella Waste Systems, Inc. Class A (a) | 817 | | 12,345 |
Century Business Services, Inc. (a) | 2,443 | | 10,505 |
Charles River Associates, Inc. (a) | 352 | | 15,185 |
Cintas Corp. | 5,369 | | 240,102 |
Coinstar, Inc. (a) | 747 | | 19,437 |
Copart, Inc. (a) | 2,899 | | 62,618 |
Corinthian Colleges, Inc. (a) | 2,942 | | 51,264 |
Corporate Executive Board Co. | 1,232 | | 82,643 |
CoStar Group, Inc. (a) | 745 | | 32,631 |
Danka Business Systems PLC sponsored ADR (a) | 836 | | 2,550 |
DiamondCluster International, Inc. Class A (a) | 1,123 | | 13,734 |
Duratek, Inc. (a) | 611 | | 14,059 |
Educate, Inc. | 1,285 | | 16,962 |
Education Management Corp. (a) | 2,387 | | 79,105 |
Electro Rent Corp. | 1,299 | | 18,420 |
Exponent, Inc. (a) | 442 | | 12,283 |
First Consulting Group, Inc. (a) | 1,495 | | 8,178 |
FirstService Corp. (a) | 400 | | 12,908 |
G&K Services, Inc. Class A | 624 | | 25,634 |
General Binding Corp. (a) | 726 | | 9,678 |
Common Stocks - continued |
| Shares | | Value (Note 1) |
INDUSTRIALS - continued |
Commercial Services & Supplies - continued |
Gevity HR, Inc. | 796 | | $ 14,097 |
Greg Manning Auctions, Inc. (a) | 1,136 | | 13,030 |
Healthcare Services Group, Inc. | 921 | | 19,102 |
Heidrick & Struggles International, Inc. (a) | 758 | | 26,075 |
Herman Miller, Inc. | 2,268 | | 55,709 |
Hudson Highland Group, Inc. (a) | 350 | | 9,559 |
Huron Consulting Group, Inc. | 752 | | 15,905 |
ICT Group, Inc. (a) | 571 | | 4,882 |
Insurance Auto Auctions, Inc. (a) | 803 | | 17,819 |
Integrated Alarm Services Group, Inc. (a)(d) | 634 | | 2,669 |
Intersections, Inc. | 441 | | 7,938 |
Kelly Services, Inc. Class A (non-vtg.) | 1,175 | | 35,720 |
Kforce, Inc. (a) | 1,302 | | 15,598 |
Laureate Education, Inc. (a) | 1,492 | | 58,770 |
Layne Christensen Co. (a) | 643 | | 12,474 |
Learning Tree International, Inc. (a) | 1,097 | | 14,404 |
LECG Corp. | 910 | | 17,791 |
McGrath RentCorp. | 370 | | 15,636 |
Mobile Mini, Inc. (a) | 762 | | 23,081 |
Monster Worldwide, Inc. (a) | 3,676 | | 103,626 |
NCO Group, Inc. (a) | 998 | | 25,060 |
On Assignment, Inc. (a) | 1,390 | | 7,256 |
PICO Holdings, Inc. (a) | 771 | | 15,890 |
Portfolio Recovery Associates, Inc. (a) | 503 | | 18,863 |
PRG-Schultz International, Inc. (a) | 2,172 | | 11,729 |
Princeton Review, Inc. (a) | 1,476 | | 8,767 |
Resources Connection, Inc. (a) | 840 | | 38,102 |
School Specialty, Inc. (a) | 580 | | 22,040 |
SOURCECORP, Inc. (a) | 474 | | 7,883 |
Stericycle, Inc. (a) | 1,414 | | 59,091 |
Strayer Education, Inc. | 437 | | 46,969 |
Teletech Holdings, Inc. (a) | 2,696 | | 26,340 |
Tetra Tech, Inc. (a) | 1,932 | | 29,444 |
United Stationers, Inc. (a) | 1,153 | | 55,206 |
Vertrue, Inc. (a) | 352 | | 12,214 |
Waste Industries USA, Inc. | 1,018 | | 11,676 |
Waste Services, Inc. (a) | 4,374 | | 16,137 |
West Corp. (a) | 2,311 | | 80,053 |
| | 2,400,684 |
Common Stocks - continued |
| Shares | | Value (Note 1) |
INDUSTRIALS - continued |
Construction & Engineering - 0.1% |
Insituform Technologies, Inc. Class A (a) | 1,365 | | $ 31,859 |
Washington Group International, Inc. (a) | 855 | | 33,345 |
| | 65,204 |
Electrical Equipment - 0.5% |
Active Power, Inc. (a) | 2,586 | | 11,766 |
American Power Conversion Corp. | 6,273 | | 132,611 |
American Superconductor Corp. (a) | 795 | | 11,008 |
Artesyn Technologies, Inc. (a) | 1,201 | | 11,434 |
Ballard Power Systems, Inc. (a) | 3,783 | | 25,232 |
Capstone Turbine Corp. (a) | 3,505 | | 6,554 |
Color Kinetics, Inc. | 533 | | 8,624 |
Deswell Industries, Inc. | 406 | | 10,008 |
Distributed Energy Systems Corp. (a) | 3,313 | | 8,879 |
Encore Wire Corp. (a) | 772 | | 10,403 |
Energy Conversion Devices, Inc. (a) | 956 | | 21,281 |
Franklin Electric Co., Inc. | 734 | | 29,844 |
FuelCell Energy, Inc. (a) | 1,447 | | 14,542 |
Genlyte Group, Inc. (a) | 447 | | 35,836 |
Hydrogenics Corp. (a) | 1,530 | | 7,934 |
II-VI, Inc. (a) | 511 | | 22,050 |
Intermagnetics General Corp. (a) | 769 | | 22,662 |
LSI Industries, Inc. | 1,131 | | 11,242 |
Medis Technologies Ltd. (a) | 795 | | 12,919 |
Microvision, Inc. (a) | 1,063 | | 8,089 |
Plug Power, Inc. (a) | 2,703 | | 15,975 |
Powell Industries, Inc. (a) | 482 | | 7,794 |
Power-One, Inc. (a) | 2,581 | | 23,719 |
Preformed Line Products Co. | 259 | | 7,317 |
Ultralife Batteries, Inc. (a) | 686 | | 10,317 |
Valence Technology, Inc. (a) | 2,374 | | 8,546 |
Vicor Corp. | 797 | | 8,663 |
Woodward Governor Co. | 364 | | 26,517 |
| | 531,766 |
Industrial Conglomerates - 0.0% |
Raven Industries, Inc. | 970 | | 20,826 |
Westaim Corp. (a) | 1,454 | | 3,752 |
| | 24,578 |
Machinery - 0.8% |
3D Systems Corp. (a) | 683 | | 11,003 |
A.S.V., Inc. (a) | 442 | | 18,533 |
Common Stocks - continued |
| Shares | | Value (Note 1) |
INDUSTRIALS - continued |
Machinery - continued |
American Science & Engineering, Inc. (a) | 239 | | $ 8,833 |
Astec Industries, Inc. (a) | 782 | | 13,012 |
Bucyrus International, Inc. Class A | 620 | | 24,490 |
Commercial Vehicle Group, Inc. | 625 | | 12,250 |
CUNO, Inc. (a) | 568 | | 37,221 |
Flanders Corp. (a) | 1,144 | | 11,417 |
GSI Lumonics, Inc. (a) | 996 | | 9,801 |
Hardinge, Inc. | 423 | | 4,738 |
Joy Global, Inc. | 1,656 | | 67,383 |
Lincoln Electric Holdings, Inc. | 1,356 | | 48,667 |
Middleby Corp. | 428 | | 24,576 |
Nordson Corp. (a) | 1,113 | | 42,361 |
PACCAR, Inc. | 5,532 | | 432,049 |
Tecumseh Products Co. | 262 | | 11,476 |
Tecumseh Products Co. Class A (non-vtg.) | 517 | | 23,673 |
Volvo AB ADR | 288 | | 11,722 |
| | 813,205 |
Marine - 0.1% |
Alexander & Baldwin, Inc. | 1,401 | | 59,276 |
Stolt-Nielsen SA Class B sponsored ADR (a) | 898 | | 25,207 |
| | 84,483 |
Road & Rail - 0.7% |
AMERCO (a) | 684 | | 28,147 |
Arkansas Best Corp. | 807 | | 34,798 |
Central Freight Lines, Inc. | 726 | | 4,617 |
Covenant Transport, Inc. Class A (a) | 611 | | 11,743 |
Heartland Express, Inc. | 2,477 | | 54,395 |
J.B. Hunt Transport Services, Inc. | 2,438 | | 98,008 |
Knight Transportation, Inc. (a) | 2,003 | | 48,272 |
Landstar System, Inc. (a) | 884 | | 62,331 |
Marten Transport Ltd. (a) | 686 | | 15,058 |
Old Dominion Freight Lines, Inc. (a) | 991 | | 31,068 |
Overnite Corp. | 959 | | 33,891 |
P.A.M. Transportation Services, Inc. (a) | 668 | | 13,560 |
Quality Distribution, Inc. | 449 | | 3,641 |
SCS Transportation, Inc. (a) | 206 | | 4,357 |
Swift Transportation Co., Inc. (a) | 2,547 | | 49,641 |
U.S. Xpress Enterprises, Inc. Class A (a) | 842 | | 21,892 |
USA Truck, Inc. (a) | 550 | | 6,815 |
USF Corp. | 921 | | 34,049 |
Common Stocks - continued |
| Shares | | Value (Note 1) |
INDUSTRIALS - continued |
Road & Rail - continued |
Werner Enterprises, Inc. | 2,420 | | $ 54,450 |
Yellow Roadway Corp. (a) | 1,596 | | 84,349 |
| | 695,082 |
Trading Companies & Distributors - 0.2% |
Aceto Corp. | 552 | | 9,384 |
Beacon Roofing Supply, Inc. | 794 | | 14,514 |
Fastenal Co. | 2,392 | | 146,295 |
Lawson Products, Inc. | 395 | | 19,296 |
NuCo2, Inc. (a) | 701 | | 17,385 |
UAP Holding Corp. | 1,607 | | 26,274 |
| | 233,148 |
TOTAL INDUSTRIALS | | 6,016,981 |
INFORMATION TECHNOLOGY - 49.1% |
Communications Equipment - 9.2% |
3Com Corp. (a) | 13,296 | | 59,034 |
ADC Telecommunications, Inc. (a) | 26,609 | | 62,531 |
Adtran, Inc. | 2,353 | | 52,731 |
Advanced Fibre Communications, Inc. (a) | 3,142 | | 51,372 |
Airspan Networks, Inc. (a) | 2,489 | | 13,665 |
Alvarion Ltd. (a) | 2,562 | | 37,585 |
Anaren, Inc. (a) | 662 | | 8,893 |
Andrew Corp. (a) | 5,155 | | 73,201 |
Arris Group, Inc. (a) | 2,872 | | 16,342 |
Aspect Communications Corp. (a) | 2,029 | | 22,015 |
AudioCodes Ltd. (a) | 1,741 | | 25,593 |
Audiovox Corp. Class A (a) | 723 | | 10,809 |
Avanex Corp. (a) | 6,051 | | 18,758 |
Avici Systems, Inc. (a) | 537 | | 3,840 |
Avocent Corp. (a) | 1,639 | | 62,167 |
Bel Fuse, Inc.: | | | |
Class A | 177 | | 5,186 |
Class B | 300 | | 10,269 |
Black Box Corp. | 488 | | 20,828 |
Bookham, Inc. (a) | 1,243 | | 6,662 |
Brooktrout, Inc. (a) | 479 | | 5,873 |
C-COR.net Corp. (a) | 1,013 | | 9,066 |
Carrier Access Corp. (a) | 1,526 | | 13,780 |
Centillium Communications, Inc. (a) | 1,559 | | 3,929 |
Common Stocks - continued |
| Shares | | Value (Note 1) |
INFORMATION TECHNOLOGY - continued |
Communications Equipment - continued |
Ceragon Networks Ltd. (a) | 865 | | $ 4,740 |
CIENA Corp. (a) | 16,504 | | 42,085 |
Cisco Systems, Inc. (a) | 216,975 | | 4,059,602 |
Computer Network Technology Corp. (a) | 996 | | 5,677 |
Comtech Telecommunications Corp. (a) | 521 | | 16,401 |
Comverse Technology, Inc. (a) | 6,192 | | 131,704 |
CyberGuard Corp. (a) | 912 | | 5,627 |
Digi International, Inc. (a) | 1,004 | | 15,452 |
Ditech Communications Corp. (a) | 1,208 | | 19,038 |
Echelon Corp. (a) | 1,061 | | 8,021 |
ECI Telecom Ltd. (a) | 3,668 | | 30,444 |
ECtel Ltd. (a)(d) | 171 | | 503 |
Extreme Networks, Inc. (a) | 3,999 | | 27,313 |
F5 Networks, Inc. (a) | 1,092 | | 47,011 |
FalconStor Software, Inc. (a) | 1,358 | | 10,633 |
Finisar Corp. (a) | 5,906 | | 10,808 |
Foundry Networks, Inc. (a) | 4,534 | | 60,529 |
Glenayre Technologies, Inc. (a) | 1,379 | | 2,524 |
Harmonic, Inc. (a) | 2,575 | | 20,008 |
Inter-Tel, Inc. | 969 | | 27,442 |
InterDigital Communication Corp. (a) | 1,666 | | 33,903 |
Ixia (a) | 2,329 | | 32,839 |
JDS Uniphase Corp. (a) | 45,040 | | 142,777 |
Juniper Networks, Inc. (a) | 16,922 | | 465,863 |
MRV Communications, Inc. (a) | 4,346 | | 16,771 |
NETGEAR, Inc. (a) | 1,147 | | 18,811 |
Network Engines, Inc. (a) | 1,511 | | 3,521 |
NMS Communications Corp. (a) | 1,666 | | 10,642 |
Oplink Communications, Inc. (a) | 4,853 | | 9,949 |
Optical Communication Products, Inc. (a) | 1,330 | | 2,899 |
Packeteer, Inc. (a) | 1,039 | | 13,507 |
Paradyne Networks, Inc. (a) | 2,415 | | 9,370 |
PC-Tel, Inc. (a) | 1,155 | | 9,321 |
Performance Technologies, Inc. (a) | 470 | | 3,351 |
Polycom, Inc. (a) | 3,211 | | 73,339 |
Powerwave Technologies, Inc. (a) | 3,218 | | 26,027 |
Proxim Corp. Class A (a) | 475 | | 1,952 |
Qiao Xing Universal Telephone, Inc. (a) | 504 | | 4,641 |
QUALCOMM, Inc. | 52,213 | | 2,173,105 |
Radyne Comstream Corp. (a) | 1,102 | | 8,024 |
Redback Networks, Inc. (a) | 1,785 | | 8,568 |
Common Stocks - continued |
| Shares | | Value (Note 1) |
INFORMATION TECHNOLOGY - continued |
Communications Equipment - continued |
REMEC, Inc. (a) | 2,398 | | $ 14,460 |
Research In Motion Ltd. (a) | 6,006 | | 530,789 |
SafeNet, Inc. (a) | 810 | | 28,885 |
SCM Microsystems, Inc. (a) | 1,068 | | 3,642 |
SeaChange International, Inc. (a) | 1,245 | | 21,265 |
Sierra Wireless, Inc. (a) | 732 | | 13,826 |
SiRF Technology Holdings, Inc. | 1,141 | | 14,456 |
Sonus Networks, Inc. (a) | 8,174 | | 54,030 |
SpectraLink Corp. | 479 | | 7,017 |
Stratex Networks, Inc. (a) | 2,958 | | 6,093 |
Sunrise Telecom, Inc. | 1,483 | | 3,930 |
Superior Essex, Inc. (a) | 525 | | 8,794 |
Sycamore Networks, Inc. (a) | 8,426 | | 31,598 |
Symmetricom, Inc. (a) | 1,374 | | 14,839 |
Tekelec (a) | 2,363 | | 55,318 |
Telefonaktiebolaget LM Ericsson ADR (a) | 5,659 | | 188,162 |
Tellabs, Inc. (a) | 13,239 | | 113,193 |
Telular Corp. (a) | 871 | | 5,548 |
Terayon Communication Systems, Inc. (a) | 1,730 | | 3,443 |
Tollgrade Communications, Inc. (a) | 443 | | 4,736 |
UTStarcom, Inc. (a) | 3,667 | | 71,653 |
Verso Technologies, Inc. (a) | 3,053 | | 2,473 |
ViaSat, Inc. (a) | 976 | | 20,369 |
Westell Technologies, Inc. Class A (a) | 1,348 | | 8,829 |
WJ Communications, Inc. (a) | 2,092 | | 7,092 |
Zhone Technologies, Inc. (a) | 3,655 | | 8,918 |
| | 9,452,229 |
Computers & Peripherals - 5.7% |
ActivCard Corp. (a) | 1,423 | | 11,327 |
Adaptec, Inc. (a) | 4,706 | | 36,707 |
Advanced Digital Information Corp. (a) | 2,971 | | 27,274 |
Apple Computer, Inc. (a) | 12,463 | | 835,644 |
Applied Films Corp. (a) | 436 | | 9,662 |
Avid Technology, Inc. (a) | 945 | | 53,931 |
Brocade Communications Systems, Inc. (a) | 9,900 | | 68,607 |
Concurrent Computer Corp. (a) | 2,256 | | 4,286 |
Cray, Inc. (a) | 2,041 | | 7,164 |
Creative Technology Ltd. (Nasdaq) | 2,846 | | 36,429 |
Dell, Inc. (a)(d) | 79,957 | | 3,239,858 |
Dot Hill Systems Corp. (a) | 1,177 | | 7,768 |
Common Stocks - continued |
| Shares | | Value (Note 1) |
INFORMATION TECHNOLOGY - continued |
Computers & Peripherals - continued |
Electronics for Imaging, Inc. (a) | 1,863 | | $ 31,168 |
Hutchinson Technology, Inc. (a) | 937 | | 30,705 |
Immersion Corp. (a) | 860 | | 4,610 |
InFocus Corp. (a) | 1,431 | | 9,588 |
Innovex, Inc. (a) | 857 | | 4,276 |
Intergraph Corp. (a) | 1,107 | | 29,003 |
Komag, Inc. (a) | 960 | | 16,080 |
LaserCard Corp. (a) | 492 | | 4,890 |
Logitech International SA sponsored ADR (a) | 171 | | 10,110 |
M-Systems Flash Disk Pioneers Ltd. (a) | 696 | | 11,039 |
McDATA Corp.: | | | |
Class A (a) | 3,301 | | 18,651 |
Class B (a) | 1,013 | | 5,430 |
Mobility Electronics, Inc. (a) | 1,162 | | 11,283 |
Neoware Systems, Inc. (a) | 1,146 | | 10,039 |
Network Appliance, Inc. (a) | 11,362 | | 342,678 |
Novatel Wireless, Inc. | 861 | | 18,133 |
Overland Storage, Inc. (a) | 914 | | 13,573 |
palmOne, Inc. (a) | 1,541 | | 53,997 |
Pinnacle Systems, Inc. (a) | 2,409 | | 12,575 |
Presstek, Inc. (a) | 1,343 | | 14,343 |
QLogic Corp. (a) | 2,829 | | 97,289 |
Rimage Corp. (a) | 799 | | 12,153 |
SanDisk Corp. (a) | 5,190 | | 117,190 |
SBS Technologies, Inc. (a) | 435 | | 5,681 |
Scitex Corp. Ltd. | 1,465 | | 6,505 |
SimpleTech, Inc. (a) | 1,620 | | 8,051 |
Stratasys, Inc. (a) | 390 | | 12,597 |
Sun Microsystems, Inc. (a) | 106,224 | | 589,543 |
Synaptics, Inc. (a) | 866 | | 33,254 |
Xybernaut Corp. (a) | 5,985 | | 7,182 |
| | 5,880,273 |
Electronic Equipment & Instruments - 2.0% |
Aeroflex, Inc. (a) | 2,655 | | 32,524 |
Agilysys, Inc. | 1,074 | | 17,753 |
Argon ST, Inc. (a) | 860 | | 22,240 |
BEI Technologies, Inc. | 647 | | 18,989 |
Bell Microproducts, Inc. (a) | 812 | | 6,943 |
Brightpoint, Inc. (a) | 478 | | 9,135 |
CalAmp Corp. (a) | 1,266 | | 12,116 |
Common Stocks - continued |
| Shares | | Value (Note 1) |
INFORMATION TECHNOLOGY - continued |
Electronic Equipment & Instruments - continued |
CDW Corp. | 2,607 | | $ 171,332 |
CellStar Corp. (a) | 382 | | 1,394 |
Cherokee International Corp. | 469 | | 4,019 |
Cogent, Inc. | 2,700 | | 90,639 |
Cognex Corp. | 1,592 | | 41,074 |
Coherent, Inc. (a) | 1,061 | | 30,652 |
Daktronics, Inc. (a) | 949 | | 24,598 |
DDi Corp. (a) | 1,571 | | 4,713 |
Digital Theater Systems, Inc. (a) | 525 | | 10,957 |
Dionex Corp. (a) | 685 | | 39,312 |
Electro Scientific Industries, Inc. (a) | 948 | | 18,410 |
Excel Technology, Inc. (a) | 354 | | 9,204 |
Fargo Electronics, Inc. (a) | 609 | | 9,025 |
FARO Technologies, Inc. (a) | 383 | | 10,418 |
Flextronics International Ltd. (a) | 17,473 | | 250,738 |
FLIR Systems, Inc. (a) | 1,117 | | 62,943 |
Global Imaging Systems, Inc. (a) | 678 | | 25,371 |
Identix, Inc. (a) | 3,287 | | 26,066 |
INTAC International (a) | 1,136 | | 10,974 |
Itron, Inc. (a) | 567 | | 12,276 |
LeCroy Corp. (a) | 442 | | 9,463 |
Lexar Media, Inc. (a) | 2,584 | | 20,388 |
Lipman Electronic Engineer Ltd. (Nasdaq) | 766 | | 21,708 |
Littelfuse, Inc. (a) | 850 | | 33,167 |
M-Flex Electronix, Inc. | 868 | | 15,858 |
Mechanical Technology, Inc. (a) | 1,285 | | 7,093 |
Merix Corp. (a) | 475 | | 5,168 |
Methode Electronics, Inc. Class A | 1,293 | | 17,068 |
Metrologic Instruments, Inc. (a) | 824 | | 16,834 |
Molex, Inc. | 3,066 | | 84,530 |
Molex, Inc. Class A (non-vtg.) | 2,730 | | 66,312 |
MTS Systems Corp. | 722 | | 21,913 |
National Instruments Corp. | 2,514 | | 71,900 |
Newport Corp. (a) | 1,742 | | 21,496 |
NU Horizons Electronics Corp. (a) | 658 | | 5,462 |
Optimal Group, Inc. Class A (a) | 1,305 | | 14,225 |
Orbotech Ltd. (a) | 1,227 | | 23,264 |
OSI Systems, Inc. (a) | 490 | | 10,643 |
PC Connection, Inc. (a) | 1,121 | | 7,881 |
Pemstar, Inc. (a) | 1,399 | | 2,142 |
Photon Dynamics, Inc. (a) | 560 | | 12,348 |
Common Stocks - continued |
| Shares | | Value (Note 1) |
INFORMATION TECHNOLOGY - continued |
Electronic Equipment & Instruments - continued |
Planar Systems, Inc. (a) | 480 | | $ 5,117 |
Plexus Corp. (a) | 1,195 | | 16,431 |
RadiSys Corp. (a) | 665 | | 9,370 |
Richardson Electronics Ltd. | 989 | | 11,027 |
Rofin-Sinar Technologies, Inc. (a) | 705 | | 27,495 |
Sanmina-SCI Corp. (a) | 16,945 | | 149,624 |
ScanSource, Inc. (a) | 521 | | 33,709 |
Sirenza Microdevices, Inc. (a) | 2,267 | | 11,516 |
SpatiaLight, Inc. (a) | 1,783 | | 15,994 |
Staktek Holdings, Inc. | 1,214 | | 5,184 |
Suntron Corp. (a) | 1,647 | | 5,435 |
Superconductor Technologies, Inc. (a) | 1,907 | | 1,602 |
Taser International, Inc. (a)(d) | 1,904 | | 52,246 |
Tech Data Corp. (a) | 1,850 | | 83,972 |
Thermogenesis Corp. (a) | 1,689 | | 10,252 |
Trimble Navigation Ltd. (a) | 1,866 | | 58,910 |
TTM Technologies, Inc. (a) | 1,039 | | 10,785 |
Universal Display Corp. (a) | 1,471 | | 14,342 |
Veeco Instruments, Inc. (a) | 861 | | 16,695 |
Viisage Technology, Inc. (a) | 1,327 | | 10,709 |
Woodhead Industries, Inc. | 504 | | 7,600 |
X-Rite, Inc. | 1,218 | | 18,160 |
Xyratex Ltd. | 973 | | 13,817 |
Zomax, Inc. (a) | 2,600 | | 8,944 |
Zygo Corp. (a) | 622 | | 7,228 |
| | 2,068,842 |
Internet Software & Services - 3.5% |
24/7 Real Media, Inc. (a) | 811 | | 3,066 |
Akamai Technologies, Inc. (a) | 4,139 | | 53,600 |
Aladdin Knowledge Systems Ltd. (a) | 753 | | 21,898 |
America Online Latin America, Inc. (a) | 2,306 | | 1,476 |
aQuantive, Inc. (a) | 2,975 | | 25,853 |
Ariba, Inc. (a) | 2,305 | | 38,033 |
Art Technology Group, Inc. (a) | 2,639 | | 2,929 |
AsiaInfo Holdings, Inc. (a) | 1,307 | | 7,842 |
Ask Jeeves, Inc. (a) | 1,915 | | 49,484 |
Autobytel, Inc. (a) | 1,041 | | 7,578 |
Bankrate, Inc. (a) | 726 | | 11,587 |
Blue Coat Systems, Inc. (a) | 361 | | 6,025 |
BroadVision, Inc. (a) | 1,412 | | 3,248 |
Common Stocks - continued |
| Shares | | Value (Note 1) |
INFORMATION TECHNOLOGY - continued |
Internet Software & Services - continued |
Chordiant Software, Inc. (a) | 2,159 | | $ 4,426 |
CMGI, Inc. (a) | 22,307 | | 34,130 |
CNET Networks, Inc. (a) | 4,389 | | 40,905 |
Corillian Corp. (a) | 1,860 | | 10,807 |
Cryptologic, Inc. | 469 | | 11,623 |
CyberSource Corp. (a) | 1,115 | | 7,872 |
Digital Insight Corp. (a) | 951 | | 15,525 |
Digital River, Inc. (a) | 1,063 | | 44,561 |
Digitas, Inc. (a) | 2,292 | | 18,817 |
DoubleClick, Inc. (a) | 3,523 | | 26,423 |
EarthLink, Inc. (a) | 5,038 | | 54,612 |
eCollege.com (a) | 553 | | 6,498 |
Entrust, Inc. (a) | 2,378 | | 8,870 |
Equinix, Inc. (a) | 579 | | 22,512 |
FindWhat.com (a) | 1,339 | | 25,816 |
Google, Inc. Class A | 1,063 | | 194,529 |
GoRemote Internet Communications, Inc. (a) | 614 | | 1,105 |
Greenfield Online, Inc. | 454 | | 8,740 |
Homestore, Inc. (a) | 4,453 | | 11,578 |
InfoSpace, Inc. (a) | 1,141 | | 50,546 |
Internet Capital Group, Inc. (a) | 937 | | 6,437 |
Interwoven, Inc. (a) | 1,495 | | 14,502 |
Iona Technologies PLC ADR (a) | 533 | | 2,756 |
iPass, Inc. (a) | 1,581 | | 10,261 |
iVillage, Inc. (a) | 2,121 | | 10,064 |
j2 Global Communications, Inc. (a) | 1,052 | | 36,662 |
Jupitermedia Corp. (a) | 1,459 | | 24,467 |
Keynote Systems, Inc. (a) | 1,025 | | 13,048 |
Kintera, Inc. | 800 | | 6,504 |
LivePerson, Inc. (a) | 2,751 | | 7,263 |
LookSmart Ltd. (a) | 4,167 | | 8,288 |
Marchex, Inc. Class B | 448 | | 7,002 |
Marketwatch.com, Inc. (a) | 1,158 | | 21,006 |
MatrixOne, Inc. (a) | 1,819 | | 12,024 |
NaviSite, Inc. (a) | 523 | | 1,182 |
Neoforma, Inc. (a) | 772 | | 5,736 |
Net2Phone, Inc. (a) | 1,222 | | 4,191 |
Netease.com, Inc. sponsored ADR (a) | 507 | | 26,830 |
NetRatings, Inc. (a) | 1,039 | | 20,780 |
NIC, Inc. (a) | 1,749 | | 8,037 |
Niku Corp. (a) | 445 | | 7,445 |
Common Stocks - continued |
| Shares | | Value (Note 1) |
INFORMATION TECHNOLOGY - continued |
Internet Software & Services - continued |
Open Text Corp. (a) | 1,454 | | $ 27,083 |
Openwave Systems, Inc. (a) | 2,221 | | 29,273 |
PEC Solutions, Inc. (a) | 1,149 | | 16,304 |
PlanetOut, Inc. | 573 | | 6,985 |
Plumtree Software, Inc. (a) | 1,345 | | 4,909 |
Quovadx, Inc. (a) | 1,252 | | 2,391 |
RADVision Ltd. | 826 | | 11,019 |
RealNetworks, Inc. (a) | 5,396 | | 33,995 |
Register.com, Inc. (a) | 1,694 | | 9,859 |
Retek, Inc. (a) | 2,360 | | 14,396 |
S1 Corp. (a) | 3,058 | | 28,653 |
SAVVIS Communications Corp. (a) | 5,140 | | 4,369 |
SeeBeyond Technology Corp. (a) | 2,737 | | 8,649 |
Selectica, Inc. (a) | 2,459 | | 9,467 |
Shopping.Com Ltd. | 866 | | 26,518 |
Sina Corp. (a) | 1,642 | | 60,623 |
SkillSoft PLC sponsored ADR (a) | 3,139 | | 22,664 |
Sohu.com, Inc. (a) | 1,276 | | 21,628 |
SonicWALL, Inc. (a) | 2,405 | | 14,791 |
Stellent, Inc. (a) | 1,069 | | 8,392 |
Supportsoft, Inc. (a) | 2,282 | | 11,593 |
Terra Networks SA sponsored ADR | 666 | | 2,452 |
Tippingpoint Technologies, Inc. (a) | 279 | | 9,695 |
Tom Online, Inc. ADR | 200 | | 2,944 |
Travelzoo, Inc. (a)(d) | 630 | | 58,590 |
Tumbleweed Communications Corp. (a) | 1,264 | | 4,424 |
United Online, Inc. (a) | 1,839 | | 19,622 |
ValueClick, Inc. (a) | 2,827 | | 36,468 |
VeriSign, Inc. (a) | 8,125 | | 267,313 |
Vignette Corp. (a) | 10,020 | | 12,725 |
Vitria Technology, Inc. (a) | 2,548 | | 8,816 |
WebEx Communications, Inc. (a) | 1,430 | | 33,948 |
webMethods, Inc. (a) | 2,229 | | 13,686 |
Websense, Inc. (a) | 754 | | 36,237 |
Yahoo!, Inc. (a) | 43,609 | | 1,640,571 |
Zix Corp. (a) | 974 | | 4,461 |
| | 3,612,512 |
IT Services - 1.4% |
Acxiom Corp. | 2,548 | | 64,439 |
Answerthink, Inc. (a) | 1,964 | | 8,858 |
Common Stocks - continued |
| Shares | | Value (Note 1) |
INFORMATION TECHNOLOGY - continued |
IT Services - continued |
Applied Digital Solutions, Inc. (a) | 2,129 | | $ 11,390 |
Carreker Corp. (a) | 996 | | 8,406 |
CheckFree Corp. (a) | 2,930 | | 108,557 |
Cognizant Technology Solutions Corp. Class A (a) | 4,178 | | 159,307 |
Corio, Inc. (a) | 3,977 | | 6,602 |
Covansys Corp. (a) | 1,396 | | 18,790 |
CSG Systems International, Inc. (a) | 1,788 | | 32,488 |
Edgewater Technology, Inc. (a) | 1,090 | | 4,556 |
Elron Electronic Industries Ltd. (a) | 1,005 | | 14,603 |
Euronet Worldwide, Inc. (a) | 1,275 | | 31,365 |
Fiserv, Inc. (a) | 6,359 | | 244,885 |
Forrester Research, Inc. (a) | 638 | | 10,412 |
iGate Corp. (a) | 1,393 | | 5,572 |
Indus International, Inc. (a) | 1,166 | | 2,215 |
Infocrossing, Inc. (a)(d) | 717 | | 12,046 |
Infosys Technologies Ltd. sponsored ADR | 664 | | 47,755 |
infoUSA, Inc. (a) | 1,995 | | 21,965 |
Integral Systems, Inc. | 418 | | 8,356 |
Intrado, Inc. (a) | 517 | | 6,990 |
iPayment, Inc. (a) | 756 | | 29,061 |
Kanbay International, Inc. | 900 | | 25,857 |
Lightbridge, Inc. (a) | 1,638 | | 7,682 |
Lionbridge Technologies, Inc. (a) | 1,683 | | 9,273 |
ManTech International Corp. Class A (a) | 669 | | 16,016 |
Ness Technologies, Inc. | 932 | | 12,629 |
Paychex, Inc. | 11,935 | | 395,765 |
Pegasus Solutions, Inc. (a) | 892 | | 10,427 |
RightNow Technologies, Inc. | 1,056 | | 19,209 |
Sapient Corp. (a) | 4,930 | | 38,996 |
SM&A (a) | 996 | | 8,038 |
Sykes Enterprises, Inc. (a) | 1,314 | | 8,870 |
Syntel, Inc. | 1,406 | | 27,529 |
Telvent GIT SA | 871 | | 9,790 |
Tier Technologies, Inc. Class B (a) | 1,203 | | 10,622 |
Zanett, Inc. (a) | 2,719 | | 12,507 |
| | 1,471,828 |
Office Electronics - 0.1% |
Zebra Technologies Corp. Class A (a) | 2,251 | | 113,180 |
Semiconductors & Semiconductor Equipment - 10.4% |
8X8, Inc. (a)(d) | 2,302 | | 8,494 |
Common Stocks - continued |
| Shares | | Value (Note 1) |
INFORMATION TECHNOLOGY - continued |
Semiconductors & Semiconductor Equipment - continued |
Actel Corp. (a) | 1,079 | | $ 18,516 |
ADE Corp. (a) | 460 | | 8,492 |
Advanced Energy Industries, Inc. (a) | 961 | | 8,217 |
Alliance Semiconductor Corp. (a) | 1,231 | | 4,309 |
Altera Corp. (a) | 12,039 | | 273,045 |
AMIS Holdings, Inc. (a) | 2,448 | | 37,112 |
Amkor Technology, Inc. (a) | 6,344 | | 34,892 |
ANADIGICS, Inc. (a) | 839 | | 2,827 |
Applied Materials, Inc. (a) | 54,690 | | 910,042 |
Applied Micro Circuits Corp. (a) | 9,268 | | 34,106 |
ARM Holdings PLC sponsored ADR | 1,357 | | 7,911 |
Artisan Components, Inc. (a) | 939 | | 32,396 |
ASE Test Ltd. (a) | 3,590 | | 22,114 |
ASM International NV (Nasdaq) (a) | 397 | | 6,312 |
ASML Holding NV (NY Shares) (a) | 4,216 | | 64,294 |
Asyst Technologies, Inc. (a) | 1,284 | | 5,341 |
Atheros Communications, Inc. | 1,589 | | 17,781 |
ATI Technologies, Inc. (a) | 7,864 | | 151,252 |
Atmel Corp. (a) | 14,648 | | 52,000 |
ATMI, Inc. (a) | 1,136 | | 26,151 |
August Technology Corp. (a) | 750 | | 6,338 |
Axcelis Technologies, Inc. (a) | 2,915 | | 21,280 |
Broadcom Corp. Class A (a) | 8,308 | | 270,176 |
Brooks Automation, Inc. (a) | 1,570 | | 24,100 |
Cabot Microelectronics Corp. (a) | 748 | | 27,639 |
California Micro Devices Corp. (a) | 960 | | 8,352 |
Camtek Ltd. (a) | 1,772 | | 7,460 |
Ceva, Inc. (a) | 287 | | 2,302 |
ChipMOS TECHNOLOGIES Bermuda Ltd. (a)(d) | 2,935 | | 16,260 |
Cirrus Logic, Inc. (a) | 2,895 | | 17,167 |
Cohu, Inc. | 994 | | 16,659 |
Conexant Systems, Inc. (a) | 12,796 | | 25,464 |
Credence Systems Corp. (a) | 2,570 | | 19,635 |
Cree, Inc. (a)(d) | 2,340 | | 83,725 |
Cymer, Inc. (a) | 1,046 | | 31,819 |
Diodes, Inc. (a) | 354 | | 8,804 |
DSP Group, Inc. (a) | 799 | | 17,722 |
DuPont Photomasks, Inc. (a) | 545 | | 14,377 |
EMCORE Corp. (a) | 3,649 | | 9,706 |
Entegris, Inc. (a) | 2,942 | | 28,773 |
ESS Technology, Inc. (a) | 1,906 | | 13,437 |
Common Stocks - continued |
| Shares | | Value (Note 1) |
INFORMATION TECHNOLOGY - continued |
Semiconductors & Semiconductor Equipment - continued |
Exar Corp. (a) | 1,400 | | $ 19,572 |
FEI Co. (a) | 1,251 | | 26,759 |
FormFactor, Inc. (a) | 1,135 | | 27,365 |
FSI International, Inc. (a) | 988 | | 4,446 |
Genesis Microchip, Inc. (a) | 1,820 | | 29,684 |
Genus, Inc. (a) | 745 | | 1,296 |
Helix Technology Corp. | 651 | | 9,811 |
Hi/fn, Inc. (a) | 451 | | 3,608 |
ICOS Vision Systems NV (a) | 570 | | 13,361 |
Integrated Circuit Systems, Inc. (a) | 2,293 | | 54,207 |
Integrated Device Technology, Inc. (a) | 3,107 | | 35,264 |
Integrated Silicon Solution, Inc. (a) | 1,726 | | 13,221 |
Intel Corp. | 205,896 | | 4,601,776 |
Intersil Corp. Class A | 5,059 | | 81,450 |
Intevac, Inc. (a) | 636 | | 4,484 |
IXYS Corp. (a) | 1,068 | | 9,922 |
KLA-Tencor Corp. (a) | 6,363 | | 286,717 |
Kopin Corp. (a) | 2,638 | | 10,710 |
Kulicke & Soffa Industries, Inc. (a) | 1,390 | | 10,397 |
Lam Research Corp. (a) | 4,451 | | 115,771 |
Lattice Semiconductor Corp. (a) | 3,480 | | 18,576 |
Leadis Technology, Inc. | 715 | | 6,950 |
Linear Technology Corp. | 9,802 | | 374,044 |
LTX Corp. (a) | 1,429 | | 10,203 |
Marvell Technology Group Ltd. (a) | 8,348 | | 267,637 |
Mattson Technology, Inc. (a) | 1,825 | | 17,064 |
Maxim Integrated Products, Inc. | 10,413 | | 426,516 |
Micrel, Inc. (a) | 2,895 | | 30,919 |
Microchip Technology, Inc. | 6,387 | | 179,986 |
Microsemi Corp. (a) | 2,037 | | 36,259 |
Microtune, Inc. (a) | 1,795 | | 10,734 |
Mindspeed Technologies, Inc. (a) | 2,431 | | 6,078 |
MIPS Technologies, Inc. (a) | 1,934 | | 16,923 |
MKS Instruments, Inc. (a) | 1,544 | | 26,233 |
Monolithic System Technology, Inc. (a) | 1,045 | | 4,880 |
Nanometrics, Inc. (a) | 749 | | 12,186 |
Netlogic Microsystems, Inc. | 690 | | 7,073 |
Novellus Systems, Inc. (a) | 4,510 | | 121,499 |
NVE Corp. (a) | 234 | | 6,887 |
NVIDIA Corp. (a) | 5,090 | | 97,372 |
O2Micro International Ltd. (a) | 979 | | 11,846 |
Common Stocks - continued |
| Shares | | Value (Note 1) |
INFORMATION TECHNOLOGY - continued |
Semiconductors & Semiconductor Equipment - continued |
Omnivision Technologies, Inc. (a) | 1,822 | | $ 32,504 |
ON Semiconductor Corp. (a) | 9,654 | | 35,237 |
PDF Solutions, Inc. (a) | 891 | | 11,467 |
Pericom Semiconductor Corp. (a) | 1,064 | | 9,342 |
Photronics, Inc. (a) | 1,167 | | 21,986 |
Pixelworks, Inc. (a) | 1,850 | | 20,813 |
PLX Technology, Inc. (a) | 1,370 | | 12,344 |
PMC-Sierra, Inc. (a) | 6,281 | | 69,342 |
Portalplayer, Inc. | 710 | | 20,725 |
Power Integrations, Inc. (a) | 969 | | 19,118 |
PowerDsine Ltd. | 593 | | 8,029 |
Rambus, Inc. (a) | 3,414 | | 78,898 |
RF Micro Devices, Inc. (a) | 5,561 | | 38,705 |
Rudolph Technologies, Inc. (a) | 390 | | 6,240 |
Semitool, Inc. (a) | 1,012 | | 9,068 |
Semtech Corp. (a) | 2,180 | | 44,625 |
Sigma Designs, Inc. (a) | 683 | | 6,167 |
Sigmatel, Inc. (a) | 1,152 | | 41,219 |
Silicon Image, Inc. (a) | 2,625 | | 44,100 |
Silicon Laboratories, Inc. (a) | 1,704 | | 51,359 |
Silicon Storage Technology, Inc. (a) | 3,448 | | 23,998 |
Siliconix, Inc. (a) | 911 | | 33,698 |
Siliconware Precision Industries Co. Ltd. ADR | 518 | | 2,067 |
Sipex Corp. (a) | 1,057 | | 5,814 |
Skyworks Solutions, Inc. (a) | 5,586 | | 55,469 |
Standard Microsystems Corp. (a) | 699 | | 17,181 |
Supertex, Inc. (a) | 433 | | 9,418 |
Tessera Technologies, Inc. | 1,246 | | 44,295 |
Therma-Wave, Inc. (a) | 2,068 | | 6,618 |
Tower Semicondutor Ltd. (a) | 1,870 | | 3,815 |
Transmeta Corp. (a)(d) | 5,739 | | 9,699 |
Transwitch Corp. (a) | 3,005 | | 3,666 |
Trident Microsystems, Inc. (a) | 818 | | 12,761 |
Tripath Technology, Inc. (a) | 1,346 | | 1,144 |
TriQuint Semiconductor, Inc. (a) | 3,428 | | 14,843 |
Ultratech, Inc. (a) | 794 | | 13,681 |
Varian Semiconductor Equipment Associates, Inc. (a) | 1,080 | | 38,362 |
Virage Logic Corp. (a) | 772 | | 11,603 |
Vitesse Semiconductor Corp. (a) | 6,755 | | 22,021 |
Volterra Semiconductor Corp. | 875 | | 18,471 |
White Electronic Designs Corp. (a) | 952 | | 6,378 |
Common Stocks - continued |
| Shares | | Value (Note 1) |
INFORMATION TECHNOLOGY - continued |
Semiconductors & Semiconductor Equipment - continued |
Xilinx, Inc. | 11,232 | | $ 350,663 |
Zilog, Inc. (a) | 350 | | 2,293 |
Zoran Corp. (a) | 1,363 | | 16,152 |
| | 10,751,883 |
Software - 16.8% |
Accelrys, Inc. (a) | 737 | | 4,614 |
Activision, Inc. (a) | 4,319 | | 67,895 |
Actuate Corp. (a) | 2,431 | | 5,761 |
Adobe Systems, Inc. | 7,681 | | 465,161 |
Advent Software, Inc. (a) | 1,121 | | 22,431 |
Agile Software Corp. (a) | 2,069 | | 17,297 |
Altiris, Inc. (a) | 833 | | 23,324 |
American Software, Inc. Class A | 951 | | 5,658 |
Ansoft Corp. (a) | 662 | | 11,929 |
Ansys, Inc. (a) | 750 | | 23,018 |
Ascential Software Corp. (a) | 2,027 | | 27,709 |
Aspen Technology, Inc. (a) | 1,148 | | 6,624 |
Atari, Inc. (a) | 2,532 | | 5,748 |
Authentidate Holding Corp. (a) | 825 | | 5,726 |
Autodesk, Inc. | 3,597 | | 235,280 |
BEA Systems, Inc. (a) | 13,595 | | 109,848 |
BindView Development Corp. (a) | 1,838 | | 6,525 |
Blackbaud, Inc. | 1,180 | | 14,750 |
Blackboard, Inc. | 935 | | 14,306 |
Borland Software Corp. (a) | 2,486 | | 29,061 |
Business Objects SA sponsored ADR (a) | 1,189 | | 27,680 |
Captaris, Inc. (a) | 2,149 | | 10,552 |
Catapult Communications Corp. (a) | 635 | | 17,234 |
CCC Information Services Group, Inc. (a) | 1,057 | | 22,091 |
Check Point Software Technologies Ltd. (a) | 7,933 | | 188,329 |
Chinadotcom Corp. Class A (a) | 2,961 | | 13,058 |
Citrix Systems, Inc. (a) | 5,446 | | 128,580 |
Cognos, Inc. (a) | 2,893 | | 112,871 |
Compuware Corp. (a) | 11,737 | | 67,722 |
Concord Communications, Inc. (a) | 618 | | 5,741 |
Concur Technologies, Inc. (a) | 1,142 | | 10,735 |
Convera Corp. Class A (a) | 1,608 | | 7,493 |
Creo, Inc. (a) | 1,565 | | 21,180 |
DataMirror Corp. (a) | 206 | | 1,397 |
Datastream Systems, Inc. (a) | 963 | | 5,682 |
Common Stocks - continued |
| Shares | | Value (Note 1) |
INFORMATION TECHNOLOGY - continued |
Software - continued |
Descartes Systems Group, Inc. (a) | 893 | | $ 1,551 |
Digimarc Corp. (a) | 710 | | 6,539 |
E.piphany, Inc. (a) | 3,007 | | 13,592 |
Electronic Arts, Inc. (a) | 9,674 | | 473,059 |
Embarcadero Technologies, Inc. (a) | 915 | | 8,089 |
Epicor Software Corp. (a) | 2,019 | | 31,840 |
EPIQ Systems, Inc. (a) | 646 | | 9,684 |
Evolving Systems, Inc. (a) | 203 | | 725 |
FileNET Corp. (a) | 1,427 | | 38,258 |
Geac Computer Corp. Ltd. (a) | 2,566 | | 20,057 |
Hummingbird Ltd. (a) | 422 | | 10,141 |
Hyperion Solutions Corp. (a) | 1,296 | | 58,074 |
Informatica Corp. (a) | 3,191 | | 24,890 |
Intellisync Corp. (a) | 1,702 | | 3,064 |
Internet Security Systems, Inc. (a) | 1,483 | | 35,903 |
InterVideo, Inc. | 605 | | 6,812 |
Intervoice, Inc. (a) | 1,422 | | 18,486 |
Intuit, Inc. (a) | 6,136 | | 256,730 |
Jack Henry & Associates, Inc. | 2,913 | | 56,163 |
JAMDAT Mobile, Inc. | 590 | | 13,499 |
JDA Software Group, Inc. (a) | 644 | | 8,449 |
Kronos, Inc. (a) | 1,026 | | 51,854 |
Lawson Software, Inc. (a) | 3,015 | | 18,633 |
Macromedia, Inc. (a) | 2,182 | | 62,252 |
Macrovision Corp. (a) | 1,640 | | 43,542 |
Magic Software Enterprises Ltd. (a) | 1,246 | | 4,236 |
Magma Design Automation, Inc. (a) | 958 | | 12,990 |
Manhattan Associates, Inc. (a) | 840 | | 20,412 |
Manugistics Group, Inc. (a) | 1,559 | | 4,287 |
MAPICS, Inc. (a) | 1,217 | | 11,829 |
MapInfo Corp. (a) | 784 | | 9,369 |
Mentor Graphics Corp. (a) | 2,477 | | 31,086 |
Mercury Interactive Corp. (a) | 2,667 | | 121,642 |
Micromuse, Inc. (a) | 3,179 | | 16,715 |
MICROS Systems, Inc. (a) | 664 | | 48,718 |
Microsoft Corp. | 348,684 | | 9,348,164 |
MicroStrategy, Inc. Class A (a) | 404 | | 26,078 |
Mobius Management Systems, Inc. (a) | 1,054 | | 8,432 |
Motive, Inc. | 867 | | 11,054 |
MRO Software, Inc. (a) | 735 | | 9,445 |
Nassda Corp. (a) | 1,100 | | 4,708 |
Common Stocks - continued |
| Shares | | Value (Note 1) |
INFORMATION TECHNOLOGY - continued |
Software - continued |
NDS Group PLC sponsored ADR (a) | 374 | | $ 11,800 |
NetIQ Corp. (a) | 1,873 | | 22,982 |
NetScout Systems, Inc. (a) | 1,681 | | 12,725 |
Novell, Inc. (a) | 12,649 | | 77,159 |
Nuance Communications, Inc. (a) | 1,657 | | 7,158 |
NYFIX, Inc. (a) | 1,557 | | 9,949 |
Open Solutions, Inc. | 589 | | 15,579 |
OpenTV Corp. Class A (a) | 3,140 | | 12,623 |
Opnet Technologies, Inc. (a) | 1,106 | | 9,556 |
Opsware, Inc. (a) | 3,569 | | 24,448 |
Oracle Corp. (a) | 165,867 | | 2,099,876 |
PalmSource, Inc. (a) | 398 | | 6,304 |
Parametric Technology Corp. (a) | 9,733 | | 56,938 |
Pegasystems, Inc. (a) | 1,561 | | 11,333 |
PeopleSoft, Inc. (a) | 11,509 | | 271,727 |
Pervasive Software, Inc. (a) | 1,282 | | 5,115 |
Phase Forward, Inc. | 975 | | 8,005 |
Phoenix Technologies Ltd. (a) | 1,781 | | 14,444 |
Plato Learning, Inc. (a) | 886 | | 6,193 |
Portal Software, Inc. (a) | 1,401 | | 4,833 |
Progress Software Corp. (a) | 1,152 | | 26,150 |
QAD, Inc. | 960 | | 7,910 |
Quality Systems, Inc. (a) | 238 | | 14,616 |
Quest Software, Inc. (a) | 3,675 | | 56,889 |
Radiant Systems, Inc. (a) | 1,048 | | 6,540 |
RADWARE Ltd. (a) | 685 | | 17,406 |
Red Hat, Inc. (a) | 5,856 | | 84,795 |
Renaissance Learning, Inc. | 849 | | 16,352 |
Retalix Ltd. (a) | 546 | | 10,374 |
Roxio, Inc. (a) | 1,962 | | 18,364 |
RSA Security, Inc. (a) | 2,264 | | 47,884 |
SAFLINK Corp. (a) | 2,886 | | 7,850 |
ScanSoft, Inc. (a) | 3,794 | | 13,848 |
SCO Group, Inc. (a) | 176 | | 700 |
Secure Computing Corp. (a) | 1,421 | | 14,807 |
SERENA Software, Inc. (a) | 1,450 | | 30,233 |
Shanda Interactive Entertainment Ltd. ADR | 464 | | 18,630 |
Siebel Systems, Inc. (a) | 16,078 | | 162,066 |
Sonic Solutions, Inc. (a) | 602 | | 11,619 |
SPSS, Inc. (a) | 683 | | 10,921 |
SS&C Technologies, Inc. | 624 | | 13,971 |
Common Stocks - continued |
| Shares | | Value (Note 1) |
INFORMATION TECHNOLOGY - continued |
Software - continued |
Symantec Corp. (a) | 10,089 | | $ 643,779 |
Synopsys, Inc. (a) | 5,027 | | 88,626 |
Synplicity, Inc. (a) | 1,694 | | 9,520 |
Take-Two Interactive Software, Inc. (a) | 1,273 | | 44,491 |
TALX Corp. | 391 | | 11,495 |
Tecnomatix Technologies Ltd. (a) | 525 | | 6,552 |
THQ, Inc. (a) | 1,060 | | 22,748 |
TIBCO Software, Inc. (a) | 7,737 | | 88,976 |
Transaction Systems Architects, Inc. Class A (a) | 1,334 | | 27,374 |
Ulticom, Inc. (a) | 1,349 | | 24,215 |
Ultimate Software Group, Inc. (a) | 884 | | 11,289 |
VA Software Corp. (a) | 2,086 | | 5,152 |
Vastera, Inc. (a) | 987 | | 1,826 |
Verint Systems, Inc. (a) | 1,071 | | 44,061 |
Verisity Ltd. (a) | 1,082 | | 9,067 |
VERITAS Software Corp. (a) | 13,674 | | 299,461 |
Verity, Inc. (a) | 1,336 | | 18,317 |
WatchGuard Technologies, Inc. (a) | 1,411 | | 5,785 |
Wind River Systems, Inc. (a) | 2,650 | | 32,065 |
Witness Systems, Inc. (a) | 902 | | 13,521 |
| | 17,393,053 |
TOTAL INFORMATION TECHNOLOGY | | 50,743,800 |
MATERIALS - 1.1% |
Chemicals - 0.4% |
A. Schulman, Inc. | 796 | | 17,074 |
Akzo Nobel NV sponsored ADR | 1,949 | | 80,669 |
Hawkins, Inc. | 1,094 | | 13,019 |
Headwaters, Inc. (a) | 1,200 | | 38,436 |
LESCO, Inc. (a) | 1,061 | | 12,732 |
Methanex Corp. | 3,929 | | 69,175 |
Nanophase Technologies Corp. (a) | 626 | | 3,862 |
Sigma Aldrich Corp. | 2,155 | | 128,718 |
Symyx Technologies, Inc. (a) | 1,030 | | 32,476 |
| | 396,161 |
Construction Materials - 0.0% |
U.S. Concrete, Inc. (a) | 1,257 | | 9,138 |
Containers & Packaging - 0.2% |
Anchor Glass Container Corp. | 822 | | 5,409 |
Common Stocks - continued |
| Shares | | Value (Note 1) |
MATERIALS - continued |
Containers & Packaging - continued |
Caraustar Industries, Inc. (a) | 1,168 | | $ 18,793 |
Silgan Holdings, Inc. | 668 | | 36,272 |
Smurfit-Stone Container Corp. (a) | 8,000 | | 143,680 |
| | 204,154 |
Metals & Mining - 0.5% |
Aber Diamond Corp. (a) | 1,743 | | 67,136 |
Alliance Resource Partners LP | 215 | | 15,104 |
Anglo American PLC ADR | 864 | | 21,038 |
Century Aluminum Co. (a) | 1,180 | | 30,232 |
Commonwealth Industries, Inc. (a) | 1,619 | | 21,193 |
Durban Roodepoort Deep Ltd. sponsored ADR (a) | 4,781 | | 8,271 |
Gibraltar Industries, Inc. | 991 | | 23,873 |
Ivanhoe Mines Ltd. (a) | 8,616 | | 61,753 |
Metal Management, Inc. (a) | 906 | | 23,810 |
Metals USA, Inc. (a) | 811 | | 15,206 |
NN, Inc. | 1,342 | | 17,097 |
Pan American Silver Corp. (a) | 1,881 | | 34,053 |
Randgold Resources Ltd. ADR (a) | 1,472 | | 18,665 |
Roanoke Electric Steel Corp. | 599 | | 10,776 |
Royal Gold, Inc. | 906 | | 16,054 |
Schnitzer Steel Industries, Inc. Class A | 702 | | 26,486 |
Silver Standard Resources, Inc. (a) | 1,261 | | 17,661 |
Steel Dynamics, Inc. | 1,626 | | 65,902 |
Steel Technologies, Inc. | 420 | | 12,298 |
Wheeling Pittsburgh Corp. (a) | 523 | | 19,131 |
| | 525,739 |
Paper & Forest Products - 0.0% |
Mercer International, Inc. (SBI) (a) | 976 | | 10,638 |
TOTAL MATERIALS | | 1,145,830 |
TELECOMMUNICATION SERVICES - 2.2% |
Diversified Telecommunication Services - 0.6% |
Broadwing Corp. (a) | 1,596 | | 10,597 |
Commonwealth Telephone Enterprises, Inc. (a) | 639 | | 31,094 |
CT Communications, Inc. | 802 | | 10,610 |
D&E Communications, Inc. | 839 | | 10,991 |
General Communications, Inc. Class A (a) | 1,637 | | 16,763 |
Global Crossing Ltd. (a) | 485 | | 7,299 |
Golden Telecom, Inc. | 1,416 | | 42,902 |
Common Stocks - continued |
| Shares | | Value (Note 1) |
TELECOMMUNICATION SERVICES - continued |
Diversified Telecommunication Services - continued |
HickoryTech Corp. | 972 | | $ 10,332 |
ITC DeltaCom, Inc. (a) | 1,721 | | 2,943 |
Level 3 Communications, Inc. (a)(d) | 21,588 | | 74,479 |
MCI, Inc. | 10,212 | | 192,598 |
McLeodUSA, Inc. Class A (a) | 5,360 | | 1,394 |
North Pittsburgh Systems, Inc. | 769 | | 19,294 |
Primus Telecommunications Group, Inc. (a) | 2,302 | | 6,975 |
PTEK Holdings, Inc. (a) | 3,248 | | 34,201 |
Shenandoah Telecommunications Co. | 346 | | 10,231 |
SureWest Communications | 400 | | 11,388 |
Talk America Holdings, Inc. (a) | 989 | | 6,250 |
Teleglobe International Holdings Ltd. (a) | 1,380 | | 4,733 |
Telewest Global, Inc. (a) | 7,527 | | 110,195 |
Time Warner Telecom, Inc. Class A (a) | 1,250 | | 4,738 |
U.S. LEC Corp. Class A (a) | 1,291 | | 4,351 |
Warwick Valley Telephone Co. | 420 | | 9,441 |
| | 633,799 |
Wireless Telecommunication Services - 1.6% |
Aether Systems, Inc. (a) | 2,467 | | 9,177 |
Alamosa Holdings, Inc. (a) | 3,935 | | 42,892 |
At Road, Inc. (a) | 2,107 | | 12,705 |
Boston Communications Group, Inc. (a) | 912 | | 8,117 |
Centennial Communications Corp. Class A (a) | 3,308 | | 21,866 |
Dobson Communications Corp. Class A (a) | 2,490 | | 4,507 |
EMS Technologies, Inc. (a) | 443 | | 6,951 |
InPhonic, Inc. | 1,005 | | 25,638 |
Millicom International Cellular SA (a) | 3,019 | | 66,901 |
Nextel Communications, Inc. Class A (a) | 34,613 | | 985,086 |
Nextel Partners, Inc. Class A (a) | 5,877 | | 106,315 |
NII Holdings, Inc. (a) | 2,105 | | 91,062 |
SBA Communications Corp. Class A (a) | 2,475 | | 23,760 |
Telesystem International Wireless, Inc. (a) | 5,421 | | 62,989 |
TIM Hellas Telecommunications SA ADR | 576 | | 9,504 |
Ubiquitel, Inc. (a) | 3,855 | | 25,058 |
USA Mobility, Inc. (a) | 1,072 | | 38,978 |
Western Wireless Corp. Class A (a) | 2,616 | | 70,632 |
Wireless Facilities, Inc. (a) | 2,684 | | 22,224 |
| | 1,634,362 |
TOTAL TELECOMMUNICATION SERVICES | | 2,268,161 |
Common Stocks - continued |
| Shares | | Value (Note 1) |
UTILITIES - 0.2% |
Electric Utilities - 0.1% |
MGE Energy, Inc. | 882 | | $ 30,394 |
Otter Tail Corp. | 1,231 | | 33,151 |
| | 63,545 |
Gas Utilities - 0.0% |
EnergySouth, Inc. | 465 | | 13,387 |
Inergy LP | 330 | | 9,676 |
| | 23,063 |
Multi-Utilities & Unregulated Power - 0.0% |
NorthWestern Energy Corp. (a) | 1,050 | | 26,933 |
Water Utilities - 0.1% |
Artesian Resources Corp. Class A | 571 | | 16,588 |
Connecticut Water Service, Inc. | 559 | | 15,557 |
Middlesex Water Co. | 728 | | 14,487 |
Southwest Water Co. | 973 | | 13,243 |
York Water Co. | 855 | | 16,809 |
| | 76,684 |
TOTAL UTILITIES | | 190,225 |
TOTAL COMMON STOCKS (Cost $96,332,857) | 100,906,887 |
U.S. Treasury Obligations - 1.0% |
| Principal Amount | | |
U.S. Treasury Bills, yield at date of purchase 1.60% to 1.61% 1/6/05 (e)
(Cost $998,405) | | $ 1,000,000 | | 998,105 |
Money Market Funds - 2.0% |
| Shares | | Value (Note 1) |
Fidelity Cash Central Fund, 1.98% (b) | 657,444 | | $ 657,444 |
Fidelity Securities Lending Cash Central Fund, 2% (b)(c) | 1,429,457 | | 1,429,457 |
TOTAL MONEY MARKET FUNDS (Cost $2,086,901) | 2,086,901 |
TOTAL INVESTMENT PORTFOLIO - 100.6% (Cost $99,418,163) | | 103,991,893 |
NET OTHER ASSETS - (0.6)% | | (659,102) |
NET ASSETS - 100% | $ 103,332,791 |
Futures Contracts |
| Expiration Date | | Underlying Face Amount at Value | | Unrealized Appreciation/
(Depreciation) |
Purchased |
Equity Index Contracts |
76 Nasdaq 100 E-Mini Index Contracts | Dec. 2004 | | $ 2,390,960 | | $ 109,683 |
|
The face value of futures purchased as a percentage of net assets - 2.3% |
Legend |
(a) Non-income producing |
(b) Affiliated fund that is available only to investment companies and other accounts managed by Fidelity Investments. The rate quoted is the annualized seven-day yield of the fund at period end. A complete listing of the fund's holdings as of its most recent fiscal year end is available upon request. |
(c) Includes investment made with cash collateral received from securities on loan. |
(d) Security or a portion of the security is on loan at period end. |
(e) Security or a portion of the security was pledged to cover margin requirements for futures contracts. At the period end, the value of securities pledged amounted to $623,816. |
Income Tax Information |
The fund hereby designates approximately $47,000 as a capital gain dividend for the purpose of the dividend paid deduction. |
See accompanying notes which are an integral part of the financial statements.
Annual Report
Financial Statements
Statement of Assets and Liabilities
November 30, 2004 |
| | |
Assets | | |
Investment in securities, at value (including securities loaned of $1,395,144) (cost $99,418,163) - See accompanying schedule | | $ 103,991,893 |
Cash | | 29,223 |
Receivable for investments sold | | 13,998 |
Receivable for fund shares sold | | 57,525 |
Dividends receivable | | 1,095,042 |
Interest receivable | | 3,189 |
Prepaid expenses | | 360 |
Receivable from investment adviser for expense reductions | | 11,152 |
Other receivables | | 2,497 |
Total assets | | 105,204,879 |
| | |
Liabilities | | |
Payable for investments purchased | $ 17,913 | |
Payable for fund shares redeemed | 320,765 | |
Accrued management fee | 19,943 | |
Distribution fees payable | 13,869 | |
Payable for daily variation on futures contracts | 7,344 | |
Other affiliated payables | 15,606 | |
Other payables and accrued expenses | 47,191 | |
Collateral on securities loaned, at value | 1,429,457 | |
Total liabilities | | 1,872,088 |
| | |
Net Assets | | $ 103,332,791 |
Net Assets consist of: | | |
Paid in capital | | $ 97,250,642 |
Undistributed net investment income | | 1,097,395 |
Accumulated undistributed net realized gain (loss) on investments and foreign currency transactions | | 301,342 |
Net unrealized appreciation (depreciation) on investments and assets and liabilities in foreign currencies | | 4,683,412 |
Net Assets, for 3,589,285 shares outstanding | | $ 103,332,791 |
Net Asset Value, offering price and redemption price per share ($103,332,791 ÷ 3,589,285 shares) | | $ 28.79 |
See accompanying notes which are an integral part of the financial statements.
Annual Report
Financial Statements - continued
Statement of Operations
Year ended November 30, 2004 |
| | |
Investment Income | | |
Dividends | | $ 378,888 |
Special Dividends | | 1,029,228 |
Interest | | 34,832 |
Security lending | | 6,888 |
Total income | | 1,449,836 |
| | |
Expenses | | |
Management fee | $ 187,028 | |
Transfer agent fees | 115,860 | |
Distribution fees | 46,750 | |
Licensing fees | 38,958 | |
Accounting and security lending fees | 33,213 | |
Non-interested trustees' compensation | 386 | |
Custodian fees and expenses | 19,099 | |
Registration fees | 48,190 | |
Audit | 53,086 | |
Legal | 2,676 | |
Miscellaneous | 4,259 | |
Total expenses before reductions | 549,505 | |
Expense reductions | (199,558) | 349,947 |
Net investment income (loss) | | 1,099,889 |
Realized and Unrealized Gain (Loss) Net realized gain (loss) on: | | |
Investment securities | 324,017 | |
Foreign currency transactions | 16 | |
Futures contracts | 84,721 | |
Total net realized gain (loss) | | 408,754 |
Change in net unrealized appreciation (depreciation) on: Investment securities | 2,586,547 | |
Assets and liabilities in foreign currencies | (1) | |
Futures contracts | 93,179 | |
Total change in net unrealized appreciation (depreciation) | | 2,679,725 |
Net gain (loss) | | 3,088,479 |
Net increase (decrease) in net assets resulting from operations | | $ 4,188,368 |
See accompanying notes which are an integral part of the financial statements.
Annual Report
Statement of Changes in Net Assets
| Year ended
November 30,
2004 | For the period
September 25, 2003
(commencement
of operations) to
November 30, 2003 |
Increase (Decrease) in Net Assets | | |
Operations | | |
Net investment income (loss) | $ 1,099,889 | $ 15,979 |
Net realized gain (loss) | 408,754 | (17,339) |
Change in net unrealized appreciation
(depreciation) | 2,679,725 | 2,003,687 |
Net increase (decrease) in net assets resulting
from operations | 4,188,368 | 2,002,327 |
Distributions to shareholders from net investment income | (27,466) | - |
Distributions to shareholders from net realized gain | (74,806) | - |
Total distributions | (102,272) | - |
Share transactions
Proceeds from sales of shares | 105,799,253 | 55,487,175 |
Reinvestment of distributions | 96,366 | - |
Cost of shares redeemed | (36,422,527) | (27,812,489) |
Net increase (decrease) in net assets resulting from share transactions | 69,473,092 | 27,674,686 |
Redemption fees | 86,906 | 9,684 |
Total increase (decrease) in net assets | 73,646,094 | 29,686,697 |
| | |
Net Assets | | |
Beginning of period | 29,686,697 | - |
End of period (including undistributed net investment income of $1,097,395 and undistributed net investment income of $15,971, respectively) | $ 103,332,791 | $ 29,686,697 |
Other Information Shares | | |
Sold | 3,837,378 | 2,150,156 |
Issued in reinvestment of distributions | 3,434 | - |
Redeemed | (1,352,324) | (1,049,359) |
Net increase (decrease) | 2,488,488 | 1,100,797 |
See accompanying notes which are an integral part of the financial statements.
Annual Report
Financial Highlights
Years ended November 30, | 2004 | 2003F |
Selected Per-Share Data | | |
Net asset value, beginning of period | $ 26.97 | $ 25.00 |
Income from Investment Operations | | |
Net investment income (loss) D | .38 E | .01 |
Net realized and unrealized gain (loss) | 1.47 | 1.95 |
Total from investment operations | 1.85 | 1.96 |
Distributions from net investment income | (.02) | - |
Distributions from net realized gain | (.04) | - |
Total distributions | (.06) | - |
Redemption fees added to paid in capitalD | .03 | .01 |
Net asset value, end of period | $ 28.79 | $ 26.97 |
Total Return B, C | 6.99% | 7.88% |
Ratios to Average Net Assets G | | |
Expenses before expense reductions | .71% | 1.30% A |
Expenses net of voluntary waivers, if any | .45% | .45% A |
Expenses net of all reductions | .45% | .45% A |
Net investment income (loss) | 1.41% | .31% A |
Supplemental Data | | |
Net assets, end of period (000 omitted) | $ 103,333 | $ 29,687 |
Portfolio turnover rate | 5% | 55% A |
A Annualized
B Total returns for periods of less than one year are not annualized.
C Total returns would have been lower had certain expenses not been reduced during the periods shown.
D Calculated based on average shares outstanding during the period.
E Investment income per share reflects a special dividend which amounted to $.35 per share.
F For the period September 25, 2003 (commencement of operations) to November 30, 2003.
G Expense ratios reflect operating expenses of the fund. Expenses before reductions do not reflect amounts reimbursed by the investment adviser or reductions from brokerage service arrangements or other expense offset arrangements and do not represent the amount paid by the fund during periods when reimbursements or reductions occur. Expense ratios before reductions for start-up periods may not be representative of longer-term operating periods. Expenses net of any voluntary waivers reflect expenses after reimbursement by the investment adviser but prior to reductions from brokerage service arrangements or other expense offset arrangements. Expenses net of all reductions represent the net expenses paid by the fund.
See accompanying notes which are an integral part of the financial statements.
Annual Report
Notes to Financial Statements
For the period ended November 30, 2004
1. Significant Accounting Policies.
Fidelity NASDAQ Composite Index Fund (the fund) is a fund of Fidelity Commonwealth Trust (the trust) and is authorized to issue an unlimited number of shares. The trust is registered under the Investment Company Act of 1940, as amended (the 1940 Act), as an open-end management investment company organized as a Massachusetts business trust. The financial statements have been prepared in conformity with accounting principles generally accepted in the United States of America, which require management to make certain estimates and assumptions at the date of the financial statements. The following summarizes the significant accounting policies of the fund:
Security Valuation. Net asset value per share (NAV calculation) is calculated as of the close of business of the New York Stock Exchange, normally 4:00 p.m. Eastern time. Equity securities, including restricted securities, for which market quotations are available are valued at the last sale price or official closing price (closing bid price or last evaluated quote if no sale has occurred) on the primary market or exchange on which they trade. If prices are not readily available or do not accurately reflect fair value for a security, or if a security's value has been materially affected by events occurring after the close of the exchange or market on which the security is principally traded, that security may be valued by another method that the Board of Trustees believes accurately reflects fair value. A security's valuation may differ depending on the method used for determining value. Price movements in futures contracts and ADRs, market and trading trends, the bid/ask quotes of brokers and off-exchange institutional trading may be reviewed in the course of making a good faith determination of a security's fair value. Short-term securities with remaining maturities of sixty days or less for which quotations are not readily available are valued on the basis of amortized cost. Investments in open-end investment companies are valued at their net asset value each business day.
Foreign Currency. The fund uses foreign currency contracts to facilitate transactions in foreign-denominated securities. Losses from these transactions may arise from changes in the value of the foreign currency or if the counterparties do not perform under the contracts' terms.
Foreign-denominated assets, including investment securities, and liabilities are translated into U.S. dollars at the exchange rate at period end. Purchases and sales of investment securities, income and dividends received and expenses denominated in foreign currencies are translated into U.S. dollars at the exchange rate in effect on the transaction date.
The effects of exchange rate fluctuations on investments are included with the net realized and unrealized gain (loss) on investment securities. Other foreign currency transactions resulting in realized and unrealized gain (loss) are disclosed separately.
Annual Report
Notes to Financial Statements - continued
1. Significant Accounting Policies - continued
Investment Transactions and Income. Security transactions are accounted for as of trade date. Gains and losses on securities sold are determined on the basis of identified cost and may include proceeds received from litigation. Dividend income is recorded on the ex-dividend date, except for certain dividends from foreign securities where the ex-dividend date may have passed, which are recorded as soon as the fund is informed of the ex-dividend date. Non-cash dividends included in dividend income, if any, are recorded at the fair market value of the securities received. Distributions received on securities that represent a return of capital or capital gain are recorded as a reduction of cost of investments and/or as a realized gain. The fund estimates the components of distributions received that may be considered return of capital distributions or capital gain distributions. Large, non-recurring dividends recognized by the fund are presented separately on the Statement of Operations as "Special Dividends" and the impact of these dividends to net investment income per share is presented in the Financial Highlights. Interest income is accrued as earned. Interest income includes coupon interest and amortization of premium and accretion of discount on debt securities. Investment income is recorded net of foreign taxes withheld where recovery of such taxes is uncertain.
Expenses. Most expenses of the trust can be directly attributed to a fund. Expenses which cannot be directly attributed are apportioned among the funds in the trust.
Income Tax Information and Distributions to Shareholders. Each year, the fund intends to qualify as a regulated investment company by distributing all of its taxable income and realized gains under Subchapter M of the Internal Revenue Code. As a result, no provision for income taxes is required in the accompanying financial statements. Foreign taxes are provided for based on the fund's understanding of the tax rules and rates that exist in the foreign markets in which it invests.
Distributions are recorded on the ex-dividend date. Income and capital gain distributions are determined in accordance with income tax regulations, which may differ from generally accepted accounting principles. In addition, the fund will claim a portion of the payment made to redeeming shareholders as a distribution for income tax purposes.
Capital accounts within the financial statements are adjusted for permanent book-tax differences. These adjustments have no impact on net assets or the results of operations. Temporary book-tax differences will reverse in a subsequent period.
Book-tax differences are primarily due to losses deferred due to wash sales and futures transactions.
Annual Report
1. Significant Accounting Policies - continued
Income Tax Information and Distributions to Shareholders - continued
The tax-basis components of distributable earnings and the federal tax cost as of period end were as follows:
Unrealized appreciation | $ 13,602,919 |
Unrealized depreciation | (9,177,460) |
Net unrealized appreciation (depreciation) | 4,425,459 |
Undistributed ordinary income | 1,451,271 |
Undistributed long-term capital gain | 151,225 |
| |
Cost for federal income tax purposes | $ 99,566,434 |
The tax character of distributions paid was as follows:
| November 30, 2004 |
Ordinary Income | $ 93,441 |
Long-term Capital Gains | 8,831 |
Total | $ 102,272 |
Short-Term Trading (Redemption) Fees. Shares held in the fund less than 90 days are subject to a redemption fee equal to .75% of the proceeds of the redeemed shares. All redemption fees, including any estimated redemption fees paid by Fidelity Management & Research Company (FMR), are retained by the fund and accounted for as an addition to paid in capital.
2. Operating Policies.
Repurchase Agreements. FMR has received an Exemptive Order from the Securities and Exchange Commission (the SEC) which permits the fund and other affiliated entities of FMR to transfer uninvested cash balances into joint trading accounts. These accounts are then invested in repurchase agreements that are collateralized by U.S. Treasury or Government obligations. The fund may also invest directly with institutions, in repurchase agreements that are collateralized by commercial paper obligations and corporate obligations. Collateral is held in segregated accounts with custodian banks and may be obtained in the event of a default of the counterparty. Collateral is marked-to-market daily and maintained at a value at least equal to the principal amount of the repurchase agreement (including accrued interest).
Futures Contracts. The fund may use futures contracts to manage its exposure to the stock market. Buying futures tends to increase the fund's exposure to the underlying instrument, while selling futures tends to decrease the fund's exposure to the underlying instrument or hedge other fund investments. Futures contracts involve, to varying degrees, risk of loss in excess of any futures variation margin reflected in the Statement
Annual Report
Notes to Financial Statements - continued
2. Operating Policies - continued
Futures Contracts - continued
of Assets and Liabilities. The underlying face amount at value of any open futures contracts at period end is shown in the Schedule of Investments under the caption "Futures Contracts." This amount reflects each contract's exposure to the underlying instrument at period end. Losses may arise from changes in the value of the underlying instruments or if the counter-parties do not perform under the contracts' terms. Gains (losses) are realized upon the expiration or closing of the futures contracts. Futures contracts are valued at the settlement price established each day by the board of trade or exchange on which they are traded.
3. Purchases and Sales of Investments.
Purchases and sales of securities, other than short-term securities and U.S. government securities, aggregated $74,067,899 and $3,679,187, respectively.
4. Fees and Other Transactions with Affiliates.
Management Fee. FMR and its affiliates provide the fund with investment management related services for which the fund pays a monthly management fee that is based on an annual rate of .24% of the fund's average net assets.
Sub-Adviser. Geode Capital Management, LLC (Geode), serves as sub-adviser for the fund. Geode provides discretionary investment advisory services to the fund and is paid by FMR for providing these services.
Distribution and Service Plan. In accordance with Rule 12b-1 of the 1940 Act, the fund has adopted a Distribution and Service Plan. The fund pays Fidelity Distributors Corporation (FDC), an affiliate of FMR, a distribution fee based on annual percentage of the fund's average net assets of up to .25%. In addition, FDC pays Nasdaq for marketing services provided to the fund. For the period, the distribution fees were equivalent to an annualized rate of.06% of average net assets. The total amounts paid to and retained by FDC were $46,750 and $0, respectively.
Transfer Agent Fees. Fidelity Service Company, Inc. (FSC), an affiliate of FMR, is the fund's transfer, dividend disbursing and shareholder servicing agent. FSC receives account fees and asset-based fees that vary according to account size and type of account. FSC pays for typesetting, printing and mailing of shareholder reports, except proxy statements. For the period, the transfer agent fees were equivalent to an annual rate of .15% of average net assets.
Annual Report
4. Fees and Other Transactions with Affiliates - continued
Accounting and Security Lending Fees. FSC maintains the fund's accounting records. The accounting fee is based on the level of average net assets for the month. Under a separate contract, FSC administers the security lending program. The security lending fee is based on the number and duration of lending transactions.
Licensing Fees. Under the terms of a license agreement, FMR pays Nasdaq an annual licensing fee for the use of the Nasdaq Composite Index. FMR has entered into a sub-license agreement with the fund whereby the fund pays FMR the amount of the license fee at the rate of up to .06% of the fund's average net assets.
Central Funds. The fund may invest in affiliated Central Funds managed by Fidelity Investments Money Management, Inc. (FIMM), an affiliate of FMR. The Central Funds are open-end investment companies available only to investment companies and other accounts managed by FMR and its affiliates. The Central Funds seek preservation of capital and current income and do not pay a management fee. Income distributions earned by the fund are recorded as income in the accompanying financial statements and totaled $26,501 for the period.
5. Committed Line of Credit.
The fund participates with other funds managed by FMR in a $4.2 billion credit facility (the "line of credit") to be utilized for temporary or emergency purposes to fund shareholder redemptions or for other short-term liquidity purposes. The fund has agreed to pay commitment fees on its pro rata portion of the line of credit. During the period, there were no borrowings on this line of credit.
6. Security Lending.
The fund lends portfolio securities from time to time in order to earn additional income. The fund receives collateral (in the form of U.S. Treasury obligations, letters of credit and/or cash) against the loaned securities and maintains collateral in an amount not less than 100% of the market value of the loaned securities during the period of the loan. The market value of the loaned securities is determined at the close of business of the fund and any additional required collateral is delivered to the fund on the next business day. If the borrower defaults on its obligation to return the securities loaned because of insolvency or other reasons, a fund could experience delays and costs in recovering the securities loaned or in gaining access to the collateral. Cash collateral is invested in cash equivalents. The value of loaned securities and cash collateral at period end are disclosed on the fund's Statement of Assets and Liabilities.
Annual Report
Notes to Financial Statements - continued
7. Expense Reductions.
FMR has voluntarily agreed to reimburse the fund through October 1, 2006, to the extent annual operating expenses exceeded .45% of average net assets. Some expenses, for example interest expense, are excluded from this reimbursement. During the period, this reimbursement reduced the fund's expenses by $199,461.
In addition, through arrangements with the fund's custodian, credits realized as a result of uninvested cash balances were used to reduce the fund's expenses. During the period, these credits reduced the fund's custody expenses by $97.
Annual Report
Report of Independent Registered Public Accounting Firm
To the Trustees of Fidelity Commonwealth Trust and Shareholders of Fidelity NASDAQ Composite Index Fund:
We have audited the accompanying statement of assets and liabilities of Fidelity NASDAQ Composite Index Fund (the Fund), a fund of Fidelity Commonwealth Trust, including the portfolio of investments, as of November 30, 2004, and the related statement of operations for the year then ended, and the statement of changes in net assets and the financial highlights for the year ended November 30, 2004 and for the period September 25, 2003 (commencement of operations) to November 30, 2003. These financial statements and financial highlights are the responsibility of the Fund's management. Our responsibility is to express an opinion on these financial statements and financial highlights based on our audits.
We conducted our audits in accordance with standards of the Public Company Accounting Oversight Board (United States). Those standards require that we plan and perform
the audit to obtain reasonable assurance about whether the financial statements and financial highlights are free of material misstatement. An audit includes examining, on
a test basis, evidence supporting the amounts and disclosures in the financial statements. Our procedures included confirmation of securities owned as of November 30, 2004, by correspondence with the custodian and brokers; where replies were not received from brokers, we performed other auditing procedures. An audit also includes assessing the accounting principles used and significant estimates made by management, as well as evaluating the overall financial statement presentation. We believe that our audits provide a reasonable basis for our opinion.
In our opinion, the financial statements and financial highlights referred to above present fairly, in all material respects, the financial position of Fidelity NASDAQ Composite Index Fund as of November 30, 2004, the results of its operations for the year then ended, and the changes in its net assets and its financial highlights for the year ended November 30, 2004 and for the period September 25, 2003 (commencement of operations) to November 30, 2003, in conformity with accounting principles generally accepted in the United States of America.
/s/DELOITTE & TOUCHE LLP
DELOITTE & TOUCHE LLP
Boston, Massachusetts
January 14, 2005
Annual Report
Trustees and Officers
The Trustees, Member of the Advisory Board, and executive officers of the trust and fund, as applicable, are listed below. The Board of Trustees governs the fund and is responsible for protecting the interests of shareholders. The Trustees are experienced executives who meet periodically throughout the year to oversee the fund's activities, review contractual arrangements with companies that provide services to the fund, and review the fund's performance. Except for William O. McCoy, Dennis J. Dirks, and Kenneth L. Wolfe, each of the Trustees oversees 301 funds advised by FMR or an affiliate. Mr. McCoy oversees 303 funds advised by FMR or an affiliate. Mr. Dirks and Mr. Wolfe oversee 223 funds advised by FMR or an affiliate.
The Trustees hold office without limit in time except that (a) any Trustee may resign; (b) any Trustee may be removed by written instrument, signed by at least two-thirds of the number of Trustees prior to such removal; (c) any Trustee who requests to be retired or who has become incapacitated by illness or injury may be retired by written instrument signed by a majority of the other Trustees; and (d) any Trustee may be removed at any special meeting of shareholders by a two-thirds vote of the outstanding voting securities of the trust. In any event, each non-interested Trustee shall retire not later than the last day of the calendar year in which his or her 72nd birthday occurs. The executive officers and Advisory Board Member hold office without limit in time, except that any officer and Advisory Board Member may resign or may be removed by a vote of a majority of the Trustees at any regular meeting or any special meeting of the Trustees. Except as indicated, each individual has held the office shown or other offices in the same company for the past five years.
The fund's Statement of Additional Information (SAI) includes more information about the Trustees. To request a free copy, call Fidelity at 1-800-544-8544.
Interested Trustees*:
Correspondence intended for each Trustee who is an "interested person" (as defined in the 1940 Act) may be sent to Fidelity Investments, 82 Devonshire Street, Boston, Massachusetts 02109.
Name, Age; Principal Occupation |
Edward C. Johnson 3d (74)** |
| Year of Election or Appointment: 1974 Mr. Johnson is Chairman of the Board of Trustees. Mr. Johnson serves
as Chief Executive Officer, Chairman, and a Director of FMR Corp.; a Director and Chairman of the Board and of the Executive Committee of FMR; Chairman and a Director of Fidelity Management & Research
(Far East) Inc.; Chairman (1998) and a Director of Fidelity Investments Money Management, Inc.; and Chairman (2001) and a Director (2000) of FMR Co., Inc. |
Abigail P. Johnson (42)** |
| Year of Election or Appointment: 2001 Senior Vice President of Nasdaq Composite Index (2003). Ms. Johnson also serves as Senior Vice President of other Fidelity funds (2001). She is President and a Director of FMR (2001), Fidelity Investments Money Management, Inc. (2001), FMR Co., Inc. (2001), and a Director of FMR Corp. Previously, Ms. Johnson managed a number of Fidelity funds. |
Laura B. Cronin (50) |
| Year of Election or Appointment: 2003 Ms. Cronin is an Executive Vice President (2002) and Chief Financial Officer (2002) of FMR Corp. and is a member of the Fidelity Management Committee (2003). Previously, Ms. Cronin served as Vice President of Finance of FMR (1997-1999), and Chief Financial Officer of FMR (1999-2001), Fidelity Personal Investments (2001), and Fidelity Brokerage Company (2001-2002). |
Robert L. Reynolds (52) |
| Year of Election or Appointment: 2003 Mr. Reynolds is a Director (2003) and Chief Operating Officer (2002) of FMR Corp. and is the head of the Fidelity Management Committee (2003). He also serves on the Board at Fidelity Investments Canada, Ltd. (2000). Previously, Mr. Reynolds served as President of Fidelity Investments Institutional Retirement Group (1996-2000). |
* Trustees have been determined to be "Interested Trustees" by virtue of, among other things, their affiliation with the trust, or various entities under common control with FMR.
** Edward C. Johnson 3d, Trustee, is Abigail P. Johnson's father.
Annual Report
Non-Interested Trustees:
Correspondence intended for each non-interested Trustee (that is, the Trustees other than the Interested Trustees) may be sent to Fidelity Investments, P.O. Box 55235, Boston, Massachusetts 02205-5235.
Name, Age; Principal Occupation |
Dennis J. Dirks (56) |
| Year of Election or Appointment: 2005 Trustee of Fidelity Commonwealth Trust. Mr. Dirks also serves as a Trustee (2005) or Member of the Advisory Board (2004) of other investment companies advised by FMR. Prior to his retirement in May 2003, Mr. Dirks was Chief Operating Officer and a member of the Board of The Depository Trust & Clearing Corporation (DTCC) (1999-2003). He also served as President, Chief Operating Officer, and Board member of The Depository Trust Company (DTC) (1999-2003) and President and Board member of the National Securities Clearing Corporation (NSCC) (1999-2003). In addition, Mr. Dirks served as Chief Executive Officer and Board member of the Government Securities Clearing Corporation (2001-2003) and Chief Executive Officer and Board member of the Mortgage-Backed Securities Clearing Corporation (2001-2003). |
Robert M. Gates (61) |
| Year of Election or Appointment: 1997 Dr. Gates is Vice Chairman of the non-interested Trustees (2005). Dr. Gates is President of Texas A&M University (2002). He was Director of the Central Intelligence Agency (CIA) from 1991 to 1993. From 1989 to 1991, Dr. Gates served as Assistant to the President of the United States and Deputy National Security Advisor. Dr. Gates is a Director of NACCO Industries, Inc. (mining and manufacturing), Parker Drilling Co., Inc. (drilling and rental tools for the energy industry, 2001), and Brinker International (restaurant management, 2003). He also serves as a member of the Advisory Board of VoteHere.net (secure Internet voting, 2001). Previously, Dr. Gates served as a Director of LucasVarity PLC (automotive components and diesel engines), a Director of TRW Inc. (automotive, space, defense, and information technology), and Dean of the George Bush School of Government and Public Service at Texas A&M University (1999-2001). Dr. Gates also is a Trustee of the Forum for International Policy. |
George H. Heilmeier (68) |
| Year of Election or Appointment: 2004 Dr. Heilmeier is Chairman Emeritus of Telcordia Technologies (communication software and systems), where prior to his retirement, he served as company Chairman and Chief Executive Officer. He currently serves on the Boards of Directors of The Mitre Corporation (systems engineering and information technology support for the government), INET Technologies Inc. (telecommunications network surveillance, 2001), Teletech Holdings (customer management services), and HRL Laboratories (private research and development, 2004). He is Chairman of the General Motors Technology Advisory Committee and a Life Fellow of the Institute of Electrical and Electronics Engineers (IEEE) (2000). Dr. Heilmeier is a member of the Defense Science Board and the National Security Agency Advisory Board. He is also a member of the National Academy of Engineering, the American Academy of Arts and Sciences, and the Board of Overseers of the School of Engineering and Applied Science of the University of Pennsylvania. Previously, Dr. Heilmeier served as a Director of TRW Inc. (automotive, space, defense, and information technology, 1992-2002), Compaq (1994-2002), and Automatic Data Processing, Inc. (ADP) (technology-based business outsourcing, 1995-2002). |
Marie L. Knowles (58) |
| Year of Election or Appointment: 2001 Prior to Ms. Knowles' retirement in June 2000, she served as Executive Vice President and Chief Financial Officer of Atlantic Richfield Company (ARCO) (diversified energy, 1996-2000). From 1993 to 1996, she was a Senior Vice President of ARCO and President of ARCO Transportation Company. She served as a Director of ARCO from 1996 to 1998. She currently serves as a Director of Phelps Dodge Corporation (copper mining and manufacturing) and McKesson Corporation (healthcare service, 2002). Ms. Knowles is a Trustee of the Brookings Institution and the Catalina Island Conservancy and also serves as a member of the Advisory Board for the School of Engineering of the University of Southern California. |
Ned C. Lautenbach (60) |
| Year of Election or Appointment: 2000 Mr. Lautenbach has been a partner of Clayton, Dubilier & Rice, Inc. (private equity investment firm) since September 1998. Previously,
Mr. Lautenbach was with the International Business Machines Corporation (IBM) from 1968 until his retirement in 1998. He was most recently Senior Vice President and Group Executive of Worldwide Sales and Services. From 1993 to 1995, he was Chairman of IBM World Trade Corporation, and from 1994 to 1998 was a member of IBM's Corporate Executive Committee. Mr. Lautenbach serves as Co-Chairman and a Director of Covansys, Inc. (global provider of business and technology solutions, 2000). In addition, he is a Director of Italtel Holding S.p.A. (telecommunications (Milan, Italy), 2004) and Eaton Corporation (diversified industrial) as well as the Philharmonic Center for the Arts in Naples, Florida (1999). He also is a member of the Council on Foreign Relations. |
Marvin L. Mann (71) |
| Year of Election or Appointment: 1993 Mr. Mann is Chairman of the non-interested Trustees (2001). He is Chairman Emeritus of Lexmark International, Inc. (computer peripherals), where he served as CEO until April 1998, retired as Chairman May 1999, and remains a member of the Board. Prior to 1991, he held the positions of Vice President of International Business Machines Corporation (IBM) and President and General Manager of various IBM divisions and subsidiaries. He is a member of the Executive Committee of the Independent Director's Council of the Investment Company Institute. In addition, Mr. Mann is a member of the President's Cabinet at the University of Alabama and the Board of Visitors of the Culverhouse College of Commerce and Business Administration at the University of Alabama. |
William O. McCoy (71) |
| Year of Election or Appointment: 1997 Prior to his retirement in December 1994, Mr. McCoy was Vice Chairman of the Board of BellSouth Corporation (telecommunications) and President of BellSouth Enterprises. He is currently a Director of Liberty Corporation (holding company), Duke Realty Corporation (real estate), and Progress Energy, Inc. (electric utility). He is also a partner of Franklin Street Partners (private investment management firm) and a member of the Research Triangle Foundation Board. In addition, Mr. McCoy served as the Interim Chancellor (1999-2000) and a member of the Board of Visitors (1994-1998) for the University of North Carolina at Chapel Hill and currently serves on the Board of Directors of the University of North Carolina Health Care System and the Board of Visitors of the Kenan-Flagler Business School (University of North Carolina at Chapel Hill). He also served as Vice President of Finance for the University of North Carolina (16-school system, 1995-1998). |
Cornelia M. Small (60) |
| Year of Election or Appointment: 2005 Ms. Small is a member (2000) and Chairperson (2002) of the Investment Committee, and a member (2002) of the Board of Trustees of Smith College. Previously, she served as Chief Investment Officer (1999-2000), Director of Global Equity Investments (1996-1999), and a member of the Board of Directors of Scudder, Stevens & Clark (1990-1997) and Scudder Kemper Investments (1997-1998). In addition, Ms. Small served as Co-Chair (2000-2003) of the Annual Fund for the Fletcher School of Law and Diplomacy. |
William S. Stavropoulos (65) |
| Year of Election or Appointment: 2002 Mr. Stavropoulos is Chairman of the Board (2000), CEO (2002), a position he previously held from 1995-2000, Chairman of the Executive Committee (2000), and a Member of the Board of Directors of The Dow Chemical Company. Since joining The Dow Chemical Company in 1967, Mr. Stavropoulos served in numerous senior management positions, including President (1993-2000; 2002-2003). Currently, he is a Director of NCR Corporation (data warehousing and technology solutions), BellSouth Corporation (telecommunications), Chemical Financial Corporation, and Maersk Inc. (industrial conglomerate, 2002). He also serves as a member of the Board of Trustees of the American Enterprise Institute for Public Policy Research. In addition, Mr. Stavropoulos is a member of The Business Council, J.P. Morgan International Council and the University of Notre Dame Advisory Council for the College of Science. |
Kenneth L. Wolfe (65) |
| Year of Election or Appointment: 2005 Trustee of Fidelity Commonwealth Trust. Mr. Wolfe also serves as a Trustee (2005) or Member of the Advisory Board (2004) of other investment companies advised by FMR. Prior to his retirement in 2001, Mr. Wolfe was Chairman and Chief Executive Officer of Hershey Foods Corporation (1993-2001). He currently serves as a member of the boards of Adelphia Communications Corporation (2003), Bausch & Lomb, Inc., and Revlon Inc. (2004). |
Advisory Board Member and Executive Officers:
Correspondence intended for each executive officer and Mr. Lynch may be sent to Fidelity Investments, 82 Devonshire Street, Boston, Massachusetts 02109.
Name, Age; Principal Occupation |
Peter S. Lynch (61) |
| Year of Election or Appointment: 2003 Member of the Advisory Board of Fidelity Commonwealth Trust. Vice Chairman and a Director of FMR, and Vice Chairman (2001) and a Director (2000) of FMR Co., Inc. Previously, Mr. Lynch served as a Trustee of the Fidelity funds (1990-2003). Prior to May 31, 1990, he was a Director of FMR and Executive Vice President of FMR (a position he held until March 31, 1991), Vice President of Fidelity® Magellan® Fund and FMR Growth Group Leader, and Managing Director of FMR Corp. Mr. Lynch was also Vice President of Fidelity Investments Corporate Services. In addition, he serves as a Trustee of Boston College, Massachusetts Eye & Ear Infirmary, Historic Deerfield, John F. Kennedy Library, and the Museum of Fine Arts of Boston. |
Philip L. Bullen (45) |
| Year of Election or Appointment: 2003 Vice President of Nasdaq Composite Index. Mr. Bullen also serves as Vice President of certain Equity Funds (2001) and certain High Income Funds (2001). He is Senior Vice President of FMR (2001) and FMR Co., Inc. (2001), President and a Director of Fidelity Management & Research (Far East) Inc. (2001), President and a Director of Fidelity Management & Research (U.K.) Inc. (2002), and a Director of Strategic Advisers, Inc. (2002). Before joining Fidelity Investments, Mr. Bullen was President and Chief Investment Officer of Santander Global Advisors (1997-2000) and President and Chief Executive Officer of Boston's Baring Asset Management Inc. (1994-1997). |
Eric D. Roiter (56) |
| Year of Election or Appointment: 2003 Secretary of Nasdaq Composite Index. He also serves as Secretary of other Fidelity funds; Vice President, General Counsel, and Secretary of FMR Co., Inc. (2001-present) and FMR; Vice President and Secretary of FDC; Assistant Secretary of Fidelity Management & Research (U.K.) Inc. (2001-present), Fidelity Management & Research (Far East) Inc. (2001-present), and Assistant Secretary of Fidelity Investments Money Management, Inc. (2001-present). Mr. Roiter is an Adjunct Member, Faculty of Law, at Boston College Law School (2003-present). |
Stuart Fross (45) |
| Year of Election or Appointment: 2003 Assistant Secretary of Nasdaq Composite Index. Mr. Fross also serves as Assistant Secretary of other Fidelity funds (2003) and is an employee of FMR. |
Christine Reynolds (46) |
| Year of Election or Appointment: 2004 President, Treasurer, and Anti-Money Laundering (AML) officer of Nasdaq Composite Index. Ms. Reynolds also serves as President, Treasurer, and AML officer of other Fidelity funds (2004) and is a Vice President (2003) and an employee (2002) of FMR. Before joining Fidelity Investments, Ms. Reynolds worked at PricewaterhouseCoopers LLP (PwC) (1980-2002), where she was most recently an audit partner with PwC's investment management practice. |
Timothy F. Hayes (53) |
| Year of Election or Appointment: 2003 Chief Financial Officer of Nasdaq Composite Index. Mr. Hayes also serves as Chief Financial Officer of other Fidelity funds (2002). Recently he was appointed President of Fidelity Service Company (2003) where he also serves as a Director. Mr. Hayes also serves as President of Fidelity Investments Operations Group (FIOG, 2002), which includes Fidelity Pricing and Cash Management Services Group (FPCMS), where he was appointed President in 1998. Previously, Mr. Hayes served as Chief Financial Officer of Fidelity Investments Corporate Systems and Service Group (1998) and Fidelity Systems Company (1997-1998). |
Kenneth A. Rathgeber (57) |
| Year of Election or Appointment: 2004 Chief Compliance Officer of Nasdaq Composite Index. Mr. Rathgeber also serves as Chief Compliance Officer of other Fidelity funds (2004) and Executive Vice President of Risk Oversight for Fidelity Investments (2002). Previously, he served as Executive Vice President and Chief Operating Officer for Fidelity Investments Institutional Services Company, Inc. (1998-2002). |
John R. Hebble (46) |
| Year of Election or Appointment: 2003 Deputy Treasurer of Nasdaq Composite Index. Mr. Hebble also serves as Deputy Treasurer of other Fidelity funds (2003), and is an employee of FMR. Before joining Fidelity Investments, Mr. Hebble worked at Deutsche Asset Management where he served as Director of Fund Accounting (2002-2003) and Assistant Treasurer of the Scudder Funds (1998-2003). |
Kimberley H. Monasterio (40) |
| Year of Election or Appointment: 2004 Deputy Treasurer of Nasdaq Composite Index. Ms. Monasterio also serves as Deputy Treasurer of other Fidelity funds (2004) and is an employee of FMR (2004). Before joining Fidelity Investments, Ms. Monasterio served as Treasurer (2000-2004) and Chief Financial Officer (2002-2004) of the Franklin Templeton Funds and Senior Vice President of Franklin Templeton Services, LLC (2000-2004). |
John H. Costello (58) |
| Year of Election or Appointment: 2003 Assistant Treasurer of Nasdaq Composite Index. Mr. Costello also serves as Assistant Treasurer of other Fidelity funds and is an employee of FMR. |
Peter L. Lydecker (50) |
| Year of Election or Appointment: 2004 Assistant Treasurer of Nasdaq Composite Index. Mr. Lydecker also serves as Assistant Treasurer of other Fidelity funds (2004) and is an employee of FMR. |
Mark Osterheld (49) |
| Year of Election or Appointment: 2003 Assistant Treasurer of Nasdaq Composite Index. Mr. Osterheld also serves as Assistant Treasurer of other Fidelity funds (2002) and is an employee of FMR. |
Kenneth B. Robins (35) |
| Year of Election or Appointment: 2004 Assistant Treasurer of Nasdaq Composite Index. Mr. Robins also serves as Assistant Treasurer of other Fidelity funds (2004) and is an employee of FMR (2004). Before joining Fidelity Investments, Mr. Robins worked at KPMG LLP, where he was a partner in KPMG's department of professional practice (2002-2004) and a Senior Manager (1999-2000). In addition, Mr. Robins served as Assistant Chief Accountant, United States Securities and Exchange Commission (2000-2002). |
Thomas J. Simpson (46) |
| Year of Election or Appointment: 2003 Assistant Treasurer of Nasdaq Composite Index. Mr. Simpson is Assistant Treasurer of other Fidelity funds (2000) and an employee of FMR (1996). Prior to joining FMR, Mr. Simpson was Vice President and Fund Controller of Liberty Investment Services (1987-1995). |
Annual Report
Distributions
The Board of Trustees of Fidelity NASDAQ Composite Index Fund voted to pay to shareholders of record at the opening of business on record date, the following distributions per share derived from capital gains realized from sales of portfolio securities, and dividends derived from net investment income:
Pay Date | Record Date | Dividends | Capital Gains |
12/20/04 | 12/17/04 | $0.30 | $0.08 |
01/10/05 | 01/07/05 | - | $0.06 |
The fund designates 100% of the dividend distributed during the fiscal year as qualifying for the dividends-received deduction for corporate shareholders.
The fund designates 100% and 7% of the dividends distributed in December 2003 and January 2004, respectively during the fiscal year as amounts which may be taken into account as a dividend for purposes of the maximum rate under section 1(h)(11) of the Internal Revenue Code.
The fund will notify shareholders in January 2005 of amounts for use in preparing 2004 income tax returns.
Annual Report
Proxy Voting Results
A special meeting of the fund's shareholders was held on November 17, 2004. The results of votes taken among shareholders on proposals before them are reported below. Each vote reported represents one dollar of net asset value held on the record date for the meeting.
PROPOSAL 1 |
To amend the Declaration of Trust to allow the Board of Trustees, if permitted by applicable law, to authorize fund mergers without shareholder approval. A |
| # of
Votes | % of
Votes |
Affirmative | 12,221,814,216.15 | 73.238 |
Against | 3,155,449,238.56 | 18.908 |
Abstain | 587,539,807.37 | 3.521 |
Broker
Non-Votes | 723,047,068.58 | 4.333 |
TOTAL | 16,687,850,330.66 | 100.000 |
PROPOSAL 2 |
To elect a Board of Trustees. A |
| # of
Votes | % of
Votes |
J. Michael Cook |
Affirmative | 15,841,707,644.41 | 94.930 |
Withheld | 846,142,686.25 | 5.070 |
TOTAL | 16,687,850,330.66 | 100.000 |
Ralph F. Cox |
Affirmative | 15,797,852,227.84 | 94.667 |
Withheld | 889,998,102.82 | 5.333 |
TOTAL | 16,687,850,330.66 | 100.000 |
Laura B. Cronin |
Affirmative | 15,839,639,342.73 | 94.917 |
Withheld | 848,210,987.93 | 5.083 |
TOTAL | 16,687,850,330.66 | 100.000 |
Dennis J. Dirks B |
Affirmative | 15,848,904,973.82 | 94.973 |
Withheld | 838,945,356.84 | 5.027 |
TOTAL | 16,687,850,330.66 | 100.000 |
| # of
Votes | % of
Votes |
Robert M. Gates |
Affirmative | 15,823,470,035.51 | 94.820 |
Withheld | 864,380,295.15 | 5.180 |
TOTAL | 16,687,850,330.66 | 100.000 |
George H. Heilmeier |
Affirmative | 15,839,665,226.61 | 94.917 |
Withheld | 848,185,104.05 | 5.083 |
TOTAL | 16,687,850,330.66 | 100.000 |
Abigail P. Johnson |
Affirmative | 15,781,077,913.19 | 94.566 |
Withheld | 906,772,417.47 | 5.434 |
TOTAL | 16,687,850,330.66 | 100.000 |
Edward C. Johnson 3d |
Affirmative | 15,754,759,829.98 | 94.409 |
Withheld | 933,090,500.68 | 5.591 |
TOTAL | 16,687,850,330.66 | 100.000 |
Donald J. Kirk |
Affirmative | 15,813,230,768.50 | 94.759 |
Withheld | 874,619,562.16 | 5.241 |
TOTAL | 16,687,850,330.66 | 100.000 |
Marie L. Knowles |
Affirmative | 15,851,883,968.67 | 94.991 |
Withheld | 835,966,361.99 | 5.009 |
TOTAL | 16,687,850,330.66 | 100.000 |
Ned C. Lautenbach |
Affirmative | 15,854,530,564.20 | 95.006 |
Withheld | 833,319,766.46 | 4.994 |
TOTAL | 16,687,850,330.66 | 100.000 |
Marvin L. Mann |
Affirmative | 15,816,737,319.52 | 94.780 |
Withheld | 871,113,011.14 | 5.220 |
TOTAL | 16,687,850,330.66 | 100.000 |
| # of
Votes | % of
Votes |
William O. McCoy |
Affirmative | 15,823,167,179.17 | 94.818 |
Withheld | 864,683,151.49 | 5.182 |
TOTAL | 16,687,850,330.66 | 100.000 |
Robert L. Reynolds |
Affirmative | 15,845,001,714.22 | 94.949 |
Withheld | 842,848,616.44 | 5.051 |
TOTAL | 16,687,850,330.66 | 100.000 |
Cornelia M. Small B |
Affirmative | 15,840,247,943.36 | 94.921 |
Withheld | 847,602,387.30 | 5.079 |
TOTAL | 16,687,850,330.66 | 100.000 |
William S. Stavropoulos |
Affirmative | 15,830,742,293.62 | 94.864 |
Withheld | 857,108,037.04 | 5.136 |
TOTAL | 16,687,850,330.66 | 100.000 |
A Denotes trust-wide proposals and voting results. B Effective January 1, 2005. |
Annual Report
Annual Report
Annual Report
Annual Report
Investment Adviser
Fidelity Management & Research Company
Boston, MA
Investment Sub-Advisers
FMR Co., Inc.
Geode Capital Management, LLC
General Distributor
Fidelity Distributors Corporation
Boston, MA
Transfer Agent
Fidelity Service Company, Inc.
Boston, MA
Shareholder Servicing Agent
Fidelity Service Company, Inc.
Boston, MA
Custodian
JPMorgan Chase Bank
New York, NY
The Fidelity Telephone Connection
1-800-FIDELITY
(Fidelity Investment logo)(registered trademark)
Corporate Headquarters
82 Devonshire St., Boston, MA 02109
www.fidelity.com
EIF-UANN-0105
1.795563.101
Item 2. Code of Ethics
As of the end of the period, November 30, 2004, Fidelity Commonwealth Trust (the trust) has adopted a code of ethics, as defined in Item 2 of Form N-CSR, that applies to its President and Treasurer and its Chief Financial Officer. A copy of the code of ethics is filed as an exhibit to this Form N-CSR.
Item 3. Audit Committee Financial Expert
The Board of Trustees of the trust has determined that Marie L. Knowles is an audit committee financial expert, as defined in Item 3 of Form N-CSR. Ms. Knowles is independent for purposes of Item 3 of Form N-CSR.
Item 4. Principal Accountant Fees and Services
(a) Audit Fees.
For the fiscal years ended November 30, 2004 and November 30, 2003, the aggregate Audit Fees billed by PricewaterhouseCoopers LLP (PwC) for professional services rendered for the audits of the financial statements, or services that are normally provided in connection with statutory and regulatory filings or engagements for those fiscal years, for Fidelity Nasdaq Composite Index Tracking Stock (the fund) and for all funds in the Fidelity Group of Funds are shown in the table below.
Fund | 2004A | 2003A, B |
Fidelity Nasdaq Composite Index Tracking Stock | $50,000 | $21,000 |
All funds in the Fidelity Group of Funds audited by PwC | $10,600,000 | $10,500,000 |
A | Aggregate amounts may reflect rounding. |
B | Fidelity Nasdaq Composite Index Tracking Stock commenced operations on September 25, 2003. |
For the fiscal years ended November 30, 2004 and November 30, 2003, the aggregate Audit Fees billed by Deloitte & Touche LLP, the member firms of Deloitte Touche Tohmatsu, and their respective affiliates (collectively, "Deloitte Entities") for professional services rendered for the audits of the financial statements, or services that are normally provided in connection with statutory and regulatory filings or engagements for those fiscal years, for Fidelity Nasdaq Composite Index Fund (the fund) and for all funds in the Fidelity Group of Funds are shown in the table below.
Fund | 2004A | 2003A, B |
Fidelity Nasdaq Composite Index Fund | $31,000 | $23,000 |
All funds in the Fidelity Group of Funds audited by Deloitte Entities | $4,400,000 | $4,300,000 |
A | Aggregate amounts may reflect rounding. |
B | Fidelity Nasdaq Composite Index Fund commenced operations on September 25, 2003. |
(b) Audit-Related Fees.
In each of the fiscal years ended November 30, 2004 and November 30, 2003, the aggregate Audit-Related Fees billed by PwC for services rendered for assurance and related services to the fund that are reasonably related to the performance of the audit or review of the fund's financial statements, but not reported as Audit Fees, are shown in the table below.
Fund | 2004A | 2003 A, B, C |
Fidelity Nasdaq Composite Index Tracking Stock | $0 | $0 |
A | Aggregate amounts may reflect rounding. |
B | Includes amounts related to non-audit services prior to May 6, 2003 that would have been subject to pre-approval if the SEC rules relating to the pre-approval of non-audit services had been in effect at that time. |
C | Fidelity Nasdaq Composite Index Tracking Stock commenced operations on September 25, 2003. |
In each of the fiscal years ended November 30, 2004 and November 30, 2003, the aggregate Audit-Related Fees billed by Deloitte Entities for services rendered for assurance and related services to the fund that are reasonably related to the performance of the audit or review of the fund's financial statements, but not reported as Audit Fees, are shown in the table below.
Fund | 2004A | 2003 A, B, C |
Fidelity Nasdaq Composite Index Fund | $0 | $0 |
A | Aggregate amounts may reflect rounding. |
B | Includes amounts related to non-audit services prior to May 6, 2003 that would have been subject to pre-approval if the SEC rules relating to the pre-approval of non-audit services had been in effect at that time. |
C | Fidelity Nasdaq Composite Index Fund commenced operations on September 25, 2003. |
In each of the fiscal years ended November 30, 2004 and November 30, 2003, the aggregate Audit-Related Fees that were billed by PwC and Deloitte Entities that were required to be approved by the Audit Committee for services rendered on behalf of Fidelity Management & Research Company (FMR) and entities controlling, controlled by, or under common control with FMR (not including any sub-adviser whose role is primarily portfolio management and is subcontracted with or overseen by another investment adviser) that provide ongoing services to the funds ("Fund Service Providers") for assurance and related services that relate directly to the operations and financial reporting of each fund that are reasonably related to the performance of the audit or review of the fund's financial statements, but not reported as Audit Fees, are shown in the table below.
Billed By | 2004 A | 2003A, B, C |
PwC | $0 | $50,000 |
Deloitte Entities | $0 | $0 |
A | Aggregate amounts may reflect rounding. |
B | Includes amounts related to non-audit services prior to May 6, 2003 that would have been subject to pre-approval if the SEC rules relating to the pre-approval of non-audit services had been in effect at that time. |
C | May include amounts billed prior to Fidelity Nasdaq Composite Index Tracking Stock's and Fidelity Nasdaq Composite Index Fund's commencement of operations. |
Fees included in the audit-related category comprise assurance and related services (e.g., due diligence services) that are traditionally performed by the independent registered public accounting firm. These audit-related services include due diligence related to mergers and acquisitions, accounting consultations and audits in connection with acquisitions, internal control reviews, attest services that are not required by statute or regulation and consultation concerning financial accounting and reporting standards.
(c) Tax Fees.
In each of the fiscal years ended November 30, 2004 and November 30, 2003, the aggregate Tax Fees billed by PwC for professional services rendered for tax compliance, tax advice, and tax planning for the fund is shown in the table below.
Fund | 2004A | 2003A, B, C |
Fidelity Nasdaq Composite Index Tracking Stock | $2,200 | $2,800 |
A | Aggregate amounts may reflect rounding. |
B | Includes amounts related to non-audit services prior to May 6, 2003 that would have been subject to pre-approval if the SEC rules relating to the pre-approval of non-audit services had been in effect at that time. |
C | Fidelity Nasdaq Composite Index Tracking Stock commenced operations on September 25, 2003. |
In each of the fiscal years ended November 30, 2004 and November 30, 2003, the aggregate Tax Fees billed by Deloitte Entities for professional services rendered for tax compliance, tax advice, and tax planning for the fund is shown in the table below.
Fund | 2004A | 2003A, B, C |
Fidelity Nasdaq Composite Index Fund | $3,900 | $2,200 |
A | Aggregate amounts may reflect rounding. |
B | Includes amounts related to non-audit services prior to May 6, 2003 that would have been subject to pre-approval if the SEC rules relating to the pre-approval of non-audit services had been in effect at that time. |
C | Fidelity Nasdaq Composite Index Fund commenced operations on September 25, 2003. |
In each of the fiscal years ended November 30, 2004 and November 30, 2003, the aggregate Tax Fees billed by PwC and Deloitte Entities that were required to be approved by the Audit Committee for professional services rendered on behalf of the Fund Service Providers for tax compliance, tax advice, and tax planning that relate directly to the operations and financial reporting of each fund is shown in the table below.
Billed By | 2004A | 2003A, B, C |
PwC | $0 | $0 |
Deloitte Entities | $0 | $0 |
A | Aggregate amounts may reflect rounding. |
B | Includes amounts related to non-audit services prior to May 6, 2003 that would have been subject to pre-approval if the SEC rules relating to the pre-approval of non-audit services had been in effect at that time. |
C | May include amounts billed prior to Fidelity Nasdaq Composite Index Tracking Stock's and Fidelity Nasdaq Composite Index Fund's commencement of operations. |
Fees included in the Tax Fees category comprise all services performed by professional staff in the independent registered public accounting firm's tax division except those services related to the audit. Typically, this category would include fees for tax compliance, tax planning, and tax advice. Tax compliance, tax advice, and tax planning services include preparation of original and amended tax returns, claims for refund and tax payment-planning services, assistance with tax audits and appeals, tax advice related to mergers and acquisitions and requests for rulings or technical advice from taxing authorities.
(d) All Other Fees.
In each of the fiscal years ended November 30, 2004 and November 30, 2003, the aggregate Other Fees billed by PwC for all other non-audit services rendered to the fund is shown in the table below.
Fund | 2004A | 2003A, B, C |
Fidelity Nasdaq Composite Index Tracking Stock | $1,000 | $0 |
A | Aggregate amounts may reflect rounding. |
B | Includes amounts related to non-audit services prior to May 6, 2003 that would have been subject to pre-approval if the SEC rules relating to the pre-approval of non-audit services had been in effect at that time. |
C | Fidelity Nasdaq Composite Index Tracking Stock commenced operations on September 25, 2003. |
In each of the fiscal years ended November 30, 2004 and November 30, 2003, the aggregate Other Fees billed by Deloitte Entities for all other non-audit services rendered to the fund is shown in the table below.
Fund | 2004A | 2003A, B, C |
Fidelity Nasdaq Composite Index Fund | $0 | $0 |
A | Aggregate amounts may reflect rounding. |
B | Includes amounts related to non-audit services prior to May 6, 2003 that would have been subject to pre-approval if the SEC rules relating to the pre-approval of non-audit services had been in effect at that time. |
C | Fidelity Nasdaq Composite Index Fund commenced operations on September 25, 2003. |
In each of the fiscal years ended November 30, 2004 and November 30, 2003, the aggregate Other Fees billed by PwC and Deloitte Entities that were required to be approved by the Audit Committee for all other non-audit services rendered on behalf of the Fund Service Providers that relate directly to the operations and financial reporting of each fund is shown in the table below.
Billed By | 2004A | 2003A, B, C |
PwC | $540,000 | $140,000 |
Deloitte Entities | $850,000 | $160,000 |
A | Aggregate amounts may reflect rounding. |
B | Includes amounts related to non-audit services prior to May 6, 2003 that would have been subject to pre-approval if the SEC rules relating to the pre-approval of non-audit services had been in effect at that time. |
C | May include amounts billed prior to Fidelity Nasdaq Composite Index Tracking Stock's and Fidelity Nasdaq Composite Index Fund's commencement of operations. |
Fees included in the All Other Fees category include services related to internal control reviews, strategy and other consulting, financial information systems design and implementation, consulting on other information systems, and other tax services unrelated to the fund.
(e) (1) | Audit Committee Pre-Approval Policies and Procedures: |
The trust's Audit Committee must pre-approve all audit and non-audit services provided by the independent registered public accounting firm relating to the operations or financial reporting of the funds. Prior to the commencement of any audit or non-audit services to a fund, the Audit Committee reviews the services to determine whether they are appropriate and permissible under applicable law.
The trust's Audit Committee has adopted policies and procedures to, among other purposes, provide a framework for the Committee's consideration of non-audit services by the audit firms that audit the Fidelity funds. The policies and procedures require that any non-audit service provided by a fund audit firm to a Fidelity Fund and any non-audit service provided by a fund auditor to a Fund Service Provider that relates directly to the operations and financial reporting of a Fidelity fund (Covered Service) are subject to approval by the Audit Committee before such service is provided. Non-audit services provided by a fund audit firm for a Fund Service Provider that do not relate directly to the operations and financial reporting of a Fidelity fund (Non-Covered Service) but that are expected to exceed $50,000 are also subject to pre-approval by the Audit Committee.
All Covered Services, as well as Non-Covered Services that are expected to exceed $50,000, must be approved in advance of provision of the service either: (i) by formal resolution of the Audit Committee, or (ii) by oral or written approval of the service by the Chair of the Audit Committee (or if the Chair is unavailable, such other member of the Audit Committee as may be designated by the Chair to act in the Chair's absence). The approval contemplated by (ii) above is permitted where the Treasurer determines that action on such an engagement is necessary before the next meeting of the Audit Committee. Neither pre-approval nor advance notice of Non-Covered Service engagements for which fees are not expected to exceed $50,000 is required; such engagements are to be reported to the Audit Committee monthly.
(e) (2) | Services approved pursuant to paragraph (c)(7)(i)(C) of Rule 2-01 of Regulation S-X: |
Audit-Related Fees:
There were no amounts, including amounts related to non-audit services prior to May 6, 2003 that would have been subject to pre-approval if the SEC rules relating to the pre-approval of non-audit services had been in effect at that time, that were approved by the Audit Committee pursuant to the de minimis exception for the fiscal years ended November 30, 2004 and November 30, 2003 on behalf of each fund.
There were no amounts, including amounts related to non-audit services prior to May 6, 2003 that would have been subject to pre-approval if the SEC rules relating to the pre-approval of non-audit services had been in effect at that time, that were required to be approved by the Audit Committee pursuant to the de minimis exception for the fiscal years ended November 30, 2004 and November 30, 2003 on behalf of the Fund Service Providers that relate directly to the operations and financial reporting of each fund.
Tax Fees:
There were no amounts, including amounts related to non-audit services prior to May 6, 2003 that would have been subject to pre-approval if the SEC rules relating to the pre-approval of non-audit services had been in effect at that time, that were approved by the Audit Committee pursuant to the de minimis exception for the fiscal years ended November 30, 2004 and November 30, 2003 on behalf of each fund.
There were no amounts, including amounts related to non-audit services prior to May 6, 2003 that would have been subject to pre-approval if the SEC rules relating to the pre-approval of non-audit services had been in effect at that time, that were required to be approved by the Audit Committee pursuant to the de minimis exception for the fiscal years ended November 30, 2004 and November 30, 2003 on behalf of the Fund Service Providers that relate directly to the operations and financial reporting of each fund.
All Other Fees:
There were no amounts, including amounts related to non-audit services prior to May 6, 2003 that would have been subject to pre-approval if the SEC rules relating to the pre-approval of non-audit services had been in effect at that time, that were approved by the Audit Committee pursuant to the de minimis exception for the fiscal years ended November 30, 2004 and November 30, 2003 on behalf of each fund.
There were no amounts, including amounts related to non-audit services prior to May 6, 2003 that would have been subject to pre-approval if the SEC rules relating to the pre-approval of non-audit services had been in effect at that time, that were required to be approved by the Audit Committee pursuant to the de minimis exception for the fiscal years ended November 30, 2004 and November 30, 2003 on behalf of the Fund Service Providers that relate directly to the operations and financial reporting of each fund.
(f) According to PwC for the fiscal year ended November 30, 2004, the percentage of hours spent on the audit of the fund's financial statements for the most recent fiscal year that were attributed to work performed by persons who are not full-time, permanent employees of PwC is as follows:
Fund | 2004 |
Fidelity Nasdaq Composite Index Tracking Stock | 0% |
According to Deloitte Entities for the fiscal year ended November 30, 2004, the percentage of hours spent on the audit of the fund's financial statements for the most recent fiscal year that were attributed to work performed by persons who are not full-time, permanent employees of Deloitte Entities is as follows:
Fund | 2004 |
Fidelity Nasdaq Composite Index Fund | 0% |
(g) For the fiscal years ended November 30, 2004 and November 30, 2003, the aggregate fees billed by PwC of $2,700,000A and $1,850,000A,B,C for non-audit services rendered on behalf of the funds, FMR (not including any sub-adviser whose role is primarily portfolio management and is subcontracted with or overseen by another investment adviser) and Fund Service Providers relating to Covered Services and Non-Covered Services are shown in the table below.
| 2004A | 2003A,B,C |
Covered Services | $550,000 | $200,000 |
Non-Covered Services | $2,150,000 | $1,650,000 |
A | Aggregate amounts may reflect rounding. |
B | Includes amounts related to non-audit services prior to May 6, 2003 that would have been subject to pre-approval if the SEC rules relating to the pre-approval of non-audit services had been in effect at that time. |
C | May include amounts billed prior to Fidelity Nasdaq Composite Index Tracking Stock's commencement of operations. |
For the fiscal years ended November 30, 2004 and November 30, 2003, the aggregate fees billed by Deloitte Entities of $1,600,000A and $1,350,000A,B,C for non-audit services rendered on behalf of the fund, FMR (not including any sub-adviser whose role is primarily portfolio management and is subcontracted with or overseen by another investment adviser) and Fund Service Providers relating to Covered Services and Non-Covered Services are shown in the table below.
| 2004A | 2003A,B,C |
Covered Services | $850,000 | $150,000 |
Non-Covered Services | $750,000 | $1,200,000 |
A | Aggregate amounts may reflect rounding. |
B | Includes amounts related to non-audit services prior to May 6, 2003 that would have been subject to pre-approval if the SEC rules relating to the pre-approval of non-audit services had been in effect at that time. |
C | May include amounts billed prior to Fidelity Nasdaq Composite Index Fund's commencement of operations. |
(h) The trust's Audit Committee has considered Non-Covered Services that were not pre-approved that were provided by PwC and Deloitte Entities to Fund Service Providers to be compatible with maintaining the independence of PwC and Deloitte Entities in their audit of the funds, taking into account representations from PwC and Deloitte Entities, in accordance with Independence Standards Board Standard No.1, regarding their independence from the funds and their related entities.
Item 5. Audit Committee of Listed Registrants
Fidelity Commonwealth Trust: Fidelity Nasdaq Composite Index Tracking Stock:
The Board of Trustees of Fidelity Commonwealth Trust: Fidelity Nasdaq Composite Index Tracking Stock has established a separately-designated standing audit committee in accordance with Section 3(a)(58)(A) of the Securities Exchange Act of 1934. As of November 30, 2004, the members of the audit committee were Marie Knowles, Robert Gates, Donald Kirk and William McCoy. Mr. Kirk retired effective December 31, 2004.
Fidelity Commonwealth Trust: Fidelity Nasdaq Composite Index Fund:
Not applicable.
Item 6. Schedule of Investments
Not applicable.
Item 7. Disclosure of Proxy Voting Policies and Procedures for Closed-End Management Investment Companies
Not applicable.
Item 8. Portfolio Managers of Closed-End Management Investment Companies
Not applicable.
Item 9. Purchase of Equity Securities by Closed-End Management Investment Company and Affiliated Purchasers
Not applicable.
Item 10. Submission of Matters to a Vote of Security Holders
There were no material changes to the procedures by which shareholders may recommend nominees to the trust's Board of Trustees.
Item 11. Controls and Procedures
(a)(i) The President and Treasurer and the Chief Financial Officer have concluded that the trust's disclosure controls and procedures (as defined in Rule 30a-3(c) under the Investment Company Act) provide reasonable assurances that material information relating to the trust is made known to them by the appropriate persons, based on their evaluation of these controls and procedures as of a date within 90 days of the filing date of this report.
(a)(ii) There was no change in the trust's internal control over financial reporting (as defined in Rule 30a-3(d) under the Investment Company Act) that occurred during the second fiscal quarter of the period covered by this report that has materially affected, or is reasonably likely to materially affect, the trust's internal control over financial reporting.
Item 12. Exhibits
(a) | (1) | Code of Ethics pursuant to Item 2 of Form N-CSR is filed and attached hereto as EX-99.CODE ETH. |
(a) | (2) | Certification pursuant to Rule 30a-2(a) under the Investment Company Act of 1940 (17 CFR 270.30a-2(a)) is filed and attached hereto as Exhibit 99.CERT. |
(a) | (3) | Not applicable. |
(b) | | Certification pursuant to Rule 30a-2(b) under the Investment Company Act of 1940 (17 CFR 270.30a-2(b)) is furnished and attached hereto as Exhibit 99.906CERT. |
SIGNATURES
Pursuant to the requirements of the Securities Exchange Act of 1934 and the Investment Company Act of 1940, the registrant has duly caused this report to be signed on its behalf by the undersigned, thereunto duly authorized.
Fidelity Commonwealth Trust
By: | /s/Christine Reynolds |
| Christine Reynolds |
| President and Treasurer |
| |
Date: | January 24, 2005 |
Pursuant to the requirements of the Securities Exchange Act of 1934 and the Investment Company Act of 1940, this report has been signed below by the following persons on behalf of the registrant and in the capacities and on the dates indicated.
By: | /s/Christine Reynolds |
| Christine Reynolds |
| President and Treasurer |
| |
Date: | January 24, 2005 |
By: | /s/Timothy F. Hayes |
| Timothy F. Hayes |
| Chief Financial Officer |
| |
Date: | January 24, 2005 |