UNITED STATES
SECURITIES AND EXCHANGE COMMISSION
Washington, D.C. 20549
FORM N-CSR
CERTIFIED SHAREHOLDER REPORT OF REGISTERED
MANAGEMENT INVESTMENT COMPANIES
Investment Company Act file number 811-2546
Fidelity Commonwealth Trust
(Exact name of registrant as specified in charter)
82 Devonshire St., Boston, Massachusetts 02109
(Address of principal executive offices) (Zip code)
Eric D. Roiter, Secretary
82 Devonshire St.
Boston, Massachusetts 02109
(Name and address of agent for service)
Registrant's telephone number, including area code: 617-563-7000
Date of fiscal year end: | November 30 |
| |
Date of reporting period: | November 30, 2005 |
Item 1. Reports to Stockholders
| | Fidelity®
Nasdaq Composite® Index
Fund
|
| | Annual Report
November 30, 2005
|


| Contents | | | | |
| |
| Chairman’s Message | | 4 | | Ned Johnson’s message to shareholders. |
| Performance | | 5 | | How the fund has done over time. |
| Management’s Discussion | | 6 | | The manager’s review of fund |
| | | | | performance, strategy and outlook. |
| Shareholder Expense | | 7 | | An example of shareholder expenses. |
| Example | | | | |
| Investment Changes | | 8 | | A summary of major shifts in the fund’s |
| | | | | investments over the past six months. |
| Investments | | 9 | | A complete list of the fund’s investments |
| | | | | with their market values. |
| Financial Statements | | 65 | | Statements of assets and liabilities, |
| | | | | operations, and changes in net assets, |
| | | | | as well as financial highlights. |
| Notes | | 69 | | Notes to the financial statements. |
| Report of Independent | | 75 | | |
| Registered Public | | | | |
| Accounting Firm | | | | |
| Trustees and Officers | | 76 | | |
| Distributions | | 86 | | |
| Proxy Voting Results | | 87 | | |
| Board Approval of | | 88 | | |
| Investment Advisory | | | | |
| Contracts and | | | | |
| Management Fees | | | | |
| | To view a fund’s proxy voting guidelines and proxy voting record for the 12 month period
ended June 30, visit www.fidelity.com/proxyvotingresults or visit the Securities and Exchange
Commission’s (SEC) web site at www.sec.gov. You may also call 1-800-544-8544 to request a free
copy of the proxy voting guidelines.
Nasdaq® and Nasdaq Composite® are trademarks of The Nasdaq Stock Market, Inc. (which with its
Affiliates are the Corporations) and are licensed for use by Fidelity. The product has not been passed
on by the Corporations as to its legality or suitability. The product is not issued, endorsed or sold by the
Corporations. The Corporations make no warranties and bear no liability with respect to shares of the
product.
Standard & Poor’s, S&P and S&P 500 are registered service marks of The McGraw Hill Com
panies, Inc. and have been licensed for use by Fidelity Distributors Corporation.
Other third party marks appearing herein are the property of their respective owners.
All other marks appearing herein are registered or unregistered trademarks or service marks
of FMR Corp. or an affiliated company.
|
Annual Report 2
This report and the financial statements contained herein are submitted for the general information
of the shareholders of the fund. This report is not authorized for distribution to prospective investors
in the fund unless preceded or accompanied by an effective prospectus.
A fund files its complete schedule of portfolio holdings with the SEC for the first and third
quarters of each fiscal year on Form N Q. Forms N Q are available on the SEC’s web site at
http://www.sec.gov. A fund’s Forms N Q may be reviewed and copied at the SEC’s Public Reference
Room in Washington, DC. Information regarding the operation of the SEC’s Public Reference
Room may be obtained by calling 1-800-SEC-0330. For a complete list of a fund’s portfolio hold
ings, view the most recent quarterly holdings report, semiannual report, or annual report on
Fidelity’s web site at http://www.fidelity.com/holdings.
NOT FDIC INSURED · MAY LOSE VALUE · NO BANK GUARANTEE
Neither the fund nor Fidelity Distributors Corporation is a bank.
|
3 Annual Report
Chairman’s Message
(photograph of Edward C. Johnson 3d)
Dear Shareholder:
During the past year or so, much has been reported about the mutual fund industry, and much of it has been more critical than I believe is warranted. Allegations that some companies have been less than forthright with their shareholders have cast a shadow on the entire industry. I continue to find these reports disturbing, and assert that they do not create an accurate picture of the industry overall. Therefore, I would like to remind every one where Fidelity stands on these issues. I will say two things specifically regarding allegations that some mutual fund companies were in violation of the Securities and Exchange Commission’s forward pricing rules or were involved in so called “market timing” activities.
First, Fidelity has no agreements that permit customers who buy fund shares after 4 p.m. to obtain the 4 p.m. price. This is not a new policy. This is not to say that some one could not deceive the company through fraudulent acts. However, we are extremely diligent in preventing fraud from occurring in this manner and in every other. But I underscore again that Fidelity has no so called “agreements” that sanction illegal practices.
Second, Fidelity continues to stand on record, as we have for years, in opposition to predatory short term trading that adversely affects shareholders in a mutual fund. Back in the 1980s, we initiated a fee which is returned to the fund and, therefore, to investors to discourage this activity. Further, we took the lead several years ago in developing a Fair Value Pricing Policy to prevent market timing on foreign securities in our funds. I am confident we will find other ways to make it more difficult for predatory traders to operate. However, this will only be achieved through close cooperation among regulators, legislators and the industry.
Yes, there have been unfortunate instances of unethical and illegal activity within the mutual fund industry from time to time. That is true of any industry. When this occurs, confessed or convicted offenders should be dealt with appropriately. But we are still concerned about the risk of over regulation and the quick application of simplistic solutions to intricate problems. Every system can be improved, and we support and applaud well thought out improvements by regulators, legislators and industry representatives that achieve the common goal of building and protecting the value of investors’ holdings.
For nearly 60 years, Fidelity has worked very hard to improve its products and service to justify your trust. When our family founded this company in 1946, we had only a few hundred customers. Today, we serve more than 18 million customers including individual investors and participants in retirement plans across America.
Let me close by saying that we do not take your trust in us for granted, and we realize that we must always work to improve all aspects of our service to you. In turn, we urge you to continue your active participation with your financial matters, so that your interests can be well served.
Best regards,
/s/ Edward C. Johnson 3d
Edward C. Johnson 3d
Annual Report 4
Performance: The Bottom Line
Average annual total return reflects the change in the value of an investment, assuming reinvestment of the fund’s dividend income and capital gains (the profits earned upon the sale of securities that have grown in value) and assuming a constant rate of perfor mance each year. The $10,000 table and the fund’s returns do not reflect the deduction of taxes that a shareholder would pay on fund distributions or the redemption of fund shares. During periods of reimbursement by Fidelity, a fund’s total return will be greater than it would be had the reimbursement not occurred. How a fund did yesterday is no guarantee of how it will do tomorrow.
| Average Annual Total Returns | | | | |
| Periods ended November 30, 2005 | | Past 1 | | Life of |
| | | year | | fundA |
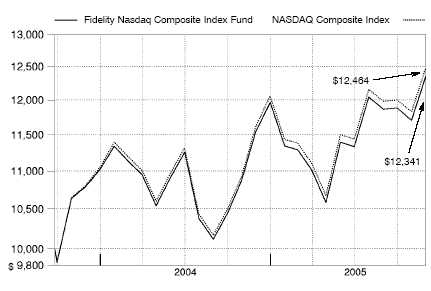
| Fidelity Nasdaq Composite Index Fund | | 6.92% | | 10.11% |
| A From September 25, 2003. | | | | |
$10,000 Over Life of Fund | | | | |
Let’s say hypothetically that $10,000 was invested in Fidelity Nasdaq Composite Index Fund on September 25, 2003, when the fund started. The chart shows how the value of your investment would have changed, and also shows how the NASDAQ Composite Index performed over the same period.
5 Annual Report
5
Management’s Discussion of Fund Performance
Comments from Jeffrey Adams, who oversees the Fidelity® Nasdaq Composite® Index Fund’s investment management team as Head of Indexing for Geode Capital Management, LLC
Numerous events unfolded during the 12 month period ending November 30, 2005, that were major influences on the U.S. equity markets. Issues exerting downward pressure on stocks included higher levels of inflation, eight short term interest rate hikes by the Federal Reserve Board, exorbitant energy prices, and a Category 4 hurricane that devastated both the city of New Orleans and several nearby oil production and refinery facilities. Grabbing most of the markets’ upbeat headlines was consistent strength in consumer spending, corporate earnings and gross domestic product (GDP). When all was said and done, investors demonstrated their conviction in the economy, pushing stocks higher across the board. By period end, the Standard & Poor’s 500SM Index and the Dow Jones Industrial AverageSM approached or exceeded four and a half year highs. For the 12 months overall, the S&P 500® was up 8.44% and the Dow advanced 6.07%, threatening to eclipse the 11,000 threshold for the first time since 2001.
The fund gained 6.92% during the past year. By comparison, the NASDAQ Composite Index rose 7.32% and the LipperSM Growth Funds Average increased 9.91% an indication that the large cap growth category was finally beginning to recover after several years of underperformance. On a sector basis, energy, telecommunication services and health care were particular areas of strength, while consumer discretionary and materials stocks lagged, producing negative returns. In terms of individual contributors, Internet search leader Google maintained its strong performance. The company continued to generate tremendous amounts of cash through its sales of targeted online ads. Apple Computer also maintained its momentum. Apple’s shares soared on strong sales of the company’s iPod digital music player, as well as optimism that higher iPod sales could lead to greater interest in Apple’s more profitable Macintosh computer line. Conversely, Dell was a note worthy underperformer. The direct retailer of personal computers and consumer electron ics has been battling fierce global competition, and its severe price cutting contributed to missed sales targets in August and October. Online auction house eBay also disappointed. The company’s shares fell sharply early in the period after it announced weaker than expected earnings and revenues.
The views expressed in this statement reflect those of the portfolio manager only through the end of the period of the report as stated on the cover and do not necessarily represent the views of Fidelity or any other person in the Fidelity organization. Any such views are subject to change at any time based upon market or other conditions and Fidelity disclaims any responsibility to update such views. These views may not be relied on as investment advice and, because investment decisions for a Fidelity fund are based on numerous factors, may not be relied on as an indication of trading intent on behalf of any Fidelity fund.
Shareholder Expense Example
As a shareholder of the Fund, you incur two types of costs: (1) transaction costs, including redemption fees, and (2) ongoing costs, including management fees, distribution and/or service (12b 1) fees and other Fund expenses. This Example is intended to help you under stand your ongoing costs (in dollars) of investing in the Fund and to compare these costs with the ongoing costs of investing in other mutual funds.
The Example is based on an investment of $1,000 invested at the beginning of the period and held for the entire period (June 1, 2005 to November 30, 2005).
Actual Expenses
The first line of the table below provides information about actual account values and actual expenses. You may use the information in this line, together with the amount you invested, to estimate the expenses that you paid over the period. Simply divide your account value by $1,000.00 (for example, an $8,600 account value divided by $1,000.00 = 8.6), then multiply the result by the number in the first line under the heading entitled “Expenses Paid During Period” to estimate the expenses you paid on your account during this period. An annual index fund fee of $10 that is charged once a year may apply for certain accounts with a value of less than $10,000. This fee is not included in the table below. If it was, the estimate of expenses you paid during the period would be higher, and your ending account value lower, by this amount.
Hypothetical Example for Comparison Purposes
The second line of the table below provides information about hypothetical account values and hypothetical expenses based on the Fund’s actual expense ratio and an assumed rate of return of 5% per year before expenses, which is not the Fund’s actual return. The hypotheti cal account values and expenses may not be used to estimate the actual ending account balance or expenses you paid for the period. You may use this information to compare the ongoing costs of investing in the Fund and other funds. To do so, compare this 5% hypotheti cal example with the 5% hypothetical examples that appear in the shareholder reports of the other funds. An annual index fund fee of $10 that is charged once a year may apply for certain accounts with a value of less than $10,000. This fee is not included in the table below. If it was, the estimate of expenses you paid during the period would be higher, and your ending account value lower, by this amount.
Please note that the expenses shown in the table are meant to highlight your ongoing costs only and do not reflect any transaction costs. Therefore, the second line of the table is useful in comparing ongoing costs only, and will not help you determine the relative total costs of owning different funds. In addition, if these transactional costs were included, your costs would have been higher.
| | | | | | | | | | | Expenses Paid |
| | | | | Beginning | | Ending | | During Period* |
| | | | | Account Value | | Account Value | | June 1, 2005 to |
| | | | | June 1, 2005 | | November 30, 2005 | | November 30, 2005 |
| Actual | | $ | | 1,000.00 | | $ | | 1,083.20 | | $ | | 2.35 |
| Hypothetical (5% return per | | | | | | | | | | | | |
| year before expenses) | | $ | | 1,000.00 | | $ | | 1,022.81 | | $ | | 2.28 |
* Expenses are equal to the Fund’s annualized expense ratio of .45%; multiplied by the average account value over the period, multiplied by 183/365 (to reflect the one half year period).
7 Annual Report
| Investment Changes | | | | |
| |
| |
| Top Ten Stocks as of November 30, 2005 | | | | |
| | | % of fund’s | | % of fund’s net assets |
| | | net assets | | 6 months ago |
| Microsoft Corp. | | 8.5 | | 8.7 |
| Intel Corp. | | 4.7 | | 5.2 |
| Cisco Systems, Inc. | | 3.2 | | 3.9 |
| Amgen, Inc. | | 2.9 | | 2.5 |
| Google, Inc. Class A (sub. vtg.) | | 2.3 | | 1.4 |
| QUALCOMM, Inc. | | 2.2 | | 1.9 |
| Dell, Inc. | | 2.1 | | 3.1 |
| Oracle Corp. | | 1.9 | | 2.1 |
| eBay, Inc. | | 1.8 | | 1.6 |
| Yahoo!, Inc. | | 1.7 | | 1.6 |
| | | 31.3 | | |
Market Sectors as of November 30, 2005 | | | | |
| | | % of fund’s | | % of fund’s net assets |
| | | net assets | | 6 months ago |
| Information Technology | | 48.4 | | 49.0 |
| Health Care | | 14.0 | | 13.0 |
| Consumer Discretionary | | 13.8 | | 14.5 |
| Financials | | 10.5 | | 10.1 |
| Industrials | | 5.3 | | 4.9 |
| Consumer Staples | | 1.7 | | 1.6 |
| Telecommunication Services | | 1.3 | | 2.5 |
| Energy | | 1.1 | | 0.8 |
| Materials | | 0.9 | | 0.8 |
| Utilities | | 0.2 | | 0.2 |
Asset Allocation (% of fund’s net assets)
To match the NASDAQ Composite® Index, Fidelity Nasdaq Composite Index Fund seeks 100% invest ment exposure to stocks at all times.
Investments November 30, 2005
Showing Percentage of Net Assets
Common Stocks 97.2%
| | | Shares | | Value (Note 1) |
| |
| CONSUMER DISCRETIONARY – 13.8% | | | | | | |
| Auto Components 0.2% | | | | | | |
| Aftermarket Technology Corp. (a) | | 800 | | $ | | 16,400 |
| Ballard Power Systems, Inc. (a) | | 3,783 | | | | 16,767 |
| China Automotive Systems, Inc. (a) | | 1,032 | | | | 7,172 |
| Dura Automotive Systems, Inc. Class A (a) | | 661 | | | | 1,699 |
| Exide Technologies (a) | | 1,105 | | | | 3,989 |
| GenTek, Inc. | | 300 | | | | 4,872 |
| Gentex Corp. | | 5,314 | | | | 100,063 |
| Hayes Lemmerz International, Inc. (a) | | 1,193 | | | | 3,627 |
| IMPCO Technologies, Inc. (a) | | 1,484 | | | | 7,717 |
| Keystone Automotive Industries, Inc. (a) | | 491 | | | | 13,748 |
| LKQ Corp. (a) | | 796 | | | | 25,942 |
| Noble International Ltd. | | 308 | | | | 6,936 |
| Quantum Fuel Systems Technologies Worldwide, Inc. (a) | | 1,681 | | | | 4,287 |
| R&B, Inc. (a) | | 807 | | | | 9,547 |
| Shiloh Industries, Inc. (a) | | 545 | | | | 7,205 |
| Sports Resorts International, Inc. (a) | | 3,572 | | | | 3,036 |
| Strattec Security Corp. (a) | | 130 | | | | 6,312 |
| | | | | | | 239,319 |
| Automobiles – 0.0% | | | | | | |
| Nissan Motor Co. Ltd. sponsored ADR | | 770 | | | | 15,793 |
| Distributors – 0.1% | | | | | | |
| Andersons, Inc. | | 386 | | | | 15,884 |
| Audiovox Corp. Class A (a) | | 723 | | | | 10,014 |
| Building Material Holding Corp. | | 508 | | | | 41,824 |
| Design Within Reach, Inc. (a) | | 763 | | | | 4,601 |
| Source Interlink Companies, Inc. (a) | | 1,783 | | | | 19,577 |
| | | | | | | 91,900 |
| Diversified Consumer Services – 0.9% | | | | | | |
| Alderwoods Group, Inc. (a) | | 1,369 | | | | 20,562 |
| Apollo Group, Inc. Class A (a) | | 6,095 | | | | 433,964 |
| Bright Horizons Family Solutions, Inc. (a) | | 856 | | | | 30,285 |
| Career Education Corp. (a) | | 3,558 | | | | 132,713 |
| Corinthian Colleges, Inc. (a) | | 2,942 | | | | 35,628 |
| Educate, Inc. (a) | | 1,285 | | | | 14,071 |
| Education Management Corp. (a) | | 2,387 | | | | 80,561 |
| Escala Group, Inc. (a)(d) | | 1,136 | | | | 18,801 |
| Laureate Education, Inc. (a) | | 1,580 | | | | 79,901 |
| Lincoln Educational Services Corp. | | 700 | | | | 9,870 |
| Matthews International Corp. Class A | | 1,245 | | | | 48,916 |
| Princeton Review, Inc. (a) | | 1,476 | | | | 7,897 |
See accompanying notes which are an integral part of the financial statements.
| Investments continued | | | | | | |
| |
| Common Stocks continued | | | | | | |
| | | Shares | | Value (Note 1) |
| |
| CONSUMER DISCRETIONARY – continued | | | | | | |
| Diversified Consumer Services – continued | | | | | | |
| Steiner Leisure Ltd. (a) | | 832 | | $ | | 31,267 |
| Stewart Enterprises, Inc. Class A | | 3,145 | | | | 16,040 |
| Strayer Education, Inc. | | 465 | | | | 46,407 |
| Vertrue, Inc. (a) | | 352 | | | | 12,718 |
| | | | | | | 1,019,601 |
| Hotels, Restaurants & Leisure 1.9% | | | | | | |
| AFC Enterprises, Inc. | | 1,055 | | | | 12,934 |
| Ambassadors Group, Inc. | | 738 | | | | 18,516 |
| Ameristar Casinos, Inc. | | 1,814 | | | | 42,792 |
| Applebee’s International, Inc. | | 2,488 | | | | 57,025 |
| BJ’s Restaurants, Inc. (a) | | 902 | | | | 21,413 |
| Bob Evans Farms, Inc. | | 1,216 | | | | 29,403 |
| Buffalo Wild Wings, Inc. (a) | | 531 | | | | 14,985 |
| California Pizza Kitchen, Inc. (a) | | 768 | | | | 25,175 |
| Caribou Coffee Co., Inc. | | 738 | | | | 7,454 |
| CBRL Group, Inc. | | 1,617 | | | | 59,813 |
| Churchill Downs, Inc. | | 483 | | | | 18,296 |
| Cosi, Inc. (a) | | 1,604 | | | | 14,019 |
| Ctrip.com International Ltd. sponsored ADR | | 360 | | | | 20,984 |
| Denny’s Corp. (a) | | 3,000 | | | | 14,640 |
| Empire Resorts, Inc. (a) | | 676 | | | | 4,022 |
| Great Wolf Resorts, Inc. | | 1,118 | | | | 10,867 |
| International Speedway Corp. Class A | | 929 | | | | 50,696 |
| Isle of Capri Casinos, Inc. (a) | | 1,198 | | | | 32,490 |
| Jameson Inns, Inc. (a) | | 3,932 | | | | 8,218 |
| Lone Star Steakhouse & Saloon, Inc. | | 829 | | | | 19,208 |
| Magna Entertainment Corp. Class A (sub. vtg.) (a) | | 2,724 | | | | 20,621 |
| McCormick & Schmick’s Seafood Restaurants (a) | | 462 | | | | 10,968 |
| Mikohn Gaming Corp. (a) | | 848 | | | | 8,488 |
| Monarch Casino & Resort, Inc. (a) | | 558 | | | | 11,936 |
| MTR Gaming Group, Inc. (a) | | 1,009 | | | | 7,527 |
| Multimedia Games, Inc. (a) | | 948 | | | | 9,651 |
| O’Charleys, Inc. (a) | | 757 | | | | 10,984 |
| P.F. Chang’s China Bistro, Inc. (a) | | 795 | | | | 40,903 |
| Panera Bread Co. Class A (a) | | 941 | | | | 63,988 |
| Papa John’s International, Inc. (a) | | 403 | | | | 21,947 |
| Penn National Gaming, Inc. (a) | | 2,874 | | | | 95,331 |
| Rare Hospitality International, Inc. (a) | | 1,283 | | | | 41,094 |
| Red Robin Gourmet Burgers, Inc. (a) | | 544 | | | | 29,866 |
| Ruth’s Chris Steak House, Inc. | | 1,086 | | | | 19,200 |
See accompanying notes which are an integral part of the financial statements.
| Common Stocks continued | | | | | | |
| | | Shares | | Value (Note 1) |
| |
| CONSUMER DISCRETIONARY – continued | | | | | | |
| Hotels, Restaurants & Leisure continued | | | | | | |
| Ryan’s Restaurant Group, Inc. (a) | | 1,417 | | $ | | 16,848 |
| Scientific Games Corp. Class A (a) | | 2,837 | | | | 80,372 |
| Shuffle Master, Inc. (a) | | 1,234 | | | | 34,564 |
| Smith & Wollensky Restaurant Group, Inc. (a) | | 1,039 | | | | 5,912 |
| Sonic Corp. (a) | | 1,834 | | | | 54,268 |
| Starbucks Corp. (a) | | 25,672 | | | | 781,712 |
| Sunterra Corp. (a) | | 868 | | | | 10,199 |
| Texas Roadhouse, Inc. Class A (a) | | 2,515 | | | | 37,977 |
| The Cheesecake Factory, Inc. (a) | | 2,876 | | | | 105,377 |
| Trump Entertainment Resorts, Inc. (a) | | 800 | | | | 14,576 |
| Wynn Resorts Ltd. (a)(d) | | 3,462 | | | | 193,283 |
| Youbet.com, Inc. (a) | | 1,585 | | | | 8,844 |
| | | | | | | 2,219,386 |
| Household Durables – 0.4% | | | | | | |
| Avatar Holdings, Inc. (a) | | 197 | | | | 11,192 |
| Bassett Furniture Industries, Inc. | | 931 | | | | 16,786 |
| Brillian Corp. (a) | | 388 | | | | 2,188 |
| California Coastal Communities, Inc. (a) | | 409 | | | | 16,066 |
| Cavco Industries, Inc. (a) | | 270 | | | | 10,598 |
| Comstock Homebuilding Companies, Inc. Class A | | 390 | | | | 5,994 |
| Craftmade International, Inc. | | 649 | | | | 11,682 |
| Dominion Homes, Inc. (a) | | 396 | | | | 3,940 |
| Dorel Industries, Inc. Class B (sub. vtg.) (a) | | 886 | | | | 21,397 |
| Flexsteel Industries, Inc. | | 620 | | | | 8,661 |
| Garmin Ltd. (d) | | 3,696 | | | | 203,650 |
| Helen of Troy Ltd. (a) | | 913 | | | | 16,452 |
| Hooker Furniture Corp. | | 696 | | | | 10,802 |
| Interface, Inc. Class A (a) | | 2,168 | | | | 18,059 |
| iRobot Corp. (d) | | 744 | | | | 21,680 |
| Kimball International, Inc. Class B | | 1,559 | | | | 16,603 |
| Lifetime Brands, Inc. | | 536 | | | | 11,663 |
| Makita Corp. sponsored ADR | | 326 | | | | 8,052 |
| Palm Harbor Homes, Inc. (a) | | 739 | | | | 13,915 |
| Stanley Furniture Co., Inc. | | 624 | | | | 15,538 |
| Universal Electronics, Inc. (a) | | 813 | | | | 14,097 |
| | | | | | | 459,015 |
| Internet & Catalog Retail 3.2% | | | | | | |
| 1-800 CONTACTS, Inc. (a) | | 518 | | | | 5,641 |
| 1-800-FLOWERS.com, Inc. Class A (a) | | 895 | | | | 6,229 |
| Alloy, Inc. (a) | | 1,976 | | | | 12,113 |
See accompanying notes which are an integral part of the financial statements.
11 Annual Report
| Investments continued | | | | | | |
| |
| Common Stocks continued | | | | | | |
| | | Shares | | Value (Note 1) |
| |
| CONSUMER DISCRETIONARY – continued | | | | | | |
| Internet & Catalog Retail continued | | | | | | |
| Amazon.com, Inc. (a) | | 13,933 | | $ | | 675,193 |
| Audible, Inc. (a) | | 670 | | | | 8,643 |
| Blue Nile, Inc. (a) | | 469 | | | | 19,459 |
| Coldwater Creek, Inc. (a) | | 2,220 | | | | 69,708 |
| Drugstore.com, Inc. (a) | | 2,140 | | | | 6,570 |
| eBay, Inc. (a) | | 45,691 | | | | 2,047,414 |
| eCost.com, Inc. (a) | | 1,212 | | | | 1,612 |
| Expedia, Inc. (a) | | 10,223 | | | | 253,428 |
| Gaiam, Inc. Class A (a) | | 839 | | | | 11,285 |
| GSI Commerce, Inc. (a) | | 1,482 | | | | 24,660 |
| IAC/InterActiveCorp (a) | | 9,936 | | | | 274,333 |
| Insight Enterprises, Inc. (a) | | 1,623 | | | | 33,807 |
| J. Jill Group, Inc. (a) | | 641 | | | | 11,737 |
| Netflix, Inc. (a) | | 1,941 | | | | 53,455 |
| NutriSystem, Inc. (a) | | 1,100 | | | | 42,823 |
| Overstock.com, Inc. (a)(d) | | 650 | | | | 24,187 |
| PC Mall, Inc. (a) | | 507 | | | | 2,500 |
| PetMed Express, Inc. (a) | | 710 | | | | 8,364 |
| Priceline.com, Inc. (a) | | 1,328 | | | | 31,899 |
| Provide Commerce, Inc. (a) | | 585 | | | | 16,883 |
| Stamps.com, Inc. (a) | | 989 | | | | 23,192 |
| ValueVision Media, Inc. Class A (a) | | 2,128 | | | | 23,621 |
| VistaPrint Ltd. | | 1,400 | | | | 25,424 |
| | | | | | | 3,714,180 |
| Leisure Equipment & Products – 0.1% | | | | | | |
| Arctic Cat, Inc. | | 607 | | | | 12,735 |
| Concord Camera Corp. (a) | | 341 | | | | 433 |
| Escalade, Inc. | | 749 | | | | 9,475 |
| JAKKS Pacific, Inc. (a) | | 1,033 | | | | 21,053 |
| Radica Games Ltd. | | 1,200 | | | | 10,716 |
| RC2 Corp. (a) | | 631 | | | | 22,300 |
| SCP Pool Corp. | | 1,758 | | | | 68,439 |
| | | | | | | 145,151 |
| Media – 3.7% | | | | | | |
| ACME Communications, Inc. (a) | | 1,400 | | | | 5,684 |
| Beasley Broadcast Group, Inc. Class A (a) | | 689 | | | | 9,660 |
| Cadmus Communications Corp. | | 538 | | | | 10,857 |
| Carmike Cinemas, Inc. | | 461 | | | | 12,134 |
| Central European Media Enterprises Ltd. Class A (a) | | 1,134 | | | | 61,327 |
| Charter Communications, Inc. Class A (a) | | 9,505 | | | | 11,311 |
See accompanying notes which are an integral part of the financial statements.
| Common Stocks continued | | | | | | |
| | | Shares | | Value (Note 1) |
| |
| CONSUMER DISCRETIONARY – continued | | | | | | |
| Media – continued | | | | | | |
| CKX, Inc. (a) | | 3,261 | | $ | | 42,263 |
| Comcast Corp.: | | | | | | |
| Class A (a) | | 45,794 | | | | 1,208,962 |
| Class A (special) (a) | | 27,012 | | | | 703,392 |
| Courier Corp. | | 559 | | | | 19,671 |
| Crown Media Holdings, Inc. Class A (a) | | 2,664 | | | | 27,706 |
| Cumulus Media, Inc. Class A (a) | | 2,009 | | | | 24,811 |
| Discovery Holding Co. Class A (a) | | 8,800 | | | | 137,368 |
| EchoStar Communications Corp. Class A | | 7,270 | | | | 187,857 |
| Emmis Communications Corp. Class A (a) | | 1,050 | | | | 21,882 |
| Fisher Communications, Inc. (a) | | 394 | | | | 17,931 |
| Focus Media Holding Ltd. ADR | | 362 | | | | 10,715 |
| Gemstar-TV Guide International, Inc. (a) | | 16,555 | | | | 43,871 |
| Global Sources Ltd. | | 1,089 | | | | 9,866 |
| Harris Interactive, Inc. (a) | | 1,659 | | | | 6,603 |
| IMAX Corp. (a) | | 1,147 | | | | 9,794 |
| Insight Communications, Inc. Class A (a) | | 2,570 | | | | 29,915 |
| Knology, Inc. (a) | | 1,452 | | | | 2,860 |
| Lamar Advertising Co. Class A (a) | | 2,927 | | | | 135,666 |
| Liberty Global, Inc.: | | | | | | |
| Class A | | 7,633 | | | | 170,292 |
| Class B | | 234 | | | | 5,499 |
| Class C (a) | | 7,867 | | | | 163,398 |
| LodgeNet Entertainment Corp. (a) | | 799 | | | | 10,954 |
| MDC Partners, Inc. Class A (sub. vtg.) (a) | | 763 | | | | 4,291 |
| Mediacom Communications Corp. Class A (a) | | 3,456 | | | | 18,006 |
| Morningstar, Inc. | | 1,288 | | | | 41,280 |
| Navarre Corp. (a) | | 871 | | | | 5,043 |
| New Frontier Media, Inc. (a) | | 1,084 | | | | 6,732 |
| Nexstar Broadcasting Group, Inc. Class A (a) | | 1,192 | | | | 5,185 |
| NTL, Inc. (a) | | 2,902 | | | | 168,983 |
| Outdoor Channel Holdings, Inc. (a) | | 796 | | | | 12,728 |
| Pixar (a) | | 4,011 | | | | 222,370 |
| Private Media Group, Inc. (a) | | 2,365 | | | | 5,440 |
| Radio One, Inc.: | | | | | | |
| Class A (a) | | 1,033 | | | | 11,508 |
| Class D (non-vtg.) (a) | | 3,233 | | | | 35,757 |
| RCN Corp. (a) | | 1,000 | | | | 21,810 |
| Regent Communication, Inc. (a) | | 1,974 | | | | 9,850 |
| Reuters Group PLC sponsored ADR | | 707 | | | | 29,270 |
| Salem Communications Corp. Class A (a) | | 1,009 | | | | 19,272 |
See accompanying notes which are an integral part of the financial statements.
13 Annual Report
| Investments continued | | | | | | |
| |
| Common Stocks continued | | | | | | |
| | | Shares | | Value (Note 1) |
| |
| CONSUMER DISCRETIONARY – continued | | | | | | |
| Media – continued | | | | | | |
| Scholastic Corp. (a) | | 1,334 | | $ | | 44,382 |
| Sinclair Broadcast Group, Inc. Class A | | 2,015 | | | | 19,384 |
| Sirius Satellite Radio, Inc. (a)(d) | | 45,123 | | | | 322,629 |
| Spanish Broadcasting System, Inc. Class A (a) | | 1,167 | | | | 5,625 |
| TiVo, Inc. (a)(d) | | 2,475 | | | | 13,316 |
| Value Line, Inc. | | 422 | | | | 17,007 |
| WorldSpace, Inc. Class A | | 630 | | | | 6,886 |
| WPP Group PLC sponsored ADR | | 841 | | | | 41,335 |
| WPT Enterprises, Inc. (a) | | 792 | | | | 5,417 |
| XM Satellite Radio Holdings, Inc. Class A (a) | | 7,486 | | | | 219,040 |
| Young Broadcasting, Inc. Class A (a) | | 630 | | | | 1,184 |
| | | | | | | 4,415,979 |
| Multiline Retail – 0.7% | | | | | | |
| Conn’s, Inc. (a) | | 665 | | | | 22,484 |
| Dollar Tree Stores, Inc. (a) | | 3,584 | | | | 82,289 |
| Fred’s, Inc. Class A | | 1,186 | | | | 19,699 |
| Sears Holdings Corp. (a) | | 5,513 | | | | 634,105 |
| The Bon-Ton Stores, Inc. | | 984 | | | | 18,174 |
| Tuesday Morning Corp. | | 1,287 | | | | 35,122 |
| | | | | | | 811,873 |
| Specialty Retail – 2.3% | | | | | | |
| AC Moore Arts & Crafts, Inc. (a) | | 657 | | | | 9,402 |
| America’s Car Mart, Inc. (a) | | 568 | | | | 9,156 |
| American Eagle Outfitters, Inc. | | 5,151 | | | | 117,237 |
| bebe Stores, Inc. | | 2,806 | | | | 45,373 |
| Bed Bath & Beyond, Inc. (a) | | 9,853 | | | | 420,329 |
| Big 5 Sporting Goods Corp. | | 1,019 | | | | 24,548 |
| Cache, Inc. (a) | | 1,204 | | | | 20,263 |
| Casual Male Retail Group, Inc. (a) | | 1,489 | | | | 9,202 |
| Charlotte Russe Holding, Inc. (a) | | 658 | | | | 12,305 |
| Charming Shoppes, Inc. (a) | | 3,839 | | | | 45,108 |
| Citi Trends, Inc. | | 825 | | | | 29,378 |
| Cost Plus, Inc. (a) | | 788 | | | | 14,483 |
| Deb Shops, Inc. | | 763 | | | | 22,188 |
| Dress Barn, Inc. (a) | | 924 | | | | 30,843 |
| Finish Line, Inc. Class A | | 1,323 | | | | 22,835 |
| Gander Mountain Co. (a)(d) | | 416 | | | | 2,367 |
| Golf Galaxy, Inc. | | 527 | | | | 8,284 |
| Goody’s Family Clothing, Inc. | | 1,432 | | | | 13,389 |
| Guitar Center, Inc. (a) | | 968 | | | | 51,052 |
See accompanying notes which are an integral part of the financial statements.
| Common Stocks continued | | | | | | |
| | | Shares | | Value (Note 1) |
| |
| CONSUMER DISCRETIONARY – continued | | | | | | |
| Specialty Retail – continued | | | | | | |
| Gymboree Corp. (a) | | 1,118 | | $ | | 25,222 |
| Hibbett Sporting Goods, Inc. (a) | | 1,056 | | | | 31,638 |
| Hot Topic, Inc. (a) | | 1,563 | | | | 24,227 |
| Jos. A. Bank Clothiers, Inc. (a) | | 461 | | | | 23,055 |
| Kirkland’s, Inc. (a) | | 622 | | | | 4,105 |
| Monro Muffler Brake, Inc. | | 669 | | | | 20,645 |
| Movie Gallery, Inc. | | 836 | | | | 4,121 |
| O’Reilly Automotive, Inc. (a) | | 3,912 | | | | 119,081 |
| Pacific Sunwear of California, Inc. (a) | | 2,336 | | | | 61,811 |
| Party City Corp. (a) | | 552 | | | | 9,445 |
| PETCO Animal Supplies, Inc. (a) | | 1,834 | | | | 38,936 |
| PETsMART, Inc. | | 4,882 | | | | 116,289 |
| Pomeroy IT Solutions, Inc. (a) | | 627 | | | | 5,047 |
| Rent-A Center, Inc. (a) | | 2,610 | | | | 51,026 |
| Restoration Hardware, Inc. (a) | | 1,275 | | | | 7,459 |
| Ross Stores, Inc. | | 5,052 | | | | 138,930 |
| Select Comfort Corp. (a) | | 1,096 | | | | 26,271 |
| Sharper Image Corp. (a) | | 608 | | | | 6,171 |
| Shoe Carnival, Inc. (a) | | 605 | | | | 12,409 |
| Stage Stores, Inc. | | 1,174 | | | | 35,114 |
| Staples, Inc. | | 24,725 | | | | 571,148 |
| Stein Mart, Inc. | | 1,359 | | | | 23,511 |
| The Children’s Place Retail Stores, Inc. (a) | | 918 | | | | 45,533 |
| The Pantry, Inc. (a) | | 751 | | | | 30,866 |
| Tractor Supply Co. (a) | | 1,268 | | | | 68,294 |
| Trans World Entertainment Corp. (a) | | 1,445 | | | | 9,436 |
| Tweeter Home Entertainment Group, Inc. (a) | | 953 | | | | 5,356 |
| Urban Outfitters, Inc. (a) | | 5,548 | | | | 171,211 |
| Volcom, Inc. | | 730 | | | | 24,798 |
| West Marine, Inc. (a) | | 829 | | | | 11,009 |
| Wet Seal, Inc. Class A (a) | | 1,165 | | | | 5,848 |
| Wilsons Leather Experts, Inc. (a) | | 2,802 | | | | 12,469 |
| Zumiez, Inc. | | 400 | | | | 15,828 |
| | | | | | | 2,664,051 |
| Textiles, Apparel & Luxury Goods – 0.3% | | | | | | |
| Charles & Colvard Ltd. | | 667 | | | | 17,982 |
| Cherokee, Inc. | | 583 | | | | 20,143 |
| Columbia Sportswear Co. (a) | | 1,249 | | | | 58,054 |
| Deckers Outdoor Corp. (a) | | 652 | | | | 15,016 |
| Fossil, Inc. (a) | | 2,593 | | | | 51,704 |
See accompanying notes which are an integral part of the financial statements.
15 Annual Report
| Investments continued | | | | | | |
| |
| Common Stocks continued | | | | | | |
| | | Shares | | Value (Note 1) |
| |
| CONSUMER DISCRETIONARY – continued | | | | | | |
| Textiles, Apparel & Luxury Goods – continued | | | | | | |
| Iconix Brand Group, Inc. (a) | | 2,108 | | $ | | 19,689 |
| K-Swiss, Inc. Class A | | 810 | | | | 25,296 |
| Perry Ellis International, Inc. (a) | | 255 | | | | 5,133 |
| Quaker Fabric Corp. (a) | | 1,024 | | | | 2,744 |
| Steven Madden Ltd | | 480 | | | | 13,070 |
| Tandy Brands Accessories, Inc. | | 905 | | | | 11,032 |
| True Religion Apparel, Inc. (a)(d) | | 899 | | | | 11,912 |
| Under Armour, Inc. Class A | | 1,000 | | | | 22,630 |
| Velcro Industries NV | | 901 | | | | 12,164 |
| Wacoal Holdings Corp. sponsored ADR | | 94 | | | | 6,329 |
| Warnaco Group, Inc. (a) | | 1,529 | | | | 37,568 |
| Weyco Group, Inc. | | 606 | | | | 11,702 |
| | | | | | | 342,168 |
| |
| TOTAL CONSUMER DISCRETIONARY | | | | | | 16,138,416 |
| |
| CONSUMER STAPLES 1.7% | | | | | | |
| Beverages – 0.1% | | | | | | |
| Coca-Cola Bottling Co. Consolidated | | 234 | | | | 10,764 |
| Hansen Natural Corp. (a) | | 752 | | | | 58,393 |
| Kirin Brewery Co. Ltd. sponsored ADR | | 730 | | | | 7,782 |
| MGP Ingredients, Inc. | | 1,096 | | | | 12,352 |
| | | | | | | 89,291 |
| Food & Staples Retailing – 1.2% | | | | | | |
| Allion Healthcare, Inc. | | 696 | | | | 10,704 |
| Arden Group, Inc. Class A | | 165 | | | | 14,395 |
| Casey’s General Stores, Inc. | | 1,703 | | | | 39,203 |
| Central European Distribution Corp. (a) | | 552 | | | | 24,128 |
| Costco Wholesale Corp. | | 16,156 | | | | 807,477 |
| Fresh Brands, Inc. (a) | | 466 | | | | 2,838 |
| Ingles Markets, Inc. Class A | | 1,128 | | | | 18,996 |
| Nash-Finch Co. | | 673 | | | | 18,084 |
| Pathmark Stores, Inc. (a) | | 1,698 | | | | 18,270 |
| Performance Food Group Co. (a) | | 1,946 | | | | 55,266 |
| Pricesmart, Inc. (a) | | 1,233 | | | | 10,222 |
| Spartan Stores, Inc. (a) | | 832 | | | | 8,328 |
| Topps Co., Inc. | | 1,768 | | | | 14,038 |
| United Natural Foods, Inc. (a) | | 1,348 | | | | 37,852 |
See accompanying notes which are an integral part of the financial statements.
| Common Stocks continued | | | | | | |
| | | Shares | | Value (Note 1) |
| |
| CONSUMER STAPLES – continued | | | | | | |
| Food & Staples Retailing – continued | | | | | | |
| Whole Foods Market, Inc. | | 2,245 | | $ | | 330,644 |
| Wild Oats Markets, Inc. (a)(d) | | 1,044 | | | | 12,612 |
| | | | | | | 1,423,057 |
| Food Products 0.3% | | | | | | |
| Alico, Inc. | | 403 | | | | 18,461 |
| Bridgford Foods Corp. (a) | | 433 | | | | 3,040 |
| Cal-Maine Foods, Inc. | | 840 | | | | 5,258 |
| Calavo Growers, Inc. | | 1,103 | | | | 11,195 |
| Cresud S.A.C.I.F.y A. sponsored ADR | | 503 | | | | 5,332 |
| Diamond Foods, Inc. | | 1,078 | | | | 17,625 |
| Farmer Brothers Co. | | 654 | | | | 13,322 |
| Gold Kist, Inc. Delaware (a) | | 1,844 | | | | 29,356 |
| Green Mountain Coffee Roasters, Inc. (a) | | 392 | | | | 16,080 |
| Hain Celestial Group, Inc. (a) | | 1,271 | | | | 28,381 |
| J&J Snack Foods Corp. | | 399 | | | | 24,235 |
| John B. Sanfilippo & Son, Inc. (a) | | 308 | | | | 4,223 |
| Lancaster Colony Corp. | | 1,046 | | | | 40,794 |
| Lance, Inc. | | 1,018 | | | | 18,670 |
| Peet’s Coffee & Tea, Inc. (a) | | 587 | | | | 18,226 |
| Premium Standard Farms, Inc. | | 1,112 | | | | 18,515 |
| Sanderson Farms, Inc. | | 668 | | | | 23,794 |
| SunOpta, Inc. (a) | | 1,281 | | | | 6,897 |
| | | | | | | 303,404 |
| Household Products – 0.0% | | | | | | |
| Central Garden & Pet Co. Class A (a) | | 571 | | | | 25,135 |
| WD 40 Co. | | 667 | | | | 18,322 |
| | | | | | | 43,457 |
| Personal Products 0.1% | | | | | | |
| Chattem, Inc. (a) | | 571 | | | | 18,141 |
| Elizabeth Arden, Inc. (a) | | 1,005 | | | | 19,135 |
| Inter Parfums, Inc. | | 544 | | | | 9,009 |
| Mannatech, Inc. | | 876 | | | | 11,423 |
| Nature’s Sunshine Products, Inc. | | 995 | | | | 18,318 |
| Parlux Fragrances, Inc. (a) | | 342 | | | | 9,843 |
| Reliv International, Inc. | | 923 | | | | 9,027 |
| USANA Health Sciences, Inc. (a) | | 727 | | | | 28,702 |
| | | | | | | 123,598 |
See accompanying notes which are an integral part of the financial statements.
17 Annual Report
| Investments continued | | | | | | |
| |
| Common Stocks continued | | | | | | |
| | | Shares | | Value (Note 1) |
| |
| CONSUMER STAPLES – continued | | | | | | |
| Tobacco 0.0% | | | | | | |
| Star Scientific, Inc. (a) | | 3,889 | | $ | | 10,111 |
| |
| TOTAL CONSUMER STAPLES | | | | | | 1,992,918 |
| |
| ENERGY 1.1% | | | | | | |
| Energy Equipment & Services – 0.5% | | | | | | |
| Bronco Drilling Co., Inc. | | 600 | | | | 14,700 |
| Cal Dive International, Inc. (a) | | 1,236 | | | | 89,746 |
| Global Industries Ltd. (a) | | 3,747 | | | | 44,402 |
| Gulf Island Fabrication, Inc. | | 426 | | | | 10,586 |
| Gulfmark Offshore, Inc. (a) | | 656 | | | | 21,897 |
| Hercules Offshore, Inc. (a) | | 1,021 | | | | 27,444 |
| Hydril Co. (a) | | 678 | | | | 43,460 |
| Lufkin Industries, Inc. | | 526 | | | | 23,539 |
| Matrix Service Co. (a) | | 325 | | | | 3,026 |
| Patterson-UTI Energy, Inc. | | 5,975 | | | | 186,659 |
| Stolt Offshore SA sponsored ADR (a) | | 2,000 | | | | 20,820 |
| Superior Well Services, Inc. | | 693 | | | | 14,595 |
| Tesco Corp. (a) | | 1,199 | | | | 22,172 |
| Trico Marine Services, Inc. (a) | | 450 | | | | 11,210 |
| Union Drilling, Inc. | | 742 | | | | 10,804 |
| | | | | | | 545,060 |
| Oil, Gas & Consumable Fuels – 0.6% | | | | | | |
| Alliance Resource Partners LP | | 430 | | | | 17,114 |
| APCO Argentina, Inc. | | 353 | | | | 18,109 |
| Atlas America, Inc. (a) | | 518 | | | | 29,288 |
| ATP Oil & Gas Corp. (a) | | 844 | | | | 30,477 |
| Brigham Exploration Co. (a) | | 2,496 | | | | 30,551 |
| Carrizo Oil & Gas, Inc. (a) | | 920 | | | | 23,304 |
| Clayton Williams Energy, Inc. (a) | | 543 | | | | 20,672 |
| Copano Energy LLC | | 474 | | | | 17,770 |
| Crosstex Energy LP | | 394 | | | | 13,317 |
| Crosstex Energy, Inc. | | 601 | | | | 39,287 |
| Dampskibsselskabet TORM AS sponsored ADR | | 205 | | | | 9,477 |
| Delta Petroleum Corp. (a) | | 1,660 | | | | 26,726 |
| Dorchester Minerals LP | | 602 | | | | 15,917 |
| Double Eagle Petroleum Co. (a) | | 564 | | | | 11,015 |
| Edge Petroleum Corp. (a) | | 838 | | | | 20,497 |
| Enterra Energy Trust (d) | | 669 | | | | 13,535 |
| FX Energy, Inc. (a) | | 1,820 | | | | 20,857 |
| GMX Resources, Inc. (a) | | 300 | | | | 8,283 |
See accompanying notes which are an integral part of the financial statements.
| Common Stocks continued | | | | | | |
| | | Shares | | Value (Note 1) |
| |
| ENERGY – continued | | | | | | |
| Oil, Gas & Consumable Fuels – continued | | | | | | |
| Golar LNG Ltd. (Nasdaq) (a) | | 2,090 | | $ | | 24,704 |
| Inergy LP | | 330 | | | | 8,333 |
| Ivanhoe Energy, Inc. (a) | | 5,764 | | | | 8,648 |
| James River Coal Co. (a) | | 623 | | | | 26,228 |
| Knightsbridge Tankers Ltd. (d) | | 576 | | | | 16,600 |
| Marine Petroleum Trust | | 475 | | | | 14,393 |
| NGAS Resources, Inc. (a) | | 717 | | | | 8,088 |
| Pacific Ethanol, Inc. (a)(d) | | 1,162 | | | | 12,515 |
| Parallel Petroleum Corp. (a) | | 1,715 | | | | 28,143 |
| Petrohawk Energy Corp. (a) | | 2,575 | | | | 34,273 |
| Petroleum Development Corp. (a) | | 469 | | | | 15,829 |
| Petroquest Energy, Inc. (a) | | 2,202 | | | | 20,104 |
| Resource America, Inc. Class A | | 592 | | | | 9,910 |
| StealthGas, Inc. | | 537 | | | | 6,326 |
| Syntroleum Corp. (a) | | 2,008 | | | | 16,205 |
| TC Pipelines LP | | 384 | | | | 12,288 |
| The Exploration Co. of Delaware, Inc. (a) | | 2,649 | | | | 16,530 |
| Top Tankers, Inc. | | 854 | | | | 11,230 |
| Toreador Resources Corp. (a) | | 505 | | | | 11,509 |
| Warren Resources, Inc. | | 1,356 | | | | 21,276 |
| | | | | | | 689,328 |
| |
| TOTAL ENERGY | | | | | | 1,234,388 |
| |
| FINANCIALS – 10.5% | | | | | | |
| Capital Markets 1.3% | | | | | | |
| American Capital Strategies Ltd. | | 3,647 | | | | 139,899 |
| Ameritrade Holding Corp. (a) | | 13,523 | | | | 315,897 |
| Calamos Asset Management, Inc. Class A | | 606 | | | | 16,423 |
| Capital Southwest Corp. | | 141 | | | | 13,072 |
| GFI Group, Inc. | | 900 | | | | 40,086 |
| Harris & Harris Group, Inc. (a) | | 1,045 | | | | 13,909 |
| Investors Financial Services Corp. | | 2,224 | | | | 83,956 |
| KHD Humboldt Wedag International Ltd. (a) | | 487 | | | | 10,358 |
| Knight Capital Group, Inc. Class A (a) | | 3,926 | | | | 39,731 |
| MarketAxess Holdings, Inc. | | 650 | | | | 7,937 |
| Northern Trust Corp. | | 7,130 | | | | 375,680 |
| optionsXpress Holdings, Inc. | | 1,978 | | | | 48,481 |
| Sanders Morris Harris Group, Inc. | | 903 | | | | 15,414 |
| SEI Investments Co. | | 3,312 | | | | 135,295 |
See accompanying notes which are an integral part of the financial statements.
19 Annual Report
| Investments continued | | | | | | |
| |
| Common Stocks continued | | | | | | |
| | | Shares | | Value (Note 1) |
| |
| FINANCIALS – continued | | | | | | |
| Capital Markets continued | | | | | | |
| T. Rowe Price Group, Inc. | | 4,318 | | $ | | 310,680 |
| TradeStation Group, Inc. (a) | | 1,353 | | | | 16,114 |
| | | | | | | 1,582,932 |
| Commercial Banks – 5.5% | | | | | | |
| 1st Source Corp. | | 501 | | | | 12,660 |
| ABC Bancorp | | 981 | | | | 19,738 |
| Alabama National Bancorp, Delaware | | 566 | | | | 37,526 |
| Alliance Financial Corp. | | 376 | | | | 11,682 |
| Amcore Financial, Inc. | | 797 | | | | 24,922 |
| Amegy Bancorp, Inc. | | 2,146 | | | | 51,246 |
| American National Bankshares, Inc. | | 549 | | | | 12,369 |
| American River Bankshares | | 564 | | | | 13,141 |
| AmericanWest Bancorp (a) | | 569 | | | | 13,115 |
| Ames National Corp. | | 710 | | | | 19,695 |
| Arrow Financial Corp. | | 779 | | | | 21,929 |
| Associated Banc-Corp. | | 4,557 | | | | 149,378 |
| Banc Corp. (a) | | 804 | | | | 9,503 |
| BancFirst Corp. | | 180 | | | | 14,348 |
| BancTrust Financial Group, Inc. | | 492 | | | | 9,929 |
| Bank of Granite Corp. | | 778 | | | | 14,938 |
| Bank of the Ozarks, Inc. | | 708 | | | | 26,267 |
| BankFinancial Corp. | | 1,166 | | | | 17,152 |
| Banner Corp. | | 553 | | | | 17,442 |
| BNC Bancorp | | 432 | | | | 8,063 |
| BOK Financial Corp. | | 2,278 | | | | 108,364 |
| Boston Private Financial Holdings, Inc. | | 1,032 | | | | 31,992 |
| Capital Bank Corp. | | 729 | | | | 11,008 |
| Capital City Bank Group, Inc. | | 607 | | | | 23,345 |
| Capital Corp. of the West | | 124 | | | | 4,285 |
| Cardinal Financial Corp. | | 1,972 | | | | 21,593 |
| Cascade Bancorp | | 616 | | | | 14,501 |
| Cascade Financial Corp. | | 809 | | | | 14,837 |
| Cathay General Bancorp | | 1,812 | | | | 68,856 |
| Cavalry Bancorp, Inc. | | 710 | | | | 17,345 |
| Centennial Bank Holdings, Inc., Delaware (a) | | 2,000 | | | | 24,800 |
| Center Bancorp, Inc. | | 551 | | | | 5,995 |
| Center Financial Corp., California | | 493 | | | | 12,374 |
| Central Coast Bancorp (a) | | 966 | | | | 23,783 |
| Century Bancorp, Inc. Class A (non-vtg.) | | 318 | | | | 9,540 |
| Chemical Financial Corp. | | 1,087 | | | | 35,132 |
See accompanying notes which are an integral part of the financial statements.
| Common Stocks continued | | | | | | |
| | | Shares | | Value (Note 1) |
| |
| FINANCIALS – continued | | | | | | |
| Commercial Banks – continued | | | | | | |
| Citizens & Northern Corp. | | 294 | | $ | | 8,217 |
| Citizens Banking Corp., Michigan | | 1,589 | | | | 47,019 |
| City Holding Co. | | 446 | | | | 16,270 |
| CNB Financial Corp., Pennsylvania | | 587 | | | | 8,664 |
| CoBiz, Inc. | | 1,170 | | | | 22,253 |
| Colony Bankcorp, Inc. | | 217 | | | | 5,555 |
| Columbia Bancorp | | 413 | | | | 17,020 |
| Columbia Bancorp, Oregon | | 234 | | | | 5,097 |
| Columbia Banking Systems, Inc. | | 724 | | | | 20,887 |
| Commerce Bancshares, Inc. | | 2,095 | | | | 108,416 |
| Community Banks, Inc. | | 867 | | | | 25,438 |
| Community Trust Bancorp, Inc. | | 474 | | | | 15,595 |
| Compass Bancshares, Inc. | | 3,934 | | | | 190,642 |
| CVB Financial Corp. | | 2,045 | | | | 41,186 |
| East West Bancorp, Inc. | | 1,796 | | | | 67,961 |
| Eastern Virgina Bankshares, Inc. | | 469 | | | | 9,859 |
| Enterprise Financial Services Corp. | | 431 | | | | 9,745 |
| Exchange National Bancshares, Inc. | | 288 | | | | 8,533 |
| Farmers Capital Bank Corp. | | 357 | | | | 11,549 |
| Fidelity Southern Corp. | | 1,009 | | | | 17,718 |
| Fifth Third Bancorp | | 18,485 | | | | 744,391 |
| Financial Institutions, Inc. | | 425 | | | | 8,581 |
| First Bancorp, North Carolina | | 705 | | | | 15,531 |
| First Charter Corp. | | 839 | | | | 21,009 |
| First Citizen Bancshares, Inc. | | 306 | | | | 57,366 |
| First Citizens Banc Corp. | | 384 | | | | 7,895 |
| First Community Bancorp, California | | 408 | | | | 21,118 |
| First Community Bancshares, Inc. | | 357 | | | | 11,024 |
| First Financial Bancorp, Ohio | | 1,319 | | | | 25,391 |
| First Financial Bankshares, Inc. | | 325 | | | | 12,087 |
| First Financial Corp., Indiana | | 404 | | | | 11,062 |
| First Indiana Corp. | | 192 | | | | 6,710 |
| First M&F Corp. | | 156 | | | | 5,343 |
| First Merchants Corp. | | 459 | | | | 11,874 |
| First Midwest Bancorp, Inc., Delaware | | 1,519 | | | | 56,856 |
| First Oak Brook Bancshares, Inc. | | 529 | | | | 14,632 |
| First of Long Island Corp. | | 286 | | | | 12,870 |
| First Regional Bancorp (a) | | 261 | | | | 18,573 |
| First South Bancorp, Inc., Virginia | | 528 | | | | 20,064 |
| First State Bancorp. | | 930 | | | | 23,008 |
| First United Corp. | | 493 | | | | 9,923 |
See accompanying notes which are an integral part of the financial statements.
21 Annual Report
| Investments continued | | | | | | |
| |
| Common Stocks continued | | | | | | |
| | | Shares | | Value (Note 1) |
| |
| FINANCIALS – continued | | | | | | |
| Commercial Banks – continued | | | | | | |
| Firstbank Corp., Michigan | | 444 | | $ | | 10,678 |
| FirstMerit Corp. | | 2,562 | | | | 68,303 |
| Flag Financial Corp. | | 932 | | | | 15,005 |
| FNB Corp., North Carolina | | 602 | | | | 10,914 |
| FNB Corp., Virginia | | 559 | | | | 17,245 |
| FNB Financial Services Corp. | | 746 | | | | 11,742 |
| Foothill Independent Bancorp | | 797 | | | | 19,096 |
| Frontier Financial Corp., Washington | | 944 | | | | 30,567 |
| Fulton Financial Corp. | | 4,967 | | | | 86,326 |
| GB&T Bancshares, Inc. | | 498 | | | | 11,210 |
| German American Bancorp | | 686 | | | | 9,254 |
| Glacier Bancorp, Inc. | | 1,058 | | | | 34,829 |
| Gold Banc Corp., Inc. | | 957 | | | | 17,322 |
| Great Southern Bancorp, Inc. | | 418 | | | | 12,711 |
| Greater Bay Bancorp | | 1,571 | | | | 41,851 |
| Greater Community Bancorp | | 792 | | | | 11,682 |
| Grupo Financiero Galicia SA sponsored ADR (a) | | 1,235 | | | | 9,065 |
| Hancock Holding Co. | | 1,143 | | | | 43,983 |
| Hanmi Financial Corp. | | 1,740 | | | | 32,416 |
| Harleysville National Corp., Pennsylvania | | 1,005 | | | | 21,226 |
| Heartland Financial USA, Inc. | | 717 | | | | 14,655 |
| Heritage Commerce Corp. | | 429 | | | | 9,421 |
| Huntington Bancshares, Inc. | | 7,175 | | | | 171,913 |
| IBERIABANK Corp. | | 300 | | | | 16,473 |
| Independent Bank Corp., Massachusetts | | 515 | | | | 15,053 |
| Independent Bank Corp., Michigan | | 286 | | | | 8,343 |
| Integra Bank Corp. | | 485 | | | | 10,403 |
| Interchange Financial Services Corp. | | 693 | | | | 12,467 |
| International Bancshares Corp. | | 2,086 | | | | 62,580 |
| Investors Bancorp, Inc. | | 3,800 | | | | 40,964 |
| Lakeland Bancorp, Inc. | | 810 | | | | 12,272 |
| Lakeland Financial Corp. | | 382 | | | | 16,598 |
| LNB Bancorp, Inc. (d) | | 836 | | | | 15,140 |
| LSB Bancshares, Inc. | | 666 | | | | 11,888 |
| Macatawa Bank Corp. | | 387 | | | | 14,760 |
| Main Street Banks, Inc. | | 668 | | | | 18,550 |
| MainSource Financial Group, Inc. | | 643 | | | | 11,632 |
| MB Financial, Inc. | | 851 | | | | 31,964 |
| MBT Financial Corp. | | 578 | | | | 10,346 |
| Mercantile Bank Corp. | | 433 | | | | 17,320 |
| Mercantile Bankshares Corp. | | 2,490 | | | | 147,931 |
See accompanying notes which are an integral part of the financial statements.
| Common Stocks continued | | | | | | |
| | | Shares | | Value (Note 1) |
| |
| FINANCIALS – continued | | | | | | |
| Commercial Banks – continued | | | | | | |
| Merchants Bancshares, Inc. | | 610 | | $ | | 15,860 |
| Mid-State Bancshares | | 709 | | | | 19,788 |
| Midwest Banc Holdings, Inc. | | 779 | | | | 17,598 |
| Nara Bancorp, Inc. | | 877 | | | | 16,417 |
| National Penn Bancshares, Inc. | | 1,556 | | | | 32,038 |
| NBT Bancorp, Inc. | | 1,162 | | | | 26,575 |
| Northern Empire Bancshares | | 751 | | | | 20,164 |
| Northern States Financial Corp. | | 462 | | | | 8,709 |
| Oak Hill Financial, Inc. | | 544 | | | | 17,952 |
| Old Second Bancorp, Inc. | | 432 | | | | 14,338 |
| Omega Financial Corp. | | 625 | | | | 18,331 |
| Pacific Capital Bancorp | | 1,566 | | | | 58,443 |
| Penns Woods Bancorp, Inc. | | 361 | | | | 13,834 |
| Peoples Bancorp, Inc. | | 541 | | | | 15,700 |
| Pinnacle Financial Partners, Inc. (a) | | 510 | | | | 12,699 |
| Placer Sierra Bancshares | | 580 | | | | 16,530 |
| Popular, Inc. | | 9,086 | | | | 201,527 |
| Preferred Bank, Los Angeles California | | 476 | | | | 20,873 |
| PremierWest Bancorp | | 712 | | | | 9,932 |
| PrivateBancorp, Inc. | | 782 | | | | 28,848 |
| Prosperity Bancshares, Inc. | | 947 | | | | 28,978 |
| Provident Bankshares Corp. | | 1,078 | | | | 38,420 |
| Renasant Corp. | | 408 | | | | 12,958 |
| Republic Bancorp, Inc. | | 3,016 | | | | 37,459 |
| Republic Bancorp, Inc., Kentucky Class A | | 621 | | | | 12,755 |
| Republic First Bancorp, Inc. | | 1,089 | | | | 13,231 |
| Royal Bancshares of Pennsylvania, Inc. Class A | | 471 | | | | 11,262 |
| Rurban Financial Corp. | | 723 | | | | 8,940 |
| S&T Bancorp, Inc. | | 901 | | | | 34,634 |
| S.Y. Bancorp, Inc. | | 925 | | | | 22,080 |
| Sandy Spring Bancorp, Inc. | | 502 | | | | 18,594 |
| SCBT Financial Corp. | | 453 | | | | 15,098 |
| Seacoast Banking Corp., Florida | | 720 | | | | 17,482 |
| Security Bank Corp., Georgia | | 740 | | | | 18,456 |
| Shore Bancshares, Inc. | | 507 | | | | 16,772 |
| Sierra Bancorp | | 727 | | | | 16,757 |
| Signature Bank, New York (a) | | 906 | | | | 26,084 |
| Simmons First National Corp. Class A | | 562 | | | | 15,747 |
| Sky Financial Group, Inc. | | 3,681 | | | | 109,252 |
| Slade’s Ferry Bancorp | | 647 | | | | 11,872 |
| South Financial Group, Inc. | | 2,562 | | | | 76,015 |
See accompanying notes which are an integral part of the financial statements.
23 Annual Report
| Investments continued | | | | | | |
| |
| Common Stocks continued | | | | | | |
| | | Shares | | Value (Note 1) |
| |
| FINANCIALS – continued | | | | | | |
| Commercial Banks – continued | | | | | | |
| Southern Community Financial Corp. | | 910 | | $ | | 8,554 |
| Southside Bancshares, Inc. | | 76 | | | | 1,521 |
| Southwest Bancorp, Inc., Oklahoma | | 811 | | | | 18,304 |
| State National Bancshares, Inc. | | 431 | | | | 11,508 |
| Sterling Bancshares, Inc. | | 1,496 | | | | 23,323 |
| Sterling Financial Corp., Pennsylvania | | 1,116 | | | | 23,648 |
| Sterling Financial Corp., Washington | | 871 | | | | 22,733 |
| Suffolk Bancorp | | 342 | | | | 11,382 |
| Summit Bancshares, Inc. | | 922 | | | | 16,928 |
| Sun Bancorp, Inc., New Jersey | | 544 | | | | 10,788 |
| Susquehanna Bancshares, Inc., Pennsylvania | | 1,486 | | | | 36,437 |
| SVB Financial Group (a) | | 1,187 | | | | 57,083 |
| Taylor Capital Group, Inc. | | 570 | | | | 22,338 |
| Texas Capital Bancshares, Inc. (a) | | 793 | | | | 19,143 |
| Texas Regional Bancshares, Inc. Class A | | 1,697 | | | | 49,468 |
| Trico Bancshares | | 1,018 | | | | 24,106 |
| Trustco Bank Corp., New York | | 3,050 | | | | 39,589 |
| Trustmark Corp. | | 1,762 | | | | 50,393 |
| UCBH Holdings, Inc. | | 3,285 | | | | 57,947 |
| UMB Financial Corp. | | 614 | | | | 40,757 |
| Umpqua Holdings Corp. | | 1,365 | | | | 36,063 |
| Union Bankshares Corp. | | 440 | | | | 21,195 |
| United Bankshares, Inc., West Virginia | | 1,513 | | | | 57,176 |
| United Community Banks, Inc., Georgia | | 1,186 | | | | 33,860 |
| United Financial Corp. | | 468 | | | | 12,238 |
| United Security Bancshares, Inc. | | 450 | | | | 13,217 |
| United Security Bancshares, California | | 454 | | | | 14,133 |
| Univest Corp. of Pennsylvania | | 562 | | | | 14,421 |
| Unizan Financial Corp. | | 626 | | | | 16,483 |
| Vail Banks, Inc. | | 945 | | | | 13,192 |
| Vineyard National Bancorp | | 343 | | | | 10,005 |
| Virginia Commerce Bancorp, Inc. (a) | | 921 | | | | 27,059 |
| Virginia Financial Group, Inc. | | 342 | | | | 12,859 |
| Washington Trust Bancorp, Inc. | | 617 | | | | 17,295 |
| WesBanco, Inc. | | 843 | | | | 26,976 |
| West Bancorp., Inc. | | 821 | | | | 16,001 |
| West Coast Bancorp, Oregon | | 748 | | | | 19,710 |
| Westamerica Bancorp. | | 1,131 | | | | 61,798 |
| Westbank Corp. | | 580 | | | | 8,833 |
| Western Sierra Bancorp (a) | | 411 | | | | 14,393 |
| Whitney Holding Corp. | | 2,282 | | | | 66,863 |
See accompanying notes which are an integral part of the financial statements.
| Common Stocks continued | | | | | | |
| | | Shares | | Value (Note 1) |
| |
| FINANCIALS – continued | | | | | | |
| Commercial Banks – continued | | | | | | |
| Wilshire Bancorp, Inc. | | 946 | | $ | | 16,091 |
| Wintrust Financial Corp. | | 889 | | | | 49,944 |
| Yadkin Valley Bank & Trust Co. | | 667 | | | | 9,183 |
| Yardville National Bancorp | | 458 | | | | 15,989 |
| Zions Bancorp | | 2,817 | | | | 213,050 |
| | | | | | | 6,404,802 |
| Consumer Finance – 0.3% | | | | | | |
| ACE Cash Express, Inc. (a) | | 435 | | | | 10,366 |
| Advanta Corp.: | | | | | | |
| Class A | | 426 | | | | 13,048 |
| Class B | | 718 | | | | 23,249 |
| Asta Funding, Inc. | | 686 | | | | 16,999 |
| Collegiate Funding Services, Inc. (a) | | 1,369 | | | | 20,891 |
| CompuCredit Corp. (a) | | 1,626 | | | | 63,528 |
| Dollar Financial Corp. | | 178 | | | | 2,116 |
| First Cash Financial Services, Inc. (a) | | 724 | | | | 20,996 |
| QC Holdings, Inc. (a) | | 1,007 | | | | 12,003 |
| United Panam Financial Corp. (a) | | 805 | | | | 18,861 |
| WFS Financial, Inc. (a) | | 1,400 | | | | 108,668 |
| World Acceptance Corp. (a) | | 583 | | | | 16,056 |
| | | | | | | 326,781 |
| Diversified Financial Services – 0.2% | | | | | | |
| Asset Acceptance Capital Corp. (a) | | 1,529 | | | | 31,207 |
| California First National Bancorp | | 627 | | | | 7,944 |
| Elron Electronic Industries Ltd. (d) | | 1,005 | | | | 10,854 |
| Encore Capital Group, Inc. (a) | | 911 | | | | 14,922 |
| eSpeed, Inc. Class A (a) | | 879 | | | | 7,533 |
| EuroBancshares, Inc. (a) | | 1,284 | | | | 16,230 |
| First Albany Companies, Inc. | | 714 | | | | 4,848 |
| Instinet Group, Inc. | | 11,680 | | | | 59,218 |
| Marlin Business Services Corp. (a) | | 759 | | | | 17,237 |
| Medallion Financial Corp. | | 1,687 | | | | 16,921 |
| Newtek Business Services, Inc. (a) | | 1,293 | | | | 2,030 |
| The Nasdaq Stock Market, Inc. (a) | | 2,600 | | | | 101,738 |
| | | | | | | 290,682 |
| Insurance – 1.5% | | | | | | |
| Affirmative Insurance Holdings, Inc. | | 317 | | | | 4,280 |
| Alfa Corp. | | 2,654 | | | | 46,259 |
| American National Insurance Co. | | 851 | | | | 99,686 |
| American Physicians Capital, Inc. (a) | | 423 | | | | 19,225 |
See accompanying notes which are an integral part of the financial statements.
25 Annual Report
| Investments continued | | | | | | |
| |
| Common Stocks continued | | | | | | |
| | | Shares | | Value (Note 1) |
| |
| FINANCIALS – continued | | | | | | |
| Insurance – continued | | | | | | |
| Arch Capital Group Ltd. (a) | | 1,149 | | $ | | 60,277 |
| Argonaut Group, Inc. (a) | | 1,185 | | | | 37,683 |
| Baldwin & Lyons, Inc. Class B | | 518 | | | | 12,986 |
| Brooke Corp. | | 617 | | | | 8,792 |
| Ceres Group, Inc. (a) | | 1,684 | | | | 8,420 |
| Cincinnati Financial Corp. | | 5,594 | | | | 249,101 |
| Direct General Corp. | | 647 | | | | 11,057 |
| Donegal Group, Inc. Class A | | 836 | | | | 20,256 |
| EMC Insurance Group | | 582 | | | | 11,384 |
| Enstar Group, Inc. (a) | | 235 | | | | 16,727 |
| Erie Indemnity Co. Class A | | 2,174 | | | | 115,222 |
| FPIC Insurance Group, Inc. (a) | | 638 | | | | 24,167 |
| Harleysville Group, Inc. | | 768 | | | | 20,974 |
| Infinity Property & Casualty Corp. | | 709 | | | | 26,198 |
| IPC Holdings Ltd. | | 2,132 | | | | 62,254 |
| James River Group, Inc. | | 685 | | | | 12,851 |
| Kansas City Life Insurance Co. | | 380 | | | | 19,182 |
| Max Re Capital Ltd. | | 1,323 | | | | 35,324 |
| Millea Holdings, Inc. sponsored ADR | | 684 | | | | 56,191 |
| National Interstate Corp. | | 862 | | | | 15,723 |
| National Western Life Insurance Co. Class A | | 73 | | | | 16,060 |
| Navigators Group, Inc. (a) | | 419 | | | | 16,932 |
| Ohio Casualty Corp. | | 1,983 | | | | 58,697 |
| Philadelphia Consolidated Holdings Corp. (a) | | 810 | | | | 78,497 |
| PMA Capital Corp. Class A (a) | | 1,857 | | | | 16,490 |
| Presidential Life Corp. | | 1,433 | | | | 27,643 |
| Quanta Capital Holdings Ltd. (a) | | 2,049 | | | | 8,585 |
| SAFECO Corp. | | 4,107 | | | | 231,019 |
| Safety Insurance Group, Inc. | | 517 | | | | 20,737 |
| SeaBright Insurance Holdings, Inc. | | 784 | | | | 10,537 |
| Selective Insurance Group, Inc. | | 823 | | | | 46,063 |
| State Auto Financial Corp. | | 1,314 | | | | 45,241 |
| The Midland Co. | | 738 | | | | 27,896 |
| Tower Group, Inc. | | 937 | | | | 18,927 |
| United America Indemnity Ltd. Class A (a) | | 701 | | | | 13,284 |
| United Fire & Casualty Co. | | 664 | | | | 30,345 |
| Universal American Financial Corp. (a) | | 2,125 | | | | 31,365 |
| USI Holdings Corp. (a) | | 1,690 | | | | 23,660 |
| | | | | | | 1,716,197 |
See accompanying notes which are an integral part of the financial statements.
| Common Stocks continued | | | | | | |
| | | Shares | | Value (Note 1) |
| |
| FINANCIALS – continued | | | | | | |
| Real Estate 0.1% | | | | | | |
| Capital Automotive (REIT) (SBI) | | 1,431 | | $ | | 55,280 |
| Elbit Medical Imaging Ltd. | | 1,441 | | | | 22,336 |
| Fieldstone Investment Corp. | | 1,600 | | | | 17,920 |
| Gladstone Commercial Corp. | | 882 | | | | 14,739 |
| Investors Real Estate Trust | | 1,872 | | | | 17,616 |
| Monmouth Real Estate Investment Corp. Class A | | 1,800 | | | | 14,382 |
| Origen Financial, Inc. | | 1,905 | | | | 12,897 |
| Tarragon Corp. (a) | | 882 | | | | 17,525 |
| ZipRealty, Inc. | | 624 | | | | 5,341 |
| | | | | | | 178,036 |
| Thrifts & Mortgage Finance – 1.6% | | | | | | |
| Accredited Home Lenders Holding Co. (a) | | 644 | | | | 27,898 |
| Aether Holdings, Inc. (a) | | 2,467 | | | | 8,585 |
| Anchor BanCorp Wisconsin, Inc. | | 723 | | | | 22,341 |
| Bank Mutual Corp. | | 2,925 | | | | 30,947 |
| BankUnited Financial Corp. Class A | | 1,086 | | | | 27,682 |
| Beverly Hills Bancorp, Inc. | | 1,022 | | | | 9,985 |
| BFC Financial Corp. Class A (a) | | 1,047 | | | | 5,936 |
| Brookline Bancorp, Inc., Delaware | | 1,822 | | | | 25,617 |
| Camco Financial Corp. | | 727 | | | | 10,287 |
| Capital Crossing Bank (a) | | 282 | | | | 9,247 |
| Capitol Federal Financial | | 2,304 | | | | 78,659 |
| CFS Bancorp, Inc. | | 1,199 | | | | 16,702 |
| Charter Financial Corp., Georgia | | 864 | | | | 30,292 |
| Citizens First Bancorp, Inc., Delaware | | 720 | | | | 16,279 |
| Citizens South Banking Corp., Delaware | | 637 | | | | 7,753 |
| City Bank Lynnwood, Washington | | 482 | | | | 16,605 |
| Clifton Savings Bancorp, Inc. | | 1,352 | | | | 13,912 |
| Coastal Financial Corp. | | 1,294 | | | | 17,378 |
| Commercial Capital Bancorp, Inc. | | 1,875 | | | | 31,275 |
| Corus Bankshares, Inc. | | 942 | | | | 55,371 |
| Dime Community Bancshares, Inc. | | 1,218 | | | | 18,039 |
| ESB Financial Corp. | | 1,247 | | | | 15,425 |
| Fidelity Bankshares, Inc. | | 627 | | | | 19,556 |
| First Busey Corp. | | 1,177 | | | | 24,741 |
| First Defiance Financial Corp. | | 519 | | | | 14,522 |
| First Federal Bancshares of Arkansas, Inc. | | 569 | | | | 14,225 |
| First Financial Holdings, Inc. | | 388 | | | | 11,850 |
| First Financial Service Corp. | | 342 | | | | 9,576 |
| First Niagara Financial Group, Inc. | | 4,274 | | | | 61,930 |
See accompanying notes which are an integral part of the financial statements.
27 Annual Report
| Investments continued | | | | | | |
| |
| Common Stocks continued | | | | | | |
| | | Shares | | Value (Note 1) |
| |
| FINANCIALS – continued | | | | | | |
| Thrifts & Mortgage Finance – continued | | | | | | |
| First PacTrust Bancorp, Inc. | | 595 | | $ | | 16,511 |
| First Place Financial Corp. | | 477 | | | | 11,381 |
| Flushing Financial Corp. | | 759 | | | | 12,751 |
| FMS Financial Corp. | | 631 | | | | 10,853 |
| Franklin Bank Corp. (a) | | 718 | | | | 13,283 |
| Harbor Florida Bancshares, Inc. | | 583 | | | | 21,956 |
| Heritage Financial Corp., Washington | | 720 | | | | 17,273 |
| HMN Financial, Inc. | | 448 | | | | 13,256 |
| Horizon Financial Corp. | | 760 | | | | 17,214 |
| Hudson City Bancorp, Inc. | | 19,897 | | | | 236,973 |
| Independence Community Bank Corp. | | 2,880 | | | | 114,163 |
| ITLA Capital Corp. (a) | | 290 | | | | 15,211 |
| K-Fed Bancorp | | 734 | | | | 8,969 |
| Kearny Financial Corp. | | 2,400 | | | | 30,360 |
| KNBT Bancorp, Inc. | | 794 | | | | 13,014 |
| LSB Corp. | | 631 | | | | 10,727 |
| MAF Bancorp., Inc. | | 1,270 | | | | 54,064 |
| MASSBANK Corp. | | 367 | | | | 11,928 |
| MutualFirst Financial, Inc. | | 550 | | | | 12,100 |
| NASB Financial, Inc. | | 336 | | | | 12,734 |
| NetBank, Inc. | | 1,454 | | | | 10,745 |
| NewMil Bancorp, Inc. | | 413 | | | | 12,555 |
| Northwest Bancorp, Inc. | | 1,622 | | | | 35,895 |
| OceanFirst Financial Corp. | | 531 | | | | 12,797 |
| Pamrapo Bancorp, Inc. | | 666 | | | | 14,153 |
| Partners Trust Financial Group, Inc. | | 1,816 | | | | 21,792 |
| Pennfed Financial Services, Inc. | | 894 | | | | 17,201 |
| People’s Bank, Connecticut | | 4,728 | | | | 147,135 |
| Provident Financial Holdings, Inc. | | 315 | | | | 8,659 |
| Provident New York Bancorp | | 1,578 | | | | 18,289 |
| PVF Capital Corp. | | 500 | | | | 5,400 |
| Riverview Bancorp, Inc. | | 510 | | | | 11,358 |
| Rockville Financial, Inc. (a) | | 725 | | | | 9,773 |
| Severn Bancorp, Inc. | | 862 | | | | 16,421 |
| SI Financial Group, Inc. | | 1,167 | | | | 13,666 |
| Sound Federal Bancorp, Inc. | | 575 | | | | 11,345 |
| TierOne Corp. | | 485 | | | | 14,535 |
| Timberland Bancorp, Inc. | | 556 | | | | 12,988 |
| Triad Guaranty, Inc. (a) | | 519 | | | | 22,504 |
| United Community Financial Corp., Ohio | | 870 | | | | 10,257 |
| Washington Federal, Inc. | | 2,683 | | | | 65,116 |
See accompanying notes which are an integral part of the financial statements.
| Common Stocks continued | | | | | | |
| | | Shares | | Value (Note 1) |
| |
| FINANCIALS – continued | | | | | | |
| Thrifts & Mortgage Finance – continued | | | | | | |
| Wauwatosa Holdings, Inc. | | 1,226 | | $ | | 14,271 |
| Willow Grove Bancorp, Inc. | | 868 | | | | 13,610 |
| WSFS Financial Corp. | | 244 | | | | 15,421 |
| | | | | | | 1,843,222 |
| |
| TOTAL FINANCIALS | | | | | | 12,342,652 |
| |
| HEALTH CARE – 14.0% | | | | | | |
| Biotechnology – 7.9% | | | | | | |
| Aastrom Biosciences, Inc. (a) | | 3,712 | | | | 8,055 |
| Abgenix, Inc. (a) | | 2,859 | | | | 39,197 |
| Acacia Research Corp. – CombiMatrix (a) | | 1,427 | | | | 2,426 |
| Acadia Pharmaceuticals, Inc. (a) | | 1,282 | | | | 11,243 |
| Accentia Biopharmaceutical, Inc. | | 1,105 | | | | 7,282 |
| AEterna Zentaris, Inc. (sub. vtg.) (a) | | 1,592 | | | | 7,070 |
| Affymetrix, Inc. (a) | | 2,111 | | | | 103,946 |
| Albany Molecular Research, Inc. (a) | | 747 | | | | 9,143 |
| Alexion Pharmaceuticals, Inc. (a) | | 1,001 | | | | 19,530 |
| Alkermes, Inc. (a) | | 3,610 | | | | 65,630 |
| Alnylam Pharmaceuticals, Inc. (a) | | 1,040 | | | | 13,062 |
| Amgen, Inc. (a) | | 41,578 | | | | 3,364,908 |
| Amylin Pharmaceuticals, Inc. (a) | | 3,567 | | | | 133,441 |
| Anadys Pharmaceuticals, Inc. (a) | | 1,141 | | | | 10,851 |
| Angiotech Pharmaceuticals, Inc. (a) | | 2,712 | | | | 39,781 |
| Antigenics, Inc. (a)(d) | | 2,149 | | | | 11,755 |
| Aphton Corp. (a) | | 1,970 | | | | 768 |
| Arena Pharmaceuticals, Inc. (a) | | 802 | | | | 8,646 |
| ARIAD Pharmaceuticals, Inc. (a) | | 1,982 | | | | 12,229 |
| ArQule, Inc. (a) | | 2,255 | | | | 15,627 |
| Array Biopharma, Inc. (a) | | 1,496 | | | | 10,053 |
| Avant Immunotherapeutics, Inc. (a) | | 3,213 | | | | 5,751 |
| Axonyx, Inc. (a) | | 2,219 | | | | 1,997 |
| BioCryst Pharmaceuticals, Inc. (a) | | 1,263 | | | | 20,511 |
| Bioenvision, Inc. (a) | | 1,026 | | | | 5,622 |
| Biogen Idec, Inc. (a) | | 11,513 | | | | 492,872 |
| BioMarin Pharmaceutical, Inc. (a) | | 3,206 | | | | 31,226 |
| Biopure Corp. Class A (a) | | 82 | | | | 82 |
| Caliper Life Sciences, Inc. (a) | | 1,195 | | | | 8,628 |
| CancerVax Corp. (a) | | 1,246 | | | | 1,732 |
| Celgene Corp. (a) | | 5,698 | | | | 347,122 |
| Cell Genesys, Inc. (a) | | 1,539 | | | | 8,957 |
See accompanying notes which are an integral part of the financial statements.
29 Annual Report
| Investments continued | | | | | | |
| |
| Common Stocks continued | | | | | | |
| | | Shares | | Value (Note 1) |
| |
| HEALTH CARE – continued | | | | | | |
| Biotechnology – continued | | | | | | |
| Cell Therapeutics, Inc. (a)(d) | | 2,256 | | $ | | 4,738 |
| Cephalon, Inc. (a) | | 1,836 | | | | 93,361 |
| Cepheid, Inc. (a) | | 1,455 | | | | 15,990 |
| Chiron Corp. (a) | | 6,385 | | | | 282,856 |
| Ciphergen Biosystems, Inc. (a) | | 1,078 | | | | 1,380 |
| Coley Pharmaceutical Group, Inc. | | 925 | | | | 14,763 |
| Compugen Ltd. (a) | | 1,757 | | | | 4,867 |
| Corgentech, Inc. (a) | | 1,296 | | | | 2,955 |
| Cotherix, Inc. (a) | | 1,041 | | | | 12,919 |
| Critical Therapeutics, Inc. (a)(d) | | 1,487 | | | | 9,621 |
| Crucell NV sponsored ADR (a) | | 512 | | | | 13,486 |
| Cubist Pharmaceuticals, Inc. (a) | | 1,710 | | | | 38,663 |
| CuraGen Corp. (a) | | 1,634 | | | | 6,732 |
| Curis, Inc. (a) | | 1,951 | | | | 7,628 |
| CV Therapeutics, Inc. (a) | | 1,590 | | | | 39,321 |
| Cytokinetics, Inc. (a) | | 1,078 | | | | 9,271 |
| deCODE genetics, Inc. (a) | | 1,985 | | | | 16,476 |
| Dendreon Corp. (a) | | 1,793 | | | | 10,597 |
| Digene Corp. (a) | | 715 | | | | 19,605 |
| Discovery Partners International, Inc. (a) | | 3,051 | | | | 7,170 |
| Diversa Corp. (a) | | 1,093 | | | | 5,596 |
| DOV Pharmaceutical, Inc. (a) | | 1,030 | | | | 14,873 |
| DUSA Pharmaceuticals, Inc. (a) | | 923 | | | | 9,212 |
| Dyax Corp. (a) | | 782 | | | | 3,433 |
| Dynavax Technologies Corp. (a) | | 1,807 | | | | 8,095 |
| Encysive Pharmaceuticals, Inc. (a) | | 2,504 | | | | 28,470 |
| Enzon Pharmaceuticals, Inc. (a) | | 1,396 | | | | 9,479 |
| Exact Sciences Corp. (a) | | 1,230 | | | | 1,796 |
| Exelixis, Inc. (a) | | 2,435 | | | | 19,675 |
| Favrille, Inc. | | 178 | | | | 614 |
| Forbes Medi-Tech, Inc. (a) | | 1,040 | | | | 1,792 |
| Genaera Corp. (a) | | 2,470 | | | | 3,532 |
| Gene Logic, Inc. (a) | | 1,810 | | | | 6,516 |
| Genelabs Technologies, Inc. (a) | | 3,567 | | | | 1,605 |
| Genitope Corp. (a) | | 1,205 | | | | 9,568 |
| Genomic Health, Inc. | | 900 | | | | 8,298 |
| Genta, Inc. (a) | | 2,036 | | | | 2,484 |
| GenVec, Inc. (a) | | 3,656 | | | | 6,032 |
| Genzyme Corp. (a) | | 8,645 | | | | 642,669 |
| Geron Corp. (a) | | 1,706 | | | | 15,320 |
| Gilead Sciences, Inc. (a) | | 15,381 | | | | 779,663 |
See accompanying notes which are an integral part of the financial statements.
| Common Stocks continued | | | | | | |
| | | Shares | | Value (Note 1) |
| |
| HEALTH CARE – continued | | | | | | |
| Biotechnology – continued | | | | | | |
| GTx, Inc. (a) | | 830 | | $ | | 6,499 |
| Harvard Bioscience, Inc. (a) | | 973 | | | | 3,746 |
| Human Genome Sciences, Inc. (a) | | 4,334 | | | | 40,090 |
| Icagen, Inc. | | 222 | | | | 1,399 |
| ICOS Corp. (a) | | 2,182 | | | | 62,165 |
| ID Biomedical Corp. (a) | | 1,335 | | | | 39,497 |
| Idenix Pharmaceuticals, Inc. (a) | | 1,720 | | | | 35,707 |
| Illumina, Inc. (a) | | 1,642 | | | | 25,862 |
| ImClone Systems, Inc. (a) | | 2,849 | | | | 92,336 |
| ImmunoGen, Inc. (a) | | 2,035 | | | | 11,254 |
| Immunomedics, Inc. (a) | | 1,704 | | | | 3,459 |
| Incyte Corp. (a) | | 2,540 | | | | 14,122 |
| Indevus Pharmaceuticals, Inc. (a) | | 1,656 | | | | 6,641 |
| Inhibitex, Inc. (a) | | 1,533 | | | | 14,042 |
| InterMune, Inc. (a) | | 1,181 | | | | 17,065 |
| Introgen Therapeutics, Inc. (a)(d) | | 1,380 | | | | 8,528 |
| Invitrogen Corp. (a) | | 1,844 | | | | 122,903 |
| Isis Pharmaceuticals, Inc. (a) | | 1,608 | | | | 8,153 |
| Kendle International, Inc. (a) | | 394 | | | | 9,417 |
| Keryx Biopharmaceuticals, Inc. (a) | | 1,032 | | | | 14,334 |
| Kosan Biosciences, Inc. (a) | | 755 | | | | 5,466 |
| La Jolla Pharmaceutical Co. (a) | | 1,785 | | | | 1,214 |
| Lexicon Genetics, Inc. (a) | | 2,296 | | | | 8,679 |
| Luminex Corp. (a) | | 900 | | | | 9,432 |
| MannKind Corp. (a) | | 1,922 | | | | 24,928 |
| Marshall Edwards, Inc. (a)(d) | | 1,945 | | | | 14,899 |
| Martek Biosciences (a) | | 979 | | | | 25,660 |
| Maxim Pharmaceuticals, Inc. (a) | | 725 | | | | 892 |
| Maxygen, Inc. (a) | | 2,330 | | | | 17,195 |
| Medarex, Inc. (a) | | 4,502 | | | | 47,091 |
| MedImmune, Inc. (a) | | 8,138 | | | | 292,236 |
| Metabasis Therapeutics, Inc. (a) | | 1,518 | | | | 8,804 |
| Millennium Pharmaceuticals, Inc. (a) | | 9,972 | | | | 104,806 |
| Momenta Pharmaceuticals, Inc. (a) | | 985 | | | | 21,769 |
| Monogram Biosciences, Inc. (a) | | 6,461 | | | | 11,565 |
| Myogen, Inc. (a) | | 1,135 | | | | 24,675 |
| Myriad Genetics, Inc. (a) | | 1,095 | | | | 21,035 |
| Nabi Biopharmaceuticals (a) | | 2,212 | | | | 7,101 |
| Nanogen, Inc. (a) | | 940 | | | | 2,651 |
| Nektar Therapeutics (a) | | 2,819 | | | | 47,416 |
| Neopharm, Inc. (a) | | 731 | | | | 6,901 |
See accompanying notes which are an integral part of the financial statements.
31 Annual Report
| Investments continued | | | | | | |
| |
| Common Stocks continued | | | | | | |
| | | Shares | | Value (Note 1) |
| |
| HEALTH CARE – continued | | | | | | |
| Biotechnology – continued | | | | | | |
| NeoRX Corp. (a) | | 507 | | $ | | 512 |
| Neose Technologies, Inc. (a) | | 1,126 | | | | 1,971 |
| Neurochem, Inc. (a)(d) | | 1,043 | | | | 14,450 |
| Neurocrine Biosciences, Inc. (a) | | 1,170 | | | | 69,638 |
| Neurogen Corp. (a) | | 1,639 | | | | 12,194 |
| Northfield Laboratories, Inc. (a) | | 914 | | | | 11,717 |
| Novavax, Inc. (a)(d) | | 2,057 | | | | 7,138 |
| NPS Pharmaceuticals, Inc. (a) | | 1,233 | | | | 14,290 |
| Nuvelo, Inc. (a) | | 1,327 | | | | 11,558 |
| ONYX Pharmaceuticals, Inc. (a) | | 1,093 | | | | 27,576 |
| Orchid Cellmark, Inc. (a) | | 1,015 | | | | 6,821 |
| Orthologic Corp. (a) | | 1,251 | | | | 5,192 |
| Oscient Pharmaceuticals Corp. (a) | | 6,157 | | | | 12,006 |
| OSI Pharmaceuticals, Inc. (a) | | 2,008 | | | | 48,694 |
| Panacos Pharmaceuticals, Inc. (a) | | 1,499 | | | | 11,857 |
| Peregrine Pharmaceuticals, Inc. (a) | | 4,452 | | | | 4,274 |
| Pharmacopeia Drug Discovery, Inc. (a) | | 368 | | | | 1,163 |
| Pharmacyclics, Inc. (a) | | 1,146 | | | | 8,515 |
| Pharmion Corp. (a) | | 1,001 | | | | 17,387 |
| PRAECIS Pharmaceuticals, Inc. (a) | | 354 | | | | 1,391 |
| Progenics Pharmaceuticals, Inc. (a) | | 1,003 | | | | 26,549 |
| Protein Design Labs, Inc. (a) | | 3,852 | | | | 107,278 |
| QIAGEN NV (a) | | 4,566 | | | | 51,276 |
| QLT, Inc. (a) | | 2,958 | | | | 19,146 |
| Regeneron Pharmaceuticals, Inc. (a) | | 1,881 | | | | 21,011 |
| Renovis, Inc. (a) | | 1,133 | | | | 17,969 |
| Rigel Pharmaceuticals, Inc. (a) | | 589 | | | | 12,911 |
| Savient Pharmaceuticals, Inc. (a) | | 2,981 | | | | 11,149 |
| SciClone Pharmaceuticals, Inc. (a) | | 1,927 | | | | 7,554 |
| Seattle Genetics, Inc. (a) | | 1,337 | | | | 6,645 |
| Senomyx, Inc. (a) | | 987 | | | | 12,574 |
| Sequenom, Inc. (a) | | 1,742 | | | | 1,550 |
| Seracare Life Sciences, Inc. (a) | | 608 | | | | 13,333 |
| Serologicals Corp. (a) | | 1,082 | | | | 21,727 |
| Sirna Therapeutics, Inc. (a)(d) | | 2,265 | | | | 8,041 |
| Solexa, Inc. (a)(d) | | 1,429 | | | | 12,561 |
| StemCells, Inc. (a) | | 2,240 | | | | 9,408 |
| Stratagene Corp. | | 589 | | | | 6,067 |
| Tanox, Inc. (a) | | 1,465 | | | | 24,334 |
| Targeted Genetics Corp. (a) | | 5,047 | | | | 3,028 |
| Techne Corp. (a) | | 1,361 | | | | 75,209 |
See accompanying notes which are an integral part of the financial statements.
| Common Stocks continued | | | | | | |
| | | Shares | | Value (Note 1) |
| |
| HEALTH CARE – continued | | | | | | |
| Biotechnology – continued | | | | | | |
| Telik, Inc. (a) | | 1,419 | | $ | | 23,811 |
| Third Wave Technologies, Inc. (a) | | 1,721 | | | | 4,716 |
| Threshold Pharmaceuticals, Inc. | | 1,985 | | | | 26,619 |
| Trimeris, Inc. (a) | | 537 | | | | 5,875 |
| United Therapeutics Corp. (a) | | 769 | | | | 54,930 |
| Vasogen, Inc. (a)(d) | | 1,722 | | | | 3,809 |
| Vertex Pharmaceuticals, Inc. (a) | | 3,242 | | | | 82,671 |
| ViaCell, Inc. | | 1,828 | | | | 11,078 |
| Vical, Inc. (a) | | 1,765 | | | | 9,090 |
| Vion Pharmaceuticals, Inc. (a) | | 2,003 | | | | 3,706 |
| ViroPharma, Inc. (a) | | 2,193 | | | | 38,312 |
| XOMA Ltd. (a) | | 1,917 | | | | 3,278 |
| Zymogenetics, Inc. (a) | | 2,659 | | | | 42,677 |
| | | | | | | 9,320,134 |
| Health Care Equipment & Supplies – 2.4% | | | | | | |
| Abaxis, Inc. (a) | | 680 | | | | 11,281 |
| Abiomed, Inc. (a) | | 907 | | | | 7,927 |
| Aksys Ltd. (a)(d) | | 1,303 | | | | 1,212 |
| Align Technology, Inc. (a) | | 2,037 | | | | 14,096 |
| American Medical Systems Holdings, Inc. (a) | | 2,199 | | | | 40,462 |
| Analogic Corp. | | 575 | | | | 27,577 |
| Angiodynamics, Inc. (a) | | 529 | | | | 10,903 |
| Animas Corp. (a) | | 862 | | | | 14,680 |
| Arrow International, Inc. | | 1,591 | | | | 47,460 |
| ArthroCare Corp. (a) | | 888 | | | | 33,966 |
| Aspect Medical Systems, Inc. (a) | | 1,014 | | | | 38,197 |
| Atricure, Inc. | | 695 | | | | 8,820 |
| BioLase Technology, Inc. (a)(d) | | 592 | | | | 3,801 |
| Biomet, Inc. | | 8,290 | | | | 295,290 |
| Biosite, Inc. (a) | | 581 | | | | 34,267 |
| BioVeris Corp. (a) | | 1,519 | | | | 7,230 |
| Bruker BioSciences Corp. (a) | | 3,748 | | | | 18,628 |
| Candela Corp. (a) | | 1,339 | | | | 19,282 |
| Cardiac Science Corp. (a) | | 240 | | | | 2,251 |
| Cardiodynamics International Corp. (a) | | 1,574 | | | | 1,637 |
| China Medical Technologies, Inc. sponsored ADR | | 337 | | | | 10,525 |
| Conceptus, Inc. (a) | | 789 | | | | 12,206 |
| CONMED Corp. (a) | | 1,180 | | | | 26,656 |
| Conor Medsystems, Inc. | | 1,000 | | | | 19,770 |
| Cutera, Inc. (a) | | 521 | | | | 20,621 |
See accompanying notes which are an integral part of the financial statements.
33 Annual Report
| Investments continued | | | | | | |
| |
| Common Stocks continued | | | | | | |
| | | Shares | | Value (Note 1) |
| |
| HEALTH CARE – continued | | | | | | |
| Health Care Equipment & Supplies – continued | | | | | | |
| Cyberonics, Inc. (a) | | 756 | | $ | | 21,327 |
| Cytyc Corp. (a) | | 3,882 | | | | 106,794 |
| Dade Behring Holdings, Inc. | | 2,738 | | | | 111,957 |
| Datascope Corp. | | 390 | | | | 13,689 |
| DENTSPLY International, Inc. | | 2,606 | | | | 144,972 |
| DexCom, Inc. | | 1,171 | | | | 16,417 |
| Dionex Corp. (a) | | 685 | | | | 32,353 |
| Encore Medical Corp. (a) | | 1,355 | | | | 7,154 |
| Endologix, Inc. (a) | | 1,944 | | | | 11,936 |
| Epix Pharmaceuticals, Inc. (a) | | 576 | | | | 2,840 |
| ev3, Inc. | | 1,484 | | | | 19,663 |
| Exactech, Inc. (a) | | 534 | | | | 6,878 |
| Foxhollow Technologies, Inc. (a) | | 837 | | | | 36,443 |
| Gen-Probe, Inc. (a) | | 1,632 | | | | 75,349 |
| Given Imaging Ltd. (a) | | 952 | | | | 22,800 |
| Hologic, Inc. (a) | | 735 | | | | 52,236 |
| I-Flow Corp. (a) | | 657 | | | | 8,613 |
| ICU Medical, Inc. (a) | | 375 | | | | 13,493 |
| IDEXX Laboratories, Inc. (a) | | 1,109 | | | | 79,349 |
| Immucor, Inc. (a) | | 1,832 | | | | 45,379 |
| INAMED Corp. (a) | | 1,167 | | | | 97,841 |
| Integra LifeSciences Holdings Corp. (a) | | 979 | | | | 35,773 |
| Intermagnetics General Corp. (a) | | 1,300 | | | | 43,472 |
| IntraLase Corp. (a) | | 1,053 | | | | 18,227 |
| Intuitive Surgical, Inc. (a) | | 1,183 | | | | 132,165 |
| IRIS International, Inc. (a) | | 690 | | | | 17,022 |
| Kensey Nash Corp. (a) | | 550 | | | | 12,590 |
| Kyphon, Inc. (a) | | 1,600 | | | | 67,984 |
| Laserscope, Inc. (a) | | 710 | | | | 15,279 |
| LifeCell Corp. (a) | | 1,282 | | | | 23,563 |
| Lifecore Biomedical, Inc. (a) | | 614 | | | | 9,198 |
| Medical Action Industries, Inc. (a) | | 947 | | | | 17,870 |
| Meridian Bioscience, Inc. | | 1,446 | | | | 26,997 |
| Merit Medical Systems, Inc. (a) | | 1,302 | | | | 16,666 |
| Micro Therapeutics, Inc. (a) | | 2,479 | | | | 15,419 |
| Microtek Medical Holdings, Inc. (a) | | 1,585 | | | | 5,880 |
| Molecular Devices Corp. (a) | | 603 | | | | 16,191 |
| Natus Medical, Inc. (a) | | 695 | | | | 11,495 |
| Neogen Corp. (a) | | 709 | | | | 14,242 |
| NeuroMetrix, Inc. (a) | | 497 | | | | 15,452 |
| Nutraceutical International Corp. (a) | | 719 | | | | 9,246 |
See accompanying notes which are an integral part of the financial statements.
| Common Stocks continued | | | | | | |
| | | Shares | | Value (Note 1) |
| |
| HEALTH CARE – continued | | | | | | |
| Health Care Equipment & Supplies – continued | | | | | | |
| NuVasive, Inc. (a) | | 1,290 | | $ | | 22,188 |
| NxStage Medical, Inc. | | 753 | | | | 10,053 |
| OccuLogix, Inc. (d) | | 1,709 | | | | 13,108 |
| OraSure Technologies, Inc. (a) | | 1,286 | | | | 17,438 |
| Orthofix International NV (a) | | 477 | | | | 17,453 |
| Orthovita, Inc. (a) | | 3,496 | | | | 12,131 |
| Palomar Medical Technologies, Inc. (a) | | 808 | | | | 27,496 |
| PolyMedica Corp. | | 1,048 | | | | 39,782 |
| Possis Medical, Inc. (a) | | 574 | | | | 5,740 |
| Quidel Corp. (a) | | 1,189 | | | | 16,598 |
| Regeneration Technologies, Inc. (a) | | 856 | | | | 7,028 |
| Respironics, Inc. (a) | | 2,378 | | | | 91,981 |
| Shamir Optical Industry Ltd. | | 707 | | | | 6,787 |
| Somanetics Corp. (a) | | 471 | | | | 14,559 |
| Sonic Innovations, Inc. (a) | | 1,373 | | | | 5,011 |
| SonoSite, Inc. (a) | | 529 | | | | 19,869 |
| Staar Surgical Co. (a) | | 832 | | | | 4,742 |
| Stereotaxis, Inc. (a) | | 1,010 | | | | 7,131 |
| SurModics, Inc. (a) | | 704 | | | | 27,604 |
| Syneron Medical Ltd. (a) | | 692 | | | | 27,542 |
| Synovis Life Technologies, Inc. (a) | | 230 | | | | 1,872 |
| The Spectranetics Corp. (a) | | 1,041 | | | | 11,451 |
| Thermogenesis Corp. (a) | | 1,689 | | | | 7,212 |
| Thoratec Corp. (a) | | 1,495 | | | | 30,573 |
| Trinity Biotech PLC sponsored ADR (a) | | 151 | | | | 1,253 |
| TriPath Imaging, Inc. (a) | | 1,154 | | | | 7,109 |
| Utah Medical Products, Inc. | | 500 | | | | 14,490 |
| Varian, Inc. (a) | | 1,095 | | | | 45,946 |
| Ventana Medical Systems, Inc. (a) | | 1,342 | | | | 51,680 |
| Vital Signs, Inc. | | 457 | | | | 21,813 |
| Vnus Medical Technologies, Inc. (a) | | 439 | | | | 3,617 |
| Wright Medical Group, Inc. (a) | | 1,176 | | | | 22,803 |
| Young Innovations, Inc. | | 390 | | | | 14,212 |
| Zoll Medical Corp. (a) | | 338 | | | | 8,791 |
| | | | | | | 2,818,022 |
| Health Care Providers & Services – 2.1% | | | | | | |
| Accelrys, Inc. (a) | | 737 | | | | 5,970 |
| Allied Healthcare International, Inc. (a) | | 1,897 | | | | 11,382 |
| Allscripts Healthcare Solutions, Inc. (a) | | 1,788 | | | | 23,959 |
| Amedisys, Inc. (a) | | 479 | | | | 21,258 |
See accompanying notes which are an integral part of the financial statements.
35 Annual Report
| Investments continued | | | | | | |
| |
| Common Stocks continued | | | | | | |
| | | Shares | | Value (Note 1) |
| |
| HEALTH CARE – continued | | | | | | |
| Health Care Providers & Services – continued | | | | | | |
| America Service Group, Inc. (a) | | 530 | | $ | | 9,143 |
| American Dental Partners, Inc. (a) | | 487 | | | | 9,092 |
| American Healthways, Inc. (a) | | 1,164 | | | | 51,693 |
| AMICAS, Inc. (a) | | 2,483 | | | | 11,794 |
| AmSurg Corp. (a) | | 897 | | | | 21,627 |
| Andrx Corp. (a) | | 2,280 | | | | 40,561 |
| Bio-Reference Laboratories, Inc. (a) | | 768 | | | | 13,932 |
| BioScrip, Inc. (a) | | 895 | | | | 7,983 |
| Cerner Corp. (a) | | 1,186 | | | | 114,330 |
| Computer Programs & Systems, Inc. | | 414 | | | | 16,668 |
| Corvel Corp. (a) | | 349 | | | | 5,654 |
| Cross Country Healthcare, Inc. (a) | | 928 | | | | 17,149 |
| Curative Health Services, Inc. (a) | | 666 | | | | 433 |
| Dendrite International, Inc. (a) | | 1,280 | | | | 24,115 |
| Dialysis Corp. of America (a) | | 301 | | | | 3,462 |
| Eclipsys Corp. (a) | | 1,688 | | | | 30,266 |
| Emageon, Inc. | | 600 | | | | 7,728 |
| Emdeon Corp. (a) | | 11,826 | | | | 90,469 |
| eResearchTechnology, Inc. (a) | | 1,605 | | | | 20,769 |
| Express Scripts, Inc. (a) | | 4,963 | | | | 419,175 |
| Genesis HealthCare Corp. (a) | | 620 | | | | 26,071 |
| Gentiva Health Services, Inc. (a) | | 964 | | | | 15,819 |
| HealthExtras, Inc. (a) | | 1,092 | | | | 24,701 |
| HealthTronics, Inc. (a) | | 1,523 | | | | 11,179 |
| Henry Schein, Inc. (a) | | 2,709 | | | | 115,539 |
| Horizon Health Corp. (a) | | 524 | | | | 12,167 |
| Hythiam, Inc. (a) | | 1,433 | | | | 7,366 |
| ICON PLC sponsored ADR (a) | | 371 | | | | 15,371 |
| IDX Systems Corp. (a) | | 986 | | | | 43,059 |
| LCA Vision, Inc. | | 840 | | | | 40,093 |
| LHC Group, Inc. | | 200 | | | | 3,282 |
| Lifeline Systems, Inc. (a) | | 712 | | | | 25,297 |
| LifePoint Hospitals, Inc. (a) | | 1,857 | | | | 70,659 |
| Lincare Holdings, Inc. (a) | | 3,302 | | | | 141,755 |
| Magellan Health Services, Inc. (a) | | 1,405 | | | | 41,054 |
| Matria Healthcare, Inc. (a) | | 570 | | | | 19,340 |
| Medcath Corp. (a) | | 731 | | | | 14,211 |
| Merge Technologies, Inc. (a) | | 574 | | | | 16,382 |
| MWI Veterinary Supply, Inc. | | 434 | | | | 10,125 |
| National Medical Health Card Systems, Inc. (a) | | 330 | | | | 9,128 |
| NationsHealth, Inc. (a) | | 1,400 | | | | 10,808 |
See accompanying notes which are an integral part of the financial statements.
| Common Stocks continued | | | | | | |
| | | Shares | | Value (Note 1) |
| |
| HEALTH CARE – continued | | | | | | |
| Health Care Providers & Services – continued | | | | | | |
| Odyssey Healthcare, Inc. (a) | | 928 | | $ | | 17,187 |
| Omnicell, Inc. (a) | | 664 | | | | 6,627 |
| Option Care, Inc. | | 1,195 | | | | 14,973 |
| PAREXEL International Corp. (a) | | 1,314 | | | | 27,029 |
| Patterson Companies, Inc. (a) | | 4,542 | | | | 158,697 |
| PDI, Inc. (a) | | 594 | | | | 7,437 |
| Per-Se Technologies, Inc. (a) | | 866 | | | | 19,814 |
| Pharmaceutical Product Development, Inc. | | 1,931 | | | | 112,558 |
| Phase Forward, Inc. (a) | | 975 | | | | 10,462 |
| PRA International | | 691 | | | | 19,168 |
| PSS World Medical, Inc. (a) | | 2,922 | | | | 48,125 |
| Psychiatric Solutions, Inc. (a) | | 882 | | | | 49,762 |
| QMed, Inc. (a) | | 603 | | | | 5,566 |
| Radiation Therapy Services, Inc. (a) | | 602 | | | | 22,840 |
| ResCare, Inc. (a) | | 930 | | | | 16,098 |
| Rotech Healthcare, Inc. (a) | | 695 | | | | 11,051 |
| SFBC International, Inc. (a) | | 543 | | | | 11,452 |
| Sun Healthcare Group, Inc. (a) | | 1,059 | | | | 7,752 |
| Symbion, Inc. (a) | | 887 | | | | 23,763 |
| TLC Vision Corp. (a) | | 2,012 | | | | 12,902 |
| TriZetto Group, Inc. (a) | | 1,531 | | | | 24,879 |
| U.S. Physical Therapy, Inc. (a) | | 574 | | | | 11,359 |
| United Surgical Partners International, Inc. (a) | | 1,345 | | | | 46,685 |
| VCA Antech, Inc. (a) | | 2,704 | | | | 75,604 |
| Ventiv Health, Inc. (a) | | 884 | | | | 21,799 |
| VistaCare, Inc. Class A (a) | | 323 | | | | 4,457 |
| Vital Images, Inc. (a) | | 671 | | | | 17,875 |
| WebMD Health Corp. Class A | | 272 | | | | 7,205 |
| | | | | | | 2,465,144 |
| Pharmaceuticals – 1.6% | | | | | | |
| Acusphere, Inc. (a) | | 1,243 | | | | 6,091 |
| Adams Respiratory Therapeutics, Inc. | | 1,000 | | | | 44,290 |
| Adolor Corp. (a) | | 1,332 | | | | 19,407 |
| Advancis Pharmaceutical Corp. (a) | | 1,591 | | | | 2,084 |
| American Pharmaceutical Partners, Inc. (a) | | 2,351 | | | | 89,385 |
| Aspreva Pharmaceuticals Corp. | | 1,130 | | | | 14,306 |
| Atherogenics, Inc. (a) | | 1,239 | | | | 18,573 |
| Auxilium Pharmaceuticals, Inc. (a) | | 1,496 | | | | 7,989 |
| Axcan Pharma, Inc. (a) | | 1,329 | | | | 19,597 |
| Barrier Therapeutics, Inc. (a) | | 1,043 | | | | 7,510 |
See accompanying notes which are an integral part of the financial statements.
37 Annual Report
| Investments continued | | | | | | |
| |
| Common Stocks continued | | | | | | |
| | | Shares | | Value (Note 1) |
| |
| HEALTH CARE – continued | | | | | | |
| Pharmaceuticals – continued | | | | | | |
| Cardiome Pharma Corp. (a) | | 1,301 | | $ | | 11,176 |
| CNS., Inc. | | 475 | | | | 10,925 |
| Columbia Laboratories, Inc. (a) | | 1,899 | | | | 7,140 |
| Connetics Corp. (a) | | 1,261 | | | | 16,721 |
| Cypress Bioscience, Inc. (a) | | 1,387 | | | | 7,837 |
| DepoMed, Inc. (a) | | 1,263 | | | | 7,591 |
| Discovery Laboratories, Inc. (a) | | 1,297 | | | | 8,716 |
| Draxis Health, Inc. (a) | | 1,236 | | | | 5,033 |
| Durect Corp. (a)(d) | | 2,421 | | | | 12,686 |
| Endo Pharmaceuticals Holdings, Inc. (a) | | 4,383 | | | | 131,139 |
| First Horizon Pharmaceutical Corp. (a) | | 1,418 | | | | 24,985 |
| Flamel Technologies SA sponsored ADR (a) | | 803 | | | | 15,281 |
| Hi-Tech Pharmacal Co., Inc. (a) | | 308 | | | | 11,769 |
| Hollis Eden Pharmaceuticals, Inc. (a)(d) | | 580 | | | | 3,109 |
| Inspire Pharmaceuticals, Inc. (a) | | 1,281 | | | | 9,274 |
| Ista Pharmaceuticals, Inc. (a) | | 753 | | | | 5,203 |
| Kos Pharmaceuticals, Inc. (a) | | 1,546 | | | | 102,933 |
| Matrixx Initiatives, Inc. (a) | | 372 | | | | 8,095 |
| Medicines Co. (a) | | 1,592 | | | | 29,086 |
| MGI Pharma, Inc. (a) | | 2,485 | | | | 49,054 |
| Nastech Pharmaceutical Co., Inc. (a) | | 1,139 | | | | 16,288 |
| New River Pharmaceuticals, Inc. (a) | | 664 | | | | 31,374 |
| Nexmed, Inc. (a) | | 672 | | | | 739 |
| NitroMed, Inc. (a)(d) | | 982 | | | | 15,948 |
| Noven Pharmaceuticals, Inc. (a) | | 899 | | | | 12,145 |
| Novogen Ltd. sponsored ADR (a) | | 97 | | | | 1,966 |
| Pain Therapeutics, Inc. (a) | | 1,553 | | | | 11,228 |
| Penwest Pharmaceuticals Co. (a) | | 793 | | | | 13,441 |
| Perrigo Co. | | 3,452 | | | | 50,054 |
| Pharmos Corp. (a) | | 462 | | | | 924 |
| Pozen, Inc. (a) | | 826 | | | | 8,400 |
| Salix Pharmaceuticals Ltd. (a) | | 1,308 | | | | 25,336 |
| Santarus, Inc. (a) | | 1,330 | | | | 7,980 |
| Sepracor, Inc. (a) | | 3,600 | | | | 197,928 |
| Shire PLC sponsored ADR | | 1,449 | | | | 52,946 |
| SuperGen, Inc. (a) | | 1,151 | | | | 6,446 |
| Taro Pharmaceutical Industries Ltd. (a) | | 783 | | | | 10,406 |
| Teva Pharmaceutical Industries Ltd. sponsored ADR | | 15,844 | | | | 647,703 |
| Vivus, Inc. (a) | | 2,040 | | | | 6,691 |
See accompanying notes which are an integral part of the financial statements.
| Common Stocks continued | | | | | | |
| | | Shares | | Value (Note 1) |
| |
| HEALTH CARE – continued | | | | | | |
| Pharmaceuticals – continued | | | | | | |
| Xenoport, Inc. | | 733 | | $ | | 9,302 |
| Zila, Inc. (a) | | 3,259 | | | | 10,918 |
| | | | | | | 1,845,148 |
| |
| TOTAL HEALTH CARE | | | | | | 16,448,448 |
| |
| INDUSTRIALS – 5.3% | | | | | | |
| Aerospace & Defense – 0.3% | | | | | | |
| Applied Signal Technology, Inc. | | 561 | | | | 10,081 |
| Argon ST, Inc. (a) | | 860 | | | | 24,811 |
| BE Aerospace, Inc. (a) | | 1,865 | | | | 32,675 |
| Ceradyne, Inc. (a) | | 865 | | | | 40,733 |
| Elbit Systems Ltd. | | 1,390 | | | | 31,650 |
| Engineered Support Systems, Inc. | | 1,473 | | | | 59,524 |
| Essex Corp. (a) | | 486 | | | | 9,258 |
| Herley Industries, Inc. (a) | | 746 | | | | 12,287 |
| Innovative Solutions & Support, Inc. (a) | | 567 | | | | 8,363 |
| Ionatron, Inc. (a)(d) | | 2,941 | | | | 30,881 |
| Kaman Corp. Class A | | 987 | | | | 18,960 |
| KVH Industries, Inc. (a) | | 419 | | | | 4,006 |
| Ladish Co., Inc. (a) | | 1,065 | | | | 21,833 |
| MTC Technologies, Inc. (a) | | 622 | | | | 20,383 |
| Sypris Solutions, Inc. | | 676 | | | | 7,470 |
| | | | | | | 332,915 |
| Air Freight & Logistics – 0.7% | | | | | | |
| ABX Air, Inc. (a) | | 1,800 | | | | 13,500 |
| C.H. Robinson Worldwide, Inc. | | 5,710 | | | | 230,970 |
| Dynamex, Inc. (a) | | 596 | | | | 11,032 |
| EGL, Inc. (a) | | 1,569 | | | | 58,273 |
| Expeditors International of Washington, Inc. | | 3,571 | | | | 253,577 |
| Forward Air Corp. | | 1,261 | | | | 48,485 |
| Hub Group, Inc. Class A (a) | | 852 | | | | 34,549 |
| Pacer International, Inc. | | 1,088 | | | | 28,756 |
| Park Ohio Holdings Corp. (a) | | 439 | | | | 6,914 |
| UTI Worldwide, Inc. | | 1,035 | | | | 100,695 |
| | | | | | | 786,751 |
| Airlines – 0.2% | | | | | | |
| Frontier Airlines, Inc. (a) | | 1,453 | | | | 11,856 |
| JetBlue Airways Corp. (a) | | 3,770 | | | | 69,519 |
| MAIR Holdings, Inc. (a) | | 1,544 | | | | 7,319 |
See accompanying notes which are an integral part of the financial statements.
39 Annual Report
| Investments continued | | | | | | |
| |
| Common Stocks continued | | | | | | |
| | | Shares | | Value (Note 1) |
| |
| INDUSTRIALS – continued | | | | | | |
| Airlines – continued | | | | | | |
| Mesa Air Group, Inc. (a) | | 1,187 | | $ | | 12,202 |
| Pinnacle Airlines Corp. (a) | | 841 | | | | 5,845 |
| Republic Airways Holdings, Inc. (a) | | 1,345 | | | | 19,543 |
| Ryanair Holdings PLC sponsored ADR (a) | | 2,033 | | | | 101,284 |
| SkyWest, Inc. | | 1,780 | | | | 52,866 |
| World Air Holdings, Inc. (a) | | 928 | | | | 9,763 |
| | | | | | | 290,197 |
| Building Products 0.1% | | | | | | |
| Aaon, Inc. (a) | | 568 | | | | 9,667 |
| American Woodmark Corp. | | 498 | | | | 12,759 |
| Apogee Enterprises, Inc. | | 1,220 | | | | 18,873 |
| Builders FirstSource, Inc. | | 900 | | | | 17,910 |
| Quixote Corp. | | 489 | | | | 10,391 |
| Universal Forest Products, Inc. | | 656 | | | | 37,694 |
| | | | | | | 107,294 |
| Commercial Services & Supplies – 1.5% | | | | | | |
| 51job, Inc. sponsored ADR (a) | | 198 | | | | 2,624 |
| Advisory Board Co. (a) | | 571 | | | | 27,591 |
| American Ecology Corp. (a) | | 1,049 | | | | 17,067 |
| Barrett Business Services, Inc. (a) | | 449 | | | | 11,315 |
| BB Holdings Ltd. (non-vtg.) | | 1,707 | | | | 11,864 |
| Casella Waste Systems, Inc. Class A (a) | | 817 | | | | 10,000 |
| CBIZ, Inc. (a) | | 2,443 | | | | 15,293 |
| Cintas Corp. | | 5,544 | | | | 247,928 |
| Clean Harbors, Inc. (a) | | 576 | | | | 16,623 |
| Coinstar, Inc. (a) | | 747 | | | | 18,152 |
| Comsys IT Partners, Inc. (a) | | 927 | | | | 11,588 |
| Copart, Inc. (a) | | 3,367 | | | | 84,781 |
| Corporate Executive Board Co. | | 1,395 | | | | 120,681 |
| CoStar Group, Inc. (a) | | 745 | | | | 34,970 |
| CRA International, Inc. (a) | | 352 | | | | 15,671 |
| Danka Business Systems PLC sponsored ADR (a) | | 836 | | | | 1,246 |
| DiamondCluster International, Inc. (a) | | 1,123 | | | | 7,120 |
| Duratek, Inc. (a) | | 611 | | | | 10,027 |
| Exponent, Inc. (a) | | 442 | | | | 12,089 |
| First Advantage Corp. Class A (a) | | 418 | | | | 11,391 |
| First Consulting Group, Inc. (a) | | 1,495 | | | | 8,746 |
| FirstService Corp. (sub. vtg.) (a) | | 1,234 | | | | 29,643 |
| G&K Services, Inc. Class A | | 624 | | | | 23,924 |
| Healthcare Services Group, Inc. | | 1,382 | | | | 29,368 |
See accompanying notes which are an integral part of the financial statements.
| Common Stocks continued | | | | | | |
| | | Shares | | Value (Note 1) |
| |
| INDUSTRIALS – continued | | | | | | |
| Commercial Services & Supplies – continued | | | | | | |
| Heidrick & Struggles International, Inc. (a) | | 758 | | $ | | 25,052 |
| Herman Miller, Inc. | | 2,268 | | | | 69,378 |
| Hudson Highland Group, Inc. (a) | | 700 | | | | 17,675 |
| Huron Consulting Group, Inc. (a) | | 752 | | | | 17,943 |
| ICT Group, Inc. (a) | | 571 | | | | 9,147 |
| Integrated Alarm Services Group, Inc. (a)(d) | | 634 | | | | 1,997 |
| Intersections, Inc. (a) | | 441 | | | | 3,987 |
| Kelly Services, Inc. Class A (non-vtg.) | | 1,175 | | | | 32,665 |
| Kenexa Corp. | | 1,245 | | | | 21,053 |
| Kforce, Inc. (a) | | 1,302 | | | | 16,158 |
| Layne Christensen Co. (a) | | 643 | | | | 14,255 |
| Learning Tree International, Inc. (a) | | 1,097 | | | | 14,831 |
| LECG Corp. (a) | | 910 | | | | 14,869 |
| McGrath RentCorp. | | 1,132 | | | | 32,364 |
| Mobile Mini, Inc. (a) | | 438 | | | | 21,900 |
| Monster Worldwide, Inc. (a) | | 4,028 | | | | 156,689 |
| NCO Group, Inc. (a) | | 998 | | | | 17,206 |
| On Assignment, Inc. (a) | | 1,390 | | | | 15,360 |
| PICO Holdings, Inc. (a) | | 771 | | | | 26,029 |
| Portfolio Recovery Associates, Inc. (a) | | 503 | | | | 19,275 |
| PRG-Schultz International, Inc. (a) | | 2,172 | | | | 1,977 |
| Providence Service Corp. (a) | | 379 | | | | 11,074 |
| Resources Connection, Inc. (a) | | 1,680 | | | | 48,787 |
| School Specialty, Inc. (a) | | 772 | | | | 28,440 |
| SOURCECORP, Inc. (a) | | 474 | | | | 12,352 |
| Stericycle, Inc. (a) | | 1,414 | | | | 86,706 |
| Synagro Technologies, Inc. | | 2,757 | | | | 11,028 |
| Taleo Corp. Class A | | 824 | | | | 10,852 |
| Teletech Holdings, Inc. (a) | | 2,696 | | | | 33,511 |
| Tetra Tech, Inc. (a) | | 1,932 | | | | 30,139 |
| TRM Corp. (a) | | 430 | | | | 3,062 |
| United Stationers, Inc. (a) | | 1,153 | | | | 56,497 |
| Waste Industries USA, Inc. | | 1,018 | | | | 14,191 |
| Waste Services, Inc. (a) | | 4,374 | | | | 15,484 |
| West Corp. (a) | | 2,311 | | | | 91,677 |
| | | | | | | 1,783,312 |
| Construction & Engineering – 0.1% | | | | | | |
| Foster Wheeler Ltd. (a) | | 1,608 | | | | 56,007 |
| Insituform Technologies, Inc. Class A (a) | | 1,365 | | | | 27,123 |
See accompanying notes which are an integral part of the financial statements.
41 Annual Report
| Investments continued | | | | | | |
| |
| Common Stocks continued | | | | | | |
| | | Shares | | Value (Note 1) |
| |
| INDUSTRIALS – continued | | | | | | |
| Construction & Engineering – continued | | | | | | |
| Washington Group International, Inc. (a) | | 855 | | $ | | 44,212 |
| Williams Scotsman International, Inc. | | 1,200 | | | | 18,804 |
| | | | | | | 146,146 |
| Electrical Equipment – 0.5% | | | | | | |
| Active Power, Inc. (a) | | 2,586 | | | | 9,025 |
| American Power Conversion Corp. | | 6,674 | | | | 149,564 |
| American Superconductor Corp. (a) | | 795 | | | | 6,479 |
| Artesyn Technologies, Inc. (a) | | 1,201 | | | | 11,986 |
| Capstone Turbine Corp. (a)(d) | | 3,505 | | | | 11,882 |
| Color Kinetics, Inc. (a) | | 533 | | | | 8,246 |
| Deswell Industries, Inc. | | 609 | | | | 8,587 |
| Distributed Energy Systems Corp. (a) | | 1,083 | | | | 10,039 |
| Encore Wire Corp. (a) | | 772 | | | | 18,381 |
| Energy Conversion Devices, Inc. (a) | | 956 | | | | 28,059 |
| Evergreen Solar, Inc. (a) | | 2,133 | | | | 25,617 |
| Franklin Electric Co., Inc. | | 734 | | | | 31,195 |
| FuelCell Energy, Inc. (a) | | 1,447 | | | | 12,198 |
| Genlyte Group, Inc. (a) | | 894 | | | | 47,114 |
| Hoku Scientific, Inc. | | 796 | | | | 7,005 |
| Hydrogenics Corp. (a) | | 3,294 | | | | 9,093 |
| II-VI, Inc. (a) | | 1,022 | | | | 19,551 |
| LSI Industries, Inc. | | 1,131 | | | | 20,358 |
| Medis Technologies Ltd. (a)(d) | | 883 | | | | 12,212 |
| Microvision, Inc. (a) | | 1,063 | | | | 3,800 |
| Plug Power, Inc. (a) | | 2,703 | | | | 13,866 |
| Powell Industries, Inc. (a) | | 482 | | | | 9,245 |
| Power-One, Inc. (a) | | 2,581 | | | | 16,054 |
| Preformed Line Products Co. | | 259 | | | | 10,699 |
| Ultralife Batteries, Inc. (a) | | 686 | | | | 8,932 |
| Valence Technology, Inc. (a)(d) | | 2,374 | | | | 4,701 |
| Vicor Corp. | | 797 | | | | 12,935 |
| Woodward Governor Co. | | 364 | | | | 29,728 |
| | | | | | | 556,551 |
| Industrial Conglomerates – 0.0% | | | | | | |
| Raven Industries, Inc. | | 970 | | | | 29,721 |
| Westaim Corp. (a) | | 3,289 | | | | 11,984 |
| | | | | | | 41,705 |
| Machinery – 0.8% | | | | | | |
| 3D Systems Corp. (a) | | 683 | | | | 12,151 |
| A.S.V., Inc. (a) | | 884 | | | | 22,118 |
See accompanying notes which are an integral part of the financial statements.
| Common Stocks continued | | | | | | |
| | | Shares | | Value (Note 1) |
| |
| INDUSTRIALS – continued | | | | | | |
| Machinery – continued | | | | | | |
| American Science & Engineering, Inc. (a) | | 281 | | $ | | 18,956 |
| Astec Industries, Inc. (a) | | 782 | | | | 21,919 |
| Bucyrus International, Inc. Class A | | 620 | | | | 29,078 |
| Columbus McKinnon Corp. (NY Shares) (a) | | 686 | | | | 14,392 |
| Commercial Vehicle Group, Inc. (a) | | 625 | | | | 12,369 |
| Dynamic Materials Corp. | | 432 | | | | 10,506 |
| Flanders Corp. (a) | | 1,144 | | | | 11,600 |
| Flow International Corp. (a) | | 2,483 | | | | 20,981 |
| FreightCar America, Inc. | | 410 | | | | 19,787 |
| Gehl Co. (a) | | 645 | | | | 16,628 |
| Hardinge, Inc. | | 423 | | | | 7,352 |
| Joy Global, Inc. | | 2,761 | | | | 146,029 |
| Lincoln Electric Holdings, Inc. | | 1,356 | | | | 55,338 |
| Middleby Corp. (a) | | 428 | | | | 33,555 |
| Nordson Corp. | | 1,291 | | | | 51,408 |
| PACCAR, Inc. | | 5,761 | | | | 413,985 |
| RBC Bearings, Inc. | | 747 | | | | 11,661 |
| Sun Hydraulics Corp. | | 516 | | | | 9,840 |
| Tecumseh Products Co.: | | | | | | |
| Class A (non-vtg.) (a) | | 517 | | | | 11,539 |
| Class B | | 262 | | | | 5,329 |
| TurboChef Technologies, Inc. (a)(d) | | 800 | | | | 10,512 |
| Volvo AB sponsored ADR | | 588 | | | | 25,031 |
| | | | | | | 992,064 |
| Marine – 0.2% | | | | | | |
| Alexander & Baldwin, Inc. | | 1,401 | | | | 70,078 |
| American Commercial Lines, Inc. | | 1,000 | | | | 29,250 |
| Aries Maritime Transport Ltd. | | 1,020 | | | | 13,535 |
| DryShips, Inc. | | 900 | | | | 11,736 |
| Eagle Bulk Shipping, Inc. | | 700 | | | | 10,822 |
| Genco Shipping & Trading Ltd. | | 721 | | | | 12,459 |
| Quintana Maritime Ltd. | | 1,744 | | | | 18,539 |
| Stolt-Nielsen SA Class B sponsored ADR | | 898 | | | | 29,356 |
| | | | | | | 195,775 |
| Road & Rail 0.6% | | | | | | |
| AMERCO (a) | | 850 | | | | 60,112 |
| Arkansas Best Corp. | | 807 | | | | 33,281 |
| Celadon Group, Inc. (a) | | 451 | | | | 12,497 |
| Central Freight Lines, Inc. (a) | | 726 | | | | 1,358 |
| Covenant Transport, Inc. Class A (a) | | 611 | | | | 7,106 |
See accompanying notes which are an integral part of the financial statements.
43 Annual Report
| Investments continued | | | | | | |
| |
| Common Stocks continued | | | | | | |
| | | Shares | | Value (Note 1) |
| |
| INDUSTRIALS – continued | | | | | | |
| Road & Rail – continued | | | | | | |
| Heartland Express, Inc. | | 2,477 | | $ | | 52,785 |
| J.B. Hunt Transport Services, Inc. | | 5,482 | | | | 122,742 |
| Landstar System, Inc. | | 2,130 | | | | 91,675 |
| Marten Transport Ltd. (a) | | 686 | | | | 18,309 |
| Old Dominion Freight Lines, Inc. (a) | | 991 | | | | 37,668 |
| P.A.M. Transportation Services, Inc. (a) | | 668 | | | | 10,902 |
| Quality Distribution, Inc. (a) | | 449 | | | | 2,748 |
| SCS Transportation, Inc. (a) | | 638 | | | | 12,575 |
| Swift Transportation Co., Inc. (a) | | 2,547 | | | | 49,870 |
| U.S. Xpress Enterprises, Inc. Class A (a) | | 842 | | | | 12,798 |
| Universal Truckload Services, Inc. | | 500 | | | | 11,680 |
| USA Truck, Inc. (a) | | 550 | | | | 14,905 |
| Vitran Corp., Inc. (a) | | 474 | | | | 8,534 |
| Werner Enterprises, Inc. | | 2,833 | | | | 57,992 |
| Yellow Roadway Corp. (a) | | 1,886 | | | | 88,849 |
| | | | | | | 708,386 |
| Trading Companies & Distributors – 0.3% | | | | | | |
| Aceto Corp. | | 828 | | | | 4,968 |
| Beacon Roofing Supply, Inc. (a) | | 794 | | | | 21,613 |
| Electro Rent Corp. (a) | | 1,299 | | | | 18,160 |
| Fastenal Co. | | 5,052 | | | | 200,564 |
| Lawson Products, Inc. | | 395 | | | | 14,911 |
| NuCo2, Inc. (a) | | 701 | | | | 19,712 |
| Rush Enterprises, Inc. Class A (a) | | 983 | | | | 15,050 |
| UAP Holding Corp. | | 1,607 | | | | 30,501 |
| | | | | | | 325,479 |
| Transportation Infrastructure 0.0% | | | | | | |
| Navios Maritime Holdings, Inc. (a) | | 1,800 | | | | 9,144 |
| |
| TOTAL INDUSTRIALS | | | | | | 6,275,719 |
| |
| INFORMATION TECHNOLOGY – 48.4% | | | | | | |
| Communications Equipment – 7.9% | | | | | | |
| 3Com Corp. (a) | | 13,296 | | | | 48,132 |
| ADC Telecommunications, Inc. (a) | | 3,801 | | | | 77,654 |
| Adtran, Inc. | | 2,611 | | | | 77,181 |
| Airspan Networks, Inc. (a) | | 2,489 | | | | 14,635 |
| Alvarion Ltd. (a) | | 2,562 | | | | 22,827 |
| Anaren, Inc. (a) | | 662 | | | | 9,500 |
| Andrew Corp. (a) | | 5,155 | | | | 56,344 |
See accompanying notes which are an integral part of the financial statements.
| Common Stocks continued | | | | | | |
| | | Shares | | Value (Note 1) |
| |
| INFORMATION TECHNOLOGY – continued | | | | | | |
| Communications Equipment – continued | | | | | | |
| Arris Group, Inc. (a) | | 3,712 | | $ | | 36,081 |
| AudioCodes Ltd. (a) | | 1,741 | | | | 17,967 |
| Avanex Corp. (a) | | 6,051 | | | | 3,933 |
| Avici Systems, Inc. (a) | | 537 | | | | 2,277 |
| Avocent Corp. (a) | | 1,639 | | | | 48,088 |
| Bel Fuse, Inc.: | | | | | | |
| Class A | | 177 | | | | 4,864 |
| Class B (non-vtg.) | | 300 | | | | 10,059 |
| Black Box Corp. | | 852 | | | | 39,797 |
| Bookham, Inc. (a) | | 1,243 | | | | 5,842 |
| C-COR, Inc. (a) | | 1,969 | | | | 11,164 |
| Carrier Access Corp. (a) | | 1,526 | | | | 7,401 |
| Centillium Communications, Inc. (a) | | 1,559 | | | | 7,171 |
| Ceragon Networks Ltd. (a) | | 865 | | | | 3,201 |
| CIENA Corp. (a) | | 23,476 | | | | 70,193 |
| Cisco Systems, Inc. (a) | | 215,838 | | | | 3,785,799 |
| Comtech Group, Inc. (a) | | 1,575 | | | | 9,308 |
| Comtech Telecommunications Corp. (a) | | 781 | | | | 34,052 |
| Comverse Technology, Inc. (a) | | 6,967 | | | | 182,605 |
| Digi International, Inc. (a) | | 1,004 | | | | 12,932 |
| Ditech Communications Corp. (a) | | 1,208 | | | | 10,594 |
| ECI Telecom Ltd. (a) | | 3,668 | | | | 31,581 |
| ECtel Ltd. (a) | | 171 | | | | 735 |
| EFJ, Inc. (a) | | 1,024 | | | | 9,994 |
| EMS Technologies, Inc. (a) | | 443 | | | | 7,513 |
| Endwave Corp. (a)(d) | | 412 | | | | 4,013 |
| Extreme Networks, Inc. (a) | | 3,999 | | | | 19,675 |
| F5 Networks, Inc. (a) | | 1,331 | | | | 70,317 |
| Finisar Corp. (a) | | 11,548 | | | | 22,172 |
| Foundry Networks, Inc. (a) | | 4,534 | | | | 62,977 |
| Glenayre Technologies, Inc. (a) | | 1,379 | | | | 4,330 |
| Harmonic, Inc. (a) | | 2,575 | | | | 14,137 |
| Inter-Tel, Inc. | | 969 | | | | 19,797 |
| InterDigital Communication Corp. (a) | | 2,421 | | | | 47,161 |
| Ituran Location & Control Ltd. | | 834 | | | | 12,126 |
| Ixia (a) | | 2,329 | | | | 32,094 |
| JDS Uniphase Corp. (a) | | 54,786 | | | | 140,800 |
| Juniper Networks, Inc. (a) | | 18,752 | | | | 421,732 |
| MRV Communications, Inc. (a) | | 4,346 | | | | 7,910 |
| NETGEAR, Inc. (a) | | 1,147 | | | | 22,137 |
| Network Engines, Inc. (a) | | 1,511 | | | | 1,859 |
See accompanying notes which are an integral part of the financial statements.
45 Annual Report
| Investments continued | | | | | | |
| |
| Common Stocks continued | | | | | | |
| | | Shares | | Value (Note 1) |
| |
| INFORMATION TECHNOLOGY – continued | | | | | | |
| Communications Equipment – continued | | | | | | |
| Nice Systems Ltd. sponsored ADR (a) | | 448 | | $ | | 20,093 |
| NMS Communications Corp. (a) | | 1,666 | | | | 6,531 |
| Oplink Communications, Inc. (a) | | 693 | | | | 9,439 |
| Optical Communication Products, Inc. (a) | | 1,330 | | | | 3,126 |
| Orckit Communications Ltd. (a) | | 601 | | | | 12,224 |
| Packeteer, Inc. (a) | | 1,039 | | | | 9,559 |
| Parkervision, Inc. (a) | | 1,061 | | | | 8,764 |
| PC-Tel, Inc. (a) | | 1,155 | | | | 10,464 |
| Performance Technologies, Inc. (a) | | 470 | | | | 4,235 |
| Polycom, Inc. (a) | | 3,211 | | | | 52,693 |
| Powerwave Technologies, Inc. (a) | | 3,586 | | | | 45,040 |
| Qiao Xing Universal Telephone, Inc. (a)(d) | | 504 | | | | 4,178 |
| QUALCOMM, Inc. | | 55,234 | | | | 2,511,490 |
| RADWARE Ltd. (a) | | 685 | | | | 12,940 |
| Radyne Corp. (a) | | 1,102 | | | | 16,717 |
| Redback Networks, Inc. (a) | | 1,785 | | | | 24,080 |
| Research In Motion Ltd. (a) | | 6,450 | | | | 391,827 |
| SafeNet, Inc. (a) | | 810 | | | | 28,796 |
| SCM Microsystems, Inc. (a) | | 1,068 | | | | 2,884 |
| SeaChange International, Inc. (a) | | 1,245 | | | | 9,574 |
| Sierra Wireless, Inc. (a) | | 732 | | | | 9,570 |
| Sonus Networks, Inc. (a) | | 8,174 | | | | 33,595 |
| SpectraLink Corp. | | 479 | | | | 6,184 |
| Stratex Networks, Inc. (a) | | 2,958 | | | | 9,761 |
| Sunrise Telecom, Inc. | | 1,483 | | | | 2,610 |
| Superior Essex, Inc. (a) | | 525 | | | | 9,896 |
| Sycamore Networks, Inc. (a) | | 8,426 | | | | 34,294 |
| Symmetricom, Inc. (a) | | 1,374 | | | | 12,036 |
| Tekelec (a) | | 2,363 | | | | 30,719 |
| Telefonaktiebolaget LM Ericsson (B Shares) sponsored ADR | | 4,225 | | | | 137,651 |
| Tellabs, Inc. (a) | | 15,522 | | | | 159,256 |
| Telular Corp. (a) | | 871 | | | | 2,761 |
| Terayon Communication Systems, Inc. (a) | | 1,730 | | | | 3,581 |
| Tollgrade Communications, Inc. (a) | | 443 | | | | 4,829 |
| UTStarcom, Inc. (a)(d) | | 3,667 | | | | 30,399 |
| ViaSat, Inc. (a) | | 976 | | | | 26,986 |
| Westell Technologies, Inc. Class A (a) | | 3,694 | | | | 17,473 |
| WJ Communications, Inc. (a) | | 2,092 | | | | 2,887 |
| Zhone Technologies, Inc. (a) | | 6,304 | | | | 13,932 |
| | | | | | | 9,295,735 |
See accompanying notes which are an integral part of the financial statements.
| Common Stocks continued | | | | | | |
| | | Shares | | Value (Note 1) |
| |
| INFORMATION TECHNOLOGY – continued | | | | | | |
| Computers & Peripherals – 5.3% | | | | | | |
| ActivCard Corp. (a) | | 1,423 | | $ | | 5,322 |
| Adaptec, Inc. (a) | | 4,706 | | | | 23,389 |
| Advanced Digital Information Corp. (a) | | 2,971 | | | | 31,196 |
| Apple Computer, Inc. (a) | | 27,981 | | | | 1,897,671 |
| Avid Technology, Inc. (a) | | 1,132 | | | | 57,143 |
| Brocade Communications Systems, Inc. (a) | | 9,900 | | | | 43,263 |
| Concurrent Computer Corp. (a) | | 2,256 | | | | 4,467 |
| Cray, Inc. (a) | | 2,041 | | | | 3,082 |
| Creative Technology Ltd. (Nasdaq) (d) | | 2,846 | | | | 23,565 |
| Dell, Inc. (a) | | 80,960 | | | | 2,441,754 |
| Dot Hill Systems Corp. (a) | | 1,177 | | | | 7,792 |
| Electronics for Imaging, Inc. (a) | | 1,863 | | | | 52,034 |
| Hutchinson Technology, Inc. (a) | | 937 | | | | 26,789 |
| Immersion Corp. (a) | | 860 | | | | 5,676 |
| InFocus Corp. (a) | | 1,431 | | | | 5,352 |
| Innovex, Inc. (a) | | 857 | | | | 3,539 |
| Intergraph Corp. (a) | | 1,107 | | | | 53,158 |
| Komag, Inc. (a) | | 960 | | | | 33,542 |
| LaserCard Corp. (a) | | 492 | | | | 5,215 |
| Logitech International SA sponsored ADR (a) | | 560 | | | | 25,648 |
| M Systems Flash Disk Pioneers Ltd. (a) | | 933 | | | | 29,063 |
| McDATA Corp.: | | | | | | |
| Class A (a) | | 4,595 | | | | 16,726 |
| Class B (a) | | 1,013 | | | | 3,525 |
| Mobility Electronics, Inc. (a) | | 1,162 | | | | 13,061 |
| Neoware Systems, Inc. (a) | | 1,146 | | | | 25,063 |
| Network Appliance, Inc. (a) | | 12,567 | | | | 365,951 |
| Novatel Wireless, Inc. (a) | | 861 | | | | 11,727 |
| Overland Storage, Inc. (a) | | 914 | | | | 7,275 |
| Palm, Inc. (a) | | 1,541 | | | | 43,734 |
| Presstek, Inc. (a) | | 1,343 | | | | 12,396 |
| QLogic Corp. (a) | | 2,741 | | | | 90,617 |
| Rackable Systems, Inc. | | 737 | | | | 13,612 |
| Rimage Corp. (a) | | 799 | | | | 22,891 |
| SanDisk Corp. (a) | | 6,149 | | | | 313,968 |
| SBS Technologies, Inc. (a) | | 435 | | | | 4,481 |
| Scitex Corp. Ltd. (a) | | 1,465 | | | | 8,658 |
| SimpleTech, Inc. (a) | | 1,620 | | | | 6,107 |
| Stratasys, Inc. (a) | | 390 | | | | 9,247 |
See accompanying notes which are an integral part of the financial statements.
47 Annual Report
| Investments continued | | | | | | |
| |
| Common Stocks continued | | | | | | |
| | | Shares | | Value (Note 1) |
| |
| INFORMATION TECHNOLOGY – continued | | | | | | |
| Computers & Peripherals – continued | | | | | | |
| Sun Microsystems, Inc. (a) | | 113,742 | | $ | | 428,807 |
| Synaptics, Inc. (a) | | 866 | | | | 23,304 |
| | | | | | | 6,199,810 |
| Electronic Equipment & Instruments – 1.6% | | | | | | |
| Acacia Research Corp. – Acacia Technologies (a) | | 1,296 | | | | 9,072 |
| Aeroflex, Inc. (a) | | 2,655 | | | | 29,125 |
| Agilysys, Inc. | | 1,074 | | | | 20,460 |
| Applied Films Corp. (a) | | 436 | | | | 8,733 |
| Bell Microproducts, Inc. (a) | | 812 | | | | 6,983 |
| Brightpoint, Inc. (a) | | 717 | | | | 20,176 |
| CalAmp Corp. (a) | | 1,266 | | | | 14,686 |
| CDW Corp. | | 2,751 | | | | 161,346 |
| Cherokee International Corp. (a) | | 469 | | | | 1,346 |
| Cogent, Inc. (a) | | 3,000 | | | | 70,860 |
| Cognex Corp. | | 1,592 | | | | 49,256 |
| Coherent, Inc. (a) | | 1,061 | | | | 33,517 |
| Daktronics, Inc. | | 949 | | | | 25,718 |
| DTS, Inc. (a) | | 525 | | | | 7,602 |
| Echelon Corp. (a) | | 1,061 | | | | 8,753 |
| Electro Scientific Industries, Inc. (a) | | 948 | | | | 23,852 |
| Excel Technology, Inc. (a) | | 354 | | | | 8,510 |
| Fargo Electronics, Inc. (a) | | 609 | | | | 11,638 |
| FARO Technologies, Inc. (a) | | 894 | | | | 17,004 |
| Flextronics International Ltd. (a) | | 18,873 | | | | 194,769 |
| FLIR Systems, Inc. (a) | | 2,234 | | | | 55,224 |
| Global Imaging Systems, Inc. (a) | | 678 | | | | 24,693 |
| GSI Group, Inc. (a) | | 996 | | | | 9,173 |
| Identix, Inc. (a) | | 3,287 | | | | 16,139 |
| INTAC International (a) | | 1,136 | | | | 6,543 |
| International DisplayWorks, Inc. (a) | | 1,000 | | | | 5,740 |
| Itron, Inc. (a) | | 767 | | | | 35,857 |
| LeCroy Corp. (a) | | 442 | | | | 7,213 |
| Lexar Media, Inc. (a) | | 2,584 | | | | 22,042 |
| Lipman Electronic Engineer Ltd. (Nasdaq) (a) | | 766 | | | | 17,166 |
| Littelfuse, Inc. (a) | | 850 | | | | 22,049 |
| LoJack Corp. (a) | | 808 | | | | 22,769 |
| M Flex Electronix, Inc. (a) | | 868 | | | | 32,116 |
| Maxwell Technologies, Inc. (a) | | 899 | | | | 12,712 |
| Measurement Specialties, Inc. (a) | | 600 | | | | 14,928 |
| Mechanical Technology, Inc. (a) | | 1,285 | | | | 3,675 |
See accompanying notes which are an integral part of the financial statements.
| Common Stocks continued | | | | | | |
| | | Shares | | Value (Note 1) |
| |
| INFORMATION TECHNOLOGY – continued | | | | | | |
| Electronic Equipment & Instruments – continued | | | | | | |
| Mercury Computer Systems, Inc. (a) | | 1,018 | | $ | | 20,340 |
| Merix Corp. (a) | | 475 | | | | 3,168 |
| Methode Electronics, Inc. Class A | | 1,293 | | | | 13,512 |
| Metrologic Instruments, Inc. (a) | | 824 | | | | 16,109 |
| Molex, Inc. | | 3,241 | | | | 86,826 |
| Molex, Inc. Class A (non-vtg.) | | 3,177 | | | | 82,380 |
| MTS Systems Corp. | | 722 | | | | 25,465 |
| National Instruments Corp. | | 2,514 | | | | 64,886 |
| Newport Corp. (a) | | 1,742 | | | | 24,040 |
| NovAtel, Inc. (a) | | 320 | | | | 9,651 |
| NU Horizons Electronics Corp. (a) | | 658 | | | | 6,573 |
| Optimal Group, Inc. Class A (a) | | 1,305 | | | | 24,756 |
| Orbotech Ltd. (a) | | 1,227 | | | | 28,454 |
| OSI Systems, Inc. (a) | | 490 | | | | 9,227 |
| PC Connection, Inc. (a) | | 1,121 | | | | 7,130 |
| Pemstar, Inc. (a) | | 1,399 | | | | 1,931 |
| Photon Dynamics, Inc. (a) | | 560 | | | | 10,304 |
| Planar Systems, Inc. (a) | | 480 | | | | 4,656 |
| Plexus Corp. (a) | | 1,195 | | | | 25,693 |
| RadiSys Corp. (a) | | 665 | | | | 12,170 |
| Richardson Electronics Ltd. | | 989 | | | | 7,081 |
| Rofin-Sinar Technologies, Inc. (a) | | 705 | | | | 30,435 |
| Sanmina-SCI Corp. (a) | | 16,945 | | | | 70,152 |
| ScanSource, Inc. (a) | | 521 | | | | 30,890 |
| Sirenza Microdevices, Inc. (a) | | 2,267 | | | | 8,932 |
| SpatiaLight, Inc. (a)(d) | | 1,783 | | | | 7,364 |
| Staktek Holdings, Inc. (a) | | 1,214 | | | | 6,981 |
| Suntron Corp. (a) | | 1,647 | | | | 1,976 |
| Superconductor Technologies, Inc. (a) | | 1,907 | | | | 1,144 |
| Taser International, Inc. (a)(d) | | 1,904 | | | | 11,614 |
| Tech Data Corp. (a) | | 1,850 | | | | 72,724 |
| Trimble Navigation Ltd. (a) | | 1,866 | | | | 60,794 |
| TTM Technologies, Inc. (a) | | 1,039 | | | | 9,496 |
| Universal Display Corp. (a) | | 1,471 | | | | 17,137 |
| Viisage Technology, Inc. (a) | | 1,327 | | | | 8,413 |
| Woodhead Industries, Inc. | | 504 | | | | 6,542 |
| X Rite, Inc. | | 1,218 | | | | 13,483 |
| Xyratex Ltd. (a) | | 973 | | | | 15,276 |
See accompanying notes which are an integral part of the financial statements.
49 Annual Report
| Investments continued | | | | | | |
| |
| Common Stocks continued | | | | | | |
| | | Shares | | Value (Note 1) |
| |
| INFORMATION TECHNOLOGY – continued | | | | | | |
| Electronic Equipment & Instruments – continued | | | | | | |
| Zomax, Inc. (a) | | 2,600 | | $ | | 5,720 |
| Zygo Corp. (a) | | 622 | | | | 8,764 |
| | | | | | | 1,903,634 |
| Internet Software & Services – 5.4% | | | | | | |
| 24/7 Real Media, Inc. (a) | | 2,353 | | | | 17,412 |
| Akamai Technologies, Inc. (a) | | 4,837 | | | | 96,547 |
| Aladdin Knowledge Systems Ltd. (a) | | 753 | | | | 12,496 |
| aQuantive, Inc. (a) | | 2,100 | | | | 56,469 |
| Ariba, Inc. (a) | | 2,305 | | | | 19,892 |
| Art Technology Group, Inc. (a) | | 2,639 | | | | 4,328 |
| AsiaInfo Holdings, Inc. (a) | | 1,307 | | | | 4,954 |
| Autobytel, Inc. (a) | | 1,041 | | | | 5,434 |
| Baidu.com, Inc. sponsored ADR | | 125 | | | | 9,748 |
| Bankrate, Inc. (a) | | 726 | | | | 23,414 |
| Blue Coat Systems, Inc. (a) | | 361 | | | | 16,350 |
| BroadVision, Inc. (a) | | 1,412 | | | | 988 |
| Chordiant Software, Inc. (a) | | 2,159 | | | | 5,894 |
| Click Commerce, Inc. (a) | | 442 | | | | 10,498 |
| CMGI, Inc. (a) | | 16,443 | | | | 28,446 |
| CNET Networks, Inc. (a) | | 4,909 | | | | 73,586 |
| Corillian Corp. (a) | | 1,860 | | | | 5,189 |
| Cryptologic, Inc. | | 469 | | | | 9,453 |
| CyberSource Corp. (a) | | 1,115 | | | | 8,374 |
| Digital Insight Corp. (a) | | 1,290 | | | | 42,725 |
| Digital River, Inc. (a) | | 1,063 | | | | 27,553 |
| Digitas, Inc. (a) | | 3,011 | | | | 37,638 |
| EarthLink, Inc. (a) | | 5,038 | | | | 57,635 |
| eCollege.com (a) | | 553 | | | | 9,174 |
| Entrust, Inc. (a) | | 2,378 | | | | 11,890 |
| Equinix, Inc. (a) | | 915 | | | | 36,527 |
| Google, Inc. Class A (sub. vtg.) (a) | | 6,720 | | | | 2,721,533 |
| GoRemote Internet Communications, Inc. (a) | | 614 | | | | 872 |
| Greenfield Online, Inc. (a) | | 454 | | | | 2,302 |
| Homestore, Inc. (a) | | 4,453 | | | | 19,638 |
| Housevalues, Inc. | | 700 | | | | 8,946 |
| InfoSpace, Inc. (a) | | 1,141 | | | | 30,077 |
| Internet Capital Group, Inc. (a) | | 2,642 | | | | 21,929 |
| Interwoven, Inc. (a) | | 1,495 | | | | 14,188 |
| Iona Technologies PLC sponsored ADR (a) | | 533 | | | | 1,594 |
| iPass, Inc. (a) | | 1,581 | | | | 10,719 |
See accompanying notes which are an integral part of the financial statements.
| Common Stocks continued | | | | | | |
| | | Shares | | Value (Note 1) |
| |
| INFORMATION TECHNOLOGY – continued | | | | | | |
| Internet Software & Services – continued | | | | | | |
| iVillage, Inc. (a) | | 2,121 | | $ | | 17,392 |
| j2 Global Communications, Inc. (a) | | 731 | | | | 34,891 |
| Jupitermedia Corp. (a) | | 1,459 | | | | 23,884 |
| Keynote Systems, Inc. (a) | | 1,025 | | | | 13,581 |
| Kintera, Inc. (a) | | 800 | | | | 2,352 |
| LivePerson, Inc. (a) | | 2,751 | | | | 14,223 |
| LookSmart Ltd. (a) | | 833 | | | | 3,524 |
| Marchex, Inc. Class B (a) | | 1,045 | | | | 24,453 |
| MatrixOne, Inc. (a) | | 1,819 | | | | 9,168 |
| MIVA, Inc. (a) | | 1,339 | | | | 6,735 |
| NaviSite, Inc. (a) | | 523 | | | | 654 |
| Neoforma, Inc. (a) | | 772 | | | | 7,604 |
| Net2Phone, Inc. (a) | | 1,222 | | | | 2,358 |
| NetEase.com, Inc. sponsored ADR (a) | | 611 | | | | 34,815 |
| NetRatings, Inc. (a) | | 1,039 | | | | 14,027 |
| NIC, Inc. (a) | | 1,749 | | | | 10,669 |
| Online Resources Corp. (a) | | 1,151 | | | | 13,490 |
| Open Text Corp. (a) | | 1,697 | | | | 25,343 |
| Openwave Systems, Inc. (a) | | 2,221 | | | | 36,891 |
| Perficient, Inc. (a) | | 1,048 | | | | 9,139 |
| PlanetOut, Inc. (a) | | 573 | | | | 4,968 |
| RADVision Ltd. (a) | | 826 | | | | 14,042 |
| RealNetworks, Inc. (a) | | 5,396 | | | | 46,675 |
| S1 Corp. (a) | | 3,058 | | | | 13,425 |
| SAVVIS, Inc. (a) | | 5,140 | | | | 3,547 |
| Selectica, Inc. (a) | | 2,459 | | | | 6,885 |
| Sina Corp. (a) | | 1,642 | | | | 40,951 |
| SkillSoft PLC sponsored ADR (a) | | 3,139 | | | | 15,569 |
| Sohu.com, Inc. (a) | | 1,276 | | | | 24,244 |
| SonicWALL, Inc. (a) | | 2,405 | | | | 17,869 |
| Stellent, Inc. (a) | | 1,069 | | | | 11,150 |
| Supportsoft, Inc. (a) | | 2,282 | | | | 9,128 |
| The Knot, Inc. (a) | | 1,118 | | | | 13,640 |
| Tom Online, Inc. sponsored ADR (a) | | 200 | | | | 4,162 |
| Travelzoo, Inc. (a)(d) | | 630 | | | | 13,677 |
| Tumbleweed Communications Corp. (a) | | 1,264 | | | | 3,678 |
| United Online, Inc. | | 1,839 | | | | 25,948 |
| ValueClick, Inc. (a) | | 3,510 | | | | 66,269 |
| VeriSign, Inc. (a) | | 8,877 | | | | 197,336 |
| Vignette Corp. (a) | | 1,002 | | | | 17,745 |
| Vitria Technology, Inc. (a) | | 2,548 | | | | 7,083 |
See accompanying notes which are an integral part of the financial statements.
51 Annual Report
| Investments continued | | | | | | |
| |
| Common Stocks continued | | | | | | |
| | | Shares | | Value (Note 1) |
| |
| INFORMATION TECHNOLOGY – continued | | | | | | |
| Internet Software & Services – continued | | | | | | |
| WebEx Communications, Inc. (a) | | 1,430 | | $ | | 34,048 |
| webMethods, Inc. (a) | | 2,229 | | | | 18,010 |
| Websense, Inc. (a) | | 754 | | | | 48,972 |
| WebSideStory, Inc. (a) | | 1,076 | | | | 19,368 |
| Website Pros, Inc. | | 652 | | | | 6,266 |
| Workstream, Inc. (a) | | 1,954 | | | | 2,482 |
| Yahoo!, Inc. (a) | | 47,563 | | | | 1,913,459 |
| Zix Corp. (a)(d) | | 974 | | | | 1,714 |
| | | | | | | 6,371,915 |
| IT Services – 1.6% | | | | | | |
| Acxiom Corp. | | 3,256 | | | | 72,218 |
| Answerthink, Inc. (a) | | 1,964 | | | | 8,170 |
| Applied Digital Solutions, Inc. (a) | | 2,129 | | | | 6,430 |
| Carreker Corp. (a) | | 996 | | | | 5,000 |
| CheckFree Corp. (a) | | 3,197 | | | | 149,779 |
| Cognizant Technology Solutions Corp. Class A (a) | | 4,649 | | | | 225,895 |
| Covansys Corp. (a) | | 1,396 | | | | 20,521 |
| CSG Systems International, Inc. (a) | | 1,788 | | | | 42,912 |
| Edgewater Technology, Inc. (a) | | 1,090 | | | | 6,540 |
| Euronet Worldwide, Inc. (a) | | 1,275 | | | | 34,451 |
| Fiserv, Inc. (a) | | 6,146 | | | | 279,704 |
| Forrester Research, Inc. (a) | | 638 | | | | 11,892 |
| Gevity HR, Inc. | | 796 | | | | 22,551 |
| iGate Corp. (a) | | 1,393 | | | | 5,642 |
| Indus International, Inc. (a) | | 1,166 | | | | 3,498 |
| Infocrossing, Inc. (a) | | 717 | | | | 5,227 |
| Infosys Technologies Ltd. sponsored ADR | | 1,264 | | | | 91,084 |
| infoUSA, Inc. | | 1,995 | | | | 20,209 |
| Integral Systems, Inc. | | 418 | | | | 9,050 |
| Intrado, Inc. (a) | | 517 | | | | 11,674 |
| iPayment, Inc. (a) | | 756 | | | | 30,255 |
| Kanbay International, Inc. (a) | | 1,468 | | | | 24,310 |
| Lightbridge, Inc. (a) | | 1,638 | | | | 16,167 |
| Lionbridge Technologies, Inc. (a) | | 1,683 | | | | 10,940 |
| ManTech International Corp. Class A (a) | | 669 | | | | 16,752 |
| Ness Technologies, Inc. (a) | | 932 | | | | 9,311 |
| Paychex, Inc. | | 12,770 | | | | 541,576 |
| Pegasus Solutions, Inc. (a) | | 892 | | | | 6,342 |
| RightNow Technologies, Inc. (a) | | 1,056 | | | | 19,124 |
| Sapient Corp. (a) | | 4,930 | | | | 30,665 |
See accompanying notes which are an integral part of the financial statements.
| Common Stocks continued | | | | | | |
| | | Shares | | Value (Note 1) |
| |
| INFORMATION TECHNOLOGY – continued | | | | | | |
| IT Services – continued | | | | | | |
| SI International, Inc. (a) | | 431 | | $ | | 11,702 |
| SM&A (a) | | 996 | | | | 8,267 |
| Sykes Enterprises, Inc. (a) | | 1,314 | | | | 18,133 |
| Syntel, Inc. | | 1,406 | | | | 28,907 |
| TALX Corp. | | 586 | | | | 24,173 |
| Telvent GIT SA (a) | | 871 | | | | 9,572 |
| Tier Technologies, Inc. Class B (a) | | 1,203 | | | | 10,009 |
| Zanett, Inc. (a) | | 2,719 | | | | 9,076 |
| | | | | | | 1,857,728 |
| Office Electronics – 0.1% | | | | | | |
| Zebra Technologies Corp. Class A (a) | | 2,372 | | | | 107,048 |
| Semiconductors & Semiconductor Equipment – 10.7% | | | | | | |
| 8X8, Inc. (a) | | 2,302 | | | | 3,683 |
| Actel Corp. (a) | | 1,079 | | | | 15,710 |
| ADE Corp. (a) | | 460 | | | | 10,856 |
| Advanced Analogic Technologies, Inc. | | 1,805 | | | | 24,873 |
| Advanced Energy Industries, Inc. (a) | | 1,755 | | | | 23,447 |
| Alliance Semiconductor Corp. (a) | | 1,231 | | | | 3,595 |
| Altera Corp. (a) | | 12,719 | | | | 232,249 |
| AMIS Holdings, Inc. (a) | | 3,292 | | | | 32,821 |
| Amkor Technology, Inc. (a) | | 6,344 | | | | 39,333 |
| ANADIGICS, Inc. (a) | | 839 | | | | 4,401 |
| Applied Materials, Inc. | | 54,638 | | | | 989,494 |
| Applied Micro Circuits Corp. (a) | | 9,268 | | | | 24,468 |
| ARM Holdings PLC sponsored ADR | | 2,713 | | | | 17,065 |
| ASE Test Ltd. (a) | | 3,590 | | | | 22,581 |
| ASM International NV (Nasdaq) (a) | | 397 | | | | 5,800 |
| ASML Holding NV (NY Shares) (a) | | 4,216 | | | | 80,779 |
| Asyst Technologies, Inc. (a) | | 1,284 | | | | 7,986 |
| Atheros Communications, Inc. (a) | | 1,589 | | | | 15,397 |
| ATI Technologies, Inc. (a) | | 8,351 | | | | 136,242 |
| Atmel Corp. (a) | | 19,801 | | | | 66,333 |
| ATMI, Inc. (a) | | 1,136 | | | | 32,501 |
| August Technology Corp. (a) | | 750 | | | | 8,078 |
| Axcelis Technologies, Inc. (a) | | 2,915 | | | | 13,817 |
| Broadcom Corp. Class A (a) | | 9,434 | | | | 439,058 |
| Brooks Automation, Inc. (a) | | 2,292 | | | | 29,475 |
| Cabot Microelectronics Corp. (a) | | 748 | | | | 23,136 |
| California Micro Devices Corp. (a) | | 960 | | | | 8,803 |
| Cambridge Display Technologies, Inc. | | 1,117 | | | | 12,566 |
See accompanying notes which are an integral part of the financial statements.
53 Annual Report
| Investments continued | | | | | | |
| |
| Common Stocks continued | | | | | | |
| | | Shares | | Value (Note 1) |
| |
| INFORMATION TECHNOLOGY – continued | | | | | | |
| Semiconductors & Semiconductor Equipment – continued | | | | | | |
| Camtek Ltd. (a) | | 1,772 | | $ | | 6,627 |
| Cascade Microtech, Inc. | | 599 | | | | 8,332 |
| Ceva, Inc. (a) | | 287 | | | | 1,756 |
| China Energy Savings Technology, Inc. (a) | | 1,108 | | | | 7,900 |
| ChipMOS TECHNOLOGIES Bermuda Ltd. (a)(d) | | 2,935 | | | | 17,170 |
| Cirrus Logic, Inc. (a) | | 2,895 | | | | 21,886 |
| Cohu, Inc. | | 994 | | | | 26,510 |
| Conexant Systems, Inc. (a) | | 22,282 | | | | 55,037 |
| Credence Systems Corp. (a) | | 2,570 | | | | 20,843 |
| Cree, Inc. (a) | | 2,605 | | | | 69,892 |
| Cymer, Inc. (a) | | 1,294 | | | | 49,457 |
| Diodes, Inc. (a) | | 588 | | | | 23,738 |
| DSP Group, Inc. (a) | | 799 | | | | 20,774 |
| EMCORE Corp. (a) | | 3,649 | | | | 22,405 |
| Entegris, Inc. (a) | | 4,542 | | | | 45,874 |
| ESS Technology, Inc. (a) | | 1,906 | | | | 5,813 |
| Exar Corp. (a) | | 1,400 | | | | 17,304 |
| FEI Co. (a) | | 1,251 | | | | 24,970 |
| FormFactor, Inc. (a) | | 1,372 | | | | 38,498 |
| FSI International, Inc. (a) | | 988 | | | | 4,041 |
| Genesis Microchip, Inc. (a) | | 1,212 | | | | 27,149 |
| Hi/fn, Inc. (a) | | 451 | | | | 2,553 |
| Hittite Microwave Corp. | | 900 | | | | 22,581 |
| ICOS Vision Systems NV (a)(d) | | 570 | | | | 18,246 |
| Ikanos Communications, Inc. | | 934 | | | | 13,085 |
| Integrated Device Technology, Inc. (a) | | 4,015 | | | | 48,100 |
| Integrated Silicon Solution, Inc. (a) | | 1,726 | | | | 12,099 |
| Intel Corp. | | 204,959 | | | | 5,468,306 |
| Intersil Corp. Class A | | 5,059 | | | | 129,763 |
| Intevac, Inc. (a) | | 636 | | | | 7,816 |
| IXYS Corp. (a) | | 1,068 | | | | 12,837 |
| KLA Tencor Corp. | | 6,524 | | | | 333,964 |
| Kopin Corp. (a) | | 2,638 | | | | 18,044 |
| Kulicke & Soffa Industries, Inc. (a) | | 1,390 | | | | 11,746 |
| Lam Research Corp. (a) | | 4,451 | | | | 167,091 |
| Lattice Semiconductor Corp. (a) | | 3,480 | | | | 17,017 |
| Leadis Technology, Inc. (a) | | 715 | | | | 3,825 |
| Linear Technology Corp. | | 10,400 | | | | 388,024 |
| LTX Corp. (a) | | 3,886 | | | | 17,254 |
| Marvell Technology Group Ltd. (a) | | 9,440 | | | | 524,298 |
| Mattson Technology, Inc. (a) | | 1,825 | | | | 18,104 |
See accompanying notes which are an integral part of the financial statements.
| Common Stocks continued | | | | | | |
| | | Shares | | Value (Note 1) |
| |
| INFORMATION TECHNOLOGY – continued | | | | | | |
| Semiconductors & Semiconductor Equipment – continued | | | | | | |
| Maxim Integrated Products, Inc. | | 11,123 | | $ | | 406,546 |
| Micrel, Inc. (a) | | 2,895 | | | | 34,972 |
| Microchip Technology, Inc. | | 7,204 | | | | 240,325 |
| Microsemi Corp. (a) | | 2,037 | | | | 56,527 |
| Microtune, Inc. (a) | | 1,795 | | | | 8,778 |
| Mindspeed Technologies, Inc. (a) | | 2,431 | | | | 4,473 |
| MIPS Technologies, Inc. (a) | | 1,934 | | | | 11,430 |
| MKS Instruments, Inc. (a) | | 2,126 | | | | 40,118 |
| Monolithic Power Systems, Inc. | | 1,663 | | | | 22,135 |
| Monolithic System Technology, Inc. (a) | | 1,045 | | | | 6,385 |
| Nanometrics, Inc. (a) | | 749 | | | | 8,314 |
| Netlogic Microsystems, Inc. (a) | | 690 | | | | 17,981 |
| Novellus Systems, Inc. (a) | | 4,510 | | | | 111,262 |
| NVE Corp. (a)(d) | | 234 | | | | 3,569 |
| NVIDIA Corp. (a) | | 5,723 | | | | 207,001 |
| O2Micro International Ltd. sponsored ADR (a) | | 1,627 | | | | 18,597 |
| Omnivision Technologies, Inc. (a) | | 1,822 | | | | 32,249 |
| ON Semiconductor Corp. (a) | | 9,654 | | | | 55,993 |
| PDF Solutions, Inc. (a) | | 891 | | | | 13,935 |
| Pericom Semiconductor Corp. (a) | | 1,064 | | | | 8,352 |
| Photronics, Inc. (a) | | 1,167 | | | | 18,532 |
| Pixelworks, Inc. (a) | | 1,850 | | | | 9,898 |
| PLX Technology, Inc. (a) | | 1,370 | | | | 13,522 |
| PMC-Sierra, Inc. (a) | | 6,281 | | | | 49,431 |
| PortalPlayer, Inc. | | 710 | | | | 17,061 |
| Power Integrations, Inc. (a) | | 969 | | | | 21,134 |
| PowerDsine Ltd. (a) | | 593 | | | | 5,082 |
| Rambus, Inc. (a) | | 3,414 | | | | 57,321 |
| RF Micro Devices, Inc. (a) | | 5,561 | | | | 31,586 |
| Rudolph Technologies, Inc. (a) | | 390 | | | | 5,012 |
| Saifun Semiconductors Ltd. | | 944 | | | | 27,282 |
| Semitool, Inc. (a) | | 1,012 | | | | 9,634 |
| Semtech Corp. (a) | | 2,730 | | | | 54,354 |
| Sigma Designs, Inc. (a) | | 683 | | | | 9,582 |
| SigmaTel, Inc. (a) | | 1,152 | | | | 16,773 |
| Silicon Image, Inc. (a) | | 2,625 | | | | 25,489 |
| Silicon Laboratories, Inc. (a) | | 1,704 | | | | 66,200 |
| Silicon Storage Technology, Inc. (a) | | 3,448 | | | | 18,998 |
| Siliconware Precision Industries Co. Ltd. sponsored ADR | | 559 | | | | 2,952 |
| SiRF Technology Holdings, Inc. (a) | | 1,828 | | | | 50,672 |
| Skyworks Solutions, Inc. (a) | | 5,586 | | | | 30,109 |
See accompanying notes which are an integral part of the financial statements.
55 Annual Report
| Investments continued | | | | | | |
| |
| Common Stocks continued | | | | | | |
| | | Shares | | Value (Note 1) |
| |
| INFORMATION TECHNOLOGY – continued | | | | | | |
| Semiconductors & Semiconductor Equipment – continued | | | | | | |
| Standard Microsystems Corp. (a) | | 699 | | $ | | 20,900 |
| STATS ChipPAC Ltd. sponsored ADR (a)(d) | | 1,789 | | | | 11,861 |
| Supertex, Inc. (a) | | 433 | | | | 18,290 |
| Tessera Technologies, Inc. (a) | | 1,658 | | | | 45,595 |
| Therma-Wave, Inc. (a) | | 2,068 | | | | 3,288 |
| Tower Semicondutor Ltd. (a) | | 1,870 | | | | 3,142 |
| Transmeta Corp. (a) | | 5,739 | | | | 7,002 |
| Transwitch Corp. (a) | | 3,005 | | | | 4,477 |
| Trident Microsystems, Inc. (a) | | 1,636 | | | | 30,822 |
| Tripath Technology, Inc. (a) | | 1,346 | | | | 579 |
| TriQuint Semiconductor, Inc. (a) | | 5,669 | | | | 25,511 |
| Ultratech, Inc. (a) | | 794 | | | | 13,045 |
| Varian Semiconductor Equipment Associates, Inc. (a) | | 1,286 | | | | 56,610 |
| Veeco Instruments, Inc. (a) | | 861 | | | | 15,248 |
| Virage Logic Corp. (a) | | 772 | | | | 8,098 |
| Vitesse Semiconductor Corp. (a) | | 6,755 | | | | 14,253 |
| Volterra Semiconductor Corp. (a) | | 875 | | | | 11,043 |
| White Electronic Designs Corp. (a) | | 952 | | | | 4,808 |
| Xilinx, Inc. | | 11,924 | | | | 315,271 |
| Zilog, Inc. (a) | | 350 | | | | 928 |
| Zoran Corp. (a) | | 1,363 | | | | 23,062 |
| | | | | | | 12,558,675 |
| Software 15.8% | | | | | | |
| Activision, Inc. (a) | | 9,280 | | | | 123,517 |
| Actuate Corp. (a) | | 2,431 | | | | 8,022 |
| Adobe Systems, Inc. | | 16,646 | | | | 542,826 |
| Advent Software, Inc. (a) | | 1,121 | | | | 32,105 |
| Agile Software Corp. (a) | | 2,069 | | | | 12,848 |
| Altiris, Inc. (a) | | 833 | | | | 13,753 |
| American Software, Inc. Class A | | 951 | | | | 5,335 |
| Ansoft Corp. (a) | | 662 | | | | 22,965 |
| Ansys, Inc. (a) | | 988 | | | | 41,516 |
| Aspen Technology, Inc. (a) | | 1,148 | | | | 8,495 |
| Atari, Inc. (a) | | 4,071 | | | | 5,129 |
| Authentidate Holding Corp. (a) | | 825 | | | | 1,576 |
| Autodesk, Inc. (a) | | 7,709 | | | | 321,619 |
| BEA Systems, Inc. (a) | | 13,595 | | | | 119,228 |
| BindView Development Corp. (a) | | 1,838 | | | | 7,278 |
| Blackbaud, Inc. | | 1,699 | | | | 28,798 |
| Blackboard, Inc. (a) | | 935 | | | | 28,929 |
See accompanying notes which are an integral part of the financial statements.
| Common Stocks continued | | | | | | |
| | | Shares | | Value (Note 1) |
| |
| INFORMATION TECHNOLOGY – continued | | | | | | |
| Software – continued | | | | | | |
| Borland Software Corp. (a) | | 2,486 | | $ | | 15,090 |
| Bottomline Technologies, Inc. (a) | | 831 | | | | 9,224 |
| Business Objects SA sponsored ADR (a) | | 1,189 | | | | 47,251 |
| Cadence Design Systems, Inc. (a) | | 9,100 | | | | 155,974 |
| Captaris, Inc. (a) | | 2,149 | | | | 8,789 |
| Captiva Software Corp. (a) | | 591 | | | | 13,067 |
| Catapult Communications Corp. (a) | | 635 | | | | 10,738 |
| CCC Information Services Group, Inc. (a) | | 1,057 | | | | 27,598 |
| CDC Corp. Class A (a) | | 2,961 | | | | 10,334 |
| Check Point Software Technologies Ltd. (a) | | 8,471 | | | | 180,348 |
| Citrix Systems, Inc. (a) | | 5,847 | | | | 158,688 |
| Cognos, Inc. (a) | | 3,033 | | | | 101,408 |
| Compuware Corp. (a) | | 12,949 | | | | 119,519 |
| Concur Technologies, Inc. (a) | | 1,142 | | | | 14,423 |
| Convera Corp. Class A (a)(d) | | 1,608 | | | | 25,085 |
| CyberGuard Corp. (a) | | 912 | | | | 8,646 |
| Descartes Systems Group, Inc. (a) | | 893 | | | | 2,105 |
| Digimarc Corp. (a) | | 710 | | | | 4,331 |
| Electronic Arts, Inc. (a) | | 10,262 | | | | 578,366 |
| Embarcadero Technologies, Inc. (a) | | 915 | | | | 6,899 |
| Epicor Software Corp. (a) | | 2,019 | | | | 27,882 |
| EPIQ Systems, Inc. (a) | | 646 | | | | 12,280 |
| Evolving Systems, Inc. (a) | | 203 | | | | 430 |
| FalconStor Software, Inc. (a) | | 1,358 | | | | 10,307 |
| FileNET Corp. (a) | | 1,427 | | | | 38,443 |
| Fundtech Ltd. (a) | | 1,047 | | | | 10,470 |
| Geac Computer Corp. Ltd. (a) | | 2,566 | | | | 27,520 |
| Gravity Co. Ltd. sponsored ADR | | 917 | | | | 6,190 |
| Hummingbird Ltd. (a) | | 422 | | | | 8,936 |
| Hyperion Solutions Corp. (a) | | 1,296 | | | | 68,623 |
| i2 Technologies, Inc. (a) | | 642 | | | | 8,828 |
| Informatica Corp. (a) | | 3,191 | | | | 35,867 |
| Intellisync Corp. (a) | | 1,702 | | | | 8,646 |
| Internet Security Systems, Inc. (a) | | 1,483 | | | | 33,901 |
| InterVideo, Inc. (a) | | 605 | | | | 6,195 |
| Intervoice, Inc. (a) | | 1,422 | | | | 12,300 |
| Intuit, Inc. (a) | | 6,177 | | | | 330,902 |
| Jack Henry & Associates, Inc. | | 2,913 | | | | 55,755 |
| JAMDAT Mobile, Inc. (a) | | 880 | | | | 20,126 |
| JDA Software Group, Inc. (a) | | 644 | | | | 9,660 |
| KongZhong Corp. sponsored ADR (a) | | 751 | | | | 8,659 |
See accompanying notes which are an integral part of the financial statements.
57 Annual Report
| Investments continued | | | | | | |
| |
| Common Stocks continued | | | | | | |
| | | Shares | | Value (Note 1) |
| |
| INFORMATION TECHNOLOGY – continued | | | | | | |
| Software – continued | | | | | | |
| Kronos, Inc. (a) | | 1,026 | | $ | | 48,561 |
| Lawson Software, Inc. (a) | | 3,015 | | | | 22,884 |
| Macromedia, Inc. (a) | | 2,519 | | | | 113,002 |
| Macrovision Corp. (a) | | 1,640 | | | | 25,486 |
| Magic Software Enterprises Ltd. (a) | | 1,246 | | | | 2,031 |
| Magma Design Automation, Inc. (a) | | 958 | | | | 8,095 |
| Majesco Entertainment Co. (a) | | 700 | | | | 966 |
| Manhattan Associates, Inc. (a) | | 1,046 | | | | 22,395 |
| Manugistics Group, Inc. (a) | | 1,559 | | | | 2,993 |
| MapInfo Corp. (a) | | 784 | | | | 11,266 |
| Mentor Graphics Corp. (a) | | 2,477 | | | | 22,194 |
| Mercury Interactive Corp. (a) | | 2,881 | | | | 80,092 |
| Micromuse, Inc. (a) | | 3,179 | | | | 23,556 |
| MICROS Systems, Inc. (a) | | 1,328 | | | | 64,156 |
| Microsoft Corp. | | 360,885 | | | | 10,000,103 |
| MicroStrategy, Inc. Class A (a) | | 404 | | | | 29,843 |
| Mobius Management Systems, Inc. (a) | | 1,054 | | | | 6,524 |
| Moldflow Corp. (a) | | 749 | | | | 10,711 |
| Motive, Inc. (a) | | 867 | | | | 2,705 |
| MRO Software, Inc. (a) | | 735 | | | | 11,201 |
| Napster, Inc. (a) | | 1,962 | | | | 6,867 |
| NDS Group PLC sponsored ADR (a) | | 374 | | | | 15,469 |
| Net 1 UEPS Technologies, Inc. (a) | | 1,210 | | | | 28,145 |
| NetIQ Corp. (a) | | 1,873 | | | | 22,382 |
| NetScout Systems, Inc. (a) | | 1,681 | | | | 9,380 |
| Novell, Inc. (a) | | 12,649 | | | | 98,409 |
| Nuance Communications, Inc. (a) | | 5,069 | | | | 31,529 |
| Open Solutions, Inc. (a) | | 589 | | | | 13,052 |
| OpenTV Corp. Class A (a) | | 3,140 | | | | 7,065 |
| Opnet Technologies, Inc. (a) | | 1,106 | | | | 10,629 |
| Opsware, Inc. (a) | | 3,569 | | | | 21,057 |
| Oracle Corp. (a) | | 174,251 | | | | 2,190,335 |
| Parametric Technology Corp. (a) | | 9,733 | | | | 56,938 |
| Pegasystems, Inc. (a) | | 1,561 | | | | 11,411 |
| Pervasive Software, Inc. (a) | | 1,282 | | | | 5,436 |
| Phoenix Technologies Ltd. (a) | | 1,781 | | | | 11,274 |
| Plato Learning, Inc. (a) | | 886 | | | | 6,397 |
| Progress Software Corp. (a) | | 1,547 | | | | 47,864 |
| QAD, Inc. | | 960 | | | | 7,488 |
| Quality Systems, Inc. | | 476 | | | | 38,613 |
| Quest Software, Inc. (a) | | 3,675 | | | | 57,881 |
See accompanying notes which are an integral part of the financial statements.
| Common Stocks continued | | | | | | |
| | | Shares | | Value (Note 1) |
| |
| INFORMATION TECHNOLOGY – continued | | | | | | |
| Software – continued | | | | | | |
| Quovadx, Inc. (a) | | 1,252 | | $ | | 3,468 |
| Radiant Systems, Inc. (a) | | 1,048 | | | | 13,655 |
| Red Hat, Inc. (a) | | 5,856 | | | | 138,026 |
| Renaissance Learning, Inc. | | 1,229 | | | | 24,383 |
| Retalix Ltd. (a) | | 546 | | | | 13,590 |
| RSA Security, Inc. (a) | | 2,264 | | | | 29,432 |
| SAFLINK Corp. (a) | | 2,886 | | | | 2,655 |
| SCO Group, Inc. (a) | | 176 | | | | 732 |
| Secure Computing Corp. (a) | | 1,421 | | | | 19,525 |
| SERENA Software, Inc. (a) | | 1,450 | | | | 33,988 |
| Shanda Interactive Entertainment Ltd. sponsored ADR (a) | | 747 | | | | 12,766 |
| Siebel Systems, Inc. | | 17,309 | | | | 181,745 |
| Smith Micro Software, Inc. (a) | | 1,031 | | | | 7,042 |
| Sonic Solutions, Inc. (a) | | 1,220 | | | | 18,788 |
| SPSS, Inc. (a) | | 683 | | | | 19,725 |
| SSA Global Technologies, Inc. | | 2,045 | | | | 37,178 |
| Symantec Corp. (a) | | 36,553 | | | | 645,892 |
| Synopsys, Inc. (a) | | 5,027 | | | | 98,127 |
| Synplicity, Inc. (a) | | 1,694 | | | | 12,959 |
| Take-Two Interactive Software, Inc. (a) | | 2,512 | | | | 45,844 |
| The9 Ltd. sponsored ADR | | 358 | | | | 5,209 |
| THQ, Inc. (a) | | 2,404 | | | | 54,619 |
| TIBCO Software, Inc. (a) | | 7,737 | | | | 64,759 |
| Transaction Systems Architects, Inc. Class A (a) | | 1,334 | | | | 38,819 |
| Ulticom, Inc. (a) | | 1,349 | | | | 15,540 |
| Ultimate Software Group, Inc. (a) | | 884 | | | | 15,214 |
| Unica Corp. | | 960 | | | | 10,646 |
| VA Software Corp. (a) | | 2,086 | | | | 3,275 |
| Vasco Data Security International, Inc. (a) | | 1,290 | | | | 14,551 |
| Verint Systems, Inc. (a) | | 1,071 | | | | 40,302 |
| Verity, Inc. (a) | | 1,336 | | | | 17,608 |
| WatchGuard Technologies, Inc. (a) | | 1,411 | | | | 5,023 |
| Wind River Systems, Inc. (a) | | 2,650 | | | | 36,517 |
| Witness Systems, Inc. (a) | | 902 | | | | 18,085 |
| | | | | | | 18,469,814 |
| |
| TOTAL INFORMATION TECHNOLOGY | | | | | | 56,764,359 |
| |
| MATERIALS 0.9% | | | | | | |
| Chemicals – 0.4% | | | | | | |
| A. Schulman, Inc. | | 796 | | | | 16,628 |
See accompanying notes which are an integral part of the financial statements.
59 Annual Report
| Investments continued | | | | | | |
| |
| Common Stocks continued | | | | | | |
| | | Shares | | Value (Note 1) |
| |
| MATERIALS – continued | | | | | | |
| Chemicals – continued | | | | | | |
| Akzo Nobel NV sponsored ADR | | 1,949 | | $ | | 87,023 |
| Hawkins, Inc. | | 1,094 | | | | 15,425 |
| Landec Corp. (a) | | 1,498 | | | | 11,040 |
| LESCO, Inc. (a) | | 1,032 | | | | 16,357 |
| Methanex Corp. | | 3,929 | | | | 68,714 |
| Nanophase Technologies Corp. (a) | | 626 | | | | 3,781 |
| Pioneer Companies, Inc. (a) | | 428 | | | | 10,627 |
| Sigma Aldrich Corp. | | 2,313 | | | | 152,751 |
| Symyx Technologies, Inc. (a) | | 1,030 | | | | 28,068 |
| Zoltek Companies, Inc. (a) | | 821 | | | | 7,225 |
| | | | | | | 417,639 |
| Construction Materials 0.0% | | | | | | |
| CRH PLC sponsored ADR | | 217 | | | | 5,796 |
| U.S. Concrete, Inc. (a) | | 1,257 | | | | 10,333 |
| United States Lime & Minerals, Inc. (a) | | 327 | | | | 9,545 |
| | | | | | | 25,674 |
| Containers & Packaging – 0.1% | | | | | | |
| Amcor Ltd. sponsored ADR | | 305 | | | | 6,301 |
| Caraustar Industries, Inc. (a) | | 1,168 | | | | 11,516 |
| Silgan Holdings, Inc. | | 1,336 | | | | 47,147 |
| Smurfit-Stone Container Corp. (a) | | 8,272 | | | | 104,806 |
| | | | | | | 169,770 |
| Metals & Mining – 0.4% | | | | | | |
| Aber Diamond Corp. | | 1,961 | | | | 70,189 |
| Anglo American PLC ADR | | 864 | | | | 27,553 |
| Century Aluminum Co. (a) | | 1,180 | | | | 27,282 |
| Chaparral Steel Co. (a) | | 759 | | | | 18,975 |
| DRDGOLD Ltd. sponsored ADR | | 4,781 | | | | 6,263 |
| Gibraltar Industries, Inc. | | 991 | | | | 21,792 |
| Lihir Gold Ltd. sponsored ADR (a) | | 283 | | | | 9,826 |
| Metal Management, Inc. | | 906 | | | | 22,804 |
| Metals USA, Inc. (a) | | 811 | | | | 17,842 |
| NN, Inc. | | 1,342 | | | | 13,339 |
| Novamerican Steel, Inc. (a) | | 329 | | | | 13,160 |
| Olympic Steel, Inc. (a) | | 422 | | | | 8,946 |
| Pan American Silver Corp. (a) | | 2,291 | | | | 43,308 |
| Randgold Resources Ltd. sponsored ADR (a) | | 1,472 | | | | 23,169 |
| Roanoke Electric Steel Corp. | | 681 | | | | 15,860 |
| Royal Gold, Inc. | | 906 | | | | 23,574 |
| Schnitzer Steel Industries, Inc. Class A | | 702 | | | | 24,212 |
See accompanying notes which are an integral part of the financial statements.
| Common Stocks continued | | | | | | |
| | | Shares | | Value (Note 1) |
| |
| MATERIALS – continued | | | | | | |
| Metals & Mining – continued | | | | | | |
| Silver Standard Resources, Inc. (a) | | 1,798 | | $ | | 26,990 |
| Steel Dynamics, Inc. | | 1,626 | | | | 56,292 |
| Steel Technologies, Inc. | | 420 | | | | 11,126 |
| Wheeling Pittsburgh Corp. (a) | | 523 | | | | 4,691 |
| | | | | | | 487,193 |
| Paper & Forest Products 0.0% | | | | | | |
| Mercer International, Inc. (SBI) (a) | | 976 | | | | 7,486 |
| |
| TOTAL MATERIALS | | | | | | 1,107,762 |
| |
| TELECOMMUNICATION SERVICES – 1.3% | | | | | | |
| Diversified Telecommunication Services – 0.7% | | | | | | |
| Alaska Communication Systems Group, Inc. | | 1,292 | | | | 12,933 |
| Arbinet-thexchange, Inc. | | 800 | | | | 5,248 |
| Broadwing Corp. (a) | | 3,837 | | | | 25,785 |
| Cbeyond Communications, Inc. | | 941 | | | | 10,718 |
| Commonwealth Telephone Enterprises, Inc. | | 639 | | | | 22,148 |
| Consolidated Communications Holdings, Inc. | | 951 | | | | 12,392 |
| CT Communications, Inc. | | 802 | | | | 9,881 |
| D&E Communications, Inc. | | 839 | | | | 7,593 |
| Eschelon Telecom, Inc. | | 959 | | | | 12,467 |
| General Communications, Inc. Class A (a) | | 2,061 | | | | 20,919 |
| Global Crossing Ltd. (a) | | 1,245 | | | | 21,215 |
| Golden Telecom, Inc. | | 1,416 | | | | 38,232 |
| HickoryTech Corp. | | 972 | | | | 7,679 |
| ITC DeltaCom, Inc. (a) | | 573 | | | | 945 |
| Level 3 Communications, Inc. (a)(d) | | 24,884 | | | | 84,606 |
| MCI, Inc. | | 10,630 | | | | 211,112 |
| North Pittsburgh Systems, Inc. | | 769 | | | | 15,057 |
| Primus Telecommunications Group, Inc. (a) | | 2,302 | | | | 2,233 |
| Shenandoah Telecommunications Co. | | 346 | | | | 14,079 |
| SureWest Communications | | 400 | | | | 11,320 |
| Talk America Holdings, Inc. (a) | | 989 | | | | 9,494 |
| Teleglobe International Holdings Ltd. (a) | | 1,380 | | | | 6,031 |
| Telewest Global, Inc. (a) | | 8,202 | | | | 182,823 |
| Time Warner Telecom, Inc. Class A (a) | | 1,250 | | | | 11,750 |
| U.S. LEC Corp. Class A (a) | | 1,291 | | | | 2,388 |
| Warwick Valley Telephone Co. | | 420 | | | | 8,434 |
| | | | | | | 767,482 |
See accompanying notes which are an integral part of the financial statements.
61 Annual Report
| Investments continued | | | | | | |
| |
| Common Stocks continued | | | | | | |
| | | Shares | | Value (Note 1) |
| |
| TELECOMMUNICATION SERVICES – continued | | | | | | |
| Wireless Telecommunication Services – 0.6% | | | | | | |
| @Road, Inc. (a) | | 2,107 | | $ | | 10,451 |
| Alamosa Holdings, Inc. (a) | | 5,470 | | | | 101,086 |
| America Movil SA de CV Series A sponsored ADR | | 375 | | | | 10,855 |
| Centennial Communications Corp. Class A (a) | | 3,308 | | | | 52,498 |
| Dobson Communications Corp. Class A (a) | | 4,712 | | | | 34,727 |
| First Ave Networks, Inc. (a) | | 2,331 | | | | 12,354 |
| InPhonic, Inc. (d) | | 1,599 | | | | 18,884 |
| Leap Wireless International, Inc. (a) | | 1,887 | | | | 71,819 |
| Linktone Ltd. sponsored ADR (a) | | 739 | | | | 7,878 |
| Millicom International Cellular SA (a) | | 3,593 | | | | 82,783 |
| NII Holdings, Inc. (a) | | 5,078 | | | | 220,639 |
| Rural Cellular Corp. Class A (a) | | 568 | | | | 7,895 |
| SBA Communications Corp. Class A (a) | | 2,475 | | | | 45,639 |
| Ubiquitel, Inc. (a) | | 3,855 | | | | 37,702 |
| USA Mobility, Inc. | | 1,072 | | | | 29,266 |
| Wireless Facilities, Inc. (a) | | 2,684 | | | | 14,869 |
| | | | | | | 759,345 |
| |
| TOTAL TELECOMMUNICATION SERVICES | | | | | | 1,526,827 |
| |
| UTILITIES – 0.2% | | | | | | |
| Electric Utilities – 0.1% | | | | | | |
| MGE Energy, Inc. | | 882 | | | | 30,976 |
| Otter Tail Corp. | | 1,231 | | | | 36,992 |
| | | | | | | 67,968 |
| Gas Utilities 0.0% | | | | | | |
| EnergySouth, Inc. | | 465 | | | | 12,876 |
| Multi-Utilities – 0.0% | | | | | | |
| NorthWestern Energy Corp. | | 1,299 | | | | 40,243 |
| Water Utilities 0.1% | | | | | | |
| Artesian Resources Corp. Class A | | 289 | | | | 8,598 |
| Connecticut Water Service, Inc. | | 559 | | | | 14,104 |
| Middlesex Water Co. | | 728 | | | | 13,868 |
See accompanying notes which are an integral part of the financial statements.
| Common Stocks continued | | | | | | | | |
| | | | | Shares | | Value (Note 1) |
| |
| UTILITIES – continued | | | | | | | | |
| Water Utilities continued | | | | | | | | |
| Southwest Water Co. | | | | 1,021 | | $ | | 13,845 |
| York Water Co. | | | | 412 | | | | 10,794 |
| | | | | | | | | 61,209 |
| |
| TOTAL UTILITIES | | | | | | | | 182,296 |
| |
| TOTAL COMMON STOCKS | | | | | | | | |
| (Cost $102,656,475) | | | | | | 114,013,785 |
| U.S. Treasury Obligations 0.4% | | | | | | |
| | | | | Principal | | | | |
| | | | | Amount | | | | |
| U.S. Treasury Bills, yield at date of purchase 3.32% to | | | | | | |
| 3.69% 12/22/05 (e) | | | | | | | | |
| (Cost $499,005) | | | | $ 500,000 | | | | 498,881 |
| Money Market Funds 3.4% | | | | | | |
| | | | | Shares | | | | |
| Fidelity Cash Central Fund, 4.08% (b) | | | | 3,027,939 | | | | 3,027,939 |
| Fidelity Securities Lending Cash Central Fund, | | | | | | |
| 4.09% (b)(c) | | | | 907,861 | | | | 907,861 |
| TOTAL MONEY MARKET FUNDS | | | | | | | | |
| (Cost $3,935,800) | | | | | | 3,935,800 |
| TOTAL INVESTMENT PORTFOLIO 101.0% | | | | | | |
| (Cost $107,091,280) | | | | | | 118,448,466 |
| |
| NET OTHER ASSETS – (1.0)% | | | | | | (1,124,610) |
| NET ASSETS 100% | | | | | | $ | | 117,323,856 |
See accompanying notes which are an integral part of the financial statements.
63 Annual Report
| Investments continued | | | | | | |
| |
| Futures Contracts | | | | | | |
| | | | | Underlying | | Unrealized |
| | | Expiration | | Face Amount | | Appreciation/ |
| | | Date | | at Value | | (Depreciation) |
| Purchased | | | | | | |
| Equity Index Contracts | | | | | | |
| 99 Nasdaq 100 E-Mini Index Contracts | | Dec. 2005 | | $ 3,316,500 | | $ 175,962 |
| |
| The face value of futures purchased as a percentage of net assets – 2.8% | | |
Legend
(a) Non-income producing
(b) Affiliated fund that is available only to
investment companies and other
accounts managed by Fidelity
Investments. The rate quoted is the
annualized seven-day yield of the fund
at period end. A complete unaudited
listing of the fund’s holdings as of its
most recent quarter end is available
upon request.
|
(c) Investment made with cash collateral
received from securities on loan.
(d) Security or a portion of the security is on
loan at period end.
(e) Security or a portion of the security was
pledged to cover margin requirements
for futures contracts. At the period end,
the value of securities pledged
amounted to $399,104.
|
Affiliated Central Funds
Information regarding income received by the fund from the affiliated Central funds during the period is as follows:
| Fund | | | | Income received |
| Fidelity Cash Central Fund | | | $ | 45,714 |
| Fidelity Securities Lending Cash Central Fund | | | | 39,862 |
| Total | | | $ | 85,576 |
See accompanying notes which are an integral part of the financial statements.
Annual Report 64
| Financial Statements | | | | | | | | |
| |
| |
| Statement of Assets and Liabilities | | | | | | | | |
| | | | | | | November 30, 2005 |
| |
| Assets | | | | | | | | |
| Investment in securities, at value (including securities | | | | | | | | |
| loaned of $867,970) See accompanying schedule: | | | | | | | | |
| Unaffiliated issuers (cost $103,155,480) | | $ | | 114,512,666 | | | | |
| Affiliated Central Funds (cost $3,935,800) | | | | 3,935,800 | | | | |
| Total Investments (cost $107,091,280) | | | | | | $ | | 118,448,466 |
| Cash | | | | | | | | 15,544 |
| Receivable for investments sold | | | | | | | | 40,831 |
| Receivable for fund shares sold | | | | | | | | 104,124 |
| Dividends receivable | | | | | | | | 76,793 |
| Interest receivable | | | | | | | | 10,203 |
| Prepaid expenses | | | | | | | | 593 |
| Receivable from investment adviser for expense | | | | | | | | |
| reductions | | | | | | | | 55,687 |
| Other affiliated receivables | | | | | | | | 57 |
| Other receivables | | | | | | | | 4,155 |
| Total assets | | | | | | | | 118,756,453 |
| |
| Liabilities | | | | | | | | |
| Payable for investments purchased | | $ | | 307,681 | | | | |
| Payable for fund shares redeemed | | | | 55,844 | | | | |
| Accrued management fee | | | | 23,007 | | | | |
| Distribution fees payable | | | | 16,520 | | | | |
| Payable for daily variation on futures contracts | | | | 11,724 | | | | |
| Other affiliated payables | | | | 18,014 | | | | |
| Other payables and accrued expenses | | | | 91,946 | | | | |
| Collateral on securities loaned, at value | | | | 907,861 | | | | |
| Total liabilities | | | | | | | | 1,432,597 |
| |
| Net Assets | | | | | | $ | | 117,323,856 |
| Net Assets consist of: | | | | | | | | |
| Paid in capital | | | | | | $ | | 105,323,144 |
| Undistributed net investment income | | | | | | | | 316,709 |
| Accumulated undistributed net realized gain (loss) on | | | | | | | | |
| investments and foreign currency transactions | | | | | | | | 150,855 |
| Net unrealized appreciation (depreciation) on | | | | | | | | |
| investments | | | | | | | | 11,533,148 |
| Net Assets, for 3,869,512 shares outstanding | | | | | | $ | | 117,323,856 |
| Net Asset Value, offering price and redemption price per | | | | | | | | |
| share ($117,323,856 ÷ 3,869,512 shares) | | | | | | $ | | 30.32 |
See accompanying notes which are an integral part of the financial statements.
65 Annual Report
| Financial Statements continued | | | | | | |
| |
| Statement of Operations | | | | | | |
| | | | | Year ended November 30, 2005 |
| |
| Investment Income | | | | | | |
| Dividends | | | | $ | | 706,372 |
| Interest | | | | | | 13,174 |
| Income from affiliated Central Funds (including $39,862 | | | | |
| from security lending) | | | | | | 85,576 |
| Total income | | | | | | 805,122 |
| |
| Expenses | | | | | | |
| Management fee | | $ | | 256,364 | | |
| Transfer agent fees | | | | 154,209 | | |
| Distribution fees | | | | 64,093 | | |
| Licensing fees | | | | 53,410 | | |
| Accounting and security lending fees | | | | 40,193 | | |
| Independent trustees’ compensation | | | | 484 | | |
| Custodian fees and expenses | | | | 9,356 | | |
| Registration fees | | | | 26,054 | | |
| Audit | | | | 43,058 | | |
| Legal | | | | 3,336 | | |
| Reports to shareholders | | | | 40,367 | | |
| Miscellaneous | | | | 971 | | |
| Total expenses before reductions | | | | 691,895 | | |
| Expense reductions | | | | (210,997) | | 480,898 |
| |
| Net investment income (loss) | | | | | | 324,224 |
| Realized and Unrealized Gain (Loss) | | | | | | |
| Net realized gain (loss) on: | | | | | | |
| Investment securities: | | | | | | |
| Unaffiliated issuers | | | | 260,342 | | |
| Foreign currency transactions | | | | (65) | | |
| Futures contracts | | | | 149,740 | | |
| Total net realized gain (loss) | | | | | | 410,017 |
| Change in net unrealized appreciation (depreciation) on: | | | | |
| Investment securities | | | | 6,783,456 | | |
| Assets and liabilities in foreign currencies | | | | 1 | | |
| Futures contracts | | | | 66,279 | | |
| Total change in net unrealized appreciation | | | | | | |
| (depreciation) | | | | | | 6,849,736 |
| Net gain (loss) | | | | | | 7,259,753 |
| Net increase (decrease) in net assets resulting from | | | | | | |
| operations | | | | $ | | 7,583,977 |
See accompanying notes which are an integral part of the financial statements.
| Statement of Changes in Net Assets | | | | | | | | |
| | | | | Year ended | | | | Year ended |
| | | | | November 30, | | | | November 30, |
| | | | | 2005 | | | | 2004 |
| Increase (Decrease) in Net Assets | | | | | | | | |
| Operations | | | | | | | | |
| Net investment income (loss) | | $ | | 324,224 | | $ | | 1,099,889 |
| Net realized gain (loss) | | | | 410,017 | | | | 408,754 |
| Change in net unrealized appreciation (depreciation) . | | | | 6,849,736 | | | | 2,679,725 |
| Net increase (decrease) in net assets resulting | | | | | | | | |
| from operations | | | | 7,583,977 | | | | 4,188,368 |
| Distributions to shareholders from net investment income . | | | | (1,095,956) | | | | (27,466) |
| Distributions to shareholders from net realized gain | | | | (516,656) | | | | (74,806) |
| Total distributions | | | | (1,612,612) | | | | (102,272) |
| Share transactions | | | | | | | | |
| Proceeds from sales of shares | | | | 54,253,390 | | | | 105,799,253 |
| Reinvestment of distributions | | | | 1,555,609 | | | | 96,366 |
| Cost of shares redeemed | | | | (47,847,789) | | | | (36,422,527) |
| Net increase (decrease) in net assets resulting from | | | | | | | | |
| share transactions | | | | 7,961,210 | | | | 69,473,092 |
| Redemption fees | | | | 58,490 | | | | 86,906 |
| Total increase (decrease) in net assets | | | | 13,991,065 | | | | 73,646,094 |
| |
| Net Assets | | | | | | | | |
| Beginning of period | | | | 103,332,791 | | | | 29,686,697 |
| End of period (including undistributed net investment | | | | | | | | |
| income of $316,709 and undistributed net invest- | | | | | | | | |
| ment income of $1,097,395, respectively) | | $ | | 117,323,856 | | $ | | 103,332,791 |
| |
| Other Information | | | | | | | | |
| Shares | | | | | | | | |
| Sold | | | | 1,915,652 | | | | 3,837,378 |
| Issued in reinvestment of distributions | | | | 53,963 | | | | 3,434 |
| Redeemed | | | | (1,689,388) | | | | (1,352,324) |
| Net increase (decrease) | | | | 280,227 | | | | 2,488,488 |
See accompanying notes which are an integral part of the financial statements.
67 Annual Report
| Financial Highlights | | | | | | |
| Years ended November 30, | | 2005 | | 2004 | | 2003F |
| Selected Per Share Data | | | | | | |
| Net asset value, beginning of period | | $ 28.79 | | $ 26.97 | | $ 25.00 |
| Income from Investment Operations | | | | | | |
| Net investment income (loss)D | | 09 | | .38E | | .01 |
| Net realized and unrealized gain (loss) | | 1.86 | | 1.47 | | 1.95 |
| Total from investment operations | | 1.95 | | 1.85 | | 1.96 |
| Distributions from net investment income | | (.30) | | (.02) | | — |
| Distributions from net realized gain | | (.14) | | (.04) | | — |
| Total distributions | | (.44) | | (.06) | | — |
| Redemption fees added to paid in capitalD | | 02 | | .03 | | .01 |
| Net asset value, end of period | | $ 30.32 | | $ 28.79 | | $ 26.97 |
| Total ReturnB,C | | 6.92% | | 6.99% | | 7.88% |
| Ratios to Average Net AssetsG | | | | | | |
| Expenses before reductions | | 65% | | .71% | | 1.30%A |
| Expenses net of fee waivers, if any | | 45% | | .45% | | .45%A |
| Expenses net of all reductions | | 45% | | .45% | | .45%A |
| Net investment income (loss) | | 30% | | 1.41% | | .31%A |
| Supplemental Data | | | | | | |
| Net assets, end of period (000 omitted) | | $117,324 | | $103,333 | | $29,687 |
| Portfolio turnover rate | | 10% | | 5% | | 55%A |
A Annualized
B Total returns for periods of less than one year are not annualized.
C Total returns would have been lower had certain expenses not been reduced during the periods shown.
D Calculated based on average shares outstanding during the period.
E Investment income per share reflects a special dividend which amounted to $.35 per share.
F For the period September 25, 2003 (commencement of operations) to November 30, 2003.
G Expense ratios reflect operating expenses of the fund. Expenses before reductions do not reflect amounts reimbursed by the investment adviser or
reductions from brokerage service arrangements or other expense offset arrangements and do not represent the amount paid by the fund during
periods when reimbursements or reductions occur. Expense ratios before reductions for start up periods may not be representative of longer term
operating periods. Expenses net of fee waivers reflect expenses after reimbursement by the investment adviser but prior to reductions from
brokerage service arrangements or other expense offset arrangements. Expenses net of all reductions represent the net expenses paid by the
fund.
|
See accompanying notes which are an integral part of the financial statements.
Notes to Financial Statements
For the period ended November 30, 2005
1. Significant Accounting Policies.
Fidelity NASDAQ Composite Index Fund (the fund) is a non diversified fund of Fidelity Commonwealth Trust (the trust) and is authorized to issue an unlimited number of shares. The trust is registered under the Investment Company Act of 1940, as amended (the 1940 Act), as an open end management investment company organized as a Massa chusetts business trust. The fund may invest in affiliated money market central funds (Money Market Central Funds) which are open end investment companies available to investment companies and other accounts managed by Fidelity Management & Research Company (FMR) and its affiliates. The financial statements have been prepared in conformity with accounting principles generally accepted in the United States of America, which require management to make certain estimates and assumptions at the date of the financial statements. The following summarizes the significant accounting policies of the fund:
Security Valuation. Investments are valued and net asset value (NAV) per share is calculated (NAV calculation) as of the close of business of the New York Stock Exchange (NYSE), normally 4:00 p.m. Eastern time. Wherever possible, the fund uses independent pricing services approved by the Board of Trustees to value its investments.
Equity securities, including restricted securities, for which market quotations are readily available, are valued at the last reported sale price or official closing price as reported by an independent pricing service on the primary market or exchange on which they are traded. In the event there were no sales during the day or closing prices are not available, securities are valued at the last quoted bid price. Investments in open end mutual funds, are valued at their closing net asset value each business day. Short term securities with remaining maturities of sixty days or less for which quotations are not readily available are valued at amortized cost, which approximates value.
When current market prices or quotations are not readily available or do not accurately reflect fair value, valuations may be determined in accordance with procedures adopted by the Board of Trustees. For example, when developments occur between the close of a market and the close of the NYSE that may materially affect the value of some or all of the securities, or when trading in a security is halted, those securities may be fair valued. Factors used in the determination of fair value may include monitoring news to identify significant market or security specific events such as changes in the value of U.S. securi ties market, reviewing developments in foreign markets and evaluating the performance of ADRs, futures contracts and exchange traded funds. Because the fund’s utilization of fair value pricing depends on market activity, the frequency with which fair value pricing is used can not be predicted and may be utilized to a significant extent. The value of securities used for NAV calculation under fair value pricing may differ from published prices for the same securities.
69 Annual Report
Notes to Financial Statements continued
1. Significant Accounting Policies continued
Foreign Currency. The fund uses foreign currency contracts to facilitate transactions in foreign denominated securities. Losses from these transactions may arise from changes in the value of the foreign currency or if the counterparties do not perform under the contracts’ terms.
Foreign denominated assets, including investment securities, and liabilities are trans lated into U.S. dollars at the exchange rate at period end. Purchases and sales of invest ment securities, income and dividends received and expenses denominated in foreign currencies are translated into U.S. dollars at the exchange rate in effect on the transac tion date.
The effects of exchange rate fluctuations on investments are included with the net realized and unrealized gain (loss) on investment securities. Other foreign currency transactions resulting in realized and unrealized gain (loss) are disclosed separately.
Investment Transactions and Income. Security transactions are accounted for as of trade date. Gains and losses on securities sold are determined on the basis of identified cost and may include proceeds received from litigation. Dividend income is recorded on the ex dividend date, except for certain dividends from foreign securities where the ex dividend date may have passed, which are recorded as soon as the fund is informed of the ex dividend date. Non cash dividends included in dividend income, if any, are recorded at the fair market value of the securities received. Distributions received on securities that represent a return of capital or capital gain are recorded as a reduction of cost of investments and/or as a realized gain. The fund estimates the components of distributions received that may be considered return of capital distributions or capital gain distributions. Interest income is accrued as earned. Interest income includes coupon interest and amortization of premium and accretion of discount on debt securi ties. Investment income is recorded net of foreign taxes withheld where recovery of such taxes is uncertain.
Expenses. Most expenses of the trust can be directly attributed to a fund. Expenses which cannot be directly attributed are apportioned among each fund in the trust.
Income Tax Information and Distributions to Shareholders. Each year, the fund intends to qualify as a regulated investment company by distributing all of its taxable income and realized gains under Subchapter M of the Internal Revenue Code. As a result, no provision for income taxes is required in the accompanying financial statements. Foreign taxes are provided for based on the fund’s understanding of the tax rules and rates that exist in the foreign markets in which it invests.
1. Significant Accounting Policies continued
| | |
| Income Tax Information and Distributions to Shareholders continued |
Distributions are recorded on the ex dividend date. Income and capital gain distribu tions are determined in accordance with income tax regulations, which may differ from generally accepted accounting principles. In addition, the fund will claim a portion of the payment made to redeeming shareholders as a distribution for income tax purposes.
Capital accounts within the financial statements are adjusted for permanent book tax differences. These adjustments have no impact on net assets or the results of operations. Temporary book tax differences will reverse in a subsequent period.
Book tax differences are primarily due to wash sales and futures transactions.
The tax basis components of distributable earnings and the federal tax cost as of period end were as follows:
| Unrealized appreciation | | | | | | $ | | 21,568,717 |
| Unrealized depreciation | | | | | | | | (10,413,890) |
| Net unrealized appreciation (depreciation) | | | | | | | | 11,154,827 |
| Undistributed ordinary income | | | | | | | | 418,638 |
| Undistributed long term capital gain | | | | | | | | 380,511 |
| |
| Cost for federal income tax purposes | | | | | | $ | | 107,293,639 |
| |
The tax character of distributions paid was as follows:
| | | | |
| | | | | November 30, 2005 | | | | November 30, 2004 |
| Ordinary Income | | $ | | 1,463,879 | | $ | | 93,441 |
| Long term Capital Gains | | | | 148,733 | | | | 8,831 |
| Total | | $ | | 1,612,612 | | $ | | 102,272 |
Short Term Trading (Redemption) Fees. Shares held in the fund less than 90 days are subject to a redemption fee equal to .75% of the proceeds of the redeemed shares. All redemption fees, including any estimated redemption fees paid by FMR, are retained by the fund and accounted for as an addition to paid in capital.
Repurchase Agreements. FMR has received an Exemptive Order from the Securities and Exchange Commission (the SEC) which permits the fund and other affiliated entities of FMR to transfer uninvested cash balances into joint trading accounts which are then invested in repurchase agreements. The fund may also invest directly with institutions in repurchase agreements. Repurchase agreements are collateralized by
71 Annual Report
Notes to Financial Statements continued
2. Operating Policies continued
Repurchase Agreements continued
government or non government securities. Collateral is held in segregated accounts with custodian banks and may be obtained in the event of a default of the counterparty. The fund monitors, on a daily basis, the value of the collateral to ensure it is at least equal to the principal amount of the repurchase agreement (including accrued interest). In the event of a default by the counterparty, realization of the collateral proceeds could be delayed, during which time the value of the collateral may decline.
Futures Contracts. The fund may use futures contracts to manage its exposure to the stock market. Buying futures tends to increase a fund’s exposure to the underlying instrument, while selling futures tends to decrease a fund’s exposure to the underlying instrument or hedge other fund investments. Futures contracts involve, to varying degrees, risk of loss in excess of any futures variation margin reflected in the Statement of Assets and Liabilities. The underlying face amount at value of any open futures contracts at period end is shown in the Schedule of Investments under the caption “Futures Contracts.” This amount reflects each contract’s exposure to the underlying instrument at period end. Losses may arise from changes in the value of the underlying instruments or if the counterparties do not perform under the contracts’ terms. Gains (losses) are realized upon the expiration or closing of the futures contracts. Futures contracts are valued at the settlement price established each day by the board of trade or exchange on which they are traded.
3. Purchases and Sales of Investments.
Purchases and sales of securities, other than short term securities and U.S. government securities, aggregated $17,227,994 and $11,021,162, respectively.
4. Fees and Other Transactions with Affiliates.
Management Fee. FMR and its affiliates provide the fund with investment manage ment related services for which the fund pays a monthly management fee that is based on an annual rate of .24% of the fund’s average net assets.
Sub Adviser. Geode Capital Management, LLC (Geode), serves as sub adviser for the fund. Geode provides discretionary investment advisory services to the fund and is paid by FMR for providing these services.
Distribution and Service Plan. In accordance with Rule 12b 1 of the 1940 Act, the fund has adopted a Distribution and Service Plan. The fund pays Fidelity Distributors Corporation (FDC), an affiliate of FMR, a distribution fee based on annual percentage of the fund’s average net assets of up to .25%. In addition, FDC pays Nasdaq for marketing services provided to the fund. For the period, the distribution fees were equivalent to an
| 4. Fees and Other Transactions with Affiliates continued |
Distribution and Service Plan continued | | |
annual rate of .06% of average net assets. The total amounts paid to and retained by FDC were $64,093 and $0, respectively.
Transfer Agent Fees. Fidelity Service Company, Inc. (FSC), an affiliate of FMR, is the fund’s transfer, dividend disbursing and shareholder servicing agent. FSC receives account fees and asset based fees that vary according to account size and type of ac count. FSC pays for typesetting, printing and mailing of shareholder reports, except proxy statements. For the period, the transfer agent fees were equivalent to an annual rate of .14% of average net assets.
Accounting and Security Lending Fees. FSC maintains the fund’s accounting re cords. The accounting fee is based on the level of average net assets for the month. Under a separate contract, FSC administers the security lending program. The security lending fee is based on the number and duration of lending transactions.
Licensing Fees. Under the terms of a license agreement, FMR pays Nasdaq an annual licensing fee for the use of the Nasdaq Composite Index. FMR has entered into a sub license agreement with the fund whereby the fund pays FMR the amount of the license fee at the rate of up to .06% of the fund’s average net assets.
Affiliated Central Funds. The fund may invest in Money Market Central Funds which seek preservation of capital and current income and are managed by Fidelity Invest ments Money Management, Inc. (FIMM), an affiliate of FMR.
The Money Market Central Funds do not pay a management fee.
5. Committed Line of Credit.
|
The fund participates with other funds managed by FMR in a $4.2 billion credit facility (the “line of credit”) to be utilized for temporary or emergency purposes to fund share holder redemptions or for other short term liquidity purposes. The fund has agreed to pay commitment fees on its pro rata portion of the line of credit. During the period, there were no borrowings on this line of credit.
The fund lends portfolio securities from time to time in order to earn additional income. The fund receives collateral (in the form of U.S. Treasury obligations, letters of credit and/or cash) against the loaned securities and maintains collateral in an amount not less than 100% of the market value of the loaned securities during the period of the loan. The market value of the loaned securities is determined at the close of business of the fund
73 Annual Report
Notes to Financial Statements continued
6. Security Lending continued
and any additional required collateral is delivered to the fund on the next business day. If the borrower defaults on its obligation to return the securities loaned because of insol vency or other reasons, a fund could experience delays and costs in recovering the securities loaned or in gaining access to the collateral. Cash collateral is invested in the Fidelity Securities Lending Cash Central Fund. The value of loaned securities and cash collateral at period end are disclosed on the fund’s Statement of Assets and Liabilities. Security lending income represents the income earned on investing cash collateral, less fees and expenses associated with the loan, plus any premium payments that may be received on the loan of certain types of securities.
FMR contractually agreed to waive expenses of the fund to the extent annual operating expenses exceeded .45% of average net assets. This waiver will remain in place through October 1, 2006. Some expenses, for example interest expense, are excluded from this waiver. During the period, this waiver reduced the fund’s expenses by $207,548.
The fund’s organizational documents provide former and current trustees and officers with a limited indemnification against liabilities arising in connection with the perfor mance of their duties to the fund. In the normal course of business, the fund may also enter into contracts that provide general indemnifications. The fund’s maximum expo sure under these arrangements is unknown as this would be dependent on future claims that may be made against the fund. The risk of material loss from such claims is considered remote.
Report of Independent Registered Public Accounting Firm
To the Trustees of Fidelity Commonwealth Trust and Shareholders of Fidelity NASDAQ Composite Index Fund:
We have audited the accompanying statement of assets and liabilities of Fidelity NASDAQ Composite Index Fund (the Fund), a fund of Fidelity Commonwealth Trust, including the schedule of investments as of November 30, 2005, and the related statement of operations for the year then ended, the statement of changes in net assets for each of the two years in the period then ended, and the financial highlights for each of the three years in the period then ended. These financial statements and financial highlights are the responsi bility of the Fund’s management. Our responsibility is to express an opinion on these financial statements and financial highlights based on our audits.
We conducted our audits in accordance with standards of the Public Company Accounting Oversight Board (United States). Those standards require that we plan and perform the audit to obtain reasonable assurance about whether the financial statements and financial highlights are free of material misstatement. The Fund is not required to have, nor were we engaged to perform, an audit of its internal control over financial reporting. Our audits included consideration of internal control over financial reporting as a basis for designing audit procedures that are appropriate in the circumstances, but not for the purpose of expressing an opinion on the effectiveness of the Fund’s internal control over financial reporting. Accordingly, we express no such opinion. An audit also includes examining, on a test basis, evidence supporting the amounts and disclosures in the financial statements, assessing the accounting principles used and significant estimates made by management, as well as evaluating the overall financial statement presentation. Our procedures in cluded confirmation of securities owned as of November 30, 2005, by correspondence with the custodians and brokers; where replies were not received from brokers, we performed other auditing procedures. We believe that our audits provide a reasonable basis for our opinion.
In our opinion, the financial statements and financial highlights referred to above present fairly, in all material respects, the financial position of Fidelity NASDAQ Composite Index Fund as of November 30, 2005, the results of its operations for the year then ended, the changes in its net assets for each of the two years in the period then ended, and its financial highlights for each of the three years in the period then ended, in conformity with accounting principles generally accepted in the United States of America.
/s/ Deloitte & Touche LLP
DELOITTE & TOUCHE LLP
Boston, Massachusetts
January 17, 2006
|
75 Annual Report
Trustees and Officers
The Trustees, Member of the Advisory Board, and executive officers of the trust and fund, as applicable, are listed below. The Board of Trustees governs the fund and is responsible for protecting the interests of shareholders. The Trustees are experienced executives who meet periodically throughout the year to oversee the fund’s activities, review contractual arrangements with companies that provide services to the fund, and review the fund’s performance. Except for William O. McCoy and Albert R. Gamper, Jr., each of the Trustees oversees 326 funds advised by FMR or an affiliate. Mr. McCoy oversees 328 funds advised by FMR or an affiliate. Mr. Gamper oversees 235 funds advised by FMR or an affiliate.
The Trustees hold office without limit in time except that (a) any Trustee may resign; (b) any Trustee may be removed by written instrument, signed by at least two thirds of the number of Trustees prior to such removal; (c) any Trustee who requests to be retired or who has become incapacitated by illness or injury may be retired by written instru ment signed by a majority of the other Trustees; and (d) any Trustee may be removed at any special meeting of shareholders by a two thirds vote of the outstanding voting securities of the trust. Each Trustee who is not an interested person (as defined in the 1940 Act) (Independent Trustee), shall retire not later than the last day of the calendar year in which his or her 72nd birthday occurs. The Independent Trustees may waive this mandatory retirement age policy with respect to individual Trustees. The executive officers and Advisory Board Member hold office without limit in time, except that any officer and Advisory Board Member may resign or may be removed by a vote of a majority of the Trustees at any regular meeting or any special meeting of the Trustees. Except as indicated, each individual has held the office shown or other offices in the same company for the past five years.
The fund’s Statement of Additional Information (SAI) includes more information about the Trustees. To request a free copy, call Fidelity at 1-800-544-8544.
Correspondence intended for each Trustee who is an interested person may be sent to Fidelity Investments, 82 Devonshire Street, Boston, Massachusetts 02109.
| | Name, Age; Principal Occupation
Edward C. Johnson 3d (75)
|
Year of Election or Appointment: 1974
Mr. Johnson is Chairman of the Board of Trustees. Mr. Johnson serves as Chief Executive Officer, Chairman, and a Director of FMR Corp.; a Di rector and Chairman of the Board and of the Executive Committee of FMR; Chairman and a Director of Fidelity Management & Research (Far East) Inc.; Chairman and a Director of Fidelity Investments Money Man agement, Inc.; and Chairman (2001 present) and a Director (2000 present) of FMR Co., Inc.
| | Name, Age; Principal Occupation
Stephen P. Jonas (52)
|
Year of Election or Appointment: 2005
Mr. Jonas is Senior Vice President of Fidelity Nasdaq Composite Index Fund (2005 present). He also serves as Senior Vice President of other Fidelity funds (2005 present). Mr. Jonas is Executive Director of FMR (2005 present). Previously, Mr. Jonas served as President of Fidelity En terprise Operations and Risk Services (2004 2005), Chief Administra tive Officer (2002 2004), and Chief Financial Officer of FMR Co. (1998 2000). Mr. Jonas has been with Fidelity Investments since 1987 and has held various financial and management positions including Chief Financial Officer of FMR. In addition, he serves on the Boards of Boston Ballet (2003 present) and Simmons College (2003 present).
Year of Election or Appointment: 2003
Mr. Reynolds is a Director (2003 present) and Chief Operating Officer (2002 present) of FMR Corp. He also serves on the Board at Fidelity Investments Canada, Ltd. (2000 present). Previously, Mr. Reynolds served as President of Fidelity Investments Institutional Retirement Group (1996 2000).
* Trustees have been determined to be “Interested Trustees” by virtue of, among other things, their affiliation with the trust or various entities under common control with FMR.
77 Annual Report
Trustees and Officers - continued
Independent Trustees:
Correspondence intended for each Independent Trustee (that is, the Trustees other than the Interested Trustees) may be sent to Fidelity Investments, P.O. Box 55235, Boston, Massachusetts 02205 5235.
| | Name, Age; Principal Occupation
Dennis J. Dirks (57)
|
Year of Election or Appointment: 2005
Prior to his retirement in May 2003, Mr. Dirks was Chief Operating Officer and a member of the Board of The Depository Trust & Clearing Corporation (DTCC) (1999 2003). He also served as President, Chief Operating Officer, and Board member of The Depository Trust Company (DTC) (1999 2003) and President and Board member of the National Securities Clearing Corporation (NSCC) (1999 2003). In addi tion, Mr. Dirks served as Chief Executive Officer and Board member of the Government Securities Clearing Corporation (2001 2003) and Chief Executive Officer and Board member of the Mortgage Backed Securities Clearing Corporation (2001 2003). Mr. Dirks also serves as a Trustee of Manhattan College (2005 present).
| | Albert R. Gamper, Jr. (63)
|
Year of Election or Appointment: 2006
Mr. Gamper also serves as a Trustee (2006 present) or Member of the Advisory Board (2005 present) of other investment companies advised by FMR. Prior to his retirement in December 2004, Mr. Gamper served as Chairman of the Board of CIT Group Inc. (commercial finance). During his tenure with CIT Group Inc. Mr. Gamper served in numerous senior management positions, including Chairman (1987 1989; 1999 2001; 2002 2004), Chief Executive Officer (1987 2004), and President (1989 2002). He currently serves as a member of the Board of Directors of Public Service Enterprise Group (utilities, 2001 present), Chairman of the Board of Governors, Rutgers University (2004 present), and Chairman of the Board of Saint Barnabas Health Care System.
Name, Age; Principal Occupation
Robert M. Gates (62)
|
Year of Election or Appointment: 1997
Dr. Gates is Chairman of the Independent Trustees (2006 present). Dr. Gates is President of Texas A&M University (2002 present). He was Director of the Central Intelligence Agency (CIA) from 1991 to 1993. From 1989 to 1991, Dr. Gates served as Assistant to the President of the United States and Deputy National Security Advisor. Dr. Gates is a Director of NACCO Industries, Inc. (mining and manufacturing), Parker Drilling Co., Inc. (drilling and rental tools for the energy industry, 2001 present), and Brinker International (restaurant management, 2003 present). Previously, Dr. Gates served as a Director of LucasVarity PLC (automotive components and diesel engines), a Director of TRW Inc. (automotive, space, defense, and information technology), and Dean of the George Bush School of Government and Public Service at Texas A&M University (1999 2001). Dr. Gates also is a Trustee of the Forum for International Policy.
Year of Election or Appointment: 2004
Dr. Heilmeier is Chairman Emeritus of Telcordia Technologies (commu nication software and systems), where prior to his retirement, he served as company Chairman and Chief Executive Officer. He currently serves on the Boards of Directors of The Mitre Corporation (systems engineer ing and information technology support for the government), and HRL Laboratories (private research and development, 2004 present). He is Chairman of the General Motors Science & Technology Advisory Board and a Life Fellow of the Institute of Electrical and Electronics Engineers (IEEE) (2000 present). Dr. Heilmeier is a member of the Defense Science Board and the National Security Agency Advisory Board. He is also a member of the National Academy of Engineering, the American Academy of Arts and Sciences, and the Board of Overseers of the School of Engineering and Applied Science of the University of Pennsyl vania. Previously, Dr. Heilmeier served as a Director of TRW Inc. (auto motive, space, defense, and information technology, 1992 2002), Compaq (1994 2002), Automatic Data Processing, Inc. (ADP) (technology based business outsourcing, 1995 2002), INET Technolo gies Inc. (telecommunications network surveillance, 2001 2004), and Teletech Holdings (customer management services). He is the recipient of the 2005 Kyoto Prize in Advanced Technology for his invention of the liquid display.
79 Annual Report
Trustees and Officers - continued
| | Name, Age; Principal Occupation
Marie L. Knowles (59)
|
Year of Election or Appointment: 2001
Prior to Ms. Knowles’ retirement in June 2000, she served as Executive Vice President and Chief Financial Officer of Atlantic Richfield Company (ARCO) (diversified energy, 1996 2000). From 1993 to 1996, she was a Senior Vice President of ARCO and President of ARCO Transportation Company. She served as a Director of ARCO from 1996 to 1998. She currently serves as a Director of Phelps Dodge Corporation (copper mining and manufacturing) and McKesson Corporation (healthcare ser vice, 2002 present). Ms. Knowles is a Trustee of the Brookings Institution and the Catalina Island Conservancy and also serves as a member of the Advisory Board for the School of Engineering of the University of Southern California.
Year of Election or Appointment: 2000
Mr. Lautenbach has been a partner of Clayton, Dubilier & Rice, Inc. (private equity investment firm) since September 1998. Previously, Mr. Lautenbach was with the International Business Machines Corporation (IBM) from 1968 until his retirement in 1998. Mr. Lautenbach serves as a Director of Italtel Holding S.p.A. (telecommunications (Milan, Italy), 2004 present) and Eaton Corporation (diversified industrial) as well as the Philharmonic Center for the Arts in Naples, Florida. He also is a member of the Board of Trustees of Fairfield University (2005 present), as well as a member of the Council on Foreign Relations.
Year of Election or Appointment: 1997
Prior to his retirement in December 1994, Mr. McCoy was Vice Chair man of the Board of BellSouth Corporation (telecommunications) and President of BellSouth Enterprises. He is currently a Director of Liberty Corporation (holding company), Duke Realty Corporation (real estate), and Progress Energy, Inc. (electric utility). He is also a partner of Frank lin Street Partners (private investment management firm) and a member of the Research Triangle Foundation Board. In addition, Mr. McCoy served as the Interim Chancellor (1999 2000) and a member of the Board of Visitors for the University of North Carolina at Chapel Hill and currently serves on the Board of Directors of the University of North Carolina Health Care System and the Board of Visitors of the Kenan Flagler Business School (University of North Carolina at Chapel Hill). He also served as Vice President of Finance for the University of North Carolina (16 school system).
Name, Age; Principal Occupation
Cornelia M. Small (61)
|
Year of Election or Appointment: 2005
Ms. Small is a member (2000 present) and Chairperson (2002 present) of the Investment Committee, and a member (2002 present) of the Board of Trustees of Smith College. Previously, she served as Chief In vestment Officer (1999 2000), Director of Global Equity Investments (1996 1999), and a member of the Board of Directors of Scudder, Stevens & Clark (1990 1997) and Scudder Kemper Investments (1997 1998). In addition, Ms. Small served as Co Chair (2000 2003) of the Annual Fund for the Fletcher School of Law and Diplomacy.
William S. Stavropoulos (66)
|
Year of Election or Appointment: 2002
Mr. Stavropoulos is Chairman of the Board (2000 present) and a Mem ber of the Board of Directors of The Dow Chemical Company. Since joining The Dow Chemical Company in 1967, Mr. Stavropoulos served in numerous senior management positions, including President (1993 2000; 2002 2003), CEO (1995 2000; 2002 2004), and Chair man of the Executive Committee (2000 2004). Currently, he is a Direc tor of NCR Corporation (data warehousing and technology solutions), BellSouth Corporation (telecommunications), Chemical Financial Corpo ration, Maersk Inc. (industrial conglomerate, 2002 present), and Metal mark Capital (private equity investment firm, 2005 present). He also serves as a member of the Board of Trustees of the American Enterprise Institute for Public Policy Research. In addition, Mr. Stavropoulos is a member of The Business Council, J.P. Morgan International Council and the University of Notre Dame Advisory Council for the College of Science.
Year of Election or Appointment: 2005
Prior to his retirement in 2001, Mr. Wolfe was Chairman and Chief Executive Officer of Hershey Foods Corporation (1993 2001). He cur rently serves as a member of the boards of Adelphia Communications Corporation (2003 present), Bausch & Lomb, Inc., and Revlon Inc. (2004 present).
81 Annual Report
Trustees and Officers - continued
Advisory Board Member and Executive Officers:
Correspondence intended for each executive officer and Mr. Lynch may be sent to Fidelity Investments, 82 Devonshire Street, Boston, Massachusetts 02109.
| | Name, Age; Principal Occupation
Peter S. Lynch (61)
|
Year of Election or Appointment: 2003
Member of the Advisory Board of Fidelity Commonwealth Trust. Vice Chairman and a Director of FMR, and Vice Chairman (2001 present) and a Director (2000 present) of FMR Co., Inc. Previously, Mr. Lynch served as a Trustee of the Fidelity funds (1990 2003). In addition, he serves as a Trustee of Boston College, Massachusetts Eye & Ear Infirmary, Historic Deerfield, John F. Kennedy Library, and the Museum of Fine Arts of Boston.
Year of Election or Appointment: 2005
Vice President of Fidelity Nasdaq Composite Index Fund. Mr. Churchill also serves as Vice President of certain Equity Funds (2005 present) and certain High Income Funds (2005 present). Previously, he served as Head of Fidelity’s Fixed Income Division (2000 2005), Vice President of Fidelity’s Money Market Funds (2000 2005), Vice President of Fidelity’s Bond Funds, and Senior Vice President of FIMM (2000) and FMR. Mr. Churchill joined Fidelity in 1993 as Vice President and Group Leader of Taxable Fixed Income Investments.
Year of Election or Appointment: 2003
Secretary of Fidelity Nasdaq Composite Index Fund. He also serves as Secretary of other Fidelity funds; Vice President, General Counsel, and Secretary of FMR Co., Inc. (2001 present) and FMR; Assistant Secretary of Fidelity Management & Research (U.K.) Inc. (2001 present), Fidelity Management & Research (Far East) Inc. (2001 present), and Fidelity Investments Money Management, Inc. (2001 present). Mr. Roiter is an Adjunct Member, Faculty of Law, at Boston College Law School (2003 present). Previously, Mr. Roiter served as Vice President and Secretary of Fidelity Distributors Corporation (FDC) (1998 2005).
Year of Election or Appointment: 2003
Assistant Secretary of Fidelity Nasdaq Composite Index Fund. Mr. Fross also serves as Assistant Secretary of other Fidelity funds (2003 present), Vice President and Secretary of FDC (2005 present), and is an em ployee of FMR.
Name, Age; Principal Occupation
Christine Reynolds (47)
|
Year of Election or Appointment: 2004
President, Treasurer, and Anti Money Laundering (AML) officer of Fidelity Nasdaq Composite Index Fund. Ms. Reynolds also serves as President, Treasurer, and AML officer of other Fidelity funds (2004) and is a Vice President (2003) and an employee (2002) of FMR. Before joining Fidelity Investments, Ms. Reynolds worked at Pricewaterhouse Coopers LLP (PwC) (1980 2002), where she was most recently an audit partner with PwC’s investment management practice.
Year of Election or Appointment: 2005
Chief Financial Officer of Fidelity Nasdaq Composite Index Fund. Mr. Murphy also serves as Chief Financial Officer of other Fidelity funds (2005 present). He also serves as Senior Vice President of Fidelity Pric ing and Cash Management Services Group (FPCMS).
Kenneth A. Rathgeber (58)
|
Year of Election or Appointment: 2004
Chief Compliance Officer of Fidelity Nasdaq Composite Index Fund. Mr. Rathgeber also serves as Chief Compliance Officer of other Fidelity funds (2004) and Executive Vice President of Risk Oversight for Fidelity Investments (2002). Previously, he served as Executive Vice President and Chief Operating Officer for Fidelity Investments Institutional Services Company, Inc. (1998 2002).
Year of Election or Appointment: 2003
Deputy Treasurer of Fidelity Nasdaq Composite Index Fund. Mr. Hebble also serves as Deputy Treasurer of other Fidelity funds (2003), and is an employee of FMR. Before joining Fidelity Investments, Mr. Hebble worked at Deutsche Asset Management where he served as Director of Fund Accounting (2002 2003) and Assistant Treasurer of the Scudder Funds (1998 2003).
Year of Election or Appointment: 2005
Deputy Treasurer of Fidelity Nasdaq Composite Index Fund. Mr. Mehr mann also serves as Deputy Treasurer of other Fidelity funds (2005 present) and is an employee of FMR. Previously, Mr. Mehrmann served as Vice President of Fidelity Investments Institutional Services Group (FIIS)/Fidelity Investments Institutional Operations Corporation, Inc. (FIIOC) Client Services (1998 2004).
83 Annual Report
Trustees and Officers - continued
| | Name, Age; Principal Occupation
Kimberley H. Monasterio (41)
|
Year of Election or Appointment: 2004
Deputy Treasurer of Fidelity Nasdaq Composite Index Fund. Ms. Monas terio also serves as Deputy Treasurer of other Fidelity funds (2004) and is an employee of FMR (2004). Before joining Fidelity Investments, Ms. Monasterio served as Treasurer (2000 2004) and Chief Financial Offi cer (2002 2004) of the Franklin Templeton Funds and Senior Vice Presi dent of Franklin Templeton Services, LLC (2000 2004).
Year of Election or Appointment: 2005
Deputy Treasurer of Fidelity Nasdaq Composite Index Fund. Mr. Robins also serves as Deputy Treasurer of other Fidelity funds (2005 present) and is an employee of FMR (2004 present). Before joining Fidelity In vestments, Mr. Robins worked at KPMG LLP, where he was a partner in KPMG’s department of professional practice (2002 2004) and a Senior Manager (1999 2000). In addition, Mr. Robins served as Assistant Chief Accountant, United States Securities and Exchange Commission (2000 2002).
Year of Election or Appointment: 2005
Assistant Treasurer of Fidelity Nasdaq Composite Index Fund. Mr. Byrnes also serves as Assistant Treasurer of other Fidelity funds (2005 present) and is an employee of FMR (2005 present). Previously, Mr. Byrnes served as Vice President of FPCMS (2003 2005). Before joining Fidelity Investments, Mr. Byrnes worked at Deutsche Asset Man agement where he served as Vice President of the Investment Opera tions Group (2000 2003).
Year of Election or Appointment: 2003
Assistant Treasurer of Fidelity Nasdaq Composite Index Fund. Mr. Costello also serves as Assistant Treasurer of other Fidelity funds and is an employee of FMR.
Year of Election or Appointment: 2004
Assistant Treasurer of Fidelity Nasdaq Composite Index Fund. Mr. Lydecker also serves as Assistant Treasurer of other Fidelity funds (2004) and is an employee of FMR.
Name, Age; Principal Occupation
Mark Osterheld (50)
|
Year of Election or Appointment: 2003
Assistant Treasurer of Fidelity Nasdaq Composite Index Fund. Mr. Oster held also serves as Assistant Treasurer of other Fidelity funds (2002) and is an employee of FMR.
Year of Election or Appointment: 2005
Assistant Treasurer of Fidelity Nasdaq Composite Index Fund. Mr. Ryan also serves as Assistant Treasurer of other Fidelity funds (2005 present) and is an employee of FMR (2005 present). Previously, Mr. Ryan served as Vice President of Fund Reporting in FPCMS (1999 2005).
Year of Election or Appointment: 2005
Assistant Treasurer of Fidelity Nasdaq Composite Index Fund. Mr. Schia vone also serves as Assistant Treasurer of other Fidelity funds (2005 present) and is an employee of FMR (2005 present). Before join ing Fidelity Investments, Mr. Schiavone worked at Deutsche Asset Man agement, where he most recently served as Assistant Treasurer (2003 2005) of the Scudder Funds and Vice President and Head of Fund Reporting (1996 2003).
85 Annual Report
The Board of Trustees of Fidelity NASDAQ Composite Index Fund voted to pay to shareholders of record at the opening of business on record date, the following distributions per share derived from capital gains realized from sales of portfolio securi ties, and dividends derived from net investment income:
| Pay Date | | Record Date | | Dividends | | Capital Gains |
| 12/16/05 | | 12/19/05 | | $0.08 | | $0.09 |
| 01/06/06 | | 01/09/06 | | — | | $0.04 |
The fund hereby designates as capital gain dividends: For dividends with respect to the taxable year ended November 30, 2005, $380,511 or, if subsequently determined to be different, the net capital gain of such year, and for dividends with respect to the taxable year ended November 30, 2004, $148,913 or, if subsequently determined to be different, the excess of: (a) the net capital gain of such year, over (b) amounts pre viously designated as capital gain dividends with respect to such year.
The fund designates 100%, and 36% of the dividends distributed in December and January, respectively during the fiscal year as qualifying for the dividends received deduction for corporate shareholders.
The fund designates 100%, and 51% of the dividends distributed in December and January, respectively during the fiscal year as amounts which may be taken into account as a dividend for the purposes of the maximum rate under section 1(h)(11) of the Internal Revenue Code.
The fund will notify shareholders in January 2006 of amounts for use in preparing 2005 income tax returns.
Proxy Voting Results
A special meeting of the fund’s shareholders was held on November 16, 2005. The results of votes taken among shareholders on proposals before them are reported below. Each vote reported represents one dollar of net asset value held on the record date for the meeting.
| PROPOSAL 1 | | |
| To elect a Board of Trustees.A | | |
| | | # of | | % of |
| | | Votes | | Votes |
| Dennis J. Dirks | | |
| Affirmative | | 18,240,248,322.53 | | 96.150 |
| Withheld | | 730,313,302.58 | | 3.850 |
| TOTAL | | 18,970,561,625.11 | | 100.000 |
| |
| Albert R. Gamper, Jr.B | | |
| Affirmative | | 18,204,838,072.06 | | 95.964 |
| Withheld | | 765,723,553.05 | | 4.036 |
| TOTAL | | 18,970,561,625.11 | | 100.000 |
| Robert M. Gates | | |
| Affirmative | | 18,191,748,681.13 | | 95.895 |
| Withheld | | 778,812,943.98 | | 4.105 |
| TOTAL | | 18,970,561,625.11 | | 100.000 |
| George H. Heilmeier | | |
| Affirmative | | 18,193,638,757.60 | | 95.905 |
| Withheld | | 776,922,867.51 | | 4.095 |
| TOTAL | | 18,970,561,625.11 | | 100.000 |
| Abigail P. Johnson | | |
| Affirmative | | 18,103,320,241.78 | | 95.428 |
| Withheld | | 867,241,383.33 | | 4.572 |
| TOTAL | | 18,970,561,625.11 | | 100.000 |
| Edward C. Johnson 3d | | |
| Affirmative | | 18,055,585,171.13 | | 95.177 |
| Withheld | | 914,976,453.98 | | 4.823 |
| TOTAL | | 18,970,561,625.11 | | 100.000 |
| Stephen P. Jonas | | |
| Affirmative | | 18,188,419,716.35 | | 95.877 |
| Withheld | | 782,141,908.76 | | 4.123 |
| TOTAL | | 18,970,561,625.11 | | 100.000 |
| Marie L. Knowles | | |
| Affirmative | | 18,208,650,664.29 | | 95.984 |
| Withheld | | 761,910,960.82 | | 4.016 |
| TOTAL | | 18,970,561,625.11 | | 100.000 |
| | | # of | | % of |
| | | Votes | | Votes |
| |
| Ned C. Lautenbach | | |
| Affirmative | | 18,224,936,039.64 | | 96.070 |
| Withheld | | 745,625,585.47 | | 3.930 |
| TOTAL | | 18,970,561,625.11 | | 100.000 |
| |
| Marvin L. Mann | | |
| Affirmative | | 18,146,216,753.93 | | 95.655 |
| Withheld | | 824,344,871.18 | | 4.345 |
| TOTAL | | 18,970,561,625.11 | | 100.000 |
| |
| William O. McCoy | | |
| Affirmative | | 18,164,580,135.79 | | 95.751 |
| Withheld | | 805,981,489.32 | | 4.249 |
| TOTAL | | 18,970,561,625.11 | | 100.000 |
| |
| Robert L. Reynolds | | |
| Affirmative | | 18,197,448,372.22 | | 95.925 |
| Withheld | | 773,113,252.89 | | 4.075 |
| TOTAL | | 18,970,561,625.11 | | 100.000 |
| |
| Cornelia M. Small | | |
| Affirmative | | 18,214,122,413.76 | | 96.013 |
| Withheld | | 756,439,211.35 | | 3.987 |
| TOTAL | | 18,970,561,625.11 | | 100.000 |
| |
| William S. Stavropoulos | | |
| Affirmative | | 18,186,563,509.46 | | 95.867 |
| Withheld | | 783,998,115.65 | | 4.133 |
| TOTAL | | 18,970,561,625.11 | | 100.000 |
| |
| Kenneth L. Wolfe | | |
| Affirmative | | 18,211,332,412.92 | | 95.998 |
| Withheld | | 759,229,212.19 | | 4.002 |
| TOTAL | | 18,970,561,625.11 | | 100.000 |
A Denotes trust-wide proposals and voting results.
B Effective on or about January 1, 2006.
|
87 Annual Report
Board Approval of Investment Advisory Contracts and Management Fees
Nasdaq Composite Index Fund
Each year, typically in July, the Board of Trustees, including the independent Trustees (together, the Board), votes on the renewal of the management contract and sub advisory agreements (together, the Advisory Contracts) for the fund. The Board, assisted by the advice of fund counsel and independent Trustees’ counsel, requests and considers a broad range of information throughout the year.
The Board meets regularly each month except August and takes into account throughout the year matters bearing on Advisory Contracts. The Board, acting directly and through its separate committees, considers at each of its meetings factors that are relevant to the annual renewal of the fund’s Advisory Contracts, including the services and support provided to the fund and its shareholders by Fidelity. At the time of the renewal, the Board had 11 standing committees, each composed of independent Trustees with varying backgrounds, to which the Board has assigned specific subject matter responsibilities in order to enhance effective decision making by the Board. Each committee has adopted a written charter outlining the structure and purposes of the committee. One such com mittee, the Equity Contract Committee, meets periodically during the first six months of each year and as necessary to consider matters specifically related to the annual renewal of Advisory Contracts. The committee requests and receives information on, and makes recommendations to the independent Trustees concerning, the approval and annual review of the Advisory Contracts.
At its July 2005 meeting, the Board of Trustees, including the independent Trustees, unanimously determined to renew the Advisory Contracts for the fund. In reaching its determination, the Board considered all factors it believed relevant, including (1) the nature, extent, and quality of the services to be provided to the fund and its shareholders by Fidelity (including the investment performance of the fund); (2) the competitiveness of the management fee and total expenses of the fund; (3) the total costs of the services to be provided by and the profits to be realized by the investment adviser and its affiliates from the relationship with the fund; (4) the extent to which economies of scale would be realized as the fund grows; and (5) whether fee levels reflect these economies of scale, if any, for the benefit of fund shareholders.
In determining whether to renew the Advisory Contracts for the fund, the Board ulti mately reached a determination, with the assistance of fund counsel and independent Trustees’ counsel, that the renewal of the Advisory Contracts and the compensation to be received by Fidelity under the management contract is consistent with Fidelity’s fidu ciary duty under applicable law. In addition to evaluating the specific factors noted above, the Board, in reaching its determination, is aware that shareholders in the fund have a broad range of investment choices available to them, including a wide choice among mutual funds offered by competitors to Fidelity, and that the fund’s shareholders, with the opportunity to review and weigh the disclosure provided by the fund in its
prospectus and other public disclosures, have chosen to invest in this fund, managed by Fidelity.
Nature, Extent, and Quality of Services Provided by Fidelity. The Board consid ered staffing within the investment adviser, FMR, and the sub advisers (together, the Investment Advisers), including the background of the fund’s portfolio manager and the fund’s investment objective and discipline. The independent Trustees also had discus sions with senior management of Fidelity’s investment operations and investment groups. The Board considered the structure of the portfolio manager compensation program and whether this structure provides appropriate incentives.
Fidelity Resources Dedicated to Investment Management and Support Services. The Board reviewed the size, education, and experience of the Investment Advisers’ invest ment staff, their use of technology, and the Investment Advisers’ approach to recruiting, training, and retaining portfolio managers and other research, advisory, and manage ment personnel.
Shareholder and Administrative Services. The Board considered the nature, extent, quality, and cost of administrative, distribution, and shareholder services performed by the Investment Advisers and their affiliates under the Advisory Contracts and under separate agreements covering transfer agency, pricing and bookkeeping, and securities lending services for the fund. The Board also considered the nature and extent of the Investment Advisers’ supervision of third party service providers, principally custodians and subcustodians. The Board reviewed the allocation of fund brokerage, including allocations to brokers affiliated with the Investment Advisers. The Board also considered the resources devoted to, and the record of compliance with, the fund’s compliance policies and procedures.
The Board noted that the growth of fund assets across the complex allows Fidelity to reinvest in the development of services designed to enhance the value or convenience of the Fidelity funds as investment vehicles. These services include 24 hour access to account information and market information through phone representatives and over the Internet, and investor education materials and asset allocation tools.
Investment in a Large Fund Family. The Board considered the benefits to shareholders of investing in a Fidelity fund, including the benefits of investing in a fund that is part of a large family of funds offering a variety of investment disciplines and providing for a large variety of mutual fund investor services. For example, fund shareholders are offered the privilege of exchanging shares of the fund for shares of other Fidelity funds, as set forth in the fund’s prospectus, without paying a sales charge. The Board noted that, since the last Advisory Contract renewals in July 2004, Fidelity has taken a number of actions that benefited particular funds, including (i) voluntarily deciding in 2004 to stop using “soft” commission dollars to pay for market data and, instead, to pay for that data out of its own resources, (ii) contractually agreeing to impose management fee reductions and
89 Annual Report
Board Approval of Investment Advisory Contracts and Management Fees continued
expense limitations on its five Spartan stock index funds and its stock index fund available through variable insurance products, (iii) contractually agreeing to eliminate the management fees on the Fidelity Freedom Funds and the Fidelity Advisor Freedom Funds, (iv) contractually agreeing to reduce the management fees on most of its investment grade taxable bond funds, and (v) contractually agreeing to impose expense limitations on its retail and Spartan investment grade taxable bond funds.
Investment Performance. The Board considered whether the fund has operated within its investment objective, as well as its record of compliance with its investment restric tions. It also reviewed the fund’s absolute investment performance, as well as the fund’s relative investment performance measured against (i) a broad based securities market index, and (ii) a peer group of mutual funds over multiple periods. Because the fund had been in existence less than three calendar years, the following chart considered by the Board shows, for the one year period ended December 31, 2004, the fund’s return, the return of a broad based securities market index (“benchmark”), and a range of returns of a peer group of mutual funds identified by Lipper Inc. as having an investment objective similar to that of the fund. The box within the chart shows the 25th percentile return (bottom of box) and the 75th percentile return (top of box) of the Lipper peer group. Returns shown above the box are in the first quartile and returns shown below the box are in the fourth quartile. The percentage beaten number noted below the chart corre sponds to the percentile box and represents the percentage of funds in the Lipper peer group whose performance was equal to or lower than that of the fund.
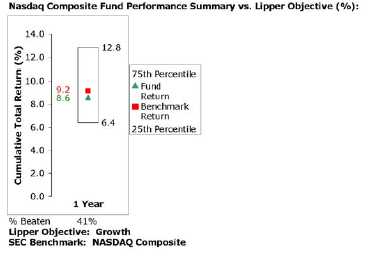
The Board reviewed the fund’s relative investment performance against its Lipper peer group and stated that the performance of the fund was in the third quartile for the one year period. The Board noted that FMR does not consider that Lipper peer group to
be a meaningful comparison for the fund, however, because the peer group includes funds with broader investment mandates than tracking the performance of the Nasdaq Composite Index. The Board also stated that the relative investment performance of the fund was lower than its benchmark for the one year period. The Board stated that it is difficult to evaluate in any comprehensive fashion the performance of the fund, in light of its relatively recent launch.
Based on its review, and giving particular weight to the nature and quality of the resources dedicated by the Investment Advisers to maintain and improve relative performance, the Board concluded that the nature, extent, and quality of the services provided by Fidelity will benefit the fund’s shareholders, particularly in light of the Board’s view that the fund’s shareholders benefit from investing in a fund that is part of a large family of funds offering a variety of investment disciplines and services.
Competitiveness of Management Fee and Total Fund Expenses. The Board considered the fund’s management fee and total expenses compared to “mapped groups” of competitive funds and classes. Fidelity creates “mapped groups” by combining similar Lipper investment objective categories that have comparable management fee charac teristics. Combining Lipper investment objective categories aids the Board’s manage ment fee and total expense comparisons by broadening the competitive group used for comparison and by reducing the number of universes to which various Fidelity funds are compared.
The Board considered two proprietary management fee comparisons for the 12 month (or shorter) periods shown in the chart below. The group of Lipper funds used by the Board for management fee comparisons is referred to below as the “Total Mapped Group” and, for the reasons explained above, is broader than the Lipper peer group used by the Board for performance comparisons. The Total Mapped Group comparison focuses on a fund’s standing relative to the total universe of comparable funds available to investors, in terms of gross management fees before expense reimbursements or caps. “TMG %” represents the percentage of funds in the Total Mapped Group that had management fees that were lower than the fund’s. For example, a TMG % of 38% means that 62% of the funds in the Total Mapped Group had higher management fees than the fund. The “Asset Size Peer Group” (ASPG) comparison focuses on a fund’s standing relative to non Fidelity funds similar in size to the fund within the Total Mapped Group. The ASPG represents at least 15% of the funds in the Total Mapped Group with comparable asset size and management fee characteristics, subject to a minimum of 50 funds (or all funds in the Total Mapped Group if fewer than 50). Additional information, such as the ASPG quartile (“quadrant”) in which the fund’s management fee ranked, is also included in the chart and considered by the Board.
91 Annual Report
Board Approval of Investment Advisory Contracts and Management Fees continued
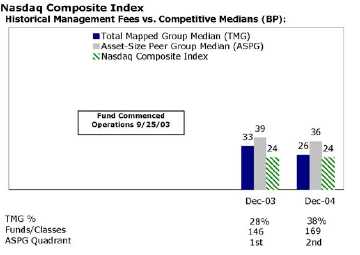
The Board noted that the fund’s management fee ranked below the median of its Total Mapped Group and below the median of its ASPG for 2004.
Based on its review, the Board concluded that the fund’s management fee was fair and reasonable in light of the services that the fund receives and the other factors considered.
In its review of the fund’s total expenses, the Board considered the fund’s management fee as well as other fund expenses, such as transfer agent fees, pricing and bookkeeping fees, fund paid 12b 1 fees, and custodial, legal, and audit fees. The Board also noted the effects of any waivers and reimbursements on fees and expenses. As part of its review, the Board also considered current and historical total expenses of the fund compared to competitive fund median expenses. The fund is compared to those funds and classes in the Total Mapped Group (used by the Board for management fee comparisons) that have a similar sales load structure.
The Board noted that the fund’s total expenses ranked above its competitive median for 2004.
In its review of total expenses, the Board also considered Fidelity fee structures and other information on clients that FMR and its affiliates service in other competitive markets, such as other mutual funds advised or subadvised by FMR or its affiliates, pension plan clients, and other institutional clients.
Based on its review, the Board concluded that the fund’s total expenses were reasonable, although above the median of the universe presented for comparison, in light of the services that the fund and its shareholders receive and the other factors considered.
Costs of the Services and Profitability. The Board considered the revenues earned and the expenses incurred by Fidelity in conducting the business of developing, market ing, distributing, managing, administering and servicing the fund and its shareholders. The Board also considered the level of Fidelity’s profits in respect of all the Fidelity funds.
On an annual basis, FMR presents to the Board Fidelity’s profitability for the fund. Fidelity calculates the profitability for each fund, as well as aggregate profitability for groups of Fidelity funds and all Fidelity funds, using a series of detailed revenue and cost allocation methodologies which originate with the audited books and records of Fidelity. The Audit Committee of the Board reviews any significant changes from the prior year’s methodologies.
PricewaterhouseCoopers LLP (PwC), independent registered accounting firm and auditor to Fidelity and certain Fidelity funds, has been engaged annually by the Board as part of the Board’s assessment of the results of Fidelity’s profitability analysis. PwC’s engagement includes the review and assessment of Fidelity’s methodologies used in determining the revenues and expenses attributable to Fidelity’s mutual fund business, and completion of agreed upon procedures surrounding the mathematical accuracy of fund profitability and its conformity to allocation methodologies. After considering PwC’s reports issued under the engagement and information provided by Fidelity, the Board believes that while other allocation methods may also be reasonable, Fidelity’s profitabil ity methodologies are reasonable in all material respects.
The Board has also reviewed Fidelity’s non fund businesses and any fall out benefits related to the mutual fund business as well as cases where Fidelity’s affiliates may benefit from or be related to the fund’s business. In addition, a special committee of the Board reviewed services provided to Fidelity by its affiliates and determined that the fees that Fidelity paid for such services were reasonable.
The Board considered the costs of the services provided by and the profits realized by Fidelity in connection with the operation of the fund and determined that the amount of profit is a fair entrepreneurial profit for the management of the fund.
Economies of Scale. The Board considered whether there have been economies of scale in respect of the management of the Fidelity funds, whether the Fidelity funds (including the fund) have appropriately benefited from any such economies of scale, and whether there is potential for realization of any further economies of scale. The Board considered the extent to which the fund will benefit from economies of scale through increased services to the fund, through waivers or reimbursements, or through fee or expense reductions, including reductions that occur through operation of the transfer agent agreement. The transfer agent fee varies in part based on the number of accounts in the fund. If the number of accounts decreases or the average account size increases, the overall transfer agent fee rate decreases. The Board concluded that any potential
93 Annual Report
Board Approval of Investment Advisory Contracts and Management Fees continued
economies of scale are being shared between fund shareholders and Fidelity in an appropriate manner.
Additional Information Requested by the Board. In order to develop fully the factual basis for consideration of the Advisory Contracts, the Board requested additional information regarding (i) equity fund transfer agency fees; (ii) Fidelity’s fund profitability methodology and the impact of various changes in the methodology over time; (iii) benefits to shareholders from economies of scale; (iv) composition and characteristics of various fund and industry data used in comparisons; and (v) com pensation of portfolio managers and research analysts.
Based on its evaluation of all of the conclusions noted above, and after considering all material factors, the Board ultimately concluded that the existing advisory fee structures are fair and reasonable, and that the fund’s existing Advisory Contracts should be renewed.
Managing Your Investments
Fidelity offers several ways to conveniently manage your personal investments via your telephone or PC. You can access your account information, conduct trades and research your investments 24 hours a day.
By Phone
Fidelity Automated Service Telephone provides a single toll free number to access account balances, positions, quotes and trading. It’s easy to navigate the service, and on your first call, the system will help you create a personal identification number (PIN) for security.


By PC
Fidelity’s web site on the Internet provides a wide range of information, including daily financial news, fund performance, interactive planning tools and news about Fidelity products and services.

* When you call the quotes line, please remember that a fund’s yield and return will vary and, except for money market funds, share price will also vary. This means that you may have a gain or loss when you sell your shares. There is no assurance that money market funds will be able to maintain a stable $1 share price; an investment in a money market fund is not insured or guar anteed by the U.S. government. Total returns are historical and include changes in share price, reinvestment of dividends and capital gains, and the effects of any sales charges.
95 Annual Report
Investment Adviser
Fidelity Management & Research Company
Boston, MA
Investment Sub Advisers
FMR Co., Inc.
Geode Capital Management, LLC
General Distributor
Fidelity Distributors Corporation
Boston, MA
Transfer and Service Agent
Fidelity Service Company, Inc.
Boston, MA
Custodian
JPMorgan Chase Bank
New York, NY
The Fidelity Telephone Connection
1 800 FIDELITY
|
EIF UANN-0106
1.795563.102
|

Fidelity®
Nasdaq Composite® Index
Tracking Stock
|
Annual Report
November 30, 2005
|


| Contents | | | | |
| |
| Chairman’s Message | | 4 | | Ned Johnson’s message to shareholders. |
| Performance | | 5 | | How the fund has done over time. |
| Management’s Discussion | | 7 | | The manager’s review of fund |
| | | | | performance, strategy and outlook. |
| Premium/Discount | | 8 | | Information regarding the fund’s NAV and |
| Analysis | | | | market price. |
| Shareholder Expense | | 9 | | An example of shareholder expenses. |
| Example | | | | |
| Investment Changes | | 10 | | A summary of major shifts in the fund’s |
| | | | | investments over the past six months. |
| Investments | | 11 | | A complete list of the fund’s investments |
| | | | | with their market values. |
| Financial Statements | | 65 | | Statements of assets and liabilities, |
| | | | | operations, and changes in net assets, |
| | | | | as well as financial highlights. |
| Notes | | 69 | | Notes to the financial statements. |
| Report of Independent | | 75 | | |
| Registered Public | | | | |
| Accounting Firm | | | | |
| Trustees and Officers | | 76 | | |
| Distributions | | 86 | | |
| Proxy Voting Results | | 87 | | |
| Board Approval of | | 88 | | |
| Investment Advisory | | | | |
| Contracts and | | | | |
| Management Fees | | | | |
To view a fund’s proxy voting guidelines and proxy voting record for the 12 month period
ended June 30, visit www.fidelity.com/proxyvotingresults or visit the Securities and Exchange
Commission’s (SEC) web site at www.sec.gov. You may also call 1-800-FIDELITY to request a free
copy of the proxy voting guidelines.
|
Annual Report 2
Nasdaq® and Nasdaq Composite® are trademarks of The Nasdaq Stock Market, Inc. (which with its
Affiliates are the Corporations) and are licensed for use by Fidelity. The product has not been
passed on by the Corporations as to its legality or suitability. The product is not issued, endorsed or
sold by the Corporations. The Corporations make no warranties and bear no liability with respect to
shares of the product.
Standard & Poor’s, S&P and S&P 500 are registered service marks of The McGraw Hill Companies, Inc.
and have been licensed for use by Fidelity Distributors Corporation.
Other third party marks appearing herein are the property of their respective owners.
All other marks appearing herein are registered or unregistered trademarks or service marks
of FMR Corp. or an affiliated company.
|
| | This report and the financial statements contained herein are submitted for the general information
of the shareholders of the fund. This report is not authorized for distribution to prospective investors
in the fund unless preceded or accompanied by an effective prospectus.
A fund files its complete schedule of portfolio holdings with the SEC for the first and third
quarters of each fiscal year on Form N Q. Forms N Q are available on the SEC’s web site at
http://www.sec.gov. A fund’s Forms N Q may be reviewed and copied at the SEC’s Public Reference
Room in Washington, DC. Information regarding the operation of the SEC’s Public Reference
Room may be obtained by calling 1-800-SEC-0330. For a complete list of a fund’s portfolio hold
ings, view the most recent quarterly holdings report, semiannual report, or annual report on
Fidelity’s web site at http://www.fidelity.com/goto/oneq.
NOT FDIC INSURED · MAY LOSE VALUE · NO BANK GUARANTEE
Neither the fund nor Fidelity Distributors Corporation is a bank.
|
Chairman’s Message
(photograph of Edward C. Johnson 3d)
Dear Shareholder:
During the past year or so, much has been reported about the mutual fund industry, and much of it has been more critical than I believe is warranted. Allegations that some companies have been less than forthright with their shareholders have cast a shadow on the entire industry. I continue to find these reports disturbing, and assert that they do not create an accurate picture of the industry overall. Therefore, I would like to remind every one where Fidelity stands on these issues. I will say two things specifically regarding allegations that some mutual fund companies were in violation of the Securities and Exchange Commission’s forward pricing rules or were involved in so called “market timing” activities.
First, Fidelity has no agreements that permit customers who buy fund shares after 4 p.m. to obtain the 4 p.m. price. This is not a new policy. This is not to say that some one could not deceive the company through fraudulent acts. However, we are extremely diligent in preventing fraud from occurring in this manner and in every other. But I underscore again that Fidelity has no so called “agreements” that sanction illegal practices.
Second, Fidelity continues to stand on record, as we have for years, in opposition to predatory short term trading that adversely affects shareholders in a mutual fund. Back in the 1980s, we initiated a fee which is returned to the fund and, therefore, to investors to discourage this activity. Further, we took the lead several years ago in developing a Fair Value Pricing Policy to prevent market timing on foreign securities in our funds. I am confident we will find other ways to make it more difficult for predatory traders to operate. However, this will only be achieved through close cooperation among regulators, legislators and the industry.
Yes, there have been unfortunate instances of unethical and illegal activity within the mutual fund industry from time to time. That is true of any industry. When this occurs, confessed or convicted offenders should be dealt with appropriately. But we are still concerned about the risk of over regulation and the quick application of simplistic solutions to intricate problems. Every system can be improved, and we support and applaud well thought out improvements by regulators, legislators and industry representatives that achieve the common goal of building and protecting the value of investors’ holdings.
For nearly 60 years, Fidelity has worked very hard to improve its products and service to justify your trust. When our family founded this company in 1946, we had only a few hundred customers. Today, we serve more than 18 million customers including individual investors and participants in retirement plans across America.
Let me close by saying that we do not take your trust in us for granted, and we realize that we must always work to improve all aspects of our service to you. In turn, we urge you to continue your active participation with your financial matters, so that your interests can be well served.
Best regards,
/s/ Edward C. Johnson 3d
Edward C. Johnson 3d
Annual Report 4
Performance: The Bottom Line
The fund’s net asset value (“NAV”) performance is based on the NAV calculated each business day. It is calculated in accordance with the standard formula for valuing mutual fund shares as of the close of regular trading hours on the Nasdaq stock market, normally 4:00 p.m. Eastern time (or NYSE if Nasdaq is closed). The fund’s market price performance is based on the daily closing price of the shares of the fund on the Nasdaq stock market.
Cumulative total returns reflect performance over the period shown generally by adding one year’s return positive or negative to the next year’s return. NAV and closing market price average annual returns reflect the change in the value of an investment, assuming reinvestment of the fund’s dividend income and capital gains (the profits earned upon the sale of securities that have grown in value), at NAV and Market Price, respectively, and assumes a constant rate of performance each year. The $10,000 table and the fund’s returns do not reflect the deduction of taxes that a share holder would pay on fund distributions or the redemption or selling of fund shares. How a fund did yesterday is no guarantee of how it will do tomorrow.
| Cumulative Total Returns | | | | | | |
| Periods ended November 30, 2005 | | | | Past 1 | | Life of |
| | | | | year | | FundA |
| Fidelity® Nasdaq Composite® Index Tracking Stock | | NAV | | 6.96% | | 23.44% |
| Fidelity Nasdaq Composite Index Tracking Stock | | Market Price | | 6.75% | | 23.31% |
| NASDAQ Composite® Index | | | | 7.32% | | 24.64% |
| |
| Average Annual Total Returns | | | | | | |
| Periods ended November 30, 2005 | | | | Past 1 | | Life of |
| | | | | year | | FundA |
| Fidelity® Nasdaq Composite® Index Tracking Stock | | NAV | | 6.96% | | 10.12% |
| Fidelity Nasdaq Composite Index Tracking Stock | | Market Price | | 6.75% | | 10.07% |
| A From September 25, 2003. | | | | | | |
5 Annual Report
5
| | $10,000 Over Life of Fund
|
Let’s say hypothetically that $10,000 was invested in Fidelity® Nasdaq Composite Index Tracking Stock NAV on September 25, 2003, when the fund started. The chart shows how the value of your investment would have changed, and also shows how the NASDAQ Composite® Index performed over the same period.
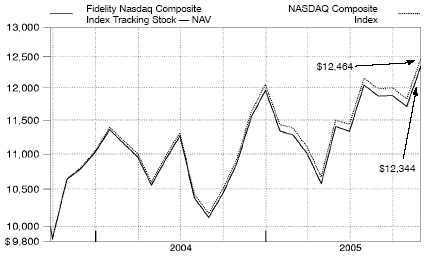
Annual Report 6
Management’s Discussion of Fund Performance
Comments from Jeffrey Adams, who oversees the Fidelity® Nasdaq Composite® Index Tracking Stock’s investment management team as Head of Indexing for Geode Capital Management, LLC
Numerous events unfolded during the 12 month period ending November 30, 2005, that were major influences on the U.S. equity markets. Issues exerting downward pressure on stocks included higher levels of inflation, eight short term interest rate hikes by the Federal Reserve Board, exorbitant energy prices, and a Category 4 hurricane that devastated both the city of New Orleans and several nearby oil production and refinery facilities. Grabbing most of the markets’ upbeat headlines was consistent strength in consumer spending, corporate earnings and gross domestic product (GDP). When all was said and done, investors demonstrated their conviction in the economy, pushing stocks higher across the board. By period end, the Standard & Poor’s 500SM Index and the Dow Jones Industrial AverageSM approached or exceeded four and a half year highs. For the 12 months overall, the S&P 500® was up 8.44% and the Dow advanced 6.07%, threatening to eclipse the 11,000 threshold for the first time since 2001.
During the past year, the fund’s return at net asset value was 6.96%, compared to the 7.32% return of the NASDAQ Composite Index and the 6.75% return of the fund’s market price. The LipperSM Growth Funds Average increased 9.91% an indication that the large cap growth category finally began to recover after several years of underperformance. On a sector basis, energy, telecommunication services and health care were particular areas of strength, while consumer discretionary and materials stocks lagged, producing negative returns. In terms of individual contributors, Internet search leader Google maintained its strong performance. The company continued to generate tremendous amounts of cash through its sales of targeted online ads. Apple Computer also maintained its momentum. Apple’s shares soared on strong sales of the company’s iPod digital music player, as well as optimism that higher iPod sales could lead to greater interest in Apple’s more profitable Macintosh computer line. Conversely, Dell was a noteworthy underperformer. The direct retailer of personal computers and consumer electronics has been battling fierce global competition, and its severe price cutting contributed to missed sales targets in August and October. Online auction house eBay also disappointed. The company’s shares fell sharply early in the period after it announced weaker than expected earnings and revenues.
The views expressed in this statement reflect those of the portfolio manager only through the end of the period of the report as stated on the cover and do not necessarily represent the views of Fidelity or any other person in the Fidelity organization. Any such views are subject to change at any time based upon market or other conditions and Fidelity disclaims any responsibility to update such views. These views may not be relied on as investment advice and, because investment decisions for a Fidelity fund are based on numerous factors, may not be relied on as an indication of trading intent on behalf of any Fidelity fund.
Premium/Discount Analysis (Unaudited)
Shares of Fidelity® Nasdaq Composite® Index Tracking Stock (the fund) are listed on the Nasdaq stock market and can be bought and sold on the secondary market at mar ket prices. Although the market price is expected to approximate the fund’s NAV, it is possible that the market price and NAV will vary significantly. The closing market price is the daily closing price as reported on the Nasdaq stock market.
Premiums or discounts are the differences (expressed as a basis point differential with 1 basis point equaling 1/100 of 1%) between the fund’s NAV and closing market price. A premium indicates that the closing market price is trading above the NAV. A discount indicates that the closing market price is trading below the NAV. A discrepancy may exist with respect to the timing of when the NAV is calculated and the determination of the closing market price.
The chart below presents information about the differences between the fund’s daily closing market price and the fund’s NAV.
| Period Ended November 30, 2005 | | | | | | |
| From commencement of operations* | | | | | | | | |
| to November 30, 2005 | | Closing Market Price | | Closing Market Price Above |
| | | Below NAV | | or Equal to NAV |
| Basis Point Differential | | Number of | | % of Total | | Number of | | % of Total |
| | | Days | | Days | | Days | | Days |
| 0 <25 | | 298 | | 54.09% | | 231 | | 41.92% |
| 25 <50 | | 15 | | 2.72% | | 6 | | 1.09% |
| 50 <75 | | 0 | | — | | 1 | | 0.18% |
| 75 <100 | | 0 | | — | | 0 | | — |
| 100 or greater | | 0 | | — | | 0 | | — |
| Total | | 313 | | 56.81% | | 238 | | 43.19% |
| * September 25, 2003 | | | | | | | | |
Shareholder Expense Example
As a shareholder of the Fund, you incur two types of costs: (1) transaction costs, and (2) ongoing costs, including management fees, distribution and/or service (12b 1) fees and other Fund expenses. This Example is intended to help you understand your ongoing costs (in dollars) of investing in the Fund and to compare these costs with the ongoing costs of investing in other mutual funds.
The Example is based on an investment of $1,000 invested at the beginning of the period and held for the entire period (June 1, 2005 to November 30, 2005).
The first line of the table below provides information about actual account values and actual expenses. You may use the information in this line, together with the amount you invested, to estimate the expenses that you paid over the period. Simply divide your account value by $1,000.00 (for example, an $8,600 account value divided by $1,000.00 = 8.6), then multiply the result by the number in the first line under the heading entitled “Expenses Paid During Period” to estimate the expenses you paid on your account during this period.
Hypothetical Example for Comparison Purposes
The second line of the table below provides information about hypothetical account values and hypothetical expenses based on the Fund’s actual expense ratio and an assumed rate of return of 5% per year before expenses, which is not the Fund’s actual return. The hypothetical account values and expenses may not be used to estimate the actual ending account balance or expenses you paid for the period. You may use this information to compare the ongoing costs of investing in the Fund and other funds. To do so, compare this 5% hypothetical example with the 5% hypothetical examples that appear in the share holder reports of the other funds.
Please note that the expenses shown in the table are meant to highlight your ongoing costs only and do not reflect any transaction costs. Therefore, the second line of the table is useful in comparing ongoing costs only, and will not help you determine the relative total costs of owning different funds.
| | | | | | | | | | | Expenses Paid |
| | | | | Beginning | | Ending | | During Period* |
| | | | | Account Value | | Account Value | | June 1, 2005 to |
| | | | | June 1, 2005 | | November 30, 2005 | | November 30, 2005 |
| Actual | | $ | | 1,000.00 | | $ | | 1,082.90 | | $ | | 1.57 |
| Hypothetical (5% return per | | | | | | | | | | | | |
| year before expenses) | | $ | | 1,000.00 | | $ | | 1,023.56 | | $ | | 1.52 |
* Expenses are equal to the Fund’s annualized expense ratio of .30%; multiplied by the average account value over the period, multiplied by 183/365 (to reflect the one half year period).
9 Annual Report
| Investment Changes | | | | |
| |
| |
| Top Ten Stocks as of November 30, 2005 | | | | |
| | | % of fund’s | | % of fund’s net assets |
| | | net assets | | 6 months ago |
| Microsoft Corp. | | 8.8 | | 8.9 |
| Intel Corp. | | 4.8 | | 5.3 |
| Cisco Systems, Inc. | | 3.3 | | 4.0 |
| Amgen, Inc. | | 3.0 | | 2.5 |
| Google, Inc. Class A (sub. vtg.) | | 2.4 | | 1.4 |
| QUALCOMM, Inc. | | 2.2 | | 2.0 |
| Dell, Inc. | | 2.2 | | 3.1 |
| Oracle Corp. | | 1.9 | | 2.1 |
| eBay, Inc. | | 1.8 | | 1.6 |
| Yahoo!, Inc. | | 1.8 | | 1.7 |
| | | 32.1 | | |
Market Sectors as of November 30, 2005 | | | | |
| | | % of fund’s | | % of fund’s net assets |
| | | net assets | | 6 months ago |
| Information Technology | | 49.8 | | 50.2 |
| Health Care | | 14.5 | | 13.3 |
| Consumer Discretionary | | 14.1 | | 15.0 |
| Financials | | 10.8 | | 10.1 |
| Industrials | | 5.5 | | 5.0 |
| Consumer Staples | | 1.7 | | 1.7 |
| Telecommunication Services | | 1.3 | | 2.5 |
| Energy | | 1.1 | | 0.8 |
| Materials | | 0.9 | | 0.8 |
| Utilities | | 0.2 | | 0.2 |
Asset Allocation (% of fund’s net assets)
To match the NASDAQ Composite® Index, Fidelity Nasdaq Composite Index Fund seeks 100% invest ment exposure to stocks at all times.
Investments November 30, 2005
Showing Percentage of Net Assets
Common Stocks 99.9%
| | | Shares | | Value (Note 1) |
| |
| CONSUMER DISCRETIONARY – 14.1% | | | | | | |
| Auto Components 0.2% | | | | | | |
| Aftermarket Technology Corp. (a) | | 1,260 | | $ | | 25,830 |
| Ballard Power Systems, Inc. (a) | | 4,599 | | | | 20,384 |
| China Automotive Systems, Inc. (a) | | 889 | | | | 6,179 |
| Dura Automotive Systems, Inc. Class A (a) | | 1,298 | | | | 3,336 |
| Exide Technologies (a) | | 915 | | | | 3,303 |
| GenTek, Inc. | | 356 | | | | 5,781 |
| Gentex Corp. | | 5,800 | | | | 109,214 |
| Hayes Lemmerz International, Inc. (a) | | 1,153 | | | | 3,505 |
| IMPCO Technologies, Inc. (a) | | 1,896 | | | | 9,859 |
| Keystone Automotive Industries, Inc. (a) | | 826 | | | | 23,128 |
| LKQ Corp. (a) | | 956 | | | | 31,156 |
| Quantum Fuel Systems Technologies Worldwide, Inc. (a) | | 1,665 | | | | 4,246 |
| R&B, Inc. (a) | | 1,161 | | | | 13,735 |
| Shiloh Industries, Inc. (a) | | 763 | | | | 10,087 |
| Sports Resorts International, Inc. (a) | | 2,474 | | | | 2,103 |
| Strattec Security Corp. (a) | | 224 | | | | 10,875 |
| | | | | | | 282,721 |
| Automobiles – 0.0% | | | | | | |
| Nissan Motor Co. Ltd. sponsored ADR | | 1,230 | | | | 25,227 |
| Distributors – 0.1% | | | | | | |
| Andersons, Inc. | | 531 | | | | 21,851 |
| Audiovox Corp. Class A (a) | | 1,039 | | | | 14,390 |
| Building Material Holding Corp. | | 518 | | | | 42,647 |
| Source Interlink Companies, Inc. (a) | | 1,455 | | | | 15,976 |
| | | | | | | 94,864 |
| Diversified Consumer Services – 0.9% | | | | | | |
| Alderwoods Group, Inc. (a) | | 1,131 | | | | 16,988 |
| Apollo Group, Inc. Class A (a) | | 6,694 | | | | 476,613 |
| Bright Horizons Family Solutions, Inc. (a) | | 1,011 | | | | 35,769 |
| Career Education Corp. (a) | | 3,735 | | | | 139,316 |
| Corinthian Colleges, Inc. (a) | | 3,131 | | | | 37,916 |
| Educate, Inc. (a) | | 1,555 | | | | 17,027 |
| Education Management Corp. (a) | | 2,549 | | | | 86,029 |
| Escala Group, Inc. (a)(d) | | 1,134 | | | | 18,768 |
| Laureate Education, Inc. (a) | | 1,627 | | | | 82,277 |
| Lincoln Educational Services Corp. | | 797 | | | | 11,238 |
| Matthews International Corp. Class A | | 1,229 | | | | 48,287 |
| Princeton Review, Inc. (a) | | 1,934 | | | | 10,347 |
| Steiner Leisure Ltd. (a) | | 784 | | | | 29,463 |
| Stewart Enterprises, Inc. Class A | | 4,886 | | | | 24,919 |
See accompanying notes which are an integral part of the financial statements.
11 Annual Report
| Investments continued | | | | | | |
| |
| Common Stocks continued | | | | | | |
| | | Shares | | Value (Note 1) |
| |
| CONSUMER DISCRETIONARY – continued | | | | | | |
| Diversified Consumer Services – continued | | | | | | |
| Strayer Education, Inc. | | 506 | | $ | | 50,499 |
| Vertrue, Inc. (a) | | 504 | | | | 18,210 |
| | | | | | | 1,103,666 |
| Hotels, Restaurants & Leisure 2.0% | | | | | | |
| AFC Enterprises, Inc. | | 965 | | | | 11,831 |
| Ambassadors Group, Inc. | | 918 | | | | 23,033 |
| Ameristar Casinos, Inc. | | 2,139 | | | | 50,459 |
| Applebee’s International, Inc. | | 2,701 | | | | 61,907 |
| BJ’s Restaurants, Inc. (a) | | 1,123 | | | | 26,660 |
| Bob Evans Farms, Inc. | | 1,243 | | | | 30,056 |
| Buffalo Wild Wings, Inc. (a) | | 409 | | | | 11,542 |
| California Pizza Kitchen, Inc. (a) | | 742 | | | | 24,323 |
| Caribou Coffee Co., Inc. | | 583 | | | | 5,888 |
| CBRL Group, Inc. | | 1,599 | | | | 59,147 |
| Churchill Downs, Inc. | | 644 | | | | 24,395 |
| Cosi, Inc. (a) | | 2,163 | | | | 18,905 |
| Ctrip.com International Ltd. sponsored ADR | | 283 | | | | 16,496 |
| Denny’s Corp. (a) | | 3,239 | | | | 15,806 |
| Empire Resorts, Inc. (a) | | 957 | | | | 5,694 |
| Great Wolf Resorts, Inc. | | 706 | | | | 6,862 |
| International Speedway Corp. Class A | | 969 | | | | 52,878 |
| Isle of Capri Casinos, Inc. (a) | | 1,243 | | | | 33,710 |
| Lone Star Steakhouse & Saloon, Inc. | | 812 | | | | 18,814 |
| Magna Entertainment Corp. Class A (sub. vtg.) (a) | | 3,086 | | | | 23,361 |
| McCormick & Schmick’s Seafood Restaurants (a) | | 743 | | | | 17,639 |
| Mikohn Gaming Corp. (a) | | 1,204 | | | | 12,052 |
| Monarch Casino & Resort, Inc. (a) | | 911 | | | | 19,486 |
| MTR Gaming Group, Inc. (a) | | 1,507 | | | | 11,242 |
| Multimedia Games, Inc. (a) | | 1,026 | | | | 10,445 |
| O’Charleys, Inc. (a) | | 955 | | | | 13,857 |
| P.F. Chang’s China Bistro, Inc. (a) | | 1,111 | | | | 57,161 |
| Panera Bread Co. Class A (a) | | 1,230 | | | | 83,640 |
| Papa John’s International, Inc. (a) | | 756 | | | | 41,172 |
| Penn National Gaming, Inc. (a) | | 3,051 | | | | 101,202 |
| Rare Hospitality International, Inc. (a) | | 1,257 | | | | 40,262 |
| Red Robin Gourmet Burgers, Inc. (a) | | 742 | | | | 40,736 |
| Ruth’s Chris Steak House, Inc. | | 602 | | | | 10,643 |
| Ryan’s Restaurant Group, Inc. (a) | | 1,920 | | | | 22,829 |
| Scientific Games Corp. Class A (a) | | 3,199 | | | | 90,628 |
| Shuffle Master, Inc. (a) | | 1,360 | | | | 38,094 |
See accompanying notes which are an integral part of the financial statements.
| Common Stocks continued | | | | | | |
| | | Shares | | Value (Note 1) |
| |
| CONSUMER DISCRETIONARY – continued | | | | | | |
| Hotels, Restaurants & Leisure continued | | | | | | |
| Sonic Corp. (a) | | 2,056 | | $ | | 60,837 |
| Starbucks Corp. (a) | | 28,616 | | | | 871,357 |
| Sunterra Corp. (a) | | 457 | | | | 5,370 |
| Texas Roadhouse, Inc. Class A (a) | | 2,206 | | | | 33,311 |
| The Cheesecake Factory, Inc. (a) | | 2,856 | | | | 104,644 |
| Trump Entertainment Resorts, Inc. (a) | | 892 | | | | 16,252 |
| Wynn Resorts Ltd. (a)(d) | | 3,606 | | | | 201,323 |
| | | | | | | 2,425,949 |
| Household Durables – 0.4% | | | | | | |
| Avatar Holdings, Inc. (a) | | 476 | | | | 27,042 |
| Bassett Furniture Industries, Inc. | | 803 | | | | 14,478 |
| Brillian Corp. (a) | | 332 | | | | 1,872 |
| California Coastal Communities, Inc. (a) | | 698 | | | | 27,417 |
| Comstock Homebuilding Companies, Inc. Class A | | 318 | | | | 4,888 |
| Craftmade International, Inc. | | 630 | | | | 11,340 |
| Dixie Group, Inc. (a) | | 1,026 | | | | 14,364 |
| Dominion Homes, Inc. (a) | | 493 | | | | 4,905 |
| Dorel Industries, Inc. Class B (sub. vtg.) (a) | | 969 | | | | 23,402 |
| Flexsteel Industries, Inc. | | 829 | | | | 11,581 |
| Garmin Ltd. | | 3,916 | | | | 215,772 |
| Helen of Troy Ltd. (a) | | 1,005 | | | | 18,110 |
| Hooker Furniture Corp. | | 731 | | | | 11,345 |
| Interface, Inc. Class A (a) | | 2,698 | | | | 22,474 |
| iRobot Corp. (d) | | 856 | | | | 24,944 |
| Kimball International, Inc. Class B | | 1,330 | | | | 14,165 |
| Lifetime Brands, Inc. | | 502 | | | | 10,924 |
| Makita Corp. sponsored ADR | | 278 | | | | 6,867 |
| Palm Harbor Homes, Inc. (a)(d) | | 1,047 | | | | 19,715 |
| Stanley Furniture Co., Inc. | | 844 | | | | 21,016 |
| Universal Electronics, Inc. (a) | | 466 | | | | 8,080 |
| | | | | | | 514,701 |
| Internet & Catalog Retail 3.2% | | | | | | |
| 1-800 CONTACTS, Inc. (a) | | 647 | | | | 7,046 |
| 1-800-FLOWERS.com, Inc. Class A (a) | | 1,679 | | | | 11,686 |
| Alloy, Inc. (a) | | 2,348 | | | | 14,393 |
| Amazon.com, Inc. (a) | | 14,911 | | | | 722,587 |
| Audible, Inc. (a) | | 731 | | | | 9,430 |
| Blue Nile, Inc. (a) | | 639 | | | | 26,512 |
| Coldwater Creek, Inc. (a) | | 1,981 | | | | 62,203 |
| Drugstore.com, Inc. (a) | | 3,044 | | | | 9,345 |
See accompanying notes which are an integral part of the financial statements.
13 Annual Report
| Investments continued | | | | |
| |
| Common Stocks continued | | | | |
| | | Shares | | Value (Note 1) |
| |
| CONSUMER DISCRETIONARY – continued | | | | |
| Internet & Catalog Retail continued | | | | |
| eBay, Inc. (a) | | 49,241 | | $ 2,206,489 |
| eCost.com, Inc. (a) | | 637 | | 847 |
| Expedia, Inc. (a) | | 11,401 | | 282,631 |
| GSI Commerce, Inc. (a) | | 1,735 | | 28,870 |
| IAC/InterActiveCorp (a) | | 10,684 | | 294,985 |
| Insight Enterprises, Inc. (a) | | 2,022 | | 42,118 |
| J. Jill Group, Inc. (a) | | 972 | | 17,797 |
| Netflix, Inc. (a)(d) | | 1,911 | | 52,629 |
| NutriSystem, Inc. (a) | | 1,144 | | 44,536 |
| Overstock.com, Inc. (a)(d) | | 728 | | 27,089 |
| PC Mall, Inc. (a) | | 527 | | 2,598 |
| PetMed Express, Inc. (a) | | 1,150 | | 13,547 |
| Priceline.com, Inc. (a) | | 1,431 | | 34,373 |
| Provide Commerce, Inc. (a) | | 409 | | 11,804 |
| Stamps.com, Inc. (a) | | 646 | | 15,149 |
| ValueVision Media, Inc. Class A (a) | | 1,525 | | 16,928 |
| VistaPrint Ltd. | | 1,500 | | 27,240 |
| | | | | 3,982,832 |
| Leisure Equipment & Products – 0.1% | | | | |
| Arctic Cat, Inc. | | 742 | | 15,567 |
| Concord Camera Corp. (a) | | 1,399 | | 1,777 |
| JAKKS Pacific, Inc. (a) | | 1,162 | | 23,682 |
| Radica Games Ltd. | | 790 | | 7,055 |
| RC2 Corp. (a) | | 826 | | 29,191 |
| SCP Pool Corp. | | 1,976 | | 76,926 |
| | | | | 154,198 |
| Media – 3.9% | | | | |
| ACME Communications, Inc. (a) | | 1,707 | | 6,930 |
| Beasley Broadcast Group, Inc. Class A (a) | | 885 | | 12,408 |
| Cadmus Communications Corp. | | 448 | | 9,041 |
| Carmike Cinemas, Inc. | | 574 | | 15,108 |
| Central European Media Enterprises Ltd. Class A (a) | | 839 | | 45,373 |
| Charter Communications, Inc. Class A (a) | | 11,965 | | 14,238 |
| CKX, Inc. (a) | | 2,884 | | 37,377 |
| Comcast Corp.: | | | | |
| Class A (a) | | 50,047 | | 1,321,241 |
| Class A (special) (a) | | 29,247 | | 761,592 |
| Courier Corp. | | 394 | | 13,865 |
| Crown Media Holdings, Inc. Class A (a) | | 3,464 | | 36,026 |
| Cumulus Media, Inc. Class A (a) | | 1,913 | | 23,626 |
See accompanying notes which are an integral part of the financial statements.
| Common Stocks continued | | | | | | |
| | | Shares | | Value (Note 1) |
| |
| CONSUMER DISCRETIONARY – continued | | | | | | |
| Media – continued | | | | | | |
| Discovery Holding Co. Class A (a) | | 9,655 | | $ | | 150,715 |
| EchoStar Communications Corp. Class A | | 8,133 | | | | 210,157 |
| EMAK Worldwide, Inc. (a) | | 952 | | | | 6,455 |
| Emmis Communications Corp. Class A (a) | | 1,109 | | | | 23,112 |
| Fisher Communications, Inc. (a) | | 350 | | | | 15,929 |
| Focus Media Holding Ltd. ADR | | 239 | | | | 7,074 |
| Gemstar-TV Guide International, Inc. (a) | | 15,706 | | | | 41,621 |
| Global Sources Ltd. | | 1,147 | | | | 10,392 |
| Harris Interactive, Inc. (a) | | 2,558 | | | | 10,181 |
| IMAX Corp. (a)(d) | | 1,489 | | | | 12,714 |
| Insight Communications, Inc. Class A (a) | | 2,264 | | | | 26,353 |
| Knology, Inc. (a) | | 1,858 | | | | 3,660 |
| Lamar Advertising Co. Class A (a) | | 3,248 | | | | 150,545 |
| Liberty Global, Inc.: | | | | | | |
| Class A | | 8,310 | | | | 185,396 |
| Class B | | 195 | | | | 4,583 |
| Class C (a) | | 8,505 | | | | 176,649 |
| LodgeNet Entertainment Corp. (a) | | 1,078 | | | | 14,779 |
| MDC Partners, Inc. Class A (sub. vtg.) (a) | | 867 | | | | 4,876 |
| Mediacom Communications Corp. Class A (a) | | 3,908 | | | | 20,361 |
| Morningstar, Inc. | | 1,375 | | | | 44,069 |
| Navarre Corp. (a)(d) | | 1,362 | | | | 7,886 |
| New Frontier Media, Inc. (a) | | 1,382 | | | | 8,582 |
| NTL, Inc. (a) | | 3,233 | | | | 188,258 |
| Outdoor Channel Holdings, Inc. (a) | | 874 | | | | 13,975 |
| Pixar (a) | | 4,366 | | | | 242,051 |
| Private Media Group, Inc. (a) | | 2,193 | | | | 5,044 |
| Radio One, Inc.: | | | | | | |
| Class A (a) | | 874 | | | | 9,736 |
| Class D (non-vtg.) (a) | | 2,974 | | | | 32,892 |
| RCN Corp. (a) | | 1,144 | | | | 24,951 |
| Regent Communication, Inc. (a) | | 2,446 | | | | 12,206 |
| Reuters Group PLC sponsored ADR | | 811 | | | | 33,575 |
| Salem Communications Corp. Class A (a) | | 745 | | | | 14,230 |
| Scholastic Corp. (a) | | 1,369 | | | | 45,547 |
| Sinclair Broadcast Group, Inc. Class A | | 1,906 | | | | 18,336 |
| Sirius Satellite Radio, Inc. (a)(d) | | 48,074 | | | | 343,729 |
| Spanish Broadcasting System, Inc. Class A (a) | | 1,665 | | | | 8,025 |
| TiVo, Inc. (a) | | 2,782 | | | | 14,967 |
| Value Line, Inc. | | 392 | | | | 15,798 |
| WorldSpace, Inc. Class A | | 690 | | | | 7,542 |
See accompanying notes which are an integral part of the financial statements.
15 Annual Report
| Investments continued | | | | | | |
| |
| Common Stocks continued | | | | | | |
| | | Shares | | Value (Note 1) |
| |
| CONSUMER DISCRETIONARY – continued | | | | | | |
| Media – continued | | | | | | |
| WPP Group PLC sponsored ADR | | 886 | | $ | | 43,547 |
| WPT Enterprises, Inc. (a) | | 703 | | | | 4,809 |
| XM Satellite Radio Holdings, Inc. Class A (a) | | 8,092 | | | | 236,772 |
| Young Broadcasting, Inc. Class A (a) | | 818 | | | | 1,538 |
| | | | | | | 4,750,442 |
| Multiline Retail – 0.7% | | | | | | |
| Conn’s, Inc. (a) | | 1,033 | | | | 34,926 |
| Dollar Tree Stores, Inc. (a) | | 4,235 | | | | 97,236 |
| Fred’s, Inc. Class A | | 1,751 | | | | 29,084 |
| Sears Holdings Corp. (a) | | 5,872 | | | | 675,397 |
| The Bon-Ton Stores, Inc. | | 921 | | | | 17,011 |
| Tuesday Morning Corp. | | 1,557 | | | | 42,491 |
| | | | | | | 896,145 |
| Specialty Retail – 2.3% | | | | | | |
| AC Moore Arts & Crafts, Inc. (a) | | 812 | | | | 11,620 |
| America’s Car Mart, Inc. (a) | | 915 | | | | 14,750 |
| American Eagle Outfitters, Inc. | | 5,472 | | | | 124,543 |
| bebe Stores, Inc. | | 3,215 | | | | 51,987 |
| Bed Bath & Beyond, Inc. (a) | | 10,762 | | | | 459,107 |
| Big 5 Sporting Goods Corp. | | 997 | | | | 24,018 |
| Cache, Inc. (a) | | 645 | | | | 10,855 |
| Casual Male Retail Group, Inc. (a) | | 1,805 | | | | 11,155 |
| Charlotte Russe Holding, Inc. (a) | | 1,039 | | | | 19,429 |
| Charming Shoppes, Inc. (a) | | 4,816 | | | | 56,588 |
| Citi Trends, Inc. | | 574 | | | | 20,440 |
| Cost Plus, Inc. (a) | | 798 | | | | 14,667 |
| Deb Shops, Inc. | | 686 | | | | 19,949 |
| Dress Barn, Inc. (a) | | 1,229 | | | | 41,024 |
| Finish Line, Inc. Class A | | 1,764 | | | | 30,447 |
| Goody’s Family Clothing, Inc. | | 1,535 | | | | 14,352 |
| Guitar Center, Inc. (a) | | 896 | | | | 47,255 |
| Gymboree Corp. (a) | | 1,092 | | | | 24,636 |
| Hibbett Sporting Goods, Inc. (a) | | 1,453 | | | | 43,532 |
| Hot Topic, Inc. (a) | | 1,795 | | | | 27,823 |
| Jos. A. Bank Clothiers, Inc. (a) | | 472 | | | | 23,605 |
| Kirkland’s, Inc. (a) | | 860 | | | | 5,676 |
| Monro Muffler Brake, Inc. | | 714 | | | | 22,034 |
| Movie Gallery, Inc. | | 1,246 | | | | 6,143 |
| O’Reilly Automotive, Inc. (a) | | 3,887 | | | | 118,320 |
| Pacific Sunwear of California, Inc. (a) | | 2,617 | | | | 69,246 |
See accompanying notes which are an integral part of the financial statements.
| Common Stocks continued | | | | | | |
| | | Shares | | Value (Note 1) |
| |
| CONSUMER DISCRETIONARY – continued | | | | | | |
| Specialty Retail – continued | | | | | | |
| Party City Corp. (a) | | 791 | | $ | | 13,534 |
| PETCO Animal Supplies, Inc. (a) | | 2,064 | | | | 43,819 |
| PETsMART, Inc. | | 5,359 | | | | 127,651 |
| Pomeroy IT Solutions, Inc. (a) | | 896 | | | | 7,213 |
| Rent-A Center, Inc. (a) | | 2,841 | | | | 55,542 |
| Restoration Hardware, Inc. (a) | | 1,906 | | | | 11,150 |
| Ross Stores, Inc. | | 5,286 | | | | 145,365 |
| Select Comfort Corp. (a) | | 1,271 | | | | 30,466 |
| Sharper Image Corp. (a) | | 619 | | | | 6,283 |
| Shoe Carnival, Inc. (a) | | 783 | | | | 16,059 |
| Stage Stores, Inc. | | 1,072 | | | | 32,064 |
| Staples, Inc. | | 26,815 | | | | 619,427 |
| Stein Mart, Inc. | | 1,654 | | | | 28,614 |
| The Children’s Place Retail Stores, Inc. (a) | | 1,131 | | | | 56,098 |
| The Pantry, Inc. (a) | | 658 | | | | 27,044 |
| Tractor Supply Co. (a) | | 1,612 | | | | 86,822 |
| Trans World Entertainment Corp. (a) | | 441 | | | | 2,880 |
| Tweeter Home Entertainment Group, Inc. (a) | | 1,535 | | | | 8,627 |
| Urban Outfitters, Inc. (a) | | 5,874 | | | | 181,272 |
| Volcom, Inc. | | 789 | | | | 26,802 |
| West Marine, Inc. (a) | | 843 | | | | 11,195 |
| Wet Seal, Inc. Class A (a) | | 1,316 | | | | 6,606 |
| Wilsons Leather Experts, Inc. (a) | | 1,493 | | | | 6,644 |
| Zumiez, Inc. | | 444 | | | | 17,569 |
| | | | | | | 2,881,947 |
| Textiles, Apparel & Luxury Goods – 0.3% | | | | | | |
| Charles & Colvard Ltd. | | 561 | | | | 15,125 |
| Cherokee, Inc. | | 612 | | | | 21,145 |
| Columbia Sportswear Co. (a) | | 1,445 | | | | 67,164 |
| Deckers Outdoor Corp. (a) | | 381 | | | | 8,774 |
| Fossil, Inc. (a) | | 2,715 | | | | 54,137 |
| Iconix Brand Group, Inc. (a) | | 1,705 | | | | 15,925 |
| K-Swiss, Inc. Class A | | 983 | | | | 30,699 |
| Perry Ellis International, Inc. (a) | | 462 | | | | 9,300 |
| Quaker Fabric Corp. (a) | | 1,948 | | | | 5,221 |
| Steven Madden Ltd | | 616 | | | | 16,774 |
| Tandy Brands Accessories, Inc. | | 944 | | | | 11,507 |
| True Religion Apparel, Inc. (a)(d) | | 889 | | | | 11,779 |
| Under Armour, Inc. Class A | | 1,100 | | | | 24,893 |
| Velcro Industries NV | | 1,056 | | | | 14,256 |
See accompanying notes which are an integral part of the financial statements.
17 Annual Report
| Investments continued | | | | | | |
| |
| Common Stocks continued | | | | | | |
| | | Shares | | Value (Note 1) |
| |
| CONSUMER DISCRETIONARY – continued | | | | | | |
| Textiles, Apparel & Luxury Goods – continued | | | | | | |
| Wacoal Holdings Corp. sponsored ADR | | 91 | | $ | | 6,127 |
| Warnaco Group, Inc. (a) | | 1,697 | | | | 41,695 |
| Weyco Group, Inc. | | 836 | | | | 16,143 |
| | | | | | | 370,664 |
| |
| TOTAL CONSUMER DISCRETIONARY | | | | | | 17,483,356 |
| |
| CONSUMER STAPLES 1.7% | | | | | | |
| Beverages – 0.1% | | | | | | |
| Coca-Cola Bottling Co. Consolidated | | 294 | | | | 13,524 |
| Hansen Natural Corp. (a) | | 1,039 | | | | 80,678 |
| Kirin Brewery Co. Ltd. sponsored ADR | | 897 | | | | 9,562 |
| MGP Ingredients, Inc. | | 1,166 | | | | 13,141 |
| | | | | | | 116,905 |
| Food & Staples Retailing – 1.2% | | | | | | |
| Arden Group, Inc. Class A | | 250 | | | | 21,810 |
| Casey’s General Stores, Inc. | | 1,749 | | | | 40,262 |
| Central European Distribution Corp. (a) | | 686 | | | | 29,985 |
| Costco Wholesale Corp. | | 17,483 | | | | 873,800 |
| Fresh Brands, Inc. (a) | | 1,042 | | | | 6,346 |
| Ingles Markets, Inc. Class A | | 1,110 | | | | 18,692 |
| Nash-Finch Co. | | 294 | | | | 7,900 |
| Pathmark Stores, Inc. (a) | | 1,735 | | | | 18,669 |
| Performance Food Group Co. (a) | | 1,445 | | | | 41,038 |
| Spartan Stores, Inc. (a) | | 1,465 | | | | 14,665 |
| Topps Co., Inc. | | 1,791 | | | | 14,221 |
| United Natural Foods, Inc. (a) | | 1,410 | | | | 39,593 |
| Whole Foods Market, Inc. | | 2,341 | | | | 344,782 |
| Wild Oats Markets, Inc. (a) | | 1,483 | | | | 17,915 |
| | | | | | | 1,489,678 |
| Food Products 0.3% | | | | | | |
| Alico, Inc. | | 236 | | | | 10,811 |
| Bridgford Foods Corp. (a) | | 1,777 | | | | 12,475 |
| Cal-Maine Foods, Inc. | | 1,044 | | | | 6,535 |
| Diamond Foods, Inc. | | 1,167 | | | | 19,080 |
| Farmer Brothers Co. | | 700 | | | | 14,259 |
| Gold Kist, Inc. Delaware (a) | | 1,823 | | | | 29,022 |
| Green Mountain Coffee Roasters, Inc. (a) | | 296 | | | | 12,142 |
| Hain Celestial Group, Inc. (a) | | 1,355 | | | | 30,257 |
| J&J Snack Foods Corp. | | 406 | | | | 24,660 |
See accompanying notes which are an integral part of the financial statements.
| Common Stocks continued | | | | | | |
| | | Shares | | Value (Note 1) |
| |
| CONSUMER STAPLES – continued | | | | | | |
| Food Products – continued | | | | | | |
| Lancaster Colony Corp. | | 1,061 | | $ | | 41,379 |
| Lance, Inc. | | 1,399 | | | | 25,658 |
| Peet’s Coffee & Tea, Inc. (a) | | 602 | | | | 18,692 |
| Premium Standard Farms, Inc. | | 1,037 | | | | 17,266 |
| Sanderson Farms, Inc. | | 728 | | | | 25,931 |
| SunOpta, Inc. (a) | | 2,665 | | | | 14,348 |
| | | | | | | 302,515 |
| Household Products – 0.0% | | | | | | |
| Central Garden & Pet Co. Class A (a) | | 616 | | | | 27,116 |
| WD 40 Co. | | 630 | | | | 17,306 |
| | | | | | | 44,422 |
| Personal Products 0.1% | | | | | | |
| Chattem, Inc. (a) | | 952 | | | | 30,245 |
| Elizabeth Arden, Inc. (a) | | 854 | | | | 16,260 |
| Inter Parfums, Inc. | | 867 | | | | 14,358 |
| Mannatech, Inc. | | 1,075 | | | | 14,018 |
| Nature’s Sunshine Products, Inc. | | 576 | | | | 10,604 |
| Parlux Fragrances, Inc. (a) | | 527 | | | | 15,167 |
| Reliv International, Inc. | | 565 | | | | 5,526 |
| USANA Health Sciences, Inc. (a) | | 756 | | | | 29,847 |
| | | | | | | 136,025 |
| Tobacco 0.0% | | | | | | |
| Star Scientific, Inc. (a) | | 3,027 | | | | 7,870 |
| |
| TOTAL CONSUMER STAPLES | | | | | | 2,097,415 |
| |
| ENERGY 1.1% | | | | | | |
| Energy Equipment & Services – 0.5% | | | | | | |
| Bronco Drilling Co., Inc. | | 638 | | | | 15,631 |
| Cal Dive International, Inc. (a) | | 1,257 | | | | 91,271 |
| Dawson Geophysical Co. (a) | | 321 | | | | 9,874 |
| Global Industries Ltd. (a) | | 4,329 | | | | 51,299 |
| Gulf Island Fabrication, Inc. | | 461 | | | | 11,456 |
| Gulfmark Offshore, Inc. (a) | | 952 | | | | 31,778 |
| Hercules Offshore, Inc. (a) | | 1,123 | | | | 30,186 |
| Hydril Co. (a) | | 588 | | | | 37,691 |
| Lufkin Industries, Inc. | | 572 | | | | 25,597 |
| Patterson-UTI Energy, Inc. | | 6,126 | | | | 191,376 |
| Stolt Offshore SA sponsored ADR (a) | | 2,277 | | | | 23,704 |
| Superior Well Services, Inc. | | 797 | | | | 16,785 |
See accompanying notes which are an integral part of the financial statements.
19 Annual Report
| Investments continued | | | | | | |
| |
| Common Stocks continued | | | | | | |
| | | Shares | | Value (Note 1) |
| |
| ENERGY – continued | | | | | | |
| Energy Equipment & Services – continued | | | | | | |
| Tesco Corp. (a) | | 1,563 | | $ | | 28,903 |
| Trico Marine Services, Inc. (a) | | 500 | | | | 12,455 |
| Union Drilling, Inc. | | 745 | | | | 10,847 |
| | | | | | | 588,853 |
| Oil, Gas & Consumable Fuels – 0.6% | | | | | | |
| Alliance Resource Partners LP | | 1,011 | | | | 40,238 |
| APCO Argentina, Inc. | | 421 | | | | 21,597 |
| Atlas America, Inc. (a) | | 388 | | | | 21,938 |
| ATP Oil & Gas Corp. (a) | | 1,088 | | | | 39,288 |
| Brigham Exploration Co. (a) | | 2,050 | | | | 25,092 |
| Canada Southern Petroleum Ltd. (ltd. vtg.) (a) | | 1,113 | | | | 6,441 |
| Carrizo Oil & Gas, Inc. (a) | | 737 | | | | 18,668 |
| Clayton Williams Energy, Inc. (a) | | 434 | | | | 16,522 |
| Copano Energy LLC | | 361 | | | | 13,534 |
| Crosstex Energy, Inc. | | 641 | | | | 41,902 |
| Delta Petroleum Corp. (a) | | 1,486 | | | | 23,925 |
| Dorchester Minerals LP | | 1,089 | | | | 28,793 |
| Double Eagle Petroleum Co. (a) | | 733 | | | | 14,315 |
| Edge Petroleum Corp. (a) | | 449 | | | | 10,983 |
| Enterra Energy Trust (d) | | 1,018 | | | | 20,597 |
| FX Energy, Inc. (a) | | 2,037 | | | | 23,344 |
| GMX Resources, Inc. (a) | | 609 | | | | 16,814 |
| Golar LNG Ltd. (Nasdaq) (a) | | 2,134 | | | | 25,224 |
| Inergy LP | | 868 | | | | 21,917 |
| Ivanhoe Energy, Inc. (a) | | 5,536 | | | | 8,306 |
| James River Coal Co. (a) | | 444 | | | | 18,692 |
| Knightsbridge Tankers Ltd. (d) | | 434 | | | | 12,508 |
| Marine Petroleum Trust | | 514 | | | | 15,574 |
| NGAS Resources, Inc. (a) | | 1,217 | | | | 13,728 |
| Pacific Ethanol, Inc. (a) | | 936 | | | | 10,081 |
| Parallel Petroleum Corp. (a) | | 1,790 | | | | 29,374 |
| Petrohawk Energy Corp. (a) | | 2,504 | | | | 33,328 |
| Petroleum Development Corp. (a) | | 771 | | | | 26,021 |
| Petroquest Energy, Inc. (a) | | 1,287 | | | | 11,750 |
| Resource America, Inc. Class A | | 640 | | | | 10,714 |
| Syntroleum Corp. (a) | | 2,496 | | | | 20,143 |
| TC Pipelines LP | | 588 | | | | 18,816 |
| The Exploration Co. of Delaware, Inc. (a) | | 2,418 | | | | 15,088 |
| Top Tankers, Inc. | | 1,399 | | | | 18,397 |
See accompanying notes which are an integral part of the financial statements.
| Common Stocks continued | | | | | | |
| | | Shares | | Value (Note 1) |
| |
| ENERGY – continued | | | | | | |
| Oil, Gas & Consumable Fuels – continued | | | | | | |
| Toreador Resources Corp. (a) | | 781 | | $ | | 17,799 |
| Warren Resources, Inc. | | 946 | | | | 14,843 |
| | | | | | | 726,294 |
| |
| TOTAL ENERGY | | | | | | 1,315,147 |
| |
| FINANCIALS – 10.8% | | | | | | |
| Capital Markets 1.4% | | | | | | |
| American Capital Strategies Ltd. | | 3,956 | | | | 151,752 |
| Ameritrade Holding Corp. (a) | �� | 14,660 | | | | 342,458 |
| Calamos Asset Management, Inc. Class A | | 570 | | | | 15,447 |
| Capital Southwest Corp. | | 125 | | | | 11,589 |
| FirstCity Financial Corp. (a) | | 811 | | | | 9,375 |
| GFI Group, Inc. | | 962 | | | | 42,847 |
| Harris & Harris Group, Inc. (a) | | 1,153 | | | | 15,346 |
| Investors Financial Services Corp. | | 2,352 | | | | 88,788 |
| KHD Humboldt Wedag International Ltd. (a) | | 840 | | | | 17,867 |
| Knight Capital Group, Inc. Class A (a) | | 4,564 | | | | 46,188 |
| MarketAxess Holdings, Inc. | | 797 | | | | 9,731 |
| Northern Trust Corp. | | 7,660 | | | | 403,605 |
| optionsXpress Holdings, Inc. | | 2,209 | | | | 54,143 |
| Sanders Morris Harris Group, Inc. | | 913 | | | | 15,585 |
| SEI Investments Co. | | 3,790 | | | | 154,822 |
| T. Rowe Price Group, Inc. | | 4,707 | | | | 338,669 |
| TradeStation Group, Inc. (a) | | 1,693 | | | | 20,164 |
| | | | | | | 1,738,376 |
| Commercial Banks – 5.6% | | | | | | |
| 1st Source Corp. | | 952 | | | | 24,057 |
| 1st State Bancorp, Inc. | | 264 | | | | 9,464 |
| ABC Bancorp | | 435 | | | | 8,752 |
| Abington Community Bancorp, Inc. | | 692 | | | | 8,975 |
| Alabama National Bancorp, Delaware | | 562 | | | | 37,261 |
| Alliance Financial Corp. | | 324 | | | | 10,067 |
| Amcore Financial, Inc. | | 728 | | | | 22,765 |
| Amegy Bancorp, Inc. | | 2,139 | | | | 51,079 |
| American National Bankshares, Inc. | | 485 | | | | 10,927 |
| American River Bankshares | | 712 | | | | 16,590 |
| AmericanWest Bancorp (a) | | 739 | | | | 17,034 |
| Ames National Corp. | | 333 | | | | 9,237 |
| Arrow Financial Corp. | | 825 | | | | 23,224 |
See accompanying notes which are an integral part of the financial statements.
21 Annual Report
| Investments continued | | | | | | |
| |
| Common Stocks continued | | | | | | |
| | | Shares | | Value (Note 1) |
| |
| FINANCIALS – continued | | | | | | |
| Commercial Banks – continued | | | | | | |
| Associated Banc-Corp. | | 5,018 | | $ | | 164,490 |
| Banc Corp. (a) | | 756 | | | | 8,936 |
| BancFirst Corp. | | 280 | | | | 22,319 |
| Bancorp Rhode Island, Inc. | | 349 | | | | 11,918 |
| Bancorp, Inc., Delaware (a) | | 574 | | | | 10,504 |
| BancTrust Financial Group, Inc. | | 416 | | | | 8,395 |
| Bank of Granite Corp. | | 770 | | | | 14,784 |
| Bank of Marin, California | | 322 | | | | 10,806 |
| Bank of the Ozarks, Inc. | | 672 | | | | 24,931 |
| BankFinancial Corp. | | 1,133 | | | | 16,666 |
| Banner Corp. | | 686 | | | | 21,636 |
| BNC Bancorp | | 888 | | | | 16,574 |
| BOK Financial Corp. | | 2,043 | | | | 97,186 |
| Boston Private Financial Holdings, Inc. | | 770 | | | | 23,870 |
| Capital Bank Corp. | | 913 | | | | 13,786 |
| Capital City Bank Group, Inc. | | 506 | | | | 19,461 |
| Capital Corp. of the West | | 381 | | | | 13,167 |
| Cardinal Financial Corp. | | 1,194 | | | | 13,074 |
| Cascade Bancorp | | 946 | | | | 22,269 |
| Cascade Financial Corp. | | 981 | | | | 17,992 |
| Cathay General Bancorp | | 1,821 | | | | 69,198 |
| Cavalry Bancorp, Inc. | | 488 | | | | 11,922 |
| Centennial Bank Holdings, Inc., Delaware (a) | | 2,200 | | | | 27,280 |
| Center Bancorp, Inc. | | 984 | | | | 10,706 |
| Center Financial Corp., California | | 239 | | | | 5,999 |
| Centerstate Banks of Florida, Inc. | | 293 | | | | 9,962 |
| Central Coast Bancorp (a) | | 1,058 | | | | 26,048 |
| Century Bancorp, Inc. Class A (non-vtg.) | | 462 | | | | 13,860 |
| Chemical Financial Corp. | | 867 | | | | 28,021 |
| Citizens & Northern Corp. | | 291 | | | | 8,133 |
| Citizens Banking Corp., Michigan | | 1,417 | | | | 41,929 |
| City Holding Co. | | 532 | | | | 19,407 |
| CNB Financial Corp., Pennsylvania (d) | | 654 | | | | 9,653 |
| CoBiz, Inc. | | 1,244 | | | | 23,661 |
| Colony Bankcorp, Inc. | | 380 | | | | 9,728 |
| Columbia Bancorp | | 518 | | | | 21,347 |
| Columbia Bancorp, Oregon | | 332 | | | | 7,231 |
| Columbia Banking Systems, Inc. | | 757 | | | | 21,839 |
| Commerce Bancshares, Inc. | | 2,292 | | | | 118,611 |
| Commercial Bankshares, Inc. | | 500 | | | | 18,930 |
| Community Bancorp, Inc. | | 433 | | | | 14,852 |
See accompanying notes which are an integral part of the financial statements.
| Common Stocks continued | | | | | | |
| | | Shares | | Value (Note 1) |
| |
| FINANCIALS – continued | | | | | | |
| Commercial Banks – continued | | | | | | |
| Community Bank of Nevada | | 220 | | $ | | 7,121 |
| Community Banks, Inc. | | 1,100 | | | | 32,274 |
| Community Trust Bancorp, Inc. | | 546 | | | | 17,963 |
| Compass Bancshares, Inc. | | 4,200 | | | | 203,532 |
| CVB Financial Corp. | | 2,163 | | | | 43,563 |
| Eagle Bancorp, Inc., Maryland | | 489 | | | | 11,614 |
| East West Bancorp, Inc. | | 1,842 | | | | 69,701 |
| Eastern Virgina Bankshares, Inc. | | 264 | | | | 5,550 |
| Enterprise Financial Services Corp. | | 796 | | | | 17,998 |
| Farmers Capital Bank Corp. | | 504 | | | | 16,304 |
| Fidelity Southern Corp. | | 1,095 | | | | 19,228 |
| Fifth Third Bancorp | | 19,951 | | | | 803,427 |
| Financial Institutions, Inc. | | 619 | | | | 12,498 |
| First Bancorp, North Carolina | | 672 | | | | 14,804 |
| First Charter Corp. | | 1,187 | | | | 29,722 |
| First Citizen Bancshares, Inc. | | 280 | | | | 52,492 |
| First Citizens Banc Corp. | | 686 | | | | 14,104 |
| First Community Bancorp, California | | 574 | | | | 29,710 |
| First Community Bancshares, Inc. | | 322 | | | | 9,943 |
| First Financial Bancorp, Ohio | | 1,833 | | | | 35,285 |
| First Financial Bankshares, Inc. | | 641 | | | | 23,839 |
| First Financial Corp., Indiana | | 504 | | | | 13,800 |
| First Indiana Corp. | | 868 | | | | 30,337 |
| First M&F Corp. | | 252 | | | | 8,631 |
| First Mariner Bancorp, Inc. (a) | | 815 | | | | 14,442 |
| First Merchants Corp. | | 546 | | | | 14,125 |
| First Midwest Bancorp, Inc., Delaware | | 1,683 | | | | 62,995 |
| First National Lincoln Corp., Maine | | 603 | | | | 11,065 |
| First Oak Brook Bancshares, Inc. | | 546 | | | | 15,102 |
| First of Long Island Corp. | | 406 | | | | 18,270 |
| First Regional Bancorp (a) | | 306 | | | | 21,775 |
| First South Bancorp, Inc., Virginia | | 321 | | | | 12,198 |
| First State Bancorp. | | 353 | | | | 8,733 |
| First United Corp. | | 530 | | | | 10,668 |
| Firstbank Corp., Michigan | | 291 | | | | 6,999 |
| FirstMerit Corp. | | 2,687 | | | | 71,635 |
| Flag Financial Corp. | | 1,051 | | | | 16,921 |
| FNB Corp., North Carolina | | 375 | | | | 6,799 |
| FNB Corp., Virginia | | 546 | | | | 16,844 |
| FNB Financial Services Corp. | | 304 | | | | 4,785 |
| Foothill Independent Bancorp | | 365 | | | | 8,745 |
See accompanying notes which are an integral part of the financial statements.
23 Annual Report
| Investments continued | | | | | | |
| |
| Common Stocks continued | | | | | | |
| | | Shares | | Value (Note 1) |
| |
| FINANCIALS – continued | | | | | | |
| Commercial Banks – continued | | | | | | |
| Frontier Financial Corp., Washington | | 560 | | $ | | 18,133 |
| Fulton Financial Corp. | | 5,233 | | | | 90,950 |
| Gateway Financial Holdings, Inc. | | 662 | | | | 11,439 |
| GB&T Bancshares, Inc. | | 700 | | | | 15,757 |
| German American Bancorp | | 1,139 | | | | 15,365 |
| Glacier Bancorp, Inc. | | 947 | | | | 31,175 |
| Gold Banc Corp., Inc. | | 1,524 | | | | 27,584 |
| Great Southern Bancorp, Inc. | | 499 | | | | 15,175 |
| Greater Bay Bancorp | | 1,837 | | | | 48,938 |
| Greater Community Bancorp | | 730 | | | | 10,768 |
| Greene County Bancshares, Inc. | | 168 | | | | 4,684 |
| Grupo Financiero Galicia SA sponsored ADR (a) | | 1,705 | | | | 12,515 |
| Hancock Holding Co. | | 1,206 | | | | 46,407 |
| Hanmi Financial Corp. | | 1,800 | | | | 33,534 |
| Harleysville National Corp., Pennsylvania | | 780 | | | | 16,474 |
| Heartland Financial USA, Inc. | | 672 | | | | 13,736 |
| Heritage Commerce Corp. | | 657 | | | | 14,428 |
| Huntington Bancshares, Inc. | | 7,854 | | | | 188,182 |
| IBERIABANK Corp. | | 325 | | | | 17,846 |
| Independent Bank Corp., Massachusetts | | 560 | | | | 16,369 |
| Independent Bank Corp., Michigan | | 649 | | | | 18,931 |
| Integra Bank Corp. | | 770 | | | | 16,517 |
| Interchange Financial Services Corp. | | 1,067 | | | | 19,195 |
| International Bancshares Corp. | | 2,462 | | | | 73,860 |
| Investors Bancorp, Inc. | | 4,200 | | | | 45,276 |
| Lakeland Bancorp, Inc. | | 1,022 | | | | 15,483 |
| Lakeland Financial Corp. | | 492 | | | | 21,377 |
| Leesport Financial Corp. | | 376 | | | | 8,725 |
| LNB Bancorp, Inc. | | 828 | | | | 14,995 |
| LSB Bancshares, Inc. | | 941 | | | | 16,797 |
| Macatawa Bank Corp. | | 305 | | | | 11,633 |
| Main Street Banks, Inc. | | 616 | | | | 17,106 |
| MainSource Financial Group, Inc. | | 367 | | | | 6,639 |
| MB Financial, Inc. | | 1,170 | | | | 43,945 |
| MBT Financial Corp. | | 952 | | | | 17,041 |
| Mercantile Bank Corp. | | 220 | | | | 8,800 |
| Mercantile Bankshares Corp. | | 2,744 | | | | 163,021 |
| Merchants Bancshares, Inc. | | 645 | | | | 16,770 |
| Metrocorp Bancshares, Inc. | | 420 | | | | 11,466 |
| Mid-State Bancshares | | 812 | | | | 22,663 |
| Midwest Banc Holdings, Inc. | | 1,215 | | | | 27,447 |
See accompanying notes which are an integral part of the financial statements.
| Common Stocks continued | | | | | | |
| | | Shares | | Value (Note 1) |
| |
| FINANCIALS – continued | | | | | | |
| Commercial Banks – continued | | | | | | |
| Nara Bancorp, Inc. | | 844 | | $ | | 15,800 |
| National Bankshares, Inc. | | 380 | | | | 17,509 |
| National Penn Bancshares, Inc. | | 1,351 | | | | 27,817 |
| NBT Bancorp, Inc. | | 1,173 | | | | 26,827 |
| North Valley Bancorp | | 531 | | | | 9,308 |
| Northern Empire Bancshares | | 336 | | | | 9,022 |
| Northern States Financial Corp. | | 367 | | | | 6,918 |
| Northrim Bancorp, Inc. | | 334 | | | | 8,033 |
| Old Point Financial Corp. | | 337 | | | | 9,884 |
| Old Second Bancorp, Inc. | | 444 | | | | 14,736 |
| Omega Financial Corp. | | 454 | | | | 13,316 |
| Pacific Capital Bancorp | | 1,345 | | | | 50,195 |
| Pacific Continental Corp. | | 828 | | | | 13,041 |
| Penns Woods Bancorp, Inc. | | 434 | | | | 16,631 |
| Pennsylvania Communication Bancorp, Inc. (a) | | 352 | | | | 11,630 |
| Peoples Bancorp, Inc. | | 462 | | | | 13,407 |
| Pinnacle Financial Partners, Inc. (a) | | 621 | | | | 15,463 |
| Placer Sierra Bancshares | | 225 | | | | 6,413 |
| Popular, Inc. | | 9,131 | | | | 202,526 |
| Preferred Bank, Los Angeles California | | 325 | | | | 14,251 |
| PremierWest Bancorp | | 611 | | | | 8,523 |
| PrivateBancorp, Inc. | | 756 | | | | 27,889 |
| Prosperity Bancshares, Inc. | | 602 | | | | 18,421 |
| Provident Bankshares Corp. | | 1,104 | | | | 39,347 |
| Renasant Corp. | | 776 | | | | 24,646 |
| Republic Bancorp, Inc. | | 2,797 | | | | 34,739 |
| Republic Bancorp, Inc., Kentucky Class A | | 929 | | | | 19,082 |
| Republic First Bancorp, Inc. | | 598 | | | | 7,266 |
| Royal Bancshares of Pennsylvania, Inc. Class A | | 640 | | | | 15,302 |
| S&T Bancorp, Inc. | | 840 | | | | 32,290 |
| S.Y. Bancorp, Inc. | | 1,001 | | | | 23,894 |
| Sandy Spring Bancorp, Inc. | | 420 | | | | 15,557 |
| SCBT Financial Corp. | | 223 | | | | 7,433 |
| Seacoast Banking Corp., Florida | | 798 | | | | 19,375 |
| Security Bank Corp., Georgia | | 803 | | | | 20,027 |
| Shore Bancshares, Inc. | | 534 | | | | 17,665 |
| Sierra Bancorp | | 794 | | | | 18,302 |
| Signature Bank, New York (a) | | 933 | | | | 26,861 |
| Simmons First National Corp. Class A | | 700 | | | | 19,614 |
| Sky Financial Group, Inc. | | 3,415 | | | | 101,357 |
| Slade’s Ferry Bancorp | | 143 | | | | 2,624 |
See accompanying notes which are an integral part of the financial statements.
25 Annual Report
| Investments continued | | | | | | |
| |
| Common Stocks continued | | | | | | |
| | | Shares | | Value (Note 1) |
| |
| FINANCIALS – continued | | | | | | |
| Commercial Banks – continued | | | | | | |
| South Financial Group, Inc. | | 2,853 | | $ | | 84,649 |
| Southern Community Financial Corp. | | 1,507 | | | | 14,166 |
| Southside Bancshares, Inc. | | 490 | | | | 9,805 |
| Southwest Bancorp, Inc., Oklahoma | | 896 | | | | 20,223 |
| Southwest Community Bancorp | | 351 | | | | 10,863 |
| State National Bancshares, Inc. | | 374 | | | | 9,986 |
| Sterling Bancshares, Inc. | | 1,805 | | | | 28,140 |
| Sterling Financial Corp., Pennsylvania | | 1,100 | | | | 23,309 |
| Sterling Financial Corp., Washington | | 1,237 | | | | 32,286 |
| Suffolk Bancorp | | 364 | | | | 12,114 |
| Summit Bancshares, Inc. | | 467 | | | | 8,574 |
| Summit Financial Group, Inc. | | 366 | | | | 8,788 |
| Sun Bancorp, Inc., New Jersey | | 617 | | | | 12,235 |
| Susquehanna Bancshares, Inc., Pennsylvania | | 1,498 | | | | 36,731 |
| SVB Financial Group (a) | | 1,257 | | | | 60,449 |
| Taylor Capital Group, Inc. | | 262 | | | | 10,268 |
| Texas Capital Bancshares, Inc. (a) | | 1,229 | | | | 29,668 |
| Texas Regional Bancshares, Inc. Class A | | 1,445 | | | | 42,122 |
| Texas United Bancshares, Inc. | | 406 | | | | 7,714 |
| TIB Financial Corp. | | 393 | | | | 12,714 |
| Trico Bancshares | | 924 | | | | 21,880 |
| Trustco Bank Corp., New York | | 2,782 | | | | 36,110 |
| Trustmark Corp. | | 1,641 | | | | 46,933 |
| UCBH Holdings, Inc. | | 2,977 | | | | 52,514 |
| UMB Financial Corp. | | 908 | | | | 60,273 |
| Umpqua Holdings Corp. | | 1,918 | | | | 50,674 |
| Union Bankshares Corp. | | 544 | | | | 26,204 |
| United Bankshares, Inc., West Virginia | | 1,271 | | | | 48,031 |
| United Community Banks, Inc., Georgia | | 1,354 | | | | 38,657 |
| United Security Bancshares, Inc. | | 434 | | | | 12,747 |
| United Security Bancshares, California | | 418 | | | | 13,012 |
| Univest Corp. of Pennsylvania | | 852 | | | | 21,862 |
| Unizan Financial Corp. | | 840 | | | | 22,117 |
| Vail Banks, Inc. | | 640 | | | | 8,934 |
| Vineyard National Bancorp | | 408 | | | | 11,901 |
| Virginia Commerce Bancorp, Inc. (a) | | 830 | | | | 24,385 |
| Virginia Financial Group, Inc. | | 434 | | | | 16,318 |
| Washington Trust Bancorp, Inc. | | 644 | | | | 18,051 |
| WesBanco, Inc. | | 630 | | | | 20,160 |
| West Bancorp., Inc. | | 1,268 | | | | 24,713 |
| West Coast Bancorp, Oregon | | 742 | | | | 19,552 |
See accompanying notes which are an integral part of the financial statements.
| Common Stocks continued | | | | | | |
| | | Shares | | Value (Note 1) |
| |
| FINANCIALS – continued | | | | | | |
| Commercial Banks – continued | | | | | | |
| Westamerica Bancorp. | | 1,201 | | $ | | 65,623 |
| Western Sierra Bancorp (a) | | 560 | | | | 19,611 |
| Whitney Holding Corp. | | 2,197 | | | | 64,372 |
| Wilshire Bancorp, Inc. | | 955 | | | | 16,245 |
| Wintrust Financial Corp. | | 984 | | | | 55,281 |
| Yadkin Valley Bank & Trust Co. | | 1,126 | | | | 15,502 |
| Yardville National Bancorp | | 658 | | | | 22,971 |
| Zions Bancorp | | 3,066 | | | | 231,882 |
| | | | | | | 6,977,460 |
| Consumer Finance – 0.3% | | | | | | |
| ACE Cash Express, Inc. (a) | | 223 | | | | 5,314 |
| Advanta Corp.: | | | | | | |
| Class A | | 440 | | | | 13,477 |
| Class B | | 669 | | | | 21,662 |
| Asta Funding, Inc. | | 474 | | | | 11,746 |
| Collegiate Funding Services, Inc. (a) | | 1,061 | | | | 16,191 |
| CompuCredit Corp. (a) | | 1,896 | | | | 74,077 |
| Dollar Financial Corp. | | 194 | | | | 2,307 |
| First Cash Financial Services, Inc. (a) | | 733 | | | | 21,257 |
| QC Holdings, Inc. (a) | | 771 | | | | 9,190 |
| United Panam Financial Corp. (a) | | 742 | | | | 17,385 |
| WFS Financial, Inc. (a) | | 1,515 | | | | 117,594 |
| World Acceptance Corp. (a) | | 868 | | | | 23,905 |
| | | | | | | 334,105 |
| Diversified Financial Services – 0.2% | | | | | | |
| Asset Acceptance Capital Corp. (a) | | 1,348 | | | | 27,513 |
| Elron Electronic Industries Ltd. | | 1,549 | | | | 16,729 |
| Encore Capital Group, Inc. (a) | | 1,317 | | | | 21,572 |
| eSpeed, Inc. Class A (a) | | 1,260 | | | | 10,798 |
| EuroBancshares, Inc. (a) | | 408 | | | | 5,157 |
| First Albany Companies, Inc. | | 987 | | | | 6,702 |
| Instinet Group, Inc. | | 14,808 | | | | 75,077 |
| Marlin Business Services Corp. (a) | | 560 | | | | 12,718 |
| Medallion Financial Corp. | | 1,022 | | | | 10,251 |
| The Nasdaq Stock Market, Inc. (a) | | 2,809 | | | | 109,916 |
| | | | | | | 296,433 |
| Insurance – 1.5% | | | | | | |
| Affirmative Insurance Holdings, Inc. | | 532 | | | | 7,182 |
| Alfa Corp. | | 2,859 | | | | 49,832 |
| American National Insurance Co. | | 969 | | | | 113,509 |
See accompanying notes which are an integral part of the financial statements.
27 Annual Report
| Investments continued | | | | | | |
| |
| Common Stocks continued | | | | | | |
| | | Shares | | Value (Note 1) |
| |
| FINANCIALS – continued | | | | | | |
| Insurance – continued | | | | | | |
| American Physicians Capital, Inc. (a) | | 532 | | $ | | 24,179 |
| Arch Capital Group Ltd. (a) | | 1,227 | | | | 64,368 |
| Argonaut Group, Inc. (a) | | 1,271 | | | | 40,418 |
| Baldwin & Lyons, Inc. Class B | | 728 | | | | 18,251 |
| Brooke Corp. | | 766 | | | | 10,916 |
| Ceres Group, Inc. (a) | | 2,824 | | | | 14,120 |
| Cincinnati Financial Corp. | | 6,306 | | | | 280,806 |
| Direct General Corp. | | 630 | | | | 10,767 |
| Donegal Group, Inc. Class A | | 266 | | | | 6,445 |
| EMC Insurance Group | | 703 | | | | 13,751 |
| Enstar Group, Inc. (a) | | 181 | | | | 12,884 |
| Erie Indemnity Co. Class A | | 2,162 | | | | 114,586 |
| FPIC Insurance Group, Inc. (a) | | 269 | | | | 10,190 |
| Harleysville Group, Inc. | | 1,159 | | | | 31,652 |
| Infinity Property & Casualty Corp. | | 770 | | | | 28,452 |
| IPC Holdings Ltd. | | 2,267 | | | | 66,196 |
| James River Group, Inc. | | 580 | | | | 10,881 |
| Kansas City Life Insurance Co. | | 476 | | | | 24,028 |
| Max Re Capital Ltd. | | 1,669 | | | | 44,562 |
| Millea Holdings, Inc. sponsored ADR | | 714 | | | | 58,655 |
| National Interstate Corp. | | 479 | | | | 8,737 |
| National Western Life Insurance Co. Class A | | 112 | | | | 24,640 |
| Navigators Group, Inc. (a) | | 420 | | | | 16,972 |
| Ohio Casualty Corp. | | 2,316 | | | | 68,554 |
| Philadelphia Consolidated Holdings Corp. (a) | | 784 | | | | 75,977 |
| PMA Capital Corp. Class A (a) | | 1,479 | | | | 13,134 |
| Presidential Life Corp. | | 1,344 | | | | 25,926 |
| Quanta Capital Holdings Ltd. (a) | | 2,018 | | | | 8,455 |
| SAFECO Corp. | | 4,738 | | | | 266,513 |
| Safety Insurance Group, Inc. | | 506 | | | | 20,296 |
| SeaBright Insurance Holdings, Inc. | | 686 | | | | 9,220 |
| Selective Insurance Group, Inc. | | 984 | | | | 55,074 |
| State Auto Financial Corp. | | 1,501 | | | | 51,679 |
| The Midland Co. | | 770 | | | | 29,106 |
| Tower Group, Inc. | | 606 | | | | 12,241 |
| United America Indemnity Ltd. Class A (a) | | 794 | | | | 15,046 |
| United Fire & Casualty Co. | | 784 | | | | 35,829 |
| Universal American Financial Corp. (a) | | 2,292 | | | | 33,830 |
| USI Holdings Corp. (a) | | 1,805 | | | | 25,270 |
| | | | | | | 1,853,129 |
See accompanying notes which are an integral part of the financial statements.
| Common Stocks continued | | | | | | |
| | | Shares | | Value (Note 1) |
| |
| FINANCIALS – continued | | | | | | |
| Real Estate 0.2% | | | | | | |
| America First Apartment Investment, Inc. | | 1,056 | | $ | | 15,080 |
| Capital Automotive (REIT) (SBI) | | 1,922 | | | | 74,247 |
| Elbit Medical Imaging Ltd. | | 1,583 | | | | 24,537 |
| Fieldstone Investment Corp. | | 1,753 | | | | 19,634 |
| Gladstone Commercial Corp. | | 528 | | | | 8,823 |
| Investors Real Estate Trust | | 2,306 | | | | 21,699 |
| Monmouth Real Estate Investment Corp. Class A | | 2,004 | | | | 16,012 |
| Origen Financial, Inc. | | 1,956 | | | | 13,242 |
| Tarragon Corp. (a) | | 941 | | | | 18,698 |
| | | | | | | 211,972 |
| Thrifts & Mortgage Finance – 1.6% | | | | | | |
| Accredited Home Lenders Holding Co. (a) | | 840 | | | | 36,389 |
| Aether Holdings, Inc. (a) | | 2,642 | | | | 9,194 |
| Anchor BanCorp Wisconsin, Inc. | | 868 | | | | 26,821 |
| Bank Mutual Corp. | | 2,612 | | | | 27,635 |
| BankUnited Financial Corp. Class A | | 938 | | | | 23,910 |
| Beverly Hills Bancorp, Inc. | | 840 | | | | 8,207 |
| BFC Financial Corp. Class A (a) | | 1,438 | | | | 8,153 |
| Brookline Bancorp, Inc., Delaware | | 1,917 | | | | 26,953 |
| Camco Financial Corp. | | 1,075 | | | | 15,211 |
| Capital Crossing Bank (a) | | 255 | | | | 8,361 |
| Capitol Federal Financial | | 2,352 | | | | 80,297 |
| CFS Bancorp, Inc. | | 1,279 | | | | 17,816 |
| Charter Financial Corp., Georgia | | 700 | | | | 24,542 |
| Citizens First Bancorp, Inc., Delaware | | 756 | | | | 17,093 |
| Citizens South Banking Corp., Delaware | | 445 | | | | 5,416 |
| City Bank Lynnwood, Washington | | 476 | | | | 16,398 |
| Clifton Savings Bancorp, Inc. | | 931 | | | | 9,580 |
| Coastal Financial Corp. | | 949 | | | | 12,745 |
| Commercial Capital Bancorp, Inc. | | 1,961 | | | | 32,709 |
| Cooperative Bankshares, Inc. | | 393 | | | | 8,253 |
| Corus Bankshares, Inc. | | 868 | | | | 51,021 |
| Dime Community Bancshares, Inc. | | 1,428 | | | | 21,149 |
| ESB Financial Corp. | | 1,383 | | | | 17,108 |
| Fidelity Bankshares, Inc. | | 938 | | | | 29,256 |
| First Busey Corp. | | 798 | | | | 16,774 |
| First Defiance Financial Corp. | | 321 | | | | 8,982 |
| First Federal Bancshares of Arkansas, Inc. | | 395 | | | | 9,875 |
| First Financial Holdings, Inc. | | 462 | | | | 14,109 |
| First Niagara Financial Group, Inc. | | 3,836 | | | | 55,584 |
See accompanying notes which are an integral part of the financial statements.
29 Annual Report
| Investments continued | | | | | | |
| |
| Common Stocks continued | | | | | | |
| | | Shares | | Value (Note 1) |
| |
| FINANCIALS – continued | | | | | | |
| Thrifts & Mortgage Finance – continued | | | | | | |
| First PacTrust Bancorp, Inc. | | 444 | | $ | | 12,321 |
| First Place Financial Corp. | | 826 | | | | 19,708 |
| Flushing Financial Corp. | | 857 | | | | 14,398 |
| FMS Financial Corp. | | 745 | | | | 12,814 |
| Franklin Bank Corp. (a) | | 797 | | | | 14,745 |
| Harbor Florida Bancshares, Inc. | | 840 | | | | 31,634 |
| Heritage Financial Corp., Washington | | 266 | | | | 6,381 |
| HMN Financial, Inc. | | 213 | | | | 6,302 |
| Home Federal Bancorp, Inc., Delaware | | 742 | | | | 9,646 |
| Horizon Financial Corp. | | 490 | | | | 11,099 |
| Hudson City Bancorp, Inc. | | 20,637 | | | | 245,787 |
| Independence Community Bank Corp. | | 3,073 | | | | 121,814 |
| ITLA Capital Corp. (a) | | 101 | | | | 5,297 |
| Kearny Financial Corp. | | 2,627 | | | | 33,232 |
| KNBT Bancorp, Inc. | | 1,390 | | | | 22,782 |
| LSB Corp. | | 737 | | | | 12,529 |
| MAF Bancorp., Inc. | | 1,369 | | | | 58,278 |
| MASSBANK Corp. | | 295 | | | | 9,588 |
| MutualFirst Financial, Inc. | | 334 | | | | 7,348 |
| NASB Financial, Inc. | | 476 | | | | 18,040 |
| NetBank, Inc. | | 1,934 | | | | 14,292 |
| NewMil Bancorp, Inc. | | 570 | | | | 17,328 |
| North Central Bancshares, Inc. | | 263 | | | | 10,178 |
| Northwest Bancorp, Inc. | | 1,515 | | | | 33,527 |
| OceanFirst Financial Corp. | | 974 | | | | 23,473 |
| Pamrapo Bancorp, Inc. | | 641 | | | | 13,621 |
| Parkvale Financial Corp. | | 276 | | | | 7,687 |
| Partners Trust Financial Group, Inc. | | 1,763 | | | | 21,156 |
| Pennfed Financial Services, Inc. | | 517 | | | | 9,947 |
| People’s Bank, Connecticut | | 5,134 | | | | 159,770 |
| Provident Financial Holdings, Inc. | | 223 | | | | 6,130 |
| Provident New York Bancorp | | 1,494 | | | | 17,315 |
| Pulaski Financial Corp. | | 781 | | | | 13,824 |
| PVF Capital Corp. | | 290 | | | | 3,132 |
| Riverview Bancorp, Inc. | | 235 | | | | 5,233 |
| Rockville Financial, Inc. (a) | | 597 | | | | 8,048 |
| Severn Bancorp, Inc. | | 601 | | | | 11,449 |
| Sound Federal Bancorp, Inc. | | 1,234 | | | | 24,347 |
| Synergy Financial Group, Inc., New Jersey | | 902 | | | | 11,040 |
| TierOne Corp. | | 742 | | | | 22,238 |
| Timberland Bancorp, Inc. | | 364 | | | | 8,503 |
See accompanying notes which are an integral part of the financial statements.
| Common Stocks continued | | | | | | |
| | | Shares | | Value (Note 1) |
| |
| FINANCIALS – continued | | | | | | |
| Thrifts & Mortgage Finance – continued | | | | | | |
| Triad Guaranty, Inc. (a) | | 518 | | $ | | 22,460 |
| United Community Financial Corp., Ohio | | 1,280 | | | | 15,091 |
| Washington Federal, Inc. | | 3,063 | | | | 74,339 |
| Wauwatosa Holdings, Inc. | | 1,110 | | | | 12,920 |
| Willow Grove Bancorp, Inc. | | 1,085 | | | | 17,013 |
| WSFS Financial Corp. | | 262 | | | | 16,558 |
| | | | | | | 1,913,903 |
| |
| TOTAL FINANCIALS | | | | | | 13,325,378 |
| |
| HEALTH CARE – 14.5% | | | | | | |
| Biotechnology – 8.2% | | | | | | |
| Aastrom Biosciences, Inc. (a) | | 4,559 | | | | 9,893 |
| Abgenix, Inc. (a) | | 3,503 | | | | 48,026 |
| Accentia Biopharmaceutical, Inc. | | 867 | | | | 5,714 |
| AEterna Zentaris, Inc. (sub. vtg.) (a) | | 2,851 | | | | 12,661 |
| Affymetrix, Inc. (a) | | 2,204 | | | | 108,525 |
| Albany Molecular Research, Inc. (a) | | 1,302 | | | | 15,936 |
| Alexion Pharmaceuticals, Inc. (a) | | 1,019 | | | | 19,881 |
| Alkermes, Inc. (a) | | 3,604 | | | | 65,521 |
| Alnylam Pharmaceuticals, Inc. (a) | | 1,219 | | | | 15,311 |
| Amgen, Inc. (a) | | 45,100 | | | | 3,649,943 |
| Amylin Pharmaceuticals, Inc. (a) | | 4,074 | | | | 152,408 |
| Anadys Pharmaceuticals, Inc. (a) | | 1,368 | | | | 13,010 |
| Angiotech Pharmaceuticals, Inc. (a) | | 3,205 | | | | 47,012 |
| Antigenics, Inc. (a)(d) | | 1,875 | | | | 10,256 |
| Aphton Corp. (a) | | 2,108 | | | | 822 |
| Arena Pharmaceuticals, Inc. (a) | | 1,791 | | | | 19,307 |
| ARIAD Pharmaceuticals, Inc. (a) | | 1,721 | | | | 10,619 |
| ArQule, Inc. (a) | | 1,716 | | | | 11,892 |
| Array Biopharma, Inc. (a) | | 2,640 | | | | 17,741 |
| Avant Immunotherapeutics, Inc. (a) | | 6,672 | | | | 11,943 |
| Axonyx, Inc. (a) | | 1,772 | | | | 1,595 |
| BioCryst Pharmaceuticals, Inc. (a) | | 1,462 | | | | 23,743 |
| Bioenvision, Inc. (a) | | 1,315 | | | | 7,206 |
| Biogen Idec, Inc. (a) | | 12,630 | | | | 540,690 |
| BioMarin Pharmaceutical, Inc. (a) | | 2,572 | | | | 25,051 |
| Biopure Corp. Class A (a) | | 331 | | | | 331 |
| Celgene Corp. (a) | | 6,068 | | | | 369,663 |
| Cell Genesys, Inc. (a) | | 1,791 | | | | 10,424 |
| Cell Therapeutics, Inc. (a)(d) | | 2,484 | | | | 5,216 |
See accompanying notes which are an integral part of the financial statements.
31 Annual Report
| Investments continued | | | | | | |
| |
| Common Stocks continued | | | | | | |
| | | Shares | | Value (Note 1) |
| |
| HEALTH CARE – continued | | | | | | |
| Biotechnology – continued | | | | | | |
| Cephalon, Inc. (a) | | 2,008 | | $ | | 102,107 |
| Cepheid, Inc. (a) | | 2,249 | | | | 24,717 |
| Chiron Corp. (a) | | 6,670 | | | | 295,481 |
| Ciphergen Biosystems, Inc. (a) | | 1,274 | | | | 1,631 |
| Coley Pharmaceutical Group, Inc. | | 1,091 | | | | 17,412 |
| Corgentech, Inc. (a) | | 904 | | | | 2,061 |
| Cotherix, Inc. (a) | | 1,291 | | | | 16,021 |
| Critical Therapeutics, Inc. (a)(d) | | 1,657 | | | | 10,721 |
| Crucell NV sponsored ADR (a) | | 436 | | | | 11,484 |
| Cubist Pharmaceuticals, Inc. (a) | | 1,941 | | | | 43,886 |
| CuraGen Corp. (a) | | 2,782 | | | | 11,462 |
| Curis, Inc. (a) | | 2,390 | | | | 9,345 |
| CV Therapeutics, Inc. (a) | | 1,870 | | | | 46,245 |
| Cytogen Corp. (a) | | 895 | | | | 2,730 |
| Cytokinetics, Inc. (a) | | 946 | | | | 8,136 |
| deCODE genetics, Inc. (a) | | 2,642 | | | | 21,929 |
| Dendreon Corp. (a) | | 2,106 | | | | 12,446 |
| Digene Corp. (a) | | 788 | | | | 21,607 |
| Discovery Partners International, Inc. (a) | | 1,990 | | | | 4,677 |
| Diversa Corp. (a) | | 2,120 | | | | 10,854 |
| DOV Pharmaceutical, Inc. (a) | | 871 | | | | 12,577 |
| Dyax Corp. (a) | | 1,399 | | | | 6,142 |
| Dynavax Technologies Corp. (a) | | 848 | | | | 3,799 |
| Encysive Pharmaceuticals, Inc. (a) | | 2,264 | | | | 25,742 |
| Enzon Pharmaceuticals, Inc. (a) | | 1,776 | | | | 12,059 |
| Exact Sciences Corp. (a) | | 888 | | | | 1,296 |
| Exelixis, Inc. (a) | | 3,226 | | | | 26,066 |
| Favrille, Inc. | | 194 | | | | 669 |
| Genaera Corp. (a) | | 2,669 | | | | 3,817 |
| Gene Logic, Inc. (a) | | 2,050 | | | | 7,380 |
| Genelabs Technologies, Inc. (a) | | 8,315 | | | | 3,742 |
| Genitope Corp. (a) | | 832 | | | | 6,606 |
| Genomic Health, Inc. | | 740 | | | | 6,823 |
| Genta, Inc. (a) | | 3,002 | | | | 3,662 |
| Genzyme Corp. (a) | | 9,218 | | | | 685,266 |
| Geron Corp. (a) | | 3,211 | | | | 28,835 |
| Gilead Sciences, Inc. (a) | | 16,438 | | | | 833,242 |
| GTx, Inc. (a) | | 1,382 | | | | 10,821 |
| Harvard Bioscience, Inc. (a) | | 1,875 | | | | 7,219 |
| Human Genome Sciences, Inc. (a) | | 5,121 | | | | 47,369 |
| Icagen, Inc. | | 250 | | | | 1,575 |
See accompanying notes which are an integral part of the financial statements.
| Common Stocks continued | | | | | | |
| | | Shares | | Value (Note 1) |
| |
| HEALTH CARE – continued | | | | | | |
| Biotechnology – continued | | | | | | |
| ICOS Corp. (a) | | 2,422 | | $ | | 69,003 |
| ID Biomedical Corp. (a) | | 1,606 | | | | 47,514 |
| Idenix Pharmaceuticals, Inc. (a) | | 1,707 | | | | 35,437 |
| Illumina, Inc. (a) | | 2,293 | | | | 36,115 |
| ImClone Systems, Inc. (a) | | 2,953 | | | | 95,707 |
| ImmunoGen, Inc. (a) | | 2,306 | | | | 12,752 |
| Immunomedics, Inc. (a) | | 2,348 | | | | 4,766 |
| Incyte Corp. (a) | | 3,226 | | | | 17,937 |
| Indevus Pharmaceuticals, Inc. (a) | | 2,306 | | | | 9,247 |
| Inhibitex, Inc. (a) | | 1,273 | | | | 11,661 |
| InterMune, Inc. (a) | | 1,358 | | | | 19,623 |
| Introgen Therapeutics, Inc. (a)(d) | | 1,479 | | | | 9,140 |
| Invitrogen Corp. (a) | | 1,851 | | | | 123,369 |
| Isis Pharmaceuticals, Inc. (a) | | 2,768 | | | | 14,034 |
| Kendle International, Inc. (a) | | 527 | | | | 12,595 |
| Keryx Biopharmaceuticals, Inc. (a) | | 1,914 | | | | 26,585 |
| Kosan Biosciences, Inc. (a) | | 1,628 | | | | 11,787 |
| La Jolla Pharmaceutical Co. (a) | | 2,008 | | | | 1,365 |
| Lexicon Genetics, Inc. (a) | | 3,100 | | | | 11,718 |
| Luminex Corp. (a) | | 1,735 | | | | 18,183 |
| MannKind Corp. (a) | | 2,085 | | | | 27,042 |
| Marshall Edwards, Inc. (a)(d) | | 2,098 | | | | 16,071 |
| Martek Biosciences (a) | | 1,091 | | | | 28,595 |
| Maxim Pharmaceuticals, Inc. (a) | | 1,536 | | | | 1,889 |
| Maxygen, Inc. (a) | | 1,595 | | | | 11,771 |
| Medarex, Inc. (a) | | 3,506 | | | | 36,673 |
| MedImmune, Inc. (a) | | 9,229 | | | | 331,413 |
| Memory Pharmaceuticals Corp. (a)(d) | | 3,000 | | | | 6,360 |
| Millennium Pharmaceuticals, Inc. (a) | | 11,310 | | | | 118,868 |
| Momenta Pharmaceuticals, Inc. (a) | | 1,039 | | | | 22,962 |
| Monogram Biosciences, Inc. (a) | | 5,981 | | | | 10,706 |
| Myogen, Inc. (a) | | 1,377 | | | | 29,936 |
| Myriad Genetics, Inc. (a) | | 1,327 | | | | 25,492 |
| Nabi Biopharmaceuticals (a) | | 2,081 | | | | 6,680 |
| Nanogen, Inc. (a) | | 1,369 | | | | 3,861 |
| Nektar Therapeutics (a) | | 3,485 | | | | 58,618 |
| Neopharm, Inc. (a) | | 1,028 | | | | 9,704 |
| Neose Technologies, Inc. (a) | | 1,246 | | | | 2,181 |
| Neurochem, Inc. (a)(d) | | 1,279 | | | | 17,719 |
| Neurocrine Biosciences, Inc. (a) | | 1,327 | | | | 78,983 |
| Neurogen Corp. (a) | | 1,735 | | | | 12,908 |
See accompanying notes which are an integral part of the financial statements.
33 Annual Report
| Investments continued | | | | | | |
| |
| Common Stocks continued | | | | | | |
| | | Shares | | Value (Note 1) |
| |
| HEALTH CARE – continued | | | | | | |
| Biotechnology – continued | | | | | | |
| Northfield Laboratories, Inc. (a) | | 1,298 | | $ | | 16,640 |
| Novavax, Inc. (a)(d) | | 1,637 | | | | 5,680 |
| NPS Pharmaceuticals, Inc. (a) | | 1,465 | | | | 16,979 |
| Nuvelo, Inc. (a) | | 1,218 | | | | 10,609 |
| ONYX Pharmaceuticals, Inc. (a) | | 1,362 | | | | 34,363 |
| Orchid Cellmark, Inc. (a) | | 692 | | | | 4,650 |
| Orthologic Corp. (a) | | 2,446 | | | | 10,151 |
| Oscient Pharmaceuticals Corp. (a) | | 2,609 | | | | 5,088 |
| OSI Pharmaceuticals, Inc. (a) | | 2,027 | | | | 49,155 |
| Panacos Pharmaceuticals, Inc. (a) | | 1,844 | | | | 14,586 |
| Peregrine Pharmaceuticals, Inc. (a) | | 6,454 | | | | 6,196 |
| Pharmacopeia Drug Discovery, Inc. (a) | | 580 | | | | 1,833 |
| Pharmacyclics, Inc. (a) | | 1,083 | | | | 8,047 |
| Pharmion Corp. (a) | | 1,034 | | | | 17,961 |
| PRAECIS Pharmaceuticals, Inc. (a) | | 520 | | | | 2,044 |
| Progenics Pharmaceuticals, Inc. (a) | | 658 | | | | 17,417 |
| Protein Design Labs, Inc. (a) | | 3,748 | | | | 104,382 |
| QIAGEN NV (a) | | 5,183 | | | | 58,205 |
| QLT, Inc. (a) | | 3,240 | | | | 20,971 |
| Regeneron Pharmaceuticals, Inc. (a) | | 1,994 | | | | 22,273 |
| Renovis, Inc. (a) | | 751 | | | | 11,911 |
| Rigel Pharmaceuticals, Inc. (a) | | 896 | | | | 19,640 |
| Savient Pharmaceuticals, Inc. (a) | | 3,100 | | | | 11,594 |
| SciClone Pharmaceuticals, Inc. (a) | | 1,791 | | | | 7,021 |
| Seattle Genetics, Inc. (a) | | 1,777 | | | | 8,832 |
| Senomyx, Inc. (a) | | 1,429 | | | | 18,205 |
| Sequenom, Inc. (a) | | 3,380 | | | | 3,008 |
| Seracare Life Sciences, Inc. (a) | | 482 | | | | 10,570 |
| Serologicals Corp. (a) | | 1,081 | | | | 21,706 |
| Sirna Therapeutics, Inc. (a) | | 1,771 | | | | 6,287 |
| Solexa, Inc. (a)(d) | | 1,301 | | | | 11,436 |
| StemCells, Inc. (a) | | 3,057 | | | | 12,839 |
| Stratagene Corp. | | 812 | | | | 8,364 |
| Tanox, Inc. (a) | | 1,815 | | | | 30,147 |
| Targeted Genetics Corp. (a) | | 5,053 | | | | 3,032 |
| Techne Corp. (a) | | 1,543 | | | | 85,266 |
| Telik, Inc. (a) | | 1,501 | | | | 25,187 |
| Third Wave Technologies, Inc. (a) | | 3,002 | | | | 8,225 |
| Threshold Pharmaceuticals, Inc. | | 1,897 | | | | 25,439 |
| Trimeris, Inc. (a) | | 826 | | | | 9,036 |
| United Therapeutics Corp. (a) | | 826 | | | | 59,001 |
See accompanying notes which are an integral part of the financial statements.
| Common Stocks continued | | | | | | |
| | | Shares | | Value (Note 1) |
| |
| HEALTH CARE – continued | | | | | | |
| Biotechnology – continued | | | | | | |
| Vasogen, Inc. (a)(d) | | 2,693 | | $ | | 5,956 |
| Vertex Pharmaceuticals, Inc. (a) | | 3,220 | | | | 82,110 |
| ViaCell, Inc. | | 1,410 | | | | 8,545 |
| Vion Pharmaceuticals, Inc. (a) | | 3,559 | | | | 6,584 |
| ViroPharma, Inc. (a) | | 2,182 | | | | 38,120 |
| XOMA Ltd. (a) | | 3,044 | | | | 5,205 |
| Zymogenetics, Inc. (a) | | 2,587 | | | | 41,521 |
| | | | | | | 10,098,986 |
| Health Care Equipment & Supplies – 2.5% | | | | | | |
| Abaxis, Inc. (a) | | 1,056 | | | | 17,519 |
| Abiomed, Inc. (a) | | 1,833 | | | | 16,020 |
| Aksys Ltd. (a)(d) | | 1,455 | | | | 1,353 |
| Align Technology, Inc. (a) | | 2,470 | | | | 17,092 |
| American Medical Systems Holdings, Inc. (a) | | 2,643 | | | | 48,631 |
| Analogic Corp. | | 476 | | | | 22,829 |
| Angiodynamics, Inc. (a) | | 394 | | | | 8,120 |
| Anika Therapeutics, Inc. (a) | | 1,153 | | | | 13,617 |
| Animas Corp. (a) | | 473 | | | | 8,055 |
| Arrow International, Inc. | | 1,641 | | | | 48,951 |
| ArthroCare Corp. (a) | | 924 | | | | 35,343 |
| Aspect Medical Systems, Inc. (a) | | 1,109 | | | | 41,776 |
| BioLase Technology, Inc. (a)(d) | | 979 | | | | 6,285 |
| Biomet, Inc. | | 9,425 | | | | 335,719 |
| Biosite, Inc. (a) | | 686 | | | | 40,460 |
| BioVeris Corp. (a) | | 918 | | | | 4,370 |
| Bruker BioSciences Corp. (a) | | 4,176 | | | | 20,755 |
| Cardiac Science Corp. (a) | | 367 | | | | 3,442 |
| Cardiodynamics International Corp. (a) | | 2,698 | | | | 2,806 |
| Conceptus, Inc. (a) | | 1,028 | | | | 15,903 |
| CONMED Corp. (a) | | 1,187 | | | | 26,814 |
| Conor Medsystems, Inc. | | 1,144 | | | | 22,617 |
| Cutera, Inc. (a) | | 393 | | | | 15,555 |
| Cyberonics, Inc. (a) | | 882 | | | | 24,881 |
| Cytyc Corp. (a) | | 4,201 | | | | 115,570 |
| Dade Behring Holdings, Inc. | | 3,381 | | | | 138,249 |
| Datascope Corp. | | 602 | | | | 21,130 |
| DENTSPLY International, Inc. | | 2,785 | | | | 154,930 |
| DexCom, Inc. | | 894 | | | | 12,534 |
| Dionex Corp. (a) | | 812 | | | | 38,351 |
| Encore Medical Corp. (a) | | 1,791 | | | | 9,456 |
See accompanying notes which are an integral part of the financial statements.
35 Annual Report
| Investments continued | | | | | | |
| |
| Common Stocks continued | | | | | | |
| | | Shares | | Value (Note 1) |
| |
| HEALTH CARE – continued | | | | | | |
| Health Care Equipment & Supplies – continued | | | | | | |
| Endologix, Inc. (a) | | 2,176 | | $ | | 13,361 |
| Epix Pharmaceuticals, Inc. (a) | | 902 | | | | 4,447 |
| ev3, Inc. | | 1,450 | | | | 19,213 |
| Exactech, Inc. (a) | | 689 | | | | 8,874 |
| Foxhollow Technologies, Inc. (a) | | 796 | | | | 34,658 |
| Gen-Probe, Inc. (a) | | 1,809 | | | | 83,522 |
| Given Imaging Ltd. (a) | | 1,215 | | | | 29,099 |
| Hologic, Inc. (a) | | 1,053 | | | | 74,837 |
| I-Flow Corp. (a) | | 1,390 | | | | 18,223 |
| ICU Medical, Inc. (a) | | 616 | | | | 22,164 |
| IDEXX Laboratories, Inc. (a) | | 1,257 | | | | 89,938 |
| Immucor, Inc. (a) | | 1,555 | | | | 38,517 |
| INAMED Corp. (a) | | 1,395 | | | | 116,957 |
| Integra LifeSciences Holdings Corp. (a) | | 1,019 | | | | 37,234 |
| Intermagnetics General Corp. (a) | | 1,011 | | | | 33,808 |
| IntraLase Corp. (a) | | 901 | | | | 15,596 |
| Intuitive Surgical, Inc. (a) | | 1,255 | | | | 140,209 |
| IRIS International, Inc. (a) | | 641 | | | | 15,813 |
| Kensey Nash Corp. (a) | | 546 | | | | 12,498 |
| Kyphon, Inc. (a) | | 1,529 | | | | 64,967 |
| Laserscope, Inc. (a) | | 983 | | | | 21,154 |
| LifeCell Corp. (a) | | 1,025 | | | | 18,840 |
| Lifecore Biomedical, Inc. (a) | | 888 | | | | 13,302 |
| Meridian Bioscience, Inc. | | 1,305 | | | | 24,364 |
| Merit Medical Systems, Inc. (a) | | 928 | | | | 11,878 |
| Micro Therapeutics, Inc. (a) | | 2,306 | | | | 14,343 |
| Molecular Devices Corp. (a) | | 714 | | | | 19,171 |
| Natus Medical, Inc. (a) | | 659 | | | | 10,900 |
| Neogen Corp. (a) | | 843 | | | | 16,934 |
| NeuroMetrix, Inc. (a) | | 546 | | | | 16,975 |
| Nutraceutical International Corp. (a) | | 1,148 | | | | 14,763 |
| NuVasive, Inc. (a) | | 968 | | | | 16,650 |
| NxStage Medical, Inc. | | 638 | | | | 8,517 |
| OccuLogix, Inc. | | 1,451 | | | | 11,129 |
| OraSure Technologies, Inc. (a) | | 1,665 | | | | 22,577 |
| Orthofix International NV (a) | | 532 | | | | 19,466 |
| Orthovita, Inc. (a) | | 2,918 | | | | 10,125 |
| Palomar Medical Technologies, Inc. (a) | | 738 | | | | 25,114 |
| PolyMedica Corp. | | 868 | | | | 32,949 |
| Possis Medical, Inc. (a) | | 846 | | | | 8,460 |
| Quidel Corp. (a) | | 1,847 | | | | 25,784 |
See accompanying notes which are an integral part of the financial statements.
| Common Stocks continued | | | | | | |
| | | Shares | | Value (Note 1) |
| |
| HEALTH CARE – continued | | | | | | |
| Health Care Equipment & Supplies – continued | | | | | | |
| Regeneration Technologies, Inc. (a) | | 1,154 | | $ | | 9,474 |
| Respironics, Inc. (a) | | 2,447 | | | | 94,650 |
| Somanetics Corp. (a) | | 482 | | | | 14,899 |
| SonoSite, Inc. (a) | | 686 | | | | 25,766 |
| Staar Surgical Co. (a) | | 972 | | | | 5,540 |
| Stereotaxis, Inc. (a) | | 1,600 | | | | 11,296 |
| SurModics, Inc. (a) | | 644 | | | | 25,251 |
| Syneron Medical Ltd. (a) | | 797 | | | | 31,721 |
| Synovis Life Technologies, Inc. (a) | | 445 | | | | 3,622 |
| The Spectranetics Corp. (a) | | 1,018 | | | | 11,198 |
| Thermogenesis Corp. (a) | | 3,102 | | | | 13,246 |
| Thoratec Corp. (a) | | 2,198 | | | | 44,949 |
| TriPath Imaging, Inc. (a) | | 1,637 | | | | 10,084 |
| Urologix, Inc. (a) | | 720 | | | | 3,125 |
| Utah Medical Products, Inc. | | 560 | | | | 16,229 |
| Varian, Inc. (a) | | 1,243 | | | | 52,156 |
| Vascular Solutions, Inc. (a)(d) | | 1,111 | | | | 9,488 |
| Ventana Medical Systems, Inc. (a) | | 1,319 | | | | 50,795 |
| Vital Signs, Inc. | | 574 | | | | 27,397 |
| Wright Medical Group, Inc. (a) | | 1,327 | | | | 25,731 |
| Young Innovations, Inc. | | 476 | | | | 17,345 |
| Zoll Medical Corp. (a) | | 392 | | | | 10,196 |
| | | | | | | 3,040,621 |
| Health Care Providers & Services – 2.2% | | | | | | |
| Accelrys, Inc. (a) | | 1,155 | | | | 9,356 |
| Allied Healthcare International, Inc. (a) | | 3,071 | | | | 18,426 |
| Allscripts Healthcare Solutions, Inc. (a) | | 2,167 | | | | 29,038 |
| Amedisys, Inc. (a) | | 625 | | | | 27,738 |
| America Service Group, Inc. (a) | | 436 | | | | 7,521 |
| American Healthways, Inc. (a) | | 1,213 | | | | 53,869 |
| AMICAS, Inc. (a) | | 2,446 | | | | 11,619 |
| AmSurg Corp. (a) | | 1,235 | | | | 29,776 |
| Andrx Corp. (a) | | 2,914 | | | | 51,840 |
| BioScrip, Inc. (a) | | 1,489 | | | | 13,282 |
| Cerner Corp. (a) | | 1,383 | | | | 133,321 |
| Computer Programs & Systems, Inc. | | 574 | | | | 23,109 |
| Corvel Corp. (a) | | 420 | | | | 6,804 |
| Cross Country Healthcare, Inc. (a) | | 1,452 | | | | 26,833 |
| Dendrite International, Inc. (a) | | 1,592 | | | | 29,993 |
| Dialysis Corp. of America (a) | | 513 | | | | 5,900 |
See accompanying notes which are an integral part of the financial statements.
37 Annual Report
| Investments continued | | | | | | |
| |
| Common Stocks continued | | | | | | |
| | | Shares | | Value (Note 1) |
| |
| HEALTH CARE – continued | | | | | | |
| Health Care Providers & Services – continued | | | | | | |
| Eclipsys Corp. (a) | | 1,942 | | $ | | 34,820 |
| Emageon, Inc. | | 706 | | | | 9,093 |
| Emdeon Corp. (a) | | 12,349 | | | | 94,470 |
| eResearchTechnology, Inc. (a) | | 1,958 | | | | 25,337 |
| Express Scripts, Inc. (a) | | 5,554 | | | | 469,091 |
| Genesis HealthCare Corp. (a) | | 770 | | | | 32,379 |
| Gentiva Health Services, Inc. (a) | | 1,483 | | | | 24,336 |
| HealthExtras, Inc. (a) | | 1,606 | | | | 36,328 |
| HealthTronics, Inc. (a) | | 1,054 | | | | 7,736 |
| Henry Schein, Inc. (a) | | 2,991 | | | | 127,566 |
| Horizon Health Corp. (a) | | 407 | | | | 9,451 |
| Hythiam, Inc. (a) | | 1,855 | | | | 9,535 |
| ICON PLC sponsored ADR (a) | | 490 | | | | 20,301 |
| IDX Systems Corp. (a) | | 1,145 | | | | 50,002 |
| LCA Vision, Inc. | | 831 | | | | 39,664 |
| LHC Group, Inc. | | 250 | | | | 4,103 |
| Lifeline Systems, Inc. (a) | | 488 | | | | 17,339 |
| LifePoint Hospitals, Inc. (a) | | 2,016 | | | | 76,709 |
| Lincare Holdings, Inc. (a) | | 3,622 | | | | 155,492 |
| Magellan Health Services, Inc. (a) | | 1,020 | | | | 29,804 |
| Matria Healthcare, Inc. (a) | | 630 | | | | 21,376 |
| Medcath Corp. (a) | | 485 | | | | 9,428 |
| Merge Technologies, Inc. (a) | | 669 | | | | 19,093 |
| MWI Veterinary Supply, Inc. | | 466 | | | | 10,872 |
| National Medical Health Card Systems, Inc. (a) | | 444 | | | | 12,281 |
| Odyssey Healthcare, Inc. (a) | | 1,372 | | | | 25,409 |
| Omnicell, Inc. (a) | | 1,063 | | | | 10,609 |
| Option Care, Inc. | | 1,693 | | | | 21,213 |
| PAREXEL International Corp. (a) | | 1,145 | | | | 23,553 |
| Patterson Companies, Inc. (a) | | 4,917 | | | | 171,800 |
| PDI, Inc. (a) | | 591 | | | | 7,399 |
| Per-Se Technologies, Inc. (a) | | 1,320 | | | | 30,202 |
| Pharmaceutical Product Development, Inc. | | 1,994 | | | | 116,230 |
| Phase Forward, Inc. (a) | | 1,299 | | | | 13,938 |
| PRA International | | 789 | | | | 21,887 |
| PSS World Medical, Inc. (a) | | 2,904 | | | | 47,829 |
| Psychiatric Solutions, Inc. (a) | | 824 | | | | 46,490 |
| Radiation Therapy Services, Inc. (a) | | 597 | | | | 22,650 |
| ResCare, Inc. (a) | | 1,271 | | | | 22,001 |
| Rotech Healthcare, Inc. (a) | | 755 | | | | 12,005 |
| Rural/Metro Corp. (a) | | 1,029 | | | | 9,107 |
See accompanying notes which are an integral part of the financial statements.
| Common Stocks continued | | | | | | |
| | | Shares | | Value (Note 1) |
| |
| HEALTH CARE – continued | | | | | | |
| Health Care Providers & Services – continued | | | | | | |
| SFBC International, Inc. (a) | | 560 | | $ | | 11,810 |
| Sun Healthcare Group, Inc. (a) | | 1,343 | | | | 9,831 |
| Symbion, Inc. (a) | | 643 | | | | 17,226 |
| TLC Vision Corp. (a) | | 2,698 | | | | 17,301 |
| TriZetto Group, Inc. (a) | | 2,222 | | | | 36,108 |
| U.S. Physical Therapy, Inc. (a) | | 645 | | | | 12,765 |
| United Surgical Partners International, Inc. (a) | | 1,654 | | | | 57,410 |
| VCA Antech, Inc. (a) | | 3,103 | | | | 86,760 |
| Ventiv Health, Inc. (a) | | 668 | | | | 16,473 |
| VistaCare, Inc. Class A (a) | | 689 | | | | 9,508 |
| Vital Images, Inc. (a) | | 486 | | | | 12,947 |
| | | | | | | 2,715,492 |
| Pharmaceuticals – 1.6% | | | | | | |
| Acusphere, Inc. (a) | | 2,008 | | | | 9,839 |
| Adams Respiratory Therapeutics, Inc. | | 1,053 | | | | 46,637 |
| Adolor Corp. (a) | | 1,274 | | | | 18,562 |
| Advancis Pharmaceutical Corp. (a) | | 401 | | | | 525 |
| American Pharmaceutical Partners, Inc. (a) | | 2,767 | | | | 105,201 |
| Aspreva Pharmaceuticals Corp. | | 1,245 | | | | 15,762 |
| Atherogenics, Inc. (a) | | 1,599 | | | | 23,969 |
| Axcan Pharma, Inc. (a) | | 1,847 | | | | 27,235 |
| Barrier Therapeutics, Inc. (a) | | 797 | | | | 5,738 |
| Cardiome Pharma Corp. (a) | | 1,619 | | | | 13,907 |
| CNS., Inc. | | 377 | | | | 8,671 |
| Connetics Corp. (a) | | 1,299 | | | | 17,225 |
| Cypress Bioscience, Inc. (a) | | 1,440 | | | | 8,136 |
| DepoMed, Inc. (a) | | 2,877 | | | | 17,291 |
| Discovery Laboratories, Inc. (a) | | 1,805 | | | | 12,130 |
| Draxis Health, Inc. (a) | | 1,243 | | | | 5,062 |
| Durect Corp. (a)(d) | | 2,237 | | | | 11,722 |
| Endo Pharmaceuticals Holdings, Inc. (a) | | 5,000 | | | | 149,600 |
| First Horizon Pharmaceutical Corp. (a) | | 1,508 | | | | 26,571 |
| Flamel Technologies SA sponsored ADR (a) | | 747 | | | | 14,215 |
| Hi-Tech Pharmacal Co., Inc. (a) | | 259 | | | | 9,896 |
| Hollis Eden Pharmaceuticals, Inc. (a) | | 735 | | | | 3,940 |
| Inspire Pharmaceuticals, Inc. (a) | | 1,344 | | | | 9,731 |
| Ista Pharmaceuticals, Inc. (a) | | 1,075 | | | | 7,428 |
| Kos Pharmaceuticals, Inc. (a) | | 1,672 | | | | 111,322 |
| Medicines Co. (a) | | 1,837 | | | | 33,562 |
| MGI Pharma, Inc. (a) | | 3,293 | | | | 65,004 |
See accompanying notes which are an integral part of the financial statements.
39 Annual Report
| Investments continued | | | | | | |
| |
| Common Stocks continued | | | | | | |
| | | Shares | | Value (Note 1) |
| |
| HEALTH CARE – continued | | | | | | |
| Pharmaceuticals – continued | | | | | | |
| Nastech Pharmaceutical Co., Inc. (a) | | 938 | | $ | | 13,413 |
| New River Pharmaceuticals, Inc. (a) | | 901 | | | | 42,572 |
| NitroMed, Inc. (a)(d) | | 1,150 | | | | 18,676 |
| Noven Pharmaceuticals, Inc. (a) | | 1,081 | | | | 14,604 |
| Novogen Ltd. sponsored ADR (a) | | 310 | | | | 6,284 |
| Pain Therapeutics, Inc. (a) | | 2,055 | | | | 14,858 |
| Penwest Pharmaceuticals Co. (a) | | 784 | | | | 13,289 |
| Perrigo Co. | | 2,792 | | | | 40,484 |
| Pharmos Corp. (a) | | 1,334 | | | | 2,668 |
| Pozen, Inc. (a) | | 1,140 | | | | 11,594 |
| Salix Pharmaceuticals Ltd. (a) | | 1,902 | | | | 36,842 |
| Santarus, Inc. (a) | | 1,321 | | | | 7,926 |
| Sepracor, Inc. (a) | | 3,861 | | | | 212,278 |
| Shire PLC sponsored ADR | | 1,702 | | | | 62,191 |
| SuperGen, Inc. (a) | | 1,791 | | | | 10,030 |
| Taro Pharmaceutical Industries Ltd. (a) | | 1,033 | | | | 13,729 |
| Teva Pharmaceutical Industries Ltd. sponsored ADR | | 17,020 | | | | 695,778 |
| Vivus, Inc. (a) | | 2,988 | | | | 9,801 |
| Xenoport, Inc. | | 570 | | | | 7,233 |
| Zila, Inc. (a) | | 3,366 | | | | 11,276 |
| | | | | | | 2,024,407 |
| |
| TOTAL HEALTH CARE | | | | | | 17,879,506 |
| |
| INDUSTRIALS – 5.5% | | | | | | |
| Aerospace & Defense – 0.3% | | | | | | |
| Applied Signal Technology, Inc. | | 630 | | | | 11,321 |
| Argon ST, Inc. (a) | | 1,034 | | | | 29,831 |
| BE Aerospace, Inc. (a) | | 2,544 | | | | 44,571 |
| Ceradyne, Inc. (a) | | 979 | | | | 46,101 |
| Elbit Systems Ltd. (d) | | 1,613 | | | | 36,728 |
| Engineered Support Systems, Inc. | | 1,277 | | | | 51,604 |
| Essex Corp. (a) | | 768 | | | | 14,630 |
| Herley Industries, Inc. (a) | | 1,150 | | | | 18,941 |
| Innovative Solutions & Support, Inc. (a) | | 800 | | | | 11,800 |
| Ionatron, Inc. (a)(d) | | 3,894 | | | | 40,887 |
| Kaman Corp. Class A | | 1,424 | | | | 27,355 |
| KVH Industries, Inc. (a) | | 501 | | | | 4,790 |
See accompanying notes which are an integral part of the financial statements.
| Common Stocks continued | | | | | | |
| | | Shares | | Value (Note 1) |
| |
| INDUSTRIALS – continued | | | | | | |
| Aerospace & Defense – continued | | | | | | |
| MTC Technologies, Inc. (a) | | 616 | | $ | | 20,186 |
| Sypris Solutions, Inc. | | 916 | | | | 10,122 |
| | | | | | | 368,867 |
| Air Freight & Logistics – 0.7% | | | | | | |
| ABX Air, Inc. (a) | | 2,018 | | | | 15,135 |
| C.H. Robinson Worldwide, Inc. | | 5,878 | | | | 237,765 |
| Dynamex, Inc. (a) | | 520 | | | | 9,625 |
| EGL, Inc. (a) | | 1,732 | | | | 64,326 |
| Expeditors International of Washington, Inc. | | 3,977 | | | | 282,407 |
| Forward Air Corp. | | 1,503 | | | | 57,790 |
| Hub Group, Inc. Class A (a) | | 789 | | | | 31,994 |
| Pacer International, Inc. | | 1,459 | | | | 38,561 |
| Park Ohio Holdings Corp. (a) | | 681 | | | | 10,726 |
| UTI Worldwide, Inc. | | 1,156 | | | | 112,467 |
| | | | | | | 860,796 |
| Airlines – 0.3% | | | | | | |
| Frontier Airlines, Inc. (a) | | 1,288 | | | | 10,510 |
| JetBlue Airways Corp. (a) | | 3,608 | | | | 66,532 |
| MAIR Holdings, Inc. (a) | | 526 | | | | 2,493 |
| Mesa Air Group, Inc. (a) | | 1,535 | | | | 15,780 |
| Pinnacle Airlines Corp. (a) | | 1,209 | | | | 8,403 |
| Republic Airways Holdings, Inc. (a) | | 1,259 | | | | 18,293 |
| Ryanair Holdings PLC sponsored ADR (a) | | 2,284 | | | | 113,789 |
| SkyWest, Inc. | | 2,288 | | | | 67,954 |
| World Air Holdings, Inc. (a) | | 778 | | | | 8,185 |
| | | | | | | 311,939 |
| Building Products 0.1% | | | | | | |
| Aaon, Inc. (a) | | 731 | | | | 12,442 |
| American Woodmark Corp. | | 601 | | | | 15,398 |
| Apogee Enterprises, Inc. | | 1,455 | | | | 22,509 |
| Builders FirstSource, Inc. | | 1,053 | | | | 20,955 |
| Quixote Corp. | | 462 | | | | 9,818 |
| Universal Forest Products, Inc. | | 686 | | | | 39,418 |
| | | | | | | 120,540 |
| Commercial Services & Supplies – 1.6% | | | | | | |
| Advisory Board Co. (a) | | 765 | | | | 36,965 |
| American Ecology Corp. (a) | | 775 | | | | 12,609 |
| Barrett Business Services, Inc. (a) | | 384 | | | | 9,677 |
| BB Holdings Ltd. (non-vtg.) (d) | | 2,824 | | | | 19,627 |
See accompanying notes which are an integral part of the financial statements.
41 Annual Report
| Investments continued | | | | | | |
| |
| Common Stocks continued | | | | | | |
| | | Shares | | Value (Note 1) |
| |
| INDUSTRIALS – continued | | | | | | |
| Commercial Services & Supplies – continued | | | | | | |
| Casella Waste Systems, Inc. Class A (a) | | 1,112 | | $ | | 13,611 |
| CBIZ, Inc. (a) | | 4,416 | | | | 27,644 |
| Cintas Corp. | | 6,359 | | | | 284,374 |
| Clean Harbors, Inc. (a) | | 740 | | | | 21,356 |
| Coinstar, Inc. (a) | | 1,025 | | | | 24,908 |
| Copart, Inc. (a) | | 3,678 | | | | 92,612 |
| Corporate Executive Board Co. | | 1,592 | | | | 137,724 |
| CoStar Group, Inc. (a) | | 714 | | | | 33,515 |
| CRA International, Inc. (a) | | 448 | | | | 19,945 |
| DiamondCluster International, Inc. (a) | | 1,692 | | | | 10,727 |
| Duratek, Inc. (a) | | 757 | | | | 12,422 |
| Exponent, Inc. (a) | | 655 | | | | 17,914 |
| FirstService Corp. (sub. vtg.) (a) | | 1,296 | | | | 31,132 |
| G&K Services, Inc. Class A | | 868 | | | | 33,279 |
| Healthcare Services Group, Inc. | | 898 | | | | 19,083 |
| Heidrick & Struggles International, Inc. (a) | | 896 | | | | 29,613 |
| Herman Miller, Inc. | | 2,575 | | | | 78,769 |
| Hudson Highland Group, Inc. (a) | | 920 | | | | 23,230 |
| Huron Consulting Group, Inc. (a) | | 672 | | | | 16,034 |
| ICT Group, Inc. (a) | | 778 | | | | 12,464 |
| Integrated Alarm Services Group, Inc. (a)(d) | | 1,413 | | | | 4,451 |
| Intersections, Inc. (a) | | 626 | | | | 5,659 |
| Kelly Services, Inc. Class A (non-vtg.) | | 1,431 | | | | 39,782 |
| Kenexa Corp. | | 896 | | | | 15,151 |
| Kforce, Inc. (a) | | 1,609 | | | | 19,968 |
| Layne Christensen Co. (a) | | 476 | | | | 10,553 |
| Learning Tree International, Inc. (a) | | 930 | | | | 12,574 |
| LECG Corp. (a) | | 672 | | | | 10,980 |
| McGrath RentCorp. | | 1,179 | | | | 33,708 |
| Mobile Mini, Inc. (a) | | 700 | | | | 35,000 |
| Monster Worldwide, Inc. (a) | | 4,235 | | | | 164,742 |
| NCO Group, Inc. (a) | | 1,047 | | | | 18,050 |
| On Assignment, Inc. (a) | | 1,571 | | | | 17,360 |
| PICO Holdings, Inc. (a) | | 395 | | | | 13,335 |
| Portfolio Recovery Associates, Inc. (a) | | 616 | | | | 23,605 |
| PRG-Schultz International, Inc. (a) | | 3,086 | | | | 2,808 |
| Providence Service Corp. (a) | | 756 | | | | 22,090 |
| Resources Connection, Inc. (a) | | 1,910 | | | | 55,466 |
| School Specialty, Inc. (a) | | 700 | | | | 25,788 |
| SOURCECORP, Inc. (a) | | 728 | | | | 18,972 |
| Stericycle, Inc. (a) | | 1,694 | | | | 103,876 |
See accompanying notes which are an integral part of the financial statements.
| Common Stocks continued | | | | | | |
| | | Shares | | Value (Note 1) |
| |
| INDUSTRIALS – continued | | | | | | |
| Commercial Services & Supplies – continued | | | | | | |
| Synagro Technologies, Inc. | | 2,740 | | $ | | 10,960 |
| Taleo Corp. Class A | | 676 | | | | 8,903 |
| Teletech Holdings, Inc. (a) | | 3,128 | | | | 38,881 |
| Tetra Tech, Inc. (a) | | 2,039 | | | | 31,808 |
| TRM Corp. (a) | | 936 | | | | 6,664 |
| United Stationers, Inc. (a) | | 1,145 | | | | 56,105 |
| Waste Industries USA, Inc. | | 663 | | | | 9,242 |
| Waste Services, Inc. (a) | | 2,252 | | | | 7,972 |
| WCA Waste Corp. (a) | | 839 | | | | 6,964 |
| West Corp. (a) | | 2,613 | | | | 103,658 |
| | | | | | | 1,954,309 |
| Construction & Engineering – 0.1% | | | | | | |
| Foster Wheeler Ltd. (a) | | 1,685 | | | | 58,689 |
| Insituform Technologies, Inc. Class A (a) | | 1,047 | | | | 20,804 |
| Washington Group International, Inc. (a) | | 983 | | | | 50,831 |
| Williams Scotsman International, Inc. | | 1,403 | | | | 21,985 |
| | | | | | | 152,309 |
| Electrical Equipment – 0.5% | | | | | | |
| Active Power, Inc. (a) | | 1,467 | | | | 5,120 |
| American Power Conversion Corp. | | 7,325 | | | | 164,153 |
| American Superconductor Corp. (a) | | 1,057 | | | | 8,615 |
| Artesyn Technologies, Inc. (a) | | 1,920 | | | | 19,162 |
| Capstone Turbine Corp. (a)(d) | | 4,047 | | | | 13,719 |
| Color Kinetics, Inc. (a) | | 769 | | | | 11,896 |
| Deswell Industries, Inc. | | 801 | | | | 11,294 |
| Distributed Energy Systems Corp. (a) | | 1,110 | | | | 10,290 |
| Encore Wire Corp. (a) | | 960 | | | | 22,858 |
| Energy Conversion Devices, Inc. (a) | | 1,206 | | | | 35,396 |
| Evergreen Solar, Inc. (a) | | 2,277 | | | | 27,347 |
| Franklin Electric Co., Inc. | | 700 | | | | 29,750 |
| FuelCell Energy, Inc. (a) | | 1,913 | | | | 16,127 |
| Genlyte Group, Inc. (a) | | 924 | | | | 48,695 |
| Hydrogenics Corp. (a) | | 2,740 | | | | 7,564 |
| II-VI, Inc. (a) | | 1,319 | | | | 25,232 |
| LSI Industries, Inc. | | 1,345 | | | | 24,210 |
| Medis Technologies Ltd. (a) | | 1,193 | | | | 16,499 |
| Microvision, Inc. (a)(d) | | 2,193 | | | | 7,840 |
| Plug Power, Inc. (a) | | 2,893 | | | | 14,841 |
| Powell Industries, Inc. (a) | | 714 | | | | 13,695 |
| Power-One, Inc. (a) | | 3,450 | | | | 21,459 |
See accompanying notes which are an integral part of the financial statements.
43 Annual Report
| Investments continued | | | | | | |
| |
| Common Stocks continued | | | | | | |
| | | Shares | | Value (Note 1) |
| |
| INDUSTRIALS – continued | | | | | | |
| Electrical Equipment – continued | | | | | | |
| Preformed Line Products Co. | | 179 | | $ | | 7,394 |
| Ultralife Batteries, Inc. (a) | | 840 | | | | 10,937 |
| Valence Technology, Inc. (a)(d) | | 3,618 | | | | 7,164 |
| Vicor Corp. | | 1,479 | | | | 24,004 |
| Woodward Governor Co. | | 448 | | | | 36,588 |
| | | | | | | 641,849 |
| Industrial Conglomerates – 0.0% | | | | | | |
| Raven Industries, Inc. | | 924 | | | | 28,311 |
| Westaim Corp. (a) | | 4,139 | | | | 15,081 |
| | | | | | | 43,392 |
| Machinery – 0.8% | | | | | | |
| 3D Systems Corp. (a) | | 630 | | | | 11,208 |
| A.S.V., Inc. (a) | | 1,291 | | | | 32,301 |
| American Science & Engineering, Inc. (a) | | 390 | | | | 26,309 |
| Astec Industries, Inc. (a) | | 1,215 | | | | 34,056 |
| Bucyrus International, Inc. Class A | | 528 | | | | 24,763 |
| Columbus McKinnon Corp. (NY Shares) (a) | | 571 | | | | 11,980 |
| Commercial Vehicle Group, Inc. (a) | | 617 | | | | 12,210 |
| Dynamic Materials Corp. | | 416 | | | | 10,117 |
| Flanders Corp. (a) | | 1,202 | | | | 12,188 |
| Flow International Corp. (a) | | 1,990 | | | | 16,816 |
| FreightCar America, Inc. | | 445 | | | | 21,476 |
| Gehl Co. (a) | | 360 | | | | 9,281 |
| Joy Global, Inc. | | 3,163 | | | | 167,291 |
| Lincoln Electric Holdings, Inc. | | 1,431 | | | | 58,399 |
| Middleby Corp. (a) | | 309 | | | | 24,226 |
| Nordson Corp. | | 1,327 | | | | 52,841 |
| PACCAR, Inc. | | 6,128 | | | | 440,358 |
| Pure Cycle Corp. (a)(d) | | 1,466 | | | | 9,822 |
| Sun Hydraulics Corp. | | 304 | | | | 5,797 |
| Tecumseh Products Co.: | | | | | | |
| Class A (non-vtg.) (a) | | 490 | | | | 10,937 |
| Class B | | 514 | | | | 10,455 |
| TurboChef Technologies, Inc. (a)(d) | | 871 | | | | 11,445 |
| Volvo AB sponsored ADR | | 669 | | | | 28,479 |
| | | | | | | 1,042,755 |
| Marine – 0.2% | | | | | | |
| Alexander & Baldwin, Inc. | | 1,740 | | | | 87,035 |
| American Commercial Lines, Inc. | | 1,100 | | | | 32,175 |
| Aries Maritime Transport Ltd. | | 938 | | | | 12,447 |
See accompanying notes which are an integral part of the financial statements.
| Common Stocks continued | | | | | | |
| | | Shares | | Value (Note 1) |
| |
| INDUSTRIALS – continued | | | | | | |
| Marine – continued | | | | | | |
| DryShips, Inc. | | 1,056 | | $ | | 13,770 |
| Eagle Bulk Shipping, Inc. | | 797 | | | | 12,322 |
| Genco Shipping & Trading Ltd. | | 726 | | | | 12,545 |
| Stolt-Nielsen SA Class B sponsored ADR | | 976 | | | | 31,905 |
| | | | | | | 202,199 |
| Road & Rail 0.6% | | | | | | |
| AMERCO (a) | | 657 | | | | 46,463 |
| Arkansas Best Corp. | | 952 | | | | 39,260 |
| Celadon Group, Inc. (a) | | 740 | | | | 20,505 |
| Covenant Transport, Inc. Class A (a) | | 804 | | | | 9,351 |
| Frozen Food Express Industries, Inc. (a) | | 1,600 | | | | 18,496 |
| Heartland Express, Inc. | | 2,715 | | | | 57,857 |
| J.B. Hunt Transport Services, Inc. | | 5,671 | | | | 126,974 |
| Landstar System, Inc. | | 2,078 | | | | 89,437 |
| Marten Transport Ltd. (a) | | 756 | | | | 20,178 |
| Old Dominion Freight Lines, Inc. (a) | | 840 | | | | 31,928 |
| P.A.M. Transportation Services, Inc. (a) | | 605 | | | | 9,874 |
| Patriot Transportation Holding, Inc. (a) | | 223 | | | | 15,253 |
| SCS Transportation, Inc. (a) | | 857 | | | | 16,891 |
| Swift Transportation Co., Inc. (a) | | 3,083 | | | | 60,365 |
| U.S. Xpress Enterprises, Inc. Class A (a) | | 650 | | | | 9,880 |
| Universal Truckload Services, Inc. | | 521 | | | | 12,171 |
| USA Truck, Inc. (a) | | 403 | | | | 10,921 |
| Vitran Corp., Inc. (a) | | 367 | | | | 6,607 |
| Werner Enterprises, Inc. | | 3,320 | | | | 67,960 |
| Yellow Roadway Corp. (a) | | 2,125 | | | | 100,109 |
| | | | | | | 770,480 |
| Trading Companies & Distributors – 0.3% | | | | | | |
| Aceto Corp. | | 918 | | | | 5,508 |
| Beacon Roofing Supply, Inc. (a) | | 952 | | | | 25,913 |
| Electro Rent Corp. (a) | | 1,529 | | | | 21,375 |
| Fastenal Co. | | 5,570 | | | | 221,129 |
| Lawson Products, Inc. | | 560 | | | | 21,140 |
| NuCo2, Inc. (a) | | 586 | | | | 16,478 |
| UAP Holding Corp. | | 1,844 | | | | 34,999 |
| | | | | | | 346,542 |
| |
| TOTAL INDUSTRIALS | | | | | | 6,815,977 |
See accompanying notes which are an integral part of the financial statements.
45 Annual Report
| Investments continued | | | | | | |
| |
| Common Stocks continued | | | | | | |
| | | Shares | | Value (Note 1) |
| |
| INFORMATION TECHNOLOGY – 49.8% | | | | | | |
| Communications Equipment – 8.1% | | | | | | |
| 3Com Corp. (a) | | 14,178 | | $ | | 51,324 |
| ADC Telecommunications, Inc. (a) | | 4,585 | | | | 93,672 |
| Adtran, Inc. | | 2,842 | | | | 84,010 |
| Airspan Networks, Inc. (a) | | 1,424 | | | | 8,373 |
| Alvarion Ltd. (a) | | 2,474 | | | | 22,043 |
| Anaren, Inc. (a) | | 1,112 | | | | 15,957 |
| Andrew Corp. (a) | | 5,841 | | | | 63,842 |
| Arris Group, Inc. (a) | | 3,422 | | | | 33,262 |
| AudioCodes Ltd. (a) | | 1,830 | | | | 18,886 |
| Avanex Corp. (a) | | 5,449 | | | | 3,542 |
| Avici Systems, Inc. (a) | | 1,125 | | | | 4,770 |
| Avocent Corp. (a) | | 1,891 | | | | 55,482 |
| Bel Fuse, Inc. Class B (non-vtg.) | | 349 | | | | 11,702 |
| Black Box Corp. | | 728 | | | | 34,005 |
| C-COR, Inc. (a) | | 2,008 | | | | 11,385 |
| Carrier Access Corp. (a) | | 2,315 | | | | 11,228 |
| Centillium Communications, Inc. (a) | | 1,637 | | | | 7,530 |
| CIENA Corp. (a) | | 21,854 | | | | 65,343 |
| Cisco Systems, Inc. (a)(d) | | 233,302 | | | | 4,092,117 |
| Comtech Telecommunications Corp. (a) | | 969 | | | | 42,248 |
| Comverse Technology, Inc. (a) | | 7,395 | | | | 193,823 |
| Digi International, Inc. (a) | | 540 | | | | 6,955 |
| Ditech Communications Corp. (a) | | 1,539 | | | | 13,497 |
| ECI Telecom Ltd. (a) | | 5,113 | | | | 44,023 |
| EFJ, Inc. (a) | | 1,805 | | | | 17,617 |
| Endwave Corp. (a) | | 293 | | | | 2,854 |
| Extreme Networks, Inc. (a) | | 5,043 | | | | 24,812 |
| F5 Networks, Inc. (a) | | 1,454 | | | | 76,815 |
| Finisar Corp. (a) | | 9,056 | | | | 17,388 |
| Foundry Networks, Inc. (a) | | 4,906 | | | | 68,144 |
| Glenayre Technologies, Inc. (a) | | 3,005 | | | | 9,436 |
| Harmonic, Inc. (a) | | 3,044 | | | | 16,712 |
| Inter-Tel, Inc. | | 1,061 | | | | 21,676 |
| InterDigital Communication Corp. (a) | | 2,239 | | | | 43,616 |
| Ituran Location & Control Ltd. | | 732 | | | | 10,643 |
| Ixia (a) | | 2,544 | | | | 35,056 |
| JDS Uniphase Corp. (a) | | 59,727 | | | | 153,498 |
| Juniper Networks, Inc. (a) | | 20,438 | | | | 459,651 |
| MRV Communications, Inc. (a) | | 5,435 | | | | 9,892 |
| NETGEAR, Inc. (a) | | 1,173 | | | | 22,639 |
| Network Engines, Inc. (a) | | 1,707 | | | | 2,100 |
See accompanying notes which are an integral part of the financial statements.
| Common Stocks continued | | | | | | |
| | | Shares | | Value (Note 1) |
| |
| INFORMATION TECHNOLOGY – continued | | | | | | |
| Communications Equipment – continued | | | | | | |
| Nice Systems Ltd. sponsored ADR (a) | | 350 | | $ | | 15,698 |
| NMS Communications Corp. (a) | | 1,892 | | | | 7,417 |
| Oplink Communications, Inc. (a) | | 1,074 | | | | 14,628 |
| Orckit Communications Ltd. (a) | | 711 | | | | 14,462 |
| Packeteer, Inc. (a) | | 1,427 | | | | 13,128 |
| PC-Tel, Inc. (a) | | 1,056 | | | | 9,567 |
| Polycom, Inc. (a) | | 3,709 | | | | 60,865 |
| Powerwave Technologies, Inc. (a) | | 4,908 | | | | 61,644 |
| Qiao Xing Universal Telephone, Inc. (a)(d) | | 791 | | | | 6,557 |
| QUALCOMM, Inc. | | 59,567 | | | | 2,708,511 |
| RADWARE Ltd. (a) | | 871 | | | | 16,453 |
| Redback Networks, Inc. (a) | | 1,927 | | | | 25,995 |
| Research In Motion Ltd. (a) | | 6,908 | | | | 419,650 |
| SafeNet, Inc. (a) | | 906 | | | | 32,208 |
| SCM Microsystems, Inc. (a) | | 1,441 | | | | 3,891 |
| SeaChange International, Inc. (a) | | 1,242 | | | | 9,551 |
| Sierra Wireless, Inc. (a) | | 709 | | | | 9,269 |
| Sonus Networks, Inc. (a) | | 8,487 | | | | 34,882 |
| SpectraLink Corp. | | 825 | | | | 10,651 |
| Stratex Networks, Inc. (a) | | 4,343 | | | | 14,332 |
| Superior Essex, Inc. (a) | | 635 | | | | 11,970 |
| Sycamore Networks, Inc. (a) | | 10,992 | | | | 44,737 |
| Symmetricom, Inc. (a) | | 2,292 | | | | 20,078 |
| Tekelec (a) | | 2,478 | | | | 32,214 |
| Telefonaktiebolaget LM Ericsson (B Shares) sponsored ADR | | 4,643 | | | | 151,269 |
| Tellabs, Inc. (a) | | 17,017 | | | | 174,594 |
| Terayon Communication Systems, Inc. (a) | | 3,436 | | | | 7,113 |
| Tollgrade Communications, Inc. (a) | | 668 | | | | 7,281 |
| UTStarcom, Inc. (a)(d) | | 3,908 | | | | 32,397 |
| ViaSat, Inc. (a) | | 1,103 | | | | 30,498 |
| Westell Technologies, Inc. Class A (a) | | 2,092 | | | | 9,895 |
| WJ Communications, Inc. (a) | | 3,170 | | | | 4,375 |
| Zhone Technologies, Inc. (a) | | 8,566 | | | | 18,931 |
| | | | | | | 10,016,279 |
| Computers & Peripherals – 5.4% | | | | | | |
| ActivCard Corp. (a) | | 2,036 | | | | 7,615 |
| Adaptec, Inc. (a) | | 4,760 | | | | 23,657 |
| Advanced Digital Information Corp. (a) | | 2,586 | | | | 27,153 |
| Apple Computer, Inc. (a) | | 30,099 | | | | 2,041,314 |
| Avid Technology, Inc. (a) | | 1,476 | | | | 74,508 |
See accompanying notes which are an integral part of the financial statements.
47 Annual Report
| Investments continued | | | | | | |
| |
| Common Stocks continued | | | | | | |
| | | Shares | | Value (Note 1) |
| |
| INFORMATION TECHNOLOGY – continued | | | | | | |
| Computers & Peripherals – continued | | | | | | |
| Brocade Communications Systems, Inc. (a) | | 10,103 | | $ | | 44,150 |
| Concurrent Computer Corp. (a) | | 3,240 | | | | 6,415 |
| Cray, Inc. (a) | | 2,796 | | | | 4,222 |
| Creative Technology Ltd. (Nasdaq) (d) | | 3,184 | | | | 26,364 |
| Dell, Inc. (a) | | 87,933 | | | | 2,652,059 |
| Dot Hill Systems Corp. (a) | | 1,371 | | | | 9,076 |
| Electronics for Imaging, Inc. (a) | | 2,022 | | | | 56,474 |
| Hutchinson Technology, Inc. (a) | | 1,005 | | | | 28,733 |
| InFocus Corp. (a) | | 2,417 | | | | 9,040 |
| Intergraph Corp. (a) | | 1,160 | | | | 55,703 |
| Komag, Inc. (a) | | 1,047 | | | | 36,582 |
| Logitech International SA sponsored ADR (a) | | 506 | | | | 23,175 |
| M Systems Flash Disk Pioneers Ltd. (a) | | 1,117 | | | | 34,795 |
| McDATA Corp.: | | | | | | |
| Class A (a) | | 4,892 | | | | 17,807 |
| Class B (a) | | 1,721 | | | | 5,989 |
| Mobility Electronics, Inc. (a) | | 1,274 | | | | 14,320 |
| Neoware Systems, Inc. (a) | | 692 | | | | 15,134 |
| Network Appliance, Inc. (a) | | 13,226 | | | | 385,141 |
| Novatel Wireless, Inc. (a) | | 1,330 | | | | 18,115 |
| Palm, Inc. (a) | | 1,807 | | | | 51,283 |
| Presstek, Inc. (a) | | 1,861 | | | | 17,177 |
| QLogic Corp. (a) | | 2,980 | | | | 98,519 |
| Rackable Systems, Inc. | | 635 | | | | 11,728 |
| Rimage Corp. (a) | | 882 | | | | 25,269 |
| SanDisk Corp. (a) | | 6,613 | | | | 337,660 |
| SBS Technologies, Inc. (a) | | 1,000 | | | | 10,300 |
| Scitex Corp. Ltd. (a) | | 2,233 | | | | 13,197 |
| SimpleTech, Inc. (a) | | 1,906 | | | | 7,186 |
| Stratasys, Inc. (a) | | 352 | | | | 8,346 |
| Sun Microsystems, Inc. (a) | | 122,711 | | | | 462,620 |
| Synaptics, Inc. (a) | | 1,123 | | | | 30,220 |
| Transact Technologies, Inc. (a) | | 552 | | | | 4,438 |
| | | | | | | 6,695,484 |
| Electronic Equipment & Instruments – 1.7% | | | | | | |
| Aeroflex, Inc. (a) | | 3,362 | | | | 36,881 |
| Agilysys, Inc. | | 1,623 | | | | 30,918 |
| Applied Films Corp. (a) | | 476 | | | | 9,534 |
| Bell Microproducts, Inc. (a) | | 2,080 | | | | 17,888 |
| Brightpoint, Inc. (a) | | 1,200 | | | | 33,768 |
See accompanying notes which are an integral part of the financial statements.
| Common Stocks continued | | | | | | |
| | | Shares | | Value (Note 1) |
| |
| INFORMATION TECHNOLOGY – continued | | | | | | |
| Electronic Equipment & Instruments – continued | | | | | | |
| CalAmp Corp. (a) | | 1,019 | | $ | | 11,820 |
| CDW Corp. | | 3,052 | | | | 179,000 |
| Cherokee International Corp. (a) | | 677 | | | | 1,943 |
| Cogent, Inc. (a) | | 3,219 | | | | 76,033 |
| Cognex Corp. | | 1,683 | | | | 52,072 |
| Coherent, Inc. (a) | | 1,187 | | | | 37,497 |
| CyberOptics Corp. (a) | | 436 | | | | 5,498 |
| Daktronics, Inc. | | 924 | | | | 25,040 |
| DTS, Inc. (a) | | 809 | | | | 11,714 |
| Echelon Corp. (a) | | 1,707 | | | | 14,083 |
| Electro Scientific Industries, Inc. (a) | | 1,243 | | | | 31,274 |
| Excel Technology, Inc. (a) | | 588 | | | | 14,136 |
| FARO Technologies, Inc. (a) | | 644 | | | | 12,249 |
| Flextronics International Ltd. (a) | | 19,954 | | | | 205,925 |
| FLIR Systems, Inc. (a) | | 2,447 | | | | 60,490 |
| Global Imaging Systems, Inc. (a) | | 756 | | | | 27,534 |
| GSI Group, Inc. (a) | | 1,913 | | | | 17,619 |
| Identix, Inc. (a) | | 3,993 | | | | 19,606 |
| INTAC International (a) | | 680 | | | | 3,917 |
| International DisplayWorks, Inc. (a) | | 1,056 | | | | 6,061 |
| Itron, Inc. (a) | | 812 | | | | 37,961 |
| Lexar Media, Inc. (a) | | 2,669 | | | | 22,767 |
| Lipman Electronic Engineer Ltd. (Nasdaq) (a) | | 934 | | | | 20,931 |
| Littelfuse, Inc. (a) | | 938 | | | | 24,332 |
| LoJack Corp. (a) | | 983 | | | | 27,701 |
| M Flex Electronix, Inc. (a) | | 1,049 | | | | 38,813 |
| Magal Security Systems Ltd. (a) | | 361 | | | | 3,072 |
| Measurement Specialties, Inc. (a) | | 501 | | | | 12,465 |
| Mechanical Technology, Inc. (a) | | 1,113 | | | | 3,183 |
| Mercury Computer Systems, Inc. (a) | | 910 | | | | 18,182 |
| Merix Corp. (a) | | 818 | | | | 5,456 |
| Methode Electronics, Inc. Class A | | 1,479 | | | | 15,456 |
| Metrologic Instruments, Inc. (a) | | 585 | | | | 11,437 |
| Molex, Inc. | | 3,930 | | | | 105,285 |
| Molex, Inc. Class A (non-vtg.) | | 3,150 | | | | 81,680 |
| MTS Systems Corp. | | 1,019 | | | | 35,940 |
| National Instruments Corp. | | 2,883 | | | | 74,410 |
| Newport Corp. (a) | | 1,693 | | | | 23,363 |
| NovAtel, Inc. (a) | | 392 | | | | 11,823 |
| NU Horizons Electronics Corp. (a) | | 1,535 | | | | 15,335 |
| Optimal Group, Inc. Class A (a) | | 1,341 | | | | 25,439 |
See accompanying notes which are an integral part of the financial statements.
49 Annual Report
| Investments continued | | | | | | |
| |
| Common Stocks continued | | | | | | |
| | | Shares | | Value (Note 1) |
| |
| INFORMATION TECHNOLOGY – continued | | | | | | |
| Electronic Equipment & Instruments – continued | | | | | | |
| Orbotech Ltd. (a) | | 1,313 | | $ | | 30,448 |
| OSI Systems, Inc. (a) | | 661 | | | | 12,447 |
| PC Connection, Inc. (a) | | 1,288 | | | | 8,192 |
| Pemstar, Inc. (a) | | 2,876 | | | | 3,969 |
| Photon Dynamics, Inc. (a) | | 714 | | | | 13,138 |
| Planar Systems, Inc. (a) | | 609 | | | | 5,907 |
| Plexus Corp. (a) | | 1,875 | | | | 40,313 |
| RadiSys Corp. (a) | | 882 | | | | 16,141 |
| Richardson Electronics Ltd. | | 1,126 | | | | 8,062 |
| Rofin-Sinar Technologies, Inc. (a) | | 532 | | | | 22,966 |
| Sanmina-SCI Corp. (a) | | 20,007 | | | | 82,829 |
| ScanSource, Inc. (a) | | 490 | | | | 29,052 |
| SpatiaLight, Inc. (a)(d) | | 2,904 | | | | 11,994 |
| Staktek Holdings, Inc. (a) | | 1,857 | | | | 10,678 |
| Suntron Corp. (a) | | 2,554 | | | | 3,065 |
| Superconductor Technologies, Inc. (a) | | 3,296 | | | | 1,978 |
| Taser International, Inc. (a)(d) | | 2,529 | | | | 15,427 |
| Tech Data Corp. (a) | | 2,078 | | | | 81,686 |
| Trimble Navigation Ltd. (a) | | 1,958 | | | | 63,792 |
| TTM Technologies, Inc. (a) | | 1,665 | | | | 15,218 |
| Universal Display Corp. (a) | | 1,242 | | | | 14,469 |
| Viisage Technology, Inc. (a) | | 2,046 | | | | 12,972 |
| X Rite, Inc. | | 1,126 | | | | 12,465 |
| Xyratex Ltd. (a) | | 1,525 | | | | 23,943 |
| Zomax, Inc. (a) | | 2,176 | | | | 4,787 |
| Zygo Corp. (a) | | 945 | | | | 13,315 |
| | | | | | | 2,116,784 |
| Internet Software & Services – 5.6% | | | | | | |
| 24/7 Real Media, Inc. (a) | | 2,476 | | | | 18,322 |
| Akamai Technologies, Inc. (a) | | 4,981 | | | | 99,421 |
| Aladdin Knowledge Systems Ltd. (a) | | 499 | | | | 8,281 |
| aQuantive, Inc. (a) | | 2,586 | | | | 69,538 |
| Ariba, Inc. (a) | | 2,615 | | | | 22,567 |
| Art Technology Group, Inc. (a) | | 4,718 | | | | 7,738 |
| AsiaInfo Holdings, Inc. (a) | | 2,120 | | | | 8,035 |
| Autobytel, Inc. (a) | | 1,637 | | | | 8,545 |
| Baidu.com, Inc. sponsored ADR (d) | | 135 | | | | 10,527 |
| Bankrate, Inc. (a) | | 949 | | | | 30,605 |
| Blue Coat Systems, Inc. (a) | | 374 | | | | 16,938 |
| Chordiant Software, Inc. (a) | | 3,352 | | | | 9,151 |
See accompanying notes which are an integral part of the financial statements.
| Common Stocks continued | | | | | | |
| | | Shares | | Value (Note 1) |
| |
| INFORMATION TECHNOLOGY – continued | | | | | | |
| Internet Software & Services – continued | | | | | | |
| Click Commerce, Inc. (a) | | 421 | | $ | | 9,999 |
| CMGI, Inc. (a) | | 16,986 | | | | 29,386 |
| CNET Networks, Inc. (a) | | 5,620 | | | | 84,244 |
| Corillian Corp. (a) | | 1,409 | | | | 3,931 |
| Cryptologic, Inc. | | 444 | | | | 8,949 |
| Digital Insight Corp. (a) | | 1,355 | | | | 44,878 |
| Digital River, Inc. (a) | | 1,243 | | | | 32,219 |
| Digitas, Inc. (a) | | 3,824 | | | | 47,800 |
| EarthLink, Inc. (a) | | 4,819 | | | | 55,129 |
| eCollege.com (a) | | 790 | | | | 13,106 |
| Entrust, Inc. (a) | | 3,240 | | | | 16,200 |
| Equinix, Inc. (a) | | 853 | | | | 34,052 |
| Google, Inc. Class A (sub. vtg.) (a) | | 7,277 | | | | 2,947,112 |
| Greenfield Online, Inc. (a) | | 611 | | | | 3,098 |
| Homestore, Inc. (a) | | 5,813 | | | | 25,635 |
| Housevalues, Inc. (d) | | 797 | | | | 10,186 |
| InfoSpace, Inc. (a) | | 1,313 | | | | 34,611 |
| Internet Capital Group, Inc. (a) | | 1,364 | | | | 11,321 |
| Interwoven, Inc. (a) | | 1,396 | | | | 13,248 |
| iPass, Inc. (a) | | 2,264 | | | | 15,350 |
| IPIX Corp. (a) | | 551 | | | | 1,223 |
| iVillage, Inc. (a) | | 3,713 | | | | 30,447 |
| j2 Global Communications, Inc. (a) | | 952 | | | | 45,439 |
| Jupitermedia Corp. (a) | | 1,583 | | | | 25,914 |
| Keynote Systems, Inc. (a) | | 1,196 | | | | 15,847 |
| Kintera, Inc. (a) | | 1,525 | | | | 4,484 |
| LivePerson, Inc. (a) | | 2,134 | | | | 11,033 |
| LookSmart Ltd. (a) | | 897 | | | | 3,794 |
| Mamma.com, Inc. (a) | | 1,354 | | | | 3,141 |
| Marchex, Inc. Class B (a) | | 534 | | | | 12,496 |
| MatrixOne, Inc. (a) | | 2,670 | | | | 13,457 |
| MIVA, Inc. (a) | | 874 | | | | 4,396 |
| NaviSite, Inc. (a) | | 3,720 | | | | 4,650 |
| Neoforma, Inc. (a) | | 902 | | | | 8,885 |
| Net2Phone, Inc. (a) | | 1,976 | | | | 3,814 |
| NetEase.com, Inc. sponsored ADR (a) | | 615 | | | | 35,043 |
| NetRatings, Inc. (a) | | 1,819 | | | | 24,557 |
| NIC, Inc. (a) | | 3,198 | | | | 19,508 |
| Online Resources Corp. (a) | | 916 | | | | 10,736 |
| Open Text Corp. (a) | | 1,621 | | | | 24,208 |
| Openwave Systems, Inc. (a) | | 2,446 | | | | 40,628 |
See accompanying notes which are an integral part of the financial statements.
51 Annual Report
| Investments continued | | | | | | |
| |
| Common Stocks continued | | | | | | |
| | | Shares | | Value (Note 1) |
| |
| INFORMATION TECHNOLOGY – continued | | | | | | |
| Internet Software & Services – continued | | | | | | |
| RADVision Ltd. (a) | | 631 | | $ | | 10,727 |
| RealNetworks, Inc. (a) | | 6,622 | | | | 57,280 |
| S1 Corp. (a) | | 3,534 | | | | 15,514 |
| SAVVIS, Inc. (a) | | 6,246 | | | | 4,310 |
| Selectica, Inc. (a) | | 2,960 | | | | 8,288 |
| Sina Corp. (a) | | 1,809 | | | | 45,116 |
| SkillSoft PLC sponsored ADR (a) | | 3,450 | | | | 17,112 |
| Sohu.com, Inc. (a) | | 1,400 | | | | 26,600 |
| SonicWALL, Inc. (a) | | 3,324 | | | | 24,697 |
| Stellent, Inc. (a) | | 1,427 | | | | 14,884 |
| Supportsoft, Inc. (a) | | 1,469 | | | | 5,876 |
| The Knot, Inc. (a) | | 1,242 | | | | 15,152 |
| Tom Online, Inc. sponsored ADR (a) | | 277 | | | | 5,764 |
| Travelzoo, Inc. (a)(d) | | 712 | | | | 15,458 |
| Tumbleweed Communications Corp. (a) | | 1,976 | | | | 5,750 |
| United Online, Inc. | | 2,371 | | | | 33,455 |
| ValueClick, Inc. (a) | | 3,905 | | | | 73,726 |
| VeriSign, Inc. (a) | | 9,522 | | | | 211,674 |
| Vignette Corp. (a) | | 1,146 | | | | 20,296 |
| Vitria Technology, Inc. (a) | | 2,194 | | | | 6,099 |
| WebEx Communications, Inc. (a) | | 1,669 | | | | 39,739 |
| webMethods, Inc. (a) | | 2,292 | | | | 18,519 |
| Websense, Inc. (a) | | 952 | | | | 61,832 |
| WebSideStory, Inc. (a) | | 893 | | | | 16,074 |
| Workstream, Inc. (a) | | 2,706 | | | | 3,437 |
| Yahoo!, Inc. (a) | | 51,023 | | | | 2,052,655 |
| Zix Corp. (a)(d) | | 1,507 | | | | 2,652 |
| | | | | | | 6,906,508 |
| IT Services – 1.7% | | | | | | |
| Acxiom Corp. | | 3,192 | | | | 70,799 |
| Answerthink, Inc. (a) | | 1,564 | | | | 6,506 |
| Applied Digital Solutions, Inc. (a) | | 1,955 | | | | 5,904 |
| Carreker Corp. (a) | | 1,223 | | | | 6,139 |
| CheckFree Corp. (a) | | 3,468 | | | | 162,476 |
| Cognizant Technology Solutions Corp. Class A (a) | | 4,833 | | | | 234,835 |
| Covansys Corp. (a) | | 2,181 | | | | 32,061 |
| CSG Systems International, Inc. (a) | | 2,218 | | | | 53,232 |
| Euronet Worldwide, Inc. (a) | | 1,368 | | | | 36,963 |
| Fiserv, Inc. (a) | | 7,129 | | | | 324,441 |
| Forrester Research, Inc. (a) | | 1,109 | | | | 20,672 |
See accompanying notes which are an integral part of the financial statements.
| Common Stocks continued | | | | | | |
| | | Shares | | Value (Note 1) |
| |
| INFORMATION TECHNOLOGY – continued | | | | | | |
| IT Services – continued | | | | | | |
| Gevity HR, Inc. | | 840 | | $ | | 23,797 |
| iGate Corp. (a) | | 2,796 | | | | 11,324 |
| Indus International, Inc. (a) | | 4,788 | | | | 14,364 |
| Infocrossing, Inc. (a) | | 1,082 | | | | 7,888 |
| Infosys Technologies Ltd. sponsored ADR | | 1,324 | | | | 95,407 |
| infoUSA, Inc. | | 2,530 | | | | 25,629 |
| Intrado, Inc. (a) | | 717 | | | | 16,190 |
| iPayment, Inc. (a) | | 573 | | | | 22,931 |
| Kanbay International, Inc. (a) | | 1,170 | | | | 19,375 |
| Lightbridge, Inc. (a) | | 1,479 | | | | 14,598 |
| Lionbridge Technologies, Inc. (a) | | 1,994 | | | | 12,961 |
| ManTech International Corp. Class A (a) | | 700 | | | | 17,528 |
| Ness Technologies, Inc. (a) | | 1,125 | | | | 11,239 |
| Paychex, Inc. | | 13,562 | | | | 575,164 |
| Pegasus Solutions, Inc. (a) | | 1,154 | | | | 8,205 |
| RightNow Technologies, Inc. (a) | | 1,035 | | | | 18,744 |
| Sapient Corp. (a) | | 5,732 | | | | 35,653 |
| SI International, Inc. (a) | | 569 | | | | 15,448 |
| SM&A (a) | | 1,042 | | | | 8,649 |
| Sykes Enterprises, Inc. (a) | | 2,194 | | | | 30,277 |
| Syntel, Inc. | | 1,529 | | | | 31,436 |
| TALX Corp. | | 840 | | | | 34,650 |
| Telvent GIT SA (a) | | 1,300 | | | | 14,287 |
| Tier Technologies, Inc. Class B (a) | | 1,392 | | | | 11,581 |
| Zanett, Inc. (a) | | 3,464 | | | | 11,563 |
| | | | | | | 2,042,916 |
| Office Electronics – 0.1% | | | | | | |
| Zebra Technologies Corp. Class A (a) | | 2,491 | | | | 112,419 |
| Semiconductors & Semiconductor Equipment – 11.0% | | | | | | |
| 8X8, Inc. (a)(d) | | 5,660 | | | | 9,056 |
| Actel Corp. (a) | | 941 | | | | 13,701 |
| ADE Corp. (a) | | 770 | | | | 18,172 |
| Advanced Analogic Technologies, Inc. | | 734 | | | | 10,115 |
| Advanced Energy Industries, Inc. (a) | | 1,400 | | | | 18,704 |
| Alliance Semiconductor Corp. (a) | | 2,390 | | | | 6,979 |
| Altera Corp. (a) | | 13,396 | | | | 244,611 |
| AMIS Holdings, Inc. (a) | | 2,526 | | | | 25,184 |
| Amkor Technology, Inc. (a) | | 6,593 | | | | 40,877 |
| Applied Materials, Inc. | | 59,841 | | | | 1,083,721 |
| Applied Micro Circuits Corp. (a) | | 11,993 | | | | 31,662 |
See accompanying notes which are an integral part of the financial statements.
53 Annual Report
| Investments continued | | | | | | |
| |
| Common Stocks continued | | | | | | |
| | | Shares | | Value (Note 1) |
| |
| INFORMATION TECHNOLOGY – continued | | | | | | |
| Semiconductors & Semiconductor Equipment – continued | | | | | | |
| ARM Holdings PLC sponsored ADR | | 1,924 | | $ | | 12,102 |
| ASE Test Ltd. (a) | | 4,140 | | | | 26,041 |
| ASM International NV (Nasdaq) (a) | | 941 | | | | 13,748 |
| ASML Holding NV (NY Shares) (a) | | 4,697 | | | | 89,995 |
| Asyst Technologies, Inc. (a) | | 1,697 | | | | 10,555 |
| Atheros Communications, Inc. (a) | | 1,632 | | | | 15,814 |
| ATI Technologies, Inc. (a) | | 9,096 | | | | 148,396 |
| Atmel Corp. (a) | | 18,838 | | | | 63,107 |
| ATMI, Inc. (a) | | 1,229 | | | | 35,162 |
| August Technology Corp. (a) | | 455 | | | | 4,900 |
| Axcelis Technologies, Inc. (a) | | 4,287 | | | | 20,320 |
| Broadcom Corp. Class A (a) | | 10,135 | | | | 471,683 |
| Brooks Automation, Inc. (a) | | 2,845 | | | | 36,587 |
| Cabot Microelectronics Corp. (a) | | 924 | | | | 28,579 |
| California Micro Devices Corp. (a) | | 1,376 | | | | 12,618 |
| Camtek Ltd. (a) | | 2,795 | | | | 10,453 |
| Ceva, Inc. (a) | | 1,182 | | | | 7,234 |
| China Energy Savings Technology, Inc. (a) | | 862 | | | | 6,146 |
| ChipMOS TECHNOLOGIES Bermuda Ltd. (a)(d) | | 3,099 | | | | 18,129 |
| Cirrus Logic, Inc. (a) | | 3,866 | | | | 29,227 |
| Cohu, Inc. | | 840 | | | | 22,403 |
| Conexant Systems, Inc. (a) | | 17,340 | | | | 42,830 |
| Credence Systems Corp. (a) | | 3,901 | | | | 31,637 |
| Cree, Inc. (a) | | 2,785 | | | | 74,722 |
| Cymer, Inc. (a) | | 1,355 | | | | 51,788 |
| Diodes, Inc. (a) | | 812 | | | | 32,780 |
| DSP Group, Inc. (a) | | 1,201 | | | | 31,226 |
| EMCORE Corp. (a) | | 574 | | | | 3,524 |
| Entegris, Inc. (a) | | 4,908 | | | | 49,571 |
| ESS Technology, Inc. (a) | | 1,735 | | | | 5,292 |
| Exar Corp. (a) | | 1,637 | | | | 20,233 |
| FEI Co. (a) | | 1,355 | | | | 27,046 |
| FormFactor, Inc. (a) | | 1,738 | | | | 48,768 |
| Genesis Microchip, Inc. (a) | | 1,382 | | | | 30,957 |
| Hittite Microwave Corp. | | 878 | | | | 22,029 |
| ICOS Vision Systems NV (a)(d) | | 541 | | | | 17,317 |
| Ikanos Communications, Inc. | | 966 | | | | 13,534 |
| Integrated Device Technology, Inc. (a) | | 3,857 | | | | 46,207 |
| Integrated Silicon Solution, Inc. (a) | | 1,413 | | | | 9,905 |
| Intel Corp. (d) | | 222,805 | | | | 5,944,437 |
| Intersil Corp. Class A | | 5,229 | | | | 134,124 |
See accompanying notes which are an integral part of the financial statements.
| Common Stocks continued | | | | | | |
| | | Shares | | Value (Note 1) |
| |
| INFORMATION TECHNOLOGY – continued | | | | | | |
| Semiconductors & Semiconductor Equipment – continued | | | | | | |
| Intevac, Inc. (a) | | 1,223 | | $ | | 15,031 |
| IXYS Corp. (a) | | 1,549 | | | | 18,619 |
| KLA Tencor Corp. | | 7,157 | | | | 366,367 |
| Kopin Corp. (a) | | 3,100 | | | | 21,204 |
| Kulicke & Soffa Industries, Inc. (a) | | 2,250 | | | | 19,013 |
| Lam Research Corp. (a) | | 4,903 | | | | 184,059 |
| Lattice Semiconductor Corp. (a) | | 4,592 | | | | 22,455 |
| Leadis Technology, Inc. (a) | | 965 | | | | 5,163 |
| Linear Technology Corp. | | 10,954 | | | | 408,694 |
| LTX Corp. (a) | | 2,194 | | | | 9,741 |
| Marvell Technology Group Ltd. (a) | | 10,192 | | | | 566,064 |
| Mattson Technology, Inc. (a) | | 2,064 | | | | 20,475 |
| Maxim Integrated Products, Inc. | | 11,610 | | | | 424,346 |
| Micrel, Inc. (a) | | 3,706 | | | | 44,768 |
| Microchip Technology, Inc. | | 7,577 | | | | 252,769 |
| Microsemi Corp. (a) | | 2,307 | | | | 64,019 |
| Microtune, Inc. (a) | | 2,941 | | | | 14,381 |
| Mindspeed Technologies, Inc. (a) | | 3,603 | | | | 6,630 |
| MIPS Technologies, Inc. (a) | | 1,857 | | | | 10,975 |
| MKS Instruments, Inc. (a) | | 2,109 | | | | 39,797 |
| Monolithic Power Systems, Inc. | | 1,593 | | | | 21,203 |
| Monolithic System Technology, Inc. (a) | | 1,427 | | | | 8,719 |
| Nanometrics, Inc. (a) | | 923 | | | | 10,245 |
| Netlogic Microsystems, Inc. (a) | | 946 | | | | 24,653 |
| Novellus Systems, Inc. (a) | | 4,714 | | | | 116,294 |
| NVE Corp. (a) | | 187 | | | | 2,852 |
| NVIDIA Corp. (a) | | 6,303 | | | | 227,980 |
| O2Micro International Ltd. sponsored ADR (a) | | 1,539 | | | | 17,591 |
| Omnivision Technologies, Inc. (a) | | 1,998 | | | | 35,365 |
| ON Semiconductor Corp. (a) | | 9,588 | | | | 55,610 |
| PDF Solutions, Inc. (a) | | 1,278 | | | | 19,988 |
| Pericom Semiconductor Corp. (a) | | 1,371 | | | | 10,762 |
| Photronics, Inc. (a) | | 1,327 | | | | 21,073 |
| Pixelworks, Inc. (a) | | 1,749 | | | | 9,357 |
| PLX Technology, Inc. (a) | | 1,521 | | | | 15,012 |
| PMC-Sierra, Inc. (a) | | 6,579 | | | | 51,777 |
| PortalPlayer, Inc. | | 822 | | | | 19,753 |
| Power Integrations, Inc. (a) | | 1,159 | | | | 25,278 |
| Rambus, Inc. (a) | | 3,740 | | | | 62,795 |
| RF Micro Devices, Inc. (a) | | 7,272 | | | | 41,305 |
| Rudolph Technologies, Inc. (a) | | 731 | | | | 9,393 |
See accompanying notes which are an integral part of the financial statements.
55 Annual Report
| Investments continued | | | | | | |
| |
| Common Stocks continued | | | | | | |
| | | Shares | | Value (Note 1) |
| |
| INFORMATION TECHNOLOGY – continued | | | | | | |
| Semiconductors & Semiconductor Equipment – continued | | | | | | |
| Saifun Semiconductors Ltd. | | 1,056 | | $ | | 30,518 |
| Semitool, Inc. (a) | | 1,637 | | | | 15,584 |
| Semtech Corp. (a) | | 2,844 | | | | 56,624 |
| SigmaTel, Inc. (a) | | 1,229 | | | | 17,894 |
| Silicon Image, Inc. (a) | | 3,072 | | | | 29,829 |
| Silicon Laboratories, Inc. (a) | | 1,896 | | | | 73,660 |
| Silicon Storage Technology, Inc. (a) | | 3,943 | | | | 21,726 |
| SiRF Technology Holdings, Inc. (a) | | 1,613 | | | | 44,712 |
| Skyworks Solutions, Inc. (a) | | 5,477 | | | | 29,521 |
| Standard Microsystems Corp. (a) | | 700 | | | | 20,930 |
| STATS ChipPAC Ltd. sponsored ADR (a) | | 1,571 | | | | 10,416 |
| Supertex, Inc. (a) | | 658 | | | | 27,794 |
| Tessera Technologies, Inc. (a) | | 1,729 | | | | 47,548 |
| Therma-Wave, Inc. (a) | | 1,804 | | | | 2,868 |
| Tower Semicondutor Ltd. (a) | | 4,049 | | | | 6,802 |
| Transmeta Corp. (a) | | 6,037 | | | | 7,365 |
| Transwitch Corp. (a) | | 5,071 | | | | 7,556 |
| Trident Microsystems, Inc. (a) | | 1,754 | | | | 33,045 |
| Tripath Technology, Inc. (a) | | 2,376 | | | | 1,022 |
| TriQuint Semiconductor, Inc. (a) | | 5,869 | | | | 26,411 |
| Ultratech, Inc. (a) | | 969 | | | | 15,921 |
| Varian Semiconductor Equipment Associates, Inc. (a) | | 1,313 | | | | 57,798 |
| Veeco Instruments, Inc. (a) | | 1,246 | | | | 22,067 |
| Virage Logic Corp. (a) | | 1,229 | | | | 12,892 |
| Vitesse Semiconductor Corp. (a) | | 8,207 | | | | 17,317 |
| Volterra Semiconductor Corp. (a) | | 1,216 | | | | 15,346 |
| White Electronic Designs Corp. (a) | | 1,154 | | | | 5,828 |
| Xilinx, Inc. | | 12,302 | | | | 325,265 |
| Zilog, Inc. (a) | | 2,374 | | | | 6,291 |
| Zoran Corp. (a) | | 1,753 | | | | 29,661 |
| | | | | | | 13,565,694 |
| Software 16.2% | | | | | | |
| Activision, Inc. (a) | | 9,583 | | | | 127,550 |
| Actuate Corp. (a) | | 3,604 | | | | 11,893 |
| Adobe Systems, Inc. | | 17,888 | | | | 583,328 |
| Advent Software, Inc. (a) | | 1,397 | | | | 40,010 |
| Agile Software Corp. (a) | | 2,264 | | | | 14,059 |
| Altiris, Inc. (a) | | 1,022 | | | | 16,873 |
| Ansoft Corp. (a) | | 686 | | | | 23,797 |
| Ansys, Inc. (a) | | 1,151 | | | | 48,365 |
See accompanying notes which are an integral part of the financial statements.
| Common Stocks continued | | | | | | |
| | | Shares | | Value (Note 1) |
| |
| INFORMATION TECHNOLOGY – continued | | | | | | |
| Software – continued | | | | | | |
| Aspen Technology, Inc. (a) | | 2,971 | | $ | | 21,985 |
| Atari, Inc. (a) | | 3,408 | | | | 4,294 |
| Authentidate Holding Corp. (a) | | 2,264 | | | | 4,324 |
| Autodesk, Inc. (a) | | 8,385 | | | | 349,822 |
| BEA Systems, Inc. (a) | | 15,185 | | | | 133,172 |
| Blackbaud, Inc. | | 1,525 | | | | 25,849 |
| Blackboard, Inc. (a) | | 924 | | | | 28,589 |
| Borland Software Corp. (a) | | 3,296 | | | | 20,007 |
| Bottomline Technologies, Inc. (a) | | 1,013 | | | | 11,244 |
| Business Objects SA sponsored ADR (a) | | 1,034 | | | | 41,091 |
| Cadence Design Systems, Inc. (a) | | 10,000 | | | | 171,400 |
| Captaris, Inc. (a) | | 2,544 | | | | 10,405 |
| Captiva Software Corp. (a) | | 520 | | | | 11,497 |
| Catapult Communications Corp. (a) | | 927 | | | | 15,676 |
| CCC Information Services Group, Inc. (a) | | 1,033 | | | | 26,972 |
| CDC Corp. Class A (a) | | 3,979 | | | | 13,887 |
| Check Point Software Technologies Ltd. (a) | | 9,229 | | | | 196,485 |
| Citrix Systems, Inc. (a) | | 6,191 | | | | 168,024 |
| Cognos, Inc. (a) | | 3,428 | | | | 114,614 |
| Compuware Corp. (a) | | 15,031 | | | | 138,736 |
| Concur Technologies, Inc. (a) | | 1,413 | | | | 17,846 |
| Convera Corp. Class A (a)(d) | | 2,558 | | | | 39,905 |
| CyberGuard Corp. (a) | | 1,168 | | | | 11,073 |
| Digimarc Corp. (a) | | 923 | | | | 5,630 |
| Electronic Arts, Inc. (a) | | 11,274 | | | | 635,403 |
| Embarcadero Technologies, Inc. (a) | | 1,312 | | | | 9,892 |
| Epicor Software Corp. (a) | | 1,900 | | | | 26,239 |
| EPIQ Systems, Inc. (a) | | 756 | | | | 14,372 |
| Evolving Systems, Inc. (a) | | 904 | | | | 1,916 |
| FalconStor Software, Inc. (a)(d) | | 2,376 | | | | 18,034 |
| FileNET Corp. (a) | | 1,411 | | | | 38,012 |
| Geac Computer Corp. Ltd. (a) | | 3,002 | | | | 32,196 |
| Hummingbird Ltd. (a) | | 840 | | | | 17,787 |
| Hyperion Solutions Corp. (a) | | 1,383 | | | | 73,230 |
| i2 Technologies, Inc. (a) | | 823 | | | | 11,316 |
| Informatica Corp. (a) | | 3,492 | | | | 39,250 |
| Intellisync Corp. (a) | | 2,474 | | | | 12,568 |
| Internet Security Systems, Inc. (a) | | 2,050 | | | | 46,863 |
| InterVideo, Inc. (a) | | 563 | | | | 5,765 |
| Intervoice, Inc. (a) | | 1,590 | | | | 13,754 |
| Intuit, Inc. (a) | | 6,792 | | | | 363,847 |
See accompanying notes which are an integral part of the financial statements.
57 Annual Report
| Investments continued | | | | | | |
| |
| Common Stocks continued | | | | | | |
| | | Shares | | Value (Note 1) |
| |
| INFORMATION TECHNOLOGY – continued | | | | | | |
| Software – continued | | | | | | |
| Jack Henry & Associates, Inc. | | 3,324 | | $ | | 63,621 |
| JAMDAT Mobile, Inc. (a) | | 712 | | | | 16,283 |
| JDA Software Group, Inc. (a) | | 1,246 | | | | 18,690 |
| Kronos, Inc. (a) | | 1,131 | | | | 53,530 |
| Lawson Software, Inc. (a) | | 4,007 | | | | 30,413 |
| Macromedia, Inc. (a) | | 2,478 | | | | 111,163 |
| Macrovision Corp. (a) | | 1,865 | | | | 28,982 |
| Magic Software Enterprises Ltd. (a) | | 2,573 | | | | 4,194 |
| Magma Design Automation, Inc. (a) | | 1,330 | | | | 11,239 |
| Majesco Entertainment Co. (a) | | 797 | | | | 1,100 |
| Manhattan Associates, Inc. (a) | | 1,159 | | | | 24,814 |
| Manugistics Group, Inc. (a) | | 3,310 | | | | 6,355 |
| Mentor Graphics Corp. (a) | | 2,665 | | | | 23,878 |
| Mercury Interactive Corp. (a) | | 3,103 | | | | 86,263 |
| Micromuse, Inc. (a) | | 3,240 | | | | 24,008 |
| MICROS Systems, Inc. (a) | | 1,431 | | | | 69,132 |
| Microsoft Corp. | | 390,809 | | | | 10,829,290 |
| MicroStrategy, Inc. Class A (a) | | 518 | | | | 38,265 |
| Motive, Inc. (a) | | 1,120 | | | | 3,494 |
| MRO Software, Inc. (a) | | 1,138 | | | | 17,343 |
| Napster, Inc. (a) | | 1,246 | | | | 4,361 |
| NDS Group PLC sponsored ADR (a) | | 685 | | | | 28,332 |
| Net 1 UEPS Technologies, Inc. (a) | | 1,320 | | | | 30,703 |
| NetIQ Corp. (a) | | 2,348 | | | | 28,059 |
| NetScout Systems, Inc. (a) | | 2,348 | | | | 13,102 |
| Novell, Inc. (a) | | 13,057 | | | | 101,583 |
| Nuance Communications, Inc. (a) | | 6,743 | | | | 41,941 |
| Open Solutions, Inc. (a) | | 659 | | | | 14,603 |
| OpenTV Corp. Class A (a) | | 4,259 | | | | 9,583 |
| Opnet Technologies, Inc. (a) | | 980 | | | | 9,418 |
| Opsware, Inc. (a) | | 3,352 | | | | 19,777 |
| Oracle Corp. (a) | | 187,524 | | | | 2,357,177 |
| Parametric Technology Corp. (a) | | 11,324 | | | | 66,245 |
| Pegasystems, Inc. (a) | | 1,679 | | | | 12,273 |
| Pervasive Software, Inc. (a) | | 1,507 | | | | 6,390 |
| Phoenix Technologies Ltd. (a) | | 1,805 | | | | 11,426 |
| Plato Learning, Inc. (a) | | 1,441 | | | | 10,404 |
| Progress Software Corp. (a) | | 1,383 | | | | 42,790 |
| QAD, Inc. | | 1,539 | | | | 12,004 |
| Quality Systems, Inc. | | 588 | | | | 47,699 |
| Quest Software, Inc. (a) | | 3,502 | | | | 55,157 |
See accompanying notes which are an integral part of the financial statements.
| Common Stocks continued | | | | | | |
| | | Shares | | Value (Note 1) |
| |
| INFORMATION TECHNOLOGY – continued | | | | | | |
| Software – continued | | | | | | |
| Radiant Systems, Inc. (a) | | 1,242 | | $ | | 16,183 |
| Red Hat, Inc. (a) | | 6,852 | | | | 161,502 |
| Renaissance Learning, Inc. | | 1,243 | | | | 24,661 |
| Retalix Ltd. (a) | | 742 | | | | 18,468 |
| RSA Security, Inc. (a) | | 2,358 | | | | 30,654 |
| SCO Group, Inc. (a) | | 721 | | | | 2,999 |
| Secure Computing Corp. (a) | | 1,497 | | | | 20,569 |
| SERENA Software, Inc. (a) | | 1,641 | | | | 38,465 |
| Shanda Interactive Entertainment Ltd. sponsored ADR (a) | | 1,054 | | | | 18,013 |
| Siebel Systems, Inc. | | 18,611 | | | | 195,416 |
| Sonic Solutions, Inc. (a) | | 910 | | | | 14,014 |
| SPSS, Inc. (a) | | 938 | | | | 27,089 |
| SSA Global Technologies, Inc. | | 2,245 | | | | 40,814 |
| Symantec Corp. (a) | | 39,535 | | | | 698,583 |
| Synopsys, Inc. (a) | | 5,691 | | | | 111,088 |
| Synplicity, Inc. (a) | | 1,990 | | | | 15,224 |
| Take-Two Interactive Software, Inc. (a) | | 2,323 | | | | 42,395 |
| THQ, Inc. (a) | | 2,125 | | | | 48,280 |
| TIBCO Software, Inc. (a) | | 8,361 | | | | 69,982 |
| Transaction Systems Architects, Inc. Class A (a) | | 1,487 | | | | 43,272 |
| Ulticom, Inc. (a) | | 1,791 | | | | 20,632 |
| Ultimate Software Group, Inc. (a) | | 1,452 | | | | 24,989 |
| VA Software Corp. (a) | | 3,016 | | | | 4,735 |
| Vasco Data Security International, Inc. (a) | | 1,418 | | | | 15,995 |
| Verint Systems, Inc. (a) | | 1,187 | | | | 44,667 |
| Verity, Inc. (a) | | 1,581 | | | | 20,838 |
| Wind River Systems, Inc. (a) | | 3,180 | | | | 43,820 |
| Witness Systems, Inc. (a) | | 1,355 | | | | 27,168 |
| | | | | | | 20,034,445 |
| |
| TOTAL INFORMATION TECHNOLOGY | | | | | | 61,490,529 |
| |
| MATERIALS 0.9% | | | | | | |
| Chemicals – 0.4% | | | | | | |
| A. Schulman, Inc. | | 1,372 | | | | 28,661 |
| Akzo Nobel NV sponsored ADR | | 2,267 | | | | 101,222 |
| Hawkins, Inc. | | 540 | | | | 7,614 |
| LESCO, Inc. (a) | | 1,084 | | | | 17,181 |
| Methanex Corp. | | 4,745 | | | | 82,985 |
| Pioneer Companies, Inc. (a) | | 503 | | | | 12,489 |
| Sigma Aldrich Corp. | | 2,352 | | | | 155,326 |
See accompanying notes which are an integral part of the financial statements.
59 Annual Report
| Investments continued | | | | | | |
| |
| Common Stocks continued | | | | | | |
| | | Shares | | Value (Note 1) |
| |
| MATERIALS – continued | | | | | | |
| Chemicals – continued | | | | | | |
| Symyx Technologies, Inc. (a) | | 1,285 | | $ | | 35,016 |
| Zoltek Companies, Inc. (a) | | 839 | | | | 7,383 |
| | | | | | | 447,877 |
| Construction Materials 0.0% | | | | | | |
| United States Lime & Minerals, Inc. (a) | | 322 | | | | 9,399 |
| Containers & Packaging – 0.1% | | | | | | |
| AEP Industries, Inc. (a) | | 388 | | | | 8,924 |
| Caraustar Industries, Inc. (a) | | 1,721 | | | | 16,969 |
| Silgan Holdings, Inc. | | 1,459 | | | | 51,488 |
| Smurfit-Stone Container Corp. (a) | | 9,028 | | | | 114,385 |
| | | | | | | 191,766 |
| Metals & Mining – 0.4% | | | | | | |
| Aber Diamond Corp. | | 2,120 | | | | 75,880 |
| Anglo American PLC ADR | | 1,133 | | | | 36,131 |
| Century Aluminum Co. (a) | | 1,102 | | | | 25,478 |
| Chaparral Steel Co. (a) | | 1,334 | | | | 33,350 |
| DRDGOLD Ltd. sponsored ADR | | 6,412 | | | | 8,400 |
| Gibraltar Industries, Inc. | | 1,067 | | | | 23,463 |
| Lihir Gold Ltd. sponsored ADR (a) | | 300 | | | | 10,416 |
| Metal Management, Inc. | | 654 | | | | 16,461 |
| Metals USA, Inc. (a) | | 462 | | | | 10,164 |
| NN, Inc. | | 986 | | | | 9,801 |
| Northwest Pipe Co. (a) | | 450 | | | | 11,052 |
| Novamerican Steel, Inc. (a) | | 408 | | | | 16,320 |
| Olympic Steel, Inc. (a) | | 579 | | | | 12,275 |
| Pan American Silver Corp. (a) | | 2,359 | | | | 44,593 |
| Randgold Resources Ltd. sponsored ADR (a) | | 1,334 | | | | 20,997 |
| Roanoke Electric Steel Corp. | | 449 | | | | 10,457 |
| Royal Gold, Inc. | | 906 | | | | 23,574 |
| Schnitzer Steel Industries, Inc. Class A | | 714 | | | | 24,626 |
| Silver Standard Resources, Inc. (a) | | 1,438 | | | | 21,586 |
| Steel Dynamics, Inc. | | 1,847 | | | | 63,943 |
| Steel Technologies, Inc. | | 431 | | | | 11,417 |
| Wheeling Pittsburgh Corp. (a) | | 468 | | | | 4,198 |
| | | | | | | 514,582 |
| Paper & Forest Products 0.0% | | | | | | |
| Mercer International, Inc. (SBI) (a) | | 882 | | | | 6,765 |
| |
| TOTAL MATERIALS | | | | | | 1,170,389 |
See accompanying notes which are an integral part of the financial statements.
| Common Stocks continued | | | | | | |
| | | Shares | | Value (Note 1) |
| |
| TELECOMMUNICATION SERVICES – 1.3% | | | | | | |
| Diversified Telecommunication Services – 0.7% | | | | | | |
| Alaska Communication Systems Group, Inc. | | 1,559 | | $ | | 15,606 |
| Arbinet-thexchange, Inc. | | 874 | | | | 5,733 |
| Broadwing Corp. (a) | | 3,225 | | | | 21,672 |
| Cbeyond Communications, Inc. | | 821 | | | | 9,351 |
| Commonwealth Telephone Enterprises, Inc. | | 868 | | | | 30,085 |
| Consolidated Communications Holdings, Inc. | | 940 | | | | 12,248 |
| CT Communications, Inc. | | 1,028 | | | | 12,665 |
| D&E Communications, Inc. | | 1,155 | | | | 10,453 |
| General Communications, Inc. Class A (a) | | 2,134 | | | | 21,660 |
| Global Crossing Ltd. (a) | | 849 | | | | 14,467 |
| Golden Telecom, Inc. | | 1,317 | | | | 35,559 |
| HickoryTech Corp. | | 1,316 | | | | 10,396 |
| ITC DeltaCom, Inc. (a) | | 402 | | | | 663 |
| Level 3 Communications, Inc. (a)(d) | | 27,052 | | | | 91,977 |
| MCI, Inc. | | 11,566 | | | | 229,701 |
| North Pittsburgh Systems, Inc. | | 924 | | | | 18,092 |
| Primus Telecommunications Group, Inc. (a) | | 2,782 | | | | 2,699 |
| Shenandoah Telecommunications Co. | | 212 | | | | 8,626 |
| SureWest Communications | | 658 | | | | 18,621 |
| Talk America Holdings, Inc. (a) | | 1,288 | | | | 12,365 |
| Teleglobe International Holdings Ltd. (a) | | 3,448 | | | | 15,068 |
| Telewest Global, Inc. (a) | | 8,993 | | | | 200,454 |
| Time Warner Telecom, Inc. Class A (a) | | 2,162 | | | | 20,323 |
| U.S. LEC Corp. Class A (a) | | 2,781 | | | | 5,145 |
| Warwick Valley Telephone Co. | | 546 | | | | 10,964 |
| | | | | | | 834,593 |
| Wireless Telecommunication Services – 0.6% | | | | | | |
| @Road, Inc. (a) | | 1,886 | | | | 9,355 |
| Alamosa Holdings, Inc. (a) | | 5,750 | | | | 106,260 |
| America Movil SA de CV Series A sponsored ADR | | 291 | | | | 8,423 |
| Centennial Communications Corp. Class A (a) | | 3,758 | | | | 59,639 |
| Dobson Communications Corp. Class A (a) | | 3,409 | | | | 25,124 |
| First Ave Networks, Inc. (a)(d) | | 2,471 | | | | 13,096 |
| InPhonic, Inc. | | 1,163 | | | | 13,735 |
| Leap Wireless International, Inc. (a) | | 2,422 | | | | 92,181 |
| Millicom International Cellular SA (a) | | 3,703 | | | | 85,317 |
| NII Holdings, Inc. (a) | | 5,506 | | | | 239,236 |
| SBA Communications Corp. Class A (a) | | 3,077 | | | | 56,740 |
| Ubiquitel, Inc. (a) | | 4,416 | | | | 43,188 |
See accompanying notes which are an integral part of the financial statements.
61 Annual Report
| Investments continued | | | | | | | | | | |
| |
| Common Stocks continued | | | | | | | | | | |
| | | | | | | Shares | | Value (Note 1) |
| |
| TELECOMMUNICATION SERVICES – continued | | | | | | | | |
| Wireless Telecommunication Services – continued | | | | | | | | |
| USA Mobility, Inc. | | | | | | 1,276 | | $ | | 34,835 |
| Wireless Facilities, Inc. (a) | | | | | | 3,013 | | | | 16,692 |
| | | | | | | | | | | 803,821 |
| |
| TOTAL TELECOMMUNICATION SERVICES | | | | | | | | 1,638,414 |
| |
| UTILITIES – 0.2% | | | | | | | | | | |
| Electric Utilities – 0.1% | | | | | | | | | | |
| MGE Energy, Inc. | | | | | | 616 | | | | 21,634 |
| Otter Tail Corp. | | | | | | 1,489 | | | | 44,744 |
| | | | | | | | | | | 66,378 |
| Gas Utilities 0.0% | | | | | | | | | | |
| EnergySouth, Inc. | | | | | | 612 | | | | 16,946 |
| Multi-Utilities – 0.0% | | | | | | | | | | |
| NorthWestern Energy Corp. | | | | | | 1,684 | | | | 52,170 |
| Water Utilities 0.1% | | | | | | | | | | |
| Artesian Resources Corp. Class A | | | | | | 418 | | | | 12,436 |
| Cadiz, Inc. (a) | | | | | | 519 | | | | 10,307 |
| Connecticut Water Service, Inc. | | | | | | 430 | | | | 10,849 |
| Consolidated Water Co., Inc. | | | | | | 670 | | | | 13,025 |
| Middlesex Water Co. | | | | | | 488 | | | | 9,296 |
| Southwest Water Co. | | | | | | 1,431 | | | | 19,404 |
| | | | | | | | | | | 75,317 |
| |
| TOTAL UTILITIES | | | | | | | | | | 210,811 |
| |
| TOTAL COMMON STOCKS | | | | | | | | | | |
| (Cost $114,293,470) | | | | | | | | 123,426,922 |
| |
| U.S. Treasury Obligations 0.1% | | | | | | | | |
| | | | | | | Principal | | | | |
| | | | | | | Amount | | | | |
| U.S. Treasury Bills, yield at date of purchase 3.32% | | | | | | | | |
| 12/22/05 (e) | | | | | | | | | | |
| (Cost $89,827) | | | | $ | | 90,000 | | | | 89,798 |
See accompanying notes which are an integral part of the financial statements.
| Money Market Funds 4.6% | | | | | | | | |
| | | | | Shares | | Value (Note 1) |
| Fidelity Cash Central Fund, 4.08% (b) | | | | 272,637 | | $ | | 272,637 |
| Fidelity Securities Lending Cash Central Fund, 4.09% (b)(c) | | 5,423,738 | | | | 5,423,738 |
| TOTAL MONEY MARKET FUNDS | | | | | | | | |
| (Cost $5,696,375) | | | | | | | | 5,696,375 |
| Cash Equivalents 0.0% | | | | | | | | |
| | | | | Maturity | | | | |
| | | | | Amount | | | | |
| Investments in repurchase agreements (Collateralized by | | | | | | |
| U.S. Treasury Obligations, in a joint trading account at | | | | | | |
| 3.97%, dated 11/30/05 due 12/1/05) | | | | | | |
| (Cost $30,000) | | | | 30,003 | | | | 30,000 |
| TOTAL INVESTMENT PORTFOLIO 104.6% | | | | | | |
| (Cost $120,109,672) | | | | | | 129,243,095 |
| |
| NET OTHER ASSETS – (4.6)% | | | | | | (5,673,004) |
| NET ASSETS 100% | | | | | | $ | | 123,570,091 |
| |
| Futures Contracts | | | | | | | | |
| | | Expiration | | Underlying | | | | Unrealized |
| | | Date | | Face Amount | | | | Appreciation/ |
| | | | | at Value | | | | (Depreciation) |
| Purchased | | | | | | | | |
| Equity Index Contracts | | | | | | | | |
| 3 Nasdaq 100 E-Mini Index Contracts | | Dec. 2005 | | $ 100,500 | | $ 5,854 |
| |
| The face value of futures purchased as a percentage of net assets – 0.1% | | | | |
Legend
(a) Non-income producing
(b) Affiliated fund that is available only to
investment companies and other
accounts managed by Fidelity
Investments. The rate quoted is the
annualized seven-day yield of the fund
at period end. A complete unaudited
listing of the fund’s holdings as of its
most recent quarter end is available
upon request.
|
(c) Investment made with cash collateral
received from securities on loan.
(d) Security or a portion of the security is on
loan at period end.
(e) Security or a portion of the security was
pledged to cover margin requirements
for futures contracts. At the period end,
the value of securities pledged
amounted to $89,798.
|
See accompanying notes which are an integral part of the financial statements.
63 Annual Report
Investments continued
Affiliated Central Funds
Information regarding income received by the fund from the affiliated Central funds during the period is as follows:
| Fund | | Income received |
| Fidelity Cash Central Fund | | $ | | 9,774 |
| Fidelity Securities Lending Cash Central Fund | | | | 48,642 |
| Total | | $ | | 58,416 |
See accompanying notes which are an integral part of the financial statements.
Annual Report 64
| Financial Statements | | | | | | | | |
| |
| |
| Statement of Assets and Liabilities | | | | | | | | |
| | | | | | | November 30, 2005 |
| |
| Assets | | | | | | | | |
| Investment in securities, at value (including securities | | | | | | | | |
| loaned of $5,253,937 and repurchase agreements of | | | | | | | | |
| $30,000) See accompanying schedule: | | | | | | | | |
| Unaffiliated issuers (cost $114,413,297) | | $ | | 123,546,720 | | | | |
| Affiliated Central Funds (cost $5,696,375) | | | | 5,696,375 | | | | |
| Total Investments (cost $120,109,672) | | | | | | $ | | 129,243,095 |
| Cash | | | | | | | | 6,508 |
| Receivable for investments sold | | | | | | | | 90,618 |
| Dividends receivable | | | | | | | | 83,025 |
| Interest receivable | | | | | | | | 945 |
| Prepaid expenses | | | | | | | | 365 |
| Receivable from investment adviser for expense | | | | | | | | |
| reductions | | | | | | | | 28,366 |
| Other receivables | | | | | | | | 4,206 |
| Total assets | | | | | | | | 129,457,128 |
| |
| Liabilities | | | | | | | | |
| Payable for investments purchased | | $ | | 323,946 | | | | |
| Accrued management fee | | | | 24,360 | | | | |
| Distribution fees payable | | | | 25,329 | | | | |
| Payable for daily variation on futures contracts | | | | 282 | | | | |
| Other affiliated payables | | | | 3,806 | | | | |
| Other payables and accrued expenses | | | | 85,576 | | | | |
| Collateral on securities loaned, at value | | | | 5,423,738 | | | | |
| Total liabilities | | | | | | | | 5,887,037 |
| |
| Net Assets | | | | | | $ | | 123,570,091 |
| Net Assets consist of: | | | | | | | | |
| Paid in capital | | | | | | $ | | 113,395,646 |
| Undistributed net investment income | | | | | | | | 109,514 |
| Accumulated undistributed net realized gain (loss) on | | | | | | | | |
| investments and foreign currency transactions | | | | | | | | 925,654 |
| Net unrealized appreciation (depreciation) on | | | | | | | | |
| investments | | | | | | | | 9,139,277 |
| Net Assets, for 1,400,000 shares outstanding | | | | | | $ | | 123,570,091 |
| Net Asset Value, offering price and redemption price per | | | | | | | | |
| share ($123,570,091 ÷ 1,400,000 shares) | | | | | | $ | | 88.26 |
See accompanying notes which are an integral part of the financial statements.
65 Annual Report
| Financial Statements continued | | | | | | |
| |
| |
| Statement of Operations | | | | | | |
| | | | | Year ended November 30, 2005 |
| |
| Investment Income | | | | | | |
| Dividends | | | | $ | | 803,121 |
| Interest | | | | | | 2,712 |
| Income from affiliated Central Funds (including $48,642 | | | | |
| from security lending) | | | | | | 58,416 |
| Total income | | | | | | 864,249 |
| |
| Expenses | | | | | | |
| Management fee | | $ | | 280,824 | | |
| Transfer agent and custody fees | | | | 101,592 | | |
| Distribution fees | | | | 105,248 | | |
| Licensing fees | | | | 58,471 | | |
| Accounting and security lending fees | | | | 44,671 | | |
| Independent trustees’ compensation | | | | 547 | | |
| Audit | | | | 67,163 | | |
| Legal | | | | 14,456 | | |
| Miscellaneous | | | | 18,307 | | |
| Total expenses before reductions | | | | 691,279 | | |
| Expense reductions | | | | (340,432) | | 350,847 |
| |
| Net investment income (loss) | | | | | | 513,402 |
| Realized and Unrealized Gain (Loss) | | | | | | |
| Net realized gain (loss) on: | | | | | | |
| Investment securities: | | | | | | |
| Unaffiliated issuers | | | | 9,098,762 | | |
| Foreign currency transactions | | | | 150 | | |
| Futures contracts | | | | 113,651 | | |
| Total net realized gain (loss) | | | | | | 9,212,563 |
| Change in net unrealized appreciation (depreciation) on: | | | | |
| Investment securities | | | | (3,630,622) | | |
| Assets and liabilities in foreign currencies | | | | 1 | | |
| Futures contracts | | | | (62,471) | | |
| Total change in net unrealized appreciation | | | | | | |
| (depreciation) | | | | | | (3,693,092) |
| Net gain (loss) | | | | | | 5,519,471 |
| Net increase (decrease) in net assets resulting from | | | | | | |
| operations | | | | $ | | 6,032,873 |
See accompanying notes which are an integral part of the financial statements.
| Statement of Changes in Net Assets | | | | | | | | |
| | | | | Year ended | | | | Year ended |
| | | | | November 30, | | | | November 30, |
| | | | | 2005 | | | | 2004 |
| Increase (Decrease) in Net Assets | | | | | | | | |
| Operations | | | | | | | | |
| Net investment income (loss) | | $ | | 513,402 | | $ | | 1,633,439 |
| Net realized gain (loss) | | | | 9,212,563 | | | | 13,019,951 |
| Change in net unrealized appreciation (depreciation) . | | | | (3,693,092) | | | | (54,276) |
| Net increase (decrease) in net assets resulting | | | | | | | | |
| from operations | | | | 6,032,873 | | | | 14,599,114 |
| Distributions to shareholders from net investment income . | | | | (1,827,000) | | | | (364,000) |
| Share transactions | | | | | | | | |
| Proceeds from sales of shares | | | | 50,797,714 | | | | 30,916,600 |
| Cost of shares redeemed | | | | (65,298,653) | | | | (91,710,000) |
| Net increase (decrease) in net assets resulting from | | | | | | | | |
| share transactions | | | | (14,500,939) | | | | (60,793,400) |
| Total increase (decrease) in net assets | | | | (10,295,066) | | | | (46,558,286) |
| |
| Net Assets | | | | | | | | |
| Beginning of period | | | | 133,865,157 | | | | 180,423,443 |
| End of period (including undistributed net investment | | | | | | | | |
| income of $109,514 and undistributed net invest- | | | | | | | | |
| ment income of $1,430,958, respectively) | | $ | | 123,570,091 | | $ | | 133,865,157 |
| |
| Other Information | | | | | | | | |
| Shares | | | | | | | | |
| Sold | | | | 600,000 | | | | 400,000 |
| Redeemed | | | | (800,000) | | | | (1,100,000) |
| Net increase (decrease) | | | | (200,000) | | | | (700,000) |
See accompanying notes which are an integral part of the financial statements.
67 Annual Report
| Financial Highlights | | | | | | | | | | | | |
| Years ended November 30, | | | | 2005 | | | | 2004 | | | | 2003F |
| Selected Per Share Data | | | | | | | | | | | | |
| Net asset value, beginning of period | | | $ | 83.67 | | $ | | 78.44 | | $ | | 72.69 |
| Income from Investment Operations | | | | | | | | | | | | |
| Net investment income (loss)D | | | | 36 | | | | 1.00E | | | | .06 |
| Net realized and unrealized gain (loss) | | | | 5.40 | | | | 4.43 | | | | 5.69 |
| Total from investment operations | | | | 5.76 | | | | 5.43 | | | | 5.75 |
| Distributions from net investment income | | | | (1.17) | | | | (.20) | | | | — |
| Net asset value, end of period | | | $ | 88.26 | | $ | | 83.67 | | $ | | 78.44 |
| Total ReturnB,C | | | | 6.96% | | | | 6.94% | | | | 7.91% |
| Ratios to Average Net AssetsG | | | | | | | | | | | | |
| Expenses before reductions | | | | 59% | | | | .56% | | | | .51%A |
| Expenses net of fee waivers, if any | | | | 30% | | | | .30% | | | | .30%A |
| Expenses net of all reductions | | | | 30% | | | | .30% | | | | .30%A |
| Net investment income (loss) | | | | 44% | | | | 1.26% | | | | .43%A |
| Supplemental Data | | | | | | | | | | | | |
| Net assets, end of period (000 omitted) | | | $ | 123,570 | | $ | | 133,865 | | $ | | 180,423 |
| Portfolio turnover rateH | | | | 9% | | | | 8% | | | | 10%A |
A Annualized
B Total returns for periods of less than one year are not annualized.
C Total returns would have been lower had certain expenses not been reduced during the periods shown.
D Calculated based on average shares outstanding during the period.
E Investment income per share reflects a special dividend which amounted to $.83 per share.
F For the period September 25, 2003 (commencement of operations) to November 30, 2003.
G Expense ratios reflect operating expenses of the fund. Expenses before reductions do not reflect amounts reimbursed by the investment adviser or
reductions from brokerage service arrangements or other expense offset arrangements and do not represent the amount paid by the fund during
periods when reimbursements or reductions occur. Expense ratios before reductions for start up periods may not be representative of longer term
operating periods. Expenses net of fee waivers reflect expenses after reimbursement by the investment adviser but prior to reductions from
brokerage service arrangements or other expense offset arrangements. Expenses net of all reductions represent the net expenses paid by the
fund.
H Portfolio turnover rate excludes securities received or delivered in kind.
|
See accompanying notes which are an integral part of the financial statements.
Notes to Financial Statements
For the period ended November 30, 2005
1. Significant Accounting Policies.
Fidelity NASDAQ Composite Index Tracking Stock (the fund) is an exchange traded and a non diversified fund of Fidelity Commonwealth Trust (the trust) and is authorized to issue an unlimited number of shares. The trust is registered under the Investment Company Act of 1940, as amended (the 1940 Act), as an open end management invest ment company organized as a Massachusetts business trust. The fund may invest in affiliated money market central funds (Money Market Central Funds) which are open end investment companies available to investment companies and other accounts managed by Fidelity Management & Research Company (FMR) and its affiliates. The financial statements have been prepared in conformity with accounting principles generally accepted in the United States of America, which require management to make certain estimates and assumptions at the date of the financial statements. The following summarizes the significant accounting policies of the fund:
Security Valuation. Investments are valued and net asset value (NAV) per share is calculated (NAV calculation) as of the close of regular trading hours on the Nasdaq stock market, normally 4:00 p.m. Eastern time. Wherever possible, the fund uses independent pricing services approved by the Board of Trustees to value its investments.
Equity securities, including restricted securities, for which market quotations are readily available, are valued at the last reported sale price or official closing price as reported by an independent pricing service on the primary market or exchange on which they are traded. In the event there were no sales during the day or closing prices are not available, securities are valued at the last quoted bid price. Investments in open end mutual funds, are valued at their closing net asset value each business day. Short term securities with remaining maturities of sixty days or less for which quotations are not readily available are valued at amortized cost, which approximates value.
When current market prices or quotations are not readily available or do not accurately reflect fair value, valuations may be determined in accordance with procedures adopted by the Board of Trustees. For example, when developments occur between the close of a market and the close of the NASDAQ that may materially affect the value of some or all of the securities, or when trading in a security is halted, those securities may be fair valued. Factors used in the determination of fair value may include monitoring news to identify significant market or security specific events such as changes in the value of U.S. securi ties market, reviewing developments in foreign markets and evaluating the performance of ADRs, futures contracts and exchange traded funds. Because the fund’s utilization of fair value pricing depends on market activity, the frequency with which fair value pricing is used can not be predicted and may be utilized to a significant extent. The value of securities used for NAV calculation under fair value pricing may differ from published prices for the same securities.
69 Annual Report
Notes to Financial Statements continued
1. Significant Accounting Policies continued
Foreign Currency. The fund uses foreign currency contracts to facilitate transactions in foreign denominated securities. Losses from these transactions may arise from changes in the value of the foreign currency or if the counterparties do not perform under the contracts’ terms.
Foreign denominated assets, including investment securities, and liabilities are trans lated into U.S. dollars at the exchange rate at period end. Purchases and sales of invest ment securities, income and dividends received and expenses denominated in foreign currencies are translated into U.S. dollars at the exchange rate in effect on the transac tion date.
The effects of exchange rate fluctuations on investments are included with the net realized and unrealized gain (loss) on investment securities. Other foreign currency transactions resulting in realized and unrealized gain (loss) are disclosed separately.
Investment Transactions and Income. Security transactions are accounted for as of trade date. Gains and losses on securities sold are determined on the basis of identified cost and may include proceeds received from litigation. Dividend income is recorded on the ex dividend date, except for certain dividends from foreign securities where the ex dividend date may have passed, which are recorded as soon as the fund is informed of the ex dividend date. Non cash dividends included in dividend income, if any, are recorded at the fair market value of the securities received. Distributions received on securities that represent a return of capital or capital gain are recorded as a reduction of cost of investments and/or as a realized gain. The fund estimates the components of distributions received that may be considered return of capital distributions or capital gain distributions. Interest income is accrued as earned. Interest income includes coupon interest and amortization of premium and accretion of discount on debt securi ties. Investment income is recorded net of foreign taxes withheld where recovery of such taxes is uncertain.
Expenses. Most expenses of the trust can be directly attributed to a fund. Expenses which cannot be directly attributed are apportioned among each fund in the trust.
Income Tax Information and Distributions to Shareholders. Each year, the fund intends to qualify as a regulated investment company by distributing all of its taxable income and realized gains under Subchapter M of the Internal Revenue Code. As a result, no provision for income taxes is required in the accompanying financial statements. Realized gain or loss resulting from in kind redemptions is not taxable to the fund and is not distributed to shareholders of the fund. Foreign taxes are provided for based on the fund’s understanding of the tax rules and rates that exist in the foreign markets in which it invests.
1. Significant Accounting Policies continued
| | |
| Income Tax Information and Distributions to Shareholders continued |
Distributions are recorded on the ex dividend date. Income and capital gain distribu tions are determined in accordance with income tax regulations, which may differ from generally accepted accounting principles. In addition, the fund will claim a portion of the payment made to redeeming shareholders as a distribution for income tax purposes.
Capital accounts within the financial statements are adjusted for permanent book tax differences. These adjustments have no impact on net assets or the results of operations. Temporary book tax differences will reverse in a subsequent period.
Book tax differences are primarily due to redemptions in kind, wash sales and futures transactions.
The tax basis components of distributable earnings and the federal tax cost as of period end were as follows:
| Unrealized appreciation | | $ | | 17,259,884 | | | | |
| Unrealized depreciation | | | | (8,139,343) | | | | |
| Net unrealized appreciation (depreciation) | | | | 9,120,541 | | | | |
| Undistributed ordinary income | | | | 98,728 | | | | |
| Undistributed long term capital gain | | | | 689,995 | | | | |
| |
| Cost for federal income tax purposes | | $ | | 120,122,554 | | | | |
| |
The tax character of distributions paid was as follows:
| | | | |
| | | | | November 30, 2005 | | | | November 30, 2004 |
| Ordinary Income | | $ | | 1,827,000 | | $ | | 364,000 |
| |
| |
| 2. Operating Policies. | | | | | | | | |
Repurchase Agreements. FMR has received an Exemptive Order from the Securities and Exchange Commission (the SEC) which permits the fund and other affiliated entities of FMR to transfer uninvested cash balances into joint trading accounts which are then invested in repurchase agreements. The fund may also invest directly with institutions in repurchase agreements. Repurchase agreements are collateralized by government or non government securities. Collateral is held in segregated accounts with custodian banks and may be obtained in the event of a default of the counterparty. The fund monitors, on a daily basis, the value of the collateral to ensure it is at least equal to the principal amount of the repurchase agreement (including accrued interest). In the event of a default by the counterparty, realization of the collateral proceeds could be delayed, during which time the value of the collateral may decline.
71 Annual Report
Notes to Financial Statements continued
2. Operating Policies continued
Futures Contracts. The fund may use futures contracts to manage its exposure to the stock market. Buying futures tends to increase a fund’s exposure to the underlying instrument, while selling futures tends to decrease a fund’s exposure to the underlying instrument or hedge other fund investments. Futures contracts involve, to varying degrees, risk of loss in excess of any futures variation margin reflected in the Statement of Assets and Liabilities. The underlying face amount at value of any open futures contracts at period end is shown in the Schedule of Investments under the caption “Futures Contracts.” This amount reflects each contract’s exposure to the underlying instrument at period end. Losses may arise from changes in the value of the underlying instruments or if the counterparties do not perform under the contracts’ terms. Gains (losses) are realized upon the expiration or closing of the futures contracts. Futures contracts are valued at the settlement price established each day by the board of trade or exchange on which they are traded.
3. Purchases and Sales of Investments.
Purchases and sales of securities, other than short term securities, U.S. government securities and in kind transactions, aggregated $10,341,049 and $10,045,753, respectively.
Securities received and delivered on an in kind basis aggregated $50,761,082 and $65,238,490, respectively. Realized gain (loss) of $8,193,478 on securities delivered on an in kind basis is included in the accompanying Statement of Operations as realized gain or loss on investment securities and is not taxable to the fund.
4. Fees and Other Transactions with Affiliates.
Management Fee. FMR and its affiliates provide the fund with investment manage ment related services for which the fund pays a monthly management fee that is based on an annual rate of .24% of the fund’s average net assets.
Sub Adviser. Geode Capital Management, LLC (Geode), serves as sub adviser for the fund. Geode provides discretionary investment advisory services to the fund and is paid by FMR for providing these services.
Distribution and Service Plan. In accordance with Rule 12b 1 of the 1940 Act, the fund has adopted a Distribution and Service Plan. The fund pays Fidelity Distributors Corpo ration (FDC), an affiliate of FMR, a distribution fee based on annual percentage of the fund’s average net assets of up to .25%. In addition, FDC pays Nasdaq for marketing services provided to the fund. For the period, the distribution fees were equivalent to an annual rate of.09% of average net assets. The total amounts paid to and retained by FDC were $105,248 and $0, respectively.
4. Fees and Other Transactions with Affiliates continued
Accounting and Security Lending Fees. Fidelity Service Company, Inc. (FSC), an affiliate of FMR, maintains the fund’s accounting records. The accounting fee is based on the level of average net assets for the month. Under a separate contract, FSC administers the security lending program. The security lending fee is based on the number and duration of lending transactions.
Licensing Fees. Under the terms of a license agreement, FMR pays Nasdaq an annual licensing fee for the use of the Nasdaq Composite Index. FMR has entered into a sub license agreement with the fund whereby the fund pays FMR the amount of the license fee at the rate of up to .06% of the fund’s average net assets.
Affiliated Central Funds. The fund may invest in Money Market Central Funds which seek preservation of capital and current income and are managed by Fidelity Invest ments Money Management, Inc. (FIMM), an affiliate of FMR.
The Money Market Central Funds do not pay a management fee.
The fund lends portfolio securities from time to time in order to earn additional income. The fund receives collateral (in the form of U.S. Treasury obligations, letters of credit and/or cash) against the loaned securities and maintains collateral in an amount not less than 100% of the market value of the loaned securities during the period of the loan. The market value of the loaned securities is determined at the close of business of the fund and any additional required collateral is delivered to the fund on the next business day. If the borrower defaults on its obligation to return the securities loaned because of insol vency or other reasons, a fund could experience delays and costs in recovering the securities loaned or in gaining access to the collateral. Cash collateral is invested in the Fidelity Securities Lending Cash Central Fund. The value of loaned securities and cash collateral at period end are disclosed on the fund’s Statement of Assets and Liabilities. Security lending income represents the income earned on investing cash collateral, less fees and expenses associated with the loan, plus any premium payments that may be received on the loan of certain types of securities.
73 Annual Report
| Notes to Financial Statements continued |
6. Expense Reductions. | | |
FMR contractually agreed to waive expenses of the fund to the extent annual operating expenses exceeded .30% of average net assets. This waiver will remain in place through October 1, 2006. Some expenses, for example interest expense, are excluded from this waiver. During the period, this waiver reduced the fund’s expenses by $340,286.
In addition, through arrangements with the fund’s custodian, credits realized as a result of uninvested cash balances were used to reduce the fund’s expenses. During the period, these credits reduced the fund’s custody expenses by $146.
The fund’s organizational documents provide former and current trustees and officers with a limited indemnification against liabilities arising in connection with the perfor mance of their duties to the fund. In the normal course of business, the fund may also enter into contracts that provide general indemnifications. The fund’s maximum expo sure under these arrangements is unknown as this would be dependent on future claims that may be made against the fund. The risk of material loss from such claims is consid ered remote.
The fund issues and redeems shares at Net Asset Value only with certain authorized participants in large increments known as Creation Units. Purchases of Creation Units are made by tendering a basket of designated stocks to the fund and redemption pro ceeds are paid with a basket of securities from the fund’s portfolio. The fund’s shares are available in smaller increments to investors in the secondary market at market prices and may be subject to commissions. A transaction fee is charged by the shareholder servicing agent when authorized participants purchase or redeem Creation Units of the fund. The fee is charged to cover the costs associated with the issuance and redemption of Creation Units. During the period, transaction fees totaled $6,000.
Report of Independent Registered Public Accounting Firm
To the Trustees of Fidelity Commonwealth Trust and the Shareholders of Fidelity NASDAQ Composite Index Tracking Stock:
In our opinion, the accompanying statement of assets and liabilities, including the sched ule of investments, and the related statements of operations and of changes in net assets and the financial highlights present fairly, in all material respects, the financial position of Fidelity NASDAQ Composite Index Tracking Stock (a fund of Fidelity Commonwealth Trust) at November 30, 2005 and the results of its operations, the changes in its net assets and the financial highlights for the periods indicated, in conformity with accounting principles generally accepted in the United States of America. These financial statements and financial highlights (hereafter referred to as “financial statements”) are the responsi bility of the Fidelity NASDAQ Composite Index Tracking Stock’s management; our responsibility is to express an opinion on these financial statements based on our audits. We conducted our audits of these financial statements in accordance with the standards of the Public Company Accounting Oversight Board (United States). Those standards require that we plan and perform the audit to obtain reasonable assurance about whether the financial statements are free of material misstatement. An audit includes examining, on a test basis, evidence supporting the amounts and disclosures in the financial state ments, assessing the accounting principles used and significant estimates made by management, and evaluating the overall financial statement presentation. We believe that our audits, which included confirmation of securities at November 30, 2005 by correspon dence with the custodian and brokers, provide a reasonable basis for our opinion.
/s/ PricewaterhouseCoopers LLP
PricewaterhouseCoopers LLP
Boston, Massachusetts
January 17, 2006
|
75 Annual Report
Trustees and Officers
The Trustees, Members of the Advisory Board, and executive officers of the trust and fund, as applicable, are listed below. The Board of Trustees governs the fund and is responsible for protecting the interests of shareholders. The Trustees are experienced executives who meet periodically throughout the year to oversee the fund’s activities, review contractual arrangements with companies that provide services to the fund, and review the fund’s performance. Except for William O. McCoy and Albert R. Gamper, Jr., each of the Trustees oversees 326 funds advised by FMR or an affiliate. Mr. McCoy oversees 328 funds advised by FMR or an affiliate. Mr. Gamper oversees 235 funds advised by FMR or an affiliate.
The Trustees hold office without limit in time except that (a) any Trustee may resign; (b) any Trustee may be removed by written instrument, signed by at least two thirds of the number of Trustees prior to such removal; (c) any Trustee who requests to be retired or who has become incapacitated by illness or injury may be retired by written instru ment signed by a majority of the other Trustees; and (d) any Trustee may be removed at any special meeting of shareholders by a two thirds vote of the outstanding voting securities of the trust. Each Trustee who is not an interested person (as defined in the 1940 Act) (Independent Trustee), shall retire not later than the last day of the calendar year in which his or her 72nd birthday occurs. The Independent Trustees may waive this mandatory retirement age policy with respect to individual Trustees. The executive officers and Advisory Board Members hold office without limit in time, except that any officer and Advisory Board Member may resign or may be removed by a vote of a majority of the Trustees at any regular meeting or any special meeting of the Trustees. Except as indicated, each individual has held the office shown or other offices in the same company for the past five years.
The fund’s Statement of Additional Information (SAI) includes more information about the Trustees. To request a free copy, call Fidelity at 1-800-FIDELITY.
Correspondence intended for each Trustee who is an interested person may be sent to Fidelity Investments, 82 Devonshire Street, Boston, Massachusetts 02109.
| | Name, Age; Principal Occupation
Edward C. Johnson 3d (75)
|
Year of Election or Appointment: 1974
Mr. Johnson is Chairman of the Board of Trustees. Mr. Johnson serves as Chief Executive Officer, Chairman, and a Director of FMR Corp.; a Di rector and Chairman of the Board and of the Executive Committee of FMR; Chairman and a Director of Fidelity Management & Research (Far East) Inc.; Chairman and a Director of Fidelity Investments Money Man agement, Inc.; and Chairman (2001 present) and a Director (2000 present) of FMR Co., Inc.
| | Name, Age; Principal Occupation
Stephen P. Jonas (52)
|
Year of Election or Appointment: 2005
Mr. Jonas is Senior Vice President of Fidelity Nasdaq Composite Index Tracking Stock (2005 present). He also serves as Senior Vice President of other Fidelity funds (2005 present). Mr. Jonas is Executive Director of FMR (2005 present). Previously, Mr. Jonas served as President of Fidelity Enterprise Operations and Risk Services (2004 2005), Chief Adminis trative Officer (2002 2004), and Chief Financial Officer of FMR Co. (1998 2000). Mr. Jonas has been with Fidelity Investments since 1987 and has held various financial and management positions including Chief Financial Officer of FMR. In addition, he serves on the Boards of Boston Ballet (2003 present) and Simmons College (2003 present).
Year of Election or Appointment: 2003
Mr. Reynolds is a Director (2003 present) and Chief Operating Officer (2002 present) of FMR Corp. He also serves on the Board at Fidelity Investments Canada, Ltd. (2000 present). Previously, Mr. Reynolds served as President of Fidelity Investments Institutional Retirement Group (1996 2000).
* Trustees have been determined to be “Interested Trustees” by virtue of, among other things, their affiliation with the trust or various entities under common control with FMR.
77 Annual Report
Trustees and Officers - continued
Independent Trustees:
Correspondence intended for each Independent Trustee (that is, the Trustees other than the Interested Trustees) may be sent to Fidelity Investments, P.O. Box 55235, Boston, Massachusetts 02205 5235.
| | Name, Age; Principal Occupation
Dennis J. Dirks (57)
|
Year of Election or Appointment: 2005
Prior to his retirement in May 2003, Mr. Dirks was Chief Operating Officer and a member of the Board of The Depository Trust & Clearing Corporation (DTCC) (1999 2003). He also served as President, Chief Operating Officer, and Board member of The Depository Trust Company (DTC) (1999 2003) and President and Board member of the National Securities Clearing Corporation (NSCC) (1999 2003). In addi tion, Mr. Dirks served as Chief Executive Officer and Board member of the Government Securities Clearing Corporation (2001 2003) and Chief Executive Officer and Board member of the Mortgage Backed Securities Clearing Corporation (2001 2003). Mr. Dirks also serves as a Trustee of Manhattan College (2005 present).
| | Albert R. Gamper, Jr. (63)
|
Year of Election or Appointment: 2006
Mr. Gamper also serves as a Trustee (2006 present) or Member of the Advisory Board (2005 present) of other investment companies advised by FMR. Prior to his retirement in December 2004, Mr. Gamper served as Chairman of the Board of CIT Group Inc. (commercial finance). Dur ing his tenure with CIT Group Inc. Mr. Gamper served in numerous senior management positions, including Chairman (1987 1989; 1999 2001; 2002 2004), Chief Executive Officer (1987 2004), and President (1989 2002). He currently serves as a member of the Board of Directors of Public Service Enterprise Group (utilities, 2001 present), Chairman of the Board of Governors, Rutgers University (2004 present), and Chairman of the Board of Saint Barnabas Health Care System.
Name, Age; Principal Occupation
Robert M. Gates (62)
|
Year of Election or Appointment: 1997
Dr. Gates is Chairman of the Independent Trustees (2006 present). Dr. Gates is President of Texas A&M University (2002 present). He was Director of the Central Intelligence Agency (CIA) from 1991 to 1993. From 1989 to 1991, Dr. Gates served as Assistant to the President of the United States and Deputy National Security Advisor. Dr. Gates is a Director of NACCO Industries, Inc. (mining and manufacturing), Parker Drilling Co., Inc. (drilling and rental tools for the energy industry, 2001 present), and Brinker International (restaurant management, 2003 present). Previously, Dr. Gates served as a Director of LucasVarity PLC (automotive components and diesel engines), a Director of TRW Inc. (automotive, space, defense, and information technology), and Dean of the George Bush School of Government and Public Service at Texas A&M University (1999 2001). Dr. Gates also is a Trustee of the Forum for International Policy.
Year of Election or Appointment: 2004
Dr. Heilmeier is Chairman Emeritus of Telcordia Technologies (commu nication software and systems), where prior to his retirement, he served as company Chairman and Chief Executive Officer. He currently serves on the Boards of Directors of The Mitre Corporation (systems engineer ing and information technology support for the government), and HRL Laboratories (private research and development, 2004 present). He is Chairman of the General Motors Science & Technology Advisory Board and a Life Fellow of the Institute of Electrical and Electronics Engineers (IEEE) (2000 present). Dr. Heilmeier is a member of the Defense Science Board and the National Security Agency Advisory Board. He is also a member of the National Academy of Engineering, the American Academy of Arts and Sciences, and the Board of Overseers of the School of Engineering and Applied Science of the University of Pennsyl vania. Previously, Dr. Heilmeier served as a Director of TRW Inc. (auto motive, space, defense, and information technology, 1992 2002), Compaq (1994 2002), Automatic Data Processing, Inc. (ADP) (technology based business outsourcing, 1995 2002), INET Technolo gies Inc. (telecommunications network surveillance, 2001 2004), and Teletech Holdings (customer management services). He is the recipient of the 2005 Kyoto Prize in Advanced Technology for his invention of the liquid display.
79 Annual Report
Trustees and Officers - continued
| | Name, Age; Principal Occupation
Marie L. Knowles (59)
|
Year of Election or Appointment: 2001
Prior to Ms. Knowles’ retirement in June 2000, she served as Executive Vice President and Chief Financial Officer of Atlantic Richfield Company (ARCO) (diversified energy, 1996 2000). From 1993 to 1996, she was a Senior Vice President of ARCO and President of ARCO Transportation Company. She served as a Director of ARCO from 1996 to 1998. She currently serves as a Director of Phelps Dodge Corporation (copper mining and manufacturing) and McKesson Corporation (healthcare ser vice, 2002 present). Ms. Knowles is a Trustee of the Brookings Institution and the Catalina Island Conservancy and also serves as a member of the Advisory Board for the School of Engineering of the University of Southern California.
Year of Election or Appointment: 2000
Mr. Lautenbach has been a partner of Clayton, Dubilier & Rice, Inc. (private equity investment firm) since September 1998. Previously, Mr. Lautenbach was with the International Business Machines Corporation (IBM) from 1968 until his retirement in 1998. Mr. Lautenbach serves as a Director of Italtel Holding S.p.A. (telecommunications (Milan, Italy), 2004 present) and Eaton Corporation (diversified industrial) as well as the Philharmonic Center for the Arts in Naples, Florida. He also is a member of the Board of Trustees of Fairfield University (2005 present), as well as a member of the Council on Foreign Relations.
Year of Election or Appointment: 1997
Prior to his retirement in December 1994, Mr. McCoy was Vice Chair man of the Board of BellSouth Corporation (telecommunications) and President of BellSouth Enterprises. He is currently a Director of Liberty Corporation (holding company), Duke Realty Corporation (real estate), and Progress Energy, Inc. (electric utility). He is also a partner of Frank lin Street Partners (private investment management firm) and a member of the Research Triangle Foundation Board. In addition, Mr. McCoy served as the Interim Chancellor (1999 2000) and a member of the Board of Visitors for the University of North Carolina at Chapel Hill and currently serves on the Board of Directors of the University of North Carolina Health Care System and the Board of Visitors of the Kenan Flagler Business School (University of North Carolina at Chapel Hill). He also served as Vice President of Finance for the University of North Car olina (16 school system).
Name, Age; Principal Occupation
Cornelia M. Small (61)
|
Year of Election or Appointment: 2005
Ms. Small is a member (2000 present) and Chairperson (2002 present) of the Investment Committee, and a member (2002 present) of the Board of Trustees of Smith College. Previously, she served as Chief In vestment Officer (1999 2000), Director of Global Equity Investments (1996 1999), and a member of the Board of Directors of Scudder, Stevens & Clark (1990 1997) and Scudder Kemper Investments (1997 1998). In addition, Ms. Small served as Co Chair (2000 2003) of the Annual Fund for the Fletcher School of Law and Diplomacy.
William S. Stavropoulos (66)
|
Year of Election or Appointment: 2002
Mr. Stavropoulos is Chairman of the Board (2000 present) and a Mem ber of the Board of Directors of The Dow Chemical Company. Since joining The Dow Chemical Company in 1967, Mr. Stavropoulos served in numerous senior management positions, including President (1993 2000; 2002 2003), CEO (1995 2000; 2002 2004), and Chair man of the Executive Committee (2000 2004). Currently, he is a Direc tor of NCR Corporation (data warehousing and technology solutions), BellSouth Corporation (telecommunications), Chemical Financial Corpo ration, Maersk Inc. (industrial conglomerate, 2002 present), and Metal mark Capital (private equity investment firm, 2005 present). He also serves as a member of the Board of Trustees of the American Enterprise Institute for Public Policy Research. In addition, Mr. Stavropoulos is a member of The Business Council, J.P. Morgan International Council and the University of Notre Dame Advisory Council for the College of Science.
Year of Election or Appointment: 2005
Prior to his retirement in 2001, Mr. Wolfe was Chairman and Chief Executive Officer of Hershey Foods Corporation (1993 2001). He cur rently serves as a member of the boards of Adelphia Communications Corporation (2003 present), Bausch & Lomb, Inc., and Revlon Inc. (2004 present).
81 Annual Report
Trustees and Officers - continued
Advisory Board Members and Executive Officers:
Correspondence intended for each executive officer and Mr. Lynch may be sent to Fidelity Investments, 82 Devonshire Street, Boston, Massachusetts 02109.
| | Name, Age; Principal Occupation
Peter S. Lynch (61)
|
Year of Election or Appointment: 2003
Member of the Advisory Board of Fidelity Commonwealth Trust. Vice Chairman and a Director of FMR, and Vice Chairman (2001 present) and a Director (2000 present) of FMR Co., Inc. Previously, Mr. Lynch served as a Trustee of the Fidelity funds (1990 2003). In addition, he serves as a Trustee of Boston College, Massachusetts Eye & Ear Infirmary, Historic Deerfield, John F. Kennedy Library, and the Museum of Fine Arts of Boston.
Year of Election or Appointment: 2005
Vice President of Fidelity Nasdaq Composite Index Tracking Stock. Mr. Churchill also serves as Vice President of certain Equity Funds (2005 present) and certain High Income Funds (2005 present). Pre viously, he served as Head of Fidelity’s Fixed Income Division (2000 2005), Vice President of Fidelity’s Money Market Funds (2000 2005), Vice President of Fidelity’s Bond Funds, and Senior Vice President of FIMM (2000) and FMR. Mr. Churchill joined Fidelity in 1993 as Vice President and Group Leader of Taxable Fixed Income Investments.
Year of Election or Appointment: 2003
Secretary of Fidelity Nasdaq Composite Index Tracking Stock. He also serves as Secretary of other Fidelity funds; Vice President, General Counsel, and Secretary of FMR Co., Inc. (2001 present) and FMR; As sistant Secretary of Fidelity Management & Research (U.K.) Inc. (2001 present), Fidelity Management & Research (Far East) Inc. (2001 present), and Fidelity Investments Money Management, Inc. (2001 present). Mr. Roiter is an Adjunct Member, Faculty of Law, at Boston College Law School (2003 present). Previously, Mr. Roiter served as Vice President and Secretary of Fidelity Distributors Corporation (FDC) (1998 2005).
Year of Election or Appointment: 2003
Assistant Secretary of Fidelity Nasdaq Composite Index Tracking Stock. Mr. Fross also serves as Assistant Secretary of other Fidelity funds (2003 present), Vice President and Secretary of FDC (2005 present), and is an employee of FMR.
Name, Age; Principal Occupation
Christine Reynolds (47)
|
Year of Election or Appointment: 2004
President, Treasurer, and Anti Money Laundering (AML) officer of Fidelity Nasdaq Composite Index Tracking Stock. Ms. Reynolds also serves as President, Treasurer, and AML officer of other Fidelity funds (2004) and is a Vice President (2003) and an employee (2002) of FMR. Before joining Fidelity Investments, Ms. Reynolds worked at Pricewater houseCoopers LLP (PwC) (1980 2002), where she was most recently an audit partner with PwC’s investment management practice.
Year of Election or Appointment: 2005
Chief Financial Officer of Fidelity Nasdaq Composite Index Tracking Stock. Mr. Murphy also serves as Chief Financial Officer of other Fidelity funds (2005 present). He also serves as Senior Vice President of Fidelity Pricing and Cash Management Services Group (FPCMS).
Kenneth A. Rathgeber (58)
|
Year of Election or Appointment: 2004
Chief Compliance Officer of Fidelity Nasdaq Composite Index Tracking Stock. Mr. Rathgeber also serves as Chief Compliance Officer of other Fidelity funds (2004) and Executive Vice President of Risk Oversight for Fidelity Investments (2002). Previously, he served as Executive Vice Pres ident and Chief Operating Officer for Fidelity Investments Institutional Services Company, Inc. (1998 2002).
Year of Election or Appointment: 2003
Deputy Treasurer of Fidelity Nasdaq Composite Index Tracking Stock. Mr. Hebble also serves as Deputy Treasurer of other Fidelity funds (2003), and is an employee of FMR. Before joining Fidelity Investments, Mr. Hebble worked at Deutsche Asset Management where he served as Director of Fund Accounting (2002 2003) and Assistant Treasurer of the Scudder Funds (1998 2003).
Year of Election or Appointment: 2005
Deputy Treasurer of Treasurer of Fidelity Nasdaq Composite Index Tracking Stock. Mr. Mehrmann also serves as Deputy Treasurer of other Fidelity funds (2005 present) and is an employee of FMR. Previously, Mr. Mehrmann served as Vice President of Fidelity Investments Institu tional Services Group (FIIS)/Fidelity Investments Institutional Operations Corporation, Inc. (FIIOC) Client Services (1998 2004).
83 Annual Report
Trustees and Officers - continued
| | Name, Age; Principal Occupation
Kimberley H. Monasterio (41)
|
Year of Election or Appointment: 2004
Deputy Treasurer of Fidelity Nasdaq Composite Index Tracking Stock. Ms. Monasterio also serves as Deputy Treasurer of other Fidelity funds (2004) and is an employee of FMR (2004). Before joining Fidelity In vestments, Ms. Monasterio served as Treasurer (2000 2004) and Chief Financial Officer (2002 2004) of the Franklin Templeton Funds and Senior Vice President of Franklin Templeton Services, LLC (2000 2004).
Year of Election or Appointment: 2005
Deputy Treasurer of Fidelity Nasdaq Composite Index Tracking Stock. Mr. Robins also serves as Deputy Treasurer of other Fidelity funds (2005 present) and is an employee of FMR (2004 present). Before join ing Fidelity Investments, Mr. Robins worked at KPMG LLP, where he was a partner in KPMG’s department of professional practice (2002 2004) and a Senior Manager (1999 2000). In addition, Mr. Robins served as Assistant Chief Accountant, United States Securities and Exchange Commission (2000 2002).
Year of Election or Appointment: 2005
Assistant Treasurer of Fidelity Nasdaq Composite Index Tracking Stock. Mr. Byrnes also serves as Assistant Treasurer of other Fidelity funds (2005 present) and is an employee of FMR (2005 present). Previously, Mr. Byrnes served as Vice President of FPCMS (2003 2005). Before joining Fidelity Investments, Mr. Byrnes worked at Deutsche Asset Man agement where he served as Vice President of the Investment Opera tions Group (2000 2003).
Year of Election or Appointment: 2003
Assistant Treasurer of Fidelity Nasdaq Composite Index Tracking Stock. Mr. Costello also serves as Assistant Treasurer of other Fidelity funds and is an employee of FMR.
Year of Election or Appointment: 2004
Assistant Treasurer of Fidelity Nasdaq Composite Index Tracking Stock. Mr. Lydecker also serves as Assistant Treasurer of other Fidelity funds (2004) and is an employee of FMR.
Name, Age; Principal Occupation
Mark Osterheld (50)
|
Year of Election or Appointment: 2003
Assistant Treasurer of Fidelity Nasdaq Composite Index Tracking Stock. Mr. Osterheld also serves as Assistant Treasurer of other Fidelity funds (2002) and is an employee of FMR.
Year of Election or Appointment: 2005
Assistant Treasurer of Fidelity Nasdaq Composite Index Tracking Stock. Mr. Ryan also serves as Assistant Treasurer of other Fidelity funds (2005 present) and is an employee of FMR (2005 present). Previously, Mr. Ryan served as Vice President of Fund Reporting in FPCMS (1999 2005).
Year of Election or Appointment: 2005
Assistant Treasurer of Fidelity Nasdaq Composite Index Tracking Stock. Mr. Schiavone also serves as Assistant Treasurer of other Fidelity funds (2005 present) and is an employee of FMR (2005 present). Before join ing Fidelity Investments, Mr. Schiavone worked at Deutsche Asset Man agement, where he most recently served as Assistant Treasurer (2003 2005) of the Scudder Funds and Vice President and Head of Fund Reporting (1996 2003).
85 Annual Report
The Board of Trustees of Fidelity NASDAQ Composite Index Tracking Stock Fund voted to pay to shareholders of record at the opening of business on record date, the following distributions per share derived from capital gains realized from sales of portfolio securities, and dividends derived from net investment income:
| Pay Date | | Record Date | | Dividends | | Capital Gains |
| 12/19/05 | | 12/16/05 | | $0.07 | | $0.50 |
The fund hereby designates as capital gain dividends: For dividends with respect to the taxable year ended November 30, 2005, $907,050 or, if subsequently determined to be different, the net capital gain of such year, and for dividends with respect to the taxable year ended November 30, 2004, $0 or, if subsequently determined to be different, the excess of: (a) the net capital gain of such year, over (b) amounts previously designated as capital gain dividends with respect to such year.
The fund designates 100% of the dividends distributed during the fiscal year as qualifying for the dividends received deduction for corporate shareholders.
The fund designates 100% of the dividends distributed during the fiscal year as amounts which may be taken into account as a dividend for the purposes of the maximum rate under section 1(h)(11) of the Internal Revenue Code.
The fund will notify shareholders in January 2006 of amounts for use in preparing 2005 income tax returns.
Proxy Voting Results
A special meeting of the fund’s shareholders was held on November 16, 2005. The results of votes taken among shareholders on proposals before them are reported below. Each vote reported represents one dollar of net asset value held on the record date for the meeting.
| PROPOSAL 1 | | |
| To elect a Board of Trustees.A | | |
| | | # of | | % of |
| | | Votes | | Votes |
| |
| Dennis J. Dirks | | |
| Affirmative | | 18,240,248,322.53 | | 96.150 |
| Withheld | | 730,313,302.58 | | 3.850 |
| TOTAL | | 18,970,561,625.11 | | 100.000 |
| Albert R. Gamper, Jr.B | | |
| Affirmative | | 18,204,838,072.06 | | 95.964 |
| Withheld | | 765,723,553.05 | | 4.036 |
| TOTAL | | 18,970,561,625.11 | | 100.000 |
| Robert M. Gates | | |
| Affirmative | | 18,191,748,681.13 | | 95.895 |
| Withheld | | 778,812,943.98 | | 4.105 |
| TOTAL | | 18,970,561,625.11 | | 100.000 |
| George H. Heilmeier | | |
| Affirmative | | 18,193,638,757.60 | | 95.905 |
| Withheld | | 776,922,867.51 | | 4.095 |
| TOTAL | | 18,970,561,625.11 | | 100.000 |
| Abigail P. Johnson | | |
| Affirmative | | 18,103,320,241.78 | | 95.428 |
| Withheld | | 867,241,383.33 | | 4.572 |
| TOTAL | | 18,970,561,625.11 | | 100.000 |
| Edward C. Johnson 3d | | |
| Affirmative | | 18,055,585,171.13 | | 95.177 |
| Withheld | | 914,976,453.98 | | 4.823 |
| TOTAL | | 18,970,561,625.11 | | 100.000 |
| Stephen P. Jonas | | |
| Affirmative | | 18,188,419,716.35 | | 95.877 |
| Withheld | | 782,141,908.76 | | 4.123 |
| TOTAL | | 18,970,561,625.11 | | 100.000 |
| Marie L. Knowles | | |
| Affirmative | | 18,208,650,664.29 | | 95.984 |
| Withheld | | 761,910,960.82 | | 4.016 |
| TOTAL | | 18,970,561,625.11 | | 100.000 |
| | | # of | | % of |
| | | Votes | | Votes |
| |
| Ned C. Lautenbach | | |
| Affirmative | | 18,224,936,039.64 | | 96.070 |
| Withheld | | 745,625,585.47 | | 3.930 |
| TOTAL | | 18,970,561,625.11 | | 100.000 |
| |
| Marvin L. Mann | | |
| Affirmative | | 18,146,216,753.93 | | 95.655 |
| Withheld | | 824,344,871.18 | | 4.345 |
| TOTAL | | 18,970,561,625.11 | | 100.000 |
| |
| William O. McCoy | | |
| Affirmative | | 18,164,580,135.79 | | 95.751 |
| Withheld | | 805,981,489.32 | | 4.249 |
| TOTAL | | 18,970,561,625.11 | | 100.000 |
| |
| Robert L. Reynolds | | |
| Affirmative | | 18,197,448,372.22 | | 95.925 |
| Withheld | | 773,113,252.89 | | 4.075 |
| TOTAL | | 18,970,561,625.11 | | 100.000 |
| |
| Cornelia M. Small | | |
| Affirmative | | 18,214,122,413.76 | | 96.013 |
| Withheld | | 756,439,211.35 | | 3.987 |
| TOTAL | | 18,970,561,625.11 | | 100.000 |
| |
| William S. Stavropoulos | | |
| Affirmative | | 18,186,563,509.46 | | 95.867 |
| Withheld | | 783,998,115.65 | | 4.133 |
| TOTAL | | 18,970,561,625.11 | | 100.000 |
| |
| Kenneth L. Wolfe | | |
| Affirmative | | 18,211,332,412.92 | | 95.998 |
| Withheld | | 759,229,212.19 | | 4.002 |
| TOTAL | | 18,970,561,625.11 | | 100.000 |
A Denotes trust-wide proposals and voting results.
B Effective on or about January 1, 2006.
|
87 Annual Report
Board Approval of Investment Advisory Contracts and Management Fees
Nasdaq Composite Index Tracking Stock
Each year, typically in July, the Board of Trustees, including the independent Trustees (together, the Board), votes on the renewal of the management contract and sub advisory agreements (together, the Advisory Contracts) for the fund. The Board, assisted by the advice of fund counsel and independent Trustees’ counsel, requests and considers a broad range of information throughout the year.
The Board meets regularly each month except August and takes into account throughout the year matters bearing on Advisory Contracts. The Board, acting directly and through its separate committees, considers at each of its meetings factors that are relevant to the annual renewal of the fund’s Advisory Contracts, including the services and support provided to the fund and its shareholders by Fidelity. At the time of the renewal, the Board had 11 standing committees, each composed of independent Trustees with varying backgrounds, to which the Board has assigned specific subject matter responsibilities in order to enhance effective decision making by the Board. Each committee has adopted a written charter outlining the structure and purposes of the committee. One such com mittee, the Equity Contract Committee, meets periodically during the first six months of each year and as necessary to consider matters specifically related to the annual renewal of Advisory Contracts. The committee requests and receives information on, and makes recommendations to the independent Trustees concerning, the approval and annual review of the Advisory Contracts.
At its July 2005 meeting, the Board of Trustees, including the independent Trustees, unanimously determined to renew the Advisory Contracts for the fund. In reaching its determination, the Board considered all factors it believed relevant, including (1) the nature, extent, and quality of the services to be provided to the fund and its shareholders by Fidelity (including the investment performance of the fund); (2) the competitiveness of the management fee and total expenses of the fund; (3) the total costs of the services to be provided by and the profits to be realized by the investment adviser and its affiliates from the relationship with the fund; (4) the extent to which economies of scale would be realized as the fund grows; and (5) whether fee levels reflect these economies of scale, if any, for the benefit of fund shareholders.
In determining whether to renew the Advisory Contracts for the fund, the Board ulti mately reached a determination, with the assistance of fund counsel and independent Trustees’ counsel, that the renewal of the Advisory Contracts and the compensation to be received by Fidelity under the management contract is consistent with Fidelity’s fidu ciary duty under applicable law. In addition to evaluating the specific factors noted above, the Board, in reaching its determination, is aware that shareholders in the fund have a broad range of investment choices available to them, including a wide choice among mutual funds offered by competitors to Fidelity, and that the fund’s shareholders, with the opportunity to review and weigh the disclosure provided by the fund in its
prospectus and other public disclosures, have chosen to invest in this fund, managed by Fidelity.
Nature, Extent, and Quality of Services Provided by Fidelity. The Board consid ered staffing within the investment adviser, FMR, and the sub advisers (together, the Investment Advisers), including the background of the fund’s portfolio manager and the fund’s investment objective and discipline. The independent Trustees also had discus sions with senior management of Fidelity’s investment operations and investment groups. The Board considered the structure of the portfolio manager compensation program and whether this structure provides appropriate incentives.
Fidelity Resources Dedicated to Investment Management and Support Services. The Board reviewed the size, education, and experience of the Investment Advisers’ invest ment staff, their use of technology, and the Investment Advisers’ approach to recruiting, training, and retaining portfolio managers and other research, advisory, and manage ment personnel.
Shareholder and Administrative Services. The Board considered the nature, extent, quality, and cost of administrative, distribution, and shareholder services performed by the Investment Advisers and their affiliates under the Advisory Contracts and under separate agreements covering pricing and bookkeeping and securities lending services for the fund. The Board also considered the nature and extent of the Investment Advis ers’ supervision of third party service providers, principally transfer agents, custodians, and subcustodians. The Board reviewed the allocation of fund brokerage, including allocations to brokers affiliated with the Investment Advisers. The Board also considered the resources devoted to, and the record of compliance with, the fund’s compliance policies and procedures.
The Board noted that the growth of fund assets across the complex allows Fidelity to reinvest in the development of services designed to enhance the value or convenience of the Fidelity funds as investment vehicles. These services include 24 hour access to account information and market information through phone representatives and over the Internet, and investor education materials and asset allocation tools.
Investment in a Large Fund Family. The Board considered the benefits to shareholders of investing in a Fidelity fund, including the benefits of investing in a fund that is part of a large family of funds offering a variety of investment disciplines and providing for a large variety of mutual fund investor services. The Board noted that, since the last Advisory Contract renewals in July 2004, Fidelity has taken a number of actions that benefited particular funds, including (i) voluntarily deciding in 2004 to stop using “soft” commis sion dollars to pay for market data and, instead, to pay for that data out of its own resources, (ii) contractually agreeing to impose management fee reductions and expense limitations on its five Spartan stock index funds and its stock index fund available through variable insurance products, (iii) contractually agreeing to eliminate
89 Annual Report
Board Approval of Investment Advisory Contracts and Management Fees continued
the management fees on the Fidelity Freedom Funds and the Fidelity Advisor Freedom Funds, (iv) contractually agreeing to reduce the management fees on most of its investment grade taxable bond funds, and (v) contractually agreeing to impose expense limitations on its retail and Spartan investment grade taxable bond funds.
Investment Performance. The Board considered whether the fund has operated within its investment objective, as well as its record of compliance with its investment restric tions. It also reviewed the fund’s absolute investment performance, as well as the fund’s relative investment performance measured against (i) a broad based securities market index, and (ii) a peer group of mutual funds over multiple periods. Because the fund had been in existence less than three calendar years, the following chart considered by the Board shows, for the one year period ended December 31, 2004, the fund’s return, the return of a broad based securities market index (“benchmark”), and a range of returns of a peer group of mutual funds identified by Lipper Inc. as having an investment objective similar to that of the fund. The box within the chart shows the 25th percentile return (bottom of box) and the 75th percentile return (top of box) of the Lipper peer group. Returns shown above the box are in the first quartile and returns shown below the box are in the fourth quartile. The percentage beaten number noted below the chart corre sponds to the percentile box and represents the percentage of funds in the Lipper peer group whose performance was equal to or lower than that of the fund.
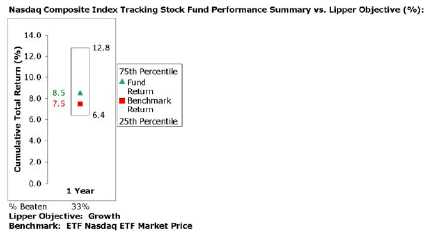
The Board reviewed the fund’s relative investment performance against its Lipper peer group and stated that the performance of the fund was in the third quartile for the one year period. The Board noted that FMR does not consider that Lipper peer group to be a meaningful comparison for the fund, however, because the peer group includes funds with broader investment mandates than tracking the performance of the Nasdaq
Composite Index. The Board also stated that the relative investment performance of the fund compared favorably to its benchmark for the one year period. The Board stated that it is difficult to evaluate in any comprehensive fashion the performance of the fund, in light of its relatively recent launch.
Based on its review, and giving particular weight to the nature and quality of the resources dedicated by the Investment Advisers to maintain and improve relative performance, the Board concluded that the nature, extent, and quality of the services provided by Fidelity will benefit the fund’s shareholders, particularly in light of the Board’s view that the fund’s shareholders benefit from investing in a fund that is part of a large family of funds offering a variety of investment disciplines and services.
Competitiveness of Management Fee and Total Fund Expenses. The Board considered the fund’s management fee and total expenses compared to “mapped groups” of competitive funds and classes. Fidelity creates “mapped groups” by combining similar Lipper investment objective categories that have comparable management fee charac teristics. Combining Lipper investment objective categories aids the Board’s manage ment fee and total expense comparisons by broadening the competitive group used for comparison and by reducing the number of universes to which various Fidelity funds are compared.
The Board considered two proprietary management fee comparisons for the 12 month (or shorter) periods shown in the chart below. The group of Lipper funds used by the Board for management fee comparisons is referred to below as the “Total Mapped Group” and, for the reasons explained above, is broader than the Lipper peer group used by the Board for performance comparisons. The Total Mapped Group comparison focuses on a fund’s standing relative to the total universe of comparable funds available to investors, in terms of gross management fees before expense reimbursements or caps. “TMG %” represents the percentage of funds in the Total Mapped Group that had management fees that were lower than the fund’s. For example, a TMG % of 38% means that 62% of the funds in the Total Mapped Group had higher management fees than the fund. The “Asset Size Peer Group” (ASPG) comparison focuses on a fund’s standing relative to non Fidelity funds similar in size to the fund within the Total Mapped Group. The ASPG represents at least 15% of the funds in the Total Mapped Group with comparable asset size and management fee characteristics, subject to a minimum of 50 funds (or all funds in the Total Mapped Group if fewer than 50). Additional information, such as the ASPG quartile (“quadrant”) in which the fund’s management fee ranked, is also included in the chart and considered by the Board.
91 Annual Report
Board Approval of Investment Advisory Contracts and Management Fees continued
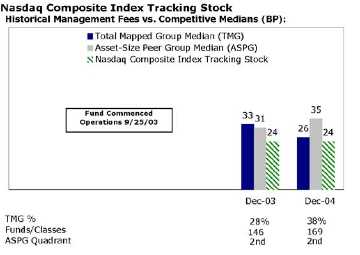
The Board noted that the fund’s management fee ranked below the median of its Total Mapped Group and below the median of its ASPG for 2004.
Based on its review, the Board concluded that the fund’s management fee was fair and reasonable in light of the services that the fund receives and the other factors considered.
In its review of the fund’s total expenses, the Board considered the fund’s management fee as well as other fund expenses, such as transfer agent fees, pricing and bookkeeping fees, fund paid 12b 1 fees, and custodial, legal, and audit fees. The Board also noted the effects of any waivers and reimbursements on fees and expenses. As part of its review, the Board also considered current and historical total expenses of the fund compared to competitive fund median expenses. The fund is compared to those funds and classes in the Total Mapped Group (used by the Board for management fee comparisons) that have a similar sales load structure.
The Board noted that the fund’s total expenses ranked below its competitive median for 2004.
In its review of total expenses, the Board also considered Fidelity fee structures and other information on clients that FMR and its affiliates service in other competitive markets, such as other mutual funds advised or subadvised by FMR or its affiliates, pension plan clients, and other institutional clients.
Based on its review, the Board concluded that the fund’s total expenses were reasonable in light of the services that the fund and its shareholders receive and the other factors considered.
Costs of the Services and Profitability. The Board considered the revenues earned and the expenses incurred by Fidelity in conducting the business of developing, market ing, distributing, managing, administering and servicing the fund and its shareholders. The Board also considered the level of Fidelity’s profits in respect of all the Fidelity funds.
On an annual basis, FMR presents to the Board Fidelity’s profitability for the fund. Fidelity calculates the profitability for each fund, as well as aggregate profitability for groups of Fidelity funds and all Fidelity funds, using a series of detailed revenue and cost allocation methodologies which originate with the audited books and records of Fidelity. The Audit Committee of the Board reviews any significant changes from the prior year’s methodologies.
PricewaterhouseCoopers LLP (PwC), independent registered accounting firm and auditor to Fidelity and certain Fidelity funds, has been engaged annually by the Board as part of the Board’s assessment of the results of Fidelity’s profitability analysis. PwC’s engagement includes the review and assessment of Fidelity’s methodologies used in determining the revenues and expenses attributable to Fidelity’s mutual fund business, and completion of agreed upon procedures surrounding the mathematical accuracy of fund profitability and its conformity to allocation methodologies. After considering PwC’s reports issued under the engagement and information provided by Fidelity, the Board believes that while other allocation methods may also be reasonable, Fidelity’s profitabil ity methodologies are reasonable in all material respects.
The Board has also reviewed Fidelity’s non fund businesses and any fall out benefits related to the mutual fund business as well as cases where Fidelity’s affiliates may benefit from or be related to the fund’s business. In addition, a special committee of the Board reviewed services provided to Fidelity by its affiliates and determined that the fees that Fidelity paid for such services were reasonable.
The Board considered the costs of the services provided by and the profits realized by Fidelity in connection with the operation of the fund and determined that the amount of profit is a fair entrepreneurial profit for the management of the fund.
Economies of Scale. The Board considered whether there have been economies of scale in respect of the management of the Fidelity funds, whether the Fidelity funds (including the fund) have appropriately benefited from any such economies of scale, and whether there is potential for realization of any further economies of scale. The Board considered the extent to which the fund will benefit from economies of scale through increased services to the fund, through waivers or reimbursements, or through fee or expense reductions. The Board concluded that any potential economies of scale are being shared between fund shareholders and Fidelity in an appropriate manner.
93 Annual Report
Board Approval of Investment Advisory Contracts and Management Fees continued
Additional Information Requested by the Board. In order to develop fully the factual basis for consideration of the Advisory Contracts, the Board requested additional information regarding (i) equity fund transfer agency fees; (ii) Fidelity’s fund profitability methodology and the impact of various changes in the methodology over time; (iii) benefits to shareholders from economies of scale; (iv) composition and characteristics of various fund and industry data used in comparisons; and (v) com pensation of portfolio managers and research analysts.
Based on its evaluation of all of the conclusions noted above, and after considering all material factors, the Board ultimately concluded that the existing advisory fee structures are fair and reasonable, and that the fund’s existing Advisory Contracts should be renewed.
Managing Your Investments
Fidelity offers several ways to conveniently manage your personal investments via your telephone or PC. You can access your account information, conduct trades and research your investments 24 hours a day.
By Phone
Fidelity Automated Service Telephone provides a single toll free number to access account balances, positions, quotes and trading. It’s easy to navigate the service, and on your first call, the system will help you create a personal identification number (PIN) for security.


By PC
Fidelity’s web site on the Internet provides a wide range of information, including daily financial news, fund performance, interactive planning tools and news about Fidelity products and services.

* When you call the quotes line, please remember that a fund’s yield and return will vary and, except for money market funds, share price will also vary. This means that you may have a gain or loss when you sell your shares. There is no assurance that money market funds will be able to maintain a stable $1 share price; an investment in a money market fund is not insured or guar anteed by the U.S. government. Total returns are historical and include changes in share price, reinvestment of dividends and capital gains, and the effects of any sales charges.
95 Annual Report
Investment Adviser
Fidelity Management & Research Company
Boston, MA
Investment Sub Advisers
FMR Co., Inc.
Geode Capital Management, LLC
General Distributor
Fidelity Distributors Corporation
Boston, MA
Transfer and Service Agents
JPMorgan Chase Bank
New York, NY
Fidelity Service Company, Inc.
Boston, MA
Custodian
JPMorgan Chase Bank
New York, NY
The Fidelity Telephone Connection
1 800 FIDELITY
|
ETF UANN-0106
1.795568.102
|

Item 2. Code of Ethics
As of the end of the period, November 30, 2005, Fidelity Commonwealth Trust (the trust) has adopted a code of ethics, as defined in Item 2 of Form N-CSR, that applies to its President and Treasurer and its Chief Financial Officer. A copy of the code of ethics is filed as an exhibit to this Form N-CSR.
Item 3. Audit Committee Financial Expert
The Board of Trustees of the trust has determined that Marie L. Knowles is an audit committee financial expert, as defined in Item 3 of Form N-CSR. Ms. Knowles is independent for purposes of Item 3 of Form N-CSR.
Item 4. Principal Accountant Fees and Services
(a) Audit Fees.
For the fiscal years ended November 30, 2005 and November 30, 2004, the aggregate Audit Fees billed by PricewaterhouseCoopers LLP (PwC) for professional services rendered for the audits of the financial statements, or services that are normally provided in connection with statutory and regulatory filings or engagements for those fiscal years, for Fidelity Nasdaq Composite Index Tracking Fund (the fund) and for all funds in the Fidelity Group of Funds are shown in the table below.
Fund | 2005A | 2004A |
Fidelity Nasdaq Composite Index Tracking Fund | $62,000 | $50,000 |
All funds in the Fidelity Group of Funds audited by PwC | $12,100,000 | $10,600,000 |
A | Aggregate amounts may reflect rounding. |
For the fiscal years ended November 30, 2005 and November 30, 2004, the aggregate Audit Fees billed by Deloitte & Touche LLP, the member firms of Deloitte Touche Tohmatsu, and their respective affiliates (collectively, "Deloitte Entities") for professional services rendered for the audits of the financial statements, or services that are normally provided in connection with statutory and regulatory filings or engagements for those fiscal years, for Fidelity Nasdaq Composite Index Fund (the fund) and for all funds in the Fidelity Group of Funds are shown in the table below.
Fund | 2005A | 2004A |
Fidelity Nasdaq Composite Index Fund | $33,000 | $31,000 |
All funds in the Fidelity Group of Funds audited by Deloitte Entities | $5,400,000 | $4,400,000 |
A | Aggregate amounts may reflect rounding. |
(b) Audit-Related Fees.
In each of the fiscal years ended November 30, 2005 and November 30, 2004, the aggregate Audit-Related Fees billed by PwC for services rendered for assurance and related services to the fund that are reasonably related to the performance of the audit or review of the fund's financial statements, but not reported as Audit Fees, are shown in the table below.
Fund | 2005A | 2004 A |
Fidelity Nasdaq Composite Index Tracking Fund | $0 | $0 |
A | Aggregate amounts may reflect rounding. |
In each of the fiscal years ended November 30, 2005 and November 30, 2004, the aggregate Audit-Related Fees billed by Deloitte Entities for services rendered for assurance and related services to the fund that are reasonably related to the performance of the audit or review of the fund's financial statements, but not reported as Audit Fees, are shown in the table below.
Fund | 2005A | 2004 A |
Fidelity Nasdaq Composite Index Fund | $0 | $0 |
A | Aggregate amounts may reflect rounding. |
In each of the fiscal years ended November 30, 2005 and November 30, 2004, the aggregate Audit-Related Fees that were billed by PwC and Deloitte Entities that were required to be approved by the Audit Committee for services rendered on behalf of Fidelity Management & Research Company (FMR) and entities controlling, controlled by, or under common control with FMR (not including any sub-adviser whose role is primarily portfolio management and is subcontracted with or overseen by another investment adviser) that provide ongoing services to the funds ("Fund Service Providers") for assurance and related services that relate directly to the operations and financial reporting of each fund that are reasonably related to the performance of the audit or review of the fund's financial statements, but not reported as Audit Fees, are shown in the table below.
Billed By | 2005 A | 2004A |
PwC | $0 | $0 |
Deloitte Entities | $0 | $0 |
A | Aggregate amounts may reflect rounding. |
Fees included in the audit-related category comprise assurance and related services (e.g., due diligence services) that are traditionally performed by the independent registered public accounting firm. These audit-related services include due diligence related to mergers and acquisitions, accounting consultations and audits in connection with acquisitions, internal control reviews, attest services that are not required by statute or regulation and consultation concerning financial accounting and reporting standards.
(c) Tax Fees.
In each of the fiscal years ended November 30, 2005 and November 30, 2004, the aggregate Tax Fees billed by PwC for professional services rendered for tax compliance, tax advice, and tax planning for the fund is shown in the table below.
Fund | 2005A | 2004A |
Fidelity Nasdaq Composite Index Tracking Fund | $2,500 | $2,200 |
A | Aggregate amounts may reflect rounding. |
In each of the fiscal years ended November 30, 2005 and November 30, 2004, the aggregate Tax Fees billed by Deloitte Entities for professional services rendered for tax compliance, tax advice, and tax planning for the fund is shown in the table below.
Fund | 2005A | 2004A |
Fidelity Nasdaq Composite Index Fund | $3,900 | $3,900 |
A | Aggregate amounts may reflect rounding. |
In each of the fiscal years ended November 30, 2005 and November 30, 2004, the aggregate Tax Fees billed by PwC and Deloitte Entities that were required to be approved by the Audit Committee for professional services rendered on behalf of the Fund Service Providers for tax compliance, tax advice, and tax planning that relate directly to the operations and financial reporting of each fund is shown in the table below.
Billed By | 2005A | 2004A |
PwC | $0 | $0 |
Deloitte Entities | $0 | $0 |
A | Aggregate amounts may reflect rounding. |
Fees included in the Tax Fees category comprise all services performed by professional staff in the independent registered public accounting firm's tax division except those services related to the audit. Typically, this category would include fees for tax compliance, tax planning, and tax advice. Tax compliance, tax advice, and tax planning services include preparation of original and amended tax returns, claims for refund and tax payment-planning services, assistance with tax audits and appeals, tax advice related to mergers and acquisitions and requests for rulings or technical advice from taxing authorities.
(d) All Other Fees.
In each of the fiscal years ended November 30, 2005 and November 30, 2004, the aggregate Other Fees billed by PwC for all other non-audit services rendered to the fund is shown in the table below.
Fund | 2005A | 2004A |
Fidelity Nasdaq Composite Index Tracking Fund | $1,000 | $1,000 |
A | Aggregate amounts may reflect rounding. |
In each of the fiscal years ended November 30, 2005 and November 30, 2004, the aggregate Other Fees billed by Deloitte Entities for all other non-audit services rendered to the fund is shown in the table below.
Fund | 2005A | 2004A |
Fidelity Nasdaq Composite Index Fund | $0 | $0 |
A | Aggregate amounts may reflect rounding. |
In each of the fiscal years ended November 30, 2005 and November 30, 2004, the aggregate Other Fees billed by PwC and Deloitte Entities that were required to be approved by the Audit Committee for all other non-audit services rendered on behalf of the Fund Service Providers that relate directly to the operations and financial reporting of each fund is shown in the table below.
Billed By | 2005A | 2004A |
PwC | $170,000 | $540,000 |
Deloitte Entities | $160,000 | $850,000 |
A | Aggregate amounts may reflect rounding. |
Fees included in the All Other Fees category include services related to internal control reviews, strategy and other consulting, financial information systems design and implementation, consulting on other information systems, and other tax services unrelated to the fund.
(e) (1) | Audit Committee Pre-Approval Policies and Procedures: |
The trust's Audit Committee must pre-approve all audit and non-audit services provided by the independent registered public accounting firm relating to the operations or financial reporting of the funds. Prior to the commencement of any audit or non-audit services to a fund, the Audit Committee reviews the services to determine whether they are appropriate and permissible under applicable law.
The trust's Audit Committee has adopted policies and procedures to, among other purposes, provide a framework for the Committee's consideration of non-audit services by the audit firms that audit the Fidelity funds. The policies and procedures require that any non-audit service provided by a fund audit firm to a Fidelity Fund and any non-audit service provided by a fund auditor to a Fund Service Provider that relates directly to the operations and financial reporting of a Fidelity fund (Covered Service) are subject to approval by the Audit Committee before such service is provided. Non-audit services provided by a fund audit firm for a Fund Service Provider that do not relate directly to the operations and financial reporting of a Fidelity fund (Non-Covered Service) but that are expected to exceed $50,000 are also subject to pre-approval by the Audit Committee.
All Covered Services, as well as Non-Covered Services that are expected to exceed $50,000, must be approved in advance of provision of the service either: (i) by formal resolution of the Audit Committee, or (ii) by oral or written approval of the service by the Chair of the Audit Committee (or if the Chair is unavailable, such other member of the Audit Committee as may be designated by the Chair to act in the Chair's absence). The approval contemplated by (ii) above is permitted where the Treasurer determines that action on such an engagement is necessary before the next meeting of the Audit Committee. Neither pre-approval nor advance notice of Non-Covered Service engagements for which fees are not expected to exceed $50,000 is required; such engagements are to be reported to the Audit Committee monthly.
(e) (2) | Services approved pursuant to paragraph (c)(7)(i)(C) of Rule 2-01 of Regulation S-X: |
Audit-Related Fees:
There were no amounts that were approved by the Audit Committee pursuant to the de minimis exception for the fiscal years ended November 30, 2005 and November 30, 2004 on behalf of each fund.
There were no amounts that were required to be approved by the Audit Committee pursuant to the de minimis exception for the fiscal years ended November 30, 2005 and November 30, 2004 on behalf of the Fund Service Providers that relate directly to the operations and financial reporting of each fund.
Tax Fees:
There were no amounts that were approved by the Audit Committee pursuant to the de minimis exception for the fiscal years ended November 30, 2005 and November 30, 2004 on behalf of each fund.
There were no amounts that were required to be approved by the Audit Committee pursuant to the de minimis exception for the fiscal years ended November 30, 2005 and November 30, 2004 on behalf of the Fund Service Providers that relate directly to the operations and financial reporting of each fund.
All Other Fees:
There were no amounts that were approved by the Audit Committee pursuant to the de minimis exception for the fiscal years ended November 30, 2005 and November 30, 2004 on behalf of each fund.
There were no amounts that were required to be approved by the Audit Committee pursuant to the de minimis exception for the fiscal years ended November 30, 2005 and November 30, 2004 on behalf of the Fund Service Providers that relate directly to the operations and financial reporting of each fund.
(f) Not applicable.
(g) For the fiscal years ended November 30, 2005 and November 30, 2004, the aggregate fees billed by PwC of $3,650,000A and $2,700,000A for non-audit services rendered on behalf of the funds, FMR (not including any sub-adviser whose role is primarily portfolio management and is subcontracted with or overseen by another investment adviser) and Fund Service Providers relating to Covered Services and Non-Covered Services are shown in the table below.
| 2005A | 2004A |
Covered Services | $150,000 | $550,000 |
Non-Covered Services | $3,500,000 | $2,150,000 |
A | Aggregate amounts may reflect rounding. |
For the fiscal years ended November 30, 2005 and November 30, 2004, the aggregate fees billed by Deloitte Entities of $400,000A and $1,600,000A for non-audit services rendered on behalf of the fund, FMR (not including any sub-adviser whose role is primarily portfolio management and is subcontracted with or overseen by another investment adviser) and Fund Service Providers relating to Covered Services and Non-Covered Services are shown in the table below.
| 2005A | 2004A |
Covered Services | $150,000 | $850,000 |
Non-Covered Services | $250,000 | $750,000 |
A | Aggregate amounts may reflect rounding. |
(h) The trust's Audit Committee has considered Non-Covered Services that were not pre-approved that were provided by PwC and Deloitte Entities to Fund Service Providers to be compatible with maintaining the independence of PwC and Deloitte Entities in their audit of the funds, taking into account representations from PwC and Deloitte Entities, in accordance with Independence Standards Board Standard No.1, regarding their independence from the funds and their related entities.
Item 5. Audit Committee of Listed Registrants
Fidelity Commonwealth Trust: Fidelity Nasdaq Composite Index Tracking Stock:
The Board of Trustees of Fidelity Commonwealth Trust: Fidelity Nasdaq Composite Index Tracking Stock has established a separately-designated standing audit committee in accordance with Section 3(a)(58)(A) of the Securities Exchange Act of 1934. As of November 30, 2005, the members of the audit committee were Marie L. Knowles, Robert M. Gates, George H. Heilmeier, William O. McCoy, and Kenneth L. Wolfe. Effective January 2006, the members of the audit committee are Marie L. Knowles, Albert R. Gamper, Jr., George H. Heilmeier, William O. McCoy, and Kenneth L. Wolfe.
Fidelity Commonwealth Trust: Fidelity Nasdaq Composite Index Fund:
Not applicable.
Item 6. Schedule of Investments
Not applicable.
Item 7. Disclosure of Proxy Voting Policies and Procedures for Closed-End Management Investment Companies
Not applicable.
Item 8. Portfolio Managers of Closed-End Management Investment Companies
Not applicable.
Item 9. Purchase of Equity Securities by Closed-End Management Investment Company and Affiliated Purchasers
Not applicable.
Item 10. Submission of Matters to a Vote of Security Holders
There were no material changes to the procedures by which shareholders may recommend nominees to the trust's Board of Trustees.
Item 11. Controls and Procedures
(a)(i) The President and Treasurer and the Chief Financial Officer have concluded that the trust's disclosure controls and procedures (as defined in Rule 30a-3(c) under the Investment Company Act) provide reasonable assurances that material information relating to the trust is made known to them by the appropriate persons, based on their evaluation of these controls and procedures as of a date within 90 days of the filing date of this report.
(a)(ii) There was no change in the trust's internal control over financial reporting (as defined in Rule 30a-3(d) under the Investment Company Act) that occurred during the second fiscal quarter of the period covered by this report that has materially affected, or is reasonably likely to materially affect, the trust's internal control over financial reporting.
Item 12. Exhibits
(a) | (1) | Code of Ethics pursuant to Item 2 of Form N-CSR is filed and attached hereto as EX-99.CODE ETH. |
(a) | (2) | Certification pursuant to Rule 30a-2(a) under the Investment Company Act of 1940 (17 CFR 270.30a-2(a)) is filed and attached hereto as Exhibit 99.CERT. |
(a) | (3) | Not applicable. |
(b) | | Certification pursuant to Rule 30a-2(b) under the Investment Company Act of 1940 (17 CFR 270.30a-2(b)) is furnished and attached hereto as Exhibit 99.906CERT. |
SIGNATURES
Pursuant to the requirements of the Securities Exchange Act of 1934 and the Investment Company Act of 1940, the registrant has duly caused this report to be signed on its behalf by the undersigned, thereunto duly authorized.
Fidelity Commonwealth Trust
By: | /s/Christine Reynolds |
| Christine Reynolds |
| President and Treasurer |
| |
Date: | January 20, 2006 |
Pursuant to the requirements of the Securities Exchange Act of 1934 and the Investment Company Act of 1940, this report has been signed below by the following persons on behalf of the registrant and in the capacities and on the dates indicated.
By: | /s/Christine Reynolds |
| Christine Reynolds |
| President and Treasurer |
| |
Date: | January 20, 2006 |
By: | /s/Paul M. Murphy |
| Paul M. Murphy |
| Chief Financial Officer |
| |
Date: | January 20, 2006 |