UNITED STATES
SECURITIES AND EXCHANGE COMMISSION
Washington, D.C. 20549
FORM N-CSR
CERTIFIED SHAREHOLDER REPORT OF REGISTERED
MANAGEMENT INVESTMENT COMPANIES
Investment Company Act file number 811-2546
Fidelity Commonwealth Trust
(Exact name of registrant as specified in charter)
82 Devonshire St., Boston, Massachusetts 02109
(Address of principal executive offices) (Zip code)
Eric D. Roiter, Secretary
82 Devonshire St.
Boston, Massachusetts 02109
(Name and address of agent for service)
Registrant's telephone number, including area code: 617-563-7000
Date of fiscal year end: | April 30 |
| |
Date of reporting period: | April 30, 2006 |
Item 1. Reports to Stockholders
| | Fidelity®
Intermediate Bond
Fund
|
Annual Report
April 30, 2006
|


| Contents | | | | |
| |
| Chairman’s Message | | 4 | | Ned Johnson’s message to shareholders. |
| Performance | | 5 | | How the fund has done over time. |
| Management’s Discussion | | 6 | | The manager’s review of fund |
| | | | | performance, strategy and outlook. |
| Shareholder Expense | | 7 | | An example of shareholder expenses. |
| Example | | | | |
| Investment Changes | | 9 | | A summary of major shifts in the fund’s |
| | | | | investments over the past six months |
| | | | | and one year. |
| Investments | | 10 | | A complete list of the fund’s investments |
| | | | | with their market values. |
| Financial Statements | | 43 | | Statements of assets and liabilities, |
| | | | | operations, and changes in net assets, |
| | | | | as well as financial highlights. |
| Notes | | 47 | | Notes to the financial statements. |
| Report of Independent | | 55 | | |
| Registered Public | | | | |
| Accounting Firm | | | | |
| Trustees and Officers | | 56 | | |
| Distributions | | 67 | | |
| Proxy Voting Results | | 68 | | |
| Board Approval of | | 69 | | |
| Investment Advisory | | | | |
| Contracts and | | | | |
| Management Fees | | | | |
To view a fund’s proxy voting guidelines and proxy voting record for the 12 month period ended
June 30, visit www.fidelity.com/proxyvotingresults or visit the Securities and Exchange Commis
sion’s (SEC) web site at www.sec.gov. You may also call 1-800-544-8544 to request a free copy of
the proxy voting guidelines.
Standard & Poor’s, S&P and S&P 500 are registered service marks of The McGraw Hill Companies, Inc.
and have been licensed for use by Fidelity Distributors Corporation.
Other third party marks appearing herein are the property of their respective owners.
All other marks appearing herein are registered or unregistered trademarks or service marks
of FMR Corp. or an affiliated company.
|
This report and the financial statements contained herein are submitted for the general information
of the shareholders of the fund. This report is not authorized for distribution to prospective investors
in the fund unless preceded or accompanied by an effective prospectus.
A fund files its complete schedule of portfolio holdings with the SEC for the first and third
quarters of each fiscal year on Form N Q. Forms N Q are available on the SEC’s web site at
http://www.sec.gov. A fund’s Forms N Q may be reviewed and copied at the SEC’s Public Refer
ence Room in Washington, DC. Information regarding the operation of the SEC’s Public Reference
Room may be obtained by calling 1-800-SEC-0330. For a complete list of a fund’s portfolio
holdings, view the most recent quarterly holdings report, semiannual report, or annual report
on Fidelity’s web site at http://www.fidelity.com/holdings.
NOT FDIC INSURED · MAY LOSE VALUE · NO BANK GUARANTEE
Neither the fund nor Fidelity Distributors Corporation is a bank.
|
3 Annual Report
Chairman’s Message
(photograph of Edward C. Johnson 3d)
Dear Shareholder:
Although many securities markets made gains in early 2006, there is only one certainty when it comes to investing: There is no sure thing. There are, however, a number of time tested, fundamental investment principles that can put the historical odds in your favor.
One of the basic tenets is to invest for the long term. Over time, riding out the markets’ inevitable ups and downs has proven much more effective than selling into panic or chasing the hottest trend. Even missing only a few of the markets’ best days can significantly diminish investor returns. Patience also affords the benefits of compounding of earning interest on additional income or reinvested dividends and capital gains. There are tax advantages and cost benefits to consider as well. The more you sell, the more taxes you pay, and the more you trade, the higher the costs. While staying the course doesn’t eliminate risk, it can considerably lessen the effect of short term declines.
You can further manage your investing risk through diversification. And today, more than ever, geographic diversification should be taken into account. Studies indicate that asset allocation is the single most important determinant of a portfolio’s long term success. The right mix of stocks, bonds and cash aligned to your particular risk tolerance and investment objective is very important. Age appropriate rebalancing is also an essential aspect of asset allocation. For younger investors, an emphasis on equities which historically have been the best performing asset class over time is encouraged. As investors near their specific goal, such as retirement or sending a child to college, consideration may be given to replacing volatile assets (e.g. common stocks) with more stable fixed investments (bonds or savings plans).
A third investment principle investing regularly can help lower the average cost of your purchases. Investing a certain amount of money each month or quarter helps ensure you won’t pay for all your shares at market highs. This strategy known as dollar cost averaging also reduces unconstructive “emotion” from investing, helping shareholders avoid selling weak performers just prior to an upswing, or chasing a hot performer just before a correction.
We invite you to contact us via the Internet, through our Investor Centers or over the phone. It is our privilege to provide you the information you need to make the investments that are right for you.
Sincerely,
/s/ Edward C. Johnson 3d
Edward C. Johnson 3d
Annual Report 4
Performance: The Bottom Line
Average annual total returns reflect the change in the value of an investment, assuming reinvestment of the fund’s dividend income and capital gains (the profits earned upon the sale of securities that have grown in value) and assuming a constant rate of perfor mance each year. The $10,000 table and the fund’s returns do not reflect the deduction of taxes that a shareholder would pay on fund distributions or the redemption of fund shares. During periods of reimbursement by Fidelity, a fund’s total return will be greater than it would be had the reimbursement not occurred. How a fund did yester day is no guarantee of how it will do tomorrow.
| Average Annual Total Returns | | | | | | |
| Periods ended April 30, 2006 | | Past 1 | | Past 5 | | Past 10 |
| | | year | | years | | years |
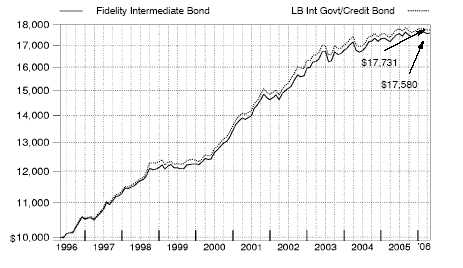
| Fidelity® Intermediate Bond Fund | | 1.36% | | 4.90% | | 5.80% |
| |
| $10,000 Over 10 Years | | | | | | |
Let’s say hypothetically that $10,000 was invested in Fidelity® Intermediate Bond Fund on April 30, 1996. The chart shows how the value of your investment would have changed, and also shows how the Lehman Brothers® Intermediate Government/Credit Bond Index performed over the same period.
Management’s Discussion of Fund Performance
Comments from Ford O’Neil, Portfolio Manager of Fidelity® Intermediate Bond Fund
The overall U.S. investment grade bond market had a modestly positive return for the year ending April 30, 2006. Citing the need to tighten monetary supply to help contain inflation, the Federal Reserve Board raised short term interest rates eight more times, hoisting the federal funds target rate to 4.75% . That marked its highest level since spring 2001, and the latest in a string of 15 consecutive increases since June 2004. The Fed’s actions contributed to a yield of more than 5.00% for the 10 year Treasury note, a threshold it last crossed in June 2002. For the 12 months overall, the Lehman Brothers® Aggregate Bond Index a measure of the taxable, investment grade bond market gained 0.71% . Among the major components of the benchmark, mortgage backed securities fared best on an absolute basis, helped by positive supply and demand dynamics. Agency bonds finished second, while corporates barely posted a positive return after coming under pressure from high profile downgrades in the automobile industry. Treasuries posted a slight loss.
During the past 12 months, Fidelity Intermediate Bond Fund returned 1.36%, while the Lehman Brothers Intermediate Government/Credit Bond Index and the LipperSM Short Intermediate Investment Grade Debt Funds Average each rose 0.98% . The biggest boost to the fund’s performance relative to the index was effective yield curve positioning, meaning how the fund’s assets were distributed across a range of maturities. The fund’s barbell strategy of emphasizing securities with both shorter and longer maturities than the index benefited performance as the yield curve flattened. Later, my decision to distribute the fund’s investments more evenly across the maturity spectrum also aided returns when longer term bond yields rose. Security selection within the corporate sector contributed to the fund’s outperformance of the index as well. The fund benefited from solid performance from most of my holdings in the group, led by gains in the transportation, electric utilities and real estate industries. In contrast, performance was hurt by holdings in some con sumer cyclical issuers, notably automobile companies, which came under severe pressure amid questions about their long term profitability and ability to compete on a global basis. On a sector basis, the fund did well by investing heavily outside the benchmark in higher yielding spread products, including asset backed securities, collateralized mortgage obligations and commercial mortgage backed securities, all of which outpaced comparable duration Treasuries.
The views expressed above reflect those of the portfolio manager(s) only through the end of the period as stated on the cover of this report and do not necessarily represent the views of Fidelity or any other person in the Fidelity organization. Any such views are subject to change at any time based upon market or other conditions and Fidelity disclaims any responsibility to update such views. These views may not be relied on as investment advice and, because investment decisions for a Fidelity fund are based on numerous factors, may not be relied on as an indication of trading intent on behalf of any Fidelity fund.
Shareholder Expense Example
As a shareholder of the Fund, you incur two types of costs: (1) transaction costs, and (2) ongoing costs, including management fees and other Fund expenses. This Example is intended to help you understand your ongoing costs (in dollars) of investing in the Fund and to compare these costs with the ongoing costs of investing in other mutual funds. The Example is based on an investment of $1,000 invested at the beginning of the period and held for the entire period (November 1, 2005 to April 30, 2006).
The first line of the table below provides information about actual account values and actual expenses. You may use the information in this line, together with the amount you invested, to estimate the expenses that you paid over the period. Simply divide your account value by $1,000.00 (for example, an $8,600 account value divided by $1,000.00 = 8.6), then multiply the result by the number in the first line under the heading entitled “Expenses Paid During Period” to estimate the expenses you paid on your account during this period. A small balance maintenance fee of $12.00 that is charged once a year may apply for certain accounts with a value of less than $2,000. This fee is not included in the table below. If it was, the estimate of expenses you paid during the period would be higher, and your ending account value lower, by this amount. In addition, the fund, as a share holder in the underlying affiliated central funds, will indirectly bear its pro rata share of the fees and expenses incurred by the underlying affiliated central funds. These fees and expenses are not included in the fund’s annualized expense ratio used to calculate the expense estimate in the table below.
Hypothetical Example for Comparison Purposes
The second line of the table below provides information about hypothetical account values and hypothetical expenses based on the Fund’s actual expense ratio and an assumed rate of return of 5% per year before expenses, which is not the Fund’s actual return. The hypothetical account values and expenses may not be used to estimate the actual ending account balance or expenses you paid for the period. You may use this information to compare the ongoing costs of investing in the Fund and other funds. To do so, compare this 5% hypothetical example with the 5% hypothetical examples that appear in the share holder reports of the other funds. A small balance maintenance fee of $12.00 that is charged once a year may apply for certain accounts with a value of less than $2,000. This fee is not included in the table below. If it was, the estimate of expenses you paid during the period would be higher, and your ending account value lower, by this amount. In addition, the fund, as a shareholder in the underlying affiliated central funds, will indirectly bear its pro rata share of the fees and expenses incurred by the underlying affiliated central funds. These fees and expenses are not included in the fund’s annualized expense ratio used to calculate the expense estimate in the table below.
Please note that the expenses shown in the table are meant to highlight your ongoing costs only and do not reflect any transaction costs. Therefore, the second line of the table is useful in comparing ongoing costs only, and will not help you determine the relative total costs of owning different funds.
7 Annual Report
| Shareholder Expense Example continued | | | | |
| |
| |
| | | | | | | | | | | Expenses Paid |
| | | | | Beginning | | Ending | | | | During Period* |
| | | | | Account Value | | Account Value | | | | November 1, 2005 |
| | | | | November 1, 2005 | | April 30, 2006 | | | | to April 30, 2006 |
| Actual | | | | $ 1,000.00 | | $ 1,009.70 | | | | $ 2.24 |
| Hypothetical (5% return per year | | | | | | | | | | |
| before expenses) | | | | $ 1,000.00 | | $ 1,022.56 | | | | $ 2.26 |
* Expenses are equal to the Fund’s annualized expense ratio of .45%; multiplied by the average account value over the period, multiplied by 181/365 (to reflect the one half year period). The fees and expenses of the underlying affiliated central funds in which the fund invests are not included in the fund’s annualized expense ratio.
Investment Changes

We have used ratings from Moody’s® Investors Services, Inc. Where Moody’s ratings are not available, we have used S&P® ratings.
| Average Years to Maturity as of April 30, 2006 | | |
| | | | | 6 months ago |
| Years | | 4.5 | | 4.6 |
Average years to maturity is based on the average time remaining until principal payments are expected from each of the fund’s bonds, weighted by dollar amount.
| Duration as of April 30, 2006 | | | | |
| | | | | | | 6 months ago |
| Years | | | | 3.6 | | 3.4 |
Duration shows how much a bond fund’s price fluctuates with changes in comparable interest rates. If rates rise 1%, for example, a fund with a five year duration is likely to lose about 5% of its value. Other factors also can influence a bond fund’s performance and share price. Accordingly, a bond fund’s actual performance may differ from this example.
The information in the above tables is based on the combined investments of the fund and its pro rata share of the investments of Fidelity’s fixed income central funds.
For an unaudited list of holdings for each fixed income central fund, visit fidelity.com.
9 Annual Report
| Investments April 30, 2006 | | | | |
| Showing Percentage of Net Assets | | | | | | | | |
| |
| Nonconvertible Bonds 24.7% | | | | | | | | |
| | | | | Principal | | Value (Note 1) |
| | | | | Amount (000s) | | (000s) |
| |
| CONSUMER DISCRETIONARY – 2.2% | | | | | | | | |
| Automobiles – 0.1% | | | | | | | | |
| Ford Motor Co. 6.625% 10/1/28 | | | | $ 13,490 | | | | $ 9,241 |
| Household Durables – 0.2% | | | | | | | | |
| Fortune Brands, Inc. 5.125% 1/15/11 | | | | 12,115 | | | | 11,825 |
| Media – 1.7% | | | | | | | | |
| AOL Time Warner, Inc. 6.875% 5/1/12 | | | | 10,855 | | | | 11,322 |
| BSKYB Finance UK PLC 5.625% 10/15/15 (c) | | | | 15,290 | | | | 14,627 |
| Comcast Corp.: | | | | | | | | |
| 4.95% 6/15/16 | | | | 9,000 | | | | 8,145 |
| 5.9% 3/15/16 | | | | 16,000 | | | | 15,603 |
| Cox Communications, Inc.: | | | | | | | | |
| 4.625% 1/15/10 | | | | 5,000 | | | | 4,805 |
| 4.625% 6/1/13 | | | | 17,415 | | | | 15,827 |
| 7.125% 10/1/12 | | | | 585 | | | | 614 |
| Hearst-Argyle Television, Inc. 7% 11/15/07 | | | | 6,500 | | | | 6,605 |
| Liberty Media Corp.: | | | | | | | | |
| 5.7% 5/15/13 (b) | | | | 16,415 | | | | 15,266 |
| 8.25% 2/1/30 | | | | 5,300 | | | | 5,079 |
| Time Warner, Inc. 9.125% 1/15/13 | | | | 14,044 | | | | 16,167 |
| Univision Communications, Inc. 3.875% 10/15/08 | | | | 8,230 | | | | 7,851 |
| Viacom, Inc. 5.75% 4/30/11 (c) | | | | 8,420 | | | | 8,358 |
| | | | | | | | | 130,269 |
| Multiline Retail – 0.2% | | | | | | | | |
| The May Department Stores Co. 4.8% 7/15/09 | | | | 15,945 | | | | 15,607 |
| |
| TOTAL CONSUMER DISCRETIONARY | | | | | | | | 166,942 |
| |
| CONSUMER STAPLES 0.4% | | | | | | | | |
| Beverages – 0.1% | | | | | | | | |
| FBG Finance Ltd. 5.125% 6/15/15 (c) | | | | 8,370 | | | | 7,728 |
| Food Products 0.1% | | | | | | | | |
| H.J. Heinz Co. 6.428% 12/1/08 (c)(g) | | | | 8,405 | | | | 8,541 |
| Personal Products 0.1% | | | | | | | | |
| Avon Products, Inc. 5.125% 1/15/11 | | | | 6,805 | | | | 6,661 |
| Tobacco 0.1% | | | | | | | | |
| Altria Group, Inc. 7% 11/4/13 | | | | 5,880 | | | | 6,236 |
| Philip Morris Companies, Inc. 7.65% 7/1/08 | | | | 2,500 | | | | 2,606 |
| | | | | | | | | 8,842 |
| |
| TOTAL CONSUMER STAPLES | | | | | | | | 31,772 |
See accompanying notes which are an integral part of the financial statements.
| Nonconvertible Bonds continued | | | | | | | | |
| | | | | Principal | | Value (Note 1) |
| | | | | Amount (000s) | | (000s) |
| |
| ENERGY 2.9% | | | | | | | | |
| Energy Equipment & Services – 0.6% | | | | | | | | |
| Petronas Capital Ltd. 7% 5/22/12 (c) | | | | $ 29,400 | | | | $ 31,360 |
| Weatherford International Ltd. 4.95% 10/15/13 | | | | 11,940 | | | | 11,300 |
| | | | | | | | | 42,660 |
| Oil, Gas & Consumable Fuels – 2.3% | | | | | | | | |
| Amerada Hess Corp. 6.65% 8/15/11 | | | | 14,136 | | | | 14,736 |
| Canadian Oil Sands Ltd. 4.8% 8/10/09 (c) | | | | 10,265 | | | | 9,953 |
| Duke Capital LLC: | | | | | | | | |
| 4.37% 3/1/09 | | | | 8,965 | | | | 8,685 |
| 6.25% 2/15/13 | | | | 20,545 | | | | 20,898 |
| Empresa Nacional de Petroleo 6.75% 11/15/12 (c) | | | | 7,914 | | | | 8,256 |
| EnCana Holdings Finance Corp. 5.8% 5/1/14 | | | | 9,605 | | | | 9,551 |
| Enterprise Products Operating LP: | | | | | | | | |
| 4.625% 10/15/09 | | | | 6,540 | | | | 6,317 |
| 4.95% 6/1/10 | | | | 3,860 | | | | 3,737 |
| 5.6% 10/15/14 | | | | 1,975 | | | | 1,892 |
| Kerr-McGee Corp. 6.875% 9/15/11 | | | | 8,405 | | | | 8,762 |
| Kinder Morgan Energy Partners LP: | | | | | | | | |
| 5.125% 11/15/14 | | | | 8,675 | | | | 8,124 |
| 5.35% 8/15/07 | | | | 7,500 | | | | 7,460 |
| Kinder Morgan Finance Co. ULC 5.35% 1/5/11 | | | | 19,640 | | | | 19,295 |
| Nexen, Inc.: | | | | | | | | |
| 5.05% 11/20/13 | | | | 7,830 | | | | 7,432 |
| 5.2% 3/10/15 | | | | 6,250 | | | | 5,910 |
| Pemex Project Funding Master Trust: | | | | | | | | |
| 5.75% 12/15/15 (c) | | | | 4,230 | | | | 4,010 |
| 6.125% 8/15/08 | | | | 17,000 | | | | 17,102 |
| 7.375% 12/15/14 | | | | 8,770 | | | | 9,296 |
| 7.875% 2/1/09 (g) | | | | 7,850 | | | | 8,231 |
| | | | | | | | | 179,647 |
| |
| TOTAL ENERGY | | | | | | | | 222,307 |
| |
| FINANCIALS – 11.4% | | | | | | | | |
| Capital Markets 1.6% | | | | | | | | |
| Bank of New York Co., Inc. 3.4% 3/15/13 (g) | | | | 9,150 | | | | 8,802 |
| Goldman Sachs Group, Inc.: | | | | | | | | |
| 4.5% 6/15/10 | | | | 7,300 | | | | 7,029 |
| 5.25% 10/15/13 | | | | 10,750 | | | | 10,381 |
| 5.7% 9/1/12 | | | | 18,260 | | | | 18,238 |
| 6.6% 1/15/12 | | | | 9,455 | | | | 9,865 |
See accompanying notes which are an integral part of the financial statements.
11 Annual Report
| Investments continued | | | | | | | | |
| |
| |
| Nonconvertible Bonds continued | | | | | | | | |
| | | | | Principal | | Value (Note 1) |
| | | | | Amount (000s) | | (000s) |
| |
| FINANCIALS – continued | | | | | | | | |
| Capital Markets continued | | | | | | | | |
| Legg Mason, Inc. 6.75% 7/2/08 | | | | $ 17,000 | | | | $ 17,455 |
| Lehman Brothers Holdings E-Capital Trust I 5.55% | | | | | | | | |
| 8/19/65 (c)(g) | | | | 4,800 | | | | 4,814 |
| Merrill Lynch & Co., Inc. 4.25% 2/8/10 | | | | 13,855 | | | | 13,276 |
| Morgan Stanley 5.05% 1/21/11 | | | | 20,815 | | | | 20,316 |
| NationsBank Corp. 6.375% 2/15/08 | | | | 5,000 | | | | 5,086 |
| Scotland International Finance No. 2 BV yankee 7.7% | | | | | | | | |
| 8/15/10 (c) | | | | 8,000 | | | | 8,669 |
| | | | | | | | | 123,931 |
| Commercial Banks – 1.9% | | | | | | | | |
| Bank of America Corp.: | | | | | | | | |
| 4.5% 8/1/10 | | | | 15,556 | | | | 15,014 |
| 7.4% 1/15/11 | | | | 38,290 | | | | 41,170 |
| Corporacion Andina de Fomento 5.2% 5/21/13 | | | | 5,145 | | | | 4,923 |
| Export-Import Bank of Korea 5.125% 2/14/11 | | | | 15,230 | | | | 14,884 |
| First Union Corp. 6.4% 4/1/08 | | | | 5,000 | | | | 5,102 |
| Key Bank NA 7% 2/1/11 | | | | 11,045 | | | | 11,678 |
| Korea Development Bank 3.875% 3/2/09 | | | | 15,040 | | | | 14,418 |
| PNC Funding Corp. 7.5% 11/1/09 | | | | 9,580 | | | | 10,202 |
| Wachovia Bank NA 4.875% 2/1/15 | | | | 6,065 | | | | 5,644 |
| Wachovia Corp. 4.875% 2/15/14 | | | | 4,951 | | | | 4,646 |
| Wells Fargo & Co. 4% 9/10/12 (g) | | | | 5,735 | | | | 5,614 |
| Woori Bank 6.125% 5/3/16 (c)(g) | | | | 6,820 | | | | 6,816 |
| | | | | | | | | 140,111 |
| Consumer Finance – 1.5% | | | | | | | | |
| Capital One Bank 6.5% 6/13/13 | | | | 8,375 | | | | 8,675 |
| Capital One Financial Corp. 5.5% 6/1/15 | | | | 6,125 | | | | 5,884 |
| Ford Motor Credit Co. 7% 10/1/13 | | | | 13,845 | | | | 12,149 |
| General Electric Capital Corp. 6% 6/15/12 | | | | 44,700 | | | | 45,710 |
| Household Finance Corp. 4.125% 11/16/09 | | | | 32,165 | | | | 30,799 |
| Household International, Inc. 5.836% 2/15/08 | | | | 12,875 | | | | 12,980 |
| | | | | | | | | 116,197 |
| Diversified Financial Services – 1.0% | | | | | | | | |
| Alliance Capital Management LP 5.625% 8/15/06 | | | | 7,995 | | | | 8,003 |
| Allstate Life Global Funding II 4.25% 9/10/08 (c) | | | | 6,525 | | | | 6,370 |
| Citigroup, Inc. 5.125% 2/14/11 | | | | 11,329 | | | | 11,151 |
| International Lease Finance Corp. 4.375% 11/1/09 | | | | 11,915 | | | | 11,404 |
| JPMorgan Chase & Co.: | | | | | | | | |
| 4.891% 9/1/15 (g) | | | | 1,980 | | | | 1,917 |
See accompanying notes which are an integral part of the financial statements.
| Nonconvertible Bonds continued | | | | | | | | |
| | | | | Principal | | Value (Note 1) |
| | | | | Amount (000s) | | (000s) |
| |
| FINANCIALS – continued | | | | | | | | |
| Diversified Financial Services – continued | | | | | | | | |
| JPMorgan Chase & Co.: – continued | | | | | | | | |
| 5.75% 1/2/13 | | | | $ 12,250 | | | | $ 12,249 |
| 6.75% 2/1/11 | | | | 14,035 | | | | 14,687 |
| Prime Property Funding II 6.25% 5/15/07 (c) | | | | 12,100 | | | | 12,130 |
| | | | | | | | | 77,911 |
| Insurance – 1.1% | | | | | | | | |
| Aegon NV 4.75% 6/1/13 | | | | 13,180 | | | | 12,371 |
| Axis Capital Holdings Ltd. 5.75% 12/1/14 | | | | 10,810 | | | | 10,338 |
| Marsh & McLennan Companies, Inc.: | | | | | | | | |
| 5.15% 9/15/10 | | | | 8,000 | | | | 7,765 |
| 7.125% 6/15/09 | | | | 7,810 | | | | 8,108 |
| Pennsylvania Mutual Life Insurance Co. 6.65% 6/15/34 (c) | | | | 11,200 | | | | 11,357 |
| Principal Life Global Funding I 6.25% 2/15/12 (c) | | | | 10,600 | | | | 10,907 |
| Prudential Financial, Inc. 4.104% 11/15/06 | | | | 7,405 | | | | 7,362 |
| Symetra Financial Corp. 6.125% 4/1/16 (c) | | | | 6,910 | | | | 6,757 |
| The St. Paul Travelers Companies, Inc. 8.125% 4/15/10 | | | | 8,475 | | | | 9,175 |
| | | | | | | | | 84,140 |
| Real Estate 3.8% | | | | | | | | |
| Archstone Smith Operating Trust: | | | | | | | | |
| 5.25% 12/1/10 | | | | 3,490 | | | | 3,424 |
| 5.25% 5/1/15 | | | | 6,450 | | | | 6,113 |
| Arden Realty LP 5.2% 9/1/11 | | | | 5,680 | | | | 5,610 |
| Boston Properties, Inc. 6.25% 1/15/13 | | | | 6,035 | | | | 6,170 |
| Brandywine Operating Partnership LP: | | | | | | | | |
| 4.5% 11/1/09 | | | | 17,825 | | | | 17,085 |
| 5.625% 12/15/10 | | | | 10,695 | | | | 10,551 |
| 5.75% 4/1/12 | | | | 5,320 | | | | 5,255 |
| BRE Properties, Inc.: | | | | | | | | |
| 4.875% 5/15/10 | | | | 9,285 | | | | 9,001 |
| 5.75% 9/1/09 | | | | 5,000 | | | | 5,028 |
| Camden Property Trust: | | | | | | | | |
| 4.375% 1/15/10 | | | | 7,700 | | | | 7,395 |
| 5.875% 11/30/12 | | | | 8,440 | | | | 8,400 |
| CarrAmerica Realty Corp.: | | | | | | | | |
| 3.625% 4/1/09 | | | | 14,990 | | | | 14,251 |
| 5.5% 12/15/10 | | | | 10,560 | | | | 10,517 |
| Colonial Properties Trust 4.75% 2/1/10 | | | | 10,290 | | | | 9,919 |
See accompanying notes which are an integral part of the financial statements.
13 Annual Report
| Investments continued | | | | | | | | |
| |
| |
| Nonconvertible Bonds continued | | | | | | | | |
| | | | | Principal | | Value (Note 1) |
| | | | | Amount (000s) | | (000s) |
| |
| FINANCIALS – continued | | | | | | | | |
| Real Estate continued | | | | | | | | |
| Developers Diversified Realty Corp.: | | | | | | | | |
| 4.625% 8/1/10 | | | | $ 11,640 | | | | $ 11,132 |
| 5% 5/3/10 | | | | 7,285 | | | | 7,066 |
| EOP Operating LP: | | | | | | | | |
| 4.65% 10/1/10 | | | | 10,000 | | | | 9,587 |
| 4.75% 3/15/14 | | | | 3,380 | | | | 3,101 |
| 6.75% 2/15/12 | | | | 1,505 | | | | 1,566 |
| 6.8% 1/15/09 | | | | 6,985 | | | | 7,200 |
| 7% 7/15/11 | | | | 6,964 | | | | 7,325 |
| Equity Residential 5.125% 3/15/16 | | | | 7,895 | | | | 7,375 |
| Heritage Property Investment Trust, Inc.: | | | | | | | | |
| 4.5% 10/15/09 | | | | 7,380 | | | | 7,066 |
| 5.125% 4/15/14 | | | | 12,250 | | | | 11,336 |
| iStar Financial, Inc.: | | | | | | | | |
| 5.375% 4/15/10 | | | | 3,545 | | | | 3,482 |
| 5.8% 3/15/11 | | | | 19,960 | | | | 19,797 |
| Liberty Property LP 5.125% 3/2/15 | | | | 3,885 | | | | 3,606 |
| Mack Cali Realty LP 7.25% 3/15/09 | | | | 4,125 | | | | 4,275 |
| Post Apartment Homes LP 5.45% 6/1/12 | | | | 9,290 | | | | 8,884 |
| Simon Property Group LP: | | | | | | | | |
| 4.6% 6/15/10 | | | | 6,420 | | | | 6,185 |
| 4.875% 8/15/10 | | | | 15,080 | | | | 14,655 |
| 5.1% 6/15/15 | | | | 9,490 | | | | 8,882 |
| Spieker Properties LP 7.25% 5/1/09 | | | | 11,700 | | | | 12,354 |
| Tanger Properties LP 6.15% 11/15/15 | | | | 13,700 | | | | 13,391 |
| | | | | | | | | 286,984 |
| Thrifts & Mortgage Finance – 0.5% | | | | | | | | |
| Countrywide Home Loans, Inc. 4% 3/22/11 | | | | 9,640 | | | | 8,917 |
| Independence Community Bank Corp.: | | | | | | | | |
| 3.5% 6/20/13 (g) | | | | 2,530 | | | | 2,420 |
| 3.75% 4/1/14 (g) | | | | 13,820 | | | | 13,087 |
| Washington Mutual, Inc. 4.625% 4/1/14 | | | | 17,534 | | | | 15,894 |
| | | | | | | | | 40,318 |
| |
| TOTAL FINANCIALS | | | | | | | | 869,592 |
| |
| INDUSTRIALS – 1.8% | | | | | | | | |
| Aerospace & Defense – 0.4% | | | | | | | | |
| BAE Systems Holdings, Inc. 4.75% 8/15/10 (c) | | | | 10,360 | | | | 9,956 |
See accompanying notes which are an integral part of the financial statements.
| Nonconvertible Bonds continued | | | | | | | | |
| | | | | Principal | | Value (Note 1) |
| | | | | Amount (000s) | | (000s) |
| |
| INDUSTRIALS – continued | | | | | | | | |
| Aerospace & Defense – continued | | | | | | | | |
| Bombardier, Inc. 6.3% 5/1/14 (c) | | | | $ 12,815 | | | | $ 11,822 |
| Northrop Grumman Corp. 4.079% 11/16/06 | | | | 8,300 | | | | 8,246 |
| | | | | | | | | 30,024 |
| Airlines – 1.1% | | | | | | | | |
| American Airlines, Inc. pass thru trust certificates: | | | | | | | | |
| 6.855% 10/15/10 | | | | 943 | | | | 958 |
| 6.978% 10/1/12 | | | | 2,500 | | | | 2,561 |
| 7.024% 4/15/11 | | | | 7,000 | | | | 7,193 |
| 7.324% 4/15/11 | | | | 2,000 | | | | 1,940 |
| 7.858% 4/1/13 | | | | 10,380 | | | | 11,038 |
| Continental Airlines, Inc. pass thru trust certificates: | | | | | | | | |
| 6.648% 3/15/19 | | | | 11,821 | | | | 11,839 |
| 6.82% 5/1/18 | | | | 2,015 | | | | 2,020 |
| 7.056% 3/15/11 | | | | 3,130 | | | | 3,220 |
| Delta Air Lines, Inc. pass thru trust certificates: | | | | | | | | |
| 7.111% 3/18/13 | | | | 5,770 | | | | 5,770 |
| 7.57% 11/18/10 | | | | 14,855 | | | | 14,855 |
| U.S. Airways pass thru trust certificates 6.85% 7/30/19 | | | | 5,196 | | | | 5,306 |
| United Airlines pass thru Certificates: | | | | | | | | |
| 6.071% 9/1/14 | | | | 5,492 | | | | 5,422 |
| 6.201% 3/1/10 | | | | 4,550 | | | | 4,550 |
| 6.602% 9/1/13 | | | | 6,892 | | | | 6,865 |
| | | | | | | | | 83,537 |
| Industrial Conglomerates – 0.2% | | | | | | | | |
| Hutchison Whampoa International 03/13 Ltd. 6.5% | | | | | | | | |
| 2/13/13 (c) | | | | 10,960 | | | | 11,212 |
| Road & Rail 0.1% | | | | | | | | |
| Norfolk Southern Corp. 6% 4/30/08 | | | | 9,250 | | | | 9,350 |
| |
| TOTAL INDUSTRIALS | | | | | | | | 134,123 |
| |
| MATERIALS 0.2% | | | | | | | | |
| Containers & Packaging – 0.0% | | | | | | | | |
| Sealed Air Corp. 6.95% 5/15/09 (c) | | | | 5,315 | | | | 5,480 |
| Metals & Mining – 0.1% | | | | | | | | |
| Corporacion Nacional del Cobre (Codelco) 6.375% | | | | | | | | |
| 11/30/12 (c) | | | | 7,265 | | | | 7,467 |
See accompanying notes which are an integral part of the financial statements.
15 Annual Report
| Investments continued | | | | | | | | |
| |
| |
| Nonconvertible Bonds continued | | | | | | | | |
| | | | | Principal | | Value (Note 1) |
| | | | | Amount (000s) | | (000s) |
| |
| MATERIALS – continued | | | | | | | | |
| Paper & Forest Products 0.1% | | | | | | | | |
| International Paper Co. 4.25% 1/15/09 | | | | $ 5,950 | | | | $ 5,749 |
| |
| TOTAL MATERIALS | | | | | | | | 18,696 |
| |
| TELECOMMUNICATION SERVICES – 2.2% | | | | | | | | |
| Diversified Telecommunication Services – 1.7% | | | | | | | | |
| Ameritech Capital Funding Corp. 6.25% 5/18/09 | | | | 5,520 | | | | 5,584 |
| AT&T Broadband Corp. 8.375% 3/15/13 | | | | 13,123 | | | | 14,691 |
| BellSouth Corp. 4.2% 9/15/09 | | | | 9,835 | | | | 9,443 |
| British Telecommunications PLC 8.375% 12/15/10 | | | | 1,200 | | | | 1,333 |
| Deutsche Telekom International Finance BV 5.25% 7/22/13 | | | | 7,505 | | | | 7,170 |
| SBC Communications, Inc. 5.875% 2/1/12 | | | | 22,365 | | | | 22,466 |
| Sprint Capital Corp. 8.375% 3/15/12 | | | | 12,500 | | | | 14,054 |
| Telecom Italia Capital: | | | | | | | | |
| 4% 1/15/10 | | | | 7,550 | | | | 7,109 |
| 4.95% 9/30/14 | | | | 10,080 | | | | 9,227 |
| Telefonos de Mexico SA de CV 4.75% 1/27/10 | | | | 19,750 | | | | 19,021 |
| Verizon Global Funding Corp. 7.25% 12/1/10 | | | | 8,218 | | | | 8,710 |
| Verizon New York, Inc. 6.875% 4/1/12 | | | | 14,865 | | | | 15,257 |
| | | | | | | | | 134,065 |
| Wireless Telecommunication Services – 0.5% | | | | | | | | |
| America Movil SA de CV 4.125% 3/1/09 | | | | 4,895 | | | | 4,692 |
| AT&T Wireless Services, Inc. 7.875% 3/1/11 | | | | 19,630 | | | | 21,484 |
| Vodafone Group PLC 5.5% 6/15/11 | | | | 10,380 | | | | 10,265 |
| | | | | | | | | 36,441 |
| |
| TOTAL TELECOMMUNICATION SERVICES | | | | | | | | 170,506 |
| |
| UTILITIES – 3.6% | | | | | | | | |
| Electric Utilities – 2.1% | | | | | | | | |
| Cleveland Electric Illuminating Co. 5.65% 12/15/13 | | | | 8,645 | | | | 8,457 |
| Exelon Corp.: | | | | | | | | |
| 4.9% 6/15/15 | | | | 15,095 | | | | 13,882 |
| 6.75% 5/1/11 | | | | 5,060 | | | | 5,281 |
| Exelon Generation Co. LLC 5.35% 1/15/14 | | | | 9,500 | | | | 9,123 |
| FirstEnergy Corp. 6.45% 11/15/11 | | | | 22,958 | | | | 23,675 |
| FPL Group Capital, Inc. 7.625% 9/15/06 | | | | 2,695 | | | | 2,716 |
| Monongahela Power Co. 5% 10/1/06 | | | | 6,860 | | | | 6,842 |
| Niagara Mohawk Power Corp. 8.875% 5/15/07 | | | | 2,485 | | | | 2,568 |
See accompanying notes which are an integral part of the financial statements.
| Nonconvertible Bonds continued | | | | | | | | |
| | | | | Principal | | Value (Note 1) |
| | | | | Amount (000s) | | (000s) |
| |
| UTILITIES – continued | | | | | | | | |
| Electric Utilities – continued | | | | | | | | |
| Pepco Holdings, Inc.: | | | | | | | | |
| 4% 5/15/10 | | | | $ 6,500 | | | | $ 6,093 |
| 6.45% 8/15/12 | | | | 4,850 | | | | 4,940 |
| PPL Energy Supply LLC 5.7% 10/15/35 | | | | 19,840 | | | | 19,043 |
| Progress Energy, Inc. 7.1% 3/1/11 | | | | 24,500 | | | | 25,883 |
| Public Service Co. of Colorado 5.5% 4/1/14 | | | | 13,045 | | | | 12,824 |
| Southwestern Public Service Co. 5.125% 11/1/06 | | | | 3,000 | | | | 2,995 |
| TXU Energy Co. LLC 7% 3/15/13 | | | | 13,930 | | | | 14,427 |
| | | | | | | | | 158,749 |
| Gas Utilities 0.2% | | | | | | | | |
| Texas Eastern Transmission Corp. 7.3% 12/1/10 | | | | 6,295 | | | | 6,698 |
| Transcontinental Gas Pipe Line Corp. 6.4% 4/15/16 (c) | | | | 6,130 | | | | 6,069 |
| | | | | | | | | 12,767 |
| Independent Power Producers & Energy Traders – 0.4% | | | | | | | | |
| Constellation Energy Group, Inc. 7% 4/1/12 | | | | 25,865 | | | | 27,395 |
| TXU Corp. 5.55% 11/15/14 | | | | 8,680 | | | | 8,075 |
| | | | | | | | | 35,470 |
| Multi-Utilities – 0.9% | | | | | | | | |
| Dominion Resources, Inc.: | | | | | | | | |
| 4.75% 12/15/10 | | | | 10,560 | | | | 10,127 |
| 6.25% 6/30/12 | | | | 25,491 | | | | 25,814 |
| MidAmerican Energy Holdings, Inc. 5.875% 10/1/12 | | | | 6,305 | | | | 6,313 |
| PSEG Funding Trust I 5.381% 11/16/07 | | | | 17,330 | | | | 17,267 |
| Sempra Energy 7.95% 3/1/10 | | | | 4,289 | | | | 4,619 |
| TECO Energy, Inc. 7% 5/1/12 | | | | 6,003 | | | | 6,183 |
| | | | | | | | | 70,323 |
| |
| TOTAL UTILITIES | | | | | | | | 277,309 |
| |
| TOTAL NONCONVERTIBLE BONDS | | | | | | | | |
| (Cost $1,930,249) | | | | | | | | 1,891,247 |
| |
| U.S. Government and Government Agency Obligations 34.2% | | | | | | | | |
| |
| U.S. Government Agency Obligations 6.6% | | | | | | | | |
| Fannie Mae: | | �� | | | | | | |
| 3.25% 1/15/08 | | | | 15,650 | | | | 15,173 |
| 3.25% 8/15/08 | | | | 92,035 | | | | 88,315 |
| 3.25% 2/15/09 | | | | 38,091 | | | | 36,222 |
See accompanying notes which are an integral part of the financial statements.
17 Annual Report
| Investments continued | | | | | | | | |
| |
| |
| U.S. Government and Government Agency Obligations continued |
| | | | | Principal | | Value (Note 1) |
| | | | | Amount (000s) | | (000s) |
| U.S. Government Agency Obligations continued | | | | | | | | |
| Fannie Mae: – continued | | | | | | | | |
| 3.375% 12/15/08 | | | | $ 31,355 | | | | $ 30,005 |
| 4.75% 12/15/10 | | | | 16,545 | | | | 16,197 |
| 5.5% 3/15/11 | | | | 24,445 | | | | 24,669 |
| 6% 5/15/11 | | | | 47,960 | | | | 49,446 |
| 6.25% 2/1/11 | | | | 134,795 | | | | 139,321 |
| Freddie Mac: | | | | | | | | |
| 4.25% 7/15/09 | | | | 75,000 | | | | 72,984 |
| 5% 1/30/14 | | | | 23,200 | | | | 22,476 |
| 5.875% 3/21/11 | | | | 3,420 | | | | 3,479 |
| U.S. Department of Housing and Urban Development | | | | | | | | |
| Government guaranteed participation certificates | | | | | | | | |
| Series 1996 A, 7.66% 8/1/15 | | | | 3,360 | | | | 3,347 |
| |
| TOTAL U.S. GOVERNMENT AGENCY OBLIGATIONS | | | | | | | | 501,634 |
| U.S. Treasury Inflation Protected Obligations 6.5% | | | | | | | | |
| U.S. Treasury Inflation-Indexed Bonds 2.375% 1/15/25 | | | | 4,216 | | | | 4,164 |
| U.S. Treasury Inflation-Indexed Notes: | | | | | | | | |
| 0.875% 4/15/10 | | | | 110,122 | | | | 104,705 |
| 2% 1/15/14 (d) | | | | 267,962 | | | | 261,478 |
| 2% 7/15/14 | | | | 131,758 | | | | 128,404 |
| |
| TOTAL U.S. TREASURY INFLATION PROTECTED OBLIGATIONS | | | | | | | | 498,751 |
| U.S. Treasury Obligations – 21.1% | | | | | | | | |
| U.S. Treasury Bonds 12% 8/15/13 | | | | 115,350 | | | | 132,963 |
| U.S. Treasury Notes: | | | | | | | | |
| 3.125% 4/15/09 | | | | 492,170 | | | | 468,622 |
| 3.375% 12/15/08 | | | | 270,000 | | | | 260,149 |
| 3.375% 10/15/09 | | | | 190,000 | | | | 180,871 |
| 4.25% 8/15/13 | | | | 300,732 | | | | 286,882 |
| 4.375% 12/15/10 | | | | 20,200 | | | | 19,748 |
| 4.75% 5/15/14 | | | | 249,365 | | | | 244,719 |
| 6.5% 2/15/10 | | | | 20,000 | | | | 21,091 |
| |
| TOTAL U.S. TREASURY OBLIGATIONS | | | | | | | | 1,615,045 |
| |
| TOTAL U.S. GOVERNMENT AND | | | | | | | | |
| GOVERNMENT AGENCY OBLIGATIONS | | | | | | | | |
| (Cost $2,691,915) | | | | | | | | 2,615,430 |
See accompanying notes which are an integral part of the financial statements.
| U.S. Government Agency Mortgage Securities 10.4% | | | | | | | | | | |
| | | | | Principal | | Value (Note 1) |
| | | | | Amount (000s) | | (000s) |
| Fannie Mae – 9.2% | | | | | | | | |
| 3.749% 12/1/34 (g) | | | | $ 1,141 | | | | $ 1,121 |
| 3.75% 1/1/34 (g) | | | | 1,002 | | | | 975 |
| 3.752% 10/1/33 (g) | | | | 1,023 | | | | 998 |
| 3.752% 10/1/33 (g) | | | | 1,189 | | | | 1,159 |
| 3.792% 6/1/34 (g) | | | | 4,699 | | | | 4,543 |
| 3.829% 1/1/35 (g) | | | | 1,030 | | | | 1,014 |
| 3.833% 4/1/33 (g) | | | | 3,144 | | | | 3,088 |
| 3.847% 1/1/35 (g) | | | | 2,979 | | | | 2,929 |
| 3.853% 11/1/34 (g) | | | | 6,246 | | | | 6,151 |
| 3.854% 10/1/33 (g) | | | | 26,606 | | | | 26,047 |
| 3.869% 1/1/35 (g) | | | | 1,778 | | | | 1,751 |
| 3.913% 5/1/34 (g) | | | | 337 | | | | 337 |
| 3.917% 12/1/34 (g) | | | | 952 | | | | 938 |
| 3.957% 1/1/35 (g) | | | | 1,257 | | | | 1,239 |
| 3.96% 5/1/33 (g) | | | | 348 | | | | 343 |
| 3.978% 12/1/34 (g) | | | | 1,300 | | | | 1,282 |
| 3.983% 12/1/34 (g) | | | | 6,523 | | | | 6,432 |
| 3.988% 1/1/35 (g) | | | | 801 | | | | 790 |
| 4% 7/1/18 | | | | 16,898 | | | | 15,800 |
| 4.006% 2/1/35 (g) | | | | 891 | | | | 878 |
| 4.021% 2/1/35 (g) | | | | 810 | | | | 800 |
| 4.048% 10/1/18 (g) | | | | 929 | | | | 912 |
| 4.05% 1/1/35 (g) | | | | 471 | | | | 465 |
| 4.066% 4/1/33 (g) | | | | 347 | | | | 343 |
| 4.09% 2/1/35 (g) | | | | 648 | | | | 639 |
| 4.091% 2/1/35 (g) | | | | 1,681 | | | | 1,659 |
| 4.092% 2/1/35 (g) | | | | 603 | | | | 595 |
| 4.106% 2/1/35 (g) | | | | 3,168 | | | | 3,129 |
| 4.109% 1/1/35 (g) | | | | 1,824 | | | | 1,800 |
| 4.115% 2/1/35 (g) | | | | 2,074 | | | | 2,047 |
| 4.122% 1/1/35 (g) | | | | 3,178 | | | | 3,138 |
| 4.144% 1/1/35 (g) | | | | 2,694 | | | | 2,669 |
| 4.153% 2/1/35 (g) | | | | 1,670 | | | | 1,649 |
| 4.166% 11/1/34 (g) | | | | 418 | | | | 413 |
| 4.176% 1/1/35 (g) | | | | 1,548 | | | | 1,529 |
| 4.178% 1/1/35 (g) | | | | 3,241 | | | | 3,205 |
| 4.178% 1/1/35 (g) | | | | 2,146 | | | | 2,087 |
| 4.188% 10/1/34 (g) | | | | 2,666 | | | | 2,646 |
| 4.22% 3/1/34 (g) | | | | 874 | | | | 856 |
| 4.223% 1/1/35 (g) | | | | 930 | | | | 920 |
| 4.226% 10/1/34 (g) | | | | 2,057 | | | | 2,037 |
See accompanying notes which are an integral part of the financial statements.
19 Annual Report
| Investments continued | | | | | | | | |
| |
| |
| U.S. Government Agency Mortgage Securities continued | | | | |
| | | | | Principal | | Value (Note 1) |
| | | | | Amount (000s) | | (000s) |
| Fannie Mae continued | | | | | | | | |
| 4.248% 1/1/34 (g) | | | | $ 2,736 | | | | $ 2,687 |
| 4.25% 2/1/35 (g) | | | | 1,086 | | | | 1,057 |
| 4.267% 2/1/35 (g) | | | | 593 | | | | 587 |
| 4.27% 10/1/34 (g) | | | | 310 | | | | 307 |
| 4.28% 8/1/33 (g) | | | | 2,060 | | | | 2,035 |
| 4.283% 3/1/35 (g) | | | | 968 | | | | 957 |
| 4.287% 7/1/34 (g) | | | | 802 | | | | 799 |
| 4.294% 3/1/33 (g) | | | | 1,237 | | | | 1,223 |
| 4.299% 5/1/35 (g) | | | | 1,382 | | | | 1,368 |
| 4.304% 3/1/33 (g) | | | | 460 | | | | 447 |
| 4.315% 10/1/33 (g) | | | | 466 | | | | 459 |
| 4.316% 3/1/33 (g) | | | | 540 | | | | 526 |
| 4.339% 9/1/34 (g) | | | | 1,388 | | | | 1,376 |
| 4.345% 6/1/33 (g) | | | | 599 | | | | 592 |
| 4.354% 9/1/34 (g) | | | | 3,307 | | | | 3,297 |
| 4.356% 1/1/35 (g) | | | | 1,076 | | | | 1,049 |
| 4.357% 4/1/35 (g) | | | | 674 | | | | 667 |
| 4.362% 2/1/34 (g) | | | | 2,423 | | | | 2,383 |
| 4.392% 1/1/35 (g) | | | | 1,213 | | | | 1,202 |
| 4.393% 11/1/34 (g) | | | | 13,928 | | | | 13,807 |
| 4.395% 5/1/35 (g) | | | | 3,048 | | | | 3,014 |
| 4.398% 2/1/35 (g) | | | | 1,631 | | | | 1,591 |
| 4.434% 10/1/34 (g) | | | | 5,090 | | | | 5,051 |
| 4.436% 4/1/34 (g) | | | | 1,599 | | | | 1,581 |
| 4.438% 3/1/35 (g) | | | | 1,456 | | | | 1,420 |
| 4.465% 8/1/34 (g) | | | | 3,149 | | | | 3,100 |
| 4.474% 5/1/35 (g) | | | | 993 | | | | 983 |
| 4.481% 1/1/35 (g) | | | | 1,465 | | | | 1,454 |
| 4.495% 3/1/35 (g) | | | | 3,465 | | | | 3,387 |
| 4.512% 10/1/35 (g) | | | | 459 | | | | 453 |
| 4.521% 3/1/35 (g) | | | | 3,171 | | | | 3,101 |
| 4.526% 2/1/35 (g) | | | | 16,668 | | | | 16,440 |
| 4.54% 2/1/35 (g) | | | | 6,633 | | | | 6,583 |
| 4.541% 7/1/34 (g) | | | | 1,553 | | | | 1,555 |
| 4.543% 2/1/35 (g) | | | | 685 | | | | 680 |
| 4.545% 7/1/35 (g) | | | | 3,769 | | | | 3,731 |
| 4.546% 2/1/35 (g) | | | | 1,044 | | | | 1,036 |
| 4.555% 1/1/35 (g) | | | | 2,090 | | | | 2,075 |
| 4.559% 9/1/34 (g) | | | | 3,906 | | | | 3,881 |
| 4.579% 2/1/35 (g) | | | | 3,098 | | | | 3,040 |
| 4.584% 8/1/34 (g) | | | | 1,393 | | | | 1,394 |
See accompanying notes which are an integral part of the financial statements.
| U.S. Government Agency Mortgage Securities continued | | | | |
| | | | | Principal | | Value (Note 1) |
| | | | | Amount (000s) | | (000s) |
| Fannie Mae continued | | | | | | | | |
| 4.584% 7/1/35 (g) | | | | $ 4,009 | | | | $ 3,972 |
| 4.587% 2/1/35 (g) | | | | 10,113 | | | | 9,910 |
| 4.618% 7/1/34 (g) | | | | 39,730 | | | | 39,519 |
| 4.626% 11/1/34 (g) | | | | 3,306 | | | | 3,250 |
| 4.629% 9/1/34 (g) | | | | 419 | | | | 420 |
| 4.633% 3/1/35 (g) | | | | 522 | | | | 518 |
| 4.641% 1/1/33 (g) | | | | 689 | | | | 685 |
| 4.668% 11/1/34 (g) | | | | 3,582 | | | | 3,526 |
| 4.677% 3/1/35 (g) | | | | 8,277 | | | | 8,229 |
| 4.704% 3/1/35 (g) | | | | 1,756 | | | | 1,725 |
| 4.705% 10/1/32 (g) | | | | 247 | | | | 246 |
| 4.726% 7/1/34 (g) | | | | 2,992 | | | | 2,951 |
| 4.728% 1/1/35 (g) | | | | 4,782 | | | | 4,759 |
| 4.731% 2/1/33 (g) | | | | 215 | | | | 214 |
| 4.74% 10/1/34 (g) | | | | 3,922 | | | | 3,867 |
| 4.746% 1/1/35 (g) | | | | 195 | | | | 194 |
| 4.747% 10/1/32 (g) | | | | 269 | | | | 268 |
| 4.78% 12/1/34 (g) | | | | 2,799 | | | | 2,759 |
| 4.798% 12/1/32 (g) | | | | 1,436 | | | | 1,431 |
| 4.798% 12/1/34 (g) | | | | 1,101 | | | | 1,086 |
| 4.812% 6/1/35 (g) | | | | 4,808 | | | | 4,779 |
| 4.815% 2/1/33 (g) | | | | 1,470 | | | | 1,465 |
| 4.815% 5/1/33 (g) | | | | 64 | | | | 63 |
| 4.83% 8/1/34 (g) | | | | 1,109 | | | | 1,107 |
| 4.844% 11/1/34 (g) | | | | 3,160 | | | | 3,121 |
| 4.873% 10/1/34 (g) | | | | 11,835 | | | | 11,700 |
| 4.969% 12/1/32 (g) | | | | 102 | | | | 101 |
| 4.984% 11/1/32 (g) | | | | 763 | | | | 762 |
| 5% 12/1/17 to 8/1/18 | | | | 66,627 | | | | 65,067 |
| 5% 2/1/35 (g) | | | | 475 | | | | 474 |
| 5.042% 7/1/34 (g) | | | | 604 | | | | 600 |
| 5.063% 11/1/34 (g) | | | | 271 | | | | 271 |
| 5.081% 9/1/34 (g) | | | | 9,954 | | | | 9,886 |
| 5.103% 9/1/34 (g) | | | | 1,053 | | | | 1,047 |
| 5.104% 5/1/35 (g) | | | | 6,987 | | | | 6,980 |
| 5.172% 5/1/35 (g) | | | | 3,916 | | | | 3,890 |
| 5.177% 5/1/35 (g) | | | | 10,780 | | | | 10,705 |
| 5.197% 8/1/33 (g) | | | | 1,487 | | | | 1,481 |
| 5.197% 6/1/35 (g) | | | | 4,952 | | | | 4,953 |
| 5.221% 5/1/35 (g) | | | | 11,082 | | | | 11,012 |
| 5.231% 3/1/35 (g) | | | | 603 | | | | 601 |
See accompanying notes which are an integral part of the financial statements.
21 Annual Report
| Investments continued | | | | | | | | |
| |
| |
| U.S. Government Agency Mortgage Securities continued | | | | |
| | | | | Principal | | Value (Note 1) |
| | | | | Amount (000s) | | (000s) |
| Fannie Mae continued | | | | | | | | |
| 5.318% 7/1/35 (g) | | | | $ 675 | | | | $ 676 |
| 5.343% 12/1/34 (g) | | | | 1,767 | | | | 1,764 |
| 5.5% 3/1/14 to 12/1/33 | | | | 146,557 | | | | 145,285 |
| 5.505% 2/1/36 (g) | | | | 18,501 | | | | 18,437 |
| 5.636% 1/1/36 (g) | | | | 5,163 | | | | 5,164 |
| 6.5% 4/1/13 to 3/1/35 | | | | 82,580 | | | | 84,281 |
| 7% 7/1/25 to 2/1/32 | | | | 178 | | | | 184 |
| 7.5% 8/1/13 to 8/1/29 | | | | 1,557 | | | | 1,626 |
| 12.5% 3/1/15 to 8/1/15 | | | | 29 | | | | 33 |
| |
| TOTAL FANNIE MAE | | | | | | | | 700,772 |
| Freddie Mac – 0.9% | | | | | | | | |
| 4.05% 12/1/34 (g) | | | | 1,076 | | | | 1,058 |
| 4.106% 12/1/34 (g) | | | | 1,532 | | | | 1,508 |
| 4.152% 1/1/35 (g) | | | | 1,496 | | | | 1,473 |
| 4.263% 3/1/35 (g) | | | | 1,423 | | | | 1,403 |
| 4.294% 5/1/35 (g) | | | | 2,515 | | | | 2,482 |
| 4.304% 12/1/34 (g) | | | | 1,517 | | | | 1,475 |
| 4.33% 1/1/35 (g) | | | | 3,456 | | | | 3,411 |
| 4.353% 2/1/35 (g) | | | | 3,091 | | | | 3,051 |
| 4.359% 3/1/35 (g) | | | | 2,324 | | | | 2,258 |
| 4.379% 2/1/35 (g) | | | | 2,898 | | | | 2,818 |
| 4.443% 3/1/35 (g) | | | | 1,493 | | | | 1,452 |
| 4.45% 2/1/34 (g) | | | | 1,441 | | | | 1,416 |
| 4.462% 6/1/35 (g) | | | | 2,158 | | | | 2,128 |
| 4.482% 3/1/35 (g) | | | | 1,632 | | | | 1,590 |
| 4.484% 3/1/35 (g) | | | | 10,154 | | | | 9,983 |
| 4.552% 2/1/35 (g) | | | | 2,359 | | | | 2,300 |
| 4.768% 10/1/32 (g) | | | | 199 | | | | 197 |
| 4.869% 3/1/33 (g) | | | | 554 | | | | 551 |
| 5.007% 4/1/35 (g) | | | | 7,811 | | | | 7,772 |
| 5.143% 4/1/35 (g) | | | | 6,859 | | | | 6,784 |
| 5.338% 6/1/35 (g) | | | | 4,973 | | | | 4,945 |
| 5.571% 1/1/36 (g) | | | | 9,060 | | | | 9,016 |
| 5.588% 4/1/32 (g) | | | | 283 | | | | 285 |
| 7% 9/1/06 to 7/1/13 | | | | 1,256 | | | | 1,278 |
| 7.5% 4/1/07 to 1/1/33 | | | | 1,900 | | | | 1,960 |
| 8.5% 6/1/13 | | | | 3 | | | | 3 |
| |
| TOTAL FREDDIE MAC | | | | | | | | 72,597 |
See accompanying notes which are an integral part of the financial statements.
| U.S. Government Agency Mortgage Securities continued | | | | |
| | | | | Principal | | Value (Note 1) |
| | | | | Amount (000s) | | (000s) |
| Government National Mortgage Association 0.3% | | | | | | | | |
| 4.25% 7/20/34 (g) | | | | $ 2,196 | | | | $ 2,164 |
| 7% 3/15/26 to 11/15/32 | | | | 17,499 | | | | 18,188 |
| 7.5% 3/15/28 | | | | 11 | | | | 12 |
| 8% 7/15/17 to 8/15/30 | | | | 4,938 | | | | 5,188 |
| |
| TOTAL GOVERNMENT NATIONAL MORTGAGE ASSOCIATION | | | | | | | | 25,552 |
| |
| TOTAL U.S. GOVERNMENT AGENCY MORTGAGE SECURITIES | | | | | | | | |
| (Cost $812,259) | | | | | | | | 798,921 |
| |
| Asset Backed Securities 5.8% | | | | | | | | |
| |
| Accredited Mortgage Loan Trust Series 2003-2 Class A1, | | | | | | |
| 4.23% 10/25/33 | | | | 5,576 | | | | 5,420 |
| ACE Securities Corp.: | | | | | | | | |
| Series 2003-HE1 Class A2, 5.3694% 11/25/33 (g) | | | | 283 | | | | 283 |
| Series 2004-HE1: | | | | | | | | |
| Class M1, 5.4594% 2/25/34 (g) | | | | 2,700 | | | | 2,708 |
| Class M2, 6.0594% 2/25/34 (g) | | | | 3,053 | | | | 3,074 |
| Aircraft Lease Securitization Ltd. Series 2005-1 Class C1, | | | | | | | | |
| 8.75% 9/9/30 (c)(g) | | | | 2,023 | | | | 2,048 |
| American Express Credit Account Master Trust Series 2004-1 | | | | | | | | |
| Class B, 5.1513% 9/15/11 (g) | | | | 7,275 | | | | 7,304 |
| AmeriCredit Automobile Receivables Trust: | | | | | | | | |
| Series 2002-EM Class A4A, 3.67% 6/8/09 | | | | 5,169 | | | | 5,146 |
| Series 2003-BX Class A4B, 4.78% 1/6/10 (g) | | | | 3,678 | | | | 3,684 |
| Series 2004-1: | | | | | | | | |
| Class B, 3.7% 1/6/09 | | | | 865 | | | | 855 |
| Class C, 4.22% 7/6/09 | | | | 925 | | | | 910 |
| Class D, 5.07% 7/6/10 | | | | 6,515 | | | | 6,443 |
| Series 2005-1 Class E, 5.82% 6/6/12 (c) | | | | 3,856 | | | | 3,844 |
| Series 2006-1: | | | | | | | | |
| Class A3, 5.11% 10/6/10 | | | | 298 | | | | 297 |
| Class B1, 5.2% 3/6/11 | | | | 910 | | | | 909 |
| Class C1, 5.28% 11/6/11 | | | | 5,595 | | | | 5,552 |
| Class D, 5.49% 4/6/12 | | | | 6,425 | | | | 6,367 |
| Class E1, 6.62% 5/6/13 (c) | | | | 6,890 | | | | 6,885 |
| Ameriquest Mortgage Securities, Inc.: | | | | | | | | |
| Series 2003-3 Class M1, 5.7594% 3/25/33 (g) | | | | 4,892 | | | | 4,916 |
| Series 2004-R2: | | | | | | | | |
| Class M1, 5.3894% 4/25/34 (g) | | | | 1,525 | | | | 1,525 |
| Class M2, 5.4394% 4/25/34 (g) | | | | 1,175 | | | | 1,175 |
See accompanying notes which are an integral part of the financial statements.
23 Annual Report
| Investments continued | | | | | | | | |
| |
| |
| Asset Backed Securities continued | | | | | | | | |
| | | | | Principal | | Value (Note 1) |
| | | | | Amount (000s) | | (000s) |
| Amortizing Residential Collateral Trust Series 2002-BC3 | | | | | | | | |
| Class A, 5.2894% 6/25/32 (g) | | | | $ 914 | | | | $ 917 |
| ARG Funding Corp. Series 2005-1A Class A1, 4.02% | | | | | | | | |
| 4/20/09 (c) | | | | 3,000 | | | | 2,926 |
| Argent Securities, Inc. Series 2004-W7: | | | | | | | | |
| Class M1, 5.5094% 5/25/34 (g) | | | | 4,965 | | | | 5,000 |
| Class M2, 5.5594% 5/25/34 (g) | | | | 4,035 | | | | 4,062 |
| Asset Backed Securities Corp. Home Equity Loan Trust | | | | | | | | |
| Series 2003-HE7 Class A3, 5.2613% 12/15/33 (g) | | | | 1,546 | | | | 1,551 |
| Bank One Issuance Trust: | | | | | | | | |
| Series 2002-B1 Class B1, 5.2813% 12/15/09 (g) | | | | 6,625 | | | | 6,642 |
| Series 2002-C1 Class C1, 5.8613% 12/15/09 (g) | | | | 9,450 | | | | 9,517 |
| Series 2004-B2 Class B2, 4.37% 4/15/12 | | | | 23,000 | | | | 22,297 |
| Bayview Financial Asset Trust Series 2003-F Class A, 5.5% | | | | | | | | |
| 9/28/43 (g) | | | | 6,286 | | | | 6,290 |
| Bear Stearns Asset Backed Securities I Series 2005-HE2: | | | | | | | | |
| Class M1, 5.4594% 2/25/35 (g) | | | | 8,255 | | | | 8,291 |
| Class M2, 5.7094% 2/25/35 (g) | | | | 3,010 | | | | 3,032 |
| Capital Auto Receivables Asset Trust Series 2006-1: | | | | | | | | |
| Class A3, 5.03% 10/15/09 | | | | 3,025 | | | | 3,011 |
| Class B, 5.26% 10/15/10 | | | | 2,875 | | | | 2,852 |
| Capital One Auto Finance Trust Series 2002-C Class A4, | | | | | | | | |
| 3.44% 6/15/09 | | | | 5,631 | | | | 5,586 |
| Capital One Multi-Asset Execution Trust: | | | | | | | | |
| Series 2003-B5 Class B5, 4.79% 8/15/13 | | | | 8,070 | | | | 7,811 |
| Series 2004-6 Class B, 4.15% 7/16/12 | | | | 13,275 | | | | 12,769 |
| CDC Mortgage Capital Trust Series 2004-HE2 Class M2, | | | | | | | | |
| 6.1594% 7/26/34 (g) | | | | 2,851 | | | | 2,875 |
| Cendant Timeshare Receivables Funding LLC Series 2005-1A | | | | | | | | |
| Class A1, 4.67% 5/20/17 (c) | | | | 4,822 | | | | 4,725 |
| CIT Equipment Collateral Trust Series 2006-VT1 Class A3, | | | | | | | | |
| 5.13% 12/21/08 | | | | 10,240 | | | | 10,208 |
| Citibank Credit Card Issuance Trust: | | | | | | | | |
| Series 2005-B1 Class B1, 4.4% 9/15/10 | | | | 32,115 | | | | 31,394 |
| Series 2006-B2 Class B2, 5.15% 3/7/11 | | | | 6,855 | | | | 6,807 |
| CNH Equipment Trust Series 2006-A Class A3, 5.2% 8/16/10 | | | | 7,330 | | | | 7,316 |
| Countrywide Home Loans, Inc.: | | | | | | | | |
| Series 2004-2 Class M1, 5.4594% 5/25/34 (g) | | | | 8,975 | | | | 9,001 |
| Series 2004-3 Class M1, 5.4594% 6/25/34 (g) | | | | 1,800 | | | | 1,806 |
| Crown Castle Towers LLC/Crown Atlantic Holdings Sub | | | | | | | | |
| LLC/Crown Communication, Inc. Series 2005-1A: | | | | | | | | |
| Class B, 4.878% 6/15/35 (c) | | | | 6,064 | | | | 5,851 |
| Class C, 5.074% 6/15/35 (c) | | | | 5,505 | | | | 5,293 |
See accompanying notes which are an integral part of the financial statements.
| Asset Backed Securities continued | | | | | | | | |
| | | | | Principal | | Value (Note 1) |
| | | | | Amount (000s) | | (000s) |
| Fieldstone Mortgage Investment Corp. Series 2003-1: | | | | | | | | |
| Class M1, 5.6394% 11/25/33 (g) | | | | $ 114 | | | | $ 114 |
| Class M2, 6.7094% 11/25/33 (g) | | | | 1,000 | | | | 1,005 |
| First Franklin Mortgage Loan Trust Series 2004-FF2: | | | | | | | | |
| Class M3, 5.5094% 3/25/34 (g) | | | | 500 | | | | 501 |
| Class M4, 5.8594% 3/25/34 (g) | | | | 375 | | | | 378 |
| Ford Credit Auto Owner Trust Series 2006-A Class A3, 5.05% | | | | | | | | |
| 11/15/09 | | | | 7,080 | | | | 7,052 |
| Fremont Home Loan Trust: | | | | | | | | |
| Series 2004 A: | | | | | | | | |
| Class M1, 5.5094% 1/25/34 (g) | | | | 5,569 | | | | 5,602 |
| Class M2, 6.1094% 1/25/34 (g) | | | | 6,475 | | | | 6,533 |
| Series 2005 A: | | | | | | | | |
| Class M1, 5.3894% 1/25/35 (g) | | | | 2,000 | | | | 2,011 |
| Class M2, 5.4194% 1/25/35 (g) | | | | 2,875 | | | | 2,887 |
| Class M3, 5.4494% 1/25/35 (g) | | | | 1,550 | | | | 1,559 |
| Class M4, 5.6394% 1/25/35 (g) | | | | 1,125 | | | | 1,136 |
| GCO Slims Trust Series 2006-1A, 5.72% 3/1/22 (c) | | | | 8,500 | | | | 8,354 |
| GSAMP Trust: | | | | | | | | |
| Series 2002-HE Class M1, 6.1725% 11/20/32 (g) | | | | 4,247 | | | | 4,258 |
| Series 2004-FM2: | | | | | | | | |
| Class M1, 5.4594% 1/25/34 (g) | | | | 3,270 | | | | 3,270 |
| Class M2, 6.0594% 1/25/34 (g) | | | | 1,800 | | | | 1,800 |
| Class M3, 6.2594% 1/25/34 (g) | | | | 1,800 | | | | 1,800 |
| Home Equity Asset Trust Series 2003-2 Class M1, 5.8394% | | | | | | | | |
| 8/25/33 (g) | | | | 3,183 | | | | 3,195 |
| Household Home Equity Loan Trust: | | | | | | | | |
| Series 2003-2 Class M, 5.5025% 9/20/33 (g) | | | | 1,067 | | | | 1,068 |
| Series 2004-1 Class M, 5.4425% 9/20/33 (g) | | | | 2,040 | | | | 2,047 |
| HSBC Home Equity Loan Trust Series 2005-2: | | | | | | | | |
| Class M1, 5.2363% 1/20/35 (g) | | | | 2,471 | | | | 2,475 |
| Class M2, 5.2663% 1/20/35 (g) | | | | 1,853 | | | | 1,858 |
| Hyundai Auto Receivables Trust: | | | | | | | | |
| Series 2004-1 Class A4, 5.26% 11/15/12 | | | | 6,095 | | | | 6,078 |
| Series 2006-1: | | | | | | | | |
| Class A3, 5.13% 6/15/10 | | | | 2,285 | | | | 2,281 |
| Class B, 5.29% 11/15/12 | | | | 940 | | | | 938 |
| Class C, 5.34% 11/15/12 | | | | 1,225 | | | | 1,222 |
| Long Beach Mortgage Loan Trust Series 2004-2: | | | | | | | | |
| Class M1, 5.4894% 6/25/34 (g) | | | | 5,225 | | | | 5,235 |
| Class M2, 6.0394% 6/25/34 (g) | | | | 1,705 | | | | 1,720 |
| MBNA Credit Card Master Note Trust: | | | | | | | | |
| Series 2002-B4 Class B4, 5.4013% 3/15/10 (g) | | | | 6,335 | | | | 6,372 |
See accompanying notes which are an integral part of the financial statements.
25 Annual Report
| Investments continued | | | | | | | | |
| |
| |
| Asset Backed Securities continued | | | | | | | | |
| | | | | Principal | | Value (Note 1) |
| | | | | Amount (000s) | | (000s) |
| MBNA Credit Card Master Note Trust: – continued | | | | | | | | |
| Series 2003-B2 Class B2, 5.2913% 10/15/10 (g) | | | | $ 1,805 | | | | $ 1,816 |
| Meritage Mortgage Loan Trust Series 2004-1: | | | | | | | | |
| Class M1, 5.4594% 7/25/34 (g) | | | | 2,625 | | | | 2,625 |
| Class M2, 5.5094% 7/25/34 (g) | | | | 450 | | | | 450 |
| Class M3, 5.9094% 7/25/34 (g) | | | | 955 | | | | 955 |
| Class M4, 6.0594% 7/25/34 (g) | | | | 650 | | | | 651 |
| Merrill Lynch Mortgage Investors, Inc.: | | | | | | | | |
| Series 2003-HE1 Class M1, 5.6594% 7/25/34 (g) | | | | 3,105 | | | | 3,128 |
| Series 2003-OPT1 Class M1, 5.6094% 7/25/34 (g) | | | | 6,775 | | | | 6,816 |
| Morgan Stanley ABS Capital I, Inc. Series 2003-NC7 | | | | | | | | |
| Class M1, 5.6594% 6/25/33 (g) | | | | 2,586 | | | | 2,594 |
| Morgan Stanley Dean Witter Capital I Trust: | | | | | | | | |
| Series 2001-NC4 Class M1, 5.9594% 1/25/32 (g) | | | | 4,293 | | | | 4,297 |
| Series 2002-NC3 Class A3, 5.2994% 8/25/32 (g) | | | | 89 | | | | 89 |
| National Collegiate Funding LLC Series 2004-GT1 Class IO1, | | | | | | | | |
| 7.87% 6/25/10 (c)(g)(i) | | | | 10,160 | | | | 2,906 |
| National Collegiate Student Loan Trust: | | | | | | | | |
| Series 2004-2 Class AIO, 9.75% 10/25/14 (i) | | | | 10,350 | | | | 4,672 |
| Series 2005-GT1 Class AIO, 6.75% 12/25/09 (i) | | | | 5,100 | | | | 1,152 |
| Nissan Auto Lease Trust Series 2003-A Class A3B, 2.57% | | | | | | | | |
| 6/15/09 | | | | 2,751 | | | | 2,736 |
| Park Place Securities, Inc. Series 2005-WCH1 Class M2, | | | | | | | | |
| 5.4794% 1/25/35 (g) | | | | 5,025 | | | | 5,049 |
| Providian Master Note Trust Series 2006-B1A Class B1, 5.35% | | | | | | | | |
| 3/15/13 (c) | | | | 13,865 | | | | 13,817 |
| Salomon Brothers Mortgage Securities VII, Inc. | | | | | | | | |
| Series 2003-UP1 Class A, 3.45% 4/25/32 (c) | | | | 2,956 | | | | 2,815 |
| Structured Asset Securities Corp. Series 2004-GEL1 Class A, | | | | | | | | |
| 5.3194% 2/25/34 (g) | | | | 733 | | | | 732 |
| Superior Wholesale Inventory Financing Trust VII | | | | | | | | |
| Series 2003-A8 Class CTFS, 5.3513% 3/15/11 (c)(g) | | | | 8,835 | | | | 8,834 |
| Superior Wholesale Inventory Financing Trust XII | | | | | | | | |
| Series 2005-A12: | | | | | | | | |
| Class B, 5.3813% 6/15/10 (g) | | | | 7,360 | | | | 7,343 |
| Class C, 6.1013% 6/15/10 (g) | | | | 3,680 | | | | 3,689 |
| Terwin Mortgage Trust Series 2003-4HE Class A1, 5.3894% | | | | | | | | |
| 9/25/34 (g) | | | | 1,019 | | | | 1,023 |
| Triad Auto Receivables Owner Trust Series 2002-A Class A4, | | | | | | | | |
| 3.24% 8/12/09 | | | | 5,638 | | | | 5,586 |
See accompanying notes which are an integral part of the financial statements.
| Asset Backed Securities continued | | | | | | | | |
| | | | | Principal | | Value (Note 1) |
| | | | | Amount (000s) | | (000s) |
| WFS Financial Owner Trust Series 2004-3 Class A4, 3.93% | | | | | | | | |
| 2/17/12 | | | | $ 13,280 | | | | $ 13,008 |
| World Omni Auto Receivables Trust Series 2006-A Class A3, | | | | | | | | |
| 5.01% 10/15/10 | | | | 6,805 | | | | 6,778 |
| TOTAL ASSET BACKED SECURITIES | | | | | | | | |
| (Cost $446,296) | | | | | | | | 443,485 |
| |
| Collateralized Mortgage Obligations 4.2% | | | | | | | | |
| |
| Private Sponsor 2.1% | | | | | | | | |
| Adjustable Rate Mortgage Trust floater: | | | | | | | | |
| Series 2004-1 Class 9A2, 5.3594% 1/25/34 (g) | | | | 3,200 | | | | 3,211 |
| Series 2005-2 Class 6A2, 5.2394% 6/25/35 (g) | | | | 1,895 | | | | 1,897 |
| Bank of America Mortgage Securities, Inc. Series 2005-E Class | | | | | | | | |
| 2A7, 4.6134% 6/25/35 (g) | | | | 8,095 | | | | 7,867 |
| Bear Stearns Adjustable Rate Mortgage Trust Series 2005-6 | | | | | | | | |
| Class 1A1, 5.1215% 8/25/35 (g) | | | | 17,897 | | | | 17,760 |
| CS First Boston Mortgage Securities Corp. floater: | | | | | | | | |
| Series 2004-AR3 Class 6A2, 5.3294% 4/25/34 (g) | | | | 1,255 | | | | 1,256 |
| Series 2004-AR6 Class 9A2, 5.3294% 10/25/34 (g) | | | | 2,612 | | | | 2,617 |
| Granite Master Issuer PLC floater Series 2006-1A Class C2, | | | | | | | | |
| 5.2569% 12/20/54 (c)(g) | | | | 6,300 | | | | 6,298 |
| JPMorgan Mortgage Trust Series 2005-A8 Class 2A3, | | | | | | | | |
| 4.9624% 11/25/35 (g) | | | | 2,290 | | | | 2,233 |
| Master Seasoned Securitization Trust Series 2004-1 Class 1A1, | | | | | | | | |
| 6.237% 8/25/17 (g) | | | | 6,674 | | | | 6,715 |
| Merrill Lynch Mortgage Investors, Inc.: | | | | | | | | |
| floater Series 2005-B Class A2, 4.79% 7/25/30 (g) | | | | 7,879 | | | | 7,873 |
| Series 2003-E Class XA1, 0.9967% 10/25/28 (g)(i) | | | | 40,609 | | | | 370 |
| Series 2003-G Class XA1, 1% 1/25/29 (i) | | | | 36,061 | | | | 364 |
| Series 2003-H Class XA1, 1% 1/25/29 (c)(i) | | | | 31,402 | | | | 325 |
| Opteum Mortgage Acceptance Corp. floater Series 2005-3 | | | | | | | | |
| Class APT, 5.2494% 7/25/35 (g) | | | | 6,115 | | | | 6,120 |
| Residential Asset Mortgage Products, Inc. sequential pay: | | | | | | | | |
| Series 2003-SL1 Class A31, 7.125% 4/25/31 | | | | 4,631 | | | | 4,631 |
| Series 2004-SL2 Class A1, 6.5% 10/25/16 | | | | 1,253 | | | | 1,267 |
| Residential Finance LP/Residential Finance Development Corp. | | | | | | | | |
| floater Series 2003-CB1: | | | | | | | | |
| Class B3, 6.2988% 6/10/35 (c)(g) | | | | 4,002 | | | | 4,080 |
| Class B4, 6.4988% 6/10/35 (c)(g) | | | | 3,581 | | | | 3,656 |
| Class B5, 7.0988% 6/10/35 (c)(g) | | | | 2,446 | | | | 2,504 |
| Class B6, 7.5988% 6/10/35 (c)(g) | | | | 1,449 | | | | 1,488 |
See accompanying notes which are an integral part of the financial statements.
27 Annual Report
| Investments continued | | | | | | | | |
| |
| |
| Collateralized Mortgage Obligations continued | | | | | | | | |
| | | | | Principal | | Value (Note 1) |
| | | | | Amount (000s) | | (000s) |
| Private Sponsor continued | | | | | | | | |
| Residential Funding Securities Corp. Series 2003-RP2 | | | | | | | | |
| Class A1, 5.4094% 6/25/33 (c)(g) | | | | $ 3,544 | | | | $ 3,559 |
| Sequoia Mortgage Funding Trust Series 2003-A Class AX1, | | | | | | | | |
| 0.8% 10/21/08 (c)(i) | | | | 122,204 | | | | 576 |
| Sequoia Mortgage Trust floater Series 2004-8 Class A2, 5.31% | | | | | | | | |
| 9/20/34 (g) | | | | 5,839 | | | | 5,845 |
| Wachovia Mortgage Loan Trust LLC Series 2005-B Class 2A4, | | | | | | | | |
| 5.1893% 10/20/35 (g) | | | | 1,835 | | | | 1,805 |
| WAMU Mortgage pass thru certificates floater | | | | | | | | |
| Series 2005-AR13 Class A1C1, 5.1494% 10/25/45 (g) | | | | 9,692 | | | | 9,686 |
| Washington Mutual Mortgage Securities Corp. sequential pay: | | | | | | | | |
| Series 2003-MS9 Class 2A1, 7.5% 12/25/33 | | | | 1,245 | | | | 1,261 |
| Series 2004-RA2 Class 2A, 7% 7/25/33 | | | | 1,861 | | | | 1,900 |
| Wells Fargo Mortgage Backed Securities Trust: | | | | | | | | |
| Series 2005-AR10 Class 2A2, 4.1095% 6/25/35 (g) | | | | 14,543 | | | | 14,204 |
| Series 2005-AR4 Class 2A2, 4.5306% 4/25/35 (g) | | | | 12,488 | | | | 12,155 |
| Series 2005-AR9 Class 2A1, 4.3623% 5/25/35 (g) | | | | 7,076 | | | | 6,962 |
| Series 2006-AR8 Class 2A6, 5.24% 4/25/36 (g) | | | | 18,835 | | | | 18,625 |
| |
| TOTAL PRIVATE SPONSOR | | | | | | | | 159,110 |
| U.S. Government Agency 2.1% | | | | | | | | |
| Fannie Mae planned amortization class Series 2003-39 | | | | | | | | |
| Class PV, 5.5% 9/25/22 | | | | 15,835 | | | | 15,677 |
| Fannie Mae guaranteed REMIC pass thru certificates: | | | | | | | | |
| planned amortization class: | | | | | | | | |
| Series 2002-73 Class QC, 5.5% 1/25/26 | | | | 10,723 | | | | 10,712 |
| Series 2003-84 Class GC, 4.5% 5/25/15 | | | | 7,965 | | | | 7,721 |
| Series 2005-67 Class HD, 5.5% 12/25/30 | | | | 14,745 | | | | 14,626 |
| sequential pay: | | | | | | | | |
| Series 2004-3 Class BA, 4% 7/25/17 | | | | 945 | | | | 902 |
| Series 2004-45 Class AV, 4.5% 10/25/22 | | | | 6,985 | | | | 6,881 |
| Series 2004-86 Class KC, 4.5% 5/25/19 | | | | 4,047 | | | | 3,895 |
| Series 2004-91 Class AH, 4.5% 5/25/29 | | | | 8,143 | | | | 7,908 |
| Series 2005-41 Class LA, 5.5% 5/25/35 | | | | 11,616 | | | | 11,394 |
| Freddie Mac: | | | | | | | | |
| planned amortization class: | | | | | | | | |
| Series 2104 Class PG, 6% 12/15/28 | | | | 8,225 | | | | 8,244 |
| Series 3033 Class UD, 5.5% 10/15/30 | | | | 5,585 | | | | 5,539 |
| sequential pay Series 2516 Class AH, 5% 1/15/16 | | | | 4,542 | | | | 4,502 |
See accompanying notes which are an integral part of the financial statements.
| Collateralized Mortgage Obligations continued | | | | | | | | |
| | | | | Principal | | Value (Note 1) |
| | | | | Amount (000s) | | (000s) |
| U.S. Government Agency continued | | | | | | | | |
| Freddie Mac Multi-class participation certificates guaranteed: | | | | | | | | |
| planned amortization class: | | | | | | | | |
| Series 2425 Class JH, 6% 3/15/17 | | | | $ 6,945 | | | | $ 7,019 |
| Series 2489 Class PD, 6% 2/15/31 | | | | 3,516 | | | | 3,528 |
| Series 2543 Class QT, 5.5% 4/15/22 | | | | 10,607 | | | | 10,408 |
| Series 2702 Class WB, 5% 4/15/17 | | | | 13,170 | | | | 12,922 |
| Series 3018 Class UD, 5.5% 9/15/30 | | | | 9,030 | | | | 8,953 |
| sequential pay: | | | | | | | | |
| Series 2777 Class AB, 4.5% 6/15/29 | | | | 18,520 | | | | 17,977 |
| Series 2809 Class UA, 4% 12/15/14 | | | | 5,498 | | | | 5,366 |
| |
| TOTAL U.S. GOVERNMENT AGENCY | | | | | | | | 164,174 |
| |
| TOTAL COLLATERALIZED MORTGAGE OBLIGATIONS | | | | | | | | |
| (Cost $326,988) | | | | | | | | 323,284 |
| |
| Commercial Mortgage Securities 6.1% | | | | | | | | |
| |
| Asset Securitization Corp.: | | | | | | | | |
| sequential pay Series 1995-MD4 Class A1, 7.1% 8/13/29 | | | | 521 | | | | 528 |
| Series 1997-D5 Class PS1, 1.107% 2/14/43 (g)(i) | | | | 95,030 | | | | 3,984 |
| Banc of America Commercial Mortgage, Inc.: | | | | | | | | |
| sequential pay: | | | | | | | | |
| Series 2004-2 Class A3, 4.05% 11/10/38 | | | | 6,527 | | | | 6,154 |
| Series 2004-4 Class A3, 4.128% 7/10/42 | | | | 7,860 | | | | 7,573 |
| Series 2003-2 Class XP, 0.4123% 3/11/41 (c)(g)(i) | | | | 160,844 | | | | 1,683 |
| Banc of America Large Loan, Inc.: | | | | | | | | |
| floater Series 2003-BBA2: | | | | | | | | |
| Class A3, 5.2213% 11/15/15 (c)(g) | | | | 6,740 | | | | 6,746 |
| Class C, 5.3713% 11/15/15 (c)(g) | | | | 1,385 | | | | 1,388 |
| Class D, 5.4513% 11/15/15 (c)(g) | | | | 2,155 | | | | 2,165 |
| Class F, 5.8013% 11/15/15 (c)(g) | | | | 1,535 | | | | 1,540 |
| Class H, 6.3013% 11/15/15 (c)(g) | | | | 1,385 | | | | 1,393 |
| Class J, 6.8513% 11/15/15 (c)(g) | | | | 1,430 | | | | 1,442 |
| Class K, 7.5013% 11/15/15 (c)(g) | | | | 1,290 | | | | 1,284 |
| Series 2006-ESH: | | | | | | | | |
| Class A, 5.74% 7/14/11 (c)(g) | | | | 3,771 | | | | 3,756 |
| Class B, 5.84% 7/14/11 (c)(g) | | | | 1,881 | | | | 1,873 |
| Class C, 5.99% 7/14/11 (c)(g) | | | | 3,766 | | | | 3,751 |
| Class D, 6.62% 7/14/11 (c)(g) | | | | 2,189 | | | | 2,182 |
See accompanying notes which are an integral part of the financial statements.
29 Annual Report
| Investments continued | | | | | | | | |
| |
| |
| Commercial Mortgage Securities continued | | | | | | | | |
| | | | | Principal | | Value (Note 1) |
| | | | | Amount (000s) | | (000s) |
| Bank of America Large Loan, Inc. floater: | | | | | | | | |
| Series 2005 ESHA: | | | | | | | | |
| Class E, 5.46% 7/14/20 (c)(g) | | | | $ 3,695 | | | | $ 3,709 |
| Class F, 5.63% 7/14/20 (c)(g) | | | | 2,230 | | | | 2,238 |
| Class G, 5.76% 7/14/20 (c)(g) | | | | 1,115 | | | | 1,119 |
| Class H, 5.98% 7/14/20 (c)(g) | | | | 1,485 | | | | 1,490 |
| Series 2005-MIB1: | | | | | | | | |
| Class C, 5.2113% 3/15/22 (c)(g) | | | | 1,710 | | | | 1,709 |
| Class D, 5.2613% 3/15/22 (c)(g) | | | | 1,730 | | | | 1,729 |
| Class F, 5.3713% 3/15/22 (c)(g) | | | | 1,685 | | | | 1,684 |
| Class G, 5.4313% 3/15/22 (c)(g) | | | | 1,090 | | | | 1,089 |
| Bayview Commercial Asset Trust: | | | | | | | | |
| floater: | | | | | | | | |
| Series 2004-1: | | | | | | | | |
| Class A, 5.3194% 4/25/34 (c)(g) | | | | 6,622 | | | | 6,630 |
| Class B, 6.8594% 4/25/34 (c)(g) | | | | 767 | | | | 774 |
| Class M1, 5.5194% 4/25/34 (c)(g) | | | | 627 | | | | 629 |
| Class M2, 6.1594% 4/25/34 (c)(g) | | | | 558 | | | | 563 |
| Series 2004-2: | | | | | | | | |
| Class A, 5.3894% 8/25/34 (c)(g) | | | | 6,727 | | | | 6,748 |
| Class M1, 5.5394% 8/25/34 (c)(g) | | | | 2,172 | | | | 2,184 |
| Series 2004-3: | | | | | | | | |
| Class A1, 5.3294% 1/25/35 (c)(g) | | | | 7,708 | | | | 7,727 |
| Class A2, 5.3794% 1/25/35 (c)(g) | | | | 1,065 | | | | 1,066 |
| Class M1, 5.4594% 1/25/35 (c)(g) | | | | 1,320 | | | | 1,323 |
| Class M2, 5.9594% 1/25/35 (c)(g) | | | | 852 | | | | 861 |
| Series 2005-4A: | | | | | | | | |
| Class A2, 5.3494% 1/25/36 (c)(g) | | | | 9,318 | | | | 9,324 |
| Class B1, 6.3594% 1/25/36 (c)(g) | | | | 785 | | | | 793 |
| Class M1, 5.4094% 1/25/36 (c)(g) | | | | 2,942 | | | | 2,950 |
| Class M2, 5.4294% 1/25/36 (c)(g) | | | | 883 | | | | 886 |
| Class M3, 5.4594% 1/25/36 (c)(g) | | | | 1,275 | | | | 1,279 |
| Class M4, 5.5694% 1/25/36 (c)(g) | | | | 687 | | | | 689 |
| Class M5, 5.6094% 1/25/36 (c)(g) | | | | 687 | | | | 689 |
| Class M6, 5.6594% 1/25/36 (c)(g) | | | | 785 | | | | 788 |
| Series 2004-1 Class IO, 1.25% 4/25/34 (c)(i) | | | | 71,686 | | | | 3,965 |
| Bear Stearns Commercial Mortgage Securities, Inc.: | | | | | | | | |
| Series 2003-PWR2 Class X2, 0.5776% 5/11/39 (c)(g)(i) | | | | 121,066 | | | | 2,499 |
| Series 2003-T12 Class X2, 0.7259% 8/13/39 (c)(g)(i) | | | | 111,711 | | | | 2,396 |
See accompanying notes which are an integral part of the financial statements.
| Commercial Mortgage Securities continued | | | | | | | | | | |
| | | | | | | Principal | | Value (Note 1) |
| | | | | | | Amount (000s) | | (000s) |
| Bear Stearns Commercial Mortgage Securities, Inc.: - | | | | | | | | | | |
| continued | | | | | | | | | | |
| Series 2004 ESA: | | | | | | | | | | |
| Class C, 4.937% 5/14/16 (c) | | | | | | $ 970 | | | | $ 958 |
| Class D, 4.986% 5/14/16 (c) | | | | | | 1,650 | | | | 1,631 |
| Class E, 5.064% 5/14/16 (c) | | | | | | 5,120 | | | | 5,079 |
| Class F, 5.182% 5/14/16 (c) | | | | | | 1,230 | | | | 1,222 |
| CDC Commercial Mortgage Trust Series 2002-FX1 Class XCL, | | | | | | | | | | |
| 0.6989% 5/15/35 (c)(g)(i) | | | | | | 120,453 | | | | 6,601 |
| Chase Commercial Mortgage Securities Corp.: | | | | | | | | | | |
| sequential pay Series 1999-2 Class A1, 7.032% 1/15/32 | | . | | | | 1,746 | | | | 1,752 |
| Series 1999-2: | | | | | | | | | | |
| Class E, 7.734% 1/15/32 | | | | | | 4,010 | | | | 4,297 |
| Class F, 7.734% 1/15/32 | | | | | | 2,170 | | | | 2,322 |
| COMM: | | | | | | | | | | |
| floater Series 2002-FL7 Class D, 5.4713% 11/15/14 (c)(g) | | | | | | 697 | | | | 698 |
| sequential pay Series 1999-1 Class A2, 6.455% 5/15/32 | | . | | | | 11,760 | | | | 11,995 |
| Series 2004-LBN2 Class X2, 1.0437% 3/10/39 (c)(g)(i) | | | | | | 19,214 | | | | 612 |
| Commercial Mortgage Asset Trust sequential pay | | | | | | | | | | |
| Series 1999-C2 Class A2, 7.546% 11/17/32 (g) | | | | | | 11,450 | | | | 12,091 |
| Commercial Mortgage pass thru certificates floater: | | | | | | | | | | |
| Series 2004-HTL1: | | | | | | | | | | |
| Class B, 5.3513% 7/15/16 (c)(g) | | | | | | 230 | | | | 230 |
| Class D, 5.4513% 7/15/16 (c)(g) | | | | | | 524 | | | | 524 |
| Class E, 5.6513% 7/15/16 (c)(g) | | | | | | 373 | | | | 373 |
| Class F, 5.7013% 7/15/16 (c)(g) | | | | | | 395 | | | | 395 |
| Class H, 6.2013% 7/15/16 (c)(g) | | | | | | 1,145 | | | | 1,146 |
| Class J, 6.3513% 7/15/16 (c)(g) | | | | | | 439 | | | | 439 |
| Class K, 7.2513% 7/15/16 (c)(g) | | | | | | 493 | | | | 494 |
| Series 2005-FL11: | | | | | | | | | | |
| Class B, 5.1513% 11/15/17 (c)(g) | | | | | | 3,719 | | | | 3,719 |
| Class E, 5.2913% 11/15/17 (c)(g) | | | | | | 1,685 | | | | 1,684 |
| Class F, 5.3513% 11/15/17 (c)(g) | | | | | | 1,530 | | | | 1,530 |
| CS First Boston Mortgage Securities Corp.: | | | | | | | | | | |
| floater Series 2004-HC1: | | | | | | | | | | |
| Class A2, 5.4013% 12/15/21 (c)(g) | | | | | | 1,935 | | | | 1,935 |
| Class B, 5.6513% 12/15/21 (c)(g) | | | | | | 5,040 | | | | 5,040 |
| sequential pay: | | | | | | | | | | |
| Series 1998-C1 Class A1B, 6.48% 5/17/40 | | | | | | 13,695 | | | | 13,957 |
| Series 1999-C1 Class A2, 7.29% 9/15/41 | | | | | | 11,361 | | | | 11,899 |
| Series 2004-C1 Class A4, 4.75% 1/15/37 | | | | | | 3,960 | | | | 3,724 |
See accompanying notes which are an integral part of the financial statements.
31 Annual Report
| Investments continued | | | | | | |
| |
| |
| Commercial Mortgage Securities continued | | | | | | |
| | | Principal | | Value (Note 1) |
| | | Amount (000s) | | (000s) |
| CS First Boston Mortgage Securities Corp.: – continued | | | | | | |
| Series 2001-CKN5 Class AX, 0.9073% 9/15/34 (c)(g)(i) | | $ 109,163 | | | | $ 6,146 |
| Series 2003-C4 Class ASP, 0.4324% 8/15/36 (c)(g)(i) | | 98,789 | | | | 1,430 |
| Series 2004-C1 Class ASP, 0.9369% 1/15/37 (c)(g)(i) | | 92,452 | | | | 2,894 |
| Deutsche Mortgage & Asset Receiving Corp. sequential pay | | | | | | |
| Series 1998-C1 Class D, 7.231% 6/15/31 | | 11,355 | | | | 11,777 |
| DLJ Commercial Mortgage Corp. sequential pay | | | | | | |
| Series 2000-CF1 Class A1A, 7.45% 6/10/33 | | 1,813 | | | | 1,819 |
| Equitable Life Assurance Society of the United States | | | | | | |
| sequential pay Series 174 Class A1, 7.24% | | | | | | |
| 5/15/06 (c) | | 6,000 | | | | 6,005 |
| First Union-Lehman Brothers Commercial Mortgage | | | | | | |
| Trust sequential pay Series 1997-C2 Class A3, 6.65% | | | | | | |
| 11/18/29 | | 4,249 | | | | 4,301 |
| GE Capital Commercial Mortgage Corp. Series 2001-1 | | | | | | |
| Class X1, 0.4789% 5/15/33 (c)(g)(i) | | 88,933 | | | | 3,039 |
| GGP Mall Properties Trust sequential pay Series 2001-C1A | | | | | | |
| Class A2, 5.007% 11/15/11 (c) | | 6,909 | | | | 6,900 |
| Ginnie Mae guaranteed Multi-family pass thru securities | | | | | | |
| sequential pay Series 2002-35 Class C, 5.8884% | | | | | | |
| 10/16/23 (g) | | 1,656 | | | | 1,677 |
| Ginnie Mae guaranteed REMIC pass thru securities | | | | | | |
| sequential pay Series 2003-47 Class C, 4.227% | | | | | | |
| 10/16/27 | | 15,506 | | | | 14,953 |
| GMAC Commercial Mortgage Securities, Inc.: | | | | | | |
| sequential pay Series 1997-C2 Class A3, 6.566% | | | | | | |
| 4/15/29 | | 4,494 | | | | 4,557 |
| Series 2003-C3 Class X2, 0.7143% 12/10/38 (c)(g)(i) | | 117,141 | | | | 2,731 |
| Series 2004-C3 Class X2, 0.7315% 12/10/41 (g)(i) | | 70,097 | | | | 1,747 |
| Greenwich Capital Commercial Funding Corp.: | | | | | | |
| Series 2003-C1 Class XP, 2.0977% 7/5/35 (c)(g)(i) | | 75,603 | | | | 4,329 |
| Series 2003-C2 Class XP, 1.0327% 1/5/36 (c)(g)(i) | | 134,321 | | | | 4,382 |
| Series 2005-GG3 Class XP, 0.8029% 8/10/42 (c)(g)(i) | | 324,745 | | | | 9,926 |
| GS Mortgage Securities Corp. II: | | | | | | |
| sequential pay Series 2003-C1 Class A2A, 3.59% | | | | | | |
| 1/10/40 | | 10,690 | | | | 10,408 |
| Series 2001-LIBA Class C, 6.733% 2/14/16 (c) | | 4,130 | | | | 4,350 |
| Series 2005-GG4 Class XP, 0.7342% 7/10/39 (c)(g)(i) | | 243,635 | | | | 7,869 |
| Series 2006-GG6 Class A2, 5.506% 4/10/38 (g) | | 7,850 | | | | 7,850 |
See accompanying notes which are an integral part of the financial statements.
| Commercial Mortgage Securities continued | | | | | | | | |
| | | | | Principal | | Value (Note 1) |
| | | | | Amount (000s) | | (000s) |
| Hilton Hotel Pool Trust Series 2000-HLTA Class D, 7.555% | | | | | | | | |
| 10/3/15 (c) | | | | $ 7,290 | | | | $ 7,571 |
| Host Marriott Pool Trust sequential pay Series 1999-HMTA: | | | | | | | | |
| Class A, 6.98% 8/3/15 (c) | | | | 3,558 | | | | 3,650 |
| Class B, 7.3% 8/3/15 (c) | | | | 2,810 | | | | 2,962 |
| Class D, 7.97% 8/3/15 (c) | | | | 2,310 | | | | 2,483 |
| JPMorgan Chase Commercial Mortgage Securities Corp.: | | | | | | | | |
| Series 2004-C1 Class X2, 0.9964% 1/15/38 (c)(g)(i) | | | | 23,512 | | | | 833 |
| Series 2004-CB8 Class X2, 1.162% 1/12/39 (c)(g)(i) | | | | 28,786 | | | | 1,163 |
| LB-UBS Commercial Mortgage Trust: | | | | | | | | |
| sequential pay: | | | | | | | | |
| Series 2000-C3 Class A2, 7.95% 1/15/10 | | | | 10,855 | | | | 11,728 |
| Series 2003-C3 Class A2, 3.086% 5/15/27 | | | | 9,205 | | | | 8,816 |
| Series 2001-C3 Class B, 6.512% 6/15/36 | | | | 5,490 | | | | 5,738 |
| Series 2004-C2 Class XCP, 1.4108% 3/1/36 (c)(i) | | | | 64,009 | | | | 2,405 |
| Leafs CMBS I Ltd./Leafs CMBS I Corp. Series 2002-1A Class B, | | | | | | | | |
| 4.13% 11/20/37 (c) | | | | 5,000 | | | | 4,527 |
| Lehman Brothers Floating Rate Commercial Mortgage Trust | | | | | | | | |
| floater Series 2003-LLFA Class K1, 7.4513% | | | | | | | | |
| 12/16/14 (c)(g) | | | | 4,035 | | | | 4,004 |
| Morgan Stanley Capital I, Inc.: | | | | | | | | |
| sequential pay Series 1998-HF2 Class A2, 6.48% | | | | | | | | |
| 11/15/30 | | | | 5,218 | | | | 5,315 |
| Series 2003-IQ5 Class X2, 0.9879% 4/15/38 (c)(g)(i) | | | | 53,277 | | | | 1,720 |
| Series 2003-IQ6 Class X2, 0.5991% 12/15/41 (c)(g)(i) | | | | 93,948 | | | | 2,346 |
| Series 2005-IQ9 Class X2, 1.0698% 7/15/56 (c)(g)(i) | | | | 83,109 | | | | 3,640 |
| Morgan Stanley Dean Witter Capital I Trust floater | | | | | | | | |
| Series 2002-XLF Class F, 6.98% 8/5/14 (c)(g) | | | | 470 | | | | 468 |
| Mortgage Capital Funding, Inc. sequential pay | | | | | | | | |
| Series 1998-MC2 Class A2, 6.423% 6/18/30 | | | | 6,047 | | | | 6,144 |
| Prudential Securities Secured Financing Corp. sequential pay | | | | | | | | |
| Series 1998-C1 Class A1B, 6.506% 7/15/08 | | | | 7,220 | | | | 7,332 |
| Salomon Brothers Mortgage Securities VII, Inc. sequential pay | | | | | | | | |
| Series 2000-C3 Class A2, 6.592% 12/18/33 | | | | 11,242 | | | | 11,672 |
| Thirteen Affiliates of General Growth Properties, Inc. | | | | | | | | |
| sequential pay Series 1 Class A2, 6.602% | | | | | | | | |
| 11/15/07 (c) | | | | 5,000 | | | | 5,088 |
| Trizechahn Office Properties Trust Series 2001-TZHA: | | | | | | | | |
| Class C3, 6.522% 3/15/13 (c) | | | | 7,630 | | | | 7,745 |
See accompanying notes which are an integral part of the financial statements.
33 Annual Report
| Investments continued | | | | | | | | |
| |
| |
| Commercial Mortgage Securities continued | | | | | | | | |
| | | | | Principal | | Value (Note 1) |
| | | | | Amount (000s) | | (000s) |
| Trizechahn Office Properties Trust Series 2001-TZHA: - | | | | | | | | |
| continued | | | | | | | | |
| Class E3, 7.253% 3/15/13 (c) | | | | $ 3,166 | | | | $ 3,249 |
| Wachovia Bank Commercial Mortgage Trust: | | | | | | | | |
| sequential pay: | | | | | | | | |
| Series 2003-C8 Class A3, 4.445% 11/15/35 | | | | 13,550 | | | | 13,008 |
| Series 2005-C16 Class A2, 4.38% 10/15/41 | | | | 9,160 | | | | 8,853 |
| Series 2003-C8 Class XP, 0.6638% 11/15/35 (c)(g)(i) | | | | 72,454 | | | | 1,166 |
| Series 2003-C9 Class XP, 0.5908% 12/15/35 (c)(g)(i) | | | | 49,496 | | | | 929 |
| TOTAL COMMERCIAL MORTGAGE SECURITIES | | | | | | | | |
| (Cost $479,244) | | | | | | | | 466,964 |
| |
| Foreign Government and Government Agency Obligations 0.8% | | | | | | | | |
| |
| Israeli State (guaranteed by U.S. Government through Agency | | | | | | | | |
| for International Development) 4.625% 6/15/13 | | | | 2,440 | | | | 2,260 |
| Manitoba Province yankee 5.5% 10/1/08 | | | | 15,000 | | | | 15,072 |
| Saskatchewan Province 7.125% 3/15/08 | | | | 4,800 | | | | 4,959 |
| United Mexican States: | | | | | | | | |
| 5.625% 1/15/17 | | | | 29,270 | | | | 27,953 |
| 5.875% 1/15/14 | | | | 9,440 | | | | 9,336 |
| TOTAL FOREIGN GOVERNMENT AND | | | | | | | | |
| GOVERNMENT AGENCY OBLIGATIONS | | | | | | | | |
| (Cost $60,310) | | | | | | | | 59,580 |
| |
| Supranational Obligations 0.2% | | | | | | | | |
| |
| Corporacion Andina de Fomento 6.875% 3/15/12 | | | | | | | | |
| (Cost $10,366) | | | | 10,460 | | | | 10,943 |
| |
| Fixed Income Funds 12.8% | | | | | | | | |
| | | | | Shares | | | | |
| Fidelity Specialized High Income Central Investment | | | | | | | | |
| Portfolio (h) | | | | 750,338 | | | | 74,043 |
| Fidelity Ultra-Short Central Fund (h) | | | | 9,136,249 | | | | 908,965 |
| TOTAL FIXED INCOME FUNDS | | | | | | | | |
| (Cost $982,564) | | | | | | | | 983,008 |
See accompanying notes which are an integral part of the financial statements.
| Preferred Securities 0.1% | | | | | | | | | | |
| | | | | | | Principal | | Value (Note 1) |
| | | | | | | Amount (000s) | | (000s) |
| |
| FINANCIALS – 0.1% | | | | | | | | | | |
| Diversified Financial Services – 0.1% | | | | | | | | | | |
| MUFG Capital Finance 1 Ltd. 6.346% (g) | | | | | | | | | | |
| (Cost $10,465) | | | | | | $ 10,465 | | | | $ 10,362 |
| |
| Cash Equivalents 0.4% | | | | | | | | | | |
| | | | | | | Maturity | | | | |
| | | | | | | Amount (000s) | | | | |
| Investments in repurchase agreements (Collateralized by | | | | | | | | | | |
| U.S. Government Obligations), in a joint trading account at: | | | | | | | | | | |
| 4.78%, dated 4/28/06 due 5/1/06 | | | | | | $ 16,220 | | | | 16,214 |
| 4.79%, dated 4/28/06 due 5/1/06 (a) | | | | | | 16,256 | | | | 16,250 |
| TOTAL CASH EQUIVALENTS | | | | | | | | | | |
| (Cost $32,464) | | | | | | | | | | 32,464 |
| |
| TOTAL INVESTMENT PORTFOLIO 99.7% | | | | | | | | |
| (Cost $7,783,120) | | | | | | | | | | 7,635,688 |
| |
| NET OTHER ASSETS – 0.3% | | | | | | | | | | 22,643 |
| NET ASSETS 100% | | | | | | | | | | $ 7,658,331 |
| |
| |
| Swap Agreements | | | | | | | | | | |
| | | Expiration | | | | Notional | | | | Value |
| | | Date | | | | Amount (000s) | | | | (000s) |
| |
| Credit Default Swaps | | | | | | | | | | |
| Receive monthly notional amount multiplied | | | | | | | | | | |
| by 2.5% and pay Credit Suisse First Boston | | | | | | | | | | |
| upon default event of Ameriquest Mortgage | | | | | | | | | | |
| Securities, Inc., par value of the notional | | | | | | | | | | |
| amount of Ameriquest Mortgage Securities, | | | | | | | | | | |
| Inc. Series 2004 R11 Class M9, 8.03% | | | | | | | | | | |
| 11/25/34 | | Dec. 2034 | | | | $ 3,225 | | | | $ 16 |
| Receive monthly notional amount multiplied | | | | | | | | | | |
| by 3.05% and pay Merrill Lynch upon | | | | | | | | | | |
| default event of Morgan Stanley ABS | | | | | | | | | | |
| Capital I, Inc., par value of the proportional | | | | | | | | | | |
| notional amount of Morgan Stanley ABS | | | | | | | | | | |
| Capital I, Inc. Series 2004 NC8 Class B3, | | | | | | | | | | |
| 7.2913% 9/25/34 | | Oct. 2034 | | | | 2,300 | | | | 38 |
See accompanying notes which are an integral part of the financial statements.
35 Annual Report
| Investments continued | | | | | | | | | | |
| |
| |
| |
| Swap Agreements continued | | | | | | | | | | |
| |
| | | Expiration | | | | Notional | | | | Value |
| | | Date | | | | Amount (000s) | | | | (000s) |
| |
| Credit Default Swaps – continued | | | | | | | | | | |
| Receive monthly notional amount multiplied | | | | | | | | | | |
| by 3.35% and pay Morgan Stanley, Inc. | | | | | | | | | | |
| upon default event of Morgan Stanley ABS | | | | | | | | | | |
| Capital I, Inc., par value of the notional | | | | | | | | | | |
| amount of Morgan Stanley ABS Capital I, | | | | | | | | | | |
| Inc. Series 2004 HE7 Class B3, 7.6913% | | | | | | | | | | |
| 8/25/34 | | Sept. 2034 | | | | $ 2,086 | | | | $ 47 |
| Receive monthly notional amount multiplied | | | | | | | | | | |
| by 3.35% and pay Morgan Stanley, Inc. | | | | | | | | | | |
| upon default event of Morgan Stanley ABS | | | | | | | | | | |
| Capital I, Inc., par value of the notional | | | | | | | | | | |
| amount of Morgan Stanley ABS Capital I, | | | | | | | | | | |
| Inc. Series 2004 NC7 Class B3, 7.6913% | | | | | | | | | | |
| 7/25/34 | | August 2034 | | | | 2,086 | | | | 44 |
| Receive monthly notional amount multiplied | | | | | | | | | | |
| by 3.35% and pay Morgan Stanley, Inc. | | | | | | | | | | |
| upon default event of Morgan Stanley ABS | | | | | | | | | | |
| Capital I, Inc., par value of the notional | | | | | | | | | | |
| amount of Morgan Stanley ABS Capital I, | | | | | | | | | | |
| Inc. Series 2004 HE8 Class B3, 7.3913% | | | | | | | | | | |
| 9/25/34 | | Oct. 2034 | | | | 2,086 | | | | 50 |
| Receive monthly notional amount multiplied | | | | | | | | | | |
| by .82% and pay UBS upon default event | | | | | | | | | | |
| of Morgan Stanley ABS Capital I, Inc., par | | | | | | | | | | |
| value of the notional amount of Morgan | | | | | | | | | | |
| Stanley ABS Capital I, Inc. Series | | | | | | | | | | |
| 2004 NC6 Class M3, 5.6413% 7/25/34 | | August 2034 | | | | 2,086 | | | | 14 |
| Receive monthly notional amount multiplied | | | | | | | | | | |
| by .85% and pay UBS upon default event | | | | | | | | | | |
| of Ameriquest Mortgage Securities, Inc., | | | | | | | | | | |
| par value of the notional amount of | | | | | | | | | | |
| Ameriquest Mortgage Securities, Inc. | | | | | | | | | | |
| Series 2004 R9 Class M5, 5.5913% | | | | | | | | | | |
| 10/25/34 | | Nov. 2034 | | | | 2,086 | | | | 12 |
| Receive monthly notional amount multiplied | | | | | | | | | | |
| by .85% and pay UBS upon default event | | | | | | | | | | |
| of Morgan Stanley ABS Capital I, Inc., par | | | | | | | | | | |
| value of the notional amount of Morgan | | | | | | | | | | |
| Stanley ABS Capital I, Inc. Series | | | | | | | | | | |
| 2004 NC8 Class M6, 5.4413% 9/25/34 | | Oct. 2034 | | | | 2,086 | | | | 14 |
| |
| |
| |
| |
| See accompanying notes which are an integral part of the financial statements. | | | | |
| |
| Annual Report | | 36 | | | | | | | | |
| Swap Agreements continued | | | | | | | | | | |
| |
| | | Expiration | | Notional | | | | Value |
| | | Date | | Amount (000s) | | | | (000s) |
| |
| Credit Default Swaps – continued | | | | | | | | | | |
| Receive monthly notional amount multiplied | | | | | | | | | | |
| by 1.6% and pay Morgan Stanley, Inc. | | | | | | | | | | |
| upon default event of Park Place Securities, | | | | | | | | | | |
| Inc., par value of the notional amount of | | | | | | | | | | |
| Park Place Securities, Inc. Series | | | | | | | | | | |
| 2005 WHQ2 Class M7, 5.4413% | | | | | | | | | | |
| 5/25/35 | | June 2035 | | | | $ 1,910 | | | | $ 26 |
| Receive monthly notional amount multiplied | | | | | | | | | | |
| by 1.65% and pay Goldman Sachs upon | | | | | | | | | | |
| default event of Fieldstone Mortgage | | | | | | | | | | |
| Investment Corp., par value of the notional | | | | | | | | | | |
| amount of Fieldstone Mortgage Investment | | | | | | | | | | |
| Corp. Series 2004 2 Class M5, 6.3413% | | | | | | | | | | |
| 7/25/34 | | August 2034 | | | | 2,507 | | | | 17 |
| Receive monthly notional amount multiplied | | | | | | | | | | |
| by 1.66% and pay Morgan Stanley, Inc. | | | | | | | | | | |
| upon default event of Park Place Securities, | | | | | | | | | | |
| Inc., par value of the notional amount of | | | | | | | | | | |
| Park Place Securities, Inc. Series | | | | | | | | | | |
| 2005 WHQ2 Class M7, 5.4413% | | | | | | | | | | |
| 5/25/35 | | June 2035 | | | | 2,086 | | | | 32 |
| Receive monthly notional amount multiplied | | | | | | | | | | |
| by 2.54% and pay Merrill Lynch upon | | | | | | | | | | |
| default event of Countrywide Home Loans, | | | | | | | | | | |
| Inc., par value of the notional amount of | | | | | | | | | | |
| Countrywide Home Loans, Inc. Series | | | | | | | | | | |
| 2003 BC1 Class B1, 7.6913% 3/25/32 | | April 2032 | | | | 701 | | | | 3 |
| Receive monthly notional amount multiplied | | | | | | | | | | |
| by 2.61% and pay Goldman Sachs upon | | | | | | | | | | |
| default event of Fremont Home Loan Trust, | | | | | | | | | | |
| par value of the notional amount of | | | | | | | | | | |
| Fremont Home Loan Trust Series 2004 1 | | | | | | | | | | |
| Class M9, 7.3913% 2/25/34 | | March 2034 | | | | 2,505 | | | | 11 |
| Receive monthly notional amount multiplied | | | | | | | | | | |
| by 2.61% and pay Goldman Sachs upon | | | | | | | | | | |
| default event of Fremont Home Loan Trust, | | | | | | | | | | |
| par value of the notional amount of | | | | | | | | | | |
| Fremont Home Loan Trust Series 2004 A | | | | | | | | | | |
| Class B3, 7.0413% 1/25/34 | | Feb. 2034 | | | | 902 | | | | 2 |
| Receive monthly notional amount multiplied | | | | | | | | | | |
| by 5% and pay Deutsche Bank upon default | | | | | | | | | | |
| event of MASTR Asset Backed Securities | | | | | | | | | | |
| Trust, par value of the notional amount of | | | | | | | | | | |
| MASTR Asset Backed Securities Trust Series | | | | | | | | | | |
| 2003 NC1 Class M6, 8.1913% 4/25/33 | | May 2033 | | | | 2,086 | | | | 25 |
| |
| |
| |
| See accompanying notes which are an integral part of the financial statements. | | | | |
| |
| | | 37 | | | | | | Annual Report |
| Investments continued | | | | | | | | | | |
| |
| |
| |
| Swap Agreements continued | | | | | | | | | | |
| |
| | | Expiration | | Notional | | | | Value |
| | | Date | | Amount (000s) | | | | (000s) |
| |
| Credit Default Swaps – continued | | | | | | | | | | |
| Receive quarterly a fixed rate of .4% multiplied | | | | | | | | | | |
| by the notional amount and pay to Merrill | | | | | | | | | | |
| Lynch, Inc., upon each default event of one | | | | | | | | | | |
| of the issues of Dow Jones CDX N.A. | | | | | | | | | | |
| Investment Grade 4 Index, par value of the | | | | | | | | | | |
| proportional notional amount (f) | | June 2010 | | | | $ 55,000 | | | | $ 80 |
| Receive quarterly a fixed rate of .5% multiplied | | | | | | | | | | |
| by the notional amount and pay to Merrill | | | | | | | | | | |
| Lynch, Inc., upon each default event of one | | | | | | | | | | |
| of the issues of Dow Jones CDX N.A. | | | | | | | | | | |
| Investment Grade 3 Index, par value of the | | | | | | | | | | |
| proportional notional amount (e) | | March 2010 | | | | 34,720 | | | | 266 |
| Receive quarterly a fixed rate of .7% | | | | | | | | | | |
| multiplied by the notional amount and pay | | | | | | | | | | |
| to Deutsche Bank, upon each default event | | | | | | | | | | |
| of one of the issues of Dow Jones CDX | | | | | | | | | | |
| N.A. Investment Grade 3 Index, par value | | | | | | | | | | |
| of the proportional notional amount (e) | | March 2015 | | | | 34,720 | | | | 312 |
| Receive quarterly notional amount multiplied | | | | | | | | | | |
| by .30% and pay Deutsche Bank upon | | | | | | | | | | |
| default event of Entergy Corp., par value of | | | | | | | | | | |
| the notional amount of Entergy Corp. | | | | | | | | | | |
| 7.75% 12/15/09 | | March 2008 | | | | 11,850 | | | | 32 |
| Receive quarterly notional amount multiplied | | | | | | | | | | |
| by .30% and pay Goldman Sachs upon | | | | | | | | | | |
| default event of Entergy Corp., par value of | | | | | | | | | | |
| the notional amount of Entergy Corp. | | | | | | | | | | |
| 7.75% 12/15/09 | | March 2008 | | | | 8,635 | | | | 24 |
| Receive quarterly notional amount multiplied | | | | | | | | | | |
| by .35% and pay Goldman Sachs upon | | | | | | | | | | |
| default event of Southern California Edison | | | | | | | | | | |
| Co., par value of the notional amount of | | | | | | | | | | |
| Southern California Edison Co. 7.625% | | | | | | | | | | |
| 1/15/10 | | Sept. 2010 | | | | 8,500 | | | | 22 |
| Receive quarterly notional amount multiplied | | | | | | | | | | |
| by .37% and pay Goldman Sachs upon | | | | | | | | | | |
| default event of Pacific Gas & Electric Co., | | | | | | | | | | |
| par value of the notional amount of Pacific | | | | | | | | | | |
| Gas & Electric Co. 4.8% 3/1/14 | | March 2011 | | | | 7,100 | | | | 23 |
| |
| |
| |
| |
| See accompanying notes which are an integral part of the financial statements. | | | | |
| |
| Annual Report | | 38 | | | | | | | | |
| Swap Agreements continued | | | | | | | | | | |
| | | Expiration | | Notional | | Value (000s) |
| | | Date | | Amount (000s) | | | | |
| |
| Credit Default Swaps – continued | | | | | | | | | | |
| Receive quarterly notional amount multiplied | | | | | | | | | | |
| by .37% and pay Morgan Stanley, Inc. | | | | | | | | | | |
| upon default event of Pacific Gas & Electric | | | | | | | | | | |
| Co. par value of the notional amount of | | | | | | | | | | |
| Pacific Gas & Electric Co. 4.8% 3/1/14 | | March 2011 | | | | $ 6,625 | | | | $ 21 |
| Receive quarterly notional amount multiplied | | | | | | | | | | |
| by .41% and pay Merrill Lynch, Inc. upon | | | | | | | | | | |
| default event of Talisman Energy, Inc., par | | | | | | | | | | |
| value of the notional amount of Talisman | | | | | | | | | | |
| Energy, Inc. 7.25% 10/15/27 | | March 2009 | | | | 5,700 | | | | 41 |
| |
| TOTAL CREDIT DEFAULT SWAPS | | | | | | 203,588 | | | | 1,172 |
| Interest Rate Swaps | | | | | | | | | | |
| Receive quarterly a fixed rate equal to | | | | | | | | | | |
| 4.039% and pay quarterly a floating rate | | | | | | | | | | |
| based on 3 month LIBOR with Lehman | | | | | | | | | | |
| Brothers, Inc. | | Feb. 2010 | | | | 100,000 | | | | (4,495) |
| Receive quarterly a fixed rate equal to | | | | | | | | | | |
| 4.3875% and pay quarterly a floating rate | | | | | | | | | | |
| based on 3 month LIBOR with Credit Suisse | | | | | | | | | | |
| First Boston | | March 2010 | | | | 35,000 | | | | (1,147) |
| Receive quarterly a fixed rate equal to | | | | | | | | | | |
| 4.774% and pay quarterly a floating rate | | | | | | | | | | |
| based on 3 month LIBOR with Credit Suisse | | | | | | | | | | |
| First Boston | | March 2015 | | | | 35,000 | | | | (1,779) |
| Receive semi annually a fixed rate equal to | | | | | | | | | | |
| 4.708% and pay quarterly a floating rate | | | | | | | | | | |
| based on 3 month LIBOR with Citibank | | Jan. 2009 | | | | 200,000 | | | | (740) |
| Receive semi annually a fixed rate equal to | | | | | | | | | | |
| 4.7515% and pay quarterly a floating rate | | | | | | | | | | |
| based on 3 month LIBOR with UBS | | Jan. 2009 | | | | 100,000 | | | | (237) |
| Receive semi annually a fixed rate equal to | | | | | | | | | | |
| 4.756% and pay quarterly a floating rate | | | | | | | | | | |
| based on 3 month LIBOR with Lehman | | | | | | | | | | |
| Brothers, Inc. | | Jan. 2009 | | | | 150,000 | | | | (285) |
| Receive semi annually a fixed rate equal to | | | | | | | | | | |
| 4.8575% and pay quarterly a floating rate | | | | | | | | | | |
| based on 3 month LIBOR with Lehman | | | | | | | | | | |
| Brothers, Inc. | | Dec. 2008 | | | | 48,000 | | | | 57 |
| |
| |
| |
| |
| See accompanying notes which are an integral part of the financial statements. | | | | |
| |
| | | 39 | | | | | | Annual Report |
| Investments continued | | | | | | | | |
| |
| |
| |
| Swap Agreements continued | | | | | | | | |
| | | Expiration | | Notional | | Value (000s) |
| | | Date | | Amount (000s) | | | | |
| |
| Interest Rate Swaps continued | | | | | | | | |
| Receive semi annually a fixed rate equal to | | | | | | | | |
| 4.921% and pay quarterly a floating rate | | | | | | | | |
| based on 3 month LIBOR with Lehman | | | | | | | | |
| Brothers, Inc. | | Dec. 2008 | | $ 355,000 | | | | $ 1,037 |
| Receive semi annually a fixed rate equal to | | | | | | | | |
| 5.3315% and pay quarterly a floating rate | | | | | | | | |
| based on 3 month LIBOR with JPMorgan | | | | | | | | |
| Chase, Inc. | | April 2011 | | 100,000 | | | | (268) |
| |
| TOTAL INTEREST RATE SWAPS | | | | 1,123,000 | | | | (7,857) |
| Total Return Swaps | | | | | | | | |
| Receive monthly a return equal to Lehman | | | | | | | | |
| Brothers CMBS AAA 8.5+ Index and pay | | | | | | | | |
| monthly a floating rate based on 1 month | | | | | | | | |
| LIBOR with Citibank | | Sept. 2006 | | 34,400 | | | | (322) |
| Receive monthly a return equal to Lehman | | | | | | | | |
| Brothers CMBS U.S. Aggregate Index and | | | | | | | | |
| pay monthly a floating rate based on | | | | | | | | |
| 1 month LIBOR with Citibank | | Sept. 2006 | | 69,100 | | | | (252) |
| Receive quarterly a return equal to Banc of | | | | | | | | |
| America Securities LLC AAA 10Yr | | | | | | | | |
| Commercial Mortgage Backed Securities | | | | | | | | |
| Daily Index and pay quarterly a floating | | | | | | | | |
| rate based on 3 month LIBOR minus 30 | | | | | | | | |
| basis points with Bank of America | | May 2006 | | 15,000 | | | | (349) |
| |
| TOTAL TOTAL RETURN SWAPS | | | | 118,500 | | | | (923) |
| |
| | | | | $ 1,445,088 | | | | $ (7,608) |
| |
| |
| |
| |
| See accompanying notes which are an integral part of the financial statements. | | | | |
| |
| Annual Report | | 40 | | | | | | |
Legend
(a) Includes investment made with cash
collateral received from securities on loan.
(b) Security or a portion of the security is on
loan at period end.
(c) Security exempt from registration under
Rule 144A of the Securities Act of 1933.
These securities may be resold in
transactions exempt from registration,
normally to qualified institutional buyers.
At the period end, the value of these
securities amounted to $552,436,000 or
7.2% of net assets.
(d) Security or a portion of the security has
been segregated as collateral for open
swap agreements. At the period end, the
value of securities pledged amounted to
$9,653,000.
(e) Dow Jones CDX N.A. Investment Grade
3 is a tradable index of credit default
swaps on investment grade debt of
U.S. companies.
(f) Dow Jones CDX N.A. Investment Grade
4 is a tradable index of credit default
swaps on investment grade debt of
U.S. companies.
|
(g) The coupon rate shown on floating or
adjustable rate securities represents the
rate at period end.
(h) Affiliated fund that is available only to
investment companies and other accounts
managed by Fidelity Investments. A
complete unaudited list of holdings for
each fixed income central fund, as of the
investing fund’s report date, is available
upon request or at fidelity.com. The
reports are located just after the fund’s
financial statements and quarterly reports
but are not part of the financial
statements or quarterly reports. In
addition, the fixed income central funds’
financial statements, which are not
covered by the investing fund’s Report of
Independent Registered Public
Accounting Firm, are available on the
EDGAR Database on the SEC’s web site,
www.sec.gov, or upon request.
(i) Security represents right to receive monthly
interest payments on an underlying pool
of mortgages. Principal shown is the par
amount of the mortgage pool.
|
Affiliated Central Funds
Information regarding fiscal year to date income earned by the fund from the affiliated Central funds is as follows:
| Fund | | Income earned |
| | | (Amounts in thousands) |
| Fidelity Specialized High Income Central Investment Portfolio | | | | $ 2,924 |
| Fidelity Ultra Short Central Fund | | | | 35,724 |
| Total | | | | $ 38,648 |
See accompanying notes which are an integral part of the financial statements.
41 Annual Report
Investments continued
Additional information regarding the fund’s fiscal year to date purchases and sales, including the ownership percentage, of the following fixed income Central Funds is as follows:
| | | Value, | | Purchases | | | | Sales | | Value, end of | | % ownership, |
| Fund | | beginning of | | | | | | Proceeds | | period | | end of period |
| (Amounts in thousands) | | period | | | | | | | | | | |
| Fidelity Specialized�� | | | | | | | | | | | | | | |
| High Income Central | | | | | | | | | | | | | | |
| Investment Portfolio | | | | $ — | | $ 74,949 | | | | $ — | | $ 74,043 | | 35.7% |
| Fidelity Ultra Short | | | | | | | | | | | | | | |
| Central Fund | | | | 809,179 | | 99,995 | | | | — | | 908,965 | | 12.7% |
| Total | | | | $ 809,179 | | $ 174,944 | | | | $ — | | $ 983,008 | | |
Income Tax Information
At April 30, 2006, the fund had a capital loss carryforward of approximately $1,022,000 all of which will expire on April 30, 2014.
See accompanying notes which are an integral part of the financial statements.
Annual Report 42
| Financial Statements | | | | | | | | |
| |
| Statement of Assets and Liabilities | | | | | | | | |
| Amounts in thousands (except per share amount) | | | | | | | | April 30, 2006 |
| |
| Assets | | | | | | | | |
| Investment in securities, at value (including securities | | | | | | | | |
| loaned of $15,932 and repurchase agreements of | | | | | | | | |
| $32,464) See accompanying schedule: | | | | | | | | |
| Unaffiliated issuers (cost $6,800,556) | | | | $ 6,652,680 | | | | |
| Affiliated Central Funds (cost $982,564) | | | | 983,008 | | | | |
| Total Investments (cost $7,783,120) | | | | | | | | $ 7,635,688 |
| Cash | | | | | | | | 1,420 |
| Receivable for investments sold | | | | | | | | 1,536 |
| Receivable for swap agreements | | | | | | | | 63 |
| Receivable for fund shares sold | | | | | | | | 8,516 |
| Interest receivable | | | | | | | | 68,166 |
| Other affiliated receivables | | | | | | | | 54 |
| Total assets | | | | | | | | 7,715,443 |
| |
| Liabilities | | | | | | | | |
| Payable for investments purchased | | | | $ 22,576 | | | | |
| Payable for fund shares redeemed | | | | 7,229 | | | | |
| Distributions payable | | | | 418 | | | | |
| Swap agreements, at value | | | | 7,608 | | | | |
| Accrued management fee | | | | 2,041 | | | | |
| Other affiliated payables | | | | 950 | | | | |
| Other payables and accrued expenses | | | | 39 | | | | |
| Collateral on securities loaned, at value | | | | 16,251 | | | | |
| Total liabilities | | | | | | | | 57,112 |
| |
| Net Assets | | | | | | | | $ 7,658,331 |
| Net Assets consist of: | | | | | | | | |
| Paid in capital | | | | | | | | $ 7,835,912 |
| Distributions in excess of net investment income | | | | | | | | (4,194) |
| Accumulated undistributed net realized gain (loss) on | | | | | | | | |
| investments | | | | | | | | (18,760) |
| Net unrealized appreciation (depreciation) on | | | | | | | | |
| investments | | | | | | | | (154,627) |
| Net Assets, for 755,533 shares outstanding | | | | | | | | $ 7,658,331 |
| Net Asset Value, offering price and redemption price per | | | | | | | | |
| share ($7,658,331 ÷ 755,533 shares) | | | | | | | | $ 10.14 |
See accompanying notes which are an integral part of the financial statements.
43 Annual Report
| Financial Statements continued | | | | |
| |
| |
| Statement of Operations | | | | | | |
| Amounts in thousands | | | | Year ended April 30, 2006 |
| |
| Investment Income | | | | | | |
| Interest | | | | | | $ 311,621 |
| Income from affiliated Central Funds | | | | | | 38,648 |
| Total income | | | | | | 350,269 |
| |
| Expenses | | | | | | |
| Management fee | | | | $ 24,724 | | |
| Transfer agent fees | | | | 7,864 | | |
| Accounting and security lending fees | | | | 102 | | |
| Fund wide operations fee | | | | 1,897 | | |
| Independent trustees’ compensation | | | | 32 | | |
| Appreciation in deferred trustee compensation account | | | | 3 | | |
| Custodian fees and expenses | | | | 15 | | |
| Registration fees | | | | 11 | | |
| Audit | | | | 8 | | |
| Legal | | | | 2 | | |
| Miscellaneous | | | | 18 | | |
| Total expenses before reductions | | | | 34,676 | | |
| Expense reductions | | | | (461) | | 34,215 |
| |
| Net investment income | | | | | | 316,054 |
| Realized and Unrealized Gain (Loss) | | | | | | |
| Net realized gain (loss) on: | | | | | | |
| Investment securities: | | | | | | |
| Unaffiliated issuers | | | | (13,184) | | |
| Swap agreements | | | | (19,240) | | |
| Total net realized gain (loss) | | | | | | (32,424) |
| Change in net unrealized appreciation (depreciation) on: | | | | | | |
| Investment securities | | | | (179,738) | | |
| Swap agreements | | | | (3,725) | | |
| Delayed delivery commitments | | | | (5) | | |
| Total change in net unrealized appreciation | | | | | | |
| (depreciation) | | | | | | (183,468) |
| Net gain (loss) | | | | | | (215,892) |
| Net increase (decrease) in net assets resulting from | | | | | | |
| operations | | | | | | $ 100,162 |
See accompanying notes which are an integral part of the financial statements.
| Statement of Changes in Net Assets | | | | | | | | |
| | | | | Year ended | | | | Year ended |
| | | | | April 30, | | | | April 30, |
| Amounts in thousands | | | | 2006 | | | | 2005 |
| Increase (Decrease) in Net Assets | | | | | | | | |
| Operations | | | | | | | | |
| Net investment income | | | | $ 316,054 | | | | $ 246,218 |
| Net realized gain (loss) | | | | (32,424) | | | | 9,712 |
| Change in net unrealized appreciation (depreciation) | | | | (183,468) | | | | (23,943) |
| Net increase (decrease) in net assets resulting | | | | | | | | |
| from operations | | | | 100,162 | | | | 231,987 |
| Distributions to shareholders from net investment income | | | | (305,552) | | | | (243,233) |
| Distributions to shareholders from net realized gain | | | | (7,046) | | | | (68,797) |
| Total distributions | | | | (312,598) | | | | (312,030) |
| Share transactions | | | | | | | | |
| Proceeds from sales of shares | | | | 1,965,733 | | | | 1,674,786 |
| Reinvestment of distributions | | | | 307,173 | | | | 305,097 |
| Cost of shares redeemed | | | | (1,673,659) | | | | (1,474,428) |
| Net increase (decrease) in net assets resulting from | | | | | | | | |
| share transactions | | | | 599,247 | | | | 505,455 |
| Total increase (decrease) in net assets | | | | 386,811 | | | | 425,412 |
| |
| Net Assets | | | | | | | | |
| Beginning of period | | | | 7,271,520 | | | | 6,846,108 |
| End of period (including distributions in excess of net | | | | | | | | |
| investment income of $4,194 and undistributed net | | | | | | | | |
| investment income of $12,663, respectively) | | | | $ 7,658,331 | | | | $ 7,271,520 |
| |
| Other Information | | | | | | | | |
| Shares | | | | | | | | |
| Sold | | | | 190,716 | | | | 159,740 |
| Issued in reinvestment of distributions | | | | 29,798 | | | | 29,181 |
| Redeemed | | | | (162,458) | | | | (140,768) |
| Net increase (decrease) | | | | 58,056 | | | | 48,153 |
See accompanying notes which are an integral part of the financial statements.
45 Annual Report
| Financial Highlights | | | | | | | | | | | | | | | | | | | | |
| |
| Years ended April 30, | | | | 2006 | | | | 2005 | | | | 2004 | | | | 2003 | | | | 2002 |
| Selected Per Share Data | | | | | | | | | | | | | | | | | | | | |
| Net asset value, | | | | | | | | | | | | | | | | | | | | |
| beginning of period | | | | $ 10.43 | | | | $ 10.54 | | | | $ 10.87 | | | | $ 10.31 | | | | $ 10.13 |
| Income from Investment | | | | | | | | | | | | | | | | | | | | |
| Operations | | | | | | | | | | | | | | | | | | | | |
| Net investment incomeB | | | | .436 | | | | .366 | | | | .374 | | | | .473 | | | | .560E |
| Net realized and unrealized | | | | | | | | | | | | | | | | | | | | |
| gain (loss) | | | | (.295) | | | | (.009) | | | | (.123) | | | | .562 | | | | .172E |
| Total from investment | | | | | | | | | | | | | | | | | | | | |
| operations | | | | .141 | | | | .357 | | | | .251 | | | | 1.035 | | | | .732 |
| Distributions from net investment | | | | | | | | | | | | | | | | | | | | |
| income | | | | (.421) | | | | (.362) | | | | (.381) | | | | (.475) | | | | (.552) |
| Distributions from net realized | | | | | | | | | | | | | | | | | | | | |
| gain | | | | (.010) | | | | (.105) | | | | (.200) | | | | — | | | | — |
| Total distributions | | | | (.431) | | | | (.467) | | | | (.581) | | | | (.475) | | | | (.552) |
| Net asset value, | | | | | | | | | | | | | | | | | | | | |
| end of period | | | | $ 10.14 | | | | $ 10.43 | | | | $ 10.54 | | | | $ 10.87 | | | | $ 10.31 |
| Total ReturnA | | | | 1.36% | | | | 3.47% | | | | 2.33% | | | | 10.25% | | | | 7.36% |
| Ratios to Average Net AssetsC,D | | | | | | | | | | | | | | | | | | | | |
| Expenses before reductions | | | | .46% | | | | .62% | | | | .61% | | | | .64% | | | | .63% |
| Expenses net of fee waivers, | | | | | | | | | | | | | | | | | | | | |
| if any | | | | .46% | | | | .62% | | | | .61% | | | | .64% | | | | .63% |
| Expenses net of all reductions | | | | .46% | | | | .61% | | | | .61% | | | | .64% | | | | .63% |
| Net investment income | | | | 4.22% | | | | 3.50% | | | | 3.48% | | | | 4.47% | | | | 5.44%E |
| Supplemental Data | | | | | | | | | | | | | | | | | | | | |
| Net assets, end of period | | | | | | | | | | | | | | | | | | | | |
| (in millions) | | | | $ 7,658 | | | | $ 7,272 | | | | $ 6,846 | | | | $ 6,983 | | | | $ 5,064 |
| Portfolio turnover rate | | | | 44% | | | | 74% | | | | 120% | | | | 117% | | | | 78% |
A Total returns would have been lower had certain expenses not been reduced during the periods shown.
B Calculated based on average shares outstanding during the period.
C Amounts do not include the activity of the affiliated central funds.
D Expense ratios reflect operating expenses of the fund. Expenses before reductions do not reflect amounts reimbursed by the investment adviser or
expense offset arrangements and do not represent the amount paid by the fund during periods when reimbursements or reductions occur.
Expenses net of fee waivers reflect expenses after reimbursement by the investment adviser but prior to reductions from expense offset arrange
ments. Expenses net of all reductions represent the net expenses paid by the fund.
E Effective May 1, 2001, the fund adopted the provisions of the AICPA Audit and Accounting Guide for Investment Companies and began amortizing
premium and discount on all debt securities. Per share data and ratios for periods prior to adoption have not been restated to reflect this change.
|
See accompanying notes which are an integral part of the financial statements.
Notes to Financial Statements
For the period ended April 30, 2006
(Amounts in thousands except ratios)
|
1. Significant Accounting Policies.
Fidelity Intermediate Bond Fund (the fund) is a fund of Fidelity Commonwealth Trust (the trust) and is authorized to issue an unlimited number of shares. The trust is regis tered under the Investment Company Act of 1940, as amended (the 1940 Act), as an open end management investment company organized as a Massachusetts business trust. The fund may invest in affiliated money market central funds (Money Market Central Funds), and fixed income Central Investment Portfolios (CIPs), collectively referred to as Central Funds, which are open end investment companies available to investment companies and other accounts managed by Fidelity Management & Research Company (FMR) and its affiliates. The financial statements have been prepared in conformity with accounting principles generally accepted in the United States of America, which require management to make certain estimates and assumptions at the date of the financial statements. The following summarizes the significant accounting policies of the fund, which are also consistently followed by the Central Funds:
Security Valuation. Investments are valued and net asset value per share is calculated (NAV calculation) as of the close of business of the New York Stock Exchange, normally 4:00 p.m. Eastern time. Wherever possible, the fund uses independent pricing services approved by the Board of Trustees to value its investments. Debt securities, including restricted securities, for which quotations are readily available, are valued by indepen dent pricing services or by dealers who make markets in such securities. Pricing services consider yield or price of bonds of comparable quality, coupon, maturity and type as well as dealer supplied prices.
When current market prices or quotations are not readily available or do not accurately reflect fair value, valuations may be determined in accordance with procedures adopted by the Board of Trustees. The frequency of when fair value pricing is used is unpredict able. The value of securities used for NAV calculation under fair value pricing may differ from published prices for the same securities. Investments in open end mutual funds, including Central Funds, are valued at their closing net asset value each business day. Short term securities with remaining maturities of sixty days or less for which quotations are not readily available are valued at amortized cost, which approximates value.
47 Annual Report
| Notes to Financial Statements continued |
| (Amounts in thousands except ratios) | | |
| |
| 1. Significant Accounting Policies continued |
Investment Transactions and Income. Security transactions, including the fund’s investment activity in the Central Funds, are accounted for as of trade date. Gains and losses on securities sold are determined on the basis of identified cost. Interest income and distributions from the Central Funds are accrued as earned. Interest income includes coupon interest and amortization of premium and accretion of discount on debt securi ties. Inflation indexed bonds are fixed income securities whose principal value is periodically adjusted to the rate of inflation. Interest is accrued based on the principal value, which is adjusted for inflation. Any increase in the principal amount of an inflation indexed bond is recorded as interest income, even though principal is not received until maturity.
Expenses. Most expenses of the trust can be directly attributed to a fund. Expenses which cannot be directly attributed are apportioned among each fund in the trust.
Deferred Trustee Compensation. Under a Deferred Compensation Plan (the Plan), independent Trustees must defer receipt of a portion of, and may elect to defer receipt of an additional portion of, their annual compensation. Deferred amounts are treated as though equivalent dollar amounts had been invested in shares of the fund or are invested in a cross section of other Fidelity funds, and are marked to market. Deferred amounts remain in the fund until distributed in accordance with the Plan.
Income Tax Information and Distributions to Shareholders. Each year, the fund intends to qualify as a regulated investment company by distributing all of its taxable income and realized gains under Subchapter M of the Internal Revenue Code. As a result, no provision for income taxes is required in the accompanying financial statements.
Dividends are declared daily and paid monthly from net investment income. Distribu tions from realized gains, if any, are recorded on the ex dividend date. Income and capital gain distributions are determined in accordance with income tax regulations, which may differ from generally accepted accounting principles.
Capital accounts within the financial statements are adjusted for permanent book tax differences. These adjustments have no impact on net assets or the results of operations. Temporary book tax differences will reverse in a subsequent period.
| 1. Significant Accounting Policies continued | | |
Income Tax Information and Distributions to Shareholders continued |
Book tax differences are primarily due to short term capital gains, swap agreements, prior period premium and discount on debt securities, market discount, partnerships (including allocations from CIPs), deferred trustees compensation, financing transac tions, capital loss carryforwards, and losses deferred due to wash sales and excise tax regulations.
The tax basis components of distributable earnings and the federal tax cost as of period end were as follows:
| Unrealized appreciation | | | | $ 26,679 | | | | |
| Unrealized depreciation | | | | (166,273) | | | | |
| Net unrealized appreciation (depreciation) | | | | (139,594) | | | | |
| Capital loss carryforward | | | | (1,022) | | | | |
| |
| Cost for federal income tax purposes | | | | $ 7,775,282 | | | | |
| |
| The tax character of distributions paid was as follows: | | | | |
| |
| | | | | April 30, 2006 | | | | April 30, 2005 |
| Ordinary Income | | | | $ 309,075 | | | | $ 259,919 |
| Long term Capital Gains | | | | 3,523 | | | | 52,111 |
| Total | | | | $ 312,598 | | | | $ 312,030 |
| |
| 2. Operating Policies. | | | | | | | | |
Repurchase Agreements. FMR has received an Exemptive Order from the Securities and Exchange Commission (the SEC) which permits the fund and other affiliated entities of FMR to transfer uninvested cash balances into joint trading accounts which are then invested in repurchase agreements. The fund may also invest directly with institutions in repurchase agreements. Repurchase agreements are collateralized by government or non government securities. Upon settlement date, collateral is held in segregated accounts with custodian banks and may be obtained in the event of a default of the counterparty. The fund monitors, on a daily basis, the value of the collateral to ensure it is at least equal to the principal amount of the repurchase agreement (including accrued interest). In the event of a default by the counterparty, realization of the collateral proceeds could be delayed, during which time the value of the collateral may decline.
49 Annual Report
| Notes to Financial Statements continued |
| (Amounts in thousands except ratios) |
| |
| 2. Operating Policies continued |
Restricted Securities. The fund may invest in securities that are subject to legal or contractual restrictions on resale. These securities generally may be resold in trans actions exempt from registration or to the public if the securities are registered. Disposal of these securities may involve time consuming negotiations and expense, and prompt sale at an acceptable price may be difficult. Information regarding restricted securities is included at the end of the fund’s Schedule of Investments.
Swap Agreements. The fund may invest in swaps for the purpose of managing its exposure to interest rate, credit or market risk.
Interest rate swaps are agreements to exchange cash flows periodically based on a notional principal amount, for example, the exchange of fixed rate interest payments for floating rate interest payments. Periodic payments received or made by the fund are recorded in the accompanying Statement of Operations as realized gains or losses, respectively. The primary risk associated with interest rate swaps is that unfavorable changes in the fluctuation of interest rates could adversely impact a fund.
Total return swaps are agreements to exchange the return generated by one instrument or index for the return generated by another instrument, for example, the agreement to pay interest in exchange for a market linked return based on a notional amount. To the extent the total return of the index exceeds the offsetting interest obligation, a fund will receive a payment from the counterparty. To the extent it is less, a fund will make a payment to the counterparty. Periodic payments received or made by the fund are recorded in the accompanying Statement of Operations as realized gains or losses, respectively.
Credit default swaps involve the exchange of a fixed rate premium for protection against the loss in value of an underlying debt instrument in the event of a defined credit event (such as payment default or bankruptcy). Under the terms of the swap, one party acts as a “guarantor” receiving a periodic payment that is a fixed percentage applied to a notional principal amount. In return the party agrees to purchase the notional amount of the underlying instrument, at par, if a credit event occurs during the term of the swap. The fund may enter into credit default swaps in which either it or its counterparty act as guarantors. By acting as the guarantor of a swap, a fund assumes the market and credit risk of the underlying instrument including liquidity and loss of value. Periodic payments and premiums received or made by the fund are recorded in the accompanying Statement of Operations as realized gains or losses, respectively.
Swaps are marked to market daily based on dealer supplied valuations and changes in value are recorded as unrealized appreciation (depreciation). Gains or losses are realized upon early termination of the swap agreement. Collateral, in the form of cash or securities, may be required to be held in segregated accounts with a fund’s custodian in
2. Operating Policies continued
Swap Agreements continued
compliance with swap contracts. Risks may exceed amounts recognized on the State ment of Assets and Liabilities. These risks include changes in the returns of the underly ing instruments, failure of the counterparties to perform under the contracts’ terms and the possible lack of liquidity with respect to the swap agreements. Details of swap agreements open at period end are included in the fund’s Schedule of Investments under the caption “Swap Agreements.”
3. Purchases and Sales of Investments.
Purchases and sales of securities, other than short term securities and U.S. government securities, aggregated $1,604,872 and $1,293,356, respectively.
4. Fees and Other Transactions with Affiliates.
Management Fee. FMR and its affiliates provide the fund with investment manage ment related services for which the fund pays a monthly management fee. The manage ment fee is the sum of an individual fund fee rate that is based on an annual rate of .30% of the fund’s average net assets (effective June 1, 2005, the fund’s management contract was amended, reducing the individual fund fee rate to .20% of average net assets) and a group fee rate that averaged .12% during the period. The group fee rate is based upon the average net assets of all the mutual funds advised by FMR. The group fee rate decreases as assets under management increase and increases as assets under management decrease. For the period, the total annual management fee rate was .33% of the fund’s average net assets.
Transfer Agent Fees. Fidelity Service Company, Inc. (FSC), an affiliate of FMR, is the fund’s transfer, dividend disbursing and shareholder servicing agent. FSC receives account fees and asset based fees that vary according to account size and type of account. FSC pays for typesetting, printing and mailing of shareholder reports, except proxy statements. Under an amended contract effective June 1, 2005, transfer agent fees include an asset based fee and were reduced to a rate of .10% of average net assets. The account fees were eliminated. For the period, the transfer agent fees were equivalent to an annual rate of .11% of average net assets.
Accounting and Security Lending Fees. FSC maintains the fund’s accounting re cords. The accounting fee is based on the level of average net assets for the month. Under a separate contract, FSC administers the security lending program. The security lending fee is based on the number and duration of lending transactions. Effective June 1, 2005, FMR pays these fees.
51 Annual Report
| Notes to Financial Statements continued | | |
| (Amounts in thousands except ratios) | | |
| |
| 4. Fees and Other Transactions with Affiliates continued |
Fundwide Operations Fee. Pursuant to a new Fundwide Operations and Expense Agreement (FWOE) effective on June 1, 2005, FMR has agreed to provide for fund level expenses (which do not include transfer agent, compensation of the independent trustees, interest (including commitment fees), taxes or extraordinary expenses, if any) in return for a FWOE fee equal to .35% less the total amount of the management fee. The FWOE paid by the fund is reduced by an amount equal to the fees and expenses paid to the independent trustees. For the period, the FWOE fee was equivalent to an annualized rate of ..03% of average net assets.
Affiliated Central Funds. The fund may invest in Money Market Central Funds which seek preservation of capital and current income and are managed by Fidelity Invest ments Money Management, Inc. (FIMM), an affiliate of FMR.
The fund may also invest in CIPs managed by FIMM or Fidelity Management & Research Company, Inc. (FMRC) each an affiliate of FMR. The Ultra Short Central Fund seeks to obtain a high level of current income consistent with preservation of capital by investing in U.S. dollar denominated money market and investment grade debt securities. The Specialized High Income Central Investment Portfolio seeks a high level of current income by normally investing in income producing debt securities, with an emphasis on lower quality debt securities.
The fund’s Schedule of Investments lists each applicable CIP as an investment of the fund but does not include the underlying holdings of each CIP. Based on their investment objectives, each CIP may invest or participate in various investment vehicles or strate gies that are similar to those of the investing fund. In addition, each CIP may also participate in delayed delivery and when issued securities, derivatives, and mortgage dollar rolls. These strategies are consistent with the investment objectives of the fund and may involve certain economic risks, including the risk that a counterparty to one or more of these transactions may be unable or unwilling to comply with the terms of the governing agreement. This may result in a decline in value of each CIP and the fund.
A complete unaudited list of holdings for each CIP, as of the fund’s report date, is avail able upon request or at fidelity.com. The reports are located just after the fund’s financial statements and quarterly reports but are not part of the financial statements or quarterly reports. In addition, each CIP’s financial statements, which are not covered by this fund’s Report of Independent Registered Public Accounting Firm, are available on the EDGAR Database on the SEC’s web site, www.sec.gov, or upon request.
The Central Funds do not pay a management fee.
5. Committed Line of Credit.
|
The fund participates with other funds managed by FMR in a $4.2 billion credit facility (the “line of credit”) to be utilized for temporary or emergency purposes to fund share holder redemptions or for other short term liquidity purposes. The fund has agreed to pay commitment fees on its pro rata portion of the line of credit, which amounts to $14 and is reflected in Miscellaneous Expense on the Statement of Operations. During the period, there were no borrowings on this line of credit.
The fund lends portfolio securities from time to time in order to earn additional income. On the settlement date of the loan, the fund receives collateral (in the form of U.S. Treasury obligations, letters of credit and/or cash) against the loaned securities and maintains collateral in an amount not less than 100% of the market value of the loaned securities during the period of the loan. The market value of the loaned securities is determined at the close of business of the fund and any additional required collateral is delivered to the fund on the next business day. If the borrower defaults on its obligation to return the securities loaned because of insolvency or other reasons, a fund could experience delays and costs in recovering the securities loaned or in gaining access to the collateral. Any cash collateral received is invested in cash equivalents. The value of loaned securities and cash collateral at period end are disclosed on the fund’s Statement of Assets and Liabilities. Security lending income represents the income earned on investing cash collateral, less fees and expenses associated with the loan, plus any premium payments that may be received on the loan of certain types of securities. Security lending income is presented in the Statement of Operations as a component of interest income. Net income from lending portfolio securities during the period amounted to $305.
In addition, through arrangements with the fund’s custodian and transfer agent, credits realized as a result of uninvested cash balances were used to reduce the fund’s expenses. During the period, these credits reduced the fund’s custody and transfer agent expenses by $15 and $446, respectively.
53 Annual Report
| Notes to Financial Statements continued |
| (Amounts in thousands except ratios) | | |
| |
| 8. Other. | | |
The fund’s organizational documents provide former and current trustees and officers with a limited indemnification against liabilities arising in connection with the performance of their duties to the fund. In the normal course of business, the fund may also enter into contracts that provide general indemnifications. The fund’s maximum exposure under these arrangements is unknown as this would be dependent on future claims that may be made against the fund. The risk of material loss from such claims is considered remote.
At the end of the period, Fidelity Freedom 2010 was the owner of record of approximately 12% of the total outstanding shares of the fund. The Fidelity Freedom Funds were the owners of record, in the aggregate, of approximately 34% of the total outstanding shares of the fund.
Report of Independent Registered Public Accounting Firm
To the Trustees of Fidelity Commonwealth Trust and Shareholders of Fidelity Intermediate Bond Fund:
We have audited the accompanying statement of assets and liabilities of Fidelity Inter mediate Bond Fund (the Fund), a fund of Fidelity Commonwealth Trust, including the schedule of investments as of April 30, 2006, and the related statement of operations for the year then ended, the statement of changes in net assets for each of the two years in the period then ended, and the financial highlights for each of the five years in the period then ended. These financial statements and financial highlights are the responsibility of the Fund’s management. Our responsibility is to express an opinion on these financial statements and financial highlights based on our audits.
We conducted our audits in accordance with standards of the Public Company Accounting Oversight Board (United States). Those standards require that we plan and perform the audit to obtain reasonable assurance about whether the financial statements and financial highlights are free of material misstatement. The Fund is not required to have, nor were we engaged to perform, an audit of its internal control over financial reporting. Our audits included consideration of internal control over financial reporting as a basis for designing audit procedures that are appropriate in the circumstances, but not for the purpose of expressing an opinion on the effectiveness of the Fund’s internal control over financial reporting. Accordingly, we express no such opinion. An audit also includes examining, on a test basis, evidence supporting the amounts and disclosures in the financial statements, assessing the accounting principles used and significant estimates made by management, as well as evaluating the overall financial statement presentation. Our procedures included confirmation of securities owned as of April 30, 2006, by correspondence with the custodians and brokers; where replies were not received from brokers, we performed other auditing procedures. We believe that our audits provide a reasonable basis for our opinion.
In our opinion, the financial statements and financial highlights referred to above present fairly, in all material respects, the financial position of Fidelity Intermediate Bond Fund as of April 30, 2006, the results of its operations for the year then ended, the changes in its net assets for each of the two years in the period then ended, and its financial highlights for each of the five years in the period then ended, in conformity with accounting prin ciples generally accepted in the United States of America.
/s/ Deloitte & Touche LLP
DELOITTE & TOUCHE LLP
Boston, Massachusetts
June 13, 2006
|
55 Annual Report
Trustees and Officers
The Trustees, Members of the Advisory Board, and executive officers of the trust and fund, as applicable, are listed below. The Board of Trustees governs the fund and is responsible for protecting the interests of shareholders. The Trustees are experienced executives who meet periodically throughout the year to oversee the fund’s activities, review contractual arrangements with companies that provide services to the fund, and review the fund’s performance. Except for William O. McCoy and Albert R. Gamper, Jr., each of the Trustees oversees 335 funds advised by FMR or an affiliate. Mr. McCoy oversees 337 funds advised by FMR or an affiliate. Mr. Gamper oversees 280 funds advised by FMR or an affiliate.
The Trustees hold office without limit in time except that (a) any Trustee may resign; (b) any Trustee may be removed by written instrument, signed by at least two thirds of the number of Trustees prior to such removal; (c) any Trustee who requests to be retired or who has become incapacitated by illness or injury may be retired by written instru ment signed by a majority of the other Trustees; and (d) any Trustee may be removed at any special meeting of shareholders by a two thirds vote of the outstanding voting securities of the trust. Each Trustee who is not an interested person (as defined in the 1940 Act) (Independent Trustee), shall retire not later than the last day of the calendar year in which his or her 72nd birthday occurs. The Independent Trustees may waive this mandatory retirement age policy with respect to individual Trustees. The executive officers and Advisory Board Members hold office without limit in time, except that any officer and Advisory Board Member may resign or may be removed by a vote of a majority of the Trustees at any regular meeting or any special meeting of the Trustees. Except as indicated, each individual has held the office shown or other offices in the same company for the past five years.
The fund’s Statement of Additional Information (SAI) includes more information about the Trustees. To request a free copy, call Fidelity at 1-800-544-8544.
Correspondence intended for each Trustee who is an interested person may be sent to Fidelity Investments, 82 Devonshire Street, Boston, Massachusetts 02109.
| | Name, Age; Principal Occupation
Edward C. Johnson 3d (75)
|
Year of Election or Appointment: 1974
Mr. Johnson is Chairman of the Board of Trustees. Mr. Johnson serves as President (2006 present), Chief Executive Officer, Chairman, and a Director of FMR Corp.; Chairman and a Director of FMR; Chairman and a Director of Fidelity Research & Analysis Company (FRAC); Chairman and a Director of Fidelity Investments Money Management, Inc.; and Chairman (2001 present) and a Director (1999 present) of FMR Co., Inc. In addition, Mr. Johnson serves as Chairman and Director of Fidelity International Limited (FIL).
| | Name, Age; Principal Occupation
Stephen P. Jonas (53)
|
Year of Election or Appointment: 2005
Mr. Jonas is Senior Vice President of Intermediate Bond (2005 present). He also serves as Senior Vice President of other Fidelity funds (2005 present). Mr. Jonas is Executive Director of FMR (2005 present) and FMR Co., Inc. (2005 present). He also serves as a Director of Fidelity Investments Money Management, Inc. (2005 present) and FMR Corp. (2003 present). Previously, Mr. Jonas served as President of Fidelity Enterprise Operations and Risk Services (2004 2005), Chief Administrative Officer (2002 2004), and Chief Financial Officer of FMR Corp. (1998 2002). In addition, he serves on the Boards of Boston Ballet (2003 present) and Simmons College (2003 present).
Year of Election or Appointment: 2003
Mr. Reynolds is President and a Director of FMR (2005 present), Fidelity Investments Money Management, Inc. (2005 present), and FMR Co., Inc. (2005 present). Mr. Reynolds also serves as a Director (2003 present) and Chief Operating Officer (2000 present) of FMR Corp. and a Director of Strategic Advisers, Inc. (2005 present). He also serves on the Board at Fidelity Investments Canada, Ltd. (2000 present). Previously, Mr. Reynolds served as President of Fidelity Investments Institutional Retirement Group (1996 2000).
* Trustees have been determined to be “Interested Trustees” by virtue of, among other things, their affiliation with the trust or various entities under common control with FMR.
57 Annual Report
Trustees and Officers - continued
Independent Trustees:
Correspondence intended for each Independent Trustee (that is, the Trustees other than the Interested Trustees) may be sent to Fidelity Investments, P.O. Box 55235, Boston, Massachusetts 02205-5235.
| | Name, Age; Principal Occupation
Dennis J. Dirks (57)
|
Year of Election or Appointment: 2005
Prior to his retirement in May 2003, Mr. Dirks was Chief Operating Officer and a member of the Board of The Depository Trust & Clearing Corporation (DTCC) (1999 2003). He also served as President, Chief Operating Officer, and Board member of The Depository Trust Company (DTC) (1999 2003) and President and Board member of the National Securities Clearing Corporation (NSCC) (1999 2003). In addition, Mr. Dirks served as Chief Executive Officer and Board member of the Government Securities Clearing Corporation (2001 2003) and Chief Executive Officer and Board member of the Mortgage Backed Securities Clearing Corporation (2001 2003). Mr. Dirks also serves as a Trustee and a member of the Finance Committee of Manhattan College (2005 present) and a Trustee and a member of the Finance Committee of AHRC of Nassau County (2006 present).
| | Albert R. Gamper, Jr. (64)
|
Year of Election or Appointment: 2006
Mr. Gamper also serves as a Trustee (2006 present) or Member of the Advisory Board (2005 present) of other investment companies advised by FMR. Prior to his retirement in December 2004, Mr. Gamper served as Chairman of the Board of CIT Group Inc. (commercial finance). During his tenure with CIT Group Inc. Mr. Gamper served in numerous senior management positions, including Chairman (1987 1989; 1999 2001; 2002 2004), Chief Executive Officer (1987 2004), and President (1989 2002). He currently serves as a member of the Board of Directors of Public Service Enterprise Group (utilities, 2001 present), Chairman of the Board of Governors, Rutgers University (2004 present), and Chairman of the Board of Saint Barnabas Health Care System.
Name, Age; Principal Occupation
Robert M. Gates (62)
|
Year of Election or Appointment: 1997
Dr. Gates is Chairman of the Independent Trustees (2006 present). Dr. Gates is President of Texas A&M University (2002 present). He was Director of the Central Intelligence Agency (CIA) from 1991 to 1993. From 1989 to 1991, Dr. Gates served as Assistant to the President of the United States and Deputy National Security Advisor. Dr. Gates is a Director of NACCO Industries, Inc. (mining and manufacturing), Parker Drilling Co., Inc. (drilling and rental tools for the energy industry, 2001 present), and Brinker International (restaurant management, 2003 present). Previously, Dr. Gates served as a Director of LucasVarity PLC (automotive components and diesel engines), a Director of TRW Inc. (automotive, space, defense, and information technology), and Dean of the George Bush School of Government and Public Service at Texas A&M University (1999 2001).
Year of Election or Appointment: 2004
Dr. Heilmeier is Chairman Emeritus of Telcordia Technologies (communication software and systems), where prior to his retirement, he served as company Chairman and Chief Executive Officer. He currently serves on the Boards of Directors of The Mitre Corporation (systems engineering and information technology support for the government), and HRL Laboratories (private research and development, 2004 present). He is Chairman of the General Motors Science & Technology Advisory Board and a Life Fellow of the Institute of Electrical and Electronics Engineers (IEEE). Dr. Heilmeier is a member of the Defense Science Board and the National Security Agency Advisory Board. He is also a member of the National Academy of Engineering, the American Academy of Arts and Sciences, and the Board of Overseers of the School of Engineering and Applied Science of the University of Pennsylvania. Previously, Dr. Heilmeier served as a Director of TRW Inc. (automotive, space, defense, and information technology, 1992 2002), Compaq (1994 2002), Automatic Data Processing, Inc. (ADP) (technology based business outsourcing, 1995 2002), INET Technologies Inc. (telecommunications network surveillance, 2001 2004), and Teletech Holdings (customer management services). He is the recipient of the 2005 Kyoto Prize in Advanced Technology for his invention of the liquid crystal display.
59 Annual Report
Trustees and Officers - continued
| | Name, Age; Principal Occupation
Marie L. Knowles (59)
|
Year of Election or Appointment: 2001
Prior to Ms. Knowles’ retirement in June 2000, she served as Executive Vice President and Chief Financial Officer of Atlantic Richfield Company (ARCO) (diversified energy, 1996 2000). From 1993 to 1996, she was a Senior Vice President of ARCO and President of ARCO Transportation Company. She served as a Director of ARCO from 1996 to 1998. She currently serves as a Director of Phelps Dodge Corporation (copper mining and manufacturing) and McKesson Corporation (healthcare service, 2002 present). Ms. Knowles is a Trustee of the Brookings Institution and the Catalina Island Conservancy and also serves as a member of the Advisory Board for the School of Engineering of the University of Southern California.
Year of Election or Appointment: 2000
Mr. Lautenbach has been a partner of Clayton, Dubilier & Rice, Inc. (private equity investment firm) since September 1998. Previously, Mr. Lautenbach was with the International Business Machines Corporation (IBM) from 1968 until his retirement in 1998. Mr. Lautenbach serves as a Director of Italtel Holding S.p.A. (telecommunications (Milan, Italy), 2004 present) and Eaton Corporation (diversified industrial) as well as the Philharmonic Center for the Arts in Naples, Florida. He also is a member of the Board of Trustees of Fairfield University (2005 present), as well as a member of the Council on Foreign Relations.
Year of Election or Appointment: 1997
Prior to his retirement in December 1994, Mr. McCoy was Vice Chairman of the Board of BellSouth Corporation (telecommunications) and President of BellSouth Enterprises. He is currently a Director of Duke Realty Corporation (real estate). He is also a partner of Franklin Street Partners (private investment management firm). In addition, Mr. McCoy served as the Interim Chancellor (1999 2000) and a member of the Board of Visitors for the University of North Carolina at Chapel Hill and currently serves as Chairman of the Board of Directors of the University of North Carolina Health Care System. He also served as Vice President of Finance for the University of North Carolina (16 school system).
Name, Age; Principal Occupation
Cornelia M. Small (61)
|
Year of Election or Appointment: 2005
Ms. Small is a member (2000 present) and Chairperson (2002 present) of the Investment Committee, and a member (2002 present) of the Board of Trustees of Smith College. Previously, she served as Chief Investment Officer (1999 2000), Director of Global Equity Investments (1996 1999), and a member of the Board of Directors of Scudder, Stevens & Clark (1990 1997) and Scudder Kemper Investments (1997 1999). In addition, Ms. Small served as Co Chair (2000 2003) of the Annual Fund for the Fletcher School of Law and Diplomacy.
William S. Stavropoulos (66)
|
Year of Election or Appointment: 2001
Mr. Stavropoulos is Chairman Emeritus of the Board of Directors of The Dow Chemical Company. Since joining The Dow Chemical Company in 1967, Mr. Stavropoulos served in numerous senior management positions, including President (1993 2000; 2002 2003), CEO (1995 2000; 2002 2004), and Chairman of the Executive Committee (2000 2004). Currently, he is a Director of NCR Corporation (data warehousing and technology solutions), BellSouth Corporation (telecommunications), Chemical Financial Corporation, Maersk Inc. (industrial conglomerate, 2002 present), and Metalmark Capital (private equity investment firm, 2005 present). He also serves as a member of the Board of Trustees of the American Enterprise Institute for Public Policy Research. In addition, Mr. Stavropoulos is a member of The Business Council, J.P. Morgan International Council and the University of Notre Dame Advisory Council for the College of Science.
Year of Election or Appointment: 2005
Prior to his retirement in 2001, Mr. Wolfe was Chairman and Chief Executive Officer of Hershey Foods Corporation (1993 2001). He currently serves as a member of the boards of Adelphia Communications Corporation (2003 present), Bausch & Lomb, Inc., and Revlon Inc. (2004 present).
61 Annual Report
Trustees and Officers - continued
Advisory Board Members and Executive Officers:
Correspondence intended for Mr. Keyes may be sent to Fidelity Investments, P.O. Box 55235, Boston, Massachusetts 02205-5235. Correspondence intended for each executive officer and Mr. Lynch may be sent to Fidelity Investments, 82 Devonshire Street, Boston, Massachusetts 02109.
| | Name, Age; Principal Occupation
James H. Keyes (65)
|
Year of Election or Appointment: 2006
Member of the Advisory Board of Fidelity Commonwealth Trust. Prior to his retirement in 2003, Mr. Keyes was Chairman, President, and Chief Executive Officer of Johnson Controls, Inc. (automotive supplier, 1993 2003). He currently serves as a member of the boards of LSI Logic Corporation (semiconductor technologies, 1984 present), Navistar International Corporation (manufacture and sale of trucks, buses, and diesel engines, 2002 present), and Pitney Bowes, Inc. (integrated mail, messaging, and document management solutions, 1998 present).
Year of Election or Appointment: 2003
Member of the Advisory Board of Fidelity Commonwealth Trust. Mr. Lynch is Vice Chairman and a Director of FMR, and Vice Chairman (2001 present) and a Director (1999 present) of FMR Co., Inc. Previously, Mr. Lynch served as a Trustee of the Fidelity funds (1990 2003). In addition, he serves as the Chairman of the Inner City Scholarship Fund.
Year of Election or Appointment: 2005
Vice President of Intermediate Bond. Mr. Donovan also serves as Vice President of Fidelity’s High Income Funds (2005 present), Fidelity’s Fixed Income Funds (2005 present), certain Asset Allocation Funds (2005 present), and certain Balanced Funds (2005 present). Mr. Donovan also serves as Executive Vice President of FMR (2005 present) and FMRC (2005 present). Previously, Mr. Donovan served as Vice President and Director of Fidelity’s International Equity Trading group (1998 2005).
Name, Age; Principal Occupation
David L. Murphy (58)
|
Year of Election or Appointment: 2005
Vice President of Intermediate Bond. Mr. Murphy also serves as Vice President of Fidelity’s Money Market Funds (2002 present), certain Asset Allocation Funds (2003 present), Fidelity’s Investment Grade Bond Funds (2005 present), and Fidelity’s Balanced Funds (2005 present). He serves as Senior Vice President (2000 present) and Head (2004 present) of the Fidelity Investments Fixed Income Division. Mr. Murphy is also a Senior Vice President of Fidelity Investments Money Management, Inc. (2003 present) and an Executive Vice President of FMR (2005 present). Previously, Mr. Murphy served as Money Market Group Leader (2002 2004), Bond Group Leader (2000 2002), and Vice President of Fidelity’s Taxable Bond Funds (2000 2002) and Fidelity’s Municipal Bond Funds (2001 2002).
Year of Election or Appointment: 2005
Vice President of Intermediate Bond. Mr. Silvia also serves as Vice President of Fidelity’s Bond Funds (2005 present), certain Balanced Funds (2005 present), certain Asset Allocation Funds (2005 present), and Senior Vice President and Bond Group Leader of the Fidelity Investments Fixed Income Division (2005 present). Previously, Mr. Silvia served as Director of Fidelity’s Taxable Bond portfolio managers (2002 2004) and a portfolio manager in the Bond Group (1997 2004).
Year of Election or Appointment: 1999
Vice President of Intermediate Bond. Mr. O’Neil also serves as Vice President of other funds advised by FMR. Prior to his current responsibilities, Mr. O’Neil worked as a research analyst and portfolio manager.
Year of Election or Appointment: 1998
Secretary of Intermediate Bond. He also serves as Secretary of other Fidelity funds; Vice President, General Counsel, and Secretary of FMR Co., Inc. (2001 present) and FMR; Assistant Secretary of Fidelity Management & Research (U.K.) Inc. (2001 present), Fidelity Research & Analysis Company (2001 present), and Fidelity Investments Money Management, Inc. (2001 present). Mr. Roiter is an Adjunct Member, Faculty of Law, at Boston College Law School (2003 present). Previously, Mr. Roiter served as Vice President and Secretary of Fidelity Distributors Corporation (FDC) (1998 2005).
63 Annual Report
Trustees and Officers - continued
| | Name, Age; Principal Occupation
|
Year of Election or Appointment: 2003
Assistant Secretary of Intermediate Bond. Mr. Fross also serves as Assistant Secretary of other Fidelity funds (2003 present), Vice President and Secretary of FDC (2005 present), and is an employee of FMR.
Year of Election or Appointment: 2004
President and Treasurer of Intermediate Bond. Ms. Reynolds also serves as President and Treasurer of other Fidelity funds (2004 present) and is a Vice President (2003 present) and an employee (2002 present) of FMR. Before joining Fidelity Investments, Ms. Reynolds worked at PricewaterhouseCoopers LLP (PwC) (1980 2002), where she was most recently an audit partner with PwC’s investment management practice.
Year of Election or Appointment: 2006
Anti Money Laundering (AML) officer of Intermediate Bond. Mr. Ganis also serves as AML officer of other Fidelity funds (2006 present) and FMR Corp. (2003 present). Before joining Fidelity Investments, Mr. Ganis practiced law at Goodwin Procter, LLP (2000 2002).
Year of Election or Appointment: 2005
Chief Financial Officer of Intermediate Bond. Mr. Murphy also serves as Chief Financial Officer of other Fidelity funds (2005 present). He also serves as Senior Vice President of Fidelity Pricing and Cash Management Services Group (FPCMS).
| | Kenneth A. Rathgeber (58)
|
Year of Election or Appointment: 2004
Chief Compliance Officer of Intermediate Bond. Mr. Rathgeber also serves as Chief Compliance Officer of other Fidelity funds (2004 present) and Executive Vice President of Risk Oversight for Fidelity Investments (2002 present). He is Chief Compliance Officer of FMR (2005 present), FMR Co., Inc. (2005 present), Fidelity Management & Research (U.K.) Inc. (2005 present), Fidelity Research & Analysis Company (2005 present), Fidelity Investments Money Management, Inc. (2005 present), and Strategic Advisers, Inc. (2005 present). Previously, Mr. Rathgeber served as Executive Vice President and Chief Operating Officer for Fidelity Investments Institutional Services Company, Inc. (1998 2002).
Name, Age; Principal Occupation
Bryan A. Mehrmann (45)
|
Year of Election or Appointment: 2005
Deputy Treasurer of Intermediate Bond. Mr. Mehrmann also serves as Deputy Treasurer of other Fidelity funds (2005 present) and is an employee of FMR. Previously, Mr. Mehrmann served as Vice President of Fidelity Investments Institutional Services Group (FIIS)/Fidelity Investments Institutional Operations Corporation, Inc. (FIIOC) Client Services (1998 2004).
Kimberley H. Monasterio (42)
|
Year of Election or Appointment: 2004
Deputy Treasurer of Intermediate Bond. Ms. Monasterio also serves as Deputy Treasurer of other Fidelity funds (2004) and is an employee of FMR (2004). Before joining Fidelity Investments, Ms. Monasterio served as Treasurer (2000 2004) and Chief Financial Officer (2002 2004) of the Franklin Templeton Funds and Senior Vice President of Franklin Templeton Services, LLC (2000 2004).
Year of Election or Appointment: 2005
Deputy Treasurer of Intermediate Bond. Mr. Robins also serves as Deputy Treasurer of other Fidelity funds (2005 present) and is an employee of FMR (2004 present). Before joining Fidelity Investments, Mr. Robins worked at KPMG LLP, where he was a partner in KPMG’s department of professional practice (2002 2004) and a Senior Manager (1999 2000). In addition, Mr. Robins served as Assistant Chief Accountant, United States Securities and Exchange Commission (2000 2002).
Year of Election or Appointment: 2005
Assistant Treasurer of Intermediate Bond. Mr. Byrnes also serves as Assistant Treasurer of other Fidelity funds (2005 present) and is an employee of FMR (2005 present). Previously, Mr. Byrnes served as Vice President of FPCMS (2003 2005). Before joining Fidelity Investments, Mr. Byrnes worked at Deutsche Asset Management where he served as Vice President of the Investment Operations Group (2000 2003).
Year of Election or Appointment: 1986
Assistant Treasurer of Intermediate Bond. Mr. Costello also serves as Assistant Treasurer of other Fidelity funds and is an employee of FMR.
65 Annual Report
Trustees and Officers - continued
| | Name, Age; Principal Occupation
Peter L. Lydecker (52)
|
Year of Election or Appointment: 2004
Assistant Treasurer of Intermediate Bond. Mr. Lydecker also serves as Assistant Treasurer of other Fidelity funds (2004) and is an employee of FMR.
Year of Election or Appointment: 2002
Assistant Treasurer of Intermediate Bond. Mr. Osterheld also serves as Assistant Treasurer of other Fidelity funds (2002) and is an employee of FMR.
Year of Election or Appointment: 2005
Assistant Treasurer of Intermediate Bond. Mr. Ryan also serves as Assistant Treasurer of other Fidelity funds (2005 present) and is an employee of FMR (2005 present). Previously, Mr. Ryan served as Vice President of Fund Reporting in FPCMS (1999 2005).
Year of Election or Appointment: 2005
Assistant Treasurer of Intermediate Bond. Mr. Schiavone also serves as Assistant Treasurer of other Fidelity funds (2005 present) and is an employee of FMR (2005 present). Before joining Fidelity Investments, Mr. Schiavone worked at Deutsche Asset Management, where he most recently served as Assistant Treasurer (2003 2005) of the Scudder Funds and Vice President and Head of Fund Reporting (1996 2003).
A total of 26.57% of the dividends distributed during the fiscal year was derived from interest on U.S. Government securities which is generally exempt from state income tax.
The fund designates $98,652,242 of distributions paid during the period January 1, 2006 to April 30, 2006 as qualifying to be taxed as interest related dividends for non resident alien shareholders.
The fund will notify shareholders in January 2007 of amounts for use in preparing 2006 income tax returns.
67 Annual Report
Proxy Voting Results
A special meeting of each fund’s shareholders was held on November 16, 2005. The results of votes taken among shareholders on proposals before them are reported below. Each vote reported represents one dollar of net asset value held on the record date for the meeting.
| PROPOSAL 1 | | |
| To elect a Board of Trustees.A | | |
| | | # of | | % of |
| | | Votes | | Votes |
| |
| Dennis J. Dirks | | |
| Affirmative | | 18,240,248,322.53 | | 96.150 |
| Withheld | | 730,313,302.58 | | 3.850 |
| TOTAL | | 18,970,561,625.11 | | 100.000 |
| Albert R. Gamper, Jr.B | | |
| Affirmative | | 18,204,838,072.06 | | 95.964 |
| Withheld | | 765,723,553.05 | | 4.036 |
| TOTAL | | 18,970,561,625.11 | | 100.000 |
| Robert M. Gates | | |
| Affirmative | | 18,191,748,681.13 | | 95.895 |
| Withheld | | 778,812,943.98 | | 4.105 |
| TOTAL | | 18,970,561,625.11 | | 100.000 |
| George H. Heilmeier | | |
| Affirmative | | 18,193,638,757.60 | | 95.905 |
| Withheld | | 776,922,867.51 | | 4.095 |
| TOTAL | | 18,970,561,625.11 | | 100.000 |
| Abigail P. Johnson | | |
| Affirmative | | 18,103,320,241.78 | | 95.428 |
| Withheld | | 867,241,383.33 | | 4.572 |
| TOTAL | | 18,970,561,625.11 | | 100.000 |
| Edward C. Johnson 3d | | |
| Affirmative | | 18,055,585,171.13 | | 95.177 |
| Withheld | | 914,976,453.98 | | 4.823 |
| TOTAL | | 18,970,561,625.11 | | 100.000 |
| Stephen P. Jonas | | |
| Affirmative | | 18,188,419,716.35 | | 95.877 |
| Withheld | | 782,141,908.76 | | 4.123 |
| TOTAL | | 18,970,561,625.11 | | 100.000 |
| Marie L. Knowles | | |
| Affirmative | | 18,208,650,664.29 | | 95.984 |
| Withheld | | 761,910,960.82 | | 4.016 |
| TOTAL | | 18,970,561,625.11 | | 100.000 |
| | | # of | | % of |
| | | Votes | | Votes |
| |
| Ned C. Lautenbach | | |
| Affirmative | | 18,224,936,039.64 | | 96.070 |
| Withheld | | 745,625,585.47 | | 3.930 |
| TOTAL | | 18,970,561,625.11 | | 100.000 |
| |
| Marvin L. Mann | | |
| Affirmative | | 18,146,216,753.93 | | 95.655 |
| Withheld | | 824,344,871.18 | | 4.345 |
| TOTAL | | 18,970,561,625.11 | | 100.000 |
| |
| William O. McCoy | | |
| Affirmative | | 18,164,580,135.79 | | 95.751 |
| Withheld | | 805,981,489.32 | | 4.249 |
| TOTAL | | 18,970,561,625.11 | | 100.000 |
| |
| Robert L. Reynolds | | |
| Affirmative | | 18,197,448,372.22 | | 95.925 |
| Withheld | | 773,113,252.89 | | 4.075 |
| TOTAL | | 18,970,561,625.11 | | 100.000 |
| |
| Cornelia M. Small | | |
| Affirmative | | 18,214,122,413.76 | | 96.013 |
| Withheld | | 756,439,211.35 | | 3.987 |
| TOTAL | | 18,970,561,625.11 | | 100.000 |
| |
| William S. Stavropoulos | | |
| Affirmative | | 18,186,563,509.46 | | 95.867 |
| Withheld | | 783,998,115.65 | | 4.133 |
| TOTAL | | 18,970,561,625.11 | | 100.000 |
| |
| Kenneth L. Wolfe | | |
| Affirmative | | 18,211,332,412.92 | | 95.998 |
| Withheld | | 759,229,212.19 | | 4.002 |
| TOTAL | | 18,970,561,625.11 | | 100.000 |
A Denotes trust-wide proposals and voting results.
B Effective on or about January 1, 2006.
|
Annual Report 68
Board Approval of Investment Advisory Contracts and Management Fees
Fidelity Intermediate Bond Fund
On January 19, 2006, the Board of Trustees, including the Independent Trustees (together, the Board), voted to approve a general research services agreement (the Agreement) between FMR, FMR Co., Inc. (FMRC), Fidelity Investments Money Manage ment, Inc. (FIMM), and Fidelity Research & Analysis Company (FRAC) (together, the Investment Advisers) for the fund, effective January 20, 2006, pursuant to which FRAC may provide general research and investment advisory support services to FMRC and FIMM. The Board considered that it has approved previously various sub advisory agreements for the fund with affiliates of FMR that allow FMR to obtain research, non discretionary advice, or discretionary portfolio management at no additional expense to the fund. The Board, assisted by the advice of fund counsel and independent Trustees’ counsel, considered a broad range of information and determined that it would be beneficial for the fund to access the research and investment advisory support services supplied by FRAC at no additional expense to the fund.
The Board reached this determination in part because the new arrangement will involve no changes in (i) the contractual terms of and fees payable under the fund’s manage ment contract or sub advisory agreements; (ii) the investment process or strategies employed in the management of the fund’s assets; (iii) the nature or level of services provided under the fund’s management contract or sub advisory agreements; (iv) the day to day management of the fund or the persons primarily responsible for such man agement; or (v) the ultimate control or beneficial ownership of FMR, FMRC, or FIMM. The Board also considered that the establishment of the Agreement would not necessi tate prior shareholder approval of the Agreement or result in an assignment and termination of the fund’s management contract or sub advisory agreements under the Investment Company Act of 1940.
Because the Board was approving an arrangement with FRAC under which the fund will not bear any additional management fees or expenses and under which the fund’s portfolio manager would not change, it did not consider the fund’s investment perfor mance, competitiveness of management fee and total expenses, costs of services and profitability, or economies of scale to be significant factors in its decision.
In connection with its future renewal of the fund’s management contract and sub advisory agreements, the Board will consider: (i) the nature, extent, and quality of services provided to the fund, including shareholder and administrative services and investment performance; (ii) the competitiveness of the fund’s management fee and total expenses; (iii) the costs of the services and profitability, including the revenues earned and the expenses incurred by Fidelity in conducting the business of developing, marketing, distributing, managing, administering, and servicing the fund and its shareholders; and (iv) whether there have been economies of scale in respect of the management of the Fidelity funds, whether the Fidelity funds (including the fund) have
69 Annual Report
Board Approval of Investment Advisory Contracts and Management Fees continued
appropriately benefited from any such economies of scale, and whether there is potential for realization of any further economies.
Based on its evaluation of all of the conclusions noted above, and after considering all material factors, the Board ultimately concluded that the fund’s Agreement is fair and reasonable, and that the fund’s Agreement should be approved.
Managing Your Investments
Fidelity offers several ways to conveniently manage your personal investments via your telephone or PC. You can access your account information, conduct trades and research your investments 24 hours a day.
By Phone
Fidelity Automated Service Telephone provides a single toll free number to access account balances, positions, quotes and trading. It’s easy to navigate the service, and on your first call, the system will help you create a personal identification number (PIN) for security.


By PC
Fidelity’s web site on the Internet provides a wide range of information, including daily financial news, fund performance, interactive planning tools and news about Fidelity products and services.

* When you call the quotes line, please remember that a fund’s yield and return will vary and, except for money market funds, share price will also vary. This means that you may have a gain or loss when you sell your shares. There is no assurance that money market funds will be able to maintain a stable $1 share price; an investment in a money market fund is not insured or guar anteed by the U.S. government. Total returns are historical and include changes in share price, reinvestment of dividends and capital gains, and the effects of any sales charges.
71 Annual Report
To Visit Fidelity
For directions and hours,
please call 1-800-544-9797.
Arizona
7001 West Ray Road
Chandler, AZ
7373 N. Scottsdale Road
Scottsdale, AZ
California
815 East Birch Street
Brea, CA
1411 Chapin Avenue
Burlingame, CA
851 East Hamilton Avenue
Campbell, CA
19200 Von Karman Avenue
Irvine, CA
601 Larkspur Landing Circle
Larkspur, CA
10100 Santa Monica Blvd.
Los Angeles, CA
27101 Puerta Real
Mission Viejo, CA
73 575 El Paseo
Palm Desert, CA
251 University Avenue
Palo Alto, CA
123 South Lake Avenue
Pasadena, CA
16995 Bernardo Ctr. Drive
Rancho Bernardo, CA
1740 Arden Way
Sacramento, CA
7676 Hazard Center Drive
San Diego, CA
8 Montgomery Street
San Francisco, CA
3793 State Street
Santa Barbara, CA
21701 Hawthorne Boulevard
Torrance, CA
2001 North Main Street
Walnut Creek, CA
6300 Canoga Avenue
Woodland Hills, CA
|
Colorado
1625 Broadway
Denver, CO
9185 East Westview Road
Littleton, CO
Connecticut
48 West Putnam Avenue
Greenwich, CT
265 Church Street
New Haven, CT
300 Atlantic Street
Stamford, CT
29 South Main Street
West Hartford, CT
Delaware
222 Delaware Avenue
Wilmington, DE
Florida
4400 N. Federal Highway
Boca Raton, FL
121 Alhambra Plaza
Coral Gables, FL
2948 N. Federal Highway
Ft. Lauderdale, FL
1907 West State Road 434
Longwood, FL
8880 Tamiami Trail, North
Naples, FL
3550 Tamiami Trail, South
Sarasota, FL
1502 N. Westshore Blvd.
Tampa, FL
2465 State Road 7
Wellington, FL
3501 PGA Boulevard
West Palm Beach, FL
Georgia
3445 Peachtree Road, N.E.
Atlanta, GA
1000 Abernathy Road
Atlanta, GA
Illinois
One North LaSalle Street
Chicago, IL
875 North Michigan Ave.
Chicago, IL
|
1415 West 22nd Street
Oak Brook, IL
1572 East Golf Road
Schaumburg, IL
3232 Lake Avenue
Wilmette, IL
Indiana
4729 East 82nd Street
Indianapolis, IN
Kansas
5400 College Boulevard
Overland Park, KS
Maine
Three Canal Plaza
Portland, ME
Maryland
7315 Wisconsin Avenue
Bethesda, MD
One W. Pennsylvania Ave.
Towson, MD
Massachusetts
801 Boylston Street
Boston, MA
155 Congress Street
Boston, MA
300 Granite Street
Braintree, MA
44 Mall Road
Burlington, MA
405 Cochituate Road
Framingham, MA
416 Belmont Street
Worcester, MA
Michigan
500 E. Eisenhower Pkwy.
Ann Arbor, MI
280 Old N. Woodward Ave.
Birmingham, MI
43420 Grand River Avenue
Novi, MI
29155 Northwestern Hwy.
Southfield, MI
Minnesota
7600 France Avenue South
Edina, MN
|
Annual Report 72
Missouri
8885 Ladue Road
Ladue, MO
Nevada
2225 Village Walk Drive
Henderson, NV
New Jersey
150 Essex Street
Millburn, NJ
56 South Street
Morristown, NJ
396 Route 17, North
Paramus, NJ
3518 Route 1 North
Princeton, NJ
530 Highway 35
Shrewsbury, NJ
New York
1055 Franklin Avenue
Garden City, NY
37 West Jericho Turnpike
Huntington Station, NY
1271 Avenue of the Americas
New York, NY
61 Broadway
New York, NY
350 Park Avenue
New York, NY
200 Fifth Avenue
New York, NY
733 Third Avenue
New York, NY
11 Penn Plaza
New York, NY
2070 Broadway
New York, NY
1075 Northern Blvd.
Roslyn, NY
North Carolina
4611 Sharon Road
Charlotte, NC
Ohio
3805 Edwards Road
Cincinnati, OH
1324 Polaris Parkway
Columbus, OH
28699 Chagrin Boulevard
Woodmere Village, OH
|
Oregon
16850 SW 72nd Avenue
Tigard, OR
Pennsylvania
600 West DeKalb Pike
King of Prussia, PA
1735 Market Street
Philadelphia, PA
12001 Perry Highway
Wexford, PA
Rhode Island
47 Providence Place
Providence, RI
Tennessee
6150 Poplar Avenue
Memphis, TN
Texas
10000 Research Boulevard
Austin, TX
4001 Northwest Parkway
Dallas, TX
12532 Memorial Drive
Houston, TX
2701 Drexel Drive
Houston, TX
6500 N. MacArthur Blvd.
Irving, TX
6005 West Park Boulevard
Plano, TX
14100 San Pedro
San Antonio, TX
1576 East Southlake Blvd.
Southlake, TX
19740 IH 45 North
Spring, TX
Utah
215 South State Street
Salt Lake City, UT
Virginia
1861 International Drive
McLean, VA
Washington
411 108th Avenue, N.E.
Bellevue, WA
1518 6th Avenue
Seattle, WA
|
Washington, DC
1900 K Street, N.W.
Washington, DC
Wisconsin
595 North Barker Road
Brookfield, WI
|
Fidelity Brokerage Services, Inc., 100 Summer St., Boston, MA 02110 Member NYSE/SIPC
73 Annual Report
73
To Write Fidelity
We’ll give your correspondence immediate attention and send you written confirmation upon completion of your request.

(such as changing name, address, bank, etc.)
Fidelity Investments
P.O. Box 770001
Cincinnati, OH 45277-0002
|

Buying shares
Fidelity Investments
P.O. Box 770001
Cincinnati, OH 45277-0003
Overnight Express
Fidelity Investments
Attn: Distribution Services
100 Crosby Parkway KC1H
Covington, KY 41015
Selling shares
Fidelity Investments
P.O. Box 770001
Cincinnati, OH 45277-0035
Overnight Express
Fidelity Investments
Attn: Distribution Services
100 Crosby Parkway KC1H
Covington, KY 41015
General Correspondence
Fidelity Investments
P.O. Box 500
Merrimack, NH 03054-0500
|

Buying shares
Fidelity Investments
P.O. Box 770001
Cincinnati, OH 45277-0003
Selling shares
Fidelity Investments
P.O. Box 770001
Cincinnati, OH 45277-0035
Overnight Express
Fidelity Investments
Attn: Distribution Services
100 Crosby Parkway KC1H
Covington, KY 41015
General Correspondence
Fidelity Investments
P.O. Box 500
Merrimack, NH 03054-0500
|
Annual Report 74
75 Annual Report
77 Annual Report
Investment Adviser
Fidelity Management & Research
Company
Boston, MA
Investment Sub Advisers
Fidelity Investments Japan Limited
Fidelity Investments Money
Management, Inc.
Fidelity Research & Analysis Company
(formerly Fidelity Management &
Research (Far East) Inc.)
Fidelity Management & Research
(U.K.) Inc.
Fidelity International Investment Advisors
Fidelity International Investment Advisors
(U.K.) Limited
General Distributor
Fidelity Distributors Corporation
Boston, MA
Transfer and Service Agent
Fidelity Service Company, Inc.
Boston, MA
Custodian
The Bank of New York
New York, NY
|
| The Fidelity Telephone Connection |
| Mutual Fund 24-Hour Service |
| Exchanges/Redemptions | | |
| and Account Assistance | | 1-800-544-6666 |
| Product Information | | 1-800-544-6666 |
| Retirement Accounts | | 1-800-544-4774 |
| (8 a.m. - 9 p.m.) | | |
| TDD Service | | 1-800-544-0118 |
| for the deaf and hearing impaired |
| (9 a.m. - 9 p.m. Eastern time) |
| Fidelity Automated Service | | |
| Telephone (FAST®) (automated phone logo) | | 1-800-544-5555 |
| (automated phone logo) Automated line for quickest service |
IBF UANN-0606
1.784721.103
|

| | Fidelity®
Large Cap Stock
Fund
|
| | Annual Report
April 30, 2006
|


| Contents | | | | |
| |
| Chairman’s Message | | 4 | | Ned Johnson’s message to shareholders. |
| Performance | | 5 | | How the fund has done over time. |
| Management’s Discussion | | 6 | | The manager’s review of fund |
| | | | | performance, strategy and outlook. |
| Shareholder Expense | | 7 | | An example of shareholder expenses. |
| Example | | | | |
| Investment Changes | | 8 | | A summary of major shifts in the fund’s |
| | | | | investments over the past six months. |
| Investments | | 9 | | A complete list of the fund’s investments |
| | | | | with their market values. |
| Financial Statements | | 18 | | Statements of assets and liabilities, |
| | | | | operations, and changes in net assets, |
| | | | | as well as financial highlights. |
| Notes | | 22 | | Notes to the financial statements. |
| Report of Independent | | 28 | | |
| Registered Public | | | | |
| Accounting Firm | | | | |
| Trustees and Officers | | 29 | | |
| Distributions | | 39 | | |
| Proxy Voting Results | | 40 | | |
| Board Approval of | | 41 | | |
| Investment Advisory | | | | |
| Contracts and | | | | |
| Management Fees | | | | |
To view a fund’s proxy voting guidelines and proxy voting record for the 12 month period ended
June 30, visit www.fidelity.com/proxyvotingresults or visit the Securities and Exchange Commis
sion’s (SEC) web site at www.sec.gov. You may also call 1-800-544-8544 to request a free copy of
the proxy voting guidelines.
Standard & Poor’s, S&P and S&P 500 are registered service marks of The McGraw Hill Companies,
Inc. and have been licensed for use by Fidelity Distributors Corporation.
Other third party marks appearing herein are the property of their respective owners.
All other marks appearing herein are registered or unregistered trademarks or service marks
of FMR Corp. or an affiliated company.
|
This report and the financial statements contained herein are submitted for the general information
of the shareholders of the fund. This report is not authorized for distribution to prospective investors
in the fund unless preceded or accompanied by an effective prospectus.
A fund files its complete schedule of portfolio holdings with the SEC for the first and third
quarters of each fiscal year on Form N Q. Forms N Q are available on the SEC’s web site at
http://www.sec.gov. A fund’s Forms N Q may be reviewed and copied at the SEC’s Public Refer
ence Room in Washington, DC. Information regarding the operation of the SEC’s Public Reference
Room may be obtained by calling 1-800-SEC-0330. For a complete list of a fund’s portfolio hold
ings, view the most recent quarterly holdings report, semiannual report, or annual report on
Fidelity’s web site at http://www.fidelity.com/holdings.
NOT FDIC INSURED · MAY LOSE VALUE · NO BANK GUARANTEE
Neither the fund nor Fidelity Distributors Corporation is a bank.
|
3 Annual Report
Chairman’s Message
(photograph of Edward C. Johnson 3d)
Dear Shareholder:
Although many securities markets made gains in early 2006, there is only one certainty when it comes to investing: There is no sure thing. There are, however, a number of time tested, funda mental investment principles that can put the historical odds in your favor.
One of the basic tenets is to invest for the long term. Over time, riding out the markets’ inevitable ups and downs has proven much more effective than selling into panic or chasing the hottest trend. Even missing only a few of the markets’ best days can significantly diminish investor returns. Patience also affords the benefits of compounding of earning interest on additional income or reinvested dividends and capital gains. There are tax advantages and cost benefits to consider as well. The more you sell, the more taxes you pay, and the more you trade, the higher the costs. While staying the course doesn’t eliminate risk, it can considerably lessen the effect of short term declines.
You can further manage your investing risk through diversification. And today, more than ever, geographic diversification should be taken into account. Stud ies indicate that asset allocation is the single most important determinant of a portfolio’s long term success. The right mix of stocks, bonds and cash aligned to your particular risk tolerance and investment objective is very important. Age appropriate rebalancing is also an essential aspect of asset allocation. For younger investors, an emphasis on equities which historically have been the best performing asset class over time is encouraged. As investors near their specific goal, such as retirement or sending a child to college, consideration may be given to replacing volatile assets (e.g. common stocks) with more stable fixed investments (bonds or savings plans).
A third investment principle investing regularly can help lower the average cost of your purchases. Investing a certain amount of money each month or quarter helps ensure you won’t pay for all your shares at market highs. This strategy known as dollar cost averaging also reduces unconstruc tive “emotion” from investing, helping shareholders avoid selling weak performers just prior to an upswing, or chasing a hot performer just before a correction.
We invite you to contact us via the Internet, through our Investor Centers or over the phone. It is our privilege to provide you the information you need to make the investments that are right for you.
Sincerely,
/s/ Edward C. Johnson 3d
Edward C. Johnson 3d
Annual Report 4
Performance: The Bottom Line
Average annual total return reflects the change in the value of an investment, assuming reinvestment of the fund’s dividend income and capital gains (the profits earned upon the sale of securities that have grown in value) and assuming a constant rate of performance each year. The $10,000 table and the fund’s returns do not reflect the deduction of taxes that a shareholder would pay on fund dis tributions or the redemption of fund shares. During periods of reimbursement by Fidelity, a fund’s total return will be greater than it would be had the reimbursement not occurred. How a fund did yesterday is no guarantee of how it will do tomorrow.
| Average Annual Total Returns | | | | | | |
| Periods ended April 30, 2006 | | Past 1 | | Past 5 | | Past 10 |
| | | year | | years | | years |
| Fidelity® Large Cap Stock | | 21.43% | | 0.64% | | 7.62% |
| |
| $10,000 Over 10 Years | | | | | | |
Let’s say hypothetically that $10,000 was invested in Fidelity® Large Cap Stock Fund on April 30, 1996. The chart shows how the value of your investment would have changed, and also shows how the Standard & Poor’s 500SM Index performed over the same period.
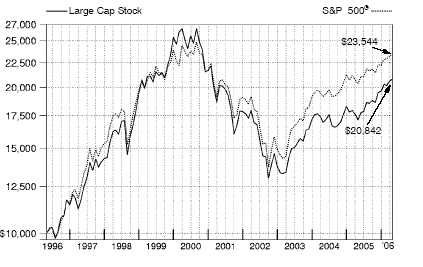
5 Annual Report
Management’s Discussion of Fund Performance
Comments from Matthew Fruhan, Portfolio Manager of Fidelity® Large Cap Stock Fund
Key U.S. equity benchmarks reached multiyear highs during the year ending April 30, 2006. The stock market’s performance reflected economic conditions and corporate earnings that continued to beat expectations. It also showed that investors generally tuned out the buzz surrounding record high energy costs, inflation and rising short term interest rates. By and large, the market’s trajectory was consistent throughout the period. In fact, as measured by the Standard & Poor’s 500SM Index, stocks rose in 10 of the past 12 months and ended the period on a six month winning streak. The gains also became more broad based, shifting from the primarily energy and utility driven returns of the period’s early stages to include more widespread contributions from other sectors such as financials and telecommunica tion services. On the capitalization spectrum, small caps continued to dominate, as the small cap Russell 2000® Index reached new heights and returned 33.47% for the year overall. In comparison, the large cap oriented S&P 500® gained 15.42%, the Dow Jones Industrial AverageSM rose 14.17% and the NASDAQ Composite® Index climbed 21.89% .
The fund returned 21.43% during the past year, outperforming both the S&P 500 and the LipperSM Growth Funds Average, which rose 19.28% . Stock selection played a large role in the performance relative to the index, especially in the financials, energy and health care sectors. The top individual contributor was Google, which continued to surpass earnings expectations as the prime beneficiary of increased advertising on the Internet. Oil field services company Halliburton also had explosive earnings growth, profiting from its pricing power and the prospect of sustained increases in spending on energy infrastructure. Valero Energy contributed among energy investments as well. In health care, the leading contribu tor was Cephalon, a specialty pharmaceutical company, while the top contributing finan cials holdings were UBS and JPMorgan Chase. Rail operator Norfolk Southern also was a standout. The fund’s overweighting of Dell Computer detracted, as the company faced increasingly tough competition. Conversely, the stock of Hewlett Packard, which I under weighted, performed very well and hurt performance relative to the index. I maintained a position in Apollo Group, an education company where enrollments and profits fell short of growth expectations and held back the stock’s performance. Another notable disappoint ment was industrial conglomerate Tyco International.
The views expressed above reflect those of the portfolio manager(s) only through the end of the period as stated on the cover of this report and do not necessarily represent the views of Fidelity or any other person in the Fidelity organization. Any such views are subject to change at any time based upon market or other conditions and Fidelity disclaims any responsibility to update such views. These views may not be relied on as investment advice and, because investment decisions for a Fidelity fund are based on numerous factors, may not be relied on as an indication of trading intent on behalf of any Fidelity fund.
Shareholder Expense Example
As a shareholder of the Fund, you incur two types of costs: (1) transaction costs, and (2) ongoing costs, including management fees and other Fund expenses. This Example is intended to help you understand your ongoing costs (in dollars) of investing in the Fund and to compare these costs with the ongoing costs of investing in other mutual funds. The Example is based on an investment of $1,000 invested at the beginning of the period and held for the entire period (November 1, 2005 to April 30, 2006).
Actual Expenses
The first line of the table below provides information about actual account values and actual expenses. You may use the information in this line, together with the amount you invested, to estimate the expenses that you paid over the period. Simply divide your account value by $1,000.00 (for example, an $8,600 account value divided by $1,000.00 = 8.6), then multiply the result by the number in the first line under the heading entitled “Expenses Paid During Period” to estimate the expenses you paid on your account during this period. A small balance maintenance fee of $12.00 that is charged once a year may apply for certain accounts with a value of less than $2,000. This fee is not included in the table below. If it was, the estimate of expenses you paid during the period would be higher, and your ending account value lower, by this amount.
Hypothetical Example for Comparison Purposes
The second line of the table below provides information about hypothetical account values and hypothetical expenses based on the Fund’s actual expense ratio and an assumed rate of return of 5% per year before expenses, which is not the Fund’s actual return. The hypothetical account values and expenses may not be used to estimate the actual ending account balance or expenses you paid for the period. You may use this information to compare the ongoing costs of investing in the Fund and other funds. To do so, compare this 5% hypothetical example with the 5% hypothetical examples that appear in the shareholder reports of the other funds. A small balance maintenance fee of $12.00 that is charged once a year may apply for certain accounts with a value of less than $2,000. This fee is not included in the table below. If it was, the estimate of expenses you paid during the period would be higher, and your ending account value lower, by this amount.
Please note that the expenses shown in the table are meant to highlight your ongoing costs only and do not reflect any transaction costs. Therefore, the second line of the table is useful in comparing ongoing costs only, and will not help you determine the relative total costs of owning different funds.
| | | | | | | | | | | Expenses Paid |
| | | Beginning | | Ending | | During Period* |
| | | Account Value | | Account Value | | November 1, 2005 |
| | | November 1, 2005 | | April 30, 2006 | | to April 30, 2006 |
| Actual | | | | $ 1,000.00 | | | | $ 1,118.00 | | | | $ 4.31 |
| Hypothetical (5% return per year | | | | | | | | | | | | |
| before expenses) | | | | $ 1,000.00 | | | | $ 1,020.73 | | | | $ 4.11 |
* Expenses are equal to the Fund’s annualized expense ratio of .82%; multiplied by the average account value over the period, multiplied by 181/365 (to reflect the one half year period).
7 Annual Report
| Investment Changes | | | | |
| |
| |
| Top Ten Stocks as of April 30, 2006 | | | | |
| | | % of fund’s | | % of fund’s net assets |
| | | net assets | | 6 months ago |
| General Electric Co. | | 7.1 | | 5.8 |
| Honeywell International, Inc. | | 3.9 | | 3.5 |
| Johnson & Johnson | | 3.5 | | 1.6 |
| American International Group, Inc. | | 3.4 | | 3.3 |
| JPMorgan Chase & Co. | | 3.2 | | 3.5 |
| Bank of America Corp. | | 2.9 | | 2.1 |
| Google, Inc. Class A (sub. vtg.) | | 2.1 | | 1.5 |
| Wal Mart Stores, Inc. | | 1.7 | | 2.4 |
| Dell, Inc. | | 1.7 | | 2.3 |
| Halliburton Co. | | 1.5 | | 1.6 |
| | | 31.0 | | |
Top Five Market Sectors as of April 30, 2006 | | |
| | | % of fund’s | | % of fund’s net assets |
| | | net assets | | 6 months ago |
| Financials | | 21.6 | | 20.1 |
| Health Care | | 17.6 | | 15.6 |
| Information Technology | | 16.5 | | 17.3 |
| Industrials | | 14.3 | | 14.7 |
| Energy | | 10.6 | | 10.6 |
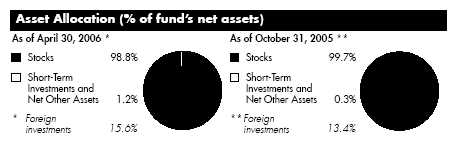
Annual Report 8
| Investments April 30, 2006 | | | | | | |
| Showing Percentage of Net Assets | | | | | | | | |
| |
| Common Stocks 98.8% | | | | | | | | |
| | | | | Shares | | Value (Note 1) |
| | | | | | | (000s) |
| |
| CONSUMER DISCRETIONARY – 8.2% | | | | | | | | |
| Automobiles – 0.1% | | | | | | | | |
| Harley Davidson, Inc. | | | | 10,100 | | | | $ 513 |
| Diversified Consumer Services – 0.6% | | | | | | | | |
| Apollo Group, Inc. Class A (a) | | | | 88,750 | | | | 4,849 |
| Hotels, Restaurants & Leisure 0.8% | | | | | | | | |
| Red Robin Gourmet Burgers, Inc. (a)(d) | | | | 129,400 | | | | 5,818 |
| Internet & Catalog Retail 0.2% | | | | | | | | |
| Coldwater Creek, Inc. (a) | | | | 63,200 | | | | 1,767 |
| Media – 2.2% | | | | | | | | |
| Clear Channel Communications, Inc. | | | | 196,400 | | | | 5,603 |
| E.W. Scripps Co. Class A | | | | 17,800 | | | | 820 |
| Lamar Advertising Co. Class A (a) | | | | 52,178 | | | | 2,869 |
| McGraw Hill Companies, Inc. | | | | 19,100 | | | | 1,063 |
| News Corp. Class B | | | | 90,000 | | | | 1,641 |
| Univision Communications, Inc. Class A (a)(d) | | | | 121,800 | | | | 4,347 |
| | | | | | | | | 16,343 |
| Multiline Retail – 1.0% | | | | | | | | |
| Federated Department Stores, Inc. | | | | 42,400 | | | | 3,301 |
| Target Corp. | | | | 75,200 | | | | 3,993 |
| | | | | | | | | 7,294 |
| Specialty Retail – 3.1% | | | | | | | | |
| Aeropostale, Inc. (a) | | | | 71,200 | | | | 2,187 |
| Best Buy Co., Inc. | | | | 70,650 | | | | 4,003 |
| Chico’s FAS, Inc. (a) | | | | 27,400 | | | | 1,015 |
| Home Depot, Inc. | | | | 282,200 | | | | 11,268 |
| Staples, Inc. | | | | 190,793 | | | | 5,039 |
| | | | | | | | | 23,512 |
| Textiles, Apparel & Luxury Goods – 0.2% | | | | | | | | |
| Deckers Outdoor Corp. (a) | | | | 37,100 | | | | 1,584 |
| |
| TOTAL CONSUMER DISCRETIONARY | | | | | | | | 61,680 |
| |
| CONSUMER STAPLES 4.9% | | | | | | | | |
| Beverages – 0.1% | | | | | | | | |
| C&C Group PLC | | | | 101,000 | | | | 784 |
| Food & Staples Retailing – 2.6% | | | | | | | | |
| CVS Corp. | | | | 168,500 | | | | 5,008 |
See accompanying notes which are an integral part of the financial statements.
| Investments continued | | | | | | |
| |
| |
| Common Stocks continued | | | | | | |
| | | Shares | | Value (Note 1) |
| | | | | (000s) |
| |
| CONSUMER STAPLES – continued | | | | | | |
| Food & Staples Retailing – continued | | | | | | |
| Wal-Mart Stores, Inc. | | 285,300 | | | | $ 12,847 |
| Walgreen Co. | | 29,100 | | | | 1,220 |
| | | | | | | 19,075 |
| Food Products 1.2% | | | | | | |
| Nestle SA (Reg.) | | 28,047 | | | | 8,553 |
| Wm. Wrigley Jr. Co. Class B | | 9,825 | | | | 463 |
| | | | | | | 9,016 |
| Personal Products 0.5% | | | | | | |
| Avon Products, Inc. | | 112,200 | | | | 3,659 |
| Tobacco 0.5% | | | | | | |
| Altria Group, Inc. | | 52,900 | | | | 3,870 |
| |
| TOTAL CONSUMER STAPLES | | | | | | 36,404 |
| |
| ENERGY 10.6% | | | | | | |
| Energy Equipment & Services – 4.3% | | | | | | |
| BJ Services Co. | | 131,800 | | | | 5,015 |
| ENSCO International, Inc. | | 17,600 | | | | 941 |
| Halliburton Co. | | 147,850 | | | | 11,554 |
| National Oilwell Varco, Inc. (a) | | 65,800 | | | | 4,538 |
| Schlumberger Ltd. (NY Shares) | | 104,100 | | | | 7,197 |
| Smith International, Inc. | | 65,800 | | | | 2,779 |
| | | | | | | 32,024 |
| Oil, Gas & Consumable Fuels – 6.3% | | | | | | |
| Amerada Hess Corp. | | 15,100 | | | | 2,163 |
| Chevron Corp. | | 39,300 | | | | 2,398 |
| ConocoPhillips | | 160,200 | | | | 10,717 |
| Exxon Mobil Corp. | | 72,800 | | | | 4,592 |
| Forest Oil Corp. (a) | | 48,000 | | | | 1,755 |
| Hugoton Royalty Trust | | 2,163 | | | | 60 |
| Mariner Energy, Inc. (a) | | 41,193 | | | | 801 |
| Occidental Petroleum Corp. | | 37,700 | | | | 3,873 |
| Quicksilver Resources, Inc. (a) | | 53,300 | | | | 2,209 |
| Range Resources Corp. | | 55,850 | | | | 1,482 |
| Total SA sponsored ADR | | 47,800 | | | | 6,597 |
| Ultra Petroleum Corp. (a) | | 14,400 | | | | 921 |
See accompanying notes which are an integral part of the financial statements.
| Common Stocks continued | | | | | | |
| | | Shares | | Value (Note 1) |
| | | | | (000s) |
| |
| ENERGY – continued | | | | | | |
| Oil, Gas & Consumable Fuels – continued | | | | | | |
| Valero Energy Corp. | | 122,500 | | | | $ 7,931 |
| XTO Energy, Inc. | | 36,300 | | | | 1,537 |
| | | | | | | 47,036 |
| |
| TOTAL ENERGY | | | | | | 79,060 |
| |
| FINANCIALS – 21.6% | | | | | | |
| Capital Markets 3.4% | | | | | | |
| Daiwa Securities Group, Inc. | | 64,000 | | | | 887 |
| Indiabulls Financial Services Ltd. | | 30,689 | | | | 193 |
| Investors Financial Services Corp. | | 174,900 | | | | 8,371 |
| Merrill Lynch & Co., Inc. | | 23,100 | | | | 1,762 |
| State Street Corp. | | 47,300 | | | | 3,090 |
| UBS AG (NY Shares) | | 91,400 | | | | 10,680 |
| | | | | | | 24,983 |
| Commercial Banks – 4.7% | | | | | | |
| Bank of America Corp. | | 432,500 | | | | 21,590 |
| FirstRand Ltd. | | 244,300 | | | | 805 |
| HSBC Holdings PLC sponsored ADR | | 26,200 | | | | 2,271 |
| Kookmin Bank | | 9,350 | | | | 838 |
| Standard Chartered PLC (United Kingdom) | | 308,925 | | | | 8,203 |
| State Bank of India | | 65,074 | | | | 1,467 |
| | | | | | | 35,174 |
| Consumer Finance – 1.8% | | | | | | |
| American Express Co. | | 166,830 | | | | 8,977 |
| Capital One Financial Corp. | | 51,200 | | | | 4,436 |
| | | | | | | 13,413 |
| Diversified Financial Services – 3.9% | | | | | | |
| African Bank Investments Ltd. | | 136,700 | | | | 764 |
| Asset Acceptance Capital Corp. (a) | | 62,392 | | | | 1,303 |
| IntercontinentalExchange, Inc. | | 35,100 | | | | 2,503 |
| JPMorgan Chase & Co. | | 528,040 | | | | 23,962 |
| NETeller PLC (a) | | 60,200 | | | | 851 |
| | | | | | | 29,383 |
| Insurance – 7.8% | | | | | | |
| ACE Ltd. | | 119,200 | | | | 6,620 |
| AMBAC Financial Group, Inc. | | 45,800 | | | | 3,772 |
| American International Group, Inc. | | 385,912 | | | | 25,181 |
See accompanying notes which are an integral part of the financial statements.
11 Annual Report
| Investments continued | | | | | | |
| |
| |
| Common Stocks continued | | | | | | |
| | | Shares | | Value (Note 1) |
| | | | | (000s) |
| |
| FINANCIALS – continued | | | | | | |
| Insurance – continued | | | | | | |
| Aspen Insurance Holdings Ltd. | | 84,600 | | | | $ 2,060 |
| Assurant, Inc. | | 15,500 | | | | 747 |
| Endurance Specialty Holdings Ltd. | | 121,300 | | | | 3,755 |
| Max Re Capital Ltd. | | 63,300 | | | | 1,551 |
| PartnerRe Ltd. | | 30,900 | | | | 1,933 |
| Platinum Underwriters Holdings Ltd. | | 156,300 | | | | 4,309 |
| Scottish Re Group Ltd. | | 37,700 | | | | 876 |
| Swiss Reinsurance Co. (Reg.) | | 24,518 | | | | 1,789 |
| XL Capital Ltd. Class A | | 84,500 | | | | 5,568 |
| | | | | | | 58,161 |
| |
| TOTAL FINANCIALS | | | | | | 161,114 |
| |
| HEALTH CARE – 17.6% | | | | | | |
| Biotechnology – 2.5% | | | | | | |
| Alkermes, Inc. (a) | | 64,474 | | | | 1,384 |
| Alnylam Pharmaceuticals, Inc. (a) | | 105,100 | | | | 1,619 |
| Amgen, Inc. (a) | | 20,400 | | | | 1,381 |
| Cephalon, Inc. (a)(d) | | 139,552 | | | | 9,163 |
| Illumina, Inc. (a) | | 25,500 | | | | 807 |
| Invitrogen Corp. (a) | | 50,600 | | | | 3,340 |
| Vertex Pharmaceuticals, Inc. (a) | | 26,600 | | | | 967 |
| | | | | | | 18,661 |
| Health Care Equipment & Supplies – 3.0% | | | | | | |
| Alcon, Inc. | | 41,300 | | | | 4,201 |
| C.R. Bard, Inc. | | 50,200 | | | | 3,738 |
| Cooper Companies, Inc. | | 81,500 | | | | 4,468 |
| Inverness Medical Innovations, Inc. (a) | | 183,601 | | | | 4,774 |
| NeuroMetrix, Inc. (a) | | 13,400 | | | | 505 |
| St. Jude Medical, Inc. (a) | | 47,300 | | | | 1,867 |
| Thermo Electron Corp. (a) | | 65,800 | | | | 2,536 |
| | | | | | | 22,089 |
| Health Care Providers & Services – 2.9% | | | | | | |
| Aetna, Inc. | | 148,200 | | | | 5,706 |
| Cardinal Health, Inc. | | 43,400 | | | | 2,923 |
| Chemed Corp. | | 20,400 | | | | 1,112 |
| Emdeon Corp. (a) | | 84,600 | | | | 965 |
See accompanying notes which are an integral part of the financial statements.
| Common Stocks continued | | | | | | |
| | | Shares | | Value (Note 1) |
| | | | | (000s) |
| |
| HEALTH CARE – continued | | | | | | |
| Health Care Providers & Services – continued | | | | | | |
| UnitedHealth Group, Inc. | | 216,000 | | | | $ 10,744 |
| WebMD Health Corp. Class A | | 11,500 | | | | 500 |
| | | | | | | 21,950 |
| Pharmaceuticals – 9.2% | | | | | | |
| Allergan, Inc. | | 67,785 | | | | 6,963 |
| Johnson & Johnson | | 441,700 | | | | 25,888 |
| Merck & Co., Inc. | | 230,328 | | | | 7,928 |
| Novartis AG sponsored ADR | | 89,500 | | | | 5,147 |
| Pfizer, Inc. | | 285,078 | | | | 7,221 |
| Roche Holding AG (participation certificate) | | 33,776 | | | | 5,193 |
| Teva Pharmaceutical Industries Ltd. sponsored ADR | | 52,800 | | | | 2,138 |
| Wyeth | | 169,400 | | | | 8,245 |
| | | | | | | 68,723 |
| |
| TOTAL HEALTH CARE | | | | | | 131,423 |
| |
| INDUSTRIALS – 14.3% | | | | | | |
| Aerospace & Defense – 5.2% | | | | | | |
| Essex Corp. (a) | | 17,400 | | | | 371 |
| Goodrich Corp. | | 94,600 | | | | 4,210 |
| Honeywell International, Inc. | | 682,100 | | | | 28,989 |
| L 3 Communications Holdings, Inc. | | 30,500 | | | | 2,492 |
| Raytheon Co. | | 17,500 | | | | 775 |
| Rolls Royce Group PLC | | 86,900 | | | | 755 |
| United Technologies Corp. | | 24,100 | | | | 1,514 |
| | | | | | | 39,106 |
| Airlines – 0.4% | | | | | | |
| UAL Corp. (a) | | 36,800 | | | | 1,325 |
| US Airways Group, Inc. (a) | | 33,700 | | | | 1,458 |
| | | | | | | 2,783 |
| Electrical Equipment – 0.1% | | | | | | |
| Vestas Wind Systems AS (a) | | 20,000 | | | | 543 |
| Industrial Conglomerates – 7.7% | | | | | | |
| General Electric Co. | | 1,540,208 | | | | 53,278 |
| Smiths Group PLC | | 169,000 | | | | 3,142 |
| Tyco International Ltd. | | 39,800 | | | | 1,049 |
| | | | | | | 57,469 |
See accompanying notes which are an integral part of the financial statements.
13 Annual Report
| Investments continued | | | | | | |
| |
| |
| Common Stocks continued | | | | | | |
| | | Shares | | Value (Note 1) |
| | | | | (000s) |
| |
| INDUSTRIALS – continued | | | | | | |
| Machinery – 0.5% | | | | | | |
| Deere & Co. | | 28,300 | | | | $ 2,484 |
| KCI Konecranes Oyj | | 19,650 | | | | 364 |
| Kone Oyj (B Shares) | | 17,580 | | | | 820 |
| | | | | | | 3,668 |
| Road & Rail 0.4% | | | | | | |
| Norfolk Southern Corp. | | 58,700 | | | | 3,170 |
| |
| TOTAL INDUSTRIALS | | | | | | 106,739 |
| |
| INFORMATION TECHNOLOGY – 16.5% | | | | | | |
| Communications Equipment – 1.5% | | | | | | |
| CSR PLC (a) | | 125,200 | | | | 2,761 |
| Juniper Networks, Inc. (a) | | 159,800 | | | | 2,953 |
| Nokia Corp. sponsored ADR | | 92,500 | | | | 2,096 |
| Research In Motion Ltd. (a) | | 43,000 | | | | 3,295 |
| | | | | | | 11,105 |
| Computers & Peripherals – 3.9% | | | | | | |
| Apple Computer, Inc. (a) | | 80,000 | | | | 5,631 |
| Dell, Inc. (a) | | 474,002 | | | | 12,419 |
| EMC Corp. (a) | | 550,223 | | | | 7,434 |
| Hewlett-Packard Co. | | 30,200 | | | | 981 |
| NCR Corp. (a) | | 57,100 | | | | 2,250 |
| Sun Microsystems, Inc. (a) | | 115,300 | | | | 577 |
| | | | | | | 29,292 |
| Electronic Equipment & Instruments – 1.0% | | | | | | |
| Agilent Technologies, Inc. (a) | | 98,500 | | | | 3,784 |
| Arrow Electronics, Inc. (a) | | 51,400 | | | | 1,861 |
| Cogent, Inc. (a) | | 64,300 | | | | 1,052 |
| Hon Hai Precision Industry Co. Ltd. (Foxconn) | | 185 | | | | 1 |
| Motech Industries, Inc. | | 23,000 | | | | 638 |
| | | | | | | 7,336 |
| Internet Software & Services – 3.9% | | | | | | |
| eBay, Inc. (a) | | 246,497 | | | | 8,482 |
| Google, Inc. Class A (sub. vtg.) (a) | | 37,100 | | | | 15,506 |
| NHN Corp. (a) | | 2,532 | | | | 899 |
| Spark Networks PLC unit (a) | | 45,200 | | | | 302 |
| Yahoo!, Inc. (a) | | 128,300 | | | | 4,206 |
| | | | | | | 29,395 |
See accompanying notes which are an integral part of the financial statements.
| Common Stocks continued | | | | | | |
| | | Shares | | Value (Note 1) |
| | | | | (000s) |
| |
| INFORMATION TECHNOLOGY – continued | | | | | | |
| IT Services – 0.3% | | | | | | |
| First Data Corp. | | 55,500 | | | | $ 2,647 |
| Semiconductors & Semiconductor Equipment – 3.1% | | | | | | |
| ARM Holdings PLC sponsored ADR | | 413,900 | | | | 3,067 |
| Cree, Inc. (a) | | 100 | | | | 3 |
| FormFactor, Inc. (a) | | 55,800 | | | | 2,326 |
| Holtek Semiconductor, Inc. | | 354,000 | | | | 709 |
| Intel Corp. | | 469,541 | | | | 9,381 |
| Linear Technology Corp. | | 57,000 | | | | 2,024 |
| MEMC Electronic Materials, Inc. (a) | | 59,700 | | | | 2,424 |
| National Semiconductor Corp. | | 79,200 | | | | 2,374 |
| Vimicro International Corp. sponsored ADR | | 49,300 | | | | 925 |
| | | | | | | 23,233 |
| Software 2.8% | | | | | | |
| Cognos, Inc. (a) | | 30,700 | | | | 1,144 |
| Microsoft Corp. | | 474,202 | | | | 11,452 |
| Oracle Corp. (a) | | 399,400 | | | | 5,827 |
| Symantec Corp. (a) | | 133,600 | | | | 2,188 |
| | | | | | | 20,611 |
| |
| TOTAL INFORMATION TECHNOLOGY | | | | | | 123,619 |
| |
| MATERIALS 1.5% | | | | | | |
| Chemicals – 1.2% | | | | | | |
| Ashland, Inc. | | 79,100 | | | | 5,206 |
| Linde AG (d) | | 12,800 | | | | 1,146 |
| Praxair, Inc. | | 43,100 | | | | 2,419 |
| | | | | | | 8,771 |
| Metals & Mining – 0.3% | | | | | | |
| Mittal Steel Co. NV Class A (NY Shares) | | 67,300 | | | | 2,523 |
| |
| TOTAL MATERIALS | | | | | | 11,294 |
| |
| TELECOMMUNICATION SERVICES – 3.0% | | | | | | |
| Diversified Telecommunication Services – 1.1% | | | | | | |
| AT&T, Inc. | | 239,300 | | | | 6,272 |
| Qwest Communications International, Inc. (a) | | 317,900 | | | | 2,133 |
| | | | | | | 8,405 |
See accompanying notes which are an integral part of the financial statements.
15 Annual Report
| Investments continued | | | | | | | | |
| |
| |
| Common Stocks continued | | | | | | | | |
| | | | | Shares | | Value (Note 1) |
| | | | | | | (000s) |
| |
| TELECOMMUNICATION SERVICES – continued | | | | | | | | |
| Wireless Telecommunication Services – 1.9% | | | | | | | | |
| American Tower Corp. Class A (a) | | | | 142,289 | | | | $ 4,858 |
| Sprint Nextel Corp. | | | | 367,084 | | | | 9,104 |
| | | | | | | | | 13,962 |
| |
| TOTAL TELECOMMUNICATION SERVICES | | | | | | | | 22,367 |
| |
| UTILITIES – 0.6% | | | | | | | | |
| Electric Utilities – 0.3% | | | | | | | | |
| Exelon Corp. | | | | 41,700 | | | | 2,252 |
| Independent Power Producers & Energy Traders – 0.3% | | | | | | | | |
| AES Corp. (a) | | | | 121,200 | | | | 2,057 |
| |
| TOTAL UTILITIES | | | | | | | | 4,309 |
| |
| TOTAL COMMON STOCKS | | | | | | | | |
| (Cost $671,596) | | | | | | | | 738,009 |
| |
| Money Market Funds 2.9% | | | | | | | | |
| |
| Fidelity Cash Central Fund, 4.8% (b) | | | | 9,744,117 | | | | 9,744 |
| Fidelity Securities Lending Cash Central Fund, | | | | | | | | |
| 4.83% (b)(c) | | | | 11,619,000 | | | | 11,619 |
| TOTAL MONEY MARKET FUNDS | | | | | | | | |
| (Cost $21,363) | | | | | | | | 21,363 |
| |
| TOTAL INVESTMENT PORTFOLIO 101.7% | | | | | | | | |
| (Cost $692,959) | | | | | | | | 759,372 |
| |
| NET OTHER ASSETS – (1.7)% | | | | | | | | (12,677) |
| NET ASSETS 100% | | | | | | | | $ 746,695 |
See accompanying notes which are an integral part of the financial statements.
Legend
(a) Non-income producing
(b) Affiliated fund that is available only to
investment companies and other
accounts managed by Fidelity
Investments. The rate quoted is the
annualized seven-day yield of the fund
at period end. A complete unaudited
listing of the fund’s holdings as of its
most recent quarter end is available
upon request.
|
(c) Investment made with cash collateral
received from securities on loan.
(d) Security or a portion of the security is on
loan at period end.
|
Affiliated Central Funds
Information regarding fiscal year to date income earned by the fund from the affiliated Central funds is as follows:
| Fund | | Income earned |
| | | (Amounts in thousands) |
| Fidelity Cash Central Fund | | | | $ 227 |
| Fidelity Securities Lending Cash Central Fund | | | | 75 |
| Total | | | | $ 302 |
Other Information
Distribution of investments by country of issue, as a percentage of total net assets, is as follows:
| United States of America | | 84.4% |
| Switzerland | | 4.8% |
| United Kingdom | | 2.8% |
| Bermuda | | 2.8% |
| Netherlands Antilles | | 1.0% |
| Others (individually less than 1%) . | | 4.2% |
| | | 100.0% |
Income Tax Information
At April 30, 2006, the fund had a capital loss carryforward of approximately $73,740,000 all of which will expire on April 30, 2011.
See accompanying notes which are an integral part of the financial statements
17 Annual Report
| Financial Statements | | | | | | | | |
| |
| Statement of Assets and Liabilities | | | | | | | | |
| Amounts in thousands (except per share amount) | | | | | | | | April 30, 2006 |
| |
| Assets | | | | | | | | |
| Investment in securities, at value (including securities | | | | | | | | |
| loaned of $11,455) See accompanying schedule: | | | | | | | | |
| Unaffiliated issuers (cost $671,596) | | | | $ 738,009 | | | | |
| Affiliated Central Funds (cost $21,363) | | | | 21,363 | | | | |
| Total Investments (cost $692,959) | | | | | | | | $ 759,372 |
| Receivable for investments sold | | | | | | | | 12,640 |
| Receivable for fund shares sold | | | | | | | | 983 |
| Dividends receivable | | | | | | | | 511 |
| Interest receivable | | | | | | | | 24 |
| Prepaid expenses | | | | | | | | 2 |
| Other receivables | | | | | | | | 56 |
| Total assets | | | | | | | | 773,588 |
| |
| Liabilities | | | | | | | | |
| Payable for investments purchased | | | | $ 12,819 | | | | |
| Payable for fund shares redeemed | | | | 1,799 | | | | |
| Accrued management fee | | | | 287 | | | | |
| Other affiliated payables | | | | 206 | | | | |
| Other payables and accrued expenses | | | | 163 | | | | |
| Collateral on securities loaned, at value | | | | 11,619 | | | | |
| Total liabilities | | | | | | | | 26,893 |
| |
| Net Assets | | | | | | | | $ 746,695 |
| Net Assets consist of: | | | | | | | | |
| Paid in capital | | | | | | | | $ 757,801 |
| Undistributed net investment income | | | | | | | | 1,223 |
| Accumulated undistributed net realized gain (loss) on | | | | | | | | |
| investments and foreign currency transactions | | | | | | | | (78,716) |
| Net unrealized appreciation (depreciation) on | | | | | | | | |
| investments and assets and liabilities in foreign | | | | | | | | |
| currencies | | | | | | | | 66,387 |
| Net Assets, for 45,131 shares outstanding | | | | | | | | $ 746,695 |
| Net Asset Value, offering price and redemption price per | | | | | | | | |
| share ($746,695 ÷ 45,131 shares) | | | | | | | | $ 16.55 |
See accompanying notes which are an integral part of the financial statements.
| Statement of Operations | | | | | | |
| Amounts in thousands | | | | Year ended April 30, 2006 |
| |
| Investment Income | | | | | | |
| Dividends | | | | | | $ 9,001 |
| Income from affiliated Central Funds | | | | | | 302 |
| Total income | | | | | | 9,303 |
| |
| Expenses | | | | | | |
| Management fee | | | | | | |
| Basic fee | | | | $ 3,794 | | |
| Performance adjustment | | | | (1,099) | | |
| Transfer agent fees | | | | 2,053 | | |
| Accounting and security lending fees | | | | 233 | | |
| Independent trustees’ compensation | | | | 3 | | |
| Custodian fees and expenses | | | | 83 | | |
| Registration fees | | | | 29 | | |
| Audit | | | | 49 | | |
| Legal | | | | 5 | | |
| Miscellaneous | | | | 60 | | |
| Total expenses before reductions | | | | 5,210 | | |
| Expense reductions | | | | (358) | | 4,852 |
| |
| Net investment income (loss) | | | | | | 4,451 |
| Realized and Unrealized Gain (Loss) | | | | | | |
| Net realized gain (loss) on: | | | | | | |
| Investment securities: | | | | | | |
| Unaffiliated issuers (net of foreign taxes of $211) | | | | 79,742 | | |
| Foreign currency transactions | | | | (75) | | |
| Total net realized gain (loss) | | | | | | 79,667 |
| Change in net unrealized appreciation (depreciation) on: | | | | | | |
| Investment securities (net of increase in deferred for- | | | | | | |
| eign taxes of $26) | | | | 43,071 | | |
| Assets and liabilities in foreign currencies | | | | (3) | | |
| Total change in net unrealized appreciation | | | | | | |
| (depreciation) | | | | | | 43,068 |
| Net gain (loss) | | | | | | 122,735 |
| Net increase (decrease) in net assets resulting from | | | | | | |
| operations | | | | | | $ 127,186 |
See accompanying notes which are an integral part of the financial statements.
19 Annual Report
| Financial Statements continued | | | | | | | | |
| |
| |
| Statement of Changes in Net Assets | | | | | | | | |
| | | | | Year ended | | | | Year ended |
| | | | | April 30, | | | | April 30, |
| Amounts in thousands | | | | 2006 | | | | 2005 |
| Increase (Decrease) in Net Assets | | | | | | | | |
| Operations | | | | | | | | |
| Net investment income (loss) | | | | $ 4,451 | | | | $ 6,493 |
| Net realized gain (loss) | | | | 79,667 | | | | 47,214 |
| Change in net unrealized appreciation (depreciation) . | | | | 43,068 | | | | (42,382) |
| Net increase (decrease) in net assets resulting | | | | | | | | |
| from operations | | | | 127,186 | | | | 11,325 |
| Distributions to shareholders from net investment income | | | | (4,334) | | | | (7,097) |
| Share transactions | | | | | | | | |
| Proceeds from sales of shares | | | | 159,648 | | | | 129,041 |
| Reinvestment of distributions | | | | 4,260 | | | | 6,962 |
| Cost of shares redeemed | | | | (152,056) | | | | (236,483) |
| Net increase (decrease) in net assets resulting from | | | | | | | | |
| share transactions | | | | 11,852 | | | | (100,480) |
| Total increase (decrease) in net assets | | | | 134,704 | | | | (96,252) |
| |
| Net Assets | | | | | | | | |
| Beginning of period | | | | 611,991 | | | | 708,243 |
| End of period (including undistributed net investment | | | | | | | | |
| income of $1,223 and undistributed net investment | | | | | | | | |
| income of $1,391, respectively) | | | | $ 746,695 | | | | $ 611,991 |
| |
| Other Information | | | | | | | | |
| Shares | | | | | | | | |
| Sold | | | | 10,191 | | | | 9,245 |
| Issued in reinvestment of distributions | | | | 282 | | | | 488 |
| Redeemed | | | | (9,952) | | | | (16,843) |
| Net increase (decrease) | | | | 521 | | | | (7,110) |
See accompanying notes which are an integral part of the financial statements.
| Financial Highlights | | | | | | | | | | | | | | | | | | | | |
| |
| Years ended April 30, | | | | 2006 | | | | 2005 | | | | 2004 | | | | 2003 | | | | 2002 |
| Selected Per Share Data | | | | | | | | | | | | | | | | | | | | |
| Net asset value, beginning of | | | | | | | | | | | | | | | | | | | | |
| period | | | | $ 13.72 | | | | $ 13.69 | | | | $ 11.61 | | | | $ 13.79 | | | | $ 16.51 |
| Income from Investment | | | | | | | | | | | | | | | | | | | | |
| Operations | | | | | | | | | | | | | | | | | | | | |
| Net investment income (loss)B | | | | 10 | | | | .13C | | | | .07 | | | | .07 | | | | .05 |
| Net realized and unrealized | | | | | | | | | | | | | | | | | | | | |
| gain (loss) | | | | 2.83 | | | | .04 | | | | 2.08 | | | | (2.19) | | | | (2.73) |
| Total from investment operations | | | | 2.93 | | | | .17 | | | | 2.15 | | | | (2.12) | | | | (2.68) |
| Distributions from net investment | | | | | | | | | | | | | | | | | | | | |
| income | | | | (.10) | | | | (.14) | | | | (.07) | | | | (.06) | | | | (.04) |
| Net asset value, end of period | | | | $ 16.55 | | | | $ 13.72 | | | | $ 13.69 | | | | $ 11.61 | | | | $ 13.79 |
| Total ReturnA | | | | 21.43% | | | | 1.21% | | | | 18.55% | | | | (15.39)% | | | | (16.25)% |
| Ratios to Average Net AssetsD | | | | | | | | | | | | | | | | | | | | |
| Expenses before reductions | | | | 78% | | | | .78% | | | | .78% | | | | .83% | | | | .91% |
| Expenses net of fee waivers, if | | | | | | | | | | | | | | | | | | | | |
| any | | | | 78% | | | | .78% | | | | .78% | | | | .83% | | | | .91% |
| Expenses net of all reductions | | | | 73% | | | | .75% | | | | .76% | | | | .78% | | | | .87% |
| Net investment income (loss) | | | | 67% | | | | .94%C | | | | .53% | | | | .59% | | | | .37% |
| Supplemental Data | | | | | | | | | | | | | | | | | | | | |
| Net assets, end of period | | | | | | | | | | | | | | | | | | | | |
| (in millions) | | | | $ 747 | | | | $ 612 | | | | $ 708 | | | | $ 599 | | | | $ 623 |
| Portfolio turnover rate | | | | 154% | | | | 55% | | | | 62% | | | | 86% | | | | 99% |
A Total returns would have been lower had certain expenses not been reduced during the periods shown.
B Calculated based on average shares outstanding during the period.
C Investment income per share reflects a special dividend which amounted to $.06 per share. Excluding the special dividend, the ratio of net
investment income (loss) to average net assets would have been .49%.
D Expense ratios reflect operating expenses of the fund. Expenses before reductions do not reflect amounts reimbursed by the investment adviser or
reductions from brokerage service arrangements or other expense offset arrangements and do not represent the amount paid by the fund during
periods when reimbursements or reductions occur. Expenses net of fee waivers reflect expenses after reimbursement by the investment adviser but
prior to reductions from brokerage service arrangements or other expense offset arrangements. Expenses net of all reductions represent the net
expenses paid by the fund.
|
See accompanying notes which are an integral part of the financial statements.
21 Annual Report
Notes to Financial Statements
For the period ended April 30, 2006
(Amounts in thousands except ratios)
|
1. Significant Accounting Policies.
Fidelity Large Cap Stock Fund (the fund) is a fund of Fidelity Commonwealth Trust (the trust) and is authorized to issue an unlimited number of shares. The trust is registered under the Investment Company Act of 1940, as amended (the 1940 Act), as an open end management investment company organized as a Massachusetts business trust. The fund may invest in affiliated money market central funds (Money Market Central Funds), which are open end investment companies available to investment companies and other accounts managed by Fidelity Management & Research Company (FMR) and its affili ates. The financial statements have been prepared in conformity with accounting principles generally accepted in the United States of America, which require manage ment to make certain estimates and assumptions at the date of the financial statements. The following summarizes the significant accounting policies of the fund:
Security Valuation. Investments are valued and net asset value (NAV) per share is calculated (NAV calculation) as of the close of business of the New York Stock Exchange (NYSE), normally 4:00 p.m. Eastern time. Wherever possible, the fund uses independent pricing services approved by the Board of Trustees to value its investments.
Equity securities, including restricted securities, for which market quotations are readily available, are valued at the last reported sale price or official closing price as reported by an independent pricing service on the primary market or exchange on which they are traded. In the event there were no sales during the day or closing prices are not available, securities are valued at the last quoted bid price. Investments in open end mutual funds are valued at their closing net asset value each business day. Short term securities with remaining maturities of sixty days or less for which quotations are not readily available are valued at amortized cost, which approximates value.
When current market prices or quotations are not readily available or do not accurately reflect fair value, valuations may be determined in accordance with procedures adopted by the Board of Trustees. For example, when developments occur between the close of a market and the close of the NYSE that may materially affect the value of some or all of the securities, or when trading in a security is halted, those securities may be fair valued. Factors used in the determination of fair value may include monitoring news to identify significant market or security specific events such as changes in the value of U.S. securi ties markets, reviewing developments in foreign markets and evaluating the perfor mance of ADRs, futures contracts and exchange traded funds. Because the fund’s utilization of fair value pricing depends on market activity, the frequency with which fair value pricing is used can not be predicted and may be utilized to a significant extent. The value of securities used for NAV calculation under fair value pricing may differ from published prices for the same securities.
1. Significant Accounting Policies continued
Foreign Currency. The fund uses foreign currency contracts to facilitate transactions in foreign denominated securities. Losses from these transactions may arise from changes in the value of the foreign currency or if the counterparties do not perform under the contracts’ terms.
Foreign denominated assets, including investment securities, and liabilities are trans lated into U.S. dollars at the exchange rate at period end. Purchases and sales of invest ment securities, income and dividends received and expenses denominated in foreign currencies are translated into U.S. dollars at the exchange rate in effect on the transaction date.
The effects of exchange rate fluctuations on investments are included with the net realized and unrealized gain (loss) on investment securities. Other foreign currency transactions resulting in realized and unrealized gain (loss) are disclosed separately.
Investment Transactions and Income. Security transactions are accounted for as of trade date. Gains and losses on securities sold are determined on the basis of identified cost and may include proceeds received from litigation. Dividend income is recorded on the ex dividend date, except for certain dividends from foreign securities where the ex dividend date may have passed, which are recorded as soon as the fund is informed of the ex dividend date. Non cash dividends included in dividend income, if any, are recorded at the fair market value of the securities received. Distributions received on securities that represent a return of capital or capital gain are recorded as a reduction of cost of investments and/or as a realized gain. The fund estimates the components of distributions received that may be considered return of capital distributions or capital gain distributions. Interest income is accrued as earned. Interest income includes coupon interest and amortization of premium and accretion of discount on debt securi ties. Investment income is recorded net of foreign taxes withheld where recovery of such taxes is uncertain.
Expenses. Most expenses of the trust can be directly attributed to a fund. Expenses which cannot be directly attributed are apportioned among each fund in the trust.
Income Tax Information and Distributions to Shareholders. Each year, the fund intends to qualify as a regulated investment company by distributing all of its taxable income and realized gains under Subchapter M of the Internal Revenue Code. As a result, no provision for income taxes is required in the accompanying financial statements. Foreign taxes are provided for based on the fund’s understanding of the tax rules and rates that exist in the foreign markets in which it invests.
Distributions are recorded on the ex dividend date. Income and capital gain distribu tions are determined in accordance with income tax regulations, which may differ from generally accepted accounting principles.
23 Annual Report
| Notes to Financial Statements continued | | |
| (Amounts in thousands except ratios) | | |
1. Significant Accounting Policies continued | | |
Income Tax Information and Distributions to Shareholders continued |
Capital accounts within the financial statements are adjusted for permanent book tax differences. These adjustments have no impact on net assets or the results of operations. Temporary book tax differences will reverse in a subsequent period.
Book tax differences are primarily due to foreign currency transactions, certain foreign taxes, capital loss carryforwards and losses deferred due to wash sales.
The tax basis components of distributable earnings and the federal tax cost as of period end were as follows:
| Unrealized appreciation | | | | | | | | $ 91,176 |
| Unrealized depreciation | | | | | | | | (29,764) |
| Net unrealized appreciation (depreciation) | | | | | | | | 61,412 |
| Undistributed ordinary income | | | | | | | | 1,223 |
| Capital loss carryforward | | | | | | | | (73,740) |
| |
| Cost for federal income tax purposes | | | | | | | | $ 697,960 |
| |
| The tax character of distributions paid was as follows: | | | | |
| |
| | | | | April 30, 2006 | | | | April 30, 2005 |
| Ordinary Income | | | | $ 4,334 | | | | $ 7,097 |
| |
| 2. Operating Policies. | | | | | | | | |
Repurchase Agreements. FMR has received an Exemptive Order from the Securities and Exchange Commission (the SEC) which permits the fund and other affiliated entities of FMR to transfer uninvested cash balances into joint trading accounts which are then invested in repurchase agreements. The fund may also invest directly with institutions in repurchase agreements. Repurchase agreements are collateralized by government or non government securities. Upon settlement date, collateral is held in segregated accounts with custodian banks and may be obtained in the event of a default of the counterparty. The fund monitors, on a daily basis, the value of the collateral to ensure it is at least equal to the principal amount of the repurchase agreement (includ ing accrued interest). In the event of a default by the counterparty, realization of the collateral proceeds could be delayed, during which time the value of the collateral may decline.
3. Purchases and Sales of Investments.
Purchases and sales of securities, other than short term securities, aggregated $1,034,125 and $1,016,390, respectively.
4. Fees and Other Transactions with Affiliates.
Management Fee. FMR and its affiliates provide the fund with investment manage ment related services for which the fund pays a monthly management fee. The manage ment fee is the sum of an individual fund fee rate that is based on an annual rate of .30% of the fund’s average net assets and a group fee rate that averaged .27% during the period. The group fee rate is based upon the average net assets of all the mutual funds advised by FMR. The group fee rate decreases as assets under management increase and increases as assets under management decrease. In addition, the management fee is subject to a performance adjustment (up to a maximum of ±.20% of the fund’s average net assets over a 36 month performance period). The upward or downward adjustment to the management fee is based on the fund’s relative investment performance as compared to an appropriate benchmark index. For the period, the total annual management fee rate, including the performance adjustment, was .40% of the fund’s average net assets.
Transfer Agent Fees. Fidelity Service Company, Inc. (FSC), an affiliate of FMR, is the fund’s transfer, dividend disbursing and shareholder servicing agent. FSC receives account fees and asset based fees that vary according to account size and type of ac count. FSC pays for typesetting, printing and mailing of shareholder reports, except proxy statements. For the period, the transfer agent fees were equivalent to an annual rate of .31% of average net assets.
Accounting and Security Lending Fees. FSC maintains the fund’s accounting re cords. The accounting fee is based on the level of average net assets for the month. Under a separate contract, FSC administers the security lending program. The security lending fee is based on the number and duration of lending transactions.
Affiliated Central Funds. The fund may invest in Money Market Central Funds which seek preservation of capital and current income and are managed by Fidelity Invest ments Money Management, Inc. (FIMM), an affiliate of FMR.
The Money Market Central Funds do not pay a management fee.
Brokerage Commissions. The fund placed a portion of its portfolio transactions with brokerage firms which are affiliates of the investment adviser. The commissions paid to these affiliated firms were $66 for the period.
25 Annual Report
| Notes to Financial Statements continued |
| (Amounts in thousands except ratios) | | |
| |
| 5. Committed Line of Credit. | | |
The fund participates with other funds managed by FMR in a $4.2 billion credit facility (the “line of credit”) to be utilized for temporary or emergency purposes to fund share holder redemptions or for other short term liquidity purposes. The fund has agreed to pay commitment fees on its pro rata portion of the line of credit, which amounts to $2 and is reflected in Miscellaneous Expense on the Statement of Operations. During the period, there were no borrowings on this line of credit.
The fund lends portfolio securities from time to time in order to earn additional income. On the settlement date of the loan, the fund receives collateral (in the form of U.S. Treasury obligations, letters of credit and/or cash) against the loaned securities and maintains collateral in an amount not less than 100% of the market value of the loaned securities during the period of the loan. The market value of the loaned securities is determined at the close of business of the fund and any additional required collateral is delivered to the fund on the next business day. If the borrower defaults on its obligation to return the securities loaned because of insolvency or other reasons, a fund could experience delays and costs in recovering the securities loaned or in gaining access to the collateral. Any cash collateral received is invested in the Fidelity Securities Lending Cash Central Fund. The value of loaned securities and cash collateral at period end are disclosed on the fund’s Statement of Assets and Liabilities. Security lending income represents the income earned on investing cash collateral, less fees and expenses associated with the loan, plus any premium payments that may be received on the loan of certain types of securities. Security lending income is presented in the Statement of Operations as a component of income from affiliated central funds. Net income from lending portfolio securities during the period amounted to $75.
Many of the brokers with whom FMR places trades on behalf of the fund provided services to the fund in addition to trade execution. These services included payments of certain expenses on behalf of the fund totaling $324 for the period. In addition, through arrangements with the fund’s custodian and transfer agent, credits realized as a result of uninvested cash balances were used to reduce the fund’s expenses. During the period, these credits reduced the fund’s custody and transfer agent expenses by $2 and $32, respectively.
The fund’s organizational documents provide former and current trustees and officers with a limited indemnification against liabilities arising in connection with the performance of their duties to the fund. In the normal course of business, the fund may also enter into contracts that provide general indemnifications. The fund’s maximum exposure under these arrangements is unknown as this would be dependent on future claims that may be made against the fund. The risk of material loss from such claims is considered remote.
27 Annual Report
Report of Independent Registered Public Accounting Firm
To the Trustees of Fidelity Commonwealth Trust and Shareholders of Fidelity Large Cap Stock Fund:
We have audited the accompanying statement of assets and liabilities of Fidelity Large Cap Stock Fund (the Fund), a fund of Fidelity Commonwealth Trust, including the schedule of investments as of April 30, 2006, and the related statement of operations for the year then ended, the statement of changes in net assets for each of the two years in the period then ended, and the financial highlights for each of the five years in the period then ended. These financial statements and financial highlights are the responsibility of the Fund’s management. Our responsibility is to express an opinion on these financial statements and financial highlights based on our audits.
We conducted our audits in accordance with standards of the Public Company Accounting Oversight Board (United States). Those standards require that we plan and perform the audit to obtain reasonable assurance about whether the financial statements and financial highlights are free of material misstatement. The Fund is not required to have, nor were we engaged to perform, an audit of its internal control over financial reporting. Our audits included consideration of internal control over financial reporting as a basis for designing audit procedures that are appropriate in the circumstances, but not for the purpose of expressing an opinion on the effectiveness of the Fund’s internal control over financial reporting. Accordingly, we express no such opinion. An audit also includes examining, on a test basis, evidence supporting the amounts and disclosures in the financial statements, assessing the accounting principles used and significant estimates made by management, as well as evaluating the overall financial statement presentation. Our procedures in cluded confirmation of securities owned as of April 30, 2006, by correspondence with the custodians and brokers; where replies were not received from brokers, we performed other auditing procedures. We believe that our audits provide a reasonable basis for our opinion.
In our opinion, the financial statements and financial highlights referred to above present fairly, in all material respects, the financial position of Fidelity Large Cap Stock Fund as of April 30, 2006, the results of its operations for the year then ended, the changes in its net assets for each of the two years in the period then ended, and its financial highlights for each of the five years in the period then ended, in conformity with accounting principles generally accepted in the United States of America.
/s/ Deloitte & Touche LLP
DELOITTE & TOUCHE LLP
Boston, Massachusetts
June 9, 2006
|
Annual Report 28
Trustees and Officers
The Trustees, Members of the Advisory Board, and executive officers of the trust and fund, as applicable, are listed below. The Board of Trustees governs the fund and is responsible for protecting the interests of shareholders. The Trustees are experienced executives who meet periodically throughout the year to oversee the fund’s activities, review contractual arrangements with companies that provide services to the fund, and review the fund’s performance. Except for William O. McCoy and Albert R. Gamper, Jr., each of the Trustees oversees 335 funds advised by FMR or an affiliate. Mr. McCoy oversees 337 funds advised by FMR or an affiliate. Mr. Gamper oversees 280 funds advised by FMR or an affiliate.
The Trustees hold office without limit in time except that (a) any Trustee may resign; (b) any Trustee may be removed by written instrument, signed by at least two thirds of the number of Trustees prior to such removal; (c) any Trustee who requests to be retired or who has become incapacitated by illness or injury may be retired by written instru ment signed by a majority of the other Trustees; and (d) any Trustee may be removed at any special meeting of shareholders by a two thirds vote of the outstanding voting securities of the trust. Each Trustee who is not an interested person (as defined in the 1940 Act) (Independent Trustee), shall retire not later than the last day of the calendar year in which his or her 72nd birthday occurs. The Independent Trustees may waive this mandatory retirement age policy with respect to individual Trustees. The executive officers and Advisory Board Members hold office without limit in time, except that any officer and Advisory Board Member may resign or may be removed by a vote of a majority of the Trustees at any regular meeting or any special meeting of the Trustees. Except as indicated, each individual has held the office shown or other offices in the same company for the past five years.
The fund’s Statement of Additional Information (SAI) includes more information about the Trustees. To request a free copy, call Fidelity at 1-800-544-8544.
Correspondence intended for each Trustee who is an interested person may be sent to Fidelity Investments, 82 Devonshire Street, Boston, Massachusetts 02109.
| | Name, Age; Principal Occupation
Edward C. Johnson 3d (75)
|
Year of Election or Appointment: 1974
Mr. Johnson is Chairman of the Board of Trustees. Mr. Johnson serves as President (2006 present), Chief Executive Officer, Chairman, and a Director of FMR Corp.; Chairman and a Director of FMR; Chairman and a Director of Fidelity Research & Analysis Company (FRAC); Chairman and a Director of Fidelity Investments Money Management, Inc.; and Chairman (2001 present) and a Director (1999 present) of FMR Co., Inc. In addition, Mr. Johnson serves as Chairman and Director of Fidelity International Limited (FIL).
29 Annual Report
Trustees and Officers - continued
| | Name, Age; Principal Occupation
Stephen P. Jonas (53)
|
Year of Election or Appointment: 2005
Mr. Jonas is Senior Vice President of Large Cap Stock (2005 present). He also serves as Senior Vice President of other Fidelity funds (2005 present). Mr. Jonas is Executive Director of FMR (2005 present) and FMR Co., Inc. (2005 present). He also serves as a Director of Fidelity Investments Money Management, Inc. (2005 present) and FMR Corp. (2003 present). Previously, Mr. Jonas served as President of Fidelity Enterprise Operations and Risk Services (2004 2005), Chief Administrative Officer (2002 2004), and Chief Financial Officer of FMR Corp. (1998 2002). In addition, he serves on the Boards of Boston Ballet (2003 present) and Simmons College (2003 present).
Year of Election or Appointment: 2003
Mr. Reynolds is President and a Director of FMR (2005 present), Fidelity Investments Money Management, Inc. (2005 present), and FMR Co., Inc. (2005 present). Mr. Reynolds also serves as a Director (2003 present) and Chief Operating Officer (2000 present) of FMR Corp. and a Director of Strategic Advisers, Inc. (2005 present). He also serves on the Board at Fidelity Investments Canada, Ltd. (2000 present). Previously, Mr. Reynolds served as President of Fidelity Investments Institutional Retirement Group (1996 2000).
* Trustees have been determined to be “Interested Trustees” by virtue of, among other things, their affiliation with the trust or various entities under common control with FMR.
Correspondence intended for each Independent Trustee (that is, the Trustees other than the Interested Trustees) may be sent to Fidelity Investments, P.O. Box 55235, Boston, Massachusetts 02205-5235.
| | Name, Age; Principal Occupation
Dennis J. Dirks (57)
|
Year of Election or Appointment: 2005
Prior to his retirement in May 2003, Mr. Dirks was Chief Operating Officer and a member of the Board of The Depository Trust & Clearing Corporation (DTCC) (1999 2003). He also served as President, Chief Operating Officer, and Board member of The Depository Trust Com pany (DTC) (1999 2003) and President and Board member of the National Securities Clearing Corporation (NSCC) (1999 2003). In addi tion, Mr. Dirks served as Chief Executive Officer and Board member of the Government Securities Clearing Corporation (2001 2003) and Chief Executive Officer and Board member of the Mortgage Backed Securities Clearing Corporation (2001 2003). Mr. Dirks also serves as a Trustee and a member of the Finance Committee of Manhattan College (2005 present) and a Trustee and a member of the Finance Committee of AHRC of Nassau County (2006 present).
| | Albert R. Gamper, Jr. (64)
|
Year of Election or Appointment: 2006
Mr. Gamper also serves as a Trustee (2006 present) or Member of the Advisory Board (2005 present) of other investment companies advised by FMR. Prior to his retirement in December 2004, Mr. Gamper served as Chairman of the Board of CIT Group Inc. (commercial finance). Dur ing his tenure with CIT Group Inc. Mr. Gamper served in numerous senior management positions, including Chairman (1987 1989; 1999 2001; 2002 2004), Chief Executive Officer (1987 2004), and President (1989 2002). He currently serves as a member of the Board of Directors of Public Service Enterprise Group (utilities, 2001 present), Chairman of the Board of Governors, Rutgers University (2004 present), and Chairman of the Board of Saint Barnabas Health Care System.
31 Annual Report
Trustees and Officers - continued
| | Name, Age; Principal Occupation
Robert M. Gates (62)
|
Year of Election or Appointment: 1997
Dr. Gates is Chairman of the Independent Trustees (2006 present). Dr. Gates is President of Texas A&M University (2002 present). He was Director of the Central Intelligence Agency (CIA) from 1991 to 1993. From 1989 to 1991, Dr. Gates served as Assistant to the President of the United States and Deputy National Security Advisor. Dr. Gates is a Director of NACCO Industries, Inc. (mining and manufacturing), Parker Drilling Co., Inc. (drilling and rental tools for the energy industry, 2001 present), and Brinker International (restaurant management, 2003 present). Previously, Dr. Gates served as a Director of LucasVarity PLC (automotive components and diesel engines), a Director of TRW Inc. (automotive, space, defense, and information technology), and Dean of the George Bush School of Government and Public Service at Texas A&M University (1999 2001).
Year of Election or Appointment: 2004
Dr. Heilmeier is Chairman Emeritus of Telcordia Technologies (commu nication software and systems), where prior to his retirement, he served as company Chairman and Chief Executive Officer. He currently serves on the Boards of Directors of The Mitre Corporation (systems engineer ing and information technology support for the government), and HRL Laboratories (private research and development, 2004 present). He is Chairman of the General Motors Science & Technology Advisory Board and a Life Fellow of the Institute of Electrical and Electronics Engineers (IEEE). Dr. Heilmeier is a member of the Defense Science Board and the National Security Agency Advisory Board. He is also a member of the National Academy of Engineering, the American Academy of Arts and Sciences, and the Board of Overseers of the School of Engineering and Applied Science of the University of Pennsylvania. Previously, Dr. Heilmeier served as a Director of TRW Inc. (automotive, space, defense, and information technology, 1992 2002), Compaq (1994 2002), Auto matic Data Processing, Inc. (ADP) (technology based business outsourc ing, 1995 2002), INET Technologies Inc. (telecommunications network surveillance, 2001 2004), and Teletech Holdings (customer manage ment services). He is the recipient of the 2005 Kyoto Prize in Advanced Technology for his invention of the liquid crystal display.
Name, Age; Principal Occupation
Marie L. Knowles (59)
|
Year of Election or Appointment: 2001
Prior to Ms. Knowles’ retirement in June 2000, she served as Executive Vice President and Chief Financial Officer of Atlantic Richfield Company (ARCO) (diversified energy, 1996 2000). From 1993 to 1996, she was a Senior Vice President of ARCO and President of ARCO Transportation Company. She served as a Director of ARCO from 1996 to 1998. She currently serves as a Director of Phelps Dodge Corporation (copper mining and manufacturing) and McKesson Corporation (healthcare service, 2002 present). Ms. Knowles is a Trustee of the Brookings Institution and the Catalina Island Conservancy and also serves as a member of the Advisory Board for the School of Engineering of the University of Southern California.
Year of Election or Appointment: 2000
Mr. Lautenbach has been a partner of Clayton, Dubilier & Rice, Inc. (private equity investment firm) since September 1998. Previously, Mr. Lautenbach was with the International Business Machines Corporation (IBM) from 1968 until his retirement in 1998. Mr. Lautenbach serves as a Director of Italtel Holding S.p.A. (telecommunications (Milan, Italy), 2004 present) and Eaton Corporation (diversified industrial) as well as the Philharmonic Center for the Arts in Naples, Florida. He also is a member of the Board of Trustees of Fairfield University (2005 present), as well as a member of the Council on Foreign Relations.
Year of Election or Appointment: 1997
Prior to his retirement in December 1994, Mr. McCoy was Vice Chair man of the Board of BellSouth Corporation (telecommunications) and President of BellSouth Enterprises. He is currently a Director of Duke Realty Corporation (real estate). He is also a partner of Franklin Street Partners (private investment management firm). In addition, Mr. McCoy served as the Interim Chancellor (1999 2000) and a member of the Board of Visitors for the University of North Carolina at Chapel Hill and currently serves as Chairman of the Board of Directors of the University of North Carolina Health Care System. He also served as Vice President of Finance for the University of North Carolina (16 school system).
33 Annual Report
Trustees and Officers - continued
| | Name, Age; Principal Occupation
Cornelia M. Small (61)
|
Year of Election or Appointment: 2005
Ms. Small is a member (2000 present) and Chairperson (2002 present) of the Investment Committee, and a member (2002 present) of the Board of Trustees of Smith College. Previously, she served as Chief In vestment Officer (1999 2000), Director of Global Equity Investments (1996 1999), and a member of the Board of Directors of Scudder, Stevens & Clark (1990 1997) and Scudder Kemper Investments (1997 1999). In addition, Ms. Small served as Co Chair (2000 2003) of the Annual Fund for the Fletcher School of Law and Diplomacy.
| | William S. Stavropoulos (66)
|
Year of Election or Appointment: 2002
Mr. Stavropoulos is Chairman Emeritus of The Dow Chemical Company. Since joining The Dow Chemical Company in 1967, Mr. Stavropoulos served in numerous senior management positions, including President (1993 2000; 2002 2003), CEO (1995 2000; 2002 2004), and Chair man of the Executive Committee (2000 2004). Currently, he is a Direc tor of NCR Corporation (data warehousing and technology solutions), BellSouth Corporation (telecommunications), Chemical Financial Corpo ration, Maersk Inc. (industrial conglomerate, 2002 present), and Metal mark Capital (private equity investment firm, 2005 present). He also serves as a member of the Board of Trustees of the American Enterprise Institute for Public Policy Research. In addition, Mr. Stavropoulos is a member of The Business Council, J.P. Morgan International Council and the University of Notre Dame Advisory Council for the College of Science.
Year of Election or Appointment: 2005
Prior to his retirement in 2001, Mr. Wolfe was Chairman and Chief Executive Officer of Hershey Foods Corporation (1993 2001). He currently serves as a member of the boards of Adelphia Communications Corporation (2003 present), Bausch & Lomb, Inc., and Revlon Inc. (2004 present).
Advisory Board Members and Executive Officers:
Correspondence intended for Mr. Keyes may be sent to Fidelity Investments, P.O. Box 55235, Boston, Massachusetts 02205-5235. Correspondence intended for each executive officer and Mr. Lynch may be sent to Fidelity Investments, 82 Devonshire Street, Boston, Massachusetts 02109.
| | Name, Age; Principal Occupation
James H. Keyes (65)
|
Year of Election or Appointment: 2006
Member of the Advisory Board of Fidelity Commonwealth Trust. Prior to his retirement in 2003, Mr. Keyes was Chairman, President, and Chief Executive Officer of Johnson Controls, Inc. (automotive supplier, 1993 2003). He currently serves as a member of the boards of LSI Logic Corporation (semiconductor technologies, 1984 present), Navistar International Corporation (manufacture and sale of trucks, buses, and diesel engines, 2002 present), and Pitney Bowes, Inc. (integrated mail, messaging, and document management solutions, 1998 present).
Year of Election or Appointment: 2003
Member of the Advisory Board of Fidelity Commonwealth Trust. Mr. Lynch is Vice Chairman and a Director of FMR, and Vice Chairman (2001 present) and a Director (1999 present) of FMR Co., Inc. Previously, Mr. Lynch served as a Trustee of the Fidelity funds (1990 2003). In addition, he serves as the Chairman of the Inner City Scholarship Fund.
Year of Election or Appointment: 2005
Vice President of Large Cap Stock. Mr. Churchill also serves as Vice President of certain Equity Funds (2005 present) and certain High In come Funds (2005 present). He is Executive Vice President of FMR (2005 present) and FMR Co., Inc. (2005 present), and Senior Vice President of Fidelity Investments Money Management, Inc. (2005 present). Previously, Mr. Churchill served as Head of Fidelity’s Fixed Income Division (2000 2005), Vice President of Fidelity’s Money Market Funds (2000 2005), Vice President of Fidelity’s Bond Funds, and Senior Vice President of FMR.
35 Annual Report
Trustees and Officers - continued
| | Name, Age; Principal Occupation
Eric D. Roiter (57)
|
Year of Election or Appointment: 1998
Secretary of Large Cap Stock. He also serves as Secretary of other Fidelity funds; Vice President, General Counsel, and Secretary of FMR Co., Inc. (2001 present) and FMR; Assistant Secretary of Fidelity Man agement & Research (U.K.) Inc. (2001 present), Fidelity Research & Analysis Company (2001 present), and Fidelity Investments Money Management, Inc. (2001 present). Mr. Roiter is an Adjunct Member, Faculty of Law, at Boston College Law School (2003 present). Previously, Mr. Roiter served as Vice President and Secretary of Fidelity Distributors Corporation (FDC) (1998 2005).
Year of Election or Appointment: 2003
Assistant Secretary of Large Cap Stock. Mr. Fross also serves as Assis tant Secretary of other Fidelity funds (2003 present), Vice President and Secretary of FDC (2005 present), and is an employee of FMR.
Year of Election or Appointment: 2004
President and Treasurer of Large Cap Stock. Ms. Reynolds also serves as President and Treasurer of other Fidelity funds (2004 present) and is a Vice President (2003 present) and an employee (2002 present) of FMR. Before joining Fidelity Investments, Ms. Reynolds worked at Pricewater houseCoopers LLP (PwC) (1980 2002), where she was most recently an audit partner with PwC’s investment management practice.
Year of Election or Appointment: 2006
Anti Money Laundering (AML) officer of Large Cap Stock. Mr. Ganis also serves as AML officer of other Fidelity funds (2006 present) and FMR Corp. (2003 present). Before joining Fidelity Investments, Mr. Ganis practiced law at Goodwin Procter, LLP (2000 2002).
Year of Election or Appointment: 2005
Chief Financial Officer of Large Cap Stock. Mr. Murphy also serves as Chief Financial Officer of other Fidelity funds (2005 present). He also serves as Senior Vice President of Fidelity Pricing and Cash Management Services Group (FPCMS).
Name, Age; Principal Occupation
Kenneth A. Rathgeber (58)
|
Year of Election or Appointment: 2004
Chief Compliance Officer of Large Cap Stock. Mr. Rathgeber also serves as Chief Compliance Officer of other Fidelity funds (2004 present) and Executive Vice President of Risk Oversight for Fidelity Investments (2002 present). He is Chief Compliance Officer of FMR (2005 present), FMR Co., Inc. (2005 present), Fidelity Management & Research (U.K.) Inc. (2005 present), Fidelity Research & Analysis Company (2005 present), Fidelity Investments Money Management, Inc. (2005 present), and Strategic Advisers, Inc. (2005 present). Previously, Mr. Rathgeber served as Executive Vice President and Chief Operating Officer for Fidelity Investments Institutional Services Company, Inc. (1998 2002).
Year of Election or Appointment: 2005
Deputy Treasurer of Large Cap Stock. Mr. Mehrmann also serves as Deputy Treasurer of other Fidelity funds (2005 present) and is an em ployee of FMR. Previously, Mr. Mehrmann served as Vice President of Fidelity Investments Institutional Services Group (FIIS)/Fidelity Investments Institutional Operations Corporation, Inc. (FIIOC) Client Services (1998 2004).
Kimberley H. Monasterio (42)
|
Year of Election or Appointment: 2004
Deputy Treasurer of Large Cap Stock. Ms. Monasterio also serves as Deputy Treasurer of other Fidelity funds (2004) and is an employee of FMR (2004). Before joining Fidelity Investments, Ms. Monasterio served as Treasurer (2000 2004) and Chief Financial Officer (2002 2004) of the Franklin Templeton Funds and Senior Vice President of Franklin Templeton Services, LLC (2000 2004).
Year of Election or Appointment: 2005
Deputy Treasurer of Large Cap Stock. Mr. Robins also serves as Deputy Treasurer of other Fidelity funds (2005 present) and is an employee of FMR (2004 present). Before joining Fidelity Investments, Mr. Robins worked at KPMG LLP, where he was a partner in KPMG’s department of professional practice (2002 2004) and a Senior Manager (1999 2000). In addition, Mr. Robins served as Assistant Chief Accountant, United States Securities and Exchange Commission (2000 2002).
37 Annual Report
Trustees and Officers - continued
| | Name, Age; Principal Occupation
Robert G. Byrnes (39)
|
Year of Election or Appointment: 2005
Assistant Treasurer of Large Cap Stock. Mr. Byrnes also serves as Assis tant Treasurer of other Fidelity funds (2005 present) and is an employee of FMR (2005 present). Previously, Mr. Byrnes served as Vice President of FPCMS (2003 2005). Before joining Fidelity Investments, Mr. Byrnes worked at Deutsche Asset Management where he served as Vice President of the Investment Operations Group (2000 2003).
Year of Election or Appointment: 1995
Assistant Treasurer of Large Cap Stock. Mr. Costello also serves as As sistant Treasurer of other Fidelity funds and is an employee of FMR.
Year of Election or Appointment: 2004
Assistant Treasurer of Large Cap Stock. Mr. Lydecker also serves as As sistant Treasurer of other Fidelity funds (2004) and is an employee of FMR.
Year of Election or Appointment: 2002
Assistant Treasurer of Large Cap Stock Fund. Mr. Osterheld also serves as Assistant Treasurer of other Fidelity funds (2002) and is an employee of FMR.
Year of Election or Appointment: 2005
Assistant Treasurer of Large Cap Stock Fund. Mr. Ryan also serves as Assistant Treasurer of other Fidelity funds (2005 present) and is an employee of FMR (2005 present). Previously, Mr. Ryan served as Vice President of Fund Reporting in FPCMS (1999 2005).
Year of Election or Appointment: 2005
Assistant Treasurer of Large Cap Stock Fund. Mr. Schiavone also serves as Assistant Treasurer of other Fidelity funds (2005 present) and is an employee of FMR (2005 present). Before joining Fidelity Investments, Mr. Schiavone worked at Deutsche Asset Management, where he most recently served as Assistant Treasurer (2003 2005) of the Scudder Funds and Vice President and Head of Fund Reporting (1996 2003).
The fund designates 100% of the dividends distributed during the fiscal year as qualifying for the dividends received deduction for corporate shareholders.
The fund designates 100% of the dividends distributed during the fiscal year as amounts which may be taken into account as a dividend for the purposes of the maximum rate under section 1(h)(11) of the Internal Revenue Code.
The fund will notify shareholders in January 2007 of amounts for use in preparing 2006 income tax returns.
39 Annual Report
Proxy Voting Results
A special meeting of each fund’s shareholders was held on November 16, 2005. The results of votes taken among shareholders on proposals before them are reported below. Each vote reported represents one dollar of net asset value held on the record date for the meeting.
| PROPOSAL 1 | | |
| To elect a Board of Trustees.A | | |
| | | # of | | % of |
| | | Votes | | Votes |
| |
| Dennis J. Dirks | | |
| Affirmative | | 18,240,248,322.53 | | 96.150 |
| Withheld | | 730,313,302.58 | | 3.850 |
| TOTAL | | 18,970,561,625.11 | | 100.000 |
| Albert R. Gamper, Jr.B | | |
| Affirmative | | 18,204,838,072.06 | | 95.964 |
| Withheld | | 765,723,553.05 | | 4.036 |
| TOTAL | | 18,970,561,625.11 | | 100.000 |
| Robert M. Gates | | |
| Affirmative | | 18,191,748,681.13 | | 95.895 |
| Withheld | | 778,812,943.98 | | 4.105 |
| TOTAL | | 18,970,561,625.11 | | 100.000 |
| George H. Heilmeier | | |
| Affirmative | | 18,193,638,757.60 | | 95.905 |
| Withheld | | 776,922,867.51 | | 4.095 |
| TOTAL | | 18,970,561,625.11 | | 100.000 |
| Abigail P. Johnson | | |
| Affirmative | | 18,103,320,241.78 | | 95.428 |
| Withheld | | 867,241,383.33 | | 4.572 |
| TOTAL | | 18,970,561,625.11 | | 100.000 |
| Edward C. Johnson 3d | | |
| Affirmative | | 18,055,585,171.13 | | 95.177 |
| Withheld | | 914,976,453.98 | | 4.823 |
| TOTAL | | 18,970,561,625.11 | | 100.000 |
| Stephen P. Jonas | | |
| Affirmative | | 18,188,419,716.35 | | 95.877 |
| Withheld | | 782,141,908.76 | | 4.123 |
| TOTAL | | 18,970,561,625.11 | | 100.000 |
| Marie L. Knowles | | |
| Affirmative | | 18,208,650,664.29 | | 95.984 |
| Withheld | | 761,910,960.82 | | 4.016 |
| TOTAL | | 18,970,561,625.11 | | 100.000 |
| Ned C. Lautenbach | | |
| Affirmative | | 18,224,936,039.64 | | 96.070 |
| Withheld | | 745,625,585.47 | | 3.930 |
| TOTAL | | 18,970,561,625.11 | | 100.000 |
| |
| Marvin L. Mann | | |
| Affirmative | | 18,146,216,753.93 | | 95.655 |
| Withheld | | 824,344,871.18 | | 4.345 |
| TOTAL | | 18,970,561,625.11 | | 100.000 |
| |
| William O. McCoy | | |
| Affirmative | | 18,164,580,135.79 | | 95.751 |
| Withheld | | 805,981,489.32 | | 4.249 |
| TOTAL | | 18,970,561,625.11 | | 100.000 |
| |
| Robert L. Reynolds | | |
| Affirmative | | 18,197,448,372.22 | | 95.925 |
| Withheld | | 773,113,252.89 | | 4.075 |
| TOTAL | | 18,970,561,625.11 | | 100.000 |
| |
| Cornelia M. Small | | |
| Affirmative | | 18,214,122,413.76 | | 96.013 |
| Withheld | | 756,439,211.35 | | 3.987 |
| TOTAL | | 18,970,561,625.11 | | 100.000 |
| |
| William S. Stavropoulos | | |
| Affirmative | | 18,186,563,509.46 | | 95.867 |
| Withheld | | 783,998,115.65 | | 4.133 |
| TOTAL | | 18,970,561,625.11 | | 100.000 |
| |
| Kenneth L. Wolfe | | |
| Affirmative | | 18,211,332,412.92 | | 95.998 |
| Withheld | | 759,229,212.19 | | 4.002 |
| TOTAL | | 18,970,561,625.11 | | 100.000 |
A Denotes trust-wide proposals and voting results.
B Effective on or about January 1, 2006.
|
Annual Report 40
Board Approval of Investment Advisory Contracts and Management Fees
Fidelity Large Cap Stock Fund
On January 19, 2006, the Board of Trustees, including the Independent Trustees (together, the Board), voted to approve a general research services agreement (the Agreement) between FMR, FMR Co., Inc. (FMRC), Fidelity Investments Money Manage ment, Inc. (FIMM), and Fidelity Research & Analysis Company (FRAC) (together, the Investment Advisers) for the fund, effective January 20, 2006, pursuant to which FRAC may provide general research and investment advisory support services to FMRC and FIMM. The Board considered that it has approved previously various sub advisory agreements for the fund with affiliates of FMR that allow FMR to obtain research, non discretionary advice, or discretionary portfolio management at no additional expense to the fund. The Board, assisted by the advice of fund counsel and independent Trustees’ counsel, considered a broad range of information and determined that it would be beneficial for the fund to access the research and investment advisory support services supplied by FRAC at no additional expense to the fund.
The Board reached this determination in part because the new arrangement will involve no changes in (i) the contractual terms of and fees payable under the fund’s manage ment contract or sub advisory agreements; (ii) the investment process or strategies employed in the management of the fund’s assets; (iii) the nature or level of services provided under the fund’s management contract or sub advisory agreements; (iv) the day to day management of the fund or the persons primarily responsible for such man agement; or (v) the ultimate control or beneficial ownership of FMR, FMRC, or FIMM. The Board also considered that the establishment of the Agreement would not necessi tate prior shareholder approval of the Agreement or result in an assignment and termination of the fund’s management contract or sub advisory agreements under the Investment Company Act of 1940.
Because the Board was approving an arrangement with FRAC under which the fund will not bear any additional management fees or expenses and under which the fund’s portfolio manager would not change, it did not consider the fund’s investment perfor mance, competitiveness of management fee and total expenses, costs of services and profitability, or economies of scale to be significant factors in its decision.
In connection with its future renewal of the fund’s management contract and sub advisory agreements, the Board will consider: (i) the nature, extent, and quality of services provided to the fund, including shareholder and administrative services and investment performance; (ii) the competitiveness of the fund’s management fee and total expenses; (iii) the costs of the services and profitability, including the revenues earned and the expenses incurred by Fidelity in conducting the business of developing, marketing, distributing, managing, administering, and servicing the fund and its shareholders; and (iv) whether there have been economies of scale in respect of the management of the Fidelity funds, whether the Fidelity funds (including the fund) have
41 Annual Report
Board Approval of Investment Advisory Contracts and Management Fees continued
appropriately benefited from any such economies of scale, and whether there is potential for realization of any further economies.
Based on its evaluation of all of the conclusions noted above, and after considering all material factors, the Board ultimately concluded that the fund’s Agreement is fair and reasonable, and that the fund’s Agreement should be approved.
Managing Your Investments
Fidelity offers several ways to conveniently manage your personal investments via your telephone or PC. You can access your account information, conduct trades and research your investments 24 hours a day.
By Phone
Fidelity Automated Service Telephone provides a single toll free number to access account balances, positions, quotes and trading. It’s easy to navigate the service, and on your first call, the system will help you create a personal identification number (PIN) for security.


By PC
Fidelity’s web site on the Internet provides a wide range of information, including daily financial news, fund performance, interactive planning tools and news about Fidelity products and services.

* When you call the quotes line, please remember that a fund’s yield and return will vary and, except for money market funds, share price will also vary. This means that you may have a gain or loss when you sell your shares. There is no assurance that money market funds will be able to maintain a stable $1 share price; an investment in a money market fund is not insured or guar anteed by the U.S. government. Total returns are historical and include changes in share price, reinvestment of dividends and capital gains, and the effects of any sales charges.
43 Annual Report
To Visit Fidelity
For directions and hours,
please call 1-800-544-9797.
Arizona
7001 West Ray Road
Chandler, AZ
7373 N. Scottsdale Road
Scottsdale, AZ
California
815 East Birch Street
Brea, CA
1411 Chapin Avenue
Burlingame, CA
851 East Hamilton Avenue
Campbell, CA
19200 Von Karman Avenue
Irvine, CA
601 Larkspur Landing Circle
Larkspur, CA
10100 Santa Monica Blvd.
Los Angeles, CA
27101 Puerta Real
Mission Viejo, CA
73 575 El Paseo
Palm Desert, CA
251 University Avenue
Palo Alto, CA
123 South Lake Avenue
Pasadena, CA
16995 Bernardo Ctr. Drive
Rancho Bernardo, CA
1740 Arden Way
Sacramento, CA
7676 Hazard Center Drive
San Diego, CA
8 Montgomery Street
San Francisco, CA
3793 State Street
Santa Barbara, CA
21701 Hawthorne Boulevard
Torrance, CA
2001 North Main Street
Walnut Creek, CA
6300 Canoga Avenue
Woodland Hills, CA
|
Colorado
1625 Broadway
Denver, CO
9185 East Westview Road
Littleton, CO
Connecticut
48 West Putnam Avenue
Greenwich, CT
265 Church Street
New Haven, CT
300 Atlantic Street
Stamford, CT
29 South Main Street
West Hartford, CT
Delaware
222 Delaware Avenue
Wilmington, DE
Florida
4400 N. Federal Highway
Boca Raton, FL
121 Alhambra Plaza
Coral Gables, FL
2948 N. Federal Highway
Ft. Lauderdale, FL
1907 West State Road 434
Longwood, FL
8880 Tamiami Trail, North
Naples, FL
3550 Tamiami Trail, South
Sarasota, FL
1502 N. Westshore Blvd.
Tampa, FL
2465 State Road 7
Wellington, FL
3501 PGA Boulevard
West Palm Beach, FL
Georgia
3445 Peachtree Road, N.E.
Atlanta, GA
1000 Abernathy Road
Atlanta, GA
Illinois
One North LaSalle Street
Chicago, IL
875 North Michigan Ave.
Chicago, IL
|
1415 West 22nd Street
Oak Brook, IL
1572 East Golf Road
Schaumburg, IL
3232 Lake Avenue
Wilmette, IL
Indiana
4729 East 82nd Street
Indianapolis, IN
Kansas
5400 College Boulevard
Overland Park, KS
Maine
Three Canal Plaza
Portland, ME
Maryland
7315 Wisconsin Avenue
Bethesda, MD
One W. Pennsylvania Ave.
Towson, MD
Massachusetts
801 Boylston Street
Boston, MA
155 Congress Street
Boston, MA
300 Granite Street
Braintree, MA
44 Mall Road
Burlington, MA
405 Cochituate Road
Framingham, MA
416 Belmont Street
Worcester, MA
Michigan
500 E. Eisenhower Pkwy.
Ann Arbor, MI
280 Old N. Woodward Ave.
Birmingham, MI
43420 Grand River Avenue
Novi, MI
29155 Northwestern Hwy.
Southfield, MI
Minnesota
7600 France Avenue South
Edina, MN
|
Annual Report 44
Missouri
8885 Ladue Road
Ladue, MO
Nevada
2225 Village Walk Drive
Henderson, NV
New Jersey
150 Essex Street
Millburn, NJ
56 South Street
Morristown, NJ
396 Route 17, North
Paramus, NJ
3518 Route 1 North
Princeton, NJ
530 Highway 35
Shrewsbury, NJ
New York
1055 Franklin Avenue
Garden City, NY
37 West Jericho Turnpike
Huntington Station, NY
1271 Avenue of the Americas
New York, NY
61 Broadway
New York, NY
350 Park Avenue
New York, NY
200 Fifth Avenue
New York, NY
733 Third Avenue
New York, NY
11 Penn Plaza
New York, NY
2070 Broadway
New York, NY
1075 Northern Blvd.
Roslyn, NY
North Carolina
4611 Sharon Road
Charlotte, NC
Ohio
3805 Edwards Road
Cincinnati, OH
1324 Polaris Parkway
Columbus, OH
28699 Chagrin Boulevard
Woodmere Village, OH
|
Oregon
16850 SW 72nd Avenue
Tigard, OR
Pennsylvania
600 West DeKalb Pike
King of Prussia, PA
1735 Market Street
Philadelphia, PA
12001 Perry Highway
Wexford, PA
Rhode Island
47 Providence Place
Providence, RI
Tennessee
6150 Poplar Avenue
Memphis, TN
Texas
10000 Research Boulevard
Austin, TX
4001 Northwest Parkway
Dallas, TX
12532 Memorial Drive
Houston, TX
2701 Drexel Drive
Houston, TX
6500 N. MacArthur Blvd.
Irving, TX
6005 West Park Boulevard
Plano, TX
14100 San Pedro
San Antonio, TX
1576 East Southlake Blvd.
Southlake, TX
19740 IH 45 North
Spring, TX
Utah
215 South State Street
Salt Lake City, UT
Virginia
1861 International Drive
McLean, VA
Washington
411 108th Avenue, N.E.
Bellevue, WA
1518 6th Avenue
Seattle, WA
|
Washington, DC
1900 K Street, N.W.
Washington, DC
Wisconsin
595 North Barker Road
Brookfield, WI
|
Fidelity Brokerage Services, Inc., 100 Summer St., Boston, MA 02110 Member NYSE/SIPC
45 Annual Report
45
To Write Fidelity
We’ll give your correspondence immediate attention and send you written confirmation upon completion of your request.

(such as changing name, address, bank, etc.)
Fidelity Investments
P.O. Box 770001
Cincinnati, OH 45277-0002
|

Buying shares
Fidelity Investments
P.O. Box 770001
Cincinnati, OH 45277-0003
Overnight Express
Fidelity Investments
Attn: Distribution Services
100 Crosby Parkway KC1H
Covington, KY 41015
Selling shares
Fidelity Investments
P.O. Box 770001
Cincinnati, OH 45277-0035
Overnight Express
Fidelity Investments
Attn: Distribution Services
100 Crosby Parkway KC1H
Covington, KY 41015
General Correspondence
Fidelity Investments
P.O. Box 500
Merrimack, NH 03054-0500
|

Buying shares
Fidelity Investments
P.O. Box 770001
Cincinnati, OH 45277-0003
Selling shares
Fidelity Investments
P.O. Box 770001
Cincinnati, OH 45277-0035
Overnight Express
Fidelity Investments
Attn: Distribution Services
100 Crosby Parkway KC1H
Covington, KY 41015
General Correspondence
Fidelity Investments
P.O. Box 500
Merrimack, NH 03054-0500
|
Annual Report 46
47 Annual Report
| | Investment Adviser
Fidelity Management & Research Company
Boston, MA
Investment Sub Advisers
FMR Co., Inc.
Fidelity Research & Analysis Company
(formerly Fidelity Management &
Research (Far East) Inc.)
Fidelity Management & Research
(U.K.) Inc.
Fidelity Investments Japan Limited
Fidelity International Investment
Advisors
Fidelity International Investment
Advisors (U.K.) Limited
General Distributor
Fidelity Distributors Corporation
Boston, MA
Transfer and Service Agent
Fidelity Service Company, Inc.
Boston, MA
Custodian
Brown Brothers Harriman & Co.
Boston, MA
|
| The Fidelity Telephone Connection |
| Mutual Fund 24-Hour Service |
| Exchanges/Redemptions | | |
| and Account Assistance | | 1-800-544-6666 |
| Product Information | | 1-800-544-6666 |
| Retirement Accounts | | 1-800-544-4774 |
| (8 a.m. - 9 p.m.) | | |
| TDD Service | | 1-800-544-0118 |
| for the deaf and hearing impaired | | |
| (9 a.m. - 9 p.m. Eastern time) | | |
| Fidelity Automated Service | | |
| Telephone (FAST®) (automated phone logo) | | 1-800-544-5555 |
| (automated phone logo) Automated line for quickest service |
LCS-UANN-0606
1.784725.103
|

| | Fidelity®
Mid-Cap Stock
Fund
|
| | Annual Report
April 30, 2006
|


| Contents | | | | |
| |
| Chairman’s Message | | 4 | | Ned Johnson’s message to shareholders. |
| Performance | | 5 | | How the fund has done over time. |
| Management’s Discussion | | 6 | | The manager’s review of fund |
| | | | | performance, strategy and outlook |
| Shareholder Expense | | 7 | | An example of shareholder expenses. |
| Example | | | | |
| Investment Changes | | 8 | | A summary of major shifts in the fund’s |
| | | | | investments over the past six months. |
| Investments | | 9 | | A complete list of the fund’s investments |
| | | | | with their market values. |
| Financial Statements | | 19 | | Statements of assets and liabilities, |
| | | | | operations, and changes in net assets, |
| | | | | as well as financial highlights. |
| Notes | | 23 | | Notes to the financial statements. |
| Report of Independent | | 29 | | |
| Registered Public | | | | |
| Accounting Firm | | | | |
| Trustees and Officers | | 30 | | |
| Distributions | | 40 | | |
| Proxy Voting Results | | 41 | | |
| Board Approval of | | 42 | | |
| Investment Advisory | | | | |
| Contracts and | | | | |
| Management Fees | | | | |
To view a fund’s proxy voting guidelines and proxy voting record for the 12 month period ended
June 30, visit www.fidelity.com/proxyvotingresults or visit the Securities and Exchange Commis
sion’s (SEC) web site at www.sec.gov. You may also call 1-800-544-8544 to request a free copy of
the proxy voting guidelines.
Standard & Poor’s, S&P and S&P 500 are registered service marks of The McGraw Hill Companies,
Inc. and have been licensed for use by Fidelity Distributors Corporation.
Other third party marks appearing herein are the property of their respective owners.
All other marks appearing herein are registered or unregistered trademarks or service marks
of FMR Corp. or an affiliated company.
|
This report and the financial statements contained herein are submitted for the general information
of the shareholders of the fund. This report is not authorized for distribution to prospective investors
in the fund unless preceded or accompanied by an effective prospectus.
A fund files its complete schedule of portfolio holdings with the SEC for the first and third
quarters of each fiscal year on Form N Q. Forms N Q are available on the SEC’s web site at
http://www.sec.gov. A fund’s Forms N Q may be reviewed and copied at the SEC’s Public Refer
ence Room in Washington, DC. Information regarding the operation of the SEC’s Public Reference
Room may be obtained by calling 1-800-SEC-0330. For a complete list of a fund’s portfolio hold
ings, view the most recent quarterly holdings report, semiannual report, or annual report on
Fidelity’s web site at http://www.fidelity.com/holdings.
NOT FDIC INSURED · MAY LOSE VALUE · NO BANK GUARANTEE
Neither the fund nor Fidelity Distributors Corporation is a bank.
|
3 Annual Report
Chairman’s Message
(photograph of Edward C. Johnson 3d)
Dear Shareholder:
Although many securities markets made gains in early 2006, there is only one certainty when it comes to investing: There is no sure thing. There are, however, a number of time tested, fundamental investment principles that can put the historical odds in your favor.
One of the basic tenets is to invest for the long term. Over time, riding out the markets’ inevitable ups and downs has proven much more effective than selling into panic or chasing the hottest trend. Even missing only a few of the markets’ best days can significantly diminish investor returns. Patience also affords the benefits of compounding of earning interest on additional income or reinvested dividends and capital gains. There are tax advantages and cost benefits to consider as well. The more you sell, the more taxes you pay, and the more you trade, the higher the costs. While staying the course doesn’t eliminate risk, it can considerably lessen the effect of short term declines.
You can further manage your investing risk through diversification. And today, more than ever, geographic diversification should be taken into account. Studies indicate that asset allocation is the single most important determinant of a portfolio’s long term success. The right mix of stocks, bonds and cash aligned to your particular risk tolerance and investment objective is very important. Age appropriate rebalancing is also an essential aspect of asset allocation. For younger investors, an emphasis on equities which historically have been the best performing asset class over time is encouraged. As investors near their specific goal, such as retirement or sending a child to college, consideration may be given to replacing volatile assets (e.g. common stocks) with more stable fixed investments (bonds or savings plans).
A third investment principle investing regularly can help lower the average cost of your purchases. Investing a certain amount of money each month or quarter helps ensure you won’t pay for all your shares at market highs. This strategy known as dollar cost averaging also reduces unconstructive “emotion” from investing, helping shareholders avoid selling weak performers just prior to an upswing, or chasing a hot performer just before a correction.
We invite you to contact us via the Internet, through our Investor Centers or over the phone. It is our privilege to provide you the information you need to make the investments that are right for you.
Sincerely,
/s/ Edward C. Johnson 3d
Edward C. Johnson 3d
Annual Report 4
Performance: The Bottom Line
Average annual total return reflects the change in the value of an investment, assuming reinvestment of the fund’s dividend income and capital gains (the profits earned upon the sale of securities that have grown in value) and assuming a constant rate of performance each year. The $10,000 table and the fund’s returns do not reflect the deduction of taxes that a shareholder would pay on fund distributions or the redemp tion of fund shares. During periods of reimbursement by Fidelity, a fund’s total return will be greater than it would be had the reimbursement not occurred. How a fund did yesterday is no guarantee of how it will do tomorrow.
| Average Annual Total Returns | | | | | | |
| Periods ended April 30, 2006 | | Past 1 | | Past 5 | | Past 10 |
| | | year | | years | | years |
| Fidelity® Mid Cap Stock Fund | | 44.52% | | 5.66% | | 13.49% |
| |
| $10,000 Over 10 Years | | | | | | |
Let’s say hypothetically that $10,000 was invested in Fidelity® Mid Cap Stock Fund on May 1, 1996. The chart shows how the value of your investment would have changed, and also shows how the Standard & Poor’s® MidCap 400 Index performed over the same period.

5 Annual Report
Management’s Discussion of Fund Performance
Comments from Shep Perkins, Portfolio Manager of Fidelity® Mid Cap Stock Fund
Key U.S. equity benchmarks reached multiyear highs during the year ending April 30, 2006. The stock market’s performance reflected economic conditions and corporate earnings that continued to beat expectations. It also showed that investors generally tuned out the buzz surrounding record high energy costs, inflation and rising short term interest rates. By and large, the market’s trajectory was consistent throughout the period. In fact, as measured by the Standard & Poor’s 500SM Index, stocks rose in 10 of the past 12 months and ended the period on a six month winning streak. The gains also became more broad based, shifting from the primarily energy and utility driven returns of the period’s early stages to include more widespread contributions from other sectors such as financials and telecommunica tion services. On the capitalization spectrum, small caps continued to dominate, as the small cap Russell 2000® Index reached new heights and returned 33.47% for the year overall. In comparison, the large cap oriented S&P 500® gained 15.42%, the Dow Jones Industrial AverageSM rose 14.17% and the NASDAQ Composite® Index climbed 21.89% .
Fidelity Mid Cap Stock Fund did particularly well during a period that was favorable for mid cap stocks overall. For the 12 months, the fund gained 44.52%, compared with 28.32% for the Standard & Poor’s® MidCap 400 Index and 27.69% for the LipperSM Mid Cap Funds Average. Performance compared with the index was driven mostly by favorable stock selection. Favorable stock picking within the telecommunication services sector while the weakest component of the index during the past year contributed almost a third of the fund’s relative outperformance, as Qwest Communications and Time Warner Telecom were two of the fund’s biggest contributors. A few strong performers in the diversified financials group notably online brokers TD Ameritrade Holding and E*TRADE Financial contributed nicely as well. In the energy space, refiner Valero Energy also helped returns. Inopportune stock selection was responsible for holding back some of the fund’s strong overall performance. Technology hardware and equipment picks Comverse Technology and Juniper Networks both disappointed, while not holding a stake in index component SanDisk also hurt, as stronger than expected demand for its flash memory products moved the stock higher.
The views expressed above reflect those of the portfolio manager(s) only through the end of the period as stated on the cover of this report and do not necessarily represent the views of Fidelity or any other person in the Fidelity organization. Any such views are subject to change at any time based upon market or other conditions and Fidelity disclaims any responsibility to update such views. These views may not be relied on as investment advice and, because investment decisions for a Fidelity fund are based on numerous factors, may not be relied on as an indication of trading intent on behalf of any Fidelity fund.
Shareholder Expense Example
As a shareholder of the Fund, you incur two types of costs: (1) transaction costs, including redemption fees, and (2) ongoing costs, including management fees and other Fund ex penses. This Example is intended to help you understand your ongoing costs (in dollars) of investing in the Fund and to compare these costs with the ongoing costs of investing in other mutual funds.
The Example is based on an investment of $1,000 invested at the beginning of the period and held for the entire period (November 1, 2005 to April 30, 2006).
Actual Expenses
The first line of the table below provides information about actual account values and actual expenses. You may use the information in this line, together with the amount you invested, to estimate the expenses that you paid over the period. Simply divide your account value by $1,000.00 (for example, an $8,600 account value divided by $1,000.00 = 8.6), then multiply the result by the number in the first line under the heading entitled “Expenses Paid During Period” to estimate the expenses you paid on your account during this period. A small balance maintenance fee of $12.00 that is charged once a year may apply for certain accounts with a value of less than $2,000. This fee is not included in the table below. If it was, the estimate of expenses you paid during the period would be higher, and your ending account value lower, by this amount.
Hypothetical Example for Comparison Purposes
The second line of the table below provides information about hypothetical account values and hypothetical expenses based on the Fund’s actual expense ratio and an assumed rate of return of 5% per year before expenses, which is not the Fund’s actual return. The hypotheti cal account values and expenses may not be used to estimate the actual ending account balance or expenses you paid for the period. You may use this information to compare the ongoing costs of investing in the Fund and other funds. To do so, compare this 5% hypotheti cal example with the 5% hypothetical examples that appear in the shareholder reports of the other funds. A small balance maintenance fee of $12.00 that is charged once a year may apply for certain accounts with a value of less than $2,000. This fee is not included in the table below. If it was, the estimate of expenses you paid during the period would be higher, and your ending account value lower, by this amount.
Please note that the expenses shown in the table are meant to highlight your ongoing costs only and do not reflect any transaction costs. Therefore, the second line of the table is useful in comparing ongoing costs only, and will not help you determine the relative total costs of owning different funds. In addition, if these transactional costs were included, your costs would have been higher.
| | | | | | | | | | | Expenses Paid |
| | | Beginning | | Ending | | During Period* |
| | | Account Value | | Account Value | | November 1, 2005 |
| | | November 1, 2005 | | April 30, 2006 | | to April 30, 2006 |
| Actual | | | | $ 1,000.00 | | | | $ 1,249.70 | | | | $ 4.07 |
| Hypothetical (5% return per year | | | | | | | | | | | | |
| before expenses) | | | | $ 1,000.00 | | | | $ 1,021.17 | | | | $ 3.66 |
* Expenses are equal to the Fund’s annualized expense ratio of .73%; multiplied by the average account value over the period, multiplied by 181/365 (to reflect the one half year period).
7 Annual Report
| Investment Changes | | | | |
| |
| |
| Top Ten Stocks as of April 30, 2006 | | | | |
| | | % of fund’s | | % of fund’s net assets |
| | | net assets | | 6 months ago |
| Qwest Communications International, Inc. | | 3.2 | | 2.8 |
| St. Jude Medical, Inc. | | 2.0 | | 0.3 |
| Comverse Technology, Inc. | | 2.0 | | 2.3 |
| Royal Caribbean Cruises Ltd. | | 2.0 | | 1.9 |
| NCR Corp. | | 1.9 | | 1.8 |
| Monsanto Co. | | 1.8 | | 2.3 |
| E*TRADE Financial Corp. | | 1.8 | | 2.0 |
| Peabody Energy Corp. | | 1.8 | | 1.8 |
| Potash Corp. of Saskatchewan | | 1.7 | | 2.0 |
| Microchip Technology, Inc. | | 1.6 | | 2.4 |
| | | 19.8 | | |
Top Five Market Sectors as of April 30, 2006 | | |
| | | % of fund’s | | % of fund’s net assets |
| | | net assets | | 6 months ago |
| Information Technology | | 25.2 | | 27.5 |
| Consumer Discretionary | | 16.4 | | 19.3 |
| Health Care | | 12.5 | | 9.9 |
| Energy | | 12.4 | | 12.3 |
| Industrials | | 11.7 | | 10.7 |

| Investments April 30, 2006 | | | | |
| Showing Percentage of Net Assets | | | | | | |
| |
| Common Stocks 98.6% | | | | | | |
| | | Shares | | Value (Note 1) |
| | | | | (000s) |
| |
| CONSUMER DISCRETIONARY – 16.4% | | | | | | |
| Auto Components 0.3% | | | | | | |
| Visteon Corp. (a)(e) | | 7,500,000 | | | | $ 44,100 |
| Hotels, Restaurants & Leisure 5.2% | | | | | | |
| Boyd Gaming Corp. | | 1,147,200 | | | | 57,154 |
| Gaylord Entertainment Co. (a) | | 643,287 | | | | 28,465 |
| MGM MIRAGE (a) | | 496,100 | | | | 22,275 |
| Morgans Hotel Group Co. (e) | | 2,314,970 | | | | 41,669 |
| OSI Restaurant Partners, Inc. | | 88,500 | | | | 3,779 |
| Penn National Gaming, Inc. (a) | | 2,000,000 | | | | 81,440 |
| Royal Caribbean Cruises Ltd. | | 6,000,000 | | | | 250,740 |
| Starbucks Corp. (a) | | 1,600,000 | | | | 59,632 |
| Starwood Hotels & Resorts Worldwide, Inc. | | 1,000,000 | | | | 57,380 |
| Wynn Resorts Ltd. (a)(d) | | 750,000 | | | | 57,083 |
| | | | | | | 659,617 |
| Household Durables – 2.3% | | | | | | |
| Harman International Industries, Inc. | | 1,000,000 | | | | 87,990 |
| LG Electronics, Inc. | | 1,304,130 | | | | 107,992 |
| Sealy Corp., Inc. | | 14,100 | | | | 225 |
| Whirlpool Corp. | | 1,000,000 | | | | 89,750 |
| | | | | | | 285,957 |
| Internet & Catalog Retail 1.0% | | | | | | |
| Blue Nile, Inc. (a)(d)(e) | | 1,729,800 | | | | 60,197 |
| GSI Commerce, Inc. (a)(d)(e) | | 4,144,519 | | | | 72,488 |
| | | | | | | 132,685 |
| Media – 3.7% | | | | | | |
| EchoStar Communications Corp. Class A (a) | | 4,000,000 | | | | 123,600 |
| Getty Images, Inc. (a) | | 1,000,000 | | | | 64,010 |
| Lamar Advertising Co. Class A (a)(d) | | 2,000,000 | | | | 109,980 |
| Omnicom Group, Inc. | | 850,000 | | | | 76,509 |
| Univision Communications, Inc. Class A (a)(d) | | 2,500,000 | | | | 89,225 |
| | | | | | | 463,324 |
| Multiline Retail – 0.6% | | | | | | |
| Federated Department Stores, Inc. | | 955,800 | | | | 74,409 |
| Specialty Retail – 3.1% | | | | | | |
| Aeropostale, Inc. (a)(e) | | 2,900,000 | | | | 89,059 |
| Circuit City Stores, Inc. | | 4,265,800 | | | | 122,642 |
| Eddie Bauer Holdings, Inc. (a) | | 1,424,900 | | | | 18,780 |
See accompanying notes which are an integral part of the financial statements.
| Investments continued | | | | | | |
| |
| |
| Common Stocks continued | | | | | | |
| | | Shares | | Value (Note 1) |
| | | | | (000s) |
| |
| CONSUMER DISCRETIONARY – continued | | | | | | |
| Specialty Retail – continued | | | | | | |
| Gamestop Corp. Class A (a)(d) | | 1,402,467 | | | | $ 66,196 |
| Staples, Inc. | | 3,499,950 | | | | 92,434 |
| | | | | | | 389,111 |
| Textiles, Apparel & Luxury Goods – 0.2% | | | | | | |
| Fossil, Inc. (a) | | 1,500,000 | | | | 24,390 |
| |
| TOTAL CONSUMER DISCRETIONARY | | | | | | 2,073,593 |
| |
| CONSUMER STAPLES 0.7% | | | | | | |
| Beverages – 0.0% | | | | | | |
| Constellation Brands, Inc. Class A (sub. vtg.) (a) | | 200,000 | | | | 4,940 |
| Food & Staples Retailing – 0.7% | | | | | | |
| CVS Corp. | | 1,000,000 | | | | 29,720 |
| Rite Aid Corp. (a)(d) | | 11,000,000 | | | | 49,500 |
| Sysco Corp. | | 200,000 | | | | 5,978 |
| | | | | | | 85,198 |
| |
| TOTAL CONSUMER STAPLES | | | | | | 90,138 |
| |
| ENERGY 12.4% | | | | | | |
| Energy Equipment & Services – 6.5% | | | | | | |
| BJ Services Co. | | 3,000,000 | | | | 114,150 |
| GlobalSantaFe Corp. | | 1,000,000 | | | | 61,210 |
| Halliburton Co. | | 1,650,000 | | | | 128,948 |
| National Oilwell Varco, Inc. (a) | | 1,551,250 | | | | 106,990 |
| Noble Corp. | | 1,400,000 | | | | 110,516 |
| Pride International, Inc. (a) | | 2,801,137 | | | | 97,732 |
| Transocean, Inc. (a) | | 1,000,000 | | | | 81,070 |
| Weatherford International Ltd. (a) | | 2,200,000 | | | | 116,446 |
| | | | | | | 817,062 |
| Oil, Gas & Consumable Fuels – 5.9% | | | | | | |
| Amerada Hess Corp. | | 700,000 | | | | 100,289 |
| Arch Coal, Inc. | | 700,000 | | | | 66,493 |
| Cameco Corp. | | 800,000 | | | | 32,551 |
| EOG Resources, Inc. | | 800,000 | | | | 56,184 |
| Massey Energy Co. | | 2,000,000 | | | | 77,300 |
See accompanying notes which are an integral part of the financial statements.
| Common Stocks continued | | | | | | |
| | | Shares | | Value (Note 1) |
| | | | | (000s) |
| |
| ENERGY – continued | | | | | | |
| Oil, Gas & Consumable Fuels – continued | | | | | | |
| Peabody Energy Corp. | | 3,500,000 | | | | $ 223,510 |
| Valero Energy Corp. | | 3,000,000 | | | | 194,220 |
| | | | | | | 750,547 |
| |
| TOTAL ENERGY | | | | | | 1,567,609 |
| |
| FINANCIALS – 5.1% | | | | | | |
| Capital Markets 2.6% | | | | | | |
| E*TRADE Financial Corp. (a) | | 9,000,000 | | | | 223,920 |
| TD Ameritrade Holding Corp. | | 6,000,000 | | | | 111,360 |
| | | | | | | 335,280 |
| Commercial Banks – 0.9% | | | | | | |
| SVB Financial Group (a) | | 930,832 | | | | 47,258 |
| Wintrust Financial Corp. | | 1,190,165 | | | | 61,591 |
| | | | | | | 108,849 |
| Insurance – 0.8% | | | | | | |
| Axis Capital Holdings Ltd. | | 2,000,000 | | | | 59,640 |
| W.R. Berkley Corp. | | 923,850 | | | | 34,570 |
| Willis Group Holdings Ltd. | | 300,000 | | | | 10,545 |
| | | | | | | 104,755 |
| Thrifts & Mortgage Finance – 0.8% | | | | | | |
| Hudson City Bancorp, Inc. | | 4,000,000 | | | | 53,640 |
| Sovereign Bancorp, Inc. | | 2,000,000 | | | | 44,340 |
| | | | | | | 97,980 |
| |
| TOTAL FINANCIALS | | | | | | 646,864 |
| |
| HEALTH CARE – 12.5% | | | | | | |
| Biotechnology – 2.5% | | | | | | |
| Celgene Corp. (a) | | 2,500,000 | | | | 105,400 |
| Genentech, Inc. (a) | | 650,000 | | | | 51,812 |
| MedImmune, Inc. (a) | | 2,173,600 | | | | 68,403 |
| ONYX Pharmaceuticals, Inc. (a) | | 1,274,900 | | | | 29,769 |
| OSI Pharmaceuticals, Inc. (a)(d) | | 2,000,000 | | | | 53,140 |
| OXiGENE, Inc. (a)(e) | | 2,000,000 | | | | 8,640 |
| | | | | | | 317,164 |
| Health Care Equipment & Supplies – 4.1% | | | | | | |
| Advanced Medical Optics, Inc. (a) | | 864,600 | | | | 40,290 |
See accompanying notes which are an integral part of the financial statements.
11 Annual Report
| Investments continued | | | | | | |
| |
| |
| Common Stocks continued | | | | | | |
| | | Shares | | Value (Note 1) |
| | | | | (000s) |
| |
| HEALTH CARE – continued | | | | | | |
| Health Care Equipment & Supplies – continued | | | | | | |
| C.R. Bard, Inc. | | 750,000 | | | | $ 55,845 |
| Conor Medsystems, Inc. (a) | | 500,000 | | | | 13,500 |
| Cyberonics, Inc. (a)(d) | | 1,136,029 | | | | 26,345 |
| Gen-Probe, Inc. (a) | | 884,700 | | | | 47,305 |
| Mentor Corp. | | 1,300,000 | | | | 56,329 |
| St. Jude Medical, Inc. (a) | | 6,500,000 | | | | 256,620 |
| Thoratec Corp. (a) | | 1,179,125 | | | | 21,236 |
| | | | | | | 517,470 |
| Health Care Providers & Services – 5.2% | | | | | | |
| Covance, Inc. (a) | | 1,593,000 | | | | 92,952 |
| Healthspring, Inc. (d)(e) | | 3,488,300 | | | | 59,301 |
| Henry Schein, Inc. (a) | | 974,700 | | | | 45,441 |
| Humana, Inc. (a) | | 2,821,763 | | | | 127,487 |
| IMS Health, Inc. | | 2,500,000 | | | | 67,950 |
| Medco Health Solutions, Inc. (a) | | 1,300,000 | | | | 69,199 |
| Omnicare, Inc. | | 2,250,000 | | | | 127,598 |
| UnitedHealth Group, Inc. | | 1,474,700 | | | | 73,352 |
| | | | | | | 663,280 |
| Pharmaceuticals – 0.7% | | | | | | |
| Allergan, Inc. | | 800,000 | | | | 82,176 |
| |
| TOTAL HEALTH CARE | | | | | | 1,580,090 |
| |
| INDUSTRIALS – 11.7% | | | | | | |
| Aerospace & Defense – 2.6% | | | | | | |
| Hexcel Corp. (a) | | 2,500,000 | | | | 55,225 |
| L 3 Communications Holdings, Inc. | | 906,476 | | | | 74,059 |
| Precision Castparts Corp. | | 1,750,000 | | | | 110,215 |
| Rockwell Collins, Inc. | | 1,500,000 | | | | 85,800 |
| | | | | | | 325,299 |
| Airlines – 0.2% | | | | | | |
| JetBlue Airways Corp. (a)(d) | | 2,892,318 | | | | 29,675 |
| Commercial Services & Supplies – 3.7% | | | | | | |
| Allied Waste Industries, Inc. (a) | | 7,000,000 | | | | 99,120 |
| American Reprographics Co. (a) | | 1,000,000 | | | | 35,470 |
| CDI Corp. (e) | | 1,119,900 | | | | 31,749 |
| Cintas Corp. | | 2,000,000 | | | | 83,960 |
| Knoll, Inc. | | 2,232,013 | | | | 48,546 |
See accompanying notes which are an integral part of the financial statements.
| Common Stocks continued | | | | | | |
| | | Shares | | Value (Note 1) |
| | | | | (000s) |
| |
| INDUSTRIALS – continued | | | | | | |
| Commercial Services & Supplies – continued | | | | | | |
| Robert Half International, Inc. | | 1,750,000 | | | | $ 73,973 |
| Waste Management, Inc. | | 2,569,900 | | | | 96,268 |
| | | | | | | 469,086 |
| Construction & Engineering – 1.1% | | | | | | |
| Chicago Bridge & Iron Co. NV (NY Shares) | | 2,500,000 | | | | 59,925 |
| Fluor Corp. | | 328,744 | | | | 30,544 |
| Quanta Services, Inc. (a) | | 3,000,000 | | | | 48,660 |
| | | | | | | 139,129 |
| Electrical Equipment – 0.7% | | | | | | |
| Evergreen Solar, Inc. (a)(d) | | 1,998,110 | | | | 27,734 |
| Global Power Equipment Group, Inc. (a)(d) | | 691,000 | | | | 2,971 |
| Rockwell Automation, Inc. | | 850,000 | | | | 61,591 |
| | | | | | | 92,296 |
| Machinery – 0.8% | | | | | | |
| Deere & Co. | | 250,000 | | | | 21,945 |
| Manitowoc Co., Inc. | | 1,500,000 | | | | 74,385 |
| | | | | | | 96,330 |
| Marine – 0.5% | | | | | | |
| American Commercial Lines, Inc. | | 500,000 | | | | 26,965 |
| Kirby Corp. (a) | | 471,800 | | | | 34,772 |
| | | | | | | 61,737 |
| Road & Rail 2.1% | | | | | | |
| Burlington Northern Santa Fe Corp. | | 1,500,000 | | | | 119,295 |
| Landstar System, Inc. | | 1,000,998 | | | | 42,532 |
| Norfolk Southern Corp. | | 2,000,000 | | | | 108,000 |
| | | | | | | 269,827 |
| |
| TOTAL INDUSTRIALS | | | | | | 1,483,379 |
| |
| INFORMATION TECHNOLOGY – 25.2% | | | | | | |
| Communications Equipment – 5.1% | | | | | | |
| Alcatel SA sponsored ADR (a) | | 8,000,000 | | | | 115,360 |
| CIENA Corp. (a) | | 20,000,000 | | | | 81,800 |
| Comverse Technology, Inc. (a)(e) | | 11,156,628 | | | | 252,698 |
| Juniper Networks, Inc. (a) | | 6,000,000 | | | | 110,880 |
| MasTec, Inc. (a) | | 3,000,000 | | | | 36,990 |
| Motorola, Inc. | | 2,000,000 | | | | 42,700 |
| | | | | | | 640,428 |
See accompanying notes which are an integral part of the financial statements.
13 Annual Report
| Investments continued | | | | | | |
| |
| |
| Common Stocks continued | | | | | | |
| | | Shares | | Value (Note 1) |
| | | | | (000s) |
| |
| INFORMATION TECHNOLOGY – continued | | | | | | |
| Computers & Peripherals – 2.4% | | | | | | |
| Diebold, Inc. | | 750,000 | | | | $ 31,913 |
| NCR Corp. (a) | | 6,250,000 | | | | 246,250 |
| QLogic Corp. (a) | | 1,000,000 | | | | 20,810 |
| | | | | | | 298,973 |
| Electronic Equipment & Instruments – 4.8% | | | | | | |
| Amphenol Corp. Class A | | 2,001,000 | | | | 115,658 |
| Arrow Electronics, Inc. (a) | | 1,499,987 | | | | 54,300 |
| Benchmark Electronics, Inc. (a)(e) | | 3,375,000 | | | | 92,138 |
| Celestica, Inc. (sub. vtg.) (a) | | 5,000,000 | | | | 56,216 |
| Flextronics International Ltd. (a) | | 11,750,000 | | | | 133,480 |
| Solectron Corp. (a) | | 40,500,000 | | | | 162,000 |
| | | | | | | 613,792 |
| Internet Software & Services – 1.3% | | | | | | |
| Akamai Technologies, Inc. (a) | | 2,000,000 | | | | 67,380 |
| eBay, Inc. (a) | | 100,000 | | | | 3,441 |
| Homestore, Inc. (a)(e) | | 15,000,000 | | | | 92,100 |
| | | | | | | 162,921 |
| IT Services – 1.5% | | | | | | |
| Alliance Data Systems Corp. (a) | | 1,250,000 | | | | 68,750 |
| Cognizant Technology Solutions Corp. Class A (a) | | 1,250,000 | | | | 79,513 |
| Telvent GIT SA (a)(e) | | 2,773,900 | | | | 38,835 |
| | | | | | | 187,098 |
| Office Electronics – 0.4% | | | | | | |
| Xerox Corp. (a) | | 4,000,000 | | | | 56,160 |
| Semiconductors & Semiconductor Equipment – 6.6% | | | | | | |
| Advanced Micro Devices, Inc. (a) | | 202,600 | | | | 6,554 |
| ATI Technologies, Inc. (a) | | 2,000,000 | | | | 31,034 |
| Axcelis Technologies, Inc. (a) | | 579,100 | | | | 3,411 |
| FormFactor, Inc. (a) | | 1,617,800 | | | | 67,446 |
| Freescale Semiconductor, Inc. Class B (a) | | 3,750,000 | | | | 118,763 |
| Intel Corp. | | 600,000 | | | | 11,988 |
| MEMC Electronic Materials, Inc. (a) | | 2,710,200 | | | | 110,034 |
| Microchip Technology, Inc. | | 5,250,000 | | | | 195,615 |
| ON Semiconductor Corp. (a) | | 7,179,450 | | | | 51,477 |
| PMC-Sierra, Inc. (a) | | 3,492,612 | | | | 43,413 |
| Samsung Electronics Co. Ltd. | | 173,710 | | | | 118,612 |
See accompanying notes which are an integral part of the financial statements.
| Common Stocks continued | | | | | | |
| | | Shares | | Value (Note 1) |
| | | | | (000s) |
| |
| INFORMATION TECHNOLOGY – continued | | | | | | |
| Semiconductors & Semiconductor Equipment – continued | | | | | | |
| Silicon Laboratories, Inc. (a) | | 1,395,300 | | | | $ 65,035 |
| United Microelectronics Corp. sponsored ADR (d) | | 3,000,000 | | | | 11,310 |
| | | | | | | 834,692 |
| Software 3.1% | | | | | | |
| Adobe Systems, Inc. | | 250,000 | | | | 9,800 |
| Amdocs Ltd. (a) | | 1,155,000 | | | | 42,966 |
| BEA Systems, Inc. (a) | | 5,000,000 | | | | 66,250 |
| Citrix Systems, Inc. (a) | | 1,700,000 | | | | 67,864 |
| FileNET Corp. (a) | | 1,749,089 | | | | 48,660 |
| Microsoft Corp. | | 200,000 | | | | 4,830 |
| NAVTEQ Corp. (a) | | 1,500,000 | | | | 62,280 |
| Symantec Corp. (a) | | 1,000,000 | | | | 16,380 |
| TIBCO Software, Inc. (a) | | 7,821,100 | | | | 67,418 |
| | | | | | | 386,448 |
| |
| TOTAL INFORMATION TECHNOLOGY | | | | | | 3,180,512 |
| |
| MATERIALS 8.7% | | | | | | |
| Chemicals – 6.1% | | | | | | |
| Agrium, Inc. | | 4,585,700 | | | | 118,539 |
| Air Products & Chemicals, Inc. | | 500,000 | | | | 34,260 |
| Chemtura Corp. | | 3,000,000 | | | | 36,600 |
| Cytec Industries, Inc. | | 1,000,000 | | | | 60,470 |
| Monsanto Co. | | 2,750,000 | | | | 229,350 |
| Nitto Denko Corp. | | 90,000 | | | | 7,548 |
| Potash Corp. of Saskatchewan | | 2,250,000 | | | | 213,005 |
| Tokuyama Corp. | | 4,000,000 | | | | 66,002 |
| | | | | | | 765,774 |
| Containers & Packaging – 0.2% | | | | | | |
| Smurfit-Stone Container Corp. (a) | | 2,453,038 | | | | 31,767 |
| Metals & Mining – 2.4% | | | | | | |
| Commercial Metals Co. | | 886,850 | | | | 48,245 |
| Gold Fields Ltd. sponsored ADR (d) | | 3,000,000 | | | | 76,230 |
| Novelis, Inc. | | 1,916,100 | | | | 46,069 |
| Oregon Steel Mills, Inc. (a) | | 605,665 | | | | 29,999 |
See accompanying notes which are an integral part of the financial statements.
15 Annual Report
| Investments continued | | | | | | |
| |
| |
| Common Stocks continued | | | | | | |
| | | Shares | | Value (Note 1) |
| | | | | (000s) |
| |
| MATERIALS – continued | | | | | | |
| Metals & Mining – continued | | | | | | |
| Steel Dynamics, Inc. | | 506,600 | | | | $ 31,632 |
| United States Steel Corp. | | 1,000,000 | | | | 68,500 |
| | | | | | | 300,675 |
| |
| TOTAL MATERIALS | | | | �� | | 1,098,216 |
| |
| TELECOMMUNICATION SERVICES – 5.6% | | | | | | |
| Diversified Telecommunication Services – 4.9% | | | | | | |
| AT&T, Inc. | | 3,500,000 | | | | 91,735 |
| Qwest Communications International, Inc. (a) | | 60,000,000 | | | | 402,592 |
| Time Warner Telecom, Inc. Class A (sub. vtg.)(a)(d) | | 7,500,000 | | | | 125,775 |
| | | | | | | 620,102 |
| Wireless Telecommunication Services – 0.7% | | | | | | |
| Nextel Partners, Inc. Class A (a) | | 910,400 | | | | 25,801 |
| NII Holdings, Inc. (a) | | 1,079,300 | | | | 64,650 |
| | | | | | | 90,451 |
| |
| TOTAL TELECOMMUNICATION SERVICES | | | | | | 710,553 |
| |
| UTILITIES – 0.3% | | | | | | |
| Independent Power Producers & Energy Traders – 0.3% | | | | | | |
| AES Corp. (a) | | 2,500,000 | | | | 42,425 |
| TOTAL COMMON STOCKS | | | | | | |
| (Cost $9,547,741) | | | | 12,473,379 |
See accompanying notes which are an integral part of the financial statements.
| Money Market Funds 2.5% | | | | | | | | |
| | | | | Shares | | | | Value (Note 1) |
| | | | | | | | | (000s) |
| Fidelity Cash Central Fund, 4.8% (b) | | | | 195,188,589 | | | | $ 195,189 |
| Fidelity Securities Lending Cash Central Fund, | | | | | | | | |
| 4.83% (b)(c) | | | | 128,735,500 | | | | 128,736 |
| TOTAL MONEY MARKET FUNDS | | | | | | | | |
| (Cost $323,925) | | | | | | | | 323,925 |
| TOTAL INVESTMENT PORTFOLIO 101.1% | | | | | | | | |
| (Cost $9,871,666) | | | | | | | | 12,797,304 |
| |
| NET OTHER ASSETS – (1.1)% | | | | | | | | (144,093) |
| NET ASSETS 100% | | | | | | | | $ 12,653,211 |
(a) Non-income producing
(b) Affiliated fund that is available only to
investment companies and other
accounts managed by Fidelity
Investments. The rate quoted is the
annualized seven-day yield of the fund
at period end. A complete unaudited
listing of the fund’s holdings as of its
most recent quarter end is available
upon request.
|
(c) Investment made with cash collateral
received from securities on loan.
(d) Security or a portion of the security is on
loan at period end.
(e) Affiliated company
|
Affiliated Central Funds
Information regarding fiscal year to date income earned by the fund from the affiliated Central funds is as follows:
| Fund | | Income earned |
| | | (Amounts in thousands) |
| Fidelity Cash Central Fund | | | | $ 4,649 |
| Fidelity Securities Lending Cash Central Fund | | | | 1,593 |
| Total | | | | $ 6,242 |
See accompanying notes which are an integral part of the financial statements.
17 Annual Report
Investments continued
Other Affiliated Issuers
An affiliated company is a company in which the fund has ownership of at least 5% of the voting securities. Fiscal year to date transactions with companies which are or were affiliates are as follows:
| | | | | Value, | | | | | | | | | | | | | | | | Value, |
| Affiliates | | beginning of | | | | | | | | Sales | | | | Dividend | | | | end of |
| (Amounts in thousands) | | | | period | | | | Purchases | | | | Proceeds | | | | Income | | | | period |
| Aeropostale, Inc. | | | | $ — | | | | $ 82,476 | | | | $ — | | | | $ — | | | | $ 89,059 |
| Benchmark Electronics, | | | | | | | | | | | | | | | | | | | | |
| Inc. | | | | 15,370 | | | | 48,371 | | | | — | | | | — | | | | 92,138 |
| Blue Nile, Inc. | | | | 28,578 | | | | 24,861 | | | | 6,407 | | | | — | | | | 60,197 |
| CDI Corp. | | | | — | | | | 31,609 | | | | — | | | | — | | | | 31,749 |
| Comverse Technology, | | | | | | | | | | | | | | | | | | | | |
| Inc. | | | | 179,373 | | | | 89,659 | | | | 14,117 | | | | | | | | 252,698 |
| Cyberonics, Inc. | | | | 90,045 | | | | 10,396 | | | | 69,150 | | | | — | | | | — |
| GSI Commerce, Inc. | | | | — | | | | 66,558 | | | | 1,130 | | | | — | | | | 72,488 |
| Healthspring, Inc. | | | | — | | | | 67,115 | | | | — | | | | — | | | | 59,301 |
| Homestore, Inc | | | | 28,757 | | | | 3,016 | | | | 2,606 | | | | — | | | | 92,100 |
| IntraLase Corp. | | | | — | | | | 31,650 | | | | 28,261 | | | | — | | | | — |
| Morgans Hotel Group | | | | | | | | | | | | | | | | | | | | |
| Co. | | | | — | | | | 43,556 | | | | — | | | | — | | | | 41,669 |
| OXiGENE, Inc | | | | — | | | | 7,300 | | | | — | | | | — | | | | 8,640 |
| Sapient Corp. | | | | 47,905 | | | | 2,464 | | | | 49,751 | | | | — | | | | — |
| Telvent GIT SA | | | | 24,272 | | | | — | | | | — | | | | — | | | | 38,835 |
| Visteon Corp | | | | — | | | | 59,412 | | | | — | | | | — | | | | 44,100 |
| Totals | | | | $ 414,300 | | | | $ 568,443 | | | | $ 171,422 | | | | $ — | | | | $ 882,974 |
Other Information
Distribution of investments by country of issue, as a percentage of total net assets, is as follows:
| United States of America | | 85.8% |
| Canada | | 4.0% |
| Liberia | | 2.0% |
| Korea (South) | | 1.8% |
| Cayman Islands | | 1.4% |
| Singapore | | 1.1% |
| Others (individually less than 1%) . | | 3.9% |
| | | 100.0% |
See accompanying notes which are an integral part of the financial statements.
| Financial Statements | | | | | | | | |
| |
| |
| Statement of Assets and Liabilities | | | | | | | | |
| Amounts in thousands (except per share amount) | | | | | | | | April 30, 2006 |
| |
| Assets | | | | | | | | |
| Investment in securities, at value (including securities | | | | | | | | |
| loaned of $125,362) See accompanying schedule: | | | | | | | | |
| Unaffiliated issuers (cost $8,760,338) | | | | $ 11,590,405 | | | | |
| Affiliated Central Funds (cost $323,925) | | | | 323,925 | | | | |
| Other affiliated issuers (cost $787,403) | | | | 882,974 | | | | |
| Total Investments (cost $9,871,666) | | | | | | | | $ 12,797,304 |
| Receivable for investments sold | | | | | | | | 16,204 |
| Receivable for fund shares sold | | | | | | | | 55,325 |
| Dividends receivable | | | | | | | | 1,124 |
| Interest receivable | | | | | | | | 430 |
| Prepaid expenses | | | | | | | | 28 |
| Other affiliated receivables | | | | | | | | 34 |
| Other receivables | | | | | | | | 320 |
| Total assets | | | | | | | | 12,870,769 |
| |
| Liabilities | | | | | | | | |
| Payable for investments purchased | | | | $ 70,210 | | | | |
| Payable for fund shares redeemed | | | | 10,045 | | | | |
| Accrued management fee | | | | 5,578 | | | | |
| Other affiliated payables | | | | 2,482 | | | | |
| Other payables and accrued expenses | | | | 507 | | | | |
| Collateral on securities loaned, at value | | | | 128,736 | | | | |
| Total liabilities | | | | | | | | 217,558 |
| |
| Net Assets | | | | | | | | $ 12,653,211 |
| Net Assets consist of: | | | | | | | | |
| Paid in capital | | | | | | | | $ 9,434,236 |
| Accumulated net investment loss | | | | | | | | (106) |
| Accumulated undistributed net realized gain (loss) on | | | | | | | | |
| investments and foreign currency transactions | | | | | | | | 293,408 |
| Net unrealized appreciation (depreciation) on | | | | | | | | |
| investments and assets and liabilities in foreign | | | | | | | | |
| currencies | | | | | | | | 2,925,673 |
| Net Assets, for 415,830 shares outstanding | | | | | | | | $ 12,653,211 |
| Net Asset Value, offering price and redemption price per | | | | | | | | |
| share ($12,653,211 ÷ 415,830 shares) | | | | | | | | $ 30.43 |
See accompanying notes which are an integral part of the financial statements.
19 Annual Report
| Financial Statements continued | | | | |
| |
| |
| Statement of Operations | | | | | | |
| Amounts in thousands | | | | Year ended April 30, 2006 |
| |
| Investment Income | | | | | | |
| Dividends | | | | | | $ 42,096 |
| Special dividends | | | | | | 16,200 |
| Interest | | | | | | 62 |
| Income from affiliated Central Funds | | | | | | 6,242 |
| Total income | | | | | | 64,600 |
| |
| Expenses | | | | | | |
| Management fee | | | | | | |
| Basic fee | | | | $ 55,883 | | |
| Performance adjustment | | | | (12,187) | | |
| Transfer agent fees | | | | 24,238 | | |
| Accounting and security lending fees | | | | 1,255 | | |
| Independent trustees’ compensation | | | | 40 | | |
| Appreciation in deferred trustee compensation account | | | | 20 | | |
| Custodian fees and expenses | | | | 307 | | |
| Registration fees | | | | 227 | | |
| Audit | | | | 91 | | |
| Legal | | | | 72 | | |
| Interest | | | | 6 | | |
| Miscellaneous | | | | 503 | | |
| Total expenses before reductions | | | | 70,455 | | |
| Expense reductions | | | | (2,723) | | 67,732 |
| |
| Net investment income (loss) | | | | | | (3,132) |
| Realized and Unrealized Gain (Loss) | | | | | | |
| Net realized gain (loss) on: | | | | | | |
| Investment securities: | | | | | | |
| Unaffiliated issuers | | | | 647,190 | | |
| Other affiliated issuers | | | | 32,494 | | |
| Foreign currency transactions | | | | 55 | | |
| Total net realized gain (loss) | | | | | | 679,739 |
| Change in net unrealized appreciation (depreciation) on: | | | | | | |
| Investment securities | | | | 2,868,399 | | |
| Assets and liabilities in foreign currencies | | | | 33 | | |
| Total change in net unrealized appreciation | | | | | | |
| (depreciation) | | | | | | 2,868,432 |
| Net gain (loss) | | | | | | 3,548,171 |
| Net increase (decrease) in net assets resulting from | | | | | | |
| operations | | | | | | $ 3,545,039 |
See accompanying notes which are an integral part of the financial statements.
| Statement of Changes in Net Assets | | | | | | | | |
| | | | | Year ended | | | | Year ended |
| | | | | April 30, | | | | April 30, |
| Amounts in thousands | | | | 2006 | | | | 2005 |
| Increase (Decrease) in Net Assets | | | | | | | | |
| Operations | | | | | | | | |
| Net investment income (loss) | | | | $ (3,132) | | | | $ 18,305 |
| Net realized gain (loss) | | | | 679,739 | | | | 801,420 |
| Change in net unrealized appreciation (depreciation) | | | | 2,868,432 | | | | (574,229) |
| Net increase (decrease) in net assets resulting | | | | | | | | |
| from operations | | | | 3,545,039 | | | | 245,496 |
| Distributions to shareholders from net investment income | | | | (14,639) | | | | (27,220) |
| Distributions to shareholders from net realized gain | | | | (218,717) | | | | — |
| Total distributions | | | | (233,356) | | | | (27,220) |
| Share transactions | | | | | | | | |
| Proceeds from sales of shares | | | | 3,077,335 | | | | 1,782,192 |
| Reinvestment of distributions | | | | 229,258 | | | | 26,657 |
| Cost of shares redeemed | | | | (1,907,242) | | | | (2,298,258) |
| Net increase (decrease) in net assets resulting from | | | | | | | | |
| share transactions | | | | 1,399,351 | | | | (489,409) |
| Redemption fees | | | | 181 | | | | 212 |
| Total increase (decrease) in net assets | | | | 4,711,215 | | | | (270,921) |
| |
| Net Assets | | | | | | | | |
| Beginning of period | | | | 7,941,996 | | | | 8,212,917 |
| End of period (including accumulated net investment | | | | | | | | |
| loss of $106 and undistributed net investment in- | | | | | | | | |
| come of $15,533, respectively) | | | | $ 12,653,211 | | | | $ 7,941,996 |
| |
| Other Information | | | | | | | | |
| Shares | | | | | | | | |
| Sold | | | | 112,062 | | | | 81,686 |
| Issued in reinvestment of distributions | | | | 8,722 | | | | 1,184 |
| Redeemed | | | | (73,167) | | | | (104,392) |
| Net increase (decrease) | | | | 47,617 | | | | (21,522) |
See accompanying notes which are an integral part of the financial statements.
21 Annual Report
| Financial Highlights | | | | | | | | | | | | | | | | | | |
| Years ended April 30, | | 2006 | | | | 2005 | | | | 2004 | | | | 2003 | | | | 2002 |
| Selected Per Share Data | | | | | | | | | | | | | | | | | | |
| Net asset value, beginning of | | | | | | | | | | | | | | | | | | |
| period | | $ 21.57 | | | | $ 21.07 | | | | $ 16.80 | | | | $ 21.42 | | | | $ 24.14 |
| Income from Investment | | | | | | | | | | | | | | | | | | |
| Operations | | | | | | | | | | | | | | | | | | |
| Net investment income | | | | | | | | | | | | | | | | | | |
| (loss)B | | (.01)C | | | | .05D | | | | .07 | | | | .13 | | | | .18F |
| Net realized and unreal- | | | | | | | | | | | | | | | | | | |
| ized gain (loss) | | 9.51 | | | | .52 | | | | 4.29 | | | | (4.66) | | | | (2.74)F |
| Total from investment | | | | | | | | | | | | | | | | | | |
| operations | | 9.50 | | | | .57 | | | | 4.36 | | | | (4.53) | | | | (2.56) |
| Distributions from net | | | | | | | | | | | | | | | | | | |
| investment income | | (.04) | | | | (.07) | | | | (.09) | | | | (.09) | | | | (.16) |
| Distributions from net realized | | | | | | | | | | | | | | | | | | |
| gain | | (.60) | | | | — | | | | — | | | | — | | | | — |
| Total distributions | | (.64) | | | | (.07) | | | | (.09) | | | | (.09) | | | | (.16) |
| Redemption fees added to | | | | | | | | | | | | | | | | | | |
| paid in capitalB | | —G | | | | —G | | | | —G | | | | —G | | | | —G |
| Net asset value, end of period | | $ 30.43 | | | | $ 21.57 | | | | $ 21.07 | | | | $ 16.80 | | | | $ 21.42 |
| Total ReturnA | | 44.52% | | | | 2.69% | | | | 25.99% | | | | (21.17)% | | | | (10.67)% |
| Ratios to Average Net AssetsE | | | | | | | | | | | | | | | | | | |
| Expenses before reductions | | .72% | | | | .71% | | | | .70% | | | | .74% | | | | .94% |
| Expenses net of fee waiv- | | | | | | | | | | | | | | | | | | |
| ers, if any | | 72% | | | | .71% | | | | .70% | | | | .74% | | | | .94% |
| Expenses net of all | | | | | | | | | | | | | | | | | | |
| reductions | | 69% | | | | .62% | | | | .65% | | | | .66% | | | | .87% |
| Net investment income | | | | | | | | | | | | | | | | | | |
| (loss) | | (.03)%C | | | | .22%D | | | | .34% | | | | .75% | | | | .79%F |
| Supplemental Data | | | | | | | | | | | | | | | | | | |
| Net assets, end of period | | | | | | | | | | | | | | | | | | |
| (in millions) | | $12,653 | | | | $ 7,942 | | | | $ 8,213 | | | | $ 5,507 | | | | $ 6,728 |
| Portfolio turnover rate | | 74% | | | | 186% | | | | 137% | | | | 120% | | | | 200% |
A Total returns would have been lower had certain expenses not been reduced during the periods shown.
B Calculated based on average shares outstanding during the period.
C Investment income per share reflects a special dividend which amounted to $.04 per share. Excluding the special dividend, the ratio of net
investment income (loss) to average net assets would have been (.20)%.
D Investment income per share reflects a special dividend which amounted to $.01 per share and an in kind dividend received in a corporate
reorganization which amounted to $.01 per share. Excluding these dividends, the ratio of net investment income to average net assets would
have been .08%.
E Expense ratios reflect operating expenses of the fund. Expenses before reductions do not reflect amounts reimbursed by the investment adviser or
reductions from brokerage service arrangements or other expense offset arrangements and do not represent the amount paid by the fund during
periods when reimbursements or reductions occur. Expenses net of fee waivers reflect expenses after reimbursement by the investment adviser but
prior to reductions from brokerage service arrangements or other expense offset arrangements. Expenses net of all reductions represent the net
expenses paid by the fund.
F Effective May 1, 2001, the fund adopted the provisions of the AICPA Audit and Accounting Guide for Investment Companies and began amortizing
premium and discount on all debt securities. Per share data and ratios for periods prior to adoption have not been restated to reflect this change.
G Amount represents less than $.01 per share.
|
See accompanying notes which are an integral part of the financial statements.
Notes to Financial Statements
For the period ended April 30, 2006
(Amounts in thousands except ratios)
|
1. Significant Accounting Policies.
Fidelity Mid Cap Stock Fund (the fund) is a fund of Fidelity Commonwealth Trust (the trust) and is authorized to issue an unlimited number of shares. Effective the close of business on April 28, 2006, the fund was closed to most new accounts. The trust is registered under the Investment Company Act of 1940, as amended (the 1940 Act), as an open end management investment company organized as a Massachusetts business trust. The fund may invest in affiliated money market central funds (Money Market Central Funds), which are open end investment companies available to investment companies and other accounts managed by Fidelity Management & Research Company (FMR) and its affiliates. The financial statements have been prepared in conformity with accounting principles generally accepted in the United States of America, which require management to make certain estimates and assumptions at the date of the financial statements. The following summarizes the significant accounting policies of the fund:
Security Valuation. Investments are valued and net asset value (NAV) per share is calculated (NAV calculation) as of the close of business of the New York Stock Exchange (NYSE), normally 4:00 p.m. Eastern time. Wherever possible, the fund uses independent pricing services approved by the Board of Trustees to value its investments.
Equity securities, including restricted securities, for which market quotations are readily available, are valued at the last reported sale price or official closing price as reported by an independent pricing service on the primary market or exchange on which they are traded. In the event there were no sales during the day or closing prices are not available, securities are valued at the last quoted bid price. Investments in open end mutual funds are valued at their closing net asset value each business day. Short term securities with remaining maturities of sixty days or less for which quotations are not readily available are valued at amortized cost, which approximates value.
When current market prices or quotations are not readily available or do not accurately reflect fair value, valuations may be determined in accordance with procedures adopted by the Board of Trustees. For example, when developments occur between the close of a market and the close of the NYSE that may materially affect the value of some or all of the securities, or when trading in a security is halted, those securities may be fair valued. Factors used in the determination of fair value may include monitoring news to identify significant market or security specific events such as changes in the value of U.S. securi ties markets, reviewing developments in foreign markets and evaluating the perfor mance of ADRs, futures contracts and exchange traded funds. Because the fund’s utilization of fair value pricing depends on market activity, the frequency with which fair value pricing is used can not be predicted and may be utilized to a significant extent. The value of securities used for NAV calculation under fair value pricing may differ from published prices for the same securities.
23 Annual Report
| Notes to Financial Statements continued |
| (Amounts in thousands except ratios) |
| |
| |
| 1. Significant Accounting Policies continued |
Foreign Currency. The fund uses foreign currency contracts to facilitate transactions in foreign denominated securities. Losses from these transactions may arise from changes in the value of the foreign currency or if the counterparties do not perform under the contracts’ terms.
Foreign denominated assets, including investment securities, and liabilities are trans lated into U.S. dollars at the exchange rate at period end. Purchases and sales of invest ment securities, income and dividends received and expenses denominated in foreign currencies are translated into U.S. dollars at the exchange rate in effect on the transac tion date.
The effects of exchange rate fluctuations on investments are included with the net realized and unrealized gain (loss) on investment securities. Other foreign currency transactions resulting in realized and unrealized gain (loss) are disclosed separately.
Investment Transactions and Income. Security transactions are accounted for as of trade date. Gains and losses on securities sold are determined on the basis of identified cost and may include proceeds received from litigation. Dividend income is recorded on the ex dividend date, except for certain dividends from foreign securities where the ex dividend date may have passed, which are recorded as soon as the fund is informed of the ex dividend date. Non cash dividends included in dividend income, if any, are recorded at the fair market value of the securities received. Distributions received on securities that represent a return of capital or capital gain are recorded as a reduction of cost of investments and/or as a realized gain. The fund estimates the components of distributions received that may be considered return of capital distributions or capital gain distributions. Large, non recurring dividends recognized by the fund are presented separately on the Statement of Operations as “Special Dividends” and the impact of these dividends is presented in the Financial Highlights. Interest income is accrued as earned. Interest income includes coupon interest and amortization of premium and accretion of discount on debt securities. Investment income is recorded net of foreign taxes withheld where recovery of such taxes is uncertain.
Expenses. Most expenses of the trust can be directly attributed to a fund. Expenses which cannot be directly attributed are apportioned among each fund in the trust.
Deferred Trustee Compensation. Under a Deferred Compensation Plan (the Plan), independent Trustees must defer receipt of a portion of, and may elect to defer receipt of an additional portion of, their annual compensation. Deferred amounts are treated as
| 1. Significant Accounting Policies continued |
Deferred Trustee Compensation continued |
though equivalent dollar amounts had been invested in shares of the fund or are invested in a cross section of other Fidelity funds, and are marked to market. Deferred amounts remain in the fund until distributed in accordance with the Plan.
Income Tax Information and Distributions to Shareholders. Each year, the fund intends to qualify as a regulated investment company by distributing all of its taxable income and realized gains under Subchapter M of the Internal Revenue Code. As a result, no provision for income taxes is required in the accompanying financial statements. Foreign taxes are provided for based on the fund’s understanding of the tax rules and rates that exist in the foreign markets in which it invests.
Distributions are recorded on the ex dividend date. Income and capital gain distribu tions are determined in accordance with income tax regulations, which may differ from generally accepted accounting principles. In addition, the fund will claim a portion of the payment made to redeeming shareholders as a distribution for income tax purposes.
Capital accounts within the financial statements are adjusted for permanent book tax differences. These adjustments have no impact on net assets or the results of operations. Temporary book tax differences will reverse in a subsequent period.
Book tax differences are primarily due foreign currency transactions, deferred trustees compensation, capital loss carryforwards and losses deferred due to wash sales.
The tax basis components of distributable earnings and the federal tax cost as of period end were as follows:
| Unrealized appreciation | | | | $ 3,173,018 | | | | |
| Unrealized depreciation | | | | (255,657) | | | | |
| Net unrealized appreciation (depreciation) . | | | | 2,917,361 | | | | |
| Undistributed ordinary income | | | | 86,685 | | | | |
| Undistributed long term capital gain | | | | 174,040 | | | | |
| |
| Cost for federal income tax purposes | | | | $ 9,879,943 | | | | |
| |
| The tax character of distributions paid was as follows: | | | | |
| |
| | | | | April 30, | | | | April 30, |
| | | | | 2006 | | | | 2005 |
| Ordinary Income | | | | $ 69,318 | | | | $ 27,220 |
| Long term Capital Gains | | | | 164,038 | | | | — |
| Total | | | | $ 233,356 | | | | $ 27,220 |
25 Annual Report
| Notes to Financial Statements continued |
| (Amounts in thousands except ratios) |
| |
| |
| 1. Significant Accounting Policies continued |
Short Term Trading (Redemption) Fees. Shares held in the fund less than 30 days are subject to a redemption fee equal to .75% of the proceeds of the redeemed shares. All redemption fees, including any estimated redemption fees paid by FMR, are retained by the fund and accounted for as an addition to paid in capital.
Repurchase Agreements. FMR has received an Exemptive Order from the Securities and Exchange Commission (the SEC) which permits the fund and other affiliated entities of FMR to transfer uninvested cash balances into joint trading accounts which are then invested in repurchase agreements. The fund may also invest directly with institutions in repurchase agreements. Repurchase agreements are collateralized by government or non government securities. Upon settlement date, collateral is held in segregated accounts with custodian banks and may be obtained in the event of a default of the counterparty. The fund monitors, on a daily basis, the value of the collateral to ensure it is at least equal to the principal amount of the repurchase agreement (includ ing accrued interest). In the event of a default by the counterparty, realization of the collateral proceeds could be delayed, during which time the value of the collateral may decline.
3. Purchases and Sales of Investments.
Purchases and sales of securities, other than short term securities, aggregated $8,357,545 and $7,251,857, respectively.
4. Fees and Other Transactions with Affiliates.
Management Fee. FMR and its affiliates provide the fund with investment manage ment related services for which the fund pays a monthly management fee. The manage ment fee is the sum of an individual fund fee rate that is based on an annual rate of .30% of the fund’s average net assets and a group fee rate that averaged .27% during the period. The group fee rate is based upon the average net assets of all the mutual funds advised by FMR. The group fee rate decreases as assets under management increase and increases as assets under management decrease. In addition, the management fee is subject to a performance adjustment (up to a maximum of ±.20% of the fund’s average net assets over a 36 month performance period). The upward or downward adjustment to the management fee is based on the fund’s relative investment performance as compared to an appropriate benchmark index. For the period, the total annual management fee rate, including the performance adjustment, was .45% of the fund’s average net assets.
4. Fees and Other Transactions with Affiliates continued
Transfer Agent Fees. Fidelity Service Company, Inc. (FSC), an affiliate of FMR, is the fund’s transfer, dividend disbursing and shareholder servicing agent. FSC receives account fees and asset based fees that vary according to account size and type of ac count. FSC pays for typesetting, printing and mailing of shareholder reports, except proxy statements. For the period, the transfer agent fees were equivalent to an annual rate of .25% of average net assets.
Accounting and Security Lending Fees. FSC maintains the fund’s accounting rec ords. The accounting fee is based on the level of average net assets for the month. Under a separate contract, FSC administers the security lending program. The security lending fee is based on the number and duration of lending transactions.
Affiliated Central Funds. The fund may invest in Money Market Central Funds which seek preservation of capital and current income and are managed by Fidelity Invest ments Money Management, Inc. (FIMM), an affiliate of FMR.
The Money Market Central Funds do not pay a management fee.
Brokerage Commissions. The fund placed a portion of its portfolio transactions with brokerage firms which are affiliates of the investment adviser. The commissions paid to these affiliated firms were $321 for the period.
Interfund Lending Program. Pursuant to an Exemptive Order issued by the SEC, the fund, along with other registered investment companies having management contracts with FMR, may participate in an interfund lending program. This program provides an alternative credit facility allowing the funds to borrow from, or lend money to, other participating affiliated funds. At period end, there were no interfund loans outstanding. The fund’s activity in this program during the period for which loans were outstanding was as follows:
| | | | | Average Daily | | Weighted Average | | | | Interest | | |
| Borrower or Lender | | | | Loan Balance | | Interest Rate | | | | Expense | | |
| Borrower | | | | $15,341 | | 4.64% | | | | $ 6 | | |
| |
| 5. Committed Line of Credit. | | | | | | | | |
The fund participates with other funds managed by FMR in a $4.2 billion credit facility (the “line of credit”) to be utilized for temporary or emergency purposes to fund share holder redemptions or for other short term liquidity purposes. The fund has agreed to pay commitment fees on its pro rata portion of the line of credit, which amounts to $29 and is reflected in Miscellaneous Expense on the Statement of Operations. During the period, there were no borrowings on this line of credit.
27 Annual Report
| Notes to Financial Statements continued |
| (Amounts in thousands except ratios) | | |
| |
| |
| 6. Security Lending. | | |
The fund lends portfolio securities from time to time in order to earn additional income. On the settlement date of the loan, the fund receives collateral (in the form of U.S. Treasury obligations, letters of credit and/or cash) against the loaned securities and maintains collateral in an amount not less than 100% of the market value of the loaned securities during the period of the loan. The market value of the loaned securities is determined at the close of business of the fund and any additional required collateral is delivered to the fund on the next business day. If the borrower defaults on its obligation to return the securities loaned because of insolvency or other reasons, a fund could experience delays and costs in recovering the securities loaned or in gaining access to the collateral. Any cash collateral received is invested in the Fidelity Securities Lending Cash Central Fund. The value of loaned securities and cash collateral at period end are disclosed on the fund’s Statement of Assets and Liabilities. Security lending income represents the income earned on investing cash collateral, less fees and expenses associated with the loan, plus any premium payments that may be received on the loan of certain types of securities. Security lending income is presented in the Statement of Operations as a component of income from affiliated central funds. Net income from lending portfolio securities during the period amounted to $1,593.
Many of the brokers with whom FMR places trades on behalf of the fund provided services to the fund in addition to trade execution. These services included payments of certain expenses on behalf of the fund totaling $2,235 for the period. In addition, through arrangements with the fund’s custodian and transfer agent, credits realized as a result of uninvested cash balances were used to reduce the fund’s expenses. During the period, these credits reduced the fund’s custody and transfer agent expenses by $9 and $479, respectively.
The fund’s organizational documents provide former and current trustees and officers with a limited indemnification against liabilities arising in connection with the performance of their duties to the fund. In the normal course of business, the fund may also enter into contracts that provide general indemnifications. The fund’s maximum exposure under these arrangements is unknown as this would be dependent on future claims that may be made against the fund. The risk of material loss from such claims is considered remote.
Report of Independent Registered Public Accounting Firm
To the Trustees of Fidelity Commonwealth Trust and Shareholders of Fidelity Mid Cap Stock Fund:
We have audited the accompanying statement of assets and liabilities of Fidelity Mid Cap Stock Fund (the Fund), a fund of Fidelity Commonwealth Trust, including the schedule of investments as of April 30, 2006, and the related statement of operations for the year then ended, the statement of changes in net assets for each of the two years in the period then ended, and the financial highlights for each of the five years in the period then ended. These financial statements and financial highlights are the responsibility of the Fund’s management. Our responsibility is to express an opinion on these financial statements and financial highlights based on our audits.
We conducted our audits in accordance with standards of the Public Company Accounting Oversight Board (United States). Those standards require that we plan and perform the audit to obtain reasonable assurance about whether the financial statements and financial highlights are free of material misstatement. The Fund is not required to have, nor were we engaged to perform, an audit of its internal control over financial reporting. Our audits included consideration of internal control over financial reporting as a basis for designing audit procedures that are appropriate in the circumstances, but not for the purpose of expressing an opinion on the effectiveness of the Fund’s internal control over financial reporting. Accordingly, we express no such opinion. An audit also includes examining, on a test basis, evidence supporting the amounts and disclosures in the financial statements, assessing the accounting principles used and significant estimates made by management, as well as evaluating the overall financial statement presentation. Our procedures in cluded confirmation of securities owned as of April 30, 2006, by correspondence with the custodians and brokers; where replies were not received from brokers, we performed other auditing procedures. We believe that our audits provide a reasonable basis for our opinion.
In our opinion, the financial statements and financial highlights referred to above present fairly, in all material respects, the financial position of Fidelity Mid Cap Stock Fund as of April 30, 2006, the results of its operations for the year then ended, the changes in its net assets for each of the two years in the period then ended, and its financial highlights for each of the five years in the period then ended, in conformity with accounting principles generally accepted in the United States of America.
/s/ Deloitte & Touche LLP
DELOITTE & TOUCHE LLP
Boston, Massachusetts
June 7, 2006
|
29 Annual Report
Trustees and Officers
The Trustees, Members of the Advisory Board, and executive officers of the trust and fund, as applicable, are listed below. The Board of Trustees governs the fund and is responsible for protecting the interests of shareholders. The Trustees are experienced executives who meet periodically throughout the year to oversee the fund’s activities, review contractual arrangements with companies that provide services to the fund, and review the fund’s performance. Except for William O. McCoy and Albert R. Gamper, Jr., each of the Trustees oversees 335 funds advised by FMR or an affiliate. Mr. McCoy oversees 337 funds advised by FMR or an affiliate. Mr. Gamper oversees 280 funds advised by FMR or an affiliate.
The Trustees hold office without limit in time except that (a) any Trustee may resign; (b) any Trustee may be removed by written instrument, signed by at least two thirds of the number of Trustees prior to such removal; (c) any Trustee who requests to be retired or who has become incapacitated by illness or injury may be retired by written instru ment signed by a majority of the other Trustees; and (d) any Trustee may be removed at any special meeting of shareholders by a two thirds vote of the outstanding voting securities of the trust. Each Trustee who is not an interested person (as defined in the 1940 Act) (Independent Trustee), shall retire not later than the last day of the calendar year in which his or her 72nd birthday occurs. The Independent Trustees may waive this mandatory retirement age policy with respect to individual Trustees. The executive officers and Advisory Board Members hold office without limit in time, except that any officer and Advisory Board Member may resign or may be removed by a vote of a majority of the Trustees at any regular meeting or any special meeting of the Trustees. Except as indicated, each individual has held the office shown or other offices in the same company for the past five years.
The fund’s Statement of Additional Information (SAI) includes more information about the Trustees. To request a free copy, call Fidelity at 1-800-544-8544.
Correspondence intended for each Trustee who is an interested person may be sent to Fidelity Investments, 82 Devonshire Street, Boston, Massachusetts 02109.
| | Name, Age; Principal Occupation
Edward C. Johnson 3d (75)
|
Year of Election or Appointment: 1974
Mr. Johnson is Chairman of the Board of Trustees. Mr. Johnson serves as President (2006 present), Chief Executive Officer, Chairman, and a Director of FMR Corp.; Chairman and a Director of FMR; Chairman and a Director of Fidelity Research & Analysis Company (FRAC); Chairman and a Director of Fidelity Investments Money Management, Inc.; and Chairman (2001 present) and a Director (1999 present) of FMR Co., Inc. In addition, Mr. Johnson serves as Chairman and Director of Fidelity International Limited (FIL).
| | Name, Age; Principal Occupation
Stephen P. Jonas (53)
|
Year of Election or Appointment: 2005
Mr. Jonas is Senior Vice President of Mid Cap Stock (2005 present). He also serves as Senior Vice President of other Fidelity funds (2005 present). Mr. Jonas is Executive Director of FMR (2005 present) and FMR Co., Inc. (2005 present). He also serves as a Director of Fidelity Investments Money Management, Inc. (2005 present) and FMR Corp. (2003 present). Previously, Mr. Jonas served as President of Fidelity Enterprise Operations and Risk Services (2004 2005), Chief Administrative Officer (2002 2004), and Chief Financial Officer of FMR Corp. (1998 2002). In addition, he serves on the Boards of Boston Ballet (2003 present) and Simmons College (2003 present).
Year of Election or Appointment: 2003
Mr. Reynolds is President and a Director of FMR (2005 present), Fidelity Investments Money Management, Inc. (2005 present), and FMR Co., Inc. (2005 present). Mr. Reynolds also serves as a Director (2003 present) and Chief Operating Officer (2000 present) of FMR Corp. and a Director of Strategic Advisers, Inc. (2005 present). He also serves on the Board at Fidelity Investments Canada, Ltd. (2000 present). Previously, Mr. Reynolds served as President of Fidelity Investments Institutional Retirement Group (1996 2000).
* Trustees have been determined to be “Interested Trustees” by virtue of, among other things, their affiliation with the trust or various entities under common control with FMR.
31 Annual Report
Trustees and Officers - continued
Independent Trustees:
Correspondence intended for each Independent Trustee (that is, the Trustees other than the Interested Trustees) may be sent to Fidelity Investments, P.O. Box 55235, Boston, Massachusetts 02205-5235.
| | Name, Age; Principal Occupation
Dennis J. Dirks (57)
|
Year of Election or Appointment: 2005
Prior to his retirement in May 2003, Mr. Dirks was Chief Operating Officer and a member of the Board of The Depository Trust & Clearing Corporation (DTCC) (1999 2003). He also served as President, Chief Operating Officer, and Board member of The Depository Trust Company (DTC) (1999 2003) and President and Board member of the National Securities Clearing Corporation (NSCC) (1999 2003). In addi tion, Mr. Dirks served as Chief Executive Officer and Board member of the Government Securities Clearing Corporation (2001 2003) and Chief Executive Officer and Board member of the Mortgage Backed Securities Clearing Corporation (2001 2003). Mr. Dirks also serves as a Trustee and a member of the Finance Committee of Manhattan College (2005 present) and a Trustee and a member of the Finance Committee of AHRC of Nassau County (2006 present).
| | Albert R. Gamper, Jr. (64)
|
Year of Election or Appointment: 2006
Mr. Gamper also serves as a Trustee (2006 present) or Member of the Advisory Board (2005 present) of other investment companies advised by FMR. Prior to his retirement in December 2004, Mr. Gamper served as Chairman of the Board of CIT Group Inc. (commercial finance). Dur ing his tenure with CIT Group Inc. Mr. Gamper served in numerous se nior management positions, including Chairman (1987 1989; 1999 2001; 2002 2004), Chief Executive Officer (1987 2004), and President (1989 2002). He currently serves as a member of the Board of Directors of Public Service Enterprise Group (utilities, 2001 present), Chairman of the Board of Governors, Rutgers University (2004 present), and Chairman of the Board of Saint Barnabas Health Care System.
Name, Age; Principal Occupation
Robert M. Gates (62)
|
Year of Election or Appointment: 1997
Dr. Gates is Chairman of the Independent Trustees (2006 present). Dr. Gates is President of Texas A&M University (2002 present). He was Director of the Central Intelligence Agency (CIA) from 1991 to 1993. From 1989 to 1991, Dr. Gates served as Assistant to the President of the United States and Deputy National Security Advisor. Dr. Gates is a Director of NACCO Industries, Inc. (mining and manufacturing), Parker Drilling Co., Inc. (drilling and rental tools for the energy industry, 2001 present), and Brinker International (restaurant management, 2003 present). Previously, Dr. Gates served as a Director of LucasVarity PLC (automotive components and diesel engines), a Director of TRW Inc. (automotive, space, defense, and information technology), and Dean of the George Bush School of Government and Public Service at Texas A&M University (1999 2001).
Year of Election or Appointment: 2004
Dr. Heilmeier is Chairman Emeritus of Telcordia Technologies (commu nication software and systems), where prior to his retirement, he served as company Chairman and Chief Executive Officer. He currently serves on the Boards of Directors of The Mitre Corporation (systems engineer ing and information technology support for the government), and HRL Laboratories (private research and development, 2004 present). He is Chairman of the General Motors Science & Technology Advisory Board and a Life Fellow of the Institute of Electrical and Electronics Engineers (IEEE). Dr. Heilmeier is a member of the Defense Science Board and the National Security Agency Advisory Board. He is also a member of the National Academy of Engineering, the American Academy of Arts and Sciences, and the Board of Overseers of the School of Engineering and Applied Science of the University of Pennsylvania. Previously, Dr. Heilmeier served as a Director of TRW Inc. (automotive, space, defense, and information technology, 1992 2002), Compaq (1994 2002), Auto matic Data Processing, Inc. (ADP) (technology based business outsourc ing, 1995 2002), INET Technologies Inc. (telecommunications network surveillance, 2001 2004), and Teletech Holdings (customer manage ment services). He is the recipient of the 2005 Kyoto Prize in Advanced Technology for his invention of the liquid crystal display.
33 Annual Report
Trustees and Officers - continued
| | Name, Age; Principal Occupation
Marie L. Knowles (59)
|
Year of Election or Appointment: 2001
Prior to Ms. Knowles’ retirement in June 2000, she served as Executive Vice President and Chief Financial Officer of Atlantic Richfield Company (ARCO) (diversified energy, 1996 2000). From 1993 to 1996, she was a Senior Vice President of ARCO and President of ARCO Transportation Company. She served as a Director of ARCO from 1996 to 1998. She currently serves as a Director of Phelps Dodge Corporation (copper mining and manufacturing) and McKesson Corporation (healthcare ser vice, 2002 present). Ms. Knowles is a Trustee of the Brookings Institution and the Catalina Island Conservancy and also serves as a member of the Advisory Board for the School of Engineering of the University of Southern California.
Year of Election or Appointment: 2000
Mr. Lautenbach has been a partner of Clayton, Dubilier & Rice, Inc. (private equity investment firm) since September 1998. Previously, Mr. Lautenbach was with the International Business Machines Corporation (IBM) from 1968 until his retirement in 1998. Mr. Lautenbach serves as a Director of Italtel Holding S.p.A. (telecommunications (Milan, Italy), 2004 present) and Eaton Corporation (diversified industrial) as well as the Philharmonic Center for the Arts in Naples, Florida. He also is a member of the Board of Trustees of Fairfield University (2005 present), as well as a member of the Council on Foreign Relations.
Year of Election or Appointment: 1997
Prior to his retirement in December 1994, Mr. McCoy was Vice Chair man of the Board of BellSouth Corporation (telecommunications) and President of BellSouth Enterprises. He is currently a Director of Duke Realty Corporation (real estate). He is also a partner of Franklin Street Partners (private investment management firm). In addition, Mr. McCoy served as the Interim Chancellor (1999 2000) and a member of the Board of Visitors for the University of North Carolina at Chapel Hill and currently serves as Chairman of the Board of Directors of the University of North Carolina Health Care System. He also served as Vice President of Finance for the University of North Carolina (16 school system).
Name, Age; Principal Occupation
Cornelia M. Small (61)
|
Year of Election or Appointment: 2005
Ms. Small is a member (2000 present) and Chairperson (2002 present) of the Investment Committee, and a member (2002 present) of the Board of Trustees of Smith College. Previously, she served as Chief Investment Officer (1999 2000), Director of Global Equity Investments (1996 1999), and a member of the Board of Directors of Scudder, Ste vens & Clark (1990 1997) and Scudder Kemper Investments (1997 1999). In addition, Ms. Small served as Co Chair (2000 2003) of the Annual Fund for the Fletcher School of Law and Diplomacy.
William S. Stavropoulos (66)
|
Year of Election or Appointment: 2002
Mr. Stavropoulos is Chairman Emeritus of The Dow Chemical Company. Since joining The Dow Chemical Company in 1967, Mr. Stavropoulos served in numerous senior management positions, including President (1993 2000; 2002 2003), CEO (1995 2000; 2002 2004), and Chairman of the Executive Committee (2000 2004). Currently, he is a Director of NCR Corporation (data warehousing and technology solutions), BellSouth Corporation (telecommunications), Chemical Financial Corporation, Maersk Inc. (industrial conglomerate, 2002 present), and Metalmark Capital (private equity investment firm, 2005 present). He also serves as a member of the Board of Trustees of the American Enterprise Institute for Public Policy Research. In addition, Mr. Stavropoulos is a member of The Business Council, J.P. Morgan International Council and the University of Notre Dame Advisory Council for the College of Science.
Year of Election or Appointment: 2005
Prior to his retirement in 2001, Mr. Wolfe was Chairman and Chief Executive Officer of Hershey Foods Corporation (1993 2001). He currently serves as a member of the boards of Adelphia Communications Corporation (2003 present), Bausch & Lomb, Inc., and Revlon Inc. (2004 present).
35 Annual Report
Trustees and Officers - continued
Advisory Board Members and Executive Officers:
Correspondence intended for Mr. Keyes may be sent to Fidelity Investments, P.O. Box 55235, Boston, Massachusetts 02205-5235. Correspondence intended for each executive officer and Mr. Lynch may be sent to Fidelity Investments, 82 Devonshire Street, Boston, Massachusetts 02109.
| | Name, Age; Principal Occupation
James H. Keyes (65)
|
Year of Election or Appointment: 2006
Member of the Advisory Board of Fidelity Commonwealth Trust. Prior to his retirement in 2003, Mr. Keyes was Chairman, President, and Chief Executive Officer of Johnson Controls, Inc. (automotive supplier, 1993 2003). He currently serves as a member of the boards of LSI Logic Corporation (semiconductor technologies, 1984 present), Navistar International Corporation (manufacture and sale of trucks, buses, and diesel engines, 2002 present), and Pitney Bowes, Inc. (integrated mail, messaging, and document management solutions, 1998 present).
Year of Election or Appointment: 2003
Member of the Advisory Board of Fidelity Commonwealth Trust. Mr. Lynch is Vice Chairman and a Director of FMR, and Vice Chairman (2001 present) and a Director (1999 present) of FMR Co., Inc. Previously, Mr. Lynch served as a Trustee of the Fidelity funds (1990 2003). In addition, he serves as the Chairman of the Inner City Scholarship Fund.
Year of Election or Appointment: 2005
Vice President of Mid Cap Stock. Mr. Churchill also serves as Vice President of certain Equity Funds (2005 present) and certain High Income Funds (2005 present). He is Executive Vice President of FMR (2005 present) and FMR Co., Inc. (2005 present), and Senior Vice President of Fidelity Investments Money Management, Inc. (2005 present). Previously, Mr. Churchill served as Head of Fidelity’s Fixed Income Divi sion (2000 2005), Vice President of Fidelity’s Money Market Funds (2000 2005), Vice President of Fidelity’s Bond Funds, and Senior Vice President of FMR.
Year of Election or Appointment: 2005
Vice President of Mid Cap Stock. Prior to assuming his current responsibilities, Mr. Perkins served as a research analyst and portfolio manager. Mr. Perkins also serves as Vice President of FMR Co., Inc. (2004).
Name, Age; Principal Occupation
Eric D. Roiter (57)
|
Year of Election or Appointment: 1998
Secretary of Mid Cap Stock. He also serves as Secretary of other Fidelity funds; Vice President, General Counsel, and Secretary of FMR Co., Inc. (2001 present) and FMR; Assistant Secretary of Fidelity Man agement & Research (U.K.) Inc. (2001 present), Fidelity Research & Analysis Company (2001 present), and Fidelity Investments Money Management, Inc. (2001 present). Mr. Roiter is an Adjunct Member, Faculty of Law, at Boston College Law School (2003 present). Previously, Mr. Roiter served as Vice President and Secretary of Fidelity Distributors Corporation (FDC) (1998 2005).
Year of Election or Appointment: 2003
Assistant Secretary of Mid Cap Stock. Mr. Fross also serves as Assistant Secretary of other Fidelity funds (2003 present), Vice President and Secretary of FDC (2005 present), and is an employee of FMR.
Year of Election or Appointment: 2004
President and Treasurer of Mid Cap Stock. Ms. Reynolds also serves as President and Treasurer of other Fidelity funds (2004 present) and is a Vice President (2003 present) and an employee (2002 present) of FMR. Before joining Fidelity Investments, Ms. Reynolds worked at PricewaterhouseCoopers LLP (PwC) (1980 2002), where she was most recently an audit partner with PwC’s investment management practice.
Year of Election or Appointment: 2006
Anti Money Laundering (AML) officer of Mid Cap Stock. Mr. Ganis also serves as AML officer of other Fidelity funds (2006 present) and FMR Corp. (2003 present). Before joining Fidelity Investments, Mr. Ganis practiced law at Goodwin Procter, LLP (2000 2002).
Year of Election or Appointment: 2005
Chief Financial Officer of Mid Cap Stock. Mr. Murphy also serves as Chief Financial Officer of other Fidelity funds (2005 present). He also serves as Senior Vice President of Fidelity Pricing and Cash Management Services Group (FPCMS).
37 Annual Report
Trustees and Officers - continued
| | Name, Age; Principal Occupation
Kenneth A. Rathgeber (58)
|
Year of Election or Appointment: 2004
Chief Compliance Officer of Mid Cap Stock. Mr. Rathgeber also serves as Chief Compliance Officer of other Fidelity funds (2004 present) and Executive Vice President of Risk Oversight for Fidelity Investments (2002 present). He is Chief Compliance Officer of FMR (2005 present), FMR Co., Inc. (2005 present), Fidelity Management & Research (U.K.) Inc. (2005 present), Fidelity Research & Analysis Company (2005 present), Fidelity Investments Money Management, Inc. (2005 present), and Strategic Advisers, Inc. (2005 present). Previously, Mr. Rathgeber served as Executive Vice President and Chief Operating Officer for Fidelity Investments Institutional Services Company, Inc. (1998 2002).
Year of Election or Appointment: 2005
Deputy Treasurer of Mid Cap Stock. Mr. Mehrmann also serves as Dep uty Treasurer of other Fidelity funds (2005 present) and is an employee of FMR. Previously, Mr. Mehrmann served as Vice President of Fidelity Investments Institutional Services Group (FIIS)/Fidelity Investments Institu tional Operations Corporation, Inc. (FIIOC) Client Services (1998 2004).
| | Kimberley H. Monasterio (42)
|
Year of Election or Appointment: 2004
Deputy Treasurer of Mid Cap Stock. Ms. Monasterio also serves as Deputy Treasurer of other Fidelity funds (2004) and is an employee of FMR (2004). Before joining Fidelity Investments, Ms. Monasterio served as Treasurer (2000 2004) and Chief Financial Officer (2002 2004) of the Franklin Templeton Funds and Senior Vice President of Franklin Templeton Services, LLC (2000 2004).
Year of Election or Appointment: 2005
Deputy Treasurer of Mid Cap Stock. Mr. Robins also serves as Deputy Treasurer of other Fidelity funds (2005 present) and is an employee of FMR (2004 present). Before joining Fidelity Investments, Mr. Robins worked at KPMG LLP, where he was a partner in KPMG’s department of professional practice (2002 2004) and a Senior Manager (1999 2000). In addition, Mr. Robins served as Assistant Chief Accountant, United States Securities and Exchange Commission (2000 2002).
Name, Age; Principal Occupation
Robert G. Byrnes (39)
|
Year of Election or Appointment: 2005
Assistant Treasurer of Mid Cap Stock. Mr. Byrnes also serves as Assistant Treasurer of other Fidelity funds (2005 present) and is an employee of FMR (2005 present). Previously, Mr. Byrnes served as Vice President of FPCMS (2003 2005). Before joining Fidelity Investments, Mr. Byrnes worked at Deutsche Asset Management where he served as Vice President of the Investment Operations Group (2000 2003).
Year of Election or Appointment: 1994
Assistant Treasurer of Mid Cap Stock. Mr. Costello also serves as Assistant Treasurer of other Fidelity funds and is an employee of FMR.
Year of Election or Appointment: 2004
Assistant Treasurer of Mid Cap Stock. Mr. Lydecker also serves as Assistant Treasurer of other Fidelity funds (2004) and is an employee of FMR.
Year of Election or Appointment: 2002
Assistant Treasurer of Mid Cap Stock. Mr. Osterheld also serves as Assistant Treasurer of other Fidelity funds (2002) and is an employee of FMR.
Year of Election or Appointment: 2005
Assistant Treasurer of Mid Cap Stock. Mr. Ryan also serves as Assistant Treasurer of other Fidelity funds (2005 present) and is an employee of FMR (2005 present). Previously, Mr. Ryan served as Vice President of Fund Reporting in FPCMS (1999 2005).
Year of Election or Appointment: 2005
Assistant Treasurer of Mid Cap Stock. Mr. Schiavone also serves as Assistant Treasurer of other Fidelity funds (2005 present) and is an em ployee of FMR (2005 present). Before joining Fidelity Investments, Mr. Schiavone worked at Deutsche Asset Management, where he most re cently served as Assistant Treasurer (2003 2005) of the Scudder Funds and Vice President and Head of Fund Reporting (1996 2003).
39 Annual Report
The Board of Trustees of Fidelity Mid-Cap Stock Fund voted to pay on 6/05/2006 to shareholders of record at the opening of business on 6/02/2006 a distribution of $.63 per share derived from capital gains realized from sales of portfolio securities.
The fund hereby designates as a capital gain dividend with respect to the taxable year ended 4/30/2006, $338,078,000, or, if subsequently determined to be different, the net capital gain of such year.
The fund designates 86% and 37% of the dividends distributed in June and December, respectively during the fiscal year as qualifying for the dividends received deduction for corporate shareholders.
The fund designates 90% and 53% of the dividends distributed in June and December, respectively during the fiscal year as amounts which may be taken into account as a dividend for the purposes of the maximum rate under section 1(h)(11) of the Internal Revenue Code.
The fund will notify shareholders in January 2007 of amounts for use in preparing 2006 income tax returns.
Proxy Voting Results
A special meeting of the fund’s shareholders was held on November 16, 2005. The results of votes taken among shareholders on proposals before them are reported below. Each vote reported represents one dollar of net asset value held on the record date for the meeting.
| PROPOSAL 1 | | |
| To elect a Board of Trustees.A | | |
| | | # of | | % of |
| | | Votes | | Votes |
| |
| Dennis J. Dirks | | |
| Affirmative | | 18,240,248,322.53 | | 96.150 |
| Withheld | | 730,313,302.58 | | 3.850 |
| TOTAL | | 18,970,561,625.11 | | 100.000 |
| Albert R. Gamper, Jr.B | | |
| Affirmative | | 18,204,838,072.06 | | 95.964 |
| Withheld | | 765,723,553.05 | | 4.036 |
| TOTAL | | 18,970,561,625.11 | | 100.000 |
| Robert M. Gates | | |
| Affirmative | | 18,191,748,681.13 | | 95.895 |
| Withheld | | 778,812,943.98 | | 4.105 |
| TOTAL | | 18,970,561,625.11 | | 100.000 |
| George H. Heilmeier | | |
| Affirmative | | 18,193,638,757.60 | | 95.905 |
| Withheld | | 776,922,867.51 | | 4.095 |
| TOTAL | | 18,970,561,625.11 | | 100.000 |
| Abigail P. Johnson | | |
| Affirmative | | 18,103,320,241.78 | | 95.428 |
| Withheld | | 867,241,383.33 | | 4.572 |
| TOTAL | | 18,970,561,625.11 | | 100.000 |
| Edward C. Johnson 3d | | |
| Affirmative | | 18,055,585,171.13 | | 95.177 |
| Withheld | | 914,976,453.98 | | 4.823 |
| TOTAL | | 18,970,561,625.11 | | 100.000 |
| Stephen P. Jonas | | |
| Affirmative | | 18,188,419,716.35 | | 95.877 |
| Withheld | | 782,141,908.76 | | 4.123 |
| TOTAL | | 18,970,561,625.11 | | 100.000 |
| Marie L. Knowles | | |
| Affirmative | | 18,208,650,664.29 | | 95.984 |
| Withheld | | 761,910,960.82 | | 4.016 |
| TOTAL | | 18,970,561,625.11 | | 100.000 |
| | | # of | | % of |
| | | Votes | | Votes |
| |
| Ned C. Lautenbach | | |
| Affirmative | | 18,224,936,039.64 | | 96.070 |
| Withheld | | 745,625,585.47 | | 3.930 |
| TOTAL | | 18,970,561,625.11 | | 100.000 |
| |
| Marvin L. Mann | | |
| Affirmative | | 18,146,216,753.93 | | 95.655 |
| Withheld | | 824,344,871.18 | | 4.345 |
| TOTAL | | 18,970,561,625.11 | | 100.000 |
| |
| William O. McCoy | | |
| Affirmative | | 18,164,580,135.79 | | 95.751 |
| Withheld | | 805,981,489.32 | | 4.249 |
| TOTAL | | 18,970,561,625.11 | | 100.000 |
| |
| Robert L. Reynolds | | |
| Affirmative | | 18,197,448,372.22 | | 95.925 |
| Withheld | | 773,113,252.89 | | 4.075 |
| TOTAL | | 18,970,561,625.11 | | 100.000 |
| |
| Cornelia M. Small | | |
| Affirmative | | 18,214,122,413.76 | | 96.013 |
| Withheld | | 756,439,211.35 | | 3.987 |
| TOTAL | | 18,970,561,625.11 | | 100.000 |
| |
| William S. Stavropoulos | | |
| Affirmative | | 18,186,563,509.46 | | 95.867 |
| Withheld | | 783,998,115.65 | | 4.133 |
| TOTAL | | 18,970,561,625.11 | | 100.000 |
| |
| Kenneth L. Wolfe | | |
| Affirmative | | 18,211,332,412.92 | | 95.998 |
| Withheld | | 759,229,212.19 | | 4.002 |
| TOTAL | | 18,970,561,625.11 | | 100.000 |
A Denotes trust-wide proposals and voting results.
B Effective on or about January 1, 2006.
|
41 Annual Report
Board Approval of Investment Advisory Contracts and Management Fees
Fidelity Mid Cap Stock Fund
On January 19, 2006, the Board of Trustees, including the Independent Trustees (together, the Board), voted to approve a general research services agreement (the Agreement) between FMR, FMR Co., Inc. (FMRC), Fidelity Investments Money Manage ment, Inc. (FIMM), and Fidelity Research & Analysis Company (FRAC) (together, the Investment Advisers) for the fund, effective January 20, 2006, pursuant to which FRAC may provide general research and investment advisory support services to FMRC and FIMM. The Board considered that it has approved previously various sub advisory agreements for the fund with affiliates of FMR that allow FMR to obtain research, non discretionary advice, or discretionary portfolio management at no additional expense to the fund. The Board, assisted by the advice of fund counsel and independent Trustees’ counsel, considered a broad range of information and determined that it would be beneficial for the fund to access the research and investment advisory support services supplied by FRAC at no additional expense to the fund.
The Board reached this determination in part because the new arrangement will involve no changes in (i) the contractual terms of and fees payable under the fund’s manage ment contract or sub advisory agreements; (ii) the investment process or strategies employed in the management of the fund’s assets; (iii) the nature or level of services provided under the fund’s management contract or sub advisory agreements; (iv) the day to day management of the fund or the persons primarily responsible for such man agement; or (v) the ultimate control or beneficial ownership of FMR, FMRC, or FIMM. The Board also considered that the establishment of the Agreement would not necessi tate prior shareholder approval of the Agreement or result in an assignment and termination of the fund’s management contract or sub advisory agreements under the Investment Company Act of 1940.
Because the Board was approving an arrangement with FRAC under which the fund will not bear any additional management fees or expenses and under which the fund’s portfolio manager would not change, it did not consider the fund’s investment perfor mance, competitiveness of management fee and total expenses, costs of services and profitability, or economies of scale to be significant factors in its decision.
In connection with its future renewal of the fund’s management contract and sub advisory agreements, the Board will consider: (i) the nature, extent, and quality of services provided to the fund, including shareholder and administrative services and investment performance; (ii) the competitiveness of the fund’s management fee and total expenses; (iii) the costs of the services and profitability, including the revenues earned and the expenses incurred by Fidelity in conducting the business of developing, marketing, distributing, managing, administering, and servicing the fund and its shareholders; and (iv) whether there have been economies of scale in respect of the management of the Fidelity funds, whether the Fidelity funds (including the fund) have
appropriately benefited from any such economies of scale, and whether there is potential for realization of any further economies.
Based on its evaluation of all of the conclusions noted above, and after considering all material factors, the Board ultimately concluded that the fund’s Agreement is fair and reasonable, and that the fund’s Agreement should be approved.
43 Annual Report
Managing Your Investments
Fidelity offers several ways to conveniently manage your personal investments via your telephone or PC. You can access your account information, conduct trades and research your investments 24 hours a day.
By Phone
Fidelity Automated Service Telephone provides a single toll free number to access account balances, positions, quotes and trading. It’s easy to navigate the service, and on your first call, the system will help you create a personal identification number (PIN) for security.


By PC
Fidelity’s web site on the Internet provides a wide range of information, including daily financial news, fund performance, interactive planning tools and news about Fidelity products and services.

* When you call the quotes line, please remember that a fund’s yield and return will vary and, except for money market funds, share price will also vary. This means that you may have a gain or loss when you sell your shares. There is no assurance that money market funds will be able to maintain a stable $1 share price; an investment in a money market fund is not insured or guar anteed by the U.S. government. Total returns are historical and include changes in share price, reinvestment of dividends and capital gains, and the effects of any sales charges.
Annual Report 44
To Write Fidelity
We’ll give your correspondence immediate attention and send you written confirmation upon completion of your request.

(such as changing name, address, bank, etc.)
Fidelity Investments
P.O. Box 770001
Cincinnati, OH 45277-0002
|

Buying shares
Fidelity Investments
P.O. Box 770001
Cincinnati, OH 45277-0003
Overnight Express
Fidelity Investments
Attn: Distribution Services
100 Crosby Parkway KC1H
Covington, KY 41015
Selling shares
Fidelity Investments
P.O. Box 770001
Cincinnati, OH 45277-0035
Overnight Express
Fidelity Investments
Attn: Distribution Services
100 Crosby Parkway KC1H
Covington, KY 41015
General Correspondence
Fidelity Investments
P.O. Box 500
Merrimack, NH 03054-0500
|

Buying shares
Fidelity Investments
P.O. Box 770001
Cincinnati, OH 45277-0003
Selling shares
Fidelity Investments
P.O. Box 770001
Cincinnati, OH 45277-0035
Overnight Express
Fidelity Investments
Attn: Distribution Services
100 Crosby Parkway KC1H
Covington, KY 41015
General Correspondence
Fidelity Investments
P.O. Box 500
Merrimack, NH 03054-0500
|
45 Annual Report
To Visit Fidelity
For directions and hours,
please call 1-800-544-9797.
Arizona
7001 West Ray Road
Chandler, AZ
7373 N. Scottsdale Road
Scottsdale, AZ
California
815 East Birch Street
Brea, CA
1411 Chapin Avenue
Burlingame, CA
851 East Hamilton Avenue
Campbell, CA
19200 Von Karman Avenue
Irvine, CA
601 Larkspur Landing Circle
Larkspur, CA
10100 Santa Monica Blvd.
Los Angeles, CA
27101 Puerta Real
Mission Viejo, CA
73 575 El Paseo
Palm Desert, CA
251 University Avenue
Palo Alto, CA
123 South Lake Avenue
Pasadena, CA
16995 Bernardo Ctr. Drive
Rancho Bernardo, CA
1740 Arden Way
Sacramento, CA
7676 Hazard Center Drive
San Diego, CA
8 Montgomery Street
San Francisco, CA
3793 State Street
Santa Barbara, CA
21701 Hawthorne Boulevard
Torrance, CA
2001 North Main Street
Walnut Creek, CA
6300 Canoga Avenue
Woodland Hills, CA
|
Colorado
1625 Broadway
Denver, CO
9185 East Westview Road
Littleton, CO
Connecticut
48 West Putnam Avenue
Greenwich, CT
265 Church Street
New Haven, CT
300 Atlantic Street
Stamford, CT
29 South Main Street
West Hartford, CT
Delaware
222 Delaware Avenue
Wilmington, DE
Florida
4400 N. Federal Highway
Boca Raton, FL
121 Alhambra Plaza
Coral Gables, FL
2948 N. Federal Highway
Ft. Lauderdale, FL
1907 West State Road 434
Longwood, FL
8880 Tamiami Trail, North
Naples, FL
3550 Tamiami Trail, South
Sarasota, FL
1502 N. Westshore Blvd.
Tampa, FL
2465 State Road 7
Wellington, FL
3501 PGA Boulevard
West Palm Beach, FL
Georgia
3445 Peachtree Road, N.E.
Atlanta, GA
1000 Abernathy Road
Atlanta, GA
Illinois
One North LaSalle Street
Chicago, IL
875 North Michigan Ave.
Chicago, IL
|
1415 West 22nd Street
Oak Brook, IL
1572 East Golf Road
Schaumburg, IL
3232 Lake Avenue
Wilmette, IL
Indiana
4729 East 82nd Street
Indianapolis, IN
Kansas
5400 College Boulevard
Overland Park, KS
Maine
Three Canal Plaza
Portland, ME
Maryland
7315 Wisconsin Avenue
Bethesda, MD
One W. Pennsylvania Ave.
Towson, MD
Massachusetts
801 Boylston Street
Boston, MA
155 Congress Street
Boston, MA
300 Granite Street
Braintree, MA
44 Mall Road
Burlington, MA
405 Cochituate Road
Framingham, MA
416 Belmont Street
Worcester, MA
Michigan
500 E. Eisenhower Pkwy.
Ann Arbor, MI
280 Old N. Woodward Ave.
Birmingham, MI
43420 Grand River Avenue
Novi, MI
29155 Northwestern Hwy.
Southfield, MI
Minnesota
7600 France Avenue South
Edina, MN
|
Annual Report 46
Missouri
8885 Ladue Road
Ladue, MO
Nevada
2225 Village Walk Drive
Henderson, NV
New Jersey
150 Essex Street
Millburn, NJ
56 South Street
Morristown, NJ
396 Route 17, North
Paramus, NJ
3518 Route 1 North
Princeton, NJ
530 Highway 35
Shrewsbury, NJ
New York
1055 Franklin Avenue
Garden City, NY
37 West Jericho Turnpike
Huntington Station, NY
1271 Avenue of the Americas
New York, NY
61 Broadway
New York, NY
350 Park Avenue
New York, NY
200 Fifth Avenue
New York, NY
733 Third Avenue
New York, NY
11 Penn Plaza
New York, NY
2070 Broadway
New York, NY
1075 Northern Blvd.
Roslyn, NY
North Carolina
4611 Sharon Road
Charlotte, NC
Ohio
3805 Edwards Road
Cincinnati, OH
1324 Polaris Parkway
Columbus, OH
28699 Chagrin Boulevard
Woodmere Village, OH
|
Oregon
16850 SW 72nd Avenue
Tigard, OR
Pennsylvania
600 West DeKalb Pike
King of Prussia, PA
1735 Market Street
Philadelphia, PA
12001 Perry Highway
Wexford, PA
Rhode Island
47 Providence Place
Providence, RI
Tennessee
6150 Poplar Avenue
Memphis, TN
Texas
10000 Research Boulevard
Austin, TX
4001 Northwest Parkway
Dallas, TX
12532 Memorial Drive
Houston, TX
2701 Drexel Drive
Houston, TX
6500 N. MacArthur Blvd.
Irving, TX
6005 West Park Boulevard
Plano, TX
14100 San Pedro
San Antonio, TX
1576 East Southlake Blvd.
Southlake, TX
19740 IH 45 North
Spring, TX
Utah
215 South State Street
Salt Lake City, UT
Virginia
1861 International Drive
McLean, VA
Washington
411 108th Avenue, N.E.
Bellevue, WA
1518 6th Avenue
Seattle, WA
|
Washington, DC
1900 K Street, N.W.
Washington, DC
Wisconsin
595 North Barker Road
Brookfield, WI
|
Fidelity Brokerage Services, Inc., 100 Summer St., Boston, MA 02110 Member NYSE/SIPC
47 Annual Report
47
| | Investment Adviser
Fidelity Management & Research Company
Boston, MA
Investment Sub Advisers
FMR Co., Inc.
Fidelity Research & Analysis Company
(formerly Fidelity Management &
Research (Far East) Inc.)
Fidelity Management & Research
(U.K.) Inc.
Fidelity Investments Japan Limited
Fidelity International Investment
Advisors
Fidelity International Investment
Advisors (U.K.) Limited
General Distributor
Fidelity Distributors Corporation
Boston, MA
Transfer and Service Agent
Fidelity Service Company, Inc.
Boston, MA
Custodian
The Northern Trust Company
Chicago, IL
|
| The Fidelity Telephone Connection |
| Mutual Fund 24-Hour Service |
| Exchanges/Redemptions | | |
| and Account Assistance | | 1-800-544-6666 |
| Product Information | | 1-800-544-6666 |
| Retirement Accounts | | 1-800-544-4774 |
| (8 a.m. - 9 p.m.) | | |
| TDD Service | | 1-800-544-0118 |
| for the deaf and hearing impaired | | |
| (9 a.m. - 9 p.m. Eastern time) | | |
| Fidelity Automated Service | | |
| Telephone (FAST®) (automated phone logo) | | 1-800-544-5555 |
| (automated phone logo) Automated line for quickest service |
MCS-UANN-0606
1.784726.103
|

| | Fidelity®
Small Cap Retirement
Fund
|
| | Annual Report
April 30, 2006
|


| Contents | | | | |
| |
| Chairman’s Message | | 4 | | Ned Johnson’s message to shareholders. |
| Performance | | 5 | | How the fund has done over time. |
| Management’s Discussion | | 6 | | The manager’s review of fund |
| | | | | performance, strategy and outlook |
| Shareholder Expense | | 7 | | An example of shareholder expenses. |
| Example | | | | |
| Investment Changes | | 8 | | A summary of major shifts in the fund’s |
| | | | | investments over the past six months. |
| Investments | | 9 | | A complete list of the fund’s investments |
| | | | | with their market values. |
| Financial Statements | | 14 | | Statements of assets and liabilities, |
| | | | | operations, and changes in net assets, |
| | | | | as well as financial highlights. |
| Notes | | 18 | | Notes to the financial statements. |
| Report of Independent | | 24 | | |
| Registered Public | | | | |
| Accounting Firm | | | | |
| Trustees and Officers | | 25 | | |
| Distributions | | 35 | | |
| Proxy Voting Results | | 36 | | |
| Board Approval of | | 37 | | |
| Investment Advisory | | | | |
| Contracts and | | | | |
| Management Fees | | | | |
To view a fund’s proxy voting guidelines and proxy voting record for the 12 month period ended
June 30, visit www.fidelity.com/proxyvotingresults or visit the Securities and Exchange Commis
sion’s (SEC) web site at www.sec.gov. You may also call 1-800-544-8544 to request a free copy of
the proxy voting guidelines.
Standard & Poor’s, S&P and S&P 500 are registered service marks of The McGraw Hill Companies,
Inc. and have been licensed for use by Fidelity Distributors Corporation.
Other third party marks appearing herein are the property of their respective owners.
All other marks appearing herein are registered or unregistered trademarks or service marks
of FMR Corp. or an affiliated company.
|
This report and the financial statements contained herein are submitted for the general informa
tion of the shareholders of the fund. This report is not authorized for distribution to prospective
investors in the fund unless preceded or accompanied by an effective prospectus.
A fund files its complete schedule of portfolio holdings with the SEC for the first and third quar
ters of each fiscal year on Form N Q. Forms N Q are available on the SEC’s web site at
http://www.sec.gov. A fund’s Forms N Q may be reviewed and copied at the SEC’s Public Reference
Room in Washington, DC. Information regarding the operation of the SEC’s Public Reference
Room may be obtained by calling 1-800-SEC-0330. For a complete list of a fund’s portfolio hold
ings, view the most recent quarterly holdings report, semiannual report, or annual report on
Fidelity’s web site at http://www.fidelity.com/holdings.
NOT FDIC INSURED · MAY LOSE VALUE · NO BANK GUARANTEE
Neither the fund nor Fidelity Distributors Corporation is a bank.
|
3 Annual Report
Chairman’s Message
(photograph of Edward C. Johnson 3d)
Dear Shareholder:
Although many securities markets made gains in early 2006, there is only one certainty when it comes to investing: There is no sure thing. There are, however, a number of time tested, funda mental investment principles that can put the historical odds in your favor.
One of the basic tenets is to invest for the long term. Over time, riding out the markets’ inevitable ups and downs has proven much more effective than selling into panic or chasing the hottest trend. Even missing only a few of the markets’ best days can significantly diminish investor returns. Patience also affords the benefits of compounding of earning interest on additional income or reinvested dividends and capital gains. There are tax advantages and cost benefits to consider as well. The more you sell, the more taxes you pay, and the more you trade, the higher the costs. While staying the course doesn’t eliminate risk, it can considerably lessen the effect of short term declines.
You can further manage your investing risk through diversification. And today, more than ever, geographic diversification should be taken into account. Studies indicate that asset allocation is the single most important determinant of a portfolio’s long term success. The right mix of stocks, bonds and cash aligned to your particular risk tolerance and investment objective is very important. Age appropriate rebalancing is also an essential aspect of asset allocation. For younger investors, an emphasis on equities which historically have been the best performing asset class over time is encouraged. As investors near their specific goal, such as retirement or sending a child to college, consideration may be given to replacing volatile assets (e.g. common stocks) with more stable fixed investments (bonds or savings plans).
A third investment principle investing regularly can help lower the average cost of your purchases. Investing a certain amount of money each month or quarter helps ensure you won’t pay for all your shares at market highs. This strategy known as dollar cost averaging also reduces unconstructive “emotion” from investing, helping shareholders avoid selling weak performers just prior to an upswing, or chasing a hot performer just before a correction.
We invite you to contact us via the Internet, through our Investor Centers or over the phone. It is our privilege to provide you the information you need to make the investments that are right for you.
Sincerely,
/s/ Edward C. Johnson 3d
Edward C. Johnson 3d
Annual Report 4
Performance: The Bottom Line
Average annual total return reflects the change in the value of an investment, assuming reinvestment of the fund’s dividend income and capital gains (the profits earned upon the sale of securities that have grown in value) and assuming a constant rate of performance each year. The $10,000 table and the fund’s returns do not reflect the deduction of taxes that a shareholder would pay on fund distributions or the redemption of fund shares. During periods of reimburse ment by Fidelity, a fund’s total return will be greater than it would be had the reimbursement not occurred. How a fund did yesterday is no guarantee of how it will do
| Average Annual Total Returns | | | | | | |
| Periods ended April 30, 2006 | | Past 1 | | Past 5 | | Life of |
| | | year | | years | | fundA |
| Fidelity® Small Cap Retirement Fund | | 30.51% | | 11.48% | | 12.83% |
| A From September 26, 2000. | | | | | | |
| |
| $10,000 Over Life of Fund | | | | | | |
Let’s say hypothetically that $10,000 was invested in Fidelity® Small Cap Retirement Fund on September 26, 2000, when the fund started. The chart shows how the value of your investment would have changed, and also shows how the Russell 2000® Index performed over the same period.
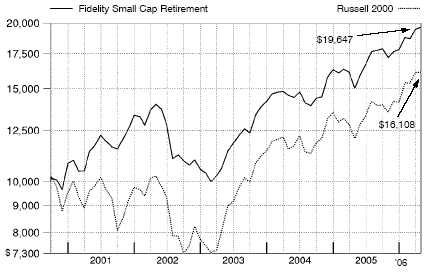
5 Annual Report
Management’s Discussion of Fund Performance
Comments from Charles Myers, who became Portfolio Manager of Fidelity® Small Cap Retirement Fund on March 1, 2006
Key U.S. equity benchmarks reached multiyear highs during the year ending April 30, 2006. The stock market’s performance reflected economic conditions and corporate earnings that continued to beat expectations. It also showed that investors generally tuned out the buzz surrounding record high energy costs, inflation and rising short term interest rates. By and large, the market’s trajectory was consistent throughout the period. In fact, as measured by the Standard & Poor’s 500SM Index, stocks rose in 10 of the past 12 months and ended the period on a six month winning streak. The gains also became more broad based, shifting from the primarily energy and utility driven returns of the period’s early stages to include more widespread contributions from other sectors such as financials and telecommunica tion services. On the capitalization spectrum, small caps continued to dominate, as the small cap Russell 2000® Index reached new heights and returned 33.47% for the year overall. In comparison, the large cap oriented S&P 500® gained 15.42%, the Dow Jones Industrial AverageSM rose 14.17% and the NASDAQ Composite® Index climbed 21.89% .
The fund gained 30.51% during the past year, trailing the Russell 2000 Index and the 31.20% return of the LipperSM Small Cap Funds Average. The Russell index was driven primarily by highly volatile small cap companies with minimal or negative earnings. These did much better than the types of higher quality, high return on capital types of names that I along with the fund’s other managers during the period favored. This trend was most obvious among our technology holdings. Stock selection in the group had a signifi cantly negative impact on relative performance during the past year. On the positive side, our overweighting in energy stocks provided a big boost, as oil prices continued to lift corporate earnings in that part of the market. Out of benchmark positions in Montpelier Re Holdings and Aspen Insurance Holdings both detracted. These reinsurance companies which insure insurance firms against big losses were hit hard by Hurricanes Katrina and Rita last fall. At period end, Montpelier Re was no longer in the portfolio. Another underperformer was digital media company Avid Technology. The fund’s top contributor and largest holding at period end was dinnerware maker Lifetime Brands, which benefited from investor optimism about two significant acquisitions completed during the period. Also detracting was oil field services stock Carpenter Technology.
The views expressed above reflect those of the portfolio manager(s) only through the end of the period as stated on the cover of this report and do not necessarily represent the views of Fidelity or any other person in the Fidelity organization. Any such views are subject to change at any time based upon market or other conditions and Fidelity disclaims any responsibility to update such views. These views may not be relied on as investment advice and, because investment decisions for a Fidelity fund are based on numerous factors, may not be relied on as an indication of trading intent on behalf of any Fidelity fund.
Shareholder Expense Example
As a shareholder of the Fund, you incur two types of costs: (1) transaction costs, including redemption fees, and (2) ongoing costs, including management fees and other Fund ex penses. This Example is intended to help you understand your ongoing costs (in dollars) of investing in the Fund and to compare these costs with the ongoing costs of investing in other mutual funds.
The Example is based on an investment of $1,000 invested at the beginning of the period and held for the entire period (November 1, 2005 to April 30, 2006).
Actual Expenses
The first line of the table below provides information about actual account values and actual expenses. You may use the information in this line, together with the amount you invested, to estimate the expenses that you paid over the period. Simply divide your account value by $1,000.00 (for example, an $8,600 account value divided by $1,000.00 = 8.6), then multiply the result by the number in the first line under the heading entitled “Expenses Paid During Period” to estimate the expenses you paid on your account during this period. A small balance maintenance fee of $12.00 that is charged once a year may apply for certain accounts with a value of less than $2,000. This fee is not included in the table below. If it was, the estimate of expenses you paid during the period would be higher, and your ending account value lower, by this amount.
Hypothetical Example for Comparison Purposes
The second line of the table below provides information about hypothetical account values and hypothetical expenses based on the Fund’s actual expense ratio and an assumed rate of return of 5% per year before expenses, which is not the Fund’s actual return. The hypotheti cal account values and expenses may not be used to estimate the actual ending account balance or expenses you paid for the period. You may use this information to compare the ongoing costs of investing in the Fund and other funds. To do so, compare this 5% hypotheti cal example with the 5% hypothetical examples that appear in the shareholder reports of the other funds. A small balance maintenance fee of $12.00 that is charged once a year may apply for certain accounts with a value of less than $2,000. This fee is not included in the table below. If it was, the estimate of expenses you paid during the period would be higher, and your ending account value lower, by this amount.
Please note that the expenses shown in the table are meant to highlight your ongoing costs only and do not reflect any transaction costs. Therefore, the second line of the table is useful in comparing ongoing costs only, and will not help you determine the relative total costs of owning different funds. In addition, if these transactional costs were included, your costs would have been higher.
| | | | | | | | | | | Expenses Paid |
| | | Beginning | | | | Ending | | During Period* |
| | | Account Value | | | | Account Value | | November 1, 2005 |
| | | November 1, 2005 | | | | April 30, 2006 | | to April 30, 2006 |
| Actual | | | | $ 1,000.00 | | | | $ 1,143.50 | | | | $ 5.58 |
| Hypothetical (5% return per year | | | | | | | | | | | | |
| before expenses) | | | | $ 1,000.00 | | | | $ 1,019.59 | | | | $ 5.26 |
* Expenses are equal to the Fund’s annualized expense ratio of 1.05%; multiplied by the average account value over the period, multiplied by 181/365 (to reflect the one half year period).
7 Annual Report
| Investment Changes | | | | |
| |
| |
| Top Ten Stocks as of April 30, 2006 | | | | |
| | | % of fund’s | | % of fund’s net assets |
| | | net assets | | 6 months ago |
| Lifetime Brands, Inc. | | 5.9 | | 0.0 |
| Omnicare, Inc. | | 5.5 | | 1.9 |
| Amedisys, Inc. | | 2.7 | | 0.0 |
| Pacific Sunwear of California, Inc. | | 2.7 | | 0.5 |
| j2 Global Communications, Inc. | | 2.6 | | 0.0 |
| Farmer Mac Class C (non vtg.) | | 2.6 | | 0.5 |
| Compass Minerals International, Inc. | | 2.6 | | 0.0 |
| Basic Energy Services, Inc. | | 2.5 | | 0.0 |
| Carpenter Technology Corp. | | 2.5 | | 0.0 |
| Mariner Energy, Inc. | | 2.5 | | 0.0 |
| | | 32.1 | | |
Top Five Market Sectors as of April 30, 2006 | | |
| | | % of fund’s | | % of fund’s net assets |
| | | net assets | | 6 months ago |
| Consumer Discretionary | | 20.7 | | 16.5 |
| Financials | | 16.3 | | 19.6 |
| Industrials | | 15.8 | | 11.7 |
| Health Care | | 15.4 | | 19.5 |
| Information Technology | | 13.7 | | 11.8 |
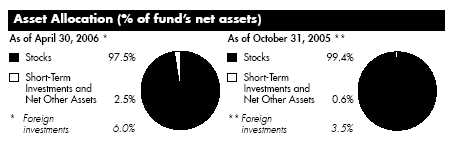
Annual Report 8
| Investments April | | 30, | | 2006 | | | | |
| Showing Percentage of Net Assets | | | | | | | | |
| |
| Common Stocks 97.5% | | | | | | | | |
| | | | | | | Shares | | Value (Note 1) |
| |
| CONSUMER DISCRETIONARY – 20.7% | | | | | | | | |
| Diversified Consumer Services – 1.4% | | | | | | | | |
| Jackson Hewitt Tax Service, Inc. | | | | | | 113,600 | | $ 3,394,368 |
| Hotels, Restaurants & Leisure 0.9% | | | | | | | | |
| Domino’s Pizza, Inc. | | | | | | 86,400 | | 2,274,912 |
| Household Durables – 5.9% | | | | | | | | |
| Lifetime Brands, Inc. | | | | | | 492,800 | | 14,596,735 |
| Media – 3.3% | | | | | | | | |
| Harte-Hanks, Inc. | | | | | | 96,700 | | 2,639,910 |
| Valassis Communications, Inc. (a) | | | | | | 186,400 | | 5,455,928 |
| | | | | | | | | 8,095,838 |
| Specialty Retail – 7.3% | | | | | | | | |
| New York & Co., Inc. (a) | | | | | | 381,600 | | 5,941,512 |
| Pacific Sunwear of California, Inc. (a) | | | | | | 279,700 | | 6,517,010 |
| The Children’s Place Retail Stores, Inc. (a) | | | | | | 89,100 | | 5,504,598 |
| | | | | | | | | 17,963,120 |
| Textiles, Apparel & Luxury Goods – 1.9% | | | | | | | | |
| Timberland Co. Class A (a) | | | | | | 140,100 | | 4,770,405 |
| |
| TOTAL CONSUMER DISCRETIONARY | | | | | | | | 51,095,378 |
| |
| ENERGY 8.6% | | | | | | | | |
| Energy Equipment & Services – 4.9% | | | | | | | | |
| Basic Energy Services, Inc. | | | | | | 184,700 | | 6,156,051 |
| Superior Energy Services, Inc. (a) | | | | | | 181,900 | | 5,848,085 |
| | | | | | | | | 12,004,136 |
| Oil, Gas & Consumable Fuels – 3.7% | | | | | | | | |
| Mariner Energy, Inc. (a) | | | | | | 314,530 | | 6,117,609 |
| Range Resources Corp. | | | | | | 118,277 | | 3,137,889 |
| | | | | | | | | 9,255,498 |
| |
| TOTAL ENERGY | | | | | | | | 21,259,634 |
| |
| FINANCIALS – 16.3% | | | | | | | | |
| Consumer Finance – 2.3% | | | | | | | | |
| Cash America International, Inc. | | | | | | 82,400 | | 2,709,312 |
| Dollar Financial Corp. (a) | | | | | | 153,400 | | 2,979,028 |
| | | | | | | | | 5,688,340 |
| Diversified Financial Services – 0.6% | | | | | | | | |
| Marlin Business Services Corp. (a) | | | | | | 66,819 | | 1,456,654 |
See accompanying notes which are an integral part of the financial statements.
| Investments continued | | | | |
| |
| |
| Common Stocks continued | | | | |
| | | Shares | | Value (Note 1) |
| |
| FINANCIALS – continued | | | | |
| Insurance – 8.9% | | | | |
| Aspen Insurance Holdings Ltd. | | 135,100 | | $ 3,289,685 |
| Hilb Rogal & Hobbs Co. | | 117,500 | | 4,803,400 |
| Markel Corp. (a) | | 14,000 | | 4,889,500 |
| Max Re Capital Ltd. | | 184,207 | | 4,513,072 |
| Philadelphia Consolidated Holdings Corp. (a) | | 71,259 | | 2,360,811 |
| RLI Corp. | | 42,700 | | 2,117,920 |
| | | | | 21,974,388 |
| Thrifts & Mortgage Finance – 4.5% | | | | |
| Farmer Mac Class C (non-vtg.) | | 224,200 | | 6,450,234 |
| Washington Federal, Inc. | | 195,200 | | 4,669,184 |
| | | | | 11,119,418 |
| |
| TOTAL FINANCIALS | | | | 40,238,800 |
| |
| HEALTH CARE – 15.4% | | | | |
| Health Care Equipment & Supplies – 2.5% | | | | |
| DexCom, Inc. | | 143,552 | | 3,611,768 |
| ICU Medical, Inc. (a) | | 62,100 | | 2,557,899 |
| | | | | 6,169,667 |
| Health Care Providers & Services – 12.9% | | | | |
| Amedisys, Inc. (a)(d) | | 202,200 | | 6,704,952 |
| Chemed Corp. | | 83,200 | | 4,533,568 |
| Emergency Medical Services Corp. Class A | | 87,600 | | 1,081,860 |
| Odyssey Healthcare, Inc. (a) | | 58,912 | | 1,024,480 |
| Omnicare, Inc. | | 237,504 | | 13,468,852 |
| VistaCare, Inc. Class A (a) | | 333,000 | | 5,068,260 |
| | | | | 31,881,972 |
| |
| TOTAL HEALTH CARE | | | | 38,051,639 |
| |
| INDUSTRIALS – 15.8% | | | | |
| Aerospace & Defense – 0.4% | | | | |
| BE Aerospace, Inc. (a) | | 36,100 | | 939,683 |
| Building Products 0.8% | | | | |
| Quixote Corp. | | 97,904 | | 2,018,780 |
| Commercial Services & Supplies – 5.3% | | | | |
| Copart, Inc. (a) | | 194,000 | | 5,208,900 |
See accompanying notes which are an integral part of the financial statements.
| Common Stocks continued | | | | |
| | | Shares | | Value (Note 1) |
| |
| INDUSTRIALS – continued | | | | |
| Commercial Services & Supplies – continued | | | | |
| Healthcare Services Group, Inc. | | 248,300 | | $ 5,301,205 |
| Navigant Consulting, Inc. (a) | | 120,700 | | 2,544,356 |
| | | | | 13,054,461 |
| Construction & Engineering – 1.4% | | | | |
| URS Corp. (a) | | 79,300 | | 3,415,451 |
| Electrical Equipment – 3.8% | | | | |
| EnerSys (a) | | 250,900 | | 3,517,618 |
| Genlyte Group, Inc. (a) | | 86,400 | | 5,953,824 |
| | | | | 9,471,442 |
| Industrial Conglomerates – 1.1% | | | | |
| Raven Industries, Inc. | | 66,700 | | 2,703,351 |
| Road & Rail 1.9% | | | | |
| Heartland Express, Inc. | | 197,800 | | 4,808,518 |
| Trading Companies & Distributors – 1.1% | | | | |
| UAP Holding Corp. | | 127,122 | | 2,626,341 |
| |
| TOTAL INDUSTRIALS | | | | 39,038,027 |
| |
| INFORMATION TECHNOLOGY – 13.7% | | | | |
| Electronic Equipment & Instruments – 0.7% | | | | |
| FARO Technologies, Inc. (a) | | 117,600 | | 1,786,344 |
| Internet Software & Services – 2.6% | | | | |
| j2 Global Communications, Inc. (a) | | 131,800 | | 6,470,062 |
| IT Services – 3.1% | | | | |
| CACI International, Inc. Class A (a) | | 72,000 | | 4,502,880 |
| Lionbridge Technologies, Inc. (a) | | 384,956 | | 3,164,338 |
| | | | | 7,667,218 |
| Office Electronics – 2.4% | | | | |
| Zebra Technologies Corp. Class A (a) | | 150,900 | | 5,989,221 |
| Semiconductors & Semiconductor Equipment – 0.7% | | | | |
| SiRF Technology Holdings, Inc. (a) | | 50,000 | | 1,707,500 |
| Software 4.2% | | | | |
| Blackbaud, Inc. | | 116,909 | | 2,456,258 |
| Cognos, Inc. (a) | | 128,400 | | 4,784,612 |
| Hyperion Solutions Corp. (a) | | 100,900 | | 3,089,558 |
| | | | | 10,330,428 |
| |
| TOTAL INFORMATION TECHNOLOGY | | | | 33,950,773 |
See accompanying notes which are an integral part of the financial statements.
11 Annual Report
| Investments continued | | | | | | |
| |
| |
| Common Stocks continued | | | | | | |
| | | | | Shares | | Value (Note 1) |
| |
| MATERIALS 7.0% | | | | | | |
| Metals & Mining – 7.0% | | | | | | |
| Apex Silver Mines Ltd. (a) | | | | 117,600 | | $ 2,504,880 |
| Carpenter Technology Corp. | | | | 51,700 | | 6,149,715 |
| Compass Minerals International, Inc. | | | | 241,800 | | 6,366,594 |
| Oregon Steel Mills, Inc. (a) | | | | 47,600 | | 2,357,628 |
| | | | | | | 17,378,817 |
| |
| TOTAL COMMON STOCKS | | | | | | |
| (Cost $218,123,355) | | | | | | 241,013,068 |
| |
| Money Market Funds 4.2% | | | | | | |
| |
| Fidelity Cash Central Fund, 4.8% (b) | | | | 5,314,744 | | 5,314,744 |
| Fidelity Securities Lending Cash Central Fund, | | | | | | |
| 4.83% (b)(c) | | | | 5,007,450 | | 5,007,450 |
| TOTAL MONEY MARKET FUNDS | | | | | | |
| (Cost $10,322,194) | | | | | | 10,322,194 |
| |
| TOTAL INVESTMENT PORTFOLIO 101.7% | | | | | | |
| (Cost $228,445,549) | | | | | | 251,335,262 |
| |
| NET OTHER ASSETS – (1.7)% | | | | | | (4,294,888) |
| NET ASSETS 100% | | | | | | $ 247,040,374 |
Legend
(a) Non-income producing
(b) Affiliated fund that is available only to
investment companies and other
accounts managed by Fidelity
Investments. The rate quoted is the
annualized seven-day yield of the fund
at period end. A complete unaudited
listing of the fund’s holdings as of its
most recent quarter end is available
upon request.
(c) Investment made with cash collateral
received from securities on loan.
(d) Security or a portion of the security is on
loan at period end.
|
See accompanying notes which are an integral part of the financial statements.
Annual Report 12
Information regarding fiscal year to date income earned by the fund from the affiliated Central funds is as follows:
| Fund | | Income earned |
| Fidelity Cash Central Fund | | | | $ 261,240 |
| Fidelity Securities Lending Cash Central Fund | | | | 43,759 |
| Total | | | | $ 304,999 |
See accompanying notes which are an integral part of the financial statements.
13 Annual Report
| Financial Statements | | | | | | | | |
| |
| Statement of Assets and Liabilities | | | | | | | | |
| | | | | | | | | April 30, 2006 |
| |
| Assets | | | | | | | | |
| Investment in securities, at value (including securities | | | | | | | | |
| loaned of $4,993,896) See accompanying | | | | | | | | |
| schedule: | | | | | | | | |
| Unaffiliated issuers (cost $218,123,355) | | | | $ 241,013,068 | | | | |
| Affiliated Central Funds (cost $10,322,194) | | | | 10,322,194 | | | | |
| Total Investments (cost $228,445,549) | | | | | | | | $ 251,335,262 |
| Cash | | | | | | | | 96,442 |
| Receivable for investments sold | | | | | | | | 5,513,675 |
| Receivable for fund shares sold | | | | | | | | 1,058,031 |
| Dividends receivable | | | | | | | | 27,313 |
| Interest receivable | | | | | | | | 24,167 |
| Prepaid expenses | | | | | | | | 509 |
| Receivable from investment adviser for expense | | | | | | | | |
| reductions | | | | | | | | 3,258 |
| Other affiliated receivables | | | | | | | | 116 |
| Other receivables | | | | | | | | 41,744 |
| Total assets | | | | | | | | 258,100,517 |
| |
| Liabilities | | | | | | | | |
| Payable for investments purchased | | | | $ 5,589,626 | | | | |
| Payable for fund shares redeemed | | | | 210,527 | | | | |
| Accrued management fee | | | | 122,793 | | | | |
| Other affiliated payables | | | | 72,800 | | | | |
| Other payables and accrued expenses | | | | 56,947 | | | | |
| Collateral on securities loaned, at value | | | | 5,007,450 | | | | |
| Total liabilities | | | | | | | | 11,060,143 |
| |
| Net Assets | | | | | | | | $ 247,040,374 |
| Net Assets consist of: | | | | | | | | |
| Paid in capital | | | | | | | | $ 197,853,387 |
| Accumulated undistributed net realized gain (loss) on | | | | | | | | |
| investments and foreign currency transactions | | | | | | | | 26,297,274 |
| Net unrealized appreciation (depreciation) on | | | | | | | | |
| investments | | | | | | | | 22,889,713 |
| Net Assets, for 13,707,341 shares outstanding | | | | | | | | $ 247,040,374 |
| Net Asset Value, offering price and redemption price per | | | | | | | | |
| share ($247,040,374 ÷ 13,707,341 shares) | | | | | | | | $ 18.02 |
See accompanying notes which are an integral part of the financial statements.
| Statement of Operations | | | | | | |
| | | | | Year ended April 30, 2006 |
| |
| Investment Income | | | | | | |
| Dividends | | | | | | $ 1,046,840 |
| Interest | | | | | | 570 |
| Income from affiliated Central Funds | | | | | | 304,999 |
| Total income | | | | | | 1,352,409 |
| |
| Expenses | | | | | | |
| Management fee | | | | | | |
| Basic fee | | | | $ 1,391,272 | | |
| Performance adjustment | | | | (203,466) | | |
| Transfer agent fees | | | | 667,193 | | |
| Accounting and security lending fees | | | | 74,847 | | |
| Independent trustees’ compensation | | | | 778 | | |
| Custodian fees and expenses | | | | 23,491 | | |
| Registration fees | | | | 41,619 | | |
| Audit | | | | 47,078 | | |
| Legal | | | | 976 | | |
| Miscellaneous | | | | 10,993 | | |
| Total expenses before reductions | | | | 2,054,781 | | |
| Expense reductions | | | | (147,322) | | 1,907,459 |
| |
| Net investment income (loss) | | | | | | (555,050) |
| Realized and Unrealized Gain (Loss) | | | | | | |
| Net realized gain (loss) on: | | | | | | |
| Investment securities: | | | | | | |
| Unaffiliated issuers | | | | 31,979,468 | | |
| Foreign currency transactions | | | | (4,039) | | |
| Total net realized gain (loss) | | | | | | 31,975,429 |
| Change in net unrealized appreciation (depreciation) on | | | | | | |
| investment securities | | | | | | 17,265,780 |
| Net gain (loss) | | | | | | 49,241,209 |
| Net increase (decrease) in net assets resulting from | | | | | | |
| operations | | | | | | $ 48,686,159 |
See accompanying notes which are an integral part of the financial statements.
15 Annual Report
| Financial Statements continued | | | | | | | | |
| |
| |
| Statement of Changes in Net Assets | | | | | | | | |
| | | | | Year ended | | | | Year ended |
| | | | | April 30, | | | | April 30, |
| | | | | 2006 | | | | 2005 |
| Increase (Decrease) in Net Assets | | | | | | | | |
| Operations | | | | | | | | |
| Net investment income (loss) | | | | $ (555,050) | | | | $ 331,171 |
| Net realized gain (loss) | | | | 31,975,429 | | | | 7,484,571 |
| Change in net unrealized appreciation (depreciation) | | | | 17,265,780 | | | | (6,643,014) |
| Net increase (decrease) in net assets resulting | | | | | | | | |
| from operations | | | | 48,686,159 | | | | 1,172,728 |
| Distributions to shareholders from net investment income | | | | (388,846) | | | | — |
| Distributions to shareholders from net realized gain | | | | (9,665,347) | | | | — |
| Total distributions | | | | (10,054,193) | | | | — |
| Share transactions | | | | | | | | |
| Proceeds from sales of shares | | | | 106,525,067 | | | | 75,530,799 |
| Reinvestment of distributions | | | | 10,047,771 | | | | — |
| Cost of shares redeemed | | | | (49,085,946) | | | | (27,685,373) |
| Net increase (decrease) in net assets resulting from | | | | | | | | |
| share transactions | | | | 67,486,892 | | | | 47,845,426 |
| Redemption fees | | | | 78,596 | | | | 48,099 |
| Total increase (decrease) in net assets | | | | 106,197,454 | | | | 49,066,253 |
| |
| Net Assets | | | | | | | | |
| Beginning of period | | | | 140,842,920 | | | | 91,776,667 |
| End of period (including undistributed net investment | | | | | | | | |
| income of $0 and undistributed net investment in- | | | | | | | | |
| come of $331,171, respectively) | | | | $ 247,040,374 | | | | $ 140,842,920 |
| |
| Other Information | | | | | | | | |
| Shares | | | | | | | | |
| Sold | | | | 6,422,447 | | | | 5,009,066 |
| Issued in reinvestment of distributions | | | | 639,694 | | | | — |
| Redeemed | | | | (2,970,577) | | | | (1,867,560) |
| Net increase (decrease) | | | | 4,091,564 | | | | 3,141,506 |
See accompanying notes which are an integral part of the financial statements.
| Financial Highlights | | | | | | | | | | |
| |
| Years ended April 30, | | 2006 | | 2005 | | 2004 | | 2003 | | 2002 |
| Selected Per Share Data | | | | | | | | | | |
| Net asset value, beginning of | | | | | | | | | | |
| period | | $ 14.65 | | $ 14.18 | | $ 10.36 | | $ 13.95 | | $ 11.41 |
| Income from Investment Operations | | | | | | | | | | |
| Net investment income (loss)B | | (.05) | | .04C | | (.08) | | (.05) | | (.06) |
| Net realized and unrealized | | | | | | | | | | |
| gain (loss) | | 4.35 | | .42 | | 3.90 | | (3.26) | | 2.63 |
| Total from investment operations | | 4.30 | | .46 | | 3.82 | | (3.31) | | 2.57 |
| Distributions from net investment | | | | | | | | | | |
| income | | (.04) | | — | | — | | — | | — |
| Distributions from net realized | | | | | | | | | | |
| gain | | (.90) | | — | | — | | (.29) | | (.06) |
| Total distributions | | (.94) | | — | | — | | (.29) | | (.06) |
| Redemption fees added to paid in | | | | | | | | | | |
| capitalB | | .01 | | .01 | | —E | | .01 | | .03 |
| Net asset value, end of period | | $ 18.02 | | $ 14.65 | | $ 14.18 | | $ 10.36 | | $ 13.95 |
| Total ReturnA | | 30.51% | | 3.31% | | 36.87% | | (24.06)% | | 22.87% |
| Ratios to Average Net AssetsD | | | | | | | | | | |
| Expenses before reductions | | 1.06% | | 1.16% | | 1.45% | | 1.71% | | 1.91% |
| Expenses net of fee waivers, if | | | | | | | | | | |
| any | | 1.05% | | 1.05% | | 1.05% | | 1.05% | | 1.05% |
| Expenses net of all reductions | | .99% | | 1.00% | | .99% | | .86% | | .92% |
| Net investment income (loss) | | (.29)% | | .29%C | | (.63)% | | (.49)% | | (.48)% |
| Supplemental Data | | | | | | | | | | |
| Net assets, end of period (000 | | | | | | | | | | |
| omitted) | | $247,040 | | $140,843 | | $91,777 | | $51,469 | | $57,579 |
| Portfolio turnover rate | | 191% | | 94% | | 151% | | 242% | | 338% |
A Total returns would have been lower had certain expenses not been reduced during the periods shown.
B Calculated based on average shares outstanding during the period.
C Investment income per share reflects special dividends which amounted to $.11 per share. Excluding these special dividends, the ratio of net
investment income (loss) to average net assets would have been (.49)%.
D Expense ratios reflect operating expenses of the fund. Expenses before reductions do not reflect amounts reimbursed by the investment adviser or
reductions from brokerage service arrangements or other expense offset arrangements and do not represent the amount paid by the fund during
periods when reimbursements or reductions occur. Expenses net of fee waivers reflect expenses after reimbursement by the investment adviser but
prior to reductions from brokerage service arrangements or other expense offset arrangements. Expenses net of all reductions represent the net
expenses paid by the fund.
E Amount represents less than $.01 per share.
|
See accompanying notes which are an integral part of the financial statements.
17 Annual Report
Notes to Financial Statements
For the period ended April 30, 2006
|
1. Significant Accounting Policies.
Fidelity Small Cap Retirement Fund (the fund) is a fund of Fidelity Commonwealth Trust (the trust) and is authorized to issue an unlimited number of shares. The trust is registered under the Investment Company Act of 1940, as amended (the 1940 Act), as an open end management investment company organized as a Massachusetts business trust. The fund may invest in affiliated money market central funds (Money Market Central Funds), which are open end investment companies available to investment companies and other accounts managed by Fidelity Management & Research Company (FMR) and its affiliates. The financial statements have been prepared in conformity with accounting principles generally accepted in the United States of America, which require management to make certain estimates and assumptions at the date of the financial statements. The following summarizes the significant accounting policies of the fund:
Security Valuation. Investments are valued and net asset value (NAV) per share is calculated (NAV calculation) as of the close of business of the New York Stock Exchange (NYSE), normally 4:00 p.m. Eastern time. Wherever possible, the fund uses independent pricing services approved by the Board of Trustees to value its investments.
Equity securities, including restricted securities, for which market quotations are readily available, are valued at the last reported sale price or official closing price as reported by an independent pricing service on the primary market or exchange on which they are traded. In the event there were no sales during the day or closing prices are not available, securities are valued at the last quoted bid price. Investments in open end mutual funds, are valued at their closing net asset value each business day. Short term securities with remaining maturities of sixty days or less for which quotations are not readily available are valued at amortized cost, which approximates value.
When current market prices or quotations are not readily available or do not accurately reflect fair value, valuations may be determined in accordance with procedures adopted by the Board of Trustees. For example, when developments occur between the close of a market and the close of the NYSE that may materially affect the value of some or all of the securities, or when trading in a security is halted, those securities may be fair valued. Factors used in the determination of fair value may include monitoring news to identify significant market or security specific events such as changes in the value of U.S. securi ties markets, reviewing developments in foreign markets and evaluating the perfor mance of ADRs, futures contracts and exchange traded funds. Because the fund’s utilization of fair value pricing depends on market activity, the frequency with which fair value pricing is used can not be predicted and may be utilized to a significant extent. The value of securities used for NAV calculation under fair value pricing may differ from published prices for the same securities.
1. Summary of Significant Accounting Policies continued
Foreign Currency. The fund uses foreign currency contracts to facilitate transactions in foreign denominated securities. Losses from these transactions may arise from changes in the value of the foreign currency or if the counterparties do not perform under the contracts’ terms.
Foreign denominated assets, including investment securities, and liabilities are trans lated into U.S. dollars at the exchange rate at period end. Purchases and sales of invest ment securities, income and dividends received and expenses denominated in foreign currencies are translated into U.S. dollars at the exchange rate in effect on the transac tion date.
The effects of exchange rate fluctuations on investments are included with the net realized and unrealized gain (loss) on investment securities. Other foreign currency transactions resulting in realized and unrealized gain (loss) are disclosed separately.
Investment Transactions and Income. Security transactions are accounted for as of trade date. Gains and losses on securities sold are determined on the basis of identified cost and may include proceeds received from litigation. Dividend income is recorded on the ex dividend date, except for certain dividends from foreign securities where the ex dividend date may have passed, which are recorded as soon as the fund is informed of the ex dividend date. Non cash dividends included in dividend income, if any, are recorded at the fair market value of the securities received. Distributions received on securities that represent a return of capital or capital gain are recorded as a reduction of cost of investments and/or as a realized gain. Interest income is accrued as earned. Interest income includes coupon interest and amortization of premium and accretion of discount on debt securities. Investment income is recorded net of foreign taxes withheld where recovery of such taxes is uncertain.
Expenses. Most expenses of the trust can be directly attributed to a fund. Expenses which cannot be directly attributed are apportioned among each fund in the trust.
Income Tax Information and Distributions to Shareholders. Each year, the fund intends to qualify as a regulated investment company by distributing all of its taxable income and realized gains under Subchapter M of the Internal Revenue Code. As a result, no provision for income taxes is required in the accompanying financial statements. Foreign taxes are provided for based on the fund’s understanding of the tax rules and rates that exist in the foreign markets in which it invests.
Distributions are recorded on the ex dividend date. Income and capital gain distributions are determined in accordance with income tax regulations, which may differ from generally accepted accounting principles.
19 Annual Report
| Notes to Financial Statements continued | | |
1. Summary of Significant Accounting Policies continued |
Income Tax Information and Distributions to Shareholders continued |
In addition, the fund will claim a portion of the payment made to redeeming sharehold ers as a distribution for income tax purposes.
Capital accounts within the financial statements are adjusted for permanent book tax differences. These adjustments have no impact on net assets or the results of operations. Temporary book tax differences will reverse in a subsequent period.
Book tax differences are primarily due to short term capital gains, foreign currency transactions, net operating losses, passive foreign investment companies (PFIC), and losses deferred due to wash sales.
The tax basis components of distributable earnings and the federal tax cost as of period end were as follows:
| Unrealized appreciation | | | | $ 25,868,796 | | | | |
| Unrealized depreciation | | | | (3,264,842) | | | | |
| Net unrealized appreciation (depreciation) | | | | 22,603,954 | | | | |
| Undistributed ordinary income | | | | 7,853,106 | | | | |
| Undistributed long term capital gain | | | | 16,898,442 | | | | |
| |
| Cost for federal income tax purposes | | | | $ 228,731,308 | | | | |
| |
| The tax character of distributions paid was as follows: | | | | |
| |
| | | | | | | | | April 30, 2006 |
| Ordinary Income | | | | | | | | $ 1,937,852 |
| Long term Capital Gains | | | | | | | | 8,116,341 |
| Total | | | | | | | | $ 10,054,193 |
Short Term Trading (Redemption) Fees. Shares held in the fund less than 90 days are subject to a redemption fee equal to 1.50% of the proceeds of the redeemed shares. All redemption fees, including any estimated redemption fees paid by FMR, are retained by the fund and accounted for as an addition to paid in capital.
Repurchase Agreements. FMR has received an Exemptive Order from the Securities and Exchange Commission (the SEC) which permits the fund and other affiliated entities of FMR to transfer uninvested cash balances into joint trading accounts which are then invested in repurchase agreements. The fund may also invest directly with institutions in repurchase agreements. Repurchase agreements are collateralized by
2. Operating Policies continued
Repurchase Agreements continued
government or non government securities. Upon settlement date, collateral is held in segregated accounts with custodian banks and may be obtained in the event of a default of the counterparty. The fund monitors, on a daily basis, the value of the collateral to ensure it is at least equal to the principal amount of the repurchase agreement (includ ing accrued interest). In the event of a default by the counterparty, realization of the collateral proceeds could be delayed, during which time the value of the collateral may decline.
3. Purchases and Sales of Investments.
Purchases and sales of securities, other than short term securities, aggregated $412,082,070 and $358,977,376, respectively.
4. Fees and Other Transactions with Affiliates.
Management Fee. FMR and its affiliates provide the fund with investment manage ment related services for which the fund pays a monthly management fee. The manage ment fee is the sum of an individual fund fee rate that is based on an annual rate of .45% of the fund’s average net assets and a group fee rate that averaged .27% during the period. The group fee rate is based upon the average net assets of all the mutual funds advised by FMR. The group fee rate decreases as assets under management increase and increases as assets under management decrease. In addition, the management fee is subject to a performance adjustment (up to a maximum of .20% of the fund’s average net assets over a 36 month performance period). The upward or downward adjustment to the management fee is based on the fund’s relative investment performance as compared to an appropriate benchmark index. For the period, the total annual management fee rate, including the performance adjustment, was .62% of the fund’s average net assets.
Transfer Agent Fees. Fidelity Investments Institutional Operations Company, Inc. (FIIOC), an affiliate of FMR, is the fund’s transfer, dividend disbursing and shareholder servicing agent. FIIOC receives account fees and asset based fees that vary according to account size and type of account. FIIOC pays for typesetting, printing and mailing of shareholder reports, except proxy statements. For the period, the transfer agent fees were equivalent to an annual rate of .35% of average net assets.
Accounting and Security Lending Fees. Fidelity Service Company, Inc. (FSC), an affiliate of FMR, maintains the fund’s accounting records. The accounting fee is based on the level of average net assets for the month. Under a separate contract, FSC administers the security lending program. The security lending fee is based on the number and duration of lending transactions.
21 Annual Report
| Notes to Financial Statements continued | | |
4. Fees and Other Transactions with Affiliates continued |
Affiliated Central Funds. The fund may invest in Money Market Central Funds which seek preservation of capital and current income and are managed by Fidelity Invest ments Money Management, Inc. (FIMM), an affiliate of FMR.
The Money Market Central Funds do not pay a management fee.
Brokerage Commissions. The fund placed a portion of its portfolio transactions with brokerage firms which are affiliates of the investment adviser. The commissions paid to these affiliated firms were $17,913 for the period.
5. Committed Line of Credit.
|
The fund participates with other funds managed by FMR in a $4.2 billion credit facility (the “line of credit”) to be utilized for temporary or emergency purposes to fund share holder redemptions or for other short term liquidity purposes. The fund has agreed to pay commitment fees on its pro rata portion of the line of credit, which amounts to $558 and is reflected in Miscellaneous Expense on the Statement of Operations. During the period, there were no borrowings on this line of credit.
The fund lends portfolio securities from time to time in order to earn additional income. On the settlement date of the loan, the fund receives collateral (in the form of U.S. Treasury obligations, letters of credit and/or cash) against the loaned securities and maintains collateral in an amount not less than 100% of the market value of the loaned securities during the period of the loan. The market value of the loaned securities is determined at the close of business of the fund and any additional required collateral is delivered to the fund on the next business day. If the borrower defaults on its obligation to return the securities loaned because of insolvency or other reasons, a fund could experience delays and costs in recovering the securities loaned or in gaining access to the collateral. Any cash collateral received is invested in the Fidelity Securities Lending Cash Central Fund. The value of loaned securities and cash collateral at period end are disclosed on the fund’s Statement of Assets and Liabilities. Security lending income represents the income earned on investing cash collateral, less fees and expenses associated with the loan, plus any premium payments that may be received on the loan of certain types of securities. Net income from lending portfolio securities during the period amounted to $43,759.
FMR voluntarily agreed to reimburse the fund to the extent annual operating expenses exceeded 1.05% of average net assets. Some expenses, for example interest expense, are excluded from this reimbursement. During the period, this reimbursement reduced the fund’s expenses by $30,200.
Many of the brokers with whom FMR places trades on behalf of the fund provided services to the fund in addition to trade execution. These services included payments of certain expenses on behalf of the fund totaling $103,863 for the period. In addition, through arrangements with the fund’s custodian and transfer agent, credits realized as a result of uninvested cash balances were used to reduce the fund’s expenses. During the period, these credits reduced the fund’s custody and transfer agent expenses by $522 and $12,737, respectively.
The fund’s organizational documents provide former and current trustees and officers with a limited indemnification against liabilities arising in connection with the performance of their duties to the fund. In the normal course of business, the fund may also enter into contracts that provide general indemnifications. The fund’s maximum exposure under these arrangements is unknown as this would be dependent on future claims that may be made against the fund. The risk of material loss from such claims is considered remote.
23 Annual Report
Report of Independent Registered Public Accounting Firm
To the Trustees of Fidelity Commonwealth Trust and Shareholders of Fidelity Small Cap Retirement Fund:
We have audited the accompanying statement of assets and liabilities of Fidelity Small Cap Retirement Fund (the Fund), a fund of Fidelity Commonwealth Trust, including the schedule of investments as of April 30, 2006, and the related statement of operations for the year then ended, the statement of changes in net assets for each of the two years in the period then ended, and the financial highlights for each of the five years in the period then ended. These financial statements and financial highlights are the responsibility of the Fund’s management. Our responsibility is to express an opinion on these financial statements and financial highlights based on our audits.
We conducted our audits in accordance with standards of the Public Company Accounting Oversight Board (United States). Those standards require that we plan and perform the audit to obtain reasonable assurance about whether the financial statements and financial highlights are free of material misstatement. The Fund is not required to have, nor were we engaged to perform, an audit of its internal control over financial reporting. Our audits included consideration of internal control over financial reporting as a basis for designing audit procedures that are appropriate in the circumstances, but not for the purpose of expressing an opinion on the effectiveness of the Fund’s internal control over financial reporting. Accordingly, we express no such opinion. An audit also includes examining, on a test basis, evidence supporting the amounts and disclosures in the financial statements, assessing the accounting principles used and significant estimates made by management, as well as evaluating the overall financial statement presentation. Our procedures in cluded confirmation of securities owned as of April 30, 2006, by correspondence with the custodians and brokers; where replies were not received from brokers, we performed other auditing procedures. We believe that our audits provide a reasonable basis for our opinion.
In our opinion, the financial statements and financial highlights referred to above present fairly, in all material respects, the financial position of Fidelity Small Cap Retirement Fund as of April 30, 2006, the results of its operations for the year then ended, the changes in its net assets for each of the two years in the period then ended, and its financial highlights for each of the five years in the period then ended, in conformity with account ing principles generally accepted in the United States of America.
/s/ Deloitte & Touche LLP
DELOITTE & TOUCHE LLP
Boston, Massachusetts
June 9, 2006
|
Annual Report 24
Trustees and Officers
The Trustees, Members of the Advisory Board, and executive officers of the trust and fund, as applicable, are listed below. The Board of Trustees governs the fund and is responsible for protecting the interests of shareholders. The Trustees are experienced executives who meet periodically throughout the year to oversee the fund’s activities, review contractual arrangements with companies that provide services to the fund, and review the fund’s performance. Except for William O. McCoy and Albert R. Gamper, Jr., each of the Trustees oversees 335 funds advised by FMR or an affiliate. Mr. McCoy oversees 337 funds advised by FMR or an affiliate. Mr. Gamper oversees 280 funds advised by FMR or an affiliate.
The Trustees hold office without limit in time except that (a) any Trustee may resign; (b) any Trustee may be removed by written instrument, signed by at least two thirds of the number of Trustees prior to such removal; (c) any Trustee who requests to be retired or who has become incapacitated by illness or injury may be retired by written instru ment signed by a majority of the other Trustees; and (d) any Trustee may be removed at any special meeting of shareholders by a two thirds vote of the outstanding voting securities of the trust. Each Trustee who is not an interested person (as defined in the 1940 Act) (Independent Trustee), shall retire not later than the last day of the calendar year in which his or her 72nd birthday occurs. The Independent Trustees may waive this mandatory retirement age policy with respect to individual Trustees. The executive officers and Advisory Board Members hold office without limit in time, except that any officer and Advisory Board Member may resign or may be removed by a vote of a majority of the Trustees at any regular meeting or any special meeting of the Trustees. Except as indicated, each individual has held the office shown or other offices in the same company for the past five years.
The fund’s Statement of Additional Information (SAI) includes more information about the Trustees. To request a free copy, call Fidelity at 1-800-544-8544.
Correspondence intended for each Trustee who is an interested person may be sent to Fidelity Investments, 82 Devonshire Street, Boston, Massachusetts 02109.
| | Name, Age; Principal Occupation
Edward C. Johnson 3d (75)
|
Year of Election or Appointment: 1974
Mr. Johnson is Chairman of the Board of Trustees. Mr. Johnson serves as President (2006 present), Chief Executive Officer, Chairman, and a Director of FMR Corp.; Chairman and a Director of FMR; Chairman and a Director of Fidelity Research & Analysis Company (FRAC); Chairman and a Director of Fidelity Investments Money Management, Inc.; and Chairman (2001 present) and a Director (1999 present) of FMR Co., Inc. In addition, Mr. Johnson serves as Chairman and Director of Fidelity International Limited (FIL).
25 Annual Report
Trustees and Officers - continued
| | Name, Age; Principal Occupation
Stephen P. Jonas (53)
|
Year of Election or Appointment: 2005
Mr. Jonas is Senior Vice President of Small Cap Retirement (2005 present). He also serves as Senior Vice President of other Fidelity funds (2005 present). Mr. Jonas is Executive Director of FMR (2005 present) and FMR Co., Inc. (2005 present). He also serves as a Director of Fidelity Investments Money Management, Inc. (2005 present) and FMR Corp. (2003 present). Previously, Mr. Jonas served as President of Fidelity Enterprise Operations and Risk Services (2004 2005), Chief Administrative Officer (2002 2004), and Chief Financial Officer of FMR Corp. (1998 2002). In addition, he serves on the Boards of Boston Ballet (2003 present) and Simmons College (2003 present).
Year of Election or Appointment: 2003
Mr. Reynolds is President and a Director of FMR (2005 present), Fidelity Investments Money Management, Inc. (2005 present), and FMR Co., Inc. (2005 present). Mr. Reynolds also serves as a Director (2003 present) and Chief Operating Officer (2000 present) of FMR Corp. and a Director of Strategic Advisers, Inc. (2005 present). He also serves on the Board at Fidelity Investments Canada, Ltd. (2000 present). Previously, Mr. Reynolds served as President of Fidelity Investments Institutional Retirement Group (1996 2000).
* Trustees have been determined to be “Interested Trustees” by virtue of, among other things, their affiliation with the trust or various entities under common control with FMR.
Correspondence intended for each Independent Trustee (that is, the Trustees other than the Interested Trustees) may be sent to Fidelity Investments, P.O. Box 55235, Boston, Massachusetts 02205-5235.
| | Name, Age; Principal Occupation
Dennis J. Dirks (57)
|
Year of Election or Appointment: 2005
Prior to his retirement in May 2003, Mr. Dirks was Chief Operating Officer and a member of the Board of The Depository Trust & Clearing Corporation (DTCC) (1999 2003). He also served as President, Chief Operating Officer, and Board member of The Depository Trust Company (DTC) (1999 2003) and President and Board member of the National Securities Clearing Corporation (NSCC) (1999 2003). In addi tion, Mr. Dirks served as Chief Executive Officer and Board member of the Government Securities Clearing Corporation (2001 2003) and Chief Executive Officer and Board member of the Mortgage Backed Securities Clearing Corporation (2001 2003). Mr. Dirks also serves as a Trustee and a member of the Finance Committee of Manhattan College (2005 present) and a Trustee and a member of the Finance Committee of AHRC of Nassau County (2006 present).
| | Albert R. Gamper, Jr. (64)
|
Year of Election or Appointment: 2006
Mr. Gamper also serves as a Trustee (2006 present) or Member of the Advisory Board (2005 present) of other investment companies advised by FMR. Prior to his retirement in December 2004, Mr. Gamper served as Chairman of the Board of CIT Group Inc. (commercial finance). During his tenure with CIT Group Inc. Mr. Gamper served in numerous senior management positions, including Chairman (1987 1989; 1999 2001; 2002 2004), Chief Executive Officer (1987 2004), and President (1989 2002). He currently serves as a member of the Board of Directors of Public Service Enterprise Group (utilities, 2001 present), Chairman of the Board of Governors, Rutgers University (2004 present), and Chairman of the Board of Saint Barnabas Health Care System.
27 Annual Report
Trustees and Officers - continued
| | Name, Age; Principal Occupation
Robert M. Gates (62)
|
Year of Election or Appointment: 1997
Dr. Gates is Chairman of the Independent Trustees (2006 present). Dr. Gates is President of Texas A&M University (2002 present). He was Director of the Central Intelligence Agency (CIA) from 1991 to 1993. From 1989 to 1991, Dr. Gates served as Assistant to the President of the United States and Deputy National Security Advisor. Dr. Gates is a Director of NACCO Industries, Inc. (mining and manufacturing), Parker Drilling Co., Inc. (drilling and rental tools for the energy industry, 2001 present), and Brinker International (restaurant management, 2003 present). Previously, Dr. Gates served as a Director of LucasVarity PLC (automotive components and diesel engines), a Director of TRW Inc. (automotive, space, defense, and information technology), and Dean of the George Bush School of Government and Public Service at Texas A&M University (1999 2001).
Year of Election or Appointment: 2004
Dr. Heilmeier is Chairman Emeritus of Telcordia Technologies (communication software and systems), where prior to his retirement, he served as company Chairman and Chief Executive Officer. He currently serves on the Boards of Directors of The Mitre Corporation (systems engineering and information technology support for the government), and HRL Laboratories (private research and development, 2004 present). He is Chairman of the General Motors Science & Technology Advisory Board and a Life Fellow of the Institute of Electrical and Electronics Engineers (IEEE). Dr. Heilmeier is a member of the Defense Science Board and the National Security Agency Advisory Board. He is also a member of the National Academy of Engineering, the American Academy of Arts and Sciences, and the Board of Overseers of the School of Engineering and Applied Science of the University of Pennsylvania. Previously, Dr. Heilmeier served as a Director of TRW Inc. (automotive, space, defense, and information technology, 1992 2002), Compaq (1994 2002), Automatic Data Processing, Inc. (ADP) (technology based business outsourcing, 1995 2002), INET Technologies Inc. (telecommunications network surveillance, 2001 2004), and Teletech Holdings (customer management services). He is the recipient of the 2005 Kyoto Prize in Advanced Technology for his invention of the liquid crystal display.
Name, Age; Principal Occupation
Marie L. Knowles (59)
|
Year of Election or Appointment: 2001
Prior to Ms. Knowles’ retirement in June 2000, she served as Executive Vice President and Chief Financial Officer of Atlantic Richfield Company (ARCO) (diversified energy, 1996 2000). From 1993 to 1996, she was a Senior Vice President of ARCO and President of ARCO Transportation Company. She served as a Director of ARCO from 1996 to 1998. She currently serves as a Director of Phelps Dodge Corporation (copper mining and manufacturing) and McKesson Corporation (healthcare ser vice, 2002 present). Ms. Knowles is a Trustee of the Brookings Institution and the Catalina Island Conservancy and also serves as a member of the Advisory Board for the School of Engineering of the University of Southern California.
Year of Election or Appointment: 2000
Mr. Lautenbach has been a partner of Clayton, Dubilier & Rice, Inc. (private equity investment firm) since September 1998. Previously, Mr. Lautenbach was with the International Business Machines Corporation (IBM) from 1968 until his retirement in 1998. Mr. Lautenbach serves as a Director of Italtel Holding S.p.A. (telecommunications (Milan, Italy), 2004 present) and Eaton Corporation (diversified industrial) as well as the Philharmonic Center for the Arts in Naples, Florida. He also is a member of the Board of Trustees of Fairfield University (2005 present), as well as a member of the Council on Foreign Relations.
Year of Election or Appointment: 1997
Prior to his retirement in December 1994, Mr. McCoy was Vice Chair man of the Board of BellSouth Corporation (telecommunications) and President of BellSouth Enterprises. He is currently a Director of Duke Realty Corporation (real estate). He is also a partner of Franklin Street Partners (private investment management firm). In addition, Mr. McCoy served as the Interim Chancellor (1999 2000) and a member of the Board of Visitors for the University of North Carolina at Chapel Hill and currently serves as Chairman of the Board of Directors of the Uni versity of North Carolina Health Care System. He also served as Vice President of Finance for the University of North Carolina (16 school system).
29 Annual Report
Trustees and Officers - continued
| | Name, Age; Principal Occupation
Cornelia M. Small (61)
|
Year of Election or Appointment: 2005
Ms. Small is a member (2000 present) and Chairperson (2002 present) of the Investment Committee, and a member (2002 present) of the Board of Trustees of Smith College. Previously, she served as Chief Investment Officer (1999 2000), Director of Global Equity Investments (1996 1999), and a member of the Board of Directors of Scudder, Stevens & Clark (1990 1997) and Scudder Kemper Investments (1997 1999). In addition, Ms. Small served as Co Chair (2000 2003) of the Annual Fund for the Fletcher School of Law and Diplomacy.
| | William S. Stavropoulos (66)
|
Year of Election or Appointment: 2002
Mr. Stavropoulos is Chairman Emeritus of the Board of Directors of The Dow Chemical Company. Since joining The Dow Chemical Company in 1967, Mr. Stavropoulos served in numerous senior management positions, including President (1993 2000; 2002 2003), CEO (1995 2000; 2002 2004), and Chairman of the Executive Committee (2000 2004). Currently, he is a Director of NCR Corporation (data warehousing and technology solutions), BellSouth Corporation (telecommunications), Chemical Financial Corporation, Maersk Inc. (industrial conglomerate, 2002 present), and Metalmark Capital (private equity investment firm, 2005 present). He also serves as a member of the Board of Trustees of the American Enterprise Institute for Public Policy Research. In addition, Mr. Stavropoulos is a member of The Business Council, J.P. Morgan International Council and the University of Notre Dame Advisory Council for the College of Science.
Year of Election or Appointment: 2005
Prior to his retirement in 2001, Mr. Wolfe was Chairman and Chief Executive Officer of Hershey Foods Corporation (1993 2001). He currently serves as a member of the boards of Adelphia Communications Corporation (2003 present), Bausch & Lomb, Inc., and Revlon Inc. (2004 present).
Advisory Board Members and Executive Officers:
Correspondence intended for Mr. Keyes may be sent to Fidelity Investments, P.O. Box 55235, Boston, Massachusetts 02205-5235. Correspondence intended for each executive officer and Mr. Lynch may be sent to Fidelity Investments, 82 Devonshire Street, Boston, Massachusetts 02109.
| | Name, Age; Principal Occupation
|
Year of Election or Appointment: 2006
Member of the Advisory Board of Fidelity Commonwealth Trust. Prior to his retirement in 2003, Mr. Keyes was Chairman, President, and Chief Executive Officer of Johnson Controls, Inc. (automotive supplier, 1993 2003). He currently serves as a member of the boards of LSI Logic Corporation (semiconductor technologies, 1984 present), Navistar International Corporation (manufacture and sale of trucks, buses, and diesel engines, 2002 present), and Pitney Bowes, Inc. (integrated mail, messaging, and document management solutions, 1998 present).
Year of Election or Appointment: 2003
Member of the Advisory Board of Fidelity Commonwealth Trust. Mr. Lynch is Vice Chairman and a Director of FMR, and Vice Chairman (2001 present) and a Director (1999 present) of FMR Co., Inc. Pre viously, Mr. Lynch served as a Trustee of the Fidelity funds (1990 2003). In addition, he serves as the Chairman of the Inner City Scholarship Fund.
Year of Election or Appointment: 2005
Vice President of Small Cap Retirement. Mr. Churchill also serves as Vice President of certain Equity Funds (2005 present) and certain High Income Funds (2005 present). He is Executive Vice President of FMR (2005 present) and FMR Co., Inc. (2005 present), and Senior Vice President of Fidelity Investments Money Management, Inc. (2005 present). Previously, Mr. Churchill served as Head of Fidelity’s Fixed Income Division (2000 2005), Vice President of Fidelity’s Money Market Funds (2000 2005), Vice President of Fidelity’s Bond Funds, and Senior Vice President of FMR.
31 Annual Report
Trustees and Officers - continued
| | Name, Age; Principal Occupation
Eric D. Roiter (57)
|
Year of Election or Appointment: 2000
Secretary of Small Cap Retirement. He also serves as Secretary of other Fidelity funds; Vice President, General Counsel, and Secretary of FMR Co., Inc. (2001 present) and FMR; Assistant Secretary of Fidelity Management & Research (U.K.) Inc. (2001 present), Fidelity Research & Analysis Company (2001 present), and Fidelity Investments Money Management, Inc. (2001 present). Mr. Roiter is an Adjunct Member, Faculty of Law, at Boston College Law School (2003 present). Previously, Mr. Roiter served as Vice President and Secretary of Fidelity Distributors Corporation (FDC) (1998 2005).
Year of Election or Appointment: 2003
Assistant Secretary of Small Cap Retirement. Mr. Fross also serves as Assistant Secretary of other Fidelity funds (2003 present), Vice President and Secretary of FDC (2005 present), and is an employee of FMR.
Year of Election or Appointment: 2004
President and Treasurer of Small Cap Retirement. Ms. Reynolds also serves as President and Treasurer of other Fidelity funds (2004 present) and is a Vice President (2003 present) and an employee (2002 present) of FMR. Before joining Fidelity Investments, Ms. Reynolds worked at PricewaterhouseCoopers LLP (PwC) (1980 2002), where she was most recently an audit partner with PwC’s investment management practice.
Year of Election or Appointment: 2006
Anti Money Laundering (AML) officer of Small Cap Retirement. Mr. Ganis also serves as AML officer of other Fidelity funds (2006 present) and FMR Corp. (2003 present). Before joining Fidelity Investments, Mr. Ganis practiced law at Goodwin Procter, LLP (2000 2002).
Year of Election or Appointment: 2005
Chief Financial Officer of Small Cap Retirement. Mr. Murphy also serves as Chief Financial Officer of other Fidelity funds (2005 present). He also serves as Senior Vice President of Fidelity Pricing and Cash Management Services Group (FPCMS).
Name, Age; Principal Occupation
Kenneth A. Rathgeber (58)
|
Year of Election or Appointment: 2004
Chief Compliance Officer of Small Cap Retirement. Mr. Rathgeber also serves as Chief Compliance Officer of other Fidelity funds (2004 present) and Executive Vice President of Risk Oversight for Fidelity Investments (2002 present). He is Chief Compliance Officer of FMR (2005 present), FMR Co., Inc. (2005 present), Fidelity Management & Research (U.K.) Inc. (2005 present), Fidelity Research & Analysis Company (2005 present), Fidelity Investments Money Management, Inc. (2005 present), and Strategic Advisers, Inc. (2005 present). Previously, Mr. Rathgeber served as Executive Vice President and Chief Operating Officer for Fidelity Investments Institutional Services Company, Inc. (1998 2002).
Year of Election or Appointment: 2005
Deputy Treasurer of Small Cap Retirement. Mr. Mehrmann also serves as Deputy Treasurer of other Fidelity funds (2005 present) and is an employee of FMR. Previously, Mr. Mehrmann served as Vice President of Fidelity Investments Institutional Services Group (FIIS)/Fidelity Investments Institutional Operations Corporation, Inc. (FIIOC) Client Services (1998 2004).
Kimberley H. Monasterio (42)
|
Year of Election or Appointment: 2004
Deputy Treasurer of Small Cap Retirement. Ms. Monasterio also serves as Deputy Treasurer of other Fidelity funds (2004) and is an employee of FMR (2004). Before joining Fidelity Investments, Ms. Monasterio served as Treasurer (2000 2004) and Chief Financial Officer (2002 2004) of the Franklin Templeton Funds and Senior Vice President of Franklin Templeton Services, LLC (2000 2004).
Year of Election or Appointment: 2005
Deputy Treasurer of Small Cap Retirement. Mr. Robins also serves as Deputy Treasurer of other Fidelity funds (2005 present) and is an employee of FMR (2004 present). Before joining Fidelity Investments, Mr. Robins worked at KPMG LLP, where he was a partner in KPMG’s de partment of professional practice (2002 2004) and a Senior Manager (1999 2000). In addition, Mr. Robins served as Assistant Chief Accountant, United States Securities and Exchange Commission (2000 2002).
33 Annual Report
Trustees and Officers - continued
| | Name, Age; Principal Occupation
Robert G. Byrnes (39)
|
Year of Election or Appointment: 2005
Assistant Treasurer of Small Cap Retirement. Mr. Byrnes also serves as Assistant Treasurer of other Fidelity funds (2005 present) and is an employee of FMR (2005 present). Previously, Mr. Byrnes served as Vice President of FPCMS (2003 2005). Before joining Fidelity Investments, Mr. Byrnes worked at Deutsche Asset Management where he served as Vice President of the Investment Operations Group (2000 2003).
Year of Election or Appointment: 2000
Assistant Treasurer of Small Cap Retirement. Mr. Costello also serves as Assistant Treasurer of other Fidelity funds and is an employee of FMR.
Year of Election or Appointment: 2004
Assistant Treasurer of Small Cap Retirement. Mr. Lydecker also serves as Assistant Treasurer of other Fidelity funds (2004) and is an employee of FMR.
Year of Election or Appointment: 2002
Assistant Treasurer of Small Cap Retirement. Mr. Osterheld also serves as Assistant Treasurer of other Fidelity funds (2002) and is an employee of FMR.
Year of Election or Appointment: 2005
Assistant Treasurer of Small Cap Retirement. Mr. Ryan also serves as Assistant Treasurer of other Fidelity funds (2005 present) and is an employee of FMR (2005 present). Previously, Mr. Ryan served as Vice Pres ident of Fund Reporting in FPCMS (1999 2005).
Year of Election or Appointment: 2005
Assistant Treasurer of Small Cap Retirement. Mr. Schiavone also serves as Assistant Treasurer of other Fidelity funds (2005 present) and is an employee of FMR (2005 present). Before joining Fidelity Investments, Mr. Schiavone worked at Deutsche Asset Management, where he most recently served as Assistant Treasurer (2003 2005) of the Scudder Funds and Vice President and Head of Fund Reporting (1996 2003).
The Board of Trustees of Fidelity Small Cap Retirement Fund voted to pay on June 5, 2006, to shareholders of record at the opening of business on June 2, 2006, a distribution of $1.79 per share derived from capital gains realized from sales of portfolio securities.
The fund hereby designates as a capital gain dividend with respect to the taxable year ended April 30, 2006, $20,643,451, or, if subsequently determined to be different, the net capital gain of such year.
The fund designates 95%, and 58% of the dividends distributed in June and Decem-ber, respectively during the fiscal year as qualifying for the dividends received deduction for corporate shareholders.
The fund designates 96%, and 65% of the dividends distributed in June and Decem-ber, respectively during the fiscal year as amounts which may be taken into account as a dividend for the purposes of the maximum rate under section 1(h)(11) of the Internal Revenue Code.
The fund will notify shareholders in January 2007 of amounts for use in preparing 2006 income tax returns.
35 Annual Report
Proxy Voting Results
A special meeting of each fund’s shareholders was held on November 16, 2005. The results of votes taken among shareholders on proposals before them are reported below. Each vote reported represents one dollar of net asset value held on the record date for the meeting.
| PROPOSAL 1 | | |
| To elect a Board of Trustees.A | | |
| | | # of | | % of |
| | | Votes | | Votes |
| |
| Dennis J. Dirks | | |
| Affirmative | | 18,240,248,322.53 | | 96.150 |
| Withheld | | 730,313,302.58 | | 3.850 |
| TOTAL | | 18,970,561,625.11 | | 100.000 |
| Albert R. Gamper, Jr.B | | |
| Affirmative | | 18,204,838,072.06 | | 95.964 |
| Withheld | | 765,723,553.05 | | 4.036 |
| TOTAL | | 18,970,561,625.11 | | 100.000 |
| Robert M. Gates | | |
| Affirmative | | 18,191,748,681.13 | | 95.895 |
| Withheld | | 778,812,943.98 | | 4.105 |
| TOTAL | | 18,970,561,625.11 | | 100.000 |
| George H. Heilmeier | | |
| Affirmative | | 18,193,638,757.60 | | 95.905 |
| Withheld | | 776,922,867.51 | | 4.095 |
| TOTAL | | 18,970,561,625.11 | | 100.000 |
| Abigail P. Johnson | | |
| Affirmative | | 18,103,320,241.78 | | 95.428 |
| Withheld | | 867,241,383.33 | | 4.572 |
| TOTAL | | 18,970,561,625.11 | | 100.000 |
| Edward C. Johnson 3d | | |
| Affirmative | | 18,055,585,171.13 | | 95.177 |
| Withheld | | 914,976,453.98 | | 4.823 |
| TOTAL | | 18,970,561,625.11 | | 100.000 |
| Stephen P. Jonas | | |
| Affirmative | | 18,188,419,716.35 | | 95.877 |
| Withheld | | 782,141,908.76 | | 4.123 |
| TOTAL | | 18,970,561,625.11 | | 100.000 |
| Marie L. Knowles | | |
| Affirmative | | 18,208,650,664.29 | | 95.984 |
| Withheld | | 761,910,960.82 | | 4.016 |
| TOTAL | | 18,970,561,625.11 | | 100.000 |
| | | # of | | % of |
| | | Votes | | Votes |
| |
| Ned C. Lautenbach | | |
| Affirmative | | 18,224,936,039.64 | | 96.070 |
| Withheld | | 745,625,585.47 | | 3.930 |
| TOTAL | | 18,970,561,625.11 | | 100.000 |
| |
| Marvin L. Mann | | |
| Affirmative | | 18,146,216,753.93 | | 95.655 |
| Withheld | | 824,344,871.18 | | 4.345 |
| TOTAL | | 18,970,561,625.11 | | 100.000 |
| |
| William O. McCoy | | |
| Affirmative | | 18,164,580,135.79 | | 95.751 |
| Withheld | | 805,981,489.32 | | 4.249 |
| TOTAL | | 18,970,561,625.11 | | 100.000 |
| |
| Robert L. Reynolds | | |
| Affirmative | | 18,197,448,372.22 | | 95.925 |
| Withheld | | 773,113,252.89 | | 4.075 |
| TOTAL | | 18,970,561,625.11 | | 100.000 |
| |
| Cornelia M. Small | | |
| Affirmative | | 18,214,122,413.76 | | 96.013 |
| Withheld | | 756,439,211.35 | | 3.987 |
| TOTAL | | 18,970,561,625.11 | | 100.000 |
| |
| William S. Stavropoulos | | |
| Affirmative | | 18,186,563,509.46 | | 95.867 |
| Withheld | | 783,998,115.65 | | 4.133 |
| TOTAL | | 18,970,561,625.11 | | 100.000 |
| |
| Kenneth L. Wolfe | | |
| Affirmative | | 18,211,332,412.92 | | 95.998 |
| Withheld | | 759,229,212.19 | | 4.002 |
| TOTAL | | 18,970,561,625.11 | | 100.000 |
A Denotes trust-wide proposals and voting results.
B Effective on or about January 1, 2006.
|
Annual Report 36
Board Approval of Investment Advisory Contracts and Management Fees
Fidelity Small Cap Retirement Fund
On January 19, 2006, the Board of Trustees, including the Independent Trustees (together, the Board), voted to approve a general research services agreement (the Agreement) between FMR, FMR Co., Inc. (FMRC), Fidelity Investments Money Manage ment, Inc. (FIMM), and Fidelity Research & Analysis Company (FRAC) (together, the Investment Advisers) for the fund, effective January 20, 2006, pursuant to which FRAC may provide general research and investment advisory support services to FMRC and FIMM. The Board considered that it has approved previously various sub advisory agreements for the fund with affiliates of FMR that allow FMR to obtain research, non discretionary advice, or discretionary portfolio management at no additional expense to the fund. The Board, assisted by the advice of fund counsel and independent Trustees’ counsel, considered a broad range of information and determined that it would be beneficial for the fund to access the research and investment advisory support services supplied by FRAC at no additional expense to the fund.
The Board reached this determination in part because the new arrangement will involve no changes in (i) the contractual terms of and fees payable under the fund’s manage ment contract or sub advisory agreements; (ii) the investment process or strategies employed in the management of the fund’s assets; (iii) the nature or level of services provided under the fund’s management contract or sub advisory agreements; (iv) the day to day management of the fund or the persons primarily responsible for such man agement; or (v) the ultimate control or beneficial ownership of FMR, FMRC, or FIMM. The Board also considered that the establishment of the Agreement would not necessi tate prior shareholder approval of the Agreement or result in an assignment and termination of the fund’s management contract or sub advisory agreements under the Investment Company Act of 1940.
Because the Board was approving an arrangement with FRAC under which the fund will not bear any additional management fees or expenses and under which the fund’s portfolio manager would not change, it did not consider the fund’s investment perfor mance, competitiveness of management fee and total expenses, costs of services and profitability, or economies of scale to be significant factors in its decision.
In connection with its future renewal of the fund’s management contract and sub advisory agreements, the Board will consider: (i) the nature, extent, and quality of services provided to the fund, including shareholder and administrative services and investment performance; (ii) the competitiveness of the fund’s management fee and total expenses; (iii) the costs of the services and profitability, including the revenues earned and the expenses incurred by Fidelity in conducting the business of developing, marketing, distributing, managing, administering, and servicing the fund and its shareholders; and (iv) whether there have been economies of scale in respect of the management of the Fidelity funds, whether the Fidelity funds (including the fund) have
37 Annual Report
Board Approval of Investment Advisory Contracts and Management Fees continued
appropriately benefited from any such economies of scale, and whether there is potential for realization of any further economies.
Based on its evaluation of all of the conclusions noted above, and after considering all material factors, the Board ultimately concluded that the fund’s Agreement is fair and reasonable, and that the fund’s Agreement should be approved.
Managing Your Investments
Fidelity offers several ways to conveniently manage your personal investments via your telephone or PC. You can access your account information, conduct trades and research your investments 24 hours a day.
By Phone
Fidelity Automated Service Telephone provides a single toll free number to access account balances, positions, quotes and trading. It’s easy to navigate the service, and on your first call, the system will help you create a personal identification number (PIN) for security.
Fidelity Automated Service Telephone (FAST®) 1-800-544-5555

By PC
Fidelity’s web site on the Internet provides a wide range of information, including daily financial news, fund performance, interactive planning tools and news about Fidelity products and services.

* When you call the quotes line, please remember that a fund’s yield and return will vary and, except for money market funds, share price will also vary. This means that you may have a gain or loss when you sell your shares. There is no assurance that money market funds will be able to maintain a stable $1 share price; an investment in a money market fund is not insured or guar anteed by the U.S. government. Total returns are historical and include changes in share price, reinvestment of dividends and capital gains, and the effects of any sales charges.
39 Annual Report
Investment Adviser
Fidelity Management & Research Company
Boston, MA
Investment Sub Advisers
FMR Co., Inc.
Fidelity Research & Analysis Company
(formerly Fidelity Management &
Research (Far East) Inc.)
Fidelity Management & Research
(U.K.) Inc.
Fidelity Investments Japan Limited
Fidelity International Investment Advisors
Fidelity International Investment Advisors
(U.K.) Limited
General Distributor
Fidelity Distributors Corporation
Boston, MA
Transfer and Service Agents
Fidelity Investments Institutional
Operations Company, Inc.
Boston, MA
Fidelity Service Company, Inc.
Boston, MA
Custodian
State Street Bank and Trust Company
Quincy, MA
|
SMR-UANN-0606
1.784729.103
|

Fidelity®
Small Cap Stock
Fund
|
| | Annual Report
April 30, 2006
|


| Contents | | | | |
| |
| Chairman’s Message | | 4 | | Ned Johnson’s message to shareholders. |
| Performance | | 5 | | How the fund has done over time. |
| Management’s Discussion | | 6 | | The manager’s review of fund |
| | | | | performance, strategy and outlook |
| Shareholder Expense | | 7 | | An example of shareholder expenses. |
| Example | | | | |
| Investment Changes | | 8 | | A summary of major shifts in the fund’s |
| | | | | investments over the past six months. |
| Investments | | 9 | | A complete list of the fund’s investments |
| | | | | with their market values. |
| Financial Statements | | 23 | | Statements of assets and liabilities, |
| | | | | operations, and changes in net assets, |
| | | | | as well as financial highlights. |
| Notes | | 27 | | Notes to the financial statements. |
| Report of Independent | | 33 | | |
| Registered Public | | | | |
| Accounting Firm | | | | |
| Trustees and Officers | | 34 | | |
| Distributions | | 44 | | |
| Proxy Voting Results | | 45 | | |
| Board Approval of | | 46 | | |
| Investment Advisory | | | | |
| Contracts and | | | | |
| Management Fees | | | | |
To view a fund’s proxy voting guidelines and proxy voting record for the 12 month period ended
June 30, visit www.fidelity.com/proxyvotingresults or visit the Securities and Exchange Commis
sion’s (SEC) web site at www.sec.gov. You may also call 1-800-544-8544 to request a free copy of
the proxy voting guidelines.
Standard & Poor’s, S&P and S&P 500 are registered service marks of The McGraw Hill Companies,
Inc. and have been licensed for use by Fidelity Distributors Corporation.
Other third party marks appearing herein are the property of their respective owners.
All other marks appearing herein are registered or unregistered trademarks or service marks
of FMR Corp. or an affiliated company.
|
This report and the financial statements contained herein are submitted for the general informa
tion of the shareholders of the fund. This report is not authorized for distribution to prospective
investors in the fund unless preceded or accompanied by an effective prospectus.
A fund files its complete schedule of portfolio holdings with the SEC for the first and third quar
ters of each fiscal year on Form N Q. Forms N Q are available on the SEC’s web site at
http://www.sec.gov. A fund’s Forms N Q may be reviewed and copied at the SEC’s Public Reference
Room in Washington, DC. Information regarding the operation of the SEC’s Public Reference
Room may be obtained by calling 1-800-SEC-0330. For a complete list of a fund’s portfolio hold
ings, view the most recent quarterly holdings report, semiannual report, or annual report on
Fidelity’s web site at http://www.fidelity.com/holdings.
NOT FDIC INSURED · MAY LOSE VALUE · NO BANK GUARANTEE
Neither the fund nor Fidelity Distributors Corporation is a bank.
|
3 Annual Report
Chairman’s Message
(photograph of Edward C. Johnson 3d)
Dear Shareholder:
Although many securities markets made gains in early 2006, there is only one certainty when it comes to investing: There is no sure thing. There are, however, a number of time tested, fundamental investment principles that can put the historical odds in your favor.
One of the basic tenets is to invest for the long term. Over time, riding out the markets’ inevitable ups and downs has proven much more effective than selling into panic or chasing the hottest trend. Even missing only a few of the markets’ best days can significantly diminish investor returns. Patience also affords the benefits of compounding of earning interest on additional income or reinvested dividends and capital gains. There are tax advantages and cost benefits to consider as well. The more you sell, the more taxes you pay, and the more you trade, the higher the costs. While staying the course doesn’t eliminate risk, it can considerably lessen the effect of short term declines.
You can further manage your investing risk through diversification. And today, more than ever, geographic diversification should be taken into account. Studies indicate that asset allocation is the single most important determinant of a portfolio’s long term success. The right mix of stocks, bonds and cash aligned to your particular risk tolerance and investment objective is very important. Age appropriate rebalancing is also an essential aspect of asset allocation. For younger investors, an emphasis on equities which historically have been the best performing asset class over time is encouraged. As investors near their specific goal, such as retirement or sending a child to college, consideration may be given to replacing volatile assets (e.g. common stocks) with more stable fixed investments (bonds or savings plans).
A third investment principle invest ing regularly can help lower the average cost of your purchases. Investing a certain amount of money each month or quarter helps ensure you won’t pay for all your shares at market highs. This strategy known as dollar cost averaging also reduces unconstructive “emotion” from investing, helping shareholders avoid selling weak performers just prior to an upswing, or chasing a hot performer just before a correction.
We invite you to contact us via the Internet, through our Investor Centers or over the phone. It is our privilege to provide you the information you need to make the investments that are right for you.
Sincerely,
/s/ Edward C. Johnson 3d
Edward C. Johnson 3d
Annual Report 4
Performance: The Bottom Line
Average annual total return reflects the change in the value of an investment, assuming reinvestment of the fund’s dividend income and capital gains (the profits earned upon the sale of securities that have grown in value) and assuming a constant rate of perfor mance each year. The $10,000 table and the fund’s returns do not reflect the deduction of taxes that a shareholder would pay on fund distributions or the redemption of fund shares. During periods of reimbursement by Fidelity, a fund’s total return will be greater than it would be had the reimbursement not occurred. How a fund did yesterday is no guarantee of how it will do tomorrow.
| Average Annual Total Returns | | | | | | |
| Periods ended April 30, 2006 | | Past 1 | | Past 5 | | Life of |
| | | year | | years | | fundA |
| Fidelity® Small Cap Stock Fund | | 34.68% | | 13.69% | | 12.65% |
| A From March 12, 1998. | | | | | | |
| |
| $10,000 Over Life of Fund | | | | | | |
Let’s say hypothetically that $10,000 was invested in Fidelity® Small Cap Stock Fund on March 12, 1998, when the fund started. The chart shows how the value of your invest ment would have changed, and also shows how the Russell 2000® Index performed over the same period.

Management’s Discussion of Fund Performance
Comments from Paul Antico, Portfolio Manager of Fidelity® Small Cap Stock Fund
Key U.S. equity benchmarks reached multiyear highs during the year ending April 30, 2006. The stock market’s performance reflected economic conditions and corporate earnings that continued to beat expectations. It also showed that investors generally tuned out the buzz surrounding record high energy costs, inflation and rising short term interest rates. By and large, the market’s trajectory was consistent throughout the period. In fact, as measured by the Standard & Poor’s 500SM Index, stocks rose in 10 of the past 12 months and ended the period on a six month winning streak. The gains also became more broad based, shifting from the primarily energy and utility driven returns of the period’s early stages to include more widespread contributions from other sectors such as financials and telecommunica tion services. On the capitalization spectrum, small caps continued to dominate, as the small cap Russell 2000® Index reached new heights and returned 33.47% for the year overall. In comparison, the large cap oriented S&P 500® gained 15.42%, the Dow Jones Industrial AverageSM rose 14.17% and the NASDAQ Composite® Index climbed 21.89% .
In addition to beating the Russell 2000, Small Cap Stock’s return of 34.68% also topped the LipperSM Small Cap Funds Average, which returned 31.20% . Good stock picks both in and out of the index, as well as strong performances by several of the fund’s international holdings, helped performance. The Children’s Place, the fund’s largest holding at period end, also was a big contributor. The kids’ fashion retailer was doing very well on its own, then improved its future prospects by acquiring The Disney Stores. Health care information technology company Cerner did well. It’s played a major role in upgrading the U.S. health care technology infrastructure and is now helping improve the health care systems in the United Kingdom and other countries. On the downside, athletic shoe retailer Foot Locker did poorly after the company’s European business struggled. Auto parts and service giant Pep Boys suffered when it lost customers on the service side of its business. Both positions were eliminated from the fund. Industrials was the biggest contributor on a sector basis, while unfavorable stock selection in materials detracted.
Note to shareholders:
Fidelity Small Cap Stock Fund will be closed to new accounts as of June 16, 2006.
The views expressed above reflect those of the portfolio manager(s) only through the end of the period as stated on the cover of this report and do not necessarily represent the views of Fidelity or any other person in the Fidelity organization. Any such views are subject to change at any time based upon market or other conditions and Fidelity disclaims any responsibility to update such views. These views may not be relied on as investment advice and, because investment decisions for a Fidelity fund are based on numerous factors, may not be relied on as an indication of trading intent on behalf of any Fidelity fund.
Shareholder Expense Example
As a shareholder of the Fund, you incur two types of costs: (1) transaction costs, including redemption fees, and (2) ongoing costs, including management fees and other Fund expenses. This Example is intended to help you understand your ongoing costs (in dollars) of investing in the Fund and to compare these costs with the ongoing costs of investing in other mutual funds.
The Example is based on an investment of $1,000 invested at the beginning of the period and held for the entire period (November 1, 2005 to April 30, 2006).
Actual Expenses
The first line of the table below provides information about actual account values and actual expenses. You may use the information in this line, together with the amount you invested, to estimate the expenses that you paid over the period. Simply divide your account value by $1,000.00 (for example, an $8,600 account value divided by $1,000.00 = 8.6), then multiply the result by the number in the first line under the heading entitled “Expenses Paid During Period” to estimate the expenses you paid on your account during this period. A small balance maintenance fee of $12.00 that is charged once a year may apply for certain accounts with a value of less than $2,000. This fee is not included in the table below. If it was, the estimate of expenses you paid during the period would be higher, and your ending account value lower, by this amount.
Hypothetical Example for Comparison Purposes
The second line of the table below provides information about hypothetical account values and hypothetical expenses based on the Fund’s actual expense ratio and an assumed rate of return of 5% per year before expenses, which is not the Fund’s actual return. The hypothetical account values and expenses may not be used to estimate the actual ending account balance or expenses you paid for the period. You may use this information to compare the ongoing costs of investing in the Fund and other funds. To do so, compare this 5% hypothetical example with the 5% hypothetical examples that appear in the share holder reports of the other funds. A small balance maintenance fee of $12.00 that is charged once a year may apply for certain accounts with a value of less than $2,000. This fee is not included in the table below. If it was, the estimate of expenses you paid during the period would be higher, and your ending account value lower, by this amount.
Please note that the expenses shown in the table are meant to highlight your ongoing costs only and do not reflect any transaction costs. Therefore, the second line of the table is useful in comparing ongoing costs only, and will not help you determine the relative total costs of owning different funds. In addition, if these transactional costs were included, your costs would have been higher.
| | | | | | | | | | | Expenses Paid |
| | | | | Beginning | | | | Ending | | During Period* |
| | | | | Account Value | | | | Account Value | | November 1, 2005 |
| | | | | November 1, 2005 | | | | April 30, 2006 | | to April 30, 2006 |
| Actual | | | | $ 1,000.00 | | | | $ 1,212.90 | | | | $ 5.38 |
| Hypothetical (5% return per | | | | | | | | | | | | |
| year before expenses) | | | | $ 1,000.00 | | | | $ 1,019.93 | | | | $ 4.91 |
* Expenses are equal to the Fund’s annualized expense ratio of .98%; multiplied by the average account value over the period, multiplied by 181/365 (to reflect the one half year period).
7 Annual Report
| Investment Changes | | | | |
| |
| |
| Top Ten Stocks as of April 30, 2006 | | | | |
| | | % of fund’s | | % of fund’s net assets |
| | | net assets | | 6 months ago |
| The Children’s Place Retail Stores, Inc. | | 3.3 | | 0.5 |
| Ingram Micro, Inc. Class A | | 2.2 | | 1.6 |
| WESCO International, Inc. | | 1.6 | | 0.9 |
| Per Se Technologies, Inc. | | 1.6 | | 1.3 |
| Healthways, Inc. | | 1.5 | | 2.4 |
| Silicon On Insulator Technologies SA (SOITEC) | | 1.5 | | 0.3 |
| Penn National Gaming, Inc. | | 1.3 | | 1.2 |
| Vishay Intertechnology, Inc. | | 1.2 | | 0.3 |
| Owens Illinois, Inc. | | 1.2 | | 1.2 |
| TTM Technologies, Inc. | | 1.2 | | 0.5 |
| | | 16.6 | | |
Top Five Market Sectors as of April 30, 2006 | | |
| | | % of fund’s | | % of fund’s net assets |
| | | net assets | | 6 months ago |
| Information Technology | | 35.8 | | 26.1 |
| Consumer Discretionary | | 19.5 | | 19.0 |
| Health Care | | 15.8 | | 17.6 |
| Industrials | | 14.1 | | 16.3 |
| Financials | | 6.9 | | 8.4 |

Annual Report 8
| Investments April 30, 2006 | | | | |
| Showing Percentage of Net Assets | | | | | | |
| |
| Common Stocks 97.9% | | | | | | |
| | | Shares | | Value (Note 1) |
| | | | | (000s) |
| |
| CONSUMER DISCRETIONARY — 19.5% | | | | | | |
| Auto Components 0.4% | | | | | | |
| Amerigon, Inc. (a)(e) | | 1,585,124 | | | | $ 11,857 |
| LKQ Corp. (a) | | 308,579 | | | | 6,493 |
| | | | | | | 18,350 |
| Diversified Consumer Services — 0.4% | | | | | | |
| Bright Horizons Family Solutions, Inc. (a) | | 131,958 | | | | 5,241 |
| Carriage Services, Inc. Class A (a)(e) | | 1,185,250 | | | | 5,559 |
| Service Corp. International (SCI) | | 1,511,500 | | | | 12,168 |
| | | | | | | 22,968 |
| Hotels, Restaurants & Leisure 3.1% | | | | | | |
| Boyd Gaming Corp. | | 374,777 | | | | 18,671 |
| Buffalo Wild Wings, Inc. (a) | | 374,871 | | | | 16,187 |
| Famous Dave’s of America, Inc. (a)(e) | | 1,059,388 | | | | 15,478 |
| Friendly Ice Cream Corp. (a) | | 324,500 | | | | 2,645 |
| Paddy Power PLC (Ireland) | | 800,000 | | | | 14,231 |
| Penn National Gaming, Inc. (a) | | 1,636,648 | | | | 66,644 |
| Six Flags, Inc. (a)(d) | | 544,000 | | | | 5,010 |
| WMS Industries, Inc. (a) | | 600,000 | | | | 18,750 |
| | | | | | | 157,616 |
| Household Durables — 1.7% | | | | | | |
| Fourlis Holdings SA | | 1,338,791 | | | | 20,776 |
| Interface, Inc. Class A (a)(e) | | 2,980,505 | | | | 38,329 |
| Lifetime Brands, Inc. (e) | | 1,010,096 | | | | 29,919 |
| | | | | | | 89,024 |
| Internet & Catalog Retail 1.0% | | | | | | |
| Insight Enterprises, Inc. (a)(e) | | 2,618,997 | | | | 51,778 |
| Leisure Equipment & Products — 1.5% | | | | | | |
| Jumbo SA (e) | | 3,637,000 | | | | 59,193 |
| MarineMax, Inc. (a) | | 501,124 | | | | 16,417 |
| | | | | | | 75,610 |
| Media — 1.1% | | | | | | |
| Focus Media Holding Ltd. ADR | | 300,063 | | | | 18,121 |
| Harris Interactive, Inc. (a)(e) | | 3,196,671 | | | | 15,440 |
| New Frontier Media, Inc. (a) | | 304,741 | | | | 2,758 |
| Salem Communications Corp. Class A (a)(e) | | 965,941 | | | | 14,760 |
| Trader Classified Media NV (A Shares) (d) | | 539,850 | | | | 7,485 |
| | | | | | | 58,564 |
| Specialty Retail — 8.5% | | | | | | |
| Big 5 Sporting Goods Corp. (e) | | 1,225,100 | | | | 22,701 |
See accompanying notes which are an integral part of the financial statements.
| Investments continued | | | | | | |
| |
| |
| Common Stocks continued | | | | | | |
| | | Shares | | Value (Note 1) |
| | | | | (000s) |
| |
| CONSUMER DISCRETIONARY — continued | | | | | | |
| Specialty Retail — continued | | | | | | |
| Eddie Bauer Holdings, Inc. (a) | | 1,330,200 | | | | $ 17,532 |
| Forzani Group Ltd. Class A (a) | | 1,300,000 | | | | 18,314 |
| Gamestop Corp.: | | | | | | |
| Class A (a) | | 1,169,663 | | | | 55,208 |
| Class B (a) | | 243,119 | | | | 10,325 |
| La Senza Corp. (sub. vtg.) | | 844,100 | | | | 16,610 |
| New York & Co., Inc. (a) | | 1,100,500 | | | | 17,135 |
| OfficeMax, Inc. | | 750,100 | | | | 29,029 |
| RONA, Inc. (a) | | 779,900 | | | | 16,086 |
| Select Comfort Corp. (a)(d) | | 600,000 | | | | 23,976 |
| The Children’s Place Retail Stores, Inc. (a)(e) | | 2,780,440 | | | | 171,773 |
| The Game Group PLC | | 478,133 | | | | 698 |
| The Men’s Wearhouse, Inc. | | 1,101,500 | | | | 39,037 |
| | | | | | | 438,424 |
| Textiles, Apparel & Luxury Goods — 1.8% | | | | | | |
| Carter’s, Inc. (a) | | 207,200 | | | | 13,957 |
| Gildan Activewear, Inc. Class A (a) | | 1,267,620 | | | | 60,717 |
| Ted Baker PLC | | 2,023,173 | | | | 17,785 |
| | | | | | | 92,459 |
| |
| TOTAL CONSUMER DISCRETIONARY | | | | | | 1,004,793 |
| |
| CONSUMER STAPLES 1.4% | | | | | | |
| Food Products 0.5% | | | | | | |
| Corn Products International, Inc. | | 849,000 | | | | 23,772 |
| Global Bio-Chem Technology Group Co. Ltd. | | 742,000 | | | | 388 |
| Global Bio-Chem Technology Group Co. Ltd. warrants | | | | | | |
| 5/31/07 (a) | | 1,750,000 | | | | 14 |
| | | | | | | 24,174 |
| Household Products — 0.0% | | | | | | |
| Central Garden & Pet Co. Class A (a) | | 15,874 | | | | 782 |
| Personal Products 0.9% | | | | | | |
| Alberto-Culver Co. | | 549,900 | | | | 24,729 |
| NBTY, Inc. (a) | | 733,900 | | | | 16,623 |
| Sarantis SA (Reg.) | | 508,727 | | | | 5,648 |
| | | | | | | 47,000 |
| |
| TOTAL CONSUMER STAPLES | | | | | | 71,956 |
See accompanying notes which are an integral part of the financial statements.
| Common Stocks continued | | | | | | |
| | | Shares | | Value (Note 1) |
| | | | | (000s) |
| |
| ENERGY 2.1% | | | | | | |
| Energy Equipment & Services — 0.9% | | | | | | |
| Hydril Co. (a) | | 325,326 | | | | $ 26,078 |
| Superior Energy Services, Inc. (a) | | 600,300 | | | | 19,300 |
| | | | | | | 45,378 |
| Oil, Gas & Consumable Fuels — 1.2% | | | | | | |
| Comstock Resources, Inc. (a) | | 499,600 | | | | 15,528 |
| Forest Oil Corp. (a) | | 347,800 | | | | 12,719 |
| Gastar Exploration Ltd. (a)(f) | | 2,264,411 | | | | 8,081 |
| Houston Exploration Co. (a) | | 300,400 | | | | 16,798 |
| Range Resources Corp. | | 475,200 | | | | 12,607 |
| | | | | | | 65,733 |
| |
| TOTAL ENERGY | | | | | | 111,111 |
| |
| FINANCIALS — 6.9% | | | | | | |
| Capital Markets 0.8% | | | | | | |
| Acta Holding ASA | | 4,000,000 | | | | 18,047 |
| TradeStation Group, Inc. (a) | | 1,438,452 | | | | 22,929 |
| | | | | | | 40,976 |
| Commercial Banks — 2.9% | | | | | | |
| Cathay General Bancorp | | 408,608 | | | | 15,633 |
| Center Financial Corp., California | | 696,844 | | | | 15,554 |
| East West Bancorp, Inc. | | 629,105 | | | | 24,957 |
| Hanmi Financial Corp. | | 930,993 | | | | 18,136 |
| Nara Bancorp, Inc. | | 766,723 | | | | 14,414 |
| Preferred Bank, Los Angeles California | | 46,209 | | | | 2,336 |
| SVB Financial Group (a) | | 667,000 | | | | 33,864 |
| UCBH Holdings, Inc. | | 633,094 | | | | 11,199 |
| Wintrust Financial Corp. | | 226,250 | | | | 11,708 |
| | | | | | | 147,801 |
| Diversified Financial Services — 0.4% | | | | | | |
| NETeller PLC (a) | | 1,552,367 | | | | 21,941 |
| Insurance — 2.0% | | | | | | |
| Aspen Insurance Holdings Ltd. | | 624,000 | | | | 15,194 |
| Endurance Specialty Holdings Ltd. | | 906,300 | | | | 28,059 |
| Navigators Group, Inc. (a) | | 145,600 | | | | 6,888 |
| Platinum Underwriters Holdings Ltd. | | 947,800 | | | | 26,131 |
See accompanying notes which are an integral part of the financial statements.
11 Annual Report
| Investments continued | | | | | | |
| |
| |
| Common Stocks continued | | | | | | |
| | | Shares | | Value (Note 1) |
| | | | | (000s) |
| |
| FINANCIALS — continued | | | | | | |
| Insurance — continued | | | | | | |
| United America Indemnity Ltd. Class A (a) | | 439,633 | | | | $ 10,437 |
| USI Holdings Corp. (a) | | 1,124,531 | | | | 17,093 |
| | | | | | | 103,802 |
| Real Estate 0.6% | | | | | | |
| CapitalSource, Inc. | | 699,400 | | | | 16,436 |
| Pennsylvania (REIT) (SBI) | | 400,000 | | | | 16,224 |
| | | | | | | 32,660 |
| Thrifts & Mortgage Finance — 0.2% | | | | | | |
| W Holding Co., Inc. | | 1,140,648 | | | | 8,543 |
| |
| TOTAL FINANCIALS | | | | | | 355,723 |
| |
| HEALTH CARE — 15.7% | | | | | | |
| Biotechnology — 3.6% | | | | | | |
| Alkermes, Inc. (a) | | 854,800 | | | | 18,353 |
| Charles River Laboratories International, Inc. (a) | | 601,500 | | | | 28,421 |
| Exelixis, Inc. (a) | | 177,100 | | | | 1,906 |
| Kendle International, Inc. (a) | | 273,500 | | | | 10,270 |
| Myriad Genetics, Inc. (a) | | 1,918,100 | | | | 49,161 |
| ONYX Pharmaceuticals, Inc. (a) | | 899,900 | | | | 21,013 |
| Renovis, Inc. (a)(d) | | 920,900 | | | | 16,245 |
| Serologicals Corp. (a) | | 986,122 | | | | 30,688 |
| Theravance, Inc. (a) | | 420,900 | | | | 11,810 |
| | | | | | | 187,867 |
| Health Care Equipment & Supplies — 3.8% | | | | | | |
| Advanced Medical Optics, Inc. (a) | | 499,700 | | | | 23,286 |
| Aspect Medical Systems, Inc. (a) | | 431,400 | | | | 12,278 |
| BioLase Technology, Inc. (d)(e) | | 1,445,531 | | | | 15,395 |
| Cholestech Corp. (a)(e) | | 1,477,600 | | | | 18,884 |
| DJ Orthopedics, Inc. (a) | | 827,600 | | | | 32,905 |
| Imaging Dynamics Co. Ltd. (a)(e) | | 2,731,200 | | | | 12,337 |
| NeuroMetrix, Inc. (a) | | 42,700 | | | | 1,611 |
| Palomar Medical Technologies, Inc. (a) | | 269,900 | | | | 11,387 |
| Regeneration Technologies, Inc. (a)(e) | | 2,881,310 | | | | 21,984 |
| ResMed, Inc. (a) | | 608,300 | | | | 26,248 |
| Somanetics Corp. (a) | | 432,906 | | | | 7,104 |
| SonoSite, Inc. (a) | | 396,100 | | | | 14,953 |
| | | | | | | 198,372 |
See accompanying notes which are an integral part of the financial statements.
| Common Stocks continued | | | | | | |
| | | Shares | | Value (Note 1) |
| | | | | (000s) |
| |
| HEALTH CARE — continued | | | | | | |
| Health Care Providers & Services — 7.9% | | | | | | |
| American Retirement Corp. (a) | | 124,200 | | | | $ 3,155 |
| Cerner Corp. (a)(d) | | 1,019,996 | | | | 40,443 |
| Covance, Inc. (a) | | 1,000,900 | | | | 58,403 |
| DaVita, Inc. (a) | | 291,700 | | | | 16,411 |
| Healthways, Inc. (a) | | 1,597,621 | | | | 78,379 |
| Horizon Health Corp. (a) | | 150,034 | | | | 3,136 |
| ICON PLC sponsored ADR (a) | | 365,900 | | | | 19,945 |
| Merge Technologies, Inc. (a)(d) | | 433,623 | | | | 5,481 |
| Per-Se Technologies, Inc. (a)(e) | | 2,927,650 | | | | 81,828 |
| Phase Forward, Inc. (a)(e) | | 3,343,015 | | | | 45,799 |
| Providence Service Corp. (a)(e) | | 791,720 | | | | 24,797 |
| Rural/Metro Corp. (a) | | 529,149 | | | | 4,233 |
| Sunrise Senior Living, Inc. (a) | | 460,800 | | | | 17,142 |
| VistaCare, Inc. Class A (a) | | 429,378 | | | | 6,535 |
| | | | | | | 405,687 |
| Pharmaceuticals — 0.4% | | | | | | |
| Atherogenics, Inc. (a) | | 363,400 | | | | 5,142 |
| Cypress Bioscience, Inc. (a) | | 1,577,900 | | | | 11,755 |
| Salix Pharmaceuticals Ltd. (a) | | 101,200 | | | | 1,386 |
| | | | | | | 18,283 |
| |
| TOTAL HEALTH CARE | | | | | | 810,209 |
| |
| INDUSTRIALS — 14.1% | | | | | | |
| Aerospace & Defense — 2.6% | | | | | | |
| AAR Corp. (a) | | 1,710,000 | | | | 45,623 |
| Alliant Techsystems, Inc. (a) | | 255,949 | | | | 20,473 |
| BE Aerospace, Inc. (a) | | 1,980,445 | | | | 51,551 |
| Triumph Group, Inc. (a) | | 379,215 | | | | 17,846 |
| | | | | | | 135,493 |
| Air Freight & Logistics — 0.8% | | | | | | |
| EGL, Inc. (a) | | 460,273 | | | | 21,504 |
| Hub Group, Inc. Class A (a) | | 390,886 | | | | 19,220 |
| | | | | | | 40,724 |
| Building Products 0.5% | | | | | | |
| Insteel Industries, Inc. | | 177,904 | | | | 6,646 |
| Quixote Corp. (e) | | 872,658 | | | | 17,994 |
| | | | | | | 24,640 |
See accompanying notes which are an integral part of the financial statements.
13 Annual Report
| Investments continued | | | | | | |
| |
| |
| Common Stocks continued | | | | | | |
| | | Shares | | Value (Note 1) |
| | | | | (000s) |
| |
| INDUSTRIALS — continued | | | | | | |
| Commercial Services & Supplies — 4.9% | | | | | | |
| Aggreko PLC | | 2,750,000 | | | | $ 15,384 |
| Corrections Corp. of America (a) | | 375,900 | | | | 16,870 |
| Datamonitor PLC (e) | | 5,633,595 | | | | 42,125 |
| DiamondCluster International, Inc. (a) | | 1,583,388 | | | | 16,372 |
| Healthcare Services Group, Inc. | | 806,626 | | | | 17,221 |
| Kforce, Inc. (a)(e) | | 2,314,318 | | | | 32,516 |
| Medialink Worldwide, Inc. (a)(d)(e) | | 602,200 | | | | 2,469 |
| Navigant Consulting, Inc. (a) | | 1,097,300 | | | | 23,131 |
| Team, Inc. (a)(e) | | 596,300 | | | | 18,724 |
| Tele Atlas NV (a)(d) | | 452,041 | | | | 11,492 |
| Tele Atlas NV (Netherlands) (a) | | 2,025,000 | | | | 51,352 |
| The Geo Group, Inc. (a) | | 86,900 | | | | 3,114 |
| | | | | | | 250,770 |
| Construction & Engineering — 0.7% | | | | | | |
| Granite Construction, Inc. | | 329,200 | | | | 15,262 |
| Perini Corp. (a) | | 793,400 | | | | 23,826 |
| | | | | | | 39,088 |
| Electrical Equipment — 1.2% | | | | | | |
| Energy Conversion Devices, Inc. (a) | | 300,000 | | | | 15,003 |
| GrafTech International Ltd. (a) | | 1,264,942 | | | | 8,551 |
| LaBarge, Inc. (a) | | 613,950 | | | | 8,933 |
| SolarWorld AG | | 88,710 | | | | 27,644 |
| | | | | | | 60,131 |
| Marine — 0.2% | | | | | | |
| Alexander & Baldwin, Inc. | | 245,611 | | | | 12,249 |
| Road & Rail 0.7% | | | | | | |
| Landstar System, Inc. | | 412,773 | | | | 17,539 |
| Universal Truckload Services, Inc. (a) | | 463,300 | | | | 14,052 |
| USA Truck, Inc. (a) | | 140,318 | | | | 3,080 |
| | | | | | | 34,671 |
| Trading Companies & Distributors — 2.5% | | | | | | |
| Hagemeyer NV (a)(d) | | 4,250,000 | | | | 23,110 |
| MSC Industrial Direct Co., Inc. Class A | | 384,000 | | | | 19,914 |
| WESCO International, Inc. (a) | | 1,133,100 | | | | 84,983 |
| | | | | | | 128,007 |
| |
| TOTAL INDUSTRIALS | | | | | | 725,773 |
See accompanying notes which are an integral part of the financial statements.
| Common Stocks continued | | | | | | |
| | | Shares | | Value (Note 1) |
| | | | | (000s) |
| |
| INFORMATION TECHNOLOGY — 35.8% | | | | | | |
| Communications Equipment — 3.1% | | | | | | |
| ADVA AG Optical Networking (a) | | 88,447 | | | | $ 1,049 |
| Belden CDT, Inc. | | 694,818 | | | | 21,748 |
| Blue Coat Systems, Inc. (a)(e) | | 798,973 | | | | 17,386 |
| China Techfaith Wireless Communication Technology Ltd. | | | | | | |
| sponsored ADR (d) | | 1,023,900 | | | | 13,935 |
| CSR PLC (a) | | 1,325,000 | | | | 29,215 |
| Finisar Corp. (a)(d) | | 4,000,000 | | | | 18,800 |
| Oplink Communications, Inc. (a)(e) | | 1,463,673 | | | | 28,220 |
| Symmetricom, Inc. (a) | | 2,199,907 | | | | 17,819 |
| TANDBERG ASA (d) | | 1,083,670 | | | | 11,036 |
| | | | | | | 159,208 |
| Computers & Peripherals — 1.9% | | | | | | |
| Emulex Corp. (a) | | 1,414,300 | | | | 25,670 |
| Intermec, Inc. (a) | | 848,631 | | | | 22,480 |
| M Systems Flash Disk Pioneers Ltd. (a) | | 850,400 | | | | 29,313 |
| QLogic Corp. (a) | | 1,000,000 | | | | 20,810 |
| | | | | | | 98,273 |
| Electronic Equipment & Instruments — 10.2% | | | | | | |
| Arrow Electronics, Inc. (a) | | 1,462,200 | | | | 52,932 |
| Avnet, Inc. (a) | | 941,204 | | | | 24,612 |
| AVX Corp. | | 830,100 | | | | 14,776 |
| Benchmark Electronics, Inc. (a) | | 428,350 | | | | 11,694 |
| Excel Technology, Inc. (a) | | 111,300 | | | | 3,291 |
| FARO Technologies, Inc. (a)(d) | | 699,700 | | | | 10,628 |
| FLIR Systems, Inc. (a) | | 169,700 | | | | 4,149 |
| Ingram Micro, Inc. Class A (a) | | 6,295,750 | | | | 115,779 |
| KEMET Corp. (a) | | 2,911,472 | | | | 31,473 |
| Kingboard Chemical Holdings Ltd. | | 187,900 | | | | 496 |
| Littelfuse, Inc. (a) | | 640,088 | | | | 20,668 |
| Metrologic Instruments, Inc. (a) | | 799,749 | | | | 13,588 |
| PC Connection, Inc. (a)(e) | | 1,915,007 | | | | 11,299 |
| SYNNEX Corp. (a)(e) | | 1,605,600 | | | | 30,426 |
| TTM Technologies, Inc. (a)(e) | | 3,805,168 | | | | 61,872 |
| Vishay Intertechnology, Inc. (a) | | 4,099,381 | | | | 64,032 |
| Xyratex Ltd. (a)(e) | | 1,899,350 | | | | 56,810 |
| | | | | | | 528,525 |
| Internet Software & Services — 2.0% | | | | | | |
| Aladdin Knowledge Systems Ltd. (a)(e) | | 905,400 | | | | 21,114 |
| Art Technology Group, Inc. (a) | | 4,172,643 | | | | 11,850 |
See accompanying notes which are an integral part of the financial statements.
15 Annual Report
| Investments continued | | | | | | |
| |
| |
| Common Stocks continued | | | | | | |
| | | Shares | | Value (Note 1) |
| | | | | (000s) |
| |
| INFORMATION TECHNOLOGY — continued | | | | | | |
| Internet Software & Services — continued | | | | | | |
| Digitas, Inc. (a) | | 2,572,391 | | | | $ 36,296 |
| United Internet AG | | 500,000 | | | | 32,803 |
| | | | | | | 102,063 |
| IT Services — 4.3% | | | | | | |
| ALTEN (a) | | 600,000 | | | | 22,710 |
| BearingPoint, Inc. (a) | | 997,600 | | | | 9,258 |
| Computershare Ltd. | | 1,773,400 | | | | 10,616 |
| Lionbridge Technologies, Inc. (a)(e) | | 5,562,918 | | | | 45,727 |
| Ness Technologies, Inc. (a)(e) | | 3,468,606 | | | | 42,144 |
| Ordina NV | | 800,000 | | | | 18,884 |
| Safeguard Scientifics, Inc. (a)(e) | | 8,988,400 | | | | 23,190 |
| Sapient Corp. (a) | | 3,251,377 | | | | 25,458 |
| SI International, Inc. (a)(e) | | 668,137 | | | | 22,763 |
| Syntel, Inc. | | 57,249 | | | | 1,233 |
| | | | | | | 221,983 |
| Semiconductors & Semiconductor Equipment — 8.0% | | | | | | |
| Advanced Analogic Technologies, Inc. | | 1,179,441 | | | | 13,233 |
| Atmel Corp. (a) | | 6,677,183 | | | | 34,988 |
| Cypress Semiconductor Corp. (a) | | 490,000 | | | | 8,408 |
| Fairchild Semiconductor International, Inc. (a) | | 1,000,300 | | | | 20,676 |
| FormFactor, Inc. (a) | | 627,723 | | | | 26,170 |
| Kontron AG | | 1,155,000 | | | | 13,115 |
| MIPS Technologies, Inc. (a) | | 806,608 | | | | 5,977 |
| MKS Instruments, Inc. (a) | | 756,100 | | | | 18,048 |
| Omnivision Technologies, Inc. (a) | | 1,150,424 | | | | 33,454 |
| ON Semiconductor Corp. (a) | | 2,555,071 | | | | 18,320 |
| PDF Solutions, Inc. (a) | | 147,039 | | | | 2,294 |
| Q Cells AG | | 177,514 | | | | 16,383 |
| Rambus, Inc. (a) | | 425,000 | | | | 16,503 |
| Rudolph Technologies, Inc. (a) | | 1,055,664 | | | | 17,503 |
| Silicon Laboratories, Inc. (a) | | 306,500 | | | | 14,286 |
| Silicon On Insulator Technologies SA (SOITEC) (a)(d) | | 2,300,000 | | | | 75,069 |
| SiRF Technology Holdings, Inc. (a) | | 1,200,944 | | | | 41,012 |
| STATS ChipPAC Ltd. sponsored ADR (a)(d) | | 2,400,270 | | | | 20,426 |
| Tessera Technologies, Inc. (a) | | 475,000 | | | | 15,233 |
| | | | | | | 411,098 |
| Software 6.3% | | | | | | |
| Ansoft Corp. (a)(e) | | 850,539 | | | | 37,577 |
| Ansys, Inc. (a) | | 500,200 | | | | 28,236 |
See accompanying notes which are an integral part of the financial statements.
| Common Stocks continued | | | | | | |
| | | Shares | | Value (Note 1) |
| | | | | (000s) |
| |
| INFORMATION TECHNOLOGY — continued | | | | | | |
| Software — continued | | | | | | |
| ARINSO International NV (a) | | 8,300 | | | | $ 214 |
| Aspen Technology, Inc. (a) | | 1,400,900 | | | | 18,016 |
| Cognos, Inc. (a) | | 1,401,700 | | | | 52,232 |
| Fundtech Ltd. (a)(e) | | 1,450,800 | | | | 18,004 |
| Hyperion Solutions Corp. (a) | | 1,192,950 | | | | 36,528 |
| Informatica Corp. (a) | | 1,547,220 | | | | 23,781 |
| JDA Software Group, Inc. (a) | | 64,400 | | | | 880 |
| Moldflow Corp. (a)(e) | | 848,979 | | | | 11,971 |
| NAVTEQ Corp. (a) | | 630,400 | | | | 26,174 |
| Plato Learning, Inc. (a)(e) | | 2,366,970 | | | | 23,670 |
| Quality Systems, Inc. | | 242,157 | | | | 8,127 |
| The9 Ltd. sponsored ADR (a)(d) | | 650,000 | | | | 19,494 |
| Wind River Systems, Inc. (a) | | 1,738,698 | | | | 19,839 |
| | | | | | | 324,743 |
| |
| TOTAL INFORMATION TECHNOLOGY | | | | | | 1,845,893 |
| |
| MATERIALS 2.4% | | | | | | |
| Chemicals — 0.3% | | | | | | |
| Albemarle Corp. | | 358,300 | | | | 17,134 |
| Containers & Packaging — 1.7% | | | | | | |
| Myers Industries, Inc. | | 1,357,195 | | | | 24,022 |
| Owens Illinois, Inc. (a) | | 3,465,624 | | | | 63,352 |
| | | | | | | 87,374 |
| Metals & Mining — 0.4% | | | | | | |
| Oregon Steel Mills, Inc. (a) | | 399,633 | | | | 19,794 |
| |
| TOTAL MATERIALS | | | | | | 124,302 |
| |
| TOTAL COMMON STOCKS | | | | | | |
| (Cost $4,019,024) | | | | | | 5,049,760 |
| |
| Preferred Stocks 0.1% | | | | | | |
| |
| Convertible Preferred Stocks 0.1% | | | | | | |
| |
| HEALTH CARE — 0.1% | | | | | | |
| Biotechnology — 0.0% | | | | | | |
| Lifelink Monitoring Corp. Series A (a)(f) | | 1,421,380 | | | | 0 |
See accompanying notes which are an integral part of the financial statements.
17 Annual Report
| Investments continued | | | | | | | | |
| |
| |
| Preferred Stocks continued | | | | | | | | |
| | | | | Shares | | Value (Note 1) |
| | | | | | | (000s) |
| Convertible Preferred Stocks continued | | | | | | | | |
| |
| HEALTH CARE — continued | | | | | | | | |
| Health Care Providers & Services — 0.1% | | | | | | | | |
| LifeMasters Supported SelfCare, Inc. Series F (f) | | | | 461,818 | | | | $ 6,059 |
| Nonconvertible Preferred Stocks 0.0% | | | | | | | | |
| |
| HEALTH CARE — 0.0% | | | | | | | | |
| Biotechnology — 0.0% | | | | | | | | |
| GeneProt, Inc. Series A (a)(f) | | | | 43,000 | | | | 1 |
| TOTAL PREFERRED STOCKS | | | | | | | | |
| (Cost $11,345) | | | | | | | | 6,060 |
| Money Market Funds 4.8% | | | | | | | | |
| Fidelity Cash Central Fund, 4.8% (b) | | | | 164,776,051 | | | | 164,776 |
| Fidelity Securities Lending Cash Central Fund, | | | | | | | | |
| 4.83% (b)(c) | | | | 85,222,604 | | | | 85,223 |
| TOTAL MONEY MARKET FUNDS | | | | | | | | |
| (Cost $249,999) | | | | | | | | 249,999 |
| TOTAL INVESTMENT PORTFOLIO 102.8% | | | | | | | | |
| (Cost $4,280,368) | | | | | | 5,305,819 |
| |
| NET OTHER ASSETS — (2.8)% | | | | | | | | (146,901) |
| NET ASSETS 100% | | | | | | | | $ 5,158,918 |
Legend
(a) Non-income producing
(b) Affiliated fund that is available only to
investment companies and other
accounts managed by Fidelity
Investments. The rate quoted is the
annualized seven-day yield of the fund
at period end. A complete unaudited
listing of the fund’s holdings as of its
most recent quarter end is available
upon request.
(c) Investment made with cash collateral
received from securities on loan.
|
(d) Security or a portion of the security is on
loan at period end.
(e) Affiliated company
(f) Restricted securities — Investment in
securities not registered under the
Securities Act of 1933 (excluding 144A
issues). At the end of the period, the
value of restricted securities (excluding
144A issues) amounted to $14,141,000
or 0.3% of net assets.
|
See accompanying notes which are an integral part of the financial statements.
Annual Report 18
Additional information on each holding is as follows:
| | | Acquisition | | Acquisition |
| Security | | Date | | Cost (000s) |
| Gastar | | | | | | |
| Exploration Ltd. | | 6/13/05 | | | | $ 6,000 |
| GeneProt, Inc. | | | | | | |
| Series A | | 7/7/00 | | | | $ 234 |
| |
| Lifelink | | 11/28/00 - | | | | |
| Monitoring Corp. | | 11/14/02 | | | | |
| Series A | | | | | | $ 6,012 |
| LifeMasters | | | | | | |
| Supported | | | | | | |
| SelfCare, Inc. | | | | | | |
| Series F | | 6/24/02 | | | | $ 5,100 |
Affiliated Central Funds
Information regarding fiscal year to date income earned by the fund from the affiliated Central funds is as follows:
| Fund | | Income earned |
| | | (Amounts in thousands) |
| Fidelity Cash Central Fund | | | | $ 5,724 |
| Fidelity Securities Lending Cash Central Fund | | | | 4,099 |
| Total | | | | $ 9,823 |
Other Affiliated Issuers
An affiliated company is a company in which the fund has ownership of at least 5% of the voting securities. Fiscal year to date transactions with companies which are or were affiliates are as follows:
| | | Value, | | | | | | | | | | | | | | | | Value, |
| Affiliate | | beginning of | | | | | | | | Sales | | Dividend | | | | end of |
| (Amounts in thousands) | | period | | Purchases | | | | Proceeds | | Income | | | | period |
| A.O. Smith Corp. | | $ 43,625 | | $ | | — | | $ | | 50,008 | | $ | | 225 | | $ | | — |
| Air Methods Corp. | | 6,663 | | | | — | | | | 11,287 | | | | — | | | | — |
| Aladdin Knowledge | | | | | | | | | | | | | | | | | | |
| Systems Ltd | | — | | | | 17,500 | | | | — | | | | — | | | | 21,114 |
| America Service Group, | | | | | | | | | | | | | | | | | | |
| Inc. | | 14,792 | | | | 4,083 | | | | 11,989 | | | | — | | | | — |
| American Healthways, Inc. | | 100,897 | | | | 32,472 | | | | 40,143 | | | | — | | | | — |
| Amerigon, Inc. | | 4,508 | | | | 2,774 | | | | — | | | | — | | | | 11,857 |
| Ansoft Corp. | | 18,366 | | | | 13,997 | | | | 13,817 | | | | — | | | | 37,577 |
| Art Technology Group, Inc. | | — | | | | 12,111 | | | | 5,876 | | | | — | | | | — |
| Baldor Electric Co. | | 53,679 | | | | — | | | | 53,047 | | | | 502 | | | | — |
See accompanying notes which are an integral part of the financial statements.
19 Annual Report
| Investments continued | | | | | | | | | | | | | | |
| |
| |
| | | Value, | | | | | | | | | | | | | | Value, |
| Affiliate | | beginning of | | | | | | | | Sales | | Dividend | | | | end of |
| (Amounts in thousands) | | period | | Purchases | | | | Proceeds | | Income | | | | period |
| Bell Microproducts, Inc. | | $ 15,859 | | $ | | 8,040 | | $ | | 18,618 | | $ — | | | | $ — |
| Big 5 Sporting Goods | | | | | | | | | | | | | | | | |
| Corp. | | 22,449 | | | | 11,396 | | | | 5,594 | | 261 | | | | 22,701 |
| BioLase Technology, Inc. | | 6,666 | | | | 13,079 | | | | 9,559 | | 10 | | | | 15,395 |
| Blue Coat Systems, Inc. | | — | | | | 18,237 | | | | — | | — | | | | 17,386 |
| Bottomline Technologies, | | | | | | | | | | | | | | | | |
| Inc. | | 20,109 | | | | — | | | | 18,097 | | — | | | | — |
| California Micro Devices | | | | | | | | | | | | | | | | |
| Corp. | | 4,035 | | | | 8,584 | | | | 12,076 | | — | | | | — |
| Carriage Services, Inc. | | | | | | | | | | | | | | | | |
| Class A | | 3,839 | | | | 3,317 | | | | — | | — | | | | 5,559 |
| Cerner Corp. | | 150,409 | | | | 20,213 | | | | 186,855 | | — | | | | — |
| Cholestech Corp | | 13,838 | | | | 1,263 | | | | — | | — | | | | 18,884 |
| Collegiate Pacific, Inc. | | 5,036 | | | | — | | | | 5,737 | | 7 | | | | — |
| COM DEV International Ltd. | | 6,573 | | | | — | | | | 5,496 | | — | | | | — |
| Comfort Systems USA, Inc. | | 18,832 | | | | 655 | | | | 27,259 | | 68 | | | | — |
| Computer Horizons Corp. . | | 9,112 | | | | — | | | | 10,917 | | — | | | | — |
| Datamonitor PLC | | 17,707 | | | | 246 | | | | — | | 662 | | | | 42,125 |
| DATATRAK International, | | | | | | | | | | | | | | | | |
| Inc. | | 8,800 | | | | 1,672 | | | | 7,227 | | — | | | | — |
| Digital River, Inc. | | 14,455 | | | | 34,047 | | | | 46,811 | | — | | | | — |
| Dynamex, Inc. | | 14,658 | | | | — | | | | 12,545 | | — | | | | — |
| EVCI Career Colleges, Inc. | | 6,983 | | | | — | | | | 3,168 | | — | | | | — |
| Famous Dave’s of America, | | | | | | | | | | | | | | | | |
| Inc. | | 11,340 | | | | 12,292 | | | | 11,496 | | — | | | | 15,478 |
| Fundtech Ltd. | | 13,237 | | | | 1,277 | | | | — | | — | | | | 18,004 |
| Harris Interactive, Inc. | | 8,820 | | | | 5,539 | | | | — | | — | | | | 15,440 |
| HealthTronics, Inc. | | 24,169 | | | | — | | | | 20,046 | | — | | | | — |
| Imaging Dynamics Co. Ltd. | | — | | | | 11,699 | | | | — | | — | | | | 12,337 |
| Insight Enterprises, Inc | | — | | | | 54,034 | | | | — | | — | | | | 51,778 |
| Intelligroup, Inc | | 2,043 | | | | — | | | | 1,911 | | — | | | | — |
| Interface, Inc. Class A | | 9,443 | | | | 15,481 | | | | — | | — | | | | 38,329 |
| Jumbo SA | | 14,329 | | | | 32,654 | | | | — | | 407 | | | | 59,193 |
| KEMET Corp. | | 33,198 | | | | 11,511 | | | | 27,911 | | — | | | | — |
| Kforce, Inc. | | 7,074 | | | | 17,187 | | | | — | | — | | | | 32,516 |
| Lifetime Brands, Inc. | | — | | | | 18,410 | | | | 5,590 | | 177 | | | | 29,919 |
| Lionbridge Technologies, | | | | | | | | | | | | | | | | |
| Inc. | | 19,874 | | | | 13,584 | | | | 4,583 | | — | | | | 45,727 |
| Medialink Worldwide, Inc. | | 2,210 | | | | | | | | | | | | | | 2,469 |
| Midas, Inc. | | 17,488 | | | | — | | | | 15,497 | | — | | | | — |
| Mobility Electronics, Inc. | | 12,581 | | | | 10,114 | | | | 22,011 | | — | | | | — |
| Moldflow Corp. | | 8,513 | | | | 11,835 | | | | 8,824 | | — | | | | 11,971 |
| MSC.Software Corp. | | 16,968 | | | | — | | | | 25,388 | | — | | | | — |
| Myers Industries, Inc | | 14,313 | | | | 6,806 | | | | 9,573 | | 317 | | | | — |
| Myriad Genetics, Inc. | | 22,723 | | | | 18,500 | | | | 8,356 | | — | | | | — |
See accompanying notes which are an integral part of the financial statements.
| | | Value, | | | | | | | | | | | | Value, |
| Affiliate | | beginning of | | | | | | | | Sales | | Dividend | | end of |
| (Amounts in thousands) | | period | | Purchases | | | | Proceeds | | Income | | period |
| Ness Technologies, Inc. | | $ 13,172 | | | | $ 23,394 | | | | $ — | | $ — | | $ 42,144 |
| Nutraceutical International | | | | | | | | | | | | | | |
| Corp. | | 8,201 | | | | 749 | | | | 9,833 | | — | | — |
| Oplink Communications, | | | | | | | | | | | | | | |
| Inc. | | 9,089 | | | | 7,911 | | | | — | | — | | 28,220 |
| Patientline PLC | | 13,459 | | | | — | | | | 6,748 | | — | | — |
| PC Connection, Inc. | | 7,241 | | | | 3,894 | | | | — | | — | | 11,299 |
| Per Se Technologies, Inc. | | 40,640 | | | | 19,071 | | | | 10,372 | | | | 81,828 |
| Phase Forward, Inc. | | 16,244 | | | | 3,586 | | | | — | | — | | 45,799 |
| Plato Learning, Inc. | | 12,407 | | | | 5,861 | | | | — | | — | | 23,670 |
| Priority Healthcare Corp. | | | | | | | | | | | | | | |
| Class B | | 99,379 | | | | — | | | | 113,474 | | — | | — |
| Providence Service Corp. . | | 20,405 | | | | 2,201 | | | | 2,037 | | | | 24,797 |
| Quixote Corp. | | 11,397 | | | | 6,711 | | | | — | | 218 | | 17,994 |
| Regeneration Technologies, | | | | | | | | | | | | | | |
| Inc. | | 13,779 | | | | 10,307 | | | | | | | | 21,984 |
| Safeguard Scientifics, Inc. . | | — | | | | 16,345 | | | | — | | — | | 23,190 |
| Salem Communications | | | | | | | | | | | | | | |
| Corp. Class A | | 17,410 | | | | 1,152 | | | | — | | — | | 14,760 |
| Sapient Corp. | | — | | | | 43,338 | | | | 32,094 | | — | | — |
| SI International, Inc. | | 8,590 | | | | 8,514 | | | | — | | — | | 22,763 |
| SYNNEX Corp | | 15,736 | | | | 10,522 | | | | 961 | | — | | 30,426 |
| Team, Inc. | | — | | | | 15,646 | | | | — | | — | | 18,724 |
| The Children’s Place Retail | | | | | | | | | | | | | | |
| Stores, Inc. | | 16,819 | | | | 117,207 | | | | 4,219 | | — | | 171,773 |
| The Pep Boys — Manny, | | | | | | | | | | | | | | |
| Moe & Jack | | 82,242 | | | | 14,771 | | | | 89,077 | | 250 | | — |
| TTM Technologies, Inc. | | 20,770 | | | | 13,704 | | | | — | | — | | 61,872 |
| Visual Networks, Inc. | | 3,152 | | | | — | | | | 3,071 | | — | | — |
| XP Power PLC | | 7,725 | | | | — | | | | 7,823 | | 125 | | — |
| Xyratex Ltd. | | 15,345 | | | | 14,174 | | | | — | | — | | 56,810 |
| TOTALS | | $ 1,273,415 | | | | $ 783,667 | | | | $ 997,021 | | $ 3,229 | | $1,223,812 |
See accompanying notes which are an integral part of the financial statements.
21 Annual Report
Investments continued
Other Information
Distribution of investments by country of issue, as a percentage of total net assets, is as follows:
| United States of America | | 79.4% |
| Canada | | 3.7% |
| Bermuda | | 2.5% |
| United Kingdom | | 2.4% |
| Netherlands | | 2.2% |
| France | | 1.9% |
| Germany | | 1.8% |
| Greece | | 1.7% |
| Israel | | 1.3% |
| Others (individually less than 1%) . | | 3.1% |
| | | 100.0% |
See accompanying notes which are an integral part of the financial statements.
| Financial Statements | | | | | | | | |
| |
| Statement of Assets and Liabilities | | | | | | | | |
| Amounts in thousands (except per share amount) | | | | | | | | April 30, 2006 |
| |
| Assets | | | | | | | | |
| Investment in securities, at value (including securities | | | | | | | | |
| loaned of $81,978) See accompanying schedule: | | | | | | | | |
| Unaffiliated issuers (cost $3,079,892) | | | | $ 3,832,008 | | | | |
| Affiliated Central Funds (cost $249,999) | | | | 249,999 | | | | |
| Other affiliated issuers (cost $950,477) | | | | 1,223,812 | | | | |
| Total Investments (cost $4,280,368) | | | | | | | | $ 5,305,819 |
| Cash | | | | | | | | 40 |
| Receivable for investments sold | | | | | | | | 37,960 |
| Receivable for fund shares sold | | | | | | | | 9,692 |
| Dividends receivable | | | | | | | | 978 |
| Interest receivable | | | | | | | | 907 |
| Prepaid expenses | | | | | | | | 13 |
| Other affiliated receivables | | | | | | | | 2 |
| Other receivables | | | | | | | | 632 |
| Total assets | | | | | | | | 5,356,043 |
| |
| Liabilities | | | | | | | | |
| Payable to custodian bank | | | | $ 1,790 | | | | |
| Payable for investments purchased | | | | 101,663 | | | | |
| Payable for fund shares redeemed | | | | 3,644 | | | | |
| Accrued management fee | | | | 3,487 | | | | |
| Other affiliated payables | | | | 1,030 | | | | |
| Other payables and accrued expenses | | | | 288 | | | | |
| Collateral on securities loaned, at value | | | | 85,223 | | | | |
| Total liabilities | | | | | | | | 197,125 |
| |
| Net Assets | | | | | | | | $ 5,158,918 |
| Net Assets consist of: | | | | | | | | |
| Paid in capital | | | | | | | | $ 3,817,547 |
| Undistributed net investment income | | | | | | | | 232 |
| Accumulated undistributed net realized gain (loss) on | | | | | | | | |
| investments and foreign currency transactions | | | | | | | | 315,721 |
| Net unrealized appreciation (depreciation) on | | | | | | | | |
| investments and assets and liabilities in foreign | | | | | | | | |
| currencies | | | | | | | | 1,025,418 |
| Net Assets, for 245,406 shares outstanding | | | | | | | | $ 5,158,918 |
| Net Asset Value, offering price and redemption price per | | | | | | | | |
| share ($5,158,918 ÷ 245,406 shares) | | | | | | | | $ 21.02 |
See accompanying notes which are an integral part of the financial statements.
23 Annual Report
| Financial Statements continued | | | | | | |
| |
| |
| Statement of Operations | | | | | | |
| Amounts in thousands | | | | Year ended April 30, 2006 |
| |
| Investment Income | | | | | | |
| Dividends (including $3,229 received from other | | | | | | |
| affiliated issuers) | | | | | | $ 20,256 |
| Interest | | | | | | 137 |
| Income from affiliated Central Funds (including $4,099 | | | | | | |
| from security lending) | | | | | | 9,823 |
| Total income | | | | | | 30,216 |
| |
| Expenses | | | | | | |
| Management fee | | | | | | |
| Basic fee | | | | $ 31,437 | | |
| Performance adjustment | | | | (1,236) | | |
| Transfer agent fees | | | | 10,451 | | |
| Accounting and security lending fees | | | | 1,051 | | |
| Independent trustees’ compensation | | | | 18 | | |
| Custodian fees and expenses | | | | 536 | | |
| Registration fees | | | | 115 | | |
| Audit | | | | 68 | | |
| Legal | | | | 26 | | |
| Miscellaneous | | | | 209 | | |
| Total expenses before reductions | | | | 42,675 | | |
| Expense reductions | | | | (2,221) | | 40,454 |
| |
| Net investment income (loss) | | | | | | (10,238) |
| Realized and Unrealized Gain (Loss) | | | | | | |
| Net realized gain (loss) on: | | | | | | |
| Investment securities: | | | | | | |
| Unaffiliated issuers | | | | 414,473 | | |
| Other affiliated issuers | | | | 72,926 | | |
| Foreign currency transactions | | | | (96) | | |
| Total net realized gain (loss) | | | | | | 487,303 |
| Change in net unrealized appreciation (depreciation) on: | | | | | | |
| Investment securities | | | | 821,489 | | |
| Assets and liabilities in foreign currencies | | | | (22) | | |
| Total change in net unrealized appreciation | | | | | | |
| (depreciation) | | | | | | 821,467 |
| Net gain (loss) | | | | | | 1,308,770 |
| Net increase (decrease) in net assets resulting from | | | | | | |
| operations | | | | | | $ 1,298,532 |
See accompanying notes which are an integral part of the financial statements.
| Statement of Changes in Net Assets | | | | | | | | |
| | | | | Year ended | | | | Year ended |
| | | | | April 30, | | | | April 30, |
| Amounts in thousands | | | | 2006 | | | | 2005 |
| Increase (Decrease) in Net Assets | | | | | | | | |
| Operations | | | | | | | | |
| Net investment income (loss) | | | | $ (10,238) | | | | $ (8,557) |
| Net realized gain (loss) | | | | 487,303 | | | | 306,144 |
| Change in net unrealized appreciation (depreciation) . | | | | 821,467 | | | | (155,919) |
| Net increase (decrease) in net assets resulting | | | | | | | | |
| from operations | | | | 1,298,532 | | | | 141,668 |
| Distributions to shareholders from net realized gain | | | | (290,312) | | | | (273,944) |
| Share transactions | | | | | | | | |
| Proceeds from sales of shares | | | | 1,030,821 | | | | 1,659,700 |
| Reinvestment of distributions | | | | 283,033 | | | | 265,060 |
| Cost of shares redeemed | | | | (1,157,980) | | | | (1,118,813) |
| Net increase (decrease) in net assets resulting from | | | | | | | | |
| share transactions | | | | 155,874 | | | | 805,947 |
| Redemption fees | | | | 877 | | | | 1,190 |
| Total increase (decrease) in net assets | | | | 1,164,971 | | | | 674,861 |
| |
| Net Assets | | | | | | | | |
| Beginning of period | | | | 3,993,947 | | | | 3,319,086 |
| End of period (including undistributed net investment | | | | | | | | |
| income of $232 and $232, respectively) | | | | $ 5,158,918 | | | | $ 3,993,947 |
| |
| Other Information | | | | | | | | |
| Shares | | | | | | | | |
| Sold | | | | 54,010 | | | | 95,502 |
| Issued in reinvestment of distributions | | | | 16,025 | | | | 15,391 |
| Redeemed | | | | (63,191) | | | | (64,652) |
| Net increase (decrease) | | | | 6,844 | | | | 46,241 |
See accompanying notes which are an integral part of the financial statements.
25 Annual Report
| Financial Highlights | | | | | | | | | | |
| |
| Years ended April 30, | | 2006 | | 2005 | | 2004 | | 2003 | | 2002 |
| Selected Per Share Data | | | | | | | | | | |
| Net asset value, beginning of | | | | | | | | | | |
| period | | $ 16.74 | | $ 17.26 | | $ 11.86 | | $ 15.11 | | $ 13.16 |
| Income from Investment | | | | | | | | | | |
| Operations | | | | | | | | | | |
| Net investment income (loss)B | | (.04) | | (.04) | | (.05)C | | .01 | | .03 |
| Net realized and unrealized | | | | | | | | | | |
| gain (loss) | | 5.58 | | .84 | | 5.51 | | (2.98) | | 1.91 |
| Total from investment | | | | | | | | | | |
| operations | | 5.54 | | .80 | | 5.46 | | (2.97) | | 1.94 |
| Distributions from net investment | | | | | | | | | | |
| income | | — | | — | | — | | — | | (.02) |
| Distributions from net realized | | | | | | | | | | |
| gain | | (1.26) | | (1.33) | | (.07) | | (.31) | | — |
| Total distributions | | (1.26) | | (1.33) | | (.07) | | (.31) | | (.02) |
| Redemption fees added to paid | | | | | | | | | | |
| in capitalB | | —E | | .01 | | .01 | | .03 | | .03 |
| Net asset value, end of period . | | $ 21.02 | | $ 16.74 | | $ 17.26 | | $ 11.86 | | $ 15.11 |
| Total ReturnA | | 34.68% | | 4.63% | | 46.15% | | (19.78)% | | 14.98% |
| Ratios to Average Net AssetsD | | | | | | | | | | |
| Expenses before reductions | | 98% | | 1.07% | | 1.13% | | 1.20% | | 1.12% |
| Expenses net of fee waivers, if | | | | | | | | | | |
| any | | 98% | | 1.07% | | 1.13% | | 1.20% | | 1.12% |
| Expenses net of all reductions | | .93% | | 1.00% | | 1.08% | | 1.10% | | 1.07% |
| Net investment income (loss) . | | (.23)% | | (.23)% | | (.34)% | | .05% | | .24% |
| Supplemental Data | | | | | | | | | | |
| Net assets, end of period (in | | | | | | | | | | |
| millions) | | $ 5,159 | | $ 3,994 | | $ 3,319 | | $ 1,413 | | $ 1,754 |
| Portfolio turnover rate | | 107% | | 99% | | 96% | | 116% | | 132% |
A Total returns would have been lower had certain expenses not been reduced during the periods shown.
B Calculated based on average shares outstanding during the period.
C Investment income per share reflects a special dividend which amounted to $.01 per share.
D Expense ratios reflect operating expenses of the fund. Expenses before reductions do not reflect amounts reimbursed by the investment adviser or
reductions from brokerage service arrangements or other expense offset arrangements and do not represent the amount paid by the fund during
periods when reimbursements or reductions occur. Expenses net of fee waivers reflect expenses after reimbursement by the investment adviser but
prior to reductions from brokerage service arrangements or other expense offset arrangements. Expenses net of all reductions represent the net
expenses paid by the fund.
E Amount represents less than $.01 per share.
|
See accompanying notes which are an integral part of the financial statements.
Notes to Financial Statements
For the period ended April 30, 2006
(Amounts in thousands except ratios)
|
1. Significant Accounting Policies.
Fidelity Small Cap Stock Fund (the fund) is a fund of Fidelity Commonwealth Trust (the trust) and is authorized to issue an unlimited number of shares. Effective the close of business on June 16, 2006, the fund was closed to most new accounts. The trust is registered under the Investment Company Act of 1940, as amended (the 1940 Act), as an open end management investment company organized as a Massachusetts business trust. The fund may invest in affiliated money market central funds (Money Market Central Funds), which are open end investment companies available to investment companies and other accounts managed by Fidelity Management & Research Company (FMR) and its affiliates. The financial statements have been prepared in conformity with accounting principles generally accepted in the United States of America, which require management to make certain estimates and assumptions at the date of the financial statements. The following summarizes the significant accounting policies of the fund:
Security Valuation. Investments are valued and net asset value (NAV) per share is calculated (NAV calculation) as of the close of business of the New York Stock Exchange (NYSE), normally 4:00 p.m. Eastern time. Wherever possible, the fund uses independent pricing services approved by the Board of Trustees to value its investments.
Equity securities, including restricted securities, for which market quotations are readily available, are valued at the last reported sale price or official closing price as reported by an independent pricing service on the primary market or exchange on which they are traded. In the event there were no sales during the day or closing prices are not available, securities are valued at the last quoted bid price. Investments in open end mutual funds, are valued at their closing net asset value each business day. Short term securities with remaining maturities of sixty days or less for which quotations are not readily available are valued at amortized cost, which approximates value.
When current market prices or quotations are not readily available or do not accurately reflect fair value, valuations may be determined in accordance with procedures adopted by the Board of Trustees. For example, when developments occur between the close of a market and the close of the NYSE that may materially affect the value of some or all of the securities, or when trading in a security is halted, those securities may be fair valued. Factors used in the determination of fair value may include monitoring news to identify significant market or security specific events such as changes in the value of U.S. securi ties markets, reviewing developments in foreign markets and evaluating the perfor mance of ADRs, futures contracts and exchange traded funds. Because the fund’s utilization of fair value pricing depends on market activity, the frequency with which fair value pricing is used can not be predicted and may be utilized to a significant extent. The value of securities used for NAV calculation under fair value pricing may differ from published prices for the same securities.
27 Annual Report
| Notes to Financial Statements continued |
| (Amounts in thousands except ratios) |
| |
| 1. Significant Accounting Policies continued |
Foreign Currency. The fund uses foreign currency contracts to facilitate transactions in foreign denominated securities. Losses from these transactions may arise from changes in the value of the foreign currency or if the counterparties do not perform under the contracts’ terms.
Foreign denominated assets, including investment securities, and liabilities are trans lated into U.S. dollars at the exchange rate at period end. Purchases and sales of invest ment securities, income and dividends received and expenses denominated in foreign currencies are translated into U.S. dollars at the exchange rate in effect on the transac tion date.
The effects of exchange rate fluctuations on investments are included with the net realized and unrealized gain (loss) on investment securities. Other foreign currency transactions resulting in realized and unrealized gain (loss) are disclosed separately.
Investment Transactions and Income. Security transactions are accounted for as of trade date. Gains and losses on securities sold are determined on the basis of identified cost and may include proceeds received from litigation. Dividend income is recorded on the ex dividend date, except for certain dividends from foreign securities where the ex dividend date may have passed, which are recorded as soon as the fund is informed of the ex dividend date. Non cash dividends included in dividend income, if any, are recorded at the fair market value of the securities received. Distributions received on securities that represent a return of capital or capital gain are recorded as a reduction of cost of investments and/or as a realized gain. The fund estimates the components of distributions received that may be considered return of capital distributions or capital gain distributions. Interest income is accrued as earned. Interest income includes coupon interest and amortization of premium and accretion of discount on debt securi ties. Investment income is recorded net of foreign taxes withheld where recovery of such taxes is uncertain.
Expenses. Most expenses of the trust can be directly attributed to a fund. Expenses which cannot be directly attributed are apportioned among each fund in the trust.
Income Tax Information and Distributions to Shareholders. Each year, the fund intends to qualify as a regulated investment company by distributing all of its taxable income and realized gains under Subchapter M of the Internal Revenue Code. As a result, no provision for income taxes is required in the accompanying financial statements. Foreign taxes are provided for based on the fund’s understanding of the tax rules and rates that exist in the foreign markets in which it invests.
| 1. Significant Accounting Policies continued | | |
Income Tax Information and Distributions to Shareholders continued |
Distributions are recorded on the ex dividend date. Income and capital gain distribu tions are determined in accordance with income tax regulations, which may differ from generally accepted accounting principles. In addition, the fund will claim a portion of the payment made to redeeming shareholders as a distribution for income tax purposes.
Capital accounts within the financial statements are adjusted for permanent book tax differences. These adjustments have no impact on net assets or the results of operations. Temporary book tax differences will reverse in a subsequent period.
Book tax differences are primarily due to foreign currency transactions, net operating losses and losses deferred due to wash sales.
The tax basis components of distributable earnings and the federal tax cost as of period end were as follows:
| Unrealized appreciation | | | | | | | | $ 1,162,067 |
| Unrealized depreciation | | | | | | | | (149,361) |
| Net unrealized appreciation (depreciation) | | | | | | | | 1,012,706 |
| Undistributed ordinary income | | | | | | | | 67,473 |
| Undistributed long term capital gain | | | | | | | | 243,396 |
| |
| Cost for federal income tax purposes | | | | | | | | $ 4,293,113 |
| |
The tax character of distributions paid was as follows:
| | | | |
| | | | | April 30, 2006 | | | | April 30, 2005 |
| Ordinary Income | | | | $ — | | | | $ 106,993 |
| Long term Capital Gains | | | | 290,312 | | | | 166,951 |
| Total | | | | $ 290,312 | | | | $ 273,944 |
Short Term Trading (Redemption) Fees. Shares held in the fund less than 90 days are subject to a redemption fee equal to 2.00% of the proceeds of the redeemed shares. All redemption fees, including any estimated redemption fees paid by FMR, are retained by the fund and accounted for as an addition to paid in capital.
Repurchase Agreements. FMR has received an Exemptive Order from the Securities and Exchange Commission (the SEC) which permits the fund and other affiliated entities of FMR to transfer uninvested cash balances into joint trading accounts which are then invested in repurchase agreements. The fund may also invest directly with
29 Annual Report
| Notes to Financial Statements continued |
| (Amounts in thousands except ratios) | | |
2. Operating Policies continued
Repurchase Agreements continued
institutions in repurchase agreements. Repurchase agreements are collateralized by government or non government securities. Upon settlement date, collateral is held in segregated accounts with custodian banks and may be obtained in the event of a default of the counterparty. The fund monitors, on a daily basis, the value of the collateral to ensure it is at least equal to the principal amount of the repurchase agreement (includ ing accrued interest). In the event of a default by the counterparty, realization of the collateral proceeds could be delayed, during which time the value of the collateral may decline.
Restricted Securities. The fund may invest in securities that are subject to legal or contractual restrictions on resale. These securities generally may be resold in transac tions exempt from registration or to the public if the securities are registered. Disposal of these securities may involve time consuming negotiations and expense, and prompt sale at an acceptable price may be difficult. Information regarding restricted securities is included at the end of the fund’s Schedule of Investments.
3. Purchases and Sales of Investments.
Purchases and sales of securities, other than short term securities, aggregated $4,573,151 and $4,705,430, respectively.
4. Fees and Other Transactions with Affiliates.
Management Fee. FMR and its affiliates provide the fund with investment manage ment related services for which the fund pays a monthly management fee. The manage ment fee is the sum of an individual fund fee rate that is based on an annual rate of .45% of the fund’s average net assets and a group fee rate that averaged .27% during the period. The group fee rate is based upon the average net assets of all the mutual funds advised by FMR. The group fee rate decreases as assets under management increase and increases as assets under management decrease. In addition, the management fee is subject to a performance adjustment (up to a maximum of .20% of the fund’s average net assets over a 36 month performance period). The upward or downward adjustment to the management fee is based on the fund’s relative investment performance as compared to an appropriate benchmark index. For the period, the total annual management fee rate, including the performance adjustment, was .69% of the fund’s average net assets.
4. Fees and Other Transactions with Affiliates continued
Transfer Agent Fees. Fidelity Service Company, Inc. (FSC), an affiliate of FMR, is the fund’s transfer, dividend disbursing and shareholder servicing agent. FSC receives account fees and asset based fees that vary according to account size and type of ac count. FSC pays for typesetting, printing and mailing of shareholder reports, except proxy statements. For the period, the transfer agent fees were equivalent to an annual rate of .24% of average net assets.
Accounting and Security Lending Fees. FSC maintains the fund’s accounting rec ords. The accounting fee is based on the level of average net assets for the month. Under a separate contract, FSC administers the security lending program. The security lending fee is based on the number and duration of lending transactions.
Affiliated Central Funds. The fund may invest in Money Market Central Funds which seek preservation of capital and current income and are managed by Fidelity Invest ments Money Management, Inc. (FIMM), an affiliate of FMR.
The Money Market Central Funds do not pay a management fee.
Brokerage Commissions. The fund placed a portion of its portfolio transactions with brokerage firms which are affiliates of the investment adviser. The commissions paid to these affiliated firms were $195 for the period.
5. Committed Line of Credit.
|
The fund participates with other funds managed by FMR in a $4.2 billion credit facility (the “line of credit”) to be utilized for temporary or emergency purposes to fund share holder redemptions or for other short term liquidity purposes. The fund has agreed to pay commitment fees on its pro rata portion of the line of credit, which amounts to $13 and is reflected in Miscellaneous Expense on the Statement of Operations. During the period, there were no borrowings on this line of credit.
The fund lends portfolio securities from time to time in order to earn additional income. On the settlement date of the loan, the fund receives collateral (in the form of U.S. Treasury obligations, letters of credit and/or cash) against the loaned securities and maintains collateral in an amount not less than 100% of the market value of the loaned securities during the period of the loan. The market value of the loaned securities is determined at the close of business of the fund and any additional required collateral is delivered to the fund on the next business day. If the borrower defaults on its obligation to return the securities loaned because of insolvency or other reasons, a fund could experience delays and costs in recovering the securities loaned or in gaining access to the collateral. Any cash collateral received is invested in the Fidelity Securities Lending
31 Annual Report
| Notes to Financial Statements continued |
| (Amounts in thousands except ratios) |
| |
| 6. Security Lending continued |
Cash Central Fund. The value of loaned securities and cash collateral at period end are disclosed on the fund’s Statement of Assets and Liabilities. Security lending income represents the income earned on investing cash collateral, less fees and expenses associated with the loan, plus any premium payments that may be received on the loan of certain types of securities.
Many of the brokers with whom FMR places trades on behalf of the fund provided services to the fund in addition to trade execution. These services included payments of certain expenses on behalf of the fund totaling $2,063 for the period. In addition, through arrangements with the fund’s custodian and transfer agent, credits realized as a result of uninvested cash balances were used to reduce the fund’s expenses. During the period, these credits reduced the fund’s custody and transfer agent expenses by $37 and $121, respectively.
The fund’s organizational documents provide former and current trustees and officers with a limited indemnification against liabilities arising in connection with the performance of their duties to the fund. In the normal course of business, the fund may also enter into contracts that provide general indemnifications. The fund’s maximum exposure under these arrangements is unknown as this would be dependent on future claims that may be made against the fund. The risk of material loss from such claims is considered remote.
Report of Independent Registered Public Accounting Firm
To the Trustees of Fidelity Commonwealth Trust and Shareholders of Fidelity Small Cap Stock Fund:
We have audited the accompanying statement of assets and liabilities of Fidelity Small Cap Stock Fund (the Fund), a fund of Fidelity Commonwealth Trust, including the schedule of investments as of April 30, 2006, and the related statement of operations for the year then ended, the statement of changes in net assets for each of the two years in the period then ended, and the financial highlights for each of the five years in the period then ended. These financial statements and financial highlights are the responsibility of the Fund’s management. Our responsibility is to express an opinion on these financial statements and financial highlights based on our audits.
We conducted our audits in accordance with standards of the Public Company Accounting Oversight Board (United States). Those standards require that we plan and perform the audit to obtain reasonable assurance about whether the financial statements and financial highlights are free of material misstatement. The Fund is not required to have, nor were we engaged to perform, an audit of its internal control over financial reporting. Our audits included consideration of internal control over financial reporting as a basis for designing audit procedures that are appropriate in the circumstances, but not for the purpose of expressing an opinion on the effectiveness of the Fund’s internal control over financial reporting. Accordingly, we express no such opinion. An audit also includes examining, on a test basis, evidence supporting the amounts and disclosures in the financial statements, assessing the accounting principles used and significant estimates made by management, as well as evaluating the overall financial statement presentation. Our procedures in cluded confirmation of securities owned as of April 30, 2006, by correspondence with the custodians and brokers; where replies were not received from brokers, we performed other auditing procedures. We believe that our audits provide a reasonable basis for our opinion.
In our opinion, the financial statements and financial highlights referred to above present fairly, in all material respects, the financial position of Fidelity Small Cap Stock Fund as of April 30, 2006, the results of its operations for the year then ended, the changes in its net assets for each of the two years in the period then ended, and its financial highlights for each of the five years in the period then ended, in conformity with accounting principles generally accepted in the United States of America.
/s/ Deloitte & Touche LLP
DELOITTE & TOUCHE LLP
Boston, Massachusetts
June 16, 2006
|
33 Annual Report
Trustees and Officers
The Trustees, Members of the Advisory Board, and executive officers of the trust and fund, as applicable, are listed below. The Board of Trustees governs the fund and is responsible for protecting the interests of shareholders. The Trustees are experienced executives who meet periodically throughout the year to oversee the fund’s activities, review contractual arrangements with companies that provide services to the fund, and review the fund’s performance. Except for William O. McCoy and Albert R. Gamper, Jr., each of the Trustees oversees 335 funds advised by FMR or an affiliate. Mr. McCoy oversees 337 funds advised by FMR or an affiliate. Mr. Gamper oversees 280 funds advised by FMR or an affiliate.
The Trustees hold office without limit in time except that (a) any Trustee may resign; (b) any Trustee may be removed by written instrument, signed by at least two thirds of the number of Trustees prior to such removal; (c) any Trustee who requests to be retired or who has become incapacitated by illness or injury may be retired by written instru ment signed by a majority of the other Trustees; and (d) any Trustee may be removed at any special meeting of shareholders by a two thirds vote of the outstanding voting securities of the trust. Each Trustee who is not an interested person (as defined in the 1940 Act) (Independent Trustee), shall retire not later than the last day of the calendar year in which his or her 72nd birthday occurs. The Independent Trustees may waive this mandatory retirement age policy with respect to individual Trustees. The executive officers and Advisory Board Members hold office without limit in time, except that any officer and Advisory Board Member may resign or may be removed by a vote of a majority of the Trustees at any regular meeting or any special meeting of the Trustees. Except as indicated, each individual has held the office shown or other offices in the same company for the past five years.
The fund’s Statement of Additional Information (SAI) includes more information about the Trustees. To request a free copy, call Fidelity at 1-800-544-8544.
Correspondence intended for each Trustee who is an interested person may be sent to Fidelity Investments, 82 Devonshire Street, Boston, Massachusetts 02109.
| | Name, Age; Principal Occupation
Edward C. Johnson 3d (75)
|
Year of Election or Appointment: 1974
Mr. Johnson is Chairman of the Board of Trustees. Mr. Johnson serves as President (2006 present), Chief Executive Officer, Chairman, and a Director of FMR Corp.; Chairman and a Director of FMR; Chairman and a Director of Fidelity Research & Analysis Company (FRAC); Chairman and a Director of Fidelity Investments Money Management, Inc.; and Chairman (2001 present) and a Director (1999 present) of FMR Co., Inc. In addition, Mr. Johnson serves as Chairman and Director of Fidelity International Limited (FIL).
| | Name, Age; Principal Occupation
Stephen P. Jonas (53)
|
Year of Election or Appointment: 2005
Mr. Jonas is Senior Vice President of Small Cap Stock (2005 present). He also serves as Senior Vice President of other Fidelity funds (2005 present). Mr. Jonas is Executive Director of FMR (2005 present) and FMR Co., Inc. (2005 present). He also serves as a Director of Fidelity Investments Money Management, Inc. (2005 present) and FMR Corp. (2003 present). Previously, Mr. Jonas served as President of Fidelity Enterprise Operations and Risk Services (2004 2005), Chief Administrative Officer (2002 2004), and Chief Financial Officer of FMR Corp. (1998 2002). In addition, he serves on the Boards of Boston Ballet (2003 present) and Simmons College (2003 present).
Year of Election or Appointment: 2003
Mr. Reynolds is President and a Director of FMR (2005 present), Fidelity Investments Money Management, Inc. (2005 present), and FMR Co., Inc. (2005 present). Mr. Reynolds also serves as a Director (2003 present) and Chief Operating Officer (2000 present) of FMR Corp. and a Director of Strategic Advisers, Inc. (2005 present). He also serves on the Board at Fidelity Investments Canada, Ltd. (2000 present). Previously, Mr. Reynolds served as President of Fidelity Investments Institutional Retirement Group (1996 2000).
* Trustees have been determined to be “Interested Trustees” by virtue of, among other things, their affiliation with the trust or various entities under common control with FMR.
35 Annual Report
Trustees and Officers - continued
Independent Trustees:
Correspondence intended for each Independent Trustee (that is, the Trustees other than the Interested Trustees) may be sent to Fidelity Investments, P.O. Box 55235, Boston, Massachusetts 02205-5235.
| | Name, Age; Principal Occupation
Dennis J. Dirks (57)
|
Year of Election or Appointment: 2005
Prior to his retirement in May 2003, Mr. Dirks was Chief Operating Officer and a member of the Board of The Depository Trust & Clearing Corporation (DTCC) (1999 2003). He also served as President, Chief Operating Officer, and Board member of The Depository Trust Company (DTC) (1999 2003) and President and Board member of the National Securities Clearing Corporation (NSCC) (1999 2003). In addition, Mr. Dirks served as Chief Executive Officer and Board member of the Government Securities Clearing Corporation (2001 2003) and Chief Executive Officer and Board member of the Mortgage Backed Securities Clearing Corporation (2001 2003). Mr. Dirks also serves as a Trustee and a member of the Finance Committee of Manhattan College (2005 present) and a Trustee and a member of the Finance Committee of AHRC of Nassau County (2006 present).
| | Albert R. Gamper, Jr. (64)
|
Year of Election or Appointment: 2006
Mr. Gamper also serves as a Trustee (2006 present) or Member of the Advisory Board (2005 present) of other investment companies advised by FMR. Prior to his retirement in December 2004, Mr. Gamper served as Chairman of the Board of CIT Group Inc. (commercial finance). During his tenure with CIT Group Inc. Mr. Gamper served in numerous senior management positions, including Chairman (1987 1989; 1999 2001; 2002 2004), Chief Executive Officer (1987 2004), and President (1989 2002). He currently serves as a member of the Board of Directors of Public Service Enterprise Group (utilities, 2001 present), Chairman of the Board of Governors, Rutgers University (2004 present), and Chairman of the Board of Saint Barnabas Health Care System.
Name, Age; Principal Occupation
Robert M. Gates (62)
|
Year of Election or Appointment: 1997
Dr. Gates is Chairman of the Independent Trustees (2006 present). Dr. Gates is President of Texas A&M University (2002 present). He was Director of the Central Intelligence Agency (CIA) from 1991 to 1993. From 1989 to 1991, Dr. Gates served as Assistant to the President of the United States and Deputy National Security Advisor. Dr. Gates is a Director of NACCO Industries, Inc. (mining and manufacturing), Parker Drilling Co., Inc. (drilling and rental tools for the energy industry, 2001 present), and Brinker International (restaurant management, 2003 present). Previously, Dr. Gates served as a Director of LucasVarity PLC (automotive components and diesel engines), a Director of TRW Inc. (automotive, space, defense, and information technology), and Dean of the George Bush School of Government and Public Service at Texas A&M University (1999 2001).
Year of Election or Appointment: 2004
Dr. Heilmeier is Chairman Emeritus of Telcordia Technologies (communication software and systems), where prior to his retirement, he served as company Chairman and Chief Executive Officer. He currently serves on the Boards of Directors of The Mitre Corporation (systems engineering and information technology support for the government), and HRL Laboratories (private research and development, 2004 present). He is Chairman of the General Motors Science & Technology Advisory Board and a Life Fellow of the Institute of Electrical and Electronics Engineers (IEEE). Dr. Heilmeier is a member of the Defense Science Board and the National Security Agency Advisory Board. He is also a member of the National Academy of Engineering, the American Academy of Arts and Sciences, and the Board of Overseers of the School of Engineering and Applied Science of the University of Pennsylvania. Previously, Dr. Heilmeier served as a Director of TRW Inc. (automotive, space, defense, and information technology, 1992 2002), Compaq (1994 2002), Automatic Data Processing, Inc. (ADP) (technology based business outsourcing, 1995 2002), INET Technologies Inc. (telecommunications network surveillance, 2001 2004), and Teletech Holdings (customer management services). He is the recipient of the 2005 Kyoto Prize in Advanced Technology for his invention of the liquid crystal display.
37 Annual Report
Trustees and Officers - continued
| | Name, Age; Principal Occupation
Marie L. Knowles (59)
|
Year of Election or Appointment: 2001
Prior to Ms. Knowles’ retirement in June 2000, she served as Executive Vice President and Chief Financial Officer of Atlantic Richfield Company (ARCO) (diversified energy, 1996 2000). From 1993 to 1996, she was a Senior Vice President of ARCO and President of ARCO Transportation Company. She served as a Director of ARCO from 1996 to 1998. She currently serves as a Director of Phelps Dodge Corporation (copper mining and manufacturing) and McKesson Corporation (healthcare ser vice, 2002 present). Ms. Knowles is a Trustee of the Brookings Institution and the Catalina Island Conservancy and also serves as a member of the Advisory Board for the School of Engineering of the University of Southern California.
Year of Election or Appointment: 2000
Mr. Lautenbach has been a partner of Clayton, Dubilier & Rice, Inc. (private equity investment firm) since September 1998. Previously, Mr. Lautenbach was with the International Business Machines Corporation (IBM) from 1968 until his retirement in 1998. Mr. Lautenbach serves as a Director of Italtel Holding S.p.A. (telecommunications (Milan, Italy), 2004 present) and Eaton Corporation (diversified industrial) as well as the Philharmonic Center for the Arts in Naples, Florida. He also is a member of the Board of Trustees of Fairfield University (2005 present), as well as a member of the Council on Foreign Relations.
Year of Election or Appointment: 1997
Prior to his retirement in December 1994, Mr. McCoy was Vice Chair man of the Board of BellSouth Corporation (telecommunications) and President of BellSouth Enterprises. He is currently a Director of Duke Realty Corporation (real estate). He is also a partner of Franklin Street Partners (private investment management firm). In addition, Mr. McCoy served as the Interim Chancellor (1999 2000) and a member of the Board of Visitors for the University of North Carolina at Chapel Hill and currently serves as Chairman of the Board of Directors of the University of North Carolina Health Care System. He also served as Vice President of Finance for the University of North Carolina (16 school system).
Name, Age; Principal Occupation
Cornelia M. Small (61)
|
Year of Election or Appointment: 2005
Ms. Small is a member (2000 present) and Chairperson (2002 present) of the Investment Committee, and a member (2002 present) of the Board of Trustees of Smith College. Previously, she served as Chief Investment Officer (1999 2000), Director of Global Equity Investments (1996 1999), and a member of the Board of Directors of Scudder, Stevens & Clark (1990 1997) and Scudder Kemper Investments (1997 1999). In addition, Ms. Small served as Co Chair (2000 2003) of the Annual Fund for the Fletcher School of Law and Diplomacy.
William S. Stavropoulos (66)
|
Year of Election or Appointment: 2002
Mr. Stavropoulos is Chairman Emeritus of The Dow Chemical Company. Since joining The Dow Chemical Company in 1967, Mr. Stavropoulos served in numerous senior management positions, including President (1993 2000; 2002 2003), CEO (1995 2000; 2002 2004), and Chairman of the Executive Committee (2000 2004). Currently, he is a Director of NCR Corporation (data warehousing and technology solutions), BellSouth Corporation (telecommunications), Chemical Financial Corporation, Maersk Inc. (industrial conglomerate, 2002 present), and Metalmark Capital (private equity investment firm, 2005 present). He also serves as a member of the Board of Trustees of the American Enterprise Institute for Public Policy Research. In addition, Mr. Stavropoulos is a member of The Business Council, J.P. Morgan International Council and the University of Notre Dame Advisory Council for the College of Science.
Year of Election or Appointment: 2005
Prior to his retirement in 2001, Mr. Wolfe was Chairman and Chief Executive Officer of Hershey Foods Corporation (1993 2001). He currently serves as a member of the boards of Adelphia Communications Corporation (2003 present), Bausch & Lomb, Inc., and Revlon Inc. (2004 present).
39 Annual Report
Trustees and Officers - continued
Advisory Board Members and Executive Officers:
Correspondence intended for Mr. Keyes may be sent to Fidelity Investments, P.O. Box 55235, Boston, Massachusetts 02205-5235. Correspondence intended for each executive officer and Mr. Lynch may be sent to Fidelity Investments, 82 Devonshire Street, Boston, Massachusetts 02109.
| | Name, Age; Principal Occupation
James H. Keyes (65)
|
Year of Election or Appointment: 2006
Member of the Advisory Board of Fidelity Commonwealth Trust. Prior to his retirement in 2003, Mr. Keyes was Chairman, President, and Chief Executive Officer of Johnson Controls, Inc. (automotive supplier, 1993 2003). He currently serves as a member of the boards of LSI Logic Corporation (semiconductor technologies, 1984 present), Navistar International Corporation (manufacture and sale of trucks, buses, and diesel engines, 2002 present), and Pitney Bowes, Inc. (integrated mail, messaging, and document management solutions, 1998 present).
Year of Election or Appointment: 2003
Member of the Advisory Board of Fidelity Commonwealth Trust. Mr. Lynch is Vice Chairman and a Director of FMR, and Vice Chairman (2001 present) and a Director (1999 present) of FMR Co., Inc. Pre viously, Mr. Lynch served as a Trustee of the Fidelity funds (1990 2003). In addition, he serves as the Chairman of the Inner City Scholarship Fund.
Year of Election or Appointment: 2005
Vice President of Small Cap Stock. Mr. Churchill also serves as Vice President of certain Equity Funds (2005 present) and certain High Income Funds (2005 present). He is Executive Vice President of FMR (2005 present) and FMR Co., Inc. (2005 present), and Senior Vice President of Fidelity Investments Money Management, Inc. (2005 present). Previously, Mr. Churchill served as Head of Fidelity’s Fixed Income Division (2000 2005), Vice President of Fidelity’s Money Market Funds (2000 2005), Vice President of Fidelity’s Bond Funds, and Senior Vice President of FMR.
Year of Election or Appointment: 1999
Vice President of Small Cap Stock. Prior to assuming his current responsibilities, Mr. Antico worked as a research analyst and portfolio manager. Mr. Antico also serves as Vice President of FMR (2000) and FMR Co., Inc. (2001).
Name, Age; Principal Occupation
Eric D. Roiter (57)
|
Year of Election or Appointment: 1998
Secretary of Small Cap Stock. He also serves as Secretary of other Fidelity funds; Vice President, General Counsel, and Secretary of FMR Co., Inc. (2001 present) and FMR; Assistant Secretary of Fidelity Management & Research (U.K.) Inc. (2001 present), Fidelity Research & Analysis Company (2001 present), and Fidelity Investments Money Management, Inc. (2001 present). Mr. Roiter is an Adjunct Member, Faculty of Law, at Boston College Law School (2003 present). Previously, Mr. Roiter served as Vice President and Secretary of Fidelity Distributors Corporation (FDC) (1998 2005).
Year of Election or Appointment: 2003
Assistant Secretary of Small Cap Stock. Mr. Fross also serves as Assistant Secretary of other Fidelity funds (2003 present), Vice President and Secretary of FDC (2005 present), and is an employee of FMR.
Year of Election or Appointment: 2004
President and Treasurer of Small Cap Stock. Ms. Reynolds also serves as President and Treasurer of other Fidelity funds (2004 present) and is a Vice President (2003 present) and an employee (2002 present) of FMR. Before joining Fidelity Investments, Ms. Reynolds worked at PricewaterhouseCoopers LLP (PwC) (1980 2002), where she was most recently an audit partner with PwC’s investment management practice.
Year of Election or Appointment: 2006
Anti Money Laundering (AML) officer of Small Cap Stock. Mr. Ganis also serves as AML officer of other Fidelity funds (2006 present) and FMR Corp. (2003 present). Before joining Fidelity Investments, Mr. Ganis practiced law at Goodwin Procter, LLP (2000 2002).
Year of Election or Appointment: 2005
Chief Financial Officer of Small Cap Stock. Mr. Murphy also serves as Chief Financial Officer of other Fidelity funds (2005 present). He also serves as Senior Vice President of Fidelity Pricing and Cash Management Services Group (FPCMS).
41 Annual Report
Trustees and Officers - continued
| | Name, Age; Principal Occupation
Kenneth A. Rathgeber (58)
|
Year of Election or Appointment: 2004
Chief Compliance Officer of Small Cap Stock. Mr. Rathgeber also serves as Chief Compliance Officer of other Fidelity funds (2004 present) and Executive Vice President of Risk Oversight for Fidelity Investments (2002 present). He is Chief Compliance Officer of FMR (2005 present), FMR Co., Inc. (2005 present), Fidelity Management & Research (U.K.) Inc. (2005 present), Fidelity Research & Analysis Company (2005 present), Fidelity Investments Money Management, Inc. (2005 present), and Strategic Advisers, Inc. (2005 present). Previously, Mr. Rathgeber served as Executive Vice President and Chief Operating Officer for Fidelity Investments Institutional Services Company, Inc. (1998 2002).
Year of Election or Appointment: 2005
Deputy Treasurer of Small Cap Stock. Mr. Mehrmann also serves as Deputy Treasurer of other Fidelity funds (2005 present) and is an employee of FMR. Previously, Mr. Mehrmann served as Vice President of Fidelity Investments Institutional Services Group (FIIS)/Fidelity Investments Institutional Operations Corporation, Inc. (FIIOC) Client Services (1998 2004).
| | Kimberley H. Monasterio (42)
|
Year of Election or Appointment: 2004
Deputy Treasurer of Small Cap Stock. Ms. Monasterio also serves as Deputy Treasurer of other Fidelity funds (2004) and is an employee of FMR (2004). Before joining Fidelity Investments, Ms. Monasterio served as Treasurer (2000 2004) and Chief Financial Officer (2002 2004) of the Franklin Templeton Funds and Senior Vice President of Franklin Templeton Services, LLC (2000 2004).
Year of Election or Appointment: 2005
Deputy Treasurer of Small Cap Stock. Mr. Robins also serves as Deputy Treasurer of other Fidelity funds (2005 present) and is an employee of FMR (2004 present). Before joining Fidelity Investments, Mr. Robins worked at KPMG LLP, where he was a partner in KPMG’s department of professional practice (2002 2004) and a Senior Manager (1999 2000). In addition, Mr. Robins served as Assistant Chief Accountant, United States Securities and Exchange Commission (2000 2002).
Name, Age; Principal Occupation
Robert G. Byrnes (39)
|
Year of Election or Appointment: 2005
Assistant Treasurer of Small Cap Stock. Mr. Byrnes also serves as Assistant Treasurer of other Fidelity funds (2005 present) and is an employee of FMR (2005 present). Previously, Mr. Byrnes served as Vice President of FPCMS (2003 2005). Before joining Fidelity Investments, Mr. Byrnes worked at Deutsche Asset Management where he served as Vice President of the Investment Operations Group (2000 2003).
Year of Election or Appointment: 1998
Assistant Treasurer of Small Cap Stock. Mr. Costello also serves as Assistant Treasurer of other Fidelity funds and is an employee of FMR.
Year of Election or Appointment: 2004
Assistant Treasurer of Small Cap Stock. Mr. Lydecker also serves as Assistant Treasurer of other Fidelity funds (2004) and is an employee of FMR.
Year of Election or Appointment: 2002
Assistant Treasurer of Small Cap Stock. Mr. Osterheld also serves as Assistant Treasurer of other Fidelity funds (2002) and is an employee of FMR.
Year of Election or Appointment: 2005
Assistant Treasurer of Small Cap Stock. Mr. Ryan also serves as Assistant Treasurer of other Fidelity funds (2005 present) and is an employee of FMR (2005 present). Previously, Mr. Ryan served as Vice President of Fund Reporting in FPCMS (1999 2005).
Year of Election or Appointment: 2005
Assistant Treasurer of Small Cap Stock. Mr. Schiavone also serves as Assistant Treasurer of other Fidelity funds (2005 present) and is an employee of FMR (2005 present). Before joining Fidelity Investments, Mr. Schiavone worked at Deutsche Asset Management, where he most recently served as Assistant Treasurer (2003 2005) of the Scudder Funds and Vice President and Head of Fund Reporting (1996 2003).
43 Annual Report
The Board of Trustees of Fidelity Small Cap Fund voted to pay on June 5, 2006, to shareholders of record at the opening of business on June 2, 2006, a distribution of $1.26 per share derived from capital gains realized from sales of portfolio securities.
The fund hereby designates as a capital gain dividend with respect to the taxable year ended April 30, 2006, $390,164,000, or, if subsequently determined to be different, the net capital gain of such year.
The fund will notify shareholders in January 2007 of amounts for use in preparing 2006 income tax returns.
Proxy Voting Results
A special meeting of the fund’s shareholders was held on November 16, 2005. The results of votes taken among shareholders on proposals before them are reported below. Each vote reported represents one dollar of net asset value held on the record date for the meeting.
| PROPOSAL 1 | | |
| To elect a Board of Trustees.A | | |
| | | # of | | % of |
| | | Votes | | Votes |
| |
| Dennis J. Dirks | | |
| Affirmative | | 18,240,248,322.53 | | 96.150 |
| Withheld | | 730,313,302.58 | | 3.850 |
| TOTAL | | 18,970,561,625.11 | | 100.000 |
| Albert R. Gamper, Jr.B | | |
| Affirmative | | 18,204,838,072.06 | | 95.964 |
| Withheld | | 765,723,553.05 | | 4.036 |
| TOTAL | | 18,970,561,625.11 | | 100.000 |
| Robert M. Gates | | |
| Affirmative | | 18,191,748,681.13 | | 95.895 |
| Withheld | | 778,812,943.98 | | 4.105 |
| TOTAL | | 18,970,561,625.11 | | 100.000 |
| George H. Heilmeier | | |
| Affirmative | | 18,193,638,757.60 | | 95.905 |
| Withheld | | 776,922,867.51 | | 4.095 |
| TOTAL | | 18,970,561,625.11 | | 100.000 |
| Abigail P. Johnson | | |
| Affirmative | | 18,103,320,241.78 | | 95.428 |
| Withheld | | 867,241,383.33 | | 4.572 |
| TOTAL | | 18,970,561,625.11 | | 100.000 |
| Edward C. Johnson 3d | | |
| Affirmative | | 18,055,585,171.13 | | 95.177 |
| Withheld | | 914,976,453.98 | | 4.823 |
| TOTAL | | 18,970,561,625.11 | | 100.000 |
| Stephen P. Jonas | | |
| Affirmative | | 18,188,419,716.35 | | 95.877 |
| Withheld | | 782,141,908.76 | | 4.123 |
| TOTAL | | 18,970,561,625.11 | | 100.000 |
| Marie L. Knowles | | |
| Affirmative | | 18,208,650,664.29 | | 95.984 |
| Withheld | | 761,910,960.82 | | 4.016 |
| TOTAL | | 18,970,561,625.11 | | 100.000 |
| Ned C. Lautenbach | | |
| Affirmative | | 18,224,936,039.64 | | 96.070 |
| Withheld | | 745,625,585.47 | | 3.930 |
| TOTAL | | 18,970,561,625.11 | | 100.000 |
| |
| Marvin L. Mann | | |
| Affirmative | | 18,146,216,753.93 | | 95.655 |
| Withheld | | 824,344,871.18 | | 4.345 |
| TOTAL | | 18,970,561,625.11 | | 100.000 |
| |
| William O. McCoy | | |
| Affirmative | | 18,164,580,135.79 | | 95.751 |
| Withheld | | 805,981,489.32 | | 4.249 |
| TOTAL | | 18,970,561,625.11 | | 100.000 |
| |
| Robert L. Reynolds | | |
| Affirmative | | 18,197,448,372.22 | | 95.925 |
| Withheld | | 773,113,252.89 | | 4.075 |
| TOTAL | | 18,970,561,625.11 | | 100.000 |
| |
| Cornelia M. Small | | |
| Affirmative | | 18,214,122,413.76 | | 96.013 |
| Withheld | | 756,439,211.35 | | 3.987 |
| TOTAL | | 18,970,561,625.11 | | 100.000 |
| |
| William S. Stavropoulos | | |
| Affirmative | | 18,186,563,509.46 | | 95.867 |
| Withheld | | 783,998,115.65 | | 4.133 |
| TOTAL | | 18,970,561,625.11 | | 100.000 |
| |
| Kenneth L. Wolfe | | |
| Affirmative | | 18,211,332,412.92 | | 95.998 |
| Withheld | | 759,229,212.19 | | 4.002 |
| TOTAL | | 18,970,561,625.11 | | 100.000 |
A Denotes trust-wide proposals and voting results.
B Effective on or about January 1, 2006.
|
45 Annual Report
Board Approval of Investment Advisory Contracts and Management Fees
Fidelity Small Cap Stock Fund
On January 19, 2006, the Board of Trustees, including the Independent Trustees (together, the Board), voted to approve a general research services agreement (the Agreement) between FMR, FMR Co., Inc. (FMRC), Fidelity Investments Money Manage ment, Inc. (FIMM), and Fidelity Research & Analysis Company (FRAC) (together, the Investment Advisers) for the fund, effective January 20, 2006, pursuant to which FRAC may provide general research and investment advisory support services to FMRC and FIMM. The Board considered that it has approved previously various sub advisory agreements for the fund with affiliates of FMR that allow FMR to obtain research, non discretionary advice, or discretionary portfolio management at no additional expense to the fund. The Board, assisted by the advice of fund counsel and independent Trustees’ counsel, considered a broad range of information and determined that it would be beneficial for the fund to access the research and investment advisory support services supplied by FRAC at no additional expense to the fund.
The Board reached this determination in part because the new arrangement will involve no changes in (i) the contractual terms of and fees payable under the fund’s manage ment contract or sub advisory agreements; (ii) the investment process or strategies employed in the management of the fund’s assets; (iii) the nature or level of services provided under the fund’s management contract or sub advisory agreements; (iv) the day to day management of the fund or the persons primarily responsible for such man agement; or (v) the ultimate control or beneficial ownership of FMR, FMRC, or FIMM. The Board also considered that the establishment of the Agreement would not necessi tate prior shareholder approval of the Agreement or result in an assignment and termination of the fund’s management contract or sub advisory agreements under the Investment Company Act of 1940.
Because the Board was approving an arrangement with FRAC under which the fund will not bear any additional management fees or expenses and under which the fund’s portfolio manager would not change, it did not consider the fund’s investment perfor mance, competitiveness of management fee and total expenses, costs of services and profitability, or economies of scale to be significant factors in its decision.
In connection with its future renewal of the fund’s management contract and sub advisory agreements, the Board will consider: (i) the nature, extent, and quality of services provided to the fund, including shareholder and administrative services and investment performance; (ii) the competitiveness of the fund’s management fee and total expenses; (iii) the costs of the services and profitability, including the revenues earned and the expenses incurred by Fidelity in conducting the business of developing, marketing, distributing, managing, administering, and servicing the fund and its shareholders; and (iv) whether there have been economies of scale in respect of the management of the Fidelity funds, whether the Fidelity funds (including the fund) have
appropriately benefited from any such economies of scale, and whether there is potential for realization of any further economies.
Based on its evaluation of all of the conclusions noted above, and after considering all material factors, the Board ultimately concluded that the fund’s Agreement is fair and reasonable, and that the fund’s Agreement should be approved.
47 Annual Report
| | Investment Adviser
Fidelity Management & Research Company
Boston, MA
Investment Sub Advisers
FMR Co., Inc.
Fidelity Research & Analysis Company
(formerly Fidelity Management &
Research (Far East) Inc.)
Fidelity Management & Research
(U.K.) Inc.
Fidelity Investments Japan Limited
Fidelity International Investment
Advisors
Fidelity International Investment
Advisors (U.K.) Limited
General Distributor
Fidelity Distributors Corporation
Boston, MA
Transfer and Service Agent
Fidelity Service Company, Inc.
Boston, MA
Custodian
Brown Brothers Harriman & Co.
Boston, MA
|
| The Fidelity Telephone Connection |
| Mutual Fund 24-Hour Service |
| Exchanges/Redemptions | | |
| and Account Assistance | | 1-800-544-6666 |
| Product Information | | 1-800-544-6666 |
| Retirement Accounts | | 1-800-544-4774 |
| (8 a.m. - 9 p.m.) | | |
| TDD Service | | 1-800-544-0118 |
| for the deaf and hearing impaired |
| (9 a.m. - 9 p.m. Eastern time) |
| Fidelity Automated Service | | |
| Telephone (FAST®) (automated phone logo) | | 1-800-544-5555 |
| (automated phone logo) Automated line for quickest service |
SLCX UANN-0606
1.784727.103
|

| | Spartan®
500 Index
Fund —
Investor Class
Fidelity Advantage Class
|
| | Annual Report
April 30, 2006
|


| Contents | | | | |
| |
| Chairman’s Message | | 4 | | Ned Johnson’s message to shareholders. |
| Performance | | 5 | | How the fund has done over time. |
| Management’s Discussion | | 6 | | The manager’s review of fund |
| | | | | performance, strategy and outlook |
| Shareholder Expense | | 7 | | An example of shareholder expenses. |
| Example | | | | |
| Investment Changes | | 9 | | A summary of major shifts in the fund’s |
| | | | | investments over the past six months. |
| Investments | | 10 | | A complete list of the fund’s investments |
| | | | | with their market values. |
| Financial Statements | | 29 | | Statements of assets and liabilities, |
| | | | | operations, and changes in net assets, |
| | | | | as well as financial highlights. |
| Notes | | 34 | | Notes to the financial statements. |
| Report of Independent | | 42 | | |
| Registered Public | | | | |
| Accounting Firm | | | | |
| Trustees and Officers | | 43 | | |
| Distributions | | 53 | | |
| Proxy Voting Results | | 54 | | |
To view a fund’s proxy voting guidelines and proxy voting record for the 12 month period ended
June 30, visit www.fidelity.com/proxyvotingresults or visit the Securities and Exchange Commis
sion’s (SEC) web site at www.sec.gov. You may also call 1-800-544-8544 to request a free copy of
the proxy voting guidelines.
Standard & Poor’s, S&P and S&P 500 are registered service marks of The McGraw Hill Companies,
Inc. and have been licensed for use by Fidelity Distributors Corporation.
Other third party marks appearing herein are the property of their respective owners.
All other marks appearing herein are registered or unregistered trademarks or service marks
of FMR Corp. or an affiliated company.
|
This report and the financial statements contained herein are submitted for the general information
of the shareholders of the fund. This report is not authorized for distribution to prospective investors
in the fund unless preceded or accompanied by an effective prospectus.
A fund files its complete schedule of portfolio holdings with the SEC for the first and third quarters of
each fiscal year on Form N Q. Forms N Q are available on the SEC’s web site at http://www.sec.gov. A
fund’s Forms N Q may be reviewed and copied at the SEC’s Public Reference Room in Washington,
DC. Information regarding the operation of the SEC’s Public Reference Room may be obtained by
calling 1-800-SEC-0330. For a complete list of a fund’s portfolio holdings, view the most recent
quarterly holdings report, semiannual report, or annual report on Fidelity’s web site at
http://www.fidelity.com/holdings.
NOT FDIC INSURED · MAY LOSE VALUE · NO BANK GUARANTEE
Neither the fund nor Fidelity Distributors Corporation is a bank.
|
3 Annual Report
Chairman’s Message
(photograph of Edward C. Johnson 3d)
Dear Shareholder:
Although many securities markets made gains in early 2006, there is only one certainty when it comes to investing: There is no sure thing. There are, however, a number of time tested, fundamental investment principles that can put the historical odds in your favor.
One of the basic tenets is to invest for the long term. Over time, riding out the markets’ inevitable ups and downs has proven much more effective than selling into panic or chasing the hottest trend. Even missing only a few of the markets’ best days can significantly diminish investor returns. Patience also affords the benefits of compounding of earning interest on additional income or reinvested dividends and capital gains. There are tax advantages and cost benefits to consider as well. The more you sell, the more taxes you pay, and the more you trade, the higher the costs. While staying the course doesn’t eliminate risk, it can considerably lessen the effect of short term declines.
You can further manage your investing risk through diversification. And today, more than ever, geographic diversification should be taken into account. Studies indicate that asset allocation is the single most important determinant of a portfolio’s long term success. The right mix of stocks, bonds and cash aligned to your particular risk tolerance and investment objective is very important. Age appropriate rebalancing is also an essential aspect of asset allocation. For younger investors, an emphasis on equities which historically have been the best performing asset class over time is encouraged. As investors near their specific goal, such as retirement or sending a child to college, consideration may be given to replacing volatile assets (e.g. common stocks) with more stable fixed investments (bonds or savings plans).
A third investment principle investing regularly can help lower the average cost of your purchases. Invest ing a certain amount of money each month or quarter helps ensure you won’t pay for all your shares at market highs. This strategy known as dollar cost averaging also reduces unconstructive “emotion” from investing, helping shareholders avoid selling weak performers just prior to an upswing, or chasing a hot performer just before a correction.
We invite you to contact us via the Internet, through our Investor Centers or over the phone. It is our privilege to provide you the information you need to make the investments that are right for you.
Sincerely,
/s/ Edward C. Johnson 3d
Edward C. Johnson 3d
Annual Report 4
Performance: The Bottom Line
Average annual total return reflects the change in the value of an investment, assuming reinvestment of the class’ dividend income and capital gains (the profits earned upon the sale of securities that have grown in value) and assuming a constant rate of performance each year. The $10,000 table and the fund’s returns do not reflect the deduction of taxes that a shareholder would pay on fund distributions or the redemption of fund shares. During periods of reimbursement by Fidelity, a fund’s total return will be greater than it would be had the reimbursement not occurred. How a fund did yesterday is no guarantee of how it will do tomorrow.
| Average Annual Total Returns | | | | | | |
| Periods ended April 30, 2006 | | Past 1 | | Past 5 | | Past 10 |
| | | year | | years | | years |
| Spartan® 500 Index Fund | | | | | | |
| Investor Class | | 15.34% | | 2.58% | | 8.76% |
| Fidelity Advantage ClassA | | 15.36% | | 2.58% | | 8.77% |
A The initial offering of Fidelity Advantage Class took place on October 14, 2005. Returns prior to October 14, 2005, are those of Investor Class.
$10,000 Over 10 Years
Let’s say hypothetically that $10,000 was invested in Spartan® 500 Index Fund Investor Class on April 30, 1996. The chart shows how the value of your investment would have changed, and also shows how the Standard & Poor’s 500SM Index (S&P 500®) performed over the same period.

5 Annual Report
Management’s Discussion of Fund Performance
Comments from Jeffrey Adams, who oversees Spartan® 500 Index Fund’s investment management team as Head of Indexing for Geode Capital Management, LLCSM
Key U.S. equity benchmarks reached multiyear highs during the year ending April 30, 2006. The stock market’s performance reflected economic conditions and corporate earnings that continued to beat expectations. It also showed that investors generally tuned out the buzz surrounding record high energy costs, inflation and rising short term interest rates. By and large, the market’s trajectory was consistent throughout the period. In fact, as measured by the Standard & Poor’s 500SM Index, stocks rose in 10 of the past 12 months and ended the period on a six month winning streak. The gains also became more broad based, shifting from the primarily energy and utility driven returns of the period’s early stages to include more widespread contributions from other sectors such as financials and telecommunica tion services. On the capitalization spectrum, small caps continued to dominate, as the small cap Russell 2000® Index reached new heights and returned 33.47% for the year overall. In comparison, the large cap oriented S&P 500® gained 15.42%, the Dow Jones Industrial AverageSM rose 14.17% and the NASDAQ Composite® Index climbed 21.89% .
For the 12 months ending April 30, 2006, the fund’s Investor Class shares gained 15.34%, in line with the S&P 500. The fund’s peer group average, the LipperSM S&P 500 Index Objective Funds Average, returned 14.82% . For additional performance information, including that of the new Fidelity Advantage Class, please refer to the performance section of this report. Energy stocks were standouts, benefiting from strength in oil and natural gas prices. Exxon Mobil and oil field services leader Schlumberger continued to see their profits rise on increased oil demand. In technology, Hewlett Packard, a maker of personal computers, printers and scientific products, rose during much of the period on improved earnings and operating margins. While no sector performed negatively during the period, health care stocks turned in essentially flat results. Health care products company Johnson & Johnson was the index’s biggest detractor from performance. J&J’s shares fell steadily throughout the period, with their sharpest decline coming in January on weaker than expected revenues and the company’s failed acquisition bid for rival Guidant. Also lagging was Intel, the world’s leading semiconductor maker, which was hurt by disappointing sales figures and strengthening competition from rival AMD.
The views expressed above reflect those of the portfolio manager(s) only through the end of the period as stated on the cover of this report and do not necessarily represent the views of Fidelity or any other person in the Fidelity organization. Any such views are subject to change at any time based upon market or other conditions and Fidelity disclaims any responsibility to update such views. These views may not be relied on as investment advice and, because investment decisions for a Fidelity fund are based on numerous factors, may not be relied on as an indication of trading intent on behalf of any Fidelity fund.
Shareholder Expense Example
As a shareholder of the Fund, you incur two types of costs: (1) transaction costs, including redemption fees, and (2) ongoing costs, including management fees and other Fund ex penses. This Example is intended to help you understand your ongoing costs (in dollars) of investing in the Fund and to compare these costs with the ongoing costs of investing in other mutual funds.
The Example is based on an investment of $1,000 invested at the beginning of the period and held for the entire period (November 1, 2005 to April 30, 2006).
The first line of the table below for each class of the Fund provides information about actual account values and actual expenses. You may use the information in this line, together with the amount you invested, to estimate the expenses that you paid over the period. Simply divide your account value by $1,000.00 (for example, an $8,600 account value divided by $1,000.00 = 8.6), then multiply the result by the number in the first line for a class of the Fund under the heading entitled “Expenses Paid During Period” to estimate the expenses you paid on your account during this period. An annual index fund fee of $10 that is charged once a year may apply for certain accounts with a value of less than $10,000. This fee is not included in the table below. If it was, the estimate of expenses you paid during the period would be higher, and your ending account value lower, by this amount.
Hypothetical Example for Comparison Purposes
The second line of the table below for each class of the Fund provides information about hypothetical account values and hypothetical expenses based on a Class’ actual expense ratio and an assumed rate of return of 5% per year before expenses, which is not the Class’ actual return. The hypothetical account values and expenses may not be used to estimate the actual ending account balance or expenses you paid for the period. You may use this informa tion to compare the ongoing costs of investing in the Fund and other funds. To do so, compare this 5% hypothetical example with the 5% hypothetical examples that appear in the shareholder reports of the other funds. An annual index fund fee of $10 that is charged once a year may apply for certain accounts with a value of less than $10,000. This fee is not included in the table below. If it was, the estimate of expenses you paid during the period would be higher, and your ending account value lower, by this amount.
7 Annual Report
Shareholder Expense Example continued
Please note that the expenses shown in the table are meant to highlight your ongoing costs only and do not reflect any transaction costs. Therefore, the second line of the table is useful in comparing ongoing costs only, and will not help you determine the relative total costs of owning different funds. In addition, if these transactional costs were included, your costs would have been higher.
| | | | | | | | | | | Expenses Paid |
| | | Beginning | | | | Ending | | During Period* |
| | | Account Value | | | | Account Value | | November 1, 2005 |
| | | November 1, 2005 | | | | April 30, 2006 | | to April 30, 2006 |
| Investor Class | | | | | | | | | | | | |
| Actual | | | | $ 1,000.00 | | | | $ 1,096.10 | | | | $ .52 |
| HypotheticalA | | | | $ 1,000.00 | | | | $ 1,024.30 | | | | $ .50 |
| Fidelity Advantage Class | | | | | | | | | | | | |
| Actual | | | | $ 1,000.00 | | | | $ 1,096.30 | | | | $ .36 |
| HypotheticalA | | | | $ 1,000.00 | | | | $ 1,024.45 | | | | $ .35 |
| |
| A 5% return per year before expenses | | | | | | | | |
* Expenses are equal to each Class’ annualized expense ratio (shown in the table below); multiplied by the average account value over the period, multiplied by 181/365 (to reflect the one half year period).
| | | Annualized |
| | | Expense Ratio |
| Investor Class | | 10% |
| Fidelity Advantage Class | | 07% |
| Investment Changes | | | | |
| |
| |
| Top Ten Stocks as of April 30, 2006 | | | | |
| | | % of fund’s | | % of fund’s net assets |
| | | net assets | | 6 months ago |
| Exxon Mobil Corp. | | 3.2 | | 3.2 |
| General Electric Co. | | 3.0 | | 3.2 |
| Citigroup, Inc. | | 2.1 | | 2.1 |
| Bank of America Corp. | | 1.9 | | 1.6 |
| Microsoft Corp. | | 1.8 | | 2.1 |
| Procter & Gamble Co. | | 1.6 | | 1.7 |
| Pfizer, Inc. | | 1.6 | | 1.5 |
| Johnson & Johnson | | 1.5 | | 1.7 |
| American International Group, Inc. | | 1.4 | | 1.5 |
| JPMorgan Chase & Co. | | 1.3 | | 1.2 |
| | | 19.4 | | |
| |
| Market Sectors as of April 30, 2006 | | | | |
| | | % of fund’s | | % of fund’s net assets |
| | | net assets | | 6 months ago |
| Financials | | 21.6 | | 20.7 |
| Information Technology | | 15.7 | | 15.0 |
| Health Care | | 12.1 | | 12.9 |
| Industrials | | 11.6 | | 11.0 |
| Consumer Discretionary | | 10.1 | | 10.6 |
| Energy | | 9.9 | | 9.3 |
| Consumer Staples | | 9.2 | | 9.7 |
| Telecommunication Services | | 3.2 | | 3.0 |
| Utilities | | 3.1 | | 3.4 |
| Materials | | 3.1 | | 2.9 |
| |
| Asset Allocation (% of fund’s net assets) | | | | |
To match the Standard & Poor’s 500SM Index, Spartan® 500 Index seeks 100% investment exposure to stocks at all times.
9 Annual Report
| Investments April 30, 2006 | | | | |
| Showing Percentage of Net Assets | | | | | | | | |
| |
| Common Stocks 99.6% | | | | | | | | |
| | | | | Shares | | Value (Note 1) |
| | | | | | | (000s) |
| |
| CONSUMER DISCRETIONARY – 10.1% | | | | | | | | |
| Auto Components 0.2% | | | | | | | | |
| Cooper Tire & Rubber Co. | | | | 71,957 | | | | $ 914 |
| Goodyear Tire & Rubber Co. (a)(d) | | | | 207,650 | | | | 2,907 |
| Johnson Controls, Inc. | | | | 227,822 | | | | 18,579 |
| | | | | | | | | 22,400 |
| Automobiles – 0.3% | | | | | | | | |
| Ford Motor Co. | | | | 2,187,174 | | | | 15,201 |
| General Motors Corp. (d) | | | | 663,504 | | | | 15,181 |
| Harley Davidson, Inc. | | | | 319,760 | | | | 16,257 |
| | | | | | | | | 46,639 |
| Distributors – 0.1% | | | | | | | | |
| Genuine Parts Co. | | | | 202,880 | | | | 8,856 |
| Diversified Consumer Services – 0.1% | | | | | | | | |
| Apollo Group, Inc. Class A (a) | | | | 164,978 | | | | 9,014 |
| H&R Block, Inc. | | | | 384,414 | | | | 8,776 |
| | | | | | | | | 17,790 |
| Hotels, Restaurants & Leisure 1.5% | | | | | | | | |
| Carnival Corp. unit | | | | 509,416 | | | | 23,851 |
| Darden Restaurants, Inc. | | | | 154,307 | | | | 6,111 |
| Harrah’s Entertainment, Inc. | | | | 215,995 | | | | 17,634 |
| Hilton Hotels Corp. | | | | 386,667 | | | | 10,417 |
| International Game Technology | | | | 395,612 | | | | 15,006 |
| Marriott International, Inc. Class A | | | | 190,341 | | | | 13,908 |
| McDonald’s Corp. | | | | 1,474,409 | | | | 50,970 |
| Starbucks Corp. (a) | | | | 895,645 | | | | 33,381 |
| Starwood Hotels & Resorts Worldwide, Inc. | | | | 253,237 | | | | 14,531 |
| Wendy’s International, Inc. | | | | 134,131 | | | | 8,287 |
| Yum! Brands, Inc. | | | | 323,629 | | | | 16,725 |
| | | | | | | | | 210,821 |
| Household Durables – 0.7% | | | | | | | | |
| Black & Decker Corp. | | | | 90,795 | | | | 8,499 |
| Centex Corp. | | | | 144,051 | | | | 8,009 |
| D.R. Horton, Inc. | | | | 318,909 | | | | 9,574 |
| Fortune Brands, Inc. | | | | 171,705 | | | | 13,788 |
| Harman International Industries, Inc. | | | | 77,023 | | | | 6,777 |
| KB Home | | | | 90,174 | | | | 5,552 |
| Leggett & Platt, Inc. | | | | 213,993 | | | | 5,677 |
| Lennar Corp. Class A | | | | 160,831 | | | | 8,834 |
| Newell Rubbermaid, Inc. | | | | 322,068 | | | | 8,831 |
See accompanying notes which are an integral part of the financial statements.
| Common Stocks continued | | | | | | |
| | | Shares | | Value (Note 1) |
| | | | | (000s) |
| |
| CONSUMER DISCRETIONARY – continued | | | | | | |
| Household Durables – continued | | | | | | |
| Pulte Homes, Inc. | | 251,032 | | | | $ 9,376 |
| Snap-On, Inc. | | 68,405 | | | | 2,839 |
| The Stanley Works | | 84,998 | | | | 4,441 |
| Whirlpool Corp. | | 91,112 | | | | 8,177 |
| | | | | | | 100,374 |
| Internet & Catalog Retail 0.1% | | | | | | |
| Amazon.com, Inc. (a) | | 361,987 | | | | 12,746 |
| Leisure Equipment & Products – 0.2% | | | | | | |
| Brunswick Corp. | | 111,488 | | | | 4,373 |
| Eastman Kodak Co. (d) | | 336,985 | | | | 9,085 |
| Hasbro, Inc. | | 208,831 | | | | 4,116 |
| Mattel, Inc. | | 456,105 | | | | 7,380 |
| | | | | | | 24,954 |
| Media – 3.3% | | | | | | |
| CBS Corp. Class B | | 906,615 | | | | 23,091 |
| Clear Channel Communications, Inc. | | 606,393 | | | | 17,300 |
| Comcast Corp. Class A (a) | | 2,509,222 | | | | 77,660 |
| Dow Jones & Co., Inc. | | 69,270 | | | | 2,561 |
| E.W. Scripps Co. Class A | | 99,808 | | | | 4,599 |
| Gannett Co., Inc. | | 279,333 | | | | 15,363 |
| Interpublic Group of Companies, Inc. (a)(d) | | 505,131 | | | | 4,839 |
| Knight-Ridder, Inc. | | 78,610 | | | | 4,874 |
| McGraw Hill Companies, Inc. | | 430,811 | | | | 23,979 |
| Meredith Corp. | | 49,124 | | | | 2,437 |
| News Corp. Class A | | 2,816,453 | | | | 48,330 |
| Omnicom Group, Inc. (d) | | 209,778 | | | | 18,882 |
| The New York Times Co. Class A (d) | | 170,354 | | | | 4,223 |
| The Walt Disney Co. | | 2,259,564 | | | | 63,177 |
| Time Warner, Inc. | | 5,286,020 | | | | 91,977 |
| Tribune Co. | | 307,188 | | | | 8,856 |
| Univision Communications, Inc. Class A (a) | | 262,333 | | | | 9,363 |
| Viacom, Inc. Class B (non-vtg.) (a) | | 906,684 | | | | 36,113 |
| | | | | | | 457,624 |
| Multiline Retail – 1.1% | | | | | | |
| Big Lots, Inc. (a)(d) | | 133,687 | | | | 1,932 |
| Dillard’s, Inc. Class A | | 72,273 | | | | 1,885 |
| Dollar General Corp. | | 371,498 | | | | 6,486 |
| Family Dollar Stores, Inc. | | 182,183 | | | | 4,555 |
| Federated Department Stores, Inc. | | 319,388 | | | | 24,864 |
See accompanying notes which are an integral part of the financial statements.
11 Annual Report
| Investments continued | | | | | | |
| |
| |
| Common Stocks continued | | | | | | |
| | | Shares | | Value (Note 1) |
| | | | | (000s) |
| |
| CONSUMER DISCRETIONARY – continued | | | | | | |
| Multiline Retail – continued | | | | | | |
| JCPenney Co., Inc. | | 272,486 | | | | $ 17,837 |
| Kohl’s Corp. (a) | | 404,495 | | | | 22,587 |
| Nordstrom, Inc. | | 256,487 | | | | 9,831 |
| Sears Holdings Corp. (a) | | 117,102 | | | | 16,826 |
| Target Corp. | | 1,031,538 | | | | 54,775 |
| | | | | | | 161,578 |
| Specialty Retail – 2.2% | | | | | | |
| AutoNation, Inc. (a)(d) | | 172,130 | | | | 3,876 |
| AutoZone, Inc. (a) | | 64,815 | | | | 6,067 |
| Bed Bath & Beyond, Inc. (a) | | 329,054 | | | | 12,619 |
| Best Buy Co., Inc. | | 477,105 | | | | 27,033 |
| Circuit City Stores, Inc. | | 178,632 | | | | 5,136 |
| Gap, Inc. | | 673,414 | | | | 12,182 |
| Home Depot, Inc. | | 2,492,403 | | | | 99,522 |
| Limited Brands, Inc. | | 408,576 | | | | 10,476 |
| Lowe’s Companies, Inc. | | 917,418 | | | | 57,843 |
| Office Depot, Inc. (a) | | 346,928 | | | | 14,078 |
| OfficeMax, Inc. | | 83,131 | | | | 3,217 |
| RadioShack Corp. | | 157,954 | | | | 2,685 |
| Sherwin-Williams Co. | | 130,122 | | | | 6,628 |
| Staples, Inc. | | 854,953 | | | | 22,579 |
| Tiffany & Co., Inc. | | 166,892 | | | | 5,823 |
| TJX Companies, Inc. | | 540,523 | | | | 13,043 |
| | | | | | | 302,807 |
| Textiles, Apparel & Luxury Goods – 0.3% | | | | | | |
| Coach, Inc. (a) | | 449,791 | | | | 14,852 |
| Jones Apparel Group, Inc | | 133,995 | | | | 4,603 |
| Liz Claiborne, Inc. | | 123,346 | | | | 4,817 |
| NIKE, Inc. Class B | | 222,064 | | | | 18,174 |
| VF Corp. | | 103,408 | | | | 6,328 |
| | | | | | | 48,774 |
| |
| TOTAL CONSUMER DISCRETIONARY | | | | | | 1,415,363 |
| |
| CONSUMER STAPLES 9.2% | | | | | | |
| Beverages – 2.0% | | | | | | |
| Anheuser-Busch Companies, Inc. | | 910,896 | | | | 40,608 |
| Brown-Forman Corp. Class B (non-vtg.) | | 97,571 | | | | 7,269 |
| Coca-Cola Enterprises, Inc. | | 356,002 | | | | 6,953 |
See accompanying notes which are an integral part of the financial statements.
| Common Stocks continued | | | | | | |
| | | Shares | | Value (Note 1) |
| | | | | (000s) |
| |
| CONSUMER STAPLES – continued | | | | | | |
| Beverages – continued | | | | | | |
| Constellation Brands, Inc. Class A (sub. vtg.) (a) | | 231,314 | | | | $ 5,713 |
| Molson Coors Brewing Co. Class B (d) | | 67,344 | | | | 4,974 |
| Pepsi Bottling Group, Inc. | | 158,658 | | | | 5,093 |
| PepsiCo, Inc. | | 1,943,863 | | | | 113,211 |
| The Coca-Cola Co. | | 2,417,045 | | | | 101,419 |
| | | | | | | 285,240 |
| Food & Staples Retailing – 2.3% | | | | | | |
| Albertsons, Inc. | | 432,708 | | | | 10,960 |
| Costco Wholesale Corp. | | 555,151 | | | | 30,217 |
| CVS Corp. | | 959,061 | | | | 28,503 |
| Kroger Co. | | 851,202 | | | | 17,245 |
| Safeway, Inc. | | 527,628 | | | | 13,259 |
| SUPERVALU, Inc. | | 159,784 | | | | 4,635 |
| Sysco Corp. | | 726,637 | | | | 21,719 |
| Wal-Mart Stores, Inc. | | 2,930,989 | | | | 131,982 |
| Walgreen Co. | | 1,187,474 | | | | 49,791 |
| Whole Foods Market, Inc. | | 163,003 | | | | 10,005 |
| | | | | | | 318,316 |
| Food Products 1.1% | | | | | | |
| Archer-Daniels Midland Co. | | 767,110 | | | | 27,877 |
| Campbell Soup Co. | | 216,220 | | | | 6,949 |
| ConAgra Foods, Inc. | | 609,246 | | | | 13,818 |
| Dean Foods Co. (a) | | 159,208 | | | | 6,306 |
| General Mills, Inc. | | 417,904 | | | | 20,619 |
| H.J. Heinz Co. | | 393,066 | | | | 16,316 |
| Hershey Co. | | 210,268 | | | | 11,216 |
| Kellogg Co. | | 294,956 | | | | 13,659 |
| McCormick & Co., Inc. (non-vtg.) | | 155,594 | | | | 5,419 |
| Sara Lee Corp. | | 891,869 | | | | 15,938 |
| Tyson Foods, Inc. Class A | | 295,629 | | | | 4,316 |
| Wm. Wrigley Jr. Co. | | 208,210 | | | | 9,800 |
| Wm. Wrigley Jr. Co. Class B | | 52,052 | | | | 2,452 |
| | | | | | | 154,685 |
| Household Products – 2.2% | | | | | | |
| Clorox Co. | | 176,122 | | | | 11,304 |
| Colgate-Palmolive Co. | | 604,662 | | | | 35,748 |
| Kimberly Clark Corp. | | 540,711 | | | | 31,648 |
| Procter & Gamble Co. | | 3,859,079 | | | | 224,637 |
| | | | | | | 303,337 |
See accompanying notes which are an integral part of the financial statements.
13 Annual Report
| Investments continued | | | | | | |
| |
| |
| Common Stocks continued | | | | | | |
| | | Shares | | Value (Note 1) |
| | | | | (000s) |
| |
| CONSUMER STAPLES – continued | | | | | | |
| Personal Products 0.2% | | | | | | |
| Alberto-Culver Co. | | 88,634 | | | | $ 3,986 |
| Avon Products, Inc. | | 528,572 | | | | 17,237 |
| Estee Lauder Companies, Inc. Class A | | 139,809 | | | | 5,190 |
| | | | | | | 26,413 |
| Tobacco 1.4% | | | | | | |
| Altria Group, Inc. | | 2,448,599 | | | | 179,140 |
| Reynolds American, Inc. (d) | | 100,367 | | | | 11,005 |
| UST, Inc. | | 191,915 | | | | 8,431 |
| | | | | | | 198,576 |
| |
| TOTAL CONSUMER STAPLES | | | | | | 1,286,567 |
| |
| ENERGY 9.9% | | | | | | |
| Energy Equipment & Services – 2.1% | | | | | | |
| Baker Hughes, Inc. | | 401,580 | | | | 32,460 |
| BJ Services Co. | | 380,338 | | | | 14,472 |
| Halliburton Co. | | 605,700 | | | | 47,335 |
| Nabors Industries Ltd. (a) | | 370,796 | | | | 13,842 |
| National Oilwell Varco, Inc. (a) | | 204,999 | | | | 14,139 |
| Noble Corp. | | 160,919 | | | | 12,703 |
| Rowan Companies, Inc. (d) | | 128,254 | | | | 5,685 |
| Schlumberger Ltd. (NY Shares) | | 1,386,518 | | | | 95,864 |
| Transocean, Inc. (a) | | 382,454 | | | | 31,006 |
| Weatherford International Ltd. (a) | | 409,251 | | | | 21,662 |
| | | | | | | 289,168 |
| Oil, Gas & Consumable Fuels – 7.8% | | | | | | |
| Amerada Hess Corp. | | 93,906 | | | | 13,454 |
| Anadarko Petroleum Corp | | 270,374 | | | | 28,341 |
| Apache Corp. | | 387,547 | | | | 27,531 |
| Chesapeake Energy Corp. | | 438,367 | | | | 13,887 |
| Chevron Corp. | | 2,611,931 | | | | 159,380 |
| ConocoPhillips | | 1,935,556 | | | | 129,489 |
| Devon Energy Corp. | | 518,436 | | | | 31,163 |
| El Paso Corp. | | 773,461 | | | | 9,985 |
| EOG Resources, Inc. | | 284,579 | | | | 19,986 |
| Exxon Mobil Corp. | | 7,164,499 | | | | 451,943 |
| Kerr-McGee Corp. | | 136,092 | | | | 13,590 |
| Kinder Morgan, Inc. | | 123,470 | | | | 10,868 |
| Marathon Oil Corp. | | 430,374 | | | | 34,154 |
See accompanying notes which are an integral part of the financial statements.
| Common Stocks continued | | | | | | |
| | | Shares | | Value (Note 1) |
| | | | | (000s) |
| |
| ENERGY – continued | | | | | | |
| Oil, Gas & Consumable Fuels – continued | | | | | | |
| Murphy Oil Corp. | | 193,737 | | | | $ 9,722 |
| Occidental Petroleum Corp. | | 505,415 | | | | 51,926 |
| Sunoco, Inc. | | 156,240 | | | | 12,662 |
| Valero Energy Corp. | | 729,596 | | | | 47,234 |
| Williams Companies, Inc. | | 697,703 | | | | 15,301 |
| XTO Energy, Inc. | | 426,134 | | | | 18,047 |
| | | | | | | 1,098,663 |
| |
| TOTAL ENERGY | | | | | | 1,387,831 |
| |
| FINANCIALS – 21.6% | | | | | | |
| Capital Markets 3.6% | | | | | | |
| Ameriprise Financial, Inc. | | 294,083 | | | | 14,422 |
| Bank of New York Co., Inc. | | 904,997 | | | | 31,811 |
| Bear Stearns Companies, Inc. | | 140,052 | | | | 19,959 |
| Charles Schwab Corp. | | 1,210,663 | | | | 21,671 |
| E*TRADE Financial Corp. (a) | | 490,331 | | | | 12,199 |
| Federated Investors, Inc. Class B (non-vtg.) | | 98,832 | | | | 3,469 |
| Franklin Resources, Inc. | | 179,053 | | | | 16,673 |
| Goldman Sachs Group, Inc. | | 511,559 | | | | 81,998 |
| Janus Capital Group, Inc. | | 251,996 | | | | 4,904 |
| Legg Mason, Inc. | | 145,332 | | | | 17,219 |
| Lehman Brothers Holdings, Inc. | | 317,267 | | | | 47,955 |
| Mellon Financial Corp. | | 486,167 | | | | 18,294 |
| Merrill Lynch & Co., Inc. | | 1,077,444 | | | | 82,166 |
| Morgan Stanley | | 1,259,863 | | | | 81,009 |
| Northern Trust Corp. | | 217,348 | | | | 12,800 |
| State Street Corp. | | 390,705 | | | | 25,521 |
| T. Rowe Price Group, Inc. | | 154,920 | | | | 13,043 |
| | | | | | | 505,113 |
| Commercial Banks – 6.2% | | | | | | |
| AmSouth Bancorp. | | 405,450 | | | | 11,734 |
| Bank of America Corp. | | 5,449,641 | | | | 272,046 |
| BB&T Corp. | | 628,202 | | | | 26,975 |
| Comerica, Inc. | | 190,989 | | | | 10,862 |
| Compass Bancshares, Inc. | | 145,014 | | | | 7,970 |
| Fifth Third Bancorp | | 651,907 | | | | 26,350 |
| First Horizon National Corp. | | 147,838 | | | | 6,271 |
| Huntington Bancshares, Inc. | | 291,836 | | | | 7,048 |
| KeyCorp | | 475,367 | | | | 18,169 |
See accompanying notes which are an integral part of the financial statements.
15 Annual Report
| Investments continued | | | | | | |
| |
| |
| Common Stocks continued | | | | | | |
| | | Shares | | Value (Note 1) |
| | | | | (000s) |
| |
| FINANCIALS – continued | | | | | | |
| Commercial Banks – continued | | | | | | |
| M&T Bank Corp. | | 93,100 | | | | $ 11,116 |
| Marshall & Ilsley Corp. | | 260,514 | | | | 11,911 |
| National City Corp. | | 642,250 | | | | 23,699 |
| North Fork Bancorp, Inc., New York | | 558,111 | | | | 16,816 |
| PNC Financial Services Group, Inc. | | 342,876 | | | | 24,505 |
| Regions Financial Corp. | | 535,433 | | | | 19,549 |
| SunTrust Banks, Inc. | | 435,026 | | | | 33,641 |
| Synovus Financial Corp. | | 367,538 | | | | 10,291 |
| U.S. Bancorp, Delaware | | 2,112,956 | | | | 66,431 |
| Wachovia Corp. | | 1,903,721 | | | | 113,938 |
| Wells Fargo & Co. | | 1,966,306 | | | | 135,066 |
| Zions Bancorp | | 122,456 | | | | 10,168 |
| | | | | | | 864,556 |
| Consumer Finance – 1.0% | | | | | | |
| American Express Co. | | 1,452,135 | | | | 78,139 |
| Capital One Financial Corp. | | 353,285 | | | | 30,609 |
| SLM Corp. | | 489,629 | | | | 25,892 |
| | | | | | | 134,640 |
| Diversified Financial Services – 3.6% | | | | | | |
| CIT Group, Inc. | | 234,395 | | | | 12,660 |
| Citigroup, Inc. | | 5,856,244 | | | | 292,519 |
| JPMorgan Chase & Co. | | 4,089,565 | | | | 185,584 |
| Moody’s Corp. | | 285,420 | | | | 17,699 |
| | | | | | | 508,462 |
| Insurance – 4.7% | | | | | | |
| ACE Ltd. | | 378,184 | | | | 21,004 |
| AFLAC, Inc. | | 584,502 | | | | 27,787 |
| Allstate Corp. | | 756,752 | | | | 42,749 |
| AMBAC Financial Group, Inc. | | 123,811 | | | | 10,197 |
| American International Group, Inc. | | 3,045,401 | | | | 198,712 |
| Aon Corp. | | 377,748 | | | | 15,831 |
| Cincinnati Financial Corp. | | 204,277 | | | | 8,710 |
| Genworth Financial, Inc. Class A (non-vtg.) | | 442,059 | | | | 14,676 |
| Hartford Financial Services Group, Inc. | | 354,870 | | | | 32,623 |
| Lincoln National Corp. | | 334,838 | | | | 19,447 |
| Loews Corp. | | 159,210 | | | | 16,900 |
| Marsh & McLennan Companies, Inc. | | 641,790 | | | | 19,684 |
| MBIA, Inc. | | 157,231 | | | | 9,376 |
| MetLife, Inc. | | 889,307 | | | | 46,333 |
See accompanying notes which are an integral part of the financial statements.
| Common Stocks continued | | | | | | |
| | | Shares | | Value (Note 1) |
| | | | | (000s) |
| |
| FINANCIALS – continued | | | | | | |
| Insurance – continued | | | | | | |
| Principal Financial Group, Inc. | | 327,934 | | | | $ 16,826 |
| Progressive Corp. | | 230,800 | | | | 25,049 |
| Prudential Financial, Inc. | | 580,779 | | | | 45,376 |
| SAFECO Corp. | | 144,637 | | | | 7,507 |
| The Chubb Corp. | | 469,106 | | | | 24,178 |
| The St. Paul Travelers Companies, Inc. | | 816,509 | | | | 35,951 |
| Torchmark Corp. | | 121,515 | | | | 7,304 |
| UnumProvident Corp. | | 350,390 | | | | 7,116 |
| XL Capital Ltd. Class A | | 204,647 | | | | 13,484 |
| | | | | | | 666,820 |
| Real Estate 0.9% | | | | | | |
| Apartment Investment & Management Co. Class A | | 113,301 | | | | 5,063 |
| Archstone-Smith Trust | | 250,272 | | | | 12,233 |
| Boston Properties, Inc. | | 105,277 | | | | 9,293 |
| Equity Office Properties Trust | | 435,707 | | | | 14,073 |
| Equity Residential (SBI) | | 340,752 | | | | 15,290 |
| Kimco Realty Corp. | | 249,357 | | | | 9,259 |
| Plum Creek Timber Co., Inc. | | 216,259 | | | | 7,850 |
| ProLogis Trust | | 285,691 | | | | 14,347 |
| Public Storage, Inc. (d) | | 97,009 | | | | 7,458 |
| Simon Property Group, Inc. | | 214,626 | | | | 17,574 |
| Vornado Realty Trust | | 139,226 | | | | 13,316 |
| | | | | | | 125,756 |
| Thrifts & Mortgage Finance – 1.6% | | | | | | |
| Countrywide Financial Corp. | | 707,488 | | | | 28,766 |
| Fannie Mae | | 1,135,632 | | | | 57,463 |
| Freddie Mac | | 810,743 | | | | 49,504 |
| Golden West Financial Corp., Delaware | | 300,429 | | | | 21,592 |
| MGIC Investment Corp. | | 102,652 | | | | 7,257 |
| Sovereign Bancorp, Inc. | | 419,050 | | | | 9,290 |
| Washington Mutual, Inc. | | 1,163,395 | | | | 52,423 |
| | | | | | | 226,295 |
| |
| TOTAL FINANCIALS | | | | | | 3,031,642 |
| |
| HEALTH CARE – 12.1% | | | | | | |
| Biotechnology – 1.2% | | | | | | |
| Amgen, Inc. (a) | | 1,371,147 | | | | 92,827 |
| Applera Corp. – Applied Biosystems Group | | 215,032 | | | | 6,202 |
See accompanying notes which are an integral part of the financial statements.
17 Annual Report
| Investments continued | | | | | | |
| |
| |
| Common Stocks continued | | | | | | |
| | | Shares | | Value (Note 1) |
| | | | | (000s) |
| |
| HEALTH CARE – continued | | | | | | |
| Biotechnology – continued | | | | | | |
| Biogen Idec, Inc. (a) | | 403,728 | | | | $ 18,107 |
| Genzyme Corp. (a) | | 304,809 | | | | 18,642 |
| Gilead Sciences, Inc. (a) | | 542,394 | | | | 31,188 |
| MedImmune, Inc. (a) | | 299,726 | | | | 9,432 |
| | | | | | | 176,398 |
| Health Care Equipment & Supplies – 1.9% | | | | | | |
| Bausch & Lomb, Inc. (d) | | 63,086 | | | | 3,088 |
| Baxter International, Inc. | | 760,860 | | | | 28,684 |
| Becton, Dickinson & Co. | | 290,196 | | | | 18,294 |
| Biomet, Inc. | | 290,420 | | | | 10,798 |
| Boston Scientific Corp. (a) | | 1,354,521 | | | | 31,479 |
| C.R. Bard, Inc. | | 122,031 | | | | 9,086 |
| Fisher Scientific International, Inc. (a) | | 144,784 | | | | 10,215 |
| Hospira, Inc. (a) | | 188,727 | | | | 7,275 |
| Medtronic, Inc. | | 1,416,175 | | | | 70,979 |
| Millipore Corp. (a) | | 61,095 | | | | 4,508 |
| PerkinElmer, Inc. | | 153,463 | | | | 3,290 |
| St. Jude Medical, Inc. (a) | | 430,105 | | | | 16,981 |
| Stryker Corp. | | 342,843 | | | | 14,999 |
| Thermo Electron Corp. (a) | | 190,277 | | | | 7,333 |
| Waters Corp. (a) | | 122,632 | | | | 5,558 |
| Zimmer Holdings, Inc. (a) | | 290,706 | | | | 18,285 |
| | | | | | | 260,852 |
| Health Care Providers & Services – 2.7% | | | | | | |
| Aetna, Inc. | | 665,373 | | | | 25,617 |
| AmerisourceBergen Corp. | | 245,240 | | | | 10,582 |
| Cardinal Health, Inc. | | 495,071 | | | | 33,343 |
| Caremark Rx, Inc. | | 526,384 | | | | 23,977 |
| CIGNA Corp. | | 142,049 | | | | 15,199 |
| Coventry Health Care, Inc. (a) | | 188,103 | | | | 9,343 |
| Express Scripts, Inc. (a) | | 171,736 | | | | 13,419 |
| HCA, Inc. | | 478,621 | | | | 21,007 |
| Health Management Associates, Inc. Class A | | 282,350 | | | | 5,847 |
| Humana, Inc. (a) | | 191,817 | | | | 8,666 |
| IMS Health, Inc. | | 233,770 | | | | 6,354 |
| Laboratory Corp. of America Holdings (a) | | 147,013 | | | | 8,394 |
| Manor Care, Inc. | | 92,773 | | | | 4,068 |
| McKesson Corp. | | 359,176 | | | | 17,452 |
| Medco Health Solutions, Inc. (a) | | 357,157 | | | | 19,011 |
See accompanying notes which are an integral part of the financial statements.
| Common Stocks continued | | | | | | |
| | | Shares | | Value (Note 1) |
| | | | | (000s) |
| |
| HEALTH CARE – continued | | | | | | |
| Health Care Providers & Services – continued | | | | | | |
| Patterson Companies, Inc. (a) | | 162,669 | | | | $ 5,300 |
| Quest Diagnostics, Inc. | | 190,874 | | | | 10,637 |
| Tenet Healthcare Corp. (a) | | 551,808 | | | | 4,591 |
| UnitedHealth Group, Inc. | | 1,591,324 | | | | 79,152 |
| WellPoint, Inc. (a) | | 774,370 | | | | 54,980 |
| | | | | | | 376,939 |
| Pharmaceuticals – 6.3% | | | | | | |
| Abbott Laboratories | | 1,805,254 | | | | 77,157 |
| Allergan, Inc. | | 177,929 | | | | 18,277 |
| Barr Pharmaceuticals, Inc. (a) | | 124,086 | | | | 7,513 |
| Bristol-Myers Squibb Co. | | 2,298,561 | | | | 58,337 |
| Eli Lilly & Co. | | 1,325,797 | | | | 70,161 |
| Forest Laboratories, Inc. (a) | | 382,364 | | | | 15,440 |
| Johnson & Johnson | | 3,491,792 | | | | 204,654 |
| King Pharmaceuticals, Inc. (a) | | 284,030 | | | | 4,939 |
| Merck & Co., Inc. | | 2,566,035 | | | | 88,323 |
| Mylan Laboratories, Inc. | | 256,484 | | | | 5,602 |
| Pfizer, Inc. | | 8,633,002 | | | | 218,674 |
| Schering-Plough Corp. | | 1,735,854 | | | | 33,537 |
| Watson Pharmaceuticals, Inc. (a) | | 119,242 | | | | 3,391 |
| Wyeth | | 1,576,997 | | | | 76,752 |
| | | | | | | 882,757 |
| |
| TOTAL HEALTH CARE | | | | | | 1,696,946 |
| |
| INDUSTRIALS – 11.6% | | | | | | |
| Aerospace & Defense – 2.4% | | | | | | |
| General Dynamics Corp. | | 469,654 | | | | 30,819 |
| Goodrich Corp. | | 144,795 | | | | 6,443 |
| Honeywell International, Inc. | | 974,547 | | | | 41,418 |
| L 3 Communications Holdings, Inc. | | 142,281 | | | | 11,624 |
| Lockheed Martin Corp. | | 420,352 | | | | 31,905 |
| Northrop Grumman Corp. | | 411,480 | | | | 27,528 |
| Raytheon Co. | | 523,422 | | | | 23,172 |
| Rockwell Collins, Inc. | | 202,138 | | | | 11,562 |
| The Boeing Co. | | 939,086 | | | | 78,367 |
| United Technologies Corp. | | 1,191,391 | | | | 74,831 |
| | | | | | | 337,669 |
See accompanying notes which are an integral part of the financial statements.
19 Annual Report
| Investments continued | | | | | | |
| |
| |
| Common Stocks continued | | | | | | |
| | | Shares | | Value (Note 1) |
| | | | | (000s) |
| |
| INDUSTRIALS – continued | | | | | | |
| Air Freight & Logistics – 1.1% | | | | | | |
| FedEx Corp. | | 356,542 | | | | $ 41,049 |
| Ryder System, Inc. | | 71,371 | | | | 3,722 |
| United Parcel Service, Inc. Class B | | 1,281,377 | | | | 103,881 |
| | | | | | | 148,652 |
| Airlines – 0.1% | | | | | | |
| Southwest Airlines Co. | | 830,809 | | | | 13,476 |
| Building Products 0.2% | | | | | | |
| American Standard Companies, Inc. | | 209,131 | | | | 9,103 |
| Masco Corp. | | 488,440 | | | | 15,581 |
| | | | | | | 24,684 |
| Commercial Services & Supplies – 0.7% | | | | | | |
| Allied Waste Industries, Inc. (a)(d) | | 283,674 | | | | 4,017 |
| Avery Dennison Corp. | | 129,604 | | | | 8,100 |
| Cendant Corp. | | 1,182,892 | | | | 20,618 |
| Cintas Corp. | | 161,648 | | | | 6,786 |
| Equifax, Inc. | | 151,840 | | | | 5,852 |
| Monster Worldwide, Inc. (a) | | 148,351 | | | | 8,515 |
| Pitney Bowes, Inc. | | 266,317 | | | | 11,145 |
| R.R. Donnelley & Sons Co. | | 253,387 | | | | 8,537 |
| Robert Half International, Inc. | | 201,215 | | | | 8,505 |
| Waste Management, Inc. | | 648,008 | | | | 24,274 |
| | | | | | | 106,349 |
| Construction & Engineering – 0.1% | | | | | | |
| Fluor Corp. (d) | | 101,871 | | | | 9,465 |
| Electrical Equipment – 0.5% | | | | | | |
| American Power Conversion Corp. | | 201,658 | | | | 4,485 |
| Cooper Industries Ltd. Class A | | 107,717 | | | | 9,851 |
| Emerson Electric Co. | | 482,702 | | | | 41,006 |
| Rockwell Automation, Inc. | | 207,944 | | | | 15,068 |
| | | | | | | 70,410 |
| Industrial Conglomerates – 4.1% | | | | | | |
| 3M Co. | | 885,821 | | | | 75,676 |
| General Electric Co. | | 12,229,699 | | | | 423,025 |
| Textron, Inc. | | 155,310 | | | | 13,970 |
| Tyco International Ltd. | | 2,364,633 | | | | 62,308 |
| | | | | | | 574,979 |
| Machinery – 1.6% | | | | | | |
| Caterpillar, Inc. | | 787,121 | | | | 59,617 |
See accompanying notes which are an integral part of the financial statements.
| Common Stocks continued | | | | | | |
| | | Shares | | Value (Note 1) |
| | | | | (000s) |
| |
| INDUSTRIALS – continued | | | | | | |
| Machinery – continued | | | | | | |
| Cummins, Inc. | | 54,507 | | | | $ 5,696 |
| Danaher Corp. | | 278,348 | | | | 17,845 |
| Deere & Co. | | 277,953 | | | | 24,399 |
| Dover Corp. | | 238,533 | | | | 11,867 |
| Eaton Corp. | | 174,703 | | | | 13,391 |
| Illinois Tool Works, Inc. | | 240,608 | | | | 24,710 |
| Ingersoll-Rand Co. Ltd. Class A | | 384,226 | | | | 16,810 |
| ITT Industries, Inc. | | 216,715 | | | | 12,186 |
| Navistar International Corp. (a) | | 72,385 | | | | 1,910 |
| PACCAR, Inc. | | 198,627 | | | | 14,287 |
| Pall Corp. | | 146,570 | | | | 4,423 |
| Parker Hannifin Corp. | | 140,480 | | | | 11,386 |
| | | | | | | 218,527 |
| Road & Rail 0.8% | | | | | | |
| Burlington Northern Santa Fe Corp. | | 437,592 | | | | 34,802 |
| CSX Corp. | | 257,456 | | | | 17,633 |
| Norfolk Southern Corp. | | 483,674 | | | | 26,118 |
| Union Pacific Corp. | | 310,851 | | | | 28,353 |
| | | | | | | 106,906 |
| Trading Companies & Distributors – 0.0% | | | | | | |
| W.W. Grainger, Inc. | | 89,709 | | | | 6,900 |
| |
| TOTAL INDUSTRIALS | | | | | | 1,618,017 |
| |
| INFORMATION TECHNOLOGY – 15.7% | | | | | | |
| Communications Equipment – 3.0% | | | | | | |
| ADC Telecommunications, Inc. (a) | | 137,394 | | | | 3,076 |
| Andrew Corp. (a) | | 186,948 | | | | 1,978 |
| Avaya, Inc. (a) | | 489,304 | | | | 5,872 |
| CIENA Corp. (a) | | 683,273 | | | | 2,795 |
| Cisco Systems, Inc. (a) | | 7,216,390 | | | | 151,183 |
| Comverse Technology, Inc. (a) | | 237,011 | | | | 5,368 |
| Corning, Inc. (a) | | 1,813,886 | | | | 50,118 |
| JDS Uniphase Corp. (a) | | 1,966,691 | | | | 6,864 |
| Lucent Technologies, Inc. (a) | | 5,243,654 | | | | 14,630 |
| Motorola, Inc. | | 2,932,770 | | | | 62,615 |
| QUALCOMM, Inc. | | 1,943,307 | | | | 99,769 |
| Tellabs, Inc. (a) | | 528,442 | | | | 8,376 |
| | | | | | | 412,644 |
See accompanying notes which are an integral part of the financial statements.
21 Annual Report
| Investments continued | | | | | | |
| |
| |
| Common Stocks continued | | | | | | |
| | | Shares | | Value (Note 1) |
| | | | | (000s) |
| |
| INFORMATION TECHNOLOGY – continued | | | | | | |
| Computers & Peripherals – 3.6% | | | | | | |
| Apple Computer, Inc. (a) | | 999,267 | | | | $ 70,338 |
| Dell, Inc. (a) | | 2,761,363 | | | | 72,348 |
| EMC Corp. (a) | | 2,788,618 | | | | 37,674 |
| Gateway, Inc. (a)(d) | | 310,081 | | | | 682 |
| Hewlett-Packard Co. | | 3,318,560 | | | | 107,754 |
| International Business Machines Corp. | | 1,838,912 | | | | 151,416 |
| Lexmark International, Inc. Class A (a) | | 127,056 | | | | 6,188 |
| NCR Corp. (a) | | 213,539 | | | | 8,413 |
| Network Appliance, Inc. (a) | | 439,003 | | | | 16,274 |
| QLogic Corp. (a) | | 189,308 | | | | 3,939 |
| SanDisk Corp. (a) | | 215,917 | | | | 13,782 |
| Sun Microsystems, Inc. (a) | | 4,060,748 | | | | 20,304 |
| | | | | | | 509,112 |
| Electronic Equipment & Instruments – 0.4% | | | | | | |
| Agilent Technologies, Inc. (a) | | 503,060 | | | | 19,328 |
| Jabil Circuit, Inc. (a) | | 204,839 | | | | 7,987 |
| Molex, Inc. | | 167,181 | | | | 6,206 |
| Sanmina-SCI Corp. (a) | | 624,387 | | | | 3,241 |
| Solectron Corp. (a) | | 1,073,044 | | | | 4,292 |
| Symbol Technologies, Inc. | | 296,824 | | | | 3,161 |
| Tektronix, Inc. | | 95,751 | | | | 3,382 |
| | | | | | | 47,597 |
| Internet Software & Services – 1.4% | | | | | | |
| eBay, Inc. (a) | | 1,353,400 | | | | 46,570 |
| Google, Inc. Class A (sub. vtg.) (a) | | 237,149 | | | | 99,114 |
| VeriSign, Inc. (a) | | 286,956 | | | | 6,749 |
| Yahoo!, Inc. (a) | | 1,480,562 | | | | 48,533 |
| | | | | | | 200,966 |
| IT Services – 1.0% | | | | | | |
| Affiliated Computer Services, Inc. Class A (a) | | 137,889 | | | | 7,689 |
| Automatic Data Processing, Inc. | | 679,998 | | | | 29,974 |
| Computer Sciences Corp. (a) | | 218,814 | | | | 12,812 |
| Convergys Corp. (a) | | 164,066 | | | | 3,194 |
| Electronic Data Systems Corp. | | 603,674 | | | | 16,347 |
| First Data Corp. | | 900,039 | | | | 42,923 |
| Fiserv, Inc. (a) | | 216,465 | | | | 9,758 |
| Paychex, Inc. | | 391,931 | | | | 15,830 |
See accompanying notes which are an integral part of the financial statements.
| Common Stocks continued | | | | | | |
| | | Shares | | Value (Note 1) |
| | | | | (000s) |
| |
| INFORMATION TECHNOLOGY – continued | | | | | | |
| IT Services – continued | | | | | | |
| Sabre Holdings Corp. Class A | | 154,694 | | | | $ 3,572 |
| Unisys Corp. (a) | | 401,225 | | | | 2,504 |
| | | | | | | 144,603 |
| Office Electronics – 0.1% | | | | | | |
| Xerox Corp. (a) | | 1,092,697 | | | | 15,341 |
| Semiconductors & Semiconductor Equipment – 3.0% | | | | | | |
| Advanced Micro Devices, Inc. (a) | | 564,221 | | | | 18,253 |
| Altera Corp. (a) | | 421,559 | | | | 9,207 |
| Analog Devices, Inc. | | 429,590 | | | | 16,290 |
| Applied Materials, Inc. | | 1,861,512 | | | | 33,414 |
| Applied Micro Circuits Corp. (a)(d) | | 345,311 | | | | 1,267 |
| Broadcom Corp. Class A (a) | | 516,830 | | | | 21,247 |
| Freescale Semiconductor, Inc. Class B (a) | | 481,512 | | | | 15,249 |
| Intel Corp. | | 6,902,465 | | | | 137,911 |
| KLA Tencor Corp. | | 234,105 | | | | 11,274 |
| Linear Technology Corp. | | 358,671 | | | | 12,733 |
| LSI Logic Corp. (a) | | 459,574 | | | | 4,894 |
| Maxim Integrated Products, Inc. | | 376,158 | | | | 13,263 |
| Micron Technology, Inc. (a) | | 789,130 | | | | 13,392 |
| National Semiconductor Corp. | | 395,968 | | | | 11,871 |
| Novellus Systems, Inc. (a) | | 156,491 | | | | 3,865 |
| NVIDIA Corp. (a) | | 401,678 | | | | 11,737 |
| PMC-Sierra, Inc. (a)(d) | | 217,978 | | | | 2,709 |
| Teradyne, Inc. (a) | | 232,424 | | | | 3,919 |
| Texas Instruments, Inc. | | 1,877,666 | | | | 65,174 |
| Xilinx, Inc. | | 404,509 | | | | 11,193 |
| | | | | | | 418,862 |
| Software 3.2% | | | | | | |
| Adobe Systems, Inc. | | 703,752 | | | | 27,587 |
| Autodesk, Inc. | | 270,795 | | | | 11,384 |
| BMC Software, Inc. (a) | | 249,704 | | | | 5,379 |
| CA, Inc. | | 535,333 | | | | 13,576 |
| Citrix Systems, Inc. (a) | | 209,402 | | | | 8,359 |
| Compuware Corp. (a) | | 449,119 | | | | 3,449 |
| Electronic Arts, Inc. (a) | | 356,439 | | | | 20,246 |
| Intuit, Inc. (a) | | 207,609 | | | | 11,246 |
| Microsoft Corp. | | 10,426,672 | | | | 251,804 |
| Novell, Inc. (a) | | 456,927 | | | | 3,756 |
| Oracle Corp. (a) | | 4,421,283 | | | | 64,507 |
See accompanying notes which are an integral part of the financial statements.
23 Annual Report
| Investments continued | | | | | | |
| |
| |
| Common Stocks continued | | | | | | |
| | | Shares | | Value (Note 1) |
| | | | | (000s) |
| |
| INFORMATION TECHNOLOGY – continued | | | | | | |
| Software – continued | | | | | | |
| Parametric Technology Corp. (a) | | 130,329 | | | | $ 1,947 |
| Symantec Corp. (a) | | 1,224,109 | | | | 20,051 |
| | | | | | | 443,291 |
| |
| TOTAL INFORMATION TECHNOLOGY | | | | | | 2,192,416 |
| |
| MATERIALS 3.1% | | | | | | |
| Chemicals – 1.5% | | | | | | |
| Air Products & Chemicals, Inc. | | 261,205 | | | | 17,898 |
| Ashland, Inc. | | 83,615 | | | | 5,504 |
| Dow Chemical Co. | | 1,135,067 | | | | 46,095 |
| E.I. du Pont de Nemours & Co. | | 1,079,391 | | | | 47,601 |
| Eastman Chemical Co. | | 95,785 | | | | 5,206 |
| Ecolab, Inc. | | 213,904 | | | | 8,086 |
| Engelhard Corp. | | 145,206 | | | | 5,577 |
| Hercules, Inc. (a) | | 132,448 | | | | 1,882 |
| International Flavors & Fragrances, Inc. | | 92,623 | | | | 3,272 |
| Monsanto Co. | | 316,056 | | | | 26,359 |
| PPG Industries, Inc. | | 193,984 | | | | 13,020 |
| Praxair, Inc. | | 378,713 | | | | 21,257 |
| Rohm & Haas Co. | | 168,976 | | | | 8,550 |
| Sigma Aldrich Corp. | | 78,461 | | | | 5,383 |
| | | | | | | 215,690 |
| Construction Materials 0.1% | | | | | | |
| Vulcan Materials Co. | | 117,789 | | | | 10,007 |
| Containers & Packaging – 0.2% | | | | | | |
| Ball Corp. | | 122,358 | | | | 4,892 |
| Bemis Co., Inc. | | 123,548 | | | | 3,887 |
| Pactiv Corp. (a) | | 168,114 | | | | 4,092 |
| Sealed Air Corp. | | 95,498 | | | | 5,143 |
| Temple-Inland, Inc. | | 130,068 | | | | 6,040 |
| | | | | | | 24,054 |
| Metals & Mining – 1.0% | | | | | | |
| Alcoa, Inc. | | 1,022,898 | | | | 34,553 |
| Allegheny Technologies, Inc. | | 101,437 | | | | 7,034 |
| Freeport-McMoRan Copper & Gold, Inc. Class B | | 215,938 | | | | 13,945 |
| Newmont Mining Corp. | | 524,209 | | | | 30,593 |
| Nucor Corp. | | 182,342 | | | | 19,842 |
See accompanying notes which are an integral part of the financial statements.
| Common Stocks continued | | | | | | |
| | | Shares | | Value (Note 1) |
| | | | | (000s) |
| |
| MATERIALS – continued | | | | | | |
| Metals & Mining – continued | | | | | | |
| Phelps Dodge Corp. | | 238,798 | | | | $ 20,582 |
| United States Steel Corp. (d) | | 127,693 | | | | 8,747 |
| | | | | | | 135,296 |
| Paper & Forest Products 0.3% | | | | | | |
| International Paper Co. | | 577,958 | | | | 21,009 |
| Louisiana-Pacific Corp. | | 124,409 | | | | 3,431 |
| MeadWestvaco Corp. | | 212,914 | | | | 6,070 |
| Weyerhaeuser Co. | | 285,410 | | | | 20,113 |
| | | | | | | 50,623 |
| |
| TOTAL MATERIALS | | | | | | 435,670 |
| |
| TELECOMMUNICATION SERVICES – 3.2% | | | | | | |
| Diversified Telecommunication Services – 2.4% | | | | | | |
| AT&T, Inc. | | 4,552,083 | | | | 119,310 |
| BellSouth Corp. | | 2,109,360 | | | | 71,254 |
| CenturyTel, Inc. | | 135,173 | | | | 5,096 |
| Citizens Communications Co. | | 385,376 | | | | 5,118 |
| Qwest Communications International, Inc. (a)(d) | | 1,820,079 | | | | 12,213 |
| Verizon Communications, Inc. | | 3,434,012 | | | | 113,425 |
| | | | | | | 326,416 |
| Wireless Telecommunication Services – 0.8% | | | | | | |
| ALLTEL Corp. | | 455,212 | | | | 29,302 |
| Sprint Nextel Corp. | | 3,481,469 | | | | 86,340 |
| | | | | | | 115,642 |
| |
| TOTAL TELECOMMUNICATION SERVICES | | | | | | 442,058 |
| |
| UTILITIES – 3.1% | | | | | | |
| Electric Utilities – 1.4% | | | | | | |
| Allegheny Energy, Inc. (a) | | 191,459 | | | | 6,822 |
| American Electric Power Co., Inc. | | 461,947 | | | | 15,457 |
| Edison International | | 382,271 | | | | 15,448 |
| Entergy Corp. | | 243,865 | | | | 17,056 |
| Exelon Corp. | | 782,858 | | | | 42,274 |
| FirstEnergy Corp. | | 386,993 | | | | 19,624 |
| FPL Group, Inc. | | 473,490 | | | | 18,750 |
| Pinnacle West Capital Corp. | | 116,351 | | | | 4,666 |
| PPL Corp. | | 446,134 | | | | 12,956 |
See accompanying notes which are an integral part of the financial statements.
25 Annual Report
| Investments continued | | | | | | |
| |
| |
| Common Stocks continued | | | | | | |
| | | Shares | | Value (Note 1) |
| | | | | (000s) |
| |
| UTILITIES – continued | | | | | | |
| Electric Utilities – continued | | | | | | |
| Progress Energy, Inc. | | 296,010 | | | | $ 12,669 |
| Southern Co. | | 870,274 | | | | 28,049 |
| | | | | | | 193,771 |
| Gas Utilities 0.0% | | | | | | |
| Nicor, Inc. | | 51,850 | | | | 2,054 |
| Peoples Energy Corp. (d) | | 44,993 | | | | 1,635 |
| | | | | | | 3,689 |
| Independent Power Producers & Energy Traders – 0.4% | | | | | | |
| AES Corp. (a) | | 769,662 | | | | 13,061 |
| Constellation Energy Group, Inc. | | 209,379 | | | | 11,499 |
| Dynegy, Inc. Class A (a)(d) | | 353,485 | | | | 1,757 |
| TXU Corp. | | 542,956 | | | | 26,947 |
| | | | | | | 53,264 |
| Multi-Utilities – 1.3% | | | | | | |
| Ameren Corp. | | 240,226 | | | | 12,100 |
| CenterPoint Energy, Inc. | | 363,844 | | | | 4,373 |
| CMS Energy Corp. (a)(d) | | 259,014 | | | | 3,450 |
| Consolidated Edison, Inc. | | 287,969 | | | | 12,417 |
| Dominion Resources, Inc. | | 407,695 | | | | 30,524 |
| DTE Energy Co. | | 208,626 | | | | 8,508 |
| Duke Energy Corp. | | 1,454,063 | | | | 42,342 |
| KeySpan Corp. | | 204,825 | | | | 8,271 |
| NiSource, Inc. | | 319,889 | | | | 6,753 |
| PG&E Corp. | | 405,161 | | | | 16,142 |
| Public Service Enterprise Group, Inc. | | 294,139 | | | | 18,443 |
| Sempra Energy | | 303,195 | | | | 13,953 |
| TECO Energy, Inc. | | 244,431 | | | | 3,906 |
| Xcel Energy, Inc. | | 473,791 | | | | 8,926 |
| | | | | | | 190,108 |
| |
| TOTAL UTILITIES | | | | | | 440,832 |
| |
| TOTAL COMMON STOCKS | | | | | | |
| (Cost $10,669,109) | | | | 13,947,342 |
See accompanying notes which are an integral part of the financial statements.
| U.S. Treasury Obligations 0.0% | | | | | | | | |
| | | | | Principal | | Value (Note 1) |
| | | | | Amount (000s) | | (000s) |
| U.S. Treasury Bills, yield at date of purchase 4.6% | | | | | | | | |
| 6/22/06 (e) | | | | | | | | | | |
| (Cost $6,953) | | | | | | $ 7,000 | | | | $ 6,954 |
| Money Market Funds 1.2% | | | | | | | | |
| | | | | Shares | | | | |
| Fidelity Cash Central Fund, 4.8% (b) | | | | 47,186,703 | | | | 47,187 |
| Fidelity Securities Lending Cash Central Fund, | | | | | | | | |
| 4.83% (b)(c) | | | | 124,027,272 | | | | 124,027 |
| TOTAL MONEY MARKET FUNDS | | | | | | | | | | |
| (Cost $171,214) | | | | | | | | | | 171,214 |
| TOTAL INVESTMENT PORTFOLIO 100.8% | | | | | | | | | | |
| (Cost $10,847,276) | | | | | | | | 14,125,510 |
| |
| NET OTHER ASSETS – (0.8)% | | | | | | | | | | (115,191) |
| NET ASSETS 100% | | | | | | | | $ 14,010,319 |
| |
| Futures Contracts | | | | | | | | | | |
| | | Expiration | | Underlying | | Unrealized |
| | | Date | | Face Amount | | Appreciation/ |
| | | | | at Value (000s) | | (Depreciation) |
| | | | | | | | | (000s) |
| Purchased | | | | | | | | | | |
| Equity Index Contracts | | | | | | | | | | |
| 199 S&P 500 Index Contracts | | June 2006 | | $ 65,466 | | | | $ 116 |
The face value of futures purchased as a percentage of net assets – 0.5%
Legend
(a) Non-income producing
(b) Affiliated fund that is available only to
investment companies and other
accounts managed by Fidelity
Investments. The rate quoted is the
annualized seven-day yield of the fund
at period end. A complete unaudited
listing of the fund’s holdings as of its
most recent quarter end is available
upon request.
|
(c) Investment made with cash collateral
received from securities on loan.
(d) Security or a portion of the security is on
loan at period end.
(e) Security or a portion of the security was
pledged to cover margin requirements
for futures contracts. At the period end,
the value of securities pledged
amounted to $6,954,000.
|
See accompanying notes which are an integral part of the financial statements.
27 Annual Report
Investments continued
Affiliated Central Funds
Information regarding fiscal year to date income earned by the fund from the affiliated Central funds is as follows:
| Fund | | Income earned |
| | | (Amounts in thousands) |
| Fidelity Cash Central Fund | | | | $ 4,372 |
| Fidelity Securities Lending Cash Central Fund | | | | 739 |
| Total | | | | $ 5,111 |
Income Tax Information
At April 30, 2006, the fund had a capital loss carryforward of approximately $77,280,000 all of which will expire on April 30, 2011.
See accompanying notes which are an integral part of the financial statements.
Annual Report 28
| Financial Statements | | | | | | | | |
| |
| Statement of Assets and Liabilities | | | | | | | | |
| Amounts in thousands (except per share amounts) | | | | | | | | April 30, 2006 |
| |
| Assets | | | | | | | | |
| Investment in securities, at value (including securities | | | | | | | | |
| loaned of $119,965) See accompanying schedule: | | | | | | | | |
| Unaffiliated issuers (cost $10,676,062) | | | | $ 13,954,296 | | | | |
| Affiliated Central Funds (cost $171,214) | | | | 171,214 | | | | |
| Total Investments (cost $10,847,276) | | | | | | | | $ 14,125,510 |
| Receivable for investments sold | | | | | | | | 775 |
| Receivable for fund shares sold | | | | | | | | 7,784 |
| Dividends receivable | | | | | | | | 16,498 |
| Interest receivable | | | | | | | | 238 |
| Receivable for daily variation on futures contracts | | | | | | | | 40 |
| Other affiliated receivables | | | | | | | | 40 |
| Other receivables | | | | | | | | 57 |
| Total assets | | | | | | | | 14,150,942 |
| |
| Liabilities | | | | | | | | |
| Payable for fund shares redeemed | | | | 15,479 | | | | |
| Accrued management fee | | | | 812 | | | | |
| Other affiliated payables | | | | 305 | | | | |
| Collateral on securities loaned, at value | | | | 124,027 | | | | |
| Total liabilities | | | | | | | | 140,623 |
| |
| Net Assets | | | | | | | | $ 14,010,319 |
| Net Assets consist of: | | | | | | | | |
| Paid in capital | | | | | | | | $ 10,789,966 |
| Undistributed net investment income | | | | | | | | 91,024 |
| Accumulated undistributed net realized gain (loss) on | | | | | | | | |
| investments | | | | | | | | (149,021) |
| Net unrealized appreciation (depreciation) on | | | | | | | | |
| investments and assets and liabilities in foreign | | | | | | | | |
| currencies | | | | | | | | 3,278,350 |
| Net Assets | | | | | | | | $ 14,010,319 |
| |
| Investor Class: | | | | | | | | |
| Net Asset Value, offering price and redemption price | | | | | | | | |
| per share ($7,246,910 ÷ 79,784 shares) | | | | | | | | $ 90.83 |
| |
| Fidelity Advantage Class: | | | | | | | | |
| Net Asset Value, offering price and redemption price | | | | | | | | |
| per share ($6,763,409 ÷ 74,453 shares) | | | | | | | | $ 90.84 |
See accompanying notes which are an integral part of the financial statements.
29 Annual Report
| Financial Statements continued | | | | |
| |
| |
| Statement of Operations | | | | | | |
| Amounts in thousands | | | | Year ended April 30, 2006 |
| |
| Investment Income | | | | | | |
| Dividends | | | | | | $ 241,699 |
| Interest | | | | | | 564 |
| Income from affiliated Central Funds | | | | | | 5,111 |
| Total income | | | | | | 247,374 |
| |
| Expenses | | | | | | |
| Management fee | | | | $ 10,784 | | |
| Transfer agent fees | | | | 1,329 | | |
| Independent trustees’ compensation | | | | 55 | | |
| Appreciation in deferred trustee compensation account | | | | 9 | | |
| Interest | | | | 2 | | |
| Miscellaneous | | | | 39 | | |
| Total expenses before reductions | | | | 12,218 | | |
| Expense reductions | | | | (77) | | 12,141 |
| |
| Net investment income (loss) | | | | | | 235,233 |
| Realized and Unrealized Gain (Loss) | | | | | | |
| Net realized gain (loss) on: | | | | | | |
| Investment securities: | | | | | | |
| Unaffiliated issuers | | | | 342,441 | | |
| Futures contracts | | | | 22,216 | | |
| Total net realized gain (loss) | | | | | | 364,657 |
| Change in net unrealized appreciation (depreciation) on: | | | | | | |
| Investment securities | | | | 1,261,580 | | |
| Futures contracts | | | | 2,909 | | |
| Total change in net unrealized appreciation | | | | | | |
| (depreciation) | | | | | | 1,264,489 |
| Net gain (loss) | | | | | | 1,629,146 |
| Net increase (decrease) in net assets resulting from | | | | | | |
| operations | | | | | | $ 1,864,379 |
See accompanying notes which are an integral part of the financial statements.
| Statement of Changes in Net Assets | | | | | | | | |
| | | | | Year ended | | | | Year ended |
| | | | | April 30, | | | | April 30, |
| Amounts in thousands | | | | 2006 | | | | 2005 |
| Increase (Decrease) in Net Assets | | | | | | | | |
| Operations | | | | | | | | |
| Net investment income (loss) | | | | $ 235,233 | | | | $ 216,293 |
| Net realized gain (loss) | | | | 364,657 | | | | (55,541) |
| Change in net unrealized appreciation (depreciation) . | | | | 1,264,489 | | | | 468,154 |
| Net increase (decrease) in net assets resulting | | | | | | | | |
| from operations | | | | 1,864,379 | | | | 628,906 |
| Distributions to shareholders from net investment income . | | | | (210,865) | | | | (195,056) |
| Share transactions - net increase (decrease) | | | | 324,647 | | | | 1,403,354 |
| Redemption fees | | | | 354 | | | | 378 |
| Total increase (decrease) in net assets | | | | 1,978,515 | | | | 1,837,582 |
| |
| Net Assets | | | | | | | | |
| Beginning of period | | | | 12,031,804 | | | | 10,194,222 |
| End of period (including undistributed net investment | | | | | | | | |
| income of $91,024 and undistributed net investment | | | | | | | | |
| income of $67,463, respectively) | | | | $ 14,010,319 | | | | $ 12,031,804 |
See accompanying notes which are an integral part of the financial statements.
31 Annual Report
| Financial Highlights Investor Class | | | | | | |
| |
| Years ended April 30, | | 2006 | | 2005 | | 2004 | | 2003 | | 2002 |
| Selected Per Share Data | | | | | | | | | | |
| Net asset value, beginning of | | | | | | | | | | |
| period | | $ 80.02 | | $ 76.63 | | $ 63.37 | | $ 74.28 | | $ 86.16 |
| Income from Investment | | | | | | | | | | |
| Operations | | | | | | | | | | |
| Net investment income (loss)B | | 1.51 | | 1.54C | | 1.10 | | 1.02 | | .96 |
| Net realized and unrealized | | | | | | | | | | |
| gain (loss) | | 10.68 | | 3.26 | | 13.18 | | (10.95) | | (11.88) |
| Total from investment operations | | 12.19 | | 4.80 | | 14.28 | | (9.93) | | (10.92) |
| Distributions from net investment | | | | | | | | | | |
| income | | (1.38) | | (1.41) | | (1.02) | | (.99) | | (.96) |
| Redemption fees added to paid in | | | | | | | | | | |
| capitalB | | —E | | —E | | —E | | .01 | | —E |
| Net asset value, end of period | | $ 90.83 | | $ 80.02 | | $ 76.63 | | $ 63.37 | | $ 74.28 |
| Total ReturnA | | 15.34% | | 6.25% | | 22.65% | | (13.38)% | | (12.77)% |
| Ratios to Average Net AssetsD | | | | | | | | | | |
| Expenses before reductions | | .10% | | .32% | | .39% | | .41% | | .39% |
| Expenses net of fee waivers, if | | | | | | | | | | |
| any | | .10% | | .13% | | .19% | | .19% | | .19% |
| Expenses net of all reductions | | .10% | | .13% | | .19% | | .19% | | .19% |
| Net investment income (loss) | | 1.77% | | 1.94%C | | 1.51% | | 1.62% | | 1.21% |
| Supplemental Data | | | | | | | | | | |
| Net assets, end of period (in | | | | | | | | | | |
| millions) | | $ 7,247 | | $12,032 | | $10,194 | | $ 7,270 | | $ 8,421 |
| Portfolio turnover rate | | 7% | | 4% | | 4% | | 9% | | 4% |
A Total returns would have been lower had certain expenses not been reduced during the periods shown.
B Calculated based on average shares outstanding during the period.
C Investment income per share reflects a special dividend which amounted to $.23 per share. Excluding the special dividend, the ratio of net
investment income (loss) to average net assets would have been 1.64% .
D Expense ratios reflect operating expenses of the class. Expenses before reductions do not reflect amounts reimbursed by the investment adviser or
reductions from brokerage service arrangements or other expense offset arrangements and do not represent the amount paid by the class during
periods when reimbursements or reductions occur. Expenses net of fee waivers reflect expenses after reimbursement by the investment adviser
but prior to reductions from brokerage service arrangements or other expense offset arrangements. Expenses net of all reductions represent the
net expenses paid by the class.
E Amount represents less than $.01 per share.
|
See accompanying notes which are an integral part of the financial statements.
| Financial Highlights Fidelity Advantage Class | | | | |
| |
| Period ended April 30, | | | | 2006E |
| Selected Per Share Data | | | | |
| Net asset value, beginning of period | | | | $ 2.30 |
| Income from Investment Operations | | | | |
| Net investment income (loss)D | | | | 87 |
| Net realized and unrealized gain (loss) | | | | 8.61 |
| Total from investment operations | | | | 9.48 |
| Distributions from net investment income | | | | (.94) |
| Redemption fees added to paid in capitalD | | | | —G |
| Net asset value, end of period | | | | $ 90.84 |
| Total ReturnB,C | | | | 11.56% |
| Ratios to Average Net AssetsF | | | | |
| Expenses before reductions | | | | 07%A |
| Expenses net of fee waivers, if any | | | | 07%A |
| Expenses net of all reductions | | | | 07%A |
| Net investment income (loss) | | | | 1.81%A |
| Supplemental Data | | | | |
| Net assets, end of period (in millions) | | | | $ 6,763 |
| Portfolio turnover rate | | | | 7% |
A Annualized
B Total returns for periods of less than one year are not annualized.
C Total returns would have been lower had certain expenses not been reduced during the periods shown.
D Calculated based on average shares outstanding during the period.
E For the period October 14, 2005 (commencement of sale of shares) to April 30, 2006.
F Expense ratios reflect operating expenses of the class. Expenses before reductions do not reflect amounts reimbursed by the investment adviser or
reductions from brokerage service arrangements or other expense offset arrangements and do not represent the amount paid by the class during
periods when reimbursements or reductions occur. Expenses net of fee waivers reflect expenses after reimbursement by the investment adviser but
prior to reductions from brokerage service arrangements or other expense offset arrangements. Expenses net of all reductions represent the net
expenses paid by the class.
G Amount represents less than $.01 per share.
|
See accompanying notes which are an integral part of the financial statements.
33 Annual Report
Notes to Financial Statements
For the period ended April 30, 2006
(Amounts in thousands except ratios)
|
1. Significant Accounting Policies.
Spartan 500 Index Fund (the fund) is a fund of Fidelity Commonwealth Trust (the trust) and is authorized to issue an unlimited number of shares. The trust is registered under the Investment Company Act of 1940, as amended (the 1940 Act), as an open end management investment company organized as a Massachusetts business trust.
The fund offers Investor Class and Fidelity Advantage Class shares, each of which has equal rights as to assets and voting privileges. Each class has exclusive voting rights with respect to matters that affect that class. The fund commenced sale of Fidelity Advantage Class (Advantage Class) shares on October 14, 2005, and the existing class of the fund was re designated as Investor Class (Investor Class). After the commencement of the Advantage Class, the fund began offering voluntary and automatic conversions between classes to eligible shareholders of the Investor Class. Investment income, realized and unrealized capital gains and losses, the common expenses of the fund, and certain fund level expense reductions, if any, are allocated on a pro rata basis to each class based on the relative net assets of each class to the total net assets of the fund. Each class differs with respect to transfer agent fees incurred and certain class level expense reductions.
The fund may invest in affiliated money market central funds (Money Market Central Funds), which are open end investment companies available to investment companies and other accounts managed by Fidelity Management & Research Company (FMR) and its affiliates. The financial statements have been prepared in conformity with accounting principles generally accepted in the United States of America, which require manage ment to make certain estimates and assumptions at the date of the financial statements. The following summarizes the significant accounting policies of the fund:
Security Valuation. Investments are valued and net asset value (NAV) per share is calculated (NAV calculation) as of the close of business of the New York Stock Exchange (NYSE), normally 4:00 p.m. Eastern time. Wherever possible, the fund uses independent pricing services approved by the Board of Trustees to value its investments.
Equity securities, including restricted securities, for which market quotations are readily available, are valued at the last reported sale price or official closing price as reported by an independent pricing service on the primary market or exchange on which they are traded. In the event there were no sales during the day or closing prices are not available, securities are valued at the last quoted bid price. Investments in open end mutual funds, are valued at their closing net asset value each business day. Short term securities with remaining maturities of sixty days or less for which quotations are not readily available are valued at amortized cost, which approximates value.
| 1. Significant Accounting Policies continued |
Security Valuation continued | | |
When current market prices or quotations are not readily available or do not accurately reflect fair value, valuations may be determined in accordance with procedures adopted by the Board of Trustees. For example, when developments occur between the close of a market and the close of the NYSE that may materially affect the value of some or all of the securities, or when trading in a security is halted, those securities may be fair valued. Factors used in the determination of fair value may include monitoring news to identify significant market or security specific events such as changes in the value of U.S. securi ties markets, reviewing developments in foreign markets and evaluating the perfor mance of ADRs, futures contracts and exchange traded funds. Because the fund’s utilization of fair value pricing depends on market activity, the frequency with which fair value pricing is used can not be predicted and may be utilized to a significant extent. The value of securities used for NAV calculation under fair value pricing may differ from published prices for the same securities.
Foreign Currency. The fund uses foreign currency contracts to facilitate transactions in foreign denominated securities. Losses from these transactions may arise from changes in the value of the foreign currency or if the counterparties do not perform under the contracts’ terms.
Foreign denominated assets, including investment securities, and liabilities are trans lated into U.S. dollars at the exchange rate at period end. Purchases and sales of invest ment securities, income and dividends received and expenses denominated in foreign currencies are translated into U.S. dollars at the exchange rate in effect on the transaction date.
The effects of exchange rate fluctuations on investments are included with the net realized and unrealized gain (loss) on investment securities. Other foreign currency transactions resulting in realized and unrealized gain (loss) are disclosed separately.
Investment Transactions and Income. Security transactions are accounted for as of trade date. Gains and losses on securities sold are determined on the basis of identified cost and may include proceeds received from litigation. Dividend income is recorded on the ex dividend date, except for certain dividends from foreign securities where the ex dividend date may have passed, which are recorded as soon as the fund is informed of the ex dividend date. Non cash dividends included in dividend income, if any, are recorded at the fair market value of the securities received. Distributions received on securities that represent a return of capital or capital gain are recorded as a reduction of cost of investments and/or as a realized gain. The fund estimates the components of distributions received that may be considered return of capital distributions or capital gain distributions. Interest income is accrued as earned. Interest income includes
35 Annual Report
| Notes to Financial Statements continued |
| (Amounts in thousands except ratios) |
| |
| 1. Significant Accounting Policies continued |
Investment Transactions and Income continued |
coupon interest and amortization of premium and accretion of discount on debt securi ties. Investment income is recorded net of foreign taxes withheld where recovery of such taxes is uncertain.
Expenses. Most expenses of the trust can be directly attributed to a fund. Expenses which cannot be directly attributed are apportioned among each fund in the trust.
Deferred Trustee Compensation. Under a Deferred Compensation Plan (the Plan), independent Trustees must defer receipt of a portion of, and may elect to defer receipt of an additional portion of, their annual compensation. Deferred amounts are treated as though equivalent dollar amounts had been invested in shares of the fund or are invested in a cross section of other Fidelity funds, and are marked to market. Deferred amounts remain in the fund until distributed in accordance with the Plan.
Income Tax Information and Distributions to Shareholders. Each year, the fund intends to qualify as a regulated investment company by distributing all of its taxable income and realized gains under Subchapter M of the Internal Revenue Code. As a result, no provision for income taxes is required in the accompanying financial statements. Foreign taxes are provided for based on the fund’s understanding of the tax rules and rates that exist in the foreign markets in which it invests.
Distributions are recorded on the ex dividend date. Income dividends and capital gain distributions are declared separately for each class. Income and capital gain distribu tions are determined in accordance with income tax regulations, which may differ from generally accepted accounting principles. In addition, the fund will claim a portion of the payment made to redeeming shareholders as a distribution for income tax purposes.
Capital accounts within the financial statements are adjusted for permanent book tax differences. These adjustments have no impact on net assets or the results of operations. Temporary book tax differences will reverse in a subsequent period.
Book tax differences are primarily due to futures transactions, partnerships, deferred trustees compensation, capital loss carryforwards and losses deferred due to wash sales.
| 1. Significant Accounting Policies continued | | |
Income Tax Information and Distributions to Shareholders continued |
The tax basis components of distributable earnings and the federal tax cost as of period end were as follows:
| Unrealized appreciation | | | | $ 4,390,358 | | | | |
| Unrealized depreciation | | | | (1,184,139) | | | | |
| Net unrealized appreciation (depreciation) | | | | 3,206,219 | | | | |
| Undistributed ordinary income | | | | 66,999 | | | | |
| Capital loss carryforward | | | | (77,280) | | | | |
| |
| Cost for federal income tax purposes | | | | $ 10,919,291 | | | | |
| |
| The tax character of distributions paid was as follows: | | | | |
| |
| | | | | April 30, | | | | April 30, |
| | | | | 2006 | | | | 2005 |
| Ordinary Income | | | | $ 210,865 | | | | $ 195,056 |
Short Term Trading (Redemption) Fees. Shares held in the fund less than 90 days are subject to a redemption fee equal to .50% of the proceeds of the redeemed shares. All redemption fees, including any estimated redemption fees paid by FMR, are retained by the fund and accounted for as an addition to paid in capital.
Futures Contracts. The fund may use futures contracts to manage its exposure to the stock market. Buying futures tends to increase a fund’s exposure to the underlying instrument, while selling futures tends to decrease a fund’s exposure to the underlying instrument or hedge other fund investments. Upon entering into a futures contract, a fund is required to deposit with a clearing broker, no later than the following business day, an amount (“initial margin”) equal to a certain percentage of the face value of the contract. The initial margin may be in the form of cash or securities and is transferred to a segregated account on settlement date. Subsequent payments (“variation margin”) are made or received by a fund depending on the daily fluctuations in the value of the futures contract and are accounted for as unrealized gains or losses. Realized gains (losses) are recorded upon the expiration or closing of the futures contract. Securities deposited to meet margin requirements are identified in the Schedule of Investments. Futures contracts involve, to varying degrees, risk of loss in excess of any futures variation margin reflected in the Statement of Assets and Liabilities. The underlying face amount at value of any open futures contracts at period end is shown in the Schedule of Investments under the caption “Futures Contracts.” This amount reflects each contract’s exposure to the underlying instrument at period end. Losses may arise from changes in the value of
37 Annual Report
| Notes to Financial Statements continued |
| (Amounts in thousands except ratios) |
| |
| 2. Operating Policies continued |
Futures Contracts continued |
the underlying instruments or if the counterparties do not perform under the contract’s terms. Futures contracts are valued at the settlement price established each day by the board of trade or exchange on which they are traded.
3. Purchases and Sales of Investments.
Purchases and sales of securities, other than short term securities, aggregated $1,360,705 and $855,514, respectively.
4. Fees and Other Transactions with Affiliates.
Management Fee. FMR and its affiliates provide the fund with investment manage ment related services for which the fund pays a monthly management fee. Effective October 1, 2005, an amendment to the management contract was approved by the Board of Trustees lowering the management fee from .10% to .07% of the fund’s average net assets.
In addition, effective October 1, 2005, a new expense contract with FMR was approved by the Board of Trustees limiting total expenses of Investor Class to .10% of average net assets and those of the Advantage Class to .07% of average net assets, excluding the compensation of the independent Trustees and certain other expenses such as interest expense. Prior to October 1, 2005, the management fee was based on an annual rate of .10% of the fund’s average net assets. FMR paid all other expenses (with certain exceptions).
Sub Adviser. Geode Capital Management, LLC (Geode), serves as sub adviser for the fund. Geode provides discretionary investment advisory services to the fund and is paid by FMR for providing these services.
Transfer Agent Fees. Fidelity Service Company, Inc. (FSC), an affiliate of FMR, is the fund’s transfer, dividend disbursing and shareholder servicing agent. Effective October 1, 2005, FSC receives asset based fees of ..06% and .03% of average net assets for the Inves tor Class and Advantage Class, respectively. Under the new expense contract, the Inves tor Class pays transfer agent fees at an annual rate of .03%, and the Advantage Class pays no transfer agent fees. FSC pays for typesetting, printing and mailing of shareholder reports, except proxy statements.
Affiliated Central Funds. The fund may invest in Money Market Central Funds which seek preservation of capital and current income and are managed by Fidelity Invest ments Money Management, Inc. (FIMM), an affiliate of FMR.
The Money Market Central Funds do not pay a management fee.
5. Committed Line of Credit.
|
The fund participates with other funds managed by FMR in a $4.2 billion credit facility (the “line of credit”) to be utilized for temporary or emergency purposes to fund share holder redemptions or for other short term liquidity purposes. The fund has agreed to pay commitment fees on its pro rata portion of the line of credit, which amounts to $39 and is reflected in Miscellaneous Expense on the Statement of Operations. During the period, there were no borrowings on this line of credit.
The fund lends portfolio securities from time to time in order to earn additional income. On the settlement date of the loan, the fund receives collateral (in the form of U.S. Treasury obligations, letters of credit and/or cash) against the loaned securities and maintains collateral in an amount not less than 100% of the market value of the loaned securities during the period of the loan. The market value of the loaned securities is determined at the close of business of the fund and any additional required collateral is delivered to the fund on the next business day. If the borrower defaults on its obligation to return the securities loaned because of insolvency or other reasons, a fund could experience delays and costs in recovering the securities loaned or in gaining access to the collateral. Any cash collateral received is invested in the Fidelity Securities Lending Cash Central Fund. The value of loaned securities and cash collateral at period end are disclosed on the fund’s Statement of Assets and Liabilities. Security lending income represents the income earned on investing cash collateral, less fees and expenses associated with the loan, plus any premium payments that may be received on the loan of certain types of securities. Security lending income is presented in the Statement of Operations as a component of income from affiliated central funds. Net income from lending portfolio securities during the period amounted to $739.
The fund is permitted to have bank borrowings for temporary or emergency purposes to fund shareholder redemptions. The fund has established borrowing arrangements with certain banks. The interest rate on the borrowings is the bank’s base rate, as revised from time to time. The average daily loan balance during the period for which loans were outstanding amounted to $16,853. The weighted average interest rate was 3.25% . At period end, there were no bank borrowings outstanding.
39 Annual Report
| Notes to Financial Statements continued |
| (Amounts in thousands except ratios) | | |
| |
| 8. Expense Reductions. | | |
Through arrangements with the fund’s custodian and transfer agent, credits realized as a result of uninvested cash balances were used to reduce the fund’s expenses. During the period, these credits reduced the fund’s miscellaneous expense and transfer agent fees by $17 and $60, respectively.
The fund’s organizational documents provide former and current trustees and officers with a limited indemnification against liabilities arising in connection with the performance of their duties to the fund. In the normal course of business, the fund may also enter into contracts that provide general indemnifications. The fund’s maximum exposure under these arrangements is unknown as this would be dependent on future claims that may be made against the fund. The risk of material loss from such claims is considered remote.
| 10. Distributions to Shareholders. | | | | | | |
| |
| Distributions to shareholders of each class were as follows: | | | | |
| |
| Years ended April 30, | | | | 2006A | | | | 2005 |
| From net investment income | | | | | | | | |
| Investor Class | | | | $ 144,378 | | | | $ 195,056 |
| Advantage Class | | | | 66,487 | | | | — |
| Total | | | | $ 210,865 | | | | $ 195,056 |
A Distributions for Advantage Class are for the period October 14, 2005 (commencement of sale of shares) to April 30, 2006.
| 11. Share Transactions. | | | | | | | | | | | | |
| |
| Transactions for each class of shares were as follows: | | | | | | | | |
| |
| | | Shares | | | | Dollars |
| Years ended April 30, | | 2006A | | 2005 | | | | 2006A | | | | 2005 |
| Investor Class | | | | | | | | | | | | |
| Shares sold | | 20,789 | | 36,404 | | | | $ 1,770,157 | | | | $ 2,923,173 |
| Conversions to Advantage Class | | (66,836) | | — | | | | (5,500,576) | | | | — |
| Reinvestment of distributions | | 1,596 | | 2,255 | | | | 135,676 | | | | 182,052 |
| Shares redeemed | | (26,132) | | (21,315) | | | | (2,247,074) | | | | (1,701,871) |
| Net increase (decrease) | | (70,583) | | 17,344 | | | | $ (5,841,817) | | | | $ 1,403,354 |
| Advantage Class | | | | | | | | | | | | |
| Shares sold | | 13,911 | | — | | | | $ 1,220,593 | | | | $ — |
| Conversions from Investor Class | | 66,836 | | — | | | | 5,500,576 | | | | — |
| Reinvestment of distributions | | 689 | | — | | | | 60,215 | | | | — |
| Shares redeemed | | (6,983) | | — | | | | (614,920) | | | | — |
| Net increase (decrease) | | 74,453 | | — | | | | $ 6,166,464 | | | | $ — |
A Share transactions for Advantage Class are for the period October 14, 2005 (commencement of sale of shares) to April 30, 2006.
41 Annual Report
Report of Independent Registered Public Accounting Firm
To the Trustees of Fidelity Commonwealth Trust and Shareholders of Spartan 500 Index Fund:
We have audited the accompanying statement of assets and liabilities of Spartan 500 Index Fund (the Fund), a fund of Fidelity Commonwealth Trust, including the schedule of investments as of April 30, 2006, and the related statement of operations for the year then ended, the statement of changes in net assets for each of the two years in the period then ended, and the financial highlights for each of the five years in the period then ended. These financial statements and financial highlights are the responsibility of the Fund’s management. Our responsibility is to express an opinion on these financial statements and financial highlights based on our audits.
We conducted our audits in accordance with standards of the Public Company Accounting Oversight Board (United States). Those standards require that we plan and perform the audit to obtain reasonable assurance about whether the financial statements and financial highlights are free of material misstatement. The Fund is not required to have, nor were we engaged to perform, an audit of its internal control over financial reporting. Our audits included consideration of internal control over financial reporting as a basis for designing audit procedures that are appropriate in the circumstances, but not for the purpose of expressing an opinion on the effectiveness of the Fund’s internal control over financial reporting. Accordingly, we express no such opinion. An audit also includes examining, on a test basis, evidence supporting the amounts and disclosures in the financial statements, assessing the accounting principles used and significant estimates made by management, as well as evaluating the overall financial statement presentation. Our procedures in cluded confirmation of securities owned as of April 30, 2006, by correspondence with the custodians. We believe that our audits provide a reasonable basis for our opinion.
In our opinion, the financial statements and financial highlights referred to above present fairly, in all material respects, the financial position of Spartan 500 Index Fund as of April 30, 2006, the results of its operations for the year then ended, the changes in its net assets for each of the two years in the period then ended, and its financial highlights for each of the five years in the period then ended, in conformity with accounting principles generally accepted in the United States of America.
/s/ Deloitte & Touche LLP
DELOITTE & TOUCHE LLP
Boston, Massachusetts
June 16, 2006
|
Trustees and Officers
The Trustees, Members of the Advisory Board, and executive officers of the trust and fund, as applicable, are listed below. The Board of Trustees governs the fund and is responsible for protecting the interests of shareholders. The Trustees are experienced executives who meet periodically throughout the year to oversee the fund’s activities, review contractual arrangements with companies that provide services to the fund, and review the fund’s performance. Except for William O. McCoy and Albert R. Gamper, Jr., each of the Trustees oversees 335 funds advised by FMR or an affiliate. Mr. McCoy oversees 337 funds advised by FMR or an affiliate. Mr. Gamper oversees 280 funds advised by FMR or an affiliate.
The Trustees hold office without limit in time except that (a) any Trustee may resign; (b) any Trustee may be removed by written instrument, signed by at least two thirds of the number of Trustees prior to such removal; (c) any Trustee who requests to be retired or who has become incapacitated by illness or injury may be retired by written instru ment signed by a majority of the other Trustees; and (d) any Trustee may be removed at any special meeting of shareholders by a two thirds vote of the outstanding voting securities of the trust. Each Trustee who is not an interested person (as defined in the 1940 Act) (Independent Trustee), shall retire not later than the last day of the calendar year in which his or her 72nd birthday occurs. The Independent Trustees may waive this mandatory retirement age policy with respect to individual Trustees. The executive officers and Advisory Board Members hold office without limit in time, except that any officer and Advisory Board Member may resign or may be removed by a vote of a majority of the Trustees at any regular meeting or any special meeting of the Trustees. Except as indicated, each individual has held the office shown or other offices in the same company for the past five years.
The fund’s Statement of Additional Information (SAI) includes more information about the Trustees. To request a free copy, call Fidelity at 1-800-544-8544.
Correspondence intended for each Trustee who is an interested person may be sent to Fidelity Investments, 82 Devonshire Street, Boston, Massachusetts 02109.
| | Name, Age; Principal Occupation
Edward C. Johnson 3d (75)
|
Year of Election or Appointment: 1974
Mr. Johnson is Chairman of the Board of Trustees. Mr. Johnson serves as President (2006 present), Chief Executive Officer, Chairman, and a Director of FMR Corp.; Chairman and a Director of FMR; Chairman and a Director of Fidelity Research & Analysis Company (FRAC); Chairman and a Director of Fidelity Investments Money Management, Inc.; and Chairman (2001 present) and a Director (1999 present) of FMR Co., Inc. In addition, Mr. Johnson serves as Chairman and Director of Fidelity International Limited (FIL).
43 Annual Report
Trustees and Officers - continued
| | Name, Age; Principal Occupation
Stephen P. Jonas (53)
|
Year of Election or Appointment: 2005
Mr. Jonas is Senior Vice President of Spartan 500 Index (2005 present). He also serves as Senior Vice President of other Fidelity funds (2005 present). Mr. Jonas is Executive Director of FMR (2005 present) and FMR Co., Inc. (2005 present). He also serves as a Director of Fidelity Investments Money Management, Inc. (2005 present) and FMR Corp. (2003 present). Previously, Mr. Jonas served as President of Fidelity Enterprise Operations and Risk Services (2004 2005), Chief Administrative Officer (2002 2004), and Chief Financial Officer of FMR Corp. (1998 2002). In addition, he serves on the Boards of Boston Ballet (2003 present) and Simmons College (2003 present).
Year of Election or Appointment: 2003
Mr. Reynolds is President and a Director of FMR (2005 present), Fidelity Investments Money Management, Inc. (2005 present), and FMR Co., Inc. (2005 present). Mr. Reynolds also serves as a Director (2003 present) and Chief Operating Officer (2002 present) of FMR Corp and a Director of Strategic Advisers, Inc. (2005 present). He also serves on the Board at Fidelity Investments Canada, Ltd. (2000 present). Previously, Mr. Reynolds served as President of Fidelity Investments Institutional Retirement Group (1996 2000).
* Trustees have been determined to be “Interested Trustees” by virtue of, among other things, their affiliation with the trust or various entities under common control with FMR.
Correspondence intended for each Independent Trustee (that is, the Trustees other than the Interested Trustees) may be sent to Fidelity Investments, P.O. Box 55235, Boston, Massachusetts 02205-5235.
| | Name, Age; Principal Occupation
Dennis J. Dirks (57)
|
Year of Election or Appointment: 2005
Prior to his retirement in May 2003, Mr. Dirks was Chief Operating Officer and a member of the Board of The Depository Trust & Clearing Corporation (DTCC) (1999 2003). He also served as President, Chief Operating Officer, and Board member of The Depository Trust Company (DTC) (1999 2003) and President and Board member of the National Securities Clearing Corporation (NSCC) (1999 2003). In addi tion, Mr. Dirks served as Chief Executive Officer and Board member of the Government Securities Clearing Corporation (2001 2003) and Chief Executive Officer and Board member of the Mortgage Backed Securities Clearing Corporation (2001 2003). Mr. Dirks also serves as a Trustee and a member of the Finance Committee of Manhattan College (2005 present) and a Trustee and a member of the Finance Committee of AHRC of Nassau County (2006 present).
| | Albert R. Gamper, Jr. (64)
|
Year of Election or Appointment: 2006
Mr. Gamper also serves as a Trustee (2006 present) or Member of the Advisory Board (2005 present) of other investment companies advised by FMR. Prior to his retirement in December 2004, Mr. Gamper served as Chairman of the Board of CIT Group Inc. (commercial finance). Dur ing his tenure with CIT Group Inc. Mr. Gamper served in numerous senior management positions, including Chairman (1987 1989; 1999 2001; 2002 2004), Chief Executive Officer (1987 2004), and President (1989 2002). He currently serves as a member of the Board of Directors of Public Service Enterprise Group (utilities, 2001 present), Chairman of the Board of Governors, Rutgers University (2004 present), and Chairman of the Board of Saint Barnabas Health Care System.
45 Annual Report
Trustees and Officers - continued
| | Name, Age; Principal Occupation
Robert M. Gates (62)
|
Year of Election or Appointment: 1997
Dr. Gates is Chairman of the Independent Trustees (2006 present). Dr. Gates is President of Texas A&M University (2002 present). He was Director of the Central Intelligence Agency (CIA) from 1991 to 1993. From 1989 to 1991, Dr. Gates served as Assistant to the President of the United States and Deputy National Security Advisor. Dr. Gates is a Director of NACCO Industries, Inc. (mining and manufacturing), Parker Drilling Co., Inc. (drilling and rental tools for the energy industry, 2001 present), and Brinker International (restaurant management, 2003 present). Previously, Dr. Gates served as a Director of LucasVarity PLC (automotive components and diesel engines), a Director of TRW Inc. (automotive, space, defense, and information technology), and Dean of the George Bush School of Government and Public Service at Texas A&M University (1999 2001).
Year of Election or Appointment: 2004
Dr. Heilmeier is Chairman Emeritus of Telcordia Technologies (commu nication software and systems), where prior to his retirement, he served as company Chairman and Chief Executive Officer. He currently serves on the Boards of Directors of The Mitre Corporation (systems engineering and information technology support for the government), and HRL Laboratories (private research and development, 2004 present). He is Chairman of the General Motors Science & Technology Advisory Board and a Life Fellow of the Institute of Electrical and Electronics Engineers (IEEE). Dr. Heilmeier is a member of the Defense Science Board and the National Security Agency Advisory Board. He is also a member of the National Academy of Engineering, the American Academy of Arts and Sciences, and the Board of Overseers of the School of Engineering and Applied Science of the University of Pennsylvania. Previously, Dr. Heilmeier served as a Director of TRW Inc. (automotive, space, defense, and information technology, 1992 2002), Compaq (1994 2002), Automatic Data Processing, Inc. (ADP) (technology based business outsourcing, 1995 2002), INET Technologies Inc. (telecommunications network surveillance, 2001 2004), and Teletech Holdings (customer management services). He is the recipient of the 2005 Kyoto Prize in Advanced Technology for his invention of the liquid crystal display.
Name, Age; Principal Occupation
Marie L. Knowles (59)
|
Year of Election or Appointment: 2001
Prior to Ms. Knowles’ retirement in June 2000, she served as Executive Vice President and Chief Financial Officer of Atlantic Richfield Company (ARCO) (diversified energy, 1996 2000). From 1993 to 1996, she was a Senior Vice President of ARCO and President of ARCO Transportation Company. She served as a Director of ARCO from 1996 to 1998. She currently serves as a Director of Phelps Dodge Corporation (copper mining and manufacturing) and McKesson Corporation (healthcare service, 2002 present). Ms. Knowles is a Trustee of the Brookings Institution and the Catalina Island Conservancy and also serves as a member of the Advisory Board for the School of Engineering of the University of Southern California.
Year of Election or Appointment: 2000
Mr. Lautenbach has been a partner of Clayton, Dubilier & Rice, Inc. (private equity investment firm) since September 1998. Previously, Mr. Lautenbach was with the International Business Machines Corpora tion (IBM) from 1968 until his retirement in 1998. Mr. Lautenbach serves as a Director of Italtel Holding S.p.A. (telecommunications (Milan, Italy), 2004 present) and Eaton Corporation (diversified industrial) as well as the Philharmonic Center for the Arts in Naples, Florida. He also is a member of the Board of Trustees of Fairfield University (2005 present), as well as a member of the Council on Foreign Relations.
Year of Election or Appointment: 1997
Prior to his retirement in December 1994, Mr. McCoy was Vice Chair man of the Board of BellSouth Corporation (telecommunications) and President of BellSouth Enterprises. He is currently a Director of Duke Realty Corporation (real estate). He is also a partner of Franklin Street Partners (private investment management firm). In addition, Mr. McCoy served as the Interim Chancellor (1999 2000) and a member of the Board of Visitors for the University of North Carolina at Chapel Hill and currently serves as Chairman of the Board of Directors of the University of North Carolina Health Care System. He also served as Vice President of Finance for the University of North Carolina (16 school system).
47 Annual Report
Trustees and Officers - continued
| | Name, Age; Principal Occupation
Cornelia M. Small (61)
|
Year of Election or Appointment: 2005
Ms. Small is a member (2000 present) and Chairperson (2002 present) of the Investment Committee, and a member (2002 present) of the Board of Trustees of Smith College. Previously, she served as Chief In vestment Officer (1999 2000), Director of Global Equity Investments (1996 1999), and a member of the Board of Directors of Scudder, Stevens & Clark (1990 1997) and Scudder Kemper Investments (1997 1999). In addition, Ms. Small served as Co Chair (2000 2003) of the Annual Fund for the Fletcher School of Law and Diplomacy.
| | William S. Stavropoulos (66)
|
Year of Election or Appointment: 2002
Mr. Stavropoulos is Chairman Emeritus of the Board of Directors of The Dow Chemical Company. Since joining The Dow Chemical Company in 1967, Mr. Stavropoulos served in numerous senior management posi tions, including President (1993 2000; 2002 2003), CEO (1995 2000; 2002 2004), and Chairman of the Executive Committee (2000 2004). Currently, he is a Director of NCR Corporation (data warehousing and technology solutions), BellSouth Corporation (telecommunications), Chemical Financial Corporation, Maersk Inc. (industrial conglomerate, 2002 present), and Metalmark Capital (private equity investment firm, 2005 present). He also serves as a member of the Board of Trustees of the American Enterprise Institute for Public Policy Research. In addition, Mr. Stavropoulos is a member of The Business Council, J.P. Morgan International Council and the University of Notre Dame Advisory Council for the College of Science.
Year of Election or Appointment: 2005
Prior to his retirement in 2001, Mr. Wolfe was Chairman and Chief Executive Officer of Hershey Foods Corporation (1993 2001). He currently serves as a member of the boards of Adelphia Communications Corporation (2003 present), Bausch & Lomb, Inc., and Revlon Inc. (2004 present).
Advisory Board Members and Executive Officers:
Correspondence intended for Mr. Keyes may be sent to Fidelity Investments,
P.O. Box 55235, Boston, Massachusetts 02205-5235. Correspondence intended for each executive officer and Mr. Lynch may be sent to Fidelity Investments, 82 Devonshire Street, Boston, Massachusetts 02109.
| | Name, Age; Principal Occupation
James H. Keyes (65)
|
Year of Election or Appointment: 2006
Member of the Advisory Board of Fidelity Commonwealth Trust. Prior to his retirement in 2003, Mr. Keyes was Chairman, President, and Chief Executive Officer of Johnson Controls, Inc. (automotive supplier, 1993 2003). He currently serves as a member of the boards of LSI Logic Corporation (semiconductor technologies, 1984 present), Navistar International Corporation (manufacture and sale of trucks, buses, and diesel engines, 2002 present), and Pitney Bowes, Inc. (integrated mail, messaging, and document management solutions, 1998 present).
Year of Election or Appointment: 2003
Member of the Advisory Board of Fidelity Commonwealth Trust. Mr. Lynch is Vice Chairman and a Director of FMR, and Vice Chairman (2001 present) and a Director (1999 present) of FMR Co., Inc. Pre viously, Mr. Lynch served as a Trustee of the Fidelity funds (1990 2003). In addition, he serves as the Chairman of the Inner City Scholarship Fund.
Year of Election or Appointment: 2005
Vice President of Spartan 500 Index. Mr. Churchill also serves as Vice President of certain Equity Funds (2005 present) and certain High Income Funds (2005 present). He is Executive Vice President of FMR (2005 present) and FMR Co., Inc. (2005 present), and Senior Vice President of Fidelity Investments Money Management, Inc. (2005 present). Previously, Mr. Churchill served as Head of Fidelity’s Fixed Income Division (2000 2005), Vice President of Fidelity’s Money Market Funds (2000 2005), Vice President of Fidelity’s Bond Funds, and Senior Vice President of FMR.
49 Annual Report
Trustees and Officers - continued
| | Name, Age; Principal Occupation
Eric D. Roiter (57)
|
Year of Election or Appointment: 1998
Secretary of Spartan 500 Index. He also serves as Secretary of other Fidelity funds; Vice President, General Counsel, and Secretary of FMR Co., Inc. (2001 present) and FMR; Assistant Secretary of Fidelity Management & Research (U.K.) Inc. (2001 present), Fidelity Research & Analysis Company (2001 present), and Fidelity Investments Money Management, Inc. (2001 present). Mr. Roiter is an Adjunct Member, Faculty of Law, at Boston College Law School (2003 present). Previously, Mr. Roiter served as Vice President and Secretary of Fidelity Distributors Corporation (FDC) (1998 2005).
Year of Election or Appointment: 2003
Assistant Secretary of Spartan 500 Index. Mr. Fross also serves as Assistant Secretary of other Fidelity funds (2003 present), Vice President and Secretary of FDC (2005 present), and is an employee of FMR.
Year of Election or Appointment: 2004
President and Treasurer of Spartan 500 Index. Ms. Reynolds also serves as President and Treasurer of other Fidelity funds (2004 present) and is a Vice President (2003 present) and an employee (2002 present) of FMR. Before joining Fidelity Investments, Ms. Reynolds worked at PricewaterhouseCoopers LLP (PwC) (1980 2002), where she was most recently an audit partner with PwC’s investment management practice.
Year of Election or Appointment: 2006
Anti Money Laundering (AML) officer of Spartan 500 Index. Mr. Ganis also serves as AML officer of other Fidelity funds (2006 present) and FMR Corp. (2003 present). Before joining Fidelity Investments, Mr. Ganis practiced law at Goodwin Procter, LLP (2000 2002).
Year of Election or Appointment: 2005
Chief Financial Officer of Spartan 500 Index. Mr. Murphy also serves as Chief Financial Officer of other Fidelity funds (2005 present). He also serves as Senior Vice President of Fidelity Pricing and Cash Management Services Group (FPCMS).
Name, Age; Principal Occupation
Kenneth A. Rathgeber (58)
|
Year of Election or Appointment: 2004
Chief Compliance Officer of Spartan 500 Index. Mr. Rathgeber also serves as Chief Compliance Officer of other Fidelity funds (2004 present) and Executive Vice President of Risk Oversight for Fidelity Investments (2002 present). He is Chief Compliance Officer of FMR (2005 present), FMR Co., Inc. (2005 present), Fidelity Management & Research (U.K.) Inc. (2005 present), Fidelity Research & Analysis Company (2005 present), Fidelity Investments Money Management, Inc. (2005 present), and Strategic Advisers, Inc. (2005 present). Previously, Mr. Rathgeber served as Executive Vice President and Chief Operating Officer for Fidelity Investments Institutional Services Company, Inc. (1998 2002).
Year of Election or Appointment: 2005
Deputy Treasurer of Spartan 500 Index. Mr. Mehrmann also serves as Deputy Treasurer of other Fidelity funds (2005 present) and is an employee of FMR. Previously, Mr. Mehrmann served as Vice President of Fidelity Investments Institutional Services Group (FIIS)/Fidelity Investments Institutional Operations Corporation, Inc. (FIIOC) Client Services (1998 2004).
Kimberley H. Monasterio (42)
|
Year of Election or Appointment: 2004
Deputy Treasurer of Spartan 500 Index. Ms. Monasterio also serves as Deputy Treasurer of other Fidelity funds (2004) and is an employee of FMR (2004). Before joining Fidelity Investments, Ms. Monasterio served as Treasurer (2000 2004) and Chief Financial Officer (2002 2004) of the Franklin Templeton Funds and Senior Vice President of Franklin Templeton Services, LLC (2000 2004).
Year of Election or Appointment: 2005
Deputy Treasurer of Spartan 500 Index. Mr. Robins also serves as Deputy Treasurer of other Fidelity funds (2005 present) and is an employee of FMR (2004 present). Before joining Fidelity Investments, Mr. Robins worked at KPMG LLP, where he was a partner in KPMG’s department of professional practice (2002 2004) and a Senior Manager (1999 2000). In addition, Mr. Robins served as Assistant Chief Accountant, United States Securities and Exchange Commission (2000 2002).
51 Annual Report
Trustees and Officers - continued
| | Name, Age; Principal Occupation
Robert G. Byrnes (39)
|
Year of Election or Appointment: 2005
Assistant Treasurer of Spartan 500 Index. Mr. Byrnes also serves as Assistant Treasurer of other Fidelity funds (2005 present) and is an employee of FMR (2005 present). Previously, Mr. Byrnes served as Vice President of FPCMS (2003 2005). Before joining Fidelity Investments, Mr. Byrnes worked at Deutsche Asset Management where he served as Vice President of the Investment Operations Group (2000 2003).
Year of Election or Appointment: 1990
Assistant Treasurer of Spartan 500 Index. Mr. Costello also serves as Assistant Treasurer of other Fidelity funds and is an employee of FMR.
Year of Election or Appointment: 2004
Assistant Treasurer of Spartan 500 Index. Mr. Lydecker also serves as Assistant Treasurer of other Fidelity funds (2004) and is an employee of FMR.
Year of Election or Appointment: 2002
Assistant Treasurer of Spartan 500 Index. Mr. Osterheld also serves as Assistant Treasurer of other Fidelity funds (2002) and is an employee of FMR.
Year of Election or Appointment: 2005
Assistant Treasurer of Spartan 500 Index. Mr. Ryan also serves as Assistant Treasurer of other Fidelity funds (2005 present) and is an employee of FMR (2005 present). Previously, Mr. Ryan served as Vice President of Fund Reporting in FPCMS (1999 2005).
Year of Election or Appointment: 2005
Assistant Treasurer of Spartan 500 Index. Mr. Schiavone also serves as Assistant Treasurer of other Fidelity funds (2005 present) and is an employee of FMR (2005 present). Before joining Fidelity Investments, Mr. Schiavone worked at Deutsche Asset Management, where he most recently served as Assistant Treasurer (2003 2005) of the Scudder Funds and Vice President and Head of Fund Reporting (1996 2003).
A percentage of the dividends distributed during the fiscal year for the following funds qualifies for the dividends received deduction for corporate shareholders:
| | | June | | December |
| Spartan 500 Index | | | | |
| Investor Class | | 100% | | 100% |
| Fidelity Advantage Class | | N/A | | 100% |
A percentage of the dividends distributed during the fiscal year for the following funds may be taken into account as a dividend for purposes of the maximum rate under section 1(h)(11) of the Internal Revenue Code.
| | | June | | December |
| Spartan 500 Index | | | | |
| Investor Class | | 100% | | 100% |
| Fidelity Advantage Class | | N/A | | 100% |
The funds will notify shareholders in January 2007 of amounts for use in preparing 2006 income tax returns.
53 Annual Report
Proxy Voting Results
A special meeting of the fund’s shareholders was held on November 16, 2005. The results of votes taken among shareholders on proposals before them are reported below. Each vote reported represents one dollar of net asset value held on the record date for the meeting.
| PROPOSAL 1 | | |
| To elect a Board of Trustees.A | | |
| | | # of | | % of |
| | | Votes | | Votes |
| |
| Dennis J. Dirks | | |
| Affirmative | | 18,240,248,322.53 | | 96.150 |
| Withheld | | 730,313,302.58 | | 3.850 |
| TOTAL | | 18,970,561,625.11 | | 100.000 |
| Albert R. Gamper, Jr.B | | |
| Affirmative | | 18,204,838,072.06 | | 95.964 |
| Withheld | | 765,723,553.05 | | 4.036 |
| TOTAL | | 18,970,561,625.11 | | 100.000 |
| Robert M. Gates | | |
| Affirmative | | 18,191,748,681.13 | | 95.895 |
| Withheld | | 778,812,943.98 | | 4.105 |
| TOTAL | | 18,970,561,625.11 | | 100.000 |
| George H. Heilmeier | | |
| Affirmative | | 18,193,638,757.60 | | 95.905 |
| Withheld | | 776,922,867.51 | | 4.095 |
| TOTAL | | 18,970,561,625.11 | | 100.000 |
| Abigail P. Johnson | | |
| Affirmative | | 18,103,320,241.78 | | 95.428 |
| Withheld | | 867,241,383.33 | | 4.572 |
| TOTAL | | 18,970,561,625.11 | | 100.000 |
| Edward C. Johnson 3d | | |
| Affirmative | | 18,055,585,171.13 | | 95.177 |
| Withheld | | 914,976,453.98 | | 4.823 |
| TOTAL | | 18,970,561,625.11 | | 100.000 |
| Stephen P. Jonas | | |
| Affirmative | | 18,188,419,716.35 | | 95.877 |
| Withheld | | 782,141,908.76 | | 4.123 |
| TOTAL | | 18,970,561,625.11 | | 100.000 |
| Marie L. Knowles | | |
| Affirmative | | 18,208,650,664.29 | | 95.984 |
| Withheld | | 761,910,960.82 | | 4.016 |
| TOTAL | | 18,970,561,625.11 | | 100.000 |
| Ned C. Lautenbach | | |
| Affirmative | | 18,224,936,039.64 | | 96.070 |
| Withheld | | 745,625,585.47 | | 3.930 |
| TOTAL | | 18,970,561,625.11 | | 100.000 |
| |
| Marvin L. Mann | | |
| Affirmative | | 18,146,216,753.93 | | 95.655 |
| Withheld | | 824,344,871.18 | | 4.345 |
| TOTAL | | 18,970,561,625.11 | | 100.000 |
| |
| William O. McCoy | | |
| Affirmative | | 18,164,580,135.79 | | 95.751 |
| Withheld | | 805,981,489.32 | | 4.249 |
| TOTAL | | 18,970,561,625.11 | | 100.000 |
| |
| Robert L. Reynolds | | |
| Affirmative | | 18,197,448,372.22 | | 95.925 |
| Withheld | | 773,113,252.89 | | 4.075 |
| TOTAL | | 18,970,561,625.11 | | 100.000 |
| |
| Cornelia M. Small | | |
| Affirmative | | 18,214,122,413.76 | | 96.013 |
| Withheld | | 756,439,211.35 | | 3.987 |
| TOTAL | | 18,970,561,625.11 | | 100.000 |
| |
| William S. Stavropoulos | | |
| Affirmative | | 18,186,563,509.46 | | 95.867 |
| Withheld | | 783,998,115.65 | | 4.133 |
| TOTAL | | 18,970,561,625.11 | | 100.000 |
| |
| Kenneth L. Wolfe | | |
| Affirmative | | 18,211,332,412.92 | | 95.998 |
| Withheld | | 759,229,212.19 | | 4.002 |
| TOTAL | | 18,970,561,625.11 | | 100.000 |
A Denotes trust-wide proposals and voting results.
B Effective on or about January 1, 2006.
|
Annual Report 54
Managing Your Investments
Fidelity offers several ways to conveniently manage your personal investments via your telephone or PC. You can access your account information, conduct trades and research your investments 24 hours a day.
By Phone
Fidelity Automated Service Telephone provides a single toll free number to access account balances, positions, quotes and trading. It’s easy to navigate the service, and on your first call, the system will help you create a personal identification number (PIN) for security.


By PC
Fidelity’s web site on the Internet provides a wide range of information, including daily financial news, fund performance, interactive planning tools and news about Fidelity products and services.

* When you call the quotes line, please remember that a fund’s yield and return will vary and, except for money market funds, share price will also vary. This means that you may have a gain or loss when you sell your shares. There is no assurance that money market funds will be able to maintain a stable $1 share price; an investment in a money market fund is not insured or guar anteed by the U.S. government. Total returns are historical and include changes in share price, reinvestment of dividends and capital gains, and the effects of any sales charges.
55 Annual Report
Investment Adviser
Fidelity Management & Research Company
Boston, MA
Investment Sub Advisers
FMR Co., Inc.
Geode Capital Management, LLC
General Distributor
Fidelity Distributors Corporation
Boston, MA
Transfer and Service Agent
Fidelity Service Company, Inc.
Boston, MA
Custodian
Mellon Bank, N.A.
Pittsburgh, PA
|
| The Fidelity Telephone Connection |
| Mutual Fund 24-Hour Service |
| Exchanges/Redemptions | | |
| and Account Assistance | | 1-800-544-6666 |
| Product Information | | 1-800-544-6666 |
| Retirement Accounts | | 1-800-544-4774 |
| (8 a.m. - 9 p.m.) | | |
| TDD Service | | 1-800-544-0118 |
| for the deaf and hearing impaired | | |
| (9 a.m. - 9 p.m. Eastern time) | | |
| Fidelity Automated Service | | |
| Telephone (FAST®) (automated phone logo) | | 1-800-544-5555 |
| (automated phone logo) Automated line for quickest service |
SMI-UANN-0606
1.784730.103
|

Item 2. Code of Ethics
As of the end of the period, April 30, 2006, Fidelity Commonwealth Trust (the trust) has adopted a code of ethics, as defined in Item 2 of Form N-CSR, that applies to its President and Treasurer and its Chief Financial Officer. A copy of the code of ethics is filed as an exhibit to this Form N-CSR.
Item 3. Audit Committee Financial Expert
The Board of Trustees of the trust has determined that Marie L. Knowles is an audit committee financial expert, as defined in Item 3 of Form N-CSR. Ms. Knowles is independent for purposes of Item 3 of Form N-CSR.
Item 4. Principal Accountant Fees and Services
(a) Audit Fees.
For the fiscal years ended April 30, 2006 and April 30, 2005, the aggregate Audit Fees billed by Deloitte & Touche LLP, the member firms of Deloitte Touche Tohmatsu, and their respective affiliates (collectively, "Deloitte Entities") for professional services rendered for the audits of the financial statements, or services that are normally provided in connection with statutory and regulatory filings or engagements for those fiscal years, for Fidelity Intermediate Bond Fund, Fidelity Large Cap Stock Fund, Fidelity Mid-Cap Stock Fund, Fidelity Small Cap Retirement Fund, Fidelity Small Cap Stock Fund and Spartan 500 Index Fund (the funds) and for all funds in the Fidelity Group of Funds are shown in the table below.
Fund | 2006A | 2005A |
Fidelity Intermediate Bond Fund | $51,000 | $76,000 |
Fidelity Large Cap Stock Fund | $35,000 | $35,000 |
Fidelity Mid-Cap Stock Fund | $45,000 | $45,000 |
Fidelity Small Cap Retirement Fund | $37,000 | $34,000 |
Fidelity Small Cap Stock Fund | $42,000 | $38,000 |
Spartan 500 Index Fund | $52,000 | $48,000 |
All funds in the Fidelity Group of Funds audited by Deloitte Entities | $5,900,000 | $4,700,000 |
A | Aggregate amounts may reflect rounding. |
(b) Audit-Related Fees.
In each of the fiscal years ended April 30, 2006 and April 30, 2005 the aggregate Audit-Related Fees billed by Deloitte Entities for services rendered for assurance and related services to each fund that are reasonably related to the performance of the audit or review of the fund's financial statements, but not reported as Audit Fees, are shown in the table below.
Fund | 2006A | 2005A |
Fidelity Intermediate Bond Fund | $0 | $0 |
Fidelity Large Cap Stock Fund | $0 | $0 |
Fidelity Mid-Cap Stock Fund | $0 | $0 |
Fidelity Small Cap Retirement Fund | $0 | $0 |
Fidelity Small Cap Stock Fund | $0 | $0 |
Spartan 500 Index Fund | $0 | $0 |
A | Aggregate amounts may reflect rounding. |
In each of the fiscal years ended April 30, 2006 and April 30, 2005, the aggregate Audit-Related Fees that were billed by Deloitte Entities that were required to be approved by the Audit Committee for services rendered on behalf of Fidelity Management & Research Company (FMR) and entities controlling, controlled by, or under common control with FMR (not including any sub-adviser whose role is primarily portfolio management and is subcontracted with or overseen by another investment adviser) that provide ongoing services to the funds ("Fund Service Providers") for assurance and related services that relate directly to the operations and financial reporting of each fund that are reasonably related to the performance of the audit or review of the fund's financial statements, but not reported as Audit Fees, are shown in the table below.
Billed By | 2006A | 2005A |
Deloitte Entities | $0 | $0 |
A | Aggregate amounts may reflect rounding. |
Fees included in the audit-related category comprise assurance and related services (e.g., due diligence services) that are traditionally performed by the independent registered public accounting firm. These audit-related services include due diligence related to mergers and acquisitions, accounting consultations and audits in connection with acquisitions, internal control reviews, attest services that are not required by statute or regulation and consultation concerning financial accounting and reporting standards.
(c) Tax Fees.
In each of the fiscal years ended April 30, 2006 and April 30, 2005, the aggregate Tax Fees billed by Deloitte Entities for professional services rendered for tax compliance, tax advice, and tax planning for each fund is shown in the table below.
Fund | 2006A | 2005A |
Fidelity Intermediate Bond Fund | $3,700 | $3,600 |
Fidelity Large Cap Stock Fund | $4,000 | $4,000 |
Fidelity Mid-Cap Stock Fund | $4,000 | $4,000 |
Fidelity Small Cap Retirement Fund | $3,800 | $3,300 |
Fidelity Small Cap Stock Fund | $4,000 | $4,000 |
Spartan 500 Index Fund | $4,000 | $4,000 |
A | Aggregate amounts may reflect rounding. |
In each of the fiscal years ended April 30, 2006 and April 30, 2005, the aggregate Tax Fees billed by Deloitte Entities that were required to be approved by the Audit Committee for professional services rendered on behalf of the Fund Service Providers for tax compliance, tax advice, and tax planning that relate directly to the operations and financial reporting of each fund is shown in the table below.
Billed By | 2006A | 2005A |
Deloitte Entities | $0 | $0 |
A | Aggregate amounts may reflect rounding. |
Fees included in the Tax Fees category comprise all services performed by professional staff in the independent registered public accounting firm's tax division except those services related to the audit. Typically, this category would include fees for tax compliance, tax planning, and tax advice. Tax compliance, tax advice, and tax planning services include preparation of original and amended tax returns, claims for refund and tax payment-planning services, assistance with tax audits and appeals, tax advice related to mergers and acquisitions and requests for rulings or technical advice from taxing authorities.
(d) All Other Fees.
In each of the fiscal years ended April 30, 2006 and April 30, 2005, the aggregate Other Fees billed by Deloitte Entities for all other non-audit services rendered to the funds is shown in the table below.
Fund | 2006A | 2005A |
Fidelity Intermediate Bond Fund | $0 | $0 |
Fidelity Large Cap Stock Fund | $0 | $0 |
Fidelity Mid-Cap Stock Fund | $0 | $0 |
Fidelity Small Cap Retirement Fund | $0 | $0 |
Fidelity Small Cap Stock Fund | $0 | $0 |
Spartan 500 Index Fund | $0 | $0 |
A | Aggregate amounts may reflect rounding. |
In each of the fiscal years ended April 30, 2006 and April 30, 2005, the aggregate Other Fees billed by Deloitte Entities that were required to be approved by the Audit Committee for all other non-audit services rendered on behalf of the Fund Service Providers that relate directly to the operations and financial reporting of each fund is shown in the table below.
Billed By | 2006A | 2005A |
Deloitte Entities | $160,000 | $400,000 |
A | Aggregate amounts may reflect rounding. |
Fees included in the All Other Fees category include services related to internal control reviews, strategy and other consulting, financial information systems design and implementation, consulting on other information systems, and other tax services unrelated to the fund.
(e) (1) | Audit Committee Pre-Approval Policies and Procedures: |
The trust's Audit Committee must pre-approve all audit and non-audit services provided by the independent registered public accounting firm relating to the operations or financial reporting of the funds. Prior to the commencement of any audit or non-audit services to a fund, the Audit Committee reviews the services to determine whether they are appropriate and permissible under applicable law.
The trust's Audit Committee has adopted policies and procedures to, among other purposes, provide a framework for the Committee's consideration of non-audit services by the audit firms that audit the Fidelity funds. The policies and procedures require that any non-audit service provided by a fund audit firm to a Fidelity Fund and any non-audit service provided by a fund auditor to a Fund Service Provider that relates directly to the operations and financial reporting of a Fidelity fund (Covered Service) are subject to approval by the Audit Committee before such service is provided. Non-audit services provided by a fund audit firm for a Fund Service Provider that do not relate directly to the operations and financial reporting of a Fidelity fund (Non-Covered Service) but that are expected to exceed $50,000 are also subject to pre-approval by the Audit Committee.
All Covered Services, as well as Non-Covered Services that are expected to exceed $50,000, must be approved in advance of provision of the service either: (i) by formal resolution of the Audit Committee, or (ii) by oral or written approval of the service by the Chair of the Audit Committee (or if the Chair is unavailable, such other member of the Audit Committee as may be designated by the Chair to act in the Chair's absence). The approval contemplated by (ii) above is permitted where the Treasurer determines that action on such an engagement is necessary before the next meeting of the Audit Committee. Neither pre-approval nor advance notice of Non-Covered Service engagements for which fees are not expected to exceed $50,000 is required; such engagements are to be reported to the Audit Committee monthly.
(e) (2) | Services approved pursuant to paragraph (c)(7)(i)(C) of Rule 2-01 of Regulation S-X: |
Audit-Related Fees:
There were no amounts that were approved by the Audit Committee pursuant to the de minimis exception for the fiscal years ended April 30, 2006 and April 30, 2005 on behalf of each fund.
There were no amounts that were required to be approved by the Audit Committee pursuant to the de minimis exception for the fiscal years ended April 30, 2006 and April 30, 2005 on behalf of the Fund Service Providers that relate directly to the operations and financial reporting of each fund.
Tax Fees:
There were no amounts that were approved by the Audit Committee pursuant to the de minimis exception for the fiscal years ended April 30, 2006 and April 30, 2005 on behalf of each fund.
There were no amounts that were required to be approved by the Audit Committee pursuant to the de minimis exception for the fiscal years ended April 30, 2006 and April 30, 2005 on behalf of the Fund Service Providers that relate directly to the operations and financial reporting of each fund.
All Other Fees:
There were no amounts that were approved by the Audit Committee pursuant to the de minimis exception for the fiscal years ended April 30, 2006 and April 30, 2005 on behalf of each fund.
There were no amounts that were required to be approved by the Audit Committee pursuant to the de minimis exception for the fiscal years ended April 30, 2006 and April 30, 2005 on behalf of the Fund Service Providers that relate directly to the operations and financial reporting of each fund.
(f) Not Applicable.
(g) For the fiscal years ended April 30, 2006 and April 30, 2005, the aggregate fees billed by Deloitte Entities of $530,000A and $700,000A,B for non-audit services rendered on behalf of the funds, FMR (not including any sub-adviser whose role is primarily portfolio management and is subcontracted with or overseen by another investment adviser) and Fund Service Providers relating to Covered Services and Non-Covered Services are shown in the table below.
| 2006A | 2005A |
Covered Services | $180,000 | $400,000 |
Non-Covered Services | $350,000 | $300,000 B |
A | Aggregate amounts may reflect rounding. |
B | Reflects current period presentation. |
(h) The trust's Audit Committee has considered Non-Covered Services that were not pre-approved that were provided by Deloitte Entities to Fund Service Providers to be compatible with maintaining the independence of Deloitte Entities in its audit of the funds, taking into account representations from Deloitte Entities, in accordance with Independence Standards Board Standard No.1, regarding its independence from the funds and their related entities.
Item 5. Audit Committee of Listed Registrants
Not applicable.
Item 6. Schedule of Investments
Not applicable.
Item 7. Disclosure of Proxy Voting Policies and Procedures for Closed-End Management Investment Companies
Not applicable.
Item 8. Portfolio Managers of Closed-End Management Investment Companies
Not applicable.
Item 9. Purchase of Equity Securities by Closed-End Management Investment Company and Affiliated Purchasers
Not applicable.
Item 10. Submission of Matters to a Vote of Security Holders
There were no material changes to the procedures by which shareholders may recommend nominees to the trust's Board of Trustees.
Item 11. Controls and Procedures
(a)(i) The President and Treasurer and the Chief Financial Officer have concluded that the trust's disclosure controls and procedures (as defined in Rule 30a-3(c) under the Investment Company Act) provide reasonable assurances that material information relating to the trust is made known to them by the appropriate persons, based on their evaluation of these controls and procedures as of a date within 90 days of the filing date of this report.
(a)(ii) There was no change in the trust's internal control over financial reporting (as defined in Rule 30a-3(d) under the Investment Company Act) that occurred during the second fiscal quarter of the period covered by this report that has materially affected, or is reasonably likely to materially affect, the trust's internal control over financial reporting.
Item 12. Exhibits
(a) | (1) | Code of Ethics pursuant to Item 2 of Form N-CSR is filed and attached hereto as EX-99.CODE ETH. |
(a) | (2) | Certification pursuant to Rule 30a-2(a) under the Investment Company Act of 1940 (17 CFR 270.30a-2(a)) is filed and attached hereto as Exhibit 99.CERT. |
(a) | (3) | Not applicable. |
(b) | | Certification pursuant to Rule 30a-2(b) under the Investment Company Act of 1940 (17 CFR 270.30a-2(b)) is furnished and attached hereto as Exhibit 99.906CERT. |
SIGNATURES
Pursuant to the requirements of the Securities Exchange Act of 1934 and the Investment Company Act of 1940, the registrant has duly caused this report to be signed on its behalf by the undersigned, thereunto duly authorized.
Fidelity Commonwealth Trust
By: | /s/Christine Reynolds |
| Christine Reynolds |
| President and Treasurer |
| |
Date: | June 21, 2006 |
Pursuant to the requirements of the Securities Exchange Act of 1934 and the Investment Company Act of 1940, this report has been signed below by the following persons on behalf of the registrant and in the capacities and on the dates indicated.
By: | /s/Christine Reynolds |
| Christine Reynolds |
| President and Treasurer |
| |
Date: | June 21, 2006 |
By: | /s/Paul M. Murphy |
| Paul M. Murphy |
| Chief Financial Officer |
| |
Date: | June 21, 2006 |