UNITED STATES
SECURITIES AND EXCHANGE COMMISSION
Washington, D.C. 20549
FORM N-CSR
CERTIFIED SHAREHOLDER REPORT OF REGISTERED
MANAGEMENT INVESTMENT COMPANIES
Investment Company Act file number 811-2546
Fidelity Commonwealth Trust
(Exact name of registrant as specified in charter)
82 Devonshire St., Boston, Massachusetts 02109
(Address of principal executive offices) (Zip code)
Eric D. Roiter, Secretary
82 Devonshire St.
Boston, Massachusetts 02109
(Name and address of agent for service)
Registrant's telephone number, including area code: 617-563-7000
Date of fiscal year end: | September 30 |
| |
Date of reporting period: | September 30, 2006 |
Item 1. Reports to Stockholders
Fidelity®
Strategic Real Return
Fund
Annual Report
September 30, 2006
(2_fidelity_logos) (Registered_Trademark)
Contents
Note to Shareholders | <Click Here> | An explanation of the changes to the fund. |
Chairman's Message | <Click Here> | Ned Johnson's message to shareholders. |
Performance | <Click Here> | How the fund has done over time. |
Management's Discussion | <Click Here> | The managers' review of fund performance, strategy and outlook |
Shareholder Expense Example | <Click Here> | An example of shareholder expenses. |
Investment Changes | <Click Here> | A summary of major shifts in the fund's investments over the past year. |
Investments | <Click Here> | A complete list of the fund's investments with their market values. |
Financial Statements | <Click Here> | Statements of assets and liabilities, operations, and changes in net assets,
as well as financial highlights. |
Notes | <Click Here> | Notes to the financial statements. |
Report of Independent Registered Public Accounting Firm | <Click Here> | |
Trustees and Officers | <Click Here> | |
Distributions | <Click Here> | |
Proxy Voting Results | <Click Here> | |
To view a fund's proxy voting guidelines and proxy voting record for the 12-month period ended June 30, visit www.fidelity.com/proxyvotingresults or visit the Securities and Exchange Commission's (SEC) web site at www.sec.gov. You may also call 1-800-544-8544 to request a free copy of the proxy voting guidelines.
Standard & Poor's, S&P and S&P 500 are registered service marks of The McGraw-Hill Companies, Inc. and have been licensed for use by Fidelity Distributors Corporation.
Other third party marks appearing herein are the property of their respective owners.
All other marks appearing herein are registered or unregistered trademarks or service marks of FMR Corp. or an affiliated company.
Annual Report
This report and the financial statements contained herein are submitted for the general information of the shareholders of the fund. This report is not authorized for distribution to prospective investors in the fund unless preceded or accompanied by an effective prospectus.
A fund files its complete schedule of portfolio holdings with the SEC for the first and third quarters of each fiscal year on Form N-Q. Forms N-Q are available on the SEC's web site at http://www.sec.gov. A fund's Forms N-Q may be reviewed and copied at the SEC's Public Reference Room in Washington, DC. Information regarding the operation of the SEC's Public Reference Room may be obtained by calling 1-800-SEC-0330. For a complete list of a fund's portfolio holdings, view the fund's most recent quarterly holdings report, semiannual report, or annual report on Fidelity's web site at http://www.fidelity.com/holdings.
NOT FDIC INSURED · MAY LOSE VALUE · NO BANK GUARANTEE
Neither the fund nor Fidelity Distributors Corporation is a bank.
Annual Report
Note to Shareholders:
Effective November 1, 2006, the real estate component of the Fidelity Strategic Real Return Composite Index - a hypothetical representation of the performance of the fund's unmanaged indexes used as a comparative benchmark - will be changed to reflect the fund's increased real estate common stock exposure. This modification will be made in order to improve the fund's opportunity for real return in periods of rising inflation, while also diversifying the fund's real estate debt exposure. The Dow Jones Wilshire Real Estate Securities IndexSM (12% weighting) will be added to the Composite index, which will continue to also include the Merrill Lynch® U.S. Real Estate Corporate Bond Index (8%), the Dow Jones-AIG Commodity IndexSM (25%), the Credit Suisse First Boston Leveraged Loan Index (25%) and the Lehman Brothers® U.S. Treasury Inflation-Protected Securities (TIPS) Index (30%). This new blend will no longer include an allocation to the FTSE NAREIT All REIT index, which was added to the Composite index on June 1, 2006, or the Morgan Stanley® REIT Preferred Index.
Annual Report
Chairman's Message
(photo_of_Edward_C_Johnson_3d)
Dear Shareholder:
Stock and bond markets around the world have seen largely positive results year to date, although weakness in the technology sector and growth stocks in general have tempered performance. While financial markets are always unpredictable, there are a number of time-tested principles that can put the historical odds in your favor.
One of the basic tenets is to invest for the long term. Over time, riding out the markets' inevitable ups and downs has proven much more effective than selling into panic or chasing the hottest trend. Even missing only a few of the markets' best days can significantly diminish investor returns. Patience also affords the benefits of compounding - of earning interest on additional income or reinvested dividends and capital gains. There are tax advantages and cost benefits to consider as well. The more you sell, the more taxes you pay, and the more you trade, the higher the costs. While staying the course doesn't eliminate risk, it can considerably lessen the effect of short-term declines.
You can further manage your investing risk through diversification. And today, more than ever, geographic diversification should be taken into account. Studies indicate that asset allocation is the single most important determinant of a portfolio's long-term success. The right mix of stocks, bonds and cash - aligned to your particular risk tolerance and investment objective - is very important. Age-appropriate rebalancing is also an essential aspect of asset allocation. For younger investors, an emphasis on equities - which historically have been the best performing asset class over time - is encouraged. As investors near their specific goal, such as retirement or sending a child to college, consideration may be given to replacing volatile assets (e.g. common stocks) with more-stable fixed investments (bonds or savings plans).
A third investment principle - investing regularly - can help lower the average cost of your purchases. Investing a certain amount of money each month or quarter helps ensure you won't pay for all your shares at market highs. This strategy - known as dollar cost averaging - also reduces unconstructive "emotion" from investing, helping shareholders avoid selling weak performers just prior to an upswing, or chasing a hot performer just before a correction.
We invite you to contact us via the Internet, through our Investor Centers or over the phone. It is our privilege to provide you the information you need to make the investments that are right for you.
Sincerely,
/s/Edward C. Johnson 3d
Edward C. Johnson 3d
Annual Report
Performance: The Bottom Line
Average annual total return reflects the change in the value of an investment, assuming reinvestment of Strategic Real Return's dividend income and capital gains (the profits earned upon the sale of securities that have grown in value) and assuming a constant rate of performance each year. The $10,000 table and the fund's returns do not reflect the deduction of taxes that a shareholder would pay on fund distributions or the redemption of fund shares. During periods of reimbursement by Fidelity, a fund's total return will be greater than it would be had the reimbursement not occurred. How a fund did yesterday is no guarantee of how it will do tomorrow.
Average Annual Total Returns
Periods ended September 30, 2006 | Past 1
year | Life of
fundA |
Strategic Real Return | 2.28% | 3.58% |
A From September 7, 2005
$10,000 Over Life of Fund
Let's say hypothetically that $10,000 was invested in Strategic Real Return on September 7, 2005, when the fund started. The chart shows how the value of your investment would have changed, and also shows how the Lehman Brothers® US TIPS Index performed over the same period.

Annual Report
Management's Discussion of Fund Performance
Comments from Christopher Sharpe and Derek Young, Co-Managers of Fidelity® Strategic Real Return Fund
Inflation was an on-again, off-again concern for most of the 12-month period ending September 30, 2006, and, as might be expected, the indexes measuring the performance of Fidelity Strategic Real Return Fund's four component asset classes showed varied results. The Lehman Brothers® U.S. Treasury Inflation-Protected Securities (TIPS) Index rose 1.84%, slightly below the 2.10% increase in the Consumer Price Index for All Urban Consumers (CPI-U), which was consistent with a generally benign inflation picture for the year overall. Meanwhile, the Dow Jones-AIG Commodity IndexSM, which tracks a group of physical commodities traded on various world exchanges, fell 6.11%, as inflationary fears pushed prices for many basic commodities lower in many world markets. Floating-rate bank debt, as measured by the Credit Suisse First Boston (CSFB) Leveraged Loan Index, rose 6.44%, reflecting increased demand for an asset class with low default rates and increasing yields. Similarly, income-oriented real estate investments were robust performers, as demonstrated by the 7.22% return of a diversified composite comprising the FTSE NAREIT All REIT index (20%), the Morgan Stanley® REIT Preferred Index (40%) and the Merrill Lynch® U.S. Real Estate Corporate Bond Index (40%).
During the one-year period, Strategic Real Return was up 2.28%, compared with gains of 2.51% for the Fidelity Strategic Real Return Composite Index and 1.84% for the Lehman Brothers U.S. TIPS Index. Security selection in the fund's subportfolios was the primary driver of performance, but asset allocation also added value. The real estate subportfolio helped overall performance and outpaced its benchmark by a wide margin due mostly to astute security selection across its broad real estate investment universe. Our investment in floating-rate bank loans - primarily through the Fidelity Floating Rate Central Investment Portfolio - had healthy overall appreciation due to strong security selection and also slightly outperformed its benchmark. The Inflation-Protected Securities subportfolio - mostly made up of TIPS - achieved a return that was just below that of its index. Volatility of the commodities markets pushed the commodity-linked note subportfolio's return into negative territory during the period, but that return was offset somewhat by the subportfolio's investments in the Fidelity Ultra-Short Central Fund, a diversified pool of short-term assets designed to outperform cash-like investments with similar characteristics.
The views expressed above reflect those of the portfolio manager(s) only through the end of the period as stated on the cover of this report and do not necessarily represent the views of Fidelity or any other person in the Fidelity organization. Any such views are subject to change at any time based upon market or other conditions and Fidelity disclaims any responsibility to update such views. These views may not be relied on as investment advice and, because investment decisions for a Fidelity fund are based on numerous factors, may not be relied on as an indication of trading intent on behalf of any Fidelity fund.
Annual Report
Shareholder Expense Example
As a shareholder of the Fund, you incur two types of costs: (1) transaction costs, including sales charges (loads) on purchase payments or redemption proceeds, redemption fees, and (2) ongoing costs, including management fees, distribution and/or service (12b-1) fees and other Fund expenses. This Example is intended to help you understand your ongoing costs (in dollars) of investing in the Fund and to compare these costs with the ongoing costs of investing in other mutual funds.
The Example is based on an investment of $1,000 invested at the beginning of the period and held for the entire period (April 1, 2006 to September 30, 2006).
Actual Expenses
The first line of the accompanying table for each class of the Fund provides information about actual account values and actual expenses. You may use the information in this line, together with the amount you invested, to estimate the expenses that you paid over the period. Simply divide your account value by $1,000.00 (for example, an $8,600 account value divided by $1,000.00 = 8.6), then multiply the result by the number in the first line for a class of the Fund under the heading entitled "Expenses Paid During Period" to estimate the expenses you paid on your account during this period. In addition, the Fund, as a shareholder in the underlying Fidelity Central Funds, will indirectly bear its pro rata share of the fees and expenses incurred by the underlying Fidelity Central Funds. These fees and expenses are not included in the Fund's annualized expense ratio used to calculate the expense estimate in the table below.
Hypothetical Example for Comparison Purposes
The second line of the accompanying table for each class of the Fund provides information about hypothetical account values and hypothetical expenses based on a Class' actual expense ratio and an assumed rate of return of 5% per year before expenses, which is not the Class' actual return. The hypothetical account values and expenses may not be used to estimate the actual ending account balance or expenses you paid for the period. You may use this information to compare the ongoing costs of investing in the Fund and other funds. To do so, compare this 5% hypothetical example with the 5% hypothetical examples that appear in the shareholder reports of the other funds. In addition, the Fund, as a shareholder in the underlying Fidelity Central Funds, will indirectly bear its pro rata share of the fees and expenses incurred by the underlying Fidelity Central Funds. These fees and expenses are not included in the Fund's annualized expense ratio used to calculate the expense estimate in the table below.
Please note that the expenses shown in the table are meant to highlight your ongoing costs only and do not reflect any transaction costs. Therefore, the second line of the table is useful in comparing ongoing costs only, and will not help you determine the relative total costs of owning different funds. In addition, if these transactional costs were included, your costs would have been higher.
Annual Report
| Beginning
Account Value
April 1, 2006 | Ending
Account Value
September 30, 2006 | Expenses Paid
During Period*
April 1, 2006
to September 30, 2006 |
Class A | | | |
Actual | $ 1,000.00 | $ 1,026.00 | $ 5.08 |
Hypothetical A | $ 1,000.00 | $ 1,020.05 | $ 5.06 |
Class T | | | |
Actual | $ 1,000.00 | $ 1,025.90 | $ 5.23 |
Hypothetical A | $ 1,000.00 | $ 1,019.90 | $ 5.22 |
Class B | | | |
Actual | $ 1,000.00 | $ 1,023.00 | $ 8.77 |
Hypothetical A | $ 1,000.00 | $ 1,016.39 | $ 8.74 |
Class C | | | |
Actual | $ 1,000.00 | $ 1,022.00 | $ 9.38 |
Hypothetical A | $ 1,000.00 | $ 1,015.79 | $ 9.35 |
Strategic Real Return | | | |
Actual | $ 1,000.00 | $ 1,027.90 | $ 3.97 |
Hypothetical A | $ 1,000.00 | $ 1,021.16 | $ 3.95 |
Institutional Class | | | |
Actual | $ 1,000.00 | $ 1,027.00 | $ 4.12 |
Hypothetical A | $ 1,000.00 | $ 1,021.01 | $ 4.10 |
A 5% return per year before expenses
* Expenses are equal to each Class' annualized expense ratio (shown in the table below); multiplied by the average account value over the period, multiplied by 183/365 (to reflect the one-half year period). The fees and expenses of the underlying Fidelity Central Funds in which the Fund invests are not included in the Fund's annualized expense ratio.
| Annualized
Expense Ratio |
Class A | 1.00% |
Class T | 1.03% |
Class B | 1.73% |
Class C | 1.85% |
Strategic Real Return | .78% |
Institutional Class | .81% |
Annual Report
Investment Changes
The information in the Quality Diversification and Asset Allocation tables is based on the combined investments of the Fund and its pro-rata share of its investments in each Fidelity Central Fund.
Holdings Distribution (% of fund's net assets) |
| As of
September 30, 2006 | As of
March 31, 2006 |
Commodity-Linked Notes and Related Investments* | 24.7% | 27.3% |
Inflation-Protected Investments | 29.5% | 27.2% |
Floating Rate High Yield | 24.7% | 23.9% |
Real Estate Investments | 18.5% | 14.8% |
Cash & Cash Equivalents | 1.8% | 0.9% |
* Includes Fidelity Ultra-Short Central Fund held in connection with commodity-linked notes and related investments. Investments in commodity-linked notes provide indirect exposure to futures contracts on physical commodities via the Dow Jones-AIG Commodity Index, the majority of which trade on U.S. exchanges. The value of commodity-linked notes will change directly based on the performance of the index. |
Quality Diversification (% of fund's net assets) |
As of September 30, 2006 | As of March 31, 2006 |
 | U.S. Government and
U.S. Government
Agency Obligations 30.8% | | | U.S. Government and
U.S. Government
Agency Obligations 28.9% | |
 | AAA 4.7% | | | AAA 4.8% | |
 | AA 0.9% | | | AA 1.1% | |
 | A 2.5% | | | A 1.9% | |
 | BBB 7.9% | | | BBB 5.0% | |
 | BB and Below 22.0% | | | BB and Below 22.8% | |
 | Structured Notes
(including
Commodity-Linked
Notes) 13.8% | | | Structured Notes
(including
Commodity-Linked
Notes) 13.8% | |
 | Equities 7.6% | | | Equities 7.6% | |
 | Short-Term
Investments and
Net Other Assets 9.8% | | | Short-Term
Investments and
Net Other Assets 14.1% | |

We have used ratings from Moody's® Investors Services, Inc. Where Moody's ratings are not available, we have used S&P® ratings. |
Asset Allocation (% of fund's net assets) |
As of September 30, 2006 * | As of March 31, 2006 ** |
| Stocks 7.6% | | | Stocks 7.6% | |
| U.S. Government and
U.S. Government
Agency Obligations 30.8% | | | U.S. Government and
U.S. Government
Agency Obligations 28.9% | |
| Corporate Bonds 12.8% | | | Corporate Bonds 8.0% | |
| Asset-Backed
Securities 6.8% | | | Asset-Backed
Securities 6.1% | |
| Structured Notes
(including Commodity- Linked Notes) 7.3% | | | Structured Notes
(including Commodity- Linked Notes 8.7% | |
| Floating Rate Loans 20.0% | | | Floating Rate Loans 21.2% | |
| CMOs and Other Mortgage Related Securities 4.3% | | | CMOs and Other Mortgage Related Securities 4.6% | |
| Other Investments 0.6% | | | Other Investments 0.8% | |
| Short-Term
Investments and
Net Other Assets 9.8% | | | Short-Term
Investments and
Net Other Assets 14.1% | |
* Foreign investments | 7.1% | | ** Foreign investments | 7.0% | |
* Futures and Swaps | 0.5% | | ** Futures and Swaps | 1.1% | |
* U.S. Treasury
Inflation-Indexed
Securities | 29.5% | | ** U.S. Treasury
Inflation-Indexed
Securities | 27.1% | |

For an unaudited list of holdings for each Fidelity Equity and Fixed-Income Central Fund, visit fidelity.com and/or advisor.fidelity.com, as applicable. The reports are located just after the Fund's financial statements and quarterly reports. |
Annual Report
Investments September 30, 2006
Showing Percentage of Net Assets
Corporate Bonds - 8.3% |
| Principal Amount | | Value
(Note 1) |
Convertible Bonds - 0.6% |
FINANCIALS - 0.6% |
Real Estate Investment Trusts - 0.5% |
American Financial Realty Trust 4.375% 7/15/24 | | $ 11,510,000 | | $ 10,728,506 |
Biomed Realty LP 4.5% 10/1/26 (b) | | 1,000,000 | | 997,500 |
Essex Portfolio LP 3.625% 11/1/25 (b) | | 600,000 | | 741,780 |
New Plan Excel Realty Trust 3.7% 9/15/26 (b) | | 1,000,000 | | 994,290 |
Washington (REIT) 3.875% 9/15/26 | | 750,000 | | 752,130 |
| | 14,214,206 |
Real Estate Management & Development - 0.1% |
Affordable Resources Communities LP 7.5% 8/15/25 (b) | | 2,250,000 | | 2,250,000 |
ERP Operating LP 3.85% 8/15/26 | | 2,000,000 | | 2,031,380 |
| | 4,281,380 |
TOTAL FINANCIALS | | 18,495,586 |
Nonconvertible Bonds - 7.7% |
CONSUMER DISCRETIONARY - 1.1% |
Hotels, Restaurants & Leisure - 0.1% |
Felcor Lodging LP 9% 6/1/11 | | 1,500,000 | | 1,588,125 |
Host Marriott LP 7% 8/15/12 | | 800,000 | | 808,000 |
Landry's Seafood Restaurants, Inc. 7.5% 12/15/14 | | 1,700,000 | | 1,627,750 |
| | 4,023,875 |
Household Durables - 1.0% |
Beazer Homes USA, Inc.: | | | | |
8.125% 6/15/16 | | 1,000,000 | | 970,000 |
8.375% 4/15/12 | | 400,000 | | 400,000 |
D.R. Horton, Inc. 6.5% 4/15/16 | | 1,000,000 | | 981,232 |
K. Hovnanian Enterprises, Inc.: | | | | |
6% 1/15/10 | | 400,000 | | 372,500 |
6.25% 1/15/16 | | 700,000 | | 616,000 |
7.5% 5/15/16 | | 500,000 | | 467,500 |
7.75% 5/15/13 | | 5,300,000 | | 4,876,000 |
KB Home: | | | | |
6.25% 6/15/15 | | 4,600,000 | | 4,230,477 |
7.75% 2/1/10 | | 1,700,000 | | 1,695,750 |
Kimball Hill, Inc. 10.5% 12/15/12 | | 2,700,000 | | 2,423,250 |
Meritage Homes Corp. 6.25% 3/15/15 | | 2,000,000 | | 1,700,000 |
Ryland Group, Inc. 6.875% 6/15/13 | | 1,000,000 | | 1,002,089 |
Standard Pacific Corp. 9.25% 4/15/12 | | 1,900,000 | | 1,833,500 |
Corporate Bonds - continued |
| Principal Amount | | Value
(Note 1) |
Nonconvertible Bonds - continued |
CONSUMER DISCRETIONARY - continued |
Household Durables |
Stanley-Martin Communities LLC 9.75% 8/15/15 | | $ 2,400,000 | | $ 1,884,000 |
Technical Olympic USA, Inc.: | | | | |
7.5% 3/15/11 | | 2,250,000 | | 1,800,000 |
8.25% 4/1/11 (b) | | 500,000 | | 460,000 |
WCI Communities, Inc.: | | | | |
7.875% 10/1/13 | | 650,000 | | 547,625 |
9.125% 5/1/12 | | 2,350,000 | | 2,103,250 |
| | 28,363,173 |
TOTAL CONSUMER DISCRETIONARY | | 32,387,048 |
FINANCIALS - 6.2% |
Real Estate Investment Trusts - 5.2% |
AMB Property LP 3.5% 3/1/09 | | 1,000,000 | | 959,122 |
American Health Properties, Inc. 7.5% 1/15/07 | | 2,975,000 | | 2,992,493 |
Archstone-Smith Operating Trust 3% 6/15/08 | | 6,050,000 | | 5,825,176 |
Archstone-Smith Trust 5% 8/15/07 | | 4,525,000 | | 4,506,601 |
Arden Realty LP: | | | | |
5.2% 9/1/11 | | 500,000 | | 500,141 |
5.25% 3/1/15 | | 600,000 | | 598,319 |
7% 11/15/07 | | 1,400,000 | | 1,424,357 |
Avalon Properties, Inc. 6.875% 12/15/07 | | 2,000,000 | | 2,028,858 |
AvalonBay Communities, Inc.: | | | | |
5% 8/1/07 | | 2,025,000 | | 2,012,599 |
5.5% 1/15/12 | | 1,000,000 | | 1,005,163 |
Brandywine Operating Partnership LP: | | | | |
4.5% 11/1/09 | | 840,000 | | 816,939 |
6% 4/1/16 | | 1,000,000 | | 1,011,142 |
BRE Properties, Inc. 5.75% 9/1/09 | | 4,500,000 | | 4,543,578 |
Camden Property Trust: | | | | |
4.7% 7/15/09 | | 1,000,000 | | 987,495 |
7% 11/15/06 | | 3,407,000 | | 3,412,741 |
Colonial Properties Trust 7% 7/14/07 | | 2,750,000 | | 2,779,222 |
Commercial Net Lease Realty, Inc. 6.15% 12/15/15 | | 400,000 | | 406,277 |
Developers Diversified Realty Corp.: | | | | |
3.875% 1/30/09 | | 2,000,000 | | 1,933,200 |
5.375% 10/15/12 | | 500,000 | | 494,883 |
Duke Realty LP 7.75% 11/15/09 | | 1,000,000 | | 1,065,483 |
Corporate Bonds - continued |
| Principal Amount | | Value
(Note 1) |
Nonconvertible Bonds - continued |
FINANCIALS - continued |
Real Estate Investment Trusts |
Equity One, Inc.: | | | | |
6% 9/15/16 | | $ 1,000,000 | | $ 1,006,877 |
6.25% 1/15/17 | | 1,000,000 | | 1,022,974 |
Evans Withycombe Residential LP 7.625% 4/15/07 | | 510,000 | | 514,023 |
Health Care Property Investors, Inc.: | | | | |
4.875% 9/15/10 | | 700,000 | | 679,856 |
6.3% 9/15/16 | | 4,500,000 | | 4,530,092 |
Health Care REIT, Inc. 6.2% 6/1/16 | | 1,000,000 | | 1,006,853 |
Healthcare Realty Trust, Inc.: | | | | |
5.125% 4/1/14 | | 500,000 | | 476,356 |
8.125% 5/1/11 | | 608,000 | | 661,096 |
HMB Capital Trust V 8.99% 12/15/36 (b)(c) | | 4,300,000 | | 4,300,000 |
Hospitality Properties Trust 6.75% 2/15/13 | | 1,250,000 | | 1,314,065 |
HRPT Properties Trust: | | | | |
5.99% 3/16/11 (c) | | 4,000,000 | | 4,005,832 |
6.5% 1/15/13 | | 1,000,000 | | 1,039,883 |
iStar Financial, Inc.: | | | | |
5.73% 9/15/09 (b)(c) | | 1,000,000 | | 999,872 |
5.94% 3/16/09 (c) | | 500,000 | | 503,360 |
5.95% 10/15/13 (b) | | 1,000,000 | | 1,005,340 |
6.64% 3/12/07 (c) | | 1,200,000 | | 1,205,849 |
Kimco Realty Corp.: | | | | |
7.46% 5/29/07 | | 1,250,000 | | 1,265,150 |
7.86% 11/1/07 | | 480,000 | | 490,485 |
Merry Land & Investment Co., Inc. 6.69% 10/30/06 | | 3,000,000 | | 3,002,205 |
Nationwide Health Properties, Inc.: | | | | |
6% 5/20/15 | | 230,000 | | 227,848 |
6.5% 7/15/11 | | 3,500,000 | | 3,578,967 |
7.23% 11/8/06 | | 1,110,000 | | 1,111,541 |
New Plan Excel Realty Trust 7.35% 6/15/07 | | 1,750,000 | | 1,772,820 |
Omega Healthcare Investors, Inc.: | | | | |
7% 4/1/14 | | 3,800,000 | | 3,771,500 |
7% 1/15/16 | | 1,658,000 | | 1,637,275 |
ProLogis Trust 7.1% 4/15/08 | | 1,500,000 | | 1,537,137 |
Rouse Co. LP/TRC, Inc. 6.75% 5/1/13 (b) | | 3,500,000 | | 3,495,450 |
Senior Housing Properties Trust 8.625% 1/15/12 | | 3,600,000 | | 3,861,000 |
Shurgard Storage Centers, Inc.: | | | | |
5.875% 3/15/13 | | 2,000,000 | | 2,048,292 |
7.75% 2/22/11 | | 1,000,000 | | 1,081,731 |
Corporate Bonds - continued |
| Principal Amount | | Value
(Note 1) |
Nonconvertible Bonds - continued |
FINANCIALS - continued |
Real Estate Investment Trusts |
Simon Property Group LP: | | | | |
5.375% 8/28/08 | | $ 3,000,000 | | $ 2,998,254 |
7% 6/15/28 (c) | | 960,000 | | 985,485 |
7.125% 9/20/07 | | 1,500,000 | | 1,519,265 |
Simon Property Group, Inc. 3.75% 1/30/09 | | 2,000,000 | | 1,930,870 |
Spieker Properties LP 7.25% 5/1/09 | | 2,600,000 | | 2,727,858 |
Tanger Properties LP 9.125% 2/15/08 | | 1,760,000 | | 1,839,200 |
The Rouse Co. 8% 4/30/09 | | 3,000,000 | | 3,123,693 |
Thornburg Mortgage, Inc. 8% 5/15/13 | | 6,450,000 | | 6,321,000 |
Trustreet Properties, Inc. 7.5% 4/1/15 | | 2,200,000 | | 2,183,500 |
United Dominion Realty Trust: | | | | |
4.5% 3/3/08 | | 1,750,000 | | 1,723,055 |
6.05% 6/1/13 | | 2,500,000 | | 2,539,373 |
Ventas Realty LP: | | | | |
6.5% 6/1/16 | | 2,660,000 | | 2,613,450 |
6.625% 10/15/14 | | 7,775,000 | | 7,755,563 |
6.75% 6/1/10 | | 2,400,000 | | 2,451,000 |
6.75% 4/1/17 | | 2,000,000 | | 2,002,500 |
8.75% 5/1/09 | | 1,920,000 | | 2,025,600 |
9% 5/1/12 | | 6,400,000 | | 7,136,000 |
Vornado Realty Trust 5.625% 6/15/07 | | 2,645,000 | | 2,642,432 |
Washington (REIT) 6.898% 2/25/18 | | 3,200,000 | | 3,268,230 |
Western Investment Real Estate Trust 7.2% 9/15/08 | | 500,000 | | 516,117 |
| | 150,759,963 |
Real Estate Management & Development - 0.8% |
American Real Estate Partners/American Real Estate Finance Corp.: | | | | |
7.125% 2/15/13 | | 1,240,000 | | 1,224,500 |
8.125% 6/1/12 | | 1,000,000 | | 1,022,500 |
Colonial Realty LP 6.05% 9/1/16 | | 1,000,000 | | 1,009,439 |
EOP Operating LP: | | | | |
4.65% 10/1/10 | | 8,500,000 | | 8,246,836 |
6.1081% 10/1/10 (c) | | 700,000 | | 706,446 |
6.763% 6/15/07 | | 3,192,000 | | 3,218,861 |
7.5% 4/19/29 | | 2,000,000 | | 2,239,950 |
ERP Operating LP 6.625% 3/15/12 | | 3,000,000 | | 3,174,885 |
First Industrial LP 5.75% 1/15/16 | | 1,000,000 | | 989,365 |
| | 21,832,782 |
Corporate Bonds - continued |
| Principal Amount | | Value
(Note 1) |
Nonconvertible Bonds - continued |
FINANCIALS - continued |
Thrifts & Mortgage Finance - 0.2% |
Saxon Capital, Inc. 12% 5/1/14 (b) | | $ 4,750,000 | | $ 6,246,250 |
TOTAL FINANCIALS | | 178,838,995 |
HEALTH CARE - 0.2% |
Health Care Providers & Services - 0.2% |
Skilled Healthcare Group, Inc. 11% 1/15/14 (b) | | 2,000,000 | | 2,140,000 |
Tenet Healthcare Corp. 7.375% 2/1/13 | | 4,000,000 | | 3,620,000 |
| | 5,760,000 |
MATERIALS - 0.1% |
Paper & Forest Products - 0.1% |
Plum Creek Timberlands LP 5.875% 11/15/15 | | 2,000,000 | | 1,978,352 |
TELECOMMUNICATION SERVICES - 0.1% |
Wireless Telecommunication Services - 0.1% |
American Tower Corp. 7.125% 10/15/12 | | 2,500,000 | | 2,556,250 |
TOTAL NONCONVERTIBLE BONDS | | 221,520,645 |
TOTAL CORPORATE BONDS (Cost $238,346,424) | 240,016,231 |
U.S. Treasury Inflation Protected Obligations - 29.5% |
|
U.S. Treasury Inflation-Indexed Bonds: | | | | |
2% 1/15/26 | | 95,779,310 | | 91,849,737 |
2.375% 1/15/25 | | 80,524,557 | | 81,799,721 |
3.625% 4/15/28 | | 24,658,172 | | 30,553,830 |
3.875% 4/15/29 | | 26,364,288 | | 34,056,101 |
U.S. Treasury Inflation-Indexed Notes: | | | | |
0.875% 4/15/10 | | 62,194,602 | | 58,943,237 |
1.625% 1/15/15 | | 47,442,738 | | 45,117,899 |
1.875% 7/15/13 | | 75,203,573 | | 73,233,994 |
1.875% 7/15/15 | | 38,329,837 | | 37,104,339 |
2% 1/15/14 | | 55,265,729 | | 54,198,064 |
2% 7/15/14 | | 20,618,259 | | 20,200,649 |
2% 1/15/16 | | 59,820,420 | | 58,412,907 |
2.375% 4/15/11 | | 19,888,104 | | 19,907,842 |
U.S. Treasury Inflation Protected Obligations - continued |
| Principal Amount | | Value
(Note 1) |
U.S. Treasury Inflation-Indexed Notes: - continued | | | | |
2.5% 7/15/16 | | $ 16,121,120 | | $ 16,320,000 |
3% 7/15/12 | | 34,761,297 | | 36,072,222 |
3.375% 1/15/12 | | 44,428,482 | | 46,763,304 |
3.5% 1/15/11 | | 18,589,008 | | 19,467,198 |
3.625% 1/15/08 | | 26,493,793 | | 26,706,438 |
3.875% 1/15/09 | | 49,815,310 | | 51,238,639 |
4.25% 1/15/10 | | 49,127,047 | | 51,942,715 |
TOTAL U.S. TREASURY INFLATION PROTECTED OBLIGATIONS (Cost $854,969,249) | 853,888,836 |
Asset-Backed Securities - 0.4% |
|
Ameriquest Mortgage Securities, Inc. Series 2004-R10 Class M1, 6.03% 11/25/34 (c) | | 105,000 | | 105,614 |
Conseco Finance Securitizations Corp.: | | | | |
Series 2002-1 Class M2, 9.546% 12/1/33 | | 1,500,000 | | 857,464 |
Series 2002-2 Class M2, 9.163% 3/1/33 | | 2,500,000 | | 1,831,613 |
Countrywide Home Loan Trust Series 2006-BC2N
Class N, 6.5% 2/25/47 (b) | | 397,584 | | 393,699 |
Crest Clarendon Street Ltd./Crest Clarendon Corp. Series 2002-1A Class D, 9% 12/28/35 (b) | | 500,000 | | 538,670 |
Fairfield Street Solar Corp. Series 2004-1A Class E1, 8.765% 11/28/39 (b)(c) | | 850,000 | | 865,513 |
Home Equity Asset Trust Series 2006-3N Class B, 6.5% 8/27/36 (b) | | 750,000 | | 739,115 |
Long Beach Asset Holdings Corp. Series 2006-4
Class N1, 5.877% 6/25/46 (b) | | 1,539,355 | | 1,537,431 |
Merit Securities Corp. Series 13 Class M1, 8.63% 12/28/33 | | 1,500,000 | | 1,365,000 |
Resi Finance LP Series 2006-B Class B6, 7.03% 6/15/38 (c) | | 998,053 | | 998,051 |
Residential Asset Securities Corp. Series 2003-KS10 Class MI3, 6.41% 12/25/33 | | 1,000,000 | | 982,852 |
Sharps SP I LLC Net Interest Margin Trust Series 2004-HE3N Class NA, 5.19% 11/25/34 (b) | | 21,331 | | 21,302 |
Structured Asset Securities Corp. Series 2006-BC1
Class B1, 7.83% 3/25/36 (b)(c) | | 100,000 | | 87,060 |
Taberna Preferred Funding III Ltd. Series 2005-3A
Class D, 8.13% 2/5/36 (b)(c) | | 250,000 | | 233,125 |
TOTAL ASSET-BACKED SECURITIES (Cost $10,538,657) | 10,556,509 |
Collateralized Mortgage Obligations - 0.2% |
| Principal Amount | | Value
(Note 1) |
Private Sponsor - 0.2% |
Banc of America Large Loan, Inc. floater Series 2003-BBA2 Class L, 9.28% 11/15/15 (b)(c) | | $ 2,000,000 | | $ 1,978,905 |
Countrywide Alternative Loan Trust Series 2006-OC5N Class N, 7.25% 7/25/37 (b) | | 913,572 | | 912,370 |
Countrywide Home Loans, Inc. Series 2005-R3 Class B3, 5.5% 9/25/35 (b)(c) | | 147,611 | | 114,612 |
Countrywide Home Loans, Inc. Series 2003-J15: | | | | |
Class B3, 4.71% 1/25/19 (b)(c) | | 106,605 | | 96,892 |
Class B4, 4.71% 1/25/19 (b)(c) | | 213,210 | | 168,281 |
Residential Finance LP/Residential Finance Development Corp. floater Series 2005-D Class B6, 7.58% 12/15/37 (b)(c) | | 492,784 | | 499,802 |
Resix Finance Ltd. floater: | | | | |
Series 2005-C Class B7, 8.43% 9/10/37 (b)(c) | | 147,936 | | 147,936 |
Series 2005-D Class B7, 9.58% 12/15/37 (b)(c) | | 295,670 | | 298,728 |
Series 2006-A Class B7, 8.83% 3/15/38 (b)(c) | | 745,095 | | 745,092 |
Series 2006-B Class B7, 9.18% 7/15/38 (b)(c) | | 998,053 | | 998,047 |
TOTAL COLLATERALIZED MORTGAGE OBLIGATIONS (Cost $5,948,870) | 5,960,665 |
Commercial Mortgage Securities - 1.0% |
|
Asset Securitization Corp. Series 1997-MD7 Class A4, 7.8496% 1/13/30 (c) | | 499,608 | | 499,608 |
Banc of America Large Loan, Inc. floater: | | | | |
Series 2003-BBA2 Class K, 7.93% 11/15/15 (b)(c) | | 675,000 | | 669,758 |
Series 2005-ESHA Class K, 7.13% 7/14/08 (b)(c) | | 300,000 | | 300,150 |
Series 2005-MIB1 Class K, 7.33% 3/15/22 (b)(c) | | 800,000 | | 791,743 |
Credit Suisse/Morgan Stanley Commercial Mortgage Trust Series 2006-HC1A Class K, 6.807% 5/15/23 (b)(c) | | 3,757,000 | | 3,757,000 |
Crest Ltd. Series 2001-1A Class C, 9% 2/25/34 (b) | | 500,000 | | 525,560 |
CS First Boston Mortgage Securities Corp. Series 2004-FL1A Class G, 8.2286% 5/15/14 (b)(c) | | 652,274 | | 652,981 |
Global Signal Trust II Series 2004-2A: | | | | |
Class D, 5.093% 12/15/14 (b) | | 1,000,000 | | 976,420 |
Class F, 6.376% 12/15/14 (b) | | 800,000 | | 788,122 |
Global Signal Trust III Series 2006-1 Class F, 7.036% 2/15/36 (b) | | 930,000 | | 948,920 |
Commercial Mortgage Securities - continued |
| Principal Amount | | Value
(Note 1) |
GMAC Commercial Mortgage Securities, Inc.: | | | | |
Series 1997-C2 Class E, 7.624% 4/15/29 (c) | | $ 900,000 | | $ 973,266 |
Series 1999-C1 Class F, 6.02% 5/15/33 (b) | | 2,500,000 | | 2,557,812 |
Series 2003-J10 Class B2, 6.75% 4/15/29 (c) | | 1,000,000 | | 1,010,508 |
Guggenheim Structure Real Estate Funding Ltd. floater Series 2006-3 Class E, 6.98% 9/25/46 (b)(c) | | 750,000 | | 750,000 |
LB-UBS Commercial Mortgage Trust sequential pay Series 2005-C7 Class A1, 4.99% 11/15/30 | | 2,588,223 | | 2,580,808 |
Mezz Capital Commercial Mortgage Trust
Series 2005-C3: | | | | |
Class D, 7.7% 5/20/44 (b) | | 600,000 | | 585,817 |
Class F, 10.813% 5/20/44 (b) | | 400,000 | | 396,127 |
TERRA LNR I Series 2006-E, 7% 6/15/17 (b)(c) | | 770,000 | | 769,992 |
Wachovia Bank Commercial Mortgage Trust Series 2005-C20 Class A3SF, 5.46% 7/15/42 (c) | | 5,200,000 | | 5,191,074 |
Wachovia Ltd./Wachovia Llc Series 2006-1 Class 1Ml, LIBOR + 5.5% 9/25/26 (b)(c) | | 3,000,000 | | 3,007,560 |
Wrightwood Capital Real Estate CDO Ltd. floater Series 2005-1A Class F, 7.3425% 11/21/40 (b)(c) | | 1,500,000 | | 1,518,615 |
TOTAL COMMERCIAL MORTGAGE SECURITIES (Cost $29,146,939) | 29,251,841 |
Common Stocks - 3.8% |
| | Shares | | |
CONSUMER DISCRETIONARY - 0.3% |
Hotels, Restaurants & Leisure - 0.2% |
Red Lion Hotels Corp. (a) | | 120,600 | | 1,297,656 |
Starwood Hotels & Resorts Worldwide, Inc. | | 60,700 | | 3,471,433 |
| | | 4,769,089 |
Household Durables - 0.1% |
KB Home | | 20,000 | | 876,000 |
Lennar Corp. Class A | | 20,700 | | 936,675 |
Ryland Group, Inc. | | 23,000 | | 993,830 |
| | | 2,806,505 |
TOTAL CONSUMER DISCRETIONARY | | | 7,575,594 |
Common Stocks - continued |
| | Shares | | Value
(Note 1) |
FINANCIALS - 3.4% |
Real Estate Investment Trusts - 3.4% |
Acadia Realty Trust (SBI) | | 21,100 | | $ 538,050 |
Alexandria Real Estate Equities, Inc. | | 26,300 | | 2,466,940 |
American Financial Realty Trust (SBI) | | 113,400 | | 1,265,544 |
American Home Mortgage Investment Corp. | | 6,000 | | 209,220 |
Annaly Capital Management, Inc. | | 335,500 | | 4,408,470 |
Anworth Mortgage Asset Corp. | | 234,300 | | 1,956,405 |
Apartment Investment & Management Co. Class A | | 7,700 | | 418,957 |
Archstone-Smith Trust | | 14,200 | | 773,048 |
AvalonBay Communities, Inc. | | 19,500 | | 2,347,800 |
Boston Properties, Inc. | | 12,800 | | 1,322,752 |
Capital Lease Funding, Inc. | | 89,600 | | 993,664 |
CBRE Realty Finance, Inc. | | 175,000 | | 2,668,750 |
Cousins Properties, Inc. | | 33,900 | | 1,159,719 |
Developers Diversified Realty Corp. | | 48,700 | | 2,715,512 |
DiamondRock Hospitality Co. | | 24,200 | | 401,962 |
Duke Realty Corp. | | 25,000 | | 933,750 |
Education Realty Trust, Inc. | | 30,550 | | 450,918 |
Equity Lifestyle Properties, Inc. | | 78,700 | | 3,597,377 |
Equity Office Properties Trust | | 79,280 | | 3,152,173 |
Equity Residential (SBI) | | 73,800 | | 3,732,804 |
Federal Realty Investment Trust (SBI) | | 26,800 | | 1,991,240 |
Fieldstone Investment Corp. | | 161,600 | | 1,410,768 |
General Growth Properties, Inc. | | 131,900 | | 6,285,035 |
Glenborough Realty Trust, Inc. | | 15,800 | | 406,534 |
GMH Communities Trust | | 84,200 | | 1,062,604 |
Healthcare Realty Trust, Inc. | | 16,300 | | 626,083 |
Hersha Hospitality Trust | | 36,900 | | 354,240 |
HomeBanc Mortgage Corp., Georgia | | 284,200 | | 1,747,830 |
Host Hotels & Resorts, Inc. | | 150,947 | | 3,461,215 |
Inland Real Estate Corp. | | 173,000 | | 3,030,960 |
Innkeepers USA Trust (SBI) | | 39,200 | | 638,568 |
Kimco Realty Corp. | | 73,400 | | 3,146,658 |
KKR Financial Corp. | | 10,200 | | 250,308 |
Lexington Corporate Properties Trust | | 17,100 | | 362,178 |
MFA Mortgage Investments, Inc. | | 298,700 | | 2,225,315 |
MortgageIT Holdings, Inc. | | 116,000 | | 1,633,280 |
Nationwide Health Properties, Inc. | | 74,300 | | 1,986,782 |
New York Mortgage Trust, Inc. | | 191,700 | | 739,962 |
Newcastle Investment Corp. | | 127,200 | | 3,486,552 |
Opteum, Inc. Class A | | 88,700 | | 714,035 |
Common Stocks - continued |
| | Shares | | Value
(Note 1) |
FINANCIALS - continued |
Real Estate Investment Trusts - continued |
Plum Creek Timber Co., Inc. | | 4,700 | | $ 159,988 |
ProLogis Trust | | 44,900 | | 2,561,994 |
Redwood Trust, Inc. | | 11,800 | | 594,366 |
Regency Centers Corp. | | 26,400 | | 1,815,264 |
Resource Capital Corp. | | 32,000 | | 494,400 |
Saxon Capital, Inc. | | 229,900 | | 3,227,796 |
Simon Property Group, Inc. | | 20,800 | | 1,884,896 |
Spirit Finance Corp. | | 388,600 | | 4,511,646 |
Strategic Hotel & Resorts, Inc. | | 47,100 | | 936,348 |
Sunstone Hotel Investors, Inc. | | 6,700 | | 199,124 |
Thornburg Mortgage, Inc. (SBI) | | 28,000 | | 713,160 |
Trizec Properties, Inc. | | 23,800 | | 688,058 |
Trustreet Properties, Inc. | | 53,700 | | 671,787 |
U-Store-It Trust | | 10,800 | | 231,768 |
United Dominion Realty Trust, Inc. (SBI) | | 47,000 | | 1,419,400 |
Ventas, Inc. | | 87,400 | | 3,368,396 |
Vornado Realty Trust | | 14,100 | | 1,536,900 |
Washington (REIT) (SBI) | | 26,300 | | 1,046,740 |
| | | 97,135,993 |
Real Estate Management & Development - 0.0% |
The St. Joe Co. | | 18,900 | | 1,037,043 |
TOTAL FINANCIALS | | | 98,173,036 |
HEALTH CARE - 0.0% |
Health Care Providers & Services - 0.0% |
Capital Senior Living Corp. (a) | | 45,000 | | 416,250 |
Emeritus Corp. (a) | | 39,300 | | 846,915 |
| | | 1,263,165 |
MATERIALS - 0.1% |
Paper & Forest Products - 0.1% |
Weyerhaeuser Co. | | 27,300 | | 1,679,769 |
TOTAL COMMON STOCKS (Cost $99,650,918) | | 108,691,564 |
Preferred Stocks - 3.8% |
| | Shares | | Value
(Note 1) |
Convertible Preferred Stocks - 0.5% |
FINANCIALS - 0.5% |
Real Estate Investment Trusts - 0.5% |
Annaly Capital Management, Inc. Series B, 6.00% | | 80,000 | | $ 2,185,760 |
Lexington Corporate Properties Trust Series C 6.50% | | 10,700 | | 501,830 |
The Mills Corp. 6.75% (b) | | 8,254 | | 6,923,043 |
Trustreet Properties, Inc. Series C, 7.50% | | 91,300 | | 1,893,562 |
Windrose Medical Properties Trust 7.50% | | 92,200 | | 2,581,600 |
| | | 14,085,795 |
Nonconvertible Preferred Stocks - 3.3% |
FINANCIALS - 3.3% |
Diversified Financial Services - 0.1% |
DRA CRT Acquisition Corp. Series A, 8.50% | | 1,700 | | 40,375 |
Red Lion Hotels Capital Trust 9.50% | | 138,465 | | 3,607,013 |
| | | 3,647,388 |
Real Estate Investment Trusts - 3.2% |
Accredited Mortgage Loan Trust Series A, 9.75% | | 100,700 | | 2,527,570 |
Alexandria Real Estate Equities, Inc.: | | | |
Series B, 9.10% | | 3,600 | | 91,224 |
Series C, 8.375% | | 10,000 | | 262,000 |
American Home Mortgage Investment Corp.: | | | |
Series A, 9.375% | | 79,300 | | 2,110,173 |
Series B, 9.25% | | 230,944 | | 5,960,665 |
Annaly Capital Management, Inc. Series A, 7.875% | | 141,300 | | 3,505,653 |
Anthracite Capital, Inc. Series C, 9.375% | | 400 | | 10,680 |
Anworth Mortgage Asset Corp. Series A, 8.625% | | 189,600 | | 4,692,600 |
Apartment Investment & Management Co. Series T, 8.00% | | 80,000 | | 2,030,400 |
Ashford Hospitality Trust, Inc. Series A, 8.55% | | 10,000 | | 255,500 |
Capital Lease Funding, Inc. Series A, 8.125% | | 20,000 | | 501,000 |
CBL & Associates Properties, Inc. Series B, 8.75% | | 64,200 | | 3,300,522 |
CenterPoint Properties Trust Series D, 5.377% | | 5,280 | | 4,224,000 |
Colonial Properties Trust (depositary shares) Series D, 8.125% | | 5,000 | | 129,950 |
Cousins Properties, Inc. Series A, 7.75% | | 49,600 | | 1,269,760 |
Crescent Real Estate Equities Co. Series B, 9.50% | | 50,000 | | 1,283,000 |
Developers Diversified Realty Corp. (depositary shares) Series F, 8.60% | | 10,000 | | 254,300 |
Digital Realty Trust, Inc.: | | | |
Series A, 8.50% | | 90,000 | | 2,335,500 |
Series B, 7.875% | | 36,100 | | 915,496 |
Eagle Hospitality Properties Trust, Inc. Series A, 8.25% | | 71,300 | | 1,829,558 |
Preferred Stocks - continued |
| | Shares | | Value
(Note 1) |
Nonconvertible Preferred Stocks - continued |
FINANCIALS - continued |
Real Estate Investment Trusts |
FelCor Lodging Trust, Inc. (depositary shares) Series C, 8.00% | | 40,000 | | $ 980,000 |
Glimcher Realty Trust Series F, 8.75% | | 30,000 | | 760,800 |
Hersha Hospitality Trust Series A, 8.00% | | 40,000 | | 1,038,400 |
Home Properties of New York, Inc. Series F, 9.00% | | 124,800 | | 3,183,648 |
HomeBanc Mortgage Corp., Georgia Series A, 10.00% | | 311,415 | | 7,866,343 |
Impac Mortgage Holdings, Inc. Series C, 9.125% | | 17,700 | | 412,587 |
Innkeepers USA Trust Series C, 8.00% | | 53,000 | | 1,341,960 |
LaSalle Hotel Properties Series A, 10.25% | | 124,500 | | 3,189,690 |
Lexington Corporate Properties Trust Series B, 8.05% | | 60,000 | | 1,534,200 |
MFA Mortgage Investments, Inc. Series A, 8.50% | | 162,900 | | 4,012,227 |
Mid-America Apartment Communities, Inc. Series H, 8.30% | | 45,100 | | 1,150,501 |
Nationwide Health Properties, Inc. 7.677% | | 19,200 | | 1,940,160 |
New Century Financial Corp. Series B 9.75% | | 25,000 | | 625,000 |
New Plan Excel Realty Trust (depositary shares) Series D, 7.80% | | 20,500 | | 1,025,000 |
Newcastle Investment Corp. Series B, 9.75% | | 79,000 | | 2,063,480 |
NorthStar Realty Finance Corp. Series A 8.75% | | 20,000 | | 513,000 |
Omega Healthcare Investors, Inc. Series D, 8.375% | | 80,000 | | 2,080,800 |
Parkway Properties, Inc. Series D, 8.00% | | 80,000 | | 2,032,800 |
Prime Group Realty Trust Series B, 9.00% | | 15,500 | | 280,550 |
PS Business Parks, Inc. (depositary shares) Series F, 8.75% | | 3,400 | | 86,088 |
Public Storage, Inc. Series I, 7.25% | | 20,000 | | 495,000 |
RAIT Investment Trust: | | | |
Series A, 7.75% | | 60,000 | | 1,473,000 |
Series B, 8.375% | | 17,000 | | 434,350 |
Realty Income Corp. 8.25% | | 100 | | 2,604 |
Saul Centers, Inc. 8.00% | | 40,000 | | 1,018,400 |
Simon Property Group, Inc. Series G, 7.89% | | 11,500 | | 593,400 |
Strategic Hotel & Resorts, Inc.: | | | |
Series A, 8.50% | | 120,000 | | 3,015,000 |
Series C, 8.25% | | 60,000 | | 1,539,000 |
Sunstone Hotel Investors, Inc. Series A, 8.00% | | 15,000 | | 381,000 |
Taubman Centers, Inc. Series G, 8.00% | | 20,000 | | 530,200 |
The Mills Corp.: | | | |
Series B, 9.00% | | 64,400 | | 1,378,160 |
Series C, 9.00% | | 156,500 | | 3,302,150 |
Series E, 8.75% | | 138,885 | | 2,880,475 |
Series G, 7.875% | | 39,933 | | 775,100 |
| | | 91,424,624 |
Preferred Stocks - continued |
| | Shares | | Value
(Note 1) |
Nonconvertible Preferred Stocks - continued |
FINANCIALS - continued |
Real Estate Management & Development - 0.0% |
Affordable Residential Communties, Inc. Series A, 8.25% | | 52,800 | | $ 1,251,360 |
TOTAL FINANCIALS | | | 96,323,372 |
TOTAL PREFERRED STOCKS (Cost $109,846,393) | | 110,409,167 |
Floating Rate Loans - 0.8% |
| | Principal
Amount | | |
CONSUMER DISCRETIONARY - 0.2% |
Hotels, Restaurants & Leisure - 0.0% |
Landry's Seafood Restaurants, Inc. term loan 7.1201% 12/28/10 (c) | | $ 997,462 | | 996,215 |
Specialty Retail - 0.2% |
The Pep Boys - Manny, Moe & Jack term loan 8.32% 1/27/11 (c) | | 39,800 | | 39,999 |
Toys 'R' US, Inc. term loan 8.33% 12/9/08 (c) | | 5,000,000 | | 4,993,750 |
| | | 5,033,749 |
TOTAL CONSUMER DISCRETIONARY | | | 6,029,964 |
CONSUMER STAPLES - 0.0% |
Food & Staples Retailing - 0.0% |
Cumberland Farms, Inc. term loan 7.37% 9/25/13 (c) | | 2,000,000 | | 2,007,500 |
FINANCIALS - 0.4% |
Real Estate Investment Trusts - 0.2% |
Capital Automotive (REIT) Tranche B, term loan 7.08% 12/16/10 (c) | | 488,393 | | 489,614 |
General Growth Properties, Inc. Tranche A1, term loan 6.58% 2/24/10 (c) | | 3,000,000 | | 2,966,250 |
Newkirk Master LP Tranche B, term loan 7.08% 8/11/08 (c) | | 1,221,055 | | 1,219,529 |
Trizec Properties, Inc. term loan 6.775% 5/2/07 (c) | | 1,140,000 | | 1,138,575 |
| | | 5,813,968 |
Floating Rate Loans - continued |
| | Principal Amount | | Value
(Note 1) |
FINANCIALS - continued |
Real Estate Management & Development - 0.1% |
MDS Realty Holdings LLC: | | | |
Tranche M1, term loan 7.6563% 1/8/08 (c) | | $ 1,872,076 | | $ 1,872,076 |
Tranche M3, term loan 8.9063% 1/8/08 (c) | | 1,497,661 | | 1,497,661 |
North Las Vegas/Olympia Group Tranche 1, term loan 8.1169% 5/9/11 (c) | | 497,500 | | 487,550 |
| | | 3,857,287 |
Thrifts & Mortgage Finance - 0.1% |
Charter Municipal Mortgage Acceptance Co. term loan 7.9% 8/15/12 (c) | | 1,500,000 | | 1,503,750 |
TOTAL FINANCIALS | | | 11,175,005 |
HEALTH CARE - 0.2% |
Health Care Providers & Services - 0.2% |
HealthSouth Corp. term loan 8.58% 3/10/13 (c) | | 3,990,000 | | 4,009,950 |
Skilled Healthcare Group, Inc. Tranche 1, term loan 8.08% 6/15/12 (c) | | 997,475 | | 1,004,956 |
| | | 5,014,906 |
TELECOMMUNICATION SERVICES - 0.0% |
Wireless Telecommunication Services - 0.0% |
Crown Castle Operating Co. Tranche B, term loan 7.65% 6/1/14 (c) | | 510,000 | | 510,000 |
TOTAL FLOATING RATE LOANS (Cost $24,758,659) | | 24,737,375 |
Commodity-Linked Notes - 7.3% |
|
AIG-FP Private Funding Ltd.: | | | | |
Master Note, one-month U.S. dollar LIBOR plus .10% due 6/29/2007 (indexed to the Dow Jones-AIG Commodity Total Return Index, multiplied by 3) (b)(c)(e) | | 7,670,000 | | 5,869,668 |
Master Note, one-month U.S. dollar LIBOR plus .10% due 7/12/2007 (indexed to the Dow Jones-AIG Commodity Total Return Index, multiplied by 3) (b)(c)(e) | | 5,000,000 | | 3,521,488 |
Master Note, one-month U.S. dollar LIBOR plus .10% due 7/6/2007 (indexed to the Dow Jones-AIG Commodity Total Return Index, multiplied by 3) (b)(c)(e) | | 9,500,000 | | 7,381,505 |
Commodity-Linked Notes - continued |
| | Principal Amount | | Value
(Note 1) |
AIG-FP Private Funding Ltd.: - continued | | | | |
Master Note, one-month U.S. dollar LIBOR plus .10% due 8/20/2007 (indexed to the Dow Jones-AIG Commodity Total Return Index, multiplied by 3) (b)(c)(e) | | $ 15,100,000 | | $ 14,642,092 |
Master Note, one-month U.S. dollar LIBOR plus .10% due 8/24/2007 (indexed to the Dow Jones-AIG Commodity Total Return Index, multiplied by 3) (b)(c)(e) | | 6,000,000 | | 6,137,428 |
Master Note, one-month U.S. dollar LIBOR plus .10% due 8/29/2007 (indexed to the Dow Jones-AIG Commodity Total Return Index, multiplied by 3) (b)(c)(e) | | 2,600,000 | | 2,697,291 |
Master Note, one-month U.S. dollar LIBOR plus .15% due 3/15/2007 (indexed to the Dow Jones-AIG Commodity Total Return Index, multiplied by 3) (b)(c)(e) | | 9,970,000 | | 8,687,327 |
Master Note, one-month U.S. dollar LIBOR plus .15% due 3/8/2007 (indexed to the Dow Jones-AIG Commodity Total Return Index, multiplied by 3) (b)(c)(e) | | 3,330,000 | | 2,993,347 |
Master Note, one-month U.S. dollar LIBOR plus .15% due 4/20/2007 (indexed to the Dow Jones-AIG Commodity Total Return Index, multiplied by 3) (b)(c)(e) | | 6,670,000 | | 4,695,243 |
Master Note, one-month U.S. dollar LIBOR plus .15% due 4/9/2007 (indexed to the Dow Jones-AIG Commodity Total Return Index, multiplied by 3) (b)(c)(e) | | 3,300,000 | | 2,282,453 |
Master Note, one-month U.S. dollar LIBOR plus .15% due 6/6/2007 (indexed to the Dow Jones-AIG Commodity Total Return Index, multiplied by 3) (b)(c)(e) | | 1,670,000 | | 1,232,797 |
Master Note, one-month U.S. dollar LIBOR plus .15% due 3/2/2007 (indexed to the Dow Jones-AIG Commodity Total Return Index, multiplied by 3) (b)(c)(e) | | 5,000,000 | | 4,721,259 |
Master Note, one-month U.S. dollar LIBOR plus .15% due 3/8/2007 (indexed to the Dow Jones-AIG Commodity Total Return Index, multiplied by 3) (b)(c)(e) | | 2,500,000 | | 2,272,002 |
JPMorgan Chase Bank NA: | | | | |
Medium Term Note, one-month U.S. dollar LIBOR minus .15% due 4/27/2007 (indexed to the Dow Jones-AIG Commodity Total Return Index, multiplied by 3) (b)(c)(e) | | 9,670,000 | | 7,845,989 |
Commodity-Linked Notes - continued |
| | Principal Amount | | Value
(Note 1) |
JPMorgan Chase Bank NA: - continued | | | | |
Medium Term Note, one-month U.S. dollar LIBOR minus .15% due 4/9/2007 (indexed to the Dow Jones-AIG Commodity Total Return Index, multiplied by 3) (b)(c)(e) | | $ 6,630,000 | | $ 4,507,896 |
Medium Term Note, one-month U.S. dollar LIBOR minus .15% due 5/4/2007 (indexed to the Dow Jones-AIG Commodity Total Return Index, multiplied by 3) (b)(c)(e) | | 5,070,000 | | 4,201,611 |
Medium Term Note, one-month U.S. dollar LIBOR minus .15% due 6/29/2007 (indexed to the Dow Jones-AIG Commodity Total Return Index, multiplied by 3) (b)(c)(e) | | 1,500,000 | | 1,139,610 |
Medium Term Note, one-month U.S. dollar LIBOR minus .15% due 6/6/2007 (indexed to the Dow Jones-AIG Commodity Total Return Index, multiplied by 3) (b)(c)(e) | | 1,670,000 | | 1,277,517 |
Medium Term Note, one-month U.S. dollar LIBOR minus .15% due 7/12/2007 (indexed to the Dow Jones-AIG Commodity Total Return Index, multiplied by 3) (b)(c)(e) | | 5,000,000 | | 3,521,687 |
Medium Term Note, one-month U.S. dollar LIBOR minus .15% due 7/20/2007 (indexed to the Dow Jones-AIG Commodity Total Return Index, multiplied by 3) (b)(c)(e) | | 4,000,000 | | 3,144,954 |
Medium Term Note, one-month U.S. dollar LIBOR minus .15% due 8/24/2007 (indexed to the Dow Jones-AIG Commodity Total Return Index, multiplied by 3) (b)(c)(e) | | 3,550,000 | | 3,707,282 |
Medium Term Note, one-month U.S. dollar LIBOR minus .15% due 8/29/2007 (indexed to the Dow Jones-AIG Commodity Total Return Index, multiplied by 3) (b)(c)(e) | | 7,210,000 | | 7,415,465 |
Medium Term Note, one-month U.S. dollar LIBOR minus .17% due 10/06/2006 (indexed to the Dow Jones-AIG Commodity Total Return Index, multiplied by 3) (b)(c)(e) | | 1,780,000 | | 1,568,657 |
Medium Term Note, one-month U.S. dollar LIBOR minus .17% due 10/16/2006 (indexed to the Dow Jones-AIG Commodity Total Return Index, multiplied by 3) (b)(c)(e) | | 4,970,000 | | 4,175,429 |
Medium Term Note, one-month U.S. dollar LIBOR minus .17% due 12/14/2006 (indexed to the Dow Jones-AIG Commodity Total Return Index, multiplied by 3) (b)(c)(e) | | 4,160,000 | | 3,735,211 |
Commodity-Linked Notes - continued |
| | Principal Amount | | Value
(Note 1) |
JPMorgan Chase Bank NA: - continued | | | | |
Medium Term Note, one-month U.S. dollar LIBOR minus .17% due 2/12/2007 (indexed to the Dow Jones-AIG Commodity Total Return Index, multiplied by 3) (b)(c)(e) | | $ 4,000,000 | | $ 4,070,736 |
Medium Term Note, one-month U.S. dollar LIBOR minus .17% due 3/15/2007 (indexed to the Dow Jones-AIG Commodity Total Return Index, multiplied by 3) (b)(c)(e) | | 2,500,000 | | 2,183,504 |
Medium Term Note, one-month U.S. dollar LIBOR minus .17% due 3/2/2007 (indexed to the Dow Jones-AIG Commodity Total Return Index, multiplied by 3) (b)(c)(e) | | 3,340,000 | | 3,272,148 |
Medium Term Note, one-month U.S. dollar LIBOR minus .18% due 10/06/2006 (indexed to the Dow Jones-AIG Commodity Total Return Index, multiplied by 3) (b)(c)(e) | | 3,060,000 | | 2,635,931 |
Morgan Stanley: | | | | |
Note, one-month U.S. dollar LIBOR minus .03% due 8/6/2007 (indexed to the Dow Jones-AIG Commodity Total Return Index, multiplied by 3) (b)(c)(e) | | 8,340,000 | | 6,997,640 |
Note, one-month U.S. dollar LIBOR minus .07% due 6/27/2007 (indexed to the Dow Jones-AIG Commodity Total Return Index, multiplied by 3) (b)(c)(e) | | 8,340,000 | | 5,859,783 |
Note, one-month U.S. dollar LIBOR minus .10% due 3/23/2007 (indexed to the Dow Jones-AIG Commodity Total Return Index, multiplied by 3) (b)(c)(e) | | 8,340,000 | | 6,178,330 |
Note, one-month U.S. dollar LIBOR minus .10% due 6/6/2007 (indexed to the Dow Jones-AIG Commodity Total Return Index, multiplied by 3) (b)(c)(e) | | 12,340,000 | | 9,787,378 |
Note, one-month U.S. dollar LIBOR minus .15% due 2/27/2007 (indexed to the Dow Jones-AIG Commodity Total Return Index, multiplied by 3) (b)(c)(e) | | 22,330,000 | | 20,955,892 |
Note, one-month U.S. dollar LIBOR minus .15% due 3/23/2007 (indexed to the Dow Jones-AIG Commodity Total Return Index, multiplied by 3) (b)(c)(e) | | 5,000,000 | | 4,487,387 |
Commodity-Linked Notes - continued |
| | Principal Amount | | Value
(Note 1) |
Societe Generale Commodities Products, LLC: | | | | |
Note, one-month U.S. dollar LIBOR minus .10% due 7/17/2007 (indexed to the Dow Jones-AIG Commodity Total Return Index, multiplied by 3) (b)(c)(e) | | $ 6,340,000 | | $ 4,557,961 |
Note, one-month U.S. dollar LIBOR minus .10% due 7/20/2007 (indexed to the Dow Jones-AIG Commodity Total Return Index, multiplied by 3) (b)(c)(e) | | 13,300,000 | | 10,629,582 |
Note, one-month U.S. dollar LIBOR minus .10% due 7/27/2007 (indexed to the Dow Jones-AIG Commodity Total Return Index, multiplied by 3) (b)(c)(e) | | 5,170,000 | | 4,136,794 |
Note, one-month U.S. dollar LIBOR minus .10% due 8/10/2007 (indexed to the Dow Jones-AIG Commodity Total Return Index, multiplied by 3) (b)(c)(e) | | 9,150,000 | | 7,975,186 |
Note, one-month U.S. dollar LIBOR minus .10% due 8/31/2007 (indexed to the Dow Jones-AIG Commodity Total Return Index, multiplied by 3) (b)(c)(e) | | 3,000,000 | | 3,014,017 |
TOTAL COMMODITY-LINKED NOTES (Cost $248,070,000) | 210,117,477 |
Fixed-Income Funds - 42.2% |
| Shares | | |
Fidelity Floating Rate Central Investment Portfolio (d) | 7,132,846 | | 715,567,111 |
Fidelity Ultra-Short Central Fund (d) | 5,084,144 | | 505,821,487 |
TOTAL FIXED-INCOME FUNDS (Cost $1,222,731,910) | 1,221,388,598 |
Preferred Securities - 0.2% |
| Principal
Amount | | |
FINANCIALS - 0.2% |
Diversified Financial Services - 0.2% |
Cairn High Grade ABS CDO II Ltd. Series 2006-2A Class SUB, 1/13/47 (b) | $ 1,200,000 | | 1,080,000 |
Crest Clarendon Street 2002-1 Ltd. Series 2002-1A Class PS, 12/28/35 (b) | 500,000 | | 521,213 |
Preferred Securities - continued |
| Principal Amount | | Value
(Note 1) |
FINANCIALS - continued |
Diversified Financial Services - continued |
Harp High Grade CDO I Ltd. Series 2006-1, 7/8/46 (b) | $ 1,650,000 | | $ 1,600,500 |
Ipswich Street CDO Series 2006-1, 6/27/46 (b) | 2,250,000 | | 2,182,500 |
TOTAL PREFERRED SECURITIES (Cost $5,445,370) | 5,384,213 |
Cash Equivalents - 1.8% |
| Maturity Amount | | |
Investments in repurchase agreements (Collateralized by U.S. Treasury Obligations), in a joint trading account at 5.08%, dated 9/29/06 due 10/2/06
(Cost $51,181,000) | $ 51,202,668 | | 51,181,000 |
TOTAL INVESTMENT PORTFOLIO - 99.3% (Cost $2,900,634,389) | | 2,871,583,476 |
NET OTHER ASSETS - 0.7% | | 21,317,909 |
NET ASSETS - 100% | $ 2,892,901,385 |
Legend |
(a) Non-income producing |
(b) Security exempt from registration under Rule 144A of the Securities Act of 1933. These securities may be resold in transactions exempt from registration, normally to qualified institutional buyers. At the end of the period, the value of these securities amounted to $275,428,372 or 9.5% of net assets. |
(c) The coupon rate shown on floating or adjustable rate securities represents the rate at period end. |
(d) Affiliated fund that is available only to investment companies and other accounts managed by Fidelity Investments. A complete unaudited list of holdings for each Fidelity Central Fund, as of the Investing Fund's report date, is available upon request or at fidelity.com and/or advisor.fidelity.com, as applicable. The reports are located just after the Investing Fund's financial statements and quarterly reports but are not part of the financial statements or quarterly reports. In addition, each Fidelity Central Fund's financial statements, which are not covered by the Investing Fund's Report of Independent Registered Public Accounting Firm, are available on the EDGAR Database on the SEC's web site, www.sec.gov, or upon request. |
(e) Security is linked to the Dow Jones-AIG Commodity Total Return Index. Securities do not guarantee any return of principal at maturity but instead, will pay at maturity or upon exchange, an amount based on the closing value of the Dow Jones-AIG Commodity Index Total Return. Although these instruments are primarily debt obligations, they indirectly provide exposure to changes in the value of the underlying commodities. Holders of the security have the right to exchange these notes at any time. |
Affiliated Central Funds |
Information regarding fiscal year to date income earned by the Fund from investments in Fidelity Central Funds is as follows: |
Fund | Income earned |
Fidelity Floating Rate Central Investment Portfolio | $ 23,003,598 |
Fidelity Ultra-Short Central Fund | 11,744,528 |
Total | $ 34,748,126 |
|
Additional information regarding the Fund's fiscal year to date purchases and sales, including the ownership percentage, of the non Money Market Central Funds is as follows: |
Fund | Value, beginning of period | Purchases | Sales Proceeds | Value, end of period | % ownership, end of period |
Fidelity Floating Rate Central Investment Portfolio | $ 7,598,671 | $ 709,374,857 | $ - | $ 715,567,111 | 46.3% |
Fidelity Ultra-Short Central Fund | 6,644,141 | 499,114,422 | - | 505,821,487 | 5.9% |
Total | $ 14,242,812 | $ 1,208,489,279 | $ - | $ 1,221,388,598 | |
See accompanying notes which are an integral part of the financial statements.
Annual Report
Financial Statements
Statement of Assets and Liabilities
| September 30, 2006 |
| | |
Assets | | |
Investment in securities, at value (including repurchase agreements of $51,181,000) -
See accompanying schedule: Unaffiliated issuers (cost $1,677,902,479) | $ 1,650,194,878 | |
Fidelity Central Funds (cost $1,222,731,910) | 1,221,388,598 | |
Total Investments (cost $2,900,634,389) | | $ 2,871,583,476 |
Receivable for investments sold | | 5,473,539 |
Receivable for fund shares sold | | 20,135,812 |
Dividends receivable | | 1,719,704 |
Interest receivable | | 19,821,398 |
Receivable from investment adviser for expense reductions | | 235 |
Other receivables | | 1,137 |
Total assets | | 2,918,735,301 |
| | |
Liabilities | | |
Payable to custodian bank | $ 839,981 | |
Payable for investments purchased | 21,149,229 | |
Payable for fund shares redeemed | 1,751,121 | |
Accrued management fee | 1,315,228 | |
Distribution fees payable | 23,721 | |
Other affiliated payables | 381,005 | |
Other payables and accrued expenses | 373,631 | |
Total liabilities | | 25,833,916 |
| | |
Net Assets | | $ 2,892,901,385 |
Net Assets consist of: | | |
Paid in capital | | $ 2,890,235,544 |
Undistributed net investment income | | 35,583,876 |
Accumulated undistributed net realized gain (loss) on investments | | (3,867,122) |
Net unrealized appreciation (depreciation) on investments | | (29,050,913) |
Net Assets | | $ 2,892,901,385 |
See accompanying notes which are an integral part of the financial statements.
Annual Report
Statement of Assets and Liabilities - continued
| September 30, 2006 |
| | |
Calculation of Maximum Offering Price
Class A:
Net Asset Value and redemption price per share
($13,335,218 ÷ 1,322,619 shares) | | $ 10.08 |
| | |
Maximum offering price per share (100/95.25 of $10.08) | | $ 10.58 |
Class T:
Net Asset Value and redemption price per share ($22,825,074 ÷ 2,264,602 shares) | | $ 10.08 |
| | |
Maximum offering price per share (100/96.50 of $10.08) | | $ 10.45 |
Class B:
Net Asset Value and offering price per share ($6,001,546 ÷ 596,777 shares)A | | $ 10.06 |
| | |
Class C:
Net Asset Value and offering price per share ($16,528,091 ÷ 1,645,914 shares)A | | $ 10.04 |
| | |
Strategic Real Return:
Net Asset Value, offering price and redemption price per share ($2,694,765,026 ÷ 266,860,845 shares) | | $ 10.10 |
| | |
Institutional Class:
Net Asset Value, offering price and redemption price per share ($139,446,430 ÷ 13,823,004 shares) | | $ 10.09 |
A Redemption price per share is equal to net asset value less any applicable contingent deferred sales charge.
See accompanying notes which are an integral part of the financial statements.
Annual Report
Financial Statements - continued
Statement of Operations
| Year ended September 30, 2006 |
| | |
Investment Income | | |
Dividends | | $ 7,049,737 |
Interest | | 41,245,356 |
Income from Fidelity Central Funds | | 34,748,126 |
Total income | | 83,043,219 |
| | |
Expenses | | |
Management fee | $ 7,570,420 | |
Transfer agent fees | 1,753,452 | |
Distribution fees | 170,374 | |
Accounting fees and expenses | 569,065 | |
Custodian fees and expenses | 25,788 | |
Independent trustees' compensation | 4,144 | |
Registration fees | 548,206 | |
Audit | 123,515 | |
Legal | 13,299 | |
Miscellaneous | 2,751 | |
Total expenses before reductions | 10,781,014 | |
Expense reductions | (87,924) | 10,693,090 |
Net investment income | | 72,350,129 |
Realized and Unrealized Gain (Loss) Net realized gain (loss) on: | | |
Investment securities: | | |
Unaffiliated issuers | | (5,738,064) |
Change in net unrealized appreciation (depreciation) on investment securities | | (29,436,055) |
Net gain (loss) | | (35,174,119) |
Net increase (decrease) in net assets resulting from operations | | $ 37,176,010 |
See accompanying notes which are an integral part of the financial statements.
Annual Report
Statement of Changes in Net Assets
| Year ended
September 30, 2006 | For the period
September 7, 2005 (commencement of operations) to
September 30, 2005 |
Increase (Decrease) in Net Assets | | |
Operations | | |
Net investment income | $ 72,350,129 | $ 81,416 |
Net realized gain (loss) | (5,738,064) | 2,066 |
Change in net unrealized appreciation (depreciation) | (29,436,055) | 385,142 |
Net increase (decrease) in net assets resulting
from operations | 37,176,010 | 468,624 |
Distributions to shareholders from net investment income | (34,978,986) | - |
Share transactions - net increase (decrease) | 2,852,107,184 | 38,055,768 |
Redemption fees | 72,674 | 111 |
Total increase (decrease) in net assets | 2,854,376,882 | 38,524,503 |
| | |
Net Assets | | |
Beginning of period | 38,524,503 | - |
End of period (including undistributed net investment income of $35,583,876 and undistributed net investment income of $78,944, respectively) | $ 2,892,901,385 | $ 38,524,503 |
See accompanying notes which are an integral part of the financial statements.
Annual Report
Financial Highlights - Class A
Years ended September 30, | 2006 | 2005 H |
Selected Per-Share Data | | |
Net asset value, beginning of period | $ 10.15 | $ 10.00 |
Income from Investment Operations | | |
Net investment income E | .524 | .031 |
Net realized and unrealized gain (loss) | (.329) | .119 |
Total from investment operations | .195 | .150 |
Distributions from net investment income | (.266) | - |
Redemption fees added to paid in capital E | .001 | - |
Net asset value, end of period | $ 10.08 | $ 10.15 |
Total Return B, C, D | 1.96% | 1.50% |
Ratios to Average Net Assets F, I | | |
Expenses before reductions | 1.02% | 4.71% A |
Expenses net of fee waivers, if any | 1.00% | 1.00% A |
Expenses net of all reductions | .99% | 1.00% A |
Net investment income | 5.24% | 4.28% A |
Supplemental Data | | |
Net assets, end of period (000 omitted) | $ 13,335 | $ 3,405 |
Portfolio turnover rate G | 11% | 78% A |
A Annualized
B Total returns for periods of less than one year are not annualized.
C Total returns would have been lower had certain expenses not been reduced during the periods shown.
D Total returns do not include the effect of the sales charges.
E Calculated based on average shares outstanding during the period.
F Fees and expenses of the underlying Fidelity Central Funds are not included in the Fund's expense ratio. The Fund indirectly bears its proportionate share of the expenses of any underlying Fidelity Central Funds.
G Amount does not include the portfolio activity of any underlying Fidelity Central Funds.
H For the period September 7, 2005 (commencement of operations) to September 30, 2005.
I Expense ratios reflect operating expenses of the class. Expenses before reductions do not reflect amounts reimbursed by the investment adviser or reductions from brokerage service arrangements or other expense offset arrangements and do not represent the amount paid by the class during periods when reimbursements or reductions occur. Expense ratios before reductions for start-up periods may not be representative of longer-term operating periods. Expenses net of fee waivers reflect expenses after reimbursement by the investment adviser but prior to reductions from brokerage service arrangements or other expense offset arrangements. Expenses net of all reductions represent the net expenses paid by the class.
See accompanying notes which are an integral part of the financial statements.
Annual Report
Financial Highlights - Class T
Years ended September 30, | 2006 | 2005 H |
Selected Per-Share Data | | |
Net asset value, beginning of period | $ 10.15 | $ 10.00 |
Income from Investment Operations | | |
Net investment income E | .517 | .030 |
Net realized and unrealized gain (loss) | (.325) | .120 |
Total from investment operations | .192 | .150 |
Distributions from net investment income | (.263) | - |
Redemption fees added to paid in capital E | .001 | - |
Net asset value, end of period | $ 10.08 | $ 10.15 |
Total Return B, C, D | 1.93% | 1.50% |
Ratios to Average Net Assets F, I | | |
Expenses before reductions | 1.05% | 4.81% A |
Expenses net of fee waivers, if any | 1.05% | 1.10% A |
Expenses net of all reductions | 1.05% | 1.10% A |
Net investment income | 5.19% | 4.18% A |
Supplemental Data | | |
Net assets, end of period (000 omitted) | $ 22,825 | $ 3,284 |
Portfolio turnover rate G | 11% | 78% A |
A Annualized
B Total returns for periods of less than one year are not annualized.
C Total returns would have been lower had certain expenses not been reduced during the periods shown.
D Total returns do not include the effect of the sales charges.
E Calculated based on average shares outstanding during the period.
F Fees and expenses of the underlying Fidelity Central Funds are not included in the Fund's expense ratio. The Fund indirectly bears its proportionate share of the expenses of any underlying Fidelity Central Funds.
G Amount does not include the portfolio activity of any underlying Fidelity Central Funds.
H For the period September 7, 2005 (commencement of operations) to September 30, 2005.
I Expense ratios reflect operating expenses of the class. Expenses before reductions do not reflect amounts reimbursed by the investment adviser or reductions from brokerage service arrangements or other expense offset arrangements and do not represent the amount paid by the class during periods when reimbursements or reductions occur. Expense ratios before reductions for start-up periods may not be representative of longer-term operating periods. Expenses net of fee waivers reflect expenses after reimbursement by the investment adviser but prior to reductions from brokerage service arrangements or other expense offset arrangements. Expenses net of all reductions represent the net expenses paid by the class.
See accompanying notes which are an integral part of the financial statements.
Annual Report
Financial Highlights - Class B
Years ended September 30, | 2006 | 2005 H |
Selected Per-Share Data | | |
Net asset value, beginning of period | $ 10.14 | $ 10.00 |
Income from Investment Operations | | |
Net investment income E | .450 | .025 |
Net realized and unrealized gain (loss) | (.318) | .115 |
Total from investment operations | .132 | .140 |
Distributions from net investment income | (.213) | - |
Redemption fees added to paid in capital E | .001 | - |
Net asset value, end of period | $ 10.06 | $ 10.14 |
Total Return B, C, D | 1.33% | 1.40% |
Ratios to Average Net Assets F, I | | |
Expenses before reductions | 1.74% | 5.47% A |
Expenses net of fee waivers, if any | 1.74% | 1.75% A |
Expenses net of all reductions | 1.73% | 1.75% A |
Net investment income | 4.49% | 3.53% A |
Supplemental Data | | |
Net assets, end of period (000 omitted) | $ 6,002 | $ 3,253 |
Portfolio turnover rate G | 11% | 78% A |
A Annualized
B Total returns for periods of less than one year are not annualized.
C Total returns would have been lower had certain expenses not been reduced during the periods shown.
D Total returns do not include the effect of the contingent deferred sales charge.
E Calculated based on average shares outstanding during the period.
F Fees and expenses of the underlying Fidelity Central Funds are not included in the Fund's expense ratio. The Fund indirectly bears its proportionate share of the expenses of any underlying Fidelity Central Funds.
G Amount does not include the portfolio activity of any underlying Fidelity Central Funds.
H For the period September 7, 2005 (commencement of operations) to September 30, 2005.
I Expense ratios reflect operating expenses of the class. Expenses before reductions do not reflect amounts reimbursed by the investment adviser or reductions from brokerage service arrangements or other expense offset arrangements and do not represent the amount paid by the class during periods when reimbursements or reductions occur. Expense ratios before reductions for start-up periods may not be representative of longer-term operating periods. Expenses net of fee waivers reflect expenses after reimbursement by the investment adviser but prior to reductions from brokerage service arrangements or other expense offset arrangements. Expenses net of all reductions represent the net expenses paid by the class.
See accompanying notes which are an integral part of the financial statements.
Annual Report
Financial Highlights - Class C
Years ended September 30, | 2006 | 2005 H |
Selected Per-Share Data | | |
Net asset value, beginning of period | $ 10.14 | $ 10.00 |
Income from Investment Operations | | |
Net investment income E | .437 | .024 |
Net realized and unrealized gain (loss) | (.323) | .116 |
Total from investment operations | .114 | .140 |
Distributions from net investment income | (.215) | - |
Redemption fees added to paid in capital E | .001 | - |
Net asset value, end of period | $ 10.04 | $ 10.14 |
Total Return B, C, D | 1.15% | 1.40% |
Ratios to Average Net Assets F, I | | |
Expenses before reductions | 1.86% | 5.56% A |
Expenses net of fee waivers, if any | 1.85% | 1.85% A |
Expenses net of all reductions | 1.84% | 1.85% A |
Net investment income | 4.39% | 3.43% A |
Supplemental Data | | |
Net assets, end of period (000 omitted) | $ 16,528 | $ 3,467 |
Portfolio turnover rate G | 11% | 78% A |
A Annualized
B Total returns for periods of less than one year are not annualized.
C Total returns would have been lower had certain expenses not been reduced during the periods shown.
D Total returns do not include the effect of the contingent deferred sales charge.
E Calculated based on average shares outstanding during the period.
F Fees and expenses of the underlying Fidelity Central Funds are not included in the Fund's expense ratio. The Fund indirectly bears its proportionate share of the expenses of any underlying Fidelity Central Funds.
G Amount does not include the portfolio activity of any underlying Fidelity Central Funds.
H For the period September 7, 2005 (commencement of operations) to September 30, 2005.
I Expense ratios reflect operating expenses of the class. Expenses before reductions do not reflect amounts reimbursed by the investment adviser or reductions from brokerage service arrangements or other expense offset arrangements and do not represent the amount paid by the class during periods when reimbursements or reductions occur. Expense ratios before reductions for start-up periods may not be representative of longer-term operating periods. Expenses net of fee waivers reflect expenses after reimbursement by the investment adviser but prior to reductions from brokerage service arrangements or other expense offset arrangements. Expenses net of all reductions represent the net expenses paid by the class.
See accompanying notes which are an integral part of the financial statements.
Annual Report
Financial Highlights - Strategic Real Return
Years ended September 30, | 2006 | 2005 G |
Selected Per-Share Data | | |
Net asset value, beginning of period | $ 10.15 | $ 10.00 |
Income from Investment Operations | | |
Net investment income D | .544 | .028 |
Net realized and unrealized gain (loss) | (.317) | .122 |
Total from investment operations | .227 | .150 |
Distributions from net investment income | (.278) | - |
Redemption fees added to paid in capital D | .001 | - I |
Net asset value, end of period | $ 10.10 | $ 10.15 |
Total Return B, C | 2.28% | 1.50% |
Ratios to Average Net Assets E, H | | |
Expenses before reductions | .80% | 4.41% A |
Expenses net of fee waivers, if any | .80% | .85% A |
Expenses net of all reductions | .79% | .85% A |
Net investment income | 5.45% | 4.43% A |
Supplemental Data | | |
Net assets, end of period (000 omitted) | $ 2,694,765 | $ 21,867 |
Portfolio turnover rate F | 11% | 78% A |
A Annualized
B Total returns for periods of less than one year are not annualized.
C Total returns would have been lower had certain expenses not been reduced during the periods shown.
D Calculated based on average shares outstanding during the period.
E Fees and expenses of the underlying Fidelity Central Funds are not included in the Fund's expense ratio. The Fund indirectly bears its proportionate share of the expenses of any underlying Fidelity Central Funds.
F Amount does not include the portfolio activity of any underlying Fidelity Central Funds.
G For the period September 7, 2005 (commencement of operations) to September 30, 2005.
H Expense ratios reflect operating expenses of the class. Expenses before reductions do not reflect amounts reimbursed by the investment adviser or reductions from brokerage service arrangements or other expense offset arrangements and do not represent the amount paid by the class during periods when reimbursements or reductions occur. Expense ratios before reductions for start-up periods may not be representative of longer-term operating periods. Expenses net of fee waivers reflect expenses after reimbursement by the investment adviser but prior to reductions from brokerage service arrangements or other expense offset arrangements. Expenses net of all reductions represent the net expenses paid by the class.
I Amount represents less than $.001 per share.
See accompanying notes which are an integral part of the financial statements.
Annual Report
Financial Highlights - Institutional Class
Years ended September 30, | 2006 | 2005 G |
Selected Per-Share Data | | |
Net asset value, beginning of period | $ 10.15 | $ 10.00 |
Income from Investment Operations | | |
Net investment income D | .540 | .032 |
Net realized and unrealized gain (loss) | (.321) | .118 |
Total from investment operations | .219 | .150 |
Distributions from net investment income | (.280) | - |
Redemption fees added to paid in capital D | .001 | - |
Net asset value, end of period | $ 10.09 | $ 10.15 |
Total Return B, C | 2.20% | 1.50% |
Ratios to Average Net Assets E, H | | |
Expenses before reductions | .82% | 4.55% A |
Expenses net of fee waivers, if any | .82% | .85% A |
Expenses net of all reductions | .82% | .85% A |
Net investment income | 5.46% | 4.43% A |
Supplemental Data | | |
Net assets, end of period (000 omitted) | $ 139,446 | $ 3,248 |
Portfolio turnover rate F | 11% | 78% A |
A Annualized
B Total returns for periods of less than one year are not annualized.
C Total returns would have been lower had certain expenses not been reduced during the periods shown.
D Calculated based on average shares outstanding during the period.
E Fees and expenses of the underlying Fidelity Central Funds are not included in the Fund's expense ratio. The Fund indirectly bears its proportionate share of the expenses of any underlying Fidelity Central Funds.
F Amount does not include the portfolio activity of any underlying Fidelity Central Funds.
G For the period September 7, 2005 (commencement of operations) to September 30, 2005.
H Expense ratios reflect operating expenses of the class. Expenses before reductions do not reflect amounts reimbursed by the investment adviser or reductions from brokerage service arrangements or other expense offset arrangements and do not represent the amount paid by the class during periods when reimbursements or reductions occur. Expense ratios before reductions for start-up periods may not be representative of longer-term operating periods. Expenses net of fee waivers reflect expenses after reimbursement by the investment adviser but prior to reductions from brokerage service arrangements or other expense offset arrangements. Expenses net of all reductions represent the net expenses paid by the class.
See accompanying notes which are an integral part of the financial statements.
Annual Report
Notes to Financial Statements
For the period ended September 30, 2006
1. Significant Accounting Policies.
Fidelity Strategic Real Return Fund (the Fund) is a fund of Fidelity Commonwealth Trust (the trust) and is authorized to issue an unlimited number of shares. The trust is registered under the Investment Company Act of 1940, as amended (the 1940 Act), as an open-end management investment company organized as a Massachusetts business trust.
The Fund offers Class A, Class T, Class B, Class C, Strategic Real Return, and Institutional Class shares, each of which has equal rights as to assets and voting privileges. Each class has exclusive voting rights with respect to matters that affect that class. Class B shares will automatically convert to Class A shares after a holding period of seven years from the initial date of purchase. Investment income, realized and unrealized capital gains and losses, the common expenses of the Fund, and certain fund-level expense reductions, if any, are allocated on a pro rata basis to each class based on the relative net assets of each class to the total net assets of the Fund. Each class differs with respect to transfer agent and distribution and service plan fees incurred. Certain expense reductions also differ by class.
The Fund may invest in Fidelity Central Funds which are open-end investment companies available to investment companies and other accounts managed by Fidelity Management & Research Company (FMR) and its affiliates. The financial statements have been prepared in conformity with accounting principles generally accepted in the United States of America, which require management to make certain estimates and assumptions at the date of the financial statements. The following summarizes the significant accounting policies of the Fund, which are also consistently followed by the Fidelity Central Funds:
Security Valuation. Investments are valued and net asset value per share is calculated (NAV calculation) as of the close of business of the New York Stock Exchange, normally 4:00 p.m. Eastern time. Wherever possible, the Fund uses independent pricing services approved by the Board of Trustees to value its investments. Debt securities, including restricted securities, for which quotations are readily available, are valued by independent pricing services or by dealers who make markets in such securities. Pricing services consider yield or price of bonds of comparable quality, coupon, maturity and type as well as dealer supplied prices. Equity securities, including restricted securities, for which market quotations are readily available, are valued at the last reported sale price or official closing price as reported by an independent pricing service on the primary market or exchange on which they are traded. In the event there were no sales during the day or closing prices are not available, securities are valued at the last quoted bid price.
Annual Report
1. Significant Accounting Policies - continued
Security Valuation - continued
When current market prices or quotations are not readily available or do not accurately reflect fair value, valuations may be determined in accordance with procedures adopted by the Board of Trustees. The frequency of when fair value pricing is used is unpredictable. The value of securities used for NAV calculation under fair value pricing may differ from published prices for the same securities. Investments in open-end mutual funds, including the Fidelity Central Funds, are valued at their closing net asset value each business day. Short-term securities with remaining maturities of sixty days or less for which quotations are not readily available are valued at amortized cost, which approximates value.
Investment Transactions and Income. Security transactions, including the Fund's investment activity in the Fidelity Central Funds, are accounted for as of trade date. Gains and losses on securities sold are determined on the basis of identified cost. Dividend income is recorded on the ex-dividend date, except for certain dividends from foreign securities where the ex-dividend date may have passed, which are recorded as soon as the Fund is informed of the ex-dividend date. Non-cash dividends included in dividend income, if any, are recorded at the fair market value of the securities received. Distributions received on securities that represent a return of capital or capital gain are recorded as a reduction of cost of investments and/or as a realized gain. The Fund estimates the components of distributions received that may be considered return of capital distributions or capital gain distributions. Interest income and distributions from the Fidelity Central Funds are accrued as earned. Interest income includes coupon interest and amortization of premium and accretion of discount on debt securities. Inflation-indexed bonds are fixed-income securities whose principal value is periodically adjusted to the rate of inflation. Interest is accrued based on the principal value, which is adjusted for inflation. Any increase in the principal amount of an inflation-indexed bond is recorded as interest income, even though principal is not received until maturity.
Expenses. Most expenses of the trust can be directly attributed to a fund. Expenses which cannot be directly attributed are apportioned among each Fund in the trust. Expense estimates are accrued in the period to which they relate and adjustments are made when actual amounts are known.
Income Tax Information and Distributions to Shareholders. Each year, the Fund intends to qualify as a regulated investment company by distributing all of its taxable income and realized gains under Subchapter M of the Internal Revenue Code. As a result, no provision for income taxes is required in the accompanying financial statements.
Annual Report
Notes to Financial Statements - continued
1. Significant Accounting Policies - continued
Income Tax Information and Distributions to Shareholders - continued
Distributions are recorded on the ex-dividend date. Income dividends and capital gain distributions are declared separately for each class. Income and capital gain distributions are determined in accordance with income tax regulations, which may differ from generally accepted accounting principles. In addition, the Fund will claim a portion of the payment made to redeeming shareholders as a distribution for income tax purposes.
Capital accounts within the financial statements are adjusted for permanent book-tax differences. These adjustments have no impact on net assets or the results of operations. Temporary book-tax differences will reverse in a subsequent period.
Book-tax differences are primarily due to market discount, partnerships (including allocations from CIPs), income recognized on commodity-linked notes and losses deferred due to wash sales and excise tax regulations.
The tax-basis components of distributable earnings and the federal tax cost as of period end were as follows:
Unrealized appreciation | $ 24,808,933 | |
Unrealized depreciation | (49,149,157) | |
Net unrealized appreciation (depreciation) | (24,340,224) | |
Undistributed ordinary income | 31,404,681 | |
Undistributed long-term capital gain | 227,005 | |
| | |
Cost for federal income tax purposes | $ 2,895,923,700 | |
The tax character of distributions paid was as follows:
| September 30, 2006 | September 30, 2005 |
Ordinary Income | $ 34,978,986 | $ - |
Short-Term Trading (Redemption) Fees. Shares held in the Fund less than 60 days are subject to a redemption fee equal to .75% of the proceeds of the redeemed shares. All redemption fees, including any estimated redemption fees paid by FMR, are retained by the Fund and accounted for as an addition to paid in capital.
Annual Report
1. Significant Accounting Policies - continued
New Accounting Pronouncement. In July 2006, Financial Accounting Standards Board Interpretation No. 48, Accounting for Uncertainty in Income Taxes - an interpretation of FASB Statement 109 (FIN 48), was issued and is effective for fiscal years beginning after December 15, 2006. FIN 48 sets forth a threshold for financial statement recognition, measurement and disclosure of a tax position taken or expected to be taken on a tax return. Management is currently evaluating the impact, if any, the adoption of FIN 48 will have on the Fund's net assets, results of operations and financial statement disclosures.
In addition, in September 2006, Statement of Financial Accounting Standards No. 157, Fair Value Measurements (SFAS 157), was issued and is effective for fiscal years beginning after November 15, 2007. SFAS 157 defines fair value, establishes a framework for measuring fair value and expands disclosures about fair value measurements. Management is currently evaluating the impact the adoption of SFAS 157 will have on the Fund's financial statement disclosures.
2. Operating Policies.
Repurchase Agreements. FMR has received an Exemptive Order from the Securities and Exchange Commission (the SEC) which permits the Fund and other affiliated entities of FMR to transfer uninvested cash balances into joint trading accounts which are then invested in repurchase agreements. The Fund may also invest directly with institutions in repurchase agreements. Repurchase agreements are collateralized by government or non-government securities. Upon settlement date, collateral is held in segregated accounts with custodian banks and may be obtained in the event of a default of the counterparty. The Fund monitors, on a daily basis, the value of the collateral to ensure it is at least equal to the principal amount of the repurchase agreement (including accrued interest). In the event of a default by the counterparty, realization of the collateral proceeds could be delayed, during which time the value of the collateral may decline.
Indexed Securities. The Fund may invest in indexed securities whose values, interest rates and/or redemption prices are linked either directly or inversely to changes in foreign currencies, interest rates, commodities, indices, or other underlying instruments. These securities may be used to increase or decrease its exposure to different underlying instruments and to gain exposure to markets that might be difficult to invest in through conventional securities. Indexed securities may be more volatile than their underlying instruments, but any loss is limited to the amount of the original investment. Indexed
Annual Report
Notes to Financial Statements - continued
2. Operating Policies - continued
Indexed Securities - continued
securities are marked-to-market daily based on dealer-supplied valuations and changes in value are recorded as unrealized appreciation (depreciation). Gains (losses) realized upon the sale of indexed securities are included in realized gains (losses) on investment securities.
Restricted Securities. The Fund may invest in securities that are subject to legal or contractual restrictions on resale. These securities generally may be resold in transactions exempt from registration or to the public if the securities are registered. Disposal of these securities may involve time-consuming negotiations and expense, and prompt sale at an acceptable price may be difficult. Information regarding restricted securities is included at the end of the Fund's Schedule of Investments.
Loans and Other Direct Debt Instruments. The Fund may invest in loans and loan participations, trade claims or other receivables. These investments may include standby financing commitments, including revolving credit facilities, that obligate the Fund to supply additional cash to the borrower on demand. Loan participations involve a risk of insolvency of the lending bank or other financial intermediary. The Fund may be contractually obligated to receive approval from the agent bank and/or borrower prior to the sale of these investments.
3. Purchases and Sales of Investments.
Purchases and sales of securities (including non Money Market Central Funds), other than short-term securities and U.S. government securities, aggregated $1,769,704,296 and $50,814,076, respectively.
4. Fees and Other Transactions with Affiliates.
Management Fee. FMR and its affiliates provide the Fund with investment management related services for which the Fund pays a monthly management fee. The management fee is the sum of an individual fund fee rate that is based on an annual rate of .45% of the Fund's average net assets and a group fee rate that averaged ..12% during the period. The group fee rate is based upon the average net assets of all the mutual funds advised by FMR. The group fee rate decreases as assets under management increase and increases as assets under management decrease. For the period, the total annual management fee rate was .57% of the Fund's average net assets.
Annual Report
4. Fees and Other Transactions with Affiliates - continued
Distribution and Service Plan. In accordance with Rule 12b-1 of the 1940 Act, the Fund has adopted separate Distribution and Service Plans for each class of shares. Certain classes pay Fidelity Distributors Corporation (FDC), an affiliate of FMR, separate Distribution and Service Fees, each of which is based on an annual percentage of each class' average net assets. In addition, FDC may pay financial intermediaries for selling shares of the Fund and providing shareholder support services. For the period, the Distribution and Service Fee rates and the total amounts paid to and retained by FDC were as follows:
| Distribution
Fee | Service
Fee | Paid to
FDC | Retained
by FDC |
Class A | 0% | .15% | $ 12,428 | $ 5,145 |
Class T | 0% | .25% | 29,199 | 13,567 |
Class B | .65% | .25% | 40,712 | 37,497 |
Class C | .75% | .25% | 88,035 | 73,578 |
| | | $ 170,374 | $ 129,787 |
Sales Load. FDC receives a front-end sales charge of up to 4.75% for selling Class A shares, and 3.50% for selling Class T shares, some of which is paid to financial intermediaries for selling shares of the Fund. FDC receives the proceeds of contingent deferred sales charges levied on Class A, Class T, Class B, and Class C redemptions. These charges depend on the holding period. The deferred sales charges range from 5% to 1% for Class B, 1% for Class C, 1.00% to .50% for certain purchases of Class A shares (.25% prior to February 24, 2006) and .25% for certain purchases of Class T shares.
For the period, sales charge amounts retained by FDC were as follows:
| Retained
by FDC |
Class A | $ 16,722 |
Class T | 5,780 |
Class B* | 1,703 |
Class C* | 1,177 |
| $ 25,382 |
* When Class B and Class C shares are initially sold, FDC pays commissions from its own resources to financial intermediaries through which the sales are made.
Transfer Agent Fees. Fidelity Investments Institutional Operations Company, Inc. (FIIOC), an affiliate of FMR, is the transfer, dividend disbursing and shareholder servicing agent for each class of the Fund, except for Strategic Real Return. Fidelity Service Company, Inc. (FSC), an affiliate of FMR, is the transfer agent for Strategic Real Return
Annual Report
Notes to Financial Statements - continued
4. Fees and Other Transactions with Affiliates - continued
Transfer Agent Fees - continued
shares. FIIOC and FSC receive account fees and asset-based fees that vary according to the account size and type of account of the shareholders of the respective classes of the Fund. FIIOC and FSC pay for typesetting, printing and mailing of shareholder reports, except proxy statements. For the period, the total transfer agent fees paid by each class to FIIOC or FSC, were as follows:
| Amount | % of
Average
Net Assets |
Class A | $ 15,898 | .19 |
Class T | 16,142 | .14 |
Class B | 7,207 | .16 |
Class C | 16,553 | .19 |
Strategic Real Return | 1,628,931 | .13 |
Institutional Class | 68,721 | .17 |
| $ 1,753,452 | |
Accounting Fees. FSC maintains the Fund's accounting records. The fee is based on the level of average net assets for the month.
Investments in Fidelity Central Funds. The Fund may invest in Fidelity Central Funds. The Fund's Schedule of Investments lists each of the Fidelity Central Funds as an investment of the Fund but does not include the underlying holdings of each Fidelity Central Fund. As an Investing Fund, the Fund indirectly bears its proportionate share of the expenses of the underlying Fidelity Central Funds. A complete unaudited list of holdings for each Fidelity Central Fund as of the Fund's report date, is available upon request or, for each non Money Market Central Fund, at fidelity.com and/or advisor.fidelity.com, as applicable. The reports are located just after the Fund's financial statements and quarterly reports but are not part of the financial statements or quarterly reports. In addition, the financial statements of the Fidelity Central Funds, which are not covered by the Fund's Report of Independent Registered Public Accounting Firm, are available on the EDGAR Database on the SEC's web site, www.sec.gov, or upon request.
Based on their investment objective, each Fidelity Central Fund may invest or participate in various investment vehicles or strategies that are similar to those of the Fund. These strategies are consistent with the investment objectives of the Fund and may involve certain economic risks which may cause a decline in value of each of the Fidelity
Annual Report
4. Fees and Other Transactions with Affiliates - continued
Investments in Fidelity Central Funds - continued
Central Funds and thus a decline in the value of the Fund. The following summarizes the Fund's investment in each Fidelity Fixed-Income Central Fund.
Central Fund | Investment Adviser | Investment Objective | Investment Practices |
Fidelity Floating Rate Central Investment Portfolio | Fidelity Management and Research Company, Inc. (FMRC) | Seeks a high level of income by normally investing in floating rate loans and other floating rate securities. | Loans & Direct Debt Instruments Repurchase Agreements Restricted Securities |
Fidelity Ultra-Short Central Fund | Fidelity Investments Money Management, Inc. (FIMM) | Seeks to obtain a high level of current income consistent with preservation of capital by investing in U.S. dollar denominated money market and investment-grade debt securities. | Delayed Delivery & When Issued Securities Futures Repurchase Agreements Restricted Securities Swap Agreements |
Brokerage Commissions. The Fund placed a portion of its portfolio transactions with brokerage firms which are affiliates of the investment adviser. The commissions paid to these affiliated firms were $11,383 for the period.
5. Committed Line of Credit.
The Fund participates with other funds managed by FMR in a $4.2 billion credit facility (the "line of credit") to be utilized for temporary or emergency purposes to fund shareholder redemptions or for other short-term liquidity purposes. The Fund has agreed to pay commitment fees on its pro rata portion of the line of credit, which amounts to $1,177 and is reflected in Miscellaneous Expense on the Statement of Operations. During the period, there were no borrowings on this line of credit.
6. Expense Reductions.
FMR voluntarily agreed to reimburse each class to the extent annual operating expenses exceeded certain levels of average net assets as noted in the table below. Some expenses, for example interest expense, are excluded from this reimbursement.
Annual Report
Notes to Financial Statements - continued
6. Expense Reductions - continued
The following classes were in reimbursement during the period:
| Expense
Limitations | Reimbursement
from adviser |
Class A | 1.00% | $ 1,573 |
Class C | 1.85% | 907 |
| | $ 2,480 |
Many of the brokers with whom FMR places trades on behalf of the Fund provided services to the Fund in addition to trade execution. These services included payments of certain expenses on behalf of the Fund totaling $7,019 for the period . In addition, through arrangements with the Fund's custodian and each class' transfer agent, credits realized as a result of uninvested cash balances were used to reduce the Fund's expenses. During the period, these credits reduced the Fund's custody expenses by $17,270. During the period, credits reduced each class' transfer agent expense as noted in the table below.
| Transfer Agent
expense reduction | |
Class A | $ 334 | |
Class T | 210 | |
Class B | 349 | |
Class C | 349 | |
Strategic Real Return | 58,536 | |
Institutional Class | 1,377 | |
| $ 61,155 | |
7. Other.
The Fund's organizational documents provide former and current trustees and officers with a limited indemnification against liabilities arising in connection with the performance of their duties to the Fund. In the normal course of business, the Fund may also enter into contracts that provide general indemnifications. The Fund's maximum exposure under these arrangements is unknown as this would be dependent on future claims that may be made against the Fund. The risk of material loss from such claims is considered remote.
During the period, the Fund's transfer agent, Fidelity Investments Institutional Operations Company, Inc. (FIIOC), an affiliate of FMR, notified the Fund that the fund's books and records did not reflect a conversion of certain Class B to Class A shares upon their conversion date. Management has determined that this did not have a material impact to the Fund's reported net assets or results of operations in the accompanying financial
Annual Report
7. Other - continued
statements. FIIOC will cause the books and records of the fund to reflect a conversion of the relevant Class B shares to Class A and is in the process of determining the impact to affected shareholder accounts for purposes of its remediation.
At the end of the period, Fidelity Freedom 2010 Fund and Fidelity Freedom 2020 Fund were the owners of record of approximately 23% and 20%, respectively, of the total outstanding shares of the Fund. The Fidelity Freedom Funds and Fidelity Advisor Freedom Funds were the owners of record, in the aggregate, of approximately 73% of the total outstanding shares of the Fund.
8. Distributions to Shareholders.
Distributions to shareholders of each class were as follows:
| Years ended September 30, |
| 2006 | 2005 A |
From net investment income | | |
Class A | $ 208,517 | $ - |
Class T | 289,389 | - |
Class B | 93,989 | - |
Class C | 179,234 | - |
Strategic Real Return | 33,243,282 | - |
Institutional Class | 964,575 | - |
Total | $ 34,978,986 | $ - |
A For the period September 7, 2005 (commencement of operations) to September 30, 2005.
Annual Report
Notes to Financial Statements - continued
9. Share Transactions.
Transactions for each class of shares were as follows:
| Shares | Dollars |
| Years ended September 30, | Years ended September 30, |
| 2006 | 2005 A | 2006 | 2005 A |
Class A | | | | |
Shares sold | 1,062,245 | 335,576 | $ 10,682,808 | $ 3,356,917 |
Reinvestment of distributions | 18,536 | - | 186,545 | - |
Shares redeemed | (93,738) | - | (941,015) | - |
Net increase (decrease) | 987,043 | 335,576 | $ 9,928,338 | $ 3,356,917 |
Class T | | | | |
Shares sold | 2,016,115 | 323,690 | $ 20,310,680 | $ 3,237,283 |
Reinvestment of distributions | 27,883 | - | 280,850 | - |
Shares redeemed | (103,086) | - | (1,039,256) | - |
Net increase (decrease) | 1,940,912 | 323,690 | $ 19,552,274 | $ 3,237,283 |
Class B | | | | |
Shares sold | 278,611 | 320,754 | $ 2,800,793 | $ 3,207,594 |
Reinvestment of distributions | 8,817 | - | 88,578 | - |
Shares redeemed | (11,405) | - | (114,615) | - |
Net increase (decrease) | 276,023 | 320,754 | $ 2,774,756 | $ 3,207,594 |
Class C | | | | |
Shares sold | 1,338,035 | 341,879 | $ 13,461,519 | $ 3,420,798 |
Reinvestment of distributions | 15,337 | - | 154,041 | - |
Shares redeemed | (49,337) | - | (493,981) | - |
Net increase (decrease) | 1,304,035 | 341,879 | $ 13,121,579 | $ 3,420,798 |
Strategic Real Return | | | | |
Shares sold | 280,727,948 | 2,155,812 | $ 2,831,792,513 | $ 21,651,987 |
Reinvestment of distributions | 3,208,074 | - | 32,357,881 | - |
Shares redeemed | (19,229,121) | (1,868) | (193,558,495) | (18,821) |
Net increase (decrease) | 264,706,901 | 2,153,944 | $ 2,670,591,899 | $ 21,633,166 |
Institutional Class | | | | |
Shares sold | 13,719,322 | 320,001 | $ 138,324,336 | $ 3,200,010 |
Reinvestment of distributions | 90,139 | - | 909,336 | - |
Shares redeemed | (306,458) | - | (3,095,334) | - |
Net increase (decrease) | 13,503,003 | 320,001 | $ 136,138,338 | $ 3,200,010 |
A For the period September 7, 2005 (commencement of operations) to September 30, 2005.
Annual Report
Report of Independent Registered Public Accounting Firm
To the Trustees of Fidelity Commonwealth Trust and Shareholders of Fidelity Strategic Real Return Fund:
We have audited the accompanying statement of assets and liabilities of Fidelity Strategic Real Return Fund (the Fund), a fund of Fidelity Commonwealth Trust, including the schedule of investments as of September 30, 2006, and the related statement of operations for the year then ended, the statement of changes in net assets and the financial highlights for the year ended September 30, 2006 and for the period September 7, 2005 (commencement of operations) to September 30, 2005. These financial statements and financial highlights are the responsibility of the Fund's management. Our responsibility is to express an opinion on these financial statements and financial highlights based on our audits.
We conducted our audits in accordance with standards of the Public Company Accounting Oversight Board (United States). Those standards require that we plan and perform the audit to obtain reasonable assurance about whether the financial statements and financial highlights are free of material misstatement. The Fund is not required to have, nor were we engaged to perform, an audit of its internal control over financial reporting. Our audits included consideration of internal control over financial reporting as a basis for designing audit procedures that are appropriate in the circumstances, but not for the purpose of expressing an opinion on the effectiveness of the Fund's internal control over financial reporting. Accordingly, we express no such opinion. An audit also includes examining, on a test basis, evidence supporting the amounts and disclosures in the financial statements, assessing the accounting principles used and significant estimates made by management, as well as evaluating the overall financial statement presentation. Our procedures included confirmation of securities owned as of September 30, 2006, by correspondence with the custodians and brokers; where replies were not received from brokers, we performed other auditing procedures. We believe that our audits provide a reasonable basis for our opinion.
In our opinion, the financial statements and financial highlights referred to above present fairly, in all material respects, the financial position of Fidelity Strategic Real Return Fund as of September 30, 2006, the results of its operations for the year then ended, and the changes in its net assets and its financial highlights for the year ended September 30, 2006 and for the period September 7, 2005 (commencement of operations) to September 30, 2005, in conformity with accounting principles generally accepted in the United States of America.
/s/ Deloitte & Touche LLP
DELOITTE & TOUCHE LLP
Boston, Massachusetts
November 22, 2006
Annual Report
Trustees and Officers
The Trustees, Members of the Advisory Board, and executive officers of the trust and fund, as applicable, are listed below. The Board of Trustees governs the fund and is responsible for protecting the interests of shareholders. The Trustees are experienced executives who meet periodically throughout the year to oversee the fund's activities, review contractual arrangements with companies that provide services to the fund, and review the fund's performance. Except for William O. McCoy, each of the Trustees oversees 347 funds advised by FMR or an affiliate. Mr. McCoy oversees 349 funds advised by FMR or an affiliate.
The Trustees hold office without limit in time except that (a) any Trustee may resign; (b) any Trustee may be removed by written instrument, signed by at least two-thirds of the number of Trustees prior to such removal; (c) any Trustee who requests to be retired or who has become incapacitated by illness or injury may be retired by written instrument signed by a majority of the other Trustees; and (d) any Trustee may be removed at any special meeting of shareholders by a two-thirds vote of the outstanding voting securities of the trust. Each Trustee who is not an interested person (as defined in the 1940 Act) (Independent Trustee), shall retire not later than the last day of the calendar year in which his or her 72nd birthday occurs. The Independent Trustees may waive this mandatory retirement age policy with respect to individual Trustees. The executive officers and Advisory Board Members hold office without limit in time, except that any officer and Advisory Board Member may resign or may be removed by a vote of a majority of the Trustees at any regular meeting or any special meeting of the Trustees. Except as indicated, each individual has held the office shown or other offices in the same company for the past five years.
The fund's Statement of Additional Information (SAI) includes more information about the Trustees. To request a free copy, call Fidelity at 1-800-544-8544.
Interested Trustees*:
Correspondence intended for each Trustee who is an interested person may be sent to Fidelity Investments, 82 Devonshire Street, Boston, Massachusetts 02109.
Name, Age; Principal Occupation |
Edward C. Johnson 3d (76) |
| Year of Election or Appointment: 1974 Mr. Johnson is Chairman of the Board of Trustees. Mr. Johnson serves as President (2006-present), Chief Executive Officer, Chairman, and a Director of FMR Corp.; Chairman and a Director of FMR; Chairman and a Director of Fidelity Research & Analysis Company (FRAC); Chairman and a Director of Fidelity Investments Money Management, Inc.; and Chairman (2001-present) and a Director of FMR Co., Inc. In addition, Mr. Johnson serves as Chairman and Director of Fidelity International Limited (FIL). |
Stephen P. Jonas (53) |
| Year of Election or Appointment: 2005 Mr. Jonas is Senior Vice President of Strategic Real Return (2005-present). He also serves as Senior Vice President of other Fidelity funds (2005-present). Mr. Jonas is Executive Director of FMR (2005-present) and FMR Co., Inc. (2005-present). He also serves as a Director of Fidelity Investments Money Management, Inc. (2005-present) and FMR Corp. (2003-present). Previously, Mr. Jonas served as President of Fidelity Enterprise Operations and Risk Services (2004-2005), Chief Administrative Officer (2002-2004), and Chief Financial Officer of FMR Corp. (1998-2002). In addition, he serves on the Boards of Boston Ballet (2003-present) and Simmons College (2003-present). |
Robert L. Reynolds (54) |
| Year of Election or Appointment: 2003 Mr. Reynolds is President and a Director of FMR (2005-present), Fidelity Investments Money Management, Inc. (2005-present), and FMR Co., Inc. (2005-present). Mr. Reynolds also serves as Vice Chairman (2006-present), a Director (2003-present), and Chief Operating Officer of FMR Corp. and a Director of Strategic Advisers, Inc. (2005-present). He also serves on the Board at Fidelity Investments Canada, Ltd. |
* Trustees have been determined to be "Interested Trustees" by virtue of, among other things, their affiliation with the trust or various entities under common control with FMR.
Annual Report
Independent Trustees:
Correspondence intended for each Independent Trustee (that is, the Trustees other than the Interested Trustees) may be sent to Fidelity Investments, P.O. Box 55235, Boston, Massachusetts 02205-5235.
Name, Age; Principal Occupation |
Dennis J. Dirks (58) |
| Year of Election or Appointment: 2005 Prior to his retirement in May 2003, Mr. Dirks was Chief Operating Officer and a member of the Board of The Depository Trust & Clearing Corporation (DTCC) (1999-2003). He also served as President, Chief Operating Officer, and Board member of The Depository Trust Company (DTC) (1999-2003) and President and Board member of the National Securities Clearing Corporation (NSCC) (1999-2003). In addition, Mr. Dirks served as Chief Executive Officer and Board member of the Government Securities Clearing Corporation (2001-2003) and Chief Executive Officer and Board member of the Mortgage-Backed Securities Clearing Corporation (2001-2003). Mr. Dirks also serves as a Trustee and a member of the Finance Committee of Manhattan College (2005-present) and a Trustee and a member of the Finance Committee of AHRC of Nassau County (2006-present). |
|
Albert R. Gamper, Jr. (64) |
| Year of Election or Appointment: 2006 Prior to his retirement in December 2004, Mr. Gamper served as Chairman of the Board of CIT Group Inc. (commercial finance). During his tenure with CIT Group Inc. Mr. Gamper served in numerous senior management positions, including Chairman (1987-1989; 1999-2001; 2002-2004), Chief Executive Officer (1987-2004), and President (1989-2002). He currently serves as a member of the Board of Directors of Public Service Enterprise Group (utilities, 2001-present), Chairman of the Board of Governors, Rutgers University (2004-present), and Chairman of the Board of Saint Barnabas Health Care System. |
Robert M. Gates (63) |
| Year of Election or Appointment: 1997 Dr. Gates is Chairman of the Independent Trustees (2006-present). Dr. Gates is President of Texas A&M University (2002-present). He was Director of the Central Intelligence Agency (CIA) from 1991 to 1993. From 1989 to 1991, Dr. Gates served as Assistant to the President of the United States and Deputy National Security Advisor. Dr. Gates is a Director of NACCO Industries, Inc. (mining and manufacturing), Parker Drilling Co., Inc. (drilling and rental tools for the energy industry, 2001-present), and Brinker International (restaurant management, 2003-present). Previously, Dr. Gates served as a Director of LucasVarity PLC (automotive components and diesel engines), a Director of TRW Inc. (automotive, space, defense, and information technology), and Dean of the George Bush School of Government and Public Service at Texas A&M University (1999-2001). |
George H. Heilmeier (70) |
| Year of Election or Appointment: 2004 Dr. Heilmeier is Chairman Emeritus of Telcordia Technologies (communication software and systems), where prior to his retirement, he served as company Chairman and Chief Executive Officer. He currently serves on the Boards of Directors of The Mitre Corporation (systems engineering and information technology support for the government), and HRL Laboratories (private research and development, 2004-present). He is Chairman of the General Motors Science & Technology Advisory Board and a Life Fellow of the Institute of Electrical and Electronics Engineers (IEEE). Dr. Heilmeier is a member of the Defense Science Board and the National Security Agency Advisory Board. He is also a member of the National Academy of Engineering, the American Academy of Arts and Sciences, and the Board of Overseers of the School of Engineering and Applied Science of the University of Pennsylvania. Previously, Dr. Heilmeier served as a Director of TRW Inc. (automotive, space, defense, and information technology, 1992-2002), Compaq (1994-2002), Automatic Data Processing, Inc. (ADP) (technology-based business outsourcing, 1995-2002), INET Technologies Inc. (telecommunications network surveillance, 2001-2004), and Teletech Holdings (customer management services). He is the recipient of the 2005 Kyoto Prize in Advanced Technology for his invention of the liquid crystal display, and a member of the Consumer Electronics Hall of Fame. |
Marie L. Knowles (59) |
| Year of Election or Appointment: 2001 Prior to Ms. Knowles' retirement in June 2000, she served as Executive Vice President and Chief Financial Officer of Atlantic Richfield Company (ARCO) (diversified energy, 1996-2000). From 1993 to 1996, she was a Senior Vice President of ARCO and President of ARCO Transportation Company. She served as a Director of ARCO from 1996 to 1998. She currently serves as a Director of Phelps Dodge Corporation (copper mining and manufacturing) and McKesson Corporation (healthcare service, 2002-present). Ms. Knowles is a Trustee of the Brookings Institution and the Catalina Island Conservancy and also serves as a member of the Advisory Board for the School of Engineering of the University of Southern California. |
Ned C. Lautenbach (62) |
| Year of Election or Appointment: 2000 Mr. Lautenbach has been a partner of Clayton, Dubilier & Rice, Inc. (private equity investment firm) since September 1998. Previously, Mr. Lautenbach was with the International Business Machines Corporation (IBM) from 1968 until his retirement in 1998. Mr. Lautenbach serves as a Director of Sony Corporation (2006-present) and Eaton Corporation (diversified industrial) as well as the Philharmonic Center for the Arts in Naples, Florida. He also is a member of the Board of Trustees of Fairfield University (2005-present), as well as a member of the Council on Foreign Relations. |
William O. McCoy (72) |
| Year of Election or Appointment: 1997 Prior to his retirement in December 1994, Mr. McCoy was Vice Chairman of the Board of BellSouth Corporation (telecommunications) and President of BellSouth Enterprises. He is currently a Director of Duke Realty Corporation (real estate). He is also a partner of Franklin Street Partners (private investment management firm). In addition, Mr. McCoy served as the Interim Chancellor (1999-2000) and a member of the Board of Visitors for the University of North Carolina at Chapel Hill and currently serves as Chairman of the Board of Directors of the University of North Carolina Health Care System. He also served as Vice President of Finance for the University of North Carolina (16-school system). |
Cornelia M. Small (62) |
| Year of Election or Appointment: 2005 Ms. Small is a member (2000-present) and Chairperson (2002-present) of the Investment Committee, and a member (2002-present) of the Board of Trustees of Smith College. Previously, she served as Chief Investment Officer (1999-2000), Director of Global Equity Investments (1996-1999), and a member of the Board of Directors of Scudder, Stevens & Clark (1990-1997) and Scudder Kemper Investments (1997-1999). In addition, Ms. Small served as Co-Chair (2000-2003) of the Annual Fund for the Fletcher School of Law and Diplomacy. |
William S. Stavropoulos (67) |
| Year of Election or Appointment: 2002 Mr. Stavropoulos is Chairman Emeritus of the Board of Directors of The Dow Chemical Company. Since joining The Dow Chemical Company in 1967, Mr. Stavropoulos served in numerous senior management positions, including President (1993-2000; 2002-2003), CEO (1995-2000; 2002-2004), and Chairman of the Executive Committee (2000-2004). Currently, he is a Director of NCR Corporation (data warehousing and technology solutions), BellSouth Corporation (telecommunications), Chemical Financial Corporation, Maersk Inc. (industrial conglomerate, 2002-present), and Metalmark Capital (private equity investment firm, 2005-present). He also serves as a member of the Board of Trustees of the American Enterprise Institute for Public Policy Research. In addition, Mr. Stavropoulos is a member of The Business Council, J.P. Morgan International Council and the University of Notre Dame Advisory Council for the College of Science. |
Kenneth L. Wolfe (67) |
| Year of Election or Appointment: 2005 Prior to his retirement in 2001, Mr. Wolfe was Chairman and Chief Executive Officer of Hershey Foods Corporation (1993-2001). He currently serves as a member of the boards of Adelphia Communications Corporation (2003-present), Bausch & Lomb, Inc., and Revlon Inc. (2004-present). |
Annual Report
Advisory Board Members and Executive Officers:
Correspondence intended for Mr. Keyes may be sent to Fidelity Investments, P.O. Box 55235, Boston, Massachusetts 02205-5235. Correspondence intended for each executive officer and Mr. Lynch may be sent to Fidelity Investments, 82 Devonshire Street, Boston, Massachusetts 02109.
Name, Age; Principal Occupation |
James H. Keyes (66) |
| Year of Election or Appointment: 2006 Member of the Advisory Board of Fidelity Commonwealth Trust. Prior to his retirement in 2003, Mr. Keyes was Chairman, President, and Chief Executive Officer of Johnson Controls, Inc. (automotive supplier, 1993-2003). He currently serves as a member of the boards of LSI Logic Corporation (semiconductor technologies), Navistar International Corporation (manufacture and sale of trucks, buses, and diesel engines, (2002-present), and Pitney Bowes, Inc. (integrated mail, messaging, and document management solutions). |
Peter S. Lynch (62) |
| Year of Election or Appointment: 2003 Member of the Advisory Board of Fidelity Commonwealth Trust. Mr. Lynch is Vice Chairman and a Director of FMR, and Vice Chairman (2001-present) and a Director of FMR Co., Inc. Previously, Mr. Lynch served as a Trustee of the Fidelity funds (1990-2003). In addition, he serves as a Trustee of Boston College and as the Chairman of the Inner-City Scholarship Fund. |
Walter C. Donovan (44) |
| Year of Election or Appointment: 2005 Vice President of Strategic Real Return. Mr. Donovan also serves as Vice President of Fidelity's High Income Funds (2005-present). Mr. Donovan also serves as Executive Vice President of FMR (2005-present) and FMR Co., Inc. (2005-present). Previously, Mr. Donovan served as Vice President of Fidelity's Fixed-Income Funds (2005-2006), certain Asset Allocation Funds (2005-2006), certain Balanced Funds (2005-2006), and as Vice President and Director of Fidelity's International Equity Trading group (1998-2005). |
Boyce I. Greer (50) |
| Year of Election or Appointment: 2005 Vice President of Strategic Real Return. Mr. Greer also serves as Vice President of certain Equity Funds (2005-present), certain Asset Allocation Funds (2005-present), Fixed-Income Funds (2006-present), and Money Market Funds (2006-present). Mr. Greer is also a Trustee of other investment companies advised by FMR (2003-present). He is an Executive Vice President of FMR (2005-present) and FMR Co., Inc. (2005-present), and Senior Vice President of Fidelity Investments Money Management, Inc. (2006-present). Previously, Mr. Greer served as a Director and Managing Director of Strategic Advisers, Inc. (2002-2005), and Executive Vice President (2000-2002) and Money Market Group Leader (1997-2002) of the Fidelity Investments Fixed Income Division. He also served as Vice President of Fidelity's Money Market Funds (1997-2002), Senior Vice President of FMR (1997-2002), and Vice President of FIMM (1998-2002). |
Robert A. Lawrence (53) |
| Year of Election or Appointment: 2006 Vice President of Strategic Real Return. Mr. Lawrence also serves as Vice President of the High Income Funds. Mr. Lawrence is Senior Vice President of FMR (2006-present) and FMR Co., Inc. (2006-present). Previously, Mr. Lawrence served as President of Fidelity Strategic Investments (2002-2005). |
David L. Murphy (58) |
| Year of Election or Appointment: 2005 Vice President of Strategic Real Return. Mr. Murphy also serves as Vice President of Fidelity's Money Market Funds (2002-present), certain Asset Allocation Funds (2003-present), Fixed-Income Funds (2005-present), and Balanced Funds (2005-present). He serves as Senior Vice President (2000-present) and Head (2004-present) of the Fidelity Investments Fixed Income Division. Mr. Murphy is also a Senior Vice President of Fidelity Investments Money Management, Inc. (2003-present) and an Executive Vice President of FMR (2005-present). Previously, Mr. Murphy served as Money Market Group Leader (2002-2004), Bond Group Leader (2000-2002), and Vice President of Fidelity's Taxable Bond Funds (2000-2002) and Fidelity's Municipal Bond Funds (2001-2002). |
Thomas J. Silvia (45) |
| Year of Election or Appointment: 2005 Vice President of Strategic Real Return. Mr. Silvia also serves as Vice President of Fidelity's Fixed-Income Funds (2005-present), certain Balanced Funds (2005-present), certain Asset Allocation Funds (2005-present), and Senior Vice President and Bond Group Leader of the Fidelity Investments Fixed-Income Division (2005-present). Previously, Mr. Silvia served as Director of Fidelity's Taxable Bond portfolio managers (2002-2004) and a portfolio manager in the Bond Group (1997-2004). |
William Irving (42) |
| Year of Election or Appointment: 2005 Vice President of Strategic Real Return. Mr. Irving also serves as Vice President of other funds advised by FMR. Prior to assuming his current responsibilities, Mr. Irving worked as a quantitative analyst and portfolio manager. |
Christopher L. Sharpe (38) |
| Year of Election or Appointment: 2005 Vice President of Strategic Real Return. Mr. Sharpe also serves as Vice President of other funds advised by FMR. Prior to assuming his current responsibilities, Mr. Sharpe worked as an associate investment policy officer for John Hancock Financial Services, Inc. in Boston. From 1990 to 2000 he was with William M. Mercer, Inc. in Boston. Mr. Sharpe also serves as Vice President of FMR (2006) and FMR Co., Inc. (2006). |
Mark Snyderman (49) |
| Year of Election or Appointment: 2005 Vice President of Strategic Real Return. Mr. Snyderman also serves as Vice President of other funds advised by FMR. Prior to assuming his current responsibilities, Mr. Snyderman served as an investment officer for commercial mortgage-backed securities in the real estate group and as a portfolio manager of real estate stock and real estate bond mutual funds and institutional accounts. Mr. Snyderman also serves as a Vice President of FMR (2004) and FMR Co., Inc. (2004). |
Derek L. Young (42) |
| Year of Election or Appointment: 2006 Vice President of Strategic Real Return. Mr. Young also serves as Vice President of other funds advised by FMR. Prior to assuming his current responsibilities, Mr. Young worked as director of Risk Management, senior vice president of Strategic Services and a portfolio manager. Mr. Young also serves as Vice President of FMR (2004) and FMR Co., Inc. (2004). |
Eric D. Roiter (57) |
| Year of Election or Appointment: 2005 Secretary of Strategic Real Return. He also serves as Secretary of other Fidelity funds; Vice President, General Counsel, and Secretary of FMR Co., Inc. (2001-present) and FMR; Assistant Secretary of Fidelity Management & Research (U.K.) Inc. (2001-present), Fidelity Research & Analysis Company (2001-present), and Fidelity Investments Money Management, Inc. (2001-present). Mr. Roiter is an Adjunct Member, Faculty of Law, at Boston College Law School (2003-present). Previously, Mr. Roiter served as Vice President and Secretary of Fidelity Distributors Corporation (FDC) (1998-2005). |
Stuart Fross (47) |
| Year of Election or Appointment: 2005 Assistant Secretary of Strategic Real Return. Mr. Fross also serves as Assistant Secretary of other Fidelity funds (2003-present), Vice President and Secretary of FDC (2005-present), and is an employee of FMR. |
Christine Reynolds (48) |
| Year of Election or Appointment: 2005 President and Treasurer of Strategic Real Return. Ms. Reynolds also serves as President and Treasurer of other Fidelity funds (2004-present) and is a Vice President (2003-present) and an employee (2002-present) of FMR. Before joining Fidelity Investments, Ms. Reynolds worked at PricewaterhouseCoopers LLP (PwC) (1980-2002), where she was most recently an audit partner with PwC's investment management practice. |
R. Stephen Ganis (40) |
| Year of Election or Appointment: 2006 Anti-Money Laundering (AML) officer of Strategic Real Return. Mr. Ganis also serves as AML officer of other Fidelity funds (2006-present) and FMR Corp. (2003-present). Before joining Fidelity Investments, Mr. Ganis practiced law at Goodwin Procter, LLP (2000-2002). |
Joseph B. Hollis (58) |
| Year of Election or Appointment: 2006 Chief Financial Officer of Strategic Real Return. Mr. Hollis also serves as Chief Financial Officer of other Fidelity funds. Mr. Hollis is President of Fidelity Pricing and Cash Management Services (FPCMS) (2005-present). Mr. Hollis also serves as President and Director of Fidelity Service Company, Inc. (2006-present). Previously, Mr. Hollis served as Senior Vice President of Cash Management Services (1999-2002) and Investment Management Operations (2002-2005). |
Kenneth A. Rathgeber (59) |
| Year of Election or Appointment: 2005 Chief Compliance Officer of Strategic Real Return. Mr. Rathgeber also serves as Chief Compliance Officer of other Fidelity funds (2004-present) and Executive Vice President of Risk Oversight for Fidelity Investments (2002-present). He is Chief Compliance Officer of FMR (2005-present), FMR Co., Inc. (2005-present), Fidelity Management & Research (U.K.) Inc. (2005-present), Fidelity Research & Analysis Company (2005-present), Fidelity Investments Money Management, Inc. (2005-present), and Strategic Advisers, Inc. (2005-present). Previously, Mr. Rathgeber served as Executive Vice President and Chief Operating Officer for Fidelity Investments Institutional Services Company, Inc. (1998-2002). |
Bryan A. Mehrmann (45) |
| Year of Election or Appointment: 2005 Deputy Treasurer of Strategic Real Return. Mr. Mehrmann also serves as Deputy Treasurer of other Fidelity funds (2005-present) and is an employee of FMR. Previously, Mr. Mehrmann served as Vice President of Fidelity Investments Institutional Services Group (FIIS)/Fidelity Investments Institutional Operations Corporation, Inc. (FIIOC) Client Services (1998-2004). |
Kimberley H. Monasterio (42) |
| Year of Election or Appointment: 2005 Deputy Treasurer of Strategic Real Return. Ms. Monasterio also serves as Deputy Treasurer of other Fidelity funds (2004) and is an employee of FMR (2004). Before joining Fidelity Investments, Ms. Monasterio served as Treasurer (2000-2004) and Chief Financial Officer (2002-2004) of the Franklin Templeton Funds and Senior Vice President of Franklin Templeton Services, LLC (2000-2004). |
Kenneth B. Robins (37) |
| Year of Election or Appointment: 2005 Deputy Treasurer of Strategic Real Return. Mr. Robins also serves as Deputy Treasurer of other Fidelity funds (2005-present) and is an employee of FMR (2004-present). Before joining Fidelity Investments, Mr. Robins worked at KPMG LLP, where he was a partner in KPMG's department of professional practice (2002-2004) and a Senior Manager (1999-2000). In addition, Mr. Robins served as Assistant Chief Accountant, United States Securities and Exchange Commission (2000-2002). |
Robert G. Byrnes (39) |
| Year of Election or Appointment: 2005 Assistant Treasurer of Strategic Real Return. Mr. Byrnes also serves as Assistant Treasurer of other Fidelity funds (2005-present) and is an employee of FMR (2005-present). Previously, Mr. Byrnes served as Vice President of FPCMS (2003-2005). Before joining Fidelity Investments, Mr. Byrnes worked at Deutsche Asset Management where he served as Vice President of the Investment Operations Group (2000-2003). |
John H. Costello (60) |
| Year of Election or Appointment: 2005 Assistant Treasurer of Strategic Real Return. Mr. Costello also serves as Assistant Treasurer of other Fidelity funds and is an employee of FMR. |
Peter L. Lydecker (52) |
| Year of Election or Appointment: 2005 Assistant Treasurer of Strategic Real Return. Mr. Lydecker also serves as Assistant Treasurer of other Fidelity funds (2004) and is an employee of FMR. |
Mark Osterheld (51) |
| Year of Election or Appointment: 2005 Assistant Treasurer of Strategic Real Return. Mr. Osterheld also serves as Assistant Treasurer of other Fidelity funds (2002) and is an employee of FMR. |
Gary W. Ryan (48) |
| Year of Election or Appointment: 2005 Assistant Treasurer of Strategic Real Return. Mr. Ryan also serves as Assistant Treasurer of other Fidelity funds (2005-present) and is an employee of FMR (2005-present). Previously, Mr. Ryan served as Vice President of Fund Reporting in FPCMS (1999-2005). |
Salvatore Schiavone (40) |
| Year of Election or Appointment: 2005 Assistant Treasurer of Strategic Real Return. Mr. Schiavone also serves as Assistant Treasurer of other Fidelity funds (2005-present) and is an employee of FMR (2005-present). Before joining Fidelity Investments, Mr. Schiavone worked at Deutsche Asset Management, where he most recently served as Assistant Treasurer (2003-2005) of the Scudder Funds and Vice President and Head of Fund Reporting (1996-2003). |
Annual Report
Distributions
The fund hereby designates as a capital gain dividend with respect to the taxable year ended September 30, 2006, $227,005, or, if subsequently determined to be different, the net capital gain of such year.
A total of 30.17% of the dividends distributed during the fiscal year was derived from interest on U.S. Government securities which is generally exempt from state income tax.
The fund designates $34,978,986 of distributions paid during the period October 1, 2005 to September 30, 2006 as qualifying to be taxed as interest-related dividends for nonresident alien shareholders.
The fund will notify shareholders in January 2007 of amounts for use in preparing 2006 income tax returns.
Annual Report
Proxy Voting Results
A special meeting of the fund's shareholders was held on November 16, 2005. The results of votes taken among shareholders on proposals before them are reported below. Each vote reported represents one dollar of net asset value held on the record date for the meeting.
PROPOSAL 1 |
To elect a Board of Trustees. A |
| # of
Votes | % of
Votes |
Dennis J. Dirks |
Affirmative | 18,240,248,322.53 | 96.150 |
Withheld | 730,313,302.58 | 3.850 |
TOTAL | 18,970,561,625.11 | 100.000 |
Albert R. Gamper, Jr. B |
Affirmative | 18,204,838,072.06 | 95.964 |
Withheld | 765,723,553.05 | 4.036 |
TOTAL | 18,970,561,625.11 | 100.000 |
Robert M. Gates |
Affirmative | 18,191,748,681.13 | 95.895 |
Withheld | 778,812,943.98 | 4.105 |
TOTAL | 18,970,561,625.11 | 100.000 |
George H. Heilmeier |
Affirmative | 18,193,638,757.60 | 95.905 |
Withheld | 776,922,867.51 | 4.095 |
TOTAL | 18,970,561,625.11 | 100.000 |
Abigail P. Johnson |
Affirmative | 18,103,320,241.78 | 95.428 |
Withheld | 867,241,383.33 | 4.572 |
TOTAL | 18,970,561,625.11 | 100.000 |
Edward C. Johnson 3d |
Affirmative | 18,055,585,171.13 | 95.177 |
Withheld | 914,976,453.98 | 4.823 |
TOTAL | 18,970,561,625.11 | 100.000 |
Stephen P. Jonas |
Affirmative | 18,188,419,716.35 | 95.877 |
Withheld | 782,141,908.76 | 4.123 |
TOTAL | 18,970,561,625.11 | 100.000 |
| # of
Votes | % of
Votes |
Marie L. Knowles |
Affirmative | 18,208,650,664.29 | 95.984 |
Withheld | 761,910,960.82 | 4.016 |
TOTAL | 18,970,561,625.11 | 100.000 |
Ned C. Lautenbach |
Affirmative | 18,224,936,039.64 | 96.070 |
Withheld | 745,625,585.47 | 3.930 |
TOTAL | 18,970,561,625.11 | 100.000 |
Marvin L. Mann |
Affirmative | 18,146,216,753.93 | 95.655 |
Withheld | 824,344,871.18 | 4.345 |
TOTAL | 18,970,561,625.11 | 100.000 |
William O. McCoy |
Affirmative | 18,164,580,135.79 | 95.751 |
Withheld | 805,981,489.32 | 4.249 |
TOTAL | 18,970,561,625.11 | 100.000 |
Robert L. Reynolds |
Affirmative | 18,197,448,372.22 | 95.925 |
Withheld | 773,113,252.89 | 4.075 |
TOTAL | 18,970,561,625.11 | 100.000 |
Cornelia M. Small |
Affirmative | 18,214,122,413.76 | 96.013 |
Withheld | 756,439,211.35 | 3.987 |
TOTAL | 18,970,561,625.11 | 100.000 |
William S. Stavropoulos |
Affirmative | 18,186,563,509.46 | 95.867 |
Withheld | 783,998,115.65 | 4.133 |
TOTAL | 18,970,561,625.11 | 100.000 |
Kenneth L. Wolfe |
Affirmative | 18,211,332,412.92 | 95.998 |
Withheld | 759,229,212.19 | 4.002 |
TOTAL | 18,970,561,625.11 | 100.000 |
A Denotes trust-wide proposals and voting results. B Effective on or about January 1, 2006. |
Annual Report
Managing Your Investments
Fidelity offers several ways to conveniently manage your personal investments via your telephone or PC. You can access your account information, conduct trades and research your investments 24 hours a day.
By Phone
Fidelity Automated Service Telephone provides a single toll-free number to access account balances, positions, quotes and trading. It's easy to navigate the service, and on your first call, the system will help you create a personal identification number (PIN) for security.
(phone_graphic)
Fidelity Automated
Service Telephone (FAST®)
1-800-544-5555
Press
1 For mutual fund and brokerage trading.
2 For quotes.*
3 For account balances and holdings.
4 To review orders and mutual
fund activity.
5 To change your PIN.
*0 To speak to a Fidelity representative.
By PC
Fidelity's web site on the Internet provides a wide range of information, including daily financial news, fund performance, interactive planning tools and news about Fidelity products and services.
(computer_graphic)
Fidelity's Web Site
www.fidelity.com
* When you call the quotes line, please remember that a fund's yield and return will vary and, except for money market funds, share price will also vary. This means that you may have a gain or loss when you sell your shares. There is no assurance that money market funds will be able to maintain a stable $1 share price; an investment in a money market fund is not insured or guaranteed by the U.S. government. Total returns are historical and include changes in share price, reinvestment of dividends and capital gains, and the effects of any sales charges.
Annual Report
To Write Fidelity
We'll give your correspondence immediate attention and send you written confirmation upon completion of your request.
(letter_graphic)
Making Changes
To Your Account
(such as changing name, address, bank, etc.)
Fidelity Investments
P.O. Box 770001
Cincinnati, OH 45277-0002
(letter_graphic)
For Non-Retirement
Accounts
Buying shares
Fidelity Investments
P.O. Box 770001
Cincinnati, OH 45277-0003
Overnight Express
Fidelity Investments
Attn: Distribution Services
100 Crosby Parkway - KC1H
Covington, KY 41015
Selling shares
Fidelity Investments
P.O. Box 770001
Cincinnati, OH 45277-0035
Overnight Express
Fidelity Investments
Attn: Distribution Services
100 Crosby Parkway - KC1H
Covington, KY 41015
General Correspondence
Fidelity Investments
P.O. Box 500
Merrimack, NH 03054-0500
(letter_graphic)
For Retirement
Accounts
Buying shares
Fidelity Investments
P.O. Box 770001
Cincinnati, OH 45277-0003
Selling shares
Fidelity Investments
P.O. Box 770001
Cincinnati, OH 45277-0035
Overnight Express
Fidelity Investments
Attn: Distribution Services
100 Crosby Parkway - KC1H
Covington, KY 41015
General Correspondence
Fidelity Investments
P.O. Box 500
Merrimack, NH 03054-0500
Annual Report
Investment Adviser
Fidelity Management & Research Company
Boston, MA
Investment Sub-Advisers
FMR Co., Inc.
Fidelity Research & Analysis Company
(formerly Fidelity Management &
Research (Far East) Inc.)
Fidelity Investments Japan Limited
Fidelity International Investment
Advisors
Fidelity International Investment
Advisors (U.K.) Limited
Geode Capital Management, LLC
General Distributor
Fidelity Distributors Corporation
Boston, MA
Transfer and Service Agent
Fidelity Service Company, Inc.
Boston, MA
Custodian
Mellon Bank, N.A.
Pittsburgh, PA
The Fidelity Telephone Connection
Mutual Fund 24-Hour Service
Exchanges/Redemptions
and Account Assistance 1-800-544-6666
Product Information 1-800-544-6666
Retirement Accounts 1-800-544-4774
(8 a.m. - 9 p.m.)
TDD Service 1-800-544-0118
for the deaf and hearing impaired
(9 a.m. - 9 p.m. Eastern time)
Fidelity Automated Service
Telephone (FAST®) (automated graphic) 1-800-544-5555
(automated graphic) Automated line for quickest service
RRS-UANN-1106
1.816441.101
(Fidelity Investment logo)(registered trademark)
(Fidelity Investment logo)(registered trademark)
Fidelity Advisor
Strategic Real Return
Fund - Class A, Class T,
Class B and Class C
Annual Report
September 30, 2006
Class A, Class T, Class B,
and Class C are classes
of Fidelity® Strategic Real
Return Fund
(2_fidelity_logos) (Registered_Trademark)
Contents
Note to Shareholders | <Click Here> | An explanation of the changes to the fund. |
Chairman's Message | <Click Here> | Ned Johnson's message to shareholders. |
Performance | <Click Here> | How the fund has done over time. |
Management's Discussion | <Click Here> | The managers' review of fund performance, strategy and outlook |
Shareholder Expense Example | <Click Here> | An example of shareholder expenses. |
Investment Changes | <Click Here> | A summary of major shifts in the fund's investments over the past year. |
Investments | <Click Here> | A complete list of the fund's investments with their market values. |
Financial Statements | <Click Here> | Statements of assets and liabilities, operations, and changes in net assets,
as well as financial highlights. |
Notes | <Click Here> | Notes to the financial statements. |
Report of Independent Registered Public Accounting Firm | <Click Here> | |
Trustees and Officers | <Click Here> | |
Distributions | <Click Here> | |
Proxy Voting Results | <Click Here> | |
To view a fund's proxy voting guidelines and proxy voting record for the 12-month period ended June 30, visit www.fidelity.com/proxyvotingresults or visit the Securities and Exchange Commission's (SEC) web site at www.sec.gov. You may also call 1-877-208-0098 to request a free copy of the proxy voting guidelines.
Standard & Poor's, S&P and S&P 500 are registered service marks of The McGraw-Hill Companies, Inc. and have been licensed for use by Fidelity Distributors Corporation.
Other third party marks appearing herein are the property of their respective owners.
All other marks appearing herein are registered or unregistered trademarks or service marks of FMR Corp. or an affiliated company.
Annual Report
This report and the financial statements contained herein are submitted for the general information of the shareholders of the fund. This report is not authorized for distribution to prospective investors in the fund unless preceded or accompanied by an effective prospectus.
A fund files its complete schedule of portfolio holdings with the SEC for the first and third quarters of each fiscal year on Form N-Q. Forms N-Q are available on the SEC's web site at http://www.sec.gov. A fund's Forms N-Q may be reviewed and copied at the SEC's Public Reference Room in Washington, DC. Information regarding the operation of the SEC's Public Reference Room may be obtained by calling 1-800-SEC-0330. For a complete list of a fund's portfolio holdings, view the most recent quarterly holdings report, semiannual report, or annual report on Fidelity's web site at http://www.advisor.fidelity.com.
NOT FDIC INSURED · MAY LOSE VALUE · NO BANK GUARANTEE
Neither the fund nor Fidelity Distributors Corporation is a bank.
Annual Report
Note to Shareholders:
Effective November 1, 2006, the real estate component of the Fidelity Strategic Real Return Composite Index - a hypothetical representation of the performance of the fund's unmanaged indexes used as a comparative benchmark - will be changed to reflect the fund's increased real estate common stock exposure. This modification will be made in order to improve the fund's opportunity for real return in periods of rising inflation, while also diversifying the fund's real estate debt exposure. The Dow Jones Wilshire Real Estate Securities IndexSM (12% weighting) will be added to the Composite index, which will continue to also include the Merrill Lynch® U.S. Real Estate Corporate Bond Index (8%), the Dow Jones-AIG Commodity IndexSM (25%), the Credit Suisse First Boston Leveraged Loan Index (25%) and the Lehman Brothers® U.S. Treasury Inflation-Protected Securities (TIPS) Index (30%). This new blend will no longer include an allocation to the FTSE NAREIT All REIT index, which was added to the Composite index on June 1, 2006, or the Morgan Stanley® REIT Preferred Index.
Annual Report
Chairman's Message
(photo_of_Edward_C_Johnson_3d)
Dear Shareholder:
Stock and bond markets around the world have seen largely positive results year to date, although weakness in the technology sector and growth stocks in general have tempered performance. While financial markets are always unpredictable, there are a number of time-tested principles that can put the historical odds in your favor.
One of the basic tenets is to invest for the long term. Over time, riding out the markets' inevitable ups and downs has proven much more effective than selling into panic or chasing the hottest trend. Even missing only a few of the markets' best days can significantly diminish investor returns. Patience also affords the benefits of compounding - of earning interest on additional income or reinvested dividends and capital gains. There are tax advantages and cost benefits to consider as well. The more you sell, the more taxes you pay, and the more you trade, the higher the costs. While staying the course doesn't eliminate risk, it can considerably lessen the effect of short-term declines.
You can further manage your investing risk through diversification. And today, more than ever, geographic diversification should be taken into account. Studies indicate that asset allocation is the single most important determinant of a portfolio's long-term success. The right mix of stocks, bonds and cash - aligned to your particular risk tolerance and investment objective - is very important. Age-appropriate rebalancing is also an essential aspect of asset allocation. For younger investors, an emphasis on equities - which historically have been the best performing asset class over time - is encouraged. As investors near their specific goal, such as retirement or sending a child to college, consideration may be given to replacing volatile assets (e.g. common stocks) with more-stable fixed investments (bonds or savings plans).
A third investment principle - investing regularly - can help lower the average cost of your purchases. Investing a certain amount of money each month or quarter helps ensure you won't pay for all your shares at market highs. This strategy - known as dollar cost averaging - also reduces unconstructive "emotion" from investing, helping shareholders avoid selling weak performers just prior to an upswing, or chasing a hot performer just before a correction.
We invite you to contact us via the Internet, through our Investor Centers or over the phone. It is our privilege to provide you the information you need to make the investments that are right for you.
Sincerely,
/s/Edward C. Johnson 3d
Edward C. Johnson 3d
Annual Report
Performance: The Bottom Line
Average annual total return reflects the change in the value of an investment, assuming reinvestment of the class' dividend income and capital gains (the profits earned upon the sale of securities that have grown in value) and assuming a constant rate of performance each year. The $10,000 table and the fund's returns do not reflect the deduction of taxes that a shareholder would pay on fund distributions or the redemption of fund shares. During periods of reimbursement by Fidelity, a fund's total return will be greater than it would be had the reimbursement not occurred. How a fund did yesterday is no guarantee of how it will do tomorrow.
Average Annual Total Returns
Periods ended September 30, 2006 | Past 1
year | Life of
fund A |
Class A (incl. 4.75% sales charge) | -2.88% | -1.34% |
Class T (incl. 3.50% sales charge) | -1.64% | -0.15% |
Class B (incl. contingent deferred sales charge) B | -3.63% | -1.18% |
Class C (incl. contingent deferred sales charge) C | 0.16% | 2.41% |
A From September 7, 2005.
B Class B shares' contingent deferred sales charges included in the past one year and life of fund total return figures are 5% and 4%, respectively.
C Class C shares' contingent deferred sales charges included in the past one year and life of fund total return figures are 1% and 0%, respectively.
Annual Report
$10,000 Over Life of Fund
Let's say hypothetically that $10,000 was invested in Fidelity® Advisor Strategic Real Return Fund - Class T on September 7, 2005, when the fund started, and the current 3.50% sales charge was paid. The chart shows how the value of your investment would have changed, and also shows how the Lehman Brothers® US TIPS Index performed over the same period.
Annual Report
Management's Discussion of Fund Performance
Comments from Christopher Sharpe and Derek Young, Co-Managers of Fidelity Advisor Strategic Real Return Fund
Inflation was an on-again, off-again concern for most of the 12-month period ending September 30, 2006, and, as might be expected, the indexes measuring the performance of Fidelity Advisor Strategic Real Return Fund's four component asset classes showed varied results. The Lehman Brothers® U.S. Treasury Inflation-Protected Securities (TIPS) Index rose 1.84%, slightly below the 2.10% increase in the Consumer Price Index for All Urban Consumers (CPI-U), which was consistent with a generally benign inflation picture for the year overall. Meanwhile, the Dow Jones-AIG Commodity IndexSM, which tracks a group of physical commodities traded on various world exchanges, fell 6.11%, as inflationary fears pushed prices for many basic commodities lower in many world markets. Floating-rate bank debt, as measured by the Credit Suisse First Boston (CSFB) Leveraged Loan Index, rose 6.44%, reflecting increased demand for an asset class with low default rates and increasing yields. Similarly, income-oriented real estate investments were robust performers, as demonstrated by the 7.22% return of a diversified composite comprising the FTSE NAREIT All REIT index (20%), the Morgan Stanley® REIT Preferred Index (40%) and the Merrill Lynch® U.S. Real Estate Corporate Bond Index (40%).
The fund's Class A, Class T, Class B and Class C shares returned 1.96%, 1.93%, 1.33% and 1.15%, respectively (excluding sales charges), during the period, compared with gains of 2.51% for the Fidelity Strategic Real Return Composite Index and 1.84% for the Lehman Brothers U.S. TIPS Index. Security selection in the fund's subportfolios was the primary driver of performance, but asset allocation also added value. The real estate subportfolio helped overall performance and outpaced its benchmark by a wide margin due mostly to astute security selection across its broad real estate investment universe. Our investment in floating-rate bank loans - primarily through the Fidelity® Floating Rate Central Investment Portfolio - had healthy overall appreciation due to strong security selection and also slightly outperformed its benchmark. The Inflation-Protected Securities subportfolio - mostly made up of TIPS - achieved a return that was just below that of its index. Volatility of the commodities markets pushed the commodity-linked note subportfolio's return into negative territory during the period, but that return was offset somewhat by the subportfolio's investments in the Fidelity Ultra-Short Central Fund, a diversified pool of short-term assets designed to outperform cash-like investments with similar characteristics.
The views expressed above reflect those of the portfolio manager(s) only through the end of the period as stated on the cover of this report and do not necessarily represent the views of Fidelity or any other person in the Fidelity organization. Any such views are subject to change at any time based upon market or other conditions and Fidelity disclaims any responsibility to update such views. These views may not be relied on as investment advice and, because investment decisions for a Fidelity fund are based on numerous factors, may not be relied on as an indication of trading intent on behalf of any Fidelity fund.
Annual Report
Shareholder Expense Example
As a shareholder of the Fund, you incur two types of costs: (1) transaction costs, including sales charges (loads) on purchase payments or redemption proceeds, redemption fees, and (2) ongoing costs, including management fees, distribution and/or service (12b-1) fees and other Fund expenses. This Example is intended to help you understand your ongoing costs (in dollars) of investing in the Fund and to compare these costs with the ongoing costs of investing in other mutual funds.
The Example is based on an investment of $1,000 invested at the beginning of the period and held for the entire period (April 1, 2006 to September 30, 2006).
Actual Expenses
The first line of the accompanying table for each class of the Fund provides information about actual account values and actual expenses. You may use the information in this line, together with the amount you invested, to estimate the expenses that you paid over the period. Simply divide your account value by $1,000.00 (for example, an $8,600 account value divided by $1,000.00 = 8.6), then multiply the result by the number in the first line for a class of the Fund under the heading entitled "Expenses Paid During Period" to estimate the expenses you paid on your account during this period. In addition, the Fund, as a shareholder in the underlying Fidelity Central Funds, will indirectly bear its pro rata share of the fees and expenses incurred by the underlying Fidelity Central Funds. These fees and expenses are not included in the Fund's annualized expense ratio used to calculate the expense estimate in the table below.
Hypothetical Example for Comparison Purposes
The second line of the accompanying table for each class of the Fund provides information about hypothetical account values and hypothetical expenses based on a Class' actual expense ratio and an assumed rate of return of 5% per year before expenses, which is not the Class' actual return. The hypothetical account values and expenses may not be used to estimate the actual ending account balance or expenses you paid for the period. You may use this information to compare the ongoing costs of investing in the Fund and other funds. To do so, compare this 5% hypothetical example with the 5% hypothetical examples that appear in the shareholder reports of the other funds. In addition, the Fund, as a shareholder in the underlying Fidelity Central Funds, will indirectly bear its pro rata share of the fees and expenses incurred by the underlying Fidelity Central Funds. These fees and expenses are not included in the Fund's annualized expense ratio used to calculate the expense estimate in the table below.
Please note that the expenses shown in the table are meant to highlight your ongoing costs only and do not reflect any transaction costs. Therefore, the second line of the table is useful in comparing ongoing costs only, and will not help you determine the relative total costs of owning different funds. In addition, if these transactional costs were included, your costs would have been higher.
Annual Report
Shareholder Expense Example - continued
| Beginning
Account Value
April 1, 2006 | Ending
Account Value
September 30, 2006 | Expenses Paid
During Period*
April 1, 2006
to September 30, 2006 |
Class A | | | |
Actual | $ 1,000.00 | $ 1,026.00 | $ 5.08 |
Hypothetical A | $ 1,000.00 | $ 1,020.05 | $ 5.06 |
Class T | | | |
Actual | $ 1,000.00 | $ 1,025.90 | $ 5.23 |
Hypothetical A | $ 1,000.00 | $ 1,019.90 | $ 5.22 |
Class B | | | |
Actual | $ 1,000.00 | $ 1,023.00 | $ 8.77 |
Hypothetical A | $ 1,000.00 | $ 1,016.39 | $ 8.74 |
Class C | | | |
Actual | $ 1,000.00 | $ 1,022.00 | $ 9.38 |
Hypothetical A | $ 1,000.00 | $ 1,015.79 | $ 9.35 |
Strategic Real Return | | | |
Actual | $ 1,000.00 | $ 1,027.90 | $ 3.97 |
Hypothetical A | $ 1,000.00 | $ 1,021.16 | $ 3.95 |
Institutional Class | | | |
Actual | $ 1,000.00 | $ 1,027.00 | $ 4.12 |
Hypothetical A | $ 1,000.00 | $ 1,021.01 | $ 4.10 |
A 5% return per year before expenses
* Expenses are equal to each Class' annualized expense ratio (shown in the table below); multiplied by the average account value over the period, multiplied by 183/365 (to reflect the one-half year period). The fees and expenses of the underlying Fidelity Central Funds in which the Fund invests are not included in the Fund's annualized expense ratio.
| Annualized
Expense Ratio |
Class A | 1.00% |
Class T | 1.03% |
Class B | 1.73% |
Class C | 1.85% |
Strategic Real Return | .78% |
Institutional Class | .81% |
Annual Report
Investment Changes
The information in the Quality Diversification and Asset Allocation tables is based on the combined investments of the Fund and its pro-rata share of its investments in each Fidelity Central Fund.
Holdings Distribution (% of fund's net assets) |
| As of
September 30, 2006 | As of
March 31, 2006 |
Commodity-Linked Notes and Related Investments* | 24.7% | 27.3% |
Inflation-Protected Investments | 29.5% | 27.2% |
Floating Rate High Yield | 24.7% | 23.9% |
Real Estate Investments | 18.5% | 14.8% |
Cash & Cash Equivalents | 1.8% | 0.9% |
* Includes Fidelity Ultra-Short Central Fund held in connection with commodity-linked notes and related investments. Investments in commodity-linked notes provide indirect exposure to futures contracts on physical commodities via the Dow Jones-AIG Commodity Index, the majority of which trade on U.S. exchanges. The value of commodity-linked notes will change directly based on the performance of the index. |
Quality Diversification (% of fund's net assets) |
As of September 30, 2006 | As of March 31, 2006 |
| U.S. Government and
U.S. Government
Agency Obligations 30.8% | | | U.S. Government and
U.S. Government
Agency Obligations 28.9% | |
| AAA 4.7% | | | AAA 4.8% | |
| AA 0.9% | | | AA 1.1% | |
| A 2.5% | | | A 1.9% | |
| BBB 7.9% | | | BBB 5.0% | |
| BB and Below 22.0% | | | BB and Below 22.8% | |
| Structured Notes
(including
Commodity-Linked
Notes) 13.8% | | | Structured Notes
(including
Commodity-Linked
Notes) 13.8% | |
| Equities 7.6% | | | Equities 7.6% | |
| Short-Term
Investments and
Net Other Assets 9.8% | | | Short-Term
Investments and
Net Other Assets 14.1% | |

We have used ratings from Moody's® Investors Services, Inc. Where Moody's ratings are not available, we have used S&P® ratings. |
Asset Allocation (% of fund's net assets) |
As of September 30, 2006 * | As of March 31, 2006 ** |
| Stocks 7.6% | | | Stocks 7.6% | |
| U.S. Government and
U.S. Government
Agency Obligations 30.8% | | | U.S. Government and
U.S. Government
Agency Obligations 28.9% | |
| Corporate Bonds 12.8% | | | Corporate Bonds 8.0% | |
| Asset-Backed
Securities 6.8% | | | Asset-Backed
Securities 6.1% | |
| Structured Notes
(including Commodity- Linked Notes) 7.3% | | | Structured Notes
(including Commodity- Linked Notes 8.7% | |
| Floating Rate Loans 20.0% | | | Floating Rate Loans 21.2% | |
| CMOs and Other Mortgage Related Securities 4.3% | | | CMOs and Other Mortgage Related Securities 4.6% | |
| Other Investments 0.6% | | | Other Investments 0.8% | |
| Short-Term
Investments and
Net Other Assets 9.8% | | | Short-Term
Investments and
Net Other Assets 14.1% | |
* Foreign investments | 7.1% | | ** Foreign investments | 7.0% | |
* Futures and Swaps | 0.5% | | ** Futures and Swaps | 1.1% | |
* U.S. Treasury
Inflation-Indexed
Securities | 29.5% | | ** U.S. Treasury
Inflation-Indexed
Securities | 27.1% | |

For an unaudited list of holdings for each Fidelity Equity and Fixed-Income Central Fund, visit fidelity.com and/or advisor.fidelity.com, as applicable. The reports are located just after the Fund's financial statements and quarterly reports. |
Annual Report
Investments September 30, 2006
Showing Percentage of Net Assets
Corporate Bonds - 8.3% |
| Principal Amount | | Value
(Note 1) |
Convertible Bonds - 0.6% |
FINANCIALS - 0.6% |
Real Estate Investment Trusts - 0.5% |
American Financial Realty Trust 4.375% 7/15/24 | | $ 11,510,000 | | $ 10,728,506 |
Biomed Realty LP 4.5% 10/1/26 (b) | | 1,000,000 | | 997,500 |
Essex Portfolio LP 3.625% 11/1/25 (b) | | 600,000 | | 741,780 |
New Plan Excel Realty Trust 3.7% 9/15/26 (b) | | 1,000,000 | | 994,290 |
Washington (REIT) 3.875% 9/15/26 | | 750,000 | | 752,130 |
| | 14,214,206 |
Real Estate Management & Development - 0.1% |
Affordable Resources Communities LP 7.5% 8/15/25 (b) | | 2,250,000 | | 2,250,000 |
ERP Operating LP 3.85% 8/15/26 | | 2,000,000 | | 2,031,380 |
| | 4,281,380 |
TOTAL FINANCIALS | | 18,495,586 |
Nonconvertible Bonds - 7.7% |
CONSUMER DISCRETIONARY - 1.1% |
Hotels, Restaurants & Leisure - 0.1% |
Felcor Lodging LP 9% 6/1/11 | | 1,500,000 | | 1,588,125 |
Host Marriott LP 7% 8/15/12 | | 800,000 | | 808,000 |
Landry's Seafood Restaurants, Inc. 7.5% 12/15/14 | | 1,700,000 | | 1,627,750 |
| | 4,023,875 |
Household Durables - 1.0% |
Beazer Homes USA, Inc.: | | | | |
8.125% 6/15/16 | | 1,000,000 | | 970,000 |
8.375% 4/15/12 | | 400,000 | | 400,000 |
D.R. Horton, Inc. 6.5% 4/15/16 | | 1,000,000 | | 981,232 |
K. Hovnanian Enterprises, Inc.: | | | | |
6% 1/15/10 | | 400,000 | | 372,500 |
6.25% 1/15/16 | | 700,000 | | 616,000 |
7.5% 5/15/16 | | 500,000 | | 467,500 |
7.75% 5/15/13 | | 5,300,000 | | 4,876,000 |
KB Home: | | | | |
6.25% 6/15/15 | | 4,600,000 | | 4,230,477 |
7.75% 2/1/10 | | 1,700,000 | | 1,695,750 |
Kimball Hill, Inc. 10.5% 12/15/12 | | 2,700,000 | | 2,423,250 |
Meritage Homes Corp. 6.25% 3/15/15 | | 2,000,000 | | 1,700,000 |
Ryland Group, Inc. 6.875% 6/15/13 | | 1,000,000 | | 1,002,089 |
Standard Pacific Corp. 9.25% 4/15/12 | | 1,900,000 | | 1,833,500 |
Corporate Bonds - continued |
| Principal Amount | | Value
(Note 1) |
Nonconvertible Bonds - continued |
CONSUMER DISCRETIONARY - continued |
Household Durables |
Stanley-Martin Communities LLC 9.75% 8/15/15 | | $ 2,400,000 | | $ 1,884,000 |
Technical Olympic USA, Inc.: | | | | |
7.5% 3/15/11 | | 2,250,000 | | 1,800,000 |
8.25% 4/1/11 (b) | | 500,000 | | 460,000 |
WCI Communities, Inc.: | | | | |
7.875% 10/1/13 | | 650,000 | | 547,625 |
9.125% 5/1/12 | | 2,350,000 | | 2,103,250 |
| | 28,363,173 |
TOTAL CONSUMER DISCRETIONARY | | 32,387,048 |
FINANCIALS - 6.2% |
Real Estate Investment Trusts - 5.2% |
AMB Property LP 3.5% 3/1/09 | | 1,000,000 | | 959,122 |
American Health Properties, Inc. 7.5% 1/15/07 | | 2,975,000 | | 2,992,493 |
Archstone-Smith Operating Trust 3% 6/15/08 | | 6,050,000 | | 5,825,176 |
Archstone-Smith Trust 5% 8/15/07 | | 4,525,000 | | 4,506,601 |
Arden Realty LP: | | | | |
5.2% 9/1/11 | | 500,000 | | 500,141 |
5.25% 3/1/15 | | 600,000 | | 598,319 |
7% 11/15/07 | | 1,400,000 | | 1,424,357 |
Avalon Properties, Inc. 6.875% 12/15/07 | | 2,000,000 | | 2,028,858 |
AvalonBay Communities, Inc.: | | | | |
5% 8/1/07 | | 2,025,000 | | 2,012,599 |
5.5% 1/15/12 | | 1,000,000 | | 1,005,163 |
Brandywine Operating Partnership LP: | | | | |
4.5% 11/1/09 | | 840,000 | | 816,939 |
6% 4/1/16 | | 1,000,000 | | 1,011,142 |
BRE Properties, Inc. 5.75% 9/1/09 | | 4,500,000 | | 4,543,578 |
Camden Property Trust: | | | | |
4.7% 7/15/09 | | 1,000,000 | | 987,495 |
7% 11/15/06 | | 3,407,000 | | 3,412,741 |
Colonial Properties Trust 7% 7/14/07 | | 2,750,000 | | 2,779,222 |
Commercial Net Lease Realty, Inc. 6.15% 12/15/15 | | 400,000 | | 406,277 |
Developers Diversified Realty Corp.: | | | | |
3.875% 1/30/09 | | 2,000,000 | | 1,933,200 |
5.375% 10/15/12 | | 500,000 | | 494,883 |
Duke Realty LP 7.75% 11/15/09 | | 1,000,000 | | 1,065,483 |
Corporate Bonds - continued |
| Principal Amount | | Value
(Note 1) |
Nonconvertible Bonds - continued |
FINANCIALS - continued |
Real Estate Investment Trusts |
Equity One, Inc.: | | | | |
6% 9/15/16 | | $ 1,000,000 | | $ 1,006,877 |
6.25% 1/15/17 | | 1,000,000 | | 1,022,974 |
Evans Withycombe Residential LP 7.625% 4/15/07 | | 510,000 | | 514,023 |
Health Care Property Investors, Inc.: | | | | |
4.875% 9/15/10 | | 700,000 | | 679,856 |
6.3% 9/15/16 | | 4,500,000 | | 4,530,092 |
Health Care REIT, Inc. 6.2% 6/1/16 | | 1,000,000 | | 1,006,853 |
Healthcare Realty Trust, Inc.: | | | | |
5.125% 4/1/14 | | 500,000 | | 476,356 |
8.125% 5/1/11 | | 608,000 | | 661,096 |
HMB Capital Trust V 8.99% 12/15/36 (b)(c) | | 4,300,000 | | 4,300,000 |
Hospitality Properties Trust 6.75% 2/15/13 | | 1,250,000 | | 1,314,065 |
HRPT Properties Trust: | | | | |
5.99% 3/16/11 (c) | | 4,000,000 | | 4,005,832 |
6.5% 1/15/13 | | 1,000,000 | | 1,039,883 |
iStar Financial, Inc.: | | | | |
5.73% 9/15/09 (b)(c) | | 1,000,000 | | 999,872 |
5.94% 3/16/09 (c) | | 500,000 | | 503,360 |
5.95% 10/15/13 (b) | | 1,000,000 | | 1,005,340 |
6.64% 3/12/07 (c) | | 1,200,000 | | 1,205,849 |
Kimco Realty Corp.: | | | | |
7.46% 5/29/07 | | 1,250,000 | | 1,265,150 |
7.86% 11/1/07 | | 480,000 | | 490,485 |
Merry Land & Investment Co., Inc. 6.69% 10/30/06 | | 3,000,000 | | 3,002,205 |
Nationwide Health Properties, Inc.: | | | | |
6% 5/20/15 | | 230,000 | | 227,848 |
6.5% 7/15/11 | | 3,500,000 | | 3,578,967 |
7.23% 11/8/06 | | 1,110,000 | | 1,111,541 |
New Plan Excel Realty Trust 7.35% 6/15/07 | | 1,750,000 | | 1,772,820 |
Omega Healthcare Investors, Inc.: | | | | |
7% 4/1/14 | | 3,800,000 | | 3,771,500 |
7% 1/15/16 | | 1,658,000 | | 1,637,275 |
ProLogis Trust 7.1% 4/15/08 | | 1,500,000 | | 1,537,137 |
Rouse Co. LP/TRC, Inc. 6.75% 5/1/13 (b) | | 3,500,000 | | 3,495,450 |
Senior Housing Properties Trust 8.625% 1/15/12 | | 3,600,000 | | 3,861,000 |
Shurgard Storage Centers, Inc.: | | | | |
5.875% 3/15/13 | | 2,000,000 | | 2,048,292 |
7.75% 2/22/11 | | 1,000,000 | | 1,081,731 |
Corporate Bonds - continued |
| Principal Amount | | Value
(Note 1) |
Nonconvertible Bonds - continued |
FINANCIALS - continued |
Real Estate Investment Trusts |
Simon Property Group LP: | | | | |
5.375% 8/28/08 | | $ 3,000,000 | | $ 2,998,254 |
7% 6/15/28 (c) | | 960,000 | | 985,485 |
7.125% 9/20/07 | | 1,500,000 | | 1,519,265 |
Simon Property Group, Inc. 3.75% 1/30/09 | | 2,000,000 | | 1,930,870 |
Spieker Properties LP 7.25% 5/1/09 | | 2,600,000 | | 2,727,858 |
Tanger Properties LP 9.125% 2/15/08 | | 1,760,000 | | 1,839,200 |
The Rouse Co. 8% 4/30/09 | | 3,000,000 | | 3,123,693 |
Thornburg Mortgage, Inc. 8% 5/15/13 | | 6,450,000 | | 6,321,000 |
Trustreet Properties, Inc. 7.5% 4/1/15 | | 2,200,000 | | 2,183,500 |
United Dominion Realty Trust: | | | | |
4.5% 3/3/08 | | 1,750,000 | | 1,723,055 |
6.05% 6/1/13 | | 2,500,000 | | 2,539,373 |
Ventas Realty LP: | | | | |
6.5% 6/1/16 | | 2,660,000 | | 2,613,450 |
6.625% 10/15/14 | | 7,775,000 | | 7,755,563 |
6.75% 6/1/10 | | 2,400,000 | | 2,451,000 |
6.75% 4/1/17 | | 2,000,000 | | 2,002,500 |
8.75% 5/1/09 | | 1,920,000 | | 2,025,600 |
9% 5/1/12 | | 6,400,000 | | 7,136,000 |
Vornado Realty Trust 5.625% 6/15/07 | | 2,645,000 | | 2,642,432 |
Washington (REIT) 6.898% 2/25/18 | | 3,200,000 | | 3,268,230 |
Western Investment Real Estate Trust 7.2% 9/15/08 | | 500,000 | | 516,117 |
| | 150,759,963 |
Real Estate Management & Development - 0.8% |
American Real Estate Partners/American Real Estate Finance Corp.: | | | | |
7.125% 2/15/13 | | 1,240,000 | | 1,224,500 |
8.125% 6/1/12 | | 1,000,000 | | 1,022,500 |
Colonial Realty LP 6.05% 9/1/16 | | 1,000,000 | | 1,009,439 |
EOP Operating LP: | | | | |
4.65% 10/1/10 | | 8,500,000 | | 8,246,836 |
6.1081% 10/1/10 (c) | | 700,000 | | 706,446 |
6.763% 6/15/07 | | 3,192,000 | | 3,218,861 |
7.5% 4/19/29 | | 2,000,000 | | 2,239,950 |
ERP Operating LP 6.625% 3/15/12 | | 3,000,000 | | 3,174,885 |
First Industrial LP 5.75% 1/15/16 | | 1,000,000 | | 989,365 |
| | 21,832,782 |
Corporate Bonds - continued |
| Principal Amount | | Value
(Note 1) |
Nonconvertible Bonds - continued |
FINANCIALS - continued |
Thrifts & Mortgage Finance - 0.2% |
Saxon Capital, Inc. 12% 5/1/14 (b) | | $ 4,750,000 | | $ 6,246,250 |
TOTAL FINANCIALS | | 178,838,995 |
HEALTH CARE - 0.2% |
Health Care Providers & Services - 0.2% |
Skilled Healthcare Group, Inc. 11% 1/15/14 (b) | | 2,000,000 | | 2,140,000 |
Tenet Healthcare Corp. 7.375% 2/1/13 | | 4,000,000 | | 3,620,000 |
| | 5,760,000 |
MATERIALS - 0.1% |
Paper & Forest Products - 0.1% |
Plum Creek Timberlands LP 5.875% 11/15/15 | | 2,000,000 | | 1,978,352 |
TELECOMMUNICATION SERVICES - 0.1% |
Wireless Telecommunication Services - 0.1% |
American Tower Corp. 7.125% 10/15/12 | | 2,500,000 | | 2,556,250 |
TOTAL NONCONVERTIBLE BONDS | | 221,520,645 |
TOTAL CORPORATE BONDS (Cost $238,346,424) | 240,016,231 |
U.S. Treasury Inflation Protected Obligations - 29.5% |
|
U.S. Treasury Inflation-Indexed Bonds: | | | | |
2% 1/15/26 | | 95,779,310 | | 91,849,737 |
2.375% 1/15/25 | | 80,524,557 | | 81,799,721 |
3.625% 4/15/28 | | 24,658,172 | | 30,553,830 |
3.875% 4/15/29 | | 26,364,288 | | 34,056,101 |
U.S. Treasury Inflation-Indexed Notes: | | | | |
0.875% 4/15/10 | | 62,194,602 | | 58,943,237 |
1.625% 1/15/15 | | 47,442,738 | | 45,117,899 |
1.875% 7/15/13 | | 75,203,573 | | 73,233,994 |
1.875% 7/15/15 | | 38,329,837 | | 37,104,339 |
2% 1/15/14 | | 55,265,729 | | 54,198,064 |
2% 7/15/14 | | 20,618,259 | | 20,200,649 |
2% 1/15/16 | | 59,820,420 | | 58,412,907 |
2.375% 4/15/11 | | 19,888,104 | | 19,907,842 |
U.S. Treasury Inflation Protected Obligations - continued |
| Principal Amount | | Value
(Note 1) |
U.S. Treasury Inflation-Indexed Notes: - continued | | | | |
2.5% 7/15/16 | | $ 16,121,120 | | $ 16,320,000 |
3% 7/15/12 | | 34,761,297 | | 36,072,222 |
3.375% 1/15/12 | | 44,428,482 | | 46,763,304 |
3.5% 1/15/11 | | 18,589,008 | | 19,467,198 |
3.625% 1/15/08 | | 26,493,793 | | 26,706,438 |
3.875% 1/15/09 | | 49,815,310 | | 51,238,639 |
4.25% 1/15/10 | | 49,127,047 | | 51,942,715 |
TOTAL U.S. TREASURY INFLATION PROTECTED OBLIGATIONS (Cost $854,969,249) | 853,888,836 |
Asset-Backed Securities - 0.4% |
|
Ameriquest Mortgage Securities, Inc. Series 2004-R10 Class M1, 6.03% 11/25/34 (c) | | 105,000 | | 105,614 |
Conseco Finance Securitizations Corp.: | | | | |
Series 2002-1 Class M2, 9.546% 12/1/33 | | 1,500,000 | | 857,464 |
Series 2002-2 Class M2, 9.163% 3/1/33 | | 2,500,000 | | 1,831,613 |
Countrywide Home Loan Trust Series 2006-BC2N
Class N, 6.5% 2/25/47 (b) | | 397,584 | | 393,699 |
Crest Clarendon Street Ltd./Crest Clarendon Corp. Series 2002-1A Class D, 9% 12/28/35 (b) | | 500,000 | | 538,670 |
Fairfield Street Solar Corp. Series 2004-1A Class E1, 8.765% 11/28/39 (b)(c) | | 850,000 | | 865,513 |
Home Equity Asset Trust Series 2006-3N Class B, 6.5% 8/27/36 (b) | | 750,000 | | 739,115 |
Long Beach Asset Holdings Corp. Series 2006-4
Class N1, 5.877% 6/25/46 (b) | | 1,539,355 | | 1,537,431 |
Merit Securities Corp. Series 13 Class M1, 8.63% 12/28/33 | | 1,500,000 | | 1,365,000 |
Resi Finance LP Series 2006-B Class B6, 7.03% 6/15/38 (c) | | 998,053 | | 998,051 |
Residential Asset Securities Corp. Series 2003-KS10 Class MI3, 6.41% 12/25/33 | | 1,000,000 | | 982,852 |
Sharps SP I LLC Net Interest Margin Trust Series 2004-HE3N Class NA, 5.19% 11/25/34 (b) | | 21,331 | | 21,302 |
Structured Asset Securities Corp. Series 2006-BC1
Class B1, 7.83% 3/25/36 (b)(c) | | 100,000 | | 87,060 |
Taberna Preferred Funding III Ltd. Series 2005-3A
Class D, 8.13% 2/5/36 (b)(c) | | 250,000 | | 233,125 |
TOTAL ASSET-BACKED SECURITIES (Cost $10,538,657) | 10,556,509 |
Collateralized Mortgage Obligations - 0.2% |
| Principal Amount | | Value
(Note 1) |
Private Sponsor - 0.2% |
Banc of America Large Loan, Inc. floater Series 2003-BBA2 Class L, 9.28% 11/15/15 (b)(c) | | $ 2,000,000 | | $ 1,978,905 |
Countrywide Alternative Loan Trust Series 2006-OC5N Class N, 7.25% 7/25/37 (b) | | 913,572 | | 912,370 |
Countrywide Home Loans, Inc. Series 2005-R3 Class B3, 5.5% 9/25/35 (b)(c) | | 147,611 | | 114,612 |
Countrywide Home Loans, Inc. Series 2003-J15: | | | | |
Class B3, 4.71% 1/25/19 (b)(c) | | 106,605 | | 96,892 |
Class B4, 4.71% 1/25/19 (b)(c) | | 213,210 | | 168,281 |
Residential Finance LP/Residential Finance Development Corp. floater Series 2005-D Class B6, 7.58% 12/15/37 (b)(c) | | 492,784 | | 499,802 |
Resix Finance Ltd. floater: | | | | |
Series 2005-C Class B7, 8.43% 9/10/37 (b)(c) | | 147,936 | | 147,936 |
Series 2005-D Class B7, 9.58% 12/15/37 (b)(c) | | 295,670 | | 298,728 |
Series 2006-A Class B7, 8.83% 3/15/38 (b)(c) | | 745,095 | | 745,092 |
Series 2006-B Class B7, 9.18% 7/15/38 (b)(c) | | 998,053 | | 998,047 |
TOTAL COLLATERALIZED MORTGAGE OBLIGATIONS (Cost $5,948,870) | 5,960,665 |
Commercial Mortgage Securities - 1.0% |
|
Asset Securitization Corp. Series 1997-MD7 Class A4, 7.8496% 1/13/30 (c) | | 499,608 | | 499,608 |
Banc of America Large Loan, Inc. floater: | | | | |
Series 2003-BBA2 Class K, 7.93% 11/15/15 (b)(c) | | 675,000 | | 669,758 |
Series 2005-ESHA Class K, 7.13% 7/14/08 (b)(c) | | 300,000 | | 300,150 |
Series 2005-MIB1 Class K, 7.33% 3/15/22 (b)(c) | | 800,000 | | 791,743 |
Credit Suisse/Morgan Stanley Commercial Mortgage Trust Series 2006-HC1A Class K, 6.807% 5/15/23 (b)(c) | | 3,757,000 | | 3,757,000 |
Crest Ltd. Series 2001-1A Class C, 9% 2/25/34 (b) | | 500,000 | | 525,560 |
CS First Boston Mortgage Securities Corp. Series 2004-FL1A Class G, 8.2286% 5/15/14 (b)(c) | | 652,274 | | 652,981 |
Global Signal Trust II Series 2004-2A: | | | | |
Class D, 5.093% 12/15/14 (b) | | 1,000,000 | | 976,420 |
Class F, 6.376% 12/15/14 (b) | | 800,000 | | 788,122 |
Global Signal Trust III Series 2006-1 Class F, 7.036% 2/15/36 (b) | | 930,000 | | 948,920 |
Commercial Mortgage Securities - continued |
| Principal Amount | | Value
(Note 1) |
GMAC Commercial Mortgage Securities, Inc.: | | | | |
Series 1997-C2 Class E, 7.624% 4/15/29 (c) | | $ 900,000 | | $ 973,266 |
Series 1999-C1 Class F, 6.02% 5/15/33 (b) | | 2,500,000 | | 2,557,812 |
Series 2003-J10 Class B2, 6.75% 4/15/29 (c) | | 1,000,000 | | 1,010,508 |
Guggenheim Structure Real Estate Funding Ltd. floater Series 2006-3 Class E, 6.98% 9/25/46 (b)(c) | | 750,000 | | 750,000 |
LB-UBS Commercial Mortgage Trust sequential pay Series 2005-C7 Class A1, 4.99% 11/15/30 | | 2,588,223 | | 2,580,808 |
Mezz Capital Commercial Mortgage Trust
Series 2005-C3: | | | | |
Class D, 7.7% 5/20/44 (b) | | 600,000 | | 585,817 |
Class F, 10.813% 5/20/44 (b) | | 400,000 | | 396,127 |
TERRA LNR I Series 2006-E, 7% 6/15/17 (b)(c) | | 770,000 | | 769,992 |
Wachovia Bank Commercial Mortgage Trust Series 2005-C20 Class A3SF, 5.46% 7/15/42 (c) | | 5,200,000 | | 5,191,074 |
Wachovia Ltd./Wachovia Llc Series 2006-1 Class 1Ml, LIBOR + 5.5% 9/25/26 (b)(c) | | 3,000,000 | | 3,007,560 |
Wrightwood Capital Real Estate CDO Ltd. floater Series 2005-1A Class F, 7.3425% 11/21/40 (b)(c) | | 1,500,000 | | 1,518,615 |
TOTAL COMMERCIAL MORTGAGE SECURITIES (Cost $29,146,939) | 29,251,841 |
Common Stocks - 3.8% |
| | Shares | | |
CONSUMER DISCRETIONARY - 0.3% |
Hotels, Restaurants & Leisure - 0.2% |
Red Lion Hotels Corp. (a) | | 120,600 | | 1,297,656 |
Starwood Hotels & Resorts Worldwide, Inc. | | 60,700 | | 3,471,433 |
| | | 4,769,089 |
Household Durables - 0.1% |
KB Home | | 20,000 | | 876,000 |
Lennar Corp. Class A | | 20,700 | | 936,675 |
Ryland Group, Inc. | | 23,000 | | 993,830 |
| | | 2,806,505 |
TOTAL CONSUMER DISCRETIONARY | | | 7,575,594 |
Common Stocks - continued |
| | Shares | | Value
(Note 1) |
FINANCIALS - 3.4% |
Real Estate Investment Trusts - 3.4% |
Acadia Realty Trust (SBI) | | 21,100 | | $ 538,050 |
Alexandria Real Estate Equities, Inc. | | 26,300 | | 2,466,940 |
American Financial Realty Trust (SBI) | | 113,400 | | 1,265,544 |
American Home Mortgage Investment Corp. | | 6,000 | | 209,220 |
Annaly Capital Management, Inc. | | 335,500 | | 4,408,470 |
Anworth Mortgage Asset Corp. | | 234,300 | | 1,956,405 |
Apartment Investment & Management Co. Class A | | 7,700 | | 418,957 |
Archstone-Smith Trust | | 14,200 | | 773,048 |
AvalonBay Communities, Inc. | | 19,500 | | 2,347,800 |
Boston Properties, Inc. | | 12,800 | | 1,322,752 |
Capital Lease Funding, Inc. | | 89,600 | | 993,664 |
CBRE Realty Finance, Inc. | | 175,000 | | 2,668,750 |
Cousins Properties, Inc. | | 33,900 | | 1,159,719 |
Developers Diversified Realty Corp. | | 48,700 | | 2,715,512 |
DiamondRock Hospitality Co. | | 24,200 | | 401,962 |
Duke Realty Corp. | | 25,000 | | 933,750 |
Education Realty Trust, Inc. | | 30,550 | | 450,918 |
Equity Lifestyle Properties, Inc. | | 78,700 | | 3,597,377 |
Equity Office Properties Trust | | 79,280 | | 3,152,173 |
Equity Residential (SBI) | | 73,800 | | 3,732,804 |
Federal Realty Investment Trust (SBI) | | 26,800 | | 1,991,240 |
Fieldstone Investment Corp. | | 161,600 | | 1,410,768 |
General Growth Properties, Inc. | | 131,900 | | 6,285,035 |
Glenborough Realty Trust, Inc. | | 15,800 | | 406,534 |
GMH Communities Trust | | 84,200 | | 1,062,604 |
Healthcare Realty Trust, Inc. | | 16,300 | | 626,083 |
Hersha Hospitality Trust | | 36,900 | | 354,240 |
HomeBanc Mortgage Corp., Georgia | | 284,200 | | 1,747,830 |
Host Hotels & Resorts, Inc. | | 150,947 | | 3,461,215 |
Inland Real Estate Corp. | | 173,000 | | 3,030,960 |
Innkeepers USA Trust (SBI) | | 39,200 | | 638,568 |
Kimco Realty Corp. | | 73,400 | | 3,146,658 |
KKR Financial Corp. | | 10,200 | | 250,308 |
Lexington Corporate Properties Trust | | 17,100 | | 362,178 |
MFA Mortgage Investments, Inc. | | 298,700 | | 2,225,315 |
MortgageIT Holdings, Inc. | | 116,000 | | 1,633,280 |
Nationwide Health Properties, Inc. | | 74,300 | | 1,986,782 |
New York Mortgage Trust, Inc. | | 191,700 | | 739,962 |
Newcastle Investment Corp. | | 127,200 | | 3,486,552 |
Opteum, Inc. Class A | | 88,700 | | 714,035 |
Common Stocks - continued |
| | Shares | | Value
(Note 1) |
FINANCIALS - continued |
Real Estate Investment Trusts - continued |
Plum Creek Timber Co., Inc. | | 4,700 | | $ 159,988 |
ProLogis Trust | | 44,900 | | 2,561,994 |
Redwood Trust, Inc. | | 11,800 | | 594,366 |
Regency Centers Corp. | | 26,400 | | 1,815,264 |
Resource Capital Corp. | | 32,000 | | 494,400 |
Saxon Capital, Inc. | | 229,900 | | 3,227,796 |
Simon Property Group, Inc. | | 20,800 | | 1,884,896 |
Spirit Finance Corp. | | 388,600 | | 4,511,646 |
Strategic Hotel & Resorts, Inc. | | 47,100 | | 936,348 |
Sunstone Hotel Investors, Inc. | | 6,700 | | 199,124 |
Thornburg Mortgage, Inc. (SBI) | | 28,000 | | 713,160 |
Trizec Properties, Inc. | | 23,800 | | 688,058 |
Trustreet Properties, Inc. | | 53,700 | | 671,787 |
U-Store-It Trust | | 10,800 | | 231,768 |
United Dominion Realty Trust, Inc. (SBI) | | 47,000 | | 1,419,400 |
Ventas, Inc. | | 87,400 | | 3,368,396 |
Vornado Realty Trust | | 14,100 | | 1,536,900 |
Washington (REIT) (SBI) | | 26,300 | | 1,046,740 |
| | | 97,135,993 |
Real Estate Management & Development - 0.0% |
The St. Joe Co. | | 18,900 | | 1,037,043 |
TOTAL FINANCIALS | | | 98,173,036 |
HEALTH CARE - 0.0% |
Health Care Providers & Services - 0.0% |
Capital Senior Living Corp. (a) | | 45,000 | | 416,250 |
Emeritus Corp. (a) | | 39,300 | | 846,915 |
| | | 1,263,165 |
MATERIALS - 0.1% |
Paper & Forest Products - 0.1% |
Weyerhaeuser Co. | | 27,300 | | 1,679,769 |
TOTAL COMMON STOCKS (Cost $99,650,918) | | 108,691,564 |
Preferred Stocks - 3.8% |
| | Shares | | Value
(Note 1) |
Convertible Preferred Stocks - 0.5% |
FINANCIALS - 0.5% |
Real Estate Investment Trusts - 0.5% |
Annaly Capital Management, Inc. Series B, 6.00% | | 80,000 | | $ 2,185,760 |
Lexington Corporate Properties Trust Series C 6.50% | | 10,700 | | 501,830 |
The Mills Corp. 6.75% (b) | | 8,254 | | 6,923,043 |
Trustreet Properties, Inc. Series C, 7.50% | | 91,300 | | 1,893,562 |
Windrose Medical Properties Trust 7.50% | | 92,200 | | 2,581,600 |
| | | 14,085,795 |
Nonconvertible Preferred Stocks - 3.3% |
FINANCIALS - 3.3% |
Diversified Financial Services - 0.1% |
DRA CRT Acquisition Corp. Series A, 8.50% | | 1,700 | | 40,375 |
Red Lion Hotels Capital Trust 9.50% | | 138,465 | | 3,607,013 |
| | | 3,647,388 |
Real Estate Investment Trusts - 3.2% |
Accredited Mortgage Loan Trust Series A, 9.75% | | 100,700 | | 2,527,570 |
Alexandria Real Estate Equities, Inc.: | | | |
Series B, 9.10% | | 3,600 | | 91,224 |
Series C, 8.375% | | 10,000 | | 262,000 |
American Home Mortgage Investment Corp.: | | | |
Series A, 9.375% | | 79,300 | | 2,110,173 |
Series B, 9.25% | | 230,944 | | 5,960,665 |
Annaly Capital Management, Inc. Series A, 7.875% | | 141,300 | | 3,505,653 |
Anthracite Capital, Inc. Series C, 9.375% | | 400 | | 10,680 |
Anworth Mortgage Asset Corp. Series A, 8.625% | | 189,600 | | 4,692,600 |
Apartment Investment & Management Co. Series T, 8.00% | | 80,000 | | 2,030,400 |
Ashford Hospitality Trust, Inc. Series A, 8.55% | | 10,000 | | 255,500 |
Capital Lease Funding, Inc. Series A, 8.125% | | 20,000 | | 501,000 |
CBL & Associates Properties, Inc. Series B, 8.75% | | 64,200 | | 3,300,522 |
CenterPoint Properties Trust Series D, 5.377% | | 5,280 | | 4,224,000 |
Colonial Properties Trust (depositary shares) Series D, 8.125% | | 5,000 | | 129,950 |
Cousins Properties, Inc. Series A, 7.75% | | 49,600 | | 1,269,760 |
Crescent Real Estate Equities Co. Series B, 9.50% | | 50,000 | | 1,283,000 |
Developers Diversified Realty Corp. (depositary shares) Series F, 8.60% | | 10,000 | | 254,300 |
Digital Realty Trust, Inc.: | | | |
Series A, 8.50% | | 90,000 | | 2,335,500 |
Series B, 7.875% | | 36,100 | | 915,496 |
Eagle Hospitality Properties Trust, Inc. Series A, 8.25% | | 71,300 | | 1,829,558 |
Preferred Stocks - continued |
| | Shares | | Value
(Note 1) |
Nonconvertible Preferred Stocks - continued |
FINANCIALS - continued |
Real Estate Investment Trusts |
FelCor Lodging Trust, Inc. (depositary shares) Series C, 8.00% | | 40,000 | | $ 980,000 |
Glimcher Realty Trust Series F, 8.75% | | 30,000 | | 760,800 |
Hersha Hospitality Trust Series A, 8.00% | | 40,000 | | 1,038,400 |
Home Properties of New York, Inc. Series F, 9.00% | | 124,800 | | 3,183,648 |
HomeBanc Mortgage Corp., Georgia Series A, 10.00% | | 311,415 | | 7,866,343 |
Impac Mortgage Holdings, Inc. Series C, 9.125% | | 17,700 | | 412,587 |
Innkeepers USA Trust Series C, 8.00% | | 53,000 | | 1,341,960 |
LaSalle Hotel Properties Series A, 10.25% | | 124,500 | | 3,189,690 |
Lexington Corporate Properties Trust Series B, 8.05% | | 60,000 | | 1,534,200 |
MFA Mortgage Investments, Inc. Series A, 8.50% | | 162,900 | | 4,012,227 |
Mid-America Apartment Communities, Inc. Series H, 8.30% | | 45,100 | | 1,150,501 |
Nationwide Health Properties, Inc. 7.677% | | 19,200 | | 1,940,160 |
New Century Financial Corp. Series B 9.75% | | 25,000 | | 625,000 |
New Plan Excel Realty Trust (depositary shares) Series D, 7.80% | | 20,500 | | 1,025,000 |
Newcastle Investment Corp. Series B, 9.75% | | 79,000 | | 2,063,480 |
NorthStar Realty Finance Corp. Series A 8.75% | | 20,000 | | 513,000 |
Omega Healthcare Investors, Inc. Series D, 8.375% | | 80,000 | | 2,080,800 |
Parkway Properties, Inc. Series D, 8.00% | | 80,000 | | 2,032,800 |
Prime Group Realty Trust Series B, 9.00% | | 15,500 | | 280,550 |
PS Business Parks, Inc. (depositary shares) Series F, 8.75% | | 3,400 | | 86,088 |
Public Storage, Inc. Series I, 7.25% | | 20,000 | | 495,000 |
RAIT Investment Trust: | | | |
Series A, 7.75% | | 60,000 | | 1,473,000 |
Series B, 8.375% | | 17,000 | | 434,350 |
Realty Income Corp. 8.25% | | 100 | | 2,604 |
Saul Centers, Inc. 8.00% | | 40,000 | | 1,018,400 |
Simon Property Group, Inc. Series G, 7.89% | | 11,500 | | 593,400 |
Strategic Hotel & Resorts, Inc.: | | | |
Series A, 8.50% | | 120,000 | | 3,015,000 |
Series C, 8.25% | | 60,000 | | 1,539,000 |
Sunstone Hotel Investors, Inc. Series A, 8.00% | | 15,000 | | 381,000 |
Taubman Centers, Inc. Series G, 8.00% | | 20,000 | | 530,200 |
The Mills Corp.: | | | |
Series B, 9.00% | | 64,400 | | 1,378,160 |
Series C, 9.00% | | 156,500 | | 3,302,150 |
Series E, 8.75% | | 138,885 | | 2,880,475 |
Series G, 7.875% | | 39,933 | | 775,100 |
| | | 91,424,624 |
Preferred Stocks - continued |
| | Shares | | Value
(Note 1) |
Nonconvertible Preferred Stocks - continued |
FINANCIALS - continued |
Real Estate Management & Development - 0.0% |
Affordable Residential Communties, Inc. Series A, 8.25% | | 52,800 | | $ 1,251,360 |
TOTAL FINANCIALS | | | 96,323,372 |
TOTAL PREFERRED STOCKS (Cost $109,846,393) | | 110,409,167 |
Floating Rate Loans - 0.8% |
| | Principal
Amount | | |
CONSUMER DISCRETIONARY - 0.2% |
Hotels, Restaurants & Leisure - 0.0% |
Landry's Seafood Restaurants, Inc. term loan 7.1201% 12/28/10 (c) | | $ 997,462 | | 996,215 |
Specialty Retail - 0.2% |
The Pep Boys - Manny, Moe & Jack term loan 8.32% 1/27/11 (c) | | 39,800 | | 39,999 |
Toys 'R' US, Inc. term loan 8.33% 12/9/08 (c) | | 5,000,000 | | 4,993,750 |
| | | 5,033,749 |
TOTAL CONSUMER DISCRETIONARY | | | 6,029,964 |
CONSUMER STAPLES - 0.0% |
Food & Staples Retailing - 0.0% |
Cumberland Farms, Inc. term loan 7.37% 9/25/13 (c) | | 2,000,000 | | 2,007,500 |
FINANCIALS - 0.4% |
Real Estate Investment Trusts - 0.2% |
Capital Automotive (REIT) Tranche B, term loan 7.08% 12/16/10 (c) | | 488,393 | | 489,614 |
General Growth Properties, Inc. Tranche A1, term loan 6.58% 2/24/10 (c) | | 3,000,000 | | 2,966,250 |
Newkirk Master LP Tranche B, term loan 7.08% 8/11/08 (c) | | 1,221,055 | | 1,219,529 |
Trizec Properties, Inc. term loan 6.775% 5/2/07 (c) | | 1,140,000 | | 1,138,575 |
| | | 5,813,968 |
Floating Rate Loans - continued |
| | Principal Amount | | Value
(Note 1) |
FINANCIALS - continued |
Real Estate Management & Development - 0.1% |
MDS Realty Holdings LLC: | | | |
Tranche M1, term loan 7.6563% 1/8/08 (c) | | $ 1,872,076 | | $ 1,872,076 |
Tranche M3, term loan 8.9063% 1/8/08 (c) | | 1,497,661 | | 1,497,661 |
North Las Vegas/Olympia Group Tranche 1, term loan 8.1169% 5/9/11 (c) | | 497,500 | | 487,550 |
| | | 3,857,287 |
Thrifts & Mortgage Finance - 0.1% |
Charter Municipal Mortgage Acceptance Co. term loan 7.9% 8/15/12 (c) | | 1,500,000 | | 1,503,750 |
TOTAL FINANCIALS | | | 11,175,005 |
HEALTH CARE - 0.2% |
Health Care Providers & Services - 0.2% |
HealthSouth Corp. term loan 8.58% 3/10/13 (c) | | 3,990,000 | | 4,009,950 |
Skilled Healthcare Group, Inc. Tranche 1, term loan 8.08% 6/15/12 (c) | | 997,475 | | 1,004,956 |
| | | 5,014,906 |
TELECOMMUNICATION SERVICES - 0.0% |
Wireless Telecommunication Services - 0.0% |
Crown Castle Operating Co. Tranche B, term loan 7.65% 6/1/14 (c) | | 510,000 | | 510,000 |
TOTAL FLOATING RATE LOANS (Cost $24,758,659) | | 24,737,375 |
Commodity-Linked Notes - 7.3% |
|
AIG-FP Private Funding Ltd.: | | | | |
Master Note, one-month U.S. dollar LIBOR plus .10% due 6/29/2007 (indexed to the Dow Jones-AIG Commodity Total Return Index, multiplied by 3) (b)(c)(e) | | 7,670,000 | | 5,869,668 |
Master Note, one-month U.S. dollar LIBOR plus .10% due 7/12/2007 (indexed to the Dow Jones-AIG Commodity Total Return Index, multiplied by 3) (b)(c)(e) | | 5,000,000 | | 3,521,488 |
Master Note, one-month U.S. dollar LIBOR plus .10% due 7/6/2007 (indexed to the Dow Jones-AIG Commodity Total Return Index, multiplied by 3) (b)(c)(e) | | 9,500,000 | | 7,381,505 |
Commodity-Linked Notes - continued |
| | Principal Amount | | Value
(Note 1) |
AIG-FP Private Funding Ltd.: - continued | | | | |
Master Note, one-month U.S. dollar LIBOR plus .10% due 8/20/2007 (indexed to the Dow Jones-AIG Commodity Total Return Index, multiplied by 3) (b)(c)(e) | | $ 15,100,000 | | $ 14,642,092 |
Master Note, one-month U.S. dollar LIBOR plus .10% due 8/24/2007 (indexed to the Dow Jones-AIG Commodity Total Return Index, multiplied by 3) (b)(c)(e) | | 6,000,000 | | 6,137,428 |
Master Note, one-month U.S. dollar LIBOR plus .10% due 8/29/2007 (indexed to the Dow Jones-AIG Commodity Total Return Index, multiplied by 3) (b)(c)(e) | | 2,600,000 | | 2,697,291 |
Master Note, one-month U.S. dollar LIBOR plus .15% due 3/15/2007 (indexed to the Dow Jones-AIG Commodity Total Return Index, multiplied by 3) (b)(c)(e) | | 9,970,000 | | 8,687,327 |
Master Note, one-month U.S. dollar LIBOR plus .15% due 3/8/2007 (indexed to the Dow Jones-AIG Commodity Total Return Index, multiplied by 3) (b)(c)(e) | | 3,330,000 | | 2,993,347 |
Master Note, one-month U.S. dollar LIBOR plus .15% due 4/20/2007 (indexed to the Dow Jones-AIG Commodity Total Return Index, multiplied by 3) (b)(c)(e) | | 6,670,000 | | 4,695,243 |
Master Note, one-month U.S. dollar LIBOR plus .15% due 4/9/2007 (indexed to the Dow Jones-AIG Commodity Total Return Index, multiplied by 3) (b)(c)(e) | | 3,300,000 | | 2,282,453 |
Master Note, one-month U.S. dollar LIBOR plus .15% due 6/6/2007 (indexed to the Dow Jones-AIG Commodity Total Return Index, multiplied by 3) (b)(c)(e) | | 1,670,000 | | 1,232,797 |
Master Note, one-month U.S. dollar LIBOR plus .15% due 3/2/2007 (indexed to the Dow Jones-AIG Commodity Total Return Index, multiplied by 3) (b)(c)(e) | | 5,000,000 | | 4,721,259 |
Master Note, one-month U.S. dollar LIBOR plus .15% due 3/8/2007 (indexed to the Dow Jones-AIG Commodity Total Return Index, multiplied by 3) (b)(c)(e) | | 2,500,000 | | 2,272,002 |
JPMorgan Chase Bank NA: | | | | |
Medium Term Note, one-month U.S. dollar LIBOR minus .15% due 4/27/2007 (indexed to the Dow Jones-AIG Commodity Total Return Index, multiplied by 3) (b)(c)(e) | | 9,670,000 | | 7,845,989 |
Commodity-Linked Notes - continued |
| | Principal Amount | | Value
(Note 1) |
JPMorgan Chase Bank NA: - continued | | | | |
Medium Term Note, one-month U.S. dollar LIBOR minus .15% due 4/9/2007 (indexed to the Dow Jones-AIG Commodity Total Return Index, multiplied by 3) (b)(c)(e) | | $ 6,630,000 | | $ 4,507,896 |
Medium Term Note, one-month U.S. dollar LIBOR minus .15% due 5/4/2007 (indexed to the Dow Jones-AIG Commodity Total Return Index, multiplied by 3) (b)(c)(e) | | 5,070,000 | | 4,201,611 |
Medium Term Note, one-month U.S. dollar LIBOR minus .15% due 6/29/2007 (indexed to the Dow Jones-AIG Commodity Total Return Index, multiplied by 3) (b)(c)(e) | | 1,500,000 | | 1,139,610 |
Medium Term Note, one-month U.S. dollar LIBOR minus .15% due 6/6/2007 (indexed to the Dow Jones-AIG Commodity Total Return Index, multiplied by 3) (b)(c)(e) | | 1,670,000 | | 1,277,517 |
Medium Term Note, one-month U.S. dollar LIBOR minus .15% due 7/12/2007 (indexed to the Dow Jones-AIG Commodity Total Return Index, multiplied by 3) (b)(c)(e) | | 5,000,000 | | 3,521,687 |
Medium Term Note, one-month U.S. dollar LIBOR minus .15% due 7/20/2007 (indexed to the Dow Jones-AIG Commodity Total Return Index, multiplied by 3) (b)(c)(e) | | 4,000,000 | | 3,144,954 |
Medium Term Note, one-month U.S. dollar LIBOR minus .15% due 8/24/2007 (indexed to the Dow Jones-AIG Commodity Total Return Index, multiplied by 3) (b)(c)(e) | | 3,550,000 | | 3,707,282 |
Medium Term Note, one-month U.S. dollar LIBOR minus .15% due 8/29/2007 (indexed to the Dow Jones-AIG Commodity Total Return Index, multiplied by 3) (b)(c)(e) | | 7,210,000 | | 7,415,465 |
Medium Term Note, one-month U.S. dollar LIBOR minus .17% due 10/06/2006 (indexed to the Dow Jones-AIG Commodity Total Return Index, multiplied by 3) (b)(c)(e) | | 1,780,000 | | 1,568,657 |
Medium Term Note, one-month U.S. dollar LIBOR minus .17% due 10/16/2006 (indexed to the Dow Jones-AIG Commodity Total Return Index, multiplied by 3) (b)(c)(e) | | 4,970,000 | | 4,175,429 |
Medium Term Note, one-month U.S. dollar LIBOR minus .17% due 12/14/2006 (indexed to the Dow Jones-AIG Commodity Total Return Index, multiplied by 3) (b)(c)(e) | | 4,160,000 | | 3,735,211 |
Commodity-Linked Notes - continued |
| | Principal Amount | | Value
(Note 1) |
JPMorgan Chase Bank NA: - continued | | | | |
Medium Term Note, one-month U.S. dollar LIBOR minus .17% due 2/12/2007 (indexed to the Dow Jones-AIG Commodity Total Return Index, multiplied by 3) (b)(c)(e) | | $ 4,000,000 | | $ 4,070,736 |
Medium Term Note, one-month U.S. dollar LIBOR minus .17% due 3/15/2007 (indexed to the Dow Jones-AIG Commodity Total Return Index, multiplied by 3) (b)(c)(e) | | 2,500,000 | | 2,183,504 |
Medium Term Note, one-month U.S. dollar LIBOR minus .17% due 3/2/2007 (indexed to the Dow Jones-AIG Commodity Total Return Index, multiplied by 3) (b)(c)(e) | | 3,340,000 | | 3,272,148 |
Medium Term Note, one-month U.S. dollar LIBOR minus .18% due 10/06/2006 (indexed to the Dow Jones-AIG Commodity Total Return Index, multiplied by 3) (b)(c)(e) | | 3,060,000 | | 2,635,931 |
Morgan Stanley: | | | | |
Note, one-month U.S. dollar LIBOR minus .03% due 8/6/2007 (indexed to the Dow Jones-AIG Commodity Total Return Index, multiplied by 3) (b)(c)(e) | | 8,340,000 | | 6,997,640 |
Note, one-month U.S. dollar LIBOR minus .07% due 6/27/2007 (indexed to the Dow Jones-AIG Commodity Total Return Index, multiplied by 3) (b)(c)(e) | | 8,340,000 | | 5,859,783 |
Note, one-month U.S. dollar LIBOR minus .10% due 3/23/2007 (indexed to the Dow Jones-AIG Commodity Total Return Index, multiplied by 3) (b)(c)(e) | | 8,340,000 | | 6,178,330 |
Note, one-month U.S. dollar LIBOR minus .10% due 6/6/2007 (indexed to the Dow Jones-AIG Commodity Total Return Index, multiplied by 3) (b)(c)(e) | | 12,340,000 | | 9,787,378 |
Note, one-month U.S. dollar LIBOR minus .15% due 2/27/2007 (indexed to the Dow Jones-AIG Commodity Total Return Index, multiplied by 3) (b)(c)(e) | | 22,330,000 | | 20,955,892 |
Note, one-month U.S. dollar LIBOR minus .15% due 3/23/2007 (indexed to the Dow Jones-AIG Commodity Total Return Index, multiplied by 3) (b)(c)(e) | | 5,000,000 | | 4,487,387 |
Commodity-Linked Notes - continued |
| | Principal Amount | | Value
(Note 1) |
Societe Generale Commodities Products, LLC: | | | | |
Note, one-month U.S. dollar LIBOR minus .10% due 7/17/2007 (indexed to the Dow Jones-AIG Commodity Total Return Index, multiplied by 3) (b)(c)(e) | | $ 6,340,000 | | $ 4,557,961 |
Note, one-month U.S. dollar LIBOR minus .10% due 7/20/2007 (indexed to the Dow Jones-AIG Commodity Total Return Index, multiplied by 3) (b)(c)(e) | | 13,300,000 | | 10,629,582 |
Note, one-month U.S. dollar LIBOR minus .10% due 7/27/2007 (indexed to the Dow Jones-AIG Commodity Total Return Index, multiplied by 3) (b)(c)(e) | | 5,170,000 | | 4,136,794 |
Note, one-month U.S. dollar LIBOR minus .10% due 8/10/2007 (indexed to the Dow Jones-AIG Commodity Total Return Index, multiplied by 3) (b)(c)(e) | | 9,150,000 | | 7,975,186 |
Note, one-month U.S. dollar LIBOR minus .10% due 8/31/2007 (indexed to the Dow Jones-AIG Commodity Total Return Index, multiplied by 3) (b)(c)(e) | | 3,000,000 | | 3,014,017 |
TOTAL COMMODITY-LINKED NOTES (Cost $248,070,000) | 210,117,477 |
Fixed-Income Funds - 42.2% |
| Shares | | |
Fidelity Floating Rate Central Investment Portfolio (d) | 7,132,846 | | 715,567,111 |
Fidelity Ultra-Short Central Fund (d) | 5,084,144 | | 505,821,487 |
TOTAL FIXED-INCOME FUNDS (Cost $1,222,731,910) | 1,221,388,598 |
Preferred Securities - 0.2% |
| Principal
Amount | | |
FINANCIALS - 0.2% |
Diversified Financial Services - 0.2% |
Cairn High Grade ABS CDO II Ltd. Series 2006-2A Class SUB, 1/13/47 (b) | $ 1,200,000 | | 1,080,000 |
Crest Clarendon Street 2002-1 Ltd. Series 2002-1A Class PS, 12/28/35 (b) | 500,000 | | 521,213 |
Preferred Securities - continued |
| Principal Amount | | Value
(Note 1) |
FINANCIALS - continued |
Diversified Financial Services - continued |
Harp High Grade CDO I Ltd. Series 2006-1, 7/8/46 (b) | $ 1,650,000 | | $ 1,600,500 |
Ipswich Street CDO Series 2006-1, 6/27/46 (b) | 2,250,000 | | 2,182,500 |
TOTAL PREFERRED SECURITIES (Cost $5,445,370) | 5,384,213 |
Cash Equivalents - 1.8% |
| Maturity Amount | | |
Investments in repurchase agreements (Collateralized by U.S. Treasury Obligations), in a joint trading account at 5.08%, dated 9/29/06 due 10/2/06
(Cost $51,181,000) | $ 51,202,668 | | 51,181,000 |
TOTAL INVESTMENT PORTFOLIO - 99.3% (Cost $2,900,634,389) | | 2,871,583,476 |
NET OTHER ASSETS - 0.7% | | 21,317,909 |
NET ASSETS - 100% | $ 2,892,901,385 |
Legend |
(a) Non-income producing |
(b) Security exempt from registration under Rule 144A of the Securities Act of 1933. These securities may be resold in transactions exempt from registration, normally to qualified institutional buyers. At the end of the period, the value of these securities amounted to $275,428,372 or 9.5% of net assets. |
(c) The coupon rate shown on floating or adjustable rate securities represents the rate at period end. |
(d) Affiliated fund that is available only to investment companies and other accounts managed by Fidelity Investments. A complete unaudited list of holdings for each Fidelity Central Fund, as of the Investing Fund's report date, is available upon request or at fidelity.com and/or advisor.fidelity.com, as applicable. The reports are located just after the Investing Fund's financial statements and quarterly reports but are not part of the financial statements or quarterly reports. In addition, each Fidelity Central Fund's financial statements, which are not covered by the Investing Fund's Report of Independent Registered Public Accounting Firm, are available on the EDGAR Database on the SEC's web site, www.sec.gov, or upon request. |
(e) Security is linked to the Dow Jones-AIG Commodity Total Return Index. Securities do not guarantee any return of principal at maturity but instead, will pay at maturity or upon exchange, an amount based on the closing value of the Dow Jones-AIG Commodity Index Total Return. Although these instruments are primarily debt obligations, they indirectly provide exposure to changes in the value of the underlying commodities. Holders of the security have the right to exchange these notes at any time. |
Affiliated Central Funds |
Information regarding fiscal year to date income earned by the Fund from investments in Fidelity Central Funds is as follows: |
Fund | Income earned |
Fidelity Floating Rate Central Investment Portfolio | $ 23,003,598 |
Fidelity Ultra-Short Central Fund | 11,744,528 |
Total | $ 34,748,126 |
|
Additional information regarding the Fund's fiscal year to date purchases and sales, including the ownership percentage, of the non Money Market Central Funds is as follows: |
Fund | Value, beginning of period | Purchases | Sales Proceeds | Value, end of period | % ownership, end of period |
Fidelity Floating Rate Central Investment Portfolio | $ 7,598,671 | $ 709,374,857 | $ - | $ 715,567,111 | 46.3% |
Fidelity Ultra-Short Central Fund | 6,644,141 | 499,114,422 | - | 505,821,487 | 5.9% |
Total | $ 14,242,812 | $ 1,208,489,279 | $ - | $ 1,221,388,598 | |
See accompanying notes which are an integral part of the financial statements.
Annual Report
Financial Statements
Statement of Assets and Liabilities
| September 30, 2006 |
| | |
Assets | | |
Investment in securities, at value (including repurchase agreements of $51,181,000) -
See accompanying schedule: Unaffiliated issuers (cost $1,677,902,479) | $ 1,650,194,878 | |
Fidelity Central Funds (cost $1,222,731,910) | 1,221,388,598 | |
Total Investments (cost $2,900,634,389) | | $ 2,871,583,476 |
Receivable for investments sold | | 5,473,539 |
Receivable for fund shares sold | | 20,135,812 |
Dividends receivable | | 1,719,704 |
Interest receivable | | 19,821,398 |
Receivable from investment adviser for expense reductions | | 235 |
Other receivables | | 1,137 |
Total assets | | 2,918,735,301 |
| | |
Liabilities | | |
Payable to custodian bank | $ 839,981 | |
Payable for investments purchased | 21,149,229 | |
Payable for fund shares redeemed | 1,751,121 | |
Accrued management fee | 1,315,228 | |
Distribution fees payable | 23,721 | |
Other affiliated payables | 381,005 | |
Other payables and accrued expenses | 373,631 | |
Total liabilities | | 25,833,916 |
| | |
Net Assets | | $ 2,892,901,385 |
Net Assets consist of: | | |
Paid in capital | | $ 2,890,235,544 |
Undistributed net investment income | | 35,583,876 |
Accumulated undistributed net realized gain (loss) on investments | | (3,867,122) |
Net unrealized appreciation (depreciation) on investments | | (29,050,913) |
Net Assets | | $ 2,892,901,385 |
See accompanying notes which are an integral part of the financial statements.
Annual Report
Financial Statements - continued
Statement of Assets and Liabilities - continued
| September 30, 2006 |
| | |
Calculation of Maximum Offering Price
Class A:
Net Asset Value and redemption price per share
($13,335,218 ÷ 1,322,619 shares) | | $ 10.08 |
| | |
Maximum offering price per share (100/95.25 of $10.08) | | $ 10.58 |
Class T:
Net Asset Value and redemption price per share ($22,825,074 ÷ 2,264,602 shares) | | $ 10.08 |
| | |
Maximum offering price per share (100/96.50 of $10.08) | | $ 10.45 |
Class B:
Net Asset Value and offering price per share ($6,001,546 ÷ 596,777 shares)A | | $ 10.06 |
| | |
Class C:
Net Asset Value and offering price per share ($16,528,091 ÷ 1,645,914 shares)A | | $ 10.04 |
| | |
Strategic Real Return:
Net Asset Value, offering price and redemption price per share ($2,694,765,026 ÷ 266,860,845 shares) | | $ 10.10 |
| | |
Institutional Class:
Net Asset Value, offering price and redemption price per share ($139,446,430 ÷ 13,823,004 shares) | | $ 10.09 |
A Redemption price per share is equal to net asset value less any applicable contingent deferred sales charge.
See accompanying notes which are an integral part of the financial statements.
Annual Report
Statement of Operations
| Year ended September 30, 2006 |
| | |
Investment Income | | |
Dividends | | $ 7,049,737 |
Interest | | 41,245,356 |
Income from Fidelity Central Funds | | 34,748,126 |
Total income | | 83,043,219 |
| | |
Expenses | | |
Management fee | $ 7,570,420 | |
Transfer agent fees | 1,753,452 | |
Distribution fees | 170,374 | |
Accounting fees and expenses | 569,065 | |
Custodian fees and expenses | 25,788 | |
Independent trustees' compensation | 4,144 | |
Registration fees | 548,206 | |
Audit | 123,515 | |
Legal | 13,299 | |
Miscellaneous | 2,751 | |
Total expenses before reductions | 10,781,014 | |
Expense reductions | (87,924) | 10,693,090 |
Net investment income | | 72,350,129 |
Realized and Unrealized Gain (Loss) Net realized gain (loss) on: | | |
Investment securities: | | |
Unaffiliated issuers | | (5,738,064) |
Change in net unrealized appreciation (depreciation) on investment securities | | (29,436,055) |
Net gain (loss) | | (35,174,119) |
Net increase (decrease) in net assets resulting from operations | | $ 37,176,010 |
See accompanying notes which are an integral part of the financial statements.
Annual Report
Financial Statements - continued
Statement of Changes in Net Assets
| Year ended
September 30, 2006 | For the period
September 7, 2005 (commencement of operations) to
September 30, 2005 |
Increase (Decrease) in Net Assets | | |
Operations | | |
Net investment income | $ 72,350,129 | $ 81,416 |
Net realized gain (loss) | (5,738,064) | 2,066 |
Change in net unrealized appreciation (depreciation) | (29,436,055) | 385,142 |
Net increase (decrease) in net assets resulting
from operations | 37,176,010 | 468,624 |
Distributions to shareholders from net investment income | (34,978,986) | - |
Share transactions - net increase (decrease) | 2,852,107,184 | 38,055,768 |
Redemption fees | 72,674 | 111 |
Total increase (decrease) in net assets | 2,854,376,882 | 38,524,503 |
| | |
Net Assets | | |
Beginning of period | 38,524,503 | - |
End of period (including undistributed net investment income of $35,583,876 and undistributed net investment income of $78,944, respectively) | $ 2,892,901,385 | $ 38,524,503 |
See accompanying notes which are an integral part of the financial statements.
Annual Report
Financial Highlights - Class A
Years ended September 30, | 2006 | 2005 H |
Selected Per-Share Data | | |
Net asset value, beginning of period | $ 10.15 | $ 10.00 |
Income from Investment Operations | | |
Net investment income E | .524 | .031 |
Net realized and unrealized gain (loss) | (.329) | .119 |
Total from investment operations | .195 | .150 |
Distributions from net investment income | (.266) | - |
Redemption fees added to paid in capital E | .001 | - |
Net asset value, end of period | $ 10.08 | $ 10.15 |
Total Return B, C, D | 1.96% | 1.50% |
Ratios to Average Net Assets F, I | | |
Expenses before reductions | 1.02% | 4.71% A |
Expenses net of fee waivers, if any | 1.00% | 1.00% A |
Expenses net of all reductions | .99% | 1.00% A |
Net investment income | 5.24% | 4.28% A |
Supplemental Data | | |
Net assets, end of period (000 omitted) | $ 13,335 | $ 3,405 |
Portfolio turnover rate G | 11% | 78% A |
A Annualized
B Total returns for periods of less than one year are not annualized.
C Total returns would have been lower had certain expenses not been reduced during the periods shown.
D Total returns do not include the effect of the sales charges.
E Calculated based on average shares outstanding during the period.
F Fees and expenses of the underlying Fidelity Central Funds are not included in the Fund's expense ratio. The Fund indirectly bears its proportionate share of the expenses of any underlying Fidelity Central Funds.
G Amount does not include the portfolio activity of any underlying Fidelity Central Funds.
H For the period September 7, 2005 (commencement of operations) to September 30, 2005.
I Expense ratios reflect operating expenses of the class. Expenses before reductions do not reflect amounts reimbursed by the investment adviser or reductions from brokerage service arrangements or other expense offset arrangements and do not represent the amount paid by the class during periods when reimbursements or reductions occur. Expense ratios before reductions for start-up periods may not be representative of longer-term operating periods. Expenses net of fee waivers reflect expenses after reimbursement by the investment adviser but prior to reductions from brokerage service arrangements or other expense offset arrangements. Expenses net of all reductions represent the net expenses paid by the class.
See accompanying notes which are an integral part of the financial statements.
Annual Report
Financial Highlights - Class T
Years ended September 30, | 2006 | 2005 H |
Selected Per-Share Data | | |
Net asset value, beginning of period | $ 10.15 | $ 10.00 |
Income from Investment Operations | | |
Net investment income E | .517 | .030 |
Net realized and unrealized gain (loss) | (.325) | .120 |
Total from investment operations | .192 | .150 |
Distributions from net investment income | (.263) | - |
Redemption fees added to paid in capital E | .001 | - |
Net asset value, end of period | $ 10.08 | $ 10.15 |
Total Return B, C, D | 1.93% | 1.50% |
Ratios to Average Net Assets F, I | | |
Expenses before reductions | 1.05% | 4.81% A |
Expenses net of fee waivers, if any | 1.05% | 1.10% A |
Expenses net of all reductions | 1.05% | 1.10% A |
Net investment income | 5.19% | 4.18% A |
Supplemental Data | | |
Net assets, end of period (000 omitted) | $ 22,825 | $ 3,284 |
Portfolio turnover rate G | 11% | 78% A |
A Annualized
B Total returns for periods of less than one year are not annualized.
C Total returns would have been lower had certain expenses not been reduced during the periods shown.
D Total returns do not include the effect of the sales charges.
E Calculated based on average shares outstanding during the period.
F Fees and expenses of the underlying Fidelity Central Funds are not included in the Fund's expense ratio. The Fund indirectly bears its proportionate share of the expenses of any underlying Fidelity Central Funds.
G Amount does not include the portfolio activity of any underlying Fidelity Central Funds.
H For the period September 7, 2005 (commencement of operations) to September 30, 2005.
I Expense ratios reflect operating expenses of the class. Expenses before reductions do not reflect amounts reimbursed by the investment adviser or reductions from brokerage service arrangements or other expense offset arrangements and do not represent the amount paid by the class during periods when reimbursements or reductions occur. Expense ratios before reductions for start-up periods may not be representative of longer-term operating periods. Expenses net of fee waivers reflect expenses after reimbursement by the investment adviser but prior to reductions from brokerage service arrangements or other expense offset arrangements. Expenses net of all reductions represent the net expenses paid by the class.
See accompanying notes which are an integral part of the financial statements.
Annual Report
Financial Highlights - Class B
Years ended September 30, | 2006 | 2005 H |
Selected Per-Share Data | | |
Net asset value, beginning of period | $ 10.14 | $ 10.00 |
Income from Investment Operations | | |
Net investment income E | .450 | .025 |
Net realized and unrealized gain (loss) | (.318) | .115 |
Total from investment operations | .132 | .140 |
Distributions from net investment income | (.213) | - |
Redemption fees added to paid in capital E | .001 | - |
Net asset value, end of period | $ 10.06 | $ 10.14 |
Total Return B, C, D | 1.33% | 1.40% |
Ratios to Average Net Assets F, I | | |
Expenses before reductions | 1.74% | 5.47% A |
Expenses net of fee waivers, if any | 1.74% | 1.75% A |
Expenses net of all reductions | 1.73% | 1.75% A |
Net investment income | 4.49% | 3.53% A |
Supplemental Data | | |
Net assets, end of period (000 omitted) | $ 6,002 | $ 3,253 |
Portfolio turnover rate G | 11% | 78% A |
A Annualized
B Total returns for periods of less than one year are not annualized.
C Total returns would have been lower had certain expenses not been reduced during the periods shown.
D Total returns do not include the effect of the contingent deferred sales charge.
E Calculated based on average shares outstanding during the period.
F Fees and expenses of the underlying Fidelity Central Funds are not included in the Fund's expense ratio. The Fund indirectly bears its proportionate share of the expenses of any underlying Fidelity Central Funds.
G Amount does not include the portfolio activity of any underlying Fidelity Central Funds.
H For the period September 7, 2005 (commencement of operations) to September 30, 2005.
I Expense ratios reflect operating expenses of the class. Expenses before reductions do not reflect amounts reimbursed by the investment adviser or reductions from brokerage service arrangements or other expense offset arrangements and do not represent the amount paid by the class during periods when reimbursements or reductions occur. Expense ratios before reductions for start-up periods may not be representative of longer-term operating periods. Expenses net of fee waivers reflect expenses after reimbursement by the investment adviser but prior to reductions from brokerage service arrangements or other expense offset arrangements. Expenses net of all reductions represent the net expenses paid by the class.
See accompanying notes which are an integral part of the financial statements.
Annual Report
Financial Highlights - Class C
Years ended September 30, | 2006 | 2005 H |
Selected Per-Share Data | | |
Net asset value, beginning of period | $ 10.14 | $ 10.00 |
Income from Investment Operations | | |
Net investment income E | .437 | .024 |
Net realized and unrealized gain (loss) | (.323) | .116 |
Total from investment operations | .114 | .140 |
Distributions from net investment income | (.215) | - |
Redemption fees added to paid in capital E | .001 | - |
Net asset value, end of period | $ 10.04 | $ 10.14 |
Total Return B, C, D | 1.15% | 1.40% |
Ratios to Average Net Assets F, I | | |
Expenses before reductions | 1.86% | 5.56% A |
Expenses net of fee waivers, if any | 1.85% | 1.85% A |
Expenses net of all reductions | 1.84% | 1.85% A |
Net investment income | 4.39% | 3.43% A |
Supplemental Data | | |
Net assets, end of period (000 omitted) | $ 16,528 | $ 3,467 |
Portfolio turnover rate G | 11% | 78% A |
A Annualized
B Total returns for periods of less than one year are not annualized.
C Total returns would have been lower had certain expenses not been reduced during the periods shown.
D Total returns do not include the effect of the contingent deferred sales charge.
E Calculated based on average shares outstanding during the period.
F Fees and expenses of the underlying Fidelity Central Funds are not included in the Fund's expense ratio. The Fund indirectly bears its proportionate share of the expenses of any underlying Fidelity Central Funds.
G Amount does not include the portfolio activity of any underlying Fidelity Central Funds.
H For the period September 7, 2005 (commencement of operations) to September 30, 2005.
I Expense ratios reflect operating expenses of the class. Expenses before reductions do not reflect amounts reimbursed by the investment adviser or reductions from brokerage service arrangements or other expense offset arrangements and do not represent the amount paid by the class during periods when reimbursements or reductions occur. Expense ratios before reductions for start-up periods may not be representative of longer-term operating periods. Expenses net of fee waivers reflect expenses after reimbursement by the investment adviser but prior to reductions from brokerage service arrangements or other expense offset arrangements. Expenses net of all reductions represent the net expenses paid by the class.
See accompanying notes which are an integral part of the financial statements.
Annual Report
Financial Highlights - Strategic Real Return
Years ended September 30, | 2006 | 2005 G |
Selected Per-Share Data | | |
Net asset value, beginning of period | $ 10.15 | $ 10.00 |
Income from Investment Operations | | |
Net investment income D | .544 | .028 |
Net realized and unrealized gain (loss) | (.317) | .122 |
Total from investment operations | .227 | .150 |
Distributions from net investment income | (.278) | - |
Redemption fees added to paid in capital D | .001 | - I |
Net asset value, end of period | $ 10.10 | $ 10.15 |
Total Return B, C | 2.28% | 1.50% |
Ratios to Average Net Assets E, H | | |
Expenses before reductions | .80% | 4.41% A |
Expenses net of fee waivers, if any | .80% | .85% A |
Expenses net of all reductions | .79% | .85% A |
Net investment income | 5.45% | 4.43% A |
Supplemental Data | | |
Net assets, end of period (000 omitted) | $ 2,694,765 | $ 21,867 |
Portfolio turnover rate F | 11% | 78% A |
A Annualized
B Total returns for periods of less than one year are not annualized.
C Total returns would have been lower had certain expenses not been reduced during the periods shown.
D Calculated based on average shares outstanding during the period.
E Fees and expenses of the underlying Fidelity Central Funds are not included in the Fund's expense ratio. The Fund indirectly bears its proportionate share of the expenses of any underlying Fidelity Central Funds.
F Amount does not include the portfolio activity of any underlying Fidelity Central Funds.
G For the period September 7, 2005 (commencement of operations) to September 30, 2005.
H Expense ratios reflect operating expenses of the class. Expenses before reductions do not reflect amounts reimbursed by the investment adviser or reductions from brokerage service arrangements or other expense offset arrangements and do not represent the amount paid by the class during periods when reimbursements or reductions occur. Expense ratios before reductions for start-up periods may not be representative of longer-term operating periods. Expenses net of fee waivers reflect expenses after reimbursement by the investment adviser but prior to reductions from brokerage service arrangements or other expense offset arrangements. Expenses net of all reductions represent the net expenses paid by the class.
I Amount represents less than $.001 per share.
See accompanying notes which are an integral part of the financial statements.
Annual Report
Financial Highlights - Institutional Class
Years ended September 30, | 2006 | 2005 G |
Selected Per-Share Data | | |
Net asset value, beginning of period | $ 10.15 | $ 10.00 |
Income from Investment Operations | | |
Net investment income D | .540 | .032 |
Net realized and unrealized gain (loss) | (.321) | .118 |
Total from investment operations | .219 | .150 |
Distributions from net investment income | (.280) | - |
Redemption fees added to paid in capital D | .001 | - |
Net asset value, end of period | $ 10.09 | $ 10.15 |
Total Return B, C | 2.20% | 1.50% |
Ratios to Average Net Assets E, H | | |
Expenses before reductions | .82% | 4.55% A |
Expenses net of fee waivers, if any | .82% | .85% A |
Expenses net of all reductions | .82% | .85% A |
Net investment income | 5.46% | 4.43% A |
Supplemental Data | | |
Net assets, end of period (000 omitted) | $ 139,446 | $ 3,248 |
Portfolio turnover rate F | 11% | 78% A |
A Annualized
B Total returns for periods of less than one year are not annualized.
C Total returns would have been lower had certain expenses not been reduced during the periods shown.
D Calculated based on average shares outstanding during the period.
E Fees and expenses of the underlying Fidelity Central Funds are not included in the Fund's expense ratio. The Fund indirectly bears its proportionate share of the expenses of any underlying Fidelity Central Funds.
F Amount does not include the portfolio activity of any underlying Fidelity Central Funds.
G For the period September 7, 2005 (commencement of operations) to September 30, 2005.
H Expense ratios reflect operating expenses of the class. Expenses before reductions do not reflect amounts reimbursed by the investment adviser or reductions from brokerage service arrangements or other expense offset arrangements and do not represent the amount paid by the class during periods when reimbursements or reductions occur. Expense ratios before reductions for start-up periods may not be representative of longer-term operating periods. Expenses net of fee waivers reflect expenses after reimbursement by the investment adviser but prior to reductions from brokerage service arrangements or other expense offset arrangements. Expenses net of all reductions represent the net expenses paid by the class.
See accompanying notes which are an integral part of the financial statements.
Annual Report
Notes to Financial Statements
For the period ended September 30, 2006
1. Significant Accounting Policies.
Fidelity Strategic Real Return Fund (the Fund) is a fund of Fidelity Commonwealth Trust (the trust) and is authorized to issue an unlimited number of shares. The trust is registered under the Investment Company Act of 1940, as amended (the 1940 Act), as an open-end management investment company organized as a Massachusetts business trust.
The Fund offers Class A, Class T, Class B, Class C, Strategic Real Return, and Institutional Class shares, each of which has equal rights as to assets and voting privileges. Each class has exclusive voting rights with respect to matters that affect that class. Class B shares will automatically convert to Class A shares after a holding period of seven years from the initial date of purchase. Investment income, realized and unrealized capital gains and losses, the common expenses of the Fund, and certain fund-level expense reductions, if any, are allocated on a pro rata basis to each class based on the relative net assets of each class to the total net assets of the Fund. Each class differs with respect to transfer agent and distribution and service plan fees incurred. Certain expense reductions also differ by class.
The Fund may invest in Fidelity Central Funds which are open-end investment companies available to investment companies and other accounts managed by Fidelity Management & Research Company (FMR) and its affiliates. The financial statements have been prepared in conformity with accounting principles generally accepted in the United States of America, which require management to make certain estimates and assumptions at the date of the financial statements. The following summarizes the significant accounting policies of the Fund, which are also consistently followed by the Fidelity Central Funds:
Security Valuation. Investments are valued and net asset value per share is calculated (NAV calculation) as of the close of business of the New York Stock Exchange, normally 4:00 p.m. Eastern time. Wherever possible, the Fund uses independent pricing services approved by the Board of Trustees to value its investments. Debt securities, including restricted securities, for which quotations are readily available, are valued by independent pricing services or by dealers who make markets in such securities. Pricing services consider yield or price of bonds of comparable quality, coupon, maturity and type as well as dealer supplied prices. Equity securities, including restricted securities, for which market quotations are readily available, are valued at the last reported sale price or official closing price as reported by an independent pricing service on the primary market or exchange on which they are traded. In the event there were no sales during the day or closing prices are not available, securities are valued at the last quoted bid price.
Annual Report
Notes to Financial Statements - continued
1. Significant Accounting Policies - continued
Security Valuation - continued
When current market prices or quotations are not readily available or do not accurately reflect fair value, valuations may be determined in accordance with procedures adopted by the Board of Trustees. The frequency of when fair value pricing is used is unpredictable. The value of securities used for NAV calculation under fair value pricing may differ from published prices for the same securities. Investments in open-end mutual funds, including the Fidelity Central Funds, are valued at their closing net asset value each business day. Short-term securities with remaining maturities of sixty days or less for which quotations are not readily available are valued at amortized cost, which approximates value.
Investment Transactions and Income. Security transactions, including the Fund's investment activity in the Fidelity Central Funds, are accounted for as of trade date. Gains and losses on securities sold are determined on the basis of identified cost. Dividend income is recorded on the ex-dividend date, except for certain dividends from foreign securities where the ex-dividend date may have passed, which are recorded as soon as the Fund is informed of the ex-dividend date. Non-cash dividends included in dividend income, if any, are recorded at the fair market value of the securities received. Distributions received on securities that represent a return of capital or capital gain are recorded as a reduction of cost of investments and/or as a realized gain. The Fund estimates the components of distributions received that may be considered return of capital distributions or capital gain distributions. Interest income and distributions from the Fidelity Central Funds are accrued as earned. Interest income includes coupon interest and amortization of premium and accretion of discount on debt securities. Inflation-indexed bonds are fixed-income securities whose principal value is periodically adjusted to the rate of inflation. Interest is accrued based on the principal value, which is adjusted for inflation. Any increase in the principal amount of an inflation-indexed bond is recorded as interest income, even though principal is not received until maturity.
Expenses. Most expenses of the trust can be directly attributed to a fund. Expenses which cannot be directly attributed are apportioned among each Fund in the trust. Expense estimates are accrued in the period to which they relate and adjustments are made when actual amounts are known.
Income Tax Information and Distributions to Shareholders. Each year, the Fund intends to qualify as a regulated investment company by distributing all of its taxable income and realized gains under Subchapter M of the Internal Revenue Code. As a result, no provision for income taxes is required in the accompanying financial statements.
Annual Report
1. Significant Accounting Policies - continued
Income Tax Information and Distributions to Shareholders - continued
Distributions are recorded on the ex-dividend date. Income dividends and capital gain distributions are declared separately for each class. Income and capital gain distributions are determined in accordance with income tax regulations, which may differ from generally accepted accounting principles. In addition, the Fund will claim a portion of the payment made to redeeming shareholders as a distribution for income tax purposes.
Capital accounts within the financial statements are adjusted for permanent book-tax differences. These adjustments have no impact on net assets or the results of operations. Temporary book-tax differences will reverse in a subsequent period.
Book-tax differences are primarily due to market discount, partnerships (including allocations from CIPs), income recognized on commodity-linked notes and losses deferred due to wash sales and excise tax regulations.
The tax-basis components of distributable earnings and the federal tax cost as of period end were as follows:
Unrealized appreciation | $ 24,808,933 | |
Unrealized depreciation | (49,149,157) | |
Net unrealized appreciation (depreciation) | (24,340,224) | |
Undistributed ordinary income | 31,404,681 | |
Undistributed long-term capital gain | 227,005 | |
| | |
Cost for federal income tax purposes | $ 2,895,923,700 | |
The tax character of distributions paid was as follows:
| September 30, 2006 | September 30, 2005 |
Ordinary Income | $ 34,978,986 | $ - |
Short-Term Trading (Redemption) Fees. Shares held in the Fund less than 60 days are subject to a redemption fee equal to .75% of the proceeds of the redeemed shares. All redemption fees, including any estimated redemption fees paid by FMR, are retained by the Fund and accounted for as an addition to paid in capital.
Annual Report
Notes to Financial Statements - continued
1. Significant Accounting Policies - continued
New Accounting Pronouncement. In July 2006, Financial Accounting Standards Board Interpretation No. 48, Accounting for Uncertainty in Income Taxes - an interpretation of FASB Statement 109 (FIN 48), was issued and is effective for fiscal years beginning after December 15, 2006. FIN 48 sets forth a threshold for financial statement recognition, measurement and disclosure of a tax position taken or expected to be taken on a tax return. Management is currently evaluating the impact, if any, the adoption of FIN 48 will have on the Fund's net assets, results of operations and financial statement disclosures.
In addition, in September 2006, Statement of Financial Accounting Standards No. 157, Fair Value Measurements (SFAS 157), was issued and is effective for fiscal years beginning after November 15, 2007. SFAS 157 defines fair value, establishes a framework for measuring fair value and expands disclosures about fair value measurements. Management is currently evaluating the impact the adoption of SFAS 157 will have on the Fund's financial statement disclosures.
2. Operating Policies.
Repurchase Agreements. FMR has received an Exemptive Order from the Securities and Exchange Commission (the SEC) which permits the Fund and other affiliated entities of FMR to transfer uninvested cash balances into joint trading accounts which are then invested in repurchase agreements. The Fund may also invest directly with institutions in repurchase agreements. Repurchase agreements are collateralized by government or non-government securities. Upon settlement date, collateral is held in segregated accounts with custodian banks and may be obtained in the event of a default of the counterparty. The Fund monitors, on a daily basis, the value of the collateral to ensure it is at least equal to the principal amount of the repurchase agreement (including accrued interest). In the event of a default by the counterparty, realization of the collateral proceeds could be delayed, during which time the value of the collateral may decline.
Indexed Securities. The Fund may invest in indexed securities whose values, interest rates and/or redemption prices are linked either directly or inversely to changes in foreign currencies, interest rates, commodities, indices, or other underlying instruments. These securities may be used to increase or decrease its exposure to different underlying instruments and to gain exposure to markets that might be difficult to invest in through conventional securities. Indexed securities may be more volatile than their underlying instruments, but any loss is limited to the amount of the original investment. Indexed
Annual Report
2. Operating Policies - continued
Indexed Securities - continued
securities are marked-to-market daily based on dealer-supplied valuations and changes in value are recorded as unrealized appreciation (depreciation). Gains (losses) realized upon the sale of indexed securities are included in realized gains (losses) on investment securities.
Restricted Securities. The Fund may invest in securities that are subject to legal or contractual restrictions on resale. These securities generally may be resold in transactions exempt from registration or to the public if the securities are registered. Disposal of these securities may involve time-consuming negotiations and expense, and prompt sale at an acceptable price may be difficult. Information regarding restricted securities is included at the end of the Fund's Schedule of Investments.
Loans and Other Direct Debt Instruments. The Fund may invest in loans and loan participations, trade claims or other receivables. These investments may include standby financing commitments, including revolving credit facilities, that obligate the Fund to supply additional cash to the borrower on demand. Loan participations involve a risk of insolvency of the lending bank or other financial intermediary. The Fund may be contractually obligated to receive approval from the agent bank and/or borrower prior to the sale of these investments.
3. Purchases and Sales of Investments.
Purchases and sales of securities (including non Money Market Central Funds), other than short-term securities and U.S. government securities, aggregated $1,769,704,296 and $50,814,076, respectively.
4. Fees and Other Transactions with Affiliates.
Management Fee. FMR and its affiliates provide the Fund with investment management related services for which the Fund pays a monthly management fee. The management fee is the sum of an individual fund fee rate that is based on an annual rate of .45% of the Fund's average net assets and a group fee rate that averaged ..12% during the period. The group fee rate is based upon the average net assets of all the mutual funds advised by FMR. The group fee rate decreases as assets under management increase and increases as assets under management decrease. For the period, the total annual management fee rate was .57% of the Fund's average net assets.
Annual Report
Notes to Financial Statements - continued
4. Fees and Other Transactions with Affiliates - continued
Distribution and Service Plan. In accordance with Rule 12b-1 of the 1940 Act, the Fund has adopted separate Distribution and Service Plans for each class of shares. Certain classes pay Fidelity Distributors Corporation (FDC), an affiliate of FMR, separate Distribution and Service Fees, each of which is based on an annual percentage of each class' average net assets. In addition, FDC may pay financial intermediaries for selling shares of the Fund and providing shareholder support services. For the period, the Distribution and Service Fee rates and the total amounts paid to and retained by FDC were as follows:
| Distribution
Fee | Service
Fee | Paid to
FDC | Retained
by FDC |
Class A | 0% | .15% | $ 12,428 | $ 5,145 |
Class T | 0% | .25% | 29,199 | 13,567 |
Class B | .65% | .25% | 40,712 | 37,497 |
Class C | .75% | .25% | 88,035 | 73,578 |
| | | $ 170,374 | $ 129,787 |
Sales Load. FDC receives a front-end sales charge of up to 4.75% for selling Class A shares, and 3.50% for selling Class T shares, some of which is paid to financial intermediaries for selling shares of the Fund. FDC receives the proceeds of contingent deferred sales charges levied on Class A, Class T, Class B, and Class C redemptions. These charges depend on the holding period. The deferred sales charges range from 5% to 1% for Class B, 1% for Class C, 1.00% to .50% for certain purchases of Class A shares (.25% prior to February 24, 2006) and .25% for certain purchases of Class T shares.
For the period, sales charge amounts retained by FDC were as follows:
| Retained
by FDC |
Class A | $ 16,722 |
Class T | 5,780 |
Class B* | 1,703 |
Class C* | 1,177 |
| $ 25,382 |
* When Class B and Class C shares are initially sold, FDC pays commissions from its own resources to financial intermediaries through which the sales are made.
Transfer Agent Fees. Fidelity Investments Institutional Operations Company, Inc. (FIIOC), an affiliate of FMR, is the transfer, dividend disbursing and shareholder servicing agent for each class of the Fund, except for Strategic Real Return. Fidelity Service Company, Inc. (FSC), an affiliate of FMR, is the transfer agent for Strategic Real Return
Annual Report
4. Fees and Other Transactions with Affiliates - continued
Transfer Agent Fees - continued
shares. FIIOC and FSC receive account fees and asset-based fees that vary according to the account size and type of account of the shareholders of the respective classes of the Fund. FIIOC and FSC pay for typesetting, printing and mailing of shareholder reports, except proxy statements. For the period, the total transfer agent fees paid by each class to FIIOC or FSC, were as follows:
| Amount | % of
Average
Net Assets |
Class A | $ 15,898 | .19 |
Class T | 16,142 | .14 |
Class B | 7,207 | .16 |
Class C | 16,553 | .19 |
Strategic Real Return | 1,628,931 | .13 |
Institutional Class | 68,721 | .17 |
| $ 1,753,452 | |
Accounting Fees. FSC maintains the Fund's accounting records. The fee is based on the level of average net assets for the month.
Investments in Fidelity Central Funds. The Fund may invest in Fidelity Central Funds. The Fund's Schedule of Investments lists each of the Fidelity Central Funds as an investment of the Fund but does not include the underlying holdings of each Fidelity Central Fund. As an Investing Fund, the Fund indirectly bears its proportionate share of the expenses of the underlying Fidelity Central Funds. A complete unaudited list of holdings for each Fidelity Central Fund as of the Fund's report date, is available upon request or, for each non Money Market Central Fund, at fidelity.com and/or advisor.fidelity.com, as applicable. The reports are located just after the Fund's financial statements and quarterly reports but are not part of the financial statements or quarterly reports. In addition, the financial statements of the Fidelity Central Funds, which are not covered by the Fund's Report of Independent Registered Public Accounting Firm, are available on the EDGAR Database on the SEC's web site, www.sec.gov, or upon request.
Based on their investment objective, each Fidelity Central Fund may invest or participate in various investment vehicles or strategies that are similar to those of the Fund. These strategies are consistent with the investment objectives of the Fund and may involve certain economic risks which may cause a decline in value of each of the Fidelity
Annual Report
Notes to Financial Statements - continued
4. Fees and Other Transactions with Affiliates - continued
Investments in Fidelity Central Funds - continued
Central Funds and thus a decline in the value of the Fund. The following summarizes the Fund's investment in each Fidelity Fixed-Income Central Fund.
Central Fund | Investment Adviser | Investment Objective | Investment Practices |
Fidelity Floating Rate Central Investment Portfolio | Fidelity Management and Research Company, Inc. (FMRC) | Seeks a high level of income by normally investing in floating rate loans and other floating rate securities. | Loans & Direct Debt Instruments Repurchase Agreements Restricted Securities |
Fidelity Ultra-Short Central Fund | Fidelity Investments Money Management, Inc. (FIMM) | Seeks to obtain a high level of current income consistent with preservation of capital by investing in U.S. dollar denominated money market and investment-grade debt securities. | Delayed Delivery & When Issued Securities Futures Repurchase Agreements Restricted Securities Swap Agreements |
Brokerage Commissions. The Fund placed a portion of its portfolio transactions with brokerage firms which are affiliates of the investment adviser. The commissions paid to these affiliated firms were $11,383 for the period.
5. Committed Line of Credit.
The Fund participates with other funds managed by FMR in a $4.2 billion credit facility (the "line of credit") to be utilized for temporary or emergency purposes to fund shareholder redemptions or for other short-term liquidity purposes. The Fund has agreed to pay commitment fees on its pro rata portion of the line of credit, which amounts to $1,177 and is reflected in Miscellaneous Expense on the Statement of Operations. During the period, there were no borrowings on this line of credit.
6. Expense Reductions.
FMR voluntarily agreed to reimburse each class to the extent annual operating expenses exceeded certain levels of average net assets as noted in the table below. Some expenses, for example interest expense, are excluded from this reimbursement.
Annual Report
6. Expense Reductions - continued
The following classes were in reimbursement during the period:
| Expense
Limitations | Reimbursement
from adviser |
Class A | 1.00% | $ 1,573 |
Class C | 1.85% | 907 |
| | $ 2,480 |
Many of the brokers with whom FMR places trades on behalf of the Fund provided services to the Fund in addition to trade execution. These services included payments of certain expenses on behalf of the Fund totaling $7,019 for the period . In addition, through arrangements with the Fund's custodian and each class' transfer agent, credits realized as a result of uninvested cash balances were used to reduce the Fund's expenses. During the period, these credits reduced the Fund's custody expenses by $17,270. During the period, credits reduced each class' transfer agent expense as noted in the table below.
| Transfer Agent
expense reduction | |
Class A | $ 334 | |
Class T | 210 | |
Class B | 349 | |
Class C | 349 | |
Strategic Real Return | 58,536 | |
Institutional Class | 1,377 | |
| $ 61,155 | |
7. Other.
The Fund's organizational documents provide former and current trustees and officers with a limited indemnification against liabilities arising in connection with the performance of their duties to the Fund. In the normal course of business, the Fund may also enter into contracts that provide general indemnifications. The Fund's maximum exposure under these arrangements is unknown as this would be dependent on future claims that may be made against the Fund. The risk of material loss from such claims is considered remote.
During the period, the Fund's transfer agent, Fidelity Investments Institutional Operations Company, Inc. (FIIOC), an affiliate of FMR, notified the Fund that the fund's books and records did not reflect a conversion of certain Class B to Class A shares upon their conversion date. Management has determined that this did not have a material impact to the Fund's reported net assets or results of operations in the accompanying financial
Annual Report
Notes to Financial Statements - continued
7. Other - continued
statements. FIIOC will cause the books and records of the fund to reflect a conversion of the relevant Class B shares to Class A and is in the process of determining the impact to affected shareholder accounts for purposes of its remediation.
At the end of the period, Fidelity Freedom 2010 Fund and Fidelity Freedom 2020 Fund were the owners of record of approximately 23% and 20%, respectively, of the total outstanding shares of the Fund. The Fidelity Freedom Funds and Fidelity Advisor Freedom Funds were the owners of record, in the aggregate, of approximately 73% of the total outstanding shares of the Fund.
8. Distributions to Shareholders.
Distributions to shareholders of each class were as follows:
| Years ended September 30, |
| 2006 | 2005 A |
From net investment income | | |
Class A | $ 208,517 | $ - |
Class T | 289,389 | - |
Class B | 93,989 | - |
Class C | 179,234 | - |
Strategic Real Return | 33,243,282 | - |
Institutional Class | 964,575 | - |
Total | $ 34,978,986 | $ - |
A For the period September 7, 2005 (commencement of operations) to September 30, 2005.
Annual Report
9. Share Transactions.
Transactions for each class of shares were as follows:
| Shares | Dollars |
| Years ended September 30, | Years ended September 30, |
| 2006 | 2005 A | 2006 | 2005 A |
Class A | | | | |
Shares sold | 1,062,245 | 335,576 | $ 10,682,808 | $ 3,356,917 |
Reinvestment of distributions | 18,536 | - | 186,545 | - |
Shares redeemed | (93,738) | - | (941,015) | - |
Net increase (decrease) | 987,043 | 335,576 | $ 9,928,338 | $ 3,356,917 |
Class T | | | | |
Shares sold | 2,016,115 | 323,690 | $ 20,310,680 | $ 3,237,283 |
Reinvestment of distributions | 27,883 | - | 280,850 | - |
Shares redeemed | (103,086) | - | (1,039,256) | - |
Net increase (decrease) | 1,940,912 | 323,690 | $ 19,552,274 | $ 3,237,283 |
Class B | | | | |
Shares sold | 278,611 | 320,754 | $ 2,800,793 | $ 3,207,594 |
Reinvestment of distributions | 8,817 | - | 88,578 | - |
Shares redeemed | (11,405) | - | (114,615) | - |
Net increase (decrease) | 276,023 | 320,754 | $ 2,774,756 | $ 3,207,594 |
Class C | | | | |
Shares sold | 1,338,035 | 341,879 | $ 13,461,519 | $ 3,420,798 |
Reinvestment of distributions | 15,337 | - | 154,041 | - |
Shares redeemed | (49,337) | - | (493,981) | - |
Net increase (decrease) | 1,304,035 | 341,879 | $ 13,121,579 | $ 3,420,798 |
Strategic Real Return | | | | |
Shares sold | 280,727,948 | 2,155,812 | $ 2,831,792,513 | $ 21,651,987 |
Reinvestment of distributions | 3,208,074 | - | 32,357,881 | - |
Shares redeemed | (19,229,121) | (1,868) | (193,558,495) | (18,821) |
Net increase (decrease) | 264,706,901 | 2,153,944 | $ 2,670,591,899 | $ 21,633,166 |
Institutional Class | | | | |
Shares sold | 13,719,322 | 320,001 | $ 138,324,336 | $ 3,200,010 |
Reinvestment of distributions | 90,139 | - | 909,336 | - |
Shares redeemed | (306,458) | - | (3,095,334) | - |
Net increase (decrease) | 13,503,003 | 320,001 | $ 136,138,338 | $ 3,200,010 |
A For the period September 7, 2005 (commencement of operations) to September 30, 2005.
Annual Report
Report of Independent Registered Public Accounting Firm
To the Trustees of Fidelity Commonwealth Trust and Shareholders of Fidelity Strategic Real Return Fund:
We have audited the accompanying statement of assets and liabilities of Fidelity Strategic Real Return Fund (the Fund), a fund of Fidelity Commonwealth Trust, including the schedule of investments as of September 30, 2006, and the related statement of operations for the year then ended, the statement of changes in net assets and the financial highlights for the year ended September 30, 2006 and for the period September 7, 2005 (commencement of operations) to September 30, 2005. These financial statements and financial highlights are the responsibility of the Fund's management. Our responsibility is to express an opinion on these financial statements and financial highlights based on our audits.
We conducted our audits in accordance with standards of the Public Company Accounting Oversight Board (United States). Those standards require that we plan and perform the audit to obtain reasonable assurance about whether the financial statements and financial highlights are free of material misstatement. The Fund is not required to have, nor were we engaged to perform, an audit of its internal control over financial reporting. Our audits included consideration of internal control over financial reporting as a basis for designing audit procedures that are appropriate in the circumstances, but not for the purpose of expressing an opinion on the effectiveness of the Fund's internal control over financial reporting. Accordingly, we express no such opinion. An audit also includes examining, on a test basis, evidence supporting the amounts and disclosures in the financial statements, assessing the accounting principles used and significant estimates made by management, as well as evaluating the overall financial statement presentation. Our procedures included confirmation of securities owned as of September 30, 2006, by correspondence with the custodians and brokers; where replies were not received from brokers, we performed other auditing procedures. We believe that our audits provide a reasonable basis for our opinion.
In our opinion, the financial statements and financial highlights referred to above present fairly, in all material respects, the financial position of Fidelity Strategic Real Return Fund as of September 30, 2006, the results of its operations for the year then ended, and the changes in its net assets and its financial highlights for the year ended September 30, 2006 and for the period September 7, 2005 (commencement of operations) to September 30, 2005, in conformity with accounting principles generally accepted in the United States of America.
/s/ Deloitte & Touche LLP
DELOITTE & TOUCHE LLP
Boston, Massachusetts
November 22, 2006
Annual Report
Trustees and Officers
The Trustees, Members of the Advisory Board, and executive officers of the trust and fund, as applicable, are listed below. The Board of Trustees governs the fund and is responsible for protecting the interests of shareholders. The Trustees are experienced executives who meet periodically throughout the year to oversee the fund's activities, review contractual arrangements with companies that provide services to the fund, and review the fund's performance. Except for William O. McCoy, each of the Trustees oversees 347 funds advised by FMR or an affiliate. Mr. McCoy oversees 349 funds advised by FMR or an affiliate.
The Trustees hold office without limit in time except that (a) any Trustee may resign; (b) any Trustee may be removed by written instrument, signed by at least two-thirds of the number of Trustees prior to such removal; (c) any Trustee who requests to be retired or who has become incapacitated by illness or injury may be retired by written instrument signed by a majority of the other Trustees; and (d) any Trustee may be removed at any special meeting of shareholders by a two-thirds vote of the outstanding voting securities of the trust. Each Trustee who is not an interested person (as defined in the 1940 Act) (Independent Trustee), shall retire not later than the last day of the calendar year in which his or her 72nd birthday occurs. The Independent Trustees may waive this mandatory retirement age policy with respect to individual Trustees. The executive officers and Advisory Board Members hold office without limit in time, except that any officer and Advisory Board Member may resign or may be removed by a vote of a majority of the Trustees at any regular meeting or any special meeting of the Trustees. Except as indicated, each individual has held the office shown or other offices in the same company for the past five years.
The fund's Statement of Additional Information (SAI) includes more information about the Trustees. To request a free copy, call Fidelity at 1-877-208-0098.
Interested Trustees*:
Correspondence intended for each Trustee who is an interested person may be sent to Fidelity Investments, 82 Devonshire Street, Boston, Massachusetts 02109.
Name, Age; Principal Occupation |
Edward C. Johnson 3d (76) |
| Year of Election or Appointment: 1974 Mr. Johnson is Chairman of the Board of Trustees. Mr. Johnson serves as President (2006-present), Chief Executive Officer, Chairman, and a Director of FMR Corp.; Chairman and a Director of FMR; Chairman and a Director of Fidelity Research & Analysis Company (FRAC); Chairman and a Director of Fidelity Investments Money Management, Inc.; and Chairman (2001-present) and a Director of FMR Co., Inc. In addition, Mr. Johnson serves as Chairman and Director of Fidelity International Limited (FIL). |
Stephen P. Jonas (53) |
| Year of Election or Appointment: 2005 Mr. Jonas is Senior Vice President of the fund (2005-present). He also serves as Senior Vice President of other Fidelity funds (2005-present). Mr. Jonas is Executive Director of FMR (2005-present) and FMR Co., Inc. (2005-present). He also serves as a Director of Fidelity Investments Money Management, Inc. (2005-present) and FMR Corp. (2003-present). Previously, Mr. Jonas served as President of Fidelity Enterprise Operations and Risk Services (2004-2005), Chief Administrative Officer (2002-2004), and Chief Financial Officer of FMR Corp. (1998-2002). In addition, he serves on the Boards of Boston Ballet (2003-present) and Simmons College (2003-present). |
Robert L. Reynolds (54) |
| Year of Election or Appointment: 2003 Mr. Reynolds is President and a Director of FMR (2005-present), Fidelity Investments Money Management, Inc. (2005-present), and FMR Co., Inc. (2005-present). Mr. Reynolds also serves as Vice Chairman (2006-present), a Director (2003-present), and Chief Operating Officer of FMR Corp. and a Director of Strategic Advisers, Inc. (2005-present). He also serves on the Board at Fidelity Investments Canada, Ltd. |
* Trustees have been determined to be "Interested Trustees" by virtue of, among other things, their affiliation with the trust or various entities under common control with FMR.
Annual Report
Independent Trustees:
Correspondence intended for each Independent Trustee (that is, the Trustees other than the Interested Trustees) may be sent to Fidelity Investments, P.O. Box 55235, Boston, Massachusetts 02205-5235.
Name, Age; Principal Occupation |
Dennis J. Dirks (58) |
| Year of Election or Appointment: 2005 Prior to his retirement in May 2003, Mr. Dirks was Chief Operating Officer and a member of the Board of The Depository Trust & Clearing Corporation (DTCC) (1999-2003). He also served as President, Chief Operating Officer, and Board member of The Depository Trust Company (DTC) (1999-2003) and President and Board member of the National Securities Clearing Corporation (NSCC) (1999-2003). In addition, Mr. Dirks served as Chief Executive Officer and Board member of the Government Securities Clearing Corporation (2001-2003) and Chief Executive Officer and Board member of the Mortgage-Backed Securities Clearing Corporation (2001-2003). Mr. Dirks also serves as a Trustee and a member of the Finance Committee of Manhattan College (2005-present) and a Trustee and a member of the Finance Committee of AHRC of Nassau County (2006-present). |
|
Albert R. Gamper, Jr. (64) |
| Year of Election or Appointment: 2006 Prior to his retirement in December 2004, Mr. Gamper served as Chairman of the Board of CIT Group Inc. (commercial finance). During his tenure with CIT Group Inc. Mr. Gamper served in numerous senior management positions, including Chairman (1987-1989; 1999-2001; 2002-2004), Chief Executive Officer (1987-2004), and President (1989-2002). He currently serves as a member of the Board of Directors of Public Service Enterprise Group (utilities, 2001-present), Chairman of the Board of Governors, Rutgers University (2004-present), and Chairman of the Board of Saint Barnabas Health Care System. |
Robert M. Gates (63) |
| Year of Election or Appointment: 1997 Dr. Gates is Chairman of the Independent Trustees (2006-present). Dr. Gates is President of Texas A&M University (2002-present). He was Director of the Central Intelligence Agency (CIA) from 1991 to 1993. From 1989 to 1991, Dr. Gates served as Assistant to the President of the United States and Deputy National Security Advisor. Dr. Gates is a Director of NACCO Industries, Inc. (mining and manufacturing), Parker Drilling Co., Inc. (drilling and rental tools for the energy industry, 2001-present), and Brinker International (restaurant management, 2003-present). Previously, Dr. Gates served as a Director of LucasVarity PLC (automotive components and diesel engines), a Director of TRW Inc. (automotive, space, defense, and information technology), and Dean of the George Bush School of Government and Public Service at Texas A&M University (1999-2001). |
George H. Heilmeier (70) |
| Year of Election or Appointment: 2004 Dr. Heilmeier is Chairman Emeritus of Telcordia Technologies (communication software and systems), where prior to his retirement, he served as company Chairman and Chief Executive Officer. He currently serves on the Boards of Directors of The Mitre Corporation (systems engineering and information technology support for the government), and HRL Laboratories (private research and development, 2004-present). He is Chairman of the General Motors Science & Technology Advisory Board and a Life Fellow of the Institute of Electrical and Electronics Engineers (IEEE). Dr. Heilmeier is a member of the Defense Science Board and the National Security Agency Advisory Board. He is also a member of the National Academy of Engineering, the American Academy of Arts and Sciences, and the Board of Overseers of the School of Engineering and Applied Science of the University of Pennsylvania. Previously, Dr. Heilmeier served as a Director of TRW Inc. (automotive, space, defense, and information technology, 1992-2002), Compaq (1994-2002), Automatic Data Processing, Inc. (ADP) (technology-based business outsourcing, 1995-2002), INET Technologies Inc. (telecommunications network surveillance, 2001-2004), and Teletech Holdings (customer management services). He is the recipient of the 2005 Kyoto Prize in Advanced Technology for his invention of the liquid crystal display, and a member of the Consumer Electronics Hall of Fame. |
Marie L. Knowles (59) |
| Year of Election or Appointment: 2001 Prior to Ms. Knowles' retirement in June 2000, she served as Executive Vice President and Chief Financial Officer of Atlantic Richfield Company (ARCO) (diversified energy, 1996-2000). From 1993 to 1996, she was a Senior Vice President of ARCO and President of ARCO Transportation Company. She served as a Director of ARCO from 1996 to 1998. She currently serves as a Director of Phelps Dodge Corporation (copper mining and manufacturing) and McKesson Corporation (healthcare service, 2002-present). Ms. Knowles is a Trustee of the Brookings Institution and the Catalina Island Conservancy and also serves as a member of the Advisory Board for the School of Engineering of the University of Southern California. |
Ned C. Lautenbach (62) |
| Year of Election or Appointment: 2000 Mr. Lautenbach has been a partner of Clayton, Dubilier & Rice, Inc. (private equity investment firm) since September 1998. Previously, Mr. Lautenbach was with the International Business Machines Corporation (IBM) from 1968 until his retirement in 1998. Mr. Lautenbach serves as a Director of Sony Corporation (2006-present) and Eaton Corporation (diversified industrial) as well as the Philharmonic Center for the Arts in Naples, Florida. He also is a member of the Board of Trustees of Fairfield University (2005-present), as well as a member of the Council on Foreign Relations. |
William O. McCoy (72) |
| Year of Election or Appointment: 1997 Prior to his retirement in December 1994, Mr. McCoy was Vice Chairman of the Board of BellSouth Corporation (telecommunications) and President of BellSouth Enterprises. He is currently a Director of Duke Realty Corporation (real estate). He is also a partner of Franklin Street Partners (private investment management firm). In addition, Mr. McCoy served as the Interim Chancellor (1999-2000) and a member of the Board of Visitors for the University of North Carolina at Chapel Hill and currently serves as Chairman of the Board of Directors of the University of North Carolina Health Care System. He also served as Vice President of Finance for the University of North Carolina (16-school system). |
Cornelia M. Small (62) |
| Year of Election or Appointment: 2005 Ms. Small is a member (2000-present) and Chairperson (2002-present) of the Investment Committee, and a member (2002-present) of the Board of Trustees of Smith College. Previously, she served as Chief Investment Officer (1999-2000), Director of Global Equity Investments (1996-1999), and a member of the Board of Directors of Scudder, Stevens & Clark (1990-1997) and Scudder Kemper Investments (1997-1999). In addition, Ms. Small served as Co-Chair (2000-2003) of the Annual Fund for the Fletcher School of Law and Diplomacy. |
William S. Stavropoulos (67) |
| Year of Election or Appointment: 2002 Mr. Stavropoulos is Chairman Emeritus of the Board of Directors of The Dow Chemical Company. Since joining The Dow Chemical Company in 1967, Mr. Stavropoulos served in numerous senior management positions, including President (1993-2000; 2002-2003), CEO (1995-2000; 2002-2004), and Chairman of the Executive Committee (2000-2004). Currently, he is a Director of NCR Corporation (data warehousing and technology solutions), BellSouth Corporation (telecommunications), Chemical Financial Corporation, Maersk Inc. (industrial conglomerate, 2002-present), and Metalmark Capital (private equity investment firm, 2005-present). He also serves as a member of the Board of Trustees of the American Enterprise Institute for Public Policy Research. In addition, Mr. Stavropoulos is a member of The Business Council, J.P. Morgan International Council and the University of Notre Dame Advisory Council for the College of Science. |
Kenneth L. Wolfe (67) |
| Year of Election or Appointment: 2005 Prior to his retirement in 2001, Mr. Wolfe was Chairman and Chief Executive Officer of Hershey Foods Corporation (1993-2001). He currently serves as a member of the boards of Adelphia Communications Corporation (2003-present), Bausch & Lomb, Inc., and Revlon Inc. (2004-present). |
Annual Report
Advisory Board Members and Executive Officers:
Correspondence intended for Mr. Keyes may be sent to Fidelity Investments, P.O. Box 55235, Boston, Massachusetts 02205-5235. Correspondence intended for each executive officer and Mr. Lynch may be sent to Fidelity Investments, 82 Devonshire Street, Boston, Massachusetts 02109.
Name, Age; Principal Occupation |
James H. Keyes (66) |
| Year of Election or Appointment: 2006 Member of the Advisory Board of Fidelity Commonwealth Trust. Prior to his retirement in 2003, Mr. Keyes was Chairman, President, and Chief Executive Officer of Johnson Controls, Inc. (automotive supplier, 1993-2003). He currently serves as a member of the boards of LSI Logic Corporation (semiconductor technologies), Navistar International Corporation (manufacture and sale of trucks, buses, and diesel engines, (2002-present), and Pitney Bowes, Inc. (integrated mail, messaging, and document management solutions). |
Peter S. Lynch (62) |
| Year of Election or Appointment: 2003 Member of the Advisory Board of Fidelity Commonwealth Trust. Mr. Lynch is Vice Chairman and a Director of FMR, and Vice Chairman (2001-present) and a Director of FMR Co., Inc. Previously, Mr. Lynch served as a Trustee of the Fidelity funds (1990-2003). In addition, he serves as a Trustee of Boston College and as the Chairman of the Inner-City Scholarship Fund. |
Walter C. Donovan (44) |
| Year of Election or Appointment: 2005 Vice President of the fund. Mr. Donovan also serves as Vice President of Fidelity's High Income Funds (2005-present). Mr. Donovan also serves as Executive Vice President of FMR (2005-present) and FMR Co., Inc. (2005-present). Previously, Mr. Donovan served as Vice President of Fidelity's Fixed-Income Funds (2005-2006), certain Asset Allocation Funds (2005-2006), certain Balanced Funds (2005-2006), and as Vice President and Director of Fidelity's International Equity Trading group (1998-2005). |
Boyce I. Greer (50) |
| Year of Election or Appointment: 2005 Vice President of the fund. Mr. Greer also serves as Vice President of certain Equity Funds (2005-present), certain Asset Allocation Funds (2005-present), Fixed-Income Funds (2006-present), and Money Market Funds (2006-present). Mr. Greer is also a Trustee of other investment companies advised by FMR (2003-present). He is an Executive Vice President of FMR (2005-present) and FMR Co., Inc. (2005-present), and Senior Vice President of Fidelity Investments Money Management, Inc. (2006-present). Previously, Mr. Greer served as a Director and Managing Director of Strategic Advisers, Inc. (2002-2005), and Executive Vice President (2000-2002) and Money Market Group Leader (1997-2002) of the Fidelity Investments Fixed Income Division. He also served as Vice President of Fidelity's Money Market Funds (1997-2002), Senior Vice President of FMR (1997-2002), and Vice President of FIMM (1998-2002). |
Robert A. Lawrence (53) |
| Year of Election or Appointment: 2006 Vice President of the fund. Mr. Lawrence also serves as Vice President of the High Income Funds. Mr. Lawrence is Senior Vice President of FMR (2006-present) and FMR Co., Inc. (2006-present). Previously, Mr. Lawrence served as President of Fidelity Strategic Investments (2002-2005). |
David L. Murphy (58) |
| Year of Election or Appointment: 2005 Vice President of the fund. Mr. Murphy also serves as Vice President of Fidelity's Money Market Funds (2002-present), certain Asset Allocation Funds (2003-present), Fixed-Income Funds (2005-present), and Balanced Funds (2005-present). He serves as Senior Vice President (2000-present) and Head (2004-present) of the Fidelity Investments Fixed Income Division. Mr. Murphy is also a Senior Vice President of Fidelity Investments Money Management, Inc. (2003-present) and an Executive Vice President of FMR (2005-present). Previously, Mr. Murphy served as Money Market Group Leader (2002-2004), Bond Group Leader (2000-2002), and Vice President of Fidelity's Taxable Bond Funds (2000-2002) and Fidelity's Municipal Bond Funds (2001-2002). |
Thomas J. Silvia (45) |
| Year of Election or Appointment: 2005 Vice President of the fund. Mr. Silvia also serves as Vice President of Fidelity's Fixed-Income Funds (2005-present), certain Balanced Funds (2005-present), certain Asset Allocation Funds (2005-present), and Senior Vice President and Bond Group Leader of the Fidelity Investments Fixed-Income Division (2005-present). Previously, Mr. Silvia served as Director of Fidelity's Taxable Bond portfolio managers (2002-2004) and a portfolio manager in the Bond Group (1997-2004). |
William Irving (42) |
| Year of Election or Appointment: 2005 Vice President of the fund. Mr. Irving also serves as Vice President of other funds advised by FMR. Prior to assuming his current responsibilities, Mr. Irving worked as a quantitative analyst and portfolio manager. |
Christopher L. Sharpe (38) |
| Year of Election or Appointment: 2005 Vice President of the fund. Mr. Sharpe also serves as Vice President of other funds advised by FMR. Prior to assuming his current responsibilities, Mr. Sharpe worked as an associate investment policy officer for John Hancock Financial Services, Inc. in Boston. From 1990 to 2000 he was with William M. Mercer, Inc. in Boston. Mr. Sharpe also serves as Vice President of FMR (2006) and FMR Co., Inc. (2006). |
Mark Snyderman (49) |
| Year of Election or Appointment: 2005 Vice President of the fund. Mr. Snyderman also serves as Vice President of other funds advised by FMR. Prior to assuming his current responsibilities, Mr. Snyderman served as an investment officer for commercial mortgage-backed securities in the real estate group and as a portfolio manager of real estate stock and real estate bond mutual funds and institutional accounts. Mr. Snyderman also serves as a Vice President of FMR (2004) and FMR Co., Inc. (2004). |
Derek L. Young (42) |
| Year of Election or Appointment: 2005 Vice President of the fund. Mr. Young also serves as Vice President of other funds advised by FMR. Prior to assuming his current responsibilities, Mr. Young worked as director of Risk Management, senior vice president of Strategic Services and a portfolio manager. Mr. Young also serves as Vice President of FMR (2004) and FMR Co., Inc. (2004). |
Eric D. Roiter (57) |
| Year of Election or Appointment: 2005 Secretary of the fund. He also serves as Secretary of other Fidelity funds; Vice President, General Counsel, and Secretary of FMR Co., Inc. (2001-present) and FMR; Assistant Secretary of Fidelity Management & Research (U.K.) Inc. (2001-present), Fidelity Research & Analysis Company (2001-present), and Fidelity Investments Money Management, Inc. (2001-present). Mr. Roiter is an Adjunct Member, Faculty of Law, at Boston College Law School (2003-present). Previously, Mr. Roiter served as Vice President and Secretary of Fidelity Distributors Corporation (FDC) (1998-2005). |
Stuart Fross (47) |
| Year of Election or Appointment: 2005 Assistant Secretary of the fund. Mr. Fross also serves as Assistant Secretary of other Fidelity funds (2003-present), Vice President and Secretary of FDC (2005-present), and is an employee of FMR. |
Christine Reynolds (48) |
| Year of Election or Appointment: 2005 President and Treasurer of the fund. Ms. Reynolds also serves as President and Treasurer of other Fidelity funds (2004-present) and is a Vice President (2003-present) and an employee (2002-present) of FMR. Before joining Fidelity Investments, Ms. Reynolds worked at PricewaterhouseCoopers LLP (PwC) (1980-2002), where she was most recently an audit partner with PwC's investment management practice. |
R. Stephen Ganis (40) |
| Year of Election or Appointment: 2006 Anti-Money Laundering (AML) officer of the fund. Mr. Ganis also serves as AML officer of other Fidelity funds (2006-present) and FMR Corp. (2003-present). Before joining Fidelity Investments, Mr. Ganis practiced law at Goodwin Procter, LLP (2000-2002). |
Joseph B. Hollis (58) |
| Year of Election or Appointment: 2006 Chief Financial Officer of the fund. Mr. Hollis also serves as Chief Financial Officer of other Fidelity funds. Mr. Hollis is President of Fidelity Pricing and Cash Management Services (FPCMS) (2005-present). Mr. Hollis also serves as President and Director of Fidelity Service Company, Inc. (2006-present). Previously, Mr. Hollis served as Senior Vice President of Cash Management Services (1999-2002) and Investment Management Operations (2002-2005). |
Kenneth A. Rathgeber (59) |
| Year of Election or Appointment: 2005 Chief Compliance Officer of the fund. Mr. Rathgeber also serves as Chief Compliance Officer of other Fidelity funds (2004-present) and Executive Vice President of Risk Oversight for Fidelity Investments (2002-present). He is Chief Compliance Officer of FMR (2005-present), FMR Co., Inc. (2005-present), Fidelity Management & Research (U.K.) Inc. (2005-present), Fidelity Research & Analysis Company (2005-present), Fidelity Investments Money Management, Inc. (2005-present), and Strategic Advisers, Inc. (2005-present). Previously, Mr. Rathgeber served as Executive Vice President and Chief Operating Officer for Fidelity Investments Institutional Services Company, Inc. (1998-2002). |
Bryan A. Mehrmann (45) |
| Year of Election or Appointment: 2005 Deputy Treasurer of the fund. Mr. Mehrmann also serves as Deputy Treasurer of other Fidelity funds (2005-present) and is an employee of FMR. Previously, Mr. Mehrmann served as Vice President of Fidelity Investments Institutional Services Group (FIIS)/Fidelity Investments Institutional Operations Corporation, Inc. (FIIOC) Client Services (1998-2004). |
Kimberley H. Monasterio (42) |
| Year of Election or Appointment: 2005 Deputy Treasurer of the fund. Ms. Monasterio also serves as Deputy Treasurer of other Fidelity funds (2004) and is an employee of FMR (2004). Before joining Fidelity Investments, Ms. Monasterio served as Treasurer (2000-2004) and Chief Financial Officer (2002-2004) of the Franklin Templeton Funds and Senior Vice President of Franklin Templeton Services, LLC (2000-2004). |
Kenneth B. Robins (37) |
| Year of Election or Appointment: 2005 Deputy Treasurer of the fund. Mr. Robins also serves as Deputy Treasurer of other Fidelity funds (2005-present) and is an employee of FMR (2004-present). Before joining Fidelity Investments, Mr. Robins worked at KPMG LLP, where he was a partner in KPMG's department of professional practice (2002-2004) and a Senior Manager (1999-2000). In addition, Mr. Robins served as Assistant Chief Accountant, United States Securities and Exchange Commission (2000-2002). |
Robert G. Byrnes (39) |
| Year of Election or Appointment: 2005 Assistant Treasurer of the fund. Mr. Byrnes also serves as Assistant Treasurer of other Fidelity funds (2005-present) and is an employee of FMR (2005-present). Previously, Mr. Byrnes served as Vice President of FPCMS (2003-2005). Before joining Fidelity Investments, Mr. Byrnes worked at Deutsche Asset Management where he served as Vice President of the Investment Operations Group (2000-2003). |
John H. Costello (60) |
| Year of Election or Appointment: 2005 Assistant Treasurer of the fund. Mr. Costello also serves as Assistant Treasurer of other Fidelity funds and is an employee of FMR. |
Peter L. Lydecker (52) |
| Year of Election or Appointment: 2005 Assistant Treasurer of the fund. Mr. Lydecker also serves as Assistant Treasurer of other Fidelity funds (2004) and is an employee of FMR. |
Mark Osterheld (51) |
| Year of Election or Appointment: 2005 Assistant Treasurer of the fund. Mr. Osterheld also serves as Assistant Treasurer of other Fidelity funds (2002) and is an employee of FMR. |
Gary W. Ryan (48) |
| Year of Election or Appointment: 2005 Assistant Treasurer of the fund. Mr. Ryan also serves as Assistant Treasurer of other Fidelity funds (2005-present) and is an employee of FMR (2005-present). Previously, Mr. Ryan served as Vice President of Fund Reporting in FPCMS (1999-2005). |
Salvatore Schiavone (40) |
| Year of Election or Appointment: 2005 Assistant Treasurer of the fund. Mr. Schiavone also serves as Assistant Treasurer of other Fidelity funds (2005-present) and is an employee of FMR (2005-present). Before joining Fidelity Investments, Mr. Schiavone worked at Deutsche Asset Management, where he most recently served as Assistant Treasurer (2003-2005) of the Scudder Funds and Vice President and Head of Fund Reporting (1996-2003). |
Annual Report
Distributions
The fund hereby designates as a capital gain dividend with respect to the taxable year ended September 30, 2006, $227,005, or, if subsequently determined to be different, the net capital gain of such year.
A total of 30.17% of the dividends distributed during the fiscal year was derived from interest on U.S. Government securities which is generally exempt from state income tax.
The fund designates $34,978,986 of distributions paid during the period October 1, 2005 to September 30, 2006 as qualifying to be taxed as interest-related dividends for nonresident alien shareholders.
The fund will notify shareholders in January 2007 of amounts for use in preparing 2006 income tax returns.
Annual Report
Proxy Voting Results
A special meeting of the fund's shareholders was held on November 16, 2005. The results of votes taken among shareholders on proposals before them are reported below. Each vote reported represents one dollar of net asset value held on the record date for the meeting.
PROPOSAL 1 |
To elect a Board of Trustees. A |
| # of
Votes | % of
Votes |
Dennis J. Dirks |
Affirmative | 18,240,248,322.53 | 96.150 |
Withheld | 730,313,302.58 | 3.850 |
TOTAL | 18,970,561,625.11 | 100.000 |
Albert R. Gamper, Jr. B |
Affirmative | 18,204,838,072.06 | 95.964 |
Withheld | 765,723,553.05 | 4.036 |
TOTAL | 18,970,561,625.11 | 100.000 |
Robert M. Gates |
Affirmative | 18,191,748,681.13 | 95.895 |
Withheld | 778,812,943.98 | 4.105 |
TOTAL | 18,970,561,625.11 | 100.000 |
George H. Heilmeier |
Affirmative | 18,193,638,757.60 | 95.905 |
Withheld | 776,922,867.51 | 4.095 |
TOTAL | 18,970,561,625.11 | 100.000 |
Abigail P. Johnson |
Affirmative | 18,103,320,241.78 | 95.428 |
Withheld | 867,241,383.33 | 4.572 |
TOTAL | 18,970,561,625.11 | 100.000 |
Edward C. Johnson 3d |
Affirmative | 18,055,585,171.13 | 95.177 |
Withheld | 914,976,453.98 | 4.823 |
TOTAL | 18,970,561,625.11 | 100.000 |
Stephen P. Jonas |
Affirmative | 18,188,419,716.35 | 95.877 |
Withheld | 782,141,908.76 | 4.123 |
TOTAL | 18,970,561,625.11 | 100.000 |
| # of
Votes | % of
Votes |
Marie L. Knowles |
Affirmative | 18,208,650,664.29 | 95.984 |
Withheld | 761,910,960.82 | 4.016 |
TOTAL | 18,970,561,625.11 | 100.000 |
Ned C. Lautenbach |
Affirmative | 18,224,936,039.64 | 96.070 |
Withheld | 745,625,585.47 | 3.930 |
TOTAL | 18,970,561,625.11 | 100.000 |
Marvin L. Mann |
Affirmative | 18,146,216,753.93 | 95.655 |
Withheld | 824,344,871.18 | 4.345 |
TOTAL | 18,970,561,625.11 | 100.000 |
William O. McCoy |
Affirmative | 18,164,580,135.79 | 95.751 |
Withheld | 805,981,489.32 | 4.249 |
TOTAL | 18,970,561,625.11 | 100.000 |
Robert L. Reynolds |
Affirmative | 18,197,448,372.22 | 95.925 |
Withheld | 773,113,252.89 | 4.075 |
TOTAL | 18,970,561,625.11 | 100.000 |
Cornelia M. Small |
Affirmative | 18,214,122,413.76 | 96.013 |
Withheld | 756,439,211.35 | 3.987 |
TOTAL | 18,970,561,625.11 | 100.000 |
William S. Stavropoulos |
Affirmative | 18,186,563,509.46 | 95.867 |
Withheld | 783,998,115.65 | 4.133 |
TOTAL | 18,970,561,625.11 | 100.000 |
Kenneth L. Wolfe |
Affirmative | 18,211,332,412.92 | 95.998 |
Withheld | 759,229,212.19 | 4.002 |
TOTAL | 18,970,561,625.11 | 100.000 |
A Denotes trust-wide proposals and voting results. B Effective on or about January 1, 2006. |
Annual Report
Annual Report
Investment Adviser
Fidelity Management & Research Company
Boston, MA
Investment Sub-Advisers
FMR Co., Inc.
Fidelity Research & Analysis Company
(formerly Fidelity Management &
Research (Far East) Inc.)
Fidelity International Investment Advisors
Fidelity Investments Japan Limited
Fidelity International Investment Advisors (U.K.) Limited
Geode Capital Management, LLC
General Distributor
Fidelity Distributors Corporation
Boston, MA
Transfer and Service Agents
Fidelity Investments Institutional
Operations Company, Inc.
Boston, MA
Fidelity Service Company, Inc.
Boston, MA
Custodian
Mellon Bank, N.A.
Pittsburgh, PA
ARRS-UANN-1106
1.814972.101
(Fidelity Investment logo)(registered trademark)
(Fidelity Investment logo)(registered trademark)
Fidelity Advisor
Strategic Real Return
Fund - Institutional Class
Annual Report
September 30, 2006
Institutional Class
is a class of Fidelity®
Strategic Real Return
Fund
(2_fidelity_logos) (Registered_Trademark)
Contents
Note to Shareholders | <Click Here> | An explanation of the changes to the fund. |
Chairman's Message | <Click Here> | Ned Johnson's message to shareholders. |
Performance | <Click Here> | How the fund has done over time. |
Management's Discussion | <Click Here> | The managers' review of fund performance, strategy and outlook |
Shareholder Expense Example | <Click Here> | An example of shareholder expenses. |
Investment Changes | <Click Here> | A summary of major shifts in the fund's investments over the past year. |
Investments | <Click Here> | A complete list of the fund's investments with their market values. |
Financial Statements | <Click Here> | Statements of assets and liabilities, operations, and changes in net assets,
as well as financial highlights. |
Notes | <Click Here> | Notes to the financial statements. |
Report of Independent Registered Public Accounting Firm | <Click Here> | |
Trustees and Officers | <Click Here> | |
Distributions | <Click Here> | |
Proxy Voting Results | <Click Here> | |
To view a fund's proxy voting guidelines and proxy voting record for the 12-month period ended June 30, visit www.fidelity.com/proxyvotingresults or visit the Securities and Exchange Commission's (SEC) web site at www.sec.gov. You may also call 1-877-208-0098 to request a free copy of the proxy voting guidelines.
Standard & Poor's, S&P and S&P 500 are registered service marks of The McGraw-Hill Companies, Inc. and have been licensed for use by Fidelity Distributors Corporation.
Other third party marks appearing herein are the property of their respective owners.
All other marks appearing herein are registered or unregistered trademarks or service marks of FMR Corp. or an affiliated company.
Annual Report
This report and the financial statements contained herein are submitted for the general information of the shareholders of the fund. This report is not authorized for distribution to prospective investors in the fund unless preceded or accompanied by an effective prospectus.
A fund files its complete schedule of portfolio holdings with the SEC for the first and third quarters of each fiscal year on Form N-Q. Forms N-Q are available on the SEC's web site at http://www.sec.gov. A fund's Forms N-Q may be reviewed and copied at the SEC's Public Reference Room in Washington, DC. Information regarding the operation of the SEC's Public Reference Room may be obtained by calling 1-800-SEC-0330. For a complete list of a fund's portfolio holdings, view the most recent quarterly holdings report, semiannual report, or annual report on Fidelity's web site at http://www.advisor.fidelity.com.
NOT FDIC INSURED · MAY LOSE VALUE · NO BANK GUARANTEE
Neither the fund nor Fidelity Distributors Corporation is a bank.
Annual Report
Note to Shareholders:
Effective November 1, 2006, the real estate component of the Fidelity Strategic Real Return Composite Index - a hypothetical representation of the performance of the fund's unmanaged indexes used as a comparative benchmark - will be changed to reflect the fund's increased real estate common stock exposure. This modification will be made in order to improve the fund's opportunity for real return in periods of rising inflation, while also diversifying the fund's real estate debt exposure. The Dow Jones Wilshire Real Estate Securities IndexSM (12% weighting) will be added to the Composite index, which will continue to also include the Merrill Lynch® U.S. Real Estate Corporate Bond Index (8%), the Dow Jones-AIG Commodity IndexSM (25%), the Credit Suisse First Boston Leveraged Loan Index (25%) and the Lehman Brothers® U.S. Treasury Inflation-Protected Securities (TIPS) Index (30%). This new blend will no longer include an allocation to the FTSE NAREIT All REIT index, which was added to the Composite index on June 1, 2006, or the Morgan Stanley® REIT Preferred Index.
Annual Report
Chairman's Message
(photo_of_Edward_C_Johnson_3d)
Dear Shareholder:
Stock and bond markets around the world have seen largely positive results year to date, although weakness in the technology sector and growth stocks in general have tempered performance. While financial markets are always unpredictable, there are a number of time-tested principles that can put the historical odds in your favor.
One of the basic tenets is to invest for the long term. Over time, riding out the markets' inevitable ups and downs has proven much more effective than selling into panic or chasing the hottest trend. Even missing only a few of the markets' best days can significantly diminish investor returns. Patience also affords the benefits of compounding - of earning interest on additional income or reinvested dividends and capital gains. There are tax advantages and cost benefits to consider as well. The more you sell, the more taxes you pay, and the more you trade, the higher the costs. While staying the course doesn't eliminate risk, it can considerably lessen the effect of short-term declines.
You can further manage your investing risk through diversification. And today, more than ever, geographic diversification should be taken into account. Studies indicate that asset allocation is the single most important determinant of a portfolio's long-term success. The right mix of stocks, bonds and cash - aligned to your particular risk tolerance and investment objective - is very important. Age-appropriate rebalancing is also an essential aspect of asset allocation. For younger investors, an emphasis on equities - which historically have been the best performing asset class over time - is encouraged. As investors near their specific goal, such as retirement or sending a child to college, consideration may be given to replacing volatile assets (e.g. common stocks) with more-stable fixed investments (bonds or savings plans).
A third investment principle - investing regularly - can help lower the average cost of your purchases. Investing a certain amount of money each month or quarter helps ensure you won't pay for all your shares at market highs. This strategy - known as dollar cost averaging - also reduces unconstructive "emotion" from investing, helping shareholders avoid selling weak performers just prior to an upswing, or chasing a hot performer just before a correction.
We invite you to contact us via the Internet, through our Investor Centers or over the phone. It is our privilege to provide you the information you need to make the investments that are right for you.
Sincerely,
/s/Edward C. Johnson 3d
Edward C. Johnson 3d
Annual Report
Performance: The Bottom Line
Average annual total return reflects the change in the value of an investment, assuming reinvestment of the class' dividend income and capital gains (the profits earned upon the sale of securities that have grown in value) and assuming a constant rate of performance each year. The $10,000 table and the fund's returns do not reflect the deduction of taxes that a shareholder would pay on fund distributions or the redemption of fund shares. During periods of reimbursement by Fidelity, a fund's total return will be greater than it would be had the reimbursement not occurred. How a fund did yesterday is no guarantee of how it will do tomorrow.
Average Annual Total Returns
Periods ended September 30, 2006 | Past 1
year | Life of
fundA |
Institutional Class | 2.20% | 3.51% |
A From September 7, 2005.
$10,000 Over Life of Fund
Let's say hypothetically that $10,000 was invested in Fidelity® Advisor Strategic Real Return Fund - Institutional Class on September 7, 2005, when the fund started. The chart shows how the value of your investment would have changed, and also shows how the Lehman Brothers® US TIPS Index performed over the same period.
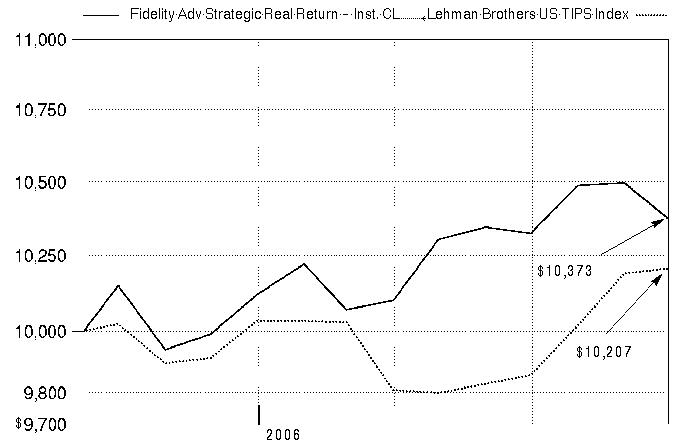
Annual Report
Management's Discussion of Fund Performance
Comments from Christopher Sharpe and Derek Young, Co-Managers of Fidelity Advisor Strategic Real Return Fund
Inflation was an on-again, off-again concern for most of the 12-month period ending September 30, 2006, and, as might be expected, the indexes measuring the performance of Fidelity Advisor Strategic Real Return Fund's four component asset classes showed varied results. The Lehman Brothers® U.S. Treasury Inflation-Protected Securities (TIPS) Index rose 1.84%, slightly below the 2.10% increase in the Consumer Price Index for All Urban Consumers (CPI-U), which was consistent with a generally benign inflation picture for the year overall. Meanwhile, the Dow Jones-AIG Commodity IndexSM, which tracks a group of physical commodities traded on various world exchanges, fell 6.11%, as inflationary fears pushed prices for many basic commodities lower in many world markets. Floating-rate bank debt, as measured by the Credit Suisse First Boston (CSFB) Leveraged Loan Index, rose 6.44%, reflecting increased demand for an asset class with low default rates and increasing yields. Similarly, income-oriented real estate investments were robust performers, as demonstrated by the 7.22% return of a diversified composite comprising the FTSE NAREIT All REIT index (20%), the Morgan Stanley® REIT Preferred Index (40%) and the Merrill Lynch® U.S. Real Estate Corporate Bond Index (40%).
The fund's Institutional Class shares returned 2.20% during the period, compared with gains of 2.51% for the Fidelity Strategic Real Return Composite Index and 1.84% for the Lehman Brothers U.S. TIPS Index. Security selection in the fund's subportfolios was the primary driver of performance, but asset allocation also added value. The real estate subportfolio helped overall performance and outpaced its benchmark by a wide margin due mostly to astute security selection across its broad real estate investment universe. Our investment in floating-rate bank loans - primarily through the Fidelity® Floating Rate Central Investment Portfolio - had healthy overall appreciation due to strong security selection and also slightly outperformed its benchmark. The Inflation-Protected Securities subportfolio - mostly made up of TIPS - achieved a return that was just below that of its index. Volatility of the commodities markets pushed the commodity-linked note subportfolio's return into negative territory during the period, but that return was offset somewhat by the subportfolio's investments in the Fidelity Ultra-Short Central Fund, a diversified pool of short-term assets designed to outperform cash-like investments with similar characteristics.
The views expressed above reflect those of the portfolio manager(s) only through the end of the period as stated on the cover of this report and do not necessarily represent the views of Fidelity or any other person in the Fidelity organization. Any such views are subject to change at any time based upon market or other conditions and Fidelity disclaims any responsibility to update such views. These views may not be relied on as investment advice and, because investment decisions for a Fidelity fund are based on numerous factors, may not be relied on as an indication of trading intent on behalf of any Fidelity fund.
Annual Report
Shareholder Expense Example
As a shareholder of the Fund, you incur two types of costs: (1) transaction costs, including sales charges (loads) on purchase payments or redemption proceeds, redemption fees, and (2) ongoing costs, including management fees, distribution and/or service (12b-1) fees and other Fund expenses. This Example is intended to help you understand your ongoing costs (in dollars) of investing in the Fund and to compare these costs with the ongoing costs of investing in other mutual funds.
The Example is based on an investment of $1,000 invested at the beginning of the period and held for the entire period (April 1, 2006 to September 30, 2006).
Actual Expenses
The first line of the accompanying table for each class of the Fund provides information about actual account values and actual expenses. You may use the information in this line, together with the amount you invested, to estimate the expenses that you paid over the period. Simply divide your account value by $1,000.00 (for example, an $8,600 account value divided by $1,000.00 = 8.6), then multiply the result by the number in the first line for a class of the Fund under the heading entitled "Expenses Paid During Period" to estimate the expenses you paid on your account during this period. In addition, the Fund, as a shareholder in the underlying Fidelity Central Funds, will indirectly bear its pro rata share of the fees and expenses incurred by the underlying Fidelity Central Funds. These fees and expenses are not included in the Fund's annualized expense ratio used to calculate the expense estimate in the table below.
Hypothetical Example for Comparison Purposes
The second line of the accompanying table for each class of the Fund provides information about hypothetical account values and hypothetical expenses based on a Class' actual expense ratio and an assumed rate of return of 5% per year before expenses, which is not the Class' actual return. The hypothetical account values and expenses may not be used to estimate the actual ending account balance or expenses you paid for the period. You may use this information to compare the ongoing costs of investing in the Fund and other funds. To do so, compare this 5% hypothetical example with the 5% hypothetical examples that appear in the shareholder reports of the other funds. In addition, the Fund, as a shareholder in the underlying Fidelity Central Funds, will indirectly bear its pro rata share of the fees and expenses incurred by the underlying Fidelity Central Funds. These fees and expenses are not included in the Fund's annualized expense ratio used to calculate the expense estimate in the table below.
Please note that the expenses shown in the table are meant to highlight your ongoing costs only and do not reflect any transaction costs. Therefore, the second line of the table is useful in comparing ongoing costs only, and will not help you determine the relative total costs of owning different funds. In addition, if these transactional costs were included, your costs would have been higher.
Annual Report
| Beginning
Account Value
April 1, 2006 | Ending
Account Value
September 30, 2006 | Expenses Paid
During Period*
April 1, 2006
to September 30, 2006 |
Class A | | | |
Actual | $ 1,000.00 | $ 1,026.00 | $ 5.08 |
Hypothetical A | $ 1,000.00 | $ 1,020.05 | $ 5.06 |
Class T | | | |
Actual | $ 1,000.00 | $ 1,025.90 | $ 5.23 |
Hypothetical A | $ 1,000.00 | $ 1,019.90 | $ 5.22 |
Class B | | | |
Actual | $ 1,000.00 | $ 1,023.00 | $ 8.77 |
Hypothetical A | $ 1,000.00 | $ 1,016.39 | $ 8.74 |
Class C | | | |
Actual | $ 1,000.00 | $ 1,022.00 | $ 9.38 |
Hypothetical A | $ 1,000.00 | $ 1,015.79 | $ 9.35 |
Strategic Real Return | | | |
Actual | $ 1,000.00 | $ 1,027.90 | $ 3.97 |
Hypothetical A | $ 1,000.00 | $ 1,021.16 | $ 3.95 |
Institutional Class | | | |
Actual | $ 1,000.00 | $ 1,027.00 | $ 4.12 |
Hypothetical A | $ 1,000.00 | $ 1,021.01 | $ 4.10 |
A 5% return per year before expenses
* Expenses are equal to each Class' annualized expense ratio (shown in the table below); multiplied by the average account value over the period, multiplied by 183/365 (to reflect the one-half year period). The fees and expenses of the underlying Fidelity Central Funds in which the Fund invests are not included in the Fund's annualized expense ratio.
| Annualized
Expense Ratio |
Class A | 1.00% |
Class T | 1.03% |
Class B | 1.73% |
Class C | 1.85% |
Strategic Real Return | .78% |
Institutional Class | .81% |
Annual Report
Investment Changes
The information in the Quality Diversification and Asset Allocation tables is based on the combined investments of the Fund and its pro-rata share of its investments in each Fidelity Central Fund.
Holdings Distribution (% of fund's net assets) |
| As of
September 30, 2006 | As of
March 31, 2006 |
Commodity-Linked Notes and Related Investments* | 24.7% | 27.3% |
Inflation-Protected Investments | 29.5% | 27.2% |
Floating Rate High Yield | 24.7% | 23.9% |
Real Estate Investments | 18.5% | 14.8% |
Cash & Cash Equivalents | 1.8% | 0.9% |
* Includes Fidelity Ultra-Short Central Fund held in connection with commodity-linked notes and related investments. Investments in commodity-linked notes provide indirect exposure to futures contracts on physical commodities via the Dow Jones-AIG Commodity Index, the majority of which trade on U.S. exchanges. The value of commodity-linked notes will change directly based on the performance of the index. |
Quality Diversification (% of fund's net assets) |
As of September 30, 2006 | As of March 31, 2006 |
| U.S. Government and
U.S. Government
Agency Obligations 30.8% | | | U.S. Government and
U.S. Government
Agency Obligations 28.9% | |
| AAA 4.7% | | | AAA 4.8% | |
| AA 0.9% | | | AA 1.1% | |
| A 2.5% | | | A 1.9% | |
| BBB 7.9% | | | BBB 5.0% | |
| BB and Below 22.0% | | | BB and Below 22.8% | |
 | Structured Notes
(including
Commodity-Linked
Notes) 13.8% | | | Structured Notes
(including
Commodity-Linked
Notes) 13.8% | |
| Equities 7.6% | | | Equities 7.6% | |
| Short-Term
Investments and
Net Other Assets 9.8% | | | Short-Term
Investments and
Net Other Assets 14.1% | |

We have used ratings from Moody's® Investors Services, Inc. Where Moody's ratings are not available, we have used S&P® ratings. |
Asset Allocation (% of fund's net assets) |
As of September 30, 2006 * | As of March 31, 2006 ** |
| Stocks 7.6% | | | Stocks 7.6% | |
| U.S. Government and
U.S. Government
Agency Obligations 30.8% | | | U.S. Government and
U.S. Government
Agency Obligations 28.9% | |
| Corporate Bonds 12.8% | | | Corporate Bonds 8.0% | |
| Asset-Backed
Securities 6.8% | | | Asset-Backed
Securities 6.1% | |
| Structured Notes
(including Commodity- Linked Notes) 7.3% | | | Structured Notes
(including Commodity- Linked Notes 8.7% | |
| Floating Rate Loans 20.0% | | | Floating Rate Loans 21.2% | |
| CMOs and Other Mortgage Related Securities 4.3% | | | CMOs and Other Mortgage Related Securities 4.6% | |
| Other Investments 0.6% | | | Other Investments 0.8% | |
| Short-Term
Investments and
Net Other Assets 9.8% | | | Short-Term
Investments and
Net Other Assets 14.1% | |
* Foreign investments | 7.1% | | ** Foreign investments | 7.0% | |
* Futures and Swaps | 0.5% | | ** Futures and Swaps | 1.1% | |
* U.S. Treasury
Inflation-Indexed
Securities | 29.5% | | ** U.S. Treasury
Inflation-Indexed
Securities | 27.1% | |

For an unaudited list of holdings for each Fidelity Equity and Fixed-Income Central Fund, visit fidelity.com and/or advisor.fidelity.com, as applicable. The reports are located just after the Fund's financial statements and quarterly reports. |
Annual Report
Investments September 30, 2006
Showing Percentage of Net Assets
Corporate Bonds - 8.3% |
| Principal Amount | | Value
(Note 1) |
Convertible Bonds - 0.6% |
FINANCIALS - 0.6% |
Real Estate Investment Trusts - 0.5% |
American Financial Realty Trust 4.375% 7/15/24 | | $ 11,510,000 | | $ 10,728,506 |
Biomed Realty LP 4.5% 10/1/26 (b) | | 1,000,000 | | 997,500 |
Essex Portfolio LP 3.625% 11/1/25 (b) | | 600,000 | | 741,780 |
New Plan Excel Realty Trust 3.7% 9/15/26 (b) | | 1,000,000 | | 994,290 |
Washington (REIT) 3.875% 9/15/26 | | 750,000 | | 752,130 |
| | 14,214,206 |
Real Estate Management & Development - 0.1% |
Affordable Resources Communities LP 7.5% 8/15/25 (b) | | 2,250,000 | | 2,250,000 |
ERP Operating LP 3.85% 8/15/26 | | 2,000,000 | | 2,031,380 |
| | 4,281,380 |
TOTAL FINANCIALS | | 18,495,586 |
Nonconvertible Bonds - 7.7% |
CONSUMER DISCRETIONARY - 1.1% |
Hotels, Restaurants & Leisure - 0.1% |
Felcor Lodging LP 9% 6/1/11 | | 1,500,000 | | 1,588,125 |
Host Marriott LP 7% 8/15/12 | | 800,000 | | 808,000 |
Landry's Seafood Restaurants, Inc. 7.5% 12/15/14 | | 1,700,000 | | 1,627,750 |
| | 4,023,875 |
Household Durables - 1.0% |
Beazer Homes USA, Inc.: | | | | |
8.125% 6/15/16 | | 1,000,000 | | 970,000 |
8.375% 4/15/12 | | 400,000 | | 400,000 |
D.R. Horton, Inc. 6.5% 4/15/16 | | 1,000,000 | | 981,232 |
K. Hovnanian Enterprises, Inc.: | | | | |
6% 1/15/10 | | 400,000 | | 372,500 |
6.25% 1/15/16 | | 700,000 | | 616,000 |
7.5% 5/15/16 | | 500,000 | | 467,500 |
7.75% 5/15/13 | | 5,300,000 | | 4,876,000 |
KB Home: | | | | |
6.25% 6/15/15 | | 4,600,000 | | 4,230,477 |
7.75% 2/1/10 | | 1,700,000 | | 1,695,750 |
Kimball Hill, Inc. 10.5% 12/15/12 | | 2,700,000 | | 2,423,250 |
Meritage Homes Corp. 6.25% 3/15/15 | | 2,000,000 | | 1,700,000 |
Ryland Group, Inc. 6.875% 6/15/13 | | 1,000,000 | | 1,002,089 |
Standard Pacific Corp. 9.25% 4/15/12 | | 1,900,000 | | 1,833,500 |
Corporate Bonds - continued |
| Principal Amount | | Value
(Note 1) |
Nonconvertible Bonds - continued |
CONSUMER DISCRETIONARY - continued |
Household Durables |
Stanley-Martin Communities LLC 9.75% 8/15/15 | | $ 2,400,000 | | $ 1,884,000 |
Technical Olympic USA, Inc.: | | | | |
7.5% 3/15/11 | | 2,250,000 | | 1,800,000 |
8.25% 4/1/11 (b) | | 500,000 | | 460,000 |
WCI Communities, Inc.: | | | | |
7.875% 10/1/13 | | 650,000 | | 547,625 |
9.125% 5/1/12 | | 2,350,000 | | 2,103,250 |
| | 28,363,173 |
TOTAL CONSUMER DISCRETIONARY | | 32,387,048 |
FINANCIALS - 6.2% |
Real Estate Investment Trusts - 5.2% |
AMB Property LP 3.5% 3/1/09 | | 1,000,000 | | 959,122 |
American Health Properties, Inc. 7.5% 1/15/07 | | 2,975,000 | | 2,992,493 |
Archstone-Smith Operating Trust 3% 6/15/08 | | 6,050,000 | | 5,825,176 |
Archstone-Smith Trust 5% 8/15/07 | | 4,525,000 | | 4,506,601 |
Arden Realty LP: | | | | |
5.2% 9/1/11 | | 500,000 | | 500,141 |
5.25% 3/1/15 | | 600,000 | | 598,319 |
7% 11/15/07 | | 1,400,000 | | 1,424,357 |
Avalon Properties, Inc. 6.875% 12/15/07 | | 2,000,000 | | 2,028,858 |
AvalonBay Communities, Inc.: | | | | |
5% 8/1/07 | | 2,025,000 | | 2,012,599 |
5.5% 1/15/12 | | 1,000,000 | | 1,005,163 |
Brandywine Operating Partnership LP: | | | | |
4.5% 11/1/09 | | 840,000 | | 816,939 |
6% 4/1/16 | | 1,000,000 | | 1,011,142 |
BRE Properties, Inc. 5.75% 9/1/09 | | 4,500,000 | | 4,543,578 |
Camden Property Trust: | | | | |
4.7% 7/15/09 | | 1,000,000 | | 987,495 |
7% 11/15/06 | | 3,407,000 | | 3,412,741 |
Colonial Properties Trust 7% 7/14/07 | | 2,750,000 | | 2,779,222 |
Commercial Net Lease Realty, Inc. 6.15% 12/15/15 | | 400,000 | | 406,277 |
Developers Diversified Realty Corp.: | | | | |
3.875% 1/30/09 | | 2,000,000 | | 1,933,200 |
5.375% 10/15/12 | | 500,000 | | 494,883 |
Duke Realty LP 7.75% 11/15/09 | | 1,000,000 | | 1,065,483 |
Corporate Bonds - continued |
| Principal Amount | | Value
(Note 1) |
Nonconvertible Bonds - continued |
FINANCIALS - continued |
Real Estate Investment Trusts |
Equity One, Inc.: | | | | |
6% 9/15/16 | | $ 1,000,000 | | $ 1,006,877 |
6.25% 1/15/17 | | 1,000,000 | | 1,022,974 |
Evans Withycombe Residential LP 7.625% 4/15/07 | | 510,000 | | 514,023 |
Health Care Property Investors, Inc.: | | | | |
4.875% 9/15/10 | | 700,000 | | 679,856 |
6.3% 9/15/16 | | 4,500,000 | | 4,530,092 |
Health Care REIT, Inc. 6.2% 6/1/16 | | 1,000,000 | | 1,006,853 |
Healthcare Realty Trust, Inc.: | | | | |
5.125% 4/1/14 | | 500,000 | | 476,356 |
8.125% 5/1/11 | | 608,000 | | 661,096 |
HMB Capital Trust V 8.99% 12/15/36 (b)(c) | | 4,300,000 | | 4,300,000 |
Hospitality Properties Trust 6.75% 2/15/13 | | 1,250,000 | | 1,314,065 |
HRPT Properties Trust: | | | | |
5.99% 3/16/11 (c) | | 4,000,000 | | 4,005,832 |
6.5% 1/15/13 | | 1,000,000 | | 1,039,883 |
iStar Financial, Inc.: | | | | |
5.73% 9/15/09 (b)(c) | | 1,000,000 | | 999,872 |
5.94% 3/16/09 (c) | | 500,000 | | 503,360 |
5.95% 10/15/13 (b) | | 1,000,000 | | 1,005,340 |
6.64% 3/12/07 (c) | | 1,200,000 | | 1,205,849 |
Kimco Realty Corp.: | | | | |
7.46% 5/29/07 | | 1,250,000 | | 1,265,150 |
7.86% 11/1/07 | | 480,000 | | 490,485 |
Merry Land & Investment Co., Inc. 6.69% 10/30/06 | | 3,000,000 | | 3,002,205 |
Nationwide Health Properties, Inc.: | | | | |
6% 5/20/15 | | 230,000 | | 227,848 |
6.5% 7/15/11 | | 3,500,000 | | 3,578,967 |
7.23% 11/8/06 | | 1,110,000 | | 1,111,541 |
New Plan Excel Realty Trust 7.35% 6/15/07 | | 1,750,000 | | 1,772,820 |
Omega Healthcare Investors, Inc.: | | | | |
7% 4/1/14 | | 3,800,000 | | 3,771,500 |
7% 1/15/16 | | 1,658,000 | | 1,637,275 |
ProLogis Trust 7.1% 4/15/08 | | 1,500,000 | | 1,537,137 |
Rouse Co. LP/TRC, Inc. 6.75% 5/1/13 (b) | | 3,500,000 | | 3,495,450 |
Senior Housing Properties Trust 8.625% 1/15/12 | | 3,600,000 | | 3,861,000 |
Shurgard Storage Centers, Inc.: | | | | |
5.875% 3/15/13 | | 2,000,000 | | 2,048,292 |
7.75% 2/22/11 | | 1,000,000 | | 1,081,731 |
Corporate Bonds - continued |
| Principal Amount | | Value
(Note 1) |
Nonconvertible Bonds - continued |
FINANCIALS - continued |
Real Estate Investment Trusts |
Simon Property Group LP: | | | | |
5.375% 8/28/08 | | $ 3,000,000 | | $ 2,998,254 |
7% 6/15/28 (c) | | 960,000 | | 985,485 |
7.125% 9/20/07 | | 1,500,000 | | 1,519,265 |
Simon Property Group, Inc. 3.75% 1/30/09 | | 2,000,000 | | 1,930,870 |
Spieker Properties LP 7.25% 5/1/09 | | 2,600,000 | | 2,727,858 |
Tanger Properties LP 9.125% 2/15/08 | | 1,760,000 | | 1,839,200 |
The Rouse Co. 8% 4/30/09 | | 3,000,000 | | 3,123,693 |
Thornburg Mortgage, Inc. 8% 5/15/13 | | 6,450,000 | | 6,321,000 |
Trustreet Properties, Inc. 7.5% 4/1/15 | | 2,200,000 | | 2,183,500 |
United Dominion Realty Trust: | | | | |
4.5% 3/3/08 | | 1,750,000 | | 1,723,055 |
6.05% 6/1/13 | | 2,500,000 | | 2,539,373 |
Ventas Realty LP: | | | | |
6.5% 6/1/16 | | 2,660,000 | | 2,613,450 |
6.625% 10/15/14 | | 7,775,000 | | 7,755,563 |
6.75% 6/1/10 | | 2,400,000 | | 2,451,000 |
6.75% 4/1/17 | | 2,000,000 | | 2,002,500 |
8.75% 5/1/09 | | 1,920,000 | | 2,025,600 |
9% 5/1/12 | | 6,400,000 | | 7,136,000 |
Vornado Realty Trust 5.625% 6/15/07 | | 2,645,000 | | 2,642,432 |
Washington (REIT) 6.898% 2/25/18 | | 3,200,000 | | 3,268,230 |
Western Investment Real Estate Trust 7.2% 9/15/08 | | 500,000 | | 516,117 |
| | 150,759,963 |
Real Estate Management & Development - 0.8% |
American Real Estate Partners/American Real Estate Finance Corp.: | | | | |
7.125% 2/15/13 | | 1,240,000 | | 1,224,500 |
8.125% 6/1/12 | | 1,000,000 | | 1,022,500 |
Colonial Realty LP 6.05% 9/1/16 | | 1,000,000 | | 1,009,439 |
EOP Operating LP: | | | | |
4.65% 10/1/10 | | 8,500,000 | | 8,246,836 |
6.1081% 10/1/10 (c) | | 700,000 | | 706,446 |
6.763% 6/15/07 | | 3,192,000 | | 3,218,861 |
7.5% 4/19/29 | | 2,000,000 | | 2,239,950 |
ERP Operating LP 6.625% 3/15/12 | | 3,000,000 | | 3,174,885 |
First Industrial LP 5.75% 1/15/16 | | 1,000,000 | | 989,365 |
| | 21,832,782 |
Corporate Bonds - continued |
| Principal Amount | | Value
(Note 1) |
Nonconvertible Bonds - continued |
FINANCIALS - continued |
Thrifts & Mortgage Finance - 0.2% |
Saxon Capital, Inc. 12% 5/1/14 (b) | | $ 4,750,000 | | $ 6,246,250 |
TOTAL FINANCIALS | | 178,838,995 |
HEALTH CARE - 0.2% |
Health Care Providers & Services - 0.2% |
Skilled Healthcare Group, Inc. 11% 1/15/14 (b) | | 2,000,000 | | 2,140,000 |
Tenet Healthcare Corp. 7.375% 2/1/13 | | 4,000,000 | | 3,620,000 |
| | 5,760,000 |
MATERIALS - 0.1% |
Paper & Forest Products - 0.1% |
Plum Creek Timberlands LP 5.875% 11/15/15 | | 2,000,000 | | 1,978,352 |
TELECOMMUNICATION SERVICES - 0.1% |
Wireless Telecommunication Services - 0.1% |
American Tower Corp. 7.125% 10/15/12 | | 2,500,000 | | 2,556,250 |
TOTAL NONCONVERTIBLE BONDS | | 221,520,645 |
TOTAL CORPORATE BONDS (Cost $238,346,424) | 240,016,231 |
U.S. Treasury Inflation Protected Obligations - 29.5% |
|
U.S. Treasury Inflation-Indexed Bonds: | | | | |
2% 1/15/26 | | 95,779,310 | | 91,849,737 |
2.375% 1/15/25 | | 80,524,557 | | 81,799,721 |
3.625% 4/15/28 | | 24,658,172 | | 30,553,830 |
3.875% 4/15/29 | | 26,364,288 | | 34,056,101 |
U.S. Treasury Inflation-Indexed Notes: | | | | |
0.875% 4/15/10 | | 62,194,602 | | 58,943,237 |
1.625% 1/15/15 | | 47,442,738 | | 45,117,899 |
1.875% 7/15/13 | | 75,203,573 | | 73,233,994 |
1.875% 7/15/15 | | 38,329,837 | | 37,104,339 |
2% 1/15/14 | | 55,265,729 | | 54,198,064 |
2% 7/15/14 | | 20,618,259 | | 20,200,649 |
2% 1/15/16 | | 59,820,420 | | 58,412,907 |
2.375% 4/15/11 | | 19,888,104 | | 19,907,842 |
U.S. Treasury Inflation Protected Obligations - continued |
| Principal Amount | | Value
(Note 1) |
U.S. Treasury Inflation-Indexed Notes: - continued | | | | |
2.5% 7/15/16 | | $ 16,121,120 | | $ 16,320,000 |
3% 7/15/12 | | 34,761,297 | | 36,072,222 |
3.375% 1/15/12 | | 44,428,482 | | 46,763,304 |
3.5% 1/15/11 | | 18,589,008 | | 19,467,198 |
3.625% 1/15/08 | | 26,493,793 | | 26,706,438 |
3.875% 1/15/09 | | 49,815,310 | | 51,238,639 |
4.25% 1/15/10 | | 49,127,047 | | 51,942,715 |
TOTAL U.S. TREASURY INFLATION PROTECTED OBLIGATIONS (Cost $854,969,249) | 853,888,836 |
Asset-Backed Securities - 0.4% |
|
Ameriquest Mortgage Securities, Inc. Series 2004-R10 Class M1, 6.03% 11/25/34 (c) | | 105,000 | | 105,614 |
Conseco Finance Securitizations Corp.: | | | | |
Series 2002-1 Class M2, 9.546% 12/1/33 | | 1,500,000 | | 857,464 |
Series 2002-2 Class M2, 9.163% 3/1/33 | | 2,500,000 | | 1,831,613 |
Countrywide Home Loan Trust Series 2006-BC2N
Class N, 6.5% 2/25/47 (b) | | 397,584 | | 393,699 |
Crest Clarendon Street Ltd./Crest Clarendon Corp. Series 2002-1A Class D, 9% 12/28/35 (b) | | 500,000 | | 538,670 |
Fairfield Street Solar Corp. Series 2004-1A Class E1, 8.765% 11/28/39 (b)(c) | | 850,000 | | 865,513 |
Home Equity Asset Trust Series 2006-3N Class B, 6.5% 8/27/36 (b) | | 750,000 | | 739,115 |
Long Beach Asset Holdings Corp. Series 2006-4
Class N1, 5.877% 6/25/46 (b) | | 1,539,355 | | 1,537,431 |
Merit Securities Corp. Series 13 Class M1, 8.63% 12/28/33 | | 1,500,000 | | 1,365,000 |
Resi Finance LP Series 2006-B Class B6, 7.03% 6/15/38 (c) | | 998,053 | | 998,051 |
Residential Asset Securities Corp. Series 2003-KS10 Class MI3, 6.41% 12/25/33 | | 1,000,000 | | 982,852 |
Sharps SP I LLC Net Interest Margin Trust Series 2004-HE3N Class NA, 5.19% 11/25/34 (b) | | 21,331 | | 21,302 |
Structured Asset Securities Corp. Series 2006-BC1
Class B1, 7.83% 3/25/36 (b)(c) | | 100,000 | | 87,060 |
Taberna Preferred Funding III Ltd. Series 2005-3A
Class D, 8.13% 2/5/36 (b)(c) | | 250,000 | | 233,125 |
TOTAL ASSET-BACKED SECURITIES (Cost $10,538,657) | 10,556,509 |
Collateralized Mortgage Obligations - 0.2% |
| Principal Amount | | Value
(Note 1) |
Private Sponsor - 0.2% |
Banc of America Large Loan, Inc. floater Series 2003-BBA2 Class L, 9.28% 11/15/15 (b)(c) | | $ 2,000,000 | | $ 1,978,905 |
Countrywide Alternative Loan Trust Series 2006-OC5N Class N, 7.25% 7/25/37 (b) | | 913,572 | | 912,370 |
Countrywide Home Loans, Inc. Series 2005-R3 Class B3, 5.5% 9/25/35 (b)(c) | | 147,611 | | 114,612 |
Countrywide Home Loans, Inc. Series 2003-J15: | | | | |
Class B3, 4.71% 1/25/19 (b)(c) | | 106,605 | | 96,892 |
Class B4, 4.71% 1/25/19 (b)(c) | | 213,210 | | 168,281 |
Residential Finance LP/Residential Finance Development Corp. floater Series 2005-D Class B6, 7.58% 12/15/37 (b)(c) | | 492,784 | | 499,802 |
Resix Finance Ltd. floater: | | | | |
Series 2005-C Class B7, 8.43% 9/10/37 (b)(c) | | 147,936 | | 147,936 |
Series 2005-D Class B7, 9.58% 12/15/37 (b)(c) | | 295,670 | | 298,728 |
Series 2006-A Class B7, 8.83% 3/15/38 (b)(c) | | 745,095 | | 745,092 |
Series 2006-B Class B7, 9.18% 7/15/38 (b)(c) | | 998,053 | | 998,047 |
TOTAL COLLATERALIZED MORTGAGE OBLIGATIONS (Cost $5,948,870) | 5,960,665 |
Commercial Mortgage Securities - 1.0% |
|
Asset Securitization Corp. Series 1997-MD7 Class A4, 7.8496% 1/13/30 (c) | | 499,608 | | 499,608 |
Banc of America Large Loan, Inc. floater: | | | | |
Series 2003-BBA2 Class K, 7.93% 11/15/15 (b)(c) | | 675,000 | | 669,758 |
Series 2005-ESHA Class K, 7.13% 7/14/08 (b)(c) | | 300,000 | | 300,150 |
Series 2005-MIB1 Class K, 7.33% 3/15/22 (b)(c) | | 800,000 | | 791,743 |
Credit Suisse/Morgan Stanley Commercial Mortgage Trust Series 2006-HC1A Class K, 6.807% 5/15/23 (b)(c) | | 3,757,000 | | 3,757,000 |
Crest Ltd. Series 2001-1A Class C, 9% 2/25/34 (b) | | 500,000 | | 525,560 |
CS First Boston Mortgage Securities Corp. Series 2004-FL1A Class G, 8.2286% 5/15/14 (b)(c) | | 652,274 | | 652,981 |
Global Signal Trust II Series 2004-2A: | | | | |
Class D, 5.093% 12/15/14 (b) | | 1,000,000 | | 976,420 |
Class F, 6.376% 12/15/14 (b) | | 800,000 | | 788,122 |
Global Signal Trust III Series 2006-1 Class F, 7.036% 2/15/36 (b) | | 930,000 | | 948,920 |
Commercial Mortgage Securities - continued |
| Principal Amount | | Value
(Note 1) |
GMAC Commercial Mortgage Securities, Inc.: | | | | |
Series 1997-C2 Class E, 7.624% 4/15/29 (c) | | $ 900,000 | | $ 973,266 |
Series 1999-C1 Class F, 6.02% 5/15/33 (b) | | 2,500,000 | | 2,557,812 |
Series 2003-J10 Class B2, 6.75% 4/15/29 (c) | | 1,000,000 | | 1,010,508 |
Guggenheim Structure Real Estate Funding Ltd. floater Series 2006-3 Class E, 6.98% 9/25/46 (b)(c) | | 750,000 | | 750,000 |
LB-UBS Commercial Mortgage Trust sequential pay Series 2005-C7 Class A1, 4.99% 11/15/30 | | 2,588,223 | | 2,580,808 |
Mezz Capital Commercial Mortgage Trust
Series 2005-C3: | | | | |
Class D, 7.7% 5/20/44 (b) | | 600,000 | | 585,817 |
Class F, 10.813% 5/20/44 (b) | | 400,000 | | 396,127 |
TERRA LNR I Series 2006-E, 7% 6/15/17 (b)(c) | | 770,000 | | 769,992 |
Wachovia Bank Commercial Mortgage Trust Series 2005-C20 Class A3SF, 5.46% 7/15/42 (c) | | 5,200,000 | | 5,191,074 |
Wachovia Ltd./Wachovia Llc Series 2006-1 Class 1Ml, LIBOR + 5.5% 9/25/26 (b)(c) | | 3,000,000 | | 3,007,560 |
Wrightwood Capital Real Estate CDO Ltd. floater Series 2005-1A Class F, 7.3425% 11/21/40 (b)(c) | | 1,500,000 | | 1,518,615 |
TOTAL COMMERCIAL MORTGAGE SECURITIES (Cost $29,146,939) | 29,251,841 |
Common Stocks - 3.8% |
| | Shares | | |
CONSUMER DISCRETIONARY - 0.3% |
Hotels, Restaurants & Leisure - 0.2% |
Red Lion Hotels Corp. (a) | | 120,600 | | 1,297,656 |
Starwood Hotels & Resorts Worldwide, Inc. | | 60,700 | | 3,471,433 |
| | | 4,769,089 |
Household Durables - 0.1% |
KB Home | | 20,000 | | 876,000 |
Lennar Corp. Class A | | 20,700 | | 936,675 |
Ryland Group, Inc. | | 23,000 | | 993,830 |
| | | 2,806,505 |
TOTAL CONSUMER DISCRETIONARY | | | 7,575,594 |
Common Stocks - continued |
| | Shares | | Value
(Note 1) |
FINANCIALS - 3.4% |
Real Estate Investment Trusts - 3.4% |
Acadia Realty Trust (SBI) | | 21,100 | | $ 538,050 |
Alexandria Real Estate Equities, Inc. | | 26,300 | | 2,466,940 |
American Financial Realty Trust (SBI) | | 113,400 | | 1,265,544 |
American Home Mortgage Investment Corp. | | 6,000 | | 209,220 |
Annaly Capital Management, Inc. | | 335,500 | | 4,408,470 |
Anworth Mortgage Asset Corp. | | 234,300 | | 1,956,405 |
Apartment Investment & Management Co. Class A | | 7,700 | | 418,957 |
Archstone-Smith Trust | | 14,200 | | 773,048 |
AvalonBay Communities, Inc. | | 19,500 | | 2,347,800 |
Boston Properties, Inc. | | 12,800 | | 1,322,752 |
Capital Lease Funding, Inc. | | 89,600 | | 993,664 |
CBRE Realty Finance, Inc. | | 175,000 | | 2,668,750 |
Cousins Properties, Inc. | | 33,900 | | 1,159,719 |
Developers Diversified Realty Corp. | | 48,700 | | 2,715,512 |
DiamondRock Hospitality Co. | | 24,200 | | 401,962 |
Duke Realty Corp. | | 25,000 | | 933,750 |
Education Realty Trust, Inc. | | 30,550 | | 450,918 |
Equity Lifestyle Properties, Inc. | | 78,700 | | 3,597,377 |
Equity Office Properties Trust | | 79,280 | | 3,152,173 |
Equity Residential (SBI) | | 73,800 | | 3,732,804 |
Federal Realty Investment Trust (SBI) | | 26,800 | | 1,991,240 |
Fieldstone Investment Corp. | | 161,600 | | 1,410,768 |
General Growth Properties, Inc. | | 131,900 | | 6,285,035 |
Glenborough Realty Trust, Inc. | | 15,800 | | 406,534 |
GMH Communities Trust | | 84,200 | | 1,062,604 |
Healthcare Realty Trust, Inc. | | 16,300 | | 626,083 |
Hersha Hospitality Trust | | 36,900 | | 354,240 |
HomeBanc Mortgage Corp., Georgia | | 284,200 | | 1,747,830 |
Host Hotels & Resorts, Inc. | | 150,947 | | 3,461,215 |
Inland Real Estate Corp. | | 173,000 | | 3,030,960 |
Innkeepers USA Trust (SBI) | | 39,200 | | 638,568 |
Kimco Realty Corp. | | 73,400 | | 3,146,658 |
KKR Financial Corp. | | 10,200 | | 250,308 |
Lexington Corporate Properties Trust | | 17,100 | | 362,178 |
MFA Mortgage Investments, Inc. | | 298,700 | | 2,225,315 |
MortgageIT Holdings, Inc. | | 116,000 | | 1,633,280 |
Nationwide Health Properties, Inc. | | 74,300 | | 1,986,782 |
New York Mortgage Trust, Inc. | | 191,700 | | 739,962 |
Newcastle Investment Corp. | | 127,200 | | 3,486,552 |
Opteum, Inc. Class A | | 88,700 | | 714,035 |
Common Stocks - continued |
| | Shares | | Value
(Note 1) |
FINANCIALS - continued |
Real Estate Investment Trusts - continued |
Plum Creek Timber Co., Inc. | | 4,700 | | $ 159,988 |
ProLogis Trust | | 44,900 | | 2,561,994 |
Redwood Trust, Inc. | | 11,800 | | 594,366 |
Regency Centers Corp. | | 26,400 | | 1,815,264 |
Resource Capital Corp. | | 32,000 | | 494,400 |
Saxon Capital, Inc. | | 229,900 | | 3,227,796 |
Simon Property Group, Inc. | | 20,800 | | 1,884,896 |
Spirit Finance Corp. | | 388,600 | | 4,511,646 |
Strategic Hotel & Resorts, Inc. | | 47,100 | | 936,348 |
Sunstone Hotel Investors, Inc. | | 6,700 | | 199,124 |
Thornburg Mortgage, Inc. (SBI) | | 28,000 | | 713,160 |
Trizec Properties, Inc. | | 23,800 | | 688,058 |
Trustreet Properties, Inc. | | 53,700 | | 671,787 |
U-Store-It Trust | | 10,800 | | 231,768 |
United Dominion Realty Trust, Inc. (SBI) | | 47,000 | | 1,419,400 |
Ventas, Inc. | | 87,400 | | 3,368,396 |
Vornado Realty Trust | | 14,100 | | 1,536,900 |
Washington (REIT) (SBI) | | 26,300 | | 1,046,740 |
| | | 97,135,993 |
Real Estate Management & Development - 0.0% |
The St. Joe Co. | | 18,900 | | 1,037,043 |
TOTAL FINANCIALS | | | 98,173,036 |
HEALTH CARE - 0.0% |
Health Care Providers & Services - 0.0% |
Capital Senior Living Corp. (a) | | 45,000 | | 416,250 |
Emeritus Corp. (a) | | 39,300 | | 846,915 |
| | | 1,263,165 |
MATERIALS - 0.1% |
Paper & Forest Products - 0.1% |
Weyerhaeuser Co. | | 27,300 | | 1,679,769 |
TOTAL COMMON STOCKS (Cost $99,650,918) | | 108,691,564 |
Preferred Stocks - 3.8% |
| | Shares | | Value
(Note 1) |
Convertible Preferred Stocks - 0.5% |
FINANCIALS - 0.5% |
Real Estate Investment Trusts - 0.5% |
Annaly Capital Management, Inc. Series B, 6.00% | | 80,000 | | $ 2,185,760 |
Lexington Corporate Properties Trust Series C 6.50% | | 10,700 | | 501,830 |
The Mills Corp. 6.75% (b) | | 8,254 | | 6,923,043 |
Trustreet Properties, Inc. Series C, 7.50% | | 91,300 | | 1,893,562 |
Windrose Medical Properties Trust 7.50% | | 92,200 | | 2,581,600 |
| | | 14,085,795 |
Nonconvertible Preferred Stocks - 3.3% |
FINANCIALS - 3.3% |
Diversified Financial Services - 0.1% |
DRA CRT Acquisition Corp. Series A, 8.50% | | 1,700 | | 40,375 |
Red Lion Hotels Capital Trust 9.50% | | 138,465 | | 3,607,013 |
| | | 3,647,388 |
Real Estate Investment Trusts - 3.2% |
Accredited Mortgage Loan Trust Series A, 9.75% | | 100,700 | | 2,527,570 |
Alexandria Real Estate Equities, Inc.: | | | |
Series B, 9.10% | | 3,600 | | 91,224 |
Series C, 8.375% | | 10,000 | | 262,000 |
American Home Mortgage Investment Corp.: | | | |
Series A, 9.375% | | 79,300 | | 2,110,173 |
Series B, 9.25% | | 230,944 | | 5,960,665 |
Annaly Capital Management, Inc. Series A, 7.875% | | 141,300 | | 3,505,653 |
Anthracite Capital, Inc. Series C, 9.375% | | 400 | | 10,680 |
Anworth Mortgage Asset Corp. Series A, 8.625% | | 189,600 | | 4,692,600 |
Apartment Investment & Management Co. Series T, 8.00% | | 80,000 | | 2,030,400 |
Ashford Hospitality Trust, Inc. Series A, 8.55% | | 10,000 | | 255,500 |
Capital Lease Funding, Inc. Series A, 8.125% | | 20,000 | | 501,000 |
CBL & Associates Properties, Inc. Series B, 8.75% | | 64,200 | | 3,300,522 |
CenterPoint Properties Trust Series D, 5.377% | | 5,280 | | 4,224,000 |
Colonial Properties Trust (depositary shares) Series D, 8.125% | | 5,000 | | 129,950 |
Cousins Properties, Inc. Series A, 7.75% | | 49,600 | | 1,269,760 |
Crescent Real Estate Equities Co. Series B, 9.50% | | 50,000 | | 1,283,000 |
Developers Diversified Realty Corp. (depositary shares) Series F, 8.60% | | 10,000 | | 254,300 |
Digital Realty Trust, Inc.: | | | |
Series A, 8.50% | | 90,000 | | 2,335,500 |
Series B, 7.875% | | 36,100 | | 915,496 |
Eagle Hospitality Properties Trust, Inc. Series A, 8.25% | | 71,300 | | 1,829,558 |
Preferred Stocks - continued |
| | Shares | | Value
(Note 1) |
Nonconvertible Preferred Stocks - continued |
FINANCIALS - continued |
Real Estate Investment Trusts |
FelCor Lodging Trust, Inc. (depositary shares) Series C, 8.00% | | 40,000 | | $ 980,000 |
Glimcher Realty Trust Series F, 8.75% | | 30,000 | | 760,800 |
Hersha Hospitality Trust Series A, 8.00% | | 40,000 | | 1,038,400 |
Home Properties of New York, Inc. Series F, 9.00% | | 124,800 | | 3,183,648 |
HomeBanc Mortgage Corp., Georgia Series A, 10.00% | | 311,415 | | 7,866,343 |
Impac Mortgage Holdings, Inc. Series C, 9.125% | | 17,700 | | 412,587 |
Innkeepers USA Trust Series C, 8.00% | | 53,000 | | 1,341,960 |
LaSalle Hotel Properties Series A, 10.25% | | 124,500 | | 3,189,690 |
Lexington Corporate Properties Trust Series B, 8.05% | | 60,000 | | 1,534,200 |
MFA Mortgage Investments, Inc. Series A, 8.50% | | 162,900 | | 4,012,227 |
Mid-America Apartment Communities, Inc. Series H, 8.30% | | 45,100 | | 1,150,501 |
Nationwide Health Properties, Inc. 7.677% | | 19,200 | | 1,940,160 |
New Century Financial Corp. Series B 9.75% | | 25,000 | | 625,000 |
New Plan Excel Realty Trust (depositary shares) Series D, 7.80% | | 20,500 | | 1,025,000 |
Newcastle Investment Corp. Series B, 9.75% | | 79,000 | | 2,063,480 |
NorthStar Realty Finance Corp. Series A 8.75% | | 20,000 | | 513,000 |
Omega Healthcare Investors, Inc. Series D, 8.375% | | 80,000 | | 2,080,800 |
Parkway Properties, Inc. Series D, 8.00% | | 80,000 | | 2,032,800 |
Prime Group Realty Trust Series B, 9.00% | | 15,500 | | 280,550 |
PS Business Parks, Inc. (depositary shares) Series F, 8.75% | | 3,400 | | 86,088 |
Public Storage, Inc. Series I, 7.25% | | 20,000 | | 495,000 |
RAIT Investment Trust: | | | |
Series A, 7.75% | | 60,000 | | 1,473,000 |
Series B, 8.375% | | 17,000 | | 434,350 |
Realty Income Corp. 8.25% | | 100 | | 2,604 |
Saul Centers, Inc. 8.00% | | 40,000 | | 1,018,400 |
Simon Property Group, Inc. Series G, 7.89% | | 11,500 | | 593,400 |
Strategic Hotel & Resorts, Inc.: | | | |
Series A, 8.50% | | 120,000 | | 3,015,000 |
Series C, 8.25% | | 60,000 | | 1,539,000 |
Sunstone Hotel Investors, Inc. Series A, 8.00% | | 15,000 | | 381,000 |
Taubman Centers, Inc. Series G, 8.00% | | 20,000 | | 530,200 |
The Mills Corp.: | | | |
Series B, 9.00% | | 64,400 | | 1,378,160 |
Series C, 9.00% | | 156,500 | | 3,302,150 |
Series E, 8.75% | | 138,885 | | 2,880,475 |
Series G, 7.875% | | 39,933 | | 775,100 |
| | | 91,424,624 |
Preferred Stocks - continued |
| | Shares | | Value
(Note 1) |
Nonconvertible Preferred Stocks - continued |
FINANCIALS - continued |
Real Estate Management & Development - 0.0% |
Affordable Residential Communties, Inc. Series A, 8.25% | | 52,800 | | $ 1,251,360 |
TOTAL FINANCIALS | | | 96,323,372 |
TOTAL PREFERRED STOCKS (Cost $109,846,393) | | 110,409,167 |
Floating Rate Loans - 0.8% |
| | Principal
Amount | | |
CONSUMER DISCRETIONARY - 0.2% |
Hotels, Restaurants & Leisure - 0.0% |
Landry's Seafood Restaurants, Inc. term loan 7.1201% 12/28/10 (c) | | $ 997,462 | | 996,215 |
Specialty Retail - 0.2% |
The Pep Boys - Manny, Moe & Jack term loan 8.32% 1/27/11 (c) | | 39,800 | | 39,999 |
Toys 'R' US, Inc. term loan 8.33% 12/9/08 (c) | | 5,000,000 | | 4,993,750 |
| | | 5,033,749 |
TOTAL CONSUMER DISCRETIONARY | | | 6,029,964 |
CONSUMER STAPLES - 0.0% |
Food & Staples Retailing - 0.0% |
Cumberland Farms, Inc. term loan 7.37% 9/25/13 (c) | | 2,000,000 | | 2,007,500 |
FINANCIALS - 0.4% |
Real Estate Investment Trusts - 0.2% |
Capital Automotive (REIT) Tranche B, term loan 7.08% 12/16/10 (c) | | 488,393 | | 489,614 |
General Growth Properties, Inc. Tranche A1, term loan 6.58% 2/24/10 (c) | | 3,000,000 | | 2,966,250 |
Newkirk Master LP Tranche B, term loan 7.08% 8/11/08 (c) | | 1,221,055 | | 1,219,529 |
Trizec Properties, Inc. term loan 6.775% 5/2/07 (c) | | 1,140,000 | | 1,138,575 |
| | | 5,813,968 |
Floating Rate Loans - continued |
| | Principal Amount | | Value
(Note 1) |
FINANCIALS - continued |
Real Estate Management & Development - 0.1% |
MDS Realty Holdings LLC: | | | |
Tranche M1, term loan 7.6563% 1/8/08 (c) | | $ 1,872,076 | | $ 1,872,076 |
Tranche M3, term loan 8.9063% 1/8/08 (c) | | 1,497,661 | | 1,497,661 |
North Las Vegas/Olympia Group Tranche 1, term loan 8.1169% 5/9/11 (c) | | 497,500 | | 487,550 |
| | | 3,857,287 |
Thrifts & Mortgage Finance - 0.1% |
Charter Municipal Mortgage Acceptance Co. term loan 7.9% 8/15/12 (c) | | 1,500,000 | | 1,503,750 |
TOTAL FINANCIALS | | | 11,175,005 |
HEALTH CARE - 0.2% |
Health Care Providers & Services - 0.2% |
HealthSouth Corp. term loan 8.58% 3/10/13 (c) | | 3,990,000 | | 4,009,950 |
Skilled Healthcare Group, Inc. Tranche 1, term loan 8.08% 6/15/12 (c) | | 997,475 | | 1,004,956 |
| | | 5,014,906 |
TELECOMMUNICATION SERVICES - 0.0% |
Wireless Telecommunication Services - 0.0% |
Crown Castle Operating Co. Tranche B, term loan 7.65% 6/1/14 (c) | | 510,000 | | 510,000 |
TOTAL FLOATING RATE LOANS (Cost $24,758,659) | | 24,737,375 |
Commodity-Linked Notes - 7.3% |
|
AIG-FP Private Funding Ltd.: | | | | |
Master Note, one-month U.S. dollar LIBOR plus .10% due 6/29/2007 (indexed to the Dow Jones-AIG Commodity Total Return Index, multiplied by 3) (b)(c)(e) | | 7,670,000 | | 5,869,668 |
Master Note, one-month U.S. dollar LIBOR plus .10% due 7/12/2007 (indexed to the Dow Jones-AIG Commodity Total Return Index, multiplied by 3) (b)(c)(e) | | 5,000,000 | | 3,521,488 |
Master Note, one-month U.S. dollar LIBOR plus .10% due 7/6/2007 (indexed to the Dow Jones-AIG Commodity Total Return Index, multiplied by 3) (b)(c)(e) | | 9,500,000 | | 7,381,505 |
Commodity-Linked Notes - continued |
| | Principal Amount | | Value
(Note 1) |
AIG-FP Private Funding Ltd.: - continued | | | | |
Master Note, one-month U.S. dollar LIBOR plus .10% due 8/20/2007 (indexed to the Dow Jones-AIG Commodity Total Return Index, multiplied by 3) (b)(c)(e) | | $ 15,100,000 | | $ 14,642,092 |
Master Note, one-month U.S. dollar LIBOR plus .10% due 8/24/2007 (indexed to the Dow Jones-AIG Commodity Total Return Index, multiplied by 3) (b)(c)(e) | | 6,000,000 | | 6,137,428 |
Master Note, one-month U.S. dollar LIBOR plus .10% due 8/29/2007 (indexed to the Dow Jones-AIG Commodity Total Return Index, multiplied by 3) (b)(c)(e) | | 2,600,000 | | 2,697,291 |
Master Note, one-month U.S. dollar LIBOR plus .15% due 3/15/2007 (indexed to the Dow Jones-AIG Commodity Total Return Index, multiplied by 3) (b)(c)(e) | | 9,970,000 | | 8,687,327 |
Master Note, one-month U.S. dollar LIBOR plus .15% due 3/8/2007 (indexed to the Dow Jones-AIG Commodity Total Return Index, multiplied by 3) (b)(c)(e) | | 3,330,000 | | 2,993,347 |
Master Note, one-month U.S. dollar LIBOR plus .15% due 4/20/2007 (indexed to the Dow Jones-AIG Commodity Total Return Index, multiplied by 3) (b)(c)(e) | | 6,670,000 | | 4,695,243 |
Master Note, one-month U.S. dollar LIBOR plus .15% due 4/9/2007 (indexed to the Dow Jones-AIG Commodity Total Return Index, multiplied by 3) (b)(c)(e) | | 3,300,000 | | 2,282,453 |
Master Note, one-month U.S. dollar LIBOR plus .15% due 6/6/2007 (indexed to the Dow Jones-AIG Commodity Total Return Index, multiplied by 3) (b)(c)(e) | | 1,670,000 | | 1,232,797 |
Master Note, one-month U.S. dollar LIBOR plus .15% due 3/2/2007 (indexed to the Dow Jones-AIG Commodity Total Return Index, multiplied by 3) (b)(c)(e) | | 5,000,000 | | 4,721,259 |
Master Note, one-month U.S. dollar LIBOR plus .15% due 3/8/2007 (indexed to the Dow Jones-AIG Commodity Total Return Index, multiplied by 3) (b)(c)(e) | | 2,500,000 | | 2,272,002 |
JPMorgan Chase Bank NA: | | | | |
Medium Term Note, one-month U.S. dollar LIBOR minus .15% due 4/27/2007 (indexed to the Dow Jones-AIG Commodity Total Return Index, multiplied by 3) (b)(c)(e) | | 9,670,000 | | 7,845,989 |
Commodity-Linked Notes - continued |
| | Principal Amount | | Value
(Note 1) |
JPMorgan Chase Bank NA: - continued | | | | |
Medium Term Note, one-month U.S. dollar LIBOR minus .15% due 4/9/2007 (indexed to the Dow Jones-AIG Commodity Total Return Index, multiplied by 3) (b)(c)(e) | | $ 6,630,000 | | $ 4,507,896 |
Medium Term Note, one-month U.S. dollar LIBOR minus .15% due 5/4/2007 (indexed to the Dow Jones-AIG Commodity Total Return Index, multiplied by 3) (b)(c)(e) | | 5,070,000 | | 4,201,611 |
Medium Term Note, one-month U.S. dollar LIBOR minus .15% due 6/29/2007 (indexed to the Dow Jones-AIG Commodity Total Return Index, multiplied by 3) (b)(c)(e) | | 1,500,000 | | 1,139,610 |
Medium Term Note, one-month U.S. dollar LIBOR minus .15% due 6/6/2007 (indexed to the Dow Jones-AIG Commodity Total Return Index, multiplied by 3) (b)(c)(e) | | 1,670,000 | | 1,277,517 |
Medium Term Note, one-month U.S. dollar LIBOR minus .15% due 7/12/2007 (indexed to the Dow Jones-AIG Commodity Total Return Index, multiplied by 3) (b)(c)(e) | | 5,000,000 | | 3,521,687 |
Medium Term Note, one-month U.S. dollar LIBOR minus .15% due 7/20/2007 (indexed to the Dow Jones-AIG Commodity Total Return Index, multiplied by 3) (b)(c)(e) | | 4,000,000 | | 3,144,954 |
Medium Term Note, one-month U.S. dollar LIBOR minus .15% due 8/24/2007 (indexed to the Dow Jones-AIG Commodity Total Return Index, multiplied by 3) (b)(c)(e) | | 3,550,000 | | 3,707,282 |
Medium Term Note, one-month U.S. dollar LIBOR minus .15% due 8/29/2007 (indexed to the Dow Jones-AIG Commodity Total Return Index, multiplied by 3) (b)(c)(e) | | 7,210,000 | | 7,415,465 |
Medium Term Note, one-month U.S. dollar LIBOR minus .17% due 10/06/2006 (indexed to the Dow Jones-AIG Commodity Total Return Index, multiplied by 3) (b)(c)(e) | | 1,780,000 | | 1,568,657 |
Medium Term Note, one-month U.S. dollar LIBOR minus .17% due 10/16/2006 (indexed to the Dow Jones-AIG Commodity Total Return Index, multiplied by 3) (b)(c)(e) | | 4,970,000 | | 4,175,429 |
Medium Term Note, one-month U.S. dollar LIBOR minus .17% due 12/14/2006 (indexed to the Dow Jones-AIG Commodity Total Return Index, multiplied by 3) (b)(c)(e) | | 4,160,000 | | 3,735,211 |
Commodity-Linked Notes - continued |
| | Principal Amount | | Value
(Note 1) |
JPMorgan Chase Bank NA: - continued | | | | |
Medium Term Note, one-month U.S. dollar LIBOR minus .17% due 2/12/2007 (indexed to the Dow Jones-AIG Commodity Total Return Index, multiplied by 3) (b)(c)(e) | | $ 4,000,000 | | $ 4,070,736 |
Medium Term Note, one-month U.S. dollar LIBOR minus .17% due 3/15/2007 (indexed to the Dow Jones-AIG Commodity Total Return Index, multiplied by 3) (b)(c)(e) | | 2,500,000 | | 2,183,504 |
Medium Term Note, one-month U.S. dollar LIBOR minus .17% due 3/2/2007 (indexed to the Dow Jones-AIG Commodity Total Return Index, multiplied by 3) (b)(c)(e) | | 3,340,000 | | 3,272,148 |
Medium Term Note, one-month U.S. dollar LIBOR minus .18% due 10/06/2006 (indexed to the Dow Jones-AIG Commodity Total Return Index, multiplied by 3) (b)(c)(e) | | 3,060,000 | | 2,635,931 |
Morgan Stanley: | | | | |
Note, one-month U.S. dollar LIBOR minus .03% due 8/6/2007 (indexed to the Dow Jones-AIG Commodity Total Return Index, multiplied by 3) (b)(c)(e) | | 8,340,000 | | 6,997,640 |
Note, one-month U.S. dollar LIBOR minus .07% due 6/27/2007 (indexed to the Dow Jones-AIG Commodity Total Return Index, multiplied by 3) (b)(c)(e) | | 8,340,000 | | 5,859,783 |
Note, one-month U.S. dollar LIBOR minus .10% due 3/23/2007 (indexed to the Dow Jones-AIG Commodity Total Return Index, multiplied by 3) (b)(c)(e) | | 8,340,000 | | 6,178,330 |
Note, one-month U.S. dollar LIBOR minus .10% due 6/6/2007 (indexed to the Dow Jones-AIG Commodity Total Return Index, multiplied by 3) (b)(c)(e) | | 12,340,000 | | 9,787,378 |
Note, one-month U.S. dollar LIBOR minus .15% due 2/27/2007 (indexed to the Dow Jones-AIG Commodity Total Return Index, multiplied by 3) (b)(c)(e) | | 22,330,000 | | 20,955,892 |
Note, one-month U.S. dollar LIBOR minus .15% due 3/23/2007 (indexed to the Dow Jones-AIG Commodity Total Return Index, multiplied by 3) (b)(c)(e) | | 5,000,000 | | 4,487,387 |
Commodity-Linked Notes - continued |
| | Principal Amount | | Value
(Note 1) |
Societe Generale Commodities Products, LLC: | | | | |
Note, one-month U.S. dollar LIBOR minus .10% due 7/17/2007 (indexed to the Dow Jones-AIG Commodity Total Return Index, multiplied by 3) (b)(c)(e) | | $ 6,340,000 | | $ 4,557,961 |
Note, one-month U.S. dollar LIBOR minus .10% due 7/20/2007 (indexed to the Dow Jones-AIG Commodity Total Return Index, multiplied by 3) (b)(c)(e) | | 13,300,000 | | 10,629,582 |
Note, one-month U.S. dollar LIBOR minus .10% due 7/27/2007 (indexed to the Dow Jones-AIG Commodity Total Return Index, multiplied by 3) (b)(c)(e) | | 5,170,000 | | 4,136,794 |
Note, one-month U.S. dollar LIBOR minus .10% due 8/10/2007 (indexed to the Dow Jones-AIG Commodity Total Return Index, multiplied by 3) (b)(c)(e) | | 9,150,000 | | 7,975,186 |
Note, one-month U.S. dollar LIBOR minus .10% due 8/31/2007 (indexed to the Dow Jones-AIG Commodity Total Return Index, multiplied by 3) (b)(c)(e) | | 3,000,000 | | 3,014,017 |
TOTAL COMMODITY-LINKED NOTES (Cost $248,070,000) | 210,117,477 |
Fixed-Income Funds - 42.2% |
| Shares | | |
Fidelity Floating Rate Central Investment Portfolio (d) | 7,132,846 | | 715,567,111 |
Fidelity Ultra-Short Central Fund (d) | 5,084,144 | | 505,821,487 |
TOTAL FIXED-INCOME FUNDS (Cost $1,222,731,910) | 1,221,388,598 |
Preferred Securities - 0.2% |
| Principal
Amount | | |
FINANCIALS - 0.2% |
Diversified Financial Services - 0.2% |
Cairn High Grade ABS CDO II Ltd. Series 2006-2A Class SUB, 1/13/47 (b) | $ 1,200,000 | | 1,080,000 |
Crest Clarendon Street 2002-1 Ltd. Series 2002-1A Class PS, 12/28/35 (b) | 500,000 | | 521,213 |
Preferred Securities - continued |
| Principal Amount | | Value
(Note 1) |
FINANCIALS - continued |
Diversified Financial Services - continued |
Harp High Grade CDO I Ltd. Series 2006-1, 7/8/46 (b) | $ 1,650,000 | | $ 1,600,500 |
Ipswich Street CDO Series 2006-1, 6/27/46 (b) | 2,250,000 | | 2,182,500 |
TOTAL PREFERRED SECURITIES (Cost $5,445,370) | 5,384,213 |
Cash Equivalents - 1.8% |
| Maturity Amount | | |
Investments in repurchase agreements (Collateralized by U.S. Treasury Obligations), in a joint trading account at 5.08%, dated 9/29/06 due 10/2/06
(Cost $51,181,000) | $ 51,202,668 | | 51,181,000 |
TOTAL INVESTMENT PORTFOLIO - 99.3% (Cost $2,900,634,389) | | 2,871,583,476 |
NET OTHER ASSETS - 0.7% | | 21,317,909 |
NET ASSETS - 100% | $ 2,892,901,385 |
Legend |
(a) Non-income producing |
(b) Security exempt from registration under Rule 144A of the Securities Act of 1933. These securities may be resold in transactions exempt from registration, normally to qualified institutional buyers. At the end of the period, the value of these securities amounted to $275,428,372 or 9.5% of net assets. |
(c) The coupon rate shown on floating or adjustable rate securities represents the rate at period end. |
(d) Affiliated fund that is available only to investment companies and other accounts managed by Fidelity Investments. A complete unaudited list of holdings for each Fidelity Central Fund, as of the Investing Fund's report date, is available upon request or at fidelity.com and/or advisor.fidelity.com, as applicable. The reports are located just after the Investing Fund's financial statements and quarterly reports but are not part of the financial statements or quarterly reports. In addition, each Fidelity Central Fund's financial statements, which are not covered by the Investing Fund's Report of Independent Registered Public Accounting Firm, are available on the EDGAR Database on the SEC's web site, www.sec.gov, or upon request. |
(e) Security is linked to the Dow Jones-AIG Commodity Total Return Index. Securities do not guarantee any return of principal at maturity but instead, will pay at maturity or upon exchange, an amount based on the closing value of the Dow Jones-AIG Commodity Index Total Return. Although these instruments are primarily debt obligations, they indirectly provide exposure to changes in the value of the underlying commodities. Holders of the security have the right to exchange these notes at any time. |
Affiliated Central Funds |
Information regarding fiscal year to date income earned by the Fund from investments in Fidelity Central Funds is as follows: |
Fund | Income earned |
Fidelity Floating Rate Central Investment Portfolio | $ 23,003,598 |
Fidelity Ultra-Short Central Fund | 11,744,528 |
Total | $ 34,748,126 |
|
Additional information regarding the Fund's fiscal year to date purchases and sales, including the ownership percentage, of the non Money Market Central Funds is as follows: |
Fund | Value, beginning of period | Purchases | Sales Proceeds | Value, end of period | % ownership, end of period |
Fidelity Floating Rate Central Investment Portfolio | $ 7,598,671 | $ 709,374,857 | $ - | $ 715,567,111 | 46.3% |
Fidelity Ultra-Short Central Fund | 6,644,141 | 499,114,422 | - | 505,821,487 | 5.9% |
Total | $ 14,242,812 | $ 1,208,489,279 | $ - | $ 1,221,388,598 | |
See accompanying notes which are an integral part of the financial statements.
Annual Report
Financial Statements
Statement of Assets and Liabilities
| September 30, 2006 |
| | |
Assets | | |
Investment in securities, at value (including repurchase agreements of $51,181,000) -
See accompanying schedule: Unaffiliated issuers (cost $1,677,902,479) | $ 1,650,194,878 | |
Fidelity Central Funds (cost $1,222,731,910) | 1,221,388,598 | |
Total Investments (cost $2,900,634,389) | | $ 2,871,583,476 |
Receivable for investments sold | | 5,473,539 |
Receivable for fund shares sold | | 20,135,812 |
Dividends receivable | | 1,719,704 |
Interest receivable | | 19,821,398 |
Receivable from investment adviser for expense reductions | | 235 |
Other receivables | | 1,137 |
Total assets | | 2,918,735,301 |
| | |
Liabilities | | |
Payable to custodian bank | $ 839,981 | |
Payable for investments purchased | 21,149,229 | |
Payable for fund shares redeemed | 1,751,121 | |
Accrued management fee | 1,315,228 | |
Distribution fees payable | 23,721 | |
Other affiliated payables | 381,005 | |
Other payables and accrued expenses | 373,631 | |
Total liabilities | | 25,833,916 |
| | |
Net Assets | | $ 2,892,901,385 |
Net Assets consist of: | | |
Paid in capital | | $ 2,890,235,544 |
Undistributed net investment income | | 35,583,876 |
Accumulated undistributed net realized gain (loss) on investments | | (3,867,122) |
Net unrealized appreciation (depreciation) on investments | | (29,050,913) |
Net Assets | | $ 2,892,901,385 |
See accompanying notes which are an integral part of the financial statements.
Annual Report
Statement of Assets and Liabilities - continued
| September 30, 2006 |
| | |
Calculation of Maximum Offering Price
Class A:
Net Asset Value and redemption price per share
($13,335,218 ÷ 1,322,619 shares) | | $ 10.08 |
| | |
Maximum offering price per share (100/95.25 of $10.08) | | $ 10.58 |
Class T:
Net Asset Value and redemption price per share ($22,825,074 ÷ 2,264,602 shares) | | $ 10.08 |
| | |
Maximum offering price per share (100/96.50 of $10.08) | | $ 10.45 |
Class B:
Net Asset Value and offering price per share ($6,001,546 ÷ 596,777 shares)A | | $ 10.06 |
| | |
Class C:
Net Asset Value and offering price per share ($16,528,091 ÷ 1,645,914 shares)A | | $ 10.04 |
| | |
Strategic Real Return:
Net Asset Value, offering price and redemption price per share ($2,694,765,026 ÷ 266,860,845 shares) | | $ 10.10 |
| | |
Institutional Class:
Net Asset Value, offering price and redemption price per share ($139,446,430 ÷ 13,823,004 shares) | | $ 10.09 |
A Redemption price per share is equal to net asset value less any applicable contingent deferred sales charge.
See accompanying notes which are an integral part of the financial statements.
Annual Report
Financial Statements - continued
Statement of Operations
| Year ended September 30, 2006 |
| | |
Investment Income | | |
Dividends | | $ 7,049,737 |
Interest | | 41,245,356 |
Income from Fidelity Central Funds | | 34,748,126 |
Total income | | 83,043,219 |
| | |
Expenses | | |
Management fee | $ 7,570,420 | |
Transfer agent fees | 1,753,452 | |
Distribution fees | 170,374 | |
Accounting fees and expenses | 569,065 | |
Custodian fees and expenses | 25,788 | |
Independent trustees' compensation | 4,144 | |
Registration fees | 548,206 | |
Audit | 123,515 | |
Legal | 13,299 | |
Miscellaneous | 2,751 | |
Total expenses before reductions | 10,781,014 | |
Expense reductions | (87,924) | 10,693,090 |
Net investment income | | 72,350,129 |
Realized and Unrealized Gain (Loss) Net realized gain (loss) on: | | |
Investment securities: | | |
Unaffiliated issuers | | (5,738,064) |
Change in net unrealized appreciation (depreciation) on investment securities | | (29,436,055) |
Net gain (loss) | | (35,174,119) |
Net increase (decrease) in net assets resulting from operations | | $ 37,176,010 |
See accompanying notes which are an integral part of the financial statements.
Annual Report
Statement of Changes in Net Assets
| Year ended
September 30, 2006 | For the period
September 7, 2005 (commencement of operations) to
September 30, 2005 |
Increase (Decrease) in Net Assets | | |
Operations | | |
Net investment income | $ 72,350,129 | $ 81,416 |
Net realized gain (loss) | (5,738,064) | 2,066 |
Change in net unrealized appreciation (depreciation) | (29,436,055) | 385,142 |
Net increase (decrease) in net assets resulting
from operations | 37,176,010 | 468,624 |
Distributions to shareholders from net investment income | (34,978,986) | - |
Share transactions - net increase (decrease) | 2,852,107,184 | 38,055,768 |
Redemption fees | 72,674 | 111 |
Total increase (decrease) in net assets | 2,854,376,882 | 38,524,503 |
| | |
Net Assets | | |
Beginning of period | 38,524,503 | - |
End of period (including undistributed net investment income of $35,583,876 and undistributed net investment income of $78,944, respectively) | $ 2,892,901,385 | $ 38,524,503 |
See accompanying notes which are an integral part of the financial statements.
Annual Report
Financial Highlights - Class A
Years ended September 30, | 2006 | 2005 H |
Selected Per-Share Data | | |
Net asset value, beginning of period | $ 10.15 | $ 10.00 |
Income from Investment Operations | | |
Net investment income E | .524 | .031 |
Net realized and unrealized gain (loss) | (.329) | .119 |
Total from investment operations | .195 | .150 |
Distributions from net investment income | (.266) | - |
Redemption fees added to paid in capital E | .001 | - |
Net asset value, end of period | $ 10.08 | $ 10.15 |
Total Return B, C, D | 1.96% | 1.50% |
Ratios to Average Net Assets F, I | | |
Expenses before reductions | 1.02% | 4.71% A |
Expenses net of fee waivers, if any | 1.00% | 1.00% A |
Expenses net of all reductions | .99% | 1.00% A |
Net investment income | 5.24% | 4.28% A |
Supplemental Data | | |
Net assets, end of period (000 omitted) | $ 13,335 | $ 3,405 |
Portfolio turnover rate G | 11% | 78% A |
A Annualized
B Total returns for periods of less than one year are not annualized.
C Total returns would have been lower had certain expenses not been reduced during the periods shown.
D Total returns do not include the effect of the sales charges.
E Calculated based on average shares outstanding during the period.
F Fees and expenses of the underlying Fidelity Central Funds are not included in the Fund's expense ratio. The Fund indirectly bears its proportionate share of the expenses of any underlying Fidelity Central Funds.
G Amount does not include the portfolio activity of any underlying Fidelity Central Funds.
H For the period September 7, 2005 (commencement of operations) to September 30, 2005.
I Expense ratios reflect operating expenses of the class. Expenses before reductions do not reflect amounts reimbursed by the investment adviser or reductions from brokerage service arrangements or other expense offset arrangements and do not represent the amount paid by the class during periods when reimbursements or reductions occur. Expense ratios before reductions for start-up periods may not be representative of longer-term operating periods. Expenses net of fee waivers reflect expenses after reimbursement by the investment adviser but prior to reductions from brokerage service arrangements or other expense offset arrangements. Expenses net of all reductions represent the net expenses paid by the class.
See accompanying notes which are an integral part of the financial statements.
Annual Report
Financial Highlights - Class T
Years ended September 30, | 2006 | 2005 H |
Selected Per-Share Data | | |
Net asset value, beginning of period | $ 10.15 | $ 10.00 |
Income from Investment Operations | | |
Net investment income E | .517 | .030 |
Net realized and unrealized gain (loss) | (.325) | .120 |
Total from investment operations | .192 | .150 |
Distributions from net investment income | (.263) | - |
Redemption fees added to paid in capital E | .001 | - |
Net asset value, end of period | $ 10.08 | $ 10.15 |
Total Return B, C, D | 1.93% | 1.50% |
Ratios to Average Net Assets F, I | | |
Expenses before reductions | 1.05% | 4.81% A |
Expenses net of fee waivers, if any | 1.05% | 1.10% A |
Expenses net of all reductions | 1.05% | 1.10% A |
Net investment income | 5.19% | 4.18% A |
Supplemental Data | | |
Net assets, end of period (000 omitted) | $ 22,825 | $ 3,284 |
Portfolio turnover rate G | 11% | 78% A |
A Annualized
B Total returns for periods of less than one year are not annualized.
C Total returns would have been lower had certain expenses not been reduced during the periods shown.
D Total returns do not include the effect of the sales charges.
E Calculated based on average shares outstanding during the period.
F Fees and expenses of the underlying Fidelity Central Funds are not included in the Fund's expense ratio. The Fund indirectly bears its proportionate share of the expenses of any underlying Fidelity Central Funds.
G Amount does not include the portfolio activity of any underlying Fidelity Central Funds.
H For the period September 7, 2005 (commencement of operations) to September 30, 2005.
I Expense ratios reflect operating expenses of the class. Expenses before reductions do not reflect amounts reimbursed by the investment adviser or reductions from brokerage service arrangements or other expense offset arrangements and do not represent the amount paid by the class during periods when reimbursements or reductions occur. Expense ratios before reductions for start-up periods may not be representative of longer-term operating periods. Expenses net of fee waivers reflect expenses after reimbursement by the investment adviser but prior to reductions from brokerage service arrangements or other expense offset arrangements. Expenses net of all reductions represent the net expenses paid by the class.
See accompanying notes which are an integral part of the financial statements.
Annual Report
Financial Highlights - Class B
Years ended September 30, | 2006 | 2005 H |
Selected Per-Share Data | | |
Net asset value, beginning of period | $ 10.14 | $ 10.00 |
Income from Investment Operations | | |
Net investment income E | .450 | .025 |
Net realized and unrealized gain (loss) | (.318) | .115 |
Total from investment operations | .132 | .140 |
Distributions from net investment income | (.213) | - |
Redemption fees added to paid in capital E | .001 | - |
Net asset value, end of period | $ 10.06 | $ 10.14 |
Total Return B, C, D | 1.33% | 1.40% |
Ratios to Average Net Assets F, I | | |
Expenses before reductions | 1.74% | 5.47% A |
Expenses net of fee waivers, if any | 1.74% | 1.75% A |
Expenses net of all reductions | 1.73% | 1.75% A |
Net investment income | 4.49% | 3.53% A |
Supplemental Data | | |
Net assets, end of period (000 omitted) | $ 6,002 | $ 3,253 |
Portfolio turnover rate G | 11% | 78% A |
A Annualized
B Total returns for periods of less than one year are not annualized.
C Total returns would have been lower had certain expenses not been reduced during the periods shown.
D Total returns do not include the effect of the contingent deferred sales charge.
E Calculated based on average shares outstanding during the period.
F Fees and expenses of the underlying Fidelity Central Funds are not included in the Fund's expense ratio. The Fund indirectly bears its proportionate share of the expenses of any underlying Fidelity Central Funds.
G Amount does not include the portfolio activity of any underlying Fidelity Central Funds.
H For the period September 7, 2005 (commencement of operations) to September 30, 2005.
I Expense ratios reflect operating expenses of the class. Expenses before reductions do not reflect amounts reimbursed by the investment adviser or reductions from brokerage service arrangements or other expense offset arrangements and do not represent the amount paid by the class during periods when reimbursements or reductions occur. Expense ratios before reductions for start-up periods may not be representative of longer-term operating periods. Expenses net of fee waivers reflect expenses after reimbursement by the investment adviser but prior to reductions from brokerage service arrangements or other expense offset arrangements. Expenses net of all reductions represent the net expenses paid by the class.
See accompanying notes which are an integral part of the financial statements.
Annual Report
Financial Highlights - Class C
Years ended September 30, | 2006 | 2005 H |
Selected Per-Share Data | | |
Net asset value, beginning of period | $ 10.14 | $ 10.00 |
Income from Investment Operations | | |
Net investment income E | .437 | .024 |
Net realized and unrealized gain (loss) | (.323) | .116 |
Total from investment operations | .114 | .140 |
Distributions from net investment income | (.215) | - |
Redemption fees added to paid in capital E | .001 | - |
Net asset value, end of period | $ 10.04 | $ 10.14 |
Total Return B, C, D | 1.15% | 1.40% |
Ratios to Average Net Assets F, I | | |
Expenses before reductions | 1.86% | 5.56% A |
Expenses net of fee waivers, if any | 1.85% | 1.85% A |
Expenses net of all reductions | 1.84% | 1.85% A |
Net investment income | 4.39% | 3.43% A |
Supplemental Data | | |
Net assets, end of period (000 omitted) | $ 16,528 | $ 3,467 |
Portfolio turnover rate G | 11% | 78% A |
A Annualized
B Total returns for periods of less than one year are not annualized.
C Total returns would have been lower had certain expenses not been reduced during the periods shown.
D Total returns do not include the effect of the contingent deferred sales charge.
E Calculated based on average shares outstanding during the period.
F Fees and expenses of the underlying Fidelity Central Funds are not included in the Fund's expense ratio. The Fund indirectly bears its proportionate share of the expenses of any underlying Fidelity Central Funds.
G Amount does not include the portfolio activity of any underlying Fidelity Central Funds.
H For the period September 7, 2005 (commencement of operations) to September 30, 2005.
I Expense ratios reflect operating expenses of the class. Expenses before reductions do not reflect amounts reimbursed by the investment adviser or reductions from brokerage service arrangements or other expense offset arrangements and do not represent the amount paid by the class during periods when reimbursements or reductions occur. Expense ratios before reductions for start-up periods may not be representative of longer-term operating periods. Expenses net of fee waivers reflect expenses after reimbursement by the investment adviser but prior to reductions from brokerage service arrangements or other expense offset arrangements. Expenses net of all reductions represent the net expenses paid by the class.
See accompanying notes which are an integral part of the financial statements.
Annual Report
Financial Highlights - Strategic Real Return
Years ended September 30, | 2006 | 2005 G |
Selected Per-Share Data | | |
Net asset value, beginning of period | $ 10.15 | $ 10.00 |
Income from Investment Operations | | |
Net investment income D | .544 | .028 |
Net realized and unrealized gain (loss) | (.317) | .122 |
Total from investment operations | .227 | .150 |
Distributions from net investment income | (.278) | - |
Redemption fees added to paid in capital D | .001 | - I |
Net asset value, end of period | $ 10.10 | $ 10.15 |
Total Return B, C | 2.28% | 1.50% |
Ratios to Average Net Assets E, H | | |
Expenses before reductions | .80% | 4.41% A |
Expenses net of fee waivers, if any | .80% | .85% A |
Expenses net of all reductions | .79% | .85% A |
Net investment income | 5.45% | 4.43% A |
Supplemental Data | | |
Net assets, end of period (000 omitted) | $ 2,694,765 | $ 21,867 |
Portfolio turnover rate F | 11% | 78% A |
A Annualized
B Total returns for periods of less than one year are not annualized.
C Total returns would have been lower had certain expenses not been reduced during the periods shown.
D Calculated based on average shares outstanding during the period.
E Fees and expenses of the underlying Fidelity Central Funds are not included in the Fund's expense ratio. The Fund indirectly bears its proportionate share of the expenses of any underlying Fidelity Central Funds.
F Amount does not include the portfolio activity of any underlying Fidelity Central Funds.
G For the period September 7, 2005 (commencement of operations) to September 30, 2005.
H Expense ratios reflect operating expenses of the class. Expenses before reductions do not reflect amounts reimbursed by the investment adviser or reductions from brokerage service arrangements or other expense offset arrangements and do not represent the amount paid by the class during periods when reimbursements or reductions occur. Expense ratios before reductions for start-up periods may not be representative of longer-term operating periods. Expenses net of fee waivers reflect expenses after reimbursement by the investment adviser but prior to reductions from brokerage service arrangements or other expense offset arrangements. Expenses net of all reductions represent the net expenses paid by the class.
I Amount represents less than $.001 per share.
See accompanying notes which are an integral part of the financial statements.
Annual Report
Financial Highlights - Institutional Class
Years ended September 30, | 2006 | 2005 G |
Selected Per-Share Data | | |
Net asset value, beginning of period | $ 10.15 | $ 10.00 |
Income from Investment Operations | | |
Net investment income D | .540 | .032 |
Net realized and unrealized gain (loss) | (.321) | .118 |
Total from investment operations | .219 | .150 |
Distributions from net investment income | (.280) | - |
Redemption fees added to paid in capital D | .001 | - |
Net asset value, end of period | $ 10.09 | $ 10.15 |
Total Return B, C | 2.20% | 1.50% |
Ratios to Average Net Assets E, H | | |
Expenses before reductions | .82% | 4.55% A |
Expenses net of fee waivers, if any | .82% | .85% A |
Expenses net of all reductions | .82% | .85% A |
Net investment income | 5.46% | 4.43% A |
Supplemental Data | | |
Net assets, end of period (000 omitted) | $ 139,446 | $ 3,248 |
Portfolio turnover rate F | 11% | 78% A |
A Annualized
B Total returns for periods of less than one year are not annualized.
C Total returns would have been lower had certain expenses not been reduced during the periods shown.
D Calculated based on average shares outstanding during the period.
E Fees and expenses of the underlying Fidelity Central Funds are not included in the Fund's expense ratio. The Fund indirectly bears its proportionate share of the expenses of any underlying Fidelity Central Funds.
F Amount does not include the portfolio activity of any underlying Fidelity Central Funds.
G For the period September 7, 2005 (commencement of operations) to September 30, 2005.
H Expense ratios reflect operating expenses of the class. Expenses before reductions do not reflect amounts reimbursed by the investment adviser or reductions from brokerage service arrangements or other expense offset arrangements and do not represent the amount paid by the class during periods when reimbursements or reductions occur. Expense ratios before reductions for start-up periods may not be representative of longer-term operating periods. Expenses net of fee waivers reflect expenses after reimbursement by the investment adviser but prior to reductions from brokerage service arrangements or other expense offset arrangements. Expenses net of all reductions represent the net expenses paid by the class.
See accompanying notes which are an integral part of the financial statements.
Annual Report
Notes to Financial Statements
For the period ended September 30, 2006
1. Significant Accounting Policies.
Fidelity Strategic Real Return Fund (the Fund) is a fund of Fidelity Commonwealth Trust (the trust) and is authorized to issue an unlimited number of shares. The trust is registered under the Investment Company Act of 1940, as amended (the 1940 Act), as an open-end management investment company organized as a Massachusetts business trust.
The Fund offers Class A, Class T, Class B, Class C, Strategic Real Return, and Institutional Class shares, each of which has equal rights as to assets and voting privileges. Each class has exclusive voting rights with respect to matters that affect that class. Class B shares will automatically convert to Class A shares after a holding period of seven years from the initial date of purchase. Investment income, realized and unrealized capital gains and losses, the common expenses of the Fund, and certain fund-level expense reductions, if any, are allocated on a pro rata basis to each class based on the relative net assets of each class to the total net assets of the Fund. Each class differs with respect to transfer agent and distribution and service plan fees incurred. Certain expense reductions also differ by class.
The Fund may invest in Fidelity Central Funds which are open-end investment companies available to investment companies and other accounts managed by Fidelity Management & Research Company (FMR) and its affiliates. The financial statements have been prepared in conformity with accounting principles generally accepted in the United States of America, which require management to make certain estimates and assumptions at the date of the financial statements. The following summarizes the significant accounting policies of the Fund, which are also consistently followed by the Fidelity Central Funds:
Security Valuation. Investments are valued and net asset value per share is calculated (NAV calculation) as of the close of business of the New York Stock Exchange, normally 4:00 p.m. Eastern time. Wherever possible, the Fund uses independent pricing services approved by the Board of Trustees to value its investments. Debt securities, including restricted securities, for which quotations are readily available, are valued by independent pricing services or by dealers who make markets in such securities. Pricing services consider yield or price of bonds of comparable quality, coupon, maturity and type as well as dealer supplied prices. Equity securities, including restricted securities, for which market quotations are readily available, are valued at the last reported sale price or official closing price as reported by an independent pricing service on the primary market or exchange on which they are traded. In the event there were no sales during the day or closing prices are not available, securities are valued at the last quoted bid price.
Annual Report
1. Significant Accounting Policies - continued
Security Valuation - continued
When current market prices or quotations are not readily available or do not accurately reflect fair value, valuations may be determined in accordance with procedures adopted by the Board of Trustees. The frequency of when fair value pricing is used is unpredictable. The value of securities used for NAV calculation under fair value pricing may differ from published prices for the same securities. Investments in open-end mutual funds, including the Fidelity Central Funds, are valued at their closing net asset value each business day. Short-term securities with remaining maturities of sixty days or less for which quotations are not readily available are valued at amortized cost, which approximates value.
Investment Transactions and Income. Security transactions, including the Fund's investment activity in the Fidelity Central Funds, are accounted for as of trade date. Gains and losses on securities sold are determined on the basis of identified cost. Dividend income is recorded on the ex-dividend date, except for certain dividends from foreign securities where the ex-dividend date may have passed, which are recorded as soon as the Fund is informed of the ex-dividend date. Non-cash dividends included in dividend income, if any, are recorded at the fair market value of the securities received. Distributions received on securities that represent a return of capital or capital gain are recorded as a reduction of cost of investments and/or as a realized gain. The Fund estimates the components of distributions received that may be considered return of capital distributions or capital gain distributions. Interest income and distributions from the Fidelity Central Funds are accrued as earned. Interest income includes coupon interest and amortization of premium and accretion of discount on debt securities. Inflation-indexed bonds are fixed-income securities whose principal value is periodically adjusted to the rate of inflation. Interest is accrued based on the principal value, which is adjusted for inflation. Any increase in the principal amount of an inflation-indexed bond is recorded as interest income, even though principal is not received until maturity.
Expenses. Most expenses of the trust can be directly attributed to a fund. Expenses which cannot be directly attributed are apportioned among each Fund in the trust. Expense estimates are accrued in the period to which they relate and adjustments are made when actual amounts are known.
Income Tax Information and Distributions to Shareholders. Each year, the Fund intends to qualify as a regulated investment company by distributing all of its taxable income and realized gains under Subchapter M of the Internal Revenue Code. As a result, no provision for income taxes is required in the accompanying financial statements.
Annual Report
Notes to Financial Statements - continued
1. Significant Accounting Policies - continued
Income Tax Information and Distributions to Shareholders - continued
Distributions are recorded on the ex-dividend date. Income dividends and capital gain distributions are declared separately for each class. Income and capital gain distributions are determined in accordance with income tax regulations, which may differ from generally accepted accounting principles. In addition, the Fund will claim a portion of the payment made to redeeming shareholders as a distribution for income tax purposes.
Capital accounts within the financial statements are adjusted for permanent book-tax differences. These adjustments have no impact on net assets or the results of operations. Temporary book-tax differences will reverse in a subsequent period.
Book-tax differences are primarily due to market discount, partnerships (including allocations from CIPs), income recognized on commodity-linked notes and losses deferred due to wash sales and excise tax regulations.
The tax-basis components of distributable earnings and the federal tax cost as of period end were as follows:
Unrealized appreciation | $ 24,808,933 | |
Unrealized depreciation | (49,149,157) | |
Net unrealized appreciation (depreciation) | (24,340,224) | |
Undistributed ordinary income | 31,404,681 | |
Undistributed long-term capital gain | 227,005 | |
| | |
Cost for federal income tax purposes | $ 2,895,923,700 | |
The tax character of distributions paid was as follows:
| September 30, 2006 | September 30, 2005 |
Ordinary Income | $ 34,978,986 | $ - |
Short-Term Trading (Redemption) Fees. Shares held in the Fund less than 60 days are subject to a redemption fee equal to .75% of the proceeds of the redeemed shares. All redemption fees, including any estimated redemption fees paid by FMR, are retained by the Fund and accounted for as an addition to paid in capital.
Annual Report
1. Significant Accounting Policies - continued
New Accounting Pronouncement. In July 2006, Financial Accounting Standards Board Interpretation No. 48, Accounting for Uncertainty in Income Taxes - an interpretation of FASB Statement 109 (FIN 48), was issued and is effective for fiscal years beginning after December 15, 2006. FIN 48 sets forth a threshold for financial statement recognition, measurement and disclosure of a tax position taken or expected to be taken on a tax return. Management is currently evaluating the impact, if any, the adoption of FIN 48 will have on the Fund's net assets, results of operations and financial statement disclosures.
In addition, in September 2006, Statement of Financial Accounting Standards No. 157, Fair Value Measurements (SFAS 157), was issued and is effective for fiscal years beginning after November 15, 2007. SFAS 157 defines fair value, establishes a framework for measuring fair value and expands disclosures about fair value measurements. Management is currently evaluating the impact the adoption of SFAS 157 will have on the Fund's financial statement disclosures.
2. Operating Policies.
Repurchase Agreements. FMR has received an Exemptive Order from the Securities and Exchange Commission (the SEC) which permits the Fund and other affiliated entities of FMR to transfer uninvested cash balances into joint trading accounts which are then invested in repurchase agreements. The Fund may also invest directly with institutions in repurchase agreements. Repurchase agreements are collateralized by government or non-government securities. Upon settlement date, collateral is held in segregated accounts with custodian banks and may be obtained in the event of a default of the counterparty. The Fund monitors, on a daily basis, the value of the collateral to ensure it is at least equal to the principal amount of the repurchase agreement (including accrued interest). In the event of a default by the counterparty, realization of the collateral proceeds could be delayed, during which time the value of the collateral may decline.
Indexed Securities. The Fund may invest in indexed securities whose values, interest rates and/or redemption prices are linked either directly or inversely to changes in foreign currencies, interest rates, commodities, indices, or other underlying instruments. These securities may be used to increase or decrease its exposure to different underlying instruments and to gain exposure to markets that might be difficult to invest in through conventional securities. Indexed securities may be more volatile than their underlying instruments, but any loss is limited to the amount of the original investment. Indexed
Annual Report
Notes to Financial Statements - continued
2. Operating Policies - continued
Indexed Securities - continued
securities are marked-to-market daily based on dealer-supplied valuations and changes in value are recorded as unrealized appreciation (depreciation). Gains (losses) realized upon the sale of indexed securities are included in realized gains (losses) on investment securities.
Restricted Securities. The Fund may invest in securities that are subject to legal or contractual restrictions on resale. These securities generally may be resold in transactions exempt from registration or to the public if the securities are registered. Disposal of these securities may involve time-consuming negotiations and expense, and prompt sale at an acceptable price may be difficult. Information regarding restricted securities is included at the end of the Fund's Schedule of Investments.
Loans and Other Direct Debt Instruments. The Fund may invest in loans and loan participations, trade claims or other receivables. These investments may include standby financing commitments, including revolving credit facilities, that obligate the Fund to supply additional cash to the borrower on demand. Loan participations involve a risk of insolvency of the lending bank or other financial intermediary. The Fund may be contractually obligated to receive approval from the agent bank and/or borrower prior to the sale of these investments.
3. Purchases and Sales of Investments.
Purchases and sales of securities (including non Money Market Central Funds), other than short-term securities and U.S. government securities, aggregated $1,769,704,296 and $50,814,076, respectively.
4. Fees and Other Transactions with Affiliates.
Management Fee. FMR and its affiliates provide the Fund with investment management related services for which the Fund pays a monthly management fee. The management fee is the sum of an individual fund fee rate that is based on an annual rate of .45% of the Fund's average net assets and a group fee rate that averaged ..12% during the period. The group fee rate is based upon the average net assets of all the mutual funds advised by FMR. The group fee rate decreases as assets under management increase and increases as assets under management decrease. For the period, the total annual management fee rate was .57% of the Fund's average net assets.
Annual Report
4. Fees and Other Transactions with Affiliates - continued
Distribution and Service Plan. In accordance with Rule 12b-1 of the 1940 Act, the Fund has adopted separate Distribution and Service Plans for each class of shares. Certain classes pay Fidelity Distributors Corporation (FDC), an affiliate of FMR, separate Distribution and Service Fees, each of which is based on an annual percentage of each class' average net assets. In addition, FDC may pay financial intermediaries for selling shares of the Fund and providing shareholder support services. For the period, the Distribution and Service Fee rates and the total amounts paid to and retained by FDC were as follows:
| Distribution
Fee | Service
Fee | Paid to
FDC | Retained
by FDC |
Class A | 0% | .15% | $ 12,428 | $ 5,145 |
Class T | 0% | .25% | 29,199 | 13,567 |
Class B | .65% | .25% | 40,712 | 37,497 |
Class C | .75% | .25% | 88,035 | 73,578 |
| | | $ 170,374 | $ 129,787 |
Sales Load. FDC receives a front-end sales charge of up to 4.75% for selling Class A shares, and 3.50% for selling Class T shares, some of which is paid to financial intermediaries for selling shares of the Fund. FDC receives the proceeds of contingent deferred sales charges levied on Class A, Class T, Class B, and Class C redemptions. These charges depend on the holding period. The deferred sales charges range from 5% to 1% for Class B, 1% for Class C, 1.00% to .50% for certain purchases of Class A shares (.25% prior to February 24, 2006) and .25% for certain purchases of Class T shares.
For the period, sales charge amounts retained by FDC were as follows:
| Retained
by FDC |
Class A | $ 16,722 |
Class T | 5,780 |
Class B* | 1,703 |
Class C* | 1,177 |
| $ 25,382 |
* When Class B and Class C shares are initially sold, FDC pays commissions from its own resources to financial intermediaries through which the sales are made.
Transfer Agent Fees. Fidelity Investments Institutional Operations Company, Inc. (FIIOC), an affiliate of FMR, is the transfer, dividend disbursing and shareholder servicing agent for each class of the Fund, except for Strategic Real Return. Fidelity Service Company, Inc. (FSC), an affiliate of FMR, is the transfer agent for Strategic Real Return
Annual Report
Notes to Financial Statements - continued
4. Fees and Other Transactions with Affiliates - continued
Transfer Agent Fees - continued
shares. FIIOC and FSC receive account fees and asset-based fees that vary according to the account size and type of account of the shareholders of the respective classes of the Fund. FIIOC and FSC pay for typesetting, printing and mailing of shareholder reports, except proxy statements. For the period, the total transfer agent fees paid by each class to FIIOC or FSC, were as follows:
| Amount | % of
Average
Net Assets |
Class A | $ 15,898 | .19 |
Class T | 16,142 | .14 |
Class B | 7,207 | .16 |
Class C | 16,553 | .19 |
Strategic Real Return | 1,628,931 | .13 |
Institutional Class | 68,721 | .17 |
| $ 1,753,452 | |
Accounting Fees. FSC maintains the Fund's accounting records. The fee is based on the level of average net assets for the month.
Investments in Fidelity Central Funds. The Fund may invest in Fidelity Central Funds. The Fund's Schedule of Investments lists each of the Fidelity Central Funds as an investment of the Fund but does not include the underlying holdings of each Fidelity Central Fund. As an Investing Fund, the Fund indirectly bears its proportionate share of the expenses of the underlying Fidelity Central Funds. A complete unaudited list of holdings for each Fidelity Central Fund as of the Fund's report date, is available upon request or, for each non Money Market Central Fund, at fidelity.com and/or advisor.fidelity.com, as applicable. The reports are located just after the Fund's financial statements and quarterly reports but are not part of the financial statements or quarterly reports. In addition, the financial statements of the Fidelity Central Funds, which are not covered by the Fund's Report of Independent Registered Public Accounting Firm, are available on the EDGAR Database on the SEC's web site, www.sec.gov, or upon request.
Based on their investment objective, each Fidelity Central Fund may invest or participate in various investment vehicles or strategies that are similar to those of the Fund. These strategies are consistent with the investment objectives of the Fund and may involve certain economic risks which may cause a decline in value of each of the Fidelity
Annual Report
4. Fees and Other Transactions with Affiliates - continued
Investments in Fidelity Central Funds - continued
Central Funds and thus a decline in the value of the Fund. The following summarizes the Fund's investment in each Fidelity Fixed-Income Central Fund.
Central Fund | Investment Adviser | Investment Objective | Investment Practices |
Fidelity Floating Rate Central Investment Portfolio | Fidelity Management and Research Company, Inc. (FMRC) | Seeks a high level of income by normally investing in floating rate loans and other floating rate securities. | Loans & Direct Debt Instruments Repurchase Agreements Restricted Securities |
Fidelity Ultra-Short Central Fund | Fidelity Investments Money Management, Inc. (FIMM) | Seeks to obtain a high level of current income consistent with preservation of capital by investing in U.S. dollar denominated money market and investment-grade debt securities. | Delayed Delivery & When Issued Securities Futures Repurchase Agreements Restricted Securities Swap Agreements |
Brokerage Commissions. The Fund placed a portion of its portfolio transactions with brokerage firms which are affiliates of the investment adviser. The commissions paid to these affiliated firms were $11,383 for the period.
5. Committed Line of Credit.
The Fund participates with other funds managed by FMR in a $4.2 billion credit facility (the "line of credit") to be utilized for temporary or emergency purposes to fund shareholder redemptions or for other short-term liquidity purposes. The Fund has agreed to pay commitment fees on its pro rata portion of the line of credit, which amounts to $1,177 and is reflected in Miscellaneous Expense on the Statement of Operations. During the period, there were no borrowings on this line of credit.
6. Expense Reductions.
FMR voluntarily agreed to reimburse each class to the extent annual operating expenses exceeded certain levels of average net assets as noted in the table below. Some expenses, for example interest expense, are excluded from this reimbursement.
Annual Report
Notes to Financial Statements - continued
6. Expense Reductions - continued
The following classes were in reimbursement during the period:
| Expense
Limitations | Reimbursement
from adviser |
Class A | 1.00% | $ 1,573 |
Class C | 1.85% | 907 |
| | $ 2,480 |
Many of the brokers with whom FMR places trades on behalf of the Fund provided services to the Fund in addition to trade execution. These services included payments of certain expenses on behalf of the Fund totaling $7,019 for the period . In addition, through arrangements with the Fund's custodian and each class' transfer agent, credits realized as a result of uninvested cash balances were used to reduce the Fund's expenses. During the period, these credits reduced the Fund's custody expenses by $17,270. During the period, credits reduced each class' transfer agent expense as noted in the table below.
| Transfer Agent
expense reduction | |
Class A | $ 334 | |
Class T | 210 | |
Class B | 349 | |
Class C | 349 | |
Strategic Real Return | 58,536 | |
Institutional Class | 1,377 | |
| $ 61,155 | |
7. Other.
The Fund's organizational documents provide former and current trustees and officers with a limited indemnification against liabilities arising in connection with the performance of their duties to the Fund. In the normal course of business, the Fund may also enter into contracts that provide general indemnifications. The Fund's maximum exposure under these arrangements is unknown as this would be dependent on future claims that may be made against the Fund. The risk of material loss from such claims is considered remote.
During the period, the Fund's transfer agent, Fidelity Investments Institutional Operations Company, Inc. (FIIOC), an affiliate of FMR, notified the Fund that the fund's books and records did not reflect a conversion of certain Class B to Class A shares upon their conversion date. Management has determined that this did not have a material impact to the Fund's reported net assets or results of operations in the accompanying financial
Annual Report
7. Other - continued
statements. FIIOC will cause the books and records of the fund to reflect a conversion of the relevant Class B shares to Class A and is in the process of determining the impact to affected shareholder accounts for purposes of its remediation.
At the end of the period, Fidelity Freedom 2010 Fund and Fidelity Freedom 2020 Fund were the owners of record of approximately 23% and 20%, respectively, of the total outstanding shares of the Fund. The Fidelity Freedom Funds and Fidelity Advisor Freedom Funds were the owners of record, in the aggregate, of approximately 73% of the total outstanding shares of the Fund.
8. Distributions to Shareholders.
Distributions to shareholders of each class were as follows:
| Years ended September 30, |
| 2006 | 2005 A |
From net investment income | | |
Class A | $ 208,517 | $ - |
Class T | 289,389 | - |
Class B | 93,989 | - |
Class C | 179,234 | - |
Strategic Real Return | 33,243,282 | - |
Institutional Class | 964,575 | - |
Total | $ 34,978,986 | $ - |
A For the period September 7, 2005 (commencement of operations) to September 30, 2005.
Annual Report
Notes to Financial Statements - continued
9. Share Transactions.
Transactions for each class of shares were as follows:
| Shares | Dollars |
| Years ended September 30, | Years ended September 30, |
| 2006 | 2005 A | 2006 | 2005 A |
Class A | | | | |
Shares sold | 1,062,245 | 335,576 | $ 10,682,808 | $ 3,356,917 |
Reinvestment of distributions | 18,536 | - | 186,545 | - |
Shares redeemed | (93,738) | - | (941,015) | - |
Net increase (decrease) | 987,043 | 335,576 | $ 9,928,338 | $ 3,356,917 |
Class T | | | | |
Shares sold | 2,016,115 | 323,690 | $ 20,310,680 | $ 3,237,283 |
Reinvestment of distributions | 27,883 | - | 280,850 | - |
Shares redeemed | (103,086) | - | (1,039,256) | - |
Net increase (decrease) | 1,940,912 | 323,690 | $ 19,552,274 | $ 3,237,283 |
Class B | | | | |
Shares sold | 278,611 | 320,754 | $ 2,800,793 | $ 3,207,594 |
Reinvestment of distributions | 8,817 | - | 88,578 | - |
Shares redeemed | (11,405) | - | (114,615) | - |
Net increase (decrease) | 276,023 | 320,754 | $ 2,774,756 | $ 3,207,594 |
Class C | | | | |
Shares sold | 1,338,035 | 341,879 | $ 13,461,519 | $ 3,420,798 |
Reinvestment of distributions | 15,337 | - | 154,041 | - |
Shares redeemed | (49,337) | - | (493,981) | - |
Net increase (decrease) | 1,304,035 | 341,879 | $ 13,121,579 | $ 3,420,798 |
Strategic Real Return | | | | |
Shares sold | 280,727,948 | 2,155,812 | $ 2,831,792,513 | $ 21,651,987 |
Reinvestment of distributions | 3,208,074 | - | 32,357,881 | - |
Shares redeemed | (19,229,121) | (1,868) | (193,558,495) | (18,821) |
Net increase (decrease) | 264,706,901 | 2,153,944 | $ 2,670,591,899 | $ 21,633,166 |
Institutional Class | | | | |
Shares sold | 13,719,322 | 320,001 | $ 138,324,336 | $ 3,200,010 |
Reinvestment of distributions | 90,139 | - | 909,336 | - |
Shares redeemed | (306,458) | - | (3,095,334) | - |
Net increase (decrease) | 13,503,003 | 320,001 | $ 136,138,338 | $ 3,200,010 |
A For the period September 7, 2005 (commencement of operations) to September 30, 2005.
Annual Report
Report of Independent Registered Public Accounting Firm
To the Trustees of Fidelity Commonwealth Trust and Shareholders of Fidelity Strategic Real Return Fund:
We have audited the accompanying statement of assets and liabilities of Fidelity Strategic Real Return Fund (the Fund), a fund of Fidelity Commonwealth Trust, including the schedule of investments as of September 30, 2006, and the related statement of operations for the year then ended, the statement of changes in net assets and the financial highlights for the year ended September 30, 2006 and for the period September 7, 2005 (commencement of operations) to September 30, 2005. These financial statements and financial highlights are the responsibility of the Fund's management. Our responsibility is to express an opinion on these financial statements and financial highlights based on our audits.
We conducted our audits in accordance with standards of the Public Company Accounting Oversight Board (United States). Those standards require that we plan and perform the audit to obtain reasonable assurance about whether the financial statements and financial highlights are free of material misstatement. The Fund is not required to have, nor were we engaged to perform, an audit of its internal control over financial reporting. Our audits included consideration of internal control over financial reporting as a basis for designing audit procedures that are appropriate in the circumstances, but not for the purpose of expressing an opinion on the effectiveness of the Fund's internal control over financial reporting. Accordingly, we express no such opinion. An audit also includes examining, on a test basis, evidence supporting the amounts and disclosures in the financial statements, assessing the accounting principles used and significant estimates made by management, as well as evaluating the overall financial statement presentation. Our procedures included confirmation of securities owned as of September 30, 2006, by correspondence with the custodians and brokers; where replies were not received from brokers, we performed other auditing procedures. We believe that our audits provide a reasonable basis for our opinion.
In our opinion, the financial statements and financial highlights referred to above present fairly, in all material respects, the financial position of Fidelity Strategic Real Return Fund as of September 30, 2006, the results of its operations for the year then ended, and the changes in its net assets and its financial highlights for the year ended September 30, 2006 and for the period September 7, 2005 (commencement of operations) to September 30, 2005, in conformity with accounting principles generally accepted in the United States of America.
/s/ Deloitte & Touche LLP
DELOITTE & TOUCHE LLP
Boston, Massachusetts
November 22, 2006
Annual Report
Trustees and Officers
The Trustees, Members of the Advisory Board, and executive officers of the trust and fund, as applicable, are listed below. The Board of Trustees governs the fund and is responsible for protecting the interests of shareholders. The Trustees are experienced executives who meet periodically throughout the year to oversee the fund's activities, review contractual arrangements with companies that provide services to the fund, and review the fund's performance. Except for William O. McCoy, each of the Trustees oversees 347 funds advised by FMR or an affiliate. Mr. McCoy oversees 349 funds advised by FMR or an affiliate.
The Trustees hold office without limit in time except that (a) any Trustee may resign; (b) any Trustee may be removed by written instrument, signed by at least two-thirds of the number of Trustees prior to such removal; (c) any Trustee who requests to be retired or who has become incapacitated by illness or injury may be retired by written instrument signed by a majority of the other Trustees; and (d) any Trustee may be removed at any special meeting of shareholders by a two-thirds vote of the outstanding voting securities of the trust. Each Trustee who is not an interested person (as defined in the 1940 Act) (Independent Trustee), shall retire not later than the last day of the calendar year in which his or her 72nd birthday occurs. The Independent Trustees may waive this mandatory retirement age policy with respect to individual Trustees. The executive officers and Advisory Board Members hold office without limit in time, except that any officer and Advisory Board Member may resign or may be removed by a vote of a majority of the Trustees at any regular meeting or any special meeting of the Trustees. Except as indicated, each individual has held the office shown or other offices in the same company for the past five years.
The fund's Statement of Additional Information (SAI) includes more information about the Trustees. To request a free copy, call Fidelity at 1-877-208-0098.
Interested Trustees*:
Correspondence intended for each Trustee who is an interested person may be sent to Fidelity Investments, 82 Devonshire Street, Boston, Massachusetts 02109.
Name, Age; Principal Occupation |
Edward C. Johnson 3d (76) |
| Year of Election or Appointment: 1974 Mr. Johnson is Chairman of the Board of Trustees. Mr. Johnson serves as President (2006-present), Chief Executive Officer, Chairman, and a Director of FMR Corp.; Chairman and a Director of FMR; Chairman and a Director of Fidelity Research & Analysis Company (FRAC); Chairman and a Director of Fidelity Investments Money Management, Inc.; and Chairman (2001-present) and a Director of FMR Co., Inc. In addition, Mr. Johnson serves as Chairman and Director of Fidelity International Limited (FIL). |
Stephen P. Jonas (53) |
| Year of Election or Appointment: 2005 Mr. Jonas is Senior Vice President of the fund (2005-present). He also serves as Senior Vice President of other Fidelity funds (2005-present). Mr. Jonas is Executive Director of FMR (2005-present) and FMR Co., Inc. (2005-present). He also serves as a Director of Fidelity Investments Money Management, Inc. (2005-present) and FMR Corp. (2003-present). Previously, Mr. Jonas served as President of Fidelity Enterprise Operations and Risk Services (2004-2005), Chief Administrative Officer (2002-2004), and Chief Financial Officer of FMR Corp. (1998-2002). In addition, he serves on the Boards of Boston Ballet (2003-present) and Simmons College (2003-present). |
Robert L. Reynolds (54) |
| Year of Election or Appointment: 2003 Mr. Reynolds is President and a Director of FMR (2005-present), Fidelity Investments Money Management, Inc. (2005-present), and FMR Co., Inc. (2005-present). Mr. Reynolds also serves as Vice Chairman (2006-present), a Director (2003-present), and Chief Operating Officer of FMR Corp. and a Director of Strategic Advisers, Inc. (2005-present). He also serves on the Board at Fidelity Investments Canada, Ltd. |
* Trustees have been determined to be "Interested Trustees" by virtue of, among other things, their affiliation with the trust or various entities under common control with FMR.
Annual Report
Independent Trustees:
Correspondence intended for each Independent Trustee (that is, the Trustees other than the Interested Trustees) may be sent to Fidelity Investments, P.O. Box 55235, Boston, Massachusetts 02205-5235.
Name, Age; Principal Occupation |
Dennis J. Dirks (58) |
| Year of Election or Appointment: 2005 Prior to his retirement in May 2003, Mr. Dirks was Chief Operating Officer and a member of the Board of The Depository Trust & Clearing Corporation (DTCC) (1999-2003). He also served as President, Chief Operating Officer, and Board member of The Depository Trust Company (DTC) (1999-2003) and President and Board member of the National Securities Clearing Corporation (NSCC) (1999-2003). In addition, Mr. Dirks served as Chief Executive Officer and Board member of the Government Securities Clearing Corporation (2001-2003) and Chief Executive Officer and Board member of the Mortgage-Backed Securities Clearing Corporation (2001-2003). Mr. Dirks also serves as a Trustee and a member of the Finance Committee of Manhattan College (2005-present) and a Trustee and a member of the Finance Committee of AHRC of Nassau County (2006-present). |
|
Albert R. Gamper, Jr. (64) |
| Year of Election or Appointment: 2006 Prior to his retirement in December 2004, Mr. Gamper served as Chairman of the Board of CIT Group Inc. (commercial finance). During his tenure with CIT Group Inc. Mr. Gamper served in numerous senior management positions, including Chairman (1987-1989; 1999-2001; 2002-2004), Chief Executive Officer (1987-2004), and President (1989-2002). He currently serves as a member of the Board of Directors of Public Service Enterprise Group (utilities, 2001-present), Chairman of the Board of Governors, Rutgers University (2004-present), and Chairman of the Board of Saint Barnabas Health Care System. |
Robert M. Gates (63) |
| Year of Election or Appointment: 1997 Dr. Gates is Chairman of the Independent Trustees (2006-present). Dr. Gates is President of Texas A&M University (2002-present). He was Director of the Central Intelligence Agency (CIA) from 1991 to 1993. From 1989 to 1991, Dr. Gates served as Assistant to the President of the United States and Deputy National Security Advisor. Dr. Gates is a Director of NACCO Industries, Inc. (mining and manufacturing), Parker Drilling Co., Inc. (drilling and rental tools for the energy industry, 2001-present), and Brinker International (restaurant management, 2003-present). Previously, Dr. Gates served as a Director of LucasVarity PLC (automotive components and diesel engines), a Director of TRW Inc. (automotive, space, defense, and information technology), and Dean of the George Bush School of Government and Public Service at Texas A&M University (1999-2001). |
George H. Heilmeier (70) |
| Year of Election or Appointment: 2004 Dr. Heilmeier is Chairman Emeritus of Telcordia Technologies (communication software and systems), where prior to his retirement, he served as company Chairman and Chief Executive Officer. He currently serves on the Boards of Directors of The Mitre Corporation (systems engineering and information technology support for the government), and HRL Laboratories (private research and development, 2004-present). He is Chairman of the General Motors Science & Technology Advisory Board and a Life Fellow of the Institute of Electrical and Electronics Engineers (IEEE). Dr. Heilmeier is a member of the Defense Science Board and the National Security Agency Advisory Board. He is also a member of the National Academy of Engineering, the American Academy of Arts and Sciences, and the Board of Overseers of the School of Engineering and Applied Science of the University of Pennsylvania. Previously, Dr. Heilmeier served as a Director of TRW Inc. (automotive, space, defense, and information technology, 1992-2002), Compaq (1994-2002), Automatic Data Processing, Inc. (ADP) (technology-based business outsourcing, 1995-2002), INET Technologies Inc. (telecommunications network surveillance, 2001-2004), and Teletech Holdings (customer management services). He is the recipient of the 2005 Kyoto Prize in Advanced Technology for his invention of the liquid crystal display, and a member of the Consumer Electronics Hall of Fame. |
Marie L. Knowles (59) |
| Year of Election or Appointment: 2001 Prior to Ms. Knowles' retirement in June 2000, she served as Executive Vice President and Chief Financial Officer of Atlantic Richfield Company (ARCO) (diversified energy, 1996-2000). From 1993 to 1996, she was a Senior Vice President of ARCO and President of ARCO Transportation Company. She served as a Director of ARCO from 1996 to 1998. She currently serves as a Director of Phelps Dodge Corporation (copper mining and manufacturing) and McKesson Corporation (healthcare service, 2002-present). Ms. Knowles is a Trustee of the Brookings Institution and the Catalina Island Conservancy and also serves as a member of the Advisory Board for the School of Engineering of the University of Southern California. |
Ned C. Lautenbach (62) |
| Year of Election or Appointment: 2000 Mr. Lautenbach has been a partner of Clayton, Dubilier & Rice, Inc. (private equity investment firm) since September 1998. Previously, Mr. Lautenbach was with the International Business Machines Corporation (IBM) from 1968 until his retirement in 1998. Mr. Lautenbach serves as a Director of Sony Corporation (2006-present) and Eaton Corporation (diversified industrial) as well as the Philharmonic Center for the Arts in Naples, Florida. He also is a member of the Board of Trustees of Fairfield University (2005-present), as well as a member of the Council on Foreign Relations. |
William O. McCoy (72) |
| Year of Election or Appointment: 1997 Prior to his retirement in December 1994, Mr. McCoy was Vice Chairman of the Board of BellSouth Corporation (telecommunications) and President of BellSouth Enterprises. He is currently a Director of Duke Realty Corporation (real estate). He is also a partner of Franklin Street Partners (private investment management firm). In addition, Mr. McCoy served as the Interim Chancellor (1999-2000) and a member of the Board of Visitors for the University of North Carolina at Chapel Hill and currently serves as Chairman of the Board of Directors of the University of North Carolina Health Care System. He also served as Vice President of Finance for the University of North Carolina (16-school system). |
Cornelia M. Small (62) |
| Year of Election or Appointment: 2005 Ms. Small is a member (2000-present) and Chairperson (2002-present) of the Investment Committee, and a member (2002-present) of the Board of Trustees of Smith College. Previously, she served as Chief Investment Officer (1999-2000), Director of Global Equity Investments (1996-1999), and a member of the Board of Directors of Scudder, Stevens & Clark (1990-1997) and Scudder Kemper Investments (1997-1999). In addition, Ms. Small served as Co-Chair (2000-2003) of the Annual Fund for the Fletcher School of Law and Diplomacy. |
William S. Stavropoulos (67) |
| Year of Election or Appointment: 2002 Mr. Stavropoulos is Chairman Emeritus of the Board of Directors of The Dow Chemical Company. Since joining The Dow Chemical Company in 1967, Mr. Stavropoulos served in numerous senior management positions, including President (1993-2000; 2002-2003), CEO (1995-2000; 2002-2004), and Chairman of the Executive Committee (2000-2004). Currently, he is a Director of NCR Corporation (data warehousing and technology solutions), BellSouth Corporation (telecommunications), Chemical Financial Corporation, Maersk Inc. (industrial conglomerate, 2002-present), and Metalmark Capital (private equity investment firm, 2005-present). He also serves as a member of the Board of Trustees of the American Enterprise Institute for Public Policy Research. In addition, Mr. Stavropoulos is a member of The Business Council, J.P. Morgan International Council and the University of Notre Dame Advisory Council for the College of Science. |
Kenneth L. Wolfe (67) |
| Year of Election or Appointment: 2005 Prior to his retirement in 2001, Mr. Wolfe was Chairman and Chief Executive Officer of Hershey Foods Corporation (1993-2001). He currently serves as a member of the boards of Adelphia Communications Corporation (2003-present), Bausch & Lomb, Inc., and Revlon Inc. (2004-present). |
Annual Report
Advisory Board Members and Executive Officers:
Correspondence intended for Mr. Keyes may be sent to Fidelity Investments, P.O. Box 55235, Boston, Massachusetts 02205-5235. Correspondence intended for each executive officer and Mr. Lynch may be sent to Fidelity Investments, 82 Devonshire Street, Boston, Massachusetts 02109.
Name, Age; Principal Occupation |
James H. Keyes (66) |
| Year of Election or Appointment: 2006 Member of the Advisory Board of Fidelity Commonwealth Trust. Prior to his retirement in 2003, Mr. Keyes was Chairman, President, and Chief Executive Officer of Johnson Controls, Inc. (automotive supplier, 1993-2003). He currently serves as a member of the boards of LSI Logic Corporation (semiconductor technologies), Navistar International Corporation (manufacture and sale of trucks, buses, and diesel engines, (2002-present), and Pitney Bowes, Inc. (integrated mail, messaging, and document management solutions). |
Peter S. Lynch (62) |
| Year of Election or Appointment: 2003 Member of the Advisory Board of Fidelity Commonwealth Trust. Mr. Lynch is Vice Chairman and a Director of FMR, and Vice Chairman (2001-present) and a Director of FMR Co., Inc. Previously, Mr. Lynch served as a Trustee of the Fidelity funds (1990-2003). In addition, he serves as a Trustee of Boston College and as the Chairman of the Inner-City Scholarship Fund. |
Walter C. Donovan (44) |
| Year of Election or Appointment: 2005 Vice President of the fund. Mr. Donovan also serves as Vice President of Fidelity's High Income Funds (2005-present). Mr. Donovan also serves as Executive Vice President of FMR (2005-present) and FMR Co., Inc. (2005-present). Previously, Mr. Donovan served as Vice President of Fidelity's Fixed-Income Funds (2005-2006), certain Asset Allocation Funds (2005-2006), certain Balanced Funds (2005-2006), and as Vice President and Director of Fidelity's International Equity Trading group (1998-2005). |
Boyce I. Greer (50) |
| Year of Election or Appointment: 2005 Vice President of the fund. Mr. Greer also serves as Vice President of certain Equity Funds (2005-present), certain Asset Allocation Funds (2005-present), Fixed-Income Funds (2006-present), and Money Market Funds (2006-present). Mr. Greer is also a Trustee of other investment companies advised by FMR (2003-present). He is an Executive Vice President of FMR (2005-present) and FMR Co., Inc. (2005-present), and Senior Vice President of Fidelity Investments Money Management, Inc. (2006-present). Previously, Mr. Greer served as a Director and Managing Director of Strategic Advisers, Inc. (2002-2005), and Executive Vice President (2000-2002) and Money Market Group Leader (1997-2002) of the Fidelity Investments Fixed Income Division. He also served as Vice President of Fidelity's Money Market Funds (1997-2002), Senior Vice President of FMR (1997-2002), and Vice President of FIMM (1998-2002). |
Robert A. Lawrence (53) |
| Year of Election or Appointment: 2006 Vice President of the fund. Mr. Lawrence also serves as Vice President of the High Income Funds. Mr. Lawrence is Senior Vice President of FMR (2006-present) and FMR Co., Inc. (2006-present). Previously, Mr. Lawrence served as President of Fidelity Strategic Investments (2002-2005). |
David L. Murphy (58) |
| Year of Election or Appointment: 2005 Vice President of the fund. Mr. Murphy also serves as Vice President of Fidelity's Money Market Funds (2002-present), certain Asset Allocation Funds (2003-present), Fixed-Income Funds (2005-present), and Balanced Funds (2005-present). He serves as Senior Vice President (2000-present) and Head (2004-present) of the Fidelity Investments Fixed Income Division. Mr. Murphy is also a Senior Vice President of Fidelity Investments Money Management, Inc. (2003-present) and an Executive Vice President of FMR (2005-present). Previously, Mr. Murphy served as Money Market Group Leader (2002-2004), Bond Group Leader (2000-2002), and Vice President of Fidelity's Taxable Bond Funds (2000-2002) and Fidelity's Municipal Bond Funds (2001-2002). |
Thomas J. Silvia (45) |
| Year of Election or Appointment: 2005 Vice President of the fund. Mr. Silvia also serves as Vice President of Fidelity's Fixed-Income Funds (2005-present), certain Balanced Funds (2005-present), certain Asset Allocation Funds (2005-present), and Senior Vice President and Bond Group Leader of the Fidelity Investments Fixed-Income Division (2005-present). Previously, Mr. Silvia served as Director of Fidelity's Taxable Bond portfolio managers (2002-2004) and a portfolio manager in the Bond Group (1997-2004). |
William Irving (42) |
| Year of Election or Appointment: 2005 Vice President of the fund. Mr. Irving also serves as Vice President of other funds advised by FMR. Prior to assuming his current responsibilities, Mr. Irving worked as a quantitative analyst and portfolio manager. |
Christopher L. Sharpe (38) |
| Year of Election or Appointment: 2005 Vice President of the fund. Mr. Sharpe also serves as Vice President of other funds advised by FMR. Prior to assuming his current responsibilities, Mr. Sharpe worked as an associate investment policy officer for John Hancock Financial Services, Inc. in Boston. From 1990 to 2000 he was with William M. Mercer, Inc. in Boston. Mr. Sharpe also serves as Vice President of FMR (2006) and FMR Co., Inc. (2006). |
Mark Snyderman (49) |
| Year of Election or Appointment: 2005 Vice President of the fund. Mr. Snyderman also serves as Vice President of other funds advised by FMR. Prior to assuming his current responsibilities, Mr. Snyderman served as an investment officer for commercial mortgage-backed securities in the real estate group and as a portfolio manager of real estate stock and real estate bond mutual funds and institutional accounts. Mr. Snyderman also serves as a Vice President of FMR (2004) and FMR Co., Inc. (2004). |
Derek L. Young (42) |
| Year of Election or Appointment: 2005 Vice President of the fund. Mr. Young also serves as Vice President of other funds advised by FMR. Prior to assuming his current responsibilities, Mr. Young worked as director of Risk Management, senior vice president of Strategic Services and a portfolio manager. Mr. Young also serves as Vice President of FMR (2004) and FMR Co., Inc. (2004). |
Eric D. Roiter (57) |
| Year of Election or Appointment: 2005 Secretary of the fund. He also serves as Secretary of other Fidelity funds; Vice President, General Counsel, and Secretary of FMR Co., Inc. (2001-present) and FMR; Assistant Secretary of Fidelity Management & Research (U.K.) Inc. (2001-present), Fidelity Research & Analysis Company (2001-present), and Fidelity Investments Money Management, Inc. (2001-present). Mr. Roiter is an Adjunct Member, Faculty of Law, at Boston College Law School (2003-present). Previously, Mr. Roiter served as Vice President and Secretary of Fidelity Distributors Corporation (FDC) (1998-2005). |
Stuart Fross (47) |
| Year of Election or Appointment: 2005 Assistant Secretary of the fund. Mr. Fross also serves as Assistant Secretary of other Fidelity funds (2003-present), Vice President and Secretary of FDC (2005-present), and is an employee of FMR. |
Christine Reynolds (48) |
| Year of Election or Appointment: 2005 President and Treasurer of the fund. Ms. Reynolds also serves as President and Treasurer of other Fidelity funds (2004-present) and is a Vice President (2003-present) and an employee (2002-present) of FMR. Before joining Fidelity Investments, Ms. Reynolds worked at PricewaterhouseCoopers LLP (PwC) (1980-2002), where she was most recently an audit partner with PwC's investment management practice. |
R. Stephen Ganis (40) |
| Year of Election or Appointment: 2006 Anti-Money Laundering (AML) officer of the fund. Mr. Ganis also serves as AML officer of other Fidelity funds (2006-present) and FMR Corp. (2003-present). Before joining Fidelity Investments, Mr. Ganis practiced law at Goodwin Procter, LLP (2000-2002). |
Joseph B. Hollis (58) |
| Year of Election or Appointment: 2006 Chief Financial Officer of the fund. Mr. Hollis also serves as Chief Financial Officer of other Fidelity funds. Mr. Hollis is President of Fidelity Pricing and Cash Management Services (FPCMS) (2005-present). Mr. Hollis also serves as President and Director of Fidelity Service Company, Inc. (2006-present). Previously, Mr. Hollis served as Senior Vice President of Cash Management Services (1999-2002) and Investment Management Operations (2002-2005). |
Kenneth A. Rathgeber (59) |
| Year of Election or Appointment: 2005 Chief Compliance Officer of the fund. Mr. Rathgeber also serves as Chief Compliance Officer of other Fidelity funds (2004-present) and Executive Vice President of Risk Oversight for Fidelity Investments (2002-present). He is Chief Compliance Officer of FMR (2005-present), FMR Co., Inc. (2005-present), Fidelity Management & Research (U.K.) Inc. (2005-present), Fidelity Research & Analysis Company (2005-present), Fidelity Investments Money Management, Inc. (2005-present), and Strategic Advisers, Inc. (2005-present). Previously, Mr. Rathgeber served as Executive Vice President and Chief Operating Officer for Fidelity Investments Institutional Services Company, Inc. (1998-2002). |
Bryan A. Mehrmann (45) |
| Year of Election or Appointment: 2005 Deputy Treasurer of the fund. Mr. Mehrmann also serves as Deputy Treasurer of other Fidelity funds (2005-present) and is an employee of FMR. Previously, Mr. Mehrmann served as Vice President of Fidelity Investments Institutional Services Group (FIIS)/Fidelity Investments Institutional Operations Corporation, Inc. (FIIOC) Client Services (1998-2004). |
Kimberley H. Monasterio (42) |
| Year of Election or Appointment: 2005 Deputy Treasurer of the fund. Ms. Monasterio also serves as Deputy Treasurer of other Fidelity funds (2004) and is an employee of FMR (2004). Before joining Fidelity Investments, Ms. Monasterio served as Treasurer (2000-2004) and Chief Financial Officer (2002-2004) of the Franklin Templeton Funds and Senior Vice President of Franklin Templeton Services, LLC (2000-2004). |
Kenneth B. Robins (37) |
| Year of Election or Appointment: 2005 Deputy Treasurer of the fund. Mr. Robins also serves as Deputy Treasurer of other Fidelity funds (2005-present) and is an employee of FMR (2004-present). Before joining Fidelity Investments, Mr. Robins worked at KPMG LLP, where he was a partner in KPMG's department of professional practice (2002-2004) and a Senior Manager (1999-2000). In addition, Mr. Robins served as Assistant Chief Accountant, United States Securities and Exchange Commission (2000-2002). |
Robert G. Byrnes (39) |
| Year of Election or Appointment: 2005 Assistant Treasurer of the fund. Mr. Byrnes also serves as Assistant Treasurer of other Fidelity funds (2005-present) and is an employee of FMR (2005-present). Previously, Mr. Byrnes served as Vice President of FPCMS (2003-2005). Before joining Fidelity Investments, Mr. Byrnes worked at Deutsche Asset Management where he served as Vice President of the Investment Operations Group (2000-2003). |
John H. Costello (60) |
| Year of Election or Appointment: 2005 Assistant Treasurer of the fund. Mr. Costello also serves as Assistant Treasurer of other Fidelity funds and is an employee of FMR. |
Peter L. Lydecker (52) |
| Year of Election or Appointment: 2005 Assistant Treasurer of the fund. Mr. Lydecker also serves as Assistant Treasurer of other Fidelity funds (2004) and is an employee of FMR. |
Mark Osterheld (51) |
| Year of Election or Appointment: 2005 Assistant Treasurer of the fund. Mr. Osterheld also serves as Assistant Treasurer of other Fidelity funds (2002) and is an employee of FMR. |
Gary W. Ryan (48) |
| Year of Election or Appointment: 2005 Assistant Treasurer of the fund. Mr. Ryan also serves as Assistant Treasurer of other Fidelity funds (2005-present) and is an employee of FMR (2005-present). Previously, Mr. Ryan served as Vice President of Fund Reporting in FPCMS (1999-2005). |
Salvatore Schiavone (40) |
| Year of Election or Appointment: 2005 Assistant Treasurer of the fund. Mr. Schiavone also serves as Assistant Treasurer of other Fidelity funds (2005-present) and is an employee of FMR (2005-present). Before joining Fidelity Investments, Mr. Schiavone worked at Deutsche Asset Management, where he most recently served as Assistant Treasurer (2003-2005) of the Scudder Funds and Vice President and Head of Fund Reporting (1996-2003). |
Annual Report
Distributions
The fund hereby designates as a capital gain dividend with respect to the taxable year ended September 30, 2006, $227,005, or, if subsequently determined to be different, the net capital gain of such year.
A total of 30.17% of the dividends distributed during the fiscal year was derived from interest on U.S. Government securities which is generally exempt from state income tax.
The fund designates $34,978,986 of distributions paid during the period October 1, 2005 to September 30, 2006 as qualifying to be taxed as interest-related dividends for nonresident alien shareholders.
The fund will notify shareholders in January 2007 of amounts for use in preparing 2006 income tax returns.
Annual Report
Proxy Voting Results
A special meeting of the fund's shareholders was held on November 16, 2005. The results of votes taken among shareholders on proposals before them are reported below. Each vote reported represents one dollar of net asset value held on the record date for the meeting.
PROPOSAL 1 |
To elect a Board of Trustees. A |
| # of
Votes | % of
Votes |
Dennis J. Dirks |
Affirmative | 18,240,248,322.53 | 96.150 |
Withheld | 730,313,302.58 | 3.850 |
TOTAL | 18,970,561,625.11 | 100.000 |
Albert R. Gamper, Jr. B |
Affirmative | 18,204,838,072.06 | 95.964 |
Withheld | 765,723,553.05 | 4.036 |
TOTAL | 18,970,561,625.11 | 100.000 |
Robert M. Gates |
Affirmative | 18,191,748,681.13 | 95.895 |
Withheld | 778,812,943.98 | 4.105 |
TOTAL | 18,970,561,625.11 | 100.000 |
George H. Heilmeier |
Affirmative | 18,193,638,757.60 | 95.905 |
Withheld | 776,922,867.51 | 4.095 |
TOTAL | 18,970,561,625.11 | 100.000 |
Abigail P. Johnson |
Affirmative | 18,103,320,241.78 | 95.428 |
Withheld | 867,241,383.33 | 4.572 |
TOTAL | 18,970,561,625.11 | 100.000 |
Edward C. Johnson 3d |
Affirmative | 18,055,585,171.13 | 95.177 |
Withheld | 914,976,453.98 | 4.823 |
TOTAL | 18,970,561,625.11 | 100.000 |
Stephen P. Jonas |
Affirmative | 18,188,419,716.35 | 95.877 |
Withheld | 782,141,908.76 | 4.123 |
TOTAL | 18,970,561,625.11 | 100.000 |
| # of
Votes | % of
Votes |
Marie L. Knowles |
Affirmative | 18,208,650,664.29 | 95.984 |
Withheld | 761,910,960.82 | 4.016 |
TOTAL | 18,970,561,625.11 | 100.000 |
Ned C. Lautenbach |
Affirmative | 18,224,936,039.64 | 96.070 |
Withheld | 745,625,585.47 | 3.930 |
TOTAL | 18,970,561,625.11 | 100.000 |
Marvin L. Mann |
Affirmative | 18,146,216,753.93 | 95.655 |
Withheld | 824,344,871.18 | 4.345 |
TOTAL | 18,970,561,625.11 | 100.000 |
William O. McCoy |
Affirmative | 18,164,580,135.79 | 95.751 |
Withheld | 805,981,489.32 | 4.249 |
TOTAL | 18,970,561,625.11 | 100.000 |
Robert L. Reynolds |
Affirmative | 18,197,448,372.22 | 95.925 |
Withheld | 773,113,252.89 | 4.075 |
TOTAL | 18,970,561,625.11 | 100.000 |
Cornelia M. Small |
Affirmative | 18,214,122,413.76 | 96.013 |
Withheld | 756,439,211.35 | 3.987 |
TOTAL | 18,970,561,625.11 | 100.000 |
William S. Stavropoulos |
Affirmative | 18,186,563,509.46 | 95.867 |
Withheld | 783,998,115.65 | 4.133 |
TOTAL | 18,970,561,625.11 | 100.000 |
Kenneth L. Wolfe |
Affirmative | 18,211,332,412.92 | 95.998 |
Withheld | 759,229,212.19 | 4.002 |
TOTAL | 18,970,561,625.11 | 100.000 |
A Denotes trust-wide proposals and voting results. B Effective on or about January 1, 2006. |
Annual Report
Annual Report
Annual Report
Investment Adviser
Fidelity Management & Research Company
Boston, MA
Investment Sub-Advisers
FMR Co., Inc.
Fidelity Research & Analysis Company
(formerly Fidelity Management &
Research (Far East) Inc.)
Fidelity International Investment Advisors
Fidelity Investments Japan Limited
Fidelity International Investment Advisors (U.K.) Limited
Geode Capital Management, LLC
General Distributor
Fidelity Distributors Corporation
Boston, MA
Transfer and Service Agents
Fidelity Investments Institutional
Operations Company, Inc.
Boston, MA
Fidelity Service Company, Inc.
Boston, MA
Custodian
Mellon Bank, N.A.
Pittsburgh, PA
ARRSI-UANN-1106
1.814967.101
(Fidelity Investment logo)(registered trademark)
Corporate Headquarters
82 Devonshire St., Boston, MA 02109
www.fidelity.com
Item 2. Code of Ethics
As of the end of the period, September 30, 2006, Fidelity Commonwealth Trust (the trust) has adopted a code of ethics, as defined in Item 2 of Form N-CSR, that applies to its President and Treasurer and its Chief Financial Officer. A copy of the code of ethics is filed as an exhibit to this Form N-CSR.
Item 3. Audit Committee Financial Expert
The Board of Trustees of the trust has determined that Marie L. Knowles is an audit committee financial expert, as defined in Item 3 of Form N-CSR. Ms. Knowles is independent for purposes of Item 3 of Form N-CSR.
Item 4. Principal Accountant Fees and Services
(a) Audit Fees.
For the fiscal years ended September 30, 2006 and September 30, 2005, the aggregate Audit Fees billed by Deloitte & Touche LLP, the member firms of Deloitte Touche Tohmatsu, and their respective affiliates (collectively, "Deloitte Entities") for professional services rendered for the audits of the financial statements, or services that are normally provided in connection with statutory and regulatory filings or engagements for those fiscal years, for the Fidelity Strategic Real Return Fund (the fund) and for all funds in the Fidelity Group of Funds are shown in the table below.
Fund | 2006A | 2005A,B |
Fidelity Strategic Real Return Fund | $110,000 | $53,000 |
All funds in the Fidelity Group of Funds audited by Deloitte Entities | $6,400,000 | $5,200,000 |
A | Aggregate amounts may reflect rounding. |
B | Fidelity Strategic Real Return Fund commenced operations on September 7, 2005. |
(b) Audit-Related Fees.
In each of the fiscal years ended September 30, 2006 and September 30, 2005 the aggregate Audit-Related Fees billed by Deloitte Entities for services rendered for assurance and related services to the fund that are reasonably related to the performance of the audit or review of the fund's financial statements, but not reported as Audit Fees, are shown in the table below.
Fund | 2006A | 2005A,B |
Fidelity Strategic Real Return Fund | $0 | $0 |
A | Aggregate amounts may reflect rounding. |
B | Fidelity Strategic Real Return Fund commenced operations on September 7, 2005. |
In each of the fiscal years ended September 30, 2006 and September 30, 2005, the aggregate Audit-Related Fees that were billed by Deloitte Entities that were required to be approved by the Audit Committee for services rendered on behalf of Fidelity Management & Research Company (FMR) and entities controlling, controlled by, or under common control with FMR (not including any sub-adviser whose role is primarily portfolio management and is subcontracted with or overseen by another investment adviser) that provide ongoing services to the fund ("Fund Service Providers") for assurance and related services that relate directly to the operations and financial reporting of the fund that are reasonably related to the performance of the audit or review of the fund's financial statements, but not reported as Audit Fees, are shown in the table below.
Billed By | 2006A | 2005A,B |
Deloitte Entities | $0 | $0 |
A | Aggregate amounts may reflect rounding. |
B | May include amounts billed prior to the fund's commencement of operations. |
Fees included in the audit-related category comprise assurance and related services (e.g., due diligence services) that are traditionally performed by the independent registered public accounting firm. These audit-related services include due diligence related to mergers and acquisitions, accounting consultations and audits in connection with acquisitions, internal control reviews, attest services that are not required by statute or regulation and consultation concerning financial accounting and reporting standards.
(c) Tax Fees.
In each of the fiscal years ended September 30, 2006 and September 30, 2005, the aggregate Tax Fees billed by Deloitte Entities for professional services rendered for tax compliance, tax advice, and tax planning for the fund is shown in the table below.
Fund | 2006A | 2005A,B |
Fidelity Strategic Real Return Fund | $4,300 | $4,300 |
A | Aggregate amounts may reflect rounding. |
B | Fidelity Strategic Real Return Fund commenced operations on September 7, 2005. |
In each of the fiscal years ended September 30, 2006 and September 30, 2005, the aggregate Tax Fees billed by Deloitte Entities that were required to be approved by the Audit Committee for professional services rendered on behalf of the Fund Service Providers for tax compliance, tax advice, and tax planning that relate directly to the operations and financial reporting of the fund is shown in the table below.
Billed By | 2006A | 2005A,B |
Deloitte Entities | $0 | $0 |
A | Aggregate amounts may reflect rounding. |
B | May include amounts billed prior to the fund's commencement of operations. |
Fees included in the Tax Fees category comprise all services performed by professional staff in the independent registered public accounting firm's tax division except those services related to the audit. Typically, this category would include fees for tax compliance, tax planning, and tax advice. Tax compliance, tax advice, and tax planning services include preparation of original and amended tax returns, claims for refund and tax payment-planning services, assistance with tax audits and appeals, tax advice related to mergers and acquisitions and requests for rulings or technical advice from taxing authorities.
(d) All Other Fees.
In each of the fiscal years ended September 30, 2006 and September 30, 2005, the aggregate Other Fees billed by Deloitte Entities for all other non-audit services rendered to the fund is shown in the table below.
Fund | 2006A | 2005A,B |
Fidelity Strategic Real Return Fund | $0 | $0 |
A | Aggregate amounts may reflect rounding. |
B | Fidelity Strategic Real Return Fund commenced operations on September 7, 2005. |
In each of the fiscal years ended September 30, 2006 and September 30, 2005, the aggregate Other Fees billed by Deloitte Entities that were required to be approved by the Audit Committee for all other non-audit services rendered on behalf of the Fund Service Providers that relate directly to the operations and financial reporting of the fund is shown in the table below.
Billed By | 2006A | 2005A,B |
Deloitte Entities | $255,000 | $210,000 |
A | Aggregate amounts may reflect rounding. |
B | May include amounts billed prior to the fund's commencement of operations. |
Fees included in the All Other Fees category include services related to internal control reviews, strategy and other consulting, financial information systems design and implementation, consulting on other information systems, and other tax services unrelated to the fund.
(e) (1) | Audit Committee Pre-Approval Policies and Procedures: |
The trust's Audit Committee must pre-approve all audit and non-audit services provided by the independent registered public accounting firm relating to the operations or financial reporting of the fund. Prior to the commencement of any audit or non-audit services to a fund, the Audit Committee reviews the services to determine whether they are appropriate and permissible under applicable law.
The trust's Audit Committee has adopted policies and procedures to, among other purposes, provide a framework for the Committee's consideration of non-audit services by the audit firms that audit the Fidelity funds. The policies and procedures require that any non-audit service provided by a fund audit firm to a Fidelity Fund and any non-audit service provided by a fund auditor to a Fund Service Provider that relates directly to the operations and financial reporting of a Fidelity fund (Covered Service) are subject to approval by the Audit Committee before such service is provided. Non-audit services provided by a fund audit firm for a Fund Service Provider that do not relate directly to the operations and financial reporting of a Fidelity fund (Non-Covered Service) but that are expected to exceed $50,000 are also subject to pre-approval by the Audit Committee.
All Covered Services, as well as Non-Covered Services that are expected to exceed $50,000, must be approved in advance of provision of the service either: (i) by formal resolution of the Audit Committee, or (ii) by oral or written approval of the service by the Chair of the Audit Committee (or if the Chair is unavailable, such other member of the Audit Committee as may be designated by the Chair to act in the Chair's absence). The approval contemplated by (ii) above is permitted where the Treasurer determines that action on such an engagement is necessary before the next meeting of the Audit Committee. Neither pre-approval nor advance notice of Non-Covered Service engagements for which fees are not expected to exceed $50,000 is required; such engagements are to be reported to the Audit Committee monthly.
(e) (2) | Services approved pursuant to paragraph (c)(7)(i)(C) of Rule 2-01 of Regulation S-X: |
Audit-Related Fees:
There were no amounts that were approved by the Audit Committee pursuant to the de minimis exception for the fiscal years ended September 30, 2006 and September 30, 2005 on behalf of the fund.
There were no amounts that were required to be approved by the Audit Committee pursuant to the de minimis exception for the fiscal years ended September 30, 2006 and September 30, 2005 on behalf of the Fund Service Providers that relate directly to the operations and financial reporting of the fund.
Tax Fees:
There were no amounts that were approved by the Audit Committee pursuant to the de minimis exception for the fiscal years ended September 30, 2006 and September 30, 2005 on behalf of the fund.
There were no amounts that were required to be approved by the Audit Committee pursuant to the de minimis exception for the fiscal years ended September 30, 2006 and September 30, 2005 on behalf of the Fund Service Providers that relate directly to the operations and financial reporting of the fund.
All Other Fees:
There were no amounts that were approved by the Audit Committee pursuant to the de minimis exception for the fiscal years ended September 30, 2006 and September 30, 2005 on behalf of the fund.
There were no amounts that were required to be approved by the Audit Committee pursuant to the de minimis exception for the fiscal years ended September 30, 2006 and September 30, 2005 on behalf of the Fund Service Providers that relate directly to the operations and financial reporting of the fund.
(f) Not Applicable.
(g) For the fiscal years ended September 30, 2006 and September 30, 2005, the aggregate fees billed by Deloitte Entities of $800,000A and $525,000A,B,C for non-audit services rendered on behalf of the fund, FMR (not including any sub-adviser whose role is primarily portfolio management and is subcontracted with or overseen by another investment adviser) and Fund Service Providers relating to Covered Services and Non-Covered Services are shown in the table below.
| 2006A,B | 2005A,B |
Covered Services | $270,000 | $200,000 |
Non-Covered Services | $530,000 | $325,000C |
A | Aggregate amounts may reflect rounding. |
B | May include amounts billed prior to the fund's commencement of operations. |
C | Reflects current period presentation. |
(h) The trust's Audit Committee has considered Non-Covered Services that were not pre-approved that were provided by Deloitte Entities to Fund Service Providers to be compatible with maintaining the independence of Deloitte Entities in its audit of the fund, taking into account representations from Deloitte Entities, in accordance with Independence Standards Board Standard No.1, regarding its independence from the fund and its related entities.
Item 5. Audit Committee of Listed Registrants
Not applicable.
Item 6. Schedule of Investments
Not applicable.
Item 7. Disclosure of Proxy Voting Policies and Procedures for Closed-End Management Investment Companies
Not applicable.
Item 8. Portfolio Managers of Closed-End Management Investment Companies
Not applicable.
Item 9. Purchase of Equity Securities by Closed-End Management Investment Company and Affiliated Purchasers
Not applicable.
Item 10. Submission of Matters to a Vote of Security Holders
There were no material changes to the procedures by which shareholders may recommend nominees to the trust's Board of Trustees.
Item 11. Controls and Procedures
(a)(i) The President and Treasurer and the Chief Financial Officer have concluded that the trust's disclosure controls and procedures (as defined in Rule 30a-3(c) under the Investment Company Act) provide reasonable assurances that material information relating to the trust is made known to them by the appropriate persons, based on their evaluation of these controls and procedures as of a date within 90 days of the filing date of this report.
(a)(ii) There was no change in the trust's internal control over financial reporting (as defined in Rule 30a-3(d) under the Investment Company Act) that occurred during the second fiscal quarter of the period covered by this report that has materially affected, or is reasonably likely to materially affect, the trust's internal control over financial reporting.
Item 12. Exhibits
(a) | (1) | Code of Ethics pursuant to Item 2 of Form N-CSR is filed and attached hereto as EX-99.CODE ETH. |
(a) | (2) | Certification pursuant to Rule 30a-2(a) under the Investment Company Act of 1940 (17 CFR 270.30a-2(a)) is filed and attached hereto as Exhibit 99.CERT. |
(a) | (3) | Not applicable. |
(b) | | Certification pursuant to Rule 30a-2(b) under the Investment Company Act of 1940 (17 CFR 270.30a-2(b)) is furnished and attached hereto as Exhibit 99.906CERT. |
SIGNATURES
Pursuant to the requirements of the Securities Exchange Act of 1934 and the Investment Company Act of 1940, the registrant has duly caused this report to be signed on its behalf by the undersigned, thereunto duly authorized.
Fidelity Commonwealth Trust
By: | /s/Christine Reynolds |
| Christine Reynolds |
| President and Treasurer |
| |
Date: | November 22, 2006 |
Pursuant to the requirements of the Securities Exchange Act of 1934 and the Investment Company Act of 1940, this report has been signed below by the following persons on behalf of the registrant and in the capacities and on the dates indicated.
By: | /s/Christine Reynolds |
| Christine Reynolds |
| President and Treasurer |
| |
Date: | November 22, 2006 |
By: | /s/Joseph B. Hollis |
| Joseph B. Hollis |
| Chief Financial Officer |
| |
Date: | November 22, 2006 |