UNITED STATES
SECURITIES AND EXCHANGE COMMISSION
Washington, D.C. 20549
FORM N-CSR
CERTIFIED SHAREHOLDER REPORT OF REGISTERED
MANAGEMENT INVESTMENT COMPANIES
Investment Company Act file number 811-2546
Fidelity Commonwealth Trust
(Exact name of registrant as specified in charter)
82 Devonshire St., Boston, Massachusetts 02109
(Address of principal executive offices) (Zip code)
Eric D. Roiter, Secretary
82 Devonshire St.
Boston, Massachusetts 02109
(Name and address of agent for service)
Registrant's telephone number, including area code: 617-563-7000
Date of fiscal year end: | September 30 |
| |
Date of reporting period: | September 30, 2005 |
Item 1. Reports to Stockholders
| | Fidelity®
Strategic Real Return
Fund
|
Annual Report
September 30, 2005
|


| Contents | | | | |
| |
| Chairman’s Message | | 4 | | Ned Johnson’s message to shareholders. |
| Shareholder Expense | | 5 | | An example of shareholder expenses. |
| Example | | | | |
| Investment Summary | | 7 | | A summary of the fund’s investments. |
| Investments | | 8 | | A complete list of the fund’s investments |
| | | | | with their market values. |
| Financial Statements | | 13 | | Statements of assets and liabilities, |
| | | | | operations, and changes in net assets, |
| | | | | as well as financial highlights. |
| Notes | | 23 | | Notes to the financial statements. |
| Report of Independent | | 31 | | |
| Registered Public | | | | |
| Accounting Firm | | | | |
| Trustees and Officers | | 32 | | |
| Distributions | | 44 | | |
| Board Approval of | | 45 | | |
| Investment Advisory | | | | |
| Contracts and | | | | |
| Management Fees | | | | |
| Central Fund Investments | | 49 | | Complete list of investments for Fidelity’s |
| | | | | fixed-income central funds. |
To view a fund’s proxy voting guidelines and proxy voting record for the 12 month period ended June 30, visit www.fidelity.com/proxyvotingresults or visit the Securities and Exchange Commission’s (SEC) web site at www.sec.gov. You may also call 1-800-544-8544 to request a free copy of the proxy voting guidelines.
Standard & Poor’s, S&P and S&P 500 are registered service marks of The McGraw Hill Companies, Inc. and have been licensed for use by Fidelity Distributors Corporation.
Other third party marks appearing herein are the property of their respective owners. All other marks appearing herein are registered or unregistered trademarks or service marks of FMR Corp. or an affiliated company.
Annual Report 2
This report and the financial statements contained herein are submitted for the general information
of the shareholders of the fund. This report is not authorized for distribution to prospective investors
in the fund unless preceded or accompanied by an effective prospectus.
A fund files its complete schedule of portfolio holdings with the SEC for the first and third quar
ters of each fiscal year on Form N Q. Forms N Q are available on the SEC’s web site at
http://www.sec.gov. A fund’s Forms N Q may be reviewed and copied at the SEC’s Public Refer
ence Room in Washington, DC. Information regarding the operation of the SEC’s Public Refer
ence Room may be obtained by calling 1-800-SEC-0330. For a complete list of a fund’s portfolio
holdings, view the fund’s most recent quarterly holdings report, semiannual report, or annual
report on Fidelity’s web site at http://www.fidelity.com/holdings.
NOT FDIC INSURED · MAY LOSE VALUE · NO BANK GUARANTEE
Neither the fund nor Fidelity Distributors Corporation is a bank.
|
3 Annual Report
Chairman’s Message
(photograph of Edward C. Johnson 3d)
Dear Shareholder:
During the past year or so, much has been reported about the mutual fund industry, and much of it has been more critical than I believe is warranted. Allegations that some companies have been less than forthright with their shareholders have cast a shadow on the entire industry. I continue to find these reports disturbing, and assert that they do not create an accurate picture of the industry overall. Therefore, I would like to remind every one where Fidelity stands on these issues. I will say two things specifically regarding allegations that some mutual fund companies were in violation of the Securities and Exchange Commission’s forward pricing rules or were involved in so called “market timing” activities.
First, Fidelity has no agreements that per mit customers who buy fund shares after 4 p.m. to obtain the 4 p.m. price. This is not a new policy. This is not to say that some one could not deceive the company through fraudulent acts. However, we are extremely diligent in preventing fraud from occurring in this manner and in every other. But I underscore again that Fidelity has no so called “agreements” that sanction illegal practices.
Second, Fidelity continues to stand on record, as we have for years, in opposition to predatory short term trading that adversely affects shareholders in a mutual fund. Back in the 1980s, we initiated a fee which is returned to the fund and, therefore, to investors to discourage this activity. Further, we took the lead several years ago in developing a Fair Value Pricing Policy to prevent market timing on foreign securities in our funds. I am confi dent we will find other ways to make it more difficult for predatory traders to operate. However, this will only be achieved through close cooperation among regulators, legislators and the industry.
Yes, there have been unfortunate instances of unethical and illegal activity within the mutual fund industry from time to time. That is true of any industry. When this occurs, confessed or convicted offend ers should be dealt with appropriately. But we are still concerned about the risk of over regulation and the quick application of simplistic solutions to intricate problems. Every system can be improved, and we support and applaud well thought out improvements by regulators, legislators and industry representatives that achieve the common goal of building and protecting the value of investors’ holdings.
For nearly 60 years, Fidelity has worked very hard to improve its products and service to justify your trust. When our family founded this company in 1946, we had only a few hundred customers. Today, we serve more than 18 million customers including individual investors and partici pants in retirement plans across America.
Let me close by saying that we do not take your trust in us for granted, and we realize that we must always work to improve all aspects of our service to you. In turn, we urge you to continue your active participation with your financial matters, so that your interests can be well served.
Best regards,
/s/ Edward C. Johnson 3d
Edward C. Johnson 3d
Annual Report 4
Shareholder Expense Example
As a shareholder of the Fund, you incur two types of costs: (1) transaction costs, including sales charges (loads) on purchase payments or redemption proceeds, redemption fees, and (2) ongoing costs, including management fees, distribution and/or service (12b 1) fees and other Fund expenses. This Example is intended to help you understand your ongoing costs (in dollars) of investing in the Fund and to compare these costs with the ongoing costs of investing in other mutual funds.
The Example is based on an investment of $1,000 invested at the beginning of the period and held for the entire period (September 7, 2005 to September 30, 2005). The hypo thetical expense example is based on an investment of $1,000 invested for the one half year period (April 1, 2005 to September 30, 2005).
The first line of the table below for each class of the Fund provides information about actual account values and actual expenses. You may use the information in this line, together with the amount you invested, to estimate the expenses that you paid over the period. Simply divide your account value by $1,000.00 (for example, an $8,600 account value divided by $1,000.00 = 8.6), then multiply the result by the number in the first line for a class of the Fund under the heading entitled “Expenses Paid During Period” to estimate the expenses you paid on your account during this period. In addition, the fund, as a shareholder in underlying affiliated central funds, will indirectly bear its pro rata share of the fees and expenses incurred by the underlying affiliated central funds. These fees and expenses are not included in the fund’s annualized expense ratio used to calculate the expense estimate in the table below.
Hypothetical Example for Comparison Purposes
The second line of the table below for each class of the Fund provides information about hypothetical account values and hypothetical expenses based on a Class’ actual expense ratio and an assumed rate of return of 5% per year before expenses, which is not the Class’ actual return. The hypothetical account values and expenses may not be used to estimate the actual ending account balance or expenses you paid for the period. You may use this information to compare the ongoing costs of investing in the Fund and other funds. To do so, compare this 5% hypothetical example with the 5% hypothetical examples that appear in the shareholder reports of the other funds. In addition, the fund, as a shareholder in underlying affiliated central funds, will indirectly bear its pro rata share of the fees and expenses incurred by the underlying affiliated central funds. These fees and expenses are not included in the fund’s annualized expense ratio used to calculate the expense estimate in the table below.
Please note that the expenses shown in the table are meant to highlight your ongoing costs only and do not reflect any transaction costs. Therefore, the second line of the table is useful in comparing ongoing costs only, and will not help you determine the relative total costs of owning different funds. In addition, if these transactional costs were included, your costs would have been higher.
5 Annual Report
| Shareholder Expense Example continued | | | | |
| |
| |
| | | | | | | | | Ending | | | | |
| | | | | Beginning | | | | Account Value | | | | Expenses Paid |
| | | | | Account Value | | | | September 30, 2005 | | | | During Period |
| Class A | | | | | | | | | | | | |
| Actual | | $ | | 1,000.00 | | $ | | 1,015.00 | | $ | | .66B |
| HypotheticalA | | $ | | 1,000.00 | | $ | | 1,020.05 | | $ | | 5.06C |
| Class T | | | | | | | | | | | | |
| Actual | | $ | | 1,000.00 | | $ | | 1,015.00 | | $ | | .73B |
| HypotheticalA | | $ | | 1,000.00 | | $ | | 1,019.55 | | $ | | 5.57C |
| Class B | | | | | | | | | | | | |
| Actual | | $ | | 1,000.00 | | $ | | 1,014.00 | | $ | | 1.16B |
| HypotheticalA | | $ | | 1,000.00 | | $ | | 1,016.29 | | $ | | 8.85C |
| Class C | | | | | | | | | | | | |
| Actual | | $ | | 1,000.00 | | $ | | 1,014.00 | | $ | | 1.22B |
| HypotheticalA | | $ | | 1,000.00 | | $ | | 1,015.79 | | $ | | 9.35C |
| Strategic Real Return | | | | | | | | | | | | |
| Actual | | $ | | 1,000.00 | | $ | | 1,015.00 | | $ | | .56B |
| HypotheticalA | | $ | | 1,000.00 | | $ | | 1,020.81 | | $ | | 4.31C |
| Institutional Class | | | | | | | | | | | | |
| Actual | | $ | | 1,000.00 | | $ | | 1,015.00 | | $ | | .56B |
| HypotheticalA | | $ | | 1,000.00 | | $ | | 1,020.81 | | $ | | 4.31C |
A 5% return per year before expenses
B Actual expenses are equal to each Class’ annualized expense ratio (shown in the table below); multiplied by the average account value over the period, multiplied by 24/365 (to reflect the period September 7, 2005 to September 30, 2005). The fees and expenses of the underlying affiliated central funds in which the fund invests are not included in the fund’s annualized expense ratio.
C Hypothetical expenses are equal to each Class’ annualized expense ratio (shown in the table below); multiplied by the average account value over the period, multiplied by 183/365 (to reflect the one-half year period). The fees and expenses of the underlying affiliated central funds in which the fund invests are not included in the fund’s annualized expense ratio.
| | | Annualized |
| | | Expense Ratio |
| Class A | | 1.00% |
| Class T | | 1.10% |
| Class B | | 1.75% |
| Class C | | 1.85% |
| Strategic Real Return | | 85% |
| Institutional Class | | 85% |
Annual Report 6
| Holdings Distribution as of September 30, 2005 | | |
| | | % of Fund’s |
| | | Net Assets |
| Inflation Protected Investments | | 27.9% |
| Floating Rate High Yield | | 19.7% |
| Commodity-Linked Notes and Related Investments* | | 27.1% |
| Real Estate Investments | | 17.0% |
| Cash & Cash Equivalents | | 7.9% |
* Includes Fidelity Ultra Short Central Fund held in connection with commodity linked notes and related investments. Investments in commodity linked notes provide indirect exposure to futures contracts on physical commodities via the Dow Jones AIG Commodity Index, the majority of which trade on U.S. exchanges. The value of commodity linked notes will change directly based on the performance of the index.
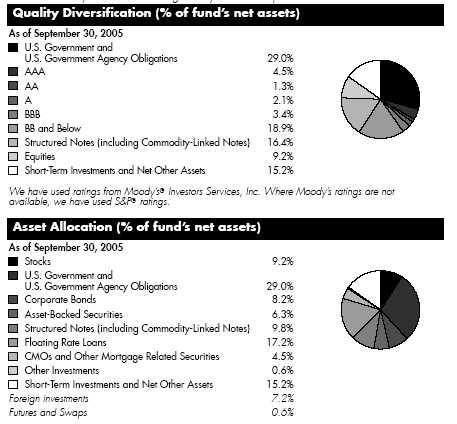
The information in the above tables is based on the combined investments of the fund and its pro rata share of the investments of Fidelity’s fixed income central funds.
7 Annual Report
| Investments September 30, 2005 | | |
| Showing Percentage of Net Assets | | | | |
| Corporate Bonds 6.0% | | | | |
| | | Principal | | Value |
| | | Amount | | (Note 1) |
| Convertible Bonds 0.7% | | | | |
| |
| FINANCIALS – 0.7% | | | | |
| Real Estate 0.7% | | | | |
| Affordable Resources Communities LP 7.5% 8/15/25 (b) | | $ 250,000 | | $ 249,875 |
| Nonconvertible Bonds – 5.3% | | | | |
| |
| CONSUMER DISCRETIONARY – 1.4% | | | | |
| Hotels, Restaurants & Leisure 0.8% | | | | |
| Host Marriott LP 7% 8/15/12 | | 300,000 | | 303,750 |
| Household Durables – 0.6% | | | | |
| Stanley Martin Communities LLC 9.75% 8/15/15 (b) | | 250,000 | | 246,875 |
| |
| TOTAL CONSUMER DISCRETIONARY | | | | 550,625 |
| |
| FINANCIALS – 3.9% | | | | |
| Real Estate 3.9% | | | | |
| Camden Property Trust 7% 11/15/06 | | 200,000 | | 204,735 |
| Colonial Properties Trust 7% 7/14/07 | | 250,000 | | 258,489 |
| MeriStar Hospitality Corp. 9% 1/15/08 | | 300,000 | | 312,375 |
| Thornburg Mortgage, Inc. 8% 5/15/13 | | 250,000 | | 247,500 |
| Trustreet Properties, Inc. 7.5% 4/1/15 (b) | | 200,000 | | 204,500 |
| Ventas Realty LP/Ventas Capital Corp. 8.75% 5/1/09 | | 250,000 | | 273,125 |
| | | | | 1,500,724 |
| |
| TOTAL NONCONVERTIBLE BONDS | | | | 2,051,349 |
| |
| TOTAL CORPORATE BONDS | | | | |
| (Cost $2,330,141) | | | | 2,301,224 |
| |
| U.S. Treasury Inflation Protected Obligations 27.9% | | |
| |
| U.S. Treasury Inflation-Indexed Bonds 2.375% 1/15/25 | | 2,974,640 | | 3,182,400 |
| U.S. Treasury Inflation-Indexed Notes: | | | | |
| 0.875% 4/15/10 | | 1,175,648 | | 1,145,614 |
| 1.625% 1/15/15 | | 1,145,950 | | 1,132,342 |
| 1.875% 7/15/13 | | 616,963 | | 625,254 |
| 2% 1/15/14 | | 1,141,927 | | 1,165,702 |
| 3% 7/15/12 | | 397,696 | | 432,774 |
| 3.375% 1/15/07 | | 197,299 | | 204,043 |
| 3.375% 1/15/12 | | 968,246 | | 1,072,257 |
See accompanying notes which are an integral part of the financial statements.
Annual Report 8
U.S. Treasury Inflation Protected Obligations continued
| | |
| | | Principal | | Value |
| | | Amount | | (Note 1) |
| U.S. Treasury Inflation-Indexed Notes: – continued | | | | |
| 3.625% 1/15/08 | | $ 816,284 | | $ 864,050 |
| 3.875% 1/15/09 | | 869,634 | | 943,418 |
| TOTAL U.S. TREASURY INFLATION PROTECTED OBLIGATIONS | | |
| (Cost $10,809,535) | | | | 10,767,854 |
| |
| Asset Backed Securities 0.6% | | | | |
| |
| Taberna Preferred Funding III Ltd. Series 2005-3A Class | | | | |
| D, 6.52% 2/5/36 (b)(c) | | | | |
| (Cost $250,000) | | 250,000 | | 250,000 |
| |
| Collateralized Mortgage Obligations 0.4% | | | | |
| |
| Private Sponsor 0.4% | | | | |
| Resix Finance Ltd. Series 2005-C Class B7, 6.79% | | | | |
| 9/10/37 (b)(c) | | | | |
| (Cost $150,010) | | 150,000 | | 150,000 |
| |
| Commercial Mortgage Securities 0.8% | | | | |
| |
| Bank of America Large Loan, Inc. floater Series | | | | |
| 2005-ESHA Class K, 5.68% 7/14/08 (b)(c) | | | | |
| (Cost $300,000) | | 300,000 | | 300,000 |
| |
| Common Stocks 2.7% | | | | |
| | | Shares | | |
| |
| CONSUMER DISCRETIONARY – 0.1% | | | | |
| Hotels, Restaurants & Leisure 0.1% | | | | |
| Starwood Hotels & Resorts Worldwide, Inc. unit | | 1,000 | | 57,170 |
| |
| FINANCIALS – 2.4% | | | | |
| Real Estate 2.4% | | | | |
| Annaly Mortgage Management, Inc. | | 1,500 | | 19,425 |
| Anworth Mortgage Asset Corp. | | 10,000 | | 82,700 |
| Equity Residential (SBI) | | 2,500 | | 94,625 |
| General Growth Properties, Inc. | | 2,500 | | 112,325 |
| Host Marriott Corp. | | 7,500 | | 126,750 |
| Inland Real Estate Corp. | | 2,000 | | 31,320 |
| LTC Properties, Inc. | | 5,000 | | 106,000 |
| MortgageIT Holdings, Inc. | | 1,500 | | 21,330 |
| ProLogis Trust | | 3,500 | | 155,085 |
See accompanying notes which are an integral part of the financial statements.
| Investments continued | | | | | | | | |
| |
Common Stocks continued
| | | | | | | | |
| | | | | Shares | | | | Value |
| | | | | | | | | (Note 1) |
| |
| FINANCIALS – continued | | | | | | | | |
| Real Estate continued | | | | | | | | |
| Saxon Capital, Inc. | | | | 2,000 | | $ | | 23,700 |
| Spirit Finance Corp. | | | | 4,000 | | | | 45,000 |
| Trizec Properties, Inc. | | | | 2,000 | | | | 46,120 |
| Ventas, Inc. | | | | 1,500 | | | | 48,300 |
| | | | | | | | | 912,680 |
| |
| HEALTH CARE – 0.2% | | | | | | | | |
| Health Care Providers & Services – 0.2% | | | | | | | | |
| Capital Senior Living Corp. (a) | | | | 8,000 | | | | 66,800 |
| TOTAL COMMON STOCKS | | | | | | | | |
| (Cost $1,030,706) | | | | | | | | 1,036,650 |
| |
| Preferred Stocks 6.5% | | | | | | | | |
| |
| Convertible Preferred Stocks 0.7% | | | | | | | | |
| |
| FINANCIALS – 0.7% | | | | | | | | |
| Real Estate 0.7% | | | | | | | | |
| Windrose Medical Properties Trust 7.50% | | | | 9,000 | | | | 245,250 |
| Nonconvertible Preferred Stocks 5.8% | | | | | | | | |
| |
| FINANCIALS – 5.8% | | | | | | | | |
| Real Estate 5.8% | | | | | | | | |
| Accredited Mortgage Loan Trust Series A, 9.75% | | | | 6,000 | | | | 153,900 |
| American Home Mortgage Investment Corp. Series B, 9.25% | | . | | 2,200 | | | | 57,200 |
| Annaly Mortgage Management, Inc. Series A, 7.875% | | | | 2,000 | | | | 49,100 |
| Anworth Mortgage Asset Corp. Series A, 8.625% | | | | 4,100 | | | | 101,926 |
| Capital Automotive (REIT) 6.75% | | | | 12,300 | | | | 301,842 |
| Host Marriott Corp. Class C, 10.00% | | | | 5,000 | | | | 127,200 |
| Impac Mortgage Holdings, Inc. Series C, 9.125% | | | | 5,000 | | | | 122,450 |
| LaSalle Hotel Properties Series A, 10.25% | | | | 5,000 | | | | 133,000 |
| MFA Mortgage Investments, Inc. Series A, 8.50% | | | | 18,100 | | | | 447,975 |
| Newcastle Investment Corp. Series B, 9.75% | | | | 12,000 | | | | 318,600 |
| Prime Group Realty Trust Series B, 9.00% | | | | 1,800 | | | | 41,400 |
| PS Business Parks, Inc. Series D, 9.50% | | | | 7,000 | | | | 179,200 |
| The Mills Corp. Series B, 9.00% | | | | 8,000 | | | | 209,200 |
| | | | | | | | | 2,242,993 |
| |
| TOTAL PREFERRED STOCKS | | | | | | | | |
| (Cost $2,498,047) | | | | | | | | 2,488,243 |
See accompanying notes which are an integral part of the financial statements.
Commodity Linked Notes 9.8%
| | | | |
| | | Principal | | Value |
| | | Amount | | (Note 1) |
| |
| AIG-FP Private Funding Ltd. Master Note, one-month | | | | |
| U.S. dollar LIBOR minus .10% due 8/18/2006 | | | | |
| (indexed to the Dow Jones-AIG Commodity Index Total | | | | |
| Return, multiplied by 3) (e) | | $ 190,000 | | $ 232,380 |
| AIG-FP Private Funding Ltd. Master Note, one-month | | | | |
| U.S. dollar LIBOR minus .10% due 8/18/2006 | | | | |
| (indexed to the Dow Jones-AIG Commodity Index Total | | | | |
| Return, multiplied by 3) (e) | | 200,000 | | 214,236 |
| AIG-FP Private Funding Ltd. Master Note, one-month | | | | |
| U.S. dollar LIBOR minus .10% due 8/18/2006 | | | | |
| (indexed to the Dow Jones-AIG Commodity Index Total | | | | |
| Return, multiplied by 3) (e) | | 110,000 | | 118,418 |
| AIG-FP Private Funding Ltd. Master Note, one-month | | | | |
| U.S. LIBOR minus .10% due 8/18/2006 (indexed to | | | | |
| the Dow Jones-AIG Commodity Index Total Return, | | | | |
| multiplied by 3) (e) | | 330,000 | | 329,112 |
| AIG-FP Private Funding Ltd. Master Note, three-month | | | | |
| U.S. dollar LIBOR minus .10% due 8/10/2006 | | | | |
| (indexed to the Dow Jones-AIG Commodity Index Total | | | | |
| Return, multiplied by 3) (e) | | 600,000 | | 702,126 |
| JPMorgan Chase Bank, NA Medium Term Note, one- | | | | |
| month U.S. dollar LIBOR minus .18% due 8/10/2006 | | | | |
| (indexed to the Dow Jones-AIG Commodity Index Total | | | | |
| Return, multiplied by 3) (b)(e) | | 470,000 | | 550,012 |
| JPMorgan Chase Bank, NA Medium Term Note, one- | | | | |
| month U.S. dollar LIBOR minus .18% due 8/18/2006 | | | | |
| (indexed to the Dow Jones-AIG Commodity Index Total | | | | |
| Return, multiplied by 3) (b)(e) | | 280,000 | | 332,841 |
| JPMorgan Chase Bank, NA Medium Term Note, one- | | | | |
| month U.S. dollar LIBOR minus .18% due 8/18/2006 | | | | |
| (indexed to the Dow Jones-AIG Commodity Index Total | | | | |
| Return, multiplied by 3) (b)(e) | | 380,000 | | 422,773 |
| Societe Generale Floating Rate Note, one-month U.S. | | | | |
| dollar LIBOR minus .10% due 8/10/2006 (indexed to | | | | |
| the Dow Jones-AIG Commodity Index Total Return, | | | | |
| multiplied by 3) (b)(e) | | 600,000 | | 702,060 |
| Societe Generale Floating Rate Note, one-month U.S. | | | | |
| dollar LIBOR minus .10% due 8/10/2006 (indexed to | | | | |
| the Dow Jones-AIG Commodity Index Total Return, | | | | |
| multiplied by 3) (b)(e) | | 160,000 | | 175,472 |
| |
| TOTAL COMMODITY LINKED NOTES | | | | |
| (Cost $3,320,000) | | | | 3,779,430 |
| |
| |
| |
| |
| See accompanying notes which are an integral part of the financial statements. | | |
| |
| 11 | | | | Annual Report |
| Investments continued | | | | | | |
| |
Fixed Income Funds 37.0%
| | | | | | |
| | | Shares | | | | Value |
| | | | | | | (Note 1) |
| Fidelity Floating Rate Central Investment Portfolio (d) | | 75,526 | | | | $ 7,598,671 |
| Fidelity Ultra-Short Central Fund (d) | | 66,782 | | | | 6,644,141 |
| TOTAL FIXED INCOME FUNDS | | | | | | |
| (Cost $14,242,632) | | | | | | 14,242,812 |
| Cash Equivalents 7.9% | | | | | | |
| | | Maturity | | | | |
| | | Amount | | | | |
| Investments in repurchase agreements (Collateralized by U.S. | | | | | | |
| Treasury Obligations, in a joint trading account at 3.16%, | | | | | | |
| dated 9/30/05 due 10/3/05) | | | | | | |
| (Cost $3,041,000) | | $ 3,041,800 | | | | 3,041,000 |
| |
| TOTAL INVESTMENT PORTFOLIO 99.6% | | | | | | |
| (Cost $37,972,071) | | | | | | 38,357,213 |
| |
| NET OTHER ASSETS – 0.4% | | | | | | 167,290 |
| NET ASSETS 100% | | | | $ | | 38,524,503 |
(a) Non-income producing
(b) Security exempt from registration under
Rule 144A of the Securities Act of 1933.
These securities may be resold in
transactions exempt from registration,
normally to qualified institutional buyers.
At the period end, the value of these
securities amounted to $3,584,408 or
9.3% of net assets.
(c) The coupon rate shown on floating or
adjustable rate securities represents the
rate at period end.
(d) Affiliated fund that is available only to
investment companies and other accounts
managed by Fidelity Investments. A
complete unaudited listing of the
fixed income central funds’ holdings is
provided at the end of this report.
|
(e) Security is linked to the Dow Jones-AIG
Commodity Index Total Return. Securities
do not guarantee any return of principal
at maturity, but instead will pay at
maturity or upon exchange an amount
based on the closing value of the Dow
Jones-AIG Commodity Index Total
Return. Although these instruments are
primarily debt obligations, they provide
exposure indirectly to changes in the
value of the underlying commodities.
Holders of the security have the right to
exchange these notes daily.
|
See accompanying notes which are an integral part of the financial statements.
| Financial Statements | | | | | | | | |
| |
| |
| Statement of Assets and Liabilities | | | | | | | | |
| | | | | | | September 30, 2005 |
| |
| Assets | | | | | | | | |
| Investment in securities, at value (including repurchase | | | | | | | | |
| agreements of $3,041,000) (cost $37,972,071) | | | | | | | | |
| See accompanying schedule | | | | | | $ | | 38,357,213 |
| Cash | | | | | | | | 51 |
| Receivable for fund shares sold | | | | | | | | 1,418,768 |
| Dividends receivable | | | | | | | | 18,607 |
| Interest receivable | | | | | | | | 138,626 |
| Receivable from investment adviser for expense | | | | | | | | |
| reductions | | | | | | | | 71,385 |
| Total assets | | | | | | | | 40,004,650 |
| |
| Liabilities | | | | | | | | |
| Payable for investments purchased | | $ | | 1,384,611 | | | | |
| Payable for fund shares redeemed | | | | 2,238 | | | | |
| Accrued management fee | | | | 11,016 | | | | |
| Distribution fees payable | | | | 5,303 | | | | |
| Other affiliated payables | | | | 4,042 | | | | |
| Other payables and accrued expenses | | | | 72,937 | | | | |
| Total liabilities | | | | | | | | 1,480,147 |
| |
| Net Assets | | | | | | $ | | 38,524,503 |
| Net Assets consist of: | | | | | | | | |
| Paid in capital | | | | | | $ | | 38,055,879 |
| Undistributed net investment income | | | | | | | | 78,944 |
| Accumulated undistributed net realized gain (loss) on | | | | | | | | |
| investments | | | | | | | | 4,538 |
| Net unrealized appreciation (depreciation) on | | | | | | | | |
| investments | | | | | | | | 385,142 |
| Net Assets | | | | | | $ | | 38,524,503 |
See accompanying notes which are an integral part of the financial statements.
13 Annual Report
| Financial Statements continued | | | | |
| |
| |
| Statement of Assets and Liabilities continued | | | | |
| | | September 30, 2005 |
| |
| Calculation of Maximum Offering Price | | | | |
| Class A: | | | | |
| Net Asset Value and redemption price per share | | | | |
| ($3,405,325 ÷ 335,576 shares) | | $ | | 10.15 |
| Maximum offering price per share (100/95.25 of $10.15) | | $ | | 10.66 |
| Class T: | | | | |
| Net Asset Value and redemption price per share | | | | |
| ($3,284,482 ÷ 323,690 shares) | | $ | | 10.15 |
| Maximum offering price per share (100/96.50 of $10.15) | | $ | | 10.52 |
| Class B: | | | | |
| Net Asset Value and offering price per share | | | | |
| ($3,253,180 ÷ 320,754 shares)A | | $ | | 10.14 |
| Class C: | | | | |
| Net Asset Value and offering price per share | | | | |
| ($3,467,220 ÷ 341,879 shares)A | | $ | | 10.14 |
| Strategic Real Return: | | | | |
| Net Asset Value, offering price and redemption price per | | | | |
| share ($21,866,671 ÷ 2,153,944 shares) | | $ | | 10.15 |
| Institutional Class: | | | | |
| Net Asset Value, offering price and redemption price per | | | | |
| share ($3,247,625 ÷ 320,001 shares) | | $ | | 10.15 |
| A Redemption price per share is equal to net asset value less any applicable contingent deferred sales charge. | | | | |
See accompanying notes which are an integral part of the financial statements.
Annual Report 14
| | For the period September 7, 2005 (commencement of operations) to September 30, 2005
| Investment Income | | | | | | |
| Dividends | | | | $ | | 16,197 |
| Interest | | | | | | 87,139 |
| Total income | | | | | | 103,336 |
| |
| Expenses | | | | | | |
| Management fee | | $ | | 11,016 | | |
| Transfer agent fees | | | | 3,044 | | |
| Distribution fees | | | | 5,304 | | |
| Accounting fees and expenses | | | | 1,005 | | |
| Custodian fees and expenses | | | | 1,200 | | |
| Registration fees | | | | 10,236 | | |
| Audit | | | | 61,500 | | |
| Total expenses before reductions | | | | 93,305 | | |
| Expense reductions | | | | (71,385) | | 21,920 |
| |
| Net investment income | | | | | | 81,416 |
| Realized and Unrealized Gain (Loss) | | | | | | |
| Net realized gain (loss) on investment securities | | | | | | 2,066 |
| Change in net unrealized appreciation (depreciation) on | | | | |
| investment securities | | | | | | 385,142 |
| Net gain (loss) | | | | | | 387,208 |
| Net increase (decrease) in net assets resulting from | | | | | | |
| operations | | | | $ | | 468,624 |
See accompanying notes which are an integral part of the financial statements.
15 Annual Report
| Financial Statements continued | | | | |
| |
| |
| Statement of Changes in Net Assets | | | | |
| | | For the period |
| | | September 7, 2005 |
| | | (commencement of |
| | | operations) to |
| | | September 30, 2005 |
| Increase (Decrease) in Net Assets | | | | |
| Operations | | | | |
| Net investment income | | $ | | 81,416 |
| Net realized gain (loss) | | | | 2,066 |
| Change in net unrealized appreciation (depreciation) | | | | 385,142 |
| Net increase (decrease) in net assets resulting from operations | | | | 468,624 |
| Share transactions - net increase (decrease) | | | | 38,055,768 |
| Redemption fees | | | | 111 |
| Total increase (decrease) in net assets | | | | 38,524,503 |
| |
| Net Assets | | | | |
| Beginning of period | | | | — |
| End of period (including undistributed net investment income of $78,944) | | $ | | 38,524,503 |
See accompanying notes which are an integral part of the financial statements.
| Financial Highlights Class A | | | | |
| |
| Year ended September 30, | | | | 2005F |
| Selected Per Share Data | | | | |
| Net asset value, beginning of period | | $ | | 10.00 |
| Income from Investment Operations | | | | |
| Net investment incomeE | | | | 031 |
| Net realized and unrealized gain (loss) | | | | 119 |
| Total from investment operations | | | | 150 |
| Net asset value, end of period | | $ | | 10.15 |
| Total ReturnB,C,D | | | | 1.50% |
| Ratios to Average Net AssetsG,H | | | | |
| Expenses before expense reductions | | | | 4.71%A |
| Expenses net of voluntary waivers, if any | | | | 1.00%A |
| Expenses net of all reductions | | | | 1.00%A |
| Net investment income | | | | 4.28%A |
| Supplemental Data | | | | |
| Net assets, end of period (000 omitted) | | $ | | 3,405 |
| Portfolio turnover rate | | | | 78%A |
A Annualized
B Total returns for periods of less than one year are not annualized.
C Total returns would have been lower had certain expenses not been reduced during the periods shown.
D Total returns do not include the effect of the sales charges.
E Calculated based on average shares outstanding during the period.
F For the period September 7, 2005 (commencement of operations) to September 30, 2005.
G Expense ratios reflect operating expenses of the class. Expenses before reductions do not reflect amounts reimbursed by the investment adviser or
reductions from brokerage service arrangements or other expense offset arrangements and do not represent the amount paid by the class during
periods when reimbursements or reductions occur. Expense ratios before reductions for start up periods may not be representative of longer term
operating periods. Expenses net of any voluntary waivers reflect expenses after reimbursement by the investment adviser but prior to reductions from
brokerage service arrangements or other expense offset arrangements. Expenses net of all reductions represent the net expenses paid by the class.
H Amounts do not include the activity of the underlying funds.
|
See accompanying notes which are an integral part of the financial statements.
17 Annual Report
| Financial Highlights Class T | | | | |
| |
| Year ended September 30, | | | | 2005F |
| Selected Per Share Data | | | | |
| Net asset value, beginning of period | | $ | | 10.00 |
| Income from Investment Operations | | | | |
| Net investment incomeE | | | | 030 |
| Net realized and unrealized gain (loss) | | | | 120 |
| Total from investment operations | | | | 150 |
| Net asset value, end of period | | $ | | 10.15 |
| Total ReturnB,C,D | | | | 1.50% |
| Ratios to Average Net AssetsG,H | | | | |
| Expenses before expense reductions | | | | 4.81%A |
| Expenses net of voluntary waivers, if any | | | | 1.10%A |
| Expenses net of all reductions | | | | 1.10%A |
| Net investment income | | | | 4.18%A |
| Supplemental Data | | | | |
| Net assets, end of period (000 omitted) | | $ | | 3,284 |
| Portfolio turnover rate | | | | 78%A |
A Annualized
B Total returns for periods of less than one year are not annualized.
C Total returns would have been lower had certain expenses not been reduced during the periods shown.
D Total returns do not include the effect of the sales charges.
E Calculated based on average shares outstanding during the period.
F For the period September 7, 2005 (commencement of operations) to September 30, 2005.
G Expense ratios reflect operating expenses of the class. Expenses before reductions do not reflect amounts reimbursed by the investment adviser or
reductions from brokerage service arrangements or other expense offset arrangements and do not represent the amount paid by the class during
periods when reimbursements or reductions occur. Expense ratios before reductions for start up periods may not be representative of longer term
operating periods. Expenses net of any voluntary waivers reflect expenses after reimbursement by the investment adviser but prior to reductions from
brokerage service arrangements or other expense offset arrangements. Expenses net of all reductions represent the net expenses paid by the class.
H Amounts do not include the activity of the underlying funds.
|
See accompanying notes which are an integral part of the financial statements.
| Financial Highlights Class B | | | | |
| |
| Year ended September 30, | | | | 2005F |
| Selected Per Share Data | | | | |
| Net asset value, beginning of period | | $ | | 10.00 |
| Income from Investment Operations | | | | |
| Net investment incomeE | | | | 025 |
| Net realized and unrealized gain (loss) | | | | 115 |
| Total from investment operations | | | | 140 |
| Net asset value, end of period | | $ | | 10.14 |
| Total ReturnB,C,D | | | | 1.40% |
| Ratios to Average Net AssetsG,H | | | | |
| Expenses before expense reductions | | | | 5.47%A |
| Expenses net of voluntary waivers, if any | | | | 1.75%A |
| Expenses net of all reductions | | | | 1.75%A |
| Net investment income | | | | 3.53%A |
| Supplemental Data | | | | |
| Net assets, end of period (000 omitted) | | $ | | 3,253 |
| Portfolio turnover rate | | | | 78%A |
A Annualized
B Total returns for periods of less than one year are not annualized.
C Total returns would have been lower had certain expenses not been reduced during the periods shown.
D Total returns do not include the effect of the contingent deferred sales charge.
E Calculated based on average shares outstanding during the period.
F For the period September 7, 2005 (commencement of operations) to September 30, 2005.
G Expense ratios reflect operating expenses of the class. Expenses before reductions do not reflect amounts reimbursed by the investment adviser or
reductions from brokerage service arrangements or other expense offset arrangements and do not represent the amount paid by the class during
periods when reimbursements or reductions occur. Expense ratios before reductions for start up periods may not be representative of longer term
operating periods. Expenses net of any voluntary waivers reflect expenses after reimbursement by the investment adviser but prior to reductions from
brokerage service arrangements or other expense offset arrangements. Expenses net of all reductions represent the net expenses paid by the class.
H Amounts do not include the activity of the underlying funds.
|
See accompanying notes which are an integral part of the financial statements.
19 Annual Report
| Financial Highlights Class C | | | | |
| |
| Year ended September 30, | | | | 2005F |
| Selected Per Share Data | | | | |
| Net asset value, beginning of period | | $ | | 10.00 |
| Income from Investment Operations | | | | |
| Net investment incomeE | | | | 024 |
| Net realized and unrealized gain (loss) | | | | 116 |
| Total from investment operations | | | | 140 |
| Net asset value, end of period | | $ | | 10.14 |
| Total ReturnB,C,D | | | | 1.40% |
| Ratios to Average Net AssetsG,H | | | | |
| Expenses before expense reductions | | | | 5.56%A |
| Expenses net of voluntary waivers, if any | | | | 1.85%A |
| Expenses net of all reductions | | | | 1.85%A |
| Net investment income | | | | 3.43%A |
| Supplemental Data | | | | |
| Net assets, end of period (000 omitted) | | $ | | 3,467 |
| Portfolio turnover rate | | | | 78%A |
A Annualized
B Total returns for periods of less than one year are not annualized.
C Total returns would have been lower had certain expenses not been reduced during the periods shown.
D Total returns do not include the effect of the contingent deferred sales charge.
E Calculated based on average shares outstanding during the period.
F For the period September 7, 2005 (commencement of operations) to September 30, 2005.
G Expense ratios reflect operating expenses of the class. Expenses before reductions do not reflect amounts reimbursed by the investment adviser or
reductions from brokerage service arrangements or other expense offset arrangements and do not represent the amount paid by the class during
periods when reimbursements or reductions occur. Expense ratios before reductions for start up periods may not be representative of longer term
operating periods. Expenses net of any voluntary waivers reflect expenses after reimbursement by the investment adviser but prior to reductions from
brokerage service arrangements or other expense offset arrangements. Expenses net of all reductions represent the net expenses paid by the class.
H Amounts do not include the activity of the underlying funds.
|
See accompanying notes which are an integral part of the financial statements.
| Financial Highlights Strategic Real Return | | | | |
| |
| Year ended September 30, | | | | 2005E |
| Selected Per Share Data | | | | |
| Net asset value, beginning of period | | $ | | 10.00 |
| Income from Investment Operations | | | | |
| Net investment incomeD | | | | 028 |
| Net realized and unrealized gain (loss) | | | | 122 |
| Total from investment operations | | | | 150 |
| Net asset value, end of period | | $ | | 10.15 |
| Total ReturnB,C | | | | 1.50% |
| Ratios to Average Net AssetsF,G | | | | |
| Expenses before expense reductions | | | | 4.41%A |
| Expenses net of voluntary waivers, if any | | | | 85%A |
| Expenses net of all reductions | | | | 85%A |
| Net investment income | | | | 4.43%A |
| Supplemental Data | | | | |
| Net assets, end of period (000 omitted) | | $21,867 |
| Portfolio turnover rate | | | | 78%A |
A Annualized
B Total returns for periods of less than one year are not annualized.
C Total returns would have been lower had certain expenses not been reduced during the periods shown.
D Calculated based on average shares outstanding during the period.
E For the period September 7, 2005 (commencement of operations) to September 30, 2005.
F Expense ratios reflect operating expenses of the class. Expenses before reductions do not reflect amounts reimbursed by the investment adviser or
reductions from brokerage service arrangements or other expense offset arrangements and do not represent the amount paid by the class during
periods when reimbursements or reductions occur. Expense ratios before reductions for start up periods may not be representative of longer term
operating periods. Expenses net of any voluntary waivers reflect expenses after reimbursement by the investment adviser but prior to reductions from
brokerage service arrangements or other expense offset arrangements. Expenses net of all reductions represent the net expenses paid by the class.
G Amounts do not include the activity of the underlying funds.
|
See accompanying notes which are an integral part of the financial statements.
21 Annual Report
| Financial Highlights Institutional Class | | | | |
| |
| Year ended September 30, | | | | 2005E |
| Selected Per Share Data | | | | |
| Net asset value, beginning of period | | $ | | 10.00 |
| Income from Investment Operations | | | | |
| Net investment incomeD | | | | 032 |
| Net realized and unrealized gain (loss) | | | | 118 |
| Total from investment operations | | | | 150 |
| Net asset value, end of period | | $ | | 10.15 |
| Total ReturnB,C | | | | 1.50% |
| Ratios to Average Net AssetsF,G | | | | |
| Expenses before expense reductions | | | | 4.55%A |
| Expenses net of voluntary waivers, if any | | | | 85%A |
| Expenses net of all reductions | | | | 85%A |
| Net investment income | | | | 4.43%A |
| Supplemental Data | | | | |
| Net assets, end of period (000 omitted) | | $ | | 3,248 |
| Portfolio turnover rate | | | | 78%A |
A Annualized
B Total returns for periods of less than one year are not annualized.
C Total returns would have been lower had certain expenses not been reduced during the periods shown.
D Calculated based on average shares outstanding during the period.
E For the period September 7, 2005 (commencement of operations) to September 30, 2005.
F Expense ratios reflect operating expenses of the class. Expenses before reductions do not reflect amounts reimbursed by the investment adviser or
reductions from brokerage service arrangements or other expense offset arrangements and do not represent the amount paid by the class during
periods when reimbursements or reductions occur. Expense ratios before reductions for start up periods may not be representative of longer term
operating periods. Expenses net of any voluntary waivers reflect expenses after reimbursement by the investment adviser but prior to reductions from
brokerage service arrangements or other expense offset arrangements. Expenses net of all reductions represent the net expenses paid by the class.
G Amounts do not include the activity of the underlying funds.
|
See accompanying notes which are an integral part of the financial statements.
Notes to Financial Statements
For the period ended September 30, 2005
1. Significant Accounting Policies.
Fidelity Strategic Real Return Fund (the fund) is a fund of Fidelity Commonwealth Trust (the trust) and is authorized to issue an unlimited number of shares. The trust is regis tered under the Investment Company Act of 1940, as amended (the 1940 Act), as an open end management investment company organized as a Massachusetts business trust.
The fund offers Class A, Class T, Class B, Class C, Strategic Real Return, and Institutional Class shares, each of which has equal rights as to assets and voting privileges. Each class has exclusive voting rights with respect to matters that affect that class. Class B shares will automatically convert to Class A shares after a holding period of seven years from the initial date of purchase. Investment income, realized and unrealized capital gains and losses, the common expenses of the fund, and certain fund level expense reductions, if any, are allocated on a pro rata basis to each class based on the relative net assets of each class to the total net assets of the fund. Each class differs with respect to transfer agent and distribution and service plan fees incurred. Certain expense reductions also differ by class.
The fund may invest in affiliated money market central funds (Money Market Central Funds) and fixed income Central Investment Portfolios (CIPs), collectively referred to as Central Funds, which are open end investment companies available to investment companies and other accounts managed by Fidelity Management & Research Company (FMR) and its affiliates. The financial statements have been prepared in conformity with accounting principles generally accepted in the United States of America, which require management to make certain estimates and assumptions at the date of the financial statements. The following summarizes the significant accounting policies of the fund, which are also consistently followed by the Central Funds:
Security Valuation. Net asset value per share (NAV calculation) is calculated as of the close of business of the New York Stock Exchange, normally 4:00 p.m. Eastern time. Debt securities, including restricted securities, for which quotations are readily available are valued at their most recent bid prices (sales prices if the principal market is an exchange) in the principal market in which such securities are normally traded, as determined by recognized dealers in such securities, or securities are valued on the basis of information provided by a pricing service. Pricing services use valuation matrices that incorporate both dealer supplied valuations and valuation models. Equity securities, including restricted securities, for which market quotations are available are valued at the last sale price or official closing price (closing bid price or last evaluated quote if no sale has occurred) on the primary market or exchange on which they trade. If prices are not readily available or do not accurately reflect fair value for a security, or if a security’s value has been materially affected by events occurring after the close of the exchange or market on which the security is principally traded, that security may be valued by another method that the Board of Trustees believes accurately reflects fair value. A security’s valuation may differ
23 Annual Report
Notes to Financial Statements continued
1. Significant Accounting Policies continued
Security Valuation continued
|
depending on the method used for determining value. Price movements in futures contracts and ADRs, market and trading trends, the bid/ask quotes of brokers and off exchange institutional trading may be reviewed in the course of making a good faith determination of a security’s fair value. Short term securities with remaining maturities of sixty days or less for which quotations are not readily available are valued on the basis of amortized cost. Investments in open end investment companies, including Central Funds, are valued at their net asset value each business day.
Investment Transactions and Income. Security transactions, including the fund’s investment activity in the Central Funds, are accounted for as of trade date. Gains and losses on securities sold are determined on the basis of identified cost. Dividend income is recorded on the ex dividend date, except for certain dividends from foreign securities where the ex dividend date may have passed, which are recorded as soon as the fund is informed of the ex dividend date. Non cash dividends included in dividend income, if any, are recorded at the fair market value of the securities received. Distributions received on securities that represent a return of capital or capital gains are recorded as a reduction of cost of investments and/or as a realized gain. The fund estimates the components of distributions received that may be considered return of capital distribu tions or capital gain distributions. Interest income, including distributions from the Central Funds, is accrued as earned. Interest income includes coupon interest and amortization of premium and accretion of discount on debt securities. Inflation indexed bonds are fixed income securities whose principal value is periodically adjusted accord ing to the rate of inflation. Interest is accrued based on the principal value which is adjusted for inflation. Any increase in the principal amount of an inflation indexed bond is recorded as interest income, even though the principal is not received until maturity.
Expenses. Most expenses of the trust can be directly attributed to a fund. Expenses which cannot be directly attributed are apportioned among each fund in the trust.
Income Tax Information and Distributions to Shareholders. Each year, the fund intends to qualify as a regulated investment company by distributing all of its taxable income and realized gains under Subchapter M of the Internal Revenue Code. As a result, no provision for income taxes is required in the accompanying financial statements.
Distributions are recorded on the ex dividend date. Income dividends and capital gain distributions are declared separately for each class. Income and capital gain distribu tions are determined in accordance with income tax regulations, which may differ from generally accepted accounting principles. In addition, the fund will claim a portion of the payment made to redeeming shareholders as a distribution for income tax purposes.
Capital accounts within the financial statements are adjusted for permanent book tax differences. These adjustments have no impact on net assets or the results of operations. Temporary book tax differences will reverse in a subsequent period.
1. Significant Accounting Policies continued
Income Tax Information and Distributions to Shareholders continued
|
Book tax differences are primarily due to partnerships (including allocations from the CIPs), and income recognized on commodity linked notes.
Distributions are recorded on the ex dividend date. Income dividends and capital gain distributions are declared separately for each class. Income and capital gain distribu tions are determined in accordance with income tax regulations, which may differ from generally accepted accounting principles.
Capital accounts within the financial statements are adjusted for permanent book tax differences. These adjustments have no impact on net assets or the results of operations. Temporary book tax differences will reverse in a subsequent period.
The tax basis components of distributable earnings and the federal tax cost as of period end were as follows:
| Unrealized appreciation | | $ | | 476,278 |
| Unrealized depreciation | | | | (100,753) |
| Net unrealized appreciation (depreciation) | | | | 375,525 |
| Undistributed ordinary income | | | | 84,659 |
| Undistributed long term capital gain | | | | 4,585 |
| |
| Cost for federal income tax purposes | | $ | | 37,981,688 |
Short Term Trading (Redemption) Fees. Shares purchased on or after September 7, 2005 and held in the fund less than 60 days are subject to a redemption fee equal to .75% of the proceeds of the redeemed shares. All redemption fees, including any estimated redemption fees paid by Fidelity Management & Research Company (FMR), are retained by the fund and accounted for as an addition to paid in capital.
Repurchase Agreements. FMR has received an Exemptive Order from the Securities and Exchange Commission (the SEC) which permits the fund and other affiliated entities of FMR to transfer uninvested cash balances into joint trading accounts which are then invested in repurchase agreements. The fund may also invest directly with institutions in repurchase agreements. Repurchase agreements are collateralized by government or non government securities. Collateral is held in segregated accounts with custodian banks and may be obtained in the event of a default of the counterparty. The fund monitors, on a daily basis, the value of the collateral to ensure it is at least equal to the principal amount of the repurchase agreement (including accrued interest). In the event of a default by the counterparty, realization of the collateral proceeds could be delayed, during which time the value of the collateral may decline.
25 Annual Report
Notes to Financial Statements continued
2. Operating Policies continued
Indexed Securities. The fund may invest in indexed securities whose values, interest rates and/or redemption prices are linked to changes in commodities, foreign currencies, interest rates, indices, or other underlying instruments. These securities may be used to increase or decrease exposure to different underlying instruments and to gain exposure to markets that might be difficult to access through conventional securities. Indexed securities may be more volatile than their underlying instruments, but any loss is limited to the amount of the original investment. Indexed securities are marked to market daily based on dealer supplied valuations and changes in value are recorded as unrealized appreciation (depreciation). Gains and losses realized upon the sale of indexed securi ties are included in realized gains (losses) on investment securities.
Restricted Securities. The fund may invest in securities that are subject to legal or contractual restrictions on resale. These securities generally may be resold in transac tions exempt from registration or to the public if the securities are registered. Disposal of these securities may involve time consuming negotiations and expense, and prompt sale at an acceptable price may be difficult. Information regarding restricted securities is included at the end of the fund’s Schedule of Investments.
3. Purchases and Sales of Investments.
Purchases and sales of securities, other than short term securities, and U.S. government securities, aggregated $25,147,525 and $1,025,010, respectively.
4. Fees and Other Transactions with Affiliates.
Management Fee. FMR and its affiliates provide the fund with investment manage ment related services for which the fund pays a monthly management fee. The manage ment fee is the sum of an individual fund fee rate that is based on an annual rate of .45% of the fund’s average net assets and a group fee rate that averaged .12% during the period. The group fee rate is based upon the average net assets of all the mutual funds advised by FMR. The group fee rate decreases as assets under management increase and increases as assets under management decrease. For the period, the total annualized management fee rate was .56% of the fund’s average net assets.
Distribution and Service Plan. In accordance with Rule 12b 1 of the 1940 Act, the fund has adopted separate Distribution and Service Plans for each class of shares. Certain classes pay Fidelity Distributors Corporation (FDC), an affiliate of FMR, separate Dis tribution and Service Fees, each of which is based on an annual percentage of each class’ average net assets. In addition, FDC may pay financial intermediaries for selling shares of
4. Fees and Other Transactions with Affiliates continued
Distribution and Service Plan continued
|
the fund and providing shareholder support services. For the period, the Distribution and Service Fee rates and the total amounts paid to and retained by FDC were as follows:
| | | Distribution | | Service | | | | Paid to | | | | Retained |
| | | Fee | | Fee | | | | FDC | | | | by FDC |
| Class A | | 0% | | .15% | | $ | | 349 | | $ | | 344 |
| Class T | | 0% | | .25% | | | | 575 | | | | 574 |
| Class B | | 65% | | .25% | | | | 2,067 | | | | 2,067 |
| Class C | | 75% | | .25% | | | | 2,313 | | | | 2,313 |
| | | | | | | $ | | 5,304 | | $ | | 5,298 |
Sales Load. FDC receives a front end sales charge of up to 4.75% for selling Class A shares, and 3.50% for selling Class T shares, some of which is paid to financial intermedi aries for selling shares of the fund. FDC receives the proceeds of contingent deferred sales charges levied on Class A, Class T, Class B, and Class C redemptions. These charges depend on the holding period. The deferred sales charges range from 5% to 1% for Class B, 1% for Class C, and .25% for certain purchases of Class A and Class T shares.
For the period, sales charge amounts retained by FDC were as follows:
| | |
| | | | | Retained |
| | | | | by FDC |
| Class A | | $ | | 294 |
| Class T | | | | 30 |
| | | $ | | 324 |
Transfer Agent Fees. Fidelity Investments Institutional Operations Company, Inc. (FIIOC), an affiliate of FMR, is the transfer, dividend disbursing and shareholder servicing agent for each class of the fund, except for Strategic Real Return. Fidelity Service Company, Inc. (FSC), an affiliate of FMR, is the transfer agent for Strategic Real Return shares. FIIOC and FSC receive account fees and asset based fees that vary according to the account size and type of account of the shareholders of the respective classes of the fund. FIIOC and FSC pay for typesetting, printing and mailing of shareholder reports,
27 Annual Report
Notes to Financial Statements continued
4. Fees and Other Transactions with Affiliates continued
Transfer Agent Fees continued
|
except proxy statements. For the period the total transfer agent fees paid by each class to FIIOC or FSC, were as follows:
| | | | | | | % of |
| | | | | | | Average |
| | | | | Amount | | Net Assets* |
| Class A | | $ | | 355 | | .17 |
| Class T | | | | 341 | | .16 |
| Class B | | | | 340 | | .16 |
| Class C | | | | 355 | | .17 |
| Strategic Real Return | | | | 1,341 | | .18 |
| Institutional Class | | | | 312 | | .15 |
| | | $ | | 3,044 | | |
| * Annualized | | | | | | |
Accounting Fees. FSC maintains the fund’s accounting records. The fee is based on the level of average net assets for the month.
Affiliated Central Funds. The fund may invest in Money Market Central Funds which seek preservation of capital and current income and are managed by Fidelity Investments Money Management, Inc. (FIMM) an affiliate of FMR.
The fund may also invest in CIPs managed by FIMM or Fidelity Management & Research Company, Inc. (FMRC) each an affiliate of FMR. The Ultra Short Central Fund seeks to obtain a high level of current income consistent with preservation of capital by investing in U.S. dollar denominated money market and investment grade debt securities. The Floating Rate Central Investment Portfolio seeks a high level of income by normally investing in floating rate loans and other floating rate securities.
The fund’s Schedule of Investments lists each applicable CIP as an investment of the fund but does not include the underlying holdings of the CIPs. Based on their investment objectives, each CIP may invest or participate in various investment vehicles or strate gies that are similar to those of the investing fund. In addition, the CIPs may also par ticipate in delayed delivery and when issued securities, loans and other direct debt instruments, derivatives and financing transactions. These strategies are consistent with the investment objectives of the fund and may involve certain economic risks, including the risk that a counterparty to one or more of these transactions may be unable or unwilling to comply with the terms of the governing agreement. This may result in a decline in value of each CIP and the fund.
4. Fees and Other Transactions with Affiliates continued
Affiliated Central Funds continued
|
A complete list of holdings for each CIP is available at the end of this report. In addition, a copy of each CIP’s financial statements is available on the EDGAR Database on the SEC’s website www.sec.gov, or at the Commission’s public reference room in Washington, DC.
The Central Funds do not pay a management fee. Income distributions earned by the fund are recorded as income in the accompanying financial statements and totaled $32,428 for the period.
FMR voluntarily agreed to reimburse each class to the extent annual operating expenses exceeded certain levels of average net assets as noted in the table below. Some expenses, for example interest expense, are excluded from this reimbursement.
The following classes were in reimbursement during the period:
| | | | |
| | | Expense | | | | Reimbursement |
| | | Limitations | | | | from adviser |
| Class A | | 1.00% | | $ | | 8,615 |
| Class T | | 1.10% | | | | 8,512 |
| Class B | | 1.75% | | | | 8,504 |
| Class C | | 1.85% | | | | 8,581 |
| Strategic Real Return | | 85% | | | | 28,706 |
| Institutional Class | | 85% | | | | 8,467 |
| | | | | $ | | 71,385 |
| |
| 6. Other. | | | | | | |
The fund’s organizational documents provide former and current trustees and officers with a limited indemnification against liabilities arising in connection with the perfor mance of their duties to the fund. In the normal course of business, the fund may also enter into contracts that provide general indemnifications. The fund’s maximum exposure under these arrangements is unknown as this would be dependent on future claims that may be made against the fund. The risk of material loss from such claims is considered remote.
At the end of the period, FMR or its affiliates were the owners of record of 53% of the total outstanding shares of the fund.
29 Annual Report
| Notes to Financial Statements continued | | | | | | |
| |
| 7. Share Transactions. | | | | | | | | |
| |
| Transactions for each class of shares were as follows: | | | | | | |
| |
| | | | | SharesA | | | | DollarsA |
| | | | | Year ended September 30, 2005 |
| Class A | | | | | | | | |
| Shares sold | | | | 335,576 | | $ | | 3,356,917 |
| Shares redeemed | | | | — | | | | — |
| Net increase (decrease) | | | | 335,576 | | $ | | 3,356,917 |
| Class T | | | | | | | | |
| Shares sold | | | | 323,690 | | $ | | 3,237,283 |
| Shares redeemed | | | | — | | | | — |
| Net increase (decrease) | | | | 323,690 | | $ | | 3,237,283 |
| Class B | | | | | | | | |
| Shares sold | | | | 320,754 | | $ | | 3,207,594 |
| Shares redeemed | | | | — | | | | — |
| Net increase (decrease) | | | | 320,754 | | $ | | 3,207,594 |
| Class C | | | | | | | | |
| Shares sold | | | | 341,879 | | $ | | 3,420,798 |
| Shares redeemed | | | | — | | | | — |
| Net increase (decrease) | | | | 341,879 | | $ | | 3,420,798 |
| Strategic Real Return | | | | | | | | |
| Shares sold | | | | 2,155,812 | | $ 21,651,987 |
| Shares redeemed | | | | (1,868) | | | | (18,821) |
| Net increase (decrease) | | | | 2,153,944 | | $ 21,633,166 |
| Institutional Class | | | | | | | | |
| Shares sold | | | | 320,001 | | $ | | 3,200,010 |
| Shares redeemed | | | | — | | | | — |
| Net increase (decrease) | | | | 320,001 | | $ | | 3,200,010 |
| |
| A For the period September 7, 2005 (commencement of operations) to September 30, 2005. | | | | | | |
Report of Independent Registered Public Accounting Firm
To the Trustees of Fidelity Commonwealth Trust and Shareholders of Fidelity Strategic Real Return Fund:
We have audited the accompanying statement of assets and liabilities of Fidelity Strategic Real Return Fund (the Fund), a fund of Fidelity Commonwealth Trust, including the schedule of investments, as of September 30, 2005, and the related statement of opera tions, the statement of changes in net assets, and the financial highlights for the period from September 7, 2005 (commencement of operations) to September 30, 2005. These financial statements and financial highlights are the responsibility of the Fund’s manage ment. Our responsibility is to express an opinion on these financial statements and financial highlights based on our audit.
We conducted our audit in accordance with standards of the Public Company Accounting Oversight Board (United States). Those standards require that we plan and perform the audit to obtain reasonable assurance about whether the financial statements and financial highlights are free of material misstatement. The Fund is not required to have, nor were we engaged to perform, an audit of its internal control over financial reporting. Our audit included consideration of internal control over financial reporting as a basis for designing audit procedures that are appropriate in the circumstances, but not for the purpose of expressing an opinion on the effectiveness of the Fund’s internal control over financial reporting. Accordingly, we express no such opinion. An audit also includes examining, on a test basis, evidence supporting the amounts and disclosures in the financial statements, assessing the accounting principles used and significant estimates made by management, as well as evaluating the overall financial statement presentation. Our procedures included confirmation of securities owned as of September 30, 2005, by correspondence with the custodians and brokers; where replies were not received from brokers, we performed other auditing procedures. We believe that our audit provides a reasonable basis for our opinion.
In our opinion, the financial statements and financial highlights referred to above present fairly, in all material respects, the financial position of Fidelity Strategic Real Return Fund as of September 30, 2005, the results of its operations, the changes in its net assets, and its financial highlights for the period from September 7, 2005 (commencement of operations) to September 30, 2005, in conformity with accounting principles generally accepted in the United States of America.
/s/ Deloitte & Touche LLP
DELOITTE & TOUCHE LLP
Boston, Massachusetts
November18, 2005
|
31 Annual Report
Trustees and Officers
The Trustees, Members of the Advisory Board, and executive officers of the trust and fund, as applicable, are listed below. The Board of Trustees governs the fund and is responsible for protecting the interests of shareholders. The Trustees are experienced executives who meet periodically throughout the year to oversee the fund’s activities, review contractual arrangements with companies that provide services to the fund, and review the fund’s performance. Except for William O. McCoy, Stephen P. Jonas, and Kenneth L. Wolfe, each of the Trustees oversees 322 funds advised by FMR or an affiliate. Mr. McCoy oversees 324 funds advised by FMR or an affiliate. Mr. Jonas and Mr. Wolfe oversee 319 funds advised by FMR or an affiliate.
The Trustees hold office without limit in time except that (a) any Trustee may resign; (b) any Trustee may be removed by written instrument, signed by at least two thirds of the number of Trustees prior to such removal; (c) any Trustee who requests to be retired or who has become incapacitated by illness or injury may be retired by written instru ment signed by a majority of the other Trustees; and (d) any Trustee may be removed at any special meeting of shareholders by a two thirds vote of the outstanding voting securities of the trust. Each Trustee who is not an interested person (as defined in the 1940 Act) (Independent Trustee), shall retire not later than the last day of the calendar year in which his or her 72nd birthday occurs. The Independent Trustees may waive this mandatory retirement age policy with respect to individual Trustees. The executive officers and Advisory Board Members hold office without limit in time, except that any officer and Advisory Board Member may resign or may be removed by a vote of a majority of the Trustees at any regular meeting or any special meeting of the Trustees. Except as indicated, each individual has held the office shown or other offices in the same company for the past five years.
The fund’s Statement of Additional Information (SAI) includes more information about the Trustees. To request a free copy, call Fidelity at 1-800-544-8544.
Correspondence intended for each Trustee who is an interested person may be sent to Fidelity Investments, 82 Devonshire Street, Boston, Massachusetts 02109.
| | Name, Age; Principal Occupation
Edward C. Johnson 3d (75)**
|
Year of Election or Appointment: 1974
Mr. Johnson is Chairman of the Board of Trustees. Mr. Johnson serves as Chief Executive Officer, Chairman, and a Director of FMR Corp.; a Director and Chairman of the Board and of the Executive Committee of FMR; Chairman and a Director of Fidelity Management & Research (Far East) Inc.; Chairman and a Director of Fidelity Investments Money Management, Inc.; and Chairman (2001 present) and a Director (2000 present) of FMR Co., Inc.
| | Name, Age; Principal Occupation
Abigail P. Johnson (43)**
|
Year of Election or Appointment: 2001
Ms. Johnson serves as President of Fidelity Employer Services Company (FESCO) (2005 present). She is President and a Director of Fidelity Investments Money Management, Inc. (2001 present), FMR Co., Inc. (2001 present), and a Director of FMR Corp. Previously, Ms. Johnson served as President and a Director of FMR (2001 2005), Senior Vice President of the Fidelity funds (2001 2005), and managed a number of Fidelity funds.
Year of Election or Appointment: 2005
Mr. Jonas is Senior Vice President of Strategic Real Return (2005 present). He also serves as Senior Vice President of other Fidelity funds (2005 present). Mr. Jonas is Executive Director of FMR (2005 present). Previously, Mr. Jonas served as President of Fidelity Enterprise Operations and Risk Services (2004 2005), Chief Adminis trative Officer (2002 2004), and Chief Financial Officer of FMR Co. (1998 2000). Mr. Jonas has been with Fidelity Investments since 1987 and has held various financial and management positions including Chief Financial Officer of FMR. In addition, he serves on the Boards of Boston Ballet (2003 present) and Simmons College (2003 present).
Year of Election or Appointment: 2003
Mr. Reynolds is a Director (2003 present) and Chief Operating Officer (2002 present) of FMR Corp. He also serves on the Board at Fidelity Investments Canada, Ltd. (2000 present). Previously, Mr. Reynolds served as President of Fidelity Investments Institutional Retirement Group (1996 2000).
* Trustees have been determined to be “Interested Trustees” by virtue of, among other things, their affiliation with the trust or various entities under common control with FMR.
** Edward C. Johnson 3d, Trustee, is Abigail P. Johnson’s father.
33 Annual Report
Trustees and Officers - continued
Independent Trustees:
Correspondence intended for each Independent Trustee (that is, the Trustees other than the Interested Trustees) may be sent to Fidelity Investments, P.O. Box 55235, Boston, Massachusetts 02205 5235.
| | Name, Age; Principal Occupation
Dennis J. Dirks (57)
|
Year of Election or Appointment: 2005
Prior to his retirement in May 2003, Mr. Dirks was Chief Operating Officer and a member of the Board of The Depository Trust & Clearing Corporation (DTCC) (1999 2003). He also served as President, Chief Operating Officer, and Board member of The Depository Trust Company (DTC) (1999 2003) and President and Board member of the National Securities Clearing Corporation (NSCC) (1999 2003). In addition, Mr. Dirks served as Chief Executive Officer and Board member of the Government Securities Clearing Corporation (2001 2003) and Chief Executive Officer and Board member of the Mortgage Backed Securities Clearing Corporation (2001 2003). Mr. Dirks also serves as a Trustee of Manhattan College (2005 present).
Year of Election or Appointment: 1997
Dr. Gates is Vice Chairman of the Independent Trustees (2005 present). Dr. Gates is President of Texas A&M University (2002 present). He was Director of the Central Intelligence Agency (CIA) from 1991 to 1993. From 1989 to 1991, Dr. Gates served as Assistant to the President of the United States and Deputy National Security Advisor. Dr. Gates is a Director of NACCO Industries, Inc. (mining and manufacturing), Parker Drilling Co., Inc. (drilling and rental tools for the energy industry, 2001 present), and Brinker International (restaurant management, 2003 present). Previously, Dr. Gates served as a Director of LucasVarity PLC (automotive components and diesel engines), a Director of TRW Inc. (automotive, space, defense, and information technology), and Dean of the George Bush School of Government and Public Service at Texas A&M University (1999 2001). Dr. Gates also is a Trustee of the Forum for International Policy.
Name, Age; Principal Occupation
George H. Heilmeier (69)
|
Year of Election or Appointment: 2004
Dr. Heilmeier is Chairman Emeritus of Telcordia Technologies (commu nication software and systems), where prior to his retirement, he served as company Chairman and Chief Executive Officer. He currently serves on the Boards of Directors of The Mitre Corporation (systems engineer ing and information technology support for the government), and HRL Laboratories (private research and development, 2004 present). He is Chairman of the General Motors Science & Technology Advisory Board and a Life Fellow of the Institute of Electrical and Electronics Engineers (IEEE) (2000 present). Dr. Heilmeier is a member of the Defense Science Board and the National Security Agency Advisory Board. He is also a member of the National Academy of Engineering, the American Academy of Arts and Sciences, and the Board of Overseers of the School of Engineering and Applied Science of the University of Pennsylvania. Previously, Dr. Heilmeier served as a Director of TRW Inc. (automotive, space, defense, and information technology, 1992 2002), Compaq (1994 2002), Automatic Data Processing, Inc. (ADP) (technology based business outsourcing, 1995 2002), INET Technologies Inc. (telecommu nications network surveillance, 2001 2004), and Teletech Holdings (customer management services). He is the recipient of the 2005 Kyoto Prize in Advanced Technology for his invention of the liquid display.
Year of Election or Appointment: 2001
Prior to Ms. Knowles’ retirement in June 2000, she served as Executive Vice President and Chief Financial Officer of Atlantic Richfield Company (ARCO) (diversified energy, 1996 2000). From 1993 to 1996, she was a Senior Vice President of ARCO and President of ARCO Transportation Company. She served as a Director of ARCO from 1996 to 1998. She currently serves as a Director of Phelps Dodge Corporation (copper mining and manufacturing) and McKesson Corporation (healthcare service, 2002 present). Ms. Knowles is a Trustee of the Brookings Institu tion and the Catalina Island Conservancy and also serves as a member of the Advisory Board for the School of Engineering of the University of Southern California.
35 Annual Report
Trustees and Officers - continued
| | Name, Age; Principal Occupation
Ned C. Lautenbach (61)
|
Year of Election or Appointment: 2000
Mr. Lautenbach has been a partner of Clayton, Dubilier & Rice, Inc. (private equity investment firm) since September 1998. Previously, Mr. Lautenbach was with the International Business Machines Corpora tion (IBM) from 1968 until his retirement in 1998. Mr. Lautenbach serves as a Director of Italtel Holding S.p.A. (telecommunications (Milan, Italy), 2004 present) and Eaton Corporation (diversified industrial) as well as the Philharmonic Center for the Arts in Naples, Florida. He also is a member of the Board of Trustees of Fairfield University (2005 present), as well as a member of the Council on Foreign Relations.
Year of Election or Appointment: 1993
Mr. Mann is Chairman of the Independent Trustees (2001 present). He is Chairman Emeritus of Lexmark International, Inc. (computer peripherals), where he served as CEO until April 1998, retired as Chairman May 1999, and remains a member of the Board. Prior to 1991, he held the positions of Vice President of International Business Machines Corpora tion (IBM) and President and General Manager of various IBM divisions and subsidiaries. He is a member of the Executive Committee of the Independent Director’s Council of the Investment Company Institute. In addition, Mr. Mann is a member of the President’s Cabinet at the Uni versity of Alabama and the Board of Visitors of the Culverhouse College of Commerce and Business Administration at the University of Alabama.
Year of Election or Appointment: 1997
Prior to his retirement in December 1994, Mr. McCoy was Vice Chair man of the Board of BellSouth Corporation (telecommunications) and President of BellSouth Enterprises. He is currently a Director of Liberty Corporation (holding company), Duke Realty Corporation (real estate), and Progress Energy, Inc. (electric utility). He is also a partner of Frank lin Street Partners (private investment management firm) and a member of the Research Triangle Foundation Board. In addition, Mr. McCoy served as the Interim Chancellor (1999 2000) and a member of the Board of Visitors for the University of North Carolina at Chapel Hill and currently serves on the Board of Directors of the University of North Carolina Health Care System and the Board of Visitors of the Kenan Flagler Business School (University of North Carolina at Chapel Hill). He also served as Vice President of Finance for the University of North Carolina (16 school system).
Name, Age; Principal Occupation
Cornelia M. Small (61)
|
Year of Election or Appointment: 2005
Ms. Small is a member (2000 present) and Chairperson (2002 present) of the Investment Committee, and a member (2002 present) of the Board of Trustees of Smith College. Previously, she served as Chief Investment Officer (1999 2000), Director of Global Equity Investments (1996 1999), and a member of the Board of Directors of Scudder, Stevens & Clark (1990 1997) and Scudder Kemper Investments (1997 1998). In addition, Ms. Small served as Co Chair (2000 2003) of the Annual Fund for the Fletcher School of Law and Diplomacy.
William S. Stavropoulos (66)
|
Year of Election or Appointment: 2002
Mr. Stavropoulos is Chairman of the Board (2000 present) and a Member of the Board of Directors of The Dow Chemical Company. Since joining The Dow Chemical Company in 1967, Mr. Stavropoulos served in numerous senior management positions, including President (1993 2000; 2002 2003), CEO (1995 2000; 2002 2004), and Chair man of the Executive Committee (2000 2004). Currently, he is a Direc tor of NCR Corporation (data warehousing and technology solutions), BellSouth Corporation (telecommunications), Chemical Financial Corpo ration, Maersk Inc. (industrial conglomerate, 2002 present), and Metal mark Capital (private equity investment firm, 2005 present). He also serves as a member of the Board of Trustees of the American Enterprise Institute for Public Policy Research. In addition, Mr. Stavropoulos is a member of The Business Council, J.P. Morgan International Council and the University of Notre Dame Advisory Council for the College of Science.
Year of Election or Appointment: 2005
Mr. Wolfe also serves as a Trustee (2005 present) or Member of the Advisory Board (2004 present) of other investment companies advised by FMR. Prior to his retirement in 2001, Mr. Wolfe was Chairman and Chief Executive Officer of Hershey Foods Corporation (1993 2001). He currently serves as a member of the boards of Adelphia Communica tions Corporation (2003 present), Bausch & Lomb, Inc., and Revlon Inc. (2004 present).
37 Annual Report
Trustees and Officers - continued
Advisory Board Members and Executive Officers:
Correspondence intended for Mr. Gamper may be sent to Fidelity Investments, P.O. Box 55235, Boston, Massachusetts 02205 5235. Correspondence intended for each executive officer and Mr. Lynch may be sent to Fidelity Investments, 82 Devonshire Street, Boston, Massachusetts 02109.
| | Name, Age; Principal Occupation
Albert R. Gamper, Jr. (63)
|
Year of Election or Appointment: 2005
Member of the Advisory Board of Fidelity Commonwealth Trust. Prior to his retirement in December 2004, Mr. Gamper served as Chairman of the Board of CIT Group Inc. (commercial finance). During his tenure with CIT Group Inc. Mr. Gamper served in numerous senior manage ment positions, including Chairman (1987 1989; 1999 2001; 2002 2004), Chief Executive Officer (1987 2004), and President (1989 2002). He currently serves as a member of the Board of Direc tors of Public Service Enterprise Group (utilities, 2001 present), Chair man of the Board of Governors, Rutgers University (2004 present), and Chairman of the Board of Saint Barnabas Health Care System.
Year of Election or Appointment: 2003
Member of the Advisory Board of Fidelity Commonwealth Trust. Vice Chairman and a Director of FMR, and Vice Chairman (2001 present) and a Director (2000 present) of FMR Co., Inc. Previously, Mr. Lynch served as a Trustee of the Fidelity funds (1990 2003). In addition, he serves as a Trustee of Boston College, Massachusetts Eye & Ear Infirmary, Historic Deerfield, John F. Kennedy Library, and the Museum of Fine Arts of Boston.
Year of Election or Appointment: 2005
Vice President of Strategic Real Return. Mr. Churchill also serves as Vice President of certain Equity Funds (2005 present) and certain High Income Funds (2005 present). Previously, he served as Head of Fidelity’s Fixed Income Division (2000 2005), Vice President of Fidelity’s Money Market Funds (2000 2005), Vice President of Fidelity’s Bond Funds, and Senior Vice President of FIMM (2000) and FMR. Mr. Churchill joined Fidelity in 1993 as Vice President and Group Leader of Taxable Fixed Income Investments.
Name, Age; Principal Occupation
Walter C. Donovan (43)
|
Year of Election or Appointment: 2005
Vice President of Strategic Real Return. Mr. Donovan also serves as Vice President of Fidelity’s High Income Funds (2005 present), Fidelity’s Fixed Income Funds (2005 present), certain Asset Allocation Funds (2005 present), and certain Balanced Funds (2005 present). Mr. Donovan also serves as Executive Vice President of FMR (2005 present) and FMRC (2005 present). Previously, Mr. Donovan served as Vice President and Director of Fidelity’s International Equity Trading group (1998 2005).
Year of Election or Appointment: 2005
Vice President of Strategic Real Return. Mr. Greer also serves as Vice President of the Fidelity Select Portfolios (2005 present), certain Asset Allocation Funds (2005 present), a Trustee of other investment compa nies advised by FMR (2003 present), and a member of the FMR senior management team (2005 present). Previously, Mr. Greer served as a Director and Managing Director of Strategic Advisers, Inc. (2002 2005), Executive Vice President (2000 2002), and Money Market Group Leader (1997 2002) of the Fidelity Investments Fixed Income Division. He also served as Vice President of Fidelity’s Money Market Funds (1997 2002), Senior Vice President of FMR (1997 2002), and Vice President of FIMM (1998 2002).
Year of Election or Appointment: 2005
Vice President of Strategic Real Return. Mr. Murphy also serves as Vice President of Fidelity’s Money Market Funds (2002 present), certain Asset Allocation Funds (2003 present), Fidelity’s Investment Grade Bond Funds (2005 present), and Fidelity’s Balanced Funds (2005 present). He serves as Senior Vice President (2000 present) and Head (2004 present) of the Fidelity Investments Fixed Income Division. Mr. Murphy is also a Senior Vice President of FIMM (2003 present) and a Vice President of FMR (2000 present). Previously, Mr. Murphy served as Money Market Group Leader (2002 2004), Bond Group Leader (2000 2002), and Vice President of Fidelity’s Taxable Bond Funds (2000 2002) and Fidelity’s Municipal Bond Funds (2001 2002). Mr. Murphy joined Fidelity Invest ments in 1989 as a portfolio manager in the Bond Group.
39 Annual Report
Trustees and Officers - continued
| | Name, Age; Principal Occupation
Thomas J. Silvia (44)
|
Year of Election or Appointment: 2005
Vice President of Strategic Real Return. Mr. Silvia also serves as Vice President of Fidelity’s Bond Funds (2005 present) and Senior Vice Presi dent and Bond Group Leader of the Fidelity Investments Fixed Income Division (2005 present). Previously, Mr. Silvia served as Director of Fidelity’s Taxable Bond portfolio managers (2002 2004) and a portfolio manager in the Bond Group (1997 2004).
Year of Election or Appointment: 2005
Vice President of Strategic Real Return. Mr. Dudley also serves as Vice President of other funds advised by FMR. Prior to assuming his current responsibilities, Mr. Dudley managed a variety of Fidelity funds.
Year of Election or Appointment: 2005
Vice President of Strategic Real Return. Mr. Snyderman also serves as Vice President of another fund advised by FMR. Prior to assuming his current responsibilities, Mr. Snyderman managed a variety of Fidelity funds. Mr. Snyderman also serves as Vice President of FMR (2004) and FMR Co., Inc. (2004).
Year of Election or Appointment: 2005
Secretary of Strategic Real Return. He also serves as Secretary of other Fidelity funds; Vice President, General Counsel, and Secretary of FMR Co., Inc. (2001 present) and FMR; Assistant Secretary of Fidelity Man agement & Research (U.K.) Inc. (2001 present), Fidelity Management & Research (Far East) Inc. (2001 present), and Fidelity Investments Money Management, Inc. (2001 present). Mr. Roiter is an Adjunct Member, Faculty of Law, at Boston College Law School (2003 present). Previously, Mr. Roiter served as Vice President and Secretary of Fidelity Distributors Corporation (FDC) (1998 2005).
Year of Election or Appointment: 2005
Assistant Secretary of Strategic Real Return. Mr. Fross also serves as Assistant Secretary of other Fidelity funds (2003 present), Vice President and Secretary of FDC (2005 present), and is an employee of FMR.
Name, Age; Principal Occupation
Christine Reynolds (47)
|
Year of Election or Appointment: 2005
President, Treasurer, and Anti Money Laundering (AML) officer of Strategic Real Return. Ms. Reynolds also serves as President, Treasurer, and AML officer of other Fidelity funds (2004) and is a Vice President (2003) and an employee (2002) of FMR. Before joining Fidelity Invest ments, Ms. Reynolds worked at PricewaterhouseCoopers LLP (PwC) (1980 2002), where she was most recently an audit partner with PwC’s investment management practice.
Year of Election or Appointment: 2005
Chief Financial Officer of Strategic Real Return. Mr. Hayes also serves as Chief Financial Officer of other Fidelity funds (2002 present) and President of Fidelity Investment Operations (2005 present) which includes Fidelity Pricing and Cash Management Services Group (FPCMS), where he served as President (1998 2005). Mr. Hayes serves as President of Fidelity Service Company (2003 present) where he also serves as a Director. Mr. Hayes also served as President of Fidelity Investments Operations Group (FIOG, 2002 2005).
Kenneth A. Rathgeber (58)
|
Year of Election or Appointment: 2005
Chief Compliance Officer of Strategic Real Return. Mr. Rathgeber also serves as Chief Compliance Officer of other Fidelity funds (2004) and Executive Vice President of Risk Oversight for Fidelity Investments (2002). Previously, he served as Executive Vice President and Chief Operating Officer for Fidelity Investments Institutional Services Com pany, Inc. (1998 2002).
Year of Election or Appointment: 2005
Deputy Treasurer of Strategic Real Return. Mr. Hebble also serves as Deputy Treasurer of other Fidelity funds (2003), and is an employee of FMR. Before joining Fidelity Investments, Mr. Hebble worked at Deutsche Asset Management where he served as Director of Fund Accounting (2002 2003) and Assistant Treasurer of the Scudder Funds (1998 2003).
Year of Election or Appointment: 2005
Deputy Treasurer of Strategic Real Return. Mr. Mehrmann also serves as Deputy Treasurer of other Fidelity funds (2005 present) and is an employee of FMR. Previously, Mr. Mehrmann served as Vice President of Fidelity Investments Institutional Services Group (FIIS)/Fidelity Invest ments Institutional Operations Corporation, Inc. (FIIOC) Client Services (1998 2004).
41 Annual Report
Trustees and Officers - continued
| | Name, Age; Principal Occupation
Kimberley H. Monasterio (41)
|
Year of Election or Appointment: 2005
Deputy Treasurer of Strategic Real Return. Ms. Monasterio also serves as Deputy Treasurer of other Fidelity funds (2004) and is an employee of FMR (2004). Before joining Fidelity Investments, Ms. Monasterio served as Treasurer (2000 2004) and Chief Financial Officer (2002 2004) of the Franklin Templeton Funds and Senior Vice President of Franklin Templeton Services, LLC (2000 2004).
Year of Election or Appointment: 2005
Deputy Treasurer of Strategic Real Return. Mr. Robins also serves as Deputy Treasurer of other Fidelity funds (2005 present) and is an employee of FMR (2004 present). Before joining Fidelity Investments, Mr. Robins worked at KPMG LLP, where he was a partner in KPMG’s department of professional practice (2002 2004) and a Senior Man ager (1999 2000). In addition, Mr. Robins served as Assistant Chief Accountant, United States Securities and Exchange Commission (2000 2002).
Year of Election or Appointment: 2005
Assistant Treasurer of Strategic Real Return. Mr. Byrnes also serves as Assistant Treasurer of other Fidelity funds (2005 present) and is an employee of FMR (2005 present). Previously, Mr. Byrnes served as Vice President of FPCMS (2003 2005). Before joining Fidelity Investments, Mr. Byrnes worked at Deutsche Asset Management where he served as Vice President of the Investment Operations Group (2000 2003).
Year of Election or Appointment: 2005
Assistant Treasurer of Strategic Real Return. Mr. Costello also serves as Assistant Treasurer of other Fidelity funds and is an employee of FMR.
Year of Election or Appointment: 2005
Assistant Treasurer of Strategic Real Return. Mr. Lydecker also serves as Assistant Treasurer of other Fidelity funds (2004) and is an employee of FMR.
Year of Election or Appointment: 2005
Assistant Treasurer of Strategic Real Return. Mr. Osterheld also serves as Assistant Treasurer of other Fidelity funds (2002) and is an employee of FMR.
Name, Age; Principal Occupation
Gary W. Ryan (47)
|
Year of Election or Appointment: 2005
Assistant Treasurer of Strategic Real Return. Mr. Ryan also serves as Assistant Treasurer of other Fidelity funds (2005 present) and is an employee of FMR (2005 present). Previously, Mr. Ryan served as Vice President of Fund Reporting in FPCMS (1999 2005).
Year of Election or Appointment: 2005
Assistant Treasurer of Strategic Real Return. Mr. Schiavone also serves as Assistant Treasurer of other Fidelity funds (2005 present) and is an employee of FMR (2005 present). Before joining Fidelity Investments, Mr. Schiavone worked at Deutsche Asset Management, where he most recently served as Assistant Treasurer (2003 2005) of the Scudder Funds and Vice President and Head of Fund Reporting (1996 2003).
43 Annual Report
The fund hereby designates as capital gain dividends: For dividends with respect to the taxable year ended September 30, 2005, $4,585, or, if subsequently determined to be different, the net capital gain of such year.
A total of 30.96% of the dividends distributed during the fiscal year was derived from interest on U.S. Government securities which is generally exempt from state income tax.
The fund will notify shareholders in January 2006 of amounts for use in preparing 2005 income tax returns.
Board Approval of Investment Advisory Contracts and Management Fees
Fidelity Strategic Real Return Fund
On July 21, 2005, the Board of Trustees, including the independent Trustees (together, the Board), voted to approve the management contract and subadvisory agreements (together, the Advisory Contracts) for the fund. The Board, assisted by the advice of fund counsel and independent Trustees’ counsel, considered a broad range of information.
In determining whether to approve the Advisory Contracts for the fund, the Board was aware that shareholders have a broad range of investment choices available to them, including a wide choice among mutual funds offered by competitors to Fidelity, and that shareholders, with the opportunity to review and weigh the disclosure provided by the fund in its prospectus and other public disclosures, may choose to invest in this fund, managed by Fidelity.
Nature, Extent, and Quality of Services Provided by Fidelity. The Board consid ered staffing within the investment adviser, FMR, and the sub advisers (together, the Investment Advisers), including the background of the fund’s portfolio manager and the fund’s investment objective and discipline.
Fidelity Resources Dedicated to Investment Management and Support Services. The Board considered Fidelity’s extensive global research capabilities that enable the Investment Advisers to aggregate data from various sources in an effort to produce positive investment results. The Board noted that Fidelity’s analysts have access to a variety of technological tools that enable them to perform both fundamental and quanti tative analysis and to specialize in various disciplines. The Board also considered that Fidelity’s portfolio managers and analysts have access to daily portfolio attribution that allows for monitoring of a fund’s portfolio, as well as an electronic communication system that provides immediate real time access to research concerning issuers and credit enhancers.
Shareholder and Administrative Services. The Board considered the nature, extent, quality, and cost of administrative, distribution, and shareholder services performed by the Investment Advisers and their affiliates under the Advisory Contracts and under separate agreements covering transfer agency, pricing and bookkeeping, and securities lending services for the fund. The Board also considered the nature and extent of the Investment Advisers’ supervision of third party service providers, principally custodians and subcustodians.
The Board noted that the growth of fund assets across the complex allows Fidelity to reinvest in the development of services designed to enhance the value or convenience of the Fidelity funds as investment vehicles. These services include 24 hour access to account information and market information through phone representatives and over the Internet, and investor education materials and asset allocation tools.
45 Annual Report
Board Approval of Investment Advisory Contracts and Management Fees continued
Investment in a Large Fund Family. The Board considered the benefits to shareholders of investing in a Fidelity fund, including the benefits of investing in a fund that is part of a large family of funds offering a variety of investment disciplines and providing for a large variety of mutual fund investor services. For example, fund shareholders are offered the privilege of exchanging shares of the fund for shares of other Fidelity funds, as set forth in the fund’s prospectus, without paying an additional sales charge.
Investment Performance. Fidelity Strategic Real Return is a new fund and therefore had no historical performance for the Board to review at the time it approved the fund’s Advisory Contracts.
Based on its review, the Board concluded that the nature, extent, and quality of the services provided by Fidelity will benefit the fund’s shareholders, particularly in light of the Board’s view that the fund’s shareholders benefit from investing in a fund that is part of a large family of funds offering a variety of investment disciplines and services.
Competitiveness of Management Fee and Total Fund Expenses. The Board considered the fund’s proposed management fee and projected operating expenses in reviewing the Advisory Contracts. The Board noted that the fund’s proposed manage ment fee rate is lower than the median fee rate of funds with similar Lipper investment objective categories and comparable management fee characteristics. The Board also noted that the fund’s management fee and projected expenses are comparable to those of similar funds that Fidelity offers to shareholders.
Based on its review, the Board concluded that the fund’s management fee and the total expenses for each class of the fund were fair and reasonable in light of the services that the fund and its shareholders receive and the other factors considered.
Costs of the Services and Profitability. The fund is a new fund and therefore no revenue, cost, or profitability data was available for the Board to review in respect of the fund at the time it approved the Advisory Contracts.
Economies of Scale. The Board considered the extent to which the fund will benefit from economies of scale through increased services to the fund, through waivers or reimbursements, or through fee or expense reductions, including reductions that occur through operation of the transfer agent agreement. The transfer agent fee varies in part based on the number of accounts in the fund. If the number of accounts decreases or the average account size increases, the overall transfer agent fee rate decreases.
The Board recognized that the fund’s management contract incorporates a “group fee” structure, which provides for lower fee rates as total fund assets under FMR’s manage ment increase, and for higher fee rates as total fund assets under FMR’s management decrease. The Board considered that the group fee is designed to deliver the benefits of economies of scale to fund shareholders when total fund assets increase, even if assets of any particular fund are unchanged or have declined, because some portion of Fidelity’s
costs are attributable to services provided to all Fidelity funds, and all funds benefit if those costs can be allocated among more assets.
The Board concluded that, given the group fee structure, fund shareholders will achieve a certain level of economies of scale as assets under FMR’s management increase at the fund complex level, regardless of whether Fidelity achieves any such economies of scale.
Additional Information Requested by the Board. In order to develop fully the factual basis for consideration of the Advisory Contracts, the Board received additional information explaining that the fund will obtain commodity exposure by investing in a combination of structured notes and other short term securities. The Board considered that the fund offers an option for investors concerned about the impact of inflation on the markets and that the fund seeks real return consistent with reasonable investment risk by allocating its assets across investment categories that are selected to provide broad diversification, inflation protection, and risk mitigation. The Board also consid ered additional information regarding similar funds offered by other fund companies.
Based on its evaluation of all of the conclusions noted above, and after considering all material factors, the Board ultimately concluded that the advisory fee structures are fair and reasonable, and that the fund’s Advisory Contracts should be approved.
47 Annual Report
The following is a complete listing of investments for Fidelity’s fixed income central funds as of September 30, 2005 which are direct investments of Fidelity Strategic Real Return Fund. These underlying holdings of the Fidelity fixed income central funds are not included in the Schedule of Investments as part of the Financial Statements.
Fidelity Floating Rate Central Investment Portfolio
Investments September 30, 2005 (Unaudited)
Showing Percentage of Net Assets
| Floating Rate Loans (c) 89.6% | | | | | | |
| | | | | Principal | | Value |
| | | | | Amount | | |
| Aerospace – 0.3% | | | | | | |
| Mid-Western Aircraft Systems, Inc. Tranche B, term loan | | | | | | |
| 5.9606% 12/31/11 (b) | | $ | | 1,386,525 | | $ 1,409,056 |
| Air Transportation – 1.3% | | | | | | |
| United Air Lines, Inc. Tranche B, term loan 7.96% | | | | | | |
| 12/30/05 (b) | | | | 2,120,000 | | 2,141,200 |
| US Airways Group, Inc. Tranche 1A, term loan | | | | | | |
| 12.2062% 9/30/10 (b) | | | | 4,000,000 | | 4,000,000 |
| | | | | | | 6,141,200 |
| Automotive 4.2% | | | | | | |
| Accuride Corp. term loan 6.1797% 1/31/12 (b) | | | | 2,343,409 | | 2,366,843 |
| AM General LLC Tranche B1, term loan 8.2044% | | | | | | |
| 11/1/11 (b) | | | | 3,747,436 | | 3,916,071 |
| Goodyear Tire & Rubber Co.: | | | | | | |
| Tranche 1, 4.7852% 4/30/10 (b) | | | | 1,060,000 | | 1,069,275 |
| Tranche 2, term loan 6.32% 4/30/10 (b) | | | | 1,480,000 | | 1,500,350 |
| Travelcenters of America, Inc. Tranche B, term loan | | | | | | |
| 5.71% 12/1/11 (b) | | | | 7,916,840 | | 8,005,904 |
| TRW Automotive Holdings Corp. Tranche B, term loan | | | | | | |
| 5.25% 6/30/12 (b) | | | | 2,770,717 | | 2,798,424 |
| | | | | | | 19,656,867 |
| Broadcasting – 2.0% | | | | | | |
| Entravision Communications Corp. term loan 5.55% | | | | | | |
| 3/29/13 (b) | | | | 4,000,000 | | 4,035,000 |
| Nexstar Broadcasting, Inc. Tranche B, term loan | | | | | | |
| 5.6644% 10/1/12 (b) | | | | 3,828,592 | | 3,852,520 |
| Spanish Broadcasting System, Inc. Tranche 1, term loan | | | | | | |
| 6.03% 6/10/12 (b) | | | | 1,567,125 | | 1,590,632 |
| | | | | | | 9,478,152 |
| Building Materials – 1.0% | | | | | | |
| Euramax International, Inc./Euramax International | | | | | | |
| Holdings BV Tranche 1, term loan 6.6297% | | | | | | |
| 6/29/12 (b) | | | | 1,845,375 | | 1,859,215 |
| Goodman Global Holdings, Inc. term loan 5.875% | | | | | | |
| 12/23/11 (b) | | | | 1,210,850 | | 1,227,499 |
| Masonite International Corp. term loan 5.6659% | | | | | | |
| 4/5/13 (b) | | | | 1,462,650 | | 1,466,307 |
| | | | | | | 4,553,021 |
| Cable TV 6.4% | | | | | | |
| Adelphia Communications Corp. Tranche B, term loan | | | | | | |
| 6.3041% 3/31/06 (b) | | | | 2,450,000 | | 2,462,250 |
| Century Cable Holdings LLC Tranche B, term loan 8.75% | | | | | | |
| 6/30/09 (b) | | | | 3,000,000 | | 2,977,500 |
| |
| |
| 49 | | | | | | Annual Report |
| Investments (Unaudited) continued | | | | | | | | |
| |
Floating Rate Loans (c) continued
| | | | | | | | |
| | | | | | | Principal | | | | Value |
| | | | | | | Amount | | | | |
| Cable TV – continued | | | | | | | | | | |
| Charter Communications Operating LLC: | | | | | | | | | | |
| Tranche A, term loan 6.68% 4/27/10 (b) | | $ | | 6,630,902 | | $ | | 6,630,902 |
| Tranche B, term loan 6.93% 4/7/11 (b) | | | | | | 1,987,454 | | | | 1,997,391 |
| DIRECTV Holdings LLC Tranche B, term loan 5.3375% | | | | | | | | |
| 4/13/13 (b) | | | | | | 2,260,000 | | | | 2,282,600 |
| NTL Investment Holdings Ltd. Tranche B, term loan 6.41% | | | | | | | | |
| 6/13/12 (b) | | | | | | 3,000,000 | | | | 3,015,000 |
| UPC Broadband Holding BV Tranche H2, term loan | | | | | | | | |
| 6.0044% 9/30/12 (b) | | | | | | 3,940,000 | | | | 3,984,325 |
| UPC Distribution Holdings BV Tranche F, term loan | | | | | | | | |
| 7.19% 12/31/11 (b) | | | | | | 4,000,000 | | | | 4,065,000 |
| WideOpenWest Illinois, Inc. Tranche B, term loan | | | | | | | | |
| 6.8036% 6/22/11 (b) | | | | | | 2,586,902 | | | | 2,612,771 |
| | | | | | | | | | | 30,027,739 |
| Capital Goods 1.7% | | | | | | | | | | |
| Alliance Laundry Systems LLC term loan 6.0021% | | | | | | | | |
| 1/27/12 (b) | | | | | | 1,870,000 | | | | 1,893,375 |
| Flowserve Corp. term loan 5.8125% 8/10/12 (b) | | | | 1,280,000 | | | | 1,296,000 |
| GenTek, Inc. term loan 6.4034% 2/28/11 (b) | | | | 1,939,064 | | | | 1,939,064 |
| Hexcel Corp. Tranche B, term loan 5.3632% 3/1/12 (b) | | | | 370,000 | | | | 373,700 |
| Mueller Group, Inc. term loan 6.2371% 10/3/12 (b) | | | | 670,000 | | | | 680,050 |
| Walter Industries, Inc. term loan 6.0399% 10/3/12 (b) . | | | | 720,000 | | | | 729,900 |
| Wastequip, Inc. Tranche B1, term loan 6.5204% | | | | | | | | |
| 7/15/11 (b) | | | | | | 967,575 | | | | 977,251 |
| | | | | | | | | | | 7,889,340 |
| Chemicals – 1.7% | | | | | | | | | | |
| Basell USA, Inc.: | | | | | | | | | | |
| Tranche B2, term loan 6.3533% 8/1/13 (b) | | | | 190,000 | | | | 193,563 |
| Tranche C2, term loan 6.8533% 8/1/14 (b) | | | | 190,000 | | | | 193,563 |
| Celanese Holding LLC term loan 6.2967% 4/6/11 (b) | | | | 2,334,674 | | | | 2,369,695 |
| Mosaic Co. Tranche B, term loan 5.2323% 2/21/12 (b) | | | | 1,890,500 | | | | 1,914,131 |
| PQ Corp. term loan 6.0625% 2/11/12 (b) | | | | 3,283,500 | | | | 3,320,439 |
| | | | | | | | | | | 7,991,391 |
| Consumer Products – 1.2% | | | | | | | | | | |
| Burt’s Bees, Inc. term loan 6.2397% 3/28/10 (b) | | | | 398,000 | | | | 402,478 |
| Central Garden & Pet Co. Tranche B, term loan 5.5591% | | | | | | | | |
| 5/14/09 (b) | | | | | | 396,974 | | | | 401,936 |
| Fender Musical Instrument Corp. Tranche B, term loan | | | | | | | | |
| 5.85% 3/30/12 (b) | | | | | | 807,975 | | | | 816,055 |
| Jarden Corp. Tranche B2, term loan 5.6881% | | | | | | | | |
| 1/24/12 (b) | | | | | | 375,189 | | | | 377,065 |
| |
| |
| |
| Annual Report | | 50 | | | | | | | | |
Floating Rate Loans (c) continued
| | | | | | |
| | | | | Principal | | Value |
| | | | | Amount | | |
| Consumer Products – continued | | | | | | |
| Jostens IH Corp. Tranche A, term loan 6.4381% | | | | | | |
| 10/4/10 (b) | | $ | | 1,800,000 | | $ 1,822,500 |
| Simmons Bedding Co. Tranche C, term loan 6.0144% | | | | | | |
| 12/19/11 (b) | | | | 1,941,162 | | 1,960,574 |
| | | | | | | 5,780,608 |
| Containers – 0.2% | | | | | | |
| Berry Plastics Corp. term loan 6.105% 12/2/11 (b) | | | | 947,625 | | 960,655 |
| Diversified Financial Services – 0.8% | | | | | | |
| Newkirk Master LP Tranche B, term loan 5.6931% | | | | | | |
| 8/11/08 (b) | | | | 644,334 | | 653,999 |
| Refco Finance Holdings LLC term loan 5.8406% | | | | | | |
| 8/5/11 (b) | | | | 2,972,222 | | 3,005,660 |
| | | | | | | 3,659,659 |
| Diversified Media – 0.2% | | | | | | |
| R.H. Donnelley Corp. Tranche A3, term loan 5.6939% | | | | | | |
| 12/31/09 (b) | | | | 1,159,682 | | 1,162,582 |
| Electric Utilities – 4.5% | | | | | | |
| Allegheny Energy Supply Co. LLC term loan 5.7691% | | | | | | |
| 3/8/11 (b) | | | | 3,138,340 | | 3,181,492 |
| Centerpoint Energy House Electric LLC term loan | | | | | | |
| 13.2425% 11/11/05 (b) | | | | 2,000,000 | | 2,025,000 |
| Covanta Energy Corp. Tranche 1: | | | | | | |
| Credit-Linked Deposit 6.8628% 6/24/12 (b) | | | | 2,211,382 | | 2,244,553 |
| term loan 6.9606% 6/24/12 (b) | | | | 1,784,146 | | 1,810,909 |
| NRG Energy, Inc.: | | | | | | |
| Credit-Linked Deposit 5.7953% 12/24/11 (b) | | | | 1,706,250 | | 1,714,781 |
| term loan 5.8954% 12/24/11 (b) | | | | 2,177,297 | | 2,188,183 |
| Primary Energy Finance LLC term loan 6.0204% | | | | | | |
| 8/24/12 (b) | | | | 3,030,000 | | 3,075,450 |
| Reliant Energy, Inc. term loan 6.0972% 4/30/10 (b) | | | | 1,990,000 | | 2,004,925 |
| Texas Genco LLC term loan 5.8632% 12/14/11 (b) | | | | 2,977,500 | | 2,992,388 |
| | | | | | | 21,237,681 |
| Energy – 7.8% | | | | | | |
| Boart Longyear Holdings, Inc. Tranche 1, term loan | | | | | | |
| 6.53% 7/22/12 (b) | | | | 369,075 | | 374,611 |
| Coffeyville Resources LLC: | | | | | | |
| Credit-Linked Deposit 6.3604% 7/8/11 (b) | | | | 704,000 | | 715,440 |
| Tranche B1, term loan 6.57% 7/8/12 (b) | | | | 1,056,000 | | 1,073,160 |
| El Paso Corp. Credit-Linked Deposit 6.6466% | | | | | | |
| 11/22/09 (b) | | | | 6,000,000 | | 6,060,000 |
| Energy Transfer Partners LP term loan 6.8125% | | | | | | |
| 6/16/08 (b) | | | | 5,000,000 | | 5,056,250 |
| |
| |
| 51 | | | | | | Annual Report |
| Investments (Unaudited) continued | | | | | | | | |
| |
Floating Rate Loans (c) continued
| | | | | | | | |
| | | | | | | Principal | | | | Value |
| | | | | | | Amount | | | | |
| Energy – continued | | | | | | | | | | |
| EPCO Holdings, Inc. Tranche B, term loan 6.0394% | | | | | | | | |
| 8/16/10 (b) | | | | $ | | 3,460,000 | | $ | | 3,520,550 |
| Kerr-McGee Corp. Tranche B, term loan 6.3149% | | | | | | | | |
| 5/24/11 (b) | | | | | | 9,975,000 | | | | 10,024,875 |
| Key Energy Services, Inc. Tranche B, term loan 7.02% | | | | | | | | |
| 6/30/12 (b) | | | | | | 4,230,000 | | | | 4,293,450 |
| LB Pacific LP term loan 6.8044% 3/3/12 (b) | | | | 3,980,000 | | | | 4,029,750 |
| Universal Compression, Inc. term loan 7.5% | | | | | | | | |
| 2/15/12 (b) | | | | | | 1,055,500 | | | | 1,063,416 |
| Vulcan/Plains Resources, Inc. term loan 5.8492% | | | | | | | | |
| 8/12/11 (b) | | | | | | 540,000 | | | | 547,425 |
| | | | | | | | | | | 36,758,927 |
| Entertainment/Film 1.8% | | | | | | | | | | |
| MGM Holdings II, Inc. Tranche B, term loan 6.2704% | | | | | | | | |
| 4/8/12 (b) | | | | | | 8,550,000 | | | | 8,635,500 |
| Environmental – 1.4% | | | | | | | | | | |
| Allied Waste Industries, Inc.: | | | | | | | | | | |
| term loan 5.8505% 1/15/12 (b) | | | | | | 2,088,868 | | | | 2,107,146 |
| Tranche A, Credit-Linked Deposit 5.105% 1/15/12 (b) | | | | 789,324 | | | | 796,231 |
| Envirocare of Utah, Inc. Tranche 1, term loan 6.11% | | | | | | | | |
| 4/13/10 (b) | | | | | | 3,727,273 | | | | 3,787,841 |
| | | | | | | | | | | 6,691,218 |
| Food/Beverage/Tobacco – 1.8% | | | | | | | | | | |
| Centerplate, Inc. term loan 6.9252% 10/1/10 (b) | | | | 4,895,400 | | | | 4,932,116 |
| Commonwealth Brands, Inc. term loan 6.875% | | | | | | | | |
| 8/28/07 (b) | | | | | | 135,204 | | | | 137,570 |
| Constellation Brands, Inc. Tranche B, term loan 5.9093% | | | | | | | | |
| 11/30/11 (b) | | | | | | 2,297,889 | | | | 2,326,612 |
| Herbalife International, Inc. term loan 5.41% | | | | | | | | |
| 12/21/10 (b) | | | | | | 1,190,000 | | | | 1,201,900 |
| | | | | | | | | | | 8,598,198 |
| Gaming – 2.6% | | | | | | | | | | |
| BLB Worldwide Holdings, Inc.: | | | | | | | | | | |
| Tranche 1, term loan 6.079% 6/30/12 (b) | | | | 870,000 | | | | 883,050 |
| Tranche 2, term loan 7.83% 7/18/11 (b) | | | | 1,360,000 | | | | 1,385,500 |
| Green Valley Ranch Gaming LLC term loan 6.0204% | | | | | | | | |
| 12/17/11 (b) | | | | | | 2,176,056 | | | | 2,197,817 |
| Herbst Gaming, Inc. term loan 6.1973% 1/7/11 (b) | | | | 398,000 | | | | 402,478 |
| Isle of Capri Casinos, Inc. term loan 5.4859% | | | | | | | | |
| 2/4/11 (b) | | | | | | 198,500 | | | | 200,981 |
| Marina District Finance Co., Inc. term loan 5.5906% | | | | | | | | |
| 10/14/11 (b) | | | | | | 3,970,000 | | | | 3,994,813 |
| |
| |
| Annual Report | | 52 | | | | | | | | |
Floating Rate Loans (c) continued
| | | | | | |
| | | | | Principal | | Value |
| | | | | Amount | | |
| Gaming – continued | | | | | | |
| Motor City Casino Tranche B, term loan 5.9333% | | | | | | |
| 7/29/12 (b) | | $ | | 1,426,425 | | $ 1,438,906 |
| Resorts International Hotel & Casino, Inc. Tranche B1, | | | | | | |
| term loan 6.53% 4/26/12 (b) | | | | 783,465 | | 787,382 |
| Venetian Casino Resort LLC Tranche B, term loan | | | | | | |
| 5.7704% 6/15/11 (b) | | | | 900,000 | | 904,500 |
| | | | | | | 12,195,427 |
| Healthcare 9.8% | | | | | | |
| AMR HoldCo, Inc./ EmCare HoldCo, Inc. term loan | | | | | | |
| 6.1093% 2/7/12 (b) | | | | 3,283,500 | | 3,332,753 |
| Community Health Systems, Inc. term loan 5.61% | | | | | | |
| 8/19/11 (b) | | | | 3,964,962 | | 4,019,481 |
| CRC Health Corp. term loan 6.8125% 5/11/11 (b) | | | | 947,625 | | 952,363 |
| DaVita, Inc. Tranche B, term loan 4.1581% 7/30/12 (b) | | | | 7,686,275 | | 7,811,176 |
| Genoa Healthcare Group LLC Tranche 1, term loan | | | | | | |
| 7.2614% 8/4/12 (b) | | | | 1,421,000 | | 1,442,315 |
| HealthSouth Corp.: | | | | | | |
| Credit-Linked Deposit 6.2818% 6/14/07 (b) | | | | 807,500 | | 811,538 |
| term loan 6.53% 6/14/07 (b) | | | | 2,985,019 | | 2,999,944 |
| Lifecare Holdings, Inc. term loan 6.09% 8/11/12 (b) | | | | 1,260,000 | | 1,244,250 |
| LifePoint Hospitals, Inc. Tranche B, term loan 5.435% | | | | | | |
| 4/15/12 (b) | | | | 3,196,814 | | 3,224,787 |
| Mylan Laboratories, Inc. Tranche B, term loan 5.4% | | | | | | |
| 6/30/10 (b) | | | | 480,000 | | 486,600 |
| Newquest, Inc. Tranche A, term loan 6.66% 3/1/11 (b) | | | | 475,000 | | 480,938 |
| PacifiCare Health Systems, Inc. Tranche B, term loan | | | | | | |
| 5.2204% 12/6/10 (b) | | | | 6,947,500 | | 6,947,500 |
| Psychiatric Solutions, Inc. term loan 5.73% 7/1/12 (b) . | | | | 510,769 | | 516,515 |
| Skilled Healthcare Group, Inc. Tranche 2, term loan | | | | | | |
| 11.53% 12/15/12 (b) | | | | 3,000,000 | | 3,030,000 |
| Vicar Operating, Inc. term loan 5.375% 5/16/11 (b) | | | | 4,644,362 | | 4,690,806 |
| Warner Chilcott Corp. term loan 6.6701% 1/18/12 (b) | | | | 3,992,057 | | 4,012,017 |
| | | | | | | 46,002,983 |
| Homebuilding/Real Estate – 5.7% | | | | | | |
| CB Richard Ellis Services, Inc. term loan 5.1051% | | | | | | |
| 3/31/10 (b) | | | | 1,430,172 | | 1,440,898 |
| General Growth Properties, Inc. Tranche B, term loan | | | | | | |
| 5.85% 11/12/08 (b) | | | | 5,961,545 | | 6,050,968 |
| Lake Las Vegas LLC Tranche 1, term loan 6.3129% | | | | | | |
| 11/1/09 (b) | | | | 3,902,166 | | 3,960,699 |
| Lion Gables Realty LP term loan 5.63% 9/30/06 (b) | | | | 4,124,421 | | 4,150,199 |
| |
| |
| |
| 53 | | | | | | Annual Report |
| Investments (Unaudited) continued | | | | | | | | |
| |
Floating Rate Loans (c) continued
| | | | | | | | |
| | | | | | | Principal | | | | Value |
| | | | | | | Amount | | | | |
| Homebuilding/Real Estate – continued | | | | | | | | | | |
| LNR Property Corp. Tranche B, term loan 6.7112% | | | | | | | | |
| 2/3/08 (b) | | | | $ | | 3,919,880 | | $ | | 3,968,879 |
| Maguire Properties, Inc. Tranche B, term loan 5.4663% | | | | | | | | |
| 3/15/10 (b) | | | | | | 4,611,111 | | | | 4,651,458 |
| Shea Mountain House LLC Tranche B, term loan 5.8% | | | | | | | | |
| 5/11/11 (b) | | | | | | 2,430,000 | | | | 2,454,300 |
| | | | | | | | | | | 26,677,401 |
| Hotels 1.0% | | | | | | | | | | |
| Starwood Hotels & Resorts Worldwide, Inc. term loan | | | | | | | | |
| 5.0906% 10/9/06 (b) | | | | | | 4,893,939 | | | | 4,893,939 |
| Leisure – 0.7% | | | | | | | | | | |
| 24 Hour Fitness Worldwide, Inc. Tranche B, term loan | | | | | | | | |
| 6.78% 6/8/12 (b) | | | | | | 3,000,000 | | | | 3,045,000 |
| Mega Bloks, Inc. Tranche B, term loan 5.6034% | | | | | | | | |
| 7/26/12 (b) | | | | | | 440,000 | | | | 445,500 |
| | | | | | | | | | | 3,490,500 |
| Metals/Mining – 2.6% | | | | | | | | | | |
| Murray Energy Corp. Tranche 1, term loan 6.86% | | | | | | | | |
| 1/28/10 (b) | | | | | | 497,500 | | | | 501,231 |
| Novelis, Inc. term loan 5.46% 1/7/12 (b) | | | | | | 3,123,077 | | | | 3,158,212 |
| Peabody Energy Corp. term loan 4.625% 3/21/10 (b) . | | | | 2,947,385 | | | | 2,965,806 |
| Trout Coal Holdings LLC / Dakota Tranche 1, term loan | | | | | | | | |
| 6.0302% 3/23/11 (b) | | | | | | 5,676,487 | | | | 5,683,583 |
| | | | | | | | | | | 12,308,832 |
| Paper 2.9% | | | | | | | | | | |
| Escanaba Timber LLC term loan 6.43% 5/2/08 (b) | | | | 520,000 | | | | 525,850 |
| Georgia-Pacific Corp. term loan 5.3152% 7/2/09 (b) | | | | 1,000,000 | | | | 1,001,800 |
| Koch Cellulose LLC: | | | | | | | | | | |
| term loan 5.77% 5/7/11 (b) | | | | | | 1,952,469 | | | | 1,984,197 |
| Credit-Linked Deposit 5.1931% 5/7/11 (b) | | | | 602,945 | | | | 612,743 |
| Smurfit-Stone Container Enterprises, Inc.: | | | | | | | | | | |
| Credit-Linked Deposit 5.25% 11/1/10 (b) | | | | 655,111 | | | | 661,662 |
| Tranche B, term loan 5.6969% 11/1/11 (b) | | | | 5,208,155 | | | | 5,266,747 |
| Tranche C, term loan 5.8338% 11/1/11 (b) | | | | 1,923,018 | | | | 1,944,652 |
| Xerium Technologies, Inc. Tranche B, term loan 6.0204% | | | | | | | | |
| 5/18/12 (b) | | | | | | 1,496,250 | | | | 1,514,953 |
| | | | | | | | | | | 13,512,604 |
| Publishing/Printing – 3.0% | | | | | | | | | | |
| Dex Media West LLC/Dex Media West Finance Co. | | | | | | | | |
| Tranche B, term loan 5.5119% 3/9/10 (b) | | | | 6,513,707 | | | | 6,546,276 |
| |
| |
| |
| Annual Report | | 54 | | | | | | | | |
Floating Rate Loans (c) continued
| | | | | | | | |
| | | | | Principal | | | | Value |
| | | | | Amount | | | | |
| Publishing/Printing – continued | | | | | | | | |
| Liberty Group Operating, Inc. Tranche B, term loan 6% | | | | | | | | |
| 2/28/12 (b) | | $ | | 196,513 | | $ | | 198,478 |
| PRIMEDIA, Inc. Tranche B, term loan 6.1138% | | | | | | | | |
| 9/30/13 (b) | | | | 3,170,000 | | | | 3,197,738 |
| R.H. Donnelley Corp. Tranche B2, term loan 5.6181% | | | | | | | | |
| 6/30/11 (b) | | | | 4,287,315 | | | | 4,314,111 |
| | | | | | | | | 14,256,603 |
| Railroad 1.5% | | | | | | | | |
| Helm Holding Corp. Tranche 1, term loan 6.259% | | | | | | | | |
| 7/8/11 (b) | | | | 1,187,025 | | | | 1,198,895 |
| Kansas City Southern Railway Co. Tranche B1, term loan | | | | | | | | |
| 5.5903% 3/30/08 (b) | | | | 2,779,000 | | | | 2,820,685 |
| RailAmerica, Inc. term loan 5.875% 9/29/11 (b) | | | | 3,090,201 | | | | 3,144,280 |
| | | | | | | | | 7,163,860 |
| Restaurants 3.3% | | | | | | | | |
| Arby’s Restaurant Group, Inc. Tranche B, term loan | | | | | | | | |
| 6.1446% 7/25/12 (b) | | | | 3,990,000 | | | | 4,019,925 |
| Burger King Corp. Tranche B, term loan 5.5% | | | | | | | | |
| 6/30/12 (b) | | | | 1,845,375 | | | | 1,873,056 |
| Domino’s, Inc. term loan 5.8125% 6/25/10 (b) | | | | 4,809,121 | | | | 4,881,258 |
| Jack in the Box, Inc. term loan 5.4457% 1/8/11 (b) | | | | 3,117,746 | | | | 3,145,026 |
| Landry’s Seafood Restaurants, Inc. term loan 5.949% | | | | | | | | |
| 12/28/10 (b) | | | | 1,454,013 | | | | 1,470,370 |
| | | | | | | | | 15,389,635 |
| Services – 4.6% | | | | | | | | |
| Coinstar, Inc. term loan 5.55% 7/1/11 (b) | | | | 825,144 | | | | 837,521 |
| DynCorp term loan 6.7498% 2/11/11 (b) | | | | 1,995,000 | | | | 2,004,975 |
| Iron Mountain, Inc.: | | | | | | | | |
| term loan 5.625% 4/2/11 (b) | | | | 3,712,842 | | | | 3,749,970 |
| Tranche R, term loan 5.5313% 4/2/11 (b) | | | | 4,962,500 | | | | 5,012,125 |
| Knowledge Learning Corp. term loan 6.35% 1/7/12 (b) | | | | 4,050,907 | | | | 4,061,035 |
| Rural/Metro Corp.: | | | | | | | | |
| Credit-Linked Deposit 6.2% 3/4/11 (b) | | | | 520,882 | | | | 528,044 |
| term loan 6.0439% 3/4/11 (b) | | | | 1,904,941 | | | | 1,931,134 |
| United Rentals, Inc.: | | | | | | | | |
| term loan 6.0948% 2/14/11 (b) | | | | 2,836,779 | | | | 2,865,147 |
| Tranche B, Credit-Linked Deposit 5.4925% | | | | | | | | |
| 2/14/11 (b) | | | | 575,996 | | | | 581,756 |
| | | | | | | | | 21,571,707 |
55 Annual Report
| Investments (Unaudited) continued | | | | | | | | |
| |
Floating Rate Loans (c) continued
| | | | | | | | |
| | | | | Principal | | | | Value |
| | | | | Amount | | | | |
| Shipping – 0.1% | | | | | | | | |
| Baker Tanks, Inc. term loan 6.4731% 1/30/11 (b) | | $ | | 248,750 | | $ | | 250,616 |
| Ozburn Hessey Holding Co. LLC term loan 6.3406% | | | | | | | | |
| 8/9/12 (b) | | | | 370,000 | | | | 375,550 |
| | | | | | | | | 626,166 |
| Technology – 7.8% | | | | | | | | |
| AMI Semiconductor, Inc. term loan 5.3406% 4/1/12 (b) | | | | 2,090,751 | | | | 2,095,978 |
| Fairchild Semiconductor Corp. Tranche B3, term loan | | | | | | | | |
| 5.605% 12/31/10 (b) | | | | 2,055,157 | | | | 2,078,277 |
| Fidelity National Information Solutions, Inc. Tranche B, | | | | | | | | |
| term loan 5.4771% 3/9/13 (b) | | | | 5,471,500 | | | | 5,498,858 |
| Infor Global Solutions AG Tranche 1, term loan 6.943% | | | | | | | | |
| 4/18/11 (b) | | | | 6,000,000 | | | | 6,060,000 |
| ON Semiconductor Corp. Tranche G, term loan | | | | | | | | |
| 7.0625% 12/15/11 (b) | | | | 2,977,500 | | | | 3,022,163 |
| SSA Global Technologies, Inc. term loan 5.97% | | | | | | | | |
| 9/22/11 (b) | | | | 2,180,000 | | | | 2,190,900 |
| SunGard Data Systems, Inc. Tranche B, term loan 6.28% | | | | | | | | |
| 2/10/13 (b) | | | | 14,962,500 | | | | 15,149,520 |
| UGS Holdings, Inc. Tranche C, term loan 5.84% | | | | | | | | |
| 3/31/12 (b) | | | | 464,828 | | | | 471,219 |
| | | | | | | | | 36,566,915 |
| Telecommunications – 5.4% | | | | | | | | |
| AAT Communications Corp.: | | | | | | | | |
| Tranche 2, term loan 6.61% 7/29/13 (b) | | | | 300,000 | | | | 305,625 |
| Tranche B1, term loan 5.61% 7/27/12 (b) | | | | 1,850,000 | | | | 1,875,438 |
| Alaska Communications Systems Holding term loan | | | | | | | | |
| 6.0204% 2/1/12 (b) | | | | 7,100,000 | | | | 7,188,750 |
| American Tower LP Tranche C, term loan 4.9601% | | | | | | | | |
| 8/31/11 (b) | | | | 2,567,100 | | | | 2,570,309 |
| Conversant Holdings, Inc. Tranche B, term loan 7.8144% | | | | | | | | |
| 3/31/11 (b) | | | | 1,925,000 | | | | 1,920,188 |
| Intelsat Ltd. term loan 5.8125% 7/28/11 (b) | | | | 3,228,410 | | | | 3,260,694 |
| Madison River Capital LLC/Madison River Finance Corp. | | | | | | | | |
| Tranche B, term loan 6.22% 7/29/12 (b) | | | | 1,270,000 | | | | 1,290,638 |
| New Skies Satellites BV term loan 5.8888% 5/2/11 (b) . | | | | 1,327,565 | | | | 1,347,479 |
| NTELOS, Inc.: | | | | | | | | |
| term loan 9.03% 2/24/12 (b) | | | | 200,000 | | | | 199,250 |
| Tranche B, term loan 6.53% 8/24/11 (b) | | | | 992,500 | | | | 1,003,666 |
| Qwest Corp. Tranche A, term loan 8.53% 6/30/07 (b) . | | | | 1,600,000 | | | | 1,650,000 |
Floating Rate Loans (c) continued
| | | | | | |
| | | | | Principal | | Value |
| | | | | Amount | | |
| Telecommunications – continued | | | | | | |
| SpectraSite Communications, Inc. Tranche B, term loan | | | | | | |
| 5.27% 5/19/12 (b) | | $ | | 1,985,000 | | $ 1,987,481 |
| Valor Telecommunications Enterprises LLC/Valor Finance | | | | | | |
| Corp. Tranche B, term loan 5.7754% 2/14/12 (b) | | | | 773,333 | | 783,967 |
| | | | | | | 25,383,485 |
| Textiles & Apparel – 0.3% | | | | | | |
| St. John Knits International, Inc. Tranche B, term loan | | | | | | |
| 6.5401% 3/23/12 (b) | | | | 497,500 | | 503,719 |
| William Carter Co. term loan 5.7178% 6/29/12 (b) | | | | 796,875 | | 808,828 |
| | | | | | | 1,312,547 |
| |
| TOTAL FLOATING RATE LOANS | | | | | | |
| (Cost $419,395,818) | | | | | | 421,984,398 |
| |
| Nonconvertible Bonds 7.9% | | | | | | |
| |
| Automotive 2.5% | | | | | | |
| General Motors Acceptance Corp.: | | | | | | |
| 4.6769% 5/18/06 (b) | | | | 2,000,000 | | 1,989,398 |
| 4.87% 10/20/05 (b) | | | | 5,000,000 | | 5,000,060 |
| 5.11% 9/23/08 (b) | | | | 3,000,000 | | 2,779,644 |
| 6.75% 1/15/06 | | | | 2,000,000 | | 2,010,456 |
| | | | | | | 11,779,558 |
| Diversified Financial Services – 1.1% | | | | | | |
| Residential Capital Corp. 5.385% 6/29/07 (a)(b) | | | | 5,000,000 | | 5,041,365 |
| Super Retail – 1.1% | | | | | | |
| GSC Holdings Corp./Gamestop, Inc. 7.875% | | | | | | |
| 10/1/11 (a)(b) | | | | 5,000,000 | | 5,037,500 |
| Technology – 1.3% | | | | | | |
| Nortel Networks Corp. 6.125% 2/15/06 | | | | 5,000,000 | | 5,025,000 |
| SunGard Data Systems, Inc. 8.5248% 8/15/13 (a)(b) | | | | 1,090,000 | | 1,124,063 |
| | | | | | | 6,149,063 |
| Telecommunications – 1.9% | | | | | | |
| Qwest Corp. 7.12% 6/15/13 (a)(b) | | | | 2,840,000 | | 2,953,600 |
| Rogers Communications, Inc. 6.995% 12/15/10 (b) | | | | 6,000,000 | | 6,217,500 |
| | | | | | | 9,171,100 |
| |
| TOTAL NONCONVERTIBLE BONDS | | | | | | |
| (Cost $37,125,822) | | | | | | 37,178,586 |
57 Annual Report
| Investments (Unaudited) continued | | | | |
| |
Cash Equivalents 7.7%
| | | | | | |
| | | | | Maturity | | Value |
| | | | | Amount | | |
| Investments in repurchase agreements (Collateralized by U.S. | | | | |
| Government Obligations, in a joint trading account at | | | | |
| 3.89%, dated 9/30/05 due 10/3/05) | | | | | | |
| (Cost $36,404,000) | | | | $36,415,815 | | $36,404,000 |
| TOTAL INVESTMENT PORTFOLIO 105.2% | | | | |
| (Cost $492,925,640) | | | | | | 495,566,984 |
| |
| NET OTHER ASSETS – (5.2)% | | | | | | (24,405,171) |
| NET ASSETS 100% | | | | | | $ 471,161,813 |
(a) Security exempt from registration under
Rule 144A of the Securities Act of 1933.
These securities may be resold in
transactions exempt from registration,
normally to qualified institutional buyers.
At the period end, the value of these
securities amounted to $14,156,528 or
3.0% of net assets.
(b) The coupon rate shown on floating or
adjustable rate securities represents the
rate at period end.
(c) Remaining maturities of floating rate
loans may be less than the stated
maturities shown as a result of
contractual or optional prepayments by
the borrower. Such prepayments cannot
be predicted with certainty.
|
Fidelity Ultra-Short Central Fund
Investments September 30, 2005 (Unaudited)
Showing Percentage of Net Assets
|
| Nonconvertible Bonds 4.8% | | | | |
| | | Principal | | Value |
| | | Amount | | |
| |
| CONSUMER DISCRETIONARY – 1.1% | | | | |
| Auto Components 0.3% | | | | |
| DaimlerChrysler NA Holding Corp.: | | | | |
| 4.3138% 9/10/07 (d) | | $ 16,665,000 | | $ 16,704,263 |
| 4.43% 5/24/06 (d) | | 4,700,000 | | 4,713,090 |
| | | | | 21,417,353 |
| Media – 0.8% | | | | |
| Continental Cablevision, Inc. 8.3% 5/15/06 | | 8,000,000 | | 8,183,384 |
| Cox Communications, Inc. (Reg. S) 4.4069% 12/14/07 (d) | | . 12,140,000 | | 12,222,965 |
| Cox Radio, Inc. 6.625% 2/15/06 | | 5,575,000 | | 5,612,319 |
| Liberty Media Corp. 5.37% 9/17/06 (d) | | 16,694,000 | | 16,816,200 |
| Univision Communications, Inc. 2.875% 10/15/06 | | 8,505,000 | | 8,336,763 |
| | | | | 51,171,631 |
| |
| TOTAL CONSUMER DISCRETIONARY | | | | 72,588,984 |
| |
| ENERGY 0.2% | | | | |
| Oil, Gas & Consumable Fuels – 0.2% | | | | |
| Valero Energy Corp. 7.375% 3/15/06 | | 11,550,000 | | 11,671,298 |
| |
| FINANCIALS – 1.5% | | | | |
| Capital Markets 0.2% | | | | |
| State Street Capital Trust II 4.29% 2/15/08 (d) | | 10,000,000 | | 10,007,360 |
| Commercial Banks – 0.2% | | | | |
| Wells Fargo & Co. 3.8738% 3/10/08 (d) | | 16,600,000 | | 16,600,166 |
| Consumer Finance – 0.5% | | | | |
| General Motors Acceptance Corp. 4.87% 10/20/05 (d) | | 14,765,000 | | 14,765,177 |
| MBNA Europe Funding PLC 3.97% 9/7/07 (a)(d) | | 19,925,000 | | 19,915,914 |
| | | | | 34,681,091 |
| Thrifts & Mortgage Finance – 0.6% | | | | |
| Countrywide Financial Corp. 3.71% 4/11/07 (d) | | 11,025,000 | | 11,037,105 |
| Residential Capital Corp. 5.385% 6/29/07 (a)(d) | | 14,150,000 | | 14,267,063 |
| Washington Mutual Bank 3.9363% 8/25/08 (d) | | 16,325,000 | | 16,330,126 |
| | | | | 41,634,294 |
| |
| TOTAL FINANCIALS | | | | 102,922,911 |
| |
| TELECOMMUNICATION SERVICES – 1.1% | | | | |
| Diversified Telecommunication Services – 1.0% | | | | |
| British Telecommunications PLC 7.875% 12/15/05 | | 18,145,000 | | 18,268,277 |
| |
| |
| |
| 59 | | | | Annual Report |
| Investments (Unaudited) continued | | | | |
| |
Nonconvertible Bonds continued
| | | | | | |
| | | | | | | Principal | | Value |
| | | | | | | Amount | | |
| |
| TELECOMMUNICATION SERVICES – continued | | | | | | |
| Diversified Telecommunication Services – continued | | | | | | |
| France Telecom SA 7.2% 3/1/06 | | | | $ | | 5,600,000 | | $ 5,664,966 |
| GTE Corp. 6.36% 4/15/06 | | | | | | 9,000,000 | | 9,087,354 |
| SBC Communications, Inc. 4.389% 6/5/06 (a) | | | | 15,315,000 | | 15,296,316 |
| Sprint Capital Corp. 4.78% 8/17/06 | | | | | | 6,000,000 | | 6,009,276 |
| Telefonos de Mexico SA de CV 4.5% 11/19/08 | | | | 10,240,000 | | 10,107,679 |
| TELUS Corp. yankee 7.5% 6/1/07 | | | | | | 6,500,000 | | 6,787,638 |
| | | | | | | | | 71,221,506 |
| Wireless Telecommunication Services – 0.1% | | | | | | |
| AT&T Wireless Services, Inc. 7.35% 3/1/06 | | | | 5,500,000 | | 5,563,866 |
| |
| TOTAL TELECOMMUNICATION SERVICES | | | | | | 76,785,372 |
| |
| UTILITIES – 0.9% | | | | | | | | |
| Electric Utilities – 0.2% | | | | | | | | |
| Pinnacle West Energy Corp. 4.0044% 4/1/07 (a)(d) | | | | 12,800,000 | | 12,800,000 |
| Gas Utilities 0.1% | | | | | | | | |
| NiSource Finance Corp. 7.625% 11/15/05 | | | | 9,250,000 | | 9,284,012 |
| Multi-Utilities – 0.6% | | | | | | | | |
| Dominion Resources, Inc. 4.27% 9/28/07 (d) | | | | 17,150,000 | | 17,145,301 |
| DTE Energy Co. 6.45% 6/1/06 | | | | | | 13,190,000 | | 13,350,324 |
| Sempra Energy 4.75% 5/15/09 | | | | | | 5,500,000 | | 5,461,247 |
| | | | | | | | | 35,956,872 |
| |
| TOTAL UTILITIES | | | | | | | | 58,040,884 |
| |
| TOTAL NONCONVERTIBLE BONDS | | | | | | | | |
| (Cost $322,361,771) | | | | | | | | 322,009,449 |
| |
| U.S. Government Agency Obligations 0.0% | | | | |
| |
| Federal Home Loan Bank 0% 12/28/05 (c) | | | | | | |
| (Cost $1,981,349) | | | | | | 2,000,000 | | 1,981,988 |
| |
| Asset Backed Securities 33.0% | | | | | | |
| |
| Accredited Mortgage Loan Trust: | | | | | | | | |
| Series 2004-2 Class A2, 4.13% 7/25/34 (d) | | | | 7,454,076 | | 7,464,885 |
| Series 2004-3 Class 2A4, 4.18% 10/25/34 (d) | | | | 10,915,000 | | 10,939,272 |
| Series 2004-4 Class A2D, 4.18% 1/25/35 (d) | | | | 3,210,800 | | 3,218,701 |
| |
| |
| |
| Annual Report | | 60 | | | | | | |
Asset Backed Securities continued
| | | | |
| | | Principal | | Value |
| | | Amount | | |
| Accredited Mortgage Loan Trust: – continued | | | | |
| Series 2005-1: | | | | |
| Class M1, 4.3% 4/25/35 (d) | | $11,280,000 | | $ 11,284,074 |
| Class M2, 4.52% 4/25/35 (d) | | 5,275,000 | | 5,288,969 |
| ACE Securities Corp.: | | | | |
| Series 2002-HE1 Class M1, 4.48% 6/25/32 (d) | | 1,842,987 | | 1,860,106 |
| Series 2002-HE2 Class M1, 4.68% 8/25/32 (d) | | 18,631,213 | | 18,689,976 |
| Series 2003-FM1 Class M2, 5.68% 11/25/32 (d) | | 3,015,000 | | 3,044,567 |
| Series 2003-HS1: | | | | |
| Class M1, 4.58% 6/25/33 (d) | | 800,000 | | 803,891 |
| Class M2, 5.58% 6/25/33 (d) | | 856,000 | | 870,466 |
| Series 2003-NC1 Class M1, 4.61% 7/25/33 (d) | | 1,600,000 | | 1,608,662 |
| Series 2004-HE1: | | | | |
| Class M1, 4.33% 2/25/34 (d) | | 2,193,000 | | 2,194,100 |
| Class M2, 4.93% 2/25/34 (d) | | 2,475,000 | | 2,476,472 |
| Series 2004-OP1: | | | | |
| Class M1, 4.35% 4/25/34 (d) | | 4,420,000 | | 4,424,381 |
| Class M2, 4.88% 4/25/34 (d) | | 6,240,000 | | 6,332,494 |
| Series 2005-HE2: | | | | |
| Class M1, 4.27% 4/25/35 (d) | | 1,530,000 | | 1,529,959 |
| Class M2, 4.28% 4/25/35 (d) | | 1,803,000 | | 1,802,229 |
| Class M3, 4.31% 4/25/35 (d) | | 1,040,000 | | 1,041,214 |
| Class M4, 4.47% 4/25/35 (d) | | 1,340,000 | | 1,341,550 |
| Series 2005-HE3: | | | | |
| Class A2A, 3.93% 5/25/35 (d) | | 7,170,954 | | 7,171,304 |
| Class A2B, 4.04% 5/25/35 (d) | | 4,370,000 | | 4,367,703 |
| Series 2005-SD1 Class A1, 4.23% 11/25/50 (d) | | 2,337,292 | | 2,340,041 |
| Aesop Funding II LLC Series 2005-1A Class A2, 3.8563% | | | | |
| 4/20/09 (a)(d) | | 8,800,000 | | 8,800,906 |
| American Express Credit Account Master Trust: | | | | |
| Series 2002-6 Class B, 4.2181% 3/15/10 (d) | | 5,000,000 | | 5,028,652 |
| Series 2004-1 Class B, 4.0181% 9/15/11 (d) | | 5,775,000 | | 5,797,497 |
| Series 2004-C Class C, 4.2681% 2/15/12 (a)(d) | | 14,647,039 | | 14,680,928 |
| Series 2005-1 Class A, 3.7981% 10/15/12 (d) | | 15,455,000 | | 15,483,856 |
| Series 2005-6 Class C, 4.0181% 3/15/11 (a)(d) | | 9,085,000 | | 9,087,816 |
| AmeriCredit Automobile Receivables Trust: | | | | |
| Series 2002-EM Class A4A, 3.67% 6/8/09 | | 25,000,000 | | 24,882,623 |
| Series 2003-AM Class A4B, 4.15% 11/6/09 (d) | | 11,965,573 | | 11,999,441 |
| Series 2003-BX Class A4B, 3.9688% 1/6/10 (d) | | 3,265,000 | | 3,273,821 |
| Series 2003-CF Class A3, 2.75% 10/9/07 | | 8,861,691 | | 8,837,682 |
| Series 2005-1 Class C, 4.73% 7/6/10 | | 15,500,000 | | 15,420,941 |
| Ameriquest Mortgage Securities, Inc.: | | | | |
| Series 2002-3 Class M1, 4.53% 8/25/32 (d) | | 2,969,781 | | 2,983,343 |
| |
| |
| 61 | | | | Annual Report |
| Investments (Unaudited) continued | | | | | | | | |
| |
Asset Backed Securities continued
| | | | | | | | |
| | | | | | | Principal | | | | Value |
| | | | | | | Amount | | | | |
| Ameriquest Mortgage Securities, Inc.: – continued | | | | | | | | |
| Series 2003-1: | | | | | | | | | | |
| Class A2, 4.24% 2/25/33 (d) | | | | $ | | 200,427 | | $ | | 200,481 |
| Class M1, 4.73% 2/25/33 (d) | | | | | | 6,150,000 | | | | 6,188,493 |
| Series 2003-3 Class M1, 4.63% 3/25/33 (d) | | | | 1,590,000 | | | | 1,598,400 |
| Series 2003-6: | | | | | | | | | | |
| Class M1, 4.59% 8/25/33 (d) | | | | | | 7,560,000 | | | | 7,610,158 |
| Class M2, 5.68% 5/25/33 (d) | | | | | | 2,750,000 | | | | 2,804,670 |
| Series 2003-AR1 Class M1, 4.98% 1/25/33 (d) | | | | 7,000,000 | | | | 7,068,037 |
| Series 2004-R2: | | | | | | | | | | |
| Class M1, 4.26% 4/25/34 (d) | | | | | | 1,230,000 | | | | 1,229,969 |
| Class M2, 4.31% 4/25/34 (d) | | | | | | 950,000 | | | | 949,976 |
| Class M3, 4.38% 4/25/34 (d) | | | | | | 3,500,000 | | | | 3,499,912 |
| Class M4, 4.88% 4/25/34 (d) | | | | | | 4,500,000 | | | | 4,499,883 |
| Series 2004-R9 Class A3, 4.15% 10/25/34 (d) | | | | 9,206,545 | | | | 9,219,109 |
| Series 2005-R1: | | | | | | | | | | |
| Class M1, 4.28% 3/25/35 (d) | | | | | | 5,710,000 | | | | 5,707,639 |
| Class M2, 4.31% 3/25/35 (d) | | | | | | 1,925,000 | | | | 1,924,232 |
| Series 2005-R2 Class M1, 4.28% 4/25/35 (d) | | | | 12,500,000 | | | | 12,499,668 |
| Amortizing Residential Collateral Trust: | | | | | | | | |
| Series 2002-BC3 Class A, 4.16% 6/25/32 (d) | | | | 2,411,175 | | | | 2,418,320 |
| Series 2002-BC6 Class M1, 4.58% 8/25/32 (d) | | | | 24,900,000 | | | | 25,095,555 |
| Series 2002-BC7: | | | | | | | | | | |
| Class M1, 4.63% 10/25/32 (d) | | | | | | 10,000,000 | | | | 10,028,130 |
| Class M2, 4.73% 10/25/32 (d) | | | | | | 5,575,000 | | | | 5,605,898 |
| Series 2002-BC1 Class M2, 4.93% 1/25/32 (d) | | | | 758,836 | | | | 762,053 |
| ARG Funding Corp.: | | | | | | | | | | |
| Series 2005-1A Class A2, 3.8963% 4/20/09 (a)(d) | | | | 11,000,000 | | | | 10,975,938 |
| Series 2005-2A Class A2, 3.9063% 5/20/09 (a)(d) | | | | 5,200,000 | | | | 5,190,453 |
| Argent Securities, Inc.: | | | | | | | | | | |
| Series 2003-W3 Class M2, 5.63% 9/25/33 (d) | | | | 20,000,000 | | | | 20,596,100 |
| Series 2003-W7 Class A2, 4.22% 3/1/34 (d) | | | | 3,948,904 | | | | 3,957,510 |
| Series 2004-W5 Class M1, 4.43% 4/25/34 (d) | | | | 3,960,000 | | | | 3,964,674 |
| Series 2004-W7: | | | | | | | | | | |
| Class M1, 4.38% 5/25/34 (d) | | | | | | 4,085,000 | | | | 4,084,893 |
| Class M2, 4.43% 5/25/34 (d) | | | | | | 3,320,000 | | | | 3,319,914 |
| Asset Backed Securities Corp. Home Equity Loan Trust: | | | | | | | | |
| Series 2003-HE2: | | | | | | | | | | |
| Class A2, 4.1481% 4/15/33 (d) | | | | | | 664,884 | | | | 664,968 |
| Class M1, 4.6681% 4/15/33 (d) | | | | 11,365,000 | | | | 11,414,716 |
| Series 2003-HE3: | | | | | | | | | | |
| Class M1, 4.5981% 6/15/33 (d) | | | | 2,185,000 | | | | 2,196,793 |
| Class M2, 5.7681% 6/15/33 (d) | | | | 10,000,000 | | | | 10,168,072 |
| |
| |
| Annual Report | | 62 | | | | | | | | |
Asset Backed Securities continued
| | | | | | | | |
| | | | | Principal | | | | Value |
| | | | | Amount | | | | |
| Asset Backed Securities Corp. Home Equity Loan Trust: - | | | | | | | | |
| continued | | | | | | | | |
| Series 2003-HE4 Class M2, 5.7681% 8/15/33 (d) | | $ | | 5,695,000 | | $ | | 5,779,144 |
| Series 2003-HE5 Class A2A, 4.1281% 8/15/33 (d) | | | | 347,110 | | | | 347,153 |
| Series 2003-HE6 Class M1, 4.48% 11/25/33 (d) | | | | 3,475,000 | | | | 3,497,595 |
| Series 2004-HE2 Class M1, 4.38% 4/25/34 (d) | | | | 6,060,000 | | | | 6,083,075 |
| Series 2004-HE3: | | | | | | | | |
| Class M1, 4.37% 6/25/34 (d) | | | | 1,450,000 | | | | 1,457,158 |
| Class M2, 4.95% 6/25/34 (d) | | | | 3,350,000 | | | | 3,391,294 |
| Series 2004-HE6 Class A2, 4.19% 6/25/34 (d) | | | | 15,110,414 | | | | 15,141,786 |
| Series 2005-HE2: | | | | | | | | |
| Class M1, 4.28% 3/25/35 (d) | | | | 8,250,000 | | | | 8,259,768 |
| Class M2, 4.33% 3/25/35 (d) | | | | 2,065,000 | | | | 2,070,757 |
| Series 2005-HE3 Class A4, 4.03% 4/25/35 (d) | | | | 11,650,000 | | | | 11,649,725 |
| Series 2005-HE6 Class A2B, 4.08% 7/25/35 (d) | | | | 10,000,000 | | | | 10,009,980 |
| Bank One Issuance Trust: | | | | | | | | |
| Series 2002-B1 Class B1, 4.1481% 12/15/09 (d) | | | | 20,655,000 | | | | 20,734,158 |
| Series 2002-B3 Class B, 4.1281% 8/15/08 (d) | | | | 14,500,000 | | | | 14,503,495 |
| Series 2002-C1 Class C1, 4.7281% 12/15/09 (d) | | | | 7,980,000 | | | | 8,063,633 |
| Series 2003-C4 Class C4, 4.7981% 2/15/11 (d) | | | | 14,910,000 | | | | 15,197,991 |
| Bayview Financial Acquisition Trust Series 2004-C | | | | | | | | |
| Class A1, 4.2575% 5/28/44 (d) | | | | 7,735,211 | | | | 7,751,217 |
| Bayview Financial Asset Trust Series 2003-F Class A, | | | | | | | | |
| 4.3375% 9/28/43 (d) | | | | 9,005,591 | | | | 9,025,757 |
| Bayview Financial Mortgage Loan Trust Series 2004-A Class | | | | | | | | |
| A, 4.2875% 2/28/44 (d) | | | | 5,177,035 | | | | 5,186,096 |
| Bear Stearns Asset Backed Securities, Inc. Series 2005-3 | | | | | | | | |
| Class A1, 4.28% 9/25/35 (d) | | | | 4,051,990 | | | | 4,051,990 |
| Bear Stearns Asset Backed Securities I: | | | | | | | | |
| Series 2005-HE2: | | | | | | | | |
| Class M1, 4.33% 2/25/35 (d) | | | | 6,655,000 | | | | 6,657,302 |
| Class M2, 4.58% 2/25/35 (d) | | | | 2,430,000 | | | | 2,438,309 |
| Series 2005-HE5 Class 1A1, 3.94% 6/25/35 (d) | | | | 9,315,999 | | | | 9,314,540 |
| Capital Auto Receivables Asset Trust: | | | | | | | | |
| Series 2002-5 Class B, 2.8% 4/15/08 | | | | 2,439,941 | | | | 2,415,147 |
| Series 2003-1 Class B, 4.2381% 6/15/10 (a)(d) | | | | 4,946,375 | | | | 4,959,105 |
| Series 2003-2 Class B, 4.0481% 1/15/09 (d) | | | | 2,369,381 | | | | 2,373,293 |
| Series 2005-1 Class B, 4.1431% 6/15/10 (d) | | | | 5,725,000 | | | | 5,757,133 |
| Capital One Auto Finance Trust: | | | | | | | | |
| Series 2003-A Class A4B, 4.0481% 1/15/10 (d) | | | | 9,630,000 | | | | 9,651,642 |
| Series 2004-B Class A4, 3.8781% 8/15/11 (d) | | | | 16,300,000 | | | | 16,304,722 |
63 Annual Report
| Investments (Unaudited) continued | | | | | | | | |
| |
Asset Backed Securities continued
| | | | | | | | |
| | | | | | | Principal | | | | Value |
| | | | | | | Amount | | | | |
| Capital One Master Trust: | | | | | | | | | | |
| Series 1999-3 Class B, 4.2481% 9/15/09 (d) | | $ | | 5,000,000 | | $ | | 5,001,993 |
| Series 2001-1 Class B, 4.2781% 12/15/10 (d) | | | | 19,500,000 | | | | 19,636,007 |
| Series 2001-8A Class B, 4.3181% 8/17/09 (d) | | | | 9,585,000 | | | | 9,627,823 |
| Series 2002-4A Class B, 4.2681% 3/15/10 (d) | | | | 6,000,000 | | | | 6,026,994 |
| Capital One Multi-Asset Execution Trust Series 2003-B1 Class | | | | | | | | |
| B1, 4.9381% 2/17/09 (d) | | | | | | 15,470,000 | | | | 15,540,698 |
| Capital Trust Ltd. Series 2004-1: | | | | | | | | | | |
| Class A2, 4.2463% 7/20/39 (a)(d) | | | | 2,968,000 | | | | 2,974,368 |
| Class B, 4.5463% 7/20/39 (a)(d) | | | | | | 1,550,000 | | | | 1,553,325 |
| Class C, 4.8963% 7/20/39 (a)(d) | | | | | | 1,994,000 | | | | 1,998,276 |
| CDC Mortgage Capital Trust: | | | | | | | | | | |
| Series 2001-HE1 Class M1, 4.86% 1/25/32 (d) | | | | 3,470,154 | | | | 3,471,347 |
| Series 2002-HE2 Class M1, 4.53% 1/25/33 (d) | | | | 9,278,431 | | | | 9,305,483 |
| Series 2002-HE3: | | | | | | | | | | |
| Class M1, 4.93% 3/25/33 (d) | | | | | | 21,339,884 | | | | 21,583,539 |
| Class M2, 5.8913% 3/25/33 (d) | | | | 9,968,976 | | | | 10,111,477 |
| Series 2003-HE1: | | | | | | | | | | |
| Class M1, 4.5413% 8/25/33 (d) | | | | 1,907,142 | | | | 1,913,922 |
| Class M2, 5.5913% 8/25/33 (d) | | | | 4,369,996 | | | | 4,416,852 |
| Series 2003-HE2 Class A, 3.9913% 10/25/33 (d) | | | | 1,011,328 | | | | 1,011,776 |
| Series 2003-HE3: | | | | | | | | | | |
| Class M1, 4.53% 11/25/33 (d) | | | | | | 2,254,989 | | | | 2,275,897 |
| Class M2, 5.58% 11/25/33 (d) | | | | | | 1,719,992 | | | | 1,749,395 |
| Series 2004-HE2 Class M2, 5.03% 7/26/34 (d) | | | | 2,345,000 | | | | 2,366,343 |
| Cendant Timeshare Receivables Funding LLC Series 2005 1A | | | | | | | | |
| Class 2A2, 3.9763% 5/20/17 (a)(d) | | | | 9,256,185 | | | | 9,256,185 |
| Chase Credit Card Owner Trust: | | | | | | | | | | |
| Series 2001-6 Class B, 4.2481% 3/16/09 (d) | | | | 1,305,000 | | | | 1,310,645 |
| Series 2002-6 Class B, 4.1181% 1/15/08 (d) | | | | 11,850,000 | | | | 11,850,281 |
| Series 2003-6 Class C, 4.5681% 2/15/11 (d) | | | | 16,400,000 | | | | 16,641,039 |
| Series 2004-1 Class B, 3.9681% 5/15/09 (d) | | | | 4,105,000 | | | | 4,104,601 |
| Citibank Credit Card Issuance Trust: | | | | | | | | | | |
| Series 2000-C2 Class C2, 4.2488% 10/15/07 (d) | | | | 17,500,000 | | | | 17,499,286 |
| Series 2001-B2 Class B2, 4.3038% 12/10/08 (d) | | | | 11,945,000 | | | | 11,995,489 |
| Series 2002-B1 Class B1, 4.2906% 6/25/09 (d) | | | | 9,010,000 | | | | 9,041,853 |
| Series 2002-C1 Class C1, 4.7369% 2/9/09 (d) | | | | 17,500,000 | | | | 17,675,320 |
| Series 2003-B1 Class B1, 4.0763% 3/7/08 (d) | | | | 25,000,000 | | | | 25,035,435 |
| Series 2003-C1 Class C1, 4.65% 4/7/10 (d) | | | | 17,785,000 | | | | 18,159,908 |
| Citigroup Mortgage Loan Trust Series 2003-HE4 | | | | | | | | |
| Class A, 4.24% 12/25/33 (a)(d) | | | | | | 7,601,624 | | | | 7,602,413 |
| CNH Wholesale Master Note Trust Series 2005-1: | | | | | | | | |
| Class A, 3.8781% 6/15/11 (d) | | | | | | 18,000,000 | | | | 17,997,386 |
| |
| |
| Annual Report | | 64 | | | | | | | | |
Asset Backed Securities continued
| | | | | | |
| | | | | Principal | | Value |
| | | | | Amount | | |
| CNH Wholesale Master Note Trust Series 2005-1: - | | | | | | |
| continued | | | | | | |
| Class B, 4.1681% 6/15/11 (d) | | $ | | 2,280,000 | | $ 2,279,668 |
| Countrywide Home Loans, Inc.: | | | | | | |
| Series 2002-6 Class AV1, 4.26% 5/25/33 (d) | | | | 1,255,649 | | 1,258,682 |
| Series 2003-BC1 Class M2, 5.83% 9/25/32 (d) | | | | 11,065,000 | | 11,184,059 |
| Series 2003-SD3 Class A1, 4.25% 12/25/32 (a)(d) | | | | 752,994 | | 756,713 |
| Series 2004-2 Class M1, 4.33% 5/25/34 (d) | | | | 5,200,000 | | 5,209,564 |
| Series 2004-3: | | | | | | |
| Class 3A4, 4.08% 8/25/34 (d) | | | | 445,702 | | 444,067 |
| Class M1, 4.33% 6/25/34 (d) | | | | 1,475,000 | | 1,476,401 |
| Series 2004-4: | | | | | | |
| Class A, 4.2% 8/25/34 (d) | | | | 2,130,303 | | 2,132,323 |
| Class M1, 4.31% 7/25/34 (d) | | | | 3,650,000 | | 3,660,809 |
| Class M2, 4.36% 6/25/34 (d) | | | | 4,395,000 | | 4,399,618 |
| Series 2005-1: | | | | | | |
| Class 1AV2, 4.03% 7/25/35 (d) | | | | 8,780,000 | | 8,777,753 |
| Class M1, 4.25% 8/25/35 (d) | | | | 19,600,000 | | 19,586,004 |
| Class MV1, 4.23% 7/25/35 (d) | | | | 3,135,000 | | 3,133,802 |
| Class MV2, 4.27% 7/25/35 (d) | | | | 3,765,000 | | 3,762,360 |
| Class MV3, 4.31% 7/25/35 (d) | | | | 1,560,000 | | 1,561,512 |
| Series 2005-3 Class MV1, 4.25% 8/25/35 (d) | | | | 11,125,000 | | 11,116,813 |
| Series 2005-AB1 Class A2, 4.04% 8/25/35 (d) | | | | 17,520,000 | | 17,515,387 |
| Series 2005-BC1 Class 2A2, 4.03% 5/25/35 (d) | | | | 8,375,000 | | 8,376,323 |
| Series 2005-IM1 Class A1, 3.96% 11/25/35 (d) | | | | 16,452,556 | | 16,453,841 |
| CS First Boston Mortgage Securities Corp.: | | | | | | |
| Series 2003-8 Class A2, 4.22% 4/25/34 (d) | | | | 2,207,328 | | 2,216,663 |
| Series 2004-FRE1: | | | | | | |
| Class A2, 4.18% 4/25/34 (d) | | | | 1,945,674 | | 1,945,630 |
| Class M3, 4.48% 4/25/34 (d) | | | | 5,885,000 | | 5,884,847 |
| Discover Card Master Trust I Series 2003-4 Class B1, | | | | | | |
| 4.0981% 5/16/11 (d) | | | | 8,155,000 | | 8,200,894 |
| Fannie Mae guaranteed REMIC pass thru certificates Series | | | | | | |
| 2004-T5 Class AB3, 4.222% 5/28/35 (d) | | | | 5,382,969 | | 5,384,840 |
| Fieldstone Mortgage Investment Corp.: | | | | | | |
| Series 2003-1: | | | | | | |
| Class M1, 4.51% 11/25/33 (d) | | | | 1,300,000 | | 1,311,510 |
| Class M2, 5.58% 11/25/33 (d) | | | | 700,000 | | 718,059 |
| Series 2004-1 Class M2, 4.93% 1/25/35 (d) | | | | 3,700,000 | | 3,743,249 |
| Series 2004-2 Class M2, 4.98% 7/25/34 (d) | | | | 9,890,000 | | 9,889,746 |
| Series 2004-3 Class M5, 5.28% 8/25/34 (d) | | | | 2,000,000 | | 2,035,525 |
| Series 2005-2 Class 2A1, 3.95% 7/25/36 (d) | | | | 16,387,547 | | 16,385,833 |
| |
| |
| |
| 65 | | | | | | Annual Report |
| Investments (Unaudited) continued | | | | | | | | |
| |
Asset Backed Securities continued
| | | | | | | | |
| | | | | Principal | | | | Value |
| | | | | Amount | | | | |
| First Franklin Mortgage Loan Asset Backed Certificates: | | | | | | | | |
| Series 2005-FF2 Class A2A, 3.92% 3/25/35 (d) | | $ | | 6,441,811 | | $ | | 6,442,575 |
| Series 2005-FF2 Class M6, 4.53% 3/25/35 (d) | | | | 6,950,000 | | | | 6,966,453 |
| First Franklin Mortgage Loan Trust Series 2004-FF2: | | | | | | | | |
| Class M3, 4.38% 3/25/34 (d) | | | | 400,000 | | | | 400,662 |
| Class M4, 4.73% 3/25/34 (d) | | | | 300,000 | | | | 302,870 |
| First USA Credit Card Master Trust Series 2001-4 Class B, | | | | | | | | |
| 4.1281% 1/12/09 (d) | | | | 15,000,000 | | | | 15,017,273 |
| First USA Secured Note Trust Series 2001-3 Class C, | | | | | | | | |
| 4.8394% 11/19/08 (a)(d) | | | | 11,580,000 | | | | 11,661,421 |
| Ford Credit Auto Owner Trust Series 2003-B Class B2, | | | | | | | | |
| 4.1981% 10/15/07 (d) | | | | 19,600,000 | | | | 19,672,465 |
| Ford Credit Floorplan Master Owner Trust Series 2005 1: | | | | | | | | |
| Class A, 3.9181% 5/17/10 (d) | | | | 9,590,000 | | | | 9,586,223 |
| Class B, 4.2081% 5/17/10 (d) | | | | 2,625,000 | | | | 2,623,968 |
| Fremont Home Loan Trust: | | | | | | | | |
| Series 2004-1: | | | | | | | | |
| Class 1A1, 4.05% 2/25/34 (d) | | | | 2,196,026 | | | | 2,197,373 |
| Class M1, 4.28% 2/25/34 (d) | | | | 750,000 | | | | 750,227 |
| Class M2, 4.33% 2/25/34 (d) | | | | 800,000 | | | | 800,745 |
| Series 2004-C Class 2A2, 4.38% 8/25/34 (d) | | | | 10,000,000 | | | | 10,060,514 |
| Series 2004-D Class 3A2, 4.11% 11/25/34 (d) | | | | 2,153,210 | | | | 2,158,681 |
| Series 2005-2 Class 2A1, 3.94% 6/25/35 (d) | | | | 14,216,532 | | | | 14,212,883 |
| Series 2005 A: | | | | | | | | |
| Class 2A2, 4.07% 2/25/35 (d) | | | | 11,850,000 | | | | 11,862,896 |
| Class M1, 4.26% 1/25/35 (d) | | | | 1,603,000 | | | | 1,608,402 |
| Class M2, 4.29% 1/25/35 (d) | | | | 2,325,000 | | | | 2,326,557 |
| Class M3, 4.32% 1/25/35 (d) | | | | 1,250,000 | | | | 1,252,900 |
| Class M4, 4.51% 1/25/35 (d) | | | | 925,000 | | | | 931,377 |
| GE Business Loan Trust Series 2003-1 Class A, 4.1981% | | | | | | | | |
| 4/15/31 (a)(d) | | | | 5,238,178 | | | | 5,267,176 |
| GE Capital Credit Card Master Note Trust Series 2005-2 | | | | | | | | |
| Class B, 3.9681% 6/15/11 (d) | | | | 6,475,000 | | | | 6,474,059 |
| Gracechurch Card Funding No. 9 PLC Series 2005-2: | | | | | | | | |
| Class B, 3.9818% 9/15/10 (d) | | | | 3,560,000 | | | | 3,560,000 |
| Class C, 4.1418% 9/15/10 (d) | | | | 13,000,000 | | | | 13,000,000 |
| Gracechurch Card Funding PLC: | | | | | | | | |
| Series 5: | | | | | | | | |
| Class B, 3.9981% 8/15/08 (d) | | | | 1,520,000 | | | | 1,520,806 |
| Class C, 4.6981% 8/15/08 (d) | | | | 5,580,000 | | | | 5,600,379 |
| Series 6 Class B, 3.9581% 2/17/09 (d) | | | | 1,030,000 | | | | 1,030,878 |
| Series 8 Class C, 4.0981% 6/15/10 (d) | | | | 18,450,000 | | | | 18,485,634 |
Asset Backed Securities continued
| | | | | | |
| | | | | Principal | | Value |
| | | | | Amount | | |
| GSAMP Trust: | | | | | | |
| Series 2002-HE Class M1, 5.0463% 11/20/32 (d) | | $ | | 2,882,888 | | $ 2,926,670 |
| Series 2002-NC1: | | | | | | |
| Class A2, 4.15% 7/25/32 (d) | | | | 54,777 | | 55,120 |
| Class M1, 4.47% 7/25/32 (d) | | | | 8,861,000 | | 8,942,540 |
| Series 2003-FM1 Class M1, 4.6163% 3/20/33 (d) | | | | 15,000,000 | | 15,157,449 |
| Series 2004-FM1: | | | | | | |
| Class M1, 4.48% 11/25/33 (d) | | | | 2,865,000 | | 2,864,925 |
| Class M2, 5.23% 11/25/33 (d) | | | | 1,975,000 | | 2,008,385 |
| Series 2004-FM2: | | | | | | |
| Class M1, 4.33% 1/25/34 (d) | | | | 3,500,000 | | 3,499,910 |
| Class M2, 4.93% 1/25/34 (d) | | | | 1,500,000 | | 1,499,961 |
| Class M3, 5.13% 1/25/34 (d) | | | | 1,500,000 | | 1,499,961 |
| Series 2004-HE1: | | | | | | |
| Class M1, 4.38% 5/25/34 (d) | | | | 4,045,000 | | 4,044,896 |
| Class M2, 4.98% 5/25/34 (d) | | | | 1,750,000 | | 1,765,219 |
| Series 2005-9 Class 2A1, 3.95% 8/25/35 (d) | | | | 16,206,183 | | 16,206,183 |
| Series 2005-FF2 Class M5, 4.46% 3/25/35 (d) | | | | 3,500,000 | | 3,506,922 |
| Series 2005-HE2 Class M, 4.26% 3/25/35 (d) | | | | 8,780,000 | | 8,776,221 |
| Series 2005-NC1 Class M1, 4.28% 2/25/35 (d) | | | | 9,010,000 | | 9,013,305 |
| Guggenheim Structured Real Estate Funding Ltd. | | | | | | |
| Series 2005-1 Class C, 4.91% 5/25/30 (a)(d) | | | | 14,000,000 | | 13,987,145 |
| HSBC Home Equity Loan Trust Series 2005-2: | | | | | | |
| Class M1, 4.2563% 1/20/35 (d) | | | | 2,914,233 | | 2,914,529 |
| Class M2, 4.2863% 1/20/35 (d) | | | | 2,182,286 | | 2,182,488 |
| Home Equity Asset Trust: | | | | | | |
| Series 2002-2 Class M1, 4.63% 6/25/32 (d) | | | | 10,000,000 | | 10,011,960 |
| Series 2002-3 Class A5, 4.27% 2/25/33 (d) | | | | 2,763 | | 2,767 |
| Series 2002-5: | | | | | | |
| Class A3, 4.35% 5/25/33 (d) | | | | 1,901,156 | | 1,905,789 |
| Class M1, 5.03% 5/25/33 (d) | | | | 13,800,000 | | 13,948,517 |
| Series 2003-1: | | | | | | |
| Class A2, 4.3% 6/25/33 (d) | | | | 3,368,416 | | 3,370,517 |
| Class M1, 4.83% 6/25/33 (d) | | | | 8,335,000 | | 8,371,945 |
| Series 2003-2: | �� | | | | | |
| Class A2, 4.21% 8/25/33 (d) | | | | 159,893 | | 160,447 |
| Class M1, 4.71% 8/25/33 (d) | | | | 2,245,000 | | 2,271,910 |
| Series 2003-3: | | | | | | |
| Class A2, 4.19% 8/25/33 (d) | | | | 1,245,521 | | 1,250,195 |
| Class M1, 4.69% 8/25/33 (d) | | | | 8,185,000 | | 8,277,490 |
| Series 2003-4: | | | | | | |
| Class M1, 4.4413% 10/25/33 (d) | | | | 3,415,000 | | 3,437,752 |
| |
| |
| |
| 67 | | | | | | Annual Report |
| Investments (Unaudited) continued | | | | | | | | |
| |
Asset Backed Securities continued
| | | | | | | | |
| | | | | | | Principal | | | | Value |
| | | | | | | Amount | | | | |
| Home Equity Asset Trust: – continued | | | | | | | | | | |
| Series 2003-4: | | | | | | | | | | |
| Class M2, 5.5413% 10/25/33 (d) | | $ | | 4,040,000 | | $ | | 4,087,070 |
| Series 2003-5: | | | | | | | | | | |
| Class A2, 4.18% 12/25/33 (d) | | | | | | 3,793,784 | | | | 3,806,470 |
| Class M1, 4.53% 12/25/33 (d) | | | | | | 3,175,000 | | | | 3,197,905 |
| Class M2, 5.56% 12/25/33 (d) | | | | | | 1,345,000 | | | | 1,376,130 |
| Series 2003-7 Class A2, 4.21% 3/25/34 (d) | | | | 2,866,529 | | | | 2,872,858 |
| Series 2004-2 Class A2, 4.12% 7/25/34 (d) | | | | 5,111,457 | | | | 5,111,384 |
| Series 2004-3: | | | | | | | | | | |
| Class M1, 4.4% 8/25/34 (d) | | | | | | 2,015,000 | | | | 2,023,738 |
| Class M2, 5.03% 8/25/34 (d) | | | | | | 2,200,000 | | | | 2,239,606 |
| Series 2004-4 Class A2, 4.15% 10/25/34 (d) | | | | 7,288,824 | | | | 7,313,693 |
| Series 2004-6 Class A2, 4.18% 12/25/34 (d) | | | | 8,069,368 | | | | 8,094,037 |
| Series 2004-7 Class A3, 4.22% 1/25/35 (d) | | | | 2,551,011 | | | | 2,562,040 |
| Series 2005-1: | | | | | | | | | | |
| Class M1, 4.26% 5/25/35 (d) | | | | | | 9,705,000 | | | | 9,708,301 |
| Class M2, 4.28% 5/25/35 (d) | | | | | | 5,780,000 | | | | 5,775,826 |
| Class M3, 4.33% 5/25/35 (d) | | | | | | 5,825,000 | | | | 5,820,912 |
| Series 2005-2: | | | | | | | | | | |
| Class 2A2, 4.03% 7/25/35 (d) | | | | | | 13,170,000 | | | | 13,169,687 |
| Class M1, 4.28% 7/25/35 (d) | | | | | | 10,085,000 | | | | 10,084,736 |
| Series 2005-3 Class M1, 4.24% 8/25/35 (d) | | | | 9,450,000 | | | | 9,442,313 |
| Series 2005-5 Class 2A2, 4.08% 11/25/35 (d) | | | | 15,000,000 | | | | 15,024,030 |
| Household Affinity Credit Card Master Note Trust I | | | | | | | | |
| Series 2003-3 Class B, 4.0581% 8/15/08 (d) | | | | 10,000,000 | | | | 10,012,255 |
| Household Credit Card Master Trust I Series 2002-1 Class B, | | | | | | | | |
| 4.4181% 7/15/08 (d) | | | | | | 22,589,000 | | | | 22,592,725 |
| Household Home Equity Loan Trust: | | | | | | | | | | |
| Series 2002-2 Class A, 4.0963% 4/20/32 (d) | | | | 3,046,635 | | | | 3,047,537 |
| Series 2002-3 Class A, 4.2463% 7/20/32 (d) | | | | 2,468,824 | | | | 2,470,761 |
| Series 2003-1 Class M, 4.4263% 10/20/32 (d) | | | | 686,032 | | | | 686,682 |
| Series 2003-2: | | | | | | | | | | |
| Class A, 4.1263% 9/20/33 (d) | | | | | | 2,534,598 | | | | 2,539,076 |
| Class M, 4.3763% 9/20/33 (d) | | | | | | 1,191,893 | | | | 1,194,376 |
| Series 2004-1 Class M, 4.3163% 9/20/33 (d) | | | | 2,389,256 | | | | 2,393,972 |
| Household Mortgage Loan Trust: | | | | | | | | | | |
| Series 2003-HC1 Class M, 4.4463% 2/20/33 (d) | | | | 1,500,530 | | | | 1,505,086 |
| Series 2004-HC1: | | | | | | | | | | |
| Class A, 4.1463% 2/20/34 (d) | | | | | | 4,182,768 | | | | 4,193,747 |
| Class M, 4.2963% 2/20/34 (d) | | | | | | 2,528,917 | | | | 2,530,110 |
| Household Private Label Credit Card Master Note Trust I: | | | | | | | | |
| Series 2002-1 Class B, 4.3181% 1/18/11 (d) | | | | 8,850,000 | | | | 8,865,532 |
| |
| |
| Annual Report | | 68 | | | | | | | | |
Asset Backed Securities continued
| | | | | | |
| | | | | Principal | | Value |
| | | | | Amount | | |
| Household Private Label Credit Card Master Note Trust I: – | | | | | | |
| continued | | | | | | |
| Series 2002-2: | | | | | | |
| Class A, 3.9381% 1/18/11 (d) | | $ | | 9,000,000 | | $ 9,010,691 |
| Class B, 4.3181% 1/18/11 (d) | | | | 14,275,000 | | 14,347,032 |
| Series 2002-3 Class B, 5.0181% 9/15/09 (d) | | | | 4,150,000 | | 4,153,962 |
| Ikon Receivables Funding LLC Series 2003-1 Class A3A, | | | | | | |
| 4.0081% 12/17/07 (d) | | | | 2,012,271 | | 2,012,612 |
| IXIS Real Estate Capital Trust Series 2005-HE1: | | | | | | |
| Class A1, 4.08% 6/25/35 (d) | | | | 10,270,940 | | 10,270,696 |
| Class M1, 4.3% 6/25/35 (d) | | | | 4,100,000 | | 4,098,296 |
| Class M2, 4.32% 6/25/35 (d) | | | | 2,775,000 | | 2,773,872 |
| Class M3, 4.35% 6/25/35 (d) | | | | 1,975,000 | | 1,977,174 |
| Keycorp Student Loan Trust Series 1999-A Class A2, 4.34% | | | | | | |
| 12/27/09 (d) | | | | 14,973,894 | | 15,030,475 |
| Long Beach Mortgage Loan Trust: | | | | | | |
| Series 2003-2: | | | | | | |
| Class AV, 4.15% 6/25/33 (d) | | | | 124,347 | | 124,374 |
| Class M1, 4.65% 6/25/33 (d) | | | | 19,500,000 | | 19,585,995 |
| Series 2003-3 Class M1, 4.3913% 7/25/33 (d) | | | | 7,770,000 | | 7,819,867 |
| Series 2004-2: | | | | | | |
| Class M1, 4.36% 6/25/34 (d) | | | | 4,275,000 | | 4,284,930 |
| Class M2, 4.91% 6/25/34 (d) | | | | 1,400,000 | | 1,415,675 |
| Series 2005-2 Class 2A2, 4.01% 4/25/35 (d) | | | | 12,000,000 | | 12,003,775 |
| MASTR Asset Backed Securities Trust: | | | | | | |
| Series 2003-NC1: | | | | | | |
| Class M1, 4.56% 4/25/33 (d) | | | | 3,500,000 | | 3,520,473 |
| Class M2, 5.68% 4/25/33 (d) | | | | 1,500,000 | | 1,531,476 |
| Series 2004-FRE1 Class M1, 4.38% 7/25/34 (d) | | | | 5,223,000 | | 5,243,096 |
| MBNA Asset Backed Note Trust Series 2000-K Class C, | | | | | | |
| 4.5681% 3/17/08 (a)(d) | | | | 7,250,000 | | 7,251,305 |
| MBNA Credit Card Master Note Trust: | | | | | | |
| Series 2001-B1 Class B1, 4.1431% 10/15/08 (d) | | | | 30,000,000 | | 30,032,436 |
| Series 2001-B2 Class B2, 4.1281% 1/15/09 (d) | | | | 30,353,000 | | 30,408,661 |
| Series 2002-B2 Class B2, 4.1481% 10/15/09 (d) | | | | 20,000,000 | | 20,080,518 |
| Series 2002-B4 Class B4, 4.2681% 3/15/10 (d) | | | | 14,800,000 | | 14,906,795 |
| Series 2003-B2 Class B2, 4.1581% 10/15/10 (d) | | | | 1,530,000 | | 1,544,849 |
| Series 2003-B3 Class B3, 4.1431% 1/18/11 (d) | | | | 1,130,000 | | 1,136,193 |
| Series 2003-B5 Class B5, 4.1381% 2/15/11 (d) | | | | 705,000 | | 710,072 |
| MBNA Master Credit Card Trust II: | | | | | | |
| Series 1998-E Class B, 3.9288% 9/15/10 (d) | | | | 7,800,000 | | 7,843,689 |
| Series 1998-G Class B, 4.1681% 2/17/09 (d) | | | | 20,000,000 | | 20,034,530 |
| |
| |
| |
| 69 | | | | | | Annual Report |
| Investments (Unaudited) continued | | | | | | | | |
| |
Asset Backed Securities continued
| | | | | | | | |
| | | | | | | Principal | | | | Value |
| | | | | | | Amount | | | | |
| Meritage Mortgage Loan Trust Series 2004-1: | | | | | | | | |
| Class M1, 4.33% 7/25/34 (d) | | | | $ | | 2,125,000 | | $ | | 2,124,946 |
| Class M2, 4.38% 7/25/34 (d) | | | | | | 375,000 | | | | 374,991 |
| Class M3, 4.78% 7/25/34 (d) | | | | | | 775,000 | | | | 774,980 |
| Class M4, 4.93% 7/25/34 (d) | | | | | | 525,000 | | | | 524,987 |
| Merrill Lynch Mortgage Investors, Inc. Series 2003-HE1 Class | | | | | | | | |
| M1, 4.53% 7/25/34 (d) | | | | | | 2,321,000 | | | | 2,334,630 |
| Morgan Stanley ABS Capital I, Inc.: | | | | | | | | | | |
| Series 2002-NC6 Class M2, 5.93% 11/25/32 (d) | | | | 2,370,000 | | | | 2,430,872 |
| Series 2003-NC5 Class M2, 5.83% 4/25/33 (d) | | | | 2,800,000 | | | | 2,827,761 |
| Series 2003-NC6 Class M2, 5.5913% 6/27/33 (d) | | | | 12,835,000 | | | | 13,193,861 |
| Series 2003-NC7 Class M1, 4.53% 6/25/33 (d) | | | | 1,785,000 | | | | 1,790,756 |
| Series 2003-NC8 Class M1, 4.53% 9/25/33 (d) | | | | 2,350,000 | | | | 2,380,069 |
| Series 2004-HE6 Class A2, 4.17% 8/25/34 (d) | | | | 6,065,683 | | | | 6,084,818 |
| Series 2004-NC2 Class M1, 4.38% 12/25/33 (d) | | | | 2,595,000 | | | | 2,604,510 |
| Series 2004-NC6 Class A2, 4.17% 7/25/34 (d) | | | | 2,716,074 | | | | 2,721,759 |
| Series 2005-1: | | | | | | | | | | |
| Class M2, 4.3% 12/25/34 (d) | | | | | | 4,425,000 | | | | 4,429,882 |
| Class M3, 4.35% 12/25/34 (d) | | | | | | 4,000,000 | | | | 4,007,356 |
| Series 2005-HE1: | | | | | | | | | | |
| Class A3B, 4.05% 12/25/34 (d) | | | | | | 3,885,000 | | | | 3,889,760 |
| Class M1, 4.28% 12/25/34 (d) | | | | | | 1,100,000 | | | | 1,103,379 |
| Class M2, 4.3% 12/25/34 (d) | | | | | | 2,970,000 | | | | 2,974,441 |
| Series 2005-HE2: | | | | | | | | | | |
| Class M1, 4.23% 1/25/35 (d) | | | | | | 2,665,000 | | | | 2,673,338 |
| Class M2, 4.27% 1/25/35 (d) | | | | | | 1,900,000 | | | | 1,899,216 |
| Series 2005-NC1: | | | | | | | | | | |
| Class M1, 4.27% 1/25/35 (d) | | | | | | 2,425,000 | | | | 2,434,295 |
| Class M2, 4.3% 1/25/35 (d) | | | | | | 2,425,000 | | | | 2,427,680 |
| Class M3, 4.34% 1/25/35 (d) | | | | | | 2,425,000 | | | | 2,431,267 |
| Morgan Stanley Dean Witter Capital I Trust: | | | | | | | | |
| Series 2001-AM1: | | | | | | | | | | |
| Class M1, 4.68% 2/25/32 (d) | | | | | | 1,510,288 | | | | 1,511,306 |
| Class M2, 5.23% 2/25/32 (d) | | | | | | 5,305,979 | | | | 5,312,043 |
| Series 2001-NC4 Class M1, 4.83% 1/25/32 (d) | | | | 3,827,881 | | | | 3,838,780 |
| Series 2002-AM3 Class A3, 4.32% 2/25/33 (d) | | | | 992,554 | | | | 995,836 |
| Series 2002-HE1 Class M1, 4.43% 7/25/32 (d) | | | | 5,860,000 | | | | 5,893,166 |
| Series 2002-HE2 Class M1, 4.53% 8/25/32 (d) | | | | 9,925,000 | | | | 9,964,301 |
| Series 2002-NC3 Class A3, 4.17% 8/25/32 (d) | | | | 147,864 | | | | 148,113 |
| Series 2002-OP1 Class M1, 4.58% 9/25/32 (d) | | | | 3,894,745 | | | | 3,907,257 |
| Series 2003-NC1: | | | | | | | | | | |
| Class M1, 4.88% 11/25/32 (d) | | | | | | 2,391,382 | | | | 2,406,740 |
| Class M2, 5.88% 11/25/32 (d) | | | | | | 1,880,000 | | | | 1,897,592 |
| |
| |
| Annual Report | | 70 | | | | | | | | |
Asset Backed Securities continued
| | | | | | | | |
| | | | | Principal | | | | Value |
| | | | | Amount | | | | |
| New Century Home Equity Loan Trust: | | | | | | | | |
| Series 2003-2 Class M2, 5.83% 1/25/33 (d) | | $ | | 4,600,000 | | $ | | 4,665,213 |
| Series 2003-6 Class M1, 4.55% 1/25/34 (d) | | | | 5,180,000 | | | | 5,212,663 |
| Series 2005-1: | | | | | | | | |
| Class M1, 4.28% 3/25/35 (d) | | | | 4,395,000 | | | | 4,396,544 |
| Class M2, 4.31% 3/25/35 (d) | | | | 4,395,000 | | | | 4,396,491 |
| Class M3, 4.35% 3/25/35 (d) | | | | 2,120,000 | | | | 2,126,029 |
| Nissan Auto Lease Trust: | | | | | | | | |
| Series 2003-A Class A3A, 3.9081% 6/15/09 (d) | | | | 11,639,609 | | | | 11,648,579 |
| Series 2004-A Class A4A, 3.8381% 6/15/10 (d) | | | | 10,570,000 | | | | 10,581,156 |
| NovaStar Home Equity Loan Series 2004-1: | | | | | | | | |
| Class M1, 4.28% 6/25/34 (d) | | | | 1,450,000 | | | | 1,451,161 |
| Class M4, 4.805% 6/25/34 (d) | | | | 2,435,000 | | | | 2,444,337 |
| Ocala Funding LLC Series 2005-1A Class A, 5.2963% | | | | | | | | |
| 3/20/10 (a)(d) | | | | 3,675,000 | | | | 3,675,000 |
| Ownit Mortgage Loan Asset-Backed Certificates Series | | | | | | | | |
| 2005 3 Class A2A, 3.95% 6/25/36 (d) | | | | 14,975,059 | | | | 14,974,727 |
| Park Place Securities, Inc.: | | | | | | | | |
| Series 2004-WCW1: | | | | | | | | |
| Class M1, 4.46% 9/25/34 (d) | | | | 3,745,000 | | | | 3,767,310 |
| Class M2, 4.51% 9/25/34 (d) | | | | 1,755,000 | | | | 1,767,858 |
| Class M3, 5.08% 9/25/34 (d) | | | | 3,355,000 | | | | 3,402,867 |
| Class M4, 5.28% 9/25/34 (d) | | | | 4,700,000 | | | | 4,776,320 |
| Series 2004-WCW2 Class A2, 4.21% 10/25/34 (d) | | | | 6,455,574 | | | | 6,471,464 |
| Series 2005-WCH1: | | | | | | | | |
| Class A3B, 4.05% 1/25/35 (d) | | | | 2,775,000 | | | | 2,780,119 |
| Class M2, 4.35% 1/25/35 (d) | | | | 4,175,000 | | | | 4,178,114 |
| Class M3, 4.39% 1/25/35 (d) | | | | 3,290,000 | | | | 3,299,846 |
| Class M5, 4.71% 1/25/35 (d) | | | | 3,095,000 | | | | 3,111,984 |
| Series 2005-WHQ2 Class M7, 5.08% 5/25/35 (d) | | | | 5,950,000 | | | | 5,961,145 |
| People’s Choice Home Loan Securities Trust Series 2005 2: | | | | | | | | |
| Class A1, 3.94% 9/25/24 (d) | | | | 5,833,593 | | | | 5,834,512 |
| Class M4, 4.46% 5/25/35 (d) | | | | 6,000,000 | | | | 6,025,129 |
| Providian Gateway Master Trust Series 2002-B Class A, | | | | | | | | |
| 4.4681% 6/15/09 (a)(d) | | | | 15,000,000 | | | | 15,021,564 |
| Residental Asset Securities Corp.: | | | | | | | | |
| Series 2005-KS4 Class M2, 4.41% 5/25/35 (d) | | | | 1,040,000 | | | | 1,044,543 |
| Series 2005-KS7 Class A1, 3.93% 8/25/35 (d) | | | | 10,017,807 | | | | 10,017,586 |
| Residential Asset Mortgage Products, Inc. Series 2004-RS10 | | | | | | | | |
| Class MII2, 5.08% 10/25/34 (d) | | | | 5,500,000 | | | | 5,587,075 |
| Salomon Brothers Mortgage Securities VII, Inc. Series | | | | | | | | |
| 2003-HE1 Class A, 4.23% 4/25/33 (d) | | | | 632,314 | | | | 635,086 |
71 Annual Report
| Investments (Unaudited) continued | | | | | | |
| |
Asset Backed Securities continued
| | | | | | |
| | | | | | | Principal | | Value |
| | | | | | | Amount | | |
| Saxon Asset Securities Trust: | | | | | | | | |
| Series 2004-1 Class M1, 4.36% 3/25/35 (d) | | $ | | 4,415,000 | | $ 4,418,970 |
| Series 2004-2 Class MV1, 4.41% 8/25/35 (d) | | | | 4,495,000 | | 4,507,503 |
| Sears Credit Account Master Trust II: | | | | | | | | |
| Series 2001-1 Class B, 4.1931% 2/15/10 (d) | | | | 10,000,000 | | 9,990,039 |
| Series 2002-5 Class B, 5.0181% 11/17/09 (d) | | | | 30,000,000 | | 30,025,965 |
| Securitized Asset Backed Receivables LLC Trust | | | | | | |
| Series 2004-NC1 Class M1, 4.35% 2/25/34 (d) | | | | 2,910,000 | | 2,912,781 |
| Specialty Underwriting & Residential Finance | | | | | | |
| Series 2003-BC4 Class M1, 4.43% 11/25/34 (d) | | | | 1,810,000 | | 1,819,343 |
| Structured Asset Securities Corp. Series 2004-GEL1 Class A, | | | | |
| 4.19% 2/25/34 (d) | | | | | | 901,062 | | 901,041 |
| Superior Wholesale Inventory Financing Trust VII Series | | | | | | |
| 2003-A8 Class CTFS, 4.2181% 3/15/11 (a)(d) | | | | 10,835,000 | | 10,826,536 |
| Superior Wholesale Inventory Financing Trust XII Series | | | | | | |
| 2005-A12 Class C, 4.9681% 6/15/10 (d) | | | | 6,840,000 | | 6,849,450 |
| Terwin Mortgage Trust: | | | | | | | | |
| Series 2003-4HE Class A1, 4.26% 9/25/34 (d) | | | | 2,051,939 | | 2,062,554 |
| Series 2003-6HE Class A1, 4.3% 11/25/33 (d) | | | | 1,467,936 | | 1,471,055 |
| Series 2005-14HE Class AF1, 3.9753% 8/25/36 (d) | | | | 8,635,000 | | 8,634,326 |
| Series 2005-8HE Class A1, 3.95% 7/25/35 (a)(d) | | | | 6,932,173 | | 6,938,671 |
| TOTAL ASSET BACKED SECURITIES | | | | | | | | |
| (Cost $2,188,022,238) | | | | | | | | 2,194,887,925 |
| |
| Collateralized Mortgage Obligations 20.2% | | | | |
| |
| Private Sponsor – 13.8% | | | | | | | | |
| Adjustable Rate Mortgage Trust floater: | | | | | | | | |
| Series 2004-2 Class 7A3, 4.23% 2/25/35 (d) | | | | 8,271,247 | | 8,288,629 |
| Series 2004-4 Class 5A2, 4.23% 3/25/35 (d) | | | | 3,344,187 | | 3,351,688 |
| Series 2005-1 Class 5A2, 4.16% 5/25/35 (d) | | | | 5,517,368 | | 5,520,788 |
| Series 2005-10 Class 5A1, 4.101% 1/25/36 (d) | | | | 15,000,000 | | 15,000,000 |
| Series 2005-2: | | | | | | | | |
| Class 6A2, 4.11% 6/25/35 (d) | | | | | | 2,499,864 | | 2,501,436 |
| Class 6M2, 4.31% 6/25/35 (d) | | | | | | 10,145,000 | | 10,144,980 |
| Series 2005-3 Class 8A2, 4.07% 7/25/35 (d) | | | | 16,519,250 | | 16,529,773 |
| Series 2005-4 Class 7A2, 4.06% 8/25/35 (d) | | | | 8,125,015 | | 8,130,280 |
| Series 2005-8 Class 7A2, 4.11% 11/25/35 (d) | | | | 7,166,967 | | 7,168,085 |
| American Home Mortgage Investment Trust Series 2005-4 | | | | | | |
| Class 1A1, 4.18% 11/25/45 (d) | | | | | | 11,080,000 | | 11,080,000 |
| Bear Stearns Adjustable Rate Mortgage Trust Series 2005-6 | | | | |
| Class 1A1, 5.17% 8/25/35 (d) | | | | | | 17,862,312 | | 17,866,889 |
| |
| |
| |
| Annual Report | | 72 | | | | | | |
Collateralized Mortgage Obligations continued
| | |
| | | Principal | | Value |
| | | Amount | | |
| Private Sponsor continued | | | | |
| Bear Stearns Alt-A Trust floater: | | | | |
| Series 2005-1 Class A1, 4.11% 1/25/35 (d) | | $18,993,594 | | $ 19,005,465 |
| Series 2005-2 Class 1A1, 4.08% 3/25/35 (d) | | 13,521,981 | | 13,515,643 |
| Series 2005-5 Class 1A1, 4.05% 7/25/35 (d) | | 17,169,385 | | 17,155,972 |
| Countrywide Alternative Loan Trust planned amortization | | | | |
| class Series 2003-5T2 Class A2, 4.23% 5/25/33 (d) | | 5,006,668 | | 5,009,604 |
| CS First Boston Mortgage Securities Corp. floater: | | | | |
| Series 2004-AR2 Class 6A1, 4.23% 3/25/34 (d) | | 4,681,479 | | 4,678,694 |
| Series 2004-AR3 Class 6A2, 4.2% 4/25/34 (d) | | 1,948,417 | | 1,950,279 |
| Series 2004-AR4 Class 5A2, 4.2% 5/25/34 (d) | | 1,821,930 | | 1,820,850 |
| Series 2004-AR5 Class 11A2, 4.2% 6/25/34 (d) | | 2,698,314 | | 2,692,965 |
| Series 2004-AR6 Class 9A2, 4.2% 10/25/34 (d) | | 3,422,844 | | 3,424,695 |
| Series 2004-AR7 Class 6A2, 4.21% 8/25/34 (d) | | 4,894,739 | | 4,898,151 |
| Series 2004-AR8 Class 8A2, 4.21% 9/25/34 (d) | | 3,798,541 | | 3,805,156 |
| CWALT, Inc. floater Series 2005-56 Class 3A1, 4.2494% | | | | |
| 10/25/35 (d) | | 8,490,000 | | 8,490,000 |
| First Horizon Mortgage pass thru Trust floater Series | | | | |
| 2004-FL1 Class 2A1, 4.39% 12/25/34 (d) | | 3,472,618 | | 3,467,751 |
| Granite Master Issuer PLC: | | | | |
| floater: | | | | |
| Series 2005-1: | | | | |
| Class A3, 3.97% 12/21/24 (d) | | 5,300,000 | | 5,299,172 |
| Class B1, 4.02% 12/20/54 (d) | | 7,050,000 | | 7,047,797 |
| Class M1, 4.12% 12/20/54 (d) | | 5,300,000 | | 5,298,344 |
| Series 2005-2 Class C1, 4.39% 12/20/54 (d) | | 7,975,000 | | 7,972,508 |
| Series 2005-4 Class M2, 4.305% 12/20/54 (d) | | 6,500,000 | | 6,498,731 |
| Series 2005-4 Class C1, 4.455% 12/20/54 (d) | | 6,800,000 | | 6,798,672 |
| Granite Mortgages PLC floater: | | | | |
| Series 2004-1: | | | | |
| Class 1B, 4.1% 3/20/44 (d) | | 1,415,000 | | 1,415,442 |
| Class 1C, 4.79% 3/20/44 (d) | | 4,075,000 | | 4,089,008 |
| Class 1M, 4.3% 3/20/44 (d) | | 4,935,000 | | 4,939,627 |
| Series 2004-2: | | | | |
| Class 1A2, 3.96% 6/20/28 (d) | | 4,162,145 | | 4,162,145 |
| Class 1B, 4.06% 6/20/44 (d) | | 786,966 | | 787,059 |
| Class 1C, 4.59% 6/20/44 (d) | | 2,865,029 | | 2,869,506 |
| Class 1M, 4.17% 6/20/44 (d) | | 2,104,798 | | 2,104,240 |
| Series 2004-3: | | | | |
| Class 1B, 4.05% 9/20/44 (d) | | 2,100,000 | | 2,100,042 |
| Class 1C, 4.48% 9/20/44 (d) | | 5,415,000 | | 5,424,314 |
| Class 1M, 4.16% 9/20/44 (d) | | 1,200,000 | | 1,200,228 |
| |
| |
| |
| 73 | | | | Annual Report |
| Investments (Unaudited) continued | | | | | | |
| |
Collateralized Mortgage Obligations continued
| | | | |
| | | | | Principal | | | | Value |
| | | | | Amount | | | | |
| Private Sponsor continued | | | | | | | | |
| Harborview Mortgage Loan Trust floater Series 2005-2 | | | | | | |
| Class 2A1A, 4.0094% 5/19/35 (d) | | | | $11,231,269 | | $ | | 11,199,681 |
| Holmes Financing No. 7 PLC floater Series 2 Class M, | | | | | | |
| 4.3988% 7/15/40 (d) | | | | 2,560,000 | | | | 2,563,183 |
| Holmes Financing No. 8 PLC floater Series 2: | | | | | | |
| Class A, 3.6788% 4/15/11 (d) | | | | 25,000,000 | | | | 25,002,930 |
| Class B, 3.7688% 7/15/40 (d) | | | | 2,695,000 | | | | 2,696,264 |
| Class C, 4.3188% 7/15/40 (d) | | | | 10,280,000 | | | | 10,318,550 |
| Home Equity Asset Trust floater Series 2005-3 Class 2A1, | | | | | | |
| 3.92% 8/25/35 (d) | | | | 5,995,565 | | | | 5,996,642 |
| Homestar Mortgage Acceptance Corp. floater Series 2004-5 | | | | | | |
| Class A1, 4.28% 10/25/34 (d) | | | | 4,056,783 | | | | 4,068,310 |
| Impac CMB Trust: | | | | | | | | |
| floater: | | | | | | | | |
| Series 2004-11 Class 2A2, 4.2% 3/25/35 (d) | | 7,904,651 | | | | 7,903,107 |
| Series 2004-6 Class 1A2, 4.22% 10/25/34 (d) | | 3,065,340 | | | | 3,070,216 |
| Series 2005-1: | | | | | | | | |
| Class M1, 4.29% 4/25/35 (d) | | | | 3,028,498 | | | | 3,026,014 |
| Class M2, 4.33% 4/25/35 (d) | | | | 5,302,005 | | | | 5,298,691 |
| Class M3, 4.36% 4/25/35 (d) | | | | 1,300,974 | | | | 1,299,907 |
| Class M4, 4.58% 4/25/35 (d) | | | | 767,788 | | | | 768,718 |
| Class M5, 4.6% 4/25/35 (d) | | | | 767,788 | | | | 767,788 |
| Class M6, 4.65% 4/25/35 (d) | | | | 1,228,460 | | | | 1,228,460 |
| Series 2005-2 Class 1A2, 4.14% 4/25/35 (d) | | 12,453,621 | | | | 12,443,892 |
| Series 2005-3 Class A1, 4.07% 8/25/35 (d) | | 14,447,985 | | | | 14,423,717 |
| Series 2005-4 Class 1B1, 5.13% 5/25/35 (d) | | 4,978,738 | | | | 4,972,515 |
| Series 2005-6 Class 1M3, 4.44% 10/25/35 (d) | | 3,323,541 | | | | 3,323,557 |
| Series 2005-7: | | | | | | | | |
| Class M1, 4.208% 11/25/35 (d) | | | | 1,765,000 | | | | 1,765,000 |
| Class M2, 4.248% 11/25/35 (d) | | | | 1,325,000 | | | | 1,325,000 |
| Class M3, 4.348% 11/25/35 (d) | | | | 6,615,000 | | | | 6,615,000 |
| Lehman Structured Securities Corp. floater Series 2005-1 | | | | | | |
| Class A2, 4.22% 9/26/45 (a)(d) | | | | 15,180,141 | | | | 15,180,141 |
| MASTR Adjustable Rate Mortgages Trust: | | | | | | | | |
| floater Series 2005-1 Class 1A1, 4.1% 3/25/35 (d) | | 11,034,855 | | | | 11,047,023 |
| Series 2004-6 Class 4A2, 4.1657% 7/25/34 (d) | | 5,969,000 | | | | 5,946,443 |
| Merrill Lynch Mortgage Investors, Inc. floater: | | | | | | |
| Series 2003-A Class 2A1, 4.22% 3/25/28 (d) | | 7,093,116 | | | | 7,130,471 |
| Series 2003-B Class A1, 4.17% 4/25/28 (d) | | 7,213,924 | | | | 7,254,849 |
| Series 2003-D Class A, 4.14% 8/25/28 (d) | | 6,608,802 | | | | 6,619,465 |
| Series 2003-E Class A2, 4.3831% 10/25/28 (d) | | 9,116,686 | | | | 9,126,651 |
| Series 2003-F Class A2, 4.43% 10/25/28 (d) | | 11,828,156 | | | | 11,835,544 |
| |
| |
| Annual Report | | 74 | | | | | | |
Collateralized Mortgage Obligations continued
| | | | |
| | | Principal | | | | Value |
| | | Amount | | | | |
Private Sponsor continued
| | | | | | |
| Merrill Lynch Mortgage Investors, Inc. floater: - continued | | | | |
| Series 2004-A Class A2, 4.34% 4/25/29 (d) | | $10,025,427 | | $ | | 10,017,623 |
| Series 2004-B Class A2, 3.79% 6/25/29 (d) | | 7,905,839 | | | | 7,888,355 |
| Series 2004-C Class A2, 3.95% 7/25/29 (d) | | 11,598,172 | | | | 11,567,548 |
| Series 2004-D Class A2, 4.4131% 9/25/29 (d) | | 8,519,942 | | | | 8,524,812 |
| Series 2004-E: | | | | | | |
| Class A2B, 4.45% 11/25/29 (d) | | 7,561,387 | | | | 7,550,087 |
| Class A2D, 4.64% 11/25/29 (d) | | 1,758,462 | | | | 1,766,187 |
| Series 2004-G Class A2, 3.95% 11/25/29 (d) | | 3,530,484 | | | | 3,529,545 |
| Series 2005-A Class A2, 4.3031% 2/25/30 (d) | | 9,875,800 | | | | 9,882,274 |
| Mortgage Asset Backed Securities Trust floater Series | | | | | | |
| 2002-NC1 Class M1, 4.68% 10/25/32 (d) | | 3,128,220 | | | | 3,140,706 |
| MortgageIT Trust floater: | | | | | | |
| Series 2004-2: | | | | | | |
| Class A1, 4.2% 12/25/34 (d) | | 4,638,420 | | | | 4,648,806 |
| Class A2, 4.28% 12/25/34 (d) | | 6,275,019 | | | | 6,320,305 |
| Series 2005-2 Class 1A1, 4.1% 5/25/35 (d) | | 4,811,489 | | | | 4,814,744 |
| Opteum Mortgage Acceptance Corp. floater Series 2005-3 | | | | |
| Class APT, 4.12% 7/25/35 (d) | | 18,530,057 | | | | 18,540,914 |
| Permanent Financing No. 3 PLC floater Series 2 Class C, | | | | |
| 4.8838% 6/10/42 (d) | | 4,845,000 | | | | 4,893,450 |
| Permanent Financing No. 4 PLC floater Series 2 Class C, | | | | |
| 4.5538% 6/10/42 (d) | | 15,400,000 | | | | 15,474,437 |
| Permanent Financing No. 5 PLC floater: | | | | | | |
| Series 2 Class C, 4.4838% 6/10/42 (d) | | 4,215,000 | | | | 4,240,489 |
| Series 3 Class C, 4.6538% 6/10/42 (d) | | 8,890,000 | | | | 8,998,425 |
| Permanent Financing No. 6 PLC floater Series 6 Class 2C, | | | | |
| 4.2888% 6/10/42 (d) | | 5,350,000 | | | | 5,344,539 |
| Permanent Financing No. 7 PLC floater Series 7: | | | | | | |
| Class 1B, 3.9238% 6/10/42 (d) | | 2,000,000 | | | | 1,999,747 |
| Class 1C, 4.1138% 6/10/42 (d) | | 3,840,000 | | | | 3,849,303 |
| Class 2C, 4.1638% 6/10/42 (d) | | 8,065,000 | | | | 8,047,042 |
| Permanent Financing No. 8 PLC floater Series 8: | | | | | | |
| Class 1C, 4.1638% 6/10/42 (d) | | 7,165,000 | | | | 7,161,740 |
| Class 2C, 4.2338% 6/10/42 (d) | | 9,945,000 | | | | 9,940,465 |
| Residential Asset Mortgage Products, Inc.: | | | | | | |
| sequential pay Series 2003-SL1 Class 3A1, 7.125% | | | | |
| 4/25/31 | | 4,284,316 | | | | 4,353,251 |
| Series 2005-AR5 Class 1A1, 4.903% 9/19/35 (d) | | 5,016,521 | | | | 5,020,936 |
75 Annual Report
| Investments (Unaudited) continued | | | | | | |
| |
Collateralized Mortgage Obligations continued
| | | | |
| | | Principal | | | | Value |
| | | Amount | | | | |
Private Sponsor continued
| | | | | | |
| Residential Finance LP/Residential Finance Development | | | | | | |
| Corp. floater Series 2003-A: | | | | | | |
| Class B4, 5.5281% 3/10/35 (a)(d) | | $ 5,475,801 | | $ | | 5,557,938 |
| Class B5, 6.0781% 3/10/35 (a)(d) | | 5,666,940 | | | | 5,791,014 |
| Residential Funding Securities Corp.: | | | | | | |
| Series 2003-RP1 Class A1, 4.33% 11/25/34 (d) | | 2,387,142 | | | | 2,396,787 |
| Series 2003-RP2 Class A1, 4.28% 6/25/33 (a)(d) | | 3,567,765 | | | | 3,579,472 |
| Sequoia Mortgage Trust floater: | | | | | | |
| Series 2003-5 Class A2, 4.37% 9/20/33 (d) | | 9,869,908 | | | | 9,866,749 |
| Series 2003-7 Class A2, 3.835% 1/20/34 (d) | | 8,292,646 | | | | 8,287,744 |
| Series 2004-1 Class A, 4.15% 2/20/34 (d) | | 5,352,427 | | | | 5,344,162 |
| Series 2004-10 Class A4, 3.6681% 11/20/34 (d) | | 9,021,376 | | | | 9,016,217 |
| Series 2004-3 Class A, 3.5463% 5/20/34 (d) | | 9,243,861 | | | | 9,221,165 |
| Series 2004-4 Class A, 3.5881% 5/20/34 (d) | | 11,574,850 | | | | 11,560,488 |
| Series 2004-5 Class A3, 3.77% 6/20/34 (d) | | 7,745,333 | | | | 7,741,702 |
| Series 2004-6: | | | | | | |
| Class A3A, 4.3175% 6/20/35 (d) | | 6,761,373 | | | | 6,757,088 |
| Class A3B, 4.08% 7/20/34 (d) | | 845,172 | | | | 844,660 |
| Series 2004-7: | | | | | | |
| Class A3A, 4.365% 8/20/34 (d) | | 6,627,084 | | | | 6,622,167 |
| Class A3B, 4.59% 7/20/34 (d) | | 1,192,509 | | | | 1,195,319 |
| Series 2004-8 Class A2, 4.41% 9/20/34 (d) | | 11,824,016 | | | | 11,827,689 |
| Series 2005-1 Class A2, 4.1% 2/20/35 (d) | | 6,778,467 | | | | 6,773,241 |
| Series 2005-2 Class A2, 4.29% 3/20/35 (d) | | 11,841,861 | | | | 11,841,861 |
| Series 2005-3 Class A1, 3.9963% 5/20/35 (d) | | 8,335,848 | | | | 8,318,878 |
| Structured Adjustable Rate Mortgage Loan Trust floater | | | | | | |
| Series 2001-14 Class A1, 4.14% 7/25/35 (d) | | 10,719,814 | | | | 10,719,814 |
| Structured Asset Securities Corp. floater Series 2004-NP1 | | | | | | |
| Class A, 4.23% 9/25/33 (a)(d) | | 2,217,986 | | | | 2,219,280 |
| Thornburg Mortgage Securities Trust floater: | | | | | | |
| Series 2004-3 Class A, 4.2% 9/25/34 (d) | | 20,272,244 | | | | 20,312,652 |
| Series 2005-3 Class A4, 4.108% 8/25/45 (d) | | 17,180,000 | | | | 17,180,000 |
| WAMU Mortgage pass thru certificates: | | | | | | |
| floater: | | | | | | |
| Series 2005-AR11 Class A1C1, 4.03% 8/25/45 (d) | | 14,112,684 | | | | 14,112,684 |
| Series 2005 AR6 Class 2A 1A, 4.06% 4/25/45 (d) | | 5,975,614 | | | | 5,955,102 |
| Series 2005-AR13 Class A1C1, 4.2275% 10/25/45 (d) | | 23,000,000 | | | | 23,000,000 |
Collateralized Mortgage Obligations continued
| | | | |
| | | Principal | | | | Value |
| | | Amount | | | | |
Private Sponsor continued
| | | | | | |
| Wells Fargo Mortgage Backed Securities Trust: | | | | | | |
| Series 2004-M Class A3, 4.6963% 8/25/34 (d) | | $19,880,000 | | $ | | 19,778,179 |
| Series 2005-AR12 Class 2A1, 4.3223% 7/25/35 (d) | | 29,218,529 | | | | 28,883,740 |
| |
| TOTAL PRIVATE SPONSOR | | | | | | 919,943,859 |
| U.S. Government Agency 6.4% | | | | | | |
| Fannie Mae: | | | | | | |
| floater: | | | | | | |
| Series 2000-38 Class F, 4.2394% 11/18/30 (d) | | 1,056,182 | | | | 1,064,379 |
| Series 2000-40 Class FA, 4.32% 7/25/30 (d) | | 2,281,210 | | | | 2,291,156 |
| Series 2002-89 Class F, 4.13% 1/25/33 (d) | | 3,350,148 | | | | 3,355,218 |
| target amortization class Series G94-2 Class D, 6.45% | | | | | | |
| 1/25/24 | | 4,411,824 | | | | 4,499,998 |
| Fannie Mae guaranteed REMIC pass thru certificates: | | | | | | |
| floater: | | | | | | |
| Series 2001-34 Class FR, 4.1894% 8/18/31 (d) | | 2,367,009 | | | | 2,374,326 |
| Series 2001-44 Class FB, 4.13% 9/25/31 (d) | | 2,114,017 | | | | 2,120,062 |
| Series 2001-46 Class F, 4.1894% 9/18/31 (d) | | 6,088,369 | | | | 6,121,939 |
| Series 2002-11 Class QF, 4.32% 3/25/32 (d) | | 4,222,858 | | | | 4,259,537 |
| Series 2002-36 Class FT, 4.33% 6/25/32 (d) | | 1,422,268 | | | | 1,434,270 |
| Series 2002-64 Class FE, 4.1394% 10/18/32 (d) | | 2,093,663 | | | | 2,103,206 |
| Series 2002-65 Class FA, 4.13% 10/25/17 (d) | | 2,302,618 | | | | 2,306,533 |
| Series 2002-74 Class FV, 4.28% 11/25/32 (d) | | 7,876,453 | | | | 7,931,623 |
| Series 2003-11: | | | | | | |
| Class DF, 4.28% 2/25/33 (d) | | 2,877,518 | | | | 2,897,926 |
| Class EF, 4.28% 2/25/33 (d) | | 2,080,685 | | | | 2,088,534 |
| Series 2003-119 Class FK, 4.33% 5/25/18 (d) | | 2,500,000 | | | | 2,523,405 |
| Series 2003-15 Class WF, 4.18% 8/25/17 (d) | | 5,404,393 | | | | 5,425,600 |
| Series 2003-63 Class F1, 4.13% 11/25/27 (d) | | 5,763,648 | | | | 5,767,740 |
| Series 2005-45 Class XA, 4.17% 6/25/35 (d) | | 74,298,346 | | | | 74,267,779 |
| planned amortization class: | | | | | | |
| Series 1998-63 Class PG, 6% 3/25/27 | | 800,852 | | | | 799,909 |
| Series 2001-62 Class PG, 6.5% 10/25/30 | | 2,944,838 | | | | 2,948,170 |
| Series 2001-76 Class UB, 5.5% 10/25/13 | | 590,038 | | | | 589,350 |
| Series 2002-16 Class QD, 5.5% 6/25/14 | | 272,009 | | | | 272,519 |
| Series 2002-28 Class PJ, 6.5% 3/25/31 | | 3,732,778 | | | | 3,734,286 |
| Series 2002-8 Class PD, 6.5% 7/25/30 | | 2,442,173 | | | | 2,447,766 |
| Series 2005-72 Class FG, 4.08% 5/25/35 (d) | | 51,234,540 | | | | 51,079,581 |
77 Annual Report
| Investments (Unaudited) continued | | | | | | |
| |
Collateralized Mortgage Obligations continued
| | | | |
| | | Principal | | | | Value |
| | | Amount | | | | |
U.S. Government Agency continued
| | | | | | |
| Freddie Mac: | | | | | | |
| floater: | | | | | | |
| Series 2510 Class FE, 4.1681% 10/15/32 (d) | | $ 5,715,277 | | $ | | 5,746,827 |
| 0% 9/15/35 (d) | | 854,545 | | | | 828,909 |
| planned amortization class: | | | | | | |
| Series 2091 Class PP, 6% 2/15/27 | | 261,467 | | | | 261,106 |
| Series 2353 Class PC, 6.5% 9/15/15 | | 967,841 | | | | 969,335 |
| Freddie Mac Manufactured Housing participation certificates | | | | | | |
| guaranteed floater Series 2338 Class FJ, 3.9681% | | | | | | |
| 7/15/31 (d) | | 4,919,686 | | | | 4,918,386 |
| Freddie Mac Multi-class participation certificates guaranteed: | | | | | | |
| floater: | | | | | | |
| Series 2395 Class FA, 4.3681% 6/15/29 (d) | | 1,092,096 | | | | 1,099,242 |
| Series 2406: | | | | | | |
| Class FP, 4.7481% 1/15/32 (d) | | 10,270,000 | | | | 10,491,773 |
| Class PF, 4.7481% 12/15/31 (d) | | 8,125,000 | | | | 8,332,235 |
| Series 2410 Class PF, 4.7481% 2/15/32 (d) | | 18,644,444 | | | | 19,060,741 |
| Series 2474 Class FJ, 4.1181% 7/15/17 (d) | | 4,331,267 | | | | 4,353,673 |
| Series 2526 Class FC, 4.1681% 11/15/32 (d) | | 3,152,494 | | | | 3,162,233 |
| Series 2538 Class FB, 4.1681% 12/15/32 (d) | | 6,277,777 | | | | 6,315,699 |
| Series 2551 Class FH, 4.2181% 1/15/33 (d) | | 2,959,949 | | | | 2,972,585 |
| Series 2861 Class JF, 4.0681% 4/15/17 (d) | | 6,852,338 | | | | 6,850,151 |
| Series 2994 Class FB, 3.9181% 6/15/20 (d) | | 6,647,098 | | | | 6,631,097 |
| planned amortization class: | | | | | | |
| Series 2136 Class PE, 6% 1/15/28 | | 10,378,825 | | | | 10,418,016 |
| Series 2394 Class ND, 6% 6/15/27 | | 587,334 | | | | 587,187 |
| Series 2395 Class PE, 6% 2/15/30 | | 4,447,447 | | | | 4,468,111 |
| Series 2398 Class DK, 6.5% 1/15/31 | | 236,820 | | | | 236,922 |
| Series 2410 Class ML, 6.5% 12/15/30 | | 1,069,946 | | | | 1,072,088 |
| Series 2420 Class BE, 6.5% 12/15/30 | | 961,583 | | | | 961,848 |
| Series 2443 Class TD, 6.5% 10/15/30 | | 1,793,679 | | | | 1,798,791 |
| Series 2461 Class PG, 6.5% 1/15/31 | | 2,027,839 | | | | 2,050,146 |
| Series 2650 Class FV, 4.1681% 12/15/32 (d) | | 14,042,153 | | | | 14,060,363 |
| Series 2776 Class UJ, 4.5% 5/15/20 (e) | | 6,660,101 | | | | 345,325 |
| Series 2828 Class JA, 4.5% 1/15/10 | | 10,955,858 | | | | 10,959,149 |
| Series 3013 Class AF, 4.0181% 5/15/35 (d) | | 80,739,897 | | | | 80,382,844 |
| sequential pay Series 2430 Class ZE, 6.5% 8/15/27 | | 328,637 | | | | 328,381 |
| Ginnie Mae guaranteed REMIC pass thru securities floater: | | | | | | |
| Series 2001-46 Class FB, 4.1219% 5/16/23 (d) | | 2,819,644 | | | | 2,831,835 |
| Series 2001-50 Class FV, 3.9719% 9/16/27 (d) | | 8,689,581 | | | | 8,689,113 |
Collateralized Mortgage Obligations continued
| | |
| | | Principal | | Value |
| | | Amount | | |
| U.S. Government Agency continued | | | | |
| Ginnie Mae guaranteed REMIC pass thru securities floater: – | | | | |
| continued | | | | |
| Series 2002-24 Class FX, 4.3219% 4/16/32 (d) | | $ 2,453,441 | | $ 2,475,244 |
| Series 2002-31 Class FW, 4.1719% 6/16/31 (d) | | 3,364,460 | | 3,383,514 |
| Series 2002-5 Class KF, 4.1719% 8/16/26 (d) | | 474,812 | | 475,074 |
| |
| TOTAL U.S. GOVERNMENT AGENCY | | | | 422,222,755 |
| |
| TOTAL COLLATERALIZED MORTGAGE OBLIGATIONS | | | | |
| (Cost $1,343,654,425) | | | | 1,342,166,614 |
| |
| Commercial Mortgage Securities 5.4% | | | | |
| |
| Banc of America Large Loan, Inc. floater: | | | | |
| Series 2003-BBA2 Class A3, 4.0881% 11/15/15 (a)(d) | | 5,038,226 | | 5,042,678 |
| Series 2005-BBA6: | | | | |
| Class B, 3.9781% 1/15/19 (a)(d) | | 2,800,000 | | 2,799,998 |
| Class C, 4.0181% 1/15/19 (a)(d) | | 2,857,948 | | 2,857,946 |
| Class D, 4.07% 1/15/19 (a)(d) | | 2,800,000 | | 2,799,998 |
| Class E, 4.1081% 1/15/19 (a)(d) | | 1,750,000 | | 1,749,998 |
| Class F, 4.1581% 1/15/19 (a)(d) | | 1,170,000 | | 1,169,999 |
| Class G, 4.1881% 1/15/19 (a)(d) | | 915,000 | | 915,000 |
| Series 2005-BOCA: | | | | |
| Class H, 4.7181% 12/15/16 (a)(d) | | 2,065,000 | | 2,062,371 |
| Class J, 4.8681% 12/15/16 (a)(d) | | 1,020,000 | | 1,018,703 |
| Class K, 5.1181% 12/15/16 (a)(d) | | 6,659,000 | | 6,652,116 |
| Bank of America Large Loan, Inc.: | | | | |
| floater Series 2005-ESHA: | | | | |
| Class F, 4.63% 7/14/08 (a)(b)(d) | | 6,395,000 | | 6,395,000 |
| Class G, 4.76% 7/14/08 (a)(b)(d) | | 4,355,000 | | 4,355,000 |
| Class H, 4.98% 7/14/08 (a)(b)(d) | | 5,365,000 | | 5,365,000 |
| Series 2005 ESHA Class X1, 0.696% 7/14/08 (a)(b)(d)(e) | | 334,645,000 | | 5,112,372 |
| Bayview Commercial Asset Trust floater: | | | | |
| Series 2003-1 Class A, 4.2213% 8/25/33 (a)(d) | | 6,317,900 | | 6,392,956 |
| Series 2003-2: | | | | |
| Class A, 4.41% 12/25/33 (a)(d) | | 13,127,372 | | 13,287,836 |
| Class M1, 4.68% 12/25/33 (a)(d) | | 2,136,269 | | 2,171,502 |
| Series 2004-1: | | | | |
| Class A, 4.19% 4/25/34 (a)(d) | | 6,224,975 | | 6,227,901 |
| Class B, 5.73% 4/25/34 (a)(d) | | 646,751 | | 654,153 |
| Class M1, 4.39% 4/25/34 (a)(d) | | 565,907 | | 568,383 |
| Class M2, 5.03% 4/25/34 (a)(d) | | 485,063 | | 490,747 |
| |
| |
| 79 | | | | Annual Report |
| Investments (Unaudited) continued | | | | | | | | |
| |
Commercial Mortgage Securities continued
| | | | | | | | |
| | | | | Principal | | | | Value |
| | | | | Amount | | | | |
| Bayview Commercial Asset Trust floater: – continued | | | | | | | | |
| Series 2004-2: | | | | | | | | |
| Class A, 4.26% 8/25/34 (a)(d) | | $ | | 6,109,217 | | $ | | 6,122,596 |
| Class M1, 4.41% 8/25/34 (a)(d) | | | | 1,969,875 | | | | 1,977,570 |
| Series 2004-3: | | | | | | | | |
| Class A1, 4.2% 1/25/35 (a)(d) | | | | 6,475,016 | | | | 6,482,074 |
| Class A2, 4.25% 1/25/35 (a)(d) | | | | 899,933 | | | | 903,103 |
| Class M1, 4.33% 1/25/35 (a)(d) | | | | 1,079,169 | | | | 1,080,629 |
| Class M2, 4.83% 1/25/35 (a)(d) | | | | 703,806 | | | | 707,992 |
| Series 2005-2A: | | | | | | | | |
| Class M1, 4.3% 8/25/35 (a)(d) | | | | 1,288,534 | | | | 1,288,534 |
| Class M2, 4.32% 8/25/35 (a)(d) | | | | 2,121,126 | | | | 2,121,126 |
| Class M3, 4.38% 8/25/35 (a)(d) | | | | 1,174,549 | | | | 1,174,549 |
| Class M4, 4.53% 8/25/35 (a)(d) | | | | 1,080,387 | | | | 1,080,387 |
| Bear Stearns Commercial Mortgage Securities, Inc. floater: | | | | | | | | |
| Series 2003 BA1A: | | | | | | | | |
| Class JFCM, 5.17% 4/14/15 (a)(d) | | | | 1,344,296 | | | | 1,347,949 |
| Class KFCM, 5.6% 4/14/15 (a)(d) | | | | 1,436,661 | | | | 1,440,773 |
| Class LFCM, 6% 4/14/15 (a)(d) | | | | 1,601,905 | | | | 1,601,896 |
| Class MFCM, 6.3% 4/14/15 (a)(d) | | | | 2,218,251 | | | | 2,218,238 |
| Series 2004-BBA3 Class E, 4.4681% 6/15/17 (a)(d) | | | | 10,415,000 | | | | 10,416,411 |
| Chase Commercial Mortgage Securities Corp. floater | | | | | | | | |
| Series 2000-FL1A: | | | | | | | | |
| Class B, 4.1781% 12/12/13 (a)(d) | | | | 896,672 | | | | 878,739 |
| Class C, 4.5281% 12/12/13 (a)(d) | | | | 1,793,345 | | | | 1,793,345 |
| COMM floater: | | | | | | | | |
| Series 2001-FL5A Class E, 5.2681% 11/15/13 (a)(d) | | | | 3,021,068 | | | | 3,020,103 |
| Series 2002-FL6: | | | | | | | | |
| Class F, 5.2181% 6/14/14 (a)(d) | | | | 11,163,000 | | | | 11,182,139 |
| Class G, 5.6681% 6/14/14 (a)(d) | | | | 5,000,000 | | | | 4,999,659 |
| Series 2003-FL9 Class B, 4.2681% 11/15/15 (a)(d) | | | | 8,579,991 | | | | 8,604,476 |
| Commercial Mortgage pass thru certificates floater: | | | | | | | | |
| Series 2004-CNL: | | | | | | | | |
| Class A2, 4.0681% 9/15/14 (a)(d) | | | | 3,570,000 | | | | 3,573,125 |
| Class G, 4.7481% 9/15/14 (a)(d) | | | | 1,345,000 | | | | 1,345,534 |
| Class H, 4.8481% 9/15/14 (a)(d) | | | | 1,430,000 | | | | 1,430,567 |
| Class J, 5.3681% 9/15/14 (a)(d) | | | | 490,000 | | | | 491,353 |
| Class K, 5.7681% 9/15/14 (a)(d) | | | | 770,000 | | | | 771,393 |
| Class L, 5.9681% 9/15/14 (a)(d) | | | | 625,000 | | | | 624,774 |
| Series 2004-HTL1: | | | | | | | | |
| Class B, 4.2181% 7/15/16 (a)(d) | | | | 426,802 | | | | 427,072 |
Commercial Mortgage Securities continued
| | | | | | | | |
| | | | | Principal | | | | Value |
| | | | | Amount | | | | |
| Commercial Mortgage pass thru certificates floater: - | | | | | | | | |
| continued | | | | | | | | |
| Series 2004-HTL1: | | | | | | | | |
| Class D, 4.3181% 7/15/16 (a)(d) | | $ | | 969,949 | | $ | | 970,109 |
| Class E, 4.5181% 7/15/16 (a)(d) | | | | 694,177 | | | | 694,425 |
| Class F, 4.5681% 7/15/16 (a)(d) | | | | 734,671 | | | | 735,088 |
| Class H, 5.0681% 7/15/16 (a)(d) | | | | 2,129,763 | | | | 2,130,459 |
| Class J, 5.2181% 7/15/16 (a)(d) | | | | 818,412 | | | | 818,679 |
| Class K, 6.1181% 7/15/16 (a)(d) | | | | 921,324 | | | | 921,038 |
| Commercial Mortgage pass thru Certificates floater Series | | | | | | | | |
| 2005-F10A: | | | | | | | | |
| Class B, 3.9981% 4/15/17 (a)(d) | | | | 7,080,000 | | | | 7,074,591 |
| Class C, 4.0381% 4/15/17 (a)(d) | | | | 3,006,000 | | | | 3,000,368 |
| Class D, 4.0781% 4/15/17 (a)(d) | | | | 2,440,000 | | | | 2,437,663 |
| Class E, 4.1381% 4/15/17 (a)(d) | | | | 1,821,000 | | | | 1,819,257 |
| Class F, 4.1781% 4/15/17 (a)(d) | | | | 1,035,000 | | | | 1,034,719 |
| Class G, 4.3181% 4/15/17 (a)(d) | | | | 1,035,000 | | | | 1,034,956 |
| Class H, 4.3881% 4/15/17 (a)(d) | | | | 1,035,000 | | | | 1,034,365 |
| Class I, 4.6181% 4/15/17 (a)(d) | | | | 335,000 | | | | 334,605 |
| Class MOA3, 4.0681% 3/15/20 (a)(d) | | | | 4,590,000 | | | | 4,589,812 |
| CS First Boston Mortgage Securities Corp.: | | | | | | | | |
| floater: | | | | | | | | |
| Series 2003-TF2A Class A2, 4.0881% 11/15/14 (a)(d) . | | | | 3,837,106 | | | | 3,838,834 |
| Series 2004-FL1 Class B, 4.2181% 5/15/14 (a)(d) | | | | 11,230,000 | | | | 11,246,403 |
| Series 2004-HC1: | | | | | | | | |
| Class A2, 4.2681% 12/15/21 (a)(d) | | | | 1,475,000 | | | | 1,474,997 |
| Class B, 4.5181% 12/15/21 (a)(d) | | | | 3,835,000 | | | | 3,834,992 |
| Series 2004-TF2A Class E, 4.1881% 11/15/19 (a)(d) | | | | 4,450,000 | | | | 4,456,359 |
| Series 2004-TFL1: | | | | | | | | |
| Class A2, 3.9581% 2/15/14 (a)(d) | | | | 7,005,000 | | | | 7,005,853 |
| Class E, 4.3181% 2/15/14 (a)(d) | | | | 2,800,000 | | | | 2,802,824 |
| Class F, 4.3681% 2/15/14 (a)(d) | | | | 2,325,000 | | | | 2,327,963 |
| Class G, 4.6181% 2/15/14 (a)(d) | | | | 1,875,000 | | | | 1,879,139 |
| Class H, 4.8681% 2/15/14 (a)(d) | | | | 1,400,000 | | | | 1,403,371 |
| Class J, 5.1681% 2/15/14 (a)(d) | | | | 750,000 | | | | 753,317 |
| Series 2005-TF2A Class F, 4.2681% 11/15/19 (a)(d) | | | | 1,540,000 | | | | 1,542,198 |
| Series 2005-TFLA: | | | | | | | | |
| Class C, 4.0081% 2/15/20 (a)(d) | | | | 5,650,000 | | | | 5,649,989 |
| Class E, 4.0981% 2/15/20 (a)(d) | | | | 3,955,000 | | | | 3,954,988 |
| Class F, 4.1481% 2/15/20 (a)(d) | | | | 1,745,000 | | | | 1,744,997 |
| Class G, 4.2881% 2/15/20 (a)(d) | | | | 505,000 | | | | 504,998 |
81 Annual Report
| Investments (Unaudited) continued | | | | | | | | |
| |
Commercial Mortgage Securities continued
| | | | | | | | |
| | | | | Principal | | | | Value |
| | | | | Amount | | | | |
| CS First Boston Mortgage Securities Corp.: – continued | | | | | | | | |
| Series 2005-TFLA: | | | | | | | | |
| Class H, 4.5181% 2/15/20 (a)(d) | | $ | | 715,000 | | $ | | 714,998 |
| sequential pay Series 1997-C2 Class A2, 6.52% 1/17/35 | | | | 235,680 | | | | 236,453 |
| GMAC Commercial Mortgage Securities, Inc. floater Series | | | | | | | | |
| 2001-FL1A Class E, 4.5781% 2/11/11 (a)(d) | | | | 152,562 | | | | 152,409 |
| GS Mortgage Securities Corp. II floater Series 2005-FL7A | | | | | | | | |
| Class A1, 3.84% 11/6/19 (a)(d) | | | | 10,128,306 | | | | 10,129,534 |
| Impac CMB Trust Series 2005-7 Class M4, 4.388% | | | | | | | | |
| 11/25/35 (d) | | | | 3,169,000 | | | | 3,169,000 |
| John Hancock Tower Mortgage Trust floater Series 2003-C5A | | | | | | | | |
| Class B, 6.2166% 4/10/15 (a)(d) | | | | 8,245,000 | | | | 8,245,000 |
| Lehman Brothers Floating Rate Commercial Mortgage Trust: | | | | | | | | |
| floater Series 2003-LLFA: | | | | | | | | |
| Class A2, 4.14% 12/16/14 (a)(d) | | | | 11,700,000 | | | | 11,705,144 |
| Class B, 4.35% 12/16/14 (a)(d) | | | | 4,615,000 | | | | 4,623,295 |
| Class C, 4.45% 12/16/14 (a)(d) | | | | 4,982,000 | | | | 4,993,212 |
| Series 2005-LLFA Class FAIR, 5.4181% 7/15/18 (a)(d) | | | | 4,360,000 | | | | 4,360,000 |
| Morgan Stanley Capital I, Inc. Series 2005-XLF: | | | | | | | | |
| Class B, 3.9781% 8/15/19 (a)(d) | | | | 6,705,000 | | | | 6,705,000 |
| Class C, 4.0081% 8/15/19 (a)(d) | | | | 525,000 | | | | 525,000 |
| Class D, 4.0281% 8/15/19 (a)(d) | | | | 1,915,000 | | | | 1,915,000 |
| Class E, 4.0481% 8/15/19 (a)(d) | | | | 1,745,000 | | | | 1,745,000 |
| Class F, 4.0881% 8/15/19 (a)(d) | | | | 1,220,000 | | | | 1,220,000 |
| Class G, 4.1381% 8/15/19 (a)(d) | | | | 870,000 | | | | 870,000 |
| Class H, 4.1581% 8/15/19 (a)(d) | | | | 695,000 | | | | 695,000 |
| Class J, 4.2281% 8/15/19 (a)(d) | | | | 525,000 | | | | 525,000 |
| Morgan Stanley Dean Witter Capital I Trust floater | | | | | | | | |
| Series 2002-XLF Class F, 5.8663% 8/5/14 (a)(d) | | | | 5,359,368 | | | | 5,359,351 |
| Salomon Brothers Mortgage Securities VII, Inc.: | | | | | | | | |
| floater Series 2001-CDCA: | | | | | | | | |
| Class C, 4.5681% 2/15/13 (a)(d) | | | | 4,711,321 | | | | 4,701,152 |
| Class D, 4.5681% 2/15/13 (a)(d) | | | | 4,000,000 | | | | 3,987,882 |
| Series 2000-NL1 Class E, 7.0607% 10/15/30 (a)(d) | | | | 3,188,867 | | | | 3,197,433 |
| SDG Macerich Properties LP floater Series 2000-1 Class A3, | | | | | | | | |
| 4.1081% 5/15/09 (a)(d) | | | | 18,000,000 | | | | 17,994,375 |
| STRIPS III Ltd./STRIPS III Corp. floater Series 2004-1A | | | | | | | | |
| Class A, 4.31% 3/24/18 (a)(d) | | | | 6,950,497 | | | | 6,950,497 |
| Wachovia Bank Commercial Mortgage Trust floater: | | | | | | | | |
| Series 2004-WHL3: | | | | | | | | |
| Class A2, 3.9481% 3/15/14 (a)(d) | | | | 3,510,000 | | | | 3,510,856 |
| Class E, 4.2681% 3/15/14 (a)(d) | | | | 2,190,000 | | | | 2,191,761 |
Commercial Mortgage Securities continued
| | | | |
| | | | | Principal | | Value |
| | | | | Amount | | |
| Wachovia Bank Commercial Mortgage Trust floater: - | | | | |
| continued | | | | | | |
| Series 2004-WHL3: | | | | | | |
| Class F, 4.3181% 3/15/14 (a)(d) | | $ | | 1,755,000 | | $ 1,756,359 |
| Class G, 4.5481% 3/15/14 (a)(d) | | | | 875,000 | | 875,871 |
| Series 2005-WL5A: | | | | | | |
| Class KHP1, 4.1181% 1/15/18 (a)(d) | | | | 1,745,000 | | 1,744,663 |
| Class KHP2, 4.3181% 1/15/18 (a)(d) | | | | 1,745,000 | | 1,747,772 |
| Class KHP3, 4.6181% 1/15/18 (a)(d) | | | | 2,060,000 | | 2,062,033 |
| Class KHP4, 4.7181% 1/15/18 (a)(d) | | | | 1,600,000 | | 1,602,203 |
| Class KHP5, 4.9181% 1/15/18 (a)(d) | | | | 1,855,000 | | 1,845,971 |
| TOTAL COMMERCIAL MORTGAGE SECURITIES | | | | |
| (Cost $361,655,067) | | | | | | 362,304,343 |
| |
| Certificates of Deposit 0.9% | | | | | | |
| |
| DEPFA BANK PLC yankee 4.265% 9/1/06 | | | | 30,000,000 | | 29,964,651 |
| Deutsche Bank AG yankee 4.21% 8/24/06 | | | | 30,000,000 | | 29,958,345 |
| TOTAL CERTIFICATES OF DEPOSIT | | | | | | |
| (Cost $60,000,000) | | | | | | 59,922,996 |
| |
| Commercial Paper 0.4% | | | | | | |
| |
| Fortune Brands, Inc. 3.79% 10/31/05 | | | | | | |
| (Cost $26,416,304) | | | | 26,500,000 | | 26,417,781 |
83 Annual Report
| Investments (Unaudited) continued | | | | | | |
| |
Cash Equivalents 36.3%
| | | | | | | | |
| | | | | Maturity | | | | Value |
| | | | | Amount | | | | |
| Investments in repurchase agreements (Collateralized by | | | | | | |
| U.S. Government Obligations, in a joint trading | | | | | | |
| account at 3.89%, dated 9/30/05 due 10/3/05) (g) . $2,120,321,927 | | $2,119,634,000 |
| Investments in repurchase agreements (Collateralized by | | | | | | |
| U.S. Treasury Obligations, in a joint trading account at | | | | | | |
| 3.27%, dated 9/30/05 due 10/3/05) (g) | | 6,298,716 | | | | 6,297,000 |
| With Goldman Sachs & Co. at 4.04%, dated 8/23/05 | | | | | | |
| due 11/21/05 (Collateralized by Mortgage Loan | | | | | | |
| Obligations valued at $304,500,001, 4.54%– 4.56%, | | | | | | |
| 9/25/35 - 9/25/35) (d)(f) | | | | 292,929,000 | | 289,962,793 |
| TOTAL CASH EQUIVALENTS | | | | | | | | |
| (Cost $2,415,931,000) | | | | 2,415,893,793 |
| |
| TOTAL INVESTMENT PORTFOLIO 101.0% | | | | | | |
| (Cost $6,720,022,154) | | | | 6,725,584,889 |
| |
| NET OTHER ASSETS – (1.0)% | | | | | | (65,032,717) |
| NET ASSETS 100% | | | | $ 6,660,552,172 |
| |
| |
| Futures Contracts | | | | | | | | |
| | | Expiration | | Underlying | | Unrealized |
| | | Date | | Face Amount | | Appreciation/ |
| | | | | at Value | | (Depreciation) |
| Sold | | | | | | | | |
| |
| Eurodollar Contracts | | | | | | | | |
| 73 Eurodollar 90 Day Index Contracts | | Dec. 2005 | | $72,199,738 | | $ | | 56,706 |
| 49 Eurodollar 90 Day Index Contracts | | March 2006 | | 48,442,625 | | | | 50,086 |
| 32 Eurodollar 90 Day Index Contracts | | June 2006 | | 31,631,600 | | | | 30,247 |
| 32 Eurodollar 90 Day Index Contracts | | Sept. 2006 | | 31,630,800 | | | | 28,072 |
| 31 Eurodollar 90 Day Index Contracts | | Dec. 2006 | | 30,642,725 | | | | 23,176 |
| 29 Eurodollar 90 Day Index Contracts | | March 2007 | | 28,668,313 | | | | 17,947 |
| 22 Eurodollar 90 Day Index Contracts | | June 2007 | | 21,748,925 | | | | 8,962 |
| 21 Eurodollar 90 Day Index Contracts | | Sept. 2007 | | 20,760,075 | | | | 7,941 |
| 20 Eurodollar 90 Day Index Contracts | | Dec. 2007 | | 19,770,250 | | | | 7,370 |
| 20 Eurodollar 90 Day Index Contracts | | March 2008 | | 19,770,000 | | | | 6,620 |
| 13 Eurodollar 90 Day Index Contracts | | June 2008 | | 12,850,013 | | | | 8,836 |
| 12 Eurodollar 90 Day Index Contracts | | Sept. 2008 | | 11,860,950 | | | | 8,052 |
| 5 Eurodollar 90 Day Index Contracts | | Dec. 2008 | | 4,941,625 | | | | 1,230 |
| 3 Eurodollar 90 Day Index Contracts | | March 2009 | | 2,964,900 | | | | 688 |
| TOTAL EURODOLLAR CONTRACTS | | | | | | $ | | 255,933 |
| |
| |
| |
| Annual Report | | 84 | | | | | | |
| Swap Agreements | | | | | | | | | | |
| |
| | | Expiration | | | | Notional | | | | Value |
| | | Date | | | | Amount | | | | |
| |
| Credit Default Swap | | | | | | | | | | |
| Receive from Citibank, upon default event | | | | | | | | | | |
| of DaimlerChrysler NA Holding Corp., | | | | | | | | | | |
| par value of the notional amount of | | | | | | | | | | |
| DaimlerChrysler NA Holding Corp. 6.5% | | | | | | | | | | |
| 11/15/13, and pay quarterly notional | | | | | | | | | | |
| amount multiplied by .8% | | June 2007 | | $ | | 14,000,000 | | $ | | (129,454) |
| Receive quarterly notional amount | | | | | | | | | | |
| multiplied by .48% and pay Goldman | | | | | | | | | | |
| Sachs upon default event of TXU Energy | | | | | | | | | | |
| Co. LLC, par value of the notional amount | | | | | | | | | | |
| of TXU Energy Co. LLC 7% 3/15/13 | | Sept. 2008 | | | | 13,540,000 | | | | (82,090) |
| Receive quarterly notional amount | | | | | | | | | | |
| multiplied by 1.12% and pay Morgan | | | | | | | | | | |
| Stanley, Inc. upon default of Comcast | | | | | | | | | | |
| Cable Communications, Inc., par value of | | | | | | | | | | |
| the notional amount of Comcast Cable | | | | | | | | | | |
| Communications, Inc. 6.75% 1/30/11 | | June 2006 | | | | 10,000,000 | | | | 75,975 |
| |
| TOTAL CREDIT DEFAULT SWAP | | | | $ | | 37,540,000 | | $ | | (135,569) |
| |
| Total Return Swap | | | | | | | | | | |
| Receive monthly notional amount multiplied | | | | | | | | | | |
| by the nominal spread appreciation of | | | | | | | | | | |
| the Lehman Brothers CMBS U.S. Aggre- | | | | | | | | | | |
| gate Index adjusted by a modified dura- | | | | | | | | | | |
| tion factor plus 10 basis points and pay | | | | | | | | | | |
| monthly notional amount multiplied by | | | | | | | | | | |
| the nominal spread depreciation of the | | | | | | | | | | |
| Lehman Brothers CMBS U.S. Aggregate | | | | | | | | | | |
| Index adjusted by a modified duration | | | | | | | | | | |
| factor with Lehman Brothers, Inc. | | Oct. 2005 | | | | 48,200,000 | | | | (43,480) |
| Receive monthly notional amount multiplied | | | | | | | | | | |
| by the nominal spread appreciation of the | | | | | | | | | | |
| Lehman Brothers CMBS U.S. Aggregate | | | | | | | | | | |
| Index adjusted by a modified duration fac | | | | | | | | | | |
| tor plus 30 basis points and pay monthly | | | | | | | | | | |
| notional amount multiplied by the nominal | | | | | | | | | | |
| spread depreciation of the Lehman Broth | | | | | | | | | | |
| ers CMBS U.S. Aggregate Index adjusted | | | | | | | | | | |
| by a modified duration factor with | | | | | | | | | | |
| Citibank | | April 2006 | | | | 67,500,000 | | | | (31,167) |
| |
| |
| |
| |
| | | 85 | | | | | | Annual Report |
| Investments (Unaudited) continued | | | | | | |
| |
| Swap Agreements continued | | | | | | | | |
| |
| | | Expiration | | Notional | | | | Value |
| | | Date | | Amount | | | | |
| |
| Total Return Swap continued | | | | | | | | |
| Receive monthly notional amount multiplied | | | | | | | | |
| by the nominal spread appreciation of the | | | | | | | | |
| Lehman Brothers CMBS U.S. Aggregate | | | | | | | | |
| Index adjusted by a modified duration fac | | | | | | | | |
| tor plus 15 basis points and pay monthly | | | | | | | | |
| notional amount multiplied by the nominal | | | | | | | | |
| spread depreciation of the Lehman Broth | | | | | | | | |
| ers CMBS U.S. Aggregate Index adjusted | | | | | | | | |
| by a modified duration factor with Citibank | | April 2006 | | $ 48,200,000 | | $ | | 0 |
| Receive monthly notional amount multiplied | | | | | | | | |
| by the nominal spread appreciation of | | | | | | | | |
| the Lehman Brothers CMBS U.S. Aggre- | | | | | | | | |
| gate Index adjusted by a modified dura- | | | | | | | | |
| tion factor plus 25 basis points and pay | | | | | | | | |
| monthly notional amount multiplied by | | | | | | | | |
| the nominal spread depreciation of the | | | | | | | | |
| Lehman Brothers CMBS U.S. Aggregate | | | | | | | | |
| Index adjusted by a modified duration | | | | | | | | |
| factor with Lehman Brothers, Inc. | | Dec. 2005 | | 30,000,000 | | | | (23,390) |
| Receive monthly notional amount multiplied | | | | | | | | |
| by the nominal spread appreciation of | | | | | | | | |
| the Lehman Brothers CMBS U.S. Aggre- | | | | | | | | |
| gate Index adjusted by a modified dura- | | | | | | | | |
| tion factor plus 22 basis points and pay | | | | | | | | |
| monthly notional amount multiplied by | | | | | | | | |
| the nominal spread depreciation of the | | | | | | | | |
| Lehman Brothers CMBS U.S. Aggregate | | | | | | | | |
| Index adjusted by a modified duration | | | | | | | | |
| factor with Lehman Brothers, Inc. | | Jan. 2006 | | 35,100,000 | | | | (27,970) |
| Receive monthly notional amount multiplied | | | | | | | | |
| by the nominal spread appreciation of | | | | | | | | |
| the Lehman Brothers CMBS U.S. Aggre- | | | | | | | | |
| gate Index adjusted by a modified dura- | | | | | | | | |
| tion factor plus 7.5 basis points and pay | | | | | | | | |
| monthly notional amount multiplied by | | | | | | | | |
| the nominal spread depreciation of the | | | | | | | | |
| Lehman Brothers CMBS U.S. Aggregate | | | | | | | | |
| Index adjusted by a modified duration | | | | | | | | |
| factor with Lehman Brothers, Inc. | | Nov. 2005 | | 35,100,000 | | | | (13,586) |
| Receive monthly a return equal to Lehman | | | | | | | | |
| Brothers ABS Floating Rate Index and | | | | | | | | |
| pay monthly a floating rate based on the | | | | | | | | |
| 1-month LIBOR minus 11.1 basis points | | | | | | | | |
| with Lehman Brothers, Inc. | | Nov. 2005 | | 30,000,000 | | | | 8,273 |
| |
| TOTAL TOTAL RETURN SWAP | | | | $ 294,100,000 | | $ | | (131,320) |
| |
| |
| | | | | $ 331,640,000 | | $ | | (266,889) |
| |
| |
| |
| |
| Annual Report | | 86 | | | | | | |
Legend
(a) Security exempt from registration under
Rule 144A of the Securities Act of 1933.
These securities may be resold in
transactions exempt from registration,
normally to qualified institutional buyers.
At the period end, the value of these
securities amounted to $605,971,272
or 9.1% of net assets.
(b) Security or a portion of the security
purchased on a delayed delivery or
when-issued basis.
(c) Security or a portion of the security was
pledged to cover margin requirements
for futures contracts. At the period end,
the value of securities pledged
amounted to $990,994.
(d) The coupon rate shown on floating or
adjustable rate securities represents the
rate at period end.
(e) Security represents right to receive
monthly interest payments on an
underlying pool of mortgages. Principal
shown is the par amount of the
mortgage pool.
(f) The maturity amount is based on the
rate at period end.
(g) Additional information on each
counterparty to the repurchase
agreement is as follows:
|
| Repurchase Agreement/ | | | | Value |
| Counterparty | | | | |
| $6,297,000 due | | | | |
| 10/3/05 at 3.27% | | | | |
| Banc of America | | | | |
| Securities LLC. | | $ | | 878,400 |
| Barclays Capital Inc. | | | | 2,037,889 |
| BNP Paribas Securities | | | | |
| Corp. | | | | 2,318,977 |
| State Street Bank and | | | | |
| Trust Company | | | | 1,061,734 |
| | | $ | | 6,297,000 |
| Repurchase Agreement/ | | Value |
| Counterparty | | |
| $2,119,634,000 due | | |
| 10/3/05 at 3.89% | | |
| Banc of America | | |
| Securities LLC. | | $ 406,558,229 |
| Bank of America, | | |
| National Association | | 138,994,266 |
| Barclays Capital Inc. | | 625,474,199 |
| Bear Stearns & Co. Inc. . | | 104,245,700 |
| Countrywide Securities | | |
| Corporation | | 138,994,266 |
| Goldman Sachs & Co. | | 382,234,233 |
| Morgan Stanley & Co. | | |
| Incorporated. | | 34,720,003 |
| UBS Securities LLC | | 288,413,104 |
| | | $ 2,119,634,000 |
Income Tax Information
At September 30, 2005, the fund had a capital loss carryforward of approximately $4,905,519 all of which will expire on September 30, 2011.
87 Annual Report
Managing Your Investments
Fidelity offers several ways to conveniently manage your personal investments via your telephone or PC. You can access your account information, conduct trades and research your investments 24 hours a day.
By Phone
Fidelity Automated Service Telephone provides a single toll free number to access account balances, positions, quotes and trading. It’s easy to navigate the service, and on your first call, the system will help you create a personal identification number (PIN) for security.


By PC
Fidelity’s web site on the Internet provides a wide range of information, including daily financial news, fund performance, interactive planning tools and news about Fidelity products and services.

* When you call the quotes line, please remember that a fund’s yield and return will vary and, except for money market funds, share price will also vary. This means that you may have a gain or loss when you sell your shares. There is no assurance that money market funds will be able to maintain a stable $1 share price; an investment in a money market fund is not insured or guar anteed by the U.S. government. Total returns are historical and include changes in share price, reinvestment of dividends and capital gains, and the effects of any sales charges.
Annual Report 88
To Visit Fidelity
For directions and hours,
please call 1-800-544-9797.
Arizona
7001 West Ray Road
Chandler, AZ
7373 N. Scottsdale Road
Scottsdale, AZ
California
815 East Birch Street
Brea, CA
1411 Chapin Avenue
Burlingame, CA
851 East Hamilton Avenue
Campbell, CA
19200 Von Karman Avenue
Irvine, CA
601 Larkspur Landing Circle
Larkspur, CA
10100 Santa Monica Blvd.
Los Angeles, CA
27101 Puerta Real
Mission Viejo, CA
73 575 El Paseo
Palm Desert, CA
251 University Avenue
Palo Alto, CA
123 South Lake Avenue
Pasadena, CA
16995 Bernardo Ctr. Drive
Rancho Bernardo, CA
1740 Arden Way
Sacramento, CA
7676 Hazard Center Drive
San Diego, CA
8 Montgomery Street
San Francisco, CA
3793 State Street
Santa Barbara, CA
21701 Hawthorne Boulevard
Torrance, CA
2001 North Main Street
Walnut Creek, CA
6300 Canoga Avenue
Woodland Hills, CA
|
Colorado
1625 Broadway
Denver, CO
9185 East Westview Road
Littleton, CO
Connecticut
48 West Putnam Avenue
Greenwich, CT
265 Church Street
New Haven, CT
300 Atlantic Street
Stamford, CT
29 South Main Street
West Hartford, CT
Delaware
222 Delaware Avenue
Wilmington, DE
Florida
4400 N. Federal Highway
Boca Raton, FL
121 Alhambra Plaza
Coral Gables, FL
2948 N. Federal Highway
Ft. Lauderdale, FL
1907 West State Road 434
Longwood, FL
8880 Tamiami Trail, North
Naples, FL
3550 Tamiami Trail, South
Sarasota, FL
1502 N. Westshore Blvd.
Tampa, FL
2465 State Road 7
Wellington, FL
3501 PGA Boulevard
West Palm Beach, FL
Georgia
3445 Peachtree Road, N.E.
Atlanta, GA
1000 Abernathy Road
Atlanta, GA
Illinois
One North LaSalle Street
Chicago, IL
875 North Michigan Ave.
Chicago, IL
1415 West 22nd Street
Oak Brook, IL
|
1700 East Golf Road
Schaumburg, IL
3232 Lake Avenue
Wilmette, IL
Indiana
4729 East 82nd Street
Indianapolis, IN
Kansas
5400 College Boulevard
Overland Park, KS
Maine
Three Canal Plaza
Portland, ME
Maryland
7315 Wisconsin Avenue
Bethesda, MD
One W. Pennsylvania Ave.
Towson, MD
Massachusetts
801 Boylston Street
Boston, MA
155 Congress Street
Boston, MA
300 Granite Street
Braintree, MA
44 Mall Road
Burlington, MA
405 Cochituate Road
Framingham, MA
416 Belmont Street
Worcester, MA
Michigan
500 E. Eisenhower Pkwy.
Ann Arbor, MI
280 Old N. Woodward Ave.
Birmingham, MI
43420 Grand River Avenue
Novi, MI
29155 Northwestern Hwy.
Southfield, MI
Minnesota
7600 France Avenue South
Edina, MN
Missouri
8885 Ladue Road
Ladue, MO
|
Fidelity Brokerage Services, Inc., 100 Summer St., Boston, MA 02110 Member NYSE/SIPC
89 Annual Report
89
Nevada
2225 Village Walk Drive
Henderson, NV
New Jersey
150 Essex Street
Millburn, NJ
56 South Street
Morristown, NJ
396 Route 17, North
Paramus, NJ
3518 Route 1 North
Princeton, NJ
530 Highway 35
Shrewsbury, NJ
New York
1055 Franklin Avenue
Garden City, NY
37 West Jericho Turnpike
Huntington Station, NY
1271 Avenue of the Americas
New York, NY
61 Broadway
New York, NY
350 Park Avenue
New York, NY
200 Fifth Avenue
New York, NY
733 Third Avenue
New York, NY
11 Penn Plaza
New York, NY
2070 Broadway
New York, NY
1075 Northern Blvd.
Roslyn, NY
North Carolina
4611 Sharon Road
Charlotte, NC
Ohio
3805 Edwards Road
Cincinnati, OH
1324 Polaris Parkway
Columbus, OH
28699 Chagrin Boulevard
Woodmere Village, OH
Oregon
16850 SW 72nd Avenue
Tigard, OR
|
Pennsylvania
600 West DeKalb Pike
King of Prussia, PA
1735 Market Street
Philadelphia, PA
12001 Perry Highway
Wexford, PA
Rhode Island
47 Providence Place
Providence, RI
Tennessee
6150 Poplar Avenue
Memphis, TN
Texas
10000 Research Boulevard
Austin, TX
4001 Northwest Parkway
Dallas, TX
12532 Memorial Drive
Houston, TX
2701 Drexel Drive
Houston, TX
6500 N. MacArthur Blvd.
Irving, TX
6005 West Park Boulevard
Plano, TX
14100 San Pedro
San Antonio, TX
1576 East Southlake Blvd.
Southlake, TX
19740 IH 45 North
Spring, TX
Utah
215 South State Street
Salt Lake City, UT
Virginia
1861 International Drive
McLean, VA
Washington
411 108th Avenue, N.E.
Bellevue, WA
1518 6th Avenue
Seattle, WA
Washington, DC
1900 K Street, N.W.
Washington, DC
Wisconsin
595 North Barker Road
Brookfield, WI
|
Annual Report 90
To Write Fidelity
We’ll give your correspondence immediate attention and send you written confirmation upon completion of your request.

(such as changing name, address, bank, etc.)
| | Fidelity Investments
P.O. Box 770001
Cincinnati, OH 45277-0002
|

Buying shares
Fidelity Investments
P.O. Box 770001
Cincinnati, OH 45277-0003
Overnight Express
Fidelity Investments
Attn: Distribution Services
100 Crosby Parkway KC1H
Covington, KY 41015
Selling shares
Fidelity Investments
P.O. Box 770001
Cincinnati, OH 45277-0035
Overnight Express
Fidelity Investments
Attn: Distribution Services
100 Crosby Parkway KC1H
Covington, KY 41015
General Correspondence
Fidelity Investments
P.O. Box 500
Merrimack, NH 03054-0500
|

Buying shares
Fidelity Investments
P.O. Box 770001
Cincinnati, OH 45277-0003
Selling shares
Fidelity Investments
P.O. Box 770001
Cincinnati, OH 45277-0035
Overnight Express
Fidelity Investments
Attn: Distribution Services
100 Crosby Parkway KC1H
Covington, KY 41015
General Correspondence
Fidelity Investments
P.O. Box 500
Merrimack, NH 03054-0500
|
91 Annual Report
93 Annual Report
95 Annual Report
Investment Adviser
Fidelity Management & Research Company
Boston, MA
Investment Sub Advisers
FMR Co., Inc.
Fidelity Management & Research
(Far East) Inc.
Fidelity Management & Research
(U.K.) Inc.
Fidelity Investments Japan Limited
Fidelity International Investment
Advisors
Fidelity International Investment
Advisors (U.K.) Limited
Geode Capital Management, LLC
General Distributor
Fidelity Distributors Corporation
Boston, MA
Transfer and Service Agent
Fidelity Service Company, Inc.
Boston, MA
Custodian
Mellon Bank, N.A.
Pittsburgh, PA
|
| The Fidelity Telephone Connection |
| Mutual Fund 24-Hour Service |
| Exchanges/Redemptions | | |
| and Account Assistance | | 1-800-544-6666 |
| Product Information | | 1-800-544-6666 |
| Retirement Accounts | | 1-800-544-4774 |
| (8 a.m. - 9 p.m.) | | |
| TDD Service | | 1-800-544-0118 |
| for the deaf and hearing impaired |
| (9 a.m. - 9 p.m. Eastern time) |
| Fidelity Automated Service | | |
| Telephone (FAST®) (automated phone logo) | | 1-800-544-5555 |
(automated phone logo)
Automated line for quickest serviceRRS-UANN-1105
1.816441.100
|


Fidelity Advisor
Strategic Real Return
Fund - Class A, Class T,
Class B and Class C
|
Annual Report
September 30, 2005
|

Class A, Class T, Class B, and Class C are classes of Fidelity® Strategic Real Return Fund
| Contents | | | | |
| |
| Chairman’s Message | | 4 | | Ned Johnson’s message to shareholders. |
| Shareholder Expense | | 5 | | An example of shareholder expenses. |
| Example | | | | |
| Investment Summary | | 7 | | A summary of the fund’s investments. |
| Investments | | 8 | | A complete list of the fund’s investments |
| | | | | with their market values. |
| Financial Statements | | 13 | | Statements of assets and liabilities, |
| | | | | operations, and changes in net assets, |
| | | | | as well as financial highlights. |
| Notes | | 23 | | Notes to the financial statements. |
| Report of Independent | | 31 | | |
| Registered Public | | | | |
| Accounting Firm | | | | |
| Trustees and Officers | | 32 | | |
| Distributions | | 44 | | |
| Board Approval of | | 45 | | |
| Investment Advisory | | | | |
| Contracts and | | | | |
| Management Fees | | | | |
| Central Fund Investments | | 49 | | Complete list of investments for Fidelity’s |
| | | | | fixed-income central funds. |
To view a fund’s proxy voting guidelines and proxy voting record for the 12 month period ended
June 30, visit www.fidelity.com/proxyvotingresults or visit the Securities and Exchange Commis
sion’s (SEC) web site at www.sec.gov. You may also call 1-877-208-0098 to request a free copy of
the proxy voting guidelines.
Standard & Poor’s, S&P and S&P 500 are registered service marks of The McGraw Hill Companies,
Inc. and have been licensed for use by Fidelity Distributors Corporation.
Other third party marks appearing herein are the property of their respective owners.
All other marks appearing herein are registered or unregistered trademarks or service marks
of FMR Corp. or an affiliated company.
|
This report and the financial statements contained herein are submitted for the general information
of the shareholders of the fund. This report is not authorized for distribution to prospective investors
in the fund unless preceded or accompanied by an effective prospectus.
A fund files its complete schedule of portfolio holdings with the SEC for the first and third
quarters of each fiscal year on Form N Q. Forms N Q are available on the SEC’s web site at
http://www.sec.gov. A fund’s Forms N Q may be reviewed and copied at the SEC’s Public Reference
Room in Washington, DC. Information regarding the operation of the SEC’s Public Reference
Room may be obtained by calling 1-800-SEC-0330. For a complete list of a fund’s portfolio hold
ings, view the most recent quarterly holdings report, semiannual report, or annual report on
Fidelity’s web site at http://www.advisor.fidelity.com.
NOT FDIC INSURED · MAY LOSE VALUE · NO BANK GUARANTEE
Neither the fund nor Fidelity Distributors Corporation is a bank.
|
3 Annual Report
Chairman’s Message
(photograph of Edward C. Johnson 3d)
Dear Shareholder:
During the past year or so, much has been reported about the mutual fund industry, and much of it has been more critical than I believe is warranted. Allegations that some companies have been less than forthright with their shareholders have cast a shadow on the entire industry. I continue to find these reports disturbing, and assert that they do not create an accurate picture of the industry overall. Therefore, I would like to remind every one where Fidelity stands on these issues. I will say two things specifically regarding allegations that some mutual fund compa nies were in violation of the Securities and Exchange Commission’s forward pricing rules or were involved in so called “market timing” activities.
First, Fidelity has no agreements that permit customers who buy fund shares after 4 p.m. to obtain the 4 p.m. price. This is not a new policy. This is not to say that some one could not deceive the company through fraudulent acts. However, we are extremely diligent in preventing fraud from occurring in this manner and in every other. But I underscore again that Fidelity has no so called “agreements” that sanction illegal practices.
Second, Fidelity continues to stand on record, as we have for years, in opposition to predatory short term trading that adversely affects shareholders in a mutual fund. Back in the 1980s, we initiated a fee which is returned to the fund and, therefore, to investors to discourage this activity. Further, we took the lead several years ago in developing a Fair Value Pricing Policy to prevent market timing on foreign securities in our funds. I am confident we will find other ways to make it more difficult for predatory traders to operate. However, this will only be achieved through close cooperation among regulators, legislators and the industry.
Yes, there have been unfortunate instances of unethical and illegal activity within the mutual fund industry from time to time. That is true of any industry. When this occurs, confessed or convicted offend ers should be dealt with appropriately. But we are still concerned about the risk of over regulation and the quick application of simplistic solutions to intricate problems. Every system can be improved, and we support and applaud well thought out improvements by regulators, legislators and industry representatives that achieve the common goal of building and protecting the value of investors’ holdings.
For nearly 60 years, Fidelity has worked very hard to improve its products and service to justify your trust. When our family founded this company in 1946, we had only a few hundred customers. Today, we serve more than 18 million customers including individual investors and participants in retirement plans across America.
Let me close by saying that we do not take your trust in us for granted, and we realize that we must always work to improve all aspects of our service to you. In turn, we urge you to continue your active participation with your financial matters, so that your interests can be well served.
Best regards,
/s/ Edward C. Johnson 3d
Edward C. Johnson 3d
Annual Report 4
Shareholder Expense Example
As a shareholder of the Fund, you incur two types of costs: (1) transaction costs, including sales charges (loads) on purchase payments or redemption proceeds, redemption fees, and (2) ongoing costs, including management fees, distribution and/or service (12b 1) fees and other Fund expenses. This Example is intended to help you understand your ongoing costs (in dollars) of investing in the Fund and to compare these costs with the ongoing costs of investing in other mutual funds.
The Example is based on an investment of $1,000 invested at the beginning of the period and held for the entire period (September 7, 2005 to September 30, 2005). The hypo thetical expense example is based on an investment of $1,000 invested for the one half year period (April 1, 2005 to September 30, 2005).
The first line of the table below for each class of the Fund provides information about actual account values and actual expenses. You may use the information in this line, together with the amount you invested, to estimate the expenses that you paid over the period. Simply divide your account value by $1,000.00 (for example, an $8,600 account value divided by $1,000.00 = 8.6), then multiply the result by the number in the first line for a class of the Fund under the heading entitled “Expenses Paid During Period” to estimate the expenses you paid on your account during this period. In addition, the fund, as a shareholder in underlying affiliated central funds, will indirectly bear its pro rata share of the fees and expenses incurred by the underlying affiliated central funds. These fees and expenses are not included in the fund’s annualized expense ratio used to calculate the expense estimate in the table below.
Hypothetical Example for Comparison Purposes
The second line of the table below for each class of the Fund provides information about hypothetical account values and hypothetical expenses based on a Class’ actual expense ratio and an assumed rate of return of 5% per year before expenses, which is not the Class’ actual return. The hypothetical account values and expenses may not be used to estimate the actual ending account balance or expenses you paid for the period. You may use this information to compare the ongoing costs of investing in the Fund and other funds. To do so, compare this 5% hypothetical example with the 5% hypothetical examples that appear in the shareholder reports of the other funds. In addition, the fund, as a shareholder in underlying affiliated central funds, will indirectly bear its pro rata share of the fees and expenses incurred by the underlying affiliated central funds. These fees and expenses are not included in the fund’s annualized expense ratio used to calculate the expense estimate in the table below.
Please note that the expenses shown in the table are meant to highlight your ongoing costs only and do not reflect any transaction costs. Therefore, the second line of the table is useful in comparing ongoing costs only, and will not help you determine the relative total costs of owning different funds. In addition, if these transactional costs were included, your costs would have been higher.
5 Annual Report
| Shareholder Expense Example continued | | | | |
| |
| | | | | | | Ending | | | | |
| | | | | Beginning | | Account Value | | | | Expenses Paid |
| | | | | Account Value | | September 30, 2005 | | | | During Period |
| Class A | | | | | | | | | | | | |
| Actual | | $ | | 1,000.00 | | $ | | 1,015.00 | | $ | | .66B |
| HypotheticalA | | $ | | 1,000.00 | | $ | | 1,020.05 | | $ | | 5.06C |
| Class T | | | | | | | | | | | | |
| Actual | | $ | | 1,000.00 | | $ | | 1,015.00 | | $ | | .73B |
| HypotheticalA | | $ | | 1,000.00 | | $ | | 1,019.55 | | $ | | 5.57C |
| Class B | | | | | | | | | | | | |
| Actual | | $ | | 1,000.00 | | $ | | 1,014.00 | | $ | | 1.16B |
| HypotheticalA | | $ | | 1,000.00 | | $ | | 1,016.29 | | $ | | 8.85C |
| Class C | | | | | | | | | | | | |
| Actual | | $ | | 1,000.00 | | $ | | 1,014.00 | | $ | | 1.22B |
| HypotheticalA | | $ | | 1,000.00 | | $ | | 1,015.79 | | $ | | 9.35C |
| Strategic Real Return | | | | | | | | | | | | |
| Actual | | $ | | 1,000.00 | | $ | | 1,015.00 | | $ | | .56B |
| HypotheticalA | | $ | | 1,000.00 | | $ | | 1,020.81 | | $ | | 4.31C |
| Institutional Class | | | | | | | | | | | | |
| Actual | | $ | | 1,000.00 | | $ | | 1,015.00 | | $ | | .56B |
| HypotheticalA | | $ | | 1,000.00 | | $ | | 1,020.81 | | $ | | 4.31C |
A 5% return per year before expenses
B Actual expenses are equal to each Class’ annualized expense ratio (shown in the table below); multiplied by the average account value over the period, multiplied by 24/365 (to reflect the period September 7, 2005 to September 30, 2005). The fees and expenses of the underlying affiliated central funds in which the fund invests are not included in the fund’s annualized expense ratio.
C Hypothetical expenses are equal to each Class’ annualized expense ratio (shown in the table below); multiplied by the average account value over the period, multiplied by 183/365 (to reflect the one-half year period). The fees and expenses of the underlying affiliated central funds in which the fund invests are not included in the fund’s annualized expense ratio.
| | | Annualized |
| | | Expense Ratio |
| Class A | | 1.00% |
| Class T | | 1.10% |
| Class B | | 1.75% |
| Class C | | 1.85% |
| Strategic Real Return | | 85% |
| Institutional Class | | 85% |
Annual Report 6
Investment Summary
| Holdings Distribution as of September 30, 2005 | | |
| | | % of Fund’s |
| | | Net Assets |
| Inflation Protected Investments | | 27.9% |
| Floating Rate High Yield | | 19.7% |
| Commodity-Linked Notes and Related Investments* | | 27.1% |
| Real Estate Investments | | 17.0% |
| Cash & Cash Equivalents | | 7.9% |
* Includes Fidelity Ultra Short Central Fund held in connection with commodity linked notes and related investments. Investments in commodity linked notes provide indirect exposure to futures contracts on physical commodities via the Dow Jones AIG Commodity Index, the majority of which trade on U.S. exchanges. The value of commodity linked notes will change directly based on the performance of the index.
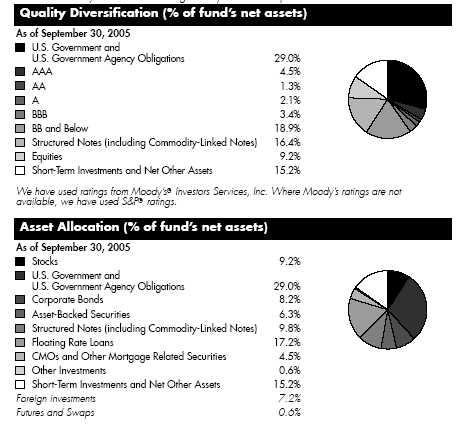
The information in the above tables is based on the combined investments of the fund and its pro rata share of the investments of Fidelity’s fixed income central funds.
7 Annual Report
| Investments September 30, 2005 | | |
Showing Percentage of Net Assets
| | | | |
| Corporate Bonds 6.0% | | | | |
| | | Principal | | Value |
| | | Amount | | (Note 1) |
| Convertible Bonds 0.7% | | | | |
| |
| FINANCIALS – 0.7% | | | | |
| Real Estate 0.7% | | | | |
| Affordable Resources Communities LP 7.5% 8/15/25 (b) | | $ 250,000 | | $ 249,875 |
| Nonconvertible Bonds – 5.3% | | | | |
| |
| CONSUMER DISCRETIONARY – 1.4% | | | | |
| Hotels, Restaurants & Leisure 0.8% | | | | |
| Host Marriott LP 7% 8/15/12 | | 300,000 | | 303,750 |
| Household Durables – 0.6% | | | | |
| Stanley Martin Communities LLC 9.75% 8/15/15 (b) | | 250,000 | | 246,875 |
| |
| TOTAL CONSUMER DISCRETIONARY | | | | 550,625 |
| |
| FINANCIALS – 3.9% | | | | |
| Real Estate 3.9% | | | | |
| Camden Property Trust 7% 11/15/06 | | 200,000 | | 204,735 |
| Colonial Properties Trust 7% 7/14/07 | | 250,000 | | 258,489 |
| MeriStar Hospitality Corp. 9% 1/15/08 | | 300,000 | | 312,375 |
| Thornburg Mortgage, Inc. 8% 5/15/13 | | 250,000 | | 247,500 |
| Trustreet Properties, Inc. 7.5% 4/1/15 (b) | | 200,000 | | 204,500 |
| Ventas Realty LP/Ventas Capital Corp. 8.75% 5/1/09 | | 250,000 | | 273,125 |
| | | | | 1,500,724 |
| |
| TOTAL NONCONVERTIBLE BONDS | | | | 2,051,349 |
| |
| TOTAL CORPORATE BONDS | | | | |
| (Cost $2,330,141) | | | | 2,301,224 |
| |
| U.S. Treasury Inflation Protected Obligations 27.9% | | |
| |
| U.S. Treasury Inflation-Indexed Bonds 2.375% 1/15/25 | | 2,974,640 | | 3,182,400 |
| U.S. Treasury Inflation-Indexed Notes: | | | | |
| 0.875% 4/15/10 | | 1,175,648 | | 1,145,614 |
| 1.625% 1/15/15 | | 1,145,950 | | 1,132,342 |
| 1.875% 7/15/13 | | 616,963 | | 625,254 |
| 2% 1/15/14 | | 1,141,927 | | 1,165,702 |
| 3% 7/15/12 | | 397,696 | | 432,774 |
| 3.375% 1/15/07 | | 197,299 | | 204,043 |
| 3.375% 1/15/12 | | 968,246 | | 1,072,257 |
See accompanying notes which are an integral part of the financial statements.
Annual Report 8
U.S. Treasury Inflation Protected Obligations continued
| | |
| | | Principal | | Value |
| | | Amount | | (Note 1) |
| U.S. Treasury Inflation-Indexed Notes: – continued | | | | |
| 3.625% 1/15/08 | | $ 816,284 | | $ 864,050 |
| 3.875% 1/15/09 | | 869,634 | | 943,418 |
| TOTAL U.S. TREASURY INFLATION PROTECTED OBLIGATIONS | | |
| (Cost $10,809,535) | | | | 10,767,854 |
| |
| Asset Backed Securities 0.6% | | | | |
| |
| Taberna Preferred Funding III Ltd. Series 2005-3A Class | | | | |
| D, 6.52% 2/5/36 (b)(c) | | | | |
| (Cost $250,000) | | 250,000 | | 250,000 |
| |
| Collateralized Mortgage Obligations 0.4% | | | | |
| |
| Private Sponsor 0.4% | | | | |
| Resix Finance Ltd. Series 2005-C Class B7, 6.79% | | | | |
| 9/10/37 (b)(c) | | | | |
| (Cost $150,010) | | 150,000 | | 150,000 |
| |
| Commercial Mortgage Securities 0.8% | | | | |
| |
| Bank of America Large Loan, Inc. floater Series | | | | |
| 2005-ESHA Class K, 5.68% 7/14/08 (b)(c) | | | | |
| (Cost $300,000) | | 300,000 | | 300,000 |
| |
| Common Stocks 2.7% | | | | |
| | | Shares | | |
| |
| CONSUMER DISCRETIONARY – 0.1% | | | | |
| Hotels, Restaurants & Leisure 0.1% | | | | |
| Starwood Hotels & Resorts Worldwide, Inc. unit | | 1,000 | | 57,170 |
| |
| FINANCIALS – 2.4% | | | | |
| Real Estate 2.4% | | | | |
| Annaly Mortgage Management, Inc. | | 1,500 | | 19,425 |
| Anworth Mortgage Asset Corp. | | 10,000 | | 82,700 |
| Equity Residential (SBI) | | 2,500 | | 94,625 |
| General Growth Properties, Inc. | | 2,500 | | 112,325 |
| Host Marriott Corp. | | 7,500 | | 126,750 |
| Inland Real Estate Corp. | | 2,000 | | 31,320 |
| LTC Properties, Inc. | | 5,000 | | 106,000 |
| MortgageIT Holdings, Inc. | | 1,500 | | 21,330 |
| ProLogis Trust | | 3,500 | | 155,085 |
See accompanying notes which are an integral part of the financial statements.
| Investments continued | | | | | | | | |
| |
Common Stocks continued
| | | | | | | | |
| | | | | Shares | | | | Value |
| | | | | | | | | (Note 1) |
| |
| FINANCIALS – continued | | | | | | | | |
| Real Estate continued | | | | | | | | |
| Saxon Capital, Inc. | | | | 2,000 | | $ | | 23,700 |
| Spirit Finance Corp. | | | | 4,000 | | | | 45,000 |
| Trizec Properties, Inc. | | | | 2,000 | | | | 46,120 |
| Ventas, Inc. | | | | 1,500 | | | | 48,300 |
| | | | | | | | | 912,680 |
| |
| HEALTH CARE – 0.2% | | | | | | | | |
| Health Care Providers & Services – 0.2% | | | | | | | | |
| Capital Senior Living Corp. (a) | | | | 8,000 | | | | 66,800 |
| TOTAL COMMON STOCKS | | | | | | | | |
| (Cost $1,030,706) | | | | | | | | 1,036,650 |
| |
| Preferred Stocks 6.5% | | | | | | | | |
| |
| Convertible Preferred Stocks 0.7% | | | | | | | | |
| |
| FINANCIALS – 0.7% | | | | | | | | |
| Real Estate 0.7% | | | | | | | | |
| Windrose Medical Properties Trust 7.50% | | | | 9,000 | | | | 245,250 |
| Nonconvertible Preferred Stocks 5.8% | | | | | | | | |
| |
| FINANCIALS – 5.8% | | | | | | | | |
| Real Estate 5.8% | | | | | | | | |
| Accredited Mortgage Loan Trust Series A, 9.75% | | | | 6,000 | | | | 153,900 |
| American Home Mortgage Investment Corp. Series B, 9.25% | | . | | 2,200 | | | | 57,200 |
| Annaly Mortgage Management, Inc. Series A, 7.875% | | | | 2,000 | | | | 49,100 |
| Anworth Mortgage Asset Corp. Series A, 8.625% | | | | 4,100 | | | | 101,926 |
| Capital Automotive (REIT) 6.75% | | | | 12,300 | | | | 301,842 |
| Host Marriott Corp. Class C, 10.00% | | | | 5,000 | | | | 127,200 |
| Impac Mortgage Holdings, Inc. Series C, 9.125% | | | | 5,000 | | | | 122,450 |
| LaSalle Hotel Properties Series A, 10.25% | | | | 5,000 | | | | 133,000 |
| MFA Mortgage Investments, Inc. Series A, 8.50% | | | | 18,100 | | | | 447,975 |
| Newcastle Investment Corp. Series B, 9.75% | | | | 12,000 | | | | 318,600 |
| Prime Group Realty Trust Series B, 9.00% | | | | 1,800 | | | | 41,400 |
| PS Business Parks, Inc. Series D, 9.50% | | | | 7,000 | | | | 179,200 |
| The Mills Corp. Series B, 9.00% | | | | 8,000 | | | | 209,200 |
| | | | | | | | | 2,242,993 |
| |
| TOTAL PREFERRED STOCKS | | | | | | | | |
| (Cost $2,498,047) | | | | | | | | 2,488,243 |
See accompanying notes which are an integral part of the financial statements.
Commodity Linked Notes 9.8%
| | | | |
| | | Principal | | Value |
| | | Amount | | (Note 1) |
| |
| AIG-FP Private Funding Ltd. Master Note, one-month | | | | |
| U.S. dollar LIBOR minus .10% due 8/18/2006 | | | | |
| (indexed to the Dow Jones-AIG Commodity Index Total | | | | |
| Return, multiplied by 3) (e) | | $ 190,000 | | $ 232,380 |
| AIG-FP Private Funding Ltd. Master Note, one-month | | | | |
| U.S. dollar LIBOR minus .10% due 8/18/2006 | | | | |
| (indexed to the Dow Jones-AIG Commodity Index Total | | | | |
| Return, multiplied by 3) (e) | | 200,000 | | 214,236 |
| AIG-FP Private Funding Ltd. Master Note, one-month | | | | |
| U.S. dollar LIBOR minus .10% due 8/18/2006 | | | | |
| (indexed to the Dow Jones-AIG Commodity Index Total | | | | |
| Return, multiplied by 3) (e) | | 110,000 | | 118,418 |
| AIG-FP Private Funding Ltd. Master Note, one-month | | | | |
| U.S. LIBOR minus .10% due 8/18/2006 (indexed to | | | | |
| the Dow Jones-AIG Commodity Index Total Return, | | | | |
| multiplied by 3) (e) | | 330,000 | | 329,112 |
| AIG-FP Private Funding Ltd. Master Note, three-month | | | | |
| U.S. dollar LIBOR minus .10% due 8/10/2006 | | | | |
| (indexed to the Dow Jones-AIG Commodity Index Total | | | | |
| Return, multiplied by 3) (e) | | 600,000 | | 702,126 |
| JPMorgan Chase Bank, NA Medium Term Note, one- | | | | |
| month U.S. dollar LIBOR minus .18% due 8/10/2006 | | | | |
| (indexed to the Dow Jones-AIG Commodity Index Total | | | | |
| Return, multiplied by 3) (b)(e) | | 470,000 | | 550,012 |
| JPMorgan Chase Bank, NA Medium Term Note, one- | | | | |
| month U.S. dollar LIBOR minus .18% due 8/18/2006 | | | | |
| (indexed to the Dow Jones-AIG Commodity Index Total | | | | |
| Return, multiplied by 3) (b)(e) | | 280,000 | | 332,841 |
| JPMorgan Chase Bank, NA Medium Term Note, one- | | | | |
| month U.S. dollar LIBOR minus .18% due 8/18/2006 | | | | |
| (indexed to the Dow Jones-AIG Commodity Index Total | | | | |
| Return, multiplied by 3) (b)(e) | | 380,000 | | 422,773 |
| Societe Generale Floating Rate Note, one-month U.S. | | | | |
| dollar LIBOR minus .10% due 8/10/2006 (indexed to | | | | |
| the Dow Jones-AIG Commodity Index Total Return, | | | | |
| multiplied by 3) (b)(e) | | 600,000 | | 702,060 |
| Societe Generale Floating Rate Note, one-month U.S. | | | | |
| dollar LIBOR minus .10% due 8/10/2006 (indexed to | | | | |
| the Dow Jones-AIG Commodity Index Total Return, | | | | |
| multiplied by 3) (b)(e) | | 160,000 | | 175,472 |
| |
| TOTAL COMMODITY LINKED NOTES | | | | |
| (Cost $3,320,000) | | | | 3,779,430 |
| |
| |
| |
| |
| See accompanying notes which are an integral part of the financial statements. | | |
| |
| 11 | | | | Annual Report |
| Investments continued | | | | | | |
| |
Fixed Income Funds 37.0%
| | | | | | |
| | | Shares | | | | Value |
| | | | | | | (Note 1) |
| Fidelity Floating Rate Central Investment Portfolio (d) | | 75,526 | | | | $ 7,598,671 |
| Fidelity Ultra-Short Central Fund (d) | | 66,782 | | | | 6,644,141 |
| TOTAL FIXED INCOME FUNDS | | | | | | |
| (Cost $14,242,632) | | | | | | 14,242,812 |
| Cash Equivalents 7.9% | | | | | | |
| | | Maturity | | | | |
| | | Amount | | | | |
| Investments in repurchase agreements (Collateralized by U.S. | | | | | | |
| Treasury Obligations, in a joint trading account at 3.16%, | | | | | | |
| dated 9/30/05 due 10/3/05) | | | | | | |
| (Cost $3,041,000) | | $ 3,041,800 | | | | 3,041,000 |
| |
| TOTAL INVESTMENT PORTFOLIO 99.6% | | | | | | |
| (Cost $37,972,071) | | | | | | 38,357,213 |
| |
| NET OTHER ASSETS – 0.4% | | | | | | 167,290 |
| NET ASSETS 100% | | | | $ | | 38,524,503 |
(a) Non-income producing
(b) Security exempt from registration under
Rule 144A of the Securities Act of 1933.
These securities may be resold in
transactions exempt from registration,
normally to qualified institutional buyers.
At the period end, the value of these
securities amounted to $3,584,408 or
9.3% of net assets.
(c) The coupon rate shown on floating or
adjustable rate securities represents the
rate at period end.
(d) Affiliated fund that is available only to
investment companies and other accounts
managed by Fidelity Investments. A
complete unaudited listing of the
fixed income central funds’ holdings is
provided at the end of this report.
|
(e) Security is linked to the Dow Jones-AIG
Commodity Index Total Return. Securities
do not guarantee any return of principal
at maturity, but instead will pay at
maturity or upon exchange an amount
based on the closing value of the Dow
Jones-AIG Commodity Index Total
Return. Although these instruments are
primarily debt obligations, they provide
exposure indirectly to changes in the
value of the underlying commodities.
Holders of the security have the right to
exchange these notes daily.
|
See accompanying notes which are an integral part of the financial statements.
| Financial Statements | | | | | | | | |
| |
| |
| Statement of Assets and Liabilities | | | | | | | | |
| | | | | | | September 30, 2005 |
| |
| Assets | | | | | | | | |
| Investment in securities, at value (including repurchase | | | | | | | | |
| agreements of $3,041,000) (cost $37,972,071) | | | | | | | | |
| See accompanying schedule | | | | | | $ | | 38,357,213 |
| Cash | | | | | | | | 51 |
| Receivable for fund shares sold | | | | | | | | 1,418,768 |
| Dividends receivable | | | | | | | | 18,607 |
| Interest receivable | | | | | | | | 138,626 |
| Receivable from investment adviser for expense | | | | | | | | |
| reductions | | | | | | | | 71,385 |
| Total assets | | | | | | | | 40,004,650 |
| |
| Liabilities | | | | | | | | |
| Payable for investments purchased | | $ | | 1,384,611 | | | | |
| Payable for fund shares redeemed | | | | 2,238 | | | | |
| Accrued management fee | | | | 11,016 | | | | |
| Distribution fees payable | | | | 5,303 | | | | |
| Other affiliated payables | | | | 4,042 | | | | |
| Other payables and accrued expenses | | | | 72,937 | | | | |
| Total liabilities | | | | | | | | 1,480,147 |
| |
| Net Assets | | | | | | $ | | 38,524,503 |
| Net Assets consist of: | | | | | | | | |
| Paid in capital | | | | | | $ | | 38,055,879 |
| Undistributed net investment income | | | | | | | | 78,944 |
| Accumulated undistributed net realized gain (loss) on | | | | | | | | |
| investments | | | | | | | | 4,538 |
| Net unrealized appreciation (depreciation) on | | | | | | | | |
| investments | | | | | | | | 385,142 |
| Net Assets | | | | | | $ | | 38,524,503 |
See accompanying notes which are an integral part of the financial statements.
13 Annual Report
| Financial Statements continued | | | | |
| |
| |
| Statement of Assets and Liabilities continued | | | | |
| | | September 30, 2005 |
| |
| Calculation of Maximum Offering Price | | | | |
| Class A: | | | | |
| Net Asset Value and redemption price per share | | | | |
| ($3,405,325 ÷ 335,576 shares) | | $ | | 10.15 |
| Maximum offering price per share (100/95.25 of $10.15) | | $ | | 10.66 |
| Class T: | | | | |
| Net Asset Value and redemption price per share | | | | |
| ($3,284,482 ÷ 323,690 shares) | | $ | | 10.15 |
| Maximum offering price per share (100/96.50 of $10.15) | | $ | | 10.52 |
| Class B: | | | | |
| Net Asset Value and offering price per share | | | | |
| ($3,253,180 ÷ 320,754 shares)A | | $ | | 10.14 |
| Class C: | | | | |
| Net Asset Value and offering price per share | | | | |
| ($3,467,220 ÷ 341,879 shares)A | | $ | | 10.14 |
| Strategic Real Return: | | | | |
| Net Asset Value, offering price and redemption price per | | | | |
| share ($21,866,671 ÷ 2,153,944 shares) | | $ | | 10.15 |
| Institutional Class: | | | | |
| Net Asset Value, offering price and redemption price per | | | | |
| share ($3,247,625 ÷ 320,001 shares) | | $ | | 10.15 |
| A Redemption price per share is equal to net asset value less any applicable contingent deferred sales charge. | | | | |
See accompanying notes which are an integral part of the financial statements.
Annual Report 14
| Statement of Operations | | | | | | |
| For the period September 7, 2005 (commencement of operations) to September 30, 2005 |
| |
| Investment Income | | | | | | |
| Dividends | | | | $ | | 16,197 |
| Interest | | | | | | 87,139 |
| Total income | | | | | | 103,336 |
| |
| Expenses | | | | | | |
| Management fee | | $ | | 11,016 | | |
| Transfer agent fees | | | | 3,044 | | |
| Distribution fees | | | | 5,304 | | |
| Accounting fees and expenses | | | | 1,005 | | |
| Custodian fees and expenses | | | | 1,200 | | |
| Registration fees | | | | 10,236 | | |
| Audit | | | | 61,500 | | |
| Total expenses before reductions | | | | 93,305 | | |
| Expense reductions | | | | (71,385) | | 21,920 |
| |
| Net investment income | | | | | | 81,416 |
| Realized and Unrealized Gain (Loss) | | | | | | |
| Net realized gain (loss) on investment securities | | | | | | 2,066 |
| Change in net unrealized appreciation (depreciation) on | | | | |
| investment securities | | | | | | 385,142 |
| Net gain (loss) | | | | | | 387,208 |
| Net increase (decrease) in net assets resulting from | | | | | | |
| operations | | | | $ | | 468,624 |
See accompanying notes which are an integral part of the financial statements.
15 Annual Report
| Financial Statements continued | | | | |
| |
| |
| Statement of Changes in Net Assets | | | | |
| | | For the period |
| | | September 7, 2005 |
| | | (commencement of |
| | | operations) to |
| | | September 30, 2005 |
| Increase (Decrease) in Net Assets | | | | |
| Operations | | | | |
| Net investment income | | $ | | 81,416 |
| Net realized gain (loss) | | | | 2,066 |
| Change in net unrealized appreciation (depreciation) | | | | 385,142 |
| Net increase (decrease) in net assets resulting from operations | | | | 468,624 |
| Share transactions - net increase (decrease) | | | | 38,055,768 |
| Redemption fees | | | | 111 |
| Total increase (decrease) in net assets | | | | 38,524,503 |
| |
| Net Assets | | | | |
| Beginning of period | | | | — |
| End of period (including undistributed net investment income of $78,944) | | $ | | 38,524,503 |
See accompanying notes which are an integral part of the financial statements.
| Financial Highlights Class A | | | | |
| |
| Year ended September 30, | | | | 2005F |
| Selected Per Share Data | | | | |
| Net asset value, beginning of period | | $ | | 10.00 |
| Income from Investment Operations | | | | |
| Net investment incomeE | | | | 031 |
| Net realized and unrealized gain (loss) | | | | 119 |
| Total from investment operations | | | | 150 |
| Net asset value, end of period | | $ | | 10.15 |
| Total ReturnB,C,D | | | | 1.50% |
| Ratios to Average Net AssetsG,H | | | | |
| Expenses before expense reductions | | | | 4.71%A |
| Expenses net of voluntary waivers, if any | | | | 1.00%A |
| Expenses net of all reductions | | | | 1.00%A |
| Net investment income | | | | 4.28%A |
| Supplemental Data | | | | |
| Net assets, end of period (000 omitted) | | $ | | 3,405 |
| Portfolio turnover rate | | | | 78%A |
A Annualized
B Total returns for periods of less than one year are not annualized.
C Total returns would have been lower had certain expenses not been reduced during the periods shown.
D Total returns do not include the effect of the sales charges.
E Calculated based on average shares outstanding during the period.
F For the period September 7, 2005 (commencement of operations) to September 30, 2005.
G Expense ratios reflect operating expenses of the class. Expenses before reductions do not reflect amounts reimbursed by the investment adviser or
reductions from brokerage service arrangements or other expense offset arrangements and do not represent the amount paid by the class during
periods when reimbursements or reductions occur. Expense ratios before reductions for start up periods may not be representative of longer term
operating periods. Expenses net of any voluntary waivers reflect expenses after reimbursement by the investment adviser but prior to reductions from
brokerage service arrangements or other expense offset arrangements. Expenses net of all reductions represent the net expenses paid by the class.
H Amounts do not include the activity of the underlying funds.
|
See accompanying notes which are an integral part of the financial statements.
17 Annual Report
| Financial Highlights Class T | | | | |
| |
| Year ended September 30, | | | | 2005F |
| Selected Per Share Data | | | | |
| Net asset value, beginning of period | | $ | | 10.00 |
| Income from Investment Operations | | | | |
| Net investment incomeE | | | | 030 |
| Net realized and unrealized gain (loss) | | | | 120 |
| Total from investment operations | | | | 150 |
| Net asset value, end of period | | $ | | 10.15 |
| Total ReturnB,C,D | | | | 1.50% |
| Ratios to Average Net AssetsG,H | | | | |
| Expenses before expense reductions | | | | 4.81%A |
| Expenses net of voluntary waivers, if any | | | | 1.10%A |
| Expenses net of all reductions | | | | 1.10%A |
| Net investment income | | | | 4.18%A |
| Supplemental Data | | | | |
| Net assets, end of period (000 omitted) | | $ | | 3,284 |
| Portfolio turnover rate | | | | 78%A |
A Annualized
B Total returns for periods of less than one year are not annualized.
C Total returns would have been lower had certain expenses not been reduced during the periods shown.
D Total returns do not include the effect of the sales charges.
E Calculated based on average shares outstanding during the period.
F For the period September 7, 2005 (commencement of operations) to September 30, 2005.
G Expense ratios reflect operating expenses of the class. Expenses before reductions do not reflect amounts reimbursed by the investment adviser or
reductions from brokerage service arrangements or other expense offset arrangements and do not represent the amount paid by the class during
periods when reimbursements or reductions occur. Expense ratios before reductions for start up periods may not be representative of longer term
operating periods. Expenses net of any voluntary waivers reflect expenses after reimbursement by the investment adviser but prior to reductions from
brokerage service arrangements or other expense offset arrangements. Expenses net of all reductions represent the net expenses paid by the class.
H Amounts do not include the activity of the underlying funds.
|
See accompanying notes which are an integral part of the financial statements.
| Financial Highlights Class B | | | | |
| |
| Year ended September 30, | | | | 2005F |
| Selected Per Share Data | | | | |
| Net asset value, beginning of period | | $ | | 10.00 |
| Income from Investment Operations | | | | |
| Net investment incomeE | | | | 025 |
| Net realized and unrealized gain (loss) | | | | 115 |
| Total from investment operations | | | | 140 |
| Net asset value, end of period | | $ | | 10.14 |
| Total ReturnB,C,D | | | | 1.40% |
| Ratios to Average Net AssetsG,H | | | | |
| Expenses before expense reductions | | | | 5.47%A |
| Expenses net of voluntary waivers, if any | | | | 1.75%A |
| Expenses net of all reductions | | | | 1.75%A |
| Net investment income | | | | 3.53%A |
| Supplemental Data | | | | |
| Net assets, end of period (000 omitted) | | $ | | 3,253 |
| Portfolio turnover rate | | | | 78%A |
A Annualized
B Total returns for periods of less than one year are not annualized.
C Total returns would have been lower had certain expenses not been reduced during the periods shown.
D Total returns do not include the effect of the contingent deferred sales charge.
E Calculated based on average shares outstanding during the period.
F For the period September 7, 2005 (commencement of operations) to September 30, 2005.
G Expense ratios reflect operating expenses of the class. Expenses before reductions do not reflect amounts reimbursed by the investment adviser or
reductions from brokerage service arrangements or other expense offset arrangements and do not represent the amount paid by the class during
periods when reimbursements or reductions occur. Expense ratios before reductions for start up periods may not be representative of longer term
operating periods. Expenses net of any voluntary waivers reflect expenses after reimbursement by the investment adviser but prior to reductions from
brokerage service arrangements or other expense offset arrangements. Expenses net of all reductions represent the net expenses paid by the class.
H Amounts do not include the activity of the underlying funds.
|
See accompanying notes which are an integral part of the financial statements.
19 Annual Report
| Financial Highlights Class C | | | | |
| |
| Year ended September 30, | | | | 2005F |
| Selected Per Share Data | | | | |
| Net asset value, beginning of period | | $ | | 10.00 |
| Income from Investment Operations | | | | |
| Net investment incomeE | | | | 024 |
| Net realized and unrealized gain (loss) | | | | 116 |
| Total from investment operations | | | | 140 |
| Net asset value, end of period | | $ | | 10.14 |
| Total ReturnB,C,D | | | | 1.40% |
| Ratios to Average Net AssetsG,H | | | | |
| Expenses before expense reductions | | | | 5.56%A |
| Expenses net of voluntary waivers, if any | | | | 1.85%A |
| Expenses net of all reductions | | | | 1.85%A |
| Net investment income | | | | 3.43%A |
| Supplemental Data | | | | |
| Net assets, end of period (000 omitted) | | $ | | 3,467 |
| Portfolio turnover rate | | | | 78%A |
A Annualized
B Total returns for periods of less than one year are not annualized.
C Total returns would have been lower had certain expenses not been reduced during the periods shown.
D Total returns do not include the effect of the contingent deferred sales charge.
E Calculated based on average shares outstanding during the period.
F For the period September 7, 2005 (commencement of operations) to September 30, 2005.
G Expense ratios reflect operating expenses of the class. Expenses before reductions do not reflect amounts reimbursed by the investment adviser or
reductions from brokerage service arrangements or other expense offset arrangements and do not represent the amount paid by the class during
periods when reimbursements or reductions occur. Expense ratios before reductions for start up periods may not be representative of longer term
operating periods. Expenses net of any voluntary waivers reflect expenses after reimbursement by the investment adviser but prior to reductions from
brokerage service arrangements or other expense offset arrangements. Expenses net of all reductions represent the net expenses paid by the class.
H Amounts do not include the activity of the underlying funds.
|
See accompanying notes which are an integral part of the financial statements.
| Financial Highlights Strategic Real Return | | | | |
| |
| Year ended September 30, | | | | 2005E |
| Selected Per Share Data | | | | |
| Net asset value, beginning of period | | $ | | 10.00 |
| Income from Investment Operations | | | | |
| Net investment incomeD | | | | 028 |
| Net realized and unrealized gain (loss) | | | | 122 |
| Total from investment operations | | | | 150 |
| Net asset value, end of period | | $ | | 10.15 |
| Total ReturnB,C | | | | 1.50% |
| Ratios to Average Net AssetsF,G | | | | |
| Expenses before expense reductions | | | | 4.41%A |
| Expenses net of voluntary waivers, if any | | | | 85%A |
| Expenses net of all reductions | | | | 85%A |
| Net investment income | | | | 4.43%A |
| Supplemental Data | | | | |
| Net assets, end of period (000 omitted) | | $21,867 |
| Portfolio turnover rate | | | | 78%A |
A Annualized
B Total returns for periods of less than one year are not annualized.
C Total returns would have been lower had certain expenses not been reduced during the periods shown.
D Calculated based on average shares outstanding during the period.
E For the period September 7, 2005 (commencement of operations) to September 30, 2005.
F Expense ratios reflect operating expenses of the class. Expenses before reductions do not reflect amounts reimbursed by the investment adviser or
reductions from brokerage service arrangements or other expense offset arrangements and do not represent the amount paid by the class during
periods when reimbursements or reductions occur. Expense ratios before reductions for start up periods may not be representative of longer term
operating periods. Expenses net of any voluntary waivers reflect expenses after reimbursement by the investment adviser but prior to reductions from
brokerage service arrangements or other expense offset arrangements. Expenses net of all reductions represent the net expenses paid by the class.
G Amounts do not include the activity of the underlying funds.
|
See accompanying notes which are an integral part of the financial statements.
21 Annual Report
| Financial Highlights Institutional Class | | | | |
| |
| Year ended September 30, | | | | 2005E |
| Selected Per Share Data | | | | |
| Net asset value, beginning of period | | $ | | 10.00 |
| Income from Investment Operations | | | | |
| Net investment incomeD | | | | 032 |
| Net realized and unrealized gain (loss) | | | | 118 |
| Total from investment operations | | | | 150 |
| Net asset value, end of period | | $ | | 10.15 |
| Total ReturnB,C | | | | 1.50% |
| Ratios to Average Net AssetsF,G | | | | |
| Expenses before expense reductions | | | | 4.55%A |
| Expenses net of voluntary waivers, if any | | | | 85%A |
| Expenses net of all reductions | | | | 85%A |
| Net investment income | | | | 4.43%A |
| Supplemental Data | | | | |
| Net assets, end of period (000 omitted) | | $ | | 3,248 |
| Portfolio turnover rate | | | | 78%A |
A Annualized
B Total returns for periods of less than one year are not annualized.
C Total returns would have been lower had certain expenses not been reduced during the periods shown.
D Calculated based on average shares outstanding during the period.
E For the period September 7, 2005 (commencement of operations) to September 30, 2005.
F Expense ratios reflect operating expenses of the class. Expenses before reductions do not reflect amounts reimbursed by the investment adviser or
reductions from brokerage service arrangements or other expense offset arrangements and do not represent the amount paid by the class during
periods when reimbursements or reductions occur. Expense ratios before reductions for start up periods may not be representative of longer term
operating periods. Expenses net of any voluntary waivers reflect expenses after reimbursement by the investment adviser but prior to reductions from
brokerage service arrangements or other expense offset arrangements. Expenses net of all reductions represent the net expenses paid by the class.
G Amounts do not include the activity of the underlying funds.
|
See accompanying notes which are an integral part of the financial statements.
Notes to Financial Statements
For the period ended September 30, 2005
1. Significant Accounting Policies.
Fidelity Strategic Real Return Fund (the fund) is a fund of Fidelity Commonwealth Trust (the trust) and is authorized to issue an unlimited number of shares. The trust is regis tered under the Investment Company Act of 1940, as amended (the 1940 Act), as an open end management investment company organized as a Massachusetts business trust.
The fund offers Class A, Class T, Class B, Class C, Strategic Real Return, and Institutional Class shares, each of which has equal rights as to assets and voting privileges. Each class has exclusive voting rights with respect to matters that affect that class. Class B shares will automatically convert to Class A shares after a holding period of seven years from the initial date of purchase. Investment income, realized and unrealized capital gains and losses, the common expenses of the fund, and certain fund level expense reductions, if any, are allocated on a pro rata basis to each class based on the relative net assets of each class to the total net assets of the fund. Each class differs with respect to transfer agent and distribution and service plan fees incurred. Certain expense reductions also differ by class.
The fund may invest in affiliated money market central funds (Money Market Central Funds) and fixed income Central Investment Portfolios (CIPs), collectively referred to as Central Funds, which are open end investment companies available to investment companies and other accounts managed by Fidelity Management & Research Company (FMR) and its affiliates. The financial statements have been prepared in conformity with accounting principles generally accepted in the United States of America, which require management to make certain estimates and assumptions at the date of the financial statements. The following summarizes the significant accounting policies of the fund, which are also consistently followed by the Central Funds:
Security Valuation. Net asset value per share (NAV calculation) is calculated as of the close of business of the New York Stock Exchange, normally 4:00 p.m. Eastern time. Debt securities, including restricted securities, for which quotations are readily available are valued at their most recent bid prices (sales prices if the principal market is an exchange) in the principal market in which such securities are normally traded, as determined by recognized dealers in such securities, or securities are valued on the basis of information provided by a pricing service. Pricing services use valuation matrices that incorporate both dealer supplied valuations and valuation models. Equity securities, including restricted securities, for which market quotations are available are valued at the last sale price or official closing price (closing bid price or last evaluated quote if no sale has occurred) on the primary market or exchange on which they trade. If prices are not readily available or do not accurately reflect fair value for a security, or if a security’s value has been materially affected by events occurring after the close of the exchange or market on which the security is principally traded, that security may be valued by another method that the Board of Trustees believes accurately reflects fair value. A security’s valuation may differ
23 Annual Report
Notes to Financial Statements continued
1. Significant Accounting Policies continued
Security Valuation continued
|
depending on the method used for determining value. Price movements in futures contracts and ADRs, market and trading trends, the bid/ask quotes of brokers and off exchange institutional trading may be reviewed in the course of making a good faith determination of a security’s fair value. Short term securities with remaining maturities of sixty days or less for which quotations are not readily available are valued on the basis of amortized cost. Investments in open end investment companies, including Central Funds, are valued at their net asset value each business day.
Investment Transactions and Income. Security transactions, including the fund’s investment activity in the Central Funds, are accounted for as of trade date. Gains and losses on securities sold are determined on the basis of identified cost. Dividend income is recorded on the ex dividend date, except for certain dividends from foreign securities where the ex dividend date may have passed, which are recorded as soon as the fund is informed of the ex dividend date. Non cash dividends included in dividend income, if any, are recorded at the fair market value of the securities received. Distributions received on securities that represent a return of capital or capital gains are recorded as a reduction of cost of investments and/or as a realized gain. The fund estimates the components of distributions received that may be considered return of capital distribu tions or capital gain distributions. Interest income, including distributions from the Central Funds, is accrued as earned. Interest income includes coupon interest and amortization of premium and accretion of discount on debt securities. Inflation indexed bonds are fixed income securities whose principal value is periodically adjusted accord ing to the rate of inflation. Interest is accrued based on the principal value which is adjusted for inflation. Any increase in the principal amount of an inflation indexed bond is recorded as interest income, even though the principal is not received until maturity.
Expenses. Most expenses of the trust can be directly attributed to a fund. Expenses which cannot be directly attributed are apportioned among each fund in the trust.
Income Tax Information and Distributions to Shareholders. Each year, the fund intends to qualify as a regulated investment company by distributing all of its taxable income and realized gains under Subchapter M of the Internal Revenue Code. As a result, no provision for income taxes is required in the accompanying financial statements.
Distributions are recorded on the ex dividend date. Income dividends and capital gain distributions are declared separately for each class. Income and capital gain distribu tions are determined in accordance with income tax regulations, which may differ from generally accepted accounting principles. In addition, the fund will claim a portion of the payment made to redeeming shareholders as a distribution for income tax purposes.
Capital accounts within the financial statements are adjusted for permanent book tax differences. These adjustments have no impact on net assets or the results of operations. Temporary book tax differences will reverse in a subsequent period.
1. Significant Accounting Policies continued
Income Tax Information and Distributions to Shareholders continued
|
Book tax differences are primarily due to partnerships (including allocations from the CIPs), and income recognized on commodity linked notes.
Distributions are recorded on the ex dividend date. Income dividends and capital gain distributions are declared separately for each class. Income and capital gain distribu tions are determined in accordance with income tax regulations, which may differ from generally accepted accounting principles.
Capital accounts within the financial statements are adjusted for permanent book tax differences. These adjustments have no impact on net assets or the results of operations. Temporary book tax differences will reverse in a subsequent period.
The tax basis components of distributable earnings and the federal tax cost as of period end were as follows:
| Unrealized appreciation | | $ | | 476,278 |
| Unrealized depreciation | | | | (100,753) |
| Net unrealized appreciation (depreciation) | | | | 375,525 |
| Undistributed ordinary income | | | | 84,659 |
| Undistributed long term capital gain | | | | 4,585 |
| |
| Cost for federal income tax purposes | | $ | | 37,981,688 |
Short Term Trading (Redemption) Fees. Shares purchased on or after September 7, 2005 and held in the fund less than 60 days are subject to a redemption fee equal to .75% of the proceeds of the redeemed shares. All redemption fees, including any estimated redemption fees paid by Fidelity Management & Research Company (FMR), are retained by the fund and accounted for as an addition to paid in capital.
Repurchase Agreements. FMR has received an Exemptive Order from the Securities and Exchange Commission (the SEC) which permits the fund and other affiliated entities of FMR to transfer uninvested cash balances into joint trading accounts which are then invested in repurchase agreements. The fund may also invest directly with institutions in repurchase agreements. Repurchase agreements are collateralized by government or non government securities. Collateral is held in segregated accounts with custodian banks and may be obtained in the event of a default of the counterparty. The fund monitors, on a daily basis, the value of the collateral to ensure it is at least equal to the principal amount of the repurchase agreement (including accrued interest). In the event of a default by the counterparty, realization of the collateral proceeds could be delayed, during which time the value of the collateral may decline.
25 Annual Report
Notes to Financial Statements continued
2. Operating Policies continued
|
Indexed Securities. The fund may invest in indexed securities whose values, interest rates and/or redemption prices are linked to changes in commodities, foreign currencies, interest rates, indices, or other underlying instruments. These securities may be used to increase or decrease exposure to different underlying instruments and to gain exposure to markets that might be difficult to access through conventional securities. Indexed securities may be more volatile than their underlying instruments, but any loss is limited to the amount of the original investment. Indexed securities are marked to market daily based on dealer supplied valuations and changes in value are recorded as unrealized appreciation (depreciation). Gains and losses realized upon the sale of indexed securi ties are included in realized gains (losses) on investment securities.
Restricted Securities. The fund may invest in securities that are subject to legal or contractual restrictions on resale. These securities generally may be resold in transac tions exempt from registration or to the public if the securities are registered. Disposal of these securities may involve time consuming negotiations and expense, and prompt sale at an acceptable price may be difficult. Information regarding restricted securities is included at the end of the fund’s Schedule of Investments.
3. Purchases and Sales of Investments.
Purchases and sales of securities, other than short term securities, and U.S. government securities, aggregated $25,147,525 and $1,025,010, respectively.
4. Fees and Other Transactions with Affiliates.
Management Fee. FMR and its affiliates provide the fund with investment manage ment related services for which the fund pays a monthly management fee. The manage ment fee is the sum of an individual fund fee rate that is based on an annual rate of .45% of the fund’s average net assets and a group fee rate that averaged .12% during the period. The group fee rate is based upon the average net assets of all the mutual funds advised by FMR. The group fee rate decreases as assets under management increase and increases as assets under management decrease. For the period, the total annualized management fee rate was .56% of the fund’s average net assets.
Distribution and Service Plan. In accordance with Rule 12b 1 of the 1940 Act, the fund has adopted separate Distribution and Service Plans for each class of shares. Certain classes pay Fidelity Distributors Corporation (FDC), an affiliate of FMR, separate Dis tribution and Service Fees, each of which is based on an annual percentage of each class’ average net assets. In addition, FDC may pay financial intermediaries for selling shares of
4. Fees and Other Transactions with Affiliates continued
Distribution and Service Plan continued
|
the fund and providing shareholder support services. For the period, the Distribution and Service Fee rates and the total amounts paid to and retained by FDC were as follows:
| | | Distribution | | Service | | | | Paid to | | | | Retained |
| | | Fee | | Fee | | | | FDC | | | | by FDC |
| Class A | | 0% | | .15% | | $ | | 349 | | $ | | 344 |
| Class T | | 0% | | .25% | | | | 575 | | | | 574 |
| Class B | | 65% | | .25% | | | | 2,067 | | | | 2,067 |
| Class C | | 75% | | .25% | | | | 2,313 | | | | 2,313 |
| | | | | | | $ | | 5,304 | | $ | | 5,298 |
Sales Load. FDC receives a front end sales charge of up to 4.75% for selling Class A shares, and 3.50% for selling Class T shares, some of which is paid to financial intermedi aries for selling shares of the fund. FDC receives the proceeds of contingent deferred sales charges levied on Class A, Class T, Class B, and Class C redemptions. These charges depend on the holding period. The deferred sales charges range from 5% to 1% for Class B, 1% for Class C, and .25% for certain purchases of Class A and Class T shares.
For the period, sales charge amounts retained by FDC were as follows:
| | |
| | | | | Retained |
| | | | | by FDC |
| Class A | | $ | | 294 |
| Class T | | | | 30 |
| | | $ | | 324 |
Transfer Agent Fees. Fidelity Investments Institutional Operations Company, Inc. (FIIOC), an affiliate of FMR, is the transfer, dividend disbursing and shareholder servicing agent for each class of the fund, except for Strategic Real Return. Fidelity Service Company, Inc. (FSC), an affiliate of FMR, is the transfer agent for Strategic Real Return shares. FIIOC and FSC receive account fees and asset based fees that vary according to the account size and type of account of the shareholders of the respective classes of the fund. FIIOC and FSC pay for typesetting, printing and mailing of shareholder reports,
27 Annual Report
Notes to Financial Statements continued
4. Fees and Other Transactions with Affiliates continued
Transfer Agent Fees continued
|
except proxy statements. For the period the total transfer agent fees paid by each class to FIIOC or FSC, were as follows:
| | | | | | | % of |
| | | | | | | Average |
| | | | | Amount | | Net Assets* |
| Class A | | $ | | 355 | | .17 |
| Class T | | | | 341 | | .16 |
| Class B | | | | 340 | | .16 |
| Class C | | | | 355 | | .17 |
| Strategic Real Return | | | | 1,341 | | .18 |
| Institutional Class | | | | 312 | | .15 |
| | | $ | | 3,044 | | |
| * Annualized | | | | | | |
Accounting Fees. FSC maintains the fund’s accounting records. The fee is based on the level of average net assets for the month.
Affiliated Central Funds. The fund may invest in Money Market Central Funds which seek preservation of capital and current income and are managed by Fidelity Investments Money Management, Inc. (FIMM) an affiliate of FMR.
The fund may also invest in CIPs managed by FIMM or Fidelity Management & Research Company, Inc. (FMRC) each an affiliate of FMR. The Ultra Short Central Fund seeks to obtain a high level of current income consistent with preservation of capital by investing in U.S. dollar denominated money market and investment grade debt securities. The Floating Rate Central Investment Portfolio seeks a high level of income by normally investing in floating rate loans and other floating rate securities.
The fund’s Schedule of Investments lists each applicable CIP as an investment of the fund but does not include the underlying holdings of the CIPs. Based on their investment objectives, each CIP may invest or participate in various investment vehicles or strate gies that are similar to those of the investing fund. In addition, the CIPs may also par ticipate in delayed delivery and when issued securities, loans and other direct debt instruments, derivatives and financing transactions. These strategies are consistent with the investment objectives of the fund and may involve certain economic risks, including the risk that a counterparty to one or more of these transactions may be unable or unwilling to comply with the terms of the governing agreement. This may result in a decline in value of each CIP and the fund.
4. Fees and Other Transactions with Affiliates continued
Affiliated Central Funds continued
|
A complete list of holdings for each CIP is available at the end of this report. In addition, a copy of each CIP’s financial statements is available on the EDGAR Database on the SEC’s website www.sec.gov, or at the Commission’s public reference room in Washington, DC.
The Central Funds do not pay a management fee. Income distributions earned by the fund are recorded as income in the accompanying financial statements and totaled $32,428 for the period.
FMR voluntarily agreed to reimburse each class to the extent annual operating expenses exceeded certain levels of average net assets as noted in the table below. Some expenses, for example interest expense, are excluded from this reimbursement.
The following classes were in reimbursement during the period:
| | | | |
| | | Expense | | | | Reimbursement |
| | | Limitations | | | | from adviser |
| Class A | | 1.00% | | $ | | 8,615 |
| Class T | | 1.10% | | | | 8,512 |
| Class B | | 1.75% | | | | 8,504 |
| Class C | | 1.85% | | | | 8,581 |
| Strategic Real Return | | 85% | | | | 28,706 |
| Institutional Class | | 85% | | | | 8,467 |
| | | | | $ | | 71,385 |
| |
| 6. Other. | | | | | | |
The fund’s organizational documents provide former and current trustees and officers with a limited indemnification against liabilities arising in connection with the perfor mance of their duties to the fund. In the normal course of business, the fund may also enter into contracts that provide general indemnifications. The fund’s maximum exposure under these arrangements is unknown as this would be dependent on future claims that may be made against the fund. The risk of material loss from such claims is considered remote.
At the end of the period, FMR or its affiliates were the owners of record of 53% of the total outstanding shares of the fund.
29 Annual Report
| | Notes to Financial Statements continued
7. Share Transactions.
Transactions for each class of shares were as follows:
|
| | | SharesA | | | | DollarsA |
| | | Year ended September 30, 2005 |
| Class A | | | | | | |
| Shares sold | | 335,576 | | $ | | 3,356,917 |
| Shares redeemed | | — | | | | — |
| Net increase (decrease) | | 335,576 | | $ | | 3,356,917 |
| Class T | | | | | | |
| Shares sold | | 323,690 | | $ | | 3,237,283 |
| Shares redeemed | | — | | | | — |
| Net increase (decrease) | | 323,690 | | $ | | 3,237,283 |
| Class B | | | | | | |
| Shares sold | | 320,754 | | $ | | 3,207,594 |
| Shares redeemed | | — | | | | — |
| Net increase (decrease) | | 320,754 | | $ | | 3,207,594 |
| Class C | | | | | | |
| Shares sold | | 341,879 | | $ | | 3,420,798 |
| Shares redeemed | | — | | | | — |
| Net increase (decrease) | | 341,879 | | $ | | 3,420,798 |
| Strategic Real Return | | | | | | |
| Shares sold | | 2,155,812 | | $ 21,651,987 |
| Shares redeemed | | (1,868) | | | | (18,821) |
| Net increase (decrease) | | 2,153,944 | | $ 21,633,166 |
| Institutional Class | | | | | | |
| Shares sold | | 320,001 | | $ | | 3,200,010 |
| Shares redeemed | | — | | | | — |
| Net increase (decrease) | | 320,001 | | $ | | 3,200,010 |
A For the period September 7, 2005 (commencement of operations) to September 30, 2005.
Annual Report 30
Report of Independent Registered Public Accounting Firm
To the Trustees of Fidelity Commonwealth Trust and Shareholders of Fidelity Strategic Real Return Fund:
We have audited the accompanying statement of assets and liabilities of Fidelity Strategic Real Return Fund (the Fund), a fund of Fidelity Commonwealth Trust, including the schedule of investments, as of September 30, 2005, and the related statement of opera tions, the statement of changes in net assets, and the financial highlights for the period from September 7, 2005 (commencement of operations) to September 30, 2005. These financial statements and financial highlights are the responsibility of the Fund’s manage ment. Our responsibility is to express an opinion on these financial statements and financial highlights based on our audit.
We conducted our audit in accordance with standards of the Public Company Accounting Oversight Board (United States). Those standards require that we plan and perform the audit to obtain reasonable assurance about whether the financial statements and financial highlights are free of material misstatement. The Fund is not required to have, nor were we engaged to perform, an audit of its internal control over financial reporting. Our audit included consideration of internal control over financial reporting as a basis for designing audit procedures that are appropriate in the circumstances, but not for the purpose of expressing an opinion on the effectiveness of the Fund’s internal control over financial reporting. Accordingly, we express no such opinion. An audit also includes examining, on a test basis, evidence supporting the amounts and disclosures in the financial statements, assessing the accounting principles used and significant estimates made by management, as well as evaluating the overall financial statement presentation. Our procedures included confirmation of securities owned as of September 30, 2005, by correspondence with the custodians and brokers; where replies were not received from brokers, we performed other auditing procedures. We believe that our audit provides a reasonable basis for our opinion.
In our opinion, the financial statements and financial highlights referred to above present fairly, in all material respects, the financial position of Fidelity Strategic Real Return Fund as of September 30, 2005, the results of its operations, the changes in its net assets, and its financial highlights for the period from September 7, 2005 (commencement of operations) to September 30, 2005, in conformity with accounting principles generally accepted in the United States of America.
/s/ Deloitte & Touche LLP
DELOITTE & TOUCHE LLP
Boston, Massachusetts
November18, 2005
|
31 Annual Report
Trustees and Officers
The Trustees, Members of the Advisory Board, and executive officers of the trust and fund, as applicable, are listed below. The Board of Trustees governs the fund and is responsible for protecting the interests of shareholders. The Trustees are experienced executives who meet periodically throughout the year to oversee the fund’s activities, review contractual arrangements with companies that provide services to the fund, and review the fund’s performance. Except for William O. McCoy, Stephen P. Jonas, and Kenneth L. Wolfe, each of the Trustees oversees 322 funds advised by FMR or an affiliate. Mr. McCoy oversees 324 funds advised by FMR or an affiliate. Mr. Jonas and Mr. Wolfe oversee 319 funds advised by FMR or an affiliate.
The Trustees hold office without limit in time except that (a) any Trustee may resign; (b) any Trustee may be removed by written instrument, signed by at least two thirds of the number of Trustees prior to such removal; (c) any Trustee who requests to be retired or who has become incapacitated by illness or injury may be retired by written instru ment signed by a majority of the other Trustees; and (d) any Trustee may be removed at any special meeting of shareholders by a two thirds vote of the outstanding voting securities of the trust. Each Trustee who is not an interested person (as defined in the 1940 Act) (Independent Trustee), shall retire not later than the last day of the calendar year in which his or her 72nd birthday occurs. The Independent Trustees may waive this mandatory retirement age policy with respect to individual Trustees. The executive officers and Advisory Board Members hold office without limit in time, except that any officer and Advisory Board Member may resign or may be removed by a vote of a majority of the Trustees at any regular meeting or any special meeting of the Trustees. Except as indicated, each individual has held the office shown or other offices in the same company for the past five years.
The fund’s Statement of Additional Information (SAI) includes more information about the Trustees. To request a free copy, call Fidelity at 1-877-208-0098.
Correspondence intended for each Trustee who is an interested person may be sent to Fidelity Investments, 82 Devonshire Street, Boston, Massachusetts 02109.
| | Name, Age; Principal Occupation
Edward C. Johnson 3d (75)**
|
Year of Election or Appointment: 1974
Mr. Johnson is Chairman of the Board of Trustees. Mr. Johnson serves as Chief Executive Officer, Chairman, and a Director of FMR Corp.; a Director and Chairman of the Board and of the Executive Committee of FMR; Chairman and a Director of Fidelity Management & Research (Far East) Inc.; Chairman and a Director of Fidelity Investments Money Man agement, Inc.; and Chairman (2001 present) and a Director (2000 present) of FMR Co., Inc.
| | Name, Age; Principal Occupation
Abigail P. Johnson (43)**
|
Year of Election or Appointment: 2001
Ms. Johnson serves as President of Fidelity Employer Services Company (FESCO) (2005 present). She is President and a Director of Fidelity Investments Money Management, Inc. (2001 present), FMR Co., Inc. (2001 present), and a Director of FMR Corp. Previously, Ms. Johnson served as President and a Director of FMR (2001 2005), Senior Vice President of the Fidelity funds (2001 2005), and managed a number of Fidelity funds.
Year of Election or Appointment: 2005
Mr. Jonas is Senior Vice President of the fund (2005 present). He also serves as Senior Vice President of other Fidelity funds (2005 present). Mr. Jonas is Executive Director of FMR (2005 present). Previously, Mr. Jonas served as President of Fidelity Enterprise Operations and Risk Services (2004 2005), Chief Administrative Officer (2002 2004), and Chief Financial Officer of FMR Co. (1998 2000). Mr. Jonas has been with Fidelity Investments since 1987 and has held various financial and management positions including Chief Financial Officer of FMR. In addi tion, he serves on the Boards of Boston Ballet (2003 present) and Sim mons College (2003 present).
Year of Election or Appointment: 2003
Mr. Reynolds is a Director (2003 present) and Chief Operating Officer (2002 present) of FMR Corp. He also serves on the Board at Fidelity Investments Canada, Ltd. (2000 present). Previously, Mr. Reynolds served as President of Fidelity Investments Institutional Retirement Group (1996 2000).
* Trustees have been determined to be “Interested Trustees” by virtue of, among other things, their affiliation with the trust or various entities under common control with FMR.
** Edward C. Johnson 3d, Trustee, is Abigail P. Johnson’s father.
33 Annual Report
Trustees and Officers - continued
Independent Trustees:
Correspondence intended for each Independent Trustee (that is, the Trustees other than the Interested Trustees) may be sent to Fidelity Investments, P.O. Box 55235, Boston, Massachusetts 02205 5235.
| | Name, Age; Principal Occupation
Dennis J. Dirks (57)
|
Year of Election or Appointment: 2005
Prior to his retirement in May 2003, Mr. Dirks was Chief Operating Officer and a member of the Board of The Depository Trust & Clearing Corporation (DTCC) (1999 2003). He also served as President, Chief Operating Officer, and Board member of The Depository Trust Com pany (DTC) (1999 2003) and President and Board member of the National Securities Clearing Corporation (NSCC) (1999 2003). In addition, Mr. Dirks served as Chief Executive Officer and Board mem ber of the Government Securities Clearing Corporation (2001 2003) and Chief Executive Officer and Board member of the Mortgage Backed Securities Clearing Corporation (2001 2003). Mr. Dirks also serves as a Trustee of Manhattan College (2005 present).
Year of Election or Appointment: 1997
Dr. Gates is Vice Chairman of the Independent Trustees (2005 present). Dr. Gates is President of Texas A&M University (2002 present). He was Director of the Central Intelligence Agency (CIA) from 1991 to 1993. From 1989 to 1991, Dr. Gates served as Assistant to the President of the United States and Deputy National Security Advisor. Dr. Gates is a Director of NACCO Industries, Inc. (mining and manufacturing), Parker Drilling Co., Inc. (drilling and rental tools for the energy industry, 2001 present), and Brinker International (restaurant management, 2003 present). Previously, Dr. Gates served as a Director of LucasVarity PLC (automotive components and diesel engines), a Director of TRW Inc. (automotive, space, defense, and information technology), and Dean of the George Bush School of Government and Public Service at Texas A&M University (1999 2001). Dr. Gates also is a Trustee of the Forum for International Policy.
Name, Age; Principal Occupation
George H. Heilmeier (69)
|
Year of Election or Appointment: 2004
Dr. Heilmeier is Chairman Emeritus of Telcordia Technologies (commu nication software and systems), where prior to his retirement, he served as company Chairman and Chief Executive Officer. He currently serves on the Boards of Directors of The Mitre Corporation (systems engineer ing and information technology support for the government), and HRL Laboratories (private research and development, 2004 present). He is Chairman of the General Motors Science & Technology Advisory Board and a Life Fellow of the Institute of Electrical and Electronics Engineers (IEEE) (2000 present). Dr. Heilmeier is a member of the Defense Science Board and the National Security Agency Advisory Board. He is also a member of the National Academy of Engineering, the American Academy of Arts and Sciences, and the Board of Overseers of the School of Engineering and Applied Science of the University of Pennsylvania. Pre viously, Dr. Heilmeier served as a Director of TRW Inc. (automotive, space, defense, and information technology, 1992 2002), Compaq (1994 2002), Automatic Data Processing, Inc. (ADP) (technology based business outsourcing, 1995 2002), INET Technologies Inc. (telecommunications network surveillance, 2001 2004), and Teletech Holdings (cus tomer management services). He is the recipient of the 2005 Kyoto Prize in Advanced Technology for his invention of the liquid display.
Year of Election or Appointment: 2001
Prior to Ms. Knowles’ retirement in June 2000, she served as Executive Vice President and Chief Financial Officer of Atlantic Richfield Company (ARCO) (diversified energy, 1996 2000). From 1993 to 1996, she was a Senior Vice President of ARCO and President of ARCO Transportation Company. She served as a Director of ARCO from 1996 to 1998. She currently serves as a Director of Phelps Dodge Corporation (copper mining and manufacturing) and McKesson Corporation (healthcare ser vice, 2002 present). Ms. Knowles is a Trustee of the Brookings Institution and the Catalina Island Conservancy and also serves as a member of the Advisory Board for the School of Engineering of the University of Southern California.
35 Annual Report
Trustees and Officers - continued
| | Name, Age; Principal Occupation
Ned C. Lautenbach (61)
|
Year of Election or Appointment: 2000
Mr. Lautenbach has been a partner of Clayton, Dubilier & Rice, Inc. (private equity investment firm) since September 1998. Previously, Mr. Lautenbach was with the International Business Machines Corpora tion (IBM) from 1968 until his retirement in 1998. Mr. Lautenbach serves as a Director of Italtel Holding S.p.A. (telecommunications (Milan, Italy), 2004 present) and Eaton Corporation (diversified industrial) as well as the Philharmonic Center for the Arts in Naples, Florida. He also is a member of the Board of Trustees of Fairfield University (2005 present), as well as a member of the Council on Foreign Relations.
Year of Election or Appointment: 1993
Mr. Mann is Chairman of the Independent Trustees (2001 present). He is Chairman Emeritus of Lexmark International, Inc. (computer peripherals), where he served as CEO until April 1998, retired as Chairman May 1999, and remains a member of the Board. Prior to 1991, he held the positions of Vice President of International Business Machines Corporation (IBM) and President and General Manager of various IBM divisions and subsidiaries. He is a member of the Executive Committee of the Independent Director’s Council of the Investment Com pany Institute. In addition, Mr. Mann is a member of the President’s Cabinet at the University of Alabama and the Board of Visitors of the Culverhouse College of Commerce and Business Administration at the University of Alabama.
Year of Election or Appointment: 1997
Prior to his retirement in December 1994, Mr. McCoy was Vice Chair man of the Board of BellSouth Corporation (telecommunications) and President of BellSouth Enterprises. He is currently a Director of Liberty Corporation (holding company), Duke Realty Corporation (real estate), and Progress Energy, Inc. (electric utility). He is also a partner of Frank lin Street Partners (private investment management firm) and a member of the Research Triangle Foundation Board. In addition, Mr. McCoy served as the Interim Chancellor (1999 2000) and a member of the Board of Visitors for the University of North Carolina at Chapel Hill and currently serves on the Board of Directors of the University of North Carolina Health Care System and the Board of Visitors of the Kenan Flagler Business School (University of North Carolina at Chapel Hill). He also served as Vice President of Finance for the University of North Car olina (16 school system).
Name, Age; Principal Occupation
Cornelia M. Small (61)
|
Year of Election or Appointment: 2005
Ms. Small is a member (2000 present) and Chairperson (2002 present) of the Investment Committee, and a member (2002 present) of the Board of Trustees of Smith College. Previously, she served as Chief In vestment Officer (1999 2000), Director of Global Equity Investments (1996 1999), and a member of the Board of Directors of Scudder, Ste vens & Clark (1990 1997) and Scudder Kemper Investments (1997 1998). In addition, Ms. Small served as Co Chair (2000 2003) of the Annual Fund for the Fletcher School of Law and Diplomacy.
William S. Stavropoulos (66)
|
Year of Election or Appointment: 2002
Mr. Stavropoulos is Chairman of the Board (2000 present) and a Mem ber of the Board of Directors of The Dow Chemical Company. Since joining The Dow Chemical Company in 1967, Mr. Stavropoulos served in numerous senior management positions, including President (1993 2000; 2002 2003), CEO (1995 2000; 2002 2004), and Chair man of the Executive Committee (2000 2004). Currently, he is a Direc tor of NCR Corporation (data warehousing and technology solutions), BellSouth Corporation (telecommunications), Chemical Financial Corpo ration, Maersk Inc. (industrial conglomerate, 2002 present), and Metal mark Capital (private equity investment firm, 2005 present). He also serves as a member of the Board of Trustees of the American Enterprise Institute for Public Policy Research. In addition, Mr. Stavropoulos is a member of The Business Council, J.P. Morgan International Council and the University of Notre Dame Advisory Council for the College of Science.
Year of Election or Appointment: 2005
Mr. Wolfe also serves as a Trustee (2005 present) or Member of the Advisory Board (2004 present) of other investment companies advised by FMR. Prior to his retirement in 2001, Mr. Wolfe was Chairman and Chief Executive Officer of Hershey Foods Corporation (1993 2001). He currently serves as a member of the boards of Adelphia Communica tions Corporation (2003 present), Bausch & Lomb, Inc., and Revlon Inc. (2004 present).
37 Annual Report
Trustees and Officers - continued
Advisory Board Members and Executive Officers:
Correspondence intended for Mr. Gamper may be sent to Fidelity Investments, P.O. Box 55235, Boston, Massachusetts 02205 5235. Correspondence intended for each executive officer and Mr. Lynch may be sent to Fidelity Investments, 82 Devonshire Street, Boston, Massachusetts 02109.
| | Name, Age; Principal Occupation
Albert R. Gamper, Jr. (63)
|
Year of Election or Appointment: 2005
Member of the Advisory Board of Fidelity Commonwealth Trust. Prior to his retirement in December 2004, Mr. Gamper served as Chairman of the Board of CIT Group Inc. (commercial finance). During his tenure with CIT Group Inc. Mr. Gamper served in numerous senior manage ment positions, including Chairman (1987 1989; 1999 2001; 2002 2004), Chief Executive Officer (1987 2004), and President (1989 2002). He currently serves as a member of the Board of Direc tors of Public Service Enterprise Group (utilities, 2001 present), Chair man of the Board of Governors, Rutgers University (2004 present), and Chairman of the Board of Saint Barnabas Health Care System.
Year of Election or Appointment: 2003
Member of the Advisory Board of Fidelity Commonwealth Trust. Vice Chairman and a Director of FMR, and Vice Chairman (2001 present) and a Director (2000 present) of FMR Co., Inc. Previously, Mr. Lynch served as a Trustee of the Fidelity funds (1990 2003). In addition, he serves as a Trustee of Boston College, Massachusetts Eye & Ear Infir mary, Historic Deerfield, John F. Kennedy Library, and the Museum of Fine Arts of Boston.
Year of Election or Appointment: 2005
Vice President of the fund. Mr. Churchill also serves as Vice President of certain Equity Funds (2005 present) and certain High Income Funds (2005 present). Previously, he served as Head of Fidelity’s Fixed Income Division (2000 2005), Vice President of Fidelity’s Money Market Funds (2000 2005), Vice President of Fidelity’s Bond Funds, and Senior Vice President of FIMM (2000) and FMR. Mr. Churchill joined Fidelity in 1993 as Vice President and Group Leader of Taxable Fixed Income Investments.
Name, Age; Principal Occupation
Walter C. Donovan (43)
|
Year of Election or Appointment: 2005
Vice President of the fund. Mr. Donovan also serves as Vice President of Fidelity’s High Income Funds (2005 present), Fidelity’s Fixed Income Funds (2005 present), certain Asset Allocation Funds (2005 present), and certain Balanced Funds (2005 present). Mr. Donovan also serves as Executive Vice President of FMR (2005 present) and FMRC
(2005 present). Previously, Mr. Donovan served as Vice President and Director of Fidelity’s International Equity Trading group (1998 2005).
Year of Election or Appointment: 2005
Vice President of the fund. Mr. Greer also serves as Vice President of the Fidelity Select Portfolios (2005 present), certain Asset Allocation Funds (2005 present), a Trustee of other investment companies advised by FMR (2003 present), and a member of the FMR senior management team (2005 present). Previously, Mr. Greer served as a Director and Managing Director of Strategic Advisers, Inc. (2002 2005), Executive Vice President (2000 2002), and Money Market Group Leader (1997 2002) of the Fidelity Investments Fixed Income Division. He also served as Vice President of Fidelity’s Money Market Funds (1997 2002), Senior Vice President of FMR (1997 2002), and Vice President of FIMM (1998 2002).
Year of Election or Appointment: 2005
Vice President of the fund. Mr. Murphy also serves as Vice President of Fidelity’s Money Market Funds (2002 present), certain Asset Allocation Funds (2003 present), Fidelity’s Investment Grade Bond Funds (2005 present), and Fidelity’s Balanced Funds (2005 present). He serves as Senior Vice President (2000 present) and Head (2004 present) of the Fidelity Investments Fixed Income Division. Mr. Murphy is also a Senior Vice President of FIMM (2003 present) and a Vice President of FMR (2000 present). Previously, Mr. Murphy served as Money Market Group Leader (2002 2004), Bond Group Leader (2000 2002), and Vice Presi dent of Fidelity’s Taxable Bond Funds (2000 2002) and Fidelity’s Munici pal Bond Funds (2001 2002). Mr. Murphy joined Fidelity Investments in 1989 as a portfolio manager in the Bond Group.
39 Annual Report
Trustees and Officers - continued
| | Name, Age; Principal Occupation
Thomas J. Silvia (44)
|
Year of Election or Appointment: 2005
Vice President of the fund. Mr. Silvia also serves as Vice President of Fidelity’s Bond Funds (2005 present) and Senior Vice President and Bond Group Leader of the Fidelity Investments Fixed Income Division (2005 present). Previously, Mr. Silvia served as Director of Fidelity’s Tax able Bond portfolio managers (2002 2004) and a portfolio manager in the Bond Group (1997 2004).
Year of Election or Appointment: 2005
Vice President of the fund. Mr. Dudley also serves as Vice President of other funds advised by FMR. Prior to assuming his current responsibili ties, Mr. Dudley managed a variety of Fidelity funds.
Year of Election or Appointment: 2005
Vice President of the fund. Mr. Snyderman also serves as Vice Presi dent of another fund advised by FMR. Prior to assuming his current responsibilities, Mr. Snyderman managed a variety of Fidelity funds. Mr. Snyderman also serves as Vice President of FMR (2004) and FMR Co., Inc. (2004).
Year of Election or Appointment: 2005
Secretary of the fund. He also serves as Secretary of other Fidelity funds; Vice President, General Counsel, and Secretary of FMR Co., Inc. (2001 present) and FMR; Assistant Secretary of Fidelity Management & Research (U.K.) Inc. (2001 present), Fidelity Management & Research (Far East) Inc. (2001 present), and Fidelity Investments Money Manage ment, Inc. (2001 present). Mr. Roiter is an Adjunct Member, Faculty of Law, at Boston College Law School (2003 present). Previously, Mr. Roiter served as Vice President and Secretary of Fidelity Distributors Corpora tion (FDC) (1998 2005).
Year of Election or Appointment: 2005
Assistant Secretary of the fund. Mr. Fross also serves as Assistant Secre tary of other Fidelity funds (2003 present), Vice President and Secretary of FDC (2005 present), and is an employee of FMR.
Name, Age; Principal Occupation
Christine Reynolds (47)
|
Year of Election or Appointment: 2005
President, Treasurer, and Anti Money Laundering (AML) officer of the fund. Ms. Reynolds also serves as President, Treasurer, and AML officer of other Fidelity funds (2004) and is a Vice President (2003) and an employee (2002) of FMR. Before joining Fidelity Investments, Ms. Reynolds worked at PricewaterhouseCoopers LLP (PwC) (1980 2002), where she was most recently an audit partner with PwC’s investment management practice.
Year of Election or Appointment: 2005
Chief Financial Officer of the fund. Mr. Hayes also serves as Chief Financial Officer of other Fidelity funds (2002 present) and President of Fidelity Investment Operations (2005 present) which includes Fidelity Pricing and Cash Management Services Group (FPCMS), where he served as President (1998 2005). Mr. Hayes serves as President of Fidelity Service Company (2003 present) where he also serves as a Director. Mr. Hayes also served as President of Fidelity Investments Operations Group (FIOG, 2002 2005).
Kenneth A. Rathgeber (58)
|
Year of Election or Appointment: 2005
Chief Compliance Officer of the fund. Mr. Rathgeber also serves as Chief Compliance Officer of other Fidelity funds (2004) and Executive Vice President of Risk Oversight for Fidelity Investments (2002). Pre viously, he served as Executive Vice President and Chief Operating Offi cer for Fidelity Investments Institutional Services Company, Inc.
(1998 2002).
Year of Election or Appointment: 2005
Deputy Treasurer of the fund. Mr. Hebble also serves as Deputy Trea surer of other Fidelity funds (2003), and is an employee of FMR. Before joining Fidelity Investments, Mr. Hebble worked at Deutsche Asset Man agement where he served as Director of Fund Accounting (2002 2003) and Assistant Treasurer of the Scudder Funds (1998 2003).
Year of Election or Appointment: 2005
Deputy Treasurer of the fund. Mr. Mehrmann also serves as Deputy Treasurer of other Fidelity funds (2005 present) and is an employee of FMR. Previously, Mr. Mehrmann served as Vice President of Fidelity Investments Institutional Services Group (FIIS)/Fidelity Investments Institu tional Operations Corporation, Inc. (FIIOC) Client Services (1998 2004).
41 Annual Report
Trustees and Officers - continued
| | Name, Age; Principal Occupation
Kimberley H. Monasterio (41)
|
Year of Election or Appointment: 2005
Deputy Treasurer of the fund. Ms. Monasterio also serves as Deputy Treasurer of other Fidelity funds (2004) and is an employee of FMR (2004). Before joining Fidelity Investments, Ms. Monasterio served as Treasurer (2000 2004) and Chief Financial Officer (2002 2004) of the Franklin Templeton Funds and Senior Vice President of Franklin Temple ton Services, LLC (2000 2004).
Year of Election or Appointment: 2005
Deputy Treasurer of the fund. Mr. Robins also serves as Deputy Treasurer of other Fidelity funds (2005 present) and is an employee of FMR (2004 present). Before joining Fidelity Investments, Mr. Robins worked at KPMG LLP, where he was a partner in KPMG’s department of profes sional practice (2002 2004) and a Senior Manager (1999 2000). In addition, Mr. Robins served as Assistant Chief Accountant, United States Securities and Exchange Commission (2000 2002).
Year of Election or Appointment: 2005
Assistant Treasurer of the fund. Mr. Byrnes also serves as Assistant Trea surer of other Fidelity funds (2005 present) and is an employee of FMR (2005 present). Previously, Mr. Byrnes served as Vice President of FPCMS (2003 2005). Before joining Fidelity Investments, Mr. Byrnes worked at Deutsche Asset Management where he served as Vice Presi dent of the Investment Operations Group (2000 2003).
Year of Election or Appointment: 2005
Assistant Treasurer of the fund. Mr. Costello also serves as Assistant Treasurer of other Fidelity funds and is an employee of FMR.
Year of Election or Appointment: 2005
Assistant Treasurer of the fund. Mr. Lydecker also serves as Assistant Treasurer of other Fidelity funds (2004) and is an employee of FMR.
Year of Election or Appointment: 2005
Assistant Treasurer of the fund. Mr. Osterheld also serves as Assistant Treasurer of other Fidelity funds (2002) and is an employee of FMR.
Name, Age; Principal Occupation
Gary W. Ryan (47)
|
Year of Election or Appointment: 2005
Assistant Treasurer of the fund. Mr. Ryan also serves as Assistant Trea surer of other Fidelity funds (2005 present) and is an employee of FMR (2005 present). Previously, Mr. Ryan served as Vice President of Fund Reporting in FPCMS (1999 2005).
Year of Election or Appointment: 2005
Assistant Treasurer of the fund. Mr. Schiavone also serves as Assistant Treasurer of other Fidelity funds (2005 present) and is an employee of FMR (2005 present). Before joining Fidelity Investments, Mr. Schiavone worked at Deutsche Asset Management, where he most recently served as Assistant Treasurer (2003 2005) of the Scudder Funds and Vice Pres ident and Head of Fund Reporting (1996 2003).
43 Annual Report
The fund hereby designates as capital gain dividends: For dividends with respect to the taxable year ended September 30, 2005, $4,585, or, if subsequently determined to be different, the net capital gain of such year.
A total of 30.96% of the dividends distributed during the fiscal year was derived from interest on U.S. Government securities which is generally exempt from state income tax.
The fund will notify shareholders in January 2006 of amounts for use in preparing 2005 income tax returns.
Board Approval of Investment Advisory Contracts and Management Fees
Fidelity Strategic Real Return Fund
On July 21, 2005, the Board of Trustees, including the independent Trustees (together, the Board), voted to approve the management contract and subadvisory agreements (together, the Advisory Contracts) for the fund. The Board, assisted by the advice of fund counsel and independent Trustees’ counsel, considered a broad range of information.
In determining whether to approve the Advisory Contracts for the fund, the Board was aware that shareholders have a broad range of investment choices available to them, including a wide choice among mutual funds offered by competitors to Fidelity, and that shareholders, with the opportunity to review and weigh the disclosure provided by the fund in its prospectus and other public disclosures, may choose to invest in this fund, managed by Fidelity.
Nature, Extent, and Quality of Services Provided by Fidelity. The Board consid ered staffing within the investment adviser, FMR, and the sub advisers (together, the Investment Advisers), including the background of the fund’s portfolio manager and the fund’s investment objective and discipline.
Fidelity Resources Dedicated to Investment Management and Support Services. The Board considered Fidelity’s extensive global research capabilities that enable the Investment Advisers to aggregate data from various sources in an effort to produce positive investment results. The Board noted that Fidelity’s analysts have access to a variety of technological tools that enable them to perform both fundamental and quanti tative analysis and to specialize in various disciplines. The Board also considered that Fidelity’s portfolio managers and analysts have access to daily portfolio attribution that allows for monitoring of a fund’s portfolio, as well as an electronic communication system that provides immediate real time access to research concerning issuers and credit enhancers.
Shareholder and Administrative Services. The Board considered the nature, extent, quality, and cost of administrative, distribution, and shareholder services performed by the Investment Advisers and their affiliates under the Advisory Contracts and under separate agreements covering transfer agency, pricing and bookkeeping, and securities lending services for the fund. The Board also considered the nature and extent of the Investment Advisers’ supervision of third party service providers, principally custodians and subcustodians.
The Board noted that the growth of fund assets across the complex allows Fidelity to reinvest in the development of services designed to enhance the value or convenience of the Fidelity funds as investment vehicles. These services include 24 hour access to account information and market information through phone representatives and over the Internet, and investor education materials and asset allocation tools.
45 Annual Report
Board Approval of Investment Advisory Contracts and Management Fees continued
Investment in a Large Fund Family. The Board considered the benefits to shareholders of investing in a Fidelity fund, including the benefits of investing in a fund that is part of a large family of funds offering a variety of investment disciplines and providing for a large variety of mutual fund investor services. For example, fund shareholders are offered the privilege of exchanging shares of the fund for shares of other Fidelity funds, as set forth in the fund’s prospectus, without paying an additional sales charge.
Investment Performance. Fidelity Strategic Real Return is a new fund and therefore had no historical performance for the Board to review at the time it approved the fund’s Advisory Contracts.
Based on its review, the Board concluded that the nature, extent, and quality of the services provided by Fidelity will benefit the fund’s shareholders, particularly in light of the Board’s view that the fund’s shareholders benefit from investing in a fund that is part of a large family of funds offering a variety of investment disciplines and services.
Competitiveness of Management Fee and Total Fund Expenses. The Board considered the fund’s proposed management fee and projected operating expenses in reviewing the Advisory Contracts. The Board noted that the fund’s proposed manage ment fee rate is lower than the median fee rate of funds with similar Lipper investment objective categories and comparable management fee characteristics. The Board also noted that the fund’s management fee and projected expenses are comparable to those of similar funds that Fidelity offers to shareholders.
Based on its review, the Board concluded that the fund’s management fee and the total expenses for each class of the fund were fair and reasonable in light of the services that the fund and its shareholders receive and the other factors considered.
Costs of the Services and Profitability. The fund is a new fund and therefore no revenue, cost, or profitability data was available for the Board to review in respect of the fund at the time it approved the Advisory Contracts.
Economies of Scale. The Board considered the extent to which the fund will benefit from economies of scale through increased services to the fund, through waivers or reimbursements, or through fee or expense reductions, including reductions that occur through operation of the transfer agent agreement. The transfer agent fee varies in part based on the number of accounts in the fund. If the number of accounts decreases or the average account size increases, the overall transfer agent fee rate decreases.
The Board recognized that the fund’s management contract incorporates a “group fee” structure, which provides for lower fee rates as total fund assets under FMR’s manage ment increase, and for higher fee rates as total fund assets under FMR’s management decrease. The Board considered that the group fee is designed to deliver the benefits of economies of scale to fund shareholders when total fund assets increase, even if assets of any particular fund are unchanged or have declined, because some portion of Fidelity’s
costs are attributable to services provided to all Fidelity funds, and all funds benefit if those costs can be allocated among more assets.
The Board concluded that, given the group fee structure, fund shareholders will achieve a certain level of economies of scale as assets under FMR’s management increase at the fund complex level, regardless of whether Fidelity achieves any such economies of scale.
Additional Information Requested by the Board. In order to develop fully the factual basis for consideration of the Advisory Contracts, the Board received additional information explaining that the fund will obtain commodity exposure by investing in a combination of structured notes and other short term securities. The Board considered that the fund offers an option for investors concerned about the impact of inflation on the markets and that the fund seeks real return consistent with reasonable investment risk by allocating its assets across investment categories that are selected to provide broad diversification, inflation protection, and risk mitigation. The Board also consid ered additional information regarding similar funds offered by other fund companies.
Based on its evaluation of all of the conclusions noted above, and after considering all material factors, the Board ultimately concluded that the advisory fee structures are fair and reasonable, and that the fund’s Advisory Contracts should be approved.
47 Annual Report
The following is a complete listing of investments for Fidelity’s fixed income central funds as of September 30, 2005 which are direct investments of Fidelity Strategic Real Return Fund. These underlying holdings of the Fidelity fixed income central funds are not included in the Schedule of Investments as part of the Financial Statements.
| | Fidelity Floating Rate Central Investment Portfolio
Investments September 30, 2005 (Unaudited)
Showing Percentage of Net Assets
|
Floating Rate Loans (c) 89.6%
�� | | | | | | |
| | | | | Principal | | Value |
| | | | | Amount | | |
| Aerospace – 0.3% | | | | | | |
| Mid-Western Aircraft Systems, Inc. Tranche B, term loan | | | | | | |
| 5.9606% 12/31/11 (b) | | $ | | 1,386,525 | | $ 1,409,056 |
| Air Transportation – 1.3% | | | | | | |
| United Air Lines, Inc. Tranche B, term loan 7.96% | | | | | | |
| 12/30/05 (b) | | | | 2,120,000 | | 2,141,200 |
| US Airways Group, Inc. Tranche 1A, term loan | | | | | | |
| 12.2062% 9/30/10 (b) | | | | 4,000,000 | | 4,000,000 |
| | | | | | | 6,141,200 |
| Automotive 4.2% | | | | | | |
| Accuride Corp. term loan 6.1797% 1/31/12 (b) | | | | 2,343,409 | | 2,366,843 |
| AM General LLC Tranche B1, term loan 8.2044% | | | | | | |
| 11/1/11 (b) | | | | 3,747,436 | | 3,916,071 |
| Goodyear Tire & Rubber Co.: | | | | | | |
| Tranche 1, 4.7852% 4/30/10 (b) | | | | 1,060,000 | | 1,069,275 |
| Tranche 2, term loan 6.32% 4/30/10 (b) | | | | 1,480,000 | | 1,500,350 |
| Travelcenters of America, Inc. Tranche B, term loan | | | | | | |
| 5.71% 12/1/11 (b) | | | | 7,916,840 | | 8,005,904 |
| TRW Automotive Holdings Corp. Tranche B, term loan | | | | | | |
| 5.25% 6/30/12 (b) | | | | 2,770,717 | | 2,798,424 |
| | | | | | | 19,656,867 |
| Broadcasting – 2.0% | | | | | | |
| Entravision Communications Corp. term loan 5.55% | | | | | | |
| 3/29/13 (b) | | | | 4,000,000 | | 4,035,000 |
| Nexstar Broadcasting, Inc. Tranche B, term loan | | | | | | |
| 5.6644% 10/1/12 (b) | | | | 3,828,592 | | 3,852,520 |
| Spanish Broadcasting System, Inc. Tranche 1, term loan | | | | | | |
| 6.03% 6/10/12 (b) | | | | 1,567,125 | | 1,590,632 |
| | | | | | | 9,478,152 |
| Building Materials – 1.0% | | | | | | |
| Euramax International, Inc./Euramax International | | | | | | |
| Holdings BV Tranche 1, term loan 6.6297% | | | | | | |
| 6/29/12 (b) | | | | 1,845,375 | | 1,859,215 |
| Goodman Global Holdings, Inc. term loan 5.875% | | | | | | |
| 12/23/11 (b) | | | | 1,210,850 | | 1,227,499 |
| Masonite International Corp. term loan 5.6659% | | | | | | |
| 4/5/13 (b) | | | | 1,462,650 | | 1,466,307 |
| | | | | | | 4,553,021 |
| Cable TV 6.4% | | | | | | |
| Adelphia Communications Corp. Tranche B, term loan | | | | | | |
| 6.3041% 3/31/06 (b) | | | | 2,450,000 | | 2,462,250 |
| Century Cable Holdings LLC Tranche B, term loan 8.75% | | | | | | |
| 6/30/09 (b) | | | | 3,000,000 | | 2,977,500 |
| |
| |
| 49 | | | | | | Annual Report |
| Investments (Unaudited) continued | | | | | | | | |
| |
Floating Rate Loans (c) continued
| | | | | | | | |
| | | | | | | Principal | | | | Value |
| | | | | | | Amount | | | | |
| Cable TV – continued | | | | | | | | | | |
| Charter Communications Operating LLC: | | | | | | | | | | |
| Tranche A, term loan 6.68% 4/27/10 (b) | | $ | | 6,630,902 | | $ | | 6,630,902 |
| Tranche B, term loan 6.93% 4/7/11 (b) | | | | | | 1,987,454 | | | | 1,997,391 |
| DIRECTV Holdings LLC Tranche B, term loan 5.3375% | | | | | | | | |
| 4/13/13 (b) | | | | | | 2,260,000 | | | | 2,282,600 |
| NTL Investment Holdings Ltd. Tranche B, term loan 6.41% | | | | | | | | |
| 6/13/12 (b) | | | | | | 3,000,000 | | | | 3,015,000 |
| UPC Broadband Holding BV Tranche H2, term loan | | | | | | | | |
| 6.0044% 9/30/12 (b) | | | | | | 3,940,000 | | | | 3,984,325 |
| UPC Distribution Holdings BV Tranche F, term loan | | | | | | | | |
| 7.19% 12/31/11 (b) | | | | | | 4,000,000 | | | | 4,065,000 |
| WideOpenWest Illinois, Inc. Tranche B, term loan | | | | | | | | |
| 6.8036% 6/22/11 (b) | | | | | | 2,586,902 | | | | 2,612,771 |
| | | | | | | | | | | 30,027,739 |
| Capital Goods 1.7% | | | | | | | | | | |
| Alliance Laundry Systems LLC term loan 6.0021% | | | | | | | | |
| 1/27/12 (b) | | | | | | 1,870,000 | | | | 1,893,375 |
| Flowserve Corp. term loan 5.8125% 8/10/12 (b) | | | | 1,280,000 | | | | 1,296,000 |
| GenTek, Inc. term loan 6.4034% 2/28/11 (b) | | | | 1,939,064 | | | | 1,939,064 |
| Hexcel Corp. Tranche B, term loan 5.3632% 3/1/12 (b) | | | | 370,000 | | | | 373,700 |
| Mueller Group, Inc. term loan 6.2371% 10/3/12 (b) | | | | 670,000 | | | | 680,050 |
| Walter Industries, Inc. term loan 6.0399% 10/3/12 (b) . | | | | 720,000 | | | | 729,900 |
| Wastequip, Inc. Tranche B1, term loan 6.5204% | | | | | | | | |
| 7/15/11 (b) | | | | | | 967,575 | | | | 977,251 |
| | | | | | | | | | | 7,889,340 |
| Chemicals – 1.7% | | | | | | | | | | |
| Basell USA, Inc.: | | | | | | | | | | |
| Tranche B2, term loan 6.3533% 8/1/13 (b) | | | | 190,000 | | | | 193,563 |
| Tranche C2, term loan 6.8533% 8/1/14 (b) | | | | 190,000 | | | | 193,563 |
| Celanese Holding LLC term loan 6.2967% 4/6/11 (b) | | | | 2,334,674 | | | | 2,369,695 |
| Mosaic Co. Tranche B, term loan 5.2323% 2/21/12 (b) | | | | 1,890,500 | | | | 1,914,131 |
| PQ Corp. term loan 6.0625% 2/11/12 (b) | | | | 3,283,500 | | | | 3,320,439 |
| | | | | | | | | | | 7,991,391 |
| Consumer Products – 1.2% | | | | | | | | | | |
| Burt’s Bees, Inc. term loan 6.2397% 3/28/10 (b) | | | | 398,000 | | | | 402,478 |
| Central Garden & Pet Co. Tranche B, term loan 5.5591% | | | | | | | | |
| 5/14/09 (b) | | | | | | 396,974 | | | | 401,936 |
| Fender Musical Instrument Corp. Tranche B, term loan | | | | | | | | |
| 5.85% 3/30/12 (b) | | | | | | 807,975 | | | | 816,055 |
| Jarden Corp. Tranche B2, term loan 5.6881% | | | | | | | | |
| 1/24/12 (b) | | | | | | 375,189 | | | | 377,065 |
| |
| |
| |
| Annual Report | | 50 | | | | | | | | |
Floating Rate Loans (c) continued
| | | | | | |
| | | | | Principal | | Value |
| | | | | Amount | | |
| Consumer Products – continued | | | | | | |
| Jostens IH Corp. Tranche A, term loan 6.4381% | | | | | | |
| 10/4/10 (b) | | $ | | 1,800,000 | | $ 1,822,500 |
| Simmons Bedding Co. Tranche C, term loan 6.0144% | | | | | | |
| 12/19/11 (b) | | | | 1,941,162 | | 1,960,574 |
| | | | | | | 5,780,608 |
| Containers – 0.2% | | | | | | |
| Berry Plastics Corp. term loan 6.105% 12/2/11 (b) | | | | 947,625 | | 960,655 |
| Diversified Financial Services – 0.8% | | | | | | |
| Newkirk Master LP Tranche B, term loan 5.6931% | | | | | | |
| 8/11/08 (b) | | | | 644,334 | | 653,999 |
| Refco Finance Holdings LLC term loan 5.8406% | | | | | | |
| 8/5/11 (b) | | | | 2,972,222 | | 3,005,660 |
| | | | | | | 3,659,659 |
| Diversified Media – 0.2% | | | | | | |
| R.H. Donnelley Corp. Tranche A3, term loan 5.6939% | | | | | | |
| 12/31/09 (b) | | | | 1,159,682 | | 1,162,582 |
| Electric Utilities – 4.5% | | | | | | |
| Allegheny Energy Supply Co. LLC term loan 5.7691% | | | | | | |
| 3/8/11 (b) | | | | 3,138,340 | | 3,181,492 |
| Centerpoint Energy House Electric LLC term loan | | | | | | |
| 13.2425% 11/11/05 (b) | | | | 2,000,000 | | 2,025,000 |
| Covanta Energy Corp. Tranche 1: | | | | | | |
| Credit-Linked Deposit 6.8628% 6/24/12 (b) | | | | 2,211,382 | | 2,244,553 |
| term loan 6.9606% 6/24/12 (b) | | | | 1,784,146 | | 1,810,909 |
| NRG Energy, Inc.: | | | | | | |
| Credit-Linked Deposit 5.7953% 12/24/11 (b) | | | | 1,706,250 | | 1,714,781 |
| term loan 5.8954% 12/24/11 (b) | | | | 2,177,297 | | 2,188,183 |
| Primary Energy Finance LLC term loan 6.0204% | | | | | | |
| 8/24/12 (b) | | | | 3,030,000 | | 3,075,450 |
| Reliant Energy, Inc. term loan 6.0972% 4/30/10 (b) | | | | 1,990,000 | | 2,004,925 |
| Texas Genco LLC term loan 5.8632% 12/14/11 (b) | | | | 2,977,500 | | 2,992,388 |
| | | | | | | 21,237,681 |
| Energy – 7.8% | | | | | | |
| Boart Longyear Holdings, Inc. Tranche 1, term loan | | | | | | |
| 6.53% 7/22/12 (b) | | | | 369,075 | | 374,611 |
| Coffeyville Resources LLC: | | | | | | |
| Credit-Linked Deposit 6.3604% 7/8/11 (b) | | | | 704,000 | | 715,440 |
| Tranche B1, term loan 6.57% 7/8/12 (b) | | | | 1,056,000 | | 1,073,160 |
| El Paso Corp. Credit-Linked Deposit 6.6466% | | | | | | |
| 11/22/09 (b) | | | | 6,000,000 | | 6,060,000 |
| Energy Transfer Partners LP term loan 6.8125% | | | | | | |
| 6/16/08 (b) | | | | 5,000,000 | | 5,056,250 |
| |
| |
| 51 | | | | | | Annual Report |
| Investments (Unaudited) continued | | | | | | | | |
| |
Floating Rate Loans (c) continued
| | | | | | | | |
| | | | | | | Principal | | | | Value |
| | | | | | | Amount | | | | |
| Energy – continued | | | | | | | | | | |
| EPCO Holdings, Inc. Tranche B, term loan 6.0394% | | | | | | | | |
| 8/16/10 (b) | | | | $ | | 3,460,000 | | $ | | 3,520,550 |
| Kerr-McGee Corp. Tranche B, term loan 6.3149% | | | | | | | | |
| 5/24/11 (b) | | | | | | 9,975,000 | | | | 10,024,875 |
| Key Energy Services, Inc. Tranche B, term loan 7.02% | | | | | | | | |
| 6/30/12 (b) | | | | | | 4,230,000 | | | | 4,293,450 |
| LB Pacific LP term loan 6.8044% 3/3/12 (b) | | | | 3,980,000 | | | | 4,029,750 |
| Universal Compression, Inc. term loan 7.5% | | | | | | | | |
| 2/15/12 (b) | | | | | | 1,055,500 | | | | 1,063,416 |
| Vulcan/Plains Resources, Inc. term loan 5.8492% | | | | | | | | |
| 8/12/11 (b) | | | | | | 540,000 | | | | 547,425 |
| | | | | | | | | | | 36,758,927 |
| Entertainment/Film 1.8% | | | | | | | | | | |
| MGM Holdings II, Inc. Tranche B, term loan 6.2704% | | | | | | | | |
| 4/8/12 (b) | | | | | | 8,550,000 | | | | 8,635,500 |
| Environmental – 1.4% | | | | | | | | | | |
| Allied Waste Industries, Inc.: | | | | | | | | | | |
| term loan 5.8505% 1/15/12 (b) | | | | | | 2,088,868 | | | | 2,107,146 |
| Tranche A, Credit-Linked Deposit 5.105% 1/15/12 (b) | | | | 789,324 | | | | 796,231 |
| Envirocare of Utah, Inc. Tranche 1, term loan 6.11% | | | | | | | | |
| 4/13/10 (b) | | | | | | 3,727,273 | | | | 3,787,841 |
| | | | | | | | | | | 6,691,218 |
| Food/Beverage/Tobacco – 1.8% | | | | | | | | | | |
| Centerplate, Inc. term loan 6.9252% 10/1/10 (b) | | | | 4,895,400 | | | | 4,932,116 |
| Commonwealth Brands, Inc. term loan 6.875% | | | | | | | | |
| 8/28/07 (b) | | | | | | 135,204 | | | | 137,570 |
| Constellation Brands, Inc. Tranche B, term loan 5.9093% | | | | | | | | |
| 11/30/11 (b) | | | | | | 2,297,889 | | | | 2,326,612 |
| Herbalife International, Inc. term loan 5.41% | | | | | | | | |
| 12/21/10 (b) | | | | | | 1,190,000 | | | | 1,201,900 |
| | | | | | | | | | | 8,598,198 |
| Gaming – 2.6% | | | | | | | | | | |
| BLB Worldwide Holdings, Inc.: | | | | | | | | | | |
| Tranche 1, term loan 6.079% 6/30/12 (b) | | | | 870,000 | | | | 883,050 |
| Tranche 2, term loan 7.83% 7/18/11 (b) | | | | 1,360,000 | | | | 1,385,500 |
| Green Valley Ranch Gaming LLC term loan 6.0204% | | | | | | | | |
| 12/17/11 (b) | | | | | | 2,176,056 | | | | 2,197,817 |
| Herbst Gaming, Inc. term loan 6.1973% 1/7/11 (b) | | | | 398,000 | | | | 402,478 |
| Isle of Capri Casinos, Inc. term loan 5.4859% | | | | | | | | |
| 2/4/11 (b) | | | | | | 198,500 | | | | 200,981 |
| Marina District Finance Co., Inc. term loan 5.5906% | | | | | | | | |
| 10/14/11 (b) | | | | | | 3,970,000 | | | | 3,994,813 |
| |
| |
| Annual Report | | 52 | | | | | | | | |
Floating Rate Loans (c) continued
| | | | | | |
| | | | | Principal | | Value |
| | | | | Amount | | |
| Gaming – continued | | | | | | |
| Motor City Casino Tranche B, term loan 5.9333% | | | | | | |
| 7/29/12 (b) | | $ | | 1,426,425 | | $ 1,438,906 |
| Resorts International Hotel & Casino, Inc. Tranche B1, | | | | | | |
| term loan 6.53% 4/26/12 (b) | | | | 783,465 | | 787,382 |
| Venetian Casino Resort LLC Tranche B, term loan | | | | | | |
| 5.7704% 6/15/11 (b) | | | | 900,000 | | 904,500 |
| | | | | | | 12,195,427 |
| Healthcare 9.8% | | | | | | |
| AMR HoldCo, Inc./ EmCare HoldCo, Inc. term loan | | | | | | |
| 6.1093% 2/7/12 (b) | | | | 3,283,500 | | 3,332,753 |
| Community Health Systems, Inc. term loan 5.61% | | | | | | |
| 8/19/11 (b) | | | | 3,964,962 | | 4,019,481 |
| CRC Health Corp. term loan 6.8125% 5/11/11 (b) | | | | 947,625 | | 952,363 |
| DaVita, Inc. Tranche B, term loan 4.1581% 7/30/12 (b) | | | | 7,686,275 | | 7,811,176 |
| Genoa Healthcare Group LLC Tranche 1, term loan | | | | | | |
| 7.2614% 8/4/12 (b) | | | | 1,421,000 | | 1,442,315 |
| HealthSouth Corp.: | | | | | | |
| Credit-Linked Deposit 6.2818% 6/14/07 (b) | | | | 807,500 | | 811,538 |
| term loan 6.53% 6/14/07 (b) | | | | 2,985,019 | | 2,999,944 |
| Lifecare Holdings, Inc. term loan 6.09% 8/11/12 (b) | | | | 1,260,000 | | 1,244,250 |
| LifePoint Hospitals, Inc. Tranche B, term loan 5.435% | | | | | | |
| 4/15/12 (b) | | | | 3,196,814 | | 3,224,787 |
| Mylan Laboratories, Inc. Tranche B, term loan 5.4% | | | | | | |
| 6/30/10 (b) | | | | 480,000 | | 486,600 |
| Newquest, Inc. Tranche A, term loan 6.66% 3/1/11 (b) | | | | 475,000 | | 480,938 |
| PacifiCare Health Systems, Inc. Tranche B, term loan | | | | | | |
| 5.2204% 12/6/10 (b) | | | | 6,947,500 | | 6,947,500 |
| Psychiatric Solutions, Inc. term loan 5.73% 7/1/12 (b) . | | | | 510,769 | | 516,515 |
| Skilled Healthcare Group, Inc. Tranche 2, term loan | | | | | | |
| 11.53% 12/15/12 (b) | | | | 3,000,000 | | 3,030,000 |
| Vicar Operating, Inc. term loan 5.375% 5/16/11 (b) | | | | 4,644,362 | | 4,690,806 |
| Warner Chilcott Corp. term loan 6.6701% 1/18/12 (b) | | | | 3,992,057 | | 4,012,017 |
| | | | | | | 46,002,983 |
| Homebuilding/Real Estate – 5.7% | | | | | | |
| CB Richard Ellis Services, Inc. term loan 5.1051% | | | | | | |
| 3/31/10 (b) | | | | 1,430,172 | | 1,440,898 |
| General Growth Properties, Inc. Tranche B, term loan | | | | | | |
| 5.85% 11/12/08 (b) | | | | 5,961,545 | | 6,050,968 |
| Lake Las Vegas LLC Tranche 1, term loan 6.3129% | | | | | | |
| 11/1/09 (b) | | | | 3,902,166 | | 3,960,699 |
| Lion Gables Realty LP term loan 5.63% 9/30/06 (b) | | | | 4,124,421 | | 4,150,199 |
| |
| |
| |
| 53 | | | | | | Annual Report |
| Investments (Unaudited) continued | | | | | | | | |
| |
Floating Rate Loans (c) continued
| | | | | | | | |
| | | | | | | Principal | | | | Value |
| | | | | | | Amount | | | | |
| Homebuilding/Real Estate – continued | | | | | | | | | | |
| LNR Property Corp. Tranche B, term loan 6.7112% | | | | | | | | |
| 2/3/08 (b) | | | | $ | | 3,919,880 | | $ | | 3,968,879 |
| Maguire Properties, Inc. Tranche B, term loan 5.4663% | | | | | | | | |
| 3/15/10 (b) | | | | | | 4,611,111 | | | | 4,651,458 |
| Shea Mountain House LLC Tranche B, term loan 5.8% | | | | | | | | |
| 5/11/11 (b) | | | | | | 2,430,000 | | | | 2,454,300 |
| | | | | | | | | | | 26,677,401 |
| Hotels 1.0% | | | | | | | | | | |
| Starwood Hotels & Resorts Worldwide, Inc. term loan | | | | | | | | |
| 5.0906% 10/9/06 (b) | | | | | | 4,893,939 | | | | 4,893,939 |
| Leisure – 0.7% | | | | | | | | | | |
| 24 Hour Fitness Worldwide, Inc. Tranche B, term loan | | | | | | | | |
| 6.78% 6/8/12 (b) | | | | | | 3,000,000 | | | | 3,045,000 |
| Mega Bloks, Inc. Tranche B, term loan 5.6034% | | | | | | | | |
| 7/26/12 (b) | | | | | | 440,000 | | | | 445,500 |
| | | | | | | | | | | 3,490,500 |
| Metals/Mining – 2.6% | | | | | | | | | | |
| Murray Energy Corp. Tranche 1, term loan 6.86% | | | | | | | | |
| 1/28/10 (b) | | | | | | 497,500 | | | | 501,231 |
| Novelis, Inc. term loan 5.46% 1/7/12 (b) | | | | | | 3,123,077 | | | | 3,158,212 |
| Peabody Energy Corp. term loan 4.625% 3/21/10 (b) . | | | | 2,947,385 | | | | 2,965,806 |
| Trout Coal Holdings LLC / Dakota Tranche 1, term loan | | | | | | | | |
| 6.0302% 3/23/11 (b) | | | | | | 5,676,487 | | | | 5,683,583 |
| | | | | | | | | | | 12,308,832 |
| Paper 2.9% | | | | | | | | | | |
| Escanaba Timber LLC term loan 6.43% 5/2/08 (b) | | | | 520,000 | | | | 525,850 |
| Georgia-Pacific Corp. term loan 5.3152% 7/2/09 (b) | | | | 1,000,000 | | | | 1,001,800 |
| Koch Cellulose LLC: | | | | | | | | | | |
| term loan 5.77% 5/7/11 (b) | | | | | | 1,952,469 | | | | 1,984,197 |
| Credit-Linked Deposit 5.1931% 5/7/11 (b) | | | | 602,945 | | | | 612,743 |
| Smurfit-Stone Container Enterprises, Inc.: | | | | | | | | | | |
| Credit-Linked Deposit 5.25% 11/1/10 (b) | | | | 655,111 | | | | 661,662 |
| Tranche B, term loan 5.6969% 11/1/11 (b) | | | | 5,208,155 | | | | 5,266,747 |
| Tranche C, term loan 5.8338% 11/1/11 (b) | | | | 1,923,018 | | | | 1,944,652 |
| Xerium Technologies, Inc. Tranche B, term loan 6.0204% | | | | | | | | |
| 5/18/12 (b) | | | | | | 1,496,250 | | | | 1,514,953 |
| | | | | | | | | | | 13,512,604 |
| Publishing/Printing – 3.0% | | | | | | | | | | |
| Dex Media West LLC/Dex Media West Finance Co. | | | | | | | | |
| Tranche B, term loan 5.5119% 3/9/10 (b) | | | | 6,513,707 | | | | 6,546,276 |
| |
| |
| |
| Annual Report | | 54 | | | | | | | | |
Floating Rate Loans (c) continued
| | | | | | | | |
| | | | | Principal | | | | Value |
| | | | | Amount | | | | |
| Publishing/Printing – continued | | | | | | | | |
| Liberty Group Operating, Inc. Tranche B, term loan 6% | | | | | | | | |
| 2/28/12 (b) | | $ | | 196,513 | | $ | | 198,478 |
| PRIMEDIA, Inc. Tranche B, term loan 6.1138% | | | | | | | | |
| 9/30/13 (b) | | | | 3,170,000 | | | | 3,197,738 |
| R.H. Donnelley Corp. Tranche B2, term loan 5.6181% | | | | | | | | |
| 6/30/11 (b) | | | | 4,287,315 | | | | 4,314,111 |
| | | | | | | | | 14,256,603 |
| Railroad 1.5% | | | | | | | | |
| Helm Holding Corp. Tranche 1, term loan 6.259% | | | | | | | | |
| 7/8/11 (b) | | | | 1,187,025 | | | | 1,198,895 |
| Kansas City Southern Railway Co. Tranche B1, term loan | | | | | | | | |
| 5.5903% 3/30/08 (b) | | | | 2,779,000 | | | | 2,820,685 |
| RailAmerica, Inc. term loan 5.875% 9/29/11 (b) | | | | 3,090,201 | | | | 3,144,280 |
| | | | | | | | | 7,163,860 |
| Restaurants 3.3% | | | | | | | | |
| Arby’s Restaurant Group, Inc. Tranche B, term loan | | | | | | | | |
| 6.1446% 7/25/12 (b) | | | | 3,990,000 | | | | 4,019,925 |
| Burger King Corp. Tranche B, term loan 5.5% | | | | | | | | |
| 6/30/12 (b) | | | | 1,845,375 | | | | 1,873,056 |
| Domino’s, Inc. term loan 5.8125% 6/25/10 (b) | | | | 4,809,121 | | | | 4,881,258 |
| Jack in the Box, Inc. term loan 5.4457% 1/8/11 (b) | | | | 3,117,746 | | | | 3,145,026 |
| Landry’s Seafood Restaurants, Inc. term loan 5.949% | | | | | | | | |
| 12/28/10 (b) | | | | 1,454,013 | | | | 1,470,370 |
| | | | | | | | | 15,389,635 |
| Services – 4.6% | | | | | | | | |
| Coinstar, Inc. term loan 5.55% 7/1/11 (b) | | | | 825,144 | | | | 837,521 |
| DynCorp term loan 6.7498% 2/11/11 (b) | | | | 1,995,000 | | | | 2,004,975 |
| Iron Mountain, Inc.: | | | | | | | | |
| term loan 5.625% 4/2/11 (b) | | | | 3,712,842 | | | | 3,749,970 |
| Tranche R, term loan 5.5313% 4/2/11 (b) | | | | 4,962,500 | | | | 5,012,125 |
| Knowledge Learning Corp. term loan 6.35% 1/7/12 (b) | | | | 4,050,907 | | | | 4,061,035 |
| Rural/Metro Corp.: | | | | | | | | |
| Credit-Linked Deposit 6.2% 3/4/11 (b) | | | | 520,882 | | | | 528,044 |
| term loan 6.0439% 3/4/11 (b) | | | | 1,904,941 | | | | 1,931,134 |
| United Rentals, Inc.: | | | | | | | | |
| term loan 6.0948% 2/14/11 (b) | | | | 2,836,779 | | | | 2,865,147 |
| Tranche B, Credit-Linked Deposit 5.4925% | | | | | | | | |
| 2/14/11 (b) | | | | 575,996 | | | | 581,756 |
| | | | | | | | | 21,571,707 |
55 Annual Report
| Investments (Unaudited) continued | | | | | | | | |
| |
Floating Rate Loans (c) continued
| | | | | | | | |
| | | | | Principal | | | | Value |
| | | | | Amount | | | | |
| Shipping – 0.1% | | | | | | | | |
| Baker Tanks, Inc. term loan 6.4731% 1/30/11 (b) | | $ | | 248,750 | | $ | | 250,616 |
| Ozburn Hessey Holding Co. LLC term loan 6.3406% | | | | | | | | |
| 8/9/12 (b) | | | | 370,000 | | | | 375,550 |
| | | | | | | | | 626,166 |
| Technology – 7.8% | | | | | | | | |
| AMI Semiconductor, Inc. term loan 5.3406% 4/1/12 (b) | | | | 2,090,751 | | | | 2,095,978 |
| Fairchild Semiconductor Corp. Tranche B3, term loan | | | | | | | | |
| 5.605% 12/31/10 (b) | | | | 2,055,157 | | | | 2,078,277 |
| Fidelity National Information Solutions, Inc. Tranche B, | | | | | | | | |
| term loan 5.4771% 3/9/13 (b) | | | | 5,471,500 | | | | 5,498,858 |
| Infor Global Solutions AG Tranche 1, term loan 6.943% | | | | | | | | |
| 4/18/11 (b) | | | | 6,000,000 | | | | 6,060,000 |
| ON Semiconductor Corp. Tranche G, term loan | | | | | | | | |
| 7.0625% 12/15/11 (b) | | | | 2,977,500 | | | | 3,022,163 |
| SSA Global Technologies, Inc. term loan 5.97% | | | | | | | | |
| 9/22/11 (b) | | | | 2,180,000 | | | | 2,190,900 |
| SunGard Data Systems, Inc. Tranche B, term loan 6.28% | | | | | | | | |
| 2/10/13 (b) | | | | 14,962,500 | | | | 15,149,520 |
| UGS Holdings, Inc. Tranche C, term loan 5.84% | | | | | | | | |
| 3/31/12 (b) | | | | 464,828 | | | | 471,219 |
| | | | | | | | | 36,566,915 |
| Telecommunications – 5.4% | | | | | | | | |
| AAT Communications Corp.: | | | | | | | | |
| Tranche 2, term loan 6.61% 7/29/13 (b) | | | | 300,000 | | | | 305,625 |
| Tranche B1, term loan 5.61% 7/27/12 (b) | | | | 1,850,000 | | | | 1,875,438 |
| Alaska Communications Systems Holding term loan | | | | | | | | |
| 6.0204% 2/1/12 (b) | | | | 7,100,000 | | | | 7,188,750 |
| American Tower LP Tranche C, term loan 4.9601% | | | | | | | | |
| 8/31/11 (b) | | | | 2,567,100 | | | | 2,570,309 |
| Conversant Holdings, Inc. Tranche B, term loan 7.8144% | | | | | | | | |
| 3/31/11 (b) | | | | 1,925,000 | | | | 1,920,188 |
| Intelsat Ltd. term loan 5.8125% 7/28/11 (b) | | | | 3,228,410 | | | | 3,260,694 |
| Madison River Capital LLC/Madison River Finance Corp. | | | | | | | | |
| Tranche B, term loan 6.22% 7/29/12 (b) | | | | 1,270,000 | | | | 1,290,638 |
| New Skies Satellites BV term loan 5.8888% 5/2/11 (b) . | | | | 1,327,565 | | | | 1,347,479 |
| NTELOS, Inc.: | | | | | | | | |
| term loan 9.03% 2/24/12 (b) | | | | 200,000 | | | | 199,250 |
| Tranche B, term loan 6.53% 8/24/11 (b) | | | | 992,500 | | | | 1,003,666 |
| Qwest Corp. Tranche A, term loan 8.53% 6/30/07 (b) . | | | | 1,600,000 | | | | 1,650,000 |
Floating Rate Loans (c) continued
| | | | | | |
| | | | | Principal | | Value |
| | | | | Amount | | |
| Telecommunications – continued | | | | | | |
| SpectraSite Communications, Inc. Tranche B, term loan | | | | | | |
| 5.27% 5/19/12 (b) | | $ | | 1,985,000 | | $ 1,987,481 |
| Valor Telecommunications Enterprises LLC/Valor Finance | | | | | | |
| Corp. Tranche B, term loan 5.7754% 2/14/12 (b) | | | | 773,333 | | 783,967 |
| | | | | | | 25,383,485 |
| Textiles & Apparel – 0.3% | | | | | | |
| St. John Knits International, Inc. Tranche B, term loan | | | | | | |
| 6.5401% 3/23/12 (b) | | | | 497,500 | | 503,719 |
| William Carter Co. term loan 5.7178% 6/29/12 (b) | | | | 796,875 | | 808,828 |
| | | | | | | 1,312,547 |
| |
| TOTAL FLOATING RATE LOANS | | | | | | |
| (Cost $419,395,818) | | | | | | 421,984,398 |
| |
| Nonconvertible Bonds 7.9% | | | | | | |
| |
| Automotive 2.5% | | | | | | |
| General Motors Acceptance Corp.: | | | | | | |
| 4.6769% 5/18/06 (b) | | | | 2,000,000 | | 1,989,398 |
| 4.87% 10/20/05 (b) | | | | 5,000,000 | | 5,000,060 |
| 5.11% 9/23/08 (b) | | | | 3,000,000 | | 2,779,644 |
| 6.75% 1/15/06 | | | | 2,000,000 | | 2,010,456 |
| | | | | | | 11,779,558 |
| Diversified Financial Services – 1.1% | | | | | | |
| Residential Capital Corp. 5.385% 6/29/07 (a)(b) | | | | 5,000,000 | | 5,041,365 |
| Super Retail – 1.1% | | | | | | |
| GSC Holdings Corp./Gamestop, Inc. 7.875% | | | | | | |
| 10/1/11 (a)(b) | | | | 5,000,000 | | 5,037,500 |
| Technology – 1.3% | | | | | | |
| Nortel Networks Corp. 6.125% 2/15/06 | | | | 5,000,000 | | 5,025,000 |
| SunGard Data Systems, Inc. 8.5248% 8/15/13 (a)(b) | | | | 1,090,000 | | 1,124,063 |
| | | | | | | 6,149,063 |
| Telecommunications – 1.9% | | | | | | |
| Qwest Corp. 7.12% 6/15/13 (a)(b) | | | | 2,840,000 | | 2,953,600 |
| Rogers Communications, Inc. 6.995% 12/15/10 (b) | | | | 6,000,000 | | 6,217,500 |
| | | | | | | 9,171,100 |
| |
| TOTAL NONCONVERTIBLE BONDS | | | | | | |
| (Cost $37,125,822) | | | | | | 37,178,586 |
57 Annual Report
| Investments (Unaudited) continued | | | | |
| |
Cash Equivalents 7.7%
| | | | | | |
| | | | | Maturity | | Value |
| | | | | Amount | | |
| Investments in repurchase agreements (Collateralized by U.S. | | | | |
| Government Obligations, in a joint trading account at | | | | |
| 3.89%, dated 9/30/05 due 10/3/05) | | | | | | |
| (Cost $36,404,000) | | | | $ 36,415,815 | | $36,404,000 |
| TOTAL INVESTMENT PORTFOLIO 105.2% | | | | |
| (Cost $492,925,640) | | | | | | 495,566,984 |
| |
| NET OTHER ASSETS – (5.2)% | | | | | | (24,405,171) |
| NET ASSETS 100% | | | | | | $ 471,161,813 |
(a) Security exempt from registration under
Rule 144A of the Securities Act of 1933.
These securities may be resold in
transactions exempt from registration,
normally to qualified institutional buyers.
At the period end, the value of these
securities amounted to $14,156,528 or
3.0% of net assets.
(b) The coupon rate shown on floating or
adjustable rate securities represents the
rate at period end.
(c) Remaining maturities of floating rate
loans may be less than the stated
maturities shown as a result of
contractual or optional prepayments by
the borrower. Such prepayments cannot
be predicted with certainty.
|
Fidelity Ultra-Short Central Fund
Investments September 30, 2005 (Unaudited)
Showing Percentage of Net Assets
|
Nonconvertible Bonds 4.8%
| | | | |
| | | Principal | | Value |
| | | Amount | | |
| |
| CONSUMER DISCRETIONARY – 1.1% | | | | |
| Auto Components 0.3% | | | | |
| DaimlerChrysler NA Holding Corp.: | | | | |
| 4.3138% 9/10/07 (d) | | $16,665,000 | | $ 16,704,263 |
| 4.43% 5/24/06 (d) | | 4,700,000 | | 4,713,090 |
| | | | | 21,417,353 |
| Media – 0.8% | | | | |
| Continental Cablevision, Inc. 8.3% 5/15/06 | | 8,000,000 | | 8,183,384 |
| Cox Communications, Inc. (Reg. S) 4.4069% 12/14/07 (d) | | . 12,140,000 | | 12,222,965 |
| Cox Radio, Inc. 6.625% 2/15/06 | | 5,575,000 | | 5,612,319 |
| Liberty Media Corp. 5.37% 9/17/06 (d) | | 16,694,000 | | 16,816,200 |
| Univision Communications, Inc. 2.875% 10/15/06 | | 8,505,000 | | 8,336,763 |
| | | | | 51,171,631 |
| |
| TOTAL CONSUMER DISCRETIONARY | | | | 72,588,984 |
| |
| ENERGY 0.2% | | | | |
| Oil, Gas & Consumable Fuels – 0.2% | | | | |
| Valero Energy Corp. 7.375% 3/15/06 | | 11,550,000 | | 11,671,298 |
| |
| FINANCIALS – 1.5% | | | | |
| Capital Markets 0.2% | | | | |
| State Street Capital Trust II 4.29% 2/15/08 (d) | | 10,000,000 | | 10,007,360 |
| Commercial Banks – 0.2% | | | | |
| Wells Fargo & Co. 3.8738% 3/10/08 (d) | | 16,600,000 | | 16,600,166 |
| Consumer Finance – 0.5% | | | | |
| General Motors Acceptance Corp. 4.87% 10/20/05 (d) | | 14,765,000 | | 14,765,177 |
| MBNA Europe Funding PLC 3.97% 9/7/07 (a)(d) | | 19,925,000 | | 19,915,914 |
| | | | | 34,681,091 |
| Thrifts & Mortgage Finance – 0.6% | | | | |
| Countrywide Financial Corp. 3.71% 4/11/07 (d) | | 11,025,000 | | 11,037,105 |
| Residential Capital Corp. 5.385% 6/29/07 (a)(d) | | 14,150,000 | | 14,267,063 |
| Washington Mutual Bank 3.9363% 8/25/08 (d) | | 16,325,000 | | 16,330,126 |
| | | | | 41,634,294 |
| |
| TOTAL FINANCIALS | | | | 102,922,911 |
| |
| TELECOMMUNICATION SERVICES – 1.1% | | | | |
| Diversified Telecommunication Services – 1.0% | | | | |
| British Telecommunications PLC 7.875% 12/15/05 | | 18,145,000 | | 18,268,277 |
| |
| |
| |
| 59 | | | | Annual Report |
| Investments (Unaudited) continued | | | | |
| |
Nonconvertible Bonds continued
| | | | | | |
| | | | | | | Principal | | Value |
| | | | | | | Amount | | |
| |
| TELECOMMUNICATION SERVICES – continued | | | | | | |
| Diversified Telecommunication Services – continued | | | | | | |
| France Telecom SA 7.2% 3/1/06 | | | | $ | | 5,600,000 | | $ 5,664,966 |
| GTE Corp. 6.36% 4/15/06 | | | | | | 9,000,000 | | 9,087,354 |
| SBC Communications, Inc. 4.389% 6/5/06 (a) | | | | 15,315,000 | | 15,296,316 |
| Sprint Capital Corp. 4.78% 8/17/06 | | | | | | 6,000,000 | | 6,009,276 |
| Telefonos de Mexico SA de CV 4.5% 11/19/08 | | | | 10,240,000 | | 10,107,679 |
| TELUS Corp. yankee 7.5% 6/1/07 | | | | | | 6,500,000 | | 6,787,638 |
| | | | | | | | | 71,221,506 |
| Wireless Telecommunication Services – 0.1% | | | | | | |
| AT&T Wireless Services, Inc. 7.35% 3/1/06 | | | | 5,500,000 | | 5,563,866 |
| |
| TOTAL TELECOMMUNICATION SERVICES | | | | | | 76,785,372 |
| |
| UTILITIES – 0.9% | | | | | | | | |
| Electric Utilities – 0.2% | | | | | | | | |
| Pinnacle West Energy Corp. 4.0044% 4/1/07 (a)(d) | | | | 12,800,000 | | 12,800,000 |
| Gas Utilities 0.1% | | | | | | | | |
| NiSource Finance Corp. 7.625% 11/15/05 | | | | 9,250,000 | | 9,284,012 |
| Multi-Utilities – 0.6% | | | | | | | | |
| Dominion Resources, Inc. 4.27% 9/28/07 (d) | | | | 17,150,000 | | 17,145,301 |
| DTE Energy Co. 6.45% 6/1/06 | | | | | | 13,190,000 | | 13,350,324 |
| Sempra Energy 4.75% 5/15/09 | | | | | | 5,500,000 | | 5,461,247 |
| | | | | | | | | 35,956,872 |
| |
| TOTAL UTILITIES | | | | | | | | 58,040,884 |
| |
| TOTAL NONCONVERTIBLE BONDS | | | | | | | | |
| (Cost $322,361,771) | | | | | | | | 322,009,449 |
| |
| U.S. Government Agency Obligations 0.0% | | | | |
| |
| Federal Home Loan Bank 0% 12/28/05 (c) | | | | | | |
| (Cost $1,981,349) | | | | | | 2,000,000 | | 1,981,988 |
| |
| Asset Backed Securities 33.0% | | | | | | |
| |
| Accredited Mortgage Loan Trust: | | | | | | | | |
| Series 2004-2 Class A2, 4.13% 7/25/34 (d) | | | | 7,454,076 | | 7,464,885 |
| Series 2004-3 Class 2A4, 4.18% 10/25/34 (d) | | | | 10,915,000 | | 10,939,272 |
| Series 2004-4 Class A2D, 4.18% 1/25/35 (d) | | | | 3,210,800 | | 3,218,701 |
| |
| |
| |
| Annual Report | | 60 | | | | | | |
Asset Backed Securities continued
| | | | |
| | | Principal | | Value |
| | | Amount | | |
| Accredited Mortgage Loan Trust: – continued | | | | |
| Series 2005-1: | | | | |
| Class M1, 4.3% 4/25/35 (d) | | $11,280,000 | | $ 11,284,074 |
| Class M2, 4.52% 4/25/35 (d) | | 5,275,000 | | 5,288,969 |
| ACE Securities Corp.: | | | | |
| Series 2002-HE1 Class M1, 4.48% 6/25/32 (d) | | 1,842,987 | | 1,860,106 |
| Series 2002-HE2 Class M1, 4.68% 8/25/32 (d) | | 18,631,213 | | 18,689,976 |
| Series 2003-FM1 Class M2, 5.68% 11/25/32 (d) | | 3,015,000 | | 3,044,567 |
| Series 2003-HS1: | | | | |
| Class M1, 4.58% 6/25/33 (d) | | 800,000 | | 803,891 |
| Class M2, 5.58% 6/25/33 (d) | | 856,000 | | 870,466 |
| Series 2003-NC1 Class M1, 4.61% 7/25/33 (d) | | 1,600,000 | | 1,608,662 |
| Series 2004-HE1: | | | | |
| Class M1, 4.33% 2/25/34 (d) | | 2,193,000 | | 2,194,100 |
| Class M2, 4.93% 2/25/34 (d) | | 2,475,000 | | 2,476,472 |
| Series 2004-OP1: | | | | |
| Class M1, 4.35% 4/25/34 (d) | | 4,420,000 | | 4,424,381 |
| Class M2, 4.88% 4/25/34 (d) | | 6,240,000 | | 6,332,494 |
| Series 2005-HE2: | | | | |
| Class M1, 4.27% 4/25/35 (d) | | 1,530,000 | | 1,529,959 |
| Class M2, 4.28% 4/25/35 (d) | | 1,803,000 | | 1,802,229 |
| Class M3, 4.31% 4/25/35 (d) | | 1,040,000 | | 1,041,214 |
| Class M4, 4.47% 4/25/35 (d) | | 1,340,000 | | 1,341,550 |
| Series 2005-HE3: | | | | |
| Class A2A, 3.93% 5/25/35 (d) | | 7,170,954 | | 7,171,304 |
| Class A2B, 4.04% 5/25/35 (d) | | 4,370,000 | | 4,367,703 |
| Series 2005-SD1 Class A1, 4.23% 11/25/50 (d) | | 2,337,292 | | 2,340,041 |
| Aesop Funding II LLC Series 2005-1A Class A2, 3.8563% | | | | |
| 4/20/09 (a)(d) | | 8,800,000 | | 8,800,906 |
| American Express Credit Account Master Trust: | | | | |
| Series 2002-6 Class B, 4.2181% 3/15/10 (d) | | 5,000,000 | | 5,028,652 |
| Series 2004-1 Class B, 4.0181% 9/15/11 (d) | | 5,775,000 | | 5,797,497 |
| Series 2004-C Class C, 4.2681% 2/15/12 (a)(d) | | 14,647,039 | | 14,680,928 |
| Series 2005-1 Class A, 3.7981% 10/15/12 (d) | | 15,455,000 | | 15,483,856 |
| Series 2005-6 Class C, 4.0181% 3/15/11 (a)(d) | | 9,085,000 | | 9,087,816 |
| AmeriCredit Automobile Receivables Trust: | | | | |
| Series 2002-EM Class A4A, 3.67% 6/8/09 | | 25,000,000 | | 24,882,623 |
| Series 2003-AM Class A4B, 4.15% 11/6/09 (d) | | 11,965,573 | | 11,999,441 |
| Series 2003-BX Class A4B, 3.9688% 1/6/10 (d) | | 3,265,000 | | 3,273,821 |
| Series 2003-CF Class A3, 2.75% 10/9/07 | | 8,861,691 | | 8,837,682 |
| Series 2005-1 Class C, 4.73% 7/6/10 | | 15,500,000 | | 15,420,941 |
| Ameriquest Mortgage Securities, Inc.: | | | | |
| Series 2002-3 Class M1, 4.53% 8/25/32 (d) | | 2,969,781 | | 2,983,343 |
| |
| |
| 61 | | | | Annual Report |
| Investments (Unaudited) continued | | | | | | | | |
| |
Asset Backed Securities continued
| | | | | | | | |
| | | | | | | Principal | | | | Value |
| | | | | | | Amount | | | | |
| Ameriquest Mortgage Securities, Inc.: – continued | | | | | | | | |
| Series 2003-1: | | | | | | | | | | |
| Class A2, 4.24% 2/25/33 (d) | | | | $ | | 200,427 | | $ | | 200,481 |
| Class M1, 4.73% 2/25/33 (d) | | | | | | 6,150,000 | | | | 6,188,493 |
| Series 2003-3 Class M1, 4.63% 3/25/33 (d) | | | | 1,590,000 | | | | 1,598,400 |
| Series 2003-6: | | | | | | | | | | |
| Class M1, 4.59% 8/25/33 (d) | | | | | | 7,560,000 | | | | 7,610,158 |
| Class M2, 5.68% 5/25/33 (d) | | | | | | 2,750,000 | | | | 2,804,670 |
| Series 2003-AR1 Class M1, 4.98% 1/25/33 (d) | | | | 7,000,000 | | | | 7,068,037 |
| Series 2004-R2: | | | | | | | | | | |
| Class M1, 4.26% 4/25/34 (d) | | | | | | 1,230,000 | | | | 1,229,969 |
| Class M2, 4.31% 4/25/34 (d) | | | | | | 950,000 | | | | 949,976 |
| Class M3, 4.38% 4/25/34 (d) | | | | | | 3,500,000 | | | | 3,499,912 |
| Class M4, 4.88% 4/25/34 (d) | | | | | | 4,500,000 | | | | 4,499,883 |
| Series 2004-R9 Class A3, 4.15% 10/25/34 (d) | | | | 9,206,545 | | | | 9,219,109 |
| Series 2005-R1: | | | | | | | | | | |
| Class M1, 4.28% 3/25/35 (d) | | | | | | 5,710,000 | | | | 5,707,639 |
| Class M2, 4.31% 3/25/35 (d) | | | | | | 1,925,000 | | | | 1,924,232 |
| Series 2005-R2 Class M1, 4.28% 4/25/35 (d) | | | | 12,500,000 | | | | 12,499,668 |
| Amortizing Residential Collateral Trust: | | | | | | | | |
| Series 2002-BC3 Class A, 4.16% 6/25/32 (d) | | | | 2,411,175 | | | | 2,418,320 |
| Series 2002-BC6 Class M1, 4.58% 8/25/32 (d) | | | | 24,900,000 | | | | 25,095,555 |
| Series 2002-BC7: | | | | | | | | | | |
| Class M1, 4.63% 10/25/32 (d) | | | | | | 10,000,000 | | | | 10,028,130 |
| Class M2, 4.73% 10/25/32 (d) | | | | | | 5,575,000 | | | | 5,605,898 |
| Series 2002-BC1 Class M2, 4.93% 1/25/32 (d) | | | | 758,836 | | | | 762,053 |
| ARG Funding Corp.: | | | | | | | | | | |
| Series 2005-1A Class A2, 3.8963% 4/20/09 (a)(d) | | | | 11,000,000 | | | | 10,975,938 |
| Series 2005-2A Class A2, 3.9063% 5/20/09 (a)(d) | | | | 5,200,000 | | | | 5,190,453 |
| Argent Securities, Inc.: | | | | | | | | | | |
| Series 2003-W3 Class M2, 5.63% 9/25/33 (d) | | | | 20,000,000 | | | | 20,596,100 |
| Series 2003-W7 Class A2, 4.22% 3/1/34 (d) | | | | 3,948,904 | | | | 3,957,510 |
| Series 2004-W5 Class M1, 4.43% 4/25/34 (d) | | | | 3,960,000 | | | | 3,964,674 |
| Series 2004-W7: | | | | | | | | | | |
| Class M1, 4.38% 5/25/34 (d) | | | | | | 4,085,000 | | | | 4,084,893 |
| Class M2, 4.43% 5/25/34 (d) | | | | | | 3,320,000 | | | | 3,319,914 |
| Asset Backed Securities Corp. Home Equity Loan Trust: | | | | | | | | |
| Series 2003-HE2: | | | | | | | | | | |
| Class A2, 4.1481% 4/15/33 (d) | | | | | | 664,884 | | | | 664,968 |
| Class M1, 4.6681% 4/15/33 (d) | | | | 11,365,000 | | | | 11,414,716 |
| Series 2003-HE3: | | | | | | | | | | |
| Class M1, 4.5981% 6/15/33 (d) | | | | 2,185,000 | | | | 2,196,793 |
| Class M2, 5.7681% 6/15/33 (d) | | | | 10,000,000 | | | | 10,168,072 |
| |
| |
| Annual Report | | 62 | | | | | | | | |
Asset Backed Securities continued
| | | | | | | | |
| | | | | Principal | | | | Value |
| | | | | Amount | | | | |
| Asset Backed Securities Corp. Home Equity Loan Trust: - | | | | | | | | |
| continued | | | | | | | | |
| Series 2003-HE4 Class M2, 5.7681% 8/15/33 (d) | | $ | | 5,695,000 | | $ | | 5,779,144 |
| Series 2003-HE5 Class A2A, 4.1281% 8/15/33 (d) | | | | 347,110 | | | | 347,153 |
| Series 2003-HE6 Class M1, 4.48% 11/25/33 (d) | | | | 3,475,000 | | | | 3,497,595 |
| Series 2004-HE2 Class M1, 4.38% 4/25/34 (d) | | | | 6,060,000 | | | | 6,083,075 |
| Series 2004-HE3: | | | | | | | | |
| Class M1, 4.37% 6/25/34 (d) | | | | 1,450,000 | | | | 1,457,158 |
| Class M2, 4.95% 6/25/34 (d) | | | | 3,350,000 | | | | 3,391,294 |
| Series 2004-HE6 Class A2, 4.19% 6/25/34 (d) | | | | 15,110,414 | | | | 15,141,786 |
| Series 2005-HE2: | | | | | | | | |
| Class M1, 4.28% 3/25/35 (d) | | | | 8,250,000 | | | | 8,259,768 |
| Class M2, 4.33% 3/25/35 (d) | | | | 2,065,000 | | | | 2,070,757 |
| Series 2005-HE3 Class A4, 4.03% 4/25/35 (d) | | | | 11,650,000 | | | | 11,649,725 |
| Series 2005-HE6 Class A2B, 4.08% 7/25/35 (d) | | | | 10,000,000 | | | | 10,009,980 |
| Bank One Issuance Trust: | | | | | | | | |
| Series 2002-B1 Class B1, 4.1481% 12/15/09 (d) | | | | 20,655,000 | | | | 20,734,158 |
| Series 2002-B3 Class B, 4.1281% 8/15/08 (d) | | | | 14,500,000 | | | | 14,503,495 |
| Series 2002-C1 Class C1, 4.7281% 12/15/09 (d) | | | | 7,980,000 | | | | 8,063,633 |
| Series 2003-C4 Class C4, 4.7981% 2/15/11 (d) | | | | 14,910,000 | | | | 15,197,991 |
| Bayview Financial Acquisition Trust Series 2004-C | | | | | | | | |
| Class A1, 4.2575% 5/28/44 (d) | | | | 7,735,211 | | | | 7,751,217 |
| Bayview Financial Asset Trust Series 2003-F Class A, | | | | | | | | |
| 4.3375% 9/28/43 (d) | | | | 9,005,591 | | | | 9,025,757 |
| Bayview Financial Mortgage Loan Trust Series 2004-A Class | | | | | | | | |
| A, 4.2875% 2/28/44 (d) | | | | 5,177,035 | | | | 5,186,096 |
| Bear Stearns Asset Backed Securities, Inc. Series 2005-3 | | | | | | | | |
| Class A1, 4.28% 9/25/35 (d) | | | | 4,051,990 | | | | 4,051,990 |
| Bear Stearns Asset Backed Securities I: | | | | | | | | |
| Series 2005-HE2: | | | | | | | | |
| Class M1, 4.33% 2/25/35 (d) | | | | 6,655,000 | | | | 6,657,302 |
| Class M2, 4.58% 2/25/35 (d) | | | | 2,430,000 | | | | 2,438,309 |
| Series 2005-HE5 Class 1A1, 3.94% 6/25/35 (d) | | | | 9,315,999 | | | | 9,314,540 |
| Capital Auto Receivables Asset Trust: | | | | | | | | |
| Series 2002-5 Class B, 2.8% 4/15/08 | | | | 2,439,941 | | | | 2,415,147 |
| Series 2003-1 Class B, 4.2381% 6/15/10 (a)(d) | | | | 4,946,375 | | | | 4,959,105 |
| Series 2003-2 Class B, 4.0481% 1/15/09 (d) | | | | 2,369,381 | | | | 2,373,293 |
| Series 2005-1 Class B, 4.1431% 6/15/10 (d) | | | | 5,725,000 | | | | 5,757,133 |
| Capital One Auto Finance Trust: | | | | | | | | |
| Series 2003-A Class A4B, 4.0481% 1/15/10 (d) | | | | 9,630,000 | | | | 9,651,642 |
| Series 2004-B Class A4, 3.8781% 8/15/11 (d) | | | | 16,300,000 | | | | 16,304,722 |
63 Annual Report
| Investments (Unaudited) continued | | | | | | | | |
| |
Asset Backed Securities continued
| | | | | | | | |
| | | | | | | Principal | | | | Value |
| | | | | | | Amount | | | | |
| Capital One Master Trust: | | | | | | | | | | |
| Series 1999-3 Class B, 4.2481% 9/15/09 (d) | | $ | | 5,000,000 | | $ | | 5,001,993 |
| Series 2001-1 Class B, 4.2781% 12/15/10 (d) | | | | 19,500,000 | | | | 19,636,007 |
| Series 2001-8A Class B, 4.3181% 8/17/09 (d) | | | | 9,585,000 | | | | 9,627,823 |
| Series 2002-4A Class B, 4.2681% 3/15/10 (d) | | | | 6,000,000 | | | | 6,026,994 |
| Capital One Multi-Asset Execution Trust Series 2003-B1 Class | | | | | | | | |
| B1, 4.9381% 2/17/09 (d) | | | | | | 15,470,000 | | | | 15,540,698 |
| Capital Trust Ltd. Series 2004-1: | | | | | | | | | | |
| Class A2, 4.2463% 7/20/39 (a)(d) | | | | 2,968,000 | | | | 2,974,368 |
| Class B, 4.5463% 7/20/39 (a)(d) | | | | | | 1,550,000 | | | | 1,553,325 |
| Class C, 4.8963% 7/20/39 (a)(d) | | | | | | 1,994,000 | | | | 1,998,276 |
| CDC Mortgage Capital Trust: | | | | | | | | | | |
| Series 2001-HE1 Class M1, 4.86% 1/25/32 (d) | | | | 3,470,154 | | | | 3,471,347 |
| Series 2002-HE2 Class M1, 4.53% 1/25/33 (d) | | | | 9,278,431 | | | | 9,305,483 |
| Series 2002-HE3: | | | | | | | | | | |
| Class M1, 4.93% 3/25/33 (d) | | | | | | 21,339,884 | | | | 21,583,539 |
| Class M2, 5.8913% 3/25/33 (d) | | | | 9,968,976 | | | | 10,111,477 |
| Series 2003-HE1: | | | | | | | | | | |
| Class M1, 4.5413% 8/25/33 (d) | | | | 1,907,142 | | | | 1,913,922 |
| Class M2, 5.5913% 8/25/33 (d) | | | | 4,369,996 | | | | 4,416,852 |
| Series 2003-HE2 Class A, 3.9913% 10/25/33 (d) | | | | 1,011,328 | | | | 1,011,776 |
| Series 2003-HE3: | | | | | | | | | | |
| Class M1, 4.53% 11/25/33 (d) | | | | | | 2,254,989 | | | | 2,275,897 |
| Class M2, 5.58% 11/25/33 (d) | | | | | | 1,719,992 | | | | 1,749,395 |
| Series 2004-HE2 Class M2, 5.03% 7/26/34 (d) | | | | 2,345,000 | | | | 2,366,343 |
| Cendant Timeshare Receivables Funding LLC Series 2005 1A | | | | | | | | |
| Class 2A2, 3.9763% 5/20/17 (a)(d) | | | | 9,256,185 | | | | 9,256,185 |
| Chase Credit Card Owner Trust: | | | | | | | | | | |
| Series 2001-6 Class B, 4.2481% 3/16/09 (d) | | | | 1,305,000 | | | | 1,310,645 |
| Series 2002-6 Class B, 4.1181% 1/15/08 (d) | | | | 11,850,000 | | | | 11,850,281 |
| Series 2003-6 Class C, 4.5681% 2/15/11 (d) | | | | 16,400,000 | | | | 16,641,039 |
| Series 2004-1 Class B, 3.9681% 5/15/09 (d) | | | | 4,105,000 | | | | 4,104,601 |
| Citibank Credit Card Issuance Trust: | | | | | | | | | | |
| Series 2000-C2 Class C2, 4.2488% 10/15/07 (d) | | | | 17,500,000 | | | | 17,499,286 |
| Series 2001-B2 Class B2, 4.3038% 12/10/08 (d) | | | | 11,945,000 | | | | 11,995,489 |
| Series 2002-B1 Class B1, 4.2906% 6/25/09 (d) | | | | 9,010,000 | | | | 9,041,853 |
| Series 2002-C1 Class C1, 4.7369% 2/9/09 (d) | | | | 17,500,000 | | | | 17,675,320 |
| Series 2003-B1 Class B1, 4.0763% 3/7/08 (d) | | | | 25,000,000 | | | | 25,035,435 |
| Series 2003-C1 Class C1, 4.65% 4/7/10 (d) | | | | 17,785,000 | | | | 18,159,908 |
| Citigroup Mortgage Loan Trust Series 2003-HE4 | | | | | | | | |
| Class A, 4.24% 12/25/33 (a)(d) | | | | | | 7,601,624 | | | | 7,602,413 |
| CNH Wholesale Master Note Trust Series 2005-1: | | | | | | | | |
| Class A, 3.8781% 6/15/11 (d) | | | | | | 18,000,000 | | | | 17,997,386 |
| |
| |
| Annual Report | | 64 | | | | | | | | |
Asset Backed Securities continued
| | | | | | |
| | | | | Principal | | Value |
| | | | | Amount | | |
| CNH Wholesale Master Note Trust Series 2005-1: - | | | | | | |
| continued | | | | | | |
| Class B, 4.1681% 6/15/11 (d) | | $ | | 2,280,000 | | $ 2,279,668 |
| Countrywide Home Loans, Inc.: | | | | | | |
| Series 2002-6 Class AV1, 4.26% 5/25/33 (d) | | | | 1,255,649 | | 1,258,682 |
| Series 2003-BC1 Class M2, 5.83% 9/25/32 (d) | | | | 11,065,000 | | 11,184,059 |
| Series 2003-SD3 Class A1, 4.25% 12/25/32 (a)(d) | | | | 752,994 | | 756,713 |
| Series 2004-2 Class M1, 4.33% 5/25/34 (d) | | | | 5,200,000 | | 5,209,564 |
| Series 2004-3: | | | | | | |
| Class 3A4, 4.08% 8/25/34 (d) | | | | 445,702 | | 444,067 |
| Class M1, 4.33% 6/25/34 (d) | | | | 1,475,000 | | 1,476,401 |
| Series 2004-4: | | | | | | |
| Class A, 4.2% 8/25/34 (d) | | | | 2,130,303 | | 2,132,323 |
| Class M1, 4.31% 7/25/34 (d) | | | | 3,650,000 | | 3,660,809 |
| Class M2, 4.36% 6/25/34 (d) | | | | 4,395,000 | | 4,399,618 |
| Series 2005-1: | | | | | | |
| Class 1AV2, 4.03% 7/25/35 (d) | | | | 8,780,000 | | 8,777,753 |
| Class M1, 4.25% 8/25/35 (d) | | | | 19,600,000 | | 19,586,004 |
| Class MV1, 4.23% 7/25/35 (d) | | | | 3,135,000 | | 3,133,802 |
| Class MV2, 4.27% 7/25/35 (d) | | | | 3,765,000 | | 3,762,360 |
| Class MV3, 4.31% 7/25/35 (d) | | | | 1,560,000 | | 1,561,512 |
| Series 2005-3 Class MV1, 4.25% 8/25/35 (d) | | | | 11,125,000 | | 11,116,813 |
| Series 2005-AB1 Class A2, 4.04% 8/25/35 (d) | | | | 17,520,000 | | 17,515,387 |
| Series 2005-BC1 Class 2A2, 4.03% 5/25/35 (d) | | | | 8,375,000 | | 8,376,323 |
| Series 2005-IM1 Class A1, 3.96% 11/25/35 (d) | | | | 16,452,556 | | 16,453,841 |
| CS First Boston Mortgage Securities Corp.: | | | | | | |
| Series 2003-8 Class A2, 4.22% 4/25/34 (d) | | | | 2,207,328 | | 2,216,663 |
| Series 2004-FRE1: | | | | | | |
| Class A2, 4.18% 4/25/34 (d) | | | | 1,945,674 | | 1,945,630 |
| Class M3, 4.48% 4/25/34 (d) | | | | 5,885,000 | | 5,884,847 |
| Discover Card Master Trust I Series 2003-4 Class B1, | | | | | | |
| 4.0981% 5/16/11 (d) | | | | 8,155,000 | | 8,200,894 |
| Fannie Mae guaranteed REMIC pass thru certificates Series | | | | | | |
| 2004-T5 Class AB3, 4.222% 5/28/35 (d) | | | | 5,382,969 | | 5,384,840 |
| Fieldstone Mortgage Investment Corp.: | | | | | | |
| Series 2003-1: | | | | | | |
| Class M1, 4.51% 11/25/33 (d) | | | | 1,300,000 | | 1,311,510 |
| Class M2, 5.58% 11/25/33 (d) | | | | 700,000 | | 718,059 |
| Series 2004-1 Class M2, 4.93% 1/25/35 (d) | | | | 3,700,000 | | 3,743,249 |
| Series 2004-2 Class M2, 4.98% 7/25/34 (d) | | | | 9,890,000 | | 9,889,746 |
| Series 2004-3 Class M5, 5.28% 8/25/34 (d) | | | | 2,000,000 | | 2,035,525 |
| Series 2005-2 Class 2A1, 3.95% 7/25/36 (d) | | | | 16,387,547 | | 16,385,833 |
| |
| |
| |
| 65 | | | | | | Annual Report |
| Investments (Unaudited) continued | | | | | | | | |
| |
Asset Backed Securities continued
| | | | | | | | |
| | | | | Principal | | | | Value |
| | | | | Amount | | | | |
| First Franklin Mortgage Loan Asset Backed Certificates: | | | | | | | | |
| Series 2005-FF2 Class A2A, 3.92% 3/25/35 (d) | | $ | | 6,441,811 | | $ | | 6,442,575 |
| Series 2005-FF2 Class M6, 4.53% 3/25/35 (d) | | | | 6,950,000 | | | | 6,966,453 |
| First Franklin Mortgage Loan Trust Series 2004-FF2: | | | | | | | | |
| Class M3, 4.38% 3/25/34 (d) | | | | 400,000 | | | | 400,662 |
| Class M4, 4.73% 3/25/34 (d) | | | | 300,000 | | | | 302,870 |
| First USA Credit Card Master Trust Series 2001-4 Class B, | | | | | | | | |
| 4.1281% 1/12/09 (d) | | | | 15,000,000 | | | | 15,017,273 |
| First USA Secured Note Trust Series 2001-3 Class C, | | | | | | | | |
| 4.8394% 11/19/08 (a)(d) | | | | 11,580,000 | | | | 11,661,421 |
| Ford Credit Auto Owner Trust Series 2003-B Class B2, | | | | | | | | |
| 4.1981% 10/15/07 (d) | | | | 19,600,000 | | | | 19,672,465 |
| Ford Credit Floorplan Master Owner Trust Series 2005 1: | | | | | | | | |
| Class A, 3.9181% 5/17/10 (d) | | | | 9,590,000 | | | | 9,586,223 |
| Class B, 4.2081% 5/17/10 (d) | | | | 2,625,000 | | | | 2,623,968 |
| Fremont Home Loan Trust: | | | | | | | | |
| Series 2004-1: | | | | | | | | |
| Class 1A1, 4.05% 2/25/34 (d) | | | | 2,196,026 | | | | 2,197,373 |
| Class M1, 4.28% 2/25/34 (d) | | | | 750,000 | | | | 750,227 |
| Class M2, 4.33% 2/25/34 (d) | | | | 800,000 | | | | 800,745 |
| Series 2004-C Class 2A2, 4.38% 8/25/34 (d) | | | | 10,000,000 | | | | 10,060,514 |
| Series 2004-D Class 3A2, 4.11% 11/25/34 (d) | | | | 2,153,210 | | | | 2,158,681 |
| Series 2005-2 Class 2A1, 3.94% 6/25/35 (d) | | | | 14,216,532 | | | | 14,212,883 |
| Series 2005 A: | | | | | | | | |
| Class 2A2, 4.07% 2/25/35 (d) | | | | 11,850,000 | | | | 11,862,896 |
| Class M1, 4.26% 1/25/35 (d) | | | | 1,603,000 | | | | 1,608,402 |
| Class M2, 4.29% 1/25/35 (d) | | | | 2,325,000 | | | | 2,326,557 |
| Class M3, 4.32% 1/25/35 (d) | | | | 1,250,000 | | | | 1,252,900 |
| Class M4, 4.51% 1/25/35 (d) | | | | 925,000 | | | | 931,377 |
| GE Business Loan Trust Series 2003-1 Class A, 4.1981% | | | | | | | | |
| 4/15/31 (a)(d) | | | | 5,238,178 | | | | 5,267,176 |
| GE Capital Credit Card Master Note Trust Series 2005-2 | | | | | | | | |
| Class B, 3.9681% 6/15/11 (d) | | | | 6,475,000 | | | | 6,474,059 |
| Gracechurch Card Funding No. 9 PLC Series 2005-2: | | | | | | | | |
| Class B, 3.9818% 9/15/10 (d) | | | | 3,560,000 | | | | 3,560,000 |
| Class C, 4.1418% 9/15/10 (d) | | | | 13,000,000 | | | | 13,000,000 |
| Gracechurch Card Funding PLC: | | | | | | | | |
| Series 5: | | | | | | | | |
| Class B, 3.9981% 8/15/08 (d) | | | | 1,520,000 | | | | 1,520,806 |
| Class C, 4.6981% 8/15/08 (d) | | | | 5,580,000 | | | | 5,600,379 |
| Series 6 Class B, 3.9581% 2/17/09 (d) | | | | 1,030,000 | | | | 1,030,878 |
| Series 8 Class C, 4.0981% 6/15/10 (d) | | | | 18,450,000 | | | | 18,485,634 |
Asset Backed Securities continued
| | | | | | |
| | | | | Principal | | Value |
| | | | | Amount | | |
| GSAMP Trust: | | | | | | |
| Series 2002-HE Class M1, 5.0463% 11/20/32 (d) | | $ | | 2,882,888 | | $ 2,926,670 |
| Series 2002-NC1: | | | | | | |
| Class A2, 4.15% 7/25/32 (d) | | | | 54,777 | | 55,120 |
| Class M1, 4.47% 7/25/32 (d) | | | | 8,861,000 | | 8,942,540 |
| Series 2003-FM1 Class M1, 4.6163% 3/20/33 (d) | | | | 15,000,000 | | 15,157,449 |
| Series 2004-FM1: | | | | | | |
| Class M1, 4.48% 11/25/33 (d) | | | | 2,865,000 | | 2,864,925 |
| Class M2, 5.23% 11/25/33 (d) | | | | 1,975,000 | | 2,008,385 |
| Series 2004-FM2: | | | | | | |
| Class M1, 4.33% 1/25/34 (d) | | | | 3,500,000 | | 3,499,910 |
| Class M2, 4.93% 1/25/34 (d) | | | | 1,500,000 | | 1,499,961 |
| Class M3, 5.13% 1/25/34 (d) | | | | 1,500,000 | | 1,499,961 |
| Series 2004-HE1: | | | | | | |
| Class M1, 4.38% 5/25/34 (d) | | | | 4,045,000 | | 4,044,896 |
| Class M2, 4.98% 5/25/34 (d) | | | | 1,750,000 | | 1,765,219 |
| Series 2005-9 Class 2A1, 3.95% 8/25/35 (d) | | | | 16,206,183 | | 16,206,183 |
| Series 2005-FF2 Class M5, 4.46% 3/25/35 (d) | | | | 3,500,000 | | 3,506,922 |
| Series 2005-HE2 Class M, 4.26% 3/25/35 (d) | | | | 8,780,000 | | 8,776,221 |
| Series 2005-NC1 Class M1, 4.28% 2/25/35 (d) | | | | 9,010,000 | | 9,013,305 |
| Guggenheim Structured Real Estate Funding Ltd. | | | | | | |
| Series 2005-1 Class C, 4.91% 5/25/30 (a)(d) | | | | 14,000,000 | | 13,987,145 |
| HSBC Home Equity Loan Trust Series 2005-2: | | | | | | |
| Class M1, 4.2563% 1/20/35 (d) | | | | 2,914,233 | | 2,914,529 |
| Class M2, 4.2863% 1/20/35 (d) | | | | 2,182,286 | | 2,182,488 |
| Home Equity Asset Trust: | | | | | | |
| Series 2002-2 Class M1, 4.63% 6/25/32 (d) | | | | 10,000,000 | | 10,011,960 |
| Series 2002-3 Class A5, 4.27% 2/25/33 (d) | | | | 2,763 | | 2,767 |
| Series 2002-5: | | | | | | |
| Class A3, 4.35% 5/25/33 (d) | | | | 1,901,156 | | 1,905,789 |
| Class M1, 5.03% 5/25/33 (d) | | | | 13,800,000 | | 13,948,517 |
| Series 2003-1: | | | | | | |
| Class A2, 4.3% 6/25/33 (d) | | | | 3,368,416 | | 3,370,517 |
| Class M1, 4.83% 6/25/33 (d) | | | | 8,335,000 | | 8,371,945 |
| Series 2003-2: | | | | | | |
| Class A2, 4.21% 8/25/33 (d) | | | | 159,893 | | 160,447 |
| Class M1, 4.71% 8/25/33 (d) | | | | 2,245,000 | | 2,271,910 |
| Series 2003-3: | | | | | | |
| Class A2, 4.19% 8/25/33 (d) | | | | 1,245,521 | | 1,250,195 |
| Class M1, 4.69% 8/25/33 (d) | | | | 8,185,000 | | 8,277,490 |
| Series 2003-4: | | | | | | |
| Class M1, 4.4413% 10/25/33 (d) | | | | 3,415,000 | | 3,437,752 |
| |
| |
| |
| 67 | | | | | | Annual Report |
| Investments (Unaudited) continued | | | | | | | | |
| |
Asset Backed Securities continued
| | | | | | | | |
| | | | | | | Principal | | | | Value |
| | | | | | | Amount | | | | |
| Home Equity Asset Trust: – continued | | | | | | | | | | |
| Series 2003-4: | | | | | | | | | | |
| Class M2, 5.5413% 10/25/33 (d) | | $ | | 4,040,000 | | $ | | 4,087,070 |
| Series 2003-5: | | | | | | | | | | |
| Class A2, 4.18% 12/25/33 (d) | | | | | | 3,793,784 | | | | 3,806,470 |
| Class M1, 4.53% 12/25/33 (d) | | | | | | 3,175,000 | | | | 3,197,905 |
| Class M2, 5.56% 12/25/33 (d) | | | | | | 1,345,000 | | | | 1,376,130 |
| Series 2003-7 Class A2, 4.21% 3/25/34 (d) | | | | 2,866,529 | | | | 2,872,858 |
| Series 2004-2 Class A2, 4.12% 7/25/34 (d) | | | | 5,111,457 | | | | 5,111,384 |
| Series 2004-3: | | | | | | | | | | |
| Class M1, 4.4% 8/25/34 (d) | | | | | | 2,015,000 | | | | 2,023,738 |
| Class M2, 5.03% 8/25/34 (d) | | | | | | 2,200,000 | | | | 2,239,606 |
| Series 2004-4 Class A2, 4.15% 10/25/34 (d) | | | | 7,288,824 | | | | 7,313,693 |
| Series 2004-6 Class A2, 4.18% 12/25/34 (d) | | | | 8,069,368 | | | | 8,094,037 |
| Series 2004-7 Class A3, 4.22% 1/25/35 (d) | | | | 2,551,011 | | | | 2,562,040 |
| Series 2005-1: | | | | | | | | | | |
| Class M1, 4.26% 5/25/35 (d) | | | | | | 9,705,000 | | | | 9,708,301 |
| Class M2, 4.28% 5/25/35 (d) | | | | | | 5,780,000 | | | | 5,775,826 |
| Class M3, 4.33% 5/25/35 (d) | | | | | | 5,825,000 | | | | 5,820,912 |
| Series 2005-2: | | | | | | | | | | |
| Class 2A2, 4.03% 7/25/35 (d) | | | | | | 13,170,000 | | | | 13,169,687 |
| Class M1, 4.28% 7/25/35 (d) | | | | | | 10,085,000 | | | | 10,084,736 |
| Series 2005-3 Class M1, 4.24% 8/25/35 (d) | | | | 9,450,000 | | | | 9,442,313 |
| Series 2005-5 Class 2A2, 4.08% 11/25/35 (d) | | | | 15,000,000 | | | | 15,024,030 |
| Household Affinity Credit Card Master Note Trust I | | | | | | | | |
| Series 2003-3 Class B, 4.0581% 8/15/08 (d) | | | | 10,000,000 | | | | 10,012,255 |
| Household Credit Card Master Trust I Series 2002-1 Class B, | | | | | | | | |
| 4.4181% 7/15/08 (d) | | | | | | 22,589,000 | | | | 22,592,725 |
| Household Home Equity Loan Trust: | | | | | | | | | | |
| Series 2002-2 Class A, 4.0963% 4/20/32 (d) | | | | 3,046,635 | | | | 3,047,537 |
| Series 2002-3 Class A, 4.2463% 7/20/32 (d) | | | | 2,468,824 | | | | 2,470,761 |
| Series 2003-1 Class M, 4.4263% 10/20/32 (d) | | | | 686,032 | | | | 686,682 |
| Series 2003-2: | | | | | | | | | | |
| Class A, 4.1263% 9/20/33 (d) | | | | | | 2,534,598 | | | | 2,539,076 |
| Class M, 4.3763% 9/20/33 (d) | | | | | | 1,191,893 | | | | 1,194,376 |
| Series 2004-1 Class M, 4.3163% 9/20/33 (d) | | | | 2,389,256 | | | | 2,393,972 |
| Household Mortgage Loan Trust: | | | | | | | | | | |
| Series 2003-HC1 Class M, 4.4463% 2/20/33 (d) | | | | 1,500,530 | | | | 1,505,086 |
| Series 2004-HC1: | | | | | | | | | | |
| Class A, 4.1463% 2/20/34 (d) | | | | | | 4,182,768 | | | | 4,193,747 |
| Class M, 4.2963% 2/20/34 (d) | | | | | | 2,528,917 | | | | 2,530,110 |
| Household Private Label Credit Card Master Note Trust I: | | | | | | | | |
| Series 2002-1 Class B, 4.3181% 1/18/11 (d) | | | | 8,850,000 | | | | 8,865,532 |
| |
| |
| Annual Report | | 68 | | | | | | | | |
Asset Backed Securities continued
| | | | | | |
| | | | | Principal | | Value |
| | | | | Amount | | |
| Household Private Label Credit Card Master Note Trust I: – | | | | | | |
| continued | | | | | | |
| Series 2002-2: | | | | | | |
| Class A, 3.9381% 1/18/11 (d) | | $ | | 9,000,000 | | $ 9,010,691 |
| Class B, 4.3181% 1/18/11 (d) | | | | 14,275,000 | | 14,347,032 |
| Series 2002-3 Class B, 5.0181% 9/15/09 (d) | | | | 4,150,000 | | 4,153,962 |
| Ikon Receivables Funding LLC Series 2003-1 Class A3A, | | | | | | |
| 4.0081% 12/17/07 (d) | | | | 2,012,271 | | 2,012,612 |
| IXIS Real Estate Capital Trust Series 2005-HE1: | | | | | | |
| Class A1, 4.08% 6/25/35 (d) | | | | 10,270,940 | | 10,270,696 |
| Class M1, 4.3% 6/25/35 (d) | | | | 4,100,000 | | 4,098,296 |
| Class M2, 4.32% 6/25/35 (d) | | | | 2,775,000 | | 2,773,872 |
| Class M3, 4.35% 6/25/35 (d) | | | | 1,975,000 | | 1,977,174 |
| Keycorp Student Loan Trust Series 1999-A Class A2, 4.34% | | | | | | |
| 12/27/09 (d) | | | | 14,973,894 | | 15,030,475 |
| Long Beach Mortgage Loan Trust: | | | | | | |
| Series 2003-2: | | | | | | |
| Class AV, 4.15% 6/25/33 (d) | | | | 124,347 | | 124,374 |
| Class M1, 4.65% 6/25/33 (d) | | | | 19,500,000 | | 19,585,995 |
| Series 2003-3 Class M1, 4.3913% 7/25/33 (d) | | | | 7,770,000 | | 7,819,867 |
| Series 2004-2: | | | | | | |
| Class M1, 4.36% 6/25/34 (d) | | | | 4,275,000 | | 4,284,930 |
| Class M2, 4.91% 6/25/34 (d) | | | | 1,400,000 | | 1,415,675 |
| Series 2005-2 Class 2A2, 4.01% 4/25/35 (d) | | | | 12,000,000 | | 12,003,775 |
| MASTR Asset Backed Securities Trust: | | | | | | |
| Series 2003-NC1: | | | | | | |
| Class M1, 4.56% 4/25/33 (d) | | | | 3,500,000 | | 3,520,473 |
| Class M2, 5.68% 4/25/33 (d) | | | | 1,500,000 | | 1,531,476 |
| Series 2004-FRE1 Class M1, 4.38% 7/25/34 (d) | | | | 5,223,000 | | 5,243,096 |
| MBNA Asset Backed Note Trust Series 2000-K Class C, | | | | | | |
| 4.5681% 3/17/08 (a)(d) | | | | 7,250,000 | | 7,251,305 |
| MBNA Credit Card Master Note Trust: | | | | | | |
| Series 2001-B1 Class B1, 4.1431% 10/15/08 (d) | | | | 30,000,000 | | 30,032,436 |
| Series 2001-B2 Class B2, 4.1281% 1/15/09 (d) | | | | 30,353,000 | | 30,408,661 |
| Series 2002-B2 Class B2, 4.1481% 10/15/09 (d) | | | | 20,000,000 | | 20,080,518 |
| Series 2002-B4 Class B4, 4.2681% 3/15/10 (d) | | | | 14,800,000 | | 14,906,795 |
| Series 2003-B2 Class B2, 4.1581% 10/15/10 (d) | | | | 1,530,000 | | 1,544,849 |
| Series 2003-B3 Class B3, 4.1431% 1/18/11 (d) | | | | 1,130,000 | | 1,136,193 |
| Series 2003-B5 Class B5, 4.1381% 2/15/11 (d) | | | | 705,000 | | 710,072 |
| MBNA Master Credit Card Trust II: | | | | | | |
| Series 1998-E Class B, 3.9288% 9/15/10 (d) | | | | 7,800,000 | | 7,843,689 |
| Series 1998-G Class B, 4.1681% 2/17/09 (d) | | | | 20,000,000 | | 20,034,530 |
| |
| |
| |
| 69 | | | | | | Annual Report |
| Investments (Unaudited) continued | | | | | | | | |
| |
Asset Backed Securities continued
| | | | | | | | |
| | | | | | | Principal | | | | Value |
| | | | | | | Amount | | | | |
| Meritage Mortgage Loan Trust Series 2004-1: | | | | | | | | |
| Class M1, 4.33% 7/25/34 (d) | | | | $ | | 2,125,000 | | $ | | 2,124,946 |
| Class M2, 4.38% 7/25/34 (d) | | | | | | 375,000 | | | | 374,991 |
| Class M3, 4.78% 7/25/34 (d) | | | | | | 775,000 | | | | 774,980 |
| Class M4, 4.93% 7/25/34 (d) | | | | | | 525,000 | | | | 524,987 |
| Merrill Lynch Mortgage Investors, Inc. Series 2003-HE1 Class | | | | | | | | |
| M1, 4.53% 7/25/34 (d) | | | | | | 2,321,000 | | | | 2,334,630 |
| Morgan Stanley ABS Capital I, Inc.: | | | | | | | | | | |
| Series 2002-NC6 Class M2, 5.93% 11/25/32 (d) | | | | 2,370,000 | | | | 2,430,872 |
| Series 2003-NC5 Class M2, 5.83% 4/25/33 (d) | | | | 2,800,000 | | | | 2,827,761 |
| Series 2003-NC6 Class M2, 5.5913% 6/27/33 (d) | | | | 12,835,000 | | | | 13,193,861 |
| Series 2003-NC7 Class M1, 4.53% 6/25/33 (d) | | | | 1,785,000 | | | | 1,790,756 |
| Series 2003-NC8 Class M1, 4.53% 9/25/33 (d) | | | | 2,350,000 | | | | 2,380,069 |
| Series 2004-HE6 Class A2, 4.17% 8/25/34 (d) | | | | 6,065,683 | | | | 6,084,818 |
| Series 2004-NC2 Class M1, 4.38% 12/25/33 (d) | | | | 2,595,000 | | | | 2,604,510 |
| Series 2004-NC6 Class A2, 4.17% 7/25/34 (d) | | | | 2,716,074 | | | | 2,721,759 |
| Series 2005-1: | | | | | | | | | | |
| Class M2, 4.3% 12/25/34 (d) | | | | | | 4,425,000 | | | | 4,429,882 |
| Class M3, 4.35% 12/25/34 (d) | | | | | | 4,000,000 | | | | 4,007,356 |
| Series 2005-HE1: | | | | | | | | | | |
| Class A3B, 4.05% 12/25/34 (d) | | | | | | 3,885,000 | | | | 3,889,760 |
| Class M1, 4.28% 12/25/34 (d) | | | | | | 1,100,000 | | | | 1,103,379 |
| Class M2, 4.3% 12/25/34 (d) | | | | | | 2,970,000 | | | | 2,974,441 |
| Series 2005-HE2: | | | | | | | | | | |
| Class M1, 4.23% 1/25/35 (d) | | | | | | 2,665,000 | | | | 2,673,338 |
| Class M2, 4.27% 1/25/35 (d) | | | | | | 1,900,000 | | | | 1,899,216 |
| Series 2005-NC1: | | | | | | | | | | |
| Class M1, 4.27% 1/25/35 (d) | | | | | | 2,425,000 | | | | 2,434,295 |
| Class M2, 4.3% 1/25/35 (d) | | | | | | 2,425,000 | | | | 2,427,680 |
| Class M3, 4.34% 1/25/35 (d) | | | | | | 2,425,000 | | | | 2,431,267 |
| Morgan Stanley Dean Witter Capital I Trust: | | | | | | | | |
| Series 2001-AM1: | | | | | | | | | | |
| Class M1, 4.68% 2/25/32 (d) | | | | | | 1,510,288 | | | | 1,511,306 |
| Class M2, 5.23% 2/25/32 (d) | | | | | | 5,305,979 | | | | 5,312,043 |
| Series 2001-NC4 Class M1, 4.83% 1/25/32 (d) | | | | 3,827,881 | | | | 3,838,780 |
| Series 2002-AM3 Class A3, 4.32% 2/25/33 (d) | | | | 992,554 | | | | 995,836 |
| Series 2002-HE1 Class M1, 4.43% 7/25/32 (d) | | | | 5,860,000 | | | | 5,893,166 |
| Series 2002-HE2 Class M1, 4.53% 8/25/32 (d) | | | | 9,925,000 | | | | 9,964,301 |
| Series 2002-NC3 Class A3, 4.17% 8/25/32 (d) | | | | 147,864 | | | | 148,113 |
| Series 2002-OP1 Class M1, 4.58% 9/25/32 (d) | | | | 3,894,745 | | | | 3,907,257�� |
| Series 2003-NC1: | | | | | | | | | | |
| Class M1, 4.88% 11/25/32 (d) | | | | | | 2,391,382 | | | | 2,406,740 |
| Class M2, 5.88% 11/25/32 (d) | | | | | | 1,880,000 | | | | 1,897,592 |
| |
| |
| Annual Report | | 70 | | | | | | | | |
Asset Backed Securities continued
| | | | | | | | |
| | | | | Principal | | | | Value |
| | | | | Amount | | | | |
| New Century Home Equity Loan Trust: | | | | | | | | |
| Series 2003-2 Class M2, 5.83% 1/25/33 (d) | | $ | | 4,600,000 | | $ | | 4,665,213 |
| Series 2003-6 Class M1, 4.55% 1/25/34 (d) | | | | 5,180,000 | | | | 5,212,663 |
| Series 2005-1: | | | | | | | | |
| Class M1, 4.28% 3/25/35 (d) | | | | 4,395,000 | | | | 4,396,544 |
| Class M2, 4.31% 3/25/35 (d) | | | | 4,395,000 | | | | 4,396,491 |
| Class M3, 4.35% 3/25/35 (d) | | | | 2,120,000 | | | | 2,126,029 |
| Nissan Auto Lease Trust: | | | | | | | | |
| Series 2003-A Class A3A, 3.9081% 6/15/09 (d) | | | | 11,639,609 | | | | 11,648,579 |
| Series 2004-A Class A4A, 3.8381% 6/15/10 (d) | | | | 10,570,000 | | | | 10,581,156 |
| NovaStar Home Equity Loan Series 2004-1: | | | | | | | | |
| Class M1, 4.28% 6/25/34 (d) | | | | 1,450,000 | | | | 1,451,161 |
| Class M4, 4.805% 6/25/34 (d) | | | | 2,435,000 | | | | 2,444,337 |
| Ocala Funding LLC Series 2005-1A Class A, 5.2963% | | | | | | | | |
| 3/20/10 (a)(d) | | | | 3,675,000 | | | | 3,675,000 |
| Ownit Mortgage Loan Asset-Backed Certificates Series | | | | | | | | |
| 2005 3 Class A2A, 3.95% 6/25/36 (d) | | | | 14,975,059 | | | | 14,974,727 |
| Park Place Securities, Inc.: | | | | | | | | |
| Series 2004-WCW1: | | | | | | | | |
| Class M1, 4.46% 9/25/34 (d) | | | | 3,745,000 | | | | 3,767,310 |
| Class M2, 4.51% 9/25/34 (d) | | | | 1,755,000 | | | | 1,767,858 |
| Class M3, 5.08% 9/25/34 (d) | | | | 3,355,000 | | | | 3,402,867 |
| Class M4, 5.28% 9/25/34 (d) | | | | 4,700,000 | | | | 4,776,320 |
| Series 2004-WCW2 Class A2, 4.21% 10/25/34 (d) | | | | 6,455,574 | | | | 6,471,464 |
| Series 2005-WCH1: | | | | | | | | |
| Class A3B, 4.05% 1/25/35 (d) | | | | 2,775,000 | | | | 2,780,119 |
| Class M2, 4.35% 1/25/35 (d) | | | | 4,175,000 | | | | 4,178,114 |
| Class M3, 4.39% 1/25/35 (d) | | | | 3,290,000 | | | | 3,299,846 |
| Class M5, 4.71% 1/25/35 (d) | | | | 3,095,000 | | | | 3,111,984 |
| Series 2005-WHQ2 Class M7, 5.08% 5/25/35 (d) | | | | 5,950,000 | | | | 5,961,145 |
| People’s Choice Home Loan Securities Trust Series 2005 2: | | | | | | | | |
| Class A1, 3.94% 9/25/24 (d) | | | | 5,833,593 | | | | 5,834,512 |
| Class M4, 4.46% 5/25/35 (d) | | | | 6,000,000 | | | | 6,025,129 |
| Providian Gateway Master Trust Series 2002-B Class A, | | | | | | | | |
| 4.4681% 6/15/09 (a)(d) | | | | 15,000,000 | | | | 15,021,564 |
| Residental Asset Securities Corp.: | | | | | | | | |
| Series 2005-KS4 Class M2, 4.41% 5/25/35 (d) | | | | 1,040,000 | | | | 1,044,543 |
| Series 2005-KS7 Class A1, 3.93% 8/25/35 (d) | | | | 10,017,807 | | | | 10,017,586 |
| Residential Asset Mortgage Products, Inc. Series 2004-RS10 | | | | | | | | |
| Class MII2, 5.08% 10/25/34 (d) | | | | 5,500,000 | | | | 5,587,075 |
| Salomon Brothers Mortgage Securities VII, Inc. Series | | | | | | | | |
| 2003-HE1 Class A, 4.23% 4/25/33 (d) | | | | 632,314 | | | | 635,086 |
71 Annual Report
| Investments (Unaudited) continued | | | | | | |
| |
Asset Backed Securities continued
| | | | | | |
| | | | | | | Principal | | Value |
| | | | | | | Amount | | |
| Saxon Asset Securities Trust: | | | | | | | | |
| Series 2004-1 Class M1, 4.36% 3/25/35 (d) | | $ | | 4,415,000 | | $ 4,418,970 |
| Series 2004-2 Class MV1, 4.41% 8/25/35 (d) | | | | 4,495,000 | | 4,507,503 |
| Sears Credit Account Master Trust II: | | | | | | | | |
| Series 2001-1 Class B, 4.1931% 2/15/10 (d) | | | | 10,000,000 | | 9,990,039 |
| Series 2002-5 Class B, 5.0181% 11/17/09 (d) | | | | 30,000,000 | | 30,025,965 |
| Securitized Asset Backed Receivables LLC Trust | | | | | | |
| Series 2004-NC1 Class M1, 4.35% 2/25/34 (d) | | | | 2,910,000 | | 2,912,781 |
| Specialty Underwriting & Residential Finance | | | | | | |
| Series 2003-BC4 Class M1, 4.43% 11/25/34 (d) | | | | 1,810,000 | | 1,819,343 |
| Structured Asset Securities Corp. Series 2004-GEL1 Class A, | | | | |
| 4.19% 2/25/34 (d) | | | | | | 901,062 | | 901,041 |
| Superior Wholesale Inventory Financing Trust VII Series | | | | | | |
| 2003-A8 Class CTFS, 4.2181% 3/15/11 (a)(d) | | | | 10,835,000 | | 10,826,536 |
| Superior Wholesale Inventory Financing Trust XII Series | | | | | | |
| 2005-A12 Class C, 4.9681% 6/15/10 (d) | | | | 6,840,000 | | 6,849,450 |
| Terwin Mortgage Trust: | | | | | | | | |
| Series 2003-4HE Class A1, 4.26% 9/25/34 (d) | | | | 2,051,939 | | 2,062,554 |
| Series 2003-6HE Class A1, 4.3% 11/25/33 (d) | | | | 1,467,936 | | 1,471,055 |
| Series 2005-14HE Class AF1, 3.9753% 8/25/36 (d) | | | | 8,635,000 | | 8,634,326 |
| Series 2005-8HE Class A1, 3.95% 7/25/35 (a)(d) | | | | 6,932,173 | | 6,938,671 |
| TOTAL ASSET BACKED SECURITIES | | | | | | | | |
| (Cost $2,188,022,238) | | | | | | | | 2,194,887,925 |
| |
| Collateralized Mortgage Obligations 20.2% | | | | |
| |
| Private Sponsor – 13.8% | | | | | | | | |
| Adjustable Rate Mortgage Trust floater: | | | | | | | | |
| Series 2004-2 Class 7A3, 4.23% 2/25/35 (d) | | | | 8,271,247 | | 8,288,629 |
| Series 2004-4 Class 5A2, 4.23% 3/25/35 (d) | | | | 3,344,187 | | 3,351,688 |
| Series 2005-1 Class 5A2, 4.16% 5/25/35 (d) | | | | 5,517,368 | | 5,520,788 |
| Series 2005-10 Class 5A1, 4.101% 1/25/36 (d) | | | | 15,000,000 | | 15,000,000 |
| Series 2005-2: | | | | | | | | |
| Class 6A2, 4.11% 6/25/35 (d) | | | | | | 2,499,864 | | 2,501,436 |
| Class 6M2, 4.31% 6/25/35 (d) | | | | | | 10,145,000 | | 10,144,980 |
| Series 2005-3 Class 8A2, 4.07% 7/25/35 (d) | | | | 16,519,250 | | 16,529,773 |
| Series 2005-4 Class 7A2, 4.06% 8/25/35 (d) | | | | 8,125,015 | | 8,130,280 |
| Series 2005-8 Class 7A2, 4.11% 11/25/35 (d) | | | | 7,166,967 | | 7,168,085 |
| American Home Mortgage Investment Trust Series 2005-4 | | | | | | |
| Class 1A1, 4.18% 11/25/45 (d) | | | | | | 11,080,000 | | 11,080,000 |
| Bear Stearns Adjustable Rate Mortgage Trust Series 2005-6 | | | | |
| Class 1A1, 5.17% 8/25/35 (d) | | | | | | 17,862,312 | | 17,866,889 |
| |
| |
| |
| Annual Report | | 72 | | | | | | |
Collateralized Mortgage Obligations continued
| | |
| | | Principal | | Value |
| | | Amount | | |
Private Sponsor continued
| | | | |
| Bear Stearns Alt-A Trust floater: | | | | |
| Series 2005-1 Class A1, 4.11% 1/25/35 (d) | | $18,993,594 | | $ 19,005,465 |
| Series 2005-2 Class 1A1, 4.08% 3/25/35 (d)�� | | 13,521,981 | | 13,515,643 |
| Series 2005-5 Class 1A1, 4.05% 7/25/35 (d) | | 17,169,385 | | 17,155,972 |
| Countrywide Alternative Loan Trust planned amortization | | | | |
| class Series 2003-5T2 Class A2, 4.23% 5/25/33 (d) | | 5,006,668 | | 5,009,604 |
| CS First Boston Mortgage Securities Corp. floater: | | | | |
| Series 2004-AR2 Class 6A1, 4.23% 3/25/34 (d) | | 4,681,479 | | 4,678,694 |
| Series 2004-AR3 Class 6A2, 4.2% 4/25/34 (d) | | 1,948,417 | | 1,950,279 |
| Series 2004-AR4 Class 5A2, 4.2% 5/25/34 (d) | | 1,821,930 | | 1,820,850 |
| Series 2004-AR5 Class 11A2, 4.2% 6/25/34 (d) | | 2,698,314 | | 2,692,965 |
| Series 2004-AR6 Class 9A2, 4.2% 10/25/34 (d) | | 3,422,844 | | 3,424,695 |
| Series 2004-AR7 Class 6A2, 4.21% 8/25/34 (d) | | 4,894,739 | | 4,898,151 |
| Series 2004-AR8 Class 8A2, 4.21% 9/25/34 (d) | | 3,798,541 | | 3,805,156 |
| CWALT, Inc. floater Series 2005-56 Class 3A1, 4.2494% | | | | |
| 10/25/35 (d) | | 8,490,000 | | 8,490,000 |
| First Horizon Mortgage pass thru Trust floater Series | | | | |
| 2004-FL1 Class 2A1, 4.39% 12/25/34 (d) | | 3,472,618 | | 3,467,751 |
| Granite Master Issuer PLC: | | | | |
| floater: | | | | |
| Series 2005-1: | | | | |
| Class A3, 3.97% 12/21/24 (d) | | 5,300,000 | | 5,299,172 |
| Class B1, 4.02% 12/20/54 (d) | | 7,050,000 | | 7,047,797 |
| Class M1, 4.12% 12/20/54 (d) | | 5,300,000 | | 5,298,344 |
| Series 2005-2 Class C1, 4.39% 12/20/54 (d) | | 7,975,000 | | 7,972,508 |
| Series 2005-4 Class M2, 4.305% 12/20/54 (d) | | 6,500,000 | | 6,498,731 |
| Series 2005-4 Class C1, 4.455% 12/20/54 (d) | | 6,800,000 | | 6,798,672 |
| Granite Mortgages PLC floater: | | | | |
| Series 2004-1: | | | | |
| Class 1B, 4.1% 3/20/44 (d) | | 1,415,000 | | 1,415,442 |
| Class 1C, 4.79% 3/20/44 (d) | | 4,075,000 | | 4,089,008 |
| Class 1M, 4.3% 3/20/44 (d) | | 4,935,000 | | 4,939,627 |
| Series 2004-2: | | | | |
| Class 1A2, 3.96% 6/20/28 (d) | | 4,162,145 | | 4,162,145 |
| Class 1B, 4.06% 6/20/44 (d) | | 786,966 | | 787,059 |
| Class 1C, 4.59% 6/20/44 (d) | | 2,865,029 | | 2,869,506 |
| Class 1M, 4.17% 6/20/44 (d) | | 2,104,798 | | 2,104,240 |
| Series 2004-3: | | | | |
| Class 1B, 4.05% 9/20/44 (d) | | 2,100,000 | | 2,100,042 |
| Class 1C, 4.48% 9/20/44 (d) | | 5,415,000 | | 5,424,314 |
| Class 1M, 4.16% 9/20/44 (d) | | 1,200,000 | | 1,200,228 |
| |
| |
| |
| 73 | | | | Annual Report |
| Investments (Unaudited) continued | | | | | | |
| |
Collateralized Mortgage Obligations continued
| | | | |
| | | | | Principal | | | | Value |
| | | | | Amount | | | | |
Private Sponsor continued
| | | | | | | | |
| Harborview Mortgage Loan Trust floater Series 2005-2 | | | | | | |
| Class 2A1A, 4.0094% 5/19/35 (d) | | | | $11,231,269 | | $ | | 11,199,681 |
| Holmes Financing No. 7 PLC floater Series 2 Class M, | | | | | | |
| 4.3988% 7/15/40 (d) | | | | 2,560,000 | | | | 2,563,183 |
| Holmes Financing No. 8 PLC floater Series 2: | | | | | | |
| Class A, 3.6788% 4/15/11 (d) | | | | 25,000,000 | | | | 25,002,930 |
| Class B, 3.7688% 7/15/40 (d) | | | | 2,695,000 | | | | 2,696,264 |
| Class C, 4.3188% 7/15/40 (d) | | | | 10,280,000 | | | | 10,318,550 |
| Home Equity Asset Trust floater Series 2005-3 Class 2A1, | | | | | | |
| 3.92% 8/25/35 (d) | | | | 5,995,565 | | | | 5,996,642 |
| Homestar Mortgage Acceptance Corp. floater Series 2004-5 | | | | | | |
| Class A1, 4.28% 10/25/34 (d) | | | | 4,056,783 | | | | 4,068,310 |
| Impac CMB Trust: | | | | | | | | |
| floater: | | | | | | | | |
| Series 2004-11 Class 2A2, 4.2% 3/25/35 (d) | | 7,904,651 | | | | 7,903,107 |
| Series 2004-6 Class 1A2, 4.22% 10/25/34 (d) | | 3,065,340 | | | | 3,070,216 |
| Series 2005-1: | | | | | | | | |
| Class M1, 4.29% 4/25/35 (d) | | | | 3,028,498 | | | | 3,026,014 |
| Class M2, 4.33% 4/25/35 (d) | | | | 5,302,005 | | | | 5,298,691 |
| Class M3, 4.36% 4/25/35 (d) | | | | 1,300,974 | | | | 1,299,907 |
| Class M4, 4.58% 4/25/35 (d) | | | | 767,788 | | | | 768,718 |
| Class M5, 4.6% 4/25/35 (d) | | | | 767,788 | | | | 767,788 |
| Class M6, 4.65% 4/25/35 (d) | | | | 1,228,460 | | | | 1,228,460 |
| Series 2005-2 Class 1A2, 4.14% 4/25/35 (d) | | 12,453,621 | | | | 12,443,892 |
| Series 2005-3 Class A1, 4.07% 8/25/35 (d) | | 14,447,985 | | | | 14,423,717 |
| Series 2005-4 Class 1B1, 5.13% 5/25/35 (d) | | 4,978,738 | | | | 4,972,515 |
| Series 2005-6 Class 1M3, 4.44% 10/25/35 (d) | | 3,323,541 | | | | 3,323,557 |
| Series 2005-7: | | | | | | | | |
| Class M1, 4.208% 11/25/35 (d) | | | | 1,765,000 | | | | 1,765,000 |
| Class M2, 4.248% 11/25/35 (d) | | | | 1,325,000 | | | | 1,325,000 |
| Class M3, 4.348% 11/25/35 (d) | | | | 6,615,000 | | | | 6,615,000 |
| Lehman Structured Securities Corp. floater Series 2005-1 | | | | | | |
| Class A2, 4.22% 9/26/45 (a)(d) | | | | 15,180,141 | | | | 15,180,141 |
| MASTR Adjustable Rate Mortgages Trust: | | | | | | | | |
| floater Series 2005-1 Class 1A1, 4.1% 3/25/35 (d) | | 11,034,855 | | | | 11,047,023 |
| Series 2004-6 Class 4A2, 4.1657% 7/25/34 (d) | | 5,969,000 | | | | 5,946,443 |
| Merrill Lynch Mortgage Investors, Inc. floater: | | | | | | |
| Series 2003-A Class 2A1, 4.22% 3/25/28 (d) | | 7,093,116 | | | | 7,130,471 |
| Series 2003-B Class A1, 4.17% 4/25/28 (d) | | 7,213,924 | | | | 7,254,849 |
| Series 2003-D Class A, 4.14% 8/25/28 (d) | | 6,608,802 | | | | 6,619,465 |
| Series 2003-E Class A2, 4.3831% 10/25/28 (d) | | 9,116,686 | | | | 9,126,651 |
| Series 2003-F Class A2, 4.43% 10/25/28 (d) | | 11,828,156 | | | | 11,835,544 |
| |
| |
| Annual Report | | 74 | | | | | | |
Collateralized Mortgage Obligations continued
| | | | |
| | | Principal | | | | Value |
| | | Amount | | | | |
Private Sponsor continued
| | | | | | |
| Merrill Lynch Mortgage Investors, Inc. floater: - continued | | | | |
| Series 2004-A Class A2, 4.34% 4/25/29 (d) | | $10,025,427 | | $ | | 10,017,623 |
| Series 2004-B Class A2, 3.79% 6/25/29 (d) | | 7,905,839 | | | | 7,888,355 |
| Series 2004-C Class A2, 3.95% 7/25/29 (d) | | 11,598,172 | | | | 11,567,548 |
| Series 2004-D Class A2, 4.4131% 9/25/29 (d) | | 8,519,942 | | | | 8,524,812 |
| Series 2004-E: | | | | | | |
| Class A2B, 4.45% 11/25/29 (d) | | 7,561,387 | | | | 7,550,087 |
| Class A2D, 4.64% 11/25/29 (d) | | 1,758,462 | | | | 1,766,187 |
| Series 2004-G Class A2, 3.95% 11/25/29 (d) | | 3,530,484 | | | | 3,529,545 |
| Series 2005-A Class A2, 4.3031% 2/25/30 (d) | | 9,875,800 | | | | 9,882,274 |
| Mortgage Asset Backed Securities Trust floater Series | | | | | | |
| 2002-NC1 Class M1, 4.68% 10/25/32 (d) | | 3,128,220 | | | | 3,140,706 |
| MortgageIT Trust floater: | | | | | | |
| Series 2004-2: | | | | | | |
| Class A1, 4.2% 12/25/34 (d) | | 4,638,420 | | | | 4,648,806 |
| Class A2, 4.28% 12/25/34 (d) | | 6,275,019 | | | | 6,320,305 |
| Series 2005-2 Class 1A1, 4.1% 5/25/35 (d) | | 4,811,489 | | | | 4,814,744 |
| Opteum Mortgage Acceptance Corp. floater Series 2005-3 | | | | |
| Class APT, 4.12% 7/25/35 (d) | | 18,530,057 | | | | 18,540,914 |
| Permanent Financing No. 3 PLC floater Series 2 Class C, | | | | |
| 4.8838% 6/10/42 (d) | | 4,845,000 | | | | 4,893,450 |
| Permanent Financing No. 4 PLC floater Series 2 Class C, | | | | |
| 4.5538% 6/10/42 (d) | | 15,400,000 | | | | 15,474,437 |
| Permanent Financing No. 5 PLC floater: | | | | | | |
| Series 2 Class C, 4.4838% 6/10/42 (d) | | 4,215,000 | | | | 4,240,489 |
| Series 3 Class C, 4.6538% 6/10/42 (d) | | 8,890,000 | | | | 8,998,425 |
| Permanent Financing No. 6 PLC floater Series 6 Class 2C, | | | | |
| 4.2888% 6/10/42 (d) | | 5,350,000 | | | | 5,344,539 |
| Permanent Financing No. 7 PLC floater Series 7: | | | | | | |
| Class 1B, 3.9238% 6/10/42 (d) | | 2,000,000 | | | | 1,999,747 |
| Class 1C, 4.1138% 6/10/42 (d) | | 3,840,000 | | | | 3,849,303 |
| Class 2C, 4.1638% 6/10/42 (d) | | 8,065,000 | | | | 8,047,042 |
| Permanent Financing No. 8 PLC floater Series 8: | | | | | | |
| Class 1C, 4.1638% 6/10/42 (d) | | 7,165,000 | | | | 7,161,740 |
| Class 2C, 4.2338% 6/10/42 (d) | | 9,945,000 | | | | 9,940,465 |
| Residential Asset Mortgage Products, Inc.: | | | | | | |
| sequential pay Series 2003-SL1 Class 3A1, 7.125% | | | | |
| 4/25/31 | | 4,284,316 | | | | 4,353,251 |
| Series 2005-AR5 Class 1A1, 4.903% 9/19/35 (d) | | 5,016,521 | | | | 5,020,936 |
75 Annual Report
| Investments (Unaudited) continued | | | | | | |
| |
Collateralized Mortgage Obligations continued
| | | | |
| | | Principal | | | | Value |
| | | Amount | | | | |
| Private Sponsor continued | | | | | | |
| Residential Finance LP/Residential Finance Development | | | | | | |
| Corp. floater Series 2003-A: | | | | | | |
| Class B4, 5.5281% 3/10/35 (a)(d) | | $ 5,475,801 | | $ | | 5,557,938 |
| Class B5, 6.0781% 3/10/35 (a)(d) | | 5,666,940 | | | | 5,791,014 |
| Residential Funding Securities Corp.: | | | | | | |
| Series 2003-RP1 Class A1, 4.33% 11/25/34 (d) | | 2,387,142 | | | | 2,396,787 |
| Series 2003-RP2 Class A1, 4.28% 6/25/33 (a)(d) | | 3,567,765 | | | | 3,579,472 |
| Sequoia Mortgage Trust floater: | | | | | | |
| Series 2003-5 Class A2, 4.37% 9/20/33 (d) | | 9,869,908 | | | | 9,866,749 |
| Series 2003-7 Class A2, 3.835% 1/20/34 (d) | | 8,292,646 | | | | 8,287,744 |
| Series 2004-1 Class A, 4.15% 2/20/34 (d) | | 5,352,427 | | | | 5,344,162 |
| Series 2004-10 Class A4, 3.6681% 11/20/34 (d) | | 9,021,376 | | | | 9,016,217 |
| Series 2004-3 Class A, 3.5463% 5/20/34 (d) | | 9,243,861 | | | | 9,221,165 |
| Series 2004-4 Class A, 3.5881% 5/20/34 (d) | | 11,574,850 | | | | 11,560,488 |
| Series 2004-5 Class A3, 3.77% 6/20/34 (d) | | 7,745,333 | | | | 7,741,702 |
| Series 2004-6: | | | | | | |
| Class A3A, 4.3175% 6/20/35 (d) | | 6,761,373 | | | | 6,757,088 |
| Class A3B, 4.08% 7/20/34 (d) | | 845,172 | | | | 844,660 |
| Series 2004-7: | | | | | | |
| Class A3A, 4.365% 8/20/34 (d) | | 6,627,084 | | | | 6,622,167 |
| Class A3B, 4.59% 7/20/34 (d) | | 1,192,509 | | | | 1,195,319 |
| Series 2004-8 Class A2, 4.41% 9/20/34 (d) | | 11,824,016 | | | | 11,827,689 |
| Series 2005-1 Class A2, 4.1% 2/20/35 (d) | | 6,778,467 | | | | 6,773,241 |
| Series 2005-2 Class A2, 4.29% 3/20/35 (d) | | 11,841,861 | | | | 11,841,861 |
| Series 2005-3 Class A1, 3.9963% 5/20/35 (d) | | 8,335,848 | | | | 8,318,878 |
| Structured Adjustable Rate Mortgage Loan Trust floater | | | | | | |
| Series 2001-14 Class A1, 4.14% 7/25/35 (d) | | 10,719,814 | | | | 10,719,814 |
| Structured Asset Securities Corp. floater Series 2004-NP1 | | | | | | |
| Class A, 4.23% 9/25/33 (a)(d) | | 2,217,986 | | | | 2,219,280 |
| Thornburg Mortgage Securities Trust floater: | | | | | | |
| Series 2004-3 Class A, 4.2% 9/25/34 (d) | | 20,272,244 | | | | 20,312,652 |
| Series 2005-3 Class A4, 4.108% 8/25/45 (d) | | 17,180,000 | | | | 17,180,000 |
| WAMU Mortgage pass thru certificates: | | | | | | |
| floater: | | | | | | |
| Series 2005-AR11 Class A1C1, 4.03% 8/25/45 (d) | | 14,112,684 | | | | 14,112,684 |
| Series 2005 AR6 Class 2A 1A, 4.06% 4/25/45 (d) | | 5,975,614 | | | | 5,955,102 |
| Series 2005-AR13 Class A1C1, 4.2275% 10/25/45 (d) | | 23,000,000 | | | | 23,000,000 |
Collateralized Mortgage Obligations continued
| | | | |
| | | Principal | | | | Value |
| | | Amount | | | | |
Private Sponsor continued
| | | | | | |
| Wells Fargo Mortgage Backed Securities Trust: | | | | | | |
| Series 2004-M Class A3, 4.6963% 8/25/34 (d) | | $19,880,000 | | $ | | 19,778,179 |
| Series 2005-AR12 Class 2A1, 4.3223% 7/25/35 (d) | | 29,218,529 | | | | 28,883,740 |
| |
| TOTAL PRIVATE SPONSOR | | | | | | 919,943,859 |
| U.S. Government Agency 6.4% | | | | | | |
| Fannie Mae: | | | | | | |
| floater: | | | | | | |
| Series 2000-38 Class F, 4.2394% 11/18/30 (d) | | 1,056,182 | | | | 1,064,379 |
| Series 2000-40 Class FA, 4.32% 7/25/30 (d) | | 2,281,210 | | | | 2,291,156 |
| Series 2002-89 Class F, 4.13% 1/25/33 (d) | | 3,350,148 | | | | 3,355,218 |
| target amortization class Series G94-2 Class D, 6.45% | | | | | | |
| 1/25/24 | | 4,411,824 | | | | 4,499,998 |
| Fannie Mae guaranteed REMIC pass thru certificates: | | | | | | |
| floater: | | | | | | |
| Series 2001-34 Class FR, 4.1894% 8/18/31 (d) | | 2,367,009 | | | | 2,374,326 |
| Series 2001-44 Class FB, 4.13% 9/25/31 (d) | | 2,114,017 | | | | 2,120,062 |
| Series 2001-46 Class F, 4.1894% 9/18/31 (d) | | 6,088,369 | | | | 6,121,939 |
| Series 2002-11 Class QF, 4.32% 3/25/32 (d) | | 4,222,858 | | | | 4,259,537 |
| Series 2002-36 Class FT, 4.33% 6/25/32 (d) | | 1,422,268 | | | | 1,434,270 |
| Series 2002-64 Class FE, 4.1394% 10/18/32 (d) | | 2,093,663 | | | | 2,103,206 |
| Series 2002-65 Class FA, 4.13% 10/25/17 (d) | | 2,302,618 | | | | 2,306,533 |
| Series 2002-74 Class FV, 4.28% 11/25/32 (d) | | 7,876,453 | | | | 7,931,623 |
| Series 2003-11: | | | | | | |
| Class DF, 4.28% 2/25/33 (d) | | 2,877,518 | | | | 2,897,926 |
| Class EF, 4.28% 2/25/33 (d) | | 2,080,685 | | | | 2,088,534 |
| Series 2003-119 Class FK, 4.33% 5/25/18 (d) | | 2,500,000 | | | | 2,523,405 |
| Series 2003-15 Class WF, 4.18% 8/25/17 (d) | | 5,404,393 | | | | 5,425,600 |
| Series 2003-63 Class F1, 4.13% 11/25/27 (d) | | 5,763,648 | | | | 5,767,740 |
| Series 2005-45 Class XA, 4.17% 6/25/35 (d) | | 74,298,346 | | | | 74,267,779 |
| planned amortization class: | | | | | | |
| Series 1998-63 Class PG, 6% 3/25/27 | | 800,852 | | | | 799,909 |
| Series 2001-62 Class PG, 6.5% 10/25/30 | | 2,944,838 | | | | 2,948,170 |
| Series 2001-76 Class UB, 5.5% 10/25/13 | | 590,038 | | | | 589,350 |
| Series 2002-16 Class QD, 5.5% 6/25/14 | | 272,009 | | | | 272,519 |
| Series 2002-28 Class PJ, 6.5% 3/25/31 | | 3,732,778 | | | | 3,734,286 |
| Series 2002-8 Class PD, 6.5% 7/25/30 | | 2,442,173 | | | | 2,447,766 |
| Series 2005-72 Class FG, 4.08% 5/25/35 (d) | | 51,234,540 | | | | 51,079,581 |
77 Annual Report
| Investments (Unaudited) continued | | | | | | |
| |
Collateralized Mortgage Obligations continued
| | | | |
| | | Principal | | | | Value |
| | | Amount | | | | |
U.S. Government Agency continued
| | | | | | |
| Freddie Mac: | | | | | | |
| floater: | | | | | | |
| Series 2510 Class FE, 4.1681% 10/15/32 (d) | | $ 5,715,277 | | $ | | 5,746,827 |
| 0% 9/15/35 (d) | | 854,545 | | | | 828,909 |
| planned amortization class: | | | | | | |
| Series 2091 Class PP, 6% 2/15/27 | | 261,467 | | | | 261,106 |
| Series 2353 Class PC, 6.5% 9/15/15 | | 967,841 | | | | 969,335 |
| Freddie Mac Manufactured Housing participation certificates | | | | | | |
| guaranteed floater Series 2338 Class FJ, 3.9681% | | | | | | |
| 7/15/31 (d) | | 4,919,686 | | | | 4,918,386 |
| Freddie Mac Multi-class participation certificates guaranteed: | | | | | | |
| floater: | | | | | | |
| Series 2395 Class FA, 4.3681% 6/15/29 (d) | | 1,092,096 | | | | 1,099,242 |
| Series 2406: | | | | | | |
| Class FP, 4.7481% 1/15/32 (d) | | 10,270,000 | | | | 10,491,773 |
| Class PF, 4.7481% 12/15/31 (d) | | 8,125,000 | | | | 8,332,235 |
| Series 2410 Class PF, 4.7481% 2/15/32 (d) | | 18,644,444 | | | | 19,060,741 |
| Series 2474 Class FJ, 4.1181% 7/15/17 (d) | | 4,331,267 | | | | 4,353,673 |
| Series 2526 Class FC, 4.1681% 11/15/32 (d) | | 3,152,494 | | | | 3,162,233 |
| Series 2538 Class FB, 4.1681% 12/15/32 (d) | | 6,277,777 | | | | 6,315,699 |
| Series 2551 Class FH, 4.2181% 1/15/33 (d) | | 2,959,949 | | | | 2,972,585 |
| Series 2861 Class JF, 4.0681% 4/15/17 (d) | | 6,852,338 | | | | 6,850,151 |
| Series 2994 Class FB, 3.9181% 6/15/20 (d) | | 6,647,098 | | | | 6,631,097 |
| planned amortization class: | | | | | | |
| Series 2136 Class PE, 6% 1/15/28 | | 10,378,825 | | | | 10,418,016 |
| Series 2394 Class ND, 6% 6/15/27 | | 587,334 | | | | 587,187 |
| Series 2395 Class PE, 6% 2/15/30 | | 4,447,447 | | | | 4,468,111 |
| Series 2398 Class DK, 6.5% 1/15/31 | | 236,820 | | | | 236,922 |
| Series 2410 Class ML, 6.5% 12/15/30 | | 1,069,946 | | | | 1,072,088 |
| Series 2420 Class BE, 6.5% 12/15/30 | | 961,583 | | | | 961,848 |
| Series 2443 Class TD, 6.5% 10/15/30 | | 1,793,679 | | | | 1,798,791 |
| Series 2461 Class PG, 6.5% 1/15/31 | | 2,027,839 | | | | 2,050,146 |
| Series 2650 Class FV, 4.1681% 12/15/32 (d) | | 14,042,153 | | | | 14,060,363 |
| Series 2776 Class UJ, 4.5% 5/15/20 (e) | | 6,660,101 | | | | 345,325 |
| Series 2828 Class JA, 4.5% 1/15/10 | | 10,955,858 | | | | 10,959,149 |
| Series 3013 Class AF, 4.0181% 5/15/35 (d) | | 80,739,897 | | | | 80,382,844 |
| sequential pay Series 2430 Class ZE, 6.5% 8/15/27 | | 328,637 | | | | 328,381 |
| Ginnie Mae guaranteed REMIC pass thru securities floater: | | | | | | |
| Series 2001-46 Class FB, 4.1219% 5/16/23 (d) | | 2,819,644 | | | | 2,831,835 |
| Series 2001-50 Class FV, 3.9719% 9/16/27 (d) | | 8,689,581 | | | | 8,689,113 |
Collateralized Mortgage Obligations continued
| | |
| | | Principal | | Value |
| | | Amount | | |
U.S. Government Agency continued
| | | | |
| Ginnie Mae guaranteed REMIC pass thru securities floater: – | | | | |
| continued | | | | |
| Series 2002-24 Class FX, 4.3219% 4/16/32 (d) | | $ 2,453,441 | | $ 2,475,244 |
| Series 2002-31 Class FW, 4.1719% 6/16/31 (d) | | 3,364,460 | | 3,383,514 |
| Series 2002-5 Class KF, 4.1719% 8/16/26 (d) | | 474,812 | | 475,074 |
| |
| TOTAL U.S. GOVERNMENT AGENCY | | | | 422,222,755 |
| |
| TOTAL COLLATERALIZED MORTGAGE OBLIGATIONS | | | | |
| (Cost $1,343,654,425) | | | | 1,342,166,614 |
| |
| Commercial Mortgage Securities 5.4% | | | | |
| |
| Banc of America Large Loan, Inc. floater: | | | | |
| Series 2003-BBA2 Class A3, 4.0881% 11/15/15 (a)(d) | | 5,038,226 | | 5,042,678 |
| Series 2005-BBA6: | | | | |
| Class B, 3.9781% 1/15/19 (a)(d) | | 2,800,000 | | 2,799,998 |
| Class C, 4.0181% 1/15/19 (a)(d) | | 2,857,948 | | 2,857,946 |
| Class D, 4.07% 1/15/19 (a)(d) | | 2,800,000 | | 2,799,998 |
| Class E, 4.1081% 1/15/19 (a)(d) | | 1,750,000 | | 1,749,998 |
| Class F, 4.1581% 1/15/19 (a)(d) | | 1,170,000 | | 1,169,999 |
| Class G, 4.1881% 1/15/19 (a)(d) | | 915,000 | | 915,000 |
| Series 2005-BOCA: | | | | |
| Class H, 4.7181% 12/15/16 (a)(d) | | 2,065,000 | | 2,062,371 |
| Class J, 4.8681% 12/15/16 (a)(d) | | 1,020,000 | | 1,018,703 |
| Class K, 5.1181% 12/15/16 (a)(d) | | 6,659,000 | | 6,652,116 |
| Bank of America Large Loan, Inc.: | | | | |
| floater Series 2005-ESHA: | | | | |
| Class F, 4.63% 7/14/08 (a)(b)(d) | | 6,395,000 | | 6,395,000 |
| Class G, 4.76% 7/14/08 (a)(b)(d) | | 4,355,000 | | 4,355,000 |
| Class H, 4.98% 7/14/08 (a)(b)(d) | | 5,365,000 | | 5,365,000 |
| Series 2005 ESHA Class X1, 0.696% 7/14/08 (a)(b)(d)(e) | | 334,645,000 | | 5,112,372 |
| Bayview Commercial Asset Trust floater: | | | | |
| Series 2003-1 Class A, 4.2213% 8/25/33 (a)(d) | | 6,317,900 | | 6,392,956 |
| Series 2003-2: | | | | |
| Class A, 4.41% 12/25/33 (a)(d) | | 13,127,372 | | 13,287,836 |
| Class M1, 4.68% 12/25/33 (a)(d) | | 2,136,269 | | 2,171,502 |
| Series 2004-1: | | | | |
| Class A, 4.19% 4/25/34 (a)(d) | | 6,224,975 | | 6,227,901 |
| Class B, 5.73% 4/25/34 (a)(d) | | 646,751 | | 654,153 |
| Class M1, 4.39% 4/25/34 (a)(d) | | 565,907 | | 568,383 |
| Class M2, 5.03% 4/25/34 (a)(d) | | 485,063 | | 490,747 |
| |
| |
| 79 | | | | Annual Report |
| Investments (Unaudited) continued | | | | | | | | |
| |
Commercial Mortgage Securities continued
| | | | | | | | |
| | | | | Principal | | | | Value |
| | | | | Amount | | | | |
| Bayview Commercial Asset Trust floater: – continued | | | | | | | | |
| Series 2004-2: | | | | | | | | |
| Class A, 4.26% 8/25/34 (a)(d) | | $ | | 6,109,217 | | $ | | 6,122,596 |
| Class M1, 4.41% 8/25/34 (a)(d) | | | | 1,969,875 | | | | 1,977,570 |
| Series 2004-3: | | | | | | | | |
| Class A1, 4.2% 1/25/35 (a)(d) | | | | 6,475,016 | | | | 6,482,074 |
| Class A2, 4.25% 1/25/35 (a)(d) | | | | 899,933 | | | | 903,103 |
| Class M1, 4.33% 1/25/35 (a)(d) | | | | 1,079,169 | | | | 1,080,629 |
| Class M2, 4.83% 1/25/35 (a)(d) | | | | 703,806 | | | | 707,992 |
| Series 2005-2A: | | | | | | | | |
| Class M1, 4.3% 8/25/35 (a)(d) | | | | 1,288,534 | | | | 1,288,534 |
| Class M2, 4.32% 8/25/35 (a)(d) | | | | 2,121,126 | | | | 2,121,126 |
| Class M3, 4.38% 8/25/35 (a)(d) | | | | 1,174,549 | | | | 1,174,549 |
| Class M4, 4.53% 8/25/35 (a)(d) | | | | 1,080,387 | | | | 1,080,387 |
| Bear Stearns Commercial Mortgage Securities, Inc. floater: | | | | | | | | |
| Series 2003 BA1A: | | | | | | | | |
| Class JFCM, 5.17% 4/14/15 (a)(d) | | | | 1,344,296 | | | | 1,347,949 |
| Class KFCM, 5.6% 4/14/15 (a)(d) | | | | 1,436,661 | | | | 1,440,773 |
| Class LFCM, 6% 4/14/15 (a)(d) | | | | 1,601,905 | | | | 1,601,896 |
| Class MFCM, 6.3% 4/14/15 (a)(d) | | | | 2,218,251 | | | | 2,218,238 |
| Series 2004-BBA3 Class E, 4.4681% 6/15/17 (a)(d) | | | | 10,415,000 | | | | 10,416,411 |
| Chase Commercial Mortgage Securities Corp. floater | | | | | | | | |
| Series 2000-FL1A: | | | | | | | | |
| Class B, 4.1781% 12/12/13 (a)(d) | | | | 896,672 | | | | 878,739 |
| Class C, 4.5281% 12/12/13 (a)(d) | | | | 1,793,345 | | | | 1,793,345 |
| COMM floater: | | | | | | | | |
| Series 2001-FL5A Class E, 5.2681% 11/15/13 (a)(d) | | | | 3,021,068 | | | | 3,020,103 |
| Series 2002-FL6: | | | | | | | | |
| Class F, 5.2181% 6/14/14 (a)(d) | | | | 11,163,000 | | | | 11,182,139 |
| Class G, 5.6681% 6/14/14 (a)(d) | | | | 5,000,000 | | | | 4,999,659 |
| Series 2003-FL9 Class B, 4.2681% 11/15/15 (a)(d) | | | | 8,579,991 | | | | 8,604,476 |
| Commercial Mortgage pass thru certificates floater: | | | | | | | | |
| Series 2004-CNL: | | | | | | | | |
| Class A2, 4.0681% 9/15/14 (a)(d) | | | | 3,570,000 | | | | 3,573,125 |
| Class G, 4.7481% 9/15/14 (a)(d) | | | | 1,345,000 | | | | 1,345,534 |
| Class H, 4.8481% 9/15/14 (a)(d) | | | | 1,430,000 | | | | 1,430,567 |
| Class J, 5.3681% 9/15/14 (a)(d) | | | | 490,000 | | | | 491,353 |
| Class K, 5.7681% 9/15/14 (a)(d) | | | | 770,000 | | | | 771,393 |
| Class L, 5.9681% 9/15/14 (a)(d) | | | | 625,000 | | | | 624,774 |
| Series 2004-HTL1: | | | | | | | | |
| Class B, 4.2181% 7/15/16 (a)(d) | | | | 426,802 | | | | 427,072 |
Commercial Mortgage Securities continued
| | | | | | | | |
| | | | | Principal | | | | Value |
| | | | | Amount | | | | |
| Commercial Mortgage pass thru certificates floater: - | | | | | | | | |
| continued | | | | | | | | |
| Series 2004-HTL1: | | | | | | | | |
| Class D, 4.3181% 7/15/16 (a)(d) | | $ | | 969,949 | | $ | | 970,109 |
| Class E, 4.5181% 7/15/16 (a)(d) | | | | 694,177 | | | | 694,425 |
| Class F, 4.5681% 7/15/16 (a)(d) | | | | 734,671 | | | | 735,088 |
| Class H, 5.0681% 7/15/16 (a)(d) | | | | 2,129,763 | | | | 2,130,459 |
| Class J, 5.2181% 7/15/16 (a)(d) | | | | 818,412 | | | | 818,679 |
| Class K, 6.1181% 7/15/16 (a)(d) | | | | 921,324 | | | | 921,038 |
| Commercial Mortgage pass thru Certificates floater Series | | | | | | | | |
| 2005-F10A: | | | | | | | | |
| Class B, 3.9981% 4/15/17 (a)(d) | | | | 7,080,000 | | | | 7,074,591 |
| Class C, 4.0381% 4/15/17 (a)(d) | | | | 3,006,000 | | | | 3,000,368 |
| Class D, 4.0781% 4/15/17 (a)(d) | | | | 2,440,000 | | | | 2,437,663 |
| Class E, 4.1381% 4/15/17 (a)(d) | | | | 1,821,000 | | | | 1,819,257 |
| Class F, 4.1781% 4/15/17 (a)(d) | | | | 1,035,000 | | | | 1,034,719 |
| Class G, 4.3181% 4/15/17 (a)(d) | | | | 1,035,000 | | | | 1,034,956 |
| Class H, 4.3881% 4/15/17 (a)(d) | | | | 1,035,000 | | | | 1,034,365 |
| Class I, 4.6181% 4/15/17 (a)(d) | | | | 335,000 | | | | 334,605 |
| Class MOA3, 4.0681% 3/15/20 (a)(d) | | | | 4,590,000 | | | | 4,589,812 |
| CS First Boston Mortgage Securities Corp.: | | | | | | | | |
| floater: | | | | | | | | |
| Series 2003-TF2A Class A2, 4.0881% 11/15/14 (a)(d) . | | | | 3,837,106 | | | | 3,838,834 |
| Series 2004-FL1 Class B, 4.2181% 5/15/14 (a)(d) | | | | 11,230,000 | | | | 11,246,403 |
| Series 2004-HC1: | | | | | | | | |
| Class A2, 4.2681% 12/15/21 (a)(d) | | | | 1,475,000 | | | | 1,474,997 |
| Class B, 4.5181% 12/15/21 (a)(d) | | | | 3,835,000 | | | | 3,834,992 |
| Series 2004-TF2A Class E, 4.1881% 11/15/19 (a)(d) | | | | 4,450,000 | | | | 4,456,359 |
| Series 2004-TFL1: | | | | | | | | |
| Class A2, 3.9581% 2/15/14 (a)(d) | | | | 7,005,000 | | | | 7,005,853 |
| Class E, 4.3181% 2/15/14 (a)(d) | | | | 2,800,000 | | | | 2,802,824 |
| Class F, 4.3681% 2/15/14 (a)(d) | | | | 2,325,000 | | | | 2,327,963 |
| Class G, 4.6181% 2/15/14 (a)(d) | | | | 1,875,000 | | | | 1,879,139 |
| Class H, 4.8681% 2/15/14 (a)(d) | | | | 1,400,000 | | | | 1,403,371 |
| Class J, 5.1681% 2/15/14 (a)(d) | | | | 750,000 | | | | 753,317 |
| Series 2005-TF2A Class F, 4.2681% 11/15/19 (a)(d) | | | | 1,540,000 | | | | 1,542,198 |
| Series 2005-TFLA: | | | | | | | | |
| Class C, 4.0081% 2/15/20 (a)(d) | | | | 5,650,000 | | | | 5,649,989 |
| Class E, 4.0981% 2/15/20 (a)(d) | | | | 3,955,000 | | | | 3,954,988 |
| Class F, 4.1481% 2/15/20 (a)(d) | | | | 1,745,000 | | | | 1,744,997 |
| Class G, 4.2881% 2/15/20 (a)(d) | | | | 505,000 | | | | 504,998 |
81 Annual Report
| Investments (Unaudited) continued | | | | | | | | |
| |
Commercial Mortgage Securities continued
| | | | | | | | |
| | | | | Principal | | | | Value |
| | | | | Amount | | | | |
| CS First Boston Mortgage Securities Corp.: – continued | | | | | | | | |
| Series 2005-TFLA: | | | | | | | | |
| Class H, 4.5181% 2/15/20 (a)(d) | | $ | | 715,000 | | $ | | 714,998 |
| sequential pay Series 1997-C2 Class A2, 6.52% 1/17/35 | | | | 235,680 | | | | 236,453 |
| GMAC Commercial Mortgage Securities, Inc. floater Series | | | | | | | | |
| 2001-FL1A Class E, 4.5781% 2/11/11 (a)(d) | | | | 152,562 | | | | 152,409 |
| GS Mortgage Securities Corp. II floater Series 2005-FL7A | | | | | | | | |
| Class A1, 3.84% 11/6/19 (a)(d) | | | | 10,128,306 | | | | 10,129,534 |
| Impac CMB Trust Series 2005-7 Class M4, 4.388% | | | | | | | | |
| 11/25/35 (d) | | | | 3,169,000 | | | | 3,169,000 |
| John Hancock Tower Mortgage Trust floater Series 2003-C5A | | | | | | | | |
| Class B, 6.2166% 4/10/15 (a)(d) | | | | 8,245,000 | | | | 8,245,000 |
| Lehman Brothers Floating Rate Commercial Mortgage Trust: | | | | | | | | |
| floater Series 2003-LLFA: | | | | | | | | |
| Class A2, 4.14% 12/16/14 (a)(d) | | | | 11,700,000 | | | | 11,705,144 |
| Class B, 4.35% 12/16/14 (a)(d) | | | | 4,615,000 | | | | 4,623,295 |
| Class C, 4.45% 12/16/14 (a)(d) | | | | 4,982,000 | | | | 4,993,212 |
| Series 2005-LLFA Class FAIR, 5.4181% 7/15/18 (a)(d) | | | | 4,360,000 | | | | 4,360,000 |
| Morgan Stanley Capital I, Inc. Series 2005-XLF: | | | | | | | | |
| Class B, 3.9781% 8/15/19 (a)(d) | | | | 6,705,000 | | | | 6,705,000 |
| Class C, 4.0081% 8/15/19 (a)(d) | | | | 525,000 | | | | 525,000 |
| Class D, 4.0281% 8/15/19 (a)(d) | | | | 1,915,000 | | | | 1,915,000 |
| Class E, 4.0481% 8/15/19 (a)(d) | | | | 1,745,000 | | | | 1,745,000 |
| Class F, 4.0881% 8/15/19 (a)(d) | | | | 1,220,000 | | | | 1,220,000 |
| Class G, 4.1381% 8/15/19 (a)(d) | | | | 870,000 | | | | 870,000 |
| Class H, 4.1581% 8/15/19 (a)(d) | | | | 695,000 | | | | 695,000 |
| Class J, 4.2281% 8/15/19 (a)(d) | | | | 525,000 | | | | 525,000 |
| Morgan Stanley Dean Witter Capital I Trust floater | | | | | | | | |
| Series 2002-XLF Class F, 5.8663% 8/5/14 (a)(d) | | | | 5,359,368 | | | | 5,359,351 |
| Salomon Brothers Mortgage Securities VII, Inc.: | | | | | | | | |
| floater Series 2001-CDCA: | | | | | | | | |
| Class C, 4.5681% 2/15/13 (a)(d) | | | | 4,711,321 | | | | 4,701,152 |
| Class D, 4.5681% 2/15/13 (a)(d) | | | | 4,000,000 | | | | 3,987,882 |
| Series 2000-NL1 Class E, 7.0607% 10/15/30 (a)(d) | | | | 3,188,867 | | | | 3,197,433 |
| SDG Macerich Properties LP floater Series 2000-1 Class A3, | | | | | | | | |
| 4.1081% 5/15/09 (a)(d) | | | | 18,000,000 | | | | 17,994,375 |
| STRIPS III Ltd./STRIPS III Corp. floater Series 2004-1A | | | | | | | | |
| Class A, 4.31% 3/24/18 (a)(d) | | | | 6,950,497 | | | | 6,950,497 |
| Wachovia Bank Commercial Mortgage Trust floater: | | | | | | | | |
| Series 2004-WHL3: | | | | | | | | |
| Class A2, 3.9481% 3/15/14 (a)(d) | | | | 3,510,000 | | | | 3,510,856 |
| Class E, 4.2681% 3/15/14 (a)(d) | | | | 2,190,000 | | | | 2,191,761 |
Commercial Mortgage Securities continued
| | | | |
| | | | | Principal | | Value |
| | | | | Amount | | |
| Wachovia Bank Commercial Mortgage Trust floater: - | | | | |
| continued | | | | | | |
| Series 2004-WHL3: | | | | | | |
| Class F, 4.3181% 3/15/14 (a)(d) | | $ | | 1,755,000 | | $ 1,756,359 |
| Class G, 4.5481% 3/15/14 (a)(d) | | | | 875,000 | | 875,871 |
| Series 2005-WL5A: | | | | | | |
| Class KHP1, 4.1181% 1/15/18 (a)(d) | | | | 1,745,000 | | 1,744,663 |
| Class KHP2, 4.3181% 1/15/18 (a)(d) | | | | 1,745,000 | | 1,747,772 |
| Class KHP3, 4.6181% 1/15/18 (a)(d) | | | | 2,060,000 | | 2,062,033 |
| Class KHP4, 4.7181% 1/15/18 (a)(d) | | | | 1,600,000 | | 1,602,203 |
| Class KHP5, 4.9181% 1/15/18 (a)(d) | | | | 1,855,000 | | 1,845,971 |
| TOTAL COMMERCIAL MORTGAGE SECURITIES | | | | |
| (Cost $361,655,067) | | | | | | 362,304,343 |
| |
| Certificates of Deposit 0.9% | | | | | | |
| |
| DEPFA BANK PLC yankee 4.265% 9/1/06 | | | | 30,000,000 | | 29,964,651 |
| Deutsche Bank AG yankee 4.21% 8/24/06 | | | | 30,000,000 | | 29,958,345 |
| TOTAL CERTIFICATES OF DEPOSIT | | | | | | |
| (Cost $60,000,000) | | | | | | 59,922,996 |
| |
| Commercial Paper 0.4% | | | | | | |
| |
| Fortune Brands, Inc. 3.79% 10/31/05 | | | | | | |
| (Cost $26,416,304) | | | | 26,500,000 | | 26,417,781 |
83 Annual Report
| Investments (Unaudited) continued | | | | | | |
| |
Cash Equivalents 36.3%
| | | | | | | | |
| | | | | Maturity | | | | Value |
| | | | | Amount | | | | |
| Investments in repurchase agreements (Collateralized by | | | | | | |
| U.S. Government Obligations, in a joint trading | | | | | | |
| account at 3.89%, dated 9/30/05 due 10/3/05) (g) . | | | | $2,120,321,927 | | $2,119,634,000 |
| Investments in repurchase agreements (Collateralized by | | | | | | |
| U.S. Treasury Obligations, in a joint trading account at | | | | | | |
| 3.27%, dated 9/30/05 due 10/3/05) (g) | | 6,298,716 | | | | 6,297,000 |
| With Goldman Sachs & Co. at 4.04%, dated 8/23/05 | | | | | | |
| due 11/21/05 (Collateralized by Mortgage Loan | | | | | | |
| Obligations valued at $304,500,001, 4.54%– 4.56%, | | | | | | |
| 9/25/35 - 9/25/35) (d)(f) | | | | 292,929,000 | | 289,962,793 |
| TOTAL CASH EQUIVALENTS | | | | | | | | |
| (Cost $2,415,931,000) | | | | 2,415,893,793 |
| |
| TOTAL INVESTMENT PORTFOLIO 101.0% | | | | | | |
| (Cost $6,720,022,154) | | | | 6,725,584,889 |
| |
| NET OTHER ASSETS – (1.0)% | | | | | | (65,032,717) |
| NET ASSETS 100% | | | | $ 6,660,552,172 |
| |
| |
| Futures Contracts | | | | | | | | |
| | | Expiration | | Underlying | | Unrealized |
| | | Date | | Face Amount | | Appreciation/ |
| | | | | at Value | | (Depreciation) |
| Sold | | | | | | | | |
| |
| Eurodollar Contracts | | | | | | | | |
| 73 Eurodollar 90 Day Index Contracts | | Dec. 2005 | | $72,199,738 | | $ | | 56,706 |
| 49 Eurodollar 90 Day Index Contracts | | March 2006 | | 48,442,625 | | | | 50,086 |
| 32 Eurodollar 90 Day Index Contracts | | June 2006 | | 31,631,600 | | | | 30,247 |
| 32 Eurodollar 90 Day Index Contracts | | Sept. 2006 | | 31,630,800 | | | | 28,072 |
| 31 Eurodollar 90 Day Index Contracts | | Dec. 2006 | | 30,642,725 | | | | 23,176 |
| 29 Eurodollar 90 Day Index Contracts | | March 2007 | | 28,668,313 | | | | 17,947 |
| 22 Eurodollar 90 Day Index Contracts | | June 2007 | | 21,748,925 | | | | 8,962 |
| 21 Eurodollar 90 Day Index Contracts | | Sept. 2007 | | 20,760,075 | | | | 7,941 |
| 20 Eurodollar 90 Day Index Contracts | | Dec. 2007 | | 19,770,250 | | | | 7,370 |
| 20 Eurodollar 90 Day Index Contracts | | March 2008 | | 19,770,000 | | | | 6,620 |
| 13 Eurodollar 90 Day Index Contracts | | June 2008 | | 12,850,013 | | | | 8,836 |
| 12 Eurodollar 90 Day Index Contracts | | Sept. 2008 | | 11,860,950 | | | | 8,052 |
| 5 Eurodollar 90 Day Index Contracts | | Dec. 2008 | | 4,941,625 | | | | 1,230 |
| 3 Eurodollar 90 Day Index Contracts | | March 2009 | | 2,964,900 | | | | 688 |
| TOTAL EURODOLLAR CONTRACTS | | | | | | $ | | 255,933 |
| |
| |
| |
| Annual Report | | 84 | | | | | | |
| Swap Agreements | | | | | | | | | | |
| |
| | | Expiration | | | | Notional | | | | Value |
| | | Date | | | | Amount | | | | |
| |
| Credit Default Swap | | | | | | | | | | |
| Receive from Citibank, upon default event | | | | | | | | | | |
| of DaimlerChrysler NA Holding Corp., | | | | | | | | | | |
| par value of the notional amount of | | | | | | | | | | |
| DaimlerChrysler NA Holding Corp. 6.5% | | | | | | | | | | |
| 11/15/13, and pay quarterly notional | | | | | | | | | | |
| amount multiplied by .8% | | June 2007 | | $ | | 14,000,000 | | $ | | (129,454) |
| Receive quarterly notional amount | | | | | | | | | | |
| multiplied by .48% and pay Goldman | | | | | | | | | | |
| Sachs upon default event of TXU Energy | | | | | | | | | | |
| Co. LLC, par value of the notional amount | | | | | | | | | | |
| of TXU Energy Co. LLC 7% 3/15/13 | | Sept. 2008 | | | | 13,540,000 | | | | (82,090) |
| Receive quarterly notional amount | | | | | | | | | | |
| multiplied by 1.12% and pay Morgan | | | | | | | | | | |
| Stanley, Inc. upon default of Comcast | | | | | | | | | | |
| Cable Communications, Inc., par value of | | | | | | | | | | |
| the notional amount of Comcast Cable | | | | | | | | | | |
| Communications, Inc. 6.75% 1/30/11 | | June 2006 | | | | 10,000,000 | | | | 75,975 |
| |
| TOTAL CREDIT DEFAULT SWAP | | | | $ | | 37,540,000 | | $ | | (135,569) |
| |
| Total Return Swap | | | | | | | | | | |
| Receive monthly notional amount multiplied | | | | | | | | | | |
| by the nominal spread appreciation of | | | | | | | | | | |
| the Lehman Brothers CMBS U.S. Aggre- | | | | | | | | | | |
| gate Index adjusted by a modified dura- | | | | | | | | | | |
| tion factor plus 10 basis points and pay | | | | | | | | | | |
| monthly notional amount multiplied by | | | | | | | | | | |
| the nominal spread depreciation of the | | | | | | | | | | |
| Lehman Brothers CMBS U.S. Aggregate | | | | | | | | | | |
| Index adjusted by a modified duration | | | | | | | | | | |
| factor with Lehman Brothers, Inc. | | Oct. 2005 | | | | 48,200,000 | | | | (43,480) |
| Receive monthly notional amount multiplied | | | | | | | | | | |
| by the nominal spread appreciation of the | | | | | | | | | | |
| Lehman Brothers CMBS U.S. Aggregate | | | | | | | | | | |
| Index adjusted by a modified duration fac | | | | | | | | | | |
| tor plus 30 basis points and pay monthly | | | | | | | | | | |
| notional amount multiplied by the nominal | | | | | | | | | | |
| spread depreciation of the Lehman Broth | | | | | | | | | | |
| ers CMBS U.S. Aggregate Index adjusted | | | | | | | | | | |
| by a modified duration factor with | | | | | | | | | | |
| Citibank | | April 2006 | | | | 67,500,000 | | | | (31,167) |
| |
| |
| |
| |
| | | 85 | | | | | | Annual Report |
| Investments (Unaudited) continued | | | | | | |
| |
Swap Agreements continued
| | | | | | | | |
| |
| | | Expiration | | Notional | | | | Value |
| | | Date | | Amount | | | | |
| |
| Total Return Swap continued | | | | | | | | |
| Receive monthly notional amount multiplied | | | | | | | | |
| by the nominal spread appreciation of the | | | | | | | | |
| Lehman Brothers CMBS U.S. Aggregate | | | | | | | | |
| Index adjusted by a modified duration fac | | | | | | | | |
| tor plus 15 basis points and pay monthly | | | | | | | | |
| notional amount multiplied by the nominal | | | | | | | | |
| spread depreciation of the Lehman Broth | | | | | | | | |
| ers CMBS U.S. Aggregate Index adjusted | | | | | | | | |
| by a modified duration factor with Citibank | | April 2006 | | $ 48,200,000 | | $ | | 0 |
| Receive monthly notional amount multiplied | | | | | | | | |
| by the nominal spread appreciation of | | | | | | | | |
| the Lehman Brothers CMBS U.S. Aggre- | | | | | | | | |
| gate Index adjusted by a modified dura- | | | | | | | | |
| tion factor plus 25 basis points and pay | | | | | | | | |
| monthly notional amount multiplied by | | | | | | | | |
| the nominal spread depreciation of the | | | | | | | | |
| Lehman Brothers CMBS U.S. Aggregate | | | | | | | | |
| Index adjusted by a modified duration | | | | | | | | |
| factor with Lehman Brothers, Inc. | | Dec. 2005 | | 30,000,000 | | | | (23,390) |
| Receive monthly notional amount multiplied | | | | | | | | |
| by the nominal spread appreciation of | | | | | | | | |
| the Lehman Brothers CMBS U.S. Aggre- | | | | | | | | |
| gate Index adjusted by a modified dura- | | | | | | | | |
| tion factor plus 22 basis points and pay | | | | | | | | |
| monthly notional amount multiplied by | | | | | | | | |
| the nominal spread depreciation of the | | | | | | | | |
| Lehman Brothers CMBS U.S. Aggregate | | | | | | | | |
| Index adjusted by a modified duration | | | | | | | | |
| factor with Lehman Brothers, Inc. | | Jan. 2006 | | 35,100,000 | | | | (27,970) |
| Receive monthly notional amount multiplied | | | | | | | | |
| by the nominal spread appreciation of | | | | | | | | |
| the Lehman Brothers CMBS U.S. Aggre- | | | | | | | | |
| gate Index adjusted by a modified dura- | | | | | | | | |
| tion factor plus 7.5 basis points and pay | | | | | | | | |
| monthly notional amount multiplied by | | | | | | | | |
| the nominal spread depreciation of the | | | | | | | | |
| Lehman Brothers CMBS U.S. Aggregate | | | | | | | | |
| Index adjusted by a modified duration | | | | | | | | |
| factor with Lehman Brothers, Inc. | | Nov. 2005 | | 35,100,000 | | | | (13,586) |
| Receive monthly a return equal to Lehman | | | | | | | | |
| Brothers ABS Floating Rate Index and | | | | | | | | |
| pay monthly a floating rate based on the | | | | | | | | |
| 1-month LIBOR minus 11.1 basis points | | | | | | | | |
| with Lehman Brothers, Inc. | | Nov. 2005 | | 30,000,000 | | | | 8,273 |
| |
| TOTAL TOTAL RETURN SWAP | | | | $ 294,100,000 | | $ | | (131,320) |
| |
| |
| | | | | $ 331,640,000 | | $ | | (266,889) |
| |
| |
| |
| |
| Annual Report | | 86 | | | | | | |
Legend
(a) Security exempt from registration under
Rule 144A of the Securities Act of 1933.
These securities may be resold in
transactions exempt from registration,
normally to qualified institutional buyers.
At the period end, the value of these
securities amounted to $605,971,272
or 9.1% of net assets.
(b) Security or a portion of the security
purchased on a delayed delivery or
when-issued basis.
(c) Security or a portion of the security was
pledged to cover margin requirements
for futures contracts. At the period end,
the value of securities pledged
amounted to $990,994.
(d) The coupon rate shown on floating or
adjustable rate securities represents the
rate at period end.
(e) Security represents right to receive
monthly interest payments on an
underlying pool of mortgages. Principal
shown is the par amount of the
mortgage pool.
(f) The maturity amount is based on the
rate at period end.
(g) Additional information on each
counterparty to the repurchase
agreement is as follows:
|
| Repurchase Agreement/ | | | | Value |
| Counterparty | | | | |
| $6,297,000 due | | | | |
| 10/3/05 at 3.27% | | | | |
| Banc of America | | | | |
| Securities LLC. | | $ | | 878,400 |
| Barclays Capital Inc. | | | | 2,037,889 |
| BNP Paribas Securities | | | | |
| Corp. | | | | 2,318,977 |
| State Street Bank and | | | | |
| Trust Company | | | | 1,061,734 |
| | | $ | | 6,297,000 |
| Repurchase Agreement/ | | Value |
| Counterparty | | |
| $2,119,634,000 due | | |
| 10/3/05 at 3.89% | | |
| Banc of America | | |
| Securities LLC. | | $ 406,558,229 |
| Bank of America, | | |
| National Association | | 138,994,266 |
| Barclays Capital Inc. | | 625,474,199 |
| Bear Stearns & Co. Inc. . | | 104,245,700 |
| Countrywide Securities | | |
| Corporation | | 138,994,266 |
| Goldman Sachs & Co. | | 382,234,233 |
| Morgan Stanley & Co. | | |
| Incorporated. | | 34,720,003 |
| UBS Securities LLC | | 288,413,104 |
| | | $ 2,119,634,000 |
Income Tax Information
At September 30, 2005, the fund had a capital loss carryforward of approximately $4,905,519 all of which will expire on September 30, 2011.
87 Annual Report
Investment Adviser
Fidelity Management & Research Company
Boston, MA
Investment Sub Advisers
FMR Co., Inc.
Fidelity Management & Research
(U.K.) Inc.
Fidelity Management & Research
(Far East) Inc.
Fidelity International Investment Advisors
Fidelity Investments Japan Limited
Fidelity International Investment Advisors (U.K.) Limited
Geode Capital Management, LLC
General Distributor
Fidelity Distributors Corporation
Boston, MA
Transfer and Service Agents
Fidelity Investments Institutional
Operations Company, Inc.
Boston, MA
Fidelity Service Company, Inc.
Boston, MA
Custodian
Mellon Bank, N.A.
Pittsburgh, PA
|
ARRS-UANN-1105
1.814972.100
|


| | Fidelity Advisor
Strategic Real Return
Fund - Institutional Class
|
| | Annual Report
September 30, 2005
|

Institutional Class is a class of Fidelity® Strategic Real Return Fund
| Contents | | | | |
| |
| Chairman’s Message | | 4 | | Ned Johnson’s message to shareholders. |
| Shareholder Expense | | 5 | | An example of shareholder expenses. |
| Example | | | | |
| Investment Summary | | 7 | | A summary of the fund’s investments. |
| Investments | | 8 | | A complete list of the fund’s investments |
| | | | | with their market values. |
| Financial Statements | | 13 | | Statements of assets and liabilities, |
| | | | | operations, and changes in net assets, |
| | | | | as well as financial highlights. |
| Notes | | 23 | | Notes to the financial statements. |
| Report of Independent | | 31 | | |
| Registered Public | | | | |
| Accounting Firm | | | | |
| Trustees and Officers | | 32 | | |
| Distributions | | 44 | | |
| Board Approval of | | 45 | | |
| Investment Advisory | | | | |
| Contracts and | | | | |
| Management Fees | | | | |
| Central Fund Investments | | 49 | | Complete list of investments for Fidelity’s |
| | | | | fixed-income central funds. |
To view a fund’s proxy voting guidelines and proxy voting record for the 12 month period ended
June 30, visit www.fidelity.com/proxyvotingresults or visit the Securities and Exchange Commis
sion’s (SEC) web site at www.sec.gov. You may also call 1-877-208-0098 to request a free copy of
the proxy voting guidelines.
Standard & Poor’s, S&P and S&P 500 are registered service marks of The McGraw Hill Companies,
Inc. and have been licensed for use by Fidelity Distributors Corporation.
Other third party marks appearing herein are the property of their respective owners.
All other marks appearing herein are registered or unregistered trademarks or service marks
of FMR Corp. or an affiliated company.
|
This report and the financial statements contained herein are submitted for the general information
of the shareholders of the fund. This report is not authorized for distribution to prospective investors
in the fund unless preceded or accompanied by an effective prospectus.
A fund files its complete schedule of portfolio holdings with the SEC for the first and third
quarters of each fiscal year on Form N Q. Forms N Q are available on the SEC’s web site at
http://www.sec.gov. A fund’s Forms N Q may be reviewed and copied at the SEC’s Public Reference
Room in Washington, DC. Information regarding the operation of the SEC’s Public Reference
Room may be obtained by calling 1-800-SEC-0330. For a complete list of a fund’s portfolio hold
ings, view the most recent quarterly holdings report, semiannual report, or annual report on
Fidelity’s web site at http://www.advisor.fidelity.com.
NOT FDIC INSURED · MAY LOSE VALUE · NO BANK GUARANTEE
Neither the fund nor Fidelity Distributors Corporation is a bank.
|
3 Annual Report
Chairman’s Message
(photograph of Edward C. Johnson 3d)
Dear Shareholder:
During the past year or so, much has been reported about the mutual fund industry, and much of it has been more critical than I believe is warranted. Allegations that some companies have been less than forthright with their shareholders have cast a shadow on the entire industry. I continue to find these reports disturbing, and assert that they do not create an accurate picture of the industry overall. Therefore, I would like to remind every one where Fidelity stands on these issues. I will say two things specifically regarding allegations that some mutual fund companies were in violation of the Securities and Exchange Commission’s forward pricing rules or were involved in so called “market timing” activities.
First, Fidelity has no agreements that per mit customers who buy fund shares after 4 p.m. to obtain the 4 p.m. price. This is not a new policy. This is not to say that some one could not deceive the company through fraudulent acts. However, we are extremely diligent in preventing fraud from occurring in this manner and in every other. But I underscore again that Fidelity has no so called “agreements” that sanction illegal practices.
Second, Fidelity continues to stand on record, as we have for years, in opposition to predatory short term trading that adversely affects shareholders in a mutual fund. Back in the 1980s, we initiated a fee which is returned to the fund and, therefore, to investors to discourage this activity. Further, we took the lead several years ago in developing a Fair Value Pricing Policy to prevent market timing on foreign securities in our funds. I am confident we will find other ways to make it more difficult for predatory traders to operate. However, this will only be achieved through close cooperation among regula tors, legislators and the industry.
Yes, there have been unfortunate instances of unethical and illegal activity within the mutual fund industry from time to time. That is true of any industry. When this occurs, confessed or convicted offenders should be dealt with appropriately. But we are still concerned about the risk of over regulation and the quick application of simplistic solutions to intricate problems. Every system can be improved, and we support and applaud well thought out improvements by regulators, legislators and industry representatives that achieve the common goal of building and protecting the value of investors’ holdings.
For nearly 60 years, Fidelity has worked very hard to improve its products and service to justify your trust. When our family founded this company in 1946, we had only a few hundred customers. Today, we serve more than 18 million customers including individual investors and participants in retirement plans across America.
Let me close by saying that we do not take your trust in us for granted, and we real ize that we must always work to improve all aspects of our service to you. In turn, we urge you to continue your active participation with your financial matters, so that your interests can be well served.
Best regards,
/s/ Edward C. Johnson 3d
Edward C. Johnson 3d
Annual Report 4
Shareholder Expense Example
As a shareholder of the Fund, you incur two types of costs: (1) transaction costs, including sales charges (loads) on purchase payments or redemption proceeds, redemption fees, and (2) ongoing costs, including management fees, distribution and/or service (12b 1) fees and other Fund expenses. This Example is intended to help you understand your ongoing costs (in dollars) of investing in the Fund and to compare these costs with the ongoing costs of investing in other mutual funds.
The Example is based on an investment of $1,000 invested at the beginning of the period and held for the entire period (September 7, 2005 to September 30, 2005). The hypo thetical expense example is based on an investment of $1,000 invested for the one half year period (April 1, 2005 to September 30, 2005).
The first line of the table below for each class of the Fund provides information about actual account values and actual expenses. You may use the information in this line, together with the amount you invested, to estimate the expenses that you paid over the period. Simply divide your account value by $1,000.00 (for example, an $8,600 account value divided by $1,000.00 = 8.6), then multiply the result by the number in the first line for a class of the Fund under the heading entitled “Expenses Paid During Period” to estimate the expenses you paid on your account during this period. In addition, the fund, as a shareholder in underlying affiliated central funds, will indirectly bear its pro rata share of the fees and expenses incurred by the underlying affiliated central funds. These fees and expenses are not included in the fund’s annualized expense ratio used to calculate the expense estimate in the table below.
Hypothetical Example for Comparison Purposes
The second line of the table below for each class of the Fund provides information about hypothetical account values and hypothetical expenses based on a Class’ actual expense ratio and an assumed rate of return of 5% per year before expenses, which is not the Class’ actual return. The hypothetical account values and expenses may not be used to estimate the actual ending account balance or expenses you paid for the period. You may use this information to compare the ongoing costs of investing in the Fund and other funds. To do so, compare this 5% hypothetical example with the 5% hypothetical examples that appear in the shareholder reports of the other funds. In addition, the fund, as a shareholder in underlying affiliated central funds, will indirectly bear its pro rata share of the fees and expenses incurred by the underlying affiliated central funds. These fees and expenses are not included in the fund’s annualized expense ratio used to calculate the expense estimate in the table below.
Please note that the expenses shown in the table are meant to highlight your ongoing costs only and do not reflect any transaction costs. Therefore, the second line of the table is useful in comparing ongoing costs only, and will not help you determine the relative total costs of owning different funds. In addition, if these transactional costs were included, your costs would have been higher.
5 Annual Report
| Shareholder Expense Example continued | | | | |
| |
| |
| | | | | | | Ending | | | | |
| | | | | Beginning | | Account Value | | | | Expenses Paid |
| | | | | Account Value | | September 30, 2005 | | | | During Period |
| Class A | | | | | | | | | | | | |
| Actual | | $ | | 1,000.00 | | $ | | 1,015.00 | | $ | | .66B |
| HypotheticalA | | $ | | 1,000.00 | | $ | | 1,020.05 | | $ | | 5.06C |
| Class T | | | | | | | | | | | | |
| Actual | | $ | | 1,000.00 | | $ | | 1,015.00 | | $ | | .73B |
| HypotheticalA | | $ | | 1,000.00 | | $ | | 1,019.55 | | $ | | 5.57C |
| Class B | | | | | | | | | | | | |
| Actual | | $ | | 1,000.00 | | $ | | 1,014.00 | | $ | | 1.16B |
| HypotheticalA | | $ | | 1,000.00 | | $ | | 1,016.29 | | $ | | 8.85C |
| Class C | | | | | | | | | | | | |
| Actual | | $ | | 1,000.00 | | $ | | 1,014.00 | | $ | | 1.22B |
| HypotheticalA | | $ | | 1,000.00 | | $ | | 1,015.79 | | $ | | 9.35C |
| Strategic Real Return | | | | | | | | | | | | |
| Actual | | $ | | 1,000.00 | | $ | | 1,015.00 | | $ | | .56B |
| HypotheticalA | | $ | | 1,000.00 | | $ | | 1,020.81 | | $ | | 4.31C |
| Institutional Class | | | | | | | | | | | | |
| Actual | | $ | | 1,000.00 | | $ | | 1,015.00 | | $ | | .56B |
| HypotheticalA | | $ | | 1,000.00 | | $ | | 1,020.81 | | $ | | 4.31C |
| | A 5% return per year before expenses
B Actual expenses are equal to each Class’ annualized expense ratio (shown in the
table below); multiplied by the average account value over the period, multiplied by
24/365 (to reflect the period September 7, 2005 to September 30, 2005). The fees and
expenses of the underlying affiliated central funds in which the fund invests are not
included in the fund’s annualized expense ratio.
C Hypothetical expenses are equal to each Class’ annualized expense ratio (shown
in the table below); multiplied by the average account value over the period, multi-
plied by 183/365 (to reflect the one-half year period). The fees and expenses of the
underlying affiliated central funds in which the fund invests are not included in the
fund’s annualized expense ratio.
|
| | | Annualized |
| | | Expense Ratio |
| Class A | | 1.00% |
| Class T | | 1.10% |
| Class B | | 1.75% |
| Class C | | 1.85% |
| Strategic Real Return | | 85% |
| Institutional Class | | 85% |
Annual Report 6
Investment Summary
| Holdings Distribution as of September 30, 2005 | | |
| | | % of Fund’s |
| | | Net Assets |
| Inflation Protected Investments | | 27.9% |
| Floating Rate High Yield | | 19.7% |
| Commodity-Linked Notes and Related Investments* | | 27.1% |
| Real Estate Investments | | 17.0% |
| Cash & Cash Equivalents | | 7.9% |
* Includes Fidelity Ultra Short Central Fund held in connection with commodity linked notes and related investments. Investments in commodity linked notes provide indirect exposure to futures contracts on physical commodities via the Dow Jones AIG Commodity Index, the majority of which trade on U.S. exchanges. The value of commodity linked notes will change directly based on the performance of the index.
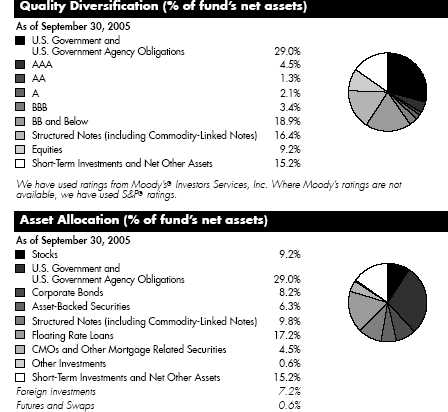
The information in the above tables is based on the combined investments of the fund and its pro rata share of the investments of Fidelity’s fixed income central funds.
7 Annual Report
| Investments September 30, 2005 | | |
Showing Percentage of Net Assets
| | | | | | |
| Corporate Bonds 6.0% | | | | | | |
| | | | | Principal | | Value |
| | | | | Amount | | (Note 1) |
| Convertible Bonds 0.7% | | | | | | |
| |
| FINANCIALS – 0.7% | | | | | | |
| Real Estate 0.7% | | | | | | |
| Affordable Resources Communities LP 7.5% 8/15/25 (b) | | $ 250,000 | | $ 249,875 |
| Nonconvertible Bonds – 5.3% | | | | | | |
| |
| CONSUMER DISCRETIONARY – 1.4% | | | | | | |
| Hotels, Restaurants & Leisure 0.8% | | | | | | |
| Host Marriott LP 7% 8/15/12 | | | | 300,000 | | 303,750 |
| Household Durables – 0.6% | | | | | | |
| Stanley Martin Communities LLC 9.75% 8/15/15 (b) | | 250,000 | | 246,875 |
| |
| TOTAL CONSUMER DISCRETIONARY | | | | | | 550,625 |
| |
| FINANCIALS – 3.9% | | | | | | |
| Real Estate 3.9% | | | | | | |
| Camden Property Trust 7% 11/15/06 | | | | 200,000 | | 204,735 |
| Colonial Properties Trust 7% 7/14/07 | | | | 250,000 | | 258,489 |
| MeriStar Hospitality Corp. 9% 1/15/08 | | | | 300,000 | | 312,375 |
| Thornburg Mortgage, Inc. 8% 5/15/13 | | | | 250,000 | | 247,500 |
| Trustreet Properties, Inc. 7.5% 4/1/15 (b) | | | | 200,000 | | 204,500 |
| Ventas Realty LP/Ventas Capital Corp. 8.75% 5/1/09 | | 250,000 | | 273,125 |
| | | | | | | 1,500,724 |
| |
| TOTAL NONCONVERTIBLE BONDS | | | | | | 2,051,349 |
| |
| TOTAL CORPORATE BONDS | | | | | | |
| (Cost $2,330,141) | | | | | | 2,301,224 |
| |
| U.S. Treasury Inflation Protected Obligations 27.9% | | |
| |
| U.S. Treasury Inflation-Indexed Bonds 2.375% 1/15/25 | | 2,974,640 | | 3,182,400 |
| U.S. Treasury Inflation-Indexed Notes: | | | | | | |
| 0.875% 4/15/10 | | | | 1,175,648 | | 1,145,614 |
| 1.625% 1/15/15 | | | | 1,145,950 | | 1,132,342 |
| 1.875% 7/15/13 | | | | 616,963 | | 625,254 |
| 2% 1/15/14 | | | | 1,141,927 | | 1,165,702 |
| 3% 7/15/12 | | | | 397,696 | | 432,774 |
| 3.375% 1/15/07 | | | | 197,299 | | 204,043 |
| 3.375% 1/15/12 | | | | 968,246 | | 1,072,257 |
| |
| |
| See accompanying notes which are an integral part of the financial statements. | | |
| |
| Annual Report | | 8 | | | | |
U.S. Treasury Inflation Protected Obligations continued
| | |
| | | Principal | | Value |
| | | Amount | | (Note 1) |
| U.S. Treasury Inflation-Indexed Notes: – continued | | | | |
| 3.625% 1/15/08 | | $ 816,284 | | $ 864,050 |
| 3.875% 1/15/09 | | 869,634 | | 943,418 |
| TOTAL U.S. TREASURY INFLATION PROTECTED OBLIGATIONS | | |
| (Cost $10,809,535) | | | | 10,767,854 |
| |
| Asset Backed Securities 0.6% | | | | |
| |
| Taberna Preferred Funding III Ltd. Series 2005-3A Class | | | | |
| D, 6.52% 2/5/36 (b)(c) | | | | |
| (Cost $250,000) | | 250,000 | | 250,000 |
| |
| Collateralized Mortgage Obligations 0.4% | | | | |
| |
| Private Sponsor 0.4% | | | | |
| Resix Finance Ltd. Series 2005-C Class B7, 6.79% | | | | |
| 9/10/37 (b)(c) | | | | |
| (Cost $150,010) | | 150,000 | | 150,000 |
| |
| Commercial Mortgage Securities 0.8% | | | | |
| |
| Bank of America Large Loan, Inc. floater Series | | | | |
| 2005-ESHA Class K, 5.68% 7/14/08 (b)(c) | | | | |
| (Cost $300,000) | | 300,000 | | 300,000 |
| |
| Common Stocks 2.7% | | | | |
| | | Shares | | |
| |
| CONSUMER DISCRETIONARY – 0.1% | | | | |
| Hotels, Restaurants & Leisure 0.1% | | | | |
| Starwood Hotels & Resorts Worldwide, Inc. unit | | 1,000 | | 57,170 |
| |
| FINANCIALS – 2.4% | | | | |
| Real Estate 2.4% | | | | |
| Annaly Mortgage Management, Inc. | | 1,500 | | 19,425 |
| Anworth Mortgage Asset Corp. | | 10,000 | | 82,700 |
| Equity Residential (SBI) | | 2,500 | | 94,625 |
| General Growth Properties, Inc. | | 2,500 | | 112,325 |
| Host Marriott Corp. | | 7,500 | | 126,750 |
| Inland Real Estate Corp. | | 2,000 | | 31,320 |
| LTC Properties, Inc. | | 5,000 | | 106,000 |
| MortgageIT Holdings, Inc. | | 1,500 | | 21,330 |
| ProLogis Trust | | 3,500 | | 155,085 |
See accompanying notes which are an integral part of the financial statements.
| Investments continued | | | | | | | | |
| |
Common Stocks continued
| | | | | | | | |
| | | | | Shares | | | | Value |
| | | | | | | | | (Note 1) |
| |
| FINANCIALS – continued | | | | | | | | |
| Real Estate continued | | | | | | | | |
| Saxon Capital, Inc. | | | | 2,000 | | $ | | 23,700 |
| Spirit Finance Corp. | | | | 4,000 | | | | 45,000 |
| Trizec Properties, Inc. | | | | 2,000 | | | | 46,120 |
| Ventas, Inc. | | | | 1,500 | | | | 48,300 |
| | | | | | | | | 912,680 |
| |
| HEALTH CARE – 0.2% | | | | | | | | |
| Health Care Providers & Services – 0.2% | | | | | | | | |
| Capital Senior Living Corp. (a) | | | | 8,000 | | | | 66,800 |
| TOTAL COMMON STOCKS | | | | | | | | |
| (Cost $1,030,706) | | | | | | | | 1,036,650 |
| |
| Preferred Stocks 6.5% | | | | | | | | |
| |
| Convertible Preferred Stocks 0.7% | | | | | | | | |
| |
| FINANCIALS – 0.7% | | | | | | | | |
| Real Estate 0.7% | | | | | | | | |
| Windrose Medical Properties Trust 7.50% | | | | 9,000 | | | | 245,250 |
| Nonconvertible Preferred Stocks 5.8% | | | | | | | | |
| |
| FINANCIALS – 5.8% | | | | | | | | |
| Real Estate 5.8% | | | | | | | | |
| Accredited Mortgage Loan Trust Series A, 9.75% | | | | 6,000 | | | | 153,900 |
| American Home Mortgage Investment Corp. Series B, 9.25% | | . | | 2,200 | | | | 57,200 |
| Annaly Mortgage Management, Inc. Series A, 7.875% | | | | 2,000 | | | | 49,100 |
| Anworth Mortgage Asset Corp. Series A, 8.625% | | | | 4,100 | | | | 101,926 |
| Capital Automotive (REIT) 6.75% | | | | 12,300 | | | | 301,842 |
| Host Marriott Corp. Class C, 10.00% | | | | 5,000 | | | | 127,200 |
| Impac Mortgage Holdings, Inc. Series C, 9.125% | | | | 5,000 | | | | 122,450 |
| LaSalle Hotel Properties Series A, 10.25% | | | | 5,000 | | | | 133,000 |
| MFA Mortgage Investments, Inc. Series A, 8.50% | | | | 18,100 | | | | 447,975 |
| Newcastle Investment Corp. Series B, 9.75% | | | | 12,000 | | | | 318,600 |
| Prime Group Realty Trust Series B, 9.00% | | | | 1,800 | | | | 41,400 |
| PS Business Parks, Inc. Series D, 9.50% | | | | 7,000 | | | | 179,200 |
| The Mills Corp. Series B, 9.00% | | | | 8,000 | | | | 209,200 |
| | | | | | | | | 2,242,993 |
| |
| TOTAL PREFERRED STOCKS | | | | | | | | |
| (Cost $2,498,047) | | | | | | | | 2,488,243 |
See accompanying notes which are an integral part of the financial statements.
Commodity Linked Notes 9.8%
| | | | |
| | | Principal | | Value |
| | | Amount | | (Note 1) |
| |
| AIG-FP Private Funding Ltd. Master Note, one-month | | | | |
| U.S. dollar LIBOR minus .10% due 8/18/2006 | | | | |
| (indexed to the Dow Jones-AIG Commodity Index Total | | | | |
| Return, multiplied by 3) (e) | | $ 190,000 | | $ 232,380 |
| AIG-FP Private Funding Ltd. Master Note, one-month | | | | |
| U.S. dollar LIBOR minus .10% due 8/18/2006 | | | | |
| (indexed to the Dow Jones-AIG Commodity Index Total | | | | |
| Return, multiplied by 3) (e) | | 200,000 | | 214,236 |
| AIG-FP Private Funding Ltd. Master Note, one-month | | | | |
| U.S. dollar LIBOR minus .10% due 8/18/2006 | | | | |
| (indexed to the Dow Jones-AIG Commodity Index Total | | | | |
| Return, multiplied by 3) (e) | | 110,000 | | 118,418 |
| AIG-FP Private Funding Ltd. Master Note, one-month | | | | |
| U.S. LIBOR minus .10% due 8/18/2006 (indexed to | | | | |
| the Dow Jones-AIG Commodity Index Total Return, | | | | |
| multiplied by 3) (e) | | 330,000 | | 329,112 |
| AIG-FP Private Funding Ltd. Master Note, three-month | | | | |
| U.S. dollar LIBOR minus .10% due 8/10/2006 | | | | |
| (indexed to the Dow Jones-AIG Commodity Index Total | | | | |
| Return, multiplied by 3) (e) | | 600,000 | | 702,126 |
| JPMorgan Chase Bank, NA Medium Term Note, one- | | | | |
| month U.S. dollar LIBOR minus .18% due 8/10/2006 | | | | |
| (indexed to the Dow Jones-AIG Commodity Index Total | | | | |
| Return, multiplied by 3) (b)(e) | | 470,000 | | 550,012 |
| JPMorgan Chase Bank, NA Medium Term Note, one- | | | | |
| month U.S. dollar LIBOR minus .18% due 8/18/2006 | | | | |
| (indexed to the Dow Jones-AIG Commodity Index Total | | | | |
| Return, multiplied by 3) (b)(e) | | 280,000 | | 332,841 |
| JPMorgan Chase Bank, NA Medium Term Note, one- | | | | |
| month U.S. dollar LIBOR minus .18% due 8/18/2006 | | | | |
| (indexed to the Dow Jones-AIG Commodity Index Total | | | | |
| Return, multiplied by 3) (b)(e) | | 380,000 | | 422,773 |
| Societe Generale Floating Rate Note, one-month U.S. | | | | |
| dollar LIBOR minus .10% due 8/10/2006 (indexed to | | | | |
| the Dow Jones-AIG Commodity Index Total Return, | | | | |
| multiplied by 3) (b)(e) | | 600,000 | | 702,060 |
| Societe Generale Floating Rate Note, one-month U.S. | | | | |
| dollar LIBOR minus .10% due 8/10/2006 (indexed to | | | | |
| the Dow Jones-AIG Commodity Index Total Return, | | | | |
| multiplied by 3) (b)(e) | | 160,000 | | 175,472 |
| |
| TOTAL COMMODITY LINKED NOTES | | | | |
| (Cost $3,320,000) | | | | 3,779,430 |
| |
| |
| |
| |
| See accompanying notes which are an integral part of the financial statements. | | |
| |
| 11 | | | | Annual Report |
| Investments continued | | | | | | |
| |
Fixed Income Funds 37.0%
| | | | | | |
| | | Shares | | | | Value |
| | | | | | | (Note 1) |
| Fidelity Floating Rate Central Investment Portfolio (d) | | 75,526 | | | | $ 7,598,671 |
| Fidelity Ultra-Short Central Fund (d) | | 66,782 | | | | 6,644,141 |
| TOTAL FIXED INCOME FUNDS | | | | | | |
| (Cost $14,242,632) | | | | | | 14,242,812 |
| Cash Equivalents 7.9% | | | | | | |
| | | Maturity | | | | |
| | | Amount | | | | |
| Investments in repurchase agreements (Collateralized by U.S. | | | | | | |
| Treasury Obligations, in a joint trading account at 3.16%, | | | | | | |
| dated 9/30/05 due 10/3/05) | | | | | | |
| (Cost $3,041,000) | | $ 3,041,800 | | | | 3,041,000 |
| |
| TOTAL INVESTMENT PORTFOLIO 99.6% | | | | | | |
| (Cost $37,972,071) | | | | | | 38,357,213 |
| |
| NET OTHER ASSETS – 0.4% | | | | | | 167,290 |
| NET ASSETS 100% | | | | $ | | 38,524,503 |
(a) Non-income producing
(b) Security exempt from registration under
Rule 144A of the Securities Act of 1933.
These securities may be resold in
transactions exempt from registration,
normally to qualified institutional buyers.
At the period end, the value of these
securities amounted to $3,584,408 or
9.3% of net assets.
(c) The coupon rate shown on floating or
adjustable rate securities represents the
rate at period end.
(d) Affiliated fund that is available only to
investment companies and other accounts
managed by Fidelity Investments. A
complete unaudited listing of the
fixed income central funds’ holdings is
provided at the end of this report.
|
(e) Security is linked to the Dow Jones-AIG
Commodity Index Total Return. Securities
do not guarantee any return of principal
at maturity, but instead will pay at
maturity or upon exchange an amount
based on the closing value of the Dow
Jones-AIG Commodity Index Total
Return. Although these instruments are
primarily debt obligations, they provide
exposure indirectly to changes in the
value of the underlying commodities.
Holders of the security have the right to
exchange these notes daily.
|
See accompanying notes which are an integral part of the financial statements.
| Financial Statements | | | | | | | | |
| |
| |
| Statement of Assets and Liabilities | | | | | | | | |
| | | | | | | September 30, 2005 |
| |
| Assets | | | | | | | | |
| Investment in securities, at value (including repurchase | | | | | | | | |
| agreements of $3,041,000) (cost $37,972,071) | | | | | | | | |
| See accompanying schedule | | | | | | $ | | 38,357,213 |
| Cash | | | | | | | | 51 |
| Receivable for fund shares sold | | | | | | | | 1,418,768 |
| Dividends receivable | | | | | | | | 18,607 |
| Interest receivable | | | | | | | | 138,626 |
| Receivable from investment adviser for expense | | | | | | | | |
| reductions | | | | | | | | 71,385 |
| Total assets | | | | | | | | 40,004,650 |
| |
| Liabilities | | | | | | | | |
| Payable for investments purchased | | $ | | 1,384,611 | | | | |
| Payable for fund shares redeemed | | | | 2,238 | | | | |
| Accrued management fee | | | | 11,016 | | | | |
| Distribution fees payable | | | | 5,303 | | | | |
| Other affiliated payables | | | | 4,042 | | | | |
| Other payables and accrued expenses | | | | 72,937 | | | | |
| Total liabilities | | | | | | | | 1,480,147 |
| |
| Net Assets | | | | | | $ | | 38,524,503 |
| Net Assets consist of: | | | | | | | | |
| Paid in capital | | | | | | $ | | 38,055,879 |
| Undistributed net investment income | | | | | | | | 78,944 |
| Accumulated undistributed net realized gain (loss) on | | | | | | | | |
| investments | | | | | | | | 4,538 |
| Net unrealized appreciation (depreciation) on | | | | | | | | |
| investments | | | | | | | | 385,142 |
| Net Assets | | | | | | $ | | 38,524,503 |
See accompanying notes which are an integral part of the financial statements.
13 Annual Report
| Financial Statements continued | | | | |
| |
| |
| Statement of Assets and Liabilities continued | | | | |
| | | September 30, 2005 |
| |
| Calculation of Maximum Offering Price | | | | |
| Class A: | | | | |
| Net Asset Value and redemption price per share | | | | |
| ($3,405,325 ÷ 335,576 shares) | | $ | | 10.15 |
| Maximum offering price per share (100/95.25 of $10.15) | | $ | | 10.66 |
| Class T: | | | | |
| Net Asset Value and redemption price per share | | | | |
| ($3,284,482 ÷ 323,690 shares) | | $ | | 10.15 |
| Maximum offering price per share (100/96.50 of $10.15) | | $ | | 10.52 |
| Class B: | | | | |
| Net Asset Value and offering price per share | | | | |
| ($3,253,180 ÷ 320,754 shares)A | | $ | | 10.14 |
| Class C: | | | | |
| Net Asset Value and offering price per share | | | | |
| ($3,467,220 ÷ 341,879 shares)A | | $ | | 10.14 |
| Strategic Real Return: | | | | |
| Net Asset Value, offering price and redemption price per | | | | |
| share ($21,866,671 ÷ 2,153,944 shares) | | $ | | 10.15 |
| Institutional Class: | | | | |
| Net Asset Value, offering price and redemption price per | | | | |
| share ($3,247,625 ÷ 320,001 shares) | | $ | | 10.15 |
| A Redemption price per share is equal to net asset value less any applicable contingent deferred sales charge. | | | | |
See accompanying notes which are an integral part of the financial statements.
Annual Report 14
| Statement of Operations | | | | | | |
| For the period September 7, 2005 (commencement of operations) to September 30, 2005 |
| |
| Investment Income | | | | | | |
| Dividends | | | | $ | | 16,197 |
| Interest | | | | | | 87,139 |
| Total income | | | | | | 103,336 |
| |
| Expenses | | | | | | |
| Management fee | | $ | | 11,016 | | |
| Transfer agent fees | | | | 3,044 | | |
| Distribution fees | | | | 5,304 | | |
| Accounting fees and expenses | | | | 1,005 | | |
| Custodian fees and expenses | | | | 1,200 | | |
| Registration fees | | | | 10,236 | | |
| Audit | | | | 61,500 | | |
| Total expenses before reductions | | | | 93,305 | | |
| Expense reductions | | | | (71,385) | | 21,920 |
| |
| Net investment income | | | | | | 81,416 |
| Realized and Unrealized Gain (Loss) | | | | | | |
| Net realized gain (loss) on investment securities | | | | | | 2,066 |
| Change in net unrealized appreciation (depreciation) on | | | | |
| investment securities | | | | | | 385,142 |
| Net gain (loss) | | | | | | 387,208 |
| Net increase (decrease) in net assets resulting from | | | | | | |
| operations | | | | $ | | 468,624 |
See accompanying notes which are an integral part of the financial statements.
15 Annual Report
| Financial Statements continued | | | | |
| |
| Statement of Changes in Net Assets | | | | |
| | | For the period |
| | | September 7, 2005 |
| | | (commencement of |
| | | operations) to |
| | | September 30, 2005 |
| Increase (Decrease) in Net Assets | | | | |
| Operations | | | | |
| Net investment income | | $ | | 81,416 |
| Net realized gain (loss) | | | | 2,066 |
| Change in net unrealized appreciation (depreciation) | | | | 385,142 |
| Net increase (decrease) in net assets resulting from operations | | | | 468,624 |
| Share transactions - net increase (decrease) | | | | 38,055,768 |
| Redemption fees | | | | 111 |
| Total increase (decrease) in net assets | | | | 38,524,503 |
| |
| Net Assets | | | | |
| Beginning of period | | | | — |
| End of period (including undistributed net investment income of $78,944) | | $ | | 38,524,503 |
See accompanying notes which are an integral part of the financial statements.
| Financial Highlights Class A | | | | |
| |
| Year ended September 30, | | | | 2005F |
| Selected Per Share Data | | | | |
| Net asset value, beginning of period | | $ | | 10.00 |
| Income from Investment Operations | | | | |
| Net investment incomeE | | | | 031 |
| Net realized and unrealized gain (loss) | | | | 119 |
| Total from investment operations | | | | 150 |
| Net asset value, end of period | | $ | | 10.15 |
| Total ReturnB,C,D | | | | 1.50% |
| Ratios to Average Net AssetsG,H | | | | |
| Expenses before expense reductions | | | | 4.71%A |
| Expenses net of voluntary waivers, if any | | | | 1.00%A |
| Expenses net of all reductions | | | | 1.00%A |
| Net investment income | | | | 4.28%A |
| Supplemental Data | | | | |
| Net assets, end of period (000 omitted) | | $ | | 3,405 |
| Portfolio turnover rate | | | | 78%A |
A Annualized
B Total returns for periods of less than one year are not annualized.
C Total returns would have been lower had certain expenses not been reduced during the periods shown.
D Total returns do not include the effect of the sales charges.
E Calculated based on average shares outstanding during the period.
F For the period September 7, 2005 (commencement of operations) to September 30, 2005.
G Expense ratios reflect operating expenses of the class. Expenses before reductions do not reflect amounts reimbursed by the investment adviser or
reductions from brokerage service arrangements or other expense offset arrangements and do not represent the amount paid by the class during
periods when reimbursements or reductions occur. Expense ratios before reductions for start up periods may not be representative of longer term
operating periods. Expenses net of any voluntary waivers reflect expenses after reimbursement by the investment adviser but prior to reductions from
brokerage service arrangements or other expense offset arrangements. Expenses net of all reductions represent the net expenses paid by the class.
H Amounts do not include the activity of the underlying funds.
|
See accompanying notes which are an integral part of the financial statements.
17 Annual Report
| Financial Highlights Class T | | | | |
| |
| Year ended September 30, | | | | 2005F |
| Selected Per Share Data | | | | |
| Net asset value, beginning of period | | $ | | 10.00 |
| Income from Investment Operations | | | | |
| Net investment incomeE | | | | 030 |
| Net realized and unrealized gain (loss) | | | | 120 |
| Total from investment operations | | | | 150 |
| Net asset value, end of period | | $ | | 10.15 |
| Total ReturnB,C,D | | | | 1.50% |
| Ratios to Average Net AssetsG,H | | | | |
| Expenses before expense reductions | | | | 4.81%A |
| Expenses net of voluntary waivers, if any | | | | 1.10%A |
| Expenses net of all reductions | | | | 1.10%A |
| Net investment income | | | | 4.18%A |
| Supplemental Data | | | | |
| Net assets, end of period (000 omitted) | | $ | | 3,284 |
| Portfolio turnover rate | | | | 78%A |
A Annualized
B Total returns for periods of less than one year are not annualized.
C Total returns would have been lower had certain expenses not been reduced during the periods shown.
D Total returns do not include the effect of the sales charges.
E Calculated based on average shares outstanding during the period.
F For the period September 7, 2005 (commencement of operations) to September 30, 2005.
G Expense ratios reflect operating expenses of the class. Expenses before reductions do not reflect amounts reimbursed by the investment adviser or
reductions from brokerage service arrangements or other expense offset arrangements and do not represent the amount paid by the class during
periods when reimbursements or reductions occur. Expense ratios before reductions for start up periods may not be representative of longer term
operating periods. Expenses net of any voluntary waivers reflect expenses after reimbursement by the investment adviser but prior to reductions from
brokerage service arrangements or other expense offset arrangements. Expenses net of all reductions represent the net expenses paid by the class.
H Amounts do not include the activity of the underlying funds.
|
See accompanying notes which are an integral part of the financial statements.
| Financial Highlights Class B | | | | |
| |
| Year ended September 30, | | | | 2005F |
| Selected Per Share Data | | | | |
| Net asset value, beginning of period | | $ | | 10.00 |
| Income from Investment Operations | | | | |
| Net investment incomeE | | | | 025 |
| Net realized and unrealized gain (loss) | | | | 115 |
| Total from investment operations | | | | 140 |
| Net asset value, end of period | | $ | | 10.14 |
| Total ReturnB,C,D | | | | 1.40% |
| Ratios to Average Net AssetsG,H | | | | |
| Expenses before expense reductions | | | | 5.47%A |
| Expenses net of voluntary waivers, if any | | | | 1.75%A |
| Expenses net of all reductions | | | | 1.75%A |
| Net investment income | | | | 3.53%A |
| Supplemental Data | | | | |
| Net assets, end of period (000 omitted) | | $ | | 3,253 |
| Portfolio turnover rate | | | | 78%A |
A Annualized
B Total returns for periods of less than one year are not annualized.
C Total returns would have been lower had certain expenses not been reduced during the periods shown.
D Total returns do not include the effect of the contingent deferred sales charge.
E Calculated based on average shares outstanding during the period.
F For the period September 7, 2005 (commencement of operations) to September 30, 2005.
G Expense ratios reflect operating expenses of the class. Expenses before reductions do not reflect amounts reimbursed by the investment adviser or
reductions from brokerage service arrangements or other expense offset arrangements and do not represent the amount paid by the class during
periods when reimbursements or reductions occur. Expense ratios before reductions for start up periods may not be representative of longer term
operating periods. Expenses net of any voluntary waivers reflect expenses after reimbursement by the investment adviser but prior to reductions from
brokerage service arrangements or other expense offset arrangements. Expenses net of all reductions represent the net expenses paid by the class.
H Amounts do not include the activity of the underlying funds.
|
See accompanying notes which are an integral part of the financial statements.
19 Annual Report
| Financial Highlights Class C | | | | |
| |
| Year ended September 30, | | | | 2005F |
| Selected Per Share Data | | | | |
| Net asset value, beginning of period | | $ | | 10.00 |
| Income from Investment Operations | | | | |
| Net investment incomeE | | | | 024 |
| Net realized and unrealized gain (loss) | | | | 116 |
| Total from investment operations | | | | 140 |
| Net asset value, end of period | | $ | | 10.14 |
| Total ReturnB,C,D | | | | 1.40% |
| Ratios to Average Net AssetsG,H | | | | |
| Expenses before expense reductions | | | | 5.56%A |
| Expenses net of voluntary waivers, if any | | | | 1.85%A |
| Expenses net of all reductions | | | | 1.85%A |
| Net investment income | | | | 3.43%A |
| Supplemental Data | | | | |
| Net assets, end of period (000 omitted) | | $ | | 3,467 |
| Portfolio turnover rate | | | | 78%A |
A Annualized
B Total returns for periods of less than one year are not annualized.
C Total returns would have been lower had certain expenses not been reduced during the periods shown.
D Total returns do not include the effect of the contingent deferred sales charge.
E Calculated based on average shares outstanding during the period.
F For the period September 7, 2005 (commencement of operations) to September 30, 2005.
G Expense ratios reflect operating expenses of the class. Expenses before reductions do not reflect amounts reimbursed by the investment adviser or
reductions from brokerage service arrangements or other expense offset arrangements and do not represent the amount paid by the class during
periods when reimbursements or reductions occur. Expense ratios before reductions for start up periods may not be representative of longer term
operating periods. Expenses net of any voluntary waivers reflect expenses after reimbursement by the investment adviser but prior to reductions from
brokerage service arrangements or other expense offset arrangements. Expenses net of all reductions represent the net expenses paid by the class.
H Amounts do not include the activity of the underlying funds.
|
See accompanying notes which are an integral part of the financial statements.
| Financial Highlights Strategic Real Return | | | | |
| |
| Year ended September 30, | | | | 2005E |
| Selected Per Share Data | | | | |
| Net asset value, beginning of period | | $ | | 10.00 |
| Income from Investment Operations | | | | |
| Net investment incomeD | | | | 028 |
| Net realized and unrealized gain (loss) | | | | 122 |
| Total from investment operations | | | | 150 |
| Net asset value, end of period | | $ | | 10.15 |
| Total ReturnB,C | | | | 1.50% |
| Ratios to Average Net AssetsF,G | | | | |
| Expenses before expense reductions | | | | 4.41%A |
| Expenses net of voluntary waivers, if any | | | | 85%A |
| Expenses net of all reductions | | | | 85%A |
| Net investment income | | | | 4.43%A |
| Supplemental Data | | | | |
| Net assets, end of period (000 omitted) | | $21,867 |
| Portfolio turnover rate | | | | 78%A |
A Annualized
B Total returns for periods of less than one year are not annualized.
C Total returns would have been lower had certain expenses not been reduced during the periods shown.
D Calculated based on average shares outstanding during the period.
E For the period September 7, 2005 (commencement of operations) to September 30, 2005.
F Expense ratios reflect operating expenses of the class. Expenses before reductions do not reflect amounts reimbursed by the investment adviser or
reductions from brokerage service arrangements or other expense offset arrangements and do not represent the amount paid by the class during
periods when reimbursements or reductions occur. Expense ratios before reductions for start up periods may not be representative of longer term
operating periods. Expenses net of any voluntary waivers reflect expenses after reimbursement by the investment adviser but prior to reductions from
brokerage service arrangements or other expense offset arrangements. Expenses net of all reductions represent the net expenses paid by the class.
G Amounts do not include the activity of the underlying funds.
|
See accompanying notes which are an integral part of the financial statements.
21 Annual Report
| Financial Highlights Institutional Class | | | | |
| |
| Year ended September 30, | | | | 2005E |
| Selected Per Share Data | | | | |
| Net asset value, beginning of period | | $ | | 10.00 |
| Income from Investment Operations | | | | |
| Net investment incomeD | | | | 032 |
| Net realized and unrealized gain (loss) | | | | 118 |
| Total from investment operations | | | | 150 |
| Net asset value, end of period | | $ | | 10.15 |
| Total ReturnB,C | | | | 1.50% |
| Ratios to Average Net AssetsF,G | | | | |
| Expenses before expense reductions | | | | 4.55%A |
| Expenses net of voluntary waivers, if any | | | | 85%A |
| Expenses net of all reductions | | | | 85%A |
| Net investment income | | | | 4.43%A |
| Supplemental Data | | | | |
| Net assets, end of period (000 omitted) | | $ | | 3,248 |
| Portfolio turnover rate | | | | 78%A |
A Annualized
B Total returns for periods of less than one year are not annualized.
C Total returns would have been lower had certain expenses not been reduced during the periods shown.
D Calculated based on average shares outstanding during the period.
E For the period September 7, 2005 (commencement of operations) to September 30, 2005.
F Expense ratios reflect operating expenses of the class. Expenses before reductions do not reflect amounts reimbursed by the investment adviser or
reductions from brokerage service arrangements or other expense offset arrangements and do not represent the amount paid by the class during
periods when reimbursements or reductions occur. Expense ratios before reductions for start up periods may not be representative of longer term
operating periods. Expenses net of any voluntary waivers reflect expenses after reimbursement by the investment adviser but prior to reductions from
brokerage service arrangements or other expense offset arrangements. Expenses net of all reductions represent the net expenses paid by the class.
G Amounts do not include the activity of the underlying funds.
|
See accompanying notes which are an integral part of the financial statements.
Notes to Financial Statements
For the period ended September 30, 2005
1. Significant Accounting Policies.
Fidelity Strategic Real Return Fund (the fund) is a fund of Fidelity Commonwealth Trust (the trust) and is authorized to issue an unlimited number of shares. The trust is regis tered under the Investment Company Act of 1940, as amended (the 1940 Act), as an open end management investment company organized as a Massachusetts business trust.
The fund offers Class A, Class T, Class B, Class C, Strategic Real Return, and Institutional Class shares, each of which has equal rights as to assets and voting privileges. Each class has exclusive voting rights with respect to matters that affect that class. Class B shares will automatically convert to Class A shares after a holding period of seven years from the initial date of purchase. Investment income, realized and unrealized capital gains and losses, the common expenses of the fund, and certain fund level expense reductions, if any, are allocated on a pro rata basis to each class based on the relative net assets of each class to the total net assets of the fund. Each class differs with respect to transfer agent and distribution and service plan fees incurred. Certain expense reductions also differ by class.
The fund may invest in affiliated money market central funds (Money Market Central Funds) and fixed income Central Investment Portfolios (CIPs), collectively referred to as Central Funds, which are open end investment companies available to investment companies and other accounts managed by Fidelity Management & Research Company (FMR) and its affiliates. The financial statements have been prepared in conformity with accounting principles generally accepted in the United States of America, which require management to make certain estimates and assumptions at the date of the financial statements. The following summarizes the significant accounting policies of the fund, which are also consistently followed by the Central Funds:
Security Valuation. Net asset value per share (NAV calculation) is calculated as of the close of business of the New York Stock Exchange, normally 4:00 p.m. Eastern time. Debt securities, including restricted securities, for which quotations are readily available are valued at their most recent bid prices (sales prices if the principal market is an exchange) in the principal market in which such securities are normally traded, as determined by recognized dealers in such securities, or securities are valued on the basis of information provided by a pricing service. Pricing services use valuation matrices that incorporate both dealer supplied valuations and valuation models. Equity securities, including restricted securities, for which market quotations are available are valued at the last sale price or official closing price (closing bid price or last evaluated quote if no sale has occurred) on the primary market or exchange on which they trade. If prices are not readily available or do not accurately reflect fair value for a security, or if a security’s value has been materially affected by events occurring after the close of the exchange or market on which the security is principally traded, that security may be valued by another method that the Board of Trustees believes accurately reflects fair value. A security’s valuation may differ
23 Annual Report
Notes to Financial Statements continued
1. Significant Accounting Policies continued
Security Valuation continued
|
depending on the method used for determining value. Price movements in futures contracts and ADRs, market and trading trends, the bid/ask quotes of brokers and off exchange institutional trading may be reviewed in the course of making a good faith determination of a security’s fair value. Short term securities with remaining maturities of sixty days or less for which quotations are not readily available are valued on the basis of amortized cost. Investments in open end investment companies, including Central Funds, are valued at their net asset value each business day.
Investment Transactions and Income. Security transactions, including the fund’s investment activity in the Central Funds, are accounted for as of trade date. Gains and losses on securities sold are determined on the basis of identified cost. Dividend income is recorded on the ex dividend date, except for certain dividends from foreign securities where the ex dividend date may have passed, which are recorded as soon as the fund is informed of the ex dividend date. Non cash dividends included in dividend income, if any, are recorded at the fair market value of the securities received. Distributions received on securities that represent a return of capital or capital gains are recorded as a reduction of cost of investments and/or as a realized gain. The fund estimates the components of distributions received that may be considered return of capital distribu tions or capital gain distributions. Interest income, including distributions from the Central Funds, is accrued as earned. Interest income includes coupon interest and amortization of premium and accretion of discount on debt securities. Inflation indexed bonds are fixed income securities whose principal value is periodically adjusted accord ing to the rate of inflation. Interest is accrued based on the principal value which is adjusted for inflation. Any increase in the principal amount of an inflation indexed bond is recorded as interest income, even though the principal is not received until maturity.
Expenses. Most expenses of the trust can be directly attributed to a fund. Expenses which cannot be directly attributed are apportioned among each fund in the trust.
Income Tax Information and Distributions to Shareholders. Each year, the fund intends to qualify as a regulated investment company by distributing all of its taxable income and realized gains under Subchapter M of the Internal Revenue Code. As a result, no provision for income taxes is required in the accompanying financial statements.
Distributions are recorded on the ex dividend date. Income dividends and capital gain distributions are declared separately for each class. Income and capital gain distribu tions are determined in accordance with income tax regulations, which may differ from generally accepted accounting principles. In addition, the fund will claim a portion of the payment made to redeeming shareholders as a distribution for income tax purposes.
Capital accounts within the financial statements are adjusted for permanent book tax differences. These adjustments have no impact on net assets or the results of operations. Temporary book tax differences will reverse in a subsequent period.
1. Significant Accounting Policies continued
Income Tax Information and Distributions to Shareholders continued
|
Book tax differences are primarily due to partnerships (including allocations from the CIPs), and income recognized on commodity linked notes.
Distributions are recorded on the ex dividend date. Income dividends and capital gain distributions are declared separately for each class. Income and capital gain distribu tions are determined in accordance with income tax regulations, which may differ from generally accepted accounting principles.
Capital accounts within the financial statements are adjusted for permanent book tax differences. These adjustments have no impact on net assets or the results of operations. Temporary book tax differences will reverse in a subsequent period.
The tax basis components of distributable earnings and the federal tax cost as of period end were as follows:
| Unrealized appreciation | | $ | | 476,278 |
| Unrealized depreciation | | | | (100,753) |
| Net unrealized appreciation (depreciation) | | | | 375,525 |
| Undistributed ordinary income | | | | 84,659 |
| Undistributed long term capital gain | | | | 4,585 |
| |
| Cost for federal income tax purposes | | $ | | 37,981,688 |
Short Term Trading (Redemption) Fees. Shares purchased on or after September 7, 2005 and held in the fund less than 60 days are subject to a redemption fee equal to .75% of the proceeds of the redeemed shares. All redemption fees, including any estimated redemption fees paid by Fidelity Management & Research Company (FMR), are retained by the fund and accounted for as an addition to paid in capital.
Repurchase Agreements. FMR has received an Exemptive Order from the Securities and Exchange Commission (the SEC) which permits the fund and other affiliated entities of FMR to transfer uninvested cash balances into joint trading accounts which are then invested in repurchase agreements. The fund may also invest directly with institutions in repurchase agreements. Repurchase agreements are collateralized by government or non government securities. Collateral is held in segregated accounts with custodian banks and may be obtained in the event of a default of the counterparty. The fund monitors, on a daily basis, the value of the collateral to ensure it is at least equal to the principal amount of the repurchase agreement (including accrued interest). In the event of a default by the counterparty, realization of the collateral proceeds could be delayed, during which time the value of the collateral may decline.
25 Annual Report
Notes to Financial Statements continued
2. Operating Policies continued
|
Indexed Securities. The fund may invest in indexed securities whose values, interest rates and/or redemption prices are linked to changes in commodities, foreign currencies, interest rates, indices, or other underlying instruments. These securities may be used to increase or decrease exposure to different underlying instruments and to gain exposure to markets that might be difficult to access through conventional securities. Indexed securities may be more volatile than their underlying instruments, but any loss is limited to the amount of the original investment. Indexed securities are marked to market daily based on dealer supplied valuations and changes in value are recorded as unrealized appreciation (depreciation). Gains and losses realized upon the sale of indexed securi ties are included in realized gains (losses) on investment securities.
Restricted Securities. The fund may invest in securities that are subject to legal or contractual restrictions on resale. These securities generally may be resold in transac tions exempt from registration or to the public if the securities are registered. Disposal of these securities may involve time consuming negotiations and expense, and prompt sale at an acceptable price may be difficult. Information regarding restricted securities is included at the end of the fund’s Schedule of Investments.
3. Purchases and Sales of Investments.
Purchases and sales of securities, other than short term securities, and U.S. government securities, aggregated $25,147,525 and $1,025,010, respectively.
4. Fees and Other Transactions with Affiliates.
Management Fee. FMR and its affiliates provide the fund with investment manage ment related services for which the fund pays a monthly management fee. The manage ment fee is the sum of an individual fund fee rate that is based on an annual rate of .45% of the fund’s average net assets and a group fee rate that averaged .12% during the period. The group fee rate is based upon the average net assets of all the mutual funds advised by FMR. The group fee rate decreases as assets under management increase and increases as assets under management decrease. For the period, the total annualized management fee rate was .56% of the fund’s average net assets.
Distribution and Service Plan. In accordance with Rule 12b 1 of the 1940 Act, the fund has adopted separate Distribution and Service Plans for each class of shares. Certain classes pay Fidelity Distributors Corporation (FDC), an affiliate of FMR, separate Dis tribution and Service Fees, each of which is based on an annual percentage of each class’ average net assets. In addition, FDC may pay financial intermediaries for selling shares of
4. Fees and Other Transactions with Affiliates continued
Distribution and Service Plan continued
|
the fund and providing shareholder support services. For the period, the Distribution and Service Fee rates and the total amounts paid to and retained by FDC were as follows:
| | | Distribution | | Service | | | | Paid to | | | | Retained |
| | | Fee | | Fee | | | | FDC | | | | by FDC |
| Class A | | 0% | | .15% | | $ | | 349 | | $ | | 344 |
| Class T | | 0% | | .25% | | | | 575 | | | | 574 |
| Class B | | 65% | | .25% | | | | 2,067 | | | | 2,067 |
| Class C | | 75% | | .25% | | | | 2,313 | | | | 2,313 |
| | | | | | | $ | | 5,304 | | $ | | 5,298 |
Sales Load. FDC receives a front end sales charge of up to 4.75% for selling Class A shares, and 3.50% for selling Class T shares, some of which is paid to financial intermedi aries for selling shares of the fund. FDC receives the proceeds of contingent deferred sales charges levied on Class A, Class T, Class B, and Class C redemptions. These charges depend on the holding period. The deferred sales charges range from 5% to 1% for Class B, 1% for Class C, and .25% for certain purchases of Class A and Class T shares.
For the period, sales charge amounts retained by FDC were as follows:
| | |
| | | | | Retained |
| | | | | by FDC |
| Class A | | $ | | 294 |
| Class T | | | | 30 |
| | | $ | | 324 |
Transfer Agent Fees. Fidelity Investments Institutional Operations Company, Inc. (FIIOC), an affiliate of FMR, is the transfer, dividend disbursing and shareholder servicing agent for each class of the fund, except for Strategic Real Return. Fidelity Service Company, Inc. (FSC), an affiliate of FMR, is the transfer agent for Strategic Real Return shares. FIIOC and FSC receive account fees and asset based fees that vary according to the account size and type of account of the shareholders of the respective classes of the fund. FIIOC and FSC pay for typesetting, printing and mailing of shareholder reports,
27 Annual Report
Notes to Financial Statements continued
4. Fees and Other Transactions with Affiliates continued
Transfer Agent Fees continued
|
except proxy statements. For the period the total transfer agent fees paid by each class to FIIOC or FSC, were as follows:
| | | | | | | % of |
| | | | | | | Average |
| | | | | Amount | | Net Assets* |
| Class A | | $ | | 355 | | .17 |
| Class T | | | | 341 | | .16 |
| Class B | | | | 340 | | .16 |
| Class C | | | | 355 | | .17 |
| Strategic Real Return | | �� | | 1,341 | | .18 |
| Institutional Class | | | | 312 | | .15 |
| | | $ | | 3,044 | | |
| * Annualized | | | | | | |
Accounting Fees. FSC maintains the fund’s accounting records. The fee is based on the level of average net assets for the month.
Affiliated Central Funds. The fund may invest in Money Market Central Funds which seek preservation of capital and current income and are managed by Fidelity Investments Money Management, Inc. (FIMM) an affiliate of FMR.
The fund may also invest in CIPs managed by FIMM or Fidelity Management & Research Company, Inc. (FMRC) each an affiliate of FMR. The Ultra Short Central Fund seeks to obtain a high level of current income consistent with preservation of capital by investing in U.S. dollar denominated money market and investment grade debt securities. The Floating Rate Central Investment Portfolio seeks a high level of income by normally investing in floating rate loans and other floating rate securities.
The fund’s Schedule of Investments lists each applicable CIP as an investment of the fund but does not include the underlying holdings of the CIPs. Based on their investment objectives, each CIP may invest or participate in various investment vehicles or strate gies that are similar to those of the investing fund. In addition, the CIPs may also participate in delayed delivery and when issued securities, loans and other direct debt instruments, derivatives and financing transactions. These strategies are consistent with the investment objectives of the fund and may involve certain economic risks, including the risk that a counterparty to one or more of these transactions may be unable or unwilling to comply with the terms of the governing agreement. This may result in a decline in value of each CIP and the fund.
4. Fees and Other Transactions with Affiliates continued
Affiliated Central Funds continued
|
A complete list of holdings for each CIP is available at the end of this report. In addition, a copy of each CIP’s financial statements is available on the EDGAR Database on the SEC’s website www.sec.gov, or at the Commission’s public reference room in Washington, DC.
The Central Funds do not pay a management fee. Income distributions earned by the fund are recorded as income in the accompanying financial statements and totaled $32,428 for the period.
FMR voluntarily agreed to reimburse each class to the extent annual operating expenses exceeded certain levels of average net assets as noted in the table below. Some expenses, for example interest expense, are excluded from this reimbursement.
The following classes were in reimbursement during the period:
| | | | |
| | | Expense | | | | Reimbursement |
| | | Limitations | | | | from adviser |
| Class A | | 1.00% | | $ | | 8,615 |
| Class T | | 1.10% | | | | 8,512 |
| Class B | | 1.75% | | | | 8,504 |
| Class C | | 1.85% | | | | 8,581 |
| Strategic Real Return | | 85% | | | | 28,706 |
| Institutional Class | | 85% | | | | 8,467 |
| | | | | $ | | 71,385 |
| |
| 6. Other. | | | | | | |
The fund’s organizational documents provide former and current trustees and officers with a limited indemnification against liabilities arising in connection with the perfor mance of their duties to the fund. In the normal course of business, the fund may also enter into contracts that provide general indemnifications. The fund’s maximum exposure under these arrangements is unknown as this would be dependent on future claims that may be made against the fund. The risk of material loss from such claims is considered remote.
At the end of the period, FMR or its affiliates were the owners of record of 53% of the total outstanding shares of the fund.
29 Annual Report
| Notes to Financial Statements continued | | | | | | |
| |
| 7. Share Transactions. | | | | | | | | |
| |
| Transactions for each class of shares were as follows: | | | | | | |
| |
| | | | | SharesA | | | | DollarsA |
| | | | | Year ended September 30, 2005 |
| Class A | | | | | | | | |
| Shares sold | | | | 335,576 | | $ | | 3,356,917 |
| Shares redeemed | | | | — | | | | — |
| Net increase (decrease) | | | | 335,576 | | $ | | 3,356,917 |
| Class T | | | | | | | | |
| Shares sold | | | | 323,690 | | $ | | 3,237,283 |
| Shares redeemed | | | | — | | | | — |
| Net increase (decrease) | | | | 323,690 | | $ | | 3,237,283 |
| Class B | | | | | | | | |
| Shares sold | | | | 320,754 | | $ | | 3,207,594 |
| Shares redeemed | | | | — | | | | — |
| Net increase (decrease) | | | | 320,754 | | $ | | 3,207,594 |
| Class C | | | | | | | | |
| Shares sold | | | | 341,879 | | $ | | 3,420,798 |
| Shares redeemed | | | | — | | | | — |
| Net increase (decrease) | | | | 341,879 | | $ | | 3,420,798 |
| Strategic Real Return | | | | | | | | |
| Shares sold | | | | 2,155,812 | | $ 21,651,987 |
| Shares redeemed | | | | (1,868) | | | | (18,821) |
| Net increase (decrease) | | | | 2,153,944 | | $ 21,633,166 |
| Institutional Class | | | | | | | | |
| Shares sold | | | | 320,001 | | $ | | 3,200,010 |
| Shares redeemed | | | | — | | | | — |
| Net increase (decrease) | | | | 320,001 | | $ | | 3,200,010 |
| |
| A For the period September 7, 2005 (commencement of operations) to September 30, 2005. | | | | | | |
Report of Independent Registered Public Accounting Firm
To the Trustees of Fidelity Commonwealth Trust and Shareholders of Fidelity Strategic Real Return Fund:
We have audited the accompanying statement of assets and liabilities of Fidelity Strategic Real Return Fund (the Fund), a fund of Fidelity Commonwealth Trust, including the schedule of investments, as of September 30, 2005, and the related statement of opera tions, the statement of changes in net assets, and the financial highlights for the period from September 7, 2005 (commencement of operations) to September 30, 2005. These financial statements and financial highlights are the responsibility of the Fund’s manage ment. Our responsibility is to express an opinion on these financial statements and financial highlights based on our audit.
We conducted our audit in accordance with standards of the Public Company Accounting Oversight Board (United States). Those standards require that we plan and perform the audit to obtain reasonable assurance about whether the financial statements and financial highlights are free of material misstatement. The Fund is not required to have, nor were we engaged to perform, an audit of its internal control over financial reporting. Our audit included consideration of internal control over financial reporting as a basis for designing audit procedures that are appropriate in the circumstances, but not for the purpose of expressing an opinion on the effectiveness of the Fund’s internal control over financial reporting. Accordingly, we express no such opinion. An audit also includes examining, on a test basis, evidence supporting the amounts and disclosures in the financial statements, assessing the accounting principles used and significant estimates made by management, as well as evaluating the overall financial statement presentation. Our procedures included confirmation of securities owned as of September 30, 2005, by correspondence with the custodians and brokers; where replies were not received from brokers, we performed other auditing procedures. We believe that our audit provides a reasonable basis for our opinion.
In our opinion, the financial statements and financial highlights referred to above present fairly, in all material respects, the financial position of Fidelity Strategic Real Return Fund as of September 30, 2005, the results of its operations, the changes in its net assets, and its financial highlights for the period from September 7, 2005 (commencement of operations) to September 30, 2005, in conformity with accounting principles generally accepted in the United States of America.
/s/ Deloitte & Touche LLP
DELOITTE & TOUCHE LLP
Boston, Massachusetts
November18, 2005
|
31 Annual Report
Trustees and Officers
The Trustees, Members of the Advisory Board, and executive officers of the trust and fund, as applicable, are listed below. The Board of Trustees governs the fund and is responsible for protecting the interests of shareholders. The Trustees are experienced executives who meet periodically throughout the year to oversee the fund’s activities, review contractual arrangements with companies that provide services to the fund, and review the fund’s performance. Except for William O. McCoy, Stephen P. Jonas, and Kenneth L. Wolfe, each of the Trustees oversees 322 funds advised by FMR or an affiliate. Mr. McCoy oversees 324 funds advised by FMR or an affiliate. Mr. Jonas and Mr. Wolfe oversee 319 funds advised by FMR or an affiliate.
The Trustees hold office without limit in time except that (a) any Trustee may resign; (b) any Trustee may be removed by written instrument, signed by at least two thirds of the number of Trustees prior to such removal; (c) any Trustee who requests to be retired or who has become incapacitated by illness or injury may be retired by written instru ment signed by a majority of the other Trustees; and (d) any Trustee may be removed at any special meeting of shareholders by a two thirds vote of the outstanding voting securities of the trust. Each Trustee who is not an interested person (as defined in the 1940 Act) (Independent Trustee), shall retire not later than the last day of the calendar year in which his or her 72nd birthday occurs. The Independent Trustees may waive this mandatory retirement age policy with respect to individual Trustees. The executive officers and Advisory Board Members hold office without limit in time, except that any officer and Advisory Board Member may resign or may be removed by a vote of a majority of the Trustees at any regular meeting or any special meeting of the Trustees. Except as indicated, each individual has held the office shown or other offices in the same company for the past five years.
The fund’s Statement of Additional Information (SAI) includes more information about the Trustees. To request a free copy, call Fidelity at 1-877-208-0098.
Correspondence intended for each Trustee who is an interested person may be sent to Fidelity Investments, 82 Devonshire Street, Boston, Massachusetts 02109.
| | Name, Age; Principal Occupation
Edward C. Johnson 3d (75)**
|
Year of Election or Appointment: 1974
Mr. Johnson is Chairman of the Board of Trustees. Mr. Johnson serves as Chief Executive Officer, Chairman, and a Director of FMR Corp.; a Director and Chairman of the Board and of the Executive Committee of FMR; Chairman and a Director of Fidelity Management & Research (Far East) Inc.; Chairman and a Director of Fidelity Investments Money Man agement, Inc.; and Chairman (2001 present) and a Director (2000 present) of FMR Co., Inc.
| | Name, Age; Principal Occupation
Abigail P. Johnson (43)**
|
Year of Election or Appointment: 2001
Ms. Johnson serves as President of Fidelity Employer Services Company (FESCO) (2005 present). She is President and a Director of Fidelity Investments Money Management, Inc. (2001 present), FMR Co., Inc. (2001 present), and a Director of FMR Corp. Previously, Ms. Johnson served as President and a Director of FMR (2001 2005), Senior Vice President of the Fidelity funds (2001 2005), and managed a number of Fidelity funds.
Year of Election or Appointment: 2005
Mr. Jonas is Senior Vice President of the fund (2005 present). He also serves as Senior Vice President of other Fidelity funds (2005 present). Mr. Jonas is Executive Director of FMR (2005 present). Previously, Mr. Jonas served as President of Fidelity Enterprise Operations and Risk Services (2004 2005), Chief Administrative Officer (2002 2004), and Chief Financial Officer of FMR Co. (1998 2000). Mr. Jonas has been with Fidelity Investments since 1987 and has held various financial and management positions including Chief Financial Officer of FMR. In addi tion, he serves on the Boards of Boston Ballet (2003 present) and Sim mons College (2003 present).
Year of Election or Appointment: 2003
Mr. Reynolds is a Director (2003 present) and Chief Operating Officer (2002 present) of FMR Corp. He also serves on the Board at Fidelity Investments Canada, Ltd. (2000 present). Previously, Mr. Reynolds served as President of Fidelity Investments Institutional Retirement Group (1996 2000).
* Trustees have been determined to be “Interested Trustees” by virtue of, among other things, their affiliation with the trust or various entities under common control with FMR.
** Edward C. Johnson 3d, Trustee, is Abigail P. Johnson’s father.
33 Annual Report
Trustees and Officers - continued
Independent Trustees:
Correspondence intended for each Independent Trustee (that is, the Trustees other than the Interested Trustees) may be sent to Fidelity Investments, P.O. Box 55235, Boston, Massachusetts 02205 5235.
| | Name, Age; Principal Occupation
Dennis J. Dirks (57)
|
Year of Election or Appointment: 2005
Prior to his retirement in May 2003, Mr. Dirks was Chief Operating Officer and a member of the Board of The Depository Trust & Clearing Corporation (DTCC) (1999 2003). He also served as President, Chief Operating Officer, and Board member of The Depository Trust Com pany (DTC) (1999 2003) and President and Board member of the National Securities Clearing Corporation (NSCC) (1999 2003). In addition, Mr. Dirks served as Chief Executive Officer and Board mem ber of the Government Securities Clearing Corporation (2001 2003) and Chief Executive Officer and Board member of the Mortgage Backed Securities Clearing Corporation (2001 2003). Mr. Dirks also serves as a Trustee of Manhattan College (2005 present).
Year of Election or Appointment: 1997
Dr. Gates is Vice Chairman of the Independent Trustees (2005 present). Dr. Gates is President of Texas A&M University (2002 present). He was Director of the Central Intelligence Agency (CIA) from 1991 to 1993. From 1989 to 1991, Dr. Gates served as Assistant to the President of the United States and Deputy National Security Advisor. Dr. Gates is a Director of NACCO Industries, Inc. (mining and manufacturing), Parker Drilling Co., Inc. (drilling and rental tools for the energy industry, 2001 present), and Brinker International (restaurant management, 2003 present). Previously, Dr. Gates served as a Director of LucasVarity PLC (automotive components and diesel engines), a Director of TRW Inc. (automotive, space, defense, and information technology), and Dean of the George Bush School of Government and Public Service at Texas A&M University (1999 2001). Dr. Gates also is a Trustee of the Forum for International Policy.
Name, Age; Principal Occupation
George H. Heilmeier (69)
|
Year of Election or Appointment: 2004
Dr. Heilmeier is Chairman Emeritus of Telcordia Technologies (commu nication software and systems), where prior to his retirement, he served as company Chairman and Chief Executive Officer. He currently serves on the Boards of Directors of The Mitre Corporation (systems engineer ing and information technology support for the government), and HRL Laboratories (private research and development, 2004 present). He is Chairman of the General Motors Science & Technology Advisory Board and a Life Fellow of the Institute of Electrical and Electronics Engineers (IEEE) (2000 present). Dr. Heilmeier is a member of the Defense Science Board and the National Security Agency Advisory Board. He is also a member of the National Academy of Engineering, the American Acad emy of Arts and Sciences, and the Board of Overseers of the School of Engineering and Applied Science of the University of Pennsylvania. Pre viously, Dr. Heilmeier served as a Director of TRW Inc. (automotive, space, defense, and information technology, 1992 2002), Compaq (1994 2002), Automatic Data Processing, Inc. (ADP) (technology based business outsourcing, 1995 2002), INET Technologies Inc. (telecommu nications network surveillance, 2001 2004), and Teletech Holdings (cus tomer management services). He is the recipient of the 2005 Kyoto Prize in Advanced Technology for his invention of the liquid display.
Year of Election or Appointment: 2001
Prior to Ms. Knowles’ retirement in June 2000, she served as Executive Vice President and Chief Financial Officer of Atlantic Richfield Company (ARCO) (diversified energy, 1996 2000). From 1993 to 1996, she was a Senior Vice President of ARCO and President of ARCO Transportation Company. She served as a Director of ARCO from 1996 to 1998. She currently serves as a Director of Phelps Dodge Corporation (copper mining and manufacturing) and McKesson Corporation (healthcare ser vice, 2002 present). Ms. Knowles is a Trustee of the Brookings Institution and the Catalina Island Conservancy and also serves as a member of the Advisory Board for the School of Engineering of the University of Southern California.
35 Annual Report
Trustees and Officers - continued
| | Name, Age; Principal Occupation
Ned C. Lautenbach (61)
|
Year of Election or Appointment: 2000
Mr. Lautenbach has been a partner of Clayton, Dubilier & Rice, Inc. (private equity investment firm) since September 1998. Previously, Mr. Lautenbach was with the International Business Machines Corpora tion (IBM) from 1968 until his retirement in 1998. Mr. Lautenbach serves as a Director of Italtel Holding S.p.A. (telecommunications (Milan, Italy), 2004 present) and Eaton Corporation (diversified industrial) as well as the Philharmonic Center for the Arts in Naples, Florida. He also is a member of the Board of Trustees of Fairfield University (2005 present), as well as a member of the Council on Foreign Relations.
Year of Election or Appointment: 1993
Mr. Mann is Chairman of the Independent Trustees (2001 present). He is Chairman Emeritus of Lexmark International, Inc. (computer peripherals), where he served as CEO until April 1998, retired as Chairman May 1999, and remains a member of the Board. Prior to 1991, he held the positions of Vice President of International Business Machines Corporation (IBM) and President and General Manager of various IBM divisions and subsidiaries. He is a member of the Executive Committee of the Independent Director’s Council of the Investment Com pany Institute. In addition, Mr. Mann is a member of the President’s Cabinet at the University of Alabama and the Board of Visitors of the Culverhouse College of Commerce and Business Administration at the University of Alabama.
Year of Election or Appointment: 1997
Prior to his retirement in December 1994, Mr. McCoy was Vice Chair man of the Board of BellSouth Corporation (telecommunications) and President of BellSouth Enterprises. He is currently a Director of Liberty Corporation (holding company), Duke Realty Corporation (real estate), and Progress Energy, Inc. (electric utility). He is also a partner of Frank lin Street Partners (private investment management firm) and a member of the Research Triangle Foundation Board. In addition, Mr. McCoy served as the Interim Chancellor (1999 2000) and a member of the Board of Visitors for the University of North Carolina at Chapel Hill and currently serves on the Board of Directors of the University of North Carolina Health Care System and the Board of Visitors of the Kenan Flagler Business School (University of North Carolina at Chapel Hill). He also served as Vice President of Finance for the University of North Car olina (16 school system).
Name, Age; Principal Occupation
Cornelia M. Small (61)
|
Year of Election or Appointment: 2005
Ms. Small is a member (2000 present) and Chairperson (2002 present) of the Investment Committee, and a member (2002 present) of the Board of Trustees of Smith College. Previously, she served as Chief In vestment Officer (1999 2000), Director of Global Equity Investments (1996 1999), and a member of the Board of Directors of Scudder, Ste vens & Clark (1990 1997) and Scudder Kemper Investments (1997 1998). In addition, Ms. Small served as Co Chair (2000 2003) of the Annual Fund for the Fletcher School of Law and Diplomacy.
William S. Stavropoulos (66)
|
Year of Election or Appointment: 2002
Mr. Stavropoulos is Chairman of the Board (2000 present) and a Mem ber of the Board of Directors of The Dow Chemical Company. Since joining The Dow Chemical Company in 1967, Mr. Stavropoulos served in numerous senior management positions, including President (1993 2000; 2002 2003), CEO (1995 2000; 2002 2004), and Chair man of the Executive Committee (2000 2004). Currently, he is a Direc tor of NCR Corporation (data warehousing and technology solutions), BellSouth Corporation (telecommunications), Chemical Financial Corpo ration, Maersk Inc. (industrial conglomerate, 2002 present), and Metal mark Capital (private equity investment firm, 2005 present). He also serves as a member of the Board of Trustees of the American Enterprise Institute for Public Policy Research. In addition, Mr. Stavropoulos is a member of The Business Council, J.P. Morgan International Council and the University of Notre Dame Advisory Council for the College of Science.
Year of Election or Appointment: 2005
Mr. Wolfe also serves as a Trustee (2005 present) or Member of the Advisory Board (2004 present) of other investment companies advised by FMR. Prior to his retirement in 2001, Mr. Wolfe was Chairman and Chief Executive Officer of Hershey Foods Corporation (1993 2001). He currently serves as a member of the boards of Adelphia Communica tions Corporation (2003 present), Bausch & Lomb, Inc., and Revlon Inc. (2004 present).
37 Annual Report
Trustees and Officers - continued
Advisory Board Members and Executive Officers:
Correspondence intended for Mr. Gamper may be sent to Fidelity Investments, P.O. Box 55235, Boston, Massachusetts 02205 5235. Correspondence intended for each executive officer and Mr. Lynch may be sent to Fidelity Investments, 82 Devonshire Street, Boston, Massachusetts 02109.
| | Name, Age; Principal Occupation
Albert R. Gamper, Jr. (63)
|
Year of Election or Appointment: 2005
Member of the Advisory Board of Fidelity Commonwealth Trust. Prior to his retirement in December 2004, Mr. Gamper served as Chairman of the Board of CIT Group Inc. (commercial finance). During his tenure with CIT Group Inc. Mr. Gamper served in numerous senior manage ment positions, including Chairman (1987 1989; 1999 2001; 2002 2004), Chief Executive Officer (1987 2004), and President (1989 2002). He currently serves as a member of the Board of Direc tors of Public Service Enterprise Group (utilities, 2001 present), Chair man of the Board of Governors, Rutgers University (2004 present), and Chairman of the Board of Saint Barnabas Health Care System.
Year of Election or Appointment: 2003
Member of the Advisory Board of Fidelity Commonwealth Trust. Vice Chairman and a Director of FMR, and Vice Chairman (2001 present) and a Director (2000 present) of FMR Co., Inc. Previously, Mr. Lynch served as a Trustee of the Fidelity funds (1990 2003). In addition, he serves as a Trustee of Boston College, Massachusetts Eye & Ear Infir mary, Historic Deerfield, John F. Kennedy Library, and the Museum of Fine Arts of Boston.
Year of Election or Appointment: 2005
Vice President of the fund. Mr. Churchill also serves as Vice President of certain Equity Funds (2005 present) and certain High Income Funds (2005 present). Previously, he served as Head of Fidelity’s Fixed Income Division (2000 2005), Vice President of Fidelity’s Money Market Funds (2000 2005), Vice President of Fidelity’s Bond Funds, and Senior Vice President of FIMM (2000) and FMR. Mr. Churchill joined Fidelity in 1993 as Vice President and Group Leader of Taxable Fixed Income Investments.
Name, Age; Principal Occupation
Walter C. Donovan (43)
|
Year of Election or Appointment: 2005
Vice President of the fund. Mr. Donovan also serves as Vice President of Fidelity’s High Income Funds (2005 present), Fidelity’s Fixed Income Funds (2005 present), certain Asset Allocation Funds (2005 present), and certain Balanced Funds (2005 present). Mr. Donovan also serves as Executive Vice President of FMR (2005 present) and FMRC
(2005 present). Previously, Mr. Donovan served as Vice President and Director of Fidelity’s International Equity Trading group (1998 2005).
Year of Election or Appointment: 2005
Vice President of the fund. Mr. Greer also serves as Vice President of the Fidelity Select Portfolios (2005 present), certain Asset Allocation Funds (2005 present), a Trustee of other investment companies advised by FMR (2003 present), and a member of the FMR senior management team (2005 present). Previously, Mr. Greer served as a Director and Managing Director of Strategic Advisers, Inc. (2002 2005), Executive Vice President (2000 2002), and Money Market Group Leader (1997 2002) of the Fidelity Investments Fixed Income Division. He also served as Vice President of Fidelity’s Money Market Funds (1997 2002), Senior Vice President of FMR (1997 2002), and Vice President of FIMM (1998 2002).
Year of Election or Appointment: 2005
Vice President of the fund. Mr. Murphy also serves as Vice President of Fidelity’s Money Market Funds (2002 present), certain Asset Allocation Funds (2003 present), Fidelity’s Investment Grade Bond Funds (2005 present), and Fidelity’s Balanced Funds (2005 present). He serves as Senior Vice President (2000 present) and Head (2004 present) of the Fidelity Investments Fixed Income Division. Mr. Murphy is also a Senior Vice President of FIMM (2003 present) and a Vice President of FMR (2000 present). Previously, Mr. Murphy served as Money Market Group Leader (2002 2004), Bond Group Leader (2000 2002), and Vice Presi dent of Fidelity’s Taxable Bond Funds (2000 2002) and Fidelity’s Munici pal Bond Funds (2001 2002). Mr. Murphy joined Fidelity Investments in 1989 as a portfolio manager in the Bond Group.
39 Annual Report
Trustees and Officers - continued
| | Name, Age; Principal Occupation
Thomas J. Silvia (44)
|
Year of Election or Appointment: 2005
Vice President of the fund. Mr. Silvia also serves as Vice President of Fidelity’s Bond Funds (2005 present) and Senior Vice President and Bond Group Leader of the Fidelity Investments Fixed Income Division (2005 present). Previously, Mr. Silvia served as Director of Fidelity’s Tax able Bond portfolio managers (2002 2004) and a portfolio manager in the Bond Group (1997 2004).
Year of Election or Appointment: 2005
Vice President of the fund. Mr. Dudley also serves as Vice President of other funds advised by FMR. Prior to assuming his current responsibili ties, Mr. Dudley managed a variety of Fidelity funds.
Year of Election or Appointment: 2005
Vice President of the fund. Mr. Snyderman also serves as Vice Presi dent of another fund advised by FMR. Prior to assuming his current responsibilities, Mr. Snyderman managed a variety of Fidelity funds. Mr. Snyderman also serves as Vice President of FMR (2004) and FMR Co., Inc. (2004).
Year of Election or Appointment: 2005
Secretary of the fund. He also serves as Secretary of other Fidelity funds; Vice President, General Counsel, and Secretary of FMR Co., Inc. (2001 present) and FMR; Assistant Secretary of Fidelity Management & Research (U.K.) Inc. (2001 present), Fidelity Management & Research (Far East) Inc. (2001 present), and Fidelity Investments Money Manage ment, Inc. (2001 present). Mr. Roiter is an Adjunct Member, Faculty of Law, at Boston College Law School (2003 present). Previously, Mr. Roiter served as Vice President and Secretary of Fidelity Distributors Corpora tion (FDC) (1998 2005).
Year of Election or Appointment: 2005
Assistant Secretary of the fund. Mr. Fross also serves as Assistant Secre tary of other Fidelity funds (2003 present), Vice President and Secretary of FDC (2005 present), and is an employee of FMR.
Name, Age; Principal Occupation
Christine Reynolds (47)
|
Year of Election or Appointment: 2005
President, Treasurer, and Anti Money Laundering (AML) officer of the fund. Ms. Reynolds also serves as President, Treasurer, and AML officer of other Fidelity funds (2004) and is a Vice President (2003) and an employee (2002) of FMR. Before joining Fidelity Investments, Ms. Reynolds worked at PricewaterhouseCoopers LLP (PwC) (1980 2002), where she was most recently an audit partner with PwC’s investment management practice.
Year of Election or Appointment: 2005
Chief Financial Officer of the fund. Mr. Hayes also serves as Chief Financial Officer of other Fidelity funds (2002 present) and President of Fidelity Investment Operations (2005 present) which includes Fidelity Pricing and Cash Management Services Group (FPCMS), where he served as President (1998 2005). Mr. Hayes serves as President of Fidelity Service Company (2003 present) where he also serves as a Director. Mr. Hayes also served as President of Fidelity Investments Operations Group (FIOG, 2002 2005).
Kenneth A. Rathgeber (58)
|
Year of Election or Appointment: 2005
Chief Compliance Officer of the fund. Mr. Rathgeber also serves as Chief Compliance Officer of other Fidelity funds (2004) and Executive Vice President of Risk Oversight for Fidelity Investments (2002). Pre viously, he served as Executive Vice President and Chief Operating Offi cer for Fidelity Investments Institutional Services Company, Inc.
(1998 2002).
Year of Election or Appointment: 2005
Deputy Treasurer of the fund. Mr. Hebble also serves as Deputy Trea surer of other Fidelity funds (2003), and is an employee of FMR. Before joining Fidelity Investments, Mr. Hebble worked at Deutsche Asset Man agement where he served as Director of Fund Accounting (2002 2003) and Assistant Treasurer of the Scudder Funds (1998 2003).
Year of Election or Appointment: 2005
Deputy Treasurer of the fund. Mr. Mehrmann also serves as Deputy Treasurer of other Fidelity funds (2005 present) and is an employee of FMR. Previously, Mr. Mehrmann served as Vice President of Fidelity Investments Institutional Services Group (FIIS)/Fidelity Investments Institu tional Operations Corporation, Inc. (FIIOC) Client Services (1998 2004).
41 Annual Report
Trustees and Officers - continued
| | Name, Age; Principal Occupation
Kimberley H. Monasterio (41)
|
Year of Election or Appointment: 2005
Deputy Treasurer of the fund. Ms. Monasterio also serves as Deputy Treasurer of other Fidelity funds (2004) and is an employee of FMR (2004). Before joining Fidelity Investments, Ms. Monasterio served as Treasurer (2000 2004) and Chief Financial Officer (2002 2004) of the Franklin Templeton Funds and Senior Vice President of Franklin Temple ton Services, LLC (2000 2004).
Year of Election or Appointment: 2005
Deputy Treasurer of the fund. Mr. Robins also serves as Deputy Treasurer of other Fidelity funds (2005 present) and is an employee of FMR (2004 present). Before joining Fidelity Investments, Mr. Robins worked at KPMG LLP, where he was a partner in KPMG’s department of profes sional practice (2002 2004) and a Senior Manager (1999 2000). In addition, Mr. Robins served as Assistant Chief Accountant, United States Securities and Exchange Commission (2000 2002).
Year of Election or Appointment: 2005
Assistant Treasurer of the fund. Mr. Byrnes also serves as Assistant Trea surer of other Fidelity funds (2005 present) and is an employee of FMR (2005 present). Previously, Mr. Byrnes served as Vice President of FPCMS (2003 2005). Before joining Fidelity Investments, Mr. Byrnes worked at Deutsche Asset Management where he served as Vice Presi dent of the Investment Operations Group (2000 2003).
Year of Election or Appointment: 2005
Assistant Treasurer of the fund. Mr. Costello also serves as Assistant Treasurer of other Fidelity funds and is an employee of FMR.
Year of Election or Appointment: 2005
Assistant Treasurer of the fund. Mr. Lydecker also serves as Assistant Treasurer of other Fidelity funds (2004) and is an employee of FMR.
Year of Election or Appointment: 2005
Assistant Treasurer of the fund. Mr. Osterheld also serves as Assistant Treasurer of other Fidelity funds (2002) and is an employee of FMR.
Name, Age; Principal Occupation
Gary W. Ryan (47)
|
Year of Election or Appointment: 2005
Assistant Treasurer of the fund. Mr. Ryan also serves as Assistant Trea surer of other Fidelity funds (2005 present) and is an employee of FMR (2005 present). Previously, Mr. Ryan served as Vice President of Fund Reporting in FPCMS (1999 2005).
Year of Election or Appointment: 2005
Assistant Treasurer of the fund. Mr. Schiavone also serves as Assistant Treasurer of other Fidelity funds (2005 present) and is an employee of FMR (2005 present). Before joining Fidelity Investments, Mr. Schiavone worked at Deutsche Asset Management, where he most recently served as Assistant Treasurer (2003 2005) of the Scudder Funds and Vice Pres ident and Head of Fund Reporting (1996 2003).
43 Annual Report
The fund hereby designates as capital gain dividends: For dividends with respect to the taxable year ended September 30, 2005, $4,585, or, if subsequently determined to be different, the net capital gain of such year.
A total of 30.96% of the dividends distributed during the fiscal year was derived from interest on U.S. Government securities which is generally exempt from state income tax.
The fund will notify shareholders in January 2006 of amounts for use in preparing 2005 income tax returns.
Board Approval of Investment Advisory Contracts and Management Fees
Fidelity Strategic Real Return Fund
On July 21, 2005, the Board of Trustees, including the independent Trustees (together, the Board), voted to approve the management contract and subadvisory agreements (together, the Advisory Contracts) for the fund. The Board, assisted by the advice of fund counsel and independent Trustees’ counsel, considered a broad range of information.
In determining whether to approve the Advisory Contracts for the fund, the Board was aware that shareholders have a broad range of investment choices available to them, including a wide choice among mutual funds offered by competitors to Fidelity, and that shareholders, with the opportunity to review and weigh the disclosure provided by the fund in its prospectus and other public disclosures, may choose to invest in this fund, managed by Fidelity.
Nature, Extent, and Quality of Services Provided by Fidelity. The Board consid ered staffing within the investment adviser, FMR, and the sub advisers (together, the Investment Advisers), including the background of the fund’s portfolio manager and the fund’s investment objective and discipline.
Fidelity Resources Dedicated to Investment Management and Support Services. The Board considered Fidelity’s extensive global research capabilities that enable the Investment Advisers to aggregate data from various sources in an effort to produce positive investment results. The Board noted that Fidelity’s analysts have access to a variety of technological tools that enable them to perform both fundamental and quanti tative analysis and to specialize in various disciplines. The Board also considered that Fidelity’s portfolio managers and analysts have access to daily portfolio attribution that allows for monitoring of a fund’s portfolio, as well as an electronic communication system that provides immediate real time access to research concerning issuers and credit enhancers.
Shareholder and Administrative Services. The Board considered the nature, extent, quality, and cost of administrative, distribution, and shareholder services performed by the Investment Advisers and their affiliates under the Advisory Contracts and under separate agreements covering transfer agency, pricing and bookkeeping, and securities lending services for the fund. The Board also considered the nature and extent of the Investment Advisers’ supervision of third party service providers, principally custodians and subcustodians.
The Board noted that the growth of fund assets across the complex allows Fidelity to reinvest in the development of services designed to enhance the value or convenience of the Fidelity funds as investment vehicles. These services include 24 hour access to account information and market information through phone representatives and over the Internet, and investor education materials and asset allocation tools.
45 Annual Report
Board Approval of Investment Advisory Contracts and Management Fees continued
Investment in a Large Fund Family. The Board considered the benefits to shareholders of investing in a Fidelity fund, including the benefits of investing in a fund that is part of a large family of funds offering a variety of investment disciplines and providing for a large variety of mutual fund investor services. For example, fund shareholders are offered the privilege of exchanging shares of the fund for shares of other Fidelity funds, as set forth in the fund’s prospectus, without paying an additional sales charge.
Investment Performance. Fidelity Strategic Real Return is a new fund and therefore had no historical performance for the Board to review at the time it approved the fund’s Advisory Contracts.
Based on its review, the Board concluded that the nature, extent, and quality of the services provided by Fidelity will benefit the fund’s shareholders, particularly in light of the Board’s view that the fund’s shareholders benefit from investing in a fund that is part of a large family of funds offering a variety of investment disciplines and services.
Competitiveness of Management Fee and Total Fund Expenses. The Board considered the fund’s proposed management fee and projected operating expenses in reviewing the Advisory Contracts. The Board noted that the fund’s proposed manage ment fee rate is lower than the median fee rate of funds with similar Lipper investment objective categories and comparable management fee characteristics. The Board also noted that the fund’s management fee and projected expenses are comparable to those of similar funds that Fidelity offers to shareholders.
Based on its review, the Board concluded that the fund’s management fee and the total expenses for each class of the fund were fair and reasonable in light of the services that the fund and its shareholders receive and the other factors considered.
Costs of the Services and Profitability. The fund is a new fund and therefore no revenue, cost, or profitability data was available for the Board to review in respect of the fund at the time it approved the Advisory Contracts.
Economies of Scale. The Board considered the extent to which the fund will benefit from economies of scale through increased services to the fund, through waivers or reimbursements, or through fee or expense reductions, including reductions that occur through operation of the transfer agent agreement. The transfer agent fee varies in part based on the number of accounts in the fund. If the number of accounts decreases or the average account size increases, the overall transfer agent fee rate decreases.
The Board recognized that the fund’s management contract incorporates a “group fee” structure, which provides for lower fee rates as total fund assets under FMR’s manage ment increase, and for higher fee rates as total fund assets under FMR’s management decrease. The Board considered that the group fee is designed to deliver the benefits of economies of scale to fund shareholders when total fund assets increase, even if assets of any particular fund are unchanged or have declined, because some portion of Fidelity’s
costs are attributable to services provided to all Fidelity funds, and all funds benefit if those costs can be allocated among more assets.
The Board concluded that, given the group fee structure, fund shareholders will achieve a certain level of economies of scale as assets under FMR’s management increase at the fund complex level, regardless of whether Fidelity achieves any such economies of scale.
Additional Information Requested by the Board. In order to develop fully the factual basis for consideration of the Advisory Contracts, the Board received additional information explaining that the fund will obtain commodity exposure by investing in a combination of structured notes and other short term securities. The Board considered that the fund offers an option for investors concerned about the impact of inflation on the markets and that the fund seeks real return consistent with reasonable investment risk by allocating its assets across investment categories that are selected to provide broad diversification, inflation protection, and risk mitigation. The Board also consid ered additional information regarding similar funds offered by other fund companies.
Based on its evaluation of all of the conclusions noted above, and after considering all material factors, the Board ultimately concluded that the advisory fee structures are fair and reasonable, and that the fund’s Advisory Contracts should be approved.
47 Annual Report
The following is a complete listing of investments for Fidelity’s fixed income central funds as of September 30, 2005 which are direct investments of Fidelity Strategic Real Return Fund. These underlying holdings of the Fidelity fixed income central funds are not included in the Schedule of Investments as part of the Financial Statements.
| Fidelity Floating Rate Central Investment Portfolio |
| Investments September 30, 2005 (Unaudited) |
| Showing Percentage of Net Assets | | | | |
| |
| Floating Rate Loans (c) 89.6% | | | | |
| | | Principal | | Value |
| | | Amount | | |
| Aerospace – 0.3% | | | | |
| Mid-Western Aircraft Systems, Inc. Tranche B, term loan | | | | |
| 5.9606% 12/31/11 (b) | | $ 1,386,525 | | $ 1,409,056 |
| Air Transportation – 1.3% | | | | |
| United Air Lines, Inc. Tranche B, term loan 7.96% | | | | |
| 12/30/05 (b) | | 2,120,000 | | 2,141,200 |
| US Airways Group, Inc. Tranche 1A, term loan | | | | |
| 12.2062% 9/30/10 (b) | | 4,000,000 | | 4,000,000 |
| | | | | 6,141,200 |
| Automotive 4.2% | | | | |
| Accuride Corp. term loan 6.1797% 1/31/12 (b) | | 2,343,409 | | 2,366,843 |
| AM General LLC Tranche B1, term loan 8.2044% | | | | |
| 11/1/11 (b) | | 3,747,436 | | 3,916,071 |
| Goodyear Tire & Rubber Co.: | | | | |
| Tranche 1, 4.7852% 4/30/10 (b) | | 1,060,000 | | 1,069,275 |
| Tranche 2, term loan 6.32% 4/30/10 (b) | | 1,480,000 | | 1,500,350 |
| Travelcenters of America, Inc. Tranche B, term loan | | | | |
| 5.71% 12/1/11 (b) | | 7,916,840 | | 8,005,904 |
| TRW Automotive Holdings Corp. Tranche B, term loan | | | | |
| 5.25% 6/30/12 (b) | | 2,770,717 | | 2,798,424 |
| | | | | 19,656,867 |
| Broadcasting – 2.0% | | | | |
| Entravision Communications Corp. term loan 5.55% | | | | |
| 3/29/13 (b) | | 4,000,000 | | 4,035,000 |
| Nexstar Broadcasting, Inc. Tranche B, term loan | | | | |
| 5.6644% 10/1/12 (b) | | 3,828,592 | | 3,852,520 |
| Spanish Broadcasting System, Inc. Tranche 1, term loan | | | | |
| 6.03% 6/10/12 (b) | | 1,567,125 | | 1,590,632 |
| | | | | 9,478,152 |
| Building Materials – 1.0% | | | | |
| Euramax International, Inc./Euramax International | | | | |
| Holdings BV Tranche 1, term loan 6.6297% | | | | |
| 6/29/12 (b) | | 1,845,375 | | 1,859,215 |
| Goodman Global Holdings, Inc. term loan 5.875% | | | | |
| 12/23/11 (b) | | 1,210,850 | | 1,227,499 |
| Masonite International Corp. term loan 5.6659% | | | | |
| 4/5/13 (b) | | 1,462,650 | | 1,466,307 |
| | | | | 4,553,021 |
| Cable TV 6.4% | | | | |
| Adelphia Communications Corp. Tranche B, term loan | | | | |
| 6.3041% 3/31/06 (b) | | 2,450,000 | | 2,462,250 |
| Century Cable Holdings LLC Tranche B, term loan 8.75% | | | | |
| 6/30/09 (b) | | 3,000,000 | | 2,977,500 |
| |
| |
| 49 | | | | Annual Report |
| Investments (Unaudited) continued | | | | | | | | |
| |
Floating Rate Loans (c) continued
| | | | | | | | |
| | | | | | | Principal | | | | Value |
| | | | | | | Amount | | | | |
| Cable TV – continued | | | | | | | | | | |
| Charter Communications Operating LLC: | | | | | | | | | | |
| Tranche A, term loan 6.68% 4/27/10 (b) | | $ | | 6,630,902 | | $ | | 6,630,902 |
| Tranche B, term loan 6.93% 4/7/11 (b) | | | | | | 1,987,454 | | | | 1,997,391 |
| DIRECTV Holdings LLC Tranche B, term loan 5.3375% | | | | | | | | |
| 4/13/13 (b) | | | | | | 2,260,000 | | | | 2,282,600 |
| NTL Investment Holdings Ltd. Tranche B, term loan 6.41% | | | | | | | | |
| 6/13/12 (b) | | | | | | 3,000,000 | | | | 3,015,000 |
| UPC Broadband Holding BV Tranche H2, term loan | | | | | | | | |
| 6.0044% 9/30/12 (b) | | | | | | 3,940,000 | | | | 3,984,325 |
| UPC Distribution Holdings BV Tranche F, term loan | | | | | | | | |
| 7.19% 12/31/11 (b) | | | | | | 4,000,000 | | | | 4,065,000 |
| WideOpenWest Illinois, Inc. Tranche B, term loan | | | | | | | | |
| 6.8036% 6/22/11 (b) | | | | | | 2,586,902 | | | | 2,612,771 |
| | | | | | | | | | | 30,027,739 |
| Capital Goods 1.7% | | | | | | | | | | |
| Alliance Laundry Systems LLC term loan 6.0021% | | | | | | | | |
| 1/27/12 (b) | | | | | | 1,870,000 | | | | 1,893,375 |
| Flowserve Corp. term loan 5.8125% 8/10/12 (b) | | | | 1,280,000 | | | | 1,296,000 |
| GenTek, Inc. term loan 6.4034% 2/28/11 (b) | | | | 1,939,064 | | | | 1,939,064 |
| Hexcel Corp. Tranche B, term loan 5.3632% 3/1/12 (b) | | | | 370,000 | | | | 373,700 |
| Mueller Group, Inc. term loan 6.2371% 10/3/12 (b) | | | | 670,000 | | | | 680,050 |
| Walter Industries, Inc. term loan 6.0399% 10/3/12 (b) . | | | | 720,000 | | | | 729,900 |
| Wastequip, Inc. Tranche B1, term loan 6.5204% | | | | | | | | |
| 7/15/11 (b) | | | | | | 967,575 | | | | 977,251 |
| | | | | | | | | | | 7,889,340 |
| Chemicals – 1.7% | | | | | | | | | | |
| Basell USA, Inc.: | | | | | | | | | | |
| Tranche B2, term loan 6.3533% 8/1/13 (b) | | | | 190,000 | | | | 193,563 |
| Tranche C2, term loan 6.8533% 8/1/14 (b) | | | | 190,000 | | | | 193,563 |
| Celanese Holding LLC term loan 6.2967% 4/6/11 (b) | | | | 2,334,674 | | | | 2,369,695 |
| Mosaic Co. Tranche B, term loan 5.2323% 2/21/12 (b) | | | | 1,890,500 | | | | 1,914,131 |
| PQ Corp. term loan 6.0625% 2/11/12 (b) | | | | 3,283,500 | | | | 3,320,439 |
| | | | | | | | | | | 7,991,391 |
| Consumer Products – 1.2% | | | | | | | | | | |
| Burt’s Bees, Inc. term loan 6.2397% 3/28/10 (b) | | | | 398,000 | | | | 402,478 |
| Central Garden & Pet Co. Tranche B, term loan 5.5591% | | | | | | | | |
| 5/14/09 (b) | | | | | | 396,974 | | | | 401,936 |
| Fender Musical Instrument Corp. Tranche B, term loan | | | | | | | | |
| 5.85% 3/30/12 (b) | | | | | | 807,975 | | | | 816,055 |
| Jarden Corp. Tranche B2, term loan 5.6881% | | | | | | | | |
| 1/24/12 (b) | | | | | | 375,189 | | | | 377,065 |
| |
| |
| |
| Annual Report | | 50 | | | | | | | | |
Floating Rate Loans (c) continued
| | | | | | |
| | | | | Principal | | Value |
| | | | | Amount | | |
| Consumer Products – continued | | | | | | |
| Jostens IH Corp. Tranche A, term loan 6.4381% | | | | | | |
| 10/4/10 (b) | | $ | | 1,800,000 | | $ 1,822,500 |
| Simmons Bedding Co. Tranche C, term loan 6.0144% | | | | | | |
| 12/19/11 (b) | | | | 1,941,162 | | 1,960,574 |
| | | | | | | 5,780,608 |
| Containers – 0.2% | | | | | | |
| Berry Plastics Corp. term loan 6.105% 12/2/11 (b) | | | | 947,625 | | 960,655 |
| Diversified Financial Services – 0.8% | | | | | | |
| Newkirk Master LP Tranche B, term loan 5.6931% | | | | | | |
| 8/11/08 (b) | | | | 644,334 | | 653,999 |
| Refco Finance Holdings LLC term loan 5.8406% | | | | | | |
| 8/5/11 (b) | | | | 2,972,222 | | 3,005,660 |
| | | | | | | 3,659,659 |
| Diversified Media – 0.2% | | | | | | |
| R.H. Donnelley Corp. Tranche A3, term loan 5.6939% | | | | | | |
| 12/31/09 (b) | | | | 1,159,682 | | 1,162,582 |
| Electric Utilities – 4.5% | | | | | | |
| Allegheny Energy Supply Co. LLC term loan 5.7691% | | | | | | |
| 3/8/11 (b) | | | | 3,138,340 | | 3,181,492 |
| Centerpoint Energy House Electric LLC term loan | | | | | | |
| 13.2425% 11/11/05 (b) | | | | 2,000,000 | | 2,025,000 |
| Covanta Energy Corp. Tranche 1: | | | | | | |
| Credit-Linked Deposit 6.8628% 6/24/12 (b) | | | | 2,211,382 | | 2,244,553 |
| term loan 6.9606% 6/24/12 (b) | | | | 1,784,146 | | 1,810,909 |
| NRG Energy, Inc.: | | | | | | |
| Credit-Linked Deposit 5.7953% 12/24/11 (b) | | | | 1,706,250 | | 1,714,781 |
| term loan 5.8954% 12/24/11 (b) | | | | 2,177,297 | | 2,188,183 |
| Primary Energy Finance LLC term loan 6.0204% | | | | | | |
| 8/24/12 (b) | | | | 3,030,000 | | 3,075,450 |
| Reliant Energy, Inc. term loan 6.0972% 4/30/10 (b) | | | | 1,990,000 | | 2,004,925 |
| Texas Genco LLC term loan 5.8632% 12/14/11 (b) | | | | 2,977,500 | | 2,992,388 |
| | | | | | | 21,237,681 |
| Energy – 7.8% | | | | | | |
| Boart Longyear Holdings, Inc. Tranche 1, term loan | | | | | | |
| 6.53% 7/22/12 (b) | | | | 369,075 | | 374,611 |
| Coffeyville Resources LLC: | | | | | | |
| Credit-Linked Deposit 6.3604% 7/8/11 (b) | | | | 704,000 | | 715,440 |
| Tranche B1, term loan 6.57% 7/8/12 (b) | | | | 1,056,000 | | 1,073,160 |
| El Paso Corp. Credit-Linked Deposit 6.6466% | | | | | | |
| 11/22/09 (b) | | | | 6,000,000 | | 6,060,000 |
| Energy Transfer Partners LP term loan 6.8125% | | | | | | |
| 6/16/08 (b) | | | | 5,000,000 | | 5,056,250 |
| |
| |
| 51 | | | | | | Annual Report |
| Investments (Unaudited) continued | | | | | | | | |
| |
Floating Rate Loans (c) continued
| | | | | | | | |
| | | | | | | Principal | | | | Value |
| | | | | | | Amount | | | | |
| Energy – continued | | | | | | | | | | |
| EPCO Holdings, Inc. Tranche B, term loan 6.0394% | | | | | | | | |
| 8/16/10 (b) | | | | $ | | 3,460,000 | | $ | | 3,520,550 |
| Kerr-McGee Corp. Tranche B, term loan 6.3149% | | | | | | | | |
| 5/24/11 (b) | | | | | | 9,975,000 | | | | 10,024,875 |
| Key Energy Services, Inc. Tranche B, term loan 7.02% | | | | | | | | |
| 6/30/12 (b) | | | | | | 4,230,000 | | | | 4,293,450 |
| LB Pacific LP term loan 6.8044% 3/3/12 (b) | | | | 3,980,000 | | | | 4,029,750 |
| Universal Compression, Inc. term loan 7.5% | | | | | | | | |
| 2/15/12 (b) | | | | | | 1,055,500 | | | | 1,063,416 |
| Vulcan/Plains Resources, Inc. term loan 5.8492% | | | | | | | | |
| 8/12/11 (b) | | | | | | 540,000 | | | | 547,425 |
| | | | | | | | | | | 36,758,927 |
| Entertainment/Film 1.8% | | | | | | | | | | |
| MGM Holdings II, Inc. Tranche B, term loan 6.2704% | | | | | | | | |
| 4/8/12 (b) | | | | | | 8,550,000 | | | | 8,635,500 |
| Environmental – 1.4% | | | | | | | | | | |
| Allied Waste Industries, Inc.: | | | | | | | | | | |
| term loan 5.8505% 1/15/12 (b) | | | | | | 2,088,868 | | | | 2,107,146 |
| Tranche A, Credit-Linked Deposit 5.105% 1/15/12 (b) | | | | 789,324 | | | | 796,231 |
| Envirocare of Utah, Inc. Tranche 1, term loan 6.11% | | | | | | | | |
| 4/13/10 (b) | | | | | | 3,727,273 | | | | 3,787,841 |
| | | | | | | | | | | 6,691,218 |
| Food/Beverage/Tobacco – 1.8% | | | | | | | | | | |
| Centerplate, Inc. term loan 6.9252% 10/1/10 (b) | | | | 4,895,400 | | | | 4,932,116 |
| Commonwealth Brands, Inc. term loan 6.875% | | | | | | | | |
| 8/28/07 (b) | | | | | | 135,204 | | | | 137,570 |
| Constellation Brands, Inc. Tranche B, term loan 5.9093% | | | | | | | | |
| 11/30/11 (b) | | | | | | 2,297,889 | | | | 2,326,612 |
| Herbalife International, Inc. term loan 5.41% | | | | | | | | |
| 12/21/10 (b) | | | | | | 1,190,000 | | | | 1,201,900 |
| | | | | | | | | | | 8,598,198 |
| Gaming – 2.6% | | | | | | | | | | |
| BLB Worldwide Holdings, Inc.: | | | | | | | | | | |
| Tranche 1, term loan 6.079% 6/30/12 (b) | | | | 870,000 | | | | 883,050 |
| Tranche 2, term loan 7.83% 7/18/11 (b) | | | | 1,360,000 | | | | 1,385,500 |
| Green Valley Ranch Gaming LLC term loan 6.0204% | | | | | | | | |
| 12/17/11 (b) | | | | | | 2,176,056 | | | | 2,197,817 |
| Herbst Gaming, Inc. term loan 6.1973% 1/7/11 (b) | | | | 398,000 | | | | 402,478 |
| Isle of Capri Casinos, Inc. term loan 5.4859% | | | | | | | | |
| 2/4/11 (b) | | | | | | 198,500 | | | | 200,981 |
| Marina District Finance Co., Inc. term loan 5.5906% | | | | | | | | |
| 10/14/11 (b) | | | | | | 3,970,000 | | | | 3,994,813 |
| |
| |
| Annual Report | | 52 | | | | | | | | |
Floating Rate Loans (c) continued
| | | | | | |
| | | | | Principal | | Value |
| | | | | Amount | | |
| Gaming – continued | | | | | | |
| Motor City Casino Tranche B, term loan 5.9333% | | | | | | |
| 7/29/12 (b) | | $ | | 1,426,425 | | $ 1,438,906 |
| Resorts International Hotel & Casino, Inc. Tranche B1, | | | | | | |
| term loan 6.53% 4/26/12 (b) | | | | 783,465 | | 787,382 |
| Venetian Casino Resort LLC Tranche B, term loan | | | | | | |
| 5.7704% 6/15/11 (b) | | | | 900,000 | | 904,500 |
| | | | | | | 12,195,427 |
| Healthcare 9.8% | | | | | | |
| AMR HoldCo, Inc./ EmCare HoldCo, Inc. term loan | | | | | | |
| 6.1093% 2/7/12 (b) | | | | 3,283,500 | | 3,332,753 |
| Community Health Systems, Inc. term loan 5.61% | | | | | | |
| 8/19/11 (b) | | | | 3,964,962 | | 4,019,481 |
| CRC Health Corp. term loan 6.8125% 5/11/11 (b) | | | | 947,625 | | 952,363 |
| DaVita, Inc. Tranche B, term loan 4.1581% 7/30/12 (b) | | | | 7,686,275 | | 7,811,176 |
| Genoa Healthcare Group LLC Tranche 1, term loan | | | | | | |
| 7.2614% 8/4/12 (b) | | | | 1,421,000 | | 1,442,315 |
| HealthSouth Corp.: | | | | | | |
| Credit-Linked Deposit 6.2818% 6/14/07 (b) | | | | 807,500 | | 811,538 |
| term loan 6.53% 6/14/07 (b) | | | | 2,985,019 | | 2,999,944 |
| Lifecare Holdings, Inc. term loan 6.09% 8/11/12 (b) | | | | 1,260,000 | | 1,244,250 |
| LifePoint Hospitals, Inc. Tranche B, term loan 5.435% | | | | | | |
| 4/15/12 (b) | | | | 3,196,814 | | 3,224,787 |
| Mylan Laboratories, Inc. Tranche B, term loan 5.4% | | | | | | |
| 6/30/10 (b) | | | | 480,000 | | 486,600 |
| Newquest, Inc. Tranche A, term loan 6.66% 3/1/11 (b) | | | | 475,000 | | 480,938 |
| PacifiCare Health Systems, Inc. Tranche B, term loan | | | | | | |
| 5.2204% 12/6/10 (b) | | | | 6,947,500 | | 6,947,500 |
| Psychiatric Solutions, Inc. term loan 5.73% 7/1/12 (b) . | | | | 510,769 | | 516,515 |
| Skilled Healthcare Group, Inc. Tranche 2, term loan | | | | | | |
| 11.53% 12/15/12 (b) | | | | 3,000,000 | | 3,030,000 |
| Vicar Operating, Inc. term loan 5.375% 5/16/11 (b) | | | | 4,644,362 | | 4,690,806 |
| Warner Chilcott Corp. term loan 6.6701% 1/18/12 (b) | | | | 3,992,057 | | 4,012,017 |
| | | | | | | 46,002,983 |
| Homebuilding/Real Estate – 5.7% | | | | | | |
| CB Richard Ellis Services, Inc. term loan 5.1051% | | | | | | |
| 3/31/10 (b) | | | | 1,430,172 | | 1,440,898 |
| General Growth Properties, Inc. Tranche B, term loan | | | | | | |
| 5.85% 11/12/08 (b) | | | | 5,961,545 | | 6,050,968 |
| Lake Las Vegas LLC Tranche 1, term loan 6.3129% | | | | | | |
| 11/1/09 (b) | | | | 3,902,166 | | 3,960,699 |
| Lion Gables Realty LP term loan 5.63% 9/30/06 (b) | | | | 4,124,421 | | 4,150,199 |
| |
| |
| |
| 53 | | | | | | Annual Report |
| Investments (Unaudited) continued | | | | | | | | |
| |
Floating Rate Loans (c) continued
| | | | | | | | |
| | | | | | | Principal | | | | Value |
| | | | | | | Amount | | | | |
| Homebuilding/Real Estate – continued | | | | | | | | | | |
| LNR Property Corp. Tranche B, term loan 6.7112% | | | | | | | | |
| 2/3/08 (b) | | | | $ | | 3,919,880 | | $ | | 3,968,879 |
| Maguire Properties, Inc. Tranche B, term loan 5.4663% | | | | | | | | |
| 3/15/10 (b) | | | | | | 4,611,111 | | | | 4,651,458 |
| Shea Mountain House LLC Tranche B, term loan 5.8% | | | | | | | | |
| 5/11/11 (b) | | | | | | 2,430,000 | | | | 2,454,300 |
| | | | | | | | | | | 26,677,401 |
| Hotels 1.0% | | | | | | | | | | |
| Starwood Hotels & Resorts Worldwide, Inc. term loan | | | | | | | | |
| 5.0906% 10/9/06 (b) | | | | | | 4,893,939 | | | | 4,893,939 |
| Leisure – 0.7% | | | | | | | | | | |
| 24 Hour Fitness Worldwide, Inc. Tranche B, term loan | | | | | | | | |
| 6.78% 6/8/12 (b) | | | | | | 3,000,000 | | | | 3,045,000 |
| Mega Bloks, Inc. Tranche B, term loan 5.6034% | | | | | | | | |
| 7/26/12 (b) | | | | | | 440,000 | | | | 445,500 |
| | | | | | | | | | | 3,490,500 |
| Metals/Mining – 2.6% | | | | | | | | | | |
| Murray Energy Corp. Tranche 1, term loan 6.86% | | | | | | | | |
| 1/28/10 (b) | | | | | | 497,500 | | | | 501,231 |
| Novelis, Inc. term loan 5.46% 1/7/12 (b) | | | | | | 3,123,077 | | | | 3,158,212 |
| Peabody Energy Corp. term loan 4.625% 3/21/10 (b) . | | | | 2,947,385 | | | | 2,965,806 |
| Trout Coal Holdings LLC / Dakota Tranche 1, term loan | | | | | | | | |
| 6.0302% 3/23/11 (b) | | | | | | 5,676,487 | | | | 5,683,583 |
| | | | | | | | | | | 12,308,832 |
| Paper 2.9% | | | | | | | | | | |
| Escanaba Timber LLC term loan 6.43% 5/2/08 (b) | | | | 520,000 | | | | 525,850 |
| Georgia-Pacific Corp. term loan 5.3152% 7/2/09 (b) | | | | 1,000,000 | | | | 1,001,800 |
| Koch Cellulose LLC: | | | | | | | | | | |
| term loan 5.77% 5/7/11 (b) | | | | | | 1,952,469 | | | | 1,984,197 |
| Credit-Linked Deposit 5.1931% 5/7/11 (b) | | | | 602,945 | | | | 612,743 |
| Smurfit-Stone Container Enterprises, Inc.: | | | | | | | | | | |
| Credit-Linked Deposit 5.25% 11/1/10 (b) | | | | 655,111 | | | | 661,662 |
| Tranche B, term loan 5.6969% 11/1/11 (b) | | | | 5,208,155 | | | | 5,266,747 |
| Tranche C, term loan 5.8338% 11/1/11 (b) | | | | 1,923,018 | | | | 1,944,652 |
| Xerium Technologies, Inc. Tranche B, term loan 6.0204% | | | | | | | | |
| 5/18/12 (b) | | | | | | 1,496,250 | | | | 1,514,953 |
| | | | | | | | | | | 13,512,604 |
| Publishing/Printing – 3.0% | | | | | | | | | | |
| Dex Media West LLC/Dex Media West Finance Co. | | | | | | | | |
| Tranche B, term loan 5.5119% 3/9/10 (b) | | | | 6,513,707 | | | | 6,546,276 |
| |
| |
| |
| Annual Report | | 54 | | | | | | | | |
Floating Rate Loans (c) continued
| | | | | | | | |
| | | | | Principal | | | | Value |
| | | | | Amount | | | | |
| Publishing/Printing – continued | | | | | | | | |
| Liberty Group Operating, Inc. Tranche B, term loan 6% | | | | | | | | |
| 2/28/12 (b) | | $ | | 196,513 | | $ | | 198,478 |
| PRIMEDIA, Inc. Tranche B, term loan 6.1138% | | | | | | | | |
| 9/30/13 (b) | | | | 3,170,000 | | | | 3,197,738 |
| R.H. Donnelley Corp. Tranche B2, term loan 5.6181% | | | | | | | | |
| 6/30/11 (b) | | | | 4,287,315 | | | | 4,314,111 |
| | | | | | | | | 14,256,603 |
| Railroad 1.5% | | | | | | | | |
| Helm Holding Corp. Tranche 1, term loan 6.259% | | | | | | | | |
| 7/8/11 (b) | | | | 1,187,025 | | | | 1,198,895 |
| Kansas City Southern Railway Co. Tranche B1, term loan | | | | | | | | |
| 5.5903% 3/30/08 (b) | | | | 2,779,000 | | | | 2,820,685 |
| RailAmerica, Inc. term loan 5.875% 9/29/11 (b) | | | | 3,090,201 | | | | 3,144,280 |
| | | | | | | | | 7,163,860 |
| Restaurants 3.3% | | | | | | | | |
| Arby’s Restaurant Group, Inc. Tranche B, term loan | | | | | | | | |
| 6.1446% 7/25/12 (b) | | | | 3,990,000 | | | | 4,019,925 |
| Burger King Corp. Tranche B, term loan 5.5% | | | | | | | | |
| 6/30/12 (b) | | | | 1,845,375 | | | | 1,873,056 |
| Domino’s, Inc. term loan 5.8125% 6/25/10 (b) | | | | 4,809,121 | | | | 4,881,258 |
| Jack in the Box, Inc. term loan 5.4457% 1/8/11 (b) | | | | 3,117,746 | | | | 3,145,026 |
| Landry’s Seafood Restaurants, Inc. term loan 5.949% | | | | | | | | |
| 12/28/10 (b) | | | | 1,454,013 | | | | 1,470,370 |
| | | | | | | | | 15,389,635 |
| Services – 4.6% | | | | | | | | |
| Coinstar, Inc. term loan 5.55% 7/1/11 (b) | | | | 825,144 | | | | 837,521 |
| DynCorp term loan 6.7498% 2/11/11 (b) | | | | 1,995,000 | | | | 2,004,975 |
| Iron Mountain, Inc.: | | | | | | | | |
| term loan 5.625% 4/2/11 (b) | | | | 3,712,842 | | | | 3,749,970 |
| Tranche R, term loan 5.5313% 4/2/11 (b) | | | | 4,962,500 | | | | 5,012,125 |
| Knowledge Learning Corp. term loan 6.35% 1/7/12 (b) | | | | 4,050,907 | | | | 4,061,035 |
| Rural/Metro Corp.: | | | | | | | | |
| Credit-Linked Deposit 6.2% 3/4/11 (b) | | | | 520,882 | | | | 528,044 |
| term loan 6.0439% 3/4/11 (b) | | | | 1,904,941 | | | | 1,931,134 |
| United Rentals, Inc.: | | | | | | | | |
| term loan 6.0948% 2/14/11 (b) | | | | 2,836,779 | | | | 2,865,147 |
| Tranche B, Credit-Linked Deposit 5.4925% | | | | | | | | |
| 2/14/11 (b) | | | | 575,996 | | | | 581,756 |
| | | | | | | | | 21,571,707 |
55 Annual Report
| Investments (Unaudited) continued | | | | | | | | |
| |
Floating Rate Loans (c) continued
| | | | | | | | |
| | | | | Principal | | | | Value |
| | | | | Amount | | | | |
| Shipping – 0.1% | | | | | | | | |
| Baker Tanks, Inc. term loan 6.4731% 1/30/11 (b) | | $ | | 248,750 | | $ | | 250,616 |
| Ozburn Hessey Holding Co. LLC term loan 6.3406% | | | | | | | | |
| 8/9/12 (b) | | | | 370,000 | | | | 375,550 |
| | | | | | | | | 626,166 |
| Technology – 7.8% | | | | | | | | |
| AMI Semiconductor, Inc. term loan 5.3406% 4/1/12 (b) | | | | 2,090,751 | | | | 2,095,978 |
| Fairchild Semiconductor Corp. Tranche B3, term loan | | | | | | | | |
| 5.605% 12/31/10 (b) | | | | 2,055,157 | | | | 2,078,277 |
| Fidelity National Information Solutions, Inc. Tranche B, | | | | | | | | |
| term loan 5.4771% 3/9/13 (b) | | | | 5,471,500 | | | | 5,498,858 |
| Infor Global Solutions AG Tranche 1, term loan 6.943% | | | | | | | | |
| 4/18/11 (b) | | | | 6,000,000 | | | | 6,060,000 |
| ON Semiconductor Corp. Tranche G, term loan | | | | | | | | |
| 7.0625% 12/15/11 (b) | | | | 2,977,500 | | | | 3,022,163 |
| SSA Global Technologies, Inc. term loan 5.97% | | | | | | | | |
| 9/22/11 (b) | | | | 2,180,000 | | | | 2,190,900 |
| SunGard Data Systems, Inc. Tranche B, term loan 6.28% | | | | | | | | |
| 2/10/13 (b) | | | | 14,962,500 | | | | 15,149,520 |
| UGS Holdings, Inc. Tranche C, term loan 5.84% | | | | | | | | |
| 3/31/12 (b) | | | | 464,828 | | | | 471,219 |
| | | | | | | | | 36,566,915 |
| Telecommunications – 5.4% | | | | | | | | |
| AAT Communications Corp.: | | | | | | | | |
| Tranche 2, term loan 6.61% 7/29/13 (b) | | | | 300,000 | | | | 305,625 |
| Tranche B1, term loan 5.61% 7/27/12 (b) | | | | 1,850,000 | | | | 1,875,438 |
| Alaska Communications Systems Holding term loan | | | | | | | | |
| 6.0204% 2/1/12 (b) | | | | 7,100,000 | | | | 7,188,750 |
| American Tower LP Tranche C, term loan 4.9601% | | | | | | | | |
| 8/31/11 (b) | | | | 2,567,100 | | | | 2,570,309 |
| Conversant Holdings, Inc. Tranche B, term loan 7.8144% | | | | | | | | |
| 3/31/11 (b) | | | | 1,925,000 | | | | 1,920,188 |
| Intelsat Ltd. term loan 5.8125% 7/28/11 (b) | | | | 3,228,410 | | | | 3,260,694 |
| Madison River Capital LLC/Madison River Finance Corp. | | | | | | | | |
| Tranche B, term loan 6.22% 7/29/12 (b) | | | | 1,270,000 | | | | 1,290,638 |
| New Skies Satellites BV term loan 5.8888% 5/2/11 (b) . | | | | 1,327,565 | | | | 1,347,479 |
| NTELOS, Inc.: | | | | | | | | |
| term loan 9.03% 2/24/12 (b) | | | | 200,000 | | | | 199,250 |
| Tranche B, term loan 6.53% 8/24/11 (b) | | | | 992,500 | | | | 1,003,666 |
| Qwest Corp. Tranche A, term loan 8.53% 6/30/07 (b) . | | | | 1,600,000 | | | | 1,650,000 |
Floating Rate Loans (c) continued
| | | | | | |
| | | | | Principal | | Value |
| | | | | Amount | | |
| Telecommunications – continued | | | | | | |
| SpectraSite Communications, Inc. Tranche B, term loan | | | | | | |
| 5.27% 5/19/12 (b) | | $ | | 1,985,000 | | $ 1,987,481 |
| Valor Telecommunications Enterprises LLC/Valor Finance | | | | | | |
| Corp. Tranche B, term loan 5.7754% 2/14/12 (b) | | | | 773,333 | | 783,967 |
| | | | | | | 25,383,485 |
| Textiles & Apparel – 0.3% | | | | | | |
| St. John Knits International, Inc. Tranche B, term loan | | | | | | |
| 6.5401% 3/23/12 (b) | | | | 497,500 | | 503,719 |
| William Carter Co. term loan 5.7178% 6/29/12 (b) | | | | 796,875 | | 808,828 |
| | | | | | | 1,312,547 |
| |
| TOTAL FLOATING RATE LOANS | | | | | | |
| (Cost $419,395,818) | | | | | | 421,984,398 |
| |
| Nonconvertible Bonds 7.9% | | | | | | |
| |
| Automotive 2.5% | | | | | | |
| General Motors Acceptance Corp.: | | | | | | |
| 4.6769% 5/18/06 (b) | | | | 2,000,000 | | 1,989,398 |
| 4.87% 10/20/05 (b) | | | | 5,000,000 | | 5,000,060 |
| 5.11% 9/23/08 (b) | | | | 3,000,000 | | 2,779,644 |
| 6.75% 1/15/06 | | | | 2,000,000 | | 2,010,456 |
| | | | | | | 11,779,558 |
| Diversified Financial Services – 1.1% | | | | | | |
| Residential Capital Corp. 5.385% 6/29/07 (a)(b) | | | | 5,000,000 | | 5,041,365 |
| Super Retail – 1.1% | | | | | | |
| GSC Holdings Corp./Gamestop, Inc. 7.875% | | | | | | |
| 10/1/11 (a)(b) | | | | 5,000,000 | | 5,037,500 |
| Technology – 1.3% | | | | | | |
| Nortel Networks Corp. 6.125% 2/15/06 | | | | 5,000,000 | | 5,025,000 |
| SunGard Data Systems, Inc. 8.5248% 8/15/13 (a)(b) | | | | 1,090,000 | | 1,124,063 |
| | | | | | | 6,149,063 |
| Telecommunications – 1.9% | | | | | | |
| Qwest Corp. 7.12% 6/15/13 (a)(b) | | | | 2,840,000 | | 2,953,600 |
| Rogers Communications, Inc. 6.995% 12/15/10 (b) | | | | 6,000,000 | | 6,217,500 |
| | | | | | | 9,171,100 |
| |
| TOTAL NONCONVERTIBLE BONDS | | | | | | |
| (Cost $37,125,822) | | | | | | 37,178,586 |
57 Annual Report
| Investments (Unaudited) continued | | | | |
| |
Cash Equivalents 7.7%
| | | | | | |
| | | | | Maturity | | Value |
| | | | | Amount | | |
| Investments in repurchase agreements (Collateralized by U.S. | | | | |
| Government Obligations, in a joint trading account at | | | | |
| 3.89%, dated 9/30/05 due 10/3/05) | | | | | | |
| (Cost $36,404,000) | | | | $36,415,815 | | $36,404,000 |
| TOTAL INVESTMENT PORTFOLIO 105.2% | | | | |
| (Cost $492,925,640) | | | | | | 495,566,984 |
| |
| NET OTHER ASSETS – (5.2)% | | | | | | (24,405,171) |
| NET ASSETS 100% | | | | | | $ 471,161,813 |
(a) Security exempt from registration under
Rule 144A of the Securities Act of 1933.
These securities may be resold in
transactions exempt from registration,
normally to qualified institutional buyers.
At the period end, the value of these
securities amounted to $14,156,528 or
3.0% of net assets.
(b) The coupon rate shown on floating or
adjustable rate securities represents the
rate at period end.
(c) Remaining maturities of floating rate
loans may be less than the stated
maturities shown as a result of
contractual or optional prepayments by
the borrower. Such prepayments cannot
be predicted with certainty.
|
Fidelity Ultra-Short Central Fund
Investments September 30, 2005 (Unaudited)
Showing Percentage of Net Assets
|
| Nonconvertible Bonds 4.8% | | | | |
| | | Principal | | Value |
| | | Amount | | |
| |
| CONSUMER DISCRETIONARY – 1.1% | | | | |
| Auto Components 0.3% | | | | |
| DaimlerChrysler NA Holding Corp.: | | | | |
| 4.3138% 9/10/07 (d) | | $16,665,000 | | $ 16,704,263 |
| 4.43% 5/24/06 (d) | | 4,700,000 | | 4,713,090 |
| | | | | 21,417,353 |
| Media – 0.8% | | | | |
| Continental Cablevision, Inc. 8.3% 5/15/06 | | 8,000,000 | | 8,183,384 |
| Cox Communications, Inc. (Reg. S) 4.4069% 12/14/07 (d) | | . 12,140,000 | | 12,222,965 |
| Cox Radio, Inc. 6.625% 2/15/06 | | 5,575,000 | | 5,612,319 |
| Liberty Media Corp. 5.37% 9/17/06 (d) | | 16,694,000 | | 16,816,200 |
| Univision Communications, Inc. 2.875% 10/15/06 | | 8,505,000 | | 8,336,763 |
| | | | | 51,171,631 |
| |
| TOTAL CONSUMER DISCRETIONARY | | | | 72,588,984 |
| |
| ENERGY 0.2% | | | | |
| Oil, Gas & Consumable Fuels – 0.2% | | | | |
| Valero Energy Corp. 7.375% 3/15/06 | | 11,550,000 | | 11,671,298 |
| |
| FINANCIALS – 1.5% | | | | |
| Capital Markets 0.2% | | | | |
| State Street Capital Trust II 4.29% 2/15/08 (d) | | 10,000,000 | | 10,007,360 |
| Commercial Banks – 0.2% | | | | |
| Wells Fargo & Co. 3.8738% 3/10/08 (d) | | 16,600,000 | | 16,600,166 |
| Consumer Finance – 0.5% | | | | |
| General Motors Acceptance Corp. 4.87% 10/20/05 (d) | | 14,765,000 | | 14,765,177 |
| MBNA Europe Funding PLC 3.97% 9/7/07 (a)(d) | | 19,925,000 | | 19,915,914 |
| | | | | 34,681,091 |
| Thrifts & Mortgage Finance – 0.6% | | | | |
| Countrywide Financial Corp. 3.71% 4/11/07 (d) | | 11,025,000 | | 11,037,105 |
| Residential Capital Corp. 5.385% 6/29/07 (a)(d) | | 14,150,000 | | 14,267,063 |
| Washington Mutual Bank 3.9363% 8/25/08 (d) | | 16,325,000 | | 16,330,126 |
| | | | | 41,634,294 |
| |
| TOTAL FINANCIALS | | | | 102,922,911 |
| |
| TELECOMMUNICATION SERVICES – 1.1% | | | | |
| Diversified Telecommunication Services – 1.0% | | | | |
| British Telecommunications PLC 7.875% 12/15/05 | | 18,145,000 | | 18,268,277 |
| |
| |
| |
| 59 | | | | Annual Report |
| Investments (Unaudited) continued | | | | |
| |
Nonconvertible Bonds continued
| | | | | | |
| | | | | | | Principal | | Value |
| | | | | | | Amount | | |
| |
| TELECOMMUNICATION SERVICES – continued | | | | | | |
| Diversified Telecommunication Services – continued | | | | | | |
| France Telecom SA 7.2% 3/1/06 | | | | $ | | 5,600,000 | | $ 5,664,966 |
| GTE Corp. 6.36% 4/15/06 | | | | | | 9,000,000 | | 9,087,354 |
| SBC Communications, Inc. 4.389% 6/5/06 (a) | | | | 15,315,000 | | 15,296,316 |
| Sprint Capital Corp. 4.78% 8/17/06 | | | | | | 6,000,000 | | 6,009,276 |
| Telefonos de Mexico SA de CV 4.5% 11/19/08 | | | | 10,240,000 | | 10,107,679 |
| TELUS Corp. yankee 7.5% 6/1/07 | | | | | | 6,500,000 | | 6,787,638 |
| | | | | | | | | 71,221,506 |
| Wireless Telecommunication Services – 0.1% | | | | | | |
| AT&T Wireless Services, Inc. 7.35% 3/1/06 | | | | 5,500,000 | | 5,563,866 |
| |
| TOTAL TELECOMMUNICATION SERVICES | | | | | | 76,785,372 |
| |
| UTILITIES – 0.9% | | | | | | | | |
| Electric Utilities – 0.2% | | | | | | | | |
| Pinnacle West Energy Corp. 4.0044% 4/1/07 (a)(d) | | | | 12,800,000 | | 12,800,000 |
| Gas Utilities 0.1% | | | | | | | | |
| NiSource Finance Corp. 7.625% 11/15/05 | | | | 9,250,000 | | 9,284,012 |
| Multi-Utilities – 0.6% | | | | | | | | |
| Dominion Resources, Inc. 4.27% 9/28/07 (d) | | | | 17,150,000 | | 17,145,301 |
| DTE Energy Co. 6.45% 6/1/06 | | | | | | 13,190,000 | | 13,350,324 |
| Sempra Energy 4.75% 5/15/09 | | | | | | 5,500,000 | | 5,461,247 |
| | | | | | | | | 35,956,872 |
| |
| TOTAL UTILITIES | | | | | | | | 58,040,884 |
| |
| TOTAL NONCONVERTIBLE BONDS | | | | | | | | |
| (Cost $322,361,771) | | | | | | | | 322,009,449 |
| |
| U.S. Government Agency Obligations 0.0% | | | | |
| |
| Federal Home Loan Bank 0% 12/28/05 (c) | | | | | | |
| (Cost $1,981,349) | | | | | | 2,000,000 | | 1,981,988 |
| |
| Asset Backed Securities 33.0% | | | | | | |
| |
| Accredited Mortgage Loan Trust: | | | | | | | | |
| Series 2004-2 Class A2, 4.13% 7/25/34 (d) | | | | 7,454,076 | | 7,464,885 |
| Series 2004-3 Class 2A4, 4.18% 10/25/34 (d) | | | | 10,915,000 | | 10,939,272 |
| Series 2004-4 Class A2D, 4.18% 1/25/35 (d) | | | | 3,210,800 | | 3,218,701 |
| |
| |
| |
| Annual Report | | 60 | | | | | | |
Asset Backed Securities continued
| | | | |
| | | Principal | | Value |
| | | Amount | | |
| Accredited Mortgage Loan Trust: – continued | | | | |
| Series 2005-1: | | | | |
| Class M1, 4.3% 4/25/35 (d) | | $11,280,000 | | $ 11,284,074 |
| Class M2, 4.52% 4/25/35 (d) | | 5,275,000 | | 5,288,969 |
| ACE Securities Corp.: | | | | |
| Series 2002-HE1 Class M1, 4.48% 6/25/32 (d) | | 1,842,987 | | 1,860,106 |
| Series 2002-HE2 Class M1, 4.68% 8/25/32 (d) | | 18,631,213 | | 18,689,976 |
| Series 2003-FM1 Class M2, 5.68% 11/25/32 (d) | | 3,015,000 | | 3,044,567 |
| Series 2003-HS1: | | | | |
| Class M1, 4.58% 6/25/33 (d) | | 800,000 | | 803,891 |
| Class M2, 5.58% 6/25/33 (d) | | 856,000 | | 870,466 |
| Series 2003-NC1 Class M1, 4.61% 7/25/33 (d) | | 1,600,000 | | 1,608,662 |
| Series 2004-HE1: | | | | |
| Class M1, 4.33% 2/25/34 (d) | | 2,193,000 | | 2,194,100 |
| Class M2, 4.93% 2/25/34 (d) | | 2,475,000 | | 2,476,472 |
| Series 2004-OP1: | | | | |
| Class M1, 4.35% 4/25/34 (d) | | 4,420,000 | | 4,424,381 |
| Class M2, 4.88% 4/25/34 (d) | | 6,240,000 | | 6,332,494 |
| Series 2005-HE2: | | | | |
| Class M1, 4.27% 4/25/35 (d) | | 1,530,000 | | 1,529,959 |
| Class M2, 4.28% 4/25/35 (d) | | 1,803,000 | | 1,802,229 |
| Class M3, 4.31% 4/25/35 (d) | | 1,040,000 | | 1,041,214 |
| Class M4, 4.47% 4/25/35 (d) | | 1,340,000 | | 1,341,550 |
| Series 2005-HE3: | | | | |
| Class A2A, 3.93% 5/25/35 (d) | | 7,170,954 | | 7,171,304 |
| Class A2B, 4.04% 5/25/35 (d) | | 4,370,000 | | 4,367,703 |
| Series 2005-SD1 Class A1, 4.23% 11/25/50 (d) | | 2,337,292 | | 2,340,041 |
| Aesop Funding II LLC Series 2005-1A Class A2, 3.8563% | | | | |
| 4/20/09 (a)(d) | | 8,800,000 | | 8,800,906 |
| American Express Credit Account Master Trust: | | | | |
| Series 2002-6 Class B, 4.2181% 3/15/10 (d) | | 5,000,000 | | 5,028,652 |
| Series 2004-1 Class B, 4.0181% 9/15/11 (d) | | 5,775,000 | | 5,797,497 |
| Series 2004-C Class C, 4.2681% 2/15/12 (a)(d) | | 14,647,039 | | 14,680,928 |
| Series 2005-1 Class A, 3.7981% 10/15/12 (d) | | 15,455,000 | | 15,483,856 |
| Series 2005-6 Class C, 4.0181% 3/15/11 (a)(d) | | 9,085,000 | | 9,087,816 |
| AmeriCredit Automobile Receivables Trust: | | | | |
| Series 2002-EM Class A4A, 3.67% 6/8/09 | | 25,000,000 | | 24,882,623 |
| Series 2003-AM Class A4B, 4.15% 11/6/09 (d) | | 11,965,573 | | 11,999,441 |
| Series 2003-BX Class A4B, 3.9688% 1/6/10 (d) | | 3,265,000 | | 3,273,821 |
| Series 2003-CF Class A3, 2.75% 10/9/07 | | 8,861,691 | | 8,837,682 |
| Series 2005-1 Class C, 4.73% 7/6/10 | | 15,500,000 | | 15,420,941 |
| Ameriquest Mortgage Securities, Inc.: | | | | |
| Series 2002-3 Class M1, 4.53% 8/25/32 (d) | | 2,969,781 | | 2,983,343 |
| |
| |
| 61 | | | | Annual Report |
| Investments (Unaudited) continued | | | | | | | | |
| |
Asset Backed Securities continued
| | | | | | | | |
| | | | | | | Principal | | | | Value |
| | | | | | | Amount | | | | |
| Ameriquest Mortgage Securities, Inc.: – continued | | | | | | | | |
| Series 2003-1: | | | | | | | | | | |
| Class A2, 4.24% 2/25/33 (d) | | | | $ | | 200,427 | | $ | | 200,481 |
| Class M1, 4.73% 2/25/33 (d) | | | | | | 6,150,000 | | | | 6,188,493 |
| Series 2003-3 Class M1, 4.63% 3/25/33 (d) | | | | 1,590,000 | | | | 1,598,400 |
| Series 2003-6: | | | | | | | | | | |
| Class M1, 4.59% 8/25/33 (d) | | | | | | 7,560,000 | | | | 7,610,158 |
| Class M2, 5.68% 5/25/33 (d) | | | | | | 2,750,000 | | | | 2,804,670 |
| Series 2003-AR1 Class M1, 4.98% 1/25/33 (d) | | | | 7,000,000 | | | | 7,068,037 |
| Series 2004-R2: | | | | | | | | | | |
| Class M1, 4.26% 4/25/34 (d) | | | | | | 1,230,000 | | | | 1,229,969 |
| Class M2, 4.31% 4/25/34 (d) | | | | | | 950,000 | | | | 949,976 |
| Class M3, 4.38% 4/25/34 (d) | | | | | | 3,500,000 | | | | 3,499,912 |
| Class M4, 4.88% 4/25/34 (d) | | | | | | 4,500,000 | | | | 4,499,883 |
| Series 2004-R9 Class A3, 4.15% 10/25/34 (d) | | | | 9,206,545 | | | | 9,219,109 |
| Series 2005-R1: | | | | | | | | | | |
| Class M1, 4.28% 3/25/35 (d) | | | | | | 5,710,000 | | | | 5,707,639 |
| Class M2, 4.31% 3/25/35 (d) | | | | | | 1,925,000 | | | | 1,924,232 |
| Series 2005-R2 Class M1, 4.28% 4/25/35 (d) | | | | 12,500,000 | | | | 12,499,668 |
| Amortizing Residential Collateral Trust: | | | | | | | | |
| Series 2002-BC3 Class A, 4.16% 6/25/32 (d) | | | | 2,411,175 | | | | 2,418,320 |
| Series 2002-BC6 Class M1, 4.58% 8/25/32 (d) | | | | 24,900,000 | | | | 25,095,555 |
| Series 2002-BC7: | | | | | | | | | | |
| Class M1, 4.63% 10/25/32 (d) | | | | | | 10,000,000 | | | | 10,028,130 |
| Class M2, 4.73% 10/25/32 (d) | | | | | | 5,575,000 | | | | 5,605,898 |
| Series 2002-BC1 Class M2, 4.93% 1/25/32 (d) | | | | 758,836 | | | | 762,053 |
| ARG Funding Corp.: | | | | | | | | | | |
| Series 2005-1A Class A2, 3.8963% 4/20/09 (a)(d) | | | | 11,000,000 | | | | 10,975,938 |
| Series 2005-2A Class A2, 3.9063% 5/20/09 (a)(d) | | | | 5,200,000 | | | | 5,190,453 |
| Argent Securities, Inc.: | | | | | | | | | | |
| Series 2003-W3 Class M2, 5.63% 9/25/33 (d) | | | | 20,000,000 | | | | 20,596,100 |
| Series 2003-W7 Class A2, 4.22% 3/1/34 (d) | | | | 3,948,904 | | | | 3,957,510 |
| Series 2004-W5 Class M1, 4.43% 4/25/34 (d) | | | | 3,960,000 | | | | 3,964,674 |
| Series 2004-W7: | | | | | | | | | | |
| Class M1, 4.38% 5/25/34 (d) | | | | | | 4,085,000 | | | | 4,084,893 |
| Class M2, 4.43% 5/25/34 (d) | | | | | | 3,320,000 | | | | 3,319,914 |
| Asset Backed Securities Corp. Home Equity Loan Trust: | | | | | | | | |
| Series 2003-HE2: | | | | | | | | | | |
| Class A2, 4.1481% 4/15/33 (d) | | | | | | 664,884 | | | | 664,968 |
| Class M1, 4.6681% 4/15/33 (d) | | | | 11,365,000 | | | | 11,414,716 |
| Series 2003-HE3: | | | | | | | | | | |
| Class M1, 4.5981% 6/15/33 (d) | | | | 2,185,000 | | | | 2,196,793 |
| Class M2, 5.7681% 6/15/33 (d) | | | | 10,000,000 | | | | 10,168,072 |
| |
| |
| Annual Report | | 62 | | | | | | | | |
Asset Backed Securities continued
| | | | | | | | |
| | | | | Principal | | | | Value |
| | | | | Amount | | | | |
| Asset Backed Securities Corp. Home Equity Loan Trust: - | | | | | | | | |
| continued | | | | | | | | |
| Series 2003-HE4 Class M2, 5.7681% 8/15/33 (d) | | $ | | 5,695,000 | | $ | | 5,779,144 |
| Series 2003-HE5 Class A2A, 4.1281% 8/15/33 (d) | | | | 347,110 | | | | 347,153 |
| Series 2003-HE6 Class M1, 4.48% 11/25/33 (d) | | | | 3,475,000 | | | | 3,497,595 |
| Series 2004-HE2 Class M1, 4.38% 4/25/34 (d) | | | | 6,060,000 | | | | 6,083,075 |
| Series 2004-HE3: | | | | | | | | |
| Class M1, 4.37% 6/25/34 (d) | | | | 1,450,000 | | | | 1,457,158 |
| Class M2, 4.95% 6/25/34 (d) | | | | 3,350,000 | | | | 3,391,294 |
| Series 2004-HE6 Class A2, 4.19% 6/25/34 (d) | | | | 15,110,414 | | | | 15,141,786 |
| Series 2005-HE2: | | | | | | | | |
| Class M1, 4.28% 3/25/35 (d) | | | | 8,250,000 | | | | 8,259,768 |
| Class M2, 4.33% 3/25/35 (d) | | | | 2,065,000 | | | | 2,070,757 |
| Series 2005-HE3 Class A4, 4.03% 4/25/35 (d) | | | | 11,650,000 | | | | 11,649,725 |
| Series 2005-HE6 Class A2B, 4.08% 7/25/35 (d) | | | | 10,000,000 | | | | 10,009,980 |
| Bank One Issuance Trust: | | | | | | | | |
| Series 2002-B1 Class B1, 4.1481% 12/15/09 (d) | | | | 20,655,000 | | | | 20,734,158 |
| Series 2002-B3 Class B, 4.1281% 8/15/08 (d) | | | | 14,500,000 | | | | 14,503,495 |
| Series 2002-C1 Class C1, 4.7281% 12/15/09 (d) | | | | 7,980,000 | | | | 8,063,633 |
| Series 2003-C4 Class C4, 4.7981% 2/15/11 (d) | | | | 14,910,000 | | | | 15,197,991 |
| Bayview Financial Acquisition Trust Series 2004-C | | | | | | | | |
| Class A1, 4.2575% 5/28/44 (d) | | | | 7,735,211 | | | | 7,751,217 |
| Bayview Financial Asset Trust Series 2003-F Class A, | | | | | | | | |
| 4.3375% 9/28/43 (d) | | | | 9,005,591 | | | | 9,025,757 |
| Bayview Financial Mortgage Loan Trust Series 2004-A Class | | | | | | | | |
| A, 4.2875% 2/28/44 (d) | | | | 5,177,035 | | | | 5,186,096 |
| Bear Stearns Asset Backed Securities, Inc. Series 2005-3 | | | | | | | | |
| Class A1, 4.28% 9/25/35 (d) | | | | 4,051,990 | | | | 4,051,990 |
| Bear Stearns Asset Backed Securities I: | | | | | | | | |
| Series 2005-HE2: | | | | | | | | |
| Class M1, 4.33% 2/25/35 (d) | | | | 6,655,000 | | | | 6,657,302 |
| Class M2, 4.58% 2/25/35 (d) | | | | 2,430,000 | | | | 2,438,309 |
| Series 2005-HE5 Class 1A1, 3.94% 6/25/35 (d) | | | | 9,315,999 | | | | 9,314,540 |
| Capital Auto Receivables Asset Trust: | | | | | | | | |
| Series 2002-5 Class B, 2.8% 4/15/08 | | | | 2,439,941 | | | | 2,415,147 |
| Series 2003-1 Class B, 4.2381% 6/15/10 (a)(d) | | | | 4,946,375 | | | | 4,959,105 |
| Series 2003-2 Class B, 4.0481% 1/15/09 (d) | | | | 2,369,381 | | | | 2,373,293 |
| Series 2005-1 Class B, 4.1431% 6/15/10 (d) | | | | 5,725,000 | | | | 5,757,133 |
| Capital One Auto Finance Trust: | | | | | | | | |
| Series 2003-A Class A4B, 4.0481% 1/15/10 (d) | | | | 9,630,000 | | | | 9,651,642 |
| Series 2004-B Class A4, 3.8781% 8/15/11 (d) | | | | 16,300,000 | | | | 16,304,722 |
63 Annual Report
| Investments (Unaudited) continued | | | | | | | | |
| |
Asset Backed Securities continued
| | | | | | | | |
| | | | | | | Principal | | | | Value |
| | | | | | | Amount | | | | |
| Capital One Master Trust: | | | | | | | | | | |
| Series 1999-3 Class B, 4.2481% 9/15/09 (d) | | $ | | 5,000,000 | | $ | | 5,001,993 |
| Series 2001-1 Class B, 4.2781% 12/15/10 (d) | | | | 19,500,000 | | | | 19,636,007 |
| Series 2001-8A Class B, 4.3181% 8/17/09 (d) | | | | 9,585,000 | | | | 9,627,823 |
| Series 2002-4A Class B, 4.2681% 3/15/10 (d) | | | | 6,000,000 | | | | 6,026,994 |
| Capital One Multi-Asset Execution Trust Series 2003-B1 Class | | | | | | | | |
| B1, 4.9381% 2/17/09 (d) | | | | | | 15,470,000 | | | | 15,540,698 |
| Capital Trust Ltd. Series 2004-1: | | | | | | | | | | |
| Class A2, 4.2463% 7/20/39 (a)(d) | | | | 2,968,000 | | | | 2,974,368 |
| Class B, 4.5463% 7/20/39 (a)(d) | | | | | | 1,550,000 | | | | 1,553,325 |
| Class C, 4.8963% 7/20/39 (a)(d) | | | | | | 1,994,000 | | | | 1,998,276 |
| CDC Mortgage Capital Trust: | | | | | | | | | | |
| Series 2001-HE1 Class M1, 4.86% 1/25/32 (d) | | | | 3,470,154 | | | | 3,471,347 |
| Series 2002-HE2 Class M1, 4.53% 1/25/33 (d) | | | | 9,278,431 | | | | 9,305,483 |
| Series 2002-HE3: | | | | | | | | | | |
| Class M1, 4.93% 3/25/33 (d) | | | | | | 21,339,884 | | | | 21,583,539 |
| Class M2, 5.8913% 3/25/33 (d) | | | | 9,968,976 | | | | 10,111,477 |
| Series 2003-HE1: | | | | | | | | | | |
| Class M1, 4.5413% 8/25/33 (d) | | | | 1,907,142 | | | | 1,913,922 |
| Class M2, 5.5913% 8/25/33 (d) | | | | 4,369,996 | | | | 4,416,852 |
| Series 2003-HE2 Class A, 3.9913% 10/25/33 (d) | | | | 1,011,328 | | | | 1,011,776 |
| Series 2003-HE3: | | | | | | | | | | |
| Class M1, 4.53% 11/25/33 (d) | | | | | | 2,254,989 | | | | 2,275,897 |
| Class M2, 5.58% 11/25/33 (d) | | | | | | 1,719,992 | | | | 1,749,395 |
| Series 2004-HE2 Class M2, 5.03% 7/26/34 (d) | | | | 2,345,000 | | | | 2,366,343 |
| Cendant Timeshare Receivables Funding LLC Series 2005 1A | | | | | | | | |
| Class 2A2, 3.9763% 5/20/17 (a)(d) | | | | 9,256,185 | | | | 9,256,185 |
| Chase Credit Card Owner Trust: | | | | | | | | | | |
| Series 2001-6 Class B, 4.2481% 3/16/09 (d) | | | | 1,305,000 | | | | 1,310,645 |
| Series 2002-6 Class B, 4.1181% 1/15/08 (d) | | | | 11,850,000 | | | | 11,850,281 |
| Series 2003-6 Class C, 4.5681% 2/15/11 (d) | | | | 16,400,000 | | | | 16,641,039 |
| Series 2004-1 Class B, 3.9681% 5/15/09 (d) | | | | 4,105,000 | | | | 4,104,601 |
| Citibank Credit Card Issuance Trust: | | | | | | | | | | |
| Series 2000-C2 Class C2, 4.2488% 10/15/07 (d) | | | | 17,500,000 | | | | 17,499,286 |
| Series 2001-B2 Class B2, 4.3038% 12/10/08 (d) | | | | 11,945,000 | | | | 11,995,489 |
| Series 2002-B1 Class B1, 4.2906% 6/25/09 (d) | | | | 9,010,000 | | | | 9,041,853 |
| Series 2002-C1 Class C1, 4.7369% 2/9/09 (d) | | | | 17,500,000 | | | | 17,675,320 |
| Series 2003-B1 Class B1, 4.0763% 3/7/08 (d) | | | | 25,000,000 | | | | 25,035,435 |
| Series 2003-C1 Class C1, 4.65% 4/7/10 (d) | | | | 17,785,000 | | | | 18,159,908 |
| Citigroup Mortgage Loan Trust Series 2003-HE4 | | | | | | | | |
| Class A, 4.24% 12/25/33 (a)(d) | | | | | | 7,601,624 | | | | 7,602,413 |
| CNH Wholesale Master Note Trust Series 2005-1: | | | | | | | | |
| Class A, 3.8781% 6/15/11 (d) | | | | | | 18,000,000 | | | | 17,997,386 |
| |
| |
| Annual Report | | 64 | | | | | | | | |
Asset Backed Securities continued
| | | | | | |
| | | | | Principal | | Value |
| | | | | Amount | | |
| CNH Wholesale Master Note Trust Series 2005-1: - | | | | | | |
| continued | | | | | | |
| Class B, 4.1681% 6/15/11 (d) | | $ | | 2,280,000 | | $ 2,279,668 |
| Countrywide Home Loans, Inc.: | | | | | | |
| Series 2002-6 Class AV1, 4.26% 5/25/33 (d) | | | | 1,255,649 | | 1,258,682 |
| Series 2003-BC1 Class M2, 5.83% 9/25/32 (d) | | | | 11,065,000 | | 11,184,059 |
| Series 2003-SD3 Class A1, 4.25% 12/25/32 (a)(d) | | | | 752,994 | | 756,713 |
| Series 2004-2 Class M1, 4.33% 5/25/34 (d) | | | | 5,200,000 | | 5,209,564 |
| Series 2004-3: | | | | | | |
| Class 3A4, 4.08% 8/25/34 (d) | | | | 445,702 | | 444,067 |
| Class M1, 4.33% 6/25/34 (d) | | | | 1,475,000 | | 1,476,401 |
| Series 2004-4: | | | | | | |
| Class A, 4.2% 8/25/34 (d) | | | | 2,130,303 | | 2,132,323 |
| Class M1, 4.31% 7/25/34 (d) | | | | 3,650,000 | | 3,660,809 |
| Class M2, 4.36% 6/25/34 (d) | | | | 4,395,000 | | 4,399,618 |
| Series 2005-1: | | | | | | |
| Class 1AV2, 4.03% 7/25/35 (d) | | | | 8,780,000 | | 8,777,753 |
| Class M1, 4.25% 8/25/35 (d) | | | | 19,600,000 | | 19,586,004 |
| Class MV1, 4.23% 7/25/35 (d) | | | | 3,135,000 | | 3,133,802 |
| Class MV2, 4.27% 7/25/35 (d) | | | | 3,765,000 | | 3,762,360 |
| Class MV3, 4.31% 7/25/35 (d) | | | | 1,560,000 | | 1,561,512 |
| Series 2005-3 Class MV1, 4.25% 8/25/35 (d) | | | | 11,125,000 | | 11,116,813 |
| Series 2005-AB1 Class A2, 4.04% 8/25/35 (d) | | | | 17,520,000 | | 17,515,387 |
| Series 2005-BC1 Class 2A2, 4.03% 5/25/35 (d) | | | | 8,375,000 | | 8,376,323 |
| Series 2005-IM1 Class A1, 3.96% 11/25/35 (d) | | | | 16,452,556 | | 16,453,841 |
| CS First Boston Mortgage Securities Corp.: | | | | | | |
| Series 2003-8 Class A2, 4.22% 4/25/34 (d) | | | | 2,207,328 | | 2,216,663 |
| Series 2004-FRE1: | | | | | | |
| Class A2, 4.18% 4/25/34 (d) | | | | 1,945,674 | | 1,945,630 |
| Class M3, 4.48% 4/25/34 (d) | | | | 5,885,000 | | 5,884,847 |
| Discover Card Master Trust I Series 2003-4 Class B1, | | | | | | |
| 4.0981% 5/16/11 (d) | | | | 8,155,000 | | 8,200,894 |
| Fannie Mae guaranteed REMIC pass thru certificates Series | | | | | | |
| 2004-T5 Class AB3, 4.222% 5/28/35 (d) | | | | 5,382,969 | | 5,384,840 |
| Fieldstone Mortgage Investment Corp.: | | | | | | |
| Series 2003-1: | | | | | | |
| Class M1, 4.51% 11/25/33 (d) | | | | 1,300,000 | | 1,311,510 |
| Class M2, 5.58% 11/25/33 (d) | | | | 700,000 | | 718,059 |
| Series 2004-1 Class M2, 4.93% 1/25/35 (d) | | | | 3,700,000 | | 3,743,249 |
| Series 2004-2 Class M2, 4.98% 7/25/34 (d) | | | | 9,890,000 | | 9,889,746 |
| Series 2004-3 Class M5, 5.28% 8/25/34 (d) | | | | 2,000,000 | | 2,035,525 |
| Series 2005-2 Class 2A1, 3.95% 7/25/36 (d) | | | | 16,387,547 | | 16,385,833 |
| |
| |
| |
| 65 | | | | | | Annual Report |
| Investments (Unaudited) continued | | | | | | | | |
| |
Asset Backed Securities continued
| | | | | | | | |
| | | | | Principal | | | | Value |
| | | | | Amount | | | | |
| First Franklin Mortgage Loan Asset Backed Certificates: | | | | | | | | |
| Series 2005-FF2 Class A2A, 3.92% 3/25/35 (d) | | $ | | 6,441,811 | | $ | | 6,442,575 |
| Series 2005-FF2 Class M6, 4.53% 3/25/35 (d) | | | | 6,950,000 | | | | 6,966,453 |
| First Franklin Mortgage Loan Trust Series 2004-FF2: | | | | | | | | |
| Class M3, 4.38% 3/25/34 (d) | | | | 400,000 | | | | 400,662 |
| Class M4, 4.73% 3/25/34 (d) | | | | 300,000 | | | | 302,870 |
| First USA Credit Card Master Trust Series 2001-4 Class B, | | | | | | | | |
| 4.1281% 1/12/09 (d) | | | | 15,000,000 | | | | 15,017,273 |
| First USA Secured Note Trust Series 2001-3 Class C, | | | | | | | | |
| 4.8394% 11/19/08 (a)(d) | | | | 11,580,000 | | | | 11,661,421 |
| Ford Credit Auto Owner Trust Series 2003-B Class B2, | | | | | | | | |
| 4.1981% 10/15/07 (d) | | | | 19,600,000 | | | | 19,672,465 |
| Ford Credit Floorplan Master Owner Trust Series 2005 1: | | | | | | | | |
| Class A, 3.9181% 5/17/10 (d) | | | | 9,590,000 | | | | 9,586,223 |
| Class B, 4.2081% 5/17/10 (d) | | | | 2,625,000 | | | | 2,623,968 |
| Fremont Home Loan Trust: | | | | | | | | |
| Series 2004-1: | | | | | | | | |
| Class 1A1, 4.05% 2/25/34 (d) | | | | 2,196,026 | | | | 2,197,373 |
| Class M1, 4.28% 2/25/34 (d) | | | | 750,000 | | | | 750,227 |
| Class M2, 4.33% 2/25/34 (d) | | | | 800,000 | | | | 800,745 |
| Series 2004-C Class 2A2, 4.38% 8/25/34 (d) | | | | 10,000,000 | | | | 10,060,514 |
| Series 2004-D Class 3A2, 4.11% 11/25/34 (d) | | | | 2,153,210 | | | | 2,158,681 |
| Series 2005-2 Class 2A1, 3.94% 6/25/35 (d) | | | | 14,216,532 | | | | 14,212,883 |
| Series 2005 A: | | | | | | | | |
| Class 2A2, 4.07% 2/25/35 (d) | | | | 11,850,000 | | | | 11,862,896 |
| Class M1, 4.26% 1/25/35 (d) | | | | 1,603,000 | | | | 1,608,402 |
| Class M2, 4.29% 1/25/35 (d) | | | | 2,325,000 | | | | 2,326,557 |
| Class M3, 4.32% 1/25/35 (d) | | | | 1,250,000 | | | | 1,252,900 |
| Class M4, 4.51% 1/25/35 (d) | | | | 925,000 | | | | 931,377 |
| GE Business Loan Trust Series 2003-1 Class A, 4.1981% | | | | | | | | |
| 4/15/31 (a)(d) | | | | 5,238,178 | | | | 5,267,176 |
| GE Capital Credit Card Master Note Trust Series 2005-2 | | | | | | | | |
| Class B, 3.9681% 6/15/11 (d) | | | | 6,475,000 | | | | 6,474,059 |
| Gracechurch Card Funding No. 9 PLC Series 2005-2: | | | | | | | | |
| Class B, 3.9818% 9/15/10 (d) | | | | 3,560,000 | | | | 3,560,000 |
| Class C, 4.1418% 9/15/10 (d) | | | | 13,000,000 | | | | 13,000,000 |
| Gracechurch Card Funding PLC: | | | | | | | | |
| Series 5: | | | | | | | | |
| Class B, 3.9981% 8/15/08 (d) | | | | 1,520,000 | | | | 1,520,806 |
| Class C, 4.6981% 8/15/08 (d) | | | | 5,580,000 | | | | 5,600,379 |
| Series 6 Class B, 3.9581% 2/17/09 (d) | | | | 1,030,000 | | | | 1,030,878 |
| Series 8 Class C, 4.0981% 6/15/10 (d) | | | | 18,450,000 | | | | 18,485,634 |
Asset Backed Securities continued
| | | | | | |
| | | | | Principal | | Value |
| | | | | Amount | | |
| GSAMP Trust: | | | | | | |
| Series 2002-HE Class M1, 5.0463% 11/20/32 (d) | | $ | | 2,882,888 | | $ 2,926,670 |
| Series 2002-NC1: | | | | | | |
| Class A2, 4.15% 7/25/32 (d) | | | | 54,777 | | 55,120 |
| Class M1, 4.47% 7/25/32 (d) | | | | 8,861,000 | | 8,942,540 |
| Series 2003-FM1 Class M1, 4.6163% 3/20/33 (d) | | | | 15,000,000 | | 15,157,449 |
| Series 2004-FM1: | | | | | | |
| Class M1, 4.48% 11/25/33 (d) | | | | 2,865,000 | | 2,864,925 |
| Class M2, 5.23% 11/25/33 (d) | | | | 1,975,000 | | 2,008,385 |
| Series 2004-FM2: | | | | | | |
| Class M1, 4.33% 1/25/34 (d) | | | | 3,500,000 | | 3,499,910 |
| Class M2, 4.93% 1/25/34 (d) | | | | 1,500,000 | | 1,499,961 |
| Class M3, 5.13% 1/25/34 (d) | | | | 1,500,000 | | 1,499,961 |
| Series 2004-HE1: | | | | | | |
| Class M1, 4.38% 5/25/34 (d) | | | | 4,045,000 | | 4,044,896 |
| Class M2, 4.98% 5/25/34 (d) | | | | 1,750,000 | | 1,765,219 |
| Series 2005-9 Class 2A1, 3.95% 8/25/35 (d) | | | | 16,206,183 | | 16,206,183 |
| Series 2005-FF2 Class M5, 4.46% 3/25/35 (d) | | | | 3,500,000 | | 3,506,922 |
| Series 2005-HE2 Class M, 4.26% 3/25/35 (d) | | | | 8,780,000 | | 8,776,221 |
| Series 2005-NC1 Class M1, 4.28% 2/25/35 (d) | | | | 9,010,000 | | 9,013,305 |
| Guggenheim Structured Real Estate Funding Ltd. | | | | | | |
| Series 2005-1 Class C, 4.91% 5/25/30 (a)(d) | | | | 14,000,000 | | 13,987,145 |
| HSBC Home Equity Loan Trust Series 2005-2: | | | | | | |
| Class M1, 4.2563% 1/20/35 (d) | | | | 2,914,233 | | 2,914,529 |
| Class M2, 4.2863% 1/20/35 (d) | | | | 2,182,286 | | 2,182,488 |
| Home Equity Asset Trust: | | | | | | |
| Series 2002-2 Class M1, 4.63% 6/25/32 (d) | | | | 10,000,000 | | 10,011,960 |
| Series 2002-3 Class A5, 4.27% 2/25/33 (d) | | | | 2,763 | | 2,767 |
| Series 2002-5: | | | | | | |
| Class A3, 4.35% 5/25/33 (d) | | | | 1,901,156 | | 1,905,789 |
| Class M1, 5.03% 5/25/33 (d) | | | | 13,800,000 | | 13,948,517 |
| Series 2003-1: | | | | | | |
| Class A2, 4.3% 6/25/33 (d) | | | | 3,368,416 | | 3,370,517 |
| Class M1, 4.83% 6/25/33 (d) | | | | 8,335,000 | | 8,371,945 |
| Series 2003-2: | | | | | | |
| Class A2, 4.21% 8/25/33 (d) | | | | 159,893 | | 160,447 |
| Class M1, 4.71% 8/25/33 (d) | | | | 2,245,000 | | 2,271,910 |
| Series 2003-3: | | | | | | |
| Class A2, 4.19% 8/25/33 (d) | | | | 1,245,521 | | 1,250,195 |
| Class M1, 4.69% 8/25/33 (d) | | | | 8,185,000 | | 8,277,490 |
| Series 2003-4: | | | | | | |
| Class M1, 4.4413% 10/25/33 (d) | | | | 3,415,000 | | 3,437,752 |
| |
| |
| |
| 67 | | | | | | Annual Report |
| Investments (Unaudited) continued | | | | | | | | |
| |
Asset Backed Securities continued
| | | | | | | | |
| | | | | | | Principal | | | | Value |
| | | | | | | Amount | | | | |
| Home Equity Asset Trust: – continued | | | | | | | | | | |
| Series 2003-4: | | | | | | | | | | |
| Class M2, 5.5413% 10/25/33 (d) | | $ | | 4,040,000 | | $ | | 4,087,070 |
| Series 2003-5: | | | | | | | | | | |
| Class A2, 4.18% 12/25/33 (d) | | | | | | 3,793,784 | | | | 3,806,470 |
| Class M1, 4.53% 12/25/33 (d) | | | | | | 3,175,000 | | | | 3,197,905 |
| Class M2, 5.56% 12/25/33 (d) | | | | | | 1,345,000 | | | | 1,376,130 |
| Series 2003-7 Class A2, 4.21% 3/25/34 (d) | | | | 2,866,529 | | | | 2,872,858 |
| Series 2004-2 Class A2, 4.12% 7/25/34 (d) | | | | 5,111,457 | | | | 5,111,384 |
| Series 2004-3: | | | | | | | | | | |
| Class M1, 4.4% 8/25/34 (d) | | | | | | 2,015,000 | | | | 2,023,738 |
| Class M2, 5.03% 8/25/34 (d) | | | | | | 2,200,000 | | | | 2,239,606 |
| Series 2004-4 Class A2, 4.15% 10/25/34 (d) | | | | 7,288,824 | | | | 7,313,693 |
| Series 2004-6 Class A2, 4.18% 12/25/34 (d) | | | | 8,069,368 | | | | 8,094,037 |
| Series 2004-7 Class A3, 4.22% 1/25/35 (d) | | | | 2,551,011 | | | | 2,562,040 |
| Series 2005-1: | | | | | | | | | | |
| Class M1, 4.26% 5/25/35 (d) | | | | | | 9,705,000 | | | | 9,708,301 |
| Class M2, 4.28% 5/25/35 (d) | | | | | | 5,780,000 | | | | 5,775,826 |
| Class M3, 4.33% 5/25/35 (d) | | | | | | 5,825,000 | | | | 5,820,912 |
| Series 2005-2: | | | | | | | | | | |
| Class 2A2, 4.03% 7/25/35 (d) | | | | | | 13,170,000 | | | | 13,169,687 |
| Class M1, 4.28% 7/25/35 (d) | | | | | | 10,085,000 | | | | 10,084,736 |
| Series 2005-3 Class M1, 4.24% 8/25/35 (d) | | | | 9,450,000 | | | | 9,442,313 |
| Series 2005-5 Class 2A2, 4.08% 11/25/35 (d) | | | | 15,000,000 | | | | 15,024,030 |
| Household Affinity Credit Card Master Note Trust I | | | | | | | | |
| Series 2003-3 Class B, 4.0581% 8/15/08 (d) | | | | 10,000,000 | | | | 10,012,255 |
| Household Credit Card Master Trust I Series 2002-1 Class B, | | | | | | | | |
| 4.4181% 7/15/08 (d) | | | | | | 22,589,000 | | | | 22,592,725 |
| Household Home Equity Loan Trust: | | | | | | | | | | |
| Series 2002-2 Class A, 4.0963% 4/20/32 (d) | | | | 3,046,635 | | | | 3,047,537 |
| Series 2002-3 Class A, 4.2463% 7/20/32 (d) | | | | 2,468,824 | | | | 2,470,761 |
| Series 2003-1 Class M, 4.4263% 10/20/32 (d) | | | | 686,032 | | | | 686,682 |
| Series 2003-2: | | | | | | | | | | |
| Class A, 4.1263% 9/20/33 (d) | | | | | | 2,534,598 | | | | 2,539,076 |
| Class M, 4.3763% 9/20/33 (d) | | | | | | 1,191,893 | | | | 1,194,376 |
| Series 2004-1 Class M, 4.3163% 9/20/33 (d) | | | | 2,389,256 | | | | 2,393,972 |
| Household Mortgage Loan Trust: | | | | | | | | | | |
| Series 2003-HC1 Class M, 4.4463% 2/20/33 (d) | | | | 1,500,530 | | | | 1,505,086 |
| Series 2004-HC1: | | | | | | | | | | |
| Class A, 4.1463% 2/20/34 (d) | | | | | | 4,182,768 | | | | 4,193,747 |
| Class M, 4.2963% 2/20/34 (d) | | | | | | 2,528,917 | | | | 2,530,110 |
| Household Private Label Credit Card Master Note Trust I: | | | | | | | | |
| Series 2002-1 Class B, 4.3181% 1/18/11 (d) | | | | 8,850,000 | | | | 8,865,532 |
| |
| |
| Annual Report | | 68 | | | | | | | | |
Asset Backed Securities continued
| | | | | | |
| | | | | Principal | | Value |
| | | | | Amount | | |
| Household Private Label Credit Card Master Note Trust I: – | | | | | | |
| continued | | | | | | |
| Series 2002-2: | | | | | | |
| Class A, 3.9381% 1/18/11 (d) | | $ | | 9,000,000 | | $ 9,010,691 |
| Class B, 4.3181% 1/18/11 (d) | | | | 14,275,000 | | 14,347,032 |
| Series 2002-3 Class B, 5.0181% 9/15/09 (d) | | | | 4,150,000 | | 4,153,962 |
| Ikon Receivables Funding LLC Series 2003-1 Class A3A, | | | | | | |
| 4.0081% 12/17/07 (d) | | | | 2,012,271 | | 2,012,612 |
| IXIS Real Estate Capital Trust Series 2005-HE1: | | | | | | |
| Class A1, 4.08% 6/25/35 (d) | | | | 10,270,940 | | 10,270,696 |
| Class M1, 4.3% 6/25/35 (d) | | | | 4,100,000 | | 4,098,296 |
| Class M2, 4.32% 6/25/35 (d) | | | | 2,775,000 | | 2,773,872 |
| Class M3, 4.35% 6/25/35 (d) | | | | 1,975,000 | | 1,977,174 |
| Keycorp Student Loan Trust Series 1999-A Class A2, 4.34% | | | | | | |
| 12/27/09 (d) | | | | 14,973,894 | | 15,030,475 |
| Long Beach Mortgage Loan Trust: | | | | | | |
| Series 2003-2: | | | | | | |
| Class AV, 4.15% 6/25/33 (d) | | | | 124,347 | | 124,374 |
| Class M1, 4.65% 6/25/33 (d) | | | | 19,500,000 | | 19,585,995 |
| Series 2003-3 Class M1, 4.3913% 7/25/33 (d) | | | | 7,770,000 | | 7,819,867 |
| Series 2004-2: | | | | | | |
| Class M1, 4.36% 6/25/34 (d) | | | | 4,275,000 | | 4,284,930 |
| Class M2, 4.91% 6/25/34 (d) | | | | 1,400,000 | | 1,415,675 |
| Series 2005-2 Class 2A2, 4.01% 4/25/35 (d) | | | | 12,000,000 | | 12,003,775 |
| MASTR Asset Backed Securities Trust: | | | | | | |
| Series 2003-NC1: | | | | | | |
| Class M1, 4.56% 4/25/33 (d) | | | | 3,500,000 | | 3,520,473 |
| Class M2, 5.68% 4/25/33 (d) | | | | 1,500,000 | | 1,531,476 |
| Series 2004-FRE1 Class M1, 4.38% 7/25/34 (d) | | | | 5,223,000 | | 5,243,096 |
| MBNA Asset Backed Note Trust Series 2000-K Class C, | | | | | | |
| 4.5681% 3/17/08 (a)(d) | | | | 7,250,000 | | 7,251,305 |
| MBNA Credit Card Master Note Trust: | | | | | | |
| Series 2001-B1 Class B1, 4.1431% 10/15/08 (d) | | | | 30,000,000 | | 30,032,436 |
| Series 2001-B2 Class B2, 4.1281% 1/15/09 (d) | | | | 30,353,000 | | 30,408,661 |
| Series 2002-B2 Class B2, 4.1481% 10/15/09 (d) | | | | 20,000,000 | | 20,080,518 |
| Series 2002-B4 Class B4, 4.2681% 3/15/10 (d) | | | | 14,800,000 | | 14,906,795 |
| Series 2003-B2 Class B2, 4.1581% 10/15/10 (d) | | | | 1,530,000 | | 1,544,849 |
| Series 2003-B3 Class B3, 4.1431% 1/18/11 (d) | | | | 1,130,000 | | 1,136,193 |
| Series 2003-B5 Class B5, 4.1381% 2/15/11 (d) | | | | 705,000 | | 710,072 |
| MBNA Master Credit Card Trust II: | | | | | | |
| Series 1998-E Class B, 3.9288% 9/15/10 (d) | | | | 7,800,000 | | 7,843,689 |
| Series 1998-G Class B, 4.1681% 2/17/09 (d) | | | | 20,000,000 | | 20,034,530 |
| |
| |
| |
| 69 | | | | | | Annual Report |
| Investments (Unaudited) continued | | | | | | | | |
| |
Asset Backed Securities continued
| | | | | | | | |
| | | | | | | Principal | | | | Value |
| | | | | | | Amount | | | | |
| Meritage Mortgage Loan Trust Series 2004-1: | | | | | | | | |
| Class M1, 4.33% 7/25/34 (d) | | | | $ | | 2,125,000 | | $ | | 2,124,946 |
| Class M2, 4.38% 7/25/34 (d) | | | | | | 375,000 | | | | 374,991 |
| Class M3, 4.78% 7/25/34 (d) | | | | | | 775,000 | | | | 774,980 |
| Class M4, 4.93% 7/25/34 (d) | | | | | | 525,000 | | | | 524,987 |
| Merrill Lynch Mortgage Investors, Inc. Series 2003-HE1 Class | | | | | | | | |
| M1, 4.53% 7/25/34 (d) | | | | | | 2,321,000 | | | | 2,334,630 |
| Morgan Stanley ABS Capital I, Inc.: | | | | | | | | | | |
| Series 2002-NC6 Class M2, 5.93% 11/25/32 (d) | | | | 2,370,000 | | | | 2,430,872 |
| Series 2003-NC5 Class M2, 5.83% 4/25/33 (d) | | | | 2,800,000 | | | | 2,827,761 |
| Series 2003-NC6 Class M2, 5.5913% 6/27/33 (d) | | | | 12,835,000 | | | | 13,193,861 |
| Series 2003-NC7 Class M1, 4.53% 6/25/33 (d) | | | | 1,785,000 | | | | 1,790,756 |
| Series 2003-NC8 Class M1, 4.53% 9/25/33 (d) | | | | 2,350,000 | | | | 2,380,069 |
| Series 2004-HE6 Class A2, 4.17% 8/25/34 (d) | | | | 6,065,683 | | | | 6,084,818 |
| Series 2004-NC2 Class M1, 4.38% 12/25/33 (d) | | | | 2,595,000 | | | | 2,604,510 |
| Series 2004-NC6 Class A2, 4.17% 7/25/34 (d) | | | | 2,716,074 | | | | 2,721,759 |
| Series 2005-1: | | | | | | | | | | |
| Class M2, 4.3% 12/25/34 (d) | | | | | | 4,425,000 | | | | 4,429,882 |
| Class M3, 4.35% 12/25/34 (d) | | | | | | 4,000,000 | | | | 4,007,356 |
| Series 2005-HE1: | | | | | | | | | | |
| Class A3B, 4.05% 12/25/34 (d) | | | | | | 3,885,000 | | | | 3,889,760 |
| Class M1, 4.28% 12/25/34 (d) | | | | | | 1,100,000 | | | | 1,103,379 |
| Class M2, 4.3% 12/25/34 (d) | | | | | | 2,970,000 | | | | 2,974,441 |
| Series 2005-HE2: | | | | | | | | | | |
| Class M1, 4.23% 1/25/35 (d) | | | | | | 2,665,000 | | | | 2,673,338 |
| Class M2, 4.27% 1/25/35 (d) | | | | | | 1,900,000 | | | | 1,899,216 |
| Series 2005-NC1: | | | | | | | | | | |
| Class M1, 4.27% 1/25/35 (d) | | | | | | 2,425,000 | | | | 2,434,295 |
| Class M2, 4.3% 1/25/35 (d) | | | | | | 2,425,000 | | | | 2,427,680 |
| Class M3, 4.34% 1/25/35 (d) | | | | | | 2,425,000 | | | | 2,431,267 |
| Morgan Stanley Dean Witter Capital I Trust: | | | | | | | | |
| Series 2001-AM1: | | | | | | | | | | |
| Class M1, 4.68% 2/25/32 (d) | | | | | | 1,510,288 | | | | 1,511,306 |
| Class M2, 5.23% 2/25/32 (d) | | | | | | 5,305,979 | | | | 5,312,043 |
| Series 2001-NC4 Class M1, 4.83% 1/25/32 (d) | | | | 3,827,881 | | | | 3,838,780 |
| Series 2002-AM3 Class A3, 4.32% 2/25/33 (d) | | | | 992,554 | | | | 995,836 |
| Series 2002-HE1 Class M1, 4.43% 7/25/32 (d) | | | | 5,860,000 | | | | 5,893,166 |
| Series 2002-HE2 Class M1, 4.53% 8/25/32 (d) | | | | 9,925,000 | | | | 9,964,301 |
| Series 2002-NC3 Class A3, 4.17% 8/25/32 (d) | | | | 147,864 | | | | 148,113 |
| Series 2002-OP1 Class M1, 4.58% 9/25/32 (d) | | | | 3,894,745 | | | | 3,907,257 |
| Series 2003-NC1: | | | | | | | | | | |
| Class M1, 4.88% 11/25/32 (d) | | | | | | 2,391,382 | | | | 2,406,740 |
| Class M2, 5.88% 11/25/32 (d) | | | | | | 1,880,000 | | | | 1,897,592 |
| |
| |
| Annual Report | | 70 | | | | | | | | |
Asset Backed Securities continued
| | | | | | | | |
| | | | | Principal | | | | Value |
| | | | | Amount | | | | |
| New Century Home Equity Loan Trust: | | | | | | | | |
| Series 2003-2 Class M2, 5.83% 1/25/33 (d) | | $ | | 4,600,000 | | $ | | 4,665,213 |
| Series 2003-6 Class M1, 4.55% 1/25/34 (d) | | | | 5,180,000 | | | | 5,212,663 |
| Series 2005-1: | | | | | | | | |
| Class M1, 4.28% 3/25/35 (d) | | | | 4,395,000 | | | | 4,396,544 |
| Class M2, 4.31% 3/25/35 (d) | | | | 4,395,000 | | | | 4,396,491 |
| Class M3, 4.35% 3/25/35 (d) | | | | 2,120,000 | | | | 2,126,029 |
| Nissan Auto Lease Trust: | | | | | | | | |
| Series 2003-A Class A3A, 3.9081% 6/15/09 (d) | | | | 11,639,609 | | | | 11,648,579 |
| Series 2004-A Class A4A, 3.8381% 6/15/10 (d) | | | | 10,570,000 | | | | 10,581,156 |
| NovaStar Home Equity Loan Series 2004-1: | | | | | | | | |
| Class M1, 4.28% 6/25/34 (d) | | | | 1,450,000 | | | | 1,451,161 |
| Class M4, 4.805% 6/25/34 (d) | | | | 2,435,000 | | | | 2,444,337 |
| Ocala Funding LLC Series 2005-1A Class A, 5.2963% | | | | | | | | |
| 3/20/10 (a)(d) | | | | 3,675,000 | | | | 3,675,000 |
| Ownit Mortgage Loan Asset-Backed Certificates Series | | | | | | | | |
| 2005 3 Class A2A, 3.95% 6/25/36 (d) | | | | 14,975,059 | | | | 14,974,727 |
| Park Place Securities, Inc.: | | | | | | | | |
| Series 2004-WCW1: | | | | | | | | |
| Class M1, 4.46% 9/25/34 (d) | | | | 3,745,000 | | | | 3,767,310 |
| Class M2, 4.51% 9/25/34 (d) | | | | 1,755,000 | | | | 1,767,858 |
| Class M3, 5.08% 9/25/34 (d) | | | | 3,355,000 | | | | 3,402,867 |
| Class M4, 5.28% 9/25/34 (d) | | | | 4,700,000 | | | | 4,776,320 |
| Series 2004-WCW2 Class A2, 4.21% 10/25/34 (d) | | | | 6,455,574 | | | | 6,471,464 |
| Series 2005-WCH1: | | | | | | | | |
| Class A3B, 4.05% 1/25/35 (d) | | | | 2,775,000 | | | | 2,780,119 |
| Class M2, 4.35% 1/25/35 (d) | | | | 4,175,000 | | | | 4,178,114 |
| Class M3, 4.39% 1/25/35 (d) | | | | 3,290,000 | | | | 3,299,846 |
| Class M5, 4.71% 1/25/35 (d) | | | | 3,095,000 | | | | 3,111,984 |
| Series 2005-WHQ2 Class M7, 5.08% 5/25/35 (d) | | | | 5,950,000 | | | | 5,961,145 |
| People’s Choice Home Loan Securities Trust Series 2005 2: | | | | | | | | |
| Class A1, 3.94% 9/25/24 (d) | | | | 5,833,593 | | | | 5,834,512 |
| Class M4, 4.46% 5/25/35 (d) | | | | 6,000,000 | | | | 6,025,129 |
| Providian Gateway Master Trust Series 2002-B Class A, | | | | | | | | |
| 4.4681% 6/15/09 (a)(d) | | | | 15,000,000 | | | | 15,021,564 |
| Residental Asset Securities Corp.: | | | | | | | | |
| Series 2005-KS4 Class M2, 4.41% 5/25/35 (d) | | | | 1,040,000 | | | | 1,044,543 |
| Series 2005-KS7 Class A1, 3.93% 8/25/35 (d) | | | | 10,017,807 | | | | 10,017,586 |
| Residential Asset Mortgage Products, Inc. Series 2004-RS10 | | | | | | | | |
| Class MII2, 5.08% 10/25/34 (d) | | | | 5,500,000 | | | | 5,587,075 |
| Salomon Brothers Mortgage Securities VII, Inc. Series | | | | | | | | |
| 2003-HE1 Class A, 4.23% 4/25/33 (d) | | | | 632,314 | | | | 635,086 |
71 Annual Report
| Investments (Unaudited) continued | | | | | | |
| |
Asset Backed Securities continued
| | | | | | |
| | | | | | | Principal | | Value |
| | | | | | | Amount | | |
| Saxon Asset Securities Trust: | | | | | | | | |
| Series 2004-1 Class M1, 4.36% 3/25/35 (d) | | $ | | 4,415,000 | | $ 4,418,970 |
| Series 2004-2 Class MV1, 4.41% 8/25/35 (d) | | | | 4,495,000 | | 4,507,503 |
| Sears Credit Account Master Trust II: | | | | | | | | |
| Series 2001-1 Class B, 4.1931% 2/15/10 (d) | | | | 10,000,000 | | 9,990,039 |
| Series 2002-5 Class B, 5.0181% 11/17/09 (d) | | | | 30,000,000 | | 30,025,965 |
| Securitized Asset Backed Receivables LLC Trust | | | | | | |
| Series 2004-NC1 Class M1, 4.35% 2/25/34 (d) | | | | 2,910,000 | | 2,912,781 |
| Specialty Underwriting & Residential Finance | | | | | | |
| Series 2003-BC4 Class M1, 4.43% 11/25/34 (d) | | | | 1,810,000 | | 1,819,343 |
| Structured Asset Securities Corp. Series 2004-GEL1 Class A, | | | | |
| 4.19% 2/25/34 (d) | | | | | | 901,062 | | 901,041 |
| Superior Wholesale Inventory Financing Trust VII Series | | | | | | |
| 2003-A8 Class CTFS, 4.2181% 3/15/11 (a)(d) | | | | 10,835,000 | | 10,826,536 |
| Superior Wholesale Inventory Financing Trust XII Series | | | | | | |
| 2005-A12 Class C, 4.9681% 6/15/10 (d) | | | | 6,840,000 | | 6,849,450 |
| Terwin Mortgage Trust: | | | | | | | | |
| Series 2003-4HE Class A1, 4.26% 9/25/34 (d) | | | | 2,051,939 | | 2,062,554 |
| Series 2003-6HE Class A1, 4.3% 11/25/33 (d) | | | | 1,467,936 | | 1,471,055 |
| Series 2005-14HE Class AF1, 3.9753% 8/25/36 (d) | | | | 8,635,000 | | 8,634,326 |
| Series 2005-8HE Class A1, 3.95% 7/25/35 (a)(d) | | | | 6,932,173 | | 6,938,671 |
| TOTAL ASSET BACKED SECURITIES | | | | | | | | |
| (Cost $2,188,022,238) | | | | | | | | 2,194,887,925 |
| |
| Collateralized Mortgage Obligations 20.2% | | | | |
| |
| Private Sponsor – 13.8% | | | | | | | | |
| Adjustable Rate Mortgage Trust floater: | | | | | | | | |
| Series 2004-2 Class 7A3, 4.23% 2/25/35 (d) | | | | 8,271,247 | | 8,288,629 |
| Series 2004-4 Class 5A2, 4.23% 3/25/35 (d) | | | | 3,344,187 | | 3,351,688 |
| Series 2005-1 Class 5A2, 4.16% 5/25/35 (d) | | | | 5,517,368 | | 5,520,788 |
| Series 2005-10 Class 5A1, 4.101% 1/25/36 (d) | | | | 15,000,000 | | 15,000,000 |
| Series 2005-2: | | | | | | | | |
| Class 6A2, 4.11% 6/25/35 (d) | | | | | | 2,499,864 | | 2,501,436 |
| Class 6M2, 4.31% 6/25/35 (d) | | | | | | 10,145,000 | | 10,144,980 |
| Series 2005-3 Class 8A2, 4.07% 7/25/35 (d) | | | | 16,519,250 | | 16,529,773 |
| Series 2005-4 Class 7A2, 4.06% 8/25/35 (d) | | | | 8,125,015 | | 8,130,280 |
| Series 2005-8 Class 7A2, 4.11% 11/25/35 (d) | | | | 7,166,967 | | 7,168,085 |
| American Home Mortgage Investment Trust Series 2005-4 | | | | | | |
| Class 1A1, 4.18% 11/25/45 (d) | | | | | | 11,080,000 | | 11,080,000 |
| Bear Stearns Adjustable Rate Mortgage Trust Series 2005-6 | | | | |
| Class 1A1, 5.17% 8/25/35 (d) | | | | | | 17,862,312 | | 17,866,889 |
| |
| |
| |
| Annual Report | | 72 | | | | | | |
Collateralized Mortgage Obligations continued
| | |
| | | Principal | | Value |
| | | Amount | | |
Private Sponsor continued
| | | | |
| Bear Stearns Alt-A Trust floater: | | | | |
| Series 2005-1 Class A1, 4.11% 1/25/35 (d) | | $18,993,594 | | $ 19,005,465 |
| Series 2005-2 Class 1A1, 4.08% 3/25/35 (d) | | 13,521,981 | | 13,515,643 |
| Series 2005-5 Class 1A1, 4.05% 7/25/35 (d) | | 17,169,385 | | 17,155,972 |
| Countrywide Alternative Loan Trust planned amortization | | | | |
| class Series 2003-5T2 Class A2, 4.23% 5/25/33 (d) | | 5,006,668 | | 5,009,604 |
| CS First Boston Mortgage Securities Corp. floater: | | | | |
| Series 2004-AR2 Class 6A1, 4.23% 3/25/34 (d) | | 4,681,479 | | 4,678,694 |
| Series 2004-AR3 Class 6A2, 4.2% 4/25/34 (d) | | 1,948,417 | | 1,950,279 |
| Series 2004-AR4 Class 5A2, 4.2% 5/25/34 (d) | | 1,821,930 | | 1,820,850 |
| Series 2004-AR5 Class 11A2, 4.2% 6/25/34 (d) | | 2,698,314 | | 2,692,965 |
| Series 2004-AR6 Class 9A2, 4.2% 10/25/34 (d) | | 3,422,844 | | 3,424,695 |
| Series 2004-AR7 Class 6A2, 4.21% 8/25/34 (d) | | 4,894,739 | | 4,898,151 |
| Series 2004-AR8 Class 8A2, 4.21% 9/25/34 (d) | | 3,798,541 | | 3,805,156 |
| CWALT, Inc. floater Series 2005-56 Class 3A1, 4.2494% | | | | |
| 10/25/35 (d) | | 8,490,000 | | 8,490,000 |
| First Horizon Mortgage pass thru Trust floater Series | | | | |
| 2004-FL1 Class 2A1, 4.39% 12/25/34 (d) | | 3,472,618 | | 3,467,751 |
| Granite Master Issuer PLC: | | | | |
| floater: | | | | |
| Series 2005-1: | | | | |
| Class A3, 3.97% 12/21/24 (d) | | 5,300,000 | | 5,299,172 |
| Class B1, 4.02% 12/20/54 (d) | | 7,050,000 | | 7,047,797 |
| Class M1, 4.12% 12/20/54 (d) | | 5,300,000 | | 5,298,344 |
| Series 2005-2 Class C1, 4.39% 12/20/54 (d) | | 7,975,000 | | 7,972,508 |
| Series 2005-4 Class M2, 4.305% 12/20/54 (d) | | 6,500,000 | | 6,498,731 |
| Series 2005-4 Class C1, 4.455% 12/20/54 (d) | | 6,800,000 | | 6,798,672 |
| Granite Mortgages PLC floater: | | | | |
| Series 2004-1: | | | | |
| Class 1B, 4.1% 3/20/44 (d) | | 1,415,000 | | 1,415,442 |
| Class 1C, 4.79% 3/20/44 (d) | | 4,075,000 | | 4,089,008 |
| Class 1M, 4.3% 3/20/44 (d) | | 4,935,000 | | 4,939,627 |
| Series 2004-2: | | | | |
| Class 1A2, 3.96% 6/20/28 (d) | | 4,162,145 | | 4,162,145 |
| Class 1B, 4.06% 6/20/44 (d) | | 786,966 | | 787,059 |
| Class 1C, 4.59% 6/20/44 (d) | | 2,865,029 | | 2,869,506 |
| Class 1M, 4.17% 6/20/44 (d) | | 2,104,798 | | 2,104,240 |
| Series 2004-3: | | | | |
| Class 1B, 4.05% 9/20/44 (d) | | 2,100,000 | | 2,100,042 |
| Class 1C, 4.48% 9/20/44 (d) | | 5,415,000 | | 5,424,314 |
| Class 1M, 4.16% 9/20/44 (d) | | 1,200,000 | | 1,200,228 |
| |
| |
| |
| 73 | | | | Annual Report |
| Investments (Unaudited) continued | | | | | | |
| |
Collateralized Mortgage Obligations continued
| | | | |
| | | | | Principal | | | | Value |
| | | | | Amount | | | | |
Private Sponsor continued
| | | | | | | | |
| Harborview Mortgage Loan Trust floater Series 2005-2 | | | | | | |
| Class 2A1A, 4.0094% 5/19/35 (d) | | | | $11,231,269 | | $ | | 11,199,681 |
| Holmes Financing No. 7 PLC floater Series 2 Class M, | | | | | | |
| 4.3988% 7/15/40 (d) | | | | 2,560,000 | | | | 2,563,183 |
| Holmes Financing No. 8 PLC floater Series 2: | | | | | | |
| Class A, 3.6788% 4/15/11 (d) | | | | 25,000,000 | | | | 25,002,930 |
| Class B, 3.7688% 7/15/40 (d) | | | | 2,695,000 | | | | 2,696,264 |
| Class C, 4.3188% 7/15/40 (d) | | | | 10,280,000 | | | | 10,318,550 |
| Home Equity Asset Trust floater Series 2005-3 Class 2A1, | | | | | | |
| 3.92% 8/25/35 (d) | | | | 5,995,565 | | | | 5,996,642 |
| Homestar Mortgage Acceptance Corp. floater Series 2004-5 | | | | | | |
| Class A1, 4.28% 10/25/34 (d) | | | | 4,056,783 | | | | 4,068,310 |
| Impac CMB Trust: | | | | | | | | |
| floater: | | | | | | | | |
| Series 2004-11 Class 2A2, 4.2% 3/25/35 (d) | | 7,904,651 | | | | 7,903,107 |
| Series 2004-6 Class 1A2, 4.22% 10/25/34 (d) | | 3,065,340 | | | | 3,070,216 |
| Series 2005-1: | | | | | | | | |
| Class M1, 4.29% 4/25/35 (d) | | | | 3,028,498 | | | | 3,026,014 |
| Class M2, 4.33% 4/25/35 (d) | | | | 5,302,005 | | | | 5,298,691 |
| Class M3, 4.36% 4/25/35 (d) | | | | 1,300,974 | | | | 1,299,907 |
| Class M4, 4.58% 4/25/35 (d) | | | | 767,788 | | | | 768,718 |
| Class M5, 4.6% 4/25/35 (d) | | | | 767,788 | | | | 767,788 |
| Class M6, 4.65% 4/25/35 (d) | | | | 1,228,460 | | | | 1,228,460 |
| Series 2005-2 Class 1A2, 4.14% 4/25/35 (d) | | 12,453,621 | | | | 12,443,892 |
| Series 2005-3 Class A1, 4.07% 8/25/35 (d) | | 14,447,985 | | | | 14,423,717 |
| Series 2005-4 Class 1B1, 5.13% 5/25/35 (d) | | 4,978,738 | | | | 4,972,515 |
| Series 2005-6 Class 1M3, 4.44% 10/25/35 (d) | | 3,323,541 | | | | 3,323,557 |
| Series 2005-7: | | | | | | | | |
| Class M1, 4.208% 11/25/35 (d) | | | | 1,765,000 | | | | 1,765,000 |
| Class M2, 4.248% 11/25/35 (d) | | | | 1,325,000 | | | | 1,325,000 |
| Class M3, 4.348% 11/25/35 (d) | | | | 6,615,000 | | | | 6,615,000 |
| Lehman Structured Securities Corp. floater Series 2005-1 | | | | | | |
| Class A2, 4.22% 9/26/45 (a)(d) | | | | 15,180,141 | | | | 15,180,141 |
| MASTR Adjustable Rate Mortgages Trust: | | | | | | | | |
| floater Series 2005-1 Class 1A1, 4.1% 3/25/35 (d) | | 11,034,855 | | | | 11,047,023 |
| Series 2004-6 Class 4A2, 4.1657% 7/25/34 (d) | | 5,969,000 | | | | 5,946,443 |
| Merrill Lynch Mortgage Investors, Inc. floater: | | | | | | |
| Series 2003-A Class 2A1, 4.22% 3/25/28 (d) | | 7,093,116 | | | | 7,130,471 |
| Series 2003-B Class A1, 4.17% 4/25/28 (d) | | 7,213,924 | | | | 7,254,849 |
| Series 2003-D Class A, 4.14% 8/25/28 (d) | | 6,608,802 | | | | 6,619,465 |
| Series 2003-E Class A2, 4.3831% 10/25/28 (d) | | 9,116,686 | | | | 9,126,651 |
| Series 2003-F Class A2, 4.43% 10/25/28 (d) | | 11,828,156 | | | | 11,835,544 |
| |
| |
| Annual Report | | 74 | | | | | | |
Collateralized Mortgage Obligations continued
| | | | |
| | | Principal | | | | Value |
| | | Amount | | | | |
Private Sponsor continued
| | | | | | |
| Merrill Lynch Mortgage Investors, Inc. floater: - continued | | | | |
| Series 2004-A Class A2, 4.34% 4/25/29 (d) | | $10,025,427 | | $ | | 10,017,623 |
| Series 2004-B Class A2, 3.79% 6/25/29 (d) | | 7,905,839 | | | | 7,888,355 |
| Series 2004-C Class A2, 3.95% 7/25/29 (d) | | 11,598,172 | | | | 11,567,548 |
| Series 2004-D Class A2, 4.4131% 9/25/29 (d) | | 8,519,942 | | | | 8,524,812 |
| Series 2004-E: | | | | | | |
| Class A2B, 4.45% 11/25/29 (d) | | 7,561,387 | | | | 7,550,087 |
| Class A2D, 4.64% 11/25/29 (d) | | 1,758,462 | | | | 1,766,187 |
| Series 2004-G Class A2, 3.95% 11/25/29 (d) | | 3,530,484 | | | | 3,529,545 |
| Series 2005-A Class A2, 4.3031% 2/25/30 (d) | | 9,875,800 | | | | 9,882,274 |
| Mortgage Asset Backed Securities Trust floater Series | | | | | | |
| 2002-NC1 Class M1, 4.68% 10/25/32 (d) | | 3,128,220 | | | | 3,140,706 |
| MortgageIT Trust floater: | | | | | | |
| Series 2004-2: | | | | | | |
| Class A1, 4.2% 12/25/34 (d) | | 4,638,420 | | | | 4,648,806 |
| Class A2, 4.28% 12/25/34 (d) | | 6,275,019 | | | | 6,320,305 |
| Series 2005-2 Class 1A1, 4.1% 5/25/35 (d) | | 4,811,489 | | | | 4,814,744 |
| Opteum Mortgage Acceptance Corp. floater Series 2005-3 | | | | |
| Class APT, 4.12% 7/25/35 (d) | | 18,530,057 | | | | 18,540,914 |
| Permanent Financing No. 3 PLC floater Series 2 Class C, | | | | |
| 4.8838% 6/10/42 (d) | | 4,845,000 | | | | 4,893,450 |
| Permanent Financing No. 4 PLC floater Series 2 Class C, | | | | |
| 4.5538% 6/10/42 (d) | | 15,400,000 | | | | 15,474,437 |
| Permanent Financing No. 5 PLC floater: | | | | | | |
| Series 2 Class C, 4.4838% 6/10/42 (d) | | 4,215,000 | | | | 4,240,489 |
| Series 3 Class C, 4.6538% 6/10/42 (d) | | 8,890,000 | | | | 8,998,425 |
| Permanent Financing No. 6 PLC floater Series 6 Class 2C, | | | | |
| 4.2888% 6/10/42 (d) | | 5,350,000 | | | | 5,344,539 |
| Permanent Financing No. 7 PLC floater Series 7: | | | | | | |
| Class 1B, 3.9238% 6/10/42 (d) | | 2,000,000 | | | | 1,999,747 |
| Class 1C, 4.1138% 6/10/42 (d) | | 3,840,000 | | | | 3,849,303 |
| Class 2C, 4.1638% 6/10/42 (d) | | 8,065,000 | | | | 8,047,042 |
| Permanent Financing No. 8 PLC floater Series 8: | | | | | | |
| Class 1C, 4.1638% 6/10/42 (d) | | 7,165,000 | | | | 7,161,740 |
| Class 2C, 4.2338% 6/10/42 (d) | | 9,945,000 | | | | 9,940,465 |
| Residential Asset Mortgage Products, Inc.: | | | | | | |
| sequential pay Series 2003-SL1 Class 3A1, 7.125% | | | | |
| 4/25/31 | | 4,284,316 | | | | 4,353,251 |
| Series 2005-AR5 Class 1A1, 4.903% 9/19/35 (d) | | 5,016,521 | | | | 5,020,936 |
75 Annual Report
| Investments (Unaudited) continued | | | | | | |
| |
Collateralized Mortgage Obligations continued
| | | | |
| | | Principal | | | | Value |
| | | Amount | | | | |
Private Sponsor continued
| | | | | | |
| Residential Finance LP/Residential Finance Development | | | | | | |
| Corp. floater Series 2003-A: | | | | | | |
| Class B4, 5.5281% 3/10/35 (a)(d) | | $ 5,475,801 | | $ | | 5,557,938 |
| Class B5, 6.0781% 3/10/35 (a)(d) | | 5,666,940 | | | | 5,791,014 |
| Residential Funding Securities Corp.: | | | | | | |
| Series 2003-RP1 Class A1, 4.33% 11/25/34 (d) | | 2,387,142 | | | | 2,396,787 |
| Series 2003-RP2 Class A1, 4.28% 6/25/33 (a)(d) | | 3,567,765 | | | | 3,579,472 |
| Sequoia Mortgage Trust floater: | | | | | | |
| Series 2003-5 Class A2, 4.37% 9/20/33 (d) | | 9,869,908 | | | | 9,866,749 |
| Series 2003-7 Class A2, 3.835% 1/20/34 (d) | | 8,292,646 | | | | 8,287,744 |
| Series 2004-1 Class A, 4.15% 2/20/34 (d) | | 5,352,427 | | | | 5,344,162 |
| Series 2004-10 Class A4, 3.6681% 11/20/34 (d) | | 9,021,376 | | | | 9,016,217 |
| Series 2004-3 Class A, 3.5463% 5/20/34 (d) | | 9,243,861 | | | | 9,221,165 |
| Series 2004-4 Class A, 3.5881% 5/20/34 (d) | | 11,574,850 | | | | 11,560,488 |
| Series 2004-5 Class A3, 3.77% 6/20/34 (d) | | 7,745,333 | | | | 7,741,702 |
| Series 2004-6: | | | | | | |
| Class A3A, 4.3175% 6/20/35 (d) | | 6,761,373 | | | | 6,757,088 |
| Class A3B, 4.08% 7/20/34 (d) | | 845,172 | | | | 844,660 |
| Series 2004-7: | | | | | | |
| Class A3A, 4.365% 8/20/34 (d) | | 6,627,084 | | | | 6,622,167 |
| Class A3B, 4.59% 7/20/34 (d) | | 1,192,509 | | | | 1,195,319 |
| Series 2004-8 Class A2, 4.41% 9/20/34 (d) | | 11,824,016 | | | | 11,827,689 |
| Series 2005-1 Class A2, 4.1% 2/20/35 (d) | | 6,778,467 | | | | 6,773,241 |
| Series 2005-2 Class A2, 4.29% 3/20/35 (d) | | 11,841,861 | | | | 11,841,861 |
| Series 2005-3 Class A1, 3.9963% 5/20/35 (d) | | 8,335,848 | | | | 8,318,878 |
| Structured Adjustable Rate Mortgage Loan Trust floater | | | | | | |
| Series 2001-14 Class A1, 4.14% 7/25/35 (d) | | 10,719,814 | | | | 10,719,814 |
| Structured Asset Securities Corp. floater Series 2004-NP1 | | | | | | |
| Class A, 4.23% 9/25/33 (a)(d) | | 2,217,986 | | | | 2,219,280 |
| Thornburg Mortgage Securities Trust floater: | | | | | | |
| Series 2004-3 Class A, 4.2% 9/25/34 (d) | | 20,272,244 | | | | 20,312,652 |
| Series 2005-3 Class A4, 4.108% 8/25/45 (d) | | 17,180,000 | | | | 17,180,000 |
| WAMU Mortgage pass thru certificates: | | | | | | |
| floater: | | | | | | |
| Series 2005-AR11 Class A1C1, 4.03% 8/25/45 (d) | | 14,112,684 | | | | 14,112,684 |
| Series 2005 AR6 Class 2A 1A, 4.06% 4/25/45 (d) | | 5,975,614 | | | | 5,955,102 |
| Series 2005-AR13 Class A1C1, 4.2275% 10/25/45 (d) | | 23,000,000 | | | | 23,000,000 |
Collateralized Mortgage Obligations continued
| | | | |
| | | Principal | | | | Value |
| | | Amount | | | | |
| Private Sponsor continued | | | | | | |
| Wells Fargo Mortgage Backed Securities Trust: | | | | | | |
| Series 2004-M Class A3, 4.6963% 8/25/34 (d) | | $19,880,000 | | $ | | 19,778,179 |
| Series 2005-AR12 Class 2A1, 4.3223% 7/25/35 (d) | | 29,218,529 | | | | 28,883,740 |
| |
| TOTAL PRIVATE SPONSOR | | | | | | 919,943,859 |
| U.S. Government Agency 6.4% | | | | | | |
| Fannie Mae: | | | | | | |
| floater: | | | | | | |
| Series 2000-38 Class F, 4.2394% 11/18/30 (d) | | 1,056,182 | | | | 1,064,379 |
| Series 2000-40 Class FA, 4.32% 7/25/30 (d) | | 2,281,210 | | | | 2,291,156 |
| Series 2002-89 Class F, 4.13% 1/25/33 (d) | | 3,350,148 | | | | 3,355,218 |
| target amortization class Series G94-2 Class D, 6.45% | | | | | | |
| 1/25/24 | | 4,411,824 | | | | 4,499,998 |
| Fannie Mae guaranteed REMIC pass thru certificates: | | | | | | |
| floater: | | | | | | |
| Series 2001-34 Class FR, 4.1894% 8/18/31 (d) | | 2,367,009 | | | | 2,374,326 |
| Series 2001-44 Class FB, 4.13% 9/25/31 (d) | | 2,114,017 | | | | 2,120,062 |
| Series 2001-46 Class F, 4.1894% 9/18/31 (d) | | 6,088,369 | | | | 6,121,939 |
| Series 2002-11 Class QF, 4.32% 3/25/32 (d) | | 4,222,858 | | | | 4,259,537 |
| Series 2002-36 Class FT, 4.33% 6/25/32 (d) | | 1,422,268 | | | | 1,434,270 |
| Series 2002-64 Class FE, 4.1394% 10/18/32 (d) | | 2,093,663 | | | | 2,103,206 |
| Series 2002-65 Class FA, 4.13% 10/25/17 (d) | | 2,302,618 | | | | 2,306,533 |
| Series 2002-74 Class FV, 4.28% 11/25/32 (d) | | 7,876,453 | | | | 7,931,623 |
| Series 2003-11: | | | | | | |
| Class DF, 4.28% 2/25/33 (d) | | 2,877,518 | | | | 2,897,926 |
| Class EF, 4.28% 2/25/33 (d) | | 2,080,685 | | | | 2,088,534 |
| Series 2003-119 Class FK, 4.33% 5/25/18 (d) | | 2,500,000 | | | | 2,523,405 |
| Series 2003-15 Class WF, 4.18% 8/25/17 (d) | | 5,404,393 | | | | 5,425,600 |
| Series 2003-63 Class F1, 4.13% 11/25/27 (d) | | 5,763,648 | | | | 5,767,740 |
| Series 2005-45 Class XA, 4.17% 6/25/35 (d) | | 74,298,346 | | | | 74,267,779 |
| planned amortization class: | | | | | | |
| Series 1998-63 Class PG, 6% 3/25/27 | | 800,852 | | | | 799,909 |
| Series 2001-62 Class PG, 6.5% 10/25/30 | | 2,944,838 | | | | 2,948,170 |
| Series 2001-76 Class UB, 5.5% 10/25/13 | | 590,038 | | | | 589,350 |
| Series 2002-16 Class QD, 5.5% 6/25/14 | | 272,009 | | | | 272,519 |
| Series 2002-28 Class PJ, 6.5% 3/25/31 | | 3,732,778 | | | | 3,734,286 |
| Series 2002-8 Class PD, 6.5% 7/25/30 | | 2,442,173 | | | | 2,447,766 |
| Series 2005-72 Class FG, 4.08% 5/25/35 (d) | | 51,234,540 | | | | 51,079,581 |
77 Annual Report
| Investments (Unaudited) continued | | | | | | |
| |
Collateralized Mortgage Obligations continued
| | | | |
| | | Principal | | | | Value |
| | | Amount | | | | |
U.S. Government Agency continued
| | | | | | |
| Freddie Mac: | | | | | | |
| floater: | | | | | | |
| Series 2510 Class FE, 4.1681% 10/15/32 (d) | | $ 5,715,277 | | $ | | 5,746,827 |
| 0% 9/15/35 (d) | | 854,545 | | | | 828,909 |
| planned amortization class: | | | | | | |
| Series 2091 Class PP, 6% 2/15/27 | | 261,467 | | | | 261,106 |
| Series 2353 Class PC, 6.5% 9/15/15 | | 967,841 | | | | 969,335 |
| Freddie Mac Manufactured Housing participation certificates | | | | | | |
| guaranteed floater Series 2338 Class FJ, 3.9681% | | | | | | |
| 7/15/31 (d) | | 4,919,686 | | | | 4,918,386 |
| Freddie Mac Multi-class participation certificates guaranteed: | | | | | | |
| floater: | | | | | | |
| Series 2395 Class FA, 4.3681% 6/15/29 (d) | | 1,092,096 | | | | 1,099,242 |
| Series 2406: | | | | | | |
| Class FP, 4.7481% 1/15/32 (d) | | 10,270,000 | | | | 10,491,773 |
| Class PF, 4.7481% 12/15/31 (d) | | 8,125,000 | | | | 8,332,235 |
| Series 2410 Class PF, 4.7481% 2/15/32 (d) | | 18,644,444 | | | | 19,060,741 |
| Series 2474 Class FJ, 4.1181% 7/15/17 (d) | | 4,331,267 | | | | 4,353,673 |
| Series 2526 Class FC, 4.1681% 11/15/32 (d) | | 3,152,494 | | | | 3,162,233 |
| Series 2538 Class FB, 4.1681% 12/15/32 (d) | | 6,277,777 | | | | 6,315,699 |
| Series 2551 Class FH, 4.2181% 1/15/33 (d) | | 2,959,949 | | | | 2,972,585 |
| Series 2861 Class JF, 4.0681% 4/15/17 (d) | | 6,852,338 | | | | 6,850,151 |
| Series 2994 Class FB, 3.9181% 6/15/20 (d) | | 6,647,098 | | | | 6,631,097 |
| planned amortization class: | | | | | | |
| Series 2136 Class PE, 6% 1/15/28 | | 10,378,825 | | | | 10,418,016 |
| Series 2394 Class ND, 6% 6/15/27 | | 587,334 | | | | 587,187 |
| Series 2395 Class PE, 6% 2/15/30 | | 4,447,447 | | | | 4,468,111 |
| Series 2398 Class DK, 6.5% 1/15/31 | | 236,820 | | | | 236,922 |
| Series 2410 Class ML, 6.5% 12/15/30 | | 1,069,946 | | | | 1,072,088 |
| Series 2420 Class BE, 6.5% 12/15/30 | | 961,583 | | | | 961,848 |
| Series 2443 Class TD, 6.5% 10/15/30 | | 1,793,679 | | | | 1,798,791 |
| Series 2461 Class PG, 6.5% 1/15/31 | | 2,027,839 | | | | 2,050,146 |
| Series 2650 Class FV, 4.1681% 12/15/32 (d) | | 14,042,153 | | | | 14,060,363 |
| Series 2776 Class UJ, 4.5% 5/15/20 (e) | | 6,660,101 | | | | 345,325 |
| Series 2828 Class JA, 4.5% 1/15/10 | | 10,955,858 | | | | 10,959,149 |
| Series 3013 Class AF, 4.0181% 5/15/35 (d) | | 80,739,897 | | | | 80,382,844 |
| sequential pay Series 2430 Class ZE, 6.5% 8/15/27 | | 328,637 | | | | 328,381 |
| Ginnie Mae guaranteed REMIC pass thru securities floater: | | | | | | |
| Series 2001-46 Class FB, 4.1219% 5/16/23 (d) | | 2,819,644 | | | | 2,831,835 |
| Series 2001-50 Class FV, 3.9719% 9/16/27 (d) | | 8,689,581 | | | | 8,689,113 |
Collateralized Mortgage Obligations continued
| | |
| | | Principal | | Value |
| | | Amount | | |
U.S. Government Agency continued
| | | | |
| Ginnie Mae guaranteed REMIC pass thru securities floater: – | | | | |
| continued | | | | |
| Series 2002-24 Class FX, 4.3219% 4/16/32 (d) | | $ 2,453,441 | | $ 2,475,244 |
| Series 2002-31 Class FW, 4.1719% 6/16/31 (d) | | 3,364,460 | | 3,383,514 |
| Series 2002-5 Class KF, 4.1719% 8/16/26 (d) | | 474,812 | | 475,074 |
| |
| TOTAL U.S. GOVERNMENT AGENCY | | | | 422,222,755 |
| |
| TOTAL COLLATERALIZED MORTGAGE OBLIGATIONS | | | | |
| (Cost $1,343,654,425) | | | | 1,342,166,614 |
| |
| Commercial Mortgage Securities 5.4% | | | | |
| |
| Banc of America Large Loan, Inc. floater: | | | | |
| Series 2003-BBA2 Class A3, 4.0881% 11/15/15 (a)(d) | | 5,038,226 | | 5,042,678 |
| Series 2005-BBA6: | | | | |
| Class B, 3.9781% 1/15/19 (a)(d) | | 2,800,000 | | 2,799,998 |
| Class C, 4.0181% 1/15/19 (a)(d) | | 2,857,948 | | 2,857,946 |
| Class D, 4.07% 1/15/19 (a)(d) | | 2,800,000 | | 2,799,998 |
| Class E, 4.1081% 1/15/19 (a)(d) | | 1,750,000 | | 1,749,998 |
| Class F, 4.1581% 1/15/19 (a)(d) | | 1,170,000 | | 1,169,999 |
| Class G, 4.1881% 1/15/19 (a)(d) | | 915,000 | | 915,000 |
| Series 2005-BOCA: | | | | |
| Class H, 4.7181% 12/15/16 (a)(d) | | 2,065,000 | | 2,062,371 |
| Class J, 4.8681% 12/15/16 (a)(d) | | 1,020,000 | | 1,018,703 |
| Class K, 5.1181% 12/15/16 (a)(d) | | 6,659,000 | | 6,652,116 |
| Bank of America Large Loan, Inc.: | | | | |
| floater Series 2005-ESHA: | | | | |
| Class F, 4.63% 7/14/08 (a)(b)(d) | | 6,395,000 | | 6,395,000 |
| Class G, 4.76% 7/14/08 (a)(b)(d) | | 4,355,000 | | 4,355,000 |
| Class H, 4.98% 7/14/08 (a)(b)(d) | | 5,365,000 | | 5,365,000 |
| Series 2005 ESHA Class X1, 0.696% 7/14/08 (a)(b)(d)(e) | | 334,645,000 | | 5,112,372 |
| Bayview Commercial Asset Trust floater: | | | | |
| Series 2003-1 Class A, 4.2213% 8/25/33 (a)(d) | | 6,317,900 | | 6,392,956 |
| Series 2003-2: | | | | |
| Class A, 4.41% 12/25/33 (a)(d) | | 13,127,372 | | 13,287,836 |
| Class M1, 4.68% 12/25/33 (a)(d) | | 2,136,269 | | 2,171,502 |
| Series 2004-1: | | | | |
| Class A, 4.19% 4/25/34 (a)(d) | | 6,224,975 | | 6,227,901 |
| Class B, 5.73% 4/25/34 (a)(d) | | 646,751 | | 654,153 |
| Class M1, 4.39% 4/25/34 (a)(d) | | 565,907 | | 568,383 |
| Class M2, 5.03% 4/25/34 (a)(d) | | 485,063 | | 490,747 |
| |
| |
| 79 | | | | Annual Report |
| Investments (Unaudited) continued | | | | | | | | |
| |
Commercial Mortgage Securities continued
| | | | | | | | |
| | | | | Principal | | | | Value |
| | | | | Amount | | | | |
| Bayview Commercial Asset Trust floater: – continued | | | | | | | | |
| Series 2004-2: | | | | | | | | |
| Class A, 4.26% 8/25/34 (a)(d) | | $ | | 6,109,217 | | $ | | 6,122,596 |
| Class M1, 4.41% 8/25/34 (a)(d) | | | | 1,969,875 | | | | 1,977,570 |
| Series 2004-3: | | | | | | | | |
| Class A1, 4.2% 1/25/35 (a)(d) | | | | 6,475,016 | | | | 6,482,074 |
| Class A2, 4.25% 1/25/35 (a)(d) | | | | 899,933 | | | | 903,103 |
| Class M1, 4.33% 1/25/35 (a)(d) | | | | 1,079,169 | | | | 1,080,629 |
| Class M2, 4.83% 1/25/35 (a)(d) | | | | 703,806 | | | | 707,992 |
| Series 2005-2A: | | | | | | | | |
| Class M1, 4.3% 8/25/35 (a)(d) | | | | 1,288,534 | | | | 1,288,534 |
| Class M2, 4.32% 8/25/35 (a)(d) | | | | 2,121,126 | | | | 2,121,126 |
| Class M3, 4.38% 8/25/35 (a)(d) | | | | 1,174,549 | | | | 1,174,549 |
| Class M4, 4.53% 8/25/35 (a)(d) | | | | 1,080,387 | | | | 1,080,387 |
| Bear Stearns Commercial Mortgage Securities, Inc. floater: | | | | | | | | |
| Series 2003 BA1A: | | | | | | | | |
| Class JFCM, 5.17% 4/14/15 (a)(d) | | | | 1,344,296 | | | | 1,347,949 |
| Class KFCM, 5.6% 4/14/15 (a)(d) | | | | 1,436,661 | | | | 1,440,773 |
| Class LFCM, 6% 4/14/15 (a)(d) | | | | 1,601,905 | | | | 1,601,896 |
| Class MFCM, 6.3% 4/14/15 (a)(d) | | | | 2,218,251 | | | | 2,218,238 |
| Series 2004-BBA3 Class E, 4.4681% 6/15/17 (a)(d) | | | | 10,415,000 | | | | 10,416,411 |
| Chase Commercial Mortgage Securities Corp. floater | | | | | | | | |
| Series 2000-FL1A: | | | | | | | | |
| Class B, 4.1781% 12/12/13 (a)(d) | | | | 896,672 | | | | 878,739 |
| Class C, 4.5281% 12/12/13 (a)(d) | | | | 1,793,345 | | | | 1,793,345 |
| COMM floater: | | | | | | | | |
| Series 2001-FL5A Class E, 5.2681% 11/15/13 (a)(d) | | | | 3,021,068 | | | | 3,020,103 |
| Series 2002-FL6: | | | | | | | | |
| Class F, 5.2181% 6/14/14 (a)(d) | | | | 11,163,000 | | | | 11,182,139 |
| Class G, 5.6681% 6/14/14 (a)(d) | | | | 5,000,000 | | | | 4,999,659 |
| Series 2003-FL9 Class B, 4.2681% 11/15/15 (a)(d) | | | | 8,579,991 | | | | 8,604,476 |
| Commercial Mortgage pass thru certificates floater: | | | | | | | | |
| Series 2004-CNL: | | | | | | | | |
| Class A2, 4.0681% 9/15/14 (a)(d) | | | | 3,570,000 | | | | 3,573,125 |
| Class G, 4.7481% 9/15/14 (a)(d) | | | | 1,345,000 | | | | 1,345,534 |
| Class H, 4.8481% 9/15/14 (a)(d) | | | | 1,430,000 | | | | 1,430,567 |
| Class J, 5.3681% 9/15/14 (a)(d) | | | | 490,000 | | | | 491,353 |
| Class K, 5.7681% 9/15/14 (a)(d) | | | | 770,000 | | | | 771,393 |
| Class L, 5.9681% 9/15/14 (a)(d) | | | | 625,000 | | | | 624,774 |
| Series 2004-HTL1: | | | | | | | | |
| Class B, 4.2181% 7/15/16 (a)(d) | | | | 426,802 | | | | 427,072 |
Commercial Mortgage Securities continued
| | | | | | | | |
| | | | | Principal | | | | Value |
| | | | | Amount | | | | |
| Commercial Mortgage pass thru certificates floater: - | | | | | | | | |
| continued | | | | | | | | |
| Series 2004-HTL1: | | | | | | | | |
| Class D, 4.3181% 7/15/16 (a)(d) | | $ | | 969,949 | | $ | | 970,109 |
| Class E, 4.5181% 7/15/16 (a)(d) | | | | 694,177 | | | | 694,425 |
| Class F, 4.5681% 7/15/16 (a)(d) | | | | 734,671 | | | | 735,088 |
| Class H, 5.0681% 7/15/16 (a)(d) | | | | 2,129,763 | | | | 2,130,459 |
| Class J, 5.2181% 7/15/16 (a)(d) | | | | 818,412 | | | | 818,679 |
| Class K, 6.1181% 7/15/16 (a)(d) | | | | 921,324 | | | | 921,038 |
| Commercial Mortgage pass thru Certificates floater Series | | | | | | | | |
| 2005-F10A: | | | | | | | | |
| Class B, 3.9981% 4/15/17 (a)(d) | | | | 7,080,000 | | | | 7,074,591 |
| Class C, 4.0381% 4/15/17 (a)(d) | | | | 3,006,000 | | | | 3,000,368 |
| Class D, 4.0781% 4/15/17 (a)(d) | | | | 2,440,000 | | | | 2,437,663 |
| Class E, 4.1381% 4/15/17 (a)(d) | | | | 1,821,000 | | | | 1,819,257 |
| Class F, 4.1781% 4/15/17 (a)(d) | | | | 1,035,000 | | | | 1,034,719 |
| Class G, 4.3181% 4/15/17 (a)(d) | | | | 1,035,000 | | | | 1,034,956 |
| Class H, 4.3881% 4/15/17 (a)(d) | | | | 1,035,000 | | | | 1,034,365 |
| Class I, 4.6181% 4/15/17 (a)(d) | | | | 335,000 | | | | 334,605 |
| Class MOA3, 4.0681% 3/15/20 (a)(d) | | | | 4,590,000 | | | | 4,589,812 |
| CS First Boston Mortgage Securities Corp.: | | | | | | | | |
| floater: | | | | | | | | |
| Series 2003-TF2A Class A2, 4.0881% 11/15/14 (a)(d) . | | | | 3,837,106 | | | | 3,838,834 |
| Series 2004-FL1 Class B, 4.2181% 5/15/14 (a)(d) | | | | 11,230,000 | | | | 11,246,403 |
| Series 2004-HC1: | | | | | | | | |
| Class A2, 4.2681% 12/15/21 (a)(d) | | | | 1,475,000 | | | | 1,474,997 |
| Class B, 4.5181% 12/15/21 (a)(d) | | | | 3,835,000 | | | | 3,834,992 |
| Series 2004-TF2A Class E, 4.1881% 11/15/19 (a)(d) | | | | 4,450,000 | | | | 4,456,359 |
| Series 2004-TFL1: | | | | | | | | |
| Class A2, 3.9581% 2/15/14 (a)(d) | | | | 7,005,000 | | | | 7,005,853 |
| Class E, 4.3181% 2/15/14 (a)(d) | | | | 2,800,000 | | | | 2,802,824 |
| Class F, 4.3681% 2/15/14 (a)(d) | | | | 2,325,000 | | | | 2,327,963 |
| Class G, 4.6181% 2/15/14 (a)(d) | | | | 1,875,000 | | | | 1,879,139 |
| Class H, 4.8681% 2/15/14 (a)(d) | | | | 1,400,000 | | | | 1,403,371 |
| Class J, 5.1681% 2/15/14 (a)(d) | | | | 750,000 | | | | 753,317 |
| Series 2005-TF2A Class F, 4.2681% 11/15/19 (a)(d) | | | | 1,540,000 | | | | 1,542,198 |
| Series 2005-TFLA: | | | | | | | | |
| Class C, 4.0081% 2/15/20 (a)(d) | | | | 5,650,000 | | | | 5,649,989 |
| Class E, 4.0981% 2/15/20 (a)(d) | | | | 3,955,000 | | | | 3,954,988 |
| Class F, 4.1481% 2/15/20 (a)(d) | | | | 1,745,000 | | | | 1,744,997 |
| Class G, 4.2881% 2/15/20 (a)(d) | | | | 505,000 | | | | 504,998 |
81 Annual Report
| Investments (Unaudited) continued | | | | | | | | |
| |
Commercial Mortgage Securities continued
| | | | | | | | |
| | | | | Principal | | | | Value |
| | | | | Amount | | | | |
| CS First Boston Mortgage Securities Corp.: – continued | | | | | | | | |
| Series 2005-TFLA: | | | | | | | | |
| Class H, 4.5181% 2/15/20 (a)(d) | | $ | | 715,000 | | $ | | 714,998 |
| sequential pay Series 1997-C2 Class A2, 6.52% 1/17/35 | | | | 235,680 | | | | 236,453 |
| GMAC Commercial Mortgage Securities, Inc. floater Series | | | | | | | | |
| 2001-FL1A Class E, 4.5781% 2/11/11 (a)(d) | | | | 152,562 | | | | 152,409 |
| GS Mortgage Securities Corp. II floater Series 2005-FL7A | | | | | | | | |
| Class A1, 3.84% 11/6/19 (a)(d) | | | | 10,128,306 | | | | 10,129,534 |
| Impac CMB Trust Series 2005-7 Class M4, 4.388% | | | | | | | | |
| 11/25/35 (d) | | | | 3,169,000 | | | | 3,169,000 |
| John Hancock Tower Mortgage Trust floater Series 2003-C5A | | | | | | | | |
| Class B, 6.2166% 4/10/15 (a)(d) | | | | 8,245,000 | | | | 8,245,000 |
| Lehman Brothers Floating Rate Commercial Mortgage Trust: | | | | | | | | |
| floater Series 2003-LLFA: | | | | | | | | |
| Class A2, 4.14% 12/16/14 (a)(d) | | | | 11,700,000 | | | | 11,705,144 |
| Class B, 4.35% 12/16/14 (a)(d) | | | | 4,615,000 | | | | 4,623,295 |
| Class C, 4.45% 12/16/14 (a)(d) | | | | 4,982,000 | | | | 4,993,212 |
| Series 2005-LLFA Class FAIR, 5.4181% 7/15/18 (a)(d) | | | | 4,360,000 | | | | 4,360,000 |
| Morgan Stanley Capital I, Inc. Series 2005-XLF: | | | | | | | | |
| Class B, 3.9781% 8/15/19 (a)(d) | | | | 6,705,000 | | | | 6,705,000 |
| Class C, 4.0081% 8/15/19 (a)(d) | | | | 525,000 | | | | 525,000 |
| Class D, 4.0281% 8/15/19 (a)(d) | | | | 1,915,000 | | | | 1,915,000 |
| Class E, 4.0481% 8/15/19 (a)(d) | | | | 1,745,000 | | | | 1,745,000 |
| Class F, 4.0881% 8/15/19 (a)(d) | | | | 1,220,000 | | | | 1,220,000 |
| Class G, 4.1381% 8/15/19 (a)(d) | | | | 870,000 | | | | 870,000 |
| Class H, 4.1581% 8/15/19 (a)(d) | | | | 695,000 | | | | 695,000 |
| Class J, 4.2281% 8/15/19 (a)(d) | | | | 525,000 | | | | 525,000 |
| Morgan Stanley Dean Witter Capital I Trust floater | | | | | | | | |
| Series 2002-XLF Class F, 5.8663% 8/5/14 (a)(d) | | | | 5,359,368 | | | | 5,359,351 |
| Salomon Brothers Mortgage Securities VII, Inc.: | | | | | | | | |
| floater Series 2001-CDCA: | | | | | | | | |
| Class C, 4.5681% 2/15/13 (a)(d) | | | | 4,711,321 | | | | 4,701,152 |
| Class D, 4.5681% 2/15/13 (a)(d) | | | | 4,000,000 | | | | 3,987,882 |
| Series 2000-NL1 Class E, 7.0607% 10/15/30 (a)(d) | | | | 3,188,867 | | | | 3,197,433 |
| SDG Macerich Properties LP floater Series 2000-1 Class A3, | | | | | | | | |
| 4.1081% 5/15/09 (a)(d) | | | | 18,000,000 | | | | 17,994,375 |
| STRIPS III Ltd./STRIPS III Corp. floater Series 2004-1A | | | | | | | | |
| Class A, 4.31% 3/24/18 (a)(d) | | | | 6,950,497 | | | | 6,950,497 |
| Wachovia Bank Commercial Mortgage Trust floater: | | | | | | | | |
| Series 2004-WHL3: | | | | | | | | |
| Class A2, 3.9481% 3/15/14 (a)(d) | | | | 3,510,000 | | | | 3,510,856 |
| Class E, 4.2681% 3/15/14 (a)(d) | | | | 2,190,000 | | | | 2,191,761 |
Commercial Mortgage Securities continued
| | | | |
| | | | | Principal | | Value |
| | | | | Amount | | |
| Wachovia Bank Commercial Mortgage Trust floater: - | | | | |
| continued | | | | | | |
| Series 2004-WHL3: | | | | | | |
| Class F, 4.3181% 3/15/14 (a)(d) | | $ | | 1,755,000 | | $ 1,756,359 |
| Class G, 4.5481% 3/15/14 (a)(d) | | | | 875,000 | | 875,871 |
| Series 2005-WL5A: | | | | | | |
| Class KHP1, 4.1181% 1/15/18 (a)(d) | | | | 1,745,000 | | 1,744,663 |
| Class KHP2, 4.3181% 1/15/18 (a)(d) | | | | 1,745,000 | | 1,747,772 |
| Class KHP3, 4.6181% 1/15/18 (a)(d) | | | | 2,060,000 | | 2,062,033 |
| Class KHP4, 4.7181% 1/15/18 (a)(d) | | | | 1,600,000 | | 1,602,203 |
| Class KHP5, 4.9181% 1/15/18 (a)(d) | | | | 1,855,000 | | 1,845,971 |
| TOTAL COMMERCIAL MORTGAGE SECURITIES | | | | |
| (Cost $361,655,067) | | | | | | 362,304,343 |
| |
| Certificates of Deposit 0.9% | | | | | | |
| |
| DEPFA BANK PLC yankee 4.265% 9/1/06 | | | | 30,000,000 | | 29,964,651 |
| Deutsche Bank AG yankee 4.21% 8/24/06 | | | | 30,000,000 | | 29,958,345 |
| TOTAL CERTIFICATES OF DEPOSIT | | | | | | |
| (Cost $60,000,000) | | | | | | 59,922,996 |
| |
| Commercial Paper 0.4% | | | | | | |
| |
| Fortune Brands, Inc. 3.79% 10/31/05 | | | | | | |
| (Cost $26,416,304) | | | | 26,500,000 | | 26,417,781 |
83 Annual Report
| Investments (Unaudited) continued | | | | | | |
| |
Cash Equivalents 36.3%
| | | | | | | | |
| | | | | Maturity | | | | Value |
| | | | | Amount | | | | |
| Investments in repurchase agreements (Collateralized by | | | | | | |
| U.S. Government Obligations, in a joint trading | | | | | | |
| account at 3.89%, dated 9/30/05 due 10/3/05) (g) . | | | | $2,120,321,927 | | $2,119,634,000 |
| Investments in repurchase agreements (Collateralized by | | | | | | |
| U.S. Treasury Obligations, in a joint trading account at | | | | | | |
| 3.27%, dated 9/30/05 due 10/3/05) (g) | | 6,298,716 | | | | 6,297,000 |
| With Goldman Sachs & Co. at 4.04%, dated 8/23/05 | | | | | | |
| due 11/21/05 (Collateralized by Mortgage Loan | | | | | | |
| Obligations valued at $304,500,001, 4.54%– 4.56%, | | | | | | |
| 9/25/35 - 9/25/35) (d)(f) | | | | 292,929,000 | | 289,962,793 |
| TOTAL CASH EQUIVALENTS | | | | | | | | |
| (Cost $2,415,931,000) | | | | 2,415,893,793 |
| |
| TOTAL INVESTMENT PORTFOLIO 101.0% | | | | | | |
| (Cost $6,720,022,154) | | | | 6,725,584,889 |
| |
| NET OTHER ASSETS – (1.0)% | | | | | | (65,032,717) |
| NET ASSETS 100% | | | | $ 6,660,552,172 |
| |
| |
| Futures Contracts | | | | | | | | |
| | | Expiration | | Underlying | | Unrealized |
| | | Date | | Face Amount | | Appreciation/ |
| | | | | at Value | | (Depreciation) |
| Sold | | | | | | | | |
| |
| Eurodollar Contracts | | | | | | | | |
| 73 Eurodollar 90 Day Index Contracts | | Dec. 2005 | | $72,199,738 | | $ | | 56,706 |
| 49 Eurodollar 90 Day Index Contracts | | March 2006 | | 48,442,625 | | | | 50,086 |
| 32 Eurodollar 90 Day Index Contracts | | June 2006 | | 31,631,600 | | | | 30,247 |
| 32 Eurodollar 90 Day Index Contracts | | Sept. 2006 | | 31,630,800 | | | | 28,072 |
| 31 Eurodollar 90 Day Index Contracts | | Dec. 2006 | | 30,642,725 | | | | 23,176 |
| 29 Eurodollar 90 Day Index Contracts | | March 2007 | | 28,668,313 | | | | 17,947 |
| 22 Eurodollar 90 Day Index Contracts | | June 2007 | | 21,748,925 | | | | 8,962 |
| 21 Eurodollar 90 Day Index Contracts | | Sept. 2007 | | 20,760,075 | | | | 7,941 |
| 20 Eurodollar 90 Day Index Contracts | | Dec. 2007 | | 19,770,250 | | | | 7,370 |
| 20 Eurodollar 90 Day Index Contracts | | March 2008 | | 19,770,000 | | | | 6,620 |
| 13 Eurodollar 90 Day Index Contracts | | June 2008 | | 12,850,013 | | | | 8,836 |
| 12 Eurodollar 90 Day Index Contracts | | Sept. 2008 | | 11,860,950 | | | | 8,052 |
| 5 Eurodollar 90 Day Index Contracts | | Dec. 2008 | | 4,941,625 | | | | 1,230 |
| 3 Eurodollar 90 Day Index Contracts | | March 2009 | | 2,964,900 | | | | 688 |
| TOTAL EURODOLLAR CONTRACTS | | | | | | $ | | 255,933 |
| |
| |
| |
| Annual Report | | 84 | | | | | | |
| Swap Agreements | | | | | | | | | | |
| |
| | | Expiration | | | | Notional | | | | Value |
| | | Date | | | | Amount | | | | |
| |
| Credit Default Swap | | | | | | | | | | |
| Receive from Citibank, upon default event | | | | | | | | | | |
| of DaimlerChrysler NA Holding Corp., | | | | | | | | | | |
| par value of the notional amount of | | | | | | | | | | |
| DaimlerChrysler NA Holding Corp. 6.5% | | | | | | | | | | |
| 11/15/13, and pay quarterly notional | | | | | | | | | | |
| amount multiplied by .8% | | June 2007 | | $ | | 14,000,000 | | $ | | (129,454) |
| Receive quarterly notional amount | | | | | | | | | | |
| multiplied by .48% and pay Goldman | | | | | | | | | | |
| Sachs upon default event of TXU Energy | | | | | | | | | | |
| Co. LLC, par value of the notional amount | | | | | | | | | | |
| of TXU Energy Co. LLC 7% 3/15/13 | | Sept. 2008 | | | | 13,540,000 | | | | (82,090) |
| Receive quarterly notional amount | | | | | | | | | | |
| multiplied by 1.12% and pay Morgan | | | | | | | | | | |
| Stanley, Inc. upon default of Comcast | | | | | | | | | | |
| Cable Communications, Inc., par value of | | | | | | | | | | |
| the notional amount of Comcast Cable | | | | | | | | | | |
| Communications, Inc. 6.75% 1/30/11 | | June 2006 | | | | 10,000,000 | | | | 75,975 |
| |
| TOTAL CREDIT DEFAULT SWAP | | | | $ | | 37,540,000 | | $ | | (135,569) |
| |
| Total Return Swap | | | | | | | | | | |
| Receive monthly notional amount multiplied | | | | | | | | | | |
| by the nominal spread appreciation of | | | | | | | | | | |
| the Lehman Brothers CMBS U.S. Aggre- | | | | | | | | | | |
| gate Index adjusted by a modified dura- | | | | | | | | | | |
| tion factor plus 10 basis points and pay | | | | | | | | | | |
| monthly notional amount multiplied by | | | | | | | | | | |
| the nominal spread depreciation of the | | | | | | | | | | |
| Lehman Brothers CMBS U.S. Aggregate | | | | | | | | | | |
| Index adjusted by a modified duration | | | | | | | | | | |
| factor with Lehman Brothers, Inc. | | Oct. 2005 | | | | 48,200,000 | | | | (43,480) |
| Receive monthly notional amount multiplied | | | | | | | | | | |
| by the nominal spread appreciation of the | | | | | | | | | | |
| Lehman Brothers CMBS U.S. Aggregate | | | | | | | | | | |
| Index adjusted by a modified duration fac | | | | | | | | | | |
| tor plus 30 basis points and pay monthly | | | | | | | | | | |
| notional amount multiplied by the nominal | | | | | | | | | | |
| spread depreciation of the Lehman Broth | | | | | | | | | | |
| ers CMBS U.S. Aggregate Index adjusted | | | | | | | | | | |
| by a modified duration factor with | | | | | | | | | | |
| Citibank | | April 2006 | | | | 67,500,000 | | | | (31,167) |
| |
| |
| |
| |
| | | 85 | | | | | | Annual Report |
| Investments (Unaudited) continued | | | | | | |
| |
| Swap Agreements continued | | | | | | | | |
| |
| | | Expiration | | Notional | | | | Value |
| | | Date | | Amount | | | | |
| |
| Total Return Swap continued | | | | | | | | |
| Receive monthly notional amount multiplied | | | | | | | | |
| by the nominal spread appreciation of the | | | | | | | | |
| Lehman Brothers CMBS U.S. Aggregate | | | | | | | | |
| Index adjusted by a modified duration fac | | | | | | | | |
| tor plus 15 basis points and pay monthly | | | | | | | | |
| notional amount multiplied by the nominal | | | | | | | | |
| spread depreciation of the Lehman Broth | | | | | | | | |
| ers CMBS U.S. Aggregate Index adjusted | | | | | | | | |
| by a modified duration factor with Citibank | | April 2006 | | $ 48,200,000 | | $ | | 0 |
| Receive monthly notional amount multiplied | | | | | | | | |
| by the nominal spread appreciation of | | | | | | | | |
| the Lehman Brothers CMBS U.S. Aggre- | | | | | | | | |
| gate Index adjusted by a modified dura- | | | | | | | | |
| tion factor plus 25 basis points and pay | | | | | | | | |
| monthly notional amount multiplied by | | | | | | | | |
| the nominal spread depreciation of the | | | | | | | | |
| Lehman Brothers CMBS U.S. Aggregate | | | | | | | | |
| Index adjusted by a modified duration | | | | | | | | |
| factor with Lehman Brothers, Inc. | | Dec. 2005 | | 30,000,000 | | | | (23,390) |
| Receive monthly notional amount multiplied | | | | | | | | |
| by the nominal spread appreciation of | | | | | | | | |
| the Lehman Brothers CMBS U.S. Aggre- | | | | | | | | |
| gate Index adjusted by a modified dura- | | | | | | | | |
| tion factor plus 22 basis points and pay | | | | | | | | |
| monthly notional amount multiplied by | | | | | | | | |
| the nominal spread depreciation of the | | | | | | | | |
| Lehman Brothers CMBS U.S. Aggregate | | | | | | | | |
| Index adjusted by a modified duration | | | | | | | | |
| factor with Lehman Brothers, Inc. | | Jan. 2006 | | 35,100,000 | | | | (27,970) |
| Receive monthly notional amount multiplied | | | | | | | | |
| by the nominal spread appreciation of | | | | | | | | |
| the Lehman Brothers CMBS U.S. Aggre- | | | | | | | | |
| gate Index adjusted by a modified dura- | | | | | | | | |
| tion factor plus 7.5 basis points and pay | | | | | | | | |
| monthly notional amount multiplied by | | | | | | | | |
| the nominal spread depreciation of the | | | | | | | | |
| Lehman Brothers CMBS U.S. Aggregate | | | | | | | | |
| Index adjusted by a modified duration | | | | | | | | |
| factor with Lehman Brothers, Inc. | | Nov. 2005 | | 35,100,000 | | | | (13,586) |
| Receive monthly a return equal to Lehman | | | | | | | | |
| Brothers ABS Floating Rate Index and | | | | | | | | |
| pay monthly a floating rate based on the | | | | | | | | |
| 1-month LIBOR minus 11.1 basis points | | | | | | | | |
| with Lehman Brothers, Inc. | | Nov. 2005 | | 30,000,000 | | | | 8,273 |
| |
| TOTAL TOTAL RETURN SWAP | | | | $ 294,100,000 | | $ | | (131,320) |
| |
| |
| | | | | $ 331,640,000 | | $ | | (266,889) |
| |
| |
| |
| |
| Annual Report | | 86 | | | | | | |
Legend
(a) Security exempt from registration under
Rule 144A of the Securities Act of 1933.
These securities may be resold in
transactions exempt from registration,
normally to qualified institutional buyers.
At the period end, the value of these
securities amounted to $605,971,272
or 9.1% of net assets.
(b) Security or a portion of the security
purchased on a delayed delivery or
when-issued basis.
(c) Security or a portion of the security was
pledged to cover margin requirements
for futures contracts. At the period end,
the value of securities pledged
amounted to $990,994.
(d) The coupon rate shown on floating or
adjustable rate securities represents the
rate at period end.
(e) Security represents right to receive
monthly interest payments on an
underlying pool of mortgages. Principal
shown is the par amount of the
mortgage pool.
(f) The maturity amount is based on the
rate at period end.
(g) Additional information on each
counterparty to the repurchase
agreement is as follows:
|
| Repurchase Agreement/ | | | | Value |
| Counterparty | | | | |
| $6,297,000 due | | | | |
| 10/3/05 at 3.27% | | | | |
| Banc of America | | | | |
| Securities LLC. | | $ | | 878,400 |
| Barclays Capital Inc. | | | | 2,037,889 |
| BNP Paribas Securities | | | | |
| Corp. | | | | 2,318,977 |
| State Street Bank and | | | | |
| Trust Company | | | | 1,061,734 |
| | | $ | | 6,297,000 |
| Repurchase Agreement/ | | Value |
| Counterparty | | |
| 2,119,634,000 due | | |
| 10/3/05 at 3.89% | | |
| Banc of America | | |
| Securities LLC. | | $ 406,558,229 |
| Bank of America, | | |
| National Association | | 138,994,266 |
| Barclays Capital Inc. | | 625,474,199 |
| Bear Stearns & Co. Inc. . | | 104,245,700 |
| Countrywide Securities | | |
| Corporation | | 138,994,266 |
| Goldman Sachs & Co. | | 382,234,233 |
| Morgan Stanley & Co. | | |
| Incorporated. | | 34,720,003 |
| UBS Securities LLC | | 288,413,104 |
| | | $ 2,119,634,000 |
Income Tax Information
At September 30, 2005, the fund had a capital loss carryforward of approximately $4,905,519 all of which will expire on September 30, 2011.
87 Annual Report
Investment Adviser
Fidelity Management & Research Company
Boston, MA
Investment Sub Advisers
FMR Co., Inc.
Fidelity Management & Research
(U.K.) Inc.
Fidelity Management & Research
(Far East) Inc.
Fidelity International Investment Advisors
Fidelity Investments Japan Limited
Fidelity International Investment Advisors (U.K.) Limited
Geode Capital Management, LLC
General Distributor
Fidelity Distributors Corporation
Boston, MA
Transfer and Service Agents
Fidelity Investments Institutional
Operations Company, Inc.
Boston, MA
Fidelity Service Company, Inc.
Boston, MA
Custodian
Mellon Bank, N.A.
Pittsburgh, PA
|
ARRSI-UANN-1105
1.814967.100
|

Item 2. Code of Ethics
As of the end of the period, September 30, 2005, Fidelity Commonwealth Trust (the trust) has adopted a code of ethics, as defined in Item 2 of Form N-CSR, that applies to its President and Treasurer and its Chief Financial Officer. A copy of the code of ethics is filed as an exhibit to this Form N-CSR.
Item 3. Audit Committee Financial Expert
The Board of Trustees of the trust has determined that Marie L. Knowles is an audit committee financial expert, as defined in Item 3 of Form N-CSR. Ms. Knowles is independent for purposes of Item 3 of Form N-CSR.
Item 4. Principal Accountant Fees and Services
(a) Audit Fees.
For the fiscal years ended September 30, 2005 and September 30, 2004, the aggregate Audit Fees billed by Deloitte & Touche LLP, the member firms of Deloitte Touche Tohmatsu, and their respective affiliates (collectively, "Deloitte Entities") for professional services rendered for the audits of the financial statements, or services that are normally provided in connection with statutory and regulatory filings or engagements for those fiscal years, for the Fidelity Strategic Real Return Fund (the fund) and for all funds in the Fidelity Group of Funds are shown in the table below.
Fund | 2005A | 2004A,B |
Fidelity Strategic Real Return Fund | $53,000 | $0 |
All funds in the Fidelity Group of Funds audited by Deloitte Entities | $5,200,000 | $4,300,000 |
A | Aggregate amounts may reflect rounding. |
B | No Audit Fees were billed by Deloitte Entities for professional services rendered for the audit of the annual financial statements, or services that are normally provided in connection with the statutory and regulatory filings or engagements, to the fund as the fund did not commence operations until September 7, 2005. |
(b) Audit-Related Fees.
In each of the fiscal years ended September 30, 2005 and September 30, 2004 the aggregate Audit-Related Fees billed by Deloitte Entities for services rendered for assurance and related services to the fund that are reasonably related to the performance of the audit or review of the fund's financial statements, but not reported as Audit Fees, are shown in the table below.
Fund | 2005A | 2004A,B |
Fidelity Strategic Real Return Fund | $0 | $0 |
A | Aggregate amounts may reflect rounding. |
B | No Audit-Related Fees were billed by Deloitte Entities for services rendered for assurance and related services to the fund as the fund did not commence operations until September 7, 2005. |
In each of the fiscal years ended September 30, 2005 and September 30, 2004, the aggregate Audit-Related Fees that were billed by Deloitte Entities that were required to be approved by the Audit Committee for services rendered on behalf of Fidelity Management & Research Company (FMR) and entities controlling, controlled by, or under common control with FMR (not including any sub-adviser whose role is primarily portfolio management and is subcontracted with or overseen by another investment adviser) that provide ongoing services to the fund ("Fund Service Providers") for assurance and related services that relate directly to the operations and financial reporting of the fund that are reasonably related to the performance of the audit or review of the fund's financial statements, but not reported as Audit Fees, are shown in the table below.
Billed By | 2005A,B | 2004A,B |
Deloitte Entities | $0 | $0 |
A | Aggregate amounts may reflect rounding. |
B | May include amounts billed prior to the fund's commencement of operations. |
Fees included in the audit-related category comprise assurance and related services (e.g., due diligence services) that are traditionally performed by the independent registered public accounting firm. These audit-related services include due diligence related to mergers and acquisitions, accounting consultations and audits in connection with acquisitions, internal control reviews, attest services that are not required by statute or regulation and consultation concerning financial accounting and reporting standards.
(c) Tax Fees.
In each of the fiscal years ended September 30, 2005 and September 30, 2004, the aggregate Tax Fees billed by Deloitte Entities for professional services rendered for tax compliance, tax advice, and tax planning for the fund is shown in the table below.
Fund | 2005A | 2004A,B |
Fidelity Strategic Real Return Fund | $8,500 | $0 |
A | Aggregate amounts may reflect rounding. |
B | No Tax Fees were billed by Deloitte Entities for services rendered for tax compliance, tax advice, and tax planning for the fund as the fund did not commence operations until September 7, 2005. |
In each of the fiscal years ended September 30, 2005 and September 30, 2004, the aggregate Tax Fees billed by Deloitte Entities that were required to be approved by the Audit Committee for professional services rendered on behalf of the Fund Service Providers for tax compliance, tax advice, and tax planning that relate directly to the operations and financial reporting of the fund is shown in the table below.
Billed By | 2005A, B | 2004A, B |
Deloitte Entities | $0 | $0 |
A | Aggregate amounts may reflect rounding. |
B | May include amounts billed prior to the fund's commencement of operations. |
Fees included in the Tax Fees category comprise all services performed by professional staff in the independent registered public accounting firm's tax division except those services related to the audit. Typically, this category would include fees for tax compliance, tax planning, and tax advice. Tax compliance, tax advice, and tax planning services include preparation of original and amended tax returns, claims for refund and tax payment-planning services, assistance with tax audits and appeals, tax advice related to mergers and acquisitions and requests for rulings or technical advice from taxing authorities.
(d) All Other Fees.
In each of the fiscal years ended September 30, 2005 and September 30, 2004, the aggregate Other Fees billed by Deloitte Entities for all other non-audit services rendered to the fund is shown in the table below.
Fund | 2005A | 2004A,B |
Fidelity Strategic Real Return Fund | $0 | $0 |
A | Aggregate amounts may reflect rounding. |
B | No Other Fees were billed by Deloitte Entities for all other non-audit services rendered to the fund as the fund did not commence operations until September 7, 2005. |
In each of the fiscal years ended September 30, 2005 and September 30, 2004, the aggregate Other Fees billed by Deloitte Entities that were required to be approved by the Audit Committee for all other non-audit services rendered on behalf of the Fund Service Providers that relate directly to the operations and financial reporting of the fund is shown in the table below.
Billed By | 2005A, B | 2004A, B |
Deloitte Entities | $210,000 | $790,000 |
A | Aggregate amounts may reflect rounding. |
B | May include amounts billed prior to the fund's commencement of operations. |
Fees included in the All Other Fees category include services related to internal control reviews, strategy and other consulting, financial information systems design and implementation, consulting on other information systems, and other tax services unrelated to the fund.
(e) (1) | Audit Committee Pre-Approval Policies and Procedures: |
The trust's Audit Committee must pre-approve all audit and non-audit services provided by the independent registered public accounting firm relating to the operations or financial reporting of the fund. Prior to the commencement of any audit or non-audit services to a fund, the Audit Committee reviews the services to determine whether they are appropriate and permissible under applicable law.
The trust's Audit Committee has adopted policies and procedures to, among other purposes, provide a framework for the Committee's consideration of non-audit services by the audit firms that audit the Fidelity funds. The policies and procedures require that any non-audit service provided by a fund audit firm to a Fidelity Fund and any non-audit service provided by a fund auditor to a Fund Service Provider that relates directly to the operations and financial reporting of a Fidelity fund (Covered Service) are subject to approval by the Audit Committee before such service is provided. Non-audit services provided by a fund audit firm for a Fund Service Provider that do not relate directly to the operations and financial reporting of a Fidelity fund (Non-Covered Service) but that are expected to exceed $50,000 are also subject to pre-approval by the Audit Committee.
All Covered Services, as well as Non-Covered Services that are expected to exceed $50,000, must be approved in advance of provision of the service either: (i) by formal resolution of the Audit Committee, or (ii) by oral or written approval of the service by the Chair of the Audit Committee (or if the Chair is unavailable, such other member of the Audit Committee as may be designated by the Chair to act in the Chair's absence). The approval contemplated by (ii) above is permitted where the Treasurer determines that action on such an engagement is necessary before the next meeting of the Audit Committee. Neither pre-approval nor advance notice of Non-Covered Service engagements for which fees are not expected to exceed $50,000 is required; such engagements are to be reported to the Audit Committee monthly.
(e) (2) | Services approved pursuant to paragraph (c)(7)(i)(C) of Rule 2-01 of Regulation S-X: |
Audit-Related Fees:
There were no amounts that were approved by the Audit Committee pursuant to the de minimis exception for the fiscal years ended September 30, 2005 and September 30, 2004 on behalf of the fund.
There were no amounts that were required to be approved by the Audit Committee pursuant to the de minimis exception for the fiscal years ended September 30, 2005 and September 30, 2004 on behalf of the Fund Service Providers that relate directly to the operations and financial reporting of the fund.
Tax Fees:
There were no amounts that were approved by the Audit Committee pursuant to the de minimis exception for the fiscal years ended September 30, 2005 and September 30, 2004 on behalf of the fund.
There were no amounts that were required to be approved by the Audit Committee pursuant to the de minimis exception for the fiscal years ended September 30, 2005 and September 30, 2004 on behalf of the Fund Service Providers that relate directly to the operations and financial reporting of the fund.
All Other Fees:
There were no amounts that were approved by the Audit Committee pursuant to the de minimis exception for the fiscal years ended September 30, 2005 and September 30, 2004 on behalf of the fund.
There were no amounts that were required to be approved by the Audit Committee pursuant to the de minimis exception for the fiscal years ended September 30, 2005 and September 30, 2004 on behalf of the Fund Service Providers that relate directly to the operations and financial reporting of the fund.
(f) Not Applicable.
(g) For the fiscal years ended September 30, 2005 and September 30, 2004, the aggregate fees billed by Deloitte Entities of $600,000A,B and $1,700,000A,B for non-audit services rendered on behalf of the fund, FMR (not including any sub-adviser whose role is primarily portfolio management and is subcontracted with or overseen by another investment adviser) and Fund Service Providers relating to Covered Services and Non-Covered Services are shown in the table below.
| 2005A,B | 2004A,B |
Covered Services | $200,000 | $750,000 |
Non-Covered Services | $400,000 | $950,000 |
A | Aggregate amounts may reflect rounding. |
B | May include amounts billed prior to the fund's commencement of operations. |
(h) The trust's Audit Committee has considered Non-Covered Services that were not pre-approved that were provided by Deloitte Entities to Fund Service Providers to be compatible with maintaining the independence of Deloitte Entities in its audit of the fund, taking into account representations from Deloitte Entities, in accordance with Independence Standards Board Standard No.1, regarding its independence from the fund and its related entities.
Item 5. Audit Committee of Listed Registrants
Not applicable.
Item 6. Schedule of Investments
Not applicable.
Item 7. Disclosure of Proxy Voting Policies and Procedures for Closed-End Management Investment Companies
Not applicable.
Item 8. Portfolio Managers of Closed-End Management Investment Companies
Not applicable.
Item 9. Purchase of Equity Securities by Closed-End Management Investment Company and Affiliated Purchasers
Not applicable.
Item 10. Submission of Matters to a Vote of Security Holders
There were no material changes to the procedures by which shareholders may recommend nominees to the trust's Board of Trustees.
Item 11. Controls and Procedures
(a)(i) The President and Treasurer and the Chief Financial Officer have concluded that the trust's disclosure controls and procedures (as defined in Rule 30a-3(c) under the Investment Company Act) provide reasonable assurances that material information relating to the trust is made known to them by the appropriate persons, based on their evaluation of these controls and procedures as of a date within 90 days of the filing date of this report.
(a)(ii) There was no change in the trust's internal control over financial reporting (as defined in Rule 30a-3(d) under the Investment Company Act) that occurred during the second fiscal quarter of the period covered by this report that has materially affected, or is reasonably likely to materially affect, the trust's internal control over financial reporting.
Item 12. Exhibits
(a) | (1) | Code of Ethics pursuant to Item 2 of Form N-CSR is filed and attached hereto as EX-99.CODE ETH. |
(a) | (2) | Certification pursuant to Rule 30a-2(a) under the Investment Company Act of 1940 (17 CFR 270.30a-2(a)) is filed and attached hereto as Exhibit 99.CERT. |
(a) | (3) | Not applicable. |
(b) | | Certification pursuant to Rule 30a-2(b) under the Investment Company Act of 1940 (17 CFR 270.30a-2(b)) is furnished and attached hereto as Exhibit 99.906CERT. |
SIGNATURES
Pursuant to the requirements of the Securities Exchange Act of 1934 and the Investment Company Act of 1940, the registrant has duly caused this report to be signed on its behalf by the undersigned, thereunto duly authorized.
Fidelity Commonwealth Trust
By: | /s/Christine Reynolds |
| Christine Reynolds |
| President and Treasurer |
| |
Date: | November 22, 2005 |
Pursuant to the requirements of the Securities Exchange Act of 1934 and the Investment Company Act of 1940, this report has been signed below by the following persons on behalf of the registrant and in the capacities and on the dates indicated.
By: | /s/Christine Reynolds |
| Christine Reynolds |
| President and Treasurer |
| |
Date: | November 22, 2005 |
By: | /s/Paul M. Murphy |
| Paul M. Murphy |
| Chief Financial Officer |
| |
Date: | November 22, 2005 |