UNITED STATES
SECURITIES AND EXCHANGE COMMISSION
Washington, D.C. 20549
FORM N-CSR
CERTIFIED SHAREHOLDER REPORT OF REGISTERED
MANAGEMENT INVESTMENT COMPANIES
Investment Company Act file number | 811-01829 |
|
Columbia Acorn Trust |
(Exact name of registrant as specified in charter) |
|
One Financial Center, Boston, Massachusetts | | 02111 |
(Address of principal executive offices) | | (Zip code) |
|
James R. Bordewick, Jr., Esq. Columbia Management Advisors, LLC One Financial Center Boston, MA 02111 |
(Name and address of agent for service) |
|
Registrant’s telephone number, including area code: | 1-617-426-3750 | |
|
Date of fiscal year end: | December 31, 2006 | |
|
Date of reporting period: | June 30, 2006 | |
| | | | | | | | |
Form N-CSR is to be used by management investment companies to file reports with the Commission not later than 10 days after the transmission to stockholders of any report that is required to be transmitted to stockholders under Rule 30e-1 under the Investment Company Act of 1940 (17 CFR 270.30e-1). The Commission may use the information provided on Form N-CSR in its regulatory, disclosure review, inspection, and policymaking roles.
A registrant is required to disclose the information specified by Form N-CSR, and the Commission will make this information public. A registrant is not required to respond to the collection of information contained in Form N-CSR unless the Form displays a currently valid Office of Management and Budget (“OMB”) control number. Please direct comments concerning the accuracy of the information collection burden estimate and any suggestions for reducing the burden to Secretary, Securities and Exchange Commission, 450 Fifth Street, NW, Washington, DC 20549-0609. The OMB has reviewed this collection of information under the clearance requirements of 44 U.S.C. § 3507.
Item 1. Reports to Stockholders.
Columbia Management®
Look inside for details on the 2006 Columbia Acorn Funds Annual Shareholder Information Meeting.

Columbia Acorn
Family of Funds
Class Z Shares
Semiannual Report
June 30, 2006
n Columbia Acorn Fund
n Columbia Acorn International
n Columbia Acorn USA
n Columbia Acorn International Select
n Columbia Acorn Select
n Columbia Thermostat Fund
Managed by Columbia Wanger Asset Management, L.P.
NOT FDIC-INSURED
May Lose Value
No Bank Guarantee
Please join us at the
2006
Annual Shareholder Information Meeting
September 26, 2006
9 a.m. – 10 a.m. Central time
Chase Auditorium
(formerly Bank One),
Plaza Level
38 South Dearborn Street
Chicago, IL 60602
Refreshments will be served prior to the meeting.
Please RSVP by September 19 by calling
(800) 922-6769
( Not able to make it but interested in hearing from your portfolio managers?
This year you can call to listen to an audio recording of the meeting. The recording will be available by 3 p.m. Central Standard Time on September 26 and can be accessed using the following number and pass code.
Toll Free dial-in number to listen to a recorded replay of the 2006 meeting: (888) 613-4193
Pass code to enter when calling: 4120362
8Questions? Email Us!
We'd love to hear from you! Email your questions to us at the following email address. Please DO NOT send questions regarding your personal account to this address. Questions regarding your account should be directed to our shareholder services representatives at (800) 922-6769. Your questions will help our portfolio managers in preparing their presentations. Answers to your questions will be made available soon after the meeting date.
Email questions to:
dg.227w-meeting_questions@bankofamerica.com
For directions and parking information, see the inside back cover of this report. 
Columbia Acorn Family of Funds Semiannual Report 2006
Table of Contents
| Performance At A Glance | | | 2 | | |
|
| Squirrel Chatter II: Understanding our Team Approach | | | 3 | | |
|
| Understanding Your Expenses | | | 6 | | |
|
| Columbia Acorn Fund | | | | | |
|
| In a Nutshell | | | 8 | | |
|
| At a Glance | | | 9 | | |
|
| Major Portfolio Changes | | | 20 | | |
|
| Statement of Investments | | | 22 | | |
|
| Columbia Acorn International | | | | | |
|
| In a Nutshell | | | 10 | | |
|
| At a Glance | | | 11 | | |
|
| Major Portfolio Changes | | | 34 | | |
|
| Statement of Investments | | | 36 | | |
|
| Portfolio Diversification | | | 41 | | |
|
| Columbia Acorn USA | | | | | |
|
| In a Nutshell | | | 12 | | |
|
| At a Glance | | | 13 | | |
|
| Major Portfolio Changes | | | 42 | | |
|
| Statement of Investments | | | 43 | | |
|
| Columbia Acorn International Select | | | | | |
|
| In a Nutshell | | | 14 | | |
|
| At a Glance | | | 15 | | |
|
| Major Portfolio Changes | | | 49 | | |
|
| Statement of Investments | | | 50 | | |
|
| Portfolio Diversification | | | 53 | | |
|
| Columbia Acorn Select | |
|
| In a Nutshell | | | 16 | | |
|
| At a Glance | | | 17 | | |
|
| Major Portfolio Changes | | | 54 | | |
|
| Statement of Investments | | | 55 | | |
|
| Columbia Thermostat Fund | |
|
| In a Nutshell | | | 18 | | |
|
| At a Glance | | | 19 | | |
|
| Statement of Investments | | | 76 | | |
|
| Statement of Assets and Liabilities | | | 77 | | |
|
| Statement of Operations | | | 78 | | |
|
| Statement of Changes in Net Assets | | | 79 | | |
|
| Financial Highlights | | | 81 | | |
|
| Notes to Financial Statements | | | 82 | | |
|
| Columbia Acorn Family of Funds | |
|
| Statements of Assets and Liabilities | | | 60 | | |
|
| Statements of Operations | | | 61 | | |
|
| Statements of Changes in Net Assets | | | 62 | | |
|
| Financial Highlights | | | 66 | | |
|
| Notes to Financial Statements | | | 70 | | |
|
Management Fee Evaluation of the
Senior Officer | | | 86 | | |
|
| Columbia Acorn Family of Funds Information | | | 91 | | |
|
>2006 Mid-Year Distributions
The following table details the Funds' mid-year distributions. The record date was June 5, 2006. The ex-dividend date was June 6, 2006 and the payable date was June 7, 2006.
| | | Short-term
Capital Gains | | Long-term
Capital Gains | | Ordinary
Income | | Reinvestment
Price | |
| Columbia Acorn Fund | | None | | $ | 0.3132 | | | | None | | | $ | 29.24 | | |
| Columbia Acorn International | | None | | $ | 0.5514 | | | $ | 0.0775 | | | $ | 37.43 | | |
| Columbia Acorn USA | | None | | $ | 0.1016 | | | | None | | | $ | 27.40 | | |
| Columbia Acorn International Select | | None | | | None | | | $ | 0.0496 | | | $ | 23.10 | | |
| Columbia Acorn Select | | $ | 0.0862 | | | | None | | | $ | 0.0492 | | | $ | 23.73 | | |
| Columbia Thermostat Fund | | $ | 0.0046 | | | $ | 0.2367 | | | $ | 0.0467 | | | $ | 12.47 | | |
The discussion in this report of portfolio companies is for illustration only and is not a recommendation of individual stocks. The information is believed to be accurate, but the information and the views of the portfolio managers may change at any time without notice and the portfolio managers may alter a Fund's portfolio holdings based on these views and the fund's circumstances at that time.
1
>Performance At A Glance Class Z Average Annual Total Returns through 6/30/06
| | | NAV on
6/30/06 | | 2nd
quarter* | | Year to
date* | | 1 year | | 3 years | | 5 years | | 10 years | | Life
of fund | |
Columbia Acorn
Fund (6/10/70) | | $ | 29.49 | | | | -3.73 | % | | | 5.81 | % | | | 16.44 | % | | | 21.94 | % | | | 12.31 | % | | | 14.97 | % | | | 16.29 | % | |
| Russell 2500 | | | | | | | -4.34 | % | | | 6.32 | % | | | 13.53 | % | | | 19.16 | % | | | 9.65 | % | | | 11.13 | % | | | NA | | |
| S&P 500 | | | | | | | -1.44 | % | | | 2.71 | % | | | 8.63 | % | | | 11.22 | % | | | 2.49 | % | | | 8.32 | % | | | 11.79 | % | |
Lipper Small-Cap Core
Funds Index | | | | | | | -4.76 | % | | | 6.30 | % | | | 14.52 | % | | | 18.59 | % | | | 9.13 | % | | | 10.03 | % | | | NA | | |
Lipper Mid-Cap Core
Funds Index | | | | | | | -3.29 | % | | | 4.31 | % | | | 12.07 | % | | | 16.41 | % | | | 7.25 | % | | | 10.42 | % | | | NA | | |
Columbia Acorn
International
(9/23/92) | | $ | 37.58 | | | | -1.11 | % | | | 14.27 | % | | | 35.18 | % | | | 32.82 | % | | | 15.42 | % | | | 11.63 | % | | | 13.74 | % | |
S&P/Citigroup EMI
Global ex-US | | | | | | | -1.70 | % | | | 10.57 | % | | | 31.22 | % | | | 31.90 | % | | | 18.28 | % | | | 8.46 | % | | | 9.60 | % | |
| MSCI EAFE | | | | | | | 0.70 | % | | | 10.16 | % | | | 26.56 | % | | | 23.94 | % | | | 10.02 | % | | | 6.39 | % | | | 8.17 | % | |
Lipper Int'l Small-Cap
Funds Index | | | | | | | -2.72 | % | | | 10.26 | % | | | 31.71 | % | | | 32.29 | % | | | 17.72 | % | | | 11.64 | % | | | NA | | |
Columbia Acorn
USA (9/4/96) | | $ | 27.52 | | | | -4.39 | % | | | 2.19 | % | | | 9.45 | % | | | 19.51 | % | | | 9.58 | % | | | | | | | 14.04 | % | |
| Russell 2000 | | | | | | | -5.02 | % | | | 8.21 | % | | | 14.58 | % | | | 18.70 | % | | | 8.50 | % | | | | | | | 9.63 | % | |
Lipper Small-Cap
Core Funds Index | | | | | | | -4.76 | % | | | 6.30 | % | | | 14.52 | % | | | 18.59 | % | | | 9.13 | % | | | | | | | 10.65 | % | |
| S&P 500 | | | | | | | -1.44 | % | | | 2.71 | % | | | 8.63 | % | | | 11.22 | % | | | 2.49 | % | | | | | | | 8.68 | % | |
Columbia Acorn Int'l
Select (11/23/98) | | $ | 23.16 | | | | 0.48 | % | | | 12.83 | % | | | 30.10 | % | | | 27.83 | % | | | 11.83 | % | | | | | | | 12.25 | % | |
S&P/Citigroup World
ex-US Cap Range $2-10B | | | | | | | -0.61 | % | | | 10.29 | % | | | 31.69 | % | | | 30.15 | % | | | 15.80 | % | | | | | | | 11.52 | % | |
| MSCI EAFE | | | | | | | 0.70 | % | | | 10.16 | % | | | 26.56 | % | | | 23.94 | % | | | 10.02 | % | | | | | | | 6.04 | % | |
Lipper International
Funds Index | | | | | | | -0.52 | % | | | 9.30 | % | | | 27.26 | % | | | 23.15 | % | | | 10.14 | % | | | | | | | 7.24 | % | |
Columbia Acorn
Select (11/23/98) | | $ | 23.87 | | | | -2.22 | % | | | 5.43 | % | | | 17.28 | % | | | 15.89 | % | | | 11.75 | % | | | | | | | 14.46 | % | |
| S&P MidCap 400 | | | | | | | -3.14 | % | | | 4.24 | % | | | 12.98 | % | | | 18.14 | % | | | 9.30 | % | | | | | | | 11.95 | % | |
Lipper Mid-Cap
Growth Index | | | | | | | -4.64 | % | | | 4.40 | % | | | 15.46 | % | | | 15.12 | % | | | 2.64 | % | | | | | | | 6.86 | % | |
| S&P 500 | | | | | | | -1.44 | % | | | 2.71 | % | | | 8.63 | % | | | 11.22 | % | | | 2.49 | % | | | | | | | 2.74 | % | |
Columbia Thermostat
Fund (9/25/02)† | | $ | 12.53 | | | | -0.55 | % | | | 2.56 | % | | | 6.65 | % | | | 9.08 | % | | | | | | | | | | | 10.83 | % | |
| S&P 500 | | | | | | | -1.44 | % | | | 2.71 | % | | | 8.63 | % | | | 11.22 | % | | | | | | | | | | | 14.41 | % | |
Lehman Brothers U.S.
Credit Intermediate
Bond Index | | | | | | | 0.06 | % | | | -0.47 | % | | | -0.61 | % | | | 1.83 | % | | | | | | | | | | | 3.97 | % | |
Lipper Flexible Portfolio
Funds Index | | | | | | | -1.30 | % | | | 3.07 | % | | | 10.01 | % | | | 10.40 | % | | | | | | | | | | | 12.58 | % | |
*Not annualized.
Performance shown here is past performance which cannot guarantee future results. Current performance may be higher or lower. The investment return and principal value of an investment in a Fund will fluctuate so that Fund shares, when redeemed, may be worth more or less than their original cost. Performance changes over time. Visit columbiafunds.com for daily and month-end updates. Net asset value (NAV) returns do not include sales charges or contingent deferred sales charges (CDSC). Class Z shares are sold only at NAV with no 12b-1 fee. Class Z shares have limited eligibility and the investment minimum requirement may vary. Please see the Funds' prospectus for details.
Performance may reflect any voluntary waivers or reimbursements of fund expenses by the advisor or its affiliates. Absent these waivers, or reimbursement arrangements, performance results may be lower.
†A "fund of funds" bears its allocable share of the costs and expenses of the underlying funds in which it invests. Such funds are thus subject to two levels of fees and potentially higher expense ratio than would be associated with an investment in an investment fund that invests and trades directly in financial instruments under the direction of a single manager.
Description of indexes: S&P 500 is a broad, market-weighted average of U.S. blue-chip company stock performance. S&P MidCap 400 is a broad market-weighted index of 400 stocks that are in the next size/tier down from the S&P 500. Russell 2000 is a market-weighted index of 2000 smaller U.S. companies, formed by taking the largest 3,000 companies and eliminating the largest 1,000. Russell 2500 is t he smallest 2,500 U.S. companies from this same group. S&P/Citigroup EMI Global ex-US is the bottom 20% of institutionally investable capital of developed and emerging countries, selected by the index sponsor, outside the U.S. MSCI EAFE is Morgan Stanley's Europe, Australasia and Far East Index, a widely recognized international benchmark that comprises 20 major markets in proportion to world stock market capitalization. S&P/Citigroup World ex-US Cap Range $2–10B is a subset of the broad market selected by the index sponsor representing the mid-cap de veloped market excluding the U.S. Lipper Indexes include the largest funds tracked by Lipper, Inc. in the named category. Lipper Mid-Cap Growth Index, 30 mid-cap growth funds; Lipper Mid-Cap Core Funds Index, 30 mid-cap core funds; Lipper International Funds Index, 30 largest non-U.S. funds, not including non-U.S. small-cap funds; Lipper Inte rnational Small-Cap Funds Index, 10 largest non-U.S. funds investing in small-cap companies, including Columbia Acorn International; Lipper Small-Cap Core Funds Index, 30 largest small-cap core funds, including Columbia Acorn Fund. Lipper Flexible Portfolio Funds Index is an equal dollar-weighted index of the 30 largest mutual funds within the Flexible Portfolio fund classification, as defined by Lipper. The Lehman Brothers U.S. Credit Intermediate Bond Index is the intermediate component of the U.S. Credit Index. The U.S. Credit Index includes publicly issued U.S. corporate and foreign debentures and secured notes that meet specified maturity, liquidity, and quality requirements. All indexes are unmanaged and returns include reinvested distributions. It is not possible to invest directly in an index.
1-800-922-6769
2
>Squirrel Chatter II: Understanding our Team Approach
 In recent Squirrel Chatters, I've discussed drivers to the historically strong, long-term performance of the Columbia Acorn Funds.1 First, I addressed our style—investing in small- and mid-cap stocks using a Growth-at-a-Reasonable-Price discipline. Next, I covered our analytical process—how we research, value and track our investments. In this final part of the series, I cover why we need a large analyst team, how we hire and train analysts, and how we empower and evaluate them.
A Large Team Provides Full Market Coverage
Investment management consultants and the financial press often express concern when small- and mid-cap funds become large. For years, many postulated that small-cap managers would stop outperforming their benchmarks once their assets exceeded $1 billion. Columbia Acorn Fund hit $1 billion in 1991. We agree that small-cap funds cannot grow indefinitely. However, historically we believe we have succeeded in managing assets far above the supposed $1 billion "limit" by employing a large analyst team.2
Based on our observations, it seems that many small- and mid-cap portfolios are managed by one or two managers, often without the help of additional analysts. (Their investment adviser may employ lots of other analysts, but they usually are focused on large-cap stocks). Many investment professionals have expertise in just a few industries or geographic regions. Consequently, small management teams tend to focus their funds on relatively small sectors of the market. When their sectors are hot, they can achieve astounding performance, and their funds can grow rapidly. We've seen this happen to some funds during technology and energy booms in the past. When the sector turned, however, many of the funds crashed and burned.
We've taken a different approach. At Columbia Wanger Asset Management, we have built a team of 21 analysts (including our portfolio managers, who are also analysts), covering virtually all important industries and geographic regions. We are not aware of any other investment firm with so many analysts focusing solely on small- and mid-cap stocks. Broad coverage can be crucial especially near market turning points. For instance, when many competitors concentrated their research and their portfolios in technology, media and communications stocks in 2000, a broader perspective led us to U.S. real estate stocks that appeared cheap at the time. We added REITs to Columbia Acorn Fund, which helped to boost fund performance for several years.
Hiring Good Analysts
In order to maintain and grow a large analyst team, Columbia Wanger Asset Management is in a perpetual hiring mode. Our directors of research, Rob Mohn on the domestic side and Zach Egan on the international side, are always looking for good people.
We require analyst candidates to have what we call a "tool kit of knowledge." Accounting, finance and economics skills are required for all analysts. In addition, cultural knowledge and language skills are needed for our international analysts. Accounting is mentioned first because we believe accounting is essential in valuing companies. We once had an analyst candidate tell us during an interview, "Some people think accounting is important for securities analysts, but I don't." Well, we do. That candidate is not a part of our investment team.
We also want candidates to be stock nuts (quite appropriate for the Columbia Acorn Funds). By that we mean people who are thinking about stocks day and night. We envision an ideal candidate as having a stack of annual reports next to the most comfortable seat at home. The candidate should be constantly on the lookout for investment opportunities, even when strolling down
3
the street. If parking lots are raising their rates, or if a restaurant chain has people lined up out the door, a true stock nut will see these as possible investment opportunities.
Academic and professional credentials, combined with investment experience listed in a candidate's resume, provide evidence of a tool kit and stock nut. Discerning our other important requirement—an economic mind—requires face time. By economic mind we mean having the ability to recognize what may be a good business over the long term and how a changing environment could affect the business. Some people seem to have that shrewdness by nature while others seem incapable of learning it.
Unless we lose an experienced analyst who follows a crucial area, we prefer to hire analysts with modest prior experience. More experienced analysts may have developed bad habits elsewhere that could be very difficult to change.
Mentoring New Analysts
We don't have a formal training program for analysts. Instead, our senior analysts mentor newer analysts. Typically, as a senior analyst becomes overburdened we "hive off" a segment of his or her coverage area, and hire a new analyst to follow it. The new analyst then inherits some stocks to follow.
As a new analyst begins to cover inherited stocks, the mentor has him or her pursue the information, valuation and time horizon edges that we discussed last quarter. The two analysts may conduct a few management meetings and attend a few conferences together so they can compare notes and the mentor can help the new analyst adopt our process and style.
We expect our analysts to properly distill, interpret and communicate information. Our analysts need to distill the massive amounts of information down to the most crucial variables. They need to see through public relations "spin" provided by companies and correctly interpret fundamentals. For example, when a company claims that it "hit earnings targets" a few weeks after it lowered those targets, our analysts can't conclude that things are fine. "Disappointing quarter, as preannounced" is a more appropriate report headline. Likewise, some brokerage firm analysts tend to "adjust" earnings estimates when business is poor. Our analysts need to communicate with words describing direction and magnitude, such as "trim" or "slash." Finally, some companies and analysts may low-ball estimates so they can raise them later, creating good news. We want unbiased estimates from our analysts, which in turn should facilitate better decisions.
Empowering and Evaluating Analysts
Many investment firms have their analysts provide information and make recommendations and have their portfolio managers make decisions. In this traditional structure, accountability is often lacking. Analysts want credit for good recommendations, whether purchased or not, and tend to forget poor recommendations, especially those that were rejected. Portfolio managers tend to believe their decisions drove performance when performance was good, but tend to blame analysts when performance was bad.
Due to the size of our flagship funds,3 the quality of our analysts, our desire for accountability, and our belief that our analysts understand their stocks better than our portfolio managers do, Columbia Acorn Fund and Columbia Acorn International senior analysts have authority to buy and sell individual stocks. Portfolio managers and mentors provide quick approval for reasonable transactions proposed by newer analysts. Portfolio managers also make strategic decisions, including industry and country weightings.
We consider our investment process to be crucial to our success, and for newer analysts we first focus on proper implementation of our proven process. Over time, results matter. We carefully track performance of our analysts' holdings and compare actual performance to analyst benchmarks comprised of their coverage areas' performance. Analysts' job one is to beat their benchmarks. Job two is to forecast whether their areas are likely to outperform and to accurately recommend weightings for their areas in the Funds. Successful analysts are highly rewarded.
1-800-922-6769
4
I hope you have found this series on our investment process to be informative. Over the years we've provided much of this information during our annual shareholder meetings and thought it may be of interest to all shareholders. We believe our approach has driven our historically strong long-term track record. We can't expect to outperform our benchmarks every year, but we do intend to continue to work hard and stay true to our time-tested approach.
CWAM News
We are pleased to announce two additions to our analyst team. Gregory Pinsky joined our domestic team, adding to our research of industrial goods, services and materials. His coverage areas include employment services (temporary help and recruiters), waste management and the business services industry. Prior to joining Columbia Wanger Asset Management, Greg was an equity investment analyst at T. Rowe Price Associates. A Certified Public Accountant, Greg received his MBA from the University of Chicago and his bachelor's degree in economics from The Wharton School of the University of Pennsylvania.
Jeannie Cheung joined our international analyst team to cover China, Taiwan and Korea. She is currently employed by Columbia Wanger Asset Management's parent company, Bank of America, in Hong Kong, to provide research to Columbia Wanger Asset Management. Jeannie has worked as an equity analyst since 1991 and was most recently director of China research for Credit Suisse (Hong Kong). Jeannie has a CFA designation and has also completed a master's degree in finance and investment at the University of Exeter in the United Kingdom.
Beginning this quarter, our shareholder reports have a new look. The Columbia Acorn Funds' quarterly reports have adopted a similar look to other funds distributed by Columbia Management.

Charles P. McQuaid
President and Chief Investment Officer
Columbia Wanger Asset Management, L.P.
Past performance is no guarantee of future results.
Stocks of small- and mid-cap companies pose special risks, including possible illiquidity and greater price volatility than stocks of larger, more established companies.
1 As of June 30, 2006 Columbia Acorn Fund, Columbia Acorn International, Columbia Acorn USA, Columbia Acorn International Select and Columbia Acorn Select all beat their benchmark indexes since inception. See Page 2 for full performance information. Columbia Thermostat Fund performance since inception through June 30, 2006 was between the S&P 500 and the Lehman Brothers U.S. Credit Intermediate Bond Index, which is in line with the Fund's investment objective.
2 Our understanding of the competing small-cap analyst team size is based on conversations we have had with competitors and information provided by third-parties who report on the fund industry.
3 As of June 30, 2006, Columbia Acorn Fund had $17.9 billion in total net assets. It owned 415 stocks, 334 domestic and 81 foreign. Columbia Acorn International had $3.6 billion and invested in 173 stocks.
The views expressed in Squirrel Chatter II are those of the author. These views are not guarantees of future performance and involve certain risks, uncertainties and assumptions that are difficult to predict so actual outcomes and results may differ significantly from the views expressed. These views are subject to change at any time based upon economic, market or other conditions and the respective parties disclaim any responsibility to update such views. These views may not be relied on as investment advice and, because investment decisions for a Columbia Acorn Fund are based on numerous factors, may not be relied on as an indication of trading intent on behalf of any particular Columbia Acorn Fund. References to specific company securities should not be construed as a recommendation or investment advice.
5
>Understanding Your Expenses
As a Fund shareholder, you incur two types of costs. There are transaction costs, which generally include sales charges on purchases and may include redemption or exchange fees. There are also ongoing costs, which generally include investment advisory fees, Rule 12b-1 fees and other Fund expenses. The information on this page is intended to help you understand your ongoing costs of investing in the Columbia Acorn Funds and to compare these costs with the ongoing costs of investing in other mutual funds.
Analyzing your Fund's expenses
To illustrate these ongoing costs, we have provided examples and calculated the expenses paid by investors in the Class Z shares of the Columbia Acorn Funds for the last six months. The information in the following table is based on an initial investment of $1,000, which is invested at the beginning of the period and held for the entire period. Expense information is calculated two ways and each method provides you with different information. The amount listed in the "Actual" column is calculated using each Fund's actual operating expenses and total return for the period. The amount listed in the "Hypothetical" column assumes that the return each year is 5% before expenses and then applies each Fund's actual expense ratio for the period to the hypothetical return. You should not use the hypothetical account values and expenses to estimate either your actual account balance at the end of the period or the expenses you paid during the reporting period. See the "Compare with other funds" information for details on using the hypothetical data.
>January 1, 2006 – June 30, 2006
| | | Account value at
the beginning of
the period ($) | | Account value at
the end of
the period ($) | | Expenses paid
during period ($) | | Fund's
annualized
expense | |
| Class Z Shares | | Actual | | Hypothetical | | Actual | | Hypothetical | | Actual | | Hypothetical | | ratio (%)* | |
| Columbia Acorn Fund | | | 1,000.00 | | | | 1,000.00 | | | | 1,058.07 | | | | 1,021.17 | | | | 3.73 | | | | 3.66 | | | | 0.73 | | |
Columbia Acorn
International | | | 1,000.00 | | | | 1,000.00 | | | | 1,142.67 | | | | 1,020.13 | | | | 4.99 | | | | 4.71 | | | | 0.94 | | |
| Columbia Acorn USA | | | 1,000.00 | | | | 1,000.00 | | | | 1,021.92 | | | | 1,019.98 | | | | 4.86 | | | | 4.86 | | | | 0.97 | | |
Columbia Acorn
International Select | | | 1,000.00 | | | | 1,000.00 | | | | 1,128.34 | | | | 1,018.40 | | | | 6.81 | | | | 6.46 | | | | 1.29 | | |
| Columbia Acorn Select | | | 1,000.00 | | | | 1,000.00 | | | | 1,054.30 | | | | 1,020.03 | | | | 4.89 | | | | 4.81 | | | | 0.96 | | |
| Columbia Thermostat Fund | | | 1,000.00 | | | | 1,000.00 | | | | 1,025.54 | | | | 1,023.55 | | | | 1.26 | | | | 1.25 | | | | 0.25 | | |
Expenses paid during the period are equal to each Fund's annualized expense ratio, multiplied by the average account value over the period and then multiplied by the number of days in the Fund's most recent fiscal half-year and divided by 365.
Had the Investment Adviser and/or Transfer Agent not reimbursed/waived a portion of expenses, total return would have been reduced.
It is important to note that the expense amounts shown in the table are meant to highlight only ongoing costs of investing in the Funds and do not reflect any transactional costs, such as sales charges, redemption or exchange fees. Therefore, the hypothetical examples provided may not help you determine the relative total costs of owning different funds. If these transactional costs were included, your costs would have been higher.
Columbia Thermostat Fund's expenses do not include fees and expenses incurred by the Fund from the underlying portfolio funds.
*For the six months ended June 30, 2006.
Compare with other funds
Since all mutual funds are required to include the same hypothetical calculations about expenses in shareholder reports, you can use this information to compare the ongoing cost of investing in the Funds with other funds. To do so, compare the 5% hypothetical example with the 5% hypothetical examples that appear in the shareholder reports of other funds. As you compare hypothetical examples of other funds, it is important to note that hypothetical examples
1-800-922-6769
6
are meant to highlight the continuing costs of investing in a fund and do not reflect any transactional costs, such as sales charges or redemption or exchange fees.
Estimating your actual expenses
To estimate the expenses that you paid over the period, first you will need your account balance at the end of the period:
• For shareholders who receive their account statements from Columbia Management Services, Inc., your account balance is available online at columbiafunds.com or by calling Shareholder Services at (800) 922-6769.
• For shareholders who receive their account statements from their brokerage firm, contact your brokerage firm to obtain your account balance.
1. Divide your ending account balance by $1,000. For example, if an account balance was $8,600 at the end of the period, the result would be 8.6.
2. In the section of the table titled "Expenses paid during the period," locate the amount for your Fund. You will find this number is in the column labeled "Actual." Multiply this number by the result from step 1. Your answer is an estimate of the expenses you paid on your account during the period.
7
Columbia Acorn Fund
>In a Nutshell


Performance data quoted represents past performance and current performance may be lower or higher. Past performance is no guarantee of future results. The investment return and principal value of an investment in the Fund will fluctuate so that shares, when redeemed, may be worth more or less than the original cost.
Visit columbiafunds.com for daily and most recent month-end performance updates.
Columbia Acorn Fund fell 3.73% in the second quarter, modestly outperforming the small-cap Russell 2500 Index while underperforming the large-cap S&P 500 Index. In the first half of 2006, Columbia Acorn Fund rose 5.81%, slightly less than the Russell 2500 and somewhat more than the S&P 500.
Expeditors International of Washington, Columbia Acorn Fund's largest dollar winner in the first quarter, kept that distinction in the second quarter, delivering another 30% gain. Other winners included takeovers—12 Columbia Acorn stocks put themselves up for sale and announced deals in the quarter! Six takeovers wound up within the top dozen percentage performers for the quarter, including software firm RSA Security and Canadian mining company Falconbridge, each surging over 50%. Sweden's Gambro and Georgia-based Serologicals, both medical products companies, jumped a healthy 30% each. Aerospace components distributor Aviall and natural gas producer Western Gas Resources rounded out the takeover winner's circle, each rising nearly 25%.
Other big winners for the quarter included FMC Technologies, a manufacturer of deep-water oil and gas production systems, which reported earnings well ahead of expectations. So did World Acceptance, a consumer loan company, and both appreciated about 30%. Retailer Christopher & Banks improved its merchandise, regained its sales and earnings momentum, and marked up a 25% gain.
Columbia Acorn Fund's largest percentage losers were three biotech stocks, each giving back in the second quarter far more than they made in the first. DOV Pharmaceuticals reported that a test of a key drug was disappointing, and its stock collapsed 80%. Neurocrine Biosciences and Pozen both failed to get new drug approvals and each plunged about 66%. We sold all three. Retailer Chico's FAS suffered some merchandise misses, and its stock was discounted 34%. We bought more Chico's stock in the quarter, as we believed its problems are temporary.
The Fund's foreign stocks rose 3.14% in the quarter and 19.99% in the half year. Takeovers Falconbridge and Gambro, discussed above, helped drive results for the quarter. During the first half, oil-pipe makers Vallourec and Tenaris jumped 111% and 76%, respectively, while temporary staffing company USG People returned 82%. Swedish kitchen cabinet company Nobia racked up excellent growth, making a 25% gain in the quarter and a 62% return in the half. The Fund's worst performing international stock was Hong Kong's Techtronic Industries, down 43% in the half year.Columbia Acorn Fund's foreign stocks have performed spectacularly well since we decided to increase their weighting three years ago—up 174% vs. an 81% gain for the overall Fund.1 We reviewed all of the Fund's foreig n holdings during the period in an attempt to be more selective. We believe that many foreign stocks continue to appear cheaper than U.S. stocks, while others may not have enough upside to compensate for possible risks. Consequently, we cut the Fund's foreign stock weighting slightly, to 13.7%.

Charles P. McQuaid
Lead Portfolio Manager

Robert A. Mohn
Co-Portfolio Manager
1 By our calculations, Columbia Acorn Fund's foreign stocks had a total return of 173.71% in the three years ending June 2006. While we are extremely pleased with that return, we note that it is not comparable to mutual fund returns, as it is before expenses and cash effects incurred by actual funds. Also, Columbia Acorn Fund's foreign stockholdings have been heavily weighted toward energy and were not purchased as a balanced, stand-alone portfolio.
Small-cap stocks are often more volatile and less liquid than the stocks of larger companies. Small companies may have a shorter history of operations than larger companies and may have a less diversified product line, making them more susceptible to market pressure. Investments in foreign securities have special risks, including political or economic instability, higher costs, different regulations, accounting standards, trading practices and levels of information, and currency exchange rate fluctuations.
As of 6/30/06, the Fund's positions in the stocks mentioned were: Expeditors International of Washington, 1.7%; RSA Security, 0.4%; Falconbridge, 0.4%; Gambro, 0.0%; Serologicals, 0.3%; Aviall, 0.3%; Western Gas Resources, 1.1%; FMC Technologies, 0.9%; World Acceptance, 0.3%; Christopher & Banks, 0.6%; DOV Pharmaceuticals, 0.0%; Neurocrine Biosciences, 0.0%; Pozen, 0.0%; Chico's FAS, 0.9%; Vallourec, 0.2%; Tenaris, 0.3%; USG People, 0.3%; Nobia, 0.3%; Techtronic Industries, 0.1%.
1-800-922-6769
8
Columbia Acorn Fund
>At a Glance Ticker Symbol: ACRNX
Pretax and After-tax Average Annual Total Returns (Class Z)
>through June 30, 2006
| Inception 6/10/70 | | Year
to date* | | 1 year | | 5 years | | 10 years | |
| Returns before taxes | | | 5.81 | % | | | 16.44 | % | | | 12.31 | % | | | 14.97 | % | |
Returns after taxes
on distributions | | | 5.64
| | | | 15.48
| | | | 11.92
| | | | 13.13
| | |
Returns after taxes
on distributions and
sale of fund shares | | | 4.00
| | | | 11.90
| | | | 10.72
| | | | 12.39
| | |
| Russell 2500 (pretax) | | | 6.32 | | | | 13.53 | | | | 9.65 | | | | 11.13 | | |
| S&P 500 (pretax) | | | 2.71 | | | | 8.63 | | | | 2.49 | | | | 8.32 | | |
Performance shown here represents past performance, which does not guarantee future results. Current performance may be higher or lower. The investment return and principal value of an investment in the Fund will fluctuate so that Fund shares, when redeemed, may be worth more or less than their original cost. Visit columbiafunds.com for daily and most recent month-end updates.
After-tax returns are calculated using the highest historical individual federal marginal income tax rates, and do not reflect the impact of state and local taxes. Returns after taxes on distributions and sale of Fund shares reflect the additional tax impact of long-term gains or losses realized when Fund shares are sold. The returns are taxed at the maximum rate and assume shares were purchased at the beginning of the period. Actual after-tax returns depend on the investor's tax situation and may differ from those shown. After-tax returns are not relevant to investors who hold their Fund shares through tax-deferred arrangements such as 401(k) plans or individual retirement accounts. After-tax returns are shown for Class Z shares only; after-tax returns for other share classes will vary. Indexes do not reflect any deduction for fees, expenses or taxes.
*Year-to-date data not annualized.
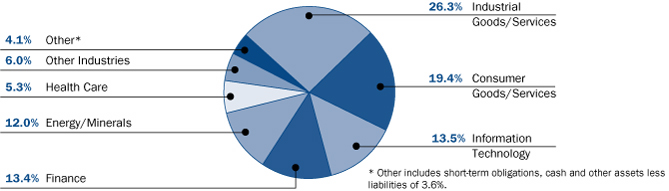
Columbia Acorn Fund Portfolio Diversification
>as a % of net assets, as of June 30, 2006

The Growth of a $75,000 Investment in Columbia Acorn Fund (Class Z)
>June 10, 1970 through June 30, 2006
This graph compares the results of $75,000 invested in Columbia Acorn Fund at inception on June 10, 1970 to the S&P 500 Stock Index, a broad, market-weighted average of U.S. blue-chip company stock performance, and to an initial $238,325 investment in the Russell 2500, an index of the 2,500 smallest U.S. companies, on the index's December 31, 1978 inception date. The indexes are unmanaged and returns for both the indexes and the Fund include reinvested dividends and capital gains. It is not possible to invest directly in an index. The graph and table do not reflect tax deductions that a shareholder would pay on Fund distributions or the sale of Fund shares.
Performance shown here represents past performance, which does not guarantee future results. Current performance may be higher or lower. The investment return and principal value of an investment in the Fund will fluctuate so that Fund shares, when redeemed, may be worth more or less than their original cost. Visit columbiafunds.com for daily and most recent month-end updates.
NAV on 6/30/06: $29.49
Total Net Assets of the Fund: $17,916.1 million
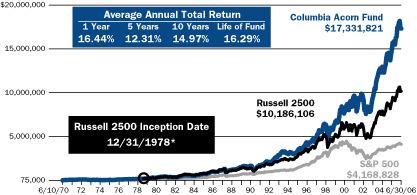
*A $75,000 investment in Columbia Acorn Fund at inception appreciated to $238,325 on December 31, 1978, the inception date of the Russell 2500. For comparison with the Russell 2500, we assigned the index the same value as the Fund at index inception.
Columbia Acorn Fund Top 10 Holdings (as a % of net assets)
1. Expeditors International of Washington
International Freight Forwarder | | | 1.7 | % | |
2. Coach
Designer & Retailer of Branded Leather Accessories | | | 1.2 | % | |
3. Western Gas Resources
Oil & Coal Seam Producer | | | 1.1 | % | |
4. AmeriCredit
Auto Lending | | | 1.0 | % | |
5. Chico's FAS
Women's Specialty Retail | | | 0.9 | % | |
6. Ultra Petroleum
Natural Gas Producer | | | 0.9 | % | |
7. FMC Technologies
Oil & Gas Well Head Manufacturer | | | 0.9 | % | |
8. Crown Castle International
Communications Towers | | | 0.9 | % | |
9. ITT Educational Services
Post-secondary Degree Programs | | | 0.8 | % | |
10. Peoples Bank Bridgeport
Connecticut Savings & Loan | | | 0.8 | % | |
The Fund's top 10 holdings and portfolio diversification vary with changes in portfolio investments. See the Statement of Investments for a complete list of the Fund's holdings.
9
Columbia Acorn International
>In a Nutshell


Performance data quoted represents past performance and current performance may be lower or higher. Past performance is no guarantee of future results. The investment return and principal value of an investment in the Fund will fluctuate so that shares, when redeemed, may be worth more or less than the original cost.
Visit columbiafunds.com for daily and most recent month-end performance updates.
Columbia Acorn International ended the quarter down 1.11% vs. a 1.70% decline for the benchmark S&P/Citigroup EMI Global ex-US Index. Year-to-date through June 30, the Fund was up 14.27%, well ahead of the 10.57% gain of the index. The Fund's half year return also easily topped the 10.16% return of the large-cap oriented MSCI EAFE Index.
Energy stocks Tullow Oil and Fugro were among the top contributors to performance for both the quarter and the six months. Tullow Oil, an exploration and development company based in the United Kingdom, was up 21% in the quarter and 53% for the half year. Fugro, a Dutch provider of survey services to the offshore industry, posted a 14% return for the quarter and a 37% six-month gain. Both of these stocks are among the Fund's top 10 holdings.
European industrial stocks continued to perform well in the second quarter. Geberit, a Swiss manufacturer of pipes and fittings for plumbers, was up 23% in the quarter and 48% for the six months on improving demand in its key German market. RPS Group, a UK provider of environmental consulting services, gained 29% in the second quarter and was up over 50% for the half year. The stock benefited from strong growth in the energy sector and its other end markets. Sweden's Hexagon, a maker of measurement equipment and polymers, gained 9% in the quarter and was up 37% for the six months on strong trading in its metrology division and successful integration of Leica Geosystems, which it acquired last year.
In the health care sector, Sweden's Gambro, a manufacturer of dialysis and blood care products, gained more than 30% in the quarter and 45% for the half year before being acquired by Swedish investment companies Investor AB and EQT in June. Canadian mining company Falconbridge, up 51% in the quarter and over 78% for the half year, was a beneficiary of drawn out takeover action involving multiple suitors.
Underperformers in the quarter included African retailer Edgars Consolidated Stores, which fell 33% on concerns that rising interest rates may slow down consumption. In Japan, fund manager Sparx Asset Management fell 26% in sympathy with the overall correction in Japanese financial stocks. In Hong Kong, power tool manufacturer Techtronic Industries gave back 24% in the quarter. The stock was hurt by continued poor sentiment on the outlook for U.S. housing and its potential impact on power tool sales.
It is noteworthy that the Fund's slightly negative return for the second quarter masks much higher underlying volatility: The Fund began the quarter on a positive note rising 11.6% before hitting its peak on May 10 and then dropping 19% to reach a low on June 13. From that point, Fund performance recovered 9.4% to end the quarter down just slightly more than 1%. Concerns regarding ongoing increases in global interest rates seem to have conspired with historically high valuations to finally change investor appetite for international risk, particularly in international small-cap equities. Notably, the second quarter was also the first in 10 in which the large-cap EAFE index outperformed the small-cap EMI index. As in the U.S. market, overseas investors generally perceive larger cap stocks to be less risky than their small cap counterparts. As we have mentioned in earlier reports, small-cap international stocks have been strong per formers in both absolute terms and relative to their large cap counterparts and no longer offer the valuation discount that they did before. While still finding compelling ideas in the sub US$5 billion market cap universe, we have been selectively adding mid-cap stocks in the US$5 to $10 billion range where valuations as a group are more attractive. Despite the increase in volatility in international small-cap equities, we believe there remain ample opportunities for new acorns to be discovered.

P. Zachary Egan
Co-Portfolio Manager

Louis J. Mendes III
Co-Portfolio Manager
Investments in foreign securities have special risk, including political or economic instability, higher costs, different regulations, accounting standards, trading practices and levels of information, and currency exchange rate fluctuations. Small-cap stocks are often more volatile and less liquid than the stocks of larger companies. Small companies may have a shorter history of operations than larger companies and may have a less diversified product line, making them more susceptible to market pressure.
As of 6/30/06, the Fund's positions in the stocks mentioned were: Tullow Oil, 1.3%; Fugro, 1.5%; Geberit, 1.0%; RPS Group, 0.8%; Hexagon, 1.6%; Gambro, 0.0%; Falconbridge, 0.5%; Edgars Consolidated Stores, 0.5%; Sparx Asset Management, 0.7%; Techtronic Industries, 0.5%.
1-800-922-6769
10
Columbia Acorn International
>At a Glance Ticker Symbol: ACINX
Pretax and After-tax Average Annual Total Returns (Class Z)
>through June 30, 2006
| Inception 9/23/92 | | Year
to date* | |
1 year | |
5 years | |
10 years | |
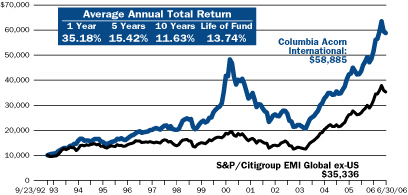
| Returns before taxes | | | 14.27 | % | | | 35.18 | % | | | 15.42 | % | | | 11.63 | % | |
Returns after taxes
on distributions | | | 13.94 | | | | 34.14 | | | | 15.14 | | | | 10.62 | | |
Returns after taxes
on distributions and
sale of fund shares | | | 9.60 | | | | 24.26 | | | | 13.55 | | | | 9.88 | | |
S&P/Citigroup EMI
Global ex-US (pretax) | | | 10.57
| | | | 31.22
| | | | 18.28
| | | | 8.46
| | |
Performance shown here represents past performance, which does not guarantee future results. Current performance may be higher or lower. The investment return and principal value of an investment in the Fund will fluctuate so that Fund shares, when redeemed, may be worth more or less than their original cost. Visit columbiafunds.com for daily and most recent month-end updates.
After-tax returns are calculated using the highest historical individual federal marginal income tax rates, and do not reflect the impact of state and local taxes. Returns after taxes on distributions and sale of Fund shares reflect the additional tax impact of long-term gains or losses realized when Fund shares are sold. The returns are taxed at the maximum rate and assume shares were purchased at the beginning of the period. Actual after-tax returns depend on the investor's tax situation and may differ from those shown. After-tax returns are not relevant to investors who hold their Fund shares through tax-deferred arrangements such as 401(k) plans or individual retirement accounts. After-tax returns are shown for Class Z shares only; after-tax returns for other share classes will vary. Indexes do not reflect any deduction for fees, expenses or taxes.
*Year-to-date data not annualized.
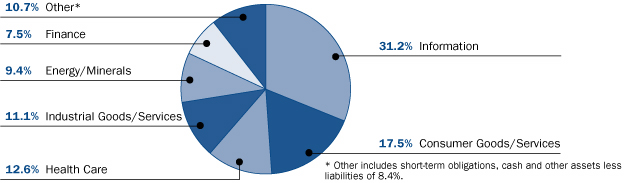
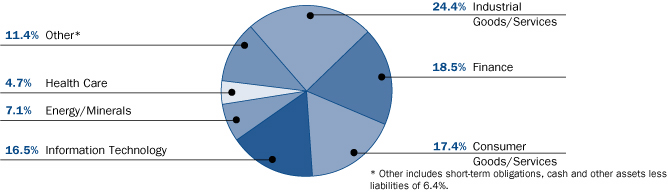
Columbia Acorn International Portfolio Diversification
>as a % of net assets, as of June 30, 2006
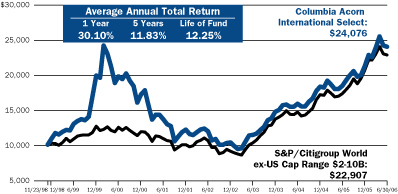
The Growth of a $10,000 Investment in Columbia Acorn International (Class Z)
>September 23, 1992 through June 30, 2006
This graph compares the results of $10,000 invested in Columbia Acorn International at inception on September 23, 1992 to the S&P/Citigroup EMI Global ex-US, Citigroup's index of the bottom 20% of institutionally investable capital of developed and emerging countries, as selected by Citigroup, excluding the U.S. The index is unmanaged and returns for both the index and Fund include reinvested dividends and capital gains. It is not possible to invest directly in an index. The graph and table do not reflect tax deductions that a shareholder would pay on Fund distributions or the sale of Fund shares.
Performance shown here represents past performance, which does not guarantee future results. Current performance may be higher or lower. The investment return and principal value of an investment in the Fund will fluctuate so that Fund shares, when redeemed, may be worth more or less than their original cost. Visit columbiafunds.com for daily and most recent month-end updates.
NAV as of 6/30/06: $37.58
Total Net Assets of the Fund: $3,596.3 million
Columbia Acorn International Top 10 Holdings (as a % of net assets)
1. Hexagon (Sweden)
Measurement Equipment & Polymers | | | 1.6 | % | |
2. Fugro (Netherlands)
Survey & GPS Services | | | 1.5 | % | |
3. USG People (Netherlands)
Temporary Staffing Services | | | 1.4 | % | |
4. Tullow Oil (United Kingdom)
Oil & Gas Producer | | | 1.3 | % | |
5. Aalberts Industries (Netherlands)
Flow Control & Heat Treatment | | | 1.1 | % | |
6. Rhoen-Klinikum (Germany)
Health Care Services | | | 1.1 | % | |
7. April Group (France)
Insurance Policy Construction | | | 1.0 | % | |
8. Bank of Ireland (Ireland)
Irish Commercial Bank | | | 1.0 | % | |
9. IAWS Group (Ireland)
Baked Goods | | | 1.0 | % | |
10. Wincor Nixdorf (Germany)
Retail POS Systems & ATM Machines | | | 1.0 | % | |
The Fund's top 10 holdings and portfolio diversification vary with changes in portfolio investments. See the Statement of Investments for a complete list of the Fund's holdings.
11
Columbia Acorn USA
>In a Nutshell

Performance data quoted represents past performance and current performance may be lower or higher. Past performance is no guarantee of future results. The investment return and principal value of an investment in the Fund will fluctuate so that shares, when redeemed, may be worth more or less than the original cost.
Visit columbiafunds.com for daily and most recent month-end performance updates.
After a first quarter surge, small caps pulled back in the second quarter. Columbia Acorn USA ended the second quarter down 4.39% vs. a 5.02% decline for the Russell 2000. First quarter underperformance dampened returns for the six-month period. Year-to-date through June 30, the Fund was up 2.19% vs. an 8.21% gain for the benchmark.
Six of our stocks received takeover offers during the quarter. Two of the six, Serologicals and Western Gas Resources, were fairly sizeable positions in the Fund and contributed positively to Fund returns as the stocks bounced on acquisition news. Serologicals, a producer of biological products and solutions, gained 29% in the quarter and was up over 59% for the six months. Western Gas Resources, a coal seam gas producer and processor, increased 24% in the second quarter and was up 27% year-to-date.
Other winners for the quarter and half year included FMC Technologies, up 32% in the quarter and 57% year-to-date. FMC makes deep-water oil and gas production systems and has been enjoying robust demand for its products as offshore drilling activity has increased. Crown Castle International, an owner of cellular communication towers, gained 22% in the quarter and 28% for the half year. Its business has been booming as cellular phone companies grab for more wireless capacity in order to beam internet sites, TV shows and other fun stuff to your cell phone.
While several Fund retail stocks faltered in the quarter, Christopher & Banks was the exception. Up 25% in the quarter and 55% for the six months, Christopher & Banks experienced a turnaround as new merchandise was positively received and same-store sales flipped from negative to positive. World Acceptance gained 30% in the quarter and was up 25% for the half year on news of strong loan growth in the second quarter and dramatically lower loan losses.
On the downside, Neurocrine Biosciences' stock collapsed when the FDA withheld full approval for the high dosage of its sleep medication Indiplon. The Fund sold out of the stock, taking a 66% blow for the quarter and 65% loss for the six months.
Interestingly enough, Neurocrine stock fell a further 50% after we got out. As mentioned, several retail names were down in the Fund. Oxford Industries, a maker of branded and private label apparel, fell 23% in the quarter and was off 28% for the six months on disappointing sales in its menswear lines. Chico's FAS, a women's specialty retailer, fell more than 34% in the quarter and 40% in the half year as new merchandise failed to move and sales came in short.
Two technology names, Avid Technology and CNET Networks also hurt Fund performance. Avid suffered indigestion from an acquisition it made last year and announced delays in new product upgrades. The stock was off 23% in the quarter and 38% for the six months. CNET Networks, a provider of software product reviews and niche technology websites, was off 44% in the quarter and 46% for the half year. CNET's business is driven by new product launches, and two highly anticipated product launches, Microsoft's Vista and Sony's PlayStation 3, were tardy.
The second quarter's pull back in small-cap stocks allowed us to add to positions in fast-growing stocks whose prices had fallen within our valuation criteria. We continue to take advantage of the many opportunities that we believe today's volatile markets offer.

Robert A. Mohn
Lead Portfolio Manager
Small-cap stocks are often more volatile and less liquid than the stocks of larger companies. Small companies may have a shorter history of operations than larger companies and may have a less diversified product line, making them more susceptible to market pressure.
As of 6/30/06, the Fund's positions in the stocks mentioned were: Serologicals, 1.2%; Western Gas Resources, 1.2%; FMC Technologies, 1.8%; Crown Castle International, 2.4%; Christopher & Banks, 1.0%: World Acceptance, 1.3%; Neurocrine Biosciences, 0.0%; Oxford Industries, 1.7%; Chico's FAS, 0.6%; Avid Technology, 1.8%; CNET Networks, 0.5%.
1-800-922-6769
12
Columbia Acorn USA
>At a Glance Ticker Symbol: AUSAX
Pretax and After-tax Average Annual Total Returns (Class Z)
>through June 30, 2006
| Inception 9/4/96 | | Year
to date* | | 1 year | | 5 years | | Life of fund | |
| Returns before taxes | | | 2.19 | % | | | 9.45 | % | | | 9.58 | % | | | 14.04 | % | |
Returns after taxes
on distributions | | | 2.13 | | | | 8.78 | | | | 9.29 | | | | 13.34 | | |
Returns after taxes
on distributions and
sale of fund shares | | | 1.50 | | | | 7.02 | | | | 8.28 | | | | 12.30 | | |
| Russell 2000 (pretax) | | | 8.21 | | | | 14.58 | | | | 8.50 | | | | 9.63 | | |
Performance shown here represents past performance, which does not guarantee future results. Current performance may be higher or lower. The investment return and principal value of an investment in the Fund will fluctuate so that Fund shares, when redeemed, may be worth more or less than their original cost. Visit columbiafunds.com for daily and most recent month-end updates.
After-tax returns are calculated using the highest historical individual federal marginal income tax rates, and do not reflect the impact of state and local taxes. Returns after taxes on distributions and sale of Fund shares reflect the additional tax impact of long-term gains or losses realized when Fund shares are sold. The returns are taxed at the maximum rate and assume shares were purchased at the beginning of the period. Actual after-tax returns depend on the investor's tax situation and may differ from those shown. After-tax returns are not relevant to investors who hold their Fund shares through tax-deferred arrangements such as 401(k) plans or individual retirement accounts. After-tax returns are shown for Class Z shares only; after-tax returns for other share classes will vary. Indexes do not reflect any deduction for fees, expenses or taxes.
*Year-to-date data not annualized.
Columbia Acorn USA Portfolio Diversification
>as a % of net assets, as of June 30, 2006
The Growth of a $75,000 Investment in Columbia Acorn USA (Class Z)
>September 4, 1996 through June 30, 2006
This graph compares the results of $75,000 invested in Columbia Acorn USA at inception on September 4, 1996 to the Russell 2000 Index, a market-weighted index of 2,000 smaller U.S. companies formed by taking the largest 3,000 U.S. companies and eliminating the largest 1,000. The index is unmanaged and returns for both the index and the Fund include reinvested dividends and capital gains. It is not possible to invest directly in an index. The graph and table do not reflect tax deductions that a shareholder would pay on Fund distributions or the sale of Fund shares.
Performance shown here represents past performance, which does not guarantee future results. Current performance may be higher or lower. The investment return and principal value of an investment in the Fund will fluctuate so that Fund shares, when redeemed, may be worth more or less than their original cost. Visit columbiafunds.com for daily and most recent month-end updates.
NAV as of 6/30/06: $27.52
Total Net Assets of the Fund: $1,470.3 million

Columbia Acorn USA Top 10 Holdings (as a % of net assets)
1. Crown Castle International
Communication Towers | | | 2.4 | % | |
2. AmeriCredit
Auto Lending | | | 2.1 | % | |
3. Esco Technologies
Automatic Electric Meter Readers | | | 2.1 | % | |
4. ITT Educational Services
Post-secondary Degree Programs | | | 1.9 | % | |
5. Genlyte Group
Commercial Lighting Fixtures | | | 1.9 | % | |
6. FMC Technologies
Oil & Gas Well Head Manufacturer | | | 1.8 | % | |
7. Edwards Lifesciences
Heart Valves | | | 1.8 | % | |
8. Avid Technology
Digital Nonlinear Editing Software & Systems | | | 1.8 | % | |
9. Oxford Industries
Branded & Private Label Apparel | | | 1.7 | % | |
10. Kronos
Labor Management Solutions | | | 1.6 | % | |
The Fund's top 10 holdings and portfolio diversification vary with changes in portfolio investments. See the Statement of Investments for a complete list of the Fund's holdings.
13
Columbia Acorn International Select
>In a Nutshell

Performance data quoted represents past performance and current performance may be lower or higher. Past performance is no guarantee of future results. The investment return and principal value of an investment in the Fund will fluctuate so that shares, when redeemed, may be worth more or less than the original cost.
Visit columbiafunds.com for daily and most recent month-end performance updates.
Columbia Acorn International Select ended the second quarter up 0.48%, outperforming the 0.61% drop of S&P/Citigroup World ex-US Cap Range $2-10B Index. Year-to-date through June 30, the Fund was up 12.83%, well ahead of the 10.29% return of the index.
Strong contributors to performance in the quarter and half year included Sweden's Gambro, a producer of renal and blood care products, and one of the Fund's largest holdings. The stock increased 44% in 2006 before it was acquired by Swedish investment companies Investor AB and EQT in June. Hong Kong Exchanges and Clearing, the Hong Kong equities and derivatives operator and another of the Fund's major holdings, was up 57% for the semiannual period, gaining 8% in the second quarter as it continued to benefit from growing trading volumes and new stock listings from China. Geberit, a Swiss manufacturer of plumbing supplies, gained 48% in the first half of the year and 23% in the second quarter thanks to improving demand in its key German market. C&C Group, an Irish beverage and snack company, was added to the Fund in the first quarter and was among its top five contributors for the quarter and half year. The company continues t o make significant inroads into the UK alcoholic beverage market with its hard cider offering that is so popular in Ireland.
Most laggards for the quarter and six months had one thing in common: Japan. After a strong rally in the fourth quarter of 2005 in Japan, corporate governance issues at a few small firms roiled the local markets and contributed to a general sell-off. In the quarter, fund manager Sparx Asset Management fell 28% despite significant earnings upgrades and increases in assets under management. Kansai Paint, a paint producer based in Japan but with operations throughout emerging Asia, fell 13%. Aeon Mall, a suburban shopping mall developer and operator, fell 16%. For the six months, Jupiter Telecommunications, the largest cable service provider in Japan, was off 13%. Outside of Japan, France's SES Global, a provider of satellite broadcasting services, fell 17% in the first half of 2006 due to higher than expected start-up costs for new activities.
While increasing interest rates, higher oil prices and geopolitical concerns have all contributed to rising volatility in the equity markets, earnings for companies in Columbia Acorn International Select's portfolio have generally come in as expected or on the higher side of expectations. As a result, we are seeing more value emerging due to the recent drop in the market. However, things can quickly change and we will continue to monitor the fundamental outlook for Fund holdings closely.

Christopher J. Olson
Lead Portfolio Manager
Mid-cap stocks tend to be more volatile and may be less liquid than the stocks of larger companies. Investments in foreign securities have special risk, including political or economic instability, higher costs, different regulations, accounting standards, trading practices and levels of information, and currency exchange rate fluctuations.
As of 6/30/06, the Fund's positions in the stocks mentioned were: Gambro, 0.0%; Hong Kong Exchanges and Clearing, 3.3%; Geberit, 2.3%; C&C Group, 3.6%; Sparx Asset Management, 1.6%; Kansai Paint, 1.9%; Aeon Mall, 1.9%; Jupiter Telecommunications, 3.1%; SES Global, 2.2%.
1-800-922-6769
14
Columbia Acorn International Select
>At a Glance Ticker Symbol: ACFFX
Pretax and After-tax Average Annual Total Returns (Class Z)
>through June 30, 2006
| Inception 11/23/98 | | Year
to date* | | 1 year | | 5 years | | Life
of fund | |
| Returns before taxes | | | 12.83 | % | | | 30.10 | % | | | 11.83 | % | | | 12.25 | % | |
Returns after taxes
on distributions | | | 12.75 | | | | 30.15 | | | | 11.83 | | | | 12.17 | | |
Returns after taxes
on distributions and
sale of fund shares | | | 8.34 | | | | 19.70 | | | | 10.41 | | | | 10.89 | | |
S&P/Citigroup World
ex-US Cap Range
$2-10B (pretax) | | | 10.29 | | | | 31.69 | | | | 15.80 | | | | 11.52 | | |
Performance shown here represents past performance, which does not guarantee future results. Current performance may be higher or lower. The investment return and principal value of an investment in the Fund will fluctuate so that Fund shares, when redeemed, may be worth more or less than their original cost. Visit columbiafunds.com for daily and most recent month-end updates.
After-tax returns are calculated using the highest historical individual federal marginal income tax rates, and do not reflect the impact of state and local taxes. Returns after taxes on distributions and sale of Fund shares reflect the additional tax impact of long-term gains or losses realized when Fund shares are sold. The returns are taxed at the maximum rate and assume shares were purchased at the beginning of the period. Actual after-tax returns depend on the investor's tax situation and may differ from those shown. After-tax returns are not relevant to investors who hold their Fund shares through tax-deferred arrangements such as 401(k) plans or individual retirement accounts. After-tax returns are shown for Class Z shares only; after-tax returns for other share classes will vary. Indexes do not reflect any deduction for fees, expenses or taxes.
*Year-to-date data not annualized.
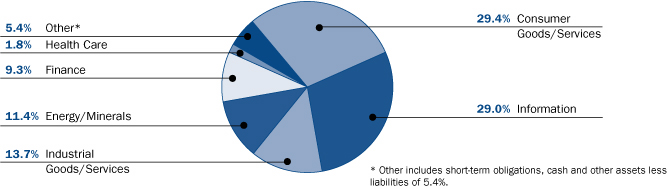
Columbia Acorn International Select Portfolio Diversification
>as a % of net assets, as of June 30, 2006
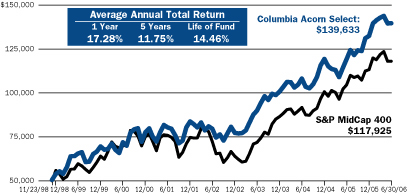
The Growth of a $10,000 Investment in Columbia Acorn International Select (Class Z)
>November 23, 1998 through June 30, 2006
This graph compares the results of $10,000 invested in Columbia Acorn International Select at inception on November 23, 1998 to the S&P/Citigroup World ex-US Cap Range $2-10B Index, a subset of Citigroup's Broad Market Index, representing a mid-cap developed market index excluding the U.S. The index is unmanaged and returns for both the index and the Fund include reinvested dividends and capital gains. It is not possible to invest directly in an index. The graph and table do not reflect tax deductions that a shareholder would pay on Fund distributions or the sale of Fund shares.
Performance shown here represents past performance, which does not guarantee future results. Current performance may be higher or lower. The investment return and principal value of an investment in the Fund will fluctuate so that Fund shares, when redeemed, may be worth more or less than their original cost. Visit columbiafunds.com for daily and most recent month-end updates.
NAV on 6/30/06: $23.16
Total Net Assets of the Fund: $119.2 million
Columbia Acorn International Select Top 10 Holdings (as a % of net assets)
1. Bank of Ireland (Ireland)
Irish Commercial Bank | | | 4.2 | % | |
2. C&C Group (Ireland)
Beverage Company | | | 3.6 | % | |
3. Daito Trust
Construction (Japan)
Apartment Builder | | | 3.5 | % | |
4. Anglo Irish Bank (Ireland)
Small Business & Middle Market Banking | | | 3.5 | % | |
5. Northern Rock (United Kingdom)
Lowest Cost Mortgage Bank in UK | | | 3.3 | % | |
6. Hoya (Japan)
Opto-Electrical Components & Eyeglass Lenses | | | 3.3 | % | |
7. Hong Kong Exchanges and
Clearing (Hong Kong)
Hong Kong Equity & Derivatives Market Operator | | | 3.3 | % | |
8. IAWS Group (Ireland)
Baked Goods | | | 3.3 | % | |
9. Jupiter
Telecommunications (Japan)
Largest Cable Service Provider in Japan | | | 3.1 | % | |
10. Synthes (Switzerland)
Products for Orthopedic Surgery | | | 3.0 | % | |
The Fund's top 10 holdings and portfolio diversification vary with changes in portfolio investments. See the Statement of Investments for a complete list of the Fund's holdings.
15
Columbia Acorn Select
>In a Nutshell

Performance data quoted represents past performance and current performance may be lower or higher. Past performance is no guarantee of future results. The investment return and principal value of an investment in the Fund will fluctuate so that shares, when redeemed, may be worth more or less than the original cost.
Visit columbiafunds.com for daily and most recent month-end performance updates.
Columbia Acorn Select was down 2.22% in the second quarter vs. a 3.14% decline of the S&P MidCap 400 Index. Year-to-date through June 30, the Fund was up 5.43%, 1.19% greater than its S&P MidCap 400 benchmark and 2.72% greater than the S&P 500's year-to-date gain of 2.71%.
Focusing on the stocks that drove Columbia Acorn Select's performance for the quarter and six months, the Fund had one stock that was consistently up and one stock that was consistently down for the half year. The Fund's up stock was Expeditors International of Washington, a freight forwarding company. Expeditors gained more than 60% for the semiannual period and added 1.6% to the Fund's overall portfolio return. On the negative side, Avid Technology cost the Fund approximately 1.6% of overall performance year-to-date. As mentioned last quarter, Avid's acquisition of Pinnacle did not initially meet expectations. I recently met with Avid's divisional head of Pinnacle, and I also met with an Avid customer. Though it's clear that we put Avid into the Fund too early, our confidence has consistently grown as well as the Fund's share position. We believe Avid is putting the right management and products in place to build on its leadin g market share in consumer video, broadcast, storage and audio.
Tellabs also hindered performance in the second quarter as the telecom sector seemed to fall out of favor with investors. We still believe Tellabs' strong fundamentals should help the company outperform over the next couple of years.
The Fund sold out of four existing positions in the quarter and purchased one new position. Three of the sales were made because we believed company fundamentals were beginning to weaken (Coventry Health Care, Associated Banc-Corp and Tektronix). IAC/Interactive, a smaller position in the Fund, was sold because we felt it was expensive. The new addition was Sanmina-SCI, a provider of electronics contract manufacturing services (EMS). Columbia Wanger Asset Management owned and sold Sanmina pre-2000 before the EMS industry got overheated. Numerous EMS companies purchased manufacturing assets or other EMS players at ridiculously high prices during the Internet bubble. Sanmina was no exception during this phase; it purchased several companies in 2000 and 2001. Since the acquisitions, Sanmina has struggled to improve its operating margins, but we believe the comp any is now on track to improve its bottom line.
U.S. stocks began to decline in the weeks following the period end. The main fear is that rising global interest rates could curtail economic growth. The small-cap Russell 2000 Index, which had been up more than 16% early in the second quarter, lost almost all of this gain just following the period end in mid-July. We noted at the end of the third quarter last year that smaller cap stocks were somewhat expensive compared to their larger cap peers. At that point, we were finding better value in larger mid-cap names. In the first few months of this year small caps got even more expensive before taking the mid-year dive. This recent sell-off has corrected some of the excess, and we are now finding some interesting stock ideas to watch among the smaller end of the Fund's investment range. We're not ready to load up on these ideas yet, but we believe that they have a lot of promise and could be drivers of the Fund's portfolio next ye ar. Could the economy slow down in the next few quarters and make some of these ideas less promising? Sure. But it's been our experience that the market usually overreacts to a slowing economy, making new investment ideas more attractive.

Ben Andrews
Lead Portfolio Manager
Columbia Acorn Select is a non-diversified fund. The performance of each of its holdings will have a greater impact on the Fund's total return, and may make the Fund's returns more volatile than a more diversified fund. Mid-cap stocks tend to be more volatile and may be less liquid than the stocks of larger companies.
As of 6/30/06, the Fund's positions in the stocks mentioned were: Expeditors International of Washington; 3.8%; Avid Technology, 2.8%; Tellabs, 6.7%; Coventry Health Care, 0.0%; Associated Banc-Corp, 0.0%; Tektronix, 0.0%; IAC/Interactive, 0.0%; Sanmina-SCI, 0.9%.
1-800-922-6769
16
Columbia Acorn Select
>At a Glance Ticker Symbol: ACTWX
Pretax and After-tax Average Annual Total Returns (Class Z)
>through June 30, 2006
| Inception 11/23/98 | | Year
to date* | | 1 year | | 5 years | | Life
of fund | |
| Returns before taxes | | | 5.43 | % | | | 17.28 | % | | | 11.75 | % | | | 14.46 | % | |
Returns after taxes
on distributions | | | 5.22 | | | | 16.63 | | | | 11.50 | | | | 13.94 | | |
Returns after taxes
on distributions and
sale of fund shares | | | 3.53 | | | | 11.75 | | | | 10.22 | | | | 12.66 | | |
S&P MidCap 400
(pretax) | | | 4.24 | | | | 12.98 | | | | 9.30 | | | | 11.95 | | |
Performance shown here represents past performance, which does not guarantee future results. Current performance may be higher or lower. The investment return and principal value of an investment in the Fund will fluctuate so that Fund shares, when redeemed, may be worth more or less than their original cost. Visit columbiafunds.com for daily and most recent month-end updates.
After-tax returns are calculated using the highest historical individual federal marginal income tax rates, and do not reflect the impact of state and local taxes. Returns after taxes on distributions and sale of Fund shares reflect the additional tax impact of long-term gains or losses realized when Fund shares are sold. The returns are taxed at the maximum rate and assume shares were purchased at the beginning of the period. Actual after-tax returns depend on the investor's tax situation and may differ from those shown. After-tax returns are not relevant to investors who hold their Fund shares through tax-deferred arrangements such as 401(k) plans or individual retirement accounts. After-tax returns are shown for Class Z shares only; after-tax returns for other share classes will vary. Indexes do not reflect any deduction for fees, expenses or taxes.
*Year-to-date data not annualized.
Columbia Acorn Select Portfolio Diversification
>as a % of net assets, as of June 30, 2006
The Growth of a $50,000 Investment in Columbia Acorn Select (Class Z)
>November 23, 1998 through June 30, 2006
This graph compares the results of $50,000 invested in Columbia Acorn Select at inception on November 23, 1998 to the S&P MidCap 400, a broad, market-weighted index of 400 stocks that are in the next size/tier down from the S&P 500. The index is unmanaged and returns for both the index and the Fund include reinvested dividends and capital gains. It is not possible to invest directly in an index. The graph and table do not reflect tax deductions that a shareholder would pay on Fund distributions or the sale of Fund shares.
Performance shown here represents past performance, which does not guarantee future results. Current performance may be higher or lower. The investment return and principal value of an investment in the Fund will fluctuate so that Fund shares, when redeemed, may be worth more or less than their original cost. Visit columbiafunds.com for daily and most recent month-end updates.
NAV on 6/30/06: $23.87
Total Net Assets of the Fund: $1,937.7 million
Columbia Acorn Select Top 10 Holdings (as a % of net assets)
1. Tellabs
Telecommunications Equipment | | | 6.7 | % | |
2. ITT Educational Services
Post-secondary Degree Programs | | | 5.5 | % | |
3. Liberty Global
CATV Holding Company | | | 4.7 | % | |
4. Safeway
Supermarkets | | | 4.7 | % | |
5. UrAsia Energy (Canada)
Uranium Mining in Kazakhstan | | | 4.1 | % | |
6. Abercrombie & Fitch
Teen Apparel Retailer | | | 4.0 | % | |
7. Expeditors International of Washington
International Freight Forwarder | | | 3.8 | % | |
8. American Tower
Communication Towers in USA & Mexico | | | 3.7 | % | |
9. Pride International
Contract Drilling | | | 3.1 | % | |
10. Harley-Davidson
Motorcycles & Related Merchandise | | | 3.1 | % | |
The Fund's top 10 holdings and portfolio diversification vary with changes in portfolio investments. See the Statement of Investments for a complete list of the Fund's holdings.
17
Columbia Thermostat Fund
>In a Nutshell

Performance data quoted represents past performance and current performance may be lower or higher. Past performance is no guarantee of future results. The investment return and principal value of an investment in the Fund will fluctuate so that shares, when redeemed, may be worth more or less than the original cost.
Visit columbiafunds.com for daily and most recent month-end performance updates.
A "fund of funds" bears its allocable share of the costs and expenses of the underlying funds in which it invests. Such funds are thus subject to two levels of fees and potentially higher expense ratio than would be associated with an investment in an investment fund that invests and trades directly in financial instruments under the direction of a single manager.
Columbia Thermostat Fund ended the second quarter down 0.55%. This compares to a 1.44% decline for the S&P 500 and a 0.06% gain for the Lehman Brothers U.S. Credit Intermediate Bond Index. The Lipper Flexible Portfolio Funds Index fell 1.30% for the three-month period. For the half year, the Fund was up 2.56% vs. 2.71% for the S&P 500, a 0.47% decline for the Lehman Brothers U.S. Credit Intermediate Bond Index and a 3.07% gain for the Lipper Flexible Portfolio Funds Index.
While the bond portion of the portfolio held up slightly better in the second quarter, both stocks and bonds were slightly negative as the markets dropped modestly. The first quarter's equity surge helped the stock portion of the portfolio maintain a gain of 5.79% for the six-month period. The bond portion was down 0.78% for the six months.
The Fund hit two reallocation triggers in the second quarter. In April the stock component was raised 5% to 45% of the portfolio. In June the weighting was raised again to 50% stocks, 50% bonds.
So far 2006 has been the type of investment environment for which Columbia Thermostat Fund was made. Thank you for your investment in the Fund.

Charles P. McQuaid
Lead Portfolio Manager
Results of the Funds Owned in Columbia Thermostat Fund at June 30, 2006
Equities
| Fund | | Weightings
in Category | | 2nd
quarter
returns | | 6-month
returns to
6/30/06 | |
| Columbia Acorn Fund | | | 15 | % | | | -3.73 | % | | | 5.81 | % | |
| Columbia Acorn Select | | | 10 | % | | | -2.22 | % | | | 5.43 | % | |
Columbia Large Cap
Value Fund | | | 15 | % | | | -0.57 | % | | | 5.45 | % | |
Columbia Acorn
International | | | 15 | % | | | -1.11 | % | | | 14.27 | % | |
Columbia Dividend
Income Fund | | | 20 | % | | | 0.48 | % | | | 4.07 | % | |
Columbia Large Cap
Enhanced Core Fund | | | 25 | % | | | -2.15 | % | | | 2.40 | % | |
Weighted Average
Equity Return | | | 100 | % | | | -1.45 | % | | | 5.79 | % | |
Fixed Income
| Fund | | Weightings
in Category | | 2nd
quarter
returns | | 6-month
return to
6/30/06 | |
Columbia Federal
Securities Fund | | | 30 | % | | | -0.26 | % | | | -1.13 | % | |
Columbia
Intermediate
Bond Fund | | | 50 | % | | | -0.22 | % | | | -0.71 | % | |
Columbia
Conservative
High Yield Fund | | | 20 | % | | | -1.70 | % | | | -0.42 | % | |
Weighted Average
Income Return | | | 100 | % | | | -0.53 | % | | | -0.78 | % | |
Columbia Thermostat Fund Rebalancing in the Second Quarter
| April 17, 2006: | | 45% stock, 55% bond | |
| June 13, 2006: | | 50% stock, 50% bond | |
The value of an investment in the Fund is based primarily on the performance of the underlying portfolio funds and the allocation of the Fund's assets among them. An investment in the underlying funds may present certain risks, including stock market fluctuations that occur in response to economic and business developments; and a greater degree of social, political and economic volatility associated with international investing. Investing in small- and mid-cap stocks may present special risks including possible illiquidity and greater price volatility than stocks of larger, more established companies. Investments in foreign securities have special risks including political or economic instability, higher costs, different regulations, accounting standards, trading practices and levels of information, and currency exchange rate fluctuations. Changes in interest rates and changes in the financial strength of issuers of lower-rated bonds may also affect underlying fund performance. The Fund is also subject to the risk that the investment adviser's decisions regarding asset classes and portfolio funds will not anticipate market trends successfully, resulting in a failure to preserve capital or lower total return. In addition, the Fund may buy and sell shares of the portfolio funds frequently. This may result in higher transaction costs and additional tax liability. This is not an offer of the shares of any other mutual fund mentioned herein.
1-800-922-6769
18
Columbia Thermostat Fund
>At a Glance Ticker Symbol: COTZX
Pretax and After-tax Average Annual Total Returns (Class Z)
>through June 30, 2006
| Inception 9/25/02 | | Year
to date* | | 1 year | | 3 year | | Life of fund | |
| Returns before taxes | | | 2.56 | % | | | 6.65 | % | | | 9.08 | % | | | 10.83 | % | |
Returns after taxes
on distributions | | | 2.13 | | | | 4.35 | | | | 7.70 | | | | 9.71 | | |
Returns after taxes
on distributions and
sale of fund shares | | | 2.04 | | | | 5.77 | | | | 7.25 | | | | 8.93 | | |
| S&P 500 (pretax) | | | 2.71 | | | | 8.63 | | | | 11.22 | | | | 14.41 | | |
Lehman Brothers U.S.
Credit Intermediate
Bond Index (pretax) | | | -0.47 | | | | -0.61 | | | | 1.83 | | | | 3.97 | | |
Lipper Flexible
Portfolio Funds
Index (pretax) | | | 3.07 | | | | 10.01 | | | | 10.40 | | | | 12.58 | | |
Performance shown here represents past performance, which does not guarantee future results. Current performance may be higher or lower. The investment return and principal value of an investment in the Fund will fluctuate so that Fund shares, when redeemed, may be worth more or less than their original cost. Visit columbiafunds.com for daily and most recent month-end updates.
After-tax returns are calculated using the highest historical individual federal marginal income tax rates, and do not reflect the impact of state and local taxes. Returns after taxes on distributions and sale of Fund shares reflect the additional tax impact of long-term gains or losses realized when Fund shares are sold. The returns are taxed at the maximum rate and assume shares were purchased at the beginning of the period. Actual after-tax returns depend on the investor's tax situation and may differ from those shown. After-tax returns are not relevant to investors who hold their Fund shares through tax-deferred arrangements such as 401(k) plans or individual retirement accounts. After-tax returns are shown for Class Z shares only; after-tax returns for other share classes will vary. Indexes do not reflect any deduction for fees, expenses or taxes.
Investment returns and principal value may fluctuate, resulting in a gain or loss on sale.
*Year-to-date data not annualized.
Columbia Thermostat Fund Portfolio Weightings
>as a % of assets in each investment category, as of June 30, 2006
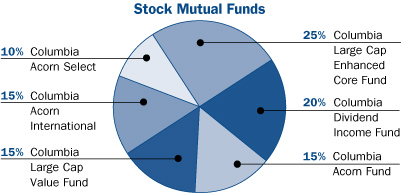
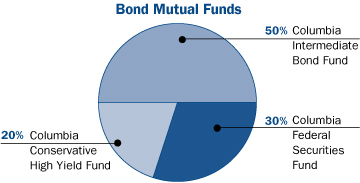
The Growth of a $10,000 Investment in Columbia Thermostat Fund (Class Z)
>September 25, 2002 through June 30, 2006
This graph compares the results of $10,000 invested in Columbia Thermostat Fund at inception on September 25, 2002 to three indexes. The S&P 500 is a broad, market-weighted average of U.S. blue-chip company stock performance. The Lehman Brothers U.S. Credit Intermediate Bond Index is the intermediate component of the U.S. Credit Index. The U.S. Credit Index includes publicly issued U.S. corporate and foreign debentures and secured notes that meet specified maturity, liquidity, and quality requirements. The Lipper Flexible Portfolio Funds Index is an equal dollar weighted index of the 30 largest mutual funds within the Flexible Portfolio Fund classification, as defined by Lipper. The indexes are unmanaged and returns for the indexes and the Fund include reinvested dividends and capital gains. It is not possible to invest directly in an index. The graph and table do not reflect tax deductions that a shareholder would pay on Fu nd distributions or the sale of Fund shares.
Performance shown here represents past performance, which does not guarantee future results. Current performance may be higher or lower. The investment return and principal value of an investment in the Fund will fluctuate so that Fund shares, when redeemed, may be worth more or less than their original cost. Visit columbiafunds.com for daily and most recent month-end updates.
NAV on 6/30/06: $12.53
Total Net Assets of the Fund: $191.3 million
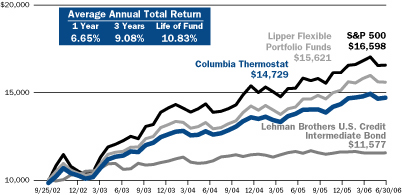
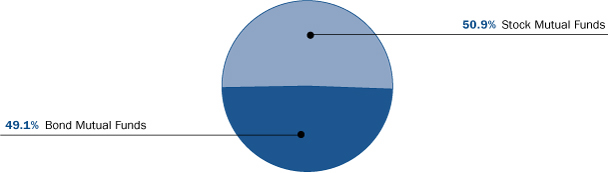
Columbia Thermostat Fund Asset Allocation
>as a % of net assets, as of June 30, 2006
19
Columbia Acorn Fund
>Major Portfolio Changes in the Second Quarter (Unaudited)
| | | Number of Shares | |
| | | 03/31/06 | | 06/30/06 | |
| Additions | |
| Information | |
Alliance Atlantis Communication
(Canada) | | | 960,000 | | | | 1,423,100 | | |
| Amphenol | | | 1,540,000 | | | | 1,620,000 | | |
| Avnet | | | 2,300,000 | | | | 2,550,000 | | |
| Belden CDT | | | 1,173,000 | | | | 1,705,000 | | |
| Ceridian | | | 2,435,000 | | | | 2,585,000 | | |
| CNET Networks | | | 3,000,000 | | | | 4,000,000 | | |
| Concur Technologies | | | 675,000 | | | | 1,766,000 | | |
| EResearch Technology | | | 0 | | | | 1,050,000 | | |
| Gemstar-TV Guide International | | | 7,912,000 | | | | 8,000,000 | | |
| II VI | | | 1,635,000 | | | | 1,885,000 | | |
| Integrated Device Technology | | | 3,060,000 | | | | 3,390,000 | | |
| Kenexa | | | 0 | | | | 160,000 | | |
| Kronos | | | 2,250,000 | | | | 2,750,000 | | |
| Micros Systems | | | 1,425,000 | | | | 1,800,000 | | |
| Navigant Consulting | | | 1,836,000 | | | | 1,900,000 | | |
| Nice Systems (Israel) | | | 1,434,000 | | | | 1,634,000 | | |
| (includes the effect of a 2 for 1 stock split) | |
| Novell | | | 11,500,000 | | | | 12,000,000 | | |
| Openwave Systems | | | 0 | | | | 1,500,000 | | |
| Proquest Company | | | 0 | | | | 2,000,000 | | |
| Radiant Systems | | | 0 | | | | 1,100,000 | | |
| Saga Communications | | | 924,000 | | | | 1,400,000 | | |
| Sanmina - SCI | | | 0 | | | | 4,000,000 | | |
| Supertex | | | 565,000 | | | | 690,000 | | |
| Symbol Technologies | | | 2,560,000 | | | | 4,425,000 | | |
| Tellabs | | | 9,800,000 | | | | 10,000,000 | | |
| THQ | | | 1,050,000 | | | | 1,700,000 | | |
| Tumbleweed Communications | | | 1,761,000 | | | | 3,240,000 | | |
| ValueClick | | | 2,000,000 | | | | 3,000,000 | | |
| webMethods | | | 518,000 | | | | 1,240,000 | | |
| Consumer Goods/Services | |
| Abercrombie & Fitch | | | 2,000,000 | | | | 2,200,000 | | |
| Borders Group | | | 1,300,000 | | | | 1,450,000 | | |
| C&C Group (Ireland) | | | 0 | | | | 2,500,000 | | |
| Cavco Industries | | | 55,000 | | | | 172,000 | | |
| Champion Enterprises | | | 0 | | | | 900,000 | | |
| Chattem | | | 0 | | | | 750,000 | | |
| Chico's FAS | | | 5,090,000 | | | | 5,960,000 | | |
| Coach | | | 5,980,000 | | | | 6,980,000 | | |
| Ducati Motor (Italy) | | | 2,850,000 | | | | 5,700,000 | | |
| Expedia | | | 0 | | | | 3,500,000 | | |
| Fleetwood Enterprises | | | 4,190,000 | | | | 4,690,000 | | |
| Helen of Troy | | | 1,416,000 | | | | 1,800,000 | | |
| HNI | | | 2,400,000 | | | | 2,550,000 | | |
| Jarden | | | 800,000 | | | | 1,000,000 | | |
| J Crew Group | | | 0 | | | | 1,100,000 | | |
| Localiza Rent A Car | | | 0 | | | | 168,800 | | |
| Pool Corporation | | | 1,820,000 | | | | 2,190,000 | | |
| Princeton Review | | | 1,939,000 | | | | 2,550,000 | | |
| | | Number of Shares | |
| | | 03/31/06 | | 06/30/06 | |
| Consumer Goods/Services—continued | |
| Red Robin Gourmet Burgers | | | 805,000 | | | | 1,000,000 | | |
| Rite Aid | | | 7,850,000 | | | | 8,000,000 | | |
| Scotts Miracle-Gro | | | 1,790,000 | | | | 2,620,000 | | |
| ServiceMaster | | | 0 | | | | 470,000 | | |
| Station Casinos | | | 885,000 | | | | 1,000,000 | | |
| Thor Industries | | | 201,000 | | | | 441,000 | | |
| True Religion Apparel | | | 600,000 | | | | 700,000 | | |
| Universal Technical Institute | | | 100,000 | | | | 1,000,000 | | |
| Urban Outfitters | | | 2,427,000 | | | | 3,900,000 | | |
| Industrial Goods/Services | |
| Donaldson | | | 3,275,000 | | | | 3,600,000 | | |
| Drew Industries | | | 730,000 | | | | 1,048,000 | | |
| Flir Systems | | | 1,300,000 | | | | 1,850,000 | | |
| Florida Rock Industries | | | 1,537,000 | | | | 1,900,000 | | |
| Goodman Global | | | 0 | | | | 1,600,000 | | |
| K&F Industries Holdings | | | 994,000 | | | | 1,187,000 | | |
| Legrand (France) | | | 0 | | | | 700,000 | | |
| Martin Marietta | | | 0 | | | | 605,000 | | |
| Quanta Services | | | 2,481,000 | | | | 2,500,000 | | |
| Simpson Manufacturing | | | 1,450,000 | | | | 2,200,000 | | |
| UTI Worldwide | | | 2,700,000 | | | | 3,000,000 | | |
| Worthington Industries | | | 1,964,000 | | | | 2,160,000 | | |
| W.W. Grainger | | | 0 | | | | 750,000 | | |
| Finance | |
| AmeriCredit | | | 6,321,000 | | | | 6,500,000 | | |
| Assurant | | | 830,000 | | | | 1,200,000 | | |
| Cascade Bancorp | | | 118,000 | | | | 500,000 | | |
| Chittenden | | | 756,000 | | | | 892,000 | | |
| Delphi Financial Group | | | 250,000 | | | | 750,000 | | |
| (includes the effect of a 3 for 2 stock split) | |
| East West Bancorp | | | 0 | | | | 400,000 | | |
| Eaton Vance | | | 3,170,000 | | | | 3,970,000 | | |
| Electro Rent | | | 361,000 | | | | 832,000 | | |
| Great Southern Bancorp | | | 675,000 | | | | 796,000 | | |
| Greene County Bancshares | | | 0 | | | | 150,000 | | |
| Marlin Business Services | | | 0 | | | | 263,000 | | |
| McGrath Rentcorp | | | 550,000 | | | | 930,000 | | |
| National Financial | | | 0 | | | | 600,000 | | |
| Philadelphia Consolidated Holding | | | 1,725,000 | | | | 2,040,000 | | |
| Scottish Re Group | | | 0 | | | | 1,700,000 | | |
| West Bancorporation | | | 758,000 | | | | 886,000 | | |
| Energy/Minerals | |
| Atwood Oceanics | | | 0 | | | | 1,000,000 | | |
| Fugro (Netherlands) | | | 1,235,000 | | | | 2,728,302 | | |
| Helmerich & Payne | | | 0 | | | | 257,000 | | |
| Hugoton Royalty | | | 0 | | | | 150,000 | | |
| Maritrans | | | 0 | | | | 600,000 | | |
| Rowan | | | 0 | | | | 971,000 | | |
1-800-922-6769
20
| | | Number of Shares | |
| | | 03/31/06 | | 06/30/06 | |
| Additions (continued) | |
| Health Care | |
| LCA Vision | | | 621,000 | | | | 875,000 | | |
| Rigel Pharmaceuticals | | | 1,216,000 | | | | 1,275,000 | | |
| Tercica | | | 198,000 | | | | 1,500,000 | | |
| Other Industries | |
| Gaylord Entertainment | | | 1,400,000 | | | | 1,560,000 | | |
| Highland Hospitality | | | 4,825,000 | | | | 5,850,000 | | |
| Parkway Properties | | | 400,000 | | | | 536,000 | | |
| Sales | |
| Information | |
| Activision | | | 2,000,000 | | | | 1,000,000 | | |
| Andrew | | | 1,750,000 | | | | 1,380,000 | | |
| CDW | | | 295,000 | | | | 0 | | |
| Getty Images | | | 1,200,000 | | | | 600,000 | | |
Hong Kong Exchanges and
Clearing (Hong Kong) | | | 9,000,000 | | | | 6,500,000 | | |
| International Game Technology | | | 3,840,000 | | | | 2,750,000 | | |
| Jabil Circuit | | | 2,275,000 | | | | 1,705,000 | | |
| Logitech (Switzerland) | | | 300,000 | | | | 0 | | |
| MRO Software | | | 1,000,000 | | | | 241,000 | | |
| Novatek Microelectronics (Taiwan) | | | 5,254,000 | | | | 4,000,000 | | |
| Plexus | | | 1,961,000 | | | | 1,570,000 | | |
| RSA Security | | | 3,000,000 | | | | 2,500,000 | | |
| Sybase | | | 1,000,000 | | | | 0 | | |
| Consumer Goods/Services | |
| Aeropostale | | | 1,040,000 | | | | 936,000 | | |
| Coinstar | | | 1,440,000 | | | | 0 | | |
| Columbia Sportswear | | | 400,000 | | | | 0 | | |
| IAWS Group (Ireland) | | | 1,900,000 | | | | 1,597,000 | | |
| Intrawest (Canada) | | | 1,044,000 | | | | 900,000 | | |
| Michaels Stores | | | 3,560,000 | | | | 2,760,000 | | |
| Natura Cosmeticos | | | 3,150,000 | | | | 1,100,000 | | |
| Park 24 (Japan) | | | 870,000 | | | | 154,000 | | |
| Shimano (Japan) | | | 780,000 | | | | 90,000 | | |
| Sports Authority | | | 1,520,000 | | | | 0 | | |
| Zale | | | 1,072,000 | | | | 0 | | |
| Industrial Goods/Services | |
| Administaff | | | 1,300,000 | | | | 1,100,000 | | |
| Grafton Group (Ireland) | | | 3,800,000 | | | | 3,500,000 | | |
| Kingspan Group (Ireland) | | | 1,250,000 | | | | 1,000,000 | | |
| Spartech | | | 3,150,000 | | | | 2,800,000 | | |
| Tenaris (Argentina) | | | 1,800,000 | | | | 1,500,000 | | |
| (includes the effect of a 5 for 1 stock split) | |
| Tennant | | | 150,000 | | | | 0 | | |
| Ultrapar (Brazil) | | | 750,000 | | | | 438,000 | | |
| USG People (Netherlands) | | | 740,000 | | | | 650,000 | | |
| Vallourec (France) | | | 95,200 | | | | 33,000 | | |
| Wienerberger (Austria) | | | 425,000 | | | | 0 | | |
| | | Number of Shares | |
| | | 03/31/06 | | 06/30/06 | |
| Finance | |
| Anglo Irish Bank (Ireland) | | | 3,600,000 | | | | 3,500,000 | | |
| Bankinter (Spain) | | | 200,000 | | | | 0 | | |
| Cascade Financial | | | 477,500 | | | | 0 | | |
| (includes the effect of a 5 for 4 stock split) | |
| Independent Bank | | | 265,000 | | | | 0 | | |
| Investment Technology Group | | | 690,000 | | | | 350,000 | | |
| Leucadia National | | | 1,993,000 | | | | 1,748,000 | | |
| (includes the effect of a 2 for 1 stock split) | |
| Northgate (United Kingdom) | | | 1,000,000 | | | | 0 | | |
| Paragon Group (United Kingdom) | | | 1,950,000 | | | | 1,120,000 | | |
| Republic | | | 1,581,000 | | | | 0 | | |
| Scottish Re Group | | | 1,700,000 | | | | 0 | | |
| Sterling Bancorp | | | 503,000 | | | | 0 | | |
| TCF Financial | | | 3,356,000 | | | | 3,156,000 | | |
| Energy/Minerals | |
| Chicago Bridge & Iron | | | 1,600,000 | | | | 1,193,000 | | |
| Newpark Resources | | | 5,000,000 | | | | 2,860,000 | | |
| Pioneer Drilling | | | 168,000 | | | | 0 | | |
| Saipem (Italy) | | | 2,000,000 | | | | 1,200,000 | | |
Sociedad Quimica Y
Minera de Chile (Chile) | | | 275,000 | | | | 195,000 | | |
| Talisman Energy (Canada) | | | 7,500,000 | | | | 4,900,000 | | |
| (includes the effect of a 2 for 1 stock split) | |
| Veritas DGC | | | 700,000 | | | | 350,000 | | |
| Health Care | |
| Charles River Laboratories | | | 1,595,000 | | | | 1,355,000 | | |
| Datascope | | | 1,065,000 | | | | 455,000 | | |
| DOV Pharmaceuticals | | | 1,540,000 | | | | 0 | | |
| Gambro (Sweden) | | | 4,260,000 | | | | 0 | | |
| Incyte | | | 3,935,000 | | | | 0 | | |
| Martek Biosciences | | | 650,000 | | | | 0 | | |
| Neurocrine Biosciences | | | 913,000 | | | | 0 | | |
| Pozen | | | 2,400,000 | | | | 0 | | |
| Sybron Dental Specialties | | | 283,000 | | | | 0 | | |
| Symmetry Medical | | | 965,000 | | | | 0 | | |
| Tanox | | | 685,000 | | | | 0 | | |
| United Drug (Ireland) | | | 4,145,810 | | | | 4,000,000 | | |
| Other Industries | |
| Comfort Del Gro (Singapore) | | | 18,000,000 | | | | 0 | | |
Grupo Aeroportuario
Del Sureste (Mexico) | | | 800,000 | | | | 760,000 | | |
| Heartland Express | | | 1,634,000 | | | | 1,584,000 | | |
| (includes the effect of a 4 for 3 stock split) | |
21
Columbia Acorn Fund
>Statement of Investments (Unaudited), June 30, 2006
| Number of Shares | | | | Value (000) | |
| | | | | Common Stocks and Other
Equity-Like Securities: 93.8% | |
| Information: 22.8% | | | |
| | | Software/Services | |
| | | >Business Software: 3.3% | |
| | 2,750,000 | | | Kronos (b)(c) | | $ | 99,577 | | |
| | | | | Labor Management Solutions | | | | | |
| | 12,000,000 | | | Novell (b) | | | 79,560 | | |
| | | | | Directory, Operating System & Identity
Management Software | | | | | |
| | 1,800,000 | | | Micros Systems (b) | | | 78,624 | | |
| | | | | Information Systems for Restaurants & Hotels | | | | | |
| | 1,800,000 | | | Avid Technology (b) | | | 59,994 | | |
| | | | | Digital Nonlinear Editing Software & Systems | | | | | |
| | 1,800,000 | | | Cadence Design Systems (b) | | | 30,870 | | |
| | | | | Electronic Design Automation | | | | | |
| | 1,427,000 | | | Witness Systems (b) | | | 28,783 | | |
| | | | | Customer Experience Management Software | | | | | |
| | 1,766,000 | | | Concur Technologies (b) | | | 27,320 | | |
| | | | | Web Enabled Enterprise Applications | | | | | |
| | 6,000,000 | | | Actuate (b)(c) | | | 24,240 | | |
| | | | | Information Delivery Software & Solutions | | | | | |
| | 1,000,000 | | | Progress Software (b) | | | 23,410 | | |
| | | | | Application Development Software | | | | | |
| | 1,490,000 | | | JDA Software (b)(c) | | | 20,905 | | |
| | | | | Applications/Software & Services for Retailers | | | | | |
| | 3,000,000 | | | Lawson Software (b) | | | 20,100 | | |
| | | | | Enterprise Resource Planning (ERP) Software | | | | | |
| | 928,000 | | | SSA Global Technologies (b) | | | 17,985 | | |
| | | | | Enterprise Resource Planning (ERP) Software | | | | | |
| | 5,600,000 | | | Indus International (b)(c) | | | 16,016 | | |
| | | | | Enterprise Asset Management Software | | | | | |
| | 1,200,000 | | | Parametric Technology (b) | | | 15,252 | | |
| | | | | Engineering Software & Services | | | | | |
| | 2,075,000 | | | Agile Software (b) | | | 13,156 | | |
| | | | | Product Design Software | | | | | |
| | 1,240,000 | | | webMethods (b) | | | 12,239 | | |
| | | | | Enterprise Applications Integration (EAI) Tools | | | | | |
| | 1,100,000 | | | Radiant Systems (b) | | | 11,627 | | |
| | | | | Point of Sale System: Convenient
Stores & Restaurants | | | | | |
| | 3,240,000 | | | Tumbleweed Communications (b)(c) | | | 9,234 | | |
| | | | | Email Content Security & File
Transfer Management | | | | | |
| | 160,000 | | | Kenexa (b) | | | 5,096 | | |
| | | | | Human Capital Management Software | | | | | |
| | 241,000 | | | MRO Software (b) | | | 4,837 | | |
| | | | | Enterprise Maintenance Software | | | | | |
| | 1,250,000 | | | ClickSoftware Technologies (b) | | | 2,150 | | |
| | | | | Service Chain Optimization Software | | | | | |
| | | | 600,975 | | |
| | | >Business Information/
Business Services/Publishing: 1.5% | |
| | 2,585,000 | | | Ceridian (b) | | | 63,177 | | |
| | | | | HR Services & Payment Processing | | | | | |
| | 1,900,000 | | | Navigant Consulting (b) | | | 43,035 | | |
| | | | | Financial Consulting Firm | | | | | |
| | 600,000 | | | Getty Images (b) | | | 38,106 | | |
| | | | | Photographs for Publications & Electronic Media | | | | | |
| | 916,000 | | | Fair Isaac | | | 33,260 | | |
| | | | | Credit Scoring & Decision Analytic Software | | | | | |
| Number of Shares | | | | Value (000) | |
| | 2,000,000 | | | Proquest Company (b)(c) | | $ | 24,580 | | |
| | | | | Information Services for Educational &
Automotive Services | | | | | |
| | 2,285,000 | | | InfoUSA | | | 23,558 | | |
| | | | | Business Data for Sales Leads | | | | | |
| | 1,500,000 | | | Openwave Systems (b) | | | 17,310 | | |
| | | | | Internet Software for Mobile Devices | | | | | |
| | 300,000 | | | Navteq (b) | | | 13,404 | | |
| | | | | Map Data for Electronic Devices | | | | | |
| | 2,500,000 | | | PRIMEDIA (b) | | | 4,575 | | |
| | | | | Specialty Magazines & Other Publications | | | | | |
| | 175,000 | | | Triple Crown Media (b) | | | 1,517 | | |
| | | | | Newspapers, Paging & Collegiate
Sports Marketing | | | | | |
| | | | 262,522 | | |
| | | >Internet: 1.2% | |
| | 2,500,000 | | | RSA Security (b) | | | 67,975 | | |
| | | | | Enterprise Security Software | | | | | |
| | 9,500,000 | | | Skillsoft Publishing (b)(c) | | | 58,140 | | |
| | | | | Provider of Web-Based Learning
Solutions (E-Learning) | | | | | |
| | 3,000,000 | | | ValueClick (b) | | | 46,050 | | |
| | | | | Internet Advertising | | | | | |
| | 4,000,000 | | | CNET Networks (b) | | | 31,920 | | |
| | | | | Internet Advertising on Niche Websites | | | | | |
| | 875,000 | | | Vital Stream (b) | | | 9,275 | | |
| | | | | Streaming Services for the Internet | | | | | |
| | 61,000 | | | Travelzoo (b) | | | 1,851 | | |
| | | | | Travel Internet Advertising | | | | | |
| | | | 215,211 | | |
| | | >Transaction Processors: 1.0% | |
| | 2,524,000 | | | Global Payments | | | 122,540 | | |
| | | | | Credit Card Processor | | | | | |
| | 6,500,000 | | | Hong Kong Exchanges and
Clearing (Hong Kong) | | | 41,776 | | |
| | | | | Hong Kong Equity & Derivatives
Market Operator | | | | | |
| | 600,000 | | | Cubic | | | 11,766 | | |
| | | | | Revenue Collection & Defense Systems | | | | | |
| | | | 176,082 | | |
| | | >Computer Services: 0.7% | |
| | 1,350,000 | | | SRA International (b) | | | 35,951 | | |
| | | | | Government I/T Services | | | | | |
| | 4,000,000 | | | Bearing Point (b) | | | 33,480 | | |
| | | | | Business Consulting & Technology Strategy | | | | | |
| | 5,000,000 | | | Igate Capital (b)(c) | | | 31,950 | | |
| | | | | I/T & BPO Outsourcing Services | | | | | |
| | 4,600,000 | | | AnswerThink Consulting (b)(c) | | | 18,538 | | |
| | | | | I/T Integration & Best Practice Research | | | | | |
| | | | 119,919 | | |
| | | >Electronics Distribution: 0.5% | |
| | 2,550,000 | | | Avnet (b) | | | 51,051 | | |
| | | | | Electronic Components Distribution | | | | | |
| | 680,000 | | | Tech Data (b) | | | 26,051 | | |
| | | | | I/T Distributor | | | | | |
| | 710,000 | | | Agilysys | | | 12,780 | | |
| | | | | I/T Distributor | | | | | |
| | | | 89,882 | | |
1-800-922-6769
22
| Number of Shares | | | | Value (000) | |
| | | >Consumer Software: 0.3% | |
| | 1,700,000 | | | THQ (b) | | $ | 36,720 | | |
| | | | | Entertainment Software | | | | | |
| | 1,000,000 | | | Activision (b) | | | 11,380 | | |
| | | | | Entertainment Software | | | | | |
| | | | 48,100 | | |
| | | Computer Related Hardware | |
| | | >Computer Hardware/
Related Systems: 3.3% | |
| | 1,620,000 | | | Amphenol | | | 90,655 | | |
| | | | | Electronic Connectors | | | | | |
| | 1,705,000 | | | Belden CDT | | | 56,350 | | |
| | | | | Specialty Cable | | | | | |
| | 870,000 | | | Rogers (b) | | | 49,016 | | |
| | | | | PCB Laminates & High Performance Foams | | | | | |
| | 4,425,000 | | | Symbol Technologies | | | 47,746 | | |
| | | | | Mobile Computers & Barcode Scanners | | | | | |
| | 1,634,000 | | | Nice Systems (Israel) (b) | | | 45,981 | | |
| | | | | Audio & Video Recording Solutions | | | | | |
| | 1,885,000 | | | II VI (b)(c) | | | 34,496 | | |
| | | | | Laser Components | | | | | |
| | 230,000 | | | Wincor Nixdorf (Germany) | | | 29,367 | | |
| | | | | Retail POS Systems & ATM Machines | | | | | |
| | 253,600 | | | Neopost (France) | | | 28,869 | | |
| | | | | Postage Meter Machines | | | | | |
| | 1,240,000 | | | Intermec (b) | | | 28,446 | | |
| | | | | Bar Code & Wireless LAN Systems | | | | | |
| | 9,761,000 | | | Advantech (Taiwan) | | | 28,019 | | |
| | | | | Embedded Computers | | | | | |
| | 1,027,000 | | | Avocent (b) | | | 26,959 | | |
| | | | | Computer Control Switches | | | | | |
| | 1,310,000 | | | CTS | | | 19,506 | | |
| | | | | Electronic Components, Sensors & EMS | | | | | |
| | 900,000 | | | Netgear (b) | | | 19,485 | | |
| | | | | Networking Products for
Small Business & Home | | | | | |
| | 625,000 | | | Excel Technologies (b)(c) | | | 18,700 | | |
| | | | | Laser Systems & Electro-Optical Components | | | | | |
| | 530,000 | | | Zebra Technologies (b) | | | 18,105 | | |
| | | | | Bar Code Printers | | | | | |
| | 375,000 | | | Diebold | | | 15,233 | | |
| | | | | Automated Teller Machines | | | | | |
| | 1,875,000 | | | Seachange International (b)(c) | | | 13,050 | | |
| | | | | Systems for Video on Demand & Ad Insertion | | | | | |
| | 5,000,000 | | | Concurrent Computer (b)(c) | | | 13,050 | | |
| | | | | Video on Demand Systems & Services | | | | | |
| | 11,999,000 | | | Phoenixtec Power (Taiwan) | | | 12,196 | | |
| | | | | Uninterruptible Power Supplies | | | | | |
| | | | 595,229 | | |
| | | >Gaming Equipment: 1.4% | |
| | 2,750,000 | | | International Game Technology | | | 104,336 | | |
| | | | | Slot Machines & Progressive Jackpots | | | | | |
| | 2,430,000 | | | Shuffle Master (b)(c) | | | 79,655 | | |
| | | | | Card Shufflers & Casino Games | | | | | |
| | 3,900,000 | | | Bally Technologies (b)(c) | | | 64,233 | | |
| | | | | Slot Machines & Software | | | | | |
| | | | 248,224 | | |
| Number of Shares | | | | Value (000) | |
| | | >Semiconductors/
Related Equipment: 1.3% | |
| | 3,390,000 | | | Integrated Device Technology (b) | | $ | 48,070 | | |
| | | | | Communications Semiconductors | | | | | |
| | 4,425,000 | | | Entegris (b) | | | 42,170 | | |
| | | | | Semiconductor Wafer
Shipping & Handling Products | | | | | |
| | 915,000 | | | Littelfuse (b) | | | 31,458 | | |
| | | | | Little Fuses | | | | | |
| | 690,000 | | | Supertex (b)(c) | | | 27,559 | | |
| | | | | Mixed-Signal Semiconductors | | | | | |
| | 1,950,000 | | | AMIS Holdings (b) | | | 19,500 | | |
| | | | | Analog & Mixed - Signal Semiconductors | | | | | |
| | 4,000,000 | | | Novatek Microelectronics (Taiwan) | | | 19,268 | | |
| | | | | LCD Related IC Designer | | | | | |
| | 1,905,000 | | | IXYS (b)(c) | | | 18,288 | | |
| | | | | Power Semiconductors | | | | | |
| | 1,235,000 | | | Semtech (b) | | | 17,846 | | |
| | | | | Analog Semiconductors | | | | | |
| | | | 224,159 | | |
| | | >Instrumentation: 1.2% | |
| | 1,250,000 | | | Trimble Navigation (b) | | | 55,800 | | |
| | | | | GPS-Based Instruments | | | | | |
| | 750,000 | | | Mettler Toledo (b) | | | 45,428 | | |
| | | | | Laboratory Equipment | | | | | |
| | 1,850,000 | | | Flir Systems (b) | | | 40,811 | | |
| | | | | Infrared Cameras | | | | | |
| | 711,000 | | | Dionex (b) | | | 38,863 | | |
| | | | | Ion & Liquid Chromatography | | | | | |
| | 670,000 | | | Varian (b) | | | 27,812 | | |
| | | | | Analytical Instruments | | | | | |
| | | | 208,714 | | |
| | | >Contract Manufacturing: 0.6% | |
| | 1,570,000 | | | Plexus (b) | | | 53,710 | | |
| | | | | Electronic Manufacturing Services | | | | | |
| | 1,705,000 | | | Jabil Circuit | | | 43,648 | | |
| | | | | Electronic Manufacturing Services | | | | | |
| | 4,000,000 | | | Sanmina - SCI (b) | | | 18,400 | | |
| | | | | BackPlane & Electronic
Manufacturing Services | | | | | |
| | | | 115,758 | | |
| | | Telecommunications | |
| | | >Telecommunication Services: 3.1% | |
| | 4,500,000 | | | Crown Castle International (b) | | | 155,430 | | |
| | | | | Communication Towers | | | | | |
| | 3,500,000 | | | American Tower (b) | | | 108,920 | | |
| | | | | Communication Towers in USA & Mexico | | | | | |
| | 1,600,000 | | | Alltel | | | 102,129 | | |
| | | | | Cellular & Wireline Telephone Services | | | | | |
| | 4,250,000 | | | Time Warner Telecom (b)(c) | | | 63,113 | | |
| | | | | Fiber Optic Data/Telephone Service Provider | | | | | |
| | 8,000,000 | | | Dobson Communications (b)(c) | | | 61,840 | | |
| | | | | Rural & Small City Cellular
Telephone Services | | | | | |
| | 780,000 | | | Telephone and Data Systems | | | 32,292 | | |
| | 300,000 | | | Telephone and Data Systems, Cl. S | | | 11,670 | | |
| | | | | Cellular & Wireline Telephone Services | | | | | |
| | 2,300,000 | | | Tele2 AB (Sweden) | | | 23,209 | | |
| | | | | European Mobile Operator &
Services Reseller | | | | | |
23
Columbia Acorn Fund
>Statement of Investments (Unaudited), continued
| Number of Shares | | | | Value (000) | |
| | | >Telecommunication Services—continued | |
| | 200,000 | | | Commonwealth Telephone | | $ | 6,632 | | |
| | | | | Rural Phone Franchises & Competitive Telco | | | | | |
| | | | 565,235 | | |
| | | >Telecommunications Equipment: 0.9% | |
| | 10,000,000 | | | Tellabs (b) | | | 133,100 | | |
| | | | | Telecommunications Equipment | | | | | |
| | 1,380,000 | | | Andrew (b) | | | 12,227 | | |
| | | | | Wireless Infrastructure Equipment | | | | | |
| | 1,510,000 | | | Symmetricom (b) | | | 10,676 | | |
| | | | | Network Timing & Synchronization Devices | | | | | |
| | | | 156,003 | | |
| | | Media | |
| | | >Television Programming/CATV: 1.8% | |
| | 4,015,000 | | | Discovery Holding (b) | | | 58,739 | | |
| | | | | CATV Programming | | | | | |
| | 70,000 | | | Jupiter Telecommunications
(Japan) (b) | | | 48,526 | | |
| | | | | Largest Cable Service Provider in Japan | | | | | |
| | 2,050,000 | | | Liberty Global, Series C (b) | | | 42,169 | | |
| | 1,750,000 | | | Liberty Global, Series A (b) | | | 37,625 | | |
| | | | | CATV Holding Company | | | | | |
| | 1,423,100 | | | Alliance Atlantis Communication
(Canada) (b) | | | 41,687 | | |
| | | | | CATV Channels, TV/Movie
Production/Distribution | | | | | |
| | 8,000,000 | | | Gemstar-TV Guide International (b) | | | 28,160 | | |
| | | | | TV Program Guides & CATV Programming | | | | | |
| | 3,000,000 | | | Lions Gate Entertainment (b) | | | 25,650 | | |
| | | | | Film & TV Studio | | | | | |
| | 655,000 | | | Liberty Media - Interactive (b) | | | 11,305 | | |
| | 130,000 | | | Liberty Media - Capital (b) | | | 10,890 | | |
| | | | | CATV Programming & Media
Company Holdings | | | | | |
| | 1,250,000 | | | Mediacom Communications (b) | | | 7,787 | | |
| | | | | Cable Television Franchises | | | | | |
| | 700,000 | | | Outdoor Channel (b) | | | 7,224 | | |
| | | | | Cable Television Programming | | | | | |
| | | | 319,762 | | |
| | | >TV/Satellite Broadcasting: 0.4% | |
| | 2,752,829 | | | SES Global (France) | | | 39,212 | | |
| | | | | Satellite Broadcasting Services | | | | | |
| | 2,500,000 | | | Entravision Communications (b) | | | 21,425 | | |
| | | | | Spanish Language TV, Radio & Outdoor | | | | | |
| | 1,750,000 | | | Gray Television | | | 10,133 | | |
| | | | | Mid Market Affiliated TV Stations | | | | | |
| | 270,000 | | | Metropole TV (France) | | | 8,439 | | |
| | | | | Television Broadcaster | | | | | |
| | | | 79,209 | | |
| | | >Radio Broadcasting: 0.3% | |
| | 1,541,000 | | | Salem Communications (b)(c) | | | 20,048 | | |
| | | | | Radio Stations for Religious Programming | | | | | |
| | 1,500,000 | | | Cumulus Media, Cl. A (b) | | | 16,005 | | |
| | | | | Radio Stations in Small Cities | | | | | |
| | 1,400,000 | | | Saga Communications (b)(c) | | | 12,684 | | |
| | | | | Radio Stations in Small & Mid-sized Cities | | | | | |
| Number of Shares | | | | Value (000) | |
| | 2,400,000 | | | Spanish Broadcasting System (b)(c) | | $ | 12,264 | | |
| | | | | Spanish Language Radio Stations | | | | | |
| | | | 61,001 | | |
| | | Information: Total | | | 4,085,985 | | |
| Consumer Goods/Services: 18.5% | | | |
| | | Services | |
| | | >Retail: 5.3% | |
| | 5,960,000 | | | Chico's FAS (b) | | | 160,801 | | |
| | | | | Women's Specialty Retail | | | | | |
| | 2,200,000 | | | Abercrombie & Fitch | | | 121,946 | | |
| | | | | Teen Apparel Retailer | | | | | |
| | 2,760,000 | | | Michaels Stores | | | 113,822 | | |
| | | | | Craft & Hobby Specialty Retailer | | | | | |
| | 3,743,000 | | | Christopher & Banks (c) | | | 108,547 | | |
| | | | | Women's Apparel Retailer | | | | | |
| | 3,900,000 | | | Urban Outfitters (b) | | | 68,211 | | |
| | | | | Apparel & Home Specialty Retailer | | | | | |
| | 1,223,000 | | | Ann Taylor Stores (b) | | | 53,054 | | |
| | | | | Women's Apparel Retailer | | | | | |
| | 1,400,000 | | | Williams Sonoma | | | 47,670 | | |
| | | | | Home Goods & Furnishing Retailer | | | | | |
| | 2,250,000 | | | Petco Animal Supplies (b) | | | 45,968 | | |
| | | | | Pet Supplies & Services | | | | | |
| | 8,000,000 | | | Rite Aid (b) | | | 33,920 | | |
| | | | | Drug Stores | | | | | |
| | 1,100,000 | | | J Crew Group (b) | | | 30,195 | | |
| | | | | Multi-Channel Branded Retailer | | | | | |
| | 1,630,000 | | | Rona (Canada) (b) | | | 29,277 | | |
| | | | | Leading Canadian DIY Retailer | | | | | |
| | 936,000 | | | Aeropostale (b) | | | 27,041 | | |
| | | | | Mall Based Teen Retailer | | | | | |
| | 1,450,000 | | | Borders Group | | | 26,767 | | |
| | | | | Bookstores | | | | | |
| | 775,000 | | | Genesco (b) | | | 26,249 | | |
| | | | | Multi-Concept Branded Footwear Retailer | | | | | |
| | 750,000 | | | Chattem (b) | | | 22,778 | | |
| | | | | Personal Care Products | | | | | |
| | 1,062,000 | | | Gaiam (b)(c) | | | 14,889 | | |
| | | | | Healthy Living Catalogs & E-Commerce | | | | | |
| | 3,500,000 | | | Edgars Consolidated Stores
(South Africa) | | | 14,109 | | |
| | | | | Leading Retail Conglomerate | | | | | |
| | | | 945,244 | | |
| | | >Consumer Services: 2.2% | |
| | 2,250,000 | | | ITT Educational Services (b)(c) | | | 148,073 | | |
| | | | | Post-secondary Degree Programs | | | | | |
| | 2,190,000 | | | Pool Corporation | | | 95,550 | | |
| | | | | Distributor of Swimming Pool Supplies
and Equipment | | | | | |
| | 1,275,000 | | | Weight Watchers | | | 52,135 | | |
| | | | | Weight Loss Programs | | | | | |
| | 800,000 | | | Regis Corp Minnesota | | | 28,488 | | |
| | | | | Hair Salons | | | | | |
| | 1,530,000 | | | Central Parking | | | 24,480 | | |
| | | | | Owner, Operator & Manager of
Parking Lots & Garages | | | | | |
1-800-922-6769
24
| Number of Shares | | | | Value (000) | |
| | | >Consumer Services—continued | |
| | 1,000,000 | | | Universal Technical Institute (b) | | $ | 22,020 | | |
| | | | | Vocational Training | | | | | |
| | 2,550,000 | | | Princeton Review (b)(c) | | | 13,566 | | |
| | | | | College Preparation Courses | | | | | |
| | 470,000 | | | ServiceMaster | | | 4,855 | | |
| | | | | Lawn Care, Pest Control, Commercial
Disaster Response | | | | | |
| | 277,000 | | | Lincoln Technical Institute (b) | | | 4,734 | | |
| | | | | Vocational Training | | | | | |
| | 154,000 | | | Park 24 (Japan) | | | 4,523 | | |
| | | | | Parking Lot Operator | | | | | |
| | | | 398,424 | | |
| | | >Travel: 1.4% | |
| | 2,110,000 | | | Vail Resorts (b)(c) | | | 78,281 | | |
| | | | | Ski Resort Operator & Developer | | | | | |
| | 915,000 | | | Four Seasons Hotels (Canada) | | | 56,218 | | |
| | | | | Luxury Hotel Operator | | | | | |
| | 3,500,000 | | | Expedia (b) | | | 52,395 | | |
| | | | | Online Travel Service Company | | | | | |
| | 900,000 | | | Intrawest (Canada) | | | 28,444 | | |
| | | | | Ski Resort Operator & Developer | | | | | |
| | 270,000 | | | Kerzner International (Bahamas) (b) | | | 21,406 | | |
| | | | | Destination Resorts & Casinos | | | | | |
| | 1,045,000 | | | Navigant International (b)(c) | | | 16,751 | | |
| | | | | Corporate Travel Agency | | | | | |
| | 168,800 | | | Localiza Rent A Car (Brazil) | | | 3,234 | | |
| | | | | Car Rental | | | | | |
| | | | 256,729 | | |
| | | >Entertainment/Leisure Products: 1.1% | |
| | 1,795,000 | | | RC2 (b)(c) | | | 69,395 | | |
| | | | | Toys, Infant Products & Collectibles | | | | | |
| | 1,416,000 | | | Speedway Motorsports | | | 53,440 | | |
| | | | | Motorsport Racetrack Owner & Operator | | | | | |
| | 1,025,000 | | | International Speedway Motors | | | 47,529 | | |
| | | | | Largest Motorsport Racetrack
Owner & Operator | | | | | |
| | 441,000 | | | Thor Industries | | | 21,366 | | |
| | | | | RV & Bus Manufacturer | | | | | |
| | 600,000 | | | Callaway Golf | | | 7,794 | | |
| | | | | Premium Golf Clubs & Balls | | | | | |
| | | | 199,524 | | |
| | | >Casinos & Gaming: 0.9% | |
| | 1,000,000 | | | Station Casinos | | | 68,080 | | |
| | | | | Casinos & Riverboats | | | | | |
| | 1,898,000 | | | Pinnacle Entertainment (b) | | | 58,174 | | |
| | | | | Regional Riverboat Casinos | | | | | |
| | 690,000 | | | Intralot (Greece) | | | 18,463 | | |
| | | | | Lottery & Gaming Systems & Services | | | | | |
| | 4,700,000 | | | Sky City Entertainment
(New Zealand) | | | 15,448 | | |
| | | | | Casino/Entertainment Complex | | | | | |
| | 226,000 | | | Lakes Entertainment (b) | | | 2,732 | | |
| | | | | Native American Casino Development | | | | | |
| | | | 162,897 | | |
| | | >Restaurants: 0.7% | |
| | 2,145,000 | | | Sonic (b) | | | 44,595 | | |
| | | | | Quick Service Restaurant | | | | | |
| | 1,000,000 | | | Red Robin Gourmet Burgers (b)(c) | | | 42,560 | | |
| | | | | Casual Dining Restaurants | | | | | |
| Number of Shares | | | | Value (000) | |
| | 800,000 | | | Cheesecake Factory (b) | | $ | 21,560 | | |
| | | | | Casual Dining Restaurants | | | | | |
| | 1,600,000 | | | AFC Enterprises (c) | | | 20,400 | | |
| | | | | Popeye's Restaurants | | | | | |
| | | | 129,115 | | |
| | | >Cruise Lines: 0.1% | |
| | 400,000 | | | Carnival | | | 16,696 | | |
| | | | | Largest Cruise Line | | | | | |
| | | Goods | |
| | | >Apparel: 1.8% | |
| | 6,980,000 | | | Coach (b) | | | 208,702 | | |
| | | | | Designer & Retailer of Branded
Leather Accessories | | | | | |
| | 1,418,000 | | | Carter's (b) | | | 37,478 | | |
| | | | | Children's Branded Apparel | | | | | |
| | 919,000 | | | Oxford Industries (c) | | | 36,218 | | |
| | | | | Branded & Private Label Apparel | | | | | |
| | 3,000,000 | | | Billabong International (Australia) | | | 34,250 | | |
| | | | | Action Sports Apparel Brand Manager | | | | | |
| | 700,000 | | | True Religion Apparel (b) | | | 12,390 | | |
| | | | | Premium Denim | | | | | |
| | | | 329,038 | | |
| | | >Furniture/Textiles: 1.7% | |
| | 2,550,000 | | | HNI | | | 115,643 | | |
| | | | | Office Furniture & Fireplaces | | | | | |
| | 765,000 | | | Mohawk Industries (b) | | | 53,818 | | |
| | | | | Carpet & Flooring | | | | | |
| | 2,068,000 | | | Herman Miller | | | 53,292 | | |
| | | | | Office Furniture | | | | | |
| | 1,398,000 | | | Nobia (Sweden) | | | 45,347 | | |
| | | | | Kitchen Cabinet Manufacturing &
Distribution | | | | | |
| | 1,435,000 | | | Knoll | | | 26,347 | | |
| | | | | Office Furniture | | | | | |
| | | | 294,447 | | |
| | | >Leisure Vehicles: 1.2% | |
| | 1,751,000 | | | Harley-Davidson | | | 96,112 | | |
| | | | | Motorcycles & Related Merchandise | | | | | |
| | 1,130,000 | | | Polaris Industries | | | 48,929 | | |
| | | | | Leisure Vehicles & Related Products | | | | | |
| | 4,690,000 | | | Fleetwood Enterprises (b)(c) | | | 35,363 | | |
| | | | | RV & Manufactured Home Maker | | | | | |
| | 690,000 | | | Winnebago | | | 21,418 | | |
| | | | | Premier Motorhome Maker | | | | | |
| | 5,700,000 | | | Ducati Motor (Italy) (b) | | | 4,839 | | |
| | | | | Motorcycles & Related Merchandise | | | | | |
| | | | 206,661 | | |
| | | >Nondurables: 1.0% | |
| | 2,620,000 | | | Scotts Miracle-Gro | | | 110,878 | | |
| | | | | Consumer Lawn & Garden Products | | | | | |
| | 1,000,000 | | | Jarden (b) | | | 30,450 | | |
| | | | | Branded Household Products | | | | | |
| | 1,886,000 | | | Prestige Brands (b) | | | 18,803 | | |
| | | | | OTC, Household & Personal Care Products | | | | | |
| | 1,100,000 | | | Natura Cosmeticos (Brazil) | | | 11,529 | | |
| | | | | Direct Retailer of Cosmetics | | | | | |
| | | | 171,660 | | |
25
Columbia Acorn Fund
>Statement of Investments (Unaudited), continued
| Number of Shares | | | | Value (000) | |
| | | >Durable Goods: 0.6% | |
| | 465,000 | | | Hyundai Mobis (South Korea) | | $ | 39,290 | | |
| | | | | Auto Parts | | | | | |
| | 1,800,000 | | | Helen of Troy (b)(c) | | | 33,120 | | |
| | | | | Hairdryers & Curling Irons | | | | | |
| | 14,999,300 | | | Techtronic Industries (Hong Kong) | | | 20,273 | | |
| | | | | Power Tools & Motorized Appliances | | | | | |
| | 900,000 | | | Champion Enterprises (b) | | | 9,936 | | |
| | | | | Manufactured Homes | | | | | |
| | 172,000 | | | Cavco Industries (b) | | | 7,644 | | |
| | | | | Higher End Manufactured Homes | | | | | |
| | 90,000 | | | Shimano (Japan) | | | 2,758 | | |
| | | | | Bicycle Components & Fishing Tackle | | | | | |
| | | | 113,021 | | |
| | | >Food & Beverages: 0.5% | |
| | 1,597,000 | | | IAWS Group (Ireland) | | | 28,157 | | |
| | | | | Baked Goods | | | | | |
| | 2,410,000 | | | Davide Campari (Italy) | | | 24,965 | | |
| | | | | Spirits & Wine | | | | | |
| | 2,500,000 | | | C&C Group (Ireland) | | | 21,711 | | |
| | | | | Beverage Company | | | | | |
| | 35,000,000 | | | Global Bio-Chem Technology
Group (China) | | | 14,800 | | |
| | | | | Refiner of Corn-Based Commodities | | | | | |
| | | | 89,633 | | |
| | | Consumer Goods/Services: Total | | | 3,313,089 | | |
| Industrial Goods/Services: 17.9% | | | |
| | | >Industrial Goods/Services: 3.3% | |
| | 1,900,000 | | | Genlyte Group (b)(c) | | | 137,617 | | |
| | | | | Commercial Lighting Fixtures | | | | | |
| | 3,600,000 | | | Donaldson | | | 121,932 | | |
| | | | | Industrial Air Filtration | | | | | |
| | 3,222,000 | | | Clarcor (c) | | | 95,983 | | |
| | | | | Mobile & Industrial Filters | | | | | |
| | 1,900,000 | | | Mine Safety Appliances (c) | | | 76,380 | | |
| | | | | Safety Equipment | | | | | |
| | 750,000 | | | W.W. Grainger | | | 56,422 | | |
| | | | | Industrial Distribution | | | | | |
| | 1,048,000 | | | Drew Industries (b) | | | 33,955 | | |
| | | | | RV & MFG Home Components | | | | | |
| | 1,600,000 | | | Goodman Global (b) | | | 24,288 | | |
| | | | | HVAC Equipment Manufacturer | | | | | |
| | 1,125,000 | | | Ushio (Japan) | | | 23,823 | | |
| | | | | Industrial Light Sources | | | | | |
| | 700,000 | | | Legrand (France) | | | 19,691 | | |
| | | | | Electrical Components | | | | | |
| | 141,000 | | | Electric City (b) | | | 155 | | |
| | | | | Electricity Conservation Devices | | | | | |
| | | | 590,246 | | |
| | | >Machinery: 3.2% | |
| | 2,200,000 | | | Esco Technologies (b)(c) | | | 117,590 | | |
| | | | | Automatic Electric Meter Readers | | | | | |
| | 2,350,000 | | | Ametek | | | 111,343 | | |
| | | | | Aerospace/Industrial Instruments | | | | | |
| | 2,750,000 | | | Pentair | | | 94,022 | | |
| | | | | Pumps, Water Treatment & Tools | | | | | |
| | 2,000,000 | | | Gardner Denver (b) | | | 77,000 | | |
| | | | | Air Compressors, Blowers & Pumps | | | | | |
| Number of Shares | | | | Value (000) | |
| | 1,500,000 | | | Nordson | | $ | 73,770 | | |
| | | | | Dispensing Systems for Adhesives & Coatings | | | | | |
| | 1,100,000 | | | Kaydon | | | 41,041 | | |
| | | | | Specialized Friction & Motion
Control Products | | | | | |
| | 522,000 | | | Toro | | | 24,377 | | |
| | | | | Turf Maintenance Equipment | | | | | |
| | 1,187,000 | | | K&F Industries Holdings (b) | | | 21,046 | | |
| | | | | Aircraft Wheels, Brakes & Fuel Tank Bladders | | | | | |
| | 212,000 | | | Oshkosh Truck | | | 10,074 | | |
| | | | | Specialty Truck Manufacturer | | | | | |
| | | | 570,263 | | |
| | | >Logistics: 2.6% | |
| | 5,500,000 | | | Expeditors International of
Washington | | | 308,055 | | |
| | | | | International Freight Forwarder | | | | | |
| | 2,000,000 | | | Forward Air (c) | | | 81,460 | | |
| | | | | Freight Transportation Between Airports | | | | | |
| | 3,000,000 | | | UTI Worldwide | | | 75,690 | | |
| | | | | Global Logistics & Freight Forwarding | | | | | |
| | | | 465,205 | | |
| | | >Industrial Distribution: 1.8% | |
| | 2,286,000 | | | Watsco (c) | | | 136,749 | | |
| | | | | HVAC Distribution | | | | | |
| | 1,925,000 | | | Airgas | | | 71,706 | | |
| | | | | Industrial Gas Distributor | | | | | |
| | 1,150,000 | | | Aviall (b) | | | 54,648 | | |
| | | | | Aircraft Replacement Parts Distributor | | | | | |
| | 3,500,000 | | | Grafton Group (Ireland) | | | 44,057 | | |
| | | | | Building Materials Wholesaling &
DIY Retailing | | | | | |
| | 1,031,000 | | | Nuco2 (b)(c) | | | 24,785 | | |
| | | | | Bulk CO2 Gas Distribution to Restaurants | | | | | |
| | | | 331,945 | | |
| | | >Construction: 1.8% | |
| | 1,900,000 | | | Florida Rock Industries | | | 94,373 | | |
| | | | | Concrete & Aggregates | | | | | |
| | 2,200,000 | | | Simpson Manufacturing | | | 79,310 | | |
| | | | | Wall Joint Maker | | | | | |
| | 605,000 | | | Martin Marietta | | | 55,146 | | |
| | | | | Aggregates | | | | | |
| | 42,500 | | | Geberit (Switzerland) | | | 49,104 | | |
| | | | | Plumbing Supplies | | | | | |
| | 380,000 | | | Daito Trust Construction (Japan) | | | 21,128 | | |
| | | | | Apartment Builder | | | | | |
| | 1,000,000 | | | Kingspan Group (Ireland) | | | 17,459 | | |
| | | | | Building Insulation & Environmental
Containers | | | | | |
| | 90,000 | | | Ciments Francais (France) | | | 14,962 | | |
| | | | | Leading French & Emerging Markets
Cement Producer | | | | | |
| | | | 331,482 | | |
| | | >Steel: 1.3% | |
| | 2,860,000 | | | Gibraltar Industries (c) | | | 82,940 | | |
| | | | | Steel Processing | | | | | |
| | 1,500,000 | | | Tenaris (Argentina) | | | 60,735 | | |
| | | | | Oil, Gas & Industrial Seamless Tubes | | | | | |
| | 2,160,000 | | | Worthington Industries | | | 45,252 | | |
| | | | | Steel Processing | | | | | |
1-800-922-6769
26
| Number of Shares | | | | Value (000) | |
| | | >Steel—continued | |
| | 33,000 | | | Vallourec (France) | | $ | 39,673 | | |
| | | | | Oil, Gas & Industrial Seamless Tubes | | | | | |
| | | | 228,600 | | |
| | | >Specialty Chemicals &
Industrial Materials: 1.2% | |
| | 2,800,000 | | | Spartech (c) | | | 63,280 | | |
| | | | | Plastics Distribution & Compounding | | | | | |
| | 730,000 | | | Novozymes (Denmark) | | | 49,201 | | |
| | | | | Industrial Enzymes | | | | | |
| | 28,000 | | | Sika (Switzerland) | | | 31,105 | | |
| | | | | Chemicals for Construction &
Industrial Application | | | | | |
| | 400,000 | | | Carbone Lorraine (France) | | | 21,994 | | |
| | | | | Advanced Industrial Materials | | | | | |
| | 200,000 | | | Imerys (France) | | | 15,980 | | |
| | | | | Industrial Minerals Producer | | | | | |
| | 20,000 | | | Givaudan (Switzerland) | | | 15,728 | | |
| | | | | Fragrances & Flavors | | | | | |
| | 430,768 | | | Koninklijke Ten Cate (Netherlands) | | | 12,646 | | |
| | | | | Advanced Textiles & Industrial Fabrics | | | | | |
| | 438,000 | | | Ultrapar (Brazil) | | | 6,896 | | |
| | | | | Specialty Chemicals & Liquid Propane
Gas Distribution | | | | | |
| | | | 216,830 | | |
| | | >Outsourcing Services & Training: 1.0% | |
| | 650,000 | | | USG People (Netherlands) | | | 49,754 | | |
| | | | | Temporary Staffing Services | | | | | |
| | 2,500,000 | | | Quanta Services (b) | | | 43,325 | | |
| | | | | Electrical & Telecom Construction Services | | | | | |
| | 1,100,000 | | | Administaff | | | 39,391 | | |
| | | | | Professional Employer Organization | | | | | |
| | 1,600,000 | | | Labor Ready (b) | | | 36,240 | | |
| | | | | Temporary Manual Labor | | | | | |
| | 600,000 | | | GP Strategies (b) | | | 4,626 | | |
| | | | | Training Programs | | | | | |
| | | | 173,336 | | |
| | | >Conglomerates: 0.6% | |
| | 765,342 | | | Aalberts Industries (Netherlands) | | | 56,261 | | |
| | | | | Flow Control & Heat Treatment | | | | | |
| | 1,325,058 | | | Hexagon (Sweden) | | | 48,238 | | |
| | | | | Measurement Equipment & Polymers | | | | | |
| | | | 104,499 | | |
| | | >Water: 0.6% | |
| | 2,500,000 | | | Pall | | | 70,000 | | |
| | | | | Filtration & Fluids Clarification | | | | | |
| | 900,000 | | | Watts Water Technologies | | | 30,195 | | |
| | | | | Water, Valves, Regulators & Filtration | | | | | |
| | | | 100,195 | | |
| | | >Other Industrial Services: 0.5% | |
| | 1,650,000 | | | Mobile Mini (b) | | | 48,279 | | |
| | | | | Portable Storage Unit Leasing | | | | | |
| | 374,000 | | | IM Tech (Netherlands) | | | 18,054 | | |
| | | | | Engineering & Technical Services | | | | | |
| | 655,000 | | | Tal International (b) | | | 15,786 | | |
| | | | | Intermodal Freight Container Leasing | | | | | |
| | 740,000 | | | Jaakko Poyry (Finland) | | | 7,956 | | |
| | | | | Engineering Consultants in Forestry, Energy | | | | | |
| | | | 90,075 | | |
| | | Industrial Goods/Services: Total | | | 3,202,676 | | |
| Number of Shares | | | | Value (000) | |
| Finance: 12.3% | | | |
| | | >Banks: 4.3% | |
| | 2,505,000 | | | BOK Financial | | $ | 124,423 | | |
| | | | | Tulsa Based S.W. Bank | | | | | |
| | 3,600,000 | | | Associated Banc-Corp | | | 113,508 | | |
| | | | | Midwest Bank | | | | | |
| | 3,156,000 | | | TCF Financial | | | 83,476 | | |
| | | | | Great Lakes Bank | | | | | |
| | 2,720,000 | | | Glacier Bancorp (c) | | | 79,614 | | |
| | | | | Mountain States Bank | | | | | |
| | 3,500,000 | | | Anglo Irish Bank (Ireland) | | | 54,536 | | |
| | | | | Small Business & Middle Market Banking | | | | | |
| | 2,850,000 | | | Northern Rock (United Kingdom) | | | 52,637 | | |
| | | | | Lowest Cost Mortgage Bank in UK | | | | | |
| | 1,320,000 | | | West Coast Bancorp (c) | | | 38,900 | | |
| | | | | Portland Small Business Lender | | | | | |
| | 2,275,000 | | | Depfa Bank (Germany) | | | 37,713 | | |
| | | | | Investment Banker to Public Authorities | | | | | |
| | 250,000 | | | Komercni Banka (Czech Republic) | | | 36,578 | | |
| | | | | Leading Czech Universal Bank | | | | | |
| | 590,000 | | | CityBank Lynnwood (c) | | | 27,529 | | |
| | | | | Seattle Real Estate Lender | | | | | |
| | 796,000 | | | Great Southern Bancorp (c) | | | 24,302 | | |
| | | | | Missouri Real Estate Lender | | | | | |
| | 892,000 | | | Chittenden | | | 23,058 | | |
| | | | | Vermont & Western Massachusetts Bank | | | | | |
| | 886,000 | | | West Bancorporation (c) | | | 16,542 | | |
| | | | | Des Moines Commercial Bank | | | | | |
| | 400,000 | | | East West Bancorp | | | 15,164 | | |
| | | | | LA Bank with Chinese Focus | | | | | |
| | 406,000 | | | First Financial BankShares | | | 14,835 | | |
| | | | | West Texas Bank | | | | | |
| | 500,000 | | | Cascade Bancorp | | | 14,255 | | |
| | | | | Central Oregon Bank | | | | | |
| | 304,000 | | | S Y Bancorp | | | 8,354 | | |
| | | | | Louisville Bank | | | | | |
| | 313,000 | | | First Mutual Bancshares (c) | | | 8,154 | | |
| | | | | Seattle Community Bank | | | | | |
| | 150,000 | | | Greene County Bancshares | | | 4,644 | | |
| | | | | Tennessee Bank | | | | | |
| | | | 778,222 | | |
| | | >Insurance: 3.1% | |
| | 2,040,000 | | | Philadelphia Consolidated Holding (b) | | | 61,934 | | |
| | | | | Specialty Insurance | | | | | |
| | 2,030,000 | | | HCC Insurance Holdings | | | 59,763 | | |
| | | | | Specialty Insurance | | | | | |
| | 1,200,000 | | | Assurant | | | 58,080 | | |
| | | | | Specialty Insurance | | | | | |
| | 1,748,000 | | | Leucadia National | | | 51,024 | | |
| | | | | Insurance Holding Company | | | | | |
| | 995,000 | | | Protective Life | | | 46,387 | | |
| | | | | Life Insurance | | | | | |
| | 710,000 | | | Selective Insurance Group | | | 39,668 | | |
| | | | | Commercial & Personal Lines Insurance | | | | | |
| | 109,000 | | | Markel (b) | | | 37,823 | | |
| | | | | Specialty Insurance | | | | | |
| | 1,550,000 | | | United America Indemnity (b)(c) | | | 32,302 | | |
| | | | | Specialty Insurance | | | | | |
| | 940,000 | | | Endurance Specialty Holdings | | | 30,080 | | |
| | | | | Commercial Lines Insurance/Reinsurance | | | | | |
27
Columbia Acorn Fund
>Statement of Investments (Unaudited), continued
| Number of Shares | | | | Value (000) | |
| | | >Insurance—continued | |
| | 1,700,000 | | | Scottish Re Group | | $ | 28,254 | | |
| | | | | Life Reinsurance | | | | | |
| | 570,000 | | | RLI | | | 27,463 | | |
| | | | | Specialty Insurance | | | | | |
| | 750,000 | | | Delphi Financial Group | | | 27,270 | | |
| | | | | Group Employee Benefit
Products and Services | | | | | |
| | 600,000 | | | National Financial | | | 26,586 | | |
| | | | | Distributor of Life Insurance, Group
Benefits & Inv adv svs | | | | | |
| | 520,000 | | | StanCorp Financial | | | 26,473 | | |
| | | | | Group Life & Disability Insurance | | | | | |
| | | | 553,107 | | |
| | | >Brokerage & Money
Management: 1.8% | |
| | 2,464,000 | | | SEI Investments | | | 120,440 | | |
| | | | | Mutual Fund Administration &
Investment Management | | | | | |
| | 3,970,000 | | | Eaton Vance | | | 99,091 | | |
| | | | | Specialty Mutual Funds | | | | | |
| | 1,757,000 | | | Nuveen Investments | | | 75,638 | | |
| | | | | Specialty Mutual Funds | | | | | |
| | 350,000 | | | Investment Technology Group (b) | | | 17,801 | | |
| | | | | Electronic Trading | | | | | |
| | | | 312,970 | | |
| | | >Finance Companies: 1.7% | |
| | 6,500,000 | | | AmeriCredit (b) | | | 181,480 | | |
| | | | | Auto Lending | | | | | |
| | 1,700,000 | | | World Acceptance (b)(c) | | | 60,384 | | |
| | | | | Personal Loans | | | | | |
| | 930,000 | | | McGrath Rentcorp | | | 25,863 | | |
| | | | | Temp Space & IT Equipment Rental | | | | | |
| | 1,120,000 | | | Paragon Group (United Kingdom) | | | 13,517 | | |
| | | | | UK Buy-to-Let Finance Company | | | | | |
| | 832,000 | | | Electro Rent (b) | | | 13,329 | | |
| | | | | Test & Measurement Rentals | | | | | |
| | 263,000 | | | Marlin Business Services (b) | | | 5,933 | | |
| | | | | National Small Equipment Leasing | | | | | |
| | 80,000 | | | American Banknote (Brazil) (b) | | | 517 | | |
| | | | | Manufacturer of Smart Cards | | | | | |
| | | | 301,023 | | |
| | | >Savings & Loans: 1.4% | |
| | 4,196,000 | | | Peoples Bank Bridgeport | | | 137,839 | | |
| | | | | Connecticut Savings & Loan | | | | | |
| | 1,700,000 | | | Housing Development Finance (India) | | | 41,847 | | |
| | | | | Premier Mortgage Lender in India | | | | | |
| | 1,178,000 | | | Anchor Bancorp Wisconsin (c) | | | 35,540 | | |
| | | | | Wisconsin Thrift | | | | | |
| | 1,285,000 | | | Washington Federal | | | 29,799 | | |
| | | | | Traditional Thrift | | | | | |
| | 360,000 | | | Provident Bancorp | | | 4,759 | | |
| | | | | New York State Thrift | | | | | |
| | | | 249,784 | | |
| | | Finance: Total | | | 2,195,106 | | |
| Energy/Minerals: 9.8% | | | |
| | | >Oil/Gas Producers: 5.0% | |
| | 3,200,000 | | | Western Gas Resources | | | 191,520 | | |
| | | | | Oil & Coal Seam Gas Producer | | | | | |
| Number of Shares | | | | Value (000) | |
| | 2,700,000 | | | Ultra Petroleum (b) | | $ | 160,029 | | |
| | | | | Natural Gas Producer | | | | | |
| | 2,500,000 | | | XTO Energy | | | 110,675 | | |
| | | | | Natural Gas Producer | | | | | |
| | 13,500,000 | | | Tullow Oil (United Kingdom) | | | 95,191 | | |
| | | | | Oil & Gas Producer | | | | | |
| | 4,900,000 | | | Talisman Energy (Canada) | | | 85,507 | | |
| | | | | Oil & Gas Producer | | | | | |
| | 2,400,000 | | | Equitable Resources | | | 80,400 | | |
| | | | | Natural Gas Producer & Utility | | | | | |
| | 2,000,000 | | | Southwestern Energy (b) | | | 62,320 | | |
| | | | | Natural Gas Producer | | | | | |
| | 1,500,000 | | | Range Resources | | | 40,785 | | |
| | | | | Oil & Gas Producer | | | | | |
| | 3,200,000 | | | Vaalco Energy (b)(c) | | | 31,232 | | |
| | | | | Oil & Gas Producer | | | | | |
| | 700,000 | | | Denbury Resources (b) | | | 22,169 | | |
| | | | | Oil Producer Using CO2 Injection | | | | | |
| | 1,200,000 | | | McMoran Exploration (b) | | | 21,120 | | |
| | | | | Natural Gas Producer & Developer | | | | | |
| | 150,000 | | | Hugoton Royalty | | | 4,455 | | |
| | | | | Oil & Gas Producer | | | | | |
| | | | 905,403 | | |
| | | >Oil Services: 3.6% | |
| | 2,350,000 | | | FMC Technologies (b) | | | 158,531 | | |
| | | | | Oil & Gas Well Head Manufacturer | | | | | |
| | 2,728,301 | | | Fugro (Netherlands) | | | 117,626 | | |
| | | | | Survey & GPS Services | | | | | |
| | 2,300,000 | | | Pride International (b) | | | 71,829 | | |
| | | | | Offshore Drilling Contractor | | | | | |
| | 1,000,000 | | | Atwood Oceanics Inc (b) | | | 49,600 | | |
| | | | | Contract Drilling | | | | | |
| | 750,000 | | | Carbo Ceramics | | | 36,848 | | |
| | | | | Natural Gas Well Stimulants | | | | | |
| | 2,400,000 | | | Key Energy Services (b) | | | 36,600 | | |
| | | | | Well Workover Services | | | | | |
| | 971,000 | | | Rowan | | | 34,557 | | |
| | | | | Offshore Drilling Contractor | | | | | |
| | 1,193,000 | | | Chicago Bridge & Iron | | | 28,811 | | |
| | | | | Engineering & Construction for
Petrochemicals & LNG | | | | | |
| | 1,140,000 | | | Enerflex Systems (Canada) (c) | | | 28,441 | | |
| | | | | Natural Gas Compresser Rental & Fabrication | | | | | |
| | 1,200,000 | | | Saipem (Italy) | | | 27,284 | | |
| | | | | Offshore Construction & Drilling | | | | | |
| | 350,000 | | | Veritas DGC (b) | | | 18,053 | | |
| | | | | Geophysical Contractor | | | | | |
| | 2,860,000 | | | Newpark Resources (b) | | | 17,589 | | |
| | | | | Drilling Fluid Services | | | | | |
| | 257,000 | | | Helmerich & Payne | | | 15,487 | | |
| | | | | Contract Driller | | | | | |
| | | | 641,256 | | |
| | | >Mining: 0.7% | |
| | 900,000 | | | Falconbridge (Canada) | | | 47,407 | | |
| | | | | Diversified Mining Holding Company | | | | | |
| | 13,100,000 | | | UrAsia Energy (Canada) | | | 32,859 | | |
| | | | | Uranium Mining in Kazakhstan | | | | | |
| | 195,000 | | | Sociedad Quimica Y Minera
de Chile (Chile) | | | 20,307 | | |
| | | | | Producer of Specialty Fertilizers,
Lithium & Iodine | | | | | |
1-800-922-6769
28
| Number of Shares | | | | Value (000) | |
| | | >Mining—continued | |
| | 2,900,000 | | | Jubilee Gold Mines (Australia) | | $ | 17,384 | | |
| | | | | Nickel Mining in Australia | | | | | |
| | 1,000,000 | | | Ivanhoe Mines (Canada) (b) | | | 6,772 | | |
| | | | | Copper Mining in Mongolia | | | | | |
| | | | 124,729 | | |
| | | >Distribution/Marketing/Refining: 0.3% | |
| | 966,000 | | | Atmos Energy | | | 26,961 | | |
| | | | | Dallas Natural Gas Utility | | | | | |
| | 600,000 | | | Maritrans | | | 14,940 | | |
| | | | | Shipping | | | | | |
| | 435,000 | | | Oneok | | | 14,807 | | |
| | | | | Natural Gas Distribution, Pipeline,
Processing & Trading | | | | | |
| | | | 56,708 | | |
| | | >Agricultural Commodities: 0.2% | |
| | 550,000 | | | Aracruz Celulose (Brazil) | | | 28,831 | | |
| | | | | Brazilian Hardwood Pulp Producer | | | | | |
| | | | | Energy/Minerals: Total | | | 1,756,927 | | |
| Health Care: 7.8% | | | |
| | | >Medical Equipment/
Laboratory Supplies: 3.1% | |
| | 1,910,000 | | | CYTYC (b) | | | 48,438 | | |
| | | | | Consumables Related to Women's Health | | | | | |
| | 475,000 | | | Essilor International (France) | | | 47,764 | | |
| | | | | Eyeglass Lenses | | | | | |
| | 1,770,000 | | | Intermagnetics General (b) | | | 47,755 | | |
| | | | | MRI Equipment | | | | | |
| | 800,000 | | | Diagnostic Products | | | 46,536 | | |
| | | | | Immunodiagnostic Kits | | | | | |
| | 1,000,000 | | | Edwards Lifesciences (b) | | | 45,430 | | |
| | | | | Heart Valves | | | | | |
| | 870,000 | | | Vital Signs (c) | | | 43,091 | | |
| | | | | Anesthesia, Respiratory & Sleep Products | | | | | |
| | 1,000,000 | | | ICU Medical (b)(c) | | | 42,240 | | |
| | | | | Intravenous Therapy Products | | | | | |
| | 350,000 | | | Synthes (Switzerland) | | | 42,169 | | |
| | | | | Products for Orthopedic Surgery | | | | | |
| | 905,000 | | | Arrow International | | | 29,747 | | |
| | | | | Disposable Catheters | | | | | |
| | 552,000 | | | Advanced Medical Optics (b) | | | 27,986 | | |
| | | | | Medical Devices for Eye Care | | | | | |
| | 875,000 | | | Viasys Healthcare (b) | | | 22,400 | | |
| | | | | Respiratory & Neurology Medical Equipment | | | | | |
| | 583,000 | | | Orthofix International (b) | | | 22,230 | | |
| | | | | Bone Fixation & Stimulation Devices | | | | | |
| | 1,250,000 | | | PSS World Medical (b) | | | 22,063 | | |
| | | | | Medical Supplies Distributor | | | | | |
| | 390,000 | | | Hogy Medical (Japan) | | | 20,496 | | |
| | | | | Disposable Surgical Products | | | | | |
| | 415,000 | | | Cooper | | | 18,380 | | |
| | | | | Contact Lens Manufacturer | | | | | |
| | 350,000 | | | Haemonetics (b) | | | 16,279 | | |
| | | | | Blood & Plasma Collection Equipment | | | | | |
| | 455,000 | | | Datascope | | | 14,032 | | |
| | | | | Medical Devices | | | | | |
| | | | 557,036 | | |
| Number of Shares | | | | Value (000) | |
| | | >Services: 2.6% | |
| | 2,491,000 | | | Lincare Holdings (b) | | $ | 94,259 | | |
| | | | | Home Health Care Services | | | | | |
| | 1,232,000 | | | Coventry Health Care (b) | | | 67,686 | | |
| | | | | HMO | | | | | |
| | 1,607,000 | | | Serologicals (b) | | | 50,524 | | |
| | | | | Blood Collection & Antibody Production | | | | | |
| | 1,355,000 | | | Charles River Laboratories (b) | | | 49,864 | | |
| | | | | Pharmaceutical Research | | | | | |
| | 875,000 | | | LCA Vision | | | 46,296 | | |
| | | | | Lasik Surgery Centers | | | | | |
| | 1,000,000 | | | Rhoen-Klinikum (Germany) | | | 44,535 | | |
| | | | | Healthcare Services | | | | | |
| | 510,000 | | | OPG Groep (Netherlands) | | | 44,300 | | |
| | | | | Healthcare Supplies & Pharmacies | | | | | |
| | 900,000 | | | United Surgical Partners (b) | | | 27,063 | | |
| | | | | Outpatient Surgery Center | | | | | |
| | 808,000 | | | PRA International (b) | | | 17,994 | | |
| | | | | Contract Research Organization | | | | | |
| | 1,433,000 | | | Dendrite International (b) | | | 13,241 | | |
| | | | | Software for Pharmaceutical Sales
Force Automation | | | | | |
| | 1,050,000 | | | Eresearch Technology (b) | | | 9,555 | | |
| | | | | Clinical Research Services | | | | | |
| | 500,000 | | | Merge Technologies (b) | | | 6,155 | | |
| | | | | Radiology Information Systems | | | | | |
| | | | 471,472 | | |
| | | >Biotechnology/Drug Delivery: 1.7% | |
| | 3,230,000 | | | Exelixis (b) | | | 32,461 | | |
| | | | | Treatments for Cancer & Metabolic Disorders | | | | | |
| | 1,360,000 | | | Nektar Therapeutics (b) | | | 24,942 | | |
| | | | | Drug Delivery Technologies | | | | | |
| | 2,380,000 | | | Ligand Pharmaceuticals (b) | | | 20,111 | | |
| | | | | Drugs for Pain, Cancer,
Osteoporosis, & Diabetes | | | | | |
| | 2,000,000 | | | Medarex (b) | | | 19,220 | | |
| | | | | Humanized Antibodies | | | | | |
| | 1,650,000 | | | Human Genome Sciences (b) | | | 17,655 | | |
| | | | | Drug Discovery/Development | | | | | |
| | 1,100,000 | | | Renovis (b) | | | 16,841 | | |
| | | | | Drug to Minimize Neurological
Damage from Strokes | | | | | |
| | 1,429,000 | | | Arena Pharmaceuticals (b) | | | 16,548 | | |
| | | | | Novel Drug Targeting Technology | | | | | |
| | 1,135,000 | | | Keryx Biopharmaceuticals (b) | | | 16,117 | | |
| | | | | Drugs for Diabetic Complications & Cancer | | | | | |
| | 2,520,000 | | | Decode Genetics (b) | | | 15,599 | | |
| | | | | Drugs for Heart Attack, Asthma &
Vascular Disease | | | | | |
| | 1,780,000 | | | Array Biopharma (b) | | | 15,308 | | |
| | | | | Drugs for Cancer & Inflammatory Diseases | | | | | |
| | 930,000 | | | Intermune (b) | | | 15,299 | | |
| | | | | Drugs for Hepatitis C, Pulmonary
Fibrosis & Cancer | | | | | |
| | 3,100,000 | | | Lexicon Genetics (b) | | | 13,609 | | |
| | | | | Drug Discovery | | | | | |
| | 2,000,000 | | | Cytokinetics (b)(c) | | | 12,580 | | |
| | | | | Drugs for Cancer & Heart Failure | | | | | |
| | 1,275,000 | | | Rigel Pharmaceuticals (b)(c) | | | 12,406 | | |
| | | | | Drugs for Hay Fever, Asthma,
Hepatitis & Cancer | | | | | |
29
Columbia Acorn Fund
>Statement of Investments (Unaudited), continued
| Number of Shares | | | | Value (000) | |
| | | >Biotechnology/Drug Delivery—continued | |
| | 1,585,000 | | | Maxygen (b) | | $ | 11,856 | | |
| | | | | Molecular Breeding | | | | | |
| | 1,750,000 | | | Genitope (b) | | | 11,060 | | |
| | | | | Cancer Vaccine | | | | | |
| | 2,300,000 | | | Seattle Genetics (b) | | | 10,580 | | |
| | | | | Antibody-Based Therapies for Cancer | | | | | |
| | 800,000 | | | Momenta Pharmaceuticals (b) | | | 10,168 | | |
| | | | | Sugar Analysis Technology for Drug Design | | | | | |
| | 1,500,000 | | | Tercica (b) | | | 7,935 | | |
| | | | | Drug to Treat Severe Short Stature In Children | | | | | |
| | 1,100,000 | | | La Jolla Pharmaceutical (b) | | | 4,037 | | |
| | | | | Lupus Treatment | | | | | |
| | 1,249,999 | | | Perlegen Sciences (d) | | | 3,375 | | |
| | | | | Large Scale Gene Sequencing | | | | | |
| | 1,875,000 | | | Locus Discovery, Series D, Pfd. (d) | | | 512 | | |
| | | | | High Throughput Rational Drug Design | | | | | |
| | 359,944 | | | Microdose (d) | | | 360 | | |
| | | | | Drug Inhalers | | | | | |
| | | | 308,579 | | |
| | | >Medical Supplies: 0.4% | |
| | 486,000 | | | Techne (b) | | | 24,747 | | |
| | | | | Cytokines, Antibodies, Other Reagents
For Life Sciences | | | | | |
| | 650,000 | | | Owens & Minor | | | 18,590 | | |
| | | | | Distribution of Medical Supplies | | | | | |
| | 4,000,000 | | | United Drug (Ireland) | | | 17,129 | | |
| | | | | Irish Pharmaceutical
Wholesaler & Outsourcer | | | | | |
| | | | 60,466 | | |
| | | Health Care: Total | | | 1,397,553 | | |
| Other Industries: 4.7% | | | |
| | | >Real Estate: 3.6% | |
| | 5,850,000 | | | Highland Hospitality (c) | | | 82,368 | | |
| | | | | Hotel Owner | | | | | |
| | 650,000 | | | SL Green Realty | | | 71,155 | | |
| | | | | Manhattan Office Buildings | | | | | |
| | 1,398,000 | | | Forest City Enterprises, Cl. B (c) | | | 69,578 | | |
| | | | | Commercial & Residential Property Developer | | | | | |
| | 1,560,000 | | | Gaylord Entertainment (b) | | | 68,078 | | |
| | | | | Convention Hotels | | | | | |
| | 1,320,000 | | | General Growth Properties | | | 59,479 | | |
| | | | | Regional Shopping Malls | | | | | |
| | 3,294,000 | | | DiamondRock Hospitality (c) | | | 48,784 | | |
| | 1,000,000 | | | DiamondRock Hospitality 144A (c)(d) | | | 14,810 | | |
| | | | | Hotel Owner | | | | | |
| | 635,000 | | | Macerich Company | | | 44,577 | | |
| | | | | Regional Shopping Malls | | | | | |
| | 575,000 | | | Federal Realty Investment Trust | | | 40,250 | | |
| | | | | Shopping Centers | | | | | |
| | 1,020,000 | | | Brandywine Realty | | | 32,813 | | |
| | | | | Office Buildings | | | | | |
| | 1,720,000 | | | Kite Realty Group (c) | | | 26,815 | | |
| | | | | Community Shopping Centers | | | | | |
| | 1,375,000 | | | Crescent Real Estate Equities | | | 25,520 | | |
| | | | | Class A Office Buildings | | | | | |
| | 536,000 | | | Parkway Properties | | | 24,388 | | |
| | | | | Office Buildings | | | | | |
Number of Shares
or Principal Amount | | | | Value (000) | |
| | 900,000 | | | American Campus Communities (c) | | $ | 22,365 | | |
| | | | | Student Housing | | | | | |
| | 4,100 | | | Kenedix (Japan) | | | 17,754 | | |
| | | | | Real Estate Investment Management | | | | | |
| | 37,407 | | | Security Capital European
Realty (Luxembourg) (d) | | | 531 | | |
| | | | | Self Storage Properties | | | | | |
| | | | 649,265 | | |
| | | >Transportation: 0.5% | |
| | 1,584,000 | | | Heartland Express | | | 28,338 | | |
| | | | | Regional Trucker | | | | | |
| | 1,086,000 | | | JB Hunt | | | 27,052 | | |
| | | | | Trucking Conglomerate | | | | | |
| | 760,000 | | | Grupo Aeroportaurio Del Sureste
(Mexico) | | | 25,528 | | |
| | | | | Cancun & Cozumel Airport Operator | | | | | |
| | | | 80,918 | | |
| | | >Waste Management: 0.3% | |
| | 1,700,000 | | | Waste Connections (b) | | | 61,880 | | |
| | | | | Solid Waste Management | | | | | |
| | | >Regulated Utilities: 0.3% | |
| | 1,650,000 | | | Northeast Utilities | | | 34,106 | | |
| | | | | Regulated Electric Utility | | | | | |
| | 589,800 | | | Red Electrica (Spain) | | | 20,338 | | |
| | | | | Spanish Power Grid | | | | | |
| | | | 54,444 | | |
| | | | | Other Industries: Total | | | 846,507 | | |
| | Total Common Stocks and Other
Equity-Like Securities: 93.8% (e)
(Cost: $10,141,998) | | | | | |
16,797,843
| | |
| Short-Term Obligations: 6.3% | | | |
| $ | 176,000 | | | Verizon Global Funding
5.18% - 5.35%
Due 8/2/06 - 8/17/06 | | | 175,002 | | |
| | 161,000 | | | HSBC Finance Corporation
5.04% - 5.05%
Due 7/14/06 - 7/27/06 | | | 160,559 | | |
| | 155,000 | | | American General Finance
5.01% - 5.06%
Due 7/6/06 - 7/19/06 | | | 154,783 | | |
| | 154,000 | | | Aluminum Company America
5.08% - 5.26%
Due 7/3/06 - 8/9/06 | | | 153,478 | | |
| | 145,000 | | | Credit Suisse First Boston
5.05% - 5.28%
Due 7/13/06 - 8/11/06 | | | 144,325 | | |
| | 91,755 | | | Hartford Financial
5.11% - 5.28%
Due 7/28/06 - 8/10/06 | | | 91,319 | | |
| | 67,000 | | | Conocophillips
5.09% Due 7/21/06 - 7/25/06 | | | 66,790 | | |
| | 60,000 | | | Countrywide Financial Funding
5.30% - 5.40%
Due 8/16/06 | | | 59,772 | | |
| | 40,000 | | | Citigroup Funding
5.02% Due 08/01/06 | | | 39,823 | | |
1-800-922-6769
30
| Principal Amount | | | | Value (000) | |
| | | >Short-Term Obligations—continued | |
| $ | 32,000 | | | American Express Credit Corp
5.03% Due 7/10/06 | | $ | 31,960 | | |
| | 29,000 | | | Bell South Corp
5.02% Due 7/12/06 | | | 28,983 | | |
| | 23,140 | | | Repurchase Agreement with
State Street Bank & Trust
dated 6/30/06, due 7/3/06
at 4.93% collateralized by
Federal Home Loan Bank,
maturing 5/22/08
market value $23,605
(repurchase proceeds: $23,150) | | | 23,140 | | |
| | | | | (Amortized Cost: $1,129,934) | | | 1,129,934 | | |
| | Total Investments: 100.1%
(Cost: $11,271,932)(a) | | | | | | 17,927,777 | | |
| | Cash and Other Assets Less Liabilities: (0.1%) | | | | | | (11,701 | ) | |
| | Total Net Assets: 100% | | | | | $ | 17,916,076 | | |
31
Columbia Acorn Fund
>Statement of Investments (Unaudited), continued
>Notes to Statement of Investments (in thousands)
(a) At June 30, 2006, for federal income tax purposes cost of investments was $11,271,932 and net unrealized appreciation was $6,655,845 consisting of gross unrealized appreciation of $7,119,226 and gross unrealized depreciation of $463,381.
(b) Non-income producing security.
(c) An affiliate may include any company in which the Fund owns five percent or more of its outstanding voting shares. On June 30, 2006, the Fund held five percent or more of the outstanding voting securities of the following companies:
| AnswerThink Consulting | | | 10.31 | | |
| Christopher & Banks | | | 10.25 | | |
| Actuate | | | 9.95 | | |
| Highland Hospitality | | | 9.79 | | |
| Gibraltar Industries | | | 9.60 | | |
| Watsco | | | 9.52 | | |
| Indus International | | | 9.49 | | |
| Igate Capital | | | 9.44 | | |
| Princeton Review | | | 9.24 | | |
| World Acceptance | | | 9.19 | | |
| Skillsoft Publishing | | | 8.79 | | |
| Spartech | | | 8.72 | | |
| RC2 | | | 8.61 | | |
| West Coast Bancorp | | | 8.60 | | |
| Kronos | | | 8.58 | | |
| Esco Technologies | | | 8.53 | | |
| Glacier Bancorp | | | 8.41 | | |
| Salem Communications | | | 8.19 | | |
| Saga Communications | | | 7.69 | | |
| Bally Technologies | | | 7.48 | | |
| Fleetwood Enterprises | | | 7.35 | | |
| ICU Medical | | | 7.00 | | |
| Concurrent Computer | | | 6.92 | | |
| Shuffle Master | | | 6.92 | | |
| Genlyte Group | | | 6.75 | | |
| Proquest Company | | | 6.69 | | |
| Nuco2 | | | 6.64 | | |
| Vital Signs | | | 6.61 | | |
| Seachange International | | | 6.55 | | |
| Tumbleweed Communications | | | 6.49 | | |
| II VI | | | 6.43 | | |
| United America Indemnity | | | 6.41 | | |
| Forward Air | | | 6.35 | | |
| Navigant International | | | 6.24 | | |
| Clarcor | | | 6.20 | | |
| DiamondRock Hospitality | | | 6.12 | | |
| Red Robin Gourmet Burgers | | | 6.04 | | |
| Kite Realty Group | | | 6.01 | | |
| Helen of Troy | | | 5.99 | | |
| Spanish Broadcasting System | | | 5.95 | | |
| First Mutual Bancshares | | | 5.88 | | |
| Great Southern Bancorp | | | 5.79 | | |
| CityBank Lynnwood | | | 5.67 | | |
| IXYS | | | 5.57 | | |
| Time Warner Telecom | | | 5.57 | | |
| Vaalco Energy | | | 5.55 | | |
| Cytokinetics | | | 5.48 | | |
| Vail Resorts | | | 5.41 | | |
| Forest City Enterprises Class B | | | 5.39 | | |
| Anchor Bancorp Wisconsin | | | 5.36 | | |
| AFC Enterprises | | | 5.35 | | |
| Dobson Communications | | | 5.31 | | |
| West Bancorporation | | | 5.30 | | |
| American Campus Communities | | | 5.23 | | |
| Oxford Industries | | | 5.21 | | |
| Mine Safety Appliances | | | 5.19 | | |
| Excel Technologies | | | 5.18 | | |
| Gaiam | | | 5.16 | | |
| ITT Educational Services | | | 5.14 | | |
| Rigel Pharmaceuticals | | | 5.13 | | |
| JDA Software | | | 5.10 | | |
| Supertex | | | 5.04 | | |
| Enerflex Systems | | | 5.02 | | |
The aggregate cost and value of these companies at June 30, 2006, was $1,819,627 and $2,934,084 respectively. Investments in affiliate companies represent 16.28% of total net assets at June 30, 2006. Investment activity and income amounts relating to affiliates during the six months ended June 30, 2006 were as follows:
| Dividend income | | $ | 13,299 | | |
| Net realized gain or loss | | | — | | |
| Change in unrealized gain or loss | | | 253,598 | | |
| Purchases | | | 262,161 | | |
| Proceeds from sales | | | 13,003 | | |
In addition, additional purchases of existing portfolio holdings that were not considered affiliates in prior years, resulted in the fund owning more than 5% of the outstanding shares of certain issues at June 30, 2006. Therefore, the cost and market value affiliate disclosure amounts include both acquisitions of new investments in affiliates during the period, as well as prior period investment holdings that became affiliates during the current period.
1-800-922-6769
32
(d) Denotes a restricted security, which is subject to restrictions on resale under federal securities laws. These securities, except for DiamondRock Hospitality, are valued in good faith by the Board of Trustees. At June 30, 2006, these securities (in thousands) amounted to $19,588, which represents 0.11% of total net assets.
Additional information on these securities is as follows:
| Security | | Acquisition
Dates | | Shares | | Cost (000) | | Value (000) | |
| DiamondRock Hospitality 144A | | 06/29/04 | | | 1,000,000 | | | $ | 10,000 | | | $ | 14,810 | | |
| Perlegen Sciences | | 03/30/01 | | | 1,249,999 | | | | 4,500 | | | | 3,375 | | |
Security Capital European Realty
(Luxembourg) | | 08/20/98 - 11/12/99 | | | 37,407 | | | | 748 | | | | 531 | | |
| Locus Discovery, Series D Pfd. | | 09/05/01 | | | 1,875,000 | | | | 7,500 | | | | 512 | | |
| Microdose | | 11/24/00 | | | 359,944 | | | | 2,005 | | | | 360 | | |
| | | | | | | | | $ | 24,753 | | | $ | 19,588 | | |
(e) On June 30, 2006, the market value of foreign securities (in thousands) represents 13.70% of total net assets. The Fund's foreign portfolio was diversified as follows:
| | | Value | | Percent | |
| Canada | | $ | 356,612 | | | | 1.99 | % | |
| Netherlands | | | 298,641 | | | | 1.67 | | |
| France | | | 236,584 | | | | 1.32 | | |
| Ireland | | | 183,049 | | | | 1.02 | | |
| United Kingdom | | | 161,345 | | | | 0.90 | | |
| Japan | | | 139,008 | | | | 0.78 | | |
| Switzerland | | | 138,106 | | | | 0.77 | | |
| Sweden | | | 116,794 | | | | 0.65 | | |
| Germany | | | 111,615 | | | | 0.62 | | |
| Hong Kong | | | 62,049 | | | | 0.35 | | |
| Luxembourg | | | 61,266 | | | | 0.34 | | |
| Taiwan | | | 59,483 | | | | 0.33 | | |
| Italy | | | 57,088 | | | | 0.32 | | |
| Australia | | | 51,635 | | | | 0.29 | | |
| Brazil | | | 51,007 | | | | 0.29 | | |
| | | Value | | Percent | |
| Denmark | | $ | 49,201 | | | | 0.28 | % | |
| Israel | | | 45,981 | | | | 0.26 | | |
| India | | | 41,847 | | | | 0.23 | | |
| South Korea | | | 39,290 | | | | 0.22 | | |
| Czech Republic | | | 36,578 | | | | 0.20 | | |
| Mexico | | | 25,528 | | | | 0.14 | | |
| Bahamas | | | 21,406 | | | | 0.12 | | |
| Spain | | | 20,338 | | | | 0.11 | | |
| Chile | | | 20,307 | | | | 0.11 | | |
| Greece | | | 18,463 | | | | 0.10 | | |
| New Zealand | | | 15,448 | | | | 0.09 | | |
| China | | | 14,800 | | | | 0.08 | | |
| South Africa | | | 14,109 | | | | 0.08 | | |
| Finland | | | 7,956 | | | | 0.04 | | |
| Total Foreign Portfolio | | $ | 2,455,534 | | | | 13.70 | % | |
33
Columbia Acorn International
>Major Portfolio Changes in the Second Quarter (Unaudited)
| | | Number of Shares | |
| | | 03/31/06 | | 06/30/06 | |
| Additions | |
| Europe | |
| >France | |
| Carbone Lorraine | | | 340,000 | | | | 395,000 | | |
| Eurofins Scientific | | | 320,000 | | | | 360,000 | | |
| Foncia Groupe | | | 0 | | | | 400,000 | | |
| Legrand | | | 0 | | | | 700,000 | | |
| Neopost | | | 236,000 | | | | 280,000 | | |
| Norbert Dentressangle | | | 300,000 | | | | 375,000 | | |
| Trigano | | | 423,000 | | | | 500,000 | | |
| >United Kingdom | |
| Randgold Resources | | | 0 | | | | 640,000 | | |
| UTV | | | 1,800,000 | | | | 2,000,000 | | |
| >Netherlands | |
| Aalberts Industries | | | 550,000 | | | | 557,534 | | |
| Fugro | | | 1,245,000 | | | | 1,268,491 | | |
| IM Tech | | | 474,000 | | | | 574,000 | | |
| >Germany | |
| Depfa Bank | | | 1,675,000 | | | | 2,000,000 | | |
| Rational AG | | | 0 | | | | 75,000 | | |
| >Switzerland | |
| Givaudan | | | 15,000 | | | | 25,000 | | |
| Kuehne & Nagel | | | 95,000 | | | | 475,000 | | |
| Synthes | | | 215,000 | | | | 275,000 | | |
| >Italy | |
| Amplifon | | | 1,700,000 | | | | 2,000,000 | | |
| (includes the effect of a 10 for 1 stock split) | |
| Cir Compagnie | | | 6,000,000 | | | | 9,100,000 | | |
| Ducati Motor | | | 6,400,000 | | | | 12,800,000 | | |
| GranitiFiandre | | | 275,000 | | | | 1,223,000 | | |
| >Sweden | |
| Sweco | | | 380,000 | | | | 422,000 | | |
| Tele2 | | | 2,100,000 | | | | 2,580,000 | | |
| >Poland | |
| Central European Distribution | | | 448,000 | | | | 820,500 | | |
| (includes the effect of a 3 for 2 stock split) | |
| | | Number of Shares | |
| | | 03/31/06 | | 06/30/06 | |
| Asia | |
| >Japan | |
| FCC | | | 454,000 | | | | 714,000 | | |
| Kansai Paint | | | 882,000 | | | | 3,700,000 | | |
| Sparx Asset Management | | | 0 | | | | 22,500 | | |
| Other Countries | |
| >Canada | |
| Alliance Atlantis Communication | | | 639,000 | | | | 1,060,000 | | |
| UrAsia Energy | | | 0 | | | | 1,475,000 | | |
| Van Houtte | | | 0 | | | | 950,000 | | |
| >Australia | |
| Sino Gold | | | 0 | | | | 5,450,000 | | |
| >South Africa | |
| Impala Platinum | | | 140,000 | | | | 180,000 | | |
| >United States | |
| Atwood Oceanics | | | 0 | | | | 415,000 | | |
| >New Zealand | |
| Sky City Entertainment | | | 5,000,000 | | | | 5,500,000 | | |
| Latin America | |
| >Brazil | |
| American Banknote | | | 0 | | | | 1,085,000 | | |
| Localiza Rent a Car | | | 0 | | | | 170,000 | | |
| Suzano | | | 3,215,000 | | | | 4,300,000 | | |
1-800-922-6769
34
| | | Number of Shares | |
| | | 03/31/06 | | 06/30/06 | |
| Sales | |
| Europe | |
| >France | |
| Essilor International | | | 300,000 | | | | 200,000 | | |
| Vallourec | | | 20,000 | | | | 0 | | |
| >United Kingdom | |
| Bloomsbury Publishing | | | 2,000,000 | | | | 916,000 | | |
| Intermediate Capital | | | 600,000 | | | | 0 | | |
| Kensington Group | | | 1,050,000 | | | | 813,050 | | |
| >Germany | |
| Bilfinger Berger | | | 300,000 | | | | 200,000 | | |
| >Ireland | |
| Anglo Irish Bank | | | 2,260,000 | | | | 2,200,000 | | |
| >Switzerland | |
| BKW Energie | | | 130,000 | | | | 27,000 | | |
| >Sweden | |
| Gambro | | | 2,042,000 | | | | 0 | | |
| >Spain | |
| Abengoa | | | 370,000 | | | | 0 | | |
| >Russia | |
| RBC Information Systems | | | 700,000 | | | | 575,800 | | |
| | | Number of Shares | |
| | | 03/31/06 | | 06/30/06 | |
| Asia | |
| >Japan | |
| Meitec | | | 475,000 | | | | 0 | | |
| Shimano | | | 900,000 | | | | 650,000 | | |
| >Taiwan | |
| Novatek Microelectronics | | | 3,244,000 | | | | 3,000,000 | | |
| >Hong Kong | |
Hong Kong Exchanges and
Clearing | | | 6,000,000 | | | | 5,000,000 | | |
| Linmark Group | | | 13,483,000 | | | | 10,996,000 | | |
| >South Korea | |
| Samsung Fire & Marine | | | 100,000 | | | | 0 | | |
| >Indonesia | |
| Perusahaan Gas Negara | | | 20,000,000 | | | | 15,000,000 | | |
| >Singapore | |
| Comfort Del Gro | | | 20,000,000 | | | | 7,053,000 | | |
| Other Countries | |
| >Canada | |
| Kinross Gold | | | 1,100,000 | | | | 835,000 | | |
| >Australia | |
| ABC Learning Center | | | 4,028,250 | | | | 4,000,000 | | |
| Latin America | |
| >Brazil | |
| America Latina Logistics | | | 280,000 | | | | 0 | | |
| Diagnosticos | | | 590,000 | | | | 392,000 | | |
| Natura Cosmeticos | | | 3,200,000 | | | | 2,500,000 | | |
| Porto Seguro | | | 1,000,000 | | | | 720,000 | | |
| Ultrapar | | | 500,000 | | | | 293,000 | | |
35
Columbia Acorn International
>Statement of Investments (Unaudited), June 30, 2006
| Number of Shares | | | | Value (000) | |
| | | | | Common Stocks: 95.9% | |
| Europe: 59.2% | | | |
| | | >France: 11.5% | |
| | 700,000 | | | April Group | | $ | 37,576 | | |
| | | | | Insurance Policy Construction | | | | | |
| | 390,000 | | | Iliad | | | 32,484 | | |
| | | | | High Speed Internet Service Provider | | | | | |
| | 280,000 | | | Neopost | | | 31,875 | | |
| | | | | Postage Meter Machines | | | | | |
| | 2,200,000 | | | SES Global | | | 31,338 | | |
| | | | | Satellite Broadcasting Service | | | | | |
| | 411,000 | | | Rubis | | | 28,755 | | |
| | | | | Tank Storage & LPG Supplier | | | | | |
| | 500,000 | | | Trigano | | | 26,540 | | |
| | | | | Leisure Vehicles & Camping Equipment | | | | | |
| | 375,000 | | | Norbert Dentressangle | | | 26,380 | | |
| | | | | Transport | | | | | |
| | 360,000 | | | Eurofins Scientific (b) | | | 23,436 | | |
| | | | | Food Screening & Testing | | | | | |
| | 206,000 | | | Pierre & Vacances | | | 22,580 | | |
| | | | | Vacation Apartment Lets | | | | | |
| | 395,000 | | | Carbone Lorraine | | | 21,719 | | |
| | | | | Advanced Industrial Materials | | | | | |
| | 200,000 | | | Essilor International | | | 20,111 | | |
| | | | | Eyeglass Lenses | | | | | |
| | 120,000 | | | Ciments Francais | | | 19,949 | | |
| | | | | Leading French & Emerging Markets
Cement Producer | | | | | |
| | 700,000 | | | Legrand | | | 19,691 | | |
| | | | | Electrical Components | | | | | |
| | 240,000 | | | Imerys | | | 19,176 | | |
| | | | | Industrial Minerals Producer | | | | | |
| | 151,000 | | | Bacou Dalloz | | | 17,981 | | |
| | | | | Safety Equipment | | | | | |
| | 400,000 | | | Foncia Groupe | | | 17,646 | | |
| | | | | Real Estate Services | | | | | |
| | 550,000 | | | Metropole Television | | | 17,190 | | |
| | | | | Television Broadcaster | | | | | |
| | | | 414,427 | | |
| | | >United Kingdom: 8.6% | |
| | 6,370,000 | | | Tullow Oil | | | 44,915 | | |
| | | | | Oil & Gas Producer | | | | | |
| | 1,850,000 | | | Northern Rock | | | 34,168 | | |
| | | | | Lowest Cost Mortgage Bank in UK | | | | | |
| | 2,800,000 | | | Paragon Group | | | 33,792 | | |
| | | | | Buy-To-Let Finance Company | | | | | |
| | 7,200,000 | | | RPS Group | | | 28,825 | | |
| | | | | Environmental Consulting & Planning | | | | | |
| | 1,850,000 | | | Expro International Group | | | 23,212 | | |
| | | | | Offshore Oilfield Services | | | | | |
| | 1,200,000 | | | Northgate | | | 23,211 | | |
| | | | | Light Commercial Vehicle Rental Specialist | | | | | |
| | 4,200,000 | | | Taylor Nelson Sofres | | | 18,065 | | |
| | | | | Market Research | | | | | |
| | 3,550,000 | | | BBA Group | | | 17,346 | | |
| | | | | Aviation Support Services &
Non-Woven Materials | | | | | |
| | 2,450,000 | | | Workspace Group | | | 16,380 | | |
| | | | | Real Estate | | | | | |
| | 813,050 | | | Kensington Group | | | 15,460 | | |
| | | | | Non-Conforming Mortgage Company | | | | | |
| Number of Shares | | | | Value (000) | |
| | 1,300,000 | | | Keller Group | | $ | 13,967 | | |
| | | | | International Ground Engineering Specialist | | | | | |
| | 640,000 | | | Randgold Resources (b) | | | 13,440 | | |
| | | | | Gold Mining in Western Africa | | | | | |
| | 2,000,000 | | | UTV | | | 12,575 | | |
| | | | | Irish Television & Radio Station Operator | | | | | |
| | 450,000 | | | Viridian Group | | | 7,952 | | |
| | | | | Northern Ireland Electric Utility | | | | | |
| | 916,000 | | | Bloomsbury Publishing | | | 5,485 | | |
| | | | | Book Publisher | | | | | |
| | | | 308,793 | | |
| | | >Netherlands: 8.3% | |
| | 1,268,491 | | | Fugro | | | 54,689 | | |
| | | | | Survey & GPS Services | | | | | |
| | 679,000 | | | USG People | | | 51,973 | | |
| | | | | Temporary Staffing Services | | | | | |
| | 557,534 | | | Aalberts Industries | | | 40,985 | | |
| | | | | Flow Control & Heat Treatment | | | | | |
| | 972,304 | | | Koninklijke Ten Cate | | | 28,545 | | |
| | | | | Advanced Textiles & Industrial Fabrics | | | | | |
| | 327,000 | | | OPG Groep | | | 28,405 | | |
| | | | | Healthcare Supplies & Pharmacies | | | | | |
| | 574,000 | | | IM Tech | | | 27,709 | | |
| | | | | Engineering & Technical Services | | | | | |
| | 439,400 | | | Sligro Food Group | | | 23,327 | | |
| | | | | Food Service & Wholesaling | | | | | |
| | 330,000 | | | Smit Internationale | | | 23,216 | | |
| | | | | Harbor & Offshore Towage & Marine Services | | | | | |
| | 890,000 | | | Unit 4 Agresso (b) | | | 17,901 | | |
| | | | | Business & Security Software | | | | | |
| | | | 296,750 | | |
| | | >Germany: 7.9% | |
| | 900,000 | | | Rhoen-Klinikum | | | 40,082 | | |
| | | | | Health Care Services | | | | | |
| | 275,000 | | | Wincor Nixdorf | | | 35,112 | | |
| | | | | Retail POS Systems & ATM Machines | | | | | |
| | 2,000,000 | | | Depfa Bank | | | 33,154 | | |
| | | | | Investment Banker to Public Authorities | | | | | |
| | 27,500 | | | Porsche | | | 26,536 | | |
| | | | | Specialty Automobile Manufacturer | | | | | |
| | 775,000 | | | CTS Eventim (b) | | | 23,763 | | |
| | | | | Event Ticket Sales | | | | | |
| | 450,000 | | | Hugo Boss Designs | | | 18,943 | | |
| | | | | Fashion Apparel | | | | | |
| | 260,000 | | | Grenkeleasing | | | 17,292 | | |
| | | | | Financing for IT Equipment | | | | | |
| | 320,000 | | | Vossloh | | | 16,225 | | |
| | | | | Rail Infrastructure & Diesel Locomotives | | | | | |
| | 415,000 | | | GFK | | | 15,128 | | |
| | | | | Market Research Services | | | | | |
| | 870,000 | | | Takkt | | | 13,828 | | |
| | | | | Mail Order Retailer of Office &
Warehouse Durables | | | | | |
| | 100,000 | | | Deutsche Boerse | | | 13,597 | | |
| | | | | Trading, Clearing, Settlement Services for
Financial Markets | | | | | |
| | 75,000 | | | Rational | | | 12,248 | | |
| | | | | Commercial Oven Manufacturer | | | | | |
| | 200,000 | | | Bilfinger Berger | | | 10,856 | | |
| | | | | Construction & Related Services | | | | | |
1-800-922-6769
36
| Number of Shares | | | | Value (000) | |
| | | >Germany—continued | |
| | 296,000 | | | Deutsche Beteiligungs | | $ | 6,172 | | |
| | | | | Private Equity Investment Management | | | | | |
| | | | 282,936 | | |
| | | >Ireland: 6.1% | |
| | 2,000,000 | | | Bank of Ireland | | | 35,801 | | |
| | | | | Irish Commercial Bank | | | | | |
| | 2,000,000 | | | IAWS Group | | | 35,262 | | |
| | | | | Baked Goods | | | | | |
| | 2,200,000 | | | Anglo Irish Bank | | | 34,280 | | |
| | | | | Small Business & Middle Market Banking | | | | | |
| | 2,350,000 | | | Grafton Group | | | 29,581 | | |
| | | | | Builders Materials Wholesaling &
Do-it-yourself Retailing | | | | | |
| | 6,856,625 | | | United Drug | | | 29,361 | | |
| | | | | Irish Pharmaceutical Wholesaler & Outsourcer | | | | | |
| | 2,500,000 | | | C&C Group | | | 21,712 | | |
| | | | | Beverage Company | | | | | |
| | 1,150,000 | | | Kingspan Group | | | 20,078 | | |
| | | | | Building Insulation & Environmental Containers | | | | | |
| | 720,000 | | | Paddy Power | | | 12,470 | | |
| | | | | Irish Betting Services | | | | | |
| | | | 218,545 | | |
| | | >Switzerland: 4.9% | |
| | 30,000 | | | Geberit | | | 34,662 | | |
| | | | | Plumbing Supplies | | | | | |
| | 475,000 | | | Kuehne & Nagel | | | 34,579 | | |
| | | | | Freight Forwarding/Logistics | | | | | |
| | 275,000 | | | Synthes | | | 33,132 | | |
| | | | | Products for Orthopedic Surgery | | | | | |
| | 24,000 | | | Sika | | | 26,661 | | |
| | | | | Chemicals for Construction &
Industrial Applications | | | | | |
| | 25,000 | | | Givaudan | | | 19,660 | | |
| | | | | Fragrances & Flavors | | | | | |
| | 300,000 | | | Schindler | | | 15,535 | | |
| | | | | Elevator Manufacturer & Service Provider | | | | | |
| | 275,000 | | | Logitech (b) | | | 10,602 | | |
| | | | | Branded Peripheral Computer Devices | | | | | |
| | 27,000 | | | BKW Energie | | | 2,364 | | |
| | | | | Electric Utility | | | | | |
| | | | 177,195 | | |
| | | >Italy: 3.3% | |
| | 9,100,000 | | | Cir Compagnie | | | 25,899 | | |
| | | | | Italian Holding Company | | | | | |
| | 2,120,000 | | | Davide Campari | | | 21,961 | | |
| | | | | Spirits & Wines | | | | | |
| | 404,000 | | | Banca Italease | | | 20,188 | | |
| | | | | Italian Leasing & Factoring Leader | | | | | |
| | 2,000,000 | | | Amplifon | | | 16,999 | | |
| | | | | Hearing Aid Retailer | | | | | |
| | 1,223,000 | | | GranitiFiandre | | | 13,163 | | |
| | | | | Innovative Stoneware | | | | | |
| | 12,800,000 | | | Ducati Motor (b) | | | 10,867 | | |
| | | | | Motorcycles & Related Merchandise | | | | | |
| | 350,000 | | | Sabaf | | | 9,961 | | |
| | | | | Supplier to White Goods OEMS | | | | | |
| | | | 119,038 | | |
| Number of Shares | | | | Value (000) | |
| | | >Sweden: 3.3% | |
| | 1,544,998 | | | Hexagon | | $ | 56,245 | | |
| | | | | Measurement Equipment & Polymers | | | | | |
| | 2,580,000 | | | Tele2 | | | 26,034 | | |
| | | | | European Mobile Operator & Services Reseller | | | | | |
| | 755,000 | | | Nobia | | | 24,490 | | |
| | | | | Kitchen Cabinet Manufacturing & Distribution | | | | | |
| | 422,000 | | | Sweco | | | 11,541 | | |
| | | | | Engineering Consultants | | | | | |
| | | | 118,310 | | |
| | | >Russia: 1.1% | |
| | 775,000 | | | Novolipetsk Steel | | | 16,999 | | |
| | | | | Vertically Integrated Steel Producer | | | | | |
| | 575,800 | | | RBC Information Systems (b) | | | 15,202 | | |
| | | | | Financial Information, Media &
IT Services in Russia | | | | | |
| | 370,000 | | | Mechel Steel Group | | | 8,284 | | |
| | | | | Coking Coal | | | | | |
| | | | 40,485 | | |
| | | >Spain: 0.8% | |
| | 620,000 | | | Red Electrica | | | 21,379 | | |
| | | | | Spanish Power Grid | | | | | |
| | 120,700 | | | Bankinter | | | 7,768 | | |
| | | | | Mortgage Lender | | | | | |
| | | | 29,147 | | |
| | | >Czech Republic: 0.7% | |
| | 183,000 | | | Komercni Banka | | | 26,775 | | |
| | | | | Leading Czech Universal Bank | | | | | |
| | | >Greece: 0.7% | |
| | 936,000 | | | Intralot | | | 25,045 | | |
| | | | | Lottery & Gaming Systems/Services | | | | | |
| | | >Poland: 0.6% | |
| | 820,500 | | | Central European Distribution (b) | | | 20,644 | | |
| | | | | Vodka Production & Alcohol Distribution | | | | | |
| | | >Finland: 0.5% | |
| | 1,756,000 | | | Jaakko Poyry | | | 18,880 | | |
| | | | | Engineering Consultants | | | | | |
| | | >Denmark: 0.5% | |
| | 280,000 | | | Novozymes | | | 18,872 | | |
| | | | | Industrial Enzymes | | | | | |
| | | >Austria: 0.4% | |
| | 300,000 | | | Wienerberger | | | 14,255 | | |
| | | | | Bricks & Clay Roofing Tiles | | | | | |
| | | Europe: Total | | | 2,130,097 | | |
| Asia: 21.5% | | | |
| | | >Japan: 15.2% | |
| | 546,000 | | | Daito Trust Construction | | | 30,358 | | |
| | | | | Apartment Builder | | | | | |
| | 43,500 | | | Jupiter Telecommunications (b) | | | 30,155 | | |
| | | | | Largest Cable Service Provider in Japan | | | | | |
37
Columbia Acorn International
>Statement of Investments (Unaudited), continued
| Number of Shares | | | | Value (000) | |
| | | >Japan—continued | |
| | 3,700,000 | | | Kansai Paint | | $ | 29,606 | | |
| | | | | Paint Producer in Japan, India,
China & Southeast Asia | | | | | |
| | 1,272,000 | | | Ushio | | | 26,935 | | |
| | | | | Industrial Light Sources | | | | | |
| | 718,000 | | | Ito En | | | 26,340 | | |
| | | | | Bottled Tea & Other Beverages | | | | | |
| | 868,000 | | | Park 24 | | | 25,496 | | |
| | | | | Parking Lot Operator | | | | | |
| | 600,000 | | | Aeon Mall | | | 25,180 | | |
| | | | | Suburban Shopping Mall Developer,
Owner & Operator | | | | | |
| | 453,000 | | | Hogy Medical | | | 23,806 | | |
| | | | | Disposable Surgical Products | | | | | |
| | 22,500 | | | Sparx Asset Management | | | 23,516 | | |
| | | | | Fund Management | | | | | |
| | 350,000 | | | USS | | | 23,172 | | |
| | | | | Used Car Auctioneer | | | | | |
| | 600,000 | | | Hoya | | | 21,450 | | |
| | | | | Opto-Electrical Components & Eyeglass Lenses | | | | | |
| | 785,000 | | | JSR | | | 19,922 | | |
| | | | | Films & Chemicals for LCD Screens & Electronics | | | | | |
| | 650,000 | | | Shimano | | | 19,922 | | |
| | | | | Bicycle Components & Fishing Tackle | | | | | |
| | 2,000,000 | | | Chiba Bank | | | 18,773 | | |
| | | | | Regional Bank | | | | | |
| | 4,310 | | | Kenedix | | | 18,665 | | |
| | | | | Real Estate Investment Management | | | | | |
| | 220,000 | | | Fast Retailing | | | 17,914 | | |
| | | | | Apparel Retailer | | | | | |
| | 710,000 | | | Sato | | | 16,445 | | |
| | | | | Bar Code Printers & Supplies | | | | | |
| | 714,000 | | | FCC | | | 14,176 | | |
| | | | | Auto/Motorcycle Clutches | | | | | |
| | 965,000 | | | T. Hasegawa | | | 13,774 | | |
| | | | | Industrial Flavors & Fragrances | | | | | |
| | 2,248,000 | | | Hiroshima Bank | | | 13,740 | | |
| | | | | Regional Bank | | | | | |
| | 918,000 | | | Toyo Technica | | | 12,665 | | |
| | | | | Value Added Reseller of Imported Instrumentation | | | | | |
| | 2,960 | | | Risa Partners | | | 11,762 | | |
| | | | | NPL & Real Estate Related Investment | | | | | |
| | 1,500,000 | | | Bank of Fukuoka | | | 11,465 | | |
| | | | | Regional Bank | | | | | |
| | 960 | | | Osaka Securities Exchange | | | 11,407 | | |
| | | | | Osaka Securities Exchange | | | | | |
| | 1,650 | | | Japan Pure Chemical | | | 10,713 | | |
| | | | | Precious Metal Plating Chemicals for Electronics | | | | | |
| | 430,000 | | | Yusen Air & Sea Service | | | 10,105 | | |
| | | | | Airfreight Logistics | | | | | |
| | 1,230,000 | | | Kamigumi | | | 9,349 | | |
| | | | | Port Cargo Handling & Logistics | | | | | |
| | 375,000 | | | Nagaileben | | | 8,438 | | |
| | | | | Medical/Healthcare Related Clothes | | | | | |
| | 321,100 | | | Kintetsu World Express | | | 7,623 | | |
| | | | | Airfreight Logistics | | | | | |
| | 450,200 | | | Ain Pharmaciez | | | 7,483 | | |
| | | | | Dispensing Pharmacy/Drugstore Operator | | | | | |
| | 1,713 | | | Advance Create | | | 4,973 | | |
| | | | | Independent Insurance Distributor | | | | | |
| | | | 545,328 | | |
| Number of Shares | | | | Value (000) | |
| | | >Taiwan: 2.1% | |
| | 6,822,000 | | | Advantech | | $ | 19,583 | | |
| | | | | Embedded Computers | | | | | |
| | 18,300,000 | | | Phoenixtec Power | | | 18,601 | | |
| | | | | Uninterruptible Power Supplies | | | | | |
| | 3,000,000 | | | Novatek Microelectronics | | | 14,451 | | |
| | | | | LCD Related IC Designer | | | | | |
| | 7,280,000 | | | Wah Lee Industrial | | | 13,352 | | |
| | | | | Distributor of Chemicals, Materials, & Equipment | | | | | |
| | 7,186,000 | | | Springsoft | | | 11,084 | | |
| | | | | Electronic Design Automation Software | | | | | |
| | | | 77,071 | | |
| | | >Hong Kong: 1.5% | |
| | 5,000,000 | | | Hong Kong Exchanges and Clearing | | | 32,136 | | |
| | | | | Hong Kong Equity & Derivatives Market Operator | | | | | |
| | 14,000,000 | | | Techtronic Industries | | | 18,922 | | |
| | | | | Power Tools & Motorized Appliances | | | | | |
| | 10,996,000 | | | Linmark Group | | | 1,731 | | |
| | | | | Global Sourcing Agent of Consumer Goods | | | | | |
| | | | 52,789 | | |
| | | >India: 0.9% | |
| | 1,300,000 | | | Housing Development Finance | | | 32,001 | | |
| | | | | Indian Mortgage Lender | | | | | |
| | | >South Korea: 0.6% | |
| | 250,000 | | | Hyundai Mobis | | | 21,124 | | |
| | | | | Auto Parts | | | | | |
| | | >China: 0.5% | |
| | 45,000,000 | | | Global Bio-Chem Technology Group | | | 19,028 | | |
| | | | | Refiner of Corn-based Commodities | | | | | |
| | | >Indonesia: 0.5% | |
| | 15,000,000 | | | Perusahaan Gas Negara | | | 18,192 | | |
| | | | | Gas Pipeline Operator | | | | | |
| | | >Singapore: 0.2% | |
| | 7,053,000 | | | Comfort Del Gro | | | 6,798 | | |
| | | | | Taxi & Mass Transit Service | | | | | |
| | | Asia: Total | | | 772,331 | | |
| Other Countries: 10.7% | | | |
| | | >Canada: 5.3% | |
| | 1,060,000 | | | Alliance Atlantis Communication (b) | | | 31,051 | | |
| | | | | CATV Channels, TV/Movie Production/Distribution | | | | | |
| | 1,370,000 | | | Rona (b) | | | 24,607 | | |
| | | | | Leading Canadian Do-it-yourself Retailer | | | | | |
| | 400,000 | | | Falconbridge | | | 21,070 | | |
| | | | | Diversified Mining Holding Company | | | | | |
| | 1,155,000 | | | Talisman Energy | | | 20,155 | | |
| | | | | Oil & Gas Producer | | | | | |
| | 1,190,000 | | | Shawcor | | | 17,685 | | |
| | | | | Oilfield Services | | | | | |
| | 6,775,000 | | | UrAsia Energy Legend (b) | | | 16,994 | | |
| | | | | Uranium Mining in Kazakhstan | | | | | |
1-800-922-6769
38
| Number of Shares | | | | Value (000) | |
| | | >Canada—continued | |
| | 950,000 | | | Van Houtte (c) | | $ | 15,795 | | |
| | | | | Coffee Services & Equipment | | | | | |
| | 530,000 | | | Major Drilling Group (b) | | | 10,597 | | |
| | | | | Mining Exploration Driller | | | | | |
| | 2,000,000 | | | Northern Orion Resources (b) | | | 9,818 | | |
| | | | | Copper & Gold Mining in Argentina | | | | | |
| | 835,000 | | | Kinross Gold (b) | | | 9,103 | | |
| | | | | Gold Mining | | | | | |
| | 850,000 | | | Ivanhoe Mines (b) | | | 5,757 | | |
| | | | | Copper Mine Project in Mongolia | | | | | |
| | 2,036,000 | | | RailPower Technologies 144A (b)(c)(d) | | | 4,377 | | |
| | 789,000 | | | RailPower Technologies (c) | | | 1,696 | | |
| | | | | Hybrid Locomotives | | | | | |
| | | | 188,705 | | |
| | | >Australia: 2.9% | |
| | 3,000,000 | | | Billabong International | | | 34,250 | | |
| | | | | Action Sports Apparel Brand Manager | | | | | |
| | 5,450,000 | | | Sino Gold (b) | | | 20,343 | | |
| | | | | Gold Mining in The People's Republic of China | | | | | |
| | 4,000,000 | | | ABC Learning Center | | | 19,036 | | |
| | | | | Childcare Centers | | | | | |
| | 350,000 | | | Perpetual Trustees | | | 19,034 | | |
| | | | | Mutual Fund Management | | | | | |
| | 2,000,000 | | | Jubilee Mines | | | 11,989 | | |
| | | | | Nickel Mining in Australia | | | | | |
| | | | 104,652 | | |
| | | >South Africa: 1.4% | |
| | 180,000 | | | Impala Platinum | | | 33,085 | | |
| | | | | Platinum Group Metals Mining & Refining | | | | | |
| | 4,500,000 | | | Edgars Consolidated Stores | | | 18,140 | | |
| | | | | Leading Retail Conglomerate | | | | | |
| | | | 51,225 | | |
| | | >United States: 0.6% | |
| | 415,000 | | | Atwood Oceanics (b) | | | 20,584 | | |
| | | | | Contract Drilling | | | | | |
| | | >New Zealand: 0.5% | |
| | 5,500,000 | | | Sky City Entertainment | | | 18,078 | | |
| | | | | Casino/Entertainment Complex | | | | | |
| | | Other Countries: Total | | | 383,244 | | |
| Latin America: 4.5% | | | |
| | | >Brazil: 2.4% | |
| | 2,500,000 | | | Natura Cosmeticos | | | 26,202 | | |
| | | | | Direct Retailer of Cosmetics | | | | | |
| | 4,300,000 | | | Suzano | | | 25,273 | | |
| | | | | Pulp & Paper Producer | | | | | |
| | 720,000 | | | Porto Seguro (b) | | | 12,300 | | |
| | | | | Auto & Life Insurance | | | | | |
| | 392,000 | | | Diagnosticos (b) | | | 7,782 | | |
| | | | | Medical Diagnostic Services | | | | | |
Number of Shares
or Principal Amount | | | | Value (000) | |
| | 1,085,000 | | | American Banknote (b) | | $ | 7,013 | | |
| | | | | Manufacturer of Smart Cards | | | | | |
| | 293,000 | | | Ultrapar | | | 4,613 | | |
| | | | | Specialty Chemicals & Liquid Propane
Gas Distribution | | | | | |
| | 170,000 | | | Localiza Rent A Car | | | 3,257 | | |
| | | | | Car Rental | | | | | |
| | | | 86,440 | | |
| | | >Mexico: 1.3% | |
| | 4,500,000 | | | Consorcio ARA | | | 18,530 | | |
| | | | | Affordable Housing Builder | | | | | |
| | 414,000 | | | Grupo Aeroportuario Del Sureste | | | 13,906 | | |
| | | | | Cancun/Cozumel Airport Operator | | | | | |
| | 4,200,000 | | | Urbi Desarrollo (b) | | | 9,740 | | |
| | | | | Affordable Housing Builder | | | | | |
| | 100,000 | | | Grupo Aeroportuario Del Pacifia | | | 3,185 | | |
| | | | | Mexican Airport Operator | | | | | |
| | | | 45,361 | | |
| | | >Chile: 0.4% | |
| | 160,000 | | | Sociedad Quimica y Minera de Chile (Chile) | | | 16,662 | | |
| | | | | Producer of Specialty Fertilizers, Lithium, & Iodine | | | | | |
| | | >Argentina: 0.4% | |
| | 350,000 | | | Tenaris | | | 14,172 | | |
| | | | | Oil, Gas & Industrial Seamless Tubes | | | | | |
| | | | | Latin America: Total | | | 162,635 | | |
| | Total Common Stocks: 95.9%
(Cost: $2,361,806) | | | | | | 3,448,307 | | |
| Short-Term Obligations: 3.4% | | | |
| $ | 75,000 | | | Conocophillips
5.30% Due 7/03/06 - 7/05/06 | | | 74,966 | | |
| | 45,000 | | | Countrywide Financial Funding
5.30% Due 7/06/06 | | | 44,967 | | |
| | 4,181 | | | Repurchase Agreement with
State Street Bank & Trust
dated 6/30/06, due 7/3/06
at 4.93% collateralized by
Federal Home Loan Bank,
maturing 5/9/09
market value $4,268
(repurchase proceeds: $4,183) | | | 4,181 | | |
| | | | | (Amortized Cost: $124,114) | | | 124,114 | | |
| | Total Investments: 99.3%
(Cost: $2,485,920)(a)(e) | | | | | | 3,572,421 | | |
| | Cash and Other Assets Less Liabilities: 0.7% | | | | | | 23,881 | | |
| | Total Net Assets: 100% | | | | | $ | 3,596,302 | | |
39
Columbia Acorn International
>Statement of Investments (Unaudited), continued
>Notes to Statement of Investments (in thousands)
(a) At June 30, 2006, for federal income tax purposes cost of investments was $2,485,920 and net unrealized appreciation was $1,086,501 consisting of gross unrealized appreciation of $1,184,404 and gross unrealized depreciation of $97,903.
(b) Non-income producing security.
(c) An affiliate may include any company in which the Fund owns five percent or more of its outstanding voting shares. On June 30, 2006, the Fund held five percent or more of the outstanding voting securities of the following companies:
| Van Houtte | | | 5.91 | % | |
| RailPower Technologies | | | 5.16 | % | |
The aggregate cost and value of these companies at June 30, 2006, was $29,676 and $21,869 respectively. Investments in affiliate companies represent 0.61% of total net assets at June 30, 2006. Investment activity and income amounts relating to affiliates during the six months ended June 30, 2006 were as follows:
| Dividend Income | | $ | 58 | | |
| Net realized gain or loss | | | — | | |
| Change in unrealized gain or loss | | | (10,121 | ) | |
| Purchases | | | 18,278 | | |
| Proceeds from sales | | | 2 | | |
(d) Denotes a restricted security, which is subject to restrictions on resale under federal securities laws. At June 30, 2006, this security (in thousands) amounted to $4,377 which represents 0.12% of total net assets.
Additional information on this security is as follows:
| Security | | Acquisition
Dates | | Shares | | Cost (000) | | Value (000) | |
| RailPower Technologies 144A | | | 11/10/05 - 11/18/05 | | | | 2,036,000 | | | $ | 9,220 | | | $ | 4,377 | | |
(e) On June 30, 2006, the Fund's total investments were denominated in currencies as follows:
| Currency | | Value | | % of
Total
Net Assets | |
| Euro | | $ | 1,419,023 | | | | 39.5 | % | |
| Japanese Yen | | | 545,329 | | | | 15.2 | | |
| British Pounds | | | 295,353 | | | | 8.2 | | |
| Canadian Dollar | | | 188,705 | | | | 5.2 | | |
Other currencies less
than 5% of total net assets | | | 1,124,011 | | | | 31.2 | | |
| | | $ | 3,572,421 | | | | 99.3 | % | |
1-800-922-6769
40
Columbia Acorn International
>Portfolio Diversification
At June 30, 2006, the Fund's portfolio investments as a percent of net assets was diversified as follows:
| | | Value (000) | | Percent | |
| >Industrial Goods/Services | |
| Other Industrial Services | | $ | 167,388 | | | | 4.6 | % | |
| Specialty Chemicals | | | 160,483 | | | | 4.5 | | |
| Construction | | | 144,124 | | | | 4.0 | | |
| Industrial Materials | | | 117,554 | | | | 3.3 | | |
| Conglomerates | | | 97,230 | | | | 2.7 | | |
| Machinery | | | 82,867 | | | | 2.3 | | |
Outsourcing &
Training Services | | | 69,320 | | | | 1.9 | | |
| Electrical Components | | | 46,626 | | | | 1.3 | | |
| Steel | | | 31,171 | | | | 0.9 | | |
| Industrial Distribution | | | 29,581 | | | | 0.8 | | |
| | | | 946,344 | | | | 26.3 | | |
| >Consumer Goods/Services | |
| Retail | | | 110,323 | | | | 3.1 | | |
| Durables Goods | | | 100,385 | | | | 2.8 | | |
| Beverage | | | 85,808 | | | | 2.4 | | |
| Other Consumer Services | | | 84,757 | | | | 2.4 | | |
| Food | | | 58,589 | | | | 1.6 | | |
| Apparels | | | 54,924 | | | | 1.5 | | |
Consumer Goods
Distribution | | | 43,816 | | | | 1.2 | | |
| Gaming | | | 37,516 | | | | 1.0 | | |
| Leisure Products | | | 26,540 | | | | 0.7 | | |
| Nondurables | | | 26,202 | | | | 0.7 | | |
| Furniture & Textiles | | | 24,490 | | | | 0.7 | | |
| Entertainment | | | 23,763 | | | | 0.7 | | |
| Casinos | | | 18,078 | | | | 0.5 | | |
| Travel | | | 3,257 | | | | 0.1 | | |
| | | | 698,448 | | | | 19.4 | | |
| >Information | |
Computer Hardware &
Related Equipment | | | 83,898 | | | | 2.3 | | |
Business Information &
Marketing Services | | | 62,018 | | | | 1.7 | | |
| Financial Processors | | | 45,732 | | | | 1.3 | | |
Semiconductors &
Related Equipment | | | 35,900 | | | | 1.0 | | |
| Internet Related | | | 32,484 | | | | 0.9 | | |
| Satellite Broadcasting | | | 31,338 | | | | 0.9 | | |
| Television Programming | | | 31,051 | | | | 0.9 | | |
| Cable Television | | | 30,155 | | | | 0.8 | | |
| Television Broadcasting | | | 29,764 | | | | 0.8 | | |
| Business Software | | | 28,986 | | | | 0.8 | | |
| Telephone Services | | | 26,034 | | | | 0.7 | | |
| Computer Services | | | 15,201 | | | | 0.4 | | |
| Electronics Distribution | | | 13,352 | | | | 0.4 | | |
| Instrumentation | | | 12,665 | | | | 0.4 | | |
| Publishing | | | 5,485 | | | | 0.2 | | |
| | | | 484,063 | | | | 13.5 | | |
| | | Value (000) | | Percent | |
| >Finance | |
| Banks | | $ | 208,157 | | | | 5.8 | % | |
| Other Finance Companies | | | 121,350 | | | | 3.4 | | |
| Insurance | | | 54,849 | | | | 1.5 | | |
| Money Management | | | 48,722 | | | | 1.4 | | |
| Savings & Loans | | | 39,769 | | | | 1.1 | | |
| Credit Cards | | | 7,013 | | | | 0.2 | | |
| | | | 479,860 | | | | 13.4 | | |
| >Energy/Minerals | |
| Mining | | | 149,883 | | | | 4.2 | | |
| Oil Services | | | 116,170 | | | | 3.2 | | |
| Oil/Gas Producers | | | 65,071 | | | | 1.8 | | |
Refining/Marketing/
Distribution | | | 46,948 | | | | 1.3 | | |
| Agricultural Commodities | | | 44,301 | | | | 1.2 | | |
| Non-Ferrous Metals | | | 10,597 | | | | 0.3 | | |
| | | | 432,970 | | | | 12.0 | | |
| >Other Industries | |
| Transportation | | | 82,834 | | | | 2.3 | | |
| Real Estate | | | 75,076 | | | | 2.1 | | |
| Regulated Utilities | | | 57,594 | | | | 1.6 | | |
| | | | 215,504 | | | | 6.0 | | |
| >Health Care | |
| Services | | | 68,486 | | | | 1.9 | | |
| Medical Equipment | | | 53,244 | | | | 1.5 | | |
Hospital/Laboratory
Supplies | | | 40,027 | | | | 1.1 | | |
| Pharmaceuticals | | | 29,361 | | | | 0.8 | | |
| | | | 191,118 | | | | 5.3 | | |
| Total Common Stocks | | | 3,448,307 | | | | 95.9 | | |
| Short-Term Obligations | | | 124,114 | | | | 3.4 | | |
| Total Investments | | | 3,572,421 | | | | 99.3 | | |
Cash and Other Assets
Less Liabilities | | | 23,878 | | | | 0.7 | | |
| Total Net Assets | | $ | 3,596,299 | | | | 100.0 | % | |
41
Columbia Acorn USA
>Major Portfolio Changes in the Second Quarter (Unaudited)
| | | Number of Shares | |
| | | 03/31/06 | | 06/30/06 | |
| Additions | |
| Information | |
| Avid Technology | | | 454,900 | | | | 779,900 | | |
| Concur Technologies | | | 30,400 | | | | 230,400 | | |
| Gemstar-TV Guide International | | | 2,375,653 | | | | 2,580,000 | | |
| II VI | | | 435,000 | | | | 505,000 | | |
| Kronos | | | 500,650 | | | | 660,650 | | |
| Nice Systems (Israel) | | | 456,600 | | | | 566,600 | | |
| (includes the effect of a 2 for 1 stock split) | |
| Openwave Systems | | | 0 | | | | 100,000 | | |
| Progress Software | | | 118,600 | | | | 347,000 | | |
| Saga Communications | | | 98,100 | | | | 300,000 | | |
| Time Warner Telecom | | | 786,000 | | | | 1,086,000 | | |
| Trimble Navigation | | | 90,000 | | | | 125,000 | | |
| ValueClick | | | 285,000 | | | | 460,000 | | |
| webMethods | | | 83,500 | | | | 279,100 | | |
| Consumer Goods/Services | |
| Carter's | | | 80,200 | | | | 545,200 | | |
| (includes the effect of a 2 for 1 stock split) | |
| J Crew Group | | | 0 | | | | 125,000 | | |
| Oxford Industries | | | 529,200 | | | | 634,200 | | |
| Petco Animal Supplies | | | 428,000 | | | | 608,000 | | |
| Red Robin Gourmet Burgers | | | 68,800 | | | | 163,800 | | |
| True Religion Apparel | | | 205,000 | | | | 675,200 | | |
| Health Care | |
| LCA-Vision | | | 143,995 | | | | 210,000 | | |
| PSS World Medical | | | 150,000 | | | | 380,000 | | |
| United Surgical Partners | | | 150,000 | | | | 550,000 | | |
| Industrial Goods/Services | |
| Goodman Global | | | 0 | | | | 132,000 | | |
| Simpson Manufacturing | | | 0 | | | | 100,000 | | |
| Other Industries | |
| Highland Hospitality | | | 235,000 | | | | 350,000 | | |
| Energy/Minerals | |
| Atwood Oceanics | | | 0 | | | | 152,000 | | |
| Finance | |
| Delphi Financial Group | | | 29,000 | | | | 87,000 | | |
| (includes the effect of a 3 for 2 stock split) | |
| | | Number of Shares | |
| | | 03/31/06 | | 06/30/06 | |
| Sales | |
| Information | |
| CDW | | | 28,000 | | | | 0 | | |
| Getty Images | | | 104,800 | | | | 44,000 | | |
| Global Payments | | | 423,280 | | | | 393,280 | | |
| JDA Software | | | 723,800 | | | | 524,000 | | |
| MRO Software | | | 242,000 | | | | 57,950 | | |
| Plexus | | | 131,100 | | | | 105,000 | | |
| Tellabs | | | 1,610,000 | | | | 1,525,000 | | |
| Consumer Goods/Services | |
| Aeropostale | | | 200,000 | | | | 130,000 | | |
| Sports Authority | | | 105,000 | | | | 0 | | |
| Health Care | |
| Charles River Laboratories | | | 303,000 | | | | 258,000 | | |
| Incyte | | | 450,000 | | | | 0 | | |
| Neurocrine Biosciences | | | 192,000 | | | | 0 | | |
| Energy/Minerals | |
| Chicago Bridge & Iron | | | 585,000 | | | | 535,000 | | |
| Newpark Resources | | | 1,001,000 | | | | 350,900 | | |
| Pioneer Drilling | | | 266,800 | | | | 0 | | |
1-800-922-6769
42
Columbia Acorn USA
>Statement of Investments (Unaudited), June 30, 2006
| Number of Shares | | | | Value (000) | |
| | | | | Common Stocks: 91.5% | |
| Information: 31.2% | | | |
| | | >Business Software: 8.2% | |
| | 779,900 | | | Avid Technology (b) | | $ | 25,994 | | |
| | | | | Digital Nonlinear Editing Software & Systems | | | | | |
| | 660,650 | | | Kronos (b) | | | 23,922 | | |
| | | | | Labor Management Solutions | | | | | |
| | 455,200 | | | Micros Systems (b) | | | 19,883 | | |
| | | | | Information Systems for Restaurants & Hotels | | | | | |
| | 2,100,000 | | | Novell (b) | | | 13,923 | | |
| | | | | Directory, Operating System &
Identity Management Software | | | | | |
| | 347,000 | | | Progress Software (b) | | | 8,123 | | |
| | | | | Application Development Software | | | | | |
| | 405,800 | | | SSA Global Technologies (b) | | | 7,864 | | |
| | | | | Enterprise Resource Planning Software | | | | | |
| | 524,000 | | | JDA Software (b) | | | 7,352 | | |
| | | | | Application/Software & Services for Retailers | | | | | |
| | 327,200 | | | Parametric Technology (b) | | | 4,159 | | |
| | | | | Engineering Software & Services | | | | | |
| | 230,400 | | | Concur Technologies (b) | | | 3,564 | | |
| | | | | Web Enabled Cost & Expense
Management Software | | | | | |
| | 279,100 | | | webMethods (b) | | | 2,755 | | |
| | | | | Enterprise Applications Integration Tools | | | | | |
| | 59,300 | | | Witness Systems (b) | | | 1,196 | | |
| | | | | Customer Experience Management Software | | | | | |
| | 57,950 | | | MRO Software (b) | | | 1,163 | | |
| | | | | Enterprise Maintenance Software | | | | | |
| | | | 119,898 | | |
| | | >Mobile Communications: 5.9% | |
| | 1,005,000 | | | Crown Castle International (b) | | | 34,713 | | |
| | | | | Communications Towers | | | | | |
| | 356,605 | | | Alltel | | | 22,762 | | |
| | | | | Cellular & Wireline Telephone Services | | | | | |
| | 506,000 | | | American Tower (b) | | | 15,747 | | |
| | | | | Communications Towers in USA & Mexico | | | | | |
| | 1,633,000 | | | Dobson Communications (b) | | | 12,623 | | |
| | | | | Rural & Small City Cellular Telephone Services | | | | | |
| | 100,000 | | | Openwave Systems (b) | | | 1,154 | | |
| | | | | Internet Software for Mobile Devices | | | | | |
| | | | 86,999 | | |
| | | >Computer Hardware and
Related Equipment: 4.1% | |
| | 566,600 | | | Nice Systems (Israel) (b) | | | 15,944 | | |
| | | | | Audio & Video Recording Solutions | | | | | |
| | 505,000 | | | II VI (b) | | | 9,242 | | |
| | | | | Laser Components | | | | | |
| | 147,800 | | | Amphenol | | | 8,271 | | |
| | | | | Electronic Connectors | | | | | |
| | 584,000 | | | Symbol Technologies | | | 6,301 | | |
| | | | | Mobile Computers & Barcode Scanners | | | | | |
| | 260,000 | | | Intermec (b) | | | 5,964 | | |
| | | | | Bar Code & Wireless LAN Systems | | | | | |
| | 99,000 | | | Zebra Technologies (b) | | | 3,382 | | |
| | | | | Bar Code Printers | | | | | |
| | 100,000 | | | Belden CDT | | | 3,305 | | |
| | | | | Specialty Cable | | | | | |
| | 424,100 | | | Seachange International (b) | | | 2,952 | | |
| | | | | Systems for Video On Demand & Ad Insertion | | | | | |
| Number of Shares | | | | Value (000) | |
| | 40,000 | | | Rogers (b) | | $ | 2,254 | | |
| | | | | PCB Laminates & High-performance Foams | | | | | |
| | 90,000 | | | Netgear (b) | | | 1,949 | | |
| | | | | Networking Products for Small Business & Home | | | | | |
| | | | 59,564 | | |
| | | >Telecommunications Equipment: 1.7% | |
| | 1,525,000 | | | Tellabs (b) | | | 20,298 | | |
| | | | | Telecommunications Equipment | | | | | |
| | 310,000 | | | Andrew (b) | | | 2,746 | | |
| | | | | Wireless Infrastructure Equipment | | | | | |
| | 323,500 | | | Symmetricom (b) | | | 2,287 | | |
| | | | | Network Timing & Synchronization Devices | | | | | |
| | | | 25,331 | | |
| | | >Semiconductors and
Related Equipment: 1.5% | |
| | 1,050,000 | | | Entegris (b) | | | 10,006 | | |
| | | | | Semiconductor Wafer Shipping & Handling Products | | | | | |
| | 683,490 | | | Integrated Device Technology (b) | | | 9,692 | | |
| | | | | Communications Semiconductors | | | | | |
| | 70,000 | | | Littelfuse (b) | | | 2,407 | | |
| | | | | Little Fuses | | | | | |
| | | | 22,105 | | |
| | | >Financial Processors: 1.3% | |
| | 393,280 | | | Global Payments | | | 19,094 | | |
| | | | | Credit Card Processor | | | | | |
| | | >Business Information and
Marketing Services: 1.2% | |
| | 530,000 | | | Ceridian (b) | | | 12,953 | | |
| | | | | HR Services & Payment Processing | | | | | |
| | 44,000 | | | Getty Images (b) | | | 2,794 | | |
| | | | | Photographs for Publications & Electronic Media | | | | | |
| | 98,300 | | | Navigant Consulting (b) | | | 2,226 | | |
| | | | | Financial Consulting Firm | | | | | |
| | | | 17,973 | | |
| | | >Telephone Services: 1.2% | |
| | 1,086,000 | | | Time Warner Telecom (b) | | | 16,127 | | |
| | | | | Fiber Optic Telephone/Data Service Provider | | | | | |
| | 50,000 | | | Commonwealth Telephone | | | 1,658 | | |
| | | | | Rural Phone Franchises & Competing Telco | | | | | |
| | | | 17,785 | | |
| | | >Internet Related: 1.0% | |
| | 980,000 | | | CNET Networks (b) | | | 7,820 | | |
| | | | | Internet Advertising on Niche Websites | | | | | |
| | 460,000 | | | ValueClick (b) | | | 7,061 | | |
| | | | | Internet Advertising | | | | | |
| | | | 14,881 | | |
| | | >Instrumentation: 1.0% | |
| | 140,000 | | | Mettler Toledo (b) | | | 8,480 | | |
| | | | | Laboratory Equipment | | | | | |
| | 125,000 | | | Trimble Navigation (b) | | | 5,580 | | |
| | | | | GPS-Based Instruments | | | | | |
| | | | 14,060 | | |
43
Columbia Acorn USA
>Statement of Investments (Unaudited), continued
| Number of Shares | | | | Value (000) | |
| | | >Radio: 0.9% | |
| | 511,100 | | | Salem Communications (b) | | $ | 6,650 | | |
| | | | | Radio Stations for Religious Programming | | | | | |
| | 705,500 | | | Spanish Broadcasting System (b) | | | 3,605 | | |
| | | | | Spanish Language Radio Stations | | | | | |
| | 300,000 | | | Saga Communications (b) | | | 2,718 | | |
| | | | | Radio Stations in Small & Mid Sized Cities | | | | | |
| | | | 12,973 | | |
| | | >Computer Services: 0.8% | |
| | 1,005,500 | | | AnswerThink Consulting (b) | | | 4,052 | | |
| | | | | IT Integration & Best Practice Research | | | | | |
| | 786,000 | | | RCM Technologies (b)(c) | | | 3,946 | | |
| | | | | Technology & Engineering Services | | | | | |
| | 95,000 | | | SRA International (b) | | | 2,530 | | |
| | | | | Government IT Services | | | | | |
| | 235,000 | | | Igate Capital (b) | | | 1,502 | | |
| | | | | IT & BPO Outsourcing Services | | | | | |
| | | | 12,030 | | |
| | | >CATV: 0.8% | |
| | 2,580,000 | | | Gemstar-TV Guide International (b) | | | 9,082 | | |
| | | | | TV Program Guides & CATV Programming | | | | | |
| | 140,000 | | | Discovery Holding (b) | | | 2,048 | | |
| | | | | CATV Programming | | | | | |
| | | | 11,130 | | |
| | | >TV Broadcasting: 0.7% | |
| | 1,125,000 | | | Entravision Communications (b) | | | 9,641 | | |
| | | | | Spanish Language TV, Radio & Outdoor | | | | | |
| | 138,500 | | | Gray Television | | | 802 | | |
| | | | | Mid Market Affiliated TV Stations | | | | | |
| | | | 10,443 | | |
| | | >Gaming Equipment: 0.4% | |
| | 200,000 | | | Bally Technologies (b) | | | 3,294 | | |
| | | | | Slot Machines & Software | | | | | |
| | 98,500 | | | Shuffle Master (b) | | | 3,229 | | |
| | | | | Card Shufflers & Casino Games | | | | | |
| | | | 6,523 | | |
| | | >Television Programming: 0.3% | |
| | 460,000 | | | Lions Gate Entertainment (b) | | | 3,933 | | |
| | | | | Film & TV Studio | | | | | |
| | | >Contract Manufacturing: 0.2% | |
| | 105,000 | | | Plexus (b) | | | 3,592 | | |
| | | | | Electronic Manufacturing Services | | | | | |
| | | >Publishing: 0.0% | |
| | 13,850 | | | Triple Crown Media (b) | | | 120 | | |
| | | | | Newspapers, Paging &
Collegiate Sports Marketing | | | | | |
| | | Information: Total | | | 458,434 | | |
| Consumer Goods/Services: 17.5% | | | |
| | | >Retail: 5.9% | |
| | 398,000 | | | Abercrombie & Fitch | | | 22,061 | | |
| | | | | Teen Apparel Retailer | | | | | |
| | 486,250 | | | Christopher & Banks | | | 14,101 | | |
| | | | | Women's Apparel Retailer | | | | | |
| Number of Shares | | | | Value (000) | |
| | 608,000 | | | Petco Animal Supplies (b) | | $ | 12,421 | | |
| | | | | Pet Supplies & Services | | | | | |
| | 224,500 | | | Ann Taylor Stores (b) | | | 9,739 | | |
| | | | | Women's Apparel Retailer | | | | | |
| | 353,000 | | | Chico's FAS (b) | | | 9,524 | | |
| | | | | Women's Specialty Retail | | | | | |
| | 203,000 | | | Michaels Stores | | | 8,372 | | |
| | | | | Craft & Hobby Specialty Retailer | | | | | |
| | 130,000 | | | Aeropostale (b) | | | 3,756 | | |
| | | | | Mall-Based Teen Retailer | | | | | |
| | 125,000 | | | J Crew Group (b) | | | 3,431 | | |
| | | | | Multi-Channel Branded Retailer | | | | | |
| | 95,000 | | | Genesco (b) | | | 3,218 | | |
| | | | | Multi-Concept Branded Footwear Retailer | | | | | |
| | | | 86,623 | | |
| | | >Apparel: 3.9% | |
| | 634,200 | | | Oxford Industries | | | 24,994 | | |
| | | | | Branded & Private Label Apparel | | | | | |
| | 545,200 | | | Carter's (b) | | | 14,410 | | |
| | | | | Children's Branded Apparel | | | | | |
| | 675,200 | | | True Religion Apparel (b) | | | 11,951 | | |
| | | | | Premium Denim | | | | | |
| | 222,200 | | | Coach (b) | | | 6,644 | | |
| | | | | Designer & Retailer of Branded
Leather Accessories | | | | | |
| | | | 57,999 | | |
| | | >Other Consumer Services: 2.4% | |
| | 416,000 | | | ITT Educational Services (b) | | | 27,377 | | |
| | | | | Post-secondary Degree Programs | | | | | |
| | 387,700 | | | Central Parking | | | 6,203 | | |
| | | | | Owner, Operator, Manager of
Parking Lots & Garages | | | | | |
| | 60,000 | | | Weight Watchers | | | 2,453 | | |
| | | | | Weight Loss Programs | | | | | |
| | | | 36,033 | | |
| | | >Leisure Products: 1.9% | |
| | 301,300 | | | International Speedway Motors | | | 13,971 | | |
| | | | | Largest Motorsports Racetrack
Owner & Operator | | | | | |
| | 195,500 | | | Speedway Motorsports | | | 7,378 | | |
| | | | | Motorsport Racetrack Owner & Operator | | | | | |
| | 106,000 | | | Polaris Industries | | | 4,590 | | |
| | | | | Leisure Vehicles & Related Products | | | | | |
| | 195,000 | | | Callaway Golf | | | 2,533 | | |
| | | | | Premium Golf Clubs & Balls | | | | | |
| | | | 28,472 | | |
| | | >Nondurables: 1.5% | |
| | 496,400 | | | Scotts Miracle-Gro | | | 21,008 | | |
| | | | | Consumer Lawn & Garden Products | | | | | |
| | 100,000 | | | Prestige Brands (b) | | | 997 | | |
| | | | | OTC, Household & Personal Care Products | | | | | |
| | | | 22,005 | | |
| | | >Restaurants: 1.0% | |
| | 337,500 | | | Sonic (b) | | | 7,017 | | |
| | | | | Quick Service Restaurant | | | | | |
| | 163,800 | | | Red Robin Gourmet Burgers (b) | | | 6,971 | | |
| | | | | Casual Dining Restaurant | | | | | |
| | | | 13,988 | | |
1-800-922-6769
44
| Number of Shares | | | | Value (000) | |
| | | >Furniture and Textiles: 0.6% | |
| | 106,000 | | | HNI | | $ | 4,807 | | |
| | | | | Office Furniture & Fireplaces | | | | | |
| | 90,000 | | | Herman Miller | | | 2,319 | | |
| | | | | Office Furniture | | | | | |
| | 20,000 | | | Mohawk Industries (b) | | | 1,407 | | |
| | | | | Carpet & Flooring | | | | | |
| | | | 8,533 | | |
| | | >Travel: 0.2% | |
| | 45,000 | | | Vail Resorts (b) | | | 1,670 | | |
| | | | | Ski Resort Operator & Developer | | | | | |
| | 13,200 | | | Kerzner International (Bahamas) (b) | | | 1,046 | | |
| | | | | Destination Resorts & Casinos | | | | | |
| | | | 2,716 | | |
| | | >Other Durable Goods
(includes auto related): 0.1% | |
| | 40,000 | | | Cavco Industries (b) | | | 1,778 | | |
| | | | | Higher End Manufactured Homes | | | | | |
| | | Consumer Goods/Services: Total | | | 258,147 | | |
| Health Care: 12.6% | | | |
| | | >Health Care Services: 4.3% | |
| | 550,000 | | | United Surgical Partners (b) | | | 16,539 | | |
| | | | | Outpatient Surgery Center | | | | | |
| | 210,000 | | | LCA-Vision | | | 11,111 | | |
| | | | | Lasik Surgery Centers | | | | | |
| | 291,800 | | | Lincare Holdings (b) | | | 11,042 | | |
| | | | | Home Healthcare Services | | | | | |
| | 199,875 | | | Coventry Health Care (b) | | | 10,981 | | |
| | | | | HMO | | | | | |
| | 258,000 | | | Charles River Laboratories (b) | | | 9,494 | | |
| | | | | Pharmaceutical Research | | | | | |
| | 175,000 | | | PRA International (b) | | | 3,897 | | |
| | | | | Contract Research Organization | | | | | |
| | | | 63,064 | | |
| | | >Medical Equipment: 3.8% | |
| | 577,400 | | | Edwards Lifesciences (b) | | | 26,231 | | |
| | | | | Heart Valves | | | | | |
| | 380,000 | | | PSS World Medical (b) | | | 6,707 | | |
| | | | | Medical Supplies Distributor | | | | | |
| | 220,000 | | | Viasys Healthcare (b) | | | 5,632 | | |
| | | | | Respiratory & Neurology Medical Equipment | | | | | |
| | 105,000 | | | Vital Signs | | | 5,201 | | |
| | | | | Anesthesia, Respiratory & Sleep Products | | | | | |
| | 94,171 | | | Advanced Medical Optics (b) | | | 4,774 | | |
| | | | | Medical Devices for Eye Care | | | | | |
| | 165,000 | | | Intermagnetics General (b) | | | 4,452 | | |
| | | | | MRI Equipment | | | | | |
| | 104,000 | | | Arrow International | | | 3,418 | | |
| | | | | Disposable Catheters | | | | | |
| | | | 56,415 | | |
| | | >Hospital/Laboratory Supplies: 3.1% | |
| | 547,400 | | | Serologicals (b) | | | 17,210 | | |
| | | | | Blood Collection & Antibody Production | | | | | |
| | 270,700 | | | ICU Medical (b) | | | 11,434 | | |
| | | | | Intravenous Therapy Products | | | | | |
| Number of Shares | | | | Value (000) | |
| | 146,200 | | | Diagnostic Products | | $ | 8,504 | | |
| | | | | Immunodiagnostic Kits | | | | | |
| | 158,300 | | | Techne (b) | | | 8,061 | | |
| | | | | Cytokines, Antibodies, other
Reagents for Life Sciences | | | | | |
| | | | 45,209 | | |
| | | >Biotechnology/Drug Delivery: 1.4% | |
| | 360,000 | | | Nektar Therapeutics (b) | | | 6,602 | | |
| | | | | Drug Delivery Technologies | | | | | |
| | 293,000 | | | Intermune (b) | | | 4,820 | | |
| | | | | Drugs for Hepatitis C, Pulmonary
Fibrosis & Cancer | | | | | |
| | 455,000 | | | Ligand Pharmaceuticals (b) | | | 3,845 | | |
| | | | | Drugs for Pain, Cancer, Osteoporosis, Diabetes | | | | | |
| | 235,000 | | | Exelixis (b) | | | 2,362 | | |
| | | | | Treatments for Cancer & Metabolic Disorders | | | | | |
| | 235,000 | | | Decode Genetics (b) | | | 1,455 | | |
| | | | | Drugs for Heart Attack,
Asthma & Vascular Disease | | | | | |
| | 100,000 | | | Momenta Pharmaceuticals (b) | | | 1,271 | | |
| | | | | Sugar Analysis Technology for Drug Design | | | | | |
| | 375,000 | | | Locus Discovery, Series D. Pfd. (d) | | | 102 | | |
| | | | | High Throughput Rational Drug Design | | | | | |
| | 363,636 | | | Metabolex, Series F (d) | | | 84 | | |
| | | | | Drugs for Diabetes | | | | | |
| | | | 20,541 | | |
| | | Health Care: Total | | | 185,229 | | |
| Industrial Goods/Services: 11.1% | | | |
| | | >Machinery: 6.5% | |
| | 580,300 | | | Esco Technologies (b) | | | 31,017 | | |
| | | | | Automatic Electric Meter Readers | | | | | |
| | 673,600 | | | Pentair | | | 23,030 | | |
| | | | | Pumps, Water Treatment & Tools | | | | | |
| | 373,600 | | | Nordson | | | 18,373 | | |
| | | | | Dispensing Systems for Adhesives & Coatings | | | | | |
| | 319,800 | | | Donaldson | | | 10,832 | | |
| | | | | Industrial Air Filtration | | | | | |
| | 110,000 | | | Ametek | | | 5,212 | | |
| | | | | Aerospace/Industrial Instruments | | | | | |
| | 189,900 | | | K&F Industries Holdings (b) | | | 3,367 | | |
| | | | | Aircraft Wheels, Brakes & Fuel Tank Bladders | | | | | |
| | 132,000 | | | Goodman Global (b) | | | 2,004 | | |
| | | | | HVAC Equipment Manufacturer | | | | | |
| | 50,000 | | | Kaydon | | | 1,866 | | |
| | | | | Specialized Friction & Motion Control Products | | | | | |
| | | | 95,701 | | |
| | | >Electrical Components: 1.9% | |
| | 376,000 | | | Genlyte Group (b) | | | 27,233 | | |
| | | | | Commercial Lighting Fixtures | | | | | |
| | | >Construction: 0.9% | |
| | 204,050 | | | Florida Rock Industries | | | 10,135 | | |
| | | | | Aggregates & Concrete | | | | | |
| | 100,000 | | | Simpson Manufacturing | | | 3,605 | | |
| | | | | Wall Joint Maker | | | | | |
| | | | 13,740 | | |
45
Columbia Acorn USA
>Statement of Investments (Unaudited), continued
| Number of Shares | | | | Value (000) | |
| | | >Specialty Chemicals: 0.5% | |
| | 357,500 | | | Spartech | | $ | 8,080 | | |
| | | | | Plastics Distribution & Compounding | | | | | |
| | | >Outsourcing Services: 0.5% | |
| | 400,000 | | | Quanta Services (b) | | | 6,932 | | |
| | | | | Electrical & Telecom Construction Services | | | | | |
| | | >Waste Management: 0.5% | |
| | 187,250 | | | Waste Connections (b) | | | 6,816 | | |
| | | | | Solid Waste Management | | | | | |
| | | >Industrial Distribution: 0.2% | |
| | 113,000 | | | NuCo2 (b) | | | 2,717 | | |
| | | | | Bulk Co2 Gas Distribution to Restaurants | | | | | |
| | | >Other Industrial Services: 0.1% | |
| | 63,000 | | | UTI Worldwide | | | 1,589 | | |
| | | | | Global Logistics & Freight Forwarding | | | | | |
| | | Industrial Goods/Services: Total | | | 162,808 | | |
| Energy/Minerals: 9.4% | | | |
| | | >Oil Services: 4.9% | |
| | 401,700 | | | FMC Technologies (b) | | | 27,099 | | |
| | | | | Oil & Gas Well Head Manufacturer | | | | | |
| | 535,000 | | | Chicago Bridge & Iron | | | 12,920 | | |
| | | | | Engineering & Construction for
Petrochemicals & LNG | | | | | |
| | 311,000 | | | Pride International (b) | | | 9,713 | | |
| | | | | Offshore Drilling Contractor | | | | | |
| | 152,000 | | | Atwood Oceanics (b) | | | 7,539 | | |
| | | | | Contract Drilling | | | | | |
| | 355,000 | | | Hanover Compressor (b) | | | 6,667 | | |
| | | | | Natural Gas Compressor Rental & Fabrications | | | | | |
| | 76,500 | | | Carbo Ceramics | | | 3,758 | | |
| | | | | Natural Gas Well Stimulants | | | | | |
| | 155,000 | | | Key Energy Services (b) | | | 2,364 | | |
| | | | | Well Workover Services | | | | | |
| | 350,900 | | | Newpark Resources (b) | | | 2,158 | | |
| | | | | Drilling Fluid Services | | | | | |
| | 11,000 | | | Helmerich & Payne | | | 663 | | |
| | | | | Contract Driller | | | | | |
| | | | 72,881 | | |
| | | >Oil and Gas Producers: 3.6% | |
| | 525,000 | | | Quicksilver Resources (b) | | | 19,325 | | |
| | | | | Natural Gas & Coal Seam Gas Producer | | | | | |
| | 282,600 | | | Western Gas Resources | | | 16,914 | | |
| | | | | Oil & Coal Seam Gas Producer | | | | | |
| | 208,400 | | | Southwestern Energy (b) | | | 6,494 | | |
| | | | | Natural Gas Producer | | | | | |
| | 450,000 | | | Vaalco Energy (b) | | | 4,392 | | |
| | | | | Oil & Gas Producer | | | | | |
| | 111,200 | | | Equitable Resources | | | 3,725 | | |
| | | | | Natural Gas Producer & Utility | | | | | |
| | 92,000 | | | McMoran Exploration (b) | | | 1,619 | | |
| | | | | Natural Gas Producer & Developer | | | | | |
| | | | 52,469 | | |
| Number of Shares | | | | Value (000) | |
| | | >Other Resources: 0.5% | |
| | 242,000 | | | Layne Christensen (b) | | $ | 6,861 | | |
| | | | | Oil & Gas Producer/Engineering &
Construction/Contract Drilling | | | | | |
| | | >Oil Refining/Marketing/Distribution: 0.4% | |
| | 155,000 | | | Atmos Energy | | | 4,326 | | |
| | | | | Dallas Natural Gas Utility | | | | | |
| | 50,250 | | | Oneok | | | 1,710 | | |
| | | | | Natural Gas Distribution, Pipeline,
Processing & Trading | | | | | |
| | | | 6,036 | | |
| | | Energy/Minerals: Total | | | 138,247 | | |
| Finance: 7.5% | | | |
| | | >Finance Companies: 3.4% | |
| | 1,121,500 | | | AmeriCredit (b) | | | 31,312 | | |
| | | | | Auto Lending | | | | | |
| | 520,200 | | | World Acceptance (b) | | | 18,478 | | |
| | | | | Personal Loans | | | | | |
| | | | 49,790 | | |
| | | >Insurance: 2.4% | |
| | 664,500 | | | HCC Insurance Holdings | | | 19,563 | | |
| | | | | Specialty Insurance | | | | | |
| | 14,000 | | | Markel (b) | | | 4,858 | | |
| | | | | Specialty Insurance | | | | | |
| | 105,000 | | | Philadelphia Consolidated Holding (b) | | | 3,188 | | |
| | | | | Specialty Insurance | | | | | |
| | 87,000 | | | Delphi Financial Group | | | 3,163 | | |
| | | | | Group Employee Benefit Products & Services | | | | | |
| | 75,000 | | | Endurance Specialty Holdings | | | 2,400 | | |
| | | | | Commercial Lines Insurance/Reinsurance | | | | | |
| | 91,000 | | | United America Indemnity (b) | | | 1,896 | | |
| | | | | Specialty Insurance | | | | | |
| | 1,600 | | | Eastern Insurance Holdings (b) | | | 20 | | |
| | | | | Workers Comp & Specialty Insurance | | | | | |
| | | | 35,088 | | |
| | | >Banks: 1.4% | |
| | 239,500 | | | TCF Financial | | | 6,335 | | |
| | | | | Great Lakes Bank | | | | | |
| | 212,756 | | | Chittenden | | | 5,500 | | |
| | | | | Vermont & Western Massachusetts Banks | | | | | |
| | 145,000 | | | Greene County Bancshares | | | 4,489 | | |
| | | | | Tennessee Bank | | | | | |
| | 94,000 | | | Associated Banc-Corp | | | 2,964 | | |
| | | | | Midwest Bank | | | | | |
| | 20,000 | | | First Financial Bankshares | | | 731 | | |
| | | | | West Texas Bank | | | | | |
| | 30,000 | | | West Bancorporation | | | 560 | | |
| | | | | Des Moines Commercial Bank | | | | | |
| | | | 20,579 | | |
| | | >Savings and Loans: 0.3% | |
| | 141,400 | | | Anchor Bancorp Wisconsin | | | 4,266 | | |
| | | | | Wisconsin Thrift | | | | | |
| | | Finance: Total | | | 109,723 | | |
1-800-922-6769
46
Number of Shares
or Principal Amount | | | | Value (000) | |
| Other Industries: 2.2% | | | |
| | | >Real Estate: 1.6% | |
| | 560,000 | | | DiamondRock Hospitality | | $ | 8,293 | | |
| | | | | Hotel Owner | | | | | |
| | 350,000 | | | Highland Hospitality | | | 4,928 | | |
| | | | | Hotel Owner | | | | | |
| | 77,500 | | | Gaylord Entertainment (b) | | | 3,382 | | |
| | | | | Convention Hotels | | | | | |
| | 150,000 | | | Kite Realty Group | | | 2,339 | | |
| | | | | Community Shopping Centers | | | | | |
| | 90,000 | | | American Campus Communities | | | 2,237 | | |
| | | | | Student Housing | | | | | |
| | 110,500 | | | Crescent Real Estate Equities | | | 2,051 | | |
| | | | | Class 'A' Office Buildings | | | | | |
| | | | 23,230 | | |
| | | >Transportation/Regulated Utilities: 0.6% | |
| | 424,720 | | | Heartland Express | | | 7,598 | | |
| | | | | Regional Trucker | | | | | |
| | 97,500 | | | Northeast Utilities | | | 2,015 | | |
| | | | | Utility | | | | | |
| | | | 9,613 | | |
| | Other Industries: Total | | | | | | 32,843 | | |
| | Total Common Stocks: 91.5% | | | (Cost: $963,933) | | | 1,345,431
| | |
| Short-Term Obligations: 8.6% | | | |
| $ | 65,000 | | | Conocophillips
5.30% Due 7/03/06 - 7/06/06 | | | 64,965 | | |
| | 32,000 | | | Countrywide Financial Funding
5.30% Due 7/03/06 | | | 31,972 | | |
| | 26,000 | | | Verizon Global Funding
5.30% Due 7/05/06 | | | 25,985 | | |
| | 2,797 | | | Repurchase Agreement with
State Street Bank & Trust
dated 6/30/06, due 7/3/06
at 4.93% collateralized by
Federal Home Loan Bank,
maturing 5/22/08
market value $2,855
(repurchase proceeds: $2,798) | | | 2,797 | | |
| | | | | (Amortized Cost: $125,719) | | | 125,719 | | |
| | Total Investments: 100.1%
(Cost: $1,089,652)(a) | | | | | | 1,471,150 | | |
| | Cash and Other Assets Less Liabilities: (0.1%) | | | | | | (817 | ) | |
| | Total Net Assets: 100% | | | | | $ | 1,470,333 | | |
47
Columbia Acorn USA
>Statement of Investments (Unaudited), continued
>Notes to Statement of Investments (in thousands)
(a) At June 30, 2006, for federal income tax purposes cost of investments was $1,089,652 and net unrealized appreciation was $381,498 consisting of gross unrealized appreciation of $445,543 and gross unrealized depreciation of $64,045.
(b) Non-income producing security.
(c) An affiliate may include any company in which the Fund owns five percent or more of its outstanding voting shares. On June 30, 2006, the Fund held five percent or more of the outstanding voting securities of the following companies:
The aggregate cost and value of this company at June 30, 2006, was $5,636 and $3,946 respectively. Investments in affiliate companies represent 0.27% of total net assets at June 30, 2006. Investment activity and income amounts relating to affiliates during the six months ended June 30, 2006 were as follows:
| Dividend Income | | $ | — | | |
| Net realized gain or loss | | | — | | |
| Change in unrealized gain or loss | | | (63 | ) | |
| Purchases | | | — | | |
| Proceeds from sales | | | — | | |
(d) Denotes a restricted security, which is subject to restrictions on resale under federal securities laws. These securities are valued in good faith by the Board of Trustees. At June 30, 2006, these securities (in thousands) amounted to $186 which represents 0.01% of total net assets.
Additional information on these securities is as follows:
| Security | | Acquisition
Dates | | Shares | | Cost (000) | | Value (000) | |
| Locus Discovery, Series D, Pfd. | | 09/05/01 | | | 375,000 | | | $ | 1,500 | | | $ | 102 | | |
| Metabolex, Series F | | 05/11/00 | | | 363,636 | | | | 2,000 | | | | 84 | | |
| | | | | | | $ | 3,500 | | | $ | 186 | | |
1-800-922-6769
48
Columbia Acorn International Select
>Major Portfolio Changes in the Second Quarter (Unaudited)
| | | Number of Shares | |
| | | 03/31/06 | | 06/30/06 | |
| Additions | |
| Europe | |
| >Ireland | |
| Anglo Irish Bank | | | 174,000 | | | | 265,000 | | |
| Bank of Ireland | | | 245,000 | | | | 280,000 | | |
| C&C Group | | | 170,000 | | | | 500,000 | | |
| >Switzerland | |
| Synthes | | | 25,000 | | | | 30,000 | | |
| >Germany | |
| Depfa Bank | | | 185,000 | | | | 215,000 | | |
| >Sweden | |
| Hexagon | | | 0 | | | | 32,000 | | |
| Tele2 | | | 160,000 | | | | 255,000 | | |
| >Czech Republic | |
| Komercni Banka | | | 10,300 | | | | 15,300 | | |
| >Netherlands | |
| USG People | | | 0 | | | | 17,000 | | |
| Asia | |
| >Japan | |
| Hoya | | | 90,000 | | | | 110,000 | | |
| Kansai Paint | | | 80,000 | | | | 280,000 | | |
| Other Countries | |
| >Canada | |
| Alliance Atlantis Communication | | | 0 | | | | 72,000 | | |
| Potash | | | 30,700 | | | | 35,000 | | |
| >United States | |
| Atwood Oceanics | | | 0 | | | | 60,800 | | |
| | | Number of Shares | |
| | | 03/31/06 | | 06/30/06 | |
| Sales | |
| Europe | |
| >Switzerland | |
| BKW Energie | | | 12,100 | | | | 2,500 | | |
| >Sweden | |
| Gambro | | | 320,200 | | | | 0 | | |
| >Norway | |
| Orkla | | | 47,000 | | | | 0 | | |
| Asia | |
| >Japan | |
| Ito En | | | 76,000 | | | | 36,000 | | |
| Shimano | | | 130,000 | | | | 5,600 | | |
| Ushio | | | 145,000 | | | | 85,000 | | |
| Other Countries | |
| >Canada | |
| Kinross Gold | | | 311,000 | | | | 111,000 | | |
| Talisman Energy | | | 78,000 | | | | 0 | | |
| (includes the effect of a 3 for 1 stock split) | |
| Latin America | |
| >Argentina | |
| Tenaris | | | 29,500 | | | | 0 | | |
| (includes the effect of a 5 for 1 stock split) | |
49
Columbia Acorn International Select
>Statement of Investments (Unaudited), June 30, 2006
| Number of Shares | | | | Value (000) | |
| | | Common Stocks: 93.6% | |
| Europe: 55.0% | | | |
| | | >Ireland: 15.9% | |
| | 280,000 | | | Bank of Ireland | | $ | 5,012 | | |
| | | | | Irish Commercial Bank | | | | | |
| | 500,000 | | | C&C Group | | | 4,342 | | |
| | | | | Beverage Company | | | | | |
| | 265,000 | | | Anglo Irish Bank | | | 4,129 | | |
| | | | | Small Business & Middle Market Banking | | | | | |
| | 220,000 | | | IAWS Group | | | 3,879 | | |
| | | | | Baked Goods | | | | | |
| | 125,000 | | | Grafton Group | | | 1,574 | | |
| | | | | Builders Materials Wholesaling &
Do-it-yourself Retailing | | | | | |
| | | | 18,936 | | |
| | | >Switzerland: 10.6% | |
| | 30,000 | | | Synthes | | | 3,614 | | |
| | | | | Products for Orthopedic Surgery | | | | | |
| | 42,500 | | | Kuehne & Nagel | | | 3,094 | | |
| | | | | Freight Forwarding/Logistics | | | | | |
| | 2,400 | | | Geberit | | | 2,773 | | |
| | | | | Plumbing Supplies | | | | | |
| | 10,250 | | | Swatch Group | | | 1,729 | | |
| | | | | Watch & Electronics Manufacturer | | | | | |
| | 23,000 | | | Schindler | | | 1,191 | | |
| | | | | Elevator Manufacturer & Service Provider | | | | | |
| | 2,500 | | | BKW Energie | | | 219 | | |
| | | | | Electric Utility | | | | | |
| | | | 12,620 | | |
| | | >France: 7.4% | |
| | 24,200 | | | Neopost | | | 2,755 | | |
| | | | | Postage Meter Machines | | | | | |
| | 182,300 | | | SES Global | | | 2,597 | | |
| | | | | Satellite Broadcasting Services | | | | | |
| | 20,000 | | | Essilor International | | | 2,011 | | |
| | | | | Eyeglass Lenses | | | | | |
| | 18,000 | | | Imerys | | | 1,438 | | |
| | | | | Industrial Minerals Producer | | | | | |
| | | | 8,801 | | |
| | | >Germany: 6.4% | |
| | 215,000 | | | Depfa Bank | | | 3,564 | | |
| | | | | Investment Banker to Public Authorities | | | | | |
| | 3,300 | | | Porsche | | | 3,184 | | |
| | | | | Specialty Automobile Manufacturer | | | | | |
| | 6,000 | | | Deutsche Boerse | | | 816 | | |
| | | | | Trading, Clearing, Settlement Services
for Financial Markets | | | | | |
| | | | 7,564 | | |
| | | >United Kingdom: 3.3% | |
| | 215,000 | | | Northern Rock | | | 3,971 | | |
| | | | | Lowest Cost Mortgage Bank in UK | | | | | |
| | | >Sweden: 3.1% | |
| | 255,000 | | | Tele2 | | | 2,573 | | |
| | | | | European Mobile Operator & Services Reseller | | | | | |
| | 32,000 | | | Hexagon | | | 1,165 | | |
| | | | | Measurement Equipment & Polymers | | | | | |
| | | | 3,738 | | |
| Number of Shares | | | | Value (000) | |
| | | >Denmark: 2.8% | |
| | 50,000 | | | Novozymes | | $ | 3,370 | | |
| | | | | Industrial Enzymes | | | | | |
| | | >Spain: 2.5% | |
| | 88,000 | | | Red Electrica | | | 3,034 | | |
| | | | | Spanish Power Grid | | | | | |
| | | >Czech Republic: 1.9% | |
| | 15,300 | | | Komercni Banka | | | 2,239 | | |
| | | | | Leading Czech Universal Bank | | | | | |
| | | >Netherlands: 1.1% | |
| | 17,000 | | | USG People | | | 1,301 | | |
| | | | | Temporary Staffing Services | | | | | |
| | | Europe: Total | | | 65,574 | | |
| Asia: 28.2% | | | |
| | | >Japan: 24.1% | |
| | 76,000 | | | Daito Trust Construction | | | 4,226 | | |
| | | | | Apartment Builder | | | | | |
| | 110,000 | | | Hoya | | | 3,932 | | |
| | | | | Opto-Electrical Components &
Eyeglass Lenses | | | | | |
| | 5,299 | | | Jupiter Telecommunications (b) | | | 3,673 | | |
| | | | | Largest Cable Service Provider in Japan | | | | | |
| | 55,000 | | | Aeon Mall | | | 2,308 | | |
| | | | | Suburban Shopping Mall Developer,
Owner & Operator | | | | | |
| | 280,000 | | | Kansai Paint | | | 2,240 | | |
| | | | | Paint Producer in Japan, India,
China & Southeast Asia | | | | | |
| | 85,000 | | | JSR | | | 2,157 | | |
| | | | | Films & Chemicals for LCD
Screens & Electronics | | | | | |
| | 30,000 | | | USS | | | 1,986 | | |
| | | | | Used Car Auctioneer | | | | | |
| | 1,800 | | | Sparx Asset Management | | | 1,881 | | |
| | | | | Fund Management | | | | | |
| | 420 | | | Kenedix | | | 1,819 | | |
| | | | | Real Estate Investment Management | | | | | |
| | 85,000 | | | Ushio | | | 1,800 | | |
| | | | | Industrial Light Sources | | | | | |
| | 36,000 | | | Ito En | | | 1,321 | | |
| | | | | Bottled Tea & Other Beverages | | | | | |
| | 199,800 | | | Hiroshima Bank | | | 1,222 | | |
| | | | | Regional Bank | | | | | |
| | 5,600 | | | Shimano | | | 172 | | |
| | | | | Bicycle Components & Fishing Tackle | | | | | |
| | | | 28,737 | | |
| | | >Hong Kong: 3.3% | |
| | 610,000 | | | Hong Kong Exchanges and Clearing | | | 3,920 | | |
| | | | | Hong Kong Equity & Derivatives
Market Operator | | | | | |
1-800-922-6769
50
Number of Shares
or Principal Amount | | | | Value (000) | |
| | | >Singapore: 0.8% | |
| | 1,000,000 | | | Comfort Del Gro | | $ | 964 | | |
| | | | | Taxi & Mass Transit Service | | | | | |
| | | | | Asia: Total | | | 33,621 | | |
| Other Countries: 10.4% | | | |
| | | >Canada: 6.8% | |
| | 35,000 | | | Potash | | | 3,009 | | |
| | | | | World's Largest Producer of Potash | | | | | |
| | 72,000 | | | Alliance Atlantis Communication (b) | | | 2,109 | | |
| | | | | CATV Channels, TV/Movie Production/Distribution | | | | | |
| | 100,000 | | | Rona (b) | | | 1,796 | | |
| | | | | Leading Canadian DIY Retailer | | | | | |
| | 111,000 | | | Kinross Gold (b) | | | 1,210 | | |
| | | | | Gold Mining | | | | | |
| | | | 8,124 | | |
| | | >United States: 2.6% | |
| | 60,800 | | | Atwood Oceanics (b) | | | 3,016 | | |
| | | | | Contract Drilling | | | | | |
| | | >South Africa: 1.0% | |
| | 6,500 | | | Impala Platinum Holdings | | | 1,195 | | |
| | | | | Platinum Group Metals Mining & Refining | | | | | |
| | | | | Other Countries: Total | | | 12,335 | | |
| | | | | Total Common Stocks: 93.6%
(Cost: $90,604) | | | 111,530
| | |
| Short-Term Obligation: 6.2% | | | |
| $ | 7,418 | | | Repurchase Agreement with
State Street Bank & Trust
dated 6/30/06, due 7/03/06
at 4.93% collateralized by
Federal Home Loan Bank,
maturing 5/22/08
market value $7,570
(repurchase proceeds: $7,421) | | | 7,418 | | |
| | | | | (Amortized Cost: $7,418) | | | | | |
| | Total Investments: 99.8%
(Cost: $98,022)(a)(c) | | | | | | 118,948 | | |
| | Cash and Other Assets Less Liabilities: 0.2% | | | | | | 230 | | |
| | Total Net Assets: 100% | | | | | $ | 119,178 | | |
51
Columbia Acorn International Select
>Statement of Investments (Unaudited), continued
>Notes to Statement of Investments (in thousands)
(a) At June 30, 2006, for federal income tax purposes cost of investments was $98,022 and net unrealized appreciation was $20,926 consisting of gross unrealized appreciation of $24,229 and gross unrealized depreciation of $3,303.
(b) Non-income producing security.
(c) On June 30, 2006, the Fund's total investments were denominated in currencies as follows:
| Currency | | Value | | % of
Total
Net Assets | |
| Euro | | $ | 39,637 | | | | 33.3 | % | |
| Japanese Yen | | | 28,737 | | | | 24.1 | | |
| US Dollar | | | 13,443 | | | | 11.3 | | |
| Swiss Franc | | | 12,620 | | | | 10.6 | | |
Other currencies less
than 5% of total
net assets | | | 24,511 | | | | 20.5 | | |
| | | $ | 118,948 | | | | 99.8 | % | |
1-800-922-6769
52
Columbia Acorn International Select
>Portfolio Diversification
At June 30, 2006, the Fund's portfolio investments as a percent of net assets was diversified as follows:
| | | Value (000) | | Percent | |
| >Industrial Goods/Services | |
| Specialty Chemicals | | $ | 7,768 | | | | 6.5 | % | |
| Construction | | | 6,999 | | | | 5.9 | | |
| Other Industrial Services | | | 4,285 | | | | 3.6 | | |
| Machinery | | | 2,755 | | | | 2.3 | | |
| Electrical Components | | | 1,800 | | | | 1.5 | | |
| Industrial Distribution | | | 1,573 | | | | 1.3 | | |
| Industrial Materials | | | 1,438 | | | | 1.2 | | |
| Outsourcing Services | | | 1,301 | | | | 1.1 | | |
| Conglomerates | | | 1,165 | | | | 1.0 | | |
| | | | 29,084 | | | | 24.4 | | |
| >Finance | |
| Banks | | | 20,136 | | | | 16.9 | | |
| Money Management | | | 1,881 | | | | 1.6 | | |
| | | | 22,017 | | | | 18.5 | | |
| >Consumer Goods/Services | |
| Beverage | | | 5,663 | | | | 4.8 | | |
| Durables Goods | | | 5,085 | | | | 4.3 | | |
| Retail | | | 4,104 | | | | 3.4 | | |
| Food | | | 3,879 | | | | 3.2 | | |
| Consumer Goods Distribution | | | 1,986 | | | | 1.7 | | |
| | | | 20,717 | | | | 17.4 | | |
| >Information | |
| Financial Processors | | | 4,736 | | | | 4.0 | | |
Semiconductors &
Related Equipment | | | 3,933 | | | | 3.3 | | |
| Cable Television | | | 3,673 | | | | 3.1 | | |
| Satellite Broadcasting | | | 2,597 | | | | 2.2 | | |
| Telephone Services | | | 2,573 | | | | 2.1 | | |
| Television Programming | | | 2,109 | | | | 1.7 | | |
| | | | 19,621 | | | | 16.4 | | |
| | | Value (000) | | Percent | |
| >Energy/Minerals | |
| Mining | | $ | 5,414 | | | | 4.6 | % | |
| Oil/Gas Producers | | | 3,015 | | | | 2.5 | | |
| | | | 8,429 | | | | 7.1 | | |
| >Other Industries | |
| Regulated Utilities | | | 3,253 | | | | 2.8 | | |
| Real Estate | | | 1,819 | | | | 1.5 | | |
| Transportation | | | 964 | | | | 0.8 | | |
| | | | 6,036 | | | | 5.1 | | |
| >Health Care | |
| Medical Equipment | | | 5,626 | | | | 4.7 | | |
| | | | 5,626 | | | | 4.7 | | |
| Total Common Stocks | | | 111,530 | | | | 93.6 | | |
| Short-Term Obligation | | | 7,418 | | | | 6.2 | | |
| Total Investments | | | 118,948 | | | | 99.8 | | |
Cash and Other Assets
Less Liabilities | | | 230 | | | | 0.2 | | |
| Total Net Assets | | $ | 119,178 | | | | 100.0 | % | |
53
Columbia Acorn Select
>Major Portfolio Changes in the Second Quarter (Unaudited)
| | | Number of Shares | |
| | | 03/31/06 | | 06/30/06 | |
| Additions | |
| Consumer Goods/Services | |
| Coach | | | 1,400,000 | | | | 1,506,000 | | |
| Expedia | | | 1,200,000 | | | | 3,300,000 | | |
| Petco Animal Supplies | | | 1,300,000 | | | | 1,350,000 | | |
| Information | |
| Avid Technology | | | 1,600,000 | | | | 1,650,000 | | |
| Liberty Global, Series A | | | 1,000,000 | | | | 1,139,734 | | |
| Novell | | | 5,000,000 | | | | 5,500,000 | | |
| Sanmina-SCI | | | 0 | | | | 4,000,000 | | |
| Tellabs | | | 9,600,000 | | | | 9,750,000 | | |
| Industrial Goods/Services | |
| Worthington Industries | | | 2,150,000 | | | | 2,250,000 | | |
| Energy/Minerals | |
| Potash (Canada) | | | 400,000 | | | | 480,000 | | |
| UrAsia Energy (Canada) | | | 1,900,000 | | | | 2,800,000 | | |
| Finance | |
| Janus Capital Group | | | 2,500,000 | | | | 3,200,000 | | |
| | | Number of Shares | |
| | | 03/31/06 | | 06/30/06 | |
| Sales | |
| Information | |
| IAC/Interactive Corp | | | 544,000 | | | | 0 | | |
| Liberty Global, Series C | | | 3,400,000 | | | | 3,232,702 | | |
| Tektronix | | | 1,400,000 | | | | 0 | | |
| Tribune Company | | | 803,700 | | | | 702,900 | | |
| Finance | |
| Associated Banc-Corp | | | 750,000 | | | | 0 | | |
| Health Care | |
| Coventry Health Care | | | 900,000 | | | | 0 | | |
1-800-922-6769
54
Columbia Acorn Select
>Statement of Investments (Unaudited), June 30, 2006
| Number of Shares | | | | Value (000) | |
| | | Common Stocks: 94.6% | |
| Consumer Goods/Services: 29.4% | | | |
| | | >Consumer Services: 11.8% | |
| | 1,625,000 | | | ITT Educational Services (b) | | $ | 106,941 | | |
| | | | | Post-secondary Degree Programs | | | | | |
| | 3,500,000 | | | Safeway | | | 91,000 | | |
| | | | | Supermarkets | | | | | |
| | 728,000 | | | Weight Watchers | | | 29,768 | | |
| | | | | Weight Loss Programs | | | | | |
| | | | 227,709 | | |
| | | >Retail: 7.9% | |
| | 1,400,000 | | | Abercrombie & Fitch | | | 77,602 | | |
| | | | | Teen Apparel Retailer | | | | | |
| | 845,000 | | | Costco Wholesale | | | 48,275 | | |
| | | | | Warehouse Superstores | | | | | |
| | 1,350,000 | | | Petco Animal Supplies (b) | | | 27,580 | | |
| | | | | Pet Supplies & Services | | | | | |
| | | | 153,457 | | |
| | | >Leisure Products: 4.9% | |
| | 1,100,000 | | | Harley-Davidson | | | 60,379 | | |
| | | | | Motorcycles & Related Merchandise | | | | | |
| | 740,000 | | | International Speedway Motors | | | 34,314 | | |
| | | | | Largest Motorsports Racetrack
Owner & Operator | | | | | |
| | | | 94,693 | | |
| | | >Travel: 2.5% | |
| | 3,300,000 | | | Expedia (b) | | | 49,401 | | |
| | | | | Online Travel Services Company | | | | | |
| | | >Apparel: 2.3% | |
| | 1,506,000 | | | Coach (b) | | | 45,029 | | |
| | | | | Designer & Retailer of Branded
Leather Accessories | | | | | |
| | | | | Consumer Goods/Services: Total | | | 570,289 | | |
| Information: 29.0% | | | |
| | | >Telecommunications Equipment: 6.7% | |
| | 9,750,000 | | | Tellabs (b) | | | 129,773 | | |
| | | | | Telecommunications Equipment | | | | | |
| | | >CATV: 6.6% | |
| | 3,232,702 | | | Liberty Global, Series C (b) | | | 66,497 | | |
| | 1,139,734 | | | Liberty Global, Series A (b) | | | 24,504 | | |
| | | | | CATV Holding Company | | | | | |
| | 2,500,000 | | | Discovery Holding (b) | | | 36,575 | | |
| | | | | CATV Programming | | | | | |
| | | | 127,576 | | |
| | | >Business Software: 4.7% | |
| | 1,650,000 | | | Avid Technology (b) | | | 54,995 | | |
| | | | | Digital Nonlinear Editing Software & Systems | | | | | |
| | 5,500,000 | | | Novell (b) | | | 36,465 | | |
| | | | | Directory, Operating System &
Identity Management Software | | | | | |
| | | | 91,460 | | |
| | | >Mobile Communications: 3.7% | |
| | 2,300,000 | | | American Tower (b) | | | 71,575 | | |
| | | | | Communications Towers in USA & Mexico | | | | | |
| Number of Shares | | | | Value (000) | |
| | | >Internet Related: 3.0% | |
| | 9,600,000 | | | Skillsoft Publishing (b)(c) | | $ | 58,752 | | |
| | | | | Web-based Learning Solutions (E-Learning) | | | | | |
| | | >Financial Processors: 1.8% | |
| | 729,500 | | | SEI Investments | | | 35,658 | | |
| | | | | Mutual Fund Administration &
Investment Management | | | | | |
| | | >Publishing: 1.2% | |
| | 702,900 | | | Tribune Company | | | 22,795 | | |
| | | | | Newspapers & TV Stations | | | | | |
| | | >Contract Manufacturing: 1.0% | |
| | 4,000,000 | | | Sanmina-SCI (b) | | | 18,400 | | |
| | | | | Backplane & Electronic Manufacturing Services | | | | | |
| | | >Computer Services: 0.3% | |
| | 1,367,000 | | | AnswerThink Consulting (b) | | | 5,509 | | |
| | | | | IT Integration & Best Practice Research | | | | | |
| | | | | Information: Total | | | 561,498 | | |
| Industrial Goods/Services: 13.7% | | | |
| | | >Other Industrial Services: 3.8% | |
| | 1,322,000 | | | Expeditors International of Washington | | | 74,045 | | |
| | | | | International Freight Forwarder | | | | | |
| | | >Outsourcing Services: 2.7% | |
| | 3,030,000 | | | Quanta Services (b) | | | 52,510 | | |
| | | | | Electrical & Telecom Construction Services | | | | | |
| | | >Steel: 2.5% | |
| | 2,250,000 | | | Worthington Industries | | | 47,138 | | |
| | | | | Steel Processing | | | | | |
| | | >Waste Management: 2.4% | |
| | 1,300,000 | | | Waste Management | | | 46,644 | | |
| | | | | U.S. Garbage Collection & Disposal | | | | | |
| | | >Industrial Materials: 2.3% | |
| | 1,125,000 | | | Mine Safety Appliances | | | 45,225 | | |
| | | | | Safety Equipment | | | | | |
| | | | | Industrial Goods/Services: Total | | | 265,562 | | |
| Energy/Minerals: 11.4% | | | |
| | | >Mining: 6.2% | |
| | 31,500,000 | | | UrAsia Energy (Canada) (b)(c) | | | 79,011 | | |
| | | | | Uranium Mining in Kazakhstan | | | | | |
| | 480,000 | | | Potash (Canada) | | | 41,266 | | |
| | | | | World's Largest Producer of Potash | | | | | |
| | | | 120,277 | | |
55
Columbia Acorn Select
>Statement of Investments (Unaudited), continued
Number of Shares
or Principal Amount | | | | Value (000) | |
| | | >Oil Services: 5.2% | |
| | 1,950,000 | | | Pride International (b) | | $ | 60,899 | | |
| | | | | Contract Drilling | | | | | |
| | 600,000 | | | FMC Technologies (b) | | | 40,475 | | |
| | | | | Oil & Gas Well Head Manufacturer | | | | | |
| | | | 101,374 | | |
| | | | | Energy/Minerals: Total | | | 221,651 | | |
| Finance: 9.3% | | | |
| | | >Money Management: 5.2% | |
| | 3,200,000 | | | Janus Capital Group | | | 57,280 | | |
| | | | | Manages Mutual Funds | | | | | |
| | 975,000 | | | Nuveen Investments | | | 41,974 | | |
| | | | | Specialty Mutual Funds | | | | | |
| | | | 99,254 | | |
| | | >Insurance: 4.1% | |
| | 1,800,000 | | | Conseco (b) | | | 41,580 | | |
| | | | | Life, Long Term Care & Medical
Supplement Insurance | | | | | |
| | 112,000 | | | Markel (b) | | | 38,865 | | |
| | | | | Specialty Insurance | | | | | |
| | | | 80,445 | | |
| | | | | Finance: Total | | | 179,699 | | |
| Health Care: 1.8% | | | |
| | | >Health Care Services: 1.8% | |
| | 910,000 | | | Lincare Holdings (b) | | | 34,434 | | |
| | | | | Home Health Care Services | | | | | |
| | | | | Health Care: Total | | | 34,434 | | |
| | | | | Total Common Stock: 94.6%
(Cost: $1,388,372) | | | 1,833,133
| | |
| Short-Term Obligations: 3.2% | | | |
| $ | 30,000 | | | Conocophillips
5.30% Due 7/03/06 | | | 29,987 | | |
| | 27,000 | | | Countrywide Financial Funding
5.25% Due 7/05/06 | | | 26,976 | | |
| | 8,784 | | | Repurchase Agreement with
State Street Bank & Trust
dated 6/30/06, due 7/3/06
at 4.93% collateralized by
Federal Home Loan Bank,
maturing 5/22/08
market value $4,880
(repurchase proceeds: $4,786) | | | 4,784 | | |
| | | | | (Amortized Cost: $61,747) | | | 61,747 | | |
| | Total Investments: 97.8%
(Cost: $1,450,119)(a) | | | | | | 1,894,880 | | |
| | Cash and Other Assets Less Liabilities: 2.2% | | | | | | 42,833 | | |
| | Total Net Assets: 100% | | | | | $ | 1,937,713 | | |
1-800-922-6769
56
>Notes to Statement of Investments (in thousands)
(a) At June 30, 2006, for federal income tax purposes cost of investments was $1,450,119 and net unrealized appreciation was $444,761 consisting of gross unrealized appreciation of $484,626 and gross unrealized depreciation of $39,865.
(b) Non-income producing security.
(c) An affiliate may include any company in which the Fund owns five percent or more of its outstanding voting shares. On June 30, 2006, the Fund held five percent or more of the outstanding voting securities of the following companies:
| Skillsoft Publishing | | | 8.88 | % | |
| UrAsia Energy (Canada) | | | 6.56 | % | |
The aggregate cost and value of these companies at June 30, 2006, was $110,886 and $137,763 respectively. Investments in affiliate companies represent 7.11% of total net assets at June 30, 2006. Investment activity and income amounts relating to affiliates during the six months ended June 30, 2006, were as follows:
| Dividend Income | | $ | — | | |
| Net realized gain or loss | | | — | | |
| Change in unrealized gain or loss | | | 24,788 | | |
| Purchases | | | 6,039 | | |
| Proceeds from sales | | | — | | |
57
This page intentionally left blank.
1-800-922-6769
58
Columbia Acorn Family of Funds
> Statements of Assets and Liabilities
> Statements of Operations
> Statements of Changes in Net Assets
> Financial Highlights
> Notes to Financial Statements
59
Columbia Acorn Family of Funds
>Statements of Assets and Liabilities (Unaudited)
| June 30, 2006 | | Columbia
Acorn
Fund | | Columbia
Acorn
International | | Columbia
Acorn
USA | | Columbia
Acorn
International Select | | Columbia
Acorn
Select | |
| (in thousands) | |
| Assets: | |
| Unaffiliated investments, at cost | | $ | 9,452,305 | | | $ | 2,456,244 | | | $ | 1,084,016 | | | $ | 98,022 | | | $ | 1,339,233 | | |
| Affiliated investments, at cost (See Note 4) | | | 1,819,627 | | | | 29,676 | | | | 5,636 | | | | — | | | | 110,886 | | |
| Unaffiliated investments, at value | | $ | 14,993,693 | | | $ | 3,550,552 | | | $ | 1,467,204 | | | $ | 118,948 | | | $ | 1,757,117 | | |
| Affiliated investments, at value (See Note 4) | | | 2,934,084 | | | | 21,869 | | | | 3,946 | | | | — | | | | 137,763 | | |
| Cash | | | 2,056 | | | | 1 | | | | 13 | | | | 1 | | | | 1 | | |
Foreign currency (cost: Columbia Acorn Fund
$5,941; Columbia Acorn International
$5,019; Columbia Acorn International Select
$200; Columbia Acorn Select $*) | | | 6,049 | | | | 5,077 | | | | — | | | | 203 | | | | — | * | |
| Receivable for: | |
| Investments sold | | | 28,918 | | | | 8,075 | | | | 1,587 | | | | 343 | | | | 45,986 | | |
| Fund shares sold | | | 24,568 | | | | 8,551 | | | | 2,822 | | | | 117 | | | | 2,178 | | |
| Dividends and interest | | | 8,609 | | | | 6,066 | | | | 400 | | | | 197 | | | | 342 | | |
| Foreign tax reclaims | | | 793 | | | | 1,042 | | | | 2 | | | | 36 | | | | — | | |
| Deferred Trustees' Compensation Investments | | | 1,927 | | | | 538 | | | | 136 | | | | — | | | | — | | |
| Other assets | | | — | | | | 122 | | | | 90 | | | | 2 | | | | — | | |
| Total Assets | | | 18,000,697 | | | | 3,601,893 | | | | 1,476,200 | | | | 119,847 | | | | 1,943,387 | | |
| Liabilities: | |
| Payable for: | |
| Investments purchased | | | 53,778 | | | | 711 | | | | 3,405 | | | | 384 | | | | 76 | | |
| Fund shares redeemed | | | 14,600 | | | | 1,357 | | | | 978 | | | | 97 | | | | 3,377 | | |
| Management fee | | | 9,220 | | | | 2,220 | | | | 1,024 | | | | 90 | | | | 1,270 | | |
| Administration fee | | | 588 | | | | 117 | | | | 48 | | | | 4 | | | | 64 | | |
| 12b-1 Service & Distribution fees | | | 2,923 | | | | 157 | | | | 132 | | | | 11 | | | | 442 | | |
| Reports to shareholders | | | 633 | | | | 205 | | | | 90 | | | | 36 | | | | 230 | | |
| Deferred Trustees' fees | | | 1,927 | | | | 538 | | | | 136 | | | | 12 | | | | 47 | | |
| Transfer agent fees | | | 600 | | | | 80 | | | | 36 | | | | 6 | | | | 135 | | |
| Trustees' fees | | | 4 | | | | — | | | | — | | | | — | * | | | 6 | | |
| Audit fee | | | 32 | | | | 34 | | | | 18 | | | | 19 | | | | 18 | | |
| Custody fees | | | 210 | | | | 172 | | | | — | | | | 10 | | | | — | | |
| Other liabilities | | | 106 | | | | — | | | | — | | | | — | | | | 9 | | |
| Total Liabilities | | | 84,621 | | | | 5,591 | | | | 5,867 | | | | 669 | | | | 5,674 | | |
| Net Assets | | $ | 17,916,076 | | | $ | 3,596,302 | | | $ | 1,470,333 | | | $ | 119,178 | | | $ | 1,937,713 | | |
| Composition of Net Assets: | |
| Paid in capital | | $ | 10,598,812 | | | $ | 2,229,793 | | | $ | 1,096,188 | | | $ | 111,933 | | | $ | 1,468,574 | | |
Undistributed (overdistributed) net investment income
(Accumulated net investment loss) | | | (6,560 | ) | | | 4,339 | | | | (1,371 | ) | | | (357 | ) | | | (15,027 | ) | |
| Accumulated net realized gain (loss) | | | 667,823 | | | | 275,512 | | | | (6,049 | ) | | | (13,330 | ) | | | 39,405 | | |
| Net unrealized appreciation (depreciation) on: | |
| Investments | | | 6,655,845 | | | | 1,086,501 | | | | 381,498 | | | | 20,926 | | | | 444,761 | | |
| Foreign currency translations | | | 156 | | | | 157 | | | | 67 | | | | 6 | | | | — | * | |
| Net Assets | | $ | 17,916,076 | | | $ | 3,596,302 | | | $ | 1,470,333 | | | $ | 119,178 | | | $ | 1,937,713 | | |
| Net asset value per share – Class A (a) | | $ | 28.81 | | | $ | 37.33 | | | $ | 26.96 | | | $ | 22.95 | | | $ | 23.55 | | |
| (Net assets/shares) | | | ($3,808,423/132,182) | | | | ($211,021/5,652) | | | | ($220,043/8,162) | | | | ($14,167/617) | | | | ($788,153/33,464) | | |
Maximum offering price per
share – Class A (b) | | $ | 30.57 | | | $ | 39.61 | | | $ | 28.60 | | | $ | 24.35 | | | $ | 24.99 | | |
(Net asset value per share/front-end
sales charge) | | | ($28.81/0.9425) | | | | ($37.33/0.9425) | | | | ($26.96/0.9425) | | | | ($22.95/0.9425) | | | | ($23.55/0.9425) | | |
Net asset value and offering price
per share – Class B (a) | | $ | 27.71 | | | $ | 36.65 | | | $ | 25.95 | | | $ | 22.24 | | | $ | 22.69 | | |
| (Net assets/shares) | | | ($1,406,504/50,764) | | | | ($82,345/2,247) | | | | ($67,649/2,607) | | | | ($7,910/356) | | | | ($203,596/8,973) | | |
Net asset value and offering price
per share – Class C (a) | | $ | 27.66 | | | $ | 36.61 | | | $ | 25.92 | | | $ | 22.23 | | | $ | 22.66 | | |
| (Net assets/shares) | | | ($1,300,779/47,032) | | | | ($76,524/2,091) | | | | ($50,799/1,960) | | | | ($5,006/225) | | | | ($155,134/6,847) | | |
Net asset value and offering price
per share – Class Z (c) | | $ | 29.49 | | | $ | 37.58 | | | $ | 27.52 | | | $ | 23.16 | | | $ | 23.87 | | |
| (Net assets/shares) | | | ($11,400,370/386,621) | | | | ($3,226,412/85,846) | | | | ($1,131,842/41,121) | | | | ($92,095/3,976) | | | | ($790,830/33,124) | | |
(a) Redemption price per share is equal to net asset value less any applicable contingent deferred sales charge.
(b) On sales of $50,000 or more the offering price is reduced.
(c) Redemption price per share is equal to net asset value less any applicable redemption fee.
* Rounds to less than $500.
See accompanying notes to financial statements.
1-800-922-6769
60
Columbia Acorn Family of Funds
>Statements of Operations
For the Six Months Ended June 30, 2006 (Unaudited)
| (in thousands) | | Columbia
Acorn
Fund | | Columbia
Acorn
International | | Columbia
Acorn
USA | | Columbia
Acorn
International Select | | Columbia
Acorn
Select | |
| Investment Income: | |
| Dividend income | | $ | 72,878 | | | $ | 39,687 | | | $ | 3,023 | | | $ | 1,249 | | | $ | 5,670 | | |
| Dividend income from affiliates (See Note 4) | | | 13,299 | | | | 58 | | | | — | | | | — | | | | — | | |
| Interest income | | | 28,493 | | | | 6,484 | | | | 3,409 | | | | 100 | | | | 1,399 | | |
| | | | 114,670 | | | | 46,229 | | | | 6,432 | | | | 1,349 | | | | 7,069 | | |
| Foreign taxes withheld | | | (2,712 | ) | | | (3,643 | ) | | | (5 | ) | | | (105 | ) | | | (16 | ) | |
| Total Investment Income | | | 111,958 | | | | 42,586 | | | | 6,427 | | | | 1,244 | | | | 7,053 | | |
| Expenses: | |
| Management fee | | | 57,105 | | | | 13,306 | | | | 6,073 | | | | 521 | | | | 7,840 | | |
| Administration fee | | | 3,643 | | | | 701 | | | | 287 | | | | 23 | | | | 391 | | |
| 12b-1 Service and Distribution fees: | |
| Class A | | | 4,680 | | | | 241 | | | | 250 | | | | 15 | | | | 984 | | |
| Class B | | | 6,192 | | | | 355 | | | | 307 | | | | 32 | | | | 890 | | |
| Class C | | | 6,533 | | | | 335 | | | | 235 | | | | 23 | | | | 780 | | |
| Transfer agent fees: | |
| Class A | | | 1,007 | | | | 69 | | | | 57 | | | | 8 | | | | 326 | | |
| Class B | | | 1,048 | | | | 74 | | | | 59 | | | | 10 | | | | 211 | | |
| Class C | | | 596 | | | | 33 | | | | 25 | | | | 4 | | | | 111 | | |
| Class Z | | | 1,265 | | | | 538 | | | | 122 | | | | 28 | | | | 234 | | |
| Custody fees | | | 922 | | | | 919 | | | | 20 | | | | 27 | | | | 29 | | |
| Trustees' fees | | | 303 | | | | 47 | | | | 21 | | | | 1 | | | | 15 | | |
| Registration & blue sky fees | | | 167 | | | | 128 | | | | 76 | | | | 42 | | | | 106 | | |
| Reports to shareholders | | | 1,248 | | | | 320 | | | | 134 | | | | 43 | | | | 308 | | |
| Compliance fees | | | 259 | | | | 48 | | | | 20 | | | | 2 | | | | 27 | | |
| Non-recurring costs (See Note 9) | | | 84 | | | | 16 | | | | 7 | | | | 1 | | | | 9 | | |
| Other expenses | | | 364 | | | | 87 | | | | 43 | | | | 30 | | | | 52 | | |
| Total expenses | | | 85,416 | | | | 17,217 | | | | 7,736 | | | | 810 | | | | 12,313 | | |
| Less custody fees paid indirectly | | | (60 | ) | | | (8 | ) | | | (2 | ) | | | — | * | | | (4 | ) | |
| Less reimbursement of expenses by Investment Adviser | | | — | | | | — | | | | — | | | | (2 | ) | | | — | | |
| Less fees waived by Transfer Agent | | | (817 | ) | | | (96 | ) | | | (48 | ) | | | (7 | ) | | | (170 | ) | |
| Non-recurring costs reimbursed (See Note 9) | | | (84 | ) | | | (16 | ) | | | (7 | ) | | | (1 | ) | | | (9 | ) | |
| Net Expenses | | | 84,455 | | | | 17,097 | | | | 7,679 | | | | 800 | | | | 12,130 | | |
| Net Investment Income (Loss) | | | 27,503 | | | | 25,489 | | | | (1,252 | ) | | | 444 | | | | (5,077 | ) | |
Net Realized and Unrealized Gain (Loss)
on Portfolio Positions: | |
| Net realized gain (loss) on: | |
| Unaffiliated investments | | | 670,179 | | | | 276,747 | | | | (3,184 | ) | | | 12,297 | | | | 39,660 | | |
| Foreign currency transactions | | | 265 | | | | (410 | ) | | | — | | | | (18 | ) | | | 13 | | |
| Net realized gain (loss) | | | 670,444 | | | | 276,337 | | | | (3,184 | ) | | | 12,279 | | | | 39,673 | | |
Net change in net unrealized appreciation
(depreciation) on: | |
| Unaffiliated investments | | | (23,305 | ) | | | 121,881 | | | | 25,365 | | | | (378 | ) | | | 35,008 | | |
| Affiliated investments (See Note 4) | | | 253,598 | | | | (10,121 | ) | | | (63 | ) | | | — | | | | 24,788 | | |
| Foreign currency translations | | | 126 | | | | 14 | | | | 67 | | | | 7 | | | | — | | |
| Foreign capital gains tax | | | — | | | | 3 | | | | — | | | | — | | | | — | | |
Net change in unrealized appreciation
(depreciation) | | | 230,419 | | | | 111,777 | | | | 25,369 | | | | (371 | ) | | | 59,796 | | |
| Net realized and unrealized gain | | | 900,863 | | | | 388,114 | | | | 22,185 | | | | 11,908 | | | | 99,469 | | |
Net Increase in Net Assets resulting
from Operations | | $ | 928,366 | | | $ | 413,603 | | | $ | 20,933 | | | $ | 12,352 | | | $ | 94,392 | | |
* Rounds to less than $500.
See accompanying notes to financial statements.
61
Columbia Acorn Family of Funds
>Statements of Changes in Net Assets
| | | Columbia
Acorn Fund | | Columbia Acorn
International | | Columbia
Acorn USA | | Columbia Acorn
International Select | | Columbia
Acorn Select | |
| Increase (Decrease) in Net Assets | | (Unaudited)
Six months
ended June 30, | | Year ended
December 31, | | (Unaudited)
Six months
ended June 30, | | Year ended
December 31, | | (Unaudited)
Six months
ended June 30, | | Year ended
December 31, | | (Unaudited)
Six months
ended June 30, | | Year ended
December 31, | | (Unaudited)
Six months
ended June 30, | | Year ended
December 31, | |
| (in thousands) | | 2006 | | 2005 | | 2006 | | 2005 | | 2006 | | 2005 | | 2006 | | 2005 | | 2006 | | 2005 | |
| Operations: | |
| Net investment income (loss) | | $ | 27,503 | | | $ | 49,723 | | | $ | 25,489 | | | $ | 24,670 | | | $ | (1,252 | ) | | $ | 1,300 | | | $ | 444 | | | $ | 431 | | | $ | (5,077 | ) | | $ | (7,333 | ) | |
Net realized gain (loss) on investments and foreign
currency transactions | | | 670,444 | | | | 890,559 | | | | 276,337 | | | | 203,167 | | | | (3,184 | ) | | | 49,825 | | | | 12,279 | | | | 5,496 | | | | 39,673 | | | | 46,214 | | |
Net change in net unrealized appreciation
(depreciation) on investments and
foreign currency translations and
foreign capital gains tax | | | 230,419 | | | | 898,946 | | | | 111,777 | | | | 258,860 | | | | 25,369 | | | | 75,612 | | | | (371 | ) | | | 5,773 | | | | 59,796 | | | | 140,962 | | |
| Net Increase from Operations | | | 928,366 | | | | 1,839,228 | | | | 413,603 | | | | 486,697 | | | | 20,933 | | | | 126,737 | | | | 12,352 | | | | 11,700 | | | | 94,392 | | | | 179,843 | | |
| Distributions Declared to Shareholders From: | |
| Net investment income – Class A | | | — | | | | (8,157 | ) | | | (1 | ) | | | (1,772 | ) | | | — | | | | — | | | | (2 | ) | | | (79 | ) | | | (788 | ) | | | — | | |
| Net realized gain – Class A | | | (40,975 | ) | | | (177,617 | ) | | | (3,315 | ) | | | (4,275 | ) | | | (819 | ) | | | (7,747 | ) | | | — | | | | — | | | | (2,891 | ) | | | (19,098 | ) | |
| Net investment income – Class B | | | — | | | | — | | | | — | * | | | (280 | ) | | | — | | | | — | | | | — | | | | (46 | ) | | | — | | | | — | | |
| Net realized gain – Class B | | | (15,915 | ) | | | (81,483 | ) | | | (1,276 | ) | | | (2,334 | ) | | | (270 | ) | | | (3,824 | ) | | | — | | | | — | | | | (780 | ) | | | (5,029 | ) | |
| Net investment income – Class C | | | — | | | | — | | | | (1 | ) | | | (171 | ) | | | — | | | | — | | | | — | * | | | (24 | ) | | | — | | | | — | | |
| Net realized gain – Class C | | | (14,668 | ) | | | (68,235 | ) | | | (1,189 | ) | | | (1,462 | ) | | | (194 | ) | | | (2,282 | ) | | | — | | | | — | | | | (593 | ) | | | (3,559 | ) | |
| Net investment income – Class Z | | | — | | | | (52,311 | ) | | | (6,544 | ) | | | (51,974 | ) | | | — | | | | (1,613 | ) | | | (196 | ) | | | (888 | ) | | | (1,614 | ) | | | — | | |
| Net realized gain – Class Z | | | (120,087 | ) | | | (547,733 | ) | | | (46,561 | ) | | | (81,064 | ) | | | (4,177 | ) | | | (43,227 | ) | | | — | | | | — | | | | (2,827 | ) | | | (19,071 | ) | |
| Total Distribution to Shareholders | | | (191,645 | ) | | | (935,536 | ) | | | (58,887 | ) | | | (143,332 | ) | | | (5,460 | ) | | | (58,693 | ) | | | (198 | ) | | | (1,037 | ) | | | (9,493 | ) | | | (46,757 | ) | |
| Share Transactions: | |
| Subscriptions – Class A | | | 659,206 | | | | 912,797 | | | | 88,963 | | | | 66,630 | | | | 72,214 | | | | 66,241 | | | | 4,045 | | | | 5,743 | | | | 88,593 | | | | 296,611 | | |
| Distributions reinvested – Class A | | | 37,164 | | | | 167,704 | | | | 2,797 | | | | 4,900 | | | | 723 | | | | 6,880 | | | | 2 | | | | 71 | | | | 3,419 | | | | 17,770 | | |
| Redemptions – Class A | | | (385,545 | ) | | | (579,536 | ) | | | (38,125 | ) | | | (14,669 | ) | | | (23,405 | ) | | | (25,265 | ) | | | (1,414 | ) | | | (1,004 | ) | | | (83,751 | ) | | | (143,717 | ) | |
| Net Increase – Class A | | | 310,825 | | | | 500,965 | | | | 53,635 | | | | 56,861 | | | | 49,532 | | | | 47,856 | | | | 2,633 | | | | 4,810 | | | | 8,261 | | | | 170,664 | | |
| Subscriptions – Class B | | | 16,838 | | | | 49,025 | | | | 10,985 | | | | 17,173 | | | | 850 | | | | 4,001 | | | | 1,272 | | | | 2,123 | | | | 3,191 | | | | 28,258 | | |
| Distributions reinvested – Class B | | | 14,515 | | | | 74,120 | | | | 1,143 | | | | 2,310 | | | | 248 | | | | 3,491 | | | | — | | | | 41 | | | | 697 | | | | 4,510 | | |
| Redemptions – Class B | | | (107,477 | ) | | | (174,945 | ) | | | (11,978 | ) | | | (10,198 | ) | | | (7,678 | ) | | | (11,124 | ) | | | (775 | ) | | | (1,480 | ) | | | (16,156 | ) | | | (26,292 | ) | |
| Net Increase (Decrease) – Class B | | | (76,124 | ) | | | (51,800 | ) | | | 150 | | | | 9,285 | | | | (6,580 | ) | | | (3,632 | ) | | | 497 | | | | 684 | | | | (12,268 | ) | | | 6,476 | | |
| Subscriptions – Class C | | | 105,355 | | | | 171,533 | | | | 33,664 | | | | 15,891 | | | | 12,391 | | | | 8,047 | | | | 950 | | | | 1,655 | | | | 11,122 | | | | 48,457 | | |
| Distributions reinvested – Class C | | | 11,709 | | | | 54,677 | | | | 890 | | | | 1,302 | | | | 163 | | | | 1,878 | | | | — | * | | | 20 | | | | 483 | | | | 2,903 | | |
| Redemptions – Class C | | | (85,492 | ) | | | (149,119 | ) | | | (10,292 | ) | | | (6,051 | ) | | | (4,935 | ) | | | (9,090 | ) | | | (522 | ) | | | (599 | ) | | | (12,280 | ) | | | (23,251 | ) | |
| Net Increase (Decrease) – Class C | | | 31,572 | | | | 77,091 | | | | 24,262 | | | | 11,142 | | | | 7,619 | | | | 835 | | | | 428 | | | | 1,076 | | | | (675 | ) | | | 28,109 | | |
| Subscriptions – Class Z | | | 1,068,234 | | | | 1,686,601 | | | | 403,326 | | | | 577,455 | | | | 262,241 | | | | 302,588 | | | | 12,943 | | | | 25,890 | | | | 135,599 | | | | 333,604 | | |
| Distributions reinvested – Class Z | | | 103,086 | | | | 513,385 | | | | 39,291 | | | | 103,732 | | | | 3,812 | | | | 40,433 | | | | 99 | | | | 582 | | | | 3,108 | | | | 13,462 | | |
| Redemptions – Class Z | | | (649,562 | ) | | | (1,080,069 | ) | | | (171,762 | ) | | | (284,340 | ) | | | (83,258 | ) | | | (105,312 | ) | | | (4,579 | ) | | | (7,003 | ) | | | (68,526 | ) | | | (155,173 | ) | |
| Net Increase – Class Z | | | 521,758 | | | | 1,119,917 | | | | 270,855 | | | | 396,847 | | | | 182,795 | | | | 237,709 | | | | 8,463 | | | | 19,469 | | | | 70,181 | | | | 191,893 | | |
| Net Increase from Share Transactions | | | 788,031 | | | | 1,646,173 | | | | 348,902 | | | | 474,135 | | | | 233,366 | | | | 282,768 | | | | 12,021 | | | | 26,039 | | | | 65,499 | | | | 397,142 | | |
| Redemption Fees | | | — | | | | — | | | | 107 | | | | 65 | | | | — | | | | — | | | | 4 | | | | 9 | | | | — | | | | — | | |
| Total Increase in Net Assets | | | 1,524,752 | | | | 2,549,865 | | | | 703,725 | | | | 817,565 | | | | 248,839 | | | | 350,812 | | | | 24,179 | | | | 36,711 | | | | 150,398 | | | | 530,228 | | |
| Net Assets: | |
| Beginning of period | | | 16,391,324 | | | | 13,841,459 | | | | 2,892,577 | | | | 2,075,012 | | | | 1,221,494 | | | | 870,682 | | | | 94,999 | | | | 58,288 | | | | 1,787,315 | | | | 1,257,087 | | |
| End of period | | $ | 17,916,076 | | | $ | 16,391,324 | | | $ | 3,596,302 | | | $ | 2,892,577 | | | $ | 1,470,333 | | | $ | 1,221,494 | | | $ | 119,178 | | | $ | 94,999 | | | $ | 1,937,713 | | | $ | 1,787,315 | | |
Undistributed (Overdistributed) Net Investment
Income or (Accumulated Net Investment Loss) | | $ | (6,560 | ) | | $ | (34,063 | ) | | $ | 4,339 | | | $ | (14,604 | ) | | $ | (1,371 | ) | | $ | (119 | ) | | $ | (357 | ) | | $ | (603 | ) | | $ | (15,027 | ) | | $ | (7,548 | ) | |
* Rounds to less than $500.
See accompanying notes to financial statements.
1-800-922-6769
62
63
Columbia Acorn Family of Funds
>Statements of Changes in Net Assets, continued
| | | Columbia
Acorn Fund | | Columbia Acorn
International | | Columbia
Acorn USA | | Columbia Acorn
International Select | | Columbia
Acorn Select | |
| Changes in Shares of Beneficial Interest: | | (Unaudited)
Six months
ended June 30, | | Year ended
December 31, | | (Unaudited)
Six months
ended June 30, | | Year ended
December 31, | | (Unaudited)
Six months
ended June 30, | | Year ended
December 31, | | (Unaudited)
Six months
ended June 30, | | Year ended
December 31, | | (Unaudited)
Six months
ended June 30, | | Year ended
December 31, | |
| (in thousands) | | 2006 | | 2005 | | 2006 | | 2005 | | 2006 | | 2005 | | 2006 | | 2005 | | 2006 | | 2005 | |
| Subscriptions – Class A | | | 22,554 | | | | 34,302 | | | | 2,347 | | | | 2,150 | | | | 2,619 | | | | 2,559 | | | | 178 | | | | 307 | | | | 3,735 | | | | 14,487 | | |
Shares issued in reinvestment and capital
gains – Class A | | | 1,300 | | | | 6,137 | | | | 75 | | | | 155 | | | | 27 | | | | 260 | | | | — | * | | | 4 | | | | 146 | | | | 802 | | |
| Less shares redeemed – Class A | | | (13,166 | ) | | | (21,923 | ) | | | (1,054 | ) | | | (476 | ) | | | (855 | ) | | | (990 | ) | | | (63 | ) | | | (53 | ) | | | (3,535 | ) | | | (6,938 | ) | |
| Net Increase – Class A | | | 10,688 | | | | 18,516 | | | | 1,368 | | | | 1,829 | | | | 1,791 | | | | 1,829 | | | | 115 | | | | 258 | | | | 346 | | | | 8,351 | | |
| Subscriptions – Class B | | | 595 | | | | 1,922 | | | | 299 | | | | 574 | | | | 32 | | | | 161 | | | | 58 | | | | 118 | | | | 139 | | | | 1,441 | | |
Shares issued in reinvestment and capital
gains – Class B | | | 528 | | | | 2,814 | | | | 31 | | | | 73 | | | | 9 | | | | 137 | | | | — | | | | 2 | | | | 31 | | | | 211 | | |
| Less shares redeemed – Class B | | | (3,813 | ) | | | (6,826 | ) | | | (332 | ) | | | (341 | ) | | | (291 | ) | | | (451 | ) | | | (35 | ) | | | (81 | ) | | | (708 | ) | | | (1,313 | ) | |
| Net Increase (Decrease) – Class B | | | (2,690 | ) | | | (2,090 | ) | | | (2 | ) | | | 306 | | | | (250 | ) | | | (153 | ) | | | 23 | | | | 39 | | | | (538 | ) | | | 339 | | |
| Subscriptions – Class C | | | 3,731 | | | | 6,667 | | | | 906 | | | | 524 | | | | 466 | | | | 321 | | | | 43 | | | | 92 | | | | 486 | | | | 2,455 | | |
Shares issued in reinvestment and capital
gains – Class C | | | 427 | | | | 2,077 | | | | 24 | | | | 41 | | | | 6 | | | | 74 | | | | — | | | | 1 | | | | 22 | | | | 136 | | |
| Less shares redeemed – Class C | | | (3,039 | ) | | | (5,835 | ) | | | (287 | ) | | | (201 | ) | | | (186 | ) | | | (363 | ) | | | (24 | ) | | | (33 | ) | | | (539 | ) | | | (1,172 | ) | |
| Net Increase (Decrease) – Class C | | | 1,119 | | | | 2,909 | | | | 643 | | | | 364 | | | | 286 | | | | 32 | | | | 19 | | | | 60 | | | | (31 | ) | | | 1,419 | | |
| Subscriptions – Class Z | | | 35,686 | | | | 62,182 | | | | 10,707 | | | | 18,615 | | | | 9,306 | | | | 11,555 | | | | 574 | | | | 1,378 | | | | 5,651 | | | | 15,890 | | |
Shares issued in reinvestment and capital
gains – Class Z | | | 3,525 | | | | 18,385 | | | | 1,050 | | | | 3,274 | | | | 139 | | | | 1,500 | | | | 4 | | | | 33 | | | | 131 | | | | 601 | | |
| Less shares redeemed – Class Z | | | (21,759 | ) | | | (39,912 | ) | | | (4,553 | ) | | | (9,349 | ) | | | (2,974 | ) | | | (4,040 | ) | | | (204 | ) | | | (378 | ) | | | (2,851 | ) | | | (7,371 | ) | |
| Net Increase – Class Z | | | 17,452 | | | | 40,655 | | | | 7,204 | | | | 12,540 | | | | 6,471 | | | | 9,015 | | | | 374 | | | | 1,033 | | | | 2,931 | | | | 9,120 | | |
| Net Increase in Shares of Beneficial Interest | | | 26,569 | | | | 59,990 | | | | 9,213 | | | | 15,039 | | | | 8,298 | | | | 10,723 | | | | 531 | | | | 1,390 | | | | 2,708 | | | | 19,229 | | |
* Rounds to less than 500 shares.
See accompanying notes to financial statements.
1-800-922-6769
64
65
Columbia Acorn Family of Funds
>Financial Highlights
| Columbia Acorn Fund | |
Class Z | | (Unaudited)
Six months
ended June 30, | |
Year Ended December 31, | |
| Selected data for a share outstanding throughout each period | | | | 2006 | | 2005 | | 2004 | | 2003 | | 2002 | | 2001 | |
| Net Asset Value, Beginning of Period | | | | $ | 28.17 | | | $ | 26.45 | | | $ | 22.56 | | | $ | 15.50 | | | $ | 17.88 | | | $ | 17.21 | | |
| Income from Investment Operations | |
| Net investment income (a) | | | | | 0.08 | | | | 0.15 | | | | 0.04 | | | | 0.03 | | | | 0.02 | | | | 0.05 | | |
| Net realized and unrealized gain (loss) | | | | | 1.55 | | | | 3.28 | | | | 4.78 | | | | 7.05 | | | | (2.40 | ) | | | 1.01 | | |
| Total from Investment Operations | | | | | 1.63 | | | | 3.43 | | | | 4.82 | | | | 7.08 | | | | (2.38 | ) | | | 1.06 | | |
| Less Distributions Declared to Shareholders | |
| From net investment income | | | | | — | | | | (0.15 | ) | | | (0.02 | ) | | | — | | | | — | | | | (0.04 | ) | |
| From net realized gains | | | | | (0.31 | ) | | | (1.56 | ) | | | (0.91 | ) | | | (0.02 | ) | | | — | | | | (0.35 | ) | |
| Total Distributions Declared to Shareholders | | | | | (0.31 | ) | | | (1.71 | ) | | | (0.93 | ) | | | (0.02 | ) | | | — | | | | (0.39 | ) | |
| Net Asset Value, End of Period | | | | $ | 29.49 | | | $ | 28.17 | | | $ | 26.45 | | | $ | 22.56 | | | $ | 15.50 | | | $ | 17.88 | | |
| Total Return (b) | | | | | 5.81 | %(c)(d) | | | 13.11 | %(c) | | | 21.51 | %(c) | | | 45.68 | % | | | (13.31 | )% | | | 6.14 | % | |
| Ratios to Average Net Assets/Supplemental Data | |
| Expenses (e) | | | | | 0.73 | %(f) | | | 0.74 | % | | | 0.81 | % | | | 0.80 | % | | | 0.82 | % | | | 0.82 | % | |
| Net investment income (e) | | | | | 0.53 | %(f) | | | 0.57 | % | | | 0.18 | % | | | 0.17 | % | | | 0.15 | % | | | 0.28 | % | |
| Waiver/reimbursement | | | | | 0.01 | %(f) | | | 0.02 | % | | | 0.02 | % | | | — | | | | — | | | | — | | |
| Portfolio turnover rate | | | | | 11 | %(d) | | | 16 | % | | | 20 | % | | | 10 | % | | | 13 | % | | | 20 | % | |
| Net assets at end of period (in millions) | | | | $ | 11,400 | | | $ | 10,399 | | | $ | 8,689 | | | $ | 7,065 | | | $ | 4,022 | | | $ | 4,220 | | |
(a) Per share data was calculated using average shares outstanding during the period.
(b) Total return at net asset value assuming all distributions reinvested.
(c) Had the Investment Adviser and/or Transfer Agent not waived and/or reimbursed a portion of expenses, total return would have been reduced.
(d) Not annualized.
(e) The benefits derived from custody fees paid indirectly had no impact.
(f) Annualized.
| Columbia Acorn International | | Class Z | | (Unaudited)
Six months
ended June 30, | | Year Ended December 31, | |
| Selected data for a share outstanding throughout each period | | | | 2006 | | 2005 | | 2004 | | 2003 | | 2002 | | 2001 | |
| Net Asset Value, Beginning of Period | | | | $ | 33.44 | | | $ | 29.03 | | | $ | 22.66 | | | $ | 15.40 | | | $ | 18.47 | | | $ | 23.85 | | |
| Income from Investment Operations | |
| Net investment income (a) | | | | | 0.29 | | | | 0.34 | | | | 0.25 | | | | 0.21 | | | | 0.14 | | | | 0.12 | | |
| Net realized and unrealized gain (loss) | | | | | 4.48 | | | | 5.87 | | | | 6.37 | | | | 7.13 | | | | (3.10 | ) | | | (5.11 | ) | |
| Total from Investment Operations | | | | | 4.77 | | | | 6.21 | | | | 6.62 | | | | 7.34 | | | | (2.96 | ) | | | (4.99 | ) | |
| Less Distributions Declared to Shareholders | |
| From net investment income | | | | | (0.08 | ) | | | (0.72 | ) | | | (0.25 | ) | | | (0.08 | ) | | | (0.11 | ) | | | — | | |
| From net realized gains | | | | | (0.55 | ) | | | (1.08 | ) | | | — | | | | — | | | | — | | | | (0.39 | ) | |
| Total Distributions Declared to Shareholders | | | | | (0.63 | ) | | | (1.80 | ) | | | (0.25 | ) | | | (0.08 | ) | | | (0.11 | ) | | | (0.39 | ) | |
| Net Asset Value, End of Period | | | | $ | 37.58 | | | $ | 33.44 | | | $ | 29.03 | | | $ | 22.66 | | | $ | 15.40 | | | $ | 18.47 | | |
| Total Return (b) | | | | | 14.27 | %(c)(d) | | | 21.81 | %(c) | | | 29.47 | %(c) | | | 47.80 | % | | | (16.10 | )% | | | (21.11 | )% | |
| Ratios to Average Net Assets/Supplemental Data | |
| Expenses (e) | | | | | 0.94 | %(f) | | | 0.99 | % | | | 1.08 | % | | | 1.05 | % | | | 1.06 | % | | | 1.06 | % | |
| Net investment income (e) | | | | | 1.54 | %(f) | | | 1.09 | % | | | 1.01 | % | | | 1.19 | % | | | 0.80 | % | | | 0.62 | % | |
| Waiver/reimbursement | | | | | 0.01 | %(f) | | | 0.02 | % | | | 0.02 | % | | | — | | | | — | | | | — | | |
| Portfolio turnover rate | | | | | 19 | %(d) | | | 27 | % | | | 40 | % | | | 40 | % | | | 52 | % | | | 45 | % | |
| Net assets at end of period (in millions) | | | | $ | 3,226 | | | $ | 2,629 | | | $ | 1,919 | | | $ | 1,563 | | | $ | 1,241 | | | $ | 1,613 | | |
(a) Per share data was calculated using average shares outstanding during the period.
(b) Total return at net asset value assuming all distributions reinvested.
(c) Had the Investment Adviser and/or Transfer Agent not waived and/or reimbursed a portion of expenses, total return would have been reduced.
(d) Not annualized.
(e) The benefits derived from custody fees paid indirectly had no impact.
(f) Annualized.
| Columbia Acorn USA | | Class Z | | (Unaudited)
Six months
ended June 30, | | Year Ended December 31, | |
| Selected data for a share outstanding throughout each period | | | | 2006 | | 2005 | | 2004 | | 2003 | | 2002 | | 2001 | |
| Net Asset Value, Beginning of Period | | | | $ | 27.03 | | | $ | 25.20 | | | $ | 21.01 | | | $ | 14.28 | | | $ | 17.52 | | | $ | 14.90 | | |
| Income from Investment Operations | |
| Net investment income (loss) (a) | | | | | (0.01 | ) | | | 0.07 | | | | (0.15 | ) | | | (0.13 | ) | | | (0.10 | ) | | | (0.08 | ) | |
| Net realized and unrealized gain (loss) | | | | | 0.60 | | | | 3.18 | | | | 4.48 | | | | 6.86 | | | | (3.14 | ) | | | 2.94 | | |
| Total from Investment Operations | | | | | 0.59 | | | | 3.25 | | | | 4.33 | | | | 6.73 | | | | (3.24 | ) | | | 2.86 | | |
| Less Distributions Declared to Shareholders | |
| From net investment income | | | | | — | | | | (0.05 | ) | | | — | | | | — | | | | — | | | | — | | |
| From net realized gains | | | | | (0.10 | ) | | | (1.37 | ) | | | (0.14 | ) | | | — | | | | — | | | | (0.24 | ) | |
| Total Distributions Declared to Shareholders | | | | | (0.10 | ) | | | (1.42 | ) | | | (0.14 | ) | | | — | | | | — | | | | (0.24 | ) | |
| Net Asset Value, End of Period | | | | $ | 27.52 | | | $ | 27.03 | | | $ | 25.20 | | | $ | 21.01 | | | $ | 14.28 | | | $ | 17.52 | | |
| Total Return (b) | | | | | 2.19 | % (c)(d) | | | 12.98 | %(c) | | | 20.62 | %(c) | | | 47.13 | % | | | (18.49 | )% | | | 19.25 | % | |
| Ratios to Average Net Assets/Supplemental Data | |
| Expenses (e) | | | | | 0.97 | % (f) | | | 1.01 | % | | | 1.09 | % | | | 1.11 | % | | | 1.17 | % | | | 1.17 | % | |
| Net investment income (loss) (e) | | | | | (0.05 | )%(f) | | | 0.28 | % | | | (0.66 | )% | | | (0.72 | )% | | | (0.64 | )% | | | (0.46 | )% | |
| Waiver/reimbursement | | | | | 0.01 | % (f) | | | 0.01 | % | | | 0.02 | % | | | — | | | | — | | | | — | | |
| Portfolio turnover rate | | | | | 5 | % (d) | | | 13 | % | | | 18 | % | | | 7 | % | | | 31 | % | | | 24 | % | |
| Net assets at end of period (in millions) | | | | $ | 1,132 | | | $ | 937 | | | $ | 646 | | | $ | 502 | | | $ | 235 | | | $ | 229 | | |
(a) Per share data was calculated using average shares outstanding during the period.
(b) Total return at net asset value assuming all distributions reinvested.
(c) Had the Investment Adviser and/or Transfer Agent not waived and/or reimbursed a portion of expenses, total return would have been reduced.
(d) Not annualized.
(e) The benefits derived from custody fees paid indirectly had no impact.
(f) Annualized.
See accompanying notes to financial statements.
1-800-922-6769
66
67
Columbia Acorn Family of Funds
>Financial Highlights, continued
| Columbia Acorn International Select | | Class Z | | (Unaudited)
Six months
ended June 30, | | Year Ended December 31, | |
| Selected data for a share outstanding throughout each period | | | | 2006 | | 2005 | | 2004 | | 2003 | | 2002 | | 2001 | |
| Net Asset Value, Beginning of Period | | | | $ | 20.57 | | | $ | 18.02 | | | $ | 14.58 | | | $ | 10.29 | | | $ | 12.09 | | | $ | 17.15 | | |
| Income from Investment Operations | |
| Net investment income (loss) (a) | | | | | 0.11 | | | | 0.13 | | | | 0.04 | | | | 0.06 | | | | 0.03 | | | | (0.05 | ) | |
| Net realized and unrealized gain (loss) | | | | | 2.53 | | | | 2.70 | | | | 3.47 | | | | 4.24 | | | | (1.83 | ) | | | (4.92 | ) | |
| Total from Investment Operations | | | | | 2.64 | | | | 2.83 | | | | 3.51 | | | | 4.30 | | | | (1.80 | ) | | | (4.97 | ) | |
| Less Distributions Declared to Shareholders | |
| From net investment income | | | | | (0.05 | ) | | | (0.28 | ) | | | (0.07 | ) | | | (0.01 | ) | | | — | | | | (0.01 | ) | |
| From net realized gains | | | | | — | | | | — | | | | — | | | | — | | | | — | | | | (0.08 | ) | |
| Total Distributions Declared to Shareholders | | | | | (0.05 | ) | | | (0.28 | ) | | | (0.07 | ) | | | (0.01 | ) | | | — | | | | (0.09 | ) | |
| Net Asset Value, End of Period | | | | $ | 23.16 | | | $ | 20.57 | | | $ | 18.02 | | | $ | 14.58 | | | $ | 10.29 | | | $ | 12.09 | | |
| Total Return (b)(c) | | | | | 12.83 | %(d) | | | 15.98 | % | | | 24.14 | % | | | 41.79 | % | | | (14.89 | )% | | | (29.05 | )% | |
| Ratios to Average Net Assets/Supplemental Data | |
| Expenses (e) | | | | | 1.29 | %(f) | | | 1.45 | % | | | 1.45 | % | | | 1.45 | % | | | 1.45 | % | | | 1.45 | % | |
| Net investment income (loss) (e) | | | | | 0.95 | %(f) | | | 0.72 | % | | | 0.27 | % | | | 0.56 | % | | | 0.26 | % | | | (0.32 | )% | |
| Waiver/reimbursement | | | | | 0.01 | %(f) | | | 0.04 | % | | | 0.29 | % | | | 0.42 | % | | | 0.33 | % | | | 0.01 | % | |
| Portfolio turnover rate | | | | | 30 | %(d) | | | 39 | % | | | 73 | % | | | 69 | % | | | 102 | % | | | 82 | % | |
| Net assets at end of period (in millions) | | | | $ | 92 | | | $ | 74 | | | $ | 46 | | | $ | 34 | | | $ | 26 | | | $ | 37 | | |
(a) Per share data was calculated using average shares outstanding during the period.
(b) Total return at net asset value assuming all distributions reinvested.
(c) Had the Investment Adviser and/or Transfer Agent not waived and/or reimbursed a portion of expenses, total return would have been reduced.
(d) Not annualized.
(e) The benefits derived from custody fees paid indirectly had no impact.
(f) Annualized.
| Columbia Acorn Select | | Class Z | | (Unaudited)
Six months
ended June 30, | | Year Ended December 31, | |
| Selected data for a share outstanding throughout each period | | | | 2006 | | 2005 | | 2004 | | 2003 | | 2002 | | 2001 | |
| Net Asset Value, Beginning of Period | | | | $ | 22.77 | | | $ | 21.13 | | | $ | 18.20 | | | $ | 14.04 | | | $ | 15.23 | | | $ | 14.13 | | |
| Income from Investment Operations | |
| Net investment loss (a) | | | | | (0.03 | ) | | | (0.03 | ) | | | (0.10 | ) | | | (0.10 | ) | | | (0.10 | ) | | | (0.05 | ) | |
| Net realized and unrealized gain (loss) | | | | | 1.27 | | | | 2.35 | | | | 3.47 | | | | 4.39 | | | | (1.09 | ) | | | 1.18 | | |
| Total from Investment Operations | | | | | 1.24 | | | | 2.32 | | | | 3.37 | | | | 4.29 | | | | (1.19 | ) | | | 1.13 | | |
| Less Distributions Declared to Shareholders | |
| From net investment income | | | | | (0.05 | ) | | | — | | | | — | | | | — | | | | — | | | | — | | |
| From net realized gains | | | | | (0.09 | ) | | | (0.68 | ) | | | (0.44 | ) | | | (0.13 | ) | | | — | | | | (0.03 | ) | |
| Total Distributions Declared to Shareholders | | | | | (0.14 | ) | | | (0.68 | ) | | | (0.44 | ) | | | (0.13 | ) | | | — | | | | (0.03 | ) | |
| Net Asset Value, End of Period | | | | $ | 23.87 | | | $ | 22.77 | | | $ | 21.13 | | | $ | 18.20 | | | $ | 14.04 | | | $ | 15.23 | | |
| Total Return (b) | | | | | 5.43 | % (c)(d) | | | 11.08 | % (c) | | | 18.58 | %(c) | | | 30.61 | % | | | (7.81 | )%(c) | | | 8.00 | %(c) | |
| Ratios to Average Net Assets/Supplemental Data | |
| Expenses | | | | | 0.96 | % (e)(f) | | | 0.99 | % (e) | | | 1.13 | % (e) | | | 1.12 | % (e) | | | 1.26 | % (e) | | | 1.35 | % | |
| Net investment loss | | | | | (0.22 | )%(e)(f) | | | (0.16 | )%(e) | | | (0.52 | )%(e) | | | (0.63 | )%(e) | | | (0.67 | )%(e) | | | (0.44 | )% | |
| Waiver/reimbursement | | | | | 0.02 | % (f) | | | 0.03 | % | | | 0.02 | % | | | — | | | | 0.01 | % | | | 0.03 | % | |
| Portfolio turnover rate | | | | | 13 | % (d) | | | 19 | % | | | 34 | % | | | 16 | % | | | 40 | % | | | 82 | % | |
| Net assets at end of period (in millions) | | | | $ | 791 | | | $ | 688 | | | $ | 445 | | | $ | 294 | | | $ | 93 | | | $ | 70 | | |
(a) Per share data was calculated using average shares outstanding during the period.
(b) Total return at net asset value assuming all distributions reinvested.
(c) Had the Investment Adviser and/or Transfer Agent not waived and/or reimbursed a portion of expenses, total return would have been reduced.
(d) Not annualized.
(e) The benefits derived from custody fees paid indirectly had no impact.
(f) Annualized.
See accompanying notes to financial statements.
1-800-922-6769
68
69
Columbia Acorn Family of Funds
>Notes to Financial Statements (Unaudited)
1. Nature of Operations
Columbia Acorn Fund, Columbia Acorn International, Columbia Acorn USA, Columbia Acorn International Select and Columbia Acorn Select (the "Funds") are each a series of Columbia Acorn Trust (the "Trust"), an open-end management investment company organized as a Massachusetts business trust. The investment objective of each Fund is to seek long-term growth of capital. The Funds may issue an unlimited number of shares. The Funds currently offer four classes of shares: Class A, Class B, Class C and Class Z.
Class A shares are sold with a front-end sales charge. Class A shares bought without an initial sales charge in accounts aggregating up to $50 million at the time of purchase are subject to a 1.00% CDSC if the shares are sold within 12 months of the time of purchase.
Class B shares are subject to a CDSC if sold within six years of purchase. Class B shares will convert to Class A shares automatically eight years after purchase.
Class C shares are subject to a CDSC on redemptions made within one year after purchase.
Columbia Acorn International and Columbia Acorn International Select impose a 2% redemption fee on Class A, Class B and Class C shares that are owned 60 days or less. See "Fund Policy on Trading of Fund Shares" as disclosed within the Funds' prospectuses for more information.
Class Z shares are offered continuously at net asset value. There are certain restrictions on the purchase of Class Z shares. Generally, you may exchange your Class Z shares of a Fund for shares of another fund distributed by Columbia Management Distributors, Inc. at no additional charge. However, if you exchange Class Z shares of Columbia Acorn International or Columbia Acorn International Select that you have owned 60 days or less, the Fund will charge you a redemption fee of 2% of the redemption proceeds. In addition, if you redeem shares of Columbia Acorn International or Columbia Acorn International Select that you have owned 60 days or less, the Fund will charge you a redemption fee of 2% of redemption proceeds, with certain exceptions. See "Fund Policy on Trading of Fund Shares and Redemption Fees" as disclosed within the Funds' prospectuses for more information.
The financial highlights for Class A, Class B and Class C shares are presented in a separate semiannual report. The semiannual financial statements for the Columbia Thermostat Fund, another Fund of the Trust, begin on page 76 of this report.
Investment income, realized and unrealized gains and losses, and certain fund-level expenses are borne pro rata on the basis of the relative net assets of all classes, except each class bears certain expenses unique to that class such as distribution services, transfer agent and certain other class specific expenses. Differences in class expenses may result in payment of different dividend distributions for each class. All the share classes of the Trust have equal rights with respect to voting subject to class specific arrangements.
2. Significant Accounting Policies
>Security valuation
Securities of the Funds are valued at market value or, if a market quotation for a security is not readily available or is deemed not to be reliable because of events or circumstances that have occurred between the market quotation and the time as of which the security is to be valued, the security is valued at a fair value determined in accordance with procedures established by the Board of Trustees. Securities traded on securities exchanges or in over-the-counter markets in which transaction prices are reported are valued at the last sales price at the time of valuation. If a security is traded principally on the Nasdaq Stock Market Inc., the Nasdaq Official Closing Price will be applied. Securities for which there are no reported sales on the valuation date are valued at the latest bid quotation. Short-term debt obligations having a maturity of 60 days or less from the valuation date are valued on an amortized cost basis, whi ch approximate fair value. Securities for which quotations are not available are valued at a fair value as determined in good faith by the Board of Trustees. The Trust has retained an independent statistical fair value pricing service to assist in the fair valuation process for securities principally traded in a foreign market in order to adjust for possible changes in value that may occur between the close of the foreign exchange and the time at which Fund shares are priced. If a security is valued at a "fair value," that value may be different from the last quoted market price for the security.
>Repurchase agreements
The Funds may engage in repurchase agreement transactions. The Funds, through their custodians, receive delivery of underlying securities collateralizing repurchase agreements. The Funds' investment adviser determines that the value of the underlying securities is at all times at least equal to the resale price. In the event of default or bankruptcy by the other party to the agreement, realization and/or retention of the collateral may be subject to legal proceedings.
1-800-922-6769
70
>Foreign currency translations
Values of investments denominated in foreign currencies are converted into U.S. dollars using the spot market rate of exchange at the time of valuation. Purchases and sales of investments and dividend and interest income are translated into U.S. dollars using the spot market rate of exchange prevailing on the respective dates of such transactions. The gain or loss resulting from changes in foreign exchange rates is included with net realized and unrealized gain or loss from investments, as appropriate.
>Security transactions and investment income
Security transactions are accounted for on the trade date (date the order to buy or sell is executed) and dividend income is recorded on the ex-dividend date, except that certain dividends from foreign securities are recorded as soon as the information is available to the Funds. Interest income is recorded on the accrual basis and includes amortization of discounts on short-term debt obligations and long-term debt obligations when required for federal income tax purposes. Realized gains and losses from security transactions are reported on an identified cost basis.
Awards from class action litigation may be recorded as a reduction of cost. If the Funds no longer own the applicable securities, the proceeds are recorded as realized gains.
The Funds estimate components of distributions from real estate investment trusts (REITs). Distributions received in excess of income are recorded as a reduction of the cost of the related investments. If the Funds no longer own the applicable securities, any distributions received in excess of income are recorded as realized gains.
>Restricted Securities
Restricted securities are securities that may only be resold upon registration under federal securities laws or in transactions exempt from registration. In some cases, the issuer of restricted securities has agreed to register such securities for resale at the issuer's expense either upon demand by the Funds or in connection with another registered offering of the securities. Many restricted securities may be resold in the secondary market in transactions exempt from registration. Such restricted securities may be determined to be liquid under criteria established by the Board of Trustees. The Funds will not incur any registration costs upon such resale.
>Use of estimates
The preparation of financial statements in conformity with accounting principles generally accepted in the United States of America requires management to make estimates and
assumptions that affect the amounts reported in the financial statements and accompanying notes. Actual results may differ from those estimates.
>Financial instruments
Each Fund may purchase or sell exchange-traded financial futures contracts, which are contracts that obligate that Fund to make or take delivery of a financial instrument or the cash value of a securities index at a specified future date at a specified price. The Funds enter into such contracts to hedge a portion of their portfolio. Gains and losses are reflected as "Net realized gain (loss) on Futures" in the Statements of Operations. Additionally, each Fund, except for Columbia Acorn USA and Columbia Acorn Select, may engage in portfolio hedging with respect to changes in foreign currency exchange rates by entering into forward foreign currency contracts to purchase or sell foreign currencies. The Statements of Operations reflect gains and losses as realized for closed forward foreign currency contracts and unrealized for open contracts. The Funds bear the market risk that arises from changes in the value of financial instrume nts and securities indices (futures contracts) or from changes in foreign currency rates (forward foreign currency contracts) and the credit risk should a counterparty fail to perform under such contracts.
None of the Funds entered into futures contracts or forward foreign currency contracts during the six months ended June 30, 2006.
>Fund share valuation
Fund shares are sold and redeemed on a continuing basis at net asset value. Net asset value per share is determined daily as of the close of trading on the New York Stock Exchange (the "Exchange") on each day the Exchange is open for trading. All income, expenses (other than the Class A, Class B and Class C 12b-1 service and distribution fees and Class A, Class B, Class C and Class Z shares transfer agent fees) and realized and unrealized gains (losses) of a Fund are allocated to each class proportionately on a daily basis for purposes of determining the net asset value of each class. Redemption fees are accounted for as an addition to paid in capital and are allocated to each class proportionately for purposes of determining the net asset value of each class.
>Custody fees/credits
Custody fees are reduced based on each Fund's cash balances maintained with the custodian. The Funds could have invested a portion of the assets utilized in connection with the expense offset arrangement in an income-producing asset if they had not entered into such an agreement. The amount is disclosed
71
Columbia Acorn Family of Funds
>Notes to Financial Statements (Unaudited), continued
as a reduction of total expenses in the Statements of Operations.
>Federal income taxes
The Funds have complied with the provisions of the Internal Revenue Code available to regulated investment companies and, in the manner provided therein, distribute all their taxable income, as well as any net realized gain on sales of investments and foreign currency transactions reportable for federal income tax purposes. Accordingly, the Funds paid no federal income taxes and no federal income tax provision was required.
>Foreign capital gains taxes
Realized gains in certain countries may be subject to foreign taxes at the fund level, at rates ranging from approximately 10% to 15%. The Funds accrue for such foreign taxes on net realized and unrealized gains at the appropriate rate for each jurisdiction.
>Distributions to Shareholders
Distributions to shareholders are recorded on the ex-date.
>Indemnification
In the normal course of business, each Fund enters into contracts that contain a variety of representations and warranties and which provide general indemnities. A Fund's maximum exposure under these arrangements is unknown, as this would involve future claims against the Fund. Also, under the Trust's organizational documents, the Trustees and Officers of the Trust are indemnified against certain liabilities that may arise out of their duties to the Trust. However, based on experience, the Funds expect the risk of loss due to these warranties and indemnities to be minimal.
3. Federal Tax Information
The tax character of distributions paid during the years ended December 31, 2005 was as follows:
| | | Ordinary
Income* | | Long-Term
Capital Gains | |
| (in thousands) | |
| Columbia Acorn Fund | | $ | 89,415 | | | $ | 846,121 | | |
| Columbia Acorn International | | | 54,197 | | | | 89,135 | | |
| Columbia Acorn USA | | | 1,825 | | | | 56,868 | | |
| Columbia Acorn International Select | | | 1,037 | | | | — | | |
| Columbia Acorn Select | | | 7,041 | | | | 39,716 | | |
*For tax purposes short-term capital gains distributions, if any, are considered ordinary income distributions.
The following capital loss carryforwards, determined as of December 31, 2005, may be available to reduce taxable income
arising from future net realized gains on investments, if any, to the extent permitted by the Internal Revenue Code:
Year of
Expiration | | Columbia Acorn
USA | | Columbia Acorn
International Select | |
| (in thousands) | |
| 2009 | | $ | 2,023 | * | | $ | 10,593 | | |
| 2010 | | | 506 | | | | 12,528 | | |
| 2011 | | | — | | | | 2,488 | | |
| TOTAL | | $ | 2,529 | | | $ | 25,609 | | |
*Of these carryforwards, $2,529 (expiring in 2009) remains from Columbia Acorn USA's merger with Stein Roe Small Company Growth Fund on 7/26/2002. Utilization of Stein Roe Small Company Growth Fund's losses could be subject to limitations imposed by the Internal Revenue Code.
The following capital loss carryforwards were utilized during the year ended December 31, 2005.
| (In thousands) | |
| Columbia Acorn International | | $ | 62,579 | | |
| Columbia Acorn USA | | | 7,025 | | |
| Columbia Acorn International Select | | | 5,542 | | |
In June 2006, the Financial Accounting Standards Board ("FASB") issued FASB Interpretation No. 48, Accounting for Uncertainty in Income Taxes, an Interpretation of FASB Statement 109 (the "Interpretation"). This Interpretation is effective for fiscal years beginning after December 15, 2006 and is to be applied to all tax positions upon initial adoption. This Interpretation prescribes a minimum recognition threshold and measurement method for the financial statement recognition of tax positions taken or expected to be taken in a tax return and also requires certain expanded disclosures. Columbia Wanger Asset Management, L.P. ("Columb ia WAM"), a wholly owned subsidiary of Columbia Management Group, Inc., which in turn is an indirect, wholly owned subsidiary of Bank of America Corporation ("BOA"), has recently begun to evaluate the application of this Interpretation to the Funds and has not at this time quantified the impact, if any, resulting from the adoption of this Interpretation on the Funds' financial statements.
4. Transactions with Affiliates
Columbia WAM furnishes continuing investment supervision to the Funds and is responsible for the overall management of the Funds' business affairs.
Effective August 1, 2006, under the Funds' investment management agreement, fees are accrued daily and paid monthly to Columbia WAM at the annual rates shown in the
1-800-922-6769
72
table below for Columbia Acorn USA and Columbia Acorn Select:
| Columbia Acorn USA | |
| Assets | | Rate of Fee | |
| Up to $200 million | | | 0.940 | % | |
| $200 million to $500 million | | | 0.890 | % | |
| $500 million to $2 billion | | | 0.840 | % | |
| $2 billion to $3 billion | | | 0.800 | % | |
| $3 billion and over | | | 0.700 | % | |
| Columbia Acorn Select | |
| Assets | | Rate of Fee | |
| Up to $700 million | | | 0.850 | % | |
| $700 million to $2 billion | | | 0.800 | % | |
| $2 billion to $3 billion | | | 0.750 | % | |
| $3 billion and over | | | 0.700 | % | |
For the period covered by this report as provided under the Funds' investment management agreement, fees were accrued daily and paid monthly to Columbia WAM at the annual rates shown in the table below for each Fund.
| Columbia Acorn Fund | |
| Assets | | Rate of Fee | |
| Up to $700 million | | | 0.740 | % | |
| $700 million to $2 billion | | | 0.690 | % | |
| $2 billion to $6 billion | | | 0.640 | % | |
| $6 billion and over | | | 0.630 | % | |
| Columbia Acorn International | |
| Assets | | Rate of Fee | |
| Up to $100 million | | | 1.190 | % | |
| $100 million to $500 million | | | 0.940 | % | |
| $500 million and over | | | 0.740 | % | |
| Columbia Acorn USA | |
| Assets | | Rate of Fee | |
| Up to $200 million | | | 0.940 | % | |
| $200 million to $500 million | | | 0.890 | % | |
| $500 million and over | | | 0.840 | % | |
| Columbia Acorn Select | |
| Assets | | Rate of Fee | |
| Up to $700 million | | | 0.850 | % | |
| $700 million and over | | | 0.800 | % | |
| Columbia Acorn International Select | |
| All Assets | | | 0.940 | % | |
For the six months ended June 30, 2006, the Funds' effective investment advisory fee rates were as follows:
| Columbia Acorn Fund | | | 0.64 | % | |
| Columbia Acorn International | | | 0.78 | % | |
| Columbia Acorn USA | | | 0.87 | % | |
| Columbia Acorn International Select | | | 0.94 | % | |
| Columbia Acorn Select | | | 0.82 | % | |
>Expense Limit
Columbia WAM has voluntarily agreed to reimburse the ordinary operating expenses (exclusive of interest, taxes and extraordinary expenses, if any) exceeding 1.45% of the average annual net assets for Columbia Acorn International Select Class Z shares and 1.35% of the average annual net assets for Columbia Acorn Select Class Z shares. This arrangement may be modified or terminated by either the Fund or Columbia WAM on 30 days notice.
Expenses reimbursed by Columbia WAM for Columbia Acorn International Select for the six months ended June 30, 2006 were $2,157.
Columbia WAM provides administrative services and receives an administration fee from the Funds at the following rates:
| Columbia Acorn Trust | |
| Average daily net asset value: | | | | | |
| On the first $8 billion | | | 0.05 | % | |
| Next $8 billion | | | 0.04 | % | |
| Average daily net asset in excess of $16 billion | | | 0.03 | % | |
For the six months ended June 30, 2006, each Fund's effective administration fee rate was 0.041%. Columbia WAM has delegated to Columbia Management Advisors, LLC, an indirect, wholly owned subsidiary of BOA, responsibility to provide certain administrative services to the Funds.
Columbia Management Distributors, Inc. ("CMDI"), a wholly owned subsidiary of BOA, is the Funds' principal underwriter and receives no compensation on the sale of Class Z shares.
Each Fund has adopted a Rule 12b-1 plan which requires it to pay CMDI a service and distribution fee on the net assets attributable to Class A, Class B and Class C shares.
Columbia Management Services, Inc. (the "Transfer Agent"), a wholly owned subsidiary of BOA, provides shareholder services to the Funds and has contracted with Boston Financial Data Services ("BFDS") to serve as sub-transfer agent. For such services, the Transfer Agent receives a fee, paid monthly, at the annual rate of $21.00 per open account. The Transfer Agent also receives reimbursement for certain out-of-pocket expenses. The Transfer Agent waived the reimbursement for certain out-of-pocket expenses for the period covered by this report.
Expenses waived by the Transfer Agent for the six months ended June 30, 2006 were as follows:
| (in thousands) | |
| Columbia Acorn Fund | | $ | 817 | | |
| Columbia Acorn International | | | 96 | | |
| Columbia Acorn USA | | | 48 | | |
| Columbia Acorn International Select | | | 7 | | |
| Columbia Acorn Select | | | 170 | | |
73
Columbia Acorn Family of Funds
>Notes to Financial Statements (Unaudited), continued
Certain officers and trustees of the Trust are also officers of Columbia WAM. The Trust makes no direct payments to its officers and trustees who are affiliated with Columbia WAM. Trustees' fees and expenses paid by the Funds for the six months ended June 30, 2006 were as follows:
| (in thousands) | |
| Columbia Acorn Fund | | $ | 303 | | |
| Columbia Acorn International | | | 47 | | |
| Columbia Acorn USA | | | 21 | | |
| Columbia Acorn International Select | | | 1 | | |
| Columbia Acorn Select | | | 15 | | |
The Board of Trustees appointed a Chief Compliance Officer to the Trust in accordance with federal securities regulations. The Funds, along with other affiliated funds, will pay their pro-rata share of the expenses associated with the Office of the Chief Compliance Officer. These expenses are disclosed separately as "Compliance fees" in the Statements of Operations.
The Trust provides a deferred compensation plan for its trustees. Under that plan, a trustee may elect to defer all or a portion of his or her compensation. Amounts deferred are retained by the Trust and represent an unfunded obligation of the Trust. The value of amounts deferred is determined by reference to the change in value of Class Z shares of one or more series of the Trust or a money market fund as specified by the trustee. Benefits under the deferred compensation plan are payable upon retirement.
An affiliate may include any company in which a fund owns five percent or more of its outstanding voting securities. On June 30, 2006, Columbia Acorn Fund, Columbia Acorn International, Columbia Acorn USA and Columbia Acorn Select each held five percent or more of the outstanding voting securities of one or more companies. Details of investments in those affiliated companies are presented on pages 33, 41, 49 and 58, respectively.
During the six months ended June 30, 2006, the Funds engaged in purchase and sale transactions with funds that have a common investment adviser (or affiliated investment advisers), common Directors/Trustees, and/or common Officers. Those transactions complied with Rule 17a-7 under the Investment Company Act of 1940 and were as follows:
| | | Purchases | | Sales | |
| (in thousands) | |
| Columbia Acorn Fund | | $ | 306 | | | $ | 9,383 | | |
| Columbia Acorn International | | | 19,613 | | | | 1,299 | | |
| Columbia Acorn International Select | | | 44 | | | | — | | |
| Columbia Acorn Select | | | — | | | | 97 | | |
5. Borrowing Arrangements
The Trust participates in a $150 million credit facility, which was entered into to facilitate portfolio liquidity. Interest is charged to each participating fund based on its borrowings at a rate per annum equal to the Federal Funds rate plus 0.50%. In addition, a commitment fee of 0.10% per annum is accrued and apportioned among the participating funds based on their pro-rata portion of the unutilized line of credit. The commitment fee is included in "Other expenses" in the Statements of Operations. No amounts were borrowed under this facility for the six months ended June 30, 2006.
6. Investment Transactions
The aggregate cost of purchases and proceeds from sales other than short-term obligations for the six months ended June 30, 2006 were:
| Columbia Acorn Fund | |
| (in thousands) | |
| Investment securities | | | | | |
| Purchases | | $ | 2,536,172 | | |
| Proceeds from sales | | | 1,828,147 | | |
| Columbia Acorn International | |
| (in thousands) | |
| Investment securities | | | | | |
| Purchases | | $ | 872,256 | | |
| Proceeds from sales | | | 618,788 | | |
| Columbia Acorn USA | |
| (in thousands) | |
| Investment securities | |
| Purchases | | $ | 298,839 | | |
| Proceeds from sales | | | 66,493 | | |
| Columbia Acorn International Select | |
| (in thousands) | |
| Investment securities | |
| Purchases | | $ | 40,440 | | |
| Proceeds from sales | | | 31,655 | | |
| Columbia Acorn Select | |
| (in thousands) | |
| Investment securities | |
| Purchases | | $ | 273,545 | | |
| Proceeds from sales | | | 235,105 | | |
7. Redemption Fees
For the six months ended June 30, 2006, the redemption fees for Columbia Acorn International and Columbia Acorn International Select amounted to $107 and $4, respectively, and are accounted for as additions to paid in capital.
1-800-922-6769
74
8. Other
During the six months ended June 30, 2006, Columbia Acorn International sold foreign currency in error, resulting in a loss of $3,523. The Fund was reimbursed by Columbia WAM for the full amount of the loss.
9. Legal Proceedings
The Trust, Columbia WAM and the Trustees of the Trust are named as defendants in class and derivative complaints that have been consolidated in a Multi-District Action (the "MDL Action") in the federal district court of Maryland. These lawsuits contend that defendants permitted certain investors to market time their trades in certain Columbia Acorn Funds. The MDL Action is ongoing. However, all claims against Columbia Acorn Trust and the independent trustees of Columbia Acorn Trust have been dismissed.
The Trust and Columbia WAM are also defendants in a class action lawsuit that alleges, in summary, that the Trust and Columbia WAM exposed shareholders of Columbia Acorn International Fund to trading by market timers by allegedly: (a) failing to properly evaluate daily whether a significant event affecting the value of the Fund's securities had occurred after foreign markets had closed but before the calculation of the Fund's net asset value ("NAV"); (b) failing to implement the Fund's portfolio valuation and share pricing policies and procedures; and (c) failing to know and implement applicable rules and regulations concerning the calculation of NAV. The Seventh Circuit ruled that the plaintiffs' state law claims were preempted under federal law resulting in the dismissal of plaintiffs' complaint. Plaintiffs appealed the Seventh Circuit's ruling to the United States Supreme Court.
On March 21, 2005, a class action complaint was filed against the Columbia Acorn Trust and Columbia WAM seeking to rescind the Contingent Deferred Sales Charges assessed upon redemption of Class B shares of Columbia Acorn Funds due to the alleged market timing of the Columbia Acorn Funds. In addition to the rescission of sales charges, plaintiffs seek recovery of actual damages, attorneys' fees and costs. The case had been transferred to the MDL Action in the federal district court of Maryland.
On April 4, 2006, all of the parties to the MDL Action executed a letter settlement agreement intended to fully resolve all of the lawsuits consolidated in the MDL Action as well as the Fair Valuation Lawsuit. The settlement has not yet been finalized or approved by the court.
Columbia WAM, the Columbia Acorn Funds and the Trustees of the Trust are also defendants in a consolidated lawsuit filed in the federal district court of Massachusetts alleging that Columbia WAM used Fund assets to make undisclosed payments to brokers as an incentive for the brokers to market the Funds over other mutual funds to investors. The complaint alleges Columbia WAM and the Trustees of the Trust breached certain common law duties and federal laws.
On November 30, 2005, the court dismissed all of the claims alleged against all of the parties in the consolidated complaint. Plaintiffs timely filed a notice of appeal of the district court's dismissal order with the First Circuit Court of Appeals. The parties subsequently executed a settlement term sheet to fully resolve all claims in the litigation. The settlement has not yet been finalized or approved by the court.
The Trust and Columbia WAM intend to defend these suits vigorously.
As a result of these matters, or any adverse publicity or other developments resulting from them, there may be increased redemptions or reduced sales of Fund shares, which could increase transaction cost or operating expenses, or have other adverse consequences for the Funds. In connection with the events described in detail above, various parties have filed suit against certain funds, their Boards and/or BOA (and affiliated entities). These suits are ongoing. However, based on currently available information, the Columbia Acorn Trust believes that the likelihood that these lawsuits will have a material adverse impact on any Fund is remote, and Columbia WAM believes that the lawsuits are not likely to materially affect its ability to provide investment management services to the Funds.
For the six months ended June 30, 2006, Columbia Management has assumed consulting services and legal fees incurred by the Funds in connection with these matters and the amounts are as follows:
| (in thousands) | |
| Columbia Acorn Fund | | $ | 84 | | |
| Columbia Acorn International | | | 16 | | |
| Columbia Acorn USA | | | 7 | | |
| Columbia Acorn International Select | | | 1 | | |
| Columbia Acorn Select | | | 9 | | |
75
Columbia Thermostat Fund
>Statement of Investments (Unaudited), June 30, 2006
Number of Shares
or Principal Amount (000) | | | | Value (000) | |
| | | >Stock Funds: 50.9% | |
| | 1,828,532 | | | Columbia Large Cap Enhanced
Core Fund, Class Z | | $ | 24,210 | | |
| | 1,542,750 | | | Columbia Dividend Income
Fund, Class Z | | | 19,300 | | |
| | 394,773 | | | Columbia Acorn International,
Class Z | | | 14,836 | | |
| | 498,693 | | | Columbia Acorn Fund, Class Z | | | 14,706 | | |
| | 1,035,323 | | | Columbia Large Cap Value
Fund, Class Z | | | 14,536 | | |
| | 409,815 | | | Columbia Acorn Select, Class Z | | | 9,782 | | |
| | | | | Total Stock Funds (Cost: $90,716) | | | 97,370 | | |
| | | >Bond Funds: 49.1% | |
| | 5,468,354 | | | Columbia Intermediate Bond Fund,
Class Z | | | 47,083 | | |
| | 2,774,361 | | | Columbia Federal Securities Fund,
Class Z | | | 28,187 | | |
| | 2,289,736 | | | Columbia Conservative High Yield Fund,
Class Z | | | 18,730 | | |
| | | | | Total Bond Funds (Cost: $97,372) | | | 94,000 | | |
| Short-Term Obligation: 0.4% | | | |
| $ | 685 | | | Repurchase Agreement with State
Street Bank & Trust dated
6/30/06, due 7/03/06 at 4.93%
collateralized by Federal Home
Loan Bank, maturing 12/12/08
market value $710
(repurchase proceeds: $685) | | | 685 | | |
| | | | | (Cost: $685) | | | 685 | | |
| | Total Investments: 100.4%
(Cost: $188,773)(a) | | | | | | 192,055 | | |
| | Cash and Other Assets Less Liabilities: (0.4)% | | | | | | (709 | ) | |
| | Total Net Assets: 100% | | | | | $ | 191,346 | | |
>Notes to Statements of Investments (in thousands)
(a) At June 30, 2006, for federal income tax purposes cost of investments was $188,773 and net unrealized appreciation was $3,282 consisting of gross unrealized appreciation of $7,550 and gross unrealized depreciation of $4,268.
1-800-922-6769
76
Columbia Thermostat Fund
>Statement of Assets and Liabilities (Unaudited)
June 30, 2006
| (in thousands) | |
| Assets: | |
| Unaffiliated investments, at value (cost: $685) | | $ | 685 | | |
| Affiliated investments, at value (cost: $188,088) | | | 191,370 | | |
| Cash | | | — | * | |
Receivable for:
Fund shares sold | | | 79 | | |
| Dividends and interest | | | 445 | | |
| Expense reimbursement due from Investment Adviser | | | 29 | | |
| Total Assets | | | 192,608 | | |
| Liabilities: | |
| Payable for: | |
| Investments purchased | | | 445 | | |
| Fund shares redeemed | | | 604 | | |
| Management fee | | | 16 | | |
| Administration fee | | | 7 | | |
| Transfer agent fees | | | 24 | | |
| Trustees' fees | | | 2 | | |
| Custody fees | | | 2 | | |
| Reports to shareholders | | | 57 | | |
| 12b-1 Service & Distribution fees | | | 93 | | |
| Deferred Trustees' fees | | | 6 | | |
| Other liabilities | | | 6 | | |
| Total Liabilities | | | 1,262 | | |
| Net Assets | | $ | 191,346 | | |
| Composition of Net Assets: | |
| Paid in capital | | $ | 180,294 | | |
| Undistributed net investment income | | | 3,327 | | |
| Accumulated net realized gain | | | 4,443 | | |
| Net unrealized appreciation on investments | | | 3,282 | | |
| Net Assets | | $ | 191,346 | | |
| Net asset value per share – Class A (a) | | $ | 12.53 | | |
| (Net assets/shares) | | | ($63,627/5,076) | | |
| Maximum offering price per share – Class A (b) | | $ | 13.29 | | |
| (Net asset value per share/front-end sales charge) | | | ($12.53/0.9425) | | |
| Net asset value and offering price per share – Class B (a) | | $ | 12.53 | | |
| (Net assets/shares) | | | ($73,634/5,876) | | |
| Net asset value and offering price per share – Class C (a) | | $ | 12.52 | | |
| (Net assets/shares) | | | ($27,319/2,182) | | |
| Net asset value, offering and redemption price per share – Class Z | | $ | 12.53 | | |
| (Net assets/shares) | | | ($26,766/2,136) | | |
*Rounds to less than $500.
(a) Redemption price per share is equal to net asset value less any applicable contingent deferred sales charge.
(b) On sales of $50,000 or more the offering price is reduced.
See accompanying notes to financial statements.
77
Columbia Thermostat Fund
>Statement of Operations (Unaudited)
For the Six Months Ended June 30, 2006
| (in thousands) | |
| Investment Income: | |
| Dividends from affiliated investment company shares | | $ | 4,130 | | |
| Interest income | | | 17 | | |
| Total Investment Income | | | 4,147 | | |
| Expenses: | |
| Management fee | | | 99 | | |
| Administration fee | | | 40 | | |
| 12b-1 Service and Distribution fees: | |
| Class A | | | 85 | | |
| Class B | | | 324 | | |
| Class C | | | 138 | | |
| Transfer agent fees: | |
| Class A | | | 51 | | |
| Class B | | | 71 | | |
| Class C | | | 25 | | |
| Class Z | | | 13 | | |
| Trustees' fees | | | 2 | | |
| Custody fees | | | 2 | | |
| Reports to shareholders | | | 70 | | |
| Compliance fees | | | 3 | | |
| Non-recurring costs (See Note 7) | | | 1 | | |
| Other expenses | | | 55 | | |
| Total expenses | | | 979 | | |
| Less custody fees paid indirectly | | | — | * | |
| Less reimbursement of expenses by Investment Adviser | | | (153 | ) | |
| Less fees waived by Transfer Agent | | | (31 | ) | |
| Non-recurring costs reimbursed (See Note 7) | | | (1 | ) | |
| Net Expenses | | | 794 | | |
| Net Investment Income | | | 3,353 | | |
| Net Realized and Unrealized Gain on Investments: | |
| Net realized gain on: | |
| Affiliated investments | | | 4,104 | | |
| Distributions from affiliated investment company shares | | | 880 | | |
| Net realized gain | | | 4,984 | | |
| Net change in unrealized appreciation (depreciation) on affiliated investments | | | (3,742 | ) | |
| Net realized and unrealized gain | | | 1,242 | | |
| Net Increase in Net Assets from Operations | | $ | 4,595 | | |
*Rounds to less than $500.
See accompanying notes to financial statements.
1-800-922-6769
78
Columbia Thermostat Fund
>Statement of Changes in Net Assets
| Increase in Net Assets: | | (Unaudited)
Six months
ended June 30, | | Year ended
December 31, | |
| (in thousands) | | 2006 | | 2005 | |
| Operations: | |
| Net investment income | | $ | 3,353 | | | $ | 5,484 | | |
| Net realized gain on affiliated investments and distributions from affiliated investment company shares | | | 4,984 | | | | 14,700 | | |
| Net change in net unrealized appreciation (depreciation) on affiliated investments | | | (3,742 | ) | | | (10,409 | ) | |
| Net Increase from Operations | | | 4,595 | | | | 9,775 | | |
| Distributions Declared to Shareholders From: | |
| Net investment income – Class A | | | (70 | ) | | | (2,069 | ) | |
| Net realized gain – Class A | | | (1,229 | ) | | | (4,875 | ) | |
| Net investment income – Class B | | | — | * | | | (1,831 | ) | |
| Net realized gain – Class B | | | (1,409 | ) | | | (5,382 | ) | |
| Net investment income – Class C | | | — | | | | (617 | ) | |
| Net realized gain – Class C | | | (520 | ) | | | (1,972 | ) | |
| Net investment income – Class Z | | | (98 | ) | | | (797 | ) | |
| Net realized gain – Class Z | | | (504 | ) | | | (1,697 | ) | |
| Total Distributions to Shareholders | | | (3,830 | ) | | | (19,240 | ) | |
| Share Transactions: | |
| Subscriptions – Class A | | | 4,262 | | | | 15,104 | | |
| Distributions reinvested – Class A | | | 1,185 | | | | 6,273 | | |
| Redemptions – Class A | | | (13,279 | ) | | | (24,089 | ) | |
| Net Decrease – Class A | | | (7,832 | ) | | | (2,712 | ) | |
| Subscriptions – Class B | | | 2,467 | | | | 8,919 | | |
| Distributions reinvested – Class B | | | 1,280 | | | | 6,512 | | |
| Redemptions – Class B | | | (8,800 | ) | | | (11,391 | ) | |
| Net Increase (Decrease) – Class B | | | (5,053 | ) | | | 4,040 | | |
| Subscriptions – Class C | | | 2,960 | | | | 5,664 | | |
| Distributions reinvested – Class C | | | 460 | | | | 2,303 | | |
| Redemptions – Class C | | | (4,467 | ) | | | (9,480 | ) | |
| Net Decrease – Class C | | | (1,047 | ) | | | (1,513 | ) | |
| Subscriptions – Class Z | | | 2,323 | | | | 5,843 | | |
| Distributions reinvested – Class Z | | | 578 | | | | 2,384 | | |
| Redemptions – Class Z | | | (1,744 | ) | | | (2,485 | ) | |
| Net Increase – Class Z | | | 1,157 | | | | 5,742 | | |
| Net Increase (Decrease) from Share Transactions | | | (12,775 | ) | | | 5,557 | | |
| Total Decrease in Net Assets | | | (12,010 | ) | | | (3,908 | ) | |
| Net Assets: | |
| Beginning of period | | | 203,356 | | | | 207,264 | | |
| End of period | | $ | 191,346 | | | $ | 203,356 | | |
| Undistributed Net Investment Income | | $ | 3,327 | | | $ | 142 | | |
*Rounds to less than $500.
See accompanying notes to financial statements.
79
Columbia Thermostat Fund
>Statement of Changes in Net Assets, continued
| Changes in Shares of Beneficial Interest: | | (Unaudited)
Six months
ended June 30, | | Year ended
December 31, | |
| (in thousands) | | 2006 | | 2005 | |
| Subscriptions – Class A | | | 333 | | | | 1,151 | | |
| Shares issued in reinvestment and capital gains – Class A | | | 95 | | | | 497 | | |
| Less shares redeemed – Class A | | | (1,039 | ) | | | (1,840 | ) | |
| Net Decrease – Class A | | | (611 | ) | | | (192 | ) | |
| Subscriptions – Class B | | | 193 | | | | 684 | | |
| Shares issued in reinvestment and capital gains – Class B | | | 102 | | | | 515 | | |
| Less shares redeemed – Class B | | | (689 | ) | | | (870 | ) | |
| Net Increase (Decrease) – Class B | | | (394 | ) | | | 329 | | |
| Subscriptions – Class C | | | 232 | | | | 434 | | |
| Shares issued in reinvestment and capital gains – Class C | | | 37 | | | | 182 | | |
| Less shares redeemed – Class C | | | (350 | ) | | | (725 | ) | |
| Net Decrease – Class C | | | (81 | ) | | | (109 | ) | |
| Subscriptions – Class Z | | | 182 | | | | 446 | | |
| Shares issued in reinvestment and capital gains – Class Z | | | 46 | | | | 189 | | |
| Less shares redeemed – Class Z | | | (136 | ) | | | (189 | ) | |
| Net Increase – Class Z | | | 92 | | | | 446 | | |
| Net Increase (Decrease) in Shares of Beneficial Interest | | | (994 | ) | | | 474 | | |
See accompanying notes to financial statements.
1-800-922-6769
80
Columbia Thermostat Fund
>Financial Highlights
| Class Z | | (Unaudited)
Six months
ended
June 30, | | Year Ended December 31, | | Inception
September 25,
2002 through
December 31, | |
| Selected data for a share outstanding throughout each period | | 2006 | | 2005 | | 2004 | | 2003 | | 2002 | |
| Net Asset Value, Beginning of Period | | $ | 12.50 | | | | 13.12 | | | $ | 12.31 | | | $ | 10.41 | | | $ | 10.00 | | |
| Income from Investment Operations | |
| Net investment income (a) | | | 0.25 | | | | 0.43 | | | | 0.31 | | | | 0.19 | | | | 0.04 | | |
| Net realized and unrealized gain | | | 0.07 | | | | 0.28 | | | | 0.82 | | | | 1.87 | | | | 0.37 | | |
| Total from Investment Operations | | | 0.32 | | | | 0.71 | | | | 1.13 | | | | 2.06 | | | | 0.41 | | |
| Less Distributions Declared to Shareholders | |
| From net investment income | | | (0.05 | ) | | | (0.42 | ) | | | (0.29 | ) | | | (0.16 | ) | | | — | | |
| From net realized gains | | | (0.24 | ) | | | (0.91 | ) | | | (0.03 | ) | | | (0.00 | )(b) | | | — | | |
| Total Distributions Declared to Shareholders | | | (0.29 | ) | | | (1.33 | ) | | | (0.32 | ) | | | (0.16 | ) | | | — | | |
| Net Asset Value, End of Period | | $ | 12.53 | | | $ | 12.50 | | | $ | 13.12 | | | $ | 12.31 | | | $ | 10.41 | | |
| Total Return (c)(d) | | | 2.56 | %(e) | | | 5.50 | % | | | 9.17 | % | | | 19.79 | % | | | 4.10 | %(e) | |
| Ratios to Average Net Assets/Supplemental Data | |
| Expenses (f) | | | 0.25 | %(g)(h) | | | 0.25 | %(g) | | | 0.25 | %(g) | | | 0.38 | %(g) | | | 0.62 | %(h)(i) | |
| Net investment income | | | 3.99 | %(g)(h) | | | 3.28 | %(g) | | | 2.48 | %(g) | | | 1.64 | %(g) | | | 1.41 | %(h)(i) | |
| Reimbursement/waiver | | | 0.12 | %(h) | | | 0.11 | % | | | 0.21 | % | | | 0.88 | % | | | 19.94 | %(h) | |
| Portfolio turnover rate | | | 29 | %(e) | | | 96 | % | | | 67 | % | | | 61 | % | | | 11 | %(e) | |
| Net assets at end of period (in millions) | | $ | 27 | | | $ | 26 | | | $ | 21 | | | $ | 14 | | | $ | 4 | | |
(a) Per share data was calculated using average shares outstanding during the period. Recognition of net investment income by the Fund is affected by the timing of the declaration of dividends by the underlying investment companies in which the Fund invests.
(b) Rounds to less than $0.01 per share.
(c) Total return at net asset value assuming all distributions reinvested.
(d) Had the Investment Adviser and/or Transfer Agent not reimbursed a portion of expenses, total return would have been reduced.
(e) Not annualized.
(f) Does not include expenses of the investment companies in which the Fund invests.
(g) The benefits derived from custody fees paid indirectly had no impact.
(h) Annualized.
(i) In accordance with a requirement of the Securities and Exchange Commission, the ratios reflect total expenses prior to the reduction of custody fees for cash balances the Fund maintains with the custodian ("custody fees paid indirectly"). The ratios of expenses to average daily net assets and net investment income to average daily net assets net of custody fees paid indirectly would have been 0.60% and 1.43%, respectively for the period ended December 31, 2002.
See accompanying notes to financial statements.
81
Columbia Thermostat Fund
>Notes to Financial Statements (Unaudited)
1. Nature of Operations
Columbia Thermostat Fund (the "Fund"), a series of Columbia Acorn Trust (the "Trust"), an open-end management investment company organized as a Massachusetts business trust. The Fund may issue an unlimited number of shares. The Fund currently offers four classes of shares: Class A, Class B, Class C and Class Z.
Class A shares are sold with a front-end sales charge. Class A shares bought without an initial sales charge in accounts aggregating up to $50 million at the time of purchase are subject to a 1.00% CDSC if the shares are sold within 12 months of the time of purchase.
Class B shares are subject to a CDSC if sold within six years of purchase. Class B shares will convert to Class A shares automatically eight years after purchase.
Class C shares are subject to a CDSC on redemptions made within one year after purchase.
Class Z shares are offered continuously at net asset value. There are certain restrictions on the purchase of Class Z shares.
The financial highlights for Class A, Class B and Class C shares are presented in a separate semiannual report. The semiannual report for the other series of the Trust is also included in this report. Generally you may exchange your Class Z shares of the Fund for shares of another Fund distributed by Columbia Management Distributors, Inc. at no additional charge. See "Fund Policy on Trading of Fund Shares" as disclosed within the Fund's prospectus.
The investment objective of the Fund is to provide long-term total return. The Fund pursues its investment objective by investing in shares of other mutual funds. As a 'fund of funds' under normal circumstances, the Fund allocates at least 95% of its net assets among a selected group of stock and bond mutual funds (the "Portfolio Funds") according to the current level of the Standard & Poor's 500 Stock Index in relation to predetermined ranges set by the Fund's investment adviser. As of June 30, 2006, the Fund invested in six stock Portfolio Funds (Columbia Acorn Fund, Columbia Acorn Select, Columbia Large Cap Value Fund, Columbia Acorn International, Columbia Dividend Income Fund and Columbia Large Cap Enhanced Core Fund) and three bond Portfolio Funds (Columbia Federal Securities Fund, Columbia Intermediate Bond Fund and Columbia Conservative High Yield Fund). The Fund also may invest up to 5% of its net assets plus any ca sh received that day in cash, repurchase agreements, high quality short-term paper and government securities.
Investment income, realized and unrealized gains and losses, and certain fund-level expenses are borne pro rata on the basis of the relative net assets of all classes, except each class bears certain expenses unique to that class such as distribution services, transfer agent, and certain other class specific expenses. Differences in class expenses may result in payment of different dividend distributions for each class. All the share classes of the Trust have equal rights with respect to voting subject to class specific arrangements.
2. Significant Accounting Policies
>Security valuation
Investments in Portfolio Funds are valued at their net asset value as reported by the underlying funds. High quality short-term paper and government securities having a maturity of 60 days or less from the valuation date are valued on an amortized cost basis, which approximates fair value.
>Repurchase agreements
The Fund may engage in repurchase agreement transactions. The Fund, through its custodian, receives delivery of underlying securities collateralizing each repurchase agreement. The Fund's investment adviser determines that the value of the underlying securities is at all times at least equal to the resale price. In the event of default or bankruptcy by the other party to the agreement, realization and/or retention of the collateral may be subject to legal proceedings.
>Security transactions and investment income
Portfolio Fund transactions are accounted for on the trade date (date the order to buy or sell is executed). Dividend income and realized gain distributions from other funds are recorded on the ex-dividend date. Interest income is recorded on the accrual basis and includes amortization of discounts on short-term debt obligations when required for federal income tax purposes. Realized gains and losses from security transactions are reported on an identified cost basis. Awards from class action litigation may be recorded as a reduction of cost by Portfolio Funds. If the Portfolio Fund no longer owns the applicable securities, the proceeds are recorded as realized gains.
>Use of estimates
The preparation of financial statements in conformity with accounting principles generally accepted in the United States of America requires management to make estimates and assumptions that affect the amounts reported in the financial statements and accompanying notes. Actual results may differ from those estimates.
>Fund share valuation
Fund shares are sold and redeemed on a continuing basis at net asset value. Net asset value per share is determined daily
1-800-922-6769
82
as of the close of trading on the New York Stock Exchange (the "Exchange") on each day the Exchange is open for trading. All income, expenses (other than Class A, Class B and Class C 12b-1 service and distribution fees, and Class A, Class B, Class C and Class Z transfer agent fees) and realized and unrealized gains (losses) of the Fund are allocated to each class proportionately on a daily basis for purposes of determining the net asset value of each class.
>Custody fees/credits
Custody fees are reduced based on the Fund's cash balance maintained with the custodian. The Fund could have invested a portion of assets utilized in connection with the expense offset arrangement in an income-producing asset if it had not entered into such an agreement. The amount is disclosed as a reduction of total expenses in the Statement of Operations.
>Federal income taxes
The Fund has complied with the provisions of the Internal Revenue Code available to regulated investment companies and, in the manner provided therein, distributes all of its taxable income, as well as any net realized gain on sales of Portfolio Fund shares and any distributions of net realized gains received by the Fund from its Portfolio Funds, reportable for federal income tax purposes. Accordingly, the Fund paid no federal income taxes and no federal income tax provision was required.
>Distributions to Shareholders
Distributions to shareholders are recorded on the ex-date.
>Indemnification
In the normal course of business, the Fund enters into contracts that contain a variety of representations and warranties and which provide general indemnities. The Funds' maximum exposure under these arrangements is unknown, as this would involve future claims against the Fund. Also, under the Trust's organizational documents, the Trustees and Officers of the Trust are indemnified against certain liabilities that may arise out of their duties to the Trust. However, based on experience, the Fund expects the risk of loss due to these warranties and indemnities to be minimal.
3. Federal Tax Information
The tax character of distributions paid during the year ended December 31, 2005 was as follows:
| (in thousands) | |
| Distributions paid from: | | | | | |
| Ordinary Income* | | | | $ | 8,262 | | |
| Long-Term Capital Gains | | | | | 10,978 | | |
*For tax purposes short-term capital gains distributions, if any, are considered ordinary income distributions.
In June 2006, the Financial Accounting Standards Board ("FASB") issued FASB Interpretation No. 48, Accounting for Uncertainty in Income Taxes, an Interpretation of FASB Statement 109 (the "Interpretation"). This Interpretation is effective for fiscal years beginning after December 15, 2006 and is to be applied to all tax positions upon initial adoption. This Interpretation prescribes a minimum recognition threshold and measurement method for the financial statement recognition of tax positions taken or expected to be taken in a tax return and also requires certain expanded disclosures. Columbia Wanger Asset Management, L.P. ("Columbia WAM"), a wholly owned subsidiary of Columbia Management Group, Inc., which in turn is an indirect, wholly owned subsidiary of Bank of America Corpor ation ("BOA"), has recently begun to evaluate the application of this Interpretation to the Fund and has not at this time quantified the impact, if any, resulting from the adoption of this Interpretation on the Fund's financial statements.
4. Transactions with Affiliates
Columbia WAM furnishes continuing investment supervision to the Fund and is responsible for the overall management of the Fund's business affairs.
Under the Fund's investment management agreement, fees are accrued daily and paid monthly to Columbia WAM at the annual rate of 0.10% of the Fund's average daily net assets.
>Expense Limit
Columbia WAM has contractually agreed to reimburse the direct operating expenses (exclusive of interest and fees on borrowings and expenses associated with the Fund's investment in other investment companies) exceeding 0.25% of the average annual net assets of the Fund's Class Z shares annually through April 30, 2007.
Fees reimbursed amounted to $153,234 for the six months ended June 30, 2006.
Columbia WAM has the right to recoup expense reimbursement payments made to the Fund through December 31, 2006. No expenses were recouped through June 30, 2006.
Columbia WAM provides administrative services and receives an administration fee from the Fund at the following annual rates:
| Columbia Acorn Trust | |
| Average daily net asset value: | | | | | |
| On the first $8 billion | | | 0.05 | % | |
| Next $8 billion | | | 0.04 | % | |
| Average daily net asset value in excess of $16 billion | | | 0.03 | % | |
For the six months ended June 30, 2006, the Fund's effective administration fee rate was 0.041%. Columbia WAM has delegated to Columbia Management Advisors, LLC, an indirect, wholly owned subsidiary of BOA, responsibility to provide certain administrative services to the Fund.
83
Columbia Thermostat Fund
>Notes to Financial Statements (Unaudited), continued
Columbia Management Distributors, Inc. ("CMDI"), a wholly owned subsidiary of BOA, is the Fund's principal indirect underwriter and receives no compensation on the sale of Class Z shares.
The Fund has adopted a 12b-1 plan which requires it to pay CMDI a service and distribution fee on net assets attributable to Class A, Class B and Class C shares.
Columbia Management Services, Inc. (the "Transfer Agent"), a wholly owned subsidiary of BOA, provides shareholder services to the Fund and has contracted with Boston Financial Data Services ("BFDS") to serve as sub-transfer agent. For such services, the Transfer Agent receives a fee, paid monthly, at the annual rate of $21.00 per open account. The Transfer Agent also receives reimbursement for certain out-of-pocket expenses. The Transfer Agent waived the reimbursement for certain out-of-pocket expenses for the period covered by this report. Expenses waived by the Transfer Agent for the six months ended June 30, 2006 were $30,576.
Certain officers and trustees of the Trust are also officers of Columbia WAM. The Trust makes no direct payments to its officers and trustees who are affiliated with Columbia WAM. Trustees' fees and expenses paid by the Fund for the six months ended June 30, 2006 were $2,362.
The Board of Trustees appointed a Chief Compliance Officer to the Trust in accordance with federal securities regulations. The Fund, along with other affiliated funds, will pay its pro-rata share of the expenses associated with the Office of the Chief Compliance Officer. This expense is disclosed separately as "Compliance fees" in the Statement of Operations.
5. Borrowing Arrangements
The Trust participates in a $150 million credit facility, which was entered into to facilitate portfolio liquidity. Interest is charged to each participating fund based on its borrowings at a rate per annum equal to the Federal Funds rate plus 0.50%. In addition, a commitment fee of 0.10% per annum is accrued and apportioned among the participating funds based on their pro-rata portion of the unutilized line of credit. The commitment fee is included in "Other expenses" in the Statement of Operations. No amounts were borrowed under this facility for the six months ended June 30, 2006.
6. Investment Transactions
The aggregate cost of purchases and proceeds from sales other than short-term obligations for the six months ended June 30, 2006 were:
| (in thousands) | |
| Purchases | | $ | 57,973 | | |
| Proceeds from sales | | | 69,846 | | |
7. Legal Proceedings
The Trust, Columbia WAM and the Trustees of the Trust are named as defendants in class and derivative complaints which have been consolidated in a Multi-District Action (the "MDL Action") in the federal district court of Maryland. These lawsuits contend that defendants permitted certain investors to market time their trades in certain Columbia Acorn Funds. The MDL Action is ongoing. However, all claims against Columbia Acorn Trust and the independent trustees of Columbia Acorn Trust have been dismissed.
The Trust and Columbia WAM are also defendants in a class action lawsuit that alleges, in summary, that the Trust and Columbia WAM exposed shareholders of Columbia Acorn International Fund to trading by market timers by allegedly: (a) failing to properly evaluate daily whether a significant event affecting the value of the Fund's securities had occurred after foreign markets had closed but before the calculation of the Fund's net asset value ("NAV"); (b) failing to implement the Fund's portfolio valuation and share pricing policies and procedures; and (c) failing to know and implement applicable rules and regulations concerning the calculation of NAV. The Seventh Circuit ruled that the plaintiffs' state law claims were preempted under federal law resulting in the dismissal of plaintiffs' complaint. Plaintiffs appealed the Seventh Circuit's ruling to the United States Supreme Court.
On March 21, 2005, a class action complaint was filed against the Columbia Acorn Trust and Columbia WAM seeking to rescind the Contingent Deferred Sales Charges assessed upon redemption of Class B shares of Columbia Acorn Funds due to the alleged market timing of the Columbia Acorn Funds. In addition to the rescission of sales charges, plaintiffs seek recovery of actual damages, attorneys' fees and costs. The case had been transferred to the MDL Action in the federal district court of Maryland.
On April 4, 2006, all of the parties to the MDL Action executed a letter settlement agreement intended to fully resolve all of the lawsuits consolidated in the MDL Action as well as the Fair Valuation Lawsuit. The settlement has not yet been finalized or approved by the court.
Columbia WAM, the Columbia Acorn Funds and the Trustees of the Trust are also defendants in a consolidated lawsuit filed in the federal district court of Massachusetts alleging that Columbia WAM used Fund assets to make undisclosed payments to brokers as an incentive for the brokers to market the Funds over other mutual funds to investors. The complaint alleges Columbia WAM and the Trustees of the Trust breached certain common law duties and federal laws.
On November 30, 2005, the court dismissed all of the claims alleged against all of the parties in the consolidated complaint. Plaintiffs timely filed a notice of appeal of the district court's dismissal order with the First Circuit Court of Appeals. The parties subsequently executed a settlement term sheet to fully resolve all claims in the litigation. The settlement has not yet been finalized or approved by the court.
1-800-922-6769
84
The Trust and Columbia WAM intend to defend these suits vigorously.
As a result of these matters or any adverse publicity or other developments resulting from them, there may be increased redemptions or reduced sales of Fund shares, which could increase transaction cost or operating expenses, or have other adverse consequences for the Fund. In connection with the events described in detail above, various parties have filed suit against certain funds, their Boards and/or BOA (and affiliated entities). These suits are ongoing. However, based on currently available information, the Columbia Acorn Trust believes that the likelihood that these lawsuits will have a material adverse impact on any Fund is remote, and Columbia WAM believes that the lawsuits are not likely to materially affect its ability to provide investment management services to the Funds.
For the six months ended June 30, 2006, Columbia Management has assumed $934 of consulting services and legal fees incurred by the Fund in connection with these matters.
85
[Excerpts from:]
Columbia Acorn Trust
Management Fee Evaluation of the Senior Officer
Prepared Pursuant to the New York Attorney General's
Assurance of Discontinuance
Robert P. Scales
Senior Vice President,
Chief Legal Officer
and General Counsel
2006
86
Introduction
The New York Attorney General's Assurance of Discontinuance ("Order") entered into by Columbia Management Advisors, Inc. ("CMAI") and Columbia Management Distributors, Inc., ("CMDI" and collectively with "CMAI," "CMG") in February 2005, allows CMAI to manage or advise a mutual fund, including the Acorn Trust's family of funds (the "Acorn Funds" or "Acorn" or "Trust"), only if the trustees of the Acorn Funds appoint a "Senior Officer" to perform specified duties and responsibilities. One of these responsibilities includes "managing the process by which proposed management fees (including but not limited to, advisory fees) to be charged the [Acorn Funds] are negotiated so that they are negotiated in a manner which is at arms' length and reasonable and consistent with this Assurance of Discontinuance."
The Order also provides that the Board of Trustees of the Acorn Funds ("Board") must determine the reasonableness of proposed "management fees" by using either an annual competitive bidding process supervised by the Senior Officer or Independent Fee Consultant, or by obtaining "an annual independent written evaluation prepared by or under the direction of the Senior Officer or the Independent Fee Consultant."
"Management fees" are only part of the costs and expenses paid by mutual fund shareholders. The expenses can vary depending upon the class of shares held but usually include: (1) investment management or advisory fees to compensate analysts and portfolio managers for stock research and portfolio management, as well as the cost of operating a trading desk; (2) administrative expenses incurred to prepare registration statements and tax returns, calculate the Funds' net asset values, maintain effective compliance procedures and perform recordkeeping services; (3) transfer agency costs for establishing accounts, accepting and disbursing funds, as well as overseeing trading in Fund shares; (4) custodial expenses incurred to hold the securities purchased by the Funds; and (5) distribution expenses, including commissions paid to brokers that sell the Fund shares to investors.
Columbia Wanger Asset Management, L.P. ("CWAM"), the adviser to the Acorn Funds, has proposed that the Trust enter into separate agreements governing the first two categories listed above: an advisory agreement governing portfolio management, and an administration agreement governing certain administration and clerical services. Together the fees paid under these two agreements are referred to as "management fees." Other fund expenses are governed by separate agreements, in particular agreements with two CWAM affiliates: CMDI, the broker-dealer that underwrites and distributes the Acorn Funds' shares, and Columbia Management Services, Inc. ("CMSI"), the Funds' transfer agent. In conformity with the terms of the Order, this evaluation, therefore, addresses only the advisory and administrative contracts between CWAM and the Trust, and does not extend to the other agreements.
According to the Order, the Senior Officer's evaluation must consider at least the following:
(1) Management fees (including components thereof) charged to institutional and other clients of CWAM for like services;
(2) Management fees (including any components thereof) charged by other mutual fund companies for like services;
(3) Costs to CWAM and its affiliates of supplying services pursuant to the management fee agreements, excluding any intra-corporate profit;
(4) Profit margins of CWAM and its affiliates from supplying such services;
(5) Possible economies of scale as the Acorn Funds grow larger; and
(6) The nature and quality of CWAM's services, including the performance of each Acorn Fund.
On November 16, 2004, the Board appointed me Senior Officer under the Order. The Board also determined not to pursue a competitive bidding process and instead, charged me with the responsibility of evaluating the Acorn Funds' proposed advisory and administrative fee contracts with CWAM in conformity with the requirements of the Order. This Report is an annual evaluation required under the Order. In discharging their responsibilities, the independent Trustees have also consulted independent, outside counsel.
87
2005 Evaluation
This is the second annual evaluation prepared in connection with the Order. The first annual evaluation ("2005 Evaluation") was issued on July 20, 2005. This evaluation follows the same structure as the 2005 Evaluation. Some areas are given more emphasis here, while others are given less. Still, the fundamental information gathered for this evaluation is the largely the same as last year. I have noted in this Report where methodologies diverged significantly.
This evaluation was performed in cooperation and regular communication with the Contract Review Committee of the Board of Trustees.
Process and Independence
The objectives of the Order are to insure the independent evaluation of the advisory fees paid by the Acorn Funds as well as to insure that all relevant factors are considered. In my view, the contract renewal process has been conducted at arms-length and with independence in gathering, considering and evaluating all relevant data. At the outset of the process, the Trustees sought and obtained from CWAM and CMG a comprehensive compilation of data regarding Fund performance and expense, adviser profitability, and other information. In advance of the contract renewal process, the Board also explored CWAM's potential capacity restraints, an issue posed by the size of the Acorn Fund and by some of the observations from the 2005 Evaluation. Performance and expense data was obtained from both Morningstar and Lipper, the leading consultants in this area. The rankings prepared by Morningstar and Lipper were independent and were not infl uenced by the adviser. CWAM itself identified what it considers its competition in formulating its own peer group, and the Trustees considered that data as well.
In the course of its work, the Contract Committee gave careful consideration to the conclusions and recommendations contained in the 2005 Evaluation. In particular, the Contract Committee considered the possible introduction of a two-tiered fee structure that would set fees on the basis of a combined CWAM complex level and individual fund level. The Committee concluded that such a fee structure might be confusing to shareholders, though it has not foreclosed such a structure in the future. The Committee is continuing to consider whether economies of scale are appropriately reflected in the Funds' fee schedules.
My evaluation of the advisory contract was shaped, as it was last year, by my experience as Acorn's Chief Compliance Officer ("CCO"). As CCO, I report solely to the Board and have no reporting obligation to or employment relationship with CMG or its affiliates, except for administrative purposes. This too contributes to the independence of this evaluation. I have commented on compliance matters in evaluating the quality of service provided by CWAM.
This Report, its supporting materials and the data contained in other materials submitted to the Contract Committee of the Board, in my view, provide a thorough factual basis upon which the Board, in consultation with independent counsel as it deems appropriate, may conduct management fee negotiations that are in the best interests of the Acorn Funds' shareholders.
The Fee Reductions Mandated under the Order
Under the terms of the Order, CMG agreed to secure certain management fee reductions for the mutual funds advised by its affiliate investment advisers. In some instances, breakpoints were also established. Although neither CWAM nor the Trust was a party to the Order, CWAM offered and the Board accepted certain advisory fee reductions last year. By the terms of the Order, these fees may not be increased before November 30, 2009. I have used these advisory fee levels in my evaluation because they are the fees in the current agreements that CWAM proposes should be continued. Hence, these fee levels are the starting point of an evaluation.
88
Conclusions
My review of the data and other material above leads to the following conclusions with respect to the factors identified in the Order.
1. Performance. The domestic Funds generally have achieved outstanding performance. The Acorn Fund, Acorn USA and Acorn Select all rank very favorably against their peers. The international Funds have not, however, performed nearly as well as the domestic funds, and continue to lag their benchmarks and peers. Management is taking steps to improve the performance of these funds.
2. Management Fees relative to Peers. The management fee rankings for most of the Funds are generally more favorable to shareholders than those of their peer group funds. Management fees do vary by Fund. Acorn Fund is the least expensive and the Acorn USA the most expensive. Acorn USA and Acorn Select were ranked by both Lipper and Morningstar below many of their peers, and therefore impose higher fees than do some of their competitors.
3. Administrative Fees. The Acorn Funds' administrative fee, which is uniform across all Funds, is at a level comparable to that of most peers, provides for appropriate services to Funds, and affords breakpoints that lower the fee as assets increase.
4. Management Fees relative to Institutional and Other Mutual Fund Accounts. CWAM's focus is on its mutual funds. It does not actively seek to manage separate or institutional accounts. The few institutional accounts it does manage vary in rate structures. Some pay advisory fees commensurate with or higher than the Acorn Funds. In a few instances, however, institutional accounts pay lower advisory fees than do the Acorn Funds. One particular institutional account is significant in size and has been under CWAM's management for over 25 years. Finally, in two instances, the Acorn Funds pay slightly higher fees than do similar funds sold through insurance companies.
5. Costs to CWAM and its Affiliates. CWAM's direct costs do not appear excessive, and in some areas have declined in the past year. Indirect costs allocated to CWAM by its parent organization, however, have increased substantially. CWAM's affiliates report operating losses and therefore do not appear to profit from CWAM's advisory agreement with the Acorn Funds.
6. Profit Margins. CWAM's firm-wide, pre-marketing expense profit margins are at the top of the industry, though these comparisons are hampered by limited industry data. High profit margins are not unexpected for firms that manage large, successful funds and have provided outstanding investment performance for investors.
7. Economies of Scale. Economies of scale do exist at CWAM and will expand as the assets of the Acorn Funds get larger. They are, however, only partially reflected in the management fee schedule for the Funds. If the Acorn Funds' assets continue to grow, under the Funds' current fee schedules, shareholders might not benefit in a manner generally commensurate with CWAM's increased profits.
8. Nature and Quality of Services. This category includes a variety of considerations that are difficult to quantify, yet can have a significant bearing on the performance of the Acorn Funds. Several areas merit comment.
a. Capacity. The Funds have continued to grow, posing ever greater challenges in deploying assets effectively. While trends here merit continued monitoring, CWAM appears to be managing assets effectively.
89
b. Compliance. CWAM has a reasonably designed compliance program that protects shareholders.
c. Administrative Services. The Acorn Funds benefit from a variety of administrative services that are performed by CWAM and CMAI.
In my opinion, the process of negotiating an advisory contract for the Acorn Funds has been conducted thoroughly and at arms' length. Further, the Trustees have sufficient information to evaluate management's proposal, and negotiate contract terms that are in the best interests of fund shareholders.
Recommendations
I believe the Trustees should:
1. Continue to consider ways to restructure the advisory fee beyond the current breakpoint schedule to reflect more fully economies of scale.
2. Monitor the performance of Acorn International and Acorn International Select.
3. Continue to monitor CWAM's capacity limitations to insure that Acorn Fund's expanding assets do not impair investment performance.
Robert P. Scales
July 18, 2006
90
Columbia Acorn Family of Funds Class Z Share Information
Minimum Initial Investment in
Columbia Acorn International,
Columbia Acorn International
Select and Columbia Thermostat
Fund | | $ | 1,000 | | | | |
| | $ | 1,000 | | | for an IRA | |
Minimum Initial Investment
in Columbia Acorn Fund
and Columbia Acorn USA | | $75,000 | |
Minimum Initial Investment
in Columbia Acorn Select | | $50,000 | |
Minimum Subsequent
Investment in all Funds | | $50 | |
| Exchange Fee | | None | |
| Columbia Acorn Fund | | | ACRNX | | |
| Management Fee | | | 0.64 | % | |
| 12b-1 Fee | | | None | | |
| Other Expenses | | | 0.09 | % | |
| Net Expense Ratio | | | 0.73 | % | |
| Columbia Acorn International | | | ACINX | | |
| Management Fee | | | 0.78 | % | |
| 12b-1 Fee | | | None | | |
| Other Expenses | | | 0.16 | % | |
| Net Expense Ratio | | | 0.94 | % | |
| Columbia Acorn USA | | | AUSAX | | |
| Management Fee | | | 0.87 | % | |
| 12b-1 Fee | | | None | | |
| Other Expenses | | | 0.10 | % | |
| Net Expense Ratio | | | 0.97 | % | |
| Columbia Acorn International Select | | | ACFFX | | |
| Management Fee | | | 0.94 | % | |
| 12b-1 Fee | | | None | | |
| Other Expenses | | | 0.35 | % | |
| Net Expense Ratio | | | 1.29 | % | |
| Columbia Acorn Select | | | ACTWX | | |
| Management Fee | | | 0.82 | % | |
| 12b-1 Fee | | | None | | |
| Other Expenses | | | 0.14 | % | |
| Net Expense Ratio | | | 0.96 | % | |
| Columbia Thermostat Fund | | | COTZX | | |
| Management Fee | | | 0.10 | % | |
| 12b-1 Fee | | | None | | |
| Other Expenses | | | 0.15 | % | |
| Net Expense Ratio | | | 0.25 | %* | |
Fees and expenses are for the six months ended June 30, 2006 and for Columbia Thermostat Fund include the effect of Columbia Wanger Asset Management's undertaking to reimburse this Fund for any ordinary operating expenses, net of custody fees paid indirectly, 0.25% of the average net assets. Columbia Thermostat Fund's reimbursement arrangement is contractual through April 30, 2007. The Funds' adviser and/or affiliates have voluntarily agreed to waive a portion of "other expenses" for the Columbia Acorn Family of Funds.
* Does not include estimated fees and expenses of 0.71% incurred by the Fund from the underlying portfolio funds.
91
Columbia Acorn
Family of Funds
Trustees
Robert E. Nason
Chairman
Allan B. Muchin
Vice Chairman
Margaret Eisen
Jerome Kahn, Jr.
Steven N. Kaplan
David C. Kleinman
Charles P. McQuaid
James A. Star
Ralph Wanger
Patricia H. Werhane
John A. Wing
Officers
Charles P. McQuaid
President
Ben Andrews
Vice President
Michael G. Clarke
Assistant Treasurer
Jeffrey R. Coleman
Assistant Treasurer
J. Kevin Connaughton
Assistant Treasurer
P. Zachary Egan
Vice President
John M. Kunka
Assistant Treasurer
Joseph C. LaPalm
Vice President
Bruce H. Lauer
Vice President, Treasurer and Secretary
Louis J. Mendes III
Vice President
Robert A. Mohn
Vice President
Christopher J. Olson
Vice President
Michelle H. Rhee
Assistant Secretary
Linda K. Roth-Wiszowaty
Assistant Secretary
Robert P. Scales
Senior Vice President, Chief Legal Officer
and General Counsel
Investment Adviser
Columbia Wanger Asset Management, L.P.
227 West Monroe Street, Suite 3000
Chicago, Illinois 60606
1-800-922-6769
Distributor
Columbia Management Distributors, Inc.
One Financial Center
Boston, Massachusetts 02111-2621
Transfer Agent, Dividend Disbursing Agent
Columbia Management Services, Inc.
P.O. Box 8081
Boston, Massachusetts 02266-8081
1-800-345-6611
Legal Counsel
Bell, Boyd & Lloyd LLC
Chicago, Illinois
This report, including the schedules of investments, is submitted for the general information of the shareholders of Columbia Acorn Trust. This report is not authorized for distribution unless preceded or accompanied by a prospectus. An investor should carefully consider charges and expenses before investing. To obtain a prospectus containing this and other information, please call (800) 922-6769 or visit our website (shown below). Please read the prospectus carefully before you invest or send money.
A description of the policies and procedures that the Funds use to determine how to vote proxies and a copy of the Funds' voting record are available (i) without charge, upon request, by calling 800-922-6769 and (ii) on the Securities and Exchange Commission's website at www.sec.gov. Information regarding how the Funds voted proxies relating to portfolio securities during the 12-month period ended June 30, is available from the SEC's website. Information regarding how the Funds voted proxies relating to portfolio securities is also available from the Fund's website.
The Funds file a complete schedule of portfolio holdings with the SEC for the first and third quarters of each fiscal year on Form N-Q. The Funds' Form N-Q is available on the SEC's website at www.sec.gov and may be reviewed and copied at the SEC's Public Reference Room in Washington, D.C. Information on the operation of the Public Reference Room may be obtained by calling 1-800-SEC-0330.
Find out what's new – visit our web site at:
www.columbiafunds.com
Our e-mail address is:
ServiceInquiries@ColumbiaManagement.com
Shareholders should not include personal information such as account numbers, Social Security numbers or taxpayer identification numbers in e-mail. We are unable to accept account transactions sent via e-mail.
1-800-922-6769
92
Directions to the 2006 Annual Shareholder Information Meeting
The Chase Bank Auditorium is located on the Plaza Level of the Chase Bank building. The Chase Bank building is located in the center of the Loop, bordered by Dearborn Street on the east, Madison Street on the north, Clark Street on the west and Monroe Street on the south.
From the south:
Take 1-57 (which merges with I-94, also known as the Dan Ryan Expressway). Take the Dan Ryan into Chicago. Follow the signs for the Kennedy Expressway West. Travel on the Kennedy and exit using the Monroe Street exit. Turn right (east) from the exit onto Monroe Street. Proceed east on Monroe Street to Dearborn.
From the north:
Take the Kennedy Expressway (I-90/94) south to Chicago. Exit in the city at Monroe Street. Turn left (east) from the exit onto Monroe Street. Proceed east on Monroe Street to Dearborn.
From the west:
Take the Eisenhower Expressway (I-290) from the west. This becomes Congress Street in the city. Take Congress east to Dearborn Street. Turn left (north) on Dearborn to Monroe Street.
From the southwest:
Take the Stevenson Expressway (I-55). Exit to the Kennedy Expressway (North-Wisconsin). Travel on the Kennedy and exit using the Monroe Street exit. Turn right (east) from the exit onto Monroe Street. Proceed east on Monroe Street to Dearborn.
Parking Information for 2006 Annual Shareholder Information Meeting
A public lot is located at 172 West Madison, between Wells and LaSalle, on the north side of the street. The entrance is on Madison. Madison is a one-way west street. This lot is approximately two blocks west of the Chase Bank building.
Valet parking is available at 183 West Monroe, between Wells and LaSalle, on the south side of the street. The entrance is on Monroe. Monroe is a one-way east street. No vans or trucks are allowed to park at this lot. This lot is approximately three blocks west of the Chase Bank building.
55 East Monroe (formerly Mid-Continental Plaza Parking) is located on East Monroe Street two and one half blocks east of the Chase Bank building. The entrance is on the south side (right) of Monroe Street, between Wabash and Michigan Avenues. Monroe is a one-way street east.
Grant Park Underground (indoor) parking is located three blocks east of the Chase Bank building on Monroe Street. The entrance is on the north side of Monroe Street between Columbus Drive and Lake Shore. Monroe is two-way between Lake Shore Drive and Michigan Avenue. West of Michigan, Monroe is a one-way east.
For directions using public transportation, call (312) 836-7000 for CTA travel information or visit the CTA website at www.transitchicago.com. For Metra information call (312) 322-6777 during business hours or find information at www.metrarail.com.
Save the Date!
September 26, 2006
Meet your portfolio managers, analysts
and fellow shareholders
at
Columbia Acorn Funds
2006 Annual Shareholder
Information Meeting
Chase Auditorium
(formerly Bank One Auditorium)
38 South Dearborn Street
Chicago, IL 60602
Columbia Acorn Family of Funds
Class Z Shares
Semiannual Report – June 30, 2006
Columbia Management®
PRESORTED
FIRST-CLASS MAIL
U.S. POSTAGE PAID
HOLLISTON, MA
PERMIT NO. 20
©2006 Columbia Management Distributors, Inc.
One Financial Center, Boston, MA 02111-2621
800-345-6611 www.columbiafunds.com
SHC-44/111880-0606 (08/06) 06/27765
Columbia Management®
Look inside for details on the 2006 Columbia Acorn Funds Annual Shareholder Information Meeting.
Columbia Acorn Funds
Class ABC Shares
Semiannual Report
June 30, 2006
n Columbia Acorn Fund
n Columbia Acorn International
n Columbia Acorn USA
n Columbia Acorn International Select
n Columbia Acorn Select
n Columbia Thermostat Fund
Managed by Columbia Wanger Asset Management, L.P.
NOT FDIC-INSURED
May Lose Value
No Bank Guarantee
Please join us at the
2006
Annual Shareholder Information Meeting
September 26, 2006
9 a.m. – 10 a.m. Central time
Chase Auditorium
(formerly Bank One),
Plaza Level
38 South Dearborn Street
Chicago, IL 60602
Refreshments will be served prior to the meeting.
Please RSVP by calling
(800) 922-6769
( Not able to make it but interested in hearing from your portfolio managers?
This year you can call to listen to an audio recording of the meeting. The recording will be available by 3 p.m. Central Standard Time on September 26 and can be accessed by visiting columbiafunds.com. The recording will be available for approximately two weeks.
Go to columbiafunds.com for the toll free dial in number and pass code.
8Questions? Email Us!
We'd love to hear from you! Email your questions to us at the following email address. Please DO NOT send questions regarding your personal account to this address. Questions regarding your account should be directed to our shareholder services representatives at (800) 922-6769. Your questions will help our portfolio managers in preparing their presentations. Answers to your questions will be made available soon after the meeting date.
Email questions to:
dg.227w-meeting_questions@bankofamerica.com
For directions and parking information, see the inside back cover of this report. 
Columbia Acorn Family of Funds Semiannual Report 2006
Table of Contents
| Columbia Acorn Family of Funds | | | | | |
|
| Net Asset Value Per Share | | | 2 | | |
|
| 2006 Mid-Year Distributions | | | 2 | | |
|
| Share Class Performance | | | 3 | | |
|
| Fund Performance vs. Benchmarks | | | 4 | | |
|
Squirrel Chatter II: Understanding
our Team Approach | | | 5 | | |
|
| Understanding Your Expenses | | | 8 | | |
|
| Columbia Acorn Fund | | | | | |
|
| In a Nutshell | | | 10 | | |
|
| At a Glance | | | 11 | | |
|
| Major Portfolio Changes | | | 22 | | |
|
| Statement of Investments | | | 24 | | |
|
| Columbia Acorn International | | | | | |
|
| In a Nutshell | | | 12 | | |
|
| At a Glance | | | 13 | | |
|
| Major Portfolio Changes | | | 36 | | |
|
| Statement of Investments | | | 38 | | |
|
| Portfolio Diversification | | | 43 | | |
|
| Columbia Acorn USA | | | | | |
|
| In a Nutshell | | | 14 | | |
|
| At a Glance | | | 15 | | |
|
| Major Portfolio Changes | | | 44 | | |
|
| Statement of Investments | | | 45 | | |
|
| Columbia Acorn International Select | | | | | |
|
| In a Nutshell | | | 16 | | |
|
| At a Glance | | | 17 | | |
|
| Major Portfolio Changes | | | 51 | | |
|
| Statement of Investments | | | 52 | | |
|
| Portfolio Diversification | | | 55 | | |
|
| Columbia Acorn Select | |
|
| In a Nutshell | | | 18 | | |
|
| At a Glance | | | 19 | | |
|
| Major Portfolio Changes | | | 56 | | |
|
| Statement of Investments | | | 57 | | |
|
| Columbia Thermostat Fund | |
|
| In a Nutshell | | | 20 | | |
|
| At a Glance | | | 21 | | |
|
| Statement of Investments | | | 80 | | |
|
| Statement of Assets and Liabilities | | | 81 | | |
|
| Statement of Operations | | | 82 | | |
|
| Statement of Changes in Net Assets | | | 83 | | |
|
| Financial Highlights | | | 85 | | |
|
| Notes to Financial Statements | | | 86 | | |
|
| Columbia Acorn Family of Funds | |
|
| Statements of Assets and Liabilities | | | 62 | | |
|
| Statements of Operations | | | 63 | | |
|
| Statements of Changes in Net Assets | | | 64 | | |
|
| Financial Highlights | | | 68 | | |
|
| Notes to Financial Statements | | | 73 | | |
|
Management Fee Evaluation
of the Senior Officer | | | 90 | | |
|
| Columbia Acorn Family of Funds Information | | | 95 | | |
|
The discussion in this report of portfolio companies is for illustration only and is not a recommendation of individual stocks. The information is believed to be accurate, but the information and the views of the portfolio managers may change at any time without notice and the portfolio managers may alter a Fund's portfolio holdings based on these views and the Fund's circumstances at that time.
1
Columbia Acorn Family of Funds
>Net Asset Value Per Share as of 6/30/06
| | |
Columbia
Acorn Fund | |
Columbia
Acorn
International | |
Columbia
Acorn USA | | Columbia
Acorn
International
Select | |
Columbia
Acorn
Select | | Columbia
Thermostat
Fund | |
| Class A | | $ | 28.81 | | | $ | 37.33 | | | $ | 26.96 | | | $ | 22.95 | | | $ | 23.55 | | | $ | 12.53 | | |
| Class B | | $ | 27.71 | | | $ | 36.65 | | | $ | 25.95 | | | $ | 22.24 | | | $ | 22.69 | | | $ | 12.53 | | |
| Class C | | $ | 27.66 | | | $ | 36.61 | | | $ | 25.92 | | | $ | 22.23 | | | $ | 22.66 | | | $ | 12.52 | | |
>2006 Mid-Year Distributions
The following table details the Funds' mid-year distributions. The record date was June 5, 2006. The ex-dividend date was June 6, 2006 and the payable date was June 7, 2006.
| | | Short-term
Capital
Gains | | Long-term
Capital
Gains | |
Ordinary
Income | | Reinvestment
Price | |
| Columbia Acorn Fund Class A, B and C | | | None | | | $ | 0.3132 | | | | None | | | | $28.58 A
$27.49 B
$27.45 C | | |
| Columbia Acorn International Class A, B and C | | | None | | | $ | 0.5514 | | | | None | | | | $37.19 A
$36.52 B
$36.48 C | | |
| Columbia Acorn USA Class A, B and C | | | None | | | $ | 0.1016 | | | | None | | | | $26.84 A
$25.85 B
$25.82 C | | |
Columbia Acorn International Select Class A (Class B and C
had no distributions) | | | None | | | | None | | | $ | 0.0031 | | | $ | 22.89 | A | |
| Columbia Acorn Select Class A | | $ | 0.0862 | | | | None | | | $ | 0.0235 | | | $ | 23.41 | A | |
| Columbia Acorn Select Class B and C | | $ | 0.0862 | | | | None | | | | None | | | | $22.56 B
$22.53 C | | |
| Columbia Thermostat Fund Class A | | $ | 0.0046 | | | $ | 0.2367 | | | $ | 0.0139 | | | $ | 12.48 | A | |
| Columbia Thermostat Fund Class B and C | | $ | 0.0046 | | | $ | 0.2367 | | | | None | | | | $12.48 B
$12.47 C | | |
1-800-922-6769
2
Columbia Acorn Family of Funds
>Share Class Performance Average Annual Total Returns through 6/30/06
| | | Class A | | Class B | | Class C | |
| | | Without
Sales Charge | | With
Sales Charge | | Without
Sales Charge | | With
Sales Charge | | Without
Sales Charge | | With
Sales Charge | |
| Columbia Acorn Fund (10/16/2000) | |
| 3 months* | | | -3.81 | % | | | -9.34 | % | | | -3.96 | % | | | -8.70 | % | | | -4.00 | % | | | -4.95 | % | |
| Year to date* | | | 5.64 | % | | | -0.43 | | | | 5.32 | % | | | 0.32 | % | | | 5.25 | % | | | 4.25 | % | |
| 1 year | | | 16.11 | % | | | 9.43 | % | | | 15.31 | % | | | 10.31 | % | | | 15.20 | % | | | 14.20 | % | |
| 3 years | | | 21.49 | % | | | 19.11 | % | | | 20.64 | % | | | 19.95 | % | | | 20.57 | % | | | 20.57 | % | |
| 5 years | | | 11.81 | % | | | 10.49 | % | | | 11.05 | % | | | 10.79 | % | | | 11.01 | % | | | 11.01 | % | |
| Life of Fund | | | 13.30 | % | | | 12.13 | % | | | 12.55 | % | | | 12.45 | % | | | 12.52 | % | | | 12.52 | % | |
Columbia Acorn
International (10/16/2000) | |
| 3 months* | | | -1.16 | % | | | -6.85 | % | | | -1.34 | % | | | -6.20 | % | | | -1.34 | % | | | -2.32 | % | |
| Year to date* | | | 14.11 | % | | | 7.55 | % | | | 13.74 | % | | | 8.74 | % | | | 13.72 | % | | | 12.72 | % | |
| 1 year | | | 34.74 | % | | | 26.99 | % | | | 33.83 | % | | | 28.83 | % | | | 33.73 | % | | | 32.73 | % | |
| 3 years | | | 32.29 | % | | | 29.70 | % | | | 31.38 | % | | | 30.80 | % | | | 31.35 | % | | | 31.35 | % | |
| 5 years | | | 14.90 | % | | | 13.55 | % | | | 14.11 | % | | | 13.87 | % | | | 14.10 | % | | | 14.10 | % | |
| Life of Fund | | | 9.00 | % | | | 7.87 | % | | | 8.27 | % | | | 8.15 | % | | | 8.25 | % | | | 8.25 | % | |
| Columbia Acorn USA (10/16/2000) | |
| 3 months* | | | -4.44 | % | | | -9.94 | % | | | -4.61 | % | | | -9.36 | % | | | -4.61 | % | | | -5.56 | % | |
| Year to date* | | | 2.04 | % | | | -3.82 | % | | | 1.73 | % | | | -3.27 | % | | | 1.69 | % | | | 0.69 | % | |
| 1 year | | | 9.12 | % | | | 2.84 | % | | | 8.38 | % | | | 3.38 | % | | | 8.30 | % | | | 7.30 | % | |
| 3 years | | | 19.07 | % | | | 16.74 | % | | | 18.24 | % | | | 17.53 | % | | | 18.20 | % | | | 18.20 | % | |
| 5 years | | | 9.07 | % | | | 7.79 | % | | | 8.34 | % | | | 8.05 | % | | | 8.31 | % | | | 8.31 | % | |
| Life of Fund | | | 13.77 | % | | | 12.60 | % | | | 13.03 | % | | | 12.93 | % | | | 13.01 | % | | | 13.01 | % | |
Columbia Acorn International
Select (10/16/2000) | |
| 3 months* | | | 0.41 | % | | | -5.37 | % | | | 0.23 | % | | | -4.77 | % | | | 0.23 | % | | | -0.77 | % | |
| Year to date* | | | 12.74 | % | | | 6.25 | % | | | 12.32 | % | | | 7.32 | % | | | 12.27 | % | | | 11.27 | % | |
| 1 year | | | 29.75 | % | | | 22.29 | % | | | 28.93 | % | | | 23.93 | % | | | 28.79 | % | | | 27.79 | % | |
| 3 years | | | 27.48 | % | | | 24.99 | % | | | 26.63 | % | | | 26.01 | % | | | 26.51 | % | | | 26.51 | % | |
| 5 years | | | 11.46 | % | | | 10.14 | % | | | 10.73 | % | | | 10.46 | % | | | 10.69 | % | | | 10.69 | % | |
| Life of Fund | | | 5.04 | % | | | 3.96 | % | | | 4.33 | % | | | 4.19 | % | | | 4.31 | % | | | 4.31 | % | |
| Columbia Acorn Select (10/16/2000) | |
| 3 months* | | | -2.27 | % | | | -7.89 | % | | | -2.41 | % | | | -7.27 | % | | | -2.46 | % | | | -3.43 | % | |
| Year to date* | | | 5.30 | % | | | -0.76 | % | | | 4.91 | % | | | -0.09 | % | | | 4.87 | % | | | 3.87 | % | |
| 1 year | | | 16.96 | % | | | 10.24 | % | | | 16.14 | % | | | 11.14 | % | | | 16.04 | % | | | 15.04 | % | |
| 3 years | | | 15.51 | % | | | 13.25 | % | | | 14.67 | % | | | 13.91 | % | | | 14.62 | % | | | 14.62 | % | |
| 5 years | | | 11.34 | % | | | 10.03 | % | | | 10.56 | % | | | 10.30 | % | | | 10.55 | % | | | 10.55 | % | |
| Life of Fund | | | 11.71 | % | | | 10.56 | % | | | 10.95 | % | | | 10.84 | % | | | 10.92 | % | | | 10.92 | % | |
| Columbia Thermostat Fund (3/3/2003)† | |
| 3 months* | | | -0.65 | % | | | -6.36 | % | | | -0.76 | % | | | -5.63 | % | | | -0.84 | % | | | -1.81 | % | |
| Year to date* | | | 2.37 | % | | | -3.51 | % | | | 2.10 | % | | | -2.90 | % | | | 2.02 | % | | | 1.02 | % | |
| 1 year | | | 6.29 | % | | | 0.18 | % | | | 5.71 | % | | | 0.90 | % | | | 5.55 | % | | | 4.59 | % | |
| 3 years | | | 8.77 | % | | | 6.64 | % | | | 8.10 | % | | | 7.24 | % | | | 8.00 | % | | | 8.00 | % | |
| Life of Fund | | | 11.66 | % | | | 9.70 | % | | | 10.96 | % | | | 10.25 | % | | | 10.87 | % | | | 10.87 | % | |
*Not annualized.
Performance data quoted represents past performance and current performance may be lower or higher. Past performance is no guarantee of future results. The investment return and principal value will fluctuate so that shares, when redeemed, may be worth more or less than the original cost. Please visit www.columbiafunds.com for daily and most recent month-end performance updates.
The "with sales charge" returns include the maximum 5.75% sales charge for Class A shares, the appropriate Class B contingent deferred sales charge for the holding period after purchase as follows: through first year—5%, second year—4%, third year—3%, fourth year—3%, fifth year—2%, sixth year—1%, thereafter—0%; and the Class C contingent deferred sales charge of 1% for the first year only. Performance of the different share classes will vary based on differences in sales charges and fees associated with each class.
Performance results reflect any voluntary waivers or reimbursements of Fund expenses by the Adviser or its affiliates. Absent these waivers or reimbursement arrangements, performance results would have been lower.
†A "fund of funds" bears its allocable share of the costs and expenses of the underlying funds in which it invests. Such funds are thus subject to two levels of fees and potentially higher expense ratio than would be associated with an investment in an investment fund that invests and trades directly in financial instruments under the direction of a single manager.
3
Columbia Acorn Family of Funds
>Fund Performance vs. Benchmarks Class A Shares, without sales charge,
Average Annual Total Returns through 6/30/06
| | | 2nd
Quarter* | | Year to
date* | | 1 year | | 3 years | | 5 years | | Life
of Fund | |
| Columbia Acorn Fund (10/16/00) | | | -3.81 | % | | | 5.64 | % | | | 16.11 | % | | | 21.49 | % | | | 11.81 | % | | | 13.30 | % | |
| Russell 2500 | | | -4.34 | % | | | 6.32 | % | | | 13.53 | % | | | 19.16 | % | | | 9.65 | % | | | 9.75 | % | |
| S&P 500 | | | -1.44 | % | | | 2.71 | % | | | 8.63 | % | | | 11.22 | % | | | 2.49 | % | | | 0.29 | % | |
| Lipper Small-Cap Core Funds Index | | | -4.76 | % | | | 6.30 | % | | | 14.52 | % | | | 18.59 | % | | | 9.13 | % | | | 9.59 | % | |
| Lipper Mid-Cap Core Funds Index | | | -3.29 | % | | | 4.31 | % | | | 12.07 | % | | | 16.41 | % | | | 7.25 | % | | | 6.12 | % | |
Columbia Acorn International
(10/16/00) | | | -1.16 | % | | | 14.11 | % | | | 34.74 | % | | | 32.29 | % | | | 14.90 | % | | | 9.00 | % | |
| S&P/Citigroup EMI Global ex-US | | | -1.70 | % | | | 10.57 | % | | | 31.22 | % | | | 31.90 | % | | | 18.28 | % | | | 14.17 | % | |
| MSCI EAFE | | | 0.70 | % | | | 10.16 | % | | | 26.56 | % | | | 23.94 | % | | | 10.02 | % | | | 5.97 | % | |
| Lipper Int'l Small-Cap Funds Index | | | -2.72 | % | | | 10.26 | % | | | 31.71 | % | | | 32.29 | % | | | 17.72 | % | | | 12.91 | % | |
| Columbia Acorn USA (10/16/00) | | | -4.44 | % | | | 2.04 | % | | | 9.12 | % | | | 19.07 | % | | | 9.07 | % | | | 13.77 | % | |
| Russell 2000 | | | -5.02 | % | | | 8.21 | % | | | 14.58 | % | | | 18.70 | % | | | 8.50 | % | | | 8.84 | % | |
| Lipper Small-Cap Core Funds Index | | | -4.76 | % | | | 6.30 | % | | | 14.52 | % | | | 18.59 | % | | | 9.13 | % | | | 9.59 | % | |
| S&P 500 | | | -1.44 | % | | | 2.71 | % | | | 8.63 | % | | | 11.22 | % | | | 2.49 | % | | | 0.29 | % | |
| Columbia Acorn Int'l Select (10/16/00) | | | 0.41 | % | | | 12.74 | % | | | 29.75 | % | | | 27.48 | % | | | 11.46 | % | | | 5.04 | % | |
S&P/Citigroup World ex-US Cap
Range $2-10B | | | -0.61 | % | | | 10.29 | % | | | 31.69 | % | | | 30.15 | % | | | 15.80 | % | | | 12.62 | % | |
| MSCI EAFE | | | 0.70 | % | | | 10.16 | % | | | 26.56 | % | | | 23.94 | % | | | 10.02 | % | | | 5.97 | % | |
| Lipper International Funds Index | | | -0.52 | % | | | 9.30 | % | | | 27.26 | % | | | 23.15 | % | | | 10.14 | % | | | 6.45 | % | |
| Columbia Acorn Select (10/16/00) | | | -2.27 | % | | | 5.30 | % | | | 16.96 | % | | | 15.51 | % | | | 11.34 | % | | | 11.71 | % | |
| S&P MidCap 400 | | | -3.14 | % | | | 4.24 | % | | | 12.98 | % | | | 18.14 | % | | | 9.30 | % | | | 8.90 | % | |
| Lipper Mid-Cap Growth Index | | | -4.64 | % | | | 4.40 | % | | | 15.46 | % | | | 15.12 | % | | | 2.64 | % | | | -2.66 | % | |
| S&P 500 | | | -1.44 | % | | | 2.71 | % | | | 8.63 | % | | | 11.22 | % | | | 2.49 | % | | | 0.29 | % | |
| Columbia Thermostat Fund (3/3/03)† | | | -0.65 | % | | | 2.37 | % | | | 6.29 | % | | | 8.77 | % | | | — | | | | 11.66 | % | |
| S&P 500 | | | -1.44 | % | | | 2.71 | % | | | 8.63 | % | | | 11.22 | % | | | — | | | | 15.20 | % | |
Lehman Brothers U.S. Credit
Intermediate Bond Index | | | 0.06 | % | | | -0.47 | % | | | -0.61 | % | | | 1.83 | % | | | — | | | | 2.92 | % | |
| Lipper Flexible Portfolio Funds Index | | | -1.30 | % | | | 3.07 | % | | | 10.01 | % | | | 10.40 | % | | | — | | | | 13.33 | % | |
*Not annualized.
Performance shown here is past performance which cannot guarantee future results. Current performance may be higher or lower. The investment return and principal value of an investment in a Fund will fluctuate so that Fund shares, when redeemed, may be worth more or less than their original cost. Performance changes over time. Visit columbiafunds.com for daily and most recent month-end updates.
Performance may reflect any voluntary waivers or reimbursements of fund expenses by the advisor or its affiliates. Absent these waivers, or reimbursement arrangements, performance results may be lower.
†A "fund of funds" bears its allocable share of the costs and expenses of the underlying funds in which it invests. Such funds are thus subject to two levels of fees and potentially higher expense ratio than would be associated with an investment in an investment fund that invests and trades directly in financial instruments under the direction of a single manager.
Description of indexes: S&P 500 is a broad, market-weighted average of U.S. blue-chip company stock performance. S&P MidCap 400 is a broad market-weighted index of 400 stocks that are in the next size/tier down from the S&P 500. Russell 2000 is a market-weighted index of 2000 smaller U.S. companies, formed by taking the largest 3,000 companies and eliminating the largest 1,000. Russell 2500 is t he smallest 2,500 U.S. companies from this same group. S&P/Citigroup EMI Global ex-US is the bottom 20% of institutionally investable capital of developed and emerging countries, selected by the index sponsor, outside the U.S. MSCI EAFE is Morgan Stanley's Europe, Australasia and Far East Index, a widely recognized international benchmark that comprises 20 major markets in proportion to world stock market capitalization. S&P/Citigroup World ex-US Cap Range $2–10B is a subset of the broad market selected by the index sponsor representing the mid-cap de veloped market excluding the U.S. Lipper Indexes include the largest funds tracked by Lipper, Inc. in the named category. Lipper Mid-Cap Growth Index, 30 mid-cap growth funds; Lipper Mid-Cap Core Funds Index, 30 mid-cap core funds; Lipper International Funds Index, 30 largest non-U.S. funds, not including non-U.S. small-cap funds; Lipper Inte rnational Small-Cap Funds Index, 10 largest non-U.S. funds investing in small-cap companies, including Columbia Acorn International; Lipper Small-Cap Core Funds Index, 30 largest small-cap core funds, including Columbia Acorn Fund. Lipper Flexible Portfolio Funds Index is an equal dollarweighted index of the 30 largest mutual funds within the Flexible Portfolio fund classification, as defined by Lipper. The Lehman Brothers U.S. Credit Intermediate Bond Index is the intermediate component o f the U.S. Credit Index. The U.S. Credit Index includes publicly issued U.S. corporate and foreign debentures and secured notes that meet specified maturity, liquidity, and quality requirements. All indexes are unmanaged and returns include reinvested distributions. It is not possible to invest directly in an index.
1-800-922-6769
4
>Squirrel Chatter II: Understanding our Team Approach
 In recent Squirrel Chatters, I've discussed the performance drivers of the Columbia Acorn Funds. First, I addressed our style—investing in small- and mid-cap stocks using a Growth-at-a-Reasonable-Price discipline. Next, I covered our analytical process—how we research, value and track our investments. In this final part of the series, I cover why we need a large analyst team, how we hire and train analysts, and how we empower and evaluate them.
A Large Team Provides Full Market Coverage
Investment management consultants and the financial press often express concern when small- and mid-cap funds become large. For years, many postulated that small-cap managers would stop outperforming their benchmarks once their assets exceeded $1 billion. Columbia Acorn Fund hit $1 billion in 1991. We agree that small-cap funds cannot grow indefinitely. However, historically we believe we have succeeded in managing assets far above the supposed $1 billion "limit" by employing a large analyst team.1
Based on our observations, it seems that many small- and mid-cap portfolios are managed by one or two managers, often without the help of additional analysts. (Their investment adviser may employ lots of other analysts, but they usually are focused on large-cap stocks). Many investment professionals have expertise in just a few industries or geographic regions. Consequently, small management teams tend to focus their funds on relatively small sectors of the market. When their sectors are hot, they can achieve astounding performance, and their funds can grow rapidly. We've seen this happen to some funds during technology and energy booms in the past. When the sector turned, however, many of the funds crashed and burned.
We've taken a different approach. At Columbia Wanger Asset Management, we have built a team of 21 analysts (including our portfolio managers, who are also analysts), covering virtually all important industries and geographic regions. We are not aware of any other investment firm with so many analysts focusing solely on small- and mid-cap stocks. Broad coverage can be crucial especially near market turning points. For instance, when many competitors concentrated their research and their portfolios in technology, media and communications stocks in 2000, a broader perspective led us to U.S. real estate stocks that appeared cheap at the time. We added REITs to Columbia Acorn Fund, which helped to boost fund performance for several years.
Hiring Good Analysts
In order to maintain and grow a large analyst team, Columbia Wanger Asset Management is in a perpetual hiring mode. Our directors of research, Rob Mohn on the domestic side and Zach Egan on the international side, are always looking for good people.
We require analyst candidates to have what we call a "tool kit of knowledge." Accounting, finance and economics skills are required for all analysts. In addition, cultural knowledge and language skills are needed for our international analysts. Accounting is mentioned first because we believe accounting is essential in valuing companies. We once had an analyst candidate tell us during an interview, "Some people think accounting is important for securities analysts, but I don't." Well, we do. That candidate is not a part of our investment team.
We also want candidates to be stock nuts (quite appropriate for the Columbia Acorn Funds). By that we mean people who are thinking about stocks day and night. We envision an ideal candidate as having a stack of annual reports next to the most comfortable seat at home. The candidate should be constantly on the lookout for investment opportunities, even when strolling down
5
the street. If parking lots are raising their rates, or if a restaurant chain has people lined up out the door, a true stock nut will see these as possible investment opportunities.
Academic and professional credentials, combined with investment experience listed in a candidate's resume, provide evidence of a tool kit and stock nut. Discerning our other important requirement—an economic mind—requires face time. By economic mind we mean having the ability to recognize what may be a good business over the long term and how a changing environment could affect the business. Some people seem to have that shrewdness by nature while others seem incapable of learning it.
Unless we lose an experienced analyst who follows a crucial area, we prefer to hire analysts with modest prior experience. More experienced analysts may have developed bad habits elsewhere that could be very difficult to change.
Mentoring New Analysts
We don't have a formal training program for analysts. Instead, our senior analysts mentor newer analysts. Typically, as a senior analyst becomes overburdened we "hive off" a segment of his or her coverage area, and hire a new analyst to follow it. The new analyst then inherits some stocks to follow.
As a new analyst begins to cover inherited stocks, the mentor has him or her pursue the information, valuation and time horizon edges that we discussed last quarter. The two analysts may conduct a few management meetings and attend a few conferences together so that they can compare notes and the mentor can help the new analyst adopt our process and style.
We expect our analysts to properly distill, interpret and communicate information. Our analysts need to distill the massive amounts of information down to the most crucial variables. They need to see through public relations "spin" provided by companies and correctly interpret fundamentals. For example, when a company claims that it "hit earnings targets" a few weeks after it lowered those targets, our analysts can't conclude that things are fine. "Disappointing quarter, as preannounced" is a more appropriate report headline. Likewise, some brokerage firm analysts tend to "adjust" earnings estimates when business is poor. Our analysts need to communicate with words describing direction and magnitude, such as "trim" or "slash." Finally, some companies and analysts may low-ball estimates so they can raise them later, creating good news. We want unbiased estimates from our analysts, which in turn should facilitate better decisions.
Empowering and Evaluating Analysts
Many investment firms have their analysts provide information and make recommendations and have their portfolio managers make decisions. In this traditional structure, accountability is often lacking. Analysts want credit for good recommendations, whether purchased or not, and tend to forget poor recommendations, especially those that were rejected. Portfolio managers tend to believe their decisions drove performance when performance was good, but tend to blame analysts when performance was bad.
Due to the size of our flagship funds,2 the quality of our analysts, our desire for accountability, and our belief that our analysts understand their stocks better than our portfolio managers do, Columbia Acorn Fund and Columbia Acorn International senior analysts have authority to buy and sell individual stocks. Portfolio managers and mentors provide quick approval for reasonable transactions proposed by newer analysts. Portfolio managers also make strategic decisions, including industry and country weightings.
We consider our investment process to be crucial to our success, and for newer analysts we first focus on proper implementation of our proven process. Over time, results matter. We carefully track performance of our analysts' holdings and compare actual performance to analyst benchmarks comprised of their coverage areas' performance. Analysts' job one is to beat their benchmarks. Job two is to forecast whether their areas are likely to outperform and to accurately recommend weightings for their areas in the Funds. Successful analysts are highly rewarded.
1-800-922-6769
6
I hope you have found this series on our investment process to be informative. Over the years we've provided much of this information during our annual shareholder meetings and thought it may be of interest to all shareholders. We intend to continue to work hard and stay true to our time-tested approach.
CWAM News
We are pleased to announce two additions to our analyst team. Gregory Pinsky joined our domestic team, adding to our research of industrial goods, services and materials. His coverage areas include employment services (temporary help and recruiters), waste management and the business services industry. Prior to joining Columbia Wanger Asset Management, Greg was an equity investment analyst at T. Rowe Price Associates. A Certified Public Accountant, Greg received his MBA from the University of Chicago and his bachelor's degree in economics from The Wharton School of the University of Pennsylvania.
Jeannie Cheung joined our international analyst team to cover China, Taiwan and Korea. She is currently employed by Columbia Wanger Asset Management's parent company, Bank of America, in Hong Kong, to provide research to Columbia Wanger Asset Management. Jeannie has worked as an equity analyst since 1991 and was most recently director of China research for Credit Suisse (Hong Kong). Jeannie has a CFA designation and has also completed a master's degree in finance and investment at the University of Exeter in the United Kingdom.

Charles P. McQuaid
President and Chief Investment Officer
Columbia Wanger Asset Management, L.P.
Past performance is no guarantee of future results.
Stocks of small- and mid-cap companies pose special risks, including possible illiquidity and greater price volatility than stocks of larger, more established companies.
1 Our understanding of the competing small-cap analyst team size is based on conversations we have had with competitors and information provided by third-parties who report on the fund industry.
2 As of June 30, 2006, Columbia Acorn Fund had $17.9 billion in total net assets. It owned 415 stocks, 334 domestic and 81 foreign. Columbia Acorn International had $3.6 billion and invested in 173 stocks.
The views expressed in Squirrel Chatter II are those of the author. These views are not guarantees of future performance and involve certain risks, uncertainties and assumptions that are difficult to predict so actual outcomes and results may differ significantly from the views expressed. These views are subject to change at any time based upon economic, market or other conditions and the respective parties disclaim any responsibility to update such views. These views may not be relied on as investment advice and, because investment decisions for a Columbia Acorn Fund are based on numerous factors, may not be relied on as an indication of trading intent on behalf of any particular Columbia Acorn Fund. References to specific company securities should not be construed as a recommendation or investment advice.
7
>Understanding Your Expenses
As a Fund shareholder, you incur two types of costs. There are transaction costs, which generally include sales charges on purchases and may include redemption or exchange fees. There are also ongoing costs, which generally include investment advisory fees, Rule 12b-1 fees and other Fund expenses. The information on this page is intended to help you understand your ongoing costs of investing in the Columbia Acorn Funds and to compare these costs with the ongoing costs of investing in other mutual funds.
Analyzing your Fund's expenses
To illustrate these ongoing costs, we have provided examples and calculated the expenses paid by investors in the Class A, B and C shares of the Columbia Acorn Funds for the last six months. The information in the following table is based on an initial investment of $1,000, which is invested at the beginning of the period and held for the entire period. Expense information is calculated two ways and each method provides you with different information. The amount listed in the "Actual" column is calculated using each Fund's actual operating expenses and total return for the period. The amount listed in the "Hypothetical" column assumes that the return each year is 5% before expenses and then applies each Fund's actual expense ratio for the period to the hypothetical return. You should not use the hypothetical account values and expenses to estimate either your actual account balance at the end of the period or the expenses you pa id during the reporting period. See the "Compare with other funds" information for details on using the hypothetical data.
Compare with other funds
Since all mutual funds are required to include the same hypothetical calculations about expenses in shareholder reports, you can use this information to compare the ongoing cost of investing in the Funds with other funds. To do so, compare the 5% hypothetical example with the 5% hypothetical examples that appear in the shareholder reports of other funds. As you compare hypothetical examples of other funds, it is important to note that hypothetical examples are meant to highlight the continuing costs of investing in a fund and do not reflect any transactional costs, such as sales charges or redemption or exchange fees.
Estimating your actual expenses
To estimate the expenses that you paid over the period, first you will need your account balance at the end of the period:
• For shareholders who receive their account statements from Columbia Management Services, Inc., your account balance is available online at columbiafunds.com or by calling Shareholder Services at (800) 922-6769.
• For shareholders who receive their account statements from their brokerage firm, contact your brokerage firm to obtain your account balance.
1. Divide your ending account balance by $1,000. For example, if an account balance was $8,600 at the end of the period, the result would be 8.6.
2. In the section of the table titled "Expenses paid during the period," locate the amount for your Fund. You will find this number is in the column labeled "Actual." Multiply this number by the result from step 1. Your answer is an estimate of the expenses you paid on your account during the period.
1-800-922-6769
8
>January 1, 2006 – June 30, 2006
| | | Account value at
the beginning of
the period ($) | | Account value at
the end of
the period ($) | | Expenses paid
during the period ($) | | Fund's
annualized
expense | |
| | | Actual | | Hypothetical | | Actual | | Hypothetical | | Actual | | Hypothetical | | ratio (%)* | |
| Columbia Acorn Fund | |
| Class A | | | 1,000.00 | | | | 1,000.00 | | | | 1,056.43 | | | | 1,019.79 | | | | 5.15 | | | | 5.06 | | | | 1.01 | | |
| Class B | | | 1,000.00 | | | | 1,000.00 | | | | 1,053.21 | | | | 1,016.36 | | | | 8.65 | | | | 8.50 | | | | 1.70 | | |
| Class C | | | 1,000.00 | | | | 1,000.00 | | | | 1,052.51 | | | | 1,015.87 | | | | 9.16 | | | | 9.00 | | | | 1.80 | | |
| Columbia Acorn International | |
| Class A | | | 1,000.00 | | | | 1,000.00 | | | | 1,141.08 | | | | 1,018.74 | | | | 6.48 | | | | 6.11 | | | | 1.22 | | |
| Class B | | | 1,000.00 | | | | 1,000.00 | | | | 1,137.36 | | | | 1,015.22 | | | | 10.23 | | | | 9.64 | | | | 1.93 | | |
| Class C | | | 1,000.00 | | | | 1,000.00 | | | | 1,137.21 | | | | 1,014.88 | | | | 10.60 | | | | 9.99 | | | | 2.00 | | |
| Columbia Acorn USA | |
| Class A | | | 1,000.00 | | | | 1,000.00 | | | | 1,020.43 | | | | 1,018.60 | | | | 6.26 | | | | 6.26 | | | | 1.25 | | |
| Class B | | | 1,000.00 | | | | 1,000.00 | | | | 1,017.26 | | | | 1,015.08 | | | | 9.80 | | | | 9.79 | | | | 1.96 | | |
| Class C | | | 1,000.00 | | | | 1,000.00 | | | | 1,016.86 | | | | 1,014.63 | | | | 10.25 | | | | 10.24 | | | | 2.05 | | |
Columbia Acorn
International Select | |
| Class A | | | 1,000.00 | | | | 1,000.00 | | | | 1,127.34 | | | | 1,016.86 | | | | 8.44 | | | | 8.00 | | | | 1.60 | | |
| Class B | | | 1,000.00 | | | | 1,000.00 | | | | 1,123.23 | | | | 1,013.44 | | | | 12.06 | | | | 11.43 | | | | 2.29 | | |
| Class C | | | 1,000.00 | | | | 1,000.00 | | | | 1,122.73 | | | | 1,012.89 | | | | 12.63 | | | | 11.98 | | | | 2.40 | | |
| Columbia Acorn Select | |
| Class A | | | 1,000.00 | | | | 1,000.00 | | | | 1,052.96 | | | | 1,018.70 | | | | 6.26 | | | | 6.16 | | | | 1.23 | | |
| Class B | | | 1,000.00 | | | | 1,000.00 | | | | 1,049.14 | | | | 1,015.12 | | | | 9.91 | | | | 9.74 | | | | 1.95 | | |
| Class C | | | 1,000.00 | | | | 1,000.00 | | | | 1,048.70 | | | | 1,014.68 | | | | 10.36 | | | | 10.19 | | | | 2.04 | | |
| Columbia Thermostat Fund | |
| Class A | | | 1,000.00 | | | | 1,000.00 | | | | 1,023.70 | | | | 1,022.32 | | | | 2.51 | | | | 2.51 | | | | 0.50 | | |
| Class B | | | 1,000.00 | | | | 1,000.00 | | | | 1,020.98 | | | | 1,019.34 | | | | 5.51 | | | | 5.51 | | | | 1.10 | | |
| Class C | | | 1,000.00 | | | | 1,000.00 | | | | 1,020.18 | | | | 1,018.60 | | | | 6.26 | | | | 6.26 | | | | 1.25 | | |
Expenses paid during the period are equal to each Fund's annualized expense ratio, multiplied by the average account value over the period and then multiplied by the number of days in the Fund's most recent fiscal half-year and divided by 365.
Had the Investment Adviser and/or Transfer Agent not reimbursed/waived a portion of expenses, total return would have been reduced.
It is important to note that the expense amounts shown in the table are meant to highlight only ongoing costs of investing in the Funds and do not reflect any transactional costs, such as sales charges, redemption or exchange fees. Therefore, the hypothetical examples provided may not help you determine the relative total costs of owning different funds. If these transactional costs were included, your costs would have been higher.
Columbia Thermostat Fund's expenses do not include fees and expenses incurred by the Fund from the underlying portfolio funds.
*For the six months ended June 30, 2006.
9
Columbia Acorn Fund
>In a Nutshell


Performance data quoted represents past performance and current performance may be lower or higher. Past performance is no guarantee of future results. The investment return and principal value of an investment in the Fund will fluctuate so that shares, when redeemed, may be worth more or less than the original cost.
Visit columbiafunds.com for daily and most recent month-end performance updates.
Columbia Acorn Fund fell 3.81% (Class A shares, without sales charge) in the second quarter, modestly outperforming the small-cap Russell 2500 Index while underperforming the large-cap S&P 500 Index. In the first half of 2006, Columbia Acorn Fund rose 5.64%, slightly less than the Russell 2500 and somewhat more than the S&P 500.
Expeditors International of Washington, Columbia Acorn Fund's largest dollar winner in the first quarter, kept that distinction in the second quarter, delivering another 30% gain. Other winners included takeovers—12 Columbia Acorn stocks put themselves up for sale and announced deals in the quarter! Six takeovers wound up within the top dozen percentage performers for the quarter, including software firm RSA Security and Canadian mining company Falconbridge, each surging over 50%. Sweden's Gambro and Georgia-based Serologicals, both medical products companies, jumped about 30% each. Aerospace components distributor Aviall and natural gas producer Western Gas Resources rounded out the takeover winner's circle, each rising nearly 25%.
Other big winners for the quarter included FMC Technologies, a manufacturer of deep-water oil and gas production systems, which reported earnings well ahead of expectations. So did World Acceptance, a consumer loan company, and both appreciated about 30%. Retailer Christopher & Banks improved its merchandise, regained its sales and earnings momentum, and marked up a 25% gain.
Columbia Acorn Fund's largest percentage losers were three biotech stocks, each giving back in the second quarter far more than they made in the first. DOV Pharmaceuticals reported that a test of a key drug was disappointing, and its stock collapsed 80%. Neurocrine Biosciences and Pozen both failed to get new drug approvals and each plunged about 66%. We sold all three. Retailer Chico's FAS suffered some merchandise misses, and its stock was discounted 34%. We bought more Chico's stock in the quarter, as we believed its problems are temporary.
The Fund's foreign stocks rose 3.14% in the quarter and 19.99% in the half year. Takeovers Falconbridge and Gambro, discussed above, helped drive results for the quarter. During the first half, oil-pipe makers Vallourec and Tenaris jumped 111% and 76%, respectively, while temporary staffing company USG People returned 82%. Swedish kitchen cabinet company Nobia racked up excellent growth, making a 25% gain in the quarter and a 62% return in the half. The Fund's worst performing international stock was Hong Kong's Techtronic Industries, down 43% in the half year.
Columbia Acorn Fund's foreign stocks have performed spectacularly well since we decided to increase their weighting three years ago—up 174% vs. a 79% gain for the overall Fund.1 We reviewed all of the Fund's foreign holdings during the period in an attempt to be more selective. We believe that many foreign stocks continue to appear cheaper than U.S. stocks, while others may not have enough upside to compensate for possible risks. Consequently, we cut the Fund's foreign stock weighting slightly, to 13.7%.

Charles P. McQuaid
Lead Portfolio Manager

Robert A. Mohn
Co-Portfolio Manager
1 By our calculations, Columbia Acorn Fund's foreign stocks had a total return of 173.71% in the three years ending June 2006. While we are extremely pleased with that return, we note that it is not comparable to mutual fund returns, as it is before expenses and cash effects incurred by actual funds. Also, Columbia Acorn Fund's foreign stockholdings have been heavily weighted toward energy and were not purchased as a balanced, stand-alone portfolio.
Small-cap stocks are often more volatile and less liquid than the stocks of larger companies. Small companies may have a shorter history of operations than larger companies and may have a less diversified product line, making them more susceptible to market pressure. Investments in foreign securities have special risks, including political or economic instability, higher costs, different regulations, accounting standards, trading practices and levels of information, and currency exchange rate fluctuations.
As of 6/30/06, the Fund's positions in the stocks mentioned were: Expeditors International of Washington, 1.7%; RSA Security, 0.4%; Falconbridge, 0.4%; Gambro, 0.0%; Serologicals, 0.3%; Aviall, 0.3%; Western Gas Resources, 1.1%; FMC Technologies, 0.9%; World Acceptance, 0.3%; Christopher & Banks, 0.6%; DOV Pharmaceuticals, 0.0%; Neurocrine Biosciences, 0.0%; Pozen, 0.0%; Chico's FAS, 0.9%; Vallourec, 0.2%; Tenaris, 0.3%; USG People, 0.3%; Nobia, 0.3%; Techtronic Industries, 0.1%.
1-800-922-6769
10
Columbia Acorn Fund (LACAX)
>At a Glance
Performance shown here represents past performance, which does not guarantee future results. Current performance may be higher or lower. The investment return and principal value of an investment in the Fund will fluctuate so that Fund shares, when redeemed, may be worth more or less than their original cost. Visit columbiafunds.com for daily and most recent month-end updates.
Pretax and After-tax Average Annual Total Returns (Based on Class A Share Returns)
>through June 30, 2006
| Inception 10/16/00 | | | | Year
to date* | | 1 year | | 5 years | | Life of fund | |
| Returns before taxes | | NAV
POP | | 5.64%
-0.43 | | 16.11%
9.43 | | 11.81%
10.49 | | 13.30%
12.13 | |
Returns after taxes
on distributions | | NAV
POP | | 5.47
-0.59 | | 15.17
8.55 | | 11.43
10.12 | | 12.45
11.29 | |
Returns after taxes
on distributions and
sale of fund shares | | NAV
POP | | 3.89
-0.07 | | 11.65
7.24 | | 10.28
9.10 | | 11.36
10.31 | |
| Russell 2500 (pretax) | | | | | 6.32 | | | | 13.53 | | | | 9.65 | | | | 9.75 | | |
| S&P 500 (pretax) | | | | | 2.71 | | | | 8.63 | | | | 2.49 | | | | 0.29 | | |
After-tax returns are calculated using the highest historical individual federal marginal income tax rates, and do not reflect the impact of state and local taxes. Returns after taxes on distributions and sale of Fund shares reflect the tax impact of gains or losses realized when Fund shares are sold. The returns are taxed at the maximum rate and assume shares were purchased at the beginning of the period. Actual after-tax returns depend on the investor's tax situation and may differ from those shown. After-tax returns are not relevant to investors who hold their Fund shares through tax-deferred arrangements such as 401(k) plans or individual retirement accounts. After-tax returns are shown for Class A shares only; after-tax returns for other share classes will vary. Indexes do not reflect any deduction for fees, expenses or taxes. Investment returns and principal value may fluctuate, resulting in a gain or loss on sale.
Public offering price (POP) returns include the maximum sales charge of 5.75% for Class A shares. Net asset value (NAV) returns do not include sales charges or contingent deferred sales charges (CDSC).
*Year-to-date data not annualized.
Columbia Acorn Fund Portfolio Diversification
>as a % of net assets, as of June 30, 2006
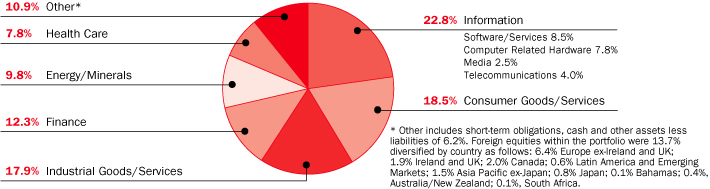
The Growth of a $75,000 Investment in Columbia Acorn Fund (Class A)
>October 16, 2000 through June 30, 2006
Illustration is based on a hypothetical $75,000 investment from inception in Class A shares of the Fund, which includes the 4.50% maximum initial sales charge for this level of investment. The Russell 2500 is the smallest 2,500 U.S. companies taken from a group of the largest 3,000 companies. The index is unmanaged and returns for the index and the Fund include reinvested dividends and capital gains. It is not possible to invest directly in an index.
Performance may reflect any voluntary waiver or reimbursement of Fund expenses by the Adviser or its affiliates. Absent these waivers or reimbursement arrangements, performance results would have been lower.
Total Net Assets of the Fund: $17,916.1 million

Columbia Acorn Fund Top 10 Holdings (as a % of net assets)
1. Expeditors International of Washington
International Freight Forwarder | | | 1.7 | % | |
2. Coach
Designer & Retailer of Branded Leather Accessories | | | 1.2 | % | |
3. Western Gas Resources
Oil & Coal Seam Gas Producer | | | 1.1 | % | |
4. AmeriCredit
Auto Lending | | | 1.0 | % | |
5. Chico's FAS
Women's Specialty Retail | | | 0.9 | % | |
6. Ultra Petroleum
Natural Gas Producer | | | 0.9 | % | |
7. FMC Technologies
Oil & Gas Well Head Manufacturer | | | 0.9 | % | |
8. Crown Castle International
Communications Towers | | | 0.9 | % | |
9. ITT Educational Services
Post-secondary Degree Programs | | | 0.8 | % | |
10. Peoples Bank Bridgeport
Connecticut Savings & Loan | | | 0.8 | % | |
The Fund's top 10 holdings and portfolio diversification vary with changes in portfolio investments. See the Statement of Investments for a complete list of the Fund's holdings.
11
Columbia Acorn International
>In a Nutshell


Performance data quoted represents past performance and current performance may be lower or higher. Past performance is no guarantee of future results. The investment return and principal value of an investment in the Fund will fluctuate so that shares, when redeemed, may be worth more or less than the original cost.
Visit columbiafunds.com for daily and most recent month-end performance updates.
Columbia Acorn International ended the quarter down 1.16% (Class A shares, without sales charge) vs. a 1.70% decline for the benchmark S&P/Citigroup EMI Global ex-US Index. Year-to-date through June 30, the Fund was up 14.11%, well ahead of the 10.57% gain of the index. The Fund's half year return also easily topped the 10.16% return of the large-cap oriented MSCI EAFE Index.
Energy stocks Tullow Oil and Fugro were among the top contributors to performance for both the quarter and the six months. Tullow Oil, an exploration and development company based in the United Kingdom, was up 21% in the quarter and 53% for the half year. Fugro, a Dutch provider of survey services to the offshore industry, posted a 14% return for the quarter and a 37% six-month gain. Both of these stocks are among the Fund's top 10 holdings.
European industrial stocks continued to perform well in the second quarter. Geberit, a Swiss manufacturer of pipes and fittings for plumbers, was up 23% in the quarter and 48% for the six months on improving demand in its key German market. RPS Group, a UK provider of environmental consulting services, gained 29% in the second quarter and was up over 50% for the half year. The stock benefited from strong growth in the energy sector and its other end markets. Sweden's Hexagon, a maker of measurement equipment and polymers, gained 9% in the quarter and was up 37% for the six months on strong trading in its metrology division and successful integration of Leica Geosystems, which it acquired last year.
In the health care sector, Sweden's Gambro, a manufacturer of dialysis and blood care products, gained more than 30% in the quarter and 45% for the half year before being acquired by Swedish investment companies Investor AB and EQT in June. Canadian mining company Falconbridge, up 51% in the quarter and over 78% for the half year, was a beneficiary of drawn out takeover action involving multiple suitors.
Underperformers in the quarter included African retailer Edgars Consolidated Stores, which fell 33% on concerns that rising interest rates may slow down consumption. In Japan, fund manager Sparx Asset Management fell 26% in sympathy with the overall correction in Japanese financial stocks. In Hong Kong, power tool manufacturer Techtronic Industries gave back 24% in the quarter. The stock was hurt by continued poor sentiment on the outlook for U.S. housing and its potential impact on power tool sales.
It is noteworthy that the Fund's slightly negative return for the second quarter masks much higher underlying volatility: The Fund began the quarter on a positive note rising 11.6% before hitting its peak on May 10 and then dropping 19% to reach a low on June 13. From that point, Fund performance recovered 9.4% to end the quarter down just slightly more than 1%. Concerns regarding ongoing increases in global interest rates seem to have conspired with historically high valuations to finally change investor appetite for international risk, particularly in international small-cap equities. Notably, the second quarter was also the first in 10 in which the large-cap EAFE index outperformed the small-cap EMI index. As in the U.S. market, overseas investors generally perceive larger cap stocks to be less risky than their small cap counterparts. As we have mentioned in earlier reports, small-cap international stocks have been strong per formers in both absolute terms and relative to their large cap counterparts and no longer offer the valuation discount that they did before. While still finding compelling ideas in the sub US$5 billion market cap universe, we have been selectively adding mid-cap stocks in the US$5 to $10 billion range where valuations as a group are more attractive. Despite the increase in volatility in international small-cap equities, we believe there remain ample opportunities for new acorns to be discovered.

P. Zachary Egan
Co-Portfolio Manager

Louis J. Mendes III
Co-Portfolio Manager
Investments in foreign securities have special risk, including political or economic instability, higher costs, different regulations, accounting standards, trading practices and levels of information, and currency exchange rate fluctuations. Small-cap stocks are often more volatile and less liquid than the stocks of larger companies. Small companies may have a shorter history of operations than larger companies and may have a less diversified product line, making them more susceptible to market pressure.
As of 6/30/06, the Fund's positions in the stocks mentioned were: Tullow Oil, 1.3%; Fugro, 1.5%; Geberit, 1.0%; RPS Group, 0.8%; Hexagon, 1.6%; Gambro, 0.0%; Falconbridge, 0.5%; Edgars Consolidated Stores, 0.5%; Sparx Asset Management, 0.7%; Techtronic Industries, 0.5%.
1-800-922-6769
12
Columbia Acorn International (LAIAX)
>At a Glance
Performance shown here represents past performance, which does not guarantee future results. Current performance may be higher or lower. The investment return and principal value of an investment in the Fund will fluctuate so that Fund shares, when redeemed, may be worth more or less than their original cost. Visit columbiafunds.com for daily and most recent month-end updates.
Pretax and After-tax Average Annual Total Returns (Based on Class A Share Returns)
>through June 30, 2006
| Inception 10/16/00 | | | | Year
to date* | | 1 year | | 5 years | | Life of fund | |
| Returns before taxes | | NAV
POP | | 14.11%
7.55 | | 34.74%
26.99 | | 14.90%
13.55 | | 9.00%
7.87 | |
Returns after taxes
on distributions | | NAV
POP | | 13.86
7.31 | | 33.85
26.15 | | 14.74
13.38 | | 8.30
7.19 | |
Returns after taxes
on distributions and
sale of fund shares | | NAV
POP | | 9.50
5.22 | | 23.93
18.82 | | 13.15
11.93 | | 7.59
6.60 | |
S&P/Citigroup EMI
Global ex-US (pretax) | | | | | 10.57 | | | | 31.22 | | | | 18.28 | | | | 14.17 | | |
After-tax returns are calculated using the highest historical individual federal marginal income tax rates, and do not reflect the impact of state and local taxes. Returns after taxes on distributions and sale of Fund shares reflect the tax impact of gains or losses realized when Fund shares are sold. The returns are taxed at the maximum rate and assume shares were purchased at the beginning of the period. Actual after-tax returns depend on the investor's tax situation and may differ from those shown. After-tax returns are not relevant to investors who hold their Fund shares through tax-deferred arrangements such as 401(k) plans or individual retirement accounts. After-tax returns are shown for Class A shares only; after-tax returns for other share classes will vary. The return after taxes on distributions may be higher than the return before taxes due to qualified foreign tax credits. Indexes do not reflect any deduction for fe es, expenses or taxes. Investment returns and principal value may fluctuate, resulting in a gain or loss on sale.
Public offering price (POP) returns include the maximum sales charge of 5.75% for Class A shares. Net asset value (NAV) returns do not include sales charges or contingent deferred sales charges (CDSC).
*Year-to-date data not annualized.
Columbia Acorn International Portfolio Diversification
>as a % of net assets, as of June 30, 2006
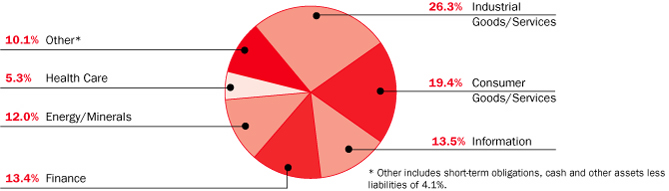
The Growth of a $10,000 Investment in Columbia Acorn International (Class A)
>October 16, 2000 through June 30, 2006
Illustration is based on a hypothetical $10,000 investment from inception in Class A shares of the Fund, which includes the 5.75% maximum initial sales charge. The S&P/Citigroup EMI Global ex-US is Citigroup's index of the bottom 20% of institutionally investable capital of developed and emerging countries, as selected by Citigroup, excluding the U.S. The index is unmanaged and returns for both the index and Fund include reinvested dividends and capital gains. It is not possible to invest directly in an index.
Performance may reflect any voluntary waiver or reimbursement of Fund expenses by the Adviser or its affiliates. Absent these waivers or reimbursement arrangements, performance results would have been lower.
Total Net Assets of the Fund: $3,596.3 million

Columbia Acorn International Top 10 Holdings (as a % of net assets)
1. Hexagon (Sweden)
Measurement Equipment & Polymers | | | 1.6 | % | |
2. Fugro (Netherlands)
Survey & GPS Services | | | 1.5 | % | |
3. USG People (Netherlands)
Temporary Staffing Services | | | 1.4 | % | |
4. Tullow Oil (United Kingdom)
Oil & Gas Producer | | | 1.3 | % | |
5. Aalberts Industries (Netherlands)
Flow Control & Heat Treatment | | | 1.1 | % | |
6. Rhoen-Klinikum (Germany)
Health Care Services | | | 1.1 | % | |
7. April Group (France)
Insurance Policy Construction | | | 1.0 | % | |
8. Bank of Ireland (Ireland)
Irish Commercial Bank | | | 1.0 | % | |
9. IAWS Group (Ireland)
Baked Goods | | | 1.0 | % | |
10. Wincor Nixdorf (Germany)
Retail POS Systems & ATM Machines | | | 1.0 | % | |
The Fund's top 10 holdings and portfolio diversification vary with changes in portfolio investments. See the Statement of Investments for a complete list of the Fund's holdings.
13
Columbia Acorn USA
>In a Nutshell

Performance data quoted represents past performance and current performance may be lower or higher. Past performance is no guarantee of future results. The investment return and principal value of an investment in the Fund will fluctuate so that shares, when redeemed, may be worth more or less than the original cost.
Visit columbiafunds.com for daily and most recent month-end performance updates.
After a first quarter surge, small caps pulled back in the second quarter. Columbia Acorn USA ended the second quarter down 4.44% (Class A shares, without sales charge) vs. a 5.02% decline for the Russell 2000. First quarter underperformance dampened returns for the six-month period. Year-to-date through June 30, the Fund was up 2.04% vs. an 8.21% gain for the benchmark.
Six of our stocks received takeover offers during the quarter. Two of the six, Serologicals and Western Gas Resources, were fairly sizeable positions in the Fund and contributed positively to Fund returns as the stocks bounced on acquisition news. Serologicals, a producer of biological products and solutions, gained 29% in the quarter and was up over 59% for the six months. Western Gas Resources, a coal seam gas producer and processor, increased 24% in the second quarter and was up 27% year-to-date.
Other winners for the quarter and half year included FMC Technologies, up 32% in the quarter and 57% year-to-date. FMC makes deep-water oil and gas production systems and has been enjoying robust demand for its products as offshore drilling activity has increased. Crown Castle International, an owner of cellular communication towers, gained 22% in the quarter and 28% for the half year. Its business has been booming as cellular phone companies grab for more wireless capacity in order to beam internet sites, TV shows and other fun stuff to your cell phone.
While several Fund retail stocks faltered in the quarter, Christopher & Banks was the exception. Up 25% in the quarter and 55% for the six months, Christopher & Banks experienced a turnaround as new merchandise was positively received and same-store sales flipped from negative to positive. World Acceptance gained 30% in the quarter and was up 25% for the half year on news of strong loan growth in the second quarter and dramatically lower loan losses.
On the downside, Neurocrine Biosciences' stock collapsed when the FDA withheld full approval for the high dosage of its sleep medication Indiplon. The Fund sold out of the stock, taking a 66% blow for the quarter and 65% loss for the six months. Interestingly enough, Neurocrine stock fell a further 50% after we got out. As mentioned, several retail names were down in the Fund. Oxford Industries, a maker of branded and private label apparel, fell 23% in the quarter and was off 28% for the six months on disappointing sales in its menswear lines. Chico's FAS, a women's specialty retailer, fell more than 34% in the quarter and 40% in the half year as new merchandise failed to move and sales came in short.
Two technology names, Avid Technology and CNET Networks also hurt Fund performance. Avid suffered indigestion from an acquisition it made last year and announced delays in new product upgrades. The stock was off 23% in the quarter and 38% for the six months. CNET Networks, a provider of software product reviews and niche technology websites, was off 44% in the quarter and 46% for the half year. CNET's business is driven by new product launches, and two highly anticipated product launches, Microsoft's Vista and Sony's PlayStation 3, were tardy.
The second quarter's pull back in small-cap stocks allowed us to add to positions in fast-growing stocks whose prices had fallen within our valuation criteria. We continue to take advantage of the many opportunities that we believe today's volatile markets offer.

Robert A. Mohn
Lead Portfolio Manager
Small-cap stocks are often more volatile and less liquid than the stocks of larger companies. Small companies may have a shorter history of operations than larger companies and may have a less diversified product line, making them more susceptible to market pressure.
As of 6/30/06, the Fund's positions in the stocks mentioned were: Serologicals, 1.2%; Western Gas Resources, 1.2%; FMC Technologies, 1.8%; Crown Castle International, 2.4%; Christopher & Banks, 1.0%: World Acceptance, 1.3%; Neurocrine Biosciences, 0.0%; Oxford Industries, 1.7%; Chico's FAS, 0.6%; Avid Technology, 1.8%; CNET Networks, 0.5%.
1-800-922-6769
14
Columbia Acorn USA (LAUAX)
>At a Glance
Performance shown here represents past performance, which does not guarantee future results. Current performance may be higher or lower. The investment return and principal value of an investment in the Fund will fluctuate so that Fund shares, when redeemed, may be worth more or less than their original cost. Visit columbiafunds.com for daily and most recent month-end updates.
Pretax and After-tax Average Annual Total Returns (Based on Class A Share Returns)
>through June 30, 2006
| Inception 10/16/00 | | | | Year
to date* | | 1 year | | 5 years | | Life of fund | |
| Returns before taxes | | NAV
POP | | 2.04%
-3.82 | | 9.12%
2.84 | | 9.07%
7.79 | | 13.77%
12.60 | |
Returns after taxes
on distributions | | NAV
POP | | 1.99
-3.88 | | 8.46
2.23 | | 8.83
7.55 | | 13.55
12.38 | |
Returns after taxes
on distributions and
sale of fund shares | | NAV
POP | | 1.41
-2.41 | | 6.79
2.66 | | 7.86
6.73 | | 12.13
11.06 | |
| Russell 2000 (pretax) | | | | | 8.21 | | | | 14.58 | | | | 8.50 | | | | 8.84 | | |
After-tax returns are calculated using the highest historical individual federal marginal income tax rates, and do not reflect the impact of state and local taxes. Returns after taxes on distributions and sale of Fund shares reflect the tax impact of gains or losses realized when Fund shares are sold. The returns are taxed at the maximum rate and assume shares were purchased at the beginning of the period. Actual after-tax returns depend on the investor's tax situation and may differ from those shown. After-tax returns are not relevant to investors who hold their Fund shares through tax-deferred arrangements such as 401(k) plans or individual retirement accounts. After-tax returns are shown for Class A shares only; after-tax returns for other share classes will vary. Indexes do not reflect any deduction for fees, expenses or taxes. Investment returns and principal value may fluctuate, resulting in a gain or loss on sale.
Public offering price (POP) returns include the maximum sales charge of 5.75% for Class A shares. Net asset value (NAV) returns do not include sales charges or contingent deferred sales charges (CDSC).
*Year-to-date data not annualized.
Columbia Acorn USA Portfolio Diversification
>as a % of net assets, as of June 30, 2006
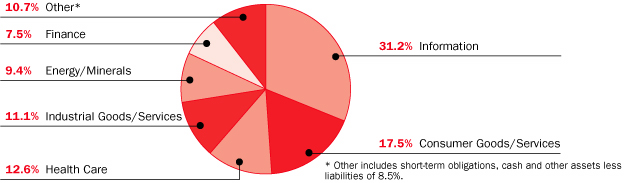
The Growth of a $75,000 Investment in Columbia Acorn USA (Class A)
>October 16, 2000 through June 30, 2006
Illustration is based on a hypothetical $75,000 investment from inception in Class A shares of the Fund, which includes the 4.50% maximum initial sales charge for this level of investment. The Russell 2000 is a market-weighted index of 2,000 smaller U.S. companies formed by taking the largest 3,000 U.S. companies and eliminating the largest 1,000. The index is unmanaged and returns for both the index and the Fund include reinvested dividends and capital gains. It is not possible to invest directly in an index.
Performance may reflect any voluntary waiver or reimbursement of Fund expenses by the Adviser or its affiliates. Absent these waivers or reimbursement arrangements, performance results would have been lower.
Total Net Assets of the Fund: $1,470.3 million
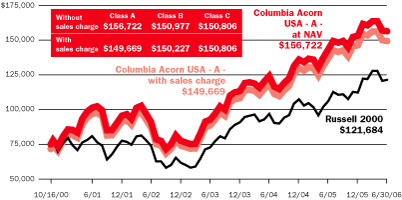
Columbia Acorn USA Top 10 Holdings (as a % of net assets)
1. Crown Castle International
Communication Towers | | | 2.4 | % | |
2. AmeriCredit
Auto Lending | | | 2.1 | % | |
3. Esco Technologies
Automatic Electric Meter Readers | | | 2.1 | % | |
4. ITT Educational Services
Post-secondary Degree Programs | | | 1.9 | % | |
5. Genlyte Group
Commercial Lighting Fixtures | | | 1.9 | % | |
6. FMC Technologies
Oil & Gas Well Head Manufacturer | | | 1.8 | % | |
7. Edwards Lifesciences
Heart Valves | | | 1.8 | % | |
8. Avid Technology
Digital Nonlinear Editing Software & Systems | | | 1.8 | % | |
9. Oxford Industries
Branded & Private Label Apparel | | | 1.7 | % | |
10. Kronos
Labor Management Solutions | | | 1.6 | % | |
The Fund's top 10 holdings and portfolio diversification vary with changes in portfolio investments. See the Statement of Investments for a complete list of the Fund's holdings.
15
Columbia Acorn International Select
>In a Nutshell

Performance data quoted represents past performance and current performance may be lower or higher. Past performance is no guarantee of future results. The investment return and principal value of an investment in the Fund will fluctuate so that shares, when redeemed, may be worth more or less than the original cost.
Visit columbiafunds.com for daily and most recent month-end performance updates.
Columbia Acorn International Select ended the second quarter up 0.41% (Class A shares, without sales charge), outperforming the 0.61% drop of S&P/Citigroup World ex-US Cap Range $2-10B Index. Year-to-date through June 30, the Fund was up 12.74%, well ahead of the 10.29% return of the index.
Strong contributors to performance in the quarter and half year included Sweden's Gambro, a producer of renal and blood care products, and one of the Fund's largest holdings. The stock increased 44% in 2006 before it was acquired by Swedish investment companies Investor AB and EQT in June. Hong Kong Exchanges and Clearing, the Hong Kong equities and derivatives operator and another of the Fund's major holdings, was up 57% for the semiannual period, gaining 8% in the second quarter as it continued to benefit from growing trading volumes and new stock listings from China. Geberit, a Swiss manufacturer of plumbing supplies, gained 48% in the first half of the year and 23% in the second quarter thanks to improving demand in its key German market. C&C Group, an Irish beverage and snack company, was added to the Fund in the first quarter and was among its top five contributors for the quarter and half year. The company continues t o make significant inroads into the UK alcoholic beverage market with its hard cider offering that is so popular in Ireland.
Most laggards for the quarter and six months had one thing in common: Japan. After a strong rally in the fourth quarter of 2005 in Japan, corporate governance issues at a few small firms roiled the local markets and contributed to a general sell-off. In the quarter, fund manager Sparx Asset Management fell 28% despite significant earnings upgrades and increases in assets under management. Kansai Paint, a paint producer based in Japan but with operations throughout emerging Asia, fell 13%. Aeon Mall, a suburban shopping mall developer and operator, fell 16%. For the six months, Jupiter Telecommunications, the largest cable service provider in Japan, was off 13%. Outside of Japan, France's SES Global, a provider of satellite broadcasting services, fell 17% in the first half of 2006 due to higher than expected start-up costs for new activities.
While increasing interest rates, higher oil prices and geopolitical concerns have all contributed to rising volatility in the equity markets, earnings for companies in Columbia Acorn International Select's portfolio have generally come in as expected or on the higher side of expectations. As a result, we are seeing more value emerging due to the recent drop in the market. However, things can quickly change and we will continue to monitor the fundamental outlook for Fund holdings closely.

Christopher J. Olson
Lead Portfolio Manager
Mid-cap stocks tend to be more volatile and may be less liquid than the stocks of larger companies. Investments in foreign securities have special risk, including political or economic instability, higher costs, different regulations, accounting standards, trading practices and levels of information, and currency exchange rate fluctuations.
As of 6/30/06, the Fund's positions in the stocks mentioned were: Gambro, 0.0%; Hong Kong Exchanges and Clearing, 3.3%; Geberit, 2.3%; C&C Group, 3.6%; Sparx Asset Management, 1.6%; Kansai Paint, 1.9%; Aeon Mall, 1.9%; Jupiter Telecommunications, 3.1%; SES Global, 2.2%.
1-800-922-6769
16
Columbia Acorn International Select (LAFAX)
>At a Glance
Performance shown here represents past performance, which does not guarantee future results. Current performance may be higher or lower. The investment return and principal value of an investment in the Fund will fluctuate so that Fund shares, when redeemed, may be worth more or less than their original cost. Visit columbiafunds.com for daily and most recent month-end updates.
Pretax and After-tax Average Annual Total Returns (Based on Class A Share Returns)
>through June 30, 2006
| Inception 10/16/00 | | | | Year
to date* | | 1 year | | 5 years | | Life of fund | |
| Returns before taxes | | NAV
POP | | 12.74%
6.25 | | 29.75%
22.29 | | 11.46%
10.14 | | 5.04%
3.96 | |
Returns after taxes
on distributions | | NAV
POP | | 12.73
6.25 | | 29.89
22.43 | | 11.49
10.18 | | 5.04
3.96 | |
Returns after taxes
on distributions and
sale of fund shares | | NAV
POP | | 8.28
4.07 | | 19.48
14.62 | | 10.09
8.92 | | 4.40
3.45 | |
S&P/Citigroup World
ex-US Cap Range
$2-10B (pretax) | | | | | 10.29 | | | | 31.69 | | | | 15.80 | | | | 12.62 | | |
After-tax returns are calculated using the highest historical individual federal marginal income tax rates, and do not reflect the impact of state and local taxes. Returns after taxes on distributions and sale of Fund shares reflect the tax impact of gains or losses realized when Fund shares are sold. The returns are taxed at the maximum rate and assume shares were purchased at the beginning of the period. Actual after-tax returns depend on the investor's tax situation and may differ from those shown. After-tax returns are not relevant to investors who hold their Fund shares through tax-deferred arrangements such as 401(k) plans or individual retirement accounts. After-tax returns are shown for Class A shares only; after-tax returns for other share classes will vary. The return after taxes on distributions may be higher than the return before taxes due to qualified foreign tax credits. Indexes do not reflect any deduction for fe es, expenses or taxes. Investment returns and principal value may fluctuate, resulting in a gain or loss on sale.
Public offering price (POP) returns include the maximum sales charge of 5.75% for Class A shares. Net asset value (NAV) returns do not include sales charges or contingent deferred sales charges (CDSC).
*Year to date data not annualized.
Columbia Acorn International Select Portfolio Diversification
>as a % of net assets, as of June 30, 2006

The Growth of a $10,000 Investment in Columbia Acorn International Select (Class A)
>October 16, 2000 through June 30, 2006
Illustration is based on a hypothetical $10,000 investment from inception in Class A shares of the Fund, which includes the 5.75% maximum initial sales charge. S&P/Citigroup World ex-US Cap Range $2-10B Index is a subset of Citigroup's Broad Market Index, representing a mid-cap developed market index excluding the U.S. The index and Fund returns include reinvested dividends and capital gains. It is not possible to invest directly in an index.
Performance may reflect any voluntary waiver or reimbursement of Fund expenses by the Adviser or its affiliates. Absent these waivers or reimbursement arrangements, performance results would have been lower.
Total Net Assets of the Fund: $119.2 million
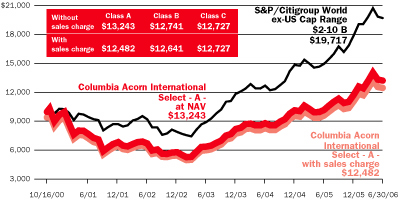
Columbia Acorn International Select Top 10 Holdings (as a % of net assets)
1. Bank of Ireland (Ireland)
Irish Commercial Bank | | | 4.2 | % | |
2. C&C Group (Ireland)
Beverage Company | | | 3.6 | % | |
3. Daito Trust
Construction (Japan)
Apartment Builder | | | 3.5 | % | |
4. Anglo Irish Bank (Ireland)
Small Business & Middle Market Banking | | | 3.5 | % | |
5. Northern Rock (United Kingdom)
Lowest Cost Mortgage Bank in UK | | | 3.3 | % | |
6. Hoya (Japan)
Opto-Electrical Components & Eyeglass Lenses | | | 3.3 | % | |
7. Hong Kong Exchanges and
Clearing (Hong Kong)
Hong Kong Equity & Derivatives Market Operator | | | 3.3 | % | |
8. IAWS Group (Ireland)
Baked Goods | | | 3.3 | % | |
9. Jupiter
Telecommunications (Japan)
Largest Cable Service Provider in Japan | | | 3.1 | % | |
10. Synthes (Switzerland)
Products for Orthopedic Surgery | | | 3.0 | % | |
The Fund's top 10 holdings and portfolio diversification vary with changes in portfolio investments. See the Statement of Investments for a complete list of the Fund's holdings.
17
Columbia Acorn Select
>In a Nutshell

Performance data quoted represents past performance and current performance may be lower or higher. Past performance is no guarantee of future results. The investment return and principal value of an investment in the Fund will fluctuate so that shares, when redeemed, may be worth more or less than the original cost.
Visit columbiafunds.com for daily and most recent month-end performance updates.
Columbia Acorn Select was down 2.27% (Class A shares, without sales charge) in the second quarter vs. a 3.14% decline of the S&P MidCap 400 Index. Year-to-date through June 30, the Fund was up 5.30%, 1.06% greater than its S&P MidCap 400 benchmark and 2.59% greater than the S&P 500's year-to-date gain of 2.71%.
Focusing on the stocks that drove Columbia Acorn Select's performance for the quarter and six months, the Fund had one stock that was consistently up and one stock that was consistently down for the half year. The Fund's up stock was Expeditors International of Washington, a freight forwarding company. Expeditors gained more than 60% for the semiannual period and added 1.6% to the Fund's overall portfolio return. On the negative side, Avid Technology cost the Fund approximately 1.6% of overall performance year-to-date. As mentioned last quarter, Avid's acquisition of Pinnacle did not initially meet expectations. I recently met with Avid's divisional head of Pinnacle, and I also met with an Avid customer. Though it's clear that we put Avid into the Fund too early, our confidence has consistently grown as well as the Fund's share position. We believe Avid is putting the right management and products in place to build on its leadin g market share in consumer video, broadcast, storage and audio.
Tellabs also hindered performance in the second quarter as the telecom sector seemed to fall out of favor with investors. We still believe Tellabs' strong fundamentals should help the company outperform over the next couple of years.
The Fund sold out of four existing positions in the quarter and purchased one new position. Three of the sales were made because we believed company fundamentals were beginning to weaken (Coventry Health Care, Associated Banc-Corp and Tektronix). IAC/Interactive, a smaller position in the Fund, was sold because we felt it was expensive. The new addition was Sanmina-SCI, a provider of electronics contract manufacturing services (EMS). Columbia Wanger Asset Management owned and sold Sanmina pre-2000 before the EMS industry got overheated. Numerous EMS companies purchased manufacturing assets or other EMS players at ridiculously high prices during the Internet bubble. Sanmina was no exception during this phase; it purchased several companies in 2000 and 2001. Since the acquisitions, Sanmina has struggled to improve its operating margins, but we believe the comp any is now on track to improve its bottom line.
U.S. stocks began to decline in the weeks following the period end. The main fear is that rising global interest rates could curtail economic growth. The small-cap Russell 2000 Index, which had been up more than 16% early in the second quarter, lost almost all of this gain just following the period end in mid-July. We noted at the end of the third quarter last year that smaller cap stocks were somewhat expensive compared to their larger cap peers. At that point, we were finding better value in larger mid-cap names. In the first few months of this year small caps got even more expensive before taking the mid-year dive. This recent sell-off has corrected some of the excess, and we are now finding some interesting stock ideas to watch among the smaller end of the Fund's investment range. We're not ready to load up on these ideas yet, but we believe that they have a lot of promise and could be drivers of the Fund's portfolio next ye ar. Could the economy slow down in the next few quarters and make some of these ideas less promising? Sure. But it's been our experience that the market usually overreacts to a slowing economy, making new investment ideas more attractive.

Ben Andrews
Lead Portfolio Manager
Columbia Acorn Select is a non-diversified fund. The performance of each of its holdings will have a greater impact on the Fund's total return, and may make the Fund's returns more volatile than a more diversified fund. Mid-cap stocks tend to be more volatile and may be less liquid than the stocks of larger companies.
As of 6/30/06, the Fund's positions in the stocks mentioned were: Expeditors International of Washington; 3.8%; Avid Technology, 2.8%; Tellabs, 6.7%; Coventry Health Care, 0.0%; Associated Banc-Corp, 0.0%; Tektronix, 0.0%; IAC/Interactive, 0.0%; Sanmina-SCI, 0.9%.
1-800-922-6769
18
Columbia Acorn Select (LTFAX)
>At a Glance
Performance shown here represents past performance, which does not guarantee future results. Current performance may be higher or lower. The investment return and principal value of an investment in the Fund will fluctuate so that Fund shares, when redeemed, may be worth more or less than their original cost. Visit columbiafunds.com for daily and most recent month-end updates.
Pretax and After-tax Average Annual Total Returns (Based on Class A Share Returns)
>through June 30, 2006
| Inception 10/16/00 | | | | Year
to date* | | 1 year | | 5 years | | Life of fund | |
| Returns before taxes | | NAV
POP | | 5.30%
-0.76 | | 16.96%
10.24 | | 11.34%
10.03 | | 11.71%
10.56 | |
Returns after taxes
on distributions | | NAV
POP | | 5.13
-0.92 | | 16.39
9.70 | | 11.11
9.81 | | 11.46
10.31 | |
Returns after taxes
on distributions and
sale of fund shares | | NAV
POP | | 3.44
-0.49 | | 11.50
7.10 | | 9.86
8.69 | | 10.21
9.18 | |
S&P MidCap 400
(pretax) | | | | | 4.24 | | | | 12.98 | | | | 9.30 | | | | 8.90 | | |
After-tax returns are calculated using the highest historical individual federal marginal income tax rates, and do not reflect the impact of state and local taxes. Returns after taxes on distributions and sale of Fund shares reflect the tax impact of gains or losses realized when Fund shares are sold. The returns are taxed at the maximum rate and assume shares were purchased at the beginning of the period. Actual after-tax returns depend on the investor's tax situation and may differ from those shown. After-tax returns are not relevant to investors who hold their Fund shares through tax-deferred arrangements such as 401(k) plans or individual retirement accounts. After-tax returns are shown for Class A shares only; after-tax returns for other share classes will vary. Indexes do not reflect any deduction for fees, expenses or taxes. Investment returns and principal value may fluctuate, resulting in a gain or loss on sale.
Public offering price (POP) returns include the maximum sales charge of 5.75% for Class A shares. Net asset value (NAV) returns do not include sales charges or contingent deferred sales charges (CDSC).
*Year-to-date data not annualized.
Columbia Acorn Select Portfolio Diversification
>as a % of net assets, as of June 30, 2006
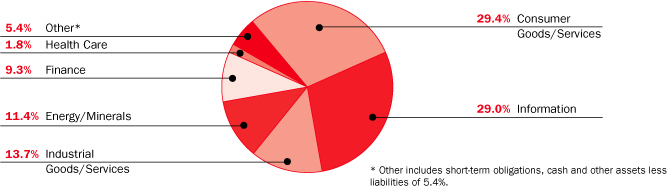
The Growth of a $50,000 Investment in Columbia Acorn Select (Class A)
>October 16, 2000 through June 30, 2006
Illustration is based on a hypothetical $50,000 investment from inception in Class A shares of the Fund, which includes the 4.50% maximum initial sales charge for this level of investment. The S&P MidCap 400 is a broad, market-weighted index of 400 stocks that are in the next size/tier down from the S&P 500. The Index is unmanaged and returns for both the index and the Fund include reinvested dividends and capital gains. It is not possible to invest directly in an index.
Performance may reflect any voluntary waiver or reimbursement of Fund expenses by the Adviser or its affiliates. Absent these waivers or reimbursement arrangements, performance results would have been lower.
Total Net Assets of the Fund: $1,937.7 million

Columbia Acorn Select Top 10 Holdings (as a % of net assets)
1. Tellabs
Telecommunications Equipment | | | 6.7 | % | |
2. ITT Educational Services
Post-secondary Degree Programs | | | 5.5 | % | |
3. Liberty Global
CATV Holding Company | | | 4.7 | % | |
4. Safeway
Supermarkets | | | 4.7 | % | |
5. UrAsia Energy (Canada)
Uranium Mining in Kazakhstan | | | 4.1 | % | |
6. Abercrombie & Fitch
Teen Apparel Retailer | | | 4.0 | % | |
7. Expeditors International of Washington
International Freight Forwarder | | | 3.8 | % | |
8. American Tower
Communication Towers in USA & Mexico | | | 3.7 | % | |
9. Pride International
Contract Drilling | | | 3.1 | % | |
10. Harley-Davidson
Motorcycles & Related Merchandise | | | 3.1 | % | |
The Fund's top 10 holdings and portfolio diversification vary with changes in portfolio investments. See the Statement of Investments for a complete list of the Fund's holdings.
19
Columbia Thermostat Fund
>In a Nutshell

Performance data quoted represents past performance and current performance may be lower or higher. Past performance is no guarantee of future results. The investment return and principal value of an investment in the Fund will fluctuate so that shares, when redeemed, may be worth more or less than the original cost.
Visit columbiafunds.com for daily and most recent month-end performance updates.
A "fund of funds" bears its allocable share of the costs and expenses of the underlying funds in which it invests. Such funds are thus subject to two levels of fees and potentially higher expense ratio than would be associated with an investment in an investment fund that invests and trades directly in financial instruments under the direction of a single manager.
Columbia Thermostat Fund ended the second quarter down 0.65% (Class A shares, without sales charge). This compares to a 1.44% decline for the S&P 500 and a 0.06% gain for the Lehman Brothers U.S. Credit Intermediate Bond Index. The Lipper Flexible Portfolio Funds Index fell 1.30% for the three-month period. For the half year, the Fund was up 2.37% vs. 2.71% for the S&P 500, a 0.47% decline for the Lehman Brothers U.S. Credit Intermediate Bond Index and a 3.07% gain for the Lipper Flexible Portfolio Funds Index.
While the bond portion of the portfolio held up slightly better in the second quarter, both stocks and bonds were slightly negative as the markets dropped modestly. The first quarter's equity surge helped the stock portion of the portfolio maintain a gain of 5.79% for the six-month period. The bond portion was down 0.78% for the six months.
The Fund hit two reallocation triggers in the second quarter. In April the stock component was raised 5% to 45% of the portfolio. In June the weighting was raised again to 50% stocks, 50% bonds.
So far 2006 has been the type of investment environment for which Columbia Thermostat Fund was made. Thank you for your investment in the Fund.

Charles P. McQuaid
Lead Portfolio Manager
Results of the Funds Owned in Columbia Thermostat Fund at June 30, 2006
Equities
| Fund | | Weightings
in Category | | 2nd
quarter
returns | | 6-month
returns to
6/30/06 | |
| Columbia Acorn Fund Z | | | 15 | % | | | -3.73 | % | | | 5.81 | % | |
| Columbia Acorn Select Z | | | 10 | % | | | -2.22 | % | | | 5.43 | % | |
Columbia Large Cap
Value Fund | | | 15 | % | | | -0.57 | % | | | 5.45 | % | |
Columbia Acorn
International Z | | | 15 | % | | | -1.11 | % | | | 14.27 | % | |
Columbia Dividend
Income Fund | | | 20 | % | | | 0.48 | % | | | 4.07 | % | |
Columbia Large Cap
Enhanced Core Fund | | | 25 | % | | | -2.15 | % | | | 2.40 | % | |
Weighted Average
Equity Return | | | 100 | % | | | -1.45 | % | | | 5.79 | % | |
Fixed Income
| Fund | |
Weightings
in Category | | 2nd
quarter
returns | | 6-month
return to
6/30/06 | |
Columbia Federal
Securities Fund | | | 30 | % | | | -0.26 | % | | | -1.13 | % | |
Columbia
Intermediate
Bond Fund | | | 50 | % | | | -0.22 | % | | | -0.71 | % | |
Columbia
Conservative
High Yield Fund | | | 20 | % | | | -1.70 | % | | | -0.42 | % | |
Weighted Average
Income Return | | | 100 | % | | | -0.53 | % | | | -0.78 | % | |
Columbia Thermostat Fund Rebalancing in the Second Quarter
| April 17, 2006: | | 45% stock, 55% bond | |
| June 13, 2006: | | 50% stock, 50% bond | |
The value of an investment in the Fund is based primarily on the performance of the underlying portfolio funds and the allocation of the Fund's assets among them. An investment in the underlying funds may present certain risks, including stock market fluctuations that occur in response to economic and business developments; and a greater degree of social, political and economic volatility associated with international investing. Investing in small- and mid-cap stocks may present special risks including possible illiquidity and greater price volatility than stocks of larger, more established companies. Investments in foreign securities have special risks including political or economic instability, higher costs, different regulations, accounting standards, trading practices and levels of information, and currency exchange rate fluctuations. Changes in interest rates and changes in the financial strength of issuers of lower-rated bonds may also affect underlying fund performance. The Fund is also subject to the risk that the investment adviser's decisions regarding asset classes and portfolio funds will not anticipate market trends successfully, resulting in a failure to preserve capital or lower total return. In addition, the Fund may buy and sell shares of the portfolio funds frequently. This may result in higher transaction costs and additional tax liability. This is not an offer of the shares of any other mutual fund mentioned herein.
1-800-922-6769
20
Columbia Thermostat Fund (CTFAX)
>At a Glance
Performance shown here represents past performance, which does not guarantee future results. Current performance may be higher or lower. The investment return and principal value of an investment in the Fund will fluctuate so that Fund shares, when redeemed, may be worth more or less than their original cost. Visit columbiafunds.com for daily and most recent month-end updates.
Pretax and After-tax Average Annual Total Returns (Based on Class A Share Returns)
>through June 30, 2006
| Inception 3/3/03 | | | | Year
to date* | | 1 year | | 3 years | | Life of fund | |
| Returns before taxes | | NAV
POP | | | 2.37%
-3.51 | | | | 6.29%
0.18 | | | | 8.77%
6.64 | | | | 11.66%
9.70 | | |
Returns after taxes
on distributions | | NAV
POP | | | 2.03
-3.83 | | | | 4.16
-1.83 | | | | 7.50
5.40 | | | | 10.49
8.54 | | |
Returns after taxes
on distributions and
sale of fund shares | | NAV
POP | | | 1.92
-1.93 | | | | 5.53
1.47 | | | | 7.05
5.22 | | | | 9.63
7.91 | | |
| S&P 500 (pretax) | | | | | 2.71 | | | | 8.63 | | | | 11.22 | | | | 15.20 | | |
Lehman Brothers U.S.
Credit Intermediate
Bond Index (pretax) | | | | | -0.47 | | | | -0.61 | | | | 1.83 | | | | 2.92 | | |
Lipper Flexible Portfolio
Funds Index (pretax) | | | | | 3.07 | | | | 10.01 | | | | 10.40 | | | | 13.33 | | |
After-tax returns are calculated using the highest historical individual federal marginal income tax rates, and do not reflect the impact of state and local taxes. Returns after taxes on distributions and sale of Fund shares reflect the tax impact of gains or losses realized when Fund shares are sold. The returns are taxed at the maximum rate and assume shares were purchased at the beginning of the period. Actual after-tax returns depend on the investor's tax situation and may differ from those shown. After-tax returns are not relevant to investors who hold their Fund shares through tax-deferred arrangements such as 401(k) plans or individual retirement accounts. After-tax returns are shown for Class A shares only; after-tax returns for other share classes will vary. Indexes do not reflect any deduction for fees, expenses or taxes. Investment returns and principal value may fluctuate, resulting in a gain or loss on sale.
Public offering price (POP) returns include the maximum sales charge of 5.75% for Class A shares. Net asset value (NAV) returns do not include sales charges or contingent deferred sales charges (CDSC).
*Year-to-date data not annualized.
Columbia Thermostat Fund Portfolio Weightings
>as a % of assets in each investment category, as of June 30, 2006
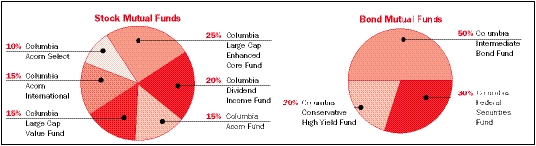
The Growth of a $10,000 Investment in Columbia Thermostat Fund (Class A)
>March 3, 2003 through June 30, 2006
Illustration is based on a hypothetical $10,000 investment from inception in Class A shares of the Fund, which includes the 5.75% maximum initial sales charge. The S&P 500 is a broad, market-weighted average of U.S. blue-chip company stock performance. The Lehman Brothers U.S. Credit Intermediate Bond Index is the intermediate component of the U.S. Credit Index. The U.S. Credit Index includes publicly issued U.S. corporate and foreign debentures and secured notes that meet specified maturity, liquidity, and quality requirements. The Lipper Flexible Portfolio Funds Index is an equal dollar weighted index of the 30 largest mutual funds within the Flexible Portfolio fund classification, as defined by Lipper. The Indexes are unmanaged and returns for the indexes and the Fund include reinvested dividends and capital gains. It is not possible to invest directly in an index.
Performance may reflect any voluntary waiver or reimbursement of Fund expenses by the Adviser or its affiliates. Absent these waivers or reimbursement arrangements, performance results would have been lower.
Total Net Assets of the Fund: $191.3 million
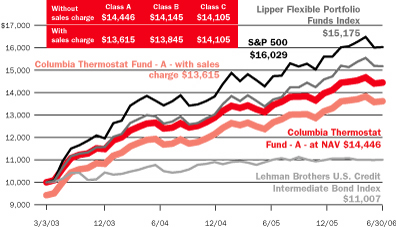
Columbia Thermostat Fund Asset Allocation
>as a % of net assets, as of June 30, 2006
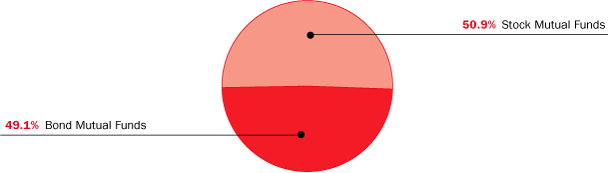
21
Columbia Acorn Fund
>Major Portfolio Changes in the Second Quarter (Unaudited)
| | | Number of Shares | |
| | | 03/31/06 | | 06/30/06 | |
| Additions | |
| Information | |
Alliance Atlantis Communication
(Canada) | | | 960,000 | | | | 1,423,100 | | |
| Amphenol | | | 1,540,000 | | | | 1,620,000 | | |
| Avnet | | | 2,300,000 | | | | 2,550,000 | | |
| Belden CDT | | | 1,173,000 | | | | 1,705,000 | | |
| Ceridian | | | 2,435,000 | | | | 2,585,000 | | |
| CNET Networks | | | 3,000,000 | | | | 4,000,000 | | |
| Concur Technologies | | | 675,000 | | | | 1,766,000 | | |
| EResearch Technology | | | 0 | | | | 1,050,000 | | |
| Gemstar-TV Guide International | | | 7,912,000 | | | | 8,000,000 | | |
| II VI | | | 1,635,000 | | | | 1,885,000 | | |
| Integrated Device Technology | | | 3,060,000 | | | | 3,390,000 | | |
| Kenexa | | | 0 | | | | 160,000 | | |
| Kronos | | | 2,250,000 | | | | 2,750,000 | | |
| Micros Systems | | | 1,425,000 | | | | 1,800,000 | | |
| Navigant Consulting | | | 1,836,000 | | | | 1,900,000 | | |
| Nice Systems (Israel) | | | 1,434,000 | | | | 1,634,000 | | |
| (includes the effect of a 2 for 1 stock split) | |
| Novell | | | 11,500,000 | | | | 12,000,000 | | |
| Openwave Systems | | | 0 | | | | 1,500,000 | | |
| Proquest Company | | | 0 | | | | 2,000,000 | | |
| Radiant Systems | | | 0 | | | | 1,100,000 | | |
| Saga Communications | | | 924,000 | | | | 1,400,000 | | |
| Sanmina - SCI | | | 0 | | | | 4,000,000 | | |
| Supertex | | | 565,000 | | | | 690,000 | | |
| Symbol Technologies | | | 2,560,000 | | | | 4,425,000 | | |
| Tellabs | | | 9,800,000 | | | | 10,000,000 | | |
| THQ | | | 1,050,000 | | | | 1,700,000 | | |
| Tumbleweed Communications | | | 1,761,000 | | | | 3,240,000 | | |
| ValueClick | | | 2,000,000 | | | | 3,000,000 | | |
| webMethods | | | 518,000 | | | | 1,240,000 | | |
| Consumer Goods/Services | |
| Abercrombie & Fitch | | | 2,000,000 | | | | 2,200,000 | | |
| Borders Group | | | 1,300,000 | | | | 1,450,000 | | |
| C&C Group (Ireland) | | | 0 | | | | 2,500,000 | | |
| Cavco Industries | | | 55,000 | | | | 172,000 | | |
| Champion Enterprises | | | 0 | | | | 900,000 | | |
| Chattem | | | 0 | | | | 750,000 | | |
| Chico's FAS | | | 5,090,000 | | | | 5,960,000 | | |
| Coach | | | 5,980,000 | | | | 6,980,000 | | |
| Ducati Motor (Italy) | | | 2,850,000 | | | | 5,700,000 | | |
| Expedia | | | 0 | | | | 3,500,000 | | |
| Fleetwood Enterprises | | | 4,190,000 | | | | 4,690,000 | | |
| Helen of Troy | | | 1,416,000 | | | | 1,800,000 | | |
| HNI | | | 2,400,000 | | | | 2,550,000 | | |
| Jarden | | | 800,000 | | | | 1,000,000 | | |
| J Crew Group | | | 0 | | | | 1,100,000 | | |
| Localiza Rent A Car | | | 0 | | | | 168,800 | | |
| Pool Corporation | | | 1,820,000 | | | | 2,190,000 | | |
| Princeton Review | | | 1,939,000 | | | | 2,550,000 | | |
| | | Number of Shares | |
| | | 03/31/06 | | 06/30/06 | |
| Consumer Goods/Services—continued | |
| Red Robin Gourmet Burgers | | | 805,000 | | | | 1,000,000 | | |
| Rite Aid | | | 7,850,000 | | | | 8,000,000 | | |
| Scotts Miracle-Gro | | | 1,790,000 | | | | 2,620,000 | | |
| ServiceMaster | | | 0 | | | | 470,000 | | |
| Station Casinos | | | 885,000 | | | | 1,000,000 | | |
| Thor Industries | | | 201,000 | | | | 441,000 | | |
| True Religion Apparel | | | 600,000 | | | | 700,000 | | |
| Universal Technical Institute | | | 100,000 | | | | 1,000,000 | | |
| Urban Outfitters | | | 2,427,000 | | | | 3,900,000 | | |
| Industrial Goods/Services | |
| Donaldson | | | 3,275,000 | | | | 3,600,000 | | |
| Drew Industries | | | 730,000 | | | | 1,048,000 | | |
| Flir Systems | | | 1,300,000 | | | | 1,850,000 | | |
| Florida Rock Industries | | | 1,537,000 | | | | 1,900,000 | | |
| Goodman Global | | | 0 | | | | 1,600,000 | | |
| K&F Industries Holdings | | | 994,000 | | | | 1,187,000 | | |
| Legrand (France) | | | 0 | | | | 700,000 | | |
| Martin Marietta | | | 0 | | | | 605,000 | | |
| Quanta Services | | | 2,481,000 | | | | 2,500,000 | | |
| Simpson Manufacturing | | | 1,450,000 | | | | 2,200,000 | | |
| UTI Worldwide | | | 2,700,000 | | | | 3,000,000 | | |
| Worthington Industries | | | 1,964,000 | | | | 2,160,000 | | |
| W.W. Grainger | | | 0 | | | | 750,000 | | |
| Finance | |
| AmeriCredit | | | 6,321,000 | | | | 6,500,000 | | |
| Assurant | | | 830,000 | | | | 1,200,000 | | |
| Cascade Bancorp | | | 118,000 | | | | 500,000 | | |
| Chittenden | | | 756,000 | | | | 892,000 | | |
| Delphi Financial Group | | | 250,000 | | | | 750,000 | | |
| (includes the effect of a 3 for 2 stock split) | |
| East West Bancorp | | | 0 | | | | 400,000 | | |
| Eaton Vance | | | 3,170,000 | | | | 3,970,000 | | |
| Electro Rent | | | 361,000 | | | | 832,000 | | |
| Great Southern Bancorp | | | 675,000 | | | | 796,000 | | |
| Greene County Bancshares | | | 0 | | | | 150,000 | | |
| Marlin Business Services | | | 0 | | | | 263,000 | | |
| McGrath Rentcorp | | | 550,000 | | | | 930,000 | | |
| National Financial | | | 0 | | | | 600,000 | | |
| Philadelphia Consolidated Holding | | | 1,725,000 | | | | 2,040,000 | | |
| Scottish Re Group | | | 0 | | | | 1,700,000 | | |
| West Bancorporation | | | 758,000 | | | | 886,000 | | |
| Energy/Minerals | |
| Atwood Oceanics | | | 0 | | | | 1,000,000 | | |
| Fugro (Netherlands) | | | 1,235,000 | | | | 2,728,302 | | |
| Helmerich & Payne | | | 0 | | | | 257,000 | | |
| Hugoton Royalty | | | 0 | | | | 150,000 | | |
| Maritrans | | | 0 | | | | 600,000 | | |
| Rowan | | | 0 | | | | 971,000 | | |
1-800-922-6769
22
| | | Number of Shares | |
| | | 03/31/06 | | 06/30/06 | |
| Additions (continued) | |
| Health Care | |
| LCA Vision | | | 621,000 | | | | 875,000 | | |
| Rigel Pharmaceuticals | | | 1,216,000 | | | | 1,275,000 | | |
| Tercica | | | 198,000 | | | | 1,500,000 | | |
| Other Industries | |
| Gaylord Entertainment | | | 1,400,000 | | | | 1,560,000 | | |
| Highland Hospitality | | | 4,825,000 | | | | 5,850,000 | | |
| Parkway Properties | | | 400,000 | | | | 536,000 | | |
| Sales | |
| Information | |
| Activision | | | 2,000,000 | | | | 1,000,000 | | |
| Andrew | | | 1,750,000 | | | | 1,380,000 | | |
| CDW | | | 295,000 | | | | 0 | | |
| Getty Images | | | 1,200,000 | | | | 600,000 | | |
Hong Kong Exchanges and
Clearing (Hong Kong) | | | 9,000,000 | | | | 6,500,000 | | |
| International Game Technology | | | 3,840,000 | | | | 2,750,000 | | |
| Jabil Circuit | | | 2,275,000 | | | | 1,705,000 | | |
| Logitech (Switzerland) | | | 300,000 | | | | 0 | | |
| MRO Software | | | 1,000,000 | | | | 241,000 | | |
| Novatek Microelectronics (Taiwan) | | | 5,254,000 | | | | 4,000,000 | | |
| Plexus | | | 1,961,000 | | | | 1,570,000 | | |
| RSA Security | | | 3,000,000 | | | | 2,500,000 | | |
| Sybase | | | 1,000,000 | | | | 0 | | |
| Consumer Goods/Services | |
| Aeropostale | | | 1,040,000 | | | | 936,000 | | |
| Coinstar | | | 1,440,000 | | | | 0 | | |
| Columbia Sportswear | | | 400,000 | | | | 0 | | |
| IAWS Group (Ireland) | | | 1,900,000 | | | | 1,597,000 | | |
| Intrawest (Canada) | | | 1,044,000 | | | | 900,000 | | |
| Michaels Stores | | | 3,560,000 | | | | 2,760,000 | | |
| Natura Cosmeticos | | | 3,150,000 | | | | 1,100,000 | | |
| Park 24 (Japan) | | | 870,000 | | | | 154,000 | | |
| Shimano (Japan) | | | 780,000 | | | | 90,000 | | |
| Sports Authority | | | 1,520,000 | | | | 0 | | |
| Zale | | | 1,072,000 | | | | 0 | | |
| Industrial Goods/Services | |
| Administaff | | | 1,300,000 | | | | 1,100,000 | | |
| Grafton Group (Ireland) | | | 3,800,000 | | | | 3,500,000 | | |
| Kingspan Group (Ireland) | | | 1,250,000 | | | | 1,000,000 | | |
| Spartech | | | 3,150,000 | | | | 2,800,000 | | |
| Tenaris (Argentina) | | | 1,800,000 | | | | 1,500,000 | | |
| (includes the effect of a 5 for 1 stock split) | |
| Tennant | | | 150,000 | | | | 0 | | |
| Ultrapar (Brazil) | | | 750,000 | | | | 438,000 | | |
| USG People (Netherlands) | | | 740,000 | | | | 650,000 | | |
| Vallourec (France) | | | 95,200 | | | | 33,000 | | |
| Wienerberger (Austria) | | | 425,000 | | | | 0 | | |
| | | Number of Shares | |
| | | 03/31/06 | | 06/30/06 | |
| Finance | |
| Anglo Irish Bank (Ireland) | | | 3,600,000 | | | | 3,500,000 | | |
| Bankinter (Spain) | | | 200,000 | | | | 0 | | |
| Cascade Financial | | | 477,500 | | | | 0 | | |
| (includes the effect of a 5 for 4 stock split) | |
| Independent Bank | | | 265,000 | | | | 0 | | |
| Investment Technology Group | | | 690,000 | | | | 350,000 | | |
| Leucadia National | | | 1,993,000 | | | | 1,748,000 | | |
| (includes the effect of a 2 for 1 stock split) | |
| Northgate (United Kingdom) | | | 1,000,000 | | | | 0 | | |
| Paragon Group (United Kingdom) | | | 1,950,000 | | | | 1,120,000 | | |
| Republic | | | 1,581,000 | | | | 0 | | |
| Scottish Re Group | | | 1,700,000 | | | | 0 | | |
| Sterling Bancorp | | | 503,000 | | | | 0 | | |
| TCF Financial | | | 3,356,000 | | | | 3,156,000 | | |
| Energy/Minerals | |
| Chicago Bridge & Iron | | | 1,600,000 | | | | 1,193,000 | | |
| Newpark Resources | | | 5,000,000 | | | | 2,860,000 | | |
| Pioneer Drilling | | | 168,000 | | | | 0 | | |
| Saipem (Italy) | | | 2,000,000 | | | | 1,200,000 | | |
Sociedad Quimica Y
Minera de Chile (Chile) | | | 275,000 | | | | 195,000 | | |
| Talisman Energy (Canada) | | | 7,500,000 | | | | 4,900,000 | | |
| (includes the effect of a 2 for 1 stock split) | |
| Veritas DGC | | | 700,000 | | | | 350,000 | | |
| Health Care | |
| Charles River Laboratories | | | 1,595,000 | | | | 1,355,000 | | |
| Datascope | | | 1,065,000 | | | | 455,000 | | |
| DOV Pharmaceuticals | | | 1,540,000 | | | | 0 | | |
| Gambro (Sweden) | | | 4,260,000 | | | | 0 | | |
| Incyte | | | 3,935,000 | | | | 0 | | |
| Martek Biosciences | | | 650,000 | | | | 0 | | |
| Neurocrine Biosciences | | | 913,000 | | | | 0 | | |
| Pozen | | | 2,400,000 | | | | 0 | | |
| Sybron Dental Specialties | | | 283,000 | | | | 0 | | |
| Symmetry Medical | | | 965,000 | | | | 0 | | |
| Tanox | | | 685,000 | | | | 0 | | |
| United Drug (Ireland) | | | 4,145,810 | | | | 4,000,000 | | |
| Other Industries | |
| Comfort Del Gro (Singapore) | | | 18,000,000 | | | | 0 | | |
Grupo Aeroportuario
Del Sureste (Mexico) | | | 800,000 | | | | 760,000 | | |
| Heartland Express | | | 1,634,000 | | | | 1,584,000 | | |
| (includes the effect of a 4 for 3 stock split) | |
23
Columbia Acorn Fund
>Statement of Investments (Unaudited), June 30, 2006
| Number of Shares | | | | Value (000) | |
| | | | | Common Stocks and Other
Equity-Like Securities: 93.8% | |
| Information: 22.8% | | | |
| | | Software/Services | |
| | | >Business Software: 3.3% | |
| | 2,750,000 | | | Kronos (b)(c) | | $ | 99,577 | | |
| | | | | Labor Management Solutions | | | | | |
| | 12,000,000 | | | Novell (b) | | | 79,560 | | |
| | | | | Directory, Operating System & Identity
Management Software | | | | | |
| | 1,800,000 | | | Micros Systems (b) | | | 78,624 | | |
| | | | | Information Systems for Restaurants & Hotels | | | | | |
| | 1,800,000 | | | Avid Technology (b) | | | 59,994 | | |
| | | | | Digital Nonlinear Editing Software & Systems | | | | | |
| | 1,800,000 | | | Cadence Design Systems (b) | | | 30,870 | | |
| | | | | Electronic Design Automation | | | | | |
| | 1,427,000 | | | Witness Systems (b) | | | 28,783 | | |
| | | | | Customer Experience Management Software | | | | | |
| | 1,766,000 | | | Concur Technologies (b) | | | 27,320 | | |
| | | | | Web Enabled Enterprise Applications | | | | | |
| | 6,000,000 | | | Actuate (b)(c) | | | 24,240 | | |
| | | | | Information Delivery Software & Solutions | | | | | |
| | 1,000,000 | | | Progress Software (b) | | | 23,410 | | |
| | | | | Application Development Software | | | | | |
| | 1,490,000 | | | JDA Software (b)(c) | | | 20,905 | | |
| | | | | Applications/Software & Services for Retailers | | | | | |
| | 3,000,000 | | | Lawson Software (b) | | | 20,100 | | |
| | | | | Enterprise Resource Planning (ERP) Software | | | | | |
| | 928,000 | | | SSA Global Technologies (b) | | | 17,985 | | |
| | | | | Enterprise Resource Planning (ERP) Software | | | | | |
| | 5,600,000 | | | Indus International (b)(c) | | | 16,016 | | |
| | | | | Enterprise Asset Management Software | | | | | |
| | 1,200,000 | | | Parametric Technology (b) | | | 15,252 | | |
| | | | | Engineering Software & Services | | | | | |
| | 2,075,000 | | | Agile Software (b) | | | 13,156 | | |
| | | | | Product Design Software | | | | | |
| | 1,240,000 | | | webMethods (b) | | | 12,239 | | |
| | | | | Enterprise Applications Integration (EAI) Tools | | | | | |
| | 1,100,000 | | | Radiant Systems (b) | | | 11,627 | | |
| | | | | Point of Sale System: Convenient
Stores & Restaurants | | | | | |
| | 3,240,000 | | | Tumbleweed Communications (b)(c) | | | 9,234 | | |
| | | | | Email Content Security & File
Transfer Management | | | | | |
| | 160,000 | | | Kenexa (b) | | | 5,096 | | |
| | | | | Human Capital Management Software | | | | | |
| | 241,000 | | | MRO Software (b) | | | 4,837 | | |
| | | | | Enterprise Maintenance Software | | | | | |
| | 1,250,000 | | | ClickSoftware Technologies (b) | | | 2,150 | | |
| | | | | Service Chain Optimization Software | | | | | |
| | | | 600,975 | | |
| | | >Business Information/
Business Services/Publishing: 1.5% | |
| | 2,585,000 | | | Ceridian (b) | | | 63,177 | | |
| | | | | HR Services & Payment Processing | | | | | |
| | 1,900,000 | | | Navigant Consulting (b) | | | 43,035 | | |
| | | | | Financial Consulting Firm | | | | | |
| | 600,000 | | | Getty Images (b) | | | 38,106 | | |
| | | | | Photographs for Publications & Electronic Media | | | | | |
| | 916,000 | | | Fair Isaac | | | 33,260 | | |
| | | | | Credit Scoring & Decision Analytic Software | | | | | |
| Number of Shares | | | | Value (000) | |
| | 2,000,000 | | | Proquest Company (b)(c) | | $ | 24,580 | | |
| | | | | Information Services for Educational &
Automotive Services | | | | | |
| | 2,285,000 | | | InfoUSA | | | 23,558 | | |
| | | | | Business Data for Sales Leads | | | | | |
| | 1,500,000 | | | Openwave Systems (b) | | | 17,310 | | |
| | | | | Internet Software for Mobile Devices | | | | | |
| | 300,000 | | | Navteq (b) | | | 13,404 | | |
| | | | | Map Data for Electronic Devices | | | | | |
| | 2,500,000 | | | PRIMEDIA (b) | | | 4,575 | | |
| | | | | Specialty Magazines & Other Publications | | | | | |
| | 175,000 | | | Triple Crown Media (b) | | | 1,517 | | |
| | | | | Newspapers, Paging & Collegiate
Sports Marketing | | | | | |
| | | | 262,522 | | |
| | | >Internet: 1.2% | |
| | 2,500,000 | | | RSA Security (b) | | | 67,975 | | |
| | | | | Enterprise Security Software | | | | | |
| | 9,500,000 | | | Skillsoft Publishing (b)(c) | | | 58,140 | | |
| | | | | Provider of Web-Based Learning
Solutions (E-Learning) | | | | | |
| | 3,000,000 | | | ValueClick (b) | | | 46,050 | | |
| | | | | Internet Advertising | | | | | |
| | 4,000,000 | | | CNET Networks (b) | | | 31,920 | | |
| | | | | Internet Advertising on Niche Websites | | | | | |
| | 875,000 | | | Vital Stream (b) | | | 9,275 | | |
| | | | | Streaming Services for the Internet | | | | | |
| | 61,000 | | | Travelzoo (b) | | | 1,851 | | |
| | | | | Travel Internet Advertising | | | | | |
| | | | 215,211 | | |
| | | >Transaction Processors: 1.0% | |
| | 2,524,000 | | | Global Payments | | | 122,540 | | |
| | | | | Credit Card Processor | | | | | |
| | 6,500,000 | | | Hong Kong Exchanges and
Clearing (Hong Kong) | | | 41,776 | | |
| | | | | Hong Kong Equity & Derivatives
Market Operator | | | | | |
| | 600,000 | | | Cubic | | | 11,766 | | |
| | | | | Revenue Collection & Defense Systems | | | | | |
| | | | 176,082 | | |
| | | >Computer Services: 0.7% | |
| | 1,350,000 | | | SRA International (b) | | | 35,951 | | |
| | | | | Government I/T Services | | | | | |
| | 4,000,000 | | | Bearing Point (b) | | | 33,480 | | |
| | | | | Business Consulting & Technology Strategy | | | | | |
| | 5,000,000 | | | Igate Capital (b)(c) | | | 31,950 | | |
| | | | | I/T & BPO Outsourcing Services | | | | | |
| | 4,600,000 | | | AnswerThink Consulting (b)(c) | | | 18,538 | | |
| | | | | I/T Integration & Best Practice Research | | | | | |
| | | | 119,919 | | |
| | | >Electronics Distribution: 0.5% | |
| | 2,550,000 | | | Avnet (b) | | | 51,051 | | |
| | | | | Electronic Components Distribution | | | | | |
| | 680,000 | | | Tech Data (b) | | | 26,051 | | |
| | | | | I/T Distributor | | | | | |
| | 710,000 | | | Agilysys | | | 12,780 | | |
| | | | | I/T Distributor | | | | | |
| | | | 89,882 | | |
1-800-922-6769
24
| Number of Shares | | | | Value (000) | |
| | | >Consumer Software: 0.3% | |
| | 1,700,000 | | | THQ (b) | | $ | 36,720 | | |
| | | | | Entertainment Software | | | | | |
| | 1,000,000 | | | Activision (b) | | | 11,380 | | |
| | | | | Entertainment Software | | | | | |
| | | | 48,100 | | |
| | | Computer Related Hardware | |
| | | >Computer Hardware/
Related Systems: 3.3% | |
| | 1,620,000 | | | Amphenol | | | 90,655 | | |
| | | | | Electronic Connectors | | | | | |
| | 1,705,000 | | | Belden CDT | | | 56,350 | | |
| | | | | Specialty Cable | | | | | |
| | 870,000 | | | Rogers (b) | | | 49,016 | | |
| | | | | PCB Laminates & High Performance Foams | | | | | |
| | 4,425,000 | | | Symbol Technologies | | | 47,746 | | |
| | | | | Mobile Computers & Barcode Scanners | | | | | |
| | 1,634,000 | | | Nice Systems (Israel) (b) | | | 45,981 | | |
| | | | | Audio & Video Recording Solutions | | | | | |
| | 1,885,000 | | | II VI (b)(c) | | | 34,496 | | |
| | | | | Laser Components | | | | | |
| | 230,000 | | | Wincor Nixdorf (Germany) | | | 29,367 | | |
| | | | | Retail POS Systems & ATM Machines | | | | | |
| | 253,600 | | | Neopost (France) | | | 28,869 | | |
| | | | | Postage Meter Machines | | | | | |
| | 1,240,000 | | | Intermec (b) | | | 28,446 | | |
| | | | | Bar Code & Wireless LAN Systems | | | | | |
| | 9,761,000 | | | Advantech (Taiwan) | | | 28,019 | | |
| | | | | Embedded Computers | | | | | |
| | 1,027,000 | | | Avocent (b) | | | 26,959 | | |
| | | | | Computer Control Switches | | | | | |
| | 1,310,000 | | | CTS | | | 19,506 | | |
| | | | | Electronic Components, Sensors & EMS | | | | | |
| | 900,000 | | | Netgear (b) | | | 19,485 | | |
| | | | | Networking Products for
Small Business & Home | | | | | |
| | 625,000 | | | Excel Technologies (b)(c) | | | 18,700 | | |
| | | | | Laser Systems & Electro-Optical Components | | | | | |
| | 530,000 | | | Zebra Technologies (b) | | | 18,105 | | |
| | | | | Bar Code Printers | | | | | |
| | 375,000 | | | Diebold | | | 15,233 | | |
| | | | | Automated Teller Machines | | | | | |
| | 1,875,000 | | | Seachange International (b)(c) | | | 13,050 | | |
| | | | | Systems for Video on Demand & Ad Insertion | | | | | |
| | 5,000,000 | | | Concurrent Computer (b)(c) | | | 13,050 | | |
| | | | | Video on Demand Systems & Services | | | | | |
| | 11,999,000 | | | Phoenixtec Power (Taiwan) | | | 12,196 | | |
| | | | | Uninterruptible Power Supplies | | | | | |
| | | | 595,229 | | |
| | | >Gaming Equipment: 1.4% | |
| | 2,750,000 | | | International Game Technology | | | 104,336 | | |
| | | | | Slot Machines & Progressive Jackpots | | | | | |
| | 2,430,000 | | | Shuffle Master (b)(c) | | | 79,655 | | |
| | | | | Card Shufflers & Casino Games | | | | | |
| | 3,900,000 | | | Bally Technologies (b)(c) | | | 64,233 | | |
| | | | | Slot Machines & Software | | | | | |
| | | | 248,224 | | |
| Number of Shares | | | | Value (000) | |
| | | >Semiconductors/
Related Equipment: 1.3% | |
| | 3,390,000 | | | Integrated Device Technology (b) | | $ | 48,070 | | |
| | | | | Communications Semiconductors | | | | | |
| | 4,425,000 | | | Entegris (b) | | | 42,170 | | |
| | | | | Semiconductor Wafer
Shipping & Handling Products | | | | | |
| | 915,000 | | | Littelfuse (b) | | | 31,458 | | |
| | | | | Little Fuses | | | | | |
| | 690,000 | | | Supertex (b)(c) | | | 27,559 | | |
| | | | | Mixed-Signal Semiconductors | | | | | |
| | 1,950,000 | | | AMIS Holdings (b) | | | 19,500 | | |
| | | | | Analog & Mixed - Signal Semiconductors | | | | | |
| | 4,000,000 | | | Novatek Microelectronics (Taiwan) | | | 19,268 | | |
| | | | | LCD Related IC Designer | | | | | |
| | 1,905,000 | | | IXYS (b)(c) | | | 18,288 | | |
| | | | | Power Semiconductors | | | | | |
| | 1,235,000 | | | Semtech (b) | | | 17,846 | | |
| | | | | Analog Semiconductors | | | | | |
| | | | 224,159 | | |
| | | >Instrumentation: 1.2% | |
| | 1,250,000 | | | Trimble Navigation (b) | | | 55,800 | | |
| | | | | GPS-Based Instruments | | | | | |
| | 750,000 | | | Mettler Toledo (b) | | | 45,428 | | |
| | | | | Laboratory Equipment | | | | | |
| | 1,850,000 | | | Flir Systems (b) | | | 40,811 | | |
| | | | | Infrared Cameras | | | | | |
| | 711,000 | | | Dionex (b) | | | 38,863 | | |
| | | | | Ion & Liquid Chromatography | | | | | |
| | 670,000 | | | Varian (b) | | | 27,812 | | |
| | | | | Analytical Instruments | | | | | |
| | | | 208,714 | | |
| | | >Contract Manufacturing: 0.6% | |
| | 1,570,000 | | | Plexus (b) | | | 53,710 | | |
| | | | | Electronic Manufacturing Services | | | | | |
| | 1,705,000 | | | Jabil Circuit | | | 43,648 | | |
| | | | | Electronic Manufacturing Services | | | | | |
| | 4,000,000 | | | Sanmina - SCI (b) | | | 18,400 | | |
| | | | | BackPlane & Electronic
Manufacturing Services | | | | | |
| | | | 115,758 | | |
| | | Telecommunications | |
| | | >Telecommunication Services: 3.1% | |
| | 4,500,000 | | | Crown Castle International (b) | | | 155,430 | | |
| | | | | Communication Towers | | | | | |
| | 3,500,000 | | | American Tower (b) | | | 108,920 | | |
| | | | | Communication Towers in USA & Mexico | | | | | |
| | 1,600,000 | | | Alltel | | | 102,129 | | |
| | | | | Cellular & Wireline Telephone Services | | | | | |
| | 4,250,000 | | | Time Warner Telecom (b)(c) | | | 63,113 | | |
| | | | | Fiber Optic Data/Telephone Service Provider | | | | | |
| | 8,000,000 | | | Dobson Communications (b)(c) | | | 61,840 | | |
| | | | | Rural & Small City Cellular
Telephone Services | | | | | |
| | 780,000 | | | Telephone and Data Systems | | | 32,292 | | |
| | 300,000 | | | Telephone and Data Systems, Cl. S | | | 11,670 | | |
| | | | | Cellular & Wireline Telephone Services | | | | | |
| | 2,300,000 | | | Tele2 AB (Sweden) | | | 23,209 | | |
| | | | | European Mobile Operator &
Services Reseller | | | | | |
25
Columbia Acorn Fund
>Statement of Investments (Unaudited), continued
| Number of Shares | | | | Value (000) | |
| | | >Telecommunication Services—continued | |
| | 200,000 | | | Commonwealth Telephone | | $ | 6,632 | | |
| | | | | Rural Phone Franchises & Competitive Telco | | | | | |
| | | | 565,235 | | |
| | | >Telecommunications Equipment: 0.9% | |
| | 10,000,000 | | | Tellabs (b) | | | 133,100 | | |
| | | | | Telecommunications Equipment | | | | | |
| | 1,380,000 | | | Andrew (b) | | | 12,227 | | |
| | | | | Wireless Infrastructure Equipment | | | | | |
| | 1,510,000 | | | Symmetricom (b) | | | 10,676 | | |
| | | | | Network Timing & Synchronization Devices | | | | | |
| | | | 156,003 | | |
| | | Media | |
| | | >Television Programming/CATV: 1.8% | |
| | 4,015,000 | | | Discovery Holding (b) | | | 58,739 | | |
| | | | | CATV Programming | | | | | |
| | 70,000 | | | Jupiter Telecommunications
(Japan) (b) | | | 48,526 | | |
| | | | | Largest Cable Service Provider in Japan | | | | | |
| | 2,050,000 | | | Liberty Global, Series C (b) | | | 42,169 | | |
| | 1,750,000 | | | Liberty Global, Series A (b) | | | 37,625 | | |
| | | | | CATV Holding Company | | | | | |
| | 1,423,100 | | | Alliance Atlantis Communication
(Canada) (b) | | | 41,687 | | |
| | | | | CATV Channels, TV/Movie
Production/Distribution | | | | | |
| | 8,000,000 | | | Gemstar-TV Guide International (b) | | | 28,160 | | |
| | | | | TV Program Guides & CATV Programming | | | | | |
| | 3,000,000 | | | Lions Gate Entertainment (b) | | | 25,650 | | |
| | | | | Film & TV Studio | | | | | |
| | 655,000 | | | Liberty Media - Interactive (b) | | | 11,305 | | |
| | 130,000 | | | Liberty Media - Capital (b) | | | 10,890 | | |
| | | | | CATV Programming & Media
Company Holdings | | | | | |
| | 1,250,000 | | | Mediacom Communications (b) | | | 7,787 | | |
| | | | | Cable Television Franchises | | | | | |
| | 700,000 | | | Outdoor Channel (b) | | | 7,224 | | |
| | | | | Cable Television Programming | | | | | |
| | | | 319,762 | | |
| | | >TV/Satellite Broadcasting: 0.4% | |
| | 2,752,829 | | | SES Global (France) | | | 39,212 | | |
| | | | | Satellite Broadcasting Services | | | | | |
| | 2,500,000 | | | Entravision Communications (b) | | | 21,425 | | |
| | | | | Spanish Language TV, Radio & Outdoor | | | | | |
| | 1,750,000 | | | Gray Television | | | 10,133 | | |
| | | | | Mid Market Affiliated TV Stations | | | | | |
| | 270,000 | | | Metropole TV (France) | | | 8,439 | | |
| | | | | Television Broadcaster | | | | | |
| | | | 79,209 | | |
| | | >Radio Broadcasting: 0.3% | |
| | 1,541,000 | | | Salem Communications (b)(c) | | | 20,048 | | |
| | | | | Radio Stations for Religious Programming | | | | | |
| | 1,500,000 | | | Cumulus Media, Cl. A (b) | | | 16,005 | | |
| | | | | Radio Stations in Small Cities | | | | | |
| | 1,400,000 | | | Saga Communications (b)(c) | | | 12,684 | | |
| | | | | Radio Stations in Small & Mid-sized Cities | | | | | |
| Number of Shares | | | | Value (000) | |
| | 2,400,000 | | | Spanish Broadcasting System (b)(c) | | $ | 12,264 | | |
| | | | | Spanish Language Radio Stations | | | | | |
| | | | 61,001 | | |
| | | Information: Total | | | 4,085,985 | | |
| Consumer Goods/Services: 18.5% | | | |
| | | Services | |
| | | >Retail: 5.3% | |
| | 5,960,000 | | | Chico's FAS (b) | | | 160,801 | | |
| | | | | Women's Specialty Retail | | | | | |
| | 2,200,000 | | | Abercrombie & Fitch | | | 121,946 | | |
| | | | | Teen Apparel Retailer | | | | | |
| | 2,760,000 | | | Michaels Stores | | | 113,822 | | |
| | | | | Craft & Hobby Specialty Retailer | | | | | |
| | 3,743,000 | | | Christopher & Banks (c) | | | 108,547 | | |
| | | | | Women's Apparel Retailer | | | | | |
| | 3,900,000 | | | Urban Outfitters (b) | | | 68,211 | | |
| | | | | Apparel & Home Specialty Retailer | | | | | |
| | 1,223,000 | | | Ann Taylor Stores (b) | | | 53,054 | | |
| | | | | Women's Apparel Retailer | | | | | |
| | 1,400,000 | | | Williams Sonoma | | | 47,670 | | |
| | | | | Home Goods & Furnishing Retailer | | | | | |
| | 2,250,000 | | | Petco Animal Supplies (b) | | | 45,968 | | |
| | | | | Pet Supplies & Services | | | | | |
| | 8,000,000 | | | Rite Aid (b) | | | 33,920 | | |
| | | | | Drug Stores | | | | | |
| | 1,100,000 | | | J Crew Group (b) | | | 30,195 | | |
| | | | | Multi-Channel Branded Retailer | | | | | |
| | 1,630,000 | | | Rona (Canada) (b) | | | 29,277 | | |
| | | | | Leading Canadian DIY Retailer | | | | | |
| | 936,000 | | | Aeropostale (b) | | | 27,041 | | |
| | | | | Mall Based Teen Retailer | | | | | |
| | 1,450,000 | | | Borders Group | | | 26,767 | | |
| | | | | Bookstores | | | | | |
| | 775,000 | | | Genesco (b) | | | 26,249 | | |
| | | | | Multi-Concept Branded Footwear Retailer | | | | | |
| | 750,000 | | | Chattem (b) | | | 22,778 | | |
| | | | | Personal Care Products | | | | | |
| | 1,062,000 | | | Gaiam (b)(c) | | | 14,889 | | |
| | | | | Healthy Living Catalogs & E-Commerce | | | | | |
| | 3,500,000 | | | Edgars Consolidated Stores
(South Africa) | | | 14,109 | | |
| | | | | Leading Retail Conglomerate | | | | | |
| | | | 945,244 | | |
| | | >Consumer Services: 2.2% | |
| | 2,250,000 | | | ITT Educational Services (b)(c) | | | 148,073 | | |
| | | | | Post-secondary Degree Programs | | | | | |
| | 2,190,000 | | | Pool Corporation | | | 95,550 | | |
| | | | | Distributor of Swimming Pool Supplies
and Equipment | | | | | |
| | 1,275,000 | | | Weight Watchers | | | 52,135 | | |
| | | | | Weight Loss Programs | | | | | |
| | 800,000 | | | Regis Corp Minnesota | | | 28,488 | | |
| | | | | Hair Salons | | | | | |
| | 1,530,000 | | | Central Parking | | | 24,480 | | |
| | | | | Owner, Operator & Manager of
Parking Lots & Garages | | | | | |
1-800-922-6769
26
| Number of Shares | | | | Value (000) | |
| | | >Consumer Services—continued | |
| | 1,000,000 | | | Universal Technical Institute (b) | | $ | 22,020 | | |
| | | | | Vocational Training | | | | | |
| | 2,550,000 | | | Princeton Review (b)(c) | | | 13,566 | | |
| | | | | College Preparation Courses | | | | | |
| | 470,000 | | | ServiceMaster | | | 4,855 | | |
| | | | | Lawn Care, Pest Control, Commercial
Disaster Response | | | | | |
| | 277,000 | | | Lincoln Technical Institute (b) | | | 4,734 | | |
| | | | | Vocational Training | | | | | |
| | 154,000 | | | Park 24 (Japan) | | | 4,523 | | |
| | | | | Parking Lot Operator | | | | | |
| | | | 398,424 | | |
| | | >Travel: 1.4% | |
| | 2,110,000 | | | Vail Resorts (b)(c) | | | 78,281 | | |
| | | | | Ski Resort Operator & Developer | | | | | |
| | 915,000 | | | Four Seasons Hotels (Canada) | | | 56,218 | | |
| | | | | Luxury Hotel Operator | | | | | |
| | 3,500,000 | | | Expedia (b) | | | 52,395 | | |
| | | | | Online Travel Service Company | | | | | |
| | 900,000 | | | Intrawest (Canada) | | | 28,444 | | |
| | | | | Ski Resort Operator & Developer | | | | | |
| | 270,000 | | | Kerzner International (Bahamas) (b) | | | 21,406 | | |
| | | | | Destination Resorts & Casinos | | | | | |
| | 1,045,000 | | | Navigant International (b)(c) | | | 16,751 | | |
| | | | | Corporate Travel Agency | | | | | |
| | 168,800 | | | Localiza Rent A Car (Brazil) | | | 3,234 | | |
| | | | | Car Rental | | | | | |
| | | | 256,729 | | |
| | | >Entertainment/Leisure Products: 1.1% | |
| | 1,795,000 | | | RC2 (b)(c) | | | 69,395 | | |
| | | | | Toys, Infant Products & Collectibles | | | | | |
| | 1,416,000 | | | Speedway Motorsports | | | 53,440 | | |
| | | | | Motorsport Racetrack Owner & Operator | | | | | |
| | 1,025,000 | | | International Speedway Motors | | | 47,529 | | |
| | | | | Largest Motorsport Racetrack
Owner & Operator | | | | | |
| | 441,000 | | | Thor Industries | | | 21,366 | | |
| | | | | RV & Bus Manufacturer | | | | | |
| | 600,000 | | | Callaway Golf | | | 7,794 | | |
| | | | | Premium Golf Clubs & Balls | | | | | |
| | | | 199,524 | | |
| | | >Casinos & Gaming: 0.9% | |
| | 1,000,000 | | | Station Casinos | | | 68,080 | | |
| | | | | Casinos & Riverboats | | | | | |
| | 1,898,000 | | | Pinnacle Entertainment (b) | | | 58,174 | | |
| | | | | Regional Riverboat Casinos | | | | | |
| | 690,000 | | | Intralot (Greece) | | | 18,463 | | |
| | | | | Lottery & Gaming Systems & Services | | | | | |
| | 4,700,000 | | | Sky City Entertainment
(New Zealand) | | | 15,448 | | |
| | | | | Casino/Entertainment Complex | | | | | |
| | 226,000 | | | Lakes Entertainment (b) | | | 2,732 | | |
| | | | | Native American Casino Development | | | | | |
| | | | 162,897 | | |
| | | >Restaurants: 0.7% | |
| | 2,145,000 | | | Sonic (b) | | | 44,595 | | |
| | | | | Quick Service Restaurant | | | | | |
| | 1,000,000 | | | Red Robin Gourmet Burgers (b)(c) | | | 42,560 | | |
| | | | | Casual Dining Restaurants | | | | | |
| Number of Shares | | | | Value (000) | |
| | 800,000 | | | Cheesecake Factory (b) | | $ | 21,560 | | |
| | | | | Casual Dining Restaurants | | | | | |
| | 1,600,000 | | | AFC Enterprises (c) | | | 20,400 | | |
| | | | | Popeye's Restaurants | | | | | |
| | | | 129,115 | | |
| | | >Cruise Lines: 0.1% | |
| | 400,000 | | | Carnival | | | 16,696 | | |
| | | | | Largest Cruise Line | | | | | |
| | | Goods | |
| | | >Apparel: 1.8% | |
| | 6,980,000 | | | Coach (b) | | | 208,702 | | |
| | | | | Designer & Retailer of Branded
Leather Accessories | | | | | |
| | 1,418,000 | | | Carter's (b) | | | 37,478 | | |
| | | | | Children's Branded Apparel | | | | | |
| | 919,000 | | | Oxford Industries (c) | | | 36,218 | | |
| | | | | Branded & Private Label Apparel | | | | | |
| | 3,000,000 | | | Billabong International (Australia) | | | 34,250 | | |
| | | | | Action Sports Apparel Brand Manager | | | | | |
| | 700,000 | | | True Religion Apparel (b) | | | 12,390 | | |
| | | | | Premium Denim | | | | | |
| | | | 329,038 | | |
| | | >Furniture/Textiles: 1.7% | |
| | 2,550,000 | | | HNI | | | 115,643 | | |
| | | | | Office Furniture & Fireplaces | | | | | |
| | 765,000 | | | Mohawk Industries (b) | | | 53,818 | | |
| | | | | Carpet & Flooring | | | | | |
| | 2,068,000 | | | Herman Miller | | | 53,292 | | |
| | | | | Office Furniture | | | | | |
| | 1,398,000 | | | Nobia (Sweden) | | | 45,347 | | |
| | | | | Kitchen Cabinet Manufacturing &
Distribution | | | | | |
| | 1,435,000 | | | Knoll | | | 26,347 | | |
| | | | | Office Furniture | | | | | |
| | | | 294,447 | | |
| | | >Leisure Vehicles: 1.2% | |
| | 1,751,000 | | | Harley-Davidson | | | 96,112 | | |
| | | | | Motorcycles & Related Merchandise | | | | | |
| | 1,130,000 | | | Polaris Industries | | | 48,929 | | |
| | | | | Leisure Vehicles & Related Products | | | | | |
| | 4,690,000 | | | Fleetwood Enterprises (b)(c) | | | 35,363 | | |
| | | | | RV & Manufactured Home Maker | | | | | |
| | 690,000 | | | Winnebago | | | 21,418 | | |
| | | | | Premier Motorhome Maker | | | | | |
| | 5,700,000 | | | Ducati Motor (Italy) (b) | | | 4,839 | | |
| | | | | Motorcycles & Related Merchandise | | | | | |
| | | | 206,661 | | |
| | | >Nondurables: 1.0% | |
| | 2,620,000 | | | Scotts Miracle-Gro | | | 110,878 | | |
| | | | | Consumer Lawn & Garden Products | | | | | |
| | 1,000,000 | | | Jarden (b) | | | 30,450 | | |
| | | | | Branded Household Products | | | | | |
| | 1,886,000 | | | Prestige Brands (b) | | | 18,803 | | |
| | | | | OTC, Household & Personal Care Products | | | | | |
| | 1,100,000 | | | Natura Cosmeticos (Brazil) | | | 11,529 | | |
| | | | | Direct Retailer of Cosmetics | | | | | |
| | | | 171,660 | | |
27
Columbia Acorn Fund
>Statement of Investments (Unaudited), continued
| Number of Shares | | | | Value (000) | |
| | | >Durable Goods: 0.6% | |
| | 465,000 | | | Hyundai Mobis (South Korea) | | $ | 39,290 | | |
| | | | | Auto Parts | | | | | |
| | 1,800,000 | | | Helen of Troy (b)(c) | | | 33,120 | | |
| | | | | Hairdryers & Curling Irons | | | | | |
| | 14,999,300 | | | Techtronic Industries (Hong Kong) | | | 20,273 | | |
| | | | | Power Tools & Motorized Appliances | | | | | |
| | 900,000 | | | Champion Enterprises (b) | | | 9,936 | | |
| | | | | Manufactured Homes | | | | | |
| | 172,000 | | | Cavco Industries (b) | | | 7,644 | | |
| | | | | Higher End Manufactured Homes | | | | | |
| | 90,000 | | | Shimano (Japan) | | | 2,758 | | |
| | | | | Bicycle Components & Fishing Tackle | | | | | |
| | | | 113,021 | | |
| | | >Food & Beverages: 0.5% | |
| | 1,597,000 | | | IAWS Group (Ireland) | | | 28,157 | | |
| | | | | Baked Goods | | | | | |
| | 2,410,000 | | | Davide Campari (Italy) | | | 24,965 | | |
| | | | | Spirits & Wine | | | | | |
| | 2,500,000 | | | C&C Group (Ireland) | | | 21,711 | | |
| | | | | Beverage Company | | | | | |
| | 35,000,000 | | | Global Bio-Chem Technology
Group (China) | | | 14,800 | | |
| | | | | Refiner of Corn-Based Commodities | | | | | |
| | | | 89,633 | | |
| | | Consumer Goods/Services: Total | | | 3,313,089 | | |
| Industrial Goods/Services: 17.9% | | | |
| | | >Industrial Goods/Services: 3.3% | |
| | 1,900,000 | | | Genlyte Group (b)(c) | | | 137,617 | | |
| | | | | Commercial Lighting Fixtures | | | | | |
| | 3,600,000 | | | Donaldson | | | 121,932 | | |
| | | | | Industrial Air Filtration | | | | | |
| | 3,222,000 | | | Clarcor (c) | | | 95,983 | | |
| | | | | Mobile & Industrial Filters | | | | | |
| | 1,900,000 | | | Mine Safety Appliances (c) | | | 76,380 | | |
| | | | | Safety Equipment | | | | | |
| | 750,000 | | | W.W. Grainger | | | 56,422 | | |
| | | | | Industrial Distribution | | | | | |
| | 1,048,000 | | | Drew Industries (b) | | | 33,955 | | |
| | | | | RV & MFG Home Components | | | | | |
| | 1,600,000 | | | Goodman Global (b) | | | 24,288 | | |
| | | | | HVAC Equipment Manufacturer | | | | | |
| | 1,125,000 | | | Ushio (Japan) | | | 23,823 | | |
| | | | | Industrial Light Sources | | | | | |
| | 700,000 | | | Legrand (France) | | | 19,691 | | |
| | | | | Electrical Components | | | | | |
| | 141,000 | | | Electric City (b) | | | 155 | | |
| | | | | Electricity Conservation Devices | | | | | |
| | | | 590,246 | | |
| | | >Machinery: 3.2% | |
| | 2,200,000 | | | Esco Technologies (b)(c) | | | 117,590 | | |
| | | | | Automatic Electric Meter Readers | | | | | |
| | 2,350,000 | | | Ametek | | | 111,343 | | |
| | | | | Aerospace/Industrial Instruments | | | | | |
| | 2,750,000 | | | Pentair | | | 94,022 | | |
| | | | | Pumps, Water Treatment & Tools | | | | | |
| | 2,000,000 | | | Gardner Denver (b) | | | 77,000 | | |
| | | | | Air Compressors, Blowers & Pumps | | | | | |
| Number of Shares | | | | Value (000) | |
| | 1,500,000 | | | Nordson | | $ | 73,770 | | |
| | | | | Dispensing Systems for Adhesives & Coatings | | | | | |
| | 1,100,000 | | | Kaydon | | | 41,041 | | |
| | | | | Specialized Friction & Motion
Control Products | | | | | |
| | 522,000 | | | Toro | | | 24,377 | | |
| | | | | Turf Maintenance Equipment | | | | | |
| | 1,187,000 | | | K&F Industries Holdings (b) | | | 21,046 | | |
| | | | | Aircraft Wheels, Brakes & Fuel Tank Bladders | | | | | |
| | 212,000 | | | Oshkosh Truck | | | 10,074 | | |
| | | | | Specialty Truck Manufacturer | | | | | |
| | | | 570,263 | | |
| | | >Logistics: 2.6% | |
| | 5,500,000 | | | Expeditors International of
Washington | | | 308,055 | | |
| | | | | International Freight Forwarder | | | | | |
| | 2,000,000 | | | Forward Air (c) | | | 81,460 | | |
| | | | | Freight Transportation Between Airports | | | | | |
| | 3,000,000 | | | UTI Worldwide | | | 75,690 | | |
| | | | | Global Logistics & Freight Forwarding | | | | | |
| | | | 465,205 | | |
| | | >Industrial Distribution: 1.8% | |
| | 2,286,000 | | | Watsco (c) | | | 136,749 | | |
| | | | | HVAC Distribution | | | | | |
| | 1,925,000 | | | Airgas | | | 71,706 | | |
| | | | | Industrial Gas Distributor | | | | | |
| | 1,150,000 | | | Aviall (b) | | | 54,648 | | |
| | | | | Aircraft Replacement Parts Distributor | | | | | |
| | 3,500,000 | | | Grafton Group (Ireland) | | | 44,057 | | |
| | | | | Building Materials Wholesaling &
DIY Retailing | | | | | |
| | 1,031,000 | | | Nuco2 (b)(c) | | | 24,785 | | |
| | | | | Bulk CO2 Gas Distribution to Restaurants | | | | | |
| | | | 331,945 | | |
| | | >Construction: 1.8% | |
| | 1,900,000 | | | Florida Rock Industries | | | 94,373 | | |
| | | | | Concrete & Aggregates | | | | | |
| | 2,200,000 | | | Simpson Manufacturing | | | 79,310 | | |
| | | | | Wall Joint Maker | | | | | |
| | 605,000 | | | Martin Marietta | | | 55,146 | | |
| | | | | Aggregates | | | | | |
| | 42,500 | | | Geberit (Switzerland) | | | 49,104 | | |
| | | | | Plumbing Supplies | | | | | |
| | 380,000 | | | Daito Trust Construction (Japan) | | | 21,128 | | |
| | | | | Apartment Builder | | | | | |
| | 1,000,000 | | | Kingspan Group (Ireland) | | | 17,459 | | |
| | | | | Building Insulation & Environmental
Containers | | | | | |
| | 90,000 | | | Ciments Francais (France) | | | 14,962 | | |
| | | | | Leading French & Emerging Markets
Cement Producer | | | | | |
| | | | 331,482 | | |
| | | >Steel: 1.3% | |
| | 2,860,000 | | | Gibraltar Industries (c) | | | 82,940 | | |
| | | | | Steel Processing | | | | | |
| | 1,500,000 | | | Tenaris (Argentina) | | | 60,735 | | |
| | | | | Oil, Gas & Industrial Seamless Tubes | | | | | |
| | 2,160,000 | | | Worthington Industries | | | 45,252 | | |
| | | | | Steel Processing | | | | | |
1-800-922-6769
28
| Number of Shares | | | | Value (000) | |
| | | >Steel—continued | |
| | 33,000 | | | Vallourec (France) | | $ | 39,673 | | |
| | | | | Oil, Gas & Industrial Seamless Tubes | | | | | |
| | | | 228,600 | | |
| | | >Specialty Chemicals &
Industrial Materials: 1.2% | |
| | 2,800,000 | | | Spartech (c) | | | 63,280 | | |
| | | | | Plastics Distribution & Compounding | | | | | |
| | 730,000 | | | Novozymes (Denmark) | | | 49,201 | | |
| | | | | Industrial Enzymes | | | | | |
| | 28,000 | | | Sika (Switzerland) | | | 31,105 | | |
| | | | | Chemicals for Construction &
Industrial Application | | | | | |
| | 400,000 | | | Carbone Lorraine (France) | | | 21,994 | | |
| | | | | Advanced Industrial Materials | | | | | |
| | 200,000 | | | Imerys (France) | | | 15,980 | | |
| | | | | Industrial Minerals Producer | | | | | |
| | 20,000 | | | Givaudan (Switzerland) | | | 15,728 | | |
| | | | | Fragrances & Flavors | | | | | |
| | 430,768 | | | Koninklijke Ten Cate (Netherlands) | | | 12,646 | | |
| | | | | Advanced Textiles & Industrial Fabrics | | | | | |
| | 438,000 | | | Ultrapar (Brazil) | | | 6,896 | | |
| | | | | Specialty Chemicals & Liquid Propane
Gas Distribution | | | | | |
| | | | 216,830 | | |
| | | >Outsourcing Services & Training: 1.0% | |
| | 650,000 | | | USG People (Netherlands) | | | 49,754 | | |
| | | | | Temporary Staffing Services | | | | | |
| | 2,500,000 | | | Quanta Services (b) | | | 43,325 | | |
| | | | | Electrical & Telecom Construction Services | | | | | |
| | 1,100,000 | | | Administaff | | | 39,391 | | |
| | | | | Professional Employer Organization | | | | | |
| | 1,600,000 | | | Labor Ready (b) | | | 36,240 | | |
| | | | | Temporary Manual Labor | | | | | |
| | 600,000 | | | GP Strategies (b) | | | 4,626 | | |
| | | | | Training Programs | | | | | |
| | | | 173,336 | | |
| | | >Conglomerates: 0.6% | |
| | 765,342 | | | Aalberts Industries (Netherlands) | | | 56,261 | | |
| | | | | Flow Control & Heat Treatment | | | | | |
| | 1,325,058 | | | Hexagon (Sweden) | | | 48,238 | | |
| | | | | Measurement Equipment & Polymers | | | | | |
| | | | 104,499 | | |
| | | >Water: 0.6% | |
| | 2,500,000 | | | Pall | | | 70,000 | | |
| | | | | Filtration & Fluids Clarification | | | | | |
| | 900,000 | | | Watts Water Technologies | | | 30,195 | | |
| | | | | Water, Valves, Regulators & Filtration | | | | | |
| | | | 100,195 | | |
| | | >Other Industrial Services: 0.5% | |
| | 1,650,000 | | | Mobile Mini (b) | | | 48,279 | | |
| | | | | Portable Storage Unit Leasing | | | | | |
| | 374,000 | | | IM Tech (Netherlands) | | | 18,054 | | |
| | | | | Engineering & Technical Services | | | | | |
| | 655,000 | | | Tal International (b) | | | 15,786 | | |
| | | | | Intermodal Freight Container Leasing | | | | | |
| | 740,000 | | | Jaakko Poyry (Finland) | | | 7,956 | | |
| | | | | Engineering Consultants in Forestry, Energy | | | | | |
| | | | 90,075 | | |
| | | Industrial Goods/Services: Total | | | 3,202,676 | | |
| Number of Shares | | | | Value (000) | |
| Finance: 12.3% | | | |
| | | >Banks: 4.3% | |
| | 2,505,000 | | | BOK Financial | | $ | 124,423 | | |
| | | | | Tulsa Based S.W. Bank | | | | | |
| | 3,600,000 | | | Associated Banc-Corp | | | 113,508 | | |
| | | | | Midwest Bank | | | | | |
| | 3,156,000 | | | TCF Financial | | | 83,476 | | |
| | | | | Great Lakes Bank | | | | | |
| | 2,720,000 | | | Glacier Bancorp (c) | | | 79,614 | | |
| | | | | Mountain States Bank | | | | | |
| | 3,500,000 | | | Anglo Irish Bank (Ireland) | | | 54,536 | | |
| | | | | Small Business & Middle Market Banking | | | | | |
| | 2,850,000 | | | Northern Rock (United Kingdom) | | | 52,637 | | |
| | | | | Lowest Cost Mortgage Bank in UK | | | | | |
| | 1,320,000 | | | West Coast Bancorp (c) | | | 38,900 | | |
| | | | | Portland Small Business Lender | | | | | |
| | 2,275,000 | | | Depfa Bank (Germany) | | | 37,713 | | |
| | | | | Investment Banker to Public Authorities | | | | | |
| | 250,000 | | | Komercni Banka (Czech Republic) | | | 36,578 | | |
| | | | | Leading Czech Universal Bank | | | | | |
| | 590,000 | | | CityBank Lynnwood (c) | | | 27,529 | | |
| | | | | Seattle Real Estate Lender | | | | | |
| | 796,000 | | | Great Southern Bancorp (c) | | | 24,302 | | |
| | | | | Missouri Real Estate Lender | | | | | |
| | 892,000 | | | Chittenden | | | 23,058 | | |
| | | | | Vermont & Western Massachusetts Bank | | | | | |
| | 886,000 | | | West Bancorporation (c) | | | 16,542 | | |
| | | | | Des Moines Commercial Bank | | | | | |
| | 400,000 | | | East West Bancorp | | | 15,164 | | |
| | | | | LA Bank with Chinese Focus | | | | | |
| | 406,000 | | | First Financial BankShares | | | 14,835 | | |
| | | | | West Texas Bank | | | | | |
| | 500,000 | | | Cascade Bancorp | | | 14,255 | | |
| | | | | Central Oregon Bank | | | | | |
| | 304,000 | | | S Y Bancorp | | | 8,354 | | |
| | | | | Louisville Bank | | | | | |
| | 313,000 | | | First Mutual Bancshares (c) | | | 8,154 | | |
| | | | | Seattle Community Bank | | | | | |
| | 150,000 | | | Greene County Bancshares | | | 4,644 | | |
| | | | | Tennessee Bank | | | | | |
| | | | 778,222 | | |
| | | >Insurance: 3.1% | |
| | 2,040,000 | | | Philadelphia Consolidated Holding (b) | | | 61,934 | | |
| | | | | Specialty Insurance | | | | | |
| | 2,030,000 | | | HCC Insurance Holdings | | | 59,763 | | |
| | | | | Specialty Insurance | | | | | |
| | 1,200,000 | | | Assurant | | | 58,080 | | |
| | | | | Specialty Insurance | | | | | |
| | 1,748,000 | | | Leucadia National | | | 51,024 | | |
| | | | | Insurance Holding Company | | | | | |
| | 995,000 | | | Protective Life | | | 46,387 | | |
| | | | | Life Insurance | | | | | |
| | 710,000 | | | Selective Insurance Group | | | 39,668 | | |
| | | | | Commercial & Personal Lines Insurance | | | | | |
| | 109,000 | | | Markel (b) | | | 37,823 | | |
| | | | | Specialty Insurance | | | | | |
| | 1,550,000 | | | United America Indemnity (b)(c) | | | 32,302 | | |
| | | | | Specialty Insurance | | | | | |
| | 940,000 | | | Endurance Specialty Holdings | | | 30,080 | | |
| | | | | Commercial Lines Insurance/Reinsurance | | | | | |
29
Columbia Acorn Fund
>Statement of Investments (Unaudited), continued
| Number of Shares | | | | Value (000) | |
| | | >Insurance—continued | |
| | 1,700,000 | | | Scottish Re Group | | $ | 28,254 | | |
| | | | | Life Reinsurance | | | | | |
| | 570,000 | | | RLI | | | 27,463 | | |
| | | | | Specialty Insurance | | | | | |
| | 750,000 | | | Delphi Financial Group | | | 27,270 | | |
| | | | | Group Employee Benefit
Products and Services | | | | | |
| | 600,000 | | | National Financial | | | 26,586 | | |
| | | | | Distributor of Life Insurance, Group
Benefits & Inv adv svs | | | | | |
| | 520,000 | | | StanCorp Financial | | | 26,473 | | |
| | | | | Group Life & Disability Insurance | | | | | |
| | | | 553,107 | | |
| | | >Brokerage & Money
Management: 1.8% | |
| | 2,464,000 | | | SEI Investments | | | 120,440 | | |
| | | | | Mutual Fund Administration &
Investment Management | | | | | |
| | 3,970,000 | | | Eaton Vance | | | 99,091 | | |
| | | | | Specialty Mutual Funds | | | | | |
| | 1,757,000 | | | Nuveen Investments | | | 75,638 | | |
| | | | | Specialty Mutual Funds | | | | | |
| | 350,000 | | | Investment Technology Group (b) | | | 17,801 | | |
| | | | | Electronic Trading | | | | | |
| | | | 312,970 | | |
| | | >Finance Companies: 1.7% | |
| | 6,500,000 | | | AmeriCredit (b) | | | 181,480 | | |
| | | | | Auto Lending | | | | | |
| | 1,700,000 | | | World Acceptance (b)(c) | | | 60,384 | | |
| | | | | Personal Loans | | | | | |
| | 930,000 | | | McGrath Rentcorp | | | 25,863 | | |
| | | | | Temp Space & IT Equipment Rental | | | | | |
| | 1,120,000 | | | Paragon Group (United Kingdom) | | | 13,517 | | |
| | | | | UK Buy-to-Let Finance Company | | | | | |
| | 832,000 | | | Electro Rent (b) | | | 13,329 | | |
| | | | | Test & Measurement Rentals | | | | | |
| | 263,000 | | | Marlin Business Services (b) | | | 5,933 | | |
| | | | | National Small Equipment Leasing | | | | | |
| | 80,000 | | | American Banknote (Brazil) (b) | | | 517 | | |
| | | | | Manufacturer of Smart Cards | | | | | |
| | | | 301,023 | | |
| | | >Savings & Loans: 1.4% | |
| | 4,196,000 | | | Peoples Bank Bridgeport | | | 137,839 | | |
| | | | | Connecticut Savings & Loan | | | | | |
| | 1,700,000 | | | Housing Development Finance (India) | | | 41,847 | | |
| | | | | Premier Mortgage Lender in India | | | | | |
| | 1,178,000 | | | Anchor Bancorp Wisconsin (c) | | | 35,540 | | |
| | | | | Wisconsin Thrift | | | | | |
| | 1,285,000 | | | Washington Federal | | | 29,799 | | |
| | | | | Traditional Thrift | | | | | |
| | 360,000 | | | Provident Bancorp | | | 4,759 | | |
| | | | | New York State Thrift | | | | | |
| | | | 249,784 | | |
| | | Finance: Total | | | 2,195,106 | | |
| Energy/Minerals: 9.8% | | | |
| | | >Oil/Gas Producers: 5.0% | |
| | 3,200,000 | | | Western Gas Resources | | | 191,520 | | |
| | | | | Oil & Coal Seam Gas Producer | | | | | |
| Number of Shares | | | | Value (000) | |
| | 2,700,000 | | | Ultra Petroleum (b) | | $ | 160,029 | | |
| | | | | Natural Gas Producer | | | | | |
| | 2,500,000 | | | XTO Energy | | | 110,675 | | |
| | | | | Natural Gas Producer | | | | | |
| | 13,500,000 | | | Tullow Oil (United Kingdom) | | | 95,191 | | |
| | | | | Oil & Gas Producer | | | | | |
| | 4,900,000 | | | Talisman Energy (Canada) | | | 85,507 | | |
| | | | | Oil & Gas Producer | | | | | |
| | 2,400,000 | | | Equitable Resources | | | 80,400 | | |
| | | | | Natural Gas Producer & Utility | | | | | |
| | 2,000,000 | | | Southwestern Energy (b) | | | 62,320 | | |
| | | | | Natural Gas Producer | | | | | |
| | 1,500,000 | | | Range Resources | | | 40,785 | | |
| | | | | Oil & Gas Producer | | | | | |
| | 3,200,000 | | | Vaalco Energy (b)(c) | | | 31,232 | | |
| | | | | Oil & Gas Producer | | | | | |
| | 700,000 | | | Denbury Resources (b) | | | 22,169 | | |
| | | | | Oil Producer Using CO2 Injection | | | | | |
| | 1,200,000 | | | McMoran Exploration (b) | | | 21,120 | | |
| | | | | Natural Gas Producer & Developer | | | | | |
| | 150,000 | | | Hugoton Royalty | | | 4,455 | | |
| | | | | Oil & Gas Producer | | | | | |
| | | | 905,403 | | |
| | | >Oil Services: 3.6% | |
| | 2,350,000 | | | FMC Technologies (b) | | | 158,531 | | |
| | | | | Oil & Gas Well Head Manufacturer | | | | | |
| | 2,728,301 | | | Fugro (Netherlands) | | | 117,626 | | |
| | | | | Survey & GPS Services | | | | | |
| | 2,300,000 | | | Pride International (b) | | | 71,829 | | |
| | | | | Offshore Drilling Contractor | | | | | |
| | 1,000,000 | | | Atwood Oceanics Inc (b) | | | 49,600 | | |
| | | | | Contract Drilling | | | | | |
| | 750,000 | | | Carbo Ceramics | | | 36,848 | | |
| | | | | Natural Gas Well Stimulants | | | | | |
| | 2,400,000 | | | Key Energy Services (b) | | | 36,600 | | |
| | | | | Well Workover Services | | | | | |
| | 971,000 | | | Rowan | | | 34,557 | | |
| | | | | Offshore Drilling Contractor | | | | | |
| | 1,193,000 | | | Chicago Bridge & Iron | | | 28,811 | | |
| | | | | Engineering & Construction for
Petrochemicals & LNG | | | | | |
| | 1,140,000 | | | Enerflex Systems (Canada) (c) | | | 28,441 | | |
| | | | | Natural Gas Compresser Rental & Fabrication | | | | | |
| | 1,200,000 | | | Saipem (Italy) | | | 27,284 | | |
| | | | | Offshore Construction & Drilling | | | | | |
| | 350,000 | | | Veritas DGC (b) | | | 18,053 | | |
| | | | | Geophysical Contractor | | | | | |
| | 2,860,000 | | | Newpark Resources (b) | | | 17,589 | | |
| | | | | Drilling Fluid Services | | | | | |
| | 257,000 | | | Helmerich & Payne | | | 15,487 | | |
| | | | | Contract Driller | | | | | |
| | | | 641,256 | | |
| | | >Mining: 0.7% | |
| | 900,000 | | | Falconbridge (Canada) | | | 47,407 | | |
| | | | | Diversified Mining Holding Company | | | | | |
| | 13,100,000 | | | UrAsia Energy (Canada) | | | 32,859 | | |
| | | | | Uranium Mining in Kazakhstan | | | | | |
| | 195,000 | | | Sociedad Quimica Y Minera
de Chile (Chile) | | | 20,307 | | |
| | | | | Producer of Specialty Fertilizers,
Lithium & Iodine | | | | | |
1-800-922-6769
30
| Number of Shares | | | | Value (000) | |
| | | >Mining—continued | |
| | 2,900,000 | | | Jubilee Gold Mines (Australia) | | $ | 17,384 | | |
| | | | | Nickel Mining in Australia | | | | | |
| | 1,000,000 | | | Ivanhoe Mines (Canada) (b) | | | 6,772 | | |
| | | | | Copper Mining in Mongolia | | | | | |
| | | | 124,729 | | |
| | | >Distribution/Marketing/Refining: 0.3% | |
| | 966,000 | | | Atmos Energy | | | 26,961 | | |
| | | | | Dallas Natural Gas Utility | | | | | |
| | 600,000 | | | Maritrans | | | 14,940 | | |
| | | | | Shipping | | | | | |
| | 435,000 | | | Oneok | | | 14,807 | | |
| | | | | Natural Gas Distribution, Pipeline,
Processing & Trading | | | | | |
| | | | 56,708 | | |
| | | >Agricultural Commodities: 0.2% | |
| | 550,000 | | | Aracruz Celulose (Brazil) | | | 28,831 | | |
| | | | | Brazilian Hardwood Pulp Producer | | | | | |
| | | | | Energy/Minerals: Total | | | 1,756,927 | | |
| Health Care: 7.8% | | | |
| | | >Medical Equipment/
Laboratory Supplies: 3.1% | |
| | 1,910,000 | | | CYTYC (b) | | | 48,438 | | |
| | | | | Consumables Related to Women's Health | | | | | |
| | 475,000 | | | Essilor International (France) | | | 47,764 | | |
| | | | | Eyeglass Lenses | | | | | |
| | 1,770,000 | | | Intermagnetics General (b) | | | 47,755 | | |
| | | | | MRI Equipment | | | | | |
| | 800,000 | | | Diagnostic Products | | | 46,536 | | |
| | | | | Immunodiagnostic Kits | | | | | |
| | 1,000,000 | | | Edwards Lifesciences (b) | | | 45,430 | | |
| | | | | Heart Valves | | | | | |
| | 870,000 | | | Vital Signs (c) | | | 43,091 | | |
| | | | | Anesthesia, Respiratory & Sleep Products | | | | | |
| | 1,000,000 | | | ICU Medical (b)(c) | | | 42,240 | | |
| | | | | Intravenous Therapy Products | | | | | |
| | 350,000 | | | Synthes (Switzerland) | | | 42,169 | | |
| | | | | Products for Orthopedic Surgery | | | | | |
| | 905,000 | | | Arrow International | | | 29,747 | | |
| | | | | Disposable Catheters | | | | | |
| | 552,000 | | | Advanced Medical Optics (b) | | | 27,986 | | |
| | | | | Medical Devices for Eye Care | | | | | |
| | 875,000 | | | Viasys Healthcare (b) | | | 22,400 | | |
| | | | | Respiratory & Neurology Medical Equipment | | | | | |
| | 583,000 | | | Orthofix International (b) | | | 22,230 | | |
| | | | | Bone Fixation & Stimulation Devices | | | | | |
| | 1,250,000 | | | PSS World Medical (b) | | | 22,063 | | |
| | | | | Medical Supplies Distributor | | | | | |
| | 390,000 | | | Hogy Medical (Japan) | | | 20,496 | | |
| | | | | Disposable Surgical Products | | | | | |
| | 415,000 | | | Cooper | | | 18,380 | | |
| | | | | Contact Lens Manufacturer | | | | | |
| | 350,000 | | | Haemonetics (b) | | | 16,279 | | |
| | | | | Blood & Plasma Collection Equipment | | | | | |
| | 455,000 | | | Datascope | | | 14,032 | | |
| | | | | Medical Devices | | | | | |
| | | | 557,036 | | |
| Number of Shares | | | | Value (000) | |
| | | >Services: 2.6% | |
| | 2,491,000 | | | Lincare Holdings (b) | | $ | 94,259 | | |
| | | | | Home Health Care Services | | | | | |
| | 1,232,000 | | | Coventry Health Care (b) | | | 67,686 | | |
| | | | | HMO | | | | | |
| | 1,607,000 | | | Serologicals (b) | | | 50,524 | | |
| | | | | Blood Collection & Antibody Production | | | | | |
| | 1,355,000 | | | Charles River Laboratories (b) | | | 49,864 | | |
| | | | | Pharmaceutical Research | | | | | |
| | 875,000 | | | LCA Vision | | | 46,296 | | |
| | | | | Lasik Surgery Centers | | | | | |
| | 1,000,000 | | | Rhoen-Klinikum (Germany) | | | 44,535 | | |
| | | | | Healthcare Services | | | | | |
| �� | 510,000 | | | OPG Groep (Netherlands) | | | 44,300 | | |
| | | | | Healthcare Supplies & Pharmacies | | | | | |
| | 900,000 | | | United Surgical Partners (b) | | | 27,063 | | |
| | | | | Outpatient Surgery Center | | | | | |
| | 808,000 | | | PRA International (b) | | | 17,994 | | |
| | | | | Contract Research Organization | | | | | |
| | 1,433,000 | | | Dendrite International (b) | | | 13,241 | | |
| | | | | Software for Pharmaceutical Sales
Force Automation | | | | | |
| | 1,050,000 | | | Eresearch Technology (b) | | | 9,555 | | |
| | | | | Clinical Research Services | | | | | |
| | 500,000 | | | Merge Technologies (b) | | | 6,155 | | |
| | | | | Radiology Information Systems | | | | | |
| | | | 471,472 | | |
| | | >Biotechnology/Drug Delivery: 1.7% | |
| | 3,230,000 | | | Exelixis (b) | | | 32,461 | | |
| | | | | Treatments for Cancer & Metabolic Disorders | | | | | |
| | 1,360,000 | | | Nektar Therapeutics (b) | | | 24,942 | | |
| | | | | Drug Delivery Technologies | | | | | |
| | 2,380,000 | | | Ligand Pharmaceuticals (b) | | | 20,111 | | |
| | | | | Drugs for Pain, Cancer,
Osteoporosis, & Diabetes | | | | | |
| | 2,000,000 | | | Medarex (b) | | | 19,220 | | |
| | | | | Humanized Antibodies | | | | | |
| | 1,650,000 | | | Human Genome Sciences (b) | | | 17,655 | | |
| | | | | Drug Discovery/Development | | | | | |
| | 1,100,000 | | | Renovis (b) | | | 16,841 | | |
| | | | | Drug to Minimize Neurological
Damage from Strokes | | | | | |
| | 1,429,000 | | | Arena Pharmaceuticals (b) | | | 16,548 | | |
| | | | | Novel Drug Targeting Technology | | | | | |
| | 1,135,000 | | | Keryx Biopharmaceuticals (b) | | | 16,117 | | |
| | | | | Drugs for Diabetic Complications & Cancer | | | | | |
| | 2,520,000 | | | Decode Genetics (b) | | | 15,599 | | |
| | | | | Drugs for Heart Attack, Asthma &
Vascular Disease | | | | | |
| | 1,780,000 | | | Array Biopharma (b) | | | 15,308 | | |
| | | | | Drugs for Cancer & Inflammatory Diseases | | | | | |
| | 930,000 | | | Intermune (b) | | | 15,299 | | |
| | | | | Drugs for Hepatitis C, Pulmonary
Fibrosis & Cancer | | | | | |
| | 3,100,000 | | | Lexicon Genetics (b) | | | 13,609 | | |
| | | | | Drug Discovery | | | | | |
| | 2,000,000 | | | Cytokinetics (b)(c) | | | 12,580 | | |
| | | | | Drugs for Cancer & Heart Failure | | | | | |
| | 1,275,000 | | | Rigel Pharmaceuticals (b)(c) | | | 12,406 | | |
| | | | | Drugs for Hay Fever, Asthma,
Hepatitis & Cancer | | | | | |
31
Columbia Acorn Fund
>Statement of Investments (Unaudited), continued
| Number of Shares | | | | Value (000) | |
| | | >Biotechnology/Drug Delivery—continued | |
| | 1,585,000 | | | Maxygen (b) | | $ | 11,856 | | |
| | | | | Molecular Breeding | | | | | |
| | 1,750,000 | | | Genitope (b) | | | 11,060 | | |
| | | | | Cancer Vaccine | | | | | |
| | 2,300,000 | | | Seattle Genetics (b) | | | 10,580 | | |
| | | | | Antibody-Based Therapies for Cancer | | | | | |
| | 800,000 | | | Momenta Pharmaceuticals (b) | | | 10,168 | | |
| | | | | Sugar Analysis Technology for Drug Design | | | | | |
| | 1,500,000 | | | Tercica (b) | | | 7,935 | | |
| | | | | Drug to Treat Severe Short Stature In Children | | | | | |
| | 1,100,000 | | | La Jolla Pharmaceutical (b) | | | 4,037 | | |
| | | | | Lupus Treatment | | | | | |
| | 1,249,999 | | | Perlegen Sciences (d) | | | 3,375 | | |
| | | | | Large Scale Gene Sequencing | | | | | |
| | 1,875,000 | | | Locus Discovery, Series D, Pfd. (d) | | | 512 | | |
| | | | | High Throughput Rational Drug Design | | | | | |
| | 359,944 | | | Microdose (d) | | | 360 | | |
| | | | | Drug Inhalers | | | | | |
| | | | 308,579 | | |
| | | >Medical Supplies: 0.4% | |
| | 486,000 | | | Techne (b) | | | 24,747 | | |
| | | | | Cytokines, Antibodies, Other Reagents
For Life Sciences | | | | | |
| | 650,000 | | | Owens & Minor | | | 18,590 | | |
| | | | | Distribution of Medical Supplies | | | | | |
| | 4,000,000 | | | United Drug (Ireland) | | | 17,129 | | |
| | | | | Irish Pharmaceutical
Wholesaler & Outsourcer | | | | | |
| | | | 60,466 | | |
| | | Health Care: Total | | | 1,397,553 | | |
| Other Industries: 4.7% | | | |
| | | >Real Estate: 3.6% | |
| | 5,850,000 | | | Highland Hospitality (c) | | | 82,368 | | |
| | | | | Hotel Owner | | | | | |
| | 650,000 | | | SL Green Realty | | | 71,155 | | |
| | | | | Manhattan Office Buildings | | | | | |
| | 1,398,000 | | | Forest City Enterprises, Cl. B (c) | | | 69,578 | | |
| | | | | Commercial & Residential Property Developer | | | | | |
| | 1,560,000 | | | Gaylord Entertainment (b) | | | 68,078 | | |
| | | | | Convention Hotels | | | | | |
| | 1,320,000 | | | General Growth Properties | | | 59,479 | | |
| | | | | Regional Shopping Malls | | | | | |
| | 3,294,000 | | | DiamondRock Hospitality (c) | | | 48,784 | | |
| | 1,000,000 | | | DiamondRock Hospitality 144A (c)(d) | | | 14,810 | | |
| | | | | Hotel Owner | | | | | |
| | 635,000 | | | Macerich Company | | | 44,577 | | |
| | | | | Regional Shopping Malls | | | | | |
| | 575,000 | | | Federal Realty Investment Trust | | | 40,250 | | |
| | | | | Shopping Centers | | | | | |
| | 1,020,000 | | | Brandywine Realty | | | 32,813 | | |
| | | | | Office Buildings | | | | | |
| | 1,720,000 | | | Kite Realty Group (c) | | | 26,815 | | |
| | | | | Community Shopping Centers | | | | | |
| | 1,375,000 | | | Crescent Real Estate Equities | | | 25,520 | | |
| | | | | Class A Office Buildings | | | | | |
| | 536,000 | | | Parkway Properties | | | 24,388 | | |
| | | | | Office Buildings | | | | | |
Number of Shares
or Principal Amount | | | | Value (000) | |
| | 900,000 | | | American Campus Communities (c) | | $ | 22,365 | | |
| | | | | Student Housing | | | | | |
| | 4,100 | | | Kenedix (Japan) | | | 17,754 | | |
| | | | | Real Estate Investment Management | | | | | |
| | 37,407 | | | Security Capital European
Realty (Luxembourg) (d) | | | 531 | | |
| | | | | Self Storage Properties | | | | | |
| | | | 649,265 | | |
| | | >Transportation: 0.5% | |
| | 1,584,000 | | | Heartland Express | | | 28,338 | | |
| | | | | Regional Trucker | | | | | |
| | 1,086,000 | | | JB Hunt | | | 27,052 | | |
| | | | | Trucking Conglomerate | | | | | |
| | 760,000 | | | Grupo Aeroportaurio Del Sureste
(Mexico) | | | 25,528 | | |
| | | | | Cancun & Cozumel Airport Operator | | | | | |
| | | | 80,918 | | |
| | | >Waste Management: 0.3% | |
| | 1,700,000 | | | Waste Connections (b) | | | 61,880 | | |
| | | | | Solid Waste Management | | | | | |
| | | >Regulated Utilities: 0.3% | |
| | 1,650,000 | | | Northeast Utilities | | | 34,106 | | |
| | | | | Regulated Electric Utility | | | | | |
| | 589,800 | | | Red Electrica (Spain) | | | 20,338 | | |
| | | | | Spanish Power Grid | | | | | |
| | | | 54,444 | | |
| | | | | Other Industries: Total | | | 846,507 | | |
| | Total Common Stocks and Other
Equity-Like Securities: 93.8% (e)
(Cost: $10,141,998) | | | | | |
16,797,843
| | |
| Short-Term Obligations: 6.3% | | | |
| $ | 176,000 | | | Verizon Global Funding
5.18% - 5.35%
Due 8/2/06 - 8/17/06 | | | 175,002 | | |
| | 161,000 | | | HSBC Finance Corporation
5.04% - 5.05%
Due 7/14/06 - 7/27/06 | | | 160,559 | | |
| | 155,000 | | | American General Finance
5.01% - 5.06%
Due 7/6/06 - 7/19/06 | | | 154,783 | | |
| | 154,000 | | | Aluminum Company America
5.08% - 5.26%
Due 7/3/06 - 8/9/06 | | | 153,478 | | |
| | 145,000 | | | Credit Suisse First Boston
5.05% - 5.28%
Due 7/13/06 - 8/11/06 | | | 144,325 | | |
| | 91,755 | | | Hartford Financial
5.11% - 5.28%
Due 7/28/06 - 8/10/06 | | | 91,319 | | |
| | 67,000 | | | Conocophillips
5.09% Due 7/21/06 - 7/25/06 | | | 66,790 | | |
| | 60,000 | | | Countrywide Financial Funding
5.30% - 5.40%
Due 8/16/06 | | | 59,772 | | |
| | 40,000 | | | Citigroup Funding
5.02% Due 08/01/06 | | | 39,823 | | |
1-800-922-6769
32
| Principal Amount | | | | Value (000) | |
| | | >Short-Term Obligations—continued | |
| $ | 32,000 | | | American Express Credit Corp
5.03% Due 7/10/06 | | $ | 31,960 | | |
| | 29,000 | | | Bell South Corp
5.02% Due 7/12/06 | | | 28,983 | | |
| | 23,140 | | | Repurchase Agreement with
State Street Bank & Trust
dated 6/30/06, due 7/3/06
at 4.93% collateralized by
Federal Home Loan Bank,
maturing 5/22/08
market value $23,605
(repurchase proceeds: $23,150) | | | 23,140 | | |
| | | | | (Amortized Cost: $1,129,934) | | | 1,129,934 | | |
| | Total Investments: 100.1%
(Cost: $11,271,932)(a) | | | | | | 17,927,777 | | |
| | Cash and Other Assets Less Liabilities: (0.1%) | | | | | | (11,701 | ) | |
| | Total Net Assets: 100% | | | | | $ | 17,916,076 | | |
33
Columbia Acorn Fund
>Statement of Investments (Unaudited), continued
>Notes to Statement of Investments (in thousands)
(a) At June 30, 2006, for federal income tax purposes cost of investments was $11,271,932 and net unrealized appreciation was $6,655,845 consisting of gross unrealized appreciation of $7,119,226 and gross unrealized depreciation of $463,381.
(b) Non-income producing security.
(c) An affiliate may include any company in which the Fund owns five percent or more of its outstanding voting shares. On June 30, 2006, the Fund held five percent or more of the outstanding voting securities of the following companies:
| AnswerThink Consulting | | | 10.31 | % | |
| Christopher & Banks | | | 10.25 | | |
| Actuate | | | 9.95 | | |
| Highland Hospitality | | | 9.79 | | |
| Gibraltar Industries | | | 9.60 | | |
| Watsco | | | 9.52 | | |
| Indus International | | | 9.49 | | |
| Igate Capital | | | 9.44 | | |
| Princeton Review | | | 9.24 | | |
| World Acceptance | | | 9.19 | | |
| Skillsoft Publishing | | | 8.79 | | |
| Spartech | | | 8.72 | | |
| RC2 | | | 8.61 | | |
| West Coast Bancorp | | | 8.60 | | |
| Kronos | | | 8.58 | | |
| Esco Technologies | | | 8.53 | | |
| Glacier Bancorp | | | 8.41 | | |
| Salem Communications | | | 8.19 | | |
| Saga Communications | | | 7.69 | | |
| Bally Technologies | | | 7.48 | | |
| Fleetwood Enterprises | | | 7.35 | | |
| ICU Medical | | | 7.00 | | |
| Concurrent Computer | | | 6.92 | | |
| Shuffle Master | | | 6.92 | | |
| Genlyte Group | | | 6.75 | | |
| Proquest Company | | | 6.69 | | |
| Nuco2 | | | 6.64 | | |
| Vital Signs | | | 6.61 | | |
| Seachange International | | | 6.55 | | |
| Tumbleweed Communications | | | 6.49 | | |
| II VI | | | 6.43 | | |
| United America Indemnity | | | 6.41 | | |
| Forward Air | | | 6.35 | % | |
| Navigant International | | | 6.24 | | |
| Clarcor | | | 6.20 | | |
| DiamondRock Hospitality | | | 6.12 | | |
| Red Robin Gourmet Burgers | | | 6.04 | | |
| Kite Realty Group | | | 6.01 | | |
| Helen of Troy | | | 5.99 | | |
| Spanish Broadcasting System | | | 5.95 | | |
| First Mutual Bancshares | | | 5.88 | | |
| Great Southern Bancorp | | | 5.79 | | |
| CityBank Lynnwood | | | 5.67 | | |
| IXYS | | | 5.57 | | |
| Time Warner Telecom | | | 5.57 | | |
| Vaalco Energy | | | 5.55 | | |
| Cytokinetics | | | 5.48 | | |
| Vail Resorts | | | 5.41 | | |
| Forest City Enterprises Class B | | | 5.39 | | |
| Anchor Bancorp Wisconsin | | | 5.36 | | |
| AFC Enterprises | | | 5.35 | | |
| Dobson Communications | | | 5.31 | | |
| West Bancorporation | | | 5.30 | | |
| American Campus Communities | | | 5.23 | | |
| Oxford Industries | | | 5.21 | | |
| Mine Safety Appliances | | | 5.19 | | |
| Excel Technologies | | | 5.18 | | |
| Gaiam | | | 5.16 | | |
| ITT Educational Services | | | 5.14 | | |
| Rigel Pharmaceuticals | | | 5.13 | | |
| JDA Software | | | 5.10 | | |
| Supertex | | | 5.04 | | |
| Enerflex Systems | | | 5.02 | | |
The aggregate cost and value of these companies at June 30, 2006, was $1,819,627 and $2,934,084 respectively. Investments in affiliate companies represent 16.28% of total net assets at June 30, 2006. Investment activity and income amounts relating to affiliates during the six months ended June 30, 2006 were as follows:
| Dividend income | | $ | 13,299 | | |
| Net realized gain or loss | | | — | | |
| Change in unrealized gain or loss | | | 253,598 | | |
| Purchases | | | 262,161 | | |
| Proceeds from sales | | | 13,003 | | |
In addition, additional purchases of existing portfolio holdings that were not considered affiliates in prior years, resulted in the fund owning more than 5% of the outstanding shares of certain issues at June 30, 2006. Therefore, the cost and market value affiliate disclosure amounts include both acquisitions of new investments in affiliates during the period, as well as prior period investment holdings that became affiliates during the current period.
1-800-922-6769
34
(d) Denotes a restricted security, which is subject to restrictions on resale under federal securities laws. These securities, except for DiamondRock Hospitality, are valued in good faith by the Board of Trustees. At June 30, 2006, these securities (in thousands) amounted to $19,588, which represents 0.11% of total net assets.
Additional information on these securities is as follows:
| Security | | Acquisition
Dates | | Shares | | Cost (000) | | Value (000) | |
| DiamondRock Hospitality 144A | | 06/29/04 | | | 1,000,000 | | | $ | 10,000 | | | $ | 14,810 | | |
| Perlegen Sciences | | 03/30/01 | | | 1,249,999 | | | | 4,500 | | | | 3,375 | | |
Security Capital European Realty
(Luxembourg) | | 08/20/98 - 11/12/99 | | | 37,407 | | | | 748 | | | | 531 | | |
| Locus Discovery, Series D Pfd. | | 09/05/01 | | | 1,875,000 | | | | 7,500 | | | | 512 | | |
| Microdose | | 11/24/00 | | | 359,944 | | | | 2,005 | | | | 360 | | |
| | | | | | | | | $ | 24,753 | | | $ | 19,588 | | |
(e) On June 30, 2006, the market value of foreign securities (in thousands) represents 13.70% of total net assets. The Fund's foreign portfolio was diversified as follows:
| | | Value | | Percent | |
| Canada | | $ | 356,612 | | | | 1.99 | % | |
| Netherlands | | | 298,641 | | | | 1.67 | | |
| France | | | 236,584 | | | | 1.32 | | |
| Ireland | | | 183,049 | | | | 1.02 | | |
| United Kingdom | | | 161,345 | | | | 0.90 | | |
| Japan | | | 139,008 | | | | 0.78 | | |
| Switzerland | | | 138,106 | | | | 0.77 | | |
| Sweden | | | 116,794 | | | | 0.65 | | |
| Germany | | | 111,615 | | | | 0.62 | | |
| Hong Kong | | | 62,049 | | | | 0.35 | | |
| Luxembourg | | | 61,266 | | | | 0.34 | | |
| Taiwan | | | 59,483 | | | | 0.33 | | |
| Italy | | | 57,088 | | | | 0.32 | | |
| Australia | | | 51,635 | | | | 0.29 | | |
| Brazil | | | 51,007 | | | | 0.29 | | |
| | | Value | | Percent | |
| Denmark | | $ | 49,201 | | | | 0.28 | % | |
| Israel | | | 45,981 | | | | 0.26 | | |
| India | | | 41,847 | | | | 0.23 | | |
| South Korea | | | 39,290 | | | | 0.22 | | |
| Czech Republic | | | 36,578 | | | | 0.20 | | |
| Mexico | | | 25,528 | | | | 0.14 | | |
| Bahamas | | | 21,406 | | | | 0.12 | | |
| Spain | | | 20,338 | | | | 0.11 | | |
| Chile | | | 20,307 | | | | 0.11 | | |
| Greece | | | 18,463 | | | | 0.10 | | |
| New Zealand | | | 15,448 | | | | 0.09 | | |
| China | | | 14,800 | | | | 0.08 | | |
| South Africa | | | 14,109 | | | | 0.08 | | |
| Finland | | | 7,956 | | | | 0.04 | | |
| Total Foreign Portfolio | | $ | 2,455,534 | | | | 13.70 | % | |
35
Columbia Acorn International
>Major Portfolio Changes in the Second Quarter (Unaudited)
| | | Number of Shares | |
| | | 03/31/06 | | 06/30/06 | |
| Additions | |
| Europe | |
| >France | |
| Carbone Lorraine | | | 340,000 | | | | 395,000 | | |
| Eurofins Scientific | | | 320,000 | | | | 360,000 | | |
| Foncia Groupe | | | 0 | | | | 400,000 | | |
| Legrand | | | 0 | | | | 700,000 | | |
| Neopost | | | 236,000 | | | | 280,000 | | |
| Norbert Dentressangle | | | 300,000 | | | | 375,000 | | |
| Trigano | | | 423,000 | | | | 500,000 | | |
| >United Kingdom | |
| Randgold Resources | | | 0 | | | | 640,000 | | |
| UTV | | | 1,800,000 | | | | 2,000,000 | | |
| >Netherlands | |
| Aalberts Industries | | | 550,000 | | | | 557,534 | | |
| Fugro | | | 1,245,000 | | | | 1,268,491 | | |
| IM Tech | | | 474,000 | | | | 574,000 | | |
| >Germany | |
| Depfa Bank | | | 1,675,000 | | | | 2,000,000 | | |
| Rational AG | | | 0 | | | | 75,000 | | |
| >Switzerland | |
| Givaudan | | | 15,000 | | | | 25,000 | | |
| Kuehne & Nagel | | | 95,000 | | | | 475,000 | | |
| Synthes | | | 215,000 | | | | 275,000 | | |
| >Italy | |
| Amplifon | | | 1,700,000 | | | | 2,000,000 | | |
| (includes the effect of a 10 for 1 stock split) | |
| Cir Compagnie | | | 6,000,000 | | | | 9,100,000 | | |
| Ducati Motor | | | 6,400,000 | | | | 12,800,000 | | |
| GranitiFiandre | | | 275,000 | | | | 1,223,000 | | |
| >Sweden | |
| Sweco | | | 380,000 | | | | 422,000 | | |
| Tele2 | | | 2,100,000 | | | | 2,580,000 | | |
| >Poland | |
| Central European Distribution | | | 448,000 | | | | 820,500 | | |
| (includes the effect of a 3 for 2 stock split) | |
| | | Number of Shares | |
| | | 03/31/06 | | 06/30/06 | |
| Asia | |
| >Japan | |
| FCC | | | 454,000 | | | | 714,000 | | |
| Kansai Paint | | | 882,000 | | | | 3,700,000 | | |
| Sparx Asset Management | | | 0 | | | | 22,500 | | |
| Other Countries | |
| >Canada | |
| Alliance Atlantis Communication | | | 639,000 | | | | 1,060,000 | | |
| UrAsia Energy | | | 0 | | | | 1,475,000 | | |
| Van Houtte | | | 0 | | | | 950,000 | | |
| >Australia | |
| Sino Gold | | | 0 | | | | 5,450,000 | | |
| >South Africa | |
| Impala Platinum | | | 140,000 | | | | 180,000 | | |
| >United States | |
| Atwood Oceanics | | | 0 | | | | 415,000 | | |
| >New Zealand | |
| Sky City Entertainment | | | 5,000,000 | | | | 5,500,000 | | |
| Latin America | |
| >Brazil | |
| American Banknote | | | 0 | | | | 1,085,000 | | |
| Localiza Rent a Car | | | 0 | | | | 170,000 | | |
| Suzano | | | 3,215,000 | | | | 4,300,000 | | |
1-800-922-6769
36
| | | Number of Shares | |
| | | 03/31/06 | | 06/30/06 | |
| Sales | |
| Europe | |
| >France | |
| Essilor International | | | 300,000 | | | | 200,000 | | |
| Vallourec | | | 20,000 | | | | 0 | | |
| >United Kingdom | |
| Bloomsbury Publishing | | | 2,000,000 | | | | 916,000 | | |
| Intermediate Capital | | | 600,000 | | | | 0 | | |
| Kensington Group | | | 1,050,000 | | | | 813,050 | | |
| >Germany | |
| Bilfinger Berger | | | 300,000 | | | | 200,000 | | |
| >Ireland | |
| Anglo Irish Bank | | | 2,260,000 | | | | 2,200,000 | | |
| >Switzerland | |
| BKW Energie | | | 130,000 | | | | 27,000 | | |
| >Sweden | |
| Gambro | | | 2,042,000 | | | | 0 | | |
| >Spain | |
| Abengoa | | | 370,000 | | | | 0 | | |
| >Russia | |
| RBC Information Systems | | | 700,000 | | | | 575,800 | | |
| | | Number of Shares | |
| | | 03/31/06 | | 06/30/06 | |
| Asia | |
| >Japan | |
| Meitec | | | 475,000 | | | | 0 | | |
| Shimano | | | 900,000 | | | | 650,000 | | |
| >Taiwan | |
| Novatek Microelectronics | | | 3,244,000 | | | | 3,000,000 | | |
| >Hong Kong | |
Hong Kong Exchanges and
Clearing | | | 6,000,000 | | | | 5,000,000 | | |
| Linmark Group | | | 13,483,000 | | | | 10,996,000 | | |
| >South Korea | |
| Samsung Fire & Marine | | | 100,000 | | | | 0 | | |
| >Indonesia | |
| Perusahaan Gas Negara | | | 20,000,000 | | | | 15,000,000 | | |
| >Singapore | |
| Comfort Del Gro | | | 20,000,000 | | | | 7,053,000 | | |
| Other Countries | |
| >Canada | |
| Kinross Gold | | | 1,100,000 | | | | 835,000 | | |
| >Australia | |
| ABC Learning Center | | | 4,028,250 | | | | 4,000,000 | | |
| Latin America | |
| >Brazil | |
| America Latina Logistics | | | 280,000 | | | | 0 | | |
| Diagnosticos | | | 590,000 | | | | 392,000 | | |
| Natura Cosmeticos | | | 3,200,000 | | | | 2,500,000 | | |
| Porto Seguro | | | 1,000,000 | | | | 720,000 | | |
| Ultrapar | | | 500,000 | | | | 293,000 | | |
37
Columbia Acorn International
>Statement of Investments (Unaudited), June 30, 2006
| Number of Shares | | | | Value (000) | |
| | | | | Common Stocks: 95.9% | |
| Europe: 59.2% | | | |
| | | >France: 11.5% | |
| | 700,000 | | | April Group | | $ | 37,576 | | |
| | | | | Insurance Policy Construction | | | | | |
| | 390,000 | | | Iliad | | | 32,484 | | |
| | | | | High Speed Internet Service Provider | | | | | |
| | 280,000 | | | Neopost | | | 31,875 | | |
| | | | | Postage Meter Machines | | | | | |
| | 2,200,000 | | | SES Global | | | 31,338 | | |
| | | | | Satellite Broadcasting Service | | | | | |
| | 411,000 | | | Rubis | | | 28,755 | | |
| | | | | Tank Storage & LPG Supplier | | | | | |
| | 500,000 | | | Trigano | | | 26,540 | | |
| | | | | Leisure Vehicles & Camping Equipment | | | | | |
| | 375,000 | | | Norbert Dentressangle | | | 26,380 | | |
| | | | | Transport | | | | | |
| | 360,000 | | | Eurofins Scientific (b) | | | 23,436 | | |
| | | | | Food Screening & Testing | | | | | |
| | 206,000 | | | Pierre & Vacances | | | 22,580 | | |
| | | | | Vacation Apartment Lets | | | | | |
| | 395,000 | | | Carbone Lorraine | | | 21,719 | | |
| | | | | Advanced Industrial Materials | | | | | |
| | 200,000 | | | Essilor International | | | 20,111 | | |
| | | | | Eyeglass Lenses | | | | | |
| | 120,000 | | | Ciments Francais | | | 19,949 | | |
| | | | | Leading French & Emerging Markets
Cement Producer | | | | | |
| | 700,000 | | | Legrand | | | 19,691 | | |
| | | | | Electrical Components | | | | | |
| | 240,000 | | | Imerys | | | 19,176 | | |
| | | | | Industrial Minerals Producer | | | | | |
| | 151,000 | | | Bacou Dalloz | | | 17,981 | | |
| | | | | Safety Equipment | | | | | |
| | 400,000 | | | Foncia Groupe | | | 17,646 | | |
| | | | | Real Estate Services | | | | | |
| | 550,000 | | | Metropole Television | | | 17,190 | | |
| | | | | Television Broadcaster | | | | | |
| | | | 414,427 | | |
| | | >United Kingdom: 8.6% | |
| | 6,370,000 | | | Tullow Oil | | | 44,915 | | |
| | | | | Oil & Gas Producer | | | | | |
| | 1,850,000 | | | Northern Rock | | | 34,168 | | |
| | | | | Lowest Cost Mortgage Bank in UK | | | | | |
| | 2,800,000 | | | Paragon Group | | | 33,792 | | |
| | | | | Buy-To-Let Finance Company | | | | | |
| | 7,200,000 | | | RPS Group | | | 28,825 | | |
| | | | | Environmental Consulting & Planning | | | | | |
| | 1,850,000 | | | Expro International Group | | | 23,212 | | |
| | | | | Offshore Oilfield Services | | | | | |
| | 1,200,000 | | | Northgate | | | 23,211 | | |
| | | | | Light Commercial Vehicle Rental Specialist | | | | | |
| | 4,200,000 | | | Taylor Nelson Sofres | | | 18,065 | | |
| | | | | Market Research | | | | | |
| | 3,550,000 | | | BBA Group | | | 17,346 | | |
| | | | | Aviation Support Services &
Non-Woven Materials | | | | | |
| | 2,450,000 | | | Workspace Group | | | 16,380 | | |
| | | | | Real Estate | | | | | |
| | 813,050 | | | Kensington Group | | | 15,460 | | |
| | | | | Non-Conforming Mortgage Company | | | | | |
| Number of Shares | | | | Value (000) | |
| | 1,300,000 | | | Keller Group | | $ | 13,967 | | |
| | | | | International Ground Engineering Specialist | | | | | |
| | 640,000 | | | Randgold Resources (b) | | | 13,440 | | |
| | | | | Gold Mining in Western Africa | | | | | |
| | 2,000,000 | | | UTV | | | 12,575 | | |
| | | | | Irish Television & Radio Station Operator | | | | | |
| | 450,000 | | | Viridian Group | | | 7,952 | | |
| | | | | Northern Ireland Electric Utility | | | | | |
| | 916,000 | | | Bloomsbury Publishing | | | 5,485 | | |
| | | | | Book Publisher | | | | | |
| | | | 308,793 | | |
| | | >Netherlands: 8.3% | |
| | 1,268,491 | | | Fugro | | | 54,689 | | |
| | | | | Survey & GPS Services | | | | | |
| | 679,000 | | | USG People | | | 51,973 | | |
| | | | | Temporary Staffing Services | | | | | |
| | 557,534 | | | Aalberts Industries | | | 40,985 | | |
| | | | | Flow Control & Heat Treatment | | | | | |
| | 972,304 | | | Koninklijke Ten Cate | | | 28,545 | | |
| | | | | Advanced Textiles & Industrial Fabrics | | | | | |
| | 327,000 | | | OPG Groep | | | 28,405 | | |
| | | | | Healthcare Supplies & Pharmacies | | | | | |
| | 574,000 | | | IM Tech | | | 27,709 | | |
| | | | | Engineering & Technical Services | | | | | |
| | 439,400 | | | Sligro Food Group | | | 23,327 | | |
| | | | | Food Service & Wholesaling | | | | | |
| | 330,000 | | | Smit Internationale | | | 23,216 | | |
| | | | | Harbor & Offshore Towage & Marine Services | | | | | |
| | 890,000 | | | Unit 4 Agresso (b) | | | 17,901 | | |
| | | | | Business & Security Software | | | | | |
| | | | 296,750 | | |
| | | >Germany: 7.9% | |
| | 900,000 | | | Rhoen-Klinikum | | | 40,082 | | |
| | | | | Health Care Services | | | | | |
| | 275,000 | | | Wincor Nixdorf | | | 35,112 | | |
| | | | | Retail POS Systems & ATM Machines | | | | | |
| | 2,000,000 | | | Depfa Bank | | | 33,154 | | |
| | | | | Investment Banker to Public Authorities | | | | | |
| | 27,500 | | | Porsche | | | 26,536 | | |
| | | | | Specialty Automobile Manufacturer | | | | | |
| | 775,000 | | | CTS Eventim (b) | | | 23,763 | | |
| | | | | Event Ticket Sales | | | | | |
| | 450,000 | | | Hugo Boss Designs | | | 18,943 | | |
| | | | | Fashion Apparel | | | | | |
| | 260,000 | | | Grenkeleasing | | | 17,292 | | |
| | | | | Financing for IT Equipment | | | | | |
| | 320,000 | | | Vossloh | | | 16,225 | | |
| | | | | Rail Infrastructure & Diesel Locomotives | | | | | |
| | 415,000 | | | GFK | | | 15,128 | | |
| | | | | Market Research Services | | | | | |
| | 870,000 | | | Takkt | | | 13,828 | | |
| | | | | Mail Order Retailer of Office &
Warehouse Durables | | | | | |
| | 100,000 | | | Deutsche Boerse | | | 13,597 | | |
| | | | | Trading, Clearing, Settlement Services for
Financial Markets | | | | | |
| | 75,000 | | | Rational | | | 12,248 | | |
| | | | | Commercial Oven Manufacturer | | | | | |
| | 200,000 | | | Bilfinger Berger | | | 10,856 | | |
| | | | | Construction & Related Services | | | | | |
1-800-922-6769
38
| Number of Shares | | | | Value (000) | |
| | | >Germany—continued | |
| | 296,000 | | | Deutsche Beteiligungs | | $ | 6,172 | | |
| | | | | Private Equity Investment Management | | | | | |
| | | | 282,936 | | |
| | | >Ireland: 6.1% | |
| | 2,000,000 | | | Bank of Ireland | | | 35,801 | | |
| | | | | Irish Commercial Bank | | | | | |
| | 2,000,000 | | | IAWS Group | | | 35,262 | | |
| | | | | Baked Goods | | | | | |
| | 2,200,000 | | | Anglo Irish Bank | | | 34,280 | | |
| | | | | Small Business & Middle Market Banking | | | | | |
| | 2,350,000 | | | Grafton Group | | | 29,581 | | |
| | | | | Builders Materials Wholesaling &
Do-it-yourself Retailing | | | | | |
| | 6,856,625 | | | United Drug | | | 29,361 | | |
| | | | | Irish Pharmaceutical Wholesaler & Outsourcer | | | | | |
| | 2,500,000 | | | C&C Group | | | 21,712 | | |
| | | | | Beverage Company | | | | | |
| | 1,150,000 | | | Kingspan Group | | | 20,078 | | |
| | | | | Building Insulation & Environmental Containers | | | | | |
| | 720,000 | | | Paddy Power | | | 12,470 | | |
| | | | | Irish Betting Services | | | | | |
| | | | 218,545 | | |
| | | >Switzerland: 4.9% | |
| | 30,000 | | | Geberit | | | 34,662 | | |
| | | | | Plumbing Supplies | | | | | |
| | 475,000 | | | Kuehne & Nagel | | | 34,579 | | |
| | | | | Freight Forwarding/Logistics | | | | | |
| | 275,000 | | | Synthes | | | 33,132 | | |
| | | | | Products for Orthopedic Surgery | | | | | |
| | 24,000 | | | Sika | | | 26,661 | | |
| | | | | Chemicals for Construction &
Industrial Applications | | | | | |
| | 25,000 | | | Givaudan | | | 19,660 | | |
| | | | | Fragrances & Flavors | | | | | |
| | 300,000 | | | Schindler | | | 15,535 | | |
| | | | | Elevator Manufacturer & Service Provider | | | | | |
| | 275,000 | | | Logitech (b) | | | 10,602 | | |
| | | | | Branded Peripheral Computer Devices | | | | | |
| | 27,000 | | | BKW Energie | | | 2,364 | | |
| | | | | Electric Utility | | | | | |
| | | | 177,195 | | |
| | | >Italy: 3.3% | |
| | 9,100,000 | | | Cir Compagnie | | | 25,899 | | |
| | | | | Italian Holding Company | | | | | |
| | 2,120,000 | | | Davide Campari | | | 21,961 | | |
| | | | | Spirits & Wines | | | | | |
| | 404,000 | | | Banca Italease | | | 20,188 | | |
| | | | | Italian Leasing & Factoring Leader | | | | | |
| | 2,000,000 | | | Amplifon | | | 16,999 | | |
| | | | | Hearing Aid Retailer | | | | | |
| | 1,223,000 | | | GranitiFiandre | | | 13,163 | | |
| | | | | Innovative Stoneware | | | | | |
| | 12,800,000 | | | Ducati Motor (b) | | | 10,867 | | |
| | | | | Motorcycles & Related Merchandise | | | | | |
| | 350,000 | | | Sabaf | | | 9,961 | | |
| | | | | Supplier to White Goods OEMS | | | | | |
| | | | 119,038 | | |
| Number of Shares | | | | Value (000) | |
| | | >Sweden: 3.3% | |
| | 1,544,998 | | | Hexagon | | $ | 56,245 | | |
| | | | | Measurement Equipment & Polymers | | | | | |
| | 2,580,000 | | | Tele2 | | | 26,034 | | |
| | | | | European Mobile Operator & Services Reseller | | | | | |
| | 755,000 | | | Nobia | | | 24,490 | | |
| | | | | Kitchen Cabinet Manufacturing & Distribution | | | | | |
| | 422,000 | | | Sweco | | | 11,541 | | |
| | | | | Engineering Consultants | | | | | |
| | | | 118,310 | | |
| | | >Russia: 1.1% | |
| | 775,000 | | | Novolipetsk Steel | | | 16,999 | | |
| | | | | Vertically Integrated Steel Producer | | | | | |
| | 575,800 | | | RBC Information Systems (b) | | | 15,202 | | |
| | | | | Financial Information, Media &
IT Services in Russia | | | | | |
| | 370,000 | | | Mechel Steel Group | | | 8,284 | | |
| | | | | Coking Coal | | | | | |
| | | | 40,485 | | |
| | | >Spain: 0.8% | |
| | 620,000 | | | Red Electrica | | | 21,379 | | |
| | | | | Spanish Power Grid | | | | | |
| | 120,700 | | | Bankinter | | | 7,768 | | |
| | | | | Mortgage Lender | | | | | |
| | | | 29,147 | | |
| | | >Czech Republic: 0.7% | |
| | 183,000 | | | Komercni Banka | | | 26,775 | | |
| | | | | Leading Czech Universal Bank | | | | | |
| | | >Greece: 0.7% | |
| | 936,000 | | | Intralot | | | 25,045 | | |
| | | | | Lottery & Gaming Systems/Services | | | | | |
| | | >Poland: 0.6% | |
| | 820,500 | | | Central European Distribution (b) | | | 20,644 | | |
| | | | | Vodka Production & Alcohol Distribution | | | | | |
| | | >Finland: 0.5% | |
| | 1,756,000 | | | Jaakko Poyry | | | 18,880 | | |
| | | | | Engineering Consultants | | | | | |
| | | >Denmark: 0.5% | |
| | 280,000 | | | Novozymes | | | 18,872 | | |
| | | | | Industrial Enzymes | | | | | |
| | | >Austria: 0.4% | |
| | 300,000 | | | Wienerberger | | | 14,255 | | |
| | | | | Bricks & Clay Roofing Tiles | | | | | |
| | | Europe: Total | | | 2,130,097 | | |
| Asia: 21.5% | | | |
| | | >Japan: 15.2% | |
| | 546,000 | | | Daito Trust Construction | | | 30,358 | | |
| | | | | Apartment Builder | | | | | |
| | 43,500 | | | Jupiter Telecommunications (b) | | | 30,155 | | |
| | | | | Largest Cable Service Provider in Japan | | | | | |
39
Columbia Acorn International
>Statement of Investments (Unaudited), continued
| Number of Shares | | | | Value (000) | |
| | | >Japan—continued | |
| | 3,700,000 | | | Kansai Paint | | $ | 29,606 | | |
| | | | | Paint Producer in Japan, India,
China & Southeast Asia | | | | | |
| | 1,272,000 | | | Ushio | | | 26,935 | | |
| | | | | Industrial Light Sources | | | | | |
| | 718,000 | | | Ito En | | | 26,340 | | |
| | | | | Bottled Tea & Other Beverages | | | | | |
| | 868,000 | | | Park 24 | | | 25,496 | | |
| | | | | Parking Lot Operator | | | | | |
| | 600,000 | | | Aeon Mall | | | 25,180 | | |
| | | | | Suburban Shopping Mall Developer,
Owner & Operator | | | | | |
| | 453,000 | | | Hogy Medical | | | 23,806 | | |
| | | | | Disposable Surgical Products | | | | | |
| | 22,500 | | | Sparx Asset Management | | | 23,516 | | |
| | | | | Fund Management | | | | | |
| | 350,000 | | | USS | | | 23,172 | | |
| | | | | Used Car Auctioneer | | | | | |
| | 600,000 | | | Hoya | | | 21,450 | | |
| | | | | Opto-Electrical Components & Eyeglass Lenses | | | | | |
| | 785,000 | | | JSR | | | 19,922 | | |
| | | | | Films & Chemicals for LCD Screens & Electronics | | | | | |
| | 650,000 | | | Shimano | | | 19,922 | | |
| | | | | Bicycle Components & Fishing Tackle | | | | | |
| | 2,000,000 | | | Chiba Bank | | | 18,773 | | |
| | | | | Regional Bank | | | | | |
| | 4,310 | | | Kenedix | | | 18,665 | | |
| | | | | Real Estate Investment Management | | | | | |
| | 220,000 | | | Fast Retailing | | | 17,914 | | |
| | | | | Apparel Retailer | | | | | |
| | 710,000 | | | Sato | | | 16,445 | | |
| | | | | Bar Code Printers & Supplies | | | | | |
| | 714,000 | | | FCC | | | 14,176 | | |
| | | | | Auto/Motorcycle Clutches | | | | | |
| | 965,000 | | | T. Hasegawa | | | 13,774 | | |
| | | | | Industrial Flavors & Fragrances | | | | | |
| | 2,248,000 | | | Hiroshima Bank | | | 13,740 | | |
| | | | | Regional Bank | | | | | |
| | 918,000 | | | Toyo Technica | | | 12,665 | | |
| | | | | Value Added Reseller of Imported Instrumentation | | | | | |
| | 2,960 | | | Risa Partners | | | 11,762 | | |
| | | | | NPL & Real Estate Related Investment | | | | | |
| | 1,500,000 | | | Bank of Fukuoka | | | 11,465 | | |
| | | | | Regional Bank | | | | | |
| | 960 | | | Osaka Securities Exchange | | | 11,407 | | |
| | | | | Osaka Securities Exchange | | | | | |
| | 1,650 | | | Japan Pure Chemical | | | 10,713 | | |
| | | | | Precious Metal Plating Chemicals for Electronics | | | | | |
| | 430,000 | | | Yusen Air & Sea Service | | | 10,105 | | |
| | | | | Airfreight Logistics | | | | | |
| | 1,230,000 | | | Kamigumi | | | 9,349 | | |
| | | | | Port Cargo Handling & Logistics | | | | | |
| | 375,000 | | | Nagaileben | | | 8,438 | | |
| | | | | Medical/Healthcare Related Clothes | | | | | |
| | 321,100 | | | Kintetsu World Express | | | 7,623 | | |
| | | | | Airfreight Logistics | | | | | |
| | 450,200 | | | Ain Pharmaciez | | | 7,483 | | |
| | | | | Dispensing Pharmacy/Drugstore Operator | | | | | |
| | 1,713 | | | Advance Create | | | 4,973 | | |
| | | | | Independent Insurance Distributor | | | | | |
| | | | 545,328 | | |
| Number of Shares | | | | Value (000) | |
| | | >Taiwan: 2.1% | |
| | 6,822,000 | | | Advantech | | $ | 19,583 | | |
| | | | | Embedded Computers | | | | | |
| | 18,300,000 | | | Phoenixtec Power | | | 18,601 | | |
| | | | | Uninterruptible Power Supplies | | | | | |
| | 3,000,000 | | | Novatek Microelectronics | | | 14,451 | | |
| | | | | LCD Related IC Designer | | | | | |
| | 7,280,000 | | | Wah Lee Industrial | | | 13,352 | | |
| | | | | Distributor of Chemicals, Materials, & Equipment | | | | | |
| | 7,186,000 | | | Springsoft | | | 11,084 | | |
| | | | | Electronic Design Automation Software | | | | | |
| | | | 77,071 | | |
| | | >Hong Kong: 1.5% | |
| | 5,000,000 | | | Hong Kong Exchanges and Clearing | | | 32,136 | | |
| | | | | Hong Kong Equity & Derivatives Market Operator | | | | | |
| | 14,000,000 | | | Techtronic Industries | | | 18,922 | | |
| | | | | Power Tools & Motorized Appliances | | | | | |
| | 10,996,000 | | | Linmark Group | | | 1,731 | | |
| | | | | Global Sourcing Agent of Consumer Goods | | | | | |
| | | | 52,789 | | |
| | | >India: 0.9% | |
| | 1,300,000 | | | Housing Development Finance | | | 32,001 | | |
| | | | | Indian Mortgage Lender | | | | | |
| | | >South Korea: 0.6% | |
| | 250,000 | | | Hyundai Mobis | | | 21,124 | | |
| | | | | Auto Parts | | | | | |
| | | >China: 0.5% | |
| | 45,000,000 | | | Global Bio-Chem Technology Group | | | 19,028 | | |
| | | | | Refiner of Corn-based Commodities | | | | | |
| | | >Indonesia: 0.5% | |
| | 15,000,000 | | | Perusahaan Gas Negara | | | 18,192 | | |
| | | | | Gas Pipeline Operator | | | | | |
| | | >Singapore: 0.2% | |
| | 7,053,000 | | | Comfort Del Gro | | | 6,798 | | |
| | | | | Taxi & Mass Transit Service | | | | | |
| | | Asia: Total | | | 772,331 | | |
| Other Countries: 10.7% | | | |
| | | >Canada: 5.3% | |
| | 1,060,000 | | | Alliance Atlantis Communication (b) | | | 31,051 | | |
| | | | | CATV Channels, TV/Movie Production/Distribution | | | | | |
| | 1,370,000 | | | Rona (b) | | | 24,607 | | |
| | | | | Leading Canadian Do-it-yourself Retailer | | | | | |
| | 400,000 | | | Falconbridge | | | 21,070 | | |
| | | | | Diversified Mining Holding Company | | | | | |
| | 1,155,000 | | | Talisman Energy | | | 20,155 | | |
| | | | | Oil & Gas Producer | | | | | |
| | 1,190,000 | | | Shawcor | | | 17,685 | | |
| | | | | Oilfield Services | | | | | |
| | 6,775,000 | | | UrAsia Energy (b) | | | 16,994 | | |
| | | | | Uranium Mining in Kazakhstan | | | | | |
1-800-922-6769
40
| Number of Shares | | | | Value (000) | |
| | | >Canada—continued | |
| | 950,000 | | | Van Houtte (c) | | $ | 15,795 | | |
| | | | | Coffee Services & Equipment | | | | | |
| | 530,000 | | | Major Drilling Group (b) | | | 10,597 | | |
| | | | | Mining Exploration Driller | | | | | |
| | 2,000,000 | | | Northern Orion Resources (b) | | | 9,818 | | |
| | | | | Copper & Gold Mining in Argentina | | | | | |
| | 835,000 | | | Kinross Gold (b) | | | 9,103 | | |
| | | | | Gold Mining | | | | | |
| | 850,000 | | | Ivanhoe Mines (b) | | | 5,757 | | |
| | | | | Copper Mine Project in Mongolia | | | | | |
| | 2,036,000 | | | RailPower Technologies 144A (b)(c)(d) | | | 4,377 | | |
| | 789,000 | | | RailPower Technologies (c) | | | 1,696 | | |
| | | | | Hybrid Locomotives | | | | | |
| | | | 188,705 | | |
| | | >Australia: 2.9% | |
| | 3,000,000 | | | Billabong International | | | 34,250 | | |
| | | | | Action Sports Apparel Brand Manager | | | | | |
| | 5,450,000 | | | Sino Gold (b) | | | 20,343 | | |
| | | | | Gold Mining in The People's Republic of China | | | | | |
| | 4,000,000 | | | ABC Learning Center | | | 19,036 | | |
| | | | | Childcare Centers | | | | | |
| | 350,000 | | | Perpetual Trustees | | | 19,034 | | |
| | | | | Mutual Fund Management | | | | | |
| | 2,000,000 | | | Jubilee Mines | | | 11,989 | | |
| | | | | Nickel Mining in Australia | | | | | |
| | | | 104,652 | | |
| | | >South Africa: 1.4% | |
| | 180,000 | | | Impala Platinum | | | 33,085 | | |
| | | | | Platinum Group Metals Mining & Refining | | | | | |
| | 4,500,000 | | | Edgars Consolidated Stores | | | 18,140 | | |
| | | | | Leading Retail Conglomerate | | | | | |
| | | | 51,225 | | |
| | | >United States: 0.6% | |
| | 415,000 | | | Atwood Oceanics (b) | | | 20,584 | | |
| | | | | Contract Drilling | | | | | |
| | | >New Zealand: 0.5% | |
| | 5,500,000 | | | Sky City Entertainment | | | 18,078 | | |
| | | | | Casino/Entertainment Complex | | | | | |
| | | Other Countries: Total | | | 383,244 | | |
| Latin America: 4.5% | | | |
| | | >Brazil: 2.4% | |
| | 2,500,000 | | | Natura Cosmeticos | | | 26,202 | | |
| | | | | Direct Retailer of Cosmetics | | | | | |
| | 4,300,000 | | | Suzano | | | 25,273 | | |
| | | | | Pulp & Paper Producer | | | | | |
| | 720,000 | | | Porto Seguro (b) | | | 12,300 | | |
| | | | | Auto & Life Insurance | | | | | |
| | 392,000 | | | Diagnosticos (b) | | | 7,782 | | |
| | | | | Medical Diagnostic Services | | | | | |
Number of Shares
or Principal Amount | | | | Value (000) | |
| | 1,085,000 | | | American Banknote (b) | | $ | 7,013 | | |
| | | | | Manufacturer of Smart Cards | | | | | |
| | 293,000 | | | Ultrapar | | | 4,613 | | |
| | | | | Specialty Chemicals & Liquid Propane
Gas Distribution | | | | | |
| | 170,000 | | | Localiza Rent A Car | | | 3,257 | | |
| | | | | Car Rental | | | | | |
| | | | 86,440 | | |
| | | >Mexico: 1.3% | |
| | 4,500,000 | | | Consorcio ARA | | | 18,530 | | |
| | | | | Affordable Housing Builder | | | | | |
| | 414,000 | | | Grupo Aeroportuario Del Sureste | | | 13,906 | | |
| | | | | Cancun/Cozumel Airport Operator | | | | | |
| | 4,200,000 | | | Urbi Desarrollo (b) | | | 9,740 | | |
| | | | | Affordable Housing Builder | | | | | |
| | 100,000 | | | Grupo Aeroportuario Del Pacifia | | | 3,185 | | |
| | | | | Mexican Airport Operator | | | | | |
| | | | 45,361 | | |
| | | >Chile: 0.4% | |
| | 160,000 | | | Sociedad Quimica y Minera de Chile (Chile) | | | 16,662 | | |
| | | | | Producer of Specialty Fertilizers, Lithium, & Iodine | | | | | |
| | | >Argentina: 0.4% | |
| | 350,000 | | | Tenaris | | | 14,172 | | |
| | | | | Oil, Gas & Industrial Seamless Tubes | | | | | |
| | | | | Latin America: Total | | | 162,635 | | |
| | Total Common Stocks: 95.9%
(Cost: $2,361,806) | | | | | | 3,448,307 | | |
| Short-Term Obligations: 3.4% | | | |
| $ | 75,000 | | | Conocophillips
5.30% Due 7/03/06 - 7/05/06 | | | 74,966 | | |
| | 45,000 | | | Countrywide Financial Funding
5.30% Due 7/06/06 | | | 44,967 | | |
| | 4,181 | | | Repurchase Agreement with
State Street Bank & Trust
dated 6/30/06, due 7/3/06
at 4.93% collateralized by
Federal Home Loan Bank,
maturing 5/9/09
market value $4,268
(repurchase proceeds: $4,183) | | | 4,181 | | |
| | | | | (Amortized Cost: $124,114) | | | 124,114 | | |
| | Total Investments: 99.3%
(Cost: $2,485,920)(a)(e) | | | | | | 3,572,421 | | |
| | Cash and Other Assets Less Liabilities: 0.7% | | | | | | 23,881 | | |
| | Total Net Assets: 100% | | | | | $ | 3,596,302 | | |
41
Columbia Acorn International
>Statement of Investments (Unaudited), continued
>Notes to Statement of Investments (in thousands)
(a) At June 30, 2006, for federal income tax purposes cost of investments was $2,485,920 and net unrealized appreciation was $1,086,501 consisting of gross unrealized appreciation of $1,184,404 and gross unrealized depreciation of $97,903.
(b) Non-income producing security.
(c) An affiliate may include any company in which the Fund owns five percent or more of its outstanding voting shares. On June 30, 2006, the Fund held five percent or more of the outstanding voting securities of the following companies:
| Van Houtte | | | 5.91 | % | |
| RailPower Technologies | | | 5.16 | % | |
The aggregate cost and value of these companies at June 30, 2006, was $29,676 and $21,869 respectively. Investments in affiliate companies represent 0.61% of total net assets at June 30, 2006. Investment activity and income amounts relating to affiliates during the six months ended June 30, 2006 were as follows:
| Dividend Income | | $ | 58 | | |
| Net realized gain or loss | | | — | | |
| Change in unrealized gain or loss | | | (10,121 | ) | |
| Purchases | | | 18,278 | | |
| Proceeds from sales | | | 2 | | |
(d) Denotes a restricted security, which is subject to restrictions on resale under federal securities laws. At June 30, 2006, this security (in thousands) amounted to $4,377 which represents 0.12% of total net assets.
Additional information on this security is as follows:
| Security | | Acquisition
Dates | | Shares | | Cost (000) | | Value (000) | |
| RailPower Technologies 144A | | | 11/10/05 - 11/18/05 | | | | 2,036,000 | | | $ | 9,220 | | | $ | 4,377 | | |
(e) On June 30, 2006, the Fund's total investments were denominated in currencies as follows:
| Currency | | Value | | % of
Total
Net Assets | |
| Euro | | $ | 1,419,023 | | | | 39.5 | % | |
| Japanese Yen | | | 545,329 | | | | 15.2 | | |
| British Pounds | | | 295,353 | | | | 8.2 | | |
| Canadian Dollar | | | 188,705 | | | | 5.2 | | |
Other currencies less
than 5% of total net assets | | | 1,124,011 | | | | 31.2 | | |
| | | $ | 3,572,421 | | | | 99.3 | % | |
1-800-922-6769
42
Columbia Acorn International
>Portfolio Diversification
At June 30, 2006, the Fund's portfolio investments as a percent of net assets was diversified as follows:
| | | Value (000) | | Percent | |
| >Industrial Goods/Services | |
| Other Industrial Services | | $ | 167,388 | | | | 4.6 | % | |
| Specialty Chemicals | | | 160,483 | | | | 4.5 | | |
| Construction | | | 144,124 | | | | 4.0 | | |
| Industrial Materials | | | 117,554 | | | | 3.3 | | |
| Conglomerates | | | 97,230 | | | | 2.7 | | |
| Machinery | | | 82,867 | | | | 2.3 | | |
Outsourcing &
Training Services | | | 69,320 | | | | 1.9 | | |
| Electrical Components | | | 46,626 | | | | 1.3 | | |
| Steel | | | 31,171 | | | | 0.9 | | |
| Industrial Distribution | | | 29,581 | | | | 0.8 | | |
| | | | 946,344 | | | | 26.3 | | |
| >Consumer Goods/Services | |
| Retail | | | 110,323 | | | | 3.1 | | |
| Durables Goods | | | 100,385 | | | | 2.8 | | |
| Beverage | | | 85,808 | | | | 2.4 | | |
| Other Consumer Services | | | 84,757 | | | | 2.4 | | |
| Food | | | 58,589 | | | | 1.6 | | |
| Apparels | | | 54,924 | | | | 1.5 | | |
Consumer Goods
Distribution | | | 43,816 | | | | 1.2 | | |
| Gaming | | | 37,516 | | | | 1.0 | | |
| Leisure Products | | | 26,540 | | | | 0.7 | | |
| Nondurables | | | 26,202 | | | | 0.7 | | |
| Furniture & Textiles | | | 24,490 | | | | 0.7 | | |
| Entertainment | | | 23,763 | | | | 0.7 | | |
| Casinos | | | 18,078 | | | | 0.5 | | |
| Travel | | | 3,257 | | | | 0.1 | | |
| | | | 698,448 | | | | 19.4 | | |
| >Information | |
Computer Hardware &
Related Equipment | | | 83,898 | | | | 2.3 | | |
Business Information &
Marketing Services | | | 62,018 | | | | 1.7 | | |
| Financial Processors | | | 45,732 | | | | 1.3 | | |
Semiconductors &
Related Equipment | | | 35,900 | | | | 1.0 | | |
| Internet Related | | | 32,484 | | | | 0.9 | | |
| Satellite Broadcasting | | | 31,338 | | | | 0.9 | | |
| Television Programming | | | 31,051 | | | | 0.9 | | |
| Cable Television | | | 30,155 | | | | 0.8 | | |
| Television Broadcasting | | | 29,764 | | | | 0.8 | | |
| Business Software | | | 28,986 | | | | 0.8 | | |
| Telephone Services | | | 26,034 | | | | 0.7 | | |
| Computer Services | | | 15,201 | | | | 0.4 | | |
| Electronics Distribution | | | 13,352 | | | | 0.4 | | |
| Instrumentation | | | 12,665 | | | | 0.4 | | |
| Publishing | | | 5,485 | | | | 0.2 | | |
| | | | 484,063 | | | | 13.5 | | |
| | | Value (000) | | Percent | |
| >Finance | |
| Banks | | $ | 208,157 | | | | 5.8 | % | |
| Other Finance Companies | | | 121,350 | | | | 3.4 | | |
| Insurance | | | 54,849 | | | | 1.5 | | |
| Money Management | | | 48,722 | | | | 1.4 | | |
| Savings & Loans | | | 39,769 | | | | 1.1 | | |
| Credit Cards | | | 7,013 | | | | 0.2 | | |
| | | | 479,860 | | | | 13.4 | | |
| >Energy/Minerals | |
| Mining | | | 149,883 | | | | 4.2 | | |
| Oil Services | | | 116,170 | | | | 3.2 | | |
| Oil/Gas Producers | | | 65,071 | | | | 1.8 | | |
Refining/Marketing/
Distribution | | | 46,948 | | | | 1.3 | | |
| Agricultural Commodities | | | 44,301 | | | | 1.2 | | |
| Non-Ferrous Metals | | | 10,597 | | | | 0.3 | | |
| | | | 432,970 | | | | 12.0 | | |
| >Other Industries | |
| Transportation | | | 82,834 | | | | 2.3 | | |
| Real Estate | | | 75,076 | | | | 2.1 | | |
| Regulated Utilities | | | 57,594 | | | | 1.6 | | |
| | | | 215,504 | | | | 6.0 | | |
| >Health Care | |
| Services | | | 68,486 | | | | 1.9 | | |
| Medical Equipment | | | 53,244 | | | | 1.5 | | |
Hospital/Laboratory
Supplies | | | 40,027 | | | | 1.1 | | |
| Pharmaceuticals | | | 29,361 | | | | 0.8 | | |
| | | | 191,118 | | | | 5.3 | | |
| Total Common Stocks | | | 3,448,307 | | | | 95.9 | | |
| Short-Term Obligations | | | 124,114 | | | | 3.4 | | |
| Total Investments | | | 3,572,421 | | | | 99.3 | | |
Cash and Other Assets
Less Liabilities | | | 23,881 | | | | 0.7 | | |
| Total Net Assets | | $ | 3,596,302 | | | | 100.0 | % | |
43
Columbia Acorn USA
>Major Portfolio Changes in the Second Quarter (Unaudited)
| | | Number of Shares | |
| | | 03/31/06 | | 06/30/06 | |
| Additions | |
| Information | |
| Avid Technology | | | 454,900 | | | | 779,900 | | |
| Concur Technologies | | | 30,400 | | | | 230,400 | | |
| Gemstar-TV Guide International | | | 2,375,653 | | | | 2,580,000 | | |
| II VI | | | 435,000 | | | | 505,000 | | |
| Kronos | | | 500,650 | | | | 660,650 | | |
| Nice Systems (Israel) | | | 456,600 | | | | 566,600 | | |
| (includes the effect of a 2 for 1 stock split) | |
| Openwave Systems | | | 0 | | | | 100,000 | | |
| Progress Software | | | 118,600 | | | | 347,000 | | |
| Saga Communications | | | 98,100 | | | | 300,000 | | |
| Time Warner Telecom | | | 786,000 | | | | 1,086,000 | | |
| Trimble Navigation | | | 90,000 | | | | 125,000 | | |
| ValueClick | | | 285,000 | | | | 460,000 | | |
| webMethods | | | 83,500 | | | | 279,100 | | |
| Consumer Goods/Services | |
| Carter's | | | 80,200 | | | | 545,200 | | |
| (includes the effect of a 2 for 1 stock split) | |
| J Crew Group | | | 0 | | | | 125,000 | | |
| Oxford Industries | | | 529,200 | | | | 634,200 | | |
| Petco Animal Supplies | | | 428,000 | | | | 608,000 | | |
| Red Robin Gourmet Burgers | | | 68,800 | | | | 163,800 | | |
| True Religion Apparel | | | 205,000 | | | | 675,200 | | |
| Health Care | |
| LCA-Vision | | | 143,995 | | | | 210,000 | | |
| PSS World Medical | | | 150,000 | | | | 380,000 | | |
| United Surgical Partners | | | 150,000 | | | | 550,000 | | |
| Industrial Goods/Services | |
| Goodman Global | | | 0 | | | | 132,000 | | |
| Simpson Manufacturing | | | 0 | | | | 100,000 | | |
| Other Industries | |
| Highland Hospitality | | | 235,000 | | | | 350,000 | | |
| Energy/Minerals | |
| Atwood Oceanics | | | 0 | | | | 152,000 | | |
| Finance | |
| Delphi Financial Group | | | 29,000 | | | | 87,000 | | |
| (includes the effect of a 3 for 2 stock split) | |
| | | Number of Shares | |
| | | 03/31/06 | | 06/30/06 | |
| Sales | |
| Information | |
| CDW | | | 28,000 | | | | 0 | | |
| Getty Images | | | 104,800 | | | | 44,000 | | |
| Global Payments | | | 423,280 | | | | 393,280 | | |
| JDA Software | | | 723,800 | | | | 524,000 | | |
| MRO Software | | | 242,000 | | | | 57,950 | | |
| Plexus | | | 131,100 | | | | 105,000 | | |
| Tellabs | | | 1,610,000 | | | | 1,525,000 | | |
| Consumer Goods/Services | |
| Aeropostale | | | 200,000 | | | | 130,000 | | |
| Sports Authority | | | 105,000 | | | | 0 | | |
| Health Care | |
| Charles River Laboratories | | | 303,000 | | | | 258,000 | | |
| Incyte | | | 450,000 | | | | 0 | | |
| Neurocrine Biosciences | | | 192,000 | | | | 0 | | |
| Energy/Minerals | |
| Chicago Bridge & Iron | | | 585,000 | | | | 535,000 | | |
| Newpark Resources | | | 1,001,000 | | | | 350,900 | | |
| Pioneer Drilling | | | 266,800 | | | | 0 | | |
1-800-922-6769
44
Columbia Acorn USA
>Statement of Investments (Unaudited), June 30, 2006
| Number of Shares | | | | Value (000) | |
| | | | | Common Stocks: 91.5% | |
| Information: 31.2% | | | |
| | | >Business Software: 8.2% | |
| | 779,900 | | | Avid Technology (b) | | $ | 25,994 | | |
| | | | | Digital Nonlinear Editing Software & Systems | | | | | |
| | 660,650 | | | Kronos (b) | | | 23,922 | | |
| | | | | Labor Management Solutions | | | | | |
| | 455,200 | | | Micros Systems (b) | | | 19,883 | | |
| | | | | Information Systems for Restaurants & Hotels | | | | | |
| | 2,100,000 | | | Novell (b) | | | 13,923 | | |
| | | | | Directory, Operating System &
Identity Management Software | | | | | |
| | 347,000 | | | Progress Software (b) | | | 8,123 | | |
| | | | | Application Development Software | | | | | |
| | 405,800 | | | SSA Global Technologies (b) | | | 7,864 | | |
| | | | | Enterprise Resource Planning Software | | | | | |
| | 524,000 | | | JDA Software (b) | | | 7,352 | | |
| | | | | Application/Software & Services for Retailers | | | | | |
| | 327,200 | | | Parametric Technology (b) | | | 4,159 | | |
| | | | | Engineering Software & Services | | | | | |
| | 230,400 | | | Concur Technologies (b) | | | 3,564 | | |
| | | | | Web Enabled Cost & Expense
Management Software | | | | | |
| | 279,100 | | | webMethods (b) | | | 2,755 | | |
| | | | | Enterprise Applications Integration Tools | | | | | |
| | 59,300 | | | Witness Systems (b) | | | 1,196 | | |
| | | | | Customer Experience Management Software | | | | | |
| | 57,950 | | | MRO Software (b) | | | 1,163 | | |
| | | | | Enterprise Maintenance Software | | | | | |
| | | | 119,898 | | |
| | | >Mobile Communications: 5.9% | |
| | 1,005,000 | | | Crown Castle International (b) | | | 34,713 | | |
| | | | | Communications Towers | | | | | |
| | 356,605 | | | Alltel | | | 22,762 | | |
| | | | | Cellular & Wireline Telephone Services | | | | | |
| | 506,000 | | | American Tower (b) | | | 15,747 | | |
| | | | | Communications Towers in USA & Mexico | | | | | |
| | 1,633,000 | | | Dobson Communications (b) | | | 12,623 | | |
| | | | | Rural & Small City Cellular Telephone Services | | | | | |
| | 100,000 | | | Openwave Systems (b) | | | 1,154 | | |
| | | | | Internet Software for Mobile Devices | | | | | |
| | | | 86,999 | | |
| | | >Computer Hardware and
Related Equipment: 4.1% | |
| | 566,600 | | | Nice Systems (Israel) (b) | | | 15,944 | | |
| | | | | Audio & Video Recording Solutions | | | | | |
| | 505,000 | | | II VI (b) | | | 9,242 | | |
| | | | | Laser Components | | | | | |
| | 147,800 | | | Amphenol | | | 8,271 | | |
| | | | | Electronic Connectors | | | | | |
| | 584,000 | | | Symbol Technologies | | | 6,301 | | |
| | | | | Mobile Computers & Barcode Scanners | | | | | |
| | 260,000 | | | Intermec (b) | | | 5,964 | | |
| | | | | Bar Code & Wireless LAN Systems | | | | | |
| | 99,000 | | | Zebra Technologies (b) | | | 3,382 | | |
| | | | | Bar Code Printers | | | | | |
| | 100,000 | | | Belden CDT | | | 3,305 | | |
| | | | | Specialty Cable | | | | | |
| | 424,100 | | | Seachange International (b) | | | 2,952 | | |
| | | | | Systems for Video On Demand & Ad Insertion | | | | | |
| Number of Shares | | | | Value (000) | |
| | 40,000 | | | Rogers (b) | | $ | 2,254 | | |
| | | | | PCB Laminates & High-performance Foams | | | | | |
| | 90,000 | | | Netgear (b) | | | 1,949 | | |
| | | | | Networking Products for Small Business & Home | | | | | |
| | | | 59,564 | | |
| | | >Telecommunications Equipment: 1.7% | |
| | 1,525,000 | | | Tellabs (b) | | | 20,298 | | |
| | | | | Telecommunications Equipment | | | | | |
| | 310,000 | | | Andrew (b) | | | 2,746 | | |
| | | | | Wireless Infrastructure Equipment | | | | | |
| | 323,500 | | | Symmetricom (b) | | | 2,287 | | |
| | | | | Network Timing & Synchronization Devices | | | | | |
| | | | 25,331 | | |
| | | >Semiconductors and
Related Equipment: 1.5% | |
| | 1,050,000 | | | Entegris (b) | | | 10,006 | | |
| | | | | Semiconductor Wafer Shipping & Handling Products | | | | | |
| | 683,490 | | | Integrated Device Technology (b) | | | 9,692 | | |
| | | | | Communications Semiconductors | | | | | |
| | 70,000 | | | Littelfuse (b) | | | 2,407 | | |
| | | | | Little Fuses | | | | | |
| | | | 22,105 | | |
| | | >Financial Processors: 1.3% | |
| | 393,280 | | | Global Payments | | | 19,094 | | |
| | | | | Credit Card Processor | | | | | |
| | | >Business Information and
Marketing Services: 1.2% | |
| | 530,000 | | | Ceridian (b) | | | 12,953 | | |
| | | | | HR Services & Payment Processing | | | | | |
| | 44,000 | | | Getty Images (b) | | | 2,794 | | |
| | | | | Photographs for Publications & Electronic Media | | | | | |
| | 98,300 | | | Navigant Consulting (b) | | | 2,226 | | |
| | | | | Financial Consulting Firm | | | | | |
| | | | 17,973 | | |
| | | >Telephone Services: 1.2% | |
| | 1,086,000 | | | Time Warner Telecom (b) | | | 16,127 | | |
| | | | | Fiber Optic Telephone/Data Service Provider | | | | | |
| | 50,000 | | | Commonwealth Telephone | | | 1,658 | | |
| | | | | Rural Phone Franchises & Competing Telco | | | | | |
| | | | 17,785 | | |
| | | >Internet Related: 1.0% | |
| | 980,000 | | | CNET Networks (b) | | | 7,820 | | |
| | | | | Internet Advertising on Niche Websites | | | | | |
| | 460,000 | | | ValueClick (b) | | | 7,061 | | |
| | | | | Internet Advertising | | | | | |
| | | | 14,881 | | |
| | | >Instrumentation: 1.0% | |
| | 140,000 | | | Mettler Toledo (b) | | | 8,480 | | |
| | | | | Laboratory Equipment | | | | | |
| | 125,000 | | | Trimble Navigation (b) | | | 5,580 | | |
| | | | | GPS-Based Instruments | | | | | |
| | | | 14,060 | | |
45
Columbia Acorn USA
>Statement of Investments (Unaudited), continued
| Number of Shares | | | | Value (000) | |
| | | >Radio: 0.9% | |
| | 511,100 | | | Salem Communications (b) | | $ | 6,650 | | |
| | | | | Radio Stations for Religious Programming | | | | | |
| | 705,500 | | | Spanish Broadcasting System (b) | | | 3,605 | | |
| | | | | Spanish Language Radio Stations | | | | | |
| | 300,000 | | | Saga Communications (b) | | | 2,718 | | |
| | | | | Radio Stations in Small & Mid Sized Cities | | | | | |
| | | | 12,973 | | |
| | | >Computer Services: 0.8% | |
| | 1,005,500 | | | AnswerThink Consulting (b) | | | 4,052 | | |
| | | | | IT Integration & Best Practice Research | | | | | |
| | 786,000 | | | RCM Technologies (b)(c) | | | 3,946 | | |
| | | | | Technology & Engineering Services | | | | | |
| | 95,000 | | | SRA International (b) | | | 2,530 | | |
| | | | | Government IT Services | | | | | |
| | 235,000 | | | Igate Capital (b) | | | 1,502 | | |
| | | | | IT & BPO Outsourcing Services | | | | | |
| | | | 12,030 | | |
| | | >CATV: 0.8% | |
| | 2,580,000 | | | Gemstar-TV Guide International (b) | | | 9,082 | | |
| | | | | TV Program Guides & CATV Programming | | | | | |
| | 140,000 | | | Discovery Holding (b) | | | 2,048 | | |
| | | | | CATV Programming | | | | | |
| | | | 11,130 | | |
| | | >TV Broadcasting: 0.7% | |
| | 1,125,000 | | | Entravision Communications (b) | | | 9,641 | | |
| | | | | Spanish Language TV, Radio & Outdoor | | | | | |
| | 138,500 | | | Gray Television | | | 802 | | |
| | | | | Mid Market Affiliated TV Stations | | | | | |
| | | | 10,443 | | |
| | | >Gaming Equipment: 0.4% | |
| | 200,000 | | | Bally Technologies (b) | | | 3,294 | | |
| | | | | Slot Machines & Software | | | | | |
| | 98,500 | | | Shuffle Master (b) | | | 3,229 | | |
| | | | | Card Shufflers & Casino Games | | | | | |
| | | | 6,523 | | |
| | | >Television Programming: 0.3% | |
| | 460,000 | | | Lions Gate Entertainment (b) | | | 3,933 | | |
| | | | | Film & TV Studio | | | | | |
| | | >Contract Manufacturing: 0.2% | |
| | 105,000 | | | Plexus (b) | | | 3,592 | | |
| | | | | Electronic Manufacturing Services | | | | | |
| | | >Publishing: 0.0% | |
| | 13,850 | | | Triple Crown Media (b) | | | 120 | | |
| | | | | Newspapers, Paging &
Collegiate Sports Marketing | | | | | |
| | | Information: Total | | | 458,434 | | |
| Consumer Goods/Services: 17.5% | | | |
| | | >Retail: 5.9% | |
| | 398,000 | | | Abercrombie & Fitch | | | 22,061 | | |
| | | | | Teen Apparel Retailer | | | | | |
| | 486,250 | | | Christopher & Banks | | | 14,101 | | |
| | | | | Women's Apparel Retailer | | | | | |
| Number of Shares | | | | Value (000) | |
| | 608,000 | | | Petco Animal Supplies (b) | | $ | 12,421 | | |
| | | | | Pet Supplies & Services | | | | | |
| | 224,500 | | | Ann Taylor Stores (b) | | | 9,739 | | |
| | | | | Women's Apparel Retailer | | | | | |
| | 353,000 | | | Chico's FAS (b) | | | 9,524 | | |
| | | | | Women's Specialty Retail | | | | | |
| | 203,000 | | | Michaels Stores | | | 8,372 | | |
| | | | | Craft & Hobby Specialty Retailer | | | | | |
| | 130,000 | | | Aeropostale (b) | | | 3,756 | | |
| | | | | Mall-Based Teen Retailer | | | | | |
| | 125,000 | | | J Crew Group (b) | | | 3,431 | | |
| | | | | Multi-Channel Branded Retailer | | | | | |
| | 95,000 | | | Genesco (b) | | | 3,218 | | |
| | | | | Multi-Concept Branded Footwear Retailer | | | | | |
| | | | 86,623 | | |
| | | >Apparel: 3.9% | |
| | 634,200 | | | Oxford Industries | | | 24,994 | | |
| | | | | Branded & Private Label Apparel | | | | | |
| | 545,200 | | | Carter's (b) | | | 14,410 | | |
| | | | | Children's Branded Apparel | | | | | |
| | 675,200 | | | True Religion Apparel (b) | | | 11,951 | | |
| | | | | Premium Denim | | | | | |
| | 222,200 | | | Coach (b) | | | 6,644 | | |
| | | | | Designer & Retailer of Branded
Leather Accessories | | | | | |
| | | | 57,999 | | |
| | | >Other Consumer Services: 2.4% | |
| | 416,000 | �� | | ITT Educational Services (b) | | | 27,377 | | |
| | | | | Post-secondary Degree Programs | | | | | |
| | 387,700 | | | Central Parking | | | 6,203 | | |
| | | | | Owner, Operator, Manager of
Parking Lots & Garages | | | | | |
| | 60,000 | | | Weight Watchers | | | 2,453 | | |
| | | | | Weight Loss Programs | | | | | |
| | | | 36,033 | | |
| | | >Leisure Products: 1.9% | |
| | 301,300 | | | International Speedway Motors | | | 13,971 | | |
| | | | | Largest Motorsports Racetrack
Owner & Operator | | | | | |
| | 195,500 | | | Speedway Motorsports | | | 7,378 | | |
| | | | | Motorsport Racetrack Owner & Operator | | | | | |
| | 106,000 | | | Polaris Industries | | | 4,590 | | |
| | | | | Leisure Vehicles & Related Products | | | | | |
| | 195,000 | | | Callaway Golf | | | 2,533 | | |
| | | | | Premium Golf Clubs & Balls | | | | | |
| | | | 28,472 | | |
| | | >Nondurables: 1.5% | |
| | 496,400 | | | Scotts Miracle-Gro | | | 21,008 | | |
| | | | | Consumer Lawn & Garden Products | | | | | |
| | 100,000 | | | Prestige Brands (b) | | | 997 | | |
| | | | | OTC, Household & Personal Care Products | | | | | |
| | | | 22,005 | | |
| | | >Restaurants: 1.0% | |
| | 337,500 | | | Sonic (b) | | | 7,017 | | |
| | | | | Quick Service Restaurant | | | | | |
| | 163,800 | | | Red Robin Gourmet Burgers (b) | | | 6,971 | | |
| | | | | Casual Dining Restaurant | | | | | |
| | | | 13,988 | | |
1-800-922-6769
46
| Number of Shares | | | | Value (000) | |
| | | >Furniture and Textiles: 0.6% | |
| | 106,000 | | | HNI | | $ | 4,807 | | |
| | | | | Office Furniture & Fireplaces | | | | | |
| | 90,000 | | | Herman Miller | | | 2,319 | | |
| | | | | Office Furniture | | | | | |
| | 20,000 | | | Mohawk Industries (b) | | | 1,407 | | |
| | | | | Carpet & Flooring | | | | | |
| | | | 8,533 | | |
| | | >Travel: 0.2% | |
| | 45,000 | | | Vail Resorts (b) | | | 1,670 | | |
| | | | | Ski Resort Operator & Developer | | | | | |
| | 13,200 | | | Kerzner International (Bahamas) (b) | | | 1,046 | | |
| | | | | Destination Resorts & Casinos | | | | | |
| | | | 2,716 | | |
| | | >Other Durable Goods
(includes auto related): 0.1% | |
| | 40,000 | | | Cavco Industries (b) | | | 1,778 | | |
| | | | | Higher End Manufactured Homes | | | | | |
| | | Consumer Goods/Services: Total | | | 258,147 | | |
| Health Care: 12.6% | | | |
| | | >Health Care Services: 4.3% | |
| | 550,000 | | | United Surgical Partners (b) | | | 16,539 | | |
| | | | | Outpatient Surgery Center | | | | | |
| | 210,000 | | | LCA-Vision | | | 11,111 | | |
| | | | | Lasik Surgery Centers | | | | | |
| | 291,800 | | | Lincare Holdings (b) | | | 11,042 | | |
| | | | | Home Healthcare Services | | | | | |
| | 199,875 | | | Coventry Health Care (b) | | | 10,981 | | |
| | | | | HMO | | | | | |
| | 258,000 | | | Charles River Laboratories (b) | | | 9,494 | | |
| | | | | Pharmaceutical Research | | | | | |
| | 175,000 | | | PRA International (b) | | | 3,897 | | |
| | | | | Contract Research Organization | | | | | |
| | | | 63,064 | | |
| | | >Medical Equipment: 3.8% | |
| | 577,400 | | | Edwards Lifesciences (b) | | | 26,231 | | |
| | | | | Heart Valves | | | | | |
| | 380,000 | | | PSS World Medical (b) | | | 6,707 | | |
| | | | | Medical Supplies Distributor | | | | | |
| | 220,000 | | | Viasys Healthcare (b) | | | 5,632 | | |
| | | | | Respiratory & Neurology Medical Equipment | | | | | |
| | 105,000 | | | Vital Signs | | | 5,201 | | |
| | | | | Anesthesia, Respiratory & Sleep Products | | | | | |
| | 94,171 | | | Advanced Medical Optics (b) | | | 4,774 | | |
| | | | | Medical Devices for Eye Care | | | | | |
| | 165,000 | | | Intermagnetics General (b) | | | 4,452 | | |
| | | | | MRI Equipment | | | | | |
| | 104,000 | | | Arrow International | | | 3,418 | | |
| | | | | Disposable Catheters | | | | | |
| | | | 56,415 | | |
| | | >Hospital/Laboratory Supplies: 3.1% | |
| | 547,400 | | | Serologicals (b) | | | 17,210 | | |
| | | | | Blood Collection & Antibody Production | | | | | |
| | 270,700 | | | ICU Medical (b) | | | 11,434 | | |
| | | | | Intravenous Therapy Products | | | | | |
| Number of Shares | | | | Value (000) | |
| | 146,200 | | | Diagnostic Products | | $ | 8,504 | | |
| | | | | Immunodiagnostic Kits | | | | | |
| | 158,300 | | | Techne (b) | | | 8,061 | | |
| | | | | Cytokines, Antibodies, other
Reagents for Life Sciences | | | | | |
| | | | 45,209 | | |
| | | >Biotechnology/Drug Delivery: 1.4% | |
| | 360,000 | | | Nektar Therapeutics (b) | | | 6,602 | | |
| | | | | Drug Delivery Technologies | | | | | |
| | 293,000 | | | Intermune (b) | | | 4,820 | | |
| | | | | Drugs for Hepatitis C, Pulmonary
Fibrosis & Cancer | | | | | |
| | 455,000 | | | Ligand Pharmaceuticals (b) | | | 3,845 | | |
| | | | | Drugs for Pain, Cancer, Osteoporosis, Diabetes | | | | | |
| | 235,000 | | | Exelixis (b) | | | 2,362 | | |
| | | | | Treatments for Cancer & Metabolic Disorders | | | | | |
| | 235,000 | | | Decode Genetics (b) | | | 1,455 | | |
| | | | | Drugs for Heart Attack,
Asthma & Vascular Disease | | | | | |
| | 100,000 | | | Momenta Pharmaceuticals (b) | | | 1,271 | | |
| | | | | Sugar Analysis Technology for Drug Design | | | | | |
| | 375,000 | | | Locus Discovery, Series D. Pfd. (d) | | | 102 | | |
| | | | | High Throughput Rational Drug Design | | | | | |
| | 363,636 | | | Metabolex, Series F (d) | | | 84 | | |
| | | | | Drugs for Diabetes | | | | | |
| | | | 20,541 | | |
| | | Health Care: Total | | | 185,229 | | |
| Industrial Goods/Services: 11.1% | | | |
| | | >Machinery: 6.5% | |
| | 580,300 | | | Esco Technologies (b) | | | 31,017 | | |
| | | | | Automatic Electric Meter Readers | | | | | |
| | 673,600 | | | Pentair | | | 23,030 | | |
| | | | | Pumps, Water Treatment & Tools | | | | | |
| | 373,600 | | | Nordson | | | 18,373 | | |
| | | | | Dispensing Systems for Adhesives & Coatings | | | | | |
| | 319,800 | | | Donaldson | | | 10,832 | | |
| | | | | Industrial Air Filtration | | | | | |
| | 110,000 | | | Ametek | | | 5,212 | | |
| | | | | Aerospace/Industrial Instruments | | | | | |
| | 189,900 | | | K&F Industries Holdings (b) | | | 3,367 | | |
| | | | | Aircraft Wheels, Brakes & Fuel Tank Bladders | | | | | |
| | 132,000 | | | Goodman Global (b) | | | 2,004 | | |
| | | | | HVAC Equipment Manufacturer | | | | | |
| | 50,000 | | | Kaydon | | | 1,866 | | |
| | | | | Specialized Friction & Motion Control Products | | | | | |
| | | | 95,701 | | |
| | | >Electrical Components: 1.9% | |
| | 376,000 | | | Genlyte Group (b) | | | 27,233 | | |
| | | | | Commercial Lighting Fixtures | | | | | |
| | | >Construction: 0.9% | |
| | 204,050 | | | Florida Rock Industries | | | 10,135 | | |
| | | | | Aggregates & Concrete | | | | | |
| | 100,000 | | | Simpson Manufacturing | | | 3,605 | | |
| | | | | Wall Joint Maker | | | | | |
| | | | 13,740 | | |
47
Columbia Acorn USA
>Statement of Investments (Unaudited), continued
| Number of Shares | | | | Value (000) | |
| | | >Specialty Chemicals: 0.5% | |
| | 357,500 | | | Spartech | | $ | 8,080 | | |
| | | | | Plastics Distribution & Compounding | | | | | |
| | | >Outsourcing Services: 0.5% | |
| | 400,000 | | | Quanta Services (b) | | | 6,932 | | |
| | | | | Electrical & Telecom Construction Services | | | | | |
| | | >Waste Management: 0.5% | |
| | 187,250 | | | Waste Connections (b) | | | 6,816 | | |
| | | | | Solid Waste Management | | | | | |
| | | >Industrial Distribution: 0.2% | |
| | 113,000 | | | NuCo2 (b) | | | 2,717 | | |
| | | | | Bulk Co2 Gas Distribution to Restaurants | | | | | |
| | | >Other Industrial Services: 0.1% | |
| | 63,000 | | | UTI Worldwide | | | 1,589 | | |
| | | | | Global Logistics & Freight Forwarding | | | | | |
| | | Industrial Goods/Services: Total | | | 162,808 | | |
| Energy/Minerals: 9.4% | | | |
| | | >Oil Services: 4.9% | |
| | 401,700 | | | FMC Technologies (b) | | | 27,099 | | |
| | | | | Oil & Gas Well Head Manufacturer | | | | | |
| | 535,000 | | | Chicago Bridge & Iron | | | 12,920 | | |
| | | | | Engineering & Construction for
Petrochemicals & LNG | | | | | |
| | 311,000 | | | Pride International (b) | | | 9,713 | | |
| | | | | Offshore Drilling Contractor | | | | | |
| | 152,000 | | | Atwood Oceanics (b) | | | 7,539 | | |
| | | | | Contract Drilling | | | | | |
| | 355,000 | | | Hanover Compressor (b) | | | 6,667 | | |
| | | | | Natural Gas Compressor Rental & Fabrications | | | | | |
| | 76,500 | | | Carbo Ceramics | | | 3,758 | | |
| | | | | Natural Gas Well Stimulants | | | | | |
| | 155,000 | | | Key Energy Services (b) | | | 2,364 | | |
| | | | | Well Workover Services | | | | | |
| | 350,900 | | | Newpark Resources (b) | | | 2,158 | | |
| | | | | Drilling Fluid Services | | | | | |
| | 11,000 | | | Helmerich & Payne | | | 663 | | |
| | | | | Contract Driller | | | | | |
| | | | 72,881 | | |
| | | >Oil and Gas Producers: 3.6% | |
| | 525,000 | | | Quicksilver Resources (b) | | | 19,325 | | |
| | | | | Natural Gas & Coal Seam Gas Producer | | | | | |
| | 282,600 | | | Western Gas Resources | | | 16,914 | | |
| | | | | Oil & Coal Seam Gas Producer | | | | | |
| | 208,400 | | | Southwestern Energy (b) | | | 6,494 | | |
| | | | | Natural Gas Producer | | | | | |
| | 450,000 | | | Vaalco Energy (b) | | | 4,392 | | |
| | | | | Oil & Gas Producer | | | | | |
| | 111,200 | | | Equitable Resources | | | 3,725 | | |
| | | | | Natural Gas Producer & Utility | | | | | |
| | 92,000 | | | McMoran Exploration (b) | | | 1,619 | | |
| | | | | Natural Gas Producer & Developer | | | | | |
| | | | 52,469 | | |
| Number of Shares | | | | Value (000) | |
| | | >Other Resources: 0.5% | |
| | 242,000 | | | Layne Christensen (b) | | $ | 6,861 | | |
| | | | | Oil & Gas Producer/Engineering &
Construction/Contract Drilling | | | | | |
| | | >Oil Refining/Marketing/Distribution: 0.4% | |
| | 155,000 | | | Atmos Energy | | | 4,326 | | |
| | | | | Dallas Natural Gas Utility | | | | | |
| | 50,250 | | | Oneok | | | 1,710 | | |
| | | | | Natural Gas Distribution, Pipeline,
Processing & Trading | | | | | |
| | | | 6,036 | | |
| | | Energy/Minerals: Total | | | 138,247 | | |
| Finance: 7.5% | | | |
| | | >Finance Companies: 3.4% | |
| | 1,121,500 | | | AmeriCredit (b) | | | 31,312 | | |
| | | | | Auto Lending | | | | | |
| | 520,200 | | | World Acceptance (b) | | | 18,478 | | |
| | | | | Personal Loans | | | | | |
| | | | 49,790 | | |
| | | >Insurance: 2.4% | |
| | 664,500 | | | HCC Insurance Holdings | | | 19,563 | | |
| | | | | Specialty Insurance | | | | | |
| | 14,000 | | | Markel (b) | | | 4,858 | | |
| | | | | Specialty Insurance | | | | | |
| | 105,000 | | | Philadelphia Consolidated Holding (b) | | | 3,188 | | |
| | | | | Specialty Insurance | | | | | |
| | 87,000 | | | Delphi Financial Group | | | 3,163 | | |
| | | | | Group Employee Benefit Products & Services | | | | | |
| | 75,000 | | | Endurance Specialty Holdings | | | 2,400 | | |
| | | | | Commercial Lines Insurance/Reinsurance | | | | | |
| | 91,000 | | | United America Indemnity (b) | | | 1,896 | | |
| | | | | Specialty Insurance | | | | | |
| | 1,600 | | | Eastern Insurance Holdings (b) | | | 20 | | |
| | | | | Workers Comp & Specialty Insurance | | | | | |
| | | | 35,088 | | |
| | | >Banks: 1.4% | |
| | 239,500 | | | TCF Financial | | | 6,335 | | |
| | | | | Great Lakes Bank | | | | | |
| | 212,756 | | | Chittenden | | | 5,500 | | |
| | | | | Vermont & Western Massachusetts Banks | | | | | |
| | 145,000 | | | Greene County Bancshares | | | 4,489 | | |
| | | | | Tennessee Bank | | | | | |
| | 94,000 | | | Associated Banc-Corp | | | 2,964 | | |
| | | | | Midwest Bank | | | | | |
| | 20,000 | | | First Financial Bankshares | | | 731 | | |
| | | | | West Texas Bank | | | | | |
| | 30,000 | | | West Bancorporation | | | 560 | | |
| | | | | Des Moines Commercial Bank | | | | | |
| | | | 20,579 | | |
| | | >Savings and Loans: 0.3% | |
| | 141,400 | | | Anchor Bancorp Wisconsin | | | 4,266 | | |
| | | | | Wisconsin Thrift | | | | | |
| | | Finance: Total | | | 109,723 | | |
1-800-922-6769
48
Number of Shares
or Principal Amount | | | | Value (000) | |
| Other Industries: 2.2% | | | |
| | | >Real Estate: 1.6% | |
| | 560,000 | | | DiamondRock Hospitality | | $ | 8,293 | | |
| | | | | Hotel Owner | | | | | |
| | 350,000 | | | Highland Hospitality | | | 4,928 | | |
| | | | | Hotel Owner | | | | | |
| | 77,500 | | | Gaylord Entertainment (b) | | | 3,382 | | |
| | | | | Convention Hotels | | | | | |
| | 150,000 | | | Kite Realty Group | | | 2,339 | | |
| | | | | Community Shopping Centers | | | | | |
| | 90,000 | | | American Campus Communities | | | 2,237 | | |
| | | | | Student Housing | | | | | |
| | 110,500 | | | Crescent Real Estate Equities | | | 2,051 | | |
| | | | | Class 'A' Office Buildings | | | | | |
| | | | 23,230 | | |
| | | >Transportation/Regulated Utilities: 0.6% | |
| | 424,720 | | | Heartland Express | | | 7,598 | | |
| | | | | Regional Trucker | | | | | |
| | 97,500 | | | Northeast Utilities | | | 2,015 | | |
| | | | | Utility | | | | | |
| | | | 9,613 | | |
| | | | | Other Industries: Total | | | 32,843 | | |
| | | | | Total Common Stocks: 91.5%
(Cost: $963,933) | | | 1,345,431
| | |
| Short-Term Obligations: 8.6% | | | |
| $ | 65,000 | | | Conocophillips
5.30% Due 7/03/06 - 7/06/06 | | | 64,965 | | |
| | 32,000 | | | Countrywide Financial Funding
5.30% Due 7/03/06 | | | 31,972 | | |
| | 26,000 | | | Verizon Global Funding
5.30% Due 7/05/06 | | | 25,985 | | |
| | 2,797 | | | Repurchase Agreement with
State Street Bank & Trust
dated 6/30/06, due 7/3/06
at 4.93% collateralized by
Federal Home Loan Bank,
maturing 5/22/08
market value $2,855
(repurchase proceeds: $2,798) | | | 2,797 | | |
| | | | | (Amortized Cost: $125,719) | | | 125,719 | | |
| | Total Investments: 100.1%
(Cost: $1,089,652)(a) | | | | | | 1,471,150 | | |
| | Cash and Other Assets Less Liabilities: (0.1%) | | | | | | (817 | ) | |
| | Total Net Assets: 100% | | | | | $ | 1,470,333 | | |
49
Columbia Acorn USA
>Statement of Investments (Unaudited), continued
>Notes to Statement of Investments (in thousands)
(a) At June 30, 2006, for federal income tax purposes cost of investments was $1,089,652 and net unrealized appreciation was $381,498 consisting of gross unrealized appreciation of $445,543 and gross unrealized depreciation of $64,045.
(b) Non-income producing security.
(c) An affiliate may include any company in which the Fund owns five percent or more of its outstanding voting shares. On June 30, 2006, the Fund held five percent or more of the outstanding voting securities of the following companies:
The aggregate cost and value of this company at June 30, 2006, was $5,636 and $3,946 respectively. Investments in affiliate companies represent 0.27% of total net assets at June 30, 2006. Investment activity and income amounts relating to affiliates during the six months ended June 30, 2006 were as follows:
| Dividend Income | | $ | — | | |
| Net realized gain or loss | | | — | | |
| Change in unrealized gain or loss | | | (63 | ) | |
| Purchases | | | — | | |
| Proceeds from sales | | | — | | |
(d) Denotes a restricted security, which is subject to restrictions on resale under federal securities laws. These securities are valued in good faith by the Board of Trustees. At June 30, 2006, these securities (in thousands) amounted to $186 which represents 0.01% of total net assets.
Additional information on these securities is as follows:
| Security | | Acquisition
Dates | | Shares | | Cost (000) | | Value (000) | |
| Locus Discovery, Series D, Pfd. | | 09/05/01 | | | 375,000 | | | $ | 1,500 | | | $ | 102 | | |
| Metabolex, Series F | | 05/11/00 | | | 363,636 | | | | 2,000 | | | | 84 | | |
| | | | | | | $ | 3,500 | | | $ | 186 | | |
1-800-922-6769
50
Columbia Acorn International Select
>Major Portfolio Changes in the Second Quarter (Unaudited)
| | | Number of Shares | |
| | | 03/31/06 | | 06/30/06 | |
| Additions | |
| Europe | |
| >Ireland | |
| Anglo Irish Bank | | | 174,000 | | | | 265,000 | | |
| Bank of Ireland | | | 245,000 | | | | 280,000 | | |
| C&C Group | | | 170,000 | | | | 500,000 | | |
| >Switzerland | |
| Synthes | | | 25,000 | | | | 30,000 | | |
| >Germany | |
| Depfa Bank | | | 185,000 | | | | 215,000 | | |
| >Sweden | |
| Hexagon | | | 0 | | | | 32,000 | | |
| Tele2 | | | 160,000 | | | | 255,000 | | |
| >Czech Republic | |
| Komercni Banka | | | 10,300 | | | | 15,300 | | |
| >Netherlands | |
| USG People | | | 0 | | | | 17,000 | | |
| Asia | |
| >Japan | |
| Hoya | | | 90,000 | | | | 110,000 | | |
| Kansai Paint | | | 80,000 | | | | 280,000 | | |
| Other Countries | |
| >Canada | |
| Alliance Atlantis Communication | | | 0 | | | | 72,000 | | |
| Potash | | | 30,700 | | | | 35,000 | | |
| >United States | |
| Atwood Oceanics | | | 0 | | | | 60,800 | | |
| | | Number of Shares | |
| | | 03/31/06 | | 06/30/06 | |
| Sales | |
| Europe | |
| >Switzerland | |
| BKW Energie | | | 12,100 | | | | 2,500 | | |
| >Sweden | |
| Gambro | | | 320,200 | | | | 0 | | |
| >Norway | |
| Orkla | | | 47,000 | | | | 0 | | |
| Asia | |
| >Japan | |
| Ito En | | | 76,000 | | | | 36,000 | | |
| Shimano | | | 130,000 | | | | 5,600 | | |
| Ushio | | | 145,000 | | | | 85,000 | | |
| Other Countries | |
| >Canada | |
| Kinross Gold | | | 311,000 | | | | 111,000 | | |
| Talisman Energy | | | 78,000 | | | | 0 | | |
| (includes the effect of a 3 for 1 stock split) | |
| Latin America | |
| >Argentina | |
| Tenaris | | | 29,500 | | | | 0 | | |
| (includes the effect of a 5 for 1 stock split) | |
51
Columbia Acorn International Select
>Statement of Investments (Unaudited), June 30, 2006
| Number of Shares | | | | Value (000) | |
| | | Common Stocks: 93.6% | |
| Europe: 55.0% | | | |
| | | >Ireland: 15.9% | |
| | 280,000 | | | Bank of Ireland | | $ | 5,012 | | |
| | | | | Irish Commercial Bank | | | | | |
| | 500,000 | | | C&C Group | | | 4,342 | | |
| | | | | Beverage Company | | | | | |
| | 265,000 | | | Anglo Irish Bank | | | 4,129 | | |
| | | | | Small Business & Middle Market Banking | | | | | |
| | 220,000 | | | IAWS Group | | | 3,879 | | |
| | | | | Baked Goods | | | | | |
| | 125,000 | | | Grafton Group | | | 1,574 | | |
| | | | | Builders Materials Wholesaling &
Do-it-yourself Retailing | | | | | |
| | | | 18,936 | | |
| | | >Switzerland: 10.6% | |
| | 30,000 | | | Synthes | | | 3,614 | | |
| | | | | Products for Orthopedic Surgery | | | | | |
| | 42,500 | | | Kuehne & Nagel | | | 3,094 | | |
| | | | | Freight Forwarding/Logistics | | | | | |
| | 2,400 | | | Geberit | | | 2,773 | | |
| | | | | Plumbing Supplies | | | | | |
| | 10,250 | | | Swatch Group | | | 1,729 | | |
| | | | | Watch & Electronics Manufacturer | | | | | |
| | 23,000 | | | Schindler | | | 1,191 | | |
| | | | | Elevator Manufacturer & Service Provider | | | | | |
| | 2,500 | | | BKW Energie | | | 219 | | |
| | | | | Electric Utility | | | | | |
| | | | 12,620 | | |
| | | >France: 7.4% | |
| | 24,200 | | | Neopost | | | 2,755 | | |
| | | | | Postage Meter Machines | | | | | |
| | 182,300 | | | SES Global | | | 2,597 | | |
| | | | | Satellite Broadcasting Services | | | | | |
| | 20,000 | | | Essilor International | | | 2,011 | | |
| | | | | Eyeglass Lenses | | | | | |
| | 18,000 | | | Imerys | | | 1,438 | | |
| | | | | Industrial Minerals Producer | | | | | |
| | | | 8,801 | | |
| | | >Germany: 6.4% | |
| | 215,000 | | | Depfa Bank | | | 3,564 | | |
| | | | | Investment Banker to Public Authorities | | | | | |
| | 3,300 | | | Porsche | | | 3,184 | | |
| | | | | Specialty Automobile Manufacturer | | | | | |
| | 6,000 | | | Deutsche Boerse | | | 816 | | |
| | | | | Trading, Clearing, Settlement Services
for Financial Markets | | | | | |
| | | | 7,564 | | |
| | | >United Kingdom: 3.3% | |
| | 215,000 | | | Northern Rock | | | 3,971 | | |
| | | | | Lowest Cost Mortgage Bank in UK | | | | | |
| | | >Sweden: 3.1% | |
| | 255,000 | | | Tele2 | | | 2,573 | | |
| | | | | European Mobile Operator & Services Reseller | | | | | |
| | 32,000 | | | Hexagon | | | 1,165 | | |
| | | | | Measurement Equipment & Polymers | | | | | |
| | | | 3,738 | | |
| Number of Shares | | | | Value (000) | |
| | | >Denmark: 2.8% | |
| | 50,000 | | | Novozymes | | $ | 3,370 | | |
| | | | | Industrial Enzymes | | | | | |
| | | >Spain: 2.5% | |
| | 88,000 | | | Red Electrica | | | 3,034 | | |
| | | | | Spanish Power Grid | | | | | |
| | | >Czech Republic: 1.9% | |
| | 15,300 | | | Komercni Banka | | | 2,239 | | |
| | | | | Leading Czech Universal Bank | | | | | |
| | | >Netherlands: 1.1% | |
| | 17,000 | | | USG People | | | 1,301 | | |
| | | | | Temporary Staffing Services | | | | | |
| | | Europe: Total | | | 65,574 | | |
| Asia: 28.2% | | | |
| | | >Japan: 24.1% | |
| | 76,000 | | | Daito Trust Construction | | | 4,226 | | |
| | | | | Apartment Builder | | | | | |
| | 110,000 | | | Hoya | | | 3,932 | | |
| | | | | Opto-Electrical Components &
Eyeglass Lenses | | | | | |
| | 5,299 | | | Jupiter Telecommunications (b) | | | 3,673 | | |
| | | | | Largest Cable Service Provider in Japan | | | | | |
| | 55,000 | | | Aeon Mall | | | 2,308 | | |
| | | | | Suburban Shopping Mall Developer,
Owner & Operator | | | | | |
| | 280,000 | | | Kansai Paint | | | 2,240 | | |
| | | | | Paint Producer in Japan, India,
China & Southeast Asia | | | | | |
| | 85,000 | | | JSR | | | 2,157 | | |
| | | | | Films & Chemicals for LCD
Screens & Electronics | | | | | |
| | 30,000 | | | USS | | | 1,986 | | |
| | | | | Used Car Auctioneer | | | | | |
| | 1,800 | | | Sparx Asset Management | | | 1,881 | | |
| | | | | Fund Management | | | | | |
| | 420 | | | Kenedix | | | 1,819 | | |
| | | | | Real Estate Investment Management | | | | | |
| | 85,000 | | | Ushio | | | 1,800 | | |
| | | | | Industrial Light Sources | | | | | |
| | 36,000 | | | Ito En | | | 1,321 | | |
| | | | | Bottled Tea & Other Beverages | | | | | |
| | 199,800 | | | Hiroshima Bank | | | 1,222 | | |
| | | | | Regional Bank | | | | | |
| | 5,600 | | | Shimano | | | 172 | | |
| | | | | Bicycle Components & Fishing Tackle | | | | | |
| | | | 28,737 | | |
| | | >Hong Kong: 3.3% | |
| | 610,000 | | | Hong Kong Exchanges and Clearing | | | 3,920 | | |
| | | | | Hong Kong Equity & Derivatives
Market Operator | | | | | |
1-800-922-6769
52
Number of Shares
or Principal Amount | | | | Value (000) | |
| | | >Singapore: 0.8% | |
| | 1,000,000 | | | Comfort Del Gro | | $ | 964 | | |
| | | | | Taxi & Mass Transit Service | | | | | |
| | | | | Asia: Total | | | 33,621 | | |
| Other Countries: 10.4% | | | |
| | | >Canada: 6.8% | |
| | 35,000 | | | Potash | | | 3,009 | | |
| | | | | World's Largest Producer of Potash | | | | | |
| | 72,000 | | | Alliance Atlantis Communication (b) | | | 2,109 | | |
| | | | | CATV Channels, TV/Movie Production/Distribution | | | | | |
| | 100,000 | | | Rona (b) | | | 1,796 | | |
| | | | | Leading Canadian DIY Retailer | | | | | |
| | 111,000 | | | Kinross Gold (b) | | | 1,210 | | |
| | | | | Gold Mining | | | | | |
| | | | 8,124 | | |
| | | >United States: 2.6% | |
| | 60,800 | | | Atwood Oceanics (b) | | | 3,016 | | |
| | | | | Contract Drilling | | | | | |
| | | >South Africa: 1.0% | |
| | 6,500 | | | Impala Platinum Holdings | | | 1,195 | | |
| | | | | Platinum Group Metals Mining & Refining | | | | | |
| | | | | Other Countries: Total | | | 12,335 | | |
| | | | | Total Common Stocks: 93.6%
(Cost: $90,604) | | | 111,530
| | |
| Short-Term Obligation: 6.2% | | | |
| $ | 7,418 | | | Repurchase Agreement with
State Street Bank & Trust
dated 6/30/06, due 7/03/06
at 4.93% collateralized by
Federal Home Loan Bank,
maturing 5/22/08
market value $7,570
(repurchase proceeds: $7,421) | | | 7,418 | | |
| | | | | (Amortized Cost: $7,418) | | | | | |
| | Total Investments: 99.8%
(Cost: $98,022)(a)(c) | | | | | | 118,948 | | |
| | Cash and Other Assets Less Liabilities: 0.2% | | | | | | 230 | | |
| | Total Net Assets: 100% | | | | | $ | 119,178 | | |
53
Columbia Acorn International Select
>Statement of Investments (Unaudited), continued
>Notes to Statement of Investments (in thousands)
(a) At June 30, 2006, for federal income tax purposes cost of investments was $98,022 and net unrealized appreciation was $20,926 consisting of gross unrealized appreciation of $24,229 and gross unrealized depreciation of $3,303.
(b) Non-income producing security.
(c) On June 30, 2006, the Fund's total investments were denominated in currencies as follows:
| Currency | | Value | | % of
Total
Net Assets | |
| Euro | | $ | 39,637 | | | | 33.3 | % | |
| Japanese Yen | | | 28,737 | | | | 24.1 | | |
| US Dollar | | | 13,443 | | | | 11.3 | | |
| Swiss Franc | | | 12,620 | | | | 10.6 | | |
Other currencies less
than 5% of total
net assets | | | 24,511 | | | | 20.5 | | |
| | | $ | 118,948 | | | | 99.8 | % | |
1-800-922-6769
54
Columbia Acorn International Select
>Portfolio Diversification
At June 30, 2006, the Fund's portfolio investments as a percent of net assets was diversified as follows:
| | | Value (000) | | Percent | |
| >Industrial Goods/Services | |
| Specialty Chemicals | | $ | 7,768 | | | | 6.5 | % | |
| Construction | | | 6,999 | | | | 5.9 | | |
| Other Industrial Services | | | 4,285 | | | | 3.6 | | |
| Machinery | | | 2,755 | | | | 2.3 | | |
| Electrical Components | | | 1,800 | | | | 1.5 | | |
| Industrial Distribution | | | 1,573 | | | | 1.3 | | |
| Industrial Materials | | | 1,438 | | | | 1.2 | | |
| Outsourcing Services | | | 1,301 | | | | 1.1 | | |
| Conglomerates | | | 1,165 | | | | 1.0 | | |
| | | | 29,084 | | | | 24.4 | | |
| >Finance | |
| Banks | | | 20,136 | | | | 16.9 | | |
| Money Management | | | 1,881 | | | | 1.6 | | |
| | | | 22,017 | | | | 18.5 | | |
| >Consumer Goods/Services | |
| Beverage | | | 5,663 | | | | 4.8 | | |
| Durables Goods | | | 5,085 | | | | 4.3 | | |
| Retail | | | 4,104 | | | | 3.4 | | |
| Food | | | 3,879 | | | | 3.2 | | |
| Consumer Goods Distribution | | | 1,986 | | | | 1.7 | | |
| | | | 20,717 | | | | 17.4 | | |
| >Information | |
| Financial Processors | | | 4,736 | | | | 4.0 | | |
Semiconductors &
Related Equipment | | | 3,933 | | | | 3.3 | | |
| Cable Television | | | 3,673 | | | | 3.1 | | |
| Satellite Broadcasting | | | 2,597 | | | | 2.2 | | |
| Telephone Services | | | 2,573 | | | | 2.1 | | |
| Television Programming | | | 2,109 | | | | 1.7 | | |
| | | | 19,621 | | | | 16.4 | | |
| | | Value (000) | | Percent | |
| >Energy/Minerals | |
| Mining | | $ | 5,414 | | | | 4.6 | % | |
| Oil/Gas Producers | | | 3,015 | | | | 2.5 | | |
| | | | 8,429 | | | | 7.1 | | |
| >Other Industries | |
| Regulated Utilities | | | 3,253 | | | | 2.8 | | |
| Real Estate | | | 1,819 | | | | 1.5 | | |
| Transportation | | | 964 | | | | 0.8 | | |
| | | | 6,036 | | | | 5.1 | | |
| >Health Care | |
| Medical Equipment | | | 5,626 | | | | 4.7 | | |
| | | | 5,626 | | | | 4.7 | | |
| Total Common Stocks | | | 111,530 | | | | 93.6 | | |
| Short-Term Obligation | | | 7,418 | | | | 6.2 | | |
| Total Investments | | | 118,948 | | | | 99.8 | | |
Cash and Other Assets
Less Liabilities | | | 230 | | | | 0.2 | | |
| Total Net Assets | | $ | 119,178 | | | | 100.0 | % | |
55
Columbia Acorn Select
>Major Portfolio Changes in the Second Quarter (Unaudited)
| | | Number of Shares | |
| | | 03/31/06 | | 06/30/06 | |
| Additions | |
| Consumer Goods/Services | |
| Coach | | | 1,400,000 | | | | 1,506,000 | | |
| Expedia | | | 1,200,000 | | | | 3,300,000 | | |
| Petco Animal Supplies | | | 1,300,000 | | | | 1,350,000 | | |
| Information | |
| Avid Technology | | | 1,600,000 | | | | 1,650,000 | | |
| Liberty Global, Series A | | | 1,000,000 | | | | 1,139,734 | | |
| Novell | | | 5,000,000 | | | | 5,500,000 | | |
| Sanmina-SCI | | | 0 | | | | 4,000,000 | | |
| Tellabs | | | 9,600,000 | | | | 9,750,000 | | |
| Industrial Goods/Services | |
| Worthington Industries | | | 2,150,000 | | | | 2,250,000 | | |
| Energy/Minerals | |
| Potash (Canada) | | | 400,000 | | | | 480,000 | | |
| UrAsia Energy (Canada) | | | 1,900,000 | | | | 2,800,000 | | |
| Finance | |
| Janus Capital Group | | | 2,500,000 | | | | 3,200,000 | | |
| | | Number of Shares | |
| | | 03/31/06 | | 06/30/06 | |
| Sales | |
| Information | |
| IAC/Interactive Corp | | | 544,000 | | | | 0 | | |
| Liberty Global, Series C | | | 3,400,000 | | | | 3,232,702 | | |
| Tektronix | | | 1,400,000 | | | | 0 | | |
| Tribune Company | | | 803,700 | | | | 702,900 | | |
| Finance | |
| Associated Banc-Corp | | | 750,000 | | | | 0 | | |
| Health Care | |
| Coventry Health Care | | | 900,000 | | | | 0 | | |
1-800-922-6769
56
Columbia Acorn Select
>Statement of Investments (Unaudited), June 30, 2006
| Number of Shares | | | | Value (000) | |
| | | Common Stocks: 94.6% | |
| Consumer Goods/Services: 29.4% | | | |
| | | >Consumer Services: 11.8% | |
| | 1,625,000 | | | ITT Educational Services (b) | | $ | 106,941 | | |
| | | | | Post-secondary Degree Programs | | | | | |
| | 3,500,000 | | | Safeway | | | 91,000 | | |
| | | | | Supermarkets | | | | | |
| | 728,000 | | | Weight Watchers | | | 29,768 | | |
| | | | | Weight Loss Programs | | | | | |
| | | | 227,709 | | |
| | | >Retail: 7.9% | |
| | 1,400,000 | | | Abercrombie & Fitch | | | 77,602 | | |
| | | | | Teen Apparel Retailer | | | | | �� |
| | 845,000 | | | Costco Wholesale | | | 48,275 | | |
| | | | | Warehouse Superstores | | | | | |
| | 1,350,000 | | | Petco Animal Supplies (b) | | | 27,580 | | |
| | | | | Pet Supplies & Services | | | | | |
| | | | 153,457 | | |
| | | >Leisure Products: 4.9% | |
| | 1,100,000 | | | Harley-Davidson | | | 60,379 | | |
| | | | | Motorcycles & Related Merchandise | | | | | |
| | 740,000 | | | International Speedway Motors | | | 34,314 | | |
| | | | | Largest Motorsports Racetrack
Owner & Operator | | | | | |
| | | | 94,693 | | |
| | | >Travel: 2.5% | |
| | 3,300,000 | | | Expedia (b) | | | 49,401 | | |
| | | | | Online Travel Services Company | | | | | |
| | | >Apparel: 2.3% | |
| | 1,506,000 | | | Coach (b) | | | 45,029 | | |
| | | | | Designer & Retailer of Branded
Leather Accessories | | | | | |
| | | | | Consumer Goods/Services: Total | | | 570,289 | | |
| Information: 29.0% | | | |
| | | >Telecommunications Equipment: 6.7% | |
| | 9,750,000 | | | Tellabs (b) | | | 129,773 | | |
| | | | | Telecommunications Equipment | | | | | |
| | | >CATV: 6.6% | |
| | 3,232,702 | | | Liberty Global, Series C (b) | | | 66,497 | | |
| | 1,139,734 | | | Liberty Global, Series A (b) | | | 24,504 | | |
| | | | | CATV Holding Company | | | | | |
| | 2,500,000 | | | Discovery Holding (b) | | | 36,575 | | |
| | | | | CATV Programming | | | | | |
| | | | 127,576 | | |
| | | >Business Software: 4.7% | |
| | 1,650,000 | | | Avid Technology (b) | | | 54,995 | | |
| | | | | Digital Nonlinear Editing Software & Systems | | | | | |
| | 5,500,000 | | | Novell (b) | | | 36,465 | | |
| | | | | Directory, Operating System &
Identity Management Software | | | | | |
| | | | 91,460 | | |
| | | >Mobile Communications: 3.7% | |
| | 2,300,000 | | | American Tower (b) | | | 71,575 | | |
| | | | | Communications Towers in USA & Mexico | | | | | |
| Number of Shares | | | | Value (000) | |
| | | >Internet Related: 3.0% | |
| | 9,600,000 | | | Skillsoft Publishing (b)(c) | | $ | 58,752 | | |
| | | | | Web-based Learning Solutions (E-Learning) | | | | | |
| | | >Financial Processors: 1.8% | |
| | 729,500 | | | SEI Investments | | | 35,658 | | |
| | | | | Mutual Fund Administration &
Investment Management | | | | | |
| | | >Publishing: 1.2% | |
| | 702,900 | | | Tribune Company | | | 22,795 | | |
| | | | | Newspapers & TV Stations | | | | | |
| | | >Contract Manufacturing: 1.0% | |
| | 4,000,000 | | | Sanmina-SCI (b) | | | 18,400 | | |
| | | | | Backplane & Electronic Manufacturing Services | | | | | |
| | | >Computer Services: 0.3% | |
| | 1,367,000 | | | AnswerThink Consulting (b) | | | 5,509 | | |
| | | | | IT Integration & Best Practice Research | | | | | |
| | | | | Information: Total | | | 561,498 | | |
| Industrial Goods/Services: 13.7% | | | |
| | | >Other Industrial Services: 3.8% | |
| | 1,322,000 | | | Expeditors International of Washington | | | 74,045 | | |
| | | | | International Freight Forwarder | | | | | |
| | | >Outsourcing Services: 2.7% | |
| | 3,030,000 | | | Quanta Services (b) | | | 52,510 | | |
| | | | | Electrical & Telecom Construction Services | | | | | |
| | | >Steel: 2.5% | |
| | 2,250,000 | | | Worthington Industries | | | 47,138 | | |
| | | | | Steel Processing | | | | | |
| | | >Waste Management: 2.4% | |
| | 1,300,000 | | | Waste Management | | | 46,644 | | |
| | | | | U.S. Garbage Collection & Disposal | | | | | |
| | | >Industrial Materials: 2.3% | |
| | 1,125,000 | | | Mine Safety Appliances | | | 45,225 | | |
| | | | | Safety Equipment | | | | | |
| | | | | Industrial Goods/Services: Total | | | 265,562 | | |
| Energy/Minerals: 11.4% | | | |
| | | >Mining: 6.2% | |
| | 31,500,000 | | | UrAsia Energy (Canada) (b)(c) | | | 79,011 | | |
| | | | | Uranium Mining in Kazakhstan | | | | | |
| | 480,000 | | | Potash (Canada) | | | 41,266 | | |
| | | | | World's Largest Producer of Potash | | | | | |
| | | | 120,277 | | |
57
Columbia Acorn Select
>Statement of Investments (Unaudited), continued
Number of Shares
or Principal Amount | | | | Value (000) | |
| | | >Oil Services: 5.2% | |
| | 1,950,000 | | | Pride International (b) | | $ | 60,899 | | |
| | | | | Contract Drilling | | | | | |
| | 600,000 | | | FMC Technologies (b) | | | 40,475 | | |
| | | | | Oil & Gas Well Head Manufacturer | | | | | |
| | | | 101,374 | | |
| | | | | Energy/Minerals: Total | | | 221,651 | | |
| Finance: 9.3% | | | |
| | | >Money Management: 5.2% | |
| | 3,200,000 | | | Janus Capital Group | | | 57,280 | | |
| | | | | Manages Mutual Funds | | | | | |
| | 975,000 | | | Nuveen Investments | | | 41,974 | | |
| | | | | Specialty Mutual Funds | | | | | |
| | | | 99,254 | | |
| | | >Insurance: 4.1% | |
| | 1,800,000 | | | Conseco (b) | | | 41,580 | | |
| | | | | Life, Long Term Care & Medical
Supplement Insurance | | | | | |
| | 112,000 | | | Markel (b) | | | 38,865 | | |
| | | | | Specialty Insurance | | | | | |
| | | | 80,445 | | |
| | | | | Finance: Total | | | 179,699 | | |
| Health Care: 1.8% | | | |
| | | >Health Care Services: 1.8% | |
| | 910,000 | | | Lincare Holdings (b) | | | 34,434 | | |
| | | | | Home Health Care Services | | | | | |
| | | | | Health Care: Total | | | 34,434 | | |
| | | | | Total Common Stock: 94.6%
(Cost: $1,388,372) | | | 1,833,133
| | |
| Short-Term Obligations: 3.2% | | | |
| $ | 30,000 | | | Conocophillips
5.30% Due 7/03/06 | | | 29,987 | | |
| | 27,000 | | | Countrywide Financial Funding
5.25% Due 7/05/06 | | | 26,976 | | |
| | 8,784 | | | Repurchase Agreement with
State Street Bank & Trust
dated 6/30/06, due 7/3/06
at 4.93% collateralized by
Federal Home Loan Bank,
maturing 5/22/08
market value $4,880
(repurchase proceeds: $4,786) | | | 4,784 | | |
| | | | | (Amortized Cost: $61,747) | | | 61,747 | | |
| | Total Investments: 97.8%
(Cost: $1,450,119)(a) | | | | | | 1,894,880 | | |
| | Cash and Other Assets Less Liabilities: 2.2% | | | | | | 42,833 | | |
| | Total Net Assets: 100% | | | | | $ | 1,937,713 | | |
1-800-922-6769
58
>Notes to Statement of Investments (in thousands)
(a) At June 30, 2006, for federal income tax purposes cost of investments was $1,450,119 and net unrealized appreciation was $444,761 consisting of gross unrealized appreciation of $484,626 and gross unrealized depreciation of $39,865.
(b) Non-income producing security.
(c) An affiliate may include any company in which the Fund owns five percent or more of its outstanding voting shares. On June 30, 2006, the Fund held five percent or more of the outstanding voting securities of the following companies:
| Skillsoft Publishing | | | 8.88 | % | |
| UrAsia Energy (Canada) | | | 6.56 | % | |
The aggregate cost and value of these companies at June 30, 2006, was $110,886 and $137,763 respectively. Investments in affiliate companies represent 7.11% of total net assets at June 30, 2006. Investment activity and income amounts relating to affiliates during the six months ended June 30, 2006, were as follows:
| Dividend Income | | $ | — | | |
| Net realized gain or loss | | | — | | |
| Change in unrealized gain or loss | | | 24,788 | | |
| Purchases | | | 6,039 | | |
| Proceeds from sales | | | — | | |
59
This page intentionally left blank.
1-800-922-6769
60
Columbia Acorn Family of Funds
> Statements of Assets and Liabilities
> Statements of Operations
> Statements of Changes in Net Assets
> Financial Highlights
> Notes to Financial Statements
61
Columbia Acorn Family of Funds
>Statements of Assets and Liabilities (Unaudited)
| June 30, 2006 | | Columbia
Acorn
Fund | | Columbia
Acorn
International | | Columbia
Acorn
USA | | Columbia
Acorn
International Select | | Columbia
Acorn
Select | |
| (in thousands) | |
| Assets: | |
| Unaffiliated investments, at cost | | $ | 9,452,305 | | | $ | 2,456,244 | | | $ | 1,084,016 | | | $ | 98,022 | | | $ | 1,339,233 | | |
| Affiliated investments, at cost (See Note 4) | | | 1,819,627 | | | | 29,676 | | | | 5,636 | | | | — | | | | 110,886 | | |
| Unaffiliated investments, at value | | $ | 14,993,693 | | | $ | 3,550,552 | | | $ | 1,467,204 | | | $ | 118,948 | | | $ | 1,757,117 | | |
| Affiliated investments, at value (See Note 4) | | | 2,934,084 | | | | 21,869 | | | | 3,946 | | | | — | | | | 137,763 | | |
| Cash | | | 2,056 | | | | 1 | | | | 13 | | | | 1 | | | | 1 | | |
Foreign currency (cost: Columbia Acorn Fund
$5,941; Columbia Acorn International
$5,019; Columbia Acorn International Select
$200; Columbia Acorn Select $*) | | | 6,049 | | | | 5,077 | | | | — | | | | 203 | | | | — | * | |
| Receivable for: | |
| Investments sold | | | 28,918 | | | | 8,075 | | | | 1,587 | | | | 343 | | | | 45,986 | | |
| Fund shares sold | | | 24,568 | | | | 8,551 | | | | 2,822 | | | | 117 | | | | 2,178 | | |
| Dividends and interest | | | 8,609 | | | | 6,066 | | | | 400 | | | | 197 | | | | 342 | | |
| Foreign tax reclaims | | | 793 | | | | 1,042 | | | | 2 | | | | 36 | | | | — | | |
| Deferred Trustees' Compensation Investments | | | 1,927 | | | | 538 | | | | 136 | | | | — | | | | — | | |
| Other assets | | | — | | | | 122 | | | | 90 | | | | 2 | | | | — | | |
| Total Assets | | | 18,000,697 | | | | 3,601,893 | | | | 1,476,200 | | | | 119,847 | | | | 1,943,387 | | |
| Liabilities: | |
| Payable for: | |
| Investments purchased | | | 53,778 | | | | 711 | | | | 3,405 | | | | 384 | | | | 76 | | |
| Fund shares redeemed | | | 14,600 | | | | 1,357 | | | | 978 | | | | 97 | | | | 3,377 | | |
| Management fee | | | 9,220 | | | | 2,220 | | | | 1,024 | | | | 90 | | | | 1,270 | | |
| Administration fee | | | 588 | | | | 117 | | | | 48 | | | | 4 | | | | 64 | | |
| 12b-1 Service & Distribution fees | | | 2,923 | | | | 157 | | | | 132 | | | | 11 | | | | 442 | | |
| Reports to shareholders | | | 633 | | | | 205 | | | | 90 | | | | 36 | | | | 230 | | |
| Deferred Trustees' fees | | | 1,927 | | | | 538 | | | | 136 | | | | 12 | | | | 47 | | |
| Transfer agent fees | | | 600 | | | | 80 | | | | 36 | | | | 6 | | | | 135 | | |
| Trustees' fees | | | 4 | | | | — | | | | — | | | | — | * | | | 6 | | |
| Audit fee | | | 32 | | | | 34 | | | | 18 | | | | 19 | | | | 18 | | |
| Custody fees | | | 210 | | | | 172 | | | | — | | | | 10 | | | | — | | |
| Other liabilities | | | 106 | | | | — | | | | — | | | | — | | | | 9 | | |
| Total Liabilities | | | 84,621 | | | | 5,591 | | | | 5,867 | | | | 669 | | | | 5,674 | | |
| Net Assets | | $ | 17,916,076 | | | $ | 3,596,302 | | | $ | 1,470,333 | | | $ | 119,178 | | | $ | 1,937,713 | | |
| Composition of Net Assets: | |
| Paid in capital | | $ | 10,598,812 | | | $ | 2,229,793 | | | $ | 1,096,188 | | | $ | 111,933 | | | $ | 1,468,574 | | |
Undistributed (overdistributed) net investment income
(Accumulated net investment loss) | | | (6,560 | ) | | | 4,339 | | | | (1,371 | ) | | | (357 | ) | | | (15,027 | ) | |
| Accumulated net realized gain (loss) | | | 667,823 | | | | 275,512 | | | | (6,049 | ) | | | (13,330 | ) | | | 39,405 | | |
| Net unrealized appreciation (depreciation) on: | |
| Investments | | | 6,655,845 | | | | 1,086,501 | | | | 381,498 | | | | 20,926 | | | | 444,761 | | |
| Foreign currency translations | | | 156 | | | | 157 | | | | 67 | | | | 6 | | | | — | * | |
| Net Assets | | $ | 17,916,076 | | | $ | 3,596,302 | | | $ | 1,470,333 | | | $ | 119,178 | | | $ | 1,937,713 | | |
| Net asset value per share – Class A (a) | | $ | 28.81 | | | $ | 37.33 | | | $ | 26.96 | | | $ | 22.95 | | | $ | 23.55 | | |
| (Net assets/shares) | | | ($3,808,423/132,182) | | | | ($211,021/5,652) | | | | ($220,043/8,162) | | | | ($14,167/617) | | | | ($788,153/33,464) | | |
Maximum offering price per
share – Class A (b) | | $ | 30.57 | | | $ | 39.61 | | | $ | 28.60 | | | $ | 24.35 | | | $ | 24.99 | | |
(Net asset value per share/front-end
sales charge) | | | ($28.81/0.9425) | | | | ($37.33/0.9425) | | | | ($26.96/0.9425) | | | | ($22.95/0.9425) | | | | ($23.55/0.9425) | | |
Net asset value and offering price
per share – Class B (a) | | $ | 27.71 | | | $ | 36.65 | | | $ | 25.95 | | | $ | 22.24 | | | $ | 22.69 | | |
| (Net assets/shares) | | | ($1,406,504/50,764) | | | | ($82,345/2,247) | | | | ($67,649/2,607) | | | | ($7,910/356) | | | | ($203,596/8,973) | | |
Net asset value and offering price
per share – Class C (a) | | $ | 27.66 | | | $ | 36.61 | | | $ | 25.92 | | | $ | 22.23 | | | $ | 22.66 | | |
| (Net assets/shares) | | | ($1,300,779/47,032) | | | | ($76,524/2,091) | | | | ($50,799/1,960) | | | | ($5,006/225) | | | | ($155,134/6,847) | | |
Net asset value and offering price
per share – Class Z (c) | | $ | 29.49 | | | $ | 37.58 | | | $ | 27.52 | | | $ | 23.16 | | | $ | 23.87 | | |
| (Net assets/shares) | | | ($11,400,370/386,621) | | | | ($3,226,412/85,846) | | | | ($1,131,842/41,121) | | | | ($92,095/3,976) | | | | ($790,830/33,124) | | |
(a) Redemption price per share is equal to net asset value less any applicable contingent deferred sales charge.
(b) On sales of $50,000 or more the offering price is reduced.
(c) Redemption price per share is equal to net asset value less any applicable redemption fee.
* Rounds to less than $500.
See accompanying notes to financial statements.
1-800-922-6769
62
Columbia Acorn Family of Funds
>Statements of Operations
For the Six Months Ended June 30, 2006 (Unaudited)
| (in thousands) | | Columbia
Acorn
Fund | | Columbia
Acorn
International | | Columbia
Acorn
USA | | Columbia
Acorn
International Select | | Columbia
Acorn
Select | |
| Investment Income: | |
| Dividend income | | $ | 72,878 | | | $ | 39,687 | | | $ | 3,023 | | | $ | 1,249 | | | $ | 5,670 | | |
| Dividend income from affiliates (See Note 4) | | | 13,299 | | | | 58 | | | | — | | | | — | | | | — | | |
| Interest income | | | 28,493 | | | | 6,484 | | | | 3,409 | | | | 100 | | | | 1,399 | | |
| | | | 114,670 | | | | 46,229 | | | | 6,432 | | | | 1,349 | | | | 7,069 | | |
| Foreign taxes withheld | | | (2,712 | ) | | | (3,643 | ) | | | (5 | ) | | | (105 | ) | | | (16 | ) | |
| Total Investment Income | | | 111,958 | | | | 42,586 | | | | 6,427 | | | | 1,244 | | | | 7,053 | | |
| Expenses: | |
| Management fee | | | 57,105 | | | | 13,306 | | | | 6,073 | | | | 521 | | | | 7,840 | | |
| Administration fee | | | 3,643 | | | | 701 | | | | 287 | | | | 23 | | | | 391 | | |
| 12b-1 Service and Distribution fees: | |
| Class A | | | 4,680 | | | | 241 | | | | 250 | | | | 15 | | | | 984 | | |
| Class B | | | 6,192 | | | | 355 | | | | 307 | | | | 32 | | | | 890 | | |
| Class C | | | 6,533 | | | | 335 | | | | 235 | | | | 23 | | | | 780 | | |
| Transfer agent fees: | |
| Class A | | | 1,007 | | | | 69 | | | | 57 | | | | 8 | | | | 326 | | |
| Class B | | | 1,048 | | | | 74 | | | | 59 | | | | 10 | | | | 211 | | |
| Class C | | | 596 | | | | 33 | | | | 25 | | | | 4 | | | | 111 | | |
| Class Z | | | 1,265 | | | | 538 | | | | 122 | | | | 28 | | | | 234 | | |
| Custody fees | | | 922 | | | | 919 | | | | 20 | | | | 27 | | | | 29 | | |
| Trustees' fees | | | 303 | | | | 47 | | | | 21 | | | | 1 | | | | 15 | | |
| Registration & blue sky fees | | | 167 | | | | 128 | | | | 76 | | | | 42 | | | | 106 | | |
| Reports to shareholders | | | 1,248 | | | | 320 | | | | 134 | | | | 43 | | | | 308 | | |
| Compliance fees | | | 259 | | | | 48 | | | | 20 | | | | 2 | | | | 27 | | |
| Non-recurring costs (See Note 9) | | | 84 | | | | 16 | | | | 7 | | | | 1 | | | | 9 | | |
| Other expenses | | | 364 | | | | 87 | | | | 43 | | | | 30 | | | | 52 | | |
| Total expenses | | | 85,416 | | | | 17,217 | | | | 7,736 | | | | 810 | | | | 12,313 | | |
| Less custody fees paid indirectly | | | (60 | ) | | | (8 | ) | | | (2 | ) | | | — | * | | | (4 | ) | |
| Less reimbursement of expenses by Investment Adviser | | | — | | | | — | | | | — | | | | (2 | ) | | | — | | |
| Less fees waived by Transfer Agent | | | (817 | ) | | | (96 | ) | | | (48 | ) | | | (7 | ) | | | (170 | ) | |
| Non-recurring costs reimbursed (See Note 9) | | | (84 | ) | | | (16 | ) | | | (7 | ) | | | (1 | ) | | | (9 | ) | |
| Net Expenses | | | 84,455 | | | | 17,097 | | | | 7,679 | | | | 800 | | | | 12,130 | | |
| Net Investment Income (Loss) | | | 27,503 | | | | 25,489 | | | | (1,252 | ) | | | 444 | | | | (5,077 | ) | |
Net Realized and Unrealized Gain (Loss)
on Portfolio Positions: | |
| Net realized gain (loss) on: | |
| Unaffiliated investments | | | 670,179 | | | | 276,747 | | | | (3,184 | ) | | | 12,297 | | | | 39,660 | | |
| Foreign currency transactions | | | 265 | | | | (410 | ) | | | — | | | | (18 | ) | | | 13 | | |
| Net realized gain (loss) | | | 670,444 | | | | 276,337 | | | | (3,184 | ) | | | 12,279 | | | | 39,673 | | |
Net change in net unrealized appreciation
(depreciation) on: | |
| Unaffiliated investments | | | (23,305 | ) | | | 121,881 | | | | 25,365 | | | | (378 | ) | | | 35,008 | | |
| Affiliated investments (See Note 4) | | | 253,598 | | | | (10,121 | ) | | | (63 | ) | | | — | | | | 24,788 | | |
| Foreign currency translations | | | 126 | | | | 14 | | | | 67 | | | | 7 | | | | — | | |
| Foreign capital gains tax | | | — | | | | 3 | | | | — | | | | — | | | | — | | |
Net change in unrealized appreciation
(depreciation) | | | 230,419 | | | | 111,777 | | | | 25,369 | | | | (371 | ) | | | 59,796 | | |
| Net realized and unrealized gain | | | 900,863 | | | | 388,114 | | | | 22,185 | | | | 11,908 | | | | 99,469 | | |
Net Increase in Net Assets resulting
from Operations | | $ | 928,366 | | | $ | 413,603 | | | $ | 20,933 | | | $ | 12,352 | | | $ | 94,392 | | |
* Rounds to less than $500.
See accompanying notes to financial statements.
63
Columbia Acorn Family of Funds
>Statements of Changes in Net Assets
| | | Columbia
Acorn Fund | | Columbia Acorn
International | | Columbia
Acorn USA | |
| Increase (Decrease) in Net Assets | | (Unaudited)
Six months
ended June 30, | | Year ended
December 31, | | (Unaudited)
Six months
ended June 30, | | Year ended
December 31, | | (Unaudited)
Six months
ended June 30, | | Year ended
December 31, | |
| (in thousands) | | 2006 | | 2005 | | 2006 | | 2005 | | 2006 | | 2005 | |
| Operations: | |
| Net investment income (loss) | | $ | 27,503 | | | $ | 49,723 | | | $ | 25,489 | | | $ | 24,670 | | | $ | (1,252 | ) | | $ | 1,300 | | |
Net realized gain (loss) on investments and foreign
currency transactions | | | 670,444 | | | | 890,559 | | | | 276,337 | | | | 203,167 | | | | (3,184 | ) | | | 49,825 | | |
Net change in net unrealized appreciation
(depreciation) on investments and
foreign currency translations and
foreign capital gains tax | | | 230,419 | | | | 898,946 | | | | 111,777 | | | | 258,860 | | | | 25,369 | | | | 75,612 | | |
| Net Increase from Operations | | | 928,366 | | | | 1,839,228 | | | | 413,603 | | | | 486,697 | | | | 20,933 | | | | 126,737 | | |
| Distributions Declared to Shareholders From: | |
| Net investment income – Class A | | | — | | | | (8,157 | ) | | | (1 | ) | | | (1,772 | ) | | | — | | | | — | | |
| Net realized gain – Class A | | | (40,975 | ) | | | (177,617 | ) | | | (3,315 | ) | | | (4,275 | ) | | | (819 | ) | | | (7,747 | ) | |
| Net investment income – Class B | | | — | | | | — | | | | — | * | | | (280 | ) | | | — | | | | — | | |
| Net realized gain – Class B | | | (15,915 | ) | | | (81,483 | ) | | | (1,276 | ) | | | (2,334 | ) | | | (270 | ) | | | (3,824 | ) | |
| Net investment income – Class C | | | — | | | | — | | | | (1 | ) | | | (171 | ) | | | — | | | | — | | |
| Net realized gain – Class C | | | (14,668 | ) | | | (68,235 | ) | | | (1,189 | ) | | | (1,462 | ) | | | (194 | ) | | | (2,282 | ) | |
| Net investment income – Class Z | | | — | | | | (52,311 | ) | | | (6,544 | ) | | | (51,974 | ) | | | — | | | | (1,613 | ) | |
| Net realized gain – Class Z | | | (120,087 | ) | | | (547,733 | ) | | | (46,561 | ) | | | (81,064 | ) | | | (4,177 | ) | | | (43,227 | ) | |
| Total Distribution to Shareholders | | | (191,645 | ) | | | (935,536 | ) | | | (58,887 | ) | | | (143,332 | ) | | | (5,460 | ) | | | (58,693 | ) | |
| Share Transactions: | |
| Subscriptions – Class A | | | 659,206 | | | | 912,797 | | | | 88,963 | | | | 66,630 | | | | 72,214 | | | | 66,241 | | |
| Distributions reinvested – Class A | | | 37,164 | | | | 167,704 | | | | 2,797 | | | | 4,900 | | | | 723 | | | | 6,880 | | |
| Redemptions – Class A | | | (385,545 | ) | | | (579,536 | ) | | | (38,125 | ) | | | (14,669 | ) | | | (23,405 | ) | | | (25,265 | ) | |
| Net Increase – Class A | | | 310,825 | | | | 500,965 | | | | 53,635 | | | | 56,861 | | | | 49,532 | | | | 47,856 | | |
| Subscriptions – Class B | | | 16,838 | | | | 49,025 | | | | 10,985 | | | | 17,173 | | | | 850 | | | | 4,001 | | |
| Distributions reinvested – Class B | | | 14,515 | | | | 74,120 | | | | 1,143 | | | | 2,310 | | | | 248 | | | | 3,491 | | |
| Redemptions – Class B | | | (107,477 | ) | | | (174,945 | ) | | | (11,978 | ) | | | (10,198 | ) | | | (7,678 | ) | | | (11,124 | ) | |
| Net Increase (Decrease) – Class B | | | (76,124 | ) | | | (51,800 | ) | | | 150 | | | | 9,285 | | | | (6,580 | ) | | | (3,632 | ) | |
| Subscriptions – Class C | | | 105,355 | | | | 171,533 | | | | 33,664 | | | | 15,891 | | | | 12,391 | | | | 8,047 | | |
| Distributions reinvested – Class C | | | 11,709 | | | | 54,677 | | | | 890 | | | | 1,302 | | | | 163 | | | | 1,878 | | |
| Redemptions – Class C | | | (85,492 | ) | | | (149,119 | ) | | | (10,292 | ) | | | (6,051 | ) | | | (4,935 | ) | | | (9,090 | ) | |
| Net Increase (Decrease) – Class C | | | 31,572 | | | | 77,091 | | | | 24,262 | | | | 11,142 | | | | 7,619 | | | | 835 | | |
| Subscriptions – Class Z | | | 1,068,234 | | | | 1,686,601 | | | | 403,326 | | | | 577,455 | | | | 262,241 | | | | 302,588 | | |
| Distributions reinvested – Class Z | | | 103,086 | | | | 513,385 | | | | 39,291 | | | | 103,732 | | | | 3,812 | | | | 40,433 | | |
| Redemptions – Class Z | | | (649,562 | ) | | | (1,080,069 | ) | | | (171,762 | ) | | | (284,340 | ) | | | (83,258 | ) | | | (105,312 | ) | |
| Net Increase – Class Z | | | 521,758 | | | | 1,119,917 | | | | 270,855 | | | | 396,847 | | | | 182,795 | | | | 237,709 | | |
| Net Increase from Share Transactions | | | 788,031 | | | | 1,646,173 | | | | 348,902 | | | | 474,135 | | | | 233,366 | | | | 282,768 | | |
| Redemption Fees | | | — | | | | — | | | | 107 | | | | 65 | | | | — | | | | — | | |
| Total Increase in Net Assets | | | 1,524,752 | | | | 2,549,865 | | | | 703,725 | | | | 817,565 | | | | 248,839 | | | | 350,812 | | |
| Net Assets: | |
| Beginning of period | | | 16,391,324 | | | | 13,841,459 | | | | 2,892,577 | | | | 2,075,012 | | | | 1,221,494 | | | | 870,682 | | |
| End of period | | $ | 17,916,076 | | | $ | 16,391,324 | | | $ | 3,596,302 | | | $ | 2,892,577 | | | $ | 1,470,333 | | | $ | 1,221,494 | | |
Undistributed (Overdistributed) Net Investment
Income or (Accumulated Net Investment Loss) | | $ | (6,560 | ) | | $ | (34,063 | ) | | $ | 4,339 | | | $ | (14,604 | ) | | $ | (1,371 | ) | | $ | (119 | ) | |
| | | Columbia Acorn
International Select | | Columbia
Acorn Select | |
| Increase (Decrease) in Net Assets | | (Unaudited)
Six months
ended June 30, | | Year ended
December 31, | | (Unaudited)
Six months
ended June 30, | | Year ended
December 31, | |
| (in thousands) | | 2006 | | 2005 | | 2006 | | 2005 | |
| Operations: | |
| Net investment income (loss) | | $ | 444 | | | $ | 431 | | | $ | (5,077 | ) | | $ | (7,333 | ) | |
Net realized gain (loss) on investments and foreign
currency transactions | | | 12,279 | | | | 5,496 | | | | 39,673 | | | | 46,214 | | |
Net change in net unrealized appreciation
(depreciation) on investments and
foreign currency translations and
foreign capital gains tax | | | (371 | ) | | | 5,773 | | | | 59,796 | | | | 140,962 | | |
| Net Increase from Operations | | | 12,352 | | | | 11,700 | | | | 94,392 | | | | 179,843 | | |
| Distributions Declared to Shareholders From: | |
| Net investment income – Class A | | | (2 | ) | | | (79 | ) | | | (788 | ) | | | — | | |
| Net realized gain – Class A | | | — | | | | — | | | | (2,891 | ) | | | (19,098 | ) | |
| Net investment income – Class B | | | — | | | | (46 | ) | | | — | | | | — | | |
| Net realized gain – Class B | | | — | | | | — | | | | (780 | ) | | | (5,029 | ) | |
| Net investment income – Class C | | | — | * | | | (24 | ) | | | — | | | | — | | |
| Net realized gain – Class C | | | — | | | | — | | | | (593 | ) | | | (3,559 | ) | |
| Net investment income – Class Z | | | (196 | ) | | | (888 | ) | | | (1,614 | ) | | | — | | |
| Net realized gain – Class Z | | | — | | | | — | | | | (2,827 | ) | | | (19,071 | ) | |
| Total Distribution to Shareholders | | | (198 | ) | | | (1,037 | ) | | | (9,493 | ) | | | (46,757 | ) | |
| Share Transactions: | |
| Subscriptions – Class A | | | 4,045 | | | | 5,743 | | | | 88,593 | | | | 296,611 | | |
| Distributions reinvested – Class A | | | 2 | | | | 71 | | | | 3,419 | | | | 17,770 | | |
| Redemptions – Class A | | | (1,414 | ) | | | (1,004 | ) | | | (83,751 | ) | | | (143,717 | ) | |
| Net Increase – Class A | | | 2,633 | | | | 4,810 | | | | 8,261 | | | | 170,664 | | |
| Subscriptions – Class B | | | 1,272 | | | | 2,123 | | | | 3,191 | | | | 28,258 | | |
| Distributions reinvested – Class B | | | — | | | | 41 | | | | 697 | | | | 4,510 | | |
| Redemptions – Class B | | | (775 | ) | | | (1,480 | ) | | | (16,156 | ) | | | (26,292 | ) | |
| Net Increase (Decrease) – Class B | | | 497 | | | | 684 | | | | (12,268 | ) | | | 6,476 | | |
| Subscriptions – Class C | | | 950 | | | | 1,655 | | | | 11,122 | | | | 48,457 | | |
| Distributions reinvested – Class C | | | — | * | | | 20 | | | | 483 | | | | 2,903 | | |
| Redemptions – Class C | | | (522 | ) | | | (599 | ) | | | (12,280 | ) | | | (23,251 | ) | |
| Net Increase (Decrease) – Class C | | | 428 | | | | 1,076 | | | | (675 | ) | | | 28,109 | | |
| Subscriptions – Class Z | | | 12,943 | | | | 25,890 | | | | 135,599 | | | | 333,604 | | |
| Distributions reinvested – Class Z | | | 99 | | | | 582 | | | | 3,108 | | | | 13,462 | | |
| Redemptions – Class Z | | | (4,579 | ) | | | (7,003 | ) | | | (68,526 | ) | | | (155,173 | ) | |
| Net Increase – Class Z | | | 8,463 | | | | 19,469 | | | | 70,181 | | | | 191,893 | | |
| Net Increase from Share Transactions | | | 12,021 | | | | 26,039 | | | | 65,499 | | | | 397,142 | | |
| Redemption Fees | | | 4 | | | | 9 | | | | — | | | | — | | |
| Total Increase in Net Assets | | | 24,179 | | | | 36,711 | | | | 150,398 | | | | 530,228 | | |
| Net Assets: | |
| Beginning of period | | | 94,999 | | | | 58,288 | | | | 1,787,315 | | | | 1,257,087 | | |
| End of period | | $ | 119,178 | | | $ | 94,999 | | | $ | 1,937,713 | | | $ | 1,787,315 | | |
Undistributed (Overdistributed) Net Investment
Income or (Accumulated Net Investment Loss) | | $ | (357 | ) | | $ | (603 | ) | | $ | (15,027 | ) | | $ | (7,548 | ) | |
* Rounds to less than $500.
See accompanying notes to financial statements.
1-800-922-6769
64
65
Columbia Acorn Family of Funds
>Statements of Changes in Net Assets, continued
| | | Columbia
Acorn Fund | | Columbia Acorn
International | | Columbia
Acorn USA | |
| Changes in Shares of Beneficial Interest: | | (Unaudited)
Six months
ended June 30, | | Year ended
December 31, | | (Unaudited)
Six months
ended June 30, | | Year ended
December 31, | | (Unaudited)
Six months
ended June 30, | | Year ended
December 31, | |
| (in thousands) | | 2006 | | 2005 | | 2006 | | 2005 | | 2006 | | 2005 | |
| Subscriptions – Class A | | | 22,554 | | | | 34,302 | | | | 2,347 | | | | 2,150 | | | | 2,619 | | | | 2,559 | | |
Shares issued in reinvestment and capital
gains – Class A | | | 1,300 | | | | 6,137 | | | | 75 | | | | 155 | | | | 27 | | | | 260 | | |
| Less shares redeemed – Class A | | | (13,166 | ) | | | (21,923 | ) | | | (1,054 | ) | | | (476 | ) | | | (855 | ) | | | (990 | ) | |
| Net Increase – Class A | | | 10,688 | | | | 18,516 | | | | 1,368 | | | | 1,829 | | | | 1,791 | | | | 1,829 | | |
| Subscriptions – Class B | | | 595 | | | | 1,922 | | | | 299 | | | | 574 | | | | 32 | | | | 161 | | |
Shares issued in reinvestment and capital
gains – Class B | | | 528 | | | | 2,814 | | | | 31 | | | | 73 | | | | 9 | | | | 137 | | |
| Less shares redeemed – Class B | | | (3,813 | ) | | | (6,826 | ) | | | (332 | ) | | | (341 | ) | | | (291 | ) | | | (451 | ) | |
| Net Increase (Decrease) – Class B | | | (2,690 | ) | | | (2,090 | ) | | | (2 | ) | | | 306 | | | | (250 | ) | | | (153 | ) | |
| Subscriptions – Class C | | | 3,731 | | | | 6,667 | | | | 906 | | | | 524 | | | | 466 | | | | 321 | | |
Shares issued in reinvestment and capital
gains – Class C | | | 427 | | | | 2,077 | | | | 24 | | | | 41 | | | | 6 | | | | 74 | | |
| Less shares redeemed – Class C | | | (3,039 | ) | | | (5,835 | ) | | | (287 | ) | | | (201 | ) | | | (186 | ) | | | (363 | ) | |
| Net Increase (Decrease) – Class C | | | 1,119 | | | | 2,909 | | | | 643 | | | | 364 | | | | 286 | | | | 32 | | |
| Subscriptions – Class Z | | | 35,686 | | | | 62,182 | | | | 10,707 | | | | 18,615 | | | | 9,306 | | | | 11,555 | | |
Shares issued in reinvestment and capital
gains – Class Z | | | 3,525 | | | | 18,385 | | | | 1,050 | | | | 3,274 | | | | 139 | | | | 1,500 | | |
| Less shares redeemed – Class Z | | | (21,759 | ) | | | (39,912 | ) | | | (4,553 | ) | | | (9,349 | ) | | | (2,974 | ) | | | (4,040 | ) | |
| Net Increase – Class Z | | | 17,452 | | | | 40,655 | | | | 7,204 | | | | 12,540 | | | | 6,471 | | | | 9,015 | | |
| Net Increase in Shares of Beneficial Interest | | | 26,569 | | | | 59,990 | | | | 9,213 | | | | 15,039 | | | | 8,298 | | | | 10,723 | | |
| | | Columbia Acorn
International Select | | Columbia
Acorn Select | |
| Changes in Shares of Beneficial Interest: | | (Unaudited)
Six months
ended June 30, | | Year ended
December 31, | | (Unaudited)
Six months
ended June 30, | | Year ended
December 31, | |
| (in thousands) | | 2006 | | 2005 | | 2006 | | 2005 | |
| Subscriptions – Class A | | | 178 | | | | 307 | | | | 3,735 | | | | 14,487 | | |
Shares issued in reinvestment and capital
gains – Class A | | | — | * | | | 4 | | | | 146 | | | | 802 | | |
| Less shares redeemed – Class A | | | (63 | ) | | | (53 | ) | | | (3,535 | ) | | | (6,938 | ) | |
| Net Increase – Class A | | | 115 | | | | 258 | | | | 346 | | | | 8,351 | | |
| Subscriptions – Class B | | | 58 | | | | 118 | | | | 139 | | | | 1,441 | | |
Shares issued in reinvestment and capital
gains – Class B | | | — | | | | 2 | | | | 31 | | | | 211 | | |
| Less shares redeemed – Class B | | | (35 | ) | | | (81 | ) | | | (708 | ) | | | (1,313 | ) | |
| Net Increase (Decrease) – Class B | | | 23 | | | | 39 | | | | (538 | ) | | | 339 | | |
| Subscriptions – Class C | | | 43 | | | | 92 | | | | 486 | | | | 2,455 | | |
Shares issued in reinvestment and capital
gains – Class C | | | — | | | | 1 | | | | 22 | | | | 136 | | |
| Less shares redeemed – Class C | | | (24 | ) | | | (33 | ) | | | (539 | ) | | | (1,172 | ) | |
| Net Increase (Decrease) – Class C | | | 19 | | | | 60 | | | | (31 | ) | | | 1,419 | | |
| Subscriptions – Class Z | | | 574 | | | | 1,378 | | | | 5,651 | | | | 15,890 | | |
Shares issued in reinvestment and capital
gains – Class Z | | | 4 | | | | 33 | | | | 131 | | | | 601 | | |
| Less shares redeemed – Class Z | | | (204 | ) | | | (378 | ) | | | (2,851 | ) | | | (7,371 | ) | |
| Net Increase – Class Z | | | 374 | | | | 1,033 | | | | 2,931 | | | | 9,120 | | |
| Net Increase in Shares of Beneficial Interest | | | 531 | | | | 1,390 | | | | 2,708 | | | | 19,229 | | |
* Rounds to less than 500 shares.
See accompanying notes to financial statements.
1-800-922-6769
66
67
Columbia Acorn Family of Funds
>Financial Highlights
Columbia Acorn Fund
| Class A Shares | | (Unaudited)
Six months
ended June 30, | | Year ended December 31, | |
| Selected data for a share outstanding throughout each period | | 2006 | | 2005 | | 2004 | | 2003 | | 2002 | | 2001 | |
| Net Asset Value, Beginning of Period | | $ | 27.57 | | | $ | 25.93 | | | $ | 22.20 | | | $ | 15.34 | | | $ | 17.80 | | | $ | 17.19 | | |
| Income from Investment Operations | |
| Net investment income (loss) (a) | | | 0.04 | | | | 0.07 | | | | (0.05 | ) | | | (0.07 | ) | | | (0.07 | ) | | | (0.05 | ) | |
| Net realized and unrealized gain (loss) | | | 1.51 | | | | 3.20 | | | | 4.69 | | | | 6.95 | | | | (2.39 | ) | | | 1.01 | | |
| Total from Investment Operations | | | 1.55 | | | | 3.27 | | | | 4.64 | | | | 6.88 | | | | (2.46 | ) | | | 0.96 | | |
| Less Distributions Declared to Shareholders | |
| From net investment income | | | — | | | | (0.07 | ) | | | — | | | | — | | | | — | | | | — | | |
| From net realized gains | | | (0.31 | ) | | | (1.56 | ) | | | (0.91 | ) | | | (0.02 | ) | | | — | | | | (0.35 | ) | |
| Total Distributions Declared to Shareholders | | | (0.31 | ) | | | (1.63 | ) | | | (0.91 | ) | | | (0.02 | ) | | | — | | | | (0.35 | ) | |
| Net Asset Value, End of Period | | $ | 28.81 | | | $ | 27.57 | | | $ | 25.93 | | | $ | 22.20 | | | $ | 15.34 | | | $ | 17.80 | | |
| Total Return (b) | | | 5.64 | %(c)(d) | | | 12.76 | %(c) | | | 21.05 | %(c) | | | 44.85 | % | | | (13.82 | )% | | | 5.56 | % | |
| Ratios to Average Net Assets/Supplemental Data | |
| Expenses (e) | | | 1.01 | %(f) | | | 1.03 | % | | | 1.20 | % | | | 1.33 | % | | | 1.42 | % | | | 1.42 | % | |
| Net investment income (loss) (e) | | | 0.25 | %(f) | | | 0.28 | % | | | (0.21 | )% | | | (0.36 | )% | | | (0.45 | )% | | | (0.33 | )% | |
| Waiver/reimbursement | | | 0.01 | %(f) | | | 0.02 | % | | | 0.02 | % | | | — | | | | — | | | | — | | |
| Portfolio turnover rate | | | 11 | %(d) | | | 16 | % | | | 20 | % | | | 10 | % | | | 13 | % | | | 20 | % | |
| Net assets at end of period (000's) | | $ | 3,808,423 | | | $ | 3,349,461 | | | $ | 2,669,936 | | | $ | 1,982,260 | | | $ | 724,121 | | | $ | 306,405 | | |
(a) Per share data was calculated using average shares outstanding during the period.
(b) Total return at net asset value assuming all distributions reinvested and no initial sales charge or contingent deferred sales charge.
(c) Had the Investment Adviser and/or Transfer Agent not waived and/or reimbursed a portion of expenses, total return would have been reduced.
(d) Not annualized.
(e) The benefits derived from custody fees paid indirectly had no impact.
(f) Annualized.
| Class B Shares | | (Unaudited)
Six months
ended June 30, | | Year ended December 31, | |
| Selected data for a share outstanding throughout each period | | 2006 | | 2005 | | 2004 | | 2003 | | 2002 | | 2001 | |
| Net Asset Value, Beginning of Period | | $ | 26.61 | | | $ | 25.19 | | | $ | 21.75 | | | $ | 15.13 | | | $ | 17.67 | | | $ | 17.17 | | |
| Income from Investment Operations | |
| Net investment loss (a) | | | (0.06 | ) | | | (0.11 | ) | | | (0.22 | ) | | | (0.18 | ) | | | (0.17 | ) | | | (0.16 | ) | |
| Net realized and unrealized gain (loss) | | | 1.47 | | | | 3.09 | | | | 4.57 | | | | 6.82 | | | | (2.37 | ) | | | 1.01 | | |
| Total from Investment Operations | | | 1.41 | | | | 2.98 | | | | 4.35 | | | | 6.64 | | | | (2.54 | ) | | | 0.85 | | |
| Less Distributions Declared to Shareholders | |
| From net realized gains | | | (0.31 | ) | | | (1.56 | ) | | | (0.91 | ) | | | (0.02 | ) | | | — | | | | (0.35 | ) | |
| Total Distributions Declared to Shareholders | | | (0.31 | ) | | | (1.56 | ) | | | (0.91 | ) | | | (0.02 | ) | | | — | | | | (0.35 | ) | |
| Net Asset Value, End of Period | | $ | 27.71 | | | $ | 26.61 | | | $ | 25.19 | | | $ | 21.75 | | | $ | 15.13 | | | $ | 17.67 | | |
| Total Return (b) | | | 5.32 | %(c)(d) | | | 11.98 | %(c) | | | 20.15 | %(c) | | | 43.89 | % | | | (14.37 | )% | | | 4.92 | % | |
| Ratios to Average Net Assets/Supplemental Data | |
| Expenses (e) | | | 1.70 | %(f) | | | 1.72 | % | | | 1.95 | % | | | 1.98 | % | | | 2.07 | % | | | 2.07 | % | |
| Net investment loss (e) | | | (0.45 | )%(f) | | | (0.42 | )% | | | (0.96 | )% | | | (1.01 | )% | | | (1.10 | )% | | | (0.98 | )% | |
| Waiver/reimbursement | | | 0.01 | %(f) | | | 0.02 | % | | | 0.02 | % | | | — | | | | — | | | | — | | |
| Portfolio turnover rate | | | 11 | %(d) | | | 16 | % | | | 20 | % | | | 10 | % | | | 13 | % | | | 20 | % | |
| Net assets at end of period (000's) | | $ | 1,406,504 | | | $ | 1,422,580 | | | $ | 1,399,135 | | | $ | 1,221,931 | | | $ | 618,727 | | | $ | 286,422 | | |
(a) Per share data was calculated using average shares outstanding during the period.
(b) Total return at net asset value assuming all distributions reinvested and no initial sales charge or contingent deferred sales charge.
(c) Had the Investment Adviser and/or Transfer Agent not waived and/or reimbursed a portion of expenses, total return would have been reduced.
(d) Not annualized.
(e) The benefits derived from custody fees paid indirectly had no impact.
(f) Annualized.
| Class C Shares | | (Unaudited)
Six months
ended June 30, | | Year ended December 31, | |
| Selected data for a share outstanding throughout each period | | 2006 | | 2005 | | 2004 | | 2003 | | 2002 | | 2001 | |
| Net Asset Value, Beginning of Period | | $ | 26.58 | | | $ | 25.18 | | | $ | 21.75 | | | $ | 15.12 | | | $ | 17.66 | | | $ | 17.17 | | |
| Income from Investment Operations | |
| Net investment loss (a) | | | (0.08 | ) | | | (0.13 | ) | | | (0.22 | ) | | | (0.18 | ) | | | (0.17 | ) | | | (0.17 | ) | |
| Net realized and unrealized gain (loss) | | | 1.47 | | | | 3.09 | | | | 4.56 | | | | 6.83 | | | | (2.37 | ) | | | 1.01 | | |
| Total from Investment Operations | | | 1.39 | | | | 2.96 | | | | 4.34 | | | | 6.65 | | | | (2.54 | ) | | | 0.84 | | |
| Less Distributions Declared to Shareholders | |
| From net realized gains | | | (0.31 | ) | | | (1.56 | ) | | | (0.91 | ) | | | (0.02 | ) | | | — | | | | (0.35 | ) | |
| Total Distributions Declared to Shareholders | | | (0.31 | ) | | | (1.56 | ) | | | (0.91 | ) | | | (0.02 | ) | | | — | | | | (0.35 | ) | |
| Net Asset Value, End of Period | | $ | 27.66 | | | $ | 26.58 | | | $ | 25.18 | | | $ | 21.75 | | | $ | 15.12 | | | $ | 17.66 | | |
| Total Return (b) | | | 5.25 | %(c)(d) | | | 11.90 | %(c) | | | 20.11 | %(c) | | | 43.99 | % | | | (14.38 | )% | | | 4.86 | % | |
| Ratios to Average Net Assets/Supplemental Data | |
| Expenses (e) | | | 1.80 | %(f) | | | 1.82 | % | | | 1.95 | % | | | 1.98 | % | | | 2.07 | % | | | 2.07 | % | |
| Net investment loss (e) | | | (0.54 | )%(f) | | | (0.51 | )% | | | (0.96 | )% | | | (1.01 | )% | | | (1.10 | )% | | | (0.98 | )% | |
| Waiver/reimbursement | | | 0.01 | %(f) | | | 0.02 | % | | | 0.02 | % | | | — | | | | — | | | | — | | |
| Portfolio turnover rate | | | 11 | %(d) | | | 16 | % | | | 20 | % | | | 10 | % | | | 13 | % | | | 20 | % | |
| Net assets at end of period (000's) | | $ | 1,300,779 | | | $ | 1,220,339 | | | $ | 1,083,006 | | | $ | 900,016 | | | $ | 376,024 | | | $ | 150,727 | | |
(a) Per share data was calculated using average shares outstanding during the period.
(b) Total return at net asset value assuming all distributions reinvested and no initial sales charge or contingent deferred sales charge.
(c) Had the Investment Adviser and/or Transfer Agent not waived and/or reimbursed a portion of expenses, total return would have been reduced.
(d) Not annualized.
(e) The benefits derived from custody fees paid indirectly had no impact.
(f) Annualized.
See accompanying notes to financial statements.
1-800-922-6769
68
Columbia Acorn International
| Class A Shares | | (Unaudited)
Six months
ended June 30, | | Year ended December 31, | |
| Selected data for a share outstanding throughout each period | | 2006 | | 2005 | | 2004 | | 2003 | | 2002 | | 2001 | |
| Net Asset Value, Beginning of Period | | $ | 33.20 | | | $ | 28.75 | | | $ | 22.45 | | | $ | 15.32 | | | $ | 18.35 | | | $ | 23.84 | | |
| Income from Investment Operations | |
| Net investment income (a) | | | 0.25 | | | | 0.22 | | | | 0.14 | | | | 0.10 | | | | 0.05 | | | | 0.01 | | |
| Net realized and unrealized gain (loss) | | | 4.43 | | | | 5.84 | | | | 6.31 | | | | 7.08 | | | | (3.07 | ) | | | (5.11 | ) | |
| Total from Investment Operations | | | 4.68 | | | | 6.06 | | | | 6.45 | | | | 7.18 | | | | (3.02 | ) | | | (5.10 | ) | |
| Less Distributions Declared to Shareholders | |
| From net investment income | | | — | | | | (0.53 | ) | | | (0.15 | ) | | | (0.05 | ) | | | (0.01 | ) | | | — | | |
| From net realized gains | | | (0.55 | ) | | | (1.08 | ) | | | — | | | | — | | | | — | | | | (0.39 | ) | |
| Total Distributions Declared to Shareholders | | | (0.55 | ) | | | (1.61 | ) | | | (0.15 | ) | | | (0.05 | ) | | | (0.01 | ) | | | (0.39 | ) | |
| Net Asset Value, End of Period | | $ | 37.33 | | | $ | 33.20 | | | $ | 28.75 | | | $ | 22.45 | | | $ | 15.32 | | | $ | 18.35 | | |
| Total Return (b) | | | 14.11 | %(c)(d) | | | 21.42 | %(c) | | | 28.91 | %(c) | | | 46.94 | % | | | (16.46 | )% | | | (21.59 | )% | |
| Ratios to Average Net Assets/Supplemental Data | |
| Expenses (e) | | | 1.22 | %(f) | | | 1.30 | % | | | 1.48 | % | | | 1.59 | % | | | 1.56 | % | | | 1.65 | % | |
| Net investment income (e) | | | 1.35 | %(f) | | | 0.72 | % | | | 0.61 | % | | | 0.57 | % | | | 0.30 | % | | | 0.03 | % | |
| Waiver/reimbursement | | | 0.01 | %(f) | | | 0.02 | % | | | 0.02 | % | | | — | | | | — | | | | — | | |
| Portfolio turnover rate | | | 19 | %(d) | | | 27 | % | | | 40 | % | | | 40 | % | | | 52 | % | | | 45 | % | |
| Net assets at end of period (000's) | | $ | 211,021 | | | $ | 142,204 | | | $ | 70,582 | | | $ | 52,872 | | | $ | 33,806 | | | $ | 25,587 | | |
(a) Per share data was calculated using average shares outstanding during the period.
(b) Total return at net asset value assuming all distributions reinvested and no initial sales charge or contingent deferred sales charge.
(c) Had the Investment Adviser and/or Transfer Agent not waived and/or reimbursed a portion of expenses, total return would have been reduced.
(d) Not annualized.
(e) The benefits derived from custody fees paid indirectly had no impact.
(f) Annualized.
| Class B Shares | | (Unaudited)
Six months
ended June 30, | | Year ended December 31, | |
| Selected data for a share outstanding throughout each period | | 2006 | | 2005 | | 2004 | | 2003 | | 2002 | | 2001 | |
| Net Asset Value, Beginning of Period | | $ | 32.71 | | | $ | 28.18 | | | $ | 22.07 | | | $ | 15.11 | | | $ | 18.22 | | | $ | 23.81 | | |
| Income from Investment Operations | |
| Net investment income (loss) (a) | | | 0.10 | | | | 0.02 | | | | (0.04 | ) | | | (0.02 | ) | | | (0.06 | ) | | | (0.12 | ) | |
| Net realized and unrealized gain (loss) | | | 4.39 | | | | 5.73 | | | | 6.19 | | | | 6.98 | | | | (3.05 | ) | | | (5.08 | ) | |
| Total from Investment Operations | | | 4.49 | | | | 5.75 | | | | 6.15 | | | | 6.96 | | | | (3.11 | ) | | | (5.20 | ) | |
| Less Distributions Declared to Shareholders | |
| From net investment income | | | — | | | | (0.14 | ) | | | (0.04 | ) | | | — | | | | — | | | | — | | |
| From net realized gains | | | (0.55 | ) | | | (1.08 | ) | | | — | | | | — | | | | — | | | | (0.39 | ) | |
| Total Distributions Declared to Shareholders | | | (0.55 | ) | | | (1.22 | ) | | | (0.04 | ) | | | — | | | | — | | | | (0.39 | ) | |
| Net Asset Value, End of Period | | $ | 36.65 | | | $ | 32.71 | | | $ | 28.18 | | | $ | 22.07 | | | $ | 15.11 | | | $ | 18.22 | | |
| Total Return (b) | | | 13.74 | %(c)(d) | | | 20.57 | %(c) | | | 27.91 | %(c) | | | 46.06 | % | | | (17.07 | )% | | | (22.04 | )% | |
| Ratios to Average Net Assets/Supplemental Data | |
| Expenses (e) | | | 1.93 | %(f) | | | 2.01 | % | | | 2.27 | % | | | 2.24 | % | | | 2.21 | % | | | 2.30 | % | |
| Net investment income (loss) (e) | | | 0.53 | %(f) | | | 0.08 | % | | | (0.18 | )% | | | (0.10 | )% | | | (0.35 | )% | | | (0.62 | )% | |
| Waiver/reimbursement | | | 0.01 | %(f) | | | 0.02 | % | | | 0.02 | % | | | — | | | | — | | | | — | | |
| Portfolio turnover rate | | | 19 | %(d) | | | 27 | % | | | 40 | % | | | 40 | % | | | 52 | % | | | 45 | % | |
| Net assets at end of period (000's) | | $ | 82,345 | | | $ | 73,572 | | | $ | 54,752 | | | $ | 39,800 | | | $ | 22,560 | | | $ | 17,235 | | |
(a) Per share data was calculated using average shares outstanding during the period.
(b) Total return at net asset value assuming all distributions reinvested and no initial sales charge or contingent deferred sales charge.
(c) Had the Investment Adviser and/or Transfer Agent not waived and/or reimbursed a portion of expenses, total return would have been reduced.
(d) Not annualized.
(e) The benefits derived from custody fees paid indirectly had no impact.
(f) Annualized.
| Class C Shares | | (Unaudited)
Six months
ended June 30, | | Year ended December 31, | |
| Selected data for a share outstanding throughout each period | | 2006 | | 2005 | | 2004 | | 2003 | | 2002 | | 2001 | |
| Net Asset Value, Beginning of Period | | $ | 32.68 | | | $ | 28.19 | | | $ | 22.06 | | | $ | 15.11 | | | $ | 18.21 | | | $ | 23.81 | | |
| Income from Investment Operations | |
| Net investment loss (a) | | | 0.11 | | | | (0.00 | )(b) | | | (0.03 | ) | | | (0.01 | ) | | | (0.06 | ) | | | (0.13 | ) | |
| Net realized and unrealized gain (loss) | | | 4.37 | | | | 5.71 | | | | 6.20 | | | | 6.96 | | | | (3.04 | ) | | | (5.08 | ) | |
| Total from Investment Operations | | | 4.48 | | | | 5.71 | | | | 6.17 | | | | 6.95 | | | | (3.10 | ) | | | (5.21 | ) | |
| Less Distributions Declared to Shareholders | |
| From net investment income | | | — | | | | (0.14 | ) | | | (0.04 | ) | | | — | | | | — | | | | — | | |
| From net realized gains | | | (0.55 | ) | | | (1.08 | ) | | | — | | | | — | | | | — | | | | (0.39 | ) | |
| Total Distributions Declared to Shareholders | | | (0.55 | ) | | | (1.22 | ) | | | (0.04 | ) | | | — | | | | — | | | | (0.39 | ) | |
| Net Asset Value, End of Period | | $ | 36.61 | | | $ | 32.68 | | | $ | 28.19 | | | $ | 22.06 | | | $ | 15.11 | | | $ | 18.21 | | |
| Total Return (c) | | | 13.72 | %(d)(e) | | | 20.45 | %(d) | | | 28.01 | %(d) | | | 46.00 | % | | | (17.02 | )% | | | (22.08 | )% | |
| Ratios to Average Net Assets/Supplemental Data | |
| Expenses (f) | | | 2.00 | %(g) | | | 2.09 | % | | | 2.24 | % | | | 2.24 | % | | | 2.21 | % | | | 2.30 | % | |
| Net investment income (loss) (f) | | | 0.60 | %(g) | | | (0.01 | )% | | | (0.15 | )% | | | (0.06 | )% | | | (0.35 | )% | | | (0.62 | )% | |
| Waiver/reimbursement | | | 0.01 | %(g) | | | 0.02 | % | | | 0.02 | % | | | — | | | | — | | | | — | | |
| Portfolio turnover rate | | | 19 | %(e) | | | 27 | % | | | 40 | % | | | 40 | % | | | 52 | % | | | 45 | % | |
| Net assets at end of period (000's) | | $ | 76,524 | | | $ | 47,325 | | | $ | 30,547 | | | $ | 22,990 | | | $ | 14,575 | | | $ | 14,327 | | |
(a) Per share data was calculated using average shares outstanding during the period.
(b) Rounds to less than $(0.01) per share.
(c) Total return at net asset value assuming all distributions reinvested and no initial sales charge or contingent deferred sales charge.
(d) Had the Investment Adviser and/or Transfer Agent not waived and/or reimbursed a portion of expenses, total return would have been reduced.
(e) Not annualized.
(f) The benefits derived from custody fees paid indirectly had no impact.
(g) Annualized.
See accompanying notes to financial statements.
69
Columbia Acorn Family of Funds
>Financial Highlights, continued
Columbia Acorn USA
| Class A Shares | | (Unaudited)
Six months
ended June 30, | | Year ended December 31, | |
| Selected data for a share outstanding throughout each period | | 2006 | | 2005 | | 2004 | | 2003 | | 2002 | | 2001 | |
| Net Asset Value, Beginning of Period | | $ | 26.52 | | | $ | 24.77 | | | $ | 20.74 | | | $ | 14.18 | | | $ | 17.50 | | | $ | 14.88 | | |
| Income from Investment Operations | |
| Net investment loss (a) | | | (0.05 | ) | | | (0.01 | ) | | | (0.24 | ) | | | (0.22 | ) | | | (0.19 | ) | | | (0.19 | ) | |
| Net realized and unrealized gain (loss) | | | 0.59 | | | | 3.13 | | | | 4.41 | | | | 6.78 | | | | (3.13 | ) | | | 2.96 | | |
| Total from Investment Operations | | | 0.54 | | | | 3.12 | | | | 4.17 | | | | 6.56 | | | | (3.32 | ) | | | 2.77 | | |
| Less Distributions Declared to Shareholders | |
| From net realized gains | | | (0.10 | ) | | | (1.37 | ) | | | (0.14 | ) | | | — | | | | — | | | | (0.15 | ) | |
| Total Distributions Declared to Shareholders | | | (0.10 | ) | | | (1.37 | ) | | | (0.14 | ) | | | — | | | | — | | | | (0.15 | ) | |
| Net Asset Value, End of Period | | $ | 26.96 | | | $ | 26.52 | | | $ | 24.77 | | | $ | 20.74 | | | $ | 14.18 | | | $ | 17.50 | | |
| Total Return (b) | | | 2.04 | %(c)(d) | | | 12.68 | %(c) | | | 20.12 | %(c) | | | 46.26 | % | | | (18.97 | )% | | | 18.65 | % | |
| Ratios to Average Net Assets/Supplemental Data | |
| Expenses (e) | | | 1.25 | %(f) | | | 1.31 | % | | | 1.51 | % | | | 1.65 | % | | | 1.74 | % | | | 1.84 | % | |
| Net investment loss (e) | | | (0.33 | )%(f) | | | (0.02 | )% | | | (1.08 | )% | | | (1.26 | )% | | | (1.21 | )% | | | (1.13 | )% | |
| Waiver/reimbursement | | | 0.01 | %(f) | | | 0.01 | % | | | 0.02 | % | | | — | | | | — | | | | — | | |
| Portfolio turnover rate | | | 5 | %(d) | | | 13 | % | | | 18 | % | | | 7 | % | | | 31 | % | | | 24 | % | |
| Net assets at end of period (000's) | | $ | 220,043 | | | $ | 168,922 | | | $ | 112,509 | | | $ | 89,650 | | | $ | 32,422 | | | $ | 20,455 | | |
(a) Per share data was calculated using average shares outstanding during the period.
(b) Total return at net asset value assuming all distributions reinvested and no initial sales charge or contingent deferred sales charge.
(c) Had the Investment Adviser and/or Transfer Agent not waived and/or reimbursed a portion of expenses, total return would have been reduced.
(d) Not annualized.
(e) The benefits derived from custody fees paid indirectly had no impact.
(f) Annualized.
| Class B Shares | | (Unaudited)
Six months
ended June 30, | | Year ended December 31, | |
| Selected data for a share outstanding throughout each period | | 2006 | | 2005 | | 2004 | | 2003 | | 2002 | | 2001 | |
| Net Asset Value, Beginning of Period | | $ | 25.61 | | | $ | 24.14 | | | $ | 20.36 | | | $ | 14.01 | | | $ | 17.40 | | | $ | 14.87 | | |
| Income from Investment Operations | |
| Net investment loss (a) | | | (0.14 | ) | | | (0.18 | ) | | | (0.39 | ) | | | (0.32 | ) | | | (0.29 | ) | | | (0.30 | ) | |
| Net realized and unrealized gain (loss) | | | 0.58 | | | | 3.02 | | | | 4.31 | | | | 6.67 | | | | (3.10 | ) | | | 2.96 | | |
| Total from Investment Operations | | | 0.44 | | | | 2.84 | | | | 3.92 | | | | 6.35 | | | | (3.39 | ) | | | 2.66 | | |
| Less Distributions Declared to Shareholders | |
| From net realized gains | | | (0.10 | ) | | | (1.37 | ) | | | (0.14 | ) | | | — | | | | — | | | | (0.13 | ) | |
| Total Distributions Declared to Shareholders | | | (0.10 | ) | | | (1.37 | ) | | | (0.14 | ) | | | — | | | | — | | | | (0.13 | ) | |
| Net Asset Value, End of Period | | $ | 25.95 | | | $ | 25.61 | | | $ | 24.14 | | | $ | 20.36 | | | $ | 14.01 | | | $ | 17.40 | | |
| Total Return (b) | | | 1.73 | %(c)(d) | | | 11.84 | %(c) | | | 19.26 | %(c) | | | 45.32 | % | | | (19.48 | )% | | | 17.92 | % | |
| Ratios to Average Net Assets/Supplemental Data | |
| Expenses (e) | | | 1.96 | %(f) | | | 2.00 | % | | | 2.23 | % | | | 2.30 | % | | | 2.39 | % | | | 2.49 | % | |
| Net investment loss (e) | | | (1.04 | )%(f) | | | (0.72 | )% | | | (1.80 | )% | | | (1.91 | )% | | | (1.86 | )% | | | (1.78 | )% | |
| Waiver/reimbursement | | | 0.01 | %(f) | | | 0.01 | % | | | 0.02 | % | | | — | | | | — | | | | — | | |
| Portfolio turnover rate | | | 5 | %(d) | | | 13 | % | | | 18 | % | | | 7 | % | | | 31 | % | | | 24 | % | |
| Net assets at end of period (000's) | | $ | 67,649 | | | $ | 73,168 | | | $ | 72,643 | | | $ | 66,175 | | | $ | 37,478 | | | $ | 27,722 | | |
(a) Per share data was calculated using average shares outstanding during the period.
(b) Total return at net asset value assuming all distributions reinvested and no initial sales charge or contingent deferred sales charge.
(c) Had the Investment Adviser and/or Transfer Agent not waived and/or reimbursed a portion of expenses, total return would have been reduced.
(d) Not annualized.
(e) The benefits derived from custody fees paid indirectly had no impact.
(f) Annualized.
| Class C Shares | | (Unaudited)
Six months
ended June 30, | | Year ended December 31, | |
| Selected data for a share outstanding throughout each period | | 2006 | | 2005 | | 2004 | | 2003 | | 2002 | | 2001 | |
| Net Asset Value, Beginning of Period | | $ | 25.59 | | | $ | 24.14 | | | $ | 20.36 | | | $ | 14.01 | | | $ | 17.40 | | | $ | 14.87 | | |
| Income from Investment Operations | |
| Net investment loss (a) | | | (0.15 | ) | | | (0.20 | ) | | | (0.39 | ) | | | (0.32 | ) | | | (0.29 | ) | | | (0.30 | ) | |
| Net realized and unrealized gain (loss) | | | 0.58 | | | | 3.02 | | | | 4.31 | | | | 6.67 | | | | (3.10 | ) | | | 2.96 | | |
| Total from Investment Operations | | | 0.43 | | | | 2.82 | | | | 3.92 | | | | 6.35 | | | | (3.39 | ) | | | 2.66 | | |
| Less Distributions Declared to Shareholders | |
| From net realized gains | | | (0.10 | ) | | | (1.37 | ) | | | (0.14 | ) | | | — | | | | — | | | | (0.13 | ) | |
| Total Distributions Declared to Shareholders | | | (0.10 | ) | | | (1.37 | ) | | | (0.14 | ) | | | — | | | | — | | | | (0.13 | ) | |
| Net Asset Value, End of Period | | $ | 25.92 | | | $ | 25.59 | | | $ | 24.14 | | | $ | 20.36 | | | $ | 14.01 | | | $ | 17.40 | | |
| Total Return (b) | | | 1.69 | %(c)(d) | | | 11.76 | %(c) | | | 19.26 | %(c) | | | 45.32 | % | | | (19.48 | )% | | | 17.92 | % | |
| Ratios to Average Net Assets/Supplemental Data | |
| Expenses (e) | | | 2.05 | %(f) | | | 2.10 | % | | | 2.23 | % | | | 2.30 | % | | | 2.39 | % | | | 2.49 | % | |
| Net investment loss (e) | | | (1.13 | )%(f) | | | (0.81 | )% | | | (1.80 | )% | | | (1.91 | )% | | | (1.86 | )% | | | (1.78 | )% | |
| Waiver/reimbursement | | | 0.01 | %(f) | | | 0.01 | % | | | 0.02 | % | | | — | | | | — | | | | — | | |
| Portfolio turnover rate | | | 5 | %(d) | | | 13 | % | | | 18 | % | | | 7 | % | | | 31 | % | | | 24 | % | |
| Net assets at end of period (000's) | | $ | 50,799 | | | $ | 42,844 | | | $ | 39,643 | | | $ | 35,662 | | | $ | 18,313 | | | $ | 13,049 | | |
(a) Per share data was calculated using average shares outstanding during the period.
(b) Total return at net asset value assuming all distributions reinvested and no initial sales charge or contingent deferred sales charge.
(c) Had the Investment Adviser and/or Transfer Agent not waived and/or reimbursed a portion of expenses, total return would have been reduced.
(d) Not annualized.
(e) The benefits derived from custody fees paid indirectly had no impact.
(f) Annualized.
See accompanying notes to financial statements.
1-800-922-6769
70
Columbia Acorn International Select
| Class A Shares | | (Unaudited)
Six months
ended June 30, | | Year ended December 31, | |
| Selected data for a share outstanding throughout each period | | 2006 | | 2005 | | 2004 | | 2003 | | 2002 | | 2001 | |
| Net Asset Value, Beginning of Period | | $ | 20.36 | | | $ | 17.85 | | | $ | 14.45 | | | $ | 10.24 | | | $ | 12.07 | | | $ | 17.15 | | |
| Income from Investment Operations | |
| Net investment income (loss) (a) | | | 0.08 | | | | 0.06 | | | | (0.00 | )(b) | | | 0.03 | | | | (0.01 | ) | | | (0.09 | ) | |
| Net realized and unrealized gain (loss) | | | 2.51 | | | | 2.69 | | | | 3.43 | | | | 4.18 | | | | (1.82 | ) | | | (4.90 | ) | |
| Total from Investment Operations | | | 2.59 | | | | 2.75 | | | | 3.43 | | | | 4.21 | | | | (1.83 | ) | | | (4.99 | ) | |
| Less Distributions Declared to Shareholders | |
| From net investment income | | | (0.00 | )(b) | | | (0.24 | ) | | | (0.03 | ) | | | — | | | | — | | | | (0.01 | ) | |
| From net realized gains | | | — | | | | — | | | | — | | | | — | | | | — | | | | (0.08 | ) | |
| Total Distributions Declared to Shareholders | | | — | | | | (0.24 | ) | | | (0.03 | ) | | | — | | | | — | | | | (0.09 | ) | |
| Net Asset Value, End of Period | | $ | 22.95 | | | $ | 20.36 | | | $ | 17.85 | | | $ | 14.45 | | | $ | 10.24 | | | $ | 12.07 | | |
| Total Return (c)(d) | | | 12.74 | %(e) | | | 15.60 | % | | | 23.76 | % | | | 41.11 | % | | | (15.16 | )% | | | (29.17 | )% | |
| Ratios to Average Net Assets/Supplemental Data | |
| Expenses (f) | | | 1.60 | %(g) | | | 1.70 | % | | | 1.75 | % | | | 1.80 | % | | | 1.80 | % | | | 1.80 | % | |
| Net investment income (loss) (f) | | | 0.68 | %(g) | | | 0.34 | % | | | (0.03 | )% | | | 0.24 | % | | | (0.09 | )% | | | (0.67 | )% | |
| Waiver/reimbursement | | | 0.01 | %(g) | | | 0.10 | % | | | 0.37 | % | | | 0.44 | % | | | 0.33 | % | | | 0.23 | % | |
| Portfolio turnover rate | | | 30 | %(e) | | | 39 | % | | | 73 | % | | | 69 | % | | | 102 | % | | | 82 | % | |
| Net assets at end of period (000's) | | $ | 14,167 | | | $ | 10,219 | | | $ | 4,357 | | | $ | 2,557 | | | $ | 2,612 | | | $ | 2,861 | | |
(a) Per share data was calculated using average shares outstanding during the period.
(b) Rounds to less than $(0.01) per share.
(c) Total return at net asset value assuming all distributions reinvested and no initial sales charge or contingent deferred sales charge.
(d) Had the Investment Adviser and/or Transfer Agent not waived and/or reimbursed a portion of expenses, total return would have been reduced.
(e) Not annualized.
(f) The benefits derived from custody fees paid indirectly had no impact.
(g) Annualized.
| Class B Shares | | (Unaudited)
Six months
ended June 30, | | Year ended December 31, | |
| Selected data for a share outstanding throughout each period | | 2006 | | 2005 | | 2004 | | 2003 | | 2002 | | 2001 | |
| Net Asset Value, Beginning of Period | | $ | 19.80 | | | $ | 17.36 | | | $ | 14.12 | | | $ | 10.08 | | | $ | 11.96 | | | $ | 17.13 | | |
| Income from Investment Operations | |
| Net investment loss (a) | | | (0.01 | ) | | | (0.03 | ) | | | (0.10 | ) | | | (0.06 | ) | | | (0.08 | ) | | | (0.18 | ) | |
| Net realized and unrealized gain (loss) | | | 2.45 | | | | 2.61 | | | | 3.34 | | | | 4.10 | | | | (1.80 | ) | | | (4.90 | ) | |
| Total from Investment Operations | | | 2.44 | | | | 2.58 | | | | 3.24 | | | | 4.04 | | | | (1.88 | ) | | | (5.08 | ) | |
| Less Distributions Declared to Shareholders | |
| From net investment income | | | — | | | | (0.14 | ) | | | — | | | | — | | | | — | | | | (0.01 | ) | |
| From net realized gains | | | — | | | | — | | | | — | | | | — | | | | — | | | | (0.08 | ) | |
| Total Distributions Declared to Shareholders | | | — | | | | (0.14 | ) | | | — | | | | — | | | | — | | | | (0.09 | ) | |
| Net Asset Value, End of Period | | $ | 22.24 | | | $ | 19.80 | | | $ | 17.36 | | | $ | 14.12 | | | $ | 10.08 | | | $ | 11.96 | | |
| Total Return (b)(c) | | | 12.32 | %(d) | | | 14.97 | % | | | 22.95 | % | | | 40.08 | % | | | (15.72 | )% | | | (29.73 | )% | |
| Ratios to Average Net Assets/Supplemental Data | |
| Expenses (e) | | | 2.29 | %(f) | | | 2.30 | % | | | 2.38 | % | | | 2.45 | % | | | 2.45 | % | | | 2.45 | % | |
| Net investment loss (e) | | | (0.05 | )%(f) | | | (0.16 | )% | | | (0.66 | )% | | | (0.52 | )% | | | (0.74 | )% | | | (1.32 | )% | |
| Waiver/reimbursement | | | 0.07 | %(f) | | | 0.28 | % | | | 0.58 | % | | | 0.44 | % | | | 0.33 | % | | | 0.23 | % | |
| Portfolio turnover rate | | | 30 | %(d) | | | 39 | % | | | 73 | % | | | 69 | % | | | 102 | % | | | 82 | % | |
| Net assets at end of period (000's) | | $ | 7,910 | | | $ | 6,594 | | | $ | 5,097 | | | $ | 3,162 | | | $ | 1,835 | | | $ | 2,069 | | |
(a) Per share data was calculated using average shares outstanding during the period.
(b) Total return at net asset value assuming all distributions reinvested and no initial sales charge or contingent deferred sales charge.
(c) Had the Investment Adviser and/or Transfer Agent not waived and/or reimbursed a portion of expenses, total return would have been reduced.
(d) Not annualized.
(e) The benefits derived from custody fees paid indirectly had no impact.
(f) Annualized.
| Class C Shares | | (Unaudited)
Six months
ended June 30, | | Year ended December 31, | |
| Selected data for a share outstanding throughout each period | | 2006 | | 2005 | | 2004 | | 2003 | | 2002 | | 2001 | |
| Net Asset Value, Beginning of Period | | $ | 19.80 | | | $ | 17.38 | | | $ | 14.14 | | | $ | 10.09 | | | $ | 11.97 | | | $ | 17.14 | | |
| Income from Investment Operations | |
| Net investment loss (a) | | | (0.02 | ) | | | (0.05 | ) | | | (0.11 | ) | | | (0.05 | ) | | | (0.08 | ) | | | (0.18 | ) | |
| Net realized and unrealized gain (loss) | | | 2.45 | | | | 2.60 | | | | 3.35 | | | | 4.10 | | | | (1.80 | ) | | | (4.90 | ) | |
| Total from Investment Operations | | | 2.43 | | | | 2.55 | | | | 3.24 | | | | 4.05 | | | | (1.88 | ) | | | (5.08 | ) | |
| Less Distributions Declared to Shareholders | |
| From net investment income | | | — | | | | (0.13 | ) | | | — | | | | — | | | | — | | | | (0.01 | ) | |
| From net realized gains | | | — | | | | — | | | | — | | | | — | | | | — | | | | (0.08 | ) | |
| Total Distributions Declared to Shareholders | | | — | | | | (0.13 | ) | | | — | | | | — | | | | — | | | | (0.09 | ) | |
| Net Asset Value, End of Period | | $ | 22.23 | | | $ | 19.80 | | | $ | 17.38 | | | $ | 14.14 | | | $ | 10.09 | | | $ | 11.97 | | |
| Total Return (b)(c) | | | 12.27 | %(d) | | | 14.77 | % | | | 22.91 | % | | | 40.14 | % | | | (15.71 | )% | | | (29.71 | )% | |
| Ratios to Average Net Assets/Supplemental Data | |
| Expenses (e) | | | 2.40 | %(f) | | | 2.45 | % | | | 2.45 | % | | | 2.45 | % | | | 2.45 | % | | | 2.45 | % | |
| Net investment loss (e) | | | (0.15 | )%(f) | | | (0.30 | )% | | | (0.73 | )% | | | (0.41 | )% | | | (0.74 | )% | | | (1.32 | )% | |
| Waiver/reimbursement | | | 0.01 | %(f) | | | 0.17 | % | | | 0.35 | % | | | 0.44 | % | | | 0.33 | % | | | 0.23 | % | |
| Portfolio turnover rate | | | 30 | %(d) | | | 39 | % | | | 73 | % | | | 69 | % | | | 102 | % | | | 82 | % | |
| Net assets at end of period (000's) | | $ | 5,006 | | | $ | 4,083 | | | $ | 2,543 | | | $ | 3,691 | | | $ | 2,915 | | | $ | 3,885 | | |
(a) Per share data was calculated using average shares outstanding during the period.
(b) Total return at net asset value assuming all distributions reinvested and no initial sales charge or contingent deferred sales charge.
(c) Had the Investment Adviser and/or Transfer Agent not waived and/or reimbursed a portion of expenses, total return would have been reduced.
(d) Not annualized.
(e) The benefits derived from custody fees paid indirectly had no impact.
(f) Annualized.
See accompanying notes to financial statements.
71
Columbia Acorn Family of Funds
>Financial Highlights, continued
Columbia Acorn Select
| Class A Shares | | (Unaudited)
Six months
ended June 30, | | Year ended December 31, | |
| Selected data for a share outstanding throughout each period | | 2006 | | 2005 | | 2004 | | 2003 | | 2002 | | 2001 | |
| Net Asset Value, Beginning of Period | | $ | 22.47 | | | $ | 20.83 | | | $ | 18.01 | | | $ | 13.93 | | | $ | 15.17 | | | $ | 14.12 | | |
| Income from Investment Operations | |
| Net investment loss (a) | | | (0.06 | ) | | | (0.09 | ) | | | (0.16 | ) | | | (0.20 | ) | | | (0.16 | ) | | | (0.10 | ) | |
| Net realized and unrealized gain (loss) | | | 1.25 | | | | 2.32 | | | | 3.42 | | | | 4.37 | | | | (1.08 | ) | | | 1.18 | | |
| Total from Investment Operations | | | 1.19 | | | | 2.23 | | | | 3.26 | | | | 4.17 | | | | (1.24 | ) | | | 1.08 | | |
| Less Distributions Declared to Shareholders | |
| From net investment income | | | (0.02 | ) | | | — | | | | — | | | | — | | | | — | | | | — | | |
| From net realized gains | | | (0.09 | ) | | | (0.59 | ) | | | (0.44 | ) | | | (0.09 | ) | | | — | | | | (0.03 | ) | |
| Total Distributions Declared to Shareholders | | | (0.11 | ) | | | (0.59 | ) | | | (0.44 | ) | | | (0.09 | ) | | | — | | | | (0.03 | ) | |
| Net Asset Value, End of Period | | $ | 23.55 | | | $ | 22.47 | | | $ | 20.83 | | | $ | 18.01 | | | $ | 13.93 | | | $ | 15.17 | | |
| Total Return (b) | | | 5.30 | %(c)(d) | | | 10.78 | %(c) | | | 18.16 | %(c) | | | 29.95 | % | | | (8.17 | )%(c) | | | 7.65 | %(c) | |
| Ratios to Average Net Assets/Supplemental Data | |
| Expenses | | | 1.23 | %(e)(f) | | | 1.26 | %(e) | | | 1.47 | %(e) | | | 1.63 | %(e) | | | 1.70 | %(e) | | | 1.70 | % | |
| Net investment loss | | | (0.49 | )%(e)(f) | | | (0.42 | )%(e) | | | (0.86 | )%(e) | | | (1.15 | )%(e) | | | (1.11 | )%(e) | | | (0.79 | )% | |
| Waiver/reimbursement | | | 0.02 | %(f) | | | 0.03 | % | | | 0.02 | % | | | — | | | | 0.10 | % | | | 0.18 | % | |
| Portfolio turnover rate | | | 13 | %(d) | | | 19 | % | | | 34 | % | | | 16 | % | | | 40 | % | | | 82 | % | |
| Net assets at end of period (000's) | | $ | 788,153 | | | $ | 744,178 | | | $ | 515,842 | | | $ | 264,679 | | | $ | 31,742 | | | $ | 11,900 | | |
(a) Per share data was calculated using average shares outstanding during the period.
(b) Total return at net asset value assuming all distributions reinvested and no initial sales charge or contingent deferred sales charge.
(c) Had the Investment Adviser and/or Transfer Agent not waived and/or reimbursed a portion of expenses, total return would have been reduced.
(d) Not annualized.
(e) The benefits derived from custody fees paid indirectly had no impact.
(f) Annualized.
| Class B Shares | | (Unaudited)
Six months
ended June 30, | | Year ended December 31, | |
| Selected data for a share outstanding throughout each period | | 2006 | | 2005 | | 2004 | | 2003 | | 2002 | | 2001 | |
| Net Asset Value, Beginning of Period | | $ | 21.71 | | | $ | 20.23 | | | $ | 17.64 | | | $ | 13.73 | | | $ | 15.05 | | | $ | 14.10 | | |
| Income from Investment Operations | |
| Net investment loss (a) | | | (0.14 | ) | | | (0.23 | ) | | | (0.31 | ) | | | (0.29 | ) | | | (0.25 | ) | | | (0.20 | ) | |
| Net realized and unrealized gain (loss) | | | 1.21 | | | | 2.24 | | | | 3.34 | | | | 4.29 | | | | (1.07 | ) | | | 1.18 | | |
| Total from Investment Operations | | | 1.07 | | | | 2.01 | | | | 3.03 | | | | 4.00 | | | | (1.32 | ) | | | 0.98 | | |
| Less Distributions Declared to Shareholders | |
| From net realized gains | | | (0.09 | ) | | | (0.53 | ) | | | (0.44 | ) | | | (0.09 | ) | | | — | | | | (0.03 | ) | |
| Total Distributions Declared to Shareholders | | | (0.09 | ) | | | (0.53 | ) | | | (0.44 | ) | | | (0.09 | ) | | | — | | | | (0.03 | ) | |
| Net Asset Value, End of Period | | $ | 22.69 | | | $ | 21.71 | | | $ | 20.23 | | | $ | 17.64 | | | $ | 13.73 | | | $ | 15.05 | | |
| Total Return (b) | | | 4.91 | %(c)(d) | | | 10.01 | %(c) | | | 17.24 | %(c) | | | 29.14 | % | | | (8.77 | )%(c) | | | 6.95 | %(c) | |
| Ratios to Average Net Assets/Supplemental Data | |
| Expenses | | | 1.95 | %(e)(f) | | | 1.99 | %(e) | | | 2.26 | %(e) | | | 2.28 | %(e) | | | 2.35 | %(e) | | | 2.35 | % | |
| Net investment loss | | | (1.21 | )%(e)(f) | | | (1.15 | )%(e) | | | (1.65 | )%(e) | | | (1.80 | )%(e) | | | (1.76 | )%(e) | | | (1.44 | )% | |
| Waiver/reimbursement | | | 0.02 | %(f) | | | 0.03 | % | | | 0.02 | % | | | — | | | | 0.10 | % | | | 0.18 | % | |
| Portfolio turnover rate | | | 13 | %(d) | | | 19 | % | | | 34 | % | | | 16 | % | | | 40 | % | | | 82 | % | |
| Net assets at end of period (000's) | | $ | 203,596 | | | $ | 206,441 | | | $ | 185,545 | | | $ | 118,064 | | | $ | 33,106 | | | $ | 13,358 | | |
(a) Per share data was calculated using average shares outstanding during the period.
(b) Total return at net asset value assuming all distributions reinvested and no initial sales charge or contingent deferred sales charge.
(c) Had the Investment Adviser and/or Transfer Agent not waived and/or reimbursed a portion of expenses, total return would have been reduced.
(d) Not annualized.
(e) The benefits derived from custody fees paid indirectly had no impact.
(f) Annualized.
| Class C Shares | | (Unaudited)
Six months
ended June 30, | | Year ended December 31, | |
| Selected data for a share outstanding throughout each period | | 2006 | | 2005 | | 2004 | | 2003 | | 2002 | | 2001 | |
| Net Asset Value, Beginning of Period | | $ | 21.69 | | | $ | 20.23 | | | $ | 17.64 | | | $ | 13.73 | | | $ | 15.05 | | | $ | 14.10 | | |
| Income from Investment Operations | |
| Net investment loss (a) | | | (0.15 | ) | | | (0.25 | ) | | | (0.30 | ) | | | (0.30 | ) | | | (0.25 | ) | | | (0.20 | ) | |
| Net realized and unrealized gain (loss) | | | 1.21 | | | | 2.24 | | | | 3.33 | | | | 4.30 | | | | (1.07 | ) | | | 1.18 | | |
| Total from Investment Operations | | | 1.06 | | | | 1.99 | | | | 3.03 | | | | 4.00 | | | | (1.32 | ) | | | 0.98 | | |
| Less Distributions Declared to Shareholders | |
| From net realized gains | | | (0.09 | ) | | | (0.53 | ) | | | (0.44 | ) | | | (0.09 | ) | | | — | | | | (0.03 | ) | |
| Total Distributions Declared to Shareholders | | | (0.09 | ) | | | (0.53 | ) | | | (0.44 | ) | | | (0.09 | ) | | | — | | | | (0.03 | ) | |
| Net Asset Value, End of Period | | $ | 22.66 | | | $ | 21.69 | | | $ | 20.23 | | | $ | 17.64 | | | $ | 13.73 | | | $ | 15.05 | | |
| Total Return (b) | | | 4.87 | %(c)(d) | | | 9.91 | %(c) | | | 17.24 | %(c) | | | 29.14 | % | | | (8.77 | )%(c) | | | 6.95 | %(c) | |
| Ratios to Average Net Assets/Supplemental Data | |
| Expenses | | | 2.04 | %(e)(f) | | | 2.08 | %(e) | | | 2.25 | %(e) | | | 2.28 | %(e) | | | 2.35 | %(e) | | | 2.35 | % | |
| Net investment loss | | | (1.30 | )%(e)(f) | | | (1.24 | )%(e) | | | (1.64 | )%(e) | | | (1.80 | )%(e) | | | (1.76 | )%(e) | | | (1.44 | )% | |
| Waiver/reimbursement | | | 0.02 | %(f) | | | 0.03 | % | | | 0.02 | % | | | — | | | | 0.10 | % | | | 0.18 | % | |
| Portfolio turnover rate | | | 13 | %(d) | | | 19 | % | | | 34 | % | | | 16 | % | | | 40 | % | | | 82 | % | |
| Net assets at end of period (000's) | | $ | 155,134 | | | $ | 149,160 | | | $ | 110,435 | | | $ | 64,212 | | | $ | 10,919 | | | $ | 4,945 | | |
(a) Per share data was calculated using average shares outstanding during the period.
(b) Total return at net asset value assuming all distributions reinvested and no initial sales charge or contingent deferred sales charge.
(c) Had the Investment Adviser and/or Transfer Agent not waived and/or reimbursed a portion of expenses, total return would have been reduced.
(d) Not annualized.
(e) The benefits derived from custody fees paid indirectly had no impact.
(f) Annualized.
See accompanying notes to financial statements.
1-800-922-6769
72
Columbia Acorn Family of Funds
>Notes to Financial Statements (Unaudited)
1. Nature of Operations
Columbia Acorn Fund, Columbia Acorn International, Columbia Acorn USA, Columbia Acorn International Select and Columbia Acorn Select (the "Funds") are each a series of Columbia Acorn Trust (the "Trust"), an open-end management investment company organized as a Massachusetts business trust. The investment objective of each Fund is to seek long-term growth of capital. The Funds may issue an unlimited number of shares. The Funds currently offer four classes of shares: Class A, Class B, Class C and Class Z.
Class A shares are sold with a front-end sales charge. Class A shares bought without an initial sales charge in accounts aggregating up to $50 million at the time of purchase are subject to a 1.00% CDSC if the shares are sold within 12 months of the time of purchase.
Class B shares are subject to a CDSC if sold within six years of purchase. Class B shares will convert to Class A shares automatically eight years after purchase.
Class C shares are subject to a CDSC on redemptions made within one year after purchase.
Columbia Acorn International and Columbia Acorn International Select impose a 2% redemption fee on Class A, Class B and Class C shares that are owned 60 days or less. See "Fund Policy on Trading of Fund Shares" as disclosed within the Funds' prospectuses for more information.
Class Z shares are offered continuously at net asset value. There are certain restrictions on the purchase of Class Z shares. Generally, you may exchange your Class Z shares of a Fund for shares of another fund distributed by Columbia Management Distributors, Inc. at no additional charge. However, if you exchange Class Z shares of Columbia Acorn International or Columbia Acorn International Select that you have owned 60 days or less, the Fund will charge you a redemption fee of 2% of the redemption proceeds. In addition, if you redeem shares of Columbia Acorn International or Columbia Acorn International Select that you have owned 60 days or less, the Fund will charge you a redemption fee of 2% of redemption proceeds, with certain exceptions. See "Fund Policy on Trading of Fund Shares and Redemption Fees" as disclosed within the Funds' prospectuses for more information.
The financial highlights for Class Z shares are presented in a separate semiannual report. The semiannual financial statements for Columbia Thermostat Fund, another Fund of the Trust, begins on page 80 of this report.
Investment income, realized and unrealized gains and losses, and certain fund-level expenses are borne pro rata on the basis of the relative net assets of all classes, except each class bears certain expenses unique to that class such as distribution services, transfer agent and certain other class specific expenses. Differences in class expenses may result in payment of different dividend distributions for each class. All the share classes of the Trust have equal rights with respect to voting subject to class specific arrangements.
2. Significant Accounting Policies
>Security valuation
Securities of the Funds are valued at marked value or, if a market quotation for a security is not readily available or is deemed not to be reliable because of events or circumstances that have occurred between the market quotation and the time as of which the security is to be valued, the security is valued at a fair value determined in accordance with procedures established by the Board of Trustees. Securities traded on securities exchanges or in over-the-counter markets in which transaction prices are reported are valued at the last sales price at the time of valuation. If a security is traded principally on the Nasdaq Stock Market Inc., the Nasdaq Official Closing Price will be applied. Securities for which there are no reported sales on the valuation date are valued at the latest bid quotation. Short-term debt obligations having a maturity of 60 days or less from the valuation date are valued on an amortized cost basis, whi ch approximate fair value. Securities for which quotations are not available are valued at a fair value as determined in good faith by the Board of Trustees. The Trust has retained an independent statistical fair value pricing service to assist in the fair valuation process for securities principally traded in a foreign market in order to adjust for possible changes in value that may occur between the close of the foreign exchange and the time at which Fund shares are priced. If a security is valued at a "fair value," that value may be different from the last quoted market price for the security.
>Repurchase agreements
The Funds may engage in repurchase agreement transactions. The Funds, through their custodians, receive delivery of underlying securities collateralizing repurchase agreements. The Funds' investment adviser determines that the value of the underlying securities is at all times at least equal to the resale price. In the event of default or bankruptcy by the other party to the agreement, realization and/or retention of the collateral may be subject to legal proceedings.
73
Columbia Acorn Family of Funds
>Notes to Financial Statements (Unaudited), continued
>Foreign currency translations
Values of investments denominated in foreign currencies are converted into U.S. dollars using the spot market rate of exchange at the time of valuation. Purchases and sales of investments and dividend and interest income are translated into U.S. dollars using the spot market rate of exchange prevailing on the respective dates of such transactions. The gain or loss resulting from changes in foreign exchange rates is included with net realized and unrealized gain or loss from investments, as appropriate.
>Security transactions and investment income
Security transactions are accounted for on the trade date (date the order to buy or sell is executed) and dividend income is recorded on the ex-dividend date, except that certain dividends from foreign securities are recorded as soon as the information is available to the Funds. Interest income is recorded on the accrual basis and includes amortization of discounts on short-term debt obligations and long-term debt obligations when required for federal income tax purposes. Realized gains and losses from security transactions are reported on an identified cost basis.
Awards from class action litigation may be recorded as a reduction of cost. If the Funds no longer own the applicable securities, the proceeds are recorded as realized gains.
The Funds estimate components of distributions from real estate investment trusts (REITs). Distributions received in excess of income are recorded as a reduction of the cost of the related investments. If the Funds no longer own the applicable securities, any distributions received in excess of income are recorded as realized gains.
>Restricted Securities
Restricted securities are securities that may only be resold upon registration under federal securities laws or in transactions exempt from registration. In some cases, the issuer of restricted securities has agreed to register such securities for resale at the issuer's expense either upon demand by the Funds or in connection with another registered offering of the securities. Many restricted securities may be resold in the secondary market in transactions exempt from registration. Such restricted securities may be determined to be liquid under criteria established by the Board of Trustees. The Funds will not incur any registration costs upon such resale.
>Use of estimates
The preparation of financial statements in conformity with accounting principles generally accepted in the United States of America requires management to make estimates and assumptions that affect the amounts reported in the financial statements and accompanying notes. Actual results may differ from those estimates.
>Financial instruments
Each Fund may purchase or sell exchange-traded financial futures contracts, which are contracts that obligate that Fund to make or take delivery of a financial instrument or the cash value of a securities index at a specified future date at a specified price. The Funds enter into such contracts to hedge a portion of their portfolio. Gains and losses are reflected as "Net realized gain (loss) on Futures" in the Statements of Operations. Additionally, each Fund, except for Columbia Acorn USA and Columbia Acorn Select, may engage in portfolio hedging with respect to changes in foreign currency exchange rates by entering into forward foreign currency contracts to purchase or sell foreign currencies. The Statements of Operations reflect gains and losses as realized for closed forward foreign currency contracts and unrealized for open contracts. The Funds bear the market risk that arises from changes in the value of financial instrume nts and securities indices (futures contracts) or from changes in foreign currency rates (forward foreign currency contracts) and the credit risk should a counterparty fail to perform under such contracts.
None of the Funds entered into futures contracts or forward foreign currency contracts during the six months ended June 30, 2006.
>Fund share valuation
Fund shares are sold and redeemed on a continuing basis at net asset value. Net asset value per share is determined daily as of the close of trading on the New York Stock Exchange (the "Exchange") on each day the Exchange is open for trading. All income, expenses (other than the Class A, Class B and Class C 12b-1 service and distribution fees and Class A, Class B, Class C and Class Z shares transfer agent fees) and realized and unrealized gains (losses) of a Fund are allocated to each class proportionately on a daily basis for purposes of determining the net asset value of each class. Redemption fees are accounted for as an addition to paid in capital and are allocated to each class proportionately for purposes of determining the net asset value of each class.
>Custody fees/credits
Custody fees are reduced based on each Fund's cash balances maintained with the custodian. The Funds could have invested a portion of the assets utilized in connection with the expense offset arrangement in an income-producing asset if they had not entered into such an agreement. The amount is disclosed
1-800-922-6769
74
as a reduction of total expenses in the Statements of Operations.
>Federal income taxes
The Funds have complied with the provisions of the Internal Revenue Code available to regulated investment companies and, in the manner provided therein, distribute all their taxable income, as well as any net realized gain on sales of investments and foreign currency transactions reportable for federal income tax purposes. Accordingly, the Funds paid no federal income taxes and no federal income tax provision was required.
>Foreign capital gains taxes
Realized gains in certain countries may be subject to foreign taxes at the fund level, at rates ranging from approximately 10% to 15%. The Funds accrue for such foreign taxes on net realized and unrealized gains at the appropriate rate for each jurisdiction.
>Distributions to Shareholders
Distributions to shareholders are recorded on the ex-date.
>Indemnification
In the normal course of business, each Fund enters into contracts that contain a variety of representations and warranties and which provide general indemnities. A Fund's maximum exposure under these arrangements is unknown, as this would involve future claims against the Fund. Also, under the Trust's organizational documents, the Trustees and Officers of the Trust are indemnified against certain liabilities that may arise out of their duties to the Trust. However, based on experience, the Funds expect the risk of loss due to these warranties and indemnities to be minimal.
3. Federal Tax Information
The tax character of distributions paid during the years ended December 31, 2005 was as follows:
| | | Ordinary
Income* | | Long-Term
Capital Gains | |
| (in thousands) | |
| Columbia Acorn Fund | | $ | 89,415 | | | $ | 846,121 | | |
| Columbia Acorn International | | | 54,197 | | | | 89,135 | | |
| Columbia Acorn USA | | | 1,825 | | | | 56,868 | | |
| Columbia Acorn International Select | | | 1,037 | | | | — | | |
| Columbia Acorn Select | | | 7,041 | | | | 39,716 | | |
*For tax purposes short-term capital gains distributions, if any, are considered ordinary income distributions.
The following capital loss carryforwards, determined as of December 31, 2005, may be available to reduce taxable income arising from future net realized gains on investments, if any, to the extent permitted by the Internal Revenue Code:
Year of
Expiration | | Columbia Acorn
USA | | Columbia Acorn
International Select | |
| (in thousands) | | | |
| | 2009 | | | $ | 2,023 | * | | $ | 10,593 | | |
| | 2010 | | | | 506 | | | | 12,528 | | |
| | 2011 | | | | — | | | | 2,488 | | |
| | TOTAL | | | $ | 2,529 | | | $ | 25,609 | | |
*Of these carryforwards, $2,529 (expiring in 2009) remains from Columbia Acorn USA's merger with Stein Roe Small Company Growth Fund on 7/26/2002. Utilization of Stein Roe Small Company Growth Fund's losses could be subject to limitations imposed by the Internal Revenue Code.
The following capital loss carryforwards were utilized during the year ended December 31, 2005.
| (In thousands) | |
| Columbia Acorn International | | $ | 62,579 | | |
| Columbia Acorn USA | | | 7,025 | | |
| Columbia Acorn International Select | | | 5,542 | | |
In June 2006, the Financial Accounting Standards Board ("FASB") issued FASB Interpretation No. 48, Accounting for Uncertainty in Income Taxes, an Interpretation of FASB Statement 109 (the "Interpretation"). This Interpretation is effective for fiscal years beginning after December 15, 2006 and is to be applied to all tax positions upon initial adoption. This Interpretation prescribes a minimum recognition threshold and measurement method for the financial statement recognition of tax positions taken or expected to be taken in a tax return and also requires certain expanded disclosures. Columbia Wanger Asset Management, L.P. ("Columbia WAM"), a wholly owned subsidiary of Columbia Ma nagement Group, Inc., which in turn is an indirect, wholly owned subsidiary of Bank of America Corporation ("BOA"), has recently begun to evaluate the application of this Interpretation to the Funds and has not at this time quantified the impact, if any, resulting from the adoption of this Interpretation on the Funds' financial statements.
4. Transactions with Affiliates
Columbia WAM furnishes continuing investment supervision to the Funds and is responsible for the overall management of the Funds' business affairs.
Effective August 1, 2006, under the Funds' investment management agreement, fees are accrued daily and paid monthly to Columbia WAM at the annual rates shown in the
75
Columbia Acorn Family of Funds
>Notes to Financial Statements (Unaudited), continued
table below for Columbia Acorn USA and Columbia Acorn Select:
| Columbia Acorn USA | |
| Assets | | Rate of Fee | |
| Up to $200 million | | | 0.940 | % | |
| $200 million to $500 million | | | 0.890 | % | |
| $500 million to $2 billion | | | 0.840 | % | |
| $2 billion to $3 billion | | | 0.800 | % | |
| $3 billion and over | | | 0.700 | % | |
| Columbia Acorn Select | |
| Assets | | Rate of Fee | |
| Up to $700 million | | | 0.850 | % | |
| $700 million to $2 billion | | | 0.800 | % | |
| $2 billion to $3 billion | | | 0.750 | % | |
| $3 billion and over | | | 0.700 | % | |
For the period covered by this report as provided under the Funds' investment management agreement, fees were
accrued daily and paid monthly to Columbia WAM at the annual rates shown in the table below for each Fund.
| Columbia Acorn Fund | |
| Assets | | Rate of Fee | |
| Up to $700 million | | | 0.740 | % | |
| $700 million to $2 billion | | | 0.690 | % | |
| $2 billion to $6 billion | | | 0.640 | % | |
| $6 billion and over | | | 0.630 | % | |
| Columbia Acorn International | |
| Assets | | Rate of Fee | |
| Up to $100 million | | | 1.190 | % | |
| $100 million to $500 million | | | 0.940 | % | |
| $500 million and over | | | 0.740 | % | |
| Columbia Acorn USA | |
| Assets | | Rate of Fee | |
| Up to $200 million | | | 0.940 | % | |
| $200 million to $500 million | | | 0.890 | % | |
| $500 million and over | | | 0.840 | % | |
| Columbia Acorn Select | |
| Assets | | Rate of Fee | |
| Up to $700 million | | | 0.850 | % | |
| $700 million and over | | | 0.800 | % | |
| Columbia Acorn International Select | |
| All Assets | | | 0.940 | % | |
For the six months ended June 30, 2006, the Funds' effective investment advisory fee rates were as follows:
| Columbia Acorn Fund | | | 0.64 | % | |
| Columbia Acorn International | | | 0.78 | % | |
| Columbia Acorn USA | | | 0.87 | % | |
| Columbia Acorn International Select | | | 0.94 | % | |
| Columbia Acorn Select | | | 0.82 | % | |
>Expense Limit
Columbia WAM has voluntarily agreed to reimburse the ordinary operating expenses (exclusive of 12b-1 service and distribution fees, interest, taxes and extraordinary expenses, if any) exceeding 1.45% of the average annual net assets for Columbia Acorn International Select Class A, Class B and Class C shares and 1.35% of the average annual net assets for Columbia Acorn Select Class A, Class B and Class C shares. This arrangement may be modified or terminated by either the Funds or Columbia WAM on 30 days notice.
Expenses reimbursed by Columbia WAM for Columbia Acorn International Select for the six months ended June 30, 2006 were $2,157.
Columbia WAM provides administrative services and receives an administration fee from the Funds at the following rates:
| Columbia Acorn Trust | |
| Average daily net asset value: | | | | | |
| On the first $8 billion | | | 0.05 | % | |
| Next $8 billion | | | 0.04 | % | |
| Average daily net asset in excess of $16 billion | | | 0.03 | % | |
For the six months ended June 30, 2006 each Fund's effective administration fee rate was 0.041%. Columbia WAM has delegated to Columbia Management Advisors, LLC, an indirect, wholly owned subsidiary of BOA, responsibility to provide certain administrative services to the Funds.
Columbia Management Distributors, Inc. ("CMDI"), a wholly owned subsidiary of BOA, is the Funds' principal underwriter and receives no compensation on the sale of Class Z shares.
For the six months ended June 30, 2006, Columbia Acorn Fund, Columbia Acorn International, Columbia Acorn USA, Columbia Acorn International Select and Columbia Acorn Select have been advised that CMDI retained $728,745 in underwriting discounts on the sale of Class A shares and received CDSCs of 1,264,118 and $57,929, on Class B and Class C share redemptions, respectively.
1-800-922-6769
76
Each Fund has adopted a 12b-1 plan which requires it to pay CMDI a monthly service fee equal to 0.25% annually of the average daily net assets attributable to Class A, Class B and Class C shares. The 12b-1 plan also requires each fund to pay CMDI a monthly distribution fee equal to 0.60% and 0.75%, annually, of the average daily net assets attributable to Class B and Class C shares, respectively. Effective August 1, 2006 the monthly distribution fee rate for Class B shares was reduced to 0.50% annually, of the average daily net assets. For the period covered by this report the monthly distribution fee was 0.60% for Class B shares.
Columbia Management Services, Inc. (the "Transfer Agent"), a wholly owned subsidiary of BOA, provides shareholder services to the Funds and has contracted with Boston Financial Data Services ("BFDS") to serve as sub-transfer agent. For such services, the Transfer Agent receives a fee, paid monthly, at the annual rate of $21.00 per open account. The Transfer Agent also receives reimbursement for certain out-of-pocket expenses. The Transfer Agent waived the reimbursement for certain out-of-pocket expenses for the period covered by this report.
Expenses waived by the Transfer Agent for the six months ended June 30, 2006 were as follows:
| (in thousands) | |
| Columbia Acorn Fund | | $ | 817 | | |
| Columbia Acorn International | | | 96 | | |
| Columbia Acorn USA | | | 48 | | |
| Columbia Acorn International Select | | | 7 | | |
| Columbia Acorn Select | | | 170 | | |
Certain officers and trustees of the Trust are also officers of Columbia WAM. The Trust makes no direct payments to its officers and trustees who are affiliated with Columbia WAM. Trustees' fees and expenses paid by the Funds for the six months ended June 30, 2006 were as follows:
| (in thousands) | |
| Columbia Acorn Fund | | $ | 303 | | |
| Columbia Acorn International | | | 47 | | |
| Columbia Acorn USA | | | 21 | | |
| Columbia Acorn International Select | | | 1 | | |
| Columbia Acorn Select | | | 15 | | |
The Board of Trustees appointed a Chief Compliance Officer to the Trust in accordance with federal securities regulations. The Funds, along with other affiliated funds, will pay their pro-rata share of the expenses associated with the Office of the Chief Compliance Officer. These expenses are disclosed separately as "Compliance fees" in the Statements of Operations.
The Trust provides a deferred compensation plan for its trustees. Under that plan, a trustee may elect to defer all or a portion of his or her compensation. Amounts deferred are retained by the Trust and represent an unfunded obligation of the Trust. The value of amounts deferred is determined by reference to the change in value of Class Z shares of one or more series of the Trust or a money market fund as specified by the trustee. Benefits under the deferred compensation plan are payable upon retirement.
An affiliate may include any company in which a fund owns five percent or more of its outstanding voting securities. On June 30, 2006, Columbia Acorn Fund, Columbia Acorn International, Columbia Acorn USA and Columbia Acorn Select each held five percent or more of the outstanding voting securities of one or more companies. Details of investments in those affiliated companies are presented on pages 34, 42, 50 and 59, respectively.
During the six months ended June 30, 2006, the Funds engaged in purchase and sale transactions with funds that have a common investment adviser (or affiliated investment advisers), common Directors/Trustees, and/or common Officers. Those transactions complied with Rule 17a-7 under the Investment Company Act of 1940 and were as follows:
| | | Purchases | | Sales | |
| (in thousands) | |
| Columbia Acorn Fund | | $ | 306 | | | $ | 9,383 | | |
| Columbia Acorn International | | | 19,613 | | | | 1,299 | | |
| Columbia Acorn International Select | | | 44 | | | | — | | |
| Columbia Acorn Select | | | — | | | | 97 | | |
5. Borrowing Arrangements
The Trust participates in a $150 million credit facility, which was entered into to facilitate portfolio liquidity. Interest is charged to each participating fund based on its borrowings at a rate per annum equal to the Federal Funds rate plus 0.50%. In addition, a commitment fee of 0.10% per annum is accrued and apportioned among the participating funds based on their pro-rata portion of the unutilized line of credit. The commitment fee is included in "Other expenses" in the Statements of Operations. No amounts were borrowed under this facility for the six months ended June 30, 2006.
77
Columbia Acorn Family of Funds
>Notes to Financial Statements (Unaudited), continued
6. Investment Transactions
The aggregate cost of purchases and proceeds from sales other than short-term obligations for the six months ended June 30, 2006 were:
| Columbia Acorn Fund | |
| (in thousands) | |
| Investment securities | | | | | |
| Purchases | | $ | 2,536,172 | | |
| Proceeds from sales | | | 1,828,147 | | |
| Columbia Acorn International | |
| (in thousands) | |
| Investment securities | | | | | |
| Purchases | | $ | 872,256 | | |
| Proceeds from sales | | | 618,788 | | |
| Columbia Acorn USA | |
| (in thousands) | |
| Investment securities | | | | | |
| Purchases | | $ | 298,839 | | |
| Proceeds from sales | | | 66,493 | | |
| Columbia Acorn International Select | |
| (in thousands) | |
| Investment securities | | | | | |
| Purchases | | $ | 40,440 | | |
| Proceeds from sales | | | 31,655 | | |
| Columbia Acorn Select | |
| (in thousands) | |
| Investment securities | | | | | |
| Purchases | | $ | 273,545 | | |
| Proceeds from sales | | | 235,105 | | |
7. Redemption Fees
For the six months ended June 30, 2006, the redemption fees for the Class Z shares of Columbia Acorn International and Columbia Acorn International Select amounted to $107 and $4, respectively, and are accounted for as additions to paid in capital.
8. Other
During the six months ended June 30, 2006, Columbia Acorn International sold foreign currency in error, resulting in a loss of $3,523. The Fund was reimbursed by Columbia WAM for the full amount of the loss.
9. Legal Proceedings
The Trust, Columbia WAM and the Trustees of the Trust are named as defendants in class and derivative complaints that have been consolidated in a Multi-District Action (the "MDL Action") in the federal district court of Maryland. These lawsuits contend that defendants permitted certain investors to market time their trades in certain Columbia Acorn Funds. The MDL Action is ongoing. However, all claims against Columbia Acorn Trust and the independent trustees of Columbia Acorn Trust have been dismissed.
The Trust and Columbia WAM are also defendants in a class action lawsuit that alleges, in summary, that the Trust and Columbia WAM exposed shareholders of Columbia Acorn International to trading by market timers by allegedly: (a) failing to properly evaluate daily whether a significant event affecting the value of the Fund's securities had occurred after foreign markets had closed but before the calculation of the Fund's net asset value ("NAV"); (b) failing to implement the Fund's portfolio valuation and share pricing policies and procedures; and (c) failing to know and implement applicable rules and regulations concerning the calculation of NAV. The Seventh Circuit ruled that the plaintiffs' state law claims were preempted under federal law resulting in the dismissal of plaintiffs' complaint. Plaintiffs appealed the Seventh Circuit's ruling to the United States Supreme Court.
On March 21, 2005, a class action complaint was filed against the Columbia Acorn Trust and Columbia WAM seeking to rescind the Contingent Deferred Sales Charges assessed upon redemption of Class B shares of Columbia Acorn Funds due to the alleged market timing of the Columbia Acorn Funds. In addition to the rescission of sales charges, plaintiffs seek recovery of actual damages, attorneys' fees and costs. The case had been transferred to the MDL Action in the federal district court of Maryland.
On April 4, 2006, all of the parties to the MDL Action executed a letter settlement agreement intended to fully resolve all of the lawsuits consolidated in the MDL Action as well as the Fair Valuation Lawsuit. The settlement has not yet been finalized or approved by the court.
Columbia WAM, the Columbia Acorn Funds and the Trustees of the Trust are also defendants in a consolidated lawsuit filed in the federal district court of Massachusetts alleging that Columbia WAM used Fund assets to make undisclosed payments to brokers as an incentive for the brokers to market the Funds over other mutual funds to investors. The complaint alleges Columbia WAM and the Trustees of the Trust breached certain common law duties and federal laws.
On November 30, 2005, the court dismissed all of the claims alleged against all of the parties in the consolidated complaint. Plaintiffs timely filed a notice of appeal of the district court's dismissal order with the First Circuit Court of Appeals. The parties subsequently executed a settlement term sheet to fully resolve all claims in the litigation. The settlement has not yet been finalized or approved by the court.
1-800-922-6769
78
The Trust and Columbia WAM intend to defend these suits vigorously.
As a result of these matters, or any adverse publicity or other developments resulting from them, there may be increased redemptions or reduced sales of Fund shares, which could increase transaction cost or operating expenses, or have other adverse consequences for the Funds. In connection with the events described in detail above, various parties have filed suit against certain funds, their Boards and/or BOA (and affiliated entities). These suits are ongoing. However, based on currently available information, the Columbia Acorn Trust believes that the likelihood that these lawsuits will have a material adverse impact on any Fund is remote, and Columbia WAM believes that the lawsuits are not likely to materially affect its ability to provide investment management services to the Funds.
For the six months ended June 30, 2006, Columbia Management has assumed consulting services and legal fees incurred by the Funds in connection with these matters and the amounts are as follows:
| (in thousands) | |
| Columbia Acorn Fund | | $ | 84 | | |
| Columbia Acorn International | | | 16 | | |
| Columbia Acorn USA | | | 7 | | |
| Columbia Acorn International Select | | | 1 | | |
| Columbia Acorn Select | | | 9 | | |
79
Columbia Thermostat Fund
>Statement of Investments (Unaudited), June 30, 2006
Number of Shares
or Principal Amount (000) | | | | Value (000) | |
| | | >Stock Funds: 50.9% | |
| | 1,828,532 | | | Columbia Large Cap Enhanced
Core Fund, Class Z | | $ | 24,210 | | |
| | 1,542,750 | | | Columbia Dividend Income
Fund, Class Z | | | 19,300 | | |
| | 394,773 | | | Columbia Acorn International,
Class Z | | | 14,836 | | |
| | 498,693 | | | Columbia Acorn Fund, Class Z | | | 14,706 | | |
| | 1,035,323 | | | Columbia Large Cap Value
Fund, Class Z | | | 14,536 | | |
| | 409,815 | | | Columbia Acorn Select, Class Z | | | 9,782 | | |
| | | | | Total Stock Funds (Cost: $90,716) | | | 97,370 | | |
| | | >Bond Funds: 49.1% | |
| | 5,468,354 | | | Columbia Intermediate Bond Fund,
Class Z | | | 47,083 | | |
| | 2,774,361 | | | Columbia Federal Securities Fund,
Class Z | | | 28,187 | | |
| | 2,289,736 | | | Columbia Conservative High Yield Fund,
Class Z | | | 18,730 | | |
| | | | | Total Bond Funds (Cost: $97,372) | | | 94,000 | | |
| Short-Term Obligation: 0.4% | | | |
| $ | 685 | | | Repurchase Agreement with State
Street Bank & Trust dated
6/30/06, due 7/03/06 at 4.93%
collateralized by Federal Home
Loan Bank, maturing 12/12/08
market value $710
(repurchase proceeds: $685) | | | 685 | | |
| | | | | (Cost: $685) | | | 685 | | |
| | Total Investments: 100.4%
(Cost: $188,773)(a) | | | | | | 192,055 | | |
| | Cash and Other Assets Less Liabilities: (0.4)% | | | | | | (709 | ) | |
| | Total Net Assets: 100% | | | | | $ | 191,346 | | |
>Notes to Statement of Investments (in thousands)
(a) At June 30, 2006, for federal income tax purposes cost of investments was $188,773 and net unrealized appreciation was $3,282 consisting of gross unrealized appreciation of $7,550 and gross unrealized depreciation of $4,268.
1-800-922-6769
80
Columbia Thermostat Fund
>Statement of Assets and Liabilities (Unaudited)
June 30, 2006
| (in thousands) | |
| Assets: | |
| Unaffiliated investments, at value (cost: $685) | | $ | 685 | | |
| Affiliated investments, at value (cost: $188,088) | | | 191,370 | | |
| Cash | | | — | * | |
Receivable for:
Fund shares sold | | | 79 | | |
| Dividends and interest | | | 445 | | |
| Expense reimbursement due from Investment Adviser | | | 29 | | |
| Total Assets | | | 192,608 | | |
| Liabilities: | |
| Payable for: | |
| Investments purchased | | | 445 | | |
| Fund shares redeemed | | | 604 | | |
| Management fee | | | 16 | | |
| Administration fee | | | 7 | | |
| Transfer agent fees | | | 24 | | |
| Trustees' fees | | | 2 | | |
| Custody fees | | | 2 | | |
| Reports to shareholders | | | 57 | | |
| 12b-1 Service & Distribution fees | | | 93 | | |
| Deferred Trustees' fees | | | 6 | | |
| Other liabilities | | | 6 | | |
| Total Liabilities | | | 1,262 | | |
| Net Assets | | $ | 191,346 | | |
| Composition of Net Assets: | |
| Paid in capital | | $ | 180,294 | | |
| Undistributed net investment income | | | 3,327 | | |
| Accumulated net realized gain | | | 4,443 | | |
| Net unrealized appreciation on investments | | | 3,282 | | |
| Net Assets | | $ | 191,346 | | |
| Net asset value per share – Class A (a) | | $ | 12.53 | | |
| (Net assets/shares) | | | ($63,627/5,076) | | |
| Maximum offering price per share – Class A (b) | | $ | 13.29 | | |
| (Net asset value per share/front-end sales charge) | | | ($12.53/0.9425) | | |
| Net asset value and offering price per share – Class B (a) | | $ | 12.53 | | |
| (Net assets/shares) | | | ($73,634/5,876) | | |
| Net asset value and offering price per share – Class C (a) | | $ | 12.52 | | |
| (Net assets/shares) | | | ($27,319/2,182) | | |
| Net asset value, offering and redemption price per share – Class Z | | $ | 12.53 | | |
| (Net assets/shares) | | | ($26,766/2,136) | | |
*Rounds to less than $500.
(a) Redemption price per share is equal to net asset value less any applicable contingent deferred sales charge.
(b) On sales of $50,000 or more the offering price is reduced.
See accompanying notes to financial statements.
81
Columbia Thermostat Fund
>Statement of Operations (Unaudited)
For the Six Months Ended June 30, 2006
| (in thousands) | |
| Investment Income: | |
| Dividends from affiliated investment company shares | | $ | 4,130 | | |
| Interest income | | | 17 | | |
| Total Investment Income | | | 4,147 | | |
| Expenses: | |
| Management fee | | | 99 | | |
| Administration fee | | | 40 | | |
| 12b-1 Service and Distribution fees: | |
| Class A | | | 85 | | |
| Class B | | | 324 | | |
| Class C | | | 138 | | |
| Transfer agent fees: | |
| Class A | | | 51 | | |
| Class B | | | 71 | | |
| Class C | | | 25 | | |
| Class Z | | | 13 | | |
| Trustees' fees | | | 2 | | |
| Custody fees | | | 2 | | |
| Reports to shareholders | | | 70 | | |
| Compliance fees | | | 3 | | |
| Non-recurring costs (See Note 7) | | | 1 | | |
| Other expenses | | | 55 | | |
| Total expenses | | | 979 | | |
| Less custody fees paid indirectly | | | — | * | |
| Less reimbursement of expenses by Investment Adviser | | | (153 | ) | |
| Less fees waived by Transfer Agent | | | (31 | ) | |
| Non-recurring costs reimbursed (See Note 7) | | | (1 | ) | |
| Net Expenses | | | 794 | | |
| Net Investment Income | | | 3,353 | | |
| Net Realized and Unrealized Gain on Investments: | |
| Net realized gain on: | |
| Affiliated investments | | | 4,104 | | |
| Distributions from affiliated investment company shares | | | 880 | | |
| Net realized gain | | | 4,984 | | |
| Net change in unrealized appreciation (depreciation) on affiliated investments | | | (3,742 | ) | |
| Net realized and unrealized gain | | | 1,242 | | |
| Net Increase in Net Assets from Operations | | $ | 4,595 | | |
*Rounds to less than $500.
See accompanying notes to financial statements.
1-800-922-6769
82
Columbia Thermostat Fund
>Statement of Changes in Net Assets
| Increase in Net Assets: | | (Unaudited)
Six months
ended June 30, | | Year ended
December 31, | |
| (in thousands) | | 2006 | | 2005 | |
| Operations: | |
| Net investment income | | $ | 3,353 | | | $ | 5,484 | | |
| Net realized gain on affiliated investments and distributions from affiliated investment company shares | | | 4,984 | | | | 14,700 | | |
| Net change in net unrealized appreciation (depreciation) on affiliated investments | | | (3,742 | ) | | | (10,409 | ) | |
| Net Increase from Operations | | | 4,595 | | | | 9,775 | | |
| Distributions Declared to Shareholders From: | |
| Net investment income – Class A | | | (70 | ) | | | (2,069 | ) | |
| Net realized gain – Class A | | | (1,229 | ) | | | (4,875 | ) | |
| Net investment income – Class B | | | — | * | | | (1,831 | ) | |
| Net realized gain – Class B | | | (1,409 | ) | | | (5,382 | ) | |
| Net investment income – Class C | | | — | | | | (617 | ) | |
| Net realized gain – Class C | | | (520 | ) | | | (1,972 | ) | |
| Net investment income – Class Z | | | (98 | ) | | | (797 | ) | |
| Net realized gain – Class Z | | | (504 | ) | | | (1,697 | ) | |
| Total Distributions to Shareholders | | | (3,830 | ) | | | (19,240 | ) | |
| Share Transactions: | |
| Subscriptions – Class A | | | 4,262 | | | | 15,104 | | |
| Distributions reinvested – Class A | | | 1,185 | | | | 6,273 | | |
| Redemptions – Class A | | | (13,279 | ) | | | (24,089 | ) | |
| Net Decrease – Class A | | | (7,832 | ) | | | (2,712 | ) | |
| Subscriptions – Class B | | | 2,467 | | | | 8,919 | | |
| Distributions reinvested – Class B | | | 1,280 | | | | 6,512 | | |
| Redemptions – Class B | | | (8,800 | ) | | | (11,391 | ) | |
| Net Increase (Decrease) – Class B | | | (5,053 | ) | | | 4,040 | | |
| Subscriptions – Class C | | | 2,960 | | | | 5,664 | | |
| Distributions reinvested – Class C | | | 460 | | | | 2,303 | | |
| Redemptions – Class C | | | (4,467 | ) | | | (9,480 | ) | |
| Net Decrease – Class C | | | (1,047 | ) | | | (1,513 | ) | |
| Subscriptions – Class Z | | | 2,323 | | | | 5,843 | | |
| Distributions reinvested – Class Z | | | 578 | | | | 2,384 | | |
| Redemptions – Class Z | | | (1,744 | ) | | | (2,485 | ) | |
| Net Increase – Class Z | | | 1,157 | | | | 5,742 | | |
| Net Increase (Decrease) from Share Transactions | | | (12,775 | ) | | | 5,557 | | |
| Total Decrease in Net Assets | | | (12,010 | ) | | | (3,908 | ) | |
| Net Assets: | |
| Beginning of period | | | 203,356 | | | | 207,264 | | |
| End of period | | $ | 191,346 | | | $ | 203,356 | | |
| Undistributed Net Investment Income | | $ | 3,327 | | | $ | 142 | | |
*Rounds to less than $500.
See accompanying notes to financial statements.
83
Columbia Thermostat Fund
>Statement of Changes in Net Assets, continued
| Changes in Shares of Beneficial Interest: | | (Unaudited)
Six months
ended June 30, | | Year ended
December 31, | |
| (in thousands) | | 2006 | | 2005 | |
| Subscriptions – Class A | | | 333 | | | | 1,151 | | |
| Shares issued in reinvestment and capital gains – Class A | | | 95 | | | | 497 | | |
| Less shares redeemed – Class A | | | (1,039 | ) | | | (1,840 | ) | |
| Net Decrease – Class A | | | (611 | ) | | | (192 | ) | |
| Subscriptions – Class B | | | 193 | | | | 684 | | |
| Shares issued in reinvestment and capital gains – Class B | | | 102 | | | | 515 | | |
| Less shares redeemed – Class B | | | (689 | ) | | | (870 | ) | |
| Net Increase (Decrease) – Class B | | | (394 | ) | | | 329 | | |
| Subscriptions – Class C | | | 232 | | | | 434 | | |
| Shares issued in reinvestment and capital gains – Class C | | | 37 | | | | 182 | | |
| Less shares redeemed – Class C | | | (350 | ) | | | (725 | ) | |
| Net Decrease – Class C | | | (81 | ) | | | (109 | ) | |
| Subscriptions – Class Z | | | 182 | | | | 446 | | |
| Shares issued in reinvestment and capital gains – Class Z | | | 46 | | | | 189 | | |
| Less shares redeemed – Class Z | | | (136 | ) | | | (189 | ) | |
| Net Increase – Class Z | | | 92 | | | | 446 | | |
| Net Increase (Decrease) in Shares of Beneficial Interest | | | (994 | ) | | | 474 | | |
See accompanying notes to financial statements.
1-800-922-6769
84
Columbia Thermostat Fund
>Financial Highlights
| Class A Shares | | (Unaudited)
Six months
ended
June 30, | | Year Ended December 31, | | Inception
March 3,
2003 through
December 31, | |
| Selected data for a share outstanding throughout each period | | 2006 | | 2005 | | 2004 | | 2003 | |
| Net Asset Value, Beginning of Period | | $ | 12.49 | | | $ | 13.11 | | | $ | 12.30 | | | $ | 10.10 | | |
| Income from Investment Operations | |
| Net investment income (a) | | | 0.23 | | | | 0.39 | | | | 0.28 | | | | 0.18 | | |
| Net realized and unrealized gain | | | 0.06 | | | | 0.29 | | | | 0.81 | | | | 2.15 | | |
| Total from Investment Operations | | | 0.29 | | | | 0.68 | | | | 1.09 | | | | 2.33 | | |
| Less Distributions Declared to Shareholders | |
| From net investment income | | | (0.01 | ) | | | (0.39 | ) | | | (0.25 | ) | | | (0.13 | ) | |
| From net realized gains | | | (0.24 | ) | | | (0.91 | ) | | | (0.03 | ) | | | (0.00 | )(b) | |
| Total Distributions Declared to Shareholders | | | (0.25 | ) | | | (1.30 | ) | | | (0.28 | ) | | | (0.13 | ) | |
| Net Asset Value, End of Period | | $ | 12.53 | | | $ | 12.49 | | | $ | 13.11 | | | $ | 12.30 | | |
| Total Return (c)(d) | | | 2.37 | %(e) | | | 5.25 | % | | | 8.92 | % | | | 23.10 | %(e) | |
| Ratios to Average Net Assets/Supplemental Data | |
| Expenses (f)(g) | | | 0.50 | %(h) | | | 0.50 | % | | | 0.50 | % | | | 0.57 | %(h) | |
| Net investment income (g) | | | 3.65 | %(h) | | | 2.97 | % | | | 2.23 | % | | | 1.86 | %(h) | |
| Reimbursement/waiver | | | 0.17 | %(h) | | | 0.15 | % | | | 0.33 | % | | | 0.66 | %(h) | |
| Portfolio turnover rate | | | 29 | %(e) | | | 96 | % | | | 67 | % | | | 61 | % | |
| Net assets at end of period (000's) | | $ | 63,627 | | | $ | 71,034 | | | $ | 77,092 | | | $ | 42,271 | | |
(a) Per share data was calculated using average shares outstanding during the period. Recognition of net investment income by the Fund is affected by the timing of the declaration of dividends by the underlying investment companies in which the Fund invests.
(b) Rounds to less than $(0.01) per share.
(c) Total return at net asset value assuming all distributions reinvested and no initial sales charge or contingent deferred sales charge.
(d) Had the Investment Adviser and/or Transfer Agent not reimbursed a portion of expenses, total return would have been reduced.
(e) Not annualized.
(f) Does not include expenses of the investment companies in which the Fund invests.
(g) The benefits derived from custody fees paid indirectly had no impact.
(h) Annualized.
| Class B Shares | | (Unaudited)
Six months
ended
June 30, | | Year Ended December 31, | | Inception
March 3,
2003 through
December 31, | |
| Selected data for a share outstanding throughout each period | | 2006 | | 2005 | | 2004 | | 2003 | |
| Net Asset Value, Beginning of Period | | $ | 12.51 | | | $ | 13.14 | | | $ | 12.32 | | | $ | 10.10 | | |
| Income from Investment Operations | |
| Net investment income (a) | | | 0.20 | | | | 0.31 | | | | 0.19 | | | | 0.10 | | |
| Net realized and unrealized gain | | | 0.06 | | | | 0.28 | | | | 0.83 | | | | 2.16 | | |
| Total from Investment Operations | | | 0.26 | | | | 0.59 | | | | 1.02 | | | | 2.26 | | |
| Less Distributions Declared to Shareholders | |
| From net investment income | | | — | | | | (0.31 | ) | | | (0.17 | ) | | | (0.04 | ) | |
| From net realized gains | | | (0.24 | ) | | | (0.91 | ) | | | (0.03 | ) | | | (0.00 | )(b) | |
| Total Distributions Declared to Shareholders | | | (0.24 | ) | | | (1.22 | ) | | | (0.20 | ) | | | (0.04 | ) | |
| Net Asset Value, End of Period | | $ | 12.53 | | | $ | 12.51 | | | $ | 13.14 | | | $ | 12.32 | | |
| Total Return (c)(d) | | | 2.10 | %(e) | | | 4.56 | % | | | 8.27 | % | | | 22.38 | %(e) | |
| Ratios to Average Net Assets/Supplemental Data | |
| Expenses (f)(g) | | | 1.10 | %(h) | | | 1.10 | % | | | 1.18 | % | | | 1.32 | %(h) | |
| Net investment income (g) | | | 3.09 | %(h) | | | 2.39 | % | | | 1.55 | % | | | 1.06 | %(h) | |
| Reimbursement/waiver | | | 0.21 | %(h) | | | 0.19 | % | | | 0.29 | % | | | 0.66 | %(h) | |
| Portfolio turnover rate | | | 29 | %(e) | | | 96 | % | | | 67 | % | | | 61 | % | |
| Net assets at end of period (000's) | | $ | 73,634 | | | $ | 78,444 | | | $ | 78,040 | | | $ | 51,501 | | |
(a) Per share data was calculated using average shares outstanding during the period. Recognition of net investment income by the Fund is affected by the timing of the declaration of dividends by the underlying investment companies in which the Fund invests.
(b) Rounds to less than $(0.01) per share.
(c) Total return at net asset value assuming all distributions reinvested and no initial sales charge or contingent deferred sales charge.
(d) Had the Investment Adviser and/or Transfer Agent not reimbursed a portion of expenses, total return would have been reduced.
(e) Not annualized.
(f) Does not include expenses of the investment companies in which the Fund invests.
(g) The benefits derived from custody fees paid indirectly had no impact.
(h) Annualized.
| Class C Shares | | (Unaudited)
Six months
ended
June 30, | | Year Ended December 31, | | Inception
March 3,
2003 through
December 31, | |
| Selected data for a share outstanding throughout each period | | 2006 | | 2005 | | 2004 | | 2003 | |
| Net Asset Value, Beginning of Period | | $ | 12.51 | | | $ | 13.13 | | | $ | 12.32 | | | $ | 10.10 | | |
| Income from Investment Operations | |
| Net investment income (a) | | | 0.19 | | | | 0.29 | | | | 0.19 | | | | 0.11 | | |
| Net realized and unrealized gain | | | 0.06 | | | | 0.29 | | | | 0.81 | | | | 2.15 | | |
| Total from Investment Operations | | | 0.25 | | | | 0.58 | | | | 1.00 | | | | 2.26 | | |
| Less Distributions Declared to Shareholders | |
| From net investment income | | | — | | | | (0.29 | ) | | | (0.16 | ) | | | (0.04 | ) | |
| From net realized gains | | | (0.24 | ) | | | (0.91 | ) | | | (0.03 | ) | | | (0.00 | )(b) | |
| Total Distributions Declared to Shareholders | | | (0.24 | ) | | | (1.20 | ) | | | (0.19 | ) | | | (0.04 | ) | |
| Net Asset Value, End of Period | | $ | 12.52 | | | $ | 12.51 | | | $ | 13.13 | | | $ | 12.32 | | |
| Total Return (c)(d) | | | 2.02 | %(e) | | | 4.49 | % | | | 8.13 | % | | | 22.38 | %(e) | |
| Ratios to Average Net Assets/Supplemental Data | |
| Expenses (f)(g) | | | 1.25 | %(h) | | | 1.25 | % | | | 1.25 | % | | | 1.32 | %(h) | |
| Net investment income (g) | | | 2.96 | %(h) | | | 2.21 | % | | | 1.48 | % | | | 1.10 | %(h) | |
| Reimbursement/waiver | | | 0.21 | %(h) | | | 0.19 | % | | | 0.26 | % | | | 0.66 | %(h) | |
| Portfolio turnover rate | | | 29 | %(e) | | | 96 | % | | | 67 | % | | | 61 | % | |
| Net assets at end of period (000's) | | $ | 27,319 | | | $ | 28,316 | | | $ | 31,161 | | | $ | 20,087 | | |
(a) Per share data was calculated using average shares outstanding during the period. Recognition of net investment income by the Fund is affected by the timing of the declaration of dividends by the underlying investment companies in which the Fund invests.
(b) Rounds to less than $(0.01) per share.
(c) Total return at net asset value assuming all distributions reinvested and no initial sales charge or contingent deferred sales charge.
(d) Had the Investment Adviser and/or Transfer Agent not reimbursed a portion of expenses, total return would have been reduced.
(e) Not annualized.
(f) Does not include expenses of the investment companies in which the Fund invests.
(g) The benefits derived from custody fees paid indirectly had no impact.
(h) Annualized.
See accompanying notes to financial statements.
85
Columbia Thermostat Fund
>Notes to Financial Statements (Unaudited)
1. Nature of Operations
Columbia Thermostat Fund (the "Fund"), is a series of Columbia Acorn Trust (the "Trust"), an open-end management investment company organized as a Massachusetts business trust. The Fund may issue an unlimited number of shares. The Fund currently offers four classes of shares: Class A, Class B, Class C and Class Z.
Class A shares are sold with a front-end sales charge. Class A shares bought without an initial sales charge in accounts aggregating up to $50 million at the time of purchase are subject to a 1.00% CDSC if the shares are sold within 12 months of the time of purchase.
Class B shares are subject to a CDSC if sold within six years of purchase. Class B shares will convert to Class A shares automatically eight years after purchase.
Class C shares are subject to a CDSC on redemptions made within one year after purchase.
Class Z shares are offered continuously at net asset value. There are certain restrictions on the purchase of Class Z shares.
The financial highlights for Class A, Class B and Class C shares are presented in a separate semiannual report. The semiannual report for the other series of the Trust is also included in this report. Generally you may exchange your Class Z shares of the Fund for shares of another Fund distributed by Columbia Management Distributors, Inc. at no additional charge. See "Fund Policy on Trading of Fund Shares" as disclosed within the Fund's prospectus.
The investment objective of the Fund is to provide long-term total return. The Fund pursues its investment objective by investing in shares of other mutual funds. As a 'fund of funds', under normal circumstances, the Fund allocates at least 95% of its net assets among a selected group of stock and bond mutual funds (the "Portfolio Funds") according to the current level of the Standard & Poor's 500 Stock Index in relation to predetermined ranges set by the Fund's investment adviser. As of June 30, 2006, the Fund invested in six stock Portfolio Funds (Columbia Acorn Fund, Columbia Acorn Select, Columbia Large Cap Value Fund, Columbia Acorn International, Columbia Dividend Income Fund and Columbia Large Cap Enhanced Core Fund) and three bond Portfolio Funds (Columbia Federal Securities Fund, Columbia Intermediate Bond Fund and Columbia Conservative High Yield Fund). The Fund may also invest up to 5% of its net assets plus any c ash received that day in cash, repurchase agreements, high quality short-term paper and government securities.
Investment income, realized and unrealized gains and losses, and certain fund-level expenses are borne pro rata on the basis of the relative net assets of all classes, except each class bears certain expenses unique to that class such as distribution services, transfer agent, and certain other class specific expenses. Differences in class expenses may result in payment of different dividend distributions for each class. All the share classes of the Trust have equal rights with respect to voting subject to class specific arrangements.
2. Significant Accounting Policies
>Security valuation
Investments in Portfolio Funds are valued at their net asset value as reported by the underlying funds. High quality short-term paper and government securities having a maturity of 60 days or less from the valuation date are valued on an amortized cost basis, which approximates fair value.
>Repurchase agreements
The Fund may engage in repurchase agreement transactions. The Fund, through its custodian, receives delivery of underlying securities collateralizing each repurchase agreement. The Fund's investment adviser determines that the value of the underlying securities is at all times at least equal to the resale price. In the event of default or bankruptcy by the other party to the agreement, realization and/or retention of the collateral may be subject to legal proceedings.
>Security transactions and investment income
Portfolio Fund transactions are accounted for on the trade date (date the order to buy or sell is executed). Dividend income and realized gain distributions from other funds are recorded on the ex-dividend date. Interest income is recorded on the accrual basis and includes amortization of discounts on short-term debt obligations when required for federal income tax purposes. Realized gains and losses from security transactions are reported on an identified cost basis. Awards from class action litigation may be recorded as a reduction of cost by Portfolio Funds. If the Portfolio Fund no longer owns the applicable securities, the proceeds are recorded as realized gains.
>Use of estimates
The preparation of financial statements in conformity with accounting principles generally accepted in the United States of America requires management to make estimates and assumptions that affect the amounts reported in the financial
1-800-922-6769
86
statements and accompanying notes. Actual results may differ from those estimates.
>Fund share valuation
Fund shares are sold and redeemed on a continuing basis at net asset value. Net asset value per share is determined daily as of the close of trading on the New York Stock Exchange (the "Exchange") on each day the Exchange is open for trading. All income, expenses (other than Class A, Class B and Class C 12b-1 service and distribution fees, and Class A, Class B, Class C and Class Z transfer agent fees) and realized and unrealized gains (losses) of the Fund are allocated to each class proportionately on a daily basis for purposes of determining the net asset value of each class.
>Custody fees/credits
Custody fees are reduced based on the Fund's cash balance maintained with the custodian. The Fund could have invested a portion of assets utilized in connection with the expense offset arrangement in an income-producing asset if it had not entered into such an agreement. The amount is disclosed as a reduction of total expenses in the Statement of Operations.
>Federal income taxes
The Fund has complied with the provisions of the Internal Revenue Code available to regulated investment companies and, in the manner provided therein, distributes all of its taxable income, as well as any net realized gain on sales of Portfolio Fund shares and any distributions of net realized gains received by the Fund from its Portfolio Funds, reportable for federal income tax purposes. Accordingly, the Fund paid no federal income taxes and no federal income tax provision was required.
>Distributions to Shareholders
Distributions to shareholders are recorded on the ex-date.
>Indemnification
In the normal course of business, the Fund enters into contracts that contain a variety of representations and warranties and which provide general indemnities. The Fund's maximum exposure under these arrangements is unknown, as this would involve future claims against the Fund. Also, under the Trust's organizational documents, the Trustees and Officers of the Trust are indemnified against certain liabilities that may arise out of their duties to the Trust. However, based on experience, the Fund expects the risk of loss due to these warranties and indemnities to be minimal.
3. Federal Tax Information
The tax character of distributions paid during the years ended December 31, 2005 was as follows:
| (in thousands) | |
| Distributions paid from: | | | |
| Ordinary Income* | | $ | 8,262 | | |
| Long-Term Capital Gains | | | 10,978 | | |
*For tax purposes short-term capital gains distributions, if any, are considered ordinary income distributions.
In June 2006, the Financial Accounting Standards Board ("FASB") issued FASB Interpretation No. 48, Accounting for Uncertainty in Income Taxes, an Interpretation of FASB Statement 109 (the "Interpretation"). This Interpretation is effective for fiscal years beginning after December 15, 2006 and is to be applied to all tax positions upon initial adoption. This Interpretation prescribes a minimum recognition threshold and measurement method for the financial statement recognition of tax positions taken or expected to be taken in a tax return and also requires certain expanded disclosures. Columbia Wanger Asset Management, L.P. ("Columbia WAM"), a wholly owned subsidiary of Columbia Management Group, Inc., which in turn is an indirect, wholly owned subsidiary of Bank of America Corpor ation ("BOA"), has recently begun to evaluate the application of this Interpretation to the Fund and has not at this time quantified the impact, if any, resulting from the adoption of this Interpretation on the Fund's financial statements.
4. Transactions with Affiliates
Columbia WAM furnishes continuing investment supervision to the Fund and is responsible for the overall management of the Fund's business affairs.
Under the Fund's investment management agreement, fees are accrued daily and paid monthly to Columbia WAM at the annual rate of 0.10% of the Fund's average daily net assets.
>Expense Limit
Columbia WAM has contractually agreed to reimburse the direct operating expenses (exclusive of 12b-1 service and distribution fees, interest and fees on borrowings and expenses associated with the Fund's investment in other investment companies) exceeding 0.25% of the average annual net assets of the Fund's Class A, Class B and Class C shares annually through April 30, 2007.
Fees reimbursed amounted to $153,234 for the six months ended June 30, 2006.
87
Columbia Thermostat Fund
>Notes to Financial Statements (Unaudited), continued
Columbia WAM has the right to recoup expense reimbursement payments made to the Fund through December 31, 2006. No expenses were recouped through June 30, 2006.
Columbia WAM provides administrative services and receives an administration fee from the Fund at the following annual rates:
| Columbia Acorn Trust | |
| Average daily net asset value: | | | | | |
| On the first $8 billion | | | 0.05 | % | |
| Next $8 billion | | | 0.04 | % | |
| Average daily net asset value in excess of $16 billion | | | 0.03 | % | |
For the six months ended June 30, 2006, the Fund's effective administration fee rate was 0.041%. Columbia WAM has delegated to Columbia Management Advisors, LLC, an indirect, wholly owned subsidiary of BOA, responsibility to provide certain administrative services to the Fund.
Columbia Management Distributors, Inc. ("CMDI"), a wholly owned subsidiary of BOA, is the Fund's principal indirect underwriter and receives no compensation on the sale of Class Z shares.
For the six months ended June 30, 2006, the Fund has been advised that CMDI retained $16,790 in underwriting discounts on the sale of Class A shares and received CDSCs of $115,164 and $4,142, respectively, on Class B and Class C share redemptions, respectively.
The Fund has adopted a 12b-1 plan which requires it to pay CMDI a monthly service fee equal to 0.25% annually of the average daily net assets attributable to Class A, Class B and Class C shares. The 12b-1 plan also requires the Fund paid CMDI a monthly distribution fee equal to 0.60% and 0.75%, annually, of the average daily net assets attributable to Class B and Class C shares, respectively. Effective August 1, 2006 the monthly distribution fee rate for Class B shares was reduced to 0.50% annually, of the average daily net assets. For the period covered by this report the monthly distribution fee was 0.60% for Class B shares.
Columbia Management Services, Inc. (the "Transfer Agent"), a wholly owned subsidiary of BOA, provides shareholder services to the Fund and has contracted with Boston Financial Data Services ("BFDS") to serve as sub-transfer agent. For such services, the Transfer Agent receives a fee, paid monthly, at the annual rate of $21.00 per open account. The Transfer Agent also receives reimbursement for certain out-of-pocket expenses. The Transfer Agent has agreed to waive the reimbursement for certain out-of-pocket expenses for the period covered by this report. Expenses waived by the Transfer Agent for the six months ended June 30, 2006 were $30,576.
Certain officers and trustees of the Trust are also officers of Columbia WAM. The Trust makes no direct payments to its officers and trustees who are affiliated with Columbia WAM. Trustees' fees and expenses paid by the Fund for the six months ended June 30, 2006 were $2,362.
The Board of Trustees appointed a Chief Compliance Officer to the Trust in accordance with federal securities regulations. The Fund, along with other affiliated funds, will pay its pro-rata share of the expenses associated with the Office of the Chief Compliance Officer. This expense is disclosed separately as "Compliance expenses" in the Statement of Operations.
5. Borrowing Arrangements
The Trust participates in a $150 million credit facility, which was entered into to facilitate portfolio liquidity. Interest is charged to each participating fund based on its borrowings at a rate per annum equal to the Federal Funds rate plus 0.50%. In addition, a commitment fee of 0.10% per annum is accrued and apportioned among the participating funds based on their pro-rata portion of the unutilized line of credit. The commitment fee is included in "Other expenses" in the Statement of Operations. No amounts were borrowed under this facility for the six months ended June 30, 2006.
6. Investment Transactions
The aggregate cost of purchases and proceeds from sales other than short-term obligations for the six months ended June 30, 2006 were:
| (in thousands) | |
| Purchases | | $ | 57,973 | | |
| Proceeds from sales | | | 69,846 | | |
7. Legal Proceedings
The Trust, Columbia WAM and the Trustees of the Trust are named as defendants in class and derivative complaints which have been consolidated in a Multi-District Action (the "MDL Action") in the federal district court of Maryland. These lawsuits contend that defendants permitted certain investors to market time their trades in certain Columbia Acorn Funds. The MDL Action is ongoing. However, all claims against Columbia Acorn Trust and the independent trustees of Columbia Acorn Trust have been dismissed.
The Trust and Columbia WAM are also defendants in a class action lawsuit that alleges, in summary, that the Trust and Columbia WAM exposed shareholders of Columbia Acorn
1-800-922-6769
88
International to trading by market timers by allegedly: (a) failing to properly evaluate daily whether a significant event affecting the value of the Fund's securities had occurred after foreign markets had closed but before the calculation of the Fund's net asset value ("NAV"); (b) failing to implement the Fund's portfolio valuation and share pricing policies and procedures; and (c) failing to know and implement applicable rules and regulations concerning the calculation of NAV. The Seventh Circuit ruled that the plaintiffs' state law claims were preempted under federal law resulting in the dismissal of plaintiffs' complaint. Plaintiffs appealed the Seventh Circuit's ruling to the United States Supreme Court.
On March 21, 2005, a class action complaint was filed against the Columbia Acorn Trust and Columbia WAM seeking to rescind the Contingent Deferred Sales Charges assessed upon redemption of Class B shares of Columbia Acorn Funds due to the alleged market timing of the Columbia Acorn Funds.
In addition to the rescission of sales charges, plaintiffs seek recovery of actual damages, attorneys' fees and costs. The case had been transferred to the MDL Action in the federal district court of Maryland.
On April 4, 2006, all of the parties to the MDL Action executed a letter settlement agreement intended to fully resolve all of the lawsuits consolidated in the MDL Action aswell as the Fair Valuation Lawsuit. The settlement has not yet been finalized or approved by the court.
Columbia WAM, the Columbia Acorn Funds and the Trustees of the Trust are also defendants in a consolidated lawsuit filed in the federal district court of Massachusetts alleging that Columbia WAM used Fund assets to make undisclosed payments to brokers as an incentive for the brokers to market the Funds over other mutual funds to investors. The complaint alleges Columbia WAM and the Trustees of the Trust breached certain common law duties and federal laws.
On November 30, 2005, the court dismissed all of the claims alleged against all of the parties in the consolidated complaint. Plaintiffs timely filed a notice of appeal of the district court's dismissal order with the First Circuit Court of Appeals. The parties subsequently executed a settlement term sheet to fully resolve all claims in the litigation. The settlement has not yet been finalized or approved by the court.
The Trust and Columbia WAM intend to defend these suits vigorously.
As a result of these matters or any adverse publicity or other developments resulting from them, there may be increased redemptions or reduced sales of Fund shares, which could increase transaction cost or operating expenses, or have other adverse consequences for the Fund. In connection with the events described in detail above, various parties have filed suit against certain funds, their Boards and/or BOA (and affiliated entities). These suits are ongoing. However, based on currently available information, the Columbia Acorn Trust believes that the likelihood that these lawsuits will have a material adverse impact on any Fund is remote, and Columbia WAM believes that the lawsuits are not likely to materially affect its ability to provide investment management services to the Funds.
For the six months ended June 30, 2006, Columbia Management has assumed $934 of consulting services and legal fees incurred by the Fund in connection with these matters.
89
[Excerpts from:]
Columbia Acorn Trust
Management Fee Evaluation of the Senior Officer
Prepared Pursuant to the New York Attorney General's
Assurance of Discontinuance
Robert P. Scales
Senior Vice President,
Chief Legal Officer
and General Counsel
2006
90
Introduction
The New York Attorney General's Assurance of Discontinuance ("Order") entered into by Columbia Management Advisors, Inc. ("CMAI") and Columbia Management Distributors, Inc., ("CMDI" and collectively with "CMAI," "CMG") in February 2005, allows CMAI to manage or advise a mutual fund, including the Acorn Trust's family of funds (the "Acorn Funds" or "Acorn" or "Trust"), only if the trustees of the Acorn Funds appoint a "Senior Officer" to perform specified duties and responsibilities. One of these responsibilities includes "managing the process by which proposed management fees (including but not limited to, advisory fees) to be charged the [Acorn Funds] are negotiated so that they are negotiated in a manner which is at arms' length and reasonable and consistent with this Assurance of Discontinuance."
The Order also provides that the Board of Trustees of the Acorn Funds ("Board") must determine the reasonableness of proposed "management fees" by using either an annual competitive bidding process supervised by the Senior Officer or Independent Fee Consultant, or by obtaining "an annual independent written evaluation prepared by or under the direction of the Senior Officer or the Independent Fee Consultant."
"Management fees" are only part of the costs and expenses paid by mutual fund shareholders. The expenses can vary depending upon the class of shares held but usually include: (1) investment management or advisory fees to compensate analysts and portfolio managers for stock research and portfolio management, as well as the cost of operating a trading desk; (2) administrative expenses incurred to prepare registration statements and tax returns, calculate the Funds' net asset values, maintain effective compliance procedures and perform recordkeeping services; (3) transfer agency costs for establishing accounts, accepting and disbursing funds, as well as overseeing trading in Fund shares; (4) custodial expenses incurred to hold the securities purchased by the Funds; and (5) distribution expenses, including commissions paid to brokers that sell the Fund shares to investors.
Columbia Wanger Asset Management, L.P. ("CWAM"), the adviser to the Acorn Funds, has proposed that the Trust enter into separate agreements governing the first two categories listed above: an advisory agreement governing portfolio management, and an administration agreement governing certain administration and clerical services. Together the fees paid under these two agreements are referred to as "management fees." Other fund expenses are governed by separate agreements, in particular agreements with two CWAM affiliates: CMDI, the broker-dealer that underwrites and distributes the Acorn Funds' shares, and Columbia Management Services, Inc. ("CMSI"), the Funds' transfer agent. In conformity with the terms of the Order, this evaluation, therefore, addresses only the advisory and administrative contracts between CWAM and the Trust, and does not extend to the other agreements.
According to the Order, the Senior Officer's evaluation must consider at least the following:
(1) Management fees (including components thereof) charged to institutional and other clients of CWAM for like services;
(2) Management fees (including any components thereof) charged by other mutual fund companies for like services;
(3) Costs to CWAM and its affiliates of supplying services pursuant to the management fee agreements, excluding any intra-corporate profit;
(4) Profit margins of CWAM and its affiliates from supplying such services;
(5) Possible economies of scale as the Acorn Funds grow larger; and
(6) The nature and quality of CWAM's services, including the performance of each Acorn Fund.
On November 16, 2004, the Board appointed me Senior Officer under the Order. The Board also determined not to pursue a competitive bidding process and instead, charged me with the responsibility of evaluating the Acorn Funds' proposed advisory and administrative fee contracts with CWAM in conformity with the requirements of the Order. This Report is an annual evaluation required under the Order. In discharging their responsibilities, the independent Trustees have also consulted independent, outside counsel.
91
2005 Evaluation
This is the second annual evaluation prepared in connection with the Order. The first annual evaluation ("2005 Evaluation") was issued on July 20, 2005. This evaluation follows the same structure as the 2005 Evaluation. Some areas are given more emphasis here, while others are given less. Still, the fundamental information gathered for this evaluation is the largely the same as last year. I have noted in this Report where methodologies diverged significantly.
This evaluation was performed in cooperation and regular communication with the Contract Review Committee of the Board of Trustees.
Process and Independence
The objectives of the Order are to insure the independent evaluation of the advisory fees paid by the Acorn Funds as well as to insure that all relevant factors are considered. In my view, the contract renewal process has been conducted at arms-length and with independence in gathering, considering and evaluating all relevant data. At the outset of the process, the Trustees sought and obtained from CWAM and CMG a comprehensive compilation of data regarding Fund performance and expense, adviser profitability, and other information. In advance of the contract renewal process, the Board also explored CWAM's potential capacity restraints, an issue posed by the size of the Acorn Fund and by some of the observations from the 2005 Evaluation. Performance and expense data was obtained from both Morningstar and Lipper, the leading consultants in this area. The rankings prepared by Morningstar and Lipper were independent and were not infl uenced by the adviser. CWAM itself identified what it considers its competition in formulating its own peer group, and the Trustees considered that data as well.
In the course of its work, the Contract Committee gave careful consideration to the conclusions and recommendations contained in the 2005 Evaluation. In particular, the Contract Committee considered the possible introduction of a two-tiered fee structure that would set fees on the basis of a combined CWAM complex level and individual fund level. The Committee concluded that such a fee structure might be confusing to shareholders, though it has not foreclosed such a structure in the future. The Committee is continuing to consider whether economies of scale are appropriately reflected in the Funds' fee schedules.
My evaluation of the advisory contract was shaped, as it was last year, by my experience as Acorn's Chief Compliance Officer ("CCO"). As CCO, I report solely to the Board and have no reporting obligation to or employment relationship with CMG or its affiliates, except for administrative purposes. This too contributes to the independence of this evaluation. I have commented on compliance matters in evaluating the quality of service provided by CWAM.
This Report, its supporting materials and the data contained in other materials submitted to the Contract Committee of the Board, in my view, provide a thorough factual basis upon which the Board, in consultation with independent counsel as it deems appropriate, may conduct management fee negotiations that are in the best interests of the Acorn Funds' shareholders.
The Fee Reductions Mandated under the Order
Under the terms of the Order, CMG agreed to secure certain management fee reductions for the mutual funds advised by its affiliate investment advisers. In some instances, breakpoints were also established. Although neither CWAM nor the Trust was a party to the Order, CWAM offered and the Board accepted certain advisory fee reductions last year. By the terms of the Order, these fees may not be increased before November 30, 2009. I have used these advisory fee levels in my evaluation because they are the fees in the current agreements that CWAM proposes should be continued. Hence, these fee levels are the starting point of an evaluation.
92
Conclusions
My review of the data and other material above leads to the following conclusions with respect to the factors identified in the Order.
1. Performance. The domestic Funds generally have achieved outstanding performance. The Acorn Fund, Acorn USA and Acorn Select all rank very favorably against their peers. The international Funds have not, however, performed nearly as well as the domestic funds, and continue to lag their benchmarks and peers. Management is taking steps to improve the performance of these funds.
2. Management Fees relative to Peers. The management fee rankings for most of the Funds are generally more favorable to shareholders than those of their peer group funds. Management fees do vary by Fund. Acorn Fund is the least expensive and the Acorn USA the most expensive. Acorn USA and Acorn Select were ranked by both Lipper and Morningstar below many of their peers, and therefore impose higher fees than do some of their competitors.
3. Administrative Fees. The Acorn Funds' administrative fee, which is uniform across all Funds, is at a level comparable to that of most peers, provides for appropriate services to Funds, and affords breakpoints that lower the fee as assets increase.
4. Management Fees relative to Institutional and Other Mutual Fund Accounts. CWAM's focus is on its mutual funds. It does not actively seek to manage separate or institutional accounts. The few institutional accounts it does manage vary in rate structures. Some pay advisory fees commensurate with or higher than the Acorn Funds. In a few instances, however, institutional accounts pay lower advisory fees than do the Acorn Funds. One particular institutional account is significant in size and has been under CWAM's management for over 25 years. Finally, in two instances, the Acorn Funds pay slightly higher fees than do similar funds sold through insurance companies.
5. Costs to CWAM and its Affiliates. CWAM's direct costs do not appear excessive, and in some areas have declined in the past year. Indirect costs allocated to CWAM by its parent organization, however, have increased substantially. CWAM's affiliates report operating losses and therefore do not appear to profit from CWAM's advisory agreement with the Acorn Funds.
6. Profit Margins. CWAM's firm-wide, pre-marketing expense profit margins are at the top of the industry, though these comparisons are hampered by limited industry data. High profit margins are not unexpected for firms that manage large, successful funds and have provided outstanding investment performance for investors.
7. Economies of Scale. Economies of scale do exist at CWAM and will expand as the assets of the Acorn Funds get larger. They are, however, only partially reflected in the management fee schedule for the Funds. If the Acorn Funds' assets continue to grow, under the Funds' current fee schedules, shareholders might not benefit in a manner generally commensurate with CWAM's increased profits.
8. Nature and Quality of Services. This category includes a variety of considerations that are difficult to quantify, yet can have a significant bearing on the performance of the Acorn Funds. Several areas merit comment.
a. Capacity. The Funds have continued to grow, posing ever greater challenges in deploying assets effectively. While trends here merit continued monitoring, CWAM appears to be managing assets effectively.
93
b. Compliance. CWAM has a reasonably designed compliance program that protects shareholders.
c. Administrative Services. The Acorn Funds benefit from a variety of administrative services that are performed by CWAM and CMAI.
In my opinion, the process of negotiating an advisory contract for the Acorn Funds has been conducted thoroughly and at arms' length. Further, the Trustees have sufficient information to evaluate management's proposal, and negotiate contract terms that are in the best interests of fund shareholders.
Recommendations
I believe the Trustees should:
1. Continue to consider ways to restructure the advisory fee beyond the current breakpoint schedule to reflect more fully economies of scale.
2. Monitor the performance of Acorn International and Acorn International Select.
3. Continue to monitor CWAM's capacity limitations to insure that Acorn Fund's expanding assets do not impair investment performance.
Robert P. Scales
July 18, 2006
94
Columbia Acorn Family of Funds Class A, B and C Share Information
| Minimum Initial Investment in | |
| |
| Columbia Acorn International, | |
| |
| Columbia Acorn International | |
| |
| Select and Columbia | |
| |
Thermostat Fund
| | $1,000
$1,000 for an IRA | |
Minimum Initial Investment
in Columbia Acorn Fund and
Columbia Acorn USA | | $75,000 | |
Minimum Initial Investment
in Columbia Acorn Select | | $50,000 | |
Minimum Subsequent
Investment in all Funds | | $50 | |
| Exchange Fee | | None | |
| Columbia Acorn Fund | | Class A | | Class B | | Class C | |
| Management Fees | | | 0.64 | % | | | 0.64 | % | | | 0.64 | % | |
| Distribution and Service (12b-1) Fees | | | 0.25 | % | | | 0.85 | % | | | 1.00 | % | |
| Other Expenses | | | 0.12 | % | | | 0.21 | % | | | 0.16 | % | |
| Net Expense Ratio | | | 1.01 | % | | | 1.70 | % | | | 1.80 | % | |
| Columbia Acorn International | | Class A | | Class B | | Class C | |
| Management Fees | | | 0.78 | % | | | 0.78 | % | | | 0.78 | % | |
| Distribution and Service (12b-1) Fees | | | 0.25 | % | | | 0.85 | % | | | 1.00 | % | |
| Other Expenses | | | 0.19 | % | | | 0.30 | % | | | 0.22 | % | |
| Net Expense Ratio | | | 1.22 | % | | | 1.93 | % | | | 2.00 | % | |
| Columbia Acorn USA | | Class A | | Class B | | Class C | |
| Management Fees | | | 0.87 | % | | | 0.87 | % | | | 0.87 | % | |
| Distribution and Service (12b-1) Fees | | | 0.25 | % | | | 0.85 | % | | | 1.00 | % | |
| Other Expenses | | | 0.13 | % | | | 0.24 | % | | | 0.18 | % | |
| Net Expense Ratio | | | 1.25 | % | | | 1.96 | % | | | 2.05 | % | |
| Columbia Acorn International Select | | Class A | | Class B | | Class C | |
| Management Fees | | | 0.94 | % | | | 0.94 | % | | | 0.94 | % | |
| Distribution and Service (12b-1) Fees | | | 0.25 | % | | | 0.85 | % | | | 1.00 | % | |
| Other Expenses | | | 0.41 | % | | | 0.50 | % | | | 0.46 | % | |
| Net Expense Ratio | | | 1.60 | % | | | 2.29 | % | | | 2.40 | % | |
| Columbia Acorn Select | | Class A | | Class B | | Class C | |
| Management Fees | | | 0.82 | % | | | 0.82 | % | | | 0.82 | % | |
| Distribution and Service (12b-1) Fees | | | 0.25 | % | | | 0.85 | % | | | 1.00 | % | |
| Other Expenses | | | 0.16 | % | | | 0.28 | % | | | 0.22 | % | |
| Net Expense Ratio | | | 1.23 | % | | | 1.95 | % | | | 2.04 | % | |
| Columbia Thermostat* | | Class A | | Class B | | Class C | |
| Management Fees | | | 0.10 | % | | | 0.10 | % | | | 0.10 | % | |
| Distribution and Service (12b-1) Fees | | | 0.25 | % | | | 0.85 | % | | | 1.00 | % | |
| Other Expenses | | | 0.15 | % | | | 0.15 | % | | | 0.15 | % | |
| Net Expense Ratio | | | 0.50 | % | | | 1.10 | % | | | 1.25 | % | |
Fees and expenses are for the six months ended June 30, 2006 and for Columbia Acorn International Select and Columbia Thermostat Fund include the effect of Columbia Wanger Asset Management's undertaking to reimburse those funds for any ordinary operating expenses (exclusive of 12b-1 service and distribution fees, interest, taxes and extraordinary expenses, if any), net of custody fees paid indirectly, exceeding 1.45% and 0.25% of their average net assets, respectively. The expense limitation for Columbia Acorn International Select is voluntary and can be terminated by Columbia Wanger Asset Management, L.P. on 30 days' notice. Columbia Thermostat Fund's reimbursement arrangement is contractual through April 30, 2007. The Funds' adviser and/or affiliates have voluntarily agreed to waive a portion of "other expenses" for the Columbia Acorn Family of Funds.
* Does not include estimated fees and expenses of 0.71% incurred by the Fund from the underlying portfolio funds.
95
Columbia Acorn
Family of Funds
Trustees
Robert E. Nason
Chairman
Allan B. Muchin
Vice Chairman
Margaret Eisen
Jerome Kahn, Jr.
Steven N. Kaplan
David C. Kleinman
Charles P. McQuaid
James A. Star
Ralph Wanger
Patricia H. Werhane
John A. Wing
Officers
Charles P. McQuaid
President
Ben Andrews
Vice President
Michael G. Clarke
Assistant Treasurer
Jeffrey R. Coleman
Assistant Treasurer
J. Kevin Connaughton
Assistant Treasurer
P. Zachary Egan
Vice President
John M. Kunka
Assistant Treasurer
Joseph C. LaPalm
Vice President
Bruce H. Lauer
Vice President, Treasurer and Secretary
Louis J. Mendes III
Vice President
Robert A. Mohn
Vice President
Christopher J. Olson
Vice President
Michelle H. Rhee
Assistant Secretary
Linda K. Roth-Wiszowaty
Assistant Secretary
Robert P. Scales
Senior Vice President, Chief Legal Officer
and General Counsel
Investment Adviser
Columbia Wanger Asset Management, L.P.
227 West Monroe Street, Suite 3000
Chicago, Illinois 60606
1-800-922-6769
Distributor
Columbia Management Distributors, Inc.
One Financial Center
Boston, Massachusetts 02111-2621
Transfer Agent, Dividend Disbursing Agent
Columbia Management Services, Inc.
P.O. Box 8081
Boston, Massachusetts 02266-8081
1-800-345-6611
Legal Counsel
Bell, Boyd & Lloyd LLC
Chicago, Illinois
This report, including the schedules of investments, is submitted for the general information of the shareholders of Columbia Acorn Trust. This report is not authorized for distribution unless preceded or accompanied by a prospectus. An investor should carefully consider charges and expenses before investing. To obtain a prospectus containing this and other information, please call (800) 922-6769 or visit our website (shown below). Please read the prospectus carefully before you invest or send money.
A description of the policies and procedures that the Funds use to determine how to vote proxies and a copy of the Funds' voting record are available (i) without charge, upon request, by calling 800-922-6769 and (ii) on the Securities and Exchange Commission's website at www.sec.gov. Information regarding how the Funds voted proxies relating to portfolio securities during the 12-month period ended June 30, is available from the SEC's website. Information regarding how the Funds voted proxies relating to portfolio securities is also available from the Fund's website.
The Funds file a complete schedule of portfolio holdings with the SEC for the first and third quarters of each fiscal year on Form N-Q. The Funds' Form N-Q is available on the SEC's website at www.sec.gov and may be reviewed and copied at the SEC's Public Reference Room in Washington, D.C. Information on the operation of the Public Reference Room may be obtained by calling 1-800-SEC-0330.
Find out what's new – visit our web site at:
www.columbiafunds.com
Our e-mail address is:
ServiceInquiries@ColumbiaManagement.com
Shareholders should not include personal information such as account numbers, Social Security numbers or taxpayer identification numbers in e-mail. We are unable to accept account transactions sent via e-mail.
1-800-922-6769
96
Directions to the 2006 Annual Shareholder Information Meeting
The Chase Bank Auditorium is located on the Plaza Level of the Chase Bank building. The Chase Bank building is located in the center of the Loop, bordered by Dearborn Street on the east, Madison Street on the north, Clark Street on the west and Monroe Street on the south.
From the south:
Take 1-57 (which merges with I-94, also known as the Dan Ryan Expressway). Take the Dan Ryan into Chicago. Follow the signs for the Kennedy Expressway West. Travel on the Kennedy and exit using the Monroe Street exit. Turn right (east) from the exit onto Monroe Street. Proceed east on Monroe Street to Dearborn.
From the north:
Take the Kennedy Expressway (I-90/94) south to Chicago. Exit in the city at Monroe Street. Turn left (east) from the exit onto Monroe Street. Proceed east on Monroe Street to Dearborn.
From the west:
Take the Eisenhower Expressway (I-290) from the west. This becomes Congress Street in the city. Take Congress east to Dearborn Street. Turn left (north) on Dearborn to Monroe Street.
From the southwest:
Take the Stevenson Expressway (I-55). Exit to the Kennedy Expressway (North-Wisconsin). Travel on the Kennedy and exit using the Monroe Street exit. Turn right (east) from the exit onto Monroe Street. Proceed east on Monroe Street to Dearborn.
Parking Information for 2006 Annual Shareholder Information Meeting
A public lot is located at 172 West Madison, between Wells and LaSalle, on the north side of the street. The entrance is on Madison. Madison is a one-way west street. This lot is approximately two blocks west of the Chase Bank building.
Valet parking is available at 183 West Monroe, between Wells and LaSalle, on the south side of the street. The entrance is on Monroe. Monroe is a one-way east street. No vans or trucks are allowed to park at this lot. This lot is approximately three blocks west of the Chase Bank building.
55 East Monroe (formerly Mid-Continental Plaza Parking) is located on East Monroe Street two and one half blocks east of the Chase Bank building. The entrance is on the south side (right) of Monroe Street, between Wabash and Michigan Avenues. Monroe is a one-way street east.
Grant Park Underground (indoor) parking is located three blocks east of the Chase Bank building on Monroe Street. The entrance is on the north side of Monroe Street between Columbus Drive and Lake Shore. Monroe is two-way between Lake Shore Drive and Michigan Avenue. West of Michigan, Monroe is a one-way east.
For directions using public transportation, call (312) 836-7000 for CTA travel information or visit the CTA website at www.transitchicago.com. For Metra information call (312) 322-6777 during business hours or find information at www.metrarail.com.
Join Us!
September 26, 2006
Meet your portfolio managers, analysts
and fellow shareholders
at
Columbia Acorn Funds
2006 Annual Shareholder
Information Meeting
Chase Auditorium
(formerly Bank One Auditorium)
38 South Dearborn Street
Chicago, IL 60602
Columbia Acorn Family of Funds
Class A, B, C Shares
Semiannual Report – June 30, 2006
PRSRT STD
U.S. POSTAGE
PAID
HOLLISTON, MA
PERMIT NO. 20
Columbia Management®
©2006 Columbia Management Distributors, Inc.
One Financial Center, Boston, MA 02111-2621
800-345-6611 www.columbiafunds.com
SHC-44/112004-0606 (08/06) 06/28577
Item 2. Code of Ethics.
Not applicable at this time.
Item 3. Audit Committee Financial Expert.
Not applicable at this time.
Item 4. Principal Accountant Fees and Services.
Not applicable at this time.
Item 5. Audit Committee of Listed Registrants.
Not applicable.
Item 6. Schedule of Investments
The registrant’s “Schedule I – Investments in securities of unaffiliated issuers” (as set forth in 17 CFR 210.12-12) is included in Item 1 of this Form N-CSR.
Item 7. Disclosure of Proxy Voting Policies and Procedures for Closed-End Management Investment Companies.
Not applicable.
Item 8. Portfolio Managers of Closed-End Management Investment Companies.
Not applicable.
Item 9. Purchases of Equity Securities by Closed-End Management Investment Company and Affiliated Purchasers.
Not applicable.
Item 10. Submission of Matters to a Vote of Security Holders.
There have not been any material changes to the procedures by which shareholders may recommend nominees to the registrant’s board of directors, since those procedures were
last disclosed in response to the requirements of Item 7(d)(2)(ii)(G) of Schedule 14A or this Item.
Item 11. Controls and Procedures.
(a) The registrant’s principal executive officer and principal financial officers, based on their evaluation of the registrant’s disclosure controls and procedures as of a date within 90 days of the filing of this report, have concluded that such controls and procedures are adequately designed to ensure that information required to be disclosed by the registrant in Form N-CSR is accumulated and communicated to the registrant’s management, including the principal executive officer and principal financial officer, or persons performing similar functions, as appropriate to allow timely decisions regarding required disclosure.
(b) There were no changes in the registrant’s internal control over financial reporting that occurred during the registrant’s second fiscal quarter of the period covered by this report that has materially affected, or is reasonably likely to materially affect, the registrant’s internal control over financial reporting.
Item 12. Exhibits.
(a)(1) Code of ethics required to be disclosed under Item 2 of Form N-CSR: Not applicable at this time.
(a)(2) Certifications pursuant to Rule 30a-2(a) under the Investment Company Act of 1940 (17 CFR 270.30a-2(a)) attached hereto as Exhibit 99.CERT.
(a)(3) Not applicable.
(b) Certification pursuant to Rule 30a-2(b) under the Investment Company Act of 1940 (17 CFR 270.30a-2(b)) attached hereto as Exhibit 99.906CERT.
SIGNATURES
Pursuant to the requirements of the Securities Exchange Act of 1934 and the Investment Company Act of 1940, the registrant has duly caused this report to be signed on its behalf by the undersigned, thereunto duly authorized.
(registrant) | | Columbia Acorn Trust |
|
|
By (Signature and Title) | /s/ | Charles P. McQuaid |
| | Charles P. McQuaid, President |
|
|
Date | | August 25, 2006 |
| | | | |
Pursuant to the requirements of the Securities Exchange Act of 1934 and the Investment Company Act of 1940, this report has been signed below by the following persons on behalf of the registrant and in the capacities and on the dates indicated.
By (Signature and Title) | /s/ | Charles P. McQuaid |
| | Charles P. McQuaid, President |
|
|
Date | | August 25, 2006 |
|
|
By (Signature and Title) | /s/ | Bruce H. Lauer |
| | Bruce H. Lauer, Treasurer |
|
|
Date | | August 25, 2006 |
| | | |