UNITED STATES
SECURITIES AND EXCHANGE COMMISSION
Washington, D.C. 20549
FORM N-CSR
CERTIFIED SHAREHOLDER REPORT OF REGISTERED
MANAGEMENT INVESTMENT COMPANIES
Investment Company Act file number | 811-01829 |
|
Columbia Acorn Trust |
(Exact name of registrant as specified in charter) |
|
One Financial Center, Boston, Massachusetts | | 02111 |
(Address of principal executive offices) | | (Zip code) |
|
James R. Bordewick, Jr., Esq. Columbia Management Advisors, LLC One Financial Center Boston, MA 02111 |
(Name and address of agent for service) |
|
Registrant’s telephone number, including area code: | 1-617-426-3750 | |
|
Date of fiscal year end: | December 31, 2007 | |
|
Date of reporting period: | June 30, 2007 | |
| | | | | | | | |
Form N-CSR is to be used by management investment companies to file reports with the Commission not later than 10 days after the transmission to stockholders of any report that is required to be transmitted to stockholders under Rule 30e-1 under the Investment Company Act of 1940 (17 CFR 270.30e-1). The Commission may use the information provided on Form N-CSR in its regulatory, disclosure review, inspection, and policymaking roles.
A registrant is required to disclose the information specified by Form N-CSR, and the Commission will make this information public. A registrant is not required to respond to the collection of information contained in Form N-CSR unless the Form displays a currently valid Office of Management and Budget (“OMB”) control number. Please direct comments concerning the accuracy of the information collection burden estimate and any suggestions for reducing the burden to Secretary, Securities and Exchange Commission, 450 Fifth Street, NW, Washington, DC 20549-0609. The OMB has reviewed this collection of information under the clearance requirements of 44 U.S.C. § 3507.
Item 1. Reports to Stockholders.

2Q
Columbia Acorn
Family of Funds
Class Z Shares
Semiannual Report
June 30, 2007
n ColumbiaTM
Acorn® Fund
n ColumbiaTM
Acorn International®
n ColumbiaTM
Acorn USA®
n ColumbiaTM
Acorn International SelectSM
n ColumbiaTM
Acorn SelectSM
n ColumbiaTM
Thermostat FundSM
Managed by Columbia Wanger Asset Management, L.P.
NOT FDIC INSURED
NOT BANK ISSUED
May Lose Value
No Bank Guarantee
Descriptions of indexes included in this report:
• Standard & Poor's (S&P) 500 Index tracks the performance of 500 widely held, large-capitalization U.S. stocks.
• Standard & Poor's (S&P) MidCap 400 Index is a market value-weighted index that tracks the performance of 400 mid-cap U.S. companies.
• Russell 2000® Index measures the performance of the 2,000 smallest companies in the Russell 3000 Index, which represents approximately 8% of the total market capitalization of the Russell 3000 Index.
• Russell 2500TM Index measures the performance of the 2,500 smallest companies in the Russell 3000 Index, which represents approximately 17% of the total market capitalization of the Russell 3000 Index.
• S&P/Citigroup EMI Global ex-US is an unmanaged index consisting of the bottom 20% of institutionally investable capital of developed and emerging countries, outside the United States.
• S&P/Citigroup Global ex-US Cap Range $500mm-$5bn Index is a subset of the broad market selected by the index sponsor representing the mid- and small-cap developed and emerging markets, excluding the United States.
• Morgan Stanley Capital International Europe, Australia, Far East (MSCI EAFE) Index is a capitalization-weighted index that tracks the total return of common stocks in 21 developed-market countries within Europe, Australia and the Far East.
• S&P/Citigroup World ex-US Cap Range $2–10B is a subset of the broad market selected by the index sponsor representing the mid-cap developed market excluding the United States.
• Lipper Indexes include the largest funds tracked by Lipper, Inc. in the named category. Lipper Mid-Cap Growth Index, 30 mid-cap growth funds; Lipper Mid-Cap Core Funds Index, 30 mid-cap core funds; Lipper International Funds Index, 30 largest non-U .S. funds, not including non-U.S. small-cap funds; Lipper International Small-Cap Funds Index, 10 largest non-U.S. funds investing in small-cap companies, including Columbia Acorn International; Lipper Small-Cap Core Funds Index, 30 largest small-cap core funds, including Columbia Acorn Fund. Lipper Flexible Portfolio Funds Index is an equal dollarweighted index of the 30 largest mutual funds within the Flexible Portfolio fund classification, as defined by Lipper.
• Lehman Brothers U.S. Credit Intermediate Bond Index is the intermediate component of the U.S. Credit Index. The U.S. Credit Index includes publicly issued U.S. corporate and foreign debentures and secured notes that meet specified maturity, liquidity, and quality requirements.
Unlike mutual funds, indexes are not managed and do not incur fees or expenses. It is not possible to invest directly in an index.
The views expressed in "Squirrel Chatter II" and "In a Nutshell" commentary reflect the current views of the respective authors. These views are not guarantees of future performance and involve certain risks, uncertainties and assumptions that are difficult to predict so actual outcomes and results may differ significantly from the views expressed. These views are subject to change at any time based upon economic, market or other conditions and the respective parties disclaim any responsibility to update such views. These views may not be relied on as investment advice and, because investment decisions for a Columbia Acorn Fund are based on numerous factors, may not be relied on as an indication of trading intent on behalf of any particular Columbia Acorn Fund. References to specific company securities should not be construed as a recommendation or investment advice.
Columbia Acorn Family of Funds
Table of Contents
| Performance At A Glance | | | 2 | | |
|
| Squirrel Chatter II: Buyout Boom | | | 3 | | |
|
| Understanding Your Expenses | | | 8 | | |
|
| Columbia Acorn Fund | |
|
| In a Nutshell | | | 10 | | |
|
| At a Glance | | | 11 | | |
|
| Major Portfolio Changes | | | 22 | | |
|
| Statement of Investments | | | 24 | | |
|
| Columbia Acorn International | |
|
| In a Nutshell | | | 12 | | |
|
| At a Glance | | | 13 | | |
|
| Major Portfolio Changes | | | 35 | | |
|
| Statement of Investments | | | 37 | | |
|
| Portfolio Diversification | | | 43 | | |
|
| Columbia Acorn USA | |
|
| In a Nutshell | | | 14 | | |
|
| At a Glance | | | 15 | | |
|
| Major Portfolio Changes | | | 44 | | |
|
| Statement of Investments | | | 45 | | |
|
| Columbia Acorn International Select | |
|
| In a Nutshell | | | 16 | | |
|
| At a Glance | | | 17 | | |
|
| Major Portfolio Changes | | | 51 | | |
|
| Statement of Investments | | | 52 | | |
|
| Portfolio Diversification | | | 55 | | |
|
| Columbia Acorn Select | |
|
| In a Nutshell | | | 18 | | |
|
| At a Glance | | | 19 | | |
|
| Major Portfolio Changes | | | 56 | | |
|
| Statement of Investments | | | 57 | | |
|
| Columbia Thermostat Fund | |
|
| In a Nutshell | | | 20 | | |
|
| At a Glance | | | 21 | | |
|
| Statement of Investments | | | 60 | | |
|
| Columbia Acorn Family of Funds | |
|
| Statements of Assets and Liabilities | | | 62 | | |
|
| Statements of Operations | | | 63 | | |
|
| Statements of Changes in Net Assets | | | 64 | | |
|
| Financial Highlights | | | 68 | | |
|
| Notes to Financial Statements | | | 71 | | |
|
| Management Fee Evaluation of the Senior Officer | | | 78 | | |
|
| Columbia Acorn Family of Funds Information | | | 83 | | |
|
2007 Mid-Year Distributions
The following table lists the Funds' mid-year distributions. The record date was June 4, 2007. The ex-dividend date was June 5, 2007 and the payable date was June 6, 2007.
| | | Short-term
Capital
Gains | | Long-term
Capital
Gains | | Ordinary
Income | | Reinvestment
Price | |
| Columbia Acorn Fund | | $ | 0.0462 | | | $ | 0.3404 | | | | None | | | $ | 33.25 | | |
| Columbia Acorn International | | | None | | | $ | 0.2470 | | | $ | 0.1207 | | | $ | 45.47 | | |
| Columbia Acorn USA | | | None | | | $ | 0.2797 | | | | None | | | $ | 31.80 | | |
| Columbia Acorn International Select | | | None | | | | None | | | $ | 0.1487 | | | $ | 30.90 | | |
| Columbia Acorn Select | | $ | 0.0898 | | | $ | 0.0978 | | | | None | | | $ | 31.25 | | |
| Columbia Thermostat Fund | | $ | 0.0207 | | | $ | 0.2751 | | | $ | 0.0633 | | | $ | 12.86 | | |
1
Columbia Acorn Family of Funds
Performance At A Glance Class Z Average Annual Total Returns through 6/30/07
| | | NAV on
6/30/07 | | 2nd
quarter* | | Year to
date* | | 1 year | | 3 years | | 5 years | | 10 years | | Life
of Fund | |
Columbia Acorn
Fund (ACRNX) (6/10/70) | | $ | 32.76 | | | | 6.70 | % | | | 11.55 | % | | | 20.66 | % | | | 17.20 | % | | | 18.09 | % | | | 15.24 | % | | | 16.41 | % | |
| Russell 2500 | | | | | | | 4.94 | % | | | 8.67 | % | | | 18.74 | % | | | 14.97 | % | | | 15.30 | % | | | 11.00 | % | | | NA | | |
| S&P 500 | | | | | | | 6.28 | % | | | 6.96 | % | | | 20.59 | % | | | 11.68 | % | | | 10.71 | % | | | 7.13 | % | | | 12.02 | % | |
Lipper Small-Cap Core
Funds Index | | | | | | | 6.21 | % | | | 9.54 | % | | | 17.17 | % | | | 13.74 | % | | | 13.79 | % | | | 10.22 | % | | | NA | | |
Lipper Mid-Cap Core
Funds Index | | | | | | | 6.06 | % | | | 11.09 | % | | | 20.82 | % | | | 14.71 | % | | | 14.16 | % | | | 10.80 | % | | | NA | | |
Columbia Acorn
International
(ACINX) (9/23/92) | | $ | 45.82 | | | | 8.61 | % | | | 14.59 | % | | | 34.91 | % | | | 30.75 | % | | | 24.42 | % | | | 13.80 | % | | | 15.06 | % | |
S&P/Citigroup EMI
Global ex-US | | | | | | | 7.37 | % | | | 14.85 | % | | | 35.90 | % | | | 29.34 | % | | | 26.03 | % | | | 11.50 | % | | | 11.21 | % | |
S&P/Citigroup Global
ex-US Cap Range
$500mm-$5bn | | | | | | | 8.02 | % | | | 15.47 | % | | | 35.50 | % | | | 29.32 | % | | | 26.22 | % | | | 11.86 | % | | | 11.73 | % | |
| MSCI EAFE Index | | | | | | | 6.40 | % | | | 10.74 | % | | | 27.00 | % | | | 22.24 | % | | | 17.73 | % | | | 7.66 | % | | | 9.35 | % | |
Lipper Int'l Small-Cap
Funds Index | | | | | | | 7.57 | % | | | 14.85 | % | | | 33.39 | % | | | 28.48 | % | | | 25.78 | % | | | 14.13 | % | | | NA | | |
Columbia Acorn USA
(AUSAX) (9/4/96) | | $ | 31.11 | | | | 5.81 | % | | | 9.50 | % | | | 16.03 | % | | | 13.73 | % | | | 15.19 | % | | | 12.22 | % | | | 14.23 | % | |
| Russell 2000 | | | | | | | 4.42 | % | | | 6.45 | % | | | 16.43 | % | | | 13.45 | % | | | 13.88 | % | | | 9.06 | % | | | 10.24 | % | |
Lipper Small-Cap Core
Funds Index | | | | | | | 6.21 | % | | | 9.54 | % | | | 17.17 | % | | | 13.74 | % | | | 13.79 | % | | | 10.22 | % | | | 11.24 | % | |
| S&P 500 | | | | | | | 6.28 | % | | | 6.96 | % | | | 20.59 | % | | | 11.68 | % | | | 10.71 | % | | | 7.13 | % | | | 9.73 | % | |
Columbia Acorn Int'l
Select (ACFFX)
(11/23/98) | | $ | 31.12 | | | | 7.38 | % | | | 11.80 | % | | | 35.02 | % | | | 26.76 | % | | | 21.96 | % | | | NA | | | | 14.69 | % | |
S&P/Citigroup World
ex-US Cap Range $2-10B | | | | | | | 6.08 | % | | | 12.04 | % | | | 29.92 | % | | | 26.26 | % | | | 22.67 | % | | | NA | | | | 13.52 | % | |
| MSCI EAFE Index | | | | | | | 6.40 | % | | | 10.74 | % | | | 27.00 | % | | | 22.24 | % | | | 17.73 | % | | | NA | | | | 8.29 | % | |
Lipper International
Funds Index | | | | | | | 7.49 | % | | | 11.48 | % | | | 28.40 | % | | | 22.84 | % | | | 17.55 | % | | | NA | | | | 9.51 | % | |
Columbia Acorn Select
(ACTWX) (11/23/98) | | $ | 30.86 | | | | 9.12 | % | | | 16.76 | % | | | 32.54 | % | | | 19.66 | % | | | 18.46 | % | | | NA | | | | 16.43 | % | |
| S&P MidCap 400 | | | | | | | 5.84 | % | | | 11.98 | % | | | 18.51 | % | | | 15.15 | % | | | 14.17 | % | | | NA | | | | 12.69 | % | |
Lipper Mid-Cap Growth
Index | | | | | | | 9.51 | % | | | 14.71 | % | | | 21.98 | % | | | 14.76 | % | | | 13.28 | % | | | NA | | | | 8.51 | % | |
| S&P 500 | | | | | | | 6.28 | % | | | 6.96 | % | | | 20.59 | % | | | 11.68 | % | | | 10.71 | % | | | NA | | | | 4.67 | % | |
Columbia Thermostat
Fund (COTZX)
(9/25/02)† | | $ | 12.77 | | | | 2.07 | % | | | 4.43 | % | | | 12.88 | % | | | 9.07 | % | | | NA | | | | NA | | | | 11.26 | % | |
| S&P 500 | | | | | | | 6.28 | % | | | 6.96 | % | | | 20.59 | % | | | 11.68 | % | | | NA | | | | NA | | | | 15.68 | % | |
Lehman Brothers U.S.
Credit Intermediate Bond
Index | | | | | | | -0.40 | % | | | 1.28 | % | | | 6.34 | % | | | 3.79 | % | | | NA | | | | NA | | | | 4.46 | % | |
Lipper Flexible Portfolio
Funds Index | | | | | | | 4.96 | % | | | 6.79 | % | | | 16.83 | % | | | 11.10 | % | | | NA | | | | NA | | | | 13.46 | % | |
*Not annualized.
Performance data quoted represents past performance and current performance may be lower or higher. Past performance is no guarantee of future results. The investment return and principal value of an investment in a Fund will fluctuate so that Fund shares, when redeemed, may be worth more or less than their original cost. Please visit columbiafunds.com for daily and most recent month-end updates. Net asset value (NAV) returns do not include sales charges or contingent deferred sales charges (CDSC). Class Z shares are sold only at NAV with no Rule 12b-1 fee. Class Z shares have limited eligibility and the investment minimum requirement may vary. Only eligible investors may purchase Class Z shares of the funds, directly or by exchange. Please see each fund's prospectus for eligibility and other details.
Performance results reflect any voluntary waivers or reimbursement of Fund expenses by the investment advisor and/or any of its affiliates. Absent these waivers or reimbursement arrangements, performance results would have been lower.
Annual operating expense ratios are as stated in each Fund prospectus that is current as of the date of this report and differences in expense ratios disclosed elsewhere in this report may result from including fee waivers and reimbursements as well as different time periods used in calculating the ratios. Columbia Acorn Fund Class Z: 0.75%. Columbia Acorn International Class Z: 0.94%. Columbia Acorn USA Class Z: 1.01%. Columbia Acorn International Select Class Z: 1.28%. Columbia Acorn Select Class Z: 0.98%. Columbia Thermostat Fund has a contractual expense waiver or reimbursement that expires April 30, 2008. Expense ratios without and with the contractual waiver, including fees and expenses associated with the Fund's investments in other investment companies, for Class Z shares are 1.10% and 0.94%, respectively. Absent the waiver or reimbursement, performance results may be lower.
†A "fund of funds" bears its allocable share of the costs and expenses of the underlying funds in which it invests. Such funds are thus subject to two levels of fees and potentially higher expense ratios than would be associated with an investment in an investment fund that invests and trades directly in financial instruments under the direction of a single manager.
All indexes are unmanaged and returns include reinvested distributions. It is not possible to invest directly in an index. For index definitions, see the inside front cover of this report.
2
Squirrel Chatter II: Buyout Boom
 In last year's annual report, we mentioned that 26 Columbia Acorn Fund stocks were subject to takeover bids during the year. Takeovers certainly helped performance and we were pleased that buyers validated our fundamental research process by finding lots of our companies to be attractive.
In the first half of 2007, the buyout boom continued to accelerate. In just six months, 27 Columbia Acorn Fund stocks announced takeovers, beating the Fund's full year 2006 record. Columbia Acorn USA had 15 takeover stocks in common with Columbia Acorn Fund and one additional buyout not owned by Columbia Acorn Fund. Columbia Acorn International had three takeovers that overlapped with Columbia Acorn Fund and another that did not. Columbia Acorn Select and Columbia Acorn International Select had one takeover each; both were also held by Columbia Acorn Fund.
Generally, buyouts come in two basic flavors: strategic and financial. Strategic buyouts are often done by similar companies that want to pursue synergies, such as cost savings or enhanced products, production, distribution or pricing. Strategic buyers are usually other public companies and sometimes use their stock to pay for all or part of the acquisition. After some stock deals, we've kept the acquiring company's stock as a long-term investment.
Financial buyouts have historically been executed by private equity partnerships with private equity firms as general partners and other entities, such as pension funds and endowments, as limited partners. Financial partnerships usually borrow 70% to 85% of the acquisition price in order to enhance returns and minimize taxes on the acquired business.1 Company management sometimes like to sell to private partners, as (1) they often get stock in the privatized company to stay and manage the business, and (2) they no longer have to deal with pesky securities analysts.
Our first half 2007 buyout announcements were a mixed lot. About 55% were strategic and 45% financial. The takeover terms have ranged from excellent to disappointing, though none so far this year have been "takeunders," at below last trade prices. We've had offers for big positions and small ones, and for long-standing holdings and newer ideas. Following are summaries of the takeover announcements made in the first half of 2007:
Takeover Log
January 8: United Surgical Partners, an operator of outpatient surgical centers, agreed to sell to a group led by Welsh, Carson, Anderson & Stowe, for $31.05 per share. Although we believed the valuation was fair based on reported results, we thought fundamentals would improve and the stock would have had high returns over the long run.
January 10: Alliance Atlantis Communications announced it was selling to a partnership including Goldman Sachs and CanWest Global Communications for C$53.2 We first bought Alliance Atlantis in 2003, when it became focused on its more successful areas, the popular CSI television series and cable TV channels in Canada. Columbia Acorn Fund sold much of its position after the announcement but our remaining holding is up 150% from its cost.
February 5: Hanover Compressor agreed to merge with Universal Compression Holdings, a competitor, in a deal for stock. Both companies rent compressors to the natural gas industry, and the companies believe the combination will result in cost savings and larger service areas. We agree and Columbia Acorn USA as of press time kept its position in Hanover.
February 8: Edgars Consolidated Stores, a South African retailer, said it would sell to Bain Capital. Edgars' offer was 50% over its price prior to deal news back in October 2006, but was not at a premium to similar public companies. We owned Edgars in Columbia Acorn Fund and Columbia Acorn International, correctly believing that new management would enable the company to benefit from an improving regional economy. While the buyout price was somewhat disappointing, both funds booked at least a double in under three years.
February 12: A twin-deal day. First, UrAsia Energy, a Canadian uranium miner with operations in Kazakhstan, announced a merger for sxr Uranium One stock. Uranium One is a Canadian uranium miner with operations primarily in South Africa. This was Columbia Acorn Select's only deal. With Columbia Acorn Fund and Columbia Acorn International also owning the stock, it was our largest dollar deal, exceeding
3
$250 million across the three funds. We continue to like uranium mining economics and the funds now own Uranium One. Second, Witness Systems agreed to sell to Verint, a strategic buyer, for $27.50 per share, a price we considered to be fair.
February 14: TALX announced a sellout to Equifax for a cash and stock deal valued at $35.50, an 11% premium to TALX's last closing price. We were disappointed by the offer, though it was more than a 20% premium to our cost. While that was an excellent compound rate of return as we owned the stock for only several months, we'd rather hold stocks for much longer periods and potentially make more money.
February 19: Florida Rock agreed to merge with fellow aggregates company Vulcan Materials for cash and stock worth a stated $68 per share, a 45% premium to Florida's prior closing price. We like the business as barriers to entry are high—people don't want rock mines in their back yards—and transportation costs keep out remote competitors. Consequently, it was one of our larger holdings. We thought Florida's stock price had seemed irrationally depressed due to concerns about the housing industry and Vulcan noticed. As of June 30, both Columbia Acorn Fund and Columbia Acorn USA had more than a double in their investment in Florida Rock and Columbia Acorn Fund also started a position in Vulcan.
February 21: Central Parking announced a sale to private equity consortium KCPC Holdings for $22.53 per share in cash. Central Parking had reportedly turned down offers that were $15 to $16 in the middle of 2006, but somehow real estate values have surged since then. We consider the new price to be fair.
March 2: Dendrite International, a provider of software and services to pharmaceutical marketing departments, reported that it would sell out to Cedegim, a French software company, for $16 in cash. We believed that Dendrite provided value to its customers, but we were disappointed by a lack of consistent growth. We think the deal was at a fair price given earnings volatility.
March 6: K&F Industries agreed to sell to Meggitt PLC, a fellow producer of aircraft wheels and brakes, for $27 per share in cash. The price represented just a 10% premium to the prior day's close and appeared cheap compared to cash flow. The company did allow competing bids, but none emerged. We believe we bought the stock at the right time in Columbia Acorn Fund and Columbia Acorn USA, as it returned over 60% in the 15 months that we held it.
March 15: WebEx announced a sellout to Cisco for $57 per share in cash, a 23% premium to its March 14 closing price. This was one of our quickest and smallest deals, as we had started buying the stock for Columbia Acorn Fund in January. Like the TALX deal, we got a fine rate of return, but we would have rather made potentially more dollars over a longer period of time.
March 19: ServiceMaster entered into a deal to sell to Clayton, Dubilier & Rice, a private equity firm, for $15.625 per share in cash. ServiceMaster was a great stock until about 1998 but it subsequently struggled. We bought it last year for Columbia Acorn Fund, thinking that new management could restructure and grow the business. Instead, the company decided to sell out at a relatively modest premium. Once again our rate of return was fine but we did not earn large dollars over the longer term.
March 23: Kronos agreed to sell to a group led by Hellman & Friedman for $55 per share in cash. We first bought Kronos over 10 years ago as a downstream-from-technology investment; the company substituted semiconductors for electromechanical devices in employee timeclocks. As years progressed, Kronos expanded its product portfolio with software offerings including shift scheduling, human resource management and recruiting. Earnings growth was erratic due to economic and product cycles and that provided some opportunities for long-term investors. We view the deal price as reasonable. Kronos was our second largest deal this year, as Columbia Acorn Fund and Columbia Acorn USA cashed out for over $180 million.
April 19: Van Houtte, a Canadian gourmet coffee equipment and services company, said it had a non-binding offer from an undisclosed buyer of C$25 per share, a 1% premium to its average price over the prior 30 days. The stock spiked up from C$17 in January, after the company said it was reviewing strategic options. In May the company entered into a definitive agreement and identified the buyer as Littlejohn & Co, a private equity firm. While we were disappointed with the sale price, Columbia Acorn International booked about a 40% profit in 14 months.
April 24: Highland Hospitality said it would sell out to JER Partners, a private equity firm focused on real estate, for $19.50 per share. Though we had cut our real estate holdings several years ago, we believed that the hotel business had favorable supply/demand characteristics and that Highland added value by acquiring and improving properties. We began buying the stock in December 2003. Upon the close of the deal in late July, Columbia Acorn Fund and
4
Columbia Acorn USA realized over 70% gains from its average cost, in addition to dividends previously booked.
May 7: Armor Holdings, a military vehicle and armor business, announced a sellout to BAE Systems, a UK defense conglomerate, for $88 per share in cash. We started buying the stock for Columbia Acorn Fund in December 2006, believing that the demand for military armor would grow over the long term and that Armor was well positioned. We thought the takeout price was fair, and when the deal closed following the period end, the Fund realized a 61% gain.
May 14: Viasys Healthcare agreed to sell out to Cardinal Health for $42.75 per share in cash, a 36% premium to its last closing price. We thought that price was a fair multiple on earnings and cash flow, and we subsequently learned that Viasys pursued a lengthy bidding process in order to obtain the highest price. We applaud management and directors for that effort. Upon the deal's close in June, Columbia Acorn Fund realized a 130% gain and Columbia Acorn USA tripled its investment.
May 15: Agile Software, a company that produces programs to handle changes in product design, said it would sell out to Oracle for $8.10 per share. The price represented a 12% premium to the stock's last trade. We bought the stock a year earlier, correctly believing that sales would increase and profits would commence.
May 21: Cellular phone company Alltel announced a sale to private equity buyers TPG Capital and Goldman Sachs for $71.50 cash per share. Our Alltel shares were derived from a previous takeover, as a result of it buying Western Wireless, a rural cellphone company. We had expected Alltel to sell out and were relieved upon the announcement because we were leery of increasing competition. We sold our remaining positions shortly after the announcement, realizing over 400% gains over our original Western Wireless costs, in both Columbia Acorn Fund and Columbia Acorn USA.
Also on May 21, Cytyc, a dominant producer of consumable diagnostic and surgical products for women's health, agreed to sell out to Hologic for a combination of cash and stock. The merger appears to make sense for both companies as we believe the combined company can boost sales and reduce costs. We have owned Cytyc since early 2005 in Columbia Acorn Fund and, at quarter end, showed a 75% profit on our investment.
May 22: Crescent Real Estate Equities, which primarily owns office buildings, announced a sale to Morgan Stanley Real Estate, a private fund, for cash. The $22.80 price was just a 6% premium to the stock's prior close, which barely offsets dividends that were cancelled until the deal is expected to close in the third quarter. Furthermore, the price represented a 5% to 10% discount to what we then believed the company was worth.
May 30: Ceridian, a provider of payroll processing, other HR services, trucker transactions processing and gift cards, agreed to sell to Thomas H. Lee Partners and Fidelity National Financial for $36 cash per share. We believe that Ceridian's core HR business is a solid franchise undergoing internal improvement and its other businesses are gems. Governance, however, became somewhat like a soap opera as an activist hedge fund bought a 15% interest, agitated for strategic restructuring, and began negotiating with a division head, who then got fired. That is all a shame, as we think the $36 price undervalues the company's potential.
June 15: Penn National Gaming, a regional casino operator, said it would sell out to a private group, which includes management, Fortress Investment and Centerbridge Partners, for $67 per share in cash. The bid was a 31% premium to the prior day's stock price, and at what we considered to be a fair multiple of cash flow. With Penn's proposed sale later this year, and Kerzner International's and Station Casino's announced sellouts last year, there are expected to be few public small- and mid-cap casino companies remaining.
June 18: Footwear retailer Genesco gave itself the boot as a public company, agreeing to sell out to Finish Line, another footwear retailer, for $54.50 cash per share. In April and May, the board of Genesco had rejected lower offers from Foot Locker. We think the $54.50 price is fair and we applaud the board for holding out for that price.
June 20: Nuveen Investments said it would be acquired by a private group lead by Madison Dearborn Partners, for $65 per share in cash. We like the investment management business, and Columbia Acorn Fund started buying Nuveen in late 2004. Columbia Acorn Select later bought a position. Unfortunately, in early 2007 we trimmed Columbia Acorn Fund's holdings and sold out of Columbia Acorn Select's position due to valuation and fears that growth would slow. Columbia Acorn Fund will realize nearly a 100% gain on its remaining shares if the deal is executed under its announced terms.
5
June 26: Stork, a Netherlands-based conglomerate, agreed to sell to private equity firm Candover Investments. The price, 47 Euros cash per share, represented a 12% premium to the stock's prior close. Stork has been harassed by activist shareholders demanding that it be split up, and the company sees the sale as a way to resolve the dispute. We believe the small premium does not reflect Stork's underlying value. We understand that a supermajority vote is needed to approve the buyout and we think the 47 Euro price may need to be increased for a transaction to occur. Columbia Acorn Fund, Columbia Acorn International and Columbia Acorn International Select owned the stock.
June 27: Chittenden, a New England bank, announced it would sell to People's United Financial, another company held by Columbia Acorn Fund and Columbia Acorn USA, for a combination of stock and cash. The banking industry in the United States has been consolidating for a long time, and Columbia Acorn Fund has benefited from a lot of bank sellouts. While we believe this sellout price is fair and Chittenden was certainly a profitable investment for Columbia Acorn Fund and Columbia Acorn USA, our funds' positions in People's United fell on the news somewhat more than their positions in Chittenden rose.
June 29: Another rural cellular phone company, Dobson Communications, announced it would sell. This deal is for cash and the buyer is AT&T, which operates nearby cellular systems that utilize the same technology as Dobson. Columbia Acorn Fund has owned cellphone franchises since the industry began in the 1980s and has benefited from numerous sellouts. Similar to the casino industry, few small- and mid-cap public cellular companies remain.
Trillion Dollar Question
Buyout booms tend to run in cycles. Typically, private equity is able to raise more equity capital after a few years of good returns, and is able to raise debt funding when interest rates for "junk" bonds are at relatively low premiums to quality bonds. Then buyout momentum accelerates. Increased private equity activity seems to spur more strategic acquisitions and buyout prices rise.
The dollar volume of private equity buyouts in the United States and Europe averaged around $30 billion a year from 2000 to 2002, and then ramped to an unprecedented level in 2006, around $384 billion!3 While the dollar amount of private buyouts in 2006 broke records, as a percentage of stock market valuation it was barely half of 1988's level. Private equity recently had about $250 billion of equity capital available for buyouts, and was continuing to raise a lot more.4 Adding debt to this equity suggests that private equity would be able to buy over a trillion dollars of assets. The trillion dollar question is whether lenders will continue to fund lots of buyouts at low interest rates.
Credit markets in the first half of 2007 were very loose relative to historical standards. While we think buyout prices were high, we believe they had not yet reached "bubble" levels. We do not think we have seen the marquee "big and dumb" deals, which would normally suggest the buyout boom is nearing an end.
However, credit market conditions changed considerably after the June 30 end of this report period. Home mortgage defaults kept growing, especially for sub-prime mortgages. Mortgage-backed security prices fell, triggering huge losses for some hedge funds and creating concerns about possible losses elsewhere. Credit markets tightened overall and premiums for "junk" bonds increased.
Previously announced financial buyout deals generally have gotten funded, at first with sweetened terms for bond financing and later by bank commitments rather than primarily by bonds. Banks appear to be honoring existing financing commitments but seem to be limiting additional obligations.
At press time, the debt market was chaotic. While several high quality corporations were able to issue new bonds, risky borrowers appear locked out. We don't know what will happen next. We believe that there is a reasonable chance that the mortgage-backed security problem will be contained and its casualties clearly defined, allowing the remainder of the credit markets to return to normal. Higher quality financial buyouts could then resume. We feel there is also a chance that credit markets will remain tight for a long time, severely limiting new buyouts.
We usually buy stocks in order to grow with them for a long time, not to participate in a buyout within a few
6
months. We recognize that buyout cycles come and go. We benefited from the buyout cycle and will likely continue to benefit from it should it resume, but we will not change our investment objectives, strategy, style or process.

Charles P. McQuaid
President and Chief Investment Officer
Columbia Wanger Asset Management, L.P.
While some of the deals have closed, there can be no assurance that the remaining transactions discussed above will be consummated on the terms and conditions, or that the Funds will profit to the extent, described herein.
All holding gains mentioned are calculated based on tax lots of securities held at the time of publication and additional tax lots may have been previously sold at higher costs for some stocks.
1 Data taken from a presentation given by Steven Kaplan, Neubauer Family Professor of Entrepreneurship and Finance, University of Chicago Graduate School of Business, to the Chicago Analyst Society on June 11, 2007. Steven is also a trustee of the Columbia Acorn Trust.
2 The "C" denotes Canadian dollars here and elsewhere in the essay.
3 "The Financing of Large Buyouts: An Empirical Analysis," a paper coauthored by Ulf Axelson, Tim Jenkinson, Per Stromberg and Michael Weisbach. Preliminary version dated April 3, 2007.
4 Ibid.
Fund weightings at June 30, 2007, in the holdings mentioned were as follows:
Alliance Atlantis Communication: Columbia Acorn Fund, 0.1%
Hanover Compressor: Columbia Acorn USA, 0.5%
Uranium One: Columbia Acorn International, 0.7%; Columbia Acorn Fund, 0.4%; Columbia Acorn Select, 6.2%
Florida Rock: Columbia Acorn USA, 0.8%; Columbia Acorn Fund, 0.6%
Vulcan Materials: Columbia Acorn Fund, 0.1%
ServiceMaster: Columbia Acorn Fund, 0.4%
Van Houtte: Columbia Acorn International, 0.4%
Highland Hospitality: Columbia Acorn Fund, 0.5%; Columbia Acorn USA, 0.4%
Armor Holdings: Columbia Acorn Fund, 0.3%
Agile Software: Columbia Acorn Fund, 0.1%; Columbia Acorn USA, 0.1%
Cytyc: Columbia Acorn Fund, 0.4%
Crescent Real Estate Equities: Columbia Acorn Fund, 0.1%
Ceridian: Columbia Acorn USA, 1.1%; Columbia Acorn Fund, 0.6%
Penn National Gaming: Columbia Acorn Fund, 0.5%
Genesco: Columbia Acorn USA, 0.3%; Columbia Acorn Fund, 0.2%
Nuveen Investments: Columbia Acorn Fund, 0.4%
Stork: Columbia Acorn International Select, 2.3%; Columbia Acorn International, 1.0%
Chittenden: Columbia Acorn USA, 0.4%; Columbia Acorn Fund, 0.2%
Dobson Communications: Columbia Acorn USA, 1.1%; Columbia Acorn Fund, 0.4%
Stocks of small- and mid-cap companies pose special risks, including possible illiquidity and greater price volatility than stocks of larger, more established companies. International investing involves special risks, including foreign taxation, currency risks, risks associated with possible differences in financial standards and other risks associated with future political and economic developments. A fund that maintains a relatively concentrated portfolio may be subject to greater risk than a fund that is more fully diversified.
Past performance is no guarantee of future results.
7
Understanding Your Expenses
As a Fund shareholder, you incur two types of costs. There are transaction costs, which generally include sales charges on purchases and may include redemption or exchange fees. There are also ongoing costs, which generally include investment advisory fees, Rule 12b-1 fees and other Fund expenses. The information on this page is intended to help you understand your ongoing costs of investing in the Columbia Acorn Funds and to compare these costs with the ongoing costs of investing in other mutual funds.
Analyzing your Fund's expenses
To illustrate these ongoing costs, we have provided examples and calculated the expenses paid by investors in the Class Z shares of the Columbia Acorn Funds for the last six months. The information in the following table is based on an initial investment of $1,000.00, which is invested at the beginning of the reporting period and held for the entire period. Expense information is calculated two ways and each method provides you with different information. The amount listed in the "Actual" column is calculated using each Fund's actual operating expenses and total return for the period. The amount listed in the "Hypothetical" column assumes that the return each year is 5% before expenses and then applies each Fund's actual expense ratio for the period to the hypothetical return. You should not use the hypothetical account values and expenses to estimate either your actual account balance at the end of the period or the expenses yo u paid during the reporting period. See the "Compare with other funds" information for details on using the hypothetical data.
January 1, 2007 – June 30, 2007
| | | Account value at
the beginning of
the period ($) | | Account value at
the end of
the period ($) | | Expenses paid
during period ($) | | Fund's
annualized
expense
ratio (%)* | |
| Class Z Shares | | Actual | | Hypothetical | | Actual | | Hypothetical | | Actual | | Hypothetical | | Actual | |
| Columbia Acorn Fund | | | 1,000.00 | | | | 1,000.00 | | | | 1,115.49 | | | | 1,021.17 | | | | 3.83 | | | | 3.66 | | | | 0.73 | | |
| Columbia Acorn International | | | 1,000.00 | | | | 1,000.00 | | | | 1,145.89 | | | | 1,020.33 | | | | 4.79 | | | | 4.51 | | | | 0.90 | | |
| Columbia Acorn USA | | | 1,000.00 | | | | 1,000.00 | | | | 1,095.01 | | | | 1,019.98 | | | | 5.04 | | | | 4.86 | | | | 0.97 | | |
| Columbia Acorn International Select | | | 1,000.00 | | | | 1,000.00 | | | | 1,118.02 | | | | 1,018.89 | | | | 6.25 | | | | 5.96 | | | | 1.19 | | |
| Columbia Acorn Select | | | 1,000.00 | | | | 1,000.00 | | | | 1,167.61 | | | | 1,020.23 | | | | 4.94 | | | | 4.61 | | | | 0.92 | | |
| Columbia Thermostat Fund | | | 1,000.00 | | | | 1,000.00 | | | | 1,043.49 | | | | 1,023.55 | | | | 1.27 | | | | 1.25 | | | | 0.25 | | |
Expenses paid during the period are equal to each Fund's annualized expense ratio, multiplied by the average account value over the period and then multiplied by the number of days in the Fund's most recent fiscal half-year and divided by 365.
Had the Investment adviser or any of its affiliates not waived or reimbursed a portion of expenses, account value at the end of the period would have been reduced.
It is important to note that the expense amounts shown in the table are meant to highlight only ongoing costs of investing in the Funds and do not reflect any transaction costs, such as sales charges, redemption fees or exchange fees. Therefore, the hypothetical examples provided may not help you determine the relative total costs of owning different funds. If these transaction costs were included, your costs would have been higher.
Columbia Thermostat Fund's expenses do not include fees and expenses incurred by the Fund from the underlying portfolio funds.
*For the six months ended June 30, 2007.
Compare with other funds
Since all mutual funds are required to include the same hypothetical calculations about expenses in shareholder reports, you can use this information to compare the ongoing cost of investing in the Funds with other funds. To do so, compare the 5% hypothetical example with the 5% hypothetical examples that appear in the shareholder reports of other funds. As you compare hypothetical examples of other funds, it is important to note that hypothetical examples are meant to highlight the continuing costs of investing in a fund and do not reflect any transaction costs, such as sales charges, redemption fees or exchange fees.
8
Estimating your actual expenses
To estimate the expenses that you actually paid over the period, first you will need your account balance at the end of the period:
• For shareholders who receive their account statements from Columbia Management Services, Inc., your account balance is available online at columbiafunds.com or by calling Shareholder Services at (800) 922-6769.
• For shareholders who receive their account statements from their brokerage firm, contact your brokerage firm to obtain your account balance.
1. Divide your ending account balance by $1,000.00. For example, if an account balance was $8,600 at the end of the period, the result would be 8.6.
2. In the section of the table titled "Expenses paid during the period," locate the amount for your Fund. You will find this number is in the column labeled "Actual." Multiply this number by the result from step 1. Your answer is an estimate of the expenses you paid on your account during the period.
9
Columbia Acorn Fund
In a Nutshell

Charles P. McQuaid
Lead Portfolio Manager

Robert A. Mohn
Co-Portfolio Manager
Performance data quoted represents past performance and current performance may be lower or higher. Past performance is no guarantee of future results. The investment return and principal value of an investment in the Fund will fluctuate so that shares, when redeemed, may be worth more or less than the original cost. Performance may reflect any voluntary waivers or reimbursements of fund expenses by the Adviser or its affiliates. Absent these waivers, or reimbursement arrangements, performance results may be lower. Please visit columbiafunds.com for daily and most recent month-end performance updates.
Fund's Positions
in Mentioned Holdings
as of 6/30/07
| ITT Educational Services | | | 1.1 | % | |
| Eaton Vance | | | 1.1 | % | |
| Fugro | | | 1.1 | % | |
| People's United | | | 0.8 | % | |
| Florida Rock | | | 0.6 | % | |
| Penn National Gaming | | | 0.5 | % | |
| Highland Hospitality | | | 0.5 | % | |
| ESCO Technologies | | | 0.4 | % | |
| Hong Kong Exchanges and Clearing | | | 0.4 | % | |
| Housing Development Finance | | | 0.4 | % | |
| Hexagon | | | 0.4 | % | |
| Armor Holdings | | | 0.3 | % | |
| Chittenden | | | 0.2 | % | |
| Shuffle Master | | | 0.2 | % | |
| Crescent Real Estate Equities | | | 0.1 | % | |
Columbia Acorn Fund rose 11.55% in the first half of 2007, nicely beating the 8.67% return of the small-cap Russell 2500 Index, and also pacing ahead of other benchmarks. The Fund rose 6.70% in the second quarter, moderately outperforming the Russell 2500's gain of 4.94%, and slightly outperforming other benchmarks.
Stock selection drove fine results, and the same three companies were our largest dollar winners for both the first half and the second quarter. ITT Educational Services jumped 77% in the half and 44% in the quarter on strong sales and profit margins. Eaton Vance appreciated 35% in the half and 24% in the quarter; its assets under management surged as the company created new closed-end funds. Netherlands-based Fugro rounded out the winners' circle, up 35% and 27% respectively, on strong demand for energy industry offshore services.
Sellouts also boosted performance. In the first half, Kronos was the Fund's largest dollar winner as a result of takeovers, clocking a 50% gain, while Armor Holdings and Florida Rock were the largest percentage winners, each up about 58%. In the second quarter, Penn National Gaming scored the Fund's largest takeover dollar jackpot and percentage gain, up 42%. There were 27 takeovers in the half, beating the 26 in all of 2006; they boosted performance by over 1.5%. We discuss these takeovers in "Squirrel Chatter II" beginning on Page 3 of this report.
The Fund had relatively low investments in industries that did not perform well. Real estate stocks within the Russell 2500 were down in the first half of 2007, after many stellar years. Columbia Acorn Fund's real estate investment was both relatively small and actually profitable, thanks to announced takeovers of Highland Hospitality and Crescent Real Estate Equities. In the second quarter, Russell 2500 bank and utility stocks also did poorly. The Fund had relatively small investments in both areas.
Columbia Acorn Fund's largest dollar loser in the first half was People's United, a Connecticut savings and loan company. It lost 16% in part due to its somewhat dilutive acquisition of another Fund bank holding, Chittenden, which rose 15%. Shuffle Master dropped 37% in the half due to poor earnings. ESCO Technologies declined 19% in the quarter on news that a major customer of its automatic meter readers was reconsidering its requirements.
Columbia Acorn Fund's international stocks resumed their outperformance in the quarter, and rose 14.56%, boosting their first half gain to 18.85%. In addition to Fugro, mentioned above, top winners for the quarter were Hong Kong Exchanges and Clearing, up 48% on regulatory changes which allow mainland Chinese to own stocks listed in Hong Kong. Housing Development Finance booked a 44% gain on India's prosperity and housing boom. Hexagon, a Swedish manufacturer of measurement equipment and polymers, gained 42% due to excellent earnings. At the end of the half, foreign stocks were 11.5% of Columbia Acorn Fund, up slightly from 11.3% last quarter but down from 13.7% year-to-year.
Small- and mid-cap stocks are often more volatile and less liquid than the stocks of larger companies. Small companies may have a shorter history of operations than larger companies and may have a less diversified product line, making them more susceptible to market pressure. International investments involve greater potential risks, including less regulation, currency fluctuations, economic instability and political developments.
Portfolio holdings are subject to change periodically and may not be representative of current characteristics and holdings.
10
Columbia Acorn Fund (ACRNX)
At a Glance
Performance data quoted represents past performance and current performance may be higher or lower. Past performance is no guarantee of future results. The investment return and principal value of an investment in the Fund will fluctuate so that Fund shares, when redeemed, may be worth more or less than their original cost. Performance may reflect any voluntary waivers or reimbursements of Fund expenses by the Adviser or any of its affiliates. Absent these waivers or reimbursement arrangements, performance results may be lower. Visit columbiafunds.com for daily and most recent month-end updates.
Pretax and After-tax Average Annual Total Returns (Class Z)
through June 30, 2007
| Inception 6/10/70 | | Year
to date* | | 1 year | | 5 years | | 10 years | |
| Returns before taxes | | | 11.55 | % | | | 20.66 | % | | | 18.09 | % | | | 15.24 | % | |
Returns after
taxes on distributions | | | 11.33 | | | | 19.18 | | | | 17.42 | | | | 13.60 | | |
Returns after taxes
on distributions and
sale of fund shares | | | 7.74 | | | | 15.09 | | | | 15.87 | | | | 12.82 | | |
| Russell 2500 (pretax) | | | 8.67 | | | | 18.74 | | | | 15.30 | | | | 11.00 | | |
| S&P 500 (pretax) | | | 6.96 | | | | 20.59 | | | | 10.71 | | | | 7.13 | | |
After-tax returns are calculated using the highest historical individual federal marginal income tax rates, and do not reflect the impact of state and local taxes. Returns after taxes on distributions and sale of Fund shares reflect the additional tax impact of long-term gains or losses realized when Fund shares are sold. The returns are taxed at the maximum rate and assume shares were purchased at the beginning of the period. Actual after-tax returns depend on the investor's tax situation and may differ from those shown. After-tax returns are not relevant to investors who hold their Fund shares through tax-deferred arrangements such as 401(k) plans or individual retirement accounts. After-tax returns are shown for Class Z shares only; after-tax returns for other share classes will vary. Indexes do not reflect any deduction for fees, expenses or taxes.
*Year to date data not annualized.
Columbia Acorn Fund Portfolio Diversification
as a % of net assets as of 6/30/07

Columbia Acorn Fund Top 10 Holdings
as a % of net assets as of 6/30/07
| | 1. | | | Coach
Designer & Retailer of Branded Leather Accessories | | | 1.6 | % | |
| | 2. | | | Eaton Vance
Specialty Mutual Funds | | | 1.1 | % | |
| | 3. | | | ITT Educational Services
Post-secondary Degree Programs | | | 1.1 | % | |
| | 4. | | | Abercrombie & Fitch
Teen Apparel Retailer | | | 1.1 | % | |
| | 5. | | | Fugro (Netherlands)
Oilfield Services | | | 1.1 | % | |
| | 6. | | | Expeditors International of Washington
International Freight Forwarder | | | 1.1 | % | |
| | 7. | | | FMC Technologies
Oil & Gas Well Head Manufacturer | | | 1.1 | % | |
| | 8. | | | Chico's FAS
Women's Specialty Retailer | | | 1.0 | % | |
| | 9. | | | Genlyte Group
Commercial Lighting Fixtures | | | 1.0 | % | |
| | 10. | | | Ametek
Aerospace/Industrial Instruments | | | 0.9 | % | |
The Fund's top 10 holdings and portfolio diversification vary with changes in portfolio investments. See the Statement of Investments for a complete list of the Fund's holdings.
The Growth of a $75,000 Investment in Columbia Acorn Fund (Class Z)
June 10, 1970 through June 30, 2007
This graph compares the results of $75,000 invested in Columbia Acorn Fund at inception on June 10, 1970 to the S&P 500 Stock Index and to an initial $238,325 investment in the Russell 2500 on the index's December 31, 1978 inception date. The indexes are unmanaged and returns for both the indexes and the Fund include reinvested dividends and capital gains. It is not possible to invest directly in an index. The graph does not reflect taxes that a shareholder would pay on Fund distributions or on a sale of Fund shares.
Total Net Assets of the Fund:
$21,231.3 million
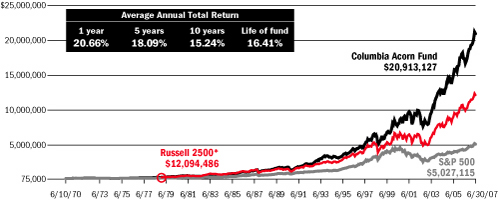
*A $75,000 investment in Columbia Acorn Fund at inception appreciated to $238,325 on December 31, 1978, the inception date of the Russell 2500. For comparison with the Russell 2500, we assigned the index the same value as the Fund at index inception.
11
Columbia Acorn International
In a Nutshell

P. Zachary Egan
Co-Portfolio Manager

Louis J. Mendes III
Co-Portfolio Manager
Performance data quoted represents past performance and current performance may be lower or higher. Past performance is no guarantee of future results. The investment return and principal value of an investment in the Fund will fluctuate so that shares, when redeemed, may be worth more or less than the original cost. Performance may reflect any voluntary waivers or reimbursements of fund expenses by the Adviser or its affiliates. Absent these waivers, or reimbursement arrangements, performance results may be lower. Please visit columbiafunds.com for daily and most recent month-end performance updates.
Fund's Positions
in Mentioned Holdings
as of 6/30/07
| Hong Kong Exchanges and Clearing | | | 1.4 | % | |
| Hexagon | | | 1.4 | % | |
| China Shipping Development | | | 1.0 | % | |
| Singapore Exchange | | | 0.8 | % | |
| Taewoong | | | 0.6 | % | |
| Burckhardt Compression | | | 0.6 | % | |
| Lenovo Group | | | 0.5 | % | |
| Sung Kwang Bend | | | 0.5 | % | |
Portfolio holdings are subject to change periodically and may not be representative of current characteristics and holdings.
Columbia Acorn International ended the quarter up 8.61% vs. a 7.37% gain for the benchmark S&P/Citigroup EMI Global ex-US Index. Year to date, the Fund was up 14.59% vs. a 14.85% gain for the benchmark.
Returns varied considerably by region. Led by Korea and China, the Fund's Asia ex-Japan holdings posted a nearly 32% return on the back of positive earnings surprises and liquidity inflows to the region. Liberalization measures in China allowing local investment companies to invest overseas—with Hong Kong as the most likely initial recipient of these funds—boosted sentiment regarding China–focused companies. China Shipping Development, one of China's largest shipping companies, rose 54% in the quarter and year to date, in part due to its large valuation gap when compared to its domestic-listed shares. Lenovo Group, China's largest computer company, rose nearly 61% in the quarter and was up 45% for the half year on improved earnings and the continued attention towards high profile Chinese companies. The regional exchanges also continued to drive good returns, with Hong Kong Exchanges and Clearing and Singapore Exch ange both jumping 48% in the second quarter as trading volumes increased in what is largely a fixed cost base business. The Fund's top two performers were two niche Korean industrial companies, Sung Kwang Bend and Taewoong. These recent additions to the Fund rose 141% and 103% respectively, in the quarter. Gains were driven by the strong growth in global infrastructure and construction projects, particularly in the Middle East where Korean companies have a long track record in infrastructure development. For the half year, Sung Kwang Bend was up an impressive 285% and Taewoong reached a 104% gain. We applaud our analyst who covers this region, Jeannie Cheung, for ferreting out these ideas.
The Fund's holdings in Continental Europe and Canada also posted strong results, rising 12% and 17%, respectively, in the quarter. Our long-term strategy of investing in what we believe to be high-quality European industrial stocks continued to pay off. Burckhardt Compression, a Swiss supplier of gas compression pumps, and Hexagon, a Swedish manufacturer of measurement equipment and polymers and the Fund's second largest position at the outset of the quarter, both rose over 40% in the second quarter on continued strong demand for their highly specialized products.
Japanese stocks dominated the list of underperformers. Despite a reasonably strong domestic economy, flat wage growth has lead to lackluster domestic consumption as consumers save rather than spend. Moreover, Japanese savers, attracted by higher yields than they can receive at home, are increasingly investing overseas. This has contributed to yen weakness relative to world currencies, placing a further drag on performance.
The other regions of note were the poorly performing British and Irish markets. After posting strong returns in 2006, these markets have seen a strong pullback thus far in 2007 on concerns over higher interest rates, extended valuations and a deepening financial crisis. Since the beginning of 2007, we have significantly reduced our exposure to these markets, but still have been affected by the overall poor sentiment. As a region, the United Kingdom/Ireland was flat in the second quarter.
International investments involve greater potential risks, including less regulation, currency fluctuations, economic instability and political developments. Investments in small- and mid-cap companies may be subject to greater volatility and price fluctuations because they may be thinly traded and less liquid.
12
Columbia Acorn International (ACINX)
At a Glance
Performance data quoted represents past performance and current performance may be higher or lower. Past performance is no guarantee of future results. The investment return and principal value of an investment in the Fund will fluctuate so that Fund shares, when redeemed, may be worth more or less than their original cost. Performance may reflect any voluntary waivers or reimbursements of Fund expenses by the Adviser or any of its affiliates. Absent these waivers or reimbursement arrangements, performance results may be lower. Visit columbiafunds.com for daily and most recent month-end updates.
Pretax and After-tax Average Annual Total Returns (Class Z)
through June 30, 2007
| Inception 9/23/92 | | Year
to date* | | 1 year | | 5 years | | 10 years | |
| Returns before taxes | | | 14.59 | % | | | 34.91 | % | | | 24.42 | % | | | 13.80 | % | |
Returns after taxes on
distributions | | | 14.39 | | | | 33.01 | | | | 23.81 | | | | 12.67 | | |
Returns after taxes
on distributions and
sale of fund shares | | | 9.60 | | | | 24.79 | | | | 21.68 | | | | 11.82 | | |
S&P/Citigroup EMI
Global ex-US
(pretax) | | | 14.85 | | | | 35.90 | | | | 26.03 | | | | 11.50 | | |
S&P/Citigroup Global
ex-US Cap Range
$500mm-$5bn | | | 15.47 | | | | 35.50 | | | | 26.22 | | | | 11.86 | | |
After-tax returns are calculated using the highest historical individual federal marginal income tax rates, and do not reflect the impact of state and local taxes. Returns after taxes on distributions and sale of Fund shares reflect the additional tax impact of long-term gains or losses realized when Fund shares are sold. The returns are taxed at the maximum rate and assume shares were purchased at the beginning of the period. Actual after-tax returns depend on the investor's tax situation and may differ from those shown. After-tax returns are not relevant to investors who hold their Fund shares through tax-deferred arrangements such as 401(k) plans or individual retirement accounts. After-tax returns are shown for Class Z shares only; after-tax returns for other share classes will vary. Indexes do not reflect any deduction for fees, expenses or taxes.
* Year to date data not annualized.
Columbia Acorn International Portfolio Diversification
as a % of net assets as of 6/30/07

Columbia Acorn International Top 10 Holdings
as a % of net assets as of 6/30/07
| | 1. | | | Fugro (Netherlands)
Oilfield Services | | | 1.6 | % | |
| | 2. | | | Hong Kong Exchanges and Clearing (Hong Kong)
Hong Kong Equity & Derivatives Market Operator | | | 1.4 | % | |
| | 3. | | | Hexagon (Sweden)
Measurement Equipment & Polymers | | | 1.4 | % | |
| | 4. | | | SES Global (France)
Satellite Broadcasting Services | | | 1.2 | % | |
| | 5. | | | Housing Development Finance (India)
Indian Mortgage Lender | | | 1.2 | % | |
| | 6. | | | Atwood Oceanics (United States)
Offshore Drilling Contractor | | | 1.1 | % | |
| | 7. | | | Suzano (Brazil)
Brazilian Pulp & Paper Producer | | | 1.1 | % | |
| | 8. | | | ShawCor (Canada)
Oil & Gas Pipeline Products | | | 1.0 | % | |
| | 9. | | | Kuehne & Nagel (Switzerland)
Freight Forwarding/Logistics | | | 1.0 | % | |
| | 10. | | | China Shipping Development (China)
China's Dominant Shipper for Oil & Coal | | | 1.0 | % | |
The Fund's top 10 holdings and portfolio diversification vary with changes in portfolio investments. See the Statement of Investments for a complete list of the Fund's holdings.
The Growth of a $10,000 Investment in Columbia Acorn International (Class Z)
September 23, 1992 through June 30, 2007
This graph compares the results of $10,000 invested in Columbia Acorn International at inception on September 23, 1992 to the S&P/Citigroup EMI Global ex-US and the S&P/Citigroup Global ex-US Cap Range $500mm-$5bn Index. The indexes are unmanaged and returns for both the indexes and Fund include reinvested dividends and capital gains. It is not possible to invest directly in an index. The graph does not reflect taxes that a shareholder would pay on Fund distributions or on a sale of Fund shares.
Total Net Assets of the Fund:
$5,458.7 million

13
Columbia Acorn USA
In a Nutshell

Robert A. Mohn
Lead Portfolio Manager
Performance data quoted represents past performance and current performance may be lower or higher. Past performance is no guarantee of future results. The investment return and principal value of an investment in the Fund will fluctuate so that shares, when redeemed, may be worth more or less than the original cost. Performance may reflect any voluntary waivers or reimbursements of fund expenses by the Adviser or its affiliates. Absent these waivers, or reimbursement arrangements, performance results may be lower. Please visit columbiafunds.com for daily and most recent month-end performance updates.
Fund's Positions
in Mentioned Holdings
as of 6/30/07
| ITT Educational Services | | | 2.5 | % | |
| FMC Technologies | | | 1.9 | % | |
| Atwood Oceanics | | | 1.5 | % | |
| ESCO Technologies | | | 1.4 | % | |
| Flir Systems | | | 1.2 | % | |
| True Religion Apparel | | | 1.1 | % | |
| Dobson Communications | | | 1.1 | % | |
| II-VI | | | 0.8 | % | |
| J. Crew Group | | | 0.6 | % | |
| Nektar Therapeutics | | | 0.3 | % | |
Portfolio holdings are subject to change periodically and may not be representative of current characteristics and holdings.
Columbia Acorn USA gained 5.81% in the second quarter, outperforming the 4.42% increase of the Russell 2000 Index. The Fund also topped the index year to date through June 30, increasing 9.50% vs. the index's 6.45% gain. A continued underweight in financials contributed to the Fund's outperformance. A victim of deteriorating fundamentals and lingering concerns over credit losses, the financial sector fell 2% in the second quarter and was down more than 6% for the half year in the Russell 2000 Index. Columbia Acorn USA had a 9% weight in financial stocks at quarter end, less than half of the 21% weight in the Russell 2000.
Strong performance of consumer stocks also bolstered the Fund's relative performance. ITT Educational Services, a provider of post-secondary degree programs, was the Fund's leader in the consumer sector and overall. The stock was up 44% for the quarter and 77% year to date on strong student enrollment growth. True Religion Apparel, a maker of high-end denim clothing, gained 25% in the quarter and 33% for the six months on aggressive retail store opening plans. Apparel retailer J. Crew Group was up 35% in the quarter and 40% for the half year thanks to explosive earnings growth of 70% year-over-year.
Other winners included Flir Systems, a manufacturer of infrared cameras. The stock gained 30% in the quarter and was up 45% year to date on news of large contract wins with the U.S. Army. Dobson Communications, a rural cellular service provider, gained 29% in the quarter on speculation that the company would be bought out. On June 29, after the market closed on the last day of the quarter, Dobson did indeed announce they were being acquired by AT&T. For the semiannual period, the stock was up 28%. Atwood Oceanics and FMC Technologies increased due to healthy demand for deep-water drilling contractors (Atwood Oceanics) and oil and gas well head manufacturers (FMC Technologies). Atwood gained 17% in the quarter and was up 40% for the half year while FMC Technologies posted a 14% quarterly gain and 29% year-to-date return.
Laggards included ESCO Technologies, a maker of automated electric meter readers. The stock fell 19% in the quarter and was off 20% for the six months on news of possible changes in a large contract with a California utility. II-VI, a maker of laser components, fell 20% in the quarter due to operational difficulties. Year-to-date the company is showing less than a 3% loss.
Two biotech names also landed in the loser column. The Medicines Company, a maker of cardiovascular drugs, fell 23% in the quarter and was off 39% for the half year as an appeal to extend one of its major drug patents was denied. We sold the stock. Nektar Therapeutics, a provider of drug delivery technologies, fell 27% in the quarter and was off 38% for the six months as sales of the company's inhaleable insulin came in under expectations.
While certain sectors, such as housing, have been under a lot of pressure so far this year, we believe the overall economy remains remarkably healthy. We feel the market is continuing to offer plenty of investment opportunities for discriminating small-cap investors.
Risks include stock market fluctuations due to economic and business developments. Investments in small- and mid-cap companies may be subject to greater volatility and price fluctuations because they may be thinly traded and less liquid.
14
Columbia Acorn USA (AUSAX)
At a Glance
Performance data quoted represents past performance and current performance may be higher or lower. Past performance is no guarantee of future results. The investment return and principal value of an investment in the Fund will fluctuate so that Fund shares, when redeemed, may be worth more or less than their original cost. Performance may reflect any voluntary waivers or reimbursements of Fund expenses by the Adviser or any of its affiliates. Absent these waivers or reimbursement arrangements, performance results may be lower. Visit columbiafunds.com for daily and most recent month-end updates.
Pretax and After-tax Average Annual Total Returns (Class Z)
through June 30, 2007
| Inception 9/4/96 | | Year
to date* | | 1 year | | 5 years | | 10 years | |
| Returns before taxes | | | 9.50 | % | | | 16.03 | % | | | 15.19 | % | | | 12.22 | % | |
Returns after taxes on
distributions | | | 9.36 | | | | 15.58 | | | | 14.89 | | | | 11.50 | | |
Returns after taxes
on distributions and
sale of fund shares | | | 6.37 | | | | 10.98 | | | | 13.34 | | | | 10.57 | | |
| Russell 2000 (pretax) | | | 6.45 | | | | 16.43 | | | | 13.88 | | | | 9.06 | | |
After-tax returns are calculated using the highest historical individual federal marginal income tax rates, and do not reflect the impact of state and local taxes. Returns after taxes on distributions and sale of Fund shares reflect the additional tax impact of long-term gains or losses realized when Fund shares are sold. The returns are taxed at the maximum rate and assume shares were purchased at the beginning of the period. Actual after-tax returns depend on the investor's tax situation and may differ from those shown. After-tax returns are not relevant to investors who hold their Fund shares through tax-deferred arrangements such as 401(k) plans or individual retirement accounts. After-tax returns are shown for Class Z shares only; after-tax returns for other share classes will vary. Indexes do not reflect any deduction for fees, expenses or taxes.
*Year to date data not annualized.
Columbia Acorn USA Portfolio Diversification
as a % of net assets as of 6/30/07

Columbia Acorn USA Top 10 Holdings
as a % of net assets as of 6/30/07
| | 1. | | | ITT Educational Services
Post-secondary Degree Programs | | | 2.5 | % | |
| | 2. | | | Genlyte Group
Commercial Lighting Fixtures | | | 2.2 | % | |
| | 3. | | | Crown Castle International
Communications Towers | | | 2.1 | % | |
| | 4. | | | FMC Technologies
Oil & Gas Well Head Manufacturer | | | 1.9 | % | |
| | 5. | | | Time Warner Telecom
Fiber Optic Telephone/Data Services | | | 1.8 | % | |
| | 6. | | | AmeriCredit
Auto Lending | | | 1.7 | % | |
| | 7. | | | Abercrombie & Fitch
Teen Apparel Retailer | | | 1.7 | % | |
| | 8. | | | Edwards Lifesciences
Heart Valves | | | 1.7 | % | |
| | 9. | | | Oxford Industries
Branded & Private Label Apparel | | | 1.7 | % | |
| | 10. | | | Tellabs
Telecommunications Equipment | | | 1.6 | % | |
The Fund's top 10 holdings and portfolio diversification vary with changes in portfolio investments. See the Statement of Investments for a complete list of the Fund's holdings.
The Growth of a $75,000 Investment in Columbia Acorn USA (Class Z)
September 4, 1996 through June 30, 2007
This graph compares the results of $75,000 invested in Columbia Acorn USA at inception on September 4, 1996 to the Russell 2000 Index. The index is unmanaged and returns for both the index and the Fund include reinvested dividends and capital gains. It is not possible to invest directly in an index. The graph does not reflect taxes that a shareholder would pay on Fund distributions or on a sale of Fund shares.
Total Net Assets of the Fund:
$1,703.5 million

15
Columbia Acorn International Select
In a Nutshell

Christopher J. Olson
Lead Portfolio Manager
Performance data quoted represents past performance and current performance may be lower or higher. Past performance is no guarantee of future results. The investment return and principal value of an investment in the Fund will fluctuate so that shares, when redeemed, may be worth more or less than the original cost. Performance may reflect any voluntary waivers or reimbursements of fund expenses by the Adviser or its affiliates. Absent these waivers, or reimbursement arrangements, performance results may be lower. Please visit columbiafunds.com for daily and most recent month-end performance updates.
Fund's Positions
in Mentioned Holdings
as of 6/30/07
| Nintendo | | | 4.9 | % | |
| Potash Corp. of Saskatchewan | | | 3.2 | % | |
| Hong Kong Exchanges and Clearing | | | 3.2 | % | |
| Hexagon | | | 2.7 | % | |
| Kenedix | | | 2.3 | % | |
| Singapore Exchange | | | 1.8 | % | |
| C&C Group | | | 0.1 | % | |
Portfolio holdings are subject to change periodically and may not be representative of current characteristics and holdings.
Columbia Acorn International Select climbed 7.38% in the second quarter, outpacing the 6.08% gain of the S&P/Citigroup World ex-US Cap Range $2-10B Index. Year to date, the Fund was up 11.80% vs. a 12.04% return for the index.
Japan's Nintendo continued to post strong returns in the second quarter, increasing 27%. For the first six months of the year, the stock was up 49% as sales of its Wii gaming system continue to break records and strong sales of its gaming software followed suit. Canada's Potash Corp. of Saskatchewan, the worlds' largest producer of potash, gained 48% in the quarter and was up 65% for the half year as increasing crop prices bode well for fertilizer prices. Sweden's Hexagon, a manufacturer of measurement equipment and polymers, increased 42% in the quarter and 35% for the six months on strong earnings news.
Increased liquidity and favorable earnings news boosted the performance of Asian markets, excluding Japan. The Fund's equity and derivatives market operators, Hong Kong Exchanges and Clearing and Singapore Exchange, both benefited from increased trading volumes. Hong Kong Exchanges and Clearing increased nearly 48% in the quarter and was up 32% for the half year. Singapore Exchange saw similar gains for the quarter, up 48%, and for the six months the stock was up 76%.
Laggards for the quarter included Kenedix, a Japanese real estate investment management company. The stock fell 27% in the quarter and was off 18% for the first half of the year due to the rise in interest rates in Japan and concerns that the real estate sector would suffer. Banca Italease, an Italian leasing and factoring company, fell 46% in the quarter and was sold out of the Fund as the company seriously misjudged the amount of exposure it had to interest rate derivatives, which could result in a required capital increase for the firm. Last year Irish beverage company C&C Group was a star performer for Columbia Acorn International Select but the stock has cooled in 2007. Company earnings and sales have declined due to increased competition and very poor summer weather. The stock fell 8% in the quarter and was down 21% year to date.
International investments involve greater potential risks, including less regulation, currency fluctuations, economic instability and political developments. Investments in small- and mid-cap companies may be subject to greater volatility and price fluctuations because they may be thinly traded and less liquid.
16
Columbia Acorn International Select (ACFFX)
At a Glance
Performance data quoted represents past performance and current performance may be higher or lower. Past performance is no guarantee of future results. The investment return and principal value of an investment in the Fund will fluctuate so that Fund shares, when redeemed, may be worth more or less than their original cost. Performance may reflect any voluntary waivers or reimbursements of Fund expenses by the Adviser or any of its affiliates. Absent these waivers or reimbursement arrangements, performance results may be lower. Visit columbiafunds.com for daily and most recent month-end updates.
Pretax and After-tax Average Annual Total Returns (Class Z)
through June 30, 2007
| Inception 11/23/98 | | Year
to date* | | 1 year | | 5 years | | Life of fund | |
| Returns before taxes | | | 11.80 | % | | | 35.02 | % | | | 21.96 | % | | | 14.69 | % | |
Returns after taxes on
distributions | | | 11.61 | | | | 34.88 | | | | 21.94 | | | | 14.61 | | |
Returns after taxes
on distributions and
sale of fund shares | | | 7.67 | | | | 22.85 | | | | 19.61 | | | | 13.21 | | |
S&P/Citigroup World ex-US
Cap Range $2-10B (pretax) | | | 12.04 | | | | 29.92 | | | | 22.67 | | | | 13.52 | | |
After-tax returns are calculated using the highest historical individual federal marginal income tax rates, and do not reflect the impact of state and local taxes. Returns after taxes on distributions and sale of Fund shares reflect the additional tax impact of long-term gains or losses realized when Fund shares are sold. The returns are taxed at the maximum rate and assume shares were purchased at the beginning of the period. Actual after-tax returns depend on the investor's tax situation and may differ from those shown. After-tax returns are not relevant to investors who hold their Fund shares through tax-deferred arrangements such as 401(k) plans or individual retirement accounts. After-tax returns are shown for Class Z shares only; after-tax returns for other share classes will vary. Indexes do not reflect any deduction for fees, expenses or taxes.
*Year to date data not annualized.
Columbia Acorn International Select Portfolio Diversification
as a % of net assets as of 6/30/07

Columbia Acorn International Select Top 10 Holdings as a % of net assets as of 6/30/07
| | 1. | | | Nintendo (Japan)
Entertainment Software & Hardware | | | 4.9 | % | |
| | 2. | | | Fugro (Netherlands)
Oilfield Services | | | 3.6 | % | |
| | 3. | | | CRH (Ireland)
Global Building Materials | | | 3.3 | % | |
| | 4. | | | Hong Kong Exchanges and Clearing (Hong Kong)
Hong Kong Equity & Derivatives Market Operator | | | 3.2 | % | |
| | 5. | | | Zumtobel (Austria)
Lighting Systems | | | 3.2 | % | |
| | 6. | | | Potash Corp. of Saskatchewan (Canada)
World's Largest Producer of Potash | | | 3.2 | % | |
| | 7. | | | Atwood Oceanics (United States)
Offshore Drilling Contractor | | | 3.1 | % | |
| | 8. | | | Synthes (Switzerland)
Products for Orthopedic Surgery | | | 3.1 | % | |
| | 9. | | | Smith & Nephew (United Kingdom)
Medical Equipment & Supplies | | | 3.0 | % | |
| | 10. | | | SES Global (France)
Satellite Broadcasting Services | | | 2.9 | % | |
The Fund's top 10 holdings and portfolio diversification vary with changes in portfolio investments. See the Statement of Investments for a complete list of the Fund's holdings.
The Growth of a $10,000 Investment in Columbia Acorn International Select (Class Z)
November 23, 1998 through June 30, 2007
This graph compares the results of $10,000 invested in Columbia Acorn International Select at inception on November 23, 1998 to the S&P/Citigroup World ex-US Cap Range $2-10B Index. The index and Fund returns include reinvested dividends and capital gains. It is not possible to invest directly in an index. The graph does not reflect taxes that a shareholder would pay on Fund distributions or on a sale of Fund shares.
Total Net Assets of the Fund: $222.0 million

17
Columbia Acorn Select
In a Nutshell

Ben Andrews
Lead Portfolio Manager
Performance data quoted represents past performance and current performance may be lower or higher. Past performance is no guarantee of future results. The investment return and principal value of an investment in the Fund will fluctuate so that shares, when redeemed, may be worth more or less than the original cost. Performance may reflect any voluntary waivers or reimbursements of fund expenses by the Adviser or its affiliates. Absent these waivers, or reimbursement arrangements, performance results may be lower. Visit columbiafunds.com for daily and most recent month-end performance updates.
Fund's Positions
in Mentioned Holdings
| as of 6/30/07 | |
| ITT Educational Services | | | 4.8 | % | |
| Liberty Global | | | 4.4 | % | |
| Potash Corp. of Saskatchewan | | | 3.5 | % | |
| Tetra Technologies | | | 1.8 | % | |
| American Commercial Lines | | | 1.7 | % | |
| JB Hunt Transport Services | | | 0.9 | % | |
Portfolio holdings are subject to change periodically and may not be representative of current characteristics and holdings.
Columbia Acorn Select gained 9.12% in the second quarter, ahead of its benchmark, the S&P MidCap 400 Index, which returned 5.84%. The Fund also topped the S&P 500's return of 6.28% in the quarter. Year to date, Columbia Acorn Select was up 16.76% vs. 11.98% for the S&P MidCap 400 and 6.96% for the S&P 500.
The top three drivers of Fund performance were the same this quarter as last quarter: ITT Educational Services, Potash Corp. of Saskatchewan and Liberty Global. All three companies displayed strong fundamentals and their combined return accounted for 4.7% of the Fund's 16.76% return year to date.
We made a few structural adjustments to Columbia Acorn Select during the quarter. The minimum dollar amount to open a new account is now $100,000, up from $50,000, and all retirement plans are now subject to the new minimum. We currently manage about $3.2 billion in assets in Columbia Acorn Select. Cash inflows have been very strong so far this year and we hope to temper this with the higher minimum. At the end of the period, the Fund had 10% of its assets in cash. We are finding ideas to buy, however most are valued at levels that we are willing to pay to build a small position but we don't want to bet the ranch, at least not yet. We do not want to be forced into initiating bigger positions just to accommodate cash inflows. While we don't believe we are reaching capacity with this product in the long run, we would like to be prudent in the short term.
We also increased the number of stocks we are allowed to hold in the Fund. Columbia Acorn Select can now invest in generally 30 to 60 companies (currently we hold 39), an increase from the previous 20 to 40. We still plan on running a select portfolio. Since starting the Fund in 1998, we have had over 40% of our assets in our top 10 names and we don't see this changing. We also slightly increased the percentage of the Fund that we can invest in foreign companies. Currently we have approximately 10% of the Fund's assets invested in international stocks, mostly in the raw materials sector.
We added three stocks to the portfolio during the quarter: American Commercial Lines, JB Hunt Transport Services and Tetra Technologies. We sold out of two positions, Nuveen Investments and Weight Watchers International.
We sold Nuveen one month before it announced it was selling itself to a private equity firm. Our crystal ball was smudged and we did not see the take out coming, but should we have? We sold Nuveen because we were concerned with the direction it was taking with its asset management division. We believe Nuveen was purchased at a much higher price than we sold it at because money has been abundant and private equity can leverage cheap money and pay lofty multiples while infusing little equity. The Nuveen sale prompted me to go back and look at our other sales since I became portfolio manager of the Fund in early 2004. We exited 22 positions and had another three companies taken over for cash during the last three years. Looking back at the reasons we had for selling the positions, we were often right yet many of these stocks trade at higher prices. This exercise reminded us how easily mistakes are forgiven in bull markets; companie s can miss earnings estimates and growth can come in slower than Wall Street originally thought yet share prices can still go up. This is true for portfolio managers as well; most of us are putting up large returns during this period but will we keep these returns when the economy goes slack? When the market does cool, we believe owning the right stocks will be very important and having more structural flexibility within the Fund should help us to preserve capital. Thank you for your continued support of Columbia Acorn Select.
Risks include stock market fluctuations due to economic and business developments. The Fund also has potentially greater price volatility due to the fund's concentration in a limited number of stocks of mid-size companies. The Fund is a non-diversified fund and may, therefore, have a greater risk of loss from a few issuers than a similar fund that invests more broadly. The Fund may not operate as a non-diversified fund at all times. International investments involve greater potential risks, including less regulation, currency fluctuations, economic instability and political developments.
18
Columbia Acorn Select (ACTWX)
At a Glance
Performance data quoted represents past performance and current performance may be higher or lower. Past performance is no guarantee of future results. The investment return and principal value of an investment in the Fund will fluctuate so that Fund shares, when redeemed, may be worth more or less than their original cost. Performance may reflect any voluntary waivers or reimbursements of Fund expenses by the Adviser or any of its affiliates. Absent these waivers or reimbursement arrangements, performance results may be lower. Visit columbiafunds.com for daily and most recent month-end updates.
Pretax and After-tax Average Annual Total Returns (Class Z)
through June 30, 2007
| Inception 11/23/98 | | Year
to date* | | 1 year | | 5 years | | Life of fund | |
| Returns before taxes | | | 16.76 | % | | | 32.54 | % | | | 18.46 | % | | | 16.43 | % | |
Returns after taxes on
distributions | | | 16.58 | | | | 31.98 | | | | 18.12 | | | | 15.91 | | |
Returns after taxes
on distributions and
sale of fund shares | | | 10.97 | | | | 21.62 | | | | 16.24 | | | | 14.56 | | |
| S&P MidCap 400 (pretax) | | | 11.98 | | | | 18.51 | | | | 14.17 | | | | 12.69 | | |
After-tax returns are calculated using the highest historical individual federal marginal income tax rates, and do not reflect the impact of state and local taxes. Returns after taxes on distributions and sale of Fund shares reflect the additional tax impact of long-term gains or losses realized when Fund shares are sold. The returns are taxed at the maximum rate and assume shares were purchased at the beginning of the period. Actual after-tax returns depend on the investor's tax situation and may differ from those shown. After-tax returns are not relevant to investors who hold their Fund shares through tax-deferred arrangements such as 401(k) plans or individual retirement accounts. After-tax returns are shown for Class Z shares only; after-tax returns for other share classes will vary. Indexes do not reflect any deduction for fees, expenses or taxes.
*Year to date data not annualized.
Columbia Acorn Select Portfolio Diversification
as a % of net assets as of 6/30/07

Columbia Acorn Select Top 10 Holdings
as a % of net assets as of 6/30/07
| | 1.
| | | Uranium One (South Africa) (previously UrAsia Energy)
Uranium Mines in South Africa, Kazakhstan,
Australia & the U.S. | | 6.2%
| |
| | 2. | | | ITT Educational Services
Post-secondary Degree Programs | | 4.8% | |
| | 3. | | | Tellabs
Telecommunications Equipment | | 4.6% | |
| | 4. | | | Liberty Global
Cable TV Franchises outside the USA | | 4.4% | |
| | 5. | | | Conseco
Life, Long-term Care & Medical Supplement Insurance | | 4.3% | |
| | 6. | | | Safeway
Supermarkets | | 3.8% | |
| | 7. | | | Abercrombie & Fitch
Teen Apparel Retailer | | 3.8% | |
| | 8. | | | Janus Capital Group
Manages Mutual Funds | | 3.5% | |
| | 9. | | | Potash Corp. of Saskatchewan (Canada)
World's Largest Producer of Potash | | 3.5% | |
| | 10. | | | Expedia
Online Travel Services Company | | 3.2% | |
The Fund's top 10 holdings and portfolio diversification vary with changes in portfolio investments. See the Statement of Investments for a complete list of the Fund's holdings.
The Growth of a $100,000 Investment in Columbia Acorn Select (Class Z)*
November 23, 1998 through June 30, 2007
This graph compares the results of $100,000 invested in Columbia Acorn Select at inception on November 23, 1998 to the S&P MidCap 400. The Index is unmanaged and returns for both the index and the Fund include reinvested dividends and capital gains. It is not possible to invest directly in an index. The graph does not reflect taxes that a shareholder would pay on Fund distributions or on a sale of Fund shares.
Total Net Assets of the Fund:
$3,206.1 million
* The minimum initial investment amount for Columbia Acorn Select was increased to $100,000 on June 25, 2007. Certain exclusions may apply.

19
Columbia Thermostat Fund
In a Nutshell

Charles P. McQuaid
Lead Portfolio Manager
Performance data quoted represents past performance and current performance may be lower or higher. Past performance is no guarantee of future results. The investment return and principal value of an investment in the Fund will fluctuate so that shares, when redeemed, may be worth more or less than the original cost. Performance may reflect any voluntary waivers or reimbursements of fund expenses by the Adviser or its affiliates. Absent these waivers, or reimbursement arrangements, performance results may be lower. Visit columbiafunds.com for daily and most recent month-end performance updates.
A "fund of fund" bears its allocable share of the costs and expenses of the underlying funds in which it invests. Such funds are thus subject to two levels of fees and potentially higher expense ratios than would be associated with a fund that invests and trades directly in financial instruments under the direction of a single manager.
Columbia Thermostat Fund ended the second quarter up 2.07% and posted a 4.43% year-to-date gain. Fund performance, as expected, was between the S&P 500 Index and the Lehman Brothers U.S. Credit Intermediate Bond Index for both time periods (see Page 2 for index data).
Fund returns came in below the 4.96% quarterly gain and 6.79% six-month increase of the Lipper Flexible Portfolio Funds Index. Key to its investment strategy, Columbia Thermostat Fund sells a portion of its stock funds when the S&P 500 goes up and invests more in bonds. Because 2007 has generally been a strong year for equities, Columbia Thermostat Fund has had more of its portfolio in bonds than the average fund in the Lipper Flexible Portfolio Funds Index. This dampened the Fund's relative returns in the first six months of this year. However, if the equity weakness that arose just following the period end persists, Columbia Thermostat Fund's relative performance is likely to improve. Additionally, our approach should automatically ensure that we are buying equities if there is a sustained drop in prices. At the end of the period, the Fund had a 35% exposure to stocks and a 65% exposure to bonds.
As the following table illustrates, the equity portion of the portfolio had impressive gains in the quarter and year to date through June 30, 2007. For the second quarter, the Fund's equity component was up 6.70% and, for the half year, it was up 9.71%. Columbia Acorn Select posted top gains for both time periods, followed by Columbia Acorn International and Columbia Acorn Fund. On the fixed income side, the Fund's income component was down 0.70% for the quarter and gained just 0.75% for the half year.
Results of the Funds Owned in Columbia Thermostat Fund
at June 30, 2007
Equities
Fund | | Weightings
in Category | | 2nd
quarter
returns | | Year-to-date
returns to
6/30/07 | |
| Columbia Acorn Fund | | | 15 | % | | | 6.70 | % | | | 11.55 | % | |
| Columbia Acorn Select | | | 10 | % | | | 9.12 | % | | | 16.76 | % | |
Columbia Marsico
Growth Fund | | | 15 | % | | | 5.34 | % | | | 6.01 | % | |
Columbia Acorn
International | | | 15 | % | | | 8.61 | % | | | 14.59 | % | |
Columbia Dividend
Income Fund | | | 20 | % | | | 5.69 | % | | | 7.88 | % | |
Columbia Large Cap
Enhanced Core Fund | | | 25 | % | | | 6.17 | % | | | 6.60 | % | |
Weighted Average
Equity Return | | | 100 | % | | | 6.70 | % | | | 9.71 | % | |
Fixed Income
Fund | | Weightings
in Category | | 2nd
quarter
returns | | Year-to-date
returns to
6/30/07 | |
Columbia Federal
Securities Fund | | | 30 | % | | | -1.06 | % | | | 0.28 | % | |
Columbia Intermediate
Bond Fund | | | 50 | % | | | -0.52 | % | | | 0.77 | % | |
Columbia Conservative
High Yield Fund | | | 20 | % | | | -0.64 | % | | | 1.42 | % | |
Weighted Average
Income Return | | | 100 | % | | | -0.70 | % | | | 0.75 | % | |
Columbia Thermostat Fund Rebalancing in the Second Quarter
| April 16, 2007: | | 35% stock, 65% bond | |
| May 4, 2007: | | 30% stock, 70% bond | |
| June 8, 2007: | | 35% stock, 65% bond | |
The value of an investment in the Fund is based primarily on the performance of the underlying portfolio funds and the allocation of the Fund's assets among them. An investment in the underlying funds may present certain risks, including stock market fluctuations that occur in response to economic and business developments; and a greater degree of social, political and economic volatility associated with international investing. Small- and mid-cap stocks are often more volatile and less liquid than the stocks of larger companies. Small companies may have a shorter history of operations than larger companies and may have a less diversified product line, making them more susceptible to market pressure. International investments involve greater potential risks, including less regulation, currency fluctuations, economic instability and political developments. Changes in interest rates and changes in the financial strength of issu ers of lower-rated bonds may also affect underlying fund performance. The Fund is also subject to the risk that the investment adviser's decisions regarding asset classes and portfolio funds will not anticipate market trends successfully, resulting in a failure to preserve capital or lower total return. In addition, the Fund may buy and sell shares of the portfolio funds frequently. This may result in higher transaction costs and additional tax liability. This is not an offer of the shares of any other mutual fund mentioned herein.
20
Columbia
Thermostat Fund (COTZX)
At a Glance
Performance data quoted represents past performance and current performance may be higher or lower. Past performance is no guarantee of future results. The investment return and principal value of an investment in the Fund will fluctuate so that Fund shares, when redeemed, may be worth more or less than their original cost. Performance may reflect any voluntary waivers or reimbursements of Fund expenses by the Adviser or any of its affiliates. Absent these waivers or reimbursement arrangements, performance results may be lower. Visit columbiafunds.com for daily and most recent month-end updates.
Pretax and After-tax Average Annual Total Returns (Class Z)
through June 30, 2007
| Inception 9/25/02 | | Year
to date* | | 1 year | | 3 year | | Life of fund | |
| Returns before taxes | | | 4.43 | % | | | 12.88 | % | | | 9.07 | % | | | 11.26 | % | |
Returns after taxes on
distributions | | | 3.87 | | | | 10.33 | | | | 7.03 | | | | 9.84 | | |
Returns after taxes
on distributions and
sale of fund shares | | | 3.32 | | | | 9.62 | | | | 6.96 | | | | 9.21 | | |
| S&P 500 (pretax) | | | 6.96 | | | | 20.59 | | | | 11.68 | | | | 15.68 | | |
Lehman Brothers U.S. Credit
Intermediate Bond Index (pretax) | | | 1.28 | | | | 6.34 | | | | 3.79 | | | | 4.46 | | |
Lipper Flexible Portfolio Funds
Index (pretax) | | | 6.79 | | | | 16.83 | | | | 11.10 | | | | 13.46 | | |
After-tax returns are calculated using the highest historical individual federal marginal income tax rates, and do not reflect the impact of state and local taxes. Returns after taxes on distributions and sale of Fund shares reflect the additional tax impact of long-term gains or losses realized when Fund shares are sold. The returns are taxed at the maximum rate and assume shares were purchased at the beginning of the period. Actual after-tax returns depend on the investor's tax situation and may differ from those shown. After-tax returns are not relevant to investors who hold their Fund shares through tax-deferred arrangements such as 401(k) plans or individual retirement accounts. After-tax returns are shown for Class Z shares only; after-tax returns for other share classes will vary. Indexes do not reflect any deduction for fees, expenses or taxes.
*Year to date data not annualized.
Columbia Thermostat Fund Asset Allocation
as a % of net assets as of 6/30/07

Columbia Thermostat Fund Portfolio Weightings
as a % of assets in each investment category
as of 6/30/07
Stock Mutual Funds
| Columbia Large Cap Enhanced Core Fund | | | 25 | % | |
| Columbia Dividend Income Fund | | | 20 | % | |
| Columbia Acorn Fund | | | 15 | % | |
| Columbia Acorn International | | | 15 | % | |
| Columbia Marsico Growth Fund | | | 15 | % | |
| Columbia Acorn Select | | | 10 | % | |
Bond Mutual Funds
| Columbia Intermediate Bond Fund | | | 50 | % | |
| Columbia Federal Securities Fund | | | 30 | % | |
| Columbia Conservative High Yield Fund | | | 20 | % | |
The Growth of a $10,000 Investment in Columbia Thermostat Fund (Class Z)
September 25, 2002 through June 30, 2007
This graph compares the results of $10,000 invested in Columbia Thermostat Fund at inception on September 25, 2002 to the S&P 500, the Lehman Brothers U.S. Credit Intermediate Bond Index and the Lipper Flexible Portfolio Funds Index. The Indexes are unmanaged and returns for the indexes and the Fund include reinvested dividends and capital gains. It is not possible to invest directly in an index. The graph does not reflect taxes that a shareholder would pay on Fund distributions or on a sale of Fund shares.
Total Net Assets of the Fund:
$180.0 million
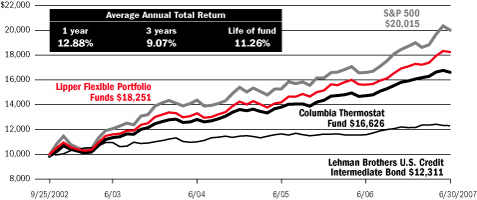
21
Columbia Acorn Fund
Major Portfolio Changes in the Second Quarter (Unaudited)
| | | Number of Shares | |
| | | 03/31/07 | | 06/30/07 | |
| Additions | |
| Information | |
| Blackbaud | | | 0 | | | | 613,000 | | |
| Ciena | | | 0 | | | | 370,000 | | |
| Dolby Laboratories | | | 0 | | | | 250,000 | | |
| Epicor | | | 671,000 | | | | 1,500,000 | | |
| Equinix | | | 190,000 | | | | 225,000 | | |
| Everlight Electronics (Taiwan) | | | 3,198,000 | | | | 6,400,000 | | |
| FARO Technologies | | | 685,000 | | | | 860,000 | | |
| II-VI | | | 2,025,000 | | | | 2,220,000 | | |
| Informa Group (United Kingdom) | | | 0 | | | | 1,300,000 | | |
| IPG Photonics | | | 750,000 | | | | 1,190,000 | | |
| Kenexa | | | 962,000 | | | | 1,200,000 | | |
| MetroPCS Communications | | | 0 | | | | 175,000 | | |
| Microsemi | | | 1,925,000 | | | | 2,250,000 | | |
| Polycom | | | 1,060,000 | | | | 1,250,000 | | |
| Red Hat | | | 0 | | | | 900,000 | | |
| Sanmina-SCI | | | 10,000,000 | | | | 14,522,000 | | |
| Scientific Games | | | 500,000 | | | | 2,000,000 | | |
| Switch & Data Facilities | | | 370,000 | | | | 877,000 | | |
Taylor Nelson Sofres
(United Kingdom) | | | 0 | | | | 2,358,000 | | |
| Tellabs | | | 14,100,000 | | | | 15,380,000 | | |
| TheStreet.com | | | 0 | | | | 1,094,000 | | |
| Time Warner Telecom | | | 4,700,000 | | | | 6,200,000 | | |
| Trimble Navigation | | | 2,900,000 | | | | 3,070,000 | | |
| Industrial Goods & Services | |
| Albany International | | | 234,000 | | | | 700,000 | | |
| American Commercial Lines | | | 0 | | | | 1,900,000 | | |
| American Reprographics | | | 1,500,000 | | | | 2,000,000 | | |
| Cytec Industries | | | 0 | | | | 400,000 | | |
| Donaldson | | | 3,800,000 | | | | 4,000,000 | | |
| Interline Brands | | | 500,000 | | | | 1,000,000 | | |
| Intertek Testing (United Kingdom) | | | 0 | | | | 631,000 | | |
| Kansai Paint (Japan) | | | 0 | | | | 124,000 | | |
| Stork (Netherlands) | | | 0 | | | | 56,492 | | |
| Union Tool (Japan) | | | 44,300 | | | | 360,000 | | |
| Vulcan Materials | | | 0 | | | | 175,000 | | |
| Wavin (Netherlands) | | | 90,000 | | | | 611,460 | | |
| Consumer Goods & Services | |
| Ambassadors Group | | | 0 | | | | 135,000 | | |
| Hansen Natural | | | 850,000 | | | | 1,650,000 | | |
| Herman Miller | | | 2,500,000 | | | | 3,800,000 | | |
| NutriSystem | | | 1,000,000 | | | | 1,120,000 | | |
| Thor Industries | | | 441,000 | | | | 561,000 | | |
| | | Number of Shares | |
| | | 03/31/07 | | 06/30/07 | |
| Finance | |
| BOK Financial | | | 2,605,000 | | | | 2,852,000 | | |
| CAI International | | | 0 | | | | 200,000 | | |
| Conseco | | | 4,000,000 | | | | 5,000,000 | | |
| First Financial Bankshares | | | 286,000 | | | | 386,000 | | |
| HCC Insurance Holdings | | | 3,125,000 | | | | 3,600,000 | | |
| MB Financial | | | 0 | | | | 700,000 | | |
Philadelphia
Consolidated Holding | | | 2,040,000 | | | | 2,390,000 | | |
| TriCo Bancshares | | | 0 | | | | 200,000 | | |
| West Bancorporation | | | 1,049,000 | | | | 1,249,000 | | |
| Energy & Minerals | |
| Carrizo Oil & Gas | | | 0 | | | | 1,100,000 | | |
| Dresser-Rand Group | | | 0 | | | | 552,000 | | |
| Fugro (Netherlands) | | | 3,418,301 | | | | 3,584,037 | | |
| SBM Offshore (Netherlands) | | | 0 | | | | 250,000 | | |
| Tesco | | | 190,000 | | | | 1,044,000 | | |
| Tetra Technologies | | | 1,228,000 | | | | 1,988,000 | | |
| Health Care | |
| Arena Pharmaceuticals | | | 1,179,000 | | | | 1,320,000 | | |
| BioMarin | | | 2,375,000 | | | | 3,940,000 | | |
| Collagenex Pharmaceuticals | | | 1,000,000 | | | | 1,200,000 | | |
| Eresearch Technology | | | 2,600,000 | | | | 3,000,000 | | |
| Healthcare Services Group | | | 0 | | | | 400,000 | | |
| OPG Groep (Netherlands) | | | 270,000 | | | | 1,080,000 | | |
| Pharmacopeia | | | 0 | | | | 825,000 | | |
| QIAGEN | | | 0 | | | | 900,000 | | |
| Seattle Genetics | | | 3,300,000 | | | | 3,720,000 | | |
| Other Industries | |
| Gaylord Entertainment | | | 1,760,000 | | | | 2,000,000 | | |
| Jiangsu Expressway (China) | | | 0 | | | | 6,790,000 | | |
22
| | | Number of Shares | |
| | | 03/31/07 | | 06/30/07 | |
| Sales | |
| Information | |
| Activision | | | 1,000,000 | | | | 750,000 | | |
| Advantech (Taiwan) | | | 9,956,115 | | | | 8,157,000 | | |
| Alltel | | | 1,200,000 | | | | 0 | | |
| Avnet | | | 3,105,000 | | | | 2,490,000 | | |
| Cubic | | | 273,000 | | | | 0 | | |
| Fair Isaac | | | 916,000 | | | | 0 | | |
Gemstar-TV Guide
International | | | 8,000,000 | | | | 0 | | |
| infoUSA | | | 1,450,000 | | | | 800,000 | | |
| Jabil Circuit | | | 1,320,000 | | | | 690,000 | | |
| JDA Software | | | 1,490,000 | | | | 0 | | |
| Kronos | | | 2,750,000 | | | | 0 | | |
Liberty Media
Corp-Interactive | | | 655,000 | | | | 0 | | |
| NAVTEQ | | | 1,400,000 | | | | 1,200,000 | | |
| Openwave Systems | | | 2,500,000 | | | | 1,500,000 | | |
| Seachange International | | | 964,000 | | | | 0 | | |
| SRA International | | | 1,350,000 | | | | 1,050,000 | | |
| Supertex | | | 950,000 | | | | 820,000 | | |
| TALX | | | 865,000 | | | | 0 | | |
| THQ | | | 2,300,000 | | | | 2,000,000 | | |
| WebEx | | | 353,000 | | | | 0 | | |
| Industrial Goods & Services | |
| Gardner Denver | | | 350,000 | | | | 0 | | |
| Grafton Group (Ireland) | | | 1,600,000 | | | | 0 | | |
| K&F Industries | | | 1,712,000 | | | | 0 | | |
| Neopost (France) | | | 140,000 | | | | 112,000 | | |
| Quanta Services | | | 2,500,000 | | | | 2,200,000 | | |
| UTI Worldwide | | | 3,000,000 | | | | 2,700,000 | | |
| Worthington Industries | | | 1,800,000 | | | | 1,500,000 | | |
| Consumer Goods & Services | |
| C&C Group (Ireland) | | | 800,000 | | | | 26,000 | | |
| Central Parking | | | 1,168,000 | | | | 0 | | |
| Ducati Motor (Italy) | | | 5,700,000 | | | | 5,410,390 | | |
Edgars Consolidated
Stores (South Africa) | | | 3,500,000 | | | | 0 | | |
| Fleetwood Enterprises | | | 3,255,000 | | | | 2,500,000 | | |
| HNI | | | 2,550,000 | | | | 2,236,000 | | |
| ITT Educational Services | | | 2,250,000 | | | | 2,000,000 | | |
| Regis | | | 800,000 | | | | 0 | | |
Techtronic Industries
(Hong Kong) | | | 14,999,300 | | | | 0 | | |
| Williams-Sonoma | | | 250,000 | | | | 0 | | |
| Winnebago | | | 540,000 | | | | 390,000 | | |
| | | Number of Shares | |
| | | 03/31/07 | | 06/30/07 | |
| Finance | |
| Anchor Bancorp Wisconsin | | | 1,178,000 | | | | 978,000 | | |
| Anglo Irish Bank (Ireland) | | | 1,800,000 | | | | 0 | | |
| Banca Italease (Italy) | | | 250,000 | | | | 0 | | |
| East West Bancorp | | | 200,000 | | | | 0 | | |
Northern Rock
(United Kingdom) | | | 2,500,000 | | | | 0 | | |
| Nuveen Investments | | | 2,157,000 | | | | 1,303,000 | | |
Paragon Group
(United Kingdom) | | | 1,000,000 | | | | 0 | | |
| RLI | | | 570,000 | | | | 0 | | |
| SY Bancorp | | | 48,000 | | | | 0 | | |
| Energy & Minerals | |
| Key Energy Services | | | 730,000 | | | | 170,000 | | |
| McMoran Exploration | | | 870,000 | | | | 470,000 | | |
| Newpark Resources | | | 310,000 | | | | 0 | | |
| St. Mary Land & Exploration | | | 850,000 | | | | 500,000 | | |
| Vaalco Energy | | | 3,200,000 | | | | 2,750,000 | | |
| Health Care | |
| Cytokinetics | | | 2,000,000 | | | | 0 | | |
| Dendrite International | | | 1,433,000 | | | | 0 | | |
| Nuvelo | | | 1,650,000 | | | | 1,025,000 | | |
| The Medicines Company | | | 600,000 | | | | 0 | | |
| United Surgical Partners | | | 1,150,000 | | | | 0 | | |
| Viasys Healthcare | | | 1,200,000 | | | | 0 | | |
| Other Industries | |
| DiamondRock Hospitality | | | 3,700,000 | | | | 3,500,000 | | |
23
Columbia Acorn Fund
Statement of Investments (Unaudited), June 30, 2007
| Number of Shares | | | | Value (000) | |
| | | | | | | | Equities: 93.6% | | |
| Information 23.6% | | | |
| | | > Business Software 3.3% | |
| | 12,000,000 | | | Novell (a) | | $ | 93,480 | | |
| | | | | Directory, Operating System &
Identity Management Software | | | | | |
| | 1,400,000 | | | Micros Systems (a) | | | 76,160 | | |
| | | | | Information Systems for Restaurants & Hotels | | | | | |
| | 3,300,000 | | | Parametric Technology (a) | | | 71,313 | | |
| | | | | Engineering Software & Services | | | | | |
| | 1,800,000 | | | Avid Technology (a) | | | 63,630 | | |
| | | | | Digital Nonlinear Editing Software & Systems | | | | | |
| | 4,000,000 | | | Informatica (a) | | | 59,080 | | |
| | | | | Enterprise Data Integration Software | | | | | |
| | 2,131,000 | | | Concur Technologies (a)(b) | | | 48,693 | | |
| | | | | Web Enabled Cost &
Expense Management Software | | | | | |
| | 1,200,000 | | | Kenexa (a) | | | 45,252 | | |
| | | | | Recruiting and Workforce Management Solutions | | | | | |
| | 6,000,000 | | | Actuate (a)(b) | | | 40,740 | | |
| | | | | Information Delivery Software & Solutions | | | | | |
| | 1,800,000 | | | Cadence Design Systems (a) | | | 39,528 | | |
| | | | | Electronic Design Automation Software | | | | | |
| | 2,500,000 | | | Radiant Systems (a)(b) | | | 33,100 | | |
| | | | | Point of Sale Systems: Convenient Stores &
Restaurants | | | | | |
| | 3,000,000 | | | Lawson Software (a) | | | 29,670 | | |
| | | | | Enterprise Resource Planning (ERP) Software | | | | | |
| | 3,500,000 | | | Agile Software (a)(b) | | | 28,210 | | |
| | | | | Product Design Software | | | | | |
| | 1,500,000 | | | Epicor (a) | | | 22,305 | | |
| | | | | Software Systems to Run Small Businesses | | | | | |
| | 900,000 | | | Red Hat (a) | | | 20,052 | | |
| | | | | Maintenance & Support for Opensource | | | | | |
| | 613,000 | | | Blackbaud | | | 13,535 | | |
| | | | | Software & Services for Non-Profits | | | | | |
| | 3,500,000 | | | Tumbleweed Communications (a)(b) | | | 8,925 | | |
| | | | | Email Content Security & File Transfer
Management | | | | | |
| | | | 693,673 | | |
| | | > Computer Hardware & Related
Equipment 3.0% | |
| | 3,800,000 | | | Amphenol | | | 135,470 | | |
| | | | | Electronic Connectors | | | | | |
| | 2,090,000 | | | Belden CDT | | | 115,681 | | |
| | | | | Specialty Cable | | | | | |
| | 2,220,000 | | | II-VI (a)(b) | | | 60,317 | | |
| | | | | Laser Components | | | | | |
| | 1,426,000 | | | Nice Systems (Israel) (a) | | | 49,539 | | |
| | | | | Audio & Video Recording Solutions | | | | | |
| | 460,000 | | | Wincor Nixdorf (Germany) | | | 42,636 | | |
| | | | | Retail POS Systems & ATM Machines | | | | | |
| | 860,000 | | | Zebra Technologies (a) | | | 33,316 | | |
| | | | | Bar Code Printers | | | | | |
| | 900,000 | | | Netgear (a) | | | 32,625 | | |
| | | | | Networking Products for Small Business & Home | | | | | |
| | 1,027,000 | | | Avocent (a) | | | 29,793 | | |
| | | | | Computer Control Switches | | | | | |
| | 8,157,000 | | | Advantech (Taiwan) | | | 26,050 | | |
| | | | | Embedded Computers | | | | | |
| Number of Shares | | | | Value (000) | |
| | 620,000 | | | Rogers (a) | | $ | 22,940 | | |
| | | | | PCB Laminates & High-performance Foams | | | | | |
| | 735,000 | | | Excel Technology (a)(b) | | | 20,536 | | |
| | | | | Laser Systems & Electro-optical Components | | | | | |
| | 375,000 | | | Diebold | | | 19,575 | | |
| | | | | Automated Teller Machines | | | | | |
| | 1,310,000 | | | CTS | | | 16,585 | | |
| | | | | Electronic Components, Sensors &
Electronics Manufacturing Solutions | | | | | |
| | 325,000 | | | Stratasys (a) | | | 15,269 | | |
| | | | | Rapid Prototyping Systems | | | | | |
| | 500,000 | | | Intermec (a) | | | 12,655 | | |
| | | | | Bar Code & Wireless LAN Systems | | | | | |
| | 250,000 | | | Dolby Laboratories (a) | | | 8,853 | | |
| | | | | Audio Technology for Consumer Electronics | | | | | |
| | | | 641,840 | | |
| | | > Mobile Communications 2.1% | |
| | 4,500,000 | | | Crown Castle International (a) | | | 163,215 | | |
| | | | | Communications Towers | | | | | |
| | 3,500,000 | | | American Tower (a) | | | 147,000 | | |
| | | | | Communications Towers in USA & Mexico | | | | | |
| | 8,000,000 | | | Dobson Communications (a)(b) | | | 88,880 | | |
| | | | | Rural & Small City Cellular Telephone Services | | | | | |
| | 600,000 | | | Telephone & Data Systems | | | 37,542 | | |
| | | | | Cellular & Wireline Telephone Services | | | | | |
| | 1,500,000 | | | Openwave Systems | | | 9,390 | | |
| | | | | Internet Software for Mobile Devices | | | | | |
| | 600,000 | | | Globalstar (a) | | | 6,210 | | |
| | | | | Satellite Mobile Voice & Data Carrier | | | | | |
| | 175,000 | | | MetroPCS Communications (a) | | | 5,782 | | |
| | | | | Discount Cellular Telephone Services | | | | | |
| | | | 458,019 | | |
| | | > Instrumentation 2.1% | |
| | 2,800,000 | | | Flir Systems (a) | | | 129,500 | | |
| | | | | Infrared Cameras | | | | | |
| | 3,070,000 | | | Trimble Navigation (a) | | | 98,854 | | |
| | | | | GPS-based Instruments | | | | | |
| | 750,000 | | | Mettler Toledo (a) | | | 71,632 | | |
| | | | | Laboratory Equipment | | | | | |
| | 800,000 | | | Varian (a) | | | 43,864 | | |
| | | | | Analytical Instruments | | | | | |
| | 600,000 | | | Dionex (a) | | | 42,594 | | |
| | | | | Ion & Liquid Chromatography | | | | | |
| | 860,000 | | | FARO Technologies (a)(b) | | | 27,400 | | |
| | | | | Precision Measurement Equipment | | | | | |
| | 1,190,000 | | | IPG Photonics (a) | | | 23,741 | | |
| | | | | Fiber Lasers | | | | | |
| | | | 437,585 | | |
| | | > CATV 1.6% | |
| | 4,500,000 | | | Discovery Holding (a) | | | 103,455 | | |
| | | | | CATV Programming | | | | | |
| | 2,050,000 | | | Liberty Global Series C (a) | | | 80,565 | | |
| | 1,500,000 | | | Liberty Global Series A (a) | | | 61,560 | | |
| | | | | Cable TV Franchises Outside the USA | | | | | |
| | 70,000 | | | Jupiter Telecommunications (Japan) (a) | | | 57,722 | | |
| | | | | Largest Cable Service Provider in Japan | | | | | |
| | 130,000 | | | Liberty Media Corp - Capital (a) | | | 15,298 | | |
| | | | | CATV Holding Company | | | | | |
24
| Number of Shares | | | | Value (000) | |
| | | > CATV—continued | |
| | 1,250,000 | | | Mediacom Communications (a) | | $ | 12,113 | | |
| | | | | Cable Television Franchises | | | | | |
| | | | 330,713 | | |
| | | > Semiconductors & Related Equipment 1.5% | |
| | 4,800,000 | | | Integrated Device Technology (a) | | | 73,296 | | |
| | | | | Communications Semiconductors | | | | | |
| | 2,250,000 | | | Microsemi (a) | | | 53,887 | | |
| | | | | Analog/Mixed Signal Semiconductors | | | | | |
| | 4,425,000 | | | Entegris (a) | | | 52,569 | | |
| | | | | Semiconductor Wafer Shipping &
Handling Products | | | | | |
| | 1,270,000 | | | Littelfuse (a)(b) | | | 42,888 | | |
| | | | | Little Fuses | | | | | |
| | 3,257,000 | | | AMIS Holdings (a) | | | 40,777 | | |
| | | | | Mixed-signal Semiconductors | | | | | |
| | 820,000 | | | Supertex (a)(b) | | | 25,699 | | |
| | | | | Mixed-signal Semiconductors | | | | | |
| | 6,400,000 | | | Everlight Electronics (Taiwan) | | | 22,868 | | |
| | | | | A Led Packager | | | | | |
| | 1,905,000 | | | IXYS (a)(b) | | | 15,907 | | |
| | | | | Power Semiconductors | | | | | |
| | | | 327,891 | | |
| | | > Gaming Equipment & Services 1.4% | |
| | 2,750,000 | | | International Game Technology | | | 109,175 | | |
| | | | | Slot Machines & Progressive Slots | | | | | |
| | 3,150,000 | | | Bally Technologies (a)(b) | | | 83,223 | | |
| | | | | Slot Machines & Software | | | | | |
| | 2,000,000 | | | Scientific Games (a) | | | 69,900 | | |
| | | | | Lottery Services Provider | | | | | |
| | 2,430,000 | | | Shuffle Master (a)(b) | | | 40,338 | | |
| | | | | Card Shufflers & Casino Games | | | | | |
| | | | 302,636 | | |
| | | > Internet Related 1.4% | |
| | 3,000,000 | | | ValueClick (a) | | | 88,380 | | |
| | | | | Internet Advertising | | | | | |
| | 9,500,000 | | | SkillSoft (a)(b) | | | 88,255 | | |
| | | | | Web-based Learning Solutions (E-Learning) | | | | | |
| | 4,000,000 | | | CNET Networks (a) | | | 32,760 | | |
| | | | | Internet Advertising on Niche Websites | | | | | |
| | 1,000,000 | | | Sohu.com (China) (a) | | | 31,990 | | |
| | | | | Advertising on Chinese Internet Portal | | | | | |
| | 225,000 | | | Equinix (a) | | | 20,581 | | |
| | | | | Network Neutral Data Centers | | | | | |
| | 877,000 | | | Switch & Data Facilities (a) | | | 16,829 | | |
| | | | | Network Neutral Data Centers | | | | | |
| | 1,094,000 | | | TheStreet.com | | | 11,903 | | |
| | | | | Financial Information Website Publisher | | | | | |
| | | | 290,698 | | |
| | | > Financial Processors 1.1% | |
| | 2,774,000 | | | Global Payments | | | 109,989 | | |
| | | | | Credit Card Processor | | | | | |
| | 6,500,000 | | | Hong Kong Exchanges and Clearing
(Hong Kong) | | | 91,966 | | |
| | | | | Hong Kong Equity & Derivatives
Market Operator | | | | | |
| | 5,000,000 | | | Singapore Exchange (Singapore) | | | 31,933 | | |
| | | | | Singapore Equity & Derivatives Market Operator | | | | | |
| | | | 233,888 | | |
| Number of Shares | | | | Value (000) | |
| | | > Telecommunications Equipment 1.1% | |
| | 15,380,000 | | | Tellabs (a) | | $ | 165,489 | | |
| | | | | Telecommunications Equipment | | | | | |
| | 1,250,000 | | | Polycom (a) | | | 42,000 | | |
| | | | | Video Conferencing Equipment | | | | | |
| | 370,000 | | | Ciena (a) | | | 13,368 | | |
| | | | | Optical Transport & Broadband
Access Equipment | | | | | |
| | 1,510,000 | | | Symmetricom (a) | | | 12,684 | | |
| | | | | Network Timing & Synchronization Devices | | | | | |
| | | | 233,541 | | |
| | | > Business Information & Marketing
Services 1.1% | |
| | 3,460,000 | | | Ceridian (a) | | | 121,100 | | |
| | | | | HR Services & Payment Processing | | | | | |
| | 2,300,000 | | | Navigant Consulting (a) | | | 42,688 | | |
| | | | | Financial Consulting Firm | | | | | |
| | 2,000,000 | | | ProQuest (b) | | | 19,080 | | |
| | | | | Education Services for the K-12 Market | | | | | |
| | 420,000 | | | FTI Consulting (a) | | | 15,973 | | |
| | | | | Financial Consulting Firm | | | | | |
| | 250,000 | | | Getty Images (a) | | | 11,952 | | |
| | | | | Photographs for Publications & Electronic Media | | | | | |
| | 2,358,000 | | | Taylor Nelson Sofres (United Kingdom) | | | 11,152 | | |
| | | | | Market Research | | | | | |
| | 800,000 | | | infoUSA | | | 8,176 | | |
| | | | | Business Data for Sales Leads | | | | | |
| | | | 230,121 | | |
| | | > Telephone Services 0.9% | |
| | 6,200,000 | | | Time Warner Telecom (a) | | | 124,620 | | |
| | | | | Fiber Optic Telephone/Data Services | | | | | |
| | 1,300,000 | | | Cogent Communications (a) | | | 38,831 | | |
| | | | | Internet Data Pipelines | | | | | |
| | 1,400,000 | | | Windstream | | | 20,664 | | |
| | | | | Rural Telephone Franchises | | | | | |
| | | | 184,115 | | |
| | | > Electronics Distribution 0.5% | |
| | 2,490,000 | | | Avnet (a) | | | 98,704 | | |
| | | | | Electronic Components Distribution | | | | | |
| | 710,000 | | | Agilysys | | | 15,975 | | |
| | | | | IT Distributor | | | | | |
| | | | 114,679 | | |
| | | > Contract Manufacturing 0.4% | |
| | 14,522,000 | | | Sanmina-SCI (a) | | | 45,454 | | |
| | | | | Electronic Manufacturing Services | | | | | |
| | 1,020,000 | | | Plexus (a) | | | 23,450 | | |
| | | | | Electronic Manufacturing Services | | | | | |
| | 690,000 | | | Jabil Circuit | | | 15,228 | | |
| | | | | Electronic Manufacturing Services | | | | | |
| | | | 84,132 | | |
| | | > Computer Services 0.4% | |
| | 5,000,000 | | | iGate (a)(b) | | | 40,100 | | |
| | | | | IT & Business Process Outsourcing Services | | | | | |
| | 1,050,000 | | | SRA International (a) | | | 26,523 | | |
| | | | | Government IT Services | | | | | |
| | 4,600,000 | | | AnswerThink (a)(b) | | | 16,652 | | |
| | | | | IT Integration & Best Practice Research | | | | | |
| | | | 83,275 | | |
25
Columbia Acorn Fund
Statement of Investments (Unaudited), continued
| Number of Shares | | | | Value (000) | |
| | | > Consumer Software 0.3% | |
| | 2,000,000 | | | THQ (a) | | $ | 61,040 | | |
| | | | | Entertainment Software | | | | | |
| | 750,000 | | | Activision (a) | | | 14,002 | | |
| | | | | Entertainment Software | | | | | |
| | | | 75,042 | | |
| | | > Television Programming 0.3% | |
| | 4,000,000 | | | Lions Gate Entertainment (a) | | | 44,120 | | |
| | | | | Film & TV Studio | | | | | |
| | 433,900 | | | Alliance Atlantis Communication
(Canada) (a) | | | 21,299 | | |
| | | | | CATV Channels, TV/Movie Production/
Distribution | | | | | |
| | | | 65,419 | | |
| | | > Publishing 0.3% | |
| | 1,200,000 | | | NAVTEQ (a) | | | 50,808 | | |
| | | | | Map Data for Electronic Devices | | | | | |
| | 1,300,000 | | | Informa Group (United Kingdom) | | | 14,451 | | |
| | | | | Global Publisher & Event Organizer | | | | | |
| | | | 65,259 | | |
| | | > Satellite Broadcasting & Services 0.3% | |
| | 2,755,000 | | | SES Global (France) | | | 59,384 | | |
| | | | | Satellite Broadcasting Services | | | | | |
| | | | 59,384 | | |
| | | > Radio 0.3% | |
| | 1,541,000 | | | Salem Communications (b) | | | 17,090 | | |
| | | | | Radio Stations for Religious Programming | | | | | |
| | 1,500,000 | | | Cumulus Media (a) | | | 14,025 | | |
| | | | | Radio Stations in Small Cities | | | | | |
| | 1,400,000 | | | Saga Communications (a)(b) | | | 13,720 | | |
| | | | | Radio Stations in Small- & Mid- Sized Cities | | | | | |
| | 2,400,000 | | | Spanish Broadcasting System (a)(b) | | | 10,320 | | |
| | | | | Spanish Language Radio Stations | | | | | |
| | | | 55,155 | | |
| | | > TV Broadcasting 0.2% | |
| | 2,500,000 | | | Entravision Communications (a) | | | 26,075 | | |
| | | | | Spanish Language TV, Radio & Outdoor | | | | | |
| | 1,750,000 | | | Gray Television | | | 16,222 | | |
| | | | | Mid Market Affiliated TV Stations | | | | | |
| | | | 42,297 | | |
| Information: Total | | | 5,009,362 | | |
| Industrial Goods & Services 18.1% | | | |
| | | > Machinery 5.5% | |
| | 5,000,000 | | | Ametek | | | 198,400 | | |
| | | | | Aerospace/Industrial Instruments | | | | | |
| | 4,000,000 | | | Donaldson (b) | | | 142,200 | | |
| | | | | Industrial Air Filtration | | | | | |
| | 3,500,000 | | | Clarcor (b) | | | 131,005 | | |
| | | | | Mobile & Industrial Filters | | | | | |
| | 2,850,000 | | | Pentair | | | 109,924 | | |
| | | | | Pumps & Water Treatment | | | | | |
| | 2,300,000 | | | Pall | | | 105,777 | | |
| | | | | Filtration & Fluids Clarification | | | | | |
| | 1,900,000 | | | Mine Safety Appliances (b) | | | 83,144 | | |
| | | | | Safety Equipment | | | | | |
| Number of Shares | | | | Value (000) | |
| | 2,200,000 | | | ESCO Technologies (b) | | $ | 79,772 | | |
| | | | | Automatic Electric Meter Readers | | | | | |
| | 1,300,000 | | | Kaydon | | | 67,756 | | |
| | | | | Specialized Friction & Motion Control Products | | | | | |
| | 750,000 | | | Armor Holdings (a) | | | 65,153 | | |
| | | | | Military Trucks, Armor & Helmets | | | | | |
| | 1,250,000 | | | Nordson | | | 62,700 | | |
| | | | | Dispensing Systems for Adhesives & Coatings | | | | | |
| | 833,000 | | | Toro | | | 49,055 | | |
| | | | | Turf Maintenance Equipment | | | | | |
| | 2,100,000 | | | Goodman Global (a) | | | 46,662 | | |
| | | | | HVAC Equipment Manufacturer | | | | | |
| | 112,000 | | | Neopost (France) | | | 16,380 | | |
| | | | | Postage Meter Machines | | | | | |
| | 360,000 | | | Union Tool (Japan) | | | 13,299 | | |
| | | | | Precision Drill Bit Manufacturer | | | | | |
| | | | 1,171,227 | | |
| | | > Other Industrial Services 3.1% | |
| | 5,500,000 | | | Expeditors International of
Washington | | | 227,150 | | |
| | | | | International Freight Forwarder | | | | | |
| | 2,700,000 | | | UTI Worldwide | | | 72,333 | | |
| | | | | Global Logistics & Freight Forwarding | | | | | |
| | 1,900,000 | | | Forward Air (b) | | | 64,771 | | |
| | | | | Freight Transportation Between Airports | | | | | |
| | 2,000,000 | | | American Reprographics (a) | | | 61,580 | | |
| | | | | Document Management & Logistics | | | | | |
| | 1,750,000 | | | Mobile Mini (a) | | | 51,100 | | |
| | | | | Portable Storage Units Leasing | | | | | |
| | 1,900,000 | | | American Commercial Lines (a) | | | 49,495 | | |
| | | | | Operator of Inland Barges/Builder of
Inland Barges | | | | | |
| | 2,000,000 | | | Labor Ready (a) | | | 46,220 | | |
| | | | | Temporary Manual Labor | | | | | |
| | 374,000 | | | Imtech (Netherlands) | | | 32,444 | | |
| | | | | Engineering & Technical Services | | | | | |
| | 600,000 | | | G&K Services | | | 23,706 | | |
| | | | | Uniform Rental | | | | | |
| | 655,000 | | | TAL International Group | | | 19,460 | | |
| | | | | Intermodal Freight Containers Leasing | | | | | |
| | 631,000 | | | Intertek Testing (United Kingdom) | | | 12,371 | | |
| | | | | Testing, Inspection, Certification Services | | | | | |
| | | | 660,630 | | |
| | | > Construction 1.9% | |
| | 1,900,000 | | | Florida Rock | | | 128,250 | | |
| | | | | Aggregates & Concrete | | | | | |
| | 650,000 | | | Martin Marietta Materials | | | 105,313 | | |
| | | | | Aggregates | | | | | |
| | 2,200,000 | | | Simpson Manufacturing | | | 74,228 | | |
| | | | | Wall Joint Maker | | | | | |
| | 300,000 | | | Geberit (Switzerland) | | | 51,187 | | |
| | | | | Plumbing Supplies | | | | | |
| | 175,000 | | | Vulcan Materials | | | 20,044 | | |
| | | | | Aggregates, Concrete & Asphalt | | | | | |
| | 700,000 | | | Kingspan Group (Ireland) | | | 19,575 | | |
| | | | | Building Insulation &
Environmental Containers | | | | | |
| | | | 398,597 | | |
26
| Number of Shares | | | | Value (000) | |
| | | > Industrial Materials & Specialty
Chemicals 1.7% | |
| | 590,000 | | | Novozymes (Denmark) | | $ | 68,394 | | |
| | | | | Industrial Enzymes | | | | | |
| | 28,000 | | | Sika (Switzerland) | | | 57,146 | | |
| | | | | Chemicals for Construction & Industrial
Applications | | | | | |
| | 2,000,000 | | | Spartech (b) | | | 53,100 | | |
| | | | | Plastics Distribution & Compounding | | | | | |
| | 1,228,000 | | | Drew Industries (a)(b) | | | 40,696 | | |
| | | | | RV & Manufactured Home Components | | | | | |
| | 195,000 | | | Sociedad Quimica y
Minera de Chile (Chile) | | | 33,548 | | |
| | | | | Producer of Specialty Fertilizers, Lithium, &
Iodine | | | | | |
| | 400,000 | | | Carbone Lorraine (France) | | | 31,042 | | |
| | | | | Advanced Industrial Materials | | | | | |
| | 700,000 | | | Albany International | | | 28,308 | | |
| | | | | Paper Machine Clothing and Advanced Textiles | | | | | |
| | 400,000 | | | Cytec Industries | | | 25,508 | | |
| | | | | Aerospace Composites & Specialty Chemical | | | | | |
| | 441,384 | | | Koninklijke TenCate (Netherlands) | | | 16,895 | | |
| | | | | Advanced Textiles & Industrial Fabrics | | | | | |
| | 611,460 | | | Wavin (Netherlands) | | | 14,709 | | |
| | | | | Largest European Plastic Pipe Systems Company | | | | | |
| | 124,000 | | | Kansai Paint (Japan) | | | 1,083 | | |
| | | | | Paint Producer in Japan, India, China &
Southeast Asia | | | | | |
| | | | 370,429 | | |
| | | > Industrial Distribution 1.7% | |
| | 2,375,000 | | | Watsco (b) | | | 129,200 | | |
| | | | | HVAC Distribution | | | | | |
| | 1,300,000 | | | WW Grainger | | | 120,965 | | |
| | | | | Industrial Distribution | | | | | |
| | 1,925,000 | | | Airgas | | | 92,207 | | |
| | | | | Industrial Gas Distributor | | | | | |
| | 1,000,000 | | | Interline Brands (a) | | | 26,080 | | |
| | | | | Industrial Distribution | | | | | |
| | | | 368,452 | | |
| | | > Electrical Components 1.3% | |
| | 2,600,000 | | | Genlyte Group (a)(b) | | | 204,204 | | |
| | | | | Commercial Lighting Fixtures | | | | | |
| | 700,000 | | | Legrand (France) | | | 25,191 | | |
| | | | | Electrical Components | | | | | |
| | 1,125,000 | | | Ushio (Japan) | | | 24,927 | | |
| | | | | Industrial Light Sources | | | | | |
| | 500,000 | | | Zumtobel (Austria) (a) | | | 18,651 | | |
| | | | | Lighting Systems | | | | | |
| | | | 272,973 | | |
| | | > Conglomerates 1.0% | |
| | 4,845,000 | | | Hexagon (Sweden) | | | 92,916 | | |
| | | | | Measurement Equipment & Polymers | | | | | |
| | 2,758,309 | | | Aalberts Industries (Netherlands) | | | 75,736 | | |
| | | | | Flow Control & Heat Treatment | | | | | |
| | 600,000 | | | Ibiden (Japan) | | | 38,634 | | |
| | | | | Electronic Parts & Ceramics | | | | | |
| | 56,492 | | | Stork (Netherlands) | | | 3,667 | | |
| | | | | Industrial Services & Food Processing Equipment | | | | | |
| | | | 210,953 | | |
| Number of Shares | | | | Value (000) | |
| | | > Outsourcing Services 0.8% | |
| | 2,200,000 | | | Quanta Services (a) | | $ | 67,474 | | |
| | | | | Electrical & Telecom Construction Services | | | | | |
| | 1,900,000 | | | Administaff (b) | | | 63,631 | | |
| | | | | Professional Employer Organization | | | | | |
| | 817,021 | | | USG People (Netherlands) | | | 38,383 | | |
| | | | | Temporary Staffing Services | | | | | |
| | 600,000 | | | GP Strategies (a) | | | 6,528 | | |
| | | | | Training Programs | | | | | |
| | | | 176,016 | | |
| | | > Steel 0.7% | |
| | 2,860,000 | | | Gibraltar Industries (b) | | | 63,349 | | |
| | | | | Steel Processing & Building Products | | | | | |
| | 135,000 | | | Vallourec (France) | | | 43,143 | | |
| | | | | Oil, Gas & Industrial Seamless Tubes | | | | | |
| | 1,500,000 | | | Worthington Industries | | | 32,475 | | |
| | | | | Steel Processing & Manufactured Metal
Products | | | | | |
| | | | 138,967 | | |
| | | > Waste Management 0.4% | |
| | 2,550,000 | | | Waste Connections (a) | | | 77,112 | | |
| | | | | Solid Waste Management | | | | | |
| | | | 77,112 | | |
| Industrial Goods & Services: Total | | | 3,845,356 | | |
| Consumer Goods & Services 18.1% | | | |
| | | > Retail 4.1% | |
| | 3,140,000 | | | Abercrombie & Fitch | | | 229,157 | | |
| | | | | Teen Apparel Retailer | | | | | |
| | 9,130,000 | | | Chico's FAS (a)(b) | | | 222,224 | | |
| | | | | Women's Specialty Retailer | | | | | |
| | 4,600,000 | | | Urban Outfitters (a) | | | 110,538 | | |
| | | | | Apparel & Home Specialty Retailer | | | | | |
| | 1,975,000 | | | J Crew Group (a) | | | 106,828 | | |
| | | | | Multi-channel Branded Retailer | | | | | |
| | 3,743,000 | | | Christopher & Banks (b) | | | 64,192 | | |
| | | | | Women's Apparel Retailer | | | | | |
| | 1,223,000 | | | AnnTaylor Stores (a) | | | 43,319 | | |
| | | | | Women's Apparel Retailer | | | | | |
| | 1,954,600 | | | RONA (Canada) (a) | | | 40,826 | | |
| | | | | Leading Canadian Do-it-yourself Retailer | | | | | |
| | 775,000 | | | Genesco (a) | | | 40,540 | | |
| | | | | Multi-concept Branded Footwear Retailer | | | | | |
| | 1,200,000 | | | Gaiam (a)(b) | | | 21,876 | | |
| | | | | Healthy Living Catalogs & E-commerce | | | | | |
| | | | 879,500 | | |
| | | > Other Consumer Services 2.5% | |
| | 2,000,000 | | | ITT Educational Services (a) | | | 234,760 | | |
| | | | | Post-secondary Degree Programs | | | | | |
| | 5,400,000 | | | ServiceMaster | | | 83,484 | | |
| | | | | Lawn Care, Pest Control, Commercial
Disaster Responce | | | | | |
| | 1,120,000 | | | NutriSystem (a) | | | 78,221 | | |
| | | | | Weight Loss Programs | | | | | |
| | 1,275,000 | | | Weight Watchers International | | | 64,821 | | |
| | | | | Weight Loss Programs | | | | | |
| | 1,500,000 | | | Universal Technical Institute (a)(b) | | | 38,085 | | |
| | | | | Vocational Training | | | | | |
27
Columbia Acorn Fund
Statement of Investments (Unaudited), continued
| Number of Shares | | | | Value (000) | |
| | | > Other Consumer Services—continued | |
| | 110,000 | | | Pierre & Vacances (France) | | $ | 16,782 | | |
| | | | | Vacation Apartment Lets | | | | | |
| | 2,550,000 | | | Princeton Review (a)(b) | | | 12,189 | | |
| | | | | College Preparation Courses | | | | | |
| | 100,000 | | | Lincoln Technical Institute (a) | | | 1,486 | | |
| | | | | Vocational Training | | | | | |
| | | | 529,828 | | |
| | | > Apparel 2.5% | |
| | 7,330,000 | | | Coach (a) | | | 347,369 | | |
| | | | | Designer & Retailer of Branded Leather
Accessories | | | | | |
| | 1,069,000 | | | Oxford Industries (b) | | | 47,399 | | |
| | | | | Branded & Private Label Apparel | | | | | |
| | 1,818,000 | | | Carter's (a) | | | 47,159 | | |
| | | | | Children's Branded Apparel | | | | | |
| | 3,000,000 | | | Billabong International (Australia) | | | 45,426 | | |
| | | | | Action Sports Apparel Brand Manager | | | | | |
| | 900,000 | | | True Religion Apparel (a) | | | 18,297 | | |
| | | | | Premium Denim | | | | | |
| | 600,000 | | | Heelys (a) | | | 15,516 | | |
| | | | | Wheeled Footwear | | | | | |
| | | | 521,166 | | |
| | | > Leisure Products 1.7% | |
| | 1,500,000 | | | Harley-Davidson | | | 89,415 | | |
| | | | | Motorcycles & Related Merchandise | | | | | |
| | 1,416,000 | | | Speedway Motorsports | | | 56,612 | | |
| | | | | Motorsport Racetrack Owner & Operator | | | | | |
| | 1,025,000 | | | International Speedway | | | 54,028 | | |
| | | | | Largest Motorsports Racetrack Owner & Operator | | | | | |
| | 900,000 | | | Polaris Industries | | | 48,744 | | |
| | | | | Leisure Vehicles & Related Products | | | | | |
| | 1,032,000 | | | RC2 (a) | | | 41,290 | | |
| | | | | Toys, Infant Products & Collectibles | | | | | |
| | 561,000 | | | Thor Industries | | | 25,323 | | |
| | | | | RV & Bus Manufacturer | | | | | |
| | 2,500,000 | | | Fleetwood Enterprises (a) | | | 22,625 | | |
| | | | | RV & Manufactured Home Maker | | | | | |
| | 390,000 | | | Winnebago | | | 11,513 | | |
| | | | | Premier Motorhome Maker | | | | | |
| | | | 349,550 | | |
| | | > Nondurables 1.6% | |
| | 2,860,000 | | | Scotts Miracle-Gro | | | 122,808 | | |
| | | | | Consumer Lawn & Garden Products | | | | | |
| | 2,060,000 | | | Jarden (a) | | | 88,601 | | |
| | | | | Branded Household Products | | | | | |
| | 1,010,000 | | | Chattem (a)(b) | | | 64,014 | | |
| | | | | Personal Care Products | | | | | |
| | 1,800,000 | | | Helen of Troy (a)(b) | | | 48,600 | | |
| | | | | Hair Dryers & Curling Irons | | | | | |
| | 1,100,000 | | | Natura Cosmeticos (Brazil) | | | 15,967 | | |
| | | | | Direct Retailer of Cosmetics | | | | | |
| | | | 339,990 | | |
| | | > Furniture & Textiles 1.4% | |
| | 3,800,000 | | | Herman Miller (b) | | | 120,080 | | |
| | | | | Office Furniture | | | | | |
| | 2,236,000 | | | HNI | | | 91,676 | | |
| | | | | Office Furniture & Fireplaces | | | | | |
| Number of Shares | | | | Value (000) | |
| | 1,818,000 | | | Knoll | | $ | 40,723 | | |
| | | | | Office Furniture | | | | | |
| | 3,144,000 | | | Nobia (Sweden) | | | 39,129 | | |
| | | | | Kitchen Cabinet Manufacturing & Distribution | | | | | |
| | | | 291,608 | | |
| | | > Travel 1.3% | |
| | 2,390,000 | | | Vail Resorts (a)(b) | | | 145,479 | | |
| | | | | Ski Resort Operator & Developer | | | | | |
| | 4,000,000 | | | Expedia (a) | | | 117,160 | | |
| | | | | Online Travel Services Company | | | | | |
| | 425,000 | | | Choice Hotels | | | 16,796 | | |
| | | | | Franchisor of Budget Hotel Brands | | | | | |
| | 135,000 | | | Ambassadors Group | | | 4,797 | | |
| | | | | Educational Student Travel Services | | | | | |
| | | | 284,232 | | |
| | | > Casinos & Gaming 1.2% | |
| | 1,700,000 | | | Penn National Gaming (a) | | | 102,153 | | |
| | | | | Regional Casino Operator | | | | | |
| | 3,200,000 | | | Pinnacle Entertainment (a)(b) | | | 90,080 | | |
| | | | | Regional Casino Operator | | | | | |
| | 400,000 | | | Station Casinos | | | 34,720 | | |
| | | | | Las Vegas Locals Casinos | | | | | |
| | 690,000 | | | Intralot (Greece) | | | 22,228 | | |
| | | | | Lottery & Gaming Systems & Services | | | | | |
| | 226,000 | | | Lakes Entertainment (a) | | | 2,669 | | |
| | | | | Native American Casinos Development | | | | | |
| | | | 251,850 | | |
| | | > Restaurants 0.7% | |
| | 2,145,000 | | | Sonic (a) | | | 47,447 | | |
| | | | | Quick Service Restaurant | | | | | |
| | 1,000,000 | | | Red Robin Gourmet Burgers (a)(b) | | | 40,370 | | |
| | | | | Casual Dining Restaurant | | | | | |
| | 1,150,000 | | | Cheesecake Factory (a) | | | 28,198 | | |
| | | | | Casual Dining Restaurants | | | | | |
| | 1,600,000 | | | AFC Enterprises (a)(b) | | | 27,664 | | |
| | | | | Popeyes Restaurants | | | | | |
| | | | 143,679 | | |
| | | > Consumer Goods Distribution 0.5% | |
| | 2,890,000 | | | Pool (b) | | | 112,797 | | |
| | | | | Distributor of Swimming Pool Supplies &
Equipment | | | | | |
| | | | 112,797 | | |
| | | > Food & Beverage 0.4% | |
| | 1,650,000 | | | Hansen Natural (a) | | | 70,917 | | |
| | | | | Alternative Beverages | | | | | |
| | 1,000,000 | | | IAWS Group (Ireland) | | | 20,947 | | |
| | | | | Baked Goods | | | | | |
| | 26,000 | | | C&C Group (Ireland) | | | 349 | | |
| | | | | Beverage Company | | | | | |
| | | | 92,213 | | |
| | | > Other Durable Goods 0.1% | |
| | 5,410,390 | | | Ducati Motor (Italy) (a) | | | 13,169 | | |
| | | | | Motorcycles & Related Merchandise | | | | | |
| | 900,000 | | | Champion Enterprises (a) | | | 8,847 | | |
| | | | | Manufactured Homes | | | | | |
| | 172,000 | | | Cavco Industries (a) | | | 6,453 | | |
| | | | | Higher End Manufactured Homes | | | | | |
| | | | 28,469 | | |
28
| Number of Shares | | | | Value (000) | |
| | | > Cruise Lines 0.1% | |
| | 400,000 | | | Carnival | | $ | 19,508 | | |
| | | | | Largest Cruise Line | | | | | |
| | | | 19,508 | | |
| Consumer Goods & Services: Total | | | 3,844,390 | | |
| Finance 12.3% | | | |
| | | > Insurance 3.9% | |
| | 3,600,000 | | | HCC Insurance Holdings | | | 120,276 | | |
| | | | | Specialty Insurance | | | | | |
| | 5,000,000 | | | Conseco (a) | | | 104,450 | | |
| | | | | Life, Long Term Care, & Medical Supplement
Insurance | | | | | |
| | 2,390,000 | | | Philadelphia Consolidated Holding (a) | | | 99,902 | | |
| | | | | Specialty Insurance | | | | | |
| | 149,000 | | | Markel (a) | | | 72,199 | | |
| | | | | Specialty Insurance | | | | | |
| | 1,200,000 | | | Assurant | | | 70,704 | | |
| | | | | Specialty Insurance | | | | | |
| | 1,748,000 | | | Leucadia National | | | 61,617 | | |
| | | | | Insurance Holding Company | | | | | |
| | 995,000 | | | Protective Life | | | 47,571 | | |
| | | | | Life Insurance | | | | | |
| | 1,000,000 | | | Endurance Specialty Holdings | | | 40,040 | | |
| | | | | Commercial Lines Insurance/Reinsurance | | | | | |
| | 740,000 | | | Stancorp Financial Group | | | 38,835 | | |
| | | | | Group Life & Disability Insurance | | | | | |
| | 1,550,000 | | | United America Indemnity (a)(b) | | | 38,548 | | |
| | | | | Specialty Insurance | | | | | |
| | 1,420,000 | | | Selective Insurance Group | | | 38,170 | | |
| | | | | Commercial & Personal Lines Insurance | | | | | |
| | 750,000 | | | Delphi Financial Group | | | 31,365 | | |
| | | | | Group Employee Benefit Products & Services | | | | | |
| | 1,000,000 | | | Aspen Insurance | | | 28,070 | | |
| | | | | Commercial Lines Insurance/Reinsurance | | | | | |
| | 600,000 | | | National Financial Partners | | | 27,786 | | |
| | | | | Distributor of Life Insurance, Group
Benefits & Investment Advisory Services | | | | | |
| | 280,000 | | | April Group (France) | | | 14,750 | | |
| | | | | Insurance Policy Construction | | | | | |
| | | | 834,283 | | |
| | | > Banks 3.0% | |
| | 2,852,000 | | | BOK Financial | | | 152,354 | | |
| | | | | Tulsa Based S.W. Bank | | | | | |
| | 3,450,000 | | | Associated Banc-Corp | | | 112,815 | | |
| | | | | Midwest Bank | | | | | |
| | 3,156,000 | | | TCF Financial | | | 87,737 | | |
| | | | | Great Lakes Bank | | | | | |
| | 4,080,000 | | | Glacier Bancorp (b) | | | 83,028 | | |
| | | | | Mountain States Bank | | | | | |
| | 1,222,000 | | | Chittenden | | | 42,709 | | |
| | | | | New England Bank | | | | | |
| | 1,320,000 | | | West Coast Bancorp (b) | | | 40,115 | | |
| | | | | Portland Small Business Bank | | | | | |
| | 700,000 | | | MB Financial | | | 24,318 | | |
| | | | | Chicago Bank | | | | | |
| | 1,249,000 | | | West Bancorporation (b) | | | 19,946 | | |
| | | | | Des Moines Commercial Bank | | | | | |
| Number of Shares | | | | Value (000) | |
| | 1,000,000 | | | Depfa Bank (Ireland) | | $ | 17,706 | | |
| | | | | Investment Banker to Public Authorities | | | | | |
| | 636,000 | | | Great Southern Bancorp | | | 17,204 | | |
| | | | | Missouri Real Estate Lender | | | | | |
| | 386,000 | | | First Financial Bankshares | | | 14,980 | | |
| | | | | West Texas Bank | | | | | |
| | 400,000 | | | First Mutual Bancshares (b) | | | 8,892 | | |
| | | | | Seattle Community Bank | | | | | |
| | 250,000 | | | First Busey | | | 4,997 | | |
| | | | | Illinois Bank | | | | | |
| | 150,000 | | | Greene County Bancshares | | | 4,689 | | |
| | | | | Tennessee Bank | | | | | |
| | 200,000 | | | TriCo Bancshares | | | 4,472 | | |
| | | | | California Central Valley Community Bank | | | | | |
| | | | 635,962 | | |
| | | > Brokerage & Money Management 2.4% | |
| | 5,500,000 | | | Eaton Vance | | | 242,990 | | |
| | | | | Specialty Mutual Funds | | | | | |
| | 5,948,000 | | | SEI Investments | | | 172,730 | | |
| | | | | Mutual Fund Administration & Investment
Management | | | | | |
| | 1,303,000 | | | Nuveen Investments | | | 80,981 | | |
| | | | | Money Management | | | | | |
| | 450,000 | | | Investment Technology Group (a) | | | 19,499 | | |
| | | | | Electronic Trading | | | | | |
| | | | 516,200 | | |
| | | > Finance Companies 1.5% | |
| | 6,500,000 | | | AmeriCredit (a)(b) | | | 172,575 | | |
| | | | | Auto Lending | | | | | |
| | 1,500,000 | | | World Acceptance (a)(b) | | | 64,095 | | |
| | | | | Personal Loans | | | | | |
| | 1,219,000 | | | McGrath Rentcorp | | | 41,068 | | |
| | | | | Temporary Space & IT Rentals | | | | | |
| | 900,000 | | | Marlin Business Services (a)(b) | | | 19,179 | | |
| | | | | Small Equipment Leasing | | | | | |
| | 1,203,000 | | | Electro Rent | | | 17,492 | | |
| | | | | Test & Measurement Rentals | | | | | |
| | 200,000 | | | CAI International (a) | | | 2,636 | | |
| | | | | International Container Leasing &
Management | | | | | |
| | | | 317,045 | | |
| | | > Savings & Loans 1.5% | |
| | 9,085,000 | | | People's United | | | 161,077 | | |
| | | | | Connecticut Savings & Loan | | | | | |
| | 1,700,000 | | | Housing Development Finance (India) | | | 84,475 | | |
| | | | | Indian Mortgage Lender | | | | | |
| | 1,285,000 | | | Washington Federal | | | 31,238 | | |
| | | | | Traditional Thrift | | | | | |
| | 978,000 | | | Anchor Bancorp Wisconsin | | | 25,614 | | |
| | | | | Wisconsin Thrift | | | | | |
| | 360,000 | | | Provident New York Bancorp | | | 4,864 | | |
| | | | | New York State Thrift | | | | | |
| | | | 307,268 | | |
| Finance: Total | | | 2,610,758 | | |
29
Columbia Acorn Fund
Statement of Investments (Unaudited), continued
| Number of Shares | | | | Value (000) | |
| Energy & Minerals 8.7% | | | |
| | | > Oil & Gas Producers 4.0% | |
| | 2,500,000 | | | XTO Energy | | $ | 150,250 | | |
| | | | | Oil & Gas Producer | | | | | |
| | 2,700,000 | | | Ultra Petroleum (a) | | | 149,148 | | |
| | | | | Oil & Gas Producer | | | | | |
| | 2,400,000 | | | Equitable Resources | | | 118,944 | | |
| | | | | Natural Gas Producer & Utility | | | | | |
| | 4,900,000 | | | Talisman Energy (Canada) | | | 94,757 | | |
| | | | | Oil & Gas Producer | | | | | |
| | 9,315,000 | | | Tullow Oil (United Kingdom) | | | 90,769 | | |
| | | | | Oil & Gas Producer | | | | | |
| | 2,000,000 | | | Southwestern Energy (a) | | | 89,000 | | |
| | | | | Oil & Gas Producer | | | | | |
| | 1,500,000 | | | Range Resources | | | 56,115 | | |
| | | | | Oil & Gas Producer | | | | | |
| | 1,100,000 | | | Carrizo Oil & Gas (a) | | | 45,617 | | |
| | | | | Explores for Natural Gas & Crude Oil | | | | | |
| | 700,000 | | | Denbury Resources (a) | | | 26,250 | | |
| | | | | Oil Producer Using Co2 Injection | | | | | |
| | 500,000 | | | St. Mary Land & Exploration | | | 18,310 | | |
| | | | | Oil & Gas Producer | | | | | |
| | 2,750,000 | | | Vaalco Energy (a) | | | 13,283 | | |
| | | | | Oil & Gas Producer | | | | | |
| | 470,000 | | | McMoran Exploration (a) | | | 6,580 | | |
| | | | | Natural Gas Producer & Developer | | | | | |
| | | | 859,023 | | |
| | | > Oil Services 3.8% | |
| | 3,584,037 | | | Fugro (Netherlands) (b) | | | 227,455 | | |
| | | | | Oilfield Services | | | | | |
| | 2,820,000 | | | FMC Technologies (a) | | | 223,400 | | |
| | | | | Oil & Gas Well Head Manufacturer | | | | | |
| | 1,200,000 | | | Atwood Oceanics (a) | | | 82,344 | | |
| | | | | Offshore Drilling Contractor | | | | | |
| | 1,761,000 | | | Rowan | | | 72,166 | | |
| | | | | Offshore Drilling Contractor | | | | | |
| | 1,988,000 | | | Tetra Technologies (a) | | | 56,062 | | |
| | | | | U.S.-based Services Company with Life of Field
Approach | | | | | |
| | 1,044,000 | | | Tesco (a) | | | 32,938 | �� | |
| | | | | Developing New Well Drilling Technologies | | | | | |
| | 750,000 | | | CARBO Ceramics | | | 32,858 | | |
| | | | | Natural Gas Well Stimulants | | | | | |
| | 1,001,000 | | | ShawCor (Canada) | | | 30,737 | | |
| | | | | Oil & Gas Pipeline Products | | | | | |
| | 552,000 | | | Dresser-Rand Group (a) | | | 21,804 | | |
| | | | | Largest Manufacturer of Compressors | | | | | |
| | 1,580,000 | | | Enerflex Systems (Canada) | | | 15,633 | | |
| | | | | Natural Gas Compresser Rental & Fabrication | | | | | |
| | 250,000 | | | SBM Offshore (Netherlands) | | | 9,530 | | |
| | | | | Builds & Leases Offshore Vessels to Process &
Store Crude Oil | | | | | |
| | 170,000 | | | Key Energy Services (a) | | | 3,150 | | |
| | | | | Well Workover Services | | | | | |
| | | | 808,077 | | |
| | | > Mining 0.6% | |
| | 5,895,000 | | | Uranium One (South Africa) (a) | | | 75,095 | | |
| | | | | Uranium Mines in South Africa,
Kazakhstan, Australia & the U.S. | | | | | |
| Number of Shares | | | | Value (000) | |
| | 2,900,000 | | | Jubilee Mines (Australia) | | $ | 39,163 | | |
| | | | | Nickel Mining in Australia | | | | | |
| | 1,000,000 | | | Ivanhoe Mines (Canada) (a) | | | 14,175 | | |
| | | | | Copper Mine Project in Mongolia | | | | | |
| | | | 128,433 | | |
| | | > Agricultural Commodities 0.2% | |
| | 550,000 | | | Aracruz Celulose (Brazil) | | | 36,432 | | |
| | | | | Brazilian Hardwood Pulp Producer | | | | | |
| | | | 36,432 | | |
| | | > Oil Refining, Marketing &
Distribution 0.1% | |
| | 435,000 | | | Oneok | | | 21,928 | | |
| | | | | Natural Gas Distribution, Pipeline
Processing & Trading | | | | | |
| | | | 21,928 | | |
| Energy & Minerals: Total | | | 1,853,893 | | |
| Health Care 7.9% | | | |
| | | > Health Care Services 1.9% | |
| | 1,000,000 | | | Rhoen-Klinikum (Germany) | | | 60,256 | | |
| | | | | Health Care Services | | | | | |
| | 1,085,000 | | | Charles River Laboratories (a) | | | 56,008 | | |
| | | | | Pharmaceutical Research | | | | | |
| | 1,125,000 | | | LCA-Vision (b) | | | 53,167 | | |
| | | | | Lasik Surgery Centers | | | | | |
| | 1,300,000 | | | Lincare Holdings (a) | | | 51,805 | | |
| | | | | Home Health Care Services | | | | | |
| | 2,250,000 | | | PSS World Medical (a) | | | 40,995 | | |
| | | | | Medical Supplies | | | | | |
| | 1,080,000 | | | OPG Groep (Netherlands) | | | 39,327 | | |
| | | | | Health Care Supplies & Pharmacies | | | | | |
| | 900,000 | | | Omnicare | | | 32,454 | | |
| | | | | Pharmacy Services for Nursing Homes | | | | | |
| | 500,000 | | | Coventry Health Care (a) | | | 28,825 | | |
| | | | | HMO | | | | | |
| | 3,000,000 | | | Eresearch Technology (a)(b) | | | 28,530 | | |
| | | | | Clinical Research Services | | | | | |
| | 400,000 | | | Healthcare Services Group | | | 11,800 | | |
| | | | | Outsourced Services to Long-term Care
Industry | | | | | |
| | | | 403,167 | | |
| | | > Medical Supplies 1.9% | |
| | 1,910,000 | | | Cytyc (a) | | | 82,340 | | |
| | | | | Consumables Related to Women's Health | | | | | |
| | 1,250,000 | | | ICU Medical (a)(b) | | | 53,675 | | |
| | | | | Intravenous Therapy Products | | | | | |
| | 929,000 | | | Henry Schein (a) | | | 49,637 | | |
| | | | | Largest Distributor of Healthcare Products | | | | | |
| | 1,200,000 | | | Owens & Minor | | | 41,928 | | |
| | | | | Distribution of Medical Supplies | | | | | |
| | 1,025,000 | | | Polymedica | | | 41,871 | | |
| | | | | Diabetes Supply Distributor | | | | | |
| | 700,000 | | | Cooper | | | 37,324 | | |
| | | | | Contact Lens Manufacturer | | | | | |
| | 905,000 | | | Arrow International | | | 34,644 | | |
| | | | | Disposable Catheters | | | | | |
| | 486,000 | | | Techne (a) | | | 27,804 | | |
| | | | | Cytokines, Antibodies & Other Reagents for
Life Science | | | | | |
30
| Number of Shares | | | | Value (000) | |
| | | > Medical Supplies—continued | |
| | 790,000 | | | Meridian Biosciences | | $ | 17,111 | | |
| | | | | Niche Diagnostics/Life Science Company | | | | | |
| | 900,000 | | | QIAGEN (a) | | | 16,011 | | |
| | | | | Life Science Company; DNA/RNA Purification | | | | | |
| | | | 402,345 | | |
| | | > Biotechnology & Drug Delivery 1.7% | |
| | 3,940,000 | | | BioMarin (a) | | | 70,684 | | |
| | | | | Biotech Focused on Orphan Diseases | | | | | |
| | 2,550,000 | | | PDL BioPharma (a) | | | 59,415 | | |
| | | | | Proprietary Monoclonal Antibodies | | | | | |
| | 3,720,000 | | | Seattle Genetics (a)(b) | | | 36,493 | | |
| | | | | Antibody-based Therapies for Cancer | | | | | |
| | 865,000 | | | Amylin (a) | | | 35,603 | | |
| | | | | Biotech Company Focused on Diabetes &
Obesity | | | | | |
| | 2,000,000 | | | Medarex (a) | | | 28,580 | | |
| | | | | Humanized Antibodies | | | | | |
| | 2,160,000 | | | Array Biopharma (a) | | | 25,207 | | |
| | | | | Drugs for Cancer & Inflammatory Diseases | | | | | |
| | 650,000 | | | Myriad Genetics (a) | | | 24,173 | | |
| | | | | Drugs/Diagnostics Hybrid | | | | | |
| | 1,650,000 | | | Nektar Therapeutics (a) | | | 15,659 | | |
| | | | | Drug Delivery Technologies | | | | | |
| | 1,320,000 | | | Arena Pharmaceuticals (a) | | | 14,507 | | |
| | | | | Novel Drug Targeting Technology | | | | | |
| | 3,100,000 | | | Lexicon Genetics (a) | | | 9,951 | | |
| | | | | Drug Discovery | | | | | |
| | 2,520,000 | | | Decode Genetics (a) | | | 9,412 | | |
| | | | | Drugs for Heart Attack, Asthma & Vascular
Disease | | | | | |
| | 1,229,000 | | | Neurogen (a) | | | 8,161 | | |
| | | | | Development-stage Biotech Focused on Neurology | | | | | |
| | 1,750,000 | | | Genitope (a) | | | 6,755 | | |
| | | | | Cancer Vaccine | | | | | |
| | 1,100,000 | | | La Jolla Pharmaceutical (a) | | | 4,928 | | |
| | | | | Lupus Treatment | | | | | |
| | 825,000 | | | Pharmacopeia (a) | | | 4,579 | | |
| | | | | Biotech Company with Broad Early-stage Pipeline | | | | | |
| | 1,025,000 | | | Nuvelo (a) | | | 2,788 | | |
| | | | | Development-stage Biotech Focused on
Cardiovascular/Cancer | | | | | |
| | 1,875,000 | | | Locus Discovery, Series D, Pfd. (a)(c) | | | 544 | | |
| | 966,441 | | | Locus Discovery, Series B, Pfd. (a)(c) | | | 280 | | |
| | | | | High Throughput Rational Drug Design | | | | | |
| | 1,249,999 | | | Perlegen Sciences (a)(c) | | | 400 | | |
| | | | | Large Scale Gene Sequencing | | | | | |
| | 359,944 | | | MicroDose Technologies (a)(c) | | | 360 | | |
| | | | | Drug Inhaler Development | | | | | |
| | | | 358,479 | | |
| | | > Medical Equipment & Devices 1.3% | |
| | 1,000,000 | | | Edwards Lifesciences (a) | | | 49,340 | | |
| | | | | Heart Valves | | | | | |
| | 870,000 | | | Vital Signs (b) | | | 48,328 | | |
| | | | | Anesthesia, Respiratory & Sleep Products | | | | | |
| | 943,000 | | | Orthofix International (a)(b) | | | 42,407 | | |
| | | | | Bone Fixation & Stimulation Devices | | | | | |
| | 315,000 | | | Synthes (Switzerland) | | | 37,806 | | |
| | | | | Products for Orthopedic Surgery | | | | | |
| Number of Shares | | | | Value (000) | |
| | 550,000 | | | Dade Behring | | $ | 29,216 | | |
| | | | | Clinical Diagnostics Supplier | | | | | |
| | 550,000 | | | Haemonetics (a) | | | 28,935 | | |
| | | | | Blood & Plasma Collection Equipment | | | | | |
| | 552,000 | | | Advanced Medical Optics (a) | | | 19,254 | | |
| | | | | Medical Devices for Eye Care | | | | | |
| | 140,000 | | | Essilor International (France) | | | 16,675 | | |
| | | | | Eyeglass Lenses | | | | | |
| | | | 271,961 | | |
| | | > Pharmaceuticals 1.1% | |
| | 900,000 | | | Cephalon (a) | | | 72,351 | | |
| | | | | Specialty Pharmaceuticals for Pain, Central
Nervous System & Oncology | | | | | |
| | 1,295,000 | | | Endo Pharmaceuticals (a) | | | 44,328 | | |
| | | | | Specialty Pharmaceuticals for Pain
Management | | | | | |
| | 1,000,000 | | | Medicis Pharmaceutical | | | 30,540 | | |
| | | | | Specialty Pharmaceuticals for Dermatology | | | | | |
| | 1,010,000 | | | MGI Pharma (a) | | | 22,594 | | |
| | | | | Specialty Pharmaceuticals for Oncology &
Acute Care | | | | | |
| | 3,000,000 | | | QLT (a) | | | 22,200 | | |
| | | | | Specialty Pharmaceuticals for Ophthalmology &
Dermatology | | | | | |
| | 3,100,000 | | | United Drug (Ireland) | | | 16,928 | | |
| | | | | Irish Pharmaceutical Wholesaler & Outsourcer | | | | | |
| | 1,200,000 | | | Collagenex Pharmaceuticals (a)(b) | | | 14,880 | | |
| | | | | Specialty Pharmaceuticals for Dermatology | | | | | |
| | 1,700,000 | | | Barrier Therapeutics (a)(b) | | | 11,050 | | |
| | | | | Specialty Pharmaceuticals for Dermatology | | | | | |
| | | | 234,871 | | |
| Health Care: Total | | | 1,670,823 | | |
| Other Industries 4.9% | | | |
| | | > Real Estate 3.8% | |
| | 5,850,000 | | | Highland Hospitality (b) | | | 112,320 | | |
| | | | | Hotel Owner | | | | | |
| | 2,000,000 | | | Gaylord Entertainment (a) | | | 107,280 | | |
| | | | | Convention Hotels | | | | | |
| | 1,398,000 | | | Forest City Enterprises, Class B (b) | | | 86,690 | | |
| | | | | Commercial & Residential Property Developer | | | | | |
| | 650,000 | | | SL Green Realty | | | 80,528 | | |
| | | | | Manhattan Office Buildings | | | | | |
| | 1,320,000 | | | General Growth Properties | | | 69,894 | | |
| | | | | Regional Shopping Malls | | | | | |
| | 3,500,000 | | | DiamondRock Hospitality | | | 66,780 | | |
| | | | | Hotel Owner | | | | | |
| | 635,000 | | | Macerich Company | | | 52,337 | | |
| | | | | Regional Shopping Malls | | | | | |
| | 575,000 | | | Federal Realty Investment Trust | | | 44,425 | | |
| | | | | Shopping Centers | | | | | |
| | 1,720,000 | | | Kite Realty Group (b) | | | 32,714 | | |
| | | | | Community Shopping Centers | | | | | |
| | 850,000 | | | Digital Realty Trust | | | 32,028 | | |
| | | | | Technology-focused Office Buildings | | | | | |
| | 1,375,000 | | | Crescent Real Estate Equities | | | 30,855 | | |
| | | | | Class 'A' Office Buildings | | | | | |
| | 628,000 | | | Parkway Properties | | | 30,163 | | |
| | | | | Office Buildings | | | | | |
31
Columbia Acorn Fund
Statement of Investments (Unaudited), continued
Number of Shares
or Principal Amount (000) | | | | Value (000) | |
| | | > Real Estate—continued | |
| | 1,020,000 | | | Brandywine Realty | | $ | 29,152 | | |
| | | | | Office Buildings | | | | | |
| | 900,000 | | | American Campus Communities | | | 25,461 | | |
| | | | | Student Housing | | | | | |
| | 8,200 | | | Kenedix (Japan) | | | 15,252 | | |
| | | | | Real Estate Investment Management | | | | | |
| | 37,407 | | | Security Capital European Realty
(Luxembourg) (a)(c)(d) | | | — | | |
| | | | | Self Storage Properties | | | | | |
| | | | 815,879 | | |
| | | > Transportation 0.8% | |
| | 1,556,000 | | | JB Hunt Transport Services | | | 45,622 | | |
| | | | | Truck & Intermodal Carrier | | | | | |
| | 826,200 | | | Grupo Aeroportuario del Surest
(Mexico) | | | 43,533 | | |
| | | | | Cancun & Cozumel Airport Operator | | | | | |
| | 14,120,000 | | | China Shipping Development (China) | | | 32,569 | | |
| | | | | China's Dominant Shipper for Oil & Coal | | | | | |
| | 1,914,000 | | | Heartland Express | | | 31,198 | | |
| | | | | Regional Trucker | | | | | |
| | 6,790,000 | | | Jiangsu Expressway (China) | | | 6,906 | | |
| | | | | Chinese Toll Road Operator | | | | | |
| | | | 159,828 | | |
| | | > Regulated Utilities 0.3% | |
| | 1,650,000 | | | Northeast Utilities | | | 46,794 | | |
| | | | | Regulated Electric Utility | | | | | |
| | 340,000 | | | Red Electrica de Espana (Spain) | | | 15,932 | | |
| | | | | Spanish Power Grid | | | | | |
| | | | 62,726 | | |
| Other Industries: Total | | | 1,038,433 | | |
Total Equities: 93.6%
(Cost: $11,345,002) | | | 19,873,015 | | |
| Short-Term Obligations 6.1% | | | |
| $ | 50,000 | | | Ebbetts Funding (e)
5.28% Due 7/11/07 | | | 49,927 | | |
| | 50,000 | | | St. Germain Holdings (e)
5.28% Due 7/27/07 | | | 49,809 | | |
| | 50,000 | | | Four Winds Funding (e)
5.27% Due 7/30/07 | | | 49,788 | | |
| | 50,000 | | | Four Winds Funding (e)
5.27% Due 7/31/07 | | | 49,780 | | |
| | 50,000 | | | Manhattan Asset Funding (e)
5.28% Due 8/01/07 | | | 49,773 | | |
| | 50,000 | | | Liberty Street Funding (e)
5.28% Due 8/15/07 | | | 49,670 | | |
| | 48,000 | | | Morrigan TRR (e)
5.28% Due 7/17/07 | | | 47,888 | | |
| | 45,000 | | | Pasa Funding (e)
5.27% Due 7/19/07 | | | 44,881 | | |
| | 45,000 | | | Ebury Finance (e)
5.28% Due 7/25/07 | | | 44,842 | | |
| | 45,000 | | | White Point Funding (e)
5.29% Due 8/13/07 | | | 44,716 | | |
| Principal Amount (000) | | | | Value (000) | |
| $ | 44,000 | | | Hannover Funding (e)
5.28% Due 7/06/07 | | $ | 43,968 | | |
| | 44,000 | | | World Omni Vehicles (e)
5.26% Due 7/09/07 | | | 43,949 | | |
| | 44,000 | | | World Omni Vehicles (e)
5.26% Due 7/10/07 | | | 43,942 | | |
| | 44,000 | | | Axon Financial (e)
5.28% Due 8/09/07 | | | 43,748 | | |
| | 44,000 | | | Axon Financial (e)
5.28% Due 8/10/07 | | | 43,742 | | |
| | 43,000 | | | Nightingale (e)
5.28% Due 8/08/07 | | | 42,760 | | |
| | 40,000 | | | Ebbetts Funding (e)
5.27% Due 7/16/07 | | | 39,912 | | |
| | 40,000 | | | Mica Funding LLC (e)
5.28% Due 8/06/07 | | | 39,789 | | |
| | 38,000 | | | Mica Funding LLC (e)
5.26% Due 7/12/07 | | | 37,939 | | |
| | 38,000 | | | Keel Capital (e)
5.27% Due 7/13/07 | | | 37,933 | | |
| | 38,000 | | | Ebury Finance (e)
5.27% Due 7/24/07 | | | 37,872 | | |
| | 38,000 | | | White Point Funding (e)
5.28% Due 8/14/07 | | | 37,755 | | |
| | 37,000 | | | Mainsail II Ltd. (e)
5.27% Due 7/20/07 | | | 36,897 | | |
| | 37,000 | | | Morrigan TRR (e)
5.28% Due 7/23/07 | | | 36,881 | | |
| | 36,000 | | | La Fayette Asset
Securitization LLC (e)
5.28% Due 7/03/07 | | | 35,989 | | |
| | 36,000 | | | Anglesea Funding (e)
5.26% Due 7/05/07 | | | 35,979 | | |
| | 35,000 | | | Anglesea Funding (e)
5.26% Due 7/02/07 | | | 34,995 | | |
| | 30,000 | | | East Fleet Financial (e)
5.28% Due 7/26/07 | | | 29,890 | | |
| | 30,000 | | | Pasa Funding (e)
5.27% Due 8/02/07 | | | 29,859 | | |
| | 28,000 | | | Manhattan Asset Funding (e)
5.27% Due 8/03/07 | | | 27,865 | | |
| | 25,000 | | | Morrigan TRR (e)
5.28% Due 7/18/07 | | | 24,938 | | |
| | 23,000 | | | Mica Funding LLC (e)
5.28% Due 8/07/07 | | | 22,875 | | |
| | 7,804 | | | Repurchase Agreement with
Fixed Income Clearing Corp.,
dated 6/29/07, due 7/02/07 at
5.050%, collateralized by a
U.S. Government Agency
Obligation, maturing 7/18/11,
market value $7,960
(repurchase proceeds $7,807) | | | 7,804 | | |
| | | | | (Amortized Cost: $1,298,355) | | | 1,298,355 | | |
Total Investments: 99.7%
(Cost: $12,643,357)(f)(g) | | | 21,171,370 | | |
| Cash and Other Assets Less Liabilities: 0.3% | | | 59,908 | | |
| Total Net Assets: 100% | | $ | 21,231,278 | | |
32
> Notes to Statement of Investments (dollar values in thousands)
(a) Non-income producing security.
(b) An affiliate may include any company in which the Fund owns five percent or more of its outstanding voting shares. Transactions in affiliated companies during the six months ended June 30, 2007, are as follows:
| Affiliates | | Balance of
Shares Held
12/31/06 | | Purchases/
Additions | | Sales/
Reductions | | Balance of
Shares Held
6/30/07 | | Value | | Dividend | |
| Actuate | | | 6,000,000 | | | | - | | | | - | | | | 6,000,000 | | | $ | 40,740 | | | $ | - | | |
| Administaff | | | 1,670,000 | | | | 230,000 | | | | - | | | | 1,900,000 | | | | 63,631 | | | | 407 | | |
| AFC Enterprises | | | 1,600,000 | | | | - | | | | - | | | | 1,600,000 | | | | 27,664 | | | | - | | |
| Agile Software | | | 3,500,000 | | | | - | | | | - | | | | 3,500,000 | | | | 28,210 | | | | - | | |
| AmeriCredit | | | 6,500,000 | | | | - | | | | - | | | | 6,500,000 | | | | 172,575 | | | | - | | |
| Anchor Bancorp Wisconsin* | | | 1,178,000 | | | | - | | | | 200,000 | | | | 978,000 | | | | 25,614 | | | | 401 | | |
| AnswerThink | | | 4,600,000 | | | | - | | | | - | | | | 4,600,000 | | | | 16,652 | | | | - | | |
| Bally Technologies | | | 3,500,000 | | | | - | | | | 350,000 | | | | 3,150,000 | | | | 83,223 | | | | - | | |
| Barrier Therapeutics | | | 1,321,000 | | | | 379,000 | | | | - | | | | 1,700,000 | | | | 11,050 | | | | - | | |
| Chattem | | | 1,010,000 | | | | - | | | | - | | | | 1,010,000 | | | | 64,014 | | | | - | | |
| Chico's FAS | | | 7,080,000 | | | | 2,050,000 | | | | - | | | | 9,130,000 | | | | 222,224 | | | | - | | |
| Christopher & Banks | | | 3,743,000 | | | | - | | | | - | | | | 3,743,000 | | | | 64,192 | | | | 449 | | |
| Clarcor | | | 3,500,000 | | | | - | | | | - | | | | 3,500,000 | | | | 131,005 | | | | 508 | | |
| Collagenex Pharmaceuticals | | | 830,000 | | | | 370,000 | | | | - | | | | 1,200,000 | | | | 14,880 | | | | - | | |
| Concur Technologies | | | 2,131,000 | | | | - | | | | - | | | | 2,131,000 | | | | 48,693 | | | | - | | |
| Cytokinetics* | | | 486,000 | | | | - | | | | 486,000 | | | | - | | | | - | | | | - | | |
| Dobson Communications | | | 8,000,000 | | | | - | | | | - | | | | 8,000,000 | | | | 88,880 | | | | - | | |
| Donaldson | | | 3,600,000 | | | | 400,000 | | | | - | | | | 4,000,000 | | | | 142,200 | | | | 666 | | |
| Drew Industries | | | 1,228,000 | | | | - | | | | - | | | | 1,228,000 | | | | 40,696 | | | | - | | |
| Enerflex Systems* | | | 2,280,000 | | | | - | | | | 700,000 | | | | 1,580,000 | | | | 15,633 | | | | 640 | | |
| Eresearch Technology | | | 2,300,000 | | | | 700,000 | | | | - | | | | 3,000,000 | | | | 28,530 | | | | - | | |
| ESCO Technologies | | | 2,200,000 | | | | - | | | | - | | | | 2,200,000 | | | | 79,772 | | | | - | | |
| Excel Technology | | | 625,000 | | | | 110,000 | | | | - | | | | 735,000 | | | | 20,536 | | | | - | | |
| FARO Technologies | | | - | | | | 860,000 | | | | - | | | | 860,000 | | | | 27,400 | | | | - | | |
| First Mutual Bancshares | | | 400,000 | | | | - | | | | - | | | | 400,000 | | | | 8,892 | | | | 72 | | |
| Fleetwood Enterprises* | | | 4,690,000 | | | | - | | | | 2,190,000 | | | | 2,500,000 | | | | 22,625 | | | | - | | |
| Forest City Enterprises, Class B | | | 1,398,000 | | | | - | | | | - | | | | 1,398,000 | | | | 86,690 | | | | 196 | | |
| Forward Air | | | 1,900,000 | | | | - | | | | - | | | | 1,900,000 | | | | 64,771 | | | | 266 | | |
| Fugro | | | 2,928,301 | | | | 655,736 | | | | - | | | | 3,584,037 | | | | 227,455 | | | | 3,860 | | |
| Gaiam | | | 1,200,000 | | | | - | | | | - | | | | 1,200,000 | | | | 21,876 | | | | - | | |
| Genlyte Group | | | 1,963,000 | | | | 637,000 | | | | - | | | | 2,600,000 | | | | 204,204 | | | | - | | |
| Gibraltar Industries | | | 2,860,000 | | | | - | | | | - | | | | 2,860,000 | | | | 63,349 | | | | 429 | | |
| Glacier Bancorp | | | 4,080,000 | | | | - | | | | - | | | | 4,080,000 | | | | 83,028 | | | | 979 | | |
| Helen of Troy | | | 1,800,000 | | | | - | | | | - | | | | 1,800,000 | | | | 48,600 | | | | - | | |
| Herman Miller | | | 2,068,000 | | | | 1,732,000 | | | | - | | | | 3,800,000 | | | | 120,080 | | | | 482 | | |
| Highland Hospitality | | | 5,850,000 | | | | - | | | | - | | | | 5,850,000 | | | | 112,320 | | | | 1,346 | | |
| HNI* | | | 2,550,000 | | | | - | | | | 314,000 | | | | 2,236,000 | | | | 91,676 | | | | 978 | | |
| ICU Medical | | | 1,083,000 | | | | 167,000 | | | | - | | | | 1,250,000 | | | | 53,675 | | | | - | | |
| iGate | | | 5,000,000 | | | | - | | | | - | | | | 5,000,000 | | | | 40,100 | | | | - | | |
| II-VI | | | 2,025,000 | | | | 195,000 | | | | - | | | | 2,220,000 | | | | 60,317 | | | | - | | |
Indus International
(merged into Vista Equity)* | | | 5,600,000 | | | | - | | | | 5,600,000 | | | | - | | | | - | | | | - | | |
| ITT Educational Services* | | | 2,250,000 | | | | - | | | | 250,000 | | | | 2,000,000 | | | | 234,760 | | | | - | | |
| IXYS | | | 1,905,000 | | | | - | | | | - | | | | 1,905,000 | | | | 15,907 | | | | - | | |
| JDA Software* | | | 1,490,000 | | | | - | | | | 1,490,000 | | | | - | | | | - | | | | - | | |
| Kite Realty Group | | | 1,720,000 | | | | - | | | | - | | | | 1,720,000 | | | | 32,714 | | | | 671 | | |
Kronos (merged into
Helman & Friedman)* | | | 2,750,000 | | | | - | | | | 2,750,000 | | | | - | | | | - | | | | - | | |
| LCA-Vision | | | 1,125,000 | | | | - | | | | - | | | | 1,125,000 | | | | 53,167 | | | | 405 | | |
| Littelfuse | | | 1,135,000 | | | | 135,000 | | | | - | | | | 1,270,000 | | | | 42,888 | | | | - | | |
| Marlin Business Services | | | 685,000 | | | | 215,000 | | | | - | | | | 900,000 | | | | 19,179 | | | | - | | |
| Mine Safety Appliances | | | 1,900,000 | | | | - | | | | - | | | | 1,900,000 | | | | 83,144 | | | | 760 | | |
| Orthofix International | | | 942,500 | | | | 500 | | | | - | | | | 943,000 | | | | 42,407 | | | | - | | |
| Oxford Industries | | | 919,000 | | | | 150,000 | | | | - | | | | 1,069,000 | | | | 47,399 | | | | 358 | | |
| Pinnacle Entertainment | | | 3,200,000 | | | | - | | | | - | | | | 3,200,000 | | | | 90,080 | | | | - | | |
| Pool | | | 2,500,000 | | | | 390,000 | | | | - | | | | 2,890,000 | | | | 112,797 | | | | 636 | | |
| Princeton Review | | | 2,550,000 | | | | - | | | | - | | | | 2,550,000 | | | | 12,189 | | | | - | | |
| ProQuest | | | 2,000,000 | | | | - | | | | - | | | | 2,000,000 | | | | 19,080 | | | | - | | |
| Radiant Systems | | | 2,500,000 | | | | - | | | | - | | | | 2,500,000 | | | | 33,100 | | | | - | | |
| Red Robin Gourmet Burgers | | | 1,000,000 | | | | - | | | | - | | | | 1,000,000 | | | | 40,370 | | | | - | | |
| Saga Communications | | | 1,400,000 | | | | - | | | | - | | | | 1,400,000 | | | | 13,720 | | | | - | | |
| Salem Communications | | | 1,541,000 | | | | - | | | | - | | | | 1,541,000 | | | | 17,090 | | | | - | | |
| Seachange International* | | | 1,875,000 | | | | - | | | | 1,875,000 | | | | - | | | | - | | | | - | | |
| Seattle Genetics | | | 2,300,000 | | | | 1,420,000 | | | | - | | | | 3,720,000 | | | | 36,493 | | | | - | | |
| Shuffle Master | | | 2,430,000 | | | | - | | | | - | | | | 2,430,000 | | | | 40,338 | | | | - | | |
| Skillsoft | | | 9,500,000 | | | | - | | | | - | | | | 9,500,000 | | | | 88,255 | | | | - | | |
| Spanish Broadcasting System | | | 2,400,000 | | | | - | | | | - | | | | 2,400,000 | | | | 10,320 | | | | - | | |
| Spartech | | | 2,700,000 | | | | - | | | | 700,000 | | | | 2,000,000 | | | | 53,100 | | | | 635 | | |
| Supertex | | | 690,000 | | | | 260,000 | | | | 130,000 | | | | 820,000 | | | | 25,699 | | | | - | | |
| Tumbleweed Communications | | | 3,500,000 | | | | - | | | | - | | | | 3,500,000 | | | | 8,925 | | | | - | | |
33
Columbia Acorn Fund
Statement of Investments (Unaudited), continued
> Notes to Statement of Investments (dollar values in thousands)
| Affiliates | | Balance of
Shares Held
12/31/06 | | Purchases/
Additions | | Sales/
Reductions | | Balance of
Shares Held
6/30/07 | | Value | | Dividend | |
| United America Indemnity | | | 1,550,000 | | | | - | | | | - | | | | 1,550,000 | | | | 38,548 | | | | - | | |
| Universal Technical Institute | | | 1,500,000 | | | | - | | | | - | | | | 1,500,000 | | | | 38,085 | | | | - | | |
| Vaalco Energy* | | | 3,200,000 | | | | - | | | | 450,000 | | | | 2,750,000 | | | | 13,283 | | | | - | | |
| Vail Resorts | | | 2,390,000 | | | | - | | | | - | | | | 2,390,000 | | | | 145,479 | | | | - | | |
| Vital Signs | | | 870,000 | | | | - | | | | - | | | | 870,000 | | | | 48,328 | | | | 165 | | |
| Watsco | | | 2,375,000 | | | | - | | | | - | | | | 2,375,000 | | | | 129,200 | | | | 1,378 | | |
| West Bancorporation | | | 949,000 | | | | 300,000 | | | | - | | | | 1,249,000 | | | | 19,946 | | | | 330 | | |
| West Coast Bancorp | | | 1,320,000 | | | | - | | | | - | | | | 1,320,000 | | | | 40,115 | | | | 317 | | |
| Witness Systems* | | | 2,500,000 | | | | | | | | 2,500,000 | | | | - | | | | - | | | | | | |
| World Acceptance | | | 1,500,000 | | | | - | | | | - | | | | 1,500,000 | | | | 64,095 | | | | - | | |
| TOTAL OF AFFILIATED TRANSACTIONS | | | 193,338,801 | | | | 11,356,236 | | | | 19,985,000 | | | | 184,710,037 | | | $ | 4,477,872 | | | $ | 17,334 | | |
* At June 30, 2007, the Fund owned less than five percent of the company's outstanding voting shares.
The aggregate cost and value of these companies at June 30, 2007, was $2,646,859 and $4,477,872 respectively. Investments in affiliate companies represent 21.09% of total net assets at June 30, 2007.
(c) Denotes a restricted security, which is subject to restrictions on resale under federal securities laws. These securities, are valued in good faith by the Board of Trustees. At June 30, 2007, these securities had an aggregate value of $1,584 which represented 0.01% of total net assets.
Additional information on these securities is as follows:
| Security | | Acquisition
Dates | | Shares | | Cost | | Value | |
| Perlegen Sciences | | 3/30/01 | | | 1,249,999 | | | $ | 4,500 | | | $ | 400 | | |
| Locus Discovery, Series D Pfd. | | 9/5/01 | | | 1,875,000 | | | | 7,500 | | | | 544 | | |
| MicroDose Technologies | | 11/24/00 | | | 359,944 | | | | 2,005 | | | | 360 | | |
| Locus Discovery, Series B Pfd. | | 2/8/07 | | | 966,441 | | | | 280 | | | | 280 | | |
| Security Capital European Realty | | 8/20/98 - 11/12/99 | | | 37,407 | | | | 205 | | | | - | | |
| | | | | | | | | $ | 14,490 | | | $ | 1,584 | | |
(d) Security has no value.
(e) Security exempt from registration under Section 4(2) of the Securities Act of 1933. These securities may only be resold in exempt transactions to qualified buyers. Private resales of these securities to qualified instutional buyers are also exempt from registration pursuant to Rule 144A under the Securities Act of 1933. At June 30, 2007, these securities had an aggregate value of $1,290,551, which represented 6.1% of net assets.
(f) At June 30, 2007, for federal income tax purposes cost of investments was $12,643,357 and net unrealized appreciation was $8,528,013 consisting of gross unrealized appreciation of $8,815,065 and gross unrealized depreciation of $287,052.
(g) On June 30, 2007, the market value of foreign securities represents 11.5% of total net assets. The Fund's foreign portfolio was diversified as follows:
| | | Value | | Percent | |
| Netherlands | | $ | 458,146 | | | | 2.16 | % | |
| France | | | 223,347 | | | | 1.05 | | |
| Canada | | | 217,427 | | | | 1.02 | | |
| Japan | | | 150,917 | | | | 0.71 | | |
| Switzerland | | | 146,139 | | | | 0.69 | | |
| Sweden | | | 132,045 | | | | 0.62 | | |
| United Kingdom | | | 128,743 | | | | 0.61 | | |
| Germany | | | 102,892 | | | | 0.48 | | |
| Hong Kong | | | 91,966 | | | | 0.43 | | |
| Australia | | | 84,589 | | | | 0.40 | | |
| India | | | 84,475 | | | | 0.40 | | |
| Ireland | | | 75,505 | | | | 0.36 | | |
| South Africa | | | 75,095 | | | | 0.35 | | |
| China | | | 71,465 | | | �� | 0.34 | | |
| | | Value | | Percent | |
| Denmark | | $ | 68,394 | | | | 0.32 | % | |
| Brazil | | | 52,399 | | | | 0.25 | | |
| Israel | | | 49,539 | | | | 0.23 | | |
| Taiwan | | | 48,918 | | | | 0.23 | | |
| Mexico | | | 43,533 | | | | 0.21 | | |
| Chile | | | 33,548 | | | | 0.16 | | |
| Singapore | | | 31,933 | | | | 0.15 | | |
| Greece | | | 22,228 | | | | 0.10 | | |
| Austria | | | 18,651 | | | | 0.09 | | |
| Spain | | | 15,932 | | | | 0.08 | | |
| Italy | | | 13,169 | | | | 0.06 | | |
| Luxembourg | | | - | | | | - | | |
| Total Foreign Portfolio | | $ | 2,440,995 | | | | 11.50 | % | |
34
Columbia Acorn International
Major Portfolio Changes in the Second Quarter (Unaudited)
| | | Number of Shares | |
| | | 03/31/07 | | 06/30/07 | |
| Additions | |
| Europe | |
| > Netherlands | |
| Aalberts Industries | | | 480,000 | | | | 1,947,042 | | |
| Boskalis Westminster | | | 163,000 | | | | 489,000 | | |
| Fugro | | | 1,271,700 | | | | 1,406,155 | | |
| Koninklijke TenCate | | | 973,000 | | | | 1,096,000 | | |
| OPG Groep | | | 191,000 | | | | 764,000 | | |
| SBM Offshore | | | 0 | | | | 450,000 | | |
| Smit Internationale | | | 520,000 | | | | 680,000 | | |
| Stork | | | 0 | | | | 825,000 | | |
| Wavin | | | 840,000 | | | | 1,182,536 | | |
| > France | |
| Rubis | | | 298,818 | | | | 332,020 | | |
| Trigano | | | 500,000 | | | | 571,000 | | |
| > Germany | |
| Deutsche Beteiligungs | | | 283,000 | | | | 354,500 | | |
| Deutsche Boerse | | | 120,000 | | | | 200,000 | | |
| MPC Muechmeyer Petersen Capital | | | 0 | | | | 300,000 | | |
| > Switzerland | |
| Kuehne & Nagel | | | 550,000 | | | | 600,000 | | |
| Nobel Biocare Holding | | | 95,000 | | | | 140,000 | | |
| Synthes | | | 330,000 | | | | 360,000 | | |
| > United Kingdom | |
| Informa Group | | | 0 | | | | 1,400,000 | | |
| Intertek Testing | | | 0 | | | | 517,000 | | |
| Northgate | | | 1,450,000 | | | | 1,875,000 | | |
| Rotork | | | 0 | | | | 448,000 | | |
| Smith & Nephew | | | 2,205,000 | | | | 2,670,000 | | |
| Taylor Nelson Sofres | | | 4,620,000 | | | | 5,922,000 | | |
| > Ireland | |
| Kingspan Group | | | 1,035,000 | | | | 1,050,000 | | |
| United Drug | | | 8,050,000 | | | | 8,100,000 | | |
| > Sweden | |
| Hexagon | | | 1,553,500 | | | | 3,960,000 | | |
| Nobia | | | 755,000 | | | | 2,265,000 | | |
| SWECO | | | 610,000 | | | | 3,135,000 | | |
| > Spain | |
| Prisa | | | 800,000 | | | | 1,050,000 | | |
| Sogecable | | | 400,000 | | | | 520,000 | | |
| > Greece | |
| Intralot | | | 1,300,000 | | | | 1,630,000 | | |
| | | Number of Shares | |
| | | 03/31/07 | | 06/30/07 | |
| Asia | |
| > Japan | |
| Aeon Delight | | | 0 | | | | 95,000 | | |
| As One | | | 396,000 | | | | 585,000 | | |
| FCC | | | 900,000 | | | | 1,150,000 | | |
| Kansai Paint | | | 3,700,000 | | | | 6,000,000 | | |
| Kansai Urban Banking | | | 0 | | | | 4,100,000 | | |
| Nakanishi | | | 92,000 | | | | 145,000 | | |
| Topcon | | | 0 | | | | 650,000 | | |
| Unicharm PetCare | | | 0 | | | | 105,000 | | |
| Union Tool | | | 403,600 | | | | 500,000 | | |
| Yusen Air & Sea Service | | | 1,273,900 | | | | 1,300,000 | | |
| > China | |
| China Green | | | 22,049,000 | | | | 25,051,000 | | |
| Fu Ji Food & Catering Services | | | 4,782,000 | | | | 6,256,000 | | |
| Hopewell Highway Infrastructure | | | 0 | | | | 20,000,000 | | |
| Jiangsu Expressway | | | 0 | | | | 17,918,000 | | |
| Travelsky Technology | | | 6,758,000 | | | | 20,910,000 | | |
| Xinyu Hengdeli | | | 0 | | | | 6,008,000 | | |
| > Hong Kong | |
| EganaGoldpfeil | | | 26,600,000 | | | | 29,344,000 | | |
Hong Kong Exchanges and
Clearing | | | 5,026,000 | | | | 5,500,000 | | |
| > South Korea | |
| Sung Kwang Bend | | | 714,000 | | | | 915,000 | | |
| > India | |
| United Phosphorus | | | 0 | | | | 192,000 | | |
| Other Countries | |
| > United States | |
| BioMarin | | | 0 | | | | 524,000 | | |
| Dresser-Rand Group | | | 0 | | | | 500,000 | | |
| FMC Technologies | | | 189,000 | | | | 379,000 | | |
| Tesco | | | 119,239 | | | | 273,000 | | |
| > New Zealand | |
| Sky City Entertainment | | | 5,661,208 | | | | 5,773,789 | | |
| Latin America | |
| > Brazil | |
| Localiza Rent A Car | | | 500,000 | | | | 1,500,000 | | |
| > Mexico | |
| Grupo Aeroportuario del Surest | | | 411,000 | | | | 500,000 | | |
35
Columbia Acorn International
Major Portfolio Changes in the Second Quarter (Unaudited) continued
| | | Number of Shares | |
| | | 03/31/07 | | 06/30/07 | |
| Sales | |
| Europe | |
| > Netherlands | |
| USG People | | | 1,103,000 | | | | 929,361 | | |
| > France | |
| Neopost | | | 200,000 | | | | 160,000 | | |
| > Germany | |
| Gagfah | | | 150,000 | | | | 0 | | |
| Hugo Boss Designs | | | 525,000 | | | | 425,000 | | |
| > United Kingdom | |
| Debt Free Direct | | | 1,300,000 | | | | 1,000,000 | | |
| Keller Group | | | 1,000,000 | | | | 650,000 | | |
| Northern Rock | | | 2,100,000 | | | | 0 | | |
| Paragon Group | | | 3,500,000 | | | | 371,000 | | |
| Workspace Group | | | 2,450,000 | | | | 1,280,000 | | |
| > Ireland | |
| Anglo Irish Bank | | | 1,300,000 | | | | 0 | | |
| Bank of Ireland | | | 2,000,000 | | | | 845,000 | | |
| C&C Group | | | 1,260,000 | | | | 255,000 | | |
| Grafton Group | | | 1,850,000 | | | | 1,040,000 | | |
| Ryanair | | | 500,000 | | | | 0 | | |
| > Italy | |
| Banca Italease | | | 590,000 | | | | 0 | | |
| Ducati Motor | | | 13,400,000 | | | | 12,531,048 | | |
| > Spain | |
| Red Electrica de Espana | | | 567,000 | | | | 400,000 | | |
| | | Number of Shares | |
| | | 03/31/07 | | 06/30/07 | |
| Asia | |
| > Japan | |
| Chiba Bank | | | 2,000,000 | | | | 1,500,000 | | |
| Daito Trust Construction | | | 546,000 | | | | 375,000 | | |
| Hiroshima Bank | | | 2,248,000 | | | | 0 | | |
| Hogy Medical | | | 321,300 | | | | 53,000 | | |
| > Hong Kong | |
| Melco-PBL Entertainment Macau | | | 200,000 | | | | 0 | | |
| Techtronic Industries | | | 14,000,000 | | | | 0 | | |
| > South Korea | |
| Woongjin Thinkbig | | | 183,500 | | | | 0 | | |
| Other Countries | |
| > Canada | |
| Major Drilling Group | | | 530,000 | | | | 0 | | |
| Northern Orion Resources | | | 839,000 | | | | 0 | | |
| Railpower Technologies | | | 1,778,000 | | | | 0 | | |
| UrAsia Energy | | | 6,775,000 | | | | 0 | | |
| > South Africa | |
| Edgars Consolidated Stores | | | 4,530,000 | | | | 0 | | |
| Latin America | |
| > Brazil | |
| Brascan Residential Properties | | | 492,000 | | | | 0 | | |
| > Mexico | |
| Grupo Aeroportuario Centro Norte | | | 200,000 | | | | 0 | | |
| Grupo Aeroportuario del Pacifica | | | 100,000 | | | | 0 | | |
36
Columbia Acorn International
Statement of Investments (Unaudited), June 30, 2007
| Number of Shares | | | | Value (000) | |
| | | | | | | | Equities: 91.9% | | |
| Europe 51.6% | | | |
| | | > Netherlands 9.3% | |
| | 1,406,155 | | | Fugro | | $ | 89,239 | | |
| | | | | Oilfield Services | | | | | |
| | 825,000 | | | Stork | | | 53,550 | | |
| | | | | Industrial Services & Food Processing Equipment | | | | | |
| | 1,947,042 | | | Aalberts Industries | | | 53,461 | | |
| | | | | Flow Control & Heat Treatment | | | | | |
| | 680,000 | | | Smit Internationale | | | 53,209 | | |
| | | | | Harbor & Offshore Towage & Marine Services | | | | | |
| | 929,361 | | | USG People | | | 43,660 | | |
| | | | | Temporary Staffing Services | | | | | |
| | 1,096,000 | | | Koninklijke TenCate | | | 41,953 | | |
| | | | | Advanced Textiles & Industrial Fabrics | | | | | |
| | 479,000 | | | Imtech | | | 41,552 | | |
| | | | | Engineering & Technical Services | | | | | |
| | 1,385,000 | | | Unit 4 Agresso (a) | | | 37,517 | | |
| | | | | Business & Security Software | | | | | |
| | 1,182,536 | | | Wavin | | | 28,447 | | |
| | | | | Largest European Plastic Pipe Systems Company | | | | | |
| | 764,000 | | | OPG Groep | | | 27,821 | | |
| | | | | Health Care Supplies & Pharmacies | | | | | |
| | 489,000 | | | Boskalis Westminster | | | 19,440 | | |
| | | | | Dredging & Maritime Contractor | | | | | |
| | 450,000 | | | SBM Offshore | | | 17,153 | | |
| | | | | Builds & Leases Offshore Vessels to Process &
Store Crude Oil | | | | | |
| | | | 507,002 | | |
| | | > France 8.4% | |
| | 3,000,000 | | | SES Global | | | 64,665 | | |
| | | | | Satellite Broadcasting Services | | | | | |
| | 600,000 | | | Carbone Lorraine | | | 46,562 | | |
| | | | | Advanced Industrial Materials | | | | | |
| | 390,000 | | | Iliad | | | 39,404 | | |
| | | | | Alternative Internet & Telecoms Provider | | | | | |
| | 375,000 | | | Norbert Dentressangle | | | 36,304 | | |
| | | | | Transport | | | | | |
| | 571,000 | | | Trigano | | | 33,816 | | |
| | | | | Leisure Vehicles & Camping Equipment | | | | | |
| | 206,000 | | | Pierre & Vacances | | | 31,429 | | |
| | | | | Vacation Apartment Lets | | | | | |
| | 332,020 | | | Rubis | | | 29,711 | | |
| | | | | Tank Storage & LPG Supplier | | | | | |
| | 190,000 | | | Bacou Dalloz | | | 28,883 | | |
| | | | | Safety Equipment | | | | | |
| | 700,000 | | | Legrand | | | 25,191 | | |
| | | | | Electrical Components | | | | | |
| | 240,000 | | | Imerys | | | 24,341 | | |
| | | | | Industrial Minerals Producer | | | | | |
| | 160,000 | | | Neopost | | | 23,399 | | |
| | | | | Postage Meter Machines | | | | | |
| | 100,000 | | | Ciments Francais | | | 22,933 | | |
| | | | | Leading French & Emerging Markets
Cement Producer | | | | | |
| | 240,000 | | | Eurofins Scientific (b) | | | 20,377 | | |
| | | | | Food Screening & Testing | | | | | |
| | 350,000 | | | April Group | | | 18,437 | | |
| | | | | Insurance Policy Construction | | | | | |
| Number of Shares | | | | Value (000) | |
| | 360,000 | | | Meetic (b) | | $ | 15,291 | | |
| | | | | Dating Services | | | | | |
| | | | 460,743 | | |
| | | > Germany 6.7% | |
| | 900,000 | | | Rhoen-Klinikum | | | 54,230 | | |
| | | | | Health Care Services | | | | | |
| | 775,000 | | | CTS Eventim | | | 38,171 | | |
| | | | | Event Ticket Sales | | | | | |
| | 400,000 | | | Wincor Nixdorf | | | 37,074 | | |
| | | | | Retail POS Systems & ATM Machines | | | | | |
| | 300,000 | | | MPC Muechmeyer Petersen Capital | | | 30,670 | | |
| | | | | Alternative Asset Manager | | | | | |
| | 250,000 | | | Vossloh | | | 29,346 | | |
| | | | | Rail Infrastructure & Diesel Locomotives | | | | | |
| | 15,000 | | | Porsche | | | 26,704 | | |
| | | | | Specialty Automobile Manufacturer | | | | | |
| | 525,000 | | | GFK | | | 25,928 | | |
| | | | | Market Research Services | | | | | |
| | 425,000 | | | Hugo Boss Designs | | | 25,446 | | |
| | | | | Fashion Apparel | | | | | |
| | 267,000 | | | Elringklinger | | | 24,359 | | |
| | | | | Automobile Components | | | | | |
| | 200,000 | | | Deutsche Boerse | | | 22,661 | | |
| | | | | Trading, Clearing, Settlement Services for
Financial Markets | | | | | |
| | 100,000 | | | Rational | | | 19,595 | | |
| | | | | Commercial Oven Manufacturer | | | | | |
| | 870,000 | | | Takkt | | | 15,493 | | |
| | | | | Mail Order Retailer of Office &
Warehouse Durables | | | | | |
| | 354,500 | | | Deutsche Beteiligungs | | | 14,384 | | |
| | | | | Private Equity Investment Management | | | | | |
| | | | 364,061 | | |
| | | > Switzerland 6.0% | |
| | 600,000 | | | Kuehne & Nagel | | | 55,263 | | |
| | | | | Freight Forwarding/Logistics | | | | | |
| | 24,000 | | | Sika | | | 48,983 | | |
| | | | | Chemicals for Construction &
Industrial Applications | | | | | |
| | 140,000 | | | Nobel Biocare Holding | | | 45,713 | | |
| | | | | Dental Implants & Ceramic Crowns | | | | | |
| | 360,000 | | | Synthes | | | 43,207 | | |
| | | | | Products for Orthopedic Surgery | | | | | |
| | 250,000 | | | Geberit | | | 42,655 | | |
| | | | | Plumbing Supplies | | | | | |
| | 140,000 | | | Burckhardt Compression (b) | | | 33,925 | | |
| | | | | Gas Compression Pumps | | | | | |
| | 375,000 | | | Schindler | | | 24,862 | | |
| | | | | Elevator Manufacturer & Service Provider | | | | | |
| | 25,000 | | | Givaudan | | | 24,686 | | |
| | | | | Fragrances & Flavors | | | | | |
| | 400,000 | | | Logitech International (b) | | | 10,599 | | |
| | | | | Branded Peripheral Computer Devices | | | | | |
| | | | 329,893 | | |
| | | > United Kingdom 5.9% | |
| | 1,970,714 | | | Expro International Group | | | 38,416 | | |
| | | | | Offshore Oilfield Services | | | | | |
| | 1,875,000 | | | Northgate | | | 38,413 | | |
| | | | | Light Commercial Vehicle Rental Specialist | | | | | |
37
Columbia Acorn International
Statement of Investments (Unaudited), continued
| Number of Shares | | | | Value (000) | |
| | | > United Kingdom—continued | |
| | 5,040,000 | | | RPS Group | | $ | 35,304 | | |
| | | | | Environmental Consulting & Planning | | | | | |
| | 2,670,000 | | | Smith & Nephew | | | 33,041 | | |
| | | | | Medical Equipment & Supplies | | | | | |
| | 3,255,691 | | | Tullow Oil | | | 31,725 | | |
| | | | | Oil & Gas Producer | | | | | |
| | 5,922,000 | | | Taylor Nelson Sofres | | | 28,007 | | |
| | | | | Market Research | | | | | |
| | 3,007,000 | | | BBA Group | | | 16,307 | | |
| | | | | Aviation Support Services | | | | | |
| | 1,400,000 | | | Informa Group | | | 15,563 | | |
| | | | | Global Publisher & Event Organizer | | | | | |
| | 640,000 | | | Randgold Resources | | | 14,202 | | |
| | | | | Gold Mining in Western Africa | | | | | |
| | 650,000 | | | Keller Group | | | 14,020 | | |
| | | | | International Ground Engineering Specialist | | | | | |
| | 1,280,000 | | | Workspace Group | | | 10,262 | | |
| | | | | UK Real Estate | | | | | |
| | 517,000 | | | Intertek Testing | | | 10,136 | | |
| | | | | Testing, Inspection, Certification Services | | | | | |
| | 1,275,000 | | | Detica | | | 9,814 | | |
| | | | | UK IT Services Company | | | | | |
| | 1,436,000 | | | Mears Group | | | 9,347 | | |
| | | | | Social Housing Mainentance | | | | | |
| | 448,000 | | | Rotork | | | 8,174 | | |
| | | | | Valve Actuators for Oil & Water Pipelines | | | | | |
| | 1,000,000 | | | Debt Free Direct | | | 4,755 | | |
| | | | | Consumer Debt Reduction &
Management Solutions | | | | | |
| | 371,000 | | | Paragon Group | | | 3,631 | | |
| | | | | UK Buy-to-let Finance Company | | | | | |
| | | | 321,117 | | |
| | | > Ireland 3.4% | |
| | 8,100,000 | | | United Drug | | | 44,231 | | |
| | | | | Irish Pharmaceutical Wholesaler & Outsourcer | | | | | |
| | 1,800,000 | | | IAWS Group | | | 37,705 | | |
| | | | | Baked Goods | | | | | |
| | 1,050,000 | | | Kingspan Group | | | 29,362 | | |
| | | | | Building Insulation & Environmental Containers | | | | | |
| | 1,300,000 | | | Depfa Bank | | | 23,018 | | |
| | | | | Investment Banker to Public Authorities | | | | | |
| | 600,000 | | | Paddy Power | | | 18,706 | | |
| | | | | Irish Betting Services | | | | | |
| | 845,000 | | | Bank of Ireland | | | 17,123 | | |
| | | | | Irish Commercial Bank | | | | | |
| | 1,040,000 | | | Grafton Group | | | 14,837 | | |
| | | | | Builders Materials Wholesaling &
Do-it-yourself Retailing | | | | | |
| | 255,000 | | | C&C Group | | | 3,420 | | |
| | | | | Beverage Company | | | | | |
| | | | 188,402 | | |
| | | > Sweden 2.4% | |
| | 3,960,000 | | | Hexagon | | | 75,944 | | |
| | | | | Measurement Equipment & Polymers | | | | | |
| | 3,135,000 | | | SWECO | | | 30,042 | | |
| | | | | Engineering Consultants | | | | | |
| | 2,265,000 | | | Nobia | | | 28,189 | | |
| | | | | Kitchen Cabinet Manufacturing & Distribution | | | | | |
| | | | 134,175 | | |
| Number of Shares | | | | Value (000) | |
| | | > Italy 2.2% | |
| | 9,100,000 | | | CIR | | $ | 34,997 | | |
| | | | | Italian Holding Company | | | | | |
| | 12,531,048 | | | Ducati Motor (b) | | | 30,501 | | |
| | | | | Motorcycles & Related Merchandise | | | | | |
| | 3,000,000 | | | Amplifon | | | 24,927 | | |
| | | | | Hearing Aid Retailer | | | | | |
| | 1,223,000 | | | GranitiFiandre | | | 15,532 | | |
| | | | | Innovative Stoneware | | | | | |
| | 375,000 | | | Sabaf | | | 14,295 | | |
| | | | | Supplier to White Goods Original Equipment
Manufacturers | | | | | |
| | | | 120,252 | | |
| | | > Spain 1.2% | |
| | 1,050,000 | | | Prisa | | | 23,092 | | |
| | | | | Leading Spanish-speaking Publisher | | | | | |
| | 520,000 | | | Sogecable (b) | | | 21,767 | | |
| | | | | Spain's Main Pay-TV | | | | | |
| | 400,000 | | | Red Electrica de Espana | | | 18,744 | | |
| | | | | Spanish Power Grid | | | | | |
| | | | 63,603 | | |
| | | > Austria 1.1% | |
| | 965,000 | | | Zumtobel (b) | | | 35,996 | | |
| | | | | Lighting Systems | | | | | |
| | 300,000 | | | Wienerberger | | | 22,123 | | |
| | | | | Bricks & Clay Roofing Tiles | | | | | |
| | | | 58,119 | | |
| | | > Russia 1.0% | |
| | 775,000 | | | Novolipetsk Steel | | | 22,746 | | |
| | | | | Vertically Integrated Steel Producer | | | | | |
| | 486,000 | | | RosBusinessConsulting (b) | | | 17,496 | | |
| | | | | Financial Information, Media &
IT Services in Russia | | | | | |
| | 370,000 | | | Mechel Steel Group | | | 13,516 | | |
| | | | | Coking Coal | | | | | |
| | | | 53,758 | | |
| | | > Greece 1.0% | |
| | 1,630,000 | | | Intralot | | | 52,509 | | |
| | | | | Lottery & Gaming Systems & Services | | | | | |
| | | | 52,509 | | |
| | | > Poland 0.7% | |
| | 1,125,500 | | | Central European Distribution (b) | | | 38,965 | | |
| | | | | Vodka Production & Alcohol Distribution | | | | | |
| | | | 38,965 | | |
| | | > Finland 0.7% | |
| | 1,756,000 | | | Poyry | | | 38,934 | | |
| | | | | Engineering Consultants | | | | | |
| | | | 38,934 | | |
| | | > Czech Republic 0.6% | |
| | 183,000 | | | Komercni Banka | | | 34,069 | | |
| | | | | Leading Czech Universal Bank | | | | | |
| | | | 34,069 | | |
| | | > Denmark 0.6% | |
| | 265,000 | | | Novozymes | | | 30,719 | | |
| | | | | Industrial Enzymes | | | | | |
| | | | 30,719 | | |
38
| Number of Shares | | | | Value (000) | |
| | | > Norway 0.4% | |
| | 2,354,000 | | | Kongsberg Automotive (a) | | $ | 19,731 | | |
| | | | | Automotive Seating & Component Supplier | | | | | |
| | | | 19,731 | | |
| Europe: Total | | | 2,816,052 | | |
| Asia 25.2% | | | |
| | | > Japan 13.3% | |
| | 6,000,000 | | | Kansai Paint | | | 52,411 | | |
| | | | | Paint Producer in Japan, India, China &
Southeast Asia | | | | | |
| | 730,000 | | | Ibiden | | | 47,005 | | |
| | | | | Electronic Parts & Ceramics | | | | | |
| | 1,205,000 | | | Aeon Mall | | | 36,964 | | |
| | | | | Suburban Shopping Mall Developer,
Owner & Operator | | | | | |
| | 43,500 | | | Jupiter Telecommunications (b) | | | 35,870 | | |
| | | | | Largest Cable Service Provider in Japan | | | | | |
| | 1,080,000 | | | Hoya | | | 35,745 | | |
| | | | | Opto-electrical Components & Eyeglass Lenses | | | | | |
| | 16,000 | | | Kenedix | | | 29,760 | | |
| | | | | Real Estate Investment Management | | | | | |
| | 1,218,000 | | | JSR | | | 29,334 | | |
| | | | | Films & Chemicals for LCD Screens &
Electronics | | | | | |
| | 1,272,000 | | | Ushio | | | 28,184 | | |
| | | | | Industrial Light Sources | | | | | |
| | 1,300,000 | | | Yusen Air & Sea Service | | | 27,785 | | |
| | | | | Airfreight Logistics | | | | | |
| | 816,200 | | | Kintetsu World Express | | | 27,647 | | |
| | | | | Airfreight Logistics | | | | | |
| | 430,000 | | | USS | | | 27,369 | | |
| | | | | Used Car Auctioneer | | | | | |
| | 1,150,000 | | | FCC | | | 23,617 | | |
| | | | | Auto/Motorcycle Clutches | | | | | |
| | 718,000 | | | Ito En | | | 23,582 | | |
| | | | | Bottled Tea & Other Beverages | | | | | |
| | 2,000,000 | | | Park24 | | | 20,081 | | |
| | | | | Parking Lot Operator | | | | | |
| | 7,000 | | | Risa Partners | | | 19,021 | | |
| | | | | NPL & Real Estate Related Investment | | | | | |
| | 500,000 | | | Union Tool | | | 18,471 | | |
| | | | | Precision Drill Bit Manufacturer | | | | | |
| | 14,000 | | | FullCast (a) | | | 18,403 | | |
| | | | | Employment Outsourcing | | | | | |
| | 145,000 | | | Nakanishi | | | 18,099 | | |
| | | | | Dental Tools & Machinery | | | | | |
| | 375,000 | | | Daito Trust Construction | | | 17,842 | | |
| | | | | Apartment Builder | | | | | |
| | 1,140,000 | | | Cosel | | | 16,520 | | |
| | | | | Industrial Standard Switching
Power Supply System | | | | | |
| | 965,000 | | | T. Hasegawa | | | 16,064 | | |
| | | | | Industrial Flavors & Fragrances | | | | | |
| | 585,000 | | | As One | | | 15,068 | | |
| | | | | Scientific Supplies Distributor | | | | | |
| | 4,100,000 | | | Kansai Urban Banking | | | 14,215 | | |
| | | | | Regional Bank | | | | | |
| | 1,500,000 | | | Chiba Bank | | | 13,313 | | |
| | | | | Regional Bank | | | | | |
| Number of Shares | | | | Value (000) | |
| | 380,000 | | | Takata | | $ | 13,245 | | |
| | | | | Safety Related Auto Parts | | | | | |
| | 370,000 | | | Shimano | | | 12,679 | | |
| | | | | Bicycle Components & Fishing Tackle | | | | | |
| | 2,400 | | | Osaka Securities Exchange | | | 11,071 | | |
| | | | | Osaka Securities Exchange | | | | | |
| | 650,000 | | | Topcon | | | 10,818 | | |
| | | | | Positioning & Medical Instrument | | | | | |
| | 1,230,000 | | | Kamigumi | | | 10,662 | | |
| | | | | Port Cargo Handling & Logistics | | | | | |
| | 1,500,000 | | | Bank of Fukuoka | | | 9,895 | | |
| | | | | Regional Bank | | | | | |
| | 643,000 | | | Ain Pharmaciez (a) | | | 9,813 | | |
| | | | | Dispensing Pharmacy/Drugstore Operator | | | | | |
| | 72,000 | | | Hirose Electric | | | 9,457 | | |
| | | | | Electrical Connectors | | | | | |
| | 374,000 | | | Nagaileben | | | 7,215 | | |
| | | | | Medical/Health Care Related Clothes | | | | | |
| | 1,650 | | | Japan Pure Chemical | | | 6,486 | | |
| | | | | Precious Metal Plating Chemicals for Electronics | | | | | |
| | 3,300 | | | Message | | | 5,353 | | |
| | | | | Nursing Care Facility Operator | | | | | |
| | 105,000 | | | Unicharm PetCare | | | 4,228 | | |
| | | | | Pet Food & Pet Toiletries | | | | | |
| | 95,000 | | | Aeon Delight | | | 2,898 | | |
| | | | | Facility Maintenance & Management | | | | | |
| | 53,000 | | | Hogy Medical | | | 2,366 | | |
| | | | | Disposable Surgical Products | | | | | |
| | | | 728,556 | | |
| | | > China 3.9% | |
| | 23,547,000 | | | China Shipping Development | | | 54,313 | | |
| | | | | China's Dominant Shipper for Oil & Coal | | | | | |
| | 48,430,000 | | | Lenovo Group | | | 28,527 | | |
| | | | | Third Largest PC Vendor Globally | | | | | |
| | 25,051,000 | | | China Green | | | 23,071 | | |
| | | | | An Agricultural Grower & Processor in China | | | | | |
| | 6,256,000 | | | Fu Ji Food & Catering Services | | | 21,445 | | |
| | | | | Food Catering Service Provider In China | | | | | |
| | 20,000,000 | | | Hopewell Highway Infrastructure | | | 18,731 | | |
| | | | | Guangdong Tollroad Leading to
Hong Kong & Macau | | | | | |
| | 17,918,000 | | | Jiangsu Expressway | | | 18,225 | | |
| | | | | Chinese Toll Road Operator | | | | | |
| | 20,910,000 | | | Travelsky Technology | | | 17,870 | | |
| | | | | Online Air Travel Bookings in China | | | | | |
| | 21,750,000 | | | TPV Technology | | | 15,035 | | |
| | | | | Original Design Manufacturer for
LCD Monitor & Flat TV | | | | | |
| | 400,000 | | | Sohu.com (b) | | | 12,796 | | |
| | | | | Advertising on Chinese Internet Portal | | | | | |
| | 6,008,000 | | | Xinyu Hengdeli | | | 2,947 | | |
| | | | | A High-end Watch Retailer in China | | | | | |
| | | | 212,960 | | |
| | | > Hong Kong 2.2% | |
| | 5,500,000 | | | Hong Kong Exchanges and Clearing | | | 77,817 | | |
| | | | | Hong Kong Equity & Derivatives
Market Operator | | | | | |
| | 29,344,000 | | | EganaGoldpfeil | | | 25,706 | | |
| | | | | A Leather & Fashion Accessories
Brand Manager | | | | | |
39
Columbia Acorn International
Statement of Investments (Unaudited), continued
| Number of Shares | | | | Value (000) | |
| | | > Hong Kong—continued | |
| | 5,000,000 | | | Lifestyle International | | $ | 19,378 | | |
| | | | | Mid to High-end Department Store Operator
in Hong Kong & China | | | | | |
| | | | 122,901 | | |
| | | > South Korea 1.7% | |
| | 444,000 | | | Taewoong | | | 31,144 | | |
| | | | | A Player in the Niche Customized
Forging Market | | | | | |
| | 160,000 | | | MegaStudy | | | 31,081 | | |
| | | | | Online Education Service Provider | | | | | |
| | 915,000 | | | Sung Kwang Bend | | | 27,053 | | |
| | | | | A Large Customized Industrial Pipe
Fitting Manufacturer | | | | | |
| | 262,000 | | | YBM Sisa.com | | | 5,031 | | |
| | | | | Online Language Educator & Tester | | | | | |
| | | | 94,309 | | |
| | | > India 1.5% | |
| | 1,300,000 | | | Housing Development Finance | | | 64,598 | | |
| | | | | Indian Mortgage Lender | | | | | |
| | 700,000 | | | Asian Paints | | | 14,250 | | |
| | | | | India's Largest Paint Company | | | | | |
| | 192,000 | | | United Phosphorus | | | 1,482 | | |
| | | | | Off-patent Crop Protection Chemicals | | | | | |
| | | | 80,330 | | |
| | | > Singapore 1.2% | |
| | 7,000,000 | | | Singapore Exchange | | | 44,707 | | |
| | | | | Singapore Equity & Derivatives
Market Operator | | | | | |
| | 13,000,000 | | | ComfortDelGro | | | 18,527 | | |
| | | | | Taxi & Mass Transit Service | | | | | |
| | | | 63,234 | | |
| | | > Taiwan 1.1% | |
| | 6,958,367 | | | Advantech | | | 22,222 | | |
| | | | | Embedded Computers | | | | | |
| | 7,280,000 | | | Wah Lee Industrial | | | 16,478 | | |
| | | | | Distributor of Chemicals, Materials &
Equipment | | | | | |
| | 3,500,000 | | | Everlight Electronics | | | 12,506 | | |
| | | | | A Led Packager | | | | | |
| | 795,826 | | | Formosa International Hotels | | | 8,565 | | |
| | | | | Hotel, Food & Beverage Operation &
Hospitality Management Services | | | | | |
| | | | 59,771 | | |
| | | > Indonesia 0.3% | |
| | 15,000,000 | | | Perusahaan Gas Negara | | | 15,668 | | |
| | | | | Gas Pipeline Operator | | | | | |
| | | | 15,668 | | |
| Asia: Total | | | 1,377,729 | | |
| Other Countries 10.4% | | | |
| | | > Australia 2.8% | |
| | 3,000,000 | | | Billabong International | | | 45,426 | | |
| | | | | Action Sports Apparel Brand Manager | | | | | |
| | 750,000 | | | Australian Stock Exchange | | | 30,851 | | |
| | | | | Australian Equity & Derivatives
Market Operator | | | | | |
| | 2,000,000 | | | Jubilee Mines | | | 27,009 | | |
| | | | | Nickel Mining in Australia | | | | | |
| Number of Shares | | | | Value (000) | |
| | 5,480,000 | | | Sino Gold (b) | | $ | 25,957 | | |
| | | | | Gold Mining in The People's Republic
of China | | | | | |
| | 350,000 | | | Perpetual Trustees | | | 23,183 | | |
| | | | | Mutual Fund Management | | | | | |
| | | | 152,426 | | |
| | | > Canada 2.6% | |
| | 1,860,000 | | | ShawCor | | | 57,114 | | |
| | | | | Oil & Gas Pipeline Products | | | | | |
| | 1,663,500 | | | RONA (b) | | | 34,746 | | |
| | | | | Leading Canadian Do-it-yourself Retailer | | | | | |
| | 950,000 | | | Van Houtte (a) | | | 22,188 | | |
| | | | | Coffee Services & Equipment | | | | | |
| | 865,000 | | | Talisman Energy | | | 16,727 | | |
| | | | | Oil & Gas Producer | | | | | |
| | 850,000 | | | Ivanhoe Mines (b) | | | 12,049 | | |
| | | | | Copper Mine Project in Mongolia | | | | | |
| | | | 142,824 | | |
| | | > United States 2.3% | |
| | 865,000 | | | Atwood Oceanics (b) | | | 59,356 | | |
| | | | | Offshore Drilling Contractor | | | | | |
| | 379,000 | | | FMC Technologies (b) | | | 30,024 | | |
| | | | | Oil & Gas Well Head Manufacturer | | | | | |
| | 500,000 | | | Dresser-Rand Group (b) | | | 19,750 | | |
| | | | | Largest Manufacturer of Compressors | | | | | |
| | 524,000 | | | BioMarin (b) | | | 9,401 | | |
| | | | | Biotech Focused on Orphan Diseases | | | | | |
| | 273,000 | | | Tesco (b) | | | 8,613 | | |
| | | | | Developing New Well Drilling Technologies | | | | | |
| | | | 127,144 | | |
| | | > South Africa 2.3% | |
| | 1,440,000 | | | Impala Platinum Holdings | | | 43,657 | | |
| | | | | Platinum Group Metals Mining & Refining | | | | | |
| | 1,560,000 | | | Naspers | | | 39,960 | | |
| | | | | Media & Education in Africa &
Other Emerging Markets | | | | | |
| | 3,048,750 | | | Uranium One (b) | | | 38,837 | | |
| | | | | Uranium Mines in South Africa,
Kazakhstan, Australia & the U.S. | | | | | |
| | | | 122,454 | | |
| | | > New Zealand 0.4% | |
| | 5,773,789 | | | Sky City Entertainment | | | 22,572 | | |
| | | | | Casino/Entertainment Complex | | | | | |
| | | | 22,572 | | |
| Other Countries: Total | | | 567,420 | | |
| Latin America 4.7% | | | |
| | | > Brazil 2.6% | |
| | 4,300,000 | | | Suzano | | | 58,180 | | |
| | | | | Brazilian Pulp & Paper Producer | | | | | |
| | 2,500,000 | | | Natura Cosmeticos | | | 36,288 | | |
| | | | | Direct Retailer of Cosmetics | | | | | |
| | 720,000 | | | Porto Seguro | | | 27,621 | | |
| | | | | Auto & Life Insurance | | | | | |
| | 1,500,000 | | | Localiza Rent A Car | | | 16,913 | | |
| | | | | Car Rental | | | | | |
| | | | 139,002 | | |
40
Number of Shares
or Principal Amount (000) | | | | Value (000) | |
| | | > Mexico 1.6% | |
| | 7,000,000 | | | Urbi Desarrollos Urbanos (b) | | $ | 32,235 | | |
| | | | | Affordable Housing Builder | | | | | |
| | 18,000,000 | | | Consorcio ARA | | | 28,991 | | |
| | | | | Affordable Housing Builder | | | | | |
| | 500,000 | | | Grupo Aeroportuario del Surest | | | 26,345 | | |
| | | | | Cancun & Cozumel Airport Operator | | | | | |
| | | | 87,571 | | |
| | | > Chile 0.5% | |
| | 160,000 | | | Sociedad Quimica y
Minera de Chile | | | 27,526 | | |
| | | | | Producer of Specialty Fertilizers,
Lithium, & Iodine | | | | | |
| | | | 27,526 | | |
| Latin America: Total | | | 254,099 | | |
Total Equities: 91.9%
(Cost: $3,002,695) | | | 5,015,300 | | |
| Short-Term Obligations 7.3% | | | |
| $ | 27,200 | | | Pasa Funding (c)
5.31% Due 7/13/07 | | | 27,152 | | |
| | 27,000 | | | Advantage Asset (c)
5.32% Due 7/12/07 | | | 26,956 | | |
| | 27,000 | | | Gotham Funding (c)
5.30% Due 7/16/07 | | | 26,940 | | |
| | 27,000 | | | Mont Blanc Capital (c)
5.30% Due 7/24/07 | | | 26,909 | | |
| | 26,900 | | | Beethoven Funding (c)
5.35% Due 7/23/07 | | | 26,812 | | |
| | 26,800 | | | Coast Asset (c)
5.31% Due 7/11/07 | | | 26,761 | | |
| | 26,500 | | | St. Germain Holdings (c)
5.33% Due 7/10/07 | | | 26,465 | | |
| | 26,400 | | | Bavaria (c)
5.29% Due 7/5/07 | | | 26,384 | | |
| | 26,300 | | | Mica Funding LLC (c)
5.29% Due 7/2/07 | | | 26,296 | | |
| | 26,300 | | | Versailles LLC (c)
5.29% Due 7/3/07 | | | 26,292 | | |
| | 26,300 | | | Whistlejacket Capital (c)
5.32% Due 7/9/07 | | | 26,269 | | |
| | 23,200 | | | Morrigan TRR (c)
5.33% Due 7/17/07 | | | 23,145 | | |
| | 22,000 | | | East Fleet Financial (c)
5.31% Due 7/6/07 | | | 21,984 | | |
| | 20,000 | | | Manhattan Asset Funding (c)
5.31% Due 7/18/07 | | | 19,950 | | |
| | 18,000 | | | Cairn High Grade LLC (c)
5.30% Due 7/20/07 | | | 17,950 | | |
| | 15,000 | | | White Point Funding (c)
5.32% Due 7/19/07 | | | 14,960 | | |
| Principal Amount (000) | | | | Value (000) | |
| $ | 7,601 | | | Repurchase Agreement with
Fixed Income Clearing Corp.,
dated 6/29/07, due 7/02/07 at
5.050%, collateralized by a
U.S. Government Agency
Obligation, maturing 7/18/11,
market value $7,756
(repurchase proceeds $7,604) | | $ | 7,601 | | |
| | | (Amortized Cost: $398,826) | | | 398,826 | | |
Total Investments: 99.2%
(Cost: $3,401,521)(d)(e) | | | 5,414,126 | | |
| Cash and Other Assets Less Liabilities: 0.8% | | | 44,604 | | |
| Total Net Assets: 100% | | $ | 5,458,730 | | |
41
Columbia Acorn International
Statement of Investments (Unaudited), continued
> Notes to Statement of Investments (dollar values in thousands)
(a) An affiliate may include any company in which the Fund owns five percent or more of its outstanding voting shares. Transactions in these affiliated companies during the six months ended June 30, 2007, are as follows:
| Affiliates | | Balance of
Shares Held
12/31/2006 | | Purchases/
Additions | | Sales/
Reductions | | Balance of
Shares Held
6/30/2007 | | Value | | Dividend | |
| AIN Pharmaciez | | | 643,000 | | | | - | | | | - | | | | 643,000 | | | $ | 9,813 | | | $ | 91 | | |
| FullCast | | | - | | | | 14,000 | | | | - | | | | 14,000 | | | | 18,403 | | | | 112 | | |
| Kongsberg Automotive | | | 2,065,000 | | | | 289,000 | | | | - | | | | 2,354,000 | | | | 19,731 | | | | 386 | | |
| Unit 4 Agresso | | | 1,385,000 | | | | - | | | | - | | | | 1,385,000 | | | | 37,517 | | | | 1,194 | | |
| Van Houtte | | | 950,000 | | | | - | | | | - | | | | 950,000 | | | | 22,188 | | | | 245 | | |
| TOTAL OF AFFILIATED TRANSACTIONS | | | 5,043,000 | | | | 303,000 | | | | - | | | | 5,346,000 | | | $ | 107,652 | | | $ | 2,028 | | |
The aggregate cost and value of these companies at June 30, 2007, was $102,622 and $107,652, respectively. Investments in affiliate companies represented 2.0% of total net assets at June 30, 2007.
(b) Non-income producing security.
(c) Security exempt from registration under Section 4(2) of the Securities Act of 1933. These securities may only be resold in exempt transactions to qualified buyers. Private resales of these securities to qualified institutional buyers are also exempt from registration pursuant to Rule 144A under the Securities Act of 1933. At June 30, 2007, these securities amounted to $391,225, which represented 7.2% of net assets.
(d) At June 30, 2007 for federal income tax purposes cost of investments was $3,401,521 and net unrealized appreciation was $2,012,605 consisting of gross unrealized appreciation of $2,090,136 and gross unrealized depreciation of $77,531.
(e) On June 30, 2007, the Fund's total investments were denominated in currencies as follows:
| Currency | | Value | | % of
Total
Net
Assets | |
| Euro | | $ | 1,853,624 | | | | 34.0 | % | |
| Japanese Yen | | | 728,556 | | | | 13.3 | | |
| US Dollar | | | 699,562 | | | | 12.8 | | |
| Swiss Franc | | | 329,893 | | | | 6.0 | | |
| Hong Kong Dollar | | | 323,065 | | | | 5.9 | | |
| British Pounds | | | 306,915 | | | | 5.6 | | |
Other currencies less than 5%
of total net assets | | | 1,172,511 | | | | 21.6 | | |
| | | $ | 5,414,126 | | | | 99.2 | % | |
42
Columbia Acorn International
Portfolio Diversification
At June 30, 2007, the Fund's portfolio investments as a percent of net assets was diversified as follows:
| | | Value (000) | | Percent | |
| > Industrial Goods & Services | |
| Materials & Specialty Chemicals | | $ | 448,628 | | | | 8.2 | % | |
| Other Industrial Services | | | 328,110 | | | | 6.0 | | |
| Conglomerates | | | 229,960 | | | | 4.2 | | |
| Machinery | | | 209,206 | | | | 3.9 | | |
| Construction | | | 148,935 | | | | 2.7 | | |
| Outsourcing & Training Services | | | 126,130 | | | | 2.3 | | |
| Electrical Components | | | 115,348 | | | | 2.1 | | |
| Industrial Distribution | | | 29,905 | | | | 0.6 | | |
| Steel | | | 22,746 | | | | 0.4 | | |
| | | | 1,658,968 | | | | 30.4 | | |
| > Consumer Goods & Services | |
| Food | | | 131,411 | | | | 2.4 | | |
| Other Consumer Services | | | 122,291 | | | | 2.3 | | |
| Durables Goods | | | 121,041 | | | | 2.2 | | |
| Retail | | | 109,397 | | | | 2.0 | | |
| Casinos | | | 93,787 | | | | 1.7 | | |
| Apparels | | | 70,872 | | | | 1.3 | | |
| Consumer Goods Distribution | | | 66,334 | | | | 1.2 | | |
| Nondurables | | | 66,222 | | | | 1.2 | | |
| Entertainment | | | 46,736 | | | | 0.9 | | |
| Travel | | | 34,783 | | | | 0.6 | | |
| Leisure Products | | | 33,816 | | | | 0.6 | | |
| Furniture & Textiles | | | 28,189 | | | | 0.5 | | |
| Consumer Electronics | | | 15,035 | | | | 0.3 | | |
| | | | 939,914 | | | | 17.2 | | |
| > Information | |
| Financial Processors | | | 145,185 | | | | 2.7 | | |
Computer Hardware &
Related Equipment | | | 98,422 | | | | 1.8 | | |
Business Information &
Marketing Services | | | 89,239 | | | | 1.6 | | |
| Satellite Broadcasting | | | 64,665 | | | | 1.2 | | |
| Cable Television | | | 57,637 | | | | 1.0 | | |
| Internet Related | | | 52,200 | | | | 1.0 | | |
Semiconductors &
Related Equipment | | | 48,251 | | | | 0.9 | | |
| Television Broadcasting | | | 39,960 | | | | 0.7 | | |
| Publishing | | | 38,655 | | | | 0.7 | | |
| Business Software | | | 37,517 | | | | 0.7 | | |
| Computer Services | | | 27,310 | | | | 0.5 | | |
| Electronics Distribution | | | 16,478 | | | | 0.3 | | |
| Instrumentation | | | 10,818 | | | | 0.2 | | |
| | | | 726,337 | | | | 13.3 | | |
| | | Value (000) | | Percent | |
| > Energy & Minerals | |
| Oil Services | | $ | 339,105 | | | | 6.2 | | |
| Mining | | | 175,227 | | | | 3.2 | | |
| Agricultural Commodities | | | 58,180 | | | | 1.1 | | |
| Oil/Gas Producers | | | 48,452 | | | | 0.9 | | |
| Refining/Marketing/Distribution | | | 45,379 | | | | 0.8 | | |
| | | | 666,343 | | | | 12.2 | | |
| > Other Industries | |
| Transportation | | | 236,316 | | | | 4.3 | | |
| Real Estate | | | 120,269 | | | | 2.2 | | |
| Regulated Utilities | | | 53,741 | | | | 1.0 | | |
| | | | 410,326 | | | | 7.5 | | |
| > Finance | |
| Banks | | | 111,633 | | | | 2.0 | | |
| Money Management | | | 68,418 | | | | 1.3 | | |
| Savings & Loans | | | 64,598 | | | | 1.2 | | |
| Insurance | | | 46,058 | | | | 0.8 | | |
| Closed End Funds | | | 30,670 | | | | 0.6 | | |
| Other Finance Companies | | | 19,457 | | | | 0.4 | | |
| | | | 340,834 | | | | 6.3 | | |
| > Health Care | |
| Medical Equipment | | | 121,961 | | | | 2.2 | | |
| Services | | | 87,404 | | | | 1.6 | | |
| Pharmaceuticals | | | 44,231 | | | | 0.8 | | |
| Hospital Laboratory Supplies | | | 9,581 | | | | 0.2 | | |
| Biotechnology Drug Delivery | | | 9,401 | | | | 0.2 | | |
| | | | 272,578 | | | | 5.0 | | |
| Total Equities: | | | 5,015,300 | | | | 91.9 | | |
| Short-Term Obligations: | | | 398,826 | | | | 7.3 | | |
| Total Investments: | | | 5,414,126 | | | | 99.2 | | |
Cash and Other Assets
Less Liabilities: | | | 44,604 | | | | 0.8 | | |
| Net Assets: | | $ | 5,458,730 | | | | 100.0 | % | |
43
Columbia Acorn USA
Major Portfolio Changes in the Second Quarter (Unaudited)
| | | Number of Shares | |
| | | 03/31/07 | | 06/30/07 | |
| Additions | |
| Information | |
| AMIS Holdings | | | 401,000 | | | | 601,000 | | |
| Blackbaud | | | 0 | | | | 177,906 | | |
| Ciena | | | 0 | | | | 85,000 | | |
| Microsemi | | | 450,000 | | | | 570,000 | | |
| Polycom | | | 305,000 | | | | 475,000 | | |
| Tellabs | | | 2,285,000 | | | | 2,585,000 | | |
| TheStreet.com | | | 0 | | | | 507,897 | | |
| Time Warner Telecom | | | 1,386,000 | | | | 1,486,000 | | |
| Trimble Navigation | | | 310,000 | | | | 368,000 | | |
| Consumer Goods & Services | |
| Cavco Industries | | | 225,000 | | | | 287,900 | | |
| Hansen Natural | | | 0 | | | | 90,000 | | |
| NutriSystem | | | 99,000 | | | | 149,000 | | |
| Pinnacle Entertainment | | | 160,000 | | | | 340,000 | | |
| Pool | | | 318,500 | | | | 523,500 | | |
| Industrial Goods & Services | |
| American Commercial Lines | | | 0 | | | | 340,000 | | |
| American Reprographics | | | 116,000 | | | | 196,000 | | |
| Drew Industries | | | 100,000 | | | | 155,000 | | |
| Genlyte Group | | | 440,000 | | | | 480,000 | | |
| Interline Brands | | | 150,000 | | | | 225,000 | | |
| Health Care | |
| Array Biopharma | | | 0 | | | | 244,094 | | |
| BioMarin | | | 440,000 | | | | 692,400 | | |
| Collagenex Pharmaceuticals | | | 200,000 | | | | 300,000 | | |
| Genitope | | | 0 | | | | 450,000 | | |
| Medarex | | | 0 | | | | 204,400 | | |
| Pharmacopeia | | | 0 | | | | 220,000 | | |
| Seattle Genetics | | | 0 | | | | 251,400 | | |
| Finance | |
| MB Financial | | | 0 | | | | 105,000 | | |
| Old Second Bancorp | | | 0 | | | | 75,000 | | |
| Pacific Continental | | | 170,000 | | | | 308,000 | | |
| Energy & Minerals | |
| Carrizo Oil & Gas | | | 0 | | | | 120,000 | | |
| Tesco | | | 57,500 | | | | 95,000 | | |
| Tetra Technologies | | | 0 | | | | 71,000 | | |
| | | Number of Shares | |
| | | 03/31/07 | | 06/30/07 | |
| Sales | |
| Information | |
| Alltel | | | 270,000 | | | | 0 | | |
| Gemstar-TV Guide International | | | 2,580,000 | | | | 0 | | |
| JDA Software | | | 524,000 | | | | 0 | | |
| Kronos | | | 660,650 | | | | 0 | | |
| Supertex | | | 220,000 | | | | 189,296 | | |
| TALX | | | 100,000 | | | | 0 | | |
| THQ | | | 60,000 | | | | 0 | | |
| Consumer Goods & Services | |
| Carter's | | | 600,200 | | | | 300,000 | | |
| Central Parking | | | 296,700 | | | | 0 | | |
| HNI | | | 106,000 | | | | 45,800 | | |
| ITT Educational Services | | | 416,000 | | | | 366,000 | | |
| Industrial Goods & Services | |
| K&F Industries | | | 236,400 | | | | 0 | | |
| Health Care | |
| The Medicines Company | | | 400,000 | | | | 0 | | |
| United Surgical Partners | | | 550,000 | | | | 0 | | |
| Viasys Healthcare | | | 220,000 | | | | 0 | | |
| Finance | |
| Anchor Bancorp Wisconsin | | | 141,400 | | | | 111,400 | | |
| Energy & Minerals | |
| St. Mary Land & Exploration | | | 80,000 | | | | 47,000 | | |
44
Columbia Acorn USA
Statement of Investments (Unaudited), June 30, 2007
| Number of Shares | | | | Value (000) | |
| | | | | | | | Equities: 96.2% | | |
| Information 30.9% | | | |
| | | > Business Software 4.8% | |
| | 779,900 | | | Avid Technology (a) | | $ | 27,569 | | |
| | | | | Digital Nonlinear Editing Software & Systems | | | | | |
| | 355,000 | | | Micros Systems (a) | | | 19,312 | | |
| | | | | Information Systems for Restaurants & Hotels | | | | | |
| | 2,100,000 | | | Novell (a) | | | 16,359 | | |
| | | | | Directory, Operating System & Identity
Management Software | | | | | |
| | 327,200 | | | Parametric Technology (a) | | | 7,071 | | |
| | | | | Engineering Software & Services | | | | | |
| | 230,400 | | | Concur Technologies (a) | | | 5,265 | | |
| | | | | Web Enabled Cost & Expense Management
Software | | | | | |
| | 177,906 | | | Blackbaud | | | 3,928 | | |
| | | | | Software & Services for Non-profits | | | | | |
| | 250,000 | | | Agile Software (a) | | | 2,015 | | |
| | | | | Product Design Software | | | | | |
| | | | 81,519 | | |
| | | > Mobile Communications 4.5% | |
| | 1,005,000 | | | Crown Castle International (a) | | | 36,451 | | |
| | | | | Communications Towers | | | | | |
| | 506,000 | | | American Tower (a) | | | 21,252 | | |
| | | | | Communications Towers in USA & Mexico | | | | | |
| | 1,633,000 | | | Dobson Communications (a) | | | 18,143 | | |
| | | | | Rural & Small City Cellular Telephone Services | | | | | |
| | 88,000 | | | Globalstar (a) | | | 911 | | |
| | | | | Satellite Mobile Voice & Data Carrier | | | | | |
| | 75,000 | | | Openwave Systems | | | 469 | | |
| | | | | Internet Software for Mobile Devices | | | | | |
| | | | 77,226 | | |
| | | > Semiconductors & Related Equipment 3.8% | |
| | 1,298,490 | | | Integrated Device Technology (a) | | | 19,828 | | |
| | | | | Communications Semiconductors | | | | | |
| | 570,000 | | | Microsemi (a) | | | 13,651 | | |
| | | | | Analog/Mixed Signal Semiconductors | | | | | |
| | 1,050,000 | | | Entegris (a) | | | 12,474 | | |
| | | | | Semiconductor Wafer Shipping & Handling
Products | | | | | |
| | 601,000 | | | AMIS Holdings (a) | | | 7,524 | | |
| | | | | Mixed-signal Semiconductors | | | | | |
| | 189,296 | | | Supertex (a) | | | 5,933 | | |
| | | | | Mixed-signal Semiconductors | | | | | |
| | 140,000 | | | Littelfuse (a) | | | 4,728 | | |
| | | | | Little Fuses | | | | | |
| | | | 64,138 | | |
| | | > Computer Hardware & Related
Equipment 3.3% | |
| | 433,581 | | | Nice Systems (a) | | | 15,063 | | |
| | | | | Audio & Video Recording Solutions | | | | | |
| | 505,000 | | | II-VI (a) | | | 13,721 | | |
| | | | | Laser Components | | | | | |
| | 295,600 | | | Amphenol | | | 10,538 | | |
| | | | | Electronic Connectors | | | | | |
| | 130,000 | | | Belden CDT | | | 7,195 | | |
| | | | | Specialty Cable | | | | | |
| | 99,000 | | | Zebra Technologies (a) | | | 3,835 | | |
| | | | | Bar Code Printers | | | | | |
| Number of Shares | | | | Value (000) | |
| | 90,000 | | | Netgear (a) | | $ | 3,263 | | |
| | | | | Networking Products for Small Business & Home | | | | | |
| | 65,000 | | | Intermec (a) | | | 1,645 | | |
| | | | | Bar Code & Wireless LAN Systems | | | | | |
| | 40,000 | | | Rogers (a) | | | 1,480 | | |
| | | | | PCB Laminates & High-performance Foams | | | | | |
| | | | 56,740 | | |
| | | > Telecommunications Equipment 2.9% | |
| | 2,585,000 | | | Tellabs (a) | | | 27,815 | | |
| | | | | Telecommunications Equipment | | | | | |
| | 475,000 | | | Polycom (a) | | | 15,960 | | |
| | | | | Video Conferencing Equipment | | | | | |
| | 85,000 | | | Ciena (a) | | | 3,071 | | |
| | | | | Optical Transport & Broadband Access Equipment | | | | | |
| | 323,500 | | | Symmetricom (a) | | | 2,717 | | |
| | | | | Network Timing & Synchronization Devices | | | | | |
| | | | 49,563 | | |
| | | > Instrumentation 2.8% | |
| | 430,000 | | | Flir Systems (a) | | | 19,887 | | |
| | | | | Infrared Cameras | | | | | |
| | 140,000 | | | Mettler Toledo (a) | | | 13,371 | | |
| | | | | Laboratory Equipment | | | | | |
| | 368,000 | | | Trimble Navigation (a) | | | 11,850 | | |
| | | | | GPS-based Instruments | | | | | |
| | 60,000 | | | FARO Technologies (a) | | | 1,912 | | |
| | | | | Precision Measurement Equipment | | | | | |
| | | | 47,020 | | |
| | | > Telephone Services 2.0% | |
| | 1,486,000 | | | Time Warner Telecom (a) | | | 29,869 | | |
| | | | | Fiber Optic Telephone/Data Services | | | | | |
| | 340,000 | | | Windstream | | | 5,018 | | |
| | | | | Rural Telephone Franchises | | | | | |
| | | | 34,887 | | |
| | | > Internet Related 1.6% | |
| | 460,000 | | | ValueClick (a) | | | 13,552 | | |
| | | | | Internet Advertising | | | | | |
| | 980,000 | | | CNET Networks (a) | | | 8,026 | | |
| | | | | Internet Advertising on Niche Websites | | | | | |
| | 507,897 | | | TheStreet.com | | | 5,526 | | |
| | | | | Financial Information Website Publisher | | | | | |
| | | | 27,104 | | |
| | | > Business Information & Marketing
Services 1.2% | |
| | 530,000 | | | Ceridian (a) | | | 18,550 | | |
| | | | | HR Services & Payment Processing | | | | | |
| | 98,300 | | | Navigant Consulting (a) | | | 1,824 | | |
| | | | | Financial Consulting Firm | | | | | |
| | | | 20,374 | | |
| | | > Financial Processors 0.9% | |
| | 393,280 | | | Global Payments | | | 15,594 | | |
| | | | | Credit Card Processor | | | | | |
| | | | 15,594 | | |
| | | > Computer Services 0.8% | |
| | 786,000 | | | RCM Technologies (a)(b) | | | 6,123 | | |
| | | | | Technology & Engineering Services | | | | | |
| | 1,005,500 | | | AnswerThink (a) | | | 3,640 | | |
| | | | | IT Integration & Best Practice Research | | | | | |
45
Columbia Acorn USA
Statement of Investments (Unaudited), continued
| Number of Shares | | | | Value (000) | |
| | | > Computer Services—continued | |
| | 95,000 | | | SRA International (a) | | $ | 2,399 | | |
| | | | | Government IT Services | | | | | |
| | 235,000 | | | iGate (a) | | | 1,885 | | |
| | | | | IT & Business Process Outsourcing Services | | | | | |
| | | | 14,047 | | |
| | | > TV Broadcasting 0.7% | |
| | 1,125,000 | | | Entravision Communications (a) | | | 11,734 | | |
| | | | | Spanish Language TV, Radio & Outdoor | | | | | |
| | | | 11,734 | | |
| | | > Radio 0.7% | |
| | 511,100 | | | Salem Communications | | | 5,668 | | |
| | | | | Radio Stations for Religious Programming | | | | | |
| | 705,500 | | | Spanish Broadcasting System (a) | | | 3,034 | | |
| | | | | Spanish Language Radio Stations | | | | | |
| | 300,000 | | | Saga Communications (a) | | | 2,940 | | |
| | | | | Radio Stations in Small- & Mid-sized Cities | | | | | |
| | | | 11,642 | | |
| | | > Television Programming 0.5% | |
| | 750,000 | | | Lions Gate Entertainment (a) | | | 8,273 | | |
| | | | | Film & TV Studio | | | | | |
| | | | 8,273 | | |
| | | > CATV 0.3% | |
| | 240,000 | | | Discovery Holding (a) | | | 5,518 | | |
| | | | | CATV Programming | | | | | |
| | | | 5,518 | | |
| | | > Gaming Equipment & Services 0.1% | |
| | 98,500 | | | Shuffle Master (a) | | | 1,635 | | |
| | | | | Card Shufflers & Casino Games | | | | | |
| | | | 1,635 | | |
| Information: Total | | | 527,014 | | |
| Consumer Goods & Services 20.4% | | | |
| | | > Retail 4.4% | |
| | 398,000 | | | Abercrombie & Fitch | | | 29,046 | | |
| | | | | Teen Apparel Retailer | | | | | |
| | 418,000 | | | Chico's FAS (a) | | | 10,174 | | |
| | | | | Women's Specialty Retailer | | | | | |
| | 175,000 | | | J Crew Group (a) | | | 9,466 | | |
| | | | | Multi-channel Branded Retailer | | | | | |
| | 486,250 | | | Christopher & Banks | | | 8,339 | | |
| | | | | Women's Apparel Retailer | | | | | |
| | 224,500 | | | AnnTaylor Stores (a) | | | 7,952 | | |
| | | | | Women's Apparel Retailer | | | | | |
| | 95,000 | | | Genesco (a) | | | 4,969 | | |
| | | | | Multi-concept Branded Footwear Retailer | | | | | |
| | 200,000 | | | Urban Outfitters (a) | | | 4,806 | | |
| | | | | Apparel & Home Specialty Retailer | | | | | |
| | | | 74,752 | | |
| | | > Apparel 3.9% | |
| | 634,200 | | | Oxford Industries | | | 28,121 | | |
| | | | | Branded & Private Label Apparel | | | | | |
| | 885,200 | | | True Religion Apparel (a) | | | 17,996 | | |
| | | | | Premium Denim | | | | | |
| | 222,200 | | | Coach (a) | | | 10,530 | | |
| | | | | Designer & Retailer of Branded Leather
Accessories | | | | | |
| Number of Shares | | | | Value (000) | |
| | 300,000 | | | Carter's (a) | | $ | 7,782 | | |
| | | | | Children's Branded Apparel | | | | | |
| | 90,000 | | | Heelys (a) | | | 2,327 | | |
| | | | | Wheeled Footwear | | | | | |
| | | | 66,756 | | |
| | | > Other Consumer Services 3.8% | |
| | 366,000 | | | ITT Educational Services (a) | | | 42,961 | | |
| | | | | Post-secondary Degree Programs | | | | | |
| | 149,000 | | | NutriSystem (a) | | | 10,406 | | |
| | | | | Weight Loss Programs | | | | | |
| | 310,000 | | | Universal Technical Institute (a) | | | 7,871 | | |
| | | | | Vocational Training | | | | | |
| | 60,000 | | | Weight Watchers International | | | 3,051 | | |
| | | | | Weight Loss Programs | | | | | |
| | | | 64,289 | | |
| | | > Other Durable Goods 1.8% | |
| | 2,078,300 | | | Champion Enterprises (a) | | | 20,430 | | |
| | | | | Manufactured Homes | | | | | |
| | 287,900 | | | Cavco Industries (a) | | | 10,802 | | |
| | | | | Higher End Manufactured Homes | | | | | |
| | | | 31,232 | | |
| | | > Leisure Products 1.8% | |
| | 301,300 | | | International Speedway | | | 15,882 | | |
| | | | | Largest Motorsports Racetrack Owner & Operator | | | | | |
| | 195,500 | | | Speedway Motorsports | | | 7,816 | | |
| | | | | Motorsport Racetrack Owner & Operator | | | | | |
| | 80,000 | | | Thor Industries | | | 3,611 | | |
| | | | | RV & Bus Manufacturer | | | | | |
| | 50,000 | | | Polaris Industries | | | 2,708 | | |
| | | | | Leisure Vehicles & Related Products | | | | | |
| | | | 30,017 | | |
| | | > Nondurables 1.6% | |
| | 531,400 | | | Scotts Miracle-Gro | | | 22,819 | | |
| | | | | Consumer Lawn & Garden Products | | | | | |
| | 108,000 | | | Jarden (a) | | | 4,645 | | |
| | | | | Branded Household Products | | | | | |
| | | | 27,464 | | |
| | | > Consumer Goods Distribution 1.2% | |
| | 523,500 | | | Pool | | | 20,432 | | |
| | | | | Distributor of Swimming Pool Supplies &
Equipment | | | | | |
| | | | 20,432 | | |
| | | > Restaurants 0.8% | |
| | 337,500 | | | Sonic (a) | | | 7,465 | | |
| | | | | Quick Service Restaurant | | | | | |
| | 163,800 | | | Red Robin Gourmet Burgers (a) | | | 6,613 | | |
| | | | | Casual Dining Restaurant | | | | | |
| | | | 14,078 | | |
| | | > Casinos & Gaming 0.6% | |
| | 340,000 | | | Pinnacle Entertainment (a) | | | 9,571 | | |
| | | | | Regional Casino Operator | | | | | |
| | | | 9,571 | | |
| | | > Food & Beverage 0.2% | |
| | 90,000 | | | Hansen Natural (a) | | | 3,868 | | |
| | | | | Alternative Beverages | | | | | |
| | | | 3,868 | | |
46
| Number of Shares | | | | Value (000) | |
| | | > Furniture & Textiles 0.2% | |
| | 45,800 | | | HNI | | $ | 1,878 | | |
| | | | | Office Furniture & Fireplaces | | | | | |
| | 56,800 | | | Knoll | | | 1,272 | | |
| | | | | Office Furniture | | | | | |
| | | | 3,150 | | |
| | | > Travel 0.1% | |
| | 45,000 | | | Vail Resorts (a) | | | 2,739 | | |
| | | | | Ski Resort Operator & Developer | | | | | |
| | | | 2,739 | | |
| Consumer Goods & Services: Total | | | 348,348 | | |
| Industrial Goods & Services 14.0% | | | |
| | | > Machinery 6.9% | |
| | 697,500 | | | Ametek | | | 27,677 | | |
| | | | | Aerospace/Industrial Instruments | | | | | |
| | 673,600 | | | Pentair | | | 25,980 | | |
| | | | | Pumps & Water Treatment | | | | | |
| | 650,300 | | | ESCO Technologies | | | 23,580 | | |
| | | | | Automatic Electric Meter Readers | | | | | |
| | 373,600 | | | Nordson | | | 18,740 | | |
| | | | | Dispensing Systems for Adhesives & Coatings | | | | | |
| | 319,800 | | | Donaldson | | | 11,369 | | |
| | | | | Industrial Air Filtration | | | | | |
| | 71,800 | | | Toro | | | 4,228 | | |
| | | | | Turf Maintenance Equipment | | | | | |
| | 132,000 | | | Goodman Global (a) | | | 2,933 | | |
| | | | | HVAC Equipment Manufacturer | | | | | |
| | 50,000 | | | Kaydon | | | 2,606 | | |
| | | | | Specialized Friction & Motion Control Products | | | | | |
| | | | 117,113 | | |
| | | > Electrical Components 2.2% | |
| | 480,000 | | | Genlyte Group (a) | | | 37,699 | | |
| | | | | Commercial Lighting Fixtures | | | | | |
| | | | 37,699 | | |
| | | > Other Industrial Services 1.5% | |
| | 340,000 | | | American Commercial Lines (a) | | | 8,857 | | |
| | | | | Operator of Inland Barges/Builder of
Inland Barges | | | | | |
| | 350,000 | | | Labor Ready (a) | | | 8,089 | | |
| | | | | Temporary Manual Labor | | | | | |
| | 196,000 | | | American Reprographics (a) | | | 6,035 | | |
| | | | | Document Management & Logistics | | | | | |
| | 89,000 | | | G&K Services | | | 3,516 | | |
| | | | | Uniform Rental | | | | | |
| | | | 26,497 | | |
| | | > Construction 1.0% | |
| | 204,050 | | | Florida Rock | | | 13,773 | | |
| | | | | Aggregates & Concrete | | | | | |
| | 100,000 | | | Simpson Manufacturing | | | 3,374 | | |
| | | | | Wall Joint Maker | | | | | |
| | | | 17,147 | | |
| | | > Outsourcing Services 1.0% | |
| | 350,000 | | | Quanta Services (a) | | | 10,734 | | |
| | | | | Electrical & Telecom Construction Services | | | | | |
| Number of Shares | | | | Value (000) | |
| | 175,000 | | | Administaff | | $ | 5,861 | | |
| | | | | Professional Employer Organization | | | | | |
| | | | 16,595 | | |
| | | > Industrial Distribution 0.6% | |
| | 225,000 | | | Interline Brands (a) | | | 5,868 | | |
| | | | | Industrial Distribution | | | | | |
| | 70,000 | | | Watsco | | | 3,808 | | |
| | | | | HVAC Distribution | | | | | |
| | | | 9,676 | | |
| | | > Waste Management 0.5% | |
| | 280,875 | | | Waste Connections (a) | | | 8,494 | | |
| | | | | Solid Waste Management | | | | | |
| | | | 8,494 | | |
| | | > Industrial Materials & Specialty
Chemicals 0.3% | |
| | 155,000 | | | Drew Industries (a) | | | 5,137 | | |
| | | | | RV & Manufactured Home Components | | | | | |
| | | | 5,137 | | |
| Industrial Goods & Services: Total | | | 238,358 | | |
| Health Care 11.8% | | | |
| | | > Biotechnology & Drug Delivery 4.4% | |
| | 885,000 | | | PDL BioPharma (a) | | | 20,620 | | |
| | | | | Proprietary Monoclonal Antibodies | | | | | |
| | 692,400 | | | BioMarin (a) | | | 12,422 | | |
| | | | | Biotech Focused on Orphan Diseases | | | | | |
| | 580,000 | | | Nektar Therapeutics (a) | | | 5,504 | | |
| | | | | Drug Delivery Technologies | | | | | |
| | 3,690,300 | | | Medicure (a) | | | 4,982 | | |
| | 738,060 | | | Medicure - Warrants (a)(c) | | | 443 | | |
| | | | | Cardiovascular Biotech Company | | | | | |
| | 125,000 | | | Myriad Genetics (a) | | | 4,649 | | |
| | | | | Drugs/Diagnostics Hybrid | | | | | |
| | 1,135,000 | | | Decode Genetics (a) | | | 4,239 | | |
| | | | | Drugs for Heart Attack, Asthma & Vascular Disease | | | | | |
| | 204,400 | | | Medarex (a) | | | 2,921 | | |
| | | | | Humanized Antibodies | | | | | |
| | 650,000 | | | La Jolla Pharmaceutical (a) | | | 2,912 | | |
| | | | | Lupus Treatment | | | | | |
| | 244,094 | | | Array Biopharma (a) | | | 2,849 | | |
| | | | | Drugs for Cancer & Inflammatory Diseases | | | | | |
| | 248,600 | | | Arena Pharmaceuticals (a) | | | 2,732 | | |
| | | | | Novel Drug Targeting Technology | | | | | |
| | 500,000 | | | IsoRay (a) | | | 2,520 | | |
| | 100,000 | | | IsoRay - Warrants (a)(c) | | | 114 | | |
| | | | | Radiology Cancer Company | | | | | |
| | 251,400 | | | Seattle Genetics (a) | | | 2,466 | | |
| | | | | Antibody-based Therapies for Cancer | | | | | |
| | 271,590 | | | Neurogen (a) | | | 1,803 | | |
| | | | | Development-stage Biotech Focused on Neurology | | | | | |
| | 450,000 | | | Genitope (a) | | | 1,737 | | |
| | | | | Cancer Vaccine | | | | | |
| | 220,000 | | | Pharmacopeia (a) | | | 1,221 | | |
| | | | | Biotech Company with Broad Early-stage Pipeline | | | | | |
| | 273,500 | | | Nuvelo (a) | | | 744 | | |
| | | | | Development-stage Biotech Focused on Cardiovascular/Cancer | | | | | |
47
Columbia Acorn USA
Statement of Investments (Unaudited), continued
| Number of Shares | | | | Value (000) | |
| | | > Biotechnology & Drug Delivery—continued | |
| | 375,000 | | | Locus Discovery, Series D, Pfd. (a)(c) | | $ | 109 | | |
| | 193,288 | | | Locus Discovery, Series B, Pfd. (a)(c) | | | 56 | | |
| | | | | High Throughput Rational Drug Design | | | | | |
| | 18,181 | | | Metabolex (a)(c) | | | 64 | | |
| | | | | Diabetes Drug Development | | | | | |
| | | | 75,107 | | |
| | | > Medical Equipment & Devices 2.2% | |
| | 577,400 | | | Edwards Lifesciences (a) | | | 28,489 | | |
| | | | | Heart Valves | | | | | |
| | 105,000 | | | Vital Signs | | | 5,833 | | |
| | | | | Anesthesia, Respiratory & Sleep Products | | | | | |
| | 94,171 | | | Advanced Medical Optics (a) | | | 3,284 | | |
| | | | | Medical Devices for Eye Care | | | | | |
| | | | 37,606 | | |
| | | > Health Care Services 2.2% | |
| | 291,800 | | | Lincare Holdings (a) | | | 11,628 | | |
| | | | | Home Health Care Services | | | | | |
| | 210,000 | | | LCA-Vision | | | 9,925 | | |
| | | | | Lasik Surgery Centers | | | | | |
| | 470,000 | | | PSS World Medical (a) | | | 8,563 | | |
| | | | | Medical Supplies | | | | | |
| | 137,000 | | | Charles River Laboratories (a) | | | 7,072 | | |
| | | | | Pharmaceutical Research | | | | | |
| | | | 37,188 | | |
| | | > Pharmaceuticals 1.6% | |
| | 250,000 | | | Medicis Pharmaceutical | | | 7,635 | | |
| | | | | Specialty Pharmaceuticals-dermatology | | | | | |
| | 270,000 | | | MGI Pharma (a) | | | 6,040 | | |
| | | | | Specialty Pharmaceuticals for Oncology &
Acute Care | | | | | |
| | 790,000 | | | QLT (a) | | | 5,846 | | |
| | | | | Specialty Pharmaceuticals for Ophthalmology & Dermatology | | | | | |
| | 300,000 | | | Collagenex Pharmaceuticals (a) | | | 3,720 | | |
| | | | | Specialty Pharmaceuticals-dermatology | | | | | |
| | 505,000 | | | Barrier Therapeutics (a) | | | 3,283 | | |
| | | | | Specialty Pharmaceuticals for Dermatology | | | | | |
| | | | 26,524 | | |
| | | > Medical Supplies 1.4% | |
| | 270,700 | | | ICU Medical (a) | | | 11,624 | | |
| | | | | Intravenous Therapy Products | | | | | |
| | 158,300 | | | Techne (a) | | | 9,056 | | |
| | | | | Cytokines, Antibodies & other Reagents for
Life Science | | | | | |
| | 104,000 | | | Arrow International | | | 3,981 | | |
| | | | | Disposable Catheters | | | | | |
| | | | 24,661 | | |
| Health Care: Total | | | 201,086 | | |
| Finance 8.8% | | | |
| | | > Finance Companies 3.2% | |
| | 1,121,500 | | | AmeriCredit (a) | | | 29,776 | | |
| | | | | Auto Lending | | | | | |
| | 482,900 | | | World Acceptance (a) | | | 20,634 | | |
| | | | | Personal Loans | | | | | |
| | 130,000 | | | McGrath Rentcorp | | | 4,380 | | |
| | | | | Temporary Space & IT Rentals | | | | | |
| | | | 54,790 | | |
| Number of Shares | | | | Value (000) | |
| | | > Insurance 2.7% | |
| | 714,500 | | | HCC Insurance Holdings | | $ | 23,872 | | |
| | | | | Specialty Insurance | | | | | |
| | 14,000 | | | Markel (a) | | | 6,784 | | |
| | | | | Specialty Insurance | | | | | |
| | 105,000 | | | Philadelphia Consolidated Holding (a) | | | 4,389 | | |
| | | | | Specialty Insurance | | | | | |
| | 87,000 | | | Delphi Financial Group | | | 3,638 | | |
| | | | | Group Employee Benefit Products & Services | | | | | |
| | 75,000 | | | Endurance Specialty Holdings | | | 3,003 | | |
| | | | | Commercial Lines Insurance/Reinsurance | | | | | |
| | 177,743 | | | Eastern Insurance Holdings | | | 2,824 | | |
| | | | | Workers Comp & Specialty Insurance | | | | | |
| | 91,000 | | | United America Indemnity (a) | | | 2,263 | | |
| | | | | Specialty Insurance | | | | | |
| | | | 46,773 | | |
| | | > Banks 2.5% | |
| | 212,756 | | | Chittenden | | | 7,436 | | |
| | | | | New England Bank | | | | | |
| | 239,500 | | | TCF Financial | | | 6,658 | | |
| | | | | Great Lakes Bank | | | | | |
| | 308,000 | | | Pacific Continental | | | 4,989 | | |
| | | | | Niche Pacific N.W. Bank | | | | | |
| | 145,000 | | | Greene County Bancshares | | | 4,533 | | |
| | | | | Tennessee Bank | | | | | |
| | 215,000 | | | First Busey | | | 4,298 | | |
| | | | | Illinois Bank | | | | | |
| | 105,000 | | | MB Financial | | | 3,648 | | |
| | | | | Chicago Bank | | | | | |
| | 94,000 | | | Associated Banc-Corp | | | 3,074 | | |
| | | | | Midwest Bank | | | | | |
| | 125,000 | | | Lakeland Financial | | | 2,659 | | |
| | | | | Indiana Bank | | | | | |
| | 114,777 | | | Glacier Bancorp | | | 2,336 | | |
| | | | | Mountain States Bank | | | | | |
| | 75,000 | | | Old Second Bancorp | | | 2,187 | | |
| | | | | Illinois Bank | | | | | |
| | 20,000 | | | First Financial Bankshares | | | 776 | | |
| | | | | West Texas Bank | | | | | |
| | 31,500 | | | West Bancorporation | | | 503 | | |
| | | | | Des Moines Commercial Bank | | | | | |
| | | | 43,097 | | |
| | | > Savings & Loans 0.4% | |
| | 168,000 | | | People's United | | | 2,979 | | |
| | | | | Connecticut Savings & Loan | | | | | |
| | 111,400 | | | Anchor Bancorp Wisconsin | | | 2,917 | | |
| | | | | Wisconsin Thrift | | | | | |
| | | | 5,896 | | |
| Finance: Total | | | 150,556 | | |
| Energy & Minerals 7.8% | | | |
| | | > Oil Services 4.3% | |
| | 401,700 | | | FMC Technologies (a) | | | 31,823 | | |
| | | | | Oil & Gas Well Head Manufacturer | | | | | |
48
| Number of Shares | | | | Value (000) | |
| | | > Oil Services—continued | |
| | 367,000 | | | Atwood Oceanics (a) | | $ | 25,184 | | |
| | | | | Offshore Drilling Contractor | | | | | |
| | 355,000 | | | Hanover Compressor (a) | | | 8,467 | | |
| | | | | Natural Gas Compressor Rental & Fabrication | | | | | |
| | 95,000 | | | Tesco (a) | | | 2,997 | | |
| | | | | Developing New Well Drilling Technologies | | | | | |
| | 67,500 | | | CARBO Ceramics | | | 2,957 | | |
| | | | | Natural Gas Well Stimulants | | | | | |
| | 71,000 | | | Tetra Technologies (a) | | | 2,002 | | |
| | | | | U.S.-based Services Company with Life of
Field Approach | | | | | |
| | 11,000 | | | Key Energy Services (a) | | | 204 | | |
| | | | | Well Workover Services | | | | | |
| | | | 73,634 | | |
| | | > Oil & Gas Producers 2.8% | |
| | 525,000 | | | Quicksilver Resources (a) | | | 23,404 | | |
| | | | | Natural Gas & Coal Seam Gas Producer | | | | | |
| | 208,400 | | | Southwestern Energy (a) | | | 9,274 | | |
| | | | | Oil & Gas Producer | | | | | |
| | 111,200 | | | Equitable Resources | | | 5,511 | | |
| | | | | Natural Gas Producer & Utility | | | | | |
| | 120,000 | | | Carrizo Oil & Gas (a) | | | 4,976 | | |
| | | | | Explores for Natural Gas & Crude Oil | | | | | |
| | 450,000 | | | Vaalco Energy (a) | | | 2,174 | | |
| | | | | Oil & Gas Producer | | | | | |
| | 47,000 | | | St. Mary Land & Exploration | | | 1,721 | | |
| | | | | Oil & Gas Producer | | | | | |
| | | | 47,060 | | |
| | | > Other Resources 0.5% | |
| | 218,000 | | | Layne Christensen (a) | | | 8,927 | | |
| | | | | Oil & Gas Production/Engineering &
Construction/Contract Drilling | | | | | |
| | | | 8,927 | | |
| | | > Oil Refining, Marketing & Distribution 0.2% | |
| | 50,250 | | | Oneok | | | 2,533 | | |
| | | | | Natural Gas Distribution, Pipeline
Processing & Trading | | | | | |
| | | | 2,533 | | |
| Energy & Minerals: Total | | | 132,154 | | |
| Other Industries 2.5% | | | |
| | | > Real Estate 1.8% | |
| | 560,000 | | | DiamondRock Hospitality | | | 10,685 | | |
| | | | | Hotel Owner | | | | | |
| | 350,000 | | | Highland Hospitality | | | 6,720 | | |
| | | | | Hotel Owner | | | | | |
| | 77,500 | | | Gaylord Entertainment (a) | | | 4,157 | | |
| | | | | Convention Hotels | | | | | |
| | 100,000 | | | Digital Realty Trust | | | 3,768 | | |
| | | | | Technology-focused Office Buildings | | | | | |
| | 150,000 | | | Kite Realty Group | | | 2,853 | | |
| | | | | Community Shopping Centers | | | | | |
| | 90,000 | | | American Campus Communities | | | 2,546 | | |
| | | | | Student Housing | | | | | |
| | | | 30,729 | | |
Number of Shares
or Principal Amount (000) | | | | Value (000) | |
| | | > Transportation 0.5% | |
| | 524,720 | | | Heartland Express | | $ | 8,553 | | |
| | | | | Regional Trucker | | | | | |
| | | | 8,553 | | |
| | | > Regulated Utilities 0.2% | |
| | 97,500 | | | Northeast Utilities | | | 2,765 | | |
| | | | | Regulated Electric Utility | | | | | |
| | | | 2,765 | | |
| Other Industries: Total | | | 42,047 | | |
Total Equities: 96.2%
(Cost: $1,132,404) | | | 1,639,563 | | |
| Short-Term Obligations 5.3% | | | |
| $ | 8,700 | | | Pasa Funding (d)
5.31% Due 7/03/07 | | | 8,697 | | |
| | 8,700 | | | World Omni Vehicle Leasing (d)
5.30% Due 7/06/07 | | | 8,693 | | |
| | 8,600 | | | Times Square Funding (d)
5.30% Due 7/02/07 | | | 8,599 | | |
| | 8,600 | | | Transamerica Asset (d)
5.40% Due 7/02/07 | | | 8,599 | | |
| | 8,600 | | | Morrigan TRR (d)
5.23% Due 7/05/07 | | | 8,595 | | |
| | 8,600 | | | Morrigan TRR (d)
5.34% Due 7/09/07 | | | 8,590 | | |
| | 8,600 | | | Natixis (d)
5.33% Due 7/10/07 | | | 8,588 | | |
| | 8,500 | | | Abbey National
5.29% Due 7/02/07 | | | 8,499 | | |
| | 8,500 | | | Erste Finance LLC (d)
5.32% Due 7/02/07 | | | 8,499 | | |
| | 8,500 | | | Mica Funding LLC 5 (d)
5.32% Due 7/02/07 | | | 8,499 | | |
| | 4,154 | | | Repurchase Agreement with
Fixed Income Clearing Corp.,
dated 6/29/07, due 7/02/07 at
5.050%, collateralized by a
U.S. Government Agency Obligation,
maturing 7/18/11, market value
$4,238 (repurchase proceeds $4,156) | | | 4,154 | | |
| | | | | (Amortized Cost: $90,012) | | | 90,012 | | |
Total Investments: 101.5%
(Cost: $1,222,416)(e) | | | 1,729,575 | | |
| Cash and Other Assets Less Liabilities: (1.5)% | | | (26,037 | ) | |
| Total Net Assets: 100% | | $ | 1,703,538 | | |
49
Columbia Acorn USA
Statement of Investments (Unaudited), continued
> Notes to Statement of Investments (dollar values in thousands)
(a) Non-income producing security.
(b) An affiliate may include any company in which the Fund owns five percent or more of its outstanding voting shares. Transactions in this affiliated company during the six months ended June 30, 2007, are as follows:
| Affiliate | | Balance of
Shares Held
12/31/2006 | | Purchases/
Additions | | Sales/
Reductions | | Balance of
Shares Held
6/30/2007 | | Value | | Dividend | |
| RCM Technologies | | | 786,000 | | | | - | | | | - | | | | 786,000 | | | $ | 6,123 | | | $ | - | | |
The aggregate cost and value of this company at June 30, 2007, was $3,130 and $6,123, respectively. Investments in affiliate companies represented 0.4% of total net assets at June 30, 2007.
(c) Denotes a restricted security, which is subject to restrictions on resale under federal securities laws. These securities, are valued in good faith by the Board of Trustees. At June 30, 2007, these securities had an aggregate value of $786 which represented 0.05% of total net assets.
Additional information on these securities is as follows:
| Security | | Acquisition
Dates | | Shares | | Cost | | Value | |
| Locus Discovery, Series D, Pfd. | | 9/5/01 | | | 375,000 | | | $ | 1,500 | | | $ | 109 | | |
| Locus Discovery, Series B, Pfd. | | 2/8/07 | | | 193,288 | | | | 56 | | | | 56 | | |
| Metabolex, Series F | | 5/11/00 | | | 18,181 | | | | 2,000 | | | | 64 | | |
| IsoRay Warrants | | 3/21/07 | | | 100,000 | | | | - | | | | 114 | | |
| Medicure Warrants | | 12/22/06 | | | 738,060 | | | | - | | | | 443 | | |
| | | | | | | | | $ | 3,556 | | | $ | 786 | | |
(d) Security exempt from registration under Section 4(2) of the Securities Act of 1933. These securities may only be resold in exempt transactions to qualified buyers. Private resales of these securities to qualified institutional buyers are also exempt from registration pursuant to Rule 144A under the Securities Act of 1933. At June 30, 2007, these securities amounted to $77,359, which represented 4.5% of net assets.
(e) At June 30, 2007, for federal income tax purposes cost of investments was $1,222,416 and net unrealized appreciation was $507,159 consisting of gross unrealized appreciation of $551,801 and gross unrealized depreciation of $44,642.
50
Columbia Acorn International Select
Major Portfolio Changes in the Second Quarter (Unaudited)
| | | Number of Shares | |
| | | 03/31/07 | | 06/30/07 | |
| Additions | |
| Europe | |
| > Switzerland | |
| Geberit | | | 2,400 | | | | 24,000 | | |
| Kuehne & Nagel | | | 49,000 | | | | 70,000 | | |
| Synthes | | | 50,500 | | | | 57,000 | | |
| > Netherlands | |
| Fugro | | | 60,000 | | | | 125,634 | | |
| SBM Offshore | | | 0 | | | | 60,000 | | |
| Stork | | | 0 | | | | 79,000 | | |
| Wavin | | | 0 | | | | 44,936 | | |
| > Ireland | |
| CRH | | | 140,000 | | | | 146,737 | | |
| United Drug | | | 710,733 | | | | 751,000 | | |
| > United Kingdom | |
| Informa Group | | | 0 | | | | 170,000 | | |
| Intertek Testing | | | 0 | | | | 71,700 | | |
| Smith & Nephew | | | 441,000 | | | | 535,000 | | |
| > Austria | |
| Zumtobel | | | 172,500 | | | | 189,500 | | |
| > Greece | |
| Intralot | | | 60,000 | | | | 130,000 | | |
| Asia | |
| > Japan | |
| Hoya | | | 140,000 | | | | 153,000 | | |
| Kansai Paint | | | 280,000 | | | | 540,000 | | |
| Nintendo | | | 21,500 | | | | 29,700 | | |
| > Hong Kong | |
Hong Kong Exchanges and
Clearing | | | 405,000 | | | | 500,000 | | |
| Other Countries | |
| > United States | |
| Atwood Oceanics | | | 97,500 | | | | 100,000 | | |
| | | Number of Shares | |
| | | 03/31/07 | | 06/30/07 | |
| Sales | |
| Europe | |
| > Ireland | |
| Anglo Irish Bank | | | 160,000 | | | | 0 | | |
| Bank of Ireland | | | 240,000 | | | | 65,000 | | |
| C&C Group | | | 100,800 | | | | 24,700 | | |
| Ryanair | | | 85,000 | | | | 0 | | |
| > United Kingdom | |
| Northern Rock | | | 215,000 | | | | 0 | | |
| Paragon Group | | | 310,000 | | | | 0 | | |
| > Spain | |
| Red Electrica de Espana | | | 90,000 | | | | 85,000 | | |
| > Italy | |
| Banca Italease | | | 30,000 | | | | 0 | | |
| Asia | |
| > Japan | |
| Daito Trust Construction | | | 68,000 | | | | 43,000 | | |
| USS | | | 40,000 | | | | 32,000 | | |
51
Columbia Acorn International Select
Statement of Investments (Unaudited), June 30, 2007
| Number of Shares | | | | Value (000) | |
| | | | | | | | Equities: 91.7% | | |
| Europe 51.4% | | | |
| | | > Switzerland 12.0% | |
| | 57,000 | | | Synthes | | $ | 6,841 | | |
| | | | | Products for Orthopedic Surgery | | | | | |
| | 70,000 | | | Kuehne & Nagel | | | 6,447 | | |
| | | | | Freight Forwarding/Logistics | | | | | |
| | 16,500 | | | Nobel Biocare Holding | | | 5,388 | | |
| | | | | Dental Implants & Ceramic Crowns | | | | | |
| | 24,000 | | | Geberit | | | 4,095 | | |
| | | | | Plumbing Supplies | | | | | |
| | 7,500 | | | Swatch Group | | | 2,130 | | |
| | | | | Watch & Electronics Manufacturer | | | | | |
| | 26,000 | | | Schindler | | | 1,724 | | |
| | | | | Elevator Manufacturer & Service Provider | | | | | |
| | | | 26,625 | | |
| | | > Netherlands 10.0% | |
| | 125,634 | | | Fugro | | | 7,973 | | |
| | | | | Oilfield Services | | | | | |
| | 79,000 | | | Stork | | | 5,128 | | |
| | | | | Industrial Services & Food Processing Equipment | | | | | |
| | 117,633 | | | Aalberts Industries | | | 3,230 | | |
| | | | | Flow Control & Heat Treatment | | | | | |
| | 60,000 | | | SBM Offshore | | | 2,287 | | |
| | | | | Builds & Leases Offshore Vessels to Process &
Store Crude Oil | | | | | |
| | 34,723 | | | USG People | | | 1,631 | | |
| | | | | Temporary Staffing Services | | | | | |
| | 44,936 | | | Wavin | | | 1,081 | | |
| | | | | Largest European Plastic Pipe Systems Company | | | | | |
| | 23,100 | | | Boskalis Westminster | | | 919 | | |
| | | | | Dredging & Maritime Contractor | | | | | |
| | | | 22,249 | | |
| | | > Ireland 7.3% | |
| | 146,737 | | | CRH | | | 7,242 | | |
| | | | | Global Building Materials | | | | | |
| | 751,000 | | | United Drug | | | 4,101 | | |
| | | | | Irish Pharmaceutical Wholesaler & Outsourcer | | | | | |
| | 150,000 | | | IAWS Group | | | 3,142 | | |
| | | | | Baked Goods | | | | | |
| | 65,000 | | | Bank of Ireland | | | 1,317 | | |
| | | | | Irish Commercial Bank | | | | | |
| | 24,700 | | | C&C Group | | | 331 | | |
| | | | | Beverage Company | | | | | |
| | | | 16,133 | | |
| | | > United Kingdom 4.5% | |
| | 535,000 | | | Smith & Nephew | | | 6,620 | | |
| | | | | Medical Equipment & Supplies | | | | | |
| | 170,000 | | | Informa Group | | | 1,890 | | |
| | | | | Global Publisher & Event Organizer | | | | | |
| | 71,700 | | | Intertek Testing | | | 1,406 | | |
| | | | | Testing, Inspection, Certification Services | | | | | |
| | | | 9,916 | | |
| | | > Germany 3.5% | |
| | 40,000 | | | Wincor Nixdorf | | | 3,708 | | |
| | | | | Retail POS Systems & ATM Machines | | | | | |
| | 1,250 | | | Porsche | | | 2,225 | | |
| | | | | Specialty Automobile Manufacturer | | | | | |
| Number of Shares | | | | Value (000) | |
| | 17,000 | | | Deutsche Boerse | | $ | 1,926 | | |
| | | | | Trading, Clearing, Settlement Services for
Financial Markets | | | | | |
| | | | 7,859 | | |
| | | > Austria 3.2% | |
| | 189,500 | | | Zumtobel (a) | | | 7,069 | | |
| | | | | Lighting Systems | | | | | |
| | | | 7,069 | | |
| | | > France 2.9% | |
| | 300,000 | | | SES Global | | | 6,466 | | |
| | | | | Satellite Broadcasting Services | | | | | |
| | | | 6,466 | | |
| | | > Sweden 2.7% | |
| | 318,000 | | | Hexagon | | | 6,098 | | |
| | | | | Measurement Equipment & Polymers | | | | | |
| | | | 6,098 | | |
| | | > Greece 1.9% | |
| | 130,000 | | | Intralot | | | 4,188 | | |
| | | | | Lottery & Gaming Systems & Services | | | | | |
| | | | 4,188 | | |
| | | > Spain 1.8% | |
| | 85,000 | | | Red Electrica de Espana | | | 3,983 | | |
| | | | | Spanish Power Grid | | | | | |
| | | | 3,983 | | |
| | | > Denmark 1.6% | |
| | 31,000 | | | Novozymes | | | 3,593 | | |
| | | | | Industrial Enzymes | | | | | |
| | | | 3,593 | | |
| Europe: Total | | | 114,179 | | |
| Asia 28.4% | | | |
| | | > Japan 23.4% | |
| | 29,700 | | | Nintendo | | | 10,847 | | |
| | | | | Entertainment Software & Hardware | | | | | |
| | 6,700 | | | Jupiter Telecommunications (a) | | | 5,525 | | |
| | | | | Largest Cable Service Provider in Japan | | | | | |
| | 153,000 | | | Hoya | | | 5,064 | | |
| | | | | Opto-electrical Components & Eyeglass Lenses | | | | | |
| | 2,700 | | | Kenedix | | | 5,022 | | |
| | | | | Real Estate Investment Management | | | | | |
| | 77,000 | | | Ibiden | | | 4,958 | | |
| | | | | Electronic Parts & Ceramics | | | | | |
| | 160,000 | | | Aeon Mall | | | 4,908 | | |
| | | | | Suburban Shopping Mall Developer,
Owner & Operator | | | | | |
| | 540,000 | | | Kansai Paint | | | 4,717 | | |
| | | | | Paint Producer in Japan, India, China &
Southeast Asia | | | | | |
| | 143,700 | | | JSR | | | 3,461 | | |
| | | | | Films & Chemicals for LCD Screens & Electronics | | | | | |
| | 43,000 | | | Daito Trust Construction | | | 2,046 | | |
| | | | | Apartment Builder | | | | | |
| | 32,000 | | | USS | | | 2,037 | | |
| | | | | Used Car Auctioneer | | | | | |
| | 85,000 | | | Ushio | | | 1,883 | | |
| | | | | Industrial Light Sources | | | | | |
52
| Number of Shares | | | | Value (000) | |
| | | > Japan—continued | |
| | 138,000 | | | Park24 | | $ | 1,385 | | |
| | | | | Parking Lot Operator | | | | | |
| | | | 51,853 | | |
| | | > Hong Kong 3.2% | |
| | 500,000 | | | Hong Kong Exchanges and
Clearing | | | 7,074 | | |
| | | | | Hong Kong Equity & Derivatives Market
Operator | | | | | |
| | | | 7,074 | | |
| | | > Singapore 1.8% | |
| | 630,000 | | | Singapore Exchange | | | 4,024 | | |
| | | | | Singapore Equity & Derivatives Market Operator | | | | | |
| | | | 4,024 | | |
| Asia: Total | | | 62,951 | | |
| Other Countries 11.9% | | | |
| | | > Canada 4.8% | |
| | 90,000 | | | Potash Corp. of Saskatchewan | | | 7,017 | | |
| | | | | World's Largest Producer of Potash | | | | | |
| | 174,400 | | | RONA (a) | | | 3,643 | | |
| | | | | Leading Canadian Do-it-yourself Retailer | | | | | |
| | | | 10,660 | | |
| | | > South Africa 4.0% | |
| | 151,300 | | | Impala Platinum Holdings | | | 4,587 | | |
| | | | | Platinum Group Metals Mining & Refining | | | | | |
| | 165,000 | | | Naspers | | | 4,227 | | |
| | | | | Media & Education in Africa & Other
Emerging Markets | | | | | |
| | | | 8,814 | | |
| | | > United States 3.1% | |
| | 100,000 | | | Atwood Oceanics (a) | | | 6,862 | | |
| | | | | Offshore Drilling Contractor | | | | | |
| | | | 6,862 | | |
| Other Countries: Total | | | 26,336 | | |
Total Equities: 91.7%
(Cost: $156,119) | | | 203,466 | | |
| Principal Amount (000) | | | | Value (000) | |
| Short-Term Obligation 7.4% | |
| $ | 16,495 | | | Repurchase Agreement with
Fixed Income Clearing Corp.,
dated 6/29/07, due 7/02/07
at 5.050%, collateralized by a
U.S. Government Agency
Obligation, maturing 7/18/11,
market value $16,825
(repurchase proceeds $16,502) | | $ | 16,495 | | |
| | | (Amortized Cost: $16,495) | | | 16,495 | | |
Total Investments: 99.1%
(Cost: $172,614)(b)(c) | | | 219,961 | | |
| Cash and Other Assets Less Liabilities: 0.9% | | | 2,031 | | |
| Total Net Assets: 100% | | $ | 221,992 | | |
53
Columbia Acorn International Select Fund
Statement of Investments (Unaudited), continued
> Notes to Statement of Investments (in thousands)
(a) Non-income producing security.
(b) At June 30, 2007, for federal income tax purposes cost of investments was $172,614 and net unrealized appreciation was $47,347 consisting of gross unrealized appreciation of $51,104 and gross unrealized depreciation of $3,757.
(c) On June 30, 2007, the Fund's total investments were denominated in currencies as follows:
| Currency | | Value | | % of
Net
Assets | |
| Euro | | $ | 67,946 | | | | 30.6 | % | |
| Japanese Yen | | | 51,853 | | | | 23.4 | | |
| US Dollar | | | 30,374 | | | | 13.7 | | |
| Swiss Franc | | | 26,625 | | | | 12.0 | | |
Other currencies less
than 5% of total net assets | | | 43,163 | | | | 19.4 | | |
| | | $ | 219,961 | | | | 99.1 | % | |
54
Columbia Acorn International Select
Portfolio Diversification
At June 30, 2007, the Fund's portfolio investments as a percent of net assets was diversified as follows:
| | | Value (000) | | Percent | |
| > Industrial Goods & Services | |
| Conglomerates | | $ | 19,414 | | | | 8.8 | % | |
| Construction | | | 13,383 | | | | 6.0 | | |
| Specialty Chemicals | | | 12,852 | | | | 5.8 | | |
| Other Industrial Services | | | 9,577 | | | | 4.3 | | |
| Electrical Components | | | 8,952 | | | | 4.0 | | |
| Outsourcing Services | | | 1,631 | | | | 0.7 | | |
| | | | 65,809 | | | | 29.6 | | |
| > Information | |
| Financial Processors | | | 13,024 | | | | 5.9 | | |
| Domestic Consumer Software | | | 10,847 | | | | 4.9 | | |
| Satellite Broadcasting | | | 6,466 | | | | 2.9 | | |
| Cable Television | | | 5,525 | | | | 2.5 | | |
Semiconductors &
Related Equipment | | | 5,064 | | | | 2.3 | | |
| Television Broadcasting | | | 4,227 | | | | 1.9 | | |
Computer Hardware &
Related Equipment | | | 3,708 | | | | 1.7 | | |
| Publishing | | | 1,890 | | | | 0.8 | | |
| | | | 50,751 | | | | 22.9 | | |
| > Energy & Minerals | |
| Oil/Gas Producers | | | 18,041 | | | | 8.1 | | |
| Mining | | | 11,604 | | | | 5.3 | | |
| | | | 29,645 | | | | 13.4 | | |
| | | Value (000) | | Percent | |
| > Consumer Goods & Services | |
| Retail | | $ | 8,551 | | | | 3.8 | | |
| Durable Goods | | | 4,355 | | | | 2.0 | | |
| Casinos | | | 4,188 | | | | 1.9 | | |
| Food | | | 3,473 | | | | 1.6 | | |
| Consumer Goods Distribution | | | 2,037 | | | | 0.9 | | |
| Consumer Services | | | 1,385 | | | | 0.6 | | |
| | | | 23,989 | | | | 10.8 | | |
| > Health Care | |
| Medical Equipment | | | 18,849 | | | | 8.5 | | |
| Pharmaceuticals | | | 4,101 | | | | 1.8 | | |
| | | | 22,950 | | | | 10.3 | | |
| > Other Industries | |
| Real Estate | | | 5,022 | | | | 2.3 | | |
| Regulated Utilities | | | 3,983 | | | | 1.8 | | |
| | | | 9,005 | | | | 4.1 | | |
| > Finance | |
| Banks | | | 1,317 | | | | 0.6 | | |
| | | | 1,317 | | | | 0.6 | | |
| Total Equities: | | | 203,466 | | | | 91.7 | | |
| Short-Term Obligations: | | | 16,495 | | | | 7.4 | | |
| Total Investments: | | | 219,961 | | | | 99.1 | | |
Cash and Other Assets
Less Liabilities: | | | 2,031 | | | | 0.9 | | |
| Net Assets: | | $ | 221,992 | | | | 100.0 | % | |
55
Columbia Acorn Select
Major Portfolio Changes in the Second Quarter (Unaudited)
| | | Number of Shares | |
| | | 03/31/07 | | 06/30/07 | |
| Additions | |
| Consumer Goods & Services | |
| Chico's FAS | | | 1,811,000 | | | | 2,000,000 | | |
| Hertz | | | 1,750,000 | | | | 2,000,000 | | |
| Information | |
| Globalstar | | | 3,514,300 | | | | 6,000,000 | | |
| Liberty Global Series C | | | 2,963,800 | | | | 3,000,000 | | |
| Sanmina-SCI | | | 11,000,000 | | | | 16,021,480 | | |
| Tellabs | | | 11,300,000 | | | | 13,757,500 | | |
| Energy & Minerals | |
| Atwood Oceanics | | | 400,000 | | | | 500,000 | | |
| Tetra Technologies | | | 0 | | | | 2,000,000 | | |
| Finance | |
| Conseco | | | 5,800,000 | | | | 6,550,000 | | |
| Janus Capital Group | | | 3,450,000 | | | | 4,050,000 | | |
| Montpelier Re | | | 1,000,000 | | | | 2,000,000 | | |
| Industrial Goods & Services | |
| American Commercial Lines | | | 0 | | | | 2,068,400 | | |
| Worthington Industries | | | 2,250,000 | | | | 2,350,000 | | |
| Other Industries | |
| JB Hunt Transport Services | | | 0 | | | | 1,000,000 | | |
| | | Number of Shares | |
| | | 03/31/07 | | 06/30/07 | |
| Sales | |
| Consumer Goods & Services | |
| ITT Educational Services | | | 1,475,000 | | | | 1,300,000 | | |
| Weight Watchers International | | | 238,200 | | | | 0 | | |
| Finance | |
| Nuveen Investments | | | 975,000 | | | | 0 | | |
| Industrial Goods & Services | |
| Quanta Services | | | 3,030,000 | | | | 2,700,000 | | |
56
Columbia Acorn Select
Statement of Investments (Unaudited), June 30, 2007
| Number of Shares | | | | Value (000) | |
| | | | | | | | Equities: 89.7% | | |
| Consumer Goods & Services 26.5% | | | |
| | | > Retail 10.6% | |
| | 3,550,000 | | | Safeway | | $ | 120,806 | | |
| | | | | Supermarkets | | | | | |
| | 1,650,000 | | | Abercrombie & Fitch | | | 120,417 | | |
| | | | | Teen Apparel Retailer | | | | | |
| | 850,000 | | | Costco Wholesale | | | 49,742 | | |
| | | | | Warehouse Superstores | | | | | |
| | 2,000,000 | | | Chico's FAS (a) | | | 48,680 | | |
| | | | | Women's Specialty Retail | | | | | |
| | | | 339,645 | | |
| | | > Other Consumer Services 6.0% | |
| | 1,300,000 | | | ITT Educational Services (a) | | | 152,594 | | |
| | | | | Post-secondary Degree Programs | | | | | |
| | 1,500,000 | | | Universal Technical Institute (a)(b) | | | 38,085 | | |
| | | | | Vocational Training | | | | | |
| | | | 190,679 | | |
| | | > Travel 4.9% | |
| | 3,550,000 | | | Expedia (a) | | | 103,979 | | |
| | | | | Online Travel Services Company | | | | | |
| | 2,000,000 | | | Hertz (a) | | | 53,140 | | |
| | | | | Largest U.S. Rental Car Operator | | | | | |
| | | | 157,119 | | |
| | | > Leisure Products 2.7% | |
| | 800,000 | | | Harley-Davidson | | | 47,688 | | |
| | | | | Motorcycles & Related Merchandise | | | | | |
| | 750,000 | | | International Speedway | | | 39,533 | | |
| | | | | Largest Motorsports Racetrack Owner & Operator | | | | | |
| | | | 87,221 | | |
| | | > Apparel 2.3% | |
| | 1,550,000 | | | Coach (a) | | | 73,455 | | |
| | | | | Designer & Retailer of Branded Leather Accessories | | | | | |
| | | | 73,455 | | |
| Consumer Goods & Services: Total | | | 848,119 | | |
| Information 25.6% | | | |
| | | > CATV 6.6% | |
| | 3,000,000 | | | Liberty Global Series C (a) | | | 117,900 | | |
| | 600,000 | | | Liberty Global Series A (a) | | | 24,624 | | |
| | | | | Cable TV Franchises Outside the USA | | | | | |
| | 3,000,000 | | | Discovery Holding (a) | | | 68,970 | | |
| | | | | CATV Programming | | | | | |
| | | | 211,494 | | |
| | | > Mobile Communications 4.9% | |
| | 2,300,000 | | | American Tower (a) | | | 96,600 | | |
| | | | | Communications Towers in USA & Mexico | | | | | |
| | 6,000,000 | | | Globalstar (a)(b) | | | 62,100 | | |
| | | | | Satellite Mobile Voice & Data Carrier | | | | | |
| | | | 158,700 | | |
| | | > Telecommunications Equipment 4.6% | |
| | 13,757,500 | | | Tellabs (a) | | | 148,031 | | |
| | | | | Telecommunications Equipment | | | | | |
| | | | 148,031 | | |
| Number of Shares | | | | Value (000) | |
| | | > Business Software 4.2% | |
| | 2,350,000 | | | Avid Technology (a)(b) | | $ | 83,072 | | |
| | | | | Digital Nonlinear Editing Software & Systems | | | | | |
| | 6,500,000 | | | Novell (a) | | | 50,635 | | |
| | | | | Directory, Operating System & Identity
Management Software | | | | | |
| | | | 133,707 | | |
| | | > Internet Related 2.8% | |
| | 9,600,000 | | | SkillSoft (a)(b) | | | 89,184 | | |
| | | | | Web-based Learning Solutions (E-Learning) | | | | | |
| | | | 89,184 | | |
| | | > Contract Manufacturing 1.6% | |
| | 16,021,480 | | | Sanmina-SCI (a) | | | 50,147 | | |
| | | | | Electronic Manufacturing Services | | | | | |
| | | | 50,147 | | |
| | | > Semiconductors & Related Equipment 0.8% | |
| | 2,700,000 | | | Canadian Solar (a)(b) | | | 25,380 | | |
| | | | | Solar Cell & Module Manufacturer | | | | | |
| | | | 25,380 | | |
| | | > Computer Services 0.1% | |
| | 1,367,000 | | | AnswerThink (a) | | | 4,949 | | |
| | | | | IT Integration & Best Practice Research | | | | | |
| | | | 4,949 | | |
| Information: Total | | | 821,592 | | |
| Energy & Minerals 14.1% | | | |
| | | > Mining 9.8% | |
| | 15,666,000 | | | Uranium One (South Africa) (a) | | | 199,566 | | |
| | | | | Uranium Mines in South Africa,
Kazakhstan, Australia & the U.S. | | | | | |
| | 1,440,000 | | | Potash Corp. of
Saskatchewan (Canada) | | | 112,277 | | |
| | | | | World's Largest Producer of Potash | | | | | |
| | | | 311,843 | | |
| | | > Oil Services 4.3% | |
| | 2,000,000 | | | Tetra Technologies (a) | | | 56,400 | | |
| | | | | U.S. Based Service Company with Life of
Field Approach | | | | | |
| | 600,000 | | | FMC Technologies (a) | | | 47,532 | | |
| | | | | Oil & Gas Well Head Manufacturer | | | | | |
| | 500,000 | | | Atwood Oceanics (a) | | | 34,310 | | |
| | | | | Offshore Drilling Contractor | | | | | |
| | | | 138,242 | | |
| Energy & Minerals: Total | | | 450,085 | | |
| Finance 12.0% | | | |
| | | > Insurance 7.1% | |
| | 6,550,000 | | | Conseco (a) | | | 136,829 | | |
| | | | | Life, Long-term Care & Medical
Supplement Insurance | | | | | |
| | 112,000 | | | Markel (a) | | | 54,271 | | |
| | | | | Specialty Insurance | | | | | |
| | 2,000,000 | | | Montpelier Re | | | 37,080 | | |
| | | | | Commercial Lines Insurance/Reinsurance | | | | | |
| | | | 228,180 | | |
57
Columbia Acorn Select
Statement of Investments (Unaudited), continued
Number of Shares
or Principal Amount (000) | | | | Value (000) | |
| | | > Brokerage & Money Management 4.9% | |
| | 4,050,000 | | | Janus Capital Group | | $ | 112,752 | | |
| | | | | Manages Mutual Funds | | | | | |
| | 1,500,000 | | | SEI Investments | | | 43,560 | | |
| | | | | Mutual Fund Administration &
Investment Management | | | | | |
| | | | 156,312 | | |
| Finance: Total | | | 384,492 | | |
| Industrial Goods & Services 9.5% | | | |
| | | > Other Industrial Services 3.5% | |
| | 1,425,000 | | | Expeditors International of
Washington | | | 58,852 | | |
| | | | | International Freight Forwarder | | | | | |
| | 2,068,400 | | | American Commercial Lines (a) | | | 53,882 | | |
| | | | | Operator of Inland Barges/Builder of
Inland Barges | | | | | |
| | | | 112,734 | | |
| | | > Outsourcing Services 2.6% | |
| | 2,700,000 | | | Quanta Services (a) | | | 82,809 | | |
| | | | | Electrical & Telecom Construction Services | | | | | |
| | | | 82,809 | | |
| | | > Waste Management 1.8% | |
| | 1,500,000 | | | Waste Management | | | 58,575 | | |
| | | | | U.S. Garbage Collection & Disposal | | | | | |
| | | | 58,575 | | |
| | | > Steel 1.6% | |
| | 2,350,000 | | | Worthington Industries | | | 50,878 | | |
| | | | | Steel Processing & Manufactured Metal Products | | | | | |
| | | | 50,878 | | |
| Industrial Goods & Services: Total | | | 304,996 | | |
| Health Care 1.1% | | | |
| | | > Health Care Services 1.1% | |
| | 910,000 | | | Lincare Holdings (a) | | | 36,263 | | |
| | | | | Home Health Care Services | | | | | |
| | | | 36,263 | | |
| Health Care: Total | | | 36,263 | | |
| Other Industries 0.9% | | | |
| | | > Transportation 0.9% | |
| | 1,000,000 | | | JB Hunt Transport Services | | | 29,320 | | |
| | | | | Truck & Intermodal Carrier | | | | | |
| | | | 29,320 | | |
| Other Industries: Total | | | 29,320 | | |
Total Equities: 89.7%
(Cost: $1,841,270) | | | 2,874,867 | | |
| Short-Term Obligations 10.0% | | | |
| $ | 15,900 | | | Natixis (c)
5.33% Due 7/11/07 | | | 15,876 | | |
| | 15,900 | | | Giro Balanced Funding (c)
5.30% Due 7/20/07 | | | 15,856 | | |
| Principal Amount (000) | | | | Value (000) | |
| $ | 15,900 | | | Old Court Funding (c)
5.35% Due 7/26/07 | | $ | 15,841 | | |
| | 15,900 | | | Keel Capital (c)
5.30% Due 7/27/07 | | | 15,839 | | |
| | 15,800 | | | Ebury Finance Ltd. (c)
5.30% Due 7/5/07 | | | 15,791 | | |
| | 15,800 | | | World Omni Vehicle Leasing (c)
5.30% Due 7/24/07 | | | 15,747 | | |
| | 15,700 | | | Anglesea Funding (c)
5.29% Due 7/2/07 | | | 15,698 | | |
| | 15,700 | | | Mainsail II Ltd. (c)
5.28% Due 7/3/07 | | | 15,695 | | |
| | 15,700 | | | Austra (c)
5.28% Due 7/6/07 | | | 15,688 | | |
| | 15,700 | | | White Point Funding (c)
5.32% Due 7/18/07 | | | 15,661 | | |
| | 15,700 | | | Hannover Funding (c)
5.30% Due 7/19/07 | | | 15,658 | | |
| | 15,700 | | | Coast Asset (c)
5.31% Due 7/23/07 | | | 15,649 | | |
| | 15,700 | | | Liberty Street Funding (c)
5.33% Due 7/25/07 | | | 15,644 | | |
| | 15,600 | | | Whistlejacket Capital (c)
5.29% Due 7/9/07 | | | 15,582 | | |
| | 15,500 | | | Mica Funding LLC (c)
5.34% Due 7/13/07 | | | 15,472 | | |
| | 15,400 | | | TSL USA (c)
5.30% Due 7/10/07 | | | 15,380 | | |
| | 15,400 | | | La Fayette Asset Securitization LLC (c)
5.28% Due 7/11/07 | | | 15,377 | | |
| | 15,300 | | | Bavaria (c)
5.31% Due 7/12/07 | | | 15,275 | | |
| | 15,000 | | | Morrigan TRR (c)
5.34% Due 7/16/07 | | | 14,967 | | |
| | 15,000 | | | Manhattan Asset Funding (c)
5.29% Due 7/17/07 | | | 14,965 | | |
| | 9,916 | | | Repurchase Agreement with
Fixed Income Clearing Corp.,
dated 6/29/07, due 7/2/07 at
5.050%, collateralized by a
U.S. Government Agency
Obligation, maturing 7/18/11,
market value of $10,118
(repurchase proceeds $9,920) | | | 9,916 | | |
| | | | | (Amortized Cost: $321,577) | | | 321,577 | | |
Total Investments: 99.7%
(Cost: $2,162,847)(d) | | | 3,196,444 | | |
| Cash and Other Assets Less Liabilities: 0.3% | | | 9,698 | | |
| Total Net Assets: 100% | | $ | 3,206,142 | | |
58
> Notes to Statement of Investments (dollar values in thousands)
(a) Non-income producing security.
(b) An affiliate may include any company in which the Fund owns five percent or more of its outstanding voting shares. Transactions in these affiliated companies during the six months ended June 30, 2007, are as follows:
| Affiliates | | Balance of
Shares Held
12/31/06 | | Purchases/
Additions | | Sales/
Reductions | | Balance of
Shares Held
6/30/07 | | Value | | Dividend | |
| Avid Technology | | | 2,200,000 | | | | 150,000 | | | | - | | | | 2,350,000 | | | $ | 83,073 | | | $ | - | | |
| Canadian Solar | | | 550,000 | | | | 2,150,000 | | | | - | | | | 2,700,000 | | | | 25,380 | | | | - | | |
| Globalstar | | | 1,600,000 | | | | 4,400,000 | | | | - | | | | 6,000,000 | | | | 62,100 | | | | - | | |
| SkillSoft | | | 9,600,000 | | | | - | | | | - | | | | 9,600,000 | | | | 89,184 | | | | - | | |
| Universal Technical Institute | | | 1,350,000 | | | | 150,000 | | | | - | | | | 1,500,000 | | | | 38,085 | | | | - | | |
| UrAsia Energy (merged into Uranium One)* | | | 30,050,000 | | | | 2,000,000 | | | | 32,050,000 | | | | - | | | | - | | | | - | | |
| TOTAL OF AFFILIATED TRANSACTIONS | | | 45,350,000 | | | | 8,850,000 | | | | 32,050,000 | | | | 22,150,000 | | | $ | 297,822 | | | $ | - | | |
* At June 30, 2007, the Fund owned less than five percent of the company's outstanding voting shares.
The aggregate cost and value of these companies at June 30, 2007, was $226,635 and $297,822, respectively. Investments in affiliate companies represented 9.3% of total net assets at June 30, 2007.
(c) Security exempt from registration under Section 4(2) of the Securities Act of 1933. These securities may only be resold in exempt transactions to qualified buyers. Private resales of these securities to qualified instutional buyers are also exempt from registration pursuant to Rule 144A under the Securities Act of 1933. At June 30, 2007, these securities had an aggregate value of $311,661, which represented 9.7% of net assets.
(d) At June 30, 2007 for federal income tax purposes cost of investments was $2,162,847 and net unrealized appreciation was $1,033,597 consisting of gross unrealized appreciation of $1,078,817 and gross unrealized depreciation of $45,220.
59
Columbia Thermostat Fund
Statement of Investments (Unaudited), June 30, 2007
Number of Shares
or Principal Amount (000) | | | | Value (000) | |
| | | > Bond Funds: 65.0% | |
| | 6,761,238 | | | Columbia Intermediate Bond Fund,
Class Z | | $ | 58,688 | | |
| | 3,449,983 | | | Columbia Federal Securities Fund,
Class Z | | | 35,190 | | |
| | 2,788,437 | | | Columbia Conservative High Yield Fund,
Class Z | | | 23,088 | | |
| Total Bond Funds (Cost: $118,839) | | | 116,966 | | |
| | | > Stock Funds: 34.8% | |
| | 1,026,125 | | | Columbia LargeCap Enhanced
Core Fund, Class Z | | | 15,659 | | |
| | 833,310 | | | Columbia Dividend Income
Fund, Class Z | | | 12,591 | | |
| | 205,779 | | | Columbia Acorn International,
Class Z | | | 9,429 | | |
| | 287,018 | | | Columbia Acorn Fund, Class Z | | | 9,403 | | |
| | 432,063 | | | Columbia Marsico Growth
Fund, Class Z | | | 9,367 | | |
| | 203,678 | | | Columbia Acorn Select, Class Z | | | 6,285 | | |
| Total Stock Funds (Cost: $52,596) | | | 62,734 | | |
| Short-Term Obligation: 0.4% | | | |
| $ | 642 | | | Repurchase Agreement with
Fixed Income Clearing Corp.,
dated 6/29/07, due 7/02/07
at 5.050%, collateralized by
a U.S. Government Agency Obligation,
maturing 7/18/11 market value
of $660 (repurchase proceeds $642) | | | 642 | | |
| | | | | (Cost: $642) | | | 642 | | |
Total Investments: 100.2%
(Cost: $172,077)(a) | | | 180,342 | | |
| Cash and Other Assets Less Liabilities: (0.2)% | | | (313 | ) | |
| Total Net Assets: 100% | | $ | 180,029 | | |
> Notes to Statement of Investments (in thousands)
(a) At June 30, 2007, for federal income tax purposes cost of investments was $172,077 and net unrealized appreciation was $8,265, consisting of gross unrealized appreciation of $10,274 and gross unrealized depreciation of $2,009.
60
This page intentionally left blank.
61
Columbia Acorn Family of Funds
Statements of Assets and Liabilities (Unaudited)
| June 30, 2007 | | Columbia
Acorn
Fund | | Columbia
Acorn
International | | Columbia
Acorn
USA | | Columbia
Acorn
International
Select | | Columbia
Acorn
Select | | Columbia
Thermostat
Fund | |
| (in thousands) | |
| Assets: | |
| Unaffiliated investments, at cost | | $ | 9,996,498 | | | $ | 3,298,899 | | | $ | 1,219,286 | | | $ | 172,614 | | | $ | 1,936,212 | | | $ | — | | |
Affiliated investments, at cost
(See Note 4) | | | 2,646,859 | | | | 102,622 | | | | 3,130 | | | | — | | | | 226,635 | | | | 172,077 | | |
| Unaffiliated investments, at value | | $ | 16,693,498 | | | $ | 5,306,474 | | | $ | 1,723,452 | | | $ | 219,961 | | | $ | 2,898,622 | | | $ | — | | |
Affiliated investments, at value
(See Note 4) | | | 4,477,872 | | | | 107,652 | | | | 6,123 | | | | — | | | | 297,822 | | | | 180,342 | | |
| Cash | | | 1,039 | | | | — | * | | | 1,796 | | | | 1 | | | | — | * | | | — | * | |
Foreign currency (cost: Columbia
Acorn Fund $8,676; Columbia
Acorn International $20,729;
Columbia Acorn International
Select $168) | | | 8,694 | | | | 20,858 | | | | — | | | | 168 | | | | — | | | | — | | |
| Receivable for: | |
| Investments sold | | | 127,912 | | | | 30,366 | | | | 13,231 | | | | 1,817 | | | | — | | | | — | | |
| Fund shares sold | | | 30,087 | | | | 7,954 | | | | 3,218 | | | | 379 | | | | 25,903 | | | | 114 | | |
| Dividends and interest | | | 8,693 | | | | 4,985 | | | | 461 | | | | 110 | | | | 398 | | | | — | * | |
| Foreign tax reclaims | | | 606 | | | | 1,183 | | | | — | | | | 59 | | | | — | | | | — | | |
Deferred Trustees' Compensation
Investments | | | 2,770 | | | | 756 | | | | 205 | | | | — | | | | — | | | | — | | |
Expense Reimbursement due
from Investment Adviser | | | — | | | | — | | | | — | | | | — | | | | — | | | | 50 | | |
| Other assets | | | — | | | | — | | | | — | | | | — | | | | 8 | | | | — | | |
| Total Assets | | | 21,351,171 | | | | 5,480,228 | | | | 1,748,486 | | | | 222,495 | | | | 3,222,753 | | | | 180,506 | | |
| Liabilities: | |
| Payable for: | |
| Investments purchased | | | 82,437 | | | | 13,814 | | | | 12,022 | | | | — | | | | 9,496 | | | | — | | |
| Fund shares redeemed | | | 15,776 | | | | 1,983 | | | | 30,937 | | | | 204 | | | | 3,578 | | | | 230 | | |
| Management fee | | | 11,164 | | | | 3,337 | | | | 1,230 | | | | 166 | | | | 2,020 | | | | 15 | | |
| Administration fee | | | 695 | | | | 174 | | | | 57 | | | | 7 | | | | 102 | | | | 6 | | |
| 12b-1 Service & Distribution fees | | | 3,044 | | | | 267 | | | | 143 | | | | 22 | | | | 572 | | | | 75 | | |
| Reports to shareholders | | | 1,568 | | | | 350 | | | | 154 | | | | 36 | | | | 331 | | | | 65 | | |
| Deferred Trustees' fees | | | 2,770 | | | | 756 | | | | 205 | | | | 26 | | | | 183 | | | | 22 | | |
| Transfer agent fees | | | 1,840 | | | | 161 | | | | 152 | | | | 6 | | | | 290 | | | | 51 | | |
| Trustees' fees | | | 112 | | | | 9 | | | | 8 | | | | — | * | | | 1 | | | | — | * | |
| Audit fee | | | 43 | | | | 42 | | | | 22 | | | | 21 | | | | 22 | | | | 11 | | |
| Custody fees | | | 231 | | | | 175 | | | | 5 | | | | 4 | | | | 16 | | | | — | * | |
Deferred foreign capital gains
tax payable | | | — | | | | 392 | | | | — | | | | — | | | | — | | | | — | | |
| Other liabilities | | | 213 | | | | 38 | | | | 13 | | | | 11 | | | | — | | | | 2 | | |
| Total Liabilities | | | 119,893 | | | | 21,498 | | | | 44,948 | | | | 503 | | | | 16,611 | | | | 477 | | |
| Net Assets | | $ | 21,231,278 | | | $ | 5,458,730 | | | $ | 1,703,538 | | | $ | 221,992 | | | $ | 3,206,142 | | | $ | 180,029 | | |
| Composition of Net Assets: | |
| Paid in capital | | $ | 11,951,843 | | | $ | 3,203,553 | | | $ | 1,134,839 | | | $ | 166,910 | | | $ | 2,138,388 | | | $ | 165,454 | | |
Undistributed (overdistributed)
net investment income
(Accumulated net investment loss) | | | 20,675 | | | | 4,898 | | | | 1,551 | | | | 547 | | | | (15,544 | ) | | | 2,903 | | |
| Accumulated net realized gain | | | 730,715 | | | | 237,906 | | | | 59,989 | | | | 7,187 | | | | 49,701 | | | | 3,407 | | |
| Net unrealized appreciation on: | |
| Investments | | | 8,528,013 | | | | 2,012,605 | | | | 507,159 | | | | 47,347 | | | | 1,033,597 | | | | 8,265 | | |
| Foreign capital gains tax | | | — | | | | (392 | ) | | | — | | | | — | | | | — | | | | — | | |
| Foreign currency translations | | | 32 | | | | 160 | | | | — | | | | 1 | | | | — | | | | — | | |
| Net Assets | | $ | 21,231,278 | | | $ | 5,458,730 | | | $ | 1,703,538 | | | $ | 221,992 | | | $ | 3,206,142 | | | $ | 180,029 | | |
Net asset value per
share – Class A (a) | | $ | 31.94 | | | $ | 45.59 | | | $ | 30.37 | | | $ | 30.82 | | | $ | 30.35 | | | $ | 12.80 | | |
| (Net assets/shares) | | | ($4,632,464/145,034) | | | | ($495,307/10,864) | | | | ($265,857/8,754) | | | | ($36,156/1,173) | | | | ($1,240,930/40,885) | | | | ($51,470/4,020) | | |
Maximum offering price per
share – Class A (b) | | $ | 33.89 | | | $ | 48.37 | | | $ | 32.22 | | | $ | 32.70 | | | $ | 32.20 | | | $ | 13.58 | | |
(Net asset value per share/front-
end sales charge) | | | ($31.94/0.9425) | | | | ($45.59/0.9425) | | | | ($30.37/0.9425) | | | | ($30.82/0.9425) | | | | ($30.35/0.9425) | | | | ($12.80/0.9425) | | |
Net asset value and offering price
per share – Class B (a) | | $ | 30.47 | | | $ | 44.69 | | | $ | 29.02 | | | $ | 29.74 | | | $ | 29.03 | | | $ | 12.84 | | |
| (Net assets/shares) | | | ($1,440,071/47,265) | | | | ($103,314/2,311) | | | | ($63,927/2,203) | | | | ($10,892/366) | | | | ($231,739/7,983) | | | | ($69,096/5,383) | | |
Net asset value and offering price
per share – Class C (a) | | $ | 30.35 | | | $ | 44.61 | | | $ | 28.93 | | | $ | 29.68 | | | $ | 28.94 | | | $ | 12.82 | | |
| (Net assets/shares) | | | ($1,450,101/47,779) | | | | ($135,340/3,035) | | | | ($57,674/1,993) | | | | ($9,778/329) | | | | ($222,201/7,679) | | | | ($25,991/2,028) | | |
Net asset value and offering price
per share – Class Z (c) | | $ | 32.76 | | | $ | 45.82 | | | $ | 31.11 | | | $ | 31.12 | | | $ | 30.86 | | | $ | 12.77 | | |
| (Net assets/shares) | | | ($13,708,642/418,519) | | | | ($4,724,769/103,107) | | | | ($1,316,080/42,302) | | | | ($165,166/5,308) | | | | ($1,511,272/48,965) | | | | ($33,472/2,622) | | |
(a) Redemption price per share is equal to net asset value less any applicable contingent deferred sales charge and redemption fee.
(b) On sales of $50,000 or more, the offering price is reduced.
(c) Redemption price per share is equal to net asset value less any applicable redemption fee.
* Rounds to less than $500.
See accompanying notes to financial statements.
62
Columbia Acorn Family of Funds
Statements of Operations (Unaudited)
For the Six Months Ended June 30, 2007
| (in thousands) | | Columbia
Acorn
Fund | | Columbia
Acorn
International | | Columbia
Acorn
USA | | Columbia
Acorn
International
Select | | Columbia
Acorn
Select | | Columbia
Thermostat
Fund | |
| Investment Income: | |
| Dividend income | | $ | 96,782 | | | $ | 55,989 | | | $ | 8,785 | | | $ | 1,827 | | | $ | 4,355 | | | $ | — | | |
Dividend income from affiliates
(See Note 4) | | | 17,334 | | | | 2,028 | | | | — | | | | — | | | | — | | | | — | | |
Dividends from affiliated investment
company shares (See Note 4) | | | — | | | | — | | | | — | | | | — | | | | — | | | | 3,618 | | |
| Interest income | | | 29,275 | | | | 7,691 | | | | 1,985 | | | | 328 | | | | 5,967 | | | | 20 | | |
| | | | 143,391 | | | | 65,708 | | | | 10,770 | | | | 2,155 | | | | 10,322 | | | | 3,638 | | |
| Foreign taxes withheld | | | (1,937 | ) | | | (4,753 | ) | | | — | * | | | (123 | ) | | | (22 | ) | | | — | | |
| Total Investment Income | | | 141,454 | | | | 60,955 | | | | 10,770 | | | | 2,032 | | | | 10,300 | | | | 3,638 | | |
| Expenses: | |
| Management fee | | | 64,166 | | | | 18,550 | | | | 7,160 | | | | 915 | | | | 10,678 | | | | 92 | | |
| Administration fee | | | 3,856 | | | | 931 | | | | 320 | | | | 37 | | | | 513 | | | | 35 | | |
| 12b-1 Service and Distribution fees: | |
| Class A | | | 5,431 | | | | 495 | | | | 328 | | | | 37 | | | | 1,354 | | | | 68 | | |
| Class B | | | 5,328 | | | | 366 | | | | 241 | | | | 39 | | | | 839 | | | | 264 | | |
| Class C | | | 6,984 | | | | 583 | | | | 282 | | | | 41 | | | | 977 | | | | 134 | | |
| Transfer agent fees: | |
| Class A | | | 1,498 | | | | 158 | | | | 91 | | | | 13 | | | | 408 | | | | 46 | | |
| Class B | | | 1,069 | | | | 90 | | | | 58 | | | | 11 | | | | 203 | | | | 63 | | |
| Class C | | | 688 | | | | 60 | | | | 30 | | | | 6 | | | | 116 | | | | 24 | | |
| Class Z | | | 1,944 | | | | 564 | | | | 250 | | | | 33 | | | | 230 | | | | 16 | | |
| Custody fees | | | 755 | | | | 997 | | | | 32 | | | | 30 | | | | 69 | | | | — | * | |
| Trustees' fees | | | 367 | | | | 74 | | | | 30 | | | | 15 | | | | 155 | | | | 18 | | |
| Registration & blue sky fees | | | 129 | | | | 82 | | | | 54 | | | | 40 | | | | 56 | | | | 32 | | |
| Reports to shareholders | | | 1,381 | | | | 355 | | | | 167 | | | | 43 | | | | 318 | | | | 71 | | |
| Chief compliance officer expenses (See Note 4) | | | 244 | | | | 58 | | | | 23 | | | | 6 | | | | 32 | | | | 6 | | |
| Other expenses | | | 480 | | | | 137 | | | | 59 | | | | 31 | | | | 70 | | | | 25 | | |
| Total expenses | | | 94,320 | | | | 23,500 | | | | 9,125 | | | | 1,297 | | | | 16,018 | | | | 894 | | |
| Less custody fees paid indirectly | | | (69 | ) | | | (1 | ) | | | (14 | ) | | | — | * | | | (45 | ) | | | — | * | |
Less reimbursement of expenses by
Investment Adviser | | | — | | | | — | | | | — | | | | — | | | | — | | | | (187 | ) | |
Less reimbursement of expenses by
Transfer Agent | |
| Class A | | | (212 | ) | | | (16 | ) | | | (11 | ) | | | (1 | ) | | | (53 | ) | | | (4 | ) | |
| Class B | | | (86 | ) | | | (7 | ) | | | (4 | ) | | | (1 | ) | | | (16 | ) | | | (5 | ) | |
| Class C | | | (63 | ) | | | (6 | ) | | | (3 | ) | | | (1 | ) | | | (10 | ) | | | (2 | ) | |
| Class Z | | | (376 | ) | | | (27 | ) | | | (48 | ) | | | (1 | ) | | | (21 | ) | | | — | * | |
| Net Expenses | | | 93,514 | | | | 23,443 | | | | 9,045 | | | | 1,293 | | | | 15,873 | | | | 696 | | |
| Net Investment Income (Loss) | | | 47,940 | | | | 37,512 | | | | 1,725 | | | | 739 | | | | (5,573 | ) | | | 2,942 | | |
Net Realized and Unrealized Gain (Loss)
on Portfolio Positions: | |
| Net realized gain (loss) on: | |
| Unaffiliated investments | | | 602,100 | | | | 240,610 | | | | 62,278 | | | | 15,823 | | | | 49,991 | | | | — | | |
| Affiliated investments (See Note 4) | | | 131,455 | | | | (20 | ) | | | — | | | | — | | | | — | | | | 4,235 | | |
| Foreign currency transactions | | | (421 | ) | | | (847 | ) | | | — | | | | (21 | ) | | | (18 | ) | | | — | | |
Net realized gain on disposal of
investments sold in error
(See Note 8) | | | 4 | | | | — | | | | — | | | | — | | | | — | | | | — | | |
| Net realized gain | | | 733,138 | | | | 239,743 | | | | 62,278 | | | | 15,802 | | | | 49,973 | | | | 4,235 | | |
Net change in net unrealized
appreciation (depreciation) on: | |
| Unaffiliated investments | | | 1,050,397 | | | | 387,043 | | | | 86,603 | | | | 5,277 | | | | 360,688 | | | | — | | |
| Affiliated investments (See Note 4) | | | 339,838 | | | | 5,031 | | | | — | | | | — | | | | — | | | | 405 | | |
| Foreign currency translations | | | 10 | | | | 109 | | | | — | | | | (2 | ) | | | 69 | | | | — | | |
| Foreign capital gains tax | | | — | | | | (392 | ) | | | — | | | | — | | | | — | | | | — | | |
Net change in unrealized appreciation
(depreciation) | | | 1,390,245 | | | | 391,791 | | | | 86,603 | | | | 5,275 | | | | 360,757 | | | | 405 | | |
| Net realized and unrealized gain | | | 2,123,383 | | | | 631,534 | | | | 148,881 | | | | 21,077 | | | | 410,730 | | | | 4,640 | | |
Net Increase in Net Assets resulting from
Operations | | $ | 2,171,323 | | | $ | 669,046 | | | $ | 150,606 | | | $ | 21,816 | | | $ | 405,157 | | | $ | 7,582 | | |
* Rounds to less than $500.
See accompanying notes to financial statements.
63
Columbia Acorn Family of Funds
Statements of Changes in Net Assets
| | | Columbia
Acorn Fund | | Columbia Acorn
International | | Columbia
Acorn USA | |
| Increase (Decrease) in Net Assets | | (Unaudited)
Six months
ended
June 30, | | Year ended
December 31, | | (Unaudited)
Six months
ended
June 30, | | Year ended
December 31, | | (Unaudited)
Six months
ended
June 30, | | Year ended
December 31, | |
| (in thousands) | | 2007 | | 2006 | | 2007 | | 2006 | | 2007 | | 2006 | |
| Operations: | |
| Net investment income (loss) | | $ | 47,940 | | | $ | 35,190 | | | $ | 37,512 | | | $ | 31,386 | | | $ | 1,725 | | | $ | (3,110 | ) | |
Net realized gain on investments and foreign
currency transactions | | | 733,138 | | | | 1,611,966 | | | | 239,743 | | | | 392,116 | | | | 62,278 | | | | 46,861 | | |
Net realized gain on affiliated investments and distributions
from affiliated investment company shares | | | — | | | | — | | | | — | | | | — | | | | — | | | | — | | |
Net change in net unrealized appreciation (depreciation)
on investments and foreign currency translations | | | 1,390,245 | | | | 712,218 | | | | 391,791 | | | | 645,701 | | | | 86,603 | | | | 64,360 | | |
Net change in net unrealized appreciation (depreciation)
on affiliated investments | | | — | | | | — | | | | — | | | | — | | | | — | | | | — | | |
| Net Increase from Operations | | | 2,171,323 | | | | 2,359,374 | | | | 669,046 | | | | 1,069,203 | | | | 150,606 | | | | 108,111 | | |
| Distributions to Shareholders From: | |
| Net investment income – Class A | | | — | | | | (5,394 | ) | | | (61 | ) | | | (2,223 | ) | | | — | | | | — | | |
| Net realized gain – Class A | | | (55,515 | ) | | | (313,513 | ) | | | (2,579 | ) | | | (26,545 | ) | | | (2,466 | ) | | | (5,181 | ) | |
| Net investment income – Class B | | | — | | | | — | | | | — | * | | | (141 | ) | | | — | | | | — | | |
| Net realized gain – Class B | | | (18,288 | ) | | | (114,707 | ) | | | (575 | ) | | | (8,646 | ) | | | (620 | ) | | | (1,487 | ) | |
| Net investment income – Class C | | | — | | | | — | | | | — | * | | | (63 | ) | | | — | | | | — | | |
| Net realized gain – Class C | | | (18,339 | ) | | | (109,093 | ) | | | (744 | ) | | | (8,998 | ) | | | (557 | ) | | | (1,223 | ) | |
| Net investment income – Class Z | | | — | | | | (48,532 | ) | | | (12,297 | ) | | | (44,617 | ) | | | — | | | | — | | |
| Net realized gain – Class Z | | | (160,345 | ) | | | (916,129 | ) | | | (25,155 | ) | | | (342,510 | ) | | | (12,016 | ) | | | (25,202 | ) | |
| Total Distributions to Shareholders | | | (252,487 | ) | | | (1,507,368 | ) | | | (41,411 | ) | | | (433,743 | ) | | | (15,659 | ) | | | (33,093 | ) | |
| Share Transactions: | |
| Subscriptions – Class A | | | 615,959 | | | | 1,078,213 | | | | 175,970 | | | | 176,101 | | | | 51,185 | | | | 113,090 | | |
| Distributions reinvested – Class A | | | 50,288 | | | | 288,002 | | | | 2,412 | | | | 25,843 | | | | 2,159 | | | | 4,383 | | |
| Redemptions – Class A | | | (513,833 | ) | | | (822,590 | ) | | | (48,303 | ) | | | (63,857 | ) | | | (53,863 | ) | | | (51,382 | ) | |
| Net Increase (Decrease) – Class A | | | 152,414 | | | | 543,625 | | | | 130,079 | | | | 138,087 | | | | (519 | ) | | | 66,091 | | |
| Subscriptions – Class B | | | 7,608 | | | | 25,556 | | | | 8,524 | | | | 17,920 | | | | 222 | | | | 1,247 | | |
| Distributions reinvested – Class B | | | 16,730 | | | | 104,566 | | | | 526 | | | | 8,016 | | | | 566 | | | | 1,351 | | |
| Redemptions – Class B | | | (119,998 | ) | | | (212,371 | ) | | | (12,274 | ) | | | (20,296 | ) | | | (6,865 | ) | | | (14,036 | ) | |
| Net Increase (Decrease) – Class B | | | (95,660 | ) | | | (82,249 | ) | | | (3,224 | ) | | | 5,640 | | | | (6,077 | ) | | | (11,438 | ) | |
| Subscriptions – Class C | | | 65,011 | | | | 166,508 | | | | 29,598 | | | | 50,734 | | | | 2,005 | | | | 17,895 | | |
| Distributions reinvested – Class C | | | 14,519 | | | | 86,726 | | | | 555 | | | | 6,707 | | | | 476 | | | | 1,038 | | |
| Redemptions – Class C | | | (102,057 | ) | | | (178,699 | ) | | | (9,005 | ) | | | (16,582 | ) | | | (4,411 | ) | | | (8,640 | ) | |
| Net Increase (Decrease) – Class C | | | (22,527 | ) | | | 74,535 | | | | 21,148 | | | | 40,859 | | | | (1,930 | ) | | | 10,293 | | |
| Subscriptions – Class Z | | | 1,051,261 | | | | 1,754,910 | | | | 497,235 | | | | 707,961 | | | | 117,188 | | | | 371,430 | | |
| Distributions reinvested – Class Z | | | 137,592 | | | | 824,254 | | | | 26,711 | | | | 279,893 | | | | 10,953 | | | | 22,838 | | |
| Redemptions – Class Z | | | (855,764 | ) | | | (1,413,279 | ) | | | (184,352 | ) | | | (357,229 | ) | | | (131,252 | ) | | | (175,498 | ) | |
| Net Increase (Decrease) – Class Z | | | 333,089 | | | | 1,165,885 | | | | 339,594 | | | | 630,625 | | | | (3,111 | ) | | | 218,770 | | |
| Net Increase (Decrease) from Share Transactions | | | 367,316 | | | | 1,701,796 | | | | 487,597 | | | | 815,211 | | | | (11,637 | ) | | | 283,716 | | |
| Redemption Fees | | | — | | | | — | | | | 103 | | | | 147 | | | | — | | | | — | | |
| Total Increase (Decrease) in Net Assets | | | 2,286,152 | | | | 2,553,802 | | | | 1,115,335 | | | | 1,450,818 | | | | 123,310 | | | | 358,734 | | |
| Net Assets: | |
| Beginning of period | | | 18,945,126 | | | | 16,391,324 | | | | 4,343,395 | | | | 2,892,577 | | | | 1,580,228 | | | | 1,221,494 | | |
| End of period | | $ | 21,231,278 | | | $ | 18,945,126 | | | $ | 5,458,730 | | | $ | 4,343,395 | | | $ | 1,703,538 | | | $ | 1,580,228 | | |
Undistributed (Overdistributed) Net Investment Income or
(Accumulated Net Investment Loss) | | $ | 20,675 | | | $ | (27,265 | ) | | $ | 4,898 | | | $ | (20,256 | ) | | $ | 1,551 | | | $ | (174 | ) | |
* Rounds to less than $500.
See accompanying notes to financial statements.
64
| | | Columbia Acorn
International Select | | Columbia
Acorn Select | | Columbia
Thermostat Fund | |
| Increase (Decrease) in Net Assets | | (Unaudited)
Six months
ended
June 30, | | Year ended
December 31, | | (Unaudited)
Six months
ended
June 30, | | Year ended
December 31, | | (Unaudited)
Six months
ended
June 30, | | Year ended
December 31, | |
| (in thousands) | | 2007 | | 2006 | | 2007 | | 2006 | | 2007 | | 2006 | |
| Operations: | |
| Net investment income (loss) | | $ | 739 | | | $ | 361 | | | $ | (5,573 | ) | | $ | (11,032 | ) | | $ | 2,942 | | | $ | 6,358 | | |
Net realized gain on investments and foreign
currency transactions | | | 15,802 | | | | 18,110 | | | | 49,973 | | | | 71,803 | | | | — | | | | — | | |
Net realized gain on affiliated investments and distributions
from affiliated investment company shares | | | — | | | | — | | | | — | | | | — | | | | 4,235 | | | | 11,669 | | |
Net change in net unrealized appreciation (depreciation)
on investments and foreign currency translations | | | 5,275 | | | | 20,770 | | | | 360,757 | | | | 287,875 | | | | — | | | | — | | |
Net change in net unrealized appreciation (depreciation)
on affiliated investments | | | — | | | | — | | | | — | | | | — | | | | 405 | | | | 836 | | |
| Net Increase from Operations | | | 21,816 | | | | 39,241 | | | | 405,157 | | | | 348,646 | | | | 7,582 | | | | 18,863 | | |
| Distributions to Shareholders From: | |
| Net investment income – Class A | | | (86 | ) | | | (2 | ) | | | — | | | | (788 | ) | | | (125 | ) | | | (2,086 | ) | |
| Net realized gain – Class A | | | — | | | | — | | | | (7,498 | ) | | | (20,503 | ) | | | (1,184 | ) | | | (3,300 | ) | |
| Net investment income – Class B | | | — | | | | — | | | | — | | | | — | | | | — | | | | (2,114 | ) | |
| Net realized gain – Class B | | | — | | | | — | | | | (1,510 | ) | | | (4,991 | ) | | | (1,571 | ) | | | (3,980 | ) | |
| Net investment income – Class C | | | — | | | | — | * | | | — | | | | — | | | | — | | | | (753 | ) | |
| Net realized gain – Class C | | | — | | | | — | | | | (1,407 | ) | | | (3,972 | ) | | | (596 | ) | | | (1,496 | ) | |
| Net investment income – Class Z | | | (782 | ) | | | (196 | ) | | | — | | | | (1,614 | ) | | | (163 | ) | | | (1,223 | ) | |
| Net realized gain – Class Z | | | — | | | | — | | | | (8,765 | ) | | | (19,241 | ) | | | (760 | ) | | | (1,585 | ) | |
| Total Distributions to Shareholders | | | (868 | ) | | | (198 | ) | | | (19,180 | ) | | | (51,109 | ) | | | (4,399 | ) | | | (16,537 | ) | |
| Share Transactions: | |
| Subscriptions – Class A | | | 13,035 | | | | 10,850 | | | | 233,175 | | | | 210,532 | | | | 3,216 | | | | 6,298 | | |
| Distributions reinvested – Class A | | | 78 | | | | 2 | | | | 6,845 | | | | 19,667 | | | | 1,205 | | | | 4,887 | | |
| Redemptions – Class A | | | (2,741 | ) | | | (3,070 | ) | | | (97,602 | ) | | | (158,467 | ) | | | (11,969 | ) | | | (25,185 | ) | |
| Net Increase (Decrease) – Class A | | | 10,372 | | | | 7,782 | | | | 142,418 | | | | 71,732 | | | | (7,548 | ) | | | (14,000 | ) | |
| Subscriptions – Class B | | | 1,382 | | | | 2,223 | | | | 2,301 | | | | 4,782 | | | | 1,993 | | | | 3,578 | | |
| Distributions reinvested – Class B | | | — | | | | — | | | | 1,343 | | | | 4,452 | | | | 1,445 | | | | 5,496 | | |
| Redemptions – Class B | | | (1,392 | ) | | | (1,437 | ) | | | (18,505 | ) | | | (31,688 | ) | | | (7,964 | ) | | | (16,105 | ) | |
| Net Increase (Decrease) – Class B | | | (10 | ) | | | 786 | | | | (14,861 | ) | | | (22,454 | ) | | | (4,526 | ) | | | (7,031 | ) | |
| Subscriptions – Class C | | | 2,439 | | | | 2,333 | | | | 34,501 | | | | 20,817 | | | | 1,995 | | | | 4,114 | | |
| Distributions reinvested – Class C | | | — | | | | — | * | | | 1,110 | | | | 3,230 | | | | 529 | | | | 1,960 | | |
| Redemptions – Class C | | | (617 | ) | | | (924 | ) | | | (14,166 | ) | | | (22,947 | ) | | | (4,352 | ) | | | (7,323 | ) | |
| Net Increase (Decrease) – Class C | | | 1,822 | | | | 1,409 | | | | 21,445 | | | | 1,100 | | | | (1,828 | ) | | | (1,249 | ) | |
| Subscriptions – Class Z | | | 30,453 | | | | 34,878 | | | | 499,307 | | | | 258,516 | | | | 3,072 | | | | 5,698 | | |
| Distributions reinvested – Class Z | | | 341 | | | | 99 | | | | 6,448 | | | | 14,293 | | | | 855 | | | | 2,633 | | |
| Redemptions – Class Z | | | (10,851 | ) | | | (10,107 | ) | | | (72,303 | ) | | | (170,328 | ) | | | (1,708 | ) | | | (3,204 | ) | |
| Net Increase (Decrease) – Class Z | | | 19,943 | | | | 24,870 | | | | 433,452 | | | | 102,481 | | | | 2,219 | | | | 5,127 | | |
| Net Increase (Decrease) from Share Transactions | | | 32,127 | | | | 34,847 | | | | 582,454 | | | | 152,859 | | | | (11,683 | ) | | | (17,153 | ) | |
| Redemption Fees | | | 19 | | | | 9 | | | | — | | | | — | | | | — | | | | — | | |
| Total Increase (Decrease) in Net Assets | | | 53,094 | | | | 73,899 | | | | 968,431 | | | | 450,396 | | | | (8,500 | ) | | | (14,827 | ) | |
| Net Assets: | |
| Beginning of period | | | 168,898 | | | | 94,999 | | | | 2,237,711 | | | | 1,787,315 | | | | 188,529 | | | | 203,356 | | |
| End of period | | $ | 221,992 | | | $ | 168,898 | | | $ | 3,206,142 | | | $ | 2,237,711 | | | $ | 180,029 | | | $ | 188,529 | | |
Undistributed (Overdistributed) Net Investment Income or
(Accumulated Net Investment Loss) | | $ | 547 | | | $ | 676 | | | $ | (15,544 | ) | | $ | (9,971 | ) | | $ | 2,903 | | | $ | 249 | | |
65
Columbia Acorn Family of Funds
Statements of Changes in Net Assets, continued
| | | Columbia
Acorn Fund | | Columbia Acorn
International | | Columbia
Acorn USA | |
| Changes in Shares of Beneficial Interest: | | (Unaudited)
Six months
ended
June 30, | | Year ended
December 31, | | (Unaudited)
Six months
ended
June 30, | | Year ended
December 31, | | (Unaudited)
Six months
ended
June 30, | | Year ended
December 31, | |
| (in thousands) | | 2007 | | 2006 | | 2007 | | 2006 | | 2007 | | 2006 | |
| Subscriptions – Class A | | | 20,066 | | | | 37,015 | | | | 4,120 | | | | 4,588 | | | | 1,756 | | | | 4,113 | | |
| Shares issued in reinvestment and capital gains – Class A | | | 1,551 | | | | 9,911 | | | | 53 | | | | 673 | | | | 70 | | | | 156 | | |
| Less shares redeemed – Class A | | | (16,739 | ) | | | (28,264 | ) | | | (1,131 | ) | | | (1,723 | ) | | | (1,835 | ) | | | (1,877 | ) | |
| Net Increase (Decrease) – Class A | | | 4,878 | | | | 18,662 | | | | 3,042 | | | | 3,538 | | | | (9 | ) | | | 2,392 | | |
| Subscriptions – Class B | | | 260 | | | | 909 | | | | 203 | | | | 482 | | | | 8 | | | | 47 | | |
| Shares issued in reinvestment and capital gains – Class B | | | 540 | | | | 3,757 | | | | 12 | | | | 212 | | | | 19 | | | | 50 | | |
| Less shares redeemed – Class B | | | (4,079 | ) | | | (7,576 | ) | | | (294 | ) | | | (553 | ) | | | (245 | ) | | | (533 | ) | |
| Net Increase (Decrease) – Class B | | | (3,279 | ) | | | (2,910 | ) | | | (79 | ) | | | 141 | | | | (218 | ) | | | (436 | ) | |
| Subscriptions – Class C | | | 2,223 | | | | 5,931 | | | | 709 | | | | 1,356 | | | | 72 | | | | 678 | | |
| Shares issued in reinvestment and capital gains – Class C | | | 471 | | | | 3,123 | | | | 13 | | | | 178 | | | | 16 | | | | 39 | | |
| Less shares redeemed – Class C | | | (3,486 | ) | | | (6,396 | ) | | | (214 | ) | | | (455 | ) | | | (158 | ) | | | (328 | ) | |
| Net Increase (Decrease) – Class C | | | (792 | ) | | | 2,658 | | | | 508 | | | | 1,079 | | | | (70 | ) | | | 389 | | |
| Subscriptions – Class Z | | | 33,477 | | | | 58,774 | | | | 11,650 | | | | 18,601 | | | | 3,909 | | | | 13,228 | | |
| Shares issued in reinvestment and capital gains – Class Z | | | 4,138 | | | | 27,709 | | | | 588 | | | | 7,251 | | | | 345 | | | | 796 | | |
| Less shares redeemed – Class Z | | | (27,249 | ) | | | (47,499 | ) | | | (4,294 | ) | | | (9,331 | ) | | | (4,324 | ) | | | (6,302 | ) | |
| Net Increase (Decrease) – Class Z | | | 10,366 | | | | 38,984 | | | | 7,944 | | | | 16,521 | | | | (70 | ) | | | 7,722 | | |
| Net Increase (Decrease) in Shares of Beneficial Interest | | | 11,173 | | | | 57,394 | | | | 11,415 | | | | 21,279 | | | | (367 | ) | | | 10,067 | | |
* Rounds to less than 500 shares.
See accompanying notes to financial statements.
66
| | | Columbia Acorn
International Select | | Columbia
Acorn Select | | Columbia
Thermostat Fund | |
| Changes in Shares of Beneficial Interest: | | (Unaudited)
Six months
ended
June 30, | | Year ended
December 31, | | (Unaudited)
Six months
ended
June 30, | | Year ended
December 31, | | (Unaudited)
Six months
ended
June 30, | | Year ended
December 31, | |
| (in thousands) | | 2007 | | 2006 | | 2007 | | 2006 | | 2007 | | 2006 | |
| Subscriptions – Class A | | | 447 | | | | 446 | | | | 8,142 | | | | 8,645 | | | | 249 | | | | 492 | | |
| Shares issued in reinvestment and capital gains – Class A | | | 3 | | | | — | * | | | 222 | | | | 777 | | | | 93 | | | | 390 | | |
| Less shares redeemed – Class A | | | (94 | ) | | | (131 | ) | | | (3,412 | ) | | | (6,607 | ) | | | (931 | ) | | | (1,960 | ) | |
| Net Increase (Decrease) – Class A | | | 356 | | | | 315 | | | | 4,952 | | | | 2,815 | | | | (589 | ) | | | (1,078 | ) | |
| Subscriptions – Class B | | | 49 | | | | 97 | | | | 85 | | | | 207 | | | | 154 | | | | 279 | | |
| Shares issued in reinvestment and capital gains – Class B | | | — | * | | | — | * | | | 45 | | | | 183 | | | | 112 | | | | 437 | | |
| Less shares redeemed – Class B | | | (49 | ) | | | (64 | ) | | | (675 | ) | | | (1,373 | ) | | | (616 | ) | | | (1,253 | ) | |
| Net Increase (Decrease) – Class B | | | — | | | | 33 | | | | (545 | ) | | | (983 | ) | | | (350 | ) | | | (537 | ) | |
| Subscriptions – Class C | | | 87 | | | | 100 | | | | 1,252 | | | | 898 | | | | 155 | | | | 322 | | |
| Shares issued in reinvestment and capital gains – Class C | | | — | | | | — | * | | | 38 | | | | 133 | | | | 40 | | | | 156 | | |
| Less shares redeemed – Class C | | | (22 | ) | | | (42 | ) | | | (518 | ) | | | (1,002 | ) | | | (336 | ) | | | (572 | ) | |
| Net Increase (Decrease) – Class C | | | 65 | | | | 58 | | | | 772 | | | | 29 | | | | (141 | ) | | | (94 | ) | |
| Subscriptions – Class Z | | | 1,040 | | | | 1,448 | | | | 17,043 | | | | 10,565 | | | | 239 | | | | 442 | | |
| Shares issued in reinvestment and capital gains – Class Z | | | 11 | | | | 5 | | | | 206 | | | | 559 | | | | 66 | | | | 210 | | |
| Less shares redeemed – Class Z | | | (371 | ) | | | (427 | ) | | | (2,490 | ) | | | (7,111 | ) | | | (131 | ) | | | (248 | ) | |
| Net Increase (Decrease) – Class Z | | | 680 | | | | 1,026 | | | | 14,759 | | | | 4,013 | | | | 174 | | | | 404 | | |
| Net Increase (Decrease) in Shares of Beneficial Interest | | | 1,101 | | | | 1,432 | | | | 19,938 | | | | 5,874 | | | | (906 | ) | | | (1,305 | ) | |
67
Columbia Acorn Family of Funds
Financial Highlights
Columbia Acorn Fund
| Class Z | | (Unaudited)
Six months
ended June 30, | | Year ended December 31, | |
| Selected data for a share outstanding throughout each period | | 2007 | | 2006 | | 2005 | | 2004 | | 2003 | | 2002 | |
| Net Asset Value, Beginning of Period | | $ | 29.71 | | | $ | 28.17 | | | $ | 26.45 | | | $ | 22.56 | | | $ | 15.50 | | | $ | 17.88 | | |
| Income from Investment Operations | |
| Net investment income (a) | | | 0.11 | | | | 0.13 | | | | 0.15 | | | | 0.04 | | | | 0.03 | | | | 0.02 | | |
| Net realized and unrealized gain (loss) | | | 3.33 | | | | 3.92 | | | | 3.28 | | | | 4.78 | | | | 7.05 | | | | (2.40 | ) | |
| Total from Investment Operations | | | 3.44 | | | | 4.05 | | | | 3.43 | | | | 4.82 | | | | 7.08 | | | | (2.38 | ) | |
| Less Distributions Declared to Shareholders | |
| From net investment income | | | — | | | | (0.13 | ) | | | (0.15 | ) | | | (0.02 | ) | | | — | | | | — | | |
| From net realized gains | | | (0.39 | ) | | | (2.38 | ) | | | (1.56 | ) | | | (0.91 | ) | | | (0.02 | ) | | | — | | |
| Total Distributions Declared to Shareholders | | | (0.39 | ) | | | (2.51 | ) | | | (1.71 | ) | | | (0.93 | ) | | | (0.02 | ) | | | — | | |
| Net Asset Value, End of Period | | $ | 32.76 | | | $ | 29.71 | | | $ | 28.17 | | | $ | 26.45 | | | $ | 22.56 | | | $ | 15.50 | | |
| Total Return (b) | | | 11.55 | %(c)(d) | | | 14.45 | %(c) | | | 13.11 | %(c) | | | 21.51 | %(c) | | | 45.68 | % | | | (13.31 | )% | |
| Ratios to Average Net Assets/Supplemental Data | |
| Net expenses (e) | | | 0.73 | %(f) | | | 0.74 | % | | | 0.74 | % | | | 0.81 | % | | | 0.80 | % | | | 0.82 | % | |
| Net investment income (e) | | | 0.67 | %(f) | | | 0.45 | % | | | 0.57 | % | | | 0.18 | % | | | 0.17 | % | | | 0.15 | % | |
| Waiver/reimbursement | | | 0.01 | %(f) | | | 0.01 | % | | | 0.02 | % | | | 0.02 | % | | | — | | | | — | | |
| Portfolio turnover rate | | | 10 | %(d) | | | 22 | % | | | 16 | % | | | 20 | % | | | 10 | % | | | 13 | % | |
| Net assets at end of period (in millions) | | $ | 13,709 | | | $ | 12,128 | | | $ | 10,399 | | | $ | 8,689 | | | $ | 7,065 | | | $ | 4,022 | | |
(a) Per share data was calculated using the average shares outstanding during the period.
(b) Total return at net asset value assuming all distributions reinvested.
(c) Had the Investment Adviser and/or Transfer Agent not waived and/or reimbursed a portion of expenses, total return would have been reduced.
(d) Not annualized.
(e) The benefits derived from custody fees paid indirectly had an impact of less than 0.01%.
(f) Annualized.
Columbia Acorn International
| Class Z | | (Unaudited)
Six months
ended June 30, | | Year ended December 31, | |
| Selected data for a share outstanding throughout each period | | 2007 | | 2006 | | 2005 | | 2004 | | 2003 | | 2002 | |
| Net Asset Value, Beginning of Period | | $ | 40.31 | | | $ | 33.44 | | | $ | 29.03 | | | $ | 22.66 | | | $ | 15.40 | | | $ | 18.47 | | |
| Income from Investment Operations | |
| Net investment income (a) | | | 0.34 | | | | 0.35 | | | | 0.34 | | | | 0.25 | | | | 0.21 | | | | 0.14 | | |
| Net realized and unrealized gain (loss) | | | 5.54 | | | | 10.94 | | | | 5.87 | | | | 6.37 | | | | 7.13 | | | | (3.10 | ) | |
| Total from Investment Operations | | | 5.88 | | | | 11.29 | | | | 6.21 | | | | 6.62 | | | | 7.34 | | | | (2.96 | ) | |
| Less Distributions Declared to Shareholders | |
| From net investment income | | | (0.12 | ) | | | (0.51 | ) | | | (0.72 | ) | | | (0.25 | ) | | | (0.08 | ) | | | (0.11 | ) | |
| From net realized gains | | | (0.25 | ) | | | (3.91 | ) | | | (1.08 | ) | | | — | | | | — | | | | — | | |
| Total Distributions Declared to Shareholders | | | (0.37 | ) | | | (4.42 | ) | | | (1.80 | ) | | | (0.25 | ) | | | (0.08 | ) | | | (0.11 | ) | |
| Redemption Fees | |
| Redemption fees added to paid in capital | | | 0.00 | (a)(b) | | | 0.00 | (a)(b) | | | 0.00 | (a)(b) | | | 0.00 | (a)(b) | | | — | | | | — | | |
| Net Asset Value, End of Period | | $ | 45.82 | | | $ | 40.31 | | | $ | 33.44 | | | $ | 29.03 | | | $ | 22.66 | | | $ | 15.40 | | |
| Total Return (c) | | | 14.59 | %(d)(e) | | | 34.53 | %(d) | | | 21.81 | %(d) | | | 29.47 | %(d) | | | 47.80 | % | | | (16.10 | )% | |
| Ratios to Average Net Assets/Supplemental Data | |
| Net expenses (f) | | | 0.90 | %(g) | | | 0.94 | % | | | 0.99 | % | | | 1.08 | % | | | 1.05 | % | | | 1.06 | % | |
| Net investment income (f) | | | 1.61 | %(g) | | | 0.92 | % | | | 1.09 | % | | | 1.01 | % | | | 1.19 | % | | | 0.80 | % | |
| Waiver/reimbursement | | | 0.00 | %(g)(h) | | | 0.01 | % | | | 0.02 | % | | | 0.02 | % | | | — | | | | — | | |
| Portfolio turnover rate | | | 16 | %(e) | | | 31 | % | | | 27 | % | | | 40 | % | | | 40 | % | | | 52 | % | |
| Net assets at end of period (in millions) | | $ | 4,725 | | | $ | 3,836 | | | $ | 2,629 | | | $ | 1,919 | | | $ | 1,563 | | | $ | 1,241 | | |
(a) Per share data was calculated using the average shares outstanding during the period.
(b) Rounds to less than $0.01 per share.
(c) Total return at net asset value assuming all distributions reinvested.
(d) Had the Investment Adviser and/or Transfer Agent not waived and/or reimbursed a portion of expenses, total return would have been reduced.
(e) Not annualized.
(f) The benefits derived from custody fees paid indirectly had an impact of less than 0.01%.
(g) Annualized.
(h) Rounds to less than 0.01%.
See accompanying notes to financial statements.
68
Columbia Acorn USA
| Class Z | | (Unaudited)
Six months
ended June 30, | | Year ended December 31, | |
| Selected data for a share outstanding throughout each period | | 2007 | | 2006 | | 2005 | | 2004 | | 2003 | | 2002 | |
| Net Asset Value, Beginning of Period | | $ | 28.66 | | | $ | 27.03 | | | $ | 25.20 | | | $ | 21.01 | | | $ | 14.28 | | | $ | 17.52 | | |
| Income from Investment Operations | |
| Net investment income (loss) (a) | | | 0.05 | | | | (0.02 | ) | | | 0.07 | | | | (0.15 | ) | | | (0.13 | ) | | | (0.10 | ) | |
| Net realized and unrealized gain (loss) | | | 2.68 | | | | 2.26 | | | | 3.18 | | | | 4.48 | | | | 6.86 | | | | (3.14 | ) | |
| Total from Investment Operations | | | 2.73 | | | | 2.24 | | | | 3.25 | | | | 4.33 | | | | 6.73 | | | | (3.24 | ) | |
| Less Distributions Declared to Shareholders | |
| From net investment income | | | — | | | | — | | | | (0.05 | ) | | | — | | | | — | | | | — | | |
| From net realized gains | | | (0.28 | ) | | | (0.61 | ) | | | (1.37 | ) | | | (0.14 | ) | | | — | | | | — | | |
| Total Distributions Declared to Shareholders | | | (0.28 | ) | | | (0.61 | ) | | | (1.42 | ) | | | (0.14 | ) | | | — | | | | — | | |
| Net Asset Value, End of Period | | $ | 31.11 | | | $ | 28.66 | | | $ | 27.03 | | | $ | 25.20 | | | $ | 21.01 | | | $ | 14.28 | | |
| Total Return (b) | | | 9.50 | %(c)(d) | | | 8.28 | %(c) | | | 12.98 | %(c) | | | 20.62 | %(c) | | | 47.13 | % | | | (18.49 | )% | |
| Ratios to Average Net Assets/Supplemental Data | |
| Net expenses (e) | | | 0.97 | %(f) | | | 0.98 | % | | | 1.01 | % | | | 1.09 | % | | | 1.11 | % | | | 1.17 | % | |
| Net investment income (loss) (e) | | | 0.31 | %(f) | | | (0.07 | )% | | | 0.28 | % | | | (0.66 | )% | | | (0.72 | )% | | | (0.64 | )% | |
| Waiver/reimbursement | | | 0.01 | %(f) | | | 0.01 | % | | | 0.01 | % | | | 0.02 | % | | | — | | | | — | | |
| Portfolio turnover rate | | | 9 | %(d) | | | 13 | % | | | 13 | % | | | 18 | % | | | 7 | % | | | 31 | % | |
| Net assets at end of period (in millions) | | $ | 1,316 | | | $ | 1,214 | | | $ | 937 | | | $ | 646 | | | $ | 502 | | | $ | 235 | | |
(a) Per share data was calculated using the average shares outstanding during the period.
(b) Total return at net asset value assuming all distributions reinvested.
(c) Had the Investment Adviser and/or Transfer Agent not waived and/or reimbursed a portion of expenses, total return would have been reduced.
(d) Not annualized.
(e) The benefits derived from custody fees paid indirectly had an impact of less than 0.01%.
(f) Annualized.
Columbia Acorn International Select
| Class Z | | (Unaudited)
Six months
ended June 30, | | Year ended December 31, | |
| Selected data for a share outstanding throughout each period | | 2007 | | 2006 | | 2005 | | 2004 | | 2003 | | 2002 | |
| Net Asset Value, Beginning of Period | | $ | 27.97 | | | $ | 20.57 | | | $ | 18.02 | | | $ | 14.58 | | | $ | 10.29 | | | $ | 12.09 | | |
| Income from Investment Operations | |
| Net investment income (a) | | | 0.13 | | | | 0.10 | | | | 0.13 | | | | 0.04 | | | | 0.06 | | | | 0.03 | | |
| Net realized and unrealized gain (loss) | | | 3.17 | | | | 7.35 | | | | 2.70 | | | | 3.47 | | | | 4.24 | | | | (1.83 | ) | |
| Total from Investment Operations | | | 3.30 | | | | 7.45 | | | | 2.83 | | | | 3.51 | | | | 4.30 | | | | (1.80 | ) | |
| Less Distributions Declared to Shareholders | |
| From net investment income | | | (0.15 | ) | | | (0.05 | ) | | | (0.28 | ) | | | (0.07 | ) | | | (0.01 | ) | | | — | | |
| Redemption Fees | |
| Redemption fees added to paid in capital | | | 0.00 | (a)(b) | | | 0.00 | (a)(b) | | | 0.00 | (a)(b) | | | 0.00 | (a)(b) | | | — | | | | — | | |
| Net Asset Value, End of Period | | $ | 31.12 | | | $ | 27.97 | | | $ | 20.57 | | | $ | 18.02 | | | $ | 14.58 | | | $ | 10.29 | | |
| Total Return (c) | | | 11.80 | %(e)(d) | | | 36.27 | %(d) | | | 15.98 | %(d) | | | 24.14 | %(d) | | | 41.79 | % | | | (14.89 | )% | |
| Ratios to Average Net Assets/Supplemental Data | |
| Net expenses (f) | | | 1.19 | %(g) | | | 1.27 | % | | | 1.45 | % | | | 1.45 | % | | | 1.45 | % | | | 1.45 | % | |
| Net investment income (f) | | | 0.89 | %(g) | | | 0.44 | % | | | 0.72 | % | | | 0.27 | % | | | 0.56 | % | | | 0.26 | % | |
| Waiver/reimbursement | | | 0.00 | %(g)(h) | | | 0.01 | % | | | 0.04 | % | | | 0.29 | % | | | 0.42 | % | | | 0.33 | % | |
| Portfolio turnover rate | | | 31 | %(e) | | | 47 | % | | | 39 | % | | | 73 | % | | | 69 | % | | | 102 | % | |
| Net assets at end of period (in millions) | | $ | 165 | | | $ | 129 | | | $ | 74 | | | $ | 46 | | | $ | 34 | | | $ | 26 | | |
(a) Per share data was calculated using the average shares outstanding during the period.
(b) Rounds to less than $0.01 per share.
(c) Total return at net asset value assuming all distributions reinvested.
(d) Had the Investment Adviser and/or Transfer Agent not waived and/or reimbursed a portion of expenses, total return would have been reduced.
(e) Not annualized.
(f) The benefits derived from custody fees paid indirectly had an impact of less than 0.01%.
(g) Annualized.
(h) Rounds to less than 0.01%.
See accompanying notes to financial statements.
69
Columbia Acorn Family of Funds
Financial Highlights, continued
Columbia Acorn Select
| Class Z | | (Unaudited)
Six months
ended June 30, | | Year ended December 31, | |
| Selected data for a share outstanding throughout each period | | 2007 | | 2006 | | 2005 | | 2004 | | 2003 | | 2002 | |
| Net Asset Value, Beginning of Period | | $ | 26.59 | | | $ | 22.77 | | | $ | 21.13 | | | $ | 18.20 | | | $ | 14.04 | | | $ | 15.23 | | |
| Income from Investment Operations | |
| Net investment loss (a) | | | (0.02 | ) | | | (0.06 | ) | | | (0.03 | ) | | | (0.10 | ) | | | (0.10 | ) | | | (0.10 | ) | |
| Net realized and unrealized gain (loss) | | | 4.48 | | | | 4.51 | | | | 2.35 | | | | 3.47 | | | | 4.39 | | | | (1.09 | ) | |
| Total from Investment Operations | | | 4.46 | | | | 4.45 | | | | 2.32 | | | | 3.37 | | | | 4.29 | | | | (1.19 | ) | |
| Less Distributions Declared to Shareholders | |
| From net investment income | | | — | | | | (0.04 | ) | | | — | | | | — | | | | — | | | | — | | |
| From net realized gains | | | (0.19 | ) | | | (0.59 | ) | | | (0.68 | ) | | | (0.44 | ) | | | (0.13 | ) | | | — | | |
| Total Distributions Declared to Shareholders | | | (0.19 | ) | | | (0.63 | ) | | | (0.68 | ) | | | (0.44 | ) | | | (0.13 | ) | | | — | | |
| Net Asset Value, End of Period | | $ | 30.86 | | | $ | 26.59 | | | $ | 22.77 | | | $ | 21.13 | | | $ | 18.20 | | | $ | 14.04 | | |
| Total Return (b) | | | 16.76 | %(c)(d) | | | 19.68 | %(c) | | | 11.08 | %(c) | | | 18.58 | %(c) | | | 30.61 | % | | | (7.81 | )%(c) | |
| Ratios to Average Net Assets/Supplemental Data | |
| Net expenses (e) | | | 0.92 | %(f) | | | 0.96 | % | | | 0.99 | % | | | 1.13 | % | | | 1.12 | % | | | 1.26 | % | |
| Net investment loss (e) | | | (0.14 | )%(f) | | | (0.26 | )% | | | (0.16 | )% | | | (0.52 | )% | | | (0.63 | )% | | | (0.67 | )% | |
| Waiver/reimbursement | | | 0.00 | %(f)(g) | | | 0.02 | % | | | 0.03 | % | | | 0.02 | % | | | — | | | | 0.01 | % | |
| Portfolio turnover rate | | | 7 | %(d) | | | 21 | % | | | 19 | % | | | 34 | % | | | 16 | % | | | 40 | % | |
| Net assets at end of period (in millions) | | $ | 1,511 | | | $ | 909 | | | $ | 688 | | | $ | 445 | | | $ | 294 | | | $ | 93 | | |
(a) Per share data was calculated using the average shares outstanding during the period.
(b) Total return at net asset value assuming all distributions reinvested.
(c) Had the Investment Adviser and/or Transfer Agent not waived and/or reimbursed a portion of expenses, total return would have been reduced.
(d) Not annualized.
(e) The benefits derived from custody fees paid indirectly had an impact of less than 0.01%.
(f) Annualized.
(g) Rounds to less than 0.01%.
Columbia Thermostat Fund
| Class Z | | (Unaudited)
Six months
ended June 30, | | Year ended December 31, | | Inception
September 25,
2002 through
December 31, | |
| Selected data for a share outstanding throughout each period | | 2007 | | 2006 | | 2005 | | 2004 | | 2003 | | 2002 | |
| Net Asset Value, Beginning of Period | | $ | 12.57 | | | $ | 12.50 | | | | 13.12 | | | $ | 12.31 | | | $ | 10.41 | | | $ | 10.00 | | |
| Income from Investment Operations | |
| Net investment income (a) | | | 0.24 | | | | 0.49 | | | | 0.43 | | | | 0.31 | | | | 0.19 | | | | 0.04 | | |
| Net realized and unrealized gain | | | 0.32 | | | | 0.84 | | | | 0.28 | | | | 0.82 | | | | 1.87 | | | | 0.37 | | |
| Total from Investment Operations | | | 0.56 | | | | 1.33 | | | | 0.71 | | | | 1.13 | | | | 2.06 | | | | 0.41 | | |
| Less Distributions Declared to Shareholders | |
| From net investment income | | | (0.06 | ) | | | (0.54 | ) | | | (0.42 | ) | | | (0.29 | ) | | | (0.16 | ) | | | — | | |
| From net realized gains | | | (0.30 | ) | | | (0.72 | ) | | | (0.91 | ) | | | (0.03 | ) | | | (0.00 | )(b) | | | — | | |
| Total Distributions Declared to Shareholders | | | (0.36 | ) | | | (1.26 | ) | | | (1.33 | ) | | | (0.32 | ) | | | (0.16 | ) | | | — | | |
| Net Asset Value, End of Period | | $ | 12.77 | | | $ | 12.57 | | | $ | 12.50 | | | $ | 13.12 | | | $ | 12.31 | | | $ | 10.41 | | |
| Total Return (c)(d) | | | 4.43 | %(e) | | | 10.86 | % | | | 5.50 | % | | | 9.17 | % | | | 19.79 | % | | | 4.10 | %(e) | |
| Ratios to Average Net Assets/Supplemental Data | |
| Net expenses (f) | | | 0.25 | %(g)(h) | | | 0.25 | %(g) | | | 0.25 | %(g) | | | 0.25 | %(g) | | | 0.38 | %(g) | | | 0.62 | %(h)(i) | |
| Net investment income | | | 3.74 | %(g)(h) | | | 3.84 | %(g) | | | 3.28 | %(g) | | | 2.48 | %(g) | | | 1.64 | %(g) | | | 1.41 | %(h)(i) | |
| Waiver/reimbursement | | | 0.15 | %(h) | | | 0.13 | % | | | 0.11 | % | | | 0.21 | % | | | 0.88 | % | | | 19.94 | %(h) | |
| Portfolio turnover rate | | | 39 | %(e) | | | 66 | % | | | 96 | % | | | 67 | % | | | 61 | % | | | 11 | %(e) | |
| Net assets at end of period (in millions) | | $ | 33 | | | $ | 31 | | | $ | 26 | | | $ | 21 | | | $ | 14 | | | $ | 4 | | |
(a) Per share data was calculated using the average shares outstanding during the period. Recognition of net investment income by the Fund is affected by the timing of the declaration of dividends by the underlying investment companies in which the Fund invests.
(b) Rounds to less than $0.01 per share.
(c) Total return at net asset value assuming all distributions reinvested.
(d) Had the Investment Adviser and/or Transfer Agent not reimbursed a portion of expenses, total return would have been reduced.
(e) Not annualized.
(f) Does not include expenses of the investment companies in which the Fund invests.
(g) The benefits derived from custody fees paid indirectly had an impact of less than 0.01%.
(h) Annualized.
(i) In accordance with a requirement of the Securities and Exchange Commission, the ratios reflect total expenses prior to the reduction of custody fees for cash balances the Fund maintains with the custodian ("custody fees paid indirectly"). The ratios of expenses to average daily net assets and net investment income to average daily net assets net of custody fees paid indirectly would have been 0.60% and 1.43%, respectively for the period ended December 31, 2002.
See accompanying notes to financial statements.
70
Columbia Acorn Family of Funds
Notes to Financial Statements (Unaudited)
1. Nature of Operations
Columbia Acorn Fund, Columbia Acorn International, Columbia Acorn USA, Columbia Acorn International Select, Columbia Acorn Select and Columbia Thermostat Fund (the "Funds") are each a series of Columbia Acorn Trust (the "Trust"), an open-end management investment company organized as a Massachusetts business trust. The investment objective of each Fund, excluding Columbia Thermostat Fund, is to seek long-term growth of capital. The investment objective of Columbia Thermostat Fund is to provide long-term total return. The Fund pursues its investment objective by investing in shares of other mutual funds. As a "fund of funds" under normal circumstances, the Fund allocates at least 95% of its net assets among a selected group of stock and bond mutual funds ("portfolio funds") according to the current level of the Standard & Poor's 500 Stock Index in relation to predetermined ranges set by the Fund's investment adviser. The Fund may invest up to 5% of its net assets plus any cash received that day in cash, repurchase agreements, high quality short-term paper and government securities.
The Funds may issue an unlimited number of shares. The Funds currently offer four classes of shares: Class A, Class B, Class C and Class Z.
Class A shares are sold with a front-end sales charge. Class A shares bought without an initial sales charge in accounts aggregating up to $50 million at the time of purchase are subject to a 1.00% contingent deferred sales charge ("CDSC") if the shares are sold within 12 months of the time to purchase.
Class B shares are subject to a CDSC if sold within six years of purchase. Class B shares will convert to Class A shares automatically eight years after purchase.
Class C shares are subject to a CDSC on redemptions made within one year after purchase.
Class Z shares are offered continuously at net asset value. There are certain restrictions on the purchase of Class Z shares. Generally, Class Z shares of a Fund may be exchanged for shares of another fund distributed by Columbia Management Distributors, Inc. at no additional charge.
Columbia Acorn International and Columbia Acorn International Select impose a 2% redemption fee on Class A, Class B, Class C and Class Z shares that are redeemed within 60 days or less. See "Fund Policy on Trading of Fund Shares" as disclosed in the Funds' prospectuses for more information.
The financial highlights for Class A, Class B and Class C shares are presented in a separate semiannual report.
Investment income, realized and unrealized gains and losses, and certain fund-level expenses are allocated pro rata on the basis of the relative net assets of all classes, except each class bears certain expenses unique to that class such as distribution services, transfer agent, and certain other class specific expenses. Differences in class expenses may result in payment of different dividend distributions for each class. All the share classes of the Trust have equal rights with respect to voting subject to Fund or class specific matters.
2. Significant Accounting Policies
>Security valuation
Securities of the Funds are valued at market value or, if a market quotation for a security is not readily available or is deemed not to be reliable because of events or circumstances that have occurred between the market quotation and the time as of which the security is to be valued, the security is valued at a fair value determined in accordance with procedures established by the Board of Trustees. With respect to Columbia Thermostat Fund, investments in portfolio funds are valued at their net asset value as reported by the underlying funds. A security traded on a securities exchange or in the over-the-counter market in which transaction prices are reported is valued at the last sales price at the time of valuation. A security traded principally on NASDAQ is valued at the NASDAQ official closing price. A security for which there is no reported sale on the valuation date is valued at the latest bid quotation. A short-term debt obligation having a maturity of 60 days or less from the valuation date is valued at amortized cost, which approximate fair value. A security for which a market quotation is not readily available and any other assets are valued in accordance with procedures established by the Board of Trustees. The Trust has retained an independent statistical fair value pricing service to assist in the fair valuation process for securities principally traded in a foreign market in order to adjust for possible changes in value that may occur between the close of the foreign exchange and the time as of which the securities are to be valued. If a security is valued at a "fair value," that value may be different from the last quoted market price for the security.
In September 2006, Statement of Financial Accounting Standards No. 157, Fair Value Measurements ("SFAS 157"), was issued. SFAS 157 is effective for fiscal years beginning after November 15, 2007. SFAS 157 defines fair value, establishes a framework for measuring fair value and expands disclosures about fair value measurements. Management is evaluating the
71
Columbia Acorn Family of Funds
Notes to Financial Statements (Unaudited), continued
impact the application of SFAS 157 will have on the Funds' financial statement disclosures.
>Repurchase agreements
The Funds may engage in repurchase agreement transactions. The Funds, through their custodians, receive delivery of underlying securities collateralizing repurchase agreements. The Funds' investment adviser determines that the value of the underlying securities is at all times at least equal to the resale price. In the event of default or bankruptcy by the other party to the agreement, realization and/or retention of the collateral may be subject to legal proceedings.
>Foreign currency translations
Values of investments denominated in foreign currencies are converted into U.S. dollars using the spot market rate of exchange at the time of valuation. Purchases and sales of investments and dividend and interest income are translated into U.S. dollars using the spot market rate of exchange prevailing on the respective dates of such transactions. The gain or loss resulting from changes in foreign exchange rates is included with net realized and unrealized gain or loss from investments, as appropriate.
>Security transactions and investment income
Security transactions, investment income and shareholder fund transactions are accounted for on the trade date (date the order to buy or sell is executed) and dividend income and realized gain distributions from other funds are recorded on the ex-dividend date, except that certain dividends from foreign securities are recorded as soon as the information is available to the Funds. Interest income is recorded on the accrual basis and includes amortization of discounts on debt obligations when required for federal income tax purposes. Realized gains and losses from security transactions are recorded on an identified cost basis.
Awards, if any, from class action litigation related to securities owned may be recorded as a reduction of cost of those securities. If the applicable securities are no longer owned, the proceeds are recorded as realized gains.
The Funds estimate components of distributions from real estate investment trusts ("REITs"). Distributions received in excess of income are recorded as a reduction of the cost of the related investments. If the applicable securities are no longer owned, any distributions received in excess of income are recorded as realized gains.
>Restricted securities
Restricted securities are securities that may only be resold upon registration under federal securities laws or in transactions exempt from registration. In some cases, the issuer of restricted securities has agreed to register such securities for resale at the issuer's expense either upon demand by the Funds or in connection with another registered offering of the securities. Many restricted securities may be resold in the secondary market in transactions exempt from registration. Such restricted securities may be determined to be liquid under criteria established by the Board of Trustees. The Funds will not incur any registration costs upon such resale.
>Use of estimates
The preparation of financial statements in conformity with accounting principles generally accepted in the United States of America ("GAAP") requires management to make estimates and assumptions that affect the amounts reported in the financial statements and accompanying notes. Actual results may differ from those estimates.
>Fund share valuation
Fund shares are sold and redeemed on a continuing basis at net asset value subject to any applicable sales charge. Net asset value per share is determined daily as of the close of trading on the New York Stock Exchange ("NYSE") on each day the NYSE is open for trading. All income, expenses (other than the Class A, Class B and Class C shares Rule 12b-1 service and distribution fees and Class A, Class B, Class C and Class Z shares transfer agent fees) and realized and unrealized gains (losses) of a Fund are allocated to each class proportionately on a daily basis for purposes of determining the net asset value of each class. Redemption fees are accounted for as an addition to paid in capital for purposes of determining the net asset value of each class.
>Custody fees/credits
Custody fees are reduced based on each Fund's cash balances maintained with the custodian. The amount is disclosed as a reduction of total expenses on the Statements of Operations.
>Federal income taxes
The Funds have complied with the provisions of the Internal Revenue Code available to regulated investment companies and, in the manner provided therein, distribute all their taxable income, as well as any net realized gain on sales of investments and foreign currency transactions reportable for federal income tax purposes. Columbia Thermostat Fund distributes all of its taxable income, as well as any net realized gain on
72
sales of portfolio fund shares and any distributions of net realized gains received by the Fund from its portfolio funds, reportable for federal income tax purposes. Accordingly, the Funds paid no federal income taxes and no federal income tax provision was required.
>Foreign capital gains taxes
Realized gains in certain countries may be subject to foreign taxes at the fund level, at rates ranging from approximately 10% to 15%. The Funds accrue for such foreign taxes on net realized and unrealized gains at the appropriate rate for each jurisdiction.
>Distributions to shareholders
Distributions to shareholders are recorded on the ex-date.
>Indemnification
In the normal course of business, each Fund enters into contracts that contain a variety of representations and warranties and which provide general indemnities. A Fund's maximum exposure under these arrangements is unknown, as this would involve future claims against the Fund. Also, under the Trust's organizational documents, the Trustees and Officers of the Trust are indemnified against certain liabilities that may arise out of their duties to the Trust. However, based on experience, the Funds expect the risk of loss due to these warranties and indemnities to be minimal.
3. Federal Tax Information
The tax character of distributions paid during the year ended December 31, 2006 was as follows:
| | | Ordinary
Income* | | Long-Term
Capital Gains | |
| (in thousands) | |
| Columbia Acorn Fund | | $ | 102,167 | | | $ | 1,405,201 | | |
| Columbia Acorn International | | | 47,043 | | | | 386,698 | | |
| Columbia Acorn USA | | | — | | | | 33,093 | | |
| Columbia Acorn International Select | | | 198 | | | | — | | |
| Columbia Acorn Select | | | 9,493 | | | | 41,617 | | |
| Columbia Thermostat Fund | | | 7,031 | | | | 9,506 | | |
*For tax purposes short-term capital gains distributions, if any, are considered ordinary income distributions.
The following capital loss carryforwards, determined as of December 31, 2006, may be available to reduce taxable income arising from future net realized gains on investments, if any, to the extent permitted by the Internal Revenue Code:
Year of
Expiration | | Columbia Acorn
USA | | Columbia Acorn
International Select | |
| (in thousands) | | | |
| 2009 | | $ | 1,517 | * | | $ | — | | |
| 2010 | | | 506 | | | | 6,126 | | |
| 2011 | | | — | | | | 2,488 | | |
| TOTAL | | $ | 2,023 | | | $ | 8,614 | | |
*Of these carryforwards, $2,023 (expiring in 2009 and 2010) remains from Columbia Acorn USA's merger with Stein Roe Small Company Growth Fund on 7/26/2002. Utilization of Stein Roe Small Company Growth Fund's losses could be subject to limitations imposed by the Internal Revenue Code.
The following capital loss carryforwards were utilized during the year ended December 31, 2006.
| (in thousands) | |
| Columbia Acorn USA | | $ | 506 | | |
| Columbia Acorn International Select | | | 16,995 | | |
The Funds adopted Financial Accounting Standards Board ("FASB") Interpretation No. 48, Accounting for Uncertainty in Income Taxes – an Interpretation of FASB Statement No. 109 ("FIN 48") effective June 29, 2007. FIN 48 requires management to determine whether a tax position of a Fund is more likely than not to be sustained upon examination by the applicable taxing authority, including resolution of any related appeals or litigation processes, based in the technical merits of the position. The tax benefit to be recognized is measured as the largest amount of benefit that is greater than fifty percent likely of being realized upon ultimate settlement. FIN 48 must be applied to all existing tax positions upon initial adoption and the cumulative effect, if any, is to be reported as an adjustment to net assets. Management has evaluated the known implications of FIN 48 on its computation of net assets for the Funds. As a result of this evaluation, management believes that FIN 48 will not have any effect on the Fund's financial statements. However, management's conclusions regarding FIN 48 may be subject to review and adjustment at a later date based on factors including, but not limited to, further guidance expected from the FASB, new tax laws, regulations, and administrative interpretations (including relevant court decisions).
4. Transactions with Affiliates
Columbia WAM furnishes continuing investment supervision to the Funds and is responsible for the overall management of the Funds' business affairs.
Effective August 1, 2007, under the Funds' investment advisory agreement, fees are accrued daily based on the Funds' average daily net assets and paid monthly to Columbia WAM at the annual rates shown in the table below for Columbia Acorn International Select:
Columbia Acorn International Select
| Average Daily Net Assets | | Annual
Fee Rate | |
| | Up to $500 million | | | | 0.940 | % | |
| | $500 million and over | | | | 0.900 | % | |
For all of the Funds, and prior to August 1, 2007, for Columbia Acorn International Select, for the period covered by this report as provided under the Funds' investment advisory agreement, fees were accrued daily based on the Funds' average daily net assets and paid monthly to Columbia WAM at the annual rates shown in the table below for each Fund.
73
Columbia Acorn Family of Funds
Notes to Financial Statements (Unaudited), continued
Columbia Acorn Fund
| Average Daily Net Assets | | Annual
Fee Rate | |
| Up to $700 million | | | 0.740 | % | |
| $700 million to $2 billion | | | 0.690 | % | |
| $2 billion to $6 billion | | | 0.640 | % | |
| $6 billion and over | | | 0.630 | % | |
Columbia Acorn International
| Average Daily Net Assets | | Annual
Fee Rate | |
| Up to $100 million | | | 1.190 | % | |
| $100 million to $500 million | | | 0.940 | % | |
| $500 million and over | | | 0.740 | % | |
Columbia Acorn USA
| Average Daily Net Assets | | Annual
Fee Rate | |
| Up to $200 million | | | 0.940 | % | |
| $200 million to $500 million | | | 0.890 | % | |
| $500 million to $2 billion | | | 0.840 | % | |
| $2 billion to $3 billion | | | 0.800 | % | |
| $3 billion and over | | | 0.700 | % | |
Columbia Acorn Select
| Average Daily Net Assets | | Annual
Fee Rate | |
| Up to $700 million | | | 0.850 | % | |
| $700 million to $2 billion | | | 0.800 | % | |
| $2 billion to $3 billion | | | 0.750 | % | |
| $3 billion and over | | | 0.700 | % | |
Columbia Acorn International Select
| All Average Daily Net Assets | | | 0.940 | % | �� |
Columbia Thermostat Fund
| All Average Daily Net Assets | | | 0.100 | % | |
For the six months ended June 30, 2007, the Funds' annualized investment advisory fee rates were as follows:
| Columbia Acorn Fund | | | 0.64 | % | |
| Columbia Acorn International | | | 0.76 | % | |
| Columbia Acorn USA | | | 0.86 | % | |
| Columbia Acorn International Select | | | 0.94 | % | |
| Columbia Acorn Select | | | 0.80 | % | |
| Columbia Thermostat Fund | | | 0.10 | % | |
>Expense limit
Columbia WAM has voluntarily agreed to reimburse the ordinary operating expenses (exclusive of interest, taxes and extraordinary expenses, if any) exceeding 1.45% of the average daily net assets for Columbia Acorn International Select Class Z shares and 1.35% of the average daily net assets for Columbia Acorn Select Class Z shares. This arrangement may be modified or terminated by either the Funds or Columbia WAM on 30 days notice.
Columbia WAM has agreed to contractually reimburse the ordinary operating expenses (exclusive of interest and fees on borrowings and expenses associated with the Fund's investment in other investment companies) exceeding 0.25% of the average daily net assets of Columbia Thermostat Fund's Class Z shares through April 30, 2008.
Expenses reimbursed by Columbia WAM for Columbia Thermostat Fund for the six months ended June 30, 2007, were $186,952.
Columbia WAM provides administrative services and receives an administration fee from the Funds at the following annual rates:
Columbia Acorn Trust
Aggregate Average Daily
Net Assets of the Trust: | | Annual
Fee Rate | |
| Up to $8 billion | | | 0.05 | % | |
| $8 billion to $16 billion | | | 0.04 | % | |
| $16 billion and over | | | 0.03 | % | |
For the six months ended June 30, 2007 each Fund's annualized effective administration fee rate was 0.04%. Columbia WAM has delegated to Columbia Management Advisors, LLC, an indirect, wholly owned subsidiary of BOA, responsibility to provide certain administrative services to the Funds.
Columbia Management Distributors, Inc. ("CMDI"), a wholly owned subsidiary of BOA, is the Funds' principal underwriter and receives no compensation on the sale of Class Z shares.
Each Fund has adopted a Rule 12b-1 plan which requires it to pay CMDI a service and distribution fee on the net assets attributable to Class A, Class B and Class C shares.
Columbia Management Services, Inc. (the "Transfer Agent"), a wholly owned subsidiary of BOA, provides shareholder services to the Funds and has contracted with Boston Financial Data Services ("BFDS") to serve as sub-transfer agent. For such services, the Transfer Agent receives a fee, paid monthly, at the annual rate of $17.00 per open account. The Transfer Agent also receives reimbursement for certain out-of-pocket expenses and sub-transfer agency expenses. During the period January 1, 2007, through March 31, 2007, a portion of these fees were contractually waived.
74
Expenses waived by the Transfer Agent for the six months ended June 30, 2007, were as follows:
| (in thousands) | |
| Columbia Acorn Fund | | $ | 737 | | |
| Columbia Acorn International | | | 56 | | |
| Columbia Acorn USA | | | 66 | | |
| Columbia Acorn International Select | | | 4 | | |
| Columbia Acorn Select | | | 100 | | |
| Columbia Thermostat Fund | | | 11 | | |
Certain officers and trustees of the Trust are also officers of Columbia WAM. The Trust makes no direct payments to its officers and trustees who are affiliated with Columbia WAM. For those trustees not affiliated with Columbia WAM, fees and expenses paid by the Funds for the six months ended June 30, 2007, were as follows:
| (in thousands) | |
| Columbia Acorn Fund | | $ | 367 | | |
| Columbia Acorn International | | | 74 | | |
| Columbia Acorn USA | | | 30 | | |
| Columbia Acorn International Select | | | 15 | | |
| Columbia Acorn Select | | | 155 | | |
| Columbia Thermostat Fund | | | 18 | | |
The Board of Trustees appointed a Chief Compliance Officer to the Trust in accordance with federal securities regulations. The Funds, along with other affiliated funds, will pay their pro-rata share of the expenses associated with the Office of the Chief Compliance Officer. Those expenses are disclosed separately as "Chief compliance officer expenses" in the Statements of Operations.
The Trust offers a deferred compensation plan for its trustees. Under that plan, a trustee may elect to defer all or a portion of his or her compensation. Amounts deferred are retained by the Trust and represent an unfunded obligation of the Trust. The value of amounts deferred is determined by reference to the change in value of Class Z shares of one or more series of the Trust or a money market fund as specified by the trustee. Benefits under the deferred compensation plan are payable when a trustee ceases to be a member of the Board of Trustees.
An affiliate may include any company in which a Fund owns five percent or more of its outstanding voting securities. On June 30, 2007, Columbia Acorn Fund, Columbia Acorn International, Columbia Acorn USA and Columbia Acorn Select each held five percent or more of the outstanding voting securities of one or more companies. Details of investments in those affiliated companies are presented on pages 33, 42, 50 and 59, respectively.
During the six months ended June 30, 2007, the Funds engaged in purchase and sale transactions with funds that have a common investment adviser (or affiliated investment advisers), common directors/trustees, and/or common officers. Those transactions complied with Rule 17a-7 under the Investment Company Act of 1940 and were as follows:
| | | Purchases | | Sales | |
| (in thousands) | |
| Columbia Acorn International | | $ | 3,841 | | | $ | 281 | | |
| Columbia USA | | | 115 | | | | — | | |
| Columbia Acorn Select | | | 3,036 | | | | — | | |
5. Borrowing Arrangements
The Trust participates in a $150 million credit facility, which was entered into to facilitate portfolio liquidity. Interest is charged to each participating fund based on its borrowings at a rate per annum equal to the Federal Funds rate plus 0.50%. In addition, a commitment fee of 0.08% per annum is accrued and apportioned among the participating funds based on their pro-rata portion of the unutilized line of credit. The commitment fee is included in "Other expenses" in the Statements of Operations. No amounts were borrowed by the Funds under this facility for the six months ended June 30, 2007.
6. Investment Transactions
The aggregate cost of purchases and proceeds from sales other than short-term obligations for the six months ended June 30, 2007, were:
Columbia Acorn Fund
| (in thousands) | |
| Investment securities | | | |
| Purchases | | $ | 2,113,213 | | |
| Proceeds from sales | | | 1,942,800 | | |
Columbia Acorn International
| (in thousands) | |
| Investment securities | | | |
| Purchases | | $ | 10,522,574 | | |
| Proceeds from sales | | | 747,816 | | |
Columbia Acorn USA
| (in thousands) | |
| Investment securities | | | |
| Purchases | | $ | 210,429 | | |
| Proceeds from sales | | | 140,893 | | |
75
Columbia Acorn Family of Funds
Notes to Financial Statements (Unaudited), continued
Columbia Acorn International Select
| (in thousands) | |
| Investment securities | | | |
| Purchases | | $ | 82,074 | | |
| Proceeds from sales | | | 57,095 | | |
Columbia Acorn Select
| (in thousands) | |
| Investment securities | | | |
| Purchases | | $ | 541,174 | | |
| Proceeds from sales | | | 167,449 | | |
Columbia Thermostat Fund
| (in thousands) | |
| Investment securities | | | |
| Purchases | | $ | 72,382 | | |
| Proceeds from sales | | | 85,432 | | |
7. Redemption Fees
For the six months ended June 30, 2007, the redemption fees imposed by Columbia Acorn International and Columbia Acorn International Select amounted to approximately $103,000 and $19,000, respectively, and are accounted for as additions to paid in capital.
8. Other
For the six months ended June 30, 2007, Columbia Acorn Fund incurred two trading errors. Columbia Acorn Fund sold shares of Enerflex Systems resulting in a loss of $364. Additionally, Columbia Acorn Fund purchased shares of BioMarin resulting in a loss of $3,750. The Fund was reimbursed by Columbia WAM for the full amount of each loss.
These financial statements reflect certain adjusting journal entries recorded on the Columbia Thermostat Fund. While the impact of these adjusting entries was less than $.002 to each share class' NAV and therefore immaterial, they did cause the NAV's to round up by $0.01 for Class B, C and Z shares when compared to the NAV reported on the shareholder account statement you received by mail.
9. Legal Proceedings
The Trust, Columbia WAM and the Trustees of the Trust (collectively, the "Columbia defendants") are named as defendants in class and derivative complaints that have been consolidated in a Multi-District Action (the "MDL Action") in the federal district court of Maryland. These lawsuits contend that defendants permitted certain investors to market time their trades in certain Columbia Acorn Funds. The MDL Action is ongoing. However, all claims against Columbia Acorn Trust and the independent trustees of the Trust have been dismissed.
The Trust and Columbia WAM are also defendants in a class action lawsuit that alleges, in summary, that the Trust and Columbia WAM exposed shareholders of Columbia Acorn International Fund to trading by market timers by allegedly: (a) failing to properly evaluate daily whether a significant event affecting the value of the Fund's securities had occurred after foreign markets had closed but before the calculation of the Fund's net asset value ("NAV"); (b) failing to implement the Fund's portfolio valuation and share pricing policies and procedures; and (c) failing to know and implement applicable rules and regulations concerning the calculation of NAV (the "Fair Valuation Lawsuit"). The Seventh Circuit ruled that the plaintiffs' state law claims were preempted under federal law resulting in the dismissal of plaintiffs' complaint. Plaintiffs appealed the Seventh Circuit's ruling to the United States Supreme Court. The Supreme Cour t reversed the Seventh Circuit's ruling on jurisdictional grounds and the case was ultimately remanded to the state court.
On March 21, 2005, a class action complaint was filed against the Columbia Acorn Trust and Columbia WAM seeking to rescind the CDSC assessed upon redemption of Class B shares of Columbia Acorn Funds due to the alleged market timing of the Columbia Acorn Funds. In addition to the rescission of sales charges, plaintiffs seek recovery of actual damages, attorneys' fees and costs. The case had been transferred to the MDL Action in the federal district court of Maryland.
On April 4, 2006, the plaintiffs and the Columbia defendants named in the MDL Action executed an agreement in principle intended to fully resolve all of the lawsuits consolidated in the MDL Action as well as the Fair Valuation Lawsuit. The court entered a stay after the parties executed a settlement agreement. The settlement has not yet been finalized or approved by the court.
Columbia WAM, the Columbia Acorn Funds and the Trustees of the Trust are also defendants in a consolidated lawsuit filed in the federal district court of Massachusetts alleging that Columbia WAM used Fund assets to make undisclosed payments to brokers as an incentive for the brokers to market the Funds over other mutual funds to investors. The complaint alleges Columbia WAM and the Trustees of the Trust breached certain common law duties and federal laws.
On November 30, 2005, the court dismissed all of the claims alleged against all of the parties in the consolidated complaint. The parties subsequently executed a formal settlement agreement resolving all claims in the litigation and the
76
plaintiffs dismissed their appeal. The settlement requires court approval, which has not yet been obtained.
On or about January 11, 2005, a putative class action lawsuit was filed in federal district court in Massachusetts against the Trust and the Trustees of the Trust, along with the Columbia Advisers, the sub-administrator of the Columbia Acorn Funds and the Wanger Advisors Funds. The plaintiffs allege that the defendants failed to submit Proof of Claims in connection with settlements of securities class action lawsuits filed against companies in which the Columbia Acorn Funds held positions. The complaint seeks compensatory and punitive damages, and the disgorgement of all fees paid to the Columbia Advisers.
Plaintiffs have voluntarily dismissed the Trust and its independent Trustees.
The Trust and Columbia WAM intend to defend these suits vigorously.
As a result of these matters, or any adverse publicity or other developments resulting from them, there may be increased redemptions or reduced sales of Fund shares, which could increase transaction costs or operating expenses, or have other adverse consequences for the Funds. However, based on currently available information, the Columbia Acorn Trust believes that the likelihood that these lawsuits will have a material adverse impact on any fund is remote, and Columbia WAM believes that the lawsuits are not likely to materially affect its ability to provide investment management services to the Funds.
77
[Excerpt from:]
Columbia Acorn Trust
Management Fee Evaluation of the Senior Officer
Prepared Pursuant to the New York Attorney General's
Assurance of Discontinuance
June 2007
78
Introduction
The New York Attorney General's Assurance of Discontinuance ("Order") entered into by Columbia Management Advisors, Inc. ("CMAI") and Columbia Management Distributors, Inc., ("CMDI" and collectively with "CMAI," "CMG") in February 2005, allows CMAI to manage or advise a mutual fund only if the trustees of the fund appoint a "Senior Officer" to perform specified duties and responsibilities. One of these responsibilities includes "managing the process by which proposed management fees (including but not limited to, advisory fees) to be charged the [Funds] are negotiated so that they are negotiated in a manner which is at arms' length and reasonable and consistent with this Assurance of Discontinuance."
This is the first year that the Columbia Acorn Trust and Wanger Advisors Trust (collectively, the "Trusts") and each series thereof (the "Acorn Funds," "WAT Funds" or collectively, the "Funds") have been overseen by the same Board of Trustees ("Board"). The Order provides that this Board must determine the reasonableness of proposed "management fees" by using either an annual competitive bidding process supervised by the Senior Officer or Independent Fee Consultant, or by obtaining "an annual independent written evaluation prepared by or under the direction of the Senior Officer or the Independent Fee Consultant."
"Management fees" are only part of the costs and expenses paid by mutual fund shareholders. The expenses can vary depending upon the class of shares held but usually include: (1) investment management or advisory fees to compensate analysts and portfolio managers for stock research and portfolio management, as well as the cost of operating a trading desk; (2) administrative expenses incurred to prepare registration statements and tax returns, calculate the Funds' net asset values, maintain effective compliance procedures and perform recordkeeping services; (3) transfer agency costs for establishing accounts, accepting and disbursing funds, as well as overseeing trading in Fund shares; (4) custodial expenses incurred to hold the securities purchased by the Funds; and (5) distribution expenses, including commissions paid to brokers that sell the Fund shares to investors.
Columbia Wanger Asset Management, L.P. ("CWAM"), the adviser to the Funds, has proposed that with respect to the Acorn Funds, the Columbia Acorn Trust continue the existing separate agreements governing the first two categories listed above: an advisory agreement governing portfolio management, and an administration agreement governing certain administration and clerical services. Together the fees paid under these two agreements are referred to as "management fees." CWAM proposes that the WAT Funds continue the existing single agreement governing both investment advisory and administrative services. A single management fee would cover both services. Other fund expenses are governed by separate agreements, in particular agreements with two CWAM affiliates: CMDI, the broker-dealer that underwrites and distributes the Funds' shares, and Columbia Management Services, Inc. ("CMSI"), the Funds' transfer agent. In conformity with the terms of the Order, this evaluation, therefore, addresses only the advisory and administrative contracts, and does not extend to the other agreements.
According to the Order, the Senior Officer's evaluation must consider at least the following:
(1) Management fees (including components thereof) charged to institutional and other clients of CWAM for like services;
(2) Management fees (including any components thereof) charged by other mutual fund companies for like services;
(3) Costs to CWAM and its affiliates of supplying services pursuant to the management fee agreements, excluding any intra-corporate profit;
(4) Profit margins of CWAM and its affiliates from supplying such services;
(5) Possible economies of scale as the Funds grow larger; and
(6) The nature and quality of CWAM's services, including the performance of each Fund.
In 2004, the Boards of the two Trusts, then separate groups, each appointed me Senior Officer under the Order. They also determined not to pursue a competitive bidding process and instead, charged me with the responsibility of evaluating the Funds' proposed advisory and administrative fee contracts with CWAM in conformity with the requirements of the Order. This Report is
79
an annual evaluation required under the Order. In discharging their responsibilities, the independent Trustees have also consulted independent, outside counsel.
2006 Evaluation
This is the third annual evaluation prepared in connection with the Order. This evaluation follows the same structure as the earlier studies. Some areas are given more emphasis here, while others are given less. Still, the fundamental information gathered for this evaluation is largely the same as past years.
Process and Independence
The objectives of the Order are to insure the independent evaluation of the advisory fees paid by the Funds as well as to insure that all relevant factors are considered. In my view, this contract renewal process has been conducted at arms-length and with independence in gathering, considering and evaluating all relevant data. At the outset of the process, the Trustees sought and obtained from CWAM and CMG a comprehensive compilation of data regarding Fund performance and expenses, adviser profitability, and other information. The Board evaluated this information thoroughly and also explored CWAM's potential capacity restraints. Performance and expense data was obtained from both Morningstar and Lipper, the leading consultants in this area. The rankings prepared by Morningstar and Lipper were independent and not influenced by the adviser. CWAM itself identified what it considers competing funds, and the Trustees considered that data as well.
In the course of its work, the Contract Committee gave careful consideration to the conclusions and recommendations contained in last year's evaluation. The Contract Committee gave particular emphasis to the issue of whether economies of scale were appropriately reflected in the Funds' fee schedules. Last year, the Board sought and CWAM agreed to additional breakpoints for two Funds, Acorn USA and Acorn Select. These breakpoints are above current asset levels, but clearly operate to share economies of scale with Fund shareholders. This year, at the Board's request, CWAM has proposed additional breakpoints for the WAT Funds, and Acorn International Select. This proposal is under consideration by the Board.
My evaluation of the advisory contract was shaped, as it was last year, by my experience as Chief Compliance Officer of the Trusts ("CCO"). As CCO, I report solely to the Board and have no reporting obligation to or employment relationship with CMG or its affiliates, except for administrative purposes. I have commented on compliance matters in evaluating the quality of service provided by CWAM.
This Report, its supporting materials and the data contained in other materials submitted to the Contract Committee of the Board, in my view, provide a thorough factual basis upon which the Board, in consultation with independent counsel as it deems appropriate, may conduct management fee negotiations that are in the best interests of the Funds' shareholders.
The Fee Reductions Mandated under the Order
Under the terms of the Order, CMG agreed to secure certain management fee reductions for the mutual funds advised by its affiliate investment advisers. In some instances, breakpoints were also established. Although neither CWAM nor the Trusts was a party to the Order, CWAM offered and the Board accepted certain advisory fee reductions during 2005. By the terms of the Order, these fees may not be increased before November 30, 2009. I have used these advisory fee levels— as modified last year to add certain breakpoints for Acorn USA and Acorn Select—in this evaluation because they are the fees in the current agreements that CWAM proposes should be continued. Hence, these fee levels are the starting point of an evaluation.
80
Conclusions
My review of the data and other material above leads to the following conclusions with respect to the factors identified in the Order.
1. Performance. The domestic Funds generally have achieved outstanding performance. The Acorn Fund, Acorn USA, Acorn Select, Wanger Select and Wanger US Smaller Companies all rank very favorably against their peers over the past five years. Although Acorn USA and Wanger US Smaller Companies had a difficult year in 2006, these returns are not characteristic of these funds, both of which have shown improved performance during the first quarter of 2007. The international Funds have relatively weaker long term records than the domestic funds, but recently have improved significantly and their one year rankings are excellent. Overall then, performance of the Funds is excellent.
2. Management Fees relative to Peers. The management fee rankings for several of the Acorn Funds are generally more favorable to shareholders than those of their peer group funds. Management fees do, however, vary by Fund. Acorn Fund is the least expensive and the Acorn USA the most expensive. Acorn Fund is very competitive, while Acorn USA and Acorn Select were ranked by both Lipper and Morningstar at or below the median, and therefore impose higher fees than do the majority of their competitors. The WAT Funds also lag their competitors and impose higher fees than their peers.
3. Administrative Fees. The Acorn Funds' administrative fee, which is uniform across all Funds, is at a level comparable to or less expensive than the fees imposed by their peers, provides for appropriate services to Funds, and affords breakpoints that lower the fee as assets increase. The WAT Funds pay a single fee for advisory and administrative services and hence do not benefit from administrative fee breakpoints, nor is it possible to assess their administrative costs relative to competitors.
4. Management Fees relative to Institutional and Other Mutual Fund Accounts. CWAM's focus is on its mutual funds. It does not actively seek to manage separate or institutional accounts. The few institutional accounts it does manage vary in rate structures. Some pay advisory fees commensurate with or higher than the Acorn and WAT Funds. In a few instances, however, institutional accounts pay lower advisory fees than do the Acorn Funds. One particular institutional account is significant in size and has been under CWAM's management for over 25 years.
5. Costs to CWAM and its Affiliates. CWAM's direct costs do not appear excessive. Overhead and indirect costs allocated to CWAM by its parent organizations, however, are significant and increasing. CWAM's affiliates report operating losses and therefore do not appear to profit from CWAM's advisory agreement with the Funds.
6. Profit Margins. CWAM's firm-wide, pre-marketing expense profit margins are at the top of the industry, though these comparisons are hampered by limited industry data. High profit margins are not unexpected for firms that manage large, successful funds and have provided outstanding investment performance for investors.
7. Economies of Scale. Economies of scale do exist at CWAM and will expand as the assets of the Funds get larger. They are, however, only partially reflected in the management fee schedule for the Acorn Funds and not reflected at all in two of the four WAT Funds. Breakpoints above current asset levels have, however, been added to the more expensive funds, Acorn Select and Acorn USA. Nonetheless, if Fund assets continue to grow, under the Funds' current fee schedules, all Fund shareholders might not benefit in a manner generally commensurate with CWAM's increased profits. Management has proposed additional breakpoints for some of the Funds that, if implement, would result in greater sharing of economies of scale.
81
8. Nature and Quality of Services. This category includes a variety of considerations that are difficult to quantify, yet can have a significant bearing on the performance of the Acorn Funds. Several areas merit comment.
a. Capacity. The Funds have continued to grow, posing ever greater challenges in deploying assets effectively. While trends here merit continued monitoring, CWAM appears to be managing assets effectively.
b. Compliance. CWAM has a reasonably designed compliance program that protects shareholders.
c. Administrative Services. The Funds benefit from a variety of administrative services that are performed by CWAM and CMAI.
9. Process. In my opinion, the process of negotiating an advisory contract for the Funds has been conducted thoroughly and at arms' length. Further, the Trustees have sufficient information to evaluate management's proposal, and negotiate contract terms that are in the best interests of fund shareholders.
Recommendations
I believe the Trustees should:
1. Continue to consider additional ways to restructure the advisory fee beyond the current breakpoint schedule to reflect more fully economies of scale.
2. Consider unbundling of the advisory and administrative fees paid by the WAT Funds.
3. Review the disparity in management fee levels between the Acorn International Fund and its related annuity-based fund, WAT International Small Cap Fund.
4. Continue to monitor CWAM's capacity limitations to insure that the Funds' expanding assets do not impair investment performance.
Robert P. Scales
Senior Vice President,
Chief Legal Officer
and General Counsel
June 18, 2007
82
Columbia Acorn Family of Funds
Class Z Share Information
Minimum Initial Investment in
Columbia Acorn International,
Columbia Acorn International
Select and Columbia Thermostat
Fund
| | | $2,500†
$1,000 for an IRA | | |
Minimum Initial Investment
in Columbia Acorn Fund
and Columbia Acorn USA | | $ | 75,000 | † | |
Minimum Initial Investment
in Columbia Acorn Select | | $ | 100,000 | *† | |
Minimum Subsequent
Investment in all Funds | | $ | 50 | | |
| Exchange Fee | | | None | | |
| Columbia Acorn Fund | | | ACRNX | | |
| Management Fee | | | 0.64 | % | |
| 12b-1 Fee | | | None | | |
| Other Expenses | | | 0.09 | % | |
| Net Expense Ratio | | | 0.73 | % | |
| Columbia Acorn International | | | ACINX | | |
| Management Fee | | | 0.76 | % | |
| 12b-1 Fee | | | None | | |
| Other Expenses | | | 0.14 | % | |
| Net Expense Ratio | | | 0.90 | % | |
| Columbia Acorn USA | | | AUSAX | | |
| Management Fee | | | 0.86 | % | |
| 12b-1 Fee | | | None | | |
| Other Expenses | | | 0.11 | % | |
| Net Expense Ratio | | | 0.97 | % | |
| Columbia Acorn International Select | | | ACFFX | | |
| Management Fee | | | 0.94 | % | |
| 12b-1 Fee | | | None | | |
| Other Expenses | | | 0.25 | % | |
| Net Expense Ratio | | | 1.19 | % | |
| Columbia Acorn Select | | | ACTWX | | |
| Management Fee | | | 0.80 | % | |
| 12b-1 Fee | | | None | | |
| Other Expenses | | | 0.12 | % | |
| Net Expense Ratio | | | 0.92 | % | |
| Columbia Thermostat Fund | | | COTZX | | |
| Management Fee | | | 0.10 | % | |
| 12b-1 Fee | | | None | | |
| Other Expenses | | | 0.15 | %** | |
| Net Expense Ratio | | | 0.25 | % | |
Fees and expenses are for the six months ended June 30, 2007, and for Columbia Thermostat Fund include the effect of Columbia Wanger Asset Management's undertaking to reimburse the Fund for any ordinary operating expenses (exclusive of interest and fees on borrowings, and expenses associated with the Fund's investment in other investment companies), net of custody fees paid indirectly, in excess of the annual rate of 0.25% of the average daily net assets. Columbia Thermostat Fund's reimbursement arrangement is contractual through April 30, 2008. The Funds' adviser and/or affiliates have agreed to contractually waive a portion of "other expenses" through March 31, 2007.
* Effective June 25, 2007, the board of trustees voted to increase the minimum initial investment for Columbia Acorn Select from $50,000 to $100,000.
** Does not include estimated fees and expenses of 0.72% incurred by the Fund from the underlying portfolio funds.
† Certain exclusions may apply.
83
Columbia Acorn Family of Funds
Trustees
Robert E. Nason
Chairman
Allan B. Muchin
Vice Chairman
Laura M. Born
Maureen M. Culhane
Margaret Eisen
Jerome Kahn, Jr.
Steven N. Kaplan
David C. Kleinman
Charles P. McQuaid
James A. Star
Ralph Wanger
Patricia H. Werhane
John A. Wing
Officers
Charles P. McQuaid
President
Ben Andrews
Vice President
Michael G. Clarke
Assistant Treasurer
Jeffrey R. Coleman
Assistant Treasurer
J. Kevin Connaughton
Assistant Treasurer
P. Zachary Egan
Vice President
Peter T. Fariel
Assistant Secretary
John M. Kunka
Assistant Treasurer
Joseph C. LaPalm
Vice President
Bruce H. Lauer
Vice President, Treasurer and Secretary
Louis J. Mendes III
Vice President
Robert A. Mohn
Vice President
Christopher J. Olson
Vice President
Linda K. Roth-Wiszowaty
Assistant Secretary
Robert P. Scales
Senior Vice President, Chief Compliance Officer
and General Counsel
Investment Adviser
Columbia Wanger Asset Management, L.P.
227 West Monroe Street, Suite 3000
Chicago, Illinois 60606
1-800-922-6769
Distributor
Columbia Management Distributors, Inc.
One Financial Center
Boston, Massachusetts 02111-2621
Transfer Agent, Dividend Disbursing Agent
Columbia Management Services, Inc.
P.O. Box 8081
Boston, Massachusetts 02266-8081
1-800-345-6611
Legal Counsel
Bell, Boyd & Lloyd LLP
Chicago, Illinois
This report, including the schedules of investments, is submitted for the general information of the shareholders of Columbia Acorn Trust. This report is not authorized for distribution unless preceded or accompanied by a prospectus. An investor should carefully consider charges and expenses before investing. To obtain a prospectus containing this and other information, please call (800) 922-6769 or visit our website (shown below). Please read the prospectus carefully before you invest or send money.
A description of the policies and procedures that the Funds use to determine how to vote proxies and a copy of the Funds' voting record are available (i) without charge, upon request, by calling 800-922-6769 and (ii) on the Securities and Exchange Commission's website at www.sec.gov. Information regarding how the Funds voted proxies relating to portfolio securities during the 12-month period ended June 30, is available from the SEC's website. Information regarding how the Funds voted proxies relating to portfolio securities is also available from the Fund's website.
The Funds file a complete schedule of portfolio holdings with the SEC for the first and third quarters of each fiscal year on Form N-Q. The Funds' Form N-Q is available on the SEC's website at www.sec.gov and may be reviewed and copied at the SEC's Public Reference Room in Washington, D.C. Information on the operation of the Public Reference Room may be obtained by calling 1-800-SEC-0330.
Please consider the investment objectives, risks, charges and expenses for the fund carefully before investing. Contact your financial advisor for a prospectus, which contains this and other important information about the fund. You should read it carefully before you invest.
Columbia Management Group, LLC ("Columbia Management") is the investment management division of Bank of America Corporation. Columbia Management entities furnish investment management services and products for institutional and individual investors. Columbia Funds are distributed by Columbia Management Distributors, Inc., member of FINRA, SIPC, part of Columbia Management and an affiliate of Bank of America Corporation.
Find out what's new – visit our web site at:
www.columbiafunds.com
Our e-mail address is:
ServiceInquiries@ColumbiaManagement.com
Shareholders should not include personal information such as account numbers, Social Security numbers or taxpayer identification numbers in e-mail. We are unable to accept account transactions sent via e-mail.
84
Columbia Acorn Family of Funds
Class Z Shares
Semiannual Report – June 30, 2007
Columbia Management®
PRESORTED
FIRST-CLASS MAIL
U.S. POSTAGE PAID
HOLLISTON, MA
PERMIT NO. 20
©2007 Columbia Management Distributors, Inc.
One Financial Center, Boston, MA 02111-2621
800-345-6611 www.columbiafunds.com
SHC-44/132914-0607 (08/07) 07/43028

2Q
Columbia Acorn
Family of Funds
Class ABC Shares
Semiannual Report
June 30, 2007
n ColumbiaTM
Acorn® Fund
n ColumbiaTM
Acorn International®
n ColumbiaTM
Acorn USA®
n ColumbiaTM
Acorn International SelectSM
n ColumbiaTM
Acorn SelectSM
n ColumbiaTM
Thermostat FundSM
Managed by Columbia Wanger Asset Management, L.P.
NOT FDIC INSURED
NOT BANK ISSUED
May Lose Value
No Bank Guarantee
>2007 Mid-Year Distributions
The following table lists the Funds' mid-year distributions. The record date was June 4, 2007. The ex-dividend date was June 5, 2007 and the payable date was June 6, 2007.
| | | Short-term
Capital Gains | | Long-term
Capital Gains | | Ordinary
Income | | Reinvestment
Price | |
| Columbia | | | | | | | | | | | | | | |
| | |
| Acorn Fund Class A, B and C | | $ | 0.0462 | | | $ | 0.3404 | | | | None | | | $ | 32.43— | A | |
| | | | | | | | | | | | | | | $ | 30.95— | B | |
| | | | | | | | | | | | | | | $ | 30.83 — | C | |
| Columbia | | | | | | | | | | | | | | |
| | |
| Acorn International Class A | | | None | | | $ | 0.2470 | | | $ | 0.0059 | | | $ | 45.24 — | A | |
| Columbia | | | | | | | | | | | | | | |
| | |
| Acorn International Class B and C | | | None | | | $ | 0.2470 | | | | None | | | $ | 44.37— | B | |
| | | | | | | | | | | | | | | $ | 44.29 — | C | |
| Columbia | | | | | | | | | | | | | | |
| | |
| Acorn USA Class A, B and C | | | None | | | $ | 0.2797 | | | | None | | | $ | 31.05— | A | |
| | | | | | | | | | | | | | | $ | 29.68— | B | |
| | | | | | | | | | | | | | | $ | 29.60 — | C | |
| Columbia | | | | | | | | | | | | | | |
| | |
| Acorn International Select Class A | | | None | | | | None | | | $ | 0.0752 | | | $ | 30.61 — | A | |
| Columbia | | | | | | | | | | | | | | |
| | |
| Acorn Select Class A, B and C | | $ | 0.0898 | | | $ | 0.0978 | | | | None | | | $ | 30.74— | A | |
| | | | | | | | | | | | | | | $ | 29.41— | B | |
| | | | | | | | | | | | | | | $ | 29.32 — | C | |
| Columbia | | | | | | | | | | | | | | |
| | |
| Thermostat Fund Class A | | $ | 0.0207 | | | $ | 0.2751 | | | $ | 0.0312 | | | $ | 12.90 — | A | |
| Columbia | | | | | | | | | | | | | | |
| | |
| Thermostat Fund Class B and C | | $ | 0.0207 | | | $ | 0.2751 | | | | None | | | $ | 12.94— | B | |
| | | | | | | | | | | | | | | $ | 12.92 — | C | |
The views expressed in "Squirrel Chatter II" and "In a Nutshell" commentary reflect the current views of the respective authors. These views are not guarantees of future performance and involve certain risks, uncertainties and assumptions that are difficult to predict so actual outcomes and results may differ significantly from the views expressed. These views are subject to change at any time based upon economic, market or other conditions and the respective parties disclaim any responsibility to update such views. These views may not be relied on as investment advice and, because investment decisions for a Columbia Acorn Fund are based on numerous factors, may not be relied on as an indication of trading intent on behalf of any particular Columbia Acorn Fund. References to specific company securities should not be construed as a recommendation or investment advice.
Columbia Acorn Family of Funds
Table of Contents
| Net Asset Value Per Share | | | 2 | | |
|
| Share Class Performance | | | 3 | | |
|
| Fund Performance vs. Benchmarks | | | 4 | | |
|
| Squirrel Chatter II: Buyout Boom | | | 5 | | |
|
| Understanding Your Expenses | | | 10 | | |
|
| Columbia Acorn Fund | |
|
| In a Nutshell | | | 12 | | |
|
| At a Glance | | | 13 | | |
|
| Major Portfolio Changes | | | 24 | | |
|
| Statement of Investments | | | 26 | | |
|
| Columbia Acorn International | |
|
| In a Nutshell | | | 14 | | |
|
| At a Glance | | | 15 | | |
|
| Major Portfolio Changes | | | 37 | | |
|
| Statement of Investments | | | 39 | | |
|
| Portfolio Diversification | | | 45 | | |
|
| Columbia Acorn USA | |
|
| In a Nutshell | | | 16 | | |
|
| At a Glance | | | 17 | | |
|
| Major Portfolio Changes | | | 46 | | |
|
| Statement of Investments | | | 47 | | |
|
| Columbia Acorn International Select | |
|
| In a Nutshell | | | 18 | | |
|
| At a Glance | | | 19 | | |
|
| Major Portfolio Changes | | | 53 | | |
|
| Statement of Investments | | | 54 | | |
|
| Portfolio Diversification | | | 57 | | |
|
| Columbia Acorn Select | |
|
| In a Nutshell | | | 20 | | |
|
| At a Glance | | | 21 | | |
|
| Major Portfolio Changes | | | 58 | | |
|
| Statement of Investments | | | 59 | | |
|
| Columbia Thermostat Fund | |
|
| In a Nutshell | | | 22 | | |
|
| At a Glance | | | 23 | | |
|
| Statement of Investments | | | 62 | | |
|
| Columbia Acorn Family of Funds | |
|
| Statements of Assets and Liabilities | | | 64 | | |
|
| Statements of Operations | | | 65 | | |
|
| Statements of Changes in Net Assets | | | 66 | | |
|
| Financial Highlights | | | 70 | | |
|
| Notes to Financial Statements | | | 77 | | |
|
| Management Fee Evaluation of the Senior Officer | | | 84 | | |
|
| Columbia Acorn Family of Funds Information | | | 91 | | |
|
1
Columbia Acorn Family of Funds
Net Asset Value Per Share as of 6/30/07
| | | Columbia
Acorn Fund | | Columbia
Acorn
International | | Columbia
Acorn USA | | Columbia
Acorn
International
Select | | Columbia
Acorn
Select | | Columbia
Thermostat
Fund | |
| Class A | | $ | 31.94 | | | $ | 45.59 | | | $ | 30.37 | | | $ | 30.82 | | | $ | 30.35 | | | $ | 12.80 | | |
| Class B | | $ | 30.47 | | | $ | 44.69 | | | $ | 29.02 | | | $ | 29.74 | | | $ | 29.03 | | | $ | 12.84 | | |
| Class C | | $ | 30.35 | | | $ | 44.61 | | | $ | 28.93 | | | $ | 29.68 | | | $ | 28.94 | | | $ | 12.82 | | |
Descriptions of indexes included in this report:
• Standard & Poor's (S&P) 500 Index tracks the performance of 500 widely held, large-capitalization U.S. stocks.
• Standard & Poor's (S&P) MidCap 400 Index is a market value-weighted index that tracks the performance of 400 mid-cap U.S. companies.
• Russell 2000® Index measures the performance of the 2,000 smallest companies in the Russell 3000 Index, which represents approximately 8% of the total market capitalization of the Russell 3000 Index.
• Russell 2500TM Index measures the performance of the 2,500 smallest companies in the Russell 3000 Index, which represents approximately 17% of the total market capitalization of the Russell 3000 Index.
• S&P/Citigroup EMI Global ex-US is an unmanaged index consisting of the bottom 20% of institutionally investable capital of developed and emerging countries, outside the United States.
• S&P/Citigroup Global ex-US Cap Range $500mm-$5bn Index is a subset of the broad market selected by the index sponsor representing the mid- and small-cap developed and emerging markets, excluding the United States.
• Morgan Stanley Capital International Europe, Australia, Far East (MSCI EAFE) Index is a capitalization-weighted index that tracks the total return of common stocks in 21 developed-market countries within Europe, Australia and the Far East.
• S&P/Citigroup World ex-US Cap Range $2–10B is a subset of the broad market selected by the index sponsor representing the mid-cap developed market excluding the United States.
• Lipper Indexes include the largest funds tracked by Lipper, Inc. in the named category. Lipper Mid-Cap Growth Index, 30 mid-cap growth funds; Lipper Mid-Cap Core Funds Index, 30 mid-cap core funds; Lipper International Funds Index, 30 largest non-U .S. funds, not including non-U.S. small-cap funds; Lipper International Small-Cap Funds Index, 10 largest non-U.S. funds investing in small-cap companies, including Columbia Acorn International; Lipper Small-Cap Core Funds Index, 30 largest small-cap core funds, including Columbia Acorn Fund. Lipper Flexible Portfolio Funds Index is an equal dollarweighted index of the 30 largest mutual funds within the Flexible Portfolio fund classification, as defined by Lipper.
• Lehman Brothers U.S. Credit Intermediate Bond Index is the intermediate component of the U.S. Credit Index. The U.S. Credit Index includes publicly issued U.S. corporate and foreign debentures and secured notes that meet specified maturity, liquidity, and quality requirements.
Indexes are not managed and do not incur fees or expenses. It is not possible to invest directly in an index.
2
Columbia Acorn Family of Funds
Share Class Performance Average Annual Total Returns through 6/30/07
| | | Class A | | Class B | | Class C | |
| | | Without
Sales Charge | | With
Sales Charge | | Without
Sales Charge | | With
Sales Charge | | Without
Sales Charge | | With
Sales Charge | |
| Columbia Acorn Fund (10/16/2000) | |
| 3 months* | | | 6.60 | % | | | 0.47 | % | | | 6.45 | % | | | 1.45 | % | | | 6.41 | % | | | 5.41 | % | |
| Year to date* | | | 11.37 | % | | | 4.97 | % | | | 11.05 | % | | | 6.05 | % | | | 10.94 | % | | | 9.94 | % | |
| 1 year | | | 20.32 | % | | | 13.40 | % | | | 19.60 | % | | | 14.60 | % | | | 19.37 | % | | | 18.37 | % | |
| 3 years | | | 16.86 | % | | | 14.57 | % | | | 16.08 | % | | | 15.33 | % | | | 15.94 | % | | | 15.94 | % | |
| 5 years | | | 17.63 | % | | | 16.24 | % | | | 16.85 | % | | | 16.63 | % | | | 16.76 | % | | | 16.76 | % | |
| Life of fund | | | 14.32 | % | | | 13.32 | % | | | 13.58 | % | | | 13.58 | % | | | 13.51 | % | | | 13.51 | % | |
| Columbia Acorn International (10/16/2000) | |
| 3 months* | | | 8.53 | % | | | 2.29 | % | | | 8.36 | % | | | 3.36 | % | | | 8.33 | % | | | 7.33 | % | |
| Year to date* | | | 14.41 | % | | | 7.83 | % | | | 14.09 | % | | | 9.09 | % | | | 14.00 | % | | | 13.00 | % | |
| 1 year | | | 34.52 | % | | | 26.78 | % | | | 33.67 | % | | | 28.67 | % | | | 33.47 | % | | | 32.47 | % | |
| 3 years | | | 30.34 | % | | | 27.79 | % | | | 29.46 | % | | | 28.86 | % | | | 29.34 | % | | | 29.34 | % | |
| 5 years | | | 23.96 | % | | | 22.50 | % | | | 23.11 | % | | | 22.93 | % | | | 23.06 | % | | | 23.06 | % | |
| Life of fund | | | 12.47 | % | | | 11.48 | % | | | 11.72 | % | | | 11.72 | % | | | 11.68 | % | | | 11.68 | % | |
| Columbia Acorn USA (10/16/2000) | |
| 3 months* | | | 5.70 | % | | | -0.37 | % | | | 5.56 | % | | | 0.56 | % | | | 5.50 | % | | | 4.50 | % | |
| Year to date* | | | 9.36 | % | | | 3.07 | % | | | 9.02 | % | | | 4.02 | % | | | 8.93 | % | | | 7.93 | % | |
| 1 year | | | 15.69 | % | | | 9.04 | % | | | 14.98 | % | | | 9.98 | % | | | 14.77 | % | | | 13.77 | % | |
| 3 years | | | 13.38 | % | | | 11.16 | % | | | 12.63 | % | | | 11.84 | % | | | 12.49 | % | | | 12.49 | % | |
| 5 years | | | 14.73 | % | | | 13.38 | % | | | 13.97 | % | | | 13.73 | % | | | 13.90 | % | | | 13.90 | % | |
| Life of fund | | | 14.05 | % | | | 13.05 | % | | | 13.32 | % | | | 13.32 | % | | | 13.27 | % | | | 13.27 | % | |
| Columbia Acorn International Select (10/16/2000) | |
| 3 months* | | | 7.31 | % | | | 1.14 | % | | | 7.13 | % | | | 2.13 | % | | | 7.11 | % | | | 6.11 | % | |
| Year to date* | | | 11.62 | % | | | 5.20 | % | | | 11.26 | % | | | 6.26 | % | | | 11.16 | % | | | 10.16 | % | |
| 1 year | | | 34.62 | % | | | 26.88 | % | | | 33.72 | % | | | 28.72 | % | | | 33.51 | % | | | 32.51 | % | |
| 3 years | | | 26.42 | % | | | 23.95 | % | | | 25.63 | % | | | 24.99 | % | | | 25.44 | % | | | 25.44 | % | |
| 5 years | | | 21.58 | % | | | 20.15 | % | | | 20.77 | % | | | 20.58 | % | | | 20.68 | % | | | 20.68 | % | |
| Life of fund | | | 9.00 | % | | | 8.04 | % | | | 8.26 | % | | | 8.26 | % | | | 8.22 | % | | | 8.22 | % | |
| Columbia Acorn Select (10/16/2000) | |
| 3 months* | | | 9.05 | % | | | 2.78 | % | | | 8.89 | % | | | 3.89 | % | | | 8.84 | % | | | 7.84 | % | |
| Year to date* | | | 16.64 | % | | | 9.93 | % | | | 16.26 | % | | | 11.26 | % | | | 16.18 | % | | | 15.18 | % | |
| 1 year | | | 32.17 | % | | | 24.57 | % | | | 31.36 | % | | | 26.36 | % | | | 31.13 | % | | | 30.13 | % | |
| 3 years | | | 19.35 | % | | | 17.02 | % | | | 18.50 | % | | | 17.79 | % | | | 18.38 | % | | | 18.38 | % | |
| 5 years | | | 18.06 | % | | | 16.67 | % | | | 17.24 | % | | | 17.02 | % | | | 17.18 | % | | | 17.18 | % | |
| Life of fund | | | 14.54 | % | | | 13.54 | % | | | 13.77 | % | | | 13.77 | % | | | 13.72 | % | | | 13.72 | % | |
| Columbia Thermostat Fund (3/3/2003)† | |
| 3 months* | | | 1.98 | % | | | -3.89 | % | | | 1.89 | % | | | -3.09 | % | | | 1.81 | % | | | 0.82 | % | |
| Year to date* | | | 4.25 | % | | | -1.75 | % | | | 4.07 | % | | | -0.93 | % | | | 3.91 | % | | | 2.91 | % | |
| 1 year | | | 12.58 | % | | | 6.11 | % | | | 12.04 | % | | | 7.04 | % | | | 11.75 | % | | | 10.75 | % | |
| 3 years | | | 8.77 | % | | | 6.65 | % | | | 8.19 | % | | | 7.33 | % | | | 8.00 | % | | | 8.00 | % | |
| Life of fund | | | 11.88 | % | | | 10.36 | % | | | 11.21 | % | | | 10.88 | % | | | 11.07 | % | | | 11.07 | % | |
*Not annualized.
Performance data quoted represents past performance and current performance may be lower or higher. Past performance is no guarantee of future results. The investment return and principal value will fluctuate so that shares, when redeemed, may be worth more or less than their original cost. Please visit columbiafunds.com for daily and most recent month-end performance updates.
The "with sales charge" returns include the maximum initial sales charge of 5.75% for Class A shares, the applicable contingent deferred sales charge (CDSC) for Class B shares (5%, 4%, 3%, 3%, 2%, 1%, 0% for the first through seventh years after purchase, respectively), and the maximum CDSC of 1.00% of Class C shares during the first year after purchase.
Annual operating expense ratios are as stated in each Fund prospectus that is current as of the date of this report. Differences in expense ratios disclosed elsewhere in this report may result from including fee waivers and reimbursements as well as different time periods used in calculating the ratios. Columbia Acorn Fund: Class A: 1.05%; Class B: 1.63%; Class C: 1.84%. Columbia Acorn International: Class A: 1.27%; Class B: 1.86%; Class C: 2.05%. Columbia Acorn USA: Class A: 1.30%; Class B: 1.89%; Class C: 2.09%. Columbia Acorn International Select: Class A: 1.63%; Class B: 2.23%; Class C: 2.42%. Columbia Acorn Select: Class A: 1.27%; Class B: 1.88%; Class C: 2.08%. Columbia Thermostat Fund has a contractual expense waiver or reimbursement that expires April 30, 2008. Expense ratios without and with the contractual waiver, including fees and expenses associated with the Fund's investments in other investment companies are: C lass A: 1.35%, 1.19%; Class B: 1.88%, 1.69%; Class C: 2.15%, 1.94%, respectively.
Performance results reflect any voluntary waivers or reimbursement of Fund expenses by the investment adviser and/or any of its affiliates. Absent these waivers or reimbursement arrangements, performance results would have been lower.
†A "fund of funds" bears its allocable share of the costs and expenses of the underlying funds in which it invests. Such funds are thus subject to two levels of fees and potentially higher expense ratios than would be associated with an investment in an investment fund that invests and trades directly in financial instruments under the direction of a single manager.
3
Columbia Acorn Family of Funds
Fund Performance vs. Benchmarks Class A Shares, without sales charge, Average Annual Total Returns through 6/30/07
| | | 2nd
quarter* | | Year to
date* | | 1 year | | 3 years | | 5 years | | Life of
Fund | |
| Columbia Acorn Fund (LACAX) (10/16/00) | | | 6.60 | % | | | 11.37 | % | | | 20.32 | % | | | 16.86 | % | | | 17.63 | % | | | 14.32 | % | |
| Russell 2500 | | | 4.94 | % | | | 8.67 | % | | | 18.74 | % | | | 14.97 | % | | | 15.30 | % | | | 11.04 | % | |
| S&P 500 | | | 6.28 | % | | | 6.96 | % | | | 20.59 | % | | | 11.68 | % | | | 10.71 | % | | | 3.09 | % | |
| Lipper Small-Cap Core Funds Index | | | 6.21 | % | | | 9.54 | % | | | 17.17 | % | | | 13.74 | % | | | 13.79 | % | | | 10.68 | % | |
| Lipper Mid-Cap Core Funds Index | | | 6.06 | % | | | 11.09 | % | | | 20.82 | % | | | 14.71 | % | | | 14.16 | % | | | 8.19 | % | |
| Columbia Acorn International (LAIAX) (10/16/00) | | | 8.53 | % | | | 14.41 | % | | | 34.52 | % | | | 30.34 | % | | | 23.96 | % | | | 12.47 | % | |
| S&P/Citigroup EMI Global ex-US | | | 7.37 | % | | | 14.85 | % | | | 35.90 | % | | | 29.34 | % | | | 26.03 | % | | | 17.17 | % | |
| S&P/Citigroup Global ex-US Cap Range $500mm-$5bn | | | 8.02 | % | | | 15.47 | % | | | 35.50 | % | | | 29.32 | % | | | 26.22 | % | | | 17.59 | % | |
| MSCI EAFE Index | | | 6.40 | % | | | 10.74 | % | | | 27.00 | % | | | 22.24 | % | | | 17.73 | % | | | 8.87 | % | |
| Lipper Int'l Small-Cap Funds Index | | | 7.57 | % | | | 14.85 | % | | | 33.39 | % | | | 28.48 | % | | | 25.78 | % | | | 15.75 | % | |
| Columbia Acorn USA (LAUAX) (10/16/00) | | | 5.70 | % | | | 9.36 | % | | | 15.69 | % | | | 13.38 | % | | | 14.73 | % | | | 14.05 | % | |
| Russell 2000 | | | 4.42 | % | | | 6.45 | % | | | 16.43 | % | | | 13.45 | % | | | 13.88 | % | | | 9.94 | % | |
| Lipper Small-Cap Core Funds Index | | | 6.21 | % | | | 9.54 | % | | | 17.17 | % | | | 13.74 | % | | | 13.79 | % | | | 10.68 | % | |
| S&P 500 | | | 6.28 | % | | | 6.96 | % | | | 20.59 | % | | | 11.68 | % | | | 10.71 | % | | | 3.09 | % | |
| Columbia Acorn Int'l Select (LAFAX) (10/16/00) | | | 7.31 | % | | | 11.62 | % | | | 34.62 | % | | | 26.42 | % | | | 21.58 | % | | | 9.00 | % | |
| S&P/Citigroup World ex-US Cap Range $2-10B | | | 6.08 | % | | | 12.04 | % | | | 29.92 | % | | | 26.26 | % | | | 22.67 | % | | | 15.04 | % | |
| MSCI EAFE Index | | | 6.40 | % | | | 10.74 | % | | | 27.00 | % | | | 22.24 | % | | | 17.73 | % | | | 8.87 | % | |
| Lipper International Funds Index | | | 7.49 | % | | | 11.48 | % | | | 28.40 | % | | | 22.84 | % | | | 17.55 | % | | | 9.47 | % | |
| Columbia Acorn Select (LTFAX) (10/16/00) | | | 9.05 | % | | | 16.64 | % | | | 32.17 | % | | | 19.35 | % | | | 18.06 | % | | | 14.54 | % | |
| S&P MidCap 400 | | | 5.84 | % | | | 11.98 | % | | | 18.51 | % | | | 15.15 | % | | | 14.17 | % | | | 10.28 | % | |
| Lipper Mid-Cap Growth Index | | | 9.51 | % | | | 14.71 | % | | | 21.98 | % | | | 14.76 | % | | | 13.28 | % | | | 0.67 | % | |
| S&P 500 | | | 6.28 | % | | | 6.96 | % | | | 20.59 | % | | | 11.68 | % | | | 10.71 | % | | | 3.09 | % | |
| Columbia Thermostat Fund (CTFAX) (3/3/03)† | | | 1.98 | % | | | 4.25 | % | | | 12.58 | % | | | 8.77 | % | | | NA | | | | 11.88 | % | |
| S&P 500 | | | 6.28 | % | | | 6.96 | % | | | 20.59 | % | | | 11.68 | % | | | NA | | | | 16.42 | % | |
| Lehman Brothers U.S. Credit Intermediate Bond Index | | | -0.40 | % | | | 1.28 | % | | | 6.34 | % | | | 3.79 | % | | | NA | | | | 3.70 | % | |
| Lipper Flexible Portfolio Funds Index | | | 4.96 | % | | | 6.79 | % | | | 16.83 | % | | | 11.10 | % | | | NA | | | | 14.13 | % | |
*Not annualized.
Performance data quoted represents past performance and current performance may be lower or higher. Past performance is no guarantee of future results. The investment return and principal value of an investment in a Fund will fluctuate so that Fund shares, when redeemed, may be worth more or less than their original cost. Performance changes over time. Please visit columbiafunds.com for daily and most recent month-end updates.
Annual operating expense ratios are as stated in each Fund prospectus that is current as of the date of this report. Differences in expense ratios disclosed elsewhere in this report may result from including fee waivers and reimbursements as well as different time periods used in calculating the ratios. Columbia Acorn Fund: Class A: 1.05%; Class B: 1.63%; Class C: 1.84%. Columbia Acorn International: Class A: 1.27%; Class B: 1.86%; Class C: 2.05%. Columbia Acorn USA: Class A: 1.30%; Class B: 1.89%; Class C: 2.09%. Columbia Acorn International Select: Class A: 1.63%; Class B: 2.23%; Class C: 2.42%. Columbia Acorn Select: Class A: 1.27%; Class B: 1.88%; Class C: 2.08%. Columbia Thermostat Fund has a contractual expense waiver or reimbursement that expires April 30, 2008. Expense ratios without and with the contractual waiver, including fees and expenses associated with the Fund's investments in other investment companies are: C lass A: 1.35%, 1.19%; Class B: 1.88%, 1.69%; Class C: 2.15%, 1.94%, respectively.
Performance results reflect any voluntary waivers or reimbursement of Fund expenses by the investment adviser and/or any of its affiliates. Absent these waivers or reimbursement arrangements, performance results would have been lower.
†A "fund of funds" bears its allocable share of the costs and expenses of the underlying funds in which it invests. Such funds are thus subject to two levels of fees and potentially higher expense ratios than would be associated with an investment in an investment fund that invests and trades directly in financial instruments under the direction of a single manager.
All indexes are unmanaged and returns include reinvested distributions. It is not possible to invest directly in an index. For index definitions, see Page 2 of this report.
4
Squirrel Chatter II: Buyout Boom
 In last year's annual report, we mentioned that 26 Columbia Acorn Fund stocks were subject to takeover bids during the year. Takeovers certainly helped performance and we were pleased that buyers validated our fundamental research process by finding lots of our companies to be attractive.
In the first half of 2007, the buyout boom continued to accelerate. In just six months, 27 Columbia Acorn Fund stocks announced takeovers, beating the Fund's full year 2006 record. Columbia Acorn USA had 15 takeover stocks in common with Columbia Acorn Fund and one additional buyout not owned by Columbia Acorn Fund. Columbia Acorn International had three takeovers that overlapped with Columbia Acorn Fund and another that did not. Columbia Acorn Select and Columbia Acorn International Select had one takeover each; both were also held by Columbia Acorn Fund.
Generally, buyouts come in two basic flavors: strategic and financial. Strategic buyouts are often done by similar companies that want to pursue synergies, such as cost savings or enhanced products, production, distribution or pricing. Strategic buyers are usually other public companies and sometimes use their stock to pay for all or part of the acquisition. After some stock deals, we've kept the acquiring company's stock as a long-term investment.
Financial buyouts have historically been executed by private equity partnerships with private equity firms as general partners and other entities, such as pension funds and endowments, as limited partners. Financial partnerships usually borrow 70% to 85% of the acquisition price in order to enhance returns and minimize taxes on the acquired business.1 Company management sometimes like to sell to private partners, as (1) they often get stock in the privatized company to stay and manage the business, and (2) they no longer have to deal with pesky securities analysts.
Our first half 2007 buyout announcements were a mixed lot. About 55% were strategic and 45% financial. The takeover terms have ranged from excellent to disappointing, though none so far this year have been "takeunders," at below last trade prices. We've had offers for big positions and small ones, and for long-standing holdings and newer ideas. Following are summaries of the takeover announcements made in the first half of 2007:
Takeover Log
January 8: United Surgical Partners, an operator of outpatient surgical centers, agreed to sell to a group led by Welsh, Carson, Anderson & Stowe, for $31.05 per share. Although we believed the valuation was fair based on reported results, we thought fundamentals would improve and the stock would have had high returns over the long run.
January 10: Alliance Atlantis Communications announced it was selling to a partnership including Goldman Sachs and CanWest Global Communications for C$53.2 We first bought Alliance Atlantis in 2003, when it became focused on its more successful areas, the popular CSI television series and cable TV channels in Canada. Columbia Acorn Fund sold much of its position after the announcement but our remaining holding is up 150% from its cost.
February 5: Hanover Compressor agreed to merge with Universal Compression Holdings, a competitor, in a deal for stock. Both companies rent compressors to the natural gas industry, and the companies believe the combination will result in cost savings and larger service areas. We agree and Columbia Acorn USA as of press time kept its position in Hanover.
February 8: Edgars Consolidated Stores, a South African retailer, said it would sell to Bain Capital. Edgars' offer was 50% over its price prior to deal news back in October 2006, but was not at a premium to similar public companies. We owned Edgars in Columbia Acorn Fund and Columbia Acorn International, correctly believing that new management would enable the company to benefit from an improving regional economy. While the buyout price was somewhat disappointing, both funds booked at least a double in under three years.
February 12: A twin-deal day. First, UrAsia Energy, a Canadian uranium miner with operations in Kazakhstan, announced a merger for sxr Uranium One stock. Uranium One is a Canadian uranium miner with operations primarily in South Africa. This was Columbia Acorn Select's only deal. With Columbia Acorn Fund and Columbia Acorn International also owning the stock, it was our largest dollar deal, exceeding
5
$250 million across the three funds. We continue to like uranium mining economics and the funds now own Uranium One. Second, Witness Systems agreed to sell to Verint, a strategic buyer, for $27.50 per share, a price we considered to be fair.
February 14: TALX announced a sellout to Equifax for a cash and stock deal valued at $35.50, an 11% premium to TALX's last closing price. We were disappointed by the offer, though it was more than a 20% premium to our cost. While that was an excellent compound rate of return as we owned the stock for only several months, we'd rather hold stocks for much longer periods and potentially make more money.
February 19: Florida Rock agreed to merge with fellow aggregates company Vulcan Materials for cash and stock worth a stated $68 per share, a 45% premium to Florida's prior closing price. We like the business as barriers to entry are high—people don't want rock mines in their back yards—and transportation costs keep out remote competitors. Consequently, it was one of our larger holdings. We thought Florida's stock price had seemed irrationally depressed due to concerns about the housing industry and Vulcan noticed. As of June 30, both Columbia Acorn Fund and Columbia Acorn USA had more than a double in their investment in Florida Rock and Columbia Acorn Fund also started a position in Vulcan.
February 21: Central Parking announced a sale to private equity consortium KCPC Holdings for $22.53 per share in cash. Central Parking had reportedly turned down offers that were $15 to $16 in the middle of 2006, but somehow real estate values have surged since then. We consider the new price to be fair.
March 2: Dendrite International, a provider of software and services to pharmaceutical marketing departments, reported that it would sell out to Cedegim, a French software company, for $16 in cash. We believed that Dendrite provided value to its customers, but we were disappointed by a lack of consistent growth. We think the deal was at a fair price given earnings volatility.
March 6: K&F Industries agreed to sell to Meggitt PLC, a fellow producer of aircraft wheels and brakes, for $27 per share in cash. The price represented just a 10% premium to the prior day's close and appeared cheap compared to cash flow. The company did allow competing bids, but none emerged. We believe we bought the stock at the right time in Columbia Acorn Fund and Columbia Acorn USA, as it returned over 60% in the 15 months that we held it.
March 15: WebEx announced a sellout to Cisco for $57 per share in cash, a 23% premium to its March 14 closing price. This was one of our quickest and smallest deals, as we had started buying the stock for Columbia Acorn Fund in January. Like the TALX deal, we got a fine rate of return, but we would have rather made potentially more dollars over a longer period of time.
March 19: ServiceMaster entered into a deal to sell to Clayton, Dubilier & Rice, a private equity firm, for $15.625 per share in cash. ServiceMaster was a great stock until about 1998 but it subsequently struggled. We bought it last year for Columbia Acorn Fund, thinking that new management could restructure and grow the business. Instead, the company decided to sell out at a relatively modest premium. Once again our rate of return was fine but we did not earn large dollars over the longer term.
March 23: Kronos agreed to sell to a group led by Hellman & Friedman for $55 per share in cash. We first bought Kronos over 10 years ago as a downstream-from-technology investment; the company substituted semiconductors for electromechanical devices in employee timeclocks. As years progressed, Kronos expanded its product portfolio with software offerings including shift scheduling, human resource management and recruiting. Earnings growth was erratic due to economic and product cycles and that provided some opportunities for long-term investors. We view the deal price as reasonable. Kronos was our second largest deal this year, as Columbia Acorn Fund and Columbia Acorn USA cashed out for over $180 million.
April 19: Van Houtte, a Canadian gourmet coffee equipment and services company, said it had a non-binding offer from an undisclosed buyer of C$25 per share, a 1% premium to its average price over the prior 30 days. The stock spiked up from C$17 in January, after the company said it was reviewing strategic options. In May the company entered into a definitive agreement and identified the buyer as Littlejohn & Co, a private equity firm. While we were disappointed with the sale price, Columbia Acorn International booked about a 40% profit in 14 months.
April 24: Highland Hospitality said it would sell out to JER Partners, a private equity firm focused on real estate, for $19.50 per share. Though we had cut our real estate holdings several years ago, we believed that the hotel business had favorable supply/demand characteristics and that Highland added value by acquiring and improving properties. We began buying the stock in December 2003. Upon the close of the deal in late July, Columbia Acorn Fund and
6
Columbia Acorn USA realized over 70% gains from its average cost, in addition to dividends previously booked.
May 7: Armor Holdings, a military vehicle and armor business, announced a sellout to BAE Systems, a UK defense conglomerate, for $88 per share in cash. We started buying the stock for Columbia Acorn Fund in December 2006, believing that the demand for military armor would grow over the long term and that Armor was well positioned. We thought the takeout price was fair, and when the deal closed following the period end, the Fund realized a 61% gain.
May 14: Viasys Healthcare agreed to sell out to Cardinal Health for $42.75 per share in cash, a 36% premium to its last closing price. We thought that price was a fair multiple on earnings and cash flow, and we subsequently learned that Viasys pursued a lengthy bidding process in order to obtain the highest price. We applaud management and directors for that effort. Upon the deal's close in June, Columbia Acorn Fund realized a 130% gain and Columbia Acorn USA tripled its investment.
May 15: Agile Software, a company that produces programs to handle changes in product design, said it would sell out to Oracle for $8.10 per share. The price represented a 12% premium to the stock's last trade. We bought the stock a year earlier, correctly believing that sales would increase and profits would commence.
May 21: Cellular phone company Alltel announced a sale to private equity buyers TPG Capital and Goldman Sachs for $71.50 cash per share. Our Alltel shares were derived from a previous takeover, as a result of it buying Western Wireless, a rural cellphone company. We had expected Alltel to sell out and were relieved upon the announcement because we were leery of increasing competition. We sold our remaining positions shortly after the announcement, realizing over 400% gains over our original Western Wireless costs, in both Columbia Acorn Fund and Columbia Acorn USA.
Also on May 21, Cytyc, a dominant producer of consumable diagnostic and surgical products for women's health, agreed to sell out to Hologic for a combination of cash and stock. The merger appears to make sense for both companies as we believe the combined company can boost sales and reduce costs. We have owned Cytyc since early 2005 in Columbia Acorn Fund and, at quarter end, showed a 75% profit on our investment.
May 22: Crescent Real Estate Equities, which primarily owns office buildings, announced a sale to Morgan Stanley Real Estate, a private fund, for cash. The $22.80 price was just a 6% premium to the stock's prior close, which barely offsets dividends that were cancelled until the deal is expected to close in the third quarter. Furthermore, the price represented a 5% to 10% discount to what we then believed the company was worth.
May 30: Ceridian, a provider of payroll processing, other HR services, trucker transactions processing and gift cards, agreed to sell to Thomas H. Lee Partners and Fidelity National Financial for $36 cash per share. We believe that Ceridian's core HR business is a solid franchise undergoing internal improvement and its other businesses are gems. Governance, however, became somewhat like a soap opera as an activist hedge fund bought a 15% interest, agitated for strategic restructuring, and began negotiating with a division head, who then got fired. That is all a shame, as we think the $36 price undervalues the company's potential.
June 15: Penn National Gaming, a regional casino operator, said it would sell out to a private group, which includes management, Fortress Investment and Centerbridge Partners, for $67 per share in cash. The bid was a 31% premium to the prior day's stock price, and at what we considered to be a fair multiple of cash flow. With Penn's proposed sale later this year, and Kerzner International's and Station Casino's announced sellouts last year, there are expected to be few public small- and mid-cap casino companies remaining.
June 18: Footwear retailer Genesco gave itself the boot as a public company, agreeing to sell out to Finish Line, another footwear retailer, for $54.50 cash per share. In April and May, the board of Genesco had rejected lower offers from Foot Locker. We think the $54.50 price is fair and we applaud the board for holding out for that price.
June 20: Nuveen Investments said it would be acquired by a private group lead by Madison Dearborn Partners, for $65 per share in cash. We like the investment management business, and Columbia Acorn Fund started buying Nuveen in late 2004. Columbia Acorn Select later bought a position. Unfortunately, in early 2007 we trimmed Columbia Acorn Fund's holdings and sold out of Columbia Acorn Select's position due to valuation and fears that growth would slow. Columbia Acorn Fund will realize nearly a 100% gain on its remaining shares if the deal is executed under its announced terms.
7
June 26: Stork, a Netherlands-based conglomerate, agreed to sell to private equity firm Candover Investments. The price, 47 Euros cash per share, represented a 12% premium to the stock's prior close. Stork has been harassed by activist shareholders demanding that it be split up, and the company sees the sale as a way to resolve the dispute. We believe the small premium does not reflect Stork's underlying value. We understand that a supermajority vote is needed to approve the buyout and we think the 47 Euro price may need to be increased for a transaction to occur. Columbia Acorn Fund, Columbia Acorn International and Columbia Acorn International Select owned the stock.
June 27: Chittenden, a New England bank, announced it would sell to People's United Financial, another company held by Columbia Acorn Fund and Columbia Acorn USA, for a combination of stock and cash. The banking industry in the United States has been consolidating for a long time, and Columbia Acorn Fund has benefited from a lot of bank sellouts. While we believe this sellout price is fair and Chittenden was certainly a profitable investment for Columbia Acorn Fund and Columbia Acorn USA, our funds' positions in People's United fell on the news somewhat more than their positions in Chittenden rose.
June 29: Another rural cellular phone company, Dobson Communications, announced it would sell. This deal is for cash and the buyer is AT&T, which operates nearby cellular systems that utilize the same technology as Dobson. Columbia Acorn Fund has owned cellphone franchises since the industry began in the 1980s and has benefited from numerous sellouts. Similar to the casino industry, few small- and mid-cap public cellular companies remain.
Trillion Dollar Question
Buyout booms tend to run in cycles. Typically, private equity is able to raise more equity capital after a few years of good returns, and is able to raise debt funding when interest rates for "junk" bonds are at relatively low premiums to quality bonds. Then buyout momentum accelerates. Increased private equity activity seems to spur more strategic acquisitions and buyout prices rise.
The dollar volume of private equity buyouts in the United States and Europe averaged around $30 billion a year from 2000 to 2002, and then ramped to an unprecedented level in 2006, around $384 billion!3 While the dollar amount of private buyouts in 2006 broke records, as a percentage of stock market valuation, it was barely half of 1988's level. Private equity recently had about $250 billion of equity capital available for buyouts, and was continuing to raise a lot more.4 Adding debt to this equity suggests that private equity would be able to buy over a trillion dollars of assets. The trillion dollar question is whether lenders will continue to fund lots of buyouts at low interest rates.
Credit markets in the first half of 2007 were very loose relative to historical standards. While we think buyout prices were high, we believe they had not yet reached "bubble" levels. We do not think we have seen the marquee "big and dumb" deals, which would normally suggest the buyout boom is nearing an end.
However, credit market conditions changed considerably after the June 30 end of this report period. Home mortgage defaults kept growing, especially for sub-prime mortgages. Mortgage-backed security prices fell, triggering huge losses for some hedge funds and creating concerns about possible losses elsewhere. Credit markets tightened overall and premiums for "junk" bonds increased.
Previously announced financial buyout deals generally have gotten funded, at first with sweetened terms for bond financing and later by bank commitments rather than primarily by bonds. Banks appear to be honoring existing financing commitments but seem to be limiting additional obligations.
At press time, the debt market was chaotic. While several high quality corporations were able to issue new bonds, risky borrowers appear locked out. We don't know what will happen next. We believe that there is a reasonable chance that the mortgage-backed security problem will be contained and its casualties clearly defined, allowing the remainder of the credit markets to return to normal. Higher quality financial buyouts could then resume. We feel there is also a chance that credit markets will remain tight for a long time, severely limiting new buyouts.
We usually buy stocks in order to grow with them for a long time, not to participate in a buyout within a few
8
months. We recognize that buyout cycles come and go. We benefited from the buyout cycle and will likely continue to benefit from it should it resume, but we will not change our investment objectives, strategy, style or process.

Charles P. McQuaid
President and Chief Investment Officer
Columbia Wanger Asset Management, L.P.
While some of the deals have closed, there can be no assurance that the remaining transactions discussed above will be consummated on the terms and conditions, or that the Funds will profit to the extent, described herein.
All holding gains mentioned are calculated based on tax lots of securities held at the time of publication and additional tax lots may have been previously sold at higher costs for some stocks.
1 Data taken from a presentation given by Steven Kaplan, Neubauer Family Professor of Entrepreneurship and Finance, University of Chicago Graduate School of Business, to the Chicago Analyst Society on June 11, 2007. Steven is also a trustee of the Columbia Acorn Trust.
2 The "C" denotes Canadian dollars here and elsewhere in the essay.
3 "The Financing of Large Buyouts: An Empirical Analysis," a paper coauthored by Ulf Axelson, Tim Jenkinson, Per Stromberg and Michael Weisbach. Preliminary version dated April 3, 2007.
4 Ibid.
Fund weightings at June 30, 2007, in the holdings mentioned were as follows:
Alliance Atlantis Communication: Columbia Acorn Fund, 0.1%
Hanover Compressor: Columbia Acorn USA, 0.5%
Uranium One: Columbia Acorn International, 0.7%; Columbia Acorn Fund, 0.4%; Columbia Acorn Select, 6.2%
Florida Rock: Columbia Acorn USA, 0.8%; Columbia Acorn Fund, 0.6%
Vulcan Materials: Columbia Acorn Fund, 0.1%
ServiceMaster: Columbia Acorn Fund, 0.4%
Van Houtte: Columbia Acorn International, 0.4%
Highland Hospitality: Columbia Acorn Fund, 0.5%; Columbia Acorn USA, 0.4%
Armor Holdings: Columbia Acorn Fund, 0.3%
Agile Software: Columbia Acorn Fund, 0.1%; Columbia Acorn USA, 0.1%
Cytyc: Columbia Acorn Fund, 0.4%
Crescent Real Estate Equities: Columbia Acorn Fund, 0.1%
Ceridian: Columbia Acorn USA, 1.1%; Columbia Acorn Fund, 0.6%
Penn National Gaming: Columbia Acorn Fund, 0.5%
Genesco: Columbia Acorn USA, 0.3%; Columbia Acorn Fund, 0.2%
Nuveen Investments: Columbia Acorn Fund, 0.4%
Stork: Columbia Acorn International Select, 2.3%; Columbia Acorn International, 1.0%
Chittenden: Columbia Acorn USA, 0.4%; Columbia Acorn Fund, 0.2%
Dobson Communications: Columbia Acorn USA, 1.1%; Columbia Acorn Fund, 0.4%
Stocks of small- and mid-cap companies pose special risks, including possible illiquidity and greater price volatility than stocks of larger, more established companies. International investing involves special risks, including foreign taxation, currency risks, risks associated with possible differences in financial standards and other risks associated with future political and economic developments. A fund that maintains a relatively concentrated portfolio may be subject to greater risk than a fund that is more fully diversified.
Past performance is no guarantee of future results.
9
Understanding Your Expenses
As a Fund shareholder, you incur two types of costs. There are transaction costs, which generally include sales charges on purchases and may include redemption or exchange fees. There are also ongoing costs, which generally include investment advisory fees, Rule 12b-1 fees and other Fund expenses. The information on this page is intended to help you understand your ongoing costs of investing in the Columbia Acorn Funds and to compare these costs with the ongoing costs of investing in other mutual funds.
Analyzing your Fund's expenses
To illustrate these ongoing costs, we have provided examples and calculated the expenses paid by investors in the Class A, B and C shares of the Columbia Acorn Funds for the last six months. The information in the following table is based on an initial investment of $1,000.00, which is invested at the beginning of the reporting period and held for the entire period. Expense information is calculated two ways and each method provides you with different information. The amount listed in the "Actual" column is calculated using each Fund's actual operating expenses and total return for the period. The amount listed in the "Hypothetical" column assumes that the return each year is 5% before expenses and then applies each Fund's actual expense ratio for the period to the hypothetical return. You should not use the hypothetical account values and expenses to estimate either your actual account balance at the end of the period or the ex penses you paid during the reporting period. See the "Compare with other funds" information for details on using the hypothetical data.
January 1, 2007 – June 30, 2007
| | | Account value at
the beginning of
the period ($) | | Account value at
the end of
the period ($) | | Expenses paid
during period ($) | | Fund's
annualized
expense
ratio (%)* | |
| | | Actual | | Hypothetical | | Actual | | Hypothetical | | Actual | | Hypothetical | | Actual | |
| Columbia Acorn Fund | |
| Class A | | | 1,000.00 | | | | 1,000.00 | | | | 1,113.71 | | | | 1,019.74 | | | | 5.35 | | | | 5.11 | | | | 1.02 | | |
| Class B | | | 1,000.00 | | | | 1,000.00 | | | | 1,110.48 | | | | 1,016.86 | | | | 8.37 | | | | 8.00 | | | | 1.60 | | |
| Class C | | | 1,000.00 | | | | 1,000.00 | | | | 1,109.39 | | | | 1,015.87 | | | | 9.41 | | | | 9.00 | | | | 1.80 | | |
| Columbia Acorn International | |
| Class A | | | 1,000.00 | | | | 1,000.00 | | | | 1,144.11 | | | | 1,018.89 | | | | 6.33 | | | | 5.96 | | | | 1.19 | | |
| Class B | | | 1,000.00 | | | | 1,000.00 | | | | 1,140.88 | | | | 1,015.92 | | | | 9.50 | | | | 8.95 | | | | 1.79 | | |
| Class C | | | 1,000.00 | | | | 1,000.00 | | | | 1,139.99 | | | | 1,015.08 | | | | 10.40 | | | | 9.79 | | | | 1.96 | | |
| Columbia Acorn USA | |
| Class A | | | 1,000.00 | | | | 1,000.00 | | | | 1,093.62 | | | | 1,018.60 | | | | 6.49 | | | | 6.26 | | | | 1.25 | | |
| Class B | | | 1,000.00 | | | | 1,000.00 | | | | 1,090.20 | | | | 1,015.57 | | | | 9.64 | | | | 9.30 | | | | 1.86 | | |
| Class C | | | 1,000.00 | | | | 1,000.00 | | | | 1,089.31 | | | | 1,014.68 | | | | 10.57 | | | | 10.19 | | | | 2.04 | | |
| Columbia Acorn International Select | |
| Class A | | | 1,000.00 | | | | 1,000.00 | | | | 1,116.19 | | | | 1,017.46 | | | | 7.77 | | | | 7.40 | | | | 1.48 | | |
| Class B | | | 1,000.00 | | | | 1,000.00 | | | | 1,112.62 | | | | 1,014.38 | | | | 11.00 | | | | 10.49 | | | | 2.10 | | |
| Class C | | | 1,000.00 | | | | 1,000.00 | | | | 1,111.62 | | | | 1,013.54 | | | | 11.88 | | | | 11.33 | | | | 2.27 | | |
10
| | | Account value at
the beginning of
the period ($) | | Account value at
the end of
the period ($) | | Expenses paid
during period ($) | | Fund's
annualized
expense
ratio (%)* | |
| | | Actual | | Hypothetical | | Actual | | Hypothetical | | Actual | | Hypothetical | | Actual | |
| Columbia Acorn Select | |
| Class A | | | 1,000.00 | | | | 1,000.00 | | | | 1,166.42 | | | | 1,018.84 | | | | 6.45 | | | | 6.01 | | | | 1.20 | | |
| Class B | | | 1,000.00 | | | | 1,000.00 | | | | 1,162.60 | | | | 1,015.87 | | | | 9.65 | | | | 9.00 | | | | 1.80 | | |
| Class C | | | 1,000.00 | | | | 1,000.00 | | | | 1,161.81 | | | | 1,014.93 | | | | 10.67 | | | | 9.94 | | | | 1.99 | | |
| Columbia Thermostat Fund | |
| Class A | | | 1,000.00 | | | | 1,000.00 | | | | 1,042.50 | | | | 1,022.32 | | | | 2.53 | | | | 2.51 | | | | .50 | | |
| Class B | | | 1,000.00 | | | | 1,000.00 | | | | 1,039.92 | | | | 1,019.84 | | | | 5.06 | | | | 5.01 | | | | 1.00 | | |
| Class C | | | 1,000.00 | | | | 1,000.00 | | | | 1,038.28 | | | | 1,018.60 | | | | 6.32 | | | | 6.26 | | | | 1.25 | | |
Expenses paid during the period are equal to each Fund's annualized expense ratio, multiplied by the average account value over the period and then multiplied by the number of days in the Fund's most recent fiscal half-year and divided by 365.
Had the investment adviser and/or any of its affiliates not waived or reimbursed a portion of expenses, account value at the end of the period would have been reduced.
It is important to note that the expense amounts shown in the table are meant to highlight only ongoing costs of investing in the Funds and do not reflect any transaction costs, such as sales charges, redemption fees or exchange fees. Therefore, the hypothetical examples provided may not help you determine the relative total costs of owning different funds. If these transaction costs were included, your costs would have been higher.
Columbia Thermostat Fund's expenses do not include fees and expenses incurred by the Fund from the underlying portfolio funds.
*For the six months ended June 30, 2007.
Compare with other funds
Since all mutual funds are required to include the same hypothetical calculations about expenses in shareholder reports, you can use this information to compare the ongoing cost of investing in the Funds with other funds. To do so, compare the 5% hypothetical example with the 5% hypothetical examples that appear in the shareholder reports of other funds. As you compare hypothetical examples of other funds, it is important to note that hypothetical examples are meant to highlight the continuing costs of investing in a fund and do not reflect any transaction costs, such as sales charges, redemption fees or exchange fees.
Estimating your actual expenses
To estimate the expenses that you actually paid over the period, first you will need your account balance at the end of the period:
• For shareholders who receive their account statements from Columbia Management Services, Inc., your account balance is available online at columbiafunds.com or by calling Shareholder Services at (800) 922-6769.
• For shareholders who receive their account statements from their brokerage firm, contact your brokerage firm to obtain your account balance.
1. Divide your ending account balance by $1,000.00. For example, if an account balance was $8,600 at the end of the period, the result would be 8.6.
2. In the section of the table titled "Expenses paid during the period," locate the amount for your Fund. You will find this number is in the column labeled "Actual." Multiply this number by the result from step 1. Your answer is an estimate of the expenses you paid on your account during the period.
11
Columbia Acorn Fund
In a Nutshell

Charles P. McQuaid
Lead Portfolio Manager

Robert A. Mohn
Co-Portfolio Manager
Performance data quoted represents past performance and current performance may be lower or higher. Past performance is no guarantee of future results. The investment return and principal value of an investment in the Fund will fluctuate so that shares, when redeemed, may be worth more or less than the original cost. Performance may reflect any voluntary waivers or reimbursements of fund expenses by the Adviser or its affiliates. Absent these waivers, or reimbursement arrangements, performance results may be lower. Please visit columbiafunds.com for daily and most recent month-end performance updates.
Fund's Positions
in Mentioned Holdings
as of 6/30/07
| ITT Educational Services | | | 1.1 | % | |
| Eaton Vance | | | 1.1 | % | |
| Fugro | | | 1.1 | % | |
| People's United | | | 0.8 | % | |
| Florida Rock | | | 0.6 | % | |
| Penn National Gaming | | | 0.5 | % | |
| Highland Hospitality | | | 0.5 | % | |
| ESCO Technologies | | | 0.4 | % | |
| Hong Kong Exchanges and Clearing | | | 0.4 | % | |
| Housing Development Finance | | | 0.4 | % | |
| Hexagon | | | 0.4 | % | |
| Armor Holdings | | | 0.3 | % | |
| Chittenden | | | 0.2 | % | |
| Shuffle Master | | | 0.2 | % | |
| Crescent Real Estate Equities | | | 0.1 | % | |
Columbia Acorn Fund rose 11.37% (Class A shares, without sales charge) in the first half of 2007, nicely beating the 8.67% return of the small-cap Russell 2500 Index, and also pacing ahead of other benchmarks. The Fund rose 6.60% in the second quarter, moderately outperforming the Russell 2500's gain of 4.94%, and slightly outperforming other benchmarks.
Stock selection drove fine results, and the same three companies were our largest dollar winners for both the first half and the second quarter. ITT Educational Services jumped 77% in the half and 44% in the quarter on strong sales and profit margins. Eaton Vance appreciated 35% in the half and 24% in the quarter; its assets under management surged as the company created new closed-end funds. Netherlands-based Fugro rounded out the winners' circle, up 35% and 27% respectively, on strong demand for energy industry offshore services.
Sellouts also boosted performance. In the first half, Kronos was the Fund's largest dollar winner as a result of takeovers, clocking a 50% gain, while Armor Holdings and Florida Rock were the largest percentage winners, each up about 58%. In the second quarter, Penn National Gaming scored the Fund's largest takeover dollar jackpot and percentage gain, up 42%. There were 27 takeovers in the half, beating the 26 in all of 2006; they boosted performance by over 1.5%. We discuss these takeovers in "Squirrel Chatter II" beginning on Page 5 of this report.
The Fund had relatively low investments in industries that did not perform well. Real estate stocks within the Russell 2500 were down in the first half of 2007, after many stellar years. Columbia Acorn Fund's real estate investment was both relatively small and actually profitable, thanks to announced takeovers of Highland Hospitality and Crescent Real Estate Equities. In the second quarter, Russell 2500 bank and utility stocks also did poorly. The Fund had relatively small investments in both areas.
Columbia Acorn Fund's largest dollar loser in the first half was People's United, a Connecticut savings and loan company. It lost 16% in part due to its somewhat dilutive acquisition of another Fund bank holding, Chittenden, which rose 15%. Shuffle Master dropped 37% in the half due to poor earnings. ESCO Technologies declined 19% in the quarter on news that a major customer of its automatic meter readers was reconsidering its requirements.
Columbia Acorn Fund's international stocks resumed their outperformance in the quarter, and rose 14.56%, boosting their first half gain to 18.85%. In addition to Fugro, mentioned above, top winners for the quarter were Hong Kong Exchanges and Clearing, up 48% on regulatory changes which allow mainland Chinese to own stocks listed in Hong Kong. Housing Development Finance booked a 44% gain on India's prosperity and housing boom. Hexagon, a Swedish manufacturer of measurement equipment and polymers, gained 42% due to excellent earnings. At the end of the half, foreign stocks were 11.5% of Columbia Acorn Fund, up slightly from 11.3% last quarter but down from 13.7% year-to-year.
Small- and mid-cap stocks are often more volatile and less liquid than the stocks of larger companies. Small companies may have a shorter history of operations than larger companies and may have a less diversified product line, making them more susceptible to market pressure. International investments involve greater potential risks, including less regulation, currency fluctuations, economic instability and political developments.
Portfolio holdings are subject to change periodically and may not be representative of current characteristics and holdings.
12
Columbia Acorn Fund (LACAX)
At a Glance
Performance data quoted represents past performance and current performance may be higher or lower. Past performance is no guarantee of future results. The investment return and principal value of an investment in the Fund will fluctuate so that Fund shares, when redeemed, may be worth more or less than their original cost. Performance may reflect any voluntary waivers or reimbursements of Fund expenses by the Adviser or any of its affiliates. Absent these waivers or reimbursement arrangements, performance results may be lower. Visit columbiafunds.com for daily and most recent month-end updates.
Pretax and After-tax Average Annual Total Returns (Based on Class A Share Returns)
through June 30, 2007
Inception 10/16/00
| |
| | Year
to date* | |
1 year | |
5 years | |
Life of fund | |
Returns before taxes
| | NAV
POP | | 11.37%
4.97 | | 20.32%
13.40 | | 17.63%
16.24 | | 14.32%
13.32 | |
Returns after taxes
on distributions | | NAV
POP | | 11.15
4.76 | | 18.86
12.02 | | 16.96
15.59 | | 13.38
12.38 | |
Returns after taxes
on distributions and
sale of fund shares | | NAV
POP
| | 7.63
3.45
| | 14.85
10.26
| | 15.45
14.19
| | 12.33
11.41
| |
| Russell 2500 (pretax) | | | | 8.67 | | 18.74 | | 15.30 | | 11.04 | |
| S&P 500 (pretax) | | | | 6.96 | | 20.59 | | 10.71 | | 3.09 | |
After-tax returns are calculated using the highest historical individual federal marginal income tax rates, and do not reflect the impact of state and local taxes. Returns after taxes on distributions and sale of Fund shares reflect the tax impact of gains or losses realized when Fund shares are sold. The returns are taxed at the maximum rate and assume shares were purchased at the beginning of the period. Actual after-tax returns depend on the investor's tax situation and may differ from those shown. After-tax returns are not relevant to investors who hold their Fund shares through tax-deferred arrangements such as 401(k) plans or individual retirement accounts. After-tax returns are shown for Class A shares only; after-tax returns for other share classes will vary. Indexes do not reflect any deduction for fees, expenses or taxes. Investment returns and principal value may fluctuate, resulting in a gain or loss on sale.
Public offering price (POP) returns include the maximum sales charge of 5.75% for Class A shares. Net asset value (NAV) returns do not include sales charges or contingent deferred sales charges (CDSC).
*Year to date data not annualized.
Columbia Acorn Fund Portfolio Diversification
as a % of net assets as of 6/30/07

Columbia Acorn Fund Top 10 Holdings
as a % of net assets as of 6/30/07
| | 1. | | | Coach
Designer & Retailer of Branded Leather Accessories | | | 1.6 | % | |
| | 2. | | | Eaton Vance
Specialty Mutual Funds | | | 1.1 | % | |
| | 3. | | | ITT Educational Services
Post-secondary Degree Programs | | | 1.1 | % | |
| | 4. | | | Abercrombie & Fitch
Teen Apparel Retailer | | | 1.1 | % | |
| | 5. | | | Fugro (Netherlands)
Oilfield Services | | | 1.1 | % | |
| | 6. | | | Expeditors International of Washington
International Freight Forwarder | | | 1.1 | % | |
| | 7. | | | FMC Technologies
Oil & Gas Well Head Manufacturer | | | 1.1 | % | |
| | 8. | | | Chico's FAS
Women's Specialty Retailer | | | 1.0 | % | |
| | 9. | | | Genlyte Group
Commercial Lighting Fixtures | | | 1.0 | % | |
| | 10. | | | Ametek
Aerospace/Industrial Instruments | | | 0.9 | % | |
The Fund's top 10 holdings and portfolio diversification vary with changes in portfolio investments. See the Statement of Investments for a complete list of the Fund's holdings.
The Growth of a $75,000 Investment in Columbia Acorn Fund (Class A)
October 16, 2000 through June 30, 2007
Illustration is based on a hypothetical $75,000 investment from inception in Class A shares of the Fund, which includes a 4.50% maximum initial sales charge for this level of investment. The index is unmanaged and returns for both the index and the Fund include reinvested dividends and capital gains. It is not possible to invest directly in an index. The graph does not reflect taxes that a shareholder would pay on Fund distributions or on a sale of Fund shares.
Total Net Assets of the Fund: $21,231.3 million

13
Columbia Acorn International
In a Nutshell

P. Zachary Egan
Co-Portfolio Manager

Louis J. Mendes III
Co-Portfolio Manager
Performance data quoted represents past performance and current performance may be lower or higher. Past performance is no guarantee of future results. The investment return and principal value of an investment in the Fund will fluctuate so that shares, when redeemed, may be worth more or less than the original cost. Performance may reflect any voluntary waivers or reimbursements of fund expenses by the Adviser or its affiliates. Absent these waivers, or reimbursement arrangements, performance results may be lower. Please visit columbiafunds.com for daily and most recent month-end performance updates.
Fund's Positions
in Mentioned Holdings
as of 6/30/07
| Hong Kong Exchanges and Clearing | | | 1.4 | % | |
| Hexagon | | | 1.4 | % | |
| China Shipping Development | | | 1.0 | % | |
| Singapore Exchange | | | 0.8 | % | |
| Taewoong | | | 0.6 | % | |
| Burckhardt Compression | | | 0.6 | % | |
| Lenovo Group | | | 0.5 | % | |
| Sung Kwang Bend | | | 0.5 | % | |
Portfolio holdings are subject to change periodically and may not be representative of current characteristics and holdings.
Columbia Acorn International ended the quarter up 8.53% (Class A shares, without sales charge) vs. a 7.37% gain for the benchmark S&P/Citigroup EMI Global ex-US Index. Year to date, the Fund was up 14.41% vs. a 14.85% gain for the benchmark.
Returns varied considerably by region. Led by Korea and China, the Fund's Asia ex-Japan holdings posted a nearly 32% return on the back of positive earnings surprises and liquidity inflows to the region. Liberalization measures in China allowing local investment companies to invest overseas—with Hong Kong as the most likely initial recipient of these funds—boosted sentiment regarding China–focused companies. China Shipping Development, one of China's largest shipping companies, rose 54% in the quarter and year to date, in part due to its large valuation gap when compared to its domestic-listed shares. Lenovo Group, China's largest computer company, rose nearly 61% in the quarter and was up 45% for the half year on improved earnings and the continued attention towards high profile Chinese companies. The regional exchanges also continued to drive good returns, with Hong Kong Exchanges and Clearing and Singapore Exch ange both jumping 48% in the second quarter as trading volumes increased in what is largely a fixed cost base business. The Fund's top two performers were two niche Korean industrial companies, Sung Kwang Bend and Taewoong. These recent additions to the Fund rose 141% and 103% respectively, in the quarter. Gains were driven by the strong growth in global infrastructure and construction projects, particularly in the Middle East where Korean companies have a long track record in infrastructure development. For the half year, Sung Kwang Bend was up an impressive 285% and Taewoong reached a 104% gain. We applaud our analyst who covers this region, Jeannie Cheung, for ferreting out these ideas.
The Fund's holdings in Continental Europe and Canada also posted strong results, rising 12% and 17%, respectively, in the quarter. Our long-term strategy of investing in what we believe to be high-quality European industrial stocks continued to pay off. Burckhardt Compression, a Swiss supplier of gas compression pumps, and Hexagon, a Swedish manufacturer of measurement equipment and polymers and the Fund's second largest position at the outset of the quarter, both rose over 40% in the second quarter on continued strong demand for their highly specialized products.
Japanese stocks dominated the list of underperformers. Despite a reasonably strong domestic economy, flat wage growth has lead to lackluster domestic consumption as consumers save rather than spend. Moreover, Japanese savers, attracted by higher yields than they can receive at home, are increasingly investing overseas. This has contributed to yen weakness relative to world currencies, placing a further drag on performance.
The other regions of note were the poorly performing British and Irish markets. After posting strong returns in 2006, these markets have seen a strong pullback thus far in 2007 on concerns over higher interest rates, extended valuations and a deepening financial crisis. Since the beginning of 2007, we have significantly reduced our exposure to these markets, but still have been affected by the overall poor sentiment. As a region, the United Kingdom/Ireland was flat in the second quarter.
International investments involve greater potential risks, including less regulation, currency fluctuations, economic instability and political developments. Investments in small- and mid-cap companies may be subject to greater volatility and price fluctuations because they may be thinly traded and less liquid.
14
Columbia Acorn International (LAIAX)
At a Glance
Performance data quoted represents past performance and current performance may be higher or lower. Past performance is no guarantee of future results. The investment return and principal value of an investment in the Fund will fluctuate so that Fund shares, when redeemed, may be worth more or less than their original cost. Performance may reflect any voluntary waivers or reimbursements of Fund expenses by the Adviser or any of its affiliates. Absent these waivers or reimbursement arrangements, performance results may be lower. Visit columbiafunds.com for daily and most recent month-end updates.
Pretax and After-tax Average Annual Total Returns (Based on Class A Share Returns)
through June 30, 2007
Inception 10/16/000
| |
| | Year
to date* | |
1 year | |
5 years | |
Life of fund | |
Returns before taxes
| | NAV
POP | | 14.41%
7.83 | | 34.52%
26.78 | | 23.96%
22.50 | | 12.47%
11.48 | |
Returns after taxes
on distributions | | NAV
POP | | 14.31
7.74 | | 32.78
25.15 | | 23.46
22.01 | | 11.64
10.66 | |
Returns after taxes
on distributions and
sale of fund shares | | NAV
POP | | 9.49
5.21
| | 24.50
19.35
| | 21.33
19.98
| | 10.68
9.79
| |
S&P/Citigroup EMI
Global ex-US (pretax) | | | |
14.85 | |
35.90 | |
26.03 | |
17.17 | |
S&P/Citigroup
Global ex-US Cap Range
$500mm-$5bn | | | | 15.47 | | 35.50 | | 26.22 | | 17.59 | |
After-tax returns are calculated using the highest historical individual federal marginal income tax rates, and do not reflect the impact of state and local taxes. Returns after taxes on distributions and sale of Fund shares reflect the tax impact of gains or losses realized when Fund shares are sold. The returns are taxed at the maximum rate and assume shares were purchased at the beginning of the period. Actual after-tax returns depend on the investor's tax situation and may differ from those shown. After-tax returns are not relevant to investors who hold their Fund shares through tax-deferred arrangements such as 401(k) plans or individual retirement accounts. After-tax returns are shown for Class A shares only; after-tax returns for other share classes will vary. Indexes do not reflect any deduction for fees, expenses or taxes.
Investment returns and principal value may fluctuate, resulting in a gain or loss on sale.
Public offering price (POP) returns include the maximum sales charge of 5.75% for Class A shares. Net asset value (NAV) returns do not include sales charges or contingent deferred sales charges (CDSC).
*Year to date data not annualized.
Columbia Acorn International Portfolio Diversification
as a % of net assets as of 6/30/07

Columbia Acorn International Top 10 Holdings
as a % of net assets as of 6/30/07
| | 1. | | | Fugro (Netherlands)
Oilfield Services | | | 1.6 | % | |
| | 2. | | | Hong Kong Exchanges and Clearing (Hong Kong)
Hong Kong Equity & Derivatives Market Operator | | | 1.4 | % | |
| | 3. | | | Hexagon (Sweden)
Measurement Equipment & Polymers | | | 1.4 | % | |
| | 4. | | | SES Global (France)
Satellite Broadcasting Services | | | 1.2 | % | |
| | 5. | | | Housing Development Finance (India)
Indian Mortgage Lender | | | 1.2 | % | |
| | 6. | | | Atwood Oceanics (United States)
Offshore Drilling Contractor | | | 1.1 | % | |
| | 7. | | | Suzano (Brazil)
Brazilian Pulp & Paper Producer | | | 1.1 | % | |
| | 8. | | | ShawCor (Canada)
Oil & Gas Pipeline Products | | | 1.0 | % | |
| | 9. | | | Kuehne & Nagel (Switzerland)
Freight Forwarding/Logistics | | | 1.0 | % | |
| | 10. | | | China Shipping Development (China)
China's Dominant Shipper for Oil & Coal | | | 1.0 | % | |
The Fund's top 10 holdings and portfolio diversification vary with changes in portfolio investments. See the Statement of Investments for a complete list of the Fund's holdings.
The Growth of a $10,000 Investment in Columbia Acorn International (Class A)
October 16, 2000 through June 30, 2007
Illustration is based on a hypothetical $10,000 investment from inception in Class A shares of the Fund, which includes a 5.75% maximum initial sales charge. The indexes are unmanaged and returns for both the indexes and the Fund include reinvested dividends and capital gains. It is not possible to invest directly in an index. The graph does not reflect taxes that a shareholder would pay on Fund distributions or on a sale of Fund shares.
Total Net Assets of the Fund:
$5,458.7 million
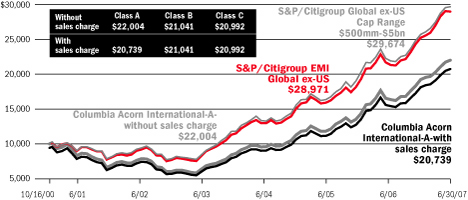
15
Columbia Acorn USA
In a Nutshell

Robert A. Mohn
Lead Portfolio Manager
Performance data quoted represents past performance and current performance may be lower or higher. Past performance is no guarantee of future results. The investment return and principal value of an investment in the Fund will fluctuate so that shares, when redeemed, may be worth more or less than the original cost. Performance may reflect any voluntary waivers or reimbursements of fund expenses by the Adviser or its affiliates. Absent these waivers, or reimbursement arrangements, performance results may be lower. Please visit columbiafunds.com for daily and most recent month-end performance updates.
Fund's Positions
in Mentioned Holdings
as of 6/30/07
| ITT Educational Services | | | 2.5 | % | |
| FMC Technologies | | | 1.9 | % | |
| Atwood Oceanics | | | 1.5 | % | |
| ESCO Technologies | | | 1.4 | % | |
| Flir Systems | | | 1.2 | % | |
| True Religion Apparel | | | 1.1 | % | |
| Dobson Communications | | | 1.1 | % | |
| II-VI | | | 0.8 | % | |
| J. Crew Group | | | 0.6 | % | |
| Nektar Therapeutics | | | 0.3 | % | |
Portfolio holdings are subject to change periodically and may not be representative of current characteristics and holdings.
Columbia Acorn USA gained 5.70% (Class A shares, without sales charge) in the second quarter, outperforming the 4.42% increase of the Russell 2000 Index. The Fund also topped the index year to date through June 30, increasing 9.36% vs. the index's 6.45% gain. A continued underweight in financials contributed to the Fund's outperformance. A victim of deteriorating fundamentals and lingering concerns over credit losses, the financial sector fell 2% in the second quarter and was down more than 6% for the half year in the Russell 2000 Index. Columbia Acorn USA had a 9% weight in financial stocks at quarter end, less than half of the 21% weight in the Russell 2000.
Strong performance of consumer stocks also bolstered the Fund's relative performance. ITT Educational Services, a provider of post-secondary degree programs, was the Fund's leader in the consumer sector and overall. The stock was up 44% for the quarter and 77% year to date on strong student enrollment growth. True Religion Apparel, a maker of high-end denim clothing, gained 25% in the quarter and 33% for the six months on aggressive retail store opening plans. Apparel retailer J. Crew Group was up 35% in the quarter and 40% for the half year thanks to explosive earnings growth of 70% year-over-year.
Other winners included Flir Systems, a manufacturer of infrared cameras. The stock gained 30% in the quarter and was up 45% year to date on news of large contract wins with the U.S. Army. Dobson Communications, a rural cellular service provider, gained 29% in the quarter on speculation that the company would be bought out. On June 29, after the market closed on the last day of the quarter, Dobson did indeed announce they were being acquired by AT&T. For the semiannual period, the stock was up 28%. Atwood Oceanics and FMC Technologies increased due to healthy demand for deep-water drilling contractors (Atwood Oceanics) and oil and gas well head manufacturers (FMC Technologies). Atwood gained 17% in the quarter and was up 40% for the half year while FMC Technologies posted a 14% quarterly gain and 29% year-to-date return.
Laggards included ESCO Technologies, a maker of automated electric meter readers. The stock fell 19% in the quarter and was off 20% for the six months on news of possible changes in a large contract with a California utility. II-VI, a maker of laser components, fell 20% in the quarter due to operational difficulties. Year-to-date the company is showing less than a 3% loss.
Two biotech names also landed in the loser column. The Medicines Company, a maker of cardiovascular drugs, fell 23% in the quarter and was off 39% for the half year as an appeal to extend one of its major drug patents was denied. We sold the stock. Nektar Therapeutics, a provider of drug delivery technologies, fell 27% in the quarter and was off 38% for the six months as sales of the company's inhaleable insulin came in under expectations.
While certain sectors, such as housing, have been under a lot of pressure so far this year, we believe the overall economy remains remarkably healthy. We feel the market is continuing to offer plenty of investment opportunities for discriminating small-cap investors.
Risks include stock market fluctuations due to economic and business developments. Investments in small- and mid-cap companies may be subject to greater volatility and price fluctuations because they may be thinly traded and less liquid.
16
Columbia Acorn USA (LAUAX)
At a Glance
Performance data quoted represents past performance and current performance may be higher or lower. Past performance is no guarantee of future results. The investment return and principal value of an investment in the Fund will fluctuate so that Fund shares, when redeemed, may be worth more or less than their original cost. Performance may reflect any voluntary waivers or reimbursements of Fund expenses by the Adviser or any of its affiliates. Absent these waivers or reimbursement arrangements, performance results may be lower. Visit columbiafunds.com for daily and most recent month-end updates.
Pretax and After-tax Average Annual Total Returns (Based on Class A Share Returns)
through June 30, 2007
| Inception 10/16/00 | |
| | Year
to date* | | 1 year | | 5 years | | Life of fund | |
| Returns before taxes | | NAV
POP | | 9.36%
3.07 | | 15.69%
9.04 | | 14.73%
13.38 | | 14.05%
13.05 | |
Returns after taxes
on distributions | | NAV
POP | | 9.22
2.94 | | 15.23
8.61 | | 14.43
13.09 | | 13.80
12.80 | |
Returns after taxes
on distributions and
sale of fund shares | | NAV
POP | | 6.29
2.19
| | 10.77
6.41
| | 12.93
11.71
| | 12.45
11.53
| |
| Russell 2000 (pretax) | | | | 6.45 | | 16.43 | | 13.88 | | 9.94 | |
After-tax returns are calculated using the highest historical individual federal marginal income tax rates, and do not reflect the impact of state and local taxes. Returns after taxes on distributions and sale of Fund shares reflect the tax impact of gains or losses realized when Fund shares are sold. The returns are taxed at the maximum rate and assume shares were purchased at the beginning of the period. Actual after-tax returns depend on the investor's tax situation and may differ from those shown. After-tax returns are not relevant to investors who hold their Fund shares through tax-deferred arrangements such as 401(k) plans or individual retirement accounts. After-tax returns are shown for Class A shares only; after-tax returns for other share classes will vary. Indexes do not reflect any deduction for fees, expenses or taxes.
Investment returns and principal value may fluctuate, resulting in a gain or loss on sale.
Public offering price (POP) returns include the maximum sales charge of 5.75% for Class A shares. Net asset value (NAV) returns do not include sales charges or contingent deferred sales charges (CDSC).
*Year to date data not annualized.
Columbia Acorn USA Portfolio Diversification
as a % of net assets as of 6/30/07

Columbia Acorn USA Top 10 Holdings
as a % of net assets as of 6/30/07
| | 1. | | | ITT Educational Services
Post-secondary Degree Programs | | | 2.5 | % | |
| | 2. | | | Genlyte Group
Commercial Lighting Fixtures | | | 2.2 | % | |
| | 3. | | | Crown Castle International
Communications Towers | | | 2.1 | % | |
| | 4. | | | FMC Technologies
Oil & Gas Well Head Manufacturer | | | 1.9 | % | |
| | 5. | | | Time Warner Telecom
Fiber Optic Telephone/Data Services | | | 1.8 | % | |
| | 6. | | | AmeriCredit
Auto Lending | | | 1.7 | % | |
| | 7. | | | Abercrombie & Fitch
Teen Apparel Retailer | | | 1.7 | % | |
| | 8. | | | Edwards Lifesciences
Heart Valves | | | 1.7 | % | |
| | 9. | | | Oxford Industries
Branded & Private Label Apparel | | | 1.7 | % | |
| | 10. | | | Tellabs
Telecommunications Equipment | | | 1.6 | % | |
The Fund's top 10 holdings and portfolio diversification vary with changes in portfolio investments. See the Statement of Investments for a complete list of the Fund's holdings.
The Growth of a $75,000 Investment in Columbia Acorn USA (Class A)
October 16, 2000 through June 30, 2007
Illustration is based on a hypothetical $75,000 investment from inception in Class A shares of the Fund, which includes a 4.50% maximum initial sales charge for this level of investment. The index is unmanaged and returns for both the index and the Fund include reinvested dividends and capital gains. It is not possible to invest directly in an index. The graph does not reflect taxes that a shareholder would pay on Fund distributions or on a sale of Fund shares.
Total Net Assets of the Fund:
$1,703.5 million

17
Columbia Acorn International Select
In a Nutshell

Christopher J. Olson
Lead Portfolio Manager
Performance data quoted represents past performance and current performance may be lower or higher. Past performance is no guarantee of future results. The investment return and principal value of an investment in the Fund will fluctuate so that shares, when redeemed, may be worth more or less than the original cost. Performance may reflect any voluntary waivers or reimbursements of fund expenses by the Adviser or its affiliates. Absent these waivers, or reimbursement arrangements, performance results may be lower. Please visit columbiafunds.com for daily and most recent month-end performance updates.
Fund's Positions
in Mentioned Holdings
as of 6/30/07
| Nintendo | | | 4.9 | % | |
| Potash Corp. of Saskatchewan | | | 3.2 | % | |
| Hong Kong Exchanges and Clearing | | | 3.2 | % | |
| Hexagon | | | 2.7 | % | |
| Kenedix | | | 2.3 | % | |
| Singapore Exchange | | | 1.8 | % | |
| C&C Group | | | 0.1 | % | |
Portfolio holdings are subject to change periodically and may not be representative of current characteristics and holdings.
Columbia Acorn International Select climbed 7.31% (Class A shares, without sales charge) in the second quarter, outpacing the 6.08% gain of the S&P/Citigroup World ex-US Cap Range $2-10B Index. Year to date, the Fund was up 11.62% vs. a 12.04% return for the index.
Japan's Nintendo continued to post strong returns in the second quarter, increasing 27%. For the first six months of the year, the stock was up 49% as sales of its Wii gaming system continue to break records and strong sales of its gaming software followed suit. Canada's Potash Corp. of Saskatchewan, the worlds' largest producer of potash, gained 48% in the quarter and was up 65% for the half year as increasing crop prices bode well for fertilizer prices. Sweden's Hexagon, a manufacturer of measurement equipment and polymers, increased 42% in the quarter and 35% for the six months on strong earnings news.
Increased liquidity and favorable earnings news boosted the performance of Asian markets, excluding Japan. The Fund's equity and derivatives market operators, Hong Kong Exchanges and Clearing and Singapore Exchange, both benefited from increased trading volumes. Hong Kong Exchanges and Clearing increased nearly 48% in the quarter and was up 32% for the half year. Singapore Exchange saw similar gains for the quarter, up 48%, and for the six months the stock was up 76%.
Laggards for the quarter included Kenedix, a Japanese real estate investment management company. The stock fell 27% in the quarter and was off 18% for the first half of the year due to the rise in interest rates in Japan and concerns that the real estate sector would suffer. Banca Italease, an Italian leasing and factoring company, fell 46% in the quarter and was sold out of the Fund as the company seriously misjudged the amount of exposure it had to interest rate derivatives, which could result in a required capital increase for the firm. Last year Irish beverage company C&C Group was a star performer for Columbia Acorn International Select but the stock has cooled in 2007. Company earnings and sales have declined due to increased competition and very poor summer weather. The stock fell 8% in the quarter and was down 21% year to date.
International investments involve greater potential risks, including less regulation, currency fluctuations, economic instability and political developments. Investments in small- and mid-cap companies may be subject to greater volatility and price fluctuations because they may be thinly traded and less liquid.
18
Columbia Acorn International Select (LAFAX)
At a Glance
Performance data quoted represents past performance and current performance may be higher or lower. Past performance is no guarantee of future results. The investment return and principal value of an investment in the Fund will fluctuate so that Fund shares, when redeemed, may be worth more or less than their original cost. Performance may reflect any voluntary waivers or reimbursements of Fund expenses by the Adviser or any of its affiliates. Absent these waivers or reimbursement arrangements, performance results may be lower. Visit columbiafunds.com for daily and most recent month-end updates.
Pretax and After-tax Average Annual Total Returns (Based on Class A Share Returns)
through June 30, 2007
| Inception 10/16/00 | |
| | Year
to date* | | 1 year | | 5 years | | Life of fund | |
| Returns before taxes | | NAV
POP | | 11.62%
5.20 | | 34.62%
26.88 | | 21.58%
20.15 | | 9.00%
8.04 | |
Returns after taxes
on distributions | | NAV
POP | | 11.52
5.11 | | 34.60
26.86 | | 21.61
20.18 | | 9.00
8.04 | |
Returns after taxes
on distributions and
sale of fund shares | | NAV
POP | | 7.55
3.38 | | 22.59
17.56 | | 19.29
17.98 | | 7.93
7.07 | |
S&P/Citigroup World
ex-US Cap Range
$2-10B (pretax) | | | | 12.04 | | 29.92 | | 22.67 | | 15.04 | |
After-tax returns are calculated using the highest historical individual federal marginal income tax rates, and do not reflect the impact of state and local taxes. Returns after taxes on distributions and sale of Fund shares reflect the tax impact of gains or losses realized when Fund shares are sold. The returns are taxed at the maximum rate and assume shares were purchased at the beginning of the period. Actual after-tax returns depend on the investor's tax situation and may differ from those shown. After-tax returns are not relevant to investors who hold their Fund shares through tax-deferred arrangements such as 401(k) plans or individual retirement accounts. After-tax returns are shown for Class A shares only; after-tax returns for other share classes will vary. Indexes do not reflect any deduction for fees, expenses or taxes.
Investment returns and principal value may fluctuate, resulting in a gain or loss on sale.
Public offering price (POP) returns include the maximum sales charge of 5.75% for Class A shares. Net asset value (NAV) returns do not include sales charges or contingent deferred sales charges (CDSC).
*Year to date data not annualized.
Columbia Acorn International Select Portfolio Diversification
as a % of net assets as of 6/30/07

Columbia Acorn International Select Top 10 Holdings as a % of net assets as of 6/30/07
| | 1. | | | Nintendo (Japan)
Entertainment Software & Hardware | | | 4.9 | % | |
| | 2. | | | Fugro (Netherlands)
Oilfield Services | | | 3.6 | % | |
| | 3. | | | CRH (Ireland)
Global Building Materials | | | 3.3 | % | |
| | 4. | | | Hong Kong Exchanges and Clearing (Hong Kong)
Hong Kong Equity & Derivatives Market Operator | | | 3.2 | % | |
| | 5. | | | Zumtobel (Austria)
Lighting Systems | | | 3.2 | % | |
| | 6. | | | Potash Corp. of Saskatchewan (Canada)
World's Largest Producer of Potash | | | 3.2 | % | |
| | 7. | | | Atwood Oceanics (United States)
Offshore Drilling Contractor | | | 3.1 | % | |
| | 8. | | | Synthes (Switzerland)
Products for Orthopedic Surgery | | | 3.1 | % | |
| | 9. | | | Smith & Nephew (United Kingdom)
Medical Equipment & Supplies | | | 3.0 | % | |
| | 10. | | | SES Global (France)
Satellite Broadcasting Services | | | 2.9 | % | |
The Fund's top 10 holdings and portfolio diversification vary with changes in portfolio investments. See the Statement of Investments for a complete list of the Fund's holdings.
The Growth of a $10,000 Investment in Columbia Acorn International Select (Class A)
October 16, 2000 through June 30, 2007
Illustration is based on a hypothetical $10,000 investment from inception in Class A shares of the Fund, which includes a 5.75% maximum initial sales charge. The index is unmanaged and returns for both the index and the Fund include reinvested dividends and capital gains. It is not possible to invest directly in an index. The graph does not reflect taxes that a shareholder would pay on Fund distributions or on a sale of Fund shares.
Total Net Assets of the Fund:
$222.0 million

19
Columbia Acorn Select
In a Nutshell

Ben Andrews
Lead Portfolio Manager
Performance data quoted represents past performance and current performance may be lower or higher. Past performance is no guarantee of future results. The investment return and principal value of an investment in the Fund will fluctuate so that shares, when redeemed, may be worth more or less than the original cost. Performance may reflect any voluntary waivers or reimbursements of fund expenses by the Adviser or its affiliates. Absent these waivers, or reimbursement arrangements, performance results may be lower. Visit columbiafunds.com for daily and most recent month-end performance updates.
Fund's Positions
in Mentioned Holdings
as of 6/30/07
| ITT Educational Services | | | 4.8 | % | |
| Liberty Global | | | 4.4 | % | |
| Potash Corp. of Saskatchewan | | | 3.5 | % | |
| Tetra Technologies | | | 1.8 | % | |
| American Commercial Lines | | | 1.7 | % | |
| JB Hunt Transport Services | | | 0.9 | % | |
Portfolio holdings are subject to change periodically and may not be representative of current characteristics and holdings.
Columbia Acorn Select gained 9.05% (Class A shares, without sales charge) in the second quarter, ahead of its benchmark, the S&P MidCap 400 Index, which returned 5.84%. The Fund also topped the S&P 500's return of 6.28% in the quarter. Year to date, Columbia Acorn Select was up 16.64% vs. 11.98% for the S&P MidCap 400 and 6.96% for the S&P 500.
The top three drivers of Fund performance were the same this quarter as last quarter: ITT Educational Services, Potash Corp. of Saskatchewan and Liberty Global. All three companies displayed strong fundamentals and their combined return accounted for 4.7% of the Fund's 16.64% return year to date.
We made a few structural adjustments to Columbia Acorn Select during the quarter. The minimum dollar amount to open a new account is now $100,000, up from $50,000, and all retirement plans are now subject to the new minimum. We currently manage about $3.2 billon in assets in Columbia Acorn Select. Cash inflows have been very strong so far this year and we hope to temper this with the higher minimum. At the end of the period, the Fund had 10% of its assets in cash. We are finding ideas to buy, however most are valued at levels that we are willing to pay to build a small position but we don't want to bet the ranch, at least not yet. We do not want to be forced into initiating bigger positions just to accommodate cash inflows. While we don't believe we are reaching capacity with this product in the long run, we would like to be prudent in the short term.
We also increased the number of stocks we are allowed to hold in the Fund. Columbia Acorn Select can now invest in generally 30 to 60 companies (currently we hold 39), an increase from the previous 20 to 40. We still plan on running a select portfolio. Since starting the Fund in 1998, we have had over 40% of our assets in our top 10 names and we don't see this changing. We also slightly increased the percentage of the Fund that we can invest in foreign companies. Currently we have approximately 10% of the Fund's assets invested in international stocks, mostly in the raw materials sector.
We added three stocks to the portfolio during the quarter: American Commercial Lines, JB Hunt Transport Services and Tetra Technologies. We sold out of two positions, Nuveen Investments and Weight Watchers International.
We sold Nuveen one month before it announced it was selling itself to a private equity firm. Our crystal ball was smudged and we did not see the take out coming, but should we have? We sold Nuveen because we were concerned with the direction it was taking with its asset management division. We believe Nuveen was purchased at a much higher price than we sold it at because money has been abundant and private equity can leverage cheap money and pay lofty multiples while infusing little equity. The Nuveen sale prompted me to go back and look at our other sales since I became portfolio manager of the Fund in early 2004. We exited 22 positions and had another three companies taken over for cash during the last three years. Looking back at the reasons we had for selling the positions, we were often right yet many of these stocks trade at higher prices. This exercise reminded us how easily mistakes are forgiven in bull markets; companie s can miss earnings estimates and growth can come in slower than Wall Street originally thought yet share prices can still go up. This is true for portfolio managers as well; most of us are putting up large returns during this period but will we keep these returns when the economy goes slack? When the market does cool, we believe owning the right stocks will be very important and having more structural flexibility within the Fund should help us to preserve capital. Thank you for your continued support of Columbia Acorn Select.
Risks include stock market fluctuations due to economic and business developments. The Fund also has potentially greater price volatility due to the fund's concentration in a limited number of stocks of mid-size companies. The Fund is a non-diversified fund and may, therefore, have a greater risk of loss from a few issuers than a similar fund that invests more broadly. The Fund may not operate as a non-diversified fund at all times. International investments involve greater potential risks, including less regulation, currency fluctuations, economic instability and political developments.
20
Columbia Acorn Select (LTFAX)
At a Glance
Performance data quoted represents past performance and current performance may be higher or lower. Past performance is no guarantee of future results. The investment return and principal value of an investment in the Fund will fluctuate so that Fund shares, when redeemed, may be worth more or less than their original cost. Performance may reflect any voluntary waivers or reimbursements of Fund expenses by the Adviser or any of its affiliates. Absent these waivers or reimbursement arrangements, performance results may be lower. Visit columbiafunds.com for daily and most recent month-end updates.
Pretax and After-tax Average Annual Total Returns (Based on Class A Share Returns)
through June 30, 2007
| Inception 10/16/000 | |
| | Year
to date* | | 1 year | | 5 years | | Life of fund | |
| Returns before taxes | | NAV
POP | | 16.64%
9.93 | | 32.17%
24.57 | | 18.06%
16.67 | | 14.54%
13.54 | |
Returns after taxes
on distributions | | NAV
POP | | 16.46
9.77 | | 31.60
24.03 | | 17.74
16.36 | | 14.26
13.26 | |
Returns after taxes
on distributions and
sale of fund shares | | NAV
POP
| | 10.89
6.53
| | 21.38
16.42
| | 15.88
14.62
| | 12.84
11.92
| |
S&P MidCap 400
(pretax) | | | | 11.98 | | 18.51 | | 14.17 | | 10.28 | |
After-tax returns are calculated using the highest historical individual federal marginal income tax rates, and do not reflect the impact of state and local taxes. Returns after taxes on distributions and sale of Fund shares reflect the tax impact of gains or losses realized when Fund shares are sold. The returns are taxed at the maximum rate and assume shares were purchased at the beginning of the period. Actual after-tax returns depend on the investor's tax situation and may differ from those shown. After-tax returns are not relevant to investors who hold their Fund shares through tax-deferred arrangements such as 401(k) plans or individual retirement accounts. After-tax returns are shown for Class A shares only; after-tax returns for other share classes will vary. Indexes do not reflect any deduction for fees, expenses or taxes.
Investment returns and principal value may fluctuate, resulting in a gain or loss on sale.
Public offering price (POP) returns include the maximum sales charge of 5.75% for Class A shares. Net asset value (NAV) returns do not include sales charges or contingent deferred sales charges (CDSC).
*Year to date data not annualized.
Columbia Acorn Select Portfolio Diversification
as a % of net assets as of 6/30/07

Columbia Acorn Select Top 10 Holdings
as a % of net assets as of 6/30/07
| | 1. | | | Uranium One (South Africa) (previously UrAsia Energy)
Uranium Mines in South Africa, Kazakhstan, Australia & the U.S. | | | 6.2 | % | |
| | 2. | | | ITT Educational Services
Post-secondary Degree Programs | | | 4.8 | % | |
| | 3. | | | Tellabs
Telecommunications Equipment | | | 4.6 | % | |
| | 4. | | | Liberty Global
Cable TV Franchises outside the USA | | | 4.4 | % | |
| | 5. | | | Conseco
Life, Long-term Care & Medical Supplement Insurance | | | 4.3 | % | |
| | 6. | | | Safeway
Supermarkets | | | 3.8 | % | |
| | 7. | | | Abercrombie & Fitch
Teen Apparel Retailer | | | 3.8 | % | |
| | 8. | | | Janus Capital Group
Manages Mutual Funds | | | 3.5 | % | |
| | 9. | | | Potash Corp. of Saskatchewan (Canada)
World's Largest Producer of Potash | | | 3.5 | % | |
| | 10. | | | Expedia
Online Travel Services Company | | | 3.2 | % | |
The Fund's top 10 holdings and portfolio diversification vary with changes in portfolio investments. See the Statement of Investments for a complete list of the Fund's holdings.
The Growth of a $100,000 Investment in Columbia Acorn Select (Class A)*
October 16, 2000 through June 30, 2007
Illustration is based on a hypothetical $100,000 investment from inception in Class A shares of the Fund, which includes a 3.50% maximum initial sales charge for this level of investment. The index is unmanaged and returns for both the index and the Fund include reinvested dividends and capital gains. It is not possible to invest directly in an index. The graph does not reflect taxes that a shareholder would pay on Fund distributions or on a sale of Fund shares.
Total Net Assets of the Fund:
$3,206.1 million
* The minimum initial investment amount for Columbia Acorn Select was increased to $100,000 on June 25, 2007. Certain exclusions may apply.

21
Columbia Thermostat Fund
In a Nutshell

Charles P. McQuaid
Lead Portfolio Manager
Performance data quoted represents past performance and current performance may be lower or higher. Past performance is no guarantee of future results. The investment return and principal value of an investment in the Fund will fluctuate so that shares, when redeemed, may be worth more or less than the original cost. Performance may reflect any voluntary waivers or reimbursements of fund expenses by the Adviser or its affiliates. Absent these waivers, or reimbursement arrangements, performance results may be lower. Visit columbiafunds.com for daily and most recent month-end performance updates.
A "fund of fund" bears its allocable share of the costs and expenses of the underlying funds in which it invests. Such funds are thus subject to two levels of fees and potentially higher expense ratios than would be associated with a fund that invests and trades directly in financial instruments under the direction of a single manager.
Columbia Thermostat Fund ended the second quarter up 1.98% (Class A shares, without sales chage) and posted a 4.25% year-to-date gain. Fund performance, as expected, was between the S&P 500 Index and the Lehman Brothers U.S. Credit Intermediate Bond Index for both time periods (see Page 4 for index data).
Fund returns came in below the 4.96% quarterly gain and 6.79% six-month increase of the Lipper Flexible Portfolio Funds Index. Key to its investment strategy, Columbia Thermostat Fund sells a portion of its stock funds when the S&P 500 goes up and invests more in bonds. Because 2007 has generally been a strong year for equities, Columbia Thermostat Fund has had more of its portfolio in bonds than the average fund in the Lipper Flexible Portfolio Funds Index. This dampened the Fund's relative returns in the first six months of this year. However, if the equity weakness that arose just following the period end persists, Columbia Thermostat Fund's relative performance is likely to improve. Additionally, our approach should automatically ensure that we are buying equities if there is a sustained drop in prices. At the end of the period, the Fund had a 35% exposure to stocks and a 65% exposure to bonds.
As the following table illustrates, the equity portion of the portfolio had impressive gains in the quarter and year to date through June 30, 2007. For the second quarter, the Fund's equity component was up 6.70% and, for the half year, it was up 9.71%. Columbia Acorn Select posted top gains for both time periods, followed by Columbia Acorn International and Columbia Acorn Fund. On the fixed income side, the Fund's income component was down 0.70% for the quarter and gained just 0.75% for the half year.
Results of the Funds Owned in Columbia Thermostat Fund
at June 30, 2007
Equities
Fund | | Weightings
in Category | | 2nd
quarter
returns | | Year-to-date
returns to
6/30/07 | |
| Columbia Acorn Fund Z | | | 15 | % | | | 6.70 | % | | | 11.55 | % | |
| Columbia Acorn Select Z | | | 10 | % | | | 9.12 | % | | | 16.76 | % | |
Columbia Marsico
Growth Fund | | | 15 | % | | | 5.34 | % | | | 6.01 | % | |
Columbia Acorn
International Z | | | 15 | % | | | 8.61 | % | | | 14.59 | % | |
Columbia Dividend
Income Fund | | | 20 | % | | | 5.69 | % | | | 7.88 | % | |
Columbia Large Cap
Enhanced Core Fund | | | 25 | % | | | 6.17 | % | | | 6.60 | % | |
Weighted Average
Equity Return | | | 100 | % | | | 6.70 | % | | | 9.71 | % | |
Fixed Income
Fund | | Weightings
in Category | | 2nd
quarter
returns | | Year-to-date
returns to
6/30/07 | |
Columbia Federal
Securities Fund | | | 30 | % | | | -1.06 | % | | | 0.28 | % | |
Columbia Intermediate
Bond Fund | | | 50 | % | | | -0.52 | % | | | 0.77 | % | |
Columbia Conservative
High Yield Fund | | | 20 | % | | | -0.64 | % | | | 1.42 | % | |
Weighted Average
Income Return | | | 100 | % | | | -0.70 | % | | | 0.75 | % | |
Columbia Thermostat Fund Rebalancing in the Second Quarter
| April 16, 2007: | | 35% stock, 65% bond | |
| May 4, 2007: | | 30% stock, 70% bond | |
| June 8, 2007: | | 35% stock, 65% bond | |
The value of an investment in the Fund is based primarily on the performance of the underlying portfolio funds and the allocation of the Fund's assets among them. An investment in the underlying funds may present certain risks, including stock market fluctuations that occur in response to economic and business developments; and a greater degree of social, political and economic volatility associated with international investing. Small- and mid-cap stocks are often more volatile and less liquid than the stocks of larger companies. Small companies may have a shorter history of operations than larger companies and may have a less diversified product line, making them more susceptible to market pressure. International investments involve greater potential risks, including less regulation, currency fluctuations, economic instability and political developments. Changes in interest rates and changes in the financial strength of issu ers of lower-rated bonds may also affect underlying fund performance. The Fund is also subject to the risk that the investment adviser's decisions regarding asset classes and portfolio funds will not anticipate market trends successfully, resulting in a failure to preserve capital or lower total return. In addition, the Fund may buy and sell shares of the portfolio funds frequently. This may result in higher transaction costs and additional tax liability. This is not an offer of the shares of any other mutual fund mentioned herein.
22
Columbia
Thermostat Fund (CTFAX)
At a Glance
Performance data quoted represents past performance and current performance may be higher or lower. Past performance is no guarantee of future results. The investment return and principal value of an investment in the Fund will fluctuate so that Fund shares, when redeemed, may be worth more or less than their original cost. Performance may reflect any voluntary waivers or reimbursements of Fund expenses by the Adviser or any of its affiliates. Absent these waivers or reimbursement arrangements, performance results may be lower. Visit columbiafunds.com for daily and most recent month-end updates.
Pretax and After-tax Average Annual Total Returns (Based on Class A Share Returns)
through June 30, 2007
| Inception 3/3/03 | |
| | Year
to date* | | 1 year | | 3 years | | Life of fund | |
| Returns before taxes | | NAV
POP | | 4.25%
-1.75 | | 12.58%
6.11 | | 8.77%
6.65 | | 11.88%
10.36 | |
Returns after taxes
on distributions | | NAV
POP | | 3.78
-2.19 | | 10.21
3.87 | | 6.87
4.78 | | 10.43
8.93 | |
Returns after taxes
on distributions and
sale of fund shares | | NAV
POP
| | 3.20
-0.72 | | 9.42
5.14 | | 6.79
4.97 | | 9.74
8.40 | |
| S&P 500 (pretax) | | | | 6.96 | | 20.59 | | 11.68 | | 16.42 | |
Lehman Brothers
U.S. Credit Intermediate
Bond Index (pretax) | | | | 1.28 | | 6.34 | | 3.79 | | 3.70 | |
Lipper Flexible Portfolio
Funds Index (pretax) | | | | 6.79 | | 16.83 | | 11.10 | | 14.13 | |
After-tax returns are calculated using the highest historical individual federal marginal income tax rates, and do not reflect the impact of state and local taxes. Returns after taxes on distributions and sale of Fund shares reflect the tax impact of gains or losses realized when Fund shares are sold. The returns are taxed at the maximum rate and assume shares were purchased at the beginning of the period. Actual after-tax returns depend on the investor's tax situation and may differ from those shown. After-tax returns are not relevant to investors who hold their Fund shares through tax-deferred arrangements such as 401(k) plans or individual retirement accounts. After-tax returns are shown for Class A shares only; after-tax returns for other share classes will vary. Indexes do not reflect any deduction for fees, expenses or taxes.
Investment returns and principal value may fluctuate, resulting in a gain or loss on sale.
Public offering price (POP) returns include the maximum sales charge of 5.75% for Class A shares. Net asset value (NAV) returns do not include sales charges or contingent deferred sales charges (CDSC).
*Year to date data not annualized.
Columbia Thermostat Fund Asset Allocation
as a % of net assets as of 6/30/07

Columbia Thermostat Fund Portfolio Weightings
as a % of assets in each investment category
as of 6/30/07
Stock Mutual Funds
| Columbia Large Cap Enhanced Core Fund | | | 25 | % | |
| Columbia Dividend Income Fund | | | 20 | % | |
| Columbia Acorn Fund | | | 15 | % | |
| Columbia Acorn International | | | 15 | % | |
| Columbia Marsico Growth Fund | | | 15 | % | |
| Columbia Acorn Select | | | 10 | % | |
Bond Mutual Funds
| Columbia Intermediate Bond Fund | | | 50 | % | |
| Columbia Federal Securities Fund | | | 30 | % | |
| Columbia Conservative High Yield Fund | | | 20 | % | |
The Growth of a $10,000 Investment in Columbia Thermostat Fund (Class A)
March 3, 2003 through June 30, 2007
Illustration is based on a hypothetical $10,000 investment from inception in Class A shares of the Fund, which includes a 5.75% maximum initial sales charge. The indexes are unmanaged and returns for both the indexes and the Fund include reinvested dividends and capital gains. It is not possible to invest directly in an index. The graph does not reflect taxes that a shareholder would pay on Fund distributions or on a sale of Fund shares.
Total Net Assets of the Fund:
$180.0 million

23
Columbia Acorn Fund
Major Portfolio Changes in the Second Quarter (Unaudited)
| | | Number of Shares | |
| | | 03/31/07 | | 06/30/07 | |
| Additions | |
| Information | |
| Blackbaud | | | 0 | | | | 613,000 | | |
| Ciena | | | 0 | | | | 370,000 | | |
| Dolby Laboratories | | | 0 | | | | 250,000 | | |
| Epicor | | | 671,000 | | | | 1,500,000 | | |
| Equinix | | | 190,000 | | | | 225,000 | | |
| Everlight Electronics (Taiwan) | | | 3,198,000 | | | | 6,400,000 | | |
| FARO Technologies | | | 685,000 | | | | 860,000 | | |
| II-VI | | | 2,025,000 | | | | 2,220,000 | | |
| Informa Group (United Kingdom) | | | 0 | | | | 1,300,000 | | |
| IPG Photonics | | | 750,000 | | | | 1,190,000 | | |
| Kenexa | | | 962,000 | | | | 1,200,000 | | |
| MetroPCS Communications | | | 0 | | | | 175,000 | | |
| Microsemi | | | 1,925,000 | | | | 2,250,000 | | |
| Polycom | | | 1,060,000 | | | | 1,250,000 | | |
| Red Hat | | | 0 | | | | 900,000 | | |
| Sanmina-SCI | | | 10,000,000 | | | | 14,522,000 | | |
| Scientific Games | | | 500,000 | | | | 2,000,000 | | |
| Switch & Data Facilities | | | 370,000 | | | | 877,000 | | |
Taylor Nelson Sofres
(United Kingdom) | | | 0 | | | | 2,358,000 | | |
| Tellabs | | | 14,100,000 | | | | 15,380,000 | | |
| TheStreet.com | | | 0 | | | | 1,094,000 | | |
| Time Warner Telecom | | | 4,700,000 | | | | 6,200,000 | | |
| Trimble Navigation | | | 2,900,000 | | | | 3,070,000 | | |
| Industrial Goods & Services | |
| Albany International | | | 234,000 | | | | 700,000 | | |
| American Commercial Lines | | | 0 | | | | 1,900,000 | | |
| American Reprographics | | | 1,500,000 | | | | 2,000,000 | | |
| Cytec Industries | | | 0 | | | | 400,000 | | |
| Donaldson | | | 3,800,000 | | | | 4,000,000 | | |
| Interline Brands | | | 500,000 | | | | 1,000,000 | | |
| Intertek Testing (United Kingdom) | | | 0 | | | | 631,000 | | |
| Kansai Paint (Japan) | | | 0 | | | | 124,000 | | |
| Stork (Netherlands) | | | 0 | | | | 56,492 | | |
| Union Tool (Japan) | | | 44,300 | | | | 360,000 | | |
| Vulcan Materials | | | 0 | | | | 175,000 | | |
| Wavin (Netherlands) | | | 90,000 | | | | 611,460 | | |
| Consumer Goods & Services | |
| Ambassadors Group | | | 0 | | | | 135,000 | | |
| Hansen Natural | | | 850,000 | | | | 1,650,000 | | |
| Herman Miller | | | 2,500,000 | | | | 3,800,000 | | |
| NutriSystem | | | 1,000,000 | | | | 1,120,000 | | |
| Thor Industries | | | 441,000 | | | | 561,000 | | |
| | | Number of Shares | |
| | | 03/31/07 | | 06/30/07 | |
| Finance | |
| BOK Financial | | | 2,605,000 | | | | 2,852,000 | | |
| CAI International | | | 0 | | | | 200,000 | | |
| Conseco | | | 4,000,000 | | | | 5,000,000 | | |
| First Financial Bankshares | | | 286,000 | | | | 386,000 | | |
| HCC Insurance Holdings | | | 3,125,000 | | | | 3,600,000 | | |
| MB Financial | | | 0 | | | | 700,000 | | |
Philadelphia
Consolidated Holding | | | 2,040,000 | | | | 2,390,000 | | |
| TriCo Bancshares | | | 0 | | | | 200,000 | | |
| West Bancorporation | | | 1,049,000 | | | | 1,249,000 | | |
| Energy & Minerals | |
| Carrizo Oil & Gas | | | 0 | | | | 1,100,000 | | |
| Dresser-Rand Group | | | 0 | | | | 552,000 | | |
| Fugro (Netherlands) | | | 3,418,301 | | | | 3,584,037 | | |
| SBM Offshore (Netherlands) | | | 0 | | | | 250,000 | | |
| Tesco | | | 190,000 | | | | 1,044,000 | | |
| Tetra Technologies | | | 1,228,000 | | | | 1,988,000 | | |
| Health Care | |
| Arena Pharmaceuticals | | | 1,179,000 | | | | 1,320,000 | | |
| BioMarin | | | 2,375,000 | | | | 3,940,000 | | |
| Collagenex Pharmaceuticals | | | 1,000,000 | | | | 1,200,000 | | |
| Eresearch Technology | | | 2,600,000 | | | | 3,000,000 | | |
| Healthcare Services Group | | | 0 | | | | 400,000 | | |
| OPG Groep (Netherlands) | | | 270,000 | | | | 1,080,000 | | |
| Pharmacopeia | | | 0 | | | | 825,000 | | |
| QIAGEN | | | 0 | | | | 900,000 | | |
| Seattle Genetics | | | 3,300,000 | | | | 3,720,000 | | |
| Other Industries | |
| Gaylord Entertainment | | | 1,760,000 | | | | 2,000,000 | | |
| Jiangsu Expressway (China) | | | 0 | | | | 6,790,000 | | |
24
| | | Number of Shares | |
| | | 03/31/07 | | 06/30/07 | |
| Sales | |
| Information | |
| Activision | | | 1,000,000 | | | | 750,000 | | |
| Advantech (Taiwan) | | | 9,956,115 | | | | 8,157,000 | | |
| Alltel | | | 1,200,000 | | | | 0 | | |
| Avnet | | | 3,105,000 | | | | 2,490,000 | | |
| Cubic | | | 273,000 | | | | 0 | | |
| Fair Isaac | | | 916,000 | | | | 0 | | |
Gemstar-TV Guide
International | | | 8,000,000 | | | | 0 | | |
| infoUSA | | | 1,450,000 | | | | 800,000 | | |
| Jabil Circuit | | | 1,320,000 | | | | 690,000 | | |
| JDA Software | | | 1,490,000 | | | | 0 | | |
| Kronos | | | 2,750,000 | | | | 0 | | |
Liberty Media
Corp-Interactive | | | 655,000 | | | | 0 | | |
| NAVTEQ | | | 1,400,000 | | | | 1,200,000 | | |
| Openwave Systems | | | 2,500,000 | | | | 1,500,000 | | |
| Seachange International | | | 964,000 | | | | 0 | | |
| SRA International | | | 1,350,000 | | | | 1,050,000 | | |
| Supertex | | | 950,000 | | | | 820,000 | | |
| TALX | | | 865,000 | | | | 0 | | |
| THQ | | | 2,300,000 | | | | 2,000,000 | | |
| WebEx | | | 353,000 | | | | 0 | | |
| Industrial Goods & Services | |
| Gardner Denver | | | 350,000 | | | | 0 | | |
| Grafton Group (Ireland) | | | 1,600,000 | | | | 0 | | |
| K&F Industries | | | 1,712,000 | | | | 0 | | |
| Neopost (France) | | | 140,000 | | | | 112,000 | | |
| Quanta Services | | | 2,500,000 | | | | 2,200,000 | | |
| UTI Worldwide | | | 3,000,000 | | | | 2,700,000 | | |
| Worthington Industries | | | 1,800,000 | | | | 1,500,000 | | |
| Consumer Goods & Services | |
| C&C Group (Ireland) | | | 800,000 | | | | 26,000 | | |
| Central Parking | | | 1,168,000 | | | | 0 | | |
| Ducati Motor (Italy) | | | 5,700,000 | | | | 5,410,390 | | |
Edgars Consolidated
Stores (South Africa) | | | 3,500,000 | | | | 0 | | |
| Fleetwood Enterprises | | | 3,255,000 | | | | 2,500,000 | | |
| HNI | | | 2,550,000 | | | | 2,236,000 | | |
| ITT Educational Services | | | 2,250,000 | | | | 2,000,000 | | |
| Regis | | | 800,000 | | | | 0 | | |
Techtronic Industries
(Hong Kong) | | | 14,999,300 | | | | 0 | | |
| Williams-Sonoma | | | 250,000 | | | | 0 | | |
| Winnebago | | | 540,000 | | | | 390,000 | | |
| | | Number of Shares | |
| | | 03/31/07 | | 06/30/07 | |
| Finance | |
| Anchor Bancorp Wisconsin | | | 1,178,000 | | | | 978,000 | | |
| Anglo Irish Bank (Ireland) | | | 1,800,000 | | | | 0 | | |
| Banca Italease (Italy) | | | 250,000 | | | | 0 | | |
| East West Bancorp | | | 200,000 | | | | 0 | | |
Northern Rock
(United Kingdom) | | | 2,500,000 | | | | 0 | | |
| Nuveen Investments | | | 2,157,000 | | | | 1,303,000 | | |
Paragon Group
(United Kingdom) | | | 1,000,000 | | | | 0 | | |
| RLI | | | 570,000 | | | | 0 | | |
| SY Bancorp | | | 48,000 | | | | 0 | | |
| Energy & Minerals | |
| Key Energy Services | | | 730,000 | | | | 170,000 | | |
| McMoran Exploration | | | 870,000 | | | | 470,000 | | |
| Newpark Resources | | | 310,000 | | | | 0 | | |
| St. Mary Land & Exploration | | | 850,000 | | | | 500,000 | | |
| Vaalco Energy | | | 3,200,000 | | | | 2,750,000 | | |
| Health Care | |
| Cytokinetics | | | 2,000,000 | | | | 0 | | |
| Dendrite International | | | 1,433,000 | | | | 0 | | |
| Nuvelo | | | 1,650,000 | | | | 1,025,000 | | |
| The Medicines Company | | | 600,000 | | | | 0 | | |
| United Surgical Partners | | | 1,150,000 | | | | 0 | | |
| Viasys Healthcare | | | 1,200,000 | | | | 0 | | |
| Other Industries | |
| DiamondRock Hospitality | | | 3,700,000 | | | | 3,500,000 | | |
25
Columbia Acorn Fund
Statement of Investments (Unaudited), June 30, 2007
| Number of Shares | | | | Value (000) | |
| | | | | | | | Equities: 93.6% | | |
| Information 23.6% | | | |
| | | > Business Software 3.3% | |
| | 12,000,000 | | | Novell (a) | | $ | 93,480 | | |
| | | | | Directory, Operating System &
Identity Management Software | | | | | |
| | 1,400,000 | | | Micros Systems (a) | | | 76,160 | | |
| | | | | Information Systems for Restaurants & Hotels | | | | | |
| | 3,300,000 | | | Parametric Technology (a) | | | 71,313 | | |
| | | | | Engineering Software & Services | | | | | |
| | 1,800,000 | | | Avid Technology (a) | | | 63,630 | | |
| | | | | Digital Nonlinear Editing Software & Systems | | | | | |
| | 4,000,000 | | | Informatica (a) | | | 59,080 | | |
| | | | | Enterprise Data Integration Software | | | | | |
| | 2,131,000 | | | Concur Technologies (a)(b) | | | 48,693 | | |
| | | | | Web Enabled Cost &
Expense Management Software | | | | | |
| | 1,200,000 | | | Kenexa (a) | | | 45,252 | | |
| | | | | Recruiting and Workforce Management Solutions | | | | | |
| | 6,000,000 | | | Actuate (a)(b) | | | 40,740 | | |
| | | | | Information Delivery Software & Solutions | | | | | |
| | 1,800,000 | | | Cadence Design Systems (a) | | | 39,528 | | |
| | | | | Electronic Design Automation Software | | | | | |
| | 2,500,000 | | | Radiant Systems (a)(b) | | | 33,100 | | |
| | | | | Point of Sale Systems: Convenient Stores &
Restaurants | | | | | |
| | 3,000,000 | | | Lawson Software (a) | | | 29,670 | | |
| | | | | Enterprise Resource Planning (ERP) Software | | | | | |
| | 3,500,000 | | | Agile Software (a)(b) | | | 28,210 | | |
| | | | | Product Design Software | | | | | |
| | 1,500,000 | | | Epicor (a) | | | 22,305 | | |
| | | | | Software Systems to Run Small Businesses | | | | | |
| | 900,000 | | | Red Hat (a) | | | 20,052 | | |
| | | | | Maintenance & Support for Opensource | | | | | |
| | 613,000 | | | Blackbaud | | | 13,535 | | |
| | | | | Software & Services for Non-Profits | | | | | |
| | 3,500,000 | | | Tumbleweed Communications (a)(b) | | | 8,925 | | |
| | | | | Email Content Security & File Transfer
Management | | | | | |
| | | | 693,673 | | |
| | | > Computer Hardware & Related
Equipment 3.0% | |
| | 3,800,000 | | | Amphenol | | | 135,470 | | |
| | | | | Electronic Connectors | | | | | |
| | 2,090,000 | | | Belden CDT | | | 115,681 | | |
| | | | | Specialty Cable | | | | | |
| | 2,220,000 | | | II-VI (a)(b) | | | 60,317 | | |
| | | | | Laser Components | | | | | |
| | 1,426,000 | | | Nice Systems (Israel) (a) | | | 49,539 | | |
| | | | | Audio & Video Recording Solutions | | | | | |
| | 460,000 | | | Wincor Nixdorf (Germany) | | | 42,636 | | |
| | | | | Retail POS Systems & ATM Machines | | | | | |
| | 860,000 | | | Zebra Technologies (a) | | | 33,316 | | |
| | | | | Bar Code Printers | | | | | |
| | 900,000 | | | Netgear (a) | | | 32,625 | | |
| | | | | Networking Products for Small Business & Home | | | | | |
| | 1,027,000 | | | Avocent (a) | | | 29,793 | | |
| | | | | Computer Control Switches | | | | | |
| | 8,157,000 | | | Advantech (Taiwan) | | | 26,050 | | |
| | | | | Embedded Computers | | | | | |
| Number of Shares | | | | Value (000) | |
| | 620,000 | | | Rogers (a) | | $ | 22,940 | | |
| | | | | PCB Laminates & High-performance Foams | | | | | |
| | 735,000 | | | Excel Technology (a)(b) | | | 20,536 | | |
| | | | | Laser Systems & Electro-optical Components | | | | | |
| | 375,000 | | | Diebold | | | 19,575 | | |
| | | | | Automated Teller Machines | | | | | |
| | 1,310,000 | | | CTS | | | 16,585 | | |
| | | | | Electronic Components, Sensors &
Electronics Manufacturing Solutions | | | | | |
| | 325,000 | | | Stratasys (a) | | | 15,269 | | |
| | | | | Rapid Prototyping Systems | | | | | |
| | 500,000 | | | Intermec (a) | | | 12,655 | | |
| | | | | Bar Code & Wireless LAN Systems | | | | | |
| | 250,000 | | | Dolby Laboratories (a) | | | 8,853 | | |
| | | | | Audio Technology for Consumer Electronics | | | | | |
| | | | 641,840 | | |
| | | > Mobile Communications 2.1% | |
| | 4,500,000 | | | Crown Castle International (a) | | | 163,215 | | |
| | | | | Communications Towers | | | | | |
| | 3,500,000 | | | American Tower (a) | | | 147,000 | | |
| | | | | Communications Towers in USA & Mexico | | | | | |
| | 8,000,000 | | | Dobson Communications (a)(b) | | | 88,880 | | |
| | | | | Rural & Small City Cellular Telephone Services | | | | | |
| | 600,000 | | | Telephone & Data Systems | | | 37,542 | | |
| | | | | Cellular & Wireline Telephone Services | | | | | |
| | 1,500,000 | | | Openwave Systems | | | 9,390 | | |
| | | | | Internet Software for Mobile Devices | | | | | |
| | 600,000 | | | Globalstar (a) | | | 6,210 | | |
| | | | | Satellite Mobile Voice & Data Carrier | | | | | |
| | 175,000 | | | MetroPCS Communications (a) | | | 5,782 | | |
| | | | | Discount Cellular Telephone Services | | | | | |
| | | | 458,019 | | |
| | | > Instrumentation 2.1% | |
| | 2,800,000 | | | Flir Systems (a) | | | 129,500 | | |
| | | | | Infrared Cameras | | | | | |
| | 3,070,000 | | | Trimble Navigation (a) | | | 98,854 | | |
| | | | | GPS-based Instruments | | | | | |
| | 750,000 | | | Mettler Toledo (a) | | | 71,632 | | |
| | | | | Laboratory Equipment | | | | | |
| | 800,000 | | | Varian (a) | | | 43,864 | | |
| | | | | Analytical Instruments | | | | | |
| | 600,000 | | | Dionex (a) | | | 42,594 | | |
| | | | | Ion & Liquid Chromatography | | | | | |
| | 860,000 | | | FARO Technologies (a)(b) | | | 27,400 | | |
| | | | | Precision Measurement Equipment | | | | | |
| | 1,190,000 | | | IPG Photonics (a) | | | 23,741 | | |
| | | | | Fiber Lasers | | | | | |
| | | | 437,585 | | |
| | | > CATV 1.6% | |
| | 4,500,000 | | | Discovery Holding (a) | | | 103,455 | | |
| | | | | CATV Programming | | | | | |
| | 2,050,000 | | | Liberty Global Series C (a) | | | 80,565 | | |
| | 1,500,000 | | | Liberty Global Series A (a) | | | 61,560 | | |
| | | | | Cable TV Franchises Outside the USA | | | | | |
| | 70,000 | | | Jupiter Telecommunications (Japan) (a) | | | 57,722 | | |
| | | | | Largest Cable Service Provider in Japan | | | | | |
| | 130,000 | | | Liberty Media Corp - Capital (a) | | | 15,298 | | |
| | | | | CATV Holding Company | | | | | |
26
| Number of Shares | | | | Value (000) | |
| | | > CATV—continued | |
| | 1,250,000 | | | Mediacom Communications (a) | | $ | 12,113 | | |
| | | | | Cable Television Franchises | | | | | |
| | | | 330,713 | | |
| | | > Semiconductors & Related Equipment 1.5% | |
| | 4,800,000 | | | Integrated Device Technology (a) | | | 73,296 | | |
| | | | | Communications Semiconductors | | | | | |
| | 2,250,000 | | | Microsemi (a) | | | 53,887 | | |
| | | | | Analog/Mixed Signal Semiconductors | | | | | |
| | 4,425,000 | | | Entegris (a) | | | 52,569 | | |
| | | | | Semiconductor Wafer Shipping &
Handling Products | | | | | |
| | 1,270,000 | | | Littelfuse (a)(b) | | | 42,888 | | |
| | | | | Little Fuses | | | | | |
| | 3,257,000 | | | AMIS Holdings (a) | | | 40,777 | | |
| | | | | Mixed-signal Semiconductors | | | | | |
| | 820,000 | | | Supertex (a)(b) | | | 25,699 | | |
| | | | | Mixed-signal Semiconductors | | | | | |
| | 6,400,000 | | | Everlight Electronics (Taiwan) | | | 22,868 | | |
| | | | | A Led Packager | | | | | |
| | 1,905,000 | | | IXYS (a)(b) | | | 15,907 | | |
| | | | | Power Semiconductors | | | | | |
| | | | 327,891 | | |
| | | > Gaming Equipment & Services 1.4% | |
| | 2,750,000 | | | International Game Technology | | | 109,175 | | |
| | | | | Slot Machines & Progressive Slots | | | | | |
| | 3,150,000 | | | Bally Technologies (a)(b) | | | 83,223 | | |
| | | | | Slot Machines & Software | | | | | |
| | 2,000,000 | | | Scientific Games (a) | | | 69,900 | | |
| | | | | Lottery Services Provider | | | | | |
| | 2,430,000 | | | Shuffle Master (a)(b) | | | 40,338 | | |
| | | | | Card Shufflers & Casino Games | | | | | |
| | | | 302,636 | | |
| | | > Internet Related 1.4% | |
| | 3,000,000 | | | ValueClick (a) | | | 88,380 | | |
| | | | | Internet Advertising | | | | | |
| | 9,500,000 | | | SkillSoft (a)(b) | | | 88,255 | | |
| | | | | Web-based Learning Solutions (E-Learning) | | | | | |
| | 4,000,000 | | | CNET Networks (a) | | | 32,760 | | |
| | | | | Internet Advertising on Niche Websites | | | | | |
| | 1,000,000 | | | Sohu.com (China) (a) | | | 31,990 | | |
| | | | | Advertising on Chinese Internet Portal | | | | | |
| | 225,000 | | | Equinix (a) | | | 20,581 | | |
| | | | | Network Neutral Data Centers | | | | | |
| | 877,000 | | | Switch & Data Facilities (a) | | | 16,829 | | |
| | | | | Network Neutral Data Centers | | | | | |
| | 1,094,000 | | | TheStreet.com | | | 11,903 | | |
| | | | | Financial Information Website Publisher | | | | | |
| | | | 290,698 | | |
| | | > Financial Processors 1.1% | |
| | 2,774,000 | | | Global Payments | | | 109,989 | | |
| | | | | Credit Card Processor | | | | | |
| | 6,500,000 | | | Hong Kong Exchanges and Clearing
(Hong Kong) | | | 91,966 | | |
| | | | | Hong Kong Equity & Derivatives
Market Operator | | | | | |
| | 5,000,000 | | | Singapore Exchange (Singapore) | | | 31,933 | | |
| | | | | Singapore Equity & Derivatives Market Operator | | | | | |
| | | | 233,888 | | |
| Number of Shares | | | | Value (000) | |
| | | > Telecommunications Equipment 1.1% | |
| | 15,380,000 | | | Tellabs (a) | | $ | 165,489 | | |
| | | | | Telecommunications Equipment | | | | | |
| | 1,250,000 | | | Polycom (a) | | | 42,000 | | |
| | | | | Video Conferencing Equipment | | | | | |
| | 370,000 | | | Ciena (a) | | | 13,368 | | |
| | | | | Optical Transport & Broadband
Access Equipment | | | | | |
| | 1,510,000 | | | Symmetricom (a) | | | 12,684 | | |
| | | | | Network Timing & Synchronization Devices | | | | | |
| | | | 233,541 | | |
| | | > Business Information & Marketing
Services 1.1% | |
| | 3,460,000 | | | Ceridian (a) | | | 121,100 | | |
| | | | | HR Services & Payment Processing | | | | | |
| | 2,300,000 | | | Navigant Consulting (a) | | | 42,688 | | |
| | | | | Financial Consulting Firm | | | | | |
| | 2,000,000 | | | ProQuest (b) | | | 19,080 | | |
| | | | | Education Services for the K-12 Market | | | | | |
| | 420,000 | | | FTI Consulting (a) | | | 15,973 | | |
| | | | | Financial Consulting Firm | | | | | |
| | 250,000 | | | Getty Images (a) | | | 11,952 | | |
| | | | | Photographs for Publications & Electronic Media | | | | | |
| | 2,358,000 | | | Taylor Nelson Sofres (United Kingdom) | | | 11,152 | | |
| | | | | Market Research | | | | | |
| | 800,000 | | | infoUSA | | | 8,176 | | |
| | | | | Business Data for Sales Leads | | | | | |
| | | | 230,121 | | |
| | | > Telephone Services 0.9% | |
| | 6,200,000 | | | Time Warner Telecom (a) | | | 124,620 | | |
| | | | | Fiber Optic Telephone/Data Services | | | | | |
| | 1,300,000 | | | Cogent Communications (a) | | | 38,831 | | |
| | | | | Internet Data Pipelines | | | | | |
| | 1,400,000 | | | Windstream | | | 20,664 | | |
| | | | | Rural Telephone Franchises | | | | | |
| | | | 184,115 | | |
| | | > Electronics Distribution 0.5% | |
| | 2,490,000 | | | Avnet (a) | | | 98,704 | | |
| | | | | Electronic Components Distribution | | | | | |
| | 710,000 | | | Agilysys | | | 15,975 | | |
| | | | | IT Distributor | | | | | |
| | | | 114,679 | | |
| | | > Contract Manufacturing 0.4% | |
| | 14,522,000 | | | Sanmina-SCI (a) | | | 45,454 | | |
| | | | | Electronic Manufacturing Services | | | | | |
| | 1,020,000 | | | Plexus (a) | | | 23,450 | | |
| | | | | Electronic Manufacturing Services | | | | | |
| | 690,000 | | | Jabil Circuit | | | 15,228 | | |
| | | | | Electronic Manufacturing Services | | | | | |
| | | | 84,132 | | |
| | | > Computer Services 0.4% | |
| | 5,000,000 | | | iGate (a)(b) | | | 40,100 | | |
| | | | | IT & Business Process Outsourcing Services | | | | | |
| | 1,050,000 | | | SRA International (a) | | | 26,523 | | |
| | | | | Government IT Services | | | | | |
| | 4,600,000 | | | AnswerThink (a)(b) | | | 16,652 | | |
| | | | | IT Integration & Best Practice Research | | | | | |
| | | | 83,275 | | |
27
Columbia Acorn Fund
Statement of Investments (Unaudited), continued
| Number of Shares | | | | Value (000) | |
| | | > Consumer Software 0.3% | |
| | 2,000,000 | | | THQ (a) | | $ | 61,040 | | |
| | | | | Entertainment Software | | | | | |
| | 750,000 | | | Activision (a) | | | 14,002 | | |
| | | | | Entertainment Software | | | | | |
| | | | 75,042 | | |
| | | > Television Programming 0.3% | |
| | 4,000,000 | | | Lions Gate Entertainment (a) | | | 44,120 | | |
| | | | | Film & TV Studio | | | | | |
| | 433,900 | | | Alliance Atlantis Communication
(Canada) (a) | | | 21,299 | | |
| | | | | CATV Channels, TV/Movie Production/
Distribution | | | | | |
| | | | 65,419 | | |
| | | > Publishing 0.3% | |
| | 1,200,000 | | | NAVTEQ (a) | | | 50,808 | | |
| | | | | Map Data for Electronic Devices | | | | | |
| | 1,300,000 | | | Informa Group (United Kingdom) | | | 14,451 | | |
| | | | | Global Publisher & Event Organizer | | | | | |
| | | | 65,259 | | |
| | | > Satellite Broadcasting & Services 0.3% | |
| | 2,755,000 | | | SES Global (France) | | | 59,384 | | |
| | | | | Satellite Broadcasting Services | | | | | |
| | | | 59,384 | | |
| | | > Radio 0.3% | |
| | 1,541,000 | | | Salem Communications (b) | | | 17,090 | | |
| | | | | Radio Stations for Religious Programming | | | | | |
| | 1,500,000 | | | Cumulus Media (a) | | | 14,025 | | |
| | | | | Radio Stations in Small Cities | | | | | |
| | 1,400,000 | | | Saga Communications (a)(b) | | | 13,720 | | |
| | | | | Radio Stations in Small- & Mid- Sized Cities | | | | | |
| | 2,400,000 | | | Spanish Broadcasting System (a)(b) | | | 10,320 | | |
| | | | | Spanish Language Radio Stations | | | | | |
| | | | 55,155 | | |
| | | > TV Broadcasting 0.2% | |
| | 2,500,000 | | | Entravision Communications (a) | | | 26,075 | | |
| | | | | Spanish Language TV, Radio & Outdoor | | | | | |
| | 1,750,000 | | | Gray Television | | | 16,222 | | |
| | | | | Mid Market Affiliated TV Stations | | | | | |
| | | | 42,297 | | |
| Information: Total | | | 5,009,362 | | |
| Industrial Goods & Services 18.1% | | | |
| | | > Machinery 5.5% | |
| | 5,000,000 | | | Ametek | | | 198,400 | | |
| | | | | Aerospace/Industrial Instruments | | | | | |
| | 4,000,000 | | | Donaldson (b) | | | 142,200 | | |
| | | | | Industrial Air Filtration | | | | | |
| | 3,500,000 | | | Clarcor (b) | | | 131,005 | | |
| | | | | Mobile & Industrial Filters | | | | | |
| | 2,850,000 | | | Pentair | | | 109,924 | | |
| | | | | Pumps & Water Treatment | | | | | |
| | 2,300,000 | | | Pall | | | 105,777 | | |
| | | | | Filtration & Fluids Clarification | | | | | |
| | 1,900,000 | | | Mine Safety Appliances (b) | | | 83,144 | | |
| | | | | Safety Equipment | | | | | |
| Number of Shares | | | | Value (000) | |
| | 2,200,000 | | | ESCO Technologies (b) | | $ | 79,772 | | |
| | | | | Automatic Electric Meter Readers | | | | | |
| | 1,300,000 | | | Kaydon | | | 67,756 | | |
| | | | | Specialized Friction & Motion Control Products | | | | | |
| | 750,000 | | | Armor Holdings (a) | | | 65,153 | | |
| | | | | Military Trucks, Armor & Helmets | | | | | |
| | 1,250,000 | | | Nordson | | | 62,700 | | |
| | | | | Dispensing Systems for Adhesives & Coatings | | | | | |
| | 833,000 | | | Toro | | | 49,055 | | |
| | | | | Turf Maintenance Equipment | | | | | |
| | 2,100,000 | | | Goodman Global (a) | | | 46,662 | | |
| | | | | HVAC Equipment Manufacturer | | | | | |
| | 112,000 | | | Neopost (France) | | | 16,380 | | |
| | | | | Postage Meter Machines | | | | | |
| | 360,000 | | | Union Tool (Japan) | | | 13,299 | | |
| | | | | Precision Drill Bit Manufacturer | | | | | |
| | | | 1,171,227 | | |
| | | > Other Industrial Services 3.1% | |
| | 5,500,000 | | | Expeditors International of
Washington | | | 227,150 | | |
| | | | | International Freight Forwarder | | | | | |
| | 2,700,000 | | | UTI Worldwide | | | 72,333 | | |
| | | | | Global Logistics & Freight Forwarding | | | | | |
| | 1,900,000 | | | Forward Air (b) | | | 64,771 | | |
| | | | | Freight Transportation Between Airports | | | | | |
| | 2,000,000 | | | American Reprographics (a) | | | 61,580 | | |
| | | | | Document Management & Logistics | | | | | |
| | 1,750,000 | | | Mobile Mini (a) | | | 51,100 | | |
| | | | | Portable Storage Units Leasing | | | | | |
| | 1,900,000 | | | American Commercial Lines (a) | | | 49,495 | | |
| | | | | Operator of Inland Barges/Builder of
Inland Barges | | | | | |
| | 2,000,000 | | | Labor Ready (a) | | | 46,220 | | |
| | | | | Temporary Manual Labor | | | | | |
| | 374,000 | | | Imtech (Netherlands) | | | 32,444 | | |
| | | | | Engineering & Technical Services | | | | | |
| | 600,000 | | | G&K Services | | | 23,706 | | |
| | | | | Uniform Rental | | | | | |
| | 655,000 | | | TAL International Group | | | 19,460 | | |
| | | | | Intermodal Freight Containers Leasing | | | | | |
| | 631,000 | | | Intertek Testing (United Kingdom) | | | 12,371 | | |
| | | | | Testing, Inspection, Certification Services | | | | | |
| | | | 660,630 | | |
| | | > Construction 1.9% | |
| | 1,900,000 | | | Florida Rock | | | 128,250 | | |
| | | | | Aggregates & Concrete | | | | | |
| | 650,000 | | | Martin Marietta Materials | | | 105,313 | | |
| | | | | Aggregates | | | | | |
| | 2,200,000 | | | Simpson Manufacturing | | | 74,228 | | |
| | | | | Wall Joint Maker | | | | | |
| | 300,000 | | | Geberit (Switzerland) | | | 51,187 | | |
| | | | | Plumbing Supplies | | | | | |
| | 175,000 | | | Vulcan Materials | | | 20,044 | | |
| | | | | Aggregates, Concrete & Asphalt | | | | | |
| | 700,000 | | | Kingspan Group (Ireland) | | | 19,575 | | |
| | | | | Building Insulation &
Environmental Containers | | | | | |
| | | | 398,597 | | |
28
| Number of Shares | | | | Value (000) | |
| | | > Industrial Materials & Specialty
Chemicals 1.7% | |
| | 590,000 | | | Novozymes (Denmark) | | $ | 68,394 | | |
| | | | | Industrial Enzymes | | | | | |
| | 28,000 | | | Sika (Switzerland) | | | 57,146 | | |
| | | | | Chemicals for Construction & Industrial
Applications | | | | | |
| | 2,000,000 | | | Spartech (b) | | | 53,100 | | |
| | | | | Plastics Distribution & Compounding | | | | | |
| | 1,228,000 | | | Drew Industries (a)(b) | | | 40,696 | | |
| | | | | RV & Manufactured Home Components | | | | | |
| | 195,000 | | | Sociedad Quimica y
Minera de Chile (Chile) | | | 33,548 | | |
| | | | | Producer of Specialty Fertilizers, Lithium, &
Iodine | | | | | |
| | 400,000 | | | Carbone Lorraine (France) | | | 31,042 | | |
| | | | | Advanced Industrial Materials | | | | | |
| | 700,000 | | | Albany International | | | 28,308 | | |
| | | | | Paper Machine Clothing and Advanced Textiles | | | | | |
| | 400,000 | | | Cytec Industries | | | 25,508 | | |
| | | | | Aerospace Composites & Specialty Chemical | | | | | |
| | 441,384 | | | Koninklijke TenCate (Netherlands) | | | 16,895 | | |
| | | | | Advanced Textiles & Industrial Fabrics | | | | | |
| | 611,460 | | | Wavin (Netherlands) | | | 14,709 | | |
| | | | | Largest European Plastic Pipe Systems Company | | | | | |
| | 124,000 | | | Kansai Paint (Japan) | | | 1,083 | | |
| | | | | Paint Producer in Japan, India, China &
Southeast Asia | | | | | |
| | | | 370,429 | | |
| | | > Industrial Distribution 1.7% | |
| | 2,375,000 | | | Watsco (b) | | | 129,200 | | |
| | | | | HVAC Distribution | | | | | |
| | 1,300,000 | | | WW Grainger | | | 120,965 | | |
| | | | | Industrial Distribution | | | | | |
| | 1,925,000 | | | Airgas | | | 92,207 | | |
| | | | | Industrial Gas Distributor | | | | | |
| | 1,000,000 | | | Interline Brands (a) | | | 26,080 | | |
| | | | | Industrial Distribution | | | | | |
| | | | 368,452 | | |
| | | > Electrical Components 1.3% | |
| | 2,600,000 | | | Genlyte Group (a)(b) | | | 204,204 | | |
| | | | | Commercial Lighting Fixtures | | | | | |
| | 700,000 | | | Legrand (France) | | | 25,191 | | |
| | | | | Electrical Components | | | | | |
| | 1,125,000 | | | Ushio (Japan) | | | 24,927 | | |
| | | | | Industrial Light Sources | | | | | |
| | 500,000 | | | Zumtobel (Austria) (a) | | | 18,651 | | |
| | | | | Lighting Systems | | | | | |
| | | | 272,973 | | |
| | | > Conglomerates 1.0% | |
| | 4,845,000 | | | Hexagon (Sweden) | | | 92,916 | | |
| | | | | Measurement Equipment & Polymers | | | | | |
| | 2,758,309 | | | Aalberts Industries (Netherlands) | | | 75,736 | | |
| | | | | Flow Control & Heat Treatment | | | | | |
| | 600,000 | | | Ibiden (Japan) | | | 38,634 | | |
| | | | | Electronic Parts & Ceramics | | | | | |
| | 56,492 | | | Stork (Netherlands) | | | 3,667 | | |
| | | | | Industrial Services & Food Processing Equipment | | | | | |
| | | | 210,953 | | |
| Number of Shares | | | | Value (000) | |
| | | > Outsourcing Services 0.8% | |
| | 2,200,000 | | | Quanta Services (a) | | $ | 67,474 | | |
| | | | | Electrical & Telecom Construction Services | | | | | |
| | 1,900,000 | | | Administaff (b) | | | 63,631 | | |
| | | | | Professional Employer Organization | | | | | |
| | 817,021 | | | USG People (Netherlands) | | | 38,383 | | |
| | | | | Temporary Staffing Services | | | | | |
| | 600,000 | | | GP Strategies (a) | | | 6,528 | | |
| | | | | Training Programs | | | | | |
| | | | 176,016 | | |
| | | > Steel 0.7% | |
| | 2,860,000 | | | Gibraltar Industries (b) | | | 63,349 | | |
| | | | | Steel Processing & Building Products | | | | | |
| | 135,000 | | | Vallourec (France) | | | 43,143 | | |
| | | | | Oil, Gas & Industrial Seamless Tubes | | | | | |
| | 1,500,000 | | | Worthington Industries | | | 32,475 | | |
| | | | | Steel Processing & Manufactured Metal
Products | | | | | |
| | | | 138,967 | | |
| | | > Waste Management 0.4% | |
| | 2,550,000 | | | Waste Connections (a) | | | 77,112 | | |
| | | | | Solid Waste Management | | | | | |
| | | | 77,112 | | |
| Industrial Goods & Services: Total | | | 3,845,356 | | |
| Consumer Goods & Services 18.1% | | | |
| | | > Retail 4.1% | |
| | 3,140,000 | | | Abercrombie & Fitch | | | 229,157 | | |
| | | | | Teen Apparel Retailer | | | | | |
| | 9,130,000 | | | Chico's FAS (a)(b) | | | 222,224 | | |
| | | | | Women's Specialty Retailer | | | | | |
| | 4,600,000 | | | Urban Outfitters (a) | | | 110,538 | | |
| | | | | Apparel & Home Specialty Retailer | | | | | |
| | 1,975,000 | | | J Crew Group (a) | | | 106,828 | | |
| | | | | Multi-channel Branded Retailer | | | | | |
| | 3,743,000 | | | Christopher & Banks (b) | | | 64,192 | | |
| | | | | Women's Apparel Retailer | | | | | |
| | 1,223,000 | | | AnnTaylor Stores (a) | | | 43,319 | | |
| | | | | Women's Apparel Retailer | | | | | |
| | 1,954,600 | | | RONA (Canada) (a) | | | 40,826 | | |
| | | | | Leading Canadian Do-it-yourself Retailer | | | | | |
| | 775,000 | | | Genesco (a) | | | 40,540 | | |
| | | | | Multi-concept Branded Footwear Retailer | | | | | |
| | 1,200,000 | | | Gaiam (a)(b) | | | 21,876 | | |
| | | | | Healthy Living Catalogs & E-commerce | | | | | |
| | | | 879,500 | | |
| | | > Other Consumer Services 2.5% | |
| | 2,000,000 | | | ITT Educational Services (a) | | | 234,760 | | |
| | | | | Post-secondary Degree Programs | | | | | |
| | 5,400,000 | | | ServiceMaster | | | 83,484 | | |
| | | | | Lawn Care, Pest Control, Commercial
Disaster Responce | | | | | |
| | 1,120,000 | | | NutriSystem (a) | | | 78,221 | | |
| | | | | Weight Loss Programs | | | | | |
| | 1,275,000 | | | Weight Watchers International | | | 64,821 | | |
| | | | | Weight Loss Programs | | | | | |
| | 1,500,000 | | | Universal Technical Institute (a)(b) | | | 38,085 | | |
| | | | | Vocational Training | | | | | |
29
Columbia Acorn Fund
Statement of Investments (Unaudited), continued
| Number of Shares | | | | Value (000) | |
| | | > Other Consumer Services—continued | |
| | 110,000 | | | Pierre & Vacances (France) | | $ | 16,782 | | |
| | | | | Vacation Apartment Lets | | | | | |
| | 2,550,000 | | | Princeton Review (a)(b) | | | 12,189 | | |
| | | | | College Preparation Courses | | | | | |
| | 100,000 | | | Lincoln Technical Institute (a) | | | 1,486 | | |
| | | | | Vocational Training | | | | | |
| | | | 529,828 | | |
| | | > Apparel 2.5% | |
| | 7,330,000 | | | Coach (a) | | | 347,369 | | |
| | | | | Designer & Retailer of Branded Leather
Accessories | | | | | |
| | 1,069,000 | | | Oxford Industries (b) | | | 47,399 | | |
| | | | | Branded & Private Label Apparel | | | | | |
| | 1,818,000 | | | Carter's (a) | | | 47,159 | | |
| | | | | Children's Branded Apparel | | | | | |
| | 3,000,000 | | | Billabong International (Australia) | | | 45,426 | | |
| | | | | Action Sports Apparel Brand Manager | | | | | |
| | 900,000 | | | True Religion Apparel (a) | | | 18,297 | | |
| | | | | Premium Denim | | | | | |
| | 600,000 | | | Heelys (a) | | | 15,516 | | |
| | | | | Wheeled Footwear | | | | | |
| | | | 521,166 | | |
| | | > Leisure Products 1.7% | |
| | 1,500,000 | | | Harley-Davidson | | | 89,415 | | |
| | | | | Motorcycles & Related Merchandise | | | | | |
| | 1,416,000 | | | Speedway Motorsports | | | 56,612 | | |
| | | | | Motorsport Racetrack Owner & Operator | | | | | |
| | 1,025,000 | | | International Speedway | | | 54,028 | | |
| | | | | Largest Motorsports Racetrack Owner & Operator | | | | | |
| | 900,000 | | | Polaris Industries | | | 48,744 | | |
| | | | | Leisure Vehicles & Related Products | | | | | |
| | 1,032,000 | | | RC2 (a) | | | 41,290 | | |
| | | | | Toys, Infant Products & Collectibles | | | | | |
| | 561,000 | | | Thor Industries | | | 25,323 | | |
| | | | | RV & Bus Manufacturer | | | | | |
| | 2,500,000 | | | Fleetwood Enterprises (a) | | | 22,625 | | |
| | | | | RV & Manufactured Home Maker | | | | | |
| | 390,000 | | | Winnebago | | | 11,513 | | |
| | | | | Premier Motorhome Maker | | | | | |
| | | | 349,550 | | |
| | | > Nondurables 1.6% | |
| | 2,860,000 | | | Scotts Miracle-Gro | | | 122,808 | | |
| | | | | Consumer Lawn & Garden Products | | | | | |
| | 2,060,000 | | | Jarden (a) | | | 88,601 | | |
| | | | | Branded Household Products | | | | | |
| | 1,010,000 | | | Chattem (a)(b) | | | 64,014 | | |
| | | | | Personal Care Products | | | | | |
| | 1,800,000 | | | Helen of Troy (a)(b) | | | 48,600 | | |
| | | | | Hair Dryers & Curling Irons | | | | | |
| | 1,100,000 | | | Natura Cosmeticos (Brazil) | | | 15,967 | | |
| | | | | Direct Retailer of Cosmetics | | | | | |
| | | | 339,990 | | |
| | | > Furniture & Textiles 1.4% | |
| | 3,800,000 | | | Herman Miller (b) | | | 120,080 | | |
| | | | | Office Furniture | | | | | |
| | 2,236,000 | | | HNI | | | 91,676 | | |
| | | | | Office Furniture & Fireplaces | | | | | |
| Number of Shares | | | | Value (000) | |
| | 1,818,000 | | | Knoll | | $ | 40,723 | | |
| | | | | Office Furniture | | | | | |
| | 3,144,000 | | | Nobia (Sweden) | | | 39,129 | | |
| | | | | Kitchen Cabinet Manufacturing & Distribution | | | | | |
| | | | 291,608 | | |
| | | > Travel 1.3% | |
| | 2,390,000 | | | Vail Resorts (a)(b) | | | 145,479 | | |
| | | | | Ski Resort Operator & Developer | | | | | |
| | 4,000,000 | | | Expedia (a) | | | 117,160 | | |
| | | | | Online Travel Services Company | | | | | |
| | 425,000 | | | Choice Hotels | | | 16,796 | | |
| | | | | Franchisor of Budget Hotel Brands | | | | | |
| | 135,000 | | | Ambassadors Group | | | 4,797 | | |
| | | | | Educational Student Travel Services | | | | | |
| | | | 284,232 | | |
| | | > Casinos & Gaming 1.2% | |
| | 1,700,000 | | | Penn National Gaming (a) | | | 102,153 | | |
| | | | | Regional Casino Operator | | | | | |
| | 3,200,000 | | | Pinnacle Entertainment (a)(b) | | | 90,080 | | |
| | | | | Regional Casino Operator | | | | | |
| | 400,000 | | | Station Casinos | | | 34,720 | | |
| | | | | Las Vegas Locals Casinos | | | | | |
| | 690,000 | | | Intralot (Greece) | | | 22,228 | | |
| | | | | Lottery & Gaming Systems & Services | | | | | |
| | 226,000 | | | Lakes Entertainment (a) | | | 2,669 | | |
| | | | | Native American Casinos Development | | | | | |
| | | | 251,850 | | |
| | | > Restaurants 0.7% | |
| | 2,145,000 | | | Sonic (a) | | | 47,447 | | |
| | | | | Quick Service Restaurant | | | | | |
| | 1,000,000 | | | Red Robin Gourmet Burgers (a)(b) | | | 40,370 | | |
| | | | | Casual Dining Restaurant | | | | | |
| | 1,150,000 | | | Cheesecake Factory (a) | | | 28,198 | | |
| | | | | Casual Dining Restaurants | | | | | |
| | 1,600,000 | | | AFC Enterprises (a)(b) | | | 27,664 | | |
| | | | | Popeyes Restaurants | | | | | |
| | | | 143,679 | | |
| | | > Consumer Goods Distribution 0.5% | |
| | 2,890,000 | | | Pool (b) | | | 112,797 | | |
| | | | | Distributor of Swimming Pool Supplies &
Equipment | | | | | |
| | | | 112,797 | | |
| | | > Food & Beverage 0.4% | |
| | 1,650,000 | | | Hansen Natural (a) | | | 70,917 | | |
| | | | | Alternative Beverages | | | | | |
| | 1,000,000 | | | IAWS Group (Ireland) | | | 20,947 | | |
| | | | | Baked Goods | | | | | |
| | 26,000 | | | C&C Group (Ireland) | | | 349 | | |
| | | | | Beverage Company | | | | | |
| | | | 92,213 | | |
| | | > Other Durable Goods 0.1% | |
| | 5,410,390 | | | Ducati Motor (Italy) (a) | | | 13,169 | | |
| | | | | Motorcycles & Related Merchandise | | | | | |
| | 900,000 | | | Champion Enterprises (a) | | | 8,847 | | |
| | | | | Manufactured Homes | | | | | |
| | 172,000 | | | Cavco Industries (a) | | | 6,453 | | |
| | | | | Higher End Manufactured Homes | | | | | |
| | | | 28,469 | | |
30
| Number of Shares | | | | Value (000) | |
| | | > Cruise Lines 0.1% | |
| | 400,000 | | | Carnival | | $ | 19,508 | | |
| | | | | Largest Cruise Line | | | | | |
| | | | 19,508 | | |
| Consumer Goods & Services: Total | | | 3,844,390 | | |
| Finance 12.3% | | | |
| | | > Insurance 3.9% | |
| | 3,600,000 | | | HCC Insurance Holdings | | | 120,276 | | |
| | | | | Specialty Insurance | | | | | |
| | 5,000,000 | | | Conseco (a) | | | 104,450 | | |
| | | | | Life, Long Term Care, & Medical Supplement
Insurance | | | | | |
| | 2,390,000 | | | Philadelphia Consolidated Holding (a) | | | 99,902 | | |
| | | | | Specialty Insurance | | | | | |
| | 149,000 | | | Markel (a) | | | 72,199 | | |
| | | | | Specialty Insurance | | | | | |
| | 1,200,000 | | | Assurant | | | 70,704 | | |
| | | | | Specialty Insurance | | | | | |
| | 1,748,000 | | | Leucadia National | | | 61,617 | | |
| | | | | Insurance Holding Company | | | | | |
| | 995,000 | | | Protective Life | | | 47,571 | | |
| | | | | Life Insurance | | | | | |
| | 1,000,000 | | | Endurance Specialty Holdings | | | 40,040 | | |
| | | | | Commercial Lines Insurance/Reinsurance | | | | | |
| | 740,000 | | | Stancorp Financial Group | | | 38,835 | | |
| | | | | Group Life & Disability Insurance | | | | | |
| | 1,550,000 | | | United America Indemnity (a)(b) | | | 38,548 | | |
| | | | | Specialty Insurance | | | | | |
| | 1,420,000 | | | Selective Insurance Group | | | 38,170 | | |
| | | | | Commercial & Personal Lines Insurance | | | | | |
| | 750,000 | | | Delphi Financial Group | | | 31,365 | | |
| | | | | Group Employee Benefit Products & Services | | | | | |
| | 1,000,000 | | | Aspen Insurance | | | 28,070 | | |
| | | | | Commercial Lines Insurance/Reinsurance | | | | | |
| | 600,000 | | | National Financial Partners | | | 27,786 | | |
| | | | | Distributor of Life Insurance, Group
Benefits & Investment Advisory Services | | | | | |
| | 280,000 | | | April Group (France) | | | 14,750 | | |
| | | | | Insurance Policy Construction | | | | | |
| | | | 834,283 | | |
| | | > Banks 3.0% | |
| | 2,852,000 | | | BOK Financial | | | 152,354 | | |
| | | | | Tulsa Based S.W. Bank | | | | | |
| | 3,450,000 | | | Associated Banc-Corp | | | 112,815 | | |
| | | | | Midwest Bank | | | | | |
| | 3,156,000 | | | TCF Financial | | | 87,737 | | |
| | | | | Great Lakes Bank | | | | | |
| | 4,080,000 | | | Glacier Bancorp (b) | | | 83,028 | | |
| | | | | Mountain States Bank | | | | | |
| | 1,222,000 | | | Chittenden | | | 42,709 | | |
| | | | | New England Bank | | | | | |
| | 1,320,000 | | | West Coast Bancorp (b) | | | 40,115 | | |
| | | | | Portland Small Business Bank | | | | | |
| | 700,000 | | | MB Financial | | | 24,318 | | |
| | | | | Chicago Bank | | | | | |
| | 1,249,000 | | | West Bancorporation (b) | | | 19,946 | | |
| | | | | Des Moines Commercial Bank | | | | | |
| Number of Shares | | | | Value (000) | |
| | 1,000,000 | | | Depfa Bank (Ireland) | | $ | 17,706 | | |
| | | | | Investment Banker to Public Authorities | | | | | |
| | 636,000 | | | Great Southern Bancorp | | | 17,204 | | |
| | | | | Missouri Real Estate Lender | | | | | |
| | 386,000 | | | First Financial Bankshares | | | 14,980 | | |
| | | | | West Texas Bank | | | | | |
| | 400,000 | | | First Mutual Bancshares (b) | | | 8,892 | | |
| | | | | Seattle Community Bank | | | | | |
| | 250,000 | | | First Busey | | | 4,997 | | |
| | | | | Illinois Bank | | | | | |
| | 150,000 | | | Greene County Bancshares | | | 4,689 | | |
| | | | | Tennessee Bank | | | | | |
| | 200,000 | | | TriCo Bancshares | | | 4,472 | | |
| | | | | California Central Valley Community Bank | | | | | |
| | | | 635,962 | | |
| | | > Brokerage & Money Management 2.4% | |
| | 5,500,000 | | | Eaton Vance | | | 242,990 | | |
| | | | | Specialty Mutual Funds | | | | | |
| | 5,948,000 | | | SEI Investments | | | 172,730 | | |
| | | | | Mutual Fund Administration & Investment
Management | | | | | |
| | 1,303,000 | | | Nuveen Investments | | | 80,981 | | |
| | | | | Money Management | | | | | |
| | 450,000 | | | Investment Technology Group (a) | | | 19,499 | | |
| | | | | Electronic Trading | | | | | |
| | | | 516,200 | | |
| | | > Finance Companies 1.5% | |
| | 6,500,000 | | | AmeriCredit (a)(b) | | | 172,575 | | |
| | | | | Auto Lending | | | | | |
| | 1,500,000 | | | World Acceptance (a)(b) | | | 64,095 | | |
| | | | | Personal Loans | | | | | |
| | 1,219,000 | | | McGrath Rentcorp | | | 41,068 | | |
| | | | | Temporary Space & IT Rentals | | | | | |
| | 900,000 | | | Marlin Business Services (a)(b) | | | 19,179 | | |
| | | | | Small Equipment Leasing | | | | | |
| | 1,203,000 | | | Electro Rent | | | 17,492 | | |
| | | | | Test & Measurement Rentals | | | | | |
| | 200,000 | | | CAI International (a) | | | 2,636 | | |
| | | | | International Container Leasing &
Management | | | | | |
| | | | 317,045 | | |
| | | > Savings & Loans 1.5% | |
| | 9,085,000 | | | People's United | | | 161,077 | | |
| | | | | Connecticut Savings & Loan | | | | | |
| | 1,700,000 | | | Housing Development Finance (India) | | | 84,475 | | |
| | | | | Indian Mortgage Lender | | | | | |
| | 1,285,000 | | | Washington Federal | | | 31,238 | | |
| | | | | Traditional Thrift | | | | | |
| | 978,000 | | | Anchor Bancorp Wisconsin | | | 25,614 | | |
| | | | | Wisconsin Thrift | | | | | |
| | 360,000 | | | Provident New York Bancorp | | | 4,864 | | |
| | | | | New York State Thrift | | | | | |
| | | | 307,268 | | |
| Finance: Total | | | 2,610,758 | | |
31
Columbia Acorn Fund
Statement of Investments (Unaudited), continued
| Number of Shares | | | | Value (000) | |
| Energy & Minerals 8.7% | | | |
| | | > Oil & Gas Producers 4.0% | |
| | 2,500,000 | | | XTO Energy | | $ | 150,250 | | |
| | | | | Oil & Gas Producer | | | | | |
| | 2,700,000 | | | Ultra Petroleum (a) | | | 149,148 | | |
| | | | | Oil & Gas Producer | | | | | |
| | 2,400,000 | | | Equitable Resources | | | 118,944 | | |
| | | | | Natural Gas Producer & Utility | | | | | |
| | 4,900,000 | | | Talisman Energy (Canada) | | | 94,757 | | |
| | | | | Oil & Gas Producer | | | | | |
| | 9,315,000 | | | Tullow Oil (United Kingdom) | | | 90,769 | | |
| | | | | Oil & Gas Producer | | | | | |
| | 2,000,000 | | | Southwestern Energy (a) | | | 89,000 | | |
| | | | | Oil & Gas Producer | | | | | |
| | 1,500,000 | | | Range Resources | | | 56,115 | | |
| | | | | Oil & Gas Producer | | | | | |
| | 1,100,000 | | | Carrizo Oil & Gas (a) | | | 45,617 | | |
| | | | | Explores for Natural Gas & Crude Oil | | | | | |
| | 700,000 | | | Denbury Resources (a) | | | 26,250 | | |
| | | | | Oil Producer Using Co2 Injection | | | | | |
| | 500,000 | | | St. Mary Land & Exploration | | | 18,310 | | |
| | | | | Oil & Gas Producer | | | | | |
| | 2,750,000 | | | Vaalco Energy (a) | | | 13,283 | | |
| | | | | Oil & Gas Producer | | | | | |
| | 470,000 | | | McMoran Exploration (a) | | | 6,580 | | |
| | | | | Natural Gas Producer & Developer | | | | | |
| | | | 859,023 | | |
| | | > Oil Services 3.8% | |
| | 3,584,037 | | | Fugro (Netherlands) (b) | | | 227,455 | | |
| | | | | Oilfield Services | | | | | |
| | 2,820,000 | | | FMC Technologies (a) | | | 223,400 | | |
| | | | | Oil & Gas Well Head Manufacturer | | | | | |
| | 1,200,000 | | | Atwood Oceanics (a) | | | 82,344 | | |
| | | | | Offshore Drilling Contractor | | | | | |
| | 1,761,000 | | | Rowan | | | 72,166 | | |
| | | | | Offshore Drilling Contractor | | | | | |
| | 1,988,000 | | | Tetra Technologies (a) | | | 56,062 | | |
| | | | | U.S.-based Services Company with Life of Field
Approach | | | | | |
| | 1,044,000 | | | Tesco (a) | | | 32,938 | | |
| | | | | Developing New Well Drilling Technologies | | | | | |
| | 750,000 | | | CARBO Ceramics | | | 32,858 | | |
| | | | | Natural Gas Well Stimulants | | | | | |
| | 1,001,000 | | | ShawCor (Canada) | | | 30,737 | | |
| | | | | Oil & Gas Pipeline Products | | | | | |
| | 552,000 | | | Dresser-Rand Group (a) | | | 21,804 | | |
| | | | | Largest Manufacturer of Compressors | | | | | |
| | 1,580,000 | | | Enerflex Systems (Canada) | | | 15,633 | | |
| | | | | Natural Gas Compresser Rental & Fabrication | | | | | |
| | 250,000 | | | SBM Offshore (Netherlands) | | | 9,530 | | |
| | | | | Builds & Leases Offshore Vessels to Process &
Store Crude Oil | | | | | |
| | 170,000 | | | Key Energy Services (a) | | | 3,150 | | |
| | | | | Well Workover Services | | | | | |
| | | | 808,077 | | |
| | | > Mining 0.6% | |
| | 5,895,000 | | | Uranium One (South Africa) (a) | | | 75,095 | | |
| | | | | Uranium Mines in South Africa,
Kazakhstan, Australia & the U.S. | | | | | |
| Number of Shares | | | | Value (000) | |
| | 2,900,000 | | | Jubilee Mines (Australia) | | $ | 39,163 | | |
| | | | | Nickel Mining in Australia | | | | | |
| | 1,000,000 | | | Ivanhoe Mines (Canada) (a) | | | 14,175 | | |
| | | | | Copper Mine Project in Mongolia | | | | | |
| | | | 128,433 | | |
| | | > Agricultural Commodities 0.2% | |
| | 550,000 | | | Aracruz Celulose (Brazil) | | | 36,432 | | |
| | | | | Brazilian Hardwood Pulp Producer | | | | | |
| | | | 36,432 | | |
| | | > Oil Refining, Marketing &
Distribution 0.1% | |
| | 435,000 | | | Oneok | | | 21,928 | | |
| | | | | Natural Gas Distribution, Pipeline
Processing & Trading | | | | | |
| | | | 21,928 | | |
| Energy & Minerals: Total | | | 1,853,893 | | |
| Health Care 7.9% | | | |
| | | > Health Care Services 1.9% | |
| | 1,000,000 | | | Rhoen-Klinikum (Germany) | | | 60,256 | | |
| | | | | Health Care Services | | | | | |
| | 1,085,000 | | | Charles River Laboratories (a) | | | 56,008 | | |
| | | | | Pharmaceutical Research | | | | | |
| | 1,125,000 | | | LCA-Vision (b) | | | 53,167 | | |
| | | | | Lasik Surgery Centers | | | | | |
| | 1,300,000 | | | Lincare Holdings (a) | | | 51,805 | | |
| | | | | Home Health Care Services | | | | | |
| | 2,250,000 | | | PSS World Medical (a) | | | 40,995 | | |
| | | | | Medical Supplies | | | | | |
| | 1,080,000 | | | OPG Groep (Netherlands) | | | 39,327 | | |
| | | | | Health Care Supplies & Pharmacies | | | | | |
| | 900,000 | | | Omnicare | | | 32,454 | | |
| | | | | Pharmacy Services for Nursing Homes | | | | | |
| | 500,000 | | | Coventry Health Care (a) | | | 28,825 | | |
| | | | | HMO | | | | | |
| | 3,000,000 | | | Eresearch Technology (a)(b) | | | 28,530 | | |
| | | | | Clinical Research Services | | | | | |
| | 400,000 | | | Healthcare Services Group | | | 11,800 | | |
| | | | | Outsourced Services to Long-term Care
Industry | | | | | |
| | | | 403,167 | | |
| | | > Medical Supplies 1.9% | |
| | 1,910,000 | | | Cytyc (a) | | | 82,340 | | |
| | | | | Consumables Related to Women's Health | | | | | |
| | 1,250,000 | | | ICU Medical (a)(b) | | | 53,675 | | |
| | | | | Intravenous Therapy Products | | | | | |
| | 929,000 | | | Henry Schein (a) | | | 49,637 | | |
| | | | | Largest Distributor of Healthcare Products | | | | | |
| | 1,200,000 | | | Owens & Minor | | | 41,928 | | |
| | | | | Distribution of Medical Supplies | | | | | |
| | 1,025,000 | | | Polymedica | | | 41,871 | | |
| | | | | Diabetes Supply Distributor | | | | | |
| | 700,000 | | | Cooper | | | 37,324 | | |
| | | | | Contact Lens Manufacturer | | | | | |
| | 905,000 | | | Arrow International | | | 34,644 | | |
| | | | | Disposable Catheters | | | | | |
| | 486,000 | | | Techne (a) | | | 27,804 | | |
| | | | | Cytokines, Antibodies & Other Reagents for
Life Science | | | | | |
32
| Number of Shares | | | | Value (000) | |
| | | > Medical Supplies—continued | |
| | 790,000 | | | Meridian Biosciences | | $ | 17,111 | | |
| | | | | Niche Diagnostics/Life Science Company | | | | | |
| | 900,000 | | | QIAGEN (a) | | | 16,011 | | |
| | | | | Life Science Company; DNA/RNA Purification | | | | | |
| | | | 402,345 | | |
| | | > Biotechnology & Drug Delivery 1.7% | |
| | 3,940,000 | | | BioMarin (a) | | | 70,684 | | |
| | | | | Biotech Focused on Orphan Diseases | | | | | |
| | 2,550,000 | | | PDL BioPharma (a) | | | 59,415 | | |
| | | | | Proprietary Monoclonal Antibodies | | | | | |
| | 3,720,000 | | | Seattle Genetics (a)(b) | | | 36,493 | | |
| | | | | Antibody-based Therapies for Cancer | | | | | |
| | 865,000 | | | Amylin (a) | | | 35,603 | | |
| | | | | Biotech Company Focused on Diabetes &
Obesity | | | | | |
| | 2,000,000 | | | Medarex (a) | | | 28,580 | | |
| | | | | Humanized Antibodies | | | | | |
| | 2,160,000 | | | Array Biopharma (a) | | | 25,207 | | |
| | | | | Drugs for Cancer & Inflammatory Diseases | | | | | |
| | 650,000 | | | Myriad Genetics (a) | | | 24,173 | | |
| | | | | Drugs/Diagnostics Hybrid | | | | | |
| | 1,650,000 | | | Nektar Therapeutics (a) | | | 15,659 | | |
| | | | | Drug Delivery Technologies | | | | | |
| | 1,320,000 | | | Arena Pharmaceuticals (a) | | | 14,507 | | |
| | | | | Novel Drug Targeting Technology | | | | | |
| | 3,100,000 | | | Lexicon Genetics (a) | | | 9,951 | | |
| | | | | Drug Discovery | | | | | |
| | 2,520,000 | | | Decode Genetics (a) | | | 9,412 | | |
| | | | | Drugs for Heart Attack, Asthma & Vascular
Disease | | | | | |
| | 1,229,000 | | | Neurogen (a) | | | 8,161 | | |
| | | | | Development-stage Biotech Focused on Neurology | | | | | |
| | 1,750,000 | | | Genitope (a) | | | 6,755 | | |
| | | | | Cancer Vaccine | | | | | |
| | 1,100,000 | | | La Jolla Pharmaceutical (a) | | | 4,928 | | |
| | | | | Lupus Treatment | | | | | |
| | 825,000 | | | Pharmacopeia (a) | | | 4,579 | | |
| | | | | Biotech Company with Broad Early-stage Pipeline | | | | | |
| | 1,025,000 | | | Nuvelo (a) | | | 2,788 | | |
| | | | | Development-stage Biotech Focused on
Cardiovascular/Cancer | | | | | |
| | 1,875,000 | | | Locus Discovery, Series D, Pfd. (a)(c) | | | 544 | | |
| | 966,441 | | | Locus Discovery, Series B, Pfd. (a)(c) | | | 280 | | |
| | | | | High Throughput Rational Drug Design | | | | | |
| | 1,249,999 | | | Perlegen Sciences (a)(c) | | | 400 | | |
| | | | | Large Scale Gene Sequencing | | | | | |
| | 359,944 | | | MicroDose Technologies (a)(c) | | | 360 | | |
| | | | | Drug Inhaler Development | | | | | |
| | | | 358,479 | | |
| | | > Medical Equipment & Devices 1.3% | |
| | 1,000,000 | | | Edwards Lifesciences (a) | | | 49,340 | | |
| | | | | Heart Valves | | | | | |
| | 870,000 | | | Vital Signs (b) | | | 48,328 | | |
| | | | | Anesthesia, Respiratory & Sleep Products | | | | | |
| | 943,000 | | | Orthofix International (a)(b) | | | 42,407 | | |
| | | | | Bone Fixation & Stimulation Devices | | | | | |
| | 315,000 | | | Synthes (Switzerland) | | | 37,806 | | |
| | | | | Products for Orthopedic Surgery | | | | | |
| Number of Shares | | | | Value (000) | |
| | 550,000 | | | Dade Behring | | $ | 29,216 | | |
| | | | | Clinical Diagnostics Supplier | | | | | |
| | 550,000 | | | Haemonetics (a) | | | 28,935 | | |
| | | | | Blood & Plasma Collection Equipment | | | | | |
| | 552,000 | | | Advanced Medical Optics (a) | | | 19,254 | | |
| | | | | Medical Devices for Eye Care | | | | | |
| | 140,000 | | | Essilor International (France) | | | 16,675 | | |
| | | | | Eyeglass Lenses | | | | | |
| | | | 271,961 | | |
| | | > Pharmaceuticals 1.1% | |
| | 900,000 | | | Cephalon (a) | | | 72,351 | | |
| | | | | Specialty Pharmaceuticals for Pain, Central
Nervous System & Oncology | | | | | |
| | 1,295,000 | | | Endo Pharmaceuticals (a) | | | 44,328 | | |
| | | | | Specialty Pharmaceuticals for Pain
Management | | | | | |
| | 1,000,000 | | | Medicis Pharmaceutical | | | 30,540 | | |
| | | | | Specialty Pharmaceuticals for Dermatology | | | | | |
| | 1,010,000 | | | MGI Pharma (a) | | | 22,594 | | |
| | | | | Specialty Pharmaceuticals for Oncology &
Acute Care | | | | | |
| | 3,000,000 | | | QLT (a) | | | 22,200 | | |
| | | | | Specialty Pharmaceuticals for Ophthalmology &
Dermatology | | | | | |
| | 3,100,000 | | | United Drug (Ireland) | | | 16,928 | | |
| | | | | Irish Pharmaceutical Wholesaler & Outsourcer | | | | | |
| | 1,200,000 | | | Collagenex Pharmaceuticals (a)(b) | | | 14,880 | | |
| | | | | Specialty Pharmaceuticals for Dermatology | | | | | |
| | 1,700,000 | | | Barrier Therapeutics (a)(b) | | | 11,050 | | |
| | | | | Specialty Pharmaceuticals for Dermatology | | | | | |
| | | | 234,871 | | |
| Health Care: Total | | | 1,670,823 | | |
| Other Industries 4.9% | | | |
| | | > Real Estate 3.8% | |
| | 5,850,000 | | | Highland Hospitality (b) | | | 112,320 | | |
| | | | | Hotel Owner | | | | | |
| | 2,000,000 | | | Gaylord Entertainment (a) | | | 107,280 | | |
| | | | | Convention Hotels | | | | | |
| | 1,398,000 | | | Forest City Enterprises, Class B (b) | | | 86,690 | | |
| | | | | Commercial & Residential Property Developer | | | | | |
| | 650,000 | | | SL Green Realty | | | 80,528 | | |
| | | | | Manhattan Office Buildings | | | | | |
| | 1,320,000 | | | General Growth Properties | | | 69,894 | | |
| | | | | Regional Shopping Malls | | | | | |
| | 3,500,000 | | | DiamondRock Hospitality | | | 66,780 | | |
| | | | | Hotel Owner | | | | | |
| | 635,000 | | | Macerich Company | | | 52,337 | | |
| | | | | Regional Shopping Malls | | | | | |
| | 575,000 | | | Federal Realty Investment Trust | | | 44,425 | | |
| | | | | Shopping Centers | | | | | |
| | 1,720,000 | | | Kite Realty Group (b) | | | 32,714 | | |
| | | | | Community Shopping Centers | | | | | |
| | 850,000 | | | Digital Realty Trust | | | 32,028 | | |
| | | | | Technology-focused Office Buildings | | | | | |
| | 1,375,000 | | | Crescent Real Estate Equities | | | 30,855 | | |
| | | | | Class 'A' Office Buildings | | | | | |
| | 628,000 | | | Parkway Properties | | | 30,163 | | |
| | | | | Office Buildings | | | | | |
33
Columbia Acorn Fund
Statement of Investments (Unaudited), continued
Number of Shares
or Principal Amount (000) | | | | Value (000) | |
| | | > Real Estate—continued | |
| | 1,020,000 | | | Brandywine Realty | | $ | 29,152 | | |
| | | | | Office Buildings | | | | | |
| | 900,000 | | | American Campus Communities | | | 25,461 | | |
| | | | | Student Housing | | | | | |
| | 8,200 | | | Kenedix (Japan) | | | 15,252 | | |
| | | | | Real Estate Investment Management | | | | | |
| | 37,407 | | | Security Capital European Realty
(Luxembourg) (a)(c)(d) | | | — | | |
| | | | | Self Storage Properties | | | | | |
| | | | 815,879 | | |
| | | > Transportation 0.8% | |
| | 1,556,000 | | | JB Hunt Transport Services | | | 45,622 | | |
| | | | | Truck & Intermodal Carrier | | | | | |
| | 826,200 | | | Grupo Aeroportuario del Surest
(Mexico) | | | 43,533 | | |
| | | | | Cancun & Cozumel Airport Operator | | | | | |
| | 14,120,000 | | | China Shipping Development (China) | | | 32,569 | | |
| | | | | China's Dominant Shipper for Oil & Coal | | | | | |
| | 1,914,000 | | | Heartland Express | | | 31,198 | | |
| | | | | Regional Trucker | | | | | |
| | 6,790,000 | | | Jiangsu Expressway (China) | | | 6,906 | | |
| | | | | Chinese Toll Road Operator | | | | | |
| | | | 159,828 | | |
| | | > Regulated Utilities 0.3% | |
| | 1,650,000 | | | Northeast Utilities | | | 46,794 | | |
| | | | | Regulated Electric Utility | | | | | |
| | 340,000 | | | Red Electrica de Espana (Spain) | | | 15,932 | | |
| | | | | Spanish Power Grid | | | | | |
| | | | 62,726 | | |
| Other Industries: Total | | | 1,038,433 | | |
Total Equities: 93.6%
(Cost: $11,345,002) | | | 19,873,015 | | |
| Short-Term Obligations 6.1% | | | |
| $ | 50,000 | | | Ebbetts Funding (e)
5.28% Due 7/11/07 | | | 49,927 | | |
| | 50,000 | | | St. Germain Holdings (e)
5.28% Due 7/27/07 | | | 49,809 | | |
| | 50,000 | | | Four Winds Funding (e)
5.27% Due 7/30/07 | | | 49,788 | | |
| | 50,000 | | | Four Winds Funding (e)
5.27% Due 7/31/07 | | | 49,780 | | |
| | 50,000 | | | Manhattan Asset Funding (e)
5.28% Due 8/01/07 | | | 49,773 | | |
| | 50,000 | | | Liberty Street Funding (e)
5.28% Due 8/15/07 | | | 49,670 | | |
| | 48,000 | | | Morrigan TRR (e)
5.28% Due 7/17/07 | | | 47,888 | | |
| | 45,000 | | | Pasa Funding (e)
5.27% Due 7/19/07 | | | 44,881 | | |
| | 45,000 | | | Ebury Finance (e)
5.28% Due 7/25/07 | | | 44,842 | | |
| | 45,000 | | | White Point Funding (e)
5.29% Due 8/13/07 | | | 44,716 | | |
| Principal Amount (000) | | | | Value (000) | |
| $ | 44,000 | | | Hannover Funding (e)
5.28% Due 7/06/07 | | $ | 43,968 | | |
| | 44,000 | | | World Omni Vehicles (e)
5.26% Due 7/09/07 | | | 43,949 | | |
| | 44,000 | | | World Omni Vehicles (e)
5.26% Due 7/10/07 | | | 43,942 | | |
| | 44,000 | | | Axon Financial (e)
5.28% Due 8/09/07 | | | 43,748 | | |
| | 44,000 | | | Axon Financial (e)
5.28% Due 8/10/07 | | | 43,742 | | |
| | 43,000 | | | Nightingale (e)
5.28% Due 8/08/07 | | | 42,760 | | |
| | 40,000 | | | Ebbetts Funding (e)
5.27% Due 7/16/07 | | | 39,912 | | |
| | 40,000 | | | Mica Funding LLC (e)
5.28% Due 8/06/07 | | | 39,789 | | |
| | 38,000 | | | Mica Funding LLC (e)
5.26% Due 7/12/07 | | | 37,939 | | |
| | 38,000 | | | Keel Capital (e)
5.27% Due 7/13/07 | | | 37,933 | | |
| | 38,000 | | | Ebury Finance (e)
5.27% Due 7/24/07 | | | 37,872 | | |
| | 38,000 | | | White Point Funding (e)
5.28% Due 8/14/07 | | | 37,755 | | |
| | 37,000 | | | Mainsail II Ltd. (e)
5.27% Due 7/20/07 | | | 36,897 | | |
| | 37,000 | | | Morrigan TRR (e)
5.28% Due 7/23/07 | | | 36,881 | | |
| | 36,000 | | | La Fayette Asset
Securitization LLC (e)
5.28% Due 7/03/07 | | | 35,989 | | |
| | 36,000 | | | Anglesea Funding (e)
5.26% Due 7/05/07 | | | 35,979 | | |
| | 35,000 | | | Anglesea Funding (e)
5.26% Due 7/02/07 | | | 34,995 | | |
| | 30,000 | | | East Fleet Financial (e)
5.28% Due 7/26/07 | | | 29,890 | | |
| | 30,000 | | | Pasa Funding (e)
5.27% Due 8/02/07 | | | 29,859 | | |
| | 28,000 | | | Manhattan Asset Funding (e)
5.27% Due 8/03/07 | | | 27,865 | | |
| | 25,000 | | | Morrigan TRR (e)
5.28% Due 7/18/07 | | | 24,938 | | |
| | 23,000 | | | Mica Funding LLC (e)
5.28% Due 8/07/07 | | | 22,875 | | |
| | 7,804 | | | Repurchase Agreement with
Fixed Income Clearing Corp.,
dated 6/29/07, due 7/02/07 at
5.050%, collateralized by a
U.S. Government Agency
Obligation, maturing 7/18/11,
market value $7,960
(repurchase proceeds $7,807) | | | 7,804 | | |
| | | | | (Amortized Cost: $1,298,355) | | | 1,298,355 | | |
Total Investments: 99.7%
(Cost: $12,643,357)(f)(g) | | | 21,171,370 | | |
| Cash and Other Assets Less Liabilities: 0.3% | | | 59,908 | | |
| Total Net Assets: 100% | | $ | 21,231,278 | | |
34
> Notes to Statement of Investments (dollar values in thousands)
(a) Non-income producing security.
(b) An affiliate may include any company in which the Fund owns five percent or more of its outstanding voting shares. Transactions in affiliated companies during the six months ended June 30, 2007, are as follows:
| Affiliates | | Balance of
Shares Held
12/31/06 | | Purchases/
Additions | | Sales/
Reductions | | Balance of
Shares Held
6/30/07 | | Value | | Dividend | |
| Actuate | | | 6,000,000 | | | | - | | | | - | | | | 6,000,000 | | | $ | 40,740 | | | $ | - | | |
| Administaff | | | 1,670,000 | | | | 230,000 | | | | - | | | | 1,900,000 | | | | 63,631 | | | | 407 | | |
| AFC Enterprises | | | 1,600,000 | | | | - | | | | - | | | | 1,600,000 | | | | 27,664 | | | | - | | |
| Agile Software | | | 3,500,000 | | | | - | | | | - | | | | 3,500,000 | | | | 28,210 | | | | - | | |
| AmeriCredit | | | 6,500,000 | | | | - | | | | - | | | | 6,500,000 | | | | 172,575 | | | | - | | |
| Anchor Bancorp Wisconsin* | | | 1,178,000 | | | | - | | | | 200,000 | | | | 978,000 | | | | 25,614 | | | | 401 | | |
| AnswerThink | | | 4,600,000 | | | | - | | | | - | | | | 4,600,000 | | | | 16,652 | | | | - | | |
| Bally Technologies | | | 3,500,000 | | | | - | | | | 350,000 | | | | 3,150,000 | | | | 83,223 | | | | - | | |
| Barrier Therapeutics | | | 1,321,000 | | | | 379,000 | | | | - | | | | 1,700,000 | | | | 11,050 | | | | - | | |
| Chattem | | | 1,010,000 | | | | - | | | | - | | | | 1,010,000 | | | | 64,014 | | | | - | | |
| Chico's FAS | | | 7,080,000 | | | | 2,050,000 | | | | - | | | | 9,130,000 | | | | 222,224 | | | | - | | |
| Christopher & Banks | | | 3,743,000 | | | | - | | | | - | | | | 3,743,000 | | | | 64,192 | | | | 449 | | |
| Clarcor | | | 3,500,000 | | | | - | | | | - | | | | 3,500,000 | | | | 131,005 | | | | 508 | | |
| Collagenex Pharmaceuticals | | | 830,000 | | | | 370,000 | | | | - | | | | 1,200,000 | | | | 14,880 | | | | - | | |
| Concur Technologies | | | 2,131,000 | | | | - | | | | - | | | | 2,131,000 | | | | 48,693 | | | | - | | |
| Cytokinetics* | | | 486,000 | | | | - | | | | 486,000 | | | | - | | | | - | | | | - | | |
| Dobson Communications | | | 8,000,000 | | | | - | | | | - | | | | 8,000,000 | | | | 88,880 | | | | - | | |
| Donaldson | | | 3,600,000 | | | | 400,000 | | | | - | | | | 4,000,000 | | | | 142,200 | | | | 666 | | |
| Drew Industries | | | 1,228,000 | | | | - | | | | - | | | | 1,228,000 | | | | 40,696 | | | | - | | |
| Enerflex Systems* | | | 2,280,000 | | | | - | | | | 700,000 | | | | 1,580,000 | | | | 15,633 | | | | 640 | | |
| Eresearch Technology | | | 2,300,000 | | | | 700,000 | | | | - | | | | 3,000,000 | | | | 28,530 | | | | - | | |
| ESCO Technologies | | | 2,200,000 | | | | - | | | | - | | | | 2,200,000 | | | | 79,772 | | | | - | | |
| Excel Technology | | | 625,000 | | | | 110,000 | | | | - | | | | 735,000 | | | | 20,536 | | | | - | | |
| FARO Technologies | | | - | | | | 860,000 | | | | - | | | | 860,000 | | | | 27,400 | | | | - | | |
| First Mutual Bancshares | | | 400,000 | | | | - | | | | - | | | | 400,000 | | | | 8,892 | | | | 72 | | |
| Fleetwood Enterprises* | | | 4,690,000 | | | | - | | | | 2,190,000 | | | | 2,500,000 | | | | 22,625 | | | | - | | |
| Forest City Enterprises, Class B | | | 1,398,000 | | | | - | | | | - | | | | 1,398,000 | | | | 86,690 | | | | 196 | | |
| Forward Air | | | 1,900,000 | | | | - | | | | - | | | | 1,900,000 | | | | 64,771 | | | | 266 | | |
| Fugro | | | 2,928,301 | | | | 655,736 | | | | - | | | | 3,584,037 | | | | 227,455 | | | | 3,860 | | |
| Gaiam | | | 1,200,000 | | | | - | | | | - | | | | 1,200,000 | | | | 21,876 | | | | - | | |
| Genlyte Group | | | 1,963,000 | | | | 637,000 | | | | - | | | | 2,600,000 | | | | 204,204 | | | | - | | |
| Gibraltar Industries | | | 2,860,000 | | | | - | | | | - | | | | 2,860,000 | | | | 63,349 | | | | 429 | | |
| Glacier Bancorp | | | 4,080,000 | | | | - | | | | - | | | | 4,080,000 | | | | 83,028 | | | | 979 | | |
| Helen of Troy | | | 1,800,000 | | | | - | | | | - | | | | 1,800,000 | | | | 48,600 | | | | - | | |
| Herman Miller | | | 2,068,000 | | | | 1,732,000 | | | | - | | | | 3,800,000 | | | | 120,080 | | | | 482 | | |
| Highland Hospitality | | | 5,850,000 | | | | - | | | | - | | | | 5,850,000 | | | | 112,320 | | | | 1,346 | | |
| HNI* | | | 2,550,000 | | | | - | | | | 314,000 | | | | 2,236,000 | | | | 91,676 | | | | 978 | | |
| ICU Medical | | | 1,083,000 | | | | 167,000 | | | | - | | | | 1,250,000 | | | | 53,675 | | | | - | | |
| iGate | | | 5,000,000 | | | | - | | | | - | | | | 5,000,000 | | | | 40,100 | | | | - | | |
| II-VI | | | 2,025,000 | | | | 195,000 | | | | - | | | | 2,220,000 | | | | 60,317 | | | | - | | |
Indus International
(merged into Vista Equity)* | | | 5,600,000 | | | | - | | | | 5,600,000 | | | | - | | | | - | | | | - | | |
| ITT Educational Services* | | | 2,250,000 | | | | - | | | | 250,000 | | | | 2,000,000 | | | | 234,760 | | | | - | | |
| IXYS | | | 1,905,000 | | | | - | | | | - | | | | 1,905,000 | | | | 15,907 | | | | - | | |
| JDA Software* | | | 1,490,000 | | | | - | | | | 1,490,000 | | | | - | | | | - | | | | - | | |
| Kite Realty Group | | | 1,720,000 | | | | - | | | | - | | | | 1,720,000 | | | | 32,714 | | | | 671 | | |
Kronos (merged into
Helman & Friedman)* | | | 2,750,000 | | | | - | | | | 2,750,000 | | | | - | | | | - | | | | - | | |
| LCA-Vision | | | 1,125,000 | | | | - | | | | - | | | | 1,125,000 | | | | 53,167 | | | | 405 | | |
| Littelfuse | | | 1,135,000 | | | | 135,000 | | | | - | | | | 1,270,000 | | | | 42,888 | | | | - | | |
| Marlin Business Services | | | 685,000 | | | | 215,000 | | | | - | | | | 900,000 | | | | 19,179 | | | | - | | |
| Mine Safety Appliances | | | 1,900,000 | | | | - | | | | - | | | | 1,900,000 | | | | 83,144 | | | | 760 | | |
| Orthofix International | | | 942,500 | | | | 500 | | | | - | | | | 943,000 | | | | 42,407 | | | | - | | |
| Oxford Industries | | | 919,000 | | | | 150,000 | | | | - | | | | 1,069,000 | | | | 47,399 | | | | 358 | | |
| Pinnacle Entertainment | | | 3,200,000 | | | | - | | | | - | | | | 3,200,000 | | | | 90,080 | | �� | | - | | |
| Pool | | | 2,500,000 | | | | 390,000 | | | | - | | | | 2,890,000 | | | | 112,797 | | | | 636 | | |
| Princeton Review | | | 2,550,000 | | | | - | | | | - | | | | 2,550,000 | | | | 12,189 | | | | - | | |
| ProQuest | | | 2,000,000 | | | | - | | | | - | | | | 2,000,000 | | | | 19,080 | | | | - | | |
| Radiant Systems | | | 2,500,000 | | | | - | | | | - | | | | 2,500,000 | | | | 33,100 | | | | - | | |
| Red Robin Gourmet Burgers | | | 1,000,000 | | | | - | | | | - | | | | 1,000,000 | | | | 40,370 | | | | - | | |
| Saga Communications | | | 1,400,000 | | | | - | | | | - | | | | 1,400,000 | | | | 13,720 | | | | - | | |
| Salem Communications | | | 1,541,000 | | | | - | | | | - | | | | 1,541,000 | | | | 17,090 | | | | - | | |
| Seachange International* | | | 1,875,000 | | | | - | | | | 1,875,000 | | | | - | | | | - | | | | - | | |
| Seattle Genetics | | | 2,300,000 | | | | 1,420,000 | | | | - | | | | 3,720,000 | | | | 36,493 | | | | - | | |
| Shuffle Master | | | 2,430,000 | | | | - | | | | - | | | | 2,430,000 | | | | 40,338 | | | | - | | |
| Skillsoft | | | 9,500,000 | | | | - | | | | - | | | | 9,500,000 | | | | 88,255 | | | | - | | |
| Spanish Broadcasting System | | | 2,400,000 | | | | - | | | | - | | | | 2,400,000 | | | | 10,320 | | | | - | | |
| Spartech | | | 2,700,000 | | | | - | | | | 700,000 | | | | 2,000,000 | | | | 53,100 | | | | 635 | | |
| Supertex | | | 690,000 | | | | 260,000 | | | | 130,000 | | | | 820,000 | | | | 25,699 | | | | - | | |
| Tumbleweed Communications | | | 3,500,000 | | | | - | | | | - | | | | 3,500,000 | | | | 8,925 | | | | - | | |
35
Columbia Acorn Fund
Statement of Investments (Unaudited), continued
> Notes to Statement of Investments (dollar values in thousands)
| Affiliates | | Balance of
Shares Held
12/31/06 | | Purchases/
Additions | | Sales/
Reductions | | Balance of
Shares Held
6/30/07 | | Value | | Dividend | |
| United America Indemnity | | | 1,550,000 | | | | - | | | | - | | | | 1,550,000 | | | | 38,548 | | | | - | | |
| Universal Technical Institute | | | 1,500,000 | | | | - | | | | - | | | | 1,500,000 | | | | 38,085 | | | | - | | |
| Vaalco Energy* | | | 3,200,000 | | | | - | | | | 450,000 | | | | 2,750,000 | | | | 13,283 | | | | - | | |
| Vail Resorts | | | 2,390,000 | | | | - | | | | - | | | | 2,390,000 | | | | 145,479 | | | | - | | |
| Vital Signs | | | 870,000 | | | | - | | | | - | | | | 870,000 | | | | 48,328 | | | | 165 | | |
| Watsco | | | 2,375,000 | | | | - | | | | - | | | | 2,375,000 | | | | 129,200 | | | | 1,378 | | |
| West Bancorporation | | | 949,000 | | | | 300,000 | | | | - | | | | 1,249,000 | | | | 19,946 | | | | 330 | | |
| West Coast Bancorp | | | 1,320,000 | | | | - | | | | - | | | | 1,320,000 | | | | 40,115 | | | | 317 | | |
| Witness Systems* | | | 2,500,000 | | | | - | | | | 2,500,000 | | | | - | | | | - | | | | - | | |
| World Acceptance | | | 1,500,000 | | | | - | | | | - | | | | 1,500,000 | | | | 64,095 | | | | - | | |
| TOTAL OF AFFILIATED TRANSACTIONS | | | 193,338,801 | | | | 11,356,236 | | | | 19,985,000 | | | | 184,710,037 | | | $ | 4,477,872 | | | $ | 17,334 | | |
* At June 30, 2007, the Fund owned less than five percent of the company's outstanding voting shares.
The aggregate cost and value of these companies at June 30, 2007, was $2,646,859 and $4,477,872 respectively. Investments in affiliate companies represent 21.09% of total net assets at June 30, 2007.
(c) Denotes a restricted security, which is subject to restrictions on resale under federal securities laws. These securities, are valued in good faith by the Board of Trustees. At June 30, 2007, these securities had an aggregate value of $1,584 which represented 0.01% of total net assets.
Additional information on these securities is as follows:
| Security | | Acquisition
Dates | | Shares | | Cost | | Value | |
| Perlegen Sciences | | 3/30/01 | | | 1,249,999 | | | $ | 4,500 | | | $ | 400 | | |
| Locus Discovery, Series D Pfd. | | 9/5/01 | | | 1,875,000 | | | | 7,500 | | | | 544 | | |
| MicroDose Technologies | | 11/24/00 | | | 359,944 | | | | 2,005 | | | | 360 | | |
| Locus Discovery, Series B Pfd. | | 2/8/07 | | | 966,441 | | | | 280 | | | | 280 | | |
| Security Capital European Realty | | 8/20/98 - 11/12/99 | | | 37,407 | | | | 205 | | | | - | | |
| | | | | | | | | $ | 14,490 | | | $ | 1,584 | | |
(d) Security has no value.
(e) Security exempt from registration under Section 4(2) of the Securities Act of 1933. These securities may only be resold in exempt transactions to qualified buyers. Private resales of these securities to qualified instutional buyers are also exempt from registration pursuant to Rule 144A under the Securities Act of 1933. At June 30, 2007, these securities had an aggregate value of $1,290,551, which represented 6.1% of net assets.
(f) At June 30, 2007, for federal income tax purposes cost of investments was $12,643,357 and net unrealized appreciation was $8,528,013 consisting of gross unrealized appreciation of $8,815,065 and gross unrealized depreciation of $287,052.
(g) On June 30, 2007, the market value of foreign securities represents 11.5% of total net assets. The Fund's foreign portfolio was diversified as follows:
| | | Value | | Percent | |
| Netherlands | | $ | 458,146 | | | | 2.16 | % | |
| France | | | 223,347 | | | | 1.05 | | |
| Canada | | | 217,427 | | | | 1.02 | | |
| Japan | | | 150,917 | | | | 0.71 | | |
| Switzerland | | | 146,139 | | | | 0.69 | | |
| Sweden | | | 132,045 | | | | 0.62 | | |
| United Kingdom | | | 128,743 | | | | 0.61 | | |
| Germany | | | 102,892 | | | | 0.48 | | |
| Hong Kong | | | 91,966 | | | | 0.43 | | |
| Australia | | | 84,589 | | | | 0.40 | | |
| India | | | 84,475 | | | | 0.40 | | |
| Ireland | | | 75,505 | | | | 0.36 | | |
| South Africa | | | 75,095 | | | | 0.35 | | |
| China | | | 71,465 | | | | 0.34 | | |
| | | Value | | Percent | |
| Denmark | | $ | 68,394 | | | | 0.32 | % | |
| Brazil | | | 52,399 | | | | 0.25 | | |
| Israel | | | 49,539 | | | | 0.23 | | |
| Taiwan | | | 48,918 | | | | 0.23 | | |
| Mexico | | | 43,533 | | | | 0.21 | | |
| Chile | | | 33,548 | | | | 0.16 | | |
| Singapore | | | 31,933 | | | | 0.15 | | |
| Greece | | | 22,228 | | | | 0.10 | | |
| Austria | | | 18,651 | | | | 0.09 | | |
| Spain | | | 15,932 | | | | 0.08 | | |
| Italy | | | 13,169 | | | | 0.06 | | |
| Luxembourg | | | - | | | | - | | |
| Total Foreign Portfolio | | $ | 2,440,995 | | | | 11.50 | % | |
36
Columbia Acorn International
Major Portfolio Changes in the Second Quarter (Unaudited)
| | | Number of Shares | |
| | | 03/31/07 | | 06/30/07 | |
| Additions | |
| Europe | |
| > Netherlands | |
| Aalberts Industries | | | 480,000 | | | | 1,947,042 | | |
| Boskalis Westminster | | | 163,000 | | | | 489,000 | | |
| Fugro | | | 1,271,700 | | | | 1,406,155 | | |
| Koninklijke TenCate | | | 973,000 | | | | 1,096,000 | | |
| OPG Groep | | | 191,000 | | | | 764,000 | | |
| SBM Offshore | | | 0 | | | | 450,000 | | |
| Smit Internationale | | | 520,000 | | | | 680,000 | | |
| Stork | | | 0 | | | | 825,000 | | |
| Wavin | | | 840,000 | | | | 1,182,536 | | |
| > France | |
| Rubis | | | 298,818 | | | | 332,020 | | |
| Trigano | | | 500,000 | | | | 571,000 | | |
| > Germany | |
| Deutsche Beteiligungs | | | 283,000 | | | | 354,500 | | |
| Deutsche Boerse | | | 120,000 | | | | 200,000 | | |
| MPC Muechmeyer Petersen Capital | | | 0 | | | | 300,000 | | |
| > Switzerland | |
| Kuehne & Nagel | | | 550,000 | | | | 600,000 | | |
| Nobel Biocare Holding | | | 95,000 | | | | 140,000 | | |
| Synthes | | | 330,000 | | | | 360,000 | | |
| > United Kingdom | |
| Informa Group | | | 0 | | | | 1,400,000 | | |
| Intertek Testing | | | 0 | | | | 517,000 | | |
| Northgate | | | 1,450,000 | | | | 1,875,000 | | |
| Rotork | | | 0 | | | | 448,000 | | |
| Smith & Nephew | | | 2,205,000 | | | | 2,670,000 | | |
| Taylor Nelson Sofres | | | 4,620,000 | | | | 5,922,000 | | |
| > Ireland | |
| Kingspan Group | | | 1,035,000 | | | | 1,050,000 | | |
| United Drug | | | 8,050,000 | | | | 8,100,000 | | |
| > Sweden | |
| Hexagon | | | 1,553,500 | | | | 3,960,000 | | |
| Nobia | | | 755,000 | | | | 2,265,000 | | |
| SWECO | | | 610,000 | | | | 3,135,000 | | |
| > Spain | |
| Prisa | | | 800,000 | | | | 1,050,000 | | |
| Sogecable | | | 400,000 | | | | 520,000 | | |
| > Greece | |
| Intralot | | | 1,300,000 | | | | 1,630,000 | | |
| | | Number of Shares | |
| | | 03/31/07 | | 06/30/07 | |
| Asia | |
| > Japan | |
| Aeon Delight | | | 0 | | | | 95,000 | | |
| As One | | | 396,000 | | | | 585,000 | | |
| FCC | | | 900,000 | | | | 1,150,000 | | |
| Kansai Paint | | | 3,700,000 | | | | 6,000,000 | | |
| Kansai Urban Banking | | | 0 | | | | 4,100,000 | | |
| Nakanishi | | | 92,000 | | | | 145,000 | | |
| Topcon | | | 0 | | | | 650,000 | | |
| Unicharm PetCare | | | 0 | | | | 105,000 | | |
| Union Tool | | | 403,600 | | | | 500,000 | | |
| Yusen Air & Sea Service | | | 1,273,900 | | | | 1,300,000 | | |
| > China | |
| China Green | | | 22,049,000 | | | | 25,051,000 | | |
| Fu Ji Food & Catering Services | | | 4,782,000 | | | | 6,256,000 | | |
| Hopewell Highway Infrastructure | | | 0 | | | | 20,000,000 | | |
| Jiangsu Expressway | | | 0 | | | | 17,918,000 | | |
| Travelsky Technology | | | 6,758,000 | | | | 20,910,000 | | |
| Xinyu Hengdeli | | | 0 | | | | 6,008,000 | | |
| > Hong Kong | |
| EganaGoldpfeil | | | 26,600,000 | | | | 29,344,000 | | |
Hong Kong Exchanges and
Clearing | | | 5,026,000 | | | | 5,500,000 | | |
| > South Korea | |
| Sung Kwang Bend | | | 714,000 | | | | 915,000 | | |
| > India | |
| United Phosphorus | | | 0 | | | | 192,000 | | |
| Other Countries | |
| > United States | |
| BioMarin | | | 0 | | | | 524,000 | | |
| Dresser-Rand Group | | | 0 | | | | 500,000 | | |
| FMC Technologies | | | 189,000 | | | | 379,000 | | |
| Tesco | | | 119,239 | | | | 273,000 | | |
| > New Zealand | |
| Sky City Entertainment | | | 5,661,208 | | | | 5,773,789 | | |
| Latin America | |
| > Brazil | |
| Localiza Rent A Car | | | 500,000 | | | | 1,500,000 | | |
| > Mexico | |
| Grupo Aeroportuario del Surest | | | 411,000 | | | | 500,000 | | |
37
Columbia Acorn International
Major Portfolio Changes in the Second Quarter (Unaudited) continued
| | | Number of Shares | |
| | | 03/31/07 | | 06/30/07 | |
| Sales | |
| Europe | |
| > Netherlands | |
| USG People | | | 1,103,000 | | | | 929,361 | | |
| > France | |
| Neopost | | | 200,000 | | | | 160,000 | | |
| > Germany | |
| Gagfah | | | 150,000 | | | | 0 | | |
| Hugo Boss Designs | | | 525,000 | | | | 425,000 | | |
| > United Kingdom | |
| Debt Free Direct | | | 1,300,000 | | | | 1,000,000 | | |
| Keller Group | | | 1,000,000 | | | | 650,000 | | |
| Northern Rock | | | 2,100,000 | | | | 0 | | |
| Paragon Group | | | 3,500,000 | | | | 371,000 | | |
| Workspace Group | | | 2,450,000 | | | | 1,280,000 | | |
| > Ireland | |
| Anglo Irish Bank | | | 1,300,000 | | | | 0 | | |
| Bank of Ireland | | | 2,000,000 | | | | 845,000 | | |
| C&C Group | | | 1,260,000 | | | | 255,000 | | |
| Grafton Group | | | 1,850,000 | | | | 1,040,000 | | |
| Ryanair | | | 500,000 | | | | 0 | | |
| > Italy | |
| Banca Italease | | | 590,000 | | | | 0 | | |
| Ducati Motor | | | 13,400,000 | | | | 12,531,048 | | |
| > Spain | |
| Red Electrica de Espana | | | 567,000 | | | | 400,000 | | |
| | | Number of Shares | |
| | | 03/31/07 | | 06/30/07 | |
| Asia | |
| > Japan | |
| Chiba Bank | | | 2,000,000 | | | | 1,500,000 | | |
| Daito Trust Construction | | | 546,000 | | | | 375,000 | | |
| Hiroshima Bank | | | 2,248,000 | | | | 0 | | |
| Hogy Medical | | | 321,300 | | | | 53,000 | | |
| > Hong Kong | |
| Melco-PBL Entertainment Macau | | | 200,000 | | | | 0 | | |
| Techtronic Industries | | | 14,000,000 | | | | 0 | | |
| > South Korea | |
| Woongjin Thinkbig | | | 183,500 | | | | 0 | | |
| Other Countries | |
| > Canada | |
| Major Drilling Group | | | 530,000 | | | | 0 | | |
| Northern Orion Resources | | | 839,000 | | | | 0 | | |
| Railpower Technologies | | | 1,778,000 | | | | 0 | | |
| UrAsia Energy | | | 6,775,000 | | | | 0 | | |
| > South Africa | |
| Edgars Consolidated Stores | | | 4,530,000 | | | | 0 | | |
| Latin America | |
| > Brazil | |
| Brascan Residential Properties | | | 492,000 | | | | 0 | | |
| > Mexico | |
| Grupo Aeroportuario Centro Norte | | | 200,000 | | | | 0 | | |
| Grupo Aeroportuario del Pacifica | | | 100,000 | | | | 0 | | |
38
Columbia Acorn International
Statement of Investments (Unaudited), June 30, 2007
| Number of Shares | | | | Value (000) | |
| | | | | | | | Equities: 91.9% | | |
| Europe 51.6% | | | |
| | | > Netherlands 9.3% | |
| | 1,406,155 | | | Fugro | | $ | 89,239 | | |
| | | | | Oilfield Services | | | | | |
| | 825,000 | | | Stork | | | 53,550 | | |
| | | | | Industrial Services & Food Processing Equipment | | | | | |
| | 1,947,042 | | | Aalberts Industries | | | 53,461 | | |
| | | | | Flow Control & Heat Treatment | | | | | |
| | 680,000 | | | Smit Internationale | | | 53,209 | | |
| | | | | Harbor & Offshore Towage & Marine Services | | | | | |
| | 929,361 | | | USG People | | | 43,660 | | |
| | | | | Temporary Staffing Services | | | | | |
| | 1,096,000 | | | Koninklijke TenCate | | | 41,953 | | |
| | | | | Advanced Textiles & Industrial Fabrics | | | | | |
| | 479,000 | | | Imtech | | | 41,552 | | |
| | | | | Engineering & Technical Services | | | | | |
| | 1,385,000 | | | Unit 4 Agresso (a) | | | 37,517 | | |
| | | | | Business & Security Software | | | | | |
| | 1,182,536 | | | Wavin | | | 28,447 | | |
| | | | | Largest European Plastic Pipe Systems Company | | | | | |
| | 764,000 | | | OPG Groep | | | 27,821 | | |
| | | | | Health Care Supplies & Pharmacies | | | | | |
| | 489,000 | | | Boskalis Westminster | | | 19,440 | | |
| | | | | Dredging & Maritime Contractor | | | | | |
| | 450,000 | | | SBM Offshore | | | 17,153 | | |
| | | | | Builds & Leases Offshore Vessels to Process &
Store Crude Oil | | | | | |
| | | | 507,002 | | |
| | | > France 8.4% | |
| | 3,000,000 | | | SES Global | | | 64,665 | | |
| | | | | Satellite Broadcasting Services | | | | | |
| | 600,000 | | | Carbone Lorraine | | | 46,562 | | |
| | | | | Advanced Industrial Materials | | | | | |
| | 390,000 | | | Iliad | | | 39,404 | | |
| | | | | Alternative Internet & Telecoms Provider | | | | | |
| | 375,000 | | | Norbert Dentressangle | | | 36,304 | | |
| | | | | Transport | | | | | |
| | 571,000 | | | Trigano | | | 33,816 | | |
| | | | | Leisure Vehicles & Camping Equipment | | | | | |
| | 206,000 | | | Pierre & Vacances | | | 31,429 | | |
| | | | | Vacation Apartment Lets | | | | | |
| | 332,020 | | | Rubis | | | 29,711 | | |
| | | | | Tank Storage & LPG Supplier | | | | | |
| | 190,000 | | | Bacou Dalloz | | | 28,883 | | |
| | | | | Safety Equipment | | | | | |
| | 700,000 | | | Legrand | | | 25,191 | | |
| | | | | Electrical Components | | | | | |
| | 240,000 | | | Imerys | | | 24,341 | | |
| | | | | Industrial Minerals Producer | | | | | |
| | 160,000 | | | Neopost | | | 23,399 | | |
| | | | | Postage Meter Machines | | | | | |
| | 100,000 | | | Ciments Francais | | | 22,933 | | |
| | | | | Leading French & Emerging Markets
Cement Producer | | | | | |
| | 240,000 | | | Eurofins Scientific (b) | | | 20,377 | | |
| | | | | Food Screening & Testing | | | | | |
| | 350,000 | | | April Group | | | 18,437 | | |
| | | | | Insurance Policy Construction | | | | | |
| Number of Shares | | | | Value (000) | |
| | 360,000 | | | Meetic (b) | | $ | 15,291 | | |
| | | | | Dating Services | | | | | |
| | | | 460,743 | | |
| | | > Germany 6.7% | |
| | 900,000 | | | Rhoen-Klinikum | | | 54,230 | | |
| | | | | Health Care Services | | | | | |
| | 775,000 | | | CTS Eventim | | | 38,171 | | |
| | | | | Event Ticket Sales | | | | | |
| | 400,000 | | | Wincor Nixdorf | | | 37,074 | | |
| | | | | Retail POS Systems & ATM Machines | | | | | |
| | 300,000 | | | MPC Muechmeyer Petersen Capital | | | 30,670 | | |
| | | | | Alternative Asset Manager | | | | | |
| | 250,000 | | | Vossloh | | | 29,346 | | |
| | | | | Rail Infrastructure & Diesel Locomotives | | | | | |
| | 15,000 | | | Porsche | | | 26,704 | | |
| | | | | Specialty Automobile Manufacturer | | | | | |
| | 525,000 | | | GFK | | | 25,928 | | |
| | | | | Market Research Services | | | | | |
| | 425,000 | | | Hugo Boss Designs | | | 25,446 | | |
| | | | | Fashion Apparel | | | | | |
| | 267,000 | | | Elringklinger | | | 24,359 | | |
| | | | | Automobile Components | | | | | |
| | 200,000 | | | Deutsche Boerse | | | 22,661 | | |
| | | | | Trading, Clearing, Settlement Services for
Financial Markets | | | | | |
| | 100,000 | | | Rational | | | 19,595 | | |
| | | | | Commercial Oven Manufacturer | | | | | |
| | 870,000 | | | Takkt | | | 15,493 | | |
| | | | | Mail Order Retailer of Office &
Warehouse Durables | | | | | |
| | 354,500 | | | Deutsche Beteiligungs | | | 14,384 | | |
| | | | | Private Equity Investment Management | | | | | |
| | | | 364,061 | | |
| | | > Switzerland 6.0% | |
| | 600,000 | | | Kuehne & Nagel | | | 55,263 | | |
| | | | | Freight Forwarding/Logistics | | | | | |
| | 24,000 | | | Sika | | | 48,983 | | |
| | | | | Chemicals for Construction &
Industrial Applications | | | | | |
| | 140,000 | | | Nobel Biocare Holding | | | 45,713 | | |
| | | | | Dental Implants & Ceramic Crowns | | | | | |
| | 360,000 | | | Synthes | | | 43,207 | | |
| | | | | Products for Orthopedic Surgery | | | | | |
| | 250,000 | | | Geberit | | | 42,655 | | |
| | | | | Plumbing Supplies | | | | | |
| | 140,000 | | | Burckhardt Compression (b) | | | 33,925 | | |
| | | | | Gas Compression Pumps | | | | | |
| | 375,000 | | | Schindler | | | 24,862 | | |
| | | | | Elevator Manufacturer & Service Provider | | | | | |
| | 25,000 | | | Givaudan | | | 24,686 | | |
| | | | | Fragrances & Flavors | | | | | |
| | 400,000 | | | Logitech International (b) | | | 10,599 | | |
| | | | | Branded Peripheral Computer Devices | | | | | |
| | | | 329,893 | | |
| | | > United Kingdom 5.9% | |
| | 1,970,714 | | | Expro International Group | | | 38,416 | | |
| | | | | Offshore Oilfield Services | | | | | |
| | 1,875,000 | | | Northgate | | | 38,413 | | |
| | | | | Light Commercial Vehicle Rental Specialist | | | | | |
39
Columbia Acorn International
Statement of Investments (Unaudited), continued
| Number of Shares | | | | Value (000) | |
| | | > United Kingdom—continued | |
| | 5,040,000 | | | RPS Group | | $ | 35,304 | | |
| | | | | Environmental Consulting & Planning | | | | | |
| | 2,670,000 | | | Smith & Nephew | | | 33,041 | | |
| | | | | Medical Equipment & Supplies | | | | | |
| | 3,255,691 | | | Tullow Oil | | | 31,725 | | |
| | | | | Oil & Gas Producer | | | | | |
| | 5,922,000 | | | Taylor Nelson Sofres | | | 28,007 | | |
| | | | | Market Research | | | | | |
| | 3,007,000 | | | BBA Group | | | 16,307 | | |
| | | | | Aviation Support Services | | | | | |
| | 1,400,000 | | | Informa Group | | | 15,563 | | |
| | | | | Global Publisher & Event Organizer | | | | | |
| | 640,000 | | | Randgold Resources | | | 14,202 | | |
| | | | | Gold Mining in Western Africa | | | | | |
| | 650,000 | | | Keller Group | | | 14,020 | | |
| | | | | International Ground Engineering Specialist | | | | | |
| | 1,280,000 | | | Workspace Group | | | 10,262 | | |
| | | | | UK Real Estate | | | | | |
| | 517,000 | | | Intertek Testing | | | 10,136 | | |
| | | | | Testing, Inspection, Certification Services | | | | | |
| | 1,275,000 | | | Detica | | | 9,814 | | |
| | | | | UK IT Services Company | | | | | |
| | 1,436,000 | | | Mears Group | | | 9,347 | | |
| | | | | Social Housing Mainentance | | | | | |
| | 448,000 | | | Rotork | | | 8,174 | | |
| | | | | Valve Actuators for Oil & Water Pipelines | | | | | |
| | 1,000,000 | | | Debt Free Direct | | | 4,755 | | |
| | | | | Consumer Debt Reduction &
Management Solutions | | | | | |
| | 371,000 | | | Paragon Group | | | 3,631 | | |
| | | | | UK Buy-to-let Finance Company | | | | | |
| | | | 321,117 | | |
| | | > Ireland 3.4% | |
| | 8,100,000 | | | United Drug | | | 44,231 | | |
| | | | | Irish Pharmaceutical Wholesaler & Outsourcer | | | | | |
| | 1,800,000 | | | IAWS Group | | | 37,705 | | |
| | | | | Baked Goods | | | | | |
| | 1,050,000 | | | Kingspan Group | | | 29,362 | | |
| | | | | Building Insulation & Environmental Containers | | | | | |
| | 1,300,000 | | | Depfa Bank | | | 23,018 | | |
| | | | | Investment Banker to Public Authorities | | | | | |
| | 600,000 | | | Paddy Power | | | 18,706 | | |
| | | | | Irish Betting Services | | | | | |
| | 845,000 | | | Bank of Ireland | | | 17,123 | | |
| | | | | Irish Commercial Bank | | | | | |
| | 1,040,000 | | | Grafton Group | | | 14,837 | | |
| | | | | Builders Materials Wholesaling &
Do-it-yourself Retailing | | | | | |
| | 255,000 | | | C&C Group | | | 3,420 | | |
| | | | | Beverage Company | | | | | |
| | | | 188,402 | | |
| | | > Sweden 2.4% | |
| | 3,960,000 | | | Hexagon | | | 75,944 | | |
| | | | | Measurement Equipment & Polymers | | | | | |
| | 3,135,000 | | | SWECO | | | 30,042 | | |
| | | | | Engineering Consultants | | | | | |
| | 2,265,000 | | | Nobia | | | 28,189 | | |
| | | | | Kitchen Cabinet Manufacturing & Distribution | | | | | |
| | | | 134,175 | | |
| Number of Shares | | | | Value (000) | |
| | | > Italy 2.2% | |
| | 9,100,000 | | | CIR | | $ | 34,997 | | |
| | | | | Italian Holding Company | | | | | |
| | 12,531,048 | | | Ducati Motor (b) | | | 30,501 | | |
| | | | | Motorcycles & Related Merchandise | | | | | |
| | 3,000,000 | | | Amplifon | | | 24,927 | | |
| | | | | Hearing Aid Retailer | | | | | |
| | 1,223,000 | | | GranitiFiandre | | | 15,532 | | |
| | | | | Innovative Stoneware | | | | | |
| | 375,000 | | | Sabaf | | | 14,295 | | |
| | | | | Supplier to White Goods Original
Equipment Manufacturers | | | | | |
| | | | 120,252 | | |
| | | > Spain 1.2% | |
| | 1,050,000 | | | Prisa | | | 23,092 | | |
| | | | | Leading Spanish-speaking Publisher | | | | | |
| | 520,000 | | | Sogecable (b) | | | 21,767 | | |
| | | | | Spain's Main Pay-TV | | | | | |
| | 400,000 | | | Red Electrica de Espana | | | 18,744 | | |
| | | | | Spanish Power Grid | | | | | |
| | | | 63,603 | | |
| | | > Austria 1.1% | |
| | 965,000 | | | Zumtobel (b) | | | 35,996 | | |
| | | | | Lighting Systems | | | | | |
| | 300,000 | | | Wienerberger | | | 22,123 | | |
| | | | | Bricks & Clay Roofing Tiles | | | | | |
| | | | 58,119 | | |
| | | > Russia 1.0% | |
| | 775,000 | | | Novolipetsk Steel | | | 22,746 | | |
| | | | | Vertically Integrated Steel Producer | | | | | |
| | 486,000 | | | RosBusinessConsulting (b) | | | 17,496 | | |
| | | | | Financial Information, Media &
IT Services in Russia | | | | | |
| | 370,000 | | | Mechel Steel Group | | | 13,516 | | |
| | | | | Coking Coal | | | | | |
| | | | 53,758 | | |
| | | > Greece 1.0% | |
| | 1,630,000 | | | Intralot | | | 52,509 | | |
| | | | | Lottery & Gaming Systems & Services | | | | | |
| | | | 52,509 | | |
| | | > Poland 0.7% | |
| | 1,125,500 | | | Central European Distribution (b) | | | 38,965 | | |
| | | | | Vodka Production & Alcohol Distribution | | | | | |
| | | | 38,965 | | |
| | | > Finland 0.7% | |
| | 1,756,000 | | | Poyry | | | 38,934 | | |
| | | | | Engineering Consultants | | | | | |
| | | | 38,934 | | |
| | | > Czech Republic 0.6% | |
| | 183,000 | | | Komercni Banka | | | 34,069 | | |
| | | | | Leading Czech Universal Bank | | | | | |
| | | | 34,069 | | |
| | | > Denmark 0.6% | |
| | 265,000 | | | Novozymes | | | 30,719 | | |
| | | | | Industrial Enzymes | | | | | |
| | | | 30,719 | | |
40
| Number of Shares | | | | Value (000) | |
| | | > Norway 0.4% | |
| | 2,354,000 | | | Kongsberg Automotive (a) | | $ | 19,731 | | |
| | | | | Automotive Seating & Component Supplier | | | | | |
| | | | 19,731 | | |
| Europe: Total | | | 2,816,052 | | |
| Asia 25.2% | | | |
| | | > Japan 13.3% | |
| | 6,000,000 | | | Kansai Paint | | | 52,411 | | |
| | | | | Paint Producer in Japan, India, China &
Southeast Asia | | | | | |
| | 730,000 | | | Ibiden | | | 47,005 | | |
| | | | | Electronic Parts & Ceramics | | | | | |
| | 1,205,000 | | | Aeon Mall | | | 36,964 | | |
| | | | | Suburban Shopping Mall Developer,
Owner & Operator | | | | | |
| | 43,500 | | | Jupiter Telecommunications (b) | | | 35,870 | | |
| | | | | Largest Cable Service Provider in Japan | | | | | |
| | 1,080,000 | | | Hoya | | | 35,745 | | |
| | | | | Opto-electrical Components & Eyeglass Lenses | | | | | |
| | 16,000 | | | Kenedix | | | 29,760 | | |
| | | | | Real Estate Investment Management | | | | | |
| | 1,218,000 | | | JSR | | | 29,334 | | |
| | | | | Films & Chemicals for LCD Screens &
Electronics | | | | | |
| | 1,272,000 | | | Ushio | | | 28,184 | | |
| | | | | Industrial Light Sources | | | | | |
| | 1,300,000 | | | Yusen Air & Sea Service | | | 27,785 | | |
| | | | | Airfreight Logistics | | | | | |
| | 816,200 | | | Kintetsu World Express | | | 27,647 | | |
| | | | | Airfreight Logistics | | | | | |
| | 430,000 | | | USS | | | 27,369 | | |
| | | | | Used Car Auctioneer | | | | | |
| | 1,150,000 | | | FCC | | | 23,617 | | |
| | | | | Auto/Motorcycle Clutches | | | | | |
| | 718,000 | | | Ito En | | | 23,582 | | |
| | | | | Bottled Tea & Other Beverages | | | | | |
| | 2,000,000 | | | Park24 | | | 20,081 | | |
| | | | | Parking Lot Operator | | | | | |
| | 7,000 | | | Risa Partners | | | 19,021 | | |
| | | | | NPL & Real Estate Related Investment | | | | | |
| | 500,000 | | | Union Tool | | | 18,471 | | |
| | | | | Precision Drill Bit Manufacturer | | | | | |
| | 14,000 | | | FullCast (a) | | | 18,403 | | |
| | | | | Employment Outsourcing | | | | | |
| | 145,000 | | | Nakanishi | | | 18,099 | | |
| | | | | Dental Tools & Machinery | | | | | |
| | 375,000 | | | Daito Trust Construction | | | 17,842 | | |
| | | | | Apartment Builder | | | | | |
| | 1,140,000 | | | Cosel | | | 16,520 | | |
| | | | | Industrial Standard Switching
Power Supply System | | | | | |
| | 965,000 | | | T. Hasegawa | | | 16,064 | | |
| | | | | Industrial Flavors & Fragrances | | | | | |
| | 585,000 | | | As One | | | 15,068 | | |
| | | | | Scientific Supplies Distributor | | | | | |
| | 4,100,000 | | | Kansai Urban Banking | | | 14,215 | | |
| | | | | Regional Bank | | | | | |
| | 1,500,000 | | | Chiba Bank | | | 13,313 | | |
| | | | | Regional Bank | | | | | |
| Number of Shares | | | | Value (000) | |
| | 380,000 | | | Takata | | $ | 13,245 | | |
| | | | | Safety Related Auto Parts | | | | | |
| | 370,000 | | | Shimano | | | 12,679 | | |
| | | | | Bicycle Components & Fishing Tackle | | | | | |
| | 2,400 | | | Osaka Securities Exchange | | | 11,071 | | |
| | | | | Osaka Securities Exchange | | | | | |
| | 650,000 | | | Topcon | | | 10,818 | | |
| | | | | Positioning & Medical Instrument | | | | | |
| | 1,230,000 | | | Kamigumi | | | 10,662 | | |
| | | | | Port Cargo Handling & Logistics | | | | | |
| | 1,500,000 | | | Bank of Fukuoka | | | 9,895 | | |
| | | | | Regional Bank | | | | | |
| | 643,000 | | | Ain Pharmaciez (a) | | | 9,813 | | |
| | | | | Dispensing Pharmacy/Drugstore Operator | | | | | |
| | 72,000 | | | Hirose Electric | | | 9,457 | | |
| | | | | Electrical Connectors | | | | | |
| | 374,000 | | | Nagaileben | | | 7,215 | | |
| | | | | Medical/Health Care Related Clothes | | | | | |
| | 1,650 | | | Japan Pure Chemical | | | 6,486 | | |
| | | | | Precious Metal Plating Chemicals for Electronics | | | | | |
| | 3,300 | | | Message | | | 5,353 | | |
| | | | | Nursing Care Facility Operator | | | | | |
| | 105,000 | | | Unicharm PetCare | | | 4,228 | | |
| | | | | Pet Food & Pet Toiletries | | | | | |
| | 95,000 | | | Aeon Delight | | | 2,898 | | |
| | | | | Facility Maintenance & Management | | | | | |
| | 53,000 | | | Hogy Medical | | | 2,366 | | |
| | | | | Disposable Surgical Products | | | | | |
| | | | 728,556 | | |
| | | > China 3.9% | |
| | 23,547,000 | | | China Shipping Development | | | 54,313 | | |
| | | | | China's Dominant Shipper for Oil & Coal | | | | | |
| | 48,430,000 | | | Lenovo Group | | | 28,527 | | |
| | | | | Third Largest PC Vendor Globally | | | | | |
| | 25,051,000 | | | China Green | | | 23,071 | | |
| | | | | An Agricultural Grower & Processor in China | | | | | |
| | 6,256,000 | | | Fu Ji Food & Catering Services | | | 21,445 | | |
| | | | | Food Catering Service Provider In China | | | | | |
| | 20,000,000 | | | Hopewell Highway Infrastructure | | | 18,731 | | |
| | | | | Guangdong Tollroad Leading to
Hong Kong & Macau | | | | | |
| | 17,918,000 | | | Jiangsu Expressway | | | 18,225 | | |
| | | | | Chinese Toll Road Operator | | | | | |
| | 20,910,000 | | | Travelsky Technology | | | 17,870 | | |
| | | | | Online Air Travel Bookings in China | | | | | |
| | 21,750,000 | | | TPV Technology | | | 15,035 | | |
| | | | | Original Design Manufacturer for LCD
Monitor & Flat TV | | | | | |
| | 400,000 | | | Sohu.com (b) | | | 12,796 | | |
| | | | | Advertising on Chinese Internet Portal | | | | | |
| | 6,008,000 | | | Xinyu Hengdeli | | | 2,947 | | |
| | | | | A High-end Watch Retailer in China | | | | | |
| | | | 212,960 | | |
| | | > Hong Kong 2.2% | |
| | 5,500,000 | | | Hong Kong Exchanges and Clearing | | | 77,817 | | |
| | | | | Hong Kong Equity & Derivatives
Market Operator | | | | | |
| | 29,344,000 | | | EganaGoldpfeil | | | 25,706 | | |
| | | | | A Leather & Fashion Accessories
Brand Manager | | | | | |
41
Columbia Acorn International
Statement of Investments (Unaudited), continued
| Number of Shares | | | | Value (000) | |
| | | > Hong Kong—continued | |
| | 5,000,000 | | | Lifestyle International | | $ | 19,378 | | |
| | | | | Mid to High-end Department Store Operator
in Hong Kong & China | | | | | |
| | | | 122,901 | | |
| | | > South Korea 1.7% | |
| | 444,000 | | | Taewoong | | | 31,144 | | |
| | | | | A Player in the Niche Customized
Forging Market | | | | | |
| | 160,000 | | | MegaStudy | | | 31,081 | | |
| | | | | Online Education Service Provider | | | | | |
| | 915,000 | | | Sung Kwang Bend | | | 27,053 | | |
| | | | | A Large Customized Industrial Pipe
Fitting Manufacturer | | | | | |
| | 262,000 | | | YBM Sisa.com | | | 5,031 | | |
| | | | | Online Language Educator & Tester | | | | | |
| | | | 94,309 | | |
| | | > India 1.5% | |
| | 1,300,000 | | | Housing Development Finance | | | 64,598 | | |
| | | | | Indian Mortgage Lender | | | | | |
| | 700,000 | | | Asian Paints | | | 14,250 | | |
| | | | | India's Largest Paint Company | | | | | |
| | 192,000 | | | United Phosphorus | | | 1,482 | | |
| | | | | Off-patent Crop Protection Chemicals | | | | | |
| | | | 80,330 | | |
| | | > Singapore 1.2% | |
| | 7,000,000 | | | Singapore Exchange | | | 44,707 | | |
| | | | | Singapore Equity & Derivatives
Market Operator | | | | | |
| | 13,000,000 | | | ComfortDelGro | | | 18,527 | | |
| | | | | Taxi & Mass Transit Service | | | | | |
| | | | 63,234 | | |
| | | > Taiwan 1.1% | |
| | 6,958,367 | | | Advantech | | | 22,222 | | |
| | | | | Embedded Computers | | | | | |
| | 7,280,000 | | | Wah Lee Industrial | | | 16,478 | | |
| | | | | Distributor of Chemicals, Materials &
Equipment | | | | | |
| | 3,500,000 | | | Everlight Electronics | | | 12,506 | | |
| | | | | A Led Packager | | | | | |
| | 795,826 | | | Formosa International Hotels | | | 8,565 | | |
| | | | | Hotel, Food & Beverage Operation &
Hospitality Management Services | | | | | |
| | | | 59,771 | | |
| | | > Indonesia 0.3% | |
| | 15,000,000 | | | Perusahaan Gas Negara | | | 15,668 | | |
| | | | | Gas Pipeline Operator | | | | | |
| | | | 15,668 | | |
| Asia: Total | | | 1,377,729 | | |
| Other Countries 10.4% | | | |
| | | > Australia 2.8% | |
| | 3,000,000 | | | Billabong International | | | 45,426 | | |
| | | | | Action Sports Apparel Brand Manager | | | | | |
| | 750,000 | | | Australian Stock Exchange | | | 30,851 | | |
| | | | | Australian Equity & Derivatives
Market Operator | | | | | |
| | 2,000,000 | | | Jubilee Mines | | | 27,009 | | |
| | | | | Nickel Mining in Australia | | | | | |
| Number of Shares | | | | Value (000) | |
| | 5,480,000 | | | Sino Gold (b) | | $ | 25,957 | | |
| | | | | Gold Mining in The People's Republic
of China | | | | | |
| | 350,000 | | | Perpetual Trustees | | | 23,183 | | |
| | | | | Mutual Fund Management | | | | | |
| | | | 152,426 | | |
| | | > Canada 2.6% | |
| | 1,860,000 | | | ShawCor | | | 57,114 | | |
| | | | | Oil & Gas Pipeline Products | | | | | |
| | 1,663,500 | | | RONA (b) | | | 34,746 | | |
| | | | | Leading Canadian Do-it-yourself Retailer | | | | | |
| | 950,000 | | | Van Houtte (a) | | | 22,188 | | |
| | | | | Coffee Services & Equipment | | | | | |
| | 865,000 | | | Talisman Energy | | | 16,727 | | |
| | | | | Oil & Gas Producer | | | | | |
| | 850,000 | | | Ivanhoe Mines (b) | | | 12,049 | | |
| | | | | Copper Mine Project in Mongolia | | | | | |
| | | | 142,824 | | |
| | | > United States 2.3% | |
| | 865,000 | | | Atwood Oceanics (b) | | | 59,356 | | |
| | | | | Offshore Drilling Contractor | | | | | |
| | 379,000 | | | FMC Technologies (b) | | | 30,024 | | |
| | | | | Oil & Gas Well Head Manufacturer | | | | | |
| | 500,000 | | | Dresser-Rand Group (b) | | | 19,750 | | |
| | | | | Largest Manufacturer of Compressors | | | | | |
| | 524,000 | | | BioMarin (b) | | | 9,401 | | |
| | | | | Biotech Focused on Orphan Diseases | | | | | |
| | 273,000 | | | Tesco (b) | | | 8,613 | | |
| | | | | Developing New Well Drilling Technologies | | | | | |
| | | | 127,144 | | |
| | | > South Africa 2.3% | |
| | 1,440,000 | | | Impala Platinum Holdings | | | 43,657 | | |
| | | | | Platinum Group Metals Mining & Refining | | | | | |
| | 1,560,000 | | | Naspers | | | 39,960 | | |
| | | | | Media & Education in Africa &
Other Emerging Markets | | | | | |
| | 3,048,750 | | | Uranium One (b) | | | 38,837 | | |
| | | | | Uranium Mines in South Africa,
Kazakhstan, Australia & the U.S. | | | | | |
| | | | 122,454 | | |
| | | > New Zealand 0.4% | |
| | 5,773,789 | | | Sky City Entertainment | | | 22,572 | | |
| | | | | Casino/Entertainment Complex | | | | | |
| | | | 22,572 | | |
| Other Countries: Total | | | 567,420 | | |
| Latin America 4.7% | | | |
| | | > Brazil 2.6% | |
| | 4,300,000 | | | Suzano | | | 58,180 | | |
| | | | | Brazilian Pulp & Paper Producer | | | | | |
| | 2,500,000 | | | Natura Cosmeticos | | | 36,288 | | |
| | | | | Direct Retailer of Cosmetics | | | | | |
| | 720,000 | | | Porto Seguro | | | 27,621 | | |
| | | | | Auto & Life Insurance | | | | | |
| | 1,500,000 | | | Localiza Rent A Car | | | 16,913 | | |
| | | | | Car Rental | | | | | |
| | | | 139,002 | | |
42
Number of Shares
or Principal Amount (000) | | | | Value (000) | |
| | | > Mexico 1.6% | |
| | 7,000,000 | | | Urbi Desarrollos Urbanos (b) | | $ | 32,235 | | |
| | | | | Affordable Housing Builder | | | | | |
| | 18,000,000 | | | Consorcio ARA | | | 28,991 | | |
| | | | | Affordable Housing Builder | | | | | |
| | 500,000 | | | Grupo Aeroportuario del Surest | | | 26,345 | | |
| | | | | Cancun & Cozumel Airport Operator | | | | | |
| | | | 87,571 | | |
| | | > Chile 0.5% | |
| | 160,000 | | | Sociedad Quimica y
Minera de Chile | | | 27,526 | | |
| | | | | Producer of Specialty Fertilizers,
Lithium, & Iodine | | | | | |
| | | | 27,526 | | |
| Latin America: Total | | | 254,099 | | |
Total Equities: 91.9%
(Cost: $3,002,695) | | | 5,015,300 | | |
| Short-Term Obligations 7.3% | | | |
| $ | 27,200 | | | Pasa Funding (c)
5.31% Due 7/13/07 | | | 27,152 | | |
| | 27,000 | | | Advantage Asset (c)
5.32% Due 7/12/07 | | | 26,956 | | |
| | 27,000 | | | Gotham Funding (c)
5.30% Due 7/16/07 | | | 26,940 | | |
| | 27,000 | | | Mont Blanc Capital (c)
5.30% Due 7/24/07 | | | 26,909 | | |
| | 26,900 | | | Beethoven Funding (c)
5.35% Due 7/23/07 | | | 26,812 | | |
| | 26,800 | | | Coast Asset (c)
5.31% Due 7/11/07 | | | 26,761 | | |
| | 26,500 | | | St. Germain Holdings (c)
5.33% Due 7/10/07 | | | 26,465 | | |
| | 26,400 | | | Bavaria (c)
5.29% Due 7/5/07 | | | 26,384 | | |
| | 26,300 | | | Mica Funding LLC (c)
5.29% Due 7/2/07 | | | 26,296 | | |
| | 26,300 | | | Versailles LLC (c)
5.29% Due 7/3/07 | | | 26,292 | | |
| | 26,300 | | | Whistlejacket Capital (c)
5.32% Due 7/9/07 | | | 26,269 | | |
| | 23,200 | | | Morrigan TRR (c)
5.33% Due 7/17/07 | | | 23,145 | | |
| | 22,000 | | | East Fleet Financial (c)
5.31% Due 7/6/07 | | | 21,984 | | |
| | 20,000 | | | Manhattan Asset Funding (c)
5.31% Due 7/18/07 | | | 19,950 | | |
| | 18,000 | | | Cairn High Grade LLC (c)
5.30% Due 7/20/07 | | | 17,950 | | |
| | 15,000 | | | White Point Funding (c)
5.32% Due 7/19/07 | | | 14,960 | | |
| Principal Amount (000) | | | | Value (000) | |
| $ | 7,601 | | | Repurchase Agreement with
Fixed Income Clearing Corp.,
dated 6/29/07, due 7/02/07 at
5.050%, collateralized by a
U.S. Government Agency
Obligation, maturing 7/18/11,
market value $7,756
(repurchase proceeds $7,604) | | $ | 7,601 | | |
| | | (Amortized Cost: $398,826) | | | 398,826 | | |
Total Investments: 99.2%
(Cost: $3,401,521)(d)(e) | | | 5,414,126 | | |
| Cash and Other Assets Less Liabilities: 0.8% | | | 44,604 | | |
| Total Net Assets: 100% | | $ | 5,458,730 | | |
43
Columbia Acorn International
Statement of Investments (Unaudited), continued
> Notes to Statement of Investments (dollar values in thousands)
(a) An affiliate may include any company in which the Fund owns five percent or more of its outstanding voting shares. Transactions in these affiliated companies during the six months ended June 30, 2007, are as follows:
| Affiliates | | Balance of
Shares Held
12/31/2006 | | Purchases/
Additions | | Sales/
Reductions | | Balance of
Shares Held
6/30/2007 | | Value | | Dividend | |
| AIN Pharmaciez | | | 643,000 | | | | - | | | | - | | | | 643,000 | | | $ | 9,813 | | | $ | 91 | | |
| FullCast | | | - | | | | 14,000 | | | | - | | | | 14,000 | | | | 18,403 | | | | 112 | | |
| Kongsberg Automotive | | | 2,065,000 | | | | 289,000 | | | | - | | | | 2,354,000 | | | | 19,731 | | | | 386 | | |
| Unit 4 Agresso | | | 1,385,000 | | | | - | | | | - | | | | 1,385,000 | | | | 37,517 | | | | 1,194 | | |
| Van Houtte | | | 950,000 | | | | - | | | | - | | | | 950,000 | | | | 22,188 | | | | 245 | | |
| TOTAL OF AFFILIATED TRANSACTIONS | | | 5,043,000 | | | | 303,000 | | | | - | | | | 5,346,000 | | | $ | 107,652 | | | $ | 2,028 | | |
The aggregate cost and value of these companies at June 30, 2007, was $102,622 and $107,652, respectively. Investments in affiliate companies represented 2.0% of total net assets at June 30, 2007.
(b) Non-income producing security.
(c) Security exempt from registration under Section 4(2) of the Securities Act of 1933. These securities may only be resold in exempt transactions to qualified buyers. Private resales of these securities to qualified institutional buyers are also exempt from registration pursuant to Rule 144A under the Securities Act of 1933. At June 30, 2007, these securities amounted to $391,225, which represented 7.2% of net assets.
(d) At June 30, 2007 for federal income tax purposes cost of investments was $3,401,521 and net unrealized appreciation was $2,012,605 consisting of gross unrealized appreciation of $2,090,136 and gross unrealized depreciation of $77,531.
(e) On June 30, 2007, the Fund's total investments were denominated in currencies as follows:
| Currency | | Value | | % of
Total
Net
Assets | |
| Euro | | $ | 1,853,624 | | | | 34.0 | % | |
| Japanese Yen | | | 728,556 | | | | 13.3 | | |
| US Dollar | | | 699,562 | | | | 12.8 | | |
| Swiss Franc | | | 329,893 | | | | 6.0 | | |
| Hong Kong Dollar | | | 323,065 | | | | 5.9 | | |
| British Pounds | | | 306,915 | | | | 5.6 | | |
Other currencies less than 5%
of total net assets | | | 1,172,511 | | | | 21.6 | | |
| | | $ | 5,414,126 | | | | 99.2 | % | |
44
Columbia Acorn International
Portfolio Diversification
At June 30, 2007, the Fund's portfolio investments as a percent of net assets was diversified as follows:
| | | Value (000) | | Percent | |
| > Industrial Goods & Services | |
| Materials & Specialty Chemicals | | $ | 448,628 | | | | 8.2 | % | |
| Other Industrial Services | | | 328,110 | | | | 6.0 | | |
| Conglomerates | | | 229,960 | | | | 4.2 | | |
| Machinery | | | 209,206 | | | | 3.9 | | |
| Construction | | | 148,935 | | | | 2.7 | | |
| Outsourcing & Training Services | | | 126,130 | | | | 2.3 | | |
| Electrical Components | | | 115,348 | | | | 2.1 | | |
| Industrial Distribution | | | 29,905 | | | | 0.6 | | |
| Steel | | | 22,746 | | | | 0.4 | | |
| | | | 1,658,968 | | | | 30.4 | | |
| > Consumer Goods & Services | |
| Food | | | 131,411 | | | | 2.4 | | |
| Other Consumer Services | | | 122,291 | | | | 2.3 | | |
| Durables Goods | | | 121,041 | | | | 2.2 | | |
| Retail | | | 109,397 | | | | 2.0 | | |
| Casinos | | | 93,787 | | | | 1.7 | | |
| Apparels | | | 70,872 | | | | 1.3 | | |
| Consumer Goods Distribution | | | 66,334 | | | | 1.2 | | |
| Nondurables | | | 66,222 | | | | 1.2 | | |
| Entertainment | | | 46,736 | | | | 0.9 | | |
| Travel | | | 34,783 | | | | 0.6 | | |
| Leisure Products | | | 33,816 | | | | 0.6 | | |
| Furniture & Textiles | | | 28,189 | | | | 0.5 | | |
| Consumer Electronics | | | 15,035 | | | | 0.3 | | |
| | | | 939,914 | | | | 17.2 | | |
| > Information | |
| Financial Processors | | | 145,185 | | | | 2.7 | | |
Computer Hardware &
Related Equipment | | | 98,422 | | | | 1.8 | | |
Business Information &
Marketing Services | | | 89,239 | | | | 1.6 | | |
| Satellite Broadcasting | | | 64,665 | | | | 1.2 | | |
| Cable Television | | | 57,637 | | | | 1.0 | | |
| Internet Related | | | 52,200 | | | | 1.0 | | |
Semiconductors &
Related Equipment | | | 48,251 | | | | 0.9 | | |
| Television Broadcasting | | | 39,960 | | | | 0.7 | | |
| Publishing | | | 38,655 | | | | 0.7 | | |
| Business Software | | | 37,517 | | | | 0.7 | | |
| Computer Services | | | 27,310 | | | | 0.5 | | |
| Electronics Distribution | | | 16,478 | | | | 0.3 | | |
| Instrumentation | | | 10,818 | | | | 0.2 | | |
| | | | 726,337 | | | | 13.3 | | |
| | | Value (000) | | Percent | |
| > Energy & Minerals | |
| Oil Services | | $ | 339,105 | | | | 6.2 | | |
| Mining | | | 175,227 | | | | 3.2 | | |
| Agricultural Commodities | | | 58,180 | | | | 1.1 | | |
| Oil/Gas Producers | | | 48,452 | | | | 0.9 | | |
| Refining/Marketing/Distribution | | | 45,379 | | | | 0.8 | | |
| | | | 666,343 | | | | 12.2 | | |
| > Other Industries | |
| Transportation | | | 236,316 | | | | 4.3 | | |
| Real Estate | | | 120,269 | | | | 2.2 | | |
| Regulated Utilities | | | 53,741 | | | | 1.0 | | |
| | | | 410,326 | | | | 7.5 | | |
| > Finance | |
| Banks | | | 111,633 | | | | 2.0 | | |
| Money Management | | | 68,418 | | | | 1.3 | | |
| Savings & Loans | | | 64,598 | | | | 1.2 | | |
| Insurance | | | 46,058 | | | | 0.8 | | |
| Closed End Funds | | | 30,670 | | | | 0.6 | | |
| Other Finance Companies | | | 19,457 | | | | 0.4 | | |
| | | | 340,834 | | | | 6.3 | | |
| > Health Care | |
| Medical Equipment | | | 121,961 | | | | 2.2 | | |
| Services | | | 87,404 | | | | 1.6 | | |
| Pharmaceuticals | | | 44,231 | | | | 0.8 | | |
| Hospital Laboratory Supplies | | | 9,581 | | | | 0.2 | | |
| Biotechnology Drug Delivery | | | 9,401 | | | | 0.2 | | |
| | | | 272,578 | | | | 5.0 | | |
| Total Equities: | | | 5,015,300 | | | | 91.9 | | |
| Short-Term Obligations: | | | 398,826 | | | | 7.3 | | |
| Total Investments: | | | 5,414,126 | | | | 99.2 | | |
Cash and Other Assets
Less Liabilities: | | | 44,604 | | | | 0.8 | | |
| Net Assets: | | $ | 5,458,730 | | | | 100.0 | % | |
45
Columbia Acorn USA
Major Portfolio Changes in the Second Quarter (Unaudited)
| | | Number of Shares | |
| | | 03/31/07 | | 06/30/07 | |
| Additions | |
| Information | |
| AMIS Holdings | | | 401,000 | | | | 601,000 | | |
| Blackbaud | | | 0 | | | | 177,906 | | |
| Ciena | | | 0 | | | | 85,000 | | |
| Microsemi | | | 450,000 | | | | 570,000 | | |
| Polycom | | | 305,000 | | | | 475,000 | | |
| Tellabs | | | 2,285,000 | | | | 2,585,000 | | |
| TheStreet.com | | | 0 | | | | 507,897 | | |
| Time Warner Telecom | | | 1,386,000 | | | | 1,486,000 | | |
| Trimble Navigation | | | 310,000 | | | | 368,000 | | |
| Consumer Goods & Services | |
| Cavco Industries | | | 225,000 | | | | 287,900 | | |
| Hansen Natural | | | 0 | | | | 90,000 | | |
| NutriSystem | | | 99,000 | | | | 149,000 | | |
| Pinnacle Entertainment | | | 160,000 | | | | 340,000 | | |
| Pool | | | 318,500 | | | | 523,500 | | |
| Industrial Goods & Services | |
| American Commercial Lines | | | 0 | | | | 340,000 | | |
| American Reprographics | | | 116,000 | | | | 196,000 | | |
| Drew Industries | | | 100,000 | | | | 155,000 | | |
| Genlyte Group | | | 440,000 | | | | 480,000 | | |
| Interline Brands | | | 150,000 | | | | 225,000 | | |
| Health Care | |
| Array Biopharma | | | 0 | | | | 244,094 | | |
| BioMarin | | | 440,000 | | | | 692,400 | | |
| Collagenex Pharmaceuticals | | | 200,000 | | | | 300,000 | | |
| Genitope | | | 0 | | | | 450,000 | | |
| Medarex | | | 0 | | | | 204,400 | | |
| Pharmacopeia | | | 0 | | | | 220,000 | | |
| Seattle Genetics | | | 0 | | | | 251,400 | | |
| Finance | |
| MB Financial | | | 0 | | | | 105,000 | | |
| Old Second Bancorp | | | 0 | | | | 75,000 | | |
| Pacific Continental | | | 170,000 | | | | 308,000 | | |
| Energy & Minerals | |
| Carrizo Oil & Gas | | | 0 | | | | 120,000 | | |
| Tesco | | | 57,500 | | | | 95,000 | | |
| Tetra Technologies | | | 0 | | | | 71,000 | | |
| | | Number of Shares | |
| | | 03/31/07 | | 06/30/07 | |
| Sales | |
| Information | |
| Alltel | | | 270,000 | | | | 0 | | |
| Gemstar-TV Guide International | | | 2,580,000 | | | | 0 | | |
| JDA Software | | | 524,000 | | | | 0 | | |
| Kronos | | | 660,650 | | | | 0 | | |
| Supertex | | | 220,000 | | | | 189,296 | | |
| TALX | | | 100,000 | | | | 0 | | |
| THQ | | | 60,000 | | | | 0 | | |
| Consumer Goods & Services | |
| Carter's | | | 600,200 | | | | 300,000 | | |
| Central Parking | | | 296,700 | | | | 0 | | |
| HNI | | | 106,000 | | | | 45,800 | | |
| ITT Educational Services | | | 416,000 | | | | 366,000 | | |
| Industrial Goods & Services | |
| K&F Industries | | | 236,400 | | | | 0 | | |
| Health Care | |
| The Medicines Company | | | 400,000 | | | | 0 | | |
| United Surgical Partners | | | 550,000 | | | | 0 | | |
| Viasys Healthcare | | | 220,000 | | | | 0 | | |
| Finance | |
| Anchor Bancorp Wisconsin | | | 141,400 | | | | 111,400 | | |
| Energy & Minerals | |
| St. Mary Land & Exploration | | | 80,000 | | | | 47,000 | | |
46
Columbia Acorn USA
Statement of Investments (Unaudited), June 30, 2007
| Number of Shares | | | | Value (000) | |
| | | | | | | | Equities: 96.2% | | |
| Information 30.9% | | | |
| | | > Business Software 4.8% | |
| | 779,900 | | | Avid Technology (a) | | $ | 27,569 | | |
| | | | | Digital Nonlinear Editing Software & Systems | | | | | |
| | 355,000 | | | Micros Systems (a) | | | 19,312 | | |
| | | | | Information Systems for Restaurants & Hotels | | | | | |
| | 2,100,000 | | | Novell (a) | | | 16,359 | | |
| | | | | Directory, Operating System & Identity
Management Software | | | | | |
| | 327,200 | | | Parametric Technology (a) | | | 7,071 | | |
| | | | | Engineering Software & Services | | | | | |
| | 230,400 | | | Concur Technologies (a) | | | 5,265 | | |
| | | | | Web Enabled Cost & Expense Management
Software | | | | | |
| | 177,906 | | | Blackbaud | | | 3,928 | | |
| | | | | Software & Services for Non-profits | | | | | |
| | 250,000 | | | Agile Software (a) | | | 2,015 | | |
| | | | | Product Design Software | | | | | |
| | | | 81,519 | | |
| | | > Mobile Communications 4.5% | |
| | 1,005,000 | | | Crown Castle International (a) | | | 36,451 | | |
| | | | | Communications Towers | | | | | |
| | 506,000 | | | American Tower (a) | | | 21,252 | | |
| | | | | Communications Towers in USA & Mexico | | | | | |
| | 1,633,000 | | | Dobson Communications (a) | | | 18,143 | | |
| | | | | Rural & Small City Cellular Telephone Services | | | | | |
| | 88,000 | | | Globalstar (a) | | | 911 | | |
| | | | | Satellite Mobile Voice & Data Carrier | | | | | |
| | 75,000 | | | Openwave Systems | | | 469 | | |
| | | | | Internet Software for Mobile Devices | | | | | |
| | | | 77,226 | | |
| | | > Semiconductors & Related Equipment 3.8% | |
| | 1,298,490 | | | Integrated Device Technology (a) | | | 19,828 | | |
| | | | �� | Communications Semiconductors | | | | | |
| | 570,000 | | | Microsemi (a) | | | 13,651 | | |
| | | | | Analog/Mixed Signal Semiconductors | | | | | |
| | 1,050,000 | | | Entegris (a) | | | 12,474 | | |
| | | | | Semiconductor Wafer Shipping & Handling
Products | | | | | |
| | 601,000 | | | AMIS Holdings (a) | | | 7,524 | | |
| | | | | Mixed-signal Semiconductors | | | | | |
| | 189,296 | | | Supertex (a) | | | 5,933 | | |
| | | | | Mixed-signal Semiconductors | | | | | |
| | 140,000 | | | Littelfuse (a) | | | 4,728 | | |
| | | | | Little Fuses | | | | | |
| | | | 64,138 | | |
| | | > Computer Hardware & Related
Equipment 3.3% | |
| | 433,581 | | | Nice Systems (a) | | | 15,063 | | |
| | | | | Audio & Video Recording Solutions | | | | | |
| | 505,000 | | | II-VI (a) | | | 13,721 | | |
| | | | | Laser Components | | | | | |
| | 295,600 | | | Amphenol | | | 10,538 | | |
| | | | | Electronic Connectors | | | | | |
| | 130,000 | | | Belden CDT | | | 7,195 | | |
| | | | | Specialty Cable | | | | | |
| | 99,000 | | | Zebra Technologies (a) | | | 3,835 | | |
| | | | | Bar Code Printers | | | | | |
| Number of Shares | | | | Value (000) | |
| | 90,000 | | | Netgear (a) | | $ | 3,263 | | |
| | | | | Networking Products for Small Business & Home | | | | | |
| | 65,000 | | | Intermec (a) | | | 1,645 | | |
| | | | | Bar Code & Wireless LAN Systems | | | | | |
| | 40,000 | | | Rogers (a) | | | 1,480 | | |
| | | | | PCB Laminates & High-performance Foams | | | | | |
| | | | 56,740 | | |
| | | > Telecommunications Equipment 2.9% | |
| | 2,585,000 | | | Tellabs (a) | | | 27,815 | | |
| | | | | Telecommunications Equipment | | | | | |
| | 475,000 | | | Polycom (a) | | | 15,960 | | |
| | | | | Video Conferencing Equipment | | | | | |
| | 85,000 | | | Ciena (a) | | | 3,071 | | |
| | | | | Optical Transport & Broadband Access Equipment | | | | | |
| | 323,500 | | | Symmetricom (a) | | | 2,717 | | |
| | | | | Network Timing & Synchronization Devices | | | | | |
| | | | 49,563 | | |
| | | > Instrumentation 2.8% | |
| | 430,000 | | | Flir Systems (a) | | | 19,887 | | |
| | | | | Infrared Cameras | | | | | |
| | 140,000 | | | Mettler Toledo (a) | | | 13,371 | | |
| | | | | Laboratory Equipment | | | | | |
| | 368,000 | | | Trimble Navigation (a) | | | 11,850 | | |
| | | | | GPS-based Instruments | | | | | |
| | 60,000 | | | FARO Technologies (a) | | | 1,912 | | |
| | | | | Precision Measurement Equipment | | | | | |
| | | | 47,020 | | |
| | | > Telephone Services 2.0% | |
| | 1,486,000 | | | Time Warner Telecom (a) | | | 29,869 | | |
| | | | | Fiber Optic Telephone/Data Services | | | | | |
| | 340,000 | | | Windstream | | | 5,018 | | |
| | | | | Rural Telephone Franchises | | | | | |
| | | | 34,887 | | |
| | | > Internet Related 1.6% | |
| | 460,000 | | | ValueClick (a) | | | 13,552 | | |
| | | | | Internet Advertising | | | | | |
| | 980,000 | | | CNET Networks (a) | | | 8,026 | | |
| | | | | Internet Advertising on Niche Websites | | | | | |
| | 507,897 | | | TheStreet.com | | | 5,526 | | |
| | | | | Financial Information Website Publisher | | | | | |
| | | | 27,104 | | |
| | | > Business Information & Marketing
Services 1.2% | |
| | 530,000 | | | Ceridian (a) | | | 18,550 | | |
| | | | | HR Services & Payment Processing | | | | | |
| | 98,300 | | | Navigant Consulting (a) | | | 1,824 | | |
| | | | | Financial Consulting Firm | | | | | |
| | | | 20,374 | | |
| | | > Financial Processors 0.9% | |
| | 393,280 | | | Global Payments | | | 15,594 | | |
| | | | | Credit Card Processor | | | | | |
| | | | 15,594 | | |
| | | > Computer Services 0.8% | |
| | 786,000 | | | RCM Technologies (a)(b) | | | 6,123 | | |
| | | | | Technology & Engineering Services | | | | | |
| | 1,005,500 | | | AnswerThink (a) | | | 3,640 | | |
| | | | | IT Integration & Best Practice Research | | | | | |
47
Columbia Acorn USA
Statement of Investments (Unaudited), continued
| Number of Shares | | | | Value (000) | |
| | | > Computer Services—continued | |
| | 95,000 | | | SRA International (a) | | $ | 2,399 | | |
| | | | | Government IT Services | | | | | |
| | 235,000 | | | iGate (a) | | | 1,885 | | |
| | | | | IT & Business Process Outsourcing Services | | | | | |
| | | | 14,047 | | |
| | | > TV Broadcasting 0.7% | |
| | 1,125,000 | | | Entravision Communications (a) | | | 11,734 | | |
| | | | | Spanish Language TV, Radio & Outdoor | | | | | |
| | | | 11,734 | | |
| | | > Radio 0.7% | |
| | 511,100 | | | Salem Communications | | | 5,668 | | |
| | | | | Radio Stations for Religious Programming | | | | | |
| | 705,500 | | | Spanish Broadcasting System (a) | | | 3,034 | | |
| | | | | Spanish Language Radio Stations | | | | | |
| | 300,000 | | | Saga Communications (a) | | | 2,940 | | |
| | | | | Radio Stations in Small- & Mid-sized Cities | | | | | |
| | | | 11,642 | | |
| | | > Television Programming 0.5% | |
| | 750,000 | | | Lions Gate Entertainment (a) | | | 8,273 | | |
| | | | | Film & TV Studio | | | | | |
| | | | 8,273 | | |
| | | > CATV 0.3% | |
| | 240,000 | | | Discovery Holding (a) | | | 5,518 | | |
| | | | | CATV Programming | | | | | |
| | | | 5,518 | | |
| | | > Gaming Equipment & Services 0.1% | |
| | 98,500 | | | Shuffle Master (a) | | | 1,635 | | |
| | | | | Card Shufflers & Casino Games | | | | | |
| | | | 1,635 | | |
| Information: Total | | | 527,014 | | |
| Consumer Goods & Services 20.4% | | | |
| | | > Retail 4.4% | |
| | 398,000 | | | Abercrombie & Fitch | | | 29,046 | | |
| | | | | Teen Apparel Retailer | | | | | |
| | 418,000 | | | Chico's FAS (a) | | | 10,174 | | |
| | | | | Women's Specialty Retailer | | | | | |
| | 175,000 | | | J Crew Group (a) | | | 9,466 | | |
| | | | | Multi-channel Branded Retailer | | | | | |
| | 486,250 | | | Christopher & Banks | | | 8,339 | | |
| | | | | Women's Apparel Retailer | | | | | |
| | 224,500 | | | AnnTaylor Stores (a) | | | 7,952 | | |
| | | | | Women's Apparel Retailer | | | | | |
| | 95,000 | | | Genesco (a) | | | 4,969 | | |
| | | | | Multi-concept Branded Footwear Retailer | | | | | |
| | 200,000 | | | Urban Outfitters (a) | | | 4,806 | | |
| | | | | Apparel & Home Specialty Retailer | | | | | |
| | | | 74,752 | | |
| | | > Apparel 3.9% | |
| | 634,200 | | | Oxford Industries | | | 28,121 | | |
| | | | | Branded & Private Label Apparel | | | | | |
| | 885,200 | | | True Religion Apparel (a) | | | 17,996 | | |
| | | | | Premium Denim | | | | | |
| | 222,200 | | | Coach (a) | | | 10,530 | | |
| | | | | Designer & Retailer of Branded Leather
Accessories | | | | | |
| Number of Shares | | | | Value (000) | |
| | 300,000 | | | Carter's (a) | | $ | 7,782 | | |
| | | | | Children's Branded Apparel | | | | | |
| | 90,000 | | | Heelys (a) | | | 2,327 | | |
| | | | | Wheeled Footwear | | | | | |
| | | | 66,756 | | |
| | | > Other Consumer Services 3.8% | |
| | 366,000 | | | ITT Educational Services (a) | | | 42,961 | | |
| | | | | Post-secondary Degree Programs | | | | | |
| | 149,000 | | | NutriSystem (a) | | | 10,406 | | |
| | | | | Weight Loss Programs | | | | | |
| | 310,000 | | | Universal Technical Institute (a) | | | 7,871 | | |
| | | | | Vocational Training | | | | | |
| | 60,000 | | | Weight Watchers International | | | 3,051 | | |
| | | | | Weight Loss Programs | | | | | |
| | | | 64,289 | | |
| | | > Other Durable Goods 1.8% | |
| | 2,078,300 | | | Champion Enterprises (a) | | | 20,430 | | |
| | | | | Manufactured Homes | | | | | |
| | 287,900 | | | Cavco Industries (a) | | | 10,802 | | |
| | | | | Higher End Manufactured Homes | | | | | |
| | | | 31,232 | | |
| | | > Leisure Products 1.8% | |
| | 301,300 | | | International Speedway | | | 15,882 | | |
| | | | | Largest Motorsports Racetrack Owner & Operator | | | | | |
| | 195,500 | | | Speedway Motorsports | | | 7,816 | | |
| | | | | Motorsport Racetrack Owner & Operator | | | | | |
| | 80,000 | | | Thor Industries | | | 3,611 | | |
| | | | | RV & Bus Manufacturer | | | | | |
| | 50,000 | | | Polaris Industries | | | 2,708 | | |
| | | | | Leisure Vehicles & Related Products | | | | | |
| | | | 30,017 | | |
| | | > Nondurables 1.6% | |
| | 531,400 | | | Scotts Miracle-Gro | | | 22,819 | | |
| | | | | Consumer Lawn & Garden Products | | | | | |
| | 108,000 | | | Jarden (a) | | | 4,645 | | |
| | | | | Branded Household Products | | | | | |
| | | | 27,464 | | |
| | | > Consumer Goods Distribution 1.2% | |
| | 523,500 | | | Pool | | | 20,432 | | |
| | | | | Distributor of Swimming Pool Supplies &
Equipment | | | | | |
| | | | 20,432 | | |
| | | > Restaurants 0.8% | |
| | 337,500 | | | Sonic (a) | | | 7,465 | | |
| | | | | Quick Service Restaurant | | | | | |
| | 163,800 | | | Red Robin Gourmet Burgers (a) | | | 6,613 | | |
| | | | | Casual Dining Restaurant | | | | | |
| | | | 14,078 | | |
| | | > Casinos & Gaming 0.6% | |
| | 340,000 | | | Pinnacle Entertainment (a) | | | 9,571 | | |
| | | | | Regional Casino Operator | | | | | |
| | | | 9,571 | | |
| | | > Food & Beverage 0.2% | |
| | 90,000 | | | Hansen Natural (a) | | | 3,868 | | |
| | | | | Alternative Beverages | | | | | |
| | | | 3,868 | | |
48
| Number of Shares | | | | Value (000) | |
| | | > Furniture & Textiles 0.2% | |
| | 45,800 | | | HNI | | $ | 1,878 | | |
| | | | | Office Furniture & Fireplaces | | | | | |
| | 56,800 | | | Knoll | | | 1,272 | | |
| | | | | Office Furniture | | | | | |
| | | | 3,150 | | |
| | | > Travel 0.1% | |
| | 45,000 | | | Vail Resorts (a) | | | 2,739 | | |
| | | | | Ski Resort Operator & Developer | | | | | |
| | | | 2,739 | | |
| Consumer Goods & Services: Total | | | 348,348 | | |
| Industrial Goods & Services 14.0% | | | |
| | | > Machinery 6.9% | |
| | 697,500 | | | Ametek | | | 27,677 | | |
| | | | | Aerospace/Industrial Instruments | | | | | |
| | 673,600 | | | Pentair | | | 25,980 | | |
| | | | | Pumps & Water Treatment | | | | | |
| | 650,300 | | | ESCO Technologies | | | 23,580 | | |
| | | | | Automatic Electric Meter Readers | | | | | |
| | 373,600 | | | Nordson | | | 18,740 | | |
| | | | | Dispensing Systems for Adhesives & Coatings | | | | | |
| | 319,800 | | | Donaldson | | | 11,369 | | |
| | | | | Industrial Air Filtration | | | | | |
| | 71,800 | | | Toro | | | 4,228 | | |
| | | | | Turf Maintenance Equipment | | | | | |
| | 132,000 | | | Goodman Global (a) | | | 2,933 | | |
| | | | | HVAC Equipment Manufacturer | | | | | |
| | 50,000 | | | Kaydon | | | 2,606 | | |
| | | | | Specialized Friction & Motion Control Products | | | | | |
| | | | 117,113 | | |
| | | > Electrical Components 2.2% | |
| | 480,000 | | | Genlyte Group (a) | | | 37,699 | | |
| | | | | Commercial Lighting Fixtures | | | | | |
| | | | 37,699 | | |
| | | > Other Industrial Services 1.5% | |
| | 340,000 | | | American Commercial Lines (a) | | | 8,857 | | |
| | | | | Operator of Inland Barges/Builder of
Inland Barges | | | | | |
| | 350,000 | | | Labor Ready (a) | | | 8,089 | | |
| | | | | Temporary Manual Labor | | | | | |
| | 196,000 | | | American Reprographics (a) | | | 6,035 | | |
| | | | | Document Management & Logistics | | | | | |
| | 89,000 | | | G&K Services | | | 3,516 | | |
| | | | | Uniform Rental | | | | | |
| | | | 26,497 | | |
| | | > Construction 1.0% | |
| | 204,050 | | | Florida Rock | | | 13,773 | | |
| | | | | Aggregates & Concrete | | | | | |
| | 100,000 | | | Simpson Manufacturing | | | 3,374 | | |
| | | | | Wall Joint Maker | | | | | |
| | | | 17,147 | | |
| | | > Outsourcing Services 1.0% | |
| | 350,000 | | | Quanta Services (a) | | | 10,734 | | |
| | | | | Electrical & Telecom Construction Services | | | | | |
| Number of Shares | | | | Value (000) | |
| | 175,000 | | | Administaff | | $ | 5,861 | | |
| | | | | Professional Employer Organization | | | | | |
| | | | 16,595 | | |
| | | > Industrial Distribution 0.6% | |
| | 225,000 | | | Interline Brands (a) | | | 5,868 | | |
| | | | | Industrial Distribution | | | | | |
| | 70,000 | | | Watsco | | | 3,808 | | |
| | | | | HVAC Distribution | | | | | |
| | | | 9,676 | | |
| | | > Waste Management 0.5% | |
| | 280,875 | | | Waste Connections (a) | | | 8,494 | | |
| | | | | Solid Waste Management | | | | | |
| | | | 8,494 | | |
| | | > Industrial Materials & Specialty
Chemicals 0.3% | |
| | 155,000 | | | Drew Industries (a) | | | 5,137 | | |
| | | | | RV & Manufactured Home Components | | | | | |
| | | | 5,137 | | |
| Industrial Goods & Services: Total | | | 238,358 | | |
| Health Care 11.8% | | | |
| | | > Biotechnology & Drug Delivery 4.4% | |
| | 885,000 | | | PDL BioPharma (a) | | | 20,620 | | |
| | | | | Proprietary Monoclonal Antibodies | | | | | |
| | 692,400 | | | BioMarin (a) | | | 12,422 | | |
| | | | | Biotech Focused on Orphan Diseases | | | | | |
| | 580,000 | | | Nektar Therapeutics (a) | | | 5,504 | | |
| | | | | Drug Delivery Technologies | | | | | |
| | 3,690,300 | | | Medicure (a) | | | 4,982 | | |
| | 738,060 | | | Medicure - Warrants (a)(c) | | | 443 | | |
| | | | | Cardiovascular Biotech Company | | | | | |
| | 125,000 | | | Myriad Genetics (a) | | | 4,649 | | |
| | | | | Drugs/Diagnostics Hybrid | | | | | |
| | 1,135,000 | | | Decode Genetics (a) | | | 4,239 | | |
| | | | | Drugs for Heart Attack, Asthma & Vascular Disease | | | | | |
| | 204,400 | | | Medarex (a) | | | 2,921 | | |
| | | | | Humanized Antibodies | | | | | |
| | 650,000 | | | La Jolla Pharmaceutical (a) | | | 2,912 | | |
| | | | | Lupus Treatment | | | | | |
| | 244,094 | | | Array Biopharma (a) | | | 2,849 | | |
| | | | | Drugs for Cancer & Inflammatory Diseases | | | | | |
| | 248,600 | | | Arena Pharmaceuticals (a) | | | 2,732 | | |
| | | | | Novel Drug Targeting Technology | | | | | |
| | 500,000 | | | IsoRay (a) | | | 2,520 | | |
| | 100,000 | | | IsoRay - Warrants (a)(c) | | | 114 | | |
| | | | | Radiology Cancer Company | | | | | |
| | 251,400 | | | Seattle Genetics (a) | | | 2,466 | | |
| | | | | Antibody-based Therapies for Cancer | | | | | |
| | 271,590 | | | Neurogen (a) | | | 1,803 | | |
| | | | | Development-stage Biotech Focused on Neurology | | | | | |
| | 450,000 | | | Genitope (a) | | | 1,737 | | |
| | | | | Cancer Vaccine | | | | | |
| | 220,000 | | | Pharmacopeia (a) | | | 1,221 | | |
| | | | | Biotech Company with Broad Early-stage Pipeline | | | | | |
| | 273,500 | | | Nuvelo (a) | | | 744 | | |
| | | | | Development-stage Biotech Focused on Cardiovascular/Cancer | | | | | |
49
Columbia Acorn USA
Statement of Investments (Unaudited), continued
| Number of Shares | | | | Value (000) | |
| | | > Biotechnology & Drug Delivery—continued | |
| | 375,000 | | | Locus Discovery, Series D, Pfd. (a)(c) | | $ | 109 | | |
| | 193,288 | | | Locus Discovery, Series B, Pfd. (a)(c) | | | 56 | | |
| | | | | High Throughput Rational Drug Design | | | | | |
| | 18,181 | | | Metabolex (a)(c) | | | 64 | | |
| | | | | Diabetes Drug Development | | | | | |
| | | | 75,107 | | |
| | | > Medical Equipment & Devices 2.2% | |
| | 577,400 | | | Edwards Lifesciences (a) | | | 28,489 | | |
| | | | | Heart Valves | | | | | |
| | 105,000 | | | Vital Signs | | | 5,833 | | |
| | | | | Anesthesia, Respiratory & Sleep Products | | | | | |
| | 94,171 | | | Advanced Medical Optics (a) | | | 3,284 | | |
| | | | | Medical Devices for Eye Care | | | | | |
| | | | 37,606 | | |
| | | > Health Care Services 2.2% | |
| | 291,800 | | | Lincare Holdings (a) | | | 11,628 | | |
| | | | | Home Health Care Services | | | | | |
| | 210,000 | | | LCA-Vision | | | 9,925 | | |
| | | | | Lasik Surgery Centers | | | | | |
| | 470,000 | | | PSS World Medical (a) | | | 8,563 | | |
| | | | | Medical Supplies | | | | | |
| | 137,000 | | | Charles River Laboratories (a) | | | 7,072 | | |
| | | | | Pharmaceutical Research | | | | | |
| | | | 37,188 | | |
| | | > Pharmaceuticals 1.6% | |
| | 250,000 | | | Medicis Pharmaceutical | | | 7,635 | | |
| | | | | Specialty Pharmaceuticals-dermatology | | | | | |
| | 270,000 | | | MGI Pharma (a) | | | 6,040 | | |
| | | | | Specialty Pharmaceuticals for Oncology &
Acute Care | | | | | |
| | 790,000 | | | QLT (a) | | | 5,846 | | |
| | | | | Specialty Pharmaceuticals for Ophthalmology & Dermatology | | | | | |
| | 300,000 | | | Collagenex Pharmaceuticals (a) | | | 3,720 | | |
| | | | | Specialty Pharmaceuticals-dermatology | | | | | |
| | 505,000 | | | Barrier Therapeutics (a) | | | 3,283 | | |
| | | | | Specialty Pharmaceuticals for Dermatology | | | | | |
| | | | 26,524 | | |
| | | > Medical Supplies 1.4% | |
| | 270,700 | | | ICU Medical (a) | | | 11,624 | | |
| | | | | Intravenous Therapy Products | | | | | |
| | 158,300 | | | Techne (a) | | | 9,056 | | |
| | | | | Cytokines, Antibodies & other Reagents for
Life Science | | | | | |
| | 104,000 | | | Arrow International | | | 3,981 | | |
| | | | | Disposable Catheters | | | | | |
| | | | 24,661 | | |
| Health Care: Total | | | 201,086 | | |
| Finance 8.8% | | | |
| | | > Finance Companies 3.2% | |
| | 1,121,500 | | | AmeriCredit (a) | | | 29,776 | | |
| | | | | Auto Lending | | | | | |
| | 482,900 | | | World Acceptance (a) | | | 20,634 | | |
| | | | | Personal Loans | | | | | |
| | 130,000 | | | McGrath Rentcorp | | | 4,380 | | |
| | | | | Temporary Space & IT Rentals | | | | | |
| | | | 54,790 | | |
| Number of Shares | | | | Value (000) | |
| | | > Insurance 2.7% | |
| | 714,500 | | | HCC Insurance Holdings | | $ | 23,872 | | |
| | | | | Specialty Insurance | | | | | |
| | 14,000 | | | Markel (a) | | | 6,784 | | |
| | | | | Specialty Insurance | | | | | |
| | 105,000 | | | Philadelphia Consolidated Holding (a) | | | 4,389 | | |
| | | | | Specialty Insurance | | | | | |
| | 87,000 | | | Delphi Financial Group | | | 3,638 | | |
| | | | | Group Employee Benefit Products & Services | | | | | |
| | 75,000 | | | Endurance Specialty Holdings | | | 3,003 | | |
| | | | | Commercial Lines Insurance/Reinsurance | | | | | |
| | 177,743 | | | Eastern Insurance Holdings | | | 2,824 | | |
| | | | | Workers Comp & Specialty Insurance | | | | | |
| | 91,000 | | | United America Indemnity (a) | | | 2,263 | | |
| | | | | Specialty Insurance | | | | | |
| | | | 46,773 | | |
| | | > Banks 2.5% | |
| | 212,756 | | | Chittenden | | | 7,436 | | |
| | | | | New England Bank | | | | | |
| | 239,500 | | | TCF Financial | | | 6,658 | | |
| | | | | Great Lakes Bank | | | | | |
| | 308,000 | | | Pacific Continental | | | 4,989 | | |
| | | | | Niche Pacific N.W. Bank | | | | | |
| | 145,000 | | | Greene County Bancshares | | | 4,533 | | |
| | | | | Tennessee Bank | | | | | |
| | 215,000 | | | First Busey | | | 4,298 | | |
| | | | | Illinois Bank | | | | | |
| | 105,000 | | | MB Financial | | | 3,648 | | |
| | | | | Chicago Bank | | | | | |
| | 94,000 | | | Associated Banc-Corp | | | 3,074 | | |
| | | | | Midwest Bank | | | | | |
| | 125,000 | | | Lakeland Financial | | | 2,659 | | |
| | | | | Indiana Bank | | | | | |
| | 114,777 | | | Glacier Bancorp | | | 2,336 | | |
| | | | | Mountain States Bank | | | | | |
| | 75,000 | | | Old Second Bancorp | | | 2,187 | | |
| | | | | Illinois Bank | | | | | |
| | 20,000 | | | First Financial Bankshares | | | 776 | | |
| | | | | West Texas Bank | | | | | |
| | 31,500 | | | West Bancorporation | | | 503 | | |
| | | | | Des Moines Commercial Bank | | | | | |
| | | | 43,097 | | |
| | | > Savings & Loans 0.4% | |
| | 168,000 | | | People's United | | | 2,979 | | |
| | | | | Connecticut Savings & Loan | | | | | |
| | 111,400 | | | Anchor Bancorp Wisconsin | | | 2,917 | | |
| | | | | Wisconsin Thrift | | | | | |
| | | | 5,896 | | |
| Finance: Total | | | 150,556 | | |
| Energy & Minerals 7.8% | | | |
| | | > Oil Services 4.3% | |
| | 401,700 | | | FMC Technologies (a) | | | 31,823 | | |
| | | | | Oil & Gas Well Head Manufacturer | | | | | |
50
| Number of Shares | | | | Value (000) | |
| | | > Oil Services—continued | |
| | 367,000 | | | Atwood Oceanics (a) | | $ | 25,184 | | |
| | | | | Offshore Drilling Contractor | | | | | |
| | 355,000 | | | Hanover Compressor (a) | | | 8,467 | | |
| | | | | Natural Gas Compressor Rental & Fabrication | | | | | |
| | 95,000 | | | Tesco (a) | | | 2,997 | | |
| | | | | Developing New Well Drilling Technologies | | | | | |
| | 67,500 | | | CARBO Ceramics | | | 2,957 | | |
| | | | | Natural Gas Well Stimulants | | | | | |
| | 71,000 | | | Tetra Technologies (a) | | | 2,002 | | |
| | | | | U.S.-based Services Company with Life of
Field Approach | | | | | |
| | 11,000 | | | Key Energy Services (a) | | | 204 | | |
| | | | | Well Workover Services | | | | | |
| | | | 73,634 | | |
| | | > Oil & Gas Producers 2.8% | |
| | 525,000 | | �� | Quicksilver Resources (a) | | | 23,404 | | |
| | | | | Natural Gas & Coal Seam Gas Producer | | | | | |
| | 208,400 | | | Southwestern Energy (a) | | | 9,274 | | |
| | | | | Oil & Gas Producer | | | | | |
| | 111,200 | | | Equitable Resources | | | 5,511 | | |
| | | | | Natural Gas Producer & Utility | | | | | |
| | 120,000 | | | Carrizo Oil & Gas (a) | | | 4,976 | | |
| | | | | Explores for Natural Gas & Crude Oil | | | | | |
| | 450,000 | | | Vaalco Energy (a) | | | 2,174 | | |
| | | | | Oil & Gas Producer | | | | | |
| | 47,000 | | | St. Mary Land & Exploration | | | 1,721 | | |
| | | | | Oil & Gas Producer | | | | | |
| | | | 47,060 | | |
| | | > Other Resources 0.5% | |
| | 218,000 | | | Layne Christensen (a) | | | 8,927 | | |
| | | | | Oil & Gas Production/Engineering &
Construction/Contract Drilling | | | | | |
| | | | 8,927 | | |
| | | > Oil Refining, Marketing & Distribution 0.2% | |
| | 50,250 | | | Oneok | | | 2,533 | | |
| | | | | Natural Gas Distribution, Pipeline
Processing & Trading | | | | | |
| | | | 2,533 | | |
| Energy & Minerals: Total | | | 132,154 | | |
| Other Industries 2.5% | | | |
| | | > Real Estate 1.8% | |
| | 560,000 | | | DiamondRock Hospitality | | | 10,685 | | |
| | | | | Hotel Owner | | | | | |
| | 350,000 | | | Highland Hospitality | | | 6,720 | | |
| | | | | Hotel Owner | | | | | |
| | 77,500 | | | Gaylord Entertainment (a) | | | 4,157 | | |
| | | | | Convention Hotels | | | | | |
| | 100,000 | | | Digital Realty Trust | | | 3,768 | | |
| | | | | Technology-focused Office Buildings | | | | | |
| | 150,000 | | | Kite Realty Group | | | 2,853 | | |
| | | | | Community Shopping Centers | | | | | |
| | 90,000 | | | American Campus Communities | | | 2,546 | | |
| | | | | Student Housing | | | | | |
| | | | 30,729 | | |
Number of Shares
or Principal Amount (000) | | | | Value (000) | |
| | | > Transportation 0.5% | |
| | 524,720 | | | Heartland Express | | $ | 8,553 | | |
| | | | | Regional Trucker | | | | | |
| | | | 8,553 | | |
| | | > Regulated Utilities 0.2% | |
| | 97,500 | | | Northeast Utilities | | | 2,765 | | |
| | | | | Regulated Electric Utility | | | | | |
| | | | 2,765 | | |
| Other Industries: Total | | | 42,047 | | |
Total Equities: 96.2%
(Cost: $1,132,404) | | | 1,639,563 | | |
| Short-Term Obligations 5.3% | | | |
| $ | 8,700 | | | Pasa Funding (d)
5.31% Due 7/03/07 | | | 8,697 | | |
| | 8,700 | | | World Omni Vehicle Leasing (d)
5.30% Due 7/06/07 | | | 8,693 | | |
| | 8,600 | | | Times Square Funding (d)
5.30% Due 7/02/07 | | | 8,599 | | |
| | 8,600 | | | Transamerica Asset (d)
5.40% Due 7/02/07 | | | 8,599 | | |
| | 8,600 | | | Morrigan TRR (d)
5.23% Due 7/05/07 | | | 8,595 | | |
| | 8,600 | | | Morrigan TRR (d)
5.34% Due 7/09/07 | | | 8,590 | | |
| | 8,600 | | | Natixis (d)
5.33% Due 7/10/07 | | | 8,588 | | |
| | 8,500 | | | Abbey National
5.29% Due 7/02/07 | | | 8,499 | | |
| | 8,500 | | | Erste Finance LLC (d)
5.32% Due 7/02/07 | | | 8,499 | | |
| | 8,500 | | | Mica Funding LLC 5 (d)
5.32% Due 7/02/07 | | | 8,499 | | |
| | 4,154 | | | Repurchase Agreement with
Fixed Income Clearing Corp.,
dated 6/29/07, due 7/02/07 at
5.050%, collateralized by a
U.S. Government Agency Obligation,
maturing 7/18/11, market value
$4,238 (repurchase proceeds $4,156) | | | 4,154 | | |
| | | | | (Amortized Cost: $90,012) | | | 90,012 | | |
Total Investments: 101.5%
(Cost: $1,222,416)(e) | | | 1,729,575 | | |
| Cash and Other Assets Less Liabilities: (1.5)% | | | (26,037 | ) | |
| Total Net Assets: 100% | | $ | 1,703,538 | | |
51
Columbia Acorn USA
Statement of Investments (Unaudited), continued
> Notes to Statement of Investments (dollar values in thousands)
(a) Non-income producing security.
(b) An affiliate may include any company in which the Fund owns five percent or more of its outstanding voting shares. Transactions in this affiliated company during the six months ended June 30, 2007, are as follows:
| Affiliate | | Balance of
Shares Held
12/31/2006 | | Purchases/
Additions | | Sales/
Reductions | | Balance of
Shares Held
6/30/2007 | | Value | | Dividend | |
| RCM Technologies | | | 786,000 | | | | - | | | | - | | | | 786,000 | | | $ | 6,123 | | | $ | - | | |
The aggregate cost and value of this company at June 30, 2007, was $3,130 and $6,123, respectively. Investments in affiliate companies represented 0.4% of total net assets at June 30, 2007.
(c) Denotes a restricted security, which is subject to restrictions on resale under federal securities laws. These securities, are valued in good faith by the Board of Trustees. At June 30, 2007, these securities had an aggregate value of $786 which represented 0.05% of total net assets.
Additional information on these securities is as follows:
| Security | | Acquisition
Dates | | Shares | | Cost | | Value | |
| Locus Discovery, Series D, Pfd. | | 9/5/01 | | | 375,000 | | | $ | 1,500 | | | $ | 109 | | |
| Locus Discovery, Series B, Pfd. | | 2/8/07 | | | 193,288 | | | | 56 | | | | 56 | | |
| Metabolex, Series F | | 5/11/00 | | | 18,181 | | | | 2,000 | | | | 64 | | |
| IsoRay Warrants | | 3/21/07 | | | 100,000 | | | | - | | | | 114 | | |
| Medicure Warrants | | 12/22/06 | | | 738,060 | | | | - | | | | 443 | | |
| | | | | | | | | $ | 3,556 | | | $ | 786 | | |
(d) Security exempt from registration under Section 4(2) of the Securities Act of 1933. These securities may only be resold in exempt transactions to qualified buyers. Private resales of these securities to qualified institutional buyers are also exempt from registration pursuant to Rule 144A under the Securities Act of 1933. At June 30, 2007, these securities amounted to $77,359, which represented 4.5% of net assets.
(e) At June 30, 2007, for federal income tax purposes cost of investments was $1,222,416 and net unrealized appreciation was $507,159 consisting of gross unrealized appreciation of $551,801 and gross unrealized depreciation of $44,642.
52
Columbia Acorn International Select
Major Portfolio Changes in the Second Quarter (Unaudited)
| | | Number of Shares | |
| | | 03/31/07 | | 06/30/07 | |
| Additions | |
| Europe | |
| > Switzerland | |
| Geberit | | | 2,400 | | | | 24,000 | | |
| Kuehne & Nagel | | | 49,000 | | | | 70,000 | | |
| Synthes | | | 50,500 | | | | 57,000 | | |
| > Netherlands | |
| Fugro | | | 60,000 | | | | 125,634 | | |
| SBM Offshore | | | 0 | | | | 60,000 | | |
| Stork | | | 0 | | | | 79,000 | | |
| Wavin | | | 0 | | | | 44,936 | | |
| > Ireland | |
| CRH | | | 140,000 | | | | 146,737 | | |
| United Drug | | | 710,733 | | | | 751,000 | | |
| > United Kingdom | |
| Informa Group | | | 0 | | | | 170,000 | | |
| Intertek Testing | | | 0 | | | | 71,700 | | |
| Smith & Nephew | | | 441,000 | | | | 535,000 | | |
| > Austria | |
| Zumtobel | | | 172,500 | | | | 189,500 | | |
| > Greece | |
| Intralot | | | 60,000 | | | | 130,000 | | |
| Asia | |
| > Japan | |
| Hoya | | | 140,000 | | | | 153,000 | | |
| Kansai Paint | | | 280,000 | | | | 540,000 | | |
| Nintendo | | | 21,500 | | | | 29,700 | | |
| > Hong Kong | |
Hong Kong Exchanges and
Clearing | | | 405,000 | | | | 500,000 | | |
| Other Countries | |
| > United States | |
| Atwood Oceanics | | | 97,500 | | | | 100,000 | | |
| | | Number of Shares | |
| | | 03/31/07 | | 06/30/07 | |
| Sales | |
| Europe | |
| > Ireland | |
| Anglo Irish Bank | | | 160,000 | | | | 0 | | |
| Bank of Ireland | | | 240,000 | | | | 65,000 | | |
| C&C Group | | | 100,800 | | | | 24,700 | | |
| Ryanair | | | 85,000 | | | | 0 | | |
| > United Kingdom | |
| Northern Rock | | | 215,000 | | | | 0 | | |
| Paragon Group | | | 310,000 | | | | 0 | | |
| > Spain | |
| Red Electrica de Espana | | | 90,000 | | | | 85,000 | | |
| > Italy | |
| Banca Italease | | | 30,000 | | | | 0 | | |
| Asia | |
| > Japan | |
| Daito Trust Construction | | | 68,000 | | | | 43,000 | | |
| USS | | | 40,000 | | | | 32,000 | | |
53
Columbia Acorn International Select
Statement of Investments (Unaudited), June 30, 2007
| Number of Shares | | | | Value (000) | |
| | | | | | | | Equities: 91.7% | | |
| Europe 51.4% | | | |
| | | > Switzerland 12.0% | |
| | 57,000 | | | Synthes | | $ | 6,841 | | |
| | | | | Products for Orthopedic Surgery | | | | | |
| | 70,000 | | | Kuehne & Nagel | | | 6,447 | | |
| | | | | Freight Forwarding/Logistics | | | | | |
| | 16,500 | | | Nobel Biocare Holding | | | 5,388 | | |
| | | | | Dental Implants & Ceramic Crowns | | | | | |
| | 24,000 | | | Geberit | | | 4,095 | | |
| | | | | Plumbing Supplies | | | | | |
| | 7,500 | | | Swatch Group | | | 2,130 | | |
| | | | | Watch & Electronics Manufacturer | | | | | |
| | 26,000 | | | Schindler | | | 1,724 | | |
| | | | | Elevator Manufacturer & Service Provider | | | | | |
| | | | 26,625 | | |
| | | > Netherlands 10.0% | |
| | 125,634 | | | Fugro | | | 7,973 | | |
| | | | | Oilfield Services | | | | | |
| | 79,000 | | | Stork | | | 5,128 | | |
| | | | | Industrial Services & Food Processing Equipment | | | | | |
| | 117,633 | | | Aalberts Industries | | | 3,230 | | |
| | | | | Flow Control & Heat Treatment | | | | | |
| | 60,000 | | | SBM Offshore | | | 2,287 | | |
| | | | | Builds & Leases Offshore Vessels to Process &
Store Crude Oil | | | | | |
| | 34,723 | | | USG People | | | 1,631 | | |
| | | | | Temporary Staffing Services | | | | | |
| | 44,936 | | | Wavin | | | 1,081 | | |
| | | | | Largest European Plastic Pipe Systems Company | | | | | |
| | 23,100 | | | Boskalis Westminster | | | 919 | | |
| | | | | Dredging & Maritime Contractor | | | | | |
| | | | 22,249 | | |
| | | > Ireland 7.3% | |
| | 146,737 | | | CRH | | | 7,242 | | |
| | | | | Global Building Materials | | | | | |
| | 751,000 | | | United Drug | | | 4,101 | | |
| | | | | Irish Pharmaceutical Wholesaler & Outsourcer | | | | | |
| | 150,000 | | | IAWS Group | | | 3,142 | | |
| | | | | Baked Goods | | | | | |
| | 65,000 | | | Bank of Ireland | | | 1,317 | | |
| | | | | Irish Commercial Bank | | | | | |
| | 24,700 | | | C&C Group | | | 331 | | |
| | | | | Beverage Company | | | | | |
| | | | 16,133 | | |
| | | > United Kingdom 4.5% | |
| | 535,000 | | | Smith & Nephew | | | 6,620 | | |
| | | | | Medical Equipment & Supplies | | | | | |
| | 170,000 | | | Informa Group | | | 1,890 | | |
| | | | | Global Publisher & Event Organizer | | | | | |
| | 71,700 | | | Intertek Testing | | | 1,406 | | |
| | | | | Testing, Inspection, Certification Services | | | | | |
| | | | 9,916 | | |
| | | > Germany 3.5% | |
| | 40,000 | | | Wincor Nixdorf | | | 3,708 | | |
| | | | | Retail POS Systems & ATM Machines | | | | | |
| | 1,250 | | | Porsche | | | 2,225 | | |
| | | | | Specialty Automobile Manufacturer | | | | | |
| Number of Shares | | | | Value (000) | |
| | 17,000 | | | Deutsche Boerse | | $ | 1,926 | | |
| | | | | Trading, Clearing, Settlement Services for
Financial Markets | | | | | |
| | | | 7,859 | | |
| | | > Austria 3.2% | |
| | 189,500 | | | Zumtobel (a) | | | 7,069 | | |
| | | | | Lighting Systems | | | | | |
| | | | 7,069 | | |
| | | > France 2.9% | |
| | 300,000 | | | SES Global | | | 6,466 | | |
| | | | | Satellite Broadcasting Services | | | | | |
| | | | 6,466 | | |
| | | > Sweden 2.7% | |
| | 318,000 | | | Hexagon | | | 6,098 | | |
| | | | | Measurement Equipment & Polymers | | | | | |
| | | | 6,098 | | |
| | | > Greece 1.9% | |
| | 130,000 | | | Intralot | | | 4,188 | | |
| | | | | Lottery & Gaming Systems & Services | | | | | |
| | | | 4,188 | | |
| | | > Spain 1.8% | |
| | 85,000 | | | Red Electrica de Espana | | | 3,983 | | |
| | | | | Spanish Power Grid | | | | | |
| | | | 3,983 | | |
| | | > Denmark 1.6% | |
| | 31,000 | | | Novozymes | | | 3,593 | | |
| | | | | Industrial Enzymes | | | | | |
| | | | 3,593 | | |
| Europe: Total | | | 114,179 | | |
| Asia 28.4% | | | |
| | | > Japan 23.4% | |
| | 29,700 | | | Nintendo | | | 10,847 | | |
| | | | | Entertainment Software & Hardware | | | | | |
| | 6,700 | | | Jupiter Telecommunications (a) | | | 5,525 | | |
| | | | | Largest Cable Service Provider in Japan | | | | | |
| | 153,000 | | | Hoya | | | 5,064 | | |
| | | | | Opto-electrical Components & Eyeglass Lenses | | | | | |
| | 2,700 | | | Kenedix | | | 5,022 | | |
| | | | | Real Estate Investment Management | | | | | |
| | 77,000 | | | Ibiden | | | 4,958 | | |
| | | | | Electronic Parts & Ceramics | | | | | |
| | 160,000 | | | Aeon Mall | | | 4,908 | | |
| | | | | Suburban Shopping Mall Developer,
Owner & Operator | | | | | |
| | 540,000 | | | Kansai Paint | | | 4,717 | | |
| | | | | Paint Producer in Japan, India, China &
Southeast Asia | | | | | |
| | 143,700 | | | JSR | | | 3,461 | | |
| | | | | Films & Chemicals for LCD Screens & Electronics | | | | | |
| | 43,000 | | | Daito Trust Construction | | | 2,046 | | |
| | | | | Apartment Builder | | | | | |
| | 32,000 | | | USS | | | 2,037 | | |
| | | | | Used Car Auctioneer | | | | | |
| | 85,000 | | | Ushio | | | 1,883 | | |
| | | | | Industrial Light Sources | | | | | |
54
| Number of Shares | | | | Value (000) | |
| | | > Japan—continued | |
| | 138,000 | | | Park24 | | $ | 1,385 | | |
| | | | | Parking Lot Operator | | | | | |
| | | | 51,853 | | |
| | | > Hong Kong 3.2% | |
| | 500,000 | | | Hong Kong Exchanges and
Clearing | | | 7,074 | | |
| | | | | Hong Kong Equity & Derivatives Market
Operator | | | | | |
| | | | 7,074 | | |
| | | > Singapore 1.8% | |
| | 630,000 | | | Singapore Exchange | | | 4,024 | | |
| | | | | Singapore Equity & Derivatives Market Operator | | | | | |
| | | | 4,024 | | |
| Asia: Total | | | 62,951 | | |
| Other Countries 11.9% | | | |
| | | > Canada 4.8% | |
| | 90,000 | | | Potash Corp. of Saskatchewan | | | 7,017 | | |
| | | | | World's Largest Producer of Potash | | | | | |
| | 174,400 | | | RONA (a) | | | 3,643 | | |
| | | | | Leading Canadian Do-it-yourself Retailer | | | | | |
| | | | 10,660 | | |
| | | > South Africa 4.0% | |
| | 151,300 | | | Impala Platinum Holdings | | | 4,587 | | |
| | | | | Platinum Group Metals Mining & Refining | | | | | |
| | 165,000 | | | Naspers | | | 4,227 | | |
| | | | | Media & Education in Africa & Other
Emerging Markets | | | | | |
| | | | 8,814 | | |
| | | > United States 3.1% | |
| | 100,000 | | | Atwood Oceanics (a) | | | 6,862 | | |
| | | | | Offshore Drilling Contractor | | | | | |
| | | | 6,862 | | |
| Other Countries: Total | | | 26,336 | | |
Total Equities: 91.7%
(Cost: $156,119) | | | 203,466 | | |
| Principal Amount (000) | | | | Value (000) | |
| Short-Term Obligation 7.4% | |
| $ | 16,495 | | | Repurchase Agreement with
Fixed Income Clearing Corp.,
dated 6/29/07, due 7/02/07
at 5.050%, collateralized by a
U.S. Government Agency
Obligation, maturing 7/18/11,
market value $16,825
(repurchase proceeds $16,502) | | $ | 16,495 | | |
| | | (Amortized Cost: $16,495) | | | 16,495 | | |
Total Investments: 99.1%
(Cost: $172,614)(b)(c) | | | 219,961 | | |
| Cash and Other Assets Less Liabilities: 0.9% | | | 2,031 | | |
| Total Net Assets: 100% | | $ | 221,992 | | |
55
Columbia Acorn International Select Fund
Statement of Investments (Unaudited), continued
> Notes to Statement of Investments (dollar values in thousands)
(a) Non-income producing security.
(b) At June 30, 2007, for federal income tax purposes cost of investments was $172,614 and net unrealized appreciation was $47,347 consisting of gross unrealized appreciation of $51,104 and gross unrealized depreciation of $3,757.
(c) On June 30, 2007, the Fund's total investments were denominated in currencies as follows:
| Currency | | Value | | % of
Net
Assets | |
| Euro | | $ | 67,946 | | | | 30.6 | % | |
| Japanese Yen | | | 51,853 | | | | 23.4 | | |
| US Dollar | | | 30,374 | | | | 13.7 | | |
| Swiss Franc | | | 26,625 | | | | 12.0 | | |
Other currencies less
than 5% of total net assets | | | 43,163 | | | | 19.4 | | |
| | | $ | 219,961 | | | | 99.1 | % | |
56
Columbia Acorn International Select
Portfolio Diversification
At June 30, 2007, the Fund's portfolio investments as a percent of net assets was diversified as follows:
| | | Value (000) | | Percent | |
| > Industrial Goods & Services | |
| Conglomerates | | $ | 19,414 | | | | 8.8 | % | |
| Construction | | | 13,383 | | | | 6.0 | | |
| Specialty Chemicals | | | 12,852 | | | | 5.8 | | |
| Other Industrial Services | | | 9,577 | | | | 4.3 | | |
| Electrical Components | | | 8,952 | | | | 4.0 | | |
| Outsourcing Services | | | 1,631 | | | | 0.7 | | |
| | | | 65,809 | | | | 29.6 | | |
| > Information | |
| Financial Processors | | | 13,024 | | | | 5.9 | | |
| Domestic Consumer Software | | | 10,847 | | | | 4.9 | | |
| Satellite Broadcasting | | | 6,466 | | | | 2.9 | | |
| Cable Television | | | 5,525 | | | | 2.5 | | |
Semiconductors &
Related Equipment | | | 5,064 | | | | 2.3 | | |
| Television Broadcasting | | | 4,227 | | | | 1.9 | | |
Computer Hardware &
Related Equipment | | | 3,708 | | | | 1.7 | | |
| Publishing | | | 1,890 | | | | 0.8 | | |
| | | | 50,751 | | | | 22.9 | | |
| > Energy & Minerals | |
| Oil/Gas Producers | | | 18,041 | | | | 8.1 | | |
| Mining | | | 11,604 | | | | 5.3 | | |
| | | | 29,645 | | | | 13.4 | | |
| | | Value (000) | | Percent | |
| > Consumer Goods & Services | |
| Retail | | $ | 8,551 | | | | 3.8 | | |
| Durable Goods | | | 4,355 | | | | 2.0 | | |
| Casinos | | | 4,188 | | | | 1.9 | | |
| Food | | | 3,473 | | | | 1.6 | | |
| Consumer Goods Distribution | | | 2,037 | | | | 0.9 | | |
| Consumer Services | | | 1,385 | | | | 0.6 | | |
| | | | 23,989 | | | | 10.8 | | |
| > Health Care | |
| Medical Equipment | | | 18,849 | | | | 8.5 | | |
| Pharmaceuticals | | | 4,101 | | | | 1.8 | | |
| | | | 22,950 | | | | 10.3 | | |
| > Other Industries | |
| Real Estate | | | 5,022 | | | | 2.3 | | |
| Regulated Utilities | | | 3,983 | | | | 1.8 | | |
| | | | 9,005 | | | | 4.1 | | |
| > Finance | |
| Banks | | | 1,317 | | | | 0.6 | | |
| | | | 1,317 | | | | 0.6 | | |
| Total Equities: | | | 203,466 | | | | 91.7 | | |
| Short-Term Obligations: | | | 16,495 | | | | 7.4 | | |
| Total Investments: | | | 219,961 | | | | 99.1 | | |
Cash and Other Assets
Less Liabilities: | | | 2,031 | | | | 0.9 | | |
| Net Assets: | | $ | 221,992 | | | | 100.0 | % | |
57
Columbia Acorn Select
Major Portfolio Changes in the Second Quarter (Unaudited)
| | | Number of Shares | |
| | | 03/31/07 | | 06/30/07 | |
| Additions | |
| Consumer Goods & Services | |
| Chico's FAS | | | 1,811,000 | | | | 2,000,000 | | |
| Hertz | | | 1,750,000 | | | | 2,000,000 | | |
| Information | |
| Globalstar | | | 3,514,300 | | | | 6,000,000 | | |
| Liberty Global Series C | | | 2,963,800 | | | | 3,000,000 | | |
| Sanmina-SCI | | | 11,000,000 | | | | 16,021,480 | | |
| Tellabs | | | 11,300,000 | | | | 13,757,500 | | |
| Energy & Minerals | |
| Atwood Oceanics | | | 400,000 | | | | 500,000 | | |
| Tetra Technologies | | | 0 | | | | 2,000,000 | | |
| Finance | |
| Conseco | | | 5,800,000 | | | | 6,550,000 | | |
| Janus Capital Group | | | 3,450,000 | | | | 4,050,000 | | |
| Montpelier Re | | | 1,000,000 | | | | 2,000,000 | | |
| Industrial Goods & Services | |
| American Commercial Lines | | | 0 | | | | 2,068,400 | | |
| Worthington Industries | | | 2,250,000 | | | | 2,350,000 | | |
| Other Industries | |
| JB Hunt Transport Services | | | 0 | | | | 1,000,000 | | |
| | | Number of Shares | |
| | | 03/31/07 | | 06/30/07 | |
| Sales | |
| Consumer Goods & Services | |
| ITT Educational Services | | | 1,475,000 | | | | 1,300,000 | | |
| Weight Watchers International | | | 238,200 | | | | 0 | | |
| Finance | |
| Nuveen Investments | | | 975,000 | | | | 0 | | |
| Industrial Goods & Services | |
| Quanta Services | | | 3,030,000 | | | | 2,700,000 | | |
58
Columbia Acorn Select
Statement of Investments (Unaudited), June 30, 2007
| Number of Shares | | | | Value (000) | |
| | | | | | | | Equities: 89.7% | | |
| Consumer Goods & Services 26.5% | | | |
| | | > Retail 10.6% | |
| | 3,550,000 | | | Safeway | | $ | 120,806 | | |
| | | | | Supermarkets | | | | | |
| | 1,650,000 | | | Abercrombie & Fitch | | | 120,417 | | |
| | | | | Teen Apparel Retailer | | | | | |
| | 850,000 | | | Costco Wholesale | | | 49,742 | | |
| | | | | Warehouse Superstores | | | | | |
| | 2,000,000 | | | Chico's FAS (a) | | | 48,680 | | |
| | | | | Women's Specialty Retail | | | | | |
| | | | 339,645 | | |
| | | > Other Consumer Services 6.0% | |
| | 1,300,000 | | | ITT Educational Services (a) | | | 152,594 | | |
| | | | | Post-secondary Degree Programs | | | | | |
| | 1,500,000 | | | Universal Technical Institute (a)(b) | | | 38,085 | | |
| | | | | Vocational Training | | | | | |
| | | | 190,679 | | |
| | | > Travel 4.9% | |
| | 3,550,000 | | | Expedia (a) | | | 103,979 | | |
| | | | | Online Travel Services Company | | | | | |
| | 2,000,000 | | | Hertz (a) | | | 53,140 | | |
| | | | | Largest U.S. Rental Car Operator | | | | | |
| | | | 157,119 | | |
| | | > Leisure Products 2.7% | |
| | 800,000 | | | Harley-Davidson | | | 47,688 | | |
| | | | | Motorcycles & Related Merchandise | | | | | |
| | 750,000 | | | International Speedway | | | 39,533 | | |
| | | | | Largest Motorsports Racetrack Owner & Operator | | | | | |
| | | | 87,221 | | |
| | | > Apparel 2.3% | |
| | 1,550,000 | | | Coach (a) | | | 73,455 | | |
| | | | | Designer & Retailer of Branded Leather Accessories | | | | | |
| | | | 73,455 | | |
| Consumer Goods & Services: Total | | | 848,119 | | |
| Information 25.6% | | | |
| | | > CATV 6.6% | |
| | 3,000,000 | | | Liberty Global Series C (a) | | | 117,900 | | |
| | 600,000 | | | Liberty Global Series A (a) | | | 24,624 | | |
| | | | | Cable TV Franchises Outside the USA | | | | | |
| | 3,000,000 | | | Discovery Holding (a) | | | 68,970 | | |
| | | | | CATV Programming | | | | | |
| | | | 211,494 | | |
| | | > Mobile Communications 4.9% | |
| | 2,300,000 | | | American Tower (a) | | | 96,600 | | |
| | | | | Communications Towers in USA & Mexico | | | | | |
| | 6,000,000 | | | Globalstar (a)(b) | | | 62,100 | | |
| | | | | Satellite Mobile Voice & Data Carrier | | | | | |
| | | | 158,700 | | |
| | | > Telecommunications Equipment 4.6% | |
| | 13,757,500 | | | Tellabs (a) | | | 148,031 | | |
| | | | | Telecommunications Equipment | | | | | |
| | | | 148,031 | | |
| Number of Shares | | | | Value (000) | |
| | | > Business Software 4.2% | |
| | 2,350,000 | | | Avid Technology (a)(b) | | $ | 83,072 | | |
| | | | | Digital Nonlinear Editing Software & Systems | | | | | |
| | 6,500,000 | | | Novell (a) | | | 50,635 | | |
| | | | | Directory, Operating System & Identity
Management Software | | | | | |
| | | | 133,707 | | |
| | | > Internet Related 2.8% | |
| | 9,600,000 | | | SkillSoft (a)(b) | | | 89,184 | | |
| | | | | Web-based Learning Solutions (E-Learning) | | | | | |
| | | | 89,184 | | |
| | | > Contract Manufacturing 1.6% | |
| | 16,021,480 | | | Sanmina-SCI (a) | | | 50,147 | | |
| | | | | Electronic Manufacturing Services | | | | | |
| | | | 50,147 | | |
| | | > Semiconductors & Related Equipment 0.8% | |
| | 2,700,000 | | | Canadian Solar (a)(b) | | | 25,380 | | |
| | | | | Solar Cell & Module Manufacturer | | | | | |
| | | | 25,380 | | |
| | | > Computer Services 0.1% | |
| | 1,367,000 | | | AnswerThink (a) | | | 4,949 | | |
| | | | | IT Integration & Best Practice Research | | | | | |
| | | | 4,949 | | |
| Information: Total | | | 821,592 | | |
| Energy & Minerals 14.1% | | | |
| | | > Mining 9.8% | |
| | 15,666,000 | | | Uranium One (South Africa) (a) | | | 199,566 | | |
| | | | | Uranium Mines in South Africa,
Kazakhstan, Australia & the U.S. | | | | | |
| | 1,440,000 | | | Potash Corp. of
Saskatchewan (Canada) | | | 112,277 | | |
| | | | | World's Largest Producer of Potash | | | | | |
| | | | 311,843 | | |
| | | > Oil Services 4.3% | |
| | 2,000,000 | | | Tetra Technologies (a) | | | 56,400 | | |
| | | | | U.S. Based Service Company with Life of
Field Approach | | | | | |
| | 600,000 | | | FMC Technologies (a) | | | 47,532 | | |
| | | | | Oil & Gas Well Head Manufacturer | | | | | |
| | 500,000 | | | Atwood Oceanics (a) | | | 34,310 | | |
| | | | | Offshore Drilling Contractor | | | | | |
| | | | 138,242 | | |
| Energy & Minerals: Total | | | 450,085 | | |
| Finance 12.0% | | | |
| | | > Insurance 7.1% | |
| | 6,550,000 | | | Conseco (a) | | | 136,829 | | |
| | | | | Life, Long-term Care & Medical
Supplement Insurance | | | | | |
| | 112,000 | | | Markel (a) | | | 54,271 | | |
| | | | | Specialty Insurance | | | | | |
| | 2,000,000 | | | Montpelier Re | | | 37,080 | | |
| | | | | Commercial Lines Insurance/Reinsurance | | | | | |
| | | | 228,180 | | |
59
Columbia Acorn Select
Statement of Investments (Unaudited), continued
Number of Shares
or Principal Amount (000) | | | | Value (000) | |
| | | > Brokerage & Money Management 4.9% | |
| | 4,050,000 | | | Janus Capital Group | | $ | 112,752 | | |
| | | | | Manages Mutual Funds | | | | | |
| | 1,500,000 | | | SEI Investments | | | 43,560 | | |
| | | | | Mutual Fund Administration &
Investment Management | | | | | |
| | | | 156,312 | | |
| Finance: Total | | | 384,492 | | |
| Industrial Goods & Services 9.5% | | | |
| | | > Other Industrial Services 3.5% | |
| | 1,425,000 | | | Expeditors International of
Washington | | | 58,852 | | |
| | | | | International Freight Forwarder | | | | | |
| | 2,068,400 | | | American Commercial Lines (a) | | | 53,882 | | |
| | | | | Operator of Inland Barges/Builder of
Inland Barges | | | | | |
| | | | 112,734 | | |
| | | > Outsourcing Services 2.6% | |
| | 2,700,000 | | | Quanta Services (a) | | | 82,809 | | |
| | | | | Electrical & Telecom Construction Services | | | | | |
| | | | 82,809 | | |
| | | > Waste Management 1.8% | |
| | 1,500,000 | | | Waste Management | | | 58,575 | | |
| | | | | U.S. Garbage Collection & Disposal | | | | | |
| | | | 58,575 | | |
| | | > Steel 1.6% | |
| | 2,350,000 | | | Worthington Industries | | | 50,878 | | |
| | | | | Steel Processing & Manufactured Metal Products | | | | | |
| | | | 50,878 | | |
| Industrial Goods & Services: Total | | | 304,996 | | |
| Health Care 1.1% | | | |
| | | > Health Care Services 1.1% | |
| | 910,000 | | | Lincare Holdings (a) | | | 36,263 | | |
| | | | | Home Health Care Services | | | | | |
| | | | 36,263 | | |
| Health Care: Total | | | 36,263 | | |
| Other Industries 0.9% | | | |
| | | > Transportation 0.9% | |
| | 1,000,000 | | | JB Hunt Transport Services | | | 29,320 | | |
| | | | | Truck & Intermodal Carrier | | | | | |
| | | | 29,320 | | |
| Other Industries: Total | | | 29,320 | | |
Total Equities: 89.7%
(Cost: $1,841,270) | | | 2,874,867 | | |
| Short-Term Obligations 10.0% | | | |
| $ | 15,900 | | | Natixis (c)
5.33% Due 7/11/07 | | | 15,876 | | |
| | 15,900 | | | Giro Balanced Funding (c)
5.30% Due 7/20/07 | | | 15,856 | | |
| Principal Amount (000) | | | | Value (000) | |
| $ | 15,900 | | | Old Court Funding (c)
5.35% Due 7/26/07 | | $ | 15,841 | | |
| | 15,900 | | | Keel Capital (c)
5.30% Due 7/27/07 | | | 15,839 | | |
| | 15,800 | | | Ebury Finance Ltd. (c)
5.30% Due 7/5/07 | | | 15,791 | | |
| | 15,800 | | | World Omni Vehicle Leasing (c)
5.30% Due 7/24/07 | | | 15,747 | | |
| | 15,700 | | | Anglesea Funding (c)
5.29% Due 7/2/07 | | | 15,698 | | |
| | 15,700 | | | Mainsail II Ltd. (c)
5.28% Due 7/3/07 | | | 15,695 | | |
| | 15,700 | | | Austra (c)
5.28% Due 7/6/07 | | | 15,688 | | |
| | 15,700 | | | White Point Funding (c)
5.32% Due 7/18/07 | | | 15,661 | | |
| | 15,700 | | | Hannover Funding (c)
5.30% Due 7/19/07 | | | 15,658 | | |
| | 15,700 | | | Coast Asset (c)
5.31% Due 7/23/07 | | | 15,649 | | |
| | 15,700 | | | Liberty Street Funding (c)
5.33% Due 7/25/07 | | | 15,644 | | |
| | 15,600 | | | Whistlejacket Capital (c)
5.29% Due 7/9/07 | | | 15,582 | | |
| | 15,500 | | | Mica Funding LLC (c)
5.34% Due 7/13/07 | | | 15,472 | | |
| | 15,400 | | | TSL USA (c)
5.30% Due 7/10/07 | | | 15,380 | | |
| | 15,400 | | | La Fayette Asset Securitization LLC (c)
5.28% Due 7/11/07 | | | 15,377 | | |
| | 15,300 | | | Bavaria (c)
5.31% Due 7/12/07 | | | 15,275 | | |
| | 15,000 | | | Morrigan TRR (c)
5.34% Due 7/16/07 | | | 14,967 | | |
| | 15,000 | | | Manhattan Asset Funding (c)
5.29% Due 7/17/07 | | | 14,965 | | |
| | 9,916 | | | Repurchase Agreement with
Fixed Income Clearing Corp.,
dated 6/29/07, due 7/2/07 at
5.050%, collateralized by a
U.S. Government Agency
Obligation, maturing 7/18/11,
market value of $10,118
(repurchase proceeds $9,920) | | | 9,916 | | |
| | | | | (Amortized Cost: $321,577) | | | 321,577 | | |
Total Investments: 99.7%
(Cost: $2,162,847)(d) | | | 3,196,444 | | |
| Cash and Other Assets Less Liabilities: 0.3% | | | 9,698 | | |
| Total Net Assets: 100% | | $ | 3,206,142 | | |
60
> Notes to Statement of Investments (dollar values in thousands)
(a) Non-income producing security.
(b) An affiliate may include any company in which the Fund owns five percent or more of its outstanding voting shares. Transactions in these affiliated companies during the six months ended June 30, 2007, are as follows:
| Affiliates | | Balance of
Shares Held
12/31/06 | | Purchases/
Additions | | Sales/
Reductions | | Balance of
Shares Held
6/30/07 | | Value | | Dividend | |
| Avid Technology | | | 2,200,000 | | | | 150,000 | | | | - | | | | 2,350,000 | | | $ | 83,073 | | | $ | - | | |
| Canadian Solar | | | 550,000 | | | | 2,150,000 | | | | - | | | | 2,700,000 | | | | 25,380 | | | | - | | |
| Globalstar | | | 1,600,000 | | | | 4,400,000 | | | | - | | | | 6,000,000 | | | | 62,100 | | | | - | | |
| SkillSoft | | | 9,600,000 | | | | - | | | | - | | | | 9,600,000 | | | | 89,184 | | | | - | | |
| Universal Technical Institute | | | 1,350,000 | | | | 150,000 | | | | - | | | | 1,500,000 | | | | 38,085 | | | | - | | |
| UrAsia Energy (merged into Uranium One)* | | | 30,050,000 | | | | 2,000,000 | | | | 32,050,000 | | | | - | | | | - | | | | - | | |
| TOTAL OF AFFILIATED TRANSACTIONS | | | 45,350,000 | | | | 8,850,000 | | | | 32,050,000 | | | | 22,150,000 | | | $ | 297,822 | | | $ | - | | |
* At June 30, 2007, the Fund owned less than five percent of the company's outstanding voting shares.
The aggregate cost and value of these companies at June 30, 2007, was $226,635 and $297,822, respectively. Investments in affiliate companies represented 9.3% of total net assets at June 30, 2007.
(c) Security exempt from registration under Section 4(2) of the Securities Act of 1933. These securities may only be resold in exempt transactions to qualified buyers. Private resales of these securities to qualified instutional buyers are also exempt from registration pursuant to Rule 144A under the Securities Act of 1933. At June 30, 2007, these securities had an aggregate value of $311,661, which represented 9.7% of net assets.
(d) At June 30, 2007 for federal income tax purposes cost of investments was $2,162,847 and net unrealized appreciation was $1,033,597 consisting of gross unrealized appreciation of $1,078,817 and gross unrealized depreciation of $45,220.
61
Columbia Thermostat Fund
Statement of Investments (Unaudited), June 30, 2007
Number of Shares
or Principal Amount (000) | | | | Value (000) | |
| | | > Bond Funds: 65.0% | |
| | 6,761,238 | | | Columbia Intermediate Bond Fund,
Class Z | | $ | 58,688 | | |
| | 3,449,983 | | | Columbia Federal Securities Fund,
Class Z | | | 35,190 | | |
| | 2,788,437 | | | Columbia Conservative High Yield Fund,
Class Z | | | 23,088 | | |
| Total Bond Funds (Cost: $118,839) | | | 116,966 | | |
| | | > Stock Funds: 34.8% | |
| | 1,026,125 | | | Columbia LargeCap Enhanced
Core Fund, Class Z | | | 15,659 | | |
| | 833,310 | | | Columbia Dividend Income
Fund, Class Z | | | 12,591 | | |
| | 205,779 | | | Columbia Acorn International,
Class Z | | | 9,429 | | |
| | 287,018 | | | Columbia Acorn Fund, Class Z | | | 9,403 | | |
| | 432,063 | | | Columbia Marsico Growth
Fund, Class Z | | | 9,367 | | |
| | 203,678 | | | Columbia Acorn Select, Class Z | | | 6,285 | | |
| Total Stock Funds (Cost: $52,596) | | | 62,734 | | |
| Short-Term Obligation: 0.4% | | | |
| $ | 642 | | | Repurchase Agreement with
Fixed Income Clearing Corp.,
dated 6/29/07, due 7/02/07
at 5.050%, collateralized by
a U.S. Government Agency Obligation,
maturing 7/18/11 market value
of $660 (repurchase proceeds $642) | | | 642 | | |
| | | | | (Cost: $642) | | | 642 | | |
Total Investments: 100.2%
(Cost: $172,077)(a) | | | 180,342 | | |
| Cash and Other Assets Less Liabilities: (0.2)% | | | (313 | ) | |
| Total Net Assets: 100% | | $ | 180,029 | | |
> Notes to Statement of Investments (dollar values in thousands)
(a) At June 30, 2007, for federal income tax purposes cost of investments was $172,077 and net unrealized appreciation was $8,265, consisting of gross unrealized appreciation of $10,274 and gross unrealized depreciation of $2,009.
62
This page intentionally left blank.
63
Columbia Acorn Family of Funds
Statements of Assets and Liabilities (Unaudited)
| June 30, 2007 | | Columbia
Acorn
Fund | | Columbia
Acorn
International | | Columbia
Acorn
USA | | Columbia
Acorn
International
Select | | Columbia
Acorn
Select | | Columbia
Thermostat
Fund | |
| (in thousands) | |
| Assets: | |
| Unaffiliated investments, at cost | | $ | 9,996,498 | | | $ | 3,298,899 | | | $ | 1,219,286 | | | $ | 172,614 | | | $ | 1,936,212 | | | $ | — | | |
Affiliated investments, at cost
(See Note 4) | | | 2,646,859 | | | | 102,622 | | | | 3,130 | | | | — | | | | 226,635 | | | | 172,077 | | |
| Unaffiliated investments, at value | | $ | 16,693,498 | | | $ | 5,306,474 | | | $ | 1,723,452 | | | $ | 219,961 | | | $ | 2,898,622 | | | $ | — | | |
Affiliated investments, at value
(See Note 4) | | | 4,477,872 | | | | 107,652 | | | | 6,123 | | | | — | | | | 297,822 | | | | 180,342 | | |
| Cash | | | 1,039 | | | | — | * | | | 1,796 | | | | 1 | | | | — | * | | | — | * | |
Foreign currency (cost: Columbia
Acorn Fund $8,676; Columbia
Acorn International $20,729;
Columbia Acorn International
Select $168) | | | 8,694 | | | | 20,858 | | | | — | | | | 168 | | | | — | | | | — | | |
| Receivable for: | |
| Investments sold | | | 127,912 | | | | 30,366 | | | | 13,231 | | | | 1,817 | | | | — | | | | — | | |
| Fund shares sold | | | 30,087 | | | | 7,954 | | | | 3,218 | | | | 379 | | | | 25,903 | | | | 114 | | |
| Dividends and interest | | | 8,693 | | | | 4,985 | | | | 461 | | | | 110 | | | | 398 | | | | — | * | |
| Foreign tax reclaims | | | 606 | | | | 1,183 | | | | — | | | | 59 | | | | — | | | | — | | |
Deferred Trustees' Compensation
Investments | | | 2,770 | | | | 756 | | | | 205 | | | | — | | | | — | | | | — | | |
Expense Reimbursement due
from Investment Adviser | | | — | | | | — | | | | — | | | | — | | | | — | | | | 50 | | |
| Other assets | | | — | | | | — | | | | — | | | | — | | | | 8 | | | | — | | |
| Total Assets | | | 21,351,171 | | | | 5,480,228 | | | | 1,748,486 | | | | 222,495 | | | | 3,222,753 | | | | 180,506 | | |
| Liabilities: | |
| Payable for: | |
| Investments purchased | | | 82,437 | | | | 13,814 | | | | 12,022 | | | | — | | | | 9,496 | | | | — | | |
| Fund shares redeemed | | | 15,776 | | | | 1,983 | | | | 30,937 | | | | 204 | | | | 3,578 | | | | 230 | | |
| Management fee | | | 11,164 | | | | 3,337 | | | | 1,230 | | | | 166 | | | | 2,020 | | | | 15 | | |
| Administration fee | | | 695 | | | | 174 | | | | 57 | | | | 7 | | | | 102 | | | | 6 | | |
| 12b-1 Service & Distribution fees | | | 3,044 | | | | 267 | | | | 143 | | | | 22 | | | | 572 | | | | 75 | | |
| Reports to shareholders | | | 1,568 | | | | 350 | | | | 154 | | | | 36 | | | | 331 | | | | 65 | | |
| Deferred Trustees' fees | | | 2,770 | | | | 756 | | | | 205 | | | | 26 | | | | 183 | | | | 22 | | |
| Transfer agent fees | | | 1,840 | | | | 161 | | | | 152 | | | | 6 | | | | 290 | | | | 51 | | |
| Trustees' fees | | | 112 | | | | 9 | | | | 8 | | | | — | * | | | 1 | | | | — | * | |
| Audit fee | | | 43 | | | | 42 | | | | 22 | | | | 21 | | | | 22 | | | | 11 | | |
| Custody fees | | | 231 | | | | 175 | | | | 5 | | | | 4 | | | | 16 | | | | — | * | |
Deferred foreign capital gains
tax payable | | | — | | | | 392 | | | | — | | | | — | | | | — | | | | — | | |
| Other liabilities | | | 213 | | | | 38 | | | | 13 | | | | 11 | | | | — | | | | 2 | | |
| Total Liabilities | | | 119,893 | | | | 21,498 | | | | 44,948 | | | | 503 | | | | 16,611 | | | | 477 | | |
| Net Assets | | $ | 21,231,278 | | | $ | 5,458,730 | | | $ | 1,703,538 | | | $ | 221,992 | | | $ | 3,206,142 | | | $ | 180,029 | | |
| Composition of Net Assets: | |
| Paid in capital | | $ | 11,951,843 | | | $ | 3,203,553 | | | $ | 1,134,839 | | | $ | 166,910 | | | $ | 2,138,388 | | | $ | 165,454 | | |
Undistributed (overdistributed)
net investment income
(Accumulated net investment loss) | | | 20,675 | | | | 4,898 | | | | 1,551 | | | | 547 | | | | (15,544 | ) | | | 2,903 | | |
| Accumulated net realized gain | | | 730,715 | | | | 237,906 | | | | 59,989 | | | | 7,187 | | | | 49,701 | | | | 3,407 | | |
| Net unrealized appreciation on: | |
| Investments | | | 8,528,013 | | | | 2,012,605 | | | | 507,159 | | | | 47,347 | | | | 1,033,597 | | | | 8,265 | | |
| Foreign capital gains tax | | | — | | | | (392 | ) | | | — | | | | — | | | | — | | | | — | | |
| Foreign currency translations | | | 32 | | | | 160 | | | | — | | | | 1 | | | | — | | | | — | | |
| Net Assets | | $ | 21,231,278 | | | $ | 5,458,730 | | | $ | 1,703,538 | | | $ | 221,992 | | | $ | 3,206,142 | | | $ | 180,029 | | |
Net asset value per
share – Class A (a) | | $ | 31.94 | | | $ | 45.59 | | | $ | 30.37 | | | $ | 30.82 | | | $ | 30.35 | | | $ | 12.80 | | |
| (Net assets/shares) | | | ($4,632,464/145,034) | | | | ($495,307/10,864) | | | | ($265,857/8,754) | | | | ($36,156/1,173) | | | | ($1,240,930/40,885) | | | | ($51,470/4,020) | | |
Maximum offering price per
share – Class A (b) | | $ | 33.89 | | | $ | 48.37 | | | $ | 32.22 | | | $ | 32.70 | | | $ | 32.20 | | | $ | 13.58 | | |
(Net asset value per share/front-
end sales charge) | | | ($31.94/0.9425) | | | | ($45.59/0.9425) | | | | ($30.37/0.9425) | | | | ($30.82/0.9425) | | | | ($30.35/0.9425) | | | | ($12.80/0.9425) | | |
Net asset value and offering price
per share – Class B (a) | | $ | 30.47 | | | $ | 44.69 | | | $ | 29.02 | | | $ | 29.74 | | | $ | 29.03 | | | $ | 12.84 | | |
| (Net assets/shares) | | | ($1,440,071/47,265) | | | | ($103,314/2,311) | | | | ($63,927/2,203) | | | | ($10,892/366) | | | | ($231,739/7,983) | | | | ($69,096/5,383) | | |
Net asset value and offering price
per share – Class C (a) | | $ | 30.35 | | | $ | 44.61 | | | $ | 28.93 | | | $ | 29.68 | | | $ | 28.94 | | | $ | 12.82 | | |
| (Net assets/shares) | | | ($1,450,101/47,779) | | | | ($135,340/3,035) | | | | ($57,674/1,993) | | | | ($9,778/329) | | | | ($222,201/7,679) | | | | ($25,991/2,028) | | |
Net asset value and offering price
per share – Class Z (c) | | $ | 32.76 | | | $ | 45.82 | | | $ | 31.11 | | | $ | 31.12 | | | $ | 30.86 | | | $ | 12.77 | | |
| (Net assets/shares) | | | ($13,708,642/418,519) | | | | ($4,724,769/103,107) | | | | ($1,316,080/42,302) | | | | ($165,166/5,308) | | | | ($1,511,272/48,965) | | | | ($33,472/2,622) | | |
(a) Redemption price per share is equal to net asset value less any applicable contingent deferred sales charge and redemption fee.
(b) On sales of $50,000 or more, the offering price is reduced.
(c) Redemption price per share is equal to net asset value less any applicable redemption fee.
* Rounds to less than $500.
See accompanying notes to financial statements.
64
Columbia Acorn Family of Funds
Statements of Operations (Unaudited)
For the Six Months Ended June 30, 2007
| (in thousands) | | Columbia
Acorn
Fund | | Columbia
Acorn
International | | Columbia
Acorn
USA | | Columbia
Acorn
International
Select | | Columbia
Acorn
Select | | Columbia
Thermostat
Fund | |
| Investment Income: | |
| Dividend income | | $ | 96,782 | | | $ | 55,989 | | | $ | 8,785 | | | $ | 1,827 | | | $ | 4,355 | | | $ | — | | |
Dividend income from affiliates
(See Note 4) | | | 17,334 | | | | 2,028 | | | | — | | | | — | | | | — | | | | — | | |
Dividends from affiliated investment
company shares (See Note 4) | | | — | | | | — | | | | — | | | | — | | | | — | | | | 3,618 | | |
| Interest income | | | 29,275 | | | | 7,691 | | | | 1,985 | | | | 328 | | | | 5,967 | | | | 20 | | |
| | | | 143,391 | | | | 65,708 | | | | 10,770 | | | | 2,155 | | | | 10,322 | | | | 3,638 | | |
| Foreign taxes withheld | | | (1,937 | ) | | | (4,753 | ) | | | — | * | | | (123 | ) | | | (22 | ) | | | — | | |
| Total Investment Income | | | 141,454 | | | | 60,955 | | | | 10,770 | | | | 2,032 | | | | 10,300 | | | | 3,638 | | |
| Expenses: | |
| Management fee | | | 64,166 | | | | 18,550 | | | | 7,160 | | | | 915 | | | | 10,678 | | | | 92 | | |
| Administration fee | | | 3,856 | | | | 931 | | | | 320 | | | | 37 | | | | 513 | | | | 35 | | |
| 12b-1 Service and Distribution fees: | |
| Class A | | | 5,431 | | | | 495 | | | | 328 | | | | 37 | | | | 1,354 | | | | 68 | | |
| Class B | | | 5,328 | | | | 366 | | | | 241 | | | | 39 | | | | 839 | | | | 264 | | |
| Class C | | | 6,984 | | | | 583 | | | | 282 | | | | 41 | | | | 977 | | | | 134 | | |
| Transfer agent fees: | |
| Class A | | | 1,498 | | | | 158 | | | | 91 | | | | 13 | | | | 408 | | | | 46 | | |
| Class B | | | 1,069 | | | | 90 | | | | 58 | | | | 11 | | | | 203 | | | | 63 | | |
| Class C | | | 688 | | | | 60 | | | | 30 | | | | 6 | | | | 116 | | | | 24 | | |
| Class Z | | | 1,944 | | | | 564 | | | | 250 | | | | 33 | | | | 230 | | | | 16 | | |
| Custody fees | | | 755 | | | | 997 | | | | 32 | | | | 30 | | | | 69 | | | | — | * | |
| Trustees' fees | | | 367 | | | | 74 | | | | 30 | | | | 15 | | | | 155 | | | | 18 | | |
| Registration & blue sky fees | | | 129 | | | | 82 | | | | 54 | | | | 40 | | | | 56 | | | | 32 | | |
| Reports to shareholders | | | 1,381 | | | | 355 | | | | 167 | | | | 43 | | | | 318 | | | | 71 | | |
| Chief compliance officer expenses (See Note 4) | | | 244 | | | | 58 | | | | 23 | | | | 6 | | | | 32 | | | | 6 | | |
| Other expenses | | | 480 | | | | 137 | | | | 59 | | | | 31 | | | | 70 | | | | 25 | | |
| Total expenses | | | 94,320 | | | | 23,500 | | | | 9,125 | | | | 1,297 | | | | 16,018 | | | | 894 | | |
| Less custody fees paid indirectly | | | (69 | ) | | | (1 | ) | | | (14 | ) | | | — | * | | | (45 | ) | | | — | * | |
Less reimbursement of expenses by
Investment Adviser | | | — | | | | — | | | | — | | | | — | | | | — | | | | (187 | ) | |
Less reimbursement of expenses by
Transfer Agent | |
| Class A | | | (212 | ) | | | (16 | ) | | | (11 | ) | | | (1 | ) | | | (53 | ) | | | (4 | ) | |
| Class B | | | (86 | ) | | | (7 | ) | | | (4 | ) | | | (1 | ) | | | (16 | ) | | | (5 | ) | |
| Class C | | | (63 | ) | | | (6 | ) | | | (3 | ) | | | (1 | ) | | | (10 | ) | | | (2 | ) | |
| Class Z | | | (376 | ) | | | (27 | ) | | | (48 | ) | | | (1 | ) | | | (21 | ) | | | — | * | |
| Net Expenses | | | 93,514 | | | | 23,443 | | | | 9,045 | | | | 1,293 | | | | 15,873 | | | | 696 | | |
| Net Investment Income (Loss) | | | 47,940 | | | | 37,512 | | | | 1,725 | | | | 739 | | | | (5,573 | ) | | | 2,942 | | |
Net Realized and Unrealized Gain (Loss)
on Portfolio Positions: | |
| Net realized gain (loss) on: | |
| Unaffiliated investments | | | 602,100 | | | | 240,610 | | | | 62,278 | | | | 15,823 | | | | 49,991 | | | | — | | |
| Affiliated investments (See Note 4) | | | 131,455 | | | | (20 | ) | | | — | | | | — | | | | — | | | | 4,235 | | |
| Foreign currency transactions | | | (421 | ) | | | (847 | ) | | | — | | | | (21 | ) | | | (18 | ) | | | — | | |
Net realized gain on disposal of
investments sold in error
(See Note 8) | | | 4 | | | | — | | | | — | | | | — | | | | — | | | | — | | |
| Net realized gain | | | 733,138 | | | | 239,743 | | | | 62,278 | | | | 15,802 | | | | 49,973 | | | | 4,235 | | |
Net change in net unrealized
appreciation (depreciation) on: | |
| Unaffiliated investments | | | 1,050,397 | | | | 387,043 | | | | 86,603 | | | | 5,277 | | | | 360,688 | | | | — | | |
| Affiliated investments (See Note 4) | | | 339,838 | | | | 5,031 | | | | — | | | | — | | | | — | | | | 405 | | |
| Foreign currency translations | | | 10 | | | | 109 | | | | — | | | | (2 | ) | | | 69 | | | | — | | |
| Foreign capital gains tax | | | — | | | | (392 | ) | | | — | | | | — | | | | — | | | | — | | |
Net change in unrealized appreciation
(depreciation) | | | 1,390,245 | | | | 391,791 | | | | 86,603 | | | | 5,275 | | | | 360,757 | | | | 405 | | |
| Net realized and unrealized gain | | | 2,123,383 | | | | 631,534 | | | | 148,881 | | | | 21,077 | | | | 410,730 | | | | 4,640 | | |
Net Increase in Net Assets resulting from
Operations | | $ | 2,171,323 | | | $ | 669,046 | | | $ | 150,606 | | | $ | 21,816 | | | $ | 405,157 | | | $ | 7,582 | | |
* Rounds to less than $500.
See accompanying notes to financial statements.
65
Columbia Acorn Family of Funds
Statements of Changes in Net Assets
| | | Columbia
Acorn Fund | | Columbia Acorn
International | | Columbia
Acorn USA | |
| Increase (Decrease) in Net Assets | | (Unaudited)
Six months
ended
June 30, | | Year ended
December 31, | | (Unaudited)
Six months
ended
June 30, | | Year ended
December 31, | | (Unaudited)
Six months
ended
June 30, | | Year ended
December 31, | |
| (in thousands) | | 2007 | | 2006 | | 2007 | | 2006 | | 2007 | | 2006 | |
| Operations: | |
| Net investment income (loss) | | $ | 47,940 | | | $ | 35,190 | | | $ | 37,512 | | | $ | 31,386 | | | $ | 1,725 | | | $ | (3,110 | ) | |
Net realized gain on investments and foreign
currency transactions | | | 733,138 | | | | 1,611,966 | | | | 239,743 | | | | 392,116 | | | | 62,278 | | | | 46,861 | | |
Net realized gain on affiliated investments and distributions
from affiliated investment company shares | | | — | | | | — | | | | — | | | | — | | | | — | | | | — | | |
Net change in net unrealized appreciation (depreciation)
on investments and foreign currency translations | | | 1,390,245 | | | | 712,218 | | | | 391,791 | | | | 645,701 | | | | 86,603 | | | | 64,360 | | |
Net change in net unrealized appreciation (depreciation)
on affiliated investments | | | — | | | | — | | | | — | | | | — | | | | — | | | | — | | |
| Net Increase from Operations | | | 2,171,323 | | | | 2,359,374 | | | | 669,046 | | | | 1,069,203 | | | | 150,606 | | | | 108,111 | | |
| Distributions to Shareholders From: | |
| Net investment income – Class A | | | — | | | | (5,394 | ) | | | (61 | ) | | | (2,223 | ) | | | — | | | | — | | |
| Net realized gain – Class A | | | (55,515 | ) | | | (313,513 | ) | | | (2,579 | ) | | | (26,545 | ) | | | (2,466 | ) | | | (5,181 | ) | |
| Net investment income – Class B | | | — | | | | — | | | | — | * | | | (141 | ) | | | — | | | | — | | |
| Net realized gain – Class B | | | (18,288 | ) | | | (114,707 | ) | | | (575 | ) | | | (8,646 | ) | | | (620 | ) | | | (1,487 | ) | |
| Net investment income – Class C | | | — | | | | — | | | | — | * | | | (63 | ) | | | — | | | | — | | |
| Net realized gain – Class C | | | (18,339 | ) | | | (109,093 | ) | | | (744 | ) | | | (8,998 | ) | | | (557 | ) | | | (1,223 | ) | |
| Net investment income – Class Z | | | — | | | | (48,532 | ) | | | (12,297 | ) | | | (44,617 | ) | | | — | | | | — | | |
| Net realized gain – Class Z | | | (160,345 | ) | | | (916,129 | ) | | | (25,155 | ) | | | (342,510 | ) | | | (12,016 | ) | | | (25,202 | ) | |
| Total Distributions to Shareholders | | | (252,487 | ) | | | (1,507,368 | ) | | | (41,411 | ) | | | (433,743 | ) | | | (15,659 | ) | | | (33,093 | ) | |
| Share Transactions: | |
| Subscriptions – Class A | | | 615,959 | | | | 1,078,213 | | | | 175,970 | | | | 176,101 | | | | 51,185 | | | | 113,090 | | |
| Distributions reinvested – Class A | | | 50,288 | | | | 288,002 | | | | 2,412 | | | | 25,843 | | | | 2,159 | | | | 4,383 | | |
| Redemptions – Class A | | | (513,833 | ) | | | (822,590 | ) | | | (48,303 | ) | | | (63,857 | ) | | | (53,863 | ) | | | (51,382 | ) | |
| Net Increase (Decrease) – Class A | | | 152,414 | | | | 543,625 | | | | 130,079 | | | | 138,087 | | | | (519 | ) | | | 66,091 | | |
| Subscriptions – Class B | | | 7,608 | | | | 25,556 | | | | 8,524 | | | | 17,920 | | | | 222 | | | | 1,247 | | |
| Distributions reinvested – Class B | | | 16,730 | | | | 104,566 | | | | 526 | | | | 8,016 | | | | 566 | | | | 1,351 | | |
| Redemptions – Class B | | | (119,998 | ) | | | (212,371 | ) | | | (12,274 | ) | | | (20,296 | ) | | | (6,865 | ) | | | (14,036 | ) | |
| Net Increase (Decrease) – Class B | | | (95,660 | ) | | | (82,249 | ) | | | (3,224 | ) | | | 5,640 | | | | (6,077 | ) | | | (11,438 | ) | |
| Subscriptions – Class C | | | 65,011 | | | | 166,508 | | | | 29,598 | | | | 50,734 | | | | 2,005 | | | | 17,895 | | |
| Distributions reinvested – Class C | | | 14,519 | | | | 86,726 | | | | 555 | | | | 6,707 | | | | 476 | | | | 1,038 | | |
| Redemptions – Class C | | | (102,057 | ) | | | (178,699 | ) | | | (9,005 | ) | | | (16,582 | ) | | | (4,411 | ) | | | (8,640 | ) | |
| Net Increase (Decrease) – Class C | | | (22,527 | ) | | | 74,535 | | | | 21,148 | | | | 40,859 | | | | (1,930 | ) | | | 10,293 | | |
| Subscriptions – Class Z | | | 1,051,261 | | | | 1,754,910 | | | | 497,235 | | | | 707,961 | | | | 117,188 | | | | 371,430 | | |
| Distributions reinvested – Class Z | | | 137,592 | | | | 824,254 | | | | 26,711 | | | | 279,893 | | | | 10,953 | | | | 22,838 | | |
| Redemptions – Class Z | | | (855,764 | ) | | | (1,413,279 | ) | | | (184,352 | ) | | | (357,229 | ) | | | (131,252 | ) | | | (175,498 | ) | |
| Net Increase (Decrease) – Class Z | | | 333,089 | | | | 1,165,885 | | | | 339,594 | | | | 630,625 | | | | (3,111 | ) | | | 218,770 | | |
| Net Increase (Decrease) from Share Transactions | | | 367,316 | | | | 1,701,796 | | | | 487,597 | | | | 815,211 | | | | (11,637 | ) | | | 283,716 | | |
| Redemption Fees | | | — | | | | — | | | | 103 | | | | 147 | | | | — | | | | — | | |
| Total Increase (Decrease) in Net Assets | | | 2,286,152 | | | | 2,553,802 | | | | 1,115,335 | | | | 1,450,818 | | | | 123,310 | | | | 358,734 | | |
| Net Assets: | |
| Beginning of period | | | 18,945,126 | | | | 16,391,324 | | | | 4,343,395 | | | | 2,892,577 | | | | 1,580,228 | | | | 1,221,494 | | |
| End of period | | $ | 21,231,278 | | | $ | 18,945,126 | | | $ | 5,458,730 | | | $ | 4,343,395 | | | $ | 1,703,538 | | | $ | 1,580,228 | | |
Undistributed (Overdistributed) Net Investment Income or
(Accumulated Net Investment Loss) | | $ | 20,675 | | | $ | (27,265 | ) | | $ | 4,898 | | | $ | (20,256 | ) | | $ | 1,551 | | | $ | (174 | ) | |
* Rounds to less than $500.
See accompanying notes to financial statements.
66
| | | Columbia Acorn
International Select | | Columbia
Acorn Select | | Columbia
Thermostat Fund | |
| Increase (Decrease) in Net Assets | | (Unaudited)
Six months
ended
June 30, | | Year ended
December 31, | | (Unaudited)
Six months
ended
June 30, | | Year ended
December 31, | | (Unaudited)
Six months
ended
June 30, | | Year ended
December 31, | |
| (in thousands) | | 2007 | | 2006 | | 2007 | | 2006 | | 2007 | | 2006 | |
| Operations: | |
| Net investment income (loss) | | $ | 739 | | | $ | 361 | | | $ | (5,573 | ) | | $ | (11,032 | ) | | $ | 2,942 | | | $ | 6,358 | | |
Net realized gain on investments and foreign
currency transactions | | | 15,802 | | | | 18,110 | | | | 49,973 | | | | 71,803 | | | | — | | | | — | | |
Net realized gain on affiliated investments and distributions
from affiliated investment company shares | | | — | | | | — | | | | — | | | | — | | | | 4,235 | | | | 11,669 | | |
Net change in net unrealized appreciation (depreciation)
on investments and foreign currency translations | | | 5,275 | | | | 20,770 | | | | 360,757 | | | | 287,875 | | | | — | | | | — | | |
Net change in net unrealized appreciation (depreciation)
on affiliated investments | | | — | | | | — | | | | — | | | | — | | | | 405 | | | | 836 | | |
| Net Increase from Operations | | | 21,816 | | | | 39,241 | | | | 405,157 | | | | 348,646 | | | | 7,582 | | | | 18,863 | | |
| Distributions to Shareholders From: | |
| Net investment income – Class A | | | (86 | ) | | | (2 | ) | | | — | | | | (788 | ) | | | (125 | ) | | | (2,086 | ) | |
| Net realized gain – Class A | | | — | | | | — | | | | (7,498 | ) | | | (20,503 | ) | | | (1,184 | ) | | | (3,300 | ) | |
| Net investment income – Class B | | | — | | | | — | | | | — | | | | — | | | | — | | | | (2,114 | ) | |
| Net realized gain – Class B | | | — | | | | — | | | | (1,510 | ) | | | (4,991 | ) | | | (1,571 | ) | | | (3,980 | ) | |
| Net investment income – Class C | | | — | | | | — | * | | | — | | | | — | | | | — | | | | (753 | ) | |
| Net realized gain – Class C | | | — | | | | — | | | | (1,407 | ) | | | (3,972 | ) | | | (596 | ) | | | (1,496 | ) | |
| Net investment income – Class Z | | | (782 | ) | | | (196 | ) | | | — | | | | (1,614 | ) | | | (163 | ) | | | (1,223 | ) | |
| Net realized gain – Class Z | | | — | | | | — | | | | (8,765 | ) | | | (19,241 | ) | | | (760 | ) | | | (1,585 | ) | |
| Total Distributions to Shareholders | | | (868 | ) | | | (198 | ) | | | (19,180 | ) | | | (51,109 | ) | | | (4,399 | ) | | | (16,537 | ) | |
| Share Transactions: | |
| Subscriptions – Class A | | | 13,035 | | | | 10,850 | | | | 233,175 | | | | 210,532 | | | | 3,216 | | | | 6,298 | | |
| Distributions reinvested – Class A | | | 78 | | | | 2 | | | | 6,845 | | | | 19,667 | | | | 1,205 | | | | 4,887 | | |
| Redemptions – Class A | | | (2,741 | ) | | | (3,070 | ) | | | (97,602 | ) | | | (158,467 | ) | | | (11,969 | ) | | | (25,185 | ) | |
| Net Increase (Decrease) – Class A | | | 10,372 | | | | 7,782 | | | | 142,418 | | | | 71,732 | | | | (7,548 | ) | | | (14,000 | ) | |
| Subscriptions – Class B | | | 1,382 | | | | 2,223 | | | | 2,301 | | | | 4,782 | | | | 1,993 | | | | 3,578 | | |
| Distributions reinvested – Class B | | | — | | | | — | | | | 1,343 | | | | 4,452 | | | | 1,445 | | | | 5,496 | | |
| Redemptions – Class B | | | (1,392 | ) | | | (1,437 | ) | | | (18,505 | ) | | | (31,688 | ) | | | (7,964 | ) | | | (16,105 | ) | |
| Net Increase (Decrease) – Class B | | | (10 | ) | | | 786 | | | | (14,861 | ) | | | (22,454 | ) | | | (4,526 | ) | | | (7,031 | ) | |
| Subscriptions – Class C | | | 2,439 | | | | 2,333 | | | | 34,501 | | | | 20,817 | | | | 1,995 | | | | 4,114 | | |
| Distributions reinvested – Class C | | | — | | | | — | * | | | 1,110 | | | | 3,230 | | | | 529 | | | | 1,960 | | |
| Redemptions – Class C | | | (617 | ) | | | (924 | ) | | | (14,166 | ) | | | (22,947 | ) | | | (4,352 | ) | | | (7,323 | ) | |
| Net Increase (Decrease) – Class C | | | 1,822 | | | | 1,409 | | | | 21,445 | | | | 1,100 | | | | (1,828 | ) | | | (1,249 | ) | |
| Subscriptions – Class Z | | | 30,453 | | | | 34,878 | | | | 499,307 | | | | 258,516 | | | | 3,072 | | | | 5,698 | | |
| Distributions reinvested – Class Z | | | 341 | | | | 99 | | | | 6,448 | | | | 14,293 | | | | 855 | | | | 2,633 | | |
| Redemptions – Class Z | | | (10,851 | ) | | | (10,107 | ) | | | (72,303 | ) | | | (170,328 | ) | | | (1,708 | ) | | | (3,204 | ) | |
| Net Increase (Decrease) – Class Z | | | 19,943 | | | | 24,870 | | | | 433,452 | | | | 102,481 | | | | 2,219 | | | | 5,127 | | |
| Net Increase (Decrease) from Share Transactions | | | 32,127 | | | | 34,847 | | | | 582,454 | | | | 152,859 | | | | (11,683 | ) | | | (17,153 | ) | |
| Redemption Fees | | | 19 | | | | 9 | | | | — | | | | — | | | | — | | | | — | | |
| Total Increase (Decrease) in Net Assets | | | 53,094 | | | | 73,899 | | | | 968,431 | | | | 450,396 | | | | (8,500 | ) | | | (14,827 | ) | |
| Net Assets: | |
| Beginning of period | | | 168,898 | | | | 94,999 | | | | 2,237,711 | | | | 1,787,315 | | | | 188,529 | | | | 203,356 | | |
| End of period | | $ | 221,992 | | | $ | 168,898 | | | $ | 3,206,142 | | | $ | 2,237,711 | | | $ | 180,029 | | | $ | 188,529 | | |
Undistributed (Overdistributed) Net Investment Income or
(Accumulated Net Investment Loss) | | $ | 547 | | | $ | 676 | | | $ | (15,544 | ) | | $ | (9,971 | ) | | $ | 2,903 | | | $ | 249 | | |
67
Columbia Acorn Family of Funds
Statements of Changes in Net Assets, continued
| | | Columbia
Acorn Fund | | Columbia Acorn
International | | Columbia
Acorn USA | |
| Changes in Shares of Beneficial Interest: | | (Unaudited)
Six months
ended
June 30, | | Year ended
December 31, | | (Unaudited)
Six months
ended
June 30, | | Year ended
December 31, | | (Unaudited)
Six months
ended
June 30, | | Year ended
December 31, | |
| (in thousands) | | 2007 | | 2006 | | 2007 | | 2006 | | 2007 | | 2006 | |
| Subscriptions – Class A | | | 20,066 | | | | 37,015 | | | | 4,120 | | | | 4,588 | | | | 1,756 | | | | 4,113 | | |
| Shares issued in reinvestment and capital gains – Class A | | | 1,551 | | | | 9,911 | | | | 53 | | | | 673 | | | | 70 | | | | 156 | | |
| Less shares redeemed – Class A | | | (16,739 | ) | | | (28,264 | ) | | | (1,131 | ) | | | (1,723 | ) | | | (1,835 | ) | | | (1,877 | ) | |
| Net Increase (Decrease) – Class A | | | 4,878 | | | | 18,662 | | | | 3,042 | | | | 3,538 | | | | (9 | ) | | | 2,392 | | |
| Subscriptions – Class B | | | 260 | | | | 909 | | | | 203 | | | | 482 | | | | 8 | | | | 47 | | |
| Shares issued in reinvestment and capital gains – Class B | | | 540 | | | | 3,757 | | | | 12 | | | | 212 | | | | 19 | | | | 50 | | |
| Less shares redeemed – Class B | | | (4,079 | ) | | | (7,576 | ) | | | (294 | ) | | | (553 | ) | | | (245 | ) | | | (533 | ) | |
| Net Increase (Decrease) – Class B | | | (3,279 | ) | | | (2,910 | ) | | | (79 | ) | | | 141 | | | | (218 | ) | | | (436 | ) | |
| Subscriptions – Class C | | | 2,223 | | | | 5,931 | | | | 709 | | | | 1,356 | | | | 72 | | | | 678 | | |
| Shares issued in reinvestment and capital gains – Class C | | | 471 | | | | 3,123 | | | | 13 | | | | 178 | | | | 16 | | | | 39 | | |
| Less shares redeemed – Class C | | | (3,486 | ) | | | (6,396 | ) | | | (214 | ) | | | (455 | ) | | | (158 | ) | | | (328 | ) | |
| Net Increase (Decrease) – Class C | | | (792 | ) | | | 2,658 | | | | 508 | | | | 1,079 | | | | (70 | ) | | | 389 | | |
| Subscriptions – Class Z | | | 33,477 | | | | 58,774 | | | | 11,650 | | | | 18,601 | | | | 3,909 | | | | 13,228 | | |
| Shares issued in reinvestment and capital gains – Class Z | | | 4,138 | | | | 27,709 | | | | 588 | | | | 7,251 | | | | 345 | | | | 796 | | |
| Less shares redeemed – Class Z | | | (27,249 | ) | | | (47,499 | ) | | | (4,294 | ) | | | (9,331 | ) | | | (4,324 | ) | | | (6,302 | ) | |
| Net Increase (Decrease) – Class Z | | | 10,366 | | | | 38,984 | | | | 7,944 | | | | 16,521 | | | | (70 | ) | | | 7,722 | | |
| Net Increase (Decrease) in Shares of Beneficial Interest | | | 11,173 | | | | 57,394 | | | | 11,415 | | | | 21,279 | | | | (367 | ) | | | 10,067 | | |
* Rounds to less than 500 shares.
See accompanying notes to financial statements.
68
| | | Columbia Acorn
International Select | | Columbia
Acorn Select | | Columbia
Thermostat Fund | |
| Changes in Shares of Beneficial Interest: | | (Unaudited)
Six months
ended
June 30, | | Year ended
December 31, | | (Unaudited)
Six months
ended
June 30, | | Year ended
December 31, | | (Unaudited)
Six months
ended
June 30, | | Year ended
December 31, | |
| (in thousands) | | 2007 | | 2006 | | 2007 | | 2006 | | 2007 | | 2006 | |
| Subscriptions – Class A | | | 447 | | | | 446 | | | | 8,142 | | | | 8,645 | | | | 249 | | | | 492 | | |
| Shares issued in reinvestment and capital gains – Class A | | | 3 | | | | — | * | | | 222 | | | | 777 | | | | 93 | | | | 390 | | |
| Less shares redeemed – Class A | | | (94 | ) | | | (131 | ) | | | (3,412 | ) | | | (6,607 | ) | | | (931 | ) | | | (1,960 | ) | |
| Net Increase (Decrease) – Class A | | | 356 | | | | 315 | | | | 4,952 | | | | 2,815 | | | | (589 | ) | | | (1,078 | ) | |
| Subscriptions – Class B | | | 49 | | | | 97 | | | | 85 | | | | 207 | | | | 154 | | | | 279 | | |
| Shares issued in reinvestment and capital gains – Class B | | | — | * | | | — | * | | | 45 | | | | 183 | | | | 112 | | | | 437 | | |
| Less shares redeemed – Class B | | | (49 | ) | | | (64 | ) | | | (675 | ) | | | (1,373 | ) | | | (616 | ) | | | (1,253 | ) | |
| Net Increase (Decrease) – Class B | | | — | | | | 33 | | | | (545 | ) | | | (983 | ) | | | (350 | ) | | | (537 | ) | |
| Subscriptions – Class C | | | 87 | | | | 100 | | | | 1,252 | | | | 898 | | | | 155 | | | | 322 | | |
| Shares issued in reinvestment and capital gains – Class C | | | — | | | | — | * | | | 38 | | | | 133 | | | | 40 | | | | 156 | | |
| Less shares redeemed – Class C | | | (22 | ) | | | (42 | ) | | | (518 | ) | | | (1,002 | ) | | | (336 | ) | | | (572 | ) | |
| Net Increase (Decrease) – Class C | | | 65 | | | | 58 | | | | 772 | | | | 29 | | | | (141 | ) | | | (94 | ) | |
| Subscriptions – Class Z | | | 1,040 | | | | 1,448 | | | | 17,043 | | | | 10,565 | | | | 239 | | | | 442 | | |
| Shares issued in reinvestment and capital gains – Class Z | | | 11 | | | | 5 | | | | 206 | | | | 559 | | | | 66 | | | | 210 | | |
| Less shares redeemed – Class Z | | | (371 | ) | | | (427 | ) | | | (2,490 | ) | | | (7,111 | ) | | | (131 | ) | | | (248 | ) | |
| Net Increase (Decrease) – Class Z | | | 680 | | | | 1,026 | | | | 14,759 | | | | 4,013 | | | | 174 | | | | 404 | | |
| Net Increase (Decrease) in Shares of Beneficial Interest | | | 1,101 | | | | 1,432 | | | | 19,938 | | | | 5,874 | | | | (906 | ) | | | (1,305 | ) | |
69
Columbia Acorn Family of Funds
Financial Highlights
Columbia Acorn Fund
| Class A Shares | | (Unaudited)
Six months
ended June 30, | | Year ended December 31, | |
| Selected data for a share outstanding throughout each period | | 2007 | | 2006 | | 2005 | | 2004 | | 2003 | | 2002 | |
| Net Asset Value, Beginning of Period | | $ | 29.02 | | | $ | 27.57 | | | $ | 25.93 | | | $ | 22.20 | | | $ | 15.34 | | | $ | 17.80 | | |
| Income from Investment Operations | |
| Net investment income (loss) (a) | | | 0.06 | | | | 0.05 | | | | 0.07 | | | | (0.05 | ) | | | (0.07 | ) | | | (0.07 | ) | |
| Net realized and unrealized gain (loss) | | | 3.25 | | | | 3.82 | | | | 3.20 | | | | 4.69 | | | | 6.95 | | | | (2.39 | ) | |
| Total from Investment Operations | | | 3.31 | | | | 3.87 | | | | 3.27 | | | | 4.64 | | | | 6.88 | | | | (2.46 | ) | |
| Less Distributions Declared to Shareholders | |
| From net investment income | | | — | | | | (0.04 | ) | | | (0.07 | ) | | | — | | | | — | | | | — | | |
| From net realized gains | | | (0.39 | ) | | | (2.38 | ) | | | (1.56 | ) | | | (0.91 | ) | | | (0.02 | ) | | | — | | |
| Total Distributions Declared to Shareholders | | | (0.39 | ) | | | (2.42 | ) | | | (1.63 | ) | | | (0.91 | ) | | | (0.02 | ) | | | — | | |
| Net Asset Value, End of Period | | $ | 31.94 | | | $ | 29.02 | | | $ | 27.57 | | | $ | 25.93 | | | $ | 22.20 | | | $ | 15.34 | | |
| Total Return (b) | | | 11.37 | %(c)(d) | | | 14.13 | %(c) | | | 12.76 | %(c) | | | 21.05 | %(c) | | | 44.85 | % | | | (13.82 | )% | |
| Ratios to Average Net Assets/Supplemental Data | |
| Net expenses (e) | | | 1.02 | %(f) | | | 1.02 | % | | | 1.03 | % | | | 1.20 | % | | | 1.33 | % | | | 1.42 | % | |
| Net investment income (loss) (e) | | | 0.39 | %(f) | | | 0.17 | % | | | 0.28 | % | | | (0.21 | )% | | | (0.36 | )% | | | (0.45 | )% | |
| Waiver/reimbursement | | | 0.01 | %(f) | | | 0.02 | % | | | 0.02 | % | | | 0.02 | % | | | — | | | | — | | |
| Portfolio turnover rate | | | 10 | %(d) | | | 22 | % | | | 16 | % | | | 20 | % | | | 10 | % | | | 13 | % | |
| Net assets at end of period (000's) | | $ | 4,632,464 | | | $ | 4,067,868 | | | $ | 3,349,461 | | | $ | 2,669,936 | | | $ | 1,982,260 | | | $ | 724,121 | | |
(a) Per share data was calculated using the average shares outstanding during the period.
(b) Total return at net asset value assuming all distributions reinvested and no initial sales charge or contingent deferred sales charge.
(c) Had the Investment Adviser and/or Transfer Agent not waived and/or reimbursed a portion of expenses, total return would have been reduced.
(d) Not annualized.
(e) The benefits derived from custody fees paid indirectly had an impact of less than 0.01%.
(f) Annualized.
| Class B Shares | | (Unaudited)
Six months
ended June 30, | | Year ended December 31, | |
| Selected data for a share outstanding throughout each period | | 2007 | | 2006 | | 2005 | | 2004 | | 2003 | | 2002 | |
| Net Asset Value, Beginning of Period | | $ | 27.78 | | | $ | 26.61 | | | $ | 25.19 | | | $ | 21.75 | | | $ | 15.13 | | | $ | 17.67 | | |
| Income from Investment Operations | |
| Net investment loss (a) | | | (0.03 | ) | | | (0.13 | ) | | | (0.11 | ) | | | (0.22 | ) | | | (0.18 | ) | | | (0.17 | ) | |
| Net realized and unrealized gain (loss) | | | 3.11 | | | | 3.68 | | | | 3.09 | | | | 4.57 | | | | 6.82 | | | | (2.37 | ) | |
| Total from Investment Operations | | | 3.08 | | | | 3.55 | | | | 2.98 | | | | 4.35 | | | | 6.64 | | | | (2.54 | ) | |
| Less Distributions Declared to Shareholders | |
| From net realized gains | | | (0.39 | ) | | | (2.38 | ) | | | (1.56 | ) | | | (0.91 | ) | | | (0.02 | ) | | | — | | |
| Total Distributions Declared to Shareholders | | | (0.39 | ) | | | (2.38 | ) | | | (1.56 | ) | | | (0.91 | ) | | | (0.02 | ) | | | — | | |
| Net Asset Value, End of Period | | $ | 30.47 | | | $ | 27.78 | | | $ | 26.61 | | | $ | 25.19 | | | $ | 21.75 | | | $ | 15.13 | | |
| Total Return (b) | | | 11.05 | %(c)(d) | | | 13.43 | %(c) | | | 11.98 | %(c) | | | 20.15 | %(c) | | | 43.89 | % | | | (14.37 | )% | |
| Ratios to Average Net Assets/Supplemental Data | |
| Net expenses (e) | | | 1.60 | %(f) | | | 1.66 | % | | | 1.72 | % | | | 1.95 | % | | | 1.98 | % | | | 2.07 | % | |
| Net investment loss (e) | | | (0.19 | )%(f) | | | (0.48 | )% | | | (0.42 | )% | | | (0.96 | )% | | | (1.01 | )% | | | (1.10 | )% | |
| Waiver/reimbursement | | | 0.01 | %(f) | | | 0.02 | % | | | 0.02 | % | | | 0.02 | % | | | — | | | | — | | |
| Portfolio turnover rate | | | 10 | %(d) | | | 22 | % | | | 16 | % | | | 20 | % | | | 10 | % | | | 13 | % | |
| Net assets at end of period (000's) | | $ | 1,440,071 | | | $ | 1,404,165 | | | $ | 1,422,580 | | | $ | 1,399,135 | | | $ | 1,221,931 | | | $ | 618,727 | | |
(a) Per share data was calculated using the average shares outstanding during the period.
(b) Total return at net asset value assuming all distributions reinvested and no initial sales charge or contingent deferred sales charge.
(c) Had the Investment Adviser and/or Transfer Agent not waived and/or reimbursed a portion of expenses, total return would have been reduced.
(d) Not annualized.
(e) The benefits derived from custody fees paid indirectly had an impact of less than 0.01%.
(f) Annualized.
| Class C Shares | | (Unaudited)
Six months
ended June 30, | | Year ended December 31, | |
| Selected data for a share outstanding throughout each period | | 2007 | | 2006 | | 2005 | | 2004 | | 2003 | | 2002 | |
| Net Asset Value, Beginning of Period | | $ | 27.70 | | | $ | 26.58 | | | $ | 25.18 | | | $ | 21.75 | | | $ | 15.12 | | | $ | 17.66 | | |
| Income from Investment Operations | |
| Net investment loss (a) | | | (0.06 | ) | | | (0.17 | ) | | | (0.13 | ) | | | (0.22 | ) | | | (0.18 | ) | | | (0.17 | ) | |
| Net realized and unrealized gain (loss) | | | 3.10 | | | | 3.67 | | | | 3.09 | | | | 4.56 | | | | 6.83 | | | | (2.37 | ) | |
| Total from Investment Operations | | | 3.04 | | | | 3.50 | | | | 2.96 | | | | 4.34 | | | | 6.65 | | | | (2.54 | ) | |
| Less Distributions Declared to Shareholders | |
| From net realized gains | | | (0.39 | ) | | | (2.38 | ) | | | (1.56 | ) | | | (0.91 | ) | | | (0.02 | ) | | | — | | |
| Total Distributions Declared to Shareholders | | | (0.39 | ) | | | (2.38 | ) | | | (1.56 | ) | | | (0.91 | ) | | | (0.02 | ) | | | — | | |
| Net Asset Value, End of Period | | $ | 30.35 | | | $ | 27.70 | | | $ | 26.58 | | | $ | 25.18 | | | $ | 21.75 | | | $ | 15.12 | | |
| Total Return (b) | | | 10.94 | %(c)(d) | | | 13.25 | %(c) | | | 11.90 | %(c) | | | 20.11 | %(c) | | | 43.99 | % | | | (14.38 | )% | |
| Ratios to Average Net Assets/Supplemental Data | |
| Net expenses (e) | | | 1.80 | %(f) | | | 1.80 | % | | | 1.82 | % | | | 1.95 | % | | | 1.98 | % | | | 2.07 | % | |
| Net investment loss (e) | | | (0.39 | )%(f) | | | (0.61 | )% | | | (0.51 | )% | | | (0.96 | )% | | | (1.01 | )% | | | (1.10 | )% | |
| Waiver/reimbursement | | | 0.01 | %(f) | | | 0.02 | % | | | 0.02 | % | | | 0.02 | % | | | — | | | | — | | |
| Portfolio turnover rate | | | 10 | %(d) | | | 22 | % | | | 16 | % | | | 20 | % | | | 10 | % | | | 13 | % | |
| Net assets at end of period (000's) | | $ | 1,450,101 | | | $ | 1,345,520 | | | $ | 1,220,339 | | | $ | 1,083,006 | | | $ | 900,016 | | | $ | 376,024 | | |
(a) Per share data was calculated using the average shares outstanding during the period.
(b) Total return at net asset value assuming all distributions reinvested and no initial sales charge or contingent deferred sales charge.
(c) Had the Investment Adviser and/or Transfer Agent not waived and/or reimbursed a portion of expenses, total return would have been reduced.
(d) Not annualized.
(e) The benefits derived from custody fees paid indirectly had an impact of less than 0.01%.
(f) Annualized.
See accompanying notes to financial statements.
70
Columbia Acorn International
| Class A Shares | | (Unaudited)
Six months
ended June 30, | | Year ended December 31, | |
| Selected data for a share outstanding throughout each period | | 2007 | | 2006 | | 2005 | | 2004 | | 2003 | | 2002 | |
| Net Asset Value, Beginning of Period | | $ | 40.07 | | | $ | 33.20 | | | $ | 28.75 | | | $ | 22.45 | | | $ | 15.32 | | | $ | 18.35 | | |
| Income from Investment Operations | |
| Net investment income (a) | | | 0.29 | | | | 0.23 | | | | 0.22 | | | | 0.14 | | | | 0.10 | | | | 0.05 | | |
| Net realized and unrealized gain (loss) | | | 5.48 | | | | 10.87 | | | | 5.84 | | | | 6.31 | | | | 7.08 | | | | (3.07 | ) | |
| Total from Investment Operations | | | 5.77 | | | | 11.10 | | | | 6.06 | | | | 6.45 | | | | 7.18 | | | | (3.02 | ) | |
| Less Distributions Declared to Shareholders | |
| From net investment income | | | — | (b) | | | (0.32 | ) | | | (0.53 | ) | | | (0.15 | ) | | | (0.05 | ) | | | (0.01 | ) | |
| From net realized gains | | | (0.25 | ) | | | (3.91 | ) | | | (1.08 | ) | | | — | | | | — | | | | — | | |
| Total Distributions Declared to Shareholders | | | (0.25 | ) | | | (4.23 | ) | | | (1.61 | ) | | | (0.15 | ) | | | (0.05 | ) | | | (0.01 | ) | |
| Net Asset Value, End of Period | | $ | 45.59 | | | $ | 40.07 | | | $ | 33.20 | | | $ | 28.75 | | | $ | 22.45 | | | $ | 15.32 | | |
| Total Return (c) | | | 14.41 | %(d)(e) | | | 34.16 | %(d) | | | 21.42 | %(d) | | | 28.91 | %(d) | | | 46.94 | % | | | (16.46 | )% | |
| Ratios to Average Net Assets/Supplemental Data | |
| Net expenses (f) | | | 1.19 | %(g) | | | 1.24 | % | | | 1.30 | % | | | 1.48 | % | | | 1.59 | % | | | 1.56 | % | |
| Net investment income (f) | | | 1.37 | %(g) | | | 0.61 | % | | | 0.72 | % | | | 0.61 | % | | | 0.57 | % | | | 0.30 | % | |
| Waiver/reimbursement | | | 0.01 | %(g) | | | 0.01 | % | | | 0.02 | % | | | 0.02 | % | | | — | | | | — | | |
| Portfolio turnover rate | | | 16 | %(e) | | | 31 | % | | | 27 | % | | | 40 | % | | | 40 | % | | | 52 | % | |
| Net assets at end of period (000's) | | $ | 495,307 | | | $ | 313,401 | | | $ | 142,204 | | | $ | 70,582 | | | $ | 52,872 | | | $ | 33,806 | | |
(a) Per share data was calculated using the average shares outstanding during the period.
(b) Rounds to less than ($0.01).
(c) Total return at net asset value assuming all distributions reinvested and no initial sales charge or contingent deferred sales charge.
(d) Had the Investment Adviser and/or Transfer Agent not waived and/or reimbursed a portion of expenses, total return would have been reduced.
(e) Not annualized.
(f) The benefits derived from custody fees paid indirectly had an impact of less than 0.01%.
(g) Annualized.
| Class B Shares | | (Unaudited)
Six months
ended June 30, | | Year ended December 31, | |
| Selected data for a share outstanding throughout each period | | 2007 | | 2006 | | 2005 | | 2004 | | 2003 | | 2002 | |
| Net Asset Value, Beginning of Period | | $ | 39.39 | | | $ | 32.71 | | | $ | 28.18 | | | $ | 22.07 | | | $ | 15.11 | | | $ | 18.22 | | |
| Income from Investment Operations | |
| Net investment income (loss) (a) | | | 0.14 | | | | (0.00 | )(b) | | | 0.02 | | | | (0.04 | ) | | | (0.02 | ) | | | (0.06 | ) | |
| Net realized and unrealized gain (loss) | | | 5.41 | | | | 10.66 | | | | 5.73 | | | | 6.19 | | | | 6.98 | | | | (3.05 | ) | |
| Total from Investment Operations | | | 5.55 | | | | 10.66 | | | | 5.75 | | | | 6.15 | | | | 6.96 | | | | (3.11 | ) | |
| Less Distributions Declared to Shareholders | |
| From net investment income | | | — | | | | (0.07 | ) | | | (0.14 | ) | | | (0.04 | ) | | | — | | | | — | | |
| From net realized gains | | | (0.25 | ) | | | (3.91 | ) | | | (1.08 | ) | | | — | | | | — | | | | — | | |
| Total Distributions Declared to Shareholders | | | (0.25 | ) | | | (3.98 | ) | | | (1.22 | ) | | | (0.04 | ) | | | — | | | | — | | |
| Net Asset Value, End of Period | | $ | 44.69 | | | $ | 39.39 | | | $ | 32.71 | | | $ | 28.18 | | | $ | 22.07 | | | $ | 15.11 | | |
| Total Return (c) | | | 14.09 | %(d)(e) | | | 33.26 | %(d) | | | 20.57 | %(d) | | | 27.91 | %(d) | | | 46.06 | % | | | (17.07 | )% | |
| Ratios to Average Net Assets/Supplemental Data | |
| Net expenses (f) | | | 1.79 | %(g) | | | 1.89 | % | | | 2.01 | % | | | 2.27 | % | | | 2.24 | % | | | 2.21 | % | |
| Net investment income (loss) (f) | | | 0.69 | %(g) | | | (0.01 | )% | | | 0.08 | % | | | (0.18 | )% | | | (0.10 | )% | | | (0.35 | )% | |
| Waiver/reimbursement | | | 0.01 | %(g) | | | 0.02 | % | | | 0.02 | % | | | 0.02 | % | | | — | | | | — | | |
| Portfolio turnover rate | | | 16 | %(e) | | | 31 | % | | | 27 | % | | | 40 | % | | | 40 | % | | | 52 | % | |
| Net assets at end of period (000's) | | $ | 103,314 | | | $ | 94,165 | | | $ | 73,572 | | | $ | 54,752 | | | $ | 39,800 | | | $ | 22,560 | | |
(a) Per share data was calculated using the average shares outstanding during the period.
(b) Rounds to less than $(0.01).
(c) Total return at net asset value assuming all distributions reinvested and no initial sales charge or contingent deferred sales charge.
(d) Had the Investment Adviser and/or Transfer Agent not waived and/or reimbursed a portion of expenses, total return would have been reduced.
(e) Not annualized.
(f) The benefits derived from custody fees paid indirectly had an impact of less than 0.01%.
(g) Annualized.
See accompanying notes to financial statements.
| Class C Shares | | (Unaudited)
Six months
ended June 30, | | Year ended December 31, | |
| Selected data for a share outstanding throughout each period | | 2007 | | 2006 | | 2005 | | 2004 | | 2003 | | 2002 | |
| Net Asset Value, Beginning of Period | | $ | 39.35 | | | $ | 32.68 | | | $ | 28.19 | | | $ | 22.06 | | | $ | 15.11 | | | $ | 18.21 | | |
| Income from Investment Operations | |
| Net investment income (loss) (a) | | | 0.12 | | | | (0.05 | ) | | | (0.00 | )(b) | | | (0.03 | ) | | | (0.01 | ) | | | (0.06 | ) | |
| Net realized and unrealized gain (loss) | | | 5.39 | | | | 10.66 | | | | 5.71 | | | | 6.20 | | | | 6.96 | | | | (3.04 | ) | |
| Total from Investment Operations | | | 5.51 | | | | 10.61 | | | | 5.71 | | | | 6.17 | | | | 6.95 | | | | (3.10 | ) | |
| Less Distributions Declared to Shareholders | |
| From net investment income | | | — | | | | (0.03 | ) | | | (0.14 | ) | | | (0.04 | ) | | | — | | | | — | | |
| From net realized gains | | | (0.25 | ) | | | (3.91 | ) | | | (1.08 | ) | | | — | | | | — | | | | — | | |
| Total Distributions Declared to Shareholders | | | (0.25 | ) | | | (3.94 | ) | | | (1.22 | ) | | | (0.04 | ) | | | — | | | | — | | |
| Net Asset Value, End of Period | | $ | 44.61 | | | $ | 39.35 | | | $ | 32.68 | | | $ | 28.19 | | | $ | 22.06 | | | $ | 15.11 | | |
| Total Return (c) | | | 14.00 | %(d)(e) | | | 33.14 | %(d) | | | 20.45 | %(d) | | | 28.01 | %(d) | | | 46.00 | % | | | (17.02 | )% | |
| Ratios to Average Net Assets/Supplemental Data | |
| Net expenses (f) | | | 1.96 | %(g) | | | 2.01 | % | | | 2.09 | % | | | 2.24 | % | | | 2.24 | % | | | 2.21 | % | |
| Net investment income (loss) (f) | | | 0.57 | %(g) | | | (0.14 | )% | | | (0.01 | )% | | | (0.15 | )% | | | (0.06 | )% | | | (0.35 | )% | |
| Waiver/reimbursement | | | 0.01 | %(g) | | | 0.01 | % | | | 0.02 | % | | | 0.02 | % | | | — | | | | — | | |
| Portfolio turnover rate | | | 16 | %(e) | | | 31 | % | | | 27 | % | | | 40 | % | | | 40 | % | | | 52 | % | |
| Net assets at end of period (000's) | | $ | 135,340 | | | $ | 99,425 | | | $ | 47,325 | | | $ | 30,547 | | | $ | 22,990 | | | $ | 14,575 | | |
(a) Per share data was calculated using the average shares outstanding during the period.
(b) Rounds to less than $(0.01).
(c) Total return at net asset value assuming all distributions reinvested and no initial sales charge or contingent deferred sales charge.
(d) Had the Investment Adviser and/or Transfer Agent not waived and/or reimbursed a portion of expenses, total return would have been reduced.
(e) Not annualized.
(f) The benefits derived from custody fees paid indirectly had an impact of less than 0.01%.
(g) Annualized.
71
Columbia Acorn Family of Funds
Financial Highlights, continued
Columbia Acorn USA
| Class A Shares | | (Unaudited)
Six months
ended June 30, | | Year ended December 31, | |
| Selected data for a share outstanding throughout each period | | 2007 | | 2006 | | 2005 | | 2004 | | 2003 | | 2002 | |
| Net Asset Value, Beginning of Period | | $ | 28.02 | | | $ | 26.52 | | | $ | 24.77 | | | $ | 20.74 | | | $ | 14.18 | | | $ | 17.50 | | |
| Income from Investment Operations | |
| Net investment income (loss) (a) | | | 0.01 | | | | (0.10 | ) | | | (0.01 | ) | | | (0.24 | ) | | | (0.22 | ) | | | (0.19 | ) | |
| Net realized and unrealized gain (loss) | | | 2.62 | | | | 2.21 | | | | 3.13 | | | | 4.41 | | | | 6.78 | | | | (3.13 | ) | |
| Total from Investment Operations | | | 2.63 | | | | 2.11 | | | | 3.12 | | | | 4.17 | | | | 6.56 | | | | (3.32 | ) | |
| Less Distributions Declared to Shareholders | |
| From net realized gains | | | (0.28 | ) | | | (0.61 | ) | | | (1.37 | ) | | | (0.14 | ) | | | — | | | | — | | |
| Net Asset Value, End of Period | | $ | 30.37 | | | $ | 28.02 | | | $ | 26.52 | | | $ | 24.77 | | | $ | 20.74 | | | $ | 14.18 | | |
| Total Return (b) | | | 9.36 | %(c)(d) | | | 7.95 | %(c) | | | 12.68 | %(c) | | | 20.12 | %(c) | | | 46.26 | % | | | (18.97 | )% | |
| Ratios to Average Net Assets/Supplemental Data | |
| Net expenses (e) | | | 1.25 | %(f) | | | 1.26 | % | | | 1.31 | % | | | 1.51 | % | | | 1.65 | % | | | 1.74 | % | |
| Net investment income (loss) (e) | | | 0.05 | %(f) | | | (0.35 | )% | | | (0.02 | )% | | | (1.08 | )% | | | (1.26 | )% | | | (1.21 | )% | |
| Waiver/reimbursement | | | 0.01 | %(f) | | | 0.01 | % | | | 0.01 | % | | | 0.02 | % | | | — | | | | — | | |
| Portfolio turnover rate | | | 9 | %(d) | | | 13 | % | | | 13 | % | | | 18 | % | | | 7 | % | | | 31 | % | |
| Net assets at end of period (000's) | | $ | 265,857 | | | $ | 245,552 | | | $ | 168,922 | | | $ | 112,509 | | | $ | 89,650 | | | $ | 32,422 | | |
(a) Per share data was calculated using the average shares outstanding during the period.
(b) Total return at net asset value assuming all distributions reinvested and no initial sales charge or contingent deferred sales charge.
(c) Had the Investment Adviser and/or Transfer Agent not waived and/or reimbursed a portion of expenses, total return would have been reduced.
(d) Not annualized.
(e) The benefits derived from custody fees paid indirectly an impact of less than 0.01%.
(f) Annualized.
| Class B Shares | | (Unaudited)
Six months
ended June 30, | | Year ended December 31, | |
| Selected data for a share outstanding throughout each period | | 2007 | | 2006 | | 2005 | | 2004 | | 2003 | | 2002 | |
| Net Asset Value, Beginning of Period | | $ | 26.87 | | | $ | 25.61 | | | $ | 24.14 | | | $ | 20.36 | | | $ | 14.01 | | | $ | 17.40 | | |
| Income from Investment Operations | |
| Net investment loss (a) | | | (0.08 | ) | | | (0.27 | ) | | | (0.18 | ) | | | (0.39 | ) | | | (0.32 | ) | | | (0.29 | ) | |
| Net realized and unrealized gain (loss) | | | 2.51 | | | | 2.14 | | | | 3.02 | | | | 4.31 | | | | 6.67 | | | | (3.10 | ) | |
| Total from Investment Operations | | | 2.43 | | | | 1.87 | | | | 2.84 | | | | 3.92 | | | | 6.35 | | | | (3.39 | ) | |
| Less Distributions Declared to Shareholders | |
| From net realized gains | | | (0.28 | ) | | | (0.61 | ) | | | (1.37 | ) | | | (0.14 | ) | | | — | | | | — | | |
| Net Asset Value, End of Period | | $ | 29.02 | | | $ | 26.87 | | | $ | 25.61 | | | $ | 24.14 | | | $ | 20.36 | | | $ | 14.01 | | |
| Total Return (b) | | | 9.02 | %(c)(d) | | | 7.29 | %(c) | | | 11.84 | %(c) | | | 19.26 | %(c) | | | 45.32 | % | | | (19.48 | )% | |
| Ratios to Average Net Assets/Supplemental Data | |
| Net expenses (e) | | | 1.86 | %(f) | | | 1.93 | % | | | 2.00 | % | | | 2.23 | % | | | 2.30 | % | | | 2.39 | % | |
| Net investment loss (e) | | | (0.57 | )%(f) | | | (1.01 | )% | | | (0.72 | )% | | | (1.80 | )% | | | (1.91 | )% | | | (1.86 | )% | |
| Waiver/reimbursement | | | 0.01 | %(f) | | | 0.02 | % | | | 0.01 | % | | | 0.02 | % | | | — | | | | — | | |
| Portfolio turnover rate | | | 9 | %(d) | | | 13 | % | | | 13 | % | | | 18 | % | | | 7 | % | | | 31 | % | |
| Net assets at end of period (000's) | | $ | 63,927 | | | $ | 65,040 | | | $ | 73,168 | | | $ | 72,643 | | | $ | 66,175 | | | $ | 37,478 | | |
(a) Per share data was calculated using the average shares outstanding during the period.
(b) Total return at net asset value assuming all distributions reinvested and no initial sales charge or contingentdeferred sales charge.
(c) Had the Investment Adviser and/or Transfer Agent not waived and/or reimbursed a portion of expenses, total return would have been reduced.
(d) Not annualized.
(e) The benefits derived from custody fees paid indirectly had an impact of less than 0.01%.
(f) Annualized.
| Class C Shares | | (Unaudited)
Six months
ended June 30, | | Year ended December 31, | |
| Selected data for a share outstanding throughout each period | | 2007 | | 2006 | | 2005 | | 2004 | | 2003 | | 2002 | |
| Net Asset Value, Beginning of Period | | $ | 26.81 | | | $ | 25.59 | | | $ | 24.14 | | | $ | 20.36 | | | $ | 14.01 | | | $ | 17.40 | | |
| Income from Investment Operations | |
| Net investment loss (a) | | | (0.10 | ) | | | (0.30 | ) | | | (0.20 | ) | | | (0.39 | ) | | | (0.32 | ) | | | (0.29 | ) | |
| Net realized and unrealized gain (loss) | | | 2.50 | | | | 2.13 | | | | 3.02 | | | | 4.31 | | | | 6.67 | | | | (3.10 | ) | |
| Total from Investment Operations | | | 2.40 | | | | 1.83 | | | | 2.82 | | | | 3.92 | | | | 6.35 | | | | (3.39 | ) | |
| Less Distributions Declared to Shareholders | |
| From net realized gains | | | (0.28 | ) | | | (0.61 | ) | | | (1.37 | ) | | | (0.14 | ) | | | — | | | | — | | |
| Net Asset Value, End of Period | | $ | 28.93 | | | $ | 26.81 | | | $ | 25.59 | | | $ | 24.14 | | | $ | 20.36 | | | $ | 14.01 | | |
| Total Return (b) | | | 8.93 | %(c)(d) | | | 7.14 | %(c) | | | 11.76 | %(c) | | | 19.26 | %(c) | | | 45.32 | % | | | (19.48 | )% | |
| Ratios to Average Net Assets/Supplemental Data | |
| Net expenses (e) | | | 2.04 | %(f) | | | 2.05 | % | | | 2.10 | % | | | 2.23 | % | | | 2.30 | % | | | 2.39 | % | |
| Net investment loss (e) | | | (0.75 | )%(f) | | | (1.14 | )% | | | (0.81 | )% | | | (1.80 | )% | | | (1.91 | )% | | | (1.86 | )% | |
| Waiver/reimbursement | | | 0.01 | %(f) | | | 0.01 | % | | | 0.01 | % | | | 0.02 | % | | | — | | | | — | | |
| Portfolio turnover rate | | | 9 | %(d) | | | 13 | % | | | 13 | % | | | 18 | % | | | 7 | % | | | 31 | % | |
| Net assets at end of period (000's) | | $ | 57,674 | | | $ | 55,306 | | | $ | 42,844 | | | $ | 39,643 | | | $ | 35,662 | | | $ | 18,313 | | |
(a) Per share data was calculated using the average shares outstanding during the period.
(b) Total return at net asset value assuming all distributions reinvested and no initial sales charge or contingent deferred sales charge.
(c) Had the Investment Adviser and/or Transfer Agent not waived and/or reimbursed a portion of expenses, total return would have been reduced.
(d) Not annualized.
(e) The benefits derived from custody fees paid indirectly had an impact of less than 0.01%.
(f) Annualized.
See accompanying notes to financial statements.
72
Columbia Acorn International Select
| Class A Shares | | (Unaudited)
Six months
ended June 30, | | Year ended December 31, | |
| Selected data for a share outstanding throughout each period | | 2007 | | 2006 | | 2005 | | 2004 | | 2003 | | 2002 | |
| Net Asset Value, Beginning of Period | | $ | 27.68 | | | $ | 20.36 | | | $ | 17.85 | | | $ | 14.45 | | | $ | 10.24 | | | $ | 12.07 | | |
| Income from Investment Operations | |
| Net investment income (loss) (a) | | | 0.09 | | | | 0.03 | | | | 0.06 | | | | (0.00 | )(b) | | | 0.03 | | | | (0.01 | ) | |
| Net realized and unrealized gain (loss) | | | 3.13 | | | | 7.29 | | | | 2.69 | | | | 3.43 | | | | 4.18 | | | | (1.82 | ) | |
| Total from Investment Operations | | | 3.22 | | | | 7.32 | | | | 2.75 | | | | 3.43 | | | | 4.21 | | | | (1.83 | ) | |
| Less Distributions Declared to Shareholders | |
| From net investment income | | | (0.08 | ) | | | — | | | | (0.24 | ) | | | (0.03 | ) | | | — | | | | — | | |
| Net Asset Value, End of Period | | $ | 30.82 | | | $ | 27.68 | | | $ | 20.36 | | | $ | 17.85 | | | $ | 14.45 | | | $ | 10.24 | | |
| Total Return (c)(d) | | | 11.62 | %(e) | | | 35.97 | % | | | 15.60 | % | | | 23.76 | % | | | 41.11 | % | | | (15.16 | )% | |
| Ratios to Average Net Assets/Supplemental Data | |
| Net expenses (f) | | | 1.48 | %(g) | | | 1.58 | % | | | 1.70 | % | | | 1.75 | % | | | 1.80 | % | | | 1.80 | % | |
| Net investment income (loss) (f) | | | 0.63 | %(g) | | | 0.11 | % | | | 0.34 | % | | | (0.03 | )% | | | 0.24 | % | | | (0.09 | )% | |
| Waiver/reimbursement | | | 0.01 | %(g) | | | 0.02 | % | | | 0.10 | % | | | 0.37 | % | | | 0.44 | % | | | 0.33 | % | |
| Portfolio turnover rate | | | 31 | %(e) | | | 47 | % | | | 39 | % | | | 73 | % | | | 69 | % | | | 102 | % | |
| Net assets at end of period (000's) | | $ | 36,156 | | | $ | 22,599 | | | $ | 10,219 | | | $ | 4,357 | | | $ | 2,557 | | | $ | 2,612 | | |
(a) Per share data was calculated using the average shares outstanding during the period.
(b) Rounds to less than $(0.01).
(c) Total return at net asset value assuming all distributions reinvested and no initial sales charge or contingent deferred sales charge.
(d) Had the Investment Adviser and/or Transfer Agent not waived and/or reimbursed a portion of expenses, total return would have been reduced.
(e) Not annualized.
(f) The benefits derived from custody fees paid indirectly had an impact of less than 0.01%.
(g) Annualized.
| Class B Shares | | (Unaudited)
Six months
ended June 30, | | Year ended December 31, | |
| Selected data for a share outstanding throughout each period | | 2007 | | 2006 | | 2005 | | 2004 | | 2003 | | 2002 | |
| Net Asset Value, Beginning of Period | | $ | 26.73 | | | $ | 19.80 | | | $ | 17.36 | | | $ | 14.12 | | | $ | 10.08 | | | $ | 11.96 | | |
| Income from Investment Operations | |
| Net investment loss (a) | | | (0.00 | )(b) | | | (0.12 | ) | | | (0.03 | ) | | | (0.10 | ) | | | (0.06 | ) | | | (0.08 | ) | |
| Net realized and unrealized gain (loss) | | | 3.01 | | | | 7.05 | | | | 2.61 | | | | 3.34 | | | | 4.10 | | | | (1.80 | ) | |
| Total from Investment Operations | | | 3.01 | | | | 6.93 | | | | 2.58 | | | | 3.24 | | | | 4.04 | | | | (1.88 | ) | |
| Less Distributions Declared to Shareholders | |
| From net investment income | | | — | | | | — | | | | (0.14 | ) | | | — | | | | — | | | | — | | |
| Net Asset Value, End of Period | | $ | 29.74 | | | $ | 26.73 | | | $ | 19.80 | | | $ | 17.36 | | | $ | 14.12 | | | $ | 10.08 | | |
| Total Return (c)(d) | | | 11.26 | %(e) | | | 35.00 | % | | | 14.97 | % | | | 22.95 | % | | | 40.08 | % | | | (15.72 | )% | |
| Ratios to Average Net Assets/Supplemental Data | |
| Net expenses (f) | | | 2.10 | %(g) | | | 2.25 | % | | | 2.30 | % | | | 2.38 | % | | | 2.45 | % | | | 2.45 | % | |
| Net investment loss (f) | | | (0.03 | )%(g) | | | (0.53 | )% | | | (0.16 | )% | | | (0.66 | )% | | | (0.52 | )% | | | (0.74 | )% | |
| Waiver/reimbursement | | | 0.02 | %(g) | | | 0.04 | % | | | 0.28 | % | | | 0.58 | % | | | 0.44 | % | | | 0.33 | % | |
| Portfolio turnover rate | | | 31 | %(e) | | | 47 | % | | | 39 | % | | | 73 | % | | | 69 | % | | | 102 | % | |
| Net assets at end of period (000's) | | $ | 10,892 | | | $ | 9,787 | | | $ | 6,594 | | | $ | 5,097 | | | $ | 3,162 | | | $ | 1,835 | | |
(a) Per share data was calculated using the average shares outstanding during the period.
(b) Rounds to less than $(0.01).
(c) Total return at net asset value assuming all distributions reinvested and no initial sales charge or contingent deferred sales charge.
(d) Had the Investment Adviser and/or Transfer Agent not waived and/or reimbursed a portion of expenses, total return would have been reduced.
(e) Not annualized.
(f) The benefits derived from custody fees paid indirectly had an impact of less than 0.01%.
(g) Annualized.
| Class C Shares | | (Unaudited)
Six months
ended June 30, | | Year ended December 31, | |
| Selected data for a share outstanding throughout each period | | 2007 | | 2006 | | 2005 | | 2004 | | 2003 | | 2002 | |
| Net Asset Value, Beginning of Period | | $ | 26.70 | | | $ | 19.80 | | | $ | 17.38 | | | $ | 14.14 | | | $ | 10.09 | | | $ | 11.97 | | |
| Income from Investment Operations | |
| Net investment loss (a) | | | (0.03 | ) | | | (0.15 | ) | | | (0.05 | ) | | | (0.11 | ) | | | (0.05 | ) | | | (0.08 | ) | |
| Net realized and unrealized gain (loss) | | | 3.01 | | | | 7.05 | | | | 2.60 | | | | 3.35 | | | | 4.10 | | | | (1.80 | ) | |
| Total from Investment Operations | | | 2.98 | | | | 6.90 | | | | 2.55 | | | | 3.24 | | | | 4.05 | | | | (1.88 | ) | |
| Less Distributions Declared to Shareholders | |
| From net investment income | | | — | | | | — | | | | (0.13 | ) | | | — | | | | — | | | | — | | |
| Net Asset Value, End of Period | | $ | 29.68 | | | $ | 26.70 | | | $ | 19.80 | | | $ | 17.38 | | | $ | 14.14 | | | $ | 10.09 | | |
| Total Return (b)(c) | | | 11.16 | %(d) | | | 34.85 | % | | | 14.77 | % | | | 22.91 | % | | | 40.14 | % | | | (15.71 | )% | |
| Ratios to Average Net Assets/Supplemental Data | |
| Net expenses (e) | | | 2.27 | %(f) | | | 2.38 | % | | | 2.45 | % | | | 2.45 | % | | | 2.45 | % | | | 2.45 | % | |
| Net investment loss (e) | | | (0.18 | )%(f) | | | (0.67 | )% | | | (0.30 | )% | | | (0.73 | )% | | | (0.41 | )% | | | (0.74 | )% | |
| Waiver/reimbursement | | | 0.01 | %(f) | | | 0.02 | % | | | 0.17 | % | | | 0.35 | % | | | 0.44 | % | | | 0.33 | % | |
| Portfolio turnover rate | | | 31 | %(d) | | | 47 | % | | | 39 | % | | | 73 | % | | | 69 | % | | | 102 | % | |
| Net assets at end of period (000's) | | $ | 9,778 | | | $ | 7,060 | | | $ | 4,083 | | | $ | 2,543 | | | $ | 3,691 | | | $ | 2,915 | | |
(a) Per share data was calculated using the average shares outstanding during the period.
(b) Total return at net asset value assuming all distributions reinvested and no initial sales charge or contingent deferred sales charge.
(c) Had the Investment Adviser and/or Transfer Agent not waived and/or reimbursed a portion of expenses, total return would have been reduced.
(d) Not annualized.
(e) The benefits derived from custody fees paid indirectly had an impact of less than 0.01%.
(f) Annualized.
See accompanying notes to financial statements.
73
Columbia Acorn Family of Funds
Financial Highlights, continued
Columbia Acorn Select
| Class A Shares | | (Unaudited)
Six months
ended June 30, | | Year ended December 31, | |
| Selected data for a share outstanding throughout each period | | 2007 | | 2006 | | 2005 | | 2004 | | 2003 | | 2002 | |
| Net Asset Value, Beginning of Period | | $ | 26.18 | | | $ | 22.47 | | | $ | 20.83 | | | $ | 18.01 | | | $ | 13.93 | | | $ | 15.17 | | |
| Income from Investment Operations | |
| Net investment loss (a) | | | (0.06 | ) | | | (0.13 | ) | | | (0.09 | ) | | | (0.16 | ) | | | (0.20 | ) | | | (0.16 | ) | |
| Net realized and unrealized gain (loss) | | | 4.42 | | | | 4.45 | | | | 2.32 | | | | 3.42 | | | | 4.37 | | | | (1.08 | ) | |
| Total from Investment Operations | | | 4.36 | | | | 4.32 | | | | 2.23 | | | | 3.26 | | | | 4.17 | | | | (1.24 | ) | |
| Less Distributions Declared to Shareholders | |
| From net investment income | | | — | | | | (0.02 | ) | | | — | | | | — | | | | — | | | | — | | |
| From net realized gains | | | (0.19 | ) | | | (0.59 | ) | | | (0.59 | ) | | | (0.44 | ) | | | (0.09 | ) | | | — | | |
| Total Distributions Declared to Shareholders | | | (0.19 | ) | | | (0.61 | ) | | | (0.59 | ) | | | (0.44 | ) | | | (0.09 | ) | | | — | | |
| Net Asset Value, End of Period | | $ | 30.35 | | | $ | 26.18 | | | $ | 22.47 | | | $ | 20.83 | | | $ | 18.01 | | | $ | 13.93 | | |
| Total Return (b) | | | 16.64 | %(c)(d) | | | 19.32 | %(c) | | | 10.78 | %(c) | | | 18.16 | %(c) | | | 29.95 | % | | | (8.17 | )%(c) | |
| Ratios to Average Net Assets/Supplemental Data | |
| Net expenses (e) | | | 1.20 | %(f) | | | 1.24 | % | | | 1.26 | % | | | 1.47 | % | | | 1.63 | % | | | 1.70 | % | |
| Net investment loss (e) | | | (0.44 | )%(f) | | | (0.54 | )% | | | (0.42 | )% | | | (0.86 | )% | | | (1.15 | )% | | | (1.11 | )% | |
| Waiver/reimbursement | | | 0.01 | %(f) | | | 0.03 | % | | | 0.03 | % | | | 0.02 | % | | | — | | | | 0.10 | % | |
| Portfolio turnover rate | | | 7 | %(d) | | | 21 | % | | | 19 | % | | | 34 | % | | | 16 | % | | | 40 | % | |
| Net assets at end of period (000's) | | $ | 1,240,930 | | | $ | 940,857 | | | $ | 744,178 | | | $ | 515,842 | | | $ | 264,679 | | | $ | 31,742 | | |
(a) Per share data was calculated using the average shares outstanding during the period.
(b) Total return at net asset value assuming all distributions reinvested and no initial sales charge or contingent deferred sales charge.
(c) Had the Investment Adviser and/or Transfer Agent not waived and/or reimbursed a portion of expenses, total return would have been reduced.
(d) Not annualized.
(e) The benefits derived from custody fees paid indirectly had an impact of less than 0.01%.
(f) Annualized.
| Class B Shares | | (Unaudited)
Six months
ended June 30, | | Year ended December 31, | |
| Selected data for a share outstanding throughout each period | | 2007 | | 2006 | | 2005 | | 2004 | | 2003 | | 2002 | |
| Net Asset Value, Beginning of Period | | $ | 25.13 | | | $ | 21.71 | | | $ | 20.23 | | | $ | 17.64 | | | $ | 13.73 | | | $ | 15.05 | | |
| Income from Investment Operations | |
| Net investment loss (a) | | | (0.14 | ) | | | (0.28 | ) | | | (0.23 | ) | | | (0.31 | ) | | | (0.29 | ) | | | (0.25 | ) | |
| Net realized and unrealized gain (loss) | | | 4.23 | | | | 4.29 | | | | 2.24 | | | | 3.34 | | | | 4.29 | | | | (1.07 | ) | |
| Total from Investment Operations | | | 4.09 | | | | 4.01 | | | | 2.01 | | | | 3.03 | | | | 4.00 | | | | (1.32 | ) | |
| Less Distributions Declared to Shareholders | |
| From net realized gains | | | (0.19 | ) | | | (0.59 | ) | | | (0.53 | ) | | | (0.44 | ) | | | (0.09 | ) | | | — | | |
| Net Asset Value, End of Period | | $ | 29.03 | | | $ | 25.13 | | | $ | 21.71 | | | $ | 20.23 | | | $ | 17.64 | | | $ | 13.73 | | |
| Total Return (b) | | | 16.26 | %(c)(d) | | | 18.54 | %(c) | | | 10.01 | %(c) | | | 17.24 | %(c) | | | 29.14 | % | | | (8.77 | )%(c) | |
| Ratios to Average Net Assets/Supplemental Data | |
| Net expenses (e) | | | 1.80 | %(f) | | | 1.91 | % | | | 1.99 | % | | | 2.26 | % | | | 2.28 | % | | | 2.35 | % | |
| Net investment loss (e) | | | (1.05 | )%(f) | | | (1.21 | )% | | | (1.15 | )% | | | (1.65 | )% | | | (1.80 | )% | | | (1.76 | )% | |
| Waiver/reimbursement | | | 0.01 | %(f) | | | 0.03 | % | | | 0.03 | % | | | 0.02 | % | | | — | | | | 0.10 | % | |
| Portfolio turnover rate | | | 7 | %(d) | | | 21 | % | | | 19 | % | | | 34 | % | | | 16 | % | | | 40 | % | |
| Net assets at end of period (000's) | | $ | 231,739 | | | $ | 214,260 | | | $ | 206,441 | | | $ | 185,545 | | | $ | 118,064 | | | $ | 33,106 | | |
(a) Per share data was calculated using the average shares outstanding during the period.
(b) Total return at net asset value assuming all distributions reinvested and no initial sales charge or contingent deferred sales charge.
(c) Had the Investment Adviser and/or Transfer Agent not waived and/or reimbursed a portion of expenses, total return would have been reduced.
(d) Not annualized.
(e) The benefits derived from custody fees paid indirectly had an impact of less than 0.01%.
(f) Annualized.
| Class C Shares | | (Unaudited)
Six months
ended June 30, | | Year ended December 31, | |
| Selected data for a share outstanding throughout each period | | 2007 | | 2006 | | 2005 | | 2004 | | 2003 | | 2002 | |
| Net Asset Value, Beginning of Period | | $ | 25.07 | | | $ | 21.69 | | | $ | 20.23 | | | $ | 17.64 | | | $ | 13.73 | | | $ | 15.05 | | |
| Income from Investment Operations | |
| Net investment loss (a) | | | (0.17 | ) | | | (0.31 | ) | | | (0.25 | ) | | | (0.30 | ) | | | (0.30 | ) | | | (0.25 | ) | |
| Net realized and unrealized gain (loss) | | | 4.23 | | | | 4.28 | | | | 2.24 | | | | 3.33 | | | | 4.30 | | | | (1.07 | ) | |
| Total from Investment Operations | | | 4.06 | | | | 3.97 | | | | 1.99 | | | | 3.03 | | | | 4.00 | | | | (1.32 | ) | |
| Less Distributions Declared to Shareholders | |
| From net realized gains | | | (0.19 | ) | | | (0.59 | ) | | | (0.53 | ) | | | (0.44 | ) | | | (0.09 | ) | | | — | | |
| Net Asset Value, End of Period | | $ | 28.94 | | | $ | 25.07 | | | $ | 21.69 | | | $ | 20.23 | | | $ | 17.64 | | | $ | 13.73 | | |
| Total Return (b) | | | 16.18 | %(c)(d) | | | 18.37 | %(c) | | | 9.91 | %(c) | | | 17.24 | %(c) | | | 29.14 | % | | | (8.77 | )%(c) | |
| Ratios to Average Net Assets/Supplemental Data | |
| Net expenses (e) | | | 1.99 | %(f) | | | 2.04 | % | | | 2.08 | % | | | 2.25 | % | | | 2.28 | % | | | 2.35 | % | |
| Net investment loss (e) | | | (1.23 | )%(f) | | | (1.34 | )% | | | (1.24 | )% | | | (1.64 | )% | | | (1.80 | )% | | | (1.76 | )% | |
| Waiver/reimbursement | | | 0.01 | %(f) | | | 0.03 | % | | | 0.03 | % | | | 0.02 | % | | | — | | | | 0.10 | % | |
| Portfolio turnover rate | | | 7 | %(d) | | | 21 | % | | | 19 | % | | | 34 | % | | | 16 | % | | | 40 | % | |
| Net assets at end of period (000's) | | $ | 222,201 | | | $ | 173,152 | | | $ | 149,160 | | | $ | 110,435 | | | $ | 64,212 | | | $ | 10,919 | | |
(a) Per share data was calculated using the average shares outstanding during the period.
(b) Total return at net asset value assuming all distributions reinvested and no initial sales charge or contingent deferred sales charge.
(c) Had the Investment Adviser and/or Transfer Agent not waived and/or reimbursed a portion of expenses, total return would have been reduced.
(d) Not annualized.
(e) The benefits derived from custody fees paid indirectly had an impact of less than 0.01%.
(f) Annualized.
See accompanying notes to financial statements.
74
Columbia Thermostat Fund
| Class A Shares | | (Unaudited)
Six months
ended
June 30, | | Year ended December 31, | | Inception
March 3, 2003
through
December 31, | |
| Selected data for a share outstanding throughout each period | | 2007 | | 2006 | | 2005 | | 2004 | | 2003 | |
| Net Asset Value, Beginning of Period | | $ | 12.59 | | | $ | 12.49 | | | $ | 13.11 | | | $ | 12.30 | | | $ | 10.10 | | |
| Income from Investment Operations | |
| Net investment income (a) | | | 0.22 | | | | 0.45 | | | | 0.39 | | | | 0.28 | | | | 0.18 | | |
| Net realized and unrealized gain | | | 0.32 | | | | 0.84 | | | | 0.29 | | | | 0.81 | | | | 2.15 | | |
| Total from Investment Operations | | | 0.54 | | | | 1.29 | | | | 0.68 | | | | 1.09 | | | | 2.33 | | |
| Less Distributions Declared to Shareholders | |
| From net investment income | | | (0.03 | ) | | | (0.47 | ) | | | (0.39 | ) | | | (0.25 | ) | | | (0.13 | ) | |
| From net realized gains | | | (0.30 | ) | | | (0.72 | ) | | | (0.91 | ) | | | (0.03 | ) | | | (0.00 | )(b) | |
| Total Distributions Declared to Shareholders | | | (0.33 | ) | | | (1.19 | ) | | | (1.30 | ) | | | (0.28 | ) | | | (0.13 | ) | |
| Net Asset Value, End of Period | | $ | 12.80 | | | $ | 12.59 | | | $ | 12.49 | | | $ | 13.11 | | | $ | 12.30 | | |
| Total Return (c)(d) | | | 4.25 | %(e) | | | 10.56 | % | | | 5.25 | % | | | 8.92 | % | | | 23.10 | %(e) | |
| Ratios to Average Net Assets/Supplemental Data | |
| Net expenses (f)(g) | | | 0.50 | %(h) | | | 0.50 | % | | | 0.50 | % | | | 0.50 | % | | | 0.57 | %(h) | |
| Net investment income (g) | | | 3.44 | %(h) | | | 3.53 | % | | | 2.97 | % | | | 2.23 | % | | | 1.86 | %(h) | |
| Waiver/reimbursement | | | 0.22 | %(h) | | | 0.20 | % | | | 0.15 | % | | | 0.33 | % | | | 0.66 | %(h) | |
| Portfolio turnover rate | | | 39 | %(e) | | | 66 | % | | | 96 | % | | | 67 | % | | | 61 | % | |
| Net assets at end of period (000's) | | $ | 51,470 | | | $ | 58,013 | | | $ | 71,034 | | | $ | 77,092 | | | $ | 42,271 | | |
(a) Per share data was calculated using the average shares outstanding during the period. Recognition of net investment income by the Fund is affected by the timing of the declaration of dividends by the underlying investment companies in which the Fund invests.
(b) Rounds to less than $(0.01).
(c) Total return at net asset value assuming all distributions reinvested and no initial sales charge or contingent deferred sales charge.
(d) Had the Investment Adviser and/or Transfer Agent not reimbursed a portion of expenses, total return would have been reduced.
(e) Not annualized.
(f) Does not include expenses of the investment companies in which the Fund invests.
(g) The benefits derived from custody fees paid indirectly had an impact of less than 0.01%.
(h) Annualized.
| Class B Shares | | (Unaudited)
Six months
ended
June 30, | | Year ended December 31, | | Inception
March 3, 2003
through
December 31, | |
| Selected data for a share outstanding throughout each period | | 2007 | | 2006 | | 2005 | | 2004 | | 2003 | |
| Net Asset Value, Beginning of Period | | $ | 12.62 | | | $ | 12.51 | | | $ | 13.14 | | | $ | 12.32 | | | $ | 10.10 | | |
| Income from Investment Operations | |
| Net investment income (a) | | | 0.19 | | | | 0.38 | | | | 0.31 | | | | 0.19 | | | | 0.10 | | |
| Net realized and unrealized gain | | | 0.33 | | | | 0.84 | | | | 0.28 | | | | 0.83 | | | | 2.16 | | |
| Total from Investment Operations | | | 0.52 | | | | 1.22 | | | | 0.59 | | | | 1.02 | | | | 2.26 | | |
| Less Distributions Declared to Shareholders | |
| From net investment income | | | — | | | | (0.39 | ) | | | (0.31 | ) | | | (0.17 | ) | | | (0.04 | ) | |
| From net realized gains | | | (0.30 | ) | | | (0.72 | ) | | | (0.91 | ) | | | (0.03 | ) | | | (0.00 | )(b) | |
| Total Distributions Declared to Shareholders | | | (0.30 | ) | | | (1.11 | ) | | | (1.22 | ) | | | (0.20 | ) | | | (0.04 | ) | |
| Net Asset Value, End of Period | | $ | 12.84 | | | $ | 12.62 | | | $ | 12.51 | | | $ | 13.14 | | | $ | 12.32 | | |
| Total Return (c)(d) | | | 4.07 | %(e) | | | 9.91 | % | | | 4.56 | % | | | 8.27 | % | | | 22.38 | %(e) | |
| Ratios to Average Net Assets/Supplemental Data | |
| Net expenses (f)(g) | | | 1.00 | %(h) | | | 1.06 | % | | | 1.10 | % | | | 1.18 | % | | | 1.32 | %(h) | |
| Net investment income (g) | | | 2.96 | %(h) | | | 2.99 | % | | | 2.39 | % | | | 1.55 | % | | | 1.06 | %(h) | |
| Waiver/reimbursement | | | 0.23 | %(h) | | | 0.23 | % | | | 0.19 | % | | | 0.29 | % | | | 0.66 | %(h) | |
| Portfolio turnover rate | | | 39 | %(e) | | | 66 | % | | | 96 | % | | | 67 | % | | | 61 | % | |
| Net assets at end of period (000's) | | $ | 69,096 | | | $ | 72,367 | | | $ | 78,444 | | | $ | 78,040 | | | $ | 51,501 | | |
(a) Per share data was calculated using the average shares outstanding during the period. Recognition of net investment income by the Fund is affected by the timing of the declaration of dividends by the underlying investment companies in which the Fund invests.
(b) Rounds to less than $(0.01).
(c) Total return at net asset value assuming all distributions reinvested and no initial sales charge or contingent deferred sales charge.
(d) Had the Investment Adviser and/or Transfer Agent not reimbursed a portion of expenses, total return would have been reduced.
(e) Not annualized.
(f) Does not include expenses of the investment companies in which the Fund invests.
(g) The benefits derived from custody fees paid indirectly had an impact of less than 0.01%.
(h) Annualized.
See accompanying notes to financial statements.
75
Columbia Acorn Family of Funds
Financial Highlights, continued
Columbia Thermostat Fund
| Class C Shares | | (Unaudited)
Six months
ended
June 30, | | Year ended December 31, | | Inception
March 3, 2003
through
December 31, | |
| Selected data for a share outstanding throughout each period | | 2007 | | 2006 | | 2005 | | 2004 | | 2003 | |
| Net Asset Value, Beginning of Period | | $ | 12.62 | | | $ | 12.51 | | | $ | 13.13 | | | $ | 12.32 | | | $ | 10.10 | | |
| Income from Investment Operations | |
| Net investment income (a) | | | 0.17 | | | | 0.36 | | | | 0.29 | | | | 0.19 | | | | 0.11 | | |
| Net realized and unrealized gain | | | 0.33 | | | | 0.84 | | | | 0.29 | | | | 0.81 | | | | 2.15 | | |
| Total from Investment Operations | | | 0.50 | | | | 1.20 | | | | 0.58 | | | | 1.00 | | | | 2.26 | | |
| Less Distributions Declared to Shareholders | |
| From net investment income | | | — | | | | (0.37 | ) | | | (0.29 | ) | | | (0.16 | ) | | | (0.04 | ) | |
| From net realized gains | | | (0.30 | ) | | | (0.72 | ) | | | (0.91 | ) | | | (0.03 | ) | | | (0.00 | )(b) | |
| Total Distributions Declared to Shareholders | | | (0.30 | ) | | | (1.09 | ) | | | (1.20 | ) | | | (0.19 | ) | | | (0.04 | ) | |
| Net Asset Value, End of Period | | $ | 12.82 | | | $ | 12.62 | | | $ | 12.51 | | | $ | 13.13 | | | $ | 12.32 | | |
| Total Return (c)(d) | | | 3.91 | %(e) | | | 9.72 | % | | | 4.49 | % | | | 8.13 | % | | | 22.38 | %(e) | |
| Ratios to Average Net Assets/Supplemental Data | |
| Net expenses (f)(g) | | | 1.25 | %(h) | | | 1.25 | % | | | 1.25 | % | | | 1.25 | % | | | 1.32 | %(h) | |
| Net investment income (g) | | | 2.71 | %(h) | | | 2.81 | % | | | 2.21 | % | | | 1.48 | % | | | 1.10 | %(h) | |
| Waiver/reimbursement | | | 0.23 | %(h) | | | 0.23 | % | | | 0.19 | % | | | 0.26 | % | | | 0.66 | %(h) | |
| Portfolio turnover rate | | | 39 | %(e) | | | 66 | % | | | 96 | % | | | 67 | % | | | 61 | % | |
| Net assets at end of period (000's) | | $ | 25,991 | | | $ | 27,375 | | | $ | 28,316 | | | $ | 31,161 | | | $ | 20,087 | | |
(a) Per share data was calculated using the average shares outstanding during the period. Recognition of net investment income by the Fund is affected by the timing of the declaration of dividends by the underlying investment companies in which the Fund invests.
(b) Rounds to less than $(0.01).
(c) Total return at net asset value assuming all distributions reinvested and no initial sales charge or contingent deferred sales charge.
(d) Had the Investment Adviser and/or Transfer Agent not reimbursed a portion of expenses, total return would have been reduced.
(e) Not annualized.
(f) Does not include expenses of the investment companies in which the Fund invests.
(g) The benefits derived from custody fees paid indirectly had an impact of less than 0.01%.
(h) Annualized.
See accompanying notes to financial statements.
76
Columbia Acorn Family of Funds
Notes to Financial Statements (Unaudited)
1. Nature of Operations
Columbia Acorn Fund, Columbia Acorn International, Columbia Acorn USA, Columbia Acorn International Select, Columbia Acorn Select and Columbia Thermostat Fund (the "Funds") are each a series of Columbia Acorn Trust (the "Trust"), an open-end management investment company organized as a Massachusetts business trust. The investment objective of each Fund, excluding Columbia Thermostat Fund, is to seek long-term growth of capital. The investment objective of Columbia Thermostat Fund is to provide long-term total return. The Fund pursues its investment objective by investing in shares of other mutual funds. As a "fund of funds" under normal circumstances, the Fund allocates at least 95% of its net assets among a selected group of stock and bond mutual funds ("portfolio funds") according to the current level of the Standard & Poor's 500 Stock Index in relation to predetermined ranges set by the Fund's investment adviser. The Fund may invest up to 5% of its net assets plus any cash received that day in cash, repurchase agreements, high quality short-term paper and government securities.
The Funds may issue an unlimited number of shares. The Funds currently offer four classes of shares: Class A, Class B, Class C and Class Z.
Class A shares are sold with a front-end sales charge. Class A shares bought without an initial sales charge in accounts aggregating up to $50 million at the time of purchase are subject to a 1.00% contingent deferred sales charge ("CDSC") if the shares are sold within 12 months of the time to purchase.
Class B shares are subject to a CDSC if sold within six years of purchase. Class B shares will convert to Class A shares automatically eight years after purchase.
Class C shares are subject to a CDSC on redemptions made within one year after purchase.
Class Z shares are offered continuously at net asset value. There are certain restrictions on the purchase of Class Z shares. Generally, Class Z shares of a Fund may be exchanged for shares of another fund distributed by Columbia Management Distributors, Inc. at no additional charge.
Columbia Acorn International and Columbia Acorn International Select impose a 2% redemption fee on Class A, Class B, Class C and Class Z shares that are redeemed within 60 days or less. See "Fund Policy on Trading of Fund Shares" as disclosed in the Funds' prospectuses for more information.
The financial highlights for Class Z shares are presented in a separate semiannual report.
Investment income, realized and unrealized gains and losses, and certain fund-level expenses are allocated pro rata on the basis of the relative net assets of all classes, except each class bears certain expenses unique to that class such as distribution services, transfer agent, and certain other class specific expenses. Differences in class expenses may result in payment of different dividend distributions for each class. All the share classes of the Trust have equal rights with respect to voting subject to Fund or class specific matters.
2. Significant Accounting Policies
>Security valuation
Securities of the Funds are valued at market value or, if a market quotation for a security is not readily available or is deemed not to be reliable because of events or circumstances that have occurred between the market quotation and the time as of which the security is to be valued, the security is valued at a fair value determined in accordance with procedures established by the Board of Trustees. With respect to Columbia Thermostat Fund, investments in portfolio funds are valued at their net asset value as reported by the underlying funds. A security traded on a securities exchange or in the over-the-counter market in which transaction prices are reported is valued at the last sales price at the time of valuation. A security traded principally on NASDAQ is valued at the NASDAQ official closing price. A security for which there is no reported sale on the valuation date is valued at the latest bid quotation. A short-term debt obligation having a maturity of 60 days or less from the valuation date is valued at amortized cost, which approximate fair value. A security for which a market quotation is not readily available and any other assets are valued in accordance with procedures established by the Board of Trustees. The Trust has retained an independent statistical fair value pricing service to assist in the fair valuation process for securities principally traded in a foreign market in order to adjust for possible changes in value that may occur between the close of the foreign exchange and the time as of which the securities are to be valued. If a security is valued at a "fair value," that value may be different from the last quoted market price for the security.
In September 2006, Statement of Financial Accounting Standards No. 157, Fair Value Measurements ("SFAS 157"), was issued. SFAS 157 is effective for fiscal years beginning after November 15, 2007. SFAS 157 defines fair value, establishes a framework for measuring fair value and expands disclosures about fair value measurements. Management is evaluating the
77
Columbia Acorn Family of Funds
Notes to Financial Statements (Unaudited), continued
impact the application of SFAS 157 will have on the Funds' financial statement disclosures.
>Repurchase agreements
The Funds may engage in repurchase agreement transactions. The Funds, through their custodians, receive delivery of underlying securities collateralizing repurchase agreements. The Funds' investment adviser determines that the value of the underlying securities is at all times at least equal to the resale price. In the event of default or bankruptcy by the other party to the agreement, realization and/or retention of the collateral may be subject to legal proceedings.
>Foreign currency translations
Values of investments denominated in foreign currencies are converted into U.S. dollars using the spot market rate of exchange at the time of valuation. Purchases and sales of investments and dividend and interest income are translated into U.S. dollars using the spot market rate of exchange prevailing on the respective dates of such transactions. The gain or loss resulting from changes in foreign exchange rates is included with net realized and unrealized gain or loss from investments, as appropriate.
>Security transactions and investment income
Security transactions, investment income and shareholder fund transactions are accounted for on the trade date (date the order to buy or sell is executed) and dividend income and realized gain distributions from other funds are recorded on the ex-dividend date, except that certain dividends from foreign securities are recorded as soon as the information is available to the Funds. Interest income is recorded on the accrual basis and includes amortization of discounts on debt obligations when required for federal income tax purposes. Realized gains and losses from security transactions are recorded on an identified cost basis.
Awards, if any, from class action litigation related to securities owned may be recorded as a reduction of cost of those securities. If the applicable securities are no longer owned, the proceeds are recorded as realized gains.
The Funds estimate components of distributions from real estate investment trusts ("REITs"). Distributions received in excess of income are recorded as a reduction of the cost of the related investments. If the applicable securities are no longer owned, any distributions received in excess of income are recorded as realized gains.
>Restricted securities
Restricted securities are securities that may only be resold upon registration under federal securities laws or in transactions exempt from registration. In some cases, the issuer of restricted securities has agreed to register such securities for resale at the issuer's expense either upon demand by the Funds or in connection with another registered offering of the securities. Many restricted securities may be resold in the secondary market in transactions exempt from registration. Such restricted securities may be determined to be liquid under criteria established by the Board of Trustees. The Funds will not incur any registration costs upon such resale.
>Use of estimates
The preparation of financial statements in conformity with accounting principles generally accepted in the United States of America ("GAAP") requires management to make estimates and assumptions that affect the amounts reported in the financial statements and accompanying notes. Actual results may differ from those estimates.
>Fund share valuation
Fund shares are sold and redeemed on a continuing basis at net asset value subject to any applicable sales charge. Net asset value per share is determined daily as of the close of trading on the New York Stock Exchange ("NYSE") on each day the NYSE is open for trading. All income, expenses (other than the Class A, Class B and Class C shares Rule 12b-1 service and distribution fees and Class A, Class B, Class C and Class Z shares transfer agent fees) and realized and unrealized gains (losses) of a Fund are allocated to each class proportionately on a daily basis for purposes of determining the net asset value of each class. Redemption fees are accounted for as an addition to paid in capital for purposes of determining the net asset value of each class.
>Custody fees/credits
Custody fees are reduced based on each Fund's cash balances maintained with the custodian. The amount is disclosed as a reduction of total expenses on the Statements of Operations.
>Federal income taxes
The Funds have complied with the provisions of the Internal Revenue Code available to regulated investment companies and, in the manner provided therein, distribute all their taxable income, as well as any net realized gain on sales of investments and foreign currency transactions reportable for federal income tax purposes. Columbia Thermostat Fund distributes all of its taxable income, as well as any net realized gain on
78
sales of portfolio fund shares and any distributions of net realized gains received by the Fund from its portfolio funds, reportable for federal income tax purposes. Accordingly, the Funds paid no federal income taxes and no federal income tax provision was required.
>Foreign capital gains taxes
Realized gains in certain countries may be subject to foreign taxes at the fund level, at rates ranging from approximately 10% to 15%. The Funds accrue for such foreign taxes on net realized and unrealized gains at the appropriate rate for each jurisdiction.
>Distributions to shareholders
Distributions to shareholders are recorded on the ex-date.
>Indemnification
In the normal course of business, each Fund enters into contracts that contain a variety of representations and warranties and which provide general indemnities. A Fund's maximum exposure under these arrangements is unknown, as this would involve future claims against the Fund. Also, under the Trust's organizational documents, the Trustees and Officers of the Trust are indemnified against certain liabilities that may arise out of their duties to the Trust. However, based on experience, the Funds expect the risk of loss due to these warranties and indemnities to be minimal.
3. Federal Tax Information
The tax character of distributions paid during the year ended December 31, 2006 was as follows:
| | | Ordinary
Income* | | Long-Term
Capital Gains | |
| (in thousands) | |
| Columbia Acorn Fund | | $ | 102,167 | | | $ | 1,405,201 | | |
| Columbia Acorn International | | | 47,043 | | | | 386,698 | | |
| Columbia Acorn USA | | | — | | | | 33,093 | | |
| Columbia Acorn International Select | | | 198 | | | | — | | |
| Columbia Acorn Select | | | 9,493 | | | | 41,617 | | |
| Columbia Thermostat Fund | | | 7,031 | | | | 9,506 | | |
*For tax purposes short-term capital gains distributions, if any, are considered ordinary income distributions.
The following capital loss carryforwards, determined as of December 31, 2006, may be available to reduce taxable income arising from future net realized gains on investments, if any, to the extent permitted by the Internal Revenue Code:
Year of
Expiration | | Columbia Acorn
USA | | Columbia Acorn
International Select | |
| (in thousands) | | | |
| | 2009 | | | $ | 1,517 | * | | $ | — | | |
| | 2010 | | | | 506 | | | | 6,126 | | |
| | 2011 | | | | — | | | | 2,488 | | |
| | TOTAL | | | $ | 2,023 | | | $ | 8,614 | | |
*Of these carryforwards, $2,023 (expiring in 2009 and 2010) remains from Columbia Acorn USA's merger with Stein Roe Small Company Growth Fund on 7/26/2002. Utilization of Stein Roe Small Company Growth Fund's losses could be subject to limitations imposed by the Internal Revenue Code.
The following capital loss carryforwards were utilized during the year ended December 31, 2006.
| (in thousands) | |
| Columbia Acorn USA | | $ | 506 | | |
| Columbia Acorn International Select | | | 16,995 | | |
The Funds adopted Financial Accounting Standards Board ("FASB") Interpretation No. 48, Accounting for Uncertainty in Income Taxes – an Interpretation of FASB Statement No. 109 ("FIN 48") effective June 29, 2007. FIN 48 requires management to determine whether a tax position of a Fund is more likely than not to be sustained upon examination by the applicable taxing authority, including resolution of any related appeals or litigation processes, based in the technical merits of the position. The tax benefit to be recognized is measured as the largest amount of benefit that is greater than fifty percent likely of being realized upon ultimate settlement. FIN 48 must be applied to all existing tax positions upon initial adoption and the cumulative effect, if any, is to be reported as an adjustment to net assets. Management has evaluated the known implications of FIN 48 on its computation of net assets for the Funds. As a result of this evaluation, management believes that FIN 48 will not have any effect on the Fund's financial statements. However, management's conclusions regarding FIN 48 may be subject to review and adjustment at a later date based on factors including, but not limited to, further guidance expected from the FASB, new tax laws, regulations, and administrative interpretations (including relevant court decisions).
4. Transactions with Affiliates
Columbia WAM furnishes continuing investment supervision to the Funds and is responsible for the overall management of the Funds' business affairs.
Effective August 1, 2007, under the Funds' investment advisory agreement, fees are accrued daily based on the Funds' average daily net assets and paid monthly to Columbia WAM at the annual rates shown in the table below for Columbia Acorn International Select:
Columbia Acorn International Select
| Average Daily Net Assets | | Annual
Fee Rate | |
| | Up to $500 million | | | | 0.940 | % | |
| | $500 million and over | | | | 0.900 | % | |
For all of the Funds, and prior to August 1, 2007, for Columbia Acorn International Select, for the period covered by this report as provided under the Funds' investment advisory
79
Columbia Acorn Family of Funds
Notes to Financial Statements (Unaudited), continued
agreement, fees were accrued daily based on the Funds' average daily net assets and paid monthly to Columbia WAM at the annual rates shown in the table below for each Fund.
Columbia Acorn Fund
| Average Daily Net Assets | | Annual
Fee Rate | |
| Up to $700 million | | | 0.740 | % | |
| $700 million to $2 billion | | | 0.690 | % | |
| $2 billion to $6 billion | | | 0.640 | % | |
| $6 billion and over | | | 0.630 | % | |
Columbia Acorn International
| Average Daily Net Assets | | Annual
Fee Rate | |
| Up to $100 million | | | 1.190 | % | |
| $100 million to $500 million | | | 0.940 | % | |
| $500 million and over | | | 0.740 | % | |
Columbia Acorn USA
| Average Daily Net Assets | | Annual
Fee Rate | |
| Up to $200 million | | | 0.940 | % | |
| $200 million to $500 million | | | 0.890 | % | |
| $500 million to $2 billion | | | 0.840 | % | |
| $2 billion to $3 billion | | | 0.800 | % | |
| $3 billion and over | | | 0.700 | % | |
Columbia Acorn Select
| Average Daily Net Assets | | Annual
Fee Rate | |
| Up to $700 million | | | 0.850 | % | |
| $700 million to $2 billion | | | 0.800 | % | |
| $2 billion to $3 billion | | | 0.750 | % | |
| $3 billion and over | | | 0.700 | % | |
Columbia Acorn International Select
| All Average Daily Net Assets | | | 0.940 | % | |
Columbia Thermostat Fund
| All Average Daily Net Assets | | | 0.100 | % | |
For the six months ended June 30, 2007, the Funds' annualized investment advisory fee rates were as follows:
| Columbia Acorn Fund | | | 0.64 | % | |
| Columbia Acorn International | | | 0.76 | % | |
| Columbia Acorn USA | | | 0.86 | % | |
| Columbia Acorn International Select | | | 0.94 | % | |
| Columbia Acorn Select | | | 0.80 | % | |
| Columbia Thermostat Fund | | | 0.10 | % | |
>Expense limit
Columbia WAM has voluntarily agreed to reimburse the ordinary operating expenses (exclusive of 12b-1 service and distribution fees, interest, taxes and extraordinary expenses, if any) exceeding 1.45% of the average daily net assets for Columbia Acorn International Select Class A, Class B and Class C shares and 1.35% of the average daily net assets for Columbia Acorn Select Class A, Class B and Class C shares. This arrangement may be modified or terminated by either the Funds or Columbia WAM on 30 days notice.
Columbia WAM has agreed to contractually reimburse the ordinary operating expenses (exclusive of Rule 12b-1 service and distribution fees, interest and fees on borrowings, and expenses associated with the Fund's investment in other investment companies) exceeding 0.25% of the average daily net assets of Columbia Thermostat Fund's Class A, Class B and Class C shares through April 30, 2008.
Expenses reimbursed by Columbia WAM for Columbia Thermostat Fund for the six months ended June 30, 2007, were $186,952.
Columbia WAM provides administrative services and receives an administration fee from the Funds at the following annual rates:
Columbia Acorn Trust
Aggregate Average Daily
Net Assets of the Trust: | | Annual
Fee Rate | |
| Up to $8 billion | | | 0.05 | % | |
| $8 billion to $16 billion | | | 0.04 | % | |
| $16 billion and over | | | 0.03 | % | |
For the six months ended June 30, 2007, each Fund's annualized effective administration fee rate was 0.04%. Columbia WAM has delegated to Columbia Management Advisors, LLC, an indirect, wholly owned subsidiary of BOA, responsibility to provide certain administrative services to the Funds.
Columbia Management Distributors, Inc. ("CMDI"), a wholly owned subsidiary of BOA, is the Funds' principal underwriter and receives no compensation on the sale of Class Z shares.
For the six months ended June 30, 2007, Columbia Acorn Fund, Columbia Acorn International, Columbia Acorn USA, Columbia Acorn International Select, Columbia Acorn Select and Columbia Thermostat have been advised that CMDI retained $578,819 in underwriting discounts on the sale of
80
Class A shares and received CDSCs of $940,520 and $52,795, on Class B and Class C share redemptions, respectively.
Each Fund has adopted a Rule 12b-1 plan which requires it to pay CMDI a monthly service fee equal to 0.25% annually of the average daily net assets attributable to Class A, Class B and Class C shares. The Rule 12b-1 plan also requires each fund to pay CMDI a monthly distribution fee equal to 0.50% and 0.75%, annually, of the average daily net assets attributable to Class B and Class C shares, respectively.
Columbia Management Services, Inc. (the "Transfer Agent"), a wholly owned subsidiary of BOA, provides shareholder services to the Funds and has contracted with Boston Financial Data Services ("BFDS") to serve as sub-transfer agent. For such services, the Transfer Agent receives a fee, paid monthly, at the annual rate of $17.00 per open account. The Transfer Agent also receives reimbursement for certain out-of-pocket expenses and sub-transfer agency expenses. During the period January 1, 2007, through March 31, 2007, a portion of these fees were contractually waived.
Expenses waived by the Transfer Agent for the six months ended June 30, 2007, were as follows:
| (in thousands) | |
| Columbia Acorn Fund | | $ | 737 | | |
| Columbia Acorn International | | | 56 | | |
| Columbia Acorn USA | | | 66 | | |
| Columbia Acorn International Select | | | 4 | | |
| Columbia Acorn Select | | | 100 | | |
| Columbia Thermostat Fund | | | 11 | | |
Certain officers and trustees of the Trust are also officers of Columbia WAM. The Trust makes no direct payments to its officers and trustees who are affiliated with Columbia WAM. For those trustees not affiliated with Columbia WAM, fees and expenses paid by the Funds for the six months ended June 30, 2007, were as follows:
| (in thousands) | |
| Columbia Acorn Fund | | $ | 367 | | |
| Columbia Acorn International | | | 74 | | |
| Columbia Acorn USA | | | 30 | | |
| Columbia Acorn International Select | | | 15 | | |
| Columbia Acorn Select | | | 155 | | |
| Columbia Thermostat Fund | | | 18 | | |
The Board of Trustees appointed a Chief Compliance Officer to the Trust in accordance with federal securities regulations. The Funds, along with other affiliated funds, will pay their pro-rata share of the expenses associated with the Office of the Chief Compliance Officer. Those expenses are disclosed separately as "Chief compliance officer expenses" in the Statements of Operations.
The Trust offers a deferred compensation plan for its trustees. Under that plan, a trustee may elect to defer all or a portion of his or her compensation. Amounts deferred are retained by the Trust and represent an unfunded obligation of the Trust. The value of amounts deferred is determined by reference to the change in value of Class Z shares of one or more series of the Trust or a money market fund as specified by the trustee. Benefits under the deferred compensation plan are payable when a trustee ceases to be a member of the Board of Trustees.
An affiliate may include any company in which a Fund owns five percent or more of its outstanding voting securities. On June 30, 2007, Columbia Acorn Fund, Columbia Acorn International, Columbia Acorn USA and Columbia Acorn Select each held five percent or more of the outstanding voting securities of one or more companies. Details of investments in those affiliated companies are presented on pages 35, 44, 52 and 61, respectively.
During the six months ended June 30, 2007, the Funds engaged in purchase and sale transactions with funds that have a common investment adviser (or affiliated investment advisers), common directors/trustees, and/or common officers. Those transactions complied with Rule 17a-7 under the Investment Company Act of 1940 and were as follows:
| | | Purchases | | Sales | |
| (in thousands) | |
| Columbia Acorn International | | $ | 3,841 | | | $ | 281 | | |
| Columbia USA | | | 115 | | | | — | | |
| Columbia Acorn Select | | | 3,036 | | | | — | | |
5. Borrowing Arrangements
The Trust participates in a $150 million credit facility, which was entered into to facilitate portfolio liquidity. Interest is charged to each participating fund based on its borrowings at a rate per annum equal to the Federal Funds rate plus 0.50%. In addition, a commitment fee of 0.08% per annum is accrued and apportioned among the participating funds based on their pro-rata portion of the unutilized line of credit. The commitment fee is included in "Other expenses" in the Statements of Operations. No amounts were borrowed by the Funds under this facility for the six months ended June 30, 2007.
81
Columbia Acorn Family of Funds
Notes to Financial Statements (Unaudited), continued
6. Investment Transactions
The aggregate cost of purchases and proceeds from sales other than short-term obligations for the six months ended June 30, 2007, were:
Columbia Acorn Fund
| (in thousands) | |
| Investment securities | | | |
| Purchases | | $ | 2,113,213 | | |
| Proceeds from sales | | | 1,942,800 | | |
Columbia Acorn International
| (in thousands) | |
| Investment securities | | | |
| Purchases | | $ | 10,522,574 | | |
| Proceeds from sales | | | 747,816 | | |
Columbia Acorn USA
| (in thousands) | |
| Investment securities | | | |
| Purchases | | $ | 210,429 | | |
| Proceeds from sales | | | 140,893 | | |
Columbia Acorn International Select
| (in thousands) | |
| Investment securities | | | |
| Purchases | | $ | 82,074 | | |
| Proceeds from sales | | | 57,095 | | |
Columbia Acorn Select
| (in thousands) | |
| Investment securities | | | |
| Purchases | | $ | 541,174 | | |
| Proceeds from sales | | | 167,449 | | |
Columbia Thermostat Fund
| (in thousands) | |
| Investment securities | | | |
| Purchases | | $ | 72,382 | | |
| Proceeds from sales | | | 85,432 | | |
7. Redemption Fees
For the six months ended June 30, 2007, the redemption fees imposed by Columbia Acorn International and Columbia Acorn International Select amounted to approximately $103,000 and $19,000, respectively, and are accounted for as additions to paid in capital.
8. Other
For the six months ended June 30, 2007, Columbia Acorn Fund incurred two trading errors. Columbia Acorn Fund sold shares of Enerflex Systems resulting in a loss of $364. Additionally, Columbia Acorn Fund purchased shares of BioMarin resulting in a loss of $3,750. The Fund was reimbursed by Columbia WAM for the full amount of each loss.
These financial statements reflect certain adjusting journal entries recorded on the Columbia Thermostat Fund. While the impact of these adjusting entries was less than $.002 to each share class' NAV and therefore immaterial, they did cause the NAV's to round up by $0.01 for Class B, C and Z shares when compared to the NAV reported on the shareholder account statement you received by mail.
9. Legal Proceedings
The Trust, Columbia WAM and the Trustees of the Trust (collectively, the "Columbia defendants") are named as defendants in class and derivative complaints that have been consolidated in a Multi-District Action (the "MDL Action") in the federal district court of Maryland. These lawsuits contend that defendants permitted certain investors to market time their trades in certain Columbia Acorn Funds. The MDL Action is ongoing. However, all claims against Columbia Acorn Trust and the independent trustees of the Trust have been dismissed.
The Trust and Columbia WAM are also defendants in a class action lawsuit that alleges, in summary, that the Trust and Columbia WAM exposed shareholders of Columbia Acorn International Fund to trading by market timers by allegedly: (a) failing to properly evaluate daily whether a significant event affecting the value of the Fund's securities had occurred after foreign markets had closed but before the calculation of the Fund's net asset value ("NAV"); (b) failing to implement the Fund's portfolio valuation and share pricing policies and procedures; and (c) failing to know and implement applicable rules and regulations concerning the calculation of NAV (the "Fair Valuation Lawsuit"). The Seventh Circuit ruled that the plaintiffs' state law claims were preempted under federal law resulting in the dismissal of plaintiffs' complaint. Plaintiffs appealed the Seventh Circuit's ruling to the United States Supreme Court. The Supreme Cour t reversed the Seventh Circuit's ruling on jurisdictional grounds and the case was ultimately remanded to the state court.
On March 21, 2005, a class action complaint was filed against the Columbia Acorn Trust and Columbia WAM seeking to rescind the CDSC assessed upon redemption of Class B shares of Columbia Acorn Funds due to the alleged market timing of the Columbia Acorn Funds. In addition to the rescission of sales charges, plaintiffs seek recovery of actual damages, attorneys' fees and costs. The case had been transferred to the MDL Action in the federal district court of Maryland.
82
On April 4, 2006, the plaintiffs and the Columbia defendants named in the MDL Action executed an agreement in principle intended to fully resolve all of the lawsuits consolidated in the MDL Action as well as the Fair Valuation Lawsuit. The court entered a stay after the parties executed a settlement agreement. The settlement has not yet been finalized or approved by the court.
Columbia WAM, the Columbia Acorn Funds and the Trustees of the Trust are also defendants in a consolidated lawsuit filed in the federal district court of Massachusetts alleging that Columbia WAM used Fund assets to make undisclosed payments to brokers as an incentive for the brokers to market the Funds over other mutual funds to investors. The complaint alleges Columbia WAM and the Trustees of the Trust breached certain common law duties and federal laws.
On November 30, 2005, the court dismissed all of the claims alleged against all of the parties in the consolidated complaint. The parties subsequently executed a formal settlement agreement resolving all claims in the litigation and the plaintiffs dismissed their appeal. The settlement requires court approval, which has not yet been obtained.
On or about January 11, 2005, a putative class action lawsuit was filed in federal district court in Massachusetts against the Trust and the Trustees of the Trust, along with the Columbia Advisers, the sub-administrator of the Columbia Acorn Funds and the Wanger Advisors Funds. The plaintiffs allege that the defendants failed to submit Proof of Claims in connection with settlements of securities class action lawsuits filed against companies in which the Columbia Acorn Funds held positions. The complaint seeks compensatory and punitive damages, and the disgorgement of all fees paid to the Columbia Advisers.
Plaintiffs have voluntarily dismissed the Trust and its independent Trustees.
The Trust and Columbia WAM intend to defend these suits vigorously.
As a result of these matters, or any adverse publicity or other developments resulting from them, there may be
increased redemptions or reduced sales of Fund shares, which could increase transaction costs or operating expenses, or have other adverse consequences for the Funds. However, based on currently available information, the Columbia Acorn Trust believes that the likelihood that these lawsuits will have a material adverse impact on any fund is remote, and Columbia WAM believes that the lawsuits are not likely to materially affect its ability to provide investment management services to the Funds.
83
[Excerpt from:]
Columbia Acorn Trust
Management Fee Evaluation of the Senior Officer
Prepared Pursuant to the New York Attorney General's
Assurance of Discontinuance
June 2007
84
Introduction
The New York Attorney General's Assurance of Discontinuance ("Order") entered into by Columbia Management Advisors, Inc. ("CMAI") and Columbia Management Distributors, Inc., ("CMDI" and collectively with "CMAI," "CMG") in February 2005, allows CMAI to manage or advise a mutual fund only if the trustees of the fund appoint a "Senior Officer" to perform specified duties and responsibilities. One of these responsibilities includes "managing the process by which proposed management fees (including but not limited to, advisory fees) to be charged the [Funds] are negotiated so that they are negotiated in a manner which is at arms' length and reasonable and consistent with this Assurance of Discontinuance."
This is the first year that the Columbia Acorn Trust and Wanger Advisors Trust (collectively, the "Trusts") and each series thereof (the "Acorn Funds," "WAT Funds" or collectively, the "Funds") have been overseen by the same Board of Trustees ("Board"). The Order provides that this Board must determine the reasonableness of proposed "management fees" by using either an annual competitive bidding process supervised by the Senior Officer or Independent Fee Consultant, or by obtaining "an annual independent written evaluation prepared by or under the direction of the Senior Officer or the Independent Fee Consultant."
"Management fees" are only part of the costs and expenses paid by mutual fund shareholders. The expenses can vary depending upon the class of shares held but usually include: (1) investment management or advisory fees to compensate analysts and portfolio managers for stock research and portfolio management, as well as the cost of operating a trading desk; (2) administrative expenses incurred to prepare registration statements and tax returns, calculate the Funds' net asset values, maintain effective compliance procedures and perform recordkeeping services; (3) transfer agency costs for establishing accounts, accepting and disbursing funds, as well as overseeing trading in Fund shares; (4) custodial expenses incurred to hold the securities purchased by the Funds; and (5) distribution expenses, including commissions paid to brokers that sell the Fund shares to investors.
Columbia Wanger Asset Management, L.P. ("CWAM"), the adviser to the Funds, has proposed that with respect to the Acorn Funds, the Columbia Acorn Trust continue the existing separate agreements governing the first two categories listed above: an advisory agreement governing portfolio management, and an administration agreement governing certain administration and clerical services. Together the fees paid under these two agreements are referred to as "management fees." CWAM proposes that the WAT Funds continue the existing single agreement governing both investment advisory and administrative services. A single management fee would cover both services. Other fund expenses are governed by separate agreements, in particular agreements with two CWAM affiliates: CMDI, the broker-dealer that underwrites and distributes the Funds' shares, and Columbia Management Services, Inc. ("CMSI"), the Funds' transfer agent. In conformity with the terms of the Order, this evaluation, therefore, addresses only the advisory and administrative contracts, and does not extend to the other agreements.
According to the Order, the Senior Officer's evaluation must consider at least the following:
(1) Management fees (including components thereof) charged to institutional and other clients of CWAM for like services;
(2) Management fees (including any components thereof) charged by other mutual fund companies for like services;
(3) Costs to CWAM and its affiliates of supplying services pursuant to the management fee agreements, excluding any intra-corporate profit;
(4) Profit margins of CWAM and its affiliates from supplying such services;
(5) Possible economies of scale as the Funds grow larger; and
(6) The nature and quality of CWAM's services, including the performance of each Fund.
In 2004, the Boards of the two Trusts, then separate groups, each appointed me Senior Officer under the Order. They also determined not to pursue a competitive bidding process and instead, charged me with the responsibility of evaluating the Funds' proposed advisory and administrative fee contracts with CWAM in conformity with the requirements of the Order. This Report is
85
an annual evaluation required under the Order. In discharging their responsibilities, the independent Trustees have also consulted independent, outside counsel.
2006 Evaluation
This is the third annual evaluation prepared in connection with the Order. This evaluation follows the same structure as the earlier studies. Some areas are given more emphasis here, while others are given less. Still, the fundamental information gathered for this evaluation is largely the same as past years.
Process and Independence
The objectives of the Order are to insure the independent evaluation of the advisory fees paid by the Funds as well as to insure that all relevant factors are considered. In my view, this contract renewal process has been conducted at arms-length and with independence in gathering, considering and evaluating all relevant data. At the outset of the process, the Trustees sought and obtained from CWAM and CMG a comprehensive compilation of data regarding Fund performance and expenses, adviser profitability, and other information. The Board evaluated this information thoroughly and also explored CWAM's potential capacity restraints. Performance and expense data was obtained from both Morningstar and Lipper, the leading consultants in this area. The rankings prepared by Morningstar and Lipper were independent and not influenced by the adviser. CWAM itself identified what it considers competing funds, and the Trustees considered that data as well.
In the course of its work, the Contract Committee gave careful consideration to the conclusions and recommendations contained in last year's evaluation. The Contract Committee gave particular emphasis to the issue of whether economies of scale were appropriately reflected in the Funds' fee schedules. Last year, the Board sought and CWAM agreed to additional breakpoints for two Funds, Acorn USA and Acorn Select. These breakpoints are above current asset levels, but clearly operate to share economies of scale with Fund shareholders. This year, at the Board's request, CWAM has proposed additional breakpoints for the WAT Funds, and Acorn International Select. This proposal is under consideration by the Board.
My evaluation of the advisory contract was shaped, as it was last year, by my experience as Chief Compliance Officer of the Trusts ("CCO"). As CCO, I report solely to the Board and have no reporting obligation to or employment relationship with CMG or its affiliates, except for administrative purposes. I have commented on compliance matters in evaluating the quality of service provided by CWAM.
This Report, its supporting materials and the data contained in other materials submitted to the Contract Committee of the Board, in my view, provide a thorough factual basis upon which the Board, in consultation with independent counsel as it deems appropriate, may conduct management fee negotiations that are in the best interests of the Funds' shareholders.
The Fee Reductions Mandated under the Order
Under the terms of the Order, CMG agreed to secure certain management fee reductions for the mutual funds advised by its affiliate investment advisers. In some instances, breakpoints were also established. Although neither CWAM nor the Trusts was a party to the Order, CWAM offered and the Board accepted certain advisory fee reductions during 2005. By the terms of the Order, these fees may not be increased before November 30, 2009. I have used these advisory fee levels – as modified last year to add certain breakpoints for Acorn USA and Acorn Select – in this evaluation because they are the fees in the current agreements that CWAM proposes should be continued. Hence, these fee levels are the starting point of an evaluation.
86
Conclusions
My review of the data and other material above leads to the following conclusions with respect to the factors identified in the Order.
1. Performance. The domestic Funds generally have achieved outstanding performance. The Acorn Fund, Acorn USA, Acorn Select, Wanger Select and Wanger US Smaller Companies all rank very favorably against their peers over the past five years. Although Acorn USA and Wanger US Smaller Companies had a difficult year in 2006, these returns are not characteristic of these funds, both of which have shown improved performance during the first quarter of 2007. The international Funds have relatively weaker long term records than the domestic funds, but recently have improved significantly and their one year rankings are excellent. Overall then, performance of the Funds is excellent.
2. Management Fees relative to Peers. The management fee rankings for several of the Acorn Funds are generally more favorable to shareholders than those of their peer group funds. Management fees do, however, vary by Fund. Acorn Fund is the least expensive and the Acorn USA the most expensive. Acorn Fund is very competitive, while Acorn USA and Acorn Select were ranked by both Lipper and Morningstar at or below the median, and therefore impose higher fees than do the majority of their competitors. The WAT Funds also lag their competitors and impose higher fees than their peers.
3. Administrative Fees. The Acorn Funds' administrative fee, which is uniform across all Funds, is at a level comparable to or less expensive than the fees imposed by their peers, provides for appropriate services to Funds, and affords breakpoints that lower the fee as assets increase. The WAT Funds pay a single fee for advisory and administrative services and hence do not benefit from administrative fee breakpoints, nor is it possible to assess their administrative costs relative to competitors.
4. Management Fees relative to Institutional and Other Mutual Fund Accounts. CWAM's focus is on its mutual funds. It does not actively seek to manage separate or institutional accounts. The few institutional accounts it does manage vary in rate structures. Some pay advisory fees commensurate with or higher than the Acorn and WAT Funds. In a few instances, however, institutional accounts pay lower advisory fees than do the Acorn Funds. One particular institutional account is significant in size and has been under CWAM's management for over 25 years.
5. Costs to CWAM and its Affiliates. CWAM's direct costs do not appear excessive. Overhead and indirect costs allocated to CWAM by its parent organizations, however, are significant and increasing. CWAM's affiliates report operating losses and therefore do not appear to profit from CWAM's advisory agreement with the Funds.
6. Profit Margins. CWAM's firm-wide, pre-marketing expense profit margins are at the top of the industry, though these comparisons are hampered by limited industry data. High profit margins are not unexpected for firms that manage large, successful funds and have provided outstanding investment performance for investors.
7. Economies of Scale. Economies of scale do exist at CWAM and will expand as the assets of the Funds get larger. They are, however, only partially reflected in the management fee schedule for the Acorn Funds and not reflected at all in two of the four WAT Funds. Breakpoints above current asset levels have, however, been added to the more expensive funds, Acorn Select and Acorn USA. Nonetheless, if Fund assets continue to grow, under the Funds' current fee schedules, all Fund shareholders might not benefit in a manner generally commensurate with CWAM's increased profits. Management has proposed additional breakpoints for some of the Funds that, if implement, would result in greater sharing of economies of scale.
87
8. Nature and Quality of Services. This category includes a variety of considerations that are difficult to quantify, yet can have a significant bearing on the performance of the Acorn Funds. Several areas merit comment.
a. Capacity. The Funds have continued to grow, posing ever greater challenges in deploying assets effectively. While trends here merit continued monitoring, CWAM appears to be managing assets effectively.
b. Compliance. CWAM has a reasonably designed compliance program that protects shareholders.
c. Administrative Services. The Funds benefit from a variety of administrative services that are performed by CWAM and CMAI.
9. Process. In my opinion, the process of negotiating an advisory contract for the Funds has been conducted thoroughly and at arms' length. Further, the Trustees have sufficient information to evaluate management's proposal, and negotiate contract terms that are in the best interests of fund shareholders.
Recommendations
I believe the Trustees should:
1. Continue to consider additional ways to restructure the advisory fee beyond the current breakpoint schedule to reflect more fully economies of scale.
2. Consider unbundling of the advisory and administrative fees paid by the WAT Funds.
3. Review the disparity in management fee levels between the Acorn International Fund and its related annuity-based fund, WAT International Small Cap Fund.
4. Continue to monitor CWAM's capacity limitations to insure that the Funds' expanding assets do not impair investment performance.
Robert P. Scales
Senior Vice President,
Chief Legal Officer
and General Counsel
June 18, 2007
88
This page intentionally left blank.
89
This page intentionally left blank.
90
Columbia Acorn Family of Funds
Class A, B and C Share Information
| Minimum Initial Investment in | |
| |
| Columbia Acorn International, | |
| |
| Columbia Acorn International | |
| |
| Select and Columbia | |
| |
Thermostat Fund
| | $2,500†
$1,000 for an IRA | |
Minimum Initial Investment
in Columbia Acorn Fund and
Columbia Acorn USA | | $75,000† | |
Minimum Initial Investment
in Columbia Acorn Select | | $100,000*† | |
Minimum Subsequent
Investment in all Funds | | $50 | |
| Exchange Fee | | None | |
| Columbia Acorn Fund | | Class A | | Class B | | Class C | |
| Management Fees | | | 0.64 | % | | | 0.64 | % | | | 0.64 | % | |
| Distribution and Service (12b-1) Fees | | | 0.25 | % | | | 0.75 | % | | | 1.00 | % | |
| Other Expenses | | | 0.13 | % | | | 0.21 | % | | | 0.16 | % | |
| Net Expense Ratio | | | 1.02 | % | | | 1.60 | % | | | 1.80 | % | |
| Columbia Acorn International | | Class A | | Class B | | Class C | |
| Management Fees | | | 0.76 | % | | | 0.76 | % | | | 0.76 | % | |
| Distribution and Service (12b-1) Fees | | | 0.25 | % | | | 0.75 | % | | | 1.00 | % | |
| Other Expenses | | | 0.18 | % | | | 0.28 | % | | | 0.20 | % | |
| Net Expense Ratio | | | 1.19 | % | | | 1.79 | % | | | 1.96 | % | |
| Columbia Acorn USA | | Class A | | Class B | | Class C | |
| Management Fees | | | 0.86 | % | | | 0.86 | % | | | 0.86 | % | |
| Distribution and Service (12b-1) Fees | | | 0.25 | % | | | 0.75 | % | | | 1.00 | % | |
| Other Expenses | | | 0.14 | % | | | 0.25 | % | | | 0.18 | % | |
| Net Expense Ratio | | | 1.25 | % | | | 1.86 | % | | | 2.04 | % | |
| Columbia Acorn International Select | | Class A | | Class B | | Class C | |
| Management Fees | | | 0.94 | % | | | 0.94 | % | | | 0.94 | % | |
| Distribution and Service (12b-1) Fees | | | 0.25 | % | | | 0.75 | % | | | 1.00 | % | |
| Other Expenses | | | 0.29 | % | | | 0.41 | % | | | 0.33 | % | |
| Net Expense Ratio | | | 1.48 | % | | | 2.10 | % | | | 2.27 | % | |
| Columbia Acorn Select | | Class A | | Class B | | Class C | |
| Management Fees | | | 0.80 | % | | | 0.80 | % | | | 0.80 | % | |
| Distribution and Service (12b-1) Fees | | | 0.25 | % | | | 0.75 | % | | | 1.00 | % | |
| Other Expenses | | | 0.15 | % | | | 0.25 | % | | | 0.19 | % | |
| Net Expense Ratio | | | 1.20 | % | | | 1.80 | % | | | 1.99 | % | |
| Columbia Thermostat | | Class A | | Class B | | Class C | |
| Management Fees | | | 0.10 | % | | | 0.10 | % | | | 0.10 | % | |
| Distribution and Service (12b-1) Fees | | | 0.25 | % | | | 0.75 | % | | | 1.00 | % | |
| Other Expenses** | | | 0.15 | % | | | 0.15 | % | | | 0.15 | % | |
| Net Expense Ratio | | | 0.50 | % | | | 1.00 | % | | | 1.25 | % | |
Fees and expenses are for the six months ended June 30, 2007, and for Columbia Thermostat Fund include the effect of Columbia Wanger Asset Management's undertaking to reimburse the Fund for any ordinary operating expenses (exclusive of Rule 12b-1 service and distribution fees, interest and fees on borrowings and expenses associated with the Fund's investment in other investment companies), net of custody fees paid indirectly, in excess of the annual rate of 0.25% of the average daily net assets. Columbia Thermostat Fund's reimbursement arrangement is contractual through April 30, 2008. The Funds' adviser and/or any affiliates have agreed to contractually waive a portion of "other expenses" through March 31, 2007.
* Effective June 25, 2007, the board of trustees voted to increase the minimum initial investment for Columbia Acorn Select from $50,000 to $100,000.
** Does not include estimated fees and expenses of 0.72% incurred by the Fund from the underlying portfolio funds.
† Certain exclusions may apply.
91
Columbia Acorn Family of Funds
Trustees
Robert E. Nason
Chairman
Allan B. Muchin
Vice Chairman
Laura M. Born
Maureen M. Culhane
Margaret Eisen
Jerome Kahn, Jr.
Steven N. Kaplan
David C. Kleinman
Charles P. McQuaid
James A. Star
Ralph Wanger
Patricia H. Werhane
John A. Wing
Officers
Charles P. McQuaid
President
Ben Andrews
Vice President
Michael G. Clarke
Assistant Treasurer
Jeffrey R. Coleman
Assistant Treasurer
J. Kevin Connaughton
Assistant Treasurer
P. Zachary Egan
Vice President
Peter T. Fariel
Assistant Secretary
John M. Kunka
Assistant Treasurer
Joseph C. LaPalm
Vice President
Bruce H. Lauer
Vice President, Treasurer and Secretary
Louis J. Mendes III
Vice President
Robert A. Mohn
Vice President
Christopher J. Olson
Vice President
Linda K. Roth-Wiszowaty
Assistant Secretary
Robert P. Scales
Senior Vice President, Chief Compliance Officer
and General Counsel
Investment Adviser
Columbia Wanger Asset Management, L.P.
227 West Monroe Street, Suite 3000
Chicago, Illinois 60606
1-800-922-6769
Distributor
Columbia Management Distributors, Inc.
One Financial Center
Boston, Massachusetts 02111-2621
Transfer Agent, Dividend Disbursing Agent
Columbia Management Services, Inc.
P.O. Box 8081
Boston, Massachusetts 02266-8081
1-800-345-6611
Legal Counsel
Bell, Boyd & Lloyd LLP
Chicago, Illinois
A description of the policies and procedures that the Funds use to determine how to vote proxies and a copy of the Funds' voting record are available (i) without charge, upon request, by calling 800-922-6769 and (ii) on the Securities and Exchange Commission's website at www.sec.gov. Information regarding how the Funds voted proxies relating to portfolio securities during the 12-month period ended June 30, is available from the SEC's website. Information regarding how the Funds voted proxies relating to portfolio securities is also available from the Fund's website.
The Funds file a complete schedule of portfolio holdings with the SEC for the first and third quarters of each fiscal year on Form N-Q. The Funds' Form N-Q is available on the SEC's website at www.sec.gov and may be reviewed and copied at the SEC's Public Reference Room in Washington, D.C. Information on the operation of the Public Reference Room may be obtained by calling 1-800-SEC-0330.
Please consider the investment objectives, risks, charges and expenses for the funds carefully before investing. Contact your financial advisor for a prospectus, which contains this and other important information about the funds. You should read it carefully before you invest.
Columbia Management Group, LLC ("Columbia Management") is the investment management division of Bank of America Corporation. Columbia Management entities furnish investment management services and products for institutional and individual investors. Columbia Funds are distributed by Columbia Management Distributors, Inc., member of FINRA, SIPC, part of Columbia Management and an affiliate of Bank of America Corporation.
Find out what's new – visit our web site at:
www.columbiafunds.com
Our e-mail address is:
ServiceInquiries@ColumbiaManagement.com
Shareholders should not include personal information such as account numbers, Social Security numbers or taxpayer identification numbers in e-mail. We are unable to accept account transactions sent via e-mail.
92
Columbia Acorn Family of Funds
Class ABC Shares
Semiannual Report – June 30, 2007
Columbia Management®
PRESORTED
FIRST-CLASS MAIL
U.S. POSTAGE PAID
HOLLISTON, MA
PERMIT NO. 20
©2007 Columbia Management Distributors, Inc.
One Financial Center, Boston, MA 02111-2621
800-345-6611 www.columbiafunds.com
SHC-44/132915-0607 07/43076
Item 2. Code of Ethics.
Not applicable for semi-annual reports.
Item 3. Audit Committee Financial Expert.
Not applicable for semi-annual reports.
Item 4. Principal Accountant Fees and Services.
Not applicable for semi-annual reports.
Item 5. Audit Committee of Listed Registrants.
Not applicable.
Item 6. Schedule of Investments
The registrant’s “Schedule I – Investments in securities of unaffiliated issuers” (as set forth in 17 CFR 210.12-12) is included in Item 1 of this Form N-CSR.
Item 7. Disclosure of Proxy Voting Policies and Procedures for Closed-End Management Investment Companies.
Not applicable.
Item 8. Portfolio Managers of Closed-End Management Investment Companies.
Not applicable.
Item 9. Purchases of Equity Securities by Closed-End Management Investment Company and Affiliated Purchasers.
Not applicable.
Item 10. Submission of Matters to a Vote of Security Holders.
There have not been any material changes to the procedures by which shareholders may recommend nominees to the registrant’s board of directors, since those procedures were last disclosed in response to requirements of Item 7(d)(2)(ii)(G) of Schedule 14A or this Item.
Item 11. Controls and Procedures.
(a) The registrant’s principal executive officer and principal financial officers, based on their evaluation of the registrant’s disclosure controls and procedures as of a date within 90 days of the filing of this report, have concluded that such controls and procedures are adequately designed to ensure that information required to be disclosed by the registrant in Form N-CSR is accumulated and communicated to the registrant’s management, including the principal executive officer and principal financial officer, or persons performing similar functions, as appropriate to allow timely decisions regarding required disclosure.
(b) There was no change in the registrant’s internal control over financial reporting that occurred during the registrant’s second fiscal quarter of the period covered by this report that has materially affected, or is reasonably likely to materially affect, the registrant’s internal control over financial reporting.
Item 12. Exhibits.
(a)(1) Code of ethics required to be disclosed under Item 2 of Form N-CSR: Not applicable at this time.
(a)(2) Certifications pursuant to Rule 30a-2(a) under the Investment Company Act of 1940 (17 CFR 270.30a-2(a)) attached hereto as Exhibit 99.CERT.
(a)(3) Not applicable.
(b) Certification pursuant to Rule 30a-2(b) under the Investment Company Act of 1940 (17 CFR 270.30a-2(b)) attached hereto as Exhibit 99.906CERT.
SIGNATURES
Pursuant to the requirements of the Securities Exchange Act of 1934 and the Investment Company Act of 1940, the registrant has duly caused this report to be signed on its behalf by the undersigned, thereunto duly authorized.
(registrant) | | Columbia Acorn Trust | |
| | | |
By (Signature and Title) | | /s/ Charles P. McQuaid | |
| Charles P. McQuaid, President | |
Pursuant to the requirements of the Securities Exchange Act of 1934 and the Investment Company Act of 1940, this report has been signed below by the following persons on behalf of the registrant and in the capacities and on the dates indicated.
By (Signature and Title) | | /s/ Charles P. McQuaid | |
| Charles P. McQuaid, President | |
| | |
Date | | August 24, 2007 | |
| | |
| | |
By (Signature and Title) | | /s/ Bruce H. Lauer | |
| Bruce H. Lauer, Treasurer | |
| | | | |