UNITED STATES
SECURITIES AND EXCHANGE COMMISSION
FORM N-CSR
CERTIFIED SHAREHOLDER REPORT OF REGISTERED MANAGEMENT INVESTMENT COMPANIES
Investment Company Act file number 811-01829
Columbia Acorn Trust
(Exact name of registrant as specified in charter)
71 S Wacker Dr.
Suite 2500
Chicago, IL 60606, USA
(Address of principal executive offices) (Zip code)
Ryan C. Larrenaga
c/o Columbia Management
Investment Advisers, LLC
225 Franklin Street
Boston, MA 02110
Matthew Litfin
Columbia Acorn Trust
71 S Wacker Dr.
Suite 2500
Chicago, IL 60606, USA
Mary C. Moynihan
Perkins Coie LLP
700 13th Street, NW
Suite 800
Washington, DC 20005
(Name and address of agent for service)
Registrant's telephone number, including area code: (312) 634-9200
Date of fiscal year end: December 31
Date of reporting period: June 30, 2020
Form N-CSR is to be used by management investment companies to file reports with the Commission not later than 10 days after the transmission to stockholders of any report that is required to be transmitted to stockholders under Rule 30e-1 under the Investment Company Act of 1940 (17 CFR 270.30e-1). The Commission may use the information provided on Form N-CSR in its regulatory, disclosure review, inspection, and policymaking roles.
A registrant is required to disclose the information specified by Form N-CSR, and the Commission will make this information public. A registrant is not required to respond to the collection of information contained in Form N-CSR unless the Form displays a currently valid Office of Management and Budget ("OMB") control number. Please direct comments concerning the accuracy of the information collection burden estimate and any suggestions for reducing the burden to Secretary, Securities and Exchange Commission, 100 F Street, NE, Washington, DC 20549. The OMB has reviewed this collection of information under the clearance requirements of 44 U.S.C. § 3507.
Item 1. Reports to Stockholders.

SemiAnnual Report
June 30, 2020
Columbia
Acorn® Fund
Columbia
Acorn International®
Columbia
Acorn USA®
Columbia
Acorn International SelectSM
Columbia
Acorn SelectSM
Columbia
Thermostat FundSM
Columbia
Acorn Emerging Markets FundSM
Columbia
Acorn European FundSM
Beginning on January 1, 2021, as permitted by regulations adopted by the Securities and Exchange Commission, paper copies of the Funds’ annual and semiannual shareholder reports like this one will no longer be sent by mail, unless you specifically request paper copies of the reports. Instead, the reports will be made available on the Funds’ website (columbiathreadneedleus.com/investor/), and each time a report is posted you will be notified by mail and provided with a website address to access the report.
If you have already elected to receive shareholder reports electronically, you will not be affected by this change and you need not take any action. You may elect to receive shareholder reports and other communications from the Funds electronically at any time by contacting your financial intermediary (such as a broker-dealer or bank) or, for Fund shares held directly with the Funds, by calling 800.345.6611 or by enrolling in “eDelivery” by logging into your account at columbiathreadneedleus.com/investor/.
You may elect to receive all future shareholder reports in paper free of charge. If you invest through a financial intermediary, you can contact your financial intermediary to request that you continue receiving paper copies of your shareholder reports. If you invest directly with the Funds, you can call 800.345.6611 to let the Funds know you wish to continue receiving paper copies of your shareholder reports. Your election to receive paper reports will apply to all Columbia Funds, including the Columbia Acorn Funds, held in your account if you invest through a financial intermediary or all Columbia Funds, including the Columbia Acorn Funds, held with the fund complex if you invest directly with the Funds.
Not Federally Insured • No Financial Institution Guarantee • May Lose Value
| 3 |
| 5 |
| 7 |
| 9 |
| 11 |
| 13 |
| 15 |
| 17 |
| 19 |
| 21 |
| 24 |
| 52 |
| 56 |
| 58 |
| 66 |
| 98 |
| 119 |
| 124 |
| 125 |
| 126 |
Columbia Acorn Family of Funds | Semiannual Report 2020
Fund at a glance
Columbia Acorn® Fund (Unaudited)
Investment objective
Columbia Acorn® Fund (the Fund) seeks long-term capital appreciation.
Portfolio management
Matthew A. Litfin, CFA
Lead Portfolio Manager or Co-Portfolio Manager since 2016
Service with Fund since 2015
Erika K. Maschmeyer, CFA
Co-Portfolio Manager since 2019
Service with Fund since 2016
Richard Watson, CFA
Co-Portfolio Manager since 2019
Service with Fund since 2006
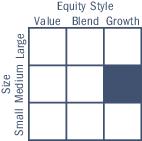
Morningstar style boxTM
The Morningstar Style Box is based on a fund’s portfolio holdings. For equity funds, the vertical axis shows the market capitalization of the stocks owned, and the horizontal axis shows investment style (value, blend, or growth). Information shown is based on the most recent data provided by Morningstar.
© 2020 Morningstar, Inc. All rights reserved. The Morningstar information contained herein: (1) is proprietary to Morningstar and/or its content providers; (2) may not be copied or distributed; and (3) is not warranted to be accurate, complete or timely. Neither Morningstar nor its content providers are responsible for any damages or losses arising from any use of this information.
| Average annual total returns (%) (for the period ended June 30, 2020) |
| | | Inception | 6 Months
cumulative | 1 Year | 5 Years | 10 Years | Life of Fund |
| Class A | Excluding sales charges | 10/16/00 | 0.93 | 5.33 | 8.88 | 12.00 | 13.67 |
| | Including sales charges | | -4.84 | -0.69 | 7.60 | 11.34 | 13.53 |
| Advisor Class | 11/08/12 | 1.03 | 5.57 | 9.12 | 12.28 | 14.02 |
| Class C | Excluding sales charges | 10/16/00 | 0.69 | 4.57 | 8.09 | 11.18 | 12.81 |
| | Including sales charges | | -0.14 | 3.88 | 8.09 | 11.18 | 12.81 |
| Institutional Class | 06/10/70 | 1.01 | 5.52 | 9.15 | 12.30 | 14.03 |
| Institutional 2 Class | 11/08/12 | 1.01 | 5.58 | 9.18 | 12.33 | 14.03 |
| Institutional 3 Class | 11/08/12 | 1.07 | 5.65 | 9.25 | 12.38 | 14.04 |
| Russell 2500 Growth Index | | 2.02 | 9.21 | 9.57 | 14.45 | - |
Performance numbers reflect all Fund expenses. Returns for Class A shares are shown with and without the maximum initial sales charge of 5.75%. Returns for Class C shares are shown with and without the maximum contingent deferred sales charge of 1.00% for the first year after purchase. The Fund’s other share classes are not subject to sales charges, but may be subject to other fees and expenses, and have limited eligibility. Please see the Fund’s prospectus for details. Performance for different share classes will vary based on differences in sales charges and certain fees and expenses associated with each share class.
As stated in the May 1, 2020 prospectus (as supplemented), the Fund’s annual operating expense ratio is 0.86% for Institutional Class shares and 1.11% for Class A shares.
All results shown assume reinvestment of distributions during the period. Returns do not reflect the deduction of taxes that a shareholder may pay on Fund distributions or on the redemption of Fund shares. Performance results reflect the effect of fee waivers or reimbursements of Fund expenses by the investment manager and/or its affiliates. Absent these fee waivers and/or expense reimbursement arrangements, performance results may have been lower.
The performance information shown represents past performance and is not a guarantee of future results. The investment return and principal value of your investment will fluctuate so that shares, when redeemed, may be worth more or less than their original cost. Current performance may be lower or higher than the performance data shown. You may obtain performance information current to the most recent month-end by contacting your financial intermediary, visiting columbiathreadneedleus.com/investor/ or calling 800.922.6769.
The returns shown for periods prior to the share class inception date (including returns for the Life of the Fund, if shown, which are since Fund inception) include the returns of the Fund’s oldest share class. These returns are adjusted to reflect any higher class-related operating expenses of the newer share classes, as applicable. Please visit columbiathreadneedleus.com/investor/investment-products/mutual-funds/appended-performance for more information.
The Russell 2500 Growth Index measures the performance of those Russell 2500 companies with higher price-to-book ratios and higher forecasted growth values.
Unlike mutual funds, indexes are not managed and do not incur fees or expenses. It is not possible to invest directly in an index.
The COVID-19 pandemic has adversely impacted economies and capital markets around the world in ways that will likely continue and may change in unforeseen ways for an indeterminate period. The COVID-19 pandemic may exacerbate pre-existing political, social and economic risks in certain countries and globally. Fund performance may be significantly negatively impacted by the economic impact of the COVID-19 pandemic.
Columbia Acorn Family of Funds | Semiannual Report 2020
| 3 |
Fund at a glance (continued)
Columbia Acorn® Fund (Unaudited)
| Portfolio breakdown (%) (at June 30, 2020) |
| Common Stocks | 97.9 |
| Money Market Funds | 1.3 |
| Securities Lending Collateral | 0.8 |
| Total | 100.0 |
Percentages indicated are based upon total investments excluding investments in derivatives, if any. The Fund’s portfolio composition is subject to change.
| Equity sector breakdown (%) (at June 30, 2020) |
| Communication Services | 2.7 |
| Consumer Discretionary | 13.0 |
| Consumer Staples | 1.2 |
| Financials | 5.5 |
| Health Care | 34.0 |
| Industrials | 15.1 |
| Information Technology | 23.9 |
| Materials | 1.6 |
| Real Estate | 3.0 |
| Total | 100.0 |
Percentages indicated are based upon total equity investments. The Fund’s portfolio composition is subject to change.
| 4 | Columbia Acorn Family of Funds | Semiannual Report 2020 |
Fund at a glance
Columbia Acorn International® (Unaudited)
Investment objective
Columbia Acorn International® (the Fund) seeks long-term capital appreciation.
Portfolio management
Louis J. Mendes, CFA*
Co-Portfolio Manager since 2003
Service with Fund since 2001
Tae Han (Simon) Kim, CFA
Co-Portfolio Manager since 2017
Service with Fund since 2011
Hans F. Stege
Co-Portfolio Manager since July 2020
Service with Fund since 2017
*Louis Mendes has announced that, on August 28, 2020, he will retire from the Fund’s Investment Manager.
Morningstar style boxTM
The Morningstar Style Box is based on a fund’s portfolio holdings. For equity funds, the vertical axis shows the market capitalization of the stocks owned, and the horizontal axis shows investment style (value, blend, or growth). Information shown is based on the most recent data provided by Morningstar.
© 2020 Morningstar, Inc. All rights reserved. The Morningstar information contained herein: (1) is proprietary to Morningstar and/or its content providers; (2) may not be copied or distributed; and (3) is not warranted to be accurate, complete or timely. Neither Morningstar nor its content providers are responsible for any damages or losses arising from any use of this information.
| Average annual total returns (%) (for the period ended June 30, 2020) |
| | | Inception | 6 Months
cumulative | 1 Year | 5 Years | 10 Years | Life of Fund |
| Class A | Excluding sales charges | 10/16/00 | -9.12 | -0.53 | 3.54 | 6.82 | 9.18 |
| | Including sales charges | | -14.35 | -6.25 | 2.32 | 6.19 | 8.94 |
| Advisor Class | 11/08/12 | -8.99 | -0.26 | 3.78 | 7.10 | 9.55 |
| Class C | Excluding sales charges | 10/16/00 | -9.46 | -1.26 | 2.76 | 6.02 | 8.37 |
| | Including sales charges | | -10.32 | -2.15 | 2.76 | 6.02 | 8.37 |
| Institutional Class | 09/23/92 | -8.99 | -0.26 | 3.80 | 7.13 | 9.57 |
| Institutional 2 Class | 08/02/11 | -8.97 | -0.20 | 3.85 | 7.17 | 9.57 |
| Institutional 3 Class | 11/08/12 | -8.93 | -0.15 | 3.91 | 7.21 | 9.59 |
| Class R | 08/02/11 | -9.20 | -0.76 | 3.25 | 6.50 | 8.89 |
| MSCI ACWI ex USA SMID Cap Growth Index (Net) | | -6.44 | 1.89 | 4.35 | 6.78 | - |
| MSCI ACWI ex USA SMID Cap Index (Net) | | -12.69 | -5.13 | 2.41 | 5.72 | - |
Performance numbers reflect all Fund expenses. Returns for Class A shares are shown with and without the maximum initial sales charge of 5.75%. Returns for Class C shares are shown with and without the maximum contingent deferred sales charge of 1.00% for the first year after purchase. The Fund’s other share classes are not subject to sales charges, but may be subject to other fees and expenses, and have limited eligibility. Please see the Fund’s prospectus for details. Performance for different share classes will vary based on differences in sales charges and certain fees and expenses associated with each share class.
As stated in the May 1, 2020 prospectus (as supplemented), the Fund’s annual operating expense ratio is 0.99% for Institutional Class shares and 1.24% for Class A shares.
All results shown assume reinvestment of distributions during the period. Returns do not reflect the deduction of taxes that a shareholder may pay on Fund distributions or on the redemption of Fund shares. Performance results reflect the effect of fee waivers or reimbursements of Fund expenses by the investment manager and/or its affiliates. Absent these fee waivers and/or expense reimbursement arrangements, performance results may have been lower.
The performance information shown represents past performance and is not a guarantee of future results. The investment return and principal value of your investment will fluctuate so that shares, when redeemed, may be worth more or less than their original cost. Current performance may be lower or higher than the performance data shown. You may obtain performance information current to the most recent month-end by contacting your financial intermediary, visiting columbiathreadneedleus.com/investor/ or calling 800.922.6769.
The returns shown for periods prior to the share class inception date (including returns for the Life of the Fund, if shown, which are since Fund inception) include the returns of the Fund’s oldest share class. These returns are adjusted to reflect any higher class-related operating expenses of the newer share classes, as applicable. Please visit columbiathreadneedleus.com/investor/investment-products/mutual-funds/appended-performance for more information.
The MSCI ACWI ex USA SMID Cap Growth Index (Net) captures a mid- and small-cap representation across 22 developed market countries and 26 emerging markets countries.
The MSCI ACWI ex USA SMID Cap Index (Net) captures a mid- and small-cap representation across 22 of 23 developed market countries (excluding the United States) and 26 emerging market countries. The index covers approximately 28% of the free float-adjusted market capitalization in each country.
Unlike mutual funds, indexes are not managed and do not incur fees or expenses. It is not possible to invest directly in an index.
The COVID-19 pandemic has adversely impacted economies and capital markets around the world in ways that will likely continue and may change in unforeseen ways for an indeterminate period. The COVID-19 pandemic may exacerbate pre-existing political, social and economic risks in certain countries and globally.Fund performance may be significantly negatively impacted by the economic impact of the COVID-19 pandemic.
Columbia Acorn Family of Funds | Semiannual Report 2020
| 5 |
Fund at a glance (continued)
Columbia Acorn International® (Unaudited)
| Equity sector breakdown (%) (at June 30, 2020) |
| Communication Services | 7.0 |
| Consumer Discretionary | 8.6 |
| Consumer Staples | 4.5 |
| Energy | 1.0 |
| Financials | 7.7 |
| Health Care | 12.1 |
| Industrials | 23.9 |
| Information Technology | 23.4 |
| Materials | 6.5 |
| Real Estate | 5.3 |
| Total | 100.0 |
Percentages indicated are based upon total equity investments. The Fund’s portfolio composition is subject to change.
| Country breakdown (%) (at June 30, 2020) |
| Australia | 5.5 |
| Austria | 0.5 |
| Brazil | 2.3 |
| Cambodia | 0.8 |
| Canada | 4.0 |
| China | 2.2 |
| Cyprus | 0.0(a) |
| Denmark | 1.6 |
| France | 1.2 |
| Germany | 5.8 |
| Hong Kong | 1.3 |
| Country breakdown (%) (at June 30, 2020) |
| India | 1.4 |
| Ireland | 1.6 |
| Israel | 0.6 |
| Italy | 3.5 |
| Japan | 20.2 |
| Malta | 0.8 |
| Mexico | 0.5 |
| Netherlands | 3.8 |
| New Zealand | 1.2 |
| Russian Federation | 0.9 |
| Singapore | 0.9 |
| South Africa | 0.3 |
| South Korea | 2.1 |
| Spain | 2.2 |
| Sweden | 9.0 |
| Switzerland | 3.2 |
| Taiwan | 4.1 |
| Thailand | 0.8 |
| United Kingdom | 11.9 |
| United States(b) | 5.8 |
| Total | 100.0 |
| (a) | Rounds to zero. |
| (b) | Includes investments in Money Market Funds. |
Country breakdown is based primarily on issuer’s place of organization/incorporation. Percentages indicated are based upon total investments excluding investments in derivatives, if any. The Fund’s portfolio composition is subject to change.
| 6 | Columbia Acorn Family of Funds | Semiannual Report 2020 |
Fund at a glance
Columbia Acorn USA® (Unaudited)
Investment objective
Columbia Acorn USA® (the Fund) seeks long-term capital appreciation.
Portfolio management
Matthew A. Litfin, CFA
Lead Portfolio Manager since 2016
Service with Fund since 2015
Richard Watson, CFA
Co-Portfolio Manager since 2017
Service with Fund since 2006
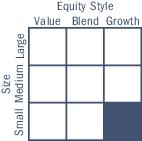
Morningstar style boxTM
The Morningstar Style Box is based on a fund’s portfolio holdings. For equity funds, the vertical axis shows the market capitalization of the stocks owned, and the horizontal axis shows investment style (value, blend, or growth). Information shown is based on the most recent data provided by Morningstar.
© 2020 Morningstar, Inc. All rights reserved. The Morningstar information contained herein: (1) is proprietary to Morningstar and/or its content providers; (2) may not be copied or distributed; and (3) is not warranted to be accurate, complete or timely. Neither Morningstar nor its content providers are responsible for any damages or losses arising from any use of this information.
| Average annual total returns (%) (for the period ended June 30, 2020) |
| | | Inception | 6 Months
cumulative | 1 Year | 5 Years | 10 Years | Life of Fund |
| Class A | Excluding sales charges | 10/16/00 | -7.66 | 1.11 | 7.84 | 12.17 | 9.98 |
| | Including sales charges | | -12.95 | -4.68 | 6.57 | 11.51 | 9.71 |
| Advisor Class | 11/08/12 | -7.51 | 1.39 | 8.11 | 12.47 | 10.33 |
| Class C | Excluding sales charges | 10/16/00 | -8.15 | 0.30 | 7.02 | 11.34 | 9.17 |
| | Including sales charges | | -8.99 | -0.42 | 7.02 | 11.34 | 9.17 |
| Institutional Class | 09/04/96 | -7.55 | 1.35 | 8.11 | 12.46 | 10.33 |
| Institutional 2 Class | 11/08/12 | -7.57 | 1.38 | 8.20 | 12.53 | 10.36 |
| Institutional 3 Class | 11/08/12 | -7.48 | 1.49 | 8.26 | 12.57 | 10.38 |
| Russell 2000 Growth Index | | -3.06 | 3.48 | 6.86 | 12.92 | - |
Performance numbers reflect all Fund expenses. Returns for Class A shares are shown with and without the maximum initial sales charge of 5.75%. Returns for Class C shares are shown with and without the maximum contingent deferred sales charge of 1.00% for the first year after purchase. The Fund’s other share classes are not subject to sales charges, but may be subject to other fees and expenses, and have limited eligibility. Please see the Fund’s prospectus for details. Performance for different share classes will vary based on differences in sales charges and certain fees and expenses associated with each share class.
As stated in the May 1, 2020 prospectus (as supplemented), the Fund’s annual operating expense ratio is 1.16% for Institutional Class shares and 1.41% for Class A shares.
All results shown assume reinvestment of distributions during the period. Returns do not reflect the deduction of taxes that a shareholder may pay on Fund distributions or on the redemption of Fund shares. Performance results reflect the effect of fee waivers or reimbursements of Fund expenses by the investment manager and/or its affiliates. Absent these fee waivers and/or expense reimbursement arrangements, performance results may have been lower.
The performance information shown represents past performance and is not a guarantee of future results. The investment return and principal value of your investment will fluctuate so that shares, when redeemed, may be worth more or less than their original cost. Current performance may be lower or higher than the performance data shown. You may obtain performance information current to the most recent month-end by contacting your financial intermediary, visiting columbiathreadneedleus.com/investor/ or calling 800.922.6769.
The returns shown for periods prior to the share class inception date (including returns for the Life of the Fund, if shown, which are since Fund inception) include the returns of the Fund’s oldest share class. These returns are adjusted to reflect any higher class-related operating expenses of the newer share classes, as applicable. Please visit columbiathreadneedleus.com/investor/investment-products/mutual-funds/appended-performance for more information.
The Russell 2000 Growth Index, an unmanaged index, measures the performance of those Russell 2000 Index companies with higher price-to-book ratios and higher forecasted growth values.
Unlike mutual funds, indexes are not managed and do not incur fees or expenses. It is not possible to invest directly in an index.
The COVID-19 pandemic has adversely impacted economies and capital markets around the world in ways that will likely continue and may change in unforeseen ways for an indeterminate period. The COVID-19 pandemic may exacerbate pre-existing political, social and economic risks in certain countries and globally.Fund performance may be significantly negatively impacted by the economic impact of the COVID-19 pandemic.
Columbia Acorn Family of Funds | Semiannual Report 2020
| 7 |
Fund at a glance (continued)
Columbia Acorn USA® (Unaudited)
| Portfolio breakdown (%) (at June 30, 2020) |
| Common Stocks | 95.9 |
| Limited Partnerships | 0.5 |
| Money Market Funds | 2.1 |
| Securities Lending Collateral | 1.5 |
| Total | 100.0 |
Percentages indicated are based upon total investments excluding investments in derivatives, if any. The Fund’s portfolio composition is subject to change.
| Equity sector breakdown (%) (at June 30, 2020) |
| Consumer Discretionary | 16.4 |
| Consumer Staples | 5.1 |
| Financials | 8.3 |
| Health Care | 32.0 |
| Industrials | 15.6 |
| Information Technology | 18.0 |
| Materials | 1.3 |
| Real Estate | 3.3 |
| Total | 100.0 |
Percentages indicated are based upon total equity investments. The Fund’s portfolio composition is subject to change.
| 8 | Columbia Acorn Family of Funds | Semiannual Report 2020 |
Fund at a glance
Columbia Acorn International SelectSM (Unaudited)
Investment objective
Columbia Acorn International SelectSM (the Fund) seeks long-term capital appreciation.
Portfolio management
Stephen Kusmierczak, CFA
Lead Portfolio Manager or Co-Portfolio Manager since 2016
Service with Fund since 2001
Hans F. Stege
Co-Portfolio Manager since December 2019
Service with Fund since 2017
Morningstar style boxTM
The Morningstar Style Box is based on a fund’s portfolio holdings. For equity funds, the vertical axis shows the market capitalization of the stocks owned, and the horizontal axis shows investment style (value, blend, or growth). Information shown is based on the most recent data provided by Morningstar.
© 2020 Morningstar, Inc. All rights reserved. The Morningstar information contained herein: (1) is proprietary to Morningstar and/or its content providers; (2) may not be copied or distributed; and (3) is not warranted to be accurate, complete or timely. Neither Morningstar nor its content providers are responsible for any damages or losses arising from any use of this information.
| Average annual total returns (%) (for the period ended June 30, 2020) |
| | | Inception | 6 Months
cumulative | 1 Year | 5 Years | 10 Years | Life of Fund |
| Class A | Excluding sales charges | 10/16/00 | -6.29 | 1.43 | 7.29 | 8.07 | 8.15 |
| | Including sales charges | | -11.67 | -4.39 | 6.03 | 7.43 | 7.86 |
| Advisor Class | 11/08/12 | -6.18 | 1.67 | 7.57 | 8.37 | 8.48 |
| Class C | Excluding sales charges | 10/16/00 | -6.61 | 0.66 | 6.48 | 7.25 | 7.33 |
| | Including sales charges | | -7.54 | -0.27 | 6.48 | 7.25 | 7.33 |
| Institutional Class | 11/23/98 | -6.17 | 1.68 | 7.56 | 8.38 | 8.49 |
| Institutional 2 Class | 11/08/12 | -6.12 | 1.79 | 7.65 | 8.44 | 8.51 |
| Institutional 3 Class | 11/08/12 | -6.12 | 1.80 | 7.71 | 8.47 | 8.53 |
| MSCI ACWI ex USA Growth Index (Net) | | -2.62 | 5.80 | 5.61 | 7.04 | - |
| MSCI ACWI ex USA Index (Net) | | -11.00 | -4.80 | 2.26 | 4.97 | - |
Performance numbers reflect all Fund expenses. Returns for Class A shares are shown with and without the maximum initial sales charge of 5.75%. Returns for Class C shares are shown with and without the maximum contingent deferred sales charge of 1.00% for the first year after purchase. The Fund’s other share classes are not subject to sales charges, but may be subject to other fees and expenses, and have limited eligibility. Please see the Fund’s prospectus for details. Performance for different share classes will vary based on differences in sales charges and certain fees and expenses associated with each share class.
As stated in the May 1, 2020 prospectus (as supplemented), the Fund’s annual operating expense ratio is 1.03% for Institutional Class shares and 1.28% for Class A shares.
All results shown assume reinvestment of distributions during the period. Returns do not reflect the deduction of taxes that a shareholder may pay on Fund distributions or on the redemption of Fund shares. Performance results reflect the effect of fee waivers or reimbursements of Fund expenses by the investment manager and/or its affiliates. Absent these fee waivers and/or expense reimbursement arrangements, performance results may have been lower.
The performance information shown represents past performance and is not a guarantee of future results. The investment return and principal value of your investment will fluctuate so that shares, when redeemed, may be worth more or less than their original cost. Current performance may be lower or higher than the performance data shown. You may obtain performance information current to the most recent month-end by contacting your financial intermediary, visiting columbiathreadneedleus.com/investor/ or calling 800.922.6769.
The returns shown for periods prior to the share class inception date (including returns for the Life of the Fund, if shown, which are since Fund inception) include the returns of the Fund’s oldest share class. These returns are adjusted to reflect any higher class-related operating expenses of the newer share classes, as applicable. Please visit columbiathreadneedleus.com/investor/investment-products/mutual-funds/appended-performance for more information.
The MSCI ACWI ex USA Growth Index (Net) captures a large- and mid-cap representation across 22 developed market countries and 26 emerging market countries.
The MSCI ACWI ex USA Index (Net) captures a large- and mid-cap representation across 22 of 23 developed market countries (excluding the United States) and 26 emerging market countries. The index covers approximately 85% of the global equity opportunity set outside the United States.
Unlike mutual funds, indexes are not managed and do not incur fees or expenses. It is not possible to invest directly in an index.
The COVID-19 pandemic has adversely impacted economies and capital markets around the world in ways that will likely continue and may change in unforeseen ways for an indeterminate period. The COVID-19 pandemic may exacerbate pre-existing political, social and economic risks in certain countries and globally.Fund performance may be significantly negatively impacted by the economic impact of the COVID-19 pandemic.
Columbia Acorn Family of Funds | Semiannual Report 2020
| 9 |
Fund at a glance (continued)
Columbia Acorn International SelectSM (Unaudited)
| Equity sector breakdown (%) (at June 30, 2020) |
| Communication Services | 12.6 |
| Consumer Discretionary | 10.5 |
| Financials | 6.1 |
| Health Care | 17.0 |
| Industrials | 19.2 |
| Information Technology | 30.3 |
| Materials | 4.3 |
| Total | 100.0 |
Percentages indicated are based upon total equity investments. The Fund’s portfolio composition is subject to change.
| Country breakdown (%) (at June 30, 2020) |
| Australia | 2.5 |
| Brazil | 2.0 |
| Canada | 4.3 |
| China | 13.0 |
| Denmark | 2.5 |
| Country breakdown (%) (at June 30, 2020) |
| Germany | 5.0 |
| Italy | 4.0 |
| Japan | 18.8 |
| Netherlands | 5.6 |
| New Zealand | 2.5 |
| South Korea | 4.2 |
| Sweden | 12.9 |
| Switzerland | 7.0 |
| Taiwan | 2.3 |
| United Kingdom | 12.9 |
| United States(a) | 0.5 |
| Total | 100.0 |
| (a) | Includes investments in Money Market Funds. |
Country breakdown is based primarily on issuer’s place of organization/incorporation. Percentages indicated are based upon total investments excluding investments in derivatives, if any. The Fund’s portfolio composition is subject to change.
| 10 | Columbia Acorn Family of Funds | Semiannual Report 2020 |
Fund at a glance
Columbia Acorn SelectSM (Unaudited)
Investment objective
Columbia Acorn SelectSM (the Fund) seeks long-term capital appreciation.
Effective July 10, 2020, the Fund was merged with and into Columbia Acorn® Fund.
Portfolio management
David L. Frank, CFA
Co-Portfolio Manager or Portfolio Manager since 2015
Service with Fund since 2002
John L. Emerson, CFA
Co-Portfolio Manager since 2019
Service with Fund since 2003
Morningstar style boxTM
The Morningstar Style Box is based on a fund’s portfolio holdings. For equity funds, the vertical axis shows the market capitalization of the stocks owned, and the horizontal axis shows investment style (value, blend, or growth). Information shown is based on the most recent data provided by Morningstar.
© 2020 Morningstar, Inc. All rights reserved. The Morningstar information contained herein: (1) is proprietary to Morningstar and/or its content providers; (2) may not be copied or distributed; and (3) is not warranted to be accurate, complete or timely. Neither Morningstar nor its content providers are responsible for any damages or losses arising from any use of this information.
| Average annual total returns (%) (for the period ended June 30, 2020) |
| | | Inception | 6 Months
cumulative | 1 Year | 5 Years | 10 Years | Life of Fund |
| Class A | Excluding sales charges | 10/16/00 | 0.38 | 10.94 | 8.27 | 10.46 | 9.60 |
| | Including sales charges | | -5.39 | 4.53 | 7.00 | 9.81 | 9.30 |
| Advisor Class | 11/08/12 | 0.50 | 11.16 | 8.53 | 10.73 | 9.92 |
| Class C | Excluding sales charges | 10/16/00 | -0.01 | 10.15 | 7.46 | 9.63 | 8.78 |
| | Including sales charges | | -0.96 | 9.25 | 7.46 | 9.63 | 8.78 |
| Institutional Class | 11/23/98 | 0.46 | 11.10 | 8.54 | 10.75 | 9.93 |
| Institutional 2 Class | 11/08/12 | 0.51 | 11.23 | 8.60 | 10.79 | 9.95 |
| Institutional 3 Class | 11/08/12 | 0.55 | 11.29 | 8.67 | 10.84 | 9.97 |
| Russell 2500 Growth Index | | 2.02 | 9.21 | 9.57 | 14.45 | - |
Performance numbers reflect all Fund expenses. Returns for Class A shares are shown with and without the maximum initial sales charge of 5.75%. Returns for Class C shares are shown with and without the maximum contingent deferred sales charge of 1.00% for the first year after purchase. The Fund’s other share classes are not subject to sales charges, but may be subject to other fees and expenses, and have limited eligibility. Please see the Fund’s prospectus for details. Performance for different share classes will vary based on differences in sales charges and certain fees and expenses associated with each share class.
As stated in the May 1, 2020 prospectus (as supplemented), the Fund’s annual operating expense ratio is 0.92% for Institutional Class shares and 1.17% for Class A shares.
All results shown assume reinvestment of distributions during the period. Returns do not reflect the deduction of taxes that a shareholder may pay on Fund distributions or on the redemption of Fund shares. Performance results reflect the effect of fee waivers or reimbursements of Fund expenses by the investment manager and/or its affiliates. Absent these fee waivers and/or expense reimbursement arrangements, performance results may have been lower.
The performance information shown represents past performance and is not a guarantee of future results. The investment return and principal value of your investment will fluctuate so that shares, when redeemed, may be worth more or less than their original cost. Current performance may be lower or higher than the performance data shown. You may obtain performance information current to the most recent month-end by contacting your financial intermediary, visiting columbiathreadneedleus.com/investor/ or calling 800.922.6769.
The returns shown for periods prior to the share class inception date (including returns for the Life of the Fund, if shown, which are since Fund inception) include the returns of the Fund’s oldest share class. These returns are adjusted to reflect any higher class-related operating expenses of the newer share classes, as applicable. Please visit columbiathreadneedleus.com/investor/investment-products/mutual-funds/appended-performance for more information.
The Russell 2500 Growth Index measures the performance of those Russell 2500 companies with higher price-to-book ratios and higher forecasted growth values.
Unlike mutual funds, indexes are not managed and do not incur fees or expenses. It is not possible to invest directly in an index.
The COVID-19 pandemic has adversely impacted economies and capital markets around the world in ways that will likely continue and may change in unforeseen ways for an indeterminate period. The COVID-19 pandemic may exacerbate pre-existing political, social and economic risks in certain countries and globally. Fund performance may be significantly negatively impacted by the economic impact of the COVID-19 pandemic.
Columbia Acorn Family of Funds | Semiannual Report 2020
| 11 |
Fund at a glance (continued)
Columbia Acorn SelectSM (Unaudited)
| Portfolio breakdown (%) (at June 30, 2020) |
| Common Stocks | 97.3 |
| Money Market Funds | 2.7 |
| Total | 100.0 |
Percentages indicated are based upon total investments excluding investments in derivatives, if any. The Fund’s portfolio composition is subject to change.
| Equity sector breakdown (%) (at June 30, 2020) |
| Communication Services | 3.2 |
| Consumer Discretionary | 11.6 |
| Consumer Staples | 1.1 |
| Financials | 9.1 |
| Health Care | 28.0 |
| Industrials | 14.5 |
| Information Technology | 29.1 |
| Real Estate | 3.4 |
| Total | 100.0 |
Percentages indicated are based upon total equity investments. The Fund’s portfolio composition is subject to change.
| 12 | Columbia Acorn Family of Funds | Semiannual Report 2020 |
Fund at a glance
Columbia Thermostat FundSM (Unaudited)
Investment objective
Columbia Thermostat FundSM (the Fund) seeks long-term capital appreciation.
Portfolio management
Anwiti Bahuguna, Ph.D.
Co-Portfolio Manager since 2018
Service with Fund since 2018
Joshua Kutin, CFA
Co-Portfolio Manager since 2018
Service with Fund since 2018
| Average annual total returns (%) (for the period ended June 30, 2020) |
| | | Inception | 6 Months
cumulative | 1 Year | 5 Years | 10 Years | Life of Fund |
| Class A | Excluding sales charges | 03/03/03 | 15.02 | 20.72 | 7.51 | 9.00 | 7.50 |
| | Including sales charges | | 8.43 | 13.77 | 6.24 | 8.36 | 7.14 |
| Advisor Class | 11/08/12 | 15.17 | 20.98 | 7.78 | 9.27 | 7.77 |
| Class C | Excluding sales charges | 03/03/03 | 14.59 | 19.77 | 6.70 | 8.18 | 6.70 |
| | Including sales charges | | 13.59 | 18.77 | 6.70 | 8.18 | 6.70 |
| Institutional Class | 09/25/02 | 15.20 | 21.04 | 7.78 | 9.27 | 7.77 |
| Institutional 2 Class | 11/08/12 | 15.22 | 21.08 | 7.82 | 9.30 | 7.79 |
| Institutional 3 Class | 11/08/12 | 15.25 | 21.09 | 7.86 | 9.33 | 7.81 |
| Blended Benchmark | | 1.92 | 8.72 | 7.78 | 9.06 | - |
| S&P 500® Index | | -3.08 | 7.51 | 10.73 | 13.99 | - |
| Bloomberg Barclays U.S. Aggregate Bond Index | | 6.14 | 8.74 | 4.30 | 3.82 | - |
Performance numbers reflect all Fund expenses. Returns for Class A shares are shown with and without the maximum initial sales charge of 5.75%. Returns for Class C shares are shown with and without the maximum contingent deferred sales charge of 1.00% for the first year after purchase. The Fund’s other share classes are not subject to sales charges, but may be subject to other fees and expenses, and have limited eligibility. Please see the Fund’s prospectus for details. Performance for different share classes will vary based on differences in sales charges and certain fees and expenses associated with each share class.
As stated in the May 1, 2020 prospectus (as supplemented), the Fund’s annual operating expense ratio is 0.64% for Institutional Class shares and 0.89% for Class A shares.
All results shown assume reinvestment of distributions during the period. Returns do not reflect the deduction of taxes that a shareholder may pay on Fund distributions or on the redemption of Fund shares. Performance results reflect the effect of fee waivers or reimbursements of Fund expenses by the investment manager and/or its affiliates. Absent these fee waivers and/or expense reimbursement arrangements, performance results may have been lower.
The performance information shown represents past performance and is not a guarantee of future results. The investment return and principal value of your investment will fluctuate so that shares, when redeemed, may be worth more or less than their original cost. Current performance may be lower or higher than the performance data shown. You may obtain performance information current to the most recent month-end by contacting your financial intermediary, visiting columbiathreadneedleus.com/investor/ or calling 800.922.6769.
The returns shown for periods prior to the share class inception date (including returns for the Life of the Fund, if shown, which are since Fund inception) include the returns of the Fund’s oldest share class. These returns are adjusted to reflect any higher class-related operating expenses of the newer share classes, as applicable. Please visit columbiathreadneedleus.com/investor/investment-products/mutual-funds/appended-performance for more information.
The Fund’s performance prior to May 1, 2018 reflects returns achieved following a principal investment strategy pursuant to which day-to-day investment decisions for the Fund were made according to only one potential form of predetermined asset allocation table. Effective May 1, 2018, the Fund follows a principal investment strategy that calls for the Investment Manager, on at least an annual basis, to determine whether the Fund’s assets should be allocated according to one of two different forms of allocation table based on the Investment Manager’s assessment of the equity market. Through April 2020, the asset allocation table in place reflected the Investment Manager’s determination that the equity market was “expensive”. During the most recent annual review, the Fund’s portfolio managers determined the market to be “normal” and therefore, on May 1, 2020, the Fund switched to the "normal" equity market table with a 50% equity floor.
The Blended Benchmark, established by the Fund’s investment manager, is an equally weighted custom composite of Columbia Thermostat Fund’s primary equity and primary debt benchmarks, the S&P 500® Index and the Bloomberg Barclays U.S. Aggregate Bond Index, respectively. The percentage of the Fund’s assets allocated to underlying stock and bond portfolio funds will vary, and accordingly the composition of the Fund’s portfolio will not always reflect the composition of the Blended Benchmark.
The S&P 500® Index tracks the performance of 500 widely held, large-capitalization U.S. stocks.
Columbia Acorn Family of Funds | Semiannual Report 2020
| 13 |
Fund at a glance (continued)
Columbia Thermostat FundSM (Unaudited)
The Bloomberg Barclays U.S. Aggregate Bond Index is a market value-weighted index that tracks the daily price, coupon, pay-downs and total return performance of fixed-rate, publicly placed, dollar-denominated and non-convertible investment-grade debt issues with at least $250 million par amount outstanding and with at least one year to final maturity.
Unlike mutual funds, indexes are not managed and do not incur fees or expenses. It is not possible to invest directly in an index.
The COVID-19 pandemic has adversely impacted economies and capital markets around the world in ways that will likely continue and may change in unforeseen ways for an indeterminate period. The COVID-19 pandemic may exacerbate pre-existing political, social and economic risks in certain countries and globally. Fund performance may be significantly negatively impacted by the economic impact of the COVID-19 pandemic.
| Portfolio breakdown (%) (at June 30, 2020) |
| Equity Funds | 45.1 |
| Exchange-Traded Equity Funds | 5.0 |
| Exchange-Traded Fixed Income Funds | 4.9 |
| Fixed Income Funds | 44.5 |
| Money Market Funds | 0.5 |
| Total | 100.0 |
Percentages indicated are based upon total investments excluding investments in derivatives, if any. The Fund’s portfolio composition is subject to change.
| 14 | Columbia Acorn Family of Funds | Semiannual Report 2020 |
Fund at a glance
Columbia Acorn Emerging Markets FundSM (Unaudited)
Investment objective
Columbia Acorn Emerging Markets FundSM (the Fund) seeks long-term capital appreciation.
Effective July 10, 2020, the Fund was merged with and into Columbia Acorn International®.
Portfolio management
Satoshi Matsunaga, CFA
Portfolio Manager or Co-Portfolio Manager since 2015
Service with Fund since 2011
Morningstar style boxTM
The Morningstar Style Box is based on a fund’s portfolio holdings. For equity funds, the vertical axis shows the market capitalization of the stocks owned, and the horizontal axis shows investment style (value, blend, or growth). Information shown is based on the most recent data provided by Morningstar.
© 2020 Morningstar, Inc. All rights reserved. The Morningstar information contained herein: (1) is proprietary to Morningstar and/or its content providers; (2) may not be copied or distributed; and (3) is not warranted to be accurate, complete or timely. Neither Morningstar nor its content providers are responsible for any damages or losses arising from any use of this information.
| Average annual total returns (%) (for the period ended June 30, 2020) |
| | | Inception | 6 Months
cumulative | 1 Year | 5 Years | Life of Fund |
| Class A | Excluding sales charges | 08/19/11 | -14.29 | -6.80 | -1.34 | 1.84 |
| | Including sales charges | | -19.21 | -12.18 | -2.50 | 1.16 |
| Advisor Class | 11/08/12 | -14.18 | -6.56 | -1.07 | 2.14 |
| Class C | Excluding sales charges | 08/19/11 | -14.61 | -7.41 | -2.06 | 1.10 |
| | Including sales charges | | -15.47 | -8.34 | -2.06 | 1.10 |
| Institutional Class | 08/19/11 | -14.19 | -6.59 | -1.08 | 2.12 |
| Institutional 2 Class | 11/08/12 | -14.08 | -6.38 | -0.96 | 2.21 |
| Institutional 3 Class | 06/13/13 | -14.12 | -6.44 | -0.94 | 2.23 |
| MSCI Emerging Markets SMID Cap Index (Net) | | -13.38 | -9.55 | -0.59 | 0.38 |
Performance numbers reflect all Fund expenses. Returns for Class A shares are shown with and without the maximum initial sales charge of 5.75%. Returns for Class C shares are shown with and without the maximum contingent deferred sales charge of 1.00% for the first year after purchase. The Fund’s other share classes are not subject to sales charges, but may be subject to other fees and expenses, and have limited eligibility. Please see the Fund’s prospectus for details. Performance for different share classes will vary based on differences in sales charges and certain fees and expenses associated with each share class.
As stated in the May 1, 2020 prospectus (as supplemented), the Fund’s annual operating expense ratio is 1.30% for Institutional Class shares and 1.55% for Class A shares.
All results shown assume reinvestment of distributions during the period. Returns do not reflect the deduction of taxes that a shareholder may pay on Fund distributions or on the redemption of Fund shares. Performance results reflect the effect of fee waivers or reimbursements of Fund expenses by the investment manager and/or its affiliates. Absent these fee waivers and/or expense reimbursement arrangements, performance results may have been lower.
The performance information shown represents past performance and is not a guarantee of future results. The investment return and principal value of your investment will fluctuate so that shares, when redeemed, may be worth more or less than their original cost. Current performance may be lower or higher than the performance data shown. You may obtain performance information current to the most recent month-end by contacting your financial intermediary, visiting columbiathreadneedleus.com/investor/ or calling 800.922.6769.
The returns shown for periods prior to the share class inception date (including returns for the Life of the Fund, if shown, which are since Fund inception) include the returns of the Fund’s oldest share class. These returns are adjusted to reflect any higher class-related operating expenses of the newer share classes, as applicable. Please visit columbiathreadneedleus.com/investor/investment-products/mutual-funds/appended-performance for more information.
The MSCI Emerging Markets SMID Cap Index (Net) captures a mid- and small-cap representation across 26 emerging market countries. The index covers approximately 29% of the free float-adjusted market capitalization in each country.
Unlike mutual funds, indexes are not managed and do not incur fees or expenses. It is not possible to invest directly in an index.
The COVID-19 pandemic has adversely impacted economies and capital markets around the world in ways that will likely continue and may change in unforeseen ways for an indeterminate period. The COVID-19 pandemic may exacerbate pre-existing political, social and economic risks in certain countries and globally. Fund performance may be significantly negatively impacted by the economic impact of the COVID-19 pandemic.
Columbia Acorn Family of Funds | Semiannual Report 2020
| 15 |
Fund at a glance (continued)
Columbia Acorn Emerging Markets FundSM (Unaudited)
| Equity sector breakdown (%) (at June 30, 2020) |
| Communication Services | 2.8 |
| Consumer Discretionary | 16.9 |
| Consumer Staples | 7.7 |
| Energy | 4.6 |
| Financials | 16.3 |
| Health Care | 5.8 |
| Industrials | 16.5 |
| Information Technology | 24.9 |
| Real Estate | 4.5 |
| Total | 100.0 |
Percentages indicated are based upon total equity investments. The Fund’s portfolio composition is subject to change.
| Country breakdown (%) (at June 30, 2020) |
| Cambodia | 4.2 |
| Canada | 4.2 |
| China | 20.5 |
| Cyprus | 1.9 |
| Hong Kong | 9.6 |
| Indonesia | 0.8 |
| Mexico | 7.2 |
| Russian Federation | 1.7 |
| South Korea | 9.6 |
| Taiwan | 22.8 |
| Thailand | 8.5 |
| United States(a) | 9.0 |
| Total | 100.0 |
| (a) | Includes investments in Money Market Funds. |
Country breakdown is based primarily on issuer’s place of organization/incorporation. Percentages indicated are based upon total investments excluding investments in derivatives, if any. The Fund’s portfolio composition is subject to change.
| 16 | Columbia Acorn Family of Funds | Semiannual Report 2020 |
Fund at a glance
Columbia Acorn European FundSM (Unaudited)
Investment objective
Columbia Acorn European FundSM (the Fund) seeks long-term capital appreciation.
Portfolio management
Stephen Kusmierczak, CFA
Portfolio Manager or Co-Portfolio Manager since 2011
Service with Fund since 2011
Morningstar style boxTM
The Morningstar Style Box is based on a fund’s portfolio holdings. For equity funds, the vertical axis shows the market capitalization of the stocks owned, and the horizontal axis shows investment style (value, blend, or growth). Information shown is based on the most recent data provided by Morningstar.
© 2020 Morningstar, Inc. All rights reserved. The Morningstar information contained herein: (1) is proprietary to Morningstar and/or its content providers; (2) may not be copied or distributed; and (3) is not warranted to be accurate, complete or timely. Neither Morningstar nor its content providers are responsible for any damages or losses arising from any use of this information.
| Average annual total returns (%) (for the period ended June 30, 2020) |
| | | Inception | 6 Months
cumulative | 1 Year | 5 Years | Life of Fund |
| Class A | Excluding sales charges | 08/19/11 | -6.50 | 5.33 | 7.58 | 9.62 |
| | Including sales charges | | -11.87 | -0.73 | 6.31 | 8.89 |
| Advisor Class | 06/25/14 | -6.41 | 5.56 | 7.86 | 9.91 |
| Class C | Excluding sales charges | 08/19/11 | -6.88 | 4.49 | 6.78 | 8.81 |
| | Including sales charges | | -7.81 | 3.49 | 6.78 | 8.81 |
| Institutional Class | 08/19/11 | -6.44 | 5.53 | 7.84 | 9.90 |
| Institutional 2 Class | 11/08/12 | -6.37 | 5.62 | 7.91 | 9.93 |
| Institutional 3 Class | 03/01/17 | -6.38 | 5.65 | 7.90 | 9.93 |
| MSCI AC Europe Small Cap Index (Net) | | -15.42 | -5.43 | 3.05 | 7.95 |
Performance numbers reflect all Fund expenses. Returns for Class A shares are shown with and without the maximum initial sales charge of 5.75%. Returns for Class C shares are shown with and without the maximum contingent deferred sales charge of 1.00% for the first year after purchase. The Fund’s other share classes are not subject to sales charges, but may be subject to other fees and expenses, and have limited eligibility. Please see the Fund’s prospectus for details. Performance for different share classes will vary based on differences in sales charges and certain fees and expenses associated with each share class.
As stated in the May 1, 2020 prospectus (as supplemented), the Fund’s annual operating expense ratio is 1.20% for Institutional Class shares and 1.45% for Class A shares.
All results shown assume reinvestment of distributions during the period. Returns do not reflect the deduction of taxes that a shareholder may pay on Fund distributions or on the redemption of Fund shares. Performance results reflect the effect of fee waivers or reimbursements of Fund expenses by the investment manager and/or its affiliates. Absent these fee waivers and/or expense reimbursement arrangements, performance results may have been lower.
The performance information shown represents past performance and is not a guarantee of future results. The investment return and principal value of your investment will fluctuate so that shares, when redeemed, may be worth more or less than their original cost. Current performance may be lower or higher than the performance data shown. You may obtain performance information current to the most recent month-end by contacting your financial intermediary, visiting columbiathreadneedleus.com/investor/ or calling 800.922.6769.
The returns shown for periods prior to the share class inception date (including returns for the Life of the Fund, if shown, which are since Fund inception) include the returns of the Fund’s oldest share class. These returns are adjusted to reflect any higher class-related operating expenses of the newer share classes, as applicable. Please visit columbiathreadneedleus.com/investor/investment-products/mutual-funds/appended-performance for more information.
The MSCI AC Europe Small Cap Index (Net) captures a small-cap representation across 21 markets in Europe. The index covers approximately 14% of the free float-adjusted market capitalization across each market country in Europe.
Unlike mutual funds, indexes are not managed and do not incur fees or expenses. It is not possible to invest directly in an index.
The COVID-19 pandemic has adversely impacted economies and capital markets around the world in ways that will likely continue and may change in unforeseen ways for an indeterminate period. The COVID-19 pandemic may exacerbate pre-existing political, social and economic risks in certain countries and globally. Fund performance may be significantly negatively impacted by the economic impact of the COVID-19 pandemic.
Columbia Acorn Family of Funds | Semiannual Report 2020
| 17 |
Fund at a glance (continued)
Columbia Acorn European FundSM (Unaudited)
| Equity sector breakdown (%) (at June 30, 2020) |
| Communication Services | 4.2 |
| Consumer Discretionary | 4.2 |
| Consumer Staples | 1.6 |
| Financials | 6.7 |
| Health Care | 16.5 |
| Industrials | 36.6 |
| Information Technology | 23.2 |
| Materials | 4.7 |
| Real Estate | 2.3 |
| Total | 100.0 |
Percentages indicated are based upon total equity investments. The Fund’s portfolio composition is subject to change.
| Country breakdown (%) (at June 30, 2020) |
| Denmark | 4.3 |
| France | 4.1 |
| Germany | 12.0 |
| Ireland | 2.0 |
| Italy | 7.7 |
| Malta | 1.3 |
| Netherlands | 4.6 |
| Spain | 2.8 |
| Sweden | 23.1 |
| Switzerland | 9.4 |
| Ukraine | 0.5 |
| United Kingdom | 24.6 |
| United States(a) | 3.6 |
| Total | 100.0 |
| (a) | Includes investments in Money Market Funds. |
Country breakdown is based primarily on issuer’s place of organization/incorporation. Percentages indicated are based upon total investments excluding investments in derivatives, if any. The Fund’s portfolio composition is subject to change.
| 18 | Columbia Acorn Family of Funds | Semiannual Report 2020 |
2020 Mid-Year Distributions
The following table details the mid-year distributions for the Columbia Acorn Funds. The information is provided on a per share basis for each share class of the Funds.
| Fund | Ordinary
income | Short-term
capital
gain | Long-term
capital
gain | Record
date | Ex-dividend
date | Payable
date |
| Columbia Acorn® Fund | | | | | | |
| Class A | None | None | 0.70274 | 6/9/2020 | 6/10/2020 | 6/10/2020 |
| Advisor Class | None | None | 0.70274 | 6/9/2020 | 6/10/2020 | 6/10/2020 |
| Class C | None | None | 0.70274 | 6/9/2020 | 6/10/2020 | 6/10/2020 |
| Institutional Class | None | None | 0.70274 | 6/9/2020 | 6/10/2020 | 6/10/2020 |
| Institutional 2 Class | None | None | 0.70274 | 6/9/2020 | 6/10/2020 | 6/10/2020 |
| Institutional 3 Class | None | None | 0.70274 | 6/9/2020 | 6/10/2020 | 6/10/2020 |
| Columbia Acorn International® | | | | | | |
| Class A | 0.19891 | None | 1.36216 | 6/9/2020 | 6/10/2020 | 6/10/2020 |
| Advisor Class | 0.19891 | None | 1.36216 | 6/9/2020 | 6/10/2020 | 6/10/2020 |
| Class C | 0.19891 | None | 1.36216 | 6/9/2020 | 6/10/2020 | 6/10/2020 |
| Institutional Class | 0.19891 | None | 1.36216 | 6/9/2020 | 6/10/2020 | 6/10/2020 |
| Institutional 2 Class | 0.19891 | None | 1.36216 | 6/9/2020 | 6/10/2020 | 6/10/2020 |
| Institutional 3 Class | 0.19891 | None | 1.36216 | 6/9/2020 | 6/10/2020 | 6/10/2020 |
| Class R | 0.19891 | None | 1.36216 | 6/9/2020 | 6/10/2020 | 6/10/2020 |
| Columbia Acorn USA® | | | | | | |
| Class A | None | None | 0.33065 | 6/9/2020 | 6/10/2020 | 6/10/2020 |
| Advisor Class | None | None | 0.33065 | 6/9/2020 | 6/10/2020 | 6/10/2020 |
| Class C | None | None | 0.33065 | 6/9/2020 | 6/10/2020 | 6/10/2020 |
| Institutional Class | None | None | 0.33065 | 6/9/2020 | 6/10/2020 | 6/10/2020 |
| Institutional 2 Class | None | None | 0.33065 | 6/9/2020 | 6/10/2020 | 6/10/2020 |
| Institutional 3 Class | None | None | 0.33065 | 6/9/2020 | 6/10/2020 | 6/10/2020 |
| Columbia Acorn International SelectSM | | | | | | |
| Class A | 0.09198 | None | None | 6/9/2020 | 6/10/2020 | 6/10/2020 |
| Advisor Class | 0.09198 | None | None | 6/9/2020 | 6/10/2020 | 6/10/2020 |
| Class C | 0.09198 | None | None | 6/9/2020 | 6/10/2020 | 6/10/2020 |
| Institutional Class | 0.09198 | None | None | 6/9/2020 | 6/10/2020 | 6/10/2020 |
| Institutional 2 Class | 0.09198 | None | None | 6/9/2020 | 6/10/2020 | 6/10/2020 |
| Institutional 3 Class | 0.09198 | None | None | 6/9/2020 | 6/10/2020 | 6/10/2020 |
| Columbia Acorn SelectSM | | | | | | |
| Class A | 0.02174 | None | 0.30882 | 4/20/2020 | 4/21/2020 | 4/21/2020 |
| Advisor Class | 0.05462 | None | 0.30882 | 4/20/2020 | 4/21/2020 | 4/21/2020 |
| Class C | 0.00000 | None | 0.30882 | 4/20/2020 | 4/21/2020 | 4/21/2020 |
| Institutional Class | 0.05462 | None | 0.30882 | 4/20/2020 | 4/21/2020 | 4/21/2020 |
| Institutional 2 Class | 0.06383 | None | 0.30882 | 4/20/2020 | 4/21/2020 | 4/21/2020 |
| Institutional 3 Class | 0.07040 | None | 0.30882 | 4/20/2020 | 4/21/2020 | 4/21/2020 |
| Columbia Thermostat FundSM | | | | | | |
| Class A | 0.01036 | 0.09863 | 0.09479 | 6/9/2020 | 6/10/2020 | 6/10/2020 |
| Advisor Class | 0.01036 | 0.09863 | 0.09479 | 6/9/2020 | 6/10/2020 | 6/10/2020 |
| Class C | 0.01036 | 0.09863 | 0.09479 | 6/9/2020 | 6/10/2020 | 6/10/2020 |
| Institutional Class | 0.01036 | 0.09863 | 0.09479 | 6/9/2020 | 6/10/2020 | 6/10/2020 |
| Institutional 2 Class | 0.01036 | 0.09863 | 0.09479 | 6/9/2020 | 6/10/2020 | 6/10/2020 |
| Institutional 3 Class | 0.01036 | 0.09863 | 0.09479 | 6/9/2020 | 6/10/2020 | 6/10/2020 |
Columbia Acorn Family of Funds | Semiannual Report 2020
| 19 |
2020 Mid-Year Distributions (continued)
| Fund | Ordinary
income | Short-term
capital
gain | Long-term
capital
gain | Record
date | Ex-dividend
date | Payable
date |
| Columbia Acorn Emerging Markets FundSM | | | | | | |
| Class A | None | None | None | 6/9/2020 | 6/10/2020 | 6/10/2020 |
| Advisor Class | None | None | None | 6/9/2020 | 6/10/2020 | 6/10/2020 |
| Class C | None | None | None | 6/9/2020 | 6/10/2020 | 6/10/2020 |
| Institutional Class | None | None | None | 6/9/2020 | 6/10/2020 | 6/10/2020 |
| Institutional 2 Class | None | None | None | 6/9/2020 | 6/10/2020 | 6/10/2020 |
| Institutional 3 Class | None | None | None | 6/9/2020 | 6/10/2020 | 6/10/2020 |
| Columbia Acorn European FundSM | | | | | | |
| Class A | 0.12517 | None | None | 6/9/2020 | 6/10/2020 | 6/10/2020 |
| Advisor Class | 0.12517 | None | None | 6/9/2020 | 6/10/2020 | 6/10/2020 |
| Class C | 0.12517 | None | None | 6/9/2020 | 6/10/2020 | 6/10/2020 |
| Institutional Class | 0.12517 | None | None | 6/9/2020 | 6/10/2020 | 6/10/2020 |
| Institutional 2 Class | 0.12517 | None | None | 6/9/2020 | 6/10/2020 | 6/10/2020 |
| Institutional 3 Class | 0.12517 | None | None | 6/9/2020 | 6/10/2020 | 6/10/2020 |
| 20 | Columbia Acorn Family of Funds | Semiannual Report 2020 |
Understanding Your Fund’s Expenses
(Unaudited)
As a shareholder, you incur two types of costs. There are shareholder transaction costs, which generally include sales charges on purchases and may include redemption fees. There are also ongoing fund costs, which generally include investment advisory fees, distribution and service (Rule 12b-1) fees, and other Fund expenses. The following information is intended to help you understand your ongoing costs (in dollars) of investing in the Fund and to help you compare these costs with the ongoing costs of investing in other mutual funds.
Analyzing your Fund’s expenses
To illustrate these ongoing costs, we have provided examples and calculated the expenses paid by investors in each share class of the Funds during the period. The actual and hypothetical information in the tables is based on an initial investment of $1,000 at the beginning of the period indicated and held for the entire period. Expense information is calculated two ways and each method provides you with different information. The amount listed in the “Actual” column is calculated using the Funds’ actual operating expenses and total return for the period. You may use the Actual information, together with the amount invested, to estimate the expenses that you paid over the period. Simply divide your account value by $1,000 (for example, an $8,600 account value divided by $1,000 = 8.6), then multiply the results by the expenses paid during the period under the Actual column. The amount listed in the “Hypothetical” column assumes a 5% annual rate of return before expenses (which is not the Funds’ actual return) and then applies the Funds’ actual expense ratio for the period to the hypothetical return. You should not use the hypothetical account values and expenses to estimate either your actual account balance at the end of the period or the expenses you paid during the period. See “Compare with other funds” below for details on how to use the hypothetical data.
In addition to the ongoing expenses which the Funds bear directly, Columbia Thermostat Fund’s shareholders indirectly bear the Fund’s allocable share of the costs and expenses of each underlying fund in which the Fund invests. You can also estimate the effective expenses paid during the period, which includes the indirect fees associated with investing in the underlying funds, by using the amounts listed in the effective expenses paid during the period column in the “Fund of Funds” table.
Compare with other funds
Since all mutual funds are required to include the same hypothetical calculations about expenses in shareholder reports, you can use this information to compare the ongoing cost of investing in the Funds with other funds. To do so, compare the hypothetical example with the 5% hypothetical examples that appear in the shareholder reports of other funds. As you compare hypothetical examples of other funds, it is important to note that hypothetical examples are meant to highlight the ongoing costs of investing in a fund only and do not reflect any transaction costs, such as sales charges, or redemption or exchange fees. Therefore, the hypothetical calculations are useful in comparing ongoing costs only, and will not help you determine the relative total costs of owning different funds. If transaction costs were included in these calculations, your costs would be higher.
| January 1, 2020 — June 30, 2020 |
| | Account value at the
beginning of the
period ($) | Account value at the
end of the
period ($) | Expenses paid during
the period ($) | Fund’s annualized
expense ratio (%) |
| | Actual | Hypothetical | Actual | Hypothetical | Actual | Hypothetical | Actual |
| Columbia Acorn® Fund |
| Class A | 1,000.00 | 1,000.00 | 1,009.30 | 1,019.34 | 5.55 | 5.57 | 1.11 |
| Advisor Class | 1,000.00 | 1,000.00 | 1,010.30 | 1,020.59 | 4.30 | 4.32 | 0.86 |
| Class C | 1,000.00 | 1,000.00 | 1,006.90 | 1,015.61 | 9.28 | 9.32 | 1.86 |
| Institutional Class | 1,000.00 | 1,000.00 | 1,010.10 | 1,020.59 | 4.30 | 4.32 | 0.86 |
| Institutional 2 Class | 1,000.00 | 1,000.00 | 1,010.10 | 1,020.79 | 4.10 | 4.12 | 0.82 |
| Institutional 3 Class | 1,000.00 | 1,000.00 | 1,010.70 | 1,020.98 | 3.90 | 3.92 | 0.78 |
Columbia Acorn Family of Funds | Semiannual Report 2020
| 21 |
Understanding Your Fund’s Expenses (continued)
(Unaudited)
| January 1, 2020 — June 30, 2020 |
| | Account value at the
beginning of the
period ($) | Account value at the
end of the
period ($) | Expenses paid during
the period ($) | Fund’s annualized
expense ratio (%) |
| | Actual | Hypothetical | Actual | Hypothetical | Actual | Hypothetical | Actual |
| Columbia Acorn International® |
| Class A | 1,000.00 | 1,000.00 | 908.80 | 1,018.70 | 5.88 | 6.22 | 1.24 |
| Advisor Class | 1,000.00 | 1,000.00 | 910.10 | 1,019.94 | 4.70 | 4.97 | 0.99 |
| Class C | 1,000.00 | 1,000.00 | 905.40 | 1,014.97 | 9.43 | 9.97 | 1.99 |
| Institutional Class | 1,000.00 | 1,000.00 | 910.10 | 1,019.94 | 4.70 | 4.97 | 0.99 |
| Institutional 2 Class | 1,000.00 | 1,000.00 | 910.30 | 1,020.29 | 4.37 | 4.62 | 0.92 |
| Institutional 3 Class | 1,000.00 | 1,000.00 | 910.70 | 1,020.49 | 4.18 | 4.42 | 0.88 |
| Class R | 1,000.00 | 1,000.00 | 908.00 | 1,017.45 | 7.07 | 7.47 | 1.49 |
| Columbia Acorn USA® |
| Class A | 1,000.00 | 1,000.00 | 923.40 | 1,017.85 | 6.74 | 7.07 | 1.41 |
| Advisor Class | 1,000.00 | 1,000.00 | 924.90 | 1,019.10 | 5.55 | 5.82 | 1.16 |
| Class C | 1,000.00 | 1,000.00 | 918.50 | 1,014.12 | 10.30 | 10.82 | 2.16 |
| Institutional Class | 1,000.00 | 1,000.00 | 924.50 | 1,019.10 | 5.55 | 5.82 | 1.16 |
| Institutional 2 Class | 1,000.00 | 1,000.00 | 924.30 | 1,019.49 | 5.17 | 5.42 | 1.08 |
| Institutional 3 Class | 1,000.00 | 1,000.00 | 925.20 | 1,019.69 | 4.98 | 5.22 | 1.04 |
| Columbia Acorn International SelectSM |
| Class A | 1,000.00 | 1,000.00 | 937.10 | 1,018.45 | 6.21 | 6.47 | 1.29 |
| Advisor Class | 1,000.00 | 1,000.00 | 938.20 | 1,019.69 | 5.01 | 5.22 | 1.04 |
| Class C | 1,000.00 | 1,000.00 | 933.90 | 1,014.72 | 9.81 | 10.22 | 2.04 |
| Institutional Class | 1,000.00 | 1,000.00 | 938.30 | 1,019.69 | 5.01 | 5.22 | 1.04 |
| Institutional 2 Class | 1,000.00 | 1,000.00 | 938.80 | 1,020.09 | 4.63 | 4.82 | 0.96 |
| Institutional 3 Class | 1,000.00 | 1,000.00 | 938.80 | 1,020.34 | 4.39 | 4.57 | 0.91 |
| Columbia Acorn SelectSM |
| Class A | 1,000.00 | 1,000.00 | 1,003.80 | 1,018.90 | 5.98 | 6.02 | 1.20 |
| Advisor Class | 1,000.00 | 1,000.00 | 1,005.00 | 1,020.19 | 4.69 | 4.72 | 0.94 |
| Class C | 1,000.00 | 1,000.00 | 999.90 | 1,015.22 | 9.65 | 9.72 | 1.94 |
| Institutional Class | 1,000.00 | 1,000.00 | 1,004.60 | 1,020.14 | 4.73 | 4.77 | 0.95 |
| Institutional 2 Class | 1,000.00 | 1,000.00 | 1,005.10 | 1,020.54 | 4.34 | 4.37 | 0.87 |
| Institutional 3 Class | 1,000.00 | 1,000.00 | 1,005.50 | 1,020.89 | 3.99 | 4.02 | 0.80 |
| Columbia Acorn Emerging Markets FundSM |
| Class A | 1,000.00 | 1,000.00 | 857.10 | 1,017.16 | 7.16 | 7.77 | 1.55 |
| Advisor Class | 1,000.00 | 1,000.00 | 858.20 | 1,018.40 | 6.01 | 6.52 | 1.30 |
| Class C | 1,000.00 | 1,000.00 | 853.90 | 1,013.43 | 10.60 | 11.51 | 2.30 |
| Institutional Class | 1,000.00 | 1,000.00 | 858.10 | 1,018.40 | 6.01 | 6.52 | 1.30 |
| Institutional 2 Class | 1,000.00 | 1,000.00 | 859.20 | 1,018.75 | 5.69 | 6.17 | 1.23 |
| Institutional 3 Class | 1,000.00 | 1,000.00 | 858.80 | 1,018.95 | 5.50 | 5.97 | 1.19 |
| Columbia Acorn European FundSM |
| Class A | 1,000.00 | 1,000.00 | 935.00 | 1,017.65 | 6.98 | 7.27 | 1.45 |
| Advisor Class | 1,000.00 | 1,000.00 | 935.90 | 1,018.90 | 5.78 | 6.02 | 1.20 |
| Class C | 1,000.00 | 1,000.00 | 931.20 | 1,013.92 | 10.56 | 11.02 | 2.20 |
| Institutional Class | 1,000.00 | 1,000.00 | 935.60 | 1,018.90 | 5.78 | 6.02 | 1.20 |
| Institutional 2 Class | 1,000.00 | 1,000.00 | 936.30 | 1,019.19 | 5.49 | 5.72 | 1.14 |
| Institutional 3 Class | 1,000.00 | 1,000.00 | 936.20 | 1,019.44 | 5.25 | 5.47 | 1.09 |
| 22 | Columbia Acorn Family of Funds | Semiannual Report 2020 |
Understanding Your Fund’s Expenses (continued)
(Unaudited)
Fund of Funds—Columbia Thermostat Fund
| January 1, 2020 — June 30, 2020 |
| | Account value at the
beginning of the
period ($) | Account value at the
end of the
period ($) | Expenses paid during
the period ($) | Fund’s annualized
expense ratio (%) | Effective expenses
paid during the
period ($) | Fund’s effective
annualized
expense ratio (%) |
| | Actual | Hypothetical | Actual | Hypothetical | Actual | Hypothetical | Actual | Actual | Hypothetical | Actual |
| Class A | 1,000.00 | 1,000.00 | 1,150.20 | 1,022.38 | 2.67 | 2.51 | 0.50 | 4.81 | 4.53 | 0.90 |
| Advisor Class | 1,000.00 | 1,000.00 | 1,151.70 | 1,023.62 | 1.34 | 1.26 | 0.25 | 3.48 | 3.27 | 0.65 |
| Class C | 1,000.00 | 1,000.00 | 1,145.90 | 1,018.65 | 6.67 | 6.27 | 1.25 | 8.80 | 8.28 | 1.65 |
| Institutional Class | 1,000.00 | 1,000.00 | 1,152.00 | 1,023.62 | 1.34 | 1.26 | 0.25 | 3.48 | 3.27 | 0.65 |
| Institutional 2 Class | 1,000.00 | 1,000.00 | 1,152.20 | 1,023.82 | 1.12 | 1.06 | 0.21 | 3.26 | 3.07 | 0.61 |
| Institutional 3 Class | 1,000.00 | 1,000.00 | 1,152.50 | 1,024.02 | 0.91 | 0.86 | 0.17 | 3.05 | 2.87 | 0.57 |
Expenses paid during the period are equal to the annualized expense ratio, multiplied by the average account value over the period and then multiplied by the number of days in the Fund’s most recent fiscal half year and divided by 366.
Except with respect to Columbia Thermostat Fund, expenses do not include any fees and expenses incurred indirectly by a Fund from the underlying funds in which the Fund may invest (also referred to as “acquired funds”), including affiliated and non-affiliated pooled investments vehicles (including mutual funds and exchange traded funds).
In the case of Columbia Thermostat Fund, effective expenses paid during the period and the Fund’s effective annualized expense ratio include expenses borne directly by the class plus the Fund’s pro rata portion of the ongoing expenses charged by the underlying funds in which it invests using the expense ratio of each class of each underlying fund as of the underlying fund’s most recent shareholder report.
Had the investment manager and/or certain of its affiliates not waived/reimbursed certain fees and expenses for the Funds, account value at the end of the period would have been reduced.
Columbia Acorn Family of Funds | Semiannual Report 2020
| 23 |
Portfolio of Investments
Columbia Acorn® Fund, June 30, 2020 (Unaudited)
(Percentages represent value of investments compared to net assets)
Investments in securities
| Common Stocks 98.4% |
| Issuer | Shares | Value ($) |
| Communication Services 2.6% |
| Entertainment 2.6% |
| Take-Two Interactive Software, Inc.(a) | 382,000 | 53,315,740 |
| Zynga, Inc., Class A(a) | 5,049,000 | 48,167,460 |
| Total | | 101,483,200 |
| Total Communication Services | 101,483,200 |
| Consumer Discretionary 12.8% |
| Diversified Consumer Services 3.4% |
| Bright Horizons Family Solutions, Inc.(a) | 399,432 | 46,813,430 |
| Chegg, Inc.(a) | 721,118 | 48,502,397 |
| Grand Canyon Education, Inc.(a) | 401,887 | 36,382,830 |
| Total | | 131,698,657 |
| Hotels, Restaurants & Leisure 2.5% |
| Chipotle Mexican Grill, Inc.(a) | 21,807 | 22,948,814 |
| DraftKings, Inc., Class A(a),(b) | 571,000 | 18,991,460 |
| Planet Fitness, Inc., Class A(a) | 478,000 | 28,952,460 |
| Wingstop, Inc. | 181,904 | 25,279,199 |
| Total | | 96,171,933 |
| Household Durables 3.2% |
| Helen of Troy Ltd.(a) | 207,197 | 39,069,066 |
| NVR, Inc.(a) | 14,600 | 47,577,750 |
| Skyline Champion Corp.(a) | 1,569,405 | 38,199,318 |
| Total | | 124,846,134 |
| Specialty Retail 3.3% |
| Five Below, Inc.(a) | 336,614 | 35,987,403 |
| Tractor Supply Co. | 393,448 | 51,852,512 |
| Williams-Sonoma, Inc. | 475,000 | 38,954,750 |
| Total | | 126,794,665 |
| Textiles, Apparel & Luxury Goods 0.4% |
| Carter’s, Inc. | 221,900 | 17,907,330 |
| Total Consumer Discretionary | 497,418,719 |
| Consumer Staples 1.1% |
| Household Products 1.1% |
| WD-40 Co. | 221,809 | 43,984,725 |
| Total Consumer Staples | 43,984,725 |
| Common Stocks (continued) |
| Issuer | Shares | Value ($) |
| Financials 5.4% |
| Banks 0.8% |
| SVB Financial Group(a) | 154,768 | 33,357,147 |
| Capital Markets 3.8% |
| Ares Management Corp., Class A | 1,638,335 | 65,041,899 |
| Hamilton Lane, Inc., Class A | 343,000 | 23,107,910 |
| Houlihan Lokey, Inc. | 456,342 | 25,390,869 |
| Raymond James Financial, Inc. | 472,123 | 32,496,226 |
| Total | | 146,036,904 |
| Consumer Finance 0.8% |
| FirstCash, Inc. | 465,000 | 31,378,200 |
| Total Financials | 210,772,251 |
| Health Care 33.5% |
| Biotechnology 12.7% |
| ACADIA Pharmaceuticals, Inc.(a) | 1,074,882 | 52,099,531 |
| Acceleron Pharma, Inc.(a) | 268,000 | 25,532,360 |
| Anika Therapeutics, Inc.(a) | 648,943 | 24,484,620 |
| Argenx SE, ADR(a) | 240,801 | 54,235,609 |
| CRISPR Therapeutics AG(a) | 782,561 | 57,510,408 |
| Enanta Pharmaceuticals, Inc.(a) | 334,000 | 16,770,140 |
| Exact Sciences Corp.(a) | 546,000 | 47,469,240 |
| Immunomedics, Inc.(a) | 1,143,878 | 40,539,036 |
| Insmed, Inc.(a) | 1,249,000 | 34,397,460 |
| Kiniksa Pharmaceuticals Ltd., Class A(a) | 851,825 | 21,704,501 |
| Mirati Therapeutics, Inc.(a) | 260,255 | 29,713,313 |
| Natera, Inc.(a) | 750,000 | 37,395,000 |
| Sarepta Therapeutics, Inc.(a) | 304,517 | 48,826,256 |
| Total | | 490,677,474 |
| Health Care Equipment & Supplies 8.9% |
| Globus Medical, Inc., Class A(a) | 1,016,000 | 48,473,360 |
| Haemonetics Corp.(a) | 250,000 | 22,390,000 |
| Hill-Rom Holdings, Inc. | 283,800 | 31,155,564 |
| Masimo Corp.(a) | 323,302 | 73,709,623 |
| Penumbra, Inc.(a) | 217,190 | 38,837,916 |
| STERIS PLC | 291,209 | 44,683,109 |
| Tactile Systems Technology, Inc.(a) | 364,687 | 15,108,982 |
The accompanying Notes to Financial Statements are an integral part of this statement.
| 24 | Columbia Acorn Family of Funds | Semiannual Report 2020 |
Portfolio of Investments (continued)
Columbia Acorn® Fund, June 30, 2020 (Unaudited)
| Common Stocks (continued) |
| Issuer | Shares | Value ($) |
| Varian Medical Systems, Inc.(a) | 252,364 | 30,919,637 |
| West Pharmaceutical Services, Inc. | 175,000 | 39,754,750 |
| Total | | 345,032,941 |
| Health Care Providers & Services 4.0% |
| Amedisys, Inc.(a) | 187,300 | 37,186,542 |
| Chemed Corp. | 116,338 | 52,476,582 |
| Encompass Health Corp. | 640,243 | 39,650,249 |
| HealthEquity, Inc.(a) | 415,000 | 24,348,050 |
| Total | | 153,661,423 |
| Health Care Technology 1.2% |
| Livongo Health, Inc.(a),(b) | 639,852 | 48,110,472 |
| Life Sciences Tools & Services 4.5% |
| 10X Genomics, Inc., Class A(a) | 295,000 | 26,346,450 |
| Bio-Rad Laboratories, Inc., Class A(a) | 82,000 | 37,022,180 |
| Bio-Techne Corp. | 179,802 | 47,480,314 |
| Pra Health Sciences, Inc.(a) | 379,340 | 36,905,989 |
| Repligen Corp.(a) | 218,000 | 26,946,980 |
| Total | | 174,701,913 |
| Pharmaceuticals 2.2% |
| Horizon Therapeutics PLC(a) | 629,089 | 34,964,767 |
| Reata Pharmaceuticals, Inc., Class A(a) | 191,871 | 29,935,713 |
| Theravance Biopharma, Inc.(a) | 963,892 | 20,232,093 |
| Total | | 85,132,573 |
| Total Health Care | 1,297,316,796 |
| Industrials 14.9% |
| Aerospace & Defense 2.4% |
| BWX Technologies, Inc. | 709,000 | 40,157,760 |
| Curtiss-Wright Corp. | 415,000 | 37,051,200 |
| HEICO Corp., Class A | 201,272 | 16,351,337 |
| Total | | 93,560,297 |
| Building Products 1.4% |
| Allegion PLC | 542,420 | 55,446,172 |
| Commercial Services & Supplies 1.6% |
| Copart, Inc.(a) | 430,000 | 35,806,100 |
| Unifirst Corp. | 138,000 | 24,695,100 |
| Total | | 60,501,200 |
| Common Stocks (continued) |
| Issuer | Shares | Value ($) |
| Electrical Equipment 0.9% |
| Atkore International Group, Inc.(a) | 1,228,496 | 33,599,366 |
| Machinery 5.5% |
| Donaldson Co., Inc. | 550,000 | 25,586,000 |
| Graco, Inc. | 612,836 | 29,410,000 |
| IDEX Corp. | 188,000 | 29,711,520 |
| ITT, Inc. | 739,070 | 43,412,972 |
| SPX Corp.(a) | 1,318,635 | 54,261,830 |
| Toro Co. (The) | 483,510 | 32,076,053 |
| Total | | 214,458,375 |
| Professional Services 1.4% |
| Exponent, Inc. | 648,000 | 52,442,640 |
| Road & Rail 0.7% |
| Old Dominion Freight Line, Inc. | 156,310 | 26,508,613 |
| Trading Companies & Distributors 1.0% |
| Watsco, Inc. | 224,750 | 39,938,075 |
| Total Industrials | 576,454,738 |
| Information Technology 23.5% |
| Electronic Equipment, Instruments & Components 2.9% |
| CDW Corp. | 429,372 | 49,884,439 |
| Dolby Laboratories, Inc., Class A | 483,000 | 31,815,210 |
| ePlus, Inc.(a) | 424,122 | 29,976,943 |
| Total | | 111,676,592 |
| IT Services 7.1% |
| Booz Allen Hamilton Holdings Corp. | 557,985 | 43,405,653 |
| EPAM Systems, Inc.(a) | 257,012 | 64,769,594 |
| Gartner, Inc.(a) | 154,100 | 18,696,953 |
| GoDaddy, Inc., Class A(a) | 325,000 | 23,832,250 |
| Jack Henry & Associates, Inc. | 343,500 | 63,214,305 |
| VeriSign, Inc.(a) | 126,000 | 26,060,580 |
| Wix.com Ltd.(a) | 137,400 | 35,204,628 |
| Total | | 275,183,963 |
| Semiconductors & Semiconductor Equipment 2.7% |
| Cabot Microelectronics Corp. | 163,000 | 22,745,020 |
| MKS Instruments, Inc. | 294,294 | 33,325,853 |
| Teradyne, Inc. | 584,061 | 49,358,995 |
| Total | | 105,429,868 |
The accompanying Notes to Financial Statements are an integral part of this statement.
Columbia Acorn Family of Funds | Semiannual Report 2020
| 25 |
Portfolio of Investments (continued)
Columbia Acorn® Fund, June 30, 2020 (Unaudited)
| Common Stocks (continued) |
| Issuer | Shares | Value ($) |
| Software 10.8% |
| Alteryx, Inc., Class A(a) | 314,752 | 51,707,459 |
| Anaplan, Inc.(a) | 615,000 | 27,865,650 |
| ANSYS, Inc.(a) | 81,417 | 23,751,781 |
| Blackline, Inc.(a) | 614,977 | 50,987,743 |
| Cadence Design Systems, Inc.(a) | 287,000 | 27,540,520 |
| CyberArk Software Ltd.(a) | 216,638 | 21,505,654 |
| Elastic NV(a) | 388,000 | 35,777,480 |
| Manhattan Associates, Inc.(a) | 589,760 | 55,555,392 |
| Mimecast Ltd.(a) | 939,465 | 39,138,112 |
| Qualys, Inc.(a) | 276,637 | 28,775,781 |
| Zscaler, Inc.(a) | 524,176 | 57,397,272 |
| Total | | 420,002,844 |
| Total Information Technology | 912,293,267 |
| Materials 1.6% |
| Chemicals 0.6% |
| PolyOne Corp. | 958,000 | 25,128,340 |
| Containers & Packaging 1.0% |
| Avery Dennison Corp. | 324,021 | 36,967,556 |
| Total Materials | 62,095,896 |
| Real Estate 3.0% |
| Equity Real Estate Investment Trusts (REITS) 1.9% |
| Americold Realty Trust | 1,099,532 | 39,913,012 |
| Equity Commonwealth | 1,064,300 | 34,270,460 |
| Total | | 74,183,472 |
| Common Stocks (continued) |
| Issuer | Shares | Value ($) |
| Real Estate Management & Development 1.1% |
| Colliers International Group, Inc. | 317,374 | 18,188,704 |
| FirstService Corp. | 217,000 | 21,862,750 |
| Total | | 40,051,454 |
| Total Real Estate | 114,234,926 |
Total Common Stocks
(Cost $2,893,357,971) | 3,816,054,518 |
|
| Securities Lending Collateral 0.8% |
| | |
| Dreyfus Government Cash Management Fund, Institutional Shares, 0.092%(c),(d) | 32,820,950 | 32,820,950 |
Total Securities Lending Collateral
(Cost $32,820,950) | 32,820,950 |
|
| Money Market Funds 1.3% |
| | Shares | Value ($) |
| Columbia Short-Term Cash Fund, 0.253%(c),(e) | 50,266,718 | 50,266,718 |
Total Money Market Funds
(Cost $50,251,246) | 50,266,718 |
Total Investments in Securities
(Cost: $2,976,430,167) | 3,899,142,186 |
| Obligation to Return Collateral for Securities Loaned | | (32,820,950) |
| Other Assets & Liabilities, Net | | 13,323,419 |
| Net Assets | 3,879,644,655 |
Notes to Portfolio of Investments
| (a) | Non-income producing security. |
| (b) | All or a portion of this security was on loan at June 30, 2020. The total market value of securities on loan at June 30, 2020 was $32,941,685. |
| (c) | The rate shown is the seven-day current annualized yield at June 30, 2020. |
| (d) | Investment made with cash collateral received from securities lending activity. |
| (e) | As defined in the Investment Company Act of 1940, an affiliated company is one in which the Fund owns 5% or more of the company’s outstanding voting securities, or a company which is under common ownership or control with the Fund. The value of the holdings and transactions in these affiliated companies during the period ended June 30, 2020 are as follows: |
| Affiliated issuers | Beginning
of period($) | Purchases($) | Sales($) | Net change in
unrealized
appreciation
(depreciation)($) | End of
period($) | Realized gain
(loss)($) | Dividends($) | End of
period shares |
| Columbia Short-Term Cash Fund, 0.253% |
| | 57,990,784 | 815,220,777 | (822,960,315) | 15,472 | 50,266,718 | (64,059) | 482,021 | 50,266,718 |
The accompanying Notes to Financial Statements are an integral part of this statement.
| 26 | Columbia Acorn Family of Funds | Semiannual Report 2020 |
Portfolio of Investments (continued)
Columbia Acorn® Fund, June 30, 2020 (Unaudited)
Abbreviation Legend
| ADR | American Depositary Receipt |
Fair value measurements
Various inputs are used in determining the value of the Fund’s investments, following the input prioritization hierarchy established by accounting principles generally accepted in the United States of America (GAAP). These inputs are summarized in the three broad levels listed below:
| ■ | Level 1 – quoted prices in active markets for identical securities |
| ■ | Level 2 – prices determined using other significant observable inputs (including quoted prices for similar securities, interest rates, prepayment speeds, credit risk and others) |
| ■ | Level 3 – prices determined using significant unobservable inputs where quoted prices or observable inputs are unavailable or less reliable (including management’s own assumptions about the factors market participants would use in pricing an investment) |
The inputs or methodology used for valuing securities are not necessarily an indication of the risk associated with investing in those securities.
Examples of the types of securities in which the Fund would typically invest and how they are classified within this hierarchy are as follows. Typical Level 1 securities include exchange traded domestic equities, mutual funds whose net asset values are published each day and exchange traded foreign equities that are not typically statistically fair valued. Typical Level 2 securities include exchange traded foreign equities that are traded in the European region or Asia Pacific region time zones which are typically statistically fair valued, forward foreign currency exchange contracts and short-term investments valued at amortized cost. Additionally, securities fair valued by Columbia Wanger Asset Management’s Valuation Committee (the Committee) that rely on significant observable inputs are also included in Level 2. Typical Level 3 securities include any security fair valued by the Committee that relies on significant unobservable inputs.
The Committee is responsible for applying the Columbia Acorn Trust Portfolio Pricing Policy and the Columbia Wanger Asset Management pricing procedures (the Policies), which are approved by and subject to the oversight of the Board of Trustees.
The Committee meets as necessary, and no less frequently than quarterly, to determine fair values for securities for which market quotations are not readily available or for which Columbia Wanger Asset Management believes that available market quotations are unreliable. The Committee also reviews the continuing appropriateness of the Policies. In circumstances where a security has been fair valued, the Committee will also review the continuing appropriateness of the current value of the security. The Policies address, among other things: circumstances under which market quotations will be deemed readily available; selection of third party pricing vendors; appropriate pricing methodologies; events that require fair valuation and fair value techniques; circumstances under which securities will be deemed to pose a potential for stale pricing, including when securities are illiquid, restricted, or in default; and certain delegations of authority to determine fair values to the Fund’s investment manager. The Committee may also meet to discuss additional valuation matters, which may include review of back-testing results, review of time-sensitive information or approval of other valuation related actions, and to review the appropriateness of the Policies.
The following table is a summary of the inputs used to value the Fund’s investments at June 30, 2020:
| | Level 1 ($) | Level 2 ($) | Level 3 ($) | Total ($) |
| Investments in Securities | | | | |
| Common Stocks | | | | |
| Communication Services | 101,483,200 | — | — | 101,483,200 |
| Consumer Discretionary | 497,418,719 | — | — | 497,418,719 |
| Consumer Staples | 43,984,725 | — | — | 43,984,725 |
| Financials | 210,772,251 | — | — | 210,772,251 |
| Health Care | 1,297,316,796 | — | — | 1,297,316,796 |
| Industrials | 576,454,738 | — | — | 576,454,738 |
| Information Technology | 912,293,267 | — | — | 912,293,267 |
| Materials | 62,095,896 | — | — | 62,095,896 |
| Real Estate | 114,234,926 | — | — | 114,234,926 |
| Total Common Stocks | 3,816,054,518 | — | — | 3,816,054,518 |
| Securities Lending Collateral | 32,820,950 | — | — | 32,820,950 |
| Money Market Funds | 50,266,718 | — | — | 50,266,718 |
| Total Investments in Securities | 3,899,142,186 | — | — | 3,899,142,186 |
See the Portfolio of Investments for all investment classifications not indicated in the table.
The accompanying Notes to Financial Statements are an integral part of this statement.
Columbia Acorn Family of Funds | Semiannual Report 2020
| 27 |
Portfolio of Investments
Columbia Acorn International®, June 30, 2020 (Unaudited)
(Percentages represent value of investments compared to net assets)
Investments in securities
| Common Stocks 96.3% |
| Issuer | Shares | Value ($) |
| Australia 5.5% |
| carsales.com Ltd. | 3,357,523 | 41,562,171 |
| Cleanaway Waste Management Ltd. | 13,423,503 | 20,610,118 |
| Evolution Mining Ltd. | 3,469,000 | 13,780,570 |
| National Storage REIT | 19,549,881 | 25,019,204 |
| Technology One Ltd. | 3,703,433 | 22,695,909 |
| Total | 123,667,972 |
| Austria 0.5% |
| S&T AG(a) | 435,000 | 11,192,292 |
| Brazil 2.3% |
| Notre Dame Intermedica Participacoes SA | 1,033,000 | 13,002,492 |
| Sul America SA | 2,248,400 | 18,886,543 |
| TOTVS SA | 4,674,400 | 20,113,819 |
| Total | 52,002,854 |
| Cambodia 0.8% |
| NagaCorp Ltd. | 14,602,000 | 17,033,965 |
| Canada 4.0% |
| Agnico Eagle Mines Ltd. | 480,131 | 30,743,804 |
| CCL Industries, Inc. | 662,003 | 21,397,092 |
| Parex Resources, Inc.(a) | 970,300 | 11,692,772 |
| Pason Systems, Inc. | 1,887,709 | 10,317,325 |
| Winpak Ltd. | 486,262 | 14,896,609 |
| Total | 89,047,602 |
| China 2.2% |
| 51job, Inc., ADR(a) | 211,000 | 15,147,690 |
| A-Living Services Co., Ltd. | 4,384,000 | 22,280,248 |
| Shenzhou International Group Holdings Ltd. | 971,000 | 11,804,655 |
| Total | 49,232,593 |
| Cyprus 0.0% |
| TCS Group Holding PLC, GDR | 49,482 | 1,004,485 |
| Denmark 1.6% |
| SimCorp AS | 337,852 | 36,539,488 |
| France 1.2% |
| Akka Technologies | 386,662 | 12,506,992 |
| Robertet SA(a) | 13,230 | 13,882,720 |
| Total | 26,389,712 |
| Common Stocks (continued) |
| Issuer | Shares | Value ($) |
| Germany 5.8% |
| Corestate Capital Holding SA(a),(b) | 522,206 | 10,618,282 |
| Eckert & Ziegler Strahlen- und Medizintechnik AG | 128,318 | 21,490,314 |
| Hypoport SE(a) | 72,624 | 32,305,657 |
| Nemetschek SE | 425,880 | 29,263,176 |
| TeamViewer AG(a) | 662,189 | 36,156,896 |
| Total | 129,834,325 |
| Hong Kong 1.3% |
| Vitasoy International Holdings Ltd.(b) | 7,378,000 | 28,358,870 |
| India 1.4% |
| Cholamandalam Investment and Finance Co., Ltd. | 7,087,056 | 17,775,816 |
| Zee Entertainment Enterprises Ltd. | 5,618,278 | 12,763,264 |
| Total | 30,539,080 |
| Ireland 1.6% |
| UDG Healthcare PLC | 4,105,015 | 36,485,959 |
| Israel 0.6% |
| CyberArk Software Ltd.(a) | 134,000 | 13,302,180 |
| Italy 3.5% |
| Amplifon SpA(a) | 845,394 | 22,584,716 |
| GVS SpA(a) | 864,717 | 10,055,120 |
| Industria Macchine Automatiche SpA(a),(b) | 458,173 | 27,539,508 |
| Nexi SpA(a) | 1,104,000 | 19,143,957 |
| Total | 79,323,301 |
| Japan 20.3% |
| Aica Kogyo Co., Ltd. | 693,200 | 22,780,441 |
| Aruhi Corp.(b) | 1,003,000 | 14,331,933 |
| Azbil Corp. | 775,240 | 23,694,843 |
| CyberAgent, Inc. | 699,200 | 34,368,243 |
| Daifuku Co., Ltd. | 299,200 | 26,219,523 |
| Daiseki Co., Ltd. | 685,200 | 18,368,257 |
| Daiwa Securities Living Investments Corp. | 30,021 | 27,959,271 |
| Disco Corp. | 61,700 | 15,047,931 |
| Fuso Chemical Co., Ltd. | 261,300 | 9,540,199 |
| Glory Ltd. | 734,700 | 16,758,839 |
| Hikari Tsushin, Inc. | 175,428 | 40,111,298 |
| Invesco Office J-REIT, Inc. | 20,046 | 2,606,087 |
The accompanying Notes to Financial Statements are an integral part of this statement.
| 28 | Columbia Acorn Family of Funds | Semiannual Report 2020 |
Portfolio of Investments (continued)
Columbia Acorn International®, June 30, 2020 (Unaudited)
| Common Stocks (continued) |
| Issuer | Shares | Value ($) |
| Lasertec Corp. | 284,000 | 26,846,684 |
| Mandom Corp. | 812,200 | 14,998,102 |
| MonotaRO Co., Ltd | 377,300 | 15,159,323 |
| Nihon M&A Center, Inc. | 300,800 | 13,679,775 |
| Nihon Unisys Ltd. | 902,700 | 28,382,003 |
| NSD Co., Ltd. | 785,400 | 13,425,625 |
| Seiren Co., Ltd. | 797,000 | 10,071,462 |
| Sekisui Chemical Co., Ltd. | 2,035,700 | 29,166,965 |
| Seria Co., Ltd. | 779,291 | 27,794,764 |
| Solasto Corp. | 1,424,600 | 14,194,811 |
| Valqua Ltd. | 462,800 | 8,322,022 |
| Total | 453,828,401 |
| Malta 0.8% |
| Kindred Group PLC(a) | 2,993,507 | 18,072,023 |
| Mexico 0.5% |
| Corporación Inmobiliaria Vesta SAB de CV | 7,207,000 | 10,758,214 |
| Netherlands 3.9% |
| Argenx SE, ADR(a) | 162,000 | 36,487,260 |
| BE Semiconductor Industries NV | 336,500 | 14,920,317 |
| IMCD NV | 372,100 | 35,088,807 |
| Total | 86,496,384 |
| New Zealand 1.2% |
| Fisher & Paykel Healthcare Corp., Ltd. | 1,157,000 | 26,653,592 |
| Russian Federation 0.9% |
| TCS Group Holding PLC, GDR | 942,700 | 19,136,810 |
| Singapore 0.9% |
| Mapletree Commercial Trust | 15,037,100 | 21,040,006 |
| South Africa 0.3% |
| Pepkor Holdings Ltd.(b) | 10,570,000 | 6,691,377 |
| South Korea 2.1% |
| Koh Young Technology, Inc. | 323,054 | 27,000,267 |
| Korea Investment Holdings Co., Ltd. | 557,098 | 20,886,242 |
| Total | 47,886,509 |
| Spain 2.2% |
| Befesa SA | 746,454 | 29,109,008 |
| Vidrala SA | 219,477 | 20,928,912 |
| Total | 50,037,920 |
| Common Stocks (continued) |
| Issuer | Shares | Value ($) |
| Sweden 9.0% |
| AddTech AB, Class B | 782,939 | 31,665,939 |
| Dometic Group AB(a) | 2,177,397 | 19,676,976 |
| Dustin Group AB | 1,016,691 | 5,551,351 |
| Hexagon AB, Class B(a) | 699,561 | 41,082,123 |
| Munters Group AB(a) | 3,772,682 | 21,268,640 |
| Sectra AB, Class B(a) | 265,000 | 15,100,829 |
| Sweco AB, Class B | 857,153 | 38,691,551 |
| Trelleborg AB, Class B(a) | 1,978,586 | 29,029,356 |
| Total | 202,066,765 |
| Switzerland 3.3% |
| Belimo Holding AG, Registered Shares | 4,122 | 30,505,786 |
| Gurit Holding AG | 4,800 | 7,031,061 |
| Inficon Holding AG | 45,183 | 35,357,357 |
| Total | 72,894,204 |
| Taiwan 4.2% |
| Grape King Bio Ltd. | 2,718,000 | 17,553,421 |
| Parade Technologies Ltd. | 575,000 | 19,272,850 |
| Silergy Corp. | 343,000 | 22,469,348 |
| Sinbon Electronics Co., Ltd. | 3,588,000 | 18,250,363 |
| Voltronic Power Technology Corp. | 528,000 | 15,214,400 |
| Total | 92,760,382 |
| Thailand 0.8% |
| Muangthai Capital PCL, Foreign Registered Shares | 10,453,400 | 17,755,951 |
| United Kingdom 12.0% |
| Abcam PLC | 1,374,000 | 22,694,647 |
| Auto Trader Group PLC | 4,209,438 | 27,406,634 |
| Dechra Pharmaceuticals PLC | 1,014,687 | 35,740,072 |
| Diploma PLC | 522,000 | 11,604,437 |
| Genus PLC | 144,000 | 6,303,651 |
| Halma PLC | 1,033,631 | 29,448,371 |
| Intermediate Capital Group PLC | 1,520,382 | 24,255,912 |
| Rentokil Initial PLC | 4,652,043 | 29,415,670 |
| Rightmove PLC | 4,994,389 | 33,759,785 |
| Safestore Holdings PLC | 1,818,863 | 16,394,482 |
| Spirax-Sarco Engineering PLC | 258,025 | 31,765,452 |
| Total | 268,789,113 |
The accompanying Notes to Financial Statements are an integral part of this statement.
Columbia Acorn Family of Funds | Semiannual Report 2020
| 29 |
Portfolio of Investments (continued)
Columbia Acorn International®, June 30, 2020 (Unaudited)
| Common Stocks (continued) |
| Issuer | Shares | Value ($) |
| United States 1.6% |
| Inter Parfums, Inc. | 733,851 | 35,334,926 |
Total Common Stocks
(Cost $1,702,104,576) | 2,154,157,255 |
|
| Securities Lending Collateral 1.0% |
| | |
| Dreyfus Government Cash Management Fund, Institutional Shares, 0.092%(c),(d) | 21,620,386 | 21,620,386 |
Total Securities Lending Collateral
(Cost $21,620,386) | 21,620,386 |
|
| Money Market Funds 3.3% |
| | Shares | Value ($) |
| Columbia Short-Term Cash Fund, 0.253%(c),(e) | 73,754,725 | 73,754,725 |
Total Money Market Funds
(Cost $73,727,199) | 73,754,725 |
Total Investments in Securities
(Cost $1,797,452,161) | 2,249,532,366 |
| Obligation to Return Collateral for Securities Loaned | | (21,620,386) |
| Other Assets & Liabilities, Net | | 9,285,142 |
| Net Assets | $2,237,197,122 |
At June 30, 2020, securities and/or cash totaling $6,721,000 were pledged as collateral.
| Long futures contracts |
| Description | Number of
contracts | Expiration
date | Trading
currency | Notional
amount | Value/Unrealized
appreciation ($) | Value/Unrealized
depreciation ($) |
| MSCI EAFE Index | 618 | 09/2020 | USD | 54,952,560 | 795,705 | — |
| MSCI Emerging Markets Index | 242 | 09/2020 | USD | 11,926,970 | 205,107 | — |
| Total | | | | | 1,000,812 | — |
Notes to Portfolio of Investments
| (a) | Non-income producing security. |
| (b) | All or a portion of this security was on loan at June 30, 2020. The total market value of securities on loan at June 30, 2020 was $20,316,271. |
| (c) | The rate shown is the seven-day current annualized yield at June 30, 2020. |
| (d) | Investment made with cash collateral received from securities lending activity. |
| (e) | As defined in the Investment Company Act of 1940, an affiliated company is one in which the Fund owns 5% or more of the company’s outstanding voting securities, or a company which is under common ownership or control with the Fund. The value of the holdings and transactions in these affiliated companies during the period ended June 30, 2020 are as follows: |
| Affiliated issuers | Beginning
of period($) | Purchases($) | Sales($) | Net change in
unrealized
appreciation
(depreciation)($) | End of
period($) | Realized gain
(loss)($) | Dividends($) | End of
period shares |
| Columbia Short-Term Cash Fund, 0.253% |
| | 55,980,746 | 430,828,445 | (413,081,992) | 27,526 | 73,754,725 | (16,894) | 317,613 | 73,754,725 |
Abbreviation Legend
| ADR | American Depositary Receipt |
| GDR | Global Depositary Receipt |
Currency Legend
Fair value measurements
Various inputs are used in determining the value of the Fund’s investments, following the input prioritization hierarchy established by accounting principles generally accepted in the United States of America (GAAP). These inputs are summarized in the three broad levels listed below:
| ■ | Level 1 – quoted prices in active markets for identical securities |
| ■ | Level 2 – prices determined using other significant observable inputs (including quoted prices for similar securities, interest rates, prepayment speeds, credit risk and others) |
The accompanying Notes to Financial Statements are an integral part of this statement.
| 30 | Columbia Acorn Family of Funds | Semiannual Report 2020 |
Portfolio of Investments (continued)
Columbia Acorn International®, June 30, 2020 (Unaudited)
Fair value measurements (continued)
| ■ | Level 3 – prices determined using significant unobservable inputs where quoted prices or observable inputs are unavailable or less reliable (including management’s own assumptions about the factors market participants would use in pricing an investment) |
The inputs or methodology used for valuing securities are not necessarily an indication of the risk associated with investing in those securities.
Examples of the types of securities in which the Fund would typically invest and how they are classified within this hierarchy are as follows. Typical Level 1 securities include exchange traded domestic equities, mutual funds whose net asset values are published each day and exchange traded foreign equities that are not typically statistically fair valued. Typical Level 2 securities include exchange traded foreign equities that are traded in the European region or Asia Pacific region time zones which are typically statistically fair valued, forward foreign currency exchange contracts and short-term investments valued at amortized cost. Additionally, securities fair valued by Columbia Wanger Asset Management’s Valuation Committee (the Committee) that rely on significant observable inputs are also included in Level 2. Typical Level 3 securities include any security fair valued by the Committee that relies on significant unobservable inputs.
The Committee is responsible for applying the Columbia Acorn Trust Portfolio Pricing Policy and the Columbia Wanger Asset Management pricing procedures (the Policies), which are approved by and subject to the oversight of the Board of Trustees.
The Committee meets as necessary, and no less frequently than quarterly, to determine fair values for securities for which market quotations are not readily available or for which Columbia Wanger Asset Management believes that available market quotations are unreliable. The Committee also reviews the continuing appropriateness of the Policies. In circumstances where a security has been fair valued, the Committee will also review the continuing appropriateness of the current value of the security. The Policies address, among other things: circumstances under which market quotations will be deemed readily available; selection of third party pricing vendors; appropriate pricing methodologies; events that require fair valuation and fair value techniques; circumstances under which securities will be deemed to pose a potential for stale pricing, including when securities are illiquid, restricted, or in default; and certain delegations of authority to determine fair values to the Fund’s investment manager. The Committee may also meet to discuss additional valuation matters, which may include review of back-testing results, review of time-sensitive information or approval of other valuation related actions, and to review the appropriateness of the Policies.
The following table is a summary of the inputs used to value the Fund’s investments at June 30, 2020:
| | Level 1 ($) | Level 2 ($) | Level 3 ($) | Total ($) |
| Investments in Securities | | | | |
| Common Stocks | | | | |
| Australia | — | 123,667,972 | — | 123,667,972 |
| Austria | — | 11,192,292 | — | 11,192,292 |
| Brazil | 52,002,854 | — | — | 52,002,854 |
| Cambodia | — | 17,033,965 | — | 17,033,965 |
| Canada | 89,047,602 | — | — | 89,047,602 |
| China | 15,147,690 | 34,084,903 | — | 49,232,593 |
| Cyprus | — | 1,004,485 | — | 1,004,485 |
| Denmark | — | 36,539,488 | — | 36,539,488 |
| France | — | 26,389,712 | — | 26,389,712 |
| Germany | — | 129,834,325 | — | 129,834,325 |
| Hong Kong | — | 28,358,870 | — | 28,358,870 |
| India | — | 30,539,080 | — | 30,539,080 |
| Ireland | — | 36,485,959 | — | 36,485,959 |
| Israel | 13,302,180 | — | — | 13,302,180 |
| Italy | — | 79,323,301 | — | 79,323,301 |
| Japan | — | 453,828,401 | — | 453,828,401 |
| Malta | — | 18,072,023 | — | 18,072,023 |
| Mexico | 10,758,214 | — | — | 10,758,214 |
| Netherlands | 36,487,260 | 50,009,124 | — | 86,496,384 |
| New Zealand | — | 26,653,592 | — | 26,653,592 |
| Russian Federation | — | 19,136,810 | — | 19,136,810 |
| Singapore | — | 21,040,006 | — | 21,040,006 |
| South Africa | — | 6,691,377 | — | 6,691,377 |
| South Korea | — | 47,886,509 | — | 47,886,509 |
| Spain | — | 50,037,920 | — | 50,037,920 |
| Sweden | — | 202,066,765 | — | 202,066,765 |
| Switzerland | — | 72,894,204 | — | 72,894,204 |
| Taiwan | — | 92,760,382 | — | 92,760,382 |
| Thailand | — | 17,755,951 | — | 17,755,951 |
| United Kingdom | — | 268,789,113 | — | 268,789,113 |
| United States | 35,334,926 | — | — | 35,334,926 |
| Total Common Stocks | 252,080,726 | 1,902,076,529 | — | 2,154,157,255 |
| Securities Lending Collateral | 21,620,386 | — | — | 21,620,386 |
| Money Market Funds | 73,754,725 | — | — | 73,754,725 |
| Total Investments in Securities | 347,455,837 | 1,902,076,529 | — | 2,249,532,366 |
The accompanying Notes to Financial Statements are an integral part of this statement.
Columbia Acorn Family of Funds | Semiannual Report 2020
| 31 |
Portfolio of Investments (continued)
Columbia Acorn International®, June 30, 2020 (Unaudited)
Fair value measurements (continued)
| | Level 1 ($) | Level 2 ($) | Level 3 ($) | Total ($) |
| Investments in Derivatives | | | | |
| Asset | | | | |
| Futures Contracts | 1,000,812 | — | — | 1,000,812 |
| Total | 348,456,649 | 1,902,076,529 | — | 2,250,533,178 |
See the Portfolio of Investments for all investment classifications not indicated in the table.
The Fund’s assets assigned to the Level 2 input category are generally valued using a market approach, in which a security’s value is determined through its correlation to prices and information from observable market transactions for similar or identical assets. Foreign equities are generally valued at the last sale price on the foreign exchange or market on which they trade. The Fund may use a statistical fair valuation model, in accordance with the policy adopted by the Board of Trustees, provided by an independent third party to value securities principally traded in foreign markets in order to adjust for possible stale pricing that may occur between the close of the foreign exchanges and the time for valuation. These models take into account available market data including intraday index, ADR, and ETF movements.
Derivative instruments are valued at unrealized appreciation (depreciation).
The accompanying Notes to Financial Statements are an integral part of this statement.
| 32 | Columbia Acorn Family of Funds | Semiannual Report 2020 |
Portfolio of Investments
Columbia Acorn USA®, June 30, 2020 (Unaudited)
(Percentages represent value of investments compared to net assets)
Investments in securities
| Common Stocks 96.6% |
| Issuer | Shares | Value ($) |
| Consumer Discretionary 15.3% |
| Auto Components 1.2% |
| Dorman Products, Inc.(a) | 27,500 | 1,844,425 |
| Visteon Corp.(a) | 21,766 | 1,490,971 |
| Total | | 3,335,396 |
| Diversified Consumer Services 1.1% |
| Grand Canyon Education, Inc.(a) | 33,163 | 3,002,246 |
| Hotels, Restaurants & Leisure 4.5% |
| Choice Hotels International, Inc. | 25,783 | 2,034,279 |
| Churchill Downs, Inc. | 22,182 | 2,953,533 |
| Extended Stay America, Inc. | 180,764 | 2,022,749 |
| Planet Fitness, Inc., Class A(a) | 26,200 | 1,586,934 |
| Red Rock Resorts, Inc., Class A | 117,000 | 1,276,470 |
| Wendy’s Co. (The) | 99,000 | 2,156,220 |
| Total | | 12,030,185 |
| Household Durables 3.3% |
| Helen of Troy Ltd.(a) | 31,102 | 5,864,593 |
| Skyline Champion Corp.(a) | 124,960 | 3,041,526 |
| Total | | 8,906,119 |
| Leisure Products 1.4% |
| Brunswick Corp. | 56,906 | 3,642,553 |
| Specialty Retail 2.7% |
| Boot Barn Holdings, Inc.(a) | 165,890 | 3,576,589 |
| Five Below, Inc.(a) | 17,700 | 1,892,307 |
| Vroom, Inc.(a) | 33,437 | 1,743,405 |
| Total | | 7,212,301 |
| Textiles, Apparel & Luxury Goods 1.1% |
| Carter’s, Inc. | 36,394 | 2,936,996 |
| Total Consumer Discretionary | 41,065,796 |
| Consumer Staples 4.9% |
| Beverages 0.6% |
| Primo Water Corp. | 110,081 | 1,513,614 |
| Food & Staples Retailing 1.5% |
| BJ’s Wholesale Club Holdings, Inc.(a) | 111,401 | 4,151,915 |
| Common Stocks (continued) |
| Issuer | Shares | Value ($) |
| Household Products 1.6% |
| WD-40 Co. | 21,321 | 4,227,954 |
| Personal Products 1.2% |
| Inter Parfums, Inc. | 67,338 | 3,242,325 |
| Total Consumer Staples | 13,135,808 |
| Financials 8.1% |
| Banks 3.6% |
| Bank of NT Butterfield & Son Ltd. (The) | 67,500 | 1,646,325 |
| First Busey Corp. | 81,229 | 1,514,921 |
| Lakeland Financial Corp. | 59,365 | 2,765,815 |
| OFG Bancorp | 135,309 | 1,809,081 |
| Trico Bancshares | 58,053 | 1,767,714 |
| Total | | 9,503,856 |
| Capital Markets 1.9% |
| Hamilton Lane, Inc., Class A | 36,701 | 2,472,547 |
| Houlihan Lokey, Inc. | 49,230 | 2,739,157 |
| Total | | 5,211,704 |
| Consumer Finance 1.0% |
| FirstCash, Inc. | 40,452 | 2,729,701 |
| Thrifts & Mortgage Finance 1.6% |
| Merchants Bancorp | 229,052 | 4,235,171 |
| Total Financials | 21,680,432 |
| Health Care 31.1% |
| Biotechnology 12.8% |
| ACADIA Pharmaceuticals, Inc.(a) | 55,100 | 2,670,697 |
| Acceleron Pharma, Inc.(a) | 34,088 | 3,247,564 |
| Anika Therapeutics, Inc.(a) | 59,000 | 2,226,070 |
| CRISPR Therapeutics AG(a) | 24,042 | 1,766,846 |
| Enanta Pharmaceuticals, Inc.(a) | 34,289 | 1,721,651 |
| Fate Therapeutics, Inc.(a) | 94,809 | 3,252,897 |
| Immunogen, Inc.(a) | 446,000 | 2,051,600 |
| Insmed, Inc.(a) | 144,309 | 3,974,270 |
| Intercept Pharmaceuticals, Inc.(a) | 38,578 | 1,848,272 |
| Kiniksa Pharmaceuticals Ltd., Class A(a) | 196,012 | 4,994,386 |
The accompanying Notes to Financial Statements are an integral part of this statement.
Columbia Acorn Family of Funds | Semiannual Report 2020
| 33 |
Portfolio of Investments (continued)
Columbia Acorn USA®, June 30, 2020 (Unaudited)
| Common Stocks (continued) |
| Issuer | Shares | Value ($) |
| Mirati Therapeutics, Inc.(a) | 17,142 | 1,957,102 |
| Natera, Inc.(a) | 88,698 | 4,422,482 |
| Total | | 34,133,837 |
| Health Care Equipment & Supplies 5.9% |
| Atrion Corp. | 3,603 | 2,295,147 |
| AxoGen, Inc.(a) | 347,285 | 3,208,913 |
| Globus Medical, Inc., Class A(a) | 78,365 | 3,738,794 |
| Haemonetics Corp.(a) | 16,250 | 1,455,350 |
| SI-BONE, Inc.(a) | 214,684 | 3,422,063 |
| Tactile Systems Technology, Inc.(a) | 40,970 | 1,697,387 |
| Total | | 15,817,654 |
| Health Care Providers & Services 7.6% |
| Amedisys, Inc.(a) | 17,162 | 3,407,343 |
| Chemed Corp. | 10,612 | 4,786,755 |
| Corvel Corp.(a) | 40,895 | 2,899,047 |
| LHC Group, Inc.(a) | 20,525 | 3,577,918 |
| National Research Corp., Class A | 95,966 | 5,586,181 |
| Total | | 20,257,244 |
| Health Care Technology 1.4% |
| Livongo Health, Inc.(a),(b) | 51,104 | 3,842,510 |
| Life Sciences Tools & Services 1.7% |
| NanoString Technologies, Inc.(a) | 58,167 | 1,707,202 |
| Repligen Corp.(a) | 23,740 | 2,934,501 |
| Total | | 4,641,703 |
| Pharmaceuticals 1.7% |
| Reata Pharmaceuticals, Inc., Class A(a) | 14,000 | 2,184,280 |
| Theravance Biopharma, Inc.(a) | 105,821 | 2,221,183 |
| Total | | 4,405,463 |
| Total Health Care | 83,098,411 |
| Industrials 15.2% |
| Aerospace & Defense 2.2% |
| BWX Technologies, Inc. | 60,974 | 3,453,567 |
| Curtiss-Wright Corp. | 27,241 | 2,432,077 |
| Total | | 5,885,644 |
| Commercial Services & Supplies 1.3% |
| Healthcare Services Group, Inc. | 49,826 | 1,218,744 |
| Unifirst Corp. | 11,788 | 2,109,462 |
| Total | | 3,328,206 |
| Common Stocks (continued) |
| Issuer | Shares | Value ($) |
| Construction & Engineering 1.4% |
| Comfort Systems U.S.A., Inc. | 92,527 | 3,770,475 |
| Electrical Equipment 1.2% |
| Atkore International Group, Inc.(a) | 120,921 | 3,307,189 |
| Machinery 4.1% |
| ITT, Inc. | 56,948 | 3,345,126 |
| SPX Corp.(a) | 112,475 | 4,628,346 |
| Watts Water Technologies, Inc., Class A | 36,171 | 2,929,851 |
| Total | | 10,903,323 |
| Professional Services 3.2% |
| Exponent, Inc. | 73,090 | 5,915,174 |
| ICF International, Inc. | 39,936 | 2,589,051 |
| Total | | 8,504,225 |
| Road & Rail 1.2% |
| Saia, Inc.(a) | 29,726 | 3,304,937 |
| Trading Companies & Distributors 0.6% |
| SiteOne Landscape Supply, Inc.(a) | 13,443 | 1,532,099 |
| Total Industrials | 40,536,098 |
| Information Technology 17.5% |
| Electronic Equipment, Instruments & Components 2.7% |
| Badger Meter, Inc. | 60,615 | 3,813,896 |
| ePlus, Inc.(a) | 46,331 | 3,274,675 |
| Total | | 7,088,571 |
| IT Services 1.7% |
| Endava PLC, ADR(a) | 35,024 | 1,691,659 |
| LiveRamp Holdings, Inc.(a) | 66,070 | 2,805,993 |
| Total | | 4,497,652 |
| Semiconductors & Semiconductor Equipment 2.4% |
| Advanced Energy Industries, Inc.(a) | 48,186 | 3,266,529 |
| Inphi Corp.(a) | 18,079 | 2,124,282 |
| Onto Innovation, Inc.(a) | 31,679 | 1,078,353 |
| Total | | 6,469,164 |
| Software 10.7% |
| Blackline, Inc.(a) | 48,826 | 4,048,164 |
| CyberArk Software Ltd.(a) | 17,386 | 1,725,908 |
| Elastic NV(a) | 19,023 | 1,754,111 |
| j2 Global, Inc.(a) | 32,059 | 2,026,449 |
The accompanying Notes to Financial Statements are an integral part of this statement.
| 34 | Columbia Acorn Family of Funds | Semiannual Report 2020 |
Portfolio of Investments (continued)
Columbia Acorn USA®, June 30, 2020 (Unaudited)
| Common Stocks (continued) |
| Issuer | Shares | Value ($) |
| Manhattan Associates, Inc.(a) | 56,440 | 5,316,648 |
| Mimecast Ltd.(a) | 97,621 | 4,066,891 |
| New Relic, Inc.(a) | 27,744 | 1,911,562 |
| Q2 Holdings, Inc.(a) | 20,601 | 1,767,360 |
| Qualys, Inc.(a) | 35,114 | 3,652,558 |
| Sprout Social, Inc., Class A(a),(b) | 90,661 | 2,447,847 |
| Total | | 28,717,498 |
| Total Information Technology | 46,772,885 |
| Materials 1.3% |
| Chemicals 1.3% |
| PolyOne Corp. | 130,388 | 3,420,077 |
| Total Materials | 3,420,077 |
| Real Estate 3.2% |
| Equity Real Estate Investment Trusts (REITS) 0.9% |
| UMH Properties, Inc. | 181,001 | 2,340,343 |
| Real Estate Management & Development 2.3% |
| FirstService Corp. | 13,549 | 1,365,062 |
| Jones Lang LaSalle, Inc. | 16,500 | 1,707,090 |
| Redfin Corp.(a) | 78,222 | 3,278,284 |
| Total | | 6,350,436 |
| Total Real Estate | 8,690,779 |
Total Common Stocks
(Cost $219,208,114) | 258,400,286 |
|
| Limited Partnerships 0.6% |
| Issuer | Shares | Value ($) |
| Consumer Discretionary 0.6% |
| Hotels, Restaurants & Leisure 0.6% |
| Cedar Fair LP | 53,301 | 1,465,778 |
| Total Consumer Discretionary | 1,465,778 |
Total Limited Partnerships
(Cost $2,660,232) | 1,465,778 |
|
| Securities Lending Collateral 1.5% |
| | |
| Dreyfus Government Cash Management Fund, Institutional Shares, 0.092%(c),(d) | 4,076,000 | 4,076,000 |
Total Securities Lending Collateral
(Cost $4,076,000) | 4,076,000 |
|
| Money Market Funds 2.1% |
| | Shares | Value ($) |
| Columbia Short-Term Cash Fund, 0.253%(c),(e) | 5,644,495 | 5,644,495 |
Total Money Market Funds
(Cost $5,643,396) | 5,644,495 |
Total Investments in Securities
(Cost: $231,587,742) | 269,586,559 |
| Obligation to Return Collateral for Securities Loaned | | (4,076,000) |
| Other Assets & Liabilities, Net | | 1,895,047 |
| Net Assets | 267,405,606 |
Notes to Portfolio of Investments
| (a) | Non-income producing security. |
| (b) | All or a portion of this security was on loan at June 30, 2020. The total market value of securities on loan at June 30, 2020 was $4,235,177. |
| (c) | The rate shown is the seven-day current annualized yield at June 30, 2020. |
| (d) | Investment made with cash collateral received from securities lending activity. |
| (e) | As defined in the Investment Company Act of 1940, an affiliated company is one in which the Fund owns 5% or more of the company’s outstanding voting securities, or a company which is under common ownership or control with the Fund. The value of the holdings and transactions in these affiliated companies during the period ended June 30, 2020 are as follows: |
| Affiliated issuers | Beginning
of period($) | Purchases($) | Sales($) | Net change in
unrealized
appreciation
(depreciation)($) | End of
period($) | Realized gain
(loss)($) | Dividends($) | End of
period shares |
| Columbia Short-Term Cash Fund, 0.253% |
| | 13,292,093 | 100,315,094 | (107,963,791) | 1,099 | 5,644,495 | (3,097) | 65,450 | 5,644,495 |
Abbreviation Legend
| ADR | American Depositary Receipt |
The accompanying Notes to Financial Statements are an integral part of this statement.
Columbia Acorn Family of Funds | Semiannual Report 2020
| 35 |
Portfolio of Investments (continued)
Columbia Acorn USA®, June 30, 2020 (Unaudited)
Fair value measurements
Various inputs are used in determining the value of the Fund’s investments, following the input prioritization hierarchy established by accounting principles generally accepted in the United States of America (GAAP). These inputs are summarized in the three broad levels listed below:
| ■ | Level 1 – quoted prices in active markets for identical securities |
| ■ | Level 2 – prices determined using other significant observable inputs (including quoted prices for similar securities, interest rates, prepayment speeds, credit risk and others) |
| ■ | Level 3 – prices determined using significant unobservable inputs where quoted prices or observable inputs are unavailable or less reliable (including management’s own assumptions about the factors market participants would use in pricing an investment) |
The inputs or methodology used for valuing securities are not necessarily an indication of the risk associated with investing in those securities.
Examples of the types of securities in which the Fund would typically invest and how they are classified within this hierarchy are as follows. Typical Level 1 securities include exchange traded domestic equities, mutual funds whose net asset values are published each day and exchange traded foreign equities that are not typically statistically fair valued. Typical Level 2 securities include exchange traded foreign equities that are traded in the European region or Asia Pacific region time zones which are typically statistically fair valued, forward foreign currency exchange contracts and short-term investments valued at amortized cost. Additionally, securities fair valued by Columbia Wanger Asset Management’s Valuation Committee (the Committee) that rely on significant observable inputs are also included in Level 2. Typical Level 3 securities include any security fair valued by the Committee that relies on significant unobservable inputs.
The Committee is responsible for applying the Columbia Acorn Trust Portfolio Pricing Policy and the Columbia Wanger Asset Management pricing procedures (the Policies), which are approved by and subject to the oversight of the Board of Trustees.
The Committee meets as necessary, and no less frequently than quarterly, to determine fair values for securities for which market quotations are not readily available or for which Columbia Wanger Asset Management believes that available market quotations are unreliable. The Committee also reviews the continuing appropriateness of the Policies. In circumstances where a security has been fair valued, the Committee will also review the continuing appropriateness of the current value of the security. The Policies address, among other things: circumstances under which market quotations will be deemed readily available; selection of third party pricing vendors; appropriate pricing methodologies; events that require fair valuation and fair value techniques; circumstances under which securities will be deemed to pose a potential for stale pricing, including when securities are illiquid, restricted, or in default; and certain delegations of authority to determine fair values to the Fund’s investment manager. The Committee may also meet to discuss additional valuation matters, which may include review of back-testing results, review of time-sensitive information or approval of other valuation related actions, and to review the appropriateness of the Policies.
The following table is a summary of the inputs used to value the Fund’s investments at June 30, 2020:
| | Level 1 ($) | Level 2 ($) | Level 3 ($) | Total ($) |
| Investments in Securities | | | | |
| Common Stocks | | | | |
| Consumer Discretionary | 41,065,796 | — | — | 41,065,796 |
| Consumer Staples | 13,135,808 | — | — | 13,135,808 |
| Financials | 21,680,432 | — | — | 21,680,432 |
| Health Care | 83,098,411 | — | — | 83,098,411 |
| Industrials | 40,536,098 | — | — | 40,536,098 |
| Information Technology | 46,772,885 | — | — | 46,772,885 |
| Materials | 3,420,077 | — | — | 3,420,077 |
| Real Estate | 8,690,779 | — | — | 8,690,779 |
| Total Common Stocks | 258,400,286 | — | — | 258,400,286 |
| Limited Partnerships | | | | |
| Consumer Discretionary | 1,465,778 | — | — | 1,465,778 |
| Total Limited Partnerships | 1,465,778 | — | — | 1,465,778 |
| Securities Lending Collateral | 4,076,000 | — | — | 4,076,000 |
| Money Market Funds | 5,644,495 | — | — | 5,644,495 |
| Total Investments in Securities | 269,586,559 | — | — | 269,586,559 |
See the Portfolio of Investments for all investment classifications not indicated in the table.
The accompanying Notes to Financial Statements are an integral part of this statement.
| 36 | Columbia Acorn Family of Funds | Semiannual Report 2020 |
Portfolio of Investments
Columbia Acorn International SelectSM, June 30, 2020 (Unaudited)
(Percentages represent value of investments compared to net assets)
Investments in securities
| Common Stocks 99.2% |
| Issuer | Shares | Value ($) |
| Australia 2.5% |
| carsales.com Ltd. | 417,659 | 5,170,125 |
| Brazil 2.0% |
| TOTVS SA | 935,600 | 4,025,862 |
| Canada 4.3% |
| CCL Industries, Inc. | 142,523 | 4,606,592 |
| Winpak Ltd. | 136,000 | 4,166,352 |
| Total | 8,772,944 |
| China 12.9% |
| 51job, Inc., ADR(a) | 67,100 | 4,817,109 |
| A-Living Services Co., Ltd. | 900,000 | 4,573,956 |
| NetEase, Inc., ADR | 15,443 | 6,630,916 |
| New Oriental Education & Technology Group, Inc., ADR(a) | 42,027 | 5,473,176 |
| Shenzhou International Group Holdings Ltd. | 402,000 | 4,887,200 |
| Total | 26,382,357 |
| Denmark 2.5% |
| SimCorp AS | 46,969 | 5,079,808 |
| Germany 5.0% |
| Nemetschek SE | 78,330 | 5,382,231 |
| TeamViewer AG(a) | 86,193 | 4,706,317 |
| Total | 10,088,548 |
| Italy 4.0% |
| Amplifon SpA(a) | 149,000 | 3,980,537 |
| Nexi SpA(a) | 243,016 | 4,214,029 |
| Total | 8,194,566 |
| Japan 18.8% |
| CyberAgent, Inc. | 113,600 | 5,583,856 |
| Hikari Tsushin, Inc. | 26,800 | 6,127,772 |
| Lasertec Corp. | 65,600 | 6,201,206 |
| Nihon Unisys Ltd. | 154,900 | 4,870,247 |
| Obic Co., Ltd. | 28,800 | 5,075,683 |
| Recruit Holdings Co., Ltd. | 164,800 | 5,667,505 |
| Sekisui Chemical Co., Ltd. | 327,500 | 4,692,333 |
| Total | 38,218,602 |
| Common Stocks (continued) |
| Issuer | Shares | Value ($) |
| Netherlands 5.5% |
| IMCD NV | 22,300 | 2,102,877 |
| Koninklijke Philips NV | 196,588 | 9,170,378 |
| Total | 11,273,255 |
| New Zealand 2.5% |
| Fisher & Paykel Healthcare Corp., Ltd. | 217,206 | 5,003,734 |
| South Korea 4.2% |
| Koh Young Technology, Inc. | 52,621 | 4,397,968 |
| Korea Investment Holdings Co., Ltd. | 110,512 | 4,143,221 |
| Total | 8,541,189 |
| Sweden 12.9% |
| Hexagon AB, Class B(a) | 142,177 | 8,349,426 |
| Sectra AB, Class B(a) | 96,500 | 5,498,981 |
| Sweco AB, Class B | 163,205 | 7,367,010 |
| Trelleborg AB, Class B(a) | 343,020 | 5,032,710 |
| Total | 26,248,127 |
| Switzerland 7.0% |
| Belimo Holding AG, Registered Shares | 681 | 5,039,894 |
| Lonza Group AG, Registered Shares(a) | 9,375 | 4,965,916 |
| Partners Group Holding AG | 4,642 | 4,227,436 |
| Total | 14,233,246 |
| Taiwan 2.2% |
| Largan Precision Co., Ltd. | 33,000 | 4,588,321 |
| United Kingdom 12.9% |
| Auto Trader Group PLC | 628,000 | 4,088,756 |
| Dechra Pharmaceuticals PLC | 165,599 | 5,832,853 |
| Halma PLC | 151,426 | 4,314,160 |
| Intermediate Capital Group PLC | 247,319 | 3,945,685 |
| Rentokil Initial PLC | 662,437 | 4,188,703 |
| Rightmove PLC | 577,767 | 3,905,441 |
| Total | 26,275,598 |
Total Common Stocks
(Cost $161,856,881) | 202,096,282 |
|
The accompanying Notes to Financial Statements are an integral part of this statement.
Columbia Acorn Family of Funds | Semiannual Report 2020
| 37 |
Portfolio of Investments (continued)
Columbia Acorn International SelectSM, June 30, 2020 (Unaudited)
| Money Market Funds 0.5% |
| | Shares | Value ($) |
| Columbia Short-Term Cash Fund, 0.253%(b),(c) | 1,030,634 | 1,030,634 |
Total Money Market Funds
(Cost $1,030,158) | 1,030,634 |
Total Investments in Securities
(Cost $162,887,039) | 203,126,916 |
| Other Assets & Liabilities, Net | | 569,390 |
| Net Assets | $203,696,306 |
Notes to Portfolio of Investments
| (a) | Non-income producing security. |
| (b) | The rate shown is the seven-day current annualized yield at June 30, 2020. |
| (c) | As defined in the Investment Company Act of 1940, an affiliated company is one in which the Fund owns 5% or more of the company’s outstanding voting securities, or a company which is under common ownership or control with the Fund. The value of the holdings and transactions in these affiliated companies during the period ended June 30, 2020 are as follows: |
| Affiliated issuers | Beginning
of period($) | Purchases($) | Sales($) | Net change in
unrealized
appreciation
(depreciation)($) | End of
period($) | Realized gain
(loss)($) | Dividends($) | End of
period shares |
| Columbia Short-Term Cash Fund, 0.253% |
| | 1,151,541 | 64,595,677 | (64,717,060) | 476 | 1,030,634 | (3,154) | 29,441 | 1,030,634 |
Abbreviation Legend
| ADR | American Depositary Receipt |
Fair value measurements
Various inputs are used in determining the value of the Fund’s investments, following the input prioritization hierarchy established by accounting principles generally accepted in the United States of America (GAAP). These inputs are summarized in the three broad levels listed below:
| ■ | Level 1 – quoted prices in active markets for identical securities |
| ■ | Level 2 – prices determined using other significant observable inputs (including quoted prices for similar securities, interest rates, prepayment speeds, credit risk and others) |
| ■ | Level 3 – prices determined using significant unobservable inputs where quoted prices or observable inputs are unavailable or less reliable (including management’s own assumptions about the factors market participants would use in pricing an investment) |
The inputs or methodology used for valuing securities are not necessarily an indication of the risk associated with investing in those securities.
Examples of the types of securities in which the Fund would typically invest and how they are classified within this hierarchy are as follows. Typical Level 1 securities include exchange traded domestic equities, mutual funds whose net asset values are published each day and exchange traded foreign equities that are not typically statistically fair valued. Typical Level 2 securities include exchange traded foreign equities that are traded in the European region or Asia Pacific region time zones which are typically statistically fair valued, forward foreign currency exchange contracts and short-term investments valued at amortized cost. Additionally, securities fair valued by Columbia Wanger Asset Management’s Valuation Committee (the Committee) that rely on significant observable inputs are also included in Level 2. Typical Level 3 securities include any security fair valued by the Committee that relies on significant unobservable inputs.
The Committee is responsible for applying the Columbia Acorn Trust Portfolio Pricing Policy and the Columbia Wanger Asset Management pricing procedures (the Policies), which are approved by and subject to the oversight of the Board of Trustees.
The Committee meets as necessary, and no less frequently than quarterly, to determine fair values for securities for which market quotations are not readily available or for which Columbia Wanger Asset Management believes that available market quotations are unreliable. The Committee also reviews the continuing appropriateness of the Policies. In circumstances where a security has been fair valued, the Committee will also review the continuing appropriateness of the current value of the security. The Policies address, among other things: circumstances under which market quotations will be deemed readily available; selection of third party pricing vendors; appropriate pricing methodologies; events that require fair valuation and fair value techniques; circumstances under which securities will be deemed to pose a potential for stale pricing, including when securities are illiquid, restricted, or in default; and certain delegations of authority to determine fair values to the Fund’s investment manager. The Committee may also meet to discuss additional valuation matters, which may include review of back-testing results, review of time-sensitive information or approval of other valuation related actions, and to review the appropriateness of the Policies.
The accompanying Notes to Financial Statements are an integral part of this statement.
| 38 | Columbia Acorn Family of Funds | Semiannual Report 2020 |
Portfolio of Investments (continued)
Columbia Acorn International SelectSM, June 30, 2020 (Unaudited)
Fair value measurements (continued)
The following table is a summary of the inputs used to value the Fund’s investments at June 30, 2020:
| | Level 1 ($) | Level 2 ($) | Level 3 ($) | Total ($) |
| Investments in Securities | | | | |
| Common Stocks | | | | |
| Australia | — | 5,170,125 | — | 5,170,125 |
| Brazil | 4,025,862 | — | — | 4,025,862 |
| Canada | 8,772,944 | — | — | 8,772,944 |
| China | 16,921,201 | 9,461,156 | — | 26,382,357 |
| Denmark | — | 5,079,808 | — | 5,079,808 |
| Germany | — | 10,088,548 | — | 10,088,548 |
| Italy | — | 8,194,566 | — | 8,194,566 |
| Japan | — | 38,218,602 | — | 38,218,602 |
| Netherlands | — | 11,273,255 | — | 11,273,255 |
| New Zealand | — | 5,003,734 | — | 5,003,734 |
| South Korea | — | 8,541,189 | — | 8,541,189 |
| Sweden | — | 26,248,127 | — | 26,248,127 |
| Switzerland | — | 14,233,246 | — | 14,233,246 |
| Taiwan | — | 4,588,321 | — | 4,588,321 |
| United Kingdom | — | 26,275,598 | — | 26,275,598 |
| Total Common Stocks | 29,720,007 | 172,376,275 | — | 202,096,282 |
| Money Market Funds | 1,030,634 | — | — | 1,030,634 |
| Total Investments in Securities | 30,750,641 | 172,376,275 | — | 203,126,916 |
See the Portfolio of Investments for all investment classifications not indicated in the table.
The Fund’s assets assigned to the Level 2 input category are generally valued using a market approach, in which a security’s value is determined through its correlation to prices and information from observable market transactions for similar or identical assets. Foreign equities are generally valued at the last sale price on the foreign exchange or market on which they trade. The Fund may use a statistical fair valuation model, in accordance with the policy adopted by the Board of Trustees, provided by an independent third party to value securities principally traded in foreign markets in order to adjust for possible stale pricing that may occur between the close of the foreign exchanges and the time for valuation. These models take into account available market data including intraday index, ADR, and ETF movements.
The accompanying Notes to Financial Statements are an integral part of this statement.
Columbia Acorn Family of Funds | Semiannual Report 2020
| 39 |
Portfolio of Investments
Columbia Acorn SelectSM, June 30, 2020 (Unaudited)
(Percentages represent value of investments compared to net assets)
Investments in securities
| Common Stocks 97.0% |
| Issuer | Shares | Value ($) |
| Communication Services 3.1% |
| Entertainment 3.1% |
| Zynga, Inc., Class A(a) | 700,599 | 6,683,714 |
| Total Communication Services | 6,683,714 |
| Consumer Discretionary 11.2% |
| Diversified Consumer Services 2.3% |
| Bright Horizons Family Solutions, Inc.(a) | 18,000 | 2,109,600 |
| Chegg, Inc.(a) | 43,100 | 2,898,906 |
| Total | | 5,008,506 |
| Household Durables 2.4% |
| Skyline Champion Corp.(a) | 218,500 | 5,318,290 |
| Specialty Retail 6.5% |
| Boot Barn Holdings, Inc.(a) | 224,200 | 4,833,752 |
| Five Below, Inc.(a) | 87,086 | 9,310,364 |
| Total | | 14,144,116 |
| Total Consumer Discretionary | 24,470,912 |
| Consumer Staples 1.1% |
| Household Products 1.1% |
| WD-40 Co. | 12,250 | 2,429,175 |
| Total Consumer Staples | 2,429,175 |
| Financials 8.8% |
| Banks 4.4% |
| SVB Financial Group(a) | 44,891 | 9,675,357 |
| Capital Markets 4.4% |
| Ares Management Corp., Class A | 238,455 | 9,466,664 |
| Total Financials | 19,142,021 |
| Health Care 27.1% |
| Biotechnology 8.8% |
| ACADIA Pharmaceuticals, Inc.(a) | 68,608 | 3,325,430 |
| CRISPR Therapeutics AG(a) | 37,250 | 2,737,502 |
| Exact Sciences Corp.(a) | 60,700 | 5,277,258 |
| Immunomedics, Inc.(a) | 89,639 | 3,176,806 |
| Insmed, Inc.(a) | 69,000 | 1,900,260 |
| Sarepta Therapeutics, Inc.(a) | 17,600 | 2,821,984 |
| Total | | 19,239,240 |
| Common Stocks (continued) |
| Issuer | Shares | Value ($) |
| Health Care Equipment & Supplies 6.3% |
| Masimo Corp.(a) | 39,848 | 9,084,946 |
| Tactile Systems Technology, Inc.(a) | 111,559 | 4,621,889 |
| Total | | 13,706,835 |
| Health Care Providers & Services 7.5% |
| Chemed Corp. | 18,858 | 8,506,278 |
| Encompass Health Corp. | 125,920 | 7,798,226 |
| Total | | 16,304,504 |
| Life Sciences Tools & Services 3.2% |
| Pra Health Sciences, Inc.(a) | 71,101 | 6,917,416 |
| Pharmaceuticals 1.3% |
| Theravance Biopharma, Inc.(a) | 135,809 | 2,850,631 |
| Total Health Care | 59,018,626 |
| Industrials 14.1% |
| Aerospace & Defense 1.0% |
| BWX Technologies, Inc. | 38,700 | 2,191,968 |
| Electrical Equipment 3.3% |
| Atkore International Group, Inc.(a) | 266,588 | 7,291,182 |
| Machinery 9.8% |
| IDEX Corp. | 37,000 | 5,847,480 |
| ITT, Inc. | 88,441 | 5,195,024 |
| SPX Corp.(a) | 204,079 | 8,397,851 |
| Toro Co. (The) | 27,000 | 1,791,180 |
| Total | | 21,231,535 |
| Total Industrials | 30,714,685 |
| Information Technology 28.3% |
| IT Services 9.6% |
| Booz Allen Hamilton Holdings Corp. | 30,800 | 2,395,932 |
| EPAM Systems, Inc.(a) | 13,000 | 3,276,130 |
| Gartner, Inc.(a) | 39,963 | 4,848,711 |
| GoDaddy, Inc., Class A(a) | 121,027 | 8,874,910 |
| VeriSign, Inc.(a) | 7,000 | 1,447,810 |
| Total | | 20,843,493 |
| Semiconductors & Semiconductor Equipment 3.9% |
| MKS Instruments, Inc. | 74,953 | 8,487,678 |
The accompanying Notes to Financial Statements are an integral part of this statement.
| 40 | Columbia Acorn Family of Funds | Semiannual Report 2020 |
Portfolio of Investments (continued)
Columbia Acorn SelectSM, June 30, 2020 (Unaudited)
| Common Stocks (continued) |
| Issuer | Shares | Value ($) |
| Software 14.8% |
| Alteryx, Inc., Class A(a) | 59,995 | 9,855,979 |
| Cadence Design Systems, Inc.(a) | 56,871 | 5,457,341 |
| j2 Global, Inc.(a) | 43,172 | 2,728,902 |
| Mimecast Ltd.(a) | 203,100 | 8,461,146 |
| Qualys, Inc.(a) | 54,163 | 5,634,035 |
| Total | | 32,137,403 |
| Total Information Technology | 61,468,574 |
| Real Estate 3.3% |
| Equity Real Estate Investment Trusts (REITS) 3.3% |
| UMH Properties, Inc. | 554,056 | 7,163,944 |
| Total Real Estate | 7,163,944 |
Total Common Stocks
(Cost $166,663,210) | 211,091,651 |
|
| Money Market Funds 2.7% |
| | Shares | Value ($) |
| Columbia Short-Term Cash Fund, 0.253%(b),(c) | 5,884,494 | 5,884,494 |
Total Money Market Funds
(Cost $5,882,397) | 5,884,494 |
Total Investments in Securities
(Cost: $172,545,607) | 216,976,145 |
| Other Assets & Liabilities, Net | | 656,500 |
| Net Assets | 217,632,645 |
Notes to Portfolio of Investments
| (a) | Non-income producing security. |
| (b) | The rate shown is the seven-day current annualized yield at June 30, 2020. |
| (c) | As defined in the Investment Company Act of 1940, an affiliated company is one in which the Fund owns 5% or more of the company’s outstanding voting securities, or a company which is under common ownership or control with the Fund. The value of the holdings and transactions in these affiliated companies during the period ended June 30, 2020 are as follows: |
| Affiliated issuers | Beginning
of period($) | Purchases($) | Sales($) | Net change in
unrealized
appreciation
(depreciation)($) | End of
period($) | Realized gain
(loss)($) | Dividends($) | End of
period shares |
| Columbia Short-Term Cash Fund, 0.253% |
| | 745,845 | 143,297,420 | (138,160,868) | 2,097 | 5,884,494 | (9,350) | 36,963 | 5,884,494 |
Fair value measurements
Various inputs are used in determining the value of the Fund’s investments, following the input prioritization hierarchy established by accounting principles generally accepted in the United States of America (GAAP). These inputs are summarized in the three broad levels listed below:
| ■ | Level 1 – quoted prices in active markets for identical securities |
| ■ | Level 2 – prices determined using other significant observable inputs (including quoted prices for similar securities, interest rates, prepayment speeds, credit risk and others) |
| ■ | Level 3 – prices determined using significant unobservable inputs where quoted prices or observable inputs are unavailable or less reliable (including management’s own assumptions about the factors market participants would use in pricing an investment) |
The inputs or methodology used for valuing securities are not necessarily an indication of the risk associated with investing in those securities.
Examples of the types of securities in which the Fund would typically invest and how they are classified within this hierarchy are as follows. Typical Level 1 securities include exchange traded domestic equities, mutual funds whose net asset values are published each day and exchange traded foreign equities that are not typically statistically fair valued. Typical Level 2 securities include exchange traded foreign equities that are traded in the European region or Asia Pacific region time zones which are typically statistically fair valued, forward foreign currency exchange contracts and short-term investments valued at amortized cost. Additionally, securities fair valued by Columbia Wanger Asset Management’s Valuation Committee (the Committee) that rely on significant observable inputs are also included in Level 2. Typical Level 3 securities include any security fair valued by the Committee that relies on significant unobservable inputs.
The Committee is responsible for applying the Columbia Acorn Trust Portfolio Pricing Policy and the Columbia Wanger Asset Management pricing procedures (the Policies), which are approved by and subject to the oversight of the Board of Trustees.
The Committee meets as necessary, and no less frequently than quarterly, to determine fair values for securities for which market quotations are not readily available or for which Columbia Wanger Asset Management believes that available market quotations are unreliable. The Committee also reviews the continuing appropriateness of the Policies. In circumstances where a security has been fair valued, the Committee will also review the continuing appropriateness of the current value of the security. The Policies address, among
The accompanying Notes to Financial Statements are an integral part of this statement.
Columbia Acorn Family of Funds | Semiannual Report 2020
| 41 |
Portfolio of Investments (continued)
Columbia Acorn SelectSM, June 30, 2020 (Unaudited)
Fair value measurements (continued)
other things: circumstances under which market quotations will be deemed readily available; selection of third party pricing vendors; appropriate pricing methodologies; events that require fair valuation and fair value techniques; circumstances under which securities will be deemed to pose a potential for stale pricing, including when securities are illiquid, restricted, or in default; and certain delegations of authority to determine fair values to the Fund’s investment manager. The Committee may also meet to discuss additional valuation matters, which may include review of back-testing results, review of time-sensitive information or approval of other valuation related actions, and to review the appropriateness of the Policies.
The following table is a summary of the inputs used to value the Fund’s investments at June 30, 2020:
| | Level 1 ($) | Level 2 ($) | Level 3 ($) | Total ($) |
| Investments in Securities | | | | |
| Common Stocks | | | | |
| Communication Services | 6,683,714 | — | — | 6,683,714 |
| Consumer Discretionary | 24,470,912 | — | — | 24,470,912 |
| Consumer Staples | 2,429,175 | — | — | 2,429,175 |
| Financials | 19,142,021 | — | — | 19,142,021 |
| Health Care | 59,018,626 | — | — | 59,018,626 |
| Industrials | 30,714,685 | — | — | 30,714,685 |
| Information Technology | 61,468,574 | — | — | 61,468,574 |
| Real Estate | 7,163,944 | — | — | 7,163,944 |
| Total Common Stocks | 211,091,651 | — | — | 211,091,651 |
| Money Market Funds | 5,884,494 | — | — | 5,884,494 |
| Total Investments in Securities | 216,976,145 | — | — | 216,976,145 |
See the Portfolio of Investments for all investment classifications not indicated in the table.
The accompanying Notes to Financial Statements are an integral part of this statement.
| 42 | Columbia Acorn Family of Funds | Semiannual Report 2020 |
Portfolio of Investments
Columbia Thermostat FundSM, June 30, 2020 (Unaudited)
(Percentages represent value of investments compared to net assets)
Investments in securities
| Equity Funds 44.7% |
| | Shares | Value ($) |
| Dividend Income 4.9% |
| Columbia Dividend Income Fund, Institutional 3 Class(a) | 2,478,244 | 55,686,137 |
| International Small Mid Cap 4.9% |
| Columbia Acorn International®, Institutional 3 Class(a) | 1,829,312 | 54,915,960 |
| U.S. Large Cap 24.9% |
| Columbia Contrarian Core Fund, Institutional 3 Class(a) | 2,061,492 | 55,763,369 |
| Columbia Large Cap Enhanced Core Fund, Institutional 3 Class(a) | 2,453,303 | 55,935,311 |
| Columbia Large Cap Index Fund, Institutional 3 Class(a) | 3,538,582 | 167,551,839 |
| Total | 279,250,519 |
| U.S. Mid Cap 5.0% |
| Columbia Select Mid Cap Value Fund, Institutional 3 Class(a) | 6,451,476 | 55,998,810 |
| U.S. Small Mid Cap 5.0% |
| Columbia Acorn® Fund, Institutional 3 Class(a),(b) | 3,635,092 | 55,762,305 |
Total Equity Funds
(Cost $439,218,123) | 501,613,731 |
|
| Exchange-Traded Equity Funds 5.0% |
| | |
| U.S. Large Cap 5.0% |
| Columbia Research Enhanced Core ETF(a) | 2,687,103 | 55,705,795 |
Total Exchange-Traded Equity Funds
(Cost $51,410,098) | 55,705,795 |
|
| Exchange-Traded Fixed Income Funds 4.9% |
| | Shares | Value ($) |
| Multisector 4.9% |
| Columbia Diversified Fixed Income Allocation ETF(a) | 2,585,022 | 54,595,665 |
Total Exchange-Traded Fixed Income Funds
(Cost $51,453,254) | 54,595,665 |
|
| Fixed Income Funds 44.2% |
| | |
| Investment Grade 44.2% |
| Columbia Corporate Income Fund, Institutional 3 Class(a) | 4,906,302 | 54,901,519 |
| Columbia Quality Income Fund, Institutional 3 Class(a) | 19,611,603 | 110,217,211 |
| Columbia Short Term Bond Fund, Institutional 3 Class(a) | 8,349,245 | 82,574,034 |
| Columbia Total Return Bond Fund, Institutional 3 Class(a) | 5,682,819 | 55,066,517 |
| Columbia U.S. Treasury Index Fund, Institutional 3 Class(a) | 15,673,170 | 193,093,455 |
| Total | 495,852,736 |
Total Fixed Income Funds
(Cost $477,814,889) | 495,852,736 |
|
| Money Market Funds 0.5% |
| | |
| Columbia Short-Term Cash Fund, 0.253%(a),(c) | 5,296,621 | 5,296,621 |
Total Money Market Funds
(Cost $5,296,618) | 5,296,621 |
Total Investments in Securities
(Cost: $1,025,192,982) | 1,113,064,548 |
| Other Assets & Liabilities, Net | | 7,362,611 |
| Net Assets | 1,120,427,159 |
Notes to Portfolio of Investments
| (a) | As defined in the Investment Company Act of 1940, an affiliated company is one in which the Fund owns 5% or more of the company’s outstanding voting securities, or a company which is under common ownership or control with the Fund. The value of the holdings and transactions in these affiliated companies during the period ended June 30, 2020 are as follows: |
| Affiliated issuers | Beginning
of period($) | Purchases($) | Sales($) | Net change in
unrealized
appreciation
(depreciation)($) | End of
period($) | Capital gain
distributions($) | Realized gain
(loss)($) | Dividends —
affiliated
issuers ($) | End of
period shares |
| Columbia Acorn International®, Institutional 3 Class |
| | 14,336,928 | 66,727,668 | (32,216,193) | 6,067,557 | 54,915,960 | 2,248,667 | 1,124,582 | 328,362 | 1,829,312 |
| Columbia Acorn SelectSM, Institutional 3 Class |
| | 14,215,080 | 44,681,686 | (57,267,750) | (1,629,016) | — | 1,414,804 | 10,745,116 | 322,525 | — |
The accompanying Notes to Financial Statements are an integral part of this statement.
Columbia Acorn Family of Funds | Semiannual Report 2020
| 43 |
Portfolio of Investments (continued)
Columbia Thermostat FundSM, June 30, 2020 (Unaudited)
Notes to Portfolio of Investments (continued)
| Affiliated issuers | Beginning
of period($) | Purchases($) | Sales($) | Net change in
unrealized
appreciation
(depreciation)($) | End of
period($) | Capital gain
distributions($) | Realized gain
(loss)($) | Dividends —
affiliated
issuers ($) | End of
period shares |
| Columbia Acorn® Fund, Institutional 3 Class |
| | 14,254,256 | 66,091,556 | (32,270,245) | 7,686,738 | 55,762,305 | 2,288,169 | 2,658,707 | — | 3,635,092 |
| Columbia Contrarian Core Fund, Institutional 3 Class |
| | 14,273,333 | 65,762,439 | (30,211,479) | 5,939,076 | 55,763,369 | — | 3,893,355 | — | 2,061,492 |
| Columbia Corporate Income Fund, Institutional 3 Class |
| | 57,276,785 | 51,812,473 | (54,636,521) | 448,782 | 54,901,519 | — | (994,680) | 741,080 | 4,906,302 |
| Columbia Diversified Fixed Income Allocation ETF |
| | 57,229,227 | 51,026,410 | (53,885,293) | 225,321 | 54,595,665 | — | (2,879,267) | 621,759 | 2,585,022 |
| Columbia Dividend Income Fund, Institutional 3 Class |
| | 14,264,391 | 69,615,172 | (31,497,062) | 3,303,636 | 55,686,137 | — | 2,668,584 | 568,603 | 2,478,244 |
| Columbia Inflation Protected Securities Fund |
| | 57,184,897 | 9,333,718 | (64,547,102) | (1,971,513) | - | — | 1,550,026 | — | — |
| Columbia Large Cap Enhanced Core Fund, Institutional 3 Class |
| | 14,253,804 | 69,955,427 | (30,710,809) | 2,436,889 | 55,935,311 | 3,678,357 | 3,446,430 | 143,127 | 2,453,303 |
| Columbia Large Cap Index Fund, Institutional 3 Class |
| | 57,074,167 | 252,388,584 | (155,409,624) | 13,498,712 | 167,551,839 | 5,654,689 | 13,800,420 | 507,791 | 3,538,582 |
| Columbia Quality Income Fund, Institutional 3 Class |
| | 114,706,732 | 107,005,223 | (113,264,781) | 1,770,037 | 110,217,211 | — | 2,349,289 | 1,376,466 | 19,611,603 |
| Columbia Research Enhanced Core ETF |
| | — | 79,963,887 | (28,553,789) | 4,295,697 | 55,705,795 | — | 391,836 | — | 2,687,103 |
| Columbia Select Mid Cap Value Fund, Institutional 3 Class |
| | — | 56,667,324 | — | (668,514) | 55,998,810 | 1,587,312 | — | 171,643 | 6,451,476 |
| Columbia Short Term Bond Fund, Institutional 3 Class |
| | 86,093,014 | 80,991,396 | (86,247,330) | 1,736,954 | 82,574,034 | — | (1,859,247) | 1,152,043 | 8,349,245 |
| Columbia Short-Term Cash Fund, 0.253% |
| | 6,263,184 | 205,724,630 | (206,691,196) | 3 | 5,296,621 | — | 3,341 | 34,771 | 5,296,621 |
| Columbia Total Return Bond Fund, Institutional 3 Class |
| | — | 66,538,053 | (13,997,837) | 2,526,301 | 55,066,517 | — | 719,525 | 306,342 | 5,682,819 |
| Columbia U.S. Treasury Index Fund, Institutional 3 Class |
| | 200,147,836 | 192,135,782 | (197,601,762) | (1,588,401) | 193,093,455 | — | 16,080,412 | 1,590,214 | 15,673,170 |
| Total | 721,573,634 | | | 44,078,259 | 1,113,064,548 | 16,871,998 | 53,698,429 | 7,864,726 | |
| (b) | Non-income producing security. |
| (c) | The rate shown is the seven-day current annualized yield at June 30, 2020. |
Fair value measurements
Various inputs are used in determining the value of the Fund’s investments, following the input prioritization hierarchy established by accounting principles generally accepted in the United States of America (GAAP). These inputs are summarized in the three broad levels listed below:
| ■ | Level 1 – quoted prices in active markets for identical securities |
| ■ | Level 2 – prices determined using other significant observable inputs (including quoted prices for similar securities, interest rates, prepayment speeds, credit risk and others) |
| ■ | Level 3 – prices determined using significant unobservable inputs where quoted prices or observable inputs are unavailable or less reliable (including management’s own assumptions about the factors market participants would use in pricing an investment) |
The inputs or methodology used for valuing securities are not necessarily an indication of the risk associated with investing in those securities.
Examples of the types of securities in which the Fund would typically invest and how they are classified within this hierarchy are as follows. Typical Level 1 securities include mutual funds whose net asset values are published each day.
The accompanying Notes to Financial Statements are an integral part of this statement.
| 44 | Columbia Acorn Family of Funds | Semiannual Report 2020 |
Portfolio of Investments (continued)
Columbia Thermostat FundSM, June 30, 2020 (Unaudited)
Fair value measurements (continued)
The Committee is responsible for applying the Columbia Acorn Trust Portfolio Pricing Policy and the Columbia Wanger Asset Management pricing procedures (the Policies), which are approved by and subject to the oversight of the Board of Trustees.
The Committee meets as necessary, and no less frequently than quarterly, to determine fair values for securities for which market quotations are not readily available or for which Columbia Wanger Asset Management believes that available market quotations are unreliable. The Committee also reviews the continuing appropriateness of the Policies. In circumstances where a security has been fair valued, the Committee will also review the continuing appropriateness of the current value of the security. The Policies address, among other things: circumstances under which market quotations will be deemed readily available; selection of third party pricing vendors; appropriate pricing methodologies; events that require fair valuation and fair value techniques; circumstances under which securities will be deemed to pose a potential for stale pricing, including when securities are illiquid, restricted, or in default; and certain delegations of authority to determine fair values to the Fund’s investment manager. The Committee may also meet to discuss additional valuation matters, which may include review of back-testing results, review of time-sensitive information or approval of other valuation related actions, and to review the appropriateness of the Policies.
The following table is a summary of the inputs used to value the Fund’s investments at June 30, 2020:
| | Level 1 ($) | Level 2 ($) | Level 3 ($) | Total ($) |
| Investments in Securities | | | | |
| Equity Funds | 501,613,731 | — | — | 501,613,731 |
| Exchange-Traded Equity Funds | 55,705,795 | — | — | 55,705,795 |
| Exchange-Traded Fixed Income Funds | 54,595,665 | — | — | 54,595,665 |
| Fixed Income Funds | 495,852,736 | — | — | 495,852,736 |
| Money Market Funds | 5,296,621 | — | — | 5,296,621 |
| Total Investments in Securities | 1,113,064,548 | — | — | 1,113,064,548 |
See the Portfolio of Investments for all investment classifications not indicated in the table.
The accompanying Notes to Financial Statements are an integral part of this statement.
Columbia Acorn Family of Funds | Semiannual Report 2020
| 45 |
Portfolio of Investments
Columbia Acorn Emerging Markets FundSM, June 30, 2020 (Unaudited)
(Percentages represent value of investments compared to net assets)
Investments in securities
| Common Stocks 89.5% |
| Issuer | Shares | Value ($) |
| Cambodia 4.2% |
| NagaCorp Ltd. | 1,135,000 | 1,324,034 |
| Canada 4.1% |
| Parex Resources, Inc.(a) | 109,373 | 1,318,019 |
| China 20.2% |
| 51job, Inc., ADR(a) | 18,426 | 1,322,803 |
| A-Living Services Co., Ltd. | 239,000 | 1,214,639 |
| China Medical System Holdings Ltd. | 263,000 | 311,026 |
| Minth Group Ltd. | 169,000 | 485,115 |
| NetEase, Inc., ADR | 1,265 | 543,166 |
| New Oriental Education & Technology Group, Inc., ADR(a) | 9,820 | 1,278,859 |
| Shenzhou International Group Holdings Ltd. | 105,500 | 1,282,586 |
| Total | 6,438,194 |
| Cyprus 1.9% |
| TCS Group Holding PLC, GDR | 30,000 | 590,651 |
| Hong Kong 9.4% |
| ASM Pacific Technology Ltd. | 122,200 | 1,291,408 |
| Stella International Holdings Ltd. | 426,500 | 437,423 |
| Vitasoy International Holdings Ltd. | 332,000 | 1,276,111 |
| Total | 3,004,942 |
| Indonesia 0.7% |
| PT Tower Bersama Infrastructure Tbk | 3,080,500 | 239,854 |
| Mexico 7.1% |
| Corporación Inmobiliaria Vesta SAB de CV | 862,100 | 1,286,895 |
| Qualitas Controladora SAB de CV | 250,321 | 984,534 |
| Total | 2,271,429 |
| Russian Federation 1.6% |
| TCS Group Holding PLC, GDR | 25,875 | 525,262 |
| South Korea 9.4% |
| KEPCO Plant Service & Engineering Co., Ltd. | 33,784 | 820,562 |
| Koh Young Technology, Inc. | 16,022 | 1,339,090 |
| Korea Investment Holdings Co., Ltd. | 22,347 | 837,815 |
| Total | 2,997,467 |
| Common Stocks (continued) |
| Issuer | Shares | Value ($) |
| Taiwan 22.5% |
| Chailease Holding Co., Ltd. | 92,996 | 396,456 |
| Grape King Bio Ltd. | 143,000 | 923,524 |
| Largan Precision Co., Ltd. | 9,000 | 1,251,360 |
| Parade Technologies Ltd. | 36,000 | 1,206,648 |
| Silergy Corp. | 15,000 | 982,624 |
| Sinbon Electronics Co., Ltd. | 206,000 | 1,047,819 |
| Voltronic Power Technology Corp. | 46,850 | 1,349,990 |
| Total | 7,158,421 |
| Thailand 8.4% |
| Bangkok Chain Hospital PCL, Foreign Registered Shares | 1,360,500 | 662,980 |
| Mega Lifesciences PCL, Foreign Registered Shares | 569,400 | 692,744 |
| Muangthai Capital PCL, Foreign Registered Shares | 776,500 | 1,318,949 |
| Total | 2,674,673 |
Total Common Stocks
(Cost $22,381,001) | 28,542,946 |
|
| Money Market Funds 8.9% |
| | Shares | Value ($) |
| Columbia Short-Term Cash Fund, 0.253%(b),(c) | 2,833,522 | 2,833,522 |
Total Money Market Funds
(Cost $2,833,754) | 2,833,522 |
Total Investments in Securities
(Cost $25,214,755) | 31,376,468 |
| Other Assets & Liabilities, Net | | 498,157 |
| Net Assets | $31,874,625 |
At June 30, 2020, securities and/or cash totaling $217,300 were pledged as collateral.
The accompanying Notes to Financial Statements are an integral part of this statement.
| 46 | Columbia Acorn Family of Funds | Semiannual Report 2020 |
Portfolio of Investments (continued)
Columbia Acorn Emerging Markets FundSM, June 30, 2020 (Unaudited)
Investments in derivatives
| Long futures contracts |
| Description | Number of
contracts | Expiration
date | Trading
currency | Notional
amount | Value/Unrealized
appreciation ($) | Value/Unrealized
depreciation ($) |
| MSCI Emerging Markets Index | 41 | 09/2020 | USD | 2,020,685 | 26,833 | — |
Notes to Portfolio of Investments
| (a) | Non-income producing security. |
| (b) | The rate shown is the seven-day current annualized yield at June 30, 2020. |
| (c) | As defined in the Investment Company Act of 1940, an affiliated company is one in which the Fund owns 5% or more of the company’s outstanding voting securities, or a company which is under common ownership or control with the Fund. The value of the holdings and transactions in these affiliated companies during the period ended June 30, 2020 are as follows: |
| Affiliated issuers | Beginning
of period($) | Purchases($) | Sales($) | Net change in
unrealized
appreciation
(depreciation)($) | End of
period($) | Realized gain
(loss)($) | Dividends($) | End of
period shares |
| Columbia Short-Term Cash Fund, 0.253% |
| | 1,956,005 | 12,550,920 | (11,673,171) | (232) | 2,833,522 | (687) | 10,936 | 2,833,522 |
Abbreviation Legend
| ADR | American Depositary Receipt |
| GDR | Global Depositary Receipt |
Currency Legend
Fair value measurements
Various inputs are used in determining the value of the Fund’s investments, following the input prioritization hierarchy established by accounting principles generally accepted in the United States of America (GAAP). These inputs are summarized in the three broad levels listed below:
| ■ | Level 1 – quoted prices in active markets for identical securities |
| ■ | Level 2 – prices determined using other significant observable inputs (including quoted prices for similar securities, interest rates, prepayment speeds, credit risk and others) |
| ■ | Level 3 – prices determined using significant unobservable inputs where quoted prices or observable inputs are unavailable or less reliable (including management’s own assumptions about the factors market participants would use in pricing an investment) |
The inputs or methodology used for valuing securities are not necessarily an indication of the risk associated with investing in those securities.
Examples of the types of securities in which the Fund would typically invest and how they are classified within this hierarchy are as follows. Typical Level 1 securities include exchange traded domestic equities, mutual funds whose net asset values are published each day and exchange traded foreign equities that are not typically statistically fair valued. Typical Level 2 securities include exchange traded foreign equities that are traded in the European region or Asia Pacific region time zones which are typically statistically fair valued, forward foreign currency exchange contracts and short-term investments valued at amortized cost. Additionally, securities fair valued by Columbia Wanger Asset Management’s Valuation Committee (the Committee) that rely on significant observable inputs are also included in Level 2. Typical Level 3 securities include any security fair valued by the Committee that relies on significant unobservable inputs.
The Committee is responsible for applying the Columbia Acorn Trust Portfolio Pricing Policy and the Columbia Wanger Asset Management pricing procedures (the Policies), which are approved by and subject to the oversight of the Board of Trustees.
The Committee meets as necessary, and no less frequently than quarterly, to determine fair values for securities for which market quotations are not readily available or for which Columbia Wanger Asset Management believes that available market quotations are unreliable. The Committee also reviews the continuing appropriateness of the Policies. In circumstances where a security has been fair valued, the Committee will also review the continuing appropriateness of the current value of the security. The Policies address, among other things: circumstances under which market quotations will be deemed readily available; selection of third party pricing vendors; appropriate pricing methodologies; events that require fair valuation and fair value techniques; circumstances under which securities will be deemed to pose a potential for stale pricing, including when securities are illiquid, restricted, or in default; and certain delegations of authority to determine fair values to the Fund’s investment manager. The Committee may also meet to discuss additional valuation matters, which may include review of back-testing results, review of time-sensitive information or approval of other valuation related actions, and to review the appropriateness of the Policies.
The accompanying Notes to Financial Statements are an integral part of this statement.
Columbia Acorn Family of Funds | Semiannual Report 2020
| 47 |
Portfolio of Investments (continued)
Columbia Acorn Emerging Markets FundSM, June 30, 2020 (Unaudited)
Fair value measurements (continued)
The following table is a summary of the inputs used to value the Fund’s investments at June 30, 2020:
| | Level 1 ($) | Level 2 ($) | Level 3 ($) | Total ($) |
| Investments in Securities | | | | |
| Common Stocks | | | | |
| Cambodia | — | 1,324,034 | — | 1,324,034 |
| Canada | 1,318,019 | — | — | 1,318,019 |
| China | 3,144,828 | 3,293,366 | — | 6,438,194 |
| Cyprus | — | 590,651 | — | 590,651 |
| Hong Kong | — | 3,004,942 | — | 3,004,942 |
| Indonesia | — | 239,854 | — | 239,854 |
| Mexico | 2,271,429 | — | — | 2,271,429 |
| Russian Federation | — | 525,262 | — | 525,262 |
| South Korea | — | 2,997,467 | — | 2,997,467 |
| Taiwan | — | 7,158,421 | — | 7,158,421 |
| Thailand | — | 2,674,673 | — | 2,674,673 |
| Total Common Stocks | 6,734,276 | 21,808,670 | — | 28,542,946 |
| Money Market Funds | 2,833,522 | — | — | 2,833,522 |
| Total Investments in Securities | 9,567,798 | 21,808,670 | — | 31,376,468 |
| Investments in Derivatives | | | | |
| Asset | | | | |
| Futures Contracts | 26,833 | — | — | 26,833 |
| Total | 9,594,631 | 21,808,670 | — | 31,403,301 |
See the Portfolio of Investments for all investment classifications not indicated in the table.
The Fund’s assets assigned to the Level 2 input category are generally valued using a market approach, in which a security’s value is determined through its correlation to prices and information from observable market transactions for similar or identical assets. Foreign equities are generally valued at the last sale price on the foreign exchange or market on which they trade. The Fund may use a statistical fair valuation model, in accordance with the policy adopted by the Board of Trustees, provided by an independent third party to value securities principally traded in foreign markets in order to adjust for possible stale pricing that may occur between the close of the foreign exchanges and the time for valuation. These models take into account available market data including intraday index, ADR, and ETF movements.
Derivative instruments are valued at unrealized appreciation (depreciation).
The accompanying Notes to Financial Statements are an integral part of this statement.
| 48 | Columbia Acorn Family of Funds | Semiannual Report 2020 |
Portfolio of Investments
Columbia Acorn European FundSM, June 30, 2020 (Unaudited)
(Percentages represent value of investments compared to net assets)
Investments in securities
| Common Stocks 98.0% |
| Issuer | Shares | Value ($) |
| Denmark 4.3% |
| ALK-Abello AS(a) | 3,190 | 853,922 |
| SimCorp AS | 20,204 | 2,185,110 |
| Total | 3,039,032 |
| France 4.1% |
| Akka Technologies | 30,827 | 997,132 |
| Robertet SA(a) | 1,807 | 1,896,151 |
| Total | 2,893,283 |
| Germany 12.1% |
| Corestate Capital Holding SA(a) | 30,159 | 613,238 |
| Deutsche Beteiligungs AG | 18,787 | 637,939 |
| Eckert & Ziegler Strahlen- und Medizintechnik AG | 7,975 | 1,335,629 |
| Hypoport SE(a) | 3,748 | 1,667,240 |
| Nemetschek SE | 24,948 | 1,714,233 |
| TeamViewer AG(a) | 31,872 | 1,740,278 |
| Washtec AG(a) | 19,481 | 802,823 |
| Total | 8,511,380 |
| Ireland 2.0% |
| UDG Healthcare PLC | 160,689 | 1,428,227 |
| Italy 7.8% |
| Amplifon SpA(a) | 39,420 | 1,053,106 |
| Carel Industries SpA | 90,572 | 1,665,183 |
| GVS SpA(a) | 53,601 | 623,284 |
| Industria Macchine Automatiche SpA(a),(b) | 16,172 | 972,054 |
| Nexi SpA(a) | 65,037 | 1,127,777 |
| Total | 5,441,404 |
| Malta 1.3% |
| Kindred Group PLC(a) | 147,914 | 892,968 |
| Netherlands 4.6% |
| BE Semiconductor Industries NV | 25,695 | 1,139,309 |
| IMCD NV | 22,366 | 2,109,100 |
| Total | 3,248,409 |
| Spain 2.9% |
| Befesa SA | 33,258 | 1,296,942 |
| Vidrala SA | 7,325 | 698,498 |
| Total | 1,995,440 |
| Common Stocks (continued) |
| Issuer | Shares | Value ($) |
| Sweden 23.2% |
| AddTech AB, Class B | 53,462 | 2,162,269 |
| Dometic Group AB(a) | 124,082 | 1,121,320 |
| Dustin Group AB | 155,530 | 849,227 |
| Hexagon AB, Class B(a) | 40,297 | 2,366,464 |
| Munters Group AB(a) | 299,317 | 1,687,411 |
| Sectra AB, Class B(a) | 58,147 | 3,313,464 |
| Sweco AB, Class B | 76,341 | 3,446,003 |
| Trelleborg AB, Class B(a) | 91,711 | 1,345,562 |
| Total | 16,291,720 |
| Switzerland 9.4% |
| Belimo Holding AG, Registered Shares | 254 | 1,879,784 |
| Gurit Holding AG | 424 | 621,077 |
| Inficon Holding AG | 2,131 | 1,667,586 |
| Kardex Energy AG | 5,361 | 985,874 |
| LEM Holding SA, Registered Shares | 459 | 679,600 |
| Partners Group Holding AG | 858 | 781,374 |
| Total | 6,615,295 |
| Ukraine 0.6% |
| Kernel Holding SA | 36,484 | 386,288 |
| United Kingdom 24.7% |
| Abcam PLC | 46,802 | 773,038 |
| Auto Trader Group PLC | 210,984 | 1,373,666 |
| Dechra Pharmaceuticals PLC | 56,838 | 2,001,991 |
| Diploma PLC | 80,708 | 1,794,197 |
| Halma PLC | 58,501 | 1,666,706 |
| Intermediate Capital Group PLC | 97,491 | 1,555,355 |
| Rentokil Initial PLC | 409,568 | 2,589,769 |
| Rightmove PLC | 222,340 | 1,502,917 |
| RWS Holdings PLC | 115,175 | 855,450 |
| Safestore Holdings PLC | 105,904 | 954,575 |
| Spirax-Sarco Engineering PLC | 18,793 | 2,313,606 |
| Total | 17,381,270 |
The accompanying Notes to Financial Statements are an integral part of this statement.
Columbia Acorn Family of Funds | Semiannual Report 2020
| 49 |
Portfolio of Investments (continued)
Columbia Acorn European FundSM, June 30, 2020 (Unaudited)
| Common Stocks (continued) |
| Issuer | Shares | Value ($) |
| United States 1.0% |
| Inter Parfums, Inc. | 15,000 | 722,250 |
Total Common Stocks
(Cost $49,745,594) | 68,846,966 |
|
| Securities Lending Collateral 0.9% |
| | |
| Dreyfus Government Cash Management Fund, Institutional Shares, 0.092%(c),(d) | 601,387 | 601,387 |
Total Securities Lending Collateral
(Cost $601,387) | 601,387 |
|
| Money Market Funds 1.7% |
| | Shares | Value ($) |
| Columbia Short-Term Cash Fund, 0.253%(c),(e) | 1,216,366 | 1,216,366 |
Total Money Market Funds
(Cost $1,216,371) | 1,216,366 |
Total Investments in Securities
(Cost $51,563,352) | 70,664,719 |
| Obligation to Return Collateral for Securities Loaned | | (601,387) |
| Other Assets & Liabilities, Net | | 195,030 |
| Net Assets | $70,258,362 |
Notes to Portfolio of Investments
| (a) | Non-income producing security. |
| (b) | All or a portion of this security was on loan at June 30, 2020. The total market value of securities on loan at June 30, 2020 was $574,506. |
| (c) | The rate shown is the seven-day current annualized yield at June 30, 2020. |
| (d) | Investment made with cash collateral received from securities lending activity. |
| (e) | As defined in the Investment Company Act of 1940, an affiliated company is one in which the Fund owns 5% or more of the company’s outstanding voting securities, or a company which is under common ownership or control with the Fund. The value of the holdings and transactions in these affiliated companies during the period ended June 30, 2020 are as follows: |
| Affiliated issuers | Beginning
of period($) | Purchases($) | Sales($) | Net change in
unrealized
appreciation
(depreciation)($) | End of
period($) | Realized gain
(loss)($) | Dividends($) | End of
period shares |
| Columbia Short-Term Cash Fund, 0.253% |
| | 3,469,112 | 17,727,031 | (19,979,772) | (5) | 1,216,366 | 351 | 10,211 | 1,216,366 |
Fair value measurements
Various inputs are used in determining the value of the Fund’s investments, following the input prioritization hierarchy established by accounting principles generally accepted in the United States of America (GAAP). These inputs are summarized in the three broad levels listed below:
| ■ | Level 1 – quoted prices in active markets for identical securities |
| ■ | Level 2 – prices determined using other significant observable inputs (including quoted prices for similar securities, interest rates, prepayment speeds, credit risk and others) |
| ■ | Level 3 – prices determined using significant unobservable inputs where quoted prices or observable inputs are unavailable or less reliable (including management’s own assumptions about the factors market participants would use in pricing an investment) |
The inputs or methodology used for valuing securities are not necessarily an indication of the risk associated with investing in those securities.
Examples of the types of securities in which the Fund would typically invest and how they are classified within this hierarchy are as follows. Typical Level 1 securities include exchange traded domestic equities, mutual funds whose net asset values are published each day and exchange traded foreign equities that are not typically statistically fair valued. Typical Level 2 securities include exchange traded foreign equities that are traded in the European region or Asia Pacific region time zones which are typically statistically fair valued, forward foreign currency exchange contracts and short-term investments valued at amortized cost. Additionally, securities fair valued by Columbia Wanger Asset Management’s Valuation Committee (the Committee) that rely on significant observable inputs are also included in Level 2. Typical Level 3 securities include any security fair valued by the Committee that relies on significant unobservable inputs.
The Committee is responsible for applying the Columbia Acorn Trust Portfolio Pricing Policy and the Columbia Wanger Asset Management pricing procedures (the Policies), which are approved by and subject to the oversight of the Board of Trustees.
The Committee meets as necessary, and no less frequently than quarterly, to determine fair values for securities for which market quotations are not readily available or for which Columbia Wanger Asset Management believes that available market quotations are unreliable. The Committee also reviews the continuing appropriateness of the Policies. In circumstances where a security has been fair valued, the Committee will also review the continuing appropriateness of the current value of the security. The Policies address, among other things: circumstances under which market quotations will be deemed readily available; selection of third party pricing vendors; appropriate pricing methodologies; events that require fair valuation and fair value techniques; circumstances under which securities will be deemed to pose a potential for stale pricing, including when securities are illiquid, restricted, or in default; and certain delegations of authority to determine fair values to the Fund’s investment manager. The Committee may also meet to discuss additional valuation matters, which may include review of back-testing results, review of time-sensitive information or approval of other valuation related actions, and to review the appropriateness of the Policies.
The accompanying Notes to Financial Statements are an integral part of this statement.
| 50 | Columbia Acorn Family of Funds | Semiannual Report 2020 |
Portfolio of Investments (continued)
Columbia Acorn European FundSM, June 30, 2020 (Unaudited)
Fair value measurements (continued)
The following table is a summary of the inputs used to value the Fund’s investments at June 30, 2020:
| | Level 1 ($) | Level 2 ($) | Level 3 ($) | Total ($) |
| Investments in Securities | | | | |
| Common Stocks | | | | |
| Denmark | — | 3,039,032 | — | 3,039,032 |
| France | — | 2,893,283 | — | 2,893,283 |
| Germany | — | 8,511,380 | — | 8,511,380 |
| Ireland | — | 1,428,227 | — | 1,428,227 |
| Italy | — | 5,441,404 | — | 5,441,404 |
| Malta | — | 892,968 | — | 892,968 |
| Netherlands | — | 3,248,409 | — | 3,248,409 |
| Spain | — | 1,995,440 | — | 1,995,440 |
| Sweden | — | 16,291,720 | — | 16,291,720 |
| Switzerland | — | 6,615,295 | — | 6,615,295 |
| Ukraine | — | 386,288 | — | 386,288 |
| United Kingdom | — | 17,381,270 | — | 17,381,270 |
| United States | 722,250 | — | — | 722,250 |
| Total Common Stocks | 722,250 | 68,124,716 | — | 68,846,966 |
| Securities Lending Collateral | 601,387 | — | — | 601,387 |
| Money Market Funds | 1,216,366 | — | — | 1,216,366 |
| Total Investments in Securities | 2,540,003 | 68,124,716 | — | 70,664,719 |
See the Portfolio of Investments for all investment classifications not indicated in the table.
The Fund’s assets assigned to the Level 2 input category are generally valued using a market approach, in which a security’s value is determined through its correlation to prices and information from observable market transactions for similar or identical assets. Foreign equities are generally valued at the last sale price on the foreign exchange or market on which they trade. The Fund may use a statistical fair valuation model, in accordance with the policy adopted by the Board of Trustees, provided by an independent third party to value securities principally traded in foreign markets in order to adjust for possible stale pricing that may occur between the close of the foreign exchanges and the time for valuation. These models take into account available market data including intraday index, ADR, and ETF movements.
The accompanying Notes to Financial Statements are an integral part of this statement.
Columbia Acorn Family of Funds | Semiannual Report 2020
| 51 |
Statement of Assets and Liabilities
June 30, 2020 (Unaudited)
| | Columbia
Acorn®
Fund | Columbia
Acorn
International® | Columbia
Acorn
USA® | Columbia
Acorn
International
SelectSM |
| Assets | | | | |
| Investments in securities, at value* | | | | |
| Unaffiliated issuers (cost $2,926,178,921, $1,723,724,962, $225,944,346, $161,856,881, respectively) | $3,848,875,468 | $2,175,777,641 | $263,942,064 | $202,096,282 |
| Affiliated issuers (cost $50,251,246, $73,727,199, $5,643,396, $1,030,158, respectively) | 50,266,718 | 73,754,725 | 5,644,495 | 1,030,634 |
| Foreign currency (cost $—, $8,856, $—, $2, respectively) | — | 8,856 | — | 2 |
| Margin deposits on: | | | | |
| Futures contracts | — | 6,721,000 | — | — |
| Receivable for: | | | | |
| Investments sold | 26,683,984 | 1,209,920 | 1,991,538 | 601,351 |
| Capital shares sold | 428,142 | 166,980 | 91,629 | 118,176 |
| Dividends | 1,345,352 | 3,236,531 | 76,764 | 436,969 |
| Securities lending income | 2,453 | 153,050 | 1,250 | — |
| Foreign tax reclaims | 5,167 | 2,310,222 | 224 | 85,755 |
| Expense reimbursement due from Investment Manager | 1,024 | 3,269 | 440 | 1,107 |
| Prepaid expenses | 36,965 | 23,326 | 2,602 | 1,192 |
| Trustees’ deferred compensation plan | 3,256,453 | 1,737,530 | 310,411 | — |
| Other assets | 5,868 | 9,568 | 330 | 9,312 |
| Total assets | 3,930,907,594 | 2,265,112,618 | 272,061,747 | 204,380,780 |
| Liabilities | | | | |
| Due upon return of securities on loan | 32,820,950 | 21,620,386 | 4,076,000 | — |
| Payable for: | | | | |
| Investments purchased | 11,438,180 | 2,340,212 | 119,021 | 56 |
| Capital shares purchased | 3,142,057 | 1,519,283 | 78,263 | 561,974 |
| Variation margin for futures contracts | — | 155,880 | — | — |
| Investment advisory fee | 70,530 | 48,487 | 6,688 | 4,943 |
| Distribution and/or service fees | 6,541 | 2,015 | 394 | 315 |
| Transfer agent fees | 337,718 | 202,115 | 25,260 | 15,666 |
| Administration fees | 5,222 | 3,045 | 360 | 278 |
| Trustees’ fees | — | — | 299 | 61,181 |
| Compensation of chief compliance officer | 77 | — | — | — |
| Other expenses | 185,211 | 286,543 | 39,445 | 40,061 |
| Trustees’ deferred compensation plan | 3,256,453 | 1,737,530 | 310,411 | — |
| Total liabilities | 51,262,939 | 27,915,496 | 4,656,141 | 684,474 |
| Net assets applicable to outstanding capital stock | $3,879,644,655 | $2,237,197,122 | $267,405,606 | $203,696,306 |
| Represented by | | | | |
| Paid in capital | 2,844,700,394 | 1,635,804,842 | 231,707,677 | 174,636,472 |
| Total distributable earnings (loss) | 1,034,944,261 | 601,392,280 | 35,697,929 | 29,059,834 |
| Total - representing net assets applicable to outstanding capital stock | $3,879,644,655 | $2,237,197,122 | $267,405,606 | $203,696,306 |
| * Includes the value of securities on loan | 32,941,685 | 20,316,271 | 4,235,117 | — |
The accompanying Notes to Financial Statements are an integral part of this statement.
| 52 | Columbia Acorn Family of Funds | Semiannual Report 2020 |
Statement of Assets and Liabilities (continued)
June 30, 2020 (Unaudited)
| | Columbia
Acorn®
Fund | Columbia
Acorn
International® | Columbia
Acorn
USA® | Columbia
Acorn
International
SelectSM |
| Class A | | | | |
| Net assets | $748,815,345 | $236,288,583 | $47,747,109 | $39,533,745 |
| Shares outstanding | 67,348,082 | 8,000,433 | 4,560,383 | 1,481,291 |
| Net asset value per share(a) | $11.12 | $29.53 | $10.47 | $26.69 |
| Maximum sales charge | 5.75% | 5.75% | 5.75% | 5.75% |
| Maximum offering price per share(b) (calculated by dividing the net asset value per share by 1.0 minus the maximum sales charge for Class A shares) | $11.80 | $31.33 | $11.11 | $28.32 |
| Advisor Class | | | | |
| Net assets | $38,952,957 | $22,001,177 | $17,040,533 | $1,887,064 |
| Shares outstanding | 2,600,779 | 733,341 | 1,154,760 | 68,964 |
| Net asset value per share(c) | $14.98 | $30.00 | $14.76 | $27.36 |
| Class C | | | | |
| Net assets | $55,667,273 | $13,520,134 | $2,676,475 | $1,696,943 |
| Shares outstanding | 16,055,679 | 494,334 | 772,527 | 70,160 |
| Net asset value per share(a) | $3.47 | $27.35 | $3.46 | $24.19 |
| Institutional Class | | | | |
| Net assets | $2,880,479,761 | $1,582,520,875 | $137,076,779 | $76,102,707 |
| Shares outstanding | 203,509,527 | 53,428,419 | 10,004,365 | 2,806,082 |
| Net asset value per share(c) | $14.15 | $29.62 | $13.70 | $27.12 |
| Institutional 2 Class | | | | |
| Net assets | $50,310,908 | $145,669,698 | $2,714,751 | $67,470,565 |
| Shares outstanding | 3,320,473 | 4,920,844 | 182,267 | 2,466,155 |
| Net asset value per share(c) | $15.15 | $29.60 | $14.89 | $27.36 |
| Institutional 3 Class | | | | |
| Net assets | $105,418,411 | $234,434,017 | $60,149,959 | $17,005,282 |
| Shares outstanding | 6,872,351 | 7,810,288 | 3,988,900 | 621,958 |
| Net asset value per share(c) | $15.34 | $30.02 | $15.08 | $27.34 |
| Class R | | | | |
| Net assets | $— | $2,762,638 | $— | $— |
| Shares outstanding | — | 93,600 | — | — |
| Net asset value per share(c) | $— | $29.52 | $— | $— |
| (a) | Redemption price per share is equal to net asset value less any applicable contingent deferred sales charge. |
| (b) | On sales of $50,000 or more the offering price is reduced. |
| (c) | Redemption price per share is equal to net asset value. |
The accompanying Notes to Financial Statements are an integral part of this statement.
Columbia Acorn Family of Funds | Semiannual Report 2020
| 53 |
Statement of Assets and Liabilities (continued)
June 30, 2020 (Unaudited)
| | Columbia
Acorn
SelectSM | Columbia
Thermostat
FundSM | Columbia
Acorn
Emerging Markets
FundSM | Columbia
Acorn
European
FundSM |
| Assets | | | | |
| Investments in securities, at value* | | | | |
| Unaffiliated issuers (cost $166,663,210, $—, $22,381,001, $50,346,981, respectively) | $211,091,651 | $— | $28,542,946 | $69,448,353 |
| Affiliated issuers (cost $5,882,397, $1,025,192,982, $2,833,754, $1,216,371, respectively) | 5,884,494 | 1,113,064,548 | 2,833,522 | 1,216,366 |
| Margin deposits on: | | | | |
| Futures contracts | — | — | 217,300 | — |
| Receivable for: | | | | |
| Investments sold | 895,527 | — | 8,195,319 | — |
| Capital shares sold | 8,071 | 8,412,527 | 9,223 | 126,524 |
| Dividends | 51,632 | 918,678 | 66,786 | 58,116 |
| Securities lending income | — | — | 553 | 2,264 |
| Foreign tax reclaims | — | — | 1,198 | 160,179 |
| Expense reimbursement due from Investment Manager | — | 1,677 | 960 | 963 |
| Prepaid expenses | 449 | 5,975 | 98 | 679 |
| Trustees’ deferred compensation plan | 257,086 | — | — | — |
| Other assets | — | 28,608 | — | 20,454 |
| Total assets | 218,188,910 | 1,122,432,013 | 39,867,905 | 71,033,898 |
| Liabilities | | | | |
| Due to custodian | — | — | 540 | — |
| Due upon return of securities on loan | — | — | — | 601,387 |
| Payable for: | | | | |
| Investments purchased | — | 916,363 | 7,818,599 | 90,751 |
| Capital shares purchased | 229,779 | 731,568 | 72,981 | 24,485 |
| Variation margin for futures contracts | — | — | 8,610 | — |
| Investment advisory fee | 3,754 | 3,022 | 1,104 | 2,266 |
| Distribution and/or service fees | 639 | 7,376 | 235 | 317 |
| Transfer agent fees | 21,984 | 90,023 | 4,898 | 7,004 |
| Administration fees | 293 | 1,511 | 44 | 95 |
| Trustees’ fees | 1,007 | 203,703 | 34,838 | 13,175 |
| Compensation of chief compliance officer | 446 | — | 98 | — |
| Other expenses | 41,277 | 51,288 | 51,333 | 36,056 |
| Trustees’ deferred compensation plan | 257,086 | — | — | — |
| Total liabilities | 556,265 | 2,004,854 | 7,993,280 | 775,536 |
| Net assets applicable to outstanding capital stock | $217,632,645 | $1,120,427,159 | $31,874,625 | $70,258,362 |
| Represented by | | | | |
| Paid in capital | 162,049,836 | 958,445,675 | 103,960,297 | 56,755,630 |
| Total distributable earnings (loss) | 55,582,809 | 161,981,484 | (72,085,672) | 13,502,732 |
| Total - representing net assets applicable to outstanding capital stock | $217,632,645 | $1,120,427,159 | $31,874,625 | $70,258,362 |
| * Includes the value of securities on loan | — | — | — | 574,506 |
The accompanying Notes to Financial Statements are an integral part of this statement.
| 54 | Columbia Acorn Family of Funds | Semiannual Report 2020 |
Statement of Assets and Liabilities (continued)
June 30, 2020 (Unaudited)
| | Columbia
Acorn
SelectSM | Columbia
Thermostat
FundSM | Columbia
Acorn
Emerging Markets
FundSM | Columbia
Acorn
European
FundSM |
| Class A | | | | |
| Net assets | $86,664,985 | $336,890,324 | $11,823,939 | $27,019,602 |
| Shares outstanding | 7,460,500 | 19,594,988 | 1,064,870 | 1,291,214 |
| Net asset value per share(a) | $11.62 | $17.19 | $11.10 | $20.93 |
| Maximum sales charge | 5.75% | 5.75% | 5.75% | 5.75% |
| Maximum offering price per share(b) (calculated by dividing the net asset value per share by 1.0 minus the maximum sales charge for Class A shares) | $12.33 | $18.24 | $11.78 | $22.21 |
| Advisor Class | | | | |
| Net assets | $1,328,066 | $41,643,088 | $410,848 | $1,175,793 |
| Shares outstanding | 91,332 | 2,443,186 | 36,497 | 55,680 |
| Net asset value per share(c) | $14.54 | $17.04 | $11.26 | $21.12 |
| Class C | | | | |
| Net assets | $2,016,622 | $188,898,346 | $5,618,899 | $4,924,417 |
| Shares outstanding | 339,580 | 10,947,640 | 516,931 | 240,198 |
| Net asset value per share(a) | $5.94 | $17.25 | $10.87 | $20.50 |
| Institutional Class | | | | |
| Net assets | $118,507,903 | $461,525,830 | $13,172,834 | $33,457,931 |
| Shares outstanding | 8,578,818 | 27,240,183 | 1,176,707 | 1,592,353 |
| Net asset value per share(c) | $13.81 | $16.94 | $11.19 | $21.01 |
| Institutional 2 Class | | | | |
| Net assets | $3,226,144 | $89,333,427 | $245,735 | $3,677,137 |
| Shares outstanding | 220,199 | 5,234,141 | 21,766 | 172,966 |
| Net asset value per share(c) | $14.65 | $17.07 | $11.29 | $21.26 |
| Institutional 3 Class | | | | |
| Net assets | $5,888,925 | $2,136,144 | $602,370 | $3,482 |
| Shares outstanding | 396,726 | 125,335 | 53,836 | 166 |
| Net asset value per share(c) | $14.84 | $17.04 | $11.19 | $20.92(d) |
| (a) | Redemption price per share is equal to net asset value less any applicable contingent deferred sales charge. |
| (b) | On sales of $50,000 or more the offering price is reduced. |
| (c) | Redemption price per share is equal to net asset value. |
| (d) | Net asset value per share rounds to this amount due to fractional shares outstanding. |
The accompanying Notes to Financial Statements are an integral part of this statement.
Columbia Acorn Family of Funds | Semiannual Report 2020
| 55 |
Statement of Operations
Six Months Ended June 30, 2020 (Unaudited)
| | Columbia
Acorn®
Fund | Columbia
Acorn
International® | Columbia
Acorn
USA® | Columbia
Acorn
International
SelectSM |
| Net investment income | | | | |
| Income: | | | | |
| Dividends — unaffiliated issuers | $13,114,619 | $19,523,820 | $891,301 | $1,443,191 |
| Dividends — affiliated issuers | 482,021 | 317,613 | 65,450 | 29,441 |
| Income from securities lending — net | 131,734 | 774,592 | 3,548 | 10,471 |
| Foreign taxes withheld | (24,412) | (1,797,874) | (5,560) | (135,910) |
| Total income | 13,703,962 | 18,818,151 | 954,739 | 1,347,193 |
| Expenses: | | | | |
| Investment advisory fee | 12,558,424 | 8,972,190 | 1,221,332 | 752,669 |
| Distribution and/or service fees | | | | |
| Class A | 898,771 | 304,354 | 59,618 | 44,683 |
| Class C | 288,969 | 71,984 | 13,607 | 9,436 |
| Class R | — | 7,224 | — | — |
| Transfer agent fees | | | | |
| Class A | 323,962 | 139,200 | 29,027 | 24,326 |
| Advisor Class | 17,502 | 10,807 | 10,242 | 1,209 |
| Class C | 26,028 | 8,227 | 1,657 | 1,269 |
| Institutional Class | 1,249,326 | 923,495 | 82,225 | 52,106 |
| Institutional 2 Class | 13,875 | 42,384 | 761 | 11,578 |
| Institutional 3 Class | 3,150 | 7,992 | 2,193 | 689 |
| Class R | — | 1,653 | — | — |
| Administration fees | 924,726 | 561,725 | 65,534 | 42,131 |
| Trustees’ fees | 232,980 | 146,824 | 17,280 | — |
| Custodian fees | 12,572 | 214,313 | 4,445 | 15,812 |
| Printing and postage fees | 85,042 | 91,465 | 16,291 | 14,320 |
| Registration fees | 49,850 | 52,467 | 42,012 | 47,586 |
| Audit fees | 21,322 | 46,933 | 16,349 | 16,453 |
| Legal fees | 425,295 | 268,481 | 30,683 | 18,072 |
| Compensation of chief compliance officer | 8,513 | 5,515 | 630 | 322 |
| Other | 119,231 | 88,754 | 11,009 | 7,600 |
| Total expenses | 17,259,538 | 11,965,987 | 1,624,895 | 1,060,261 |
| Fees waived or expenses reimbursed by Investment Manager and its affiliates | (140,747) | (575,041) | (65,297) | (146,321) |
| Fees waived by transfer agent | | | | |
| Institutional 2 Class | (790) | (3,921) | (277) | (2,267) |
| Institutional 3 Class | — | (2,794) | (2,193) | (692) |
| Total net expenses | 17,118,001 | 11,384,231 | 1,557,128 | 910,981 |
| Net investment income (loss) | (3,414,039) | 7,433,920 | (602,389) | 436,212 |
| Realized and unrealized gain (loss) — net | | | | |
| Net realized gain (loss) on: | | | | |
| Investments — unaffiliated issuers | 119,998,267 | 161,894,339 | 387,061 | (9,304,964) |
| Investments — affiliated issuers | (64,059) | (16,894) | (3,097) | (3,154) |
| Foreign currency translations | — | (150,131) | — | 26,004 |
| Futures contracts | 278,742 | 16,049,936 | 141,608 | — |
| Net realized gain (loss) | 120,212,950 | 177,777,250 | 525,572 | (9,282,114) |
| Net change in unrealized appreciation (depreciation) on: | | | | |
| Investments — unaffiliated issuers | (92,480,878) | (440,898,305) | (24,464,122) | 1,651,999 |
| Investments — affiliated issuers | 15,472 | 27,526 | 1,099 | 476 |
| Foreign currency translations | — | (43,649) | — | (4,972) |
| Futures contracts | — | 867,976 | — | — |
| Net change in unrealized appreciation (depreciation) | (92,465,406) | (440,046,452) | (24,463,023) | 1,647,503 |
| Net realized and unrealized gain (loss) | 27,747,544 | (262,269,202) | (23,937,451) | (7,634,611) |
| Net increase (decrease) in net assets resulting from operations | $24,333,505 | $(254,835,282) | $(24,539,840) | $(7,198,399) |
The accompanying Notes to Financial Statements are an integral part of this statement.
| 56 | Columbia Acorn Family of Funds | Semiannual Report 2020 |
Statement of Operations (continued)
Six Months Ended June 30, 2020 (Unaudited)
| | Columbia
Acorn
SelectSM | Columbia
Thermostat
FundSM | Columbia
Acorn
Emerging Markets
FundSM | Columbia
Acorn
European
FundSM |
| Net investment income | | | | |
| Income: | | | | |
| Dividends — unaffiliated issuers | $633,355 | $— | $355,072 | $476,661 |
| Dividends — affiliated issuers | 36,963 | 7,864,726 | 10,936 | 10,211 |
| Income from securities lending — net | 1,037 | — | 3,942 | 22,929 |
| Foreign taxes withheld | — | — | (34,969) | (55,350) |
| Total income | 671,355 | 7,864,726 | 334,981 | 454,451 |
| Expenses: | | | | |
| Investment advisory fee | 978,859 | 422,468 | 253,903 | 440,704 |
| Distribution and/or service fees | | | | |
| Class A | 106,634 | 321,465 | 19,245 | 34,136 |
| Class C | 11,380 | 819,674 | 30,244 | 25,264 |
| Transfer agent fees | | | | |
| Class A | 57,475 | 126,462 | 10,986 | 15,638 |
| Advisor Class | 1,049 | 12,458 | 456 | 812 |
| Class C | 1,529 | 80,623 | 4,391 | 2,897 |
| Institutional Class | 77,345 | 166,936 | 12,033 | 21,559 |
| Institutional 2 Class | 808 | 17,199 | 367 | 756 |
| Institutional 3 Class | 947 | 118 | 56 | 1 |
| Administration fees | 57,340 | 210,518 | 10,105 | 18,430 |
| Trustees’ fees | 15,643 | 6,823 | — | 1,535 |
| Custodian fees | 2,328 | 944 | 18,288 | 12,204 |
| Printing and postage fees | 17,690 | 34,702 | 12,945 | 9,361 |
| Registration fees | 40,702 | 67,524 | 46,183 | 29,920 |
| Audit fees | 16,306 | 7,151 | 21,210 | 16,349 |
| Legal fees | 29,868 | 86,784 | 5,815 | 9,146 |
| Line of credit interest | — | 322 | 7 | 207 |
| Compensation of chief compliance officer | 973 | 1,511 | 204 | 193 |
| Other | 15,219 | 22,731 | 2,955 | 7,497 |
| Total expenses | 1,432,095 | 2,406,413 | 449,393 | 646,609 |
| Fees waived or expenses reimbursed by Investment Manager and its affiliates | (241,836) | (227,734) | (136,647) | (143,454) |
| Fees waived by transfer agent | | | | |
| Institutional 2 Class | (51) | — | — | (223) |
| Institutional 3 Class | (89) | — | — | (1) |
| Total net expenses | 1,190,119 | 2,178,679 | 312,746 | 502,931 |
| Net investment income (loss) | (518,764) | 5,686,047 | 22,235 | (48,480) |
| Realized and unrealized gain (loss) — net | | | | |
| Net realized gain (loss) on: | | | | |
| Investments — unaffiliated issuers | 8,861,139 | — | (2,690,957) | 2,666,972 |
| Investments — affiliated issuers | (9,350) | 53,698,429 | (687) | 351 |
| Capital gain distributions from underlying affiliated funds | — | 16,871,998 | — | — |
| Foreign currency translations | — | — | (75,311) | (19,898) |
| Futures contracts | 3,689,005 | — | (543,282) | — |
| Net realized gain (loss) | 12,540,794 | 70,570,427 | (3,310,237) | 2,647,425 |
| Net change in unrealized appreciation (depreciation) on: | | | | |
| Investments — unaffiliated issuers | (2,233,464) | — | (6,049,229) | (12,031,776) |
| Investments — affiliated issuers | 2,097 | 44,078,259 | (232) | (5) |
| Foreign currency translations | — | — | (20,515) | (1,064) |
| Futures contracts | — | — | 26,833 | — |
| Net change in unrealized appreciation (depreciation) | (2,231,367) | 44,078,259 | (6,043,143) | (12,032,845) |
| Net realized and unrealized gain (loss) | 10,309,427 | 114,648,686 | (9,353,380) | (9,385,420) |
| Net increase (decrease) in net assets resulting from operations | $9,790,663 | $120,334,733 | $(9,331,145) | $(9,433,900) |
The accompanying Notes to Financial Statements are an integral part of this statement.
Columbia Acorn Family of Funds | Semiannual Report 2020
| 57 |
Statement of Changes in Net Assets
| | Columbia
Acorn® Fund | Columbia Acorn
International® |
| | Six Months Ended
June 30, 2020
(Unaudited) | Year Ended
December 31, 2019 | Six Months Ended
June 30, 2020
(Unaudited) | Year Ended
December 31, 2019 |
| Operations | | | | |
| Net investment income (loss) | $(3,414,039) | $(5,038,865) | $7,433,920 | $26,459,641 |
| Net realized gain | 120,212,950 | 537,959,386 | 177,777,250 | 189,362,155 |
| Net change in unrealized appreciation (depreciation) | (92,465,406) | 439,927,446 | (440,046,452) | 485,609,937 |
| Net increase (decrease) in net assets resulting from operations | 24,333,505 | 972,847,967 | (254,835,282) | 701,431,733 |
| Distributions to shareholders | | | | |
| Net investment income and net realized gains | | | | |
| Class A | (44,986,660) | (110,582,346) | (12,093,114) | (33,066,056) |
| Advisor Class | (1,779,215) | (4,615,704) | (1,123,821) | (1,425,903) |
| Class C | (9,659,239) | (24,489,308) | (745,821) | (2,146,649) |
| Institutional Class | (137,826,128) | (344,231,371) | (82,028,834) | (213,404,097) |
| Institutional 2 Class | (2,228,265) | (5,227,592) | (7,523,187) | (21,058,497) |
| Institutional 3 Class | (4,495,627) | (7,796,098) | (11,599,567) | (27,606,607) |
| Class R | — | — | (137,869) | (374,176) |
| Total distributions to shareholders | (200,975,134) | (496,942,419) | (115,252,213) | (299,081,985) |
| Decrease in net assets from capital stock activity | (102,876,628) | (115,107,691) | (106,963,561) | (213,532,913) |
| Total increase (decrease) in net assets | (279,518,257) | 360,797,857 | (477,051,056) | 188,816,835 |
| Net assets at beginning of period | 4,159,162,912 | 3,798,365,055 | 2,714,248,178 | 2,525,431,343 |
| Net assets at end of period | $3,879,644,655 | $4,159,162,912 | $2,237,197,122 | $2,714,248,178 |
The accompanying Notes to Financial Statements are an integral part of this statement.
| 58 | Columbia Acorn Family of Funds | Semiannual Report 2020 |
Statement of Changes in Net Assets (continued)
| | Columbia
Acorn USA® | Columbia Acorn
International SelectSM |
| | Six Months Ended
June 30, 2020
(Unaudited) | Year Ended
December 31, 2019 | Six Months Ended
June 30, 2020
(Unaudited) | Year Ended
December 31, 2019 |
| Operations | | | | |
| Net investment income (loss) | $(602,389) | $(644,036) | $436,212 | $698,274 |
| Net realized gain (loss) | 525,572 | 31,861,458 | (9,282,114) | 9,151,599 |
| Net change in unrealized appreciation (depreciation) | (24,463,023) | 49,992,890 | 1,647,503 | 27,625,785 |
| Net increase (decrease) in net assets resulting from operations | (24,539,840) | 81,210,312 | (7,198,399) | 37,475,658 |
| Distributions to shareholders | | | | |
| Net investment income and net realized gains | | | | |
| Class A | (1,480,132) | (7,620,982) | (137,241) | (3,162,237) |
| Advisor Class | (377,410) | (1,842,281) | (6,211) | (194,771) |
| Class C | (246,698) | (1,208,980) | (6,451) | (214,120) |
| Institutional Class | (3,262,723) | (16,965,767) | (262,013) | (7,922,245) |
| Institutional 2 Class | (55,333) | (383,196) | (225,716) | (289,819) |
| Institutional 3 Class | (1,269,709) | (6,484,915) | (53,063) | (1,214,883) |
| Total distributions to shareholders | (6,692,005) | (34,506,121) | (690,695) | (12,998,075) |
| Increase (decrease) in net assets from capital stock activity | (10,760,856) | (13,299,648) | 63,426,769 | 14,414,867 |
| Total increase (decrease) in net assets | (41,992,701) | 33,404,543 | 55,537,675 | 38,892,450 |
| Net assets at beginning of period | 309,398,307 | 275,993,764 | 148,158,631 | 109,266,181 |
| Net assets at end of period | $267,405,606 | $309,398,307 | $203,696,306 | $148,158,631 |
The accompanying Notes to Financial Statements are an integral part of this statement.
Columbia Acorn Family of Funds | Semiannual Report 2020
| 59 |
Statement of Changes in Net Assets (continued)
| | Columbia
Acorn SelectSM | Columbia
Thermostat FundSM |
| | Six Months Ended
June 30, 2020
(Unaudited) | Year Ended
December 31, 2019 | Six Months Ended
June 30, 2020
(Unaudited) | Year Ended
December 31, 2019 |
| Operations | | | | |
| Net investment income (loss) | $(518,764) | $(715,138) | $5,686,047 | $12,117,664 |
| Net realized gain | 12,540,794 | 31,548,954 | 70,570,427 | 35,238,644 |
| Net change in unrealized appreciation (depreciation) | (2,231,367) | 35,028,294 | 44,078,259 | 47,454,371 |
| Net increase in net assets resulting from operations | 9,790,663 | 65,862,110 | 120,334,733 | 94,810,679 |
| Distributions to shareholders | | | | |
| Net investment income and net realized gains | | | | |
| Class A | (2,480,863) | (9,817,828) | (3,746,907) | (11,138,390) |
| Advisor Class | (37,532) | (175,832) | (455,554) | (822,651) |
| Class C | (109,857) | (557,316) | (2,168,982) | (6,895,240) |
| Institutional Class | (3,090,266) | (11,309,913) | (5,254,336) | (15,210,441) |
| Institutional 2 Class | (65,972) | (227,384) | (946,397) | (2,004,840) |
| Institutional 3 Class | (1,885,205) | (2,234,860) | (24,590) | (45,752) |
| Total distributions to shareholders | (7,669,695) | (24,323,133) | (12,596,766) | (36,117,314) |
| Increase (decrease) in net assets from capital stock activity | (38,335,318) | (23,086,627) | 288,300,420 | 23,842,525 |
| Total increase (decrease) in net assets | (36,214,350) | 18,452,350 | 396,038,387 | 82,535,890 |
| Net assets at beginning of period | 253,846,995 | 235,394,645 | 724,388,772 | 641,852,882 |
| Net assets at end of period | $217,632,645 | $253,846,995 | $1,120,427,159 | $724,388,772 |
The accompanying Notes to Financial Statements are an integral part of this statement.
| 60 | Columbia Acorn Family of Funds | Semiannual Report 2020 |
Statement of Changes in Net Assets (continued)
| | Columbia Acorn
Emerging Markets FundSM | Columbia Acorn
European FundSM |
| | Six Months Ended
June 30, 2020
(Unaudited) | Year Ended
December 31, 2019 | Six Months Ended
June 30, 2020
(Unaudited) | Year Ended
December 31, 2019 |
| Operations | | | | |
| Net investment income (loss) | $22,235 | $186,997 | $(48,480) | $354,347 |
| Net realized gain (loss) | (3,310,237) | (885,529) | 2,647,425 | 1,654,113 |
| Net change in unrealized appreciation (depreciation) | (6,043,143) | 11,492,096 | (12,032,845) | 27,314,511 |
| Net increase (decrease) in net assets resulting from operations | (9,331,145) | 10,793,564 | (9,433,900) | 29,322,971 |
| Distributions to shareholders | | | | |
| Net investment income and net realized gains | | | | |
| Class A | — | — | (160,959) | (264,373) |
| Advisor Class | — | — | (7,030) | (18,540) |
| Class C | — | — | (30,429) | (12,781) |
| Institutional Class | — | — | (199,953) | (509,487) |
| Institutional 2 Class | — | — | (22,104) | (20,361) |
| Institutional 3 Class | — | — | (21) | (218) |
| Total distributions to shareholders | — | — | (420,496) | (825,760) |
| Decrease in net assets from capital stock activity | (15,430,866) | (13,243,197) | (13,149,439) | (3,740,595) |
| Total increase (decrease) in net assets | (24,762,011) | (2,449,633) | (23,003,835) | 24,756,616 |
| Net assets at beginning of period | 56,636,636 | 59,086,269 | 93,262,197 | 68,505,581 |
| Net assets at end of period | $31,874,625 | $56,636,636 | $70,258,362 | $93,262,197 |
The accompanying Notes to Financial Statements are an integral part of this statement.
Columbia Acorn Family of Funds | Semiannual Report 2020
| 61 |
Statement of Changes in Net Assets (continued)
| | Columbia
Acorn® Fund | Columbia Acorn
International® |
| | Six Months Ended | Year Ended | Six Months Ended | Year Ended |
| | June 30, 2020 (Unaudited) | December 31, 2019 | June 30, 2020 (Unaudited) | December 31, 2019 |
| | Shares | Dollars ($) | Shares | Dollars ($) | Shares | Dollars ($) | Shares | Dollars ($) |
| Capital stock activity |
| Class A | | | | | | | | |
| Subscriptions | 2,063,813 | 22,250,286 | 4,133,500 | 49,889,518 | 241,457 | 6,931,668 | 677,087 | 22,088,511 |
| Distributions reinvested | 3,687,068 | 41,221,415 | 8,657,230 | 101,720,934 | 389,132 | 11,561,097 | 970,899 | 31,720,047 |
| Redemptions | (7,644,236) | (82,515,526) | (15,689,169) | (189,802,211) | (1,631,261) | (48,064,420) | (2,698,710) | (88,374,572) |
| Net decrease | (1,893,355) | (19,043,825) | (2,898,439) | (38,191,759) | (1,000,672) | (29,571,655) | (1,050,724) | (34,566,014) |
| Advisor Class | | | | | | | | |
| Subscriptions | 178,416 | 2,537,077 | 634,032 | 9,825,645 | 478,999 | 15,232,329 | 208,923 | 6,902,364 |
| Distributions reinvested | 104,049 | 1,565,939 | 267,774 | 4,133,765 | 37,235 | 1,123,760 | 42,987 | 1,423,610 |
| Redemptions | (533,117) | (7,728,089) | (1,016,953) | (15,975,063) | (150,124) | (4,246,940) | (311,685) | (10,230,546) |
| Net increase (decrease) | (250,652) | (3,625,073) | (115,147) | (2,015,653) | 366,110 | 12,109,149 | (59,775) | (1,904,572) |
| Class C | | | | | | | | |
| Subscriptions | 573,093 | 2,071,656 | 1,119,825 | 5,491,211 | 11,532 | 308,595 | 29,066 | 886,533 |
| Distributions reinvested | 2,618,502 | 9,138,580 | 5,251,248 | 23,102,168 | 26,561 | 731,208 | 68,676 | 2,086,897 |
| Redemptions | (3,901,645) | (14,576,423) | (6,921,008) | (34,594,301) | (131,143) | (3,613,672) | (336,100) | (10,292,732) |
| Net decrease | (710,050) | (3,366,187) | (549,935) | (6,000,922) | (93,050) | (2,573,869) | (238,358) | (7,319,302) |
| Institutional Class | | | | | | | | |
| Subscriptions | 2,339,443 | 32,152,760 | 5,282,488 | 78,653,539 | 1,521,932 | 44,257,746 | 3,027,722 | 97,126,882 |
| Distributions reinvested | 8,898,685 | 126,628,315 | 21,464,688 | 314,291,159 | 2,166,008 | 64,546,951 | 5,165,099 | 169,181,217 |
| Redemptions | (19,765,812) | (268,163,669) | (31,681,570) | (472,045,610) | (7,129,547) | (200,647,672) | (13,128,298) | (430,557,597) |
| Net decrease | (8,527,684) | (109,382,594) | (4,934,394) | (79,100,912) | (3,441,607) | (91,842,975) | (4,935,477) | (164,249,498) |
| Institutional 2 Class | | | | | | | | |
| Subscriptions | 506,927 | 7,355,055 | 1,259,715 | 19,821,837 | 223,430 | 6,428,383 | 1,727,791 | 55,959,823 |
| Distributions reinvested | 146,165 | 2,226,100 | 335,376 | 5,227,592 | 99,447 | 2,961,542 | 291,169 | 9,522,689 |
| Redemptions | (621,009) | (8,846,784) | (1,005,277) | (15,963,671) | (771,459) | (22,447,905) | (2,091,836) | (68,276,761) |
| Net increase (decrease) | 32,083 | 734,371 | 589,814 | 9,085,758 | (448,582) | (13,057,980) | (72,876) | (2,794,249) |
| Institutional 3 Class | | | | | | | | |
| Subscriptions | 5,443,242 | 69,564,837 | 3,890,545 | 60,686,076 | 2,887,153 | 74,318,705 | 2,923,055 | 94,591,351 |
| Distributions reinvested | 290,469 | 4,479,024 | 493,331 | 7,781,931 | 289,262 | 8,732,830 | 612,009 | 20,271,580 |
| Redemptions | (2,983,758) | (42,237,181) | (4,198,217) | (67,352,210) | (2,272,403) | (64,718,833) | (3,297,334) | (110,042,832) |
| Net increase | 2,749,953 | 31,806,680 | 185,659 | 1,115,797 | 904,012 | 18,332,702 | 237,730 | 4,820,099 |
| Class R | | | | | | | | |
| Subscriptions | — | — | — | — | 5,807 | 166,960 | 30,713 | 995,788 |
| Distributions reinvested | — | — | — | — | 4,563 | 135,529 | 10,724 | 350,523 |
| Redemptions | — | — | — | — | (24,750) | (661,422) | (274,820) | (8,865,688) |
| Net decrease | — | — | — | — | (14,380) | (358,933) | (233,383) | (7,519,377) |
| Total net decrease | (8,599,705) | (102,876,628) | (7,722,442) | (115,107,691) | (3,728,169) | (106,963,561) | (6,352,863) | (213,532,913) |
The accompanying Notes to Financial Statements are an integral part of this statement.
| 62 | Columbia Acorn Family of Funds | Semiannual Report 2020 |
Statement of Changes in Net Assets (continued)
| | Columbia
Acorn USA® | Columbia Acorn
International SelectSM |
| | Six Months Ended | Year Ended | Six Months Ended | Year Ended |
| | June 30, 2020 (Unaudited) | December 31, 2019 | June 30, 2020 (Unaudited) | December 31, 2019 |
| | Shares | Dollars ($) | Shares | Dollars ($) | Shares | Dollars ($) | Shares | Dollars ($) |
| Capital stock activity |
| Class A | | | | | | | | |
| Subscriptions | 191,132 | 1,932,980 | 491,865 | 5,786,792 | 530,896 | 13,502,826 | 347,272 | 9,462,114 |
| Distributions reinvested | 133,006 | 1,417,839 | 634,698 | 7,303,655 | 5,031 | 134,560 | 109,077 | 3,076,483 |
| Redemptions | (602,899) | (6,046,820) | (1,072,140) | (12,603,235) | (365,546) | (8,538,450) | (257,870) | (7,091,324) |
| Net increase (decrease) | (278,761) | (2,696,001) | 54,423 | 487,212 | 170,381 | 5,098,936 | 198,479 | 5,447,273 |
| Advisor Class | | | | | | | | |
| Subscriptions | 95,337 | 1,332,897 | 120,871 | 1,933,694 | 28,888 | 781,857 | 79,526 | 2,161,624 |
| Distributions reinvested | 25,127 | 377,410 | 115,785 | 1,842,281 | 226 | 6,202 | 6,747 | 194,489 |
| Redemptions | (142,867) | (1,934,390) | (117,952) | (1,888,811) | (29,511) | (737,582) | (66,954) | (1,894,157) |
| Net increase (decrease) | (22,403) | (224,083) | 118,704 | 1,887,164 | (397) | 50,477 | 19,319 | 461,956 |
| Class C | | | | | | | | |
| Subscriptions | 71,381 | 251,847 | 92,806 | 473,031 | 3,475 | 81,889 | 15,892 | 397,853 |
| Distributions reinvested | 67,282 | 237,506 | 274,808 | 1,182,883 | 265 | 6,425 | 8,233 | 211,391 |
| Redemptions | (141,791) | (501,698) | (612,117) | (2,976,839) | (29,443) | (630,418) | (56,413) | (1,390,018) |
| Net decrease | (3,128) | (12,345) | (244,503) | (1,320,925) | (25,703) | (542,104) | (32,288) | (780,774) |
| Institutional Class | | | | | | | | |
| Subscriptions | 209,397 | 2,683,849 | 675,875 | 10,092,246 | 301,791 | 7,641,171 | 722,561 | 20,085,054 |
| Distributions reinvested | 224,587 | 3,132,986 | 1,087,911 | 16,120,066 | 8,638 | 234,700 | 249,415 | 7,131,691 |
| Redemptions | (890,671) | (11,767,437) | (2,853,692) | (42,620,474) | (570,427) | (14,336,496) | (820,978) | (22,993,971) |
| Net increase (decrease) | (456,687) | (5,950,602) | (1,089,906) | (16,408,162) | (259,998) | (6,460,625) | 150,998 | 4,222,774 |
| Institutional 2 Class | | | | | | | | |
| Subscriptions | 41,195 | 595,134 | 70,285 | 1,123,435 | 2,552,029 | 65,920,824 | 69,064 | 1,956,202 |
| Distributions reinvested | 3,648 | 55,310 | 23,915 | 383,079 | 8,235 | 225,716 | 10,034 | 289,564 |
| Redemptions | (93,882) | (1,500,967) | (103,044) | (1,613,701) | (210,123) | (5,228,635) | (13,076) | (375,971) |
| Net increase (decrease) | (49,039) | (850,523) | (8,844) | (107,187) | 2,350,141 | 60,917,905 | 66,022 | 1,869,795 |
| Institutional 3 Class | | | | | | | | |
| Subscriptions | 265,092 | 4,019,907 | 548,567 | 8,889,451 | 281,563 | 7,774,313 | 215,978 | 6,017,663 |
| Distributions reinvested | 82,632 | 1,268,396 | 399,438 | 6,478,123 | 1,931 | 52,896 | 42,076 | 1,212,536 |
| Redemptions | (438,012) | (6,315,605) | (810,994) | (13,205,324) | (135,963) | (3,465,029) | (143,101) | (4,036,356) |
| Net increase (decrease) | (90,288) | (1,027,302) | 137,011 | 2,162,250 | 147,531 | 4,362,180 | 114,953 | 3,193,843 |
| Total net increase (decrease) | (900,306) | (10,760,856) | (1,033,115) | (13,299,648) | 2,381,955 | 63,426,769 | 517,483 | 14,414,867 |
The accompanying Notes to Financial Statements are an integral part of this statement.
Columbia Acorn Family of Funds | Semiannual Report 2020
| 63 |
Statement of Changes in Net Assets (continued)
| | Columbia
Acorn SelectSM | Columbia
Thermostat FundSM |
| | Six Months Ended | Year Ended | Six Months Ended | Year Ended |
| | June 30, 2020 (Unaudited) | December 31, 2019 | June 30, 2020 (Unaudited) | December 31, 2019 |
| | Shares | Dollars ($) | Shares | Dollars ($) | Shares | Dollars ($) | Shares | Dollars ($) |
| Capital stock activity |
| Class A | | | | | | | | |
| Subscriptions | 169,308 | 1,821,331 | 310,595 | 3,646,132 | 7,336,101 | 120,102,688 | 3,581,278 | 53,531,987 |
| Distributions reinvested | 226,739 | 2,201,633 | 738,947 | 8,744,433 | 205,143 | 3,565,383 | 696,942 | 10,498,008 |
| Redemptions | (978,242) | (10,593,107) | (1,798,929) | (21,114,961) | (2,838,989) | (44,971,753) | (3,367,020) | (50,214,156) |
| Net increase (decrease) | (582,195) | (6,570,143) | (749,387) | (8,724,396) | 4,702,255 | 78,696,318 | 911,200 | 13,815,839 |
| Advisor Class | | | | | | | | |
| Subscriptions | 4,122 | 55,872 | 21,953 | 314,901 | 2,080,011 | 33,499,896 | 973,291 | 13,978,579 |
| Distributions reinvested | 3,089 | 37,531 | 11,997 | 175,831 | 26,013 | 448,211 | 55,095 | 821,970 |
| Redemptions | (50,591) | (644,820) | (241,031) | (3,217,568) | (745,727) | (11,446,590) | (806,540) | (11,813,803) |
| Net increase (decrease) | (43,380) | (551,417) | (207,081) | (2,726,836) | 1,360,297 | 22,501,517 | 221,846 | 2,986,746 |
| Class C | | | | | | | | |
| Subscriptions | 12,882 | 71,734 | 43,809 | 288,185 | 1,795,093 | 29,757,935 | 832,275 | 12,480,689 |
| Distributions reinvested | 18,807 | 93,479 | 75,190 | 477,504 | 103,059 | 1,798,380 | 370,397 | 5,611,576 |
| Redemptions | (145,513) | (822,393) | (310,195) | (2,073,320) | (1,197,774) | (19,162,211) | (2,871,430) | (42,896,426) |
| Net increase (decrease) | (113,824) | (657,180) | (191,196) | (1,307,631) | 700,378 | 12,394,104 | (1,668,758) | (24,804,161) |
| Institutional Class | | | | | | | | |
| Subscriptions | 198,564 | 2,551,551 | 381,259 | 5,311,586 | 11,868,989 | 189,482,495 | 5,266,201 | 76,965,586 |
| Distributions reinvested | 249,708 | 2,881,627 | 753,611 | 10,530,126 | 237,554 | 4,066,930 | 778,189 | 11,538,524 |
| Redemptions | (997,884) | (12,840,950) | (1,936,667) | (26,456,006) | (4,049,546) | (61,092,085) | (5,410,758) | (79,342,105) |
| Net increase (decrease) | (549,612) | (7,407,772) | (801,797) | (10,614,294) | 8,056,997 | 132,457,340 | 633,632 | 9,162,005 |
| Institutional 2 Class | | | | | | | | |
| Subscriptions | 51,828 | 733,408 | 57,886 | 833,240 | 4,098,000 | 65,601,056 | 2,180,445 | 32,262,973 |
| Distributions reinvested | 5,387 | 65,937 | 15,358 | 227,265 | 54,864 | 946,397 | 134,270 | 2,004,839 |
| Redemptions | (28,255) | (388,772) | (41,927) | (609,157) | (1,638,560) | (25,443,701) | (794,328) | (11,886,178) |
| Net increase | 28,960 | 410,573 | 31,317 | 451,348 | 2,514,304 | 41,103,752 | 1,520,387 | 22,381,634 |
| Institutional 3 Class | | | | | | | | |
| Subscriptions | 3,950,608 | 43,244,802 | 3,695,613 | 51,857,064 | 81,106 | 1,332,748 | 58,523 | 828,161 |
| Distributions reinvested | 152,030 | 1,885,170 | 149,922 | 2,234,741 | 1,426 | 24,554 | 3,059 | 45,602 |
| Redemptions | (5,050,947) | (68,689,351) | (3,657,932) | (54,256,623) | (13,145) | (209,913) | (39,256) | (573,301) |
| Net increase (decrease) | (948,309) | (23,559,379) | 187,603 | (164,818) | 69,387 | 1,147,389 | 22,326 | 300,462 |
| Total net increase (decrease) | (2,208,360) | (38,335,318) | (1,730,541) | (23,086,627) | 17,403,618 | 288,300,420 | 1,640,633 | 23,842,525 |
The accompanying Notes to Financial Statements are an integral part of this statement.
| 64 | Columbia Acorn Family of Funds | Semiannual Report 2020 |
Statement of Changes in Net Assets (continued)
| | Columbia Acorn
Emerging Markets FundSM | Columbia Acorn
European FundSM |
| | Six Months Ended | Year Ended | Six Months Ended | Year Ended |
| | June 30, 2020 (Unaudited) | December 31, 2019 | June 30, 2020 (Unaudited) | December 31, 2019 |
| | Shares | Dollars ($) | Shares | Dollars ($) | Shares | Dollars ($) | Shares | Dollars ($) |
| Capital stock activity |
| Class A | | | | | | | | |
| Subscriptions | 129,071 | 1,507,853 | 389,408 | 4,556,362 | 296,582 | 6,191,036 | 588,163 | 11,883,992 |
| Distributions reinvested | — | — | — | — | 7,687 | 160,744 | 11,556 | 254,820 |
| Redemptions | (814,874) | (8,659,926) | (728,785) | (8,618,320) | (494,273) | (9,440,177) | (587,839) | (10,901,694) |
| Net increase (decrease) | (685,803) | (7,152,073) | (339,377) | (4,061,958) | (190,004) | (3,088,397) | 11,880 | 1,237,118 |
| Advisor Class | | | | | | | | |
| Subscriptions | 6,423 | 71,572 | 8,788 | 102,728 | 10,058 | 212,174 | 45,419 | 904,047 |
| Distributions reinvested | — | — | — | — | 332 | 7,010 | 833 | 18,503 |
| Redemptions | (30,654) | (331,109) | (24,340) | (289,309) | (38,657) | (675,458) | (57,731) | (1,073,237) |
| Net decrease | (24,231) | (259,537) | (15,552) | (186,581) | (28,267) | (456,274) | (11,479) | (150,687) |
| Class C | | | | | | | | |
| Subscriptions | 4,958 | 54,430 | 22,883 | 265,684 | 6,953 | 149,307 | 21,243 | 401,532 |
| Distributions reinvested | — | — | — | — | 1,483 | 30,396 | 589 | 12,768 |
| Redemptions | (101,828) | (1,119,876) | (268,741) | (3,112,294) | (47,498) | (847,785) | (314,829) | (5,716,994) |
| Net decrease | (96,870) | (1,065,446) | (245,858) | (2,846,610) | (39,062) | (668,082) | (292,997) | (5,302,694) |
| Institutional Class | | | | | | | | |
| Subscriptions | 39,552 | 433,142 | 125,924 | 1,492,856 | 140,753 | 2,813,570 | 792,207 | 14,929,566 |
| Distributions reinvested | — | — | — | — | 9,440 | 198,135 | 22,896 | 506,245 |
| Redemptions | (573,112) | (5,877,237) | (777,599) | (9,170,301) | (754,538) | (13,452,656) | (721,406) | (13,775,797) |
| Net increase (decrease) | (533,560) | (5,444,095) | (651,675) | (7,677,445) | (604,345) | (10,440,951) | 93,697 | 1,660,014 |
| Institutional 2 Class | | | | | | | | |
| Subscriptions | 24,152 | 301,307 | 126,385 | 1,588,565 | 136,433 | 2,582,626 | 42,517 | 875,563 |
| Distributions reinvested | — | — | — | — | 1,040 | 22,084 | 909 | 20,321 |
| Redemptions | (167,621) | (1,672,250) | (8,031) | (96,730) | (59,734) | (1,088,218) | (110,095) | (2,092,686) |
| Net increase (decrease) | (143,469) | (1,370,943) | 118,354 | 1,491,835 | 77,739 | 1,516,492 | (66,669) | (1,196,802) |
| Institutional 3 Class | | | | | | | | |
| Subscriptions | 8,369 | 92,203 | 21,739 | 259,887 | 41 | 743 | 773 | 13,848 |
| Distributions reinvested | — | — | — | — | — | — | 8 | 176 |
| Redemptions | (22,025) | (230,975) | (18,691) | (222,325) | (741) | (12,970) | (81) | (1,568) |
| Net increase (decrease) | (13,656) | (138,772) | 3,048 | 37,562 | (700) | (12,227) | 700 | 12,456 |
| Total net decrease | (1,497,589) | (15,430,866) | (1,131,060) | (13,243,197) | (784,639) | (13,149,439) | (264,868) | (3,740,595) |
The accompanying Notes to Financial Statements are an integral part of this statement.
Columbia Acorn Family of Funds | Semiannual Report 2020
| 65 |
Financial Highlights
Columbia Acorn® Fund
The following tables are intended to help you understand the Funds’ financial performance. Certain information reflects financial results for a single share of a class held for the periods shown. Per share net investment income (loss) amounts are calculated based on average shares outstanding during the period. Total return assumes reinvestment of all dividends and distributions, if any. Total return does not reflect payment of sales charges, if any. Total return and portfolio turnover are not annualized for periods of less than one year. The portfolio turnover rate is calculated without regard to purchase and sales transactions of short-term instruments and certain derivatives, if any. If such transactions were included, a Fund’s portfolio turnover rate may be higher.
| | Net asset value,
beginning of
period | Net
investment
income
(loss) | Net
realized
and
unrealized
gain (loss) | Total from
investment
operations | Distributions
from net
realized
gains | Total
distributions to
shareholders |
| Class A |
| Six Months Ended 6/30/2020 (Unaudited) | $11.71 | (0.02) | 0.13 | 0.11 | (0.70) | (0.70) |
| Year Ended 12/31/2019 | $10.65 | (0.04) | 2.78 | 2.74 | (1.68) | (1.68) |
| Year Ended 12/31/2018 | $12.92 | (0.03) | (0.48) | (0.51) | (1.76) | (1.76) |
| Year Ended 12/31/2017 | $13.35 | (0.02) | 3.23 | 3.21 | (3.64) | (3.64) |
| Year Ended 12/31/2016 | $17.63 | (0.03) | 1.73 | 1.70 | (5.98) | (5.98) |
| Year Ended 12/31/2015 | $30.30 | (0.12) | (0.27)(f) | (0.39) | (12.28) | (12.28) |
| Advisor Class |
| Six Months Ended 6/30/2020 (Unaudited) | $15.52 | (0.01) | 0.17 | 0.16 | (0.70) | (0.70) |
| Year Ended 12/31/2019 | $13.63 | (0.01) | 3.58 | 3.57 | (1.68) | (1.68) |
| Year Ended 12/31/2018 | $16.06 | 0.01 | (0.64) | (0.63) | (1.80) | (1.80) |
| Year Ended 12/31/2017 | $15.83 | 0.02 | 3.85 | 3.87 | (3.64) | (3.64) |
| Year Ended 12/31/2016 | $19.84 | 0.00(g) | 1.97 | 1.97 | (5.98) | (5.98) |
| Year Ended 12/31/2015 | $32.51 | (0.07) | (0.32)(f) | (0.39) | (12.28) | (12.28) |
| Class C |
| Six Months Ended 6/30/2020 (Unaudited) | $4.14 | (0.02) | 0.05 | 0.03 | (0.70) | (0.70) |
| Year Ended 12/31/2019 | $4.69 | (0.05) | 1.18 | 1.13 | (1.68) | (1.68) |
| Year Ended 12/31/2018 | $6.58 | (0.06) | (0.17) | (0.23) | (1.66) | (1.66) |
| Year Ended 12/31/2017 | $8.34 | (0.08) | 1.96 | 1.88 | (3.64) | (3.64) |
| Year Ended 12/31/2016 | $13.16 | (0.11) | 1.27 | 1.16 | (5.98) | (5.98) |
| Year Ended 12/31/2015 | $25.92 | (0.27) | (0.21)(f) | (0.48) | (12.28) | (12.28) |
| Institutional Class |
| Six Months Ended 6/30/2020 (Unaudited) | $14.70 | (0.01) | 0.16 | 0.15 | (0.70) | (0.70) |
| Year Ended 12/31/2019 | $12.98 | (0.01) | 3.41 | 3.40 | (1.68) | (1.68) |
| Year Ended 12/31/2018 | $15.39 | 0.01 | (0.62) | (0.61) | (1.80) | (1.80) |
| Year Ended 12/31/2017 | $15.29 | 0.02 | 3.72 | 3.74 | (3.64) | (3.64) |
| Year Ended 12/31/2016 | $19.34 | 0.01 | 1.92 | 1.93 | (5.98) | (5.98) |
| Year Ended 12/31/2015 | $31.95 | (0.04) | (0.29)(f) | (0.33) | (12.28) | (12.28) |
| Institutional 2 Class |
| Six Months Ended 6/30/2020 (Unaudited) | $15.69 | (0.01) | 0.17 | 0.16 | (0.70) | (0.70) |
| Year Ended 12/31/2019 | $13.76 | (0.00)(g) | 3.61 | 3.61 | (1.68) | (1.68) |
| Year Ended 12/31/2018 | $16.20 | 0.01 | (0.65) | (0.64) | (1.80) | (1.80) |
| Year Ended 12/31/2017 | $15.94 | 0.02 | 3.88 | 3.90 | (3.64) | (3.64) |
| Year Ended 12/31/2016 | $19.92 | 0.01 | 1.99 | 2.00 | (5.98) | (5.98) |
| Year Ended 12/31/2015 | $32.55 | (0.04) | (0.31)(f) | (0.35) | (12.28) | (12.28) |
The accompanying Notes to Financial Statements are an integral part of this statement.
| 66 | Columbia Acorn Family of Funds | Semiannual Report 2020 |
Financial Highlights (continued)
Columbia Acorn® Fund
| | Net
asset
value,
end of
period | Total
return | Total gross
expense
ratio to
average
net assets(a) | Total net
expense
ratio to
average
net assets(a) | Net investment
income (loss)
ratio to
average
net assets | Portfolio
turnover | Net
assets,
end of
period
(000’s) |
| Class A |
| Six Months Ended 6/30/2020 (Unaudited) | $11.12 | 0.93%(b) | 1.12%(c) | 1.11%(c) | (0.37%)(c) | 47% | $748,815 |
| Year Ended 12/31/2019 | $11.71 | 26.21%(b) | 1.11% | 1.10%(d) | (0.30%) | 101% | $810,966 |
| Year Ended 12/31/2018 | $10.65 | (5.22%)(b) | 1.10% | 1.08%(d) | (0.20%) | 66% | $768,031 |
| Year Ended 12/31/2017 | $12.92 | 24.91% | 1.09% | 1.08%(d) | (0.13%) | 72% | $830,454 |
| Year Ended 12/31/2016 | $13.35 | 10.06% | 1.10%(e) | 1.10%(e) | (0.21%) | 85% | $931,460 |
| Year Ended 12/31/2015 | $17.63 | (1.87%) | 1.08% | 1.08% | (0.39%) | 21% | $1,388,893 |
| Advisor Class |
| Six Months Ended 6/30/2020 (Unaudited) | $14.98 | 1.03%(b) | 0.87%(c) | 0.86%(c) | (0.13%)(c) | 47% | $38,953 |
| Year Ended 12/31/2019 | $15.52 | 26.58%(b) | 0.86% | 0.85%(d) | (0.05%) | 101% | $44,248 |
| Year Ended 12/31/2018 | $13.63 | (5.00%)(b) | 0.85% | 0.83%(d) | 0.05% | 66% | $40,425 |
| Year Ended 12/31/2017 | $16.06 | 25.19% | 0.84% | 0.83%(d) | 0.12% | 72% | $38,588 |
| Year Ended 12/31/2016 | $15.83 | 10.32% | 0.89%(e) | 0.89%(e) | 0.00%(g) | 85% | $33,378 |
| Year Ended 12/31/2015 | $19.84 | (1.75%) | 0.89% | 0.89% | (0.23%) | 21% | $50,335 |
| Class C |
| Six Months Ended 6/30/2020 (Unaudited) | $3.47 | 0.69%(b) | 1.87%(c) | 1.86%(c) | (1.12%)(c) | 47% | $55,667 |
| Year Ended 12/31/2019 | $4.14 | 25.12%(b) | 1.86% | 1.85%(d) | (1.05%) | 101% | $69,471 |
| Year Ended 12/31/2018 | $4.69 | (5.86%)(b) | 1.85% | 1.82%(d) | (0.94%) | 66% | $81,149 |
| Year Ended 12/31/2017 | $6.58 | 23.88% | 1.84% | 1.83%(d) | (0.88%) | 72% | $246,450 |
| Year Ended 12/31/2016 | $8.34 | 9.29% | 1.84%(e) | 1.84%(e) | (0.95%) | 85% | $302,119 |
| Year Ended 12/31/2015 | $13.16 | (2.57%) | 1.80% | 1.80% | (1.11%) | 21% | $456,348 |
| Institutional Class |
| Six Months Ended 6/30/2020 (Unaudited) | $14.15 | 1.01%(b) | 0.87%(c) | 0.86%(c) | (0.12%)(c) | 47% | $2,880,480 |
| Year Ended 12/31/2019 | $14.70 | 26.60%(b) | 0.86% | 0.85%(d) | (0.05%) | 101% | $3,117,486 |
| Year Ended 12/31/2018 | $12.98 | (5.09%)(b) | 0.85% | 0.83%(d) | 0.05% | 66% | $2,816,948 |
| Year Ended 12/31/2017 | $15.39 | 25.24% | 0.84% | 0.83%(d) | 0.12% | 72% | $3,407,214 |
| Year Ended 12/31/2016 | $15.29 | 10.39% | 0.82%(e) | 0.82%(e) | 0.07% | 85% | $3,425,935 |
| Year Ended 12/31/2015 | $19.34 | (1.57%) | 0.80% | 0.80% | (0.11%) | 21% | $5,062,313 |
| Institutional 2 Class |
| Six Months Ended 6/30/2020 (Unaudited) | $15.15 | 1.01%(b) | 0.84%(c) | 0.82%(c) | (0.08%)(c) | 47% | $50,311 |
| Year Ended 12/31/2019 | $15.69 | 26.63%(b) | 0.83% | 0.82% | (0.02%) | 101% | $51,584 |
| Year Ended 12/31/2018 | $13.76 | (5.00%)(b) | 0.81% | 0.80% | 0.08% | 66% | $37,124 |
| Year Ended 12/31/2017 | $16.20 | 25.21% | 0.82% | 0.81% | 0.14% | 72% | $67,932 |
| Year Ended 12/31/2016 | $15.94 | 10.43% | 0.81%(e) | 0.81%(e) | 0.08% | 85% | $45,475 |
| Year Ended 12/31/2015 | $19.92 | (1.60%) | 0.77% | 0.77% | (0.11%) | 21% | $76,412 |
The accompanying Notes to Financial Statements are an integral part of this statement.
Columbia Acorn Family of Funds | Semiannual Report 2020
| 67 |
Financial Highlights (continued)
Columbia Acorn® Fund
| | Net asset value,
beginning of
period | Net
investment
income
(loss) | Net
realized
and
unrealized
gain (loss) | Total from
investment
operations | Distributions
from net
realized
gains | Total
distributions to
shareholders |
| Institutional 3 Class |
| Six Months Ended 6/30/2020 (Unaudited) | $15.87 | (0.00)(g) | 0.17 | 0.17 | (0.70) | (0.70) |
| Year Ended 12/31/2019 | $13.89 | 0.00(g) | 3.66 | 3.66 | (1.68) | (1.68) |
| Year Ended 12/31/2018 | $16.34 | 0.02 | (0.66) | (0.64) | (1.81) | (1.81) |
| Year Ended 12/31/2017 | $16.04 | 0.03 | 3.91 | 3.94 | (3.64) | (3.64) |
| Year Ended 12/31/2016 | $20.00 | 0.02 | 2.00 | 2.02 | (5.98) | (5.98) |
| Year Ended 12/31/2015 | $32.61 | (0.02) | (0.31)(f) | (0.33) | (12.28) | (12.28) |
| Notes to Financial Highlights |
| (a) | In addition to the fees and expenses that the Fund bears directly, the Fund indirectly bears a pro rata share of the fees and expenses of any other funds in which it invests, if any. Such indirect expenses are not included in the Fund’s reported expense ratios. |
| (b) | Had the Investment Manager and/or Transfer Agent not waived fees and/or reimbursed a portion of expenses, total return would have been reduced. |
| (c) | Annualized. |
| (d) | The benefits derived from expense reductions had an impact of less than 0.01%. |
| (e) | Ratios include line of credit interest expense which is less than 0.01%. |
| (f) | Calculation of the net gain (loss) per share (both realized and unrealized) does not correlate to the aggregate realized and unrealized gain (loss) presented in the Statements of Operations due to the timing of subscriptions and redemptions of Fund shares in relation to fluctuations in the market value of the portfolio. |
| (g) | Rounds to zero. |
The accompanying Notes to Financial Statements are an integral part of this statement.
| 68 | Columbia Acorn Family of Funds | Semiannual Report 2020 |
Financial Highlights (continued)
Columbia Acorn® Fund
| | Net
asset
value,
end of
period | Total
return | Total gross
expense
ratio to
average
net assets(a) | Total net
expense
ratio to
average
net assets(a) | Net investment
income (loss)
ratio to
average
net assets | Portfolio
turnover | Net
assets,
end of
period
(000’s) |
| Institutional 3 Class |
| Six Months Ended 6/30/2020 (Unaudited) | $15.34 | 1.07%(b) | 0.79%(c) | 0.78%(c) | (0.06%)(c) | 47% | $105,418 |
| Year Ended 12/31/2019 | $15.87 | 26.74%(b) | 0.78% | 0.77% | 0.03% | 101% | $65,408 |
| Year Ended 12/31/2018 | $13.89 | (4.98%)(b) | 0.76% | 0.76% | 0.13% | 66% | $54,688 |
| Year Ended 12/31/2017 | $16.34 | 25.31% | 0.76% | 0.76% | 0.19% | 72% | $47,536 |
| Year Ended 12/31/2016 | $16.04 | 10.50% | 0.76%(e) | 0.76%(e) | 0.12% | 85% | $79,518 |
| Year Ended 12/31/2015 | $20.00 | (1.54%) | 0.73% | 0.73% | (0.06%) | 21% | $130,546 |
The accompanying Notes to Financial Statements are an integral part of this statement.
Columbia Acorn Family of Funds | Semiannual Report 2020
| 69 |
Financial Highlights
Columbia Acorn International®
| | Net asset value,
beginning of
period | Net
investment
income
(loss) | Net
realized
and
unrealized
gain (loss) | Total from
investment
operations | Distributions
from net
investment
income | Distributions
from net
realized
gains | Total
distributions to
shareholders |
| Class A |
| Six Months Ended 6/30/2020 (Unaudited) | $34.20 | 0.06 | (3.17) | (3.11) | (0.20) | (1.36) | (1.56) |
| Year Ended 12/31/2019 | $29.48 | 0.25 | 8.19 | 8.44 | (0.65) | (3.07) | (3.72) |
| Year Ended 12/31/2018 | $46.51 | 0.23 | (7.41) | (7.18) | (0.29) | (9.56) | (9.85) |
| Year Ended 12/31/2017 | $37.71 | 0.25 | 11.71 | 11.96 | (0.67) | (2.49) | (3.16) |
| Year Ended 12/31/2016 | $39.08 | 0.35 | (1.31) | (0.96) | (0.15) | (0.26) | (0.41) |
| Year Ended 12/31/2015 | $41.68 | 0.39 | (1.02) | (0.63) | (0.40) | (1.57) | (1.97) |
| Advisor Class |
| Six Months Ended 6/30/2020 (Unaudited) | $34.67 | 0.12 | (3.23) | (3.11) | (0.20) | (1.36) | (1.56) |
| Year Ended 12/31/2019 | $29.84 | 0.33 | 8.30 | 8.63 | (0.73) | (3.07) | (3.80) |
| Year Ended 12/31/2018 | $46.95 | 0.46 | (7.61) | (7.15) | (0.40) | (9.56) | (9.96) |
| Year Ended 12/31/2017 | $38.03 | 0.36 | 11.82 | 12.18 | (0.77) | (2.49) | (3.26) |
| Year Ended 12/31/2016 | $39.41 | 0.48 | (1.38) | (0.90) | (0.22) | (0.26) | (0.48) |
| Year Ended 12/31/2015 | $42.02 | 0.47 | (1.03) | (0.56) | (0.48) | (1.57) | (2.05) |
| Class C |
| Six Months Ended 6/30/2020 (Unaudited) | $31.92 | (0.05) | (2.96) | (3.01) | (0.20) | (1.36) | (1.56) |
| Year Ended 12/31/2019 | $27.63 | 0.00(f) | 7.65 | 7.65 | (0.29) | (3.07) | (3.36) |
| Year Ended 12/31/2018 | $44.57 | (0.05) | (7.09) | (7.14) | (0.24) | (9.56) | (9.80) |
| Year Ended 12/31/2017 | $36.18 | (0.06) | 11.20 | 11.14 | (0.26) | (2.49) | (2.75) |
| Year Ended 12/31/2016 | $37.65 | 0.05 | (1.26) | (1.21) | — | (0.26) | (0.26) |
| Year Ended 12/31/2015 | $40.20 | 0.07 | (0.97) | (0.90) | (0.08) | (1.57) | (1.65) |
| Institutional Class |
| Six Months Ended 6/30/2020 (Unaudited) | $34.25 | 0.10 | (3.17) | (3.07) | (0.20) | (1.36) | (1.56) |
| Year Ended 12/31/2019 | $29.51 | 0.33 | 8.21 | 8.54 | (0.73) | (3.07) | (3.80) |
| Year Ended 12/31/2018 | $46.57 | 0.34 | (7.44) | (7.10) | (0.40) | (9.56) | (9.96) |
| Year Ended 12/31/2017 | $37.74 | 0.37 | 11.73 | 12.10 | (0.78) | (2.49) | (3.27) |
| Year Ended 12/31/2016 | $39.12 | 0.44 | (1.32) | (0.88) | (0.24) | (0.26) | (0.50) |
| Year Ended 12/31/2015 | $41.73 | 0.51 | (1.03) | (0.52) | (0.52) | (1.57) | (2.09) |
| Institutional 2 Class |
| Six Months Ended 6/30/2020 (Unaudited) | $34.22 | 0.11 | (3.17) | (3.06) | (0.20) | (1.36) | (1.56) |
| Year Ended 12/31/2019 | $29.49 | 0.35 | 8.20 | 8.55 | (0.75) | (3.07) | (3.82) |
| Year Ended 12/31/2018 | $46.54 | 0.37 | (7.43) | (7.06) | (0.43) | (9.56) | (9.99) |
| Year Ended 12/31/2017 | $37.72 | 0.38 | 11.72 | 12.10 | (0.79) | (2.49) | (3.28) |
| Year Ended 12/31/2016 | $39.10 | 0.44 | (1.30) | (0.86) | (0.26) | (0.26) | (0.52) |
| Year Ended 12/31/2015 | $41.71 | 0.54 | (1.05) | (0.51) | (0.53) | (1.57) | (2.10) |
| Institutional 3 Class |
| Six Months Ended 6/30/2020 (Unaudited) | $34.67 | 0.13 | (3.22) | (3.09) | (0.20) | (1.36) | (1.56) |
| Year Ended 12/31/2019 | $29.83 | 0.37 | 8.30 | 8.67 | (0.76) | (3.07) | (3.83) |
| Year Ended 12/31/2018 | $46.95 | 0.51 | (7.62) | (7.11) | (0.45) | (9.56) | (10.01) |
| Year Ended 12/31/2017 | $38.02 | 0.40 | 11.83 | 12.23 | (0.81) | (2.49) | (3.30) |
| Year Ended 12/31/2016 | $39.41 | 0.47 | (1.32) | (0.85) | (0.28) | (0.26) | (0.54) |
| Year Ended 12/31/2015 | $42.02 | 0.53 | (1.01) | (0.48) | (0.56) | (1.57) | (2.13) |
The accompanying Notes to Financial Statements are an integral part of this statement.
| 70 | Columbia Acorn Family of Funds | Semiannual Report 2020 |
Financial Highlights (continued)
Columbia Acorn International®
| | Net
asset
value,
end of
period | Total
return | Total gross
expense
ratio to
average
net assets(a) | Total net
expense
ratio to
average
net assets(a) | Net investment
income (loss)
ratio to
average
net assets | Portfolio
turnover | Net
assets,
end of
period
(000’s) |
| Class A |
| Six Months Ended 6/30/2020 (Unaudited) | $29.53 | (9.12%)(b) | 1.29%(c) | 1.24%(c) | 0.41%(c) | 36% | $236,289 |
| Year Ended 12/31/2019 | $34.20 | 29.56%(b) | 1.27%(d) | 1.24%(d),(e) | 0.76% | 32% | $307,872 |
| Year Ended 12/31/2018 | $29.48 | (16.13%)(b) | 1.25%(d) | 1.24%(d),(e) | 0.51% | 32% | $296,349 |
| Year Ended 12/31/2017 | $46.51 | 31.91% | 1.23% | 1.20%(e) | 0.56% | 37% | $465,830 |
| Year Ended 12/31/2016 | $37.71 | (2.51%) | 1.27% | 1.23% | 0.90% | 46% | $576,235 |
| Year Ended 12/31/2015 | $39.08 | (1.59%) | 1.28% | 1.24% | 0.93% | 50% | $812,479 |
| Advisor Class |
| Six Months Ended 6/30/2020 (Unaudited) | $30.00 | (8.99%)(b) | 1.05%(c) | 0.99%(c) | 0.82%(c) | 36% | $22,001 |
| Year Ended 12/31/2019 | $34.67 | 29.86%(b) | 1.02%(d) | 0.99%(d),(e) | 1.00% | 32% | $12,733 |
| Year Ended 12/31/2018 | $29.84 | (15.90%)(b) | 1.00%(d) | 0.99%(d),(e) | 0.97% | 32% | $12,740 |
| Year Ended 12/31/2017 | $46.95 | 32.21% | 0.98% | 0.98%(e) | 0.81% | 37% | $99,578 |
| Year Ended 12/31/2016 | $38.03 | (2.32%) | 1.05% | 1.05% | 1.22% | 46% | $101,988 |
| Year Ended 12/31/2015 | $39.41 | (1.41%) | 1.06% | 1.06% | 1.10% | 50% | $486,763 |
| Class C |
| Six Months Ended 6/30/2020 (Unaudited) | $27.35 | (9.46%)(b) | 2.04%(c) | 1.99%(c) | (0.35%)(c) | 36% | $13,520 |
| Year Ended 12/31/2019 | $31.92 | 28.61%(b) | 2.02%(d) | 2.00%(d),(e) | 0.01% | 32% | $18,749 |
| Year Ended 12/31/2018 | $27.63 | (16.76%)(b) | 2.00%(d) | 1.99%(d),(e) | (0.11%) | 32% | $22,817 |
| Year Ended 12/31/2017 | $44.57 | 30.93% | 1.98% | 1.97%(e) | (0.15%) | 37% | $63,787 |
| Year Ended 12/31/2016 | $36.18 | (3.26%) | 2.01% | 1.99% | 0.13% | 46% | $64,548 |
| Year Ended 12/31/2015 | $37.65 | (2.33%) | 2.01% | 1.99% | 0.18% | 50% | $88,606 |
| Institutional Class |
| Six Months Ended 6/30/2020 (Unaudited) | $29.62 | (8.99%)(b) | 1.04%(c) | 0.99%(c) | 0.67%(c) | 36% | $1,582,521 |
| Year Ended 12/31/2019 | $34.25 | 29.89%(b) | 1.02%(d) | 0.99%(d),(e) | 1.01% | 32% | $1,947,995 |
| Year Ended 12/31/2018 | $29.51 | (15.93%)(b) | 1.00%(d) | 0.99%(d),(e) | 0.76% | 32% | $1,824,055 |
| Year Ended 12/31/2017 | $46.57 | 32.24% | 0.98% | 0.98%(e) | 0.85% | 37% | $3,116,383 |
| Year Ended 12/31/2016 | $37.74 | (2.28%) | 0.98% | 0.98% | 1.13% | 46% | $3,356,348 |
| Year Ended 12/31/2015 | $39.12 | (1.33%) | 0.97% | 0.97% | 1.21% | 50% | $4,645,797 |
| Institutional 2 Class |
| Six Months Ended 6/30/2020 (Unaudited) | $29.60 | (8.97%)(b) | 0.98%(c) | 0.92%(c) | 0.72%(c) | 36% | $145,670 |
| Year Ended 12/31/2019 | $34.22 | 29.95%(b) | 0.97%(d) | 0.93%(d) | 1.06% | 32% | $183,763 |
| Year Ended 12/31/2018 | $29.49 | (15.85%)(b) | 0.93%(d) | 0.93%(d) | 0.81% | 32% | $160,488 |
| Year Ended 12/31/2017 | $46.54 | 32.27% | 0.93% | 0.93% | 0.87% | 37% | $422,916 |
| Year Ended 12/31/2016 | $37.72 | (2.23%) | 0.93% | 0.93% | 1.15% | 46% | $286,786 |
| Year Ended 12/31/2015 | $39.10 | (1.29%) | 0.92% | 0.92% | 1.26% | 50% | $320,252 |
| Institutional 3 Class |
| Six Months Ended 6/30/2020 (Unaudited) | $30.02 | (8.93%)(b) | 0.94%(c) | 0.88%(c) | 0.87%(c) | 36% | $234,434 |
| Year Ended 12/31/2019 | $34.67 | 30.04%(b) | 0.92%(d) | 0.89%(d) | 1.12% | 32% | $239,441 |
| Year Ended 12/31/2018 | $29.83 | (15.82%)(b) | 0.88%(d) | 0.88%(d) | 1.10% | 32% | $198,933 |
| Year Ended 12/31/2017 | $46.95 | 32.36% | 0.88% | 0.88% | 0.89% | 37% | $725,247 |
| Year Ended 12/31/2016 | $38.02 | (2.19%) | 0.88% | 0.88% | 1.20% | 46% | $239,733 |
| Year Ended 12/31/2015 | $39.41 | (1.23%) | 0.88% | 0.88% | 1.26% | 50% | $318,326 |
The accompanying Notes to Financial Statements are an integral part of this statement.
Columbia Acorn Family of Funds | Semiannual Report 2020
| 71 |
Financial Highlights (continued)
Columbia Acorn International®
| | Net asset value,
beginning of
period | Net
investment
income
(loss) | Net
realized
and
unrealized
gain (loss) | Total from
investment
operations | Distributions
from net
investment
income | Distributions
from net
realized
gains | Total
distributions to
shareholders |
| Class R |
| Six Months Ended 6/30/2020 (Unaudited) | $34.22 | 0.02 | (3.16) | (3.14) | (0.20) | (1.36) | (1.56) |
| Year Ended 12/31/2019 | $29.44 | 0.06 | 8.27 | 8.33 | (0.48) | (3.07) | (3.55) |
| Year Ended 12/31/2018 | $46.51 | 0.12 | (7.39) | (7.27) | (0.24) | (9.56) | (9.80) |
| Year Ended 12/31/2017 | $37.71 | 0.21 | 11.63 | 11.84 | (0.55) | (2.49) | (3.04) |
| Year Ended 12/31/2016 | $39.07 | 0.21 | (1.30) | (1.09) | (0.01) | (0.26) | (0.27) |
| Year Ended 12/31/2015 | $41.67 | 0.23 | (1.02) | (0.79) | (0.24) | (1.57) | (1.81) |
| Notes to Financial Highlights |
| (a) | In addition to the fees and expenses that the Fund bears directly, the Fund indirectly bears a pro rata share of the fees and expenses of any other funds in which it invests, if any. Such indirect expenses are not included in the Fund’s reported expense ratios. |
| (b) | Had the Investment Manager and/or Transfer Agent not waived fees and/or reimbursed a portion of expenses, total return would have been reduced. |
| (c) | Annualized. |
| (d) | Ratios include line of credit interest expense which is less than 0.01%. |
| (e) | The benefits derived from expense reductions had an impact of less than 0.01%. |
| (f) | Rounds to zero. |
The accompanying Notes to Financial Statements are an integral part of this statement.
| 72 | Columbia Acorn Family of Funds | Semiannual Report 2020 |
Financial Highlights (continued)
Columbia Acorn International®
| | Net
asset
value,
end of
period | Total
return | Total gross
expense
ratio to
average
net assets(a) | Total net
expense
ratio to
average
net assets(a) | Net investment
income (loss)
ratio to
average
net assets | Portfolio
turnover | Net
assets,
end of
period
(000’s) |
| Class R |
| Six Months Ended 6/30/2020 (Unaudited) | $29.52 | (9.20%)(b) | 1.54%(c) | 1.49%(c) | 0.15%(c) | 36% | $2,763 |
| Year Ended 12/31/2019 | $34.22 | 29.21%(b) | 1.52%(d) | 1.50%(d),(e) | 0.19% | 32% | $3,696 |
| Year Ended 12/31/2018 | $29.44 | (16.32%)(b) | 1.50%(d) | 1.49%(d),(e) | 0.26% | 32% | $10,049 |
| Year Ended 12/31/2017 | $46.51 | 31.58% | 1.49% | 1.48%(e) | 0.46% | 37% | $13,218 |
| Year Ended 12/31/2016 | $37.71 | (2.82%) | 1.55% | 1.55% | 0.55% | 46% | $4,637 |
| Year Ended 12/31/2015 | $39.07 | (1.98%) | 1.62% | 1.62% | 0.54% | 50% | $4,945 |
The accompanying Notes to Financial Statements are an integral part of this statement.
Columbia Acorn Family of Funds | Semiannual Report 2020
| 73 |
Financial Highlights
Columbia Acorn USA®
| | Net asset value,
beginning of
period | Net
investment
income
(loss) | Net
realized
and
unrealized
gain (loss) | Total from
investment
operations | Distributions
from net
investment
income | Distributions
from net
realized
gains | Total
distributions to
shareholders |
| Class A |
| Six Months Ended 6/30/2020 (Unaudited) | $11.69 | (0.03) | (0.86) | (0.89) | — | (0.33) | (0.33) |
| Year Ended 12/31/2019 | $10.28 | (0.05) | 3.14 | 3.09 | (0.01) | (1.67) | (1.68) |
| Year Ended 12/31/2018 | $12.48 | (0.07) | (0.04) | (0.11) | — | (2.09) | (2.09) |
| Year Ended 12/31/2017 | $14.95 | (0.09) | 2.84 | 2.75 | — | (5.22) | (5.22) |
| Year Ended 12/31/2016 | $20.25 | (0.11) | 2.43 | 2.32 | — | (7.62) | (7.62) |
| Year Ended 12/31/2015 | $29.13 | (0.18) | (0.18)(f) | (0.36) | — | (8.52) | (8.52) |
| Advisor Class |
| Six Months Ended 6/30/2020 (Unaudited) | $16.31 | (0.03) | (1.19) | (1.22) | — | (0.33) | (0.33) |
| Year Ended 12/31/2019 | $13.77 | (0.03) | 4.25 | 4.22 | (0.01) | (1.67) | (1.68) |
| Year Ended 12/31/2018 | $16.08 | (0.05) | (0.09) | (0.14) | — | (2.17) | (2.17) |
| Year Ended 12/31/2017 | $17.93 | (0.06) | 3.43 | 3.37 | — | (5.22) | (5.22) |
| Year Ended 12/31/2016 | $22.85 | (0.07) | 2.77 | 2.70 | — | (7.62) | (7.62) |
| Year Ended 12/31/2015 | $31.70 | (0.13) | (0.20)(f) | (0.33) | — | (8.52) | (8.52) |
| Class C |
| Six Months Ended 6/30/2020 (Unaudited) | $4.12 | (0.03) | (0.30) | (0.33) | — | (0.33) | (0.33) |
| Year Ended 12/31/2019 | $4.52 | (0.06) | 1.33 | 1.27 | — | (1.67) | (1.67) |
| Year Ended 12/31/2018 | $6.56 | (0.09) | 0.04(f) | (0.05) | — | (1.99) | (1.99) |
| Year Ended 12/31/2017 | $10.05 | (0.13) | 1.86 | 1.73 | — | (5.22) | (5.22) |
| Year Ended 12/31/2016 | $16.00 | (0.18) | 1.85 | 1.67 | — | (7.62) | (7.62) |
| Year Ended 12/31/2015 | $24.98 | (0.33) | (0.13)(f) | (0.46) | — | (8.52) | (8.52) |
| Institutional Class |
| Six Months Ended 6/30/2020 (Unaudited) | $15.17 | (0.03) | (1.11) | (1.14) | — | (0.33) | (0.33) |
| Year Ended 12/31/2019 | $12.90 | (0.03) | 3.98 | 3.95 | (0.01) | (1.67) | (1.68) |
| Year Ended 12/31/2018 | $15.21 | (0.04) | (0.09) | (0.13) | — | (2.18) | (2.18) |
| Year Ended 12/31/2017 | $17.20 | (0.05) | 3.28 | 3.23 | — | (5.22) | (5.22) |
| Year Ended 12/31/2016 | $22.19 | (0.07) | 2.70 | 2.63 | — | (7.62) | (7.62) |
| Year Ended 12/31/2015 | $31.03 | (0.12) | (0.20)(f) | (0.32) | — | (8.52) | (8.52) |
| Institutional 2 Class |
| Six Months Ended 6/30/2020 (Unaudited) | $16.46 | (0.03) | (1.21) | (1.24) | — | (0.33) | (0.33) |
| Year Ended 12/31/2019 | $13.87 | (0.01) | 4.28 | 4.27 | (0.01) | (1.67) | (1.68) |
| Year Ended 12/31/2018 | $16.21 | (0.03) | (0.11) | (0.14) | — | (2.20) | (2.20) |
| Year Ended 12/31/2017 | $18.02 | (0.03) | 3.44 | 3.41 | — | (5.22) | (5.22) |
| Year Ended 12/31/2016 | $22.90 | (0.06) | 2.80 | 2.74 | — | (7.62) | (7.62) |
| Year Ended 12/31/2015 | $31.71 | (0.10) | (0.19)(f) | (0.29) | — | (8.52) | (8.52) |
The accompanying Notes to Financial Statements are an integral part of this statement.
| 74 | Columbia Acorn Family of Funds | Semiannual Report 2020 |
Financial Highlights (continued)
Columbia Acorn USA®
| | Net
asset
value,
end of
period | Total
return | Total gross
expense
ratio to
average
net assets(a) | Total net
expense
ratio to
average
net assets(a) | Net investment
income (loss)
ratio to
average
net assets | Portfolio
turnover | Net
assets,
end of
period
(000’s) |
| Class A |
| Six Months Ended 6/30/2020 (Unaudited) | $10.47 | (7.66%)(b) | 1.46%(c) | 1.41%(c) | (0.68%)(c) | 70% | $47,747 |
| Year Ended 12/31/2019 | $11.69 | 30.88%(b) | 1.45%(d) | 1.41%(d),(e) | (0.43%) | 91% | $56,578 |
| Year Ended 12/31/2018 | $10.28 | (2.15%)(b) | 1.44%(d) | 1.42%(d),(e) | (0.49%) | 86% | $49,179 |
| Year Ended 12/31/2017 | $12.48 | 19.14%(b) | 1.44% | 1.43%(e) | (0.55%) | 84% | $47,960 |
| Year Ended 12/31/2016 | $14.95 | 12.70% | 1.41% | 1.41% | (0.58%) | 98% | $80,721 |
| Year Ended 12/31/2015 | $20.25 | (1.60%) | 1.34% | 1.34% | (0.63%) | 35% | $95,048 |
| Advisor Class |
| Six Months Ended 6/30/2020 (Unaudited) | $14.76 | (7.51%)(b) | 1.21%(c) | 1.16%(c) | (0.43%)(c) | 70% | $17,041 |
| Year Ended 12/31/2019 | $16.31 | 31.27%(b) | 1.20%(d) | 1.16%(d),(e) | (0.18%) | 91% | $19,202 |
| Year Ended 12/31/2018 | $13.77 | (1.91%)(b) | 1.18%(d) | 1.17%(d),(e) | (0.27%) | 86% | $14,579 |
| Year Ended 12/31/2017 | $16.08 | 19.42%(b) | 1.21% | 1.20%(e) | (0.31%) | 84% | $16,355 |
| Year Ended 12/31/2016 | $17.93 | 12.93% | 1.18% | 1.18% | (0.35%) | 98% | $6,172 |
| Year Ended 12/31/2015 | $22.85 | (1.36%) | 1.12% | 1.12% | (0.40%) | 35% | $8,224 |
| Class C |
| Six Months Ended 6/30/2020 (Unaudited) | $3.46 | (8.15%)(b) | 2.21%(c) | 2.16%(c) | (1.43%)(c) | 70% | $2,676 |
| Year Ended 12/31/2019 | $4.12 | 29.93%(b) | 2.20%(d) | 2.16%(d),(e) | (1.19%) | 91% | $3,195 |
| Year Ended 12/31/2018 | $4.52 | (2.92%)(b) | 2.19%(d) | 2.17%(d),(e) | (1.30%) | 86% | $4,608 |
| Year Ended 12/31/2017 | $6.56 | 18.30%(b) | 2.19% | 2.19%(e) | (1.31%) | 84% | $9,802 |
| Year Ended 12/31/2016 | $10.05 | 11.92% | 2.13% | 2.13% | (1.31%) | 98% | $12,088 |
| Year Ended 12/31/2015 | $16.00 | (2.28%) | 2.02% | 2.02% | (1.32%) | 35% | $17,255 |
| Institutional Class |
| Six Months Ended 6/30/2020 (Unaudited) | $13.70 | (7.55%)(b) | 1.21%(c) | 1.16%(c) | (0.43%)(c) | 70% | $137,077 |
| Year Ended 12/31/2019 | $15.17 | 31.28%(b) | 1.20%(d) | 1.16%(d),(e) | (0.18%) | 91% | $158,696 |
| Year Ended 12/31/2018 | $12.90 | (1.98%)(b) | 1.18%(d) | 1.17%(d),(e) | (0.26%) | 86% | $149,048 |
| Year Ended 12/31/2017 | $15.21 | 19.44%(b) | 1.16% | 1.16%(e) | (0.27%) | 84% | $189,408 |
| Year Ended 12/31/2016 | $17.20 | 13.00% | 1.16% | 1.16% | (0.34%) | 98% | $492,739 |
| Year Ended 12/31/2015 | $22.19 | (1.36%) | 1.10% | 1.10% | (0.40%) | 35% | $768,658 |
| Institutional 2 Class |
| Six Months Ended 6/30/2020 (Unaudited) | $14.89 | (7.57%)(b) | 1.15%(c) | 1.08%(c) | (0.37%)(c) | 70% | $2,715 |
| Year Ended 12/31/2019 | $16.46 | 31.41%(b) | 1.13%(d) | 1.08%(d) | (0.09%) | 91% | $3,806 |
| Year Ended 12/31/2018 | $13.87 | (1.89%)(b) | 1.11%(d) | 1.09%(d) | (0.19%) | 86% | $3,332 |
| Year Ended 12/31/2017 | $16.21 | 19.56%(b) | 1.08% | 1.08% | (0.17%) | 84% | $10,133 |
| Year Ended 12/31/2016 | $18.02 | 13.09% | 1.07% | 1.07% | (0.27%) | 98% | $13,764 |
| Year Ended 12/31/2015 | $22.90 | (1.23%) | 1.01% | 1.01% | (0.30%) | 35% | $27,112 |
The accompanying Notes to Financial Statements are an integral part of this statement.
Columbia Acorn Family of Funds | Semiannual Report 2020
| 75 |
Financial Highlights (continued)
Columbia Acorn USA®
| | Net asset value,
beginning of
period | Net
investment
income
(loss) | Net
realized
and
unrealized
gain (loss) | Total from
investment
operations | Distributions
from net
investment
income | Distributions
from net
realized
gains | Total
distributions to
shareholders |
| Institutional 3 Class |
| Six Months Ended 6/30/2020 (Unaudited) | $16.65 | (0.02) | (1.22) | (1.24) | — | (0.33) | (0.33) |
| Year Ended 12/31/2019 | $14.01 | (0.01) | 4.33 | 4.32 | (0.01) | (1.67) | (1.68) |
| Year Ended 12/31/2018 | $16.36 | (0.02) | (0.11) | (0.13) | — | (2.22) | (2.22) |
| Year Ended 12/31/2017 | $18.14 | (0.03) | 3.47 | 3.44 | — | (5.22) | (5.22) |
| Year Ended 12/31/2016 | $22.99 | (0.04) | 2.81 | 2.77 | — | (7.62) | (7.62) |
| Year Ended 12/31/2015 | $31.80 | (0.08) | (0.21)(f) | (0.29) | — | (8.52) | (8.52) |
| Notes to Financial Highlights |
| (a) | In addition to the fees and expenses that the Fund bears directly, the Fund indirectly bears a pro rata share of the fees and expenses of any other funds in which it invests, if any. Such indirect expenses are not included in the Fund’s reported expense ratios. |
| (b) | Had the Investment Manager and/or Transfer Agent not waived fees and/or reimbursed a portion of expenses, total return would have been reduced. |
| (c) | Annualized. |
| (d) | Ratios include line of credit interest expense which is less than 0.01%. |
| (e) | The benefits derived from expense reductions had an impact of less than 0.01%. |
| (f) | Calculation of the net gain (loss) per share (both realized and unrealized) does not correlate to the aggregate realized and unrealized gain (loss) presented in the Statements of Operations due to the timing of subscriptions and redemptions of Fund shares in relation to fluctuations in the market value of the portfolio. |
The accompanying Notes to Financial Statements are an integral part of this statement.
| 76 | Columbia Acorn Family of Funds | Semiannual Report 2020 |
Financial Highlights (continued)
Columbia Acorn USA®
| | Net
asset
value,
end of
period | Total
return | Total gross
expense
ratio to
average
net assets(a) | Total net
expense
ratio to
average
net assets(a) | Net investment
income (loss)
ratio to
average
net assets | Portfolio
turnover | Net
assets,
end of
period
(000’s) |
| Institutional 3 Class |
| Six Months Ended 6/30/2020 (Unaudited) | $15.08 | (7.48%)(b) | 1.09%(c) | 1.04%(c) | (0.31%)(c) | 70% | $60,150 |
| Year Ended 12/31/2019 | $16.65 | 31.45%(b) | 1.08%(d) | 1.03%(d) | (0.05%) | 91% | $67,921 |
| Year Ended 12/31/2018 | $14.01 | (1.86%)(b) | 1.06%(d) | 1.04%(d) | (0.11%) | 86% | $55,248 |
| Year Ended 12/31/2017 | $16.36 | 19.60%(b) | 1.05% | 1.05% | (0.17%) | 84% | $49,019 |
| Year Ended 12/31/2016 | $18.14 | 13.18% | 1.01% | 1.01% | (0.18%) | 98% | $38,136 |
| Year Ended 12/31/2015 | $22.99 | (1.23%) | 0.97% | 0.97% | (0.25%) | 35% | $41,658 |
The accompanying Notes to Financial Statements are an integral part of this statement.
Columbia Acorn Family of Funds | Semiannual Report 2020
| 77 |
Financial Highlights
Columbia Acorn International SelectSM
| | Net asset value,
beginning of
period | Net
investment
income
(loss) | Net
realized
and
unrealized
gain (loss) | Total from
investment
operations | Distributions
from net
investment
income | Distributions
from net
realized
gains | Tax
return of
capital | Total
distributions to
shareholders |
| Class A |
| Six Months Ended 6/30/2020 (Unaudited) | $28.58 | 0.03 | (1.83) | (1.80) | (0.09) | — | — | (0.09) |
| Year Ended 12/31/2019 | $23.44 | 0.09 | 7.67 | 7.76 | (0.28) | (2.34) | — | (2.62) |
| Year Ended 12/31/2018 | $28.89 | 0.06 | (3.66) | (3.60) | — | (1.85) | — | (1.85) |
| Year Ended 12/31/2017 | $21.36 | 0.02 | 7.52 | 7.54 | (0.01) | — | — | (0.01) |
| Year Ended 12/31/2016 | $21.33 | 0.10 | 0.09(f) | 0.19 | (0.14) | — | (0.02) | (0.16) |
| Year Ended 12/31/2015 | $22.04 | 0.17 | (0.45) | (0.28) | (0.42) | — | (0.01) | (0.43) |
| Advisor Class |
| Six Months Ended 6/30/2020 (Unaudited) | $29.26 | 0.06 | (1.87) | (1.81) | (0.09) | — | — | (0.09) |
| Year Ended 12/31/2019 | $24.00 | 0.18 | 7.84 | 8.02 | (0.42) | (2.34) | — | (2.76) |
| Year Ended 12/31/2018 | $29.46 | 0.09 | (3.70) | (3.61) | — | (1.85) | — | (1.85) |
| Year Ended 12/31/2017 | $21.77 | 0.08 | 7.68 | 7.76 | (0.07) | — | — | (0.07) |
| Year Ended 12/31/2016 | $21.74 | 0.17 | 0.08(f) | 0.25 | (0.20) | — | (0.02) | (0.22) |
| Year Ended 12/31/2015 | $22.45 | 0.22 | (0.44) | (0.22) | (0.48) | — | (0.01) | (0.49) |
| Class C |
| Six Months Ended 6/30/2020 (Unaudited) | $26.00 | (0.07) | (1.65) | (1.72) | (0.09) | — | — | (0.09) |
| Year Ended 12/31/2019 | $21.48 | (0.10) | 6.99 | 6.89 | (0.03) | (2.34) | — | (2.37) |
| Year Ended 12/31/2018 | $26.85 | (0.12) | (3.40) | (3.52) | — | (1.85) | — | (1.85) |
| Year Ended 12/31/2017 | $19.99 | (0.15) | 7.01 | 6.86 | — | — | — | — |
| Year Ended 12/31/2016 | $19.96 | (0.06) | 0.09(f) | 0.03 | — | — | — | — |
| Year Ended 12/31/2015 | $20.54 | (0.01) | (0.41) | (0.42) | (0.15) | — | (0.01) | (0.16) |
| Institutional Class |
| Six Months Ended 6/30/2020 (Unaudited) | $29.00 | 0.06 | (1.85) | (1.79) | (0.09) | — | — | (0.09) |
| Year Ended 12/31/2019 | $23.81 | 0.17 | 7.78 | 7.95 | (0.42) | (2.34) | — | (2.76) |
| Year Ended 12/31/2018 | $29.25 | 0.14 | (3.73) | (3.59) | — | (1.85) | — | (1.85) |
| Year Ended 12/31/2017 | $21.61 | 0.09 | 7.62 | 7.71 | (0.07) | — | — | (0.07) |
| Year Ended 12/31/2016 | $21.58 | 0.16 | 0.09(f) | 0.25 | (0.20) | — | (0.02) | (0.22) |
| Year Ended 12/31/2015 | $22.30 | 0.24 | (0.46) | (0.22) | (0.49) | — | (0.01) | (0.50) |
| Institutional 2 Class |
| Six Months Ended 6/30/2020 (Unaudited) | $29.24 | 0.12 | (1.91) | (1.79) | (0.09) | — | — | (0.09) |
| Year Ended 12/31/2019 | $24.01 | 0.18 | 7.86 | 8.04 | (0.47) | (2.34) | — | (2.81) |
| Year Ended 12/31/2018 | $29.44 | 0.11 | (3.69) | (3.58) | — | (1.85) | — | (1.85) |
| Year Ended 12/31/2017 | $21.76 | 0.11 | 7.66 | 7.77 | (0.09) | — | — | (0.09) |
| Year Ended 12/31/2016 | $21.72 | 0.16 | 0.11(f) | 0.27 | (0.21) | — | (0.02) | (0.23) |
| Year Ended 12/31/2015 | $22.43 | 0.22 | (0.42) | (0.20) | (0.50) | — | (0.01) | (0.51) |
The accompanying Notes to Financial Statements are an integral part of this statement.
| 78 | Columbia Acorn Family of Funds | Semiannual Report 2020 |
Financial Highlights (continued)
Columbia Acorn International SelectSM
| | Proceeds from
regulatory
settlements | Net
asset
value,
end of
period | Total
return | Total gross
expense
ratio to
average
net assets(a) | Total net
expense
ratio to
average
net assets(a) | Net investment
income (loss)
ratio to
average
net assets | Portfolio
turnover | Net
assets,
end of
period
(000’s) |
| Class A |
| Six Months Ended 6/30/2020 (Unaudited) | — | $26.69 | (6.29%)(b) | 1.47%(c) | 1.29%(c) | 0.23%(c) | 37% | $39,534 |
| Year Ended 12/31/2019 | — | $28.58 | 33.37%(b) | 1.54%(d) | 1.35%(d),(e) | 0.34% | 46% | $37,461 |
| Year Ended 12/31/2018 | — | $23.44 | (12.46%)(b) | 1.54% | 1.40%(e) | 0.20% | 48% | $26,073 |
| Year Ended 12/31/2017 | — | $28.89 | 35.30%(b) | 1.54% | 1.40%(e) | 0.07% | 49% | $26,336 |
| Year Ended 12/31/2016 | — | $21.36 | 0.90%(b) | 1.55%(g) | 1.48%(g) | 0.49% | 49% | $20,165 |
| Year Ended 12/31/2015 | 0.00(h) | $21.33 | (1.30%)(i) | 1.55% | 1.55% | 0.74% | 59% | $33,772 |
| Advisor Class |
| Six Months Ended 6/30/2020 (Unaudited) | — | $27.36 | (6.18%)(b) | 1.22%(c) | 1.04%(c) | 0.47%(c) | 37% | $1,887 |
| Year Ended 12/31/2019 | — | $29.26 | 33.73%(b) | 1.29%(d) | 1.10%(d),(e) | 0.63% | 46% | $2,030 |
| Year Ended 12/31/2018 | — | $24.00 | (12.26%)(b) | 1.29% | 1.15%(e) | 0.31% | 48% | $1,201 |
| Year Ended 12/31/2017 | — | $29.46 | 35.67%(b) | 1.29% | 1.15%(e) | 0.30% | 49% | $1,820 |
| Year Ended 12/31/2016 | — | $21.77 | 1.15%(b) | 1.29%(g) | 1.21%(g) | 0.77% | 49% | $1,106 |
| Year Ended 12/31/2015 | 0.00(h) | $21.74 | (1.00%)(i) | 1.27% | 1.27% | 0.97% | 59% | $898 |
| Class C |
| Six Months Ended 6/30/2020 (Unaudited) | — | $24.19 | (6.61%)(b) | 2.21%(c) | 2.04%(c) | (0.63%)(c) | 37% | $1,697 |
| Year Ended 12/31/2019 | — | $26.00 | 32.31%(b) | 2.29%(d) | 2.10%(d),(e) | (0.42%) | 46% | $2,493 |
| Year Ended 12/31/2018 | — | $21.48 | (13.11%)(b) | 2.28% | 2.15%(e) | (0.43%) | 48% | $2,752 |
| Year Ended 12/31/2017 | — | $26.85 | 34.32%(b) | 2.29% | 2.15%(e) | (0.64%) | 49% | $5,027 |
| Year Ended 12/31/2016 | — | $19.99 | 0.15%(b) | 2.31%(g) | 2.23%(g) | (0.29%) | 49% | $4,346 |
| Year Ended 12/31/2015 | 0.00(h) | $19.96 | (2.05%)(i) | 2.32% | 2.32% | (0.06%) | 59% | $5,390 |
| Institutional Class |
| Six Months Ended 6/30/2020 (Unaudited) | — | $27.12 | (6.17%)(b) | 1.21%(c) | 1.04%(c) | 0.43%(c) | 37% | $76,103 |
| Year Ended 12/31/2019 | — | $29.00 | 33.71%(b) | 1.29%(d) | 1.10%(d),(e) | 0.59% | 46% | $88,922 |
| Year Ended 12/31/2018 | — | $23.81 | (12.28%)(b) | 1.28% | 1.15%(e) | 0.47% | 48% | $69,413 |
| Year Ended 12/31/2017 | — | $29.25 | 35.70%(b) | 1.29% | 1.15%(e) | 0.36% | 49% | $89,266 |
| Year Ended 12/31/2016 | — | $21.61 | 1.18%(b) | 1.26%(g) | 1.19%(g) | 0.74% | 49% | $73,631 |
| Year Ended 12/31/2015 | 0.00(h) | $21.58 | (1.03%)(i) | 1.24% | 1.24% | 1.05% | 59% | $96,311 |
| Institutional 2 Class |
| Six Months Ended 6/30/2020 (Unaudited) | — | $27.36 | (6.12%)(b) | 1.15%(c) | 0.96%(c) | 0.98%(c) | 37% | $67,471 |
| Year Ended 12/31/2019 | — | $29.24 | 33.82%(b) | 1.22%(d) | 1.00%(d) | 0.65% | 46% | $3,392 |
| Year Ended 12/31/2018 | — | $24.01 | (12.16%)(b) | 1.21% | 1.06% | 0.36% | 48% | $1,200 |
| Year Ended 12/31/2017 | — | $29.44 | 35.72%(b) | 1.22% | 1.08% | 0.41% | 49% | $614 |
| Year Ended 12/31/2016 | — | $21.76 | 1.25%(b) | 1.23%(g) | 1.19%(g) | 0.76% | 49% | $440 |
| Year Ended 12/31/2015 | 0.00(h) | $21.72 | (0.94%)(i) | 1.21% | 1.21% | 0.96% | 59% | $2,268 |
The accompanying Notes to Financial Statements are an integral part of this statement.
Columbia Acorn Family of Funds | Semiannual Report 2020
| 79 |
Financial Highlights (continued)
Columbia Acorn International SelectSM
| | Net asset value,
beginning of
period | Net
investment
income
(loss) | Net
realized
and
unrealized
gain (loss) | Total from
investment
operations | Distributions
from net
investment
income | Distributions
from net
realized
gains | Tax
return of
capital | Total
distributions to
shareholders |
| Institutional 3 Class |
| Six Months Ended 6/30/2020 (Unaudited) | $29.22 | 0.08 | (1.87) | (1.79) | (0.09) | — | — | (0.09) |
| Year Ended 12/31/2019 | $24.00 | 0.20 | 7.86 | 8.06 | (0.50) | (2.34) | — | (2.84) |
| Year Ended 12/31/2018 | $29.42 | 0.17 | (3.74) | (3.57) | — | (1.85) | — | (1.85) |
| Year Ended 12/31/2017 | $21.74 | (0.07) | 7.86 | 7.79 | (0.11) | — | — | (0.11) |
| Year Ended 12/31/2016 | $21.71 | 0.16 | 0.12(f) | 0.28 | (0.23) | — | (0.02) | (0.25) |
| Year Ended 12/31/2015 | $22.42 | 0.28 | (0.47) | (0.19) | (0.51) | — | (0.01) | (0.52) |
| Notes to Financial Highlights |
| (a) | In addition to the fees and expenses that the Fund bears directly, the Fund indirectly bears a pro rata share of the fees and expenses of any other funds in which it invests, if any. Such indirect expenses are not included in the Fund’s reported expense ratios. |
| (b) | Had the Investment Manager and/or Transfer Agent not waived fees and/or reimbursed a portion of expenses, total return would have been reduced. |
| (c) | Annualized. |
| (d) | Ratios include line of credit interest expense which is less than 0.01%. |
| (e) | The benefits derived from expense reductions had an impact of less than 0.01%. |
| (f) | Calculation of the net gain (loss) per share (both realized and unrealized) does not correlate to the aggregate realized and unrealized gain (loss) presented in the Statements of Operations due to the timing of subscriptions and redemptions of Fund shares in relation to fluctuations in the market value of the portfolio. |
| (g) | Expenses have been reduced due to a reimbursement of expenses overbilled by a third party. If the reimbursement had been excluded, the expense ratios would have been higher by the percentages shown for each class in the table below. All fee waivers and expense reimbursements by the Investment Manager and its affiliates were applied before giving effect to this third party reimbursement. |
| Year Ended | Class A | Advisor
Class | Class C | Institutional
Class | Institutional 2
Class | Institutional 3
Class |
| 12/31/2016 | 0.06% | 0.06% | 0.06% | 0.06% | 0.04% | 0.09% |
| (h) | Rounds to zero. |
| (i) | The Fund received proceeds from regulatory settlements. Had the Fund not received these proceeds, the total return would have been lower by 0.02%. |
The accompanying Notes to Financial Statements are an integral part of this statement.
| 80 | Columbia Acorn Family of Funds | Semiannual Report 2020 |
Financial Highlights (continued)
Columbia Acorn International SelectSM
| | Proceeds from
regulatory
settlements | Net
asset
value,
end of
period | Total
return | Total gross
expense
ratio to
average
net assets(a) | Total net
expense
ratio to
average
net assets(a) | Net investment
income (loss)
ratio to
average
net assets | Portfolio
turnover | Net
assets,
end of
period
(000’s) |
| Institutional 3 Class |
| Six Months Ended 6/30/2020 (Unaudited) | — | $27.34 | (6.12%)(b) | 1.09%(c) | 0.91%(c) | 0.60%(c) | 37% | $17,005 |
| Year Ended 12/31/2019 | — | $29.22 | 33.90%(b) | 1.16%(d) | 0.96%(d) | 0.72% | 46% | $13,861 |
| Year Ended 12/31/2018 | — | $24.00 | (12.14%)(b) | 1.14% | 1.02% | 0.58% | 48% | $8,627 |
| Year Ended 12/31/2017 | — | $29.42 | 35.81%(b) | 1.17% | 1.03% | (0.24%) | 49% | $7,732 |
| Year Ended 12/31/2016 | — | $21.74 | 1.29%(b) | 1.12%(g) | 1.04%(g) | 0.74% | 49% | $322 |
| Year Ended 12/31/2015 | 0.00(h) | $21.71 | (0.89%)(i) | 1.14% | 1.14% | 1.21% | 59% | $660 |
The accompanying Notes to Financial Statements are an integral part of this statement.
Columbia Acorn Family of Funds | Semiannual Report 2020
| 81 |
Financial Highlights
Columbia Acorn SelectSM
| | Net asset value,
beginning of
period | Net
investment
income
(loss) | Net
realized
and
unrealized
gain (loss) | Total from
investment
operations | Distributions
from net
investment
income | Distributions
from net
realized
gains | Total
distributions to
shareholders |
| Class A |
| Six Months Ended 6/30/2020 (Unaudited) | $11.97 | (0.03) | 0.01 | (0.02) | (0.02) | (0.31) | (0.33) |
| Year Ended 12/31/2019 | $10.34 | (0.05) | 2.96 | 2.91 | — | (1.28) | (1.28) |
| Year Ended 12/31/2018 | $14.62 | (0.00)(f) | (1.52) | (1.52) | — | (2.76) | (2.76) |
| Year Ended 12/31/2017 | $13.13 | (0.03) | 3.31 | 3.28 | — | (1.79) | (1.79) |
| Year Ended 12/31/2016 | $13.94 | (0.04) | 1.56 | 1.52 | — | (2.33) | (2.33) |
| Year Ended 12/31/2015 | $21.03 | (0.09) | 0.14 | 0.05 | — | (7.14) | (7.14) |
| Advisor Class |
| Six Months Ended 6/30/2020 (Unaudited) | $14.90 | (0.02) | 0.02 | 0.00(f) | (0.05) | (0.31) | (0.36) |
| Year Ended 12/31/2019 | $12.59 | (0.03) | 3.62 | 3.59 | — | (1.28) | (1.28) |
| Year Ended 12/31/2018 | $17.19 | 0.04 | (1.85) | (1.81) | — | (2.79) | (2.79) |
| Year Ended 12/31/2017 | $15.13 | 0.01 | 3.84 | 3.85 | — | (1.79) | (1.79) |
| Year Ended 12/31/2016 | $15.69 | (0.00)(f) | 1.77 | 1.77 | — | (2.33) | (2.33) |
| Year Ended 12/31/2015 | $22.75 | (0.04) | 0.12 | 0.08 | — | (7.14) | (7.14) |
| Class C |
| Six Months Ended 6/30/2020 (Unaudited) | $6.31 | (0.04) | (0.02)(g) | (0.06) | — | (0.31) | (0.31) |
| Year Ended 12/31/2019 | $5.98 | (0.08) | 1.69 | 1.61 | — | (1.28) | (1.28) |
| Year Ended 12/31/2018 | $9.59 | (0.08) | (0.88) | (0.96) | — | (2.65) | (2.65) |
| Year Ended 12/31/2017 | $9.22 | (0.09) | 2.25 | 2.16 | — | (1.79) | (1.79) |
| Year Ended 12/31/2016 | $10.51 | (0.10) | 1.14 | 1.04 | — | (2.33) | (2.33) |
| Year Ended 12/31/2015 | $17.69 | (0.19) | 0.15 | (0.04) | — | (7.14) | (7.14) |
| Institutional Class |
| Six Months Ended 6/30/2020 (Unaudited) | $14.18 | (0.02) | 0.01 | (0.01) | (0.05) | (0.31) | (0.36) |
| Year Ended 12/31/2019 | $12.03 | (0.03) | 3.46 | 3.43 | — | (1.28) | (1.28) |
| Year Ended 12/31/2018 | $16.54 | 0.04 | (1.76) | (1.72) | — | (2.79) | (2.79) |
| Year Ended 12/31/2017 | $14.63 | 0.01 | 3.69 | 3.70 | — | (1.79) | (1.79) |
| Year Ended 12/31/2016 | $15.24 | (0.00)(f) | 1.72 | 1.72 | — | (2.33) | (2.33) |
| Year Ended 12/31/2015 | $22.28 | (0.03) | 0.13 | 0.10 | — | (7.14) | (7.14) |
| Institutional 2 Class |
| Six Months Ended 6/30/2020 (Unaudited) | $15.02 | (0.02) | 0.02 | 0.00(f) | (0.06) | (0.31) | (0.37) |
| Year Ended 12/31/2019 | $12.67 | (0.02) | 3.65 | 3.63 | — | (1.28) | (1.28) |
| Year Ended 12/31/2018 | $17.28 | 0.05 | (1.86) | (1.81) | — | (2.80) | (2.80) |
| Year Ended 12/31/2017 | $15.20 | 0.02 | 3.85 | 3.87 | — | (1.79) | (1.79) |
| Year Ended 12/31/2016 | $15.74 | 0.01 | 1.78 | 1.79 | — | (2.33) | (2.33) |
| Year Ended 12/31/2015 | $22.78 | (0.08) | 0.18 | 0.10 | — | (7.14) | (7.14) |
The accompanying Notes to Financial Statements are an integral part of this statement.
| 82 | Columbia Acorn Family of Funds | Semiannual Report 2020 |
Financial Highlights (continued)
Columbia Acorn SelectSM
| | Net
asset
value,
end of
period | Total
return(a) | Total gross
expense
ratio to
average
net assets(b) | Total net
expense
ratio to
average
net assets(b) | Net investment
income (loss)
ratio to
average
net assets | Portfolio
turnover | Net
assets,
end of
period
(000’s) |
| Class A |
| Six Months Ended 6/30/2020 (Unaudited) | $11.62 | 0.38% | 1.41%(c) | 1.20%(c) | (0.60%)(c) | 55% | $86,665 |
| Year Ended 12/31/2019 | $11.97 | 28.53% | 1.39%(d) | 1.17%(d),(e) | (0.43%) | 140% | $96,241 |
| Year Ended 12/31/2018 | $10.34 | (12.71%) | 1.38% | 1.15%(e) | (0.02%) | 60% | $90,911 |
| Year Ended 12/31/2017 | $14.62 | 26.42% | 1.37% | 1.16%(e) | (0.20%) | 41% | $106,330 |
| Year Ended 12/31/2016 | $13.13 | 11.54% | 1.37% | 1.17% | (0.27%) | 75% | $119,364 |
| Year Ended 12/31/2015 | $13.94 | (0.73%) | 1.35%(d) | 1.22%(d) | (0.42%) | 55% | $146,864 |
| Advisor Class |
| Six Months Ended 6/30/2020 (Unaudited) | $14.54 | 0.50% | 1.15%(c) | 0.94%(c) | (0.36%)(c) | 55% | $1,328 |
| Year Ended 12/31/2019 | $14.90 | 28.84% | 1.14%(d) | 0.92%(d),(e) | (0.18%) | 140% | $2,007 |
| Year Ended 12/31/2018 | $12.59 | (12.50%) | 1.13% | 0.90%(e) | 0.22% | 60% | $4,304 |
| Year Ended 12/31/2017 | $17.19 | 26.71% | 1.14% | 0.91%(e) | 0.05% | 41% | $5,590 |
| Year Ended 12/31/2016 | $15.13 | 11.86% | 1.13% | 0.93% | (0.02%) | 75% | $853 |
| Year Ended 12/31/2015 | $15.69 | (0.53%) | 1.12%(d) | 0.99%(d) | (0.18%) | 55% | $932 |
| Class C |
| Six Months Ended 6/30/2020 (Unaudited) | $5.94 | (0.01%) | 2.15%(c) | 1.94%(c) | (1.35%)(c) | 55% | $2,017 |
| Year Ended 12/31/2019 | $6.31 | 27.57% | 2.14%(d) | 1.92%(d),(e) | (1.16%) | 140% | $2,860 |
| Year Ended 12/31/2018 | $5.98 | (13.32%) | 2.13% | 1.90%(e) | (0.83%) | 60% | $3,855 |
| Year Ended 12/31/2017 | $9.59 | 25.40% | 2.12% | 1.91%(e) | (0.95%) | 41% | $22,559 |
| Year Ended 12/31/2016 | $9.22 | 10.67% | 2.11% | 1.91% | (1.01%) | 75% | $27,524 |
| Year Ended 12/31/2015 | $10.51 | (1.41%) | 2.08%(d) | 1.95%(d) | (1.15%) | 55% | $34,589 |
| Institutional Class |
| Six Months Ended 6/30/2020 (Unaudited) | $13.81 | 0.46% | 1.16%(c) | 0.95%(c) | (0.35%)(c) | 55% | $118,508 |
| Year Ended 12/31/2019 | $14.18 | 28.85% | 1.14%(d) | 0.92%(d),(e) | (0.18%) | 140% | $129,407 |
| Year Ended 12/31/2018 | $12.03 | (12.45%) | 1.13% | 0.90%(e) | 0.22% | 60% | $119,465 |
| Year Ended 12/31/2017 | $16.54 | 26.59% | 1.13% | 0.91%(e) | 0.04% | 41% | $157,664 |
| Year Ended 12/31/2016 | $14.63 | 11.88% | 1.10% | 0.90% | (0.02%) | 75% | $144,313 |
| Year Ended 12/31/2015 | $15.24 | (0.44%) | 1.07%(d) | 0.95%(d) | (0.15%) | 55% | $183,642 |
| Institutional 2 Class |
| Six Months Ended 6/30/2020 (Unaudited) | $14.65 | 0.51% | 1.09%(c) | 0.87%(c) | (0.26%)(c) | 55% | $3,226 |
| Year Ended 12/31/2019 | $15.02 | 28.98% | 1.07%(d) | 0.85%(d) | (0.12%) | 140% | $2,872 |
| Year Ended 12/31/2018 | $12.67 | (12.46%) | 1.05% | 0.84% | 0.31% | 60% | $2,027 |
| Year Ended 12/31/2017 | $17.28 | 26.72% | 1.06% | 0.85% | 0.11% | 41% | $1,735 |
| Year Ended 12/31/2016 | $15.20 | 11.96% | 1.05% | 0.85% | 0.07% | 75% | $1,036 |
| Year Ended 12/31/2015 | $15.74 | (0.44%) | 1.02%(d) | 0.95%(d) | (0.33%) | 55% | $911 |
The accompanying Notes to Financial Statements are an integral part of this statement.
Columbia Acorn Family of Funds | Semiannual Report 2020
| 83 |
Financial Highlights (continued)
Columbia Acorn SelectSM
| | Net asset value,
beginning of
period | Net
investment
income
(loss) | Net
realized
and
unrealized
gain (loss) | Total from
investment
operations | Distributions
from net
investment
income | Distributions
from net
realized
gains | Total
distributions to
shareholders |
| Institutional 3 Class |
| Six Months Ended 6/30/2020 (Unaudited) | $15.21 | (0.02) | 0.03 | 0.01 | (0.07) | (0.31) | (0.38) |
| Year Ended 12/31/2019 | $12.82 | (0.01) | 3.68 | 3.67 | — | (1.28) | (1.28) |
| Year Ended 12/31/2018 | $17.43 | 0.06 | (1.86) | (1.80) | — | (2.81) | (2.81) |
| Year Ended 12/31/2017 | $15.31 | 0.02 | 3.89 | 3.91 | — | (1.79) | (1.79) |
| Year Ended 12/31/2016 | $15.83 | 0.02 | 1.79 | 1.81 | — | (2.33) | (2.33) |
| Year Ended 12/31/2015 | $22.86 | 0.00(f) | 0.11 | 0.11 | — | (7.14) | (7.14) |
| Notes to Financial Highlights |
| (a) | Had the Investment Manager and/or Transfer Agent not waived fees and/or reimbursed a portion of expenses, total return would have been reduced. |
| (b) | In addition to the fees and expenses that the Fund bears directly, the Fund indirectly bears a pro rata share of the fees and expenses of any other funds in which it invests, if any. Such indirect expenses are not included in the Fund’s reported expense ratios. |
| (c) | Annualized. |
| (d) | Ratios include line of credit interest expense which is less than 0.01%. |
| (e) | The benefits derived from expense reductions had an impact of less than 0.01%. |
| (f) | Rounds to zero. |
| (g) | Calculation of the net gain (loss) per share (both realized and unrealized) does not correlate to the aggregate realized and unrealized gain (loss) presented in the Statement of Operations due to the timing of subscriptions and redemptions of Fund shares in relation to fluctuations in the market value of the portfolio. |
The accompanying Notes to Financial Statements are an integral part of this statement.
| 84 | Columbia Acorn Family of Funds | Semiannual Report 2020 |
Financial Highlights (continued)
Columbia Acorn SelectSM
| | Net
asset
value,
end of
period | Total
return(a) | Total gross
expense
ratio to
average
net assets(b) | Total net
expense
ratio to
average
net assets(b) | Net investment
income (loss)
ratio to
average
net assets | Portfolio
turnover | Net
assets,
end of
period
(000’s) |
| Institutional 3 Class |
| Six Months Ended 6/30/2020 (Unaudited) | $14.84 | 0.55% | 1.01%(c) | 0.80%(c) | (0.37%)(c) | 55% | $5,889 |
| Year Ended 12/31/2019 | $15.21 | 28.94% | 1.01%(d) | 0.80%(d) | (0.07%) | 140% | $20,461 |
| Year Ended 12/31/2018 | $12.82 | (12.31%) | 0.99% | 0.79% | 0.33% | 60% | $14,834 |
| Year Ended 12/31/2017 | $17.43 | 26.79% | 1.00% | 0.80% | 0.15% | 41% | $15,001 |
| Year Ended 12/31/2016 | $15.31 | 12.02% | 1.00% | 0.80% | 0.10% | 75% | $4,389 |
| Year Ended 12/31/2015 | $15.83 | (0.39%) | 0.98%(d) | 0.85%(d) | 0.02% | 55% | $5,056 |
The accompanying Notes to Financial Statements are an integral part of this statement.
Columbia Acorn Family of Funds | Semiannual Report 2020
| 85 |
Financial Highlights
Columbia Thermostat FundSM
| | Net asset value,
beginning of
period | Net
investment
income | Net
realized
and
unrealized
gain (loss) | Total from
investment
operations | Distributions
from net
investment
income | Distributions
from net
realized
gains | Total
distributions to
shareholders |
| Class A |
| Six Months Ended 6/30/2020 (Unaudited) | $15.12 | 0.11 | 2.16 | 2.27 | (0.01) | (0.19) | (0.20) |
| Year Ended 12/31/2019 | $13.85 | 0.27 | 1.79 | 2.06 | (0.26) | (0.53) | (0.79) |
| Year Ended 12/31/2018 | $14.63 | 0.24 | (0.26) | (0.02) | (0.28) | (0.48) | (0.76) |
| Year Ended 12/31/2017 | $14.60 | 0.25 | 0.50 | 0.75 | (0.50) | (0.22) | (0.72) |
| Year Ended 12/31/2016 | $14.31 | 0.20 | 0.44 | 0.64 | (0.08) | (0.27) | (0.35) |
| Year Ended 12/31/2015 | $14.86 | 0.27 | (0.26) | 0.01 | (0.28) | (0.28) | (0.56) |
| Advisor Class |
| Six Months Ended 6/30/2020 (Unaudited) | $14.97 | 0.13 | 2.14 | 2.27 | (0.01) | (0.19) | (0.20) |
| Year Ended 12/31/2019 | $13.72 | 0.31 | 1.77 | 2.08 | (0.30) | (0.53) | (0.83) |
| Year Ended 12/31/2018 | $14.50 | 0.28 | (0.27) | 0.01 | (0.31) | (0.48) | (0.79) |
| Year Ended 12/31/2017 | $14.47 | 0.29 | 0.50 | 0.79 | (0.54) | (0.22) | (0.76) |
| Year Ended 12/31/2016 | $14.19 | 0.24 | 0.42 | 0.66 | (0.11) | (0.27) | (0.38) |
| Year Ended 12/31/2015 | $14.74 | 0.30 | (0.25) | 0.05 | (0.32) | (0.28) | (0.60) |
| Class C |
| Six Months Ended 6/30/2020 (Unaudited) | $15.23 | 0.05 | 2.17 | 2.22 | (0.01) | (0.19) | (0.20) |
| Year Ended 12/31/2019 | $13.96 | 0.16 | 1.79 | 1.95 | (0.15) | (0.53) | (0.68) |
| Year Ended 12/31/2018 | $14.74 | 0.13 | (0.26) | (0.13) | (0.17) | (0.48) | (0.65) |
| Year Ended 12/31/2017 | $14.62 | 0.14 | 0.51 | 0.65 | (0.31) | (0.22) | (0.53) |
| Year Ended 12/31/2016 | $14.41 | 0.09 | 0.44 | 0.53 | (0.05) | (0.27) | (0.32) |
| Year Ended 12/31/2015 | $14.96 | 0.16 | (0.26) | (0.10) | (0.17) | (0.28) | (0.45) |
| Institutional Class |
| Six Months Ended 6/30/2020 (Unaudited) | $14.88 | 0.13 | 2.13 | 2.26 | (0.01) | (0.19) | (0.20) |
| Year Ended 12/31/2019 | $13.65 | 0.30 | 1.76 | 2.06 | (0.30) | (0.53) | (0.83) |
| Year Ended 12/31/2018 | $14.43 | 0.28 | (0.27) | 0.01 | (0.31) | (0.48) | (0.79) |
| Year Ended 12/31/2017 | $14.40 | 0.29 | 0.50 | 0.79 | (0.54) | (0.22) | (0.76) |
| Year Ended 12/31/2016 | $14.12 | 0.23 | 0.43 | 0.66 | (0.11) | (0.27) | (0.38) |
| Year Ended 12/31/2015 | $14.67 | 0.31 | (0.26) | 0.05 | (0.32) | (0.28) | (0.60) |
| Institutional 2 Class |
| Six Months Ended 6/30/2020 (Unaudited) | $14.99 | 0.13 | 2.15 | 2.28 | (0.01) | (0.19) | (0.20) |
| Year Ended 12/31/2019 | $13.74 | 0.32 | 1.77 | 2.09 | (0.31) | (0.53) | (0.84) |
| Year Ended 12/31/2018 | $14.52 | 0.29 | (0.27) | 0.02 | (0.32) | (0.48) | (0.80) |
| Year Ended 12/31/2017 | $14.49 | 0.29 | 0.50 | 0.79 | (0.54) | (0.22) | (0.76) |
| Year Ended 12/31/2016 | $14.20 | 0.24 | 0.43 | 0.67 | (0.11) | (0.27) | (0.38) |
| Year Ended 12/31/2015 | $14.75 | 0.31 | (0.26) | 0.05 | (0.32) | (0.28) | (0.60) |
The accompanying Notes to Financial Statements are an integral part of this statement.
| 86 | Columbia Acorn Family of Funds | Semiannual Report 2020 |
Financial Highlights (continued)
Columbia Thermostat FundSM
| | Net
asset
value,
end of
period | Total
return(a) | Total gross
expense
ratio to
average
net assets(b) | Total net
expense
ratio to
average
net assets(b) | Net investment
income
ratio to
average
net assets | Portfolio
turnover | Net
assets,
end of
period
(000’s) |
| Class A |
| Six Months Ended 6/30/2020 (Unaudited) | $17.19 | 15.02% | 0.55%(c),(d) | 0.50%(c),(d) | 1.36%(c) | 129% | $336,890 |
| Year Ended 12/31/2019 | $15.12 | 14.94% | 0.58%(d) | 0.50%(d),(e) | 1.81% | 158% | $225,113 |
| Year Ended 12/31/2018 | $13.85 | (0.13%) | 0.56% | 0.50%(e) | 1.66% | 122% | $193,683 |
| Year Ended 12/31/2017 | $14.63 | 5.19% | 0.54% | 0.50%(e) | 1.70% | 33% | $257,752 |
| Year Ended 12/31/2016 | $14.60 | 4.47% | 0.54% | 0.50% | 1.39% | 95% | $398,781 |
| Year Ended 12/31/2015 | $14.31 | 0.07% | 0.52% | 0.50% | 1.82% | 69% | $387,967 |
| Advisor Class |
| Six Months Ended 6/30/2020 (Unaudited) | $17.04 | 15.17% | 0.31%(c),(d) | 0.25%(c),(d) | 1.68%(c) | 129% | $41,643 |
| Year Ended 12/31/2019 | $14.97 | 15.21% | 0.33%(d) | 0.25%(d),(e) | 2.08% | 158% | $16,208 |
| Year Ended 12/31/2018 | $13.72 | 0.12% | 0.31% | 0.25%(e) | 1.91% | 122% | $11,816 |
| Year Ended 12/31/2017 | $14.50 | 5.49% | 0.29% | 0.25%(e) | 1.98% | 33% | $16,227 |
| Year Ended 12/31/2016 | $14.47 | 4.69% | 0.30% | 0.25% | 1.64% | 95% | $15,664 |
| Year Ended 12/31/2015 | $14.19 | 0.33% | 0.28% | 0.25% | 2.06% | 69% | $17,453 |
| Class C |
| Six Months Ended 6/30/2020 (Unaudited) | $17.25 | 14.59% | 1.30%(c),(d) | 1.25%(c),(d) | 0.59%(c) | 129% | $188,898 |
| Year Ended 12/31/2019 | $15.23 | 14.02% | 1.33%(d) | 1.25%(d),(e) | 1.05% | 158% | $156,027 |
| Year Ended 12/31/2018 | $13.96 | (0.88%) | 1.31% | 1.25%(e) | 0.90% | 122% | $166,292 |
| Year Ended 12/31/2017 | $14.74 | 4.48% | 1.29% | 1.25%(e) | 0.96% | 33% | $250,784 |
| Year Ended 12/31/2016 | $14.62 | 3.69% | 1.28% | 1.25% | 0.63% | 95% | $338,930 |
| Year Ended 12/31/2015 | $14.41 | (0.68%) | 1.27% | 1.25% | 1.08% | 69% | $364,684 |
| Institutional Class |
| Six Months Ended 6/30/2020 (Unaudited) | $16.94 | 15.20% | 0.30%(c),(d) | 0.25%(c),(d) | 1.62%(c) | 129% | $461,526 |
| Year Ended 12/31/2019 | $14.88 | 15.14% | 0.33%(d) | 0.25%(d),(e) | 2.06% | 158% | $285,444 |
| Year Ended 12/31/2018 | $13.65 | 0.12% | 0.31% | 0.25%(e) | 1.91% | 122% | $253,123 |
| Year Ended 12/31/2017 | $14.43 | 5.52% | 0.29% | 0.25%(e) | 1.97% | 33% | $320,483 |
| Year Ended 12/31/2016 | $14.40 | 4.72% | 0.28% | 0.25% | 1.64% | 95% | $341,629 |
| Year Ended 12/31/2015 | $14.12 | 0.33% | 0.26% | 0.25% | 2.08% | 69% | $325,159 |
| Institutional 2 Class |
| Six Months Ended 6/30/2020 (Unaudited) | $17.07 | 15.22% | 0.26%(c),(d) | 0.21%(c),(d) | 1.65%(c) | 129% | $89,333 |
| Year Ended 12/31/2019 | $14.99 | 15.25% | 0.28%(d) | 0.21%(d) | 2.16% | 158% | $40,759 |
| Year Ended 12/31/2018 | $13.74 | 0.16% | 0.26% | 0.21% | 1.97% | 122% | $16,478 |
| Year Ended 12/31/2017 | $14.52 | 5.51% | 0.26% | 0.23% | 1.97% | 33% | $13,464 |
| Year Ended 12/31/2016 | $14.49 | 4.77% | 0.27% | 0.24% | 1.66% | 95% | $12,024 |
| Year Ended 12/31/2015 | $14.20 | 0.33% | 0.25% | 0.24% | 2.14% | 69% | $6,114 |
The accompanying Notes to Financial Statements are an integral part of this statement.
Columbia Acorn Family of Funds | Semiannual Report 2020
| 87 |
Financial Highlights (continued)
Columbia Thermostat FundSM
| | Net asset value,
beginning of
period | Net
investment
income | Net
realized
and
unrealized
gain (loss) | Total from
investment
operations | Distributions
from net
investment
income | Distributions
from net
realized
gains | Total
distributions to
shareholders |
| Institutional 3 Class |
| Six Months Ended 6/30/2020 (Unaudited) | $14.96 | 0.14 | 2.14 | 2.28 | (0.01) | (0.19) | (0.20) |
| Year Ended 12/31/2019 | $13.72 | 0.32 | 1.76 | 2.08 | (0.31) | (0.53) | (0.84) |
| Year Ended 12/31/2018 | $14.50 | 0.30 | (0.27) | 0.03 | (0.33) | (0.48) | (0.81) |
| Year Ended 12/31/2017 | $14.46 | 0.30 | 0.51 | 0.81 | (0.55) | (0.22) | (0.77) |
| Year Ended 12/31/2016 | $14.18 | 0.25 | 0.42 | 0.67 | (0.12) | (0.27) | (0.39) |
| Year Ended 12/31/2015 | $14.74 | 0.31 | (0.26) | 0.05 | (0.33) | (0.28) | (0.61) |
| Notes to Financial Highlights |
| (a) | Had the Investment Manager and/or Transfer Agent not waived fees and/or reimbursed a portion of expenses, total return would have been reduced. |
| (b) | In addition to the fees and expenses that the Fund bears directly, the Fund indirectly bears a pro rata share of the fees and expenses of any other funds in which it invests, if any. Such indirect expenses are not included in the Fund’s reported expense ratios. |
| (c) | Annualized. |
| (d) | Ratios include line of credit interest expense which is less than 0.01%. |
| (e) | The benefits derived from expense reductions had an impact of less than 0.01%. |
The accompanying Notes to Financial Statements are an integral part of this statement.
| 88 | Columbia Acorn Family of Funds | Semiannual Report 2020 |
Financial Highlights (continued)
Columbia Thermostat FundSM
| | Net
asset
value,
end of
period | Total
return(a) | Total gross
expense
ratio to
average
net assets(b) | Total net
expense
ratio to
average
net assets(b) | Net investment
income
ratio to
average
net assets | Portfolio
turnover | Net
assets,
end of
period
(000’s) |
| Institutional 3 Class |
| Six Months Ended 6/30/2020 (Unaudited) | $17.04 | 15.25% | 0.23%(c),(d) | 0.17%(c),(d) | 1.79%(c) | 129% | $2,136 |
| Year Ended 12/31/2019 | $14.96 | 15.24% | 0.25%(d) | 0.16%(d) | 2.13% | 158% | $837 |
| Year Ended 12/31/2018 | $13.72 | 0.21% | 0.22% | 0.16% | 2.04% | 122% | $461 |
| Year Ended 12/31/2017 | $14.50 | 5.64% | 0.21% | 0.18% | 2.04% | 33% | $521 |
| Year Ended 12/31/2016 | $14.46 | 4.76% | 0.21% | 0.19% | 1.71% | 95% | $399 |
| Year Ended 12/31/2015 | $14.18 | 0.32% | 0.20% | 0.19% | 2.08% | 69% | $352 |
The accompanying Notes to Financial Statements are an integral part of this statement.
Columbia Acorn Family of Funds | Semiannual Report 2020
| 89 |
Financial Highlights
Columbia Acorn Emerging Markets FundSM
| | Net asset value,
beginning of
period | Net
investment
income
(loss) | Net
realized
and
unrealized
gain (loss) | Total from
investment
operations | Distributions
from net
investment
income | Tax
return of
capital | Total
distributions to
shareholders |
| Class A |
| Six Months Ended 6/30/2020 (Unaudited) | $12.95 | 0.00(b) | (1.85) | (1.85) | — | — | — |
| Year Ended 12/31/2019 | $10.74 | 0.04 | 2.17 | 2.21 | — | — | — |
| Year Ended 12/31/2018 | $13.24 | 0.07 | (2.40) | (2.33) | (0.16) | (0.01) | (0.17) |
| Year Ended 12/31/2017 | $9.84 | (0.02) | 3.42 | 3.40 | — | — | — |
| Year Ended 12/31/2016 | $10.24 | (0.01) | (0.32) | (0.33) | (0.03) | (0.04) | (0.07) |
| Year Ended 12/31/2015 | $12.72 | 0.10 | (2.42) | (2.32) | (0.15) | (0.01) | (0.16) |
| Advisor Class |
| Six Months Ended 6/30/2020 (Unaudited) | $13.12 | 0.03 | (1.89) | (1.86) | — | — | — |
| Year Ended 12/31/2019 | $10.85 | 0.07 | 2.20 | 2.27 | — | — | — |
| Year Ended 12/31/2018 | $13.38 | 0.10 | (2.43) | (2.33) | (0.19) | (0.01) | (0.20) |
| Year Ended 12/31/2017 | $9.92 | 0.02 | 3.44 | 3.46 | — | — | — |
| Year Ended 12/31/2016 | $10.32 | 0.01 | (0.31) | (0.30) | (0.06) | (0.04) | (0.10) |
| Year Ended 12/31/2015 | $12.83 | 0.17 | (2.49) | (2.32) | (0.18) | (0.01) | (0.19) |
| Class C |
| Six Months Ended 6/30/2020 (Unaudited) | $12.73 | (0.03) | (1.83) | (1.86) | — | — | — |
| Year Ended 12/31/2019 | $10.63 | (0.05) | 2.15 | 2.10 | — | — | — |
| Year Ended 12/31/2018 | $13.09 | (0.02) | (2.37) | (2.39) | (0.07) | (0.01) | (0.08) |
| Year Ended 12/31/2017 | $9.80 | (0.09) | 3.38 | 3.29 | — | — | — |
| Year Ended 12/31/2016 | $10.20 | (0.09) | (0.31) | (0.40) | — | — | — |
| Year Ended 12/31/2015 | $12.65 | 0.01 | (2.39) | (2.38) | (0.06) | (0.01) | (0.07) |
| Institutional Class |
| Six Months Ended 6/30/2020 (Unaudited) | $13.04 | 0.02 | (1.87) | (1.85) | — | — | — |
| Year Ended 12/31/2019 | $10.79 | 0.07 | 2.18 | 2.25 | — | — | — |
| Year Ended 12/31/2018 | $13.29 | 0.10 | (2.41) | (2.31) | (0.19) | (0.01) | (0.20) |
| Year Ended 12/31/2017 | $9.85 | 0.03 | 3.41 | 3.44 | — | — | — |
| Year Ended 12/31/2016 | $10.26 | (0.00)(b) | (0.31) | (0.31) | (0.06) | (0.04) | (0.10) |
| Year Ended 12/31/2015 | $12.74 | 0.13 | (2.42) | (2.29) | (0.18) | (0.01) | (0.19) |
| Institutional 2 Class |
| Six Months Ended 6/30/2020 (Unaudited) | $13.14 | 0.00(b) | (1.85) | (1.85) | — | — | — |
| Year Ended 12/31/2019 | $10.86 | 0.07 | 2.21 | 2.28 | — | — | — |
| Year Ended 12/31/2018 | $13.38 | 0.11 | (2.43) | (2.32) | (0.20) | (0.01) | (0.21) |
| Year Ended 12/31/2017 | $9.91 | 0.04 | 3.43 | 3.47 | — | — | — |
| Year Ended 12/31/2016 | $10.32 | (0.02) | (0.28) | (0.30) | (0.07) | (0.04) | (0.11) |
| Year Ended 12/31/2015 | $12.82 | 0.15 | (2.45) | (2.30) | (0.19) | (0.01) | (0.20) |
The accompanying Notes to Financial Statements are an integral part of this statement.
| 90 | Columbia Acorn Family of Funds | Semiannual Report 2020 |
Financial Highlights (continued)
Columbia Acorn Emerging Markets FundSM
| | Reimbursement
from affiliate | Net
asset
value,
end of
period | Total
return | Total gross
expense
ratio to
average
net assets(a) | Total net
expense
ratio to
average
net assets(a) | Net investment
income (loss)
ratio to
average
net assets | Portfolio
turnover | Net
assets,
end of
period
(000’s) |
| Class A |
| Six Months Ended 6/30/2020 (Unaudited) | — | $11.10 | (14.29%)(c) | 2.21%(d),(e) | 1.55%(d),(e) | 0.04%(d) | 42% | $11,824 |
| Year Ended 12/31/2019 | — | $12.95 | 20.58%(c) | 2.14% | 1.54%(f) | 0.33% | 31% | $22,674 |
| Year Ended 12/31/2018 | — | $10.74 | (17.58%)(c),(g) | 2.02%(e) | 1.52%(e),(f) | 0.54% | 53% | $22,442 |
| Year Ended 12/31/2017 | — | $13.24 | 34.55%(c) | 1.98% | 1.70%(f) | (0.14%) | 47% | $33,982 |
| Year Ended 12/31/2016 | — | $9.84 | (3.20%)(c) | 1.84%(e) | 1.84%(e) | (0.11%) | 43% | $49,141 |
| Year Ended 12/31/2015 | — | $10.24 | (18.25%) | 1.67% | 1.67% | 0.88% | 58% | $88,574 |
| Advisor Class |
| Six Months Ended 6/30/2020 (Unaudited) | — | $11.26 | (14.18%)(c) | 2.01%(d),(e) | 1.30%(d),(e) | 0.46%(d) | 42% | $411 |
| Year Ended 12/31/2019 | — | $13.12 | 20.92%(c) | 1.89% | 1.29%(f) | 0.55% | 31% | $797 |
| Year Ended 12/31/2018 | — | $10.85 | (17.39%)(c),(h) | 1.77%(e) | 1.27%(e),(f) | 0.79% | 53% | $828 |
| Year Ended 12/31/2017 | — | $13.38 | 34.88%(c) | 1.73% | 1.43%(f) | 0.19% | 47% | $1,337 |
| Year Ended 12/31/2016 | — | $9.92 | (2.91%) | 1.57%(e) | 1.57%(e) | 0.09% | 43% | $1,306 |
| Year Ended 12/31/2015 | — | $10.32 | (18.04%) | 1.36% | 1.36% | 1.37% | 58% | $3,459 |
| Class C |
| Six Months Ended 6/30/2020 (Unaudited) | — | $10.87 | (14.61%)(c) | 2.98%(d),(e) | 2.30%(d),(e) | (0.53%)(d) | 42% | $5,619 |
| Year Ended 12/31/2019 | — | $12.73 | 19.76%(c) | 2.90% | 2.29%(f) | (0.45%) | 31% | $7,811 |
| Year Ended 12/31/2018 | 0.01 | $10.63 | (18.20%)(c),(i) | 2.76%(e) | 2.26%(e),(f) | (0.20%) | 53% | $9,138 |
| Year Ended 12/31/2017 | — | $13.09 | 33.57%(c) | 2.74% | 2.43%(f) | (0.78%) | 47% | $15,546 |
| Year Ended 12/31/2016 | — | $9.80 | (3.92%)(c) | 2.60%(e) | 2.59%(e) | (0.87%) | 43% | $15,534 |
| Year Ended 12/31/2015 | — | $10.20 | (18.83%) | 2.42% | 2.42% | 0.12% | 58% | $22,953 |
| Institutional Class |
| Six Months Ended 6/30/2020 (Unaudited) | — | $11.19 | (14.19%)(c) | 1.98%(d),(e) | 1.30%(d),(e) | 0.39%(d) | 42% | $13,173 |
| Year Ended 12/31/2019 | — | $13.04 | 20.85%(c) | 1.89% | 1.29%(f) | 0.56% | 31% | $22,305 |
| Year Ended 12/31/2018 | 0.01 | $10.79 | (17.28%)(c),(j) | 1.76%(e) | 1.26%(e),(f) | 0.79% | 53% | $25,476 |
| Year Ended 12/31/2017 | — | $13.29 | 34.92%(c) | 1.74% | 1.42%(f) | 0.28% | 47% | $53,415 |
| Year Ended 12/31/2016 | — | $9.85 | (3.04%)(c) | 1.59%(e) | 1.58%(e) | (0.04%) | 43% | $38,969 |
| Year Ended 12/31/2015 | — | $10.26 | (17.98%) | 1.42% | 1.42% | 1.12% | 58% | $147,688 |
| Institutional 2 Class |
| Six Months Ended 6/30/2020 (Unaudited) | — | $11.29 | (14.08%)(c) | 1.85%(d),(e) | 1.23%(d),(e) | 0.01%(d) | 42% | $246 |
| Year Ended 12/31/2019 | — | $13.14 | 20.99%(c) | 1.81% | 1.22% | 0.61% | 31% | $2,172 |
| Year Ended 12/31/2018 | 0.01 | $10.86 | (17.24%)(c),(k) | 1.69%(e) | 1.19%(e) | 0.88% | 53% | $509 |
| Year Ended 12/31/2017 | — | $13.38 | 35.02%(c) | 1.65% | 1.33% | 0.33% | 47% | $1,030 |
| Year Ended 12/31/2016 | — | $9.91 | (2.90%) | 1.46%(e) | 1.46%(e) | (0.23%) | 43% | $806 |
| Year Ended 12/31/2015 | — | $10.32 | (17.96%) | 1.34% | 1.34% | 1.22% | 58% | $12,643 |
The accompanying Notes to Financial Statements are an integral part of this statement.
Columbia Acorn Family of Funds | Semiannual Report 2020
| 91 |
Financial Highlights (continued)
Columbia Acorn Emerging Markets FundSM
| | Net asset value,
beginning of
period | Net
investment
income
(loss) | Net
realized
and
unrealized
gain (loss) | Total from
investment
operations | Distributions
from net
investment
income | Tax
return of
capital | Total
distributions to
shareholders |
| Institutional 3 Class |
| Six Months Ended 6/30/2020 (Unaudited) | $13.03 | 0.03 | (1.87) | (1.84) | — | — | — |
| Year Ended 12/31/2019 | $10.76 | 0.08 | 2.19 | 2.27 | — | — | — |
| Year Ended 12/31/2018 | $13.27 | 0.12 | (2.41) | (2.29) | (0.21) | (0.01) | (0.22) |
| Year Ended 12/31/2017 | $9.82 | 0.02 | 3.43 | 3.45 | — | — | — |
| Year Ended 12/31/2016 | $10.23 | 0.03 | (0.33) | (0.30) | (0.07) | (0.04) | (0.11) |
| Year Ended 12/31/2015 | $12.71 | 0.15 | (2.43) | (2.28) | (0.19) | (0.01) | (0.20) |
| Notes to Financial Highlights |
| (a) | In addition to the fees and expenses that the Fund bears directly, the Fund indirectly bears a pro rata share of the fees and expenses of any other funds in which it invests, if any. Such indirect expenses are not included in the Fund’s reported expense ratios. |
| (b) | Rounds to zero. |
| (c) | Had the Investment Manager and/or Transfer Agent not waived fees and/or reimbursed a portion of expenses, total return would have been reduced. |
| (d) | Annualized. |
| (e) | Ratios include line of credit interest expense which is less than 0.01%. |
| (f) | The benefits derived from expense reductions had an impact of less than 0.01%. |
| (g) | The Fund received a payment from an affiliate. Had the Fund not received this payment, the total return would have been lower by 0.03%. |
| (h) | The Fund received a payment from an affiliate. Had the Fund not received this payment, the total return would have been lower by 0.02%. |
| (i) | The Fund received a payment from an affiliate. Had the Fund not received this payment, the total return would have been lower by 0.06%. |
| (j) | The Fund received a payment from an affiliate. Had the Fund not received this payment, the total return would have been lower by 0.09%. |
| (k) | The Fund received a payment from an affiliate. Had the Fund not received this payment, the total return would have been lower by 0.07%. |
The accompanying Notes to Financial Statements are an integral part of this statement.
| 92 | Columbia Acorn Family of Funds | Semiannual Report 2020 |
Financial Highlights (continued)
Columbia Acorn Emerging Markets FundSM
| | Reimbursement
from affiliate | Net
asset
value,
end of
period | Total
return | Total gross
expense
ratio to
average
net assets(a) | Total net
expense
ratio to
average
net assets(a) | Net investment
income (loss)
ratio to
average
net assets | Portfolio
turnover | Net
assets,
end of
period
(000’s) |
| Institutional 3 Class |
| Six Months Ended 6/30/2020 (Unaudited) | — | $11.19 | (14.12%)(c) | 1.86%(d),(e) | 1.19%(d),(e) | 0.55%(d) | 42% | $602 |
| Year Ended 12/31/2019 | — | $13.03 | 21.10%(c) | 1.78% | 1.17% | 0.71% | 31% | $879 |
| Year Ended 12/31/2018 | — | $10.76 | (17.27%)(c),(g) | 1.65%(e) | 1.14%(e) | 0.94% | 53% | $693 |
| Year Ended 12/31/2017 | — | $13.27 | 35.13%(c) | 1.59% | 1.14% | 0.16% | 47% | $912 |
| Year Ended 12/31/2016 | — | $9.82 | (2.92%)(c) | 1.45% | 1.45% | 0.29% | 43% | $2 |
| Year Ended 12/31/2015 | — | $10.23 | (17.90%) | 1.27% | 1.27% | 1.24% | 58% | $2 |
The accompanying Notes to Financial Statements are an integral part of this statement.
Columbia Acorn Family of Funds | Semiannual Report 2020
| 93 |
Financial Highlights
Columbia Acorn European FundSM
| | Net asset value,
beginning of
period | Net
investment
income
(loss) | Net
realized
and
unrealized
gain (loss) | Total from
investment
operations | Distributions
from net
investment
income | Total
distributions to
shareholders |
| Class A |
| Six Months Ended 6/30/2020 (Unaudited) | $22.52 | (0.02) | (1.44) | (1.46) | (0.13) | (0.13) |
| Year Ended 12/31/2019 | $15.56 | 0.06 | 7.09 | 7.15 | (0.19) | (0.19) |
| Year Ended 12/31/2018 | $19.27 | 0.11 | (3.70) | (3.59) | (0.12) | (0.12) |
| Year Ended 12/31/2017 | $14.12 | 0.06 | 5.28 | 5.34 | (0.19) | (0.19) |
| Year Ended 12/31/2016 | $14.75 | 0.16 | (0.67) | (0.51) | (0.12) | (0.12) |
| Year Ended 12/31/2015 | $14.34 | 0.10 | 0.50 | 0.60 | (0.19) | (0.19) |
| Advisor Class |
| Six Months Ended 6/30/2020 (Unaudited) | $22.70 | (0.00)(f) | (1.45) | (1.45) | (0.13) | (0.13) |
| Year Ended 12/31/2019 | $15.68 | 0.12 | 7.13 | 7.25 | (0.23) | (0.23) |
| Year Ended 12/31/2018 | $19.36 | 0.19 | (3.75) | (3.56) | (0.12) | (0.12) |
| Year Ended 12/31/2017 | $14.18 | 0.10 | 5.32 | 5.42 | (0.24) | (0.24) |
| Year Ended 12/31/2016 | $14.82 | 0.17 | (0.65) | (0.48) | (0.16) | (0.16) |
| Year Ended 12/31/2015 | $14.40 | 0.24 | 0.41 | 0.65 | (0.23) | (0.23) |
| Class C |
| Six Months Ended 6/30/2020 (Unaudited) | $22.15 | (0.09) | (1.43) | (1.52) | (0.13) | (0.13) |
| Year Ended 12/31/2019 | $15.33 | (0.06) | 6.93 | 6.87 | (0.05) | (0.05) |
| Year Ended 12/31/2018 | $19.12 | (0.02) | (3.65) | (3.67) | (0.12) | (0.12) |
| Year Ended 12/31/2017 | $13.99 | (0.04) | 5.21 | 5.17 | (0.04) | (0.04) |
| Year Ended 12/31/2016 | $14.63 | 0.03 | (0.64) | (0.61) | (0.03) | (0.03) |
| Year Ended 12/31/2015 | $14.16 | (0.00)(f) | 0.48 | 0.48 | (0.01) | (0.01) |
| Institutional Class |
| Six Months Ended 6/30/2020 (Unaudited) | $22.59 | 0.00(f) | (1.45) | (1.45) | (0.13) | (0.13) |
| Year Ended 12/31/2019 | $15.60 | 0.12 | 7.10 | 7.22 | (0.23) | (0.23) |
| Year Ended 12/31/2018 | $19.27 | 0.15 | (3.70) | (3.55) | (0.12) | (0.12) |
| Year Ended 12/31/2017 | $14.11 | 0.14 | 5.26 | 5.40 | (0.24) | (0.24) |
| Year Ended 12/31/2016 | $14.75 | 0.19 | (0.67) | (0.48) | (0.16) | (0.16) |
| Year Ended 12/31/2015 | $14.34 | 0.15 | 0.49 | 0.64 | (0.23) | (0.23) |
| Institutional 2 Class |
| Six Months Ended 6/30/2020 (Unaudited) | $22.84 | 0.01 | (1.46) | (1.45) | (0.13) | (0.13) |
| Year Ended 12/31/2019 | $15.78 | 0.14 | 7.17 | 7.31 | (0.25) | (0.25) |
| Year Ended 12/31/2018 | $19.46 | 0.19 | (3.75) | (3.56) | (0.12) | (0.12) |
| Year Ended 12/31/2017 | $14.25 | 0.20 | 5.25 | 5.45 | (0.24) | (0.24) |
| Year Ended 12/31/2016 | $14.89 | 0.18 | (0.66) | (0.48) | (0.16) | (0.16) |
| Year Ended 12/31/2015 | $14.47 | 0.15 | 0.50 | 0.65 | (0.23) | (0.23) |
The accompanying Notes to Financial Statements are an integral part of this statement.
| 94 | Columbia Acorn Family of Funds | Semiannual Report 2020 |
Financial Highlights (continued)
Columbia Acorn European FundSM
| | Net
asset
value,
end of
period | Total
return(a) | Total gross
expense
ratio to
average
net assets(b) | Total net
expense
ratio to
average
net assets(b) | Net investment
income (loss)
ratio to
average
net assets | Portfolio
turnover | Net
assets,
end of
period
(000’s) |
| Class A |
| Six Months Ended 6/30/2020 (Unaudited) | $20.93 | (6.50%) | 1.84%(c),(d) | 1.45%(c),(d) | (0.22%)(c) | 24% | $27,020 |
| Year Ended 12/31/2019 | $22.52 | 45.96% | 1.88% | 1.44% | 0.33% | 30% | $33,361 |
| Year Ended 12/31/2018 | $15.56 | (18.78%) | 1.81%(d) | 1.45%(d) | 0.57% | 39% | $22,870 |
| Year Ended 12/31/2017 | $19.27 | 37.89% | 1.94% | 1.58%(e) | 0.33% | 34% | $32,487 |
| Year Ended 12/31/2016 | $14.12 | (3.47%) | 2.00% | 1.75% | 1.07% | 40% | $26,269 |
| Year Ended 12/31/2015 | $14.75 | 4.17% | 2.06% | 1.75% | 0.67% | 37% | $40,368 |
| Advisor Class |
| Six Months Ended 6/30/2020 (Unaudited) | $21.12 | (6.41%) | 1.58%(c),(d) | 1.20%(c),(d) | (0.01%)(c) | 24% | $1,176 |
| Year Ended 12/31/2019 | $22.70 | 46.30% | 1.63% | 1.19% | 0.60% | 30% | $1,906 |
| Year Ended 12/31/2018 | $15.68 | (18.53%) | 1.55%(d) | 1.19%(d) | 0.97% | 39% | $1,496 |
| Year Ended 12/31/2017 | $19.36 | 38.29% | 1.71% | 1.28%(e) | 0.55% | 34% | $2,942 |
| Year Ended 12/31/2016 | $14.18 | (3.27%) | 1.79% | 1.50% | 1.15% | 40% | $362 |
| Year Ended 12/31/2015 | $14.82 | 4.48% | 1.81% | 1.50% | 1.59% | 37% | $408 |
| Class C |
| Six Months Ended 6/30/2020 (Unaudited) | $20.50 | (6.88%) | 2.59%(c),(d) | 2.20%(c),(d) | (0.96%)(c) | 24% | $4,924 |
| Year Ended 12/31/2019 | $22.15 | 44.79% | 2.64% | 2.19% | (0.30%) | 30% | $6,186 |
| Year Ended 12/31/2018 | $15.33 | (19.34%) | 2.56%(d) | 2.20%(d) | (0.12%) | 39% | $8,770 |
| Year Ended 12/31/2017 | $19.12 | 36.95% | 2.69% | 2.31%(e) | (0.25%) | 34% | $13,965 |
| Year Ended 12/31/2016 | $13.99 | (4.21%) | 2.75% | 2.50% | 0.18% | 40% | $7,112 |
| Year Ended 12/31/2015 | $14.63 | 3.41% | 2.82% | 2.50% | (0.02%) | 37% | $7,220 |
| Institutional Class |
| Six Months Ended 6/30/2020 (Unaudited) | $21.01 | (6.44%) | 1.59%(c),(d) | 1.20%(c),(d) | 0.02%(c) | 24% | $33,458 |
| Year Ended 12/31/2019 | $22.59 | 46.35% | 1.63% | 1.19% | 0.64% | 30% | $49,616 |
| Year Ended 12/31/2018 | $15.60 | (18.57%) | 1.56%(d) | 1.20%(d) | 0.80% | 39% | $32,813 |
| Year Ended 12/31/2017 | $19.27 | 38.35% | 1.69% | 1.29%(e) | 0.77% | 34% | $48,965 |
| Year Ended 12/31/2016 | $14.11 | (3.29%) | 1.73% | 1.50% | 1.29% | 40% | $11,345 |
| Year Ended 12/31/2015 | $14.75 | 4.43% | 1.78% | 1.50% | 1.01% | 37% | $11,766 |
| Institutional 2 Class |
| Six Months Ended 6/30/2020 (Unaudited) | $21.26 | (6.37%) | 1.55%(c),(d) | 1.14%(c),(d) | 0.11%(c) | 24% | $3,677 |
| Year Ended 12/31/2019 | $22.84 | 46.33% | 1.60% | 1.13% | 0.73% | 30% | $2,175 |
| Year Ended 12/31/2018 | $15.78 | (18.44%) | 1.50%(d) | 1.13%(d) | 0.96% | 39% | $2,554 |
| Year Ended 12/31/2017 | $19.46 | 38.32% | 1.64% | 1.28% | 1.14% | 34% | $3,988 |
| Year Ended 12/31/2016 | $14.25 | (3.23%) | 1.68% | 1.47% | 1.26% | 40% | $1,262 |
| Year Ended 12/31/2015 | $14.89 | 4.48% | 1.75% | 1.48% | 0.98% | 37% | $2,122 |
The accompanying Notes to Financial Statements are an integral part of this statement.
Columbia Acorn Family of Funds | Semiannual Report 2020
| 95 |
Financial Highlights (continued)
Columbia Acorn European FundSM
| | Net asset value,
beginning of
period | Net
investment
income
(loss) | Net
realized
and
unrealized
gain (loss) | Total from
investment
operations | Distributions
from net
investment
income | Total
distributions to
shareholders |
| Institutional 3 Class |
| Six Months Ended 6/30/2020 (Unaudited) | $22.48 | 0.01 | (1.44) | (1.43) | (0.13) | (0.13) |
| Year Ended 12/31/2019 | $15.53 | 0.14 | 7.06 | 7.20 | (0.25) | (0.25) |
| Year Ended 12/31/2018 | $19.17 | (0.04) | (3.48) | (3.52) | (0.12) | (0.12) |
| Year Ended 12/31/2017(g) | $15.02 | 0.03 | 4.40 | 4.43 | (0.28) | (0.28) |
| Notes to Financial Highlights |
| (a) | Had the Investment Manager and/or Transfer Agent not waived fees and/or reimbursed a portion of expenses, total return would have been reduced. |
| (b) | In addition to the fees and expenses that the Fund bears directly, the Fund indirectly bears a pro rata share of the fees and expenses of any other funds in which it invests, if any. Such indirect expenses are not included in the Fund’s reported expense ratios. |
| (c) | Annualized. |
| (d) | Ratios include line of credit interest expense which is less than 0.01%. |
| (e) | The benefits derived from expense reductions had an impact of less than 0.01%. |
| (f) | Rounds to zero. |
| (g) | Institutional 3 Class shares commenced operations on March 1, 2017. Per share data and total return reflect activity from that date. |
The accompanying Notes to Financial Statements are an integral part of this statement.
| 96 | Columbia Acorn Family of Funds | Semiannual Report 2020 |
Financial Highlights (continued)
Columbia Acorn European FundSM
| | Net
asset
value,
end of
period | Total
return(a) | Total gross
expense
ratio to
average
net assets(b) | Total net
expense
ratio to
average
net assets(b) | Net investment
income (loss)
ratio to
average
net assets | Portfolio
turnover | Net
assets,
end of
period
(000’s) |
| Institutional 3 Class |
| Six Months Ended 6/30/2020 (Unaudited) | $20.92 | (6.38%) | 1.49%(c),(d) | 1.09%(c),(d) | 0.07%(c) | 24% | $3 |
| Year Ended 12/31/2019 | $22.48 | 46.42% | 1.54% | 1.09% | 0.74% | 30% | $19 |
| Year Ended 12/31/2018 | $15.53 | (18.51%) | 1.41%(d) | 1.08%(d) | (0.21%) | 39% | $3 |
| Year Ended 12/31/2017(g) | $19.17 | 29.55% | 1.58%(c) | 1.09%(c) | 0.17%(c) | 34% | $210 |
The accompanying Notes to Financial Statements are an integral part of this statement.
Columbia Acorn Family of Funds | Semiannual Report 2020
| 97 |
Notes to Financial Statements
June 30, 2020 (Unaudited)
Note 1. Organization
Columbia Acorn® Fund, Columbia Acorn International®, Columbia Acorn USA®, Columbia Acorn International SelectSM, Columbia Acorn SelectSM, Columbia Thermostat FundSM, Columbia Acorn Emerging Markets FundSM and Columbia Acorn European FundSM (each a Fund and collectively, the Funds) are each a series of Columbia Acorn Trust (the Trust). The Trust is registered under the Investment Company Act of 1940, as amended (the 1940 Act), as an open-end management investment company organized as a Massachusetts business trust. The investment objective of each Fund is to seek long-term capital appreciation.
Columbia Thermostat FundSM pursues its investment objective by investing in shares of other mutual funds. As a “fund of funds”, under normal circumstances, the Fund allocates at least 95% of its net assets among a selected group of affiliated funds (underlying funds) according to the current level of the Standard & Poor’s (S&P) 500 Index in relation to predetermined ranges set by Columbia Wanger Asset Management, LLC (the Investment Manager or CWAM). The Fund may invest up to 5% of its net assets plus any cash received that day in cash, repurchase agreements, high quality short-term paper and government securities.
Fund shares
The Trust and each Fund may issue an unlimited number of shares (without par value). Each Fund currently offers each of the share classes listed in the Statement of Assets and Liabilities.
Although all share classes generally have identical voting, dividend and liquidation rights, each share class votes separately when required by the Trust’s organizational documents or by law. Different share classes pay shareholders different distribution amounts to the extent the expenses of the share classes differ, and the amount of distributions in the event of a Fund’s liquidation will be proportional to the net asset value of each share class of the Fund. Each share class has its own fees (sales charges), expenses and other features. These, together with information about certain conflicts of interest associated with the fees and expenses paid by certain share classes, are discussed fully in each Fund’s prospectus and Statement of Additional Information (SAI).
As described in each Fund’s prospectus, Class A and Class C shares are available to all investors. Class C shares automatically convert to Class A shares after 10 years. Advisor Class, Institutional Class, Institutional 2 Class and Institutional 3 Class are available through authorized investment professionals to retirement plans and to certain other institutional investors described in each Fund’s prospectus. Class R shares are available to retirement and health savings plans and other institutional investors.
Investment income, realized and unrealized gains and losses, and certain fund-level expenses are allocated pro rata on the basis of the relative net assets of all classes, except that each class bears certain expenses specific to that class such as distribution services, transfer agent fees, and certain other class specific expenses. Differences in class expenses may result in payment of different dividend distributions for each class. All of the Funds’ share classes have equal rights with respect to voting, subject to Fund or class-specific matters.
Note 2. Summary of significant accounting policies
Basis of preparation
Each Fund is an investment company that applies the accounting and reporting guidance in the Financial Accounting Standards Board (FASB) Accounting Standards Codification Topic 946, Financial Services - Investment Companies (ASC 946). The financial statements are prepared in accordance with U.S. generally accepted accounting principles (GAAP), which requires management to make certain estimates and assumptions that affect the reported amounts of assets and liabilities, the disclosure of contingent assets and liabilities at the date of the financial statements and the reported amounts of income and expenses during the reporting period. Actual results could differ from those estimates.
The following is a summary of significant accounting policies followed by the Funds in the preparation of their financial statements.
| 98 | Columbia Acorn Family of Funds | Semiannual Report 2020 |
Notes to Financial Statements (continued)
June 30, 2020 (Unaudited)
Security valuation
Securities of the Funds are valued at market value or, if a market quotation for a security is not readily available or is deemed not to be reliable because of events or circumstances that have occurred between the market quotation and the time as of which the security is to be valued, the security is valued at a fair value determined in good faith under consistently applied procedures established by the Board of Trustees. With respect to Columbia Thermostat FundSM, investments in underlying funds are valued at their net asset values as reported by the underlying funds. A security listed on a national securities exchange is valued at the exchange official closing price. A security traded on the over-the-counter market is valued at the mean of the latest bid and ask the prices at the time of valuation. A security for which there is no reported sale on the valuation date is valued by the mean of the latest bid and ask quotations.
Foreign equity securities are generally valued based on the closing price on the foreign exchange in which such securities are primarily traded. If any foreign equity security closing prices are not readily available, the securities are valued at the mean of the latest quoted bid and ask prices on such exchanges or markets. Foreign currency exchange rates are determined at the scheduled closing time of the New York Stock Exchange. Many securities markets and exchanges outside the U.S. close prior to the close of the New York Stock Exchange; therefore, the closing prices for securities in such markets or on such exchanges may not fully reflect events that occur after such close but before the close of the New York Stock Exchange. In situations where foreign markets are closed, where a significant event has occurred after the foreign exchange closes but before the time at which the Fund’s share price is calculated, and in the event of significant movement in the trigger index for the statistical fair valuation process established by the Board of Trustees, foreign securities will be fair valued pursuant to a policy adopted by the Board of Trustees. Under the policy, the Fund may use an independent statistical fair value pricing service that employs a systematic methodology to assist in the fair valuation process for securities principally traded in a foreign market in order to adjust for possible changes in value that may occur between the close of the foreign market and the time as of which the securities are to be valued. If a security is valued at a fair value, that value may be different from the last quoted market price for the security.
Short-term investments maturing in 60 days or less are primarily valued at amortized cost, which approximates market value.
Futures contracts are valued based upon the settlement price at the close of regular trading on their principal exchanges or, in the absence of transactions, at the mean of the latest quoted bid and ask prices.
Foreign currency transactions and translations
Values of investments denominated in foreign currencies are converted into U.S. dollars using the New York spot market rate of exchange at the time of valuation. Purchases and sales of investments and dividend and interest income are translated into U.S. dollars using the spot market rate of exchange prevailing on the respective dates of such transactions. The gain or loss resulting from changes in foreign exchange rates is included with net realized and unrealized gain or loss from investments, as appropriate.
Derivative instruments
Derivatives may involve various risks, including the potential inability of the counterparty to fulfill its obligation under the terms of the contract, the potential for an illiquid secondary market (making it difficult for the Fund to sell, including at favorable prices) and the potential for market movements which may expose the Fund to gains or losses in excess of the amount shown in the Statements of Assets and Liabilities.
For financial reporting purposes, the Funds do not offset derivative assets and derivative liabilities that are subject to netting arrangements in the Statements of Assets and Liabilities.
Futures contracts
Futures contracts are exchange-traded and represent commitments for the future purchase or sale of an asset at a specified price on a specified date. Columbia Acorn® Fund, Columbia Acorn International®, Columbia Acorn USA®, Columbia Acorn SelectSM and Columbia Acorn Emerging Markets FundSM bought and sold futures contracts during the six months ended June 30, 2020 to maintain appropriate equity market exposure while keeping sufficient cash to accommodate daily redemptions. These instruments may be used for other purposes in future periods. Upon entering into futures contracts, a
Columbia Acorn Family of Funds | Semiannual Report 2020
| 99 |
Notes to Financial Statements (continued)
June 30, 2020 (Unaudited)
Fund bears risks that it may not achieve the anticipated benefits of the futures contracts and may realize a loss. Additional risks include counterparty credit risk, the possibility of an illiquid market, and that a change in the value of the contract or option may not correlate with changes in the value of the underlying asset.
Upon entering into a futures contract, the Fund deposits cash or securities with the broker, known as a futures commission merchant (FCM), in an amount sufficient to meet the initial margin requirement. The initial margin deposit must be maintained at an established level over the life of the contract. Cash deposited as initial margin is recorded in the Statement of Assets and Liabilities as margin deposits. Securities deposited as initial margin are designated in the Portfolio of Investments. Subsequent payments (variation margin) are made or received by the Fund each day. The variation margin payments are equal to the daily change in the contract value and are recorded as variation margin receivable or payable and are offset in unrealized gains or losses. The Fund recognizes a realized gain or loss when the contract is closed or expires. Futures contracts involve, to varying degrees, risk of loss in excess of the variation margin disclosed in the Statement of Assets and Liabilities.
Effects of derivative transactions in the financial statements
The following tables are intended to provide additional information about the effect of derivatives on the financial statements of Columbia Acorn® Fund, Columbia Acorn International®, Columbia Acorn USA®, Columbia Acorn SelectSM and Columbia Acorn Emerging Markets FundSM including: the fair value of derivatives by risk category and the location of those fair values in the Statements of Assets and Liabilities; and the impact of derivative transactions over the period in the Statements of Operations, including realized gains or losses and unrealized gains or losses. The derivative schedules following the Portfolio of Investments present additional information regarding derivative instruments outstanding at the end of the period, if any.
Columbia Acorn® Fund
At June 30, 2020, the Fund had no outstanding derivatives.
The following table indicates the effect of derivative instruments (not considered to be hedging instruments for accounting disclosure purposes) in the Statement of Operations for the six months ended June 30, 2020:
| Amount of realized gain (loss) on derivatives recognized in income |
| Risk exposure category | Futures
contracts
($) |
| Equity risk | 278,742 |
The following table is a summary of the average outstanding volume by derivative instrument for the six months ended June 30, 2020:
| Derivative instrument | Average notional
amounts ($)* |
| Futures contracts — long | 972,039 |
| * | Based on the ending daily outstanding amounts for the six months ended June 30, 2020. |
Columbia Acorn International®
The following table is a summary of the fair value of derivative instruments (not considered to be hedging instruments for accounting disclosure purposes) at June 30, 2020:
| | Asset derivatives | |
Risk exposure
category | Statement
of assets and liabilities
location | Fair value ($) |
| Equity risk | Component of total distributable earnings (loss) — unrealized appreciation on futures contracts | 1,000,812* |
| * | Includes cumulative appreciation (depreciation) as reported in the tables following the Portfolio of Investments. Only the current day’s variation margin is reported in receivables or payables in the Statement of Assets and Liabilities. |
| 100 | Columbia Acorn Family of Funds | Semiannual Report 2020 |
Notes to Financial Statements (continued)
June 30, 2020 (Unaudited)
The following table indicates the effect of derivative instruments (not considered to be hedging instruments for accounting disclosure purposes) in the Statement of Operations for the six months ended June 30, 2020:
| Amount of realized gain (loss) on derivatives recognized in income |
| Risk exposure category | Futures
contracts
($) |
| Equity risk | 16,049,936 |
| |
| Change in unrealized appreciation (depreciation) on derivatives recognized in income |
| Risk exposure category | Futures
contracts
($) |
| Equity risk | 867,976 |
The following table is a summary of the average outstanding volume by derivative instrument for the six months ended June 30, 2020:
| Derivative instrument | Average notional
amounts ($)* |
| Futures contracts — long | 95,577,293 |
| * | Based on the ending quarterly outstanding amounts for the six months ended June 30, 2020. |
Columbia Acorn USA®
At June 30, 2020, the Fund had no outstanding derivatives.
The following table indicates the effect of derivative instruments (not considered to be hedging instruments for accounting disclosure purposes) in the Statement of Operations for the six months ended June 30, 2020:
| Amount of realized gain (loss) on derivatives recognized in income |
| Risk exposure category | Futures
contracts
($) |
| Equity risk | 141,608 |
The following table is a summary of the average outstanding volume by derivative instrument for the six months ended June 30, 2020:
| Derivative instrument | Average notional
amounts ($)* |
| Futures contracts — long | 3,434,670 |
| * | Based on the ending daily outstanding amounts for the six months ended June 30, 2020. |
Columbia Acorn SelectSM
At June 30, 2020, the Fund had no outstanding derivatives.
The following table indicates the effect of derivative instruments (not considered to be hedging instruments for accounting disclosure purposes) in the Statement of Operations for the six months ended June 30, 2020:
| Amount of realized gain (loss) on derivatives recognized in income |
| Risk exposure category | Futures
contracts
($) |
| Equity risk | 3,689,005 |
Columbia Acorn Family of Funds | Semiannual Report 2020
| 101 |
Notes to Financial Statements (continued)
June 30, 2020 (Unaudited)
The following table is a summary of the average outstanding volume by derivative instrument for the six months ended June 30, 2020:
| Derivative instrument | Average notional
amounts ($)* |
| Futures contracts — long | 3,835,190 |
| * | Based on the ending daily outstanding amounts for the six months ended June 30, 2020. |
Columbia Acorn Emerging Markets FundSM
The following table is a summary of the fair value of derivative instruments (not considered to be hedging instruments for accounting disclosure purposes) at June 30, 2020:
| | Asset derivatives | |
Risk exposure
category | Statement
of assets and liabilities
location | Fair value ($) |
| Equity risk | Component of total distributable earnings (loss) — unrealized appreciation on futures contracts | 26,833* |
| * | Includes cumulative appreciation (depreciation) as reported in the tables following the Portfolio of Investments. Only the current day’s variation margin is reported in receivables or payables in the Statement of Assets and Liabilities. |
The following table indicates the effect of derivative instruments (not considered to be hedging instruments for accounting disclosure purposes) in the Statement of Operations for the six months ended June 30, 2020:
| Amount of realized gain (loss) on derivatives recognized in income |
| Risk exposure category | Futures
contracts
($) |
| Equity risk | (543,282) |
| |
| Change in unrealized appreciation (depreciation) on derivatives recognized in income |
| Risk exposure category | Futures
contracts
($) |
| Equity risk | 26,833 |
The following table is a summary of the average outstanding volume by derivative instrument for the six months ended June 30, 2020:
| Derivative instrument | Average notional
amounts ($)* |
| Futures contracts — long | 2,422,200 |
| * | Based on the ending quarterly outstanding amounts for the six months ended June 30, 2020. |
Security transactions and investment income
Security transactions, investment income and shareholder fund transactions are accounted for on the trade date (date the order to buy or sell is executed) and dividend income and realized gain distributions from other funds are recorded on the ex-dividend date, except that certain dividends from foreign securities are recorded as soon as the information is available to the Funds. Interest income is recorded on the accrual basis and includes amortization of discounts on debt obligations when required for federal income tax purposes. Realized gains and losses from security transactions are recorded on an identified cost basis.
Awards, if any, from class action litigation related to securities owned may be recorded as a reduction of cost of those securities. If the applicable securities are no longer owned, the proceeds are recorded as realized gains.
| 102 | Columbia Acorn Family of Funds | Semiannual Report 2020 |
Notes to Financial Statements (continued)
June 30, 2020 (Unaudited)
The Funds may receive distributions from holdings in exchange-traded funds (ETFs), limited partnerships (LPs), other regulated investment companies (RICs), and real estate investment trusts (REITs), which report information as to the character of their distributions annually. These distributions are allocated to dividend income, capital gain and return of capital based on actual information reported. To the extent actual information has not yet been reported by the REITs, estimates for return of capital may be made by the Funds’ management. Return of capital is recorded as a reduction of the cost basis of securities held. If the Funds no longer own the applicable securities, return of capital is recorded as a realized gain. Management’s estimates are subsequently adjusted when the actual character of the distributions is disclosed by the REITs, which could result in a proportionate change in return of capital to shareholders. No estimates are made for ETFs and RICs.
Fund share valuation
Fund shares are sold and redeemed on a daily basis at net asset value, subject to any applicable sales charge. Net asset value per share is determined daily as of the close of trading on the New York Stock Exchange (NYSE) on each day the NYSE is open for trading. Generally, income, expenses and realized and unrealized gain/(losses) of a Fund are allocated to each class proportionately on a daily basis for purposes of determining the net asset value of each class. The distribution and service fees and transfer agent fees are charged to each specific class as expenses are incurred. Redemption fees are accounted for as an addition to paid in capital for purposes of determining the net asset value of each class.
Securities lending
Each Fund, except Columbia Thermostat FundSM, may lend securities up to one-third of the value of its total assets to certain approved brokers, dealers, banks and or other institutional borrowers of securities that the Funds’ securities lending agent has determined are credit worthy under guidelines established by the Board of Trustees, to earn additional income. The Funds retain the benefits of owning the securities, including the economic equivalent of dividends or interest generated by the security. The Funds also receive a fee for the loan. The Funds have the ability to recall the loans at any time and could do so in order to vote proxies or to sell the loaned securities. Each loan is collateralized by cash that exceeds the value of the securities on loan. The market value of the loaned securities is determined daily at the close of business of a Fund and any additional required collateral is delivered to the Fund on the next business day. The Funds have elected to invest the cash collateral in the Dreyfus Government Cash Management Fund, a third-party institutional government money market fund in accordance with investment guidelines contained in the securities lending agreement and approved by the Board of Trustees. The income earned from the securities lending program is paid to each Fund, net of any fees remitted to Goldman Sachs Agency Lending, the Funds’ lending agent, and net of any borrower rebates. The Investment Manager does not retain any fees earned by the lending program. Generally, in the event of borrower default, a Fund has the right to use the collateral to offset any losses incurred. In the event a Fund is delayed or prevented from exercising its right to dispose of the collateral, there may be a potential loss to the Fund. Some of these losses may be indemnified by the lending agent. The Funds bear the risk of loss with respect to the investment of collateral. The net securities lending income earned as of June 30, 2020 by each Fund is included in the Statements of Operations.
Offsetting of assets and liabilities
The following table presents the Funds’ gross and net amount of assets and liabilities available for offset under netting agreements and under a securities lending agreement as well as the related collateral received by each Fund with securities on loan as of June 30, 2020:
| | Columbia
Acorn® Fund | Columbia Acorn
International® | Columbia
Acorn USA® | Columbia Acorn
European FundSM |
| | Goldman
Sachs ($) | Goldman
Sachs ($) | Goldman
Sachs ($) | Goldman
Sachs ($) |
| Liabilities | | | | |
| Collateral on Securities Loaned | 32,820,950 | 21,620,386 | 4,076,000 | 601,387 |
| Total Liabilities | 32,820,950 | 21,620,386 | 4,076,000 | 601,387 |
| Total Financial and Derivative Net Assets | (32,820,950) | (21,620,386) | (4,076,000) | (601,387) |
| Financial Instruments | 32,941,685 | 20,316,271 | 4,235,117 | 574,506 |
| Net Amount (a) | 120,735 | (1,304,115) | 159,117 | (26,881) |
Columbia Acorn Family of Funds | Semiannual Report 2020
| 103 |
Notes to Financial Statements (continued)
June 30, 2020 (Unaudited)
| (a) | Represents the net amount due from/(to) counterparties in the event of default. |
Securities lending transactions
The following table indicates the total amount of securities loaned by type, reconciled to gross liability payable upon return of the securities loaned by the Funds as of June 30, 2020:
| | Overnight and
continuous | Up to
30 days | 30-90
days | Greater than
90 days | Total |
| Columbia Acorn® Fund | | | | | |
| Securities lending transactions | | | | | |
| Equity securities | $32,941,685 | $— | $— | $— | $32,941,685 |
| Gross amount of recognized liabilities for securities lending (collateral received) | | | | | 32,820,950 |
| Amounts due to counterparty in the event of default | | | | | $(120,735) |
| Columbia Acorn International® | | | | | |
| Securities lending transactions | | | | | |
| Equity securities | $20,316,271 | $— | $— | $— | $20,316,271 |
| Gross amount of recognized liabilities for securities lending (collateral received) | | | | | 21,620,386 |
| Amounts due to counterparty in the event of default | | | | | $1,304,115 |
| Columbia Acorn USA® | | | | | |
| Securities lending transactions | | | | | |
| Equity securities | $4,235,117 | $— | $— | $— | $4,235,117 |
| Gross amount of recognized liabilities for securities lending (collateral received) | | | | | 4,076,000 |
| Amounts due to counterparty in the event of default | | | | | $(159,117) |
| Columbia Acorn European FundSM | | | | | |
| Securities lending transactions | | | | | |
| Equity securities | $574,506 | $— | $— | $— | $574,506 |
| Gross amount of recognized liabilities for securities lending (collateral received) | | | | | 601,387 |
| Amounts due to counterparty in the event of default | | | | | $26,881 |
Federal income tax status
It is each Fund’s policy to comply with the provisions of the Internal Revenue Code available to regulated investment companies and, in the manner provided therein, distribute substantially all their taxable income, as well as any net realized gain on sales of investments and foreign currency transactions reportable for federal income tax purposes. Columbia Thermostat FundSM distributes all of its taxable income, as well as any net realized gain on sales of portfolio fund shares and any distributions of net realized gains received by the Fund from its portfolio funds, reportable for federal income tax purposes. Accordingly, the Funds paid no federal income taxes and no federal income tax provision was required.
Foreign taxes
Realized gains in certain countries may be subject to foreign taxes at the fund level. The Funds accrue for such foreign taxes on realized and unrealized gains at the appropriate rate for each jurisdiction. The amount, if any, is disclosed as a liability on the Statements of Assets and Liabilities.
Distributions to shareholders
Distributions to shareholders are recorded on the ex-dividend date.
Guarantees and indemnification
In the normal course of business, the Trust on behalf of the Funds enters into contracts that contain a variety of representations and warranties and that provide general indemnities. A Fund’s maximum exposure under these arrangements is unknown, as this would involve future claims against the Fund. Also, under the Trust’s organizational documents, the trustees and officers of the Trust are indemnified against certain liabilities that may arise out of their duties to the Trust. However, based on experience, the Funds expect the risk of loss due to these warranties and indemnities to be remote.
| 104 | Columbia Acorn Family of Funds | Semiannual Report 2020 |
Notes to Financial Statements (continued)
June 30, 2020 (Unaudited)
Note 3. Fees and other transactions with affiliates
Investment management fees
CWAM is a wholly-owned subsidiary of Columbia Management Investment Advisers, LLC (Columbia Management), which is a wholly-owned subsidiary of Ameriprise Financial, Inc. (Ameriprise Financial). CWAM furnishes continuing investment supervision to the Funds and is responsible for the overall management of the Funds’ business affairs.
CWAM receives a monthly advisory fee based on each Fund’s daily net assets at the following annual rates:
| Columbia Acorn® Fund |
| Average daily net assets | Annual
fee rate |
| Up to $700 million | 0.74% |
| $700 million to $2 billion | 0.69% |
| $2 billion to $6 billion | 0.64% |
| $6 billion and over | 0.63% |
| Columbia Acorn International® |
| Average daily net assets | Annual
fee rate |
| Up to $100 million | 1.19% |
| $100 million to $500 million | 0.94% |
| $500 million and over | 0.74% |
| Columbia Acorn USA® |
| Average daily net assets | Annual
fee rate |
| Up to $200 million | 0.94% |
| $200 million to $500 million | 0.89% |
| $500 million to $2 billion | 0.84% |
| $2 billion to $3 billion | 0.80% |
| $3 billion and over | 0.70% |
| Columbia Acorn International SelectSM |
| Average daily net assets | Annual
fee rate |
| Up to $500 million | 0.89% |
| $500 million and over | 0.85% |
| Columbia Acorn SelectSM |
| Average daily net assets | Annual
fee rate |
| Up to $700 million | 0.85% |
| $700 million to $2 billion | 0.80% |
| $2 billion to $3 billion | 0.75% |
| $3 billion and over | 0.70% |
| Columbia Thermostat FundSM |
| | Annual
fee rate |
| All average daily net assets | 0.10% |
Columbia Acorn Family of Funds | Semiannual Report 2020
| 105 |
Notes to Financial Statements (continued)
June 30, 2020 (Unaudited)
| Columbia Acorn Emerging Markets FundSM |
| Average daily net assets | Annual
fee rate |
| Up to $100 million | 1.25% |
| $100 million to $500 million | 1.00% |
| $500 million and over | 0.80% |
| Columbia Acorn European FundSM |
| Average daily net assets | Annual
fee rate |
| Up to $100 million | 1.19% |
| $100 million to $500 million | 0.94% |
| $500 million and over | 0.74% |
Through April 30, 2021, CWAM contractually agreed to waive 0.21% of the advisory fee otherwise payable to it by Columbia Acorn SelectSM. This arrangement was terminated July 10, 2020 when Columbia Acorn SelectSM was acquired by Columbia Acorn® Fund.
For the six months ended June 30, 2020, the annualized effective investment advisory fee rates (net of the advisory fee waiver for Columbia Acorn SelectSM) were as follows:
| Fund | Effective investment advisory fee rate (%) |
| Columbia Acorn® Fund | 0.68 |
| Columbia Acorn International® | 0.80 |
| Columbia Acorn USA® | 0.93 |
| Columbia Acorn International SelectSM | 0.89 |
| Columbia Acorn SelectSM | 0.64 |
| Columbia Thermostat FundSM | 0.10 |
| Columbia Acorn Emerging Markets FundSM | 1.25 |
| Columbia Acorn European FundSM | 1.19 |
Advisory Affiliates
The Investment Manager and its investment advisory affiliates, including Columbia Management (Affiliates), may coordinate in providing services to their clients. These Affiliates, like the Investment Manager, are direct or indirect subsidiaries of Ameriprise Financial and are registered with the appropriate respective regulators and, where required, the Securities and Exchange Commission and the Commodity Futures Trading Commission in the United States. From time to time, the Investment Manager may engage employees of Columbia Management to provide portfolio management services to certain accounts managed by the Investment Manager, including Columbia Thermostat FundSM. These employees provide services to the Investment Manager pursuant to personnel-sharing agreements or similar inter-company arrangements and the Funds pay no additional fees and expenses as a result of any such arrangements.
Pursuant to such arrangements, employees of Columbia Management may serve as “associated persons” of the Investment Manager and, in this capacity, may provide portfolio management services to a Fund on behalf of the Investment Manager subject to the oversight and supervision of the Investment Manager and the Funds’ Chief Compliance Officer, consistent with the investment objectives, policies and limitations set forth in the Fund’s prospectus and SAI, and the Investment Manager’s and the Funds’ compliance policies and procedures.
| 106 | Columbia Acorn Family of Funds | Semiannual Report 2020 |
Notes to Financial Statements (continued)
June 30, 2020 (Unaudited)
Administration fees
CWAM provides administrative services and receives an administration fee from the Funds at the following annual rates:
| Columbia Acorn Trust |
Aggregate average daily
net assets of the trust | Annual
fee rate |
| Up to $8 billion | 0.050% |
| $8 billion to $16 billion | 0.040% |
| $16 billion to $35 billion | 0.030% |
| $35 billion to $45 billion | 0.025% |
| $45 billion and over | 0.015% |
For the six months ended June 30, 2020, the annualized effective administration fee rate was 0.050% of each Fund’s average daily net assets. CWAM has contractually delegated to Columbia Management responsibility to provide certain sub-administrative services to the Funds.
Compensation of board members
Certain officers and trustees of the Trust are also officers of CWAM or Columbia Management. The Trust makes no direct payments to its officers and trustees who are affiliated with CWAM or Columbia Management. The Trust offers a Deferred Compensation Plan (the Deferred Plan) for its independent trustees. Under the Deferred Plan, a trustee may elect to defer all or a portion of his or her compensation. Amounts deferred are retained by the Trust and may represent an unfunded obligation of the Trust. The value of amounts deferred is determined by reference to the change in value of Institutional Class shares of one or more series of Columbia Acorn Trust or a money market fund as specified by the trustee. Benefits under the Deferred Plan are payable in accordance with the Deferred Plan.
Compensation of Chief Compliance Officer
The Board of Trustees has appointed a Chief Compliance Officer for the Funds in accordance with federal securities regulations. As disclosed in the Statement of Operations, a portion of the Chief Compliance Officer’s total compensation is allocated to the Funds, along with other allocations to affiliated registered investment companies managed by the Investment Manager and its affiliates, based on relative net assets.
Transfer agency fees
Under a Transfer, Dividend Disbursing and Shareholders’ Servicing Agent Agreement, Columbia Management Investment Services Corp. (the Transfer Agent), an affiliate of the Investment Manager and a wholly-owned subsidiary of Ameriprise Financial, is responsible for providing transfer agency, dividend disbursing and shareholder services to the Funds for which the Funds pay transfer agency fees. The Transfer Agent has contracted with DST Asset Manager Solutions, Inc. (DST) to provide certain services and assist the Transfer Agent carrying out its duties. The Transfer Agent pays the fees of DST for its services and DST is not entitled to reimbursement for such fees from the Fund (with the exception of out-of-pocket fees). In addition, the Transfer Agent enters into agreements with various financial intermediaries through which investors may hold Fund shares, including Ameriprise Financial and its affiliates. These intermediaries also may provide shareholder services (Additional Shareholder Services) for which they are compensated by the Transfer Agent, which is in turn compensated by the Funds. Additional Shareholder Services may include sub-accounting, sub-transfer agency, participant recordkeeping, shareholder or participant reporting, shareholder or participant transaction processing, shareholder or participant tax monitoring and reporting and/or the provision of call center support and other customer services.
The Funds pay the Transfer Agent a monthly transfer agency fee that varies by account type (on a per account or asset-based basis) based on the cost of servicing the Funds. In addition, subject to certain limitations described in the Funds’ prospectuses and except with respect to Institutional 3 Class shares, the Funds pay a fee to the Transfer Agent for the Additional Shareholder Services provided by financial intermediaries who maintain shares through omnibus or networked accounts in amounts that vary by share class and with the distribution channel, type of intermediary and type of services provided.
Columbia Acorn Family of Funds | Semiannual Report 2020
| 107 |
Notes to Financial Statements (continued)
June 30, 2020 (Unaudited)
The Funds compensate the Transfer Agent for certain out-of-pocket expenses as approved by the Board of Trustees from time to time. Such out-of-pocket expenses may include networking account fees paid to dealer firms by the Transfer Agent with respect to shareholder accounts established or maintained pursuant to the National Securities Clearing Corporation’s (NSCC) networking system. A significant portion of such networking account fees are paid by the Transfer Agent to dealer firms affiliated with Ameriprise Financial and its affiliates.
The Transfer Agent also receives compensation from the Funds for various shareholder services and reimbursements for certain out-of-pocket fees. Total transfer agency fees for Institutional 2 Class and Institutional 3 Class shares are subject to an annual limitation of not more than 0.07% and 0.02%, respectively, of the average daily net assets attributable to each share class.
Effective May 1, 2020 through April 30, 2022, the Transfer Agent has contractually agreed to limit the total fees payable to it by Columbia Acorn® Fund to an annual rate of not more than 0.05% of the Fund’s average daily net assets attributable to Institutional 2 Class shares. This agreement may only be amended or terminated with approval from the Fund’s Board of Trustees and the Investment Manager.
Effective May 1, 2020 through April 30, 2021, the Transfer Agent contractually agreed to limit the total fees payable to it by Columbia Acorn International® for Institutional 2 Class and Institutional 3 Class shares of the Funds to not more than 0.04% and 0.00%, respectively, of the average daily net assets attributable to each share class. This agreement may only be amended or terminated with approval from the Fund’s Board of Trustees and the Investment Manager.
Effective May 1, 2020 through April 30, 2021, the Transfer Agent has contractually agreed to limit the total fees payable to it by Columbia Acorn USA® for Institutional 2 Class and Institutional 3 Class shares of the Funds to not more than 0.04% and 0.00%, respectively, of the average daily net assets attributable to each share class. This agreement may only be amended or terminated with approval from the Fund’s Board of Trustees and the Investment Manager. Prior to May 1, 2020, the Transfer Agent contractually agreed to limit the total fees payable to it by Columbia Acorn USA® for Institutional 2 Class and Institutional 3 Class shares of the Funds to not more than 0.04% and 0.00%, respectively, of the average daily net assets attributable to each share class.
Through June 30, 2020, the Transfer Agent contractually agreed to limit the total fees payable to it by Columbia Acorn International SelectSM for Institutional 2 Class and Institutional 3 Class shares of the Funds to not more than 0.05% and 0.00%, respectively, of the average daily net assets attributable to each share class. This agreement may only be amended or terminated with approval from the Fund’s Board of Trustees and the Investment Manager.
Effective May 1, 2020 through July 10, 2020, when Columbia Acorn SelectSM was acquired by Columbia Acorn® Fund, the Transfer Agent contractually agreed to limit the total fees payable to it by Columbia Acorn SelectSM for Institutional 2 Class and Institutional 3 Class shares of the Fund to not more than 0.05% and 0.00%, respectively, of the average daily net assets attributable to each share class.
Effective May 1, 2020 through April 30, 2021, the Transfer Agent has contractually agreed to limit the total fees payable to it by Columbia Acorn European FundSM for Institutional 2 Class and Institutional 3 Class shares of the Funds to not more than 0.04% and 0.00%, respectively, of the average daily net assets attributable to each share class. This agreement may only be amended or terminated with approval from the Fund’s Board of Trustees and the Investment Manager. Prior to May 1, 2020, the Transfer Agent contractually agreed to limit the total fees payable to it by Columbia Acorn European FundSM Institutional 2 Class and Institutional 3 Class shares of the Funds to not more than 0.05% and 0.00%, respectively, of the average daily net assets attributable to each share class.
| 108 | Columbia Acorn Family of Funds | Semiannual Report 2020 |
Notes to Financial Statements (continued)
June 30, 2020 (Unaudited)
For the six months ended June 30, 2020, the Funds’ annualized effective transfer agency fee rates, as a percentage of average daily net assets of each class were as follows:
| Fund | Class A
(%) | Advisor
Class (%) | Class C
(%) | Institutional
Class (%) | Institutional 2
Class (%) | Institutional 3
Class (%) | Class R
(%) |
| Columbia Acorn® Fund | 0.09 | 0.09 | 0.09 | 0.09 | 0.06 | 0.01 | — |
| Columbia Acorn International® | 0.11 | 0.12 | 0.11 | 0.11 | 0.05 | 0.00 | 0.11 |
| Columbia Acorn USA® | 0.12 | 0.12 | 0.12 | 0.12 | 0.04 | 0.00 | — |
| Columbia Acorn International SelectSM | 0.14 | 0.14 | 0.13 | 0.14 | 0.05 | 0.00 | — |
| Columbia Acorn SelectSM | 0.13 | 0.13 | 0.13 | 0.13 | 0.06 | 0.01 | — |
| Columbia Thermostat FundSM | 0.10 | 0.10 | 0.10 | 0.10 | 0.06 | 0.02 | — |
| Columbia Acorn Emerging Markets FundSM | 0.14 | 0.15 | 0.15 | 0.14 | 0.06 | 0.02 | — |
| Columbia Acorn European FundSM | 0.11 | 0.11 | 0.11 | 0.11 | 0.05 | 0.00 | — |
An annual minimum account balance fee of $20 may apply to certain accounts with a value below the applicable share class’s initial minimum investment requirements to reduce the impact of small accounts on transfer agency fees. These minimum account balance fees are remitted to the Funds and recorded as part of expense reductions in the Statement of Operations. There were no small account fees for any of the funds.
Distribution and service fees
Columbia Management Investment Distributors, Inc. (CMID), a wholly owned subsidiary of Ameriprise Financial, is the distributor of the Funds. Each Fund has adopted a distribution and service plan which requires it to pay CMID a monthly service fee equal to 0.25% annually of the average daily net assets attributable to Class A and Class C shares and a monthly distribution fee equal to 0.75% and 0.50%, annually, of the average daily net assets attributable to Class C and Class R shares, respectively. CMID receives no compensation with respect to Advisor Class, Institutional Class, Institutional 2 Class and Institutional 3 Class shares.
Sales charges
Sales charges, including front-end charges and contingent deferred sales charges (CDSCs), received by the Distributor for distributing Fund shares for the six months ended June 30, 2020, if any, are listed below:
| | Front End (%) | CDSC (%) | Amount ($) |
| Fund | Class A | Class C | Class A | Class C | Class A | Class C |
| Columbia Acorn® Fund | 5.75 | — | 0.50 - 1.00(a) | 1.00(b) | 110,662 | 1,193 |
| Columbia Acorn International® | 5.75 | — | 0.50 - 1.00(a) | 1.00(b) | 31,288 | 104 |
| Columbia Acorn USA® | 5.75 | — | 0.50 - 1.00(a) | 1.00(b) | 12,279 | 51 |
| Columbia Acorn International SelectSM | 5.75 | — | 0.50 - 1.00(a) | 1.00(b) | 31,009 | 48 |
| Columbia Acorn SelectSM | 5.75 | — | 0.50 - 1.00(a) | 1.00(b) | 5,740 | 72 |
| Columbia Thermostat FundSM | 5.75 | — | 0.50 - 1.00(a) | 1.00(b) | 623,659 | 4,872 |
| Columbia Acorn Emerging Markets FundSM | 5.75 | — | 0.50 - 1.00(a) | 1.00(b) | 2,984 | 131 |
| Columbia Acorn European FundSM | 5.75 | — | 0.50 - 1.00(a) | 1.00(b) | 21,105 | 871 |
| (a) | This charge is imposed on certain investments of between $1 million and $50 million redeemed within 18 months after purchase, as follows: 1.00% if redeemed within 12 months after purchase, and 0.50% if redeemed more than 12, but less than 18, months after purchase, with certain limited exceptions. |
| (b) | This charge applies to redemptions within 12 months after purchase, with certain limited exceptions. |
The Funds’ other share classes are not subject to sales charges.
Columbia Acorn Family of Funds | Semiannual Report 2020
| 109 |
Notes to Financial Statements (continued)
June 30, 2020 (Unaudited)
Expenses waived/reimbursed by the Investment Manager and its affiliates
Effective May 1, 2020, through August 7, 2020, CWAM has contractually agreed to waive fees and/or reimburse expenses so that ordinary operating expenses (excluding any transaction costs and certain other investment-related expenses, interest and fees on borrowings and expenses associated with the Fund’s investments in other investment companies, if any) paid by Columbia Acorn International SelectSM did not exceed the following annual rates as a percentage of each class’ average daily net assets:
| Fund | Class A | Advisor | Class C | Institutional Class | Institutional Class 2 | Institutional Class 3 |
| Columbia Acorn International SelectSM | 1.28% | 1.03% | 2.03% | 1.03% | 0.96% | 0.91% |
Effective August 8, 2020 through April 30, 2022, CWAM has contractually agreed to waive fees and/or reimburse expenses so that ordinary operating expenses (excluding any transaction costs and certain other investment-related expenses, interest and fees on borrowings and expenses associated with each Fund’s investments in other investment companies, if any) paid by Columbia Acorn International SelectSM do not exceed the following annual rates as a percentage of each class’ average daily net assets:
| Fund | Class A | Advisor Class | Class C | Institutional Class | Institutional 2 Class | Institutional 3 Class |
| Columbia Acorn International SelectSM | 1.28% | 1.03% | 2.03% | 1.03% | 0.90% | 0.85% |
This agreement may not be modified or terminated, without approval from the Fund’s Board of Trustees and CWAM. There is no guarantee that the agreement will continue after April 30, 2022.
With respect to Columbia Acorn International SelectSM, the Transfer Agent contractually agreed to waive a portion of the fees payable by the Fund such that through June 30, 2020, fees paid by the Fund to the Transfer Agent did not exceed (i) 0.05% of the average daily net assets of Institutional 2 Class shares of the Fund and (ii) 0.00% of the average daily net assets of Institutional 3 Class shares of the Fund.
Effective May 1, 2020 through April 30, 2021, CWAM has contractually agreed to waive fees and/or reimburse so that ordinary operating expenses (excluding transaction costs and certain other investment-related expenses, interest and fees on borrowings and expenses associated with the Fund’s investments in other investment companies, if any) paid by Columbia Acorn European FundSM do not exceed the following annual rates as a percentage of each class’ average daily net assets:
| Fund | Class A | Advisor | Class C | Institutional Class | Institutional Class 2 | Institutional Class 3 |
| Columbia Acorn European FundSM | 1.45% | 1.20% | 2.20% | 1.20% | 1.14% | 1.10% |
This agreement may not be modified or terminated, without approval from the Fund’s Board of Trustees and CWAM. There is no guarantee that the agreement will continue after April 30, 2021.
With respect to Columbia Acorn European FundSM, the Transfer Agent has contractually agreed, effective May 1, 2020, to waive a portion of the fees payable by the Fund such that through April 30, 2021, fees paid by the Fund to the Transfer Agent do not exceed (i) 0.04% of the average daily net assets of Institutional 2 Class shares of the Fund and (ii) 0.00% of the average daily net assets of Institutional 3 Class shares of the Fund. Prior to May 1, 2020, the Transfer Agent contractually agreed to limit the total fees payable to it by Columbia Acorn European FundSM to not more than 0.05% and 0.00%, respectively, for Institutional 2 Class shares and Institutional 3 Class shares.
Effective May 1, 2020 through April 30, 2021, CWAM has contractually agreed to waive fees and/or reimburse expenses so that ordinary operating expenses (excluding transaction costs and certain other investment-related expenses, interest and fees on borrowings and expenses associated with the Fund’s investments in other investment companies, if any) paid by Columbia Acorn USA® do not exceed the following annual rates as a percentage of each class’ average daily net assets:
| Fund | Class A | Advisor | Class C | Institutional Class | Institutional Class 2 | Institutional Class 3 |
| Columbia Acorn USA® | 1.41% | 1.16% | 2.16% | 1.16% | 1.08% | 1.04% |
This agreement may not be modified or terminated, without approval from the Fund’s Board of Trustees and CWAM. There is no guarantee that the agreement will continue after April 30, 2021.
| 110 | Columbia Acorn Family of Funds | Semiannual Report 2020 |
Notes to Financial Statements (continued)
June 30, 2020 (Unaudited)
With respect to Columbia Acorn USA®, the Transfer Agent has contractually agreed, effective May 1, 2020, to waive a portion of the fees payable by the Fund such that through April 30, 2021, fees paid by the Fund to the Transfer Agent do not exceed (i) 0.04% of the average daily net assets of Institutional 2 Class shares of the Fund and (ii) 0.00% of the average daily net assets of Institutional 3 Class shares of the Fund. Prior to May 1, 2020, the Transfer Agent contractually agreed to limit the total fees payable to it by Columbia Acorn USA® for Institutional 2 Class and Institutional 3 Class shares of the Fund to not more than 0.04% and 0.00%, respectively, of the average daily net assets attributable to each share class.
Effective May 1, 2020 through July 10, 2020, when Columbia Acorn Emerging MarketsSM Fund was acquired by Columbia Acorn International®, CWAM contractually agreed to waive fees and/or reimburse expenses so that ordinary operating expenses (excluding any transaction costs and certain other investment-related expenses, interest and fees on borrowings and expenses associated with each Fund’s investments in other investment companies, if any) paid by Columbia Acorn Emerging Markets FundSM did not exceed the following annual rates as a percentage of each class’ average daily net assets:
| Fund | Class A | Advisor | Class C | Institutional | Institutional Class 2 | Institutional Class 3 |
| Columbia Acorn Emerging Markets FundSM | 1.55% | 1.30% | 2.30% | 1.30% | 1.24% | 1.19% |
Effective May 1, 2020 through April 30, 2021, CWAM has contractually agreed to waive fees and/or reimburse expenses so that ordinary operating expenses (excluding transaction costs and certain other investment-related expenses, interest and fees on borrowings and expenses associated with the Fund’s investments in its underlying portfolio funds) paid by Columbia Thermostat FundSM do not exceed the following annual rates as a percentage of each class’ average daily net assets:
| Fund | Class A | Advisor | Class C | Institutional | Institutional Class 2 | Institutional Class 3 |
| Columbia Thermostat FundSM | 0.50% | 0.25% | 1.25% | 0.25% | 0.21% | 0.17% |
This agreement may not be modified or terminated, without approval from the Fund’s Board of Trustees and CWAM. There is no guarantee that the agreement will continue after April 30, 2021.
Effective May 1, 2020 through April 30, 2021, CWAM has contractually agreed to waive fees and/or reimburse expenses so that ordinary operating expenses (excluding transaction costs and certain other investment-related expenses, interest and fees on borrowing and expenses associated with the Fund’s investment in other investment companies, if any) paid by Columbia Acorn® Fund and Columbia Acorn InternationalSM do not exceed the following annual rates as a percentage of each class’ average daily net assets:
| Fund | Class A | Advisor | Class C | Institutional Class | Institutional Class 2 | Institutional Class 3 | Class R |
| Columbia Acorn®Fund | 1.11% | 0.86% | 1.86% | 0.86% | 0.82% | 0.78% | — |
| Columbia Acorn InternationalSM | 1.24% | 0.99% | 1.99% | 0.99% | 0.92% | 0.88% | 1.49% |
With respect to Columbia Acorn® Fund, the Transfer Agent has contractually agreed, effective May 1, 2020, to waive a portion of the fees payable by the Fund such that through April 30, 2022, fees paid by the Fund to the Transfer Agent do not exceed 0.05% of the average daily net assets of Institutional 2 Class shares of the Fund.
With respect to Columbia Acorn International®, the Transfer Agent contractually agreed, effective May 1, 2020, to waive a portion of the fees payable by the Fund such that through April 30, 2021, fees paid by the Fund to the Transfer Agent do not exceed (i) 0.04% of the average daily net assets of Institutional 2 Class shares of the Fund and (ii) 0.00% of the average daily net assets of Institutional 3 Class shares of the Fund.
Prior to May 1, 2020, CWAM contractually waived fees and/or reimbursed expenses so that ordinary operating expenses (excluding transaction costs and certain other investment-related expenses, interest and fees on borrowings) paid by Columbia Acorn® Fund and Columbia Acorn InternationalSM did not exceed the following annual rates as a percentage of each class’ average daily net assets:
| Fund | Class A | Advisor | Class C | Institutional Class | Institutional Class 2 | Institutional Class 3 | Class R |
| Columbia Acorn® Fund | 1.11% | 0.86% | 1.86% | 0.86% | 0.82% | 0.78% | — |
| Columbia Acorn InternationalSM | 1.24% | 0.99% | 1.99% | 0.99% | 0.92% | 0.88% | 1.49% |
Columbia Acorn Family of Funds | Semiannual Report 2020
| 111 |
Notes to Financial Statements (continued)
June 30, 2020 (Unaudited)
Prior to May 1, 2020, CWAM contractually waived fees and/or reimbursed expenses so that the Funds’ ordinary operating expenses (excluding transaction costs and certain other investment-related expenses, interest and fees on borrowings and expenses associated with each Fund’s investments in other investment companies, if any), did not exceed the following annual rates as a percentage of each class’ average daily net assets:
| Fund | Class A | Advisor | Class C | Institutional Class | Institutional Class 2 | Institutional Class 3 |
| Colubmia Acorn Emerging MarketsSM | 1.55% | 1.30% | 2.30% | 1.30% | 1.24% | 1.19% |
| Columbia Acorn European FundSM | 1.45% | 1.20% | 2.20% | 1.20% | 1.14% | 1.09% |
| Columbia Acorn International SelectSM | 1.31% | 1.06% | 2.06% | 1.06% | 0.97% | 0.92% |
Prior to May 1, 2020, CWAM contractually had waived fees and/or reimbursed expenses so that ordinary operating expenses (excluding transaction costs and certain other investment-related expenses, interest and fees on borrowing and expenses associated with the Fund’s investment in other investment companies, if any) paid by Columbia Acorn USA® did not exceed the following annual rates as a percentage of each class’ average daily net assets:
| Fund | Class A | Advisor | Class C | Institutional Class | Institutional Class 2 | Institutional Class 3 |
| Columbia Acorn USA® | 1.42% | 1.17% | 2.17% | 1.17% | 1.08% | 1.04% |
Prior to May 1, 2020, CWAM had contractually waived fees and/or reimbursed expenses so that ordinary operating expenses (excluding transaction costs and certain other investment-related expenses, interest and fees on borrowings and expenses associated with the Fund’s investments in its underlying portfolio funds) paid by Columbia Thermostat FundSM did not exceed the following annual rates as a percentage of each class’ average daily net assets:
| Fund | Class A | Advisor Class | Class C | Institutional Class | Institutional 2 Class | Institutional 3 Class |
| Columbia Thermostat FundSM | 0.50% | 0.25% | 1.25% | 0.25% | 0.21% | 0.17% |
In addition to these contractual agreements, CWAM has voluntarily agreed to waive fees and/or reimburse Fund expenses (excluding transaction costs and certain other investment-related expenses, interest and fees on borrowings and expenses associated with the Fund’s investments in other investment companies, if any) so that Columbia Acorn Emerging Markets FundSM Fund level expenses (expenses directly attributable to the Fund and not to a specific share class) are waived proportionately across all share classes.
Any fees waived and/or expenses reimbursed under the expense reimbursement arrangements described above are not recoverable by the Investment Manager or its affiliates in future periods.
Expenses waived and/or reimbursed by CWAM and its affiliates for the six months ended June 30, 2020, were as follows:
| Fund | Expenses waived and/or
reimbursed ($) |
| Columbia Acorn® Fund | 141,537 |
| Columbia Acorn International® | 581,756 |
| Columbia Acorn USA® | 67,767 |
| Columbia Acorn International SelectSM | 149,280 |
| Columbia Acorn SelectSM | 241,976 |
| Columbia Thermostat FundSM | 227,734 |
| Columbia Acorn Emerging Markets FundSM | 136,647 |
| Columbia Acorn European FundSM | 143,678 |
Note 4. Federal tax information
The timing and character of income and capital gain distributions are determined in accordance with income tax regulations, which may differ from GAAP because of temporary or permanent book to tax differences.
| 112 | Columbia Acorn Family of Funds | Semiannual Report 2020 |
Notes to Financial Statements (continued)
June 30, 2020 (Unaudited)
At June 30, 2020, the approximate cost of all investments for federal income tax purposes and the aggregate gross approximate unrealized appreciation and depreciation based on that cost was:
| Fund | Tax cost ($) | Gross
unrealized
appreciation ($) | Gross
unrealized
(depreciation) ($) | Net unrealized
appreciation ($) |
| Columbia Acorn® Fund | 2,976,430,000 | 1,029,012,000 | (106,300,000) | 922,712,000 |
| Columbia Acorn International® | 1,797,452,000 | 1,028,000 | 452,053,000 | 453,081,000 |
| Columbia Acorn USA® | 231,588,000 | 50,165,000 | (12,166,000) | 37,999,000 |
| Columbia Acorn International SelectSM | 162,887,000 | 44,353,000 | (4,113,000) | 40,240,000 |
| Columbia Acorn SelectSM | 172,546,000 | 46,736,000 | (2,306,000) | 44,430,000 |
| Columbia Thermostat FundSM | 1,025,193,000 | 88,540,000 | (668,000) | 87,872,000 |
| Columbia Acorn Emerging Markets FundSM | 25,215,000 | 7,122,000 | (934,000) | 6,188,000 |
| Columbia Acorn European FundSM | 51,563,000 | 20,876,000 | (1,775,000) | 19,101,000 |
The following capital loss carryforwards, determined at December 31, 2019, may be available to reduce future net realized gains on investments, if any, to the extent permitted by the Internal Revenue Code.
| Fund | 2019 ($) | No expiration
short-term ($) | No expiration
long-term ($) | Total ($) |
| Columbia Acorn Emerging Markets FundSM | — | (45,869,771) | (28,757,480) | (74,627,251) |
| Columbia Acorn European FundSM | — | (6,998,201) | — | (6,998,201) |
Under current tax rules, regulated investment companies can elect to treat certain late-year ordinary losses incurred and post-October capital losses (capital losses realized after October 31) as arising on the first day of the following taxable year. The Funds will elect to treat the following late-year ordinary losses and post-October capital losses at December 31, 2019 as arising on January 1, 2020.
| Fund | Late year
ordinary losses ($) | Post-October
capital losses ($) |
| Columbia Acorn International SelectSM | — | 798,590 |
Management of the Funds has concluded that there are no significant uncertain tax positions in the Funds that would require recognition in the financial statements. However, management’s conclusion may be subject to review and adjustment at a later date based on factors including, but not limited to, new tax laws, regulations, and administrative interpretations (including relevant court decisions). Generally, the Funds’ federal tax returns for the prior three fiscal years remain subject to examination by the Internal Revenue Service.
Note 5. Portfolio information
The aggregate cost of purchases and proceeds from sales, other than short-term obligations, for the six months ended June 30, 2020, were:
| | Purchases
($) | Proceeds
from sales
($) |
| Columbia Acorn® Fund | 1,726,149,967 | 2,052,709,297 |
| Columbia Acorn International® | 789,087,701 | 1,006,863,760 |
| Columbia Acorn USA® | 179,144,749 | 191,195,455 |
| Columbia Acorn International SelectSM | 125,178,269 | 62,033,431 |
| Columbia Acorn SelectSM | 123,464,225 | 170,965,868 |
| Columbia Thermostat FundSM | 1,388,493,801 | 1,093,809,668 |
| Columbia Acorn Emerging Markets FundSM | 16,066,846 | 32,865,895 |
| Columbia Acorn European FundSM | 17,649,842 | 28,796,341 |
The amount of purchase and sales activity impacts the portfolio turnover rate reported in the Financial Highlights.
Columbia Acorn Family of Funds | Semiannual Report 2020
| 113 |
Notes to Financial Statements (continued)
June 30, 2020 (Unaudited)
Note 6. Line of credit
Each Fund has access to a revolving credit facility with a syndicate of banks led by Citibank, N.A., HSBC Bank USA, N.A. and JPMorgan Chase Bank, N.A. whereby the Funds may borrow for the temporary funding of shareholder redemptions or for other temporary or emergency purposes. The credit facility, which is a collective agreement between the Fund and certain other funds managed by the Investment Manager or an affiliated investment manager, severally and not jointly, permits collective borrowings up to $1 billion. Interest is charged to each participating fund based on its borrowings at a rate equal to the higher of (i) the federal funds effective rate, (ii) the one-month LIBOR rate and (iii) the overnight bank funding rate, plus in each case, 1.00%. Each borrowing under the credit facility matures no later than 60 days after the date of borrowing. The Fund also pays a commitment fee equal to its pro rata share of the unused amount of the credit facility at a rate of 0.15% per annum. The commitment fee is included in other expenses in the Statement of Operations. This agreement expires annually in December unless extended or renewed.
During the six months ended June 30, 2020, the following fund(s) had borrowings:
| Fund | Average loan
balance ($) | Weighted average
interest rate (%) | Days
outstanding |
| Columbia Thermostat FundSM | 3,050,000 | 1.85 | 2 |
| Columbia Acorn Emerging Markets FundSM | 200,000 | 1.37 | 1 |
| Columbia Acorn European FundSM | 512,500 | 1.87 | 8 |
Interest expense incurred by the Funds is recorded as a line of credit interest expense in the Statement of Operations. Columbia Thermostat FundSM, Columbia Acorn Emerging Markets FundSM and Columbia Acorn European FundSM had no outstanding borrowings at June 30, 2020.
Note 7. Significant risks
Derivatives risk
Columbia Acorn SelectSM may be more susceptible to derivatives risk. Losses involving derivative instruments may be substantial, because a relatively small movement in the underlying reference (which is generally the price, rate or other economic indicator associated with a security(ies), commodity, currency or index or other instrument or asset) may result in a substantial loss for the Fund. In addition to the potential for increased losses, the use of derivative instruments may lead to increased volatility within the Fund. Derivatives will typically increase the Fund’s exposure to principal risks to which it is otherwise exposed, and may expose the Fund to additional risks, including correlation risk, counterparty risk, hedging risk, leverage risk, liquidity risk and pricing risk.
Foreign securities and emerging market countries risk
Investing in foreign securities may involve certain risks not typically associated with investing in U.S. securities, such as increased currency volatility and risks associated with political, regulatory, economic, social, diplomatic and other conditions or events (Including, for example, military confrontations, war, terrorism, natural disasters and disease pandemics) occurring in the country or region, which may result in significant market volatility. In addition, certain foreign securities may not be as liquid as U.S. securities. Investing in emerging markets may increase these risks and expose the Funds to elevated risks associated with increased inflation, deflation or currency devaluation. To the extent that Columbia Acorn International® , Columbia Acorn International SelectSM, Columbia Acorn Emerging Markets FundSM and Columbia Acorn European FundSM concentrate their investment exposure to any one or a few specific countries, the Funds will be particularly susceptible to the risks associated with the conditions, events or other factors impacting those countries or regions and may, therefore, have a greater risk than that of a fund that is more geographically diversified. The financial information and disclosure made available by issuers of emerging market securities may be considerably less reliable than publicly available information about other foreign securities. The Public Company Accounting Oversight Board, which regulates auditors of U.S. public companies, is unable to inspect audit work papers in certain foreign companies. Investors in foreign countries often have limited rights and few practical remedies to pursue shareholder claims, including class actions or fraud claims, and the ability of the U.S. Securities and Exchange Commission, the U.S. Department of Justice and other authorities to bring and enforce actions against foreign issuers or foreign persons is limited.
| 114 | Columbia Acorn Family of Funds | Semiannual Report 2020 |
Notes to Financial Statements (continued)
June 30, 2020 (Unaudited)
Asia Pacific Region. Columbia Acorn International®, Columbia Acorn International SelectSM and Columbia Acorn Emerging Markets FundSM are particularly susceptible to economic, political, regulatory or other events or conditions affecting issuers and countries in the Asia Pacific region. Many of the countries in the region are considered underdeveloped or developing, including from a political, economic and/or social perspective, and may have relatively unstable governments and economies based on limited business, industries and/or natural resources or commodities. Events in any one country within the region may impact other countries in the region or the region as a whole. As a result, events in the region will generally have a greater effect on the Funds than if the Funds were more geographically diversified. This could result in increased volatility in the value of the Funds’ investments and losses for the Funds. Also, securities of some companies in the region can be less liquid than U.S. or other foreign securities, potentially making it difficult for the Funds to sell such securities at a desirable time and price.
Europe. Columbia Acorn International®, Columbia Acorn International SelectSM and Columbia Acorn European FundSM are particularly susceptible to economic, political, regulatory or other events or conditions affecting issuers and countries in Europe. In addition, the private and public sectors’ debt problems of a single European Union (EU) country can pose significant economic risks to the EU as a whole. As a result, the Funds’ NAV may be more volatile than the NAV of a more geographically diversified fund. If securities of issuers in Europe fall out of favor, it may cause the Funds to underperform other funds that do not focus their investments in this region of the world. At a referendum in June 2016, the UK voted to leave the EU (commonly known as “Brexit”). After several extensions of the period for withdrawal negotiations, the UK and EU agreed on the terms of a withdrawal agreement, which was approved by the UK Parliament on January 22, 2020. The UK formally exited the EU on January 31, 2020. Under the withdrawal agreement, a “transition period” runs through December 31, 2020 that is intended to allow for negotiation and implementation of new trade and other cooperative agreements. The UK will remain in the EU’s single market and customs union during the transition period. There is a significant degree of uncertainty as to the outcome of these negotiations and the future and full impact of Brexit remain uncertain and could have additional adverse effects on economies, financial markets, currencies and asset valuations around the world. During this period and beyond, the impact of Brexit on the UK and European economies and the broader global economy could be significant, resulting in negative impacts on currency and financial markets generally, such as increased volatility and illiquidity, and potentially lower economic growth in markets in Europe, which may adversely affect the value of your investment in the Funds.
Greater China. Columbia Acorn Emerging Markets FundSM is particularly susceptible to economic, political, regulatory or other events or conditions affecting issuers in the Greater China region. The region consists of Hong Kong, The People’s Republic of China and Taiwan, among other countries, and the Fund’s investments in the region are particularly susceptible to risks in that region. The Hong Kong, Taiwanese, and Chinese economies are dependent on the economies of other countries and can be significantly affected by currency fluctuations and increasing competition from other emerging economies in Asia with lower costs. Adverse events in any one country within the region may impact the other countries in the region or Asia as a whole. As a result, adverse events in the region will generally have a greater effect on the Fund than if the Fund were more geographically diversified, which could result in greater volatility in the Fund’s NAV and losses. Markets in the Greater China region can experience significant volatility due to social, economic, regulatory and political uncertainties. The public health crises caused by the COVID-19 outbreak have exacerbated political and diplomatic tensions between the United States and China, which could adversely affect international trade and the value of the Funds’ portfolio securities. Changes in Chinese government policy and economic growth rates could significantly affect local markets and the entire Greater China region. China has yet to develop comprehensive securities, corporate, or commercial laws, its market is relatively new and less developed, and its economy is experiencing a relative slowdown. Export growth continues to be a major driver of China’s economic growth. As a result, a reduction in spending on Chinese products and services, the institution of additional tariffs or other trade barriers, including as a result of heightened trade tensions between China and the United States, or a downturn in any of the economies of China’s key trading partners may have an adverse impact on the Chinese economy.
Japan. Columbia Acorn International® is highly susceptible to the social, political, economic, regulatory and other conditions or events that may affect Japan’s economy. The Japanese economy is heavily dependent upon international trade, including, among other things, the export of finished goods and the import of oil and other commodities and raw materials. Because of its trade dependence, the Japanese economy is particularly exposed to the risks of currency fluctuation, foreign trade policy and regional and global economic disruption, including the risk of increased tariffs, embargoes, and other trade limitations or factors. Strained relationships between Japan and its neighboring countries, including China, South Korea and North Korea, based on historical grievances, territorial disputes, and defense concerns, may also cause uncertainty in Japanese markets.
Columbia Acorn Family of Funds | Semiannual Report 2020
| 115 |
Notes to Financial Statements (continued)
June 30, 2020 (Unaudited)
As a result, additional tariffs, other trade barriers, or boycotts may have an adverse impact on the Japanese economy. Japanese government policy has been characterized by economic regulation, intervention, protectionism and large government deficits. The Japanese economy is also challenged by an unstable financial services sector, highly leveraged corporate balance sheets and extensive cross-ownership among major corporations. Structural social and labor market changes, including an aging workforce, population decline and traditional aversion to labor mobility may adversely affect Japan’s economic competitiveness and growth potential. The potential for natural disasters, such as earthquakes, volcanic eruptions, typhoons and tsunamis, could also have significant negative effects on Japan’s economy. As a result of the Fund’s investment in Japanese securities, the Fund’s NAV may be more volatile than the NAV of a more geographically diversified fund. If securities of issuers in Japan fall out of favor, it may cause the Fund to underperform other funds that do not focus their investments in Japan.
Health care sector risk
Columbia Acorn® Fund, Columbia Acorn USA® and Columbia Acorn SelectSM may be more susceptible to the particular risks that may affect companies in the health care sector than if they were invested in a wider variety of companies in unrelated sectors. Companies in the health care sector are subject to certain risks, including restrictions on government reimbursement for medical expenses, government approval of medical products and services, competitive pricing pressures, and the rising cost of medical products and services (especially for companies dependent upon a relatively limited number of products or services). Performance of such companies may be affected by factors including, government regulation, obtaining and protecting patents (or the failure to do so), product liability and other similar litigation as well as product obsolescence.
Industrial sector risk
Columbia Acorn International® and Columbia Acorn European FundSM may be more susceptible to the particular risks that may affect companies in the industrials sector than if they were invested in a wider variety of companies in unrelated sectors. Companies in the industrials sector are subject to certain risks, including changes in supply and demand for their specific product or service and for industrial sector products in general, including decline in demand for such products due to rapid technological developments and frequent new product introduction. Performance of such companies may be affected by factors including government regulation, world events and economic conditions and risks for environmental damage and product liability claims.
Information technology sector risk
Columbia Acorn® Fund, Columbia Acorn International®, Columbia Acorn International SelectSM, Columbia Acorn SelectSM, Columbia Acorn Emerging Markets FundSM and Columbia Acorn European FundSM may be more susceptible to the particular risks that may affect companies in the information technology sector than if they were invested in a wider variety of companies in unrelated sectors. Companies in the information technology sectors are subject to certain risks, including the risk that new services, equipment or technologies will not be accepted by consumers and businesses or will become rapidly obsolete. Performance of such companies may be affected by factors including obtaining and protecting patents (or the failure to do so) and significant competitive pressures, including aggressive pricing of their products or services, new market entrants, competition for market share and short product cycles due to an accelerated rate of technological developments. Such competitive pressures may lead to limited earnings and/or falling profit margins. As a result, the value of their securities may fall or fail to rise. In addition, many information technology sector companies have limited operating histories and prices of these companies’ securities historically have been more volatile than other securities, especially over the short term.
Market and environment risk
The Funds may incur losses due to declines in the value of one or more securities in which they invest. These declines may be due to factors affecting a particular issuer, or the result of, among other things, political, regulatory, market, economic or social developments affecting the relevant market(s) more generally. In addition, turbulence in financial markets and reduced liquidity in equity, credit and/or fixed income markets may negatively affect many issuers, which could adversely affect the Funds, including causing difficulty in assigning prices to hard-to-value assets in thinly traded and closed markets, significant redemptions and operational challenges. Global economies and financial markets are increasingly interconnected, and conditions and events in one country, region or financial market may adversely impact issuers in a different country, region or financial market. These risks may be magnified if certain events or developments adversely interrupt the global supply chain;
| 116 | Columbia Acorn Family of Funds | Semiannual Report 2020 |
Notes to Financial Statements (continued)
June 30, 2020 (Unaudited)
in these and other circumstances, such risks might affect companies worldwide. As a result, local, regional or global events such as terrorism, war, natural disasters, disease/virus outbreaks and epidemics or other public health issues, recessions, depressions or other events – or the potential for such events – could have a significant negative impact on global economic and market conditions.
The Funds performance may also be significantly negatively impacted by the economic impact of the coronavirus disease 2019 (COVID-19) pandemic. Public health crisis has become a pandemic that has resulted in, and may continue to result in, significant global economic and societal disruption and market volatility due to disruptions in market access, resource availability, facilities operations, imposition of tariffs, export controls and supply chain disruption, among others. Such disruptions may be caused, or exacerbated by, quarantines and travel restrictions, workforce displacement and loss in human and other resources. The uncertainty surrounding the magnitude, duration, reach, costs and effects of the global pandemic, as well as actions that have been or could be taken by governmental authorities or other third parties, present unknowns that are yet to unfold. The impacts, as well as the uncertainty over impacts to come, of COVID-19 – and any other infectious illness outbreaks, epidemics and pandemics that may arise in the future – could negatively affect global economies and markets in ways that cannot necessarily be foreseen. In addition, the impact of infectious illness outbreaks and epidemics in emerging market countries may be greater due to generally less established healthcare systems, governments and financial markets. Public health crises caused by the COVID-19 outbreak may exacerbate other pre-existing political, social and economic risks in certain countries or globally. The disruptions caused by COVID-19 could prevent the Funds from executing advantageous investment decisions in a timely manner and negatively impact the Funds’ ability to achieve their investment objectives. Any such event(s) could have a significant adverse impact on the value and risk profile of the Funds.
The Investment Manager and its affiliates have systematically implemented strategies to address the operating environment spurred by the COVID-19 pandemic. To promote the safety and security of our employees and to assure the continuity of our business operations, we have implemented a work from home protocol for virtually all of our employee population, restricted business travel, and provided resources for complying with the guidance from the World Health Organization, the U.S. Centers for Disease Control and governments. Our operations teams seek to operate without significant disruptions in service. Our pandemic strategy takes into consideration that a pandemic could be widespread and may occur in multiple waves, affecting different communities at different times with varying levels of severity. We cannot, however, predict the impact that natural or man-made disasters, including the COVID-19 pandemic, may have on the ability of our employees and third-party service providers to continue ordinary business operations and technology functions over near- or longer-term periods.
Shareholder concentration risk
At June 30, 2020, the table below details the affiliated and significant unaffiliated shareholder account ownership of outstanding shares of each Fund. The Funds have no knowledge about whether any portion of these unaffiliated shares were owned beneficially. Subscription and redemption activity of these accounts may have a significant effect on the operations of the Funds.
| Fund | Number of
unaffiliated
accounts | Percentage of
shares
outstanding
held —
unaffiliated (%) | Percentage of
shares
outstanding
held —
affiliated (%) |
| Columbia Acorn® Fund | — | — | — |
| Columbia Acorn International® | 1 | 11.5 | — |
| Columbia Acorn USA® | 1 | 25.1 | — |
| Columbia Acorn International SelectSM | 1 | 38.4 | 17.0 |
| Columbia Acorn SelectSM | 1 | 18.6 | — |
| Columbia Thermostat FundSM | 2 | 26.0 | 20.7 |
| Columbia Acorn Emerging Markets FundSM | — | — | 41.4 |
| Columbia Acorn European FundSM | 3 | 39.9 | 29.0 |
Columbia Acorn Family of Funds | Semiannual Report 2020
| 117 |
Notes to Financial Statements (continued)
June 30, 2020 (Unaudited)
Small- and mid-cap company risk
Columbia Acorn® Fund, Columbia Acorn International®, Columbia Acorn USA®, Columbia Acorn International SelectSM, Columbia Acorn SelectSM, Columbia Acorn Emerging Markets FundSM and Columbia Acorn European FundSM investments in small- and mid-capitalization companies (small- and mid-cap companies) often involve greater risks than investments in larger, more established companies (larger companies) because small- and mid-cap companies tend to have less predictable earnings and may lack the management experience, financial resources, product diversification and competitive strengths of larger companies. Securities of small- and mid-cap companies may be less liquid and more volatile than the securities of larger companies.
Note 8. Subsequent events
Management has evaluated the events and transactions that have occurred through the date the financial statements were issued. Other than as noted below, there were no items requiring adjustment of the financial statements or additional disclosure.
The Fund’s Board of Trustees approved reverse stock splits of the issued and outstanding Class C shares of Columbia Acorn® Fund and Columbia Acorn USA® (the Reverse Stock Split). This event does not affect the overall net assets of the class. The Reverse Stock Split is expected to occur during in the third quarter of 2020.
In February 2020, the Board of Trustees approved an Agreement and Plan of Reorganization to reorganize Columbia Acorn Emerging Markets FundSM with and into Columbia Acorn International® and to reorganize Columbia Acorn SelectSM with and into Columbia Acorn® Fund. Pursuant to applicable law (including the 1940 Act) the reorganizations were implemented without shareholder approval. The reorganizations occurred on July 10, 2020, and were tax-free reorganizations for U.S. federal income tax purposes.
Note 9. Information regarding pending and settled legal proceedings
Ameriprise Financial and certain of its affiliates have historically been involved in a number of legal, arbitration and regulatory proceedings, including routine litigation, class actions, and governmental actions, concerning matters arising in connection with the conduct of their business activities. Ameriprise Financial believes that the Funds are not currently the subject of, and that neither Ameriprise Financial nor any of its affiliates are the subject of, any pending legal, arbitration or regulatory proceedings that are likely to have a material adverse effect on the Funds or the ability of Ameriprise Financial or its affiliates to perform under their contracts with the Funds. Ameriprise Financial is required to make quarterly (10-Q), annual (10-K) and, as necessary, 8-K filings with the Securities and Exchange Commission (SEC) on legal and regulatory matters that relate to Ameriprise Financial and its affiliates. Copies of these filings may be obtained by accessing the SEC website at www.sec.gov.
There can be no assurance that these matters, or the adverse publicity associated with them, will not result in increased Fund redemptions, reduced sale of Fund shares or other adverse consequences to the Funds. Further, although we believe proceedings are not likely to have a material adverse effect on the Funds or the ability of Ameriprise Financial or its affiliates to perform under their contracts with the Funds, these proceedings are subject to uncertainties and, as such, we are unable to estimate the possible loss or range of loss that may result. An adverse outcome in one or more of these proceedings could result in adverse judgments, settlements, fines, penalties or other relief that could have a material adverse effect on the consolidated financial condition or results of operations of Ameriprise Financial.
| 118 | Columbia Acorn Family of Funds | Semiannual Report 2020 |
Board Approval of the Advisory Agreement
Columbia Acorn Trust (the “Trust”) has an investment advisory agreement (the “Advisory Agreement”) with Columbia Wanger Asset Management, LLC (“CWAM”) under which CWAM manages the Columbia Acorn Funds (each, a “Fund,” and together, the “Funds”). All of the voting trustees of the Trust are persons who have no direct or indirect interest in the Advisory Agreement and are not “interested persons” (as defined in the Investment Company Act of 1940, as amended (the “1940 Act”)) of the Trust (the “Independent Trustees”). The Independent Trustees oversee the management of each Fund and, as required by law, determine at least annually whether to continue the Advisory Agreement for each Fund.
The Contract Committee (the “Contract Committee”) of the Board of Trustees of the Trust (the “Board”), which is comprised solely of Independent Trustees, makes recommendations to the Board regarding any proposed continuation of the Advisory Agreement. After the Contract Committee has made its recommendations, the full Board determines whether to approve continuation of the Advisory Agreement. The Board also considers matters bearing on the Advisory Agreement at its various meetings throughout the year, meets at least quarterly with CWAM investment personnel (as does the Board’s Investment Performance Analysis Committee (the “Performance Committee”)), and receives monthly reports from CWAM on the performance of the Funds. In connection with their most recent consideration of the Advisory Agreement for the Funds, the Contract Committee and all Independent Trustees received and reviewed a substantial amount of information provided by CWAM, Columbia Management Investment Advisers, LLC (“Columbia Management”) and Ameriprise Financial, Inc. (“Ameriprise”), the parent of CWAM and Columbia Management, in response to written requests from the Independent Trustees and their independent legal counsel. Throughout the process, the Independent Trustees had numerous opportunities to ask questions of and request additional materials from CWAM, Columbia Management and Ameriprise.
During each meeting at which the Contract Committee or the Independent Trustees considered the Advisory Agreement, they met in at least one executive session with their independent legal counsel. Members of the Contract Committee and their independent counsel also met with representatives of CWAM, Columbia Management and Ameriprise on several occasions. In all, the Contract Committee convened formally on six separate occasions to consider the continuation of the Advisory Agreement. The Board and/or some or all of the Independent Trustees met on other occasions to receive the Contract Committee’s status reports and/or to discuss outstanding issues. In addition, the Performance Committee, which is also comprised exclusively of Independent Trustees, reviewed the performance of the Funds, met in joint meetings with the Contract Committee, and reported to the Board and/or the Contract Committee throughout the year. The chair of the Compliance Committee of the Board (the “Compliance Committee”) made available relevant information with respect to matters within the realm of the Compliance Committee’s oversight responsibilities.
The materials reviewed by the Contract Committee and the Independent Trustees included, among other items: (i) information on the investment performance of each Fund relative to independently selected peer groups of funds and the Funds’ performance benchmarks over various periods, as presented and analyzed by an independent consultant; (ii) information on each Fund’s advisory fees and other expenses, including information comparing the Fund’s fees and expenses to those of peer groups of funds and information about any applicable expense limitations and fee breakpoints; (iii) data on sales and redemptions of Fund shares; and (iv) information on the profitability to CWAM and its affiliates, as well as potential “fall-out” or ancillary benefits that CWAM and its affiliates may receive as a result of their relationships with the Funds. The Contract Committee and the Board also took into account other information, such as: (i) CWAM’s financial condition; (ii) each Fund’s investment objective and strategies; (iii) the overall level of resources devoted to the Funds; (iv) the size, education, experience and resources of CWAM’s investment staff and its use of technology, including with respect to the liquidity risk management program and external research and trading cost measurement tools; (v) changes in investment and other personnel at CWAM; (vi) the portfolio manager compensation framework at CWAM; (vii) the allocation of the Funds’ brokerage, and the use of “soft” commission dollars to pay for research products and services; (viii) CWAM’s risk management program; (ix) the resources devoted to, and the record of compliance with, the Funds’ investment policies and restrictions, policies on personal securities transactions and other compliance policies and procedures; (x) CWAM’s and its affiliates’ conflicts of interest; and (xi) CWAM’s management of the Funds in light of market and operating conditions arising from the COVID-19 pandemic.
At a meeting held on June 10, 2020, the Board considered and unanimously approved the continuation of the Advisory Agreement for each Fund. In considering the continuation of the Advisory Agreement, the Independent Trustees reviewed and analyzed various factors that they determined were relevant, none of which by itself was considered dispositive. The material factors and conclusions that formed the basis for the Independent Trustees’ determination to approve the continuation of the Advisory Agreement are discussed below.
Columbia Acorn Family of Funds | Semiannual Report 2020
| 119 |
Board Approval of the Advisory Agreement (continued)
Nature, quality and extent of services
The Independent Trustees reviewed the nature, quality and extent of the services provided by CWAM and its affiliates to the Funds under the Advisory Agreement, taking into account the investment objective and strategy of each Fund, its shareholder base and knowledge gained from meetings with management, which were held on at least a quarterly basis. They reviewed the available resources and key personnel of CWAM and its affiliates, especially those providing investment management services to the Funds. They also considered the resources dedicated specifically to CWAM by its parent company pursuant to the Advisory Agreement and the contribution of those resources to the portfolio management process. The Independent Trustees noted that these dedicated resources included the professionals responsible for Fund risk analysis and portfolio construction, the continuous development and maintenance of CWAM’s research base and the servicing and support of existing Fund shareholders.
The Independent Trustees also considered other services provided to the Funds by CWAM and its affiliates, including: managing the execution of portfolio transactions and selecting broker-dealers for those transactions; monitoring adherence to the Funds’ investment restrictions; monitoring and managing the Funds’ liquidity pursuant to the liquidity risk management program; providing support services for, and regular updates on the operations of the Funds to, the Board and committees of the Board; managing the Funds’ securities lending program; communicating with shareholders; serving as the Funds’ administrator and fund accountant; and overseeing the activities of the Funds’ other service providers, including monitoring for compliance with various policies and procedures as well as applicable securities laws and regulations. The Independent Trustees also considered CWAM’s ability to smoothly transition to an almost complete remote working environment in connection with the COVID-19 pandemic without any adverse impact on the Funds or shareholders. The Independent Trustees also noted the quality of CWAM’s compliance record.
The Independent Trustees considered the reorganizations of Columbia Acorn Select into Columbia Acorn Fund and Columbia Acorn Emerging Markets Fund into Columbia Acorn International, which the Independent Trustees had approved and which were scheduled to close in July 2020 (each a “Reorganization” and together, the “Reorganizations”). Among other things, they took into account that CWAM’s and Columbia Management’s aim in proposing the Reorganizations was to improve long-term investment outcomes for the shareholders of Columbia Acorn Select and Columbia Acorn Emerging Markets Fund who would become shareholders of Columbia Acorn Fund and Columbia Acorn International, respectively, following the completion of the Reorganizations.
The Independent Trustees considered CWAM’s extensive and focused efforts to improve the performance of the domestic and international Funds and believed they were reasonable and appropriate.
The Independent Trustees concluded that the nature, quality and extent of the services provided by CWAM and its affiliates to each Fund under the Advisory Agreement were appropriate for the Funds and that the Funds were likely to benefit from the continued provision of those services by CWAM. They also concluded that CWAM had sufficient personnel, with appropriate education and experience, to serve the Funds effectively. The Independent Trustees also considered that Ameriprise had committed to the Board that CWAM would have sufficient investment management resources to continue to improve performance, including but not limited to resources to hire investment personnel, as necessary.
Performance of the Funds
The Independent Trustees received and considered detailed performance information at various meetings of the Board, the Contract Committee and the Performance Committee throughout the year. They reviewed information comparing each Fund’s performance with that of its benchmarks and with the performance of comparable funds and peer groups as identified by independent consultant Broadridge Financial Solutions, Inc. (“Broadridge”). They evaluated the performance and risk characteristics of the Funds over various periods, including over the one-, three- and five-year periods ended December 31, 2019. They also considered more recent peer and benchmark performance data for certain Funds in order to evaluate CWAM’s progress in improving Fund performance.
The Independent Trustees observed that Columbia Acorn Fund’s performance was below its Broadridge peer group median for the one-, three- and five-year periods ended December 31, 2019. They took into account, however, that the average weighted market capitalization of the securities held by the funds included in Columbia Acorn Fund’s Broadridge peer group was substantially higher than the average weighted market capitalization of the securities held in the Fund’s portfolio and that
| 120 | Columbia Acorn Family of Funds | Semiannual Report 2020 |
Board Approval of the Advisory Agreement (continued)
larger-cap funds generally had better performance than smaller-cap funds during the periods. The Independent Trustees also noted that Columbia Acorn Fund had underperformed its primary benchmark for the one- and three-year periods ended April 30, 2020 and outperformed its primary benchmark for the five-year period ended April 30, 2020.
With respect to Columbia Acorn USA, the Independent Trustees considered that the Fund’s performance exceeded that of its Broadridge peer group median and primary benchmark for the one-, three- and five-year periods ended December 31, 2019.
The Independent Trustees considered that Columbia Acorn Select had underperformed its primary benchmark for the one-, three- and five-year periods ended December 31, 2019 and had underperformed its Broadridge peer group median for the same periods. In addition, they considered that the Fund’s performance exceeded its Broadridge peer group median and primary benchmark for the one- and five-year periods ended April 30, 2020. They also took into account the scheduled Reorganization of Columbia Acorn Select into Columbia Acorn Fund.
In considering the performance of Columbia Thermostat Fund, the Independent Trustees observed that Broadridge could not construct an appropriate peer group for the Fund because of the Fund’s unique investment strategy. Accordingly, the Independent Trustees reviewed the Fund’s performance against a universe of retail and institutional flexible portfolio funds selected by Broadridge. They took into account that the Fund had underperformed its Broadridge peer universe median for the one- and three-year periods ended December 31, 2019 and had outperformed its Broadridge peer universe median for the five-year period ended December 31, 2019. Columbia Thermostat Fund has both an equity and a debt primary benchmark, and the Independent Trustees reviewed the performance of the Fund relative to an equally-weighted custom composite of the Fund’s primary benchmarks for equity and debt securities established by CWAM (the “Blended Benchmark”). The Independent Trustees observed that the Fund’s performance lagged the Blended Benchmark for the one-, three- and five-year periods ended December 31, 2019. They also took into account that, more recently, the Fund had outperformed the Blended Benchmark for the one-, three- and five-year periods ended April 30, 2020 and that the Fund’s portfolio managers had determined that on May 1, 2020 the Fund would begin investing following the “normal” market form of stock/bond allocation table disclosed in its prospectus since May 1, 2018. The Independent Trustees believed that CWAM was devoting appropriate attention to improving the Fund’s performance.
With respect to the performance of Columbia Acorn International, the Independent Trustees considered that the Fund ranked equal to or above the median of its Broadridge peer group for the one- and three-year periods ended December 31, 2019 and below its Broadridge peer group median for the five-year period ended December 31, 2019. They also considered the Fund’s performance versus various benchmarks for the same periods and noted that the Fund had outperformed its primary benchmark for the one- and three-year periods ended December 31, 2019 and underperformed its primary benchmark for the five-year period ended December 31, 2019. In addition, they took into account that Columbia Acorn International’s performance lagged that of its primary benchmark and Broadridge peer group median for the one-, three- and five-year periods ended April 30, 2020.
The Independent Trustees considered that Columbia Acorn International Select’s performance exceeded the median of its Broadridge peer group for the one-, three- and five-year periods ended December 31, 2019 and surpassed its primary benchmark for each of the same periods. They noted that, for the one-, three- and five-year periods ended December 31, 2019, the Fund was the top-performing fund in its Broadridge peer group.
With respect to Columbia Acorn European Fund, the Independent Trustees considered that the Fund was the highest-performing fund in its Broadridge peer group for the one-, three- and five-year periods ended December 31, 2019. They also considered that the Fund’s performance exceeded its primary benchmark for the same periods.
With respect to Columbia Acorn Emerging Markets Fund, the Independent Trustees took into account that the Fund’s performance equaled its Broadridge peer group median for the three-year period ended December 31, 2019 and lagged its Broadridge peer group median for the one- and five-year periods ended December 31, 2019. They noted that the Fund had underperformed versus its primary benchmark for the five-year period ended December 31, 2019 and outperformed its primary benchmark for the one- and three-year periods ended December 31, 2019. For the more recent one-, three- and five-year periods ended April 30, 2020, the Independent Trustees considered that the Fund had underperformed its Broadridge peer group median and outperformed its primary benchmark for the one- and three-year periods ended April 30, 2020. The Independent Trustees also took into account the scheduled Reorganization of Columbia Acorn Emerging Markets Fund into Columbia Acorn International.
Columbia Acorn Family of Funds | Semiannual Report 2020
| 121 |
Board Approval of the Advisory Agreement (continued)
The Independent Trustees concluded that CWAM had taken, and continued to take, a number of corrective steps to improve the performance of underperforming Funds and that the Performance Committee was monitoring the underperforming Funds’ performance closely. In addition, the Independent Trustees considered that CWAM’s Director of Research (U.S.) and Director of International Research had reported to them at numerous Contract Committee, Performance Committee and Board meetings on the corrective steps taken over the past several years to improve certain Funds’ performance.
Costs of services and profits realized by CWAM
The Independent Trustees examined detailed information on the fees and expenses of each Fund compared with information for similar funds provided by Broadridge. Generally, the Independent Trustees considered that none of the Funds would experience a total net operating expense increase in 2020-2021, except for one share class of Columbia European Fund, and that some of the Funds and/or their share classes would experience expense decreases.
Specifically, the Independent Trustees considered that the actual advisory fees paid by Columbia Acorn Fund, Columbia Acorn Select, Columbia Thermostat Fund, Columbia Acorn International, Columbia Acorn European Fund and Columbia Acorn Emerging Markets Fund were lower than their respective Broadridge peer group medians, while the actual advisory fees paid by Columbia Acorn USA were equal to the Fund’s Broadridge peer group median and those paid by Columbia Acorn International Select were higher than the Fund’s Broadridge peer group median.
In addition, the Independent Trustees considered that CWAM had contractually agreed through April 30, 2021 to limit fees and expenses so that no Fund’s total expense ratio would increase from the prior year, except that total expense of Institutional 3 Class shares of Columbia Acorn European Fund would increase by 0.01%. They took into account that through April 30, 2021 CWAM had agreed to: extend the existing total expense caps in place for Columbia Acorn Fund and Columbia Acorn International and to implement transfer agency fee caps for Institutional 2 Class shares of both Funds and for Institutional 3 Class shares of Columbia Acorn International through April 30, 2021; reduce by 0.01% the total expense cap for all share classes of Columbia Acorn USA, except Institutional 2 Class and Institutional 3 Class shares, the total expenses of which would remain flat; extend the existing 0.21% advisory fee waiver in place for Columbia Acorn Select and to implement transfer agency fee caps for Institutional 2 Class and Institutional 3 Class shares of the Fund; extend the existing total expense caps for all share classes of Columbia Acorn Emerging Markets Fund and Columbia Thermostat Fund; and, with respect to Columbia Acorn International Select, implement lower total expense caps such that the total expense ratio of the Fund’s Institutional 2 Class and Institutional 3 Class shares would decrease by 0.01% and the total expense ratio of each of the Fund’s other share classes would decrease by 0.03%.In considering the total expense levels of each Fund, the Independent Trustees also considered the total expenses of each Fund relative to its three- and five-year performance, as prepared by Broadridge.
The Independent Trustees reviewed the advisory fee rates charged by CWAM for managing another investment company as sub-adviser that had investment strategies similar to Columbia Acorn USA’s. They noted that Columbia Acorn USA’s advisory fees were higher than CWAM’s sub-advisory fees for the sub-advised fund and considered information provided by CWAM regarding its performance of significant additional services for Columbia Acorn USA that it did not provide to its sub-advisory client, including administrative services, oversight of the Fund’s other service providers, Independent Trustee support, regulatory compliance and numerous other services, and that in servicing the Fund, CWAM assumed many legal and business risks that it did not assume in serving as a sub-adviser. The Independent Trustees also took into account that CWAM did not manage other investment companies as a sub-adviser or other institutional separate accounts that had investment strategies similar to Columbia Acorn Fund, Columbia Acorn International, Columbia Acorn Select, Columbia Acorn International Select, Columbia Thermostat Fund, Columbia Acorn European Fund or Columbia Acorn Emerging Markets Fund. It was noted that the advisory fees charged by Columbia Acorn USA, Columbia Acorn Select and Columbia Acorn International were generally comparable to their Columbia Wanger Fund counterparts, which were managed similarly by CWAM, at the same asset levels.
The Independent Trustees reviewed an analysis of CWAM’s profitability in serving as each Fund’s investment manager and of CWAM and its affiliates in their relationships with each Fund. The Contract Committee and the Board met with representatives from Ameriprise to discuss its methodologies for calculating profitability and allocating costs. They considered that Ameriprise calculated profitability and allocated costs on a contract-by-contract and Fund-by-Fund basis. Additionally, the Independent Trustees considered an analysis of CWAM’s anticipated profitability in serving as the investment manager to the Funds and
| 122 | Columbia Acorn Family of Funds | Semiannual Report 2020 |
Board Approval of the Advisory Agreement (continued)
the Columbia Wanger Fund at various hypothetical levels of total assets. They also reviewed the methodology used by CWAM and Ameriprise to determine the level of compensation payable to portfolio managers and the competitive market for investment management talent and whether the methodology was aligned with shareholders’ interests. The Independent Trustees were provided with profitability information from a third-party consultant, Strategic Insight, which compared CWAM’s profitability to other similar investment managers in the mutual fund industry. The Independent Trustees discussed, however, that profitability comparisons among fund managers may not always be meaningful due to the lack of consistency in data, small number of publicly-owned managers, and the fact that the profitability of any investment manager is affected by numerous factors, including its particular organizational structure, the types of funds and other accounts managed, other lines of business, expense allocation methodology, capital structure and other factors. The Independent Trustees evaluated CWAM’s profitability in light of the additional resources that had been, and would continue to be, provided to it by Ameriprise to assist in improving performance.
Economies of scale
At various Committee and Board meetings and other informal meetings, the Independent Trustees considered information about the extent to which CWAM realized economies of scale in connection with an increase in Fund assets. It was noted, however, that many of the Funds had lost assets over the past several years. The Independent Trustees noted that the advisory fee schedule for each Fund, other than Columbia Thermostat Fund, includes breakpoints in the rate of fees at various asset levels. In evaluating whether CWAM was sharing economies of scale with Fund shareholders, the Independent Trustees also took into account the various fee waivers/reimbursements and expense caps that CWAM had agreed to for many of the Funds for 2020 and 2021. The Independent Trustees concluded that the fee structure of the Advisory Agreement for each Fund reflected a sharing of economies of scale between CWAM and the Funds
Other Benefits to CWAM
The Independent Trustees also reviewed benefits that accrued to CWAM and its affiliates from their relationships with the Funds, based upon information provided to them by Ameriprise. They noted that the Funds’ transfer agency services were performed by Columbia Management Investment Services Corp., an affiliate of Ameriprise, which received compensation from the Funds for its transfer agent services. They considered that another affiliate of Ameriprise, Columbia Management Investment Distributors, Inc. (“CMID”), served as the Funds’ distributor under a distribution agreement, and that it received fees under the Trust’s Rule 12b-1 Plan, most of which CMID paid to broker-dealers, but received no additional compensation for its services to the Funds. In addition, they considered that Columbia Management provided sub-administration services to the Funds. The Contract Committee and the Board received information regarding the profitability of these Fund agreements to the CWAM affiliates and also reviewed information about and discussed the capabilities of each affiliated entity in performing its respective duties.
The Independent Trustees considered other ways that the Funds and CWAM might potentially benefit from their relationship with each other. For example, the Independent Trustees considered CWAM’s use of commissions paid by each Fund on its portfolio brokerage transactions to obtain research products and services benefiting the Funds and/or other clients of CWAM. They noted that the Compliance Committee reviewed CWAM’s annual “soft dollar” report during the year and met with representatives from CWAM to review CWAM’s soft dollar spending. The Independent Trustees also considered that the Compliance Committee and/or Board regularly reviewed third-party prepared reports that evaluated the quality of CWAM’s execution of the Funds’ portfolio transactions. The Independent Trustees determined that CWAM’s use of the Funds’ “soft” commission dollars to obtain research products and services was consistent with current regulatory requirements and guidance. They also concluded that CWAM benefited from the receipt of proprietary research products and services acquired through commissions paid on portfolio transactions of the Funds, and that the Funds benefitted from CWAM’s receipt of those products and services as well as research products and services acquired through commissions paid by other clients of CWAM. Finally, the Independent Trustees considered that CWAM’s affiliates benefited from management fees received in connection with Columbia Thermostat Fund’s investment in other Columbia mutual funds.
After full consideration of the above factors, as well as other factors that were instructive in evaluating the Advisory Agreement, the Independent Trustees concluded that the advisory fees were reasonable and that the continuation of the Advisory Agreement was in the best interest of each Fund. At the Board meeting held on June 10, 2020 the Trustees approved continuation of the Advisory Agreement for each Fund through July 31, 2021.
Columbia Acorn Family of Funds | Semiannual Report 2020
| 123 |
Liquidity Risk Management Program
Pursuant to Rule 22e-4 under the 1940 Act, the Funds have adopted a liquidity risk management program (Program). The Program’s principal objectives include assessing, managing and periodically reviewing each Fund’s liquidity risk. Liquidity risk is defined as the risk that a Fund could not meet redemption requests without significant dilution of remaining investors’ interests in the Fund.
The Board of Trustees has appointed the Investment Manager as the program administrator for the Program. The Investment Manager has delegated oversight of the Program to its Liquidity Risk Management Committee (the Committee). At a Board meeting during the fiscal period, the Committee provided the Board with a report addressing the operations of the Program and assessing its adequacy and effectiveness of implementation for the period December 1, 2018, through December 31, 2019. Among other things, the report indicated that:
| • | each Fund had sufficient liquidity to both meet redemptions and operate effectively on behalf of their respective shareholders; |
| • | there were no material changes to the Program during the period; |
| • | each Fund’s strategy continued to be effective for an open-end mutual fund; |
| • | the implementation of the Program was effective to manage each Fund’s liquidity risk; and |
| • | the Program operated adequately during the period. |
There can be no assurance that the Program will achieve its objectives in the future. Please refer to the Funds prospectuses for more information regarding each Fund’s exposure to liquidity risk and other principal risks to which an investment in the Funds may be subject.
| 124 | Columbia Acorn Family of Funds | Semiannual Report 2020 |
Expense Information
as of June 30, 2020
| Columbia Acorn® Fund | Class A | Class AD | Class C | Class I1 | Class I2 | Class I3 | Class R |
| Investment advisory fee | 0.68% | 0.68% | 0.68% | 0.68% | 0.68% | 0.68% | | | |
| Distribution and/or service fees | 0.25% | 0.00% | 1.00% | 0.00% | 0.00% | 0.00% | | | |
| Other expenses (a) | 0.18% | 0.18% | 0.18% | 0.18% | 0.14% | 0.10% | | | |
| Net expense ratio | 1.11% | 0.86% | 1.86% | 0.86% | 0.82% | 0.78% | | | |
| Columbia Acorn International® |
| Investment advisory fee | 0.80% | 0.80% | 0.80% | 0.80% | 0.80% | 0.80% | 0.80% | | |
| Distribution and/or service fees | 0.25% | 0.00% | 1.00% | 0.00% | 0.00% | 0.00% | 0.50% | | |
| Other expenses (a) | 0.19% | 0.19% | 0.19% | 0.19% | 0.12% | 0.08% | 0.19% | | |
| Net expense ratio | 1.24% | 0.99% | 1.99% | 0.99% | 0.92% | 0.88% | 1.49% | | |
| Columbia Acorn USA® |
| Investment advisory fee | 0.93% | 0.93% | 0.93% | 0.93% | 0.93% | 0.93% | | | |
| Distribution and/or service fees | 0.25% | 0.00% | 1.00% | 0.00% | 0.00% | 0.00% | | | |
| Other expenses (a) | 0.23% | 0.23% | 0.23% | 0.23% | 0.15% | 0.11% | | | |
| Net expense ratio | 1.41% | 1.16% | 2.16% | 1.16% | 1.08% | 1.04% | | | |
| Columbia Acorn International SelectSM |
| Investment advisory fee | 0.89% | 0.89% | 0.89% | 0.89% | 0.89% | 0.89% | | | |
| Distribution and/or service fees | 0.25% | 0.00% | 1.00% | 0.00% | 0.00% | 0.00% | | | |
| Other expenses (a) | 0.15% | 0.15% | 0.15% | 0.15% | 0.07% | 0.02% | | | |
| Net expense ratio | 1.29% | 1.04% | 2.04% | 1.04% | 0.96% | 0.91% | | | |
| Columbia Acorn SelectSM |
| Investment advisory fee | 0.64% | 0.64% | 0.64% | 0.64% | 0.64% | 0.64% | | | |
| Distribution and/or service fees | 0.25% | 0.00% | 1.00% | 0.00% | 0.00% | 0.00% | | | |
| Other expenses (a) | 0.31% | 0.30% | 0.30% | 0.31% | 0.23% | 0.16% | | | |
| Net expense ratio | 1.20% | 0.94% | 1.94% | 0.95% | 0.87% | 0.80% | | | |
| Columbia Thermostat FundSM |
| Investment advisory fee | 0.10% | 0.10% | 0.10% | 0.10% | 0.10% | 0.10% | | | |
| Distribution and/or service fees | 0.25% | 0.00% | 1.00% | 0.00% | 0.00% | 0.00% | | | |
| Other expenses (a) | 0.15% | 0.15% | 0.15% | 0.15% | 0.11% | 0.07% | | | |
| Net expense ratio (b) | 0.50% | 0.25% | 1.25% | 0.25% | 0.21% | 0.17% | | | |
| Columbia Acorn Emerging Markets FundSM |
| Investment advisory fee | 1.25% | 1.25% | 1.25% | 1.25% | 1.25% | 1.25% | | | |
| Distribution and/or service fees | 0.25% | 0.00% | 1.00% | 0.00% | 0.00% | 0.00% | | | |
| Other expenses (a) | 0.05% | 0.05% | 0.05% | 0.05% | -0.02% | -0.06% | | | |
| Net expense ratio | 1.55% | 1.30% | 2.30% | 1.30% | 1.23% | 1.19% | | | |
| Columbia Acorn European FundSM |
| Investment advisory fee | 1.19% | 1.19% | 1.19% | 1.19% | 1.19% | 1.19% | | | |
| Distribution and/or service fees | 0.25% | 0.00% | 1.00% | 0.00% | 0.00% | 0.00% | | | |
| Other expenses (a) | 0.01% | 0.01% | 0.01% | 0.01% | -0.05% | -0.10% | | | |
| Net expense ratio | 1.45% | 1.20% | 2.20% | 1.20% | 1.14% | 1.09% | | | |
See the Funds’ prospectuses for information on minimum initial investment amounts and other details of buying, selling and exchanging shares of the Funds.
Fees and expenses are for the six months ended June 30, 2020. Please see Note 3, “Fees and Other Transactions With Affiliates” in the Notes to Financial Statements of this report for information on fee waivers and/or expense reimbursements in place for the Funds.
| (a) | Other expenses include certain fee waivers and/or reimbursements, if applicable, which can potentially exceed other expenses charged. |
| (b) | Does not include estimated fees and expenses of 0.40% incurred by the Fund from the underlying portfolio funds in which it invests. |
Columbia Acorn Family of Funds | Semiannual Report 2020
| 125 |
The Funds mail one shareholder report to each shareholder address, unless such shareholder elected to receive shareholder reports from the Fund electronically. If you would like more than one report, please call shareholder services at 800.345.6611 and additional reports will be sent to you.
Proxy voting policies and procedures
The policy of the Board of Trustees is to vote the proxies of the companies in which the Funds hold investments consistent with the procedures as stated in the Statement of Additional Information (SAI). You may obtain a copy of the SAI without charge by calling 800.345.6611; contacting your financial intermediary; visiting columbiathreadneedleus.com/investor/; or searching the website of the Securities and Exchange Commission (SEC) at sec.gov. Information regarding how the Funds voted proxies relating to portfolio securities is filed with the SEC by August 31st for the most recent 12-month period ending June 30th of that year, and is available without charge by visiting columbiathreadneedleus.com/investor/, or searching the website of the SEC at sec.gov.
Quarterly schedule of investments
The Funds file a complete schedule of portfolio holdings with the SEC for the first and third quarters of each fiscal year on Form N-PORT, and for reporting periods ended prior to March 31, 2019, on Form N-Q. The Funds’ Form N-Q and Form N-PORT filings are available on the SEC’s website at sec.gov. The Funds’ complete schedule of portfolio holdings, as filed on Form N-Q or Form N-PORT, can also be obtained without charge, upon request, by calling 800.345.6611.
Additional Fund information
For more information about the Funds, please visit columbiathreadneedleus.com/investor/ or call 800.345.6611. Customer Service Representatives are available to answer your questions Monday through Friday from 8 a.m. to 7 p.m. Eastern time.
Fund investment manager
Columbia Wanger Asset Management, LLC
227 West Monroe, Suite 3000
Chicago, IL 60606
800.345.6611
Fund distributor
Columbia Management Investment Distributors, Inc.
225 Franklin Street
Boston, MA 02110
Fund transfer agent
Columbia Management Investment Services Corp.
P.O. Box 219104
Kansas City, MO 64121-9104
| 126 | Columbia Acorn Family of Funds | Semiannual Report 2020 |
Additional information (continued)
Trustees
Laura M. Born, Chair of the Board
David J. Rudis, Vice Chair of the Board
Maureen M. Culhane
Margaret M. Eisen
John C. Heaton
Charles R. Phillips
Ralph Wanger (Trustee Emeritus)
Officers
Matthew A. Litfin, Co-President
Louis J. Mendes III, Co-President*
John M. Kunka, Vice President, Treasurer and Principal Financial and Accounting Officer
Thomas P. McGuire, Chief Compliance Officer
John L. Emerson, Vice President
Tae Han (Simon) Kim, Vice President
Stephen Kusmierczak, Vice President
Joseph C. LaPalm, Vice President
Erika K. Maschmeyer, Vice President
Hans F. Stege, Vice President
Richard Watson, Vice President
Michael G. Clarke, Assistant Treasurer
Paul B. Goucher, Assistant Secretary
Ryan C. Larrenaga, Assistant Secretary
Julian Quero, Assistant Treasurer
Martha A. Skinner, Assistant Treasurer
Linda K. Roth-Wiszowaty, Secretary
* Mr. Mendes has announced that on August 28, 2020 he will retire from CWAM.
Columbia Acorn Family of Funds | Semiannual Report 2020
| 127 |
Columbia Acorn Family of Funds
P.O. Box 219104
Kansas City, MO 64121-9104
Please read and consider the investment objectives, risks, charges and expenses for any fund carefully before investing. For a prospectus and summary prospectus, which contains this and other important information about the Funds, go to columbiathreadneedleus.com/investor/. The Funds are distributed by Columbia Management Investment Distributors, Inc., member FINRA, and managed by Columbia Wanger Asset Management, LLC.
Columbia Threadneedle Investments (Columbia Threadneedle) is the global brand name of the Columbia and Threadneedle group of companies. All rights reserved. Columbia Management Investment Distributors, Inc., 225 Franklin Street, Boston, MA 02110-2804
© 2020 Columbia Management Investment Advisers, LLC.
columbiathreadneedleus.com/investor/
Item 2. Code of Ethics.
Not applicable for semiannual reports.
Item 3. Audit Committee Financial Expert.
Not applicable for semiannual reports.
Item 4. Principal Accountant Fees and Services.
Not applicable for semiannual reports.
Item 5. Audit Committee of Listed Registrants.
Not applicable.
Item 6. Investments
(a)The registrant's "Schedule I – Investments in securities of unaffiliated issuers" (as set forth in 17 CFR 210.12-12) is included in Item 1 of this Form N-CSR.
(b)Not applicable.
Item 7. Disclosure of Proxy Voting Policies and Procedures for Closed-End Management Investment Companies.
Not applicable.
Item 8. Portfolio Managers of Closed-End Management Investment Companies.
Not applicable.
Item 9. Purchases of Equity Securities by Closed-End Management Investment Company and Affiliated Purchasers.
Not applicable.
Item 10. Submission of Matters to a Vote of Security Holders.
There were no material changes to the procedures by which shareholders may recommend nominees to the registrant's board of directors.
Item 11. Controls and Procedures.
(a)The registrant's principal executive officer and principal financial officers during the period covered by this report, based on their evaluation of the registrant's disclosure controls and procedures as of a date within 90 days of the filing of this report, have concluded that such controls and procedures are adequately designed to ensure that information required to be disclosed by the registrant in Form N-CSR is accumulated and communicated to the registrant's management, including the principal executive officer and principal financial officer, or persons performing similar functions, as appropriate to allow timely decisions regarding required disclosure.
(b)There was no change in the registrant's internal control over financial reporting that occurred during the period covered by this report that has materially affected, or is reasonably likely to materially affect, the registrant's internal control over financial reporting.
Item 12. Disclosure of Securities Lending Activities for Closed-End Management Investment Companies
Not applicable.
Item 13. Exhibits.
(a)(1) Code of ethics required to be disclosed under Item 2 of Form N-CSR: Not applicable for semiannual reports.
(a)(2) Certifications pursuant to Rule 30a-2(a) under the Investment Company Act of 1940 (17 CFR 270.30a-2(a)) attached hereto as Exhibit 99.CERT.
(a)(3) Not applicable.
(b)Certification pursuant to Rule 30a-2(b) under the Investment Company Act of 1940(17 CFR 270.30a-2(b)) attached hereto as Exhibit 99.906CERT.
SIGNATURES
Pursuant to the requirements of the Securities Exchange Act of 1934 and the Investment Company Act of 1940, the registrant has duly caused this report to be signed on its behalf by the undersigned, thereunto duly authorized.
(registrant) | | Columbia Acorn Trust | | | |
By (Signature and Title) | /s/ Louis Mendes | _______ | |
| | | Louis Mendes, Co-President and Principal Executive Officer |
Date | | August 21, 2020 | | | |
Pursuant to the requirements of the Securities Exchange Act of 1934 and the Investment Company Act of 1940, this report has been signed below by the following persons on behalf of the registrant and in the capacities and on the dates indicated.
By (Signature and Title) | /s/ Louis Mendes | |
| | Louis Mendes, Co-President and Principal Executive Officer |
Date | | August 21, 2020 | |
By (Signature and Title) | /s/ John M. Kunka |
| | John M. Kunka, Treasurer and Principal Accounting and Financial Officer |
Date | | August 21, 2020 | |