UNITED STATES
SECURITIES AND EXCHANGE COMMISSION
Washington, D.C. 20549
FORM N-CSR
CERTIFIED SHAREHOLDER REPORT OF REGISTERED MANAGEMENT
INVESTMENT COMPANIES
Investment Company Act file number 811-01829
Columbia Acorn Trust
(Exact name of registrant as specified in charter)
227 W. Monroe Street
Suite 3000
Chicago, IL 60606
(Address of principal executive offices) (Zip code)
Mary C. Moynihan
Perkins Coie LLP
700 13th Street, NW
Suite 600
Washington, DC 20005
Paul B. Goucher, Esq.
Columbia Management Investment Advisers, LLC
100 Park Avenue
New York, New York 10017
P. Zachary Egan
Columbia Acorn Trust
227 West Monroe Street, Suite 3000
Chicago, Illinois 60606
(Name and address of agent for service)
Registrant’s telephone number, including area code: (312) 634-9200
Date of fiscal year end: December 31
Date of reporting period: June 30, 2017
Form N-CSR is to be used by management investment companies to file reports with the Commission not later than 10 days after the transmission to stockholders of any report that is required to be transmitted to stockholders under Rule 30e-1 under the Investment Company Act of 1940 (17 CFR 270.30e-1). The Commission may use the information provided on Form N-CSR in its regulatory, disclosure review, inspection, and policymaking roles.
A registrant is required to disclose the information specified by Form N-CSR, and the Commission will make this information public. A registrant is not required to respond to the collection of information contained in Form N-CSR unless the Form displays a currently valid Office of Management and Budget (“OMB”) control number. Please direct comments concerning the accuracy of the information collection burden estimate and any suggestions for reducing the burden to Secretary, Securities and Exchange Commission, 450 Fifth Street, NW, Washington, DC 20549-0609. The OMB has reviewed this collection of information under the clearance requirements of 44 U.S.C. § 3507.
Item 1. Reports to Stockholders.

SemiAnnual Report
June 30, 2017
Columbia Acorn® Fund
Columbia Acorn International®
Columbia Acorn USA®
Columbia Acorn International SelectSM
Columbia Acorn SelectSM
Columbia Thermostat FundSM
Columbia Acorn Emerging Markets FundSM
Columbia Acorn European FundSM
Not FDIC Insured • No bank guarantee • May lose value
| | |
 | | Stay informed with Columbia Threadneedle Investments 
Columbia Acorn funds have moved away from producing quarterly shareholder reports and are now offering a semiannual and annual report to shareholders. To find economic and market commentary, investment videos, white papers, quarterly mutual fund commentary, distribution information and more, visit our website at investor.columbiathreadneedleus.com. Subscribe to the latest information from Columbia Threadneedle. Register your information online at investor.columbiathreadneedleus.com/subscribe and select the publications you would like to receive, including: • Columbia Threadneedle Investor Newsletter, highlighting the latest macro- and micro-economic trends, investment themes, products, service changes and other items of interest to our investors • White papers that delve deep into a variety of investment topics • Quarterly portfolio manager commentary and fund fact sheets • Perspectives blog at investor.columbiathreadneedleus.com Read timely posts by our investment team. Update your subscriptions at any time by accessing the email subscription center. 
We offer you multiple ways to access our market commentary and investment insights. • Twitter.com/CTinvest_US Follow us on Twitter for quick, up-to-the-minute comments on market news and more. • Youtube.com/CTInvestUS View our commentaries on the economy, markets and current investment opportunities. • Linkedin.com/company/Columbia-Threadneedle-Investments-US Connect with us on LinkedIn for updates from our thought leaders. |
| | |
| Not part of the shareholder report | | CT-MK/113388 A (02/17) 5JA9/1705026 |
| 4 |
| 7 |
| 9 |
| 12 |
| 14 |
| 16 |
| 18 |
| 21 |
| 23 |
| 25 |
| 27 |
| 29 |
| 31 |
| 34 |
| 36 |
| 39 |
| 41 |
| 43 |
| 46 |
| 84 |
| 88 |
| 90 |
| 98 |
| 128 |
| 143 |
| 148 |
| 150 |
Columbia Acorn Family of Funds | Semiannual Report 2017
Fund at a glance
Columbia Acorn® Fund (Unaudited)
Investment objective
Columbia Acorn® Fund (the Fund) seeks long-term capital appreciation.
Portfolio management
P. Zachary Egan, CFA
Co-manager
With Fund since 1999
Matthew A. Litfin, CFA
Co-manager
With Fund since 2015
Morningstar style boxTM
The Morningstar Style Box is based on a fund’s portfolio holdings. For equity funds, the vertical axis shows the market capitalization of the stocks owned, and the horizontal axis shows investment style (value, blend, or growth). Information shown is based on the most recent data provided by Morningstar.
© 2017 Morningstar, Inc. All rights reserved. The Morningstar information contained herein: (1) is proprietary to Morningstar and/or its content providers; (2) may not be copied or distributed; and (3) is not warranted to be accurate, complete or timely. Neither Morningstar nor its content providers are responsible for any damages or losses arising from any use of this information.
| Average annual total returns (%) (for the period ended June 30, 2017) |
| | | Inception | 6 Months
cumulative | 1 Year | 5 Years | 10 Years | Life |
| Class A | Excluding sales charges | 10/16/00 | 12.27 | 24.02 | 11.40 | 6.28 | 13.88 |
| | Including sales charges | | 5.84 | 16.89 | 10.08 | 5.65 | 13.74 |
| Class C | Excluding sales charges | 10/16/00 | 11.84 | 23.14 | 10.60 | 5.49 | 13.02 |
| | Including sales charges | | 10.84 | 22.35 | 10.60 | 5.49 | 13.02 |
| Class R4 | 11/08/12 | 12.37 | 24.25 | 11.64 | 6.55 | 14.24 |
| Class R5 | 11/08/12 | 12.34 | 24.29 | 11.73 | 6.60 | 14.25 |
| Class Y | 11/08/12 | 12.33 | 24.35 | 11.78 | 6.62 | 14.26 |
| Class Z | 06/10/70 | 12.35 | 24.24 | 11.71 | 6.58 | 14.25 |
| Russell 2500 Growth Index | | 10.63 | 21.44 | 14.33 | 8.18 | N/A |
Performance numbers reflect all Fund expenses. Returns for Class A shares are shown with and without the maximum initial sales charge of 5.75%. Returns for Class C shares are shown with and without the maximum contingent deferred sales charge of 1.00% for the first year after purchase. The Fund’s other classes are not subject to sales charges, but may be subject to other fees and expenses, and have limited eligibility. Please see the Fund’s prospectus for details. Performance for different share classes will vary based on differences in sales charges and certain fees and expenses associated with each class.
As stated in the May 1, 2017, prospectus, the Fund’s annual operating expense ratio is 0.86% for Class Z shares and 1.11% for Class A shares.
All results shown assume reinvestment of distributions during the period. Returns do not reflect the deduction of taxes that a shareholder may pay on Fund distributions or on the redemption of Fund shares. Performance results may reflect the effect of any fee waivers or reimbursements of Fund expenses by the investment manager and/or any of its affiliates. Absent these fee waivers and/or expense reimbursement arrangements, performance results may have been lower.
The performance information shown represents past performance and is not a guarantee of future results. The investment return and principal value of your investment will fluctuate so that shares, when redeemed, may be worth more or less than their original cost. Current performance may be lower or higher than the performance data shown. You may obtain performance information current to the most recent month-end by contacting your financial intermediary, visiting investor.columbiathreadneedleus.com or calling 800.922.6769.
The returns shown for periods prior to the share class inception date (including returns for the Life of the Fund, which are since Fund inception) include the returns of the Fund’s oldest share class. These returns are adjusted to reflect any higher class-related operating expenses of the newer share classes, as applicable. Please visit investor.columbiathreadneedleus.com/investment-products/mutual-funds/appended-performance for more information.
Effective May 1, 2017, the Fund compares its performance to that of the Russell 2500 Growth Index. Prior to this date, the Fund compared its performance to that of the Russell 2500 Index. The Investment Manager believes that the Fund’s portfolio will generally be more closely aligned with the Russell 2500 Growth Index than with the former core benchmark from an investment style perspective. Information on the Russell 2500 Index will be included for a one-year transition period.
The Russell 2500 Growth Index measures the performance of those Russell 2500 companies with higher price-to-book ratios and higher forecasted growth values.
The Russell 2500 Index measures the performance of the 2,500 smallest companies in the Russell 3000 Index, which represents approximately 17% of the total market capitalization of the Russell 3000 Index.
Unlike mutual funds, indexes are not managed and do not incur fees or expenses. It is not possible to invest directly in an index.
| 4 | Columbia Acorn Family of Funds | Semiannual Report 2017 |
Fund at a glance (continued)
Columbia Acorn® Fund (Unaudited)
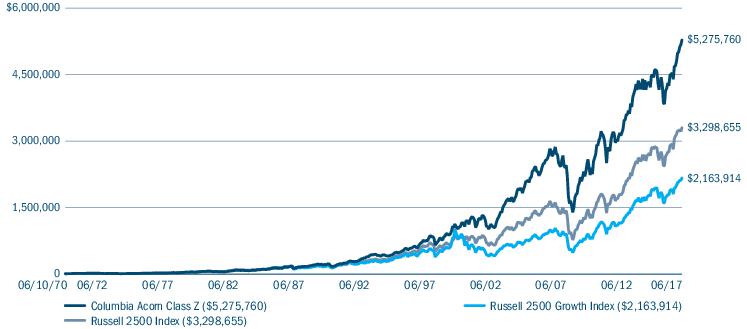
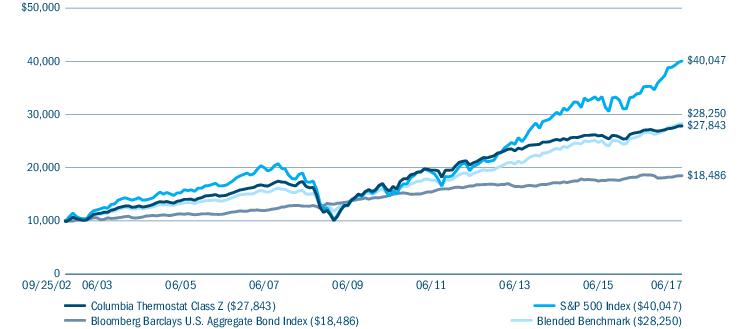
The Growth of a $10,000 Investment in Columbia Acorn® Fund Class Z Shares
June 10, 1970 (Fund inception) through June 30, 2017
This chart shows the change in value of a hypothetical $10,000 investment in Class Z shares of the Fund during the stated time period. A $10,000 investment in Columbia Acorn® Fund at inception appreciated to $117,142 on December 31, 1985, the inception date of the Russell 2500 Growth Index. A $10,000 investment in Columbia Acorn® Fund at inception appreciated to $31,777 on December 31, 1978, the inception date of the Russell 2500 Index. For comparison with the indices, we assigned each index the same value as the Fund at each index’s respective inception date. Although the indexes are provided for use in assessing the Fund’s performance, the Fund’s holdings may differ significantly from those in an index. Performance numbers reflect all Fund expenses.
| Top ten holdings (%) (at June 30, 2017) | |
Align Technology, Inc.
Designs, manufactures, and markets the Invisalign System | 2.0 |
HealthSouth Corp.
Inpatient rehabilitative healthcare services | 1.7 |
Pra Health Sciences, Inc.
Global contract research organization | 1.7 |
ANSYS, Inc.
Software solutions for design analysis and optimization | 1.5 |
IPG Photonics Corp.
High-power fiber lasers and amplifiers | 1.5 |
CDW Corp.
IT products and services | 1.5 |
Celanese Corp., Class A
Global integrated producer of chemicals and advanced materials | 1.3 |
Raymond James Financial, Inc.
Financial services to individuals, corporations, and municipalities | 1.3 |
GoDaddy, Inc., Class A
Cloud-based web platform for small businesses, web design professionals and individuals | 1.3 |
Oshkosh Corp.
Fire and emergency apparatuses and specialty commercial, and military trucks | 1.3 |
Percentages indicated are based upon total investments (excluding Money Market Funds and Securities Lending Collateral)
For further detail about these holdings, please refer to the section entitled “Portfolio of Investments."
Fund holdings are as of the date given, are subject to change at any time, and are not recommendations to buy or sell any security.
Columbia Acorn Family of Funds | Semiannual Report 2017
| 5 |
Fund at a glance (continued)
Columbia Acorn® Fund (Unaudited)
| Portfolio breakdown (%) (at June 30, 2017) |
| Common Stocks | 94.5 |
| Money Market Funds | 3.0 |
| Securities Lending Collateral | 2.5 |
| Total | 100.0 |
Percentages indicated are based upon total investments. The Fund’s portfolio composition is subject to change.
| Equity sector breakdown (%) (at June 30, 2017) |
| Consumer Discretionary | 19.5 |
| Consumer Staples | 1.6 |
| Energy | 2.3 |
| Financials | 8.4 |
| Health Care | 22.0 |
| Industrials | 17.5 |
| Information Technology | 21.7 |
| Materials | 1.3 |
| Real Estate | 4.8 |
| Telecommunication Services | 0.9 |
| Total | 100.0 |
Percentages indicated are based upon total equity investments. The Fund’s portfolio composition is subject to change.
| 6 | Columbia Acorn Family of Funds | Semiannual Report 2017 |
Manager Discussion of Fund Performance
Columbia Acorn® Fund
P. Zachary Egan, CFA
Co-Portfolio Manager
Matthew A. Litfin, CFA
Co-Portfolio Manager
Columbia Acorn Fund Class Z shares gained 5.26% during the second quarter of 2017, outperforming the Fund’s primary benchmark, the Russell 2500 Growth Index, which gained 4.13%. Fund returns for the semiannual period were 12.35% versus a gain of 10.63% for the benchmark.
Through the first half of 2017, U.S. equity markets delivered solid and steady gains with very little in the way of interruptions. Growth stocks strengthened against value stocks in a sharp reversal from 2016. Economic growth remained strong enough to fuel positive market performance, yet not so robust as to raise concerns that the U.S. Federal Reserve would need to take a more aggressive approach to raising interest rates. Corporate results were also supportive, highlighted by strength in earnings, rising revenues and profit margins, and generally positive guidance for the remainder of 2017. A meaningful decline in the U.S. dollar acted as an additional tailwind for equities by making the products and services of U.S. companies more competitive overseas.
In terms of stronger market sectors, information technology and health care continued their strong run of performance and were the best performing sectors in the benchmark during the period. The only two sectors with negative absolute returns were energy and consumer staples. The drop in oil prices from over $50 per barrel to below $43 was a primary driver of the fall in energy stocks, resulting in this sector being the standout underperformer.
The Fund’s sector allocations detracted from relative returns due to an overweight in the hard-hit energy sector. This was offset by strong stock selection in consumer discretionary as Fund holdings more than doubled benchmark returns. Stock selection in health care was also a strong contributor to the Fund’s outperformance relative to the benchmark.
Two positions that were new to the Fund during the year were the Fund’s top contributors. Consumer stock Wayfair is a popular online home furnishing store. The company’s stock rallied in the period as its online sales grew more than investors expected and the company showed a faster path toward profitability. Shares of Kite Pharma, a biotech company focused on novel treatments for cancer, flew high during the period. We believe Kite Pharma has a great management team, strong drug pipeline and one of the most advanced infrastructures for manufacturing drugs.
Among the Fund’s detractors from performance were Carrizo Oil and Gas and Tractor Supply Company. Though an efficient exploration company, it was not surprising that Carrizo’s stock declined along with the drop in crude oil prices. Tractor Supply Company engages in the sale of farm and ranch products. Its stock declined on earnings weakness and fear that online sellers would eat into its market share. We remain cognizant of the competitive risks, but we believe this retailer is more resilient than the market is anticipating, due to its appealing retail concept, its rural geographic footprint, and its strong culture and management team.
Two additional new positions during the year were iRhythm Technologies and Dave & Buster’s Entertainment. iRhythm offers the Zio ambulatory monitor and associated reporting services for detection of cardiac arrhythmias. We believe the company is strongly positioned to take significant market share by displacing traditional Holter and event monitors that have poor detection rates, are less cost-effective, and suffer from poor patient compliance. Dave & Buster’s owns and operates high volume entertainment and dining complexes. Their facilities offer a differentiated approach combining dining, gaming and sports watching. We are attracted to the company’s appeal to family members of all ages for an affordable entertainment destination. On the surface, these are very different businesses; however, both exhibit many of the characteristics we seek in new ideas for the portfolio. They offer differentiated products that have an advantage over their nearest competitors, both are in segments poised for growth and currently trade at valuations we believe are reasonable relative to their quality and future growth potential.
Global stocks markets have rewarded investors thus far in 2017. At the end of the period, averages remained at robust levels and there was sustained economic expansion around the world. However, growth was slower than in previous recoveries. Interest rates and volatility also remained low. We are
Columbia Acorn Family of Funds | Semiannual Report 2017
| 7 |
Manager Discussion of Fund Performance (continued)
Columbia Acorn® Fund
realistic about the potential risks after a global surge in stock valuations and the potential for increased volatility. In this market environment, we continue to focus on identifying exciting growth companies with sustainable competitive advantages trading at reasonable valuations.
Market risk may affect a single issuer, sector of the economy, industry or the market as a whole. Investments in small- and mid-cap companies involve risks and volatility and possible illiquidity greater than investments in larger, more established companies. Foreign investments subject the Fund to political, economic, market, social and other risks within a particular country, as well as to potential currency instabilities and less stringent financial and accounting standards generally applicable to U.S. issuers. Risks are enhanced for emerging market issuers. The Fund may invest significantly in issuers within a particular sector, which may be negatively affected by market, economic or other conditions, making the Fund more vulnerable to unfavorable developments in the sector. See the Fund’s prospectus for more information on these and other risks.
The views expressed in this report reflect the current views of the respective parties. These views are not guarantees of future performance and involve certain risks, uncertainties and assumptions that are difficult to predict, so actual outcomes and results may differ significantly from the views expressed. These views are subject to change at any time based upon economic, market or other conditions and the respective parties disclaim any responsibility to update such views. These views may not be relied on as investment advice and, because investment decisions for a Columbia Wanger fund are based on numerous factors, may not be relied on as an indication of trading intent on behalf of any particular Columbia Wanger fund. References to specific securities should not be construed as a recommendation or investment advice.
| 8 | Columbia Acorn Family of Funds | Semiannual Report 2017 |
Fund at a glance
Columbia Acorn International® (Unaudited)
Investment objective
Columbia Acorn International® (the Fund) seeks long-term capital appreciation.
Portfolio management
P. Zachary Egan, CFA
Co-manager
With Fund since 1999
Louis J. Mendes, CFA
Co-manager
With Fund since 2001
Morningstar style boxTM
The Morningstar Style Box is based on a fund’s portfolio holdings. For equity funds, the vertical axis shows the market capitalization of the stocks owned, and the horizontal axis shows investment style (value, blend, or growth). Information shown is based on the most recent data provided by Morningstar.
© 2017 Morningstar, Inc. All rights reserved. The Morningstar information contained herein: (1) is proprietary to Morningstar and/or its content providers; (2) may not be copied or distributed; and (3) is not warranted to be accurate, complete or timely. Neither Morningstar nor its content providers are responsible for any damages or losses arising from any use of this information.
| Average annual total returns (%) (for the period ended June 30, 2017) |
| | | Inception | 6 Months
cumulative | 1 Year | 5 Years | 10 Years | Life |
| Class A | Excluding sales charges | 10/16/00 | 18.43 | 17.12 | 8.11 | 3.35 | 9.92 |
| | Including sales charges | | 11.62 | 10.37 | 6.84 | 2.74 | 9.66 |
| Class B | Excluding sales charges | 10/16/00 | 18.21 | 16.60 | 7.33 | 2.65 | 9.20 |
| | Including sales charges | | 13.21 | 11.60 | 7.02 | 2.65 | 9.20 |
| Class C | Excluding sales charges | 10/16/00 | 18.01 | 16.24 | 7.30 | 2.56 | 9.11 |
| | Including sales charges | | 17.01 | 15.24 | 7.30 | 2.56 | 9.11 |
| Class R | 08/02/11 | 18.30 | 16.82 | 7.72 | 3.03 | 9.63 |
| Class R4 | 11/08/12 | 18.56 | 17.37 | 8.35 | 3.65 | 10.31 |
| Class R5 | 08/02/11 | 18.58 | 17.42 | 8.44 | 3.69 | 10.32 |
| Class Y | 11/08/12 | 18.62 | 17.47 | 8.49 | 3.72 | 10.34 |
| Class Z | 09/23/92 | 18.57 | 17.38 | 8.41 | 3.68 | 10.32 |
| MSCI ACWI ex USA SMID Cap Index (Net) | | 15.39 | 19.88 | 9.32 | 2.26 | N/A |
| MSCI ACWI ex USA SMID Cap Growth Index (Net) | | 16.50 | 16.87 | 9.11 | 1.75 | N/A |
Performance numbers reflect all Fund expenses. Returns for Class A shares are shown with and without the maximum initial sales charge of 5.75%. Returns for Class B shares are shown with and without the applicable contingent deferred sales charge (CDSC) of 5.00% in the first year, declining to 1.00% in the sixth year and eliminated thereafter. Returns for Class C shares are shown with and without the maximum CDSC of 1.00% for the first year after purchase. The Fund’s other classes are not subject to sales charges, but may be subject to other fees and expenses, and have limited eligibility. Please see the Fund’s prospectus for details. Performance for different share classes will vary based on differences in sales charges and certain fees and expenses associated with each class.
As stated in the May 1, 2017, prospectus, the Fund’s annual operating expense ratio is 1.01% for Class Z shares and 1.26% for Class A shares.
All results shown assume reinvestment of distributions during the period. Returns do not reflect the deduction of taxes that a shareholder may pay on Fund distributions or on the redemption of Fund shares. Performance results may reflect the effect of any fee waivers or reimbursements of Fund expenses by the investment manager and/or any of its affiliates. Absent these fee waivers and/or expense reimbursement arrangements, performance results may have been lower.
The performance information shown represents past performance and is not a guarantee of future results. The investment return and principal value of your investment will fluctuate so that shares, when redeemed, may be worth more or less than their original cost. Current performance may be lower or higher than the performance data shown. You may obtain performance information current to the most recent month-end by contacting your financial intermediary, visiting investor.columbiathreadneedleus.com or calling 800.922.6769.
The returns shown for periods prior to the share class inception date (including returns for the Life of the Fund, which are since Fund inception) include the returns of the Fund’s oldest share class. These returns are adjusted to reflect any higher class-related operating expenses of the newer share classes, as applicable. Please visit investor.columbiathreadneedleus.com/investment-products/mutual-funds/appended-performance for more information.
The MSCI ACWI ex USA SMID Cap Index (Net) captures a mid- and small-cap representation across 22 of 23 developed market countries (excluding the U.S.) and 24 emerging market countries. The index covers approximately 28% of the free float-adjusted market capitalization in each country.
The MSCI ACWI ex USA SMID Cap Growth Index (Net) captures mid-and small cap representation across 22 developed markets countries and 24 emerging markets countries.
Unlike mutual funds, indexes are not managed and do not incur fees or expenses. It is not possible to invest directly in an index.
Columbia Acorn Family of Funds | Semiannual Report 2017
| 9 |
Fund at a glance (continued)
Columbia Acorn International® (Unaudited)
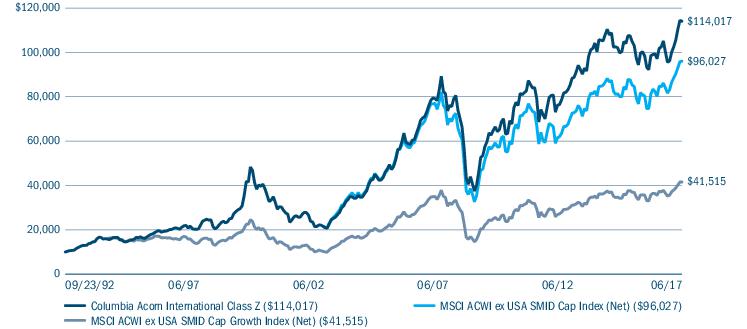
The Growth of a $10,000 Investment in Columbia Acorn International® Class Z Shares
September 23, 1992 (Fund inception) through June 30, 2017
This chart shows the change in value of a hypothetical $10,000 investment in Class Z shares of the Fund during the stated time period. A $10,000 investment in Columbia Acorn International® at inception appreciated to $21,562 on January 31, 2003, the inception date of the MSCI ACWI ex USA SMID Cap Index. A $10,000 investment in Columbia Acorn International® at inception appreciated to $15,870 on May 31, 1994, the inception date of the MCSI ACWI ex USA SMID Cap Growth Index. For comparison with the indices, we assigned each index the same value as the Fund at each index’s respective inception date. Although the indexes are provided for use in assessing the Fund’s performance, the Fund’s holdings may differ significantly from those in an index. Performance numbers reflect all Fund expenses.
| Top ten holdings (%) (at June 30, 2017) | |
CCL Industries, Inc. (Canada)
Manufacturing services and specialty packaging products for the non-durable consumer products market | 2.9 |
Partners Group Holding AG (Switzerland)
Global private markets asset management firm | 2.9 |
Hexagon AB, Class B (Sweden)
Design, measurement and visualisation technologies | 2.6 |
Brembo SpA (Italy)
Braking systems and components | 2.0 |
Wirecard AG (Germany)
Internet payment and processing services | 2.0 |
Kindred Group PLC (Malta)
Online gambling services | 1.7 |
Aalberts Industries NV (Netherlands)
Industrial services and flow control systems | 1.7 |
Grupo Aeroportuario del Sureste SAB de CV, ADR (Mexico)
Operates airports in Mexico | 1.7 |
Spirax-Sarco Engineering PLC (United Kingdom)
Consultation, service and products for the control and efficient management of steam and industrial fluids | 1.6 |
Zee Entertainment Enterprises Ltd. (India)
Hindi films, serials, game shows and children’s programs | 1.6 |
Percentages indicated are based upon total investments (excluding Money Market Funds and Securities Lending Collateral)
For further detail about these holdings, please refer to the section entitled “Portfolio of Investments."
Fund holdings are as of the date given, are subject to change at any time, and are not recommendations to buy or sell any security.
| 10 | Columbia Acorn Family of Funds | Semiannual Report 2017 |
Fund at a glance (continued)
Columbia Acorn International® (Unaudited)
| Equity sector breakdown (%) (at June 30, 2017) |
| Consumer Discretionary | 23.6 |
| Consumer Staples | 3.9 |
| Energy | 1.6 |
| Financials | 10.0 |
| Health Care | 7.7 |
| Industrials | 21.4 |
| Information Technology | 17.2 |
| Materials | 10.2 |
| Real Estate | 4.4 |
| Total | 100.0 |
Percentages indicated are based upon total equity investments. The Fund’s portfolio composition is subject to change.
| Country breakdown (%) (at June 30, 2017) |
| Australia | 1.5 |
| Brazil | 0.5 |
| Canada | 7.0 |
| Cayman Islands | 0.9 |
| China | 3.1 |
| Denmark | 3.3 |
| France | 1.7 |
| Germany | 6.4 |
| Hong Kong | 0.5 |
| India | 2.5 |
| Indonesia | 0.8 |
| Ireland | 0.6 |
| Italy | 2.4 |
| Japan | 21.0 |
| Malta | 1.6 |
| Mexico | 1.6 |
| Netherlands | 1.6 |
| New Zealand | 0.6 |
| Philippines | 0.5 |
| Singapore | 1.5 |
| South Africa | 1.4 |
| South Korea | 3.5 |
| Spain | 2.9 |
| Sweden | 4.5 |
| Switzerland | 4.1 |
| Taiwan | 1.9 |
| Thailand | 1.0 |
| United Kingdom | 14.4 |
| United States(a) | 6.7 |
| Total | 100.0 |
| (a) | Includes investments in Money Market Funds. |
Country breakdown is based primarily on issuer’s place of organization/incorporation. Percentages indicated are based upon total investments. The Fund’s portfolio composition is subject to change.
Columbia Acorn Family of Funds | Semiannual Report 2017
| 11 |
Manager Discussion of Fund Performance
Columbia Acorn International®
P. Zachary Egan, CFA
Co-Portfolio Manager
Louis J. Mendes, CFA
Co-Portfolio Manager
Columbia Acorn International Class Z shares gained 8.06% during the second quarter of 2017, outperforming the Fund’s primary benchmark, the MSCI ACWI ex USA SMID Cap Index (Net), which gained 6.32%. That brought Fund gains to 18.57% for the semiannual period versus a return of 15.39% for the primary benchmark.
The second quarter of 2017 continued the strong global equity market performance enjoyed during the first quarter. European equity performance led the charge in the first half and was aided by strong currency gains relative to the US Dollar. Also strong were markets closest to China, where a super-sized Chinese stimulus package in the second half of 2016 led to surprisingly strong growth. On the other hand, the markets that performed the worst during the period were those geared to commodity prices.
Information technology and health care, classic growth sectors where the Fund is presently overweight compared to its primary benchmark, continued their strong run and were among the top performing sectors during the first half of the year. In fact, positive performance was broadly based across sectors, with the notable exception of the energy sector, where the Fund has been underweight both its primary and secondary benchmarks. Energy was the standout underperformer during the first half of the year — the only sector not in positive territory — with the drop in oil prices from over $50 per barrel to below $43 a primary driver of this sector’s underperformance.
Fund allocations to broad regions had a minimal impact on relative performance during the first half of the year. The majority of outperformance during the period came from stock selection. The Fund outperformed in all major regions with the exception of the United Kingdom where results were roughly in line with those of the benchmark. Continental Europe, Japan, and Asia ex-Japan represented approximately 70% of Fund assets at period-end and stock selection in those regions drove first half performance versus the benchmark. From a sector perspective, relative outperformance was driven by favorable results in information technology, materials and health care. Stock selection was weak in energy, consumer staples and consumer discretionary holdings.
In Asia ex-Japan, Fund holdings in South Korea were among the top performers. Despite their small 3.3% average weight in the portfolio during the first half of the year, South Korean stocks in the Fund more than doubled the return of those in the primary benchmark, in both local and USD currencies, adding 74 basis points to performance versus the primary benchmark. The Fund underperformed relative to the primary benchmark in Australia, losing 28 basis points, and in the United Kingdom. In the latter market, the Fund has not been rewarded for holding a number of turnaround ideas within a consumer sector challenged by a weakened British Pound, rising inflation, negative or stalled real wage growth, online competition, and increasing anxiety around the Brexit process.
Two top contributors for the period were South Korean holdings Medy-Tox and Korea Investment Holdings. Medy-Tox is a pharmaceutical company that provides botulinum toxin (i.e. “Botox”) and fillers to South Korea and 40+ countries worldwide. Its products are priced well below those of U.S. market leader Allergan and take advantage of aging populations that are seeking a more youthful looking appearance. In Asian markets, this trend is not just for baby-boomers; the company has also seen tremendous growth in younger customers looking to stay ahead of the curve in competitive job (and marriage) markets. Korea Investment Holdings is the second largest broker and asset manager in South Korea. Despite geopolitical tensions emanating from its northern neighbor, Korea’s equity market has been buoyant, lifted by a new government and hopes for corporate governance reform. Rising asset values and the corresponding surge in investor activity have driven strong earnings growth at both brokerage and investment arms of the company.
Notable stock detractors included Next, a UK home retailer, and Domino’s Pizza Enterprises, an Australian pizza chain. Next over ordered inventory heading into the year which led to steeper discounting and lower margins. We decided to exit the position in favor of ideas with less challenging conditions in their end markets. Domino’s Pizza Enterprises has been a strong performer over the last
| 12 | Columbia Acorn Family of Funds | Semiannual Report 2017 |
Manager Discussion of Fund Performance (continued)
Columbia Acorn International®
two years, but declined during the period amid complaints that franchisees were underpaying employees in violation of wage laws. Domino’s Pizza Enterprises’ headquarters has revoked several Australian franchisee licenses and is further reviewing the claims. We believe the issue will be resolved, but trimmed the position to reflect an increasing risk that the company may have to share with franchisees the burden of rising labor costs.
International equities exhibited strong performance in the first half of the year. At the close of the period, prospects in Continental Europe were brightening — though it remains to be seen whether French President Emmanuel Macron can translate a seemingly decisive electoral mandate into labor market reforms capable of invigorating the economy and reducing unemployment. Japanese corporates continued to respond to policy initiatives designed to improve return on capital in an aging society that requires this to fund pension obligations. Emerging market valuations ended the period in line with historical averages and below those of slower growing developed markets. In all regions, we continue to search for exciting growth companies with sustainable competitive advantages trading at reasonable valuations.
Market risk may affect a single issuer, sector of the economy, industry or the market as a whole. International investing involves certain risks and volatility due to potential political, economic or currency instabilities and different, potentially less stringent, financial and accounting standards than those generally applicable to U.S. issuers. Risks are enhanced for emerging market issuers. Investments in small- and mid-cap companies involve risks and volatility and possible illiquidity greater than investments in larger, more established companies. See the Fund’s prospectus for more information on these and other risks.
The views expressed in this report reflect the current views of the respective parties. These views are not guarantees of future performance and involve certain risks, uncertainties and assumptions that are difficult to predict, so actual outcomes and results may differ significantly from the views expressed. These views are subject to change at any time based upon economic, market or other conditions and the respective parties disclaim any responsibility to update such views. These views may not be relied on as investment advice and, because investment decisions for a Columbia Wanger fund are based on numerous factors, may not be relied on as an indication of trading intent on behalf of any particular Columbia Wanger fund. References to specific securities should not be construed as a recommendation or investment advice.
Columbia Acorn Family of Funds | Semiannual Report 2017
| 13 |
Fund at a glance
Columbia Acorn USA® (Unaudited)
Investment objective
Columbia Acorn USA® (the Fund) seeks long-term capital appreciation.
Portfolio management
Matthew A. Litfin, CFA
Lead manager
With Fund since 2015
William J. Doyle, CFA
Co-manager
With Fund since 2006
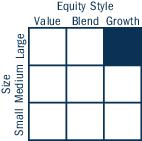
Morningstar style boxTM
The Morningstar Style Box is based on a fund’s portfolio holdings. For equity funds, the vertical axis shows the market capitalization of the stocks owned, and the horizontal axis shows investment style (value, blend, or growth). Information shown is based on the most recent data provided by Morningstar.
© 2017 Morningstar, Inc. All rights reserved. The Morningstar information contained herein: (1) is proprietary to Morningstar and/or its content providers; (2) may not be copied or distributed; and (3) is not warranted to be accurate, complete or timely. Neither Morningstar nor its content providers are responsible for any damages or losses arising from any use of this information.
| Average annual total returns (%) (for the period ended June 30, 2017) |
| | | Inception | 6 Months
cumulative | 1 Year | 5 Years | 10 Years | Life |
| Class A | Excluding sales charges | 10/16/00 | 11.27 | 24.38 | 12.70 | 6.52 | 10.24 |
| | Including sales charges | | 4.88 | 17.20 | 11.38 | 5.89 | 9.93 |
| Class C | Excluding sales charges | 10/16/00 | 10.89 | 23.54 | 11.93 | 5.75 | 9.44 |
| | Including sales charges | | 9.89 | 22.75 | 11.93 | 5.75 | 9.44 |
| Class R4 | 11/08/12 | 11.46 | 24.75 | 12.99 | 6.81 | 10.60 |
| Class R5 | 11/08/12 | 11.46 | 24.88 | 13.07 | 6.85 | 10.62 |
| Class Y | 11/08/12 | 11.49 | 24.91 | 13.13 | 6.88 | 10.64 |
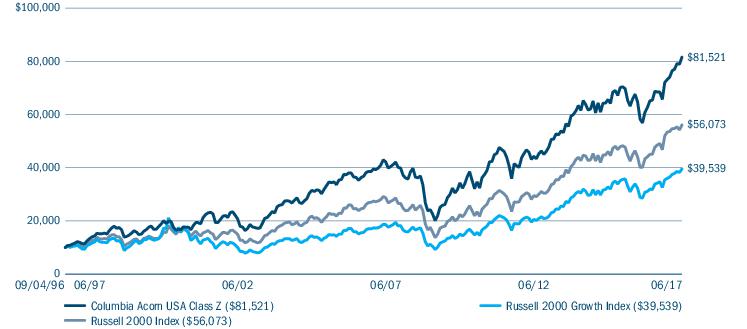
| Class Z | 09/04/96 | 11.42 | 24.76 | 12.99 | 6.81 | 10.60 |
| Russell 2000 Growth Index | | 9.97 | 24.40 | 13.98 | 7.82 | 6.83 |
Performance numbers reflect all Fund expenses. Returns for Class A shares are shown with and without the maximum initial sales charge of 5.75%. Returns for Class C shares are shown with and without the maximum contingent deferred sales charge of 1.00% for the first year after purchase. The Fund’s other classes are not subject to sales charges, but may be subject to other fees and expenses, and have limited eligibility. Please see the Fund’s prospectus for details. Performance for different share classes will vary based on differences in sales charges and certain fees and expenses associated with each class.
As stated in the May 1, 2017, prospectus, the Fund’s annual operating expense ratio is 1.17% for Class Z shares and 1.42% for Class A shares.
All results shown assume reinvestment of distributions during the period. Returns do not reflect the deduction of taxes that a shareholder may pay on Fund distributions or on the redemption of Fund shares. Performance results may reflect the effect of any fee waivers or reimbursements of Fund expenses by the investment manager and/or any of its affiliates. Absent these fee waivers and/or expense reimbursement arrangements, performance results may have been lower.
The performance information shown represents past performance and is not a guarantee of future results. The investment return and principal value of your investment will fluctuate so that shares, when redeemed, may be worth more or less than their original cost. Current performance may be lower or higher than the performance data shown. You may obtain performance information current to the most recent month-end by contacting your financial intermediary, visiting investor.columbiathreadneedleus.com or calling 800.922.6769.
The returns shown for periods prior to the share class inception date (including returns for the Life of the Fund, if shown, which are since Fund inception) include the returns of the Fund’s oldest share class. These returns are adjusted to reflect any higher class-related operating expenses of the newer share classes, as applicable. Please visit investor.columbiathreadneedleus.com/investment-products/mutual-funds/appended-performance for more information.
Effective May 1, 2017, the Fund compares its performance to that of the Russell 2000 Growth Index. Prior to this date, the Fund compared its performance to that of the Russell 2000 Index. The Investment Manager believes that the Fund’s portfolio will generally be more closely aligned with the Russell 2000 Growth Index than with the former core benchmark from an investment style perspective. Information on the Russell 2000 Index will be included for a one-year transition period.
The Russell 2000 Growth Index, an unmanaged index, measures the performance of those Russell 2000 Index companies with higher price-to-book ratios and higher forecasted growth values.
The Russell 2000 Index measures the performance of the 2,000 smallest companies in the Russell 3000 Index, which represents approximately 10% of the total market capitalization of the Russell 3000 Index. The Russell 3000 Index, an unmanaged index, measures the performance of the 3,000 largest U.S. companies based on total market capitalization, which represents approximately 98% of the investable U.S. equity market.
Unlike mutual funds, indexes are not managed and do not incur fees or expenses. It is not possible to invest directly in an index.
| 14 | Columbia Acorn Family of Funds | Semiannual Report 2017 |
Fund at a glance (continued)
Columbia Acorn USA® (Unaudited)
The Growth of a $10,000 Investment in Columbia Acorn USA® Class Z Shares
September 4, 1996 (Fund inception) through June 30, 2017
This chart shows the change in value of a hypothetical $10,000 investment in Class Z shares of the Fund during the stated time period. Although the indexes are provided for use in assessing the Fund’s performance, the Fund’s holdings may differ significantly from those in an index. Performance numbers reflect all Fund expenses.
| Top ten holdings (%) (at June 30, 2017) | |
HealthSouth Corp.
Inpatient rehabilitative healthcare services | 2.3 |
LCI Industries
Recreational vehicles and equipment | 2.2 |
MAXIMUS, Inc.
Program management and consulting services to state and local governments | 2.0 |
OM Asset Management PLC
Domestic and international equities, fixed income, and alternative investments | 1.7 |
WNS Holdings Ltd., ADR
Business process outsourcing services | 1.7 |
Texas Roadhouse, Inc.
Moderately priced, full service restaurant chain | 1.6 |
Lakeland Financial Corp.
Bank holding company | 1.5 |
LegacyTexas Financial Group, Inc.
Bank holding company | 1.5 |
Toro Co. (The)
Turf equipment | 1.5 |
Qualys, Inc.
Information technology security risk and compliance management solutions | 1.5 |
Percentages indicated are based upon total investments (excluding Money Market Funds and Securities Lending Collateral)
For further detail about these holdings, please refer to the section entitled “Portfolio of Investments."
Fund holdings are as of the date given, are subject to change at any time, and are not recommendations to buy or sell any security.
| Portfolio breakdown (%) (at June 30, 2017) |
| Common Stocks | 94.6 |
| Money Market Funds | 3.9 |
| Securities Lending Collateral | 1.5 |
| Total | 100.0 |
Percentages indicated are based upon total investments. The Fund’s portfolio composition is subject to change.
| Equity sector breakdown (%) (at June 30, 2017) |
| Consumer Discretionary | 23.1 |
| Consumer Staples | 1.0 |
| Energy | 1.9 |
| Financials | 10.9 |
| Health Care | 22.1 |
| Industrials | 14.7 |
| Information Technology | 23.4 |
| Materials | 0.7 |
| Real Estate | 2.2 |
| Total | 100.0 |
Percentages indicated are based upon total equity investments. The Fund’s portfolio composition is subject to change.
Columbia Acorn Family of Funds | Semiannual Report 2017
| 15 |
Manager Discussion of Fund Performance
Columbia Acorn USA®
Matthew A. Litfin, CFA
Lead Portfolio Manager
William J. Doyle, CFA
Co-Portfolio Manager
Columbia Acorn USA Fund Class Z shares gained 5.83% during the second quarter of 2017, outperforming the Fund’s primary benchmark, the Russell 2000 Growth Index, which gained 4.39%. Fund returns for the semiannual period were 11.42% versus a gain of 9.97% for the benchmark.
Through the first half of 2017, U.S. equity markets delivered solid and steady gains with very little in the way of interruptions. Growth stocks outperformed versus value stocks in a sharp reversal from 2016. Economic growth remained strong enough to fuel positive market performance, yet not so robust as to raise concerns that the U.S. Federal Reserve would need to take a more aggressive approach to raising interest rates. Corporate results were also supportive, highlighted by strength in earnings, rising revenues and profit margins, and generally positive guidance for the remainder of 2017. A meaningful decline in the U.S. dollar acted as an additional tailwind for U.S. equities by making the products and services of U.S. companies more competitive overseas.
In terms of strong market sectors, health care and information technology were the highest contributing sectors to performance during the period in the benchmark. The only two sectors with negative absolute returns were energy and consumer staples. The drop in oil prices from over $50 per barrel to below $43 was a primary driver of the fall in energy stocks, resulting in this sector being the standout underperformer.
In terms of allocation to sectors, overweight positions in energy, financials and consumer discretionary all detracted from Fund performance. This was offset by strong stock selection in consumer discretionary as Fund holdings in that sector more than tripled benchmark returns. Stock selection in health care and information technology also helped. Selection within energy and financials was a detractor.
Top contributors during the period were health care holding Exact Sciences and consumer company iRobot. Exact’s stock more than doubled on the strength of Cologuard, a stool-based screen for the early detection of colon cancer that we believe strikes a balance of accuracy, cost-effectiveness and convenience. We took advantage of the stock’s strength to trim our position. iRobot is the global leader in robotic floor care. The attraction for us is the company’s technological lead over the competition due to more robust R&D efforts combined with a growing marketplace for its core products. The company also is pushing into other areas and could soon be a leader in robotic lawn mowing.
Among the Fund’s detractors were Carrizo Oil and Gas and Knoll. Though an efficient exploration company, it was not surprising that Carrizo’s stock declined along with the drop in crude oil prices. Knoll manufactures and sells office furniture. Non-residential construction has been softer than expected causing the company to report softer sales and an earnings miss.
We added several new positions to the portfolio during the first half of the year, including Extended Stay America and Orasure. Extended Stay owns and operates branded hotels in the extended stay segment of the lodging industry. Over the last five years the company has renovated over 600 hotels, refinanced its balance sheet, and laid out a plan to return to unit growth. We believe investors are under-appreciating the company’s multi-faceted strategy. Orasure develops, markets and sells oral fluid specimen collection devices. The burgeoning consumer genomics market is benefiting the company’s molecular collection segment and global efforts to eradicate HIV and other epidemics are benefiting their diagnostics business. We are attracted to its highly entrenched presence in these rapidly growing areas. On the surface, these are very different businesses; however, both exhibit many of the characteristics we seek in new ideas for the Fund’s portfolio. Both offer differentiated products that we believe have an advantage over their nearest competitors, operate in segments poised for growth, and currently trade at valuations we believe are reasonable relative to their quality and future growth potential.
| 16 | Columbia Acorn Family of Funds | Semiannual Report 2017 |
Manager Discussion of Fund Performance (continued)
Columbia Acorn USA®
Global stocks markets have rewarded investors thus far in 2017. At the end of the period, averages remained at robust levels and there was sustained economic expansion around the world. However, growth was slower than in previous recoveries. Interest rates and volatility also remained low. We are realistic about the potential risks after a global surge in stock valuations and the potential for increased volatility. In this market environment, we continue to focus on identifying exciting growth companies with sustainable competitive advantages trading at reasonable valuations.
Market risk may affect a single issuer, sector of the economy, industry or the market as a whole. Investments in small- and mid-cap companies involve risks and volatility greater than investments in larger, more established companies. The Fund may invest significantly in issuers within a particular sector, which may be negatively affected by market, economic or other conditions, making the fund more vulnerable to unfavorable developments in the sector. See the Fund’s prospectus for more information on these and other risks.
The views expressed in this report reflect the current views of the respective parties. These views are not guarantees of future performance and involve certain risks, uncertainties and assumptions that are difficult to predict, so actual outcomes and results may differ significantly from the views expressed. These views are subject to change at any time based upon economic, market or other conditions and the respective parties disclaim any responsibility to update such views. These views may not be relied on as investment advice and, because investment decisions for a Columbia Wanger Fund are based on numerous factors, may not be relied on as an indication of trading intent on behalf of any particular Columbia Wanger Fund. References to specific securities should not be construed as a recommendation or investment advice.
Columbia Acorn Family of Funds | Semiannual Report 2017
| 17 |
Fund at a glance
Columbia Acorn International SelectSM (Unaudited)
Investment objective
Columbia Acorn International SelectSM (the Fund) seeks long-term capital appreciation.
Portfolio management
Stephen Kusmierczak, CFA
Co-manager
With Fund since 2001
Andreas Waldburg-Wolfegg*
Co-manager
With Fund since 2002
*Effective September 30, 2017, Mr. Waldburg-Wolfegg will no longer serve as a Portfolio Manager of the Fund.
Morningstar style boxTM
The Morningstar Style Box is based on a fund’s portfolio holdings. For equity funds, the vertical axis shows the market capitalization of the stocks owned, and the horizontal axis shows investment style (value, blend, or growth). Information shown is based on the most recent data provided by Morningstar.
© 2017 Morningstar, Inc. All rights reserved. The Morningstar information contained herein: (1) is proprietary to Morningstar and/or its content providers; (2) may not be copied or distributed; and (3) is not warranted to be accurate, complete or timely. Neither Morningstar nor its content providers are responsible for any damages or losses arising from any use of this information.
| Average annual total returns (%) (for the period ended June 30, 2017) |
| | | Inception | 6 Months
cumulative | 1 Year | 5 Years | 10 Years | Life |
| Class A | Excluding sales charges | 10/16/00 | 20.13 | 23.53 | 7.09 | 3.38 | 8.30 |
| | Including sales charges | | 13.24 | 16.41 | 5.84 | 2.77 | 7.96 |
| Class C | Excluding sales charges | 10/16/00 | 19.71 | 22.66 | 6.27 | 2.58 | 7.49 |
| | Including sales charges | | 18.71 | 21.66 | 6.27 | 2.58 | 7.49 |
| Class R4 | 11/08/12 | 20.30 | 23.85 | 7.38 | 3.70 | 8.65 |
| Class R5 | 11/08/12 | 20.36 | 23.98 | 7.45 | 3.74 | 8.67 |
| Class Y | 11/08/12 | 20.38 | 24.04 | 7.49 | 3.76 | 8.68 |
| Class Z | 11/23/98 | 20.31 | 23.86 | 7.40 | 3.72 | 8.65 |
| MSCI ACWI ex USA Index (Net) | | 14.10 | 20.45 | 7.22 | 1.13 | N/A |
| MSCI ACWI ex USA Growth Index (Net) | | 17.38 | 17.38 | 8.04 | 1.89 | N/A |
Performance numbers reflect all Fund expenses. Returns for Class A shares are shown with and without the maximum initial sales charge of 5.75%. Returns for Class C shares are shown with and without the maximum contingent deferred sales charge of 1.00% for the first year after purchase. The Fund’s other classes are not subject to sales charges, but may be subject to other fees and expenses, and have limited eligibility. Please see the Fund’s prospectus for details. Performance for different share classes will vary based on differences in sales charges and certain fees and expenses associated with each class.
As stated in the May 1, 2017, prospectus, the Fund’s annual operating expense ratio is 1.15% for Class Z shares and 1.40% for Class A shares.
All results shown assume reinvestment of distributions during the period. Returns do not reflect the deduction of taxes that a shareholder may pay on Fund distributions or on the redemption of Fund shares. Performance results may reflect the effect of any fee waivers or reimbursements of Fund expenses by the investment manager and/or any of its affiliates. Absent these fee waivers and/or expense reimbursement arrangements, performance results may have been lower.
The performance information shown represents past performance and is not a guarantee of future results. The investment return and principal value of your investment will fluctuate so that shares, when redeemed, may be worth more or less than their original cost. Current performance may be lower or higher than the performance data shown. You may obtain performance information current to the most recent month-end by contacting your financial intermediary, visiting investor.columbiathreadneedleus.com or calling 800.922.6769.
The returns shown for periods prior to the share class inception date (including returns for the Life of the Fund, if shown, which are since Fund inception) include the returns of the Fund’s oldest share class. These returns are adjusted to reflect any higher class-related operating expenses of the newer share classes, as applicable. Please visit investor.columbiathreadneedleus.com/investment-products/mutual-funds/appended-performance for more information.
The MSCI ACWI ex USA Index (Net) captures a large- and mid-cap representation across 22 of 23 developed market countries (excluding the U.S.) and 24 emerging market countries. The index covers approximately 85% of the global equity opportunity set outside the United States.
The MSCI ACWI ex USA Growth Index (Net) captures large-and mid-cap representation across 22 developed markets countries and 24 emerging markets countries.
Unlike mutual funds, indexes are not managed and do not incur fees or expenses. It is not possible to invest directly in an index.
| 18 | Columbia Acorn Family of Funds | Semiannual Report 2017 |
Fund at a glance (continued)
Columbia Acorn International SelectSM (Unaudited)
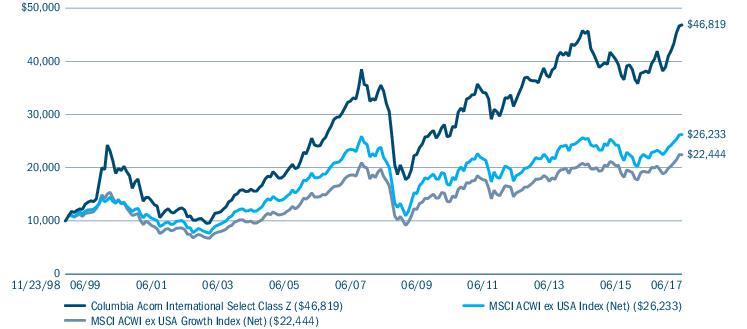
The Growth of a $10,000 Investment in Columbia Acorn International SelectSM Class Z Shares
November 23, 1998 (Fund inception) through June 30, 2017
This chart shows the change in value of a hypothetical $10,000 investment in Class Z shares of the Fund during the stated time period. A $10,000 investment in Columbia Acorn International SelectSM at inception appreciated to $11,000 on December 31, 1998, the month-end of the inception date of the MSCI ACWI ex USA Growth Index (Net) and the MSCI ACWI ex USA Index (Net). For comparison with the indices, we assigned each index the same value as the Fund at month-end of the inception date of the indices. Although the indexes are provided for use in assessing the Fund’s performance, the Fund’s holdings may differ significantly from those in an index. Performance numbers reflect all Fund expenses.
| Top ten holdings (%) (at June 30, 2017) | |
CCL Industries, Inc. (Canada)
Manufacturing services and specialty packaging products for the non-durable consumer products market | 5.9 |
Hexagon AB, Class B (Sweden)
Design, measurement and visualisation technologies | 5.3 |
Partners Group Holding AG (Switzerland)
Global private markets asset management firm | 5.1 |
Wirecard AG (Germany)
Internet payment and processing services | 5.0 |
MTU Aero Engines AG (Germany)
Develops and manufactures engines and offers commercial engine services and support | 4.1 |
NetEase, Inc., ADR (China)
Internet technology company that develops applications, services and Internet technologies | 4.1 |
Naspers Ltd., Class N (South Africa)
Electronic and print media industries | 4.1 |
Hoya Corp. (Japan)
Electro-optics products | 3.8 |
Geberit AG (Switzerland)
Water supply pipes and fittings, installation systems, drainage and flushing systems | 3.5 |
Novozymes AS, Class B (Denmark)
Enzymes for industrial use | 3.4 |
Percentages indicated are based upon total investments (excluding Money Market Funds and Securities Lending Collateral)
For further detail about these holdings, please refer to the section entitled “Portfolio of Investments."
Fund holdings are as of the date given, are subject to change at any time, and are not recommendations to buy or sell any security.
Columbia Acorn Family of Funds | Semiannual Report 2017
| 19 |
Fund at a glance (continued)
Columbia Acorn International SelectSM (Unaudited)
| Equity sector breakdown (%) (at June 30, 2017) |
| Consumer Discretionary | 16.9 |
| Consumer Staples | 3.0 |
| Financials | 8.4 |
| Health Care | 7.0 |
| Industrials | 22.5 |
| Information Technology | 25.6 |
| Materials | 13.5 |
| Real Estate | 3.1 |
| Total | 100.0 |
Percentages indicated are based upon total equity investments. The Fund’s portfolio composition is subject to change.
| Country breakdown (%) (at June 30, 2017) |
| Australia | 3.5 |
| Canada | 5.6 |
| China | 3.9 |
| Denmark | 3.3 |
| France | 3.4 |
| Germany | 8.7 |
| India | 2.8 |
| Ireland | 2.7 |
| Japan | 22.0 |
| Mexico | 2.4 |
| South Africa | 3.9 |
| South Korea | 1.9 |
| Sweden | 5.0 |
| Switzerland | 8.1 |
| Taiwan | 3.2 |
| United Kingdom | 14.4 |
| United States(a) | 5.2 |
| Total | 100.0 |
| (a) | Includes investments in Money Market Funds. |
Country breakdown is based primarily on issuer’s place of organization/incorporation. Percentages indicated are based upon total investments. The Fund’s portfolio composition is subject to change.
| 20 | Columbia Acorn Family of Funds | Semiannual Report 2017 |
Manager Discussion of Fund Performance
Columbia Acorn International SelectSM
Stephen Kusmierczak, CFA
Co-Portfolio Manager
Andreas Waldburg-Wolfegg
Co-Portfolio Manager
Columbia Acorn International Select Class Z shares gained 8.29% during the second quarter of 2017, outperforming the Fund’s primary benchmark, the MSCI ACWI ex USA Index (Net), which gained 5.78%. That brought Fund gains to 20.31% for the semiannual period versus a return of 14.10% for the benchmark.
The second quarter of 2017 continued the strong global equity market performance experienced in the first quarter. The strongest returns came from markets closest to China, where a major stimulus package in the second half of 2016 quieted worries about a sharp economic downturn. European equities also had strong returns aided by currency gains versus the US Dollar. On the other hand, the markets geared to commodity prices were the worst performers during the period.
Positive performance was broadly based across sectors. Information technology and industrials, areas where the Fund is overweight relative to the benchmark, continued their strong run and were top contributors to relative returns during the first half of the year. Energy was the notable detractor, and the Fund continues to maintain an underweight position in this sector. Energy was the only declining sector in the first half, explained largely by the drop in oil prices from over $50 per barrel to below $43.
Fund allocations across regions, specifically underweights in Greater China and South Korea and an overweight in Japan, detracted from performance. From a sector perspective, Fund positioning had a positive effect. Both the underweight in energy and the overweight in information technology contributed to Fund performance.
The Fund’s holdings and position sizes are determined through fundamental stock analysis not top-down allocations to geographies and sectors. These allocations may contribute to or detract from our relative returns over time, but our goal is to deliver a better return than the Fund’s benchmark by focusing on company fundamentals and valuations.
Top contributors for the first half were Wirecard and CCL Industries. German-based Wirecard provides payment solutions to online merchants globally. Growth is correlated with e-commerce, the rise of the retail “omni-channel”, cashless transactions, and emerging global technical standards, all of which we believe have considerable runway. Canadian company CCL Industries is a global provider of labels. The company has been an efficient consolidator of the industry, and has successfully focused on the fastest growing product categories like personal care and premium beverages. The company has consistently surprised by achieving higher synergies than expected following its acquisitions.
Notable stock detractors included Next, a UK home retailer, and Vermillion Energy, a Canadian oil and gas producer. Next over-ordered inventory heading into the year which led to steeper discounting to move items and lower margins. We decided to exit the position in favor of ideas with less challenging conditions in their end markets. Not surprisingly, Vermillion declined due to the drop in crude oil prices and we sold the position.
International equities exhibited strong performance in the first half of the year. At the close of the period, prospects in Continental Europe were brightening ? though it remains to be seen whether French President Emmanuel Macron can translate a seemingly decisive electoral mandate into labor market reforms capable of invigorating the economy and reducing unemployment. Japanese corporates continued to respond to policy initiatives designed to improve return on capital in an aging society that requires this to fund pension obligations. Emerging market valuations ended the period in line with historical averages and below those of slower growing developed markets. In all regions, we continue to search for exciting growth companies with sustainable competitive advantages trading at reasonable valuations.
Market risk may affect a single issuer, sector of the economy, industry or the market as a whole. Foreign investments subject the Fund to political, economic, market, social and other risks within a particular country, as well as to potential currency instabilities and less stringent financial and accounting standards generally applicable to U.S. issuers. Risks are enhanced for emerging market issuers. Investments in small- and mid-cap companies involve risks and volatility and possible illiquidity greater
Columbia Acorn Family of Funds | Semiannual Report 2017
| 21 |
Manager Discussion of Fund Performance (continued)
Columbia Acorn International SelectSM
than investments in larger, more established companies. The Fund may invest significantly in issuers within a particular sector, which may be negatively affected by market, economic or other conditions, making the Fund more vulnerable to unfavorable developments in the sector. See the Fund’s prospectus for more information on these and other risks.
The views expressed in this report reflect the current views of the respective parties. These views are not guarantees of future performance and involve certain risks, uncertainties and assumptions that are difficult to predict, so actual outcomes and results may differ significantly from the views expressed. These views are subject to change at any time based upon economic, market or other conditions and the respective parties disclaim any responsibility to update such views. These views may not be relied on as investment advice and, because investment decisions for a Columbia Wanger fund are based on numerous factors, may not be relied on as an indication of trading intent on behalf of any particular Columbia Wanger fund. References to specific securities should not be construed as a recommendation or investment advice.
| 22 | Columbia Acorn Family of Funds | Semiannual Report 2017 |
Fund at a glance
Columbia Acorn SelectSM (Unaudited)
Investment objective
Columbia Acorn SelectSM (the Fund) seeks long-term capital appreciation.
Portfolio management
David L. Frank, CFA
Co-manager
With Fund since 2002
Matthew S. Szafranski, CFA
Co-manager
With Fund since 2008
Morningstar style boxTM
The Morningstar Style Box is based on a fund’s portfolio holdings. For equity funds, the vertical axis shows the market capitalization of the stocks owned, and the horizontal axis shows investment style (value, blend, or growth). Information shown is based on the most recent data provided by Morningstar.
© 2017 Morningstar, Inc. All rights reserved. The Morningstar information contained herein: (1) is proprietary to Morningstar and/or its content providers; (2) may not be copied or distributed; and (3) is not warranted to be accurate, complete or timely. Neither Morningstar nor its content providers are responsible for any damages or losses arising from any use of this information.
| Average annual total returns (%) (for the period ended June 30, 2017) |
| | | Inception | 6 Months
cumulative | 1 Year | 5 Years | 10 Years | Life |
| Class A | Excluding sales charges | 10/16/00 | 11.66 | 26.22 | 12.90 | 4.69 | 9.79 |
| | Including sales charges | | 5.25 | 18.94 | 11.58 | 4.07 | 9.44 |
| Class C | Excluding sales charges | 10/16/00 | 11.29 | 25.38 | 12.08 | 3.89 | 8.97 |
| | Including sales charges | | 10.30 | 24.39 | 12.08 | 3.89 | 8.97 |
| Class R4 | 11/08/12 | 11.77 | 26.51 | 13.17 | 4.97 | 10.12 |
| Class R5 | 11/08/12 | 11.79 | 26.64 | 13.26 | 5.01 | 10.14 |
| Class Y | 11/08/12 | 11.83 | 26.75 | 13.31 | 5.03 | 10.16 |
| Class Z | 11/23/98 | 11.77 | 26.58 | 13.23 | 4.99 | 10.13 |
| Russell 2500 Growth Index | | 10.63 | 21.44 | 14.33 | 8.18 | 8.45 |
Performance numbers reflect all Fund expenses. Returns for Class A shares are shown with and without the maximum initial sales charge of 5.75%. Returns for Class C shares are shown with and without the maximum contingent deferred sales charge of 1.00% for the first year after purchase. The Fund’s other classes are not subject to sales charges, but may be subject to other fees and expenses, and have limited eligibility. Please see the Fund’s prospectus for details. Performance for different share classes will vary based on differences in sales charges and certain fees and expenses associated with each class.
As stated in the May 1, 2017, prospectus, the Fund’s annual operating expense ratio is 0.93% for Class Z shares and 1.18% for Class A shares.
All results shown assume reinvestment of distributions during the period. Returns do not reflect the deduction of taxes that a shareholder may pay on Fund distributions or on the redemption of Fund shares. Performance results may reflect the effect of any fee waivers or reimbursements of Fund expenses by the investment manager and/or any of its affiliates. Absent these fee waivers and/or expense reimbursement arrangements, performance results may have been lower.
The performance information shown represents past performance and is not a guarantee of future results. The investment return and principal value of your investment will fluctuate so that shares, when redeemed, may be worth more or less than their original cost. Current performance may be lower or higher than the performance data shown. You may obtain performance information current to the most recent month-end by contacting your financial intermediary, visiting investor.columbiathreadneedleus.com or calling 800.922.6769.
The returns shown for periods prior to the share class inception date (including returns for the Life of the Fund, if shown, which are since Fund inception) include the returns of the Fund’s oldest share class. These returns are adjusted to reflect any higher class-related operating expenses of the newer share classes, as applicable. Please visit investor.columbiathreadneedleus.com/investment-products/mutual-funds/appended-performance for more information.
Effective May 1, 2017, the Fund compares its performance to that of the Russell 2500 Growth Index. Prior to this date, the Fund compared its performance to that of the S&P MidCap 400® Index. The Investment Manager believes that the Fund’s portfolio will generally be more closely aligned with the Russell 2500 Growth Index than with the former core benchmark from an investment style perspective. Information on the S&P MidCap 400® Index will be included for a one-year transition period.
The Russell 2500 Growth Index measures the performance of those Russell 2500 companies with higher price-to-book ratios and higher forecasted growth values.
The S&P MidCap 400® Index is a market value-weighted index that tracks the performance of 400 mid-cap U.S. companies.
Unlike mutual funds, indexes are not managed and do not incur fees or expenses. It is not possible to invest directly in an index.
Columbia Acorn Family of Funds | Semiannual Report 2017
| 23 |
Fund at a glance (continued)
Columbia Acorn SelectSM (Unaudited)
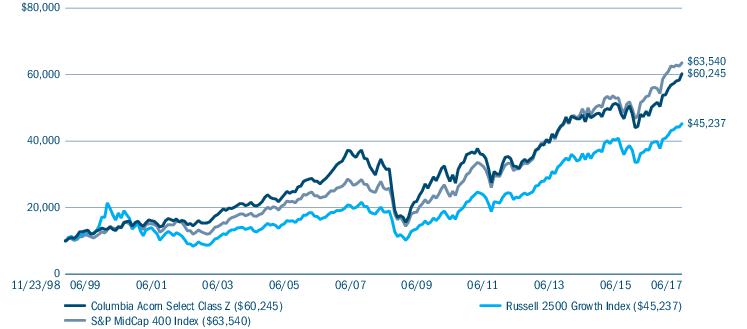
The Growth of a $10,000 Investment in Columbia Acorn SelectSM Class Z Shares
November 23, 1998 (Fund inception) through June 30, 2017
This chart shows the change in value of a hypothetical $10,000 investment in Class Z shares of the Fund during the stated time period. Although the indexes are provided for use in assessing the Fund’s performance, the Fund’s holdings may differ significantly from those in an index. Performance numbers reflect all Fund expenses.
| Top ten holdings (%) (at June 30, 2017) | |
HealthSouth Corp.
Inpatient rehabilitative healthcare services | 5.3 |
Wabtec Corp.
Technology products and services for the rail industry | 4.6 |
JB Hunt Transport Services, Inc.
Logistics services | 4.5 |
Vail Resorts, Inc.
Operates resorts globally | 4.4 |
Align Technology, Inc.
Designs, manufactures, and markets the Invisalign System | 4.4 |
Snap-On, Inc.
Tool and equipment solutions | 4.4 |
GoDaddy, Inc., Class A
Cloud-based web platform for small businesses, web design professionals and individuals | 4.3 |
AMERCO
Rental of trucks, trailers, and self storage space, as well as property and casualty and life insurance products | 4.0 |
Oshkosh Corp.
Fire and emergency apparatuses and specialty commercial, and military trucks | 3.8 |
LKQ Corp.
Automotive products and services | 3.8 |
Percentages indicated are based upon total investments (excluding Money Market Funds).
For further detail about these holdings, please refer to the section entitled “Portfolio of Investments."
Fund holdings are as of the date given, are subject to change at any time, and are not recommendations to buy or sell any security.
| Portfolio breakdown (%) (at June 30, 2017) |
| Common Stocks | 98.3 |
| Money Market Funds | 1.7 |
| Total | 100.0 |
Percentages indicated are based upon total investments. The Fund’s portfolio composition is subject to change.
| Equity sector breakdown (%) (at June 30, 2017) |
| Consumer Discretionary | 18.3 |
| Financials | 13.0 |
| Health Care | 17.2 |
| Industrials | 27.0 |
| Information Technology | 14.4 |
| Materials | 3.4 |
| Real Estate | 6.7 |
| Total | 100.0 |
Percentages indicated are based upon total equity investments. The Fund’s portfolio composition is subject to change.
| 24 | Columbia Acorn Family of Funds | Semiannual Report 2017 |
Manager Discussion of Fund Performance
Columbia Acorn SelectSM
David L. Frank, CFA
Co-Portfolio Manager
Matthew S. Szafranski, CFA
Co-Portfolio Manager
Columbia Acorn Select Fund Class Z shares gained 5.09% during the second quarter of 2017, outperforming the Fund’s primary benchmark, the Russell 2500 Growth Index, which gained 4.13%. That propelled Fund gains to 11.77% for the semiannual period versus a return of 10.63% for the benchmark.
Through the first half of 2017, U.S. equity markets delivered solid and steady gains with very little in the way of interruptions. Economic growth remained strong enough to fuel positive market performance, yet not so robust as to raise concerns that the U.S. Federal Reserve would need to take a more aggressive approach to raising interest rates. Corporate results were also supportive, highlighted by strength in earnings, rising revenues and profit margins, and generally positive guidance for the remainder of 2017. A meaningful decline in the U.S. dollar acted as an additional tailwind for equities by making the products and services of U.S. companies more competitive overseas. Growth stocks strengthened against value stocks, reversing course from prior quarters.
In terms of stronger market sectors, information technology and healthcare continued their strong run of performance and were the best performing sectors in the benchmark during the period. The only two sectors with negative absolute returns were energy and consumer staples. The drop in oil prices from over $50 per barrel to below $43 was a primary driver of the fall in energy stocks, resulting in this sector being the standout underperformer.
Fund positioning as a whole relative to benchmark was negligible to relative returns. The Fund had no exposure to energy and consumer staples during the first half of 2017 as we had not found any companies with compelling business models that appeared to have a clear path to the value creation that we seek. However, the boost this provided was largely offset by the Fund’s large overweight to industrials, where the FUnd lagged the benchmark due to poor stock selection, and its underexposure to the information technology sector, the highest performing sector in the benchmark during the first half of the year.
As should be the case with a focused fund, returns relative to the benchmark were driven by our selection of individual stocks, especially in the consumer discretionary, healthcare and financial sectors. Together, stock selection in these sectors combined to contribute over 300 basis points, which was somewhat offset by poor selection in the industrials sector.
The top contributors for the first half were Align Technology and Vail Resorts. Align Technology designs, manufactures and markets the Invisalign system, an alternative method to bracket and wire braces for treating crooked teeth. The stock rose during the period as it reported a large profit surge and beat expectations on greater adoption of its products. Vail Resorts operates a number of premier ski resorts. The company had strong earnings as it has been able to both increase season pass renewals and draw more first time customers to its slopes.
The largest detractor for the period was pizza chain Papa John’s International. The firm continues to take share in the fragmented U.S. pizza industry, but the company has lost ground to leading rival Domino’s and there was renewed concern about an ongoing turnaround at laggard Pizza Hut. Nevertheless, Papa John’s premium “clean” pizza and technology platform resonate with millennials, so we added to the position on weakness. Industrial holding Snap-On, a marketer of hand and power tools, was also a negative contributor. The stock retreated due to concerns over the company’s credit portfolio. We believe those fears are overblown and added to this position as well.
Global stocks markets have rewarded investors thus far in 2017. At the end of the period, averages remained at robust levels and there was sustained economic expansion around the world. However, growth was slower than in previous recoveries. Interest rates and volatility also remained low. We are realistic about the potential risks after a global surge in stock valuations and the potential for increased volatility. In this market environment, we continue to focus on identifying exciting growth companies with sustainable competitive advantages trading at reasonable valuations.
Columbia Acorn Family of Funds | Semiannual Report 2017
| 25 |
Manager Discussion of Fund Performance (continued)
Columbia Acorn SelectSM
Market risk may affect a single issuer, sector of the economy, industry or the market as a whole. Investments in small- and mid-cap companies involve risks and volatility and possible illiquidity greater than investments in larger, more established companies. Foreign investments subject the Fund to risks, including political, economic, market, social and other risks, within a particular country, as well as to potential currency instabilities and less stringent financial and accounting standards generally applicable to U.S. issuers. Risks are enhanced for emerging market issuers. The Fund may invest significantly in issuers within a particular sector, which may be negatively affected by market, economic or other conditions, making the Fund more vulnerable to unfavorable developments in the sector. See the Fund’s prospectus for more information on these and other risks.
The views expressed in this report reflect the current views of the respective parties. These views are not guarantees of future performance and involve certain risks, uncertainties and assumptions that are difficult to predict, so actual outcomes and results may differ significantly from the views expressed. These views are subject to change at any time based upon economic, market or other conditions and the respective parties disclaim any responsibility to update such views. These views may not be relied on as investment advice and, because investment decisions for a Columbia Wanger Fund are based on numerous factors, may not be relied on as an indication of trading intent on behalf of any particular Columbia Wanger Fund. References to specific securities should not be construed as a recommendation or investment advice.
| 26 | Columbia Acorn Family of Funds | Semiannual Report 2017 |
Fund at a glance
Columbia Thermostat FundSM (Unaudited)
Investment objective
Columbia Thermostat FundSM (the Fund) seeks long-term capital appreciation.
Portfolio management
David L. Frank, CFA
Portfolio Manager
With Fund since 2002
| Average annual total returns (%) (for the period ended June 30, 2017) |
| | | Inception | 6 Months
cumulative | 1 Year | 5 Years | 10 Years | Life |
| Class A | Excluding sales charges | 03/03/03 | 3.11 | 4.00 | 5.65 | 5.04 | 6.91 |
| | Including sales charges | | -2.82 | -1.95 | 4.41 | 4.42 | 6.48 |
| Class C | Excluding sales charges | 03/03/03 | 2.70 | 3.19 | 4.86 | 4.24 | 6.11 |
| | Including sales charges | | 1.70 | 2.19 | 4.86 | 4.24 | 6.11 |
| Class R4 | 11/08/12 | 3.27 | 4.29 | 5.91 | 5.29 | 7.18 |
| Class R5 | 11/08/12 | 3.20 | 4.23 | 5.93 | 5.30 | 7.19 |
| Class Y | 11/08/12 | 3.27 | 4.29 | 5.97 | 5.32 | 7.20 |
| Class Z | 09/25/02 | 3.22 | 4.25 | 5.91 | 5.29 | 7.18 |
| S&P 500 Index | | 9.34 | 17.90 | 14.63 | 7.18 | 9.85 |
| Bloomberg Barclays U.S. Aggregate Bond Index | | 2.27 | -0.31 | 2.21 | 4.48 | 4.25 |
| Blended Benchmark | | 5.77 | 8.50 | 8.39 | 6.14 | 7.29 |
Performance numbers reflect all Fund expenses. Returns for Class A shares are shown with and without the maximum initial sales charge of 5.75%. Returns for Class C shares are shown with and without the maximum contingent deferred sales charge of 1.00% for the first year after purchase. The Fund’s other classes are not subject to sales charges, but may be subject to other fees and expenses, and have limited eligibility. Please see the Fund’s prospectus for details. Performance for different share classes will vary based on differences in sales charges and certain fees and expenses associated with each class.
As stated in the May 1, 2017 prospectus, the Fund’s annual operating expense ratio is 0.76% for Class Z shares and 1.01% for Class A shares.
All results shown assume reinvestment of distributions during the period. Returns do not reflect the deduction of taxes that a shareholder may pay on Fund distributions or on the redemption of Fund shares. Performance results may reflect the effect of any fee waivers or reimbursements of Fund expenses by the investment manager and/or any of its affiliates. Absent these fee waivers and/or expense reimbursement arrangements, performance results may have been lower.
The performance information shown represents past performance and is not a guarantee of future results. The investment return and principal value of your investment will fluctuate so that shares, when redeemed, may be worth more or less than their original cost. Current performance may be lower or higher than the performance data shown. You may obtain performance information current to the most recent month-end by contacting your financial intermediary, visiting investor.columbiathreadneedleus.com or calling 800.922.6769.
The returns shown for periods prior to the share class inception date (including returns for the Life of the Fund, if shown, which are since Fund inception) include the returns of the Fund’s oldest share class. These returns are adjusted to reflect any higher class-related operating expenses of the newer share classes, as applicable. Please visit investor.columbiathreadneedleus.com/investment-products/mutual-funds/appended-performance for more information.
The Standard & Poor’s (S&P) 500® Index tracks the performance of 500 widely held, large-capitalization U.S. stocks.
The Bloomberg Barclays U.S. Aggregate Bond Index is a market value-weighted index that tracks the daily price, coupon, pay-downs and total return performance of fixed-rate, publicly placed, dollar-denominated and non-convertible investment grade debt issues with at least $250 million par amount outstanding and with at least one year to final maturity.
The Blended Benchmark, established by the Fund’s investment manager, is an equally weighted custom composite of Columbia Thermostat Fund’s primary equity and primary debt benchmarks, the S&P 500® Index and the Bloomberg Barclays U.S. Aggregate Bond Index, respectively. The percentage of the Fund’s assets allocated to underlying stock and bond portfolio funds will vary, and accordingly the composition of the Fund’s portfolio will not always reflect the composition of the 50/50 Blended Benchmark.
Unlike mutual funds, indexes are not managed and do not incur fees or expenses. It is not possible to invest directly in an index.
Columbia Acorn Family of Funds | Semiannual Report 2017
| 27 |
Fund at a glance (continued)
Columbia Thermostat FundSM (Unaudited)
The Growth of a $10,000 Investment in Columbia Thermostat FundSM Class Z Shares
September 25, 2002 (Fund inception) through June 30, 2017
This chart shows the change in value of a hypothetical $10,000 investment in Class Z shares of the Fund during the stated time period. Although the indexes are provided for use in assessing the Fund’s performance, the Fund’s holdings may differ significantly from those in an index. Performance numbers reflect all Fund expenses.
| Portfolio breakdown (%) (at June 30, 2017) |
| Equity Funds | 19.8 |
| Fixed-Income Funds | 79.8 |
| Money Market Funds | 0.4 |
| Total | 100.0 |
Percentages indicated are based upon total investments. The Fund’s portfolio composition is subject to change.
| 28 | Columbia Acorn Family of Funds | Semiannual Report 2017 |
Manager Discussion of Fund Performance
Columbia Thermostat FundSM
David L. Frank, CFA
Portfolio Manager
Columbia Thermostat Fund Class Z shares gained 3.22% in the first half of 2017, compared to a 9.34% gain of the Fund’s primary equity benchmark, the S&P 500 Index. The Fund’s gains topped the primary debt benchmark, the Bloomberg Barclays U.S. Aggregate Bond Index, which ended the period up 2.27%, while the Fund’s custom Blended Benchmark gained 5.77%.
The Fund’s equity portfolio had a weighted average gain of 13.29% in the first half of 2017. Six of the eight equity funds returned between 8-13% for the period. The two standout performers were Columbia Select Large Cap Growth Fund, up 24.16%, and Columbia Acorn International, up 18.62% for the six-month period.
Columbia Thermostat Fund’s bond portfolio ended the first half of the year with a weighted average gain of 1.91%. Underlying fund Columbia Income Opportunities Fund provided the best return for the period with a gain of 4.56%, while Columbia Short Term Bond Fund had the smallest gain, increasing 0.76% for the period.
There were only two reallocation triggers in the first half of the year. In the May 1, 2017 prospectus update, the Fund disclosed a new S&P 500 allocation table. The S&P 500 ranges in the new table triggered a rebalance on that date and an increase in equity allocation from 10% to 25% and a decrease in fixed-income allocation from 90% to 75%. The other rebalance took place at the beginning of June when the Fund decreased its equity exposure. As part of the May 2017 prospectus update, the Fund also added one new equity fund, Columbia Select Large Cap Equity Fund, to the mix. Columbia Select Large Cap Equity Fund is a large-cap U.S. equity fund with a core-style strategy. The planned allocation to this new fund will represent 10% of Columbia Thermostat Fund’s capital allocated to equity strategies and will be funded by reducing the allocation to Columbia Contrarian Core Fund from 20% to 10%.
We were pleased to see the Fund perform as designed in the first half of 2017, offering shareholders a return that fell between the equity and bond markets. The Fund ended the period at 20% in stocks due to the new allocation table followed by a June trim as the equity markets continued their strong performance. Global stock markets have rewarded investors thus far in 2017 and remain at robust levels. We believe that the Fund is poised to take advantage of any future market reversals.
Results of the Funds Owned in Columbia Thermostat Fund as of June 30, 2017
| Equity Funds | Weightings
in category | 2nd quarter
performance | Year to date
performance |
| Columbia Acorn International, Class Y Shares | 20% | 8.07% | 18.62% |
| Columbia Dividend Income Fund, Class Y Shares | 20% | 3.07% | 8.31% |
| Columbia Contrarian Core Fund, Class Y Shares | 10% | 3.89% | 10.99% |
| Columbia Acorn Fund, Class Y Shares | 10% | 5.24% | 12.33% |
| Columbia Acorn Select, Class Y Shares | 10% | 5.10% | 11.83% |
| Columbia Large Cap Enhanced Core Fund, Class Y Shares | 10% | 3.32% | 9.42% |
| Columbia Select Large Cap Growth Fund, Class Y Shares | 10% | 7.43% | 24.16% |
| Columbia Select Large Cap Equity Fund, Class Y Shares | 10% | 4.41% | 11.44% |
| Weighted Average Equity Gain/Loss | 100% | 5.10% | 13.29% |
| Fixed-Income Funds | Weightings
in category | 2nd quarter
performance | Year to date
performance |
| Columbia Short Term Bond Fund, Class Y Shares | 40% | 0.40% | 0.76% |
| Columbia Total Return Bond Fund, Class Y Shares | 20% | 1.47% | 2.76% |
| Columbia U.S. Government Mortgage Fund, Class Y Shares | 20% | 1.25% | 2.25% |
| Columbia Income Opportunities Fund, Class Y Shares | 10% | 2.35% | 4.56% |
| Columbia U.S. Treasury Index Fund, Class Y Shares | 10% | 1.10% | 1.74% |
| Weighted Average Income Gain/Loss | 100% | 1.05% | 1.91% |
Columbia Acorn Family of Funds | Semiannual Report 2017
| 29 |
Manager Discussion of Fund Performance (continued)
Columbia Thermostat FundSM
Columbia Thermostat Fund Rebalancing in the Second Quarter
May 1, 2017: 25% Equity, 75% Fixed-Income
June 1, 2017: 20% Equity, 80% Fixed-Income
A “fund of fund” bears its allocable share of the costs and expenses of the underlying funds in which it invests. Such funds are thus subject to two levels of fees and potentially higher expense ratios than would be associated with a fund that invests and trades directly in financial instruments under the direction of a single manager.
The Fund’s investments in the underlying funds may present certain risks, including the following. Market risk may affect a single issuer, sector of the economy, industry or the market as a whole. The Fund’s investment in other funds subjects it to the investment performance (positive or negative), risks and expenses of these underlying funds. Investments in small- and mid-cap companies involve risks and volatility and possible illiquidity greater than in investments in larger, more established companies. There are risks associated with fixed-income investments, including credit risk, market risk, interest rate risk and prepayment and extension risk. In general, bond prices fall when interest rates rise and vice versa. This effect is more pronounced for longer term securities. Non-investment-grade (high-yield or junk) securities present greater price volatility and more risk to principal and income than higher rated securities. Foreign investments subject the Fund to political, economic, market, social and other risks within a particular country, as well as to potential currency instabilities and less stringent financial and accounting standards generally applicable to U.S. issuers. Risks are enhanced for emerging market issuers. See the Fund’s prospectus for more information on these and other risks.
The views expressed in this report reflect the current views of the respective parties. These views are not guarantees of future performance and involve certain risks, uncertainties and assumptions that are difficult to predict, so actual outcomes and results may differ significantly from the views expressed. These views are subject to change at any time based upon economic, market or other conditions and the respective parties disclaim any responsibility to update such views. These views may not be relied on as investment advice and, because investment decisions for a Columbia Wanger Fund are based on numerous factors, may not be relied on as an indication of trading intent on behalf of any particular Columbia Wanger Fund. References to specific securities should not be construed as a recommendation or investment advice.
The value of an investment in the Fund is based primarily on the performance of the underlying funds in which it invests. The Fund is subject to the risk that the investment manager’s decisions regarding asset classes and underlying funds will not anticipate market trends successfully, resulting in a failure to reserve capital or lower total return. The Investment Manager may prefer an underlying fund in the Columbia Acorn Family of Funds over alternative investments. There can be no assurance that the Columbia Acorn Funds will outperform similar funds managed by the Investment Manager’s affiliates. This is not an offer of the shares of any other mutual fund mentioned herein.
| 30 | Columbia Acorn Family of Funds | Semiannual Report 2017 |
Fund at a glance
Columbia Acorn Emerging Markets FundSM (Unaudited)
Investment objective
Columbia Acorn Emerging Markets FundSM (the Fund) seeks long-term capital appreciation.
Portfolio management
Stephen Kusmierczak, CFA
Co-manager
With Fund since 2011
Louis J. Mendes, CFA
Co-manager
With Fund since 2011
Satoshi Matsunaga, CFA
Co-manager
With Fund since 2015
Morningstar style boxTM
The Morningstar Style Box is based on a fund’s portfolio holdings. For equity funds, the vertical axis shows the market capitalization of the stocks owned, and the horizontal axis shows investment style (value, blend, or growth). Information shown is based on the most recent data provided by Morningstar.
© 2017 Morningstar, Inc. All rights reserved. The Morningstar information contained herein: (1) is proprietary to Morningstar and/or its content providers; (2) may not be copied or distributed; and (3) is not warranted to be accurate, complete or timely. Neither Morningstar nor its content providers are responsible for any damages or losses arising from any use of this information.
| Average annual total returns (%) (for the period ended June 30, 2017) |
| | | Inception | 6 Months
cumulative | 1 Year | 5 Years | Life |
| Class A | Excluding sales charges | 08/19/11 | 20.22 | 15.02 | 3.97 | 3.63 |
| | Including sales charges | | 13.31 | 8.43 | 2.74 | 2.59 |
| Class C | Excluding sales charges | 08/19/11 | 19.80 | 14.20 | 3.19 | 2.89 |
| | Including sales charges | | 18.80 | 13.20 | 3.19 | 2.89 |
| Class R4 | 11/08/12 | 20.36 | 15.29 | 4.26 | 3.96 |
| Class R5 | 11/08/12 | 20.48 | 15.42 | 4.31 | 4.00 |
| Class Y | 06/13/13 | 20.57 | 15.47 | 4.35 | 4.03 |
| Class Z | 08/19/11 | 20.41 | 15.29 | 4.20 | 3.91 |
| MSCI Emerging Markets SMID Cap Index (Net) | | 17.14 | 17.49 | 4.06 | 1.63 |
Returns for Class A shares are shown with and without the maximum initial sales charge of 5.75%. Returns for Class C shares are shown with and without the maximum contingent deferred sales charge of 1.00% for the first year after purchase. The Fund’s other classes are not subject to sales charges, but may be subject to other fees and expenses, and have limited eligibility. Please see the Fund’s prospectus for details. Performance for different share classes will vary based on differences in sales charges and certain fees and expenses associated with each class.
As stated in the May 1, 2017 prospectus, as supplemented July 7, 2017, the Fund’s annual operating expense ratio is 1.31% for Class Z shares and 1.56% for Class A shares.
Performance numbers reflect all Fund expenses. All results shown assume reinvestment of distributions during the period. Returns do not reflect the deduction of taxes that a shareholder may pay on Fund distributions or on the redemption of Fund shares. Performance results may reflect the effect of any fee waivers or reimbursements of Fund expenses by the investment manager and/or any of its affiliates. Absent these fee waivers and/or expense reimbursement arrangements, performance results may have been lower.
The performance information shown represents past performance and is not a guarantee of future results. The investment return and principal value of your investment will fluctuate so that shares, when redeemed, may be worth more or less than their original cost. Current performance may be lower or higher than the performance data shown. You may obtain performance information current to the most recent month-end by contacting your financial intermediary, visiting investor.columbiathreadneedleus.com or calling 800.922.6769.
The returns shown for periods prior to the share class inception date (including returns for the Life of the Fund, if shown, which are since Fund inception) include the returns of the Fund’s oldest share class. These returns are adjusted to reflect any higher class-related operating expenses of the newer share classes, as applicable. Please visit investor.columbiathreadneedleus.com/investment-products/mutual-funds/appended-performance for more information.
The MSCI Emerging Markets SMID Cap Index (Net) captures a mid- and small-cap representation across 24 emerging market countries. The index covers approximately 29% of the free float-adjusted market capitalization in each country.
Unlike mutual funds, indexes are not managed and do not incur fees or expenses. It is not possible to invest directly in an index.
Columbia Acorn Family of Funds | Semiannual Report 2017
| 31 |
Fund at a glance (continued)
Columbia Acorn Emerging Markets FundSM (Unaudited)
The Growth of a $10,000 Investment in Columbia Acorn Emerging Markets FundSM Class Z Shares
August 19, 2011 (Fund inception) through June 30, 2017
This chart shows the change in value of a hypothetical $10,000 investment in Class Z shares of the Fund during the stated time period. Although the indexes are provided for use in assessing the Fund’s performance, the Fund’s holdings may differ significantly from those in an index. Performance numbers reflect all Fund expenses.
| Top ten holdings (%) (at June 30, 2017) | |
Care Ratings Ltd. (India)
Credit rating services | 4.3 |
Zee Entertainment Enterprises Ltd. (India)
Hindi films, serials, game shows and children’s programs | 4.1 |
Silergy Corp. (Taiwan)
High performance analog integrated circuits | 4.1 |
Koh Young Technology, Inc. (South Korea)
3D measurement and inspection equipment for testing various machineries | 4.0 |
51job, Inc., ADR (China)
Integrated human resource services | 3.2 |
Qualitas Controladora SAB de CV (Mexico)
Insurance holding company | 3.2 |
New Oriental Education & Technology Group, Inc., ADR (China)
Educational services | 3.1 |
Korea Investment Holdings Co., Ltd. (South Korea)
Financial holding company | 3.1 |
Modetour Network, Inc. (South Korea)
Travel services | 3.0 |
Logo Yazilim Sanayi Ve Ticaret AS (Turkey)
Enterprise resource planning software | 3.0 |
Percentages indicated are based upon total investments (excluding Money Market Funds).
For further detail about these holdings, please refer to the section entitled “Portfolio of Investments."
Fund holdings are as of the date given, are subject to change at any time, and are not recommendations to buy or sell any security.
| Equity sector breakdown (%) (at June 30, 2017) |
| Consumer Discretionary | 26.6 |
| Consumer Staples | 10.6 |
| Financials | 18.9 |
| Health Care | 6.1 |
| Industrials | 10.1 |
| Information Technology | 17.9 |
| Materials | 3.3 |
| Real Estate | 2.1 |
| Telecommunication Services | 4.4 |
| Total | 100.0 |
Percentages indicated are based upon total equity investments. The Fund’s portfolio composition is subject to change.
| 32 | Columbia Acorn Family of Funds | Semiannual Report 2017 |
Fund at a glance (continued)
Columbia Acorn Emerging Markets FundSM (Unaudited)
| Country breakdown (%) (at June 30, 2017) |
| Brazil | 4.2 |
| Cambodia | 2.1 |
| Cayman Islands | 4.8 |
| China | 9.8 |
| Finland | 1.1 |
| Hong Kong | 4.1 |
| India | 16.6 |
| Indonesia | 7.4 |
| Mexico | 5.8 |
| Philippines | 1.7 |
| Russian Federation | 1.1 |
| South Africa | 6.5 |
| South Korea | 13.8 |
| Taiwan | 9.3 |
| Thailand | 5.1 |
| Turkey | 2.9 |
| United States(a) | 3.7 |
| Total | 100.0 |
| (a) | Includes investments in Money Market Funds. |
Country breakdown is based primarily on issuer’s place of organization/incorporation. Percentages indicated are based upon total investments. The Fund’s portfolio composition is subject to change.
Columbia Acorn Family of Funds | Semiannual Report 2017
| 33 |
Manager Discussion of Fund Performance
Columbia Acorn Emerging Markets FundSM
Stephen Kusmierczak, CFA
Co-Portfolio Manager
Louis J. Mendes, CFA
Co-Portfolio Manager
Satoshi Matsunaga, CFA
Co-Portfolio Manager
Columbia Acorn Emerging Markets Fund Class Z shares gained 6.75% during the second quarter of 2017, outperforming the Fund’s primary benchmark, the MSCI Emerging Markets SMID Cap Index (Net), which gained 3.83%. The Fund returned 20.41% for the semiannual period versus a gain of 17.14% for the benchmark.
During the first half of the year, emerging markets exhibited strong absolute performance across all regions. Appreciation of most emerging markets’ currencies versus the U.S. dollar boosted total returns, with the exception of Greater China where the currency impact was neutral. Regions generating the largest absolute returns in U.S. dollars were South Asia (primarily India) and South Korea. The Fund lost some ground versus the benchmark due to region weightings overall; most notably as a result of an underweight in the Greater China region and an overweight in Southeast Asia. However, an overweight in India contributed over 100 basis points to relative returns.
Stock selection was generally positive in all regions except South Asia and Eastern Europe/Middle East/Africa. Good stock selection offset the slight drag from regional positioning. Over 75% of the Fund’s year-to-date upside versus benchmark was the result of very strong selection in South Korea, a region that only accounted for 13% of Fund assets on average for the first half. The Fund’s South Korean holdings returned 59% in the period in U.S. dollars, more than doubling benchmark returns. Results relative to benchmark were also favorable in Latin America, on strength in Brazil and Mexico, and in Greater China. On the downside, stock selection in India lagged as did Fund picks in Turkey and Poland.
The top two contributors for the period were South Korean holdings Modetour Network and Korea Investment Holdings. Modetour Network provides travel packages including air fare for both domestic and overseas destinations. The stock rose sharply after upward revisions driven by increasing travel demand from baby boomers entering peak travel years, as well as structurally rising vacation days for working aged persons. Korea Investment holdings is the second largest broker and asset manager in South Korea. Despite alarming news flow from its northern neighbor, Korea’s equity market has been buoyant, lifted by a new government and hopes for corporate governance reform. Rising asset values and the corresponding surge in investor activity have driven strong earnings growth at both brokerage and investment arms of the company.
Detracting from returns during the period was PChome Online, a Taiwanese e-commerce company selling computers, cameras and copiers. The company failed to meet our, as well as market, expectations as fierce competition drove market share losses. We have sold the position.
Famous Brands, a South African quick service restaurant and café, also harmed performance. Losses related to the company’s acquisition of a U.K.-based burger chain and a food catering business drove down the share price. We have maintained the Fund’s position as we assess management’s ability to integrate the new businesses.
Emerging market valuations ended the period in line with historical averages and below those of slower-growing developed markets. We are realistic about the potential risks after a global surge in stock valuations and the volatility that is inherent in emerging regions of the globe. As of the close of the reporting period, it appeared that last year’s worries about an abrupt China slowdown were overplayed, while India, the second largest emerging markets economy, continued to implement transformational reforms. We continue to search for exciting growth companies with sustainable competitive advantages trading at reasonable valuations.
Market risk may affect a single issuer, sector of the economy, industry or the market as a whole. International investing involves certain risks and volatility due to potential political, economic or currency instabilities and different, potentially less stringent, financial and accounting standards than those generally applicable to U.S. issuers. Risks are enhanced for emerging and frontier market issuers. Investments in small- and mid-cap companies involve risks and volatility and possible illiquidity greater than investments in larger, more established companies. See the Fund’s prospectus for more information on these and other risks.
| 34 | Columbia Acorn Family of Funds | Semiannual Report 2017 |
Manager Discussion of Fund Performance (continued)
Columbia Acorn Emerging Markets FundSM
The views expressed in this report reflect the current views of the respective parties. These views are not guarantees of future performance and involve certain risks, uncertainties and assumptions that are difficult to predict, so actual outcomes and results may differ significantly from the views expressed. These views are subject to change at any time based upon economic, market or other conditions and the respective parties disclaim any responsibility to update such views. These views may not be relied on as investment advice and, because investment decisions for a Columbia Wanger Fund are based on numerous factors, may not be relied on as an indication of trading intent on behalf of any particular Columbia Wanger Fund. References to specific securities should not be construed as a recommendation or investment advice.
Columbia Acorn Family of Funds | Semiannual Report 2017
| 35 |
Fund at a glance
Columbia Acorn European FundSM (Unaudited)
Investment objective
Columbia Acorn European FundSM (the Fund) seeks long-term capital appreciation.
Portfolio management
Andreas Waldburg-Wolfegg*
Co-manager
With Fund since 2011
Stephen Kusmierczak, CFA
Co-manager
With Fund since 2011
*Effective September 30, 2017, Mr. Waldburg-Wolfegg will no longer serve as a Portfolio Manager of the Fund.
Morningstar style boxTM
The Morningstar Style Box is based on a fund’s portfolio holdings. For equity funds, the vertical axis shows the market capitalization of the stocks owned, and the horizontal axis shows investment style (value, blend, or growth). Information shown is based on the most recent data provided by Morningstar.
© 2017 Morningstar, Inc. All rights reserved. The Morningstar information contained herein: (1) is proprietary to Morningstar and/or its content providers; (2) may not be copied or distributed; and (3) is not warranted to be accurate, complete or timely. Neither Morningstar nor its content providers are responsible for any damages or losses arising from any use of this information.
| Average annual total returns (%) (for the period ended June 30, 2017) |
| | | Inception | 6 Months
cumulative | 1 Year | 5 Years | Life |
| Class A | Excluding sales charges | 08/19/11 | 23.50 | 23.97 | 11.48 | 10.79 |
| | Including sales charges | | 16.41 | 16.87 | 10.17 | 9.68 |
| Class C | Excluding sales charges | 08/19/11 | 23.14 | 23.06 | 10.68 | 9.99 |
| | Including sales charges | | 22.14 | 22.06 | 10.68 | 9.99 |
| Class R4 | 06/25/14 | 23.75 | 24.36 | 11.78 | 11.10 |
| Class R5 | 11/08/12 | 23.70 | 24.35 | 11.77 | 11.09 |
| Class Y | 03/01/17 | 23.79 | 24.32 | 11.76 | 11.09 |
| Class Z | 08/19/11 | 23.80 | 24.33 | 11.76 | 11.09 |
| MSCI AC Europe Small Cap Index (Net) | | 19.61 | 27.31 | 14.86 | 12.49 |
Returns for Class A shares are shown with and without the maximum initial sales charge of 5.75%. Returns for Class C shares are shown with and without the maximum contingent deferred sales charge of 1.00% for the first year after purchase. The Fund’s other classes are not subject to sales charges, but may be subject to other fees and expenses, and have limited eligibility. Please see the Fund’s prospectus for details. Performance for different share classes will vary based on differences in sales charges and certain fees and expenses associated with each class.
As stated in the May 1, 2017 prospectus, as supplemented July 7, 2017, the Fund’s annual operating expense ratio is 1.20% for Class Z shares and 1.45% for Class A shares.
Performance numbers reflect all Fund expenses. All results shown assume reinvestment of distributions during the period. Returns do not reflect the deduction of taxes that a shareholder may pay on Fund distributions or on the redemption of Fund shares. Performance results may reflect the effect of any fee waivers or reimbursements of Fund expenses by the investment manager and/or any of its affiliates. Absent these fee waivers and/or expense reimbursement arrangements, performance results may have been lower.
The performance information shown represents past performance and is not a guarantee of future results. The investment return and principal value of your investment will fluctuate so that shares, when redeemed, may be worth more or less than their original cost. Current performance may be lower or higher than the performance data shown. You may obtain performance information current to the most recent month-end by contacting your financial intermediary, visiting investor.columbiathreadneedleus.com or calling 800.922.6769.
The returns shown for periods prior to the share class inception date (including returns for the Life of the Fund, if shown, which are since Fund inception) include the returns of the Fund’s oldest share class. These returns are adjusted to reflect any higher class-related operating expenses of the newer share classes, as applicable. Please visit investor.columbiathreadneedleus.com/investment-products/mutual-funds/appended-performance for more information.
The MSCI AC Europe Small Cap Index (Net) captures a small-cap representation across 21 markets in Europe. The index covers approximately 14% of the free float-adjusted market capitalization across each market country in Europe.
Unlike mutual funds, indexes are not managed and do not incur fees or expenses. It is not possible to invest directly in an index.
| 36 | Columbia Acorn Family of Funds | Semiannual Report 2017 |
Fund at a glance (continued)
Columbia Acorn European FundSM (Unaudited)
The Growth of a $10,000 Investment in Columbia Acorn European FundSM Class Z Shares
August 19, 2011 (Fund inception) through June 30, 2017
This chart shows the change in value of a hypothetical $10,000 investment in Class Z shares of the Fund during the stated time period. Although the indexes are provided for use in assessing the Fund’s performance, the Fund’s holdings may differ significantly from those in an index. Performance numbers reflect all Fund expenses.
| Top ten holdings (%) (at June 30, 2017) | |
Wirecard AG (Germany)
Internet payment and processing services | 3.5 |
SimCorp AS (Denmark)
Global provider of highly specialised software for the investment management industry | 3.2 |
Akka Technologies (France)
High-technology engineering consulting services | 3.1 |
Partners Group Holding AG (Switzerland)
Global private markets asset management firm | 3.0 |
Kindred Group PLC (Malta)
Online gambling services | 3.0 |
Halma PLC (United Kingdom)
Products that detect hazards and protect assets and people in public and commercial buildings | 2.9 |
Spirax-Sarco Engineering PLC (United Kingdom)
Consultation, service and products for the control and efficient management of steam and industrial fluids | 2.6 |
Rightmove PLC (United Kingdom)
Website that lists properties across Britain | 2.4 |
Inficon Holding AG (Switzerland)
Vacuum instruments used to monitor and control production processes | 2.3 |
Munksjo OYJ (Finland)
Industrial paper | 2.2 |
Percentages indicated are based upon total investments (excluding Money Market Funds and Securities Lending Collateral)
For further detail about these holdings, please refer to the section entitled “Portfolio of Investments."
Fund holdings are as of the date given, are subject to change at any time, and are not recommendations to buy or sell any security.
| Equity sector breakdown (%) (at June 30, 2017) |
| Consumer Discretionary | 20.5 |
| Consumer Staples | 1.7 |
| Financials | 9.7 |
| Health Care | 7.8 |
| Industrials | 23.8 |
| Information Technology | 21.5 |
| Materials | 9.2 |
| Real Estate | 5.8 |
| Total | 100.0 |
Percentages indicated are based upon total equity investments. The Fund’s portfolio composition is subject to change.
Columbia Acorn Family of Funds | Semiannual Report 2017
| 37 |
Fund at a glance (continued)
Columbia Acorn European FundSM (Unaudited)
| Country breakdown (%) (at June 30, 2017) |
| Belgium | 1.1 |
| Denmark | 4.6 |
| Finland | 5.4 |
| France | 5.0 |
| Germany | 16.1 |
| Ireland | 1.2 |
| Italy | 3.8 |
| Luxembourg | 1.1 |
| Malta | 2.7 |
| Netherlands | 1.8 |
| Norway | 2.0 |
| Spain | 5.5 |
| Sweden | 7.6 |
| Switzerland | 4.9 |
| Turkey | 1.1 |
| United Kingdom | 26.9 |
| United States(a) | 9.2 |
| Total | 100.0 |
| (a) | Includes investments in Money Market Funds. |
Country breakdown is based primarily on issuer’s place of organization/incorporation. Percentages indicated are based upon total investments. The Fund’s portfolio composition is subject to change.
| 38 | Columbia Acorn Family of Funds | Semiannual Report 2017 |
Manager Discussion of Fund Performance
Columbia Acorn European FundSM
Andreas Waldburg-Wolfegg
Co-Portfolio Manager
Stephen Kusmierczak, CFA
Co-Portfolio Manager
Columbia Acorn European Class Z shares gained 12.84% during the second quarter of 2017, outperforming the Fund’s primary benchmark, the MSCI AC Europe Small Cap Index (Net), which gained 10.22%. This brought Fund gains to 23.80% for the semiannual period versus a return of 19.61% for the benchmark.
Absolute returns were strong across all regions of Europe during the first half of the year in part due to the strong currency gains relative to the U.S. dollar. The Mediterranean region generated the strongest market returns, up 17% in local currency and 27% in U.S. dollars, while the weakest performance was found in the Nordic regions, up 7% in local currency and 15% in U.S. dollars.
Information technology and healthcare, classic growth sectors, continued their strong outperformance and were top gainers during the first half of the year. More broadly, all sectors except energy ended the first half with positive returns. Energy stocks lagged during the first half of 2017 ? with the drop in oil prices from over $50 per barrel to below $43 being the primary driver of this sector’s underperformance.
Strong stock selection allowed the Fund to outperform during a period of outsized market returns. In all countries in which the Fund invests, excepting the Netherlands, Poland and Turkey, stock selection contributed to relative returns. By sector, the Fund’s lack of energy stocks and its overweight in the strong performing information technology sector were beneficial.
The top contributor for the period was German-based Wirecard, a provider of payment solutions to online merchants globally. Its growth is correlated with e-commerce, the rise of the retail “omni-channel”, cashless transactions, and emerging global technical standards, all of which, we believe, have considerable runway. French engineering company Akka Technologies also helped drive results. Akka Technologies provides services to the automotive industry, mainly in France and Germany. Through a series of judicious acquisitions, the company has managed to position itself as a key provider of technical skills in man-machine interfaces and autonomous driving.
The top two detractors in the period were domiciled in the United Kingdom. Connect Group distributes newspapers, books and magazines, and efforts over the past six years to restructure its business have weighed on the stock. We believe that the new structure is poised to show accelerating top line growth, with benefits from increased capacity utilization (new contracts signed with Amazon for last-mile completion), and increased customer acceptance. Domino’s Pizza is the leading home-delivery pizza company in the U.K. Its stock declined as investors feared new store roll-outs could cannibalize existing stores. We expect that the stock will eventually benefit from the economies of scale combined with innovative menus and use of technology.
Despite strong performance from European equities in the first half of the year, valuations remained cheaper than the U.S. market at the close of the reporting period. Economic and employment growth continued strong in most of Central and Northern Europe, while long-term laggards like Italy and Portugal appeared to be improving.
International equities exhibited strong performance in the first half of the year. At the close of the period, prospects in Continental Europe were brightening ? though it remains to be seen whether French President Emmanuel Macron can translate a seemingly decisive electoral mandate into labor market reforms capable of invigorating the economy and reducing unemployment. Japanese corporates continued to respond to policy initiatives designed to improve return on capital in an aging society that requires this to fund pension obligations. We continue to search for exciting growth companies with sustainable competitive advantages trading at reasonable valuations.
Columbia Acorn Family of Funds | Semiannual Report 2017
| 39 |
Manager Discussion of Fund Performance (continued)
Columbia Acorn European FundSM
Market risk may affect a single issuer, sector of the economy, industry or the market as a whole. International investing involves certain risks and volatility due to potential political, economic or currency instabilities and different, potentially less stringent, financial and accounting standards than those generally applicable to U.S. issuers. Investments in small- and mid-cap companies involve risks and volatility and possible illiquidity greater than investments in larger, more established companies. See the Fund’s prospectus for more information on these and other risks.
The views expressed in this report reflect the current views of the respective parties. These views are not guarantees of future performance and involve certain risks, uncertainties and assumptions that are difficult to predict, so actual outcomes and results may differ significantly from the views expressed. These views are subject to change at any time based upon economic, market or other conditions and the respective parties disclaim any responsibility to update such views. These views may not be relied on as investment advice and, because investment decisions for a Columbia Wanger fund are based on numerous factors, may not be relied on as an indication of trading intent on behalf of any particular Columbia Wanger fund. References to specific securities should not be construed as a recommendation or investment advice.
| 40 | Columbia Acorn Family of Funds | Semiannual Report 2017 |
2017 Mid-Year Distributions
The following table details the mid-year distributions for the Columbia Acorn Funds. The record date was May 31, 2017 and the ex-dividend and payable date was June 1, 2017. The information is provided on a per share basis for each share class of the Funds.
| Fund | Ordinary
income | Short-term
capital
gain | Long-term
capital
gain |
| Columbia Acorn® Fund | | | |
| Class A | None | 0.07292 | 0.4918 |
| Class C | None | 0.07292 | 0.4918 |
| Class R4 | None | 0.07292 | 0.4918 |
| Class R5 | None | 0.07292 | 0.4918 |
| Class Y | None | 0.07292 | 0.4918 |
| Class Z | None | 0.07292 | 0.4918 |
| Columbia Acorn International® | | | |
| Class A | 0.38359 | None | None |
| Class B | 0.27675 | None | None |
| Class C | 0.25724 | None | None |
| Class R | 0.38359 | None | None |
| Class R4 | 0.38359 | None | None |
| Class R5 | 0.38359 | None | None |
| Class Y | 0.38359 | None | None |
| Class Z | 0.38359 | None | None |
| Columbia Acorn USA® | | | |
| Class A | None | None | 0.55655 |
| Class C | None | None | 0.55655 |
| Class R4 | None | None | 0.55655 |
| Class R5 | None | None | 0.55655 |
| Class Y | None | None | 0.55655 |
| Class Z | None | None | 0.55655 |
| Columbia Acorn International SelectSM | | | |
| Class A | None | None | None |
| Class C | None | None | None |
| Class R4 | None | None | None |
| Class R5 | None | None | None |
| Class Y | None | None | None |
| Class Z | None | None | None |
| Columbia Acorn SelectSM | | | |
| Class A | None | None | 1.1735 |
| Class C | None | None | 1.1735 |
| Class R4 | None | None | 1.1735 |
| Class R5 | None | None | 1.1735 |
| Class Y | None | None | 1.1735 |
| Class Z | None | None | 1.1735 |
| Columbia Thermostat FundSM | | | |
| Class A | 0.23315 | None | 0.0604 |
| Class C | 0.15416 | None | 0.0604 |
| Class R4 | 0.23315 | None | 0.0604 |
| Class R5 | 0.23315 | None | 0.0604 |
| Class Y | 0.23315 | None | 0.0604 |
| Class Z | 0.23315 | None | 0.0604 |
Columbia Acorn Family of Funds | Semiannual Report 2017
| 41 |
2017 Mid-Year Distributions (continued)
| Fund | Ordinary
income | Short-term
capital
gain | Long-term
capital
gain |
| Columbia Acorn Emerging Markets FundSM | | | |
| Class A | None | None | None |
| Class C | None | None | None |
| Class R4 | None | None | None |
| Class R5 | None | None | None |
| Class Y | None | None | None |
| Class Z | None | None | None |
| Columbia Acorn European FundSM | | | |
| Class A | 0.05887 | None | None |
| Class C | 0.02836 | None | None |
| Class R4 | 0.05887 | None | None |
| Class R5 | 0.05887 | None | None |
| Class Y | 0.05887 | None | None |
| Class Z | 0.05887 | None | None |
| 42 | Columbia Acorn Family of Funds | Semiannual Report 2017 |
Understanding Your Fund’s Expenses
(Unaudited)
As a shareholder, you incur two types of costs. There are transaction costs, which generally include sales charges on purchases and may include redemption fees. There are also ongoing costs, which generally include management fees, distribution and service (Rule 12b-1) fees, and other Fund expenses. The following information is intended to help you understand your ongoing costs (in dollars) of investing in the Fund and to help you compare these costs with the ongoing costs of investing in other mutual funds.
Analyzing your Fund’s expenses
To illustrate these ongoing costs, we have provided examples and calculated the expenses paid by investors in Class A, B, C, R, R4, R5, Y and Z shares of the Funds during the period. The actual and hypothetical information in the tables is based on an initial investment of $1,000 at the beginning of the period indicated and held for the entire period. Expense information is calculated two ways and each method provides you with different information. The amount listed in the “Actual” column is calculated using the Funds’ actual operating expenses and total return for the period. You may use the Actual information, together with the amount invested, to estimate the expenses that you paid over the period. Simply divide your account value by $1,000 (for example, an $8,600 account value divided by $1,000 = 8.6), then multiply the results by the expenses paid during the period under the Actual column. The amount listed in the “Hypothetical” column assumes a 5% annual rate of return before expenses (which is not the Funds’ actual return) and then applies the Funds’ actual expense ratio for the period to the hypothetical return. You should not use the hypothetical account values and expenses to estimate either your actual account balance at the end of the period or the expenses you paid during the period. See “Compare with other funds” below for details on how to use the hypothetical data.
In addition to the ongoing expenses which the Funds bear directly, Columbia Thermostat Fund’s shareholders indirectly bear the Fund’s allocable share of the costs and expenses of each underlying fund in which the Fund invests. You can also estimate the effective expenses paid during the period, which includes the indirect fees associated with investing in the underlying funds, by using the amounts listed in the effective expenses paid during the period column in the “Fund of Funds” table.
Compare with other funds
Since all mutual funds are required to include the same hypothetical calculations about expenses in shareholder reports, you can use this information to compare the ongoing cost of investing in the Funds with other funds. To do so, compare the hypothetical example with the 5% hypothetical examples that appear in the shareholder reports of other funds. As you compare hypothetical examples of other funds, it is important to note that hypothetical examples are meant to highlight the ongoing costs of investing in a fund only and do not reflect any transaction costs, such as sales charges, or redemption or exchange fees. Therefore, the hypothetical calculations are useful in comparing ongoing costs only, and will not help you determine the relative total costs of owning different funds. If transaction costs were included in these calculations, your costs would be higher.
| January 1, 2017 — June 30, 2017 |
| | Account value at the
beginning of the
period ($) | Account value at the
end of the
period ($) | Expenses paid during
the period ($) | Fund’s annualized
expense ratio (%) |
| | Actual | Hypothetical | Actual | Hypothetical | Actual | Hypothetical | Actual |
| Columbia Acorn® Fund |
| Class A | 1,000.00 | 1,000.00 | 1,122.70 | 1,019.55 | 5.72 | 5.44 | 1.08 |
| Class C | 1,000.00 | 1,000.00 | 1,118.40 | 1,015.81 | 9.67 | 9.20 | 1.83 |
| Class R4 | 1,000.00 | 1,000.00 | 1,123.70 | 1,020.79 | 4.39 | 4.18 | 0.83 |
| Class R5 | 1,000.00 | 1,000.00 | 1,123.40 | 1,020.89 | 4.29 | 4.08 | 0.81 |
| Class Y | 1,000.00 | 1,000.00 | 1,123.30 | 1,021.14 | 4.02 | 3.83 | 0.76 |
| Class Z | 1,000.00 | 1,000.00 | 1,123.50 | 1,020.79 | 4.39 | 4.18 | 0.83 |
Columbia Acorn Family of Funds | Semiannual Report 2017
| 43 |
Understanding Your Fund’s Expenses (continued)
(Unaudited)
| January 1, 2017 — June 30, 2017 |
| | Account value at the
beginning of the
period ($) | Account value at the
end of the
period ($) | Expenses paid during
the period ($) | Fund’s annualized
expense ratio (%) |
| | Actual | Hypothetical | Actual | Hypothetical | Actual | Hypothetical | Actual |
| Columbia Acorn International® |
| Class A | 1,000.00 | 1,000.00 | 1,184.30 | 1,019.10 | 6.37 | 5.89 | 1.17 |
| Class B | 1,000.00 | 1,000.00 | 1,182.10 | 1,016.85 | 8.81 | 8.15 | 1.62 |
| Class C | 1,000.00 | 1,000.00 | 1,180.10 | 1,015.26 | 10.54 | 9.75 | 1.94 |
| Class R | 1,000.00 | 1,000.00 | 1,183.00 | 1,017.65 | 7.95 | 7.34 | 1.46 |
| Class R4 | 1,000.00 | 1,000.00 | 1,185.60 | 1,020.14 | 5.23 | 4.84 | 0.96 |
| Class R5 | 1,000.00 | 1,000.00 | 1,185.80 | 1,020.29 | 5.07 | 4.68 | 0.93 |
| Class Y | 1,000.00 | 1,000.00 | 1,186.20 | 1,020.54 | 4.80 | 4.43 | 0.88 |
| Class Z | 1,000.00 | 1,000.00 | 1,185.70 | 1,020.14 | 5.23 | 4.84 | 0.96 |
| Columbia Acorn USA® |
| Class A | 1,000.00 | 1,000.00 | 1,112.70 | 1,018.00 | 7.32 | 6.99 | 1.39 |
| Class C | 1,000.00 | 1,000.00 | 1,108.90 | 1,014.26 | 11.25 | 10.75 | 2.14 |
| Class R4 | 1,000.00 | 1,000.00 | 1,114.60 | 1,019.15 | 6.12 | 5.84 | 1.16 |
| Class R5 | 1,000.00 | 1,000.00 | 1,114.60 | 1,019.70 | 5.54 | 5.29 | 1.05 |
| Class Y | 1,000.00 | 1,000.00 | 1,114.90 | 1,019.90 | 5.33 | 5.09 | 1.01 |
| Class Z | 1,000.00 | 1,000.00 | 1,114.20 | 1,019.20 | 6.06 | 5.79 | 1.15 |
| Columbia Acorn International SelectSM |
| Class A | 1,000.00 | 1,000.00 | 1,201.30 | 1,018.00 | 7.63 | 6.99 | 1.39 |
| Class C | 1,000.00 | 1,000.00 | 1,197.10 | 1,014.26 | 11.72 | 10.75 | 2.14 |
| Class R4 | 1,000.00 | 1,000.00 | 1,203.00 | 1,019.25 | 6.26 | 5.74 | 1.14 |
| Class R5 | 1,000.00 | 1,000.00 | 1,203.60 | 1,019.60 | 5.88 | 5.39 | 1.07 |
| Class Y | 1,000.00 | 1,000.00 | 1,203.80 | 1,019.85 | 5.60 | 5.14 | 1.02 |
| Class Z | 1,000.00 | 1,000.00 | 1,203.10 | 1,019.25 | 6.26 | 5.74 | 1.14 |
| Columbia Acorn SelectSM |
| Class A | 1,000.00 | 1,000.00 | 1,116.60 | 1,019.15 | 6.12 | 5.84 | 1.16 |
| Class C | 1,000.00 | 1,000.00 | 1,112.90 | 1,015.46 | 10.01 | 9.55 | 1.90 |
| Class R4 | 1,000.00 | 1,000.00 | 1,117.70 | 1,020.39 | 4.80 | 4.58 | 0.91 |
| Class R5 | 1,000.00 | 1,000.00 | 1,117.90 | 1,020.69 | 4.49 | 4.28 | 0.85 |
| Class Y | 1,000.00 | 1,000.00 | 1,118.30 | 1,020.94 | 4.22 | 4.03 | 0.80 |
| Class Z | 1,000.00 | 1,000.00 | 1,117.70 | 1,020.39 | 4.80 | 4.58 | 0.91 |
| Columbia Acorn Emerging Markets FundSM |
| Class A | 1,000.00 | 1,000.00 | 1,202.20 | 1,015.71 | 10.16 | 9.30 | 1.85 |
| Class C | 1,000.00 | 1,000.00 | 1,198.00 | 1,011.97 | 14.25 | 13.04 | 2.60 |
| Class R4 | 1,000.00 | 1,000.00 | 1,203.60 | 1,016.95 | 8.79 | 8.05 | 1.60 |
| Class R5 | 1,000.00 | 1,000.00 | 1,204.80 | 1,017.45 | 8.25 | 7.54 | 1.50 |
| Class Y | 1,000.00 | 1,000.00 | 1,205.70 | 1,017.70 | 7.97 | 7.29 | 1.45 |
| Class Z | 1,000.00 | 1,000.00 | 1,204.10 | 1,016.95 | 8.79 | 8.05 | 1.60 |
| Columbia Acorn European FundSM |
| Class A | 1,000.00 | 1,000.00 | 1,235.00 | 1,016.26 | 9.70 | 8.75 | 1.74 |
| Class C | 1,000.00 | 1,000.00 | 1,231.40 | 1,012.52 | 13.85 | 12.49 | 2.49 |
| Class R4 | 1,000.00 | 1,000.00 | 1,237.50 | 1,017.50 | 8.31 | 7.49 | 1.49 |
| Class R5 | 1,000.00 | 1,000.00 | 1,237.00 | 1,017.70 | 8.09 | 7.29 | 1.45 |
| Class Y | 1,000.00 | 1,000.00 | 1,158.30 (a) | 1,018.05 | 4.90 (a) | 6.94 | 1.38 (a) |
| Class Z | 1,000.00 | 1,000.00 | 1,238.00 | 1,017.50 | 8.31 | 7.49 | 1.49 |
| 44 | Columbia Acorn Family of Funds | Semiannual Report 2017 |
Understanding Your Fund’s Expenses (continued)
(Unaudited)
Fund of Funds—Columbia Thermostat Fund
| January 1, 2017 — June 30, 2017 |
| | Account value at the
beginning of the
period ($) | Account value at the
end of the
period ($) | Expenses paid during
the period ($) | Fund’s annualized
expense ratio (%) | Effective expenses
paid during the
period ($) | Fund’s effective
annualized
expense ratio (%) |
| | Actual | Hypothetical | Actual | Hypothetical | Actual | Hypothetical | Actual | Actual | Hypothetical | Actual |
| Class A | 1,000.00 | 1,000.00 | 1,031.10 | 1,022.44 | 2.53 | 2.52 | 0.50 | 4.96 | 4.94 | 0.98 |
| Class C | 1,000.00 | 1,000.00 | 1,027.00 | 1,018.70 | 6.32 | 6.29 | 1.25 | 8.74 | 8.71 | 1.73 |
| Class R4 | 1,000.00 | 1,000.00 | 1,032.70 | 1,023.68 | 1.27 | 1.26 | 0.25 | 3.70 | 3.68 | 0.73 |
| Class R5 | 1,000.00 | 1,000.00 | 1,032.00 | 1,023.73 | 1.22 | 1.21 | 0.24 | 3.65 | 3.63 | 0.72 |
| Class Y | 1,000.00 | 1,000.00 | 1,032.70 | 1,023.98 | 0.96 | 0.96 | 0.19 | 3.40 | 3.38 | 0.67 |
| Class Z | 1,000.00 | 1,000.00 | 1,032.20 | 1,023.68 | 1.27 | 1.26 | 0.25 | 3.70 | 3.68 | 0.73 |
(a) Based on operations from March 1, 2017 (commencement of operations) through the stated period end.
Expenses paid during the period are equal to the annualized expense ratio, multiplied by the average account value over the period and then multiplied by the number of days in the Fund’s most recent fiscal half year and divided by 365.
Except with respect to Columbia Thermostat Fund, expenses do not include any fees and expenses incurred indirectly by a Fund from the underlying funds in which the Fund may invest (also referred to as “acquired funds”), including affiliated and non-affiliated pooled investments vehicles (including mutual funds and exchange traded funds).
In the case of Columbia Thermostat Fund, effective expenses paid during the period and the Fund’s effective annualized expense ratio include expenses borne directly by the class plus the Fund’s pro rata portion of the ongoing expenses charged by the underlying funds in which it invests using the expense ratio of each class of each underlying fund as of the underlying fund’s most recent shareholder report.
Had the investment manager and/or certain of its affiliates not waived/reimbursed certain fees and expenses for Columbia Acorn International, Columbia Acorn International Select, Columbia Acorn Select, Columbia Thermostat Fund, Columbia Acorn Emerging Markets Fund and Columbia Acorn European Fund, account value at the end of the period would have been reduced.
Columbia Acorn Family of Funds | Semiannual Report 2017
| 45 |
Portfolio of Investments
Columbia Acorn® Fund, June 30, 2017 (Unaudited)
(Percentages represent value of investments compared to net assets)
| Common Stocks 97.5% |
| Issuer | Shares | Value ($) |
| Consumer Discretionary 19.1% |
| Auto Components 3.6% |
Cooper-Standard Holding, Inc.(a)
Sealing, fuel and brake delivery, fluid transfer systems, anti-vibration systems components, subsystems, and modules | 451,784 | 45,571,452 |
Gentex Corp.
Products that use electro-optic technology | 2,461,315 | 46,691,146 |
LCI Industries
Recreational vehicles and equipment | 316,159 | 32,374,682 |
Tenneco, Inc.
Emission control and ride control products and systems | 755,739 | 43,704,386 |
| Total | | 168,341,666 |
| Distributors 1.3% |
LKQ Corp.(a)
Automotive products and services | 613,166 | 20,203,820 |
Pool Corp.
Wholesale distributor of swimming pool supplies, equipment and leisure products | 363,757 | 42,766,910 |
| Total | | 62,970,730 |
| Diversified Consumer Services 1.8% |
Adtalem Global Education, Inc.
Higher education institutions | 1,166,023 | 44,250,573 |
Bright Horizons Family Solutions, Inc.(a)
Child care and early education services | 503,751 | 38,894,615 |
| Total | | 83,145,188 |
| Hotels, Restaurants & Leisure 5.3% |
Dave & Buster’s Entertainment, Inc.(a)
Venues that combine dining and entertainment for adults and families | 585,000 | 38,908,350 |
Domino’s Pizza, Inc.
Network of company-owned and franchise Domino’s Pizza stores | 146,004 | 30,884,226 |
Dunkin’ Brands Group, Inc.
Quick service restaurants serving hot and cold coffee and baked goods | 497,307 | 27,411,562 |
Extended Stay America, Inc.
Hotels and motels | 2,524,610 | 48,876,449 |
Papa John’s International, Inc.
Pizza delivery and carry-out restaurants | 388,881 | 27,906,100 |
Texas Roadhouse, Inc.
Moderately priced, full service restaurant chain | 785,585 | 40,025,556 |
Vail Resorts, Inc.
Operates resorts globally | 164,508 | 33,367,158 |
| Total | | 247,379,401 |
| Common Stocks (continued) |
| Issuer | Shares | Value ($) |
| Household Durables 2.6% |
Cavco Industries, Inc.(a)
Designs and manufactures systems-built structures | 161,382 | 20,923,176 |
iRobot Corp.(a)
Manufactures robots for cleaning | 245,019 | 20,615,899 |
Leggett & Platt, Inc.
Manufactures a wide range of engineered products | 455,960 | 23,951,579 |
NVR, Inc.(a)
Builds and markets homes and conducts mortgage banking activities | 23,620 | 56,938,608 |
| Total | | 122,429,262 |
| Internet & Direct Marketing Retail 0.8% |
Wayfair, Inc., Class A(a),(b)
Retails household goods online | 492,467 | 37,860,863 |
| Leisure Products 1.2% |
Brunswick Corp.
Consumer products serving the outdoor and indoor active recreation markets | 533,830 | 33,487,156 |
Polaris Industries, Inc.(b)
Off-road and on-road vehicles | 267,940 | 24,712,106 |
| Total | | 58,199,262 |
| Specialty Retail 2.0% |
Five Below, Inc.(a)
Specialty value retailer | 607,273 | 29,981,068 |
Monro Muffler Brake, Inc.
Automotive undercar repair and tire services | 404,719 | 16,897,018 |
Tractor Supply Co.
Retail farm store chain | 510,828 | 27,691,986 |
Ulta Beauty, Inc.(a)
Chain of beauty stores | 67,657 | 19,440,562 |
| Total | | 94,010,634 |
| Textiles, Apparel & Luxury Goods 0.5% |
Hanesbrands, Inc.
Apparel and clothing products | 1,019,311 | 23,607,243 |
| Total Consumer Discretionary | 897,944,249 |
| Consumer Staples 1.6% |
| Food & Staples Retailing 0.5% |
US Foods Holding Corp.(a)
Catering services | 847,744 | 23,075,592 |
The accompanying Notes to Financial Statements are an integral part of this statement.
| 46 | Columbia Acorn Family of Funds | Semiannual Report 2017 |
Portfolio of Investments (continued)
Columbia Acorn® Fund, June 30, 2017 (Unaudited)
| Common Stocks (continued) |
| Issuer | Shares | Value ($) |
| Household Products 1.1% |
Spectrum Brands Holdings, Inc.
Global and diversified consumer products company | 209,802 | 26,233,642 |
WD-40 Co.
Multi-purpose lubricant products and heavy-duty hand cleaners | 214,015 | 23,616,555 |
| Total | | 49,850,197 |
| Total Consumer Staples | 72,925,789 |
| Energy 2.2% |
| Energy Equipment & Services 1.1% |
Oceaneering International, Inc.
Services and products for the offshore oil and gas industry | 735,000 | 16,787,400 |
RPC, Inc.(b)
Provides specialized oilfield services and equipment | 1,656,581 | 33,479,502 |
| Total | | 50,266,902 |
| Oil, Gas & Consumable Fuels 1.1% |
Carrizo Oil & Gas, Inc.(a)
Natural gas and crude oil | 685,655 | 11,944,110 |
Cimarex Energy Co.
Crude oil and natural gas | 160,680 | 15,105,527 |
Diamondback Energy, Inc.(a)
Independent oil and natural gas company | 298,502 | 26,509,963 |
| Total | | 53,559,600 |
| Total Energy | 103,826,502 |
| Financials 8.2% |
| Banks 1.3% |
BOK Financial Corp.
Multi-bank holding company | 249,073 | 20,954,511 |
MB Financial, Inc.
Holding company for MB Financial Bank, N.A. | 534,616 | 23,544,489 |
SVB Financial Group(a)
Holding company for Silicon Valley Bank | 100,686 | 17,699,592 |
| Total | | 62,198,592 |
| Common Stocks (continued) |
| Issuer | Shares | Value ($) |
| Capital Markets 6.4% |
Ares Capital Corp.
Management investment company | 2,267,080 | 37,134,770 |
CBOE Holdings, Inc.
Marketplace for the trading of standardized and listed options on equity securities | 455,004 | 41,587,366 |
Eaton Vance Corp.
Creates, markets, and manages mutual funds | 839,859 | 39,742,128 |
Factset Research Systems, Inc.
Global economic and financial data to analysts, investment bankers, and financial professionals | 140,341 | 23,321,867 |
Interactive Brokers Group, Inc., Class A
Automated global electronic market maker and broker | 525,166 | 19,651,712 |
Lazard Ltd., Class A
Corporate Advisory & Asset Management | 640,918 | 29,693,731 |
MarketAxess Holdings, Inc.
Electronic, multi-dealer to client platform for bond trading | 119,061 | 23,943,167 |
Nasdaq, Inc.
Operates a global stock exchange | 335,947 | 24,016,851 |
Raymond James Financial, Inc.
Financial services to individuals, corporations, and municipalities | 752,851 | 60,393,707 |
| Total | | 299,485,299 |
| Consumer Finance 0.5% |
Credit Acceptance Corp.(a),(b)
Funding, receivables management, collection, sales training, and related services to automobile dealers | 99,606 | 25,612,687 |
| Total Financials | 387,296,578 |
| Health Care 21.4% |
| Biotechnology 4.5% |
Agios Pharmaceuticals, Inc.(a)
Therapeutics in the field of cancer metabolism | 446,134 | 22,953,594 |
Bioverativ, Inc.(a)
Innovative therapies for the treatment of blood disorders | 589,054 | 35,443,379 |
Celldex Therapeutics, Inc.(a),(b)
Uses applications of immunology to prevent and treat diseases | 6,019,590 | 14,868,387 |
Genomic Health, Inc.(a)
Development and commercialization of genomic-based clinical diagnostic tests for cancer | 1,178,916 | 38,373,716 |
Kite Pharma, Inc.(a),(b)
Develops and manufacturers pharmaceuticals | 268,892 | 27,876,034 |
The accompanying Notes to Financial Statements are an integral part of this statement.
Columbia Acorn Family of Funds | Semiannual Report 2017
| 47 |
Portfolio of Investments (continued)
Columbia Acorn® Fund, June 30, 2017 (Unaudited)
| Common Stocks (continued) |
| Issuer | Shares | Value ($) |
Ligand Pharmaceuticals, Inc.(a)
Drugs that regulate hormone activated intracellular receptors | 216,500 | 26,283,100 |
Seattle Genetics, Inc.(a)
Monoclonal antibody-based drugs to treat cancer and related diseases | 413,994 | 21,420,050 |
Ultragenyx Pharmaceutical, Inc.(a)
Therapeutics and sialic acid for treating metabolic, body myopathy, glucuronidase, and rare genetic diseases | 401,040 | 24,908,594 |
| Total | | 212,126,854 |
| Health Care Equipment & Supplies 9.9% |
Align Technology, Inc.(a)
Designs, manufactures, and markets the Invisalign System | 624,458 | 93,743,634 |
Dentsply Sirona, Inc.
Dental supplies | 294,726 | 19,110,034 |
Endologix, Inc.(a)
Minimally invasive treatments for vascular diseases | 4,111,934 | 19,983,999 |
Haemonetics Corp.(a)
Automated blood processing systems | 489,529 | 19,331,500 |
IDEXX Laboratories, Inc.(a)
Diagnostic, detection, and information systems for veterinary, food, and water testing applications | 116,083 | 18,738,118 |
iRhythm Technologies, Inc.(a)
Medical instruments | 750,000 | 31,867,500 |
LivaNova PLC(a)
Medical technology focusing on neuromodulation, cardiac surgery and rhythm management | 659,652 | 40,377,299 |
Masimo Corp.(a)
Medical signal processing and sensor technology for non-invasive monitoring of physiological parameters | 551,711 | 50,305,009 |
Natus Medical, Inc.(a)
Medical device company that develops, manufactures, and markets screening products | 917,745 | 34,231,888 |
ResMed, Inc.
Medical equipment for the treatment of sleep disordered breathing | 473,808 | 36,895,429 |
Varex Imaging Corp.(a)
X-ray imaging components | 1,272,569 | 43,012,832 |
Varian Medical Systems, Inc.(a)
Medical equipment | 196,943 | 20,322,548 |
West Pharmaceutical Services, Inc.
Drug therapies and healthcare products | 384,253 | 36,319,594 |
| Total | | 464,239,384 |
| Common Stocks (continued) |
| Issuer | Shares | Value ($) |
| Health Care Providers & Services 2.1% |
AMN Healthcare Services, Inc.(a)
Temporary healthcare staffing | 509,669 | 19,902,574 |
HealthSouth Corp.
Inpatient rehabilitative healthcare services | 1,651,574 | 79,936,182 |
| Total | | 99,838,756 |
| Health Care Technology 1.7% |
Evolent Health, Inc., Class A(a)
Purpose-built platform enables providers to migrate their payment models | 1,463,000 | 37,087,050 |
Medidata Solutions, Inc.(a)
Hosted clinical development solutions | 298,957 | 23,378,438 |
Veeva Systems Inc., Class A(a)
Cloud-based business services | 333,727 | 20,460,802 |
| Total | | 80,926,290 |
| Life Sciences Tools & Services 3.2% |
Agilent Technologies, Inc.
Core bio-analytical and electronic measurement solutions | 330,675 | 19,612,334 |
Cambrex Corp.(a)
Products, services, and technologies for the Life Sciences and fine chemicals industry | 500,000 | 29,875,000 |
Mettler-Toledo International, Inc.(a)
Weighing instruments for use in laboratory, industrial, and food retailing applications | 42,245 | 24,862,872 |
Pra Health Sciences, Inc.(a)
Global contract research organization | 1,039,239 | 77,953,318 |
| Total | | 152,303,524 |
| Total Health Care | 1,009,434,808 |
| Industrials 17.0% |
| Aerospace & Defense 0.8% |
HEICO Corp., Class A
Aerospace products and services | 641,221 | 39,787,763 |
| Air Freight & Logistics 0.5% |
Expeditors International of Washington, Inc.
Global logistics company | 393,886 | 22,246,681 |
The accompanying Notes to Financial Statements are an integral part of this statement.
| 48 | Columbia Acorn Family of Funds | Semiannual Report 2017 |
Portfolio of Investments (continued)
Columbia Acorn® Fund, June 30, 2017 (Unaudited)
| Common Stocks (continued) |
| Issuer | Shares | Value ($) |
| Commercial Services & Supplies 2.6% |
Cintas Corp.
Corporate identity uniform programs | 403,721 | 50,884,995 |
Copart, Inc.(a)
Services to process and sell salvage vehicles through auctions | 1,128,208 | 35,865,732 |
Unifirst Corp.
Workplace uniforms and protective clothing | 265,145 | 37,305,902 |
| Total | | 124,056,629 |
| Industrial Conglomerates 0.9% |
Carlisle Companies, Inc.
Construction materials, transportation products, and general industry products | 417,100 | 39,791,340 |
| Machinery 6.5% |
Graco, Inc.
Technology for the management of fluids in industrial and commercial applications | 208,865 | 22,824,767 |
Middleby Corp. (The)(a)
Equipment for use in cooking and preparing food | 154,088 | 18,723,233 |
Nordson Corp.
Systems that apply adhesives, sealants, and coatings to products during manufacturing | 228,430 | 27,713,128 |
Oshkosh Corp.
Fire and emergency apparatuses and specialty commercial, and military trucks | 834,877 | 57,506,328 |
REV Group, Inc.
Specialty vehicles and related aftermarket parts and services | 687,646 | 19,034,041 |
Snap-On, Inc.
Tool and equipment solutions | 267,291 | 42,231,978 |
Toro Co. (The)
Turf equipment | 658,571 | 45,632,385 |
WABCO Holdings, Inc.(a)
Electronic braking, stability, suspension, and transmission control systems commercial vehicles | 290,356 | 37,023,293 |
Wabtec Corp.
Technology products and services for the rail industry | 408,200 | 37,350,300 |
| Total | | 308,039,453 |
| Common Stocks (continued) |
| Issuer | Shares | Value ($) |
| Professional Services 3.4% |
ManpowerGroup, Inc.
Non-governmental employment services | 405,631 | 45,288,701 |
Navigant Consulting, Inc.(a)
Independent consulting firm | 232,545 | 4,595,089 |
Robert Half International, Inc.
Temporary and permanent staffing services | 398,836 | 19,116,210 |
TransUnion (a)
Offers consumer reports, risk scores, analytical services, and decisioning capabilities to businesses | 1,215,207 | 52,630,615 |
Wageworks, Inc.(a)
Tax-advantaged programs for consumer-directed health, commuter, and other employee spending account benefits | 599,078 | 40,258,042 |
| Total | | 161,888,657 |
| Road & Rail 1.2% |
JB Hunt Transport Services, Inc.
Logistics services | 216,663 | 19,798,665 |
Old Dominion Freight Line, Inc.
Inter-regional and multi-regional motor carrier | 394,560 | 37,577,894 |
| Total | | 57,376,559 |
| Trading Companies & Distributors 1.1% |
Watsco, Inc.
Air conditioning, heating, and refrigeration equipment | 322,134 | 49,673,063 |
| Total Industrials | 802,860,145 |
| Information Technology 21.1% |
| Electronic Equipment, Instruments & Components 2.9% |
CDW Corp.
IT products and services | 1,078,107 | 67,414,030 |
IPG Photonics Corp.(a)
High-power fiber lasers and amplifiers | 469,098 | 68,066,120 |
| Total | | 135,480,150 |
The accompanying Notes to Financial Statements are an integral part of this statement.
Columbia Acorn Family of Funds | Semiannual Report 2017
| 49 |
Portfolio of Investments (continued)
Columbia Acorn® Fund, June 30, 2017 (Unaudited)
| Common Stocks (continued) |
| Issuer | Shares | Value ($) |
| Internet Software & Services 4.9% |
CoStar Group, Inc.(a)
Provides building-specific information to the United States commercial real estate industry and related industries | 129,467 | 34,127,501 |
GoDaddy, Inc., Class A(a)
Cloud-based web platform for small businesses, web design professionals and individuals | 1,385,480 | 58,772,062 |
NIC, Inc.
Provides eGovernment services | 1,151,586 | 21,822,555 |
Nutanix, Inc., Class A(a),(b)
Enterprise cloud platforms | 1,299,421 | 26,183,333 |
Q2 Holdings, Inc.(a)
Secure, cloud-based virtual banking solutions | 646,494 | 23,887,953 |
Quotient Technology, Inc.(a)
Operates a promotion platform | 2,074,658 | 23,858,567 |
SPS Commerce, Inc.(a)
On-demand supply chain management solutions through an online hosted software suite | 327,715 | 20,895,108 |
VeriSign, Inc.(a)
Domain names and Internet security services | 257,539 | 23,940,826 |
| Total | | 233,487,905 |
| IT Services 5.2% |
Black Knight Financial Services, Inc., Class A(a)
Itegrated technology, workflow automation, and data and analytics for the mortgage industry | 843,434 | 34,538,623 |
Booz Allen Hamilton Holdings Corp.
Technology consulting services to the U.S. government in the defense, intelligence, and civil markets | 1,228,269 | 39,967,873 |
Broadridge Financial Solutions, Inc.
Technology-based outsourcing solutions to the financial services industry | 290,539 | 21,953,127 |
CoreLogic, Inc.(a)
Consumer, financial and property information, analytics and services to business and government | 455,856 | 19,775,033 |
ExlService Holdings, Inc.(a)
Offshore business process outsourcing solutions | 472,096 | 26,239,096 |
Gartner, Inc.(a)
Research and analysis on computer hardware, software, communications, and information technology | 436,151 | 53,869,010 |
| Common Stocks (continued) |
| Issuer | Shares | Value ($) |
MAXIMUS, Inc.
Program management and consulting services to state and local governments | 372,592 | 23,335,437 |
Vantiv, Inc., Class A(a)
Integrated payment processor | 375,392 | 23,777,329 |
| Total | | 243,455,528 |
| Semiconductors & Semiconductor Equipment 1.0% |
Advanced Energy Industries, Inc.(a)
Engineered precision power conversion, measurement and control solutions | 415,000 | 26,846,350 |
Monolithic Power Systems, Inc.
Power management solutions | 200,716 | 19,349,022 |
| Total | | 46,195,372 |
| Software 7.1% |
ANSYS, Inc.(a)
Software solutions for design analysis and optimization | 566,098 | 68,882,805 |
Blackline, Inc.(a)
Develops and markets enterprise software | 767,620 | 27,434,739 |
Cadence Design Systems, Inc.(a)
Software technology, design and consulting services and technology | 1,127,700 | 37,766,673 |
CyberArk Software Ltd.(a)
IT security solutions | 402,728 | 20,116,264 |
Guidewire Software, Inc.(a)
Enterprise software for the property and casualty insurance industry | 373,910 | 25,691,356 |
Manhattan Associates, Inc.(a)
Information technology solutions for distribution centers | 727,028 | 34,940,966 |
Qualys, Inc.(a)
Information technology security risk and compliance management solutions | 980,773 | 40,015,538 |
Synopsys, Inc.(a)
Electronic design automation solutions | 541,651 | 39,502,607 |
Ultimate Software Group, Inc. (The)(a)
Software solutions | 204,301 | 42,915,468 |
| Total | | 337,266,416 |
| Total Information Technology | 995,885,371 |
| Materials 1.3% |
| Chemicals 1.3% |
Celanese Corp., Class A
Global integrated producer of chemicals and advanced materials | 638,726 | 60,640,646 |
| Total Materials | 60,640,646 |
The accompanying Notes to Financial Statements are an integral part of this statement.
| 50 | Columbia Acorn Family of Funds | Semiannual Report 2017 |
Portfolio of Investments (continued)
Columbia Acorn® Fund, June 30, 2017 (Unaudited)
| Common Stocks (continued) |
| Issuer | Shares | Value ($) |
| Real Estate 4.7% |
| Equity Real Estate Investment Trusts (REITS) 3.9% |
CoreCivic, Inc.
Detention and corrections services | 1,567,420 | 43,229,444 |
Education Realty Trust, Inc.
Self-managed and self-advised real estate investment trust | 587,118 | 22,750,822 |
Equity Commonwealth(a)
Real estate investment trust | 607,000 | 19,181,200 |
Equity LifeStyle Properties, Inc.
Acquires properties such as camping grounds and seasonal resort communities | 239,532 | 20,681,193 |
Federal Realty Investment Trust
Self-administered real estate investment trust | 152,204 | 19,237,064 |
Lamar Advertising Co., Class A
Outdoor advertising structures | 517,980 | 38,107,789 |
SBA Communications Corp(a)
Wireless communications infrastructure | 151,235 | 20,401,601 |
| Total | | 183,589,113 |
| Real Estate Management & Development 0.8% |
Jones Lang LaSalle, Inc.
Real estate and investment management services | 298,238 | 37,279,750 |
| Total Real Estate | 220,868,863 |
| Telecommunication Services 0.9% |
| Diversified Telecommunication Services 0.4% |
Zayo Group Holdings, Inc.(a)
Global provider of bandwidth infrastructure services | 605,501 | 18,709,981 |
| Common Stocks (continued) |
| Issuer | Shares | Value ($) |
| Wireless Telecommunication Services 0.5% |
Boingo Wireless, Inc.(a)
Mobile internet services | 1,674,054 | 25,043,848 |
| Total Telecommunication Services | 43,753,829 |
Total Common Stocks
(Cost: $3,303,290,077) | 4,595,436,780 |
|
| Securities Lending Collateral 2.6% |
| | Shares | Value ($) |
Dreyfus Government Cash Management Fund, Institutional Shares, 0.910%(c),(d)
| 121,051,730 | 121,051,730 |
Total Securities Lending Collateral
(Cost: $121,051,730) | 121,051,730 |
|
| Money Market Funds 3.1% |
| | |
| JPMorgan U.S. Government Money Market Fund, IM Shares, 0.879% (c) | 148,396,636 | 148,396,636 |
Total Money Market Funds
(Cost: $148,396,636) | 148,396,636 |
Total Investments
(Cost $3,572,738,443) | 4,864,885,146 (e) |
| Obligation to Return Collateral for Securities Loaned | | (121,051,730) |
| Other Assets & Liabilities, Net | | (28,296,972) |
| Net Assets | $4,715,536,444 |
Notes to Portfolio of Investments
| (a) | Non-income producing security. |
| (b) | All or a portion of this security was on loan at June 30, 2017. The total market value of securities on loan at June 30, 2017 was $119,231,924. |
| (c) | The rate shown is the seven-day current annualized yield at June 30, 2017. |
| (d) | Investment made with cash collateral received from securities lending activity. |
The accompanying Notes to Financial Statements are an integral part of this statement.
Columbia Acorn Family of Funds | Semiannual Report 2017
| 51 |
Portfolio of Investments (continued)
Columbia Acorn® Fund, June 30, 2017 (Unaudited)
Notes to Portfolio of Investments (continued)
| (e) | An affiliated person of the Fund, as defined in the Investment Company Act of 1940, may include any company in which the Fund owns five percent or more of its outstanding voting shares. Holdings and transactions in these affiliated companies during the six months ended June 30, 2017, are as follows. At June 30, 2017, the Fund had no outstanding affiliated investments. |
| Issuer | Beginning
shares | Shares
purchased | Shares
sold | Ending
shares | Value ($) | Dividend —
affiliated issuers
($) | Realized
Gain (Loss) |
| Boingo Wireless, Inc.1 | 2,180,974 | — | (506,920) | 1,674,054 | 25,043,848 | — | 2,981,177 |
| Celldex Therapeutics, Inc.1 | 6,019,590 | — | — | 6,019,590 | 14,868,387 | — | — |
| Endologix, Inc.1 | 4,661,700 | — | (549,766) | 4,111,934 | 19,983,999 | — | (1,237,035) |
| Nutanix, Inc., Class A1 | 898,090 | 492,000 | (90,669) | 1,299,421 | 26,183,333 | — | (800,974) |
| Total of Affiliated Transactions | 13,760,354 | 492,000 | (1,147,355) | 13,104,999 | 86,079,567 | — | 943,168 |
| 1 | At June 30, 2017, the Fund owned less than five percent of the company’s outstanding voting shares. |
Fair value measurements
Various inputs are used in determining the value of the Fund’s investments, following the input prioritization hierarchy established by accounting principles generally accepted in the United States of America (GAAP). These inputs are summarized in the three broad levels listed below:
| • | Level 1 – quoted prices in active markets for identical securities |
| • | Level 2 – prices determined using other significant observable inputs (including quoted prices for similar securities, interest rates, prepayment speeds, credit risk and others) |
| • | Level 3 – prices determined using significant unobservable inputs where quoted prices or observable inputs are unavailable or less reliable (including management’s own assumptions about the factors market participants would use in pricing an investment) |
The inputs or methodology used for valuing securities are not necessarily an indication of the risk associated with investing in those securities.
Examples of the types of securities in which the Fund would typically invest and how they are classified within this hierarchy are as follows. Typical Level 1 securities include exchange traded domestic equities, mutual funds whose net asset values are published each day and exchange traded foreign equities that are not statistically fair valued. Typical Level 2 securities include exchange traded foreign equities that are statistically fair valued, forward foreign currency exchange contracts and short-term investments valued at amortized cost. Additionally, securities fair valued by Columbia Wanger Asset Management’s Valuation Committee (the Committee) that rely on significant observable inputs are also included in Level 2. Typical Level 3 securities include any security fair valued by the Committee that relies on significant unobservable inputs.
The Committee is responsible for applying the Columbia Acorn Trust Portfolio Pricing Policy and the Columbia Wanger Asset Management pricing procedures (the Policies), which are approved by and subject to the oversight of the Board of Trustees.
The Committee meets as necessary, and no less frequently than quarterly, to determine fair values for securities for which market quotations are not readily available or for which Columbia Wanger Asset Management believes that available market quotations are unreliable. The Committee also reviews the continuing appropriateness of the Policies. In circumstances where a security has been fair valued, the Committee will also review the continuing appropriateness of the current value of the security. The Policies address, among other things: circumstances under which market quotations will be deemed readily available; selection of third party pricing vendors; appropriate pricing methodologies; events that require fair valuation and fair value techniques; circumstances under which securities will be deemed to pose a potential for stale pricing, including when securities are illiquid, restricted, or in default; and certain delegations of authority to determine fair values to the Fund’s investment manager. The Committee may also meet to discuss additional valuation matters, which may include review of back-testing results, review of time-sensitive information or approval of other valuation related actions, and to review the appropriateness of the Policies.
For investments categorized as Level 3, the significant unobservable inputs used in the fair value measurement of the Fund’s securities may include: (i) data specific to the issuer or comparable issuers, (ii) general market or specific sector news and (iii) quoted prices and specific or similar security transactions. The Committee considers this data and any changes from prior periods in order to assess the reasonableness of observable and unobservable inputs, any assumptions or internal models used to value those securities and changes in fair value. Significant changes in any of these factors could result in lower or higher fair value measurements. Various factors impact the frequency of monitoring (which may occur as often as daily), however the Committee may determine that changes to inputs, assumptions and models are not required with the same frequency.
The following table is a summary of the inputs used to value the Fund’s investments at June 30, 2017:
| | Level 1
quoted prices in active
markets for identical
assets ($) | Level 2
other significant
observable inputs ($) | Level 3
significant
unobservable inputs ($) | Total ($) |
| Investments | | | | |
| Common Stocks | | | | |
| Consumer Discretionary | 897,944,249 | — | — | 897,944,249 |
| Consumer Staples | 72,925,789 | — | — | 72,925,789 |
| Energy | 103,826,502 | — | — | 103,826,502 |
| Financials | 387,296,578 | — | — | 387,296,578 |
| Health Care | 1,009,434,808 | — | — | 1,009,434,808 |
| Industrials | 802,860,145 | — | — | 802,860,145 |
| Information Technology | 995,885,371 | — | — | 995,885,371 |
The accompanying Notes to Financial Statements are an integral part of this statement.
| 52 | Columbia Acorn Family of Funds | Semiannual Report 2017 |
Portfolio of Investments (continued)
Columbia Acorn® Fund, June 30, 2017 (Unaudited)
Fair value measurements (continued)
| | Level 1
quoted prices in active
markets for identical
assets ($) | Level 2
other significant
observable inputs ($) | Level 3
significant
unobservable inputs ($) | Total ($) |
| Materials | 60,640,646 | — | — | 60,640,646 |
| Real Estate | 220,868,863 | — | — | 220,868,863 |
| Telecommunication Services | 43,753,829 | — | — | 43,753,829 |
| Total Common Stocks | 4,595,436,780 | — | — | 4,595,436,780 |
| Securities Lending Collateral | 121,051,730 | — | — | 121,051,730 |
| Money Market Funds | 148,396,636 | — | — | 148,396,636 |
| Total Investments | 4,864,885,146 | — | — | 4,864,885,146 |
There were no transfers of financial assets between levels during the period.
The accompanying Notes to Financial Statements are an integral part of this statement.
Columbia Acorn Family of Funds | Semiannual Report 2017
| 53 |
Portfolio of Investments
Columbia Acorn International®, June 30, 2017 (Unaudited)
(Percentages represent value of investments compared to net assets)
| Common Stocks 97.7% |
| Issuer | Shares | Value ($) |
| Australia 1.5% |
Amcor Ltd.
International integrated packaging company | 2,475,208 | 30,835,491 |
Domino’s Pizza Enterprises Ltd.(a)
Pizza delivery stores | 1,145,666 | 45,844,598 |
| Total | 76,680,089 |
| Brazil 0.5% |
Raia Drogasil SA
Chain of pharmaceutical stores | 1,266,000 | 26,941,049 |
| Canada 7.2% |
Boardwalk Real Estate Investment Trust(a)
Real estate company | 1,053,355 | 38,623,558 |
CAE, Inc.
Training solutions based on simulation technology and integrated training services | 2,499,934 | 43,104,969 |
CCL Industries, Inc.
Manufacturing services and specialty packaging products for the non-durable consumer products market | 2,847,220 | 144,051,592 |
PrairieSky Royalty Ltd.(a)
Indirect oil and gas investments | 1,261,650 | 28,729,584 |
ShawCor Ltd.
Energy services company | 1,082,367 | 22,101,387 |
Tahoe Resources, Inc.
Mining services | 3,755,098 | 32,373,531 |
Uni-Select, Inc.
Wholesale distribution of automotive replacement parts, equipment, tools, and accessories | 1,164,748 | 28,130,712 |
Vermilion Energy, Inc.(a)
Oil and natural gas | 803,247 | 25,482,404 |
| Total | 362,597,737 |
| Cayman Islands 1.0% |
Silicon Motion Technology Corp., ADR
Semiconductor products | 1,020,000 | 49,194,600 |
| China 3.3% |
China Medical System Holdings Ltd.
Pharmaceutical and medical products | 30,095,000 | 52,036,232 |
New Oriental Education & Technology Group, Inc., ADR(b)
Educational services | 854,964 | 60,266,413 |
Shenzhou International Group Holdings Ltd.
Manufactures and processes textiles | 3,618,000 | 23,789,699 |
TravelSky Technology Ltd., Class H
IT solutions for China’s air travel and tourism industries | 9,316,000 | 27,440,309 |
| Total | 163,532,653 |
| Common Stocks (continued) |
| Issuer | Shares | Value ($) |
| Denmark 3.5% |
Novozymes AS, Class B
Enzymes for industrial use | 1,453,477 | 63,605,735 |
SimCorp AS
Global provider of highly specialised software for the investment management industry | 932,367 | 56,483,222 |
William Demant Holding AS(b)
Hearing aids, audiometers, tympanometers, diagnostic instruments, and wireless communication equipment | 2,052,031 | 53,110,390 |
| Total | 173,199,347 |
| France 1.7% |
Elior Group
Provides catering, cleaning, and facility management services | 1,920,770 | 55,810,445 |
Ipsen SA
Medical drugs for targeted disease areas | 233,984 | 32,029,283 |
| Total | 87,839,728 |
| Germany 6.7% |
Fielmann AG
Prescription eyeglasses, specialty glasses, sunglasses, contact lenses, and optical supplies | 621,901 | 47,973,934 |
MTU Aero Engines AG
Develops and manufactures engines and offers commercial engine services and support | 445,000 | 62,769,690 |
Rational AG
Food preparation appliances/processors and kitchen accessories | 74,335 | 39,564,190 |
Stroeer SE & Co. KGaA(a)
Digital multi-channel media company | 884,049 | 52,949,521 |
Wirecard AG(a)
Internet payment and processing services | 1,525,000 | 97,051,883 |
Zalando SE(b)
Online sale of fashion accessories | 714,116 | 32,633,250 |
| Total | 332,942,468 |
| Hong Kong 0.5% |
Value Partners Group Ltd.
Independent, value oriented asset management group | 28,101,000 | 25,578,725 |
| India 2.6% |
TVS Motor Co., Ltd.
Motorcycles, mopeds and scooters | 6,268,373 | 53,220,065 |
Zee Entertainment Enterprises Ltd.
Hindi films, serials, game shows and children’s programs | 10,025,681 | 76,095,925 |
| Total | 129,315,990 |
The accompanying Notes to Financial Statements are an integral part of this statement.
| 54 | Columbia Acorn Family of Funds | Semiannual Report 2017 |
Portfolio of Investments (continued)
Columbia Acorn International®, June 30, 2017 (Unaudited)
| Common Stocks (continued) |
| Issuer | Shares | Value ($) |
| Indonesia 0.9% |
PT Matahari Department Store Tbk
Retail clothes, accessories, bags, shoes, cosmetics, household appliances, and management consulting services. | 40,982,800 | 43,584,049 |
| Ireland 0.6% |
UDG Healthcare PLC
Commercialisation solutions for health care companies | 2,857,000 | 32,224,714 |
| Italy 2.5% |
Brembo SpA
Braking systems and components | 6,731,505 | 98,488,227 |
Industria Macchine Automatiche SpA
Packaging machinery for the food, pharmaceuticals, and cosmetics industries | 290,000 | 26,646,923 |
| Total | 125,135,150 |
| Japan 21.8% |
Aeon Credit Service Co., Ltd.
Credit card company | 2,147,000 | 45,563,873 |
Aeon Mall Co., Ltd.
Large-scale shopping malls | 3,622,500 | 71,569,547 |
Aica Kogyo Co., Ltd.
Manufactures adhesives, melamine boards, and housing materials | 909,100 | 27,759,648 |
Asahi Intecc Co., Ltd.
Manufactures medical tools and stainless wire rope | 551,700 | 25,104,630 |
Bandai Namco Holdings, Inc.
Manufactures toys, stuffed animals, character goods, video games, commercial- and home-use game equipment and software | 1,324,400 | 45,251,237 |
CyberAgent, Inc.
Operates websites, internet advertising agency and creates PC and mobile contents | 1,428,000 | 44,348,799 |
DIP Corp.
Matching services through Internet for job agencies and job seekers | 235,400 | 4,788,696 |
Disco Corp.
Abrasive and precision industrial machinery for cutting and grinding purposes | 234,600 | 37,627,826 |
FamilyMart UNY Holdings Co., Ltd.
Chain of convenience stores | 947,300 | 54,247,974 |
Glory Ltd.
Vending machines, coin-operated lockers, money handling machines, and data processing terminals | 1,117,900 | 36,715,771 |
| Common Stocks (continued) |
| Issuer | Shares | Value ($) |
Hikari Tsushin, Inc.
Distribution network, telecommunication, office automation equipment, in-house products and individual insurance plans | 577,700 | 60,864,047 |
Makita Corp.
Electric power tools | 752,500 | 27,868,113 |
MonotaRO Co., Ltd(a)
Machine tools, engine parts, and factory consumable goods | 1,307,800 | 42,264,637 |
NGK Insulators Ltd.
Electrical insulators, industrial ceramic products, environmental systems and electronic parts | 1,375,200 | 27,570,208 |
NGK Spark Plug Co., Ltd.
Spark plugs for automobiles, motorcycles, agricultural machinery, ships, and aircrafts | 1,528,900 | 32,749,824 |
Nihon M&A Center, Inc.
Provides M&A advisory services to small and medium-sized enterprises | 651,200 | 23,836,800 |
Nissan Chemical Industries Ltd.
Variety of chemical products | 995,000 | 32,971,211 |
NOF Corp.
Diversified chemical producer | 3,000,000 | 38,291,092 |
Obic Co., Ltd.
Computer system integration, office automation, consultation, and system support services | 595,100 | 36,643,844 |
Omron Corp.
Electronic components, equipment and systems used for factory automation | 1,004,000 | 43,703,518 |
OSG Corp.(a)
Manufactures machine tool equipment | 1,128,300 | 23,037,300 |
Otsuka Corp.
Computer information system and software | 696,500 | 43,325,115 |
Persol Holdings Co., Ltd.
Human resource solutions | 1,600,000 | 30,061,113 |
Santen Pharmaceutical Co., Ltd.
Ophthalmic medicine | 1,902,000 | 25,835,109 |
Sekisui Chemical Co., Ltd.
Unit residential houses in addition to parcels of land | 3,671,500 | 65,879,376 |
Seven Bank Ltd.
Banking services through Automated Teller Machine (ATM) | 11,623,200 | 41,674,478 |
Sohgo Security Services Co., Ltd.
Around the clock security services | 841,400 | 37,980,876 |
Sony Financial Holdings, Inc.
Financial holding company | 1,870,000 | 31,980,711 |
Ushio, Inc.
Lamps and optical equipment | 2,383,100 | 30,079,068 |
| Total | 1,089,594,441 |
The accompanying Notes to Financial Statements are an integral part of this statement.
Columbia Acorn Family of Funds | Semiannual Report 2017
| 55 |
Portfolio of Investments (continued)
Columbia Acorn International®, June 30, 2017 (Unaudited)
| Common Stocks (continued) |
| Issuer | Shares | Value ($) |
| Malta 1.7% |
Kindred Group PLC
Online gambling services | 7,374,685 | 83,422,256 |
| Mexico 1.6% |
Grupo Aeroportuario del Sureste SAB de CV, ADR
Operates airports in Mexico | 384,900 | 80,982,960 |
| Netherlands 1.6% |
Aalberts Industries NV
Industrial services and flow control systems | 2,044,797 | 81,414,282 |
| New Zealand 0.6% |
Auckland International Airport Ltd.
Owns and operates the Auckland International Airport | 5,805,568 | 30,335,239 |
| Philippines 0.5% |
Universal Robina Corp.
Branded consumer foods | 7,700,000 | 24,872,847 |
| Singapore 1.6% |
Mapletree Commercial Trust
Singapore-focused real estate investment trust | 32,720,300 | 37,907,302 |
Singapore Exchange
Singapore’s Securities and derivatives exchange and clearing houses | 7,714,200 | 41,112,683 |
| Total | 79,019,985 |
| South Africa 1.5% |
Clicks Group Ltd.
Owns and operates chains of retail stores | 2,665,748 | 28,527,019 |
Rand Merchant Investment Holdings Ltd.
Investment holding company | 14,964,784 | 44,599,803 |
| Total | 73,126,822 |
| South Korea 3.6% |
GS Retail Co., Ltd.
Chain of retail stores | 210,616 | 9,496,747 |
Korea Aerospace Industries Ltd.
Aircraft parts | 434,400 | 21,641,218 |
Korea Investment Holdings Co., Ltd.
Financial holding company | 793,245 | 48,608,243 |
Korea Zinc Co. Ltd.
Non-ferrous metal smelting | 97,000 | 38,653,097 |
Medy-Tox, Inc.
Biopharmaceutical products using clostridium botulinum | 125,506 | 61,460,220 |
| Total | 179,859,525 |
| Common Stocks (continued) |
| Issuer | Shares | Value ($) |
| Spain 3.0% |
Bolsas y Mercados Españoles SHMSF SA(a)
Barcelona, Bilbao, Madrid, and Valencia Stock Exchanges | 1,276,000 | 46,075,163 |
Merlin Properties Socimi SA
Real estate investment trust | 2,114,000 | 26,704,418 |
Prosegur Cia de Seguridad SA, Registered Shares
Security and transportation services | 5,000,000 | 32,494,158 |
Viscofan SA
Artificial casings made of cellulose, collagen, and plastic for use in the meat industry | 751,424 | 44,456,763 |
| Total | 149,730,502 |
| Sweden 4.7% |
Hexagon AB, Class B
Design, measurement and visualisation technologies | 2,636,121 | 125,317,989 |
NetEnt AB
Computer gaming software | 3,120,000 | 27,275,511 |
Sweco AB, Class B
Consulting company specializing in engineering, environmental technology, and architecture | 1,137,443 | 28,123,183 |
Trelleborg AB, Class B
Manufactures and distributes industrial products | 2,296,587 | 52,421,294 |
| Total | 233,137,977 |
| Switzerland 4.3% |
Geberit AG
Water supply pipes and fittings, installation systems, drainage and flushing systems | 94,892 | 44,254,565 |
Givaudan SA
Manufactures and markets fragrances and flavors | 15,270 | 30,543,185 |
Partners Group Holding AG
Global private markets asset management firm | 226,380 | 140,351,350 |
| Total | 215,149,100 |
| Taiwan 2.0% |
Largan Precision Co., Ltd.
Optical lens modules and optoelectronic components | 405,000 | 64,481,898 |
Silergy Corp.
High performance analog integrated circuits | 1,770,000 | 34,081,201 |
| Total | 98,563,099 |
The accompanying Notes to Financial Statements are an integral part of this statement.
| 56 | Columbia Acorn Family of Funds | Semiannual Report 2017 |
Portfolio of Investments (continued)
Columbia Acorn International®, June 30, 2017 (Unaudited)
| Common Stocks (continued) |
| Issuer | Shares | Value ($) |
| Thailand 1.0% |
Home Product Center PCL, Foreign Registered Shares
Building materials and home improvement products | 90,670,700 | 25,602,881 |
Tisco Financial Group PCL
Bank holding company | 11,363,000 | 25,411,307 |
| Total | 51,014,188 |
| United Kingdom 15.0% |
Croda International PLC
Chemicals and chemical products | 691,401 | 34,985,007 |
Domino’s Pizza Group PLC
Pizza delivery stores | 9,120,000 | 34,910,444 |
DS Smith PLC
Provides corrugated packaging services | 8,749,564 | 53,970,824 |
Halma PLC
Products that detect hazards and protect assets and people in public and commercial buildings | 5,256,048 | 75,303,117 |
JD Sports Fashion PLC
Brand-name sports and leisure wear | 5,023,000 | 22,897,716 |
Kingfisher PLC
International home improvement company | 16,771,956 | 65,686,797 |
LivaNova PLC(b)
Medical technology focusing on neuromodulation, cardiac surgery and rhythm management | 929,961 | 56,922,913 |
Micro Focus International PLC
Enterprise application management solutions | 1,500,000 | 44,367,947 |
Rentokil Initial PLC
Fully integrated facilities management and essential support services | 11,681,194 | 41,580,318 |
Rightmove PLC
Website that lists properties across Britain | 1,351,781 | 74,826,634 |
Shaftesbury PLC
Real estate company | 3,047,464 | 38,600,163 |
Spirax-Sarco Engineering PLC
Consultation, service and products for the control and efficient management of steam and industrial fluids | 1,119,262 | 77,991,358 |
| Common Stocks (continued) |
| Issuer | Shares | Value ($) |
WH Smith PLC
Retails books, magazines, newspapers, and periodicals | 2,401,564 | 53,643,763 |
Wolseley PLC
Bathroom materials, heating and plumbing supplies, and industrial pipes, valves, and fittings | 1,181,784 | 72,543,163 |
| Total | 748,230,164 |
| United States 0.7% |
Ultragenyx Pharmaceutical, Inc.(b)
Therapeutics and sialic acid for treating metabolic, body myopathy, glucuronidase, and rare genetic diseases | 590,087 | 36,650,304 |
Total Common Stocks
(Cost: $3,367,336,900) | 4,883,869,990 |
|
| Securities Lending Collateral 3.9% |
| | Shares | Value ($) |
Dreyfus Government Cash Management Fund, Institutional Shares, 0.910%(c),(d)
| 194,056,021 | 194,056,021 |
Total Securities Lending Collateral
(Cost: $194,056,021) | 194,056,021 |
|
| Money Market Funds 2.4% |
| | |
JPMorgan U.S. Government Money Market Fund, IM Shares, 0.879% (c)
| 120,050,870 | 120,050,870 |
Total Money Market Funds
(Cost: $120,050,870) | 120,050,870 |
Total Investments
(Cost: $3,681,443,791) | 5,197,976,881 |
| Obligation to Return Collateral for Securities Loaned | | (194,056,021) |
| Other Assets & Liabilities, Net | | (6,820,541) |
| Net Assets | $4,997,100,319 |
Notes to Portfolio of Investments
| (a) | All or a portion of this security was on loan at June 30, 2017. The total market value of securities on loan at June 30, 2017 was $184,924,231. |
| (b) | Non-income producing security. |
| (c) | The rate shown is the seven-day current annualized yield at June 30, 2017. |
| (d) | Investment made with cash collateral received from securities lending activity. |
The accompanying Notes to Financial Statements are an integral part of this statement.
Columbia Acorn Family of Funds | Semiannual Report 2017
| 57 |
Portfolio of Investments (continued)
Columbia Acorn International®, June 30, 2017 (Unaudited)
Abbreviation Legend
| ADR | American Depositary Receipt |
Fair value measurements
Various inputs are used in determining the value of the Fund’s investments, following the input prioritization hierarchy established by accounting principles generally accepted in the United States of America (GAAP). These inputs are summarized in the three broad levels listed below:
| • | Level 1 – quoted prices in active markets for identical securities |
| • | Level 2 – prices determined using other significant observable inputs (including quoted prices for similar securities, interest rates, prepayment speeds, credit risk and others) |
| • | Level 3 – prices determined using significant unobservable inputs where quoted prices or observable inputs are unavailable or less reliable (including management’s own assumptions about the factors market participants would use in pricing an investment) |
The inputs or methodology used for valuing securities are not necessarily an indication of the risk associated with investing in those securities.
Examples of the types of securities in which the Fund would typically invest and how they are classified within this hierarchy are as follows. Typical Level 1 securities include exchange traded domestic equities, mutual funds whose net asset values are published each day and exchange traded foreign equities that are not statistically fair valued. Typical Level 2 securities include exchange traded foreign equities that are statistically fair valued, forward foreign currency exchange contracts and short-term investments valued at amortized cost. Additionally, securities fair valued by Columbia Wanger Asset Management’s Valuation Committee (the Committee) that rely on significant observable inputs are also included in Level 2. Typical Level 3 securities include any security fair valued by the Committee that relies on significant unobservable inputs.
The Committee is responsible for applying the Columbia Acorn Trust Portfolio Pricing Policy and the Columbia Wanger Asset Management pricing procedures (the Policies), which are approved by and subject to the oversight of the Board of Trustees.
The Committee meets as necessary, and no less frequently than quarterly, to determine fair values for securities for which market quotations are not readily available or for which Columbia Wanger Asset Management believes that available market quotations are unreliable. The Committee also reviews the continuing appropriateness of the Policies. In circumstances where a security has been fair valued, the Committee will also review the continuing appropriateness of the current value of the security. The Policies address, among other things: circumstances under which market quotations will be deemed readily available; selection of third party pricing vendors; appropriate pricing methodologies; events that require fair valuation and fair value techniques; circumstances under which securities will be deemed to pose a potential for stale pricing, including when securities are illiquid, restricted, or in default; and certain delegations of authority to determine fair values to the Fund’s investment manager. The Committee may also meet to discuss additional valuation matters, which may include review of back-testing results, review of time-sensitive information or approval of other valuation related actions, and to review the appropriateness of the Policies.
For investments categorized as Level 3, the significant unobservable inputs used in the fair value measurement of the Fund’s securities may include: (i) data specific to the issuer or comparable issuers, (ii) general market or specific sector news and (iii) quoted prices and specific or similar security transactions. The Committee considers this data and any changes from prior periods in order to assess the reasonableness of observable and unobservable inputs, any assumptions or internal models used to value those securities and changes in fair value. Significant changes in any of these factors could result in lower or higher fair value measurements. Various factors impact the frequency of monitoring (which may occur as often as daily), however the Committee may determine that changes to inputs, assumptions and models are not required with the same frequency.
The following table is a summary of the inputs used to value the Fund’s investments at June 30, 2017:
| | Level 1
quoted prices in active
markets for identical
assets ($) | Level 2
other significant
observable inputs ($) | Level 3
significant
unobservable inputs ($) | Total ($) |
| Investments | | | | |
| Common Stocks | | | | |
| Australia | — | 76,680,089 | — | 76,680,089 |
| Brazil | 26,941,049 | — | — | 26,941,049 |
| Canada | 362,597,737 | — | — | 362,597,737 |
| Cayman Islands | 49,194,600 | — | — | 49,194,600 |
| China | 60,266,413 | 103,266,240 | — | 163,532,653 |
| Denmark | — | 173,199,347 | — | 173,199,347 |
| France | — | 87,839,728 | — | 87,839,728 |
| Germany | — | 332,942,468 | — | 332,942,468 |
| Hong Kong | — | 25,578,725 | — | 25,578,725 |
| India | — | 129,315,990 | — | 129,315,990 |
| Indonesia | — | 43,584,049 | — | 43,584,049 |
| Ireland | — | 32,224,714 | — | 32,224,714 |
| Italy | — | 125,135,150 | — | 125,135,150 |
| Japan | — | 1,089,594,441 | — | 1,089,594,441 |
| Malta | — | 83,422,256 | — | 83,422,256 |
| Mexico | 80,982,960 | — | — | 80,982,960 |
| Netherlands | — | 81,414,282 | — | 81,414,282 |
| New Zealand | — | 30,335,239 | — | 30,335,239 |
| Philippines | — | 24,872,847 | — | 24,872,847 |
| Singapore | — | 79,019,985 | — | 79,019,985 |
The accompanying Notes to Financial Statements are an integral part of this statement.
| 58 | Columbia Acorn Family of Funds | Semiannual Report 2017 |
Portfolio of Investments (continued)
Columbia Acorn International®, June 30, 2017 (Unaudited)
Fair value measurements (continued)
| | Level 1
quoted prices in active
markets for identical
assets ($) | Level 2
other significant
observable inputs ($) | Level 3
significant
unobservable inputs ($) | Total ($) |
| South Africa | — | 73,126,822 | — | 73,126,822 |
| South Korea | — | 179,859,525 | — | 179,859,525 |
| Spain | — | 149,730,502 | — | 149,730,502 |
| Sweden | — | 233,137,977 | — | 233,137,977 |
| Switzerland | — | 215,149,100 | — | 215,149,100 |
| Taiwan | — | 98,563,099 | — | 98,563,099 |
| Thailand | — | 51,014,188 | — | 51,014,188 |
| United Kingdom | 56,922,913 | 691,307,251 | — | 748,230,164 |
| United States | 36,650,304 | — | — | 36,650,304 |
| Total Common Stocks | 673,555,976 | 4,210,314,014 | — | 4,883,869,990 |
| Securities Lending Collateral | 194,056,021 | — | — | 194,056,021 |
| Money Market Funds | 120,050,870 | — | — | 120,050,870 |
| Total Investments | 987,662,867 | 4,210,314,014 | — | 5,197,976,881 |
The Fund’s assets assigned to the Level 2 input category are generally valued using a market approach, in which a security’s value is determined through its correlation to prices and information from observable market transactions for similar or identical assets. Foreign equities are generally valued at the last sale price on the foreign exchange or market on which they trade. The Fund may use a statistical fair valuation model, in accordance with the policy adopted by the Board of Trustees, provided by an independent third party to value securities principally traded in foreign markets in order to adjust for possible stale pricing that may occur between the close of the foreign exchanges and the time for valuation. These models take into account available market data including intraday index, ADR, and ETF movements.
There were no transfers of financial assets between levels during the period.
The accompanying Notes to Financial Statements are an integral part of this statement.
Columbia Acorn Family of Funds | Semiannual Report 2017
| 59 |
Portfolio of Investments
Columbia Acorn USA®, June 30, 2017 (Unaudited)
(Percentages represent value of investments compared to net assets)
| Common Stocks 97.0% |
| Issuer | Shares | Value ($) |
| Consumer Discretionary 22.4% |
| Auto Components 5.3% |
Cooper-Standard Holding, Inc.(a)
Sealing, fuel and brake delivery, fluid transfer systems, anti-vibration systems components, subsystems, and modules | 45,153 | 4,554,583 |
Dorman Products, Inc.(a)
Automotive products and home hardware | 85,153 | 7,048,114 |
Gentex Corp.
Products that use electro-optic technology | 169,542 | 3,216,211 |
LCI Industries
Recreational vehicles and equipment | 133,697 | 13,690,573 |
Tenneco, Inc.
Emission control and ride control products and systems | 86,630 | 5,009,813 |
| Total | | 33,519,294 |
| Distributors 1.0% |
Pool Corp.
Wholesale distributor of swimming pool supplies, equipment and leisure products | 52,873 | 6,216,279 |
| Diversified Consumer Services 3.5% |
Adtalem Global Education, Inc.
Higher education institutions | 238,482 | 9,050,392 |
Bright Horizons Family Solutions, Inc.(a)
Child care and early education services | 89,128 | 6,881,573 |
Laureate Education, Inc., Class A(a)
Provides educational services | 373,278 | 6,543,563 |
| Total | | 22,475,528 |
| Hotels, Restaurants & Leisure 5.0% |
Extended Stay America, Inc.
Hotels and motels | 428,781 | 8,301,200 |
Papa John’s International, Inc.
Pizza delivery and carry-out restaurants | 89,957 | 6,455,314 |
Texas Roadhouse, Inc.
Moderately priced, full service restaurant chain | 199,176 | 10,148,017 |
Vail Resorts, Inc.
Operates resorts globally | 16,878 | 3,423,365 |
Wingstop, Inc.
Cooked-to-order chicken wings | 107,862 | 3,332,936 |
| Total | | 31,660,832 |
| Common Stocks (continued) |
| Issuer | Shares | Value ($) |
| Household Durables 1.4% |
Cavco Industries, Inc.(a)
Designs and manufactures systems-built structures | 41,802 | 5,419,629 |
iRobot Corp.(a)
Manufactures robots for cleaning | 45,331 | 3,814,151 |
| Total | | 9,233,780 |
| Internet & Direct Marketing Retail 1.1% |
Wayfair, Inc., Class A(a),(b)
Retails household goods online | 92,377 | 7,101,944 |
| Leisure Products 2.2% |
Brunswick Corp.
Consumer products serving the outdoor and indoor active recreation markets | 130,337 | 8,176,040 |
Polaris Industries, Inc.(b)
Off-road and on-road vehicles | 64,320 | 5,932,234 |
| Total | | 14,108,274 |
| Specialty Retail 2.9% |
Camping World Holdings, Inc., Class A
Recreational vehicles and accessories | 243,418 | 7,509,445 |
Five Below, Inc.(a)
Specialty value retailer | 159,899 | 7,894,214 |
Monro Muffler Brake, Inc.
Automotive undercar repair and tire services | 69,098 | 2,884,841 |
| Total | | 18,288,500 |
| Total Consumer Discretionary | 142,604,431 |
| Consumer Staples 0.9% |
| Household Products 0.9% |
WD-40 Co.
Multi-purpose lubricant products and heavy-duty hand cleaners | 52,593 | 5,803,637 |
| Total Consumer Staples | 5,803,637 |
| Energy 1.9% |
| Energy Equipment & Services 1.0% |
Core Laboratories NV
Reservoir description, production enhancement, and reservoir management services | 35,225 | 3,567,236 |
Oceaneering International, Inc.
Services and products for the offshore oil and gas industry | 125,430 | 2,864,821 |
| Total | | 6,432,057 |
The accompanying Notes to Financial Statements are an integral part of this statement.
| 60 | Columbia Acorn Family of Funds | Semiannual Report 2017 |
Portfolio of Investments (continued)
Columbia Acorn USA®, June 30, 2017 (Unaudited)
| Common Stocks (continued) |
| Issuer | Shares | Value ($) |
| Oil, Gas & Consumable Fuels 0.9% |
Carrizo Oil & Gas, Inc.(a)
Natural gas and crude oil | 163,326 | 2,845,139 |
PDC Energy, Inc.(a)
Petroleum products | 59,483 | 2,564,312 |
| Total | | 5,409,451 |
| Total Energy | 11,841,508 |
| Financials 10.6% |
| Banks 6.6% |
First Busey Corp.
Multi-bank holding company | 222,656 | 6,528,274 |
Great Southern Bancorp, Inc.
Real estate, commercial real estate, commercial business, consumer, and construction loans | 69,655 | 3,726,542 |
Lakeland Financial Corp.
Bank holding company | 206,649 | 9,481,056 |
LegacyTexas Financial Group, Inc.
Bank holding company | 247,299 | 9,429,511 |
MB Financial, Inc.
Holding company for MB Financial Bank, N.A. | 130,791 | 5,760,036 |
Sandy Spring Bancorp, Inc.
Holding company for Sandy Spring Bank | 83,440 | 3,392,670 |
Trico Bancshares
Holding company for Tri Counties Bank | 105,893 | 3,722,139 |
| Total | | 42,040,228 |
| Capital Markets 3.0% |
Hamilton Lane, Inc., Class A
Private market investment solutions | 175,588 | 3,861,180 |
Houlihan Lokey, Inc.
Investment bank | 138,538 | 4,834,976 |
OM Asset Management PLC
Domestic and international equities, fixed income, and alternative investments | 706,641 | 10,500,686 |
| Total | | 19,196,842 |
| Consumer Finance 1.0% |
FirstCash, Inc.
Owns and operates pawn stores | 105,231 | 6,134,967 |
| Total Financials | 67,372,037 |
| Common Stocks (continued) |
| Issuer | Shares | Value ($) |
| Health Care 21.4% |
| Biotechnology 5.3% |
Agios Pharmaceuticals, Inc.(a)
Therapeutics in the field of cancer metabolism | 133,850 | 6,886,583 |
Celldex Therapeutics, Inc.(a)
Uses applications of immunology to prevent and treat diseases | 1,039,523 | 2,567,622 |
Exact Sciences Corp.(a)
Developing and commercializing a test for the early detection and prevention of colorectal cancer | 110,335 | 3,902,549 |
Genomic Health, Inc.(a)
Development and commercialization of genomic-based clinical diagnostic tests for cancer | 106,347 | 3,461,595 |
Intercept Pharmaceuticals, Inc.(a),(b)
biopharmaceutical products | 30,605 | 3,705,347 |
Kite Pharma, Inc.(a)
Develops and manufacturers pharmaceuticals | 41,200 | 4,271,204 |
Ligand Pharmaceuticals, Inc.(a)
Drugs that regulate hormone activated intracellular receptors | 30,906 | 3,751,988 |
Ultragenyx Pharmaceutical, Inc.(a)
Therapeutics and sialic acid for treating metabolic, body myopathy, glucuronidase, and rare genetic diseases | 81,974 | 5,091,405 |
| Total | | 33,638,293 |
| Health Care Equipment & Supplies 7.8% |
Anika Therapeutics, Inc.(a)
Integrated orthopedic medicines company | 114,286 | 5,638,871 |
Atrion Corp.
Medical products and components | 9,100 | 5,854,030 |
Endologix, Inc.(a)
Minimally invasive treatments for vascular diseases | 469,553 | 2,282,028 |
Haemonetics Corp.(a)
Automated blood processing systems | 119,402 | 4,715,185 |
iRhythm Technologies, Inc.(a)
Medical instruments | 169,700 | 7,210,553 |
LeMaitre Vascular, Inc.
Medical devices for vascular surgeons and interventionists | 113,607 | 3,546,810 |
Masimo Corp.(a)
Medical signal processing and sensor technology for non-invasive monitoring of physiological parameters | 70,848 | 6,459,921 |
Natus Medical, Inc.(a)
Medical device company that develops, manufactures, and markets screening products | 144,347 | 5,384,143 |
The accompanying Notes to Financial Statements are an integral part of this statement.
Columbia Acorn Family of Funds | Semiannual Report 2017
| 61 |
Portfolio of Investments (continued)
Columbia Acorn USA®, June 30, 2017 (Unaudited)
| Common Stocks (continued) |
| Issuer | Shares | Value ($) |
OraSure Technologies, Inc.(a)
Medical devices and diagnostic products | 273,628 | 4,722,819 |
West Pharmaceutical Services, Inc.
Drug therapies and healthcare products | 40,342 | 3,813,126 |
| Total | | 49,627,486 |
| Health Care Providers & Services 4.0% |
AMN Healthcare Services, Inc.(a)
Temporary healthcare staffing | 173,498 | 6,775,097 |
HealthEquity, Inc.(a)
Technology-enabled services platforms for consumers to make healthcare saving and spending decisions | 87,808 | 4,375,473 |
HealthSouth Corp.
Inpatient rehabilitative healthcare services | 297,678 | 14,407,615 |
| Total | | 25,558,185 |
| Health Care Technology 1.7% |
Evolent Health, Inc., Class A(a)
Purpose-built platform enables providers to migrate their payment models | 218,126 | 5,529,494 |
Medidata Solutions, Inc.(a)
Hosted clinical development solutions | 67,304 | 5,263,173 |
| Total | | 10,792,667 |
| Life Sciences Tools & Services 2.6% |
Bio-Techne Corp.
Biotechnology products and clinical diagnostic controls | 73,179 | 8,598,532 |
Cambrex Corp.(a)
Products, services, and technologies for the Life Sciences and fine chemicals industry | 138,278 | 8,262,111 |
| Total | | 16,860,643 |
| Total Health Care | 136,477,274 |
| Industrials 14.2% |
| Aerospace & Defense 2.3% |
Astronics Corp.(a)
Specialized lighting, control systems, and electronics for the cockpit, cabin, and exteriors of military, commercial jet, and aviation aircraft | 138,129 | 4,208,791 |
Astronics Corp., Class B(a)
Designer & Manufacturer of Aircraft Electrical Components & Testing Equipment | 19,972 | 610,744 |
Axon Enterprise, Inc.(a),(b)
Security systems | 142,827 | 3,590,671 |
HEICO Corp., Class A
Aerospace products and services | 97,647 | 6,058,996 |
| Total | | 14,469,202 |
| Common Stocks (continued) |
| Issuer | Shares | Value ($) |
| Commercial Services & Supplies 4.6% |
Brink’s Co. (The)
Provides security services globally | 99,339 | 6,655,713 |
Copart, Inc.(a)
Services to process and sell salvage vehicles through auctions | 253,560 | 8,060,672 |
Healthcare Services Group, Inc.
Housekeeping, laundry, linen, facility maintenance, and food services | 80,316 | 3,761,198 |
Knoll, Inc.
Branded office furniture products and textiles | 151,271 | 3,032,984 |
Unifirst Corp.
Workplace uniforms and protective clothing | 55,337 | 7,785,916 |
| Total | | 29,296,483 |
| Machinery 4.8% |
Barnes Group, Inc.
International industrial and aerospace manufacturer and service provider | 129,252 | 7,565,120 |
ESCO Technologies, Inc.
Engineered products and solutions | 62,153 | 3,707,426 |
Nordson Corp.
Systems that apply adhesives, sealants, and coatings to products during manufacturing | 25,828 | 3,133,453 |
Oshkosh Corp.
Fire and emergency apparatuses and specialty commercial, and military trucks | 46,451 | 3,199,545 |
REV Group, Inc.
Specialty vehicles and related aftermarket parts and services | 134,528 | 3,723,735 |
Toro Co. (The)
Turf equipment | 134,298 | 9,305,508 |
| Total | | 30,634,787 |
| Professional Services 2.0% |
ICF International, Inc.(a)
Management, technology, policy consulting, and implementation services | 111,829 | 5,267,146 |
Wageworks, Inc.(a)
Tax-advantaged programs for consumer-directed health, commuter, and other employee spending account benefits | 112,016 | 7,527,475 |
| Total | | 12,794,621 |
| Trading Companies & Distributors 0.5% |
Watsco, Inc.
Air conditioning, heating, and refrigeration equipment | 22,574 | 3,480,911 |
| Total Industrials | 90,676,004 |
The accompanying Notes to Financial Statements are an integral part of this statement.
| 62 | Columbia Acorn Family of Funds | Semiannual Report 2017 |
Portfolio of Investments (continued)
Columbia Acorn USA®, June 30, 2017 (Unaudited)
| Common Stocks (continued) |
| Issuer | Shares | Value ($) |
| Information Technology 22.7% |
| Electronic Equipment, Instruments & Components 1.1% |
IPG Photonics Corp.(a)
High-power fiber lasers and amplifiers | 48,943 | 7,101,629 |
| Internet Software & Services 9.4% |
Alteryx, Inc., Class A(a),(b)
Data storage, retrieval, management, reporting, and analytics solutions | 210,257 | 4,104,217 |
Apptio, Inc., Class A(a)
Cloud-based business management solutions | 185,896 | 3,225,296 |
CoStar Group, Inc.(a)
Provides building-specific information to the United States commercial real estate industry and related industries | 25,882 | 6,822,495 |
j2 Global, Inc.
Cloud-based communications and storage messaging services | 104,751 | 8,913,262 |
LogMeIn, Inc.
Remote connectivity services | 45,330 | 4,736,985 |
Mimecast Ltd.(a)
Cloud security and risk management services for corporate information and email | 212,527 | 5,691,473 |
MINDBODY, Inc., Class A(a)
Business management software | 180,519 | 4,910,117 |
NIC, Inc.
Provides eGovernment services | 398,959 | 7,560,273 |
Nutanix, Inc., Class A(a),(b)
Enterprise cloud platforms | 275,307 | 5,547,436 |
Q2 Holdings, Inc.(a)
Secure, cloud-based virtual banking solutions | 139,520 | 5,155,264 |
SPS Commerce, Inc.(a)
On-demand supply chain management solutions through an online hosted software suite | 54,273 | 3,460,446 |
| Total | | 60,127,264 |
| Common Stocks (continued) |
| Issuer | Shares | Value ($) |
| IT Services 5.7% |
CoreLogic, Inc.(a)
Consumer, financial and property information, analytics and services to business and government | 92,057 | 3,993,433 |
Euronet Worldwide, Inc.(a)
Electronic financial transaction solutions | 66,822 | 5,838,238 |
ExlService Holdings, Inc.(a)
Offshore business process outsourcing solutions | 69,039 | 3,837,188 |
MAXIMUS, Inc.
Program management and consulting services to state and local governments | 201,831 | 12,640,675 |
WNS Holdings Ltd., ADR(a)
Business process outsourcing services | 298,486 | 10,255,979 |
| Total | | 36,565,513 |
| Semiconductors & Semiconductor Equipment 1.1% |
Monolithic Power Systems, Inc.
Power management solutions | 69,880 | 6,736,432 |
| Software 5.4% |
Aspen Technology, Inc.(a)
Process optimization software, products and services | 81,543 | 4,506,066 |
Blackline, Inc.(a)
Develops and markets enterprise software | 127,948 | 4,572,862 |
CyberArk Software Ltd.(a)
IT security solutions | 70,469 | 3,519,927 |
Guidewire Software, Inc.(a)
Enterprise software for the property and casualty insurance industry | 71,472 | 4,910,841 |
Manhattan Associates, Inc.(a)
Information technology solutions for distribution centers | 66,288 | 3,185,801 |
Qualys, Inc.(a)
Information technology security risk and compliance management solutions | 224,425 | 9,156,540 |
Tyler Technologies, Inc.(a)
End-to-end information management solutions and services for local governments | 24,685 | 4,336,414 |
| Total | | 34,188,451 |
| Total Information Technology | 144,719,289 |
| Materials 0.7% |
| Chemicals 0.7% |
Scotts Miracle-Gro Co. (The), Class A
Lawn and garden products | 50,106 | 4,482,483 |
| Total Materials | 4,482,483 |
The accompanying Notes to Financial Statements are an integral part of this statement.
Columbia Acorn Family of Funds | Semiannual Report 2017
| 63 |
Portfolio of Investments (continued)
Columbia Acorn USA®, June 30, 2017 (Unaudited)
| Common Stocks (continued) |
| Issuer | Shares | Value ($) |
| Real Estate 2.2% |
| Equity Real Estate Investment Trusts (REITS) 1.5% |
CoreCivic, Inc.
Detention and corrections services | 216,940 | 5,983,205 |
UMH Properties, Inc.
Real estate investment trust | 206,341 | 3,518,114 |
| Total | | 9,501,319 |
| Real Estate Management & Development 0.7% |
Colliers International Group, Inc.
Commercial real estate, residential property management and property services | 76,423 | 4,314,079 |
| Total Real Estate | 13,815,398 |
Total Common Stocks
(Cost: $458,188,062) | 617,792,061 |
|
| Securities Lending Collateral 1.6% |
| | Shares | Value ($) |
Dreyfus Government Cash Management Fund, Institutional Shares, 0.910%(c),(d)
| 9,894,600 | 9,894,600 |
Total Securities Lending Collateral
(Cost: $9,894,600) | 9,894,600 |
|
| Money Market Funds 4.0% |
| | Shares | Value ($) |
| JPMorgan U.S. Government Money Market Fund, Agency Shares, 0.780%(c) | 25,597,064 | 25,597,064 |
Total Money Market Funds
(Cost: $25,597,064) | 25,597,064 |
Total Investments
(Cost $493,679,726) | 653,283,725 |
| Obligation to Return Collateral for Securities Loaned | | (9,894,600) |
| Other Assets & Liabilities, Net | | (6,833,667) |
| Net Assets | $636,555,458 |
Notes to Portfolio of Investments
| (a) | Non-income producing security. |
| (b) | All or a portion of this security was on loan at June 30, 2017. The total market value of securities on loan at June 30, 2017 was $9,705,947. |
| (c) | The rate shown is the seven-day current annualized yield at June 30, 2017. |
| (d) | Investment made with cash collateral received from securities lending activity. |
Abbreviation Legend
| ADR | American Depositary Receipt |
Fair value measurements
Various inputs are used in determining the value of the Fund’s investments, following the input prioritization hierarchy established by accounting principles generally accepted in the United States of America (GAAP). These inputs are summarized in the three broad levels listed below:
| • | Level 1 – quoted prices in active markets for identical securities |
| • | Level 2 – prices determined using other significant observable inputs (including quoted prices for similar securities, interest rates, prepayment speeds, credit risk and others) |
| • | Level 3 – prices determined using significant unobservable inputs where quoted prices or observable inputs are unavailable or less reliable (including management’s own assumptions about the factors market participants would use in pricing an investment) |
The inputs or methodology used for valuing securities are not necessarily an indication of the risk associated with investing in those securities.
Examples of the types of securities in which the Fund would typically invest and how they are classified within this hierarchy are as follows. Typical Level 1 securities include mutual funds whose net asset values are published each day and exchange traded foreign equities that are not statistically fair valued. Typical Level 2 securities include exchange traded foreign equities that are statistically fair valued, forward foreign currency exchange contracts and short-term investments valued at amortized cost. Additionally, securities fair valued by Columbia Wanger Asset Management’s Valuation Committee (the Committee) that rely on significant observable inputs are also included in Level 2. Typical Level 3 securities include any security fair valued by the Committee that relies on significant unobservable inputs.
The accompanying Notes to Financial Statements are an integral part of this statement.
| 64 | Columbia Acorn Family of Funds | Semiannual Report 2017 |
Portfolio of Investments (continued)
Columbia Acorn USA®, June 30, 2017 (Unaudited)
Fair value measurements (continued)
The Committee is responsible for applying the Columbia Acorn Trust Portfolio Pricing Policy and the Columbia Wanger Asset Management pricing procedures (the Policies), which are approved by and subject to the oversight of the Board of Trustees.
The Committee meets as necessary, and no less frequently than quarterly, to determine fair values for securities for which market quotations are not readily available or for which Columbia Wanger Asset Management believes that available market quotations are unreliable. The Committee also reviews the continuing appropriateness of the Policies. In circumstances where a security has been fair valued, the Committee will also review the continuing appropriateness of the current value of the security. The Policies address, among other things: circumstances under which market quotations will be deemed readily available; selection of third party pricing vendors; appropriate pricing methodologies; events that require fair valuation and fair value techniques; circumstances under which securities will be deemed to pose a potential for stale pricing, including when securities are illiquid, restricted, or in default; and certain delegations of authority to determine fair values to the Fund’s investment manager. The Committee may also meet to discuss additional valuation matters, which may include review of back-testing results, review of time-sensitive information or approval of other valuation related actions, and to review the appropriateness of the Policies.
For investments categorized as Level 3, the significant unobservable inputs used in the fair value measurement of the Fund’s securities may include: (i) data specific to the issuer or comparable issuers, (ii) general market or specific sector news and (iii) quoted prices and specific or similar security transactions. The Committee considers this data and any changes from prior periods in order to assess the reasonableness of observable and unobservable inputs, any assumptions or internal models used to value those securities and changes in fair value. Significant changes in any of these factors could result in lower or higher fair value measurements. Various factors impact the frequency of monitoring (which may occur as often as daily), however the Committee may determine that changes to inputs, assumptions and models are not required with the same frequency.
The following table is a summary of the inputs used to value the Fund’s investments at June 30, 2017:
| | Level 1
quoted prices in active
markets for identical
assets ($) | Level 2
other significant
observable inputs ($) | Level 3
significant
unobservable inputs ($) | Total ($) |
| Investments | | | | |
| Common Stocks | | | | |
| Consumer Discretionary | 142,604,431 | — | — | 142,604,431 |
| Consumer Staples | 5,803,637 | — | — | 5,803,637 |
| Energy | 11,841,508 | — | — | 11,841,508 |
| Financials | 67,372,037 | — | — | 67,372,037 |
| Health Care | 136,477,274 | — | — | 136,477,274 |
| Industrials | 90,676,004 | — | — | 90,676,004 |
| Information Technology | 144,719,289 | — | — | 144,719,289 |
| Materials | 4,482,483 | — | — | 4,482,483 |
| Real Estate | 13,815,398 | — | — | 13,815,398 |
| Total Common Stocks | 617,792,061 | — | — | 617,792,061 |
| Securities Lending Collateral | 9,894,600 | — | — | 9,894,600 |
| Money Market Funds | 25,597,064 | — | — | 25,597,064 |
| Total Investments | 653,283,725 | — | — | 653,283,725 |
There were no transfers of financial assets between levels during the period.
The accompanying Notes to Financial Statements are an integral part of this statement.
Columbia Acorn Family of Funds | Semiannual Report 2017
| 65 |
Portfolio of Investments
Columbia Acorn International SelectSM, June 30, 2017 (Unaudited)
(Percentages represent value of investments compared to net assets)
| Common Stocks 99.3% |
| Issuer | Shares | Value ($) |
| Australia 3.6% |
Amcor Ltd.
International integrated packaging company | 193,000 | 2,404,343 |
Domino’s Pizza Enterprises Ltd.
Pizza delivery stores | 45,000 | 1,800,706 |
| Total | 4,205,049 |
| Canada 5.9% |
CCL Industries, Inc.
Manufacturing services and specialty packaging products for the non-durable consumer products market | 135,000 | 6,830,159 |
| China 4.1% |
NetEase, Inc., ADR
Internet technology company that develops applications, services and Internet technologies | 15,600 | 4,689,828 |
| Denmark 3.4% |
Novozymes AS, Class B
Enzymes for industrial use | 89,955 | 3,936,529 |
| France 3.6% |
Ipsen SA
Medical drugs for targeted disease areas | 6,915 | 946,571 |
Legrand SA
Products and systems for electrical installations and information networks | 46,000 | 3,218,007 |
| Total | 4,164,578 |
| Germany 9.1% |
MTU Aero Engines AG
Develops and manufactures engines and offers commercial engine services and support | 33,500 | 4,725,359 |
Wirecard AG(a)
Internet payment and processing services | 91,040 | 5,793,838 |
| Total | 10,519,197 |
| India 3.0% |
Zee Entertainment Enterprises Ltd.
Hindi films, serials, game shows and children’s programs | 452,000 | 3,430,725 |
| Ireland 2.8% |
Ryanair Holdings PLC(b)
Low fare passenger airline services | 158,000 | 3,241,055 |
| Common Stocks (continued) |
| Issuer | Shares | Value ($) |
| Japan 23.1% |
Aeon Mall Co., Ltd.
Large-scale shopping malls | 178,600 | 3,528,591 |
CyberAgent, Inc.
Operates websites, internet advertising agency and creates PC and mobile contents | 69,000 | 2,142,904 |
Hoya Corp.
Electro-optics products | 83,000 | 4,321,094 |
Omron Corp.
Electronic components, equipment and systems used for factory automation | 50,000 | 2,176,470 |
Recruit Holdings Co., Ltd.
Information providing services in human resource, housing, bridal, travel, restaurants, beauty, automobiles, and education and more | 127,200 | 2,189,097 |
Santen Pharmaceutical Co., Ltd.
Ophthalmic medicine | 203,200 | 2,760,092 |
Sekisui Chemical Co., Ltd.
Unit residential houses in addition to parcels of land | 129,000 | 2,314,705 |
Seven & I Holdings Co., Ltd.
Convenience stores, supermarkets, and department stores | 82,700 | 3,412,570 |
Sony Financial Holdings, Inc.
Financial holding company | 224,500 | 3,839,395 |
| Total | 26,684,918 |
| Mexico 2.6% |
Grupo Aeroportuario del Sureste SAB de CV, ADR
Operates airports in Mexico | 14,000 | 2,945,600 |
| South Africa 4.0% |
Naspers Ltd., Class N
Electronic and print media industries | 24,000 | 4,668,832 |
| South Korea 2.0% |
Korea Zinc Co. Ltd.
Non-ferrous metal smelting | 5,900 | 2,351,065 |
| Sweden 5.2% |
Hexagon AB, Class B
Design, measurement and visualisation technologies | 127,000 | 6,037,426 |
| Switzerland 8.5% |
Geberit AG
Water supply pipes and fittings, installation systems, drainage and flushing systems | 8,540 | 3,982,780 |
Partners Group Holding AG
Global private markets asset management firm | 9,400 | 5,827,824 |
| Total | 9,810,604 |
The accompanying Notes to Financial Statements are an integral part of this statement.
| 66 | Columbia Acorn Family of Funds | Semiannual Report 2017 |
Portfolio of Investments (continued)
Columbia Acorn International SelectSM, June 30, 2017 (Unaudited)
| Common Stocks (continued) |
| Issuer | Shares | Value ($) |
| Taiwan 3.3% |
Largan Precision Co., Ltd.
Optical lens modules and optoelectronic components | 24,000 | 3,821,149 |
| United Kingdom 15.1% |
Halma PLC
Products that detect hazards and protect assets and people in public and commercial buildings | 175,000 | 2,507,215 |
Kingfisher PLC
International home improvement company | 505,308 | 1,979,022 |
Micro Focus International PLC
Enterprise application management solutions | 68,000 | 2,011,347 |
Rightmove PLC
Website that lists properties across Britain | 43,800 | 2,424,510 |
Spirax-Sarco Engineering PLC
Consultation, service and products for the control and efficient management of steam and industrial fluids | 35,000 | 2,438,837 |
WH Smith PLC
Retails books, magazines, newspapers, and periodicals | 136,930 | 3,058,607 |
Wolseley PLC
Bathroom materials, heating and plumbing supplies, and industrial pipes, valves, and fittings | 50,000 | 3,069,223 |
| Total | 17,488,761 |
Total Common Stocks
(Cost: $80,000,981) | 114,825,475 |
|
| Securities Lending Collateral 3.9% |
| | Shares | Value ($) |
Dreyfus Government Cash Management Fund, Institutional Shares, 0.910%(c),(d)
| 4,554,276 | 4,554,276 |
Total Securities Lending Collateral
(Cost: $4,554,276) | 4,554,276 |
|
| Money Market Funds 1.5% |
| | |
JPMorgan U.S. Government Money Market Fund, IM Shares, 0.879% (c)
| 1,686,248 | 1,686,248 |
Total Money Market Funds
(Cost: $1,686,248) | 1,686,248 |
Total Investments
(Cost: $86,241,505) | 121,065,999 |
| Obligation to Return Collateral for Securities Loaned | | (4,554,276) |
| Other Assets & Liabilities, Net | | (829,253) |
| Net Assets | $115,682,470 |
Notes to Portfolio of Investments
| (a) | All or a portion of this security was on loan at June 30, 2017. The total market value of securities on loan at June 30, 2017 was $4,339,293. |
| (b) | Non-income producing security. |
| (c) | The rate shown is the seven-day current annualized yield at June 30, 2017. |
| (d) | Investment made with cash collateral received from securities lending activity. |
Abbreviation Legend
| ADR | American Depositary Receipt |
Fair value measurements
Various inputs are used in determining the value of the Fund’s investments, following the input prioritization hierarchy established by accounting principles generally accepted in the United States of America (GAAP). These inputs are summarized in the three broad levels listed below:
| • | Level 1 – quoted prices in active markets for identical securities |
| • | Level 2 – prices determined using other significant observable inputs (including quoted prices for similar securities, interest rates, prepayment speeds, credit risk and others) |
| • | Level 3 – prices determined using significant unobservable inputs where quoted prices or observable inputs are unavailable or less reliable (including management’s own assumptions about the factors market participants would use in pricing an investment) |
The inputs or methodology used for valuing securities are not necessarily an indication of the risk associated with investing in those securities.
The accompanying Notes to Financial Statements are an integral part of this statement.
Columbia Acorn Family of Funds | Semiannual Report 2017
| 67 |
Portfolio of Investments (continued)
Columbia Acorn International SelectSM, June 30, 2017 (Unaudited)
Fair value measurements (continued)
Examples of the types of securities in which the Fund would typically invest and how they are classified within this hierarchy are as follows. Typical Level 1 securities include exchange traded domestic equities, mutual funds whose net asset values are published each day and exchange traded foreign equities that are not statistically fair valued. Typical Level 2 securities include exchange traded foreign equities that are statistically fair valued, forward foreign currency exchange contracts and short-term investments valued at amortized cost. Additionally, securities fair valued by Columbia Wanger Asset Management’s Valuation Committee (the Committee) that rely on significant observable inputs are also included in Level 2. Typical Level 3 securities include any security fair valued by the Committee that relies on significant unobservable inputs.
The Committee is responsible for applying the Columbia Acorn Trust Portfolio Pricing Policy and the Columbia Wanger Asset Management pricing procedures (the Policies), which are approved by and subject to the oversight of the Board of Trustees.
The Committee meets as necessary, and no less frequently than quarterly, to determine fair values for securities for which market quotations are not readily available or for which Columbia Wanger Asset Management believes that available market quotations are unreliable. The Committee also reviews the continuing appropriateness of the Policies. In circumstances where a security has been fair valued, the Committee will also review the continuing appropriateness of the current value of the security. The Policies address, among other things: circumstances under which market quotations will be deemed readily available; selection of third party pricing vendors; appropriate pricing methodologies; events that require fair valuation and fair value techniques; circumstances under which securities will be deemed to pose a potential for stale pricing, including when securities are illiquid, restricted, or in default; and certain delegations of authority to determine fair values to the Fund’s investment manager. The Committee may also meet to discuss additional valuation matters, which may include review of back-testing results, review of time-sensitive information or approval of other valuation related actions, and to review the appropriateness of the Policies.
For investments categorized as Level 3, the significant unobservable inputs used in the fair value measurement of the Fund’s securities may include: (i) data specific to the issuer or comparable issuers, (ii) general market or specific sector news and (iii) quoted prices and specific or similar security transactions. The Committee considers this data and any changes from prior periods in order to assess the reasonableness of observable and unobservable inputs, any assumptions or internal models used to value those securities and changes in fair value. Significant changes in any of these factors could result in lower or higher fair value measurements. Various factors impact the frequency of monitoring (which may occur as often as daily), however the Committee may determine that changes to inputs, assumptions and models are not required with the same frequency.
The following table is a summary of the inputs used to value the Fund’s investments at June 30, 2017:
| | Level 1
quoted prices in active
markets for identical
assets ($) | Level 2
other significant
observable inputs ($) | Level 3
significant
unobservable inputs ($) | Total ($) |
| Investments | | | | |
| Common Stocks | | | | |
| Australia | — | 4,205,049 | — | 4,205,049 |
| Canada | 6,830,159 | — | — | 6,830,159 |
| China | 4,689,828 | — | — | 4,689,828 |
| Denmark | — | 3,936,529 | — | 3,936,529 |
| France | — | 4,164,578 | — | 4,164,578 |
| Germany | — | 10,519,197 | — | 10,519,197 |
| India | — | 3,430,725 | — | 3,430,725 |
| Ireland | — | 3,241,055 | — | 3,241,055 |
| Japan | — | 26,684,918 | — | 26,684,918 |
| Mexico | 2,945,600 | — | — | 2,945,600 |
| South Africa | — | 4,668,832 | — | 4,668,832 |
| South Korea | — | 2,351,065 | — | 2,351,065 |
| Sweden | — | 6,037,426 | — | 6,037,426 |
| Switzerland | — | 9,810,604 | — | 9,810,604 |
| Taiwan | — | 3,821,149 | — | 3,821,149 |
| United Kingdom | — | 17,488,761 | — | 17,488,761 |
| Total Common Stocks | 14,465,587 | 100,359,888 | — | 114,825,475 |
| Securities Lending Collateral | 4,554,276 | — | — | 4,554,276 |
| Money Market Funds | 1,686,248 | — | — | 1,686,248 |
| Total Investments | 20,706,111 | 100,359,888 | — | 121,065,999 |
The Fund’s assets assigned to the Level 2 input category are generally valued using a market approach, in which a security’s value is determined through its correlation to prices and information from observable market transactions for similar or identical assets. Foreign equities are generally valued at the last sale price on the foreign exchange or market on which they trade. The Fund may use a statistical fair valuation model, in accordance with the policy adopted by the Board of Trustees, provided by an independent third party to value securities principally traded in foreign markets in order to adjust for possible stale pricing that may occur between the close of the foreign exchanges and the time for valuation. These models take into account available market data including intraday index, ADR, and ETF movements.
There were no transfers of financial assets between levels during the period.
The accompanying Notes to Financial Statements are an integral part of this statement.
| 68 | Columbia Acorn Family of Funds | Semiannual Report 2017 |
Portfolio of Investments
Columbia Acorn SelectSM, June 30, 2017 (Unaudited)
(Percentages represent value of investments compared to net assets)
| Common Stocks 97.9% |
| Issuer | Shares | Value ($) |
| Consumer Discretionary 17.9% |
| Auto Components 2.3% |
LCI Industries
Recreational vehicles and equipment | 71,000 | 7,270,400 |
| Distributors 3.7% |
LKQ Corp.(a)
Automotive products and services | 355,749 | 11,721,930 |
| Hotels, Restaurants & Leisure 7.0% |
Papa John’s International, Inc.
Pizza delivery and carry-out restaurants | 116,908 | 8,389,318 |
Vail Resorts, Inc.
Operates resorts globally | 67,969 | 13,786,152 |
| Total | | 22,175,470 |
| Household Durables 1.4% |
iRobot Corp.(a)
Manufactures robots for cleaning | 51,081 | 4,297,955 |
| Media 3.5% |
Liberty Global PLC, Class A(a)
Broadband, distribution, and content companies | 346,846 | 11,140,694 |
| Total Consumer Discretionary | 56,606,449 |
| Financials 12.8% |
| Banks 3.4% |
SVB Financial Group(a)
Holding company for Silicon Valley Bank | 60,967 | 10,717,389 |
| Capital Markets 6.9% |
Eaton Vance Corp.
Creates, markets, and manages mutual funds | 233,041 | 11,027,500 |
Lazard Ltd., Class A
Corporate Advisory & Asset Management | 233,606 | 10,822,966 |
| Total | | 21,850,466 |
| Consumer Finance 2.5% |
FirstCash, Inc.
Owns and operates pawn stores | 132,870 | 7,746,321 |
| Total Financials | 40,314,176 |
| Health Care 16.9% |
| Biotechnology 0.7% |
Ultragenyx Pharmaceutical, Inc.(a)
Therapeutics and sialic acid for treating metabolic, body myopathy, glucuronidase, and rare genetic diseases | 34,660 | 2,152,733 |
| Common Stocks (continued) |
| Issuer | Shares | Value ($) |
| Health Care Equipment & Supplies 11.0% |
Align Technology, Inc.(a)
Designs, manufactures, and markets the Invisalign System | 90,774 | 13,626,993 |
LivaNova PLC(a)
Medical technology focusing on neuromodulation, cardiac surgery and rhythm management | 154,798 | 9,475,186 |
Natus Medical, Inc.(a)
Medical device company that develops, manufactures, and markets screening products | 306,411 | 11,429,130 |
| Total | | 34,531,309 |
| Health Care Providers & Services 5.2% |
HealthSouth Corp.
Inpatient rehabilitative healthcare services | 341,478 | 16,527,535 |
| Total Health Care | 53,211,577 |
| Industrials 26.4% |
| Machinery 18.1% |
Middleby Corp. (The)(a)
Equipment for use in cooking and preparing food | 88,100 | 10,705,031 |
Nordson Corp.
Systems that apply adhesives, sealants, and coatings to products during manufacturing | 55,305 | 6,709,603 |
Oshkosh Corp.
Fire and emergency apparatuses and specialty commercial, and military trucks | 171,780 | 11,832,206 |
Snap-On, Inc.
Tool and equipment solutions | 85,376 | 13,489,408 |
Wabtec Corp.
Technology products and services for the rail industry | 157,408 | 14,402,832 |
| Total | | 57,139,080 |
| Road & Rail 8.3% |
AMERCO
Rental of trucks, trailers, and self storage space, as well as property and casualty and life insurance products | 33,522 | 12,271,063 |
JB Hunt Transport Services, Inc.
Logistics services | 151,896 | 13,880,257 |
| Total | | 26,151,320 |
| Total Industrials | 83,290,400 |
The accompanying Notes to Financial Statements are an integral part of this statement.
Columbia Acorn Family of Funds | Semiannual Report 2017
| 69 |
Portfolio of Investments (continued)
Columbia Acorn SelectSM, June 30, 2017 (Unaudited)
| Common Stocks (continued) |
| Issuer | Shares | Value ($) |
| Information Technology 14.1% |
| Internet Software & Services 11.0% |
GoDaddy, Inc., Class A(a)
Cloud-based web platform for small businesses, web design professionals and individuals | 311,124 | 13,197,880 |
SPS Commerce, Inc.(a)
On-demand supply chain management solutions through an online hosted software suite | 158,914 | 10,132,356 |
VeriSign, Inc.(a)
Domain names and Internet security services | 121,307 | 11,276,699 |
| Total | | 34,606,935 |
| Software 3.1% |
ANSYS, Inc.(a)
Software solutions for design analysis and optimization | 81,875 | 9,962,550 |
| Total Information Technology | 44,569,485 |
| Materials 3.3% |
| Chemicals 3.3% |
Axalta Coating Systems Ltd.(a)
Coating systems | 124,610 | 3,992,504 |
Celanese Corp., Class A
Global integrated producer of chemicals and advanced materials | 68,200 | 6,474,908 |
| Total | | 10,467,412 |
| Total Materials | 10,467,412 |
| Common Stocks (continued) |
| Issuer | Shares | Value ($) |
| Real Estate 6.5% |
| Equity Real Estate Investment Trusts (REITS) 3.0% |
Education Realty Trust, Inc.
Self-managed and self-advised real estate investment trust | 247,076 | 9,574,195 |
| Real Estate Management & Development 3.5% |
Jones Lang LaSalle, Inc.
Real estate and investment management services | 88,626 | 11,078,250 |
| Total Real Estate | 20,652,445 |
Total Common Stocks
(Cost: $244,323,281) | 309,111,944 |
|
| Money Market Funds 1.7% |
| | Shares | Value ($) |
| JPMorgan U.S. Government Money Market Fund, Agency Shares, 0.780%(b) | 5,320,499 | 5,320,499 |
Total Money Market Funds
(Cost: $5,320,499) | 5,320,499 |
Total Investments
(Cost $249,643,780) | 314,432,443 |
| Other Assets & Liabilities, Net | | 1,254,614 |
| Net Assets | $315,687,057 |
Notes to Portfolio of Investments
| (a) | Non-income producing security. |
| (b) | The rate shown is the seven-day current annualized yield at June 30, 2017. |
Fair value measurements
Various inputs are used in determining the value of the Fund’s investments, following the input prioritization hierarchy established by accounting principles generally accepted in the United States of America (GAAP). These inputs are summarized in the three broad levels listed below:
| • | Level 1 – quoted prices in active markets for identical securities |
| • | Level 2 – prices determined using other significant observable inputs (including quoted prices for similar securities, interest rates, prepayment speeds, credit risk and others) |
| • | Level 3 – prices determined using significant unobservable inputs where quoted prices or observable inputs are unavailable or less reliable (including management’s own assumptions about the factors market participants would use in pricing an investment) |
The inputs or methodology used for valuing securities are not necessarily an indication of the risk associated with investing in those securities.
Examples of the types of securities in which the Fund would typically invest and how they are classified within this hierarchy are as follows. Typical Level 1 securities include exchange traded domestic equities, mutual funds whose net asset values are published each day and exchange traded foreign equities that are not statistically fair valued. Typical Level 2 securities include exchange traded foreign equities that are statistically fair valued, forward foreign currency exchange contracts and short-term investments valued at amortized cost. Additionally, securities fair valued by Columbia Wanger Asset Management’s Valuation Committee (the Committee) that rely on significant observable inputs are also included in Level 2. Typical Level 3 securities include any security fair valued by the Committee that relies on significant unobservable inputs.
The Committee is responsible for applying the Columbia Acorn Trust Portfolio Pricing Policy and the Columbia Wanger Asset Management pricing procedures (the Policies), which are approved by and subject to the oversight of the Board of Trustees.
The Committee meets as necessary, and no less frequently than quarterly, to determine fair values for securities for which market quotations are not readily available or for which Columbia Wanger Asset Management believes that available market quotations are unreliable. The Committee also reviews the continuing appropriateness of the Policies. In circumstances where a security has been fair valued, the Committee will also review the continuing appropriateness of the current value of the security. The Policies address, among
The accompanying Notes to Financial Statements are an integral part of this statement.
| 70 | Columbia Acorn Family of Funds | Semiannual Report 2017 |
Portfolio of Investments (continued)
Columbia Acorn SelectSM, June 30, 2017 (Unaudited)
Fair value measurements (continued)
other things: circumstances under which market quotations will be deemed readily available; selection of third party pricing vendors; appropriate pricing methodologies; events that require fair valuation and fair value techniques; circumstances under which securities will be deemed to pose a potential for stale pricing, including when securities are illiquid, restricted, or in default; and certain delegations of authority to determine fair values to the Fund’s investment manager. The Committee may also meet to discuss additional valuation matters, which may include review of back-testing results, review of time-sensitive information or approval of other valuation related actions, and to review the appropriateness of the Policies.
For investments categorized as Level 3, the significant unobservable inputs used in the fair value measurement of the Fund’s securities may include: (i) data specific to the issuer or comparable issuers, (ii) general market or specific sector news and (iii) quoted prices and specific or similar security transactions. The Committee considers this data and any changes from prior periods in order to assess the reasonableness of observable and unobservable inputs, any assumptions or internal models used to value those securities and changes in fair value. Significant changes in any of these factors could result in lower or higher fair value measurements. Various factors impact the frequency of monitoring (which may occur as often as daily), however the Committee may determine that changes to inputs, assumptions and models are not required with the same frequency.
The following table is a summary of the inputs used to value the Fund’s investments at June 30, 2017:
| | Level 1
quoted prices in active
markets for identical
assets ($) | Level 2
other significant
observable inputs ($) | Level 3
significant
unobservable inputs ($) | Total ($) |
| Investments | | | | |
| Common Stocks | | | | |
| Consumer Discretionary | 56,606,449 | — | — | 56,606,449 |
| Financials | 40,314,176 | — | — | 40,314,176 |
| Health Care | 53,211,577 | — | — | 53,211,577 |
| Industrials | 83,290,400 | — | — | 83,290,400 |
| Information Technology | 44,569,485 | — | — | 44,569,485 |
| Materials | 10,467,412 | — | — | 10,467,412 |
| Real Estate | 20,652,445 | — | — | 20,652,445 |
| Total Common Stocks | 309,111,944 | — | — | 309,111,944 |
| Money Market Funds | 5,320,499 | — | — | 5,320,499 |
| Total Investments | 314,432,443 | — | — | 314,432,443 |
There were no transfers of financial assets between levels during the period.
The accompanying Notes to Financial Statements are an integral part of this statement.
Columbia Acorn Family of Funds | Semiannual Report 2017
| 71 |
Portfolio of Investments
Columbia Thermostat FundSM, June 30, 2017 (Unaudited)
(Percentages represent value of investments compared to net assets)
| Equity Funds 19.9% |
| Issuer | Shares | Value ($) |
| Dividend Income 4.0% |
Columbia Dividend Income Fund, Class Y Shares(a)
| 1,840,187 | 38,294,291 |
| Total Dividend Income | 38,294,291 |
| International Small Mid Cap 4.0% |
Columbia Acorn International, Class Y Shares(a)
| 857,676 | 38,355,203 |
| Total International Small Mid Cap | 38,355,203 |
| U.S. Large Cap 7.9% |
Columbia Contrarian Core Fund, Class Y Shares(a)
| 755,221 | 19,144,857 |
Columbia Large Cap Enhanced Core Fund, Class Y Shares(a)
| 807,397 | 19,135,318 |
Columbia Select Large Cap Equity Fund, Class Y Shares(a)
| 1,427,163 | 19,138,256 |
Columbia Select Large Cap Growth Fund, Class Y Shares(a),(b)
| 1,153,284 | 19,017,647 |
| Total U.S. Large Cap | 76,436,078 |
| U.S. Mid Cap 2.0% |
Columbia Acorn Select Fund, Class Y Shares(a),(b)
| 1,204,947 | 19,194,795 |
| Total U.S. Mid Cap | 19,194,795 |
| U.S. Small Mid Cap 2.0% |
Columbia Acorn Fund, Class Y Shares(a),(b)
| 1,098,624 | 19,170,994 |
| Total U.S. Small Mid Cap | 19,170,994 |
Total Equity Funds
(Cost: $163,111,752) | 191,451,361 |
|
| Fixed-Income Funds 79.9% |
| Issuer | Shares | Value ($) |
| High Yield 8.0% |
Columbia Income Opportunities Fund, Class Y Shares(a)
| 7,739,980 | 77,399,800 |
| Total High Yield | 77,399,800 |
| Investment Grade 71.9% |
Columbia Short Term Bond Fund, Class Y Shares(a)
| 30,971,536 | 308,476,499 |
Columbia Total Return Bond Fund, Class Y Shares(a)
| 16,980,820 | 154,016,036 |
Columbia U.S. Government Mortgage Fund, Class Y Shares(a)
| 28,409,619 | 153,980,136 |
Columbia U.S. Treasury Index Fund, Class Y Shares(a)
| 6,891,437 | 76,839,523 |
| Total Investment Grades | 693,312,194 |
Total Fixed-Income Funds
(Cost: $765,080,096) | 770,711,994 |
|
| Money Market Funds 0.4% |
| | Shares | Value ($) |
| JPMorgan U.S. Government Money Market Fund, Agency Shares, 0.780%(c) | 3,763,746 | 3,763,746 |
Total Money Market Funds
(Cost: $3,763,746) | 3,763,746 |
Total Investments
(Cost $931,955,594) | 965,927,101 |
| Other Assets & Liabilities, Net | | (1,835,637) |
| Net Assets | $964,091,464 |
The accompanying Notes to Financial Statements are an integral part of this statement.
| 72 | Columbia Acorn Family of Funds | Semiannual Report 2017 |
Portfolio of Investments (continued)
Columbia Thermostat FundSM, June 30, 2017 (Unaudited)
Notes to Portfolio of Investments
| (a) | An affiliated person of the Fund, as defined in the Investment Company Act of 1940, may include any company in which the Fund owns five percent or more of its outstanding voting shares. Holdings and transactions in these affiliated companies during the six months ended June 30, 2017, are as follows. The aggregate cost and value of these companies at June 30, 2017, was $928,191,848 and $962,163,355, respectively. Investments in affiliated companies represented 99.80% of the Fund’s total net assets at June 30, 2017. |
| Issuer | Beginning
shares | Shares
purchased | Shares
sold | Ending
shares | Capital gain
Distributions ($) | Value ($) | Dividend —
affiliated issuers
($) | Realized gain
(loss) ($) |
| Columbia Acorn Fund, Class I Shares | 704,294 | — | (704,294) 1 | — | — | — | — | (25,299) |
| Columbia Acorn Fund, Class Y Shares | — | 1,502,308 1 | (403,684) | 1,098,624 | 784,027 | 19,170,994 | — | (55,010) |
| Columbia Acorn International, Class I Shares | 587,054 | — | (587,054) 1 | — | — | — | — | 393,821 |
| Columbia Acorn International, Class Y Shares | — | 1,191,831 1 | (334,155) | 857,676 | — | 38,355,203 | 416,869 | 649,968 |
| Columbia Acorn Select, Class Y Shares | — | 1,651,132 1 | (446,185) | 1,204,947 | 1,733,798 | 19,194,795 | — | (294,535) |
| Columbia Acorn Select, Class I Shares | 738,151 | — | (738,151) 1 | — | — | — | — | 94,331 |
| Columbia Contrarian Core Fund, Class I Shares | 966,230 | — | (966,230) 1 | — | — | — | — | 428,650 |
| Columbia Contrarian Core Fund, Class Y Shares | — | 1,041,157 1 | (285,936) | 755,221 | — | 19,144,857 | — | 591,044 |
| Columbia Dividend Income Fund, Class I Shares | 1,141,969 | 5,458 | (1,147,427) 1 | — | — | — | 109,213 | 347,840 |
| Columbia Dividend Income Fund, Class Y Shares | — | 2,490,686 1 | (650,499) | 1,840,187 | — | 38,294,291 | 191,372 | 340,257 |
| Columbia Income Opportunities Fund, Class I Shares | 10,148,993 | 79,762 | (10,228,755) 1 | — | — | — | 1,094,167 | 125,579 |
| Columbia Income Opportunities Fund, Class Y Shares | — | 10,100,121 1 | (2,360,141) | 7,739,980 | — | 77,399,800 | 1,089,020 | 978,494 |
| Columbia Large Cap Enhanced Core Fund, Class I Shares | 483,277 | — | (483,277) 1 | — | — | — | — | 295,597 |
| Columbia Large Cap Enhanced Core Fund, Class Y Shares | — | 1,086,182 1 | (278,785) | 807,397 | 710,252 | 19,135,318 | 41,380 | 181,170 |
| Columbia Select Large Cap Equity Fund, Class Y Shares | — | 1,902,948 | (475,785) | 1,427,163 | 164,761 | 19,138,256 | 24,327 | 152,752 |
The accompanying Notes to Financial Statements are an integral part of this statement.
Columbia Acorn Family of Funds | Semiannual Report 2017
| 73 |
Portfolio of Investments (continued)
Columbia Thermostat FundSM, June 30, 2017 (Unaudited)
Notes to Portfolio of Investments (continued)
| Issuer | Beginning
shares | Shares
purchased | Shares
sold | Ending
shares | Capital gain
Distributions ($) | Value ($) | Dividend —
affiliated issuers
($) | Realized gain
(loss) ($) |
| Columbia Select Large Cap Growth Fund, Class I Shares | 788,763 | — | (788,763) 1 | — | — | — | — | 285,040 |
| Columbia Select Large Cap Growth Fund, Class Y Shares | — | 1,588,661 1 | (435,377) | 1,153,284 | 1,229,299 | 19,017,647 | — | 241,733 |
| Columbia Short Term Bond Fund, Class I Shares | 39,832,272 | 90,204 | (39,922,476) 1 | — | — | — | 1,260,302 | (44,802) |
| Columbia Short Term Bond Fund, Class Y Shares | — | 39,481,815 1 | (8,510,279) | 30,971,536 | — | 308,476,499 | 1,411,327 | (93,046) |
| Columbia Total Return Bond Fund, Class I Shares | 22,201,461 | 102,335 | (22,303,796) 1 | — | — | — | 1,254,651 | (228,265) |
| Columbia Total Return Bond Fund, Class Y Shares | — | 21,899,847 1 | (4,919,027) | 16,980,820 | — | 154,016,036 | 1,227,761 | (205,338) |
| Columbia U.S. Government Mortgage Fund, Class I Shares | 36,866,439 | 145,269 | (37,011,708) 1 | — | — | — | 1,096,479 | (294,353) |
| Columbia U.S. Government Mortgage Fund, Class Y Shares | — | 36,536,945 1 | (8,127,326) | 28,409,619 | — | 153,980,136 | 1,207,582 | (106,177) |
| Columbia U.S. Treasury Index Fund, Class I Shares | 9,050,066 | 21,032 | (9,071,098) 1 | — | — | — | 324,653 | (216,893) |
| Columbia U.S. Treasury Index Fund, Class Y Shares | — | 8,873,783 1 | (1,982,346) | 6,891,437 | — | 76,839,523 | 334,854 | (519,082) |
| Total of Affiliated Transactions | 123,508,969 | 129,791,476 | (153,162,554) | 100,137,891 | 4,622,137 | 962,163,355 | 11,083,957 | 3,023,476 |
| 1 | Includes the effect of underlying share class exchange. |
| (b) | Non-income producing security. |
| (c) | The rate shown is the seven-day current annualized yield at June 30, 2017. |
Fair value measurements
Various inputs are used in determining the value of the Fund’s investments, following the input prioritization hierarchy established by accounting principles generally accepted in the United States of America (GAAP). These inputs are summarized in the three broad levels listed below:
| • | Level 1 – quoted prices in active markets for identical securities |
| • | Level 2 – prices determined using other significant observable inputs (including quoted prices for similar securities, interest rates, prepayment speeds, credit risk and others) |
| • | Level 3 – prices determined using significant unobservable inputs where quoted prices or observable inputs are unavailable or less reliable (including management’s own assumptions about the factors market participants would use in pricing an investment) |
The inputs or methodology used for valuing securities are not necessarily an indication of the risk associated with investing in those securities.
Examples of the types of securities in which the Fund would typically invest and how they are classified within this hierarchy are as follows. Typical Level 1 securities include mutual funds whose net asset values are published each day.
The accompanying Notes to Financial Statements are an integral part of this statement.
| 74 | Columbia Acorn Family of Funds | Semiannual Report 2017 |
Portfolio of Investments (continued)
Columbia Thermostat FundSM, June 30, 2017 (Unaudited)
Fair value measurements (continued)
The Committee is responsible for applying the Columbia Acorn Trust Portfolio Pricing Policy and the Columbia Wanger Asset Management pricing procedures (the Policies), which are approved by and subject to the oversight of the Board of Trustees.
The Committee meets as necessary, and no less frequently than quarterly, to determine fair values for securities for which market quotations are not readily available or for which Columbia Wanger Asset Management believes that available market quotations are unreliable. The Committee also reviews the continuing appropriateness of the Policies. In circumstances where a security has been fair valued, the Committee will also review the continuing appropriateness of the current value of the security. The Policies address, among other things: circumstances under which market quotations will be deemed readily available; selection of third party pricing vendors; appropriate pricing methodologies; events that require fair valuation and fair value techniques; circumstances under which securities will be deemed to pose a potential for stale pricing, including when securities are illiquid, restricted, or in default; and certain delegations of authority to determine fair values to the Fund’s investment manager. The Committee may also meet to discuss additional valuation matters, which may include review of back-testing results, review of time-sensitive information or approval of other valuation related actions, and to review the appropriateness of the Policies.
For investments categorized as Level 3, the significant unobservable inputs used in the fair value measurement of the Fund’s securities may include: (i) data specific to the issuer or comparable issuers, (ii) general market or specific sector news and (iii) quoted prices and specific or similar security transactions. The Committee considers this data and any changes from prior periods in order to assess the reasonableness of observable and unobservable inputs, any assumptions or internal models used to value those securities and changes in fair value. Significant changes in any of these factors could result in lower or higher fair value measurements. Various factors impact the frequency of monitoring (which may occur as often as daily), however the Committee may determine that changes to inputs, assumptions and models are not required with the same frequency.
The following table is a summary of the inputs used to value the Fund’s investments at June 30, 2017:
| | Level 1
quoted prices in active
markets for identical
assets ($) | Level 2
other significant
observable inputs ($) | Level 3
significant
unobservable inputs ($) | Total ($) |
| Investments | | | | |
| Equity Funds | 191,451,361 | — | — | 191,451,361 |
| Fixed-Income Funds | 770,711,994 | — | — | 770,711,994 |
| Money Market Funds | 3,763,746 | — | — | 3,763,746 |
| Total Investments | 965,927,101 | — | — | 965,927,101 |
There were no transfers of financial assets between levels during the period.
The accompanying Notes to Financial Statements are an integral part of this statement.
Columbia Acorn Family of Funds | Semiannual Report 2017
| 75 |
Portfolio of Investments
Columbia Acorn Emerging Markets FundSM, June 30, 2017 (Unaudited)
(Percentages represent value of investments compared to net assets)
| Common Stocks 96.4% |
| Issuer | Shares | Value ($) |
| Brazil 4.2% |
Odontoprev SA
Dental benefits company | 577,000 | 2,027,311 |
Raia Drogasil SA
Chain of pharmaceutical stores | 109,000 | 2,319,569 |
| Total | 4,346,880 |
| Cambodia 2.1% |
NagaCorp Ltd.
Leisure and tourism company | 4,056,000 | 2,130,322 |
| Cayman Islands 4.8% |
China Lodging Group Ltd.(a)
Chain of hotels | 14,000 | 1,129,520 |
Netshoes Cayman Ltd.(a)
Online sports goods and apparel | 78,358 | 1,491,153 |
Silicon Motion Technology Corp., ADR
Semiconductor products | 48,399 | 2,334,284 |
| Total | 4,954,957 |
| China 9.8% |
51job, Inc., ADR(a)
Integrated human resource services | 71,912 | 3,216,624 |
China Medical System Holdings Ltd.
Pharmaceutical and medical products | 808,000 | 1,397,085 |
New Oriental Education & Technology Group, Inc., ADR(a)
Educational services | 44,000 | 3,101,560 |
TravelSky Technology Ltd., Class H
IT solutions for China’s air travel and tourism industries | 836,000 | 2,462,441 |
| Total | 10,177,710 |
| Finland 1.1% |
Tikkurila OYJ
Manufactures paint | 51,395 | 1,111,206 |
| Hong Kong 4.1% |
Value Partners Group Ltd.
Independent, value oriented asset management group | 1,807,000 | 1,644,808 |
Vitasoy International Holdings Ltd.
Food and beverages | 1,261,000 | 2,595,570 |
| Total | 4,240,378 |
| Common Stocks (continued) |
| Issuer | Shares | Value ($) |
| India 16.6% |
Amara Raja Batteries Ltd.(a)
Industrial and automotive batteries | 162,667 | 2,112,485 |
Care Ratings Ltd.
Credit rating services | 171,000 | 4,237,290 |
GRUH Finance Ltd.
Provides a range of home loans as well as insurance products | 428,074 | 2,947,995 |
TVS Motor Co., Ltd.
Motorcycles, mopeds and scooters | 253,523 | 2,152,474 |
United Breweries Ltd.
Alcoholic beverages | 139,000 | 1,680,220 |
Zee Entertainment Enterprises Ltd.
Hindi films, serials, game shows and children’s programs | 535,472 | 4,064,286 |
| Total | 17,194,750 |
| Indonesia 7.5% |
PT Link Net Tbk
High-speed internet connection through fiber optic lines | 5,000,000 | 1,941,475 |
PT Matahari Department Store Tbk
Retail clothes, accessories, bags, shoes, cosmetics, household appliances, and management consulting services. | 1,300,000 | 1,382,513 |
PT Media Nusantara Citra Tbk(a)
Integrated media company in Southeast Asia | 14,000,000 | 1,930,010 |
PT Tower Bersama Infrastructure Tbk
Telecommunication infrastructure services to Indonesian wireless carriers | 4,850,000 | 2,461,260 |
| Total | 7,715,258 |
| Mexico 5.8% |
Grupo Aeroportuario del Centro Norte SAB de CV
Operates international airports in the northern and central regions of Mexico | 223,000 | 1,343,130 |
Grupo Aeroportuario del Sureste SAB de CV, ADR
Operates airports in Mexico | 7,000 | 1,472,800 |
Qualitas Controladora SAB de CV
Insurance holding company | 1,908,000 | 3,180,219 |
| Total | 5,996,149 |
| Philippines 1.7% |
Melco Resorts And Entertainment Philippines Corp.(a)
Owns and operates casinos | 2,937,700 | 508,992 |
Puregold Price Club, Inc.
Wholesale and retail stores, including supermarkets | 1,410,000 | 1,244,857 |
| Total | 1,753,849 |
The accompanying Notes to Financial Statements are an integral part of this statement.
| 76 | Columbia Acorn Family of Funds | Semiannual Report 2017 |
Portfolio of Investments (continued)
Columbia Acorn Emerging Markets FundSM, June 30, 2017 (Unaudited)
| Common Stocks (continued) |
| Issuer | Shares | Value ($) |
| Russian Federation 1.1% |
X5 Retail Group NV GDR, Registered Shares(a)
Food retailer company | 33,000 | 1,143,450 |
| South Africa 6.5% |
AECI Ltd.
Commercial explosives, synthetic fibers, industry chemicals and fertilizers | 129,200 | 1,049,599 |
Clicks Group Ltd.
Owns and operates chains of retail stores | 112,687 | 1,205,899 |
Famous Brands Ltd.
Food and beverage company | 192,936 | 1,858,203 |
Rand Merchant Investment Holdings Ltd.
Investment holding company | 882,911 | 2,631,355 |
| Total | 6,745,056 |
| South Korea 13.8% |
GS Retail Co., Ltd.
Chain of retail stores | 8,574 | 386,605 |
Koh Young Technology, Inc.
3D measurement and inspection equipment for testing various machineries | 75,915 | 3,981,788 |
Korea Investment Holdings Co., Ltd.
Financial holding company | 50,123 | 3,071,423 |
Korea Zinc Co. Ltd.
Non-ferrous metal smelting | 2,800 | 1,115,759 |
Medy-Tox, Inc.
Biopharmaceutical products using clostridium botulinum | 5,449 | 2,668,372 |
Modetour Network, Inc.
Travel services | 109,518 | 3,029,537 |
| Total | 14,253,484 |
| Taiwan 9.3% |
Basso Industry Corp.
Pneumatic nailers and staplers | 568,000 | 1,587,284 |
Largan Precision Co., Ltd.
Optical lens modules and optoelectronic components | 13,000 | 2,069,789 |
Silergy Corp.
High performance analog integrated circuits | 210,000 | 4,043,532 |
Voltronic Power Technology Corp.
Uninterruptible power supply products, inverters, multiple surface mounted devices and other power products | 116,000 | 1,909,275 |
| Total | 9,609,880 |
| Common Stocks (continued) |
| Issuer | Shares | Value ($) |
| Thailand 5.1% |
Beauty Community PCL(a)
Cosmetic and beauty products | 3,361,000 | 1,067,372 |
Home Product Center PCL, Foreign Registered Shares
Building materials and home improvement products | 3,838,000 | 1,083,744 |
Samui Airport Property Fund Leasehold
Closed-end property fund incorporated in Thailand | 3,033,100 | 2,053,615 |
Tisco Financial Group PCL
Bank holding company | 486,000 | 1,086,852 |
| Total | 5,291,583 |
| Turkey 2.9% |
Logo Yazilim Sanayi Ve Ticaret AS(a)
Enterprise resource planning software | 178,000 | 2,984,837 |
Total Common Stocks
(Cost: $78,880,612) | 99,649,749 |
|
| Money Market Funds 3.7% |
| | Shares | Value ($) |
JPMorgan U.S. Government Money Market Fund, IM Shares, 0.879% (b)
| 3,848,774 | 3,848,774 |
Total Money Market Funds
(Cost: $3,848,774) | 3,848,774 |
Total Investments
(Cost: $82,729,386) | 103,498,523 |
| Other Assets & Liabilities, Net | | (149,180) |
| Net Assets | $103,349,343 |
The accompanying Notes to Financial Statements are an integral part of this statement.
Columbia Acorn Family of Funds | Semiannual Report 2017
| 77 |
Portfolio of Investments (continued)
Columbia Acorn Emerging Markets FundSM, June 30, 2017 (Unaudited)
Notes to Portfolio of Investments
| (a) | Non-income producing security. |
| (b) | The rate shown is the seven-day current annualized yield at June 30, 2017. |
Abbreviation Legend
| ADR | American Depositary Receipt |
| GDR | Global Depositary Receipt |
Fair value measurements
Various inputs are used in determining the value of the Fund’s investments, following the input prioritization hierarchy established by accounting principles generally accepted in the United States of America (GAAP). These inputs are summarized in the three broad levels listed below:
| • | Level 1 – quoted prices in active markets for identical securities |
| • | Level 2 – prices determined using other significant observable inputs (including quoted prices for similar securities, interest rates, prepayment speeds, credit risk and others) |
| • | Level 3 – prices determined using significant unobservable inputs where quoted prices or observable inputs are unavailable or less reliable (including management’s own assumptions about the factors market participants would use in pricing an investment) |
The inputs or methodology used for valuing securities are not necessarily an indication of the risk associated with investing in those securities.
Examples of the types of securities in which the Fund would typically invest and how they are classified within this hierarchy are as follows. Typical Level 1 securities include exchange traded domestic equities, mutual funds whose net asset values are published each day and exchange traded foreign equities that are not statistically fair valued. Typical Level 2 securities include exchange traded foreign equities that are statistically fair valued, forward foreign currency exchange contracts and short-term investments valued at amortized cost. Additionally, securities fair valued by Columbia Wanger Asset Management’s Valuation Committee (the Committee) that rely on significant observable inputs are also included in Level 2. Typical Level 3 securities include any security fair valued by the Committee that relies on significant unobservable inputs.
The Committee is responsible for applying the Columbia Acorn Trust Portfolio Pricing Policy and the Columbia Wanger Asset Management pricing procedures (the Policies), which are approved by and subject to the oversight of the Board of Trustees.
The Committee meets as necessary, and no less frequently than quarterly, to determine fair values for securities for which market quotations are not readily available or for which Columbia Wanger Asset Management believes that available market quotations are unreliable. The Committee also reviews the continuing appropriateness of the Policies. In circumstances where a security has been fair valued, the Committee will also review the continuing appropriateness of the current value of the security. The Policies address, among other things: circumstances under which market quotations will be deemed readily available; selection of third party pricing vendors; appropriate pricing methodologies; events that require fair valuation and fair value techniques; circumstances under which securities will be deemed to pose a potential for stale pricing, including when securities are illiquid, restricted, or in default; and certain delegations of authority to determine fair values to the Fund’s investment manager. The Committee may also meet to discuss additional valuation matters, which may include review of back-testing results, review of time-sensitive information or approval of other valuation related actions, and to review the appropriateness of the Policies.
For investments categorized as Level 3, the significant unobservable inputs used in the fair value measurement of the Fund’s securities may include: (i) data specific to the issuer or comparable issuers, (ii) general market or specific sector news and (iii) quoted prices and specific or similar security transactions. The Committee considers this data and any changes from prior periods in order to assess the reasonableness of observable and unobservable inputs, any assumptions or internal models used to value those securities and changes in fair value. Significant changes in any of these factors could result in lower or higher fair value measurements. Various factors impact the frequency of monitoring (which may occur as often as daily), however the Committee may determine that changes to inputs, assumptions and models are not required with the same frequency.
The following table is a summary of the inputs used to value the Fund’s investments at June 30, 2017:
| | Level 1
quoted prices in active
markets for identical
assets ($) | Level 2
other significant
observable inputs ($) | Level 3
significant
unobservable inputs ($) | Total ($) |
| Investments | | | | |
| Common Stocks | | | | |
| Brazil | 4,346,880 | — | — | 4,346,880 |
| Cambodia | — | 2,130,322 | — | 2,130,322 |
| Cayman Islands | 4,954,957 | — | — | 4,954,957 |
| China | 6,318,184 | 3,859,526 | — | 10,177,710 |
| Finland | — | 1,111,206 | ��� | 1,111,206 |
| Hong Kong | — | 4,240,378 | — | 4,240,378 |
| India | — | 17,194,750 | — | 17,194,750 |
| Indonesia | — | 7,715,258 | — | 7,715,258 |
| Mexico | 5,996,149 | — | — | 5,996,149 |
| Philippines | — | 1,753,849 | — | 1,753,849 |
| Russian Federation | — | 1,143,450 | — | 1,143,450 |
| South Africa | — | 6,745,056 | — | 6,745,056 |
| South Korea | — | 14,253,484 | — | 14,253,484 |
The accompanying Notes to Financial Statements are an integral part of this statement.
| 78 | Columbia Acorn Family of Funds | Semiannual Report 2017 |
Portfolio of Investments (continued)
Columbia Acorn Emerging Markets FundSM, June 30, 2017 (Unaudited)
Fair value measurements (continued)
| | Level 1
quoted prices in active
markets for identical
assets ($) | Level 2
other significant
observable inputs ($) | Level 3
significant
unobservable inputs ($) | Total ($) |
| Taiwan | — | 9,609,880 | — | 9,609,880 |
| Thailand | — | 5,291,583 | — | 5,291,583 |
| Turkey | — | 2,984,837 | — | 2,984,837 |
| Total Common Stocks | 21,616,170 | 78,033,579 | — | 99,649,749 |
| Money Market Funds | 3,848,774 | — | — | 3,848,774 |
| Total Investments | 25,464,944 | 78,033,579 | — | 103,498,523 |
The Fund’s assets assigned to the Level 2 input category are generally valued using a market approach, in which a security’s value is determined through its correlation to prices and information from observable market transactions for similar or identical assets. Foreign equities are generally valued at the last sale price on the foreign exchange or market on which they trade. The Fund may use a statistical fair valuation model, in accordance with the policy adopted by the Board of Trustees, provided by an independent third party to value securities principally traded in foreign markets in order to adjust for possible stale pricing that may occur between the close of the foreign exchanges and the time for valuation. These models take into account available market data including intraday index, ADR, and ETF movements.
There were no transfers of financial assets between levels during the period.
The accompanying Notes to Financial Statements are an integral part of this statement.
Columbia Acorn Family of Funds | Semiannual Report 2017
| 79 |
Portfolio of Investments
Columbia Acorn European FundSM , June 30, 2017 (Unaudited)
(Percentages represent value of investments compared to net assets)
| Common Stocks 94.5% |
| Issuer | Shares | Value ($) |
| Belgium 1.1% |
Melexis NV
Advanced integrated semiconductors, sensor ICs, and programmable sensor IC systems | 9,217 | 756,905 |
| Denmark 4.8% |
SimCorp AS
Global provider of highly specialised software for the investment management industry | 33,125 | 2,006,727 |
William Demant Holding AS(a)
Hearing aids, audiometers, tympanometers, diagnostic instruments, and wireless communication equipment | 45,898 | 1,187,926 |
| Total | 3,194,653 |
| Finland 5.6% |
Munksjo OYJ
Industrial paper | 56,522 | 1,149,107 |
Munksjo OYJ(b)
Industrial paper | 68,560 | 1,390,780 |
Tikkurila OYJ
Manufactures paint | 55,748 | 1,205,322 |
| Total | 3,745,209 |
| France 5.2% |
Akka Technologies
High-technology engineering consulting services | 36,969 | 1,913,175 |
Elior Group
Provides catering, cleaning, and facility management services | 30,926 | 898,595 |
Korian SA(c)
Healthcare facilities & medical establishments | 18,000 | 614,191 |
| Total | 3,425,961 |
| Germany 16.8% |
AURELIUS Equity Opportunities SE & Co. KGaA(c)
Loans to distressed companies | 20,200 | 1,085,164 |
CTS Eventim AG & Co. KGaA
Online ticket sales | 21,200 | 937,549 |
Deutsche Beteiligungs AG
Private equity company, investing in domestic medium-sized companies | 17,800 | 793,592 |
Fielmann AG
Prescription eyeglasses, specialty glasses, sunglasses, contact lenses, and optical supplies | 10,038 | 774,339 |
MTU Aero Engines AG
Develops and manufactures engines and offers commercial engine services and support | 9,170 | 1,293,479 |
Nemetschek SE
Standard software for designing, constructing and managing buildings and real estate | 12,000 | 893,618 |
| Common Stocks (continued) |
| Issuer | Shares | Value ($) |
Norma Group SE
Plastic and metal-based components and systems in connecting technology | 14,600 | 758,897 |
Rational AG
Food preparation appliances/processors and kitchen accessories | 1,700 | 904,811 |
Stroeer SE & Co. KGaA
Digital multi-channel media company | 14,600 | 874,457 |
Vapiano SE(a)
Chain of restaurants | 25,227 | 656,937 |
Wirecard AG(c)
Internet payment and processing services | 34,010 | 2,164,416 |
| Total | 11,137,259 |
| Ireland 1.2% |
UDG Healthcare PLC
Commercialisation solutions for health care companies | 73,000 | 823,383 |
| Italy 4.0% |
Brembo SpA
Braking systems and components | 86,110 | 1,259,870 |
Industria Macchine Automatiche SpA
Packaging machinery for the food, pharmaceuticals, and cosmetics industries | 15,092 | 1,386,743 |
| Total | 2,646,613 |
| Luxembourg 1.2% |
eDreams ODIGEO SA(a)
Online travel company | 222,000 | 763,461 |
| Malta 2.9% |
Kindred Group PLC
Online gambling services | 167,040 | 1,889,552 |
| Netherlands 1.8% |
Aalberts Industries NV
Industrial services and flow control systems | 30,701 | 1,222,371 |
| Norway 2.1% |
Atea ASA
Nordic and Baltic supplier of IT infrastructure | 103,307 | 1,385,882 |
| Spain 5.7% |
Bolsas y Mercados Españoles SHMSF SA
Barcelona, Bilbao, Madrid, and Valencia Stock Exchanges | 26,000 | 938,836 |
Hispania Activos Inmobiliarios SOCIMI SA
Invests in residential apartments, offices and hotels | 52,000 | 859,696 |
Prosegur Cia de Seguridad SA, Registered Shares
Security and transportation services | 140,000 | 909,836 |
The accompanying Notes to Financial Statements are an integral part of this statement.
| 80 | Columbia Acorn Family of Funds | Semiannual Report 2017 |
Portfolio of Investments (continued)
Columbia Acorn European FundSM , June 30, 2017 (Unaudited)
| Common Stocks (continued) |
| Issuer | Shares | Value ($) |
Viscofan SA
Artificial casings made of cellulose, collagen, and plastic for use in the meat industry | 18,185 | 1,075,886 |
| Total | 3,784,254 |
| Sweden 7.9% |
Byggmax Group AB(c)
Discount provider of building materials | 138,000 | 1,003,300 |
NetEnt AB
Computer gaming software | 91,000 | 795,536 |
Recipharm AB, B Shares(a),(c)
Contract development and manufacture of pharmaceuticals | 71,554 | 1,044,683 |
Sweco AB, Class B
Consulting company specializing in engineering, environmental technology, and architecture | 52,867 | 1,307,132 |
Trelleborg AB, Class B
Manufactures and distributes industrial products | 47,952 | 1,094,540 |
| Total | 5,245,191 |
| Switzerland 5.1% |
Inficon Holding AG
Vacuum instruments used to monitor and control production processes | 2,950 | 1,453,619 |
Partners Group Holding AG
Global private markets asset management firm | 3,077 | 1,907,682 |
| Total | 3,361,301 |
| Turkey 1.2% |
Logo Yazilim Sanayi Ve Ticaret AS(a)
Enterprise resource planning software | 46,000 | 771,362 |
| United Kingdom 27.9% |
Assura PLC
Primary healthcare property group | 1,253,516 | 1,041,625 |
Big Yellow Group PLC
Self-storage company | 90,309 | 931,573 |
Connect Group PLC
Distribution of newspapers and magazines, and books | 575,355 | 844,916 |
Croda International PLC
Chemicals and chemical products | 14,411 | 729,199 |
Domino’s Pizza Group PLC
Pizza delivery stores | 309,000 | 1,182,821 |
DS Smith PLC
Provides corrugated packaging services | 210,000 | 1,295,364 |
Halma PLC
Products that detect hazards and protect assets and people in public and commercial buildings | 126,231 | 1,808,505 |
| Common Stocks (continued) |
| Issuer | Shares | Value ($) |
Hastings Group Holdings PLC
General insurance services to the automobile and home insurance products | 325,297 | 1,329,941 |
JD Sports Fashion PLC
Brand-name sports and leisure wear | 19,487 | 88,833 |
LivaNova PLC(a)
Medical technology focusing on neuromodulation, cardiac surgery and rhythm management | 20,451 | 1,251,806 |
Ocado Group PLC(a),(c)
Distributes a wide range of retail consumer products | 144,538 | 544,805 |
Polypipe Group PLC
Plastic piping systems | 264,385 | 1,316,443 |
Rentokil Initial PLC
Fully integrated facilities management and essential support services | 324,592 | 1,155,416 |
Rightmove PLC
Website that lists properties across Britain | 26,655 | 1,475,464 |
Shaftesbury PLC
Real estate company | 62,669 | 793,786 |
Spirax-Sarco Engineering PLC
Consultation, service and products for the control and efficient management of steam and industrial fluids | 23,541 | 1,640,362 |
WH Smith PLC
Retails books, magazines, newspapers, and periodicals | 50,000 | 1,116,850 |
| Total | 18,547,709 |
Total Common Stocks
(Cost: $48,039,264) | 62,701,066 |
|
| Securities Lending Collateral 4.6% |
| | Shares | Value ($) |
Dreyfus Government Cash Management Fund, Institutional Shares, 0.910%(d),(e)
| 3,054,871 | 3,054,871 |
Total Securities Lending Collateral
(Cost: $3,054,871) | 3,054,871 |
|
| Money Market Funds 4.9% |
| | |
JPMorgan U.S. Government Money Market Fund, IM Shares, 0.879% (d)
| 3,275,036 | 3,275,036 |
Total Money Market Funds
(Cost: $3,275,036) | 3,275,036 |
Total Investments
(Cost: $54,369,171) | 69,030,973 |
| Obligation to Return Collateral for Securities Loaned | | (3,054,871) |
| Other Assets & Liabilities, Net | | 402,887 |
| Net Assets | $66,378,989 |
The accompanying Notes to Financial Statements are an integral part of this statement.
Columbia Acorn Family of Funds | Semiannual Report 2017
| 81 |
Portfolio of Investments (continued)
Columbia Acorn European FundSM , June 30, 2017 (Unaudited)
Notes to Portfolio of Investments
| (a) | Non-income producing security. |
| (b) | Security is traded on a Swedish exchange. |
| (c) | All or a portion of this security was on loan at June 30, 2017. The total market value of securities on loan at June 30, 2017 was $2,907,619. |
| (d) | The rate shown is the seven-day current annualized yield at June 30, 2017. |
| (e) | Investment made with cash collateral received from securities lending activity. |
Fair value measurements
Various inputs are used in determining the value of the Fund’s investments, following the input prioritization hierarchy established by accounting principles generally accepted in the United States of America (GAAP). These inputs are summarized in the three broad levels listed below:
| • | Level 1 – quoted prices in active markets for identical securities |
| • | Level 2 – prices determined using other significant observable inputs (including quoted prices for similar securities, interest rates, prepayment speeds, credit risk and others) |
| • | Level 3 – prices determined using significant unobservable inputs where quoted prices or observable inputs are unavailable or less reliable (including management’s own assumptions about the factors market participants would use in pricing an investment) |
The inputs or methodology used for valuing securities are not necessarily an indication of the risk associated with investing in those securities.
Examples of the types of securities in which the Fund would typically invest and how they are classified within this hierarchy are as follows. Typical Level 1 securities include exchange traded domestic equities, mutual funds whose net asset values are published each day and exchange traded foreign equities that are not statistically fair valued. Typical Level 2 securities include exchange traded foreign equities that are statistically fair valued, forward foreign currency exchange contracts and short-term investments valued at amortized cost. Additionally, securities fair valued by Columbia Wanger Asset Management’s Valuation Committee (the Committee) that rely on significant observable inputs are also included in Level 2. Typical Level 3 securities include any security fair valued by the Committee that relies on significant unobservable inputs.
The Committee is responsible for applying the Columbia Acorn Trust Portfolio Pricing Policy and the Columbia Wanger Asset Management pricing procedures (the Policies), which are approved by and subject to the oversight of the Board of Trustees.
The Committee meets as necessary, and no less frequently than quarterly, to determine fair values for securities for which market quotations are not readily available or for which Columbia Wanger Asset Management believes that available market quotations are unreliable. The Committee also reviews the continuing appropriateness of the Policies. In circumstances where a security has been fair valued, the Committee will also review the continuing appropriateness of the current value of the security. The Policies address, among other things: circumstances under which market quotations will be deemed readily available; selection of third party pricing vendors; appropriate pricing methodologies; events that require fair valuation and fair value techniques; circumstances under which securities will be deemed to pose a potential for stale pricing, including when securities are illiquid, restricted, or in default; and certain delegations of authority to determine fair values to the Fund’s investment manager. The Committee may also meet to discuss additional valuation matters, which may include review of back-testing results, review of time-sensitive information or approval of other valuation related actions, and to review the appropriateness of the Policies.
For investments categorized as Level 3, the significant unobservable inputs used in the fair value measurement of the Fund’s securities may include: (i) data specific to the issuer or comparable issuers, (ii) general market or specific sector news and (iii) quoted prices and specific or similar security transactions. The Committee considers this data and any changes from prior periods in order to assess the reasonableness of observable and unobservable inputs, any assumptions or internal models used to value those securities and changes in fair value. Significant changes in any of these factors could result in lower or higher fair value measurements. Various factors impact the frequency of monitoring (which may occur as often as daily), however the Committee may determine that changes to inputs, assumptions and models are not required with the same frequency.
The following table is a summary of the inputs used to value the Fund’s investments at June 30, 2017:
| | Level 1
quoted prices in active
markets for identical
assets ($) | Level 2
other significant
observable inputs ($) | Level 3
significant
unobservable inputs ($) | Total ($) |
| Investments | | | | |
| Common Stocks | | | | |
| Belgium | — | 756,905 | — | 756,905 |
| Denmark | — | 3,194,653 | — | 3,194,653 |
| Finland | — | 3,745,209 | — | 3,745,209 |
| France | — | 3,425,961 | — | 3,425,961 |
| Germany | — | 11,137,259 | — | 11,137,259 |
| Ireland | — | 823,383 | — | 823,383 |
| Italy | — | 2,646,613 | — | 2,646,613 |
| Luxembourg | — | 763,461 | — | 763,461 |
| Malta | — | 1,889,552 | — | 1,889,552 |
| Netherlands | — | 1,222,371 | — | 1,222,371 |
| Norway | — | 1,385,882 | — | 1,385,882 |
| Spain | — | 3,784,254 | — | 3,784,254 |
| Sweden | — | 5,245,191 | — | 5,245,191 |
| Switzerland | — | 3,361,301 | — | 3,361,301 |
The accompanying Notes to Financial Statements are an integral part of this statement.
| 82 | Columbia Acorn Family of Funds | Semiannual Report 2017 |
Portfolio of Investments (continued)
Columbia Acorn European FundSM , June 30, 2017 (Unaudited)
Fair value measurements (continued)
| | Level 1
quoted prices in active
markets for identical
assets ($) | Level 2
other significant
observable inputs ($) | Level 3
significant
unobservable inputs ($) | Total ($) |
| Turkey | — | 771,362 | — | 771,362 |
| United Kingdom | 1,251,806 | 17,295,903 | — | 18,547,709 |
| Total Common Stocks | 1,251,806 | 61,449,260 | — | 62,701,066 |
| Securities Lending Collateral | 3,054,871 | — | — | 3,054,871 |
| Money Market Funds | 3,275,036 | — | — | 3,275,036 |
| Total Investments | 7,581,713 | 61,449,260 | — | 69,030,973 |
The Fund’s assets assigned to the Level 2 input category are generally valued using a market approach, in which a security’s value is determined through its correlation to prices and information from observable market transactions for similar or identical assets. Foreign equities are generally valued at the last sale price on the foreign exchange or market on which they trade. The Fund may use a statistical fair valuation model, in accordance with the policy adopted by the Board of Trustees, provided by an independent third party to value securities principally traded in foreign markets in order to adjust for possible stale pricing that may occur between the close of the foreign exchanges and the time for valuation. These models take into account available market data including intraday index, ADR, and ETF movements.
There were no transfers of financial assets between levels during the period.
The accompanying Notes to Financial Statements are an integral part of this statement.
Columbia Acorn Family of Funds | Semiannual Report 2017
| 83 |
Statement of Assets and Liabilities
June 30, 2017 (Unaudited)
| | Columbia
Acorn®
Fund | Columbia
Acorn
International® | Columbia
Acorn
USA® | Columbia
Acorn
International
SelectSM |
| Assets | | | | |
| Investments, at cost | | | | |
| Unaffiliated issuers, at cost | $3,572,738,443 | $3,681,443,791 | $493,679,726 | $86,241,505 |
| Total investments, at cost | 3,572,738,443 | 3,681,443,791 | 493,679,726 | 86,241,505 |
| Investments, at value | | | | |
| Unaffiliated issuers, at value (including securities on loan: $119,231,924, 184,924,231, 9,705,947 and 4,339,293, respectively) | 4,864,885,146 | 5,197,976,881 | 653,283,725 | 121,065,999 |
| Total investments, at value | 4,864,885,146 | 5,197,976,881 | 653,283,725 | 121,065,999 |
| Foreign currency (identified cost $—, $270,950, $—, $—) | — | 271,551 | — | — |
| Receivable for: | | | | |
| Investments sold | 25,221,492 | 13,021,105 | 153,560 | 44 |
| Capital shares sold | 1,470,545 | 3,298,039 | 166,745 | 47,519 |
| Regulatory settlements (Note 7) | — | — | — | 33,279 |
| Dividends | 2,243,004 | 1,907,554 | 292,622 | — |
| Securities lending income | 144,374 | 209,745 | 15,287 | 7,066 |
| Foreign tax reclaims | — | 2,892,461 | 381 | 62,006 |
| Expense reimbursement due from Investment Manager | — | 579 | — | 392 |
| Prepaid expenses | 34,590 | 34,888 | 4,137 | 668 |
| Trustees’ deferred compensation plan | 2,993,561 | 1,387,541 | 289,297 | — |
| Other assets | — | 2,595 | — | — |
| Total assets | 4,896,992,712 | 5,221,002,939 | 654,205,754 | 121,216,973 |
| Liabilities | | | | |
| Due upon return of securities on loan | 121,051,730 | 194,056,021 | 9,894,600 | 4,554,276 |
| Payable for: | | | | |
| Investments purchased | 50,707,609 | 11,136,402 | 6,792,211 | 264,982 |
| Capital shares purchased | 5,880,936 | 16,066,003 | 425,384 | 595,183 |
| Distributions to shareholders | 234 | 5 | — | — |
| Investment advisory fee | 86,214 | 105,143 | 15,609 | 2,832 |
| Distribution and/or service fees | 13,112 | 5,303 | 702 | 273 |
| Transfer agent fees | 421,009 | 476,390 | 159,284 | 9,263 |
| Administration fees | 6,022 | 6,420 | 815 | 149 |
| Trustees’ fees | — | — | — | 50,022 |
| Compensation of chief compliance officer | — | 152 | — | 4 |
| Other expenses | 295,841 | 645,855 | 72,394 | 57,519 |
| Trustees’ deferred compensation plan | 2,993,561 | 1,387,541 | 289,297 | — |
| Other liabilities | — | 17,385 | — | — |
| Total liabilities | 181,456,268 | 223,902,620 | 17,650,296 | 5,534,503 |
| Net assets applicable to outstanding capital stock | $4,715,536,444 | $4,997,100,319 | $636,555,458 | $115,682,470 |
| Represented by | | | | |
| Paid in capital | 2,757,314,098 | 3,381,289,706 | 383,386,021 | 95,170,145 |
| Undistributed (excess of distributions over) net investment income | (807,383) | 17,847,989 | (978,245) | 267,668 |
| Accumulated net realized gain (loss) | 666,883,026 | 81,402,903 | 94,543,683 | (14,582,612) |
| Unrealized appreciation (depreciation) on: | | | | |
| Investments - unaffiliated issuers | 1,292,146,703 | 1,516,533,090 | 159,603,999 | 34,824,494 |
| Foreign currency translations | — | 26,631 | — | 2,775 |
| Total - representing net assets applicable to outstanding capital stock | $4,715,536,444 | $4,997,100,319 | $636,555,458 | $115,682,470 |
The accompanying Notes to Financial Statements are an integral part of this statement.
| 84 | Columbia Acorn Family of Funds | Semiannual Report 2017 |
Statement of Assets and Liabilities (continued)
June 30, 2017 (Unaudited)
| | Columbia
Acorn®
Fund | Columbia
Acorn
International® | Columbia
Acorn
USA® | Columbia
Acorn
International
SelectSM |
| Class A | | | | |
| Net assets | $858,519,174 | $494,952,758 | $57,544,780 | $20,891,944 |
| Shares outstanding | 59,539,748 | 11,176,644 | 3,579,932 | 814,074 |
| Net asset value per share(a) | $14.42 | $44.28 | $16.07 | $25.66 |
| Maximum offering price per share(b) | $15.30 | $46.98 | $17.05 | $27.23 |
| Class B | | | | |
| Net assets | $— | $268,382 | $— | $— |
| Shares outstanding | — | 6,281 | — | — |
| Net asset value per share(a) | $— | $42.73 | $— | $— |
| Class C | | | | |
| Net assets | $264,293,902 | $63,191,344 | $11,217,434 | $4,628,210 |
| Shares outstanding | 30,182,723 | 1,488,954 | 1,060,562 | 193,411 |
| Net asset value per share(a) | $8.76 | $42.44 | $10.58 | $23.93 |
| Class R | | | | |
| Net assets | $— | $12,004,713 | $— | $— |
| Shares outstanding | — | 271,415 | — | — |
| Net asset value per share(c) | $— | $44.23 | $— | $— |
| Class R4 | | | | |
| Net assets | $38,766,112 | $101,844,389 | $15,425,107 | $1,357,077 |
| Shares outstanding | 2,250,834 | 2,277,816 | 794,422 | 51,812 |
| Net asset value per share(c) | $17.22 | $44.71 | $19.42 | $26.19 |
| Class R5 | | | | |
| Net assets | $50,097,560 | $399,347,377 | $2,797,922 | $494,697 |
| Shares outstanding | 2,888,773 | 9,003,618 | 143,321 | 18,892 |
| Net asset value per share(c) | $17.34 | $44.35 | $19.52 | $26.19 |
| Class Y | | | | |
| Net assets | $46,065,518 | $253,696,668 | $43,727,136 | $284,176 |
| Shares outstanding | 2,639,304 | 5,672,431 | 2,224,534 | 10,859 |
| Net asset value per share(c) | $17.45 | $44.72 | $19.66 | $26.17 |
| Class Z | | | | |
| Net assets | $3,457,794,178 | $3,671,794,688 | $505,843,079 | $88,026,366 |
| Shares outstanding | 208,143,482 | 82,750,590 | 27,196,453 | 3,385,306 |
| Net asset value per share(c) | $16.61 | $44.37 | $18.60 | $26.00 |
| (a) | Redemption price per share is equal to net asset value less any applicable contingent deferred sales charge. |
| (b) | On sales of $50,000 or more the offering price is reduced. |
| (c) | Redemption price per share is equal to net asset value. |
The accompanying Notes to Financial Statements are an integral part of this statement.
Columbia Acorn Family of Funds | Semiannual Report 2017
| 85 |
Statement of Assets and Liabilities (continued)
June 30, 2017 (Unaudited)
| | Columbia
Acorn
SelectSM | Columbia
Thermostat
FundSM | Columbia
Acorn
Emerging Markets
FundSM | Columbia
Acorn
European
FundSM |
| Assets | | | | |
| Investments, at cost | | | | |
| Unaffiliated issuers, at cost | $249,643,780 | $3,763,746 | $82,729,386 | $54,369,171 |
| Affiliated issuers, at cost | — | 928,191,848 | — | — |
| Total investments, at cost | 249,643,780 | 931,955,594 | 82,729,386 | 54,369,171 |
| Investments, at value | | | | |
| Unaffiliated issuers, at value (including securities on loan: $—, —, — and 2,907,619, respectively) | 314,432,443 | 3,763,746 | 103,498,523 | 69,030,973 |
| Affiliated issuers, at value | — | 962,163,355 | — | — |
| Total investments, at value | 314,432,443 | 965,927,101 | 103,498,523 | 69,030,973 |
| Foreign currency (identified cost $—, $—, $—, $11,745) | — | — | — | 11,770 |
| Receivable for: | | | | |
| Investments sold | 1,602,572 | — | 236,037 | — |
| Capital shares sold | 118,685 | 845,046 | 224,244 | 325,607 |
| Dividends | 153,526 | 1,579,106 | 44,241 | 76,941 |
| Securities lending income | — | — | — | 6,453 |
| Foreign tax reclaims | — | — | 118 | 94,430 |
| Expense reimbursement due from Investment Manager | — | 972 | 464 | 361 |
| Prepaid expenses | 2,043 | 7,005 | 966 | 355 |
| Trustees’ deferred compensation plan | 246,752 | — | — | — |
| Other assets | — | 8,911 | 1,387 | 16,522 |
| Total assets | 316,556,021 | 968,368,141 | 104,005,980 | 69,563,412 |
| Liabilities | | | | |
| Due upon return of securities on loan | — | — | — | 3,054,871 |
| Payable for: | | | | |
| Investments purchased | — | 1,579,106 | 165,035 | — |
| Capital shares purchased | 522,714 | 2,388,545 | 183,801 | 65,713 |
| Foreign capital gains taxes deferred | — | — | 168,175 | — |
| Investment advisory fee | 5,652 | 2,646 | 3,520 | 2,167 |
| Distribution and/or service fees | 1,367 | 10,036 | 646 | 408 |
| Transfer agent fees | 29,058 | 73,316 | 16,052 | 5,638 |
| Administration fees | 406 | 1,236 | 132 | 85 |
| Trustees’ fees | — | 135,254 | 30,940 | 6,142 |
| Compensation of chief compliance officer | — | — | 3 | 2 |
| Custodian fees | 1,619 | — | 41,239 | 10,050 |
| Other expenses | 61,396 | 86,538 | 45,038 | 39,347 |
| Trustees’ deferred compensation plan | 246,752 | — | — | — |
| Other liabilities | — | — | 2,056 | — |
| Total liabilities | 868,964 | 4,276,677 | 656,637 | 3,184,423 |
| Net assets applicable to outstanding capital stock | $315,687,057 | $964,091,464 | $103,349,343 | $66,378,989 |
| Represented by | | | | |
| Paid in capital | 231,941,403 | 918,077,003 | 173,046,264 | 60,436,327 |
| Undistributed (excess of distributions over) net investment income | (410,517) | 7,496,651 | (1,378,265) | 336,110 |
| Accumulated net realized gain (loss) | 19,367,508 | 4,546,303 | (88,919,307) | (9,058,054) |
| Unrealized appreciation (depreciation) on: | | | | |
| Investments - unaffiliated issuers | 64,788,663 | — | 20,769,137 | 14,661,802 |
| Investments - affiliated issuers | — | 33,971,507 | — | — |
| Foreign currency translations | — | — | (311) | 2,804 |
| Foreign capital gains tax | — | — | (168,175) | — |
| Total - representing net assets applicable to outstanding capital stock | $315,687,057 | $964,091,464 | $103,349,343 | $66,378,989 |
The accompanying Notes to Financial Statements are an integral part of this statement.
| 86 | Columbia Acorn Family of Funds | Semiannual Report 2017 |
Statement of Assets and Liabilities (continued)
June 30, 2017 (Unaudited)
| | Columbia
Acorn
SelectSM | Columbia
Thermostat
FundSM | Columbia
Acorn
Emerging Markets
FundSM | Columbia
Acorn
European
FundSM |
| Class A | | | | |
| Net assets | $107,513,154 | $293,007,581 | $32,871,949 | $19,662,668 |
| Shares outstanding | 7,981,516 | 19,856,108 | 2,778,946 | 1,131,088 |
| Net asset value per share(a) | $13.47 | $14.76 | $11.83 | $17.38 |
| Maximum offering price per share(b) | $14.29 | $15.66 | $12.55 | $18.44 |
| Class C | | | | |
| Net assets | $22,382,032 | $292,183,350 | $15,332,359 | $10,034,886 |
| Shares outstanding | 2,468,925 | 19,737,727 | 1,306,257 | 583,451 |
| Net asset value per share(a) | $9.07 | $14.80 | $11.74 | $17.20 |
| Class R4 | | | | |
| Net assets | $1,862,951 | $13,990,010 | $1,105,371 | $559,475 |
| Shares outstanding | 118,494 | 955,083 | 92,586 | 31,997 |
| Net asset value per share(c) | $15.72 | $14.65 | $11.94 | $17.49 |
| Class R5 | | | | |
| Net assets | $1,498,103 | $12,855,299 | $994,955 | $4,025,820 |
| Shares outstanding | 94,823 | 876,724 | 83,329 | 229,069 |
| Net asset value per share(c) | $15.80 | $14.66 | $11.94 | $17.57 |
| Class Y | | | | |
| Net assets | $23,667,560 | $411,153 | $2,244 | $27,191 |
| Shares outstanding | 1,485,554 | 28,079 | 190 | 1,568 |
| Net asset value per share(c) | $15.93 | $14.64 | $11.84 (d) | $17.34 |
| Class Z | | | | |
| Net assets | $158,763,257 | $351,644,071 | $53,042,465 | $32,068,949 |
| Shares outstanding | 10,475,699 | 24,131,665 | 4,470,996 | 1,842,368 |
| Net asset value per share(c) | $15.16 | $14.57 | $11.86 | $17.41 |
| (a) | Redemption price per share is equal to net asset value less any applicable contingent deferred sales charge. |
| (b) | On sales of $50,000 or more the offering price is reduced. |
| (c) | Redemption price per share is equal to net asset value. |
| (d) | Net asset value per share rounds to this amount due to fractional shares outstanding. |
The accompanying Notes to Financial Statements are an integral part of this statement.
Columbia Acorn Family of Funds | Semiannual Report 2017
| 87 |
Statement of Operations
Six Months Ended June 30, 2017 (Unaudited)
| | Columbia
Acorn®
Fund | Columbia
Acorn
International® | Columbia
Acorn
USA® | Columbia
Acorn
International
SelectSM |
| Net investment income | | | | |
| Income: | | | | |
| Dividends — unaffiliated issuers | $22,618,010 | $60,540,371 | $2,750,287 | $1,167,330 |
| Interest | — | 99 | — | — |
| Income from securities lending — net | 2,831,312 | 1,046,141 | 415,672 | 21,534 |
| Foreign taxes withheld | (38,556) | (6,322,031) | (20,678) | (174,268) |
| Total income | 25,410,766 | 55,264,580 | 3,145,281 | 1,014,596 |
| Expenses: | | | | |
| Investment advisory fee | 16,079,355 | 18,797,406 | 2,883,093 | 485,769 |
| Distribution and/or service fees | | | | |
| Class A | 1,105,649 | 673,682 | 84,767 | 25,700 |
| Class B | — | 1,422 | — | — |
| Class C | 1,449,721 | 326,977 | 58,311 | 22,932 |
| Class R | — | 21,726 | — | — |
| Transfer agent fees | | | | |
| Class A | 291,247 | 237,428 | 46,780 | 12,128 |
| Class B | — | 168 | — | — |
| Class C | 95,494 | 28,738 | 8,049 | 2,708 |
| Class R | — | 3,763 | — | — |
| Class R4 | 11,749 | 44,659 | 6,622 | 741 |
| Class R5 | 11,854 | 85,565 | 3,380 | 121 |
| Class Z | 1,142,650 | 1,567,280 | 346,247 | 48,398 |
| Administration fees | 1,123,123 | 1,145,845 | 150,443 | 25,465 |
| Trustees’ fees | 200,414 | 203,199 | 26,618 | 4,423 |
| Custodian fees | 22,770 | 390,789 | 5,254 | 11,584 |
| Printing and postage fees | 200,364 | 248,517 | 29,649 | 14,052 |
| Registration fees | 63,182 | 80,324 | 46,757 | 44,426 |
| Audit fees | 55,741 | 91,773 | 20,325 | 23,320 |
| Legal fees | 431,872 | 428,349 | 56,670 | 9,139 |
| Compensation of chief compliance officer | 7,427 | 7,077 | 1,007 | 152 |
| Other | 151,790 | 77,932 | 27,056 | 12,124 |
| Total expenses | 22,444,402 | 24,462,619 | 3,801,028 | 743,182 |
| Fees waived or expenses reimbursed by Investment Manager and its affiliates | — | — | — | (71,725) |
| Fees waived by transfer agent | | | | |
| Class A | — | (107,789) | — | — |
| Class B | — | (168) | — | — |
| Class C | — | (6,540) | — | — |
| Expense reduction | (10,246) | (10,491) | (1,760) | (816) |
| Total net expenses | 22,434,156 | 24,337,631 | 3,799,268 | 670,641 |
| Net investment income (loss) | 2,976,610 | 30,926,949 | (653,987) | 343,955 |
| Realized and unrealized gain (loss) — net | | | | |
| Net realized gain (loss) on: | | | | |
| Investments — unaffiliated issuers | 679,800,922 | 148,637,957 | 96,319,482 | 136,440 |
| Investments — affiliated issuers | 943,168 | — | — | — |
| Foreign currency translations | 5,907 | (536,468) | — | (8,398) |
| Net realized gain | 680,749,997 | 148,101,489 | 96,319,482 | 128,042 |
| Net change in unrealized appreciation (depreciation) on: | | | | |
| Investments — unaffiliated issuers | (121,058,890) | 653,207,573 | (25,714,454) | 19,374,014 |
| Investments — affiliated issuers | (1,745,360) | — | — | — |
| Foreign currency translations | — | 342,251 | — | 9,301 |
| Foreign capital gains tax | — | — | — | 11,162 |
| Net change in unrealized appreciation (depreciation) | (122,804,250) | 653,549,824 | (25,714,454) | 19,394,477 |
| Net realized and unrealized gain | 557,945,747 | 801,651,313 | 70,605,028 | 19,522,519 |
| Net increase in net assets resulting from operations | $560,922,357 | $832,578,262 | $69,951,041 | $19,866,474 |
The accompanying Notes to Financial Statements are an integral part of this statement.
| 88 | Columbia Acorn Family of Funds | Semiannual Report 2017 |
Statement of Operations (continued)
Six Months Ended June 30, 2017 (Unaudited)
| | Columbia
Acorn
SelectSM | Columbia
Thermostat
FundSM | Columbia
Acorn
Emerging Markets
FundSM | Columbia
Acorn
European
FundSM |
| Net investment income | | | | |
| Income: | | | | |
| Dividends — unaffiliated issuers | $1,586,180 | $6,811 | $872,955 | $985,940 |
| Dividends — affiliated issuers | — | 11,083,957 | — | — |
| Income from securities lending — net | 243 | — | 6,380 | 23,732 |
| Foreign taxes withheld | — | — | (81,009) | (84,103) |
| Total income | 1,586,423 | 11,090,768 | 798,326 | 925,569 |
| Expenses: | | | | |
| Investment advisory fee | 1,328,038 | 518,203 | 646,708 | 310,453 |
| Distribution and/or service fees | | | | |
| Class A | 142,205 | 425,186 | 48,892 | 26,130 |
| Class C | 130,851 | 1,580,109 | 78,139 | 41,588 |
| Transfer agent fees | | | | |
| Class A | 62,606 | 115,953 | 30,359 | 11,248 |
| Class C | 14,387 | 107,865 | 12,144 | 4,397 |
| Class R4 | 601 | 4,979 | 925 | 247 |
| Class R5 | 287 | 2,994 | 221 | 547 |
| Class Z | 83,510 | 120,847 | 37,012 | 10,583 |
| Administration fees | 72,895 | 241,785 | 24,357 | 12,171 |
| Trustees’ fees | 13,067 | 44,072 | 4,360 | 2,089 |
| Custodian fees | 2,091 | 1,331 | 54,708 | 15,602 |
| Printing and postage fees | 29,059 | 52,712 | 16,046 | 8,292 |
| Registration fees | 45,823 | 60,623 | 43,926 | 37,842 |
| Audit fees | 20,233 | 11,248 | 35,704 | 19,812 |
| Legal fees | 27,911 | 96,967 | 10,443 | 4,236 |
| Compensation of chief compliance officer | 474 | 1,646 | 157 | 69 |
| Other | 17,888 | 36,183 | 13,122 | 14,469 |
| Total expenses | 1,991,926 | 3,422,703 | 1,057,223 | 519,775 |
| Fees waived or expenses reimbursed by Investment Manager and its affiliates | (312,480) | (126,713) | (97,355) | (63,613) |
| Expense reduction | (1,847) | (680) | (80) | (20) |
| Total net expenses | 1,677,599 | 3,295,310 | 959,788 | 456,142 |
| Net investment income (loss) | (91,176) | 7,795,458 | (161,462) | 469,427 |
| Realized and unrealized gain (loss) — net | | | | |
| Net realized gain (loss) on: | | | | |
| Investments — unaffiliated issuers | 19,819,313 | — | (2,400,743) | 880,599 |
| Investments — affiliated issuers | — | 3,023,476 | — | — |
| Capital gain distributions from underlying affiliated funds | — | 4,622,139 | — | — |
| Foreign currency translations | — | — | (15,877) | (5,235) |
| Net realized gain (loss) | 19,819,313 | 7,645,615 | (2,416,620) | 875,364 |
| Net change in unrealized appreciation (depreciation) on: | | | | |
| Investments — unaffiliated issuers | 14,865,331 | — | 22,040,167 | 9,336,115 |
| Investments — affiliated issuers | — | 15,659,589 | — | — |
| Foreign currency translations | — | — | (612) | 8,693 |
| Foreign capital gains tax | — | — | (159,986) | — |
| Net change in unrealized appreciation (depreciation) | 14,865,331 | 15,659,589 | 21,879,569 | 9,344,808 |
| Net realized and unrealized gain | 34,684,644 | 23,305,204 | 19,462,949 | 10,220,172 |
| Net increase in net assets resulting from operations | $34,593,468 | $31,100,662 | $19,301,487 | $10,689,599 |
The accompanying Notes to Financial Statements are an integral part of this statement.
Columbia Acorn Family of Funds | Semiannual Report 2017
| 89 |
Statement of Changes in Net Assets
| | Columbia
Acorn®Fund | Columbia Acorn
International® |
| | Six Months Ended
June 30, 2017
(Unaudited) | Year Ended
December 31, 2016 | Six Months Ended
June 30, 2017
(Unaudited) | Year Ended
December 31, 2016 |
| Operations | | | | |
| Net investment income (loss) | $2,976,610 | $(2,693,471) | $30,926,949 | $63,212,029 |
| Net realized gain (loss) | 680,749,997 | 1,510,848,459 | 148,101,489 | (14,787,593) |
| Net change in unrealized appreciation (depreciation) | (122,804,250) | (1,031,158,606) | 653,549,824 | (171,914,114) |
| Net increase (decrease) in net assets resulting from operations | 560,922,357 | 476,996,382 | 832,578,262 | (123,489,678) |
| Distributions to shareholders | | | | |
| Net investment income | | | | |
| Class A | — | — | (4,335,267) | (2,294,349) |
| Class B | — | — | (2,069) | — |
| Class C | — | — | (387,658) | — |
| Class I(a) | — | — | — | (250,719) |
| Class R | — | — | (103,770) | (1,758) |
| Class R4 | — | — | (871,232) | (643,271) |
| Class R5 | — | — | (3,471,621) | (2,042,254) |
| Class Y | — | — | (2,721,207) | (1,616,789) |
| Class Z | — | — | (31,830,965) | (22,632,732) |
| Net realized gains | | | | |
| Class A | (33,143,420) | (355,213,879) | — | (4,791,671) |
| Class B | — | — | — | (6,422) |
| Class C | (16,469,765) | (162,765,900) | — | (553,766) |
| Class I(a) | — | (6,394,000) | — | (367,390) |
| Class R | — | — | — | (30,861) |
| Class R4 | (1,186,180) | (10,648,130) | — | (3,192,056) |
| Class R5 | (1,526,873) | (15,236,759) | — | (2,010,528) |
| Class Y | (3,389,085) | (25,706,160) | — | (1,662,627) |
| Class Z | (117,143,381) | (1,202,301,687) | — | (27,548,483) |
| Total distributions to shareholders | (172,858,704) | (1,778,266,515) | (43,723,789) | (69,645,676) |
| Decrease in net assets from capital stock activity | (501,260,965) | (1,063,279,983) | (444,692,320) | (1,887,104,246) |
| Total increase (decrease) in net assets | (113,197,312) | (2,364,550,116) | 344,162,153 | (2,080,239,600) |
| Net assets at beginning of period | 4,828,733,756 | 7,193,283,872 | 4,652,938,166 | 6,733,177,766 |
| Net assets at end of period | $4,715,536,444 | $4,828,733,756 | $4,997,100,319 | $4,652,938,166 |
| Undistributed (excess of distributions over) net investment income | $(807,383) | $(3,783,993) | $17,847,989 | $30,644,829 |
| (a) | Effective March 27, 2017, Class I shares were redeemed or exchanged for Class Y shares. |
The accompanying Notes to Financial Statements are an integral part of this statement.
| 90 | Columbia Acorn Family of Funds | Semiannual Report 2017 |
Statement of Changes in Net Assets (continued)
| | Columbia
Acorn USA® | Columbia Acorn
International SelectSM |
| | Six Months Ended
June 30, 2017
(Unaudited) | Year Ended
December 31, 2016 | Six Months Ended
June 30, 2017
(Unaudited) | Year Ended
December 31, 2016 |
| Operations | | | | |
| Net investment income (loss) | $(653,987) | $(2,585,435) | $343,955 | $727,712 |
| Net realized gain | 96,319,482 | 173,306,331 | 128,042 | 406,852 |
| Net change in unrealized appreciation (depreciation) | (25,714,454) | (116,920,216) | 19,394,477 | (727,228) |
| Net increase in net assets resulting from operations | 69,951,041 | 53,800,680 | 19,866,474 | 407,336 |
| Distributions to shareholders | | | | |
| Net investment income | | | | |
| Class A | — | — | — | (128,440) |
| Class I(a) | — | — | — | (21) |
| Class R4 | — | — | — | (10,361) |
| Class R5 | — | — | — | (4,257) |
| Class Y | — | — | — | (3,239) |
| Class Z | — | — | — | (688,337) |
| Net realized gains | | | | |
| Class A | (1,953,496) | (32,380,146) | — | — |
| Class C | (568,735) | (6,855,670) | — | — |
| Class I(a) | — | (535) | — | — |
| Class R4 | (427,408) | (2,636,761) | — | — |
| Class R5 | (405,092) | (6,082,950) | — | — |
| Class Y | (1,207,408) | (13,772,136) | — | — |
| Class Z | (14,874,507) | (176,812,357) | — | — |
| Return of capital | | | | |
| Class A | — | — | — | (21,491) |
| Class I(a) | — | — | — | (2) |
| Class R4 | — | — | — | (1,231) |
| Class R5 | — | — | — | (474) |
| Class Y | — | — | — | (333) |
| Class Z | — | — | — | (79,155) |
| Total distributions to shareholders | (19,436,646) | (238,540,555) | — | (937,341) |
| Decrease in net assets from capital stock activity | (57,579,362) | (129,621,627) | (4,195,577) | (38,779,298) |
| Total increase (decrease) in net assets | (7,064,967) | (314,361,502) | 15,670,897 | (39,309,303) |
| Net assets at beginning of period | 643,620,425 | 957,981,927 | 100,011,573 | 139,320,876 |
| Net assets at end of period | $636,555,458 | $643,620,425 | $115,682,470 | $100,011,573 |
| Undistributed (excess of distributions over) net investment income | $(978,245) | $(324,258) | $267,668 | $(76,287) |
| (a) | Effective March 27, 2017, Class I shares were redeemed or exchanged for Class Y shares. |
The accompanying Notes to Financial Statements are an integral part of this statement.
Columbia Acorn Family of Funds | Semiannual Report 2017
| 91 |
Statement of Changes in Net Assets (continued)
| | Columbia
Acorn SelectSM | Columbia
Thermostat FundSM |
| | Six Months Ended
June 30, 2017
(Unaudited) | Year Ended
December 31, 2016 | Six Months Ended
June 30, 2017
(Unaudited) | Year Ended
December 31, 2016 |
| Operations | | | | |
| Net investment income (loss) | $(91,176) | $(636,264) | $7,795,458 | $13,815,474 |
| Net realized gain | 19,819,313 | 51,359,334 | 7,645,615 | 6,455,376 |
| Net change in unrealized appreciation (depreciation) | 14,865,331 | (13,696,714) | 15,659,589 | 27,501,996 |
| Net increase in net assets resulting from operations | 34,593,468 | 37,026,356 | 31,100,662 | 47,772,846 |
| Distributions to shareholders | | | | |
| Net investment income | | | | |
| Class A | — | — | (4,626,442) | (2,065,216) |
| Class C | — | — | (3,104,507) | (1,254,586) |
| Class R4 | — | — | (221,981) | (116,893) |
| Class R5 | — | — | (184,686) | (93,729) |
| Class Y | — | — | (6,396) | (3,227) |
| Class Z | — | — | (5,661,210) | (2,661,104) |
| Net realized gains | | | | |
| Class A | (9,165,000) | (20,956,929) | (1,198,529) | (7,330,165) |
| Class C | (2,682,256) | (6,613,573) | (1,216,348) | (6,807,442) |
| Class I(a) | — | (3,413,863) | — | — |
| Class R4 | (76,385) | (137,648) | (57,507) | (270,622) |
| Class R5 | (77,918) | (169,378) | (47,845) | (227,023) |
| Class Y | (2,038,744) | (675,691) | (1,657) | (6,939) |
| Class Z | (11,563,561) | (23,230,145) | (1,466,597) | (6,421,250) |
| Total distributions to shareholders | (25,603,864) | (55,197,227) | (17,793,705) | (27,258,196) |
| Decrease in net assets from capital stock activity | (1,691,531) | (72,642,815) | (156,642,110) | (15,113,859) |
| Total increase (decrease) in net assets | 7,298,073 | (90,813,686) | (143,335,153) | 5,400,791 |
| Net assets at beginning of period | 308,388,984 | 399,202,670 | 1,107,426,617 | 1,102,025,826 |
| Net assets at end of period | $315,687,057 | $308,388,984 | $964,091,464 | $1,107,426,617 |
| Undistributed (excess of distributions over) net investment income | $(410,517) | $(319,341) | $7,496,651 | $13,506,415 |
| (a) | Effective March 27, 2017, Class I shares were redeemed or exchanged for Class Y shares. |
The accompanying Notes to Financial Statements are an integral part of this statement.
| 92 | Columbia Acorn Family of Funds | Semiannual Report 2017 |
Statement of Changes in Net Assets (continued)
| | Columbia Acorn
Emerging Markets FundSM | Columbia Acorn
European FundSM |
| | Six Months Ended
June 30, 2017
(Unaudited) | Year Ended
December 31, 2016 | Six Months Ended
June 30, 2017
(Unaudited)(a) | Year Ended
December 31, 2016 |
| Operations | | | | |
| Net investment income (loss) | $(161,462) | $(284,926) | $469,427 | $590,637 |
| Net realized gain (loss) | (2,416,620) | (45,598,080) | 875,364 | (4,579,308) |
| Net change in unrealized appreciation (depreciation) | 21,879,569 | 36,302,688 | 9,344,808 | 1,960,685 |
| Net increase (decrease) in net assets resulting from operations | 19,301,487 | (9,580,318) | 10,689,599 | (2,027,986) |
| Distributions to shareholders | | | | |
| Net investment income | | | | |
| Class A | — | (194,500) | (61,767) | (259,174) |
| Class C | — | — | (15,971) | (14,070) |
| Class I(b) | — | (15) | — | (29) |
| Class R4 | — | (9,157) | (1,849) | (4,237) |
| Class R5 | — | (6,632) | (13,461) | (14,327) |
| Class Y | — | (14) | (66) | — |
| Class Z | — | (333,824) | (95,901) | (127,499) |
| Return of capital | | | | |
| Class A | — | (199,268) | — | — |
| Class I(b) | — | (8) | — | — |
| Class R4 | — | (5,302) | — | — |
| Class R5 | — | (3,262) | — | — |
| Class Y | — | (7) | — | — |
| Class Z | — | (196,472) | — | — |
| Total distributions to shareholders | — | (948,461) | (189,015) | (419,336) |
| Increase (decrease) in net assets from capital stock activity | (21,712,543) | (159,031,334) | 9,526,092 | (13,086,756) |
| Total increase (decrease) in net assets | (2,411,056) | (169,560,113) | 20,026,676 | (15,534,078) |
| Net assets at beginning of period | 105,760,399 | 275,320,512 | 46,352,313 | 61,886,391 |
| Net assets at end of period | $103,349,343 | $105,760,399 | $66,378,989 | $46,352,313 |
| Undistributed (excess of distributions over) net investment income | $(1,378,265) | $(1,216,803) | $336,110 | $55,698 |
| (a) | Class Y shares are based on operations from March 1, 2017 (commencement of operations) through the stated period end. |
| (b) | Effective March 27, 2017, Class I shares were redeemed or exchanged for Class Y shares. |
The accompanying Notes to Financial Statements are an integral part of this statement.
Columbia Acorn Family of Funds | Semiannual Report 2017
| 93 |
Statement of Changes in Net Assets (continued)
| | Columbia
Acorn®Fund | Columbia Acorn
International® |
| | Six Months Ended | Year Ended | Six Months Ended | Year Ended |
| | June 30, 2017 (Unaudited) | December 31, 2016 | June 30, 2017 (Unaudited) | December 31, 2016 |
| | Shares | Dollars ($) | Shares | Dollars ($) | Shares | Dollars ($) | Shares | Dollars ($) |
| Capital stock activity |
| Class A | | | | | | | | |
| Subscriptions | 2,883,397 | 41,421,503 | 4,853,520 | 75,803,085 | 1,113,333 | 46,387,576 | 1,974,708 | 75,655,038 |
| Distributions reinvested | 2,078,336 | 29,824,130 | 22,814,791 | 328,819,766 | 92,959 | 4,161,790 | 175,532 | 6,887,710 |
| Redemptions | (15,171,162) | (214,066,570) | (36,704,218) | (594,559,320) | (5,311,577) | (218,701,201) | (7,659,549) | (295,352,503) |
| Net decrease | (10,209,429) | (142,820,937) | (9,035,907) | (189,936,469) | (4,105,285) | (168,151,835) | (5,509,309) | (212,809,755) |
| Class B | | | | | | | | |
| Distributions reinvested | — | — | — | — | 47 | 2,052 | 166 | 6,407 |
| Redemptions | — | — | (93,870) | (1,194,420) | (7,156) | (285,619) | (29,829) | (1,084,349) |
| Net decrease | — | — | (93,870) | (1,194,420) | (7,109) | (283,567) | (29,663) | (1,077,942) |
| Class C | | | | | | | | |
| Subscriptions | 541,758 | 4,717,470 | 2,850,481 | 28,830,261 | 45,583 | 1,821,506 | 88,146 | 3,250,023 |
| Distributions reinvested | 1,809,997 | 15,783,173 | 15,224,608 | 142,292,662 | 8,653 | 371,465 | 12,938 | 497,985 |
| Redemptions | (8,397,404) | (74,484,276) | (16,527,105) | (189,293,788) | (349,243) | (14,054,948) | (670,819) | (24,917,914) |
| Net increase (decrease) | (6,045,649) | (53,983,633) | 1,547,984 | (18,170,865) | (295,007) | (11,861,977) | (569,735) | (21,169,906) |
| Class I(a) | | | | | | | | |
| Subscriptions | — | — | 2,241,456 | 40,012,558 | — | — | 2,023,643 | 76,814,214 |
| Distributions reinvested | — | — | 384,162 | 6,393,601 | — | — | 15,790 | 618,080 |
| Redemptions | (704,360) | (11,413,369) | (3,318,699) | (60,309,700) | (587,108) | (24,144,151) | (2,841,410) | (108,946,434) |
| Net decrease | (704,360) | (11,413,369) | (693,081) | (13,903,541) | (587,108) | (24,144,151) | (801,977) | (31,514,140) |
| Class R | | | | | | | | |
| Subscriptions | — | — | — | — | 200,007 | 8,138,017 | 42,672 | 1,642,911 |
| Distributions reinvested | — | — | — | — | 2,179 | 97,434 | 704 | 28,080 |
| Redemptions | — | — | — | — | (53,725) | (2,211,764) | (46,971) | (1,810,491) |
| Net increase (decrease) | — | — | — | — | 148,461 | 6,023,687 | (3,595) | (139,500) |
| Class R4 | | | | | | | | |
| Subscriptions | 584,680 | 9,818,746 | 495,492 | 9,093,680 | 325,026 | 13,499,161 | 2,310,115 | 89,193,756 |
| Distributions reinvested | 60,225 | 1,031,656 | 568,047 | 9,572,736 | 19,278 | 871,179 | 95,799 | 3,833,333 |
| Redemptions | (502,049) | (8,413,601) | (1,492,520) | (27,409,512) | (748,422) | (30,957,447) | (12,076,499) | (488,580,771) |
| Net increase (decrease) | 142,856 | 2,436,801 | (428,981) | (8,743,096) | (404,118) | (16,587,107) | (9,670,585) | (395,553,682) |
| Class R5 | | | | | | | | |
| Subscriptions | 508,500 | 8,627,611 | 904,623 | 16,475,579 | 2,672,211 | 113,115,053 | 2,366,752 | 90,215,384 |
| Distributions reinvested | 88,470 | 1,526,102 | 896,900 | 15,226,488 | 77,214 | 3,461,513 | 103,055 | 4,001,510 |
| Redemptions | (561,291) | (9,512,145) | (2,784,189) | (50,798,909) | (1,349,109) | (57,408,540) | (3,057,775) | (116,417,523) |
| Net increase (decrease) | 35,679 | 641,568 | (982,666) | (19,096,842) | 1,400,316 | 59,168,026 | (587,968) | (22,200,629) |
| Class Y(a) | | | | | | | | |
| Subscriptions | 1,849,271 | 31,833,886 | 631,619 | 11,532,036 | 2,395,358 | 102,231,093 | 1,867,415 | 72,910,693 |
| Distributions reinvested | 195,224 | 3,389,085 | 1,502,317 | 25,706,160 | 60,074 | 2,715,338 | 83,697 | 3,278,372 |
| Redemptions | (4,364,034) | (75,174,766) | (3,702,598) | (70,187,193) | (3,088,082) | (136,129,354) | (3,723,583) | (138,860,801) |
| Net decrease | (2,319,539) | (39,951,795) | (1,568,662) | (32,948,997) | (632,650) | (31,182,923) | (1,772,471) | (62,671,736) |
| Class Z | | | | | | | | |
| Subscriptions | 8,576,348 | 138,749,997 | 12,510,656 | 225,203,283 | 5,408,351 | 222,815,683 | 10,938,039 | 423,737,709 |
| Distributions reinvested | 6,441,846 | 106,420,721 | 65,323,103 | 1,066,953,832 | 567,786 | 25,465,249 | 1,012,550 | 39,453,071 |
| Redemptions | (30,932,209) | (501,340,318) | (115,579,393) | (2,071,442,868) | (12,157,503) | (505,953,405) | (41,785,744) | (1,603,157,736) |
| Net decrease | (15,914,015) | (256,169,600) | (37,745,634) | (779,285,753) | (6,181,366) | (257,672,473) | (29,835,155) | (1,139,966,956) |
| Total net decrease | (35,014,457) | (501,260,965) | (49,000,817) | (1,063,279,983) | (10,663,866) | (444,692,320) | (48,780,458) | (1,887,104,246) |
| (a) | Effective March 27, 2017, Class I shares were redeemed or exchanged for Class Y shares. |
The accompanying Notes to Financial Statements are an integral part of this statement.
| 94 | Columbia Acorn Family of Funds | Semiannual Report 2017 |
Statement of Changes in Net Assets (continued)
| | Columbia
Acorn USA® | Columbia Acorn
International SelectSM |
| | Six Months Ended | Year Ended | Six Months Ended | Year Ended |
| | June 30, 2017 (Unaudited) | December 31, 2016 | June 30, 2017 (Unaudited) | December 31, 2016 |
| | Shares | Dollars ($) | Shares | Dollars ($) | Shares | Dollars ($) | Shares | Dollars ($) |
| Capital stock activity |
| Class A | | | | | | | | |
| Subscriptions | 276,310 | 4,326,063 | 570,239 | 10,137,511 | 249,073 | 5,992,741 | 144,898 | 3,073,366 |
| Distributions reinvested | 113,310 | 1,794,821 | 1,919,989 | 30,640,598 | — | — | 6,931 | 145,542 |
| Redemptions | (2,208,510) | (34,795,322) | (1,785,208) | (32,134,125) | (379,090) | (8,956,980) | (791,209) | (16,621,178) |
| Net increase (decrease) | (1,818,890) | (28,674,438) | 705,020 | 8,643,984 | (130,017) | (2,964,239) | (639,380) | (13,402,270) |
| Class B | | | | | | | | |
| Redemptions | — | — | (1,541) | (21,538) | — | — | (984) | (18,165) |
| Net decrease | — | — | (1,541) | (21,538) | — | — | (984) | (18,165) |
| Class C | | | | | | | | |
| Subscriptions | 57,889 | 598,984 | 117,283 | 1,391,102 | 8,930 | 205,448 | 14,021 | 278,937 |
| Distributions reinvested | 52,927 | 552,032 | 573,317 | 6,404,572 | — | — | — | — |
| Redemptions | (253,161) | (2,658,959) | (566,118) | (7,483,741) | (32,902) | (745,500) | (66,643) | (1,312,570) |
| Net increase (decrease) | (142,345) | (1,507,943) | 124,482 | 311,933 | (23,972) | (540,052) | (52,622) | (1,033,633) |
| Class I(a) | | | | | | | | |
| Redemptions | (70) | (1,266) | — | — | (92) | (2,211) | — | — |
| Net decrease | (70) | (1,266) | — | — | (92) | (2,211) | — | — |
| Class R4 | | | | | | | | |
| Subscriptions | 551,088 | 10,668,498 | 182,950 | 4,045,095 | 5,935 | 142,221 | 37,828 | 786,212 |
| Distributions reinvested | 22,342 | 427,408 | 139,452 | 2,636,761 | — | — | 541 | 11,569 |
| Redemptions | (123,171) | (2,375,310) | (338,183) | (6,985,619) | (4,915) | (119,626) | (28,908) | (628,248) |
| Net increase (decrease) | 450,259 | 8,720,596 | (15,781) | (303,763) | 1,020 | 22,595 | 9,461 | 169,533 |
| Class R5 | | | | | | | | |
| Subscriptions | 33,868 | 638,323 | 204,798 | 4,201,531 | 3,596 | 85,829 | 6,007 | 129,000 |
| Distributions reinvested | 21,064 | 405,054 | 314,491 | 6,082,419 | — | — | 220 | 4,710 |
| Redemptions | (675,429) | (13,039,418) | (939,630) | (19,229,210) | (4,936) | (121,099) | (90,410) | (1,874,479) |
| Net decrease | (620,497) | (11,996,041) | (420,341) | (8,945,260) | (1,340) | (35,270) | (84,183) | (1,740,769) |
| Class Y(a) | | | | | | | | |
| Subscriptions | 155,430 | 2,913,994 | 160,115 | 3,363,597 | 5,683 | 135,450 | 9,194 | 207,948 |
| Distributions reinvested | 62,364 | 1,207,369 | 722,739 | 13,771,606 | — | — | 166 | 3,550 |
| Redemptions | (96,068) | (1,832,253) | (591,947) | (11,971,994) | (9,641) | (223,304) | (24,953) | (526,808) |
| Net increase (decrease) | 121,726 | 2,289,110 | 290,907 | 5,163,209 | (3,958) | (87,854) | (15,593) | (315,310) |
| Class Z | | | | | | | | |
| Subscriptions | 933,585 | 16,800,572 | 2,044,441 | 42,076,329 | 490,601 | 11,734,105 | 496,718 | 10,632,273 |
| Distributions reinvested | 782,802 | 14,340,933 | 9,206,155 | 166,971,786 | — | — | 25,779 | 547,806 |
| Redemptions | (3,168,249) | (57,550,885) | (17,240,685) | (343,518,307) | (511,777) | (12,322,651) | (1,578,100) | (33,618,763) |
| Net decrease | (1,451,862) | (26,409,380) | (5,990,089) | (134,470,192) | (21,176) | (588,546) | (1,055,603) | (22,438,684) |
| Total net decrease | (3,461,679) | (57,579,362) | (5,307,343) | (129,621,627) | (179,535) | (4,195,577) | (1,838,904) | (38,779,298) |
| (a) | Effective March 27, 2017, Class I shares were redeemed or exchanged for Class Y shares. |
The accompanying Notes to Financial Statements are an integral part of this statement.
Columbia Acorn Family of Funds | Semiannual Report 2017
| 95 |
Statement of Changes in Net Assets (continued)
| | Columbia
Acorn SelectSM | Columbia
Thermostat FundSM |
| | Six Months Ended | Year Ended | Six Months Ended | Year Ended |
| | June 30, 2017 (Unaudited) | December 31, 2016 | June 30, 2017 (Unaudited) | December 31, 2016 |
| | Shares | Dollars ($) | Shares | Dollars ($) | Shares | Dollars ($) | Shares | Dollars ($) |
| Capital stock activity |
| Class A | | | | | | | | |
| Subscriptions | 628,251 | 8,686,279 | 504,342 | 6,690,492 | 1,095,341 | 16,181,552 | 8,041,017 | 116,448,340 |
| Distributions reinvested | 593,372 | 7,874,053 | 1,437,616 | 19,010,001 | 366,581 | 5,414,399 | 598,148 | 8,686,416 |
| Redemptions | (2,328,695) | (31,878,357) | (3,388,242) | (45,317,466) | (8,924,123) | (131,729,251) | (8,433,395) | (122,528,839) |
| Net increase (decrease) | (1,107,072) | (15,318,025) | (1,446,284) | (19,616,973) | (7,462,201) | (110,133,300) | 205,770 | 2,605,917 |
| Class B | | | | | | | | |
| Redemptions | — | — | (26,947) | (277,346) | — | — | (20,546) | (294,082) |
| Net decrease | — | — | (26,947) | (277,346) | — | — | (20,546) | (294,082) |
| Class C | | | | | | | | |
| Subscriptions | 34,608 | 323,676 | 247,884 | 2,349,868 | 687,691 | 10,176,230 | 3,516,437 | 51,108,804 |
| Distributions reinvested | 286,451 | 2,560,873 | 573,270 | 5,430,627 | 237,340 | 3,519,764 | 433,622 | 6,322,208 |
| Redemptions | (836,660) | (8,106,911) | (1,129,045) | (11,022,448) | (4,369,346) | (64,651,819) | (6,071,444) | (88,504,045) |
| Net decrease | (515,601) | (5,222,362) | (307,891) | (3,241,953) | (3,444,315) | (50,955,825) | (2,121,385) | (31,073,033) |
| Class I(a) | | | | | | | | |
| Subscriptions | — | — | 2,747,662 | 39,487,939 | — | — | — | — |
| Distributions reinvested | — | — | 231,745 | 3,413,645 | — | — | — | — |
| Redemptions | (738,244) | (11,402,065) | (3,993,682) | (59,895,103) | — | — | — | — |
| Net decrease | (738,244) | (11,402,065) | (1,014,275) | (16,993,519) | — | — | — | — |
| Class R4 | | | | | | | | |
| Subscriptions | 82,275 | 1,289,357 | 20,875 | 314,488 | 221,672 | 3,255,978 | 628,375 | 9,077,683 |
| Distributions reinvested | 4,931 | 76,385 | 9,104 | 137,648 | 19,061 | 279,431 | 26,865 | 387,442 |
| Redemptions | (25,074) | (399,193) | (32,975) | (491,350) | (367,907) | (5,391,086) | (803,020) | (11,457,488) |
| Net increase (decrease) | 62,132 | 966,549 | (2,996) | (39,214) | (127,174) | (1,855,677) | (147,780) | (1,992,363) |
| Class R5 | | | | | | | | |
| Subscriptions | 33,505 | 522,771 | 34,905 | 518,997 | 251,436 | 3,690,573 | 641,667 | 9,116,272 |
| Distributions reinvested | 5,001 | 77,809 | 11,146 | 169,161 | 15,851 | 232,531 | 22,173 | 319,988 |
| Redemptions | (11,836) | (189,654) | (35,794) | (532,564) | (220,532) | (3,234,641) | (264,332) | (3,843,375) |
| Net increase | 26,670 | 410,926 | 10,257 | 155,594 | 46,755 | 688,463 | 399,508 | 5,592,885 |
| Class Y(a) | | | | | | | | |
| Subscriptions | 1,568,962 | 25,642,221 | 86,025 | 1,305,072 | 1,198 | 17,547 | 4,847 | 70,136 |
| Distributions reinvested | 129,932 | 2,038,635 | 44,223 | 675,474 | 546 | 8,000 | 701 | 10,096 |
| Redemptions | (500,005) | (7,928,123) | (162,905) | (2,480,014) | (1,238) | (18,058) | (2,796) | (40,341) |
| Net increase (decrease) | 1,198,889 | 19,752,733 | (32,657) | (499,468) | 506 | 7,489 | 2,752 | 39,891 |
| Class Z | | | | | | | | |
| Subscriptions | 1,164,841 | 17,834,701 | 573,558 | 8,420,465 | 6,392,366 | 92,989,678 | 7,615,049 | 109,081,660 |
| Distributions reinvested | 707,593 | 10,564,363 | 1,406,945 | 20,616,589 | 348,707 | 5,084,149 | 426,415 | 6,116,187 |
| Redemptions | (1,264,217) | (19,278,351) | (4,164,970) | (61,166,990) | (6,334,157) | (92,467,087) | (7,344,820) | (105,190,921) |
| Net increase (decrease) | 608,217 | 9,120,713 | (2,184,467) | (32,129,936) | 406,916 | 5,606,740 | 696,644 | 10,006,926 |
| Total net decrease | (465,009) | (1,691,531) | (5,005,260) | (72,642,815) | (10,579,513) | (156,642,110) | (985,037) | (15,113,859) |
| (a) | Effective March 27, 2017, Class I shares were redeemed or exchanged for Class Y shares. |
The accompanying Notes to Financial Statements are an integral part of this statement.
| 96 | Columbia Acorn Family of Funds | Semiannual Report 2017 |
Statement of Changes in Net Assets (continued)
| | Columbia Acorn
Emerging Markets FundSM | Columbia Acorn
European FundSM |
| | Six Months Ended | Year Ended | Six Months Ended | Year Ended |
| | June 30, 2017 (Unaudited) | December 31, 2016 | June 30, 2017 (Unaudited)(a) | December 31, 2016 |
| | Shares | Dollars ($) | Shares | Dollars ($) | Shares | Dollars ($) | Shares | Dollars ($) |
| Capital stock activity |
| Class A | | | | | | | | |
| Subscriptions | 233,744 | 2,540,331 | 511,014 | 5,151,768 | 396,951 | 6,564,008 | 614,988 | 8,800,628 |
| Distributions reinvested | — | — | 38,980 | 390,579 | 3,490 | 61,767 | 18,095 | 259,128 |
| Redemptions | (2,448,659) | (25,920,358) | (4,201,955) | (43,044,856) | (1,130,312) | (17,506,086) | (1,508,418) | (21,629,960) |
| Net decrease | (2,214,915) | (23,380,027) | (3,651,961) | (37,502,509) | (729,871) | (10,880,311) | (875,335) | (12,570,204) |
| Class C | | | | | | | | |
| Subscriptions | 46,844 | 504,853 | 87,820 | 876,756 | 140,174 | 2,268,497 | 189,633 | 2,692,628 |
| Distributions reinvested | — | — | — | — | 911 | 15,971 | 926 | 14,070 |
| Redemptions | (325,886) | (3,536,903) | (752,453) | (7,590,091) | (65,938) | (1,032,846) | (175,620) | (2,481,569) |
| Net increase (decrease) | (279,042) | (3,032,050) | (664,633) | (6,713,335) | 75,147 | 1,251,622 | 14,939 | 225,129 |
| Class I(b) | | | | | | | | |
| Distributions reinvested | — | — | 2 | 23 | — | — | 2 | 29 |
| Redemptions | (205) | (2,259) | — | — | (173) | (2,700) | — | — |
| Net increase (decrease) | (205) | (2,259) | 2 | 23 | (173) | (2,700) | 2 | 29 |
| Class R4 | | | | | | | | |
| Subscriptions | 15,198 | 169,841 | 48,605 | 497,849 | 7,466 | 115,914 | 6,570 | 97,107 |
| Distributions reinvested | — | — | 1,429 | 14,438 | 104 | 1,840 | 296 | 4,213 |
| Redemptions | (54,270) | (596,079) | (253,438) | (2,611,137) | (1,128) | (16,953) | (8,873) | (126,268) |
| Net increase (decrease) | (39,072) | (426,238) | (203,404) | (2,098,850) | 6,442 | 100,801 | (2,007) | (24,948) |
| Class R5 | | | | | | | | |
| Subscriptions | 20,357 | 228,055 | 79,534 | 799,097 | 158,351 | 2,680,211 | 13,780 | 200,355 |
| Distributions reinvested | — | — | 966 | 9,749 | 752 | 13,452 | 997 | 14,301 |
| Redemptions | (18,383) | (201,060) | (1,224,039) | (12,729,815) | (18,626) | (307,218) | (68,695) | (1,011,199) |
| Net increase (decrease) | 1,974 | 26,995 | (1,143,539) | (11,920,969) | 140,477 | 2,386,445 | (53,918) | (796,543) |
| Class Y(b) | | | | | | | | |
| Subscriptions | — | — | — | — | 1,565 | 26,844 | — | — |
| Distributions reinvested | — | — | — | — | 3 | 56 | — | — |
| Net increase | — | — | — | — | 1,568 | 26,900 | — | — |
| Class Z | | | | | | | | |
| Subscriptions | 1,856,810 | 19,747,812 | 1,761,120 | 18,169,951 | 1,235,257 | 19,830,300 | 767,402 | 10,950,673 |
| Distributions reinvested | — | — | 50,737 | 508,887 | 5,392 | 95,552 | 8,898 | 126,581 |
| Redemptions | (1,340,536) | (14,646,776) | (12,253,429) | (119,474,532) | (202,113) | (3,282,517) | (770,123) | (10,997,473) |
| Net increase (decrease) | 516,274 | 5,101,036 | (10,441,572) | (100,795,694) | 1,038,536 | 16,643,335 | 6,177 | 79,781 |
| Total net increase (decrease) | (2,014,986) | (21,712,543) | (16,105,107) | (159,031,334) | 532,126 | 9,526,092 | (910,142) | (13,086,756) |
| (a) | Class Y shares are based on operations from March 1, 2017 (commencement of operations) through the stated period end. |
| (b) | Effective March 27, 2017, Class I shares were redeemed or exchanged for Class Y shares. |
The accompanying Notes to Financial Statements are an integral part of this statement.
Columbia Acorn Family of Funds | Semiannual Report 2017
| 97 |
Financial Highlights
Columbia Acorn® Fund
The following tables are intended to help you understand the Fund’s financial performance. Certain information reflects financial results for a single share of a class held for the periods shown. Per share net investment income (loss) amounts are calculated based on average shares outstanding during the period. Total return assumes reinvestment of all dividends and distributions, if any. Total return does not reflect payment of sales charges, if any. Total return and portfolio turnover are not annualized for periods of less than one year. The portfolio turnover rate is calculated without regard to purchase and sales transactions of short-term instruments and certain derivatives, if any. If such transactions were included, the Fund’s portfolio turnover rate may be higher.
| Year ended (except as noted) | Net asset value,
beginning of
period | Net
investment
income
(loss) | Net
realized
and
unrealized
gain (loss) | Total from
investment
operations | Distributions
from net
investment
income | Distributions
from net
realized
gains |
| Class A |
| 6/30/2017 (b) | $13.35 | (0.00) (c) | 1.63 | 1.63 | — | (0.56) |
| 12/31/2016 | $17.63 | (0.03) | 1.73 | 1.70 | — | (5.98) |
| 12/31/2015 | $30.30 | (0.12) | (0.27) (g) | (0.39) | — | (12.28) |
| 12/31/2014 | $35.78 | (0.08) | 0.21 | 0.13 | — | (5.61) |
| 12/31/2013 | $29.36 | (0.06) | 8.84 | 8.78 | (0.04) | (2.32) |
| 12/31/2012 | $26.63 | 0.08 | 4.53 | 4.61 | (0.06) | (1.82) |
| Class C |
| 6/30/2017 (b) | $8.34 | (0.03) | 1.01 | 0.98 | — | (0.56) |
| 12/31/2016 | $13.16 | (0.11) | 1.27 | 1.16 | — | (5.98) |
| 12/31/2015 | $25.92 | (0.27) | (0.21) (g) | (0.48) | — | (12.28) |
| 12/31/2014 | $31.64 | (0.28) | 0.17 | (0.11) | — | (5.61) |
| 12/31/2013 | $26.34 | (0.26) | 7.88 | 7.62 | — | (2.32) |
| 12/31/2012 | $24.18 | (0.12) | 4.10 | 3.98 | — | (1.82) |
| Class R4 |
| 6/30/2017 (b) | $15.83 | 0.02 | 1.93 | 1.95 | — | (0.56) |
| 12/31/2016 | $19.84 | 0.00 (c) | 1.97 | 1.97 | — | (5.98) |
| 12/31/2015 | $32.51 | (0.07) | (0.32) (g) | (0.39) | — | (12.28) |
| 12/31/2014 | $37.88 | 0.02 | 0.22 | 0.24 | — | (5.61) |
| 12/31/2013 | $30.90 | 0.06 | 9.29 | 9.35 | (0.05) | (2.32) |
| 12/31/2012 (h) | $30.59 | 0.05 | 1.84 | 1.89 | (0.12) | (1.46) |
The accompanying Notes to Financial Statements are an integral part of this statement.
| 98 | Columbia Acorn Family of Funds | Semiannual Report 2017 |
Total
distributions to
shareholders | Net
asset
value,
end of
period | Total
return | Total gross
expense
ratio to
average
net assets(a) | Total net
expense
ratio to
average
net assets(a) | Net investment
income (loss)
ratio to
average
net assets | Portfolio
turnover | Net
assets,
end of
period
(000’s) |
| |
| (0.56) | $14.42 | 12.27% | 1.08% (d) | 1.08% (d),(e) | (0.02%) (d) | 35% | $858,519 |
| (5.98) | $13.35 | 10.06% | 1.10% (f) | 1.10% (f) | (0.21%) | 85% | $931,460 |
| (12.28) | $17.63 | (1.87%) | 1.08% | 1.08% | (0.39%) | 21% | $1,388,893 |
| (5.61) | $30.30 | 0.55% | 1.08% | 1.08% | (0.22%) | 17% | $2,694,610 |
| (2.36) | $35.78 | 30.53% | 1.07% | 1.07% | (0.17%) | 18% | $3,869,734 |
| (1.88) | $29.36 | 17.62% | 1.06% | 1.06% (e) | 0.27% | 16% | $3,233,494 |
| |
| (0.56) | $8.76 | 11.84% | 1.83% (d) | 1.83% (d),(e) | (0.78%) (d) | 35% | $264,294 |
| (5.98) | $8.34 | 9.29% | 1.84% (f) | 1.84% (f) | (0.95%) | 85% | $302,119 |
| (12.28) | $13.16 | (2.57%) | 1.80% | 1.80% | (1.11%) | 21% | $456,348 |
| (5.61) | $25.92 | (0.16%) | 1.77% | 1.77% | (0.92%) | 17% | $776,370 |
| (2.32) | $31.64 | 29.58% | 1.78% | 1.78% | (0.88%) | 18% | $938,644 |
| (1.82) | $26.34 | 16.77% | 1.80% | 1.80% (e) | (0.46%) | 16% | $756,709 |
| |
| (0.56) | $17.22 | 12.37% | 0.83% (d) | 0.83% (d),(e) | 0.24% (d) | 35% | $38,766 |
| (5.98) | $15.83 | 10.32% | 0.89% (f) | 0.89% (f) | — | 85% | $33,378 |
| (12.28) | $19.84 | (1.75%) | 0.89% | 0.89% | (0.23%) | 21% | $50,335 |
| (5.61) | $32.51 | 0.81% | 0.84% | 0.84% | 0.05% | 17% | $250,457 |
| (2.37) | $37.88 | 30.85% | 0.80% | 0.80% | 0.16% | 18% | $74,188 |
| (1.58) | $30.90 | 6.31% | 0.87% (d) | 0.86% (d),(e) | 1.24% (d) | 16% | $17 |
Columbia Acorn Family of Funds | Semiannual Report 2017
| 99 |
Financial Highlights (continued)
Columbia Acorn® Fund
| Year ended (except as noted) | Net asset value,
beginning of
period | Net
investment
income
(loss) | Net
realized
and
unrealized
gain (loss) | Total from
investment
operations | Distributions
from net
investment
income | Distributions
from net
realized
gains |
| Class R5 |
| 6/30/2017 (b) | $15.94 | 0.02 | 1.94 | 1.96 | — | (0.56) |
| 12/31/2016 | $19.92 | 0.01 | 1.99 | 2.00 | — | (5.98) |
| 12/31/2015 | $32.55 | (0.04) | (0.31) (g) | (0.35) | — | (12.28) |
| 12/31/2014 | $37.89 | 0.04 | 0.23 | 0.27 | — | (5.61) |
| 12/31/2013 | $30.88 | 0.07 | 9.30 | 9.37 | (0.04) | (2.32) |
| 12/31/2012 (i) | $30.59 | 0.06 | 1.83 | 1.89 | (0.14) | (1.46) |
| Class Y |
| 6/30/2017 (b) | $16.04 | 0.02 | 1.95 | 1.97 | — | (0.56) |
| 12/31/2016 | $20.00 | 0.02 | 2.00 | 2.02 | — | (5.98) |
| 12/31/2015 | $32.61 | (0.02) | (0.31) (g) | (0.33) | — | (12.28) |
| 12/31/2014 | $37.93 | 0.05 | 0.24 | 0.29 | — | (5.61) |
| 12/31/2013 | $30.90 | 0.09 | 9.31 | 9.40 | (0.05) | (2.32) |
| 12/31/2012 (j) | $30.62 | 0.09 | 1.80 | 1.89 | (0.15) | (1.46) |
| Class Z |
| 6/30/2017 (b) | $15.29 | 0.02 | 1.86 | 1.88 | — | (0.56) |
| 12/31/2016 | $19.34 | 0.01 | 1.92 | 1.93 | — | (5.98) |
| 12/31/2015 | $31.95 | (0.04) | (0.29) (g) | (0.33) | — | (12.28) |
| 12/31/2014 | $37.32 | 0.02 | 0.22 | 0.24 | — | (5.61) |
| 12/31/2013 | $30.45 | 0.04 | 9.19 | 9.23 | (0.04) | (2.32) |
| 12/31/2012 | $27.56 | 0.17 | 4.69 | 4.86 | (0.15) | (1.82) |
| Notes to Financial Highlights |
| (a) | In addition to the fees and expenses that the Fund bears directly, the Fund indirectly bears a pro rata share of the fees and expenses of any other funds in which it invests, if any. Such indirect expenses are not included in the Fund’s reported expense ratios. |
| (b) | For the six months ended June 30, 2017 (unaudited). |
| (c) | Rounds to zero. |
| (d) | Annualized. |
| (e) | The benefits derived from expense reductions had an impact of less than 0.01%. |
| (f) | Ratios include line of credit interest expense which is less than 0.01%. |
| (g) | Calculation of the net gain (loss) per share (both realized and unrealized) does not correlate to the aggregate realized and unrealized gain (loss) presented in the Statement of Operations due to the timing of subscriptions and redemptions of Fund shares in relation to fluctuations in the market value of the portfolio. |
| (h) | Class R4 shares commenced operations on November 8, 2012. Per share data and total return reflect activity from that date. |
| (i) | Class R5 shares commenced operations on November 8, 2012. Per share data and total return reflect activity from that date. |
| (j) | Class Y shares commenced operations on November 8, 2012. Per share data and total return reflect activity from that date. |
The accompanying Notes to Financial Statements are an integral part of this statement.
| 100 | Columbia Acorn Family of Funds | Semiannual Report 2017 |
Total
distributions to
shareholders | Net
asset
value,
end of
period | Total
return | Total gross
expense
ratio to
average
net assets(a) | Total net
expense
ratio to
average
net assets(a) | Net investment
income (loss)
ratio to
average
net assets | Portfolio
turnover | Net
assets,
end of
period
(000’s) |
| |
| (0.56) | $17.34 | 12.34% | 0.81% (d) | 0.81% (d) | 0.25% (d) | 35% | $50,098 |
| (5.98) | $15.94 | 10.43% | 0.81% (f) | 0.81% (f) | 0.08% | 85% | $45,475 |
| (12.28) | $19.92 | (1.60%) | 0.77% | 0.77% | (0.11%) | 21% | $76,412 |
| (5.61) | $32.55 | 0.89% | 0.76% | 0.76% | 0.10% | 17% | $458,223 |
| (2.36) | $37.89 | 30.94% | 0.75% | 0.75% | 0.20% | 18% | $496,906 |
| (1.60) | $30.88 | 6.33% | 0.82% (d) | 0.81% (d),(e) | 1.29% (d) | 16% | $3 |
| |
| (0.56) | $17.45 | 12.33% | 0.76% (d) | 0.76% (d) | 0.26% (d) | 35% | $46,066 |
| (5.98) | $16.04 | 10.50% | 0.76% (f) | 0.76% (f) | 0.12% | 85% | $79,518 |
| (12.28) | $20.00 | (1.54%) | 0.73% | 0.73% | (0.06%) | 21% | $130,546 |
| (5.61) | $32.61 | 0.94% | 0.70% | 0.70% | 0.13% | 17% | $378,780 |
| (2.37) | $37.93 | 30.99% | 0.70% | 0.70% | 0.26% | 18% | $1,227,891 |
| (1.61) | $30.90 | 6.34% | 0.75% (d) | 0.75% (d),(e) | 2.21% (d) | 16% | $67,012 |
| |
| (0.56) | $16.61 | 12.35% | 0.83% (d) | 0.83% (d),(e) | 0.23% (d) | 35% | $3,457,794 |
| (5.98) | $15.29 | 10.39% | 0.82% (f) | 0.82% (f) | 0.07% | 85% | $3,425,935 |
| (12.28) | $19.34 | (1.57%) | 0.80% | 0.80% | (0.11%) | 21% | $5,062,313 |
| (5.61) | $31.95 | 0.82% | 0.79% | 0.79% | 0.07% | 17% | $11,340,770 |
| (2.36) | $37.32 | 30.90% | 0.78% | 0.78% | 0.12% | 18% | $14,703,948 |
| (1.97) | $30.45 | 17.93% | 0.78% | 0.78% (e) | 0.57% | 16% | $13,374,355 |
Columbia Acorn Family of Funds | Semiannual Report 2017
| 101 |
Financial Highlights
Columbia Acorn International®
| Year ended (except as noted) | Net asset value,
beginning of
period | Net
investment
income | Net
realized
and
unrealized
gain (loss) | Total from
investment
operations | Distributions
from net
investment
income | Distributions
from net
realized
gains |
| Class A |
| 6/30/2017 (b) | $37.71 | 0.20 | 6.75 | 6.95 | (0.38) | — |
| 12/31/2016 | $39.08 | 0.35 | (1.31) | (0.96) | (0.15) | (0.26) |
| 12/31/2015 | $41.68 | 0.39 | (1.02) | (0.63) | (0.40) | (1.57) |
| 12/31/2014 | $46.63 | 0.42 | (2.51) | (2.09) | (0.55) | (2.31) |
| 12/31/2013 | $40.79 | 0.45 | 8.37 | 8.82 | (1.05) | (1.93) |
| 12/31/2012 | $34.15 | 0.47 | 6.75 | 7.22 | (0.58) | — |
| Class B |
| 6/30/2017 (b) | $36.38 | 0.10 | 6.53 | 6.63 | (0.28) | — |
| 12/31/2016 | $37.80 | 0.07 | (1.23) | (1.16) | — | (0.26) |
| 12/31/2015 | $40.38 | 0.02 | (1.01) | (0.99) | (0.02) | (1.57) |
| 12/31/2014 | $45.24 | 0.07 | (2.42) | (2.35) | (0.20) | (2.31) |
| 12/31/2013 | $39.67 | 0.12 | 8.10 | 8.22 | (0.72) | (1.93) |
| 12/31/2012 | $33.17 | 0.19 | 6.55 | 6.74 | (0.24) | — |
| Class C |
| 6/30/2017 (b) | $36.18 | 0.06 | 6.46 | 6.52 | (0.26) | — |
| 12/31/2016 | $37.65 | 0.05 | (1.26) | (1.21) | — | (0.26) |
| 12/31/2015 | $40.20 | 0.07 | (0.97) | (0.90) | (0.08) | (1.57) |
| 12/31/2014 | $45.04 | 0.07 | (2.40) | (2.33) | (0.20) | (2.31) |
| 12/31/2013 | $39.50 | 0.10 | 8.08 | 8.18 | (0.71) | (1.93) |
| 12/31/2012 | $33.03 | 0.18 | 6.52 | 6.70 | (0.23) | — |
| Class R |
| 6/30/2017 (b) | $37.71 | 0.27 | 6.63 | 6.90 | (0.38) | — |
| 12/31/2016 | $39.07 | 0.21 | (1.30) | (1.09) | (0.01) | (0.26) |
| 12/31/2015 | $41.67 | 0.23 | (1.02) | (0.79) | (0.24) | (1.57) |
| 12/31/2014 | $46.60 | 0.24 | (2.50) | (2.26) | (0.36) | (2.31) |
| 12/31/2013 | $40.79 | 0.26 | 8.36 | 8.62 | (0.88) | (1.93) |
| 12/31/2012 | $34.11 | 0.21 | 6.89 | 7.10 | (0.42) | — |
| Class R4 |
| 6/30/2017 (b) | $38.03 | 0.26 | 6.80 | 7.06 | (0.38) | — |
| 12/31/2016 | $39.41 | 0.48 | (1.38) | (0.90) | (0.22) | (0.26) |
| 12/31/2015 | $42.02 | 0.47 | (1.03) | (0.56) | (0.48) | (1.57) |
| 12/31/2014 | $46.99 | 0.50 | (2.52) | (2.02) | (0.64) | (2.31) |
| 12/31/2013 | $41.08 | 0.34 | 8.67 | 9.01 | (1.17) | (1.93) |
| 12/31/2012 (h) | $39.86 | (0.00) (f) | 1.81 | 1.81 | (0.59) | — |
| Class R5 |
| 6/30/2017 (b) | $37.72 | 0.29 | 6.72 | 7.01 | (0.38) | — |
| 12/31/2016 | $39.10 | 0.44 | (1.30) | (0.86) | (0.26) | (0.26) |
| 12/31/2015 | $41.71 | 0.54 | (1.05) | (0.51) | (0.53) | (1.57) |
| 12/31/2014 | $46.66 | 0.57 | (2.51) | (1.94) | (0.70) | (2.31) |
| 12/31/2013 | $40.81 | 0.63 | 8.34 | 8.97 | (1.19) | (1.93) |
| 12/31/2012 | $34.31 | 0.75 | 6.62 | 7.37 | (0.87) | — |
The accompanying Notes to Financial Statements are an integral part of this statement.
| 102 | Columbia Acorn Family of Funds | Semiannual Report 2017 |
Total
distributions to
shareholders | Proceeds from
regulatory
settlements | Net
asset
value,
end of
period | Total
return | Total gross
expense
ratio to
average
net assets(a) | Total net
expense
ratio to
average
net assets(a) | Net investment
income (loss)
ratio to
average
net assets | Portfolio
turnover | Net
assets,
end of
period
(000’s) |
| |
| (0.38) | — | $44.28 | 18.43% (c) | 1.21% (d) | 1.17% (d),(e) | 0.95% (d) | 22% | $494,953 |
| (0.41) | — | $37.71 | (2.51%) (c) | 1.27% | 1.23% | 0.90% | 46% | $576,235 |
| (1.97) | — | $39.08 | (1.59%) (c) | 1.28% | 1.24% | 0.93% | 50% | $812,479 |
| (2.86) | — | $41.68 | (4.58%) (c) | 1.26% | 1.22% | 0.91% | 28% | $946,553 |
| (2.98) | — | $46.63 | 22.00% (c) | 1.27% | 1.23% | 1.02% | 45% | $1,089,263 |
| (0.58) | 0.00 (f) | $40.79 | 21.21% (c) | 1.28% | 1.24% (g) | 1.22% | 33% | $1,007,236 |
| |
| (0.28) | — | $42.73 | 18.21% (c) | 1.71% (d) | 1.62% (d),(e) | 0.49% (d) | 22% | $268 |
| (0.26) | — | $36.38 | (3.11%) (c) | 2.22% | 1.91% | 0.18% | 46% | $487 |
| (1.59) | — | $37.80 | (2.53%) (c) | 2.17% | 2.14% | 0.05% | 50% | $1,628 |
| (2.51) | — | $40.38 | (5.29%) (c) | 2.00% | 1.97% | 0.16% | 28% | $6,516 |
| (2.65) | — | $45.24 | 21.08% (c) | 2.00% | 1.97% | 0.27% | 45% | $13,218 |
| (0.24) | 0.00 (f) | $39.67 | 20.33% (c) | 2.00% | 1.97% (g) | 0.51% | 33% | $17,910 |
| |
| (0.26) | — | $42.44 | 18.01% (c) | 1.96% (d) | 1.94% (d),(e) | 0.30% (d) | 22% | $63,191 |
| (0.26) | — | $36.18 | (3.26%) (c) | 2.01% | 1.99% | 0.13% | 46% | $64,548 |
| (1.65) | — | $37.65 | (2.33%) (c) | 2.01% | 1.99% | 0.18% | 50% | $88,606 |
| (2.51) | — | $40.20 | (5.27%) (c) | 1.99% | 1.97% | 0.16% | 28% | $103,691 |
| (2.64) | — | $45.04 | 21.07% (c) | 2.01% | 1.99% | 0.23% | 45% | $110,875 |
| (0.23) | 0.00 (f) | $39.50 | 20.31% (c) | 2.02% | 2.00% (g) | 0.48% | 33% | $92,748 |
| |
| (0.38) | — | $44.23 | 18.30% | 1.46% (d) | 1.46% (d),(e) | 1.30% (d) | 22% | $12,005 |
| (0.27) | — | $37.71 | (2.82%) | 1.55% | 1.55% | 0.55% | 46% | $4,637 |
| (1.81) | — | $39.07 | (1.98%) | 1.62% | 1.62% | 0.54% | 50% | $4,945 |
| (2.67) | — | $41.67 | (4.95%) | 1.63% | 1.63% | 0.52% | 28% | $5,560 |
| (2.81) | — | $46.60 | 21.50% | 1.63% | 1.63% | 0.58% | 45% | $5,822 |
| (0.42) | 0.00 (f) | $40.79 | 20.83% | 1.52% | 1.51% (g) | 0.54% | 33% | $2,799 |
| |
| (0.38) | — | $44.71 | 18.56% | 0.96% (d) | 0.96% (d),(e) | 1.25% (d) | 22% | $101,844 |
| (0.48) | — | $38.03 | (2.32%) | 1.05% | 1.05% | 1.22% | 46% | $101,988 |
| (2.05) | — | $39.41 | (1.41%) | 1.06% | 1.06% | 1.10% | 50% | $486,763 |
| (2.95) | — | $42.02 | (4.39%) | 1.04% | 1.04% | 1.07% | 28% | $424,425 |
| (3.10) | — | $46.99 | 22.32% | 1.03% | 1.03% | 0.73% | 45% | $355,616 |
| (0.59) | — | $41.08 | 4.57% | 1.03% (d) | 1.02% (d),(g) | (0.02%) (d) | 33% | $15 |
| |
| (0.38) | — | $44.35 | 18.58% | 0.93% (d) | 0.93% (d) | 1.40% (d) | 22% | $399,347 |
| (0.52) | — | $37.72 | (2.23%) | 0.93% | 0.93% | 1.15% | 46% | $286,786 |
| (2.10) | — | $39.10 | (1.29%) | 0.92% | 0.92% | 1.26% | 50% | $320,252 |
| (3.01) | — | $41.71 | (4.25%) | 0.90% | 0.90% | 1.23% | 28% | $397,882 |
| (3.12) | — | $46.66 | 22.38% | 0.91% | 0.91% | 1.40% | 45% | $274,415 |
| (0.87) | 0.00 (f) | $40.81 | 21.61% | 0.89% | 0.89% (g) | 1.99% | 33% | $242 |
Columbia Acorn Family of Funds | Semiannual Report 2017
| 103 |
Financial Highlights (continued)
Columbia Acorn International®
| Year ended (except as noted) | Net asset value,
beginning of
period | Net
investment
income | Net
realized
and
unrealized
gain (loss) | Total from
investment
operations | Distributions
from net
investment
income | Distributions
from net
realized
gains |
| Class Y |
| 6/30/2017 (b) | $38.02 | 0.32 | 6.76 | 7.08 | (0.38) | — |
| 12/31/2016 | $39.41 | 0.47 | (1.32) | (0.85) | (0.28) | (0.26) |
| 12/31/2015 | $42.02 | 0.53 | (1.01) | (0.48) | (0.56) | (1.57) |
| 12/31/2014 | $46.99 | 0.58 | (2.52) | (1.94) | (0.72) | (2.31) |
| 12/31/2013 | $41.08 | 0.57 | 8.48 | 9.05 | (1.21) | (1.93) |
| 12/31/2012 (i) | $39.90 | 0.04 | 1.78 | 1.82 | (0.64) | — |
| Class Z |
| 6/30/2017 (b) | $37.74 | 0.27 | 6.74 | 7.01 | (0.38) | — |
| 12/31/2016 | $39.12 | 0.44 | (1.32) | (0.88) | (0.24) | (0.26) |
| 12/31/2015 | $41.73 | 0.51 | (1.03) | (0.52) | (0.52) | (1.57) |
| 12/31/2014 | $46.68 | 0.56 | (2.51) | (1.95) | (0.69) | (2.31) |
| 12/31/2013 | $40.84 | 0.58 | 8.38 | 8.96 | (1.19) | (1.93) |
| 12/31/2012 | $34.31 | 0.59 | 6.78 | 7.37 | (0.84) | — |
| Notes to Financial Highlights |
| (a) | In addition to the fees and expenses that the Fund bears directly, the Fund indirectly bears a pro rata share of the fees and expenses of any other funds in which it invests, if any. Such indirect expenses are not included in the Fund’s reported expense ratios. |
| (b) | For the six months ended June 30, 2017 (unaudited). |
| (c) | Had the Investment Manager and/or Transfer Agent not waived fees and/or reimbursed a portion of expenses, total return would have been reduced. |
| (d) | Annualized. |
| (e) | The benefits derived from expense reductions had an impact of less than 0.01%. |
| (f) | Rounds to zero. |
| (g) | The benefits derived from custody fees paid indirectly had an impact of 0.01%. |
| (h) | Class R4 shares commenced operations on November 8, 2012. Per share data and total return reflect activity from that date. |
| (i) | Class Y shares commenced operations on November 8, 2012. Per share data and total return reflect activity from that date. |
The accompanying Notes to Financial Statements are an integral part of this statement.
| 104 | Columbia Acorn Family of Funds | Semiannual Report 2017 |
Total
distributions to
shareholders | Proceeds from
regulatory
settlements | Net
asset
value,
end of
period | Total
return | Total gross
expense
ratio to
average
net assets(a) | Total net
expense
ratio to
average
net assets(a) | Net investment
income (loss)
ratio to
average
net assets | Portfolio
turnover | Net
assets,
end of
period
(000’s) |
| |
| (0.38) | — | $44.72 | 18.62% | 0.88% (d) | 0.88% (d) | 1.52% (d) | 22% | $253,697 |
| (0.54) | — | $38.02 | (2.19%) | 0.88% | 0.88% | 1.20% | 46% | $239,733 |
| (2.13) | — | $39.41 | (1.23%) | 0.88% | 0.88% | 1.26% | 50% | $318,326 |
| (3.03) | — | $42.02 | (4.21%) | 0.85% | 0.85% | 1.25% | 28% | $225,012 |
| (3.14) | — | $46.99 | 22.44% | 0.86% | 0.86% | 1.26% | 45% | $155,140 |
| (0.64) | — | $41.08 | 4.59% | 0.91% (d) | 0.90% (d) | 0.75% (d) | 33% | $30,856 |
| |
| (0.38) | — | $44.37 | 18.57% | 0.96% (d) | 0.96% (d),(e) | 1.29% (d) | 22% | $3,671,795 |
| (0.50) | — | $37.74 | (2.28%) | 0.98% | 0.98% | 1.13% | 46% | $3,356,348 |
| (2.09) | — | $39.12 | (1.33%) | 0.97% | 0.97% | 1.21% | 50% | $4,645,797 |
| (3.00) | — | $41.73 | (4.28%) | 0.93% | 0.93% | 1.20% | 28% | $5,585,035 |
| (3.12) | — | $46.68 | 22.33% | 0.93% | 0.93% | 1.30% | 45% | $6,293,552 |
| (0.84) | 0.00 (f) | $40.84 | 21.60% | 0.93% | 0.93% (g) | 1.53% | 33% | $5,494,506 |
Columbia Acorn Family of Funds | Semiannual Report 2017
| 105 |
Financial Highlights
Columbia Acorn USA®
| Year ended (except as noted) | Net asset value,
beginning of
period | Net
investment
income
(loss) | Net
realized
and
unrealized
gain (loss) | Total from
investment
operations | Distributions
from net
investment
income | Distributions
from net
realized
gains |
| Class A |
| 6/30/2017 (b) | $14.95 | (0.03) | 1.71 | 1.68 | — | (0.56) |
| 12/31/2016 | $20.25 | (0.11) | 2.43 | 2.32 | — | (7.62) |
| 12/31/2015 | $29.13 | (0.18) | (0.18) (e) | (0.36) | — | (8.52) |
| 12/31/2014 | $34.15 | (0.20) | 1.22 | 1.02 | — | (6.04) |
| 12/31/2013 | $28.21 | (0.15) | 9.09 | 8.94 | — | (3.00) |
| 12/31/2012 | $25.94 | 0.02 | 4.73 | 4.75 | (0.11) | (2.37) |
| Class C |
| 6/30/2017 (b) | $10.05 | (0.06) | 1.15 | 1.09 | — | (0.56) |
| 12/31/2016 | $16.00 | (0.18) | 1.85 | 1.67 | — | (7.62) |
| 12/31/2015 | $24.98 | (0.33) | (0.13) (e) | (0.46) | — | (8.52) |
| 12/31/2014 | $30.33 | (0.37) | 1.06 | 0.69 | — | (6.04) |
| 12/31/2013 | $25.49 | (0.33) | 8.17 | 7.84 | — | (3.00) |
| 12/31/2012 | $23.72 | (0.16) | 4.30 | 4.14 | — | (2.37) |
| Class R4 |
| 6/30/2017 (b) | $17.93 | (0.01) | 2.06 | 2.05 | — | (0.56) |
| 12/31/2016 | $22.85 | (0.07) | 2.77 | 2.70 | — | (7.62) |
| 12/31/2015 | $31.70 | (0.13) | (0.20) (e) | (0.33) | — | (8.52) |
| 12/31/2014 | $36.55 | (0.11) | 1.30 | 1.19 | — | (6.04) |
| 12/31/2013 | $29.92 | 0.00 (h) | 9.63 | 9.63 | — | (3.00) |
| 12/31/2012 (i) | $30.06 | 0.06 | 2.28 | 2.34 | (0.16) | (2.32) |
| Class R5 |
| 6/30/2017 (b) | $18.02 | (0.01) | 2.07 | 2.06 | — | (0.56) |
| 12/31/2016 | $22.90 | (0.06) | 2.80 | 2.74 | — | (7.62) |
| 12/31/2015 | $31.71 | (0.10) | (0.19) (e) | (0.29) | — | (8.52) |
| 12/31/2014 | $36.53 | (0.06) | 1.28 | 1.22 | — | (6.04) |
| 12/31/2013 | $29.90 | 0.02 | 9.61 | 9.63 | — | (3.00) |
| 12/31/2012 (j) | $30.06 | 0.07 | 2.27 | 2.34 | (0.18) | (2.32) |
| Class Y |
| 6/30/2017 (b) | $18.14 | (0.00) | 2.08 | 2.08 | — | (0.56) |
| 12/31/2016 | $22.99 | (0.04) | 2.81 | 2.77 | — | (7.62) |
| 12/31/2015 | $31.80 | (0.08) | (0.21) (e) | (0.29) | — | (8.52) |
| 12/31/2014 | $36.59 | (0.07) | 1.32 | 1.25 | — | (6.04) |
| 12/31/2013 | $29.93 | 0.02 | 9.64 | 9.66 | — | (3.00) |
| 12/31/2012 (k) | $30.10 | 0.07 | 2.27 | 2.34 | (0.19) | (2.32) |
The accompanying Notes to Financial Statements are an integral part of this statement.
| 106 | Columbia Acorn Family of Funds | Semiannual Report 2017 |
Total
distributions to
shareholders | Net
asset
value,
end of
period | Total
return | Total gross
expense
ratio to
average
net assets(a) | Total net
expense
ratio to
average
net assets(a) | Net investment
income (loss)
ratio to
average
net assets | Portfolio
turnover | Net
assets,
end of
period
(000’s) |
| |
| (0.56) | $16.07 | 11.27% | 1.39% (c) | 1.39% (c),(d) | (0.43%) (c) | 41% | $57,545 |
| (7.62) | $14.95 | 12.70% | 1.41% | 1.41% | (0.58%) | 98% | $80,721 |
| (8.52) | $20.25 | (1.60%) | 1.34% | 1.34% | (0.63%) | 35% | $95,048 |
| (6.04) | $29.13 | 3.35% | 1.33% | 1.33% | (0.60%) | 12% | $148,089 |
| (3.00) | $34.15 | 32.34% | 1.32% | 1.32% | (0.46%) | 17% | $201,559 |
| (2.48) | $28.21 | 18.67% | 1.32% (f) | 1.32% (f),(g) | 0.08% | 14% | $152,164 |
| |
| (0.56) | $10.58 | 10.89% | 2.14% (c) | 2.14% (c),(d) | (1.17%) (c) | 41% | $11,217 |
| (7.62) | $10.05 | 11.92% | 2.13% | 2.13% | (1.31%) | 98% | $12,088 |
| (8.52) | $16.00 | (2.28%) | 2.02% | 2.02% | (1.32%) | 35% | $17,255 |
| (6.04) | $24.98 | 2.67% | 2.00% | 2.00% | (1.26%) | 12% | $36,476 |
| (3.00) | $30.33 | 31.47% | 2.00% | 2.00% | (1.14%) | 17% | $40,395 |
| (2.37) | $25.49 | 17.82% | 2.05% (f) | 2.05% (f),(g) | (0.61%) | 14% | $31,410 |
| |
| (0.56) | $19.42 | 11.46% | 1.16% (c) | 1.16% (c),(d) | (0.13%) (c) | 41% | $15,425 |
| (7.62) | $17.93 | 12.93% | 1.18% | 1.18% | (0.35%) | 98% | $6,172 |
| (8.52) | $22.85 | (1.36%) | 1.12% | 1.12% | (0.40%) | 35% | $8,224 |
| (6.04) | $31.70 | 3.60% | 1.07% | 1.07% | (0.32%) | 12% | $7,952 |
| (3.00) | $36.55 | 32.80% | 1.00% | 1.00% | 0.01% | 17% | $6,441 |
| (2.48) | $29.92 | 8.06% | 1.14% (c),(f) | 1.14% (c),(f),(g) | 1.51% (c) | 14% | $15 |
| |
| (0.56) | $19.52 | 11.46% | 1.05% (c) | 1.05% (c) | (0.11%) (c) | 41% | $2,798 |
| (7.62) | $18.02 | 13.09% | 1.07% | 1.07% | (0.27%) | 98% | $13,764 |
| (8.52) | $22.90 | (1.23%) | 1.01% | 1.01% | (0.30%) | 35% | $27,112 |
| (6.04) | $31.71 | 3.68% | 0.99% | 0.99% | (0.17%) | 12% | $36,689 |
| (3.00) | $36.53 | 32.83% | 0.97% | 0.97% | 0.06% | 17% | $6,068 |
| (2.50) | $29.90 | 8.06% | 1.12% (c) | 1.12% (c),(g) | 1.53% (c) | 14% | $2 |
| |
| (0.56) | $19.66 | 11.49% | 1.01% (c) | 1.01% (c) | (0.03%) (c) | 41% | $43,727 |
| (7.62) | $18.14 | 13.18% | 1.01% | 1.01% | (0.18%) | 98% | $38,136 |
| (8.52) | $22.99 | (1.23%) | 0.97% | 0.97% | (0.25%) | 35% | $41,658 |
| (6.04) | $31.80 | 3.76% | 0.93% | 0.93% | (0.19%) | 12% | $35,551 |
| (3.00) | $36.59 | 32.89% | 0.93% | 0.93% | 0.07% | 17% | $48,479 |
| (2.51) | $29.93 | 8.07% | 1.04% (c) | 1.04% (c),(g) | 1.62% (c) | 14% | $2 |
Columbia Acorn Family of Funds | Semiannual Report 2017
| 107 |
Financial Highlights (continued)
Columbia Acorn USA®
| Year ended (except as noted) | Net asset value,
beginning of
period | Net
investment
income
(loss) | Net
realized
and
unrealized
gain (loss) | Total from
investment
operations | Distributions
from net
investment
income | Distributions
from net
realized
gains |
| Class Z |
| 6/30/2017 (b) | $17.20 | (0.02) | 1.98 | 1.96 | — | (0.56) |
| 12/31/2016 | $22.19 | (0.07) | 2.70 | 2.63 | — | (7.62) |
| 12/31/2015 | $31.03 | (0.12) | (0.20) (e) | (0.32) | — | (8.52) |
| 12/31/2014 | $35.90 | (0.12) | 1.29 | 1.17 | — | (6.04) |
| 12/31/2013 | $29.45 | (0.07) | 9.52 | 9.45 | — | (3.00) |
| 12/31/2012 | $26.98 | 0.11 | 4.92 | 5.03 | (0.19) | (2.37) |
| Notes to Financial Highlights |
| (a) | In addition to the fees and expenses that the Fund bears directly, the Fund indirectly bears a pro rata share of the fees and expenses of any other funds in which it invests. Such indirect expenses are not included in the Fund’s reported expense ratios. |
| (b) | For the six months ended June 30, 2017 (unaudited). |
| (c) | Annualized. |
| (d) | The benefits derived from expense reductions had an impact of less than 0.01%. |
| (e) | Calculation of the net gain (loss) per share (both realized and unrealized) does not correlate to the aggregate realized and unrealized gain (loss) presented in the Statement of Operations due to the timing of subscriptions and redemptions of Fund shares in relation to fluctuations in the market value of the portfolio. |
| (f) | Ratios include line of credit interest expense which is less than 0.01%. |
| (g) | The benefits derived from custody fees paid indirectly had an impact of less than 0.01%. |
| (h) | Rounds to zero. |
| (i) | Class R4 shares commenced operations on November 8, 2012. Per share data and total return reflect activity from that date. |
| (j) | Class R5 shares commenced operations on November 8, 2012. Per share data and total return reflect activity from that date. |
| (k) | Class Y shares commenced operations on November 8, 2012. Per share data and total return reflect activity from that date. |
The accompanying Notes to Financial Statements are an integral part of this statement.
| 108 | Columbia Acorn Family of Funds | Semiannual Report 2017 |
Total
distributions to
shareholders | Net
asset
value,
end of
period | Total
return | Total gross
expense
ratio to
average
net assets(a) | Total net
expense
ratio to
average
net assets(a) | Net investment
income (loss)
ratio to
average
net assets | Portfolio
turnover | Net
assets,
end of
period
(000’s) |
| |
| (0.56) | $18.60 | 11.42% | 1.15% (c) | 1.15% (c),(d) | (0.17%) (c) | 41% | $505,843 |
| (7.62) | $17.20 | 13.00% | 1.16% | 1.16% | (0.34%) | 98% | $492,739 |
| (8.52) | $22.19 | (1.36%) | 1.10% | 1.10% | (0.40%) | 35% | $768,658 |
| (6.04) | $31.03 | 3.61% | 1.08% | 1.08% | (0.34%) | 12% | $1,132,223 |
| (3.00) | $35.90 | 32.72% | 1.06% | 1.06% | (0.20%) | 17% | $1,496,775 |
| (2.56) | $29.45 | 18.98% | 1.07% (f) | 1.07% (f),(g) | 0.36% | 14% | $1,415,442 |
Columbia Acorn Family of Funds | Semiannual Report 2017
| 109 |
Financial Highlights
Columbia Acorn International SelectSM
| Year ended (except as noted) | Net asset value,
beginning of
period | Net
investment
income
(loss) | Net
realized
and
unrealized
gain (loss) | Total from
investment
operations | Distributions
from net
investment
income | Distributions
from net
realized
gains | Tax
return of
capital |
| Class A |
| 6/30/2017 (b) | $21.36 | 0.05 | 4.25 | 4.30 | — | — | — |
| 12/31/2016 | $21.33 | 0.10 | 0.09 (e) | 0.19 | (0.14) | — | (0.02) |
| 12/31/2015 | $22.04 | 0.17 | (0.45) | (0.28) | (0.42) | — | (0.01) |
| 12/31/2014 | $26.91 | 0.29 | (2.17) | (1.88) | (0.10) | (2.89) | — |
| 12/31/2013 | $25.61 | 0.29 | 3.29 | 3.58 | (0.37) | (1.91) | — |
| 12/31/2012 | $24.26 | 0.39 | 4.92 | 5.31 | (1.75) | (2.21) | — |
| Class C |
| 6/30/2017 (b) | $19.99 | (0.03) | 3.97 | 3.94 | — | — | — |
| 12/31/2016 | $19.96 | (0.06) | 0.09 (e) | 0.03 | — | — | — |
| 12/31/2015 | $20.54 | (0.01) | (0.41) | (0.42) | (0.15) | — | (0.01) |
| 12/31/2014 | $25.39 | 0.07 | (2.03) | (1.96) | — | (2.89) | — |
| 12/31/2013 | $24.28 | 0.08 | 3.10 | 3.18 | (0.16) | (1.91) | — |
| 12/31/2012 | $23.17 | 0.18 | 4.67 | 4.85 | (1.53) | (2.21) | — |
| Class R4 |
| 6/30/2017 (b) | $21.77 | 0.09 | 4.33 | 4.42 | — | — | — |
| 12/31/2016 | $21.74 | 0.17 | 0.08 (e) | 0.25 | (0.20) | — | (0.02) |
| 12/31/2015 | $22.45 | 0.22 | (0.44) | (0.22) | (0.48) | — | (0.01) |
| 12/31/2014 | $27.36 | 0.37 | (2.22) | (1.85) | (0.17) | (2.89) | — |
| 12/31/2013 | $25.99 | 0.29 | 3.42 | 3.71 | (0.43) | (1.91) | — |
| 12/31/2012 (l) | $29.98 | (0.02) | (0.09) (e) | (0.11) | (1.79) | (2.09) | — |
| Class R5 |
| 6/30/2017 (b) | $21.76 | 0.10 | 4.33 | 4.43 | — | — | — |
| 12/31/2016 | $21.72 | 0.16 | 0.11 (e) | 0.27 | (0.21) | — | (0.02) |
| 12/31/2015 | $22.43 | 0.22 | (0.42) | (0.20) | (0.50) | — | (0.01) |
| 12/31/2014 | $27.34 | 0.36 | (2.19) | (1.83) | (0.19) | (2.89) | — |
| 12/31/2013 | $25.98 | 0.38 | 3.35 | 3.73 | (0.46) | (1.91) | — |
| 12/31/2012 (m) | $29.98 | (0.02) | (0.09) (e) | (0.11) | (1.80) | (2.09) | — |
| Class Y |
| 6/30/2017 (b) | $21.74 | 0.09 | 4.34 | 4.43 | — | — | — |
| 12/31/2016 | $21.71 | 0.16 | 0.12 (e) | 0.28 | (0.23) | — | (0.02) |
| 12/31/2015 | $22.42 | 0.28 | (0.47) | (0.19) | (0.51) | — | (0.01) |
| 12/31/2014 | $27.33 | 0.40 | (2.21) | (1.81) | (0.21) | (2.89) | — |
| 12/31/2013 | $25.98 | 0.11 | 3.62 | 3.73 | (0.47) | (1.91) | — |
| 12/31/2012 (n) | $29.99 | (0.02) | (0.09) (e) | (0.11) | (1.81) | (2.09) | — |
The accompanying Notes to Financial Statements are an integral part of this statement.
| 110 | Columbia Acorn Family of Funds | Semiannual Report 2017 |
Total
distributions to
shareholders | Proceeds from
regulatory
settlements | Net
asset
value,
end of
period | Total
return | Total gross
expense
ratio to
average
net assets(a) | Total net
expense
ratio to
average
net assets(a) | Net investment
income (loss)
ratio to
average
net assets | Portfolio
turnover | Net
assets,
end of
period
(000’s) |
| |
| — | — | $25.66 | 20.13% | 1.52% (c) | 1.39% (c),(d) | 0.44% (c) | 28% | $20,892 |
| (0.16) | — | $21.36 | 0.90% (f) | 1.55% (g) | 1.48% (g) | 0.49% | 49% | $20,165 |
| (0.43) | 0.00 (h) | $21.33 | (1.30%) (i) | 1.55% | 1.55% | 0.74% | 59% | $33,772 |
| (2.99) | — | $22.04 | (7.06%) | 1.47% | 1.47% | 1.05% | 58% | $53,419 |
| (2.28) | — | $26.91 | 14.42% | 1.47% | 1.47% | 1.08% | 72% | $73,911 |
| (3.96) | — | $25.61 | 22.05% | 1.49% (j) | 1.49% (j),(k) | 1.43% | 63% | $74,167 |
| |
| — | — | $23.93 | 19.71% | 2.27% (c) | 2.14% (c),(d) | (0.28%) (c) | 28% | $4,628 |
| — | — | $19.99 | 0.15% (f) | 2.31% (g) | 2.23% (g) | (0.29%) | 49% | $4,346 |
| (0.16) | 0.00 (h) | $19.96 | (2.05%) (i) | 2.32% | 2.32% | (0.06%) | 59% | $5,390 |
| (2.89) | — | $20.54 | (7.80%) | 2.23% | 2.23% | 0.29% | 58% | $8,057 |
| (2.07) | — | $25.39 | 13.52% | 2.26% | 2.26% | 0.32% | 72% | $10,311 |
| (3.74) | — | $24.28 | 21.10% | 2.28% (j) | 2.27% (j),(k) | 0.67% | 63% | $9,786 |
| |
| — | — | $26.19 | 20.30% | 1.27% (c) | 1.14% (c),(d) | 0.72% (c) | 28% | $1,357 |
| (0.22) | — | $21.77 | 1.15% (f) | 1.29% (g) | 1.21% (g) | 0.77% | 49% | $1,106 |
| (0.49) | 0.00 (h) | $21.74 | (1.00%) (i) | 1.27% | 1.27% | 0.97% | 59% | $898 |
| (3.06) | — | $22.45 | (6.83%) | 1.21% | 1.21% | 1.33% | 58% | $974 |
| (2.34) | — | $27.36 | 14.72% | 1.24% | 1.24% | 1.06% | 72% | $417 |
| (3.88) | — | $25.99 | (0.27%) | 1.30% (c),(j) | 1.30% (c),(j),(k) | (0.55%) (c) | 63% | $13 |
| |
| — | — | $26.19 | 20.36% | 1.20% (c) | 1.07% (c) | 0.80% (c) | 28% | $495 |
| (0.23) | — | $21.76 | 1.25% (f) | 1.23% (g) | 1.19% (g) | 0.76% | 49% | $440 |
| (0.51) | 0.00 (h) | $21.72 | (0.94%) (i) | 1.21% | 1.21% | 0.96% | 59% | $2,268 |
| (3.08) | — | $22.43 | (6.77%) | 1.15% | 1.15% | 1.30% | 58% | $2,593 |
| (2.37) | — | $27.34 | 14.80% (f) | 1.15% | 1.15% | 1.40% | 72% | $956 |
| (3.89) | — | $25.98 | (0.27%) | 1.29% (c) | 1.28% (c),(k) | (0.55%) (c) | 63% | $2 |
| |
| — | — | $26.17 | 20.38% | 1.15% (c) | 1.02% (c) | 0.75% (c) | 28% | $284 |
| (0.25) | — | $21.74 | 1.29% (f) | 1.12% (g) | 1.04% (g) | 0.74% | 49% | $322 |
| (0.52) | 0.00 (h) | $21.71 | (0.89%) (i) | 1.14% | 1.14% | 1.21% | 59% | $660 |
| (3.10) | — | $22.42 | (6.71%) | 1.09% | 1.09% | 1.43% | 58% | $11,755 |
| (2.38) | — | $27.33 | 14.82% | 1.09% | 1.09% | 0.40% | 72% | $13,318 |
| (3.90) | — | $25.98 | (0.25%) | 1.21% (c) | 1.20% (c),(k) | (0.48%) (c) | 63% | $2 |
Columbia Acorn Family of Funds | Semiannual Report 2017
| 111 |
Financial Highlights (continued)
Columbia Acorn International SelectSM
| Year ended (except as noted) | Net asset value,
beginning of
period | Net
investment
income
(loss) | Net
realized
and
unrealized
gain (loss) | Total from
investment
operations | Distributions
from net
investment
income | Distributions
from net
realized
gains | Tax
return of
capital |
| Class Z |
| 6/30/2017 (b) | $21.61 | 0.09 | 4.30 | 4.39 | — | — | — |
| 12/31/2016 | $21.58 | 0.16 | 0.09 (e) | 0.25 | (0.20) | — | (0.02) |
| 12/31/2015 | $22.30 | 0.24 | (0.46) | (0.22) | (0.49) | — | (0.01) |
| 12/31/2014 | $27.20 | 0.38 | (2.21) | (1.83) | (0.18) | (2.89) | — |
| 12/31/2013 | $25.86 | 0.37 | 3.33 | 3.70 | (0.45) | (1.91) | — |
| 12/31/2012 | $24.46 | 0.49 | 4.95 | 5.44 | (1.83) | (2.21) | — |
| Notes to Financial Highlights |
| (a) | In addition to the fees and expenses that the Fund bears directly, the Fund indirectly bears a pro rata share of the fees and expenses of any other funds in which it invests, if any. Such indirect expenses are not included in the Fund’s reported expense ratios. |
| (b) | For the six months ended June 30, 2017 (unaudited). |
| (c) | Annualized. |
| (d) | The benefits derived from expense reductions had an impact of less than 0.01%. |
| (e) | Calculation of the net gain (loss) per share (both realized and unrealized) does not correlate to the aggregate realized and unrealized gain (loss) presented in the Statement of Operations due to the timing of subscriptions and redemptions of Fund shares in relation to fluctuations in the market value of the portfolio. |
| (f) | Had the Investment Manager and/or Transfer Agent not waived fees and/or reimbursed a portion of expenses, total return would have been reduced. |
| (g) | Expenses have been reduced due to a reimbursement of expenses overbilled by a third party. If the reimbursement had been excluded, the expense ratios would have been higher by the percentages shown for each class in the table below. All fee waivers and expense reimbursements by the Investment Manager and its affiliates were applied before giving effect to this third party reimbursement. |
| | Class A | Class C | Class R4 | Class R5 | Class Y | Class Z |
| 12/31/2016 | 0.06 % | 0.06 % | 0.06 % | 0.04 % | 0.09 % | 0.06 % |
| (h) | Rounds to zero. |
| (i) | The Fund received proceeds from regulatory settlements. Had the Fund not received these proceeds, the total return would have been lower by 0.02%. |
| (j) | Ratios include line of credit interest expense which is less than 0.01%. |
| (k) | The benefits derived from custody fees paid indirectly had an impact of 0.01%. |
| (l) | Class R4 shares commenced operations on November 8, 2012. Per share data and total return reflect activity from that date. |
| (m) | Class R5 shares commenced operations on November 8, 2012. Per share data and total return reflect activity from that date. |
| (n) | Class Y shares commenced operations on November 8, 2012. Per share data and total return reflect activity from that date. |
The accompanying Notes to Financial Statements are an integral part of this statement.
| 112 | Columbia Acorn Family of Funds | Semiannual Report 2017 |
Total
distributions to
shareholders | Proceeds from
regulatory
settlements | Net
asset
value,
end of
period | Total
return | Total gross
expense
ratio to
average
net assets(a) | Total net
expense
ratio to
average
net assets(a) | Net investment
income (loss)
ratio to
average
net assets | Portfolio
turnover | Net
assets,
end of
period
(000’s) |
| |
| — | — | $26.00 | 20.31% | 1.27% (c) | 1.14% (c),(d) | 0.73% (c) | 28% | $88,026 |
| (0.22) | — | $21.61 | 1.18% (f) | 1.26% (g) | 1.19% (g) | 0.74% | 49% | $73,631 |
| (0.50) | 0.00 (h) | $21.58 | (1.03%) (i) | 1.24% | 1.24% | 1.05% | 59% | $96,311 |
| (3.07) | — | $22.30 | (6.79%) | 1.17% | 1.17% | 1.36% | 58% | $175,764 |
| (2.36) | — | $27.20 | 14.75% | 1.19% | 1.19% | 1.37% | 72% | $256,100 |
| (4.04) | — | $25.86 | 22.42% | 1.20% (j) | 1.19% (j),(k) | 1.77% | 63% | $295,231 |
Columbia Acorn Family of Funds | Semiannual Report 2017
| 113 |
Financial Highlights
Columbia Acorn SelectSM
| Year ended (except as noted) | Net asset value,
beginning of
period | Net
investment
income
(loss) | Net
realized
and
unrealized
gain | Total from
investment
operations | Distributions
from net
investment
income | Distributions
from net
realized
gains |
| Class A |
| 6/30/2017 (b) | $13.13 | (0.01) | 1.52 | 1.51 | — | (1.17) |
| 12/31/2016 | $13.94 | (0.04) | 1.56 | 1.52 | — | (2.33) |
| 12/31/2015 | $21.03 | (0.09) | 0.14 | 0.05 | — | (7.14) |
| 12/31/2014 | $25.57 | (0.14) | 0.64 | 0.50 | — | (5.04) |
| 12/31/2013 | $24.72 | (0.15) | 7.92 | 7.77 | (0.07) | (6.85) |
| 12/31/2012 | $22.95 | 0.03 | 3.78 | 3.81 | — | (2.04) |
| Class C |
| 6/30/2017 (b) | $9.22 | (0.04) | 1.06 | 1.02 | — | (1.17) |
| 12/31/2016 | $10.51 | (0.10) | 1.14 | 1.04 | — | (2.33) |
| 12/31/2015 | $17.69 | (0.19) | 0.15 | (0.04) | — | (7.14) |
| 12/31/2014 | $22.46 | (0.28) | 0.55 | 0.27 | — | (5.04) |
| 12/31/2013 | $22.48 | (0.32) | 7.15 | 6.83 | — | (6.85) |
| 12/31/2012 | $21.20 | (0.14) | 3.46 | 3.32 | — | (2.04) |
| Class R4 |
| 6/30/2017 (b) | $15.13 | 0.01 | 1.75 | 1.76 | — | (1.17) |
| 12/31/2016 | $15.69 | (0.00) (h) | 1.77 | 1.77 | — | (2.33) |
| 12/31/2015 | $22.75 | (0.04) | 0.12 | 0.08 | — | (7.14) |
| 12/31/2014 | $27.20 | (0.10) | 0.69 | 0.59 | — | (5.04) |
| 12/31/2013 | $25.92 | (0.06) | 8.32 | 8.26 | (0.13) | (6.85) |
| 12/31/2012 (i) | $25.91 | 0.00 (h) | 1.52 | 1.52 | — | (1.51) |
| Class R5 |
| 6/30/2017 (b) | $15.20 | 0.01 | 1.76 | 1.77 | — | (1.17) |
| 12/31/2016 | $15.74 | 0.01 | 1.78 | 1.79 | — | (2.33) |
| 12/31/2015 | $22.78 | (0.08) | 0.18 | 0.10 | — | (7.14) |
| 12/31/2014 | $27.20 | (0.07) | 0.69 | 0.62 | — | (5.04) |
| 12/31/2013 | $25.93 | (0.04) | 8.31 | 8.27 | (0.15) | (6.85) |
| 12/31/2012 (j) | $25.91 | 0.00 (h) | 1.53 | 1.53 | — | (1.51) |
| Class Y |
| 6/30/2017 (b) | $15.31 | 0.02 | 1.77 | 1.79 | — | (1.17) |
| 12/31/2016 | $15.83 | 0.02 | 1.79 | 1.81 | — | (2.33) |
| 12/31/2015 | $22.86 | 0.00 (h) | 0.11 | 0.11 | — | (7.14) |
| 12/31/2014 | $27.27 | (0.06) | 0.69 | 0.63 | — | (5.04) |
| 12/31/2013 | $25.98 | (0.03) | 8.34 | 8.31 | (0.17) | (6.85) |
| 12/31/2012 (k) | $25.96 | 0.01 | 1.52 | 1.53 | — | (1.51) |
The accompanying Notes to Financial Statements are an integral part of this statement.
| 114 | Columbia Acorn Family of Funds | Semiannual Report 2017 |
Total
distributions to
shareholders | Net
asset
value,
end of
period | Total
return | Total gross
expense
ratio to
average
net assets(a) | Total net
expense
ratio to
average
net assets(a) | Net investment
income (loss)
ratio to
average
net assets | Portfolio
turnover | Net
assets,
end of
period
(000’s) |
| |
| (1.17) | $13.47 | 11.66% (c) | 1.36% (d) | 1.16% (d),(e) | (0.13%) (d) | 29% | $107,513 |
| (2.33) | $13.13 | 11.54% (c) | 1.37% | 1.17% | (0.27%) | 75% | $119,364 |
| (7.14) | $13.94 | (0.73%) (c) | 1.35% (f) | 1.22% (f) | (0.42%) | 55% | $146,864 |
| (5.04) | $21.03 | 2.17% | 1.32% | 1.32% | (0.58%) | 17% | $264,234 |
| (6.92) | $25.57 | 33.77% | 1.31% (f) | 1.31% (f) | (0.54%) | 20% | $333,193 |
| (2.04) | $24.72 | 16.87% | 1.31% (f) | 1.31% (f),(g) | 0.13% | 15% | $271,628 |
| |
| (1.17) | $9.07 | 11.29% (c) | 2.10% (d) | 1.90% (d),(e) | (0.88%) (d) | 29% | $22,382 |
| (2.33) | $9.22 | 10.67% (c) | 2.11% | 1.91% | (1.01%) | 75% | $27,524 |
| (7.14) | $10.51 | (1.41%) (c) | 2.08% (f) | 1.95% (f) | (1.15%) | 55% | $34,589 |
| (5.04) | $17.69 | 1.42% | 2.04% | 2.04% | (1.30%) | 17% | $48,591 |
| (6.85) | $22.46 | 32.85% | 2.04% (f) | 2.04% (f) | (1.28%) | 20% | $61,537 |
| (2.04) | $22.48 | 15.93% | 2.07% (f) | 2.06% (f),(g) | (0.59%) | 15% | $57,309 |
| |
| (1.17) | $15.72 | 11.77% (c) | 1.11% (d) | 0.91% (d),(e) | 0.15% (d) | 29% | $1,863 |
| (2.33) | $15.13 | 11.86% (c) | 1.13% | 0.93% | (0.02%) | 75% | $853 |
| (7.14) | $15.69 | (0.53%) (c) | 1.12% (f) | 0.99% (f) | (0.18%) | 55% | $932 |
| (5.04) | $22.75 | 2.39% | 1.12% | 1.12% | (0.37%) | 17% | $1,193 |
| (6.98) | $27.20 | 34.16% | 1.02% (f) | 1.02% (f) | (0.20%) | 20% | $1,383 |
| (1.51) | $25.92 | 5.92% | 1.07% (d) | 1.06% (d),(g) | 0.02% (d) | 15% | $15 |
| |
| (1.17) | $15.80 | 11.79% (c) | 1.05% (d) | 0.85% (d) | 0.16% (d) | 29% | $1,498 |
| (2.33) | $15.20 | 11.96% (c) | 1.05% | 0.85% | 0.07% | 75% | $1,036 |
| (7.14) | $15.74 | (0.44%) (c) | 1.02% (f) | 0.95% (f) | (0.33%) | 55% | $911 |
| (5.04) | $22.78 | 2.50% | 1.00% | 1.00% | (0.26%) | 17% | $10,697 |
| (7.00) | $27.20 | 34.21% | 0.97% (f) | 0.97% (f) | (0.13%) | 20% | $11,996 |
| (1.51) | $25.93 | 5.96% | 0.99% (d) | 0.99% (d),(g) | 0.08% (d) | 15% | $3 |
| |
| (1.17) | $15.93 | 11.83% (c) | 1.00% (d) | 0.80% (d) | 0.21% (d) | 29% | $23,668 |
| (2.33) | $15.31 | 12.02% (c) | 1.00% | 0.80% | 0.10% | 75% | $4,389 |
| (7.14) | $15.83 | (0.39%) (c) | 0.98% (f) | 0.85% (f) | 0.02% | 55% | $5,056 |
| (5.04) | $22.86 | 2.53% | 0.95% | 0.95% | (0.22%) | 17% | $3,644 |
| (7.02) | $27.27 | 34.30% | 0.93% (f) | 0.93% (f) | (0.09%) | 20% | $4,847 |
| (1.51) | $25.98 | 5.94% | 0.92% (d) | 0.92% (d),(g) | 0.15% (d) | 15% | $3 |
Columbia Acorn Family of Funds | Semiannual Report 2017
| 115 |
Financial Highlights (continued)
Columbia Acorn SelectSM
| Year ended (except as noted) | Net asset value,
beginning of
period | Net
investment
income
(loss) | Net
realized
and
unrealized
gain | Total from
investment
operations | Distributions
from net
investment
income | Distributions
from net
realized
gains |
| Class Z |
| 6/30/2017 (b) | $14.63 | 0.01 | 1.69 | 1.70 | — | (1.17) |
| 12/31/2016 | $15.24 | (0.00) (h) | 1.72 | 1.72 | — | (2.33) |
| 12/31/2015 | $22.28 | (0.03) | 0.13 | 0.10 | — | (7.14) |
| 12/31/2014 | $26.72 | (0.08) | 0.68 | 0.60 | — | (5.04) |
| 12/31/2013 | $25.57 | (0.07) | 8.21 | 8.14 | (0.14) | (6.85) |
| 12/31/2012 | $23.62 | 0.11 | 3.88 | 3.99 | — | (2.04) |
| Notes to Financial Highlights |
| (a) | In addition to the fees and expenses that the Fund bears directly, the Fund indirectly bears a pro rata share of the fees and expenses of any other funds in which it invests, if any. Such indirect expenses are not included in the Fund’s reported expense ratios. |
| (b) | For the six months ended June 30, 2017 (unaudited). |
| (c) | Had the Investment Manager and/or Transfer Agent not waived fees and/or reimbursed a portion of expenses, total return would have been reduced. |
| (d) | Annualized. |
| (e) | The benefits derived from expense reductions had an impact of less than 0.01%. |
| (f) | Ratios include line of credit interest expense which is less than 0.01%. |
| (g) | The benefits derived from custody fees paid indirectly had an impact of less than 0.01%. |
| (h) | Rounds to zero. |
| (i) | Class R4 shares commenced operations on November 8, 2012. Per share data and total return reflect activity from that date. |
| (j) | Class R5 shares commenced operations on November 8, 2012. Per share data and total return reflect activity from that date. |
| (k) | Class Y shares commenced operations on November 8, 2012. Per share data and total return reflect activity from that date. |
The accompanying Notes to Financial Statements are an integral part of this statement.
| 116 | Columbia Acorn Family of Funds | Semiannual Report 2017 |
Total
distributions to
shareholders | Net
asset
value,
end of
period | Total
return | Total gross
expense
ratio to
average
net assets(a) | Total net
expense
ratio to
average
net assets(a) | Net investment
income (loss)
ratio to
average
net assets | Portfolio
turnover | Net
assets,
end of
period
(000’s) |
| |
| (1.17) | $15.16 | 11.77% (c) | 1.11% (d) | 0.91% (d),(e) | 0.10% (d) | 29% | $158,763 |
| (2.33) | $14.63 | 11.88% (c) | 1.10% | 0.90% | (0.02%) | 75% | $144,313 |
| (7.14) | $15.24 | (0.44%) (c) | 1.07% (f) | 0.95% (f) | (0.15%) | 55% | $183,642 |
| (5.04) | $22.28 | 2.47% | 1.04% | 1.04% | (0.30%) | 17% | $318,487 |
| (6.99) | $26.72 | 34.16% | 1.02% (f) | 1.02% (f) | (0.26%) | 20% | $431,990 |
| (2.04) | $25.57 | 17.15% | 1.03% (f) | 1.03% (f),(g) | 0.40% | 15% | $587,678 |
Columbia Acorn Family of Funds | Semiannual Report 2017
| 117 |
Financial Highlights
Columbia Thermostat FundSM
| Year ended (except as noted) | Net asset value,
beginning of
period | Net
investment
income | Net
realized
and
unrealized
gain (loss) | Total from
investment
operations | Distributions
from net
investment
income | Distributions
from net
realized
gains |
| Class A |
| 6/30/2017 (c) | $14.60 | 0.12 | 0.33 | 0.45 | (0.23) | (0.06) |
| 12/31/2016 | $14.31 | 0.20 | 0.44 | 0.64 | (0.08) | (0.27) |
| 12/31/2015 | $14.86 | 0.27 | (0.26) | 0.01 | (0.28) | (0.28) |
| 12/31/2014 | $14.58 | 0.28 | 0.49 | 0.77 | (0.28) | (0.21) |
| 12/31/2013 | $14.29 | 0.29 | 1.00 | 1.29 | (0.25) | (0.75) |
| 12/31/2012 | $12.82 | 0.32 | 1.39 | 1.71 | (0.24) | — |
| Class C |
| 6/30/2017 (c) | $14.62 | 0.07 | 0.32 | 0.39 | (0.15) | (0.06) |
| 12/31/2016 | $14.41 | 0.09 | 0.44 | 0.53 | (0.05) | (0.27) |
| 12/31/2015 | $14.96 | 0.16 | (0.26) | (0.10) | (0.17) | (0.28) |
| 12/31/2014 | $14.68 | 0.17 | 0.49 | 0.66 | (0.17) | (0.21) |
| 12/31/2013 | $14.39 | 0.18 | 1.00 | 1.18 | (0.14) | (0.75) |
| 12/31/2012 | $12.91 | 0.22 | 1.39 | 1.61 | (0.13) | — |
| Class R4 |
| 6/30/2017 (c) | $14.47 | 0.14 | 0.33 | 0.47 | (0.23) | (0.06) |
| 12/31/2016 | $14.19 | 0.24 | 0.42 | 0.66 | (0.11) | (0.27) |
| 12/31/2015 | $14.74 | 0.30 | (0.25) | 0.05 | (0.32) | (0.28) |
| 12/31/2014 | $14.46 | 0.32 | 0.49 | 0.81 | (0.32) | (0.21) |
| 12/31/2013 | $14.19 | 0.36 | 0.95 | 1.31 | (0.29) | (0.75) |
| 12/31/2012 (g) | $14.08 | 0.09 | 0.28 | 0.37 | (0.26) | — |
| Class R5 |
| 6/30/2017 (c) | $14.49 | 0.14 | 0.32 | 0.46 | (0.23) | (0.06) |
| 12/31/2016 | $14.20 | 0.24 | 0.43 | 0.67 | (0.11) | (0.27) |
| 12/31/2015 | $14.75 | 0.31 | (0.26) | 0.05 | (0.32) | (0.28) |
| 12/31/2014 | $14.47 | 0.31 | 0.50 | 0.81 | (0.32) | (0.21) |
| 12/31/2013 | $14.19 | 0.37 | 0.96 | 1.33 | (0.30) | (0.75) |
| 12/31/2012 (h) | $14.08 | 0.09 | 0.27 | 0.36 | (0.25) | — |
| Class Y |
| 6/30/2017 (c) | $14.46 | 0.14 | 0.33 | 0.47 | (0.23) | (0.06) |
| 12/31/2016 | $14.18 | 0.25 | 0.42 | 0.67 | (0.12) | (0.27) |
| 12/31/2015 | $14.74 | 0.31 | (0.26) | 0.05 | (0.33) | (0.28) |
| 12/31/2014 | $14.46 | 0.32 | 0.50 | 0.82 | (0.33) | (0.21) |
| 12/31/2013 | $14.18 | 0.33 | 1.01 | 1.34 | (0.31) | (0.75) |
| 12/31/2012 (i) | $14.08 | 0.09 | 0.27 | 0.36 | (0.26) | — |
The accompanying Notes to Financial Statements are an integral part of this statement.
| 118 | Columbia Acorn Family of Funds | Semiannual Report 2017 |
Total
distributions to
shareholders | Net
asset
value,
end of
period | Total
return(a) | Total gross
expense
ratio to
average
net assets(b) | Total net
expense
ratio to
average
net assets(b) | Net investment
income
ratio to
average
net assets | Portfolio
turnover | Net
assets,
end of
period
(000’s) |
| |
| (0.29) | $14.76 | 3.11% | 0.52% (d) | 0.50% (d),(e) | 1.63% (d) | 21% | $293,008 |
| (0.35) | $14.60 | 4.47% | 0.54% | 0.50% | 1.39% | 95% | $398,781 |
| (0.56) | $14.31 | 0.07% | 0.52% | 0.50% | 1.82% | 69% | $387,967 |
| (0.49) | $14.86 | 5.30% | 0.51% | 0.50% | 1.88% | 95% | $450,258 |
| (1.00) | $14.58 | 9.07% | 0.52% | 0.50% | 1.91% | 92% | $513,293 |
| (0.24) | $14.29 | 13.34% | 0.58% | 0.50% (f) | 2.28% | 109% | $323,750 |
| |
| (0.21) | $14.80 | 2.70% | 1.27% (d) | 1.25% (d),(e) | 0.89% (d) | 21% | $292,183 |
| (0.32) | $14.62 | 3.69% | 1.28% | 1.25% | 0.63% | 95% | $338,930 |
| (0.45) | $14.41 | (0.68%) | 1.27% | 1.25% | 1.08% | 69% | $364,684 |
| (0.38) | $14.96 | 4.50% | 1.26% | 1.25% | 1.14% | 95% | $404,456 |
| (0.89) | $14.68 | 8.23% | 1.27% | 1.25% | 1.16% | 92% | $430,173 |
| (0.13) | $14.39 | 12.52% | 1.32% | 1.25% (f) | 1.56% | 109% | $253,641 |
| |
| (0.29) | $14.65 | 3.27% | 0.27% (d) | 0.25% (d),(e) | 1.89% (d) | 21% | $13,990 |
| (0.38) | $14.47 | 4.69% | 0.30% | 0.25% | 1.64% | 95% | $15,664 |
| (0.60) | $14.19 | 0.33% | 0.28% | 0.25% | 2.06% | 69% | $17,453 |
| (0.53) | $14.74 | 5.61% | 0.26% | 0.25% | 2.14% | 95% | $23,412 |
| (1.04) | $14.46 | 9.26% | 0.28% | 0.25% | 2.39% | 92% | $14,651 |
| (0.26) | $14.19 | 2.60% | 0.42% (d) | 0.25% (d),(f) | 4.59% (d) | 109% | $15 |
| |
| (0.29) | $14.66 | 3.20% | 0.26% (d) | 0.24% (d) | 1.91% (d) | 21% | $12,855 |
| (0.38) | $14.49 | 4.77% | 0.27% | 0.24% | 1.66% | 95% | $12,024 |
| (0.60) | $14.20 | 0.33% | 0.25% | 0.24% | 2.14% | 69% | $6,114 |
| (0.53) | $14.75 | 5.62% | 0.24% | 0.23% | 2.11% | 95% | $3,536 |
| (1.05) | $14.47 | 9.35% | 0.25% | 0.23% | 2.44% | 92% | $979 |
| (0.25) | $14.19 | 2.58% | 0.35% (d) | 0.27% (d),(f) | 4.60% (d) | 109% | $3 |
| |
| (0.29) | $14.64 | 3.27% | 0.21% (d) | 0.19% (d) | 1.96% (d) | 21% | $411 |
| (0.39) | $14.46 | 4.76% | 0.21% | 0.19% | 1.71% | 95% | $399 |
| (0.61) | $14.18 | 0.32% | 0.20% | 0.19% | 2.08% | 69% | $352 |
| (0.54) | $14.74 | 5.68% | 0.19% | 0.18% | 2.19% | 95% | $401 |
| (1.06) | $14.46 | 9.46% | 0.14% | 0.14% | 2.23% | 92% | $3 |
| (0.26) | $14.18 | 2.55% | 0.30% (d) | 0.22% (d),(f) | 4.63% (d) | 109% | $3 |
Columbia Acorn Family of Funds | Semiannual Report 2017
| 119 |
Financial Highlights (continued)
Columbia Thermostat FundSM
| Year ended (except as noted) | Net asset value,
beginning of
period | Net
investment
income | Net
realized
and
unrealized
gain (loss) | Total from
investment
operations | Distributions
from net
investment
income | Distributions
from net
realized
gains |
| Class Z |
| 6/30/2017 (c) | $14.40 | 0.14 | 0.32 | 0.46 | (0.23) | (0.06) |
| 12/31/2016 | $14.12 | 0.23 | 0.43 | 0.66 | (0.11) | (0.27) |
| 12/31/2015 | $14.67 | 0.31 | (0.26) | 0.05 | (0.32) | (0.28) |
| 12/31/2014 | $14.40 | 0.32 | 0.48 | 0.80 | (0.32) | (0.21) |
| 12/31/2013 | $14.13 | 0.32 | 0.99 | 1.31 | (0.29) | (0.75) |
| 12/31/2012 | $12.67 | 0.34 | 1.39 | 1.73 | (0.27) | — |
| Notes to Financial Highlights |
| (a) | Had the Investment Manager and/or Transfer Agent not waived fees and/or reimbursed a portion of expenses, total return would have been reduced. |
| (b) | In addition to the fees and expenses that the Fund bears directly, the Fund indirectly bears a pro rata share of the fees and expenses of any other funds in which it invests, if any. Such indirect expenses are not included in the Fund’s reported expense ratios. |
| (c) | For the six months ended June 30, 2017 (unaudited). |
| (d) | Annualized. |
| (e) | The benefits derived from expense reductions had an impact of less than 0.01%. |
| (f) | The benefits derived from custody fees paid indirectly had an impact of 0.01%. |
| (g) | Class R4 shares commenced operations on November 8, 2012. Per share data and total return reflect activity from that date. |
| (h) | Class R5 shares commenced operations on November 8, 2012. Per share data and total return reflect activity from that date. |
| (i) | Class Y shares commenced operations on November 8, 2012. Per share data and total return reflect activity from that date. |
The accompanying Notes to Financial Statements are an integral part of this statement.
| 120 | Columbia Acorn Family of Funds | Semiannual Report 2017 |
Total
distributions to
shareholders | Net
asset
value,
end of
period | Total
return(a) | Total gross
expense
ratio to
average
net assets(b) | Total net
expense
ratio to
average
net assets(b) | Net investment
income
ratio to
average
net assets | Portfolio
turnover | Net
assets,
end of
period
(000’s) |
| |
| (0.29) | $14.57 | 3.22% | 0.27% (d) | 0.25% (d),(e) | 1.90% (d) | 21% | $351,644 |
| (0.38) | $14.40 | 4.72% | 0.28% | 0.25% | 1.64% | 95% | $341,629 |
| (0.60) | $14.12 | 0.33% | 0.26% | 0.25% | 2.08% | 69% | $325,159 |
| (0.53) | $14.67 | 5.57% | 0.25% | 0.24% | 2.16% | 95% | $377,119 |
| (1.04) | $14.40 | 9.30% | 0.26% | 0.25% | 2.14% | 92% | $375,444 |
| (0.27) | $14.13 | 13.69% | 0.30% | 0.25% (f) | 2.48% | 109% | $292,732 |
Columbia Acorn Family of Funds | Semiannual Report 2017
| 121 |
Financial Highlights
Columbia Acorn Emerging Markets FundSM
| Year ended (except as noted) | Net asset value,
beginning of
period | Net
investment
income
(loss) | Net
realized
and
unrealized
gain (loss) | Total from
investment
operations | Distributions
from net
investment
income | Tax
return of
capital |
| Class A |
| 6/30/2017 (b) | $9.84 | (0.02) | 2.01 | 1.99 | — | — |
| 12/31/2016 | $10.24 | (0.01) | (0.32) | (0.33) | (0.03) | (0.04) |
| 12/31/2015 | $12.72 | 0.10 | (2.42) | (2.32) | (0.15) | (0.01) |
| 12/31/2014 | $13.37 | 0.06 | (0.63) | (0.57) | (0.08) | — |
| 12/31/2013 | $12.04 | 0.07 | 1.34 | 1.41 | (0.08) | — |
| 12/31/2012 | $9.26 | 0.08 | 2.78 | 2.86 | (0.08) | — |
| Class C |
| 6/30/2017 (b) | $9.80 | (0.06) | 2.00 | 1.94 | — | — |
| 12/31/2016 | $10.20 | (0.09) | (0.31) | (0.40) | — | — |
| 12/31/2015 | $12.65 | 0.01 | (2.39) | (2.38) | (0.06) | (0.01) |
| 12/31/2014 | $13.32 | (0.05) | (0.62) | (0.67) | — | — |
| 12/31/2013 | $12.01 | (0.03) | 1.34 | 1.31 | — | — |
| 12/31/2012 | $9.24 | (0.02) | 2.79 | 2.77 | — | — |
| Class R4 |
| 6/30/2017 (b) | $9.92 | (0.00) (h) | 2.02 | 2.02 | — | — |
| 12/31/2016 | $10.32 | 0.01 | (0.31) | (0.30) | (0.06) | (0.04) |
| 12/31/2015 | $12.83 | 0.17 | (2.49) | (2.32) | (0.18) | (0.01) |
| 12/31/2014 | $13.49 | 0.09 | (0.63) | (0.54) | (0.12) | — |
| 12/31/2013 | $12.14 | 0.12 | 1.35 | 1.47 | (0.12) | — |
| 12/31/2012 (i) | $11.44 | (0.01) | 0.81 | 0.80 | (0.10) | — |
| Class R5 |
| 6/30/2017 (b) | $9.91 | 0.00 (h) | 2.03 | 2.03 | — | — |
| 12/31/2016 | $10.32 | (0.02) | (0.28) | (0.30) | (0.07) | (0.04) |
| 12/31/2015 | $12.82 | 0.15 | (2.45) | (2.30) | (0.19) | (0.01) |
| 12/31/2014 | $13.48 | 0.10 | (0.64) | (0.54) | (0.12) | — |
| 12/31/2013 | $12.14 | 0.12 | 1.34 | 1.46 | (0.12) | — |
| 12/31/2012 (j) | $11.44 | (0.00) (h) | 0.81 | 0.81 | (0.11) | — |
| Class Y |
| 6/30/2017 (b) | $9.82 | 0.01 | 2.01 | 2.02 | — | — |
| 12/31/2016 | $10.23 | 0.03 | (0.33) | (0.30) | (0.07) | (0.04) |
| 12/31/2015 | $12.71 | 0.15 | (2.43) | (2.28) | (0.19) | (0.01) |
| 12/31/2014 | $13.36 | 0.09 | (0.62) | (0.53) | (0.12) | — |
| 12/31/2013 (k) | $12.22 | 0.07 | 1.20 | 1.27 | (0.13) | — |
The accompanying Notes to Financial Statements are an integral part of this statement.
| 122 | Columbia Acorn Family of Funds | Semiannual Report 2017 |
Total
distributions to
shareholders | Net
asset
value,
end of
period | Total
return | Total gross
expense
ratio to
average
net assets(a) | Total net
expense
ratio to
average
net assets(a) | Net investment
income (loss)
ratio to
average
net assets | Portfolio
turnover | Net
assets,
end of
period
(000’s) |
| |
| — | $11.83 | 20.22% (c) | 2.02% (d) | 1.85% (d),(e) | (0.46%) (d) | 28% | $32,872 |
| (0.07) | $9.84 | (3.20%) (c) | 1.84% (f) | 1.84% (f) | (0.11%) | 43% | $49,141 |
| (0.16) | $10.24 | (18.25%) | 1.67% | 1.67% | 0.88% | 58% | $88,574 |
| (0.08) | $12.72 | (4.28%) | 1.56% | 1.56% | 0.42% | 45% | $160,969 |
| (0.08) | $13.37 | 11.73% (c) | 1.80% | 1.76% | 0.52% | 36% | $177,158 |
| (0.08) | $12.04 | 30.86% (c) | 6.42% | 1.77% (g) | 0.77% | 30% | $3,103 |
| |
| — | $11.74 | 19.80% (c) | 2.78% (d) | 2.60% (d),(e) | (1.05%) (d) | 28% | $15,332 |
| — | $9.80 | (3.92%) (c) | 2.60% (f) | 2.59% (f) | (0.87%) | 43% | $15,534 |
| (0.07) | $10.20 | (18.83%) | 2.42% | 2.42% | 0.12% | 58% | $22,953 |
| — | $12.65 | (5.03%) | 2.33% | 2.33% | (0.36%) | 45% | $41,208 |
| — | $13.32 | 10.91% (c) | 2.55% | 2.51% | (0.23%) | 36% | $32,636 |
| — | $12.01 | 29.98% (c) | 7.18% | 2.56% (g) | (0.15%) | 30% | $615 |
| |
| — | $11.94 | 20.36% (c) | 1.78% (d) | 1.60% (d),(e) | (0.09%) (d) | 28% | $1,105 |
| (0.10) | $9.92 | (2.91%) | 1.57% (f) | 1.57% (f) | 0.09% | 43% | $1,306 |
| (0.19) | $10.32 | (18.04%) | 1.36% | 1.36% | 1.37% | 58% | $3,459 |
| (0.12) | $12.83 | (4.03%) | 1.28% | 1.28% | 0.66% | 45% | $15,467 |
| (0.12) | $13.49 | 12.13% (c) | 1.44% | 1.44% | 0.92% | 36% | $13,583 |
| (0.10) | $12.14 | 7.04% (c) | 5.86% (d) | 1.54% (d),(g) | (0.31%) (d) | 30% | $16 |
| |
| — | $11.94 | 20.48% (c) | 1.68% (d) | 1.50% (d) | 0.08% (d) | 28% | $995 |
| (0.11) | $9.91 | (2.90%) | 1.46% (f) | 1.46% (f) | (0.23%) | 43% | $806 |
| (0.20) | $10.32 | (17.96%) | 1.34% | 1.34% | 1.22% | 58% | $12,643 |
| (0.12) | $12.82 | (4.02%) | 1.26% | 1.26% | 0.72% | 45% | $19,632 |
| (0.12) | $13.48 | 12.07% (c) | 1.42% | 1.42% | 0.94% | 36% | $13,625 |
| (0.11) | $12.14 | 7.11% (c) | 5.81% (d) | 1.46% (d),(g) | (0.22%) (d) | 30% | $3 |
| |
| — | $11.84 | 20.57% (c) | 1.64% (d) | 1.45% (d) | 0.13% (d) | 28% | $2 |
| (0.11) | $9.82 | (2.92%) (c) | 1.45% | 1.45% | 0.29% | 43% | $2 |
| (0.20) | $10.23 | (17.90%) | 1.27% | 1.27% | 1.24% | 58% | $2 |
| (0.12) | $12.71 | (3.95%) | 1.22% | 1.22% | 0.68% | 45% | $2 |
| (0.13) | $13.36 | 10.43% (c) | 1.36% (d) | 1.36% (d) | 0.97% (d) | 36% | $3 |
Columbia Acorn Family of Funds | Semiannual Report 2017
| 123 |
Financial Highlights (continued)
Columbia Acorn Emerging Markets FundSM
| Year ended (except as noted) | Net asset value,
beginning of
period | Net
investment
income
(loss) | Net
realized
and
unrealized
gain (loss) | Total from
investment
operations | Distributions
from net
investment
income | Tax
return of
capital |
| Class Z |
| 6/30/2017 (b) | $9.85 | 0.00 (h) | 2.01 | 2.01 | — | — |
| 12/31/2016 | $10.26 | (0.00) (h) | (0.31) | (0.31) | (0.06) | (0.04) |
| 12/31/2015 | $12.74 | 0.13 | (2.42) | (2.29) | (0.18) | (0.01) |
| 12/31/2014 | $13.40 | 0.08 | (0.63) | (0.55) | (0.11) | — |
| 12/31/2013 | $12.07 | 0.11 | 1.33 | 1.44 | (0.11) | — |
| 12/31/2012 | $9.28 | 0.12 | 2.79 | 2.91 | (0.12) | — |
| Notes to Financial Highlights |
| (a) | In addition to the fees and expenses that the Fund bears directly, the Fund indirectly bears a pro rata share of the fees and expenses of any other funds in which it invests, if any. Such indirect expenses are not included in the Fund’s reported expense ratios. |
| (b) | For the six months ended June 30, 2017 (unaudited). |
| (c) | Had the Investment Manager and/or Transfer Agent not waived fees and/or reimbursed a portion of expenses, total return would have been reduced. |
| (d) | Annualized. |
| (e) | The benefits derived from expense reductions had an impact of less than 0.01%. |
| (f) | Ratios include line of credit interest expense which is less than 0.01%. |
| (g) | The benefits derived from custody fees paid indirectly had an impact of 0.01%. |
| (h) | Rounds to zero. |
| (i) | Class R4 shares commenced operations on November 8, 2012. Per share data and total return reflect activity from that date. |
| (j) | Class R5 shares commenced operations on November 8, 2012. Per share data and total return reflect activity from that date. |
| (k) | Class Y shares commenced operations on June 13, 2013. Per share data and total return reflect activity from that date. |
The accompanying Notes to Financial Statements are an integral part of this statement.
| 124 | Columbia Acorn Family of Funds | Semiannual Report 2017 |
Total
distributions to
shareholders | Net
asset
value,
end of
period | Total
return | Total gross
expense
ratio to
average
net assets(a) | Total net
expense
ratio to
average
net assets(a) | Net investment
income (loss)
ratio to
average
net assets | Portfolio
turnover | Net
assets,
end of
period
(000’s) |
| |
| — | $11.86 | 20.41% (c) | 1.79% (d) | 1.60% (d),(e) | 0.04% (d) | 28% | $53,042 |
| (0.10) | $9.85 | (3.04%) (c) | 1.59% (f) | 1.58% (f) | (0.04%) | 43% | $38,969 |
| (0.19) | $10.26 | (17.98%) | 1.42% | 1.42% | 1.12% | 58% | $147,688 |
| (0.11) | $12.74 | (4.12%) | 1.33% | 1.33% | 0.62% | 45% | $245,053 |
| (0.11) | $13.40 | 11.92% (c) | 1.58% | 1.54% | 0.89% | 36% | $177,693 |
| (0.12) | $12.07 | 31.35% (c) | 6.15% | 1.46% (g) | 1.07% | 30% | $6,846 |
Columbia Acorn Family of Funds | Semiannual Report 2017
| 125 |
Financial Highlights
Columbia Acorn European FundSM
| Year ended (except as noted) | Net asset value,
beginning of
period | Net
investment
income
(loss) | Net
realized
and
unrealized
gain (loss) | Total from
investment
operations | Distributions
from net
investment
income | Distributions
from net
realized
gains |
| Class A |
| 6/30/2017 (c) | $14.12 | 0.09 | 3.23 | 3.32 | (0.06) | — |
| 12/31/2016 | $14.75 | 0.16 | (0.67) | (0.51) | (0.12) | — |
| 12/31/2015 | $14.34 | 0.10 | 0.50 | 0.60 | (0.19) | — |
| 12/31/2014 | $15.68 | 0.13 | (1.34) | (1.21) | (0.05) | (0.08) |
| 12/31/2013 | $11.76 | (0.02) | 3.97 | 3.95 | (0.01) | (0.02) |
| 12/31/2012 | $9.43 | 0.03 | 2.37 | 2.40 | (0.07) | (0.00) (f) |
| Class C |
| 6/30/2017 (c) | $13.99 | 0.09 | 3.15 | 3.24 | (0.03) | — |
| 12/31/2016 | $14.63 | 0.03 | (0.64) | (0.61) | (0.03) | — |
| 12/31/2015 | $14.16 | (0.00) (f) | 0.48 | 0.48 | (0.01) | — |
| 12/31/2014 | $15.54 | (0.01) | (1.29) | (1.30) | — | (0.08) |
| 12/31/2013 | $11.73 | (0.15) | 3.98 | 3.83 | — | (0.02) |
| 12/31/2012 | $9.44 | (0.15) | 2.46 | 2.31 | (0.02) | (0.00) (f) |
| Class R4 |
| 6/30/2017 (c) | $14.18 | 0.17 | 3.20 | 3.37 | (0.06) | — |
| 12/31/2016 | $14.82 | 0.17 | (0.65) | (0.48) | (0.16) | — |
| 12/31/2015 | $14.40 | 0.24 | 0.41 | 0.65 | (0.23) | — |
| 12/31/2014 (h) | $15.85 | (0.02) | (1.34) | (1.36) | (0.09) | — |
| Class R5 |
| 6/30/2017 (c) | $14.25 | 0.21 | 3.17 | 3.38 | (0.06) | — |
| 12/31/2016 | $14.89 | 0.18 | (0.66) | (0.48) | (0.16) | — |
| 12/31/2015 | $14.47 | 0.15 | 0.50 | 0.65 | (0.23) | — |
| 12/31/2014 | $15.82 | 0.14 | (1.32) | (1.18) | (0.09) | (0.08) |
| 12/31/2013 | $11.86 | (0.04) | 4.06 | 4.02 | (0.04) | (0.02) |
| 12/31/2012 (i) | $11.19 | (0.02) | 0.77 | 0.75 | (0.08) | — |
| Class Y |
| 6/30/2017 (c),(j) | $15.02 | 0.18 | 2.20 | 2.38 | (0.06) | — |
| Class Z |
| 6/30/2017 (c) | $14.11 | 0.21 | 3.15 | 3.36 | (0.06) | — |
| 12/31/2016 | $14.75 | 0.19 | (0.67) | (0.48) | (0.16) | — |
| 12/31/2015 | $14.34 | 0.15 | 0.49 | 0.64 | (0.23) | — |
| 12/31/2014 | $15.68 | 0.15 | (1.32) | (1.17) | (0.09) | (0.08) |
| 12/31/2013 | $11.76 | 0.11 | 3.88 | 3.99 | (0.05) | (0.02) |
| 12/31/2012 | $9.44 | 0.08 | 2.34 | 2.42 | (0.10) | (0.00) (f) |
| Notes to Financial Highlights |
| (a) | Had the Investment Manager and/or Transfer Agent not waived fees and/or reimbursed a portion of expenses, total return would have been reduced. |
| (b) | In addition to the fees and expenses that the Fund bears directly, the Fund indirectly bears a pro rata share of the fees and expenses of any other funds in which it invests, if any. Such indirect expenses are not included in the Fund’s reported expense ratios. |
| (c) | For the six months ended June 30, 2017 (unaudited). |
| (d) | Annualized. |
| (e) | The benefits derived from expense reductions had an impact of less than 0.01%. |
| (f) | Rounds to zero. |
| (g) | The benefits derived from custody fees paid indirectly had an impact of 0.01%. |
| (h) | Class R4 shares commenced operations on June 25, 2014. Per share data and total return reflect activity from that date. |
| (i) | Class R5 shares commenced operations on November 8, 2012. Per share data and total return reflect activity from that date. |
| (j) | Class Y shares commenced operations on March 1, 2017. Per share data and total return reflect activity from that date. |
The accompanying Notes to Financial Statements are an integral part of this statement.
| 126 | Columbia Acorn Family of Funds | Semiannual Report 2017 |
Total
distributions to
shareholders | Net
asset
value,
end of
period | Total
return(a) | Total gross
expense
ratio to
average
net assets(b) | Total net
expense
ratio to
average
net assets(b) | Net investment
income (loss)
ratio to
average
net assets | Portfolio
turnover | Net
assets,
end of
period
(000’s) |
| |
| (0.06) | $17.38 | 23.50% | 1.98% (d) | 1.74% (d),(e) | 1.20% (d) | 17% | $19,663 |
| (0.12) | $14.12 | (3.47%) | 2.00% | 1.75% | 1.07% | 40% | $26,269 |
| (0.19) | $14.75 | 4.17% | 2.06% | 1.75% | 0.67% | 37% | $40,368 |
| (0.13) | $14.34 | (7.77%) | 2.05% | 1.75% | 0.86% | 74% | $21,101 |
| (0.03) | $15.68 | 33.64% | 3.33% | 1.74% | (0.11%) | 42% | $19,078 |
| (0.07) | $11.76 | 25.46% | 12.35% | 1.61% (g) | 0.23% | 37% | $453 |
| |
| (0.03) | $17.20 | 23.14% | 2.73% (d) | 2.49% (d),(e) | 1.09% (d) | 17% | $10,035 |
| (0.03) | $13.99 | (4.21%) | 2.75% | 2.50% | 0.18% | 40% | $7,112 |
| (0.01) | $14.63 | 3.41% | 2.82% | 2.50% | (0.02%) | 37% | $7,220 |
| (0.08) | $14.16 | (8.44%) | 2.84% | 2.50% | (0.10%) | 74% | $5,096 |
| (0.02) | $15.54 | 32.63% | 4.19% | 2.50% | (1.10%) | 42% | $1,400 |
| (0.02) | $11.73 | 24.46% | 12.83% | 2.32% (g) | (1.33%) | 37% | $89 |
| |
| (0.06) | $17.49 | 23.75% | 1.73% (d) | 1.49% (d),(e) | 2.14% (d) | 17% | $559 |
| (0.16) | $14.18 | (3.27%) | 1.79% | 1.50% | 1.15% | 40% | $362 |
| (0.23) | $14.82 | 4.48% | 1.81% | 1.50% | 1.59% | 37% | $408 |
| (0.09) | $14.40 | (8.60%) | 1.87% (d) | 1.50% (d) | (0.30%) (d) | 74% | $302 |
| |
| (0.06) | $17.57 | 23.70% | 1.68% (d) | 1.45% (d) | 2.62% (d) | 17% | $4,026 |
| (0.16) | $14.25 | (3.23%) | 1.68% | 1.47% | 1.26% | 40% | $1,262 |
| (0.23) | $14.89 | 4.48% | 1.75% | 1.48% | 0.98% | 37% | $2,122 |
| (0.17) | $14.47 | (7.54%) | 1.75% | 1.52% | 0.92% | 74% | $1,633 |
| (0.06) | $15.82 | 33.97% | 2.76% | 1.51% | (0.29%) | 42% | $1,891 |
| (0.08) | $11.86 | 6.70% | 14.07% (d) | 1.36% (d),(g) | (1.07%) (d) | 37% | $3 |
| |
| (0.06) | $17.34 | 15.83% | 1.65% (d) | 1.38% (d) | 3.35% (d) | 17% | $27 |
| |
| (0.06) | $17.41 | 23.80% | 1.74% (d) | 1.49% (d),(e) | 2.61% (d) | 17% | $32,069 |
| (0.16) | $14.11 | (3.29%) | 1.73% | 1.50% | 1.29% | 40% | $11,345 |
| (0.23) | $14.75 | 4.43% | 1.78% | 1.50% | 1.01% | 37% | $11,766 |
| (0.17) | $14.34 | (7.52%) | 1.79% | 1.50% | 0.97% | 74% | $8,499 |
| (0.07) | $15.68 | 33.98% | 3.98% | 1.45% | 0.83% | 42% | $4,407 |
| (0.10) | $11.76 | 25.66% | 12.07% | 1.33% (g) | 0.76% | 37% | $2,727 |
Columbia Acorn Family of Funds | Semiannual Report 2017
| 127 |
Notes to Financial Statements
June 30, 2017 (Unaudited)
Note 1. Organization
Columbia Acorn® Fund, Columbia Acorn International®, Columbia Acorn USA®, Columbia Acorn International SelectSM, Columbia Acorn SelectSM, Columbia Thermostat FundSM, Columbia Acorn Emerging Markets FundSM and Columbia Acorn European FundSM (each a Fund and collectively, the Funds) are each a series of Columbia Acorn Trust (the Trust). The Trust is registered under the Investment Company Act of 1940, as amended (the 1940 Act), as an open-end management investment company organized as a Massachusetts business trust. The investment objective of each Fund is to seek long-term capital appreciation.
Columbia Thermostat FundSM pursues its investment objective by investing in shares of other mutual funds. As a “fund of funds”, under normal circumstances, the Fund allocates at least 95% of its net assets among a selected group of affiliated stock and bond mutual funds (underlying funds) according to the current level of the Standard & Poor’s (S&P) 500 Index in relation to predetermined ranges set by Columbia Wanger Asset Management, LLC (the Investment Manager or CWAM). The Fund may invest up to 5% of its net assets plus any cash received that day in cash, repurchase agreements, high quality short-term paper and government securities.
Fund shares
Each Fund may issue an unlimited number of shares. Columbia Acorn® Fund, Columbia Acorn USA®, Columbia Acorn SelectSM and Columbia Acorn SelectSM each currently offers Class A, Class C, Class R4, Class R5, Class Y and Class Z shares. Columbia Acorn International® currently offers Class A, Class C, Class R, Class R4, Class R5, Class Y and Class Z shares. Columbia Thermostat FundSM currently offers Class A, Class C, Class R4, Class R5, Class Y and Class Z shares. Columbia Acorn Emerging Markets FundSM currently offers Class A, Class C, Class R4, Class R5, Class Y and Class Z shares. Columbia Acorn European FundSM currently offers Class A, Class C, Class R4, Class R5, Class Y and Class Z shares. Columbia Acorn International® generally no longer accepts investments by new or existing investors in the Fund’s Class B shares, except in connection with the reinvestment of any dividend and/or capital gain distributions in Class B shares of the Fund. Effective March 27, 2017, Class I shares are no longer offered in Columbia Acorn® Fund, Columbia Acorn Emerging Markets FundSM, Columbia Acorn European FundSM , Columbia Acorn International®, Columbia Acorn SelectSM, Columbia Acorn SelectSM and Columbia Acorn USA®. Effective July 17, 2017, Class B shares are no longer offered in Columbia Acorn International®.
Class A shares are sold with a front-end sales charge. Class A shares bought without an initial sales charge in accounts aggregating $1 million to $50 million at the time of purchase are subject to a 1.00% contingent deferred sales charge (CDSC) if the shares are redeemed within 12 months after purchase, and a 0.50% CDSC if the shares are redeemed more than 12, but less than 18, months after purchase, with certain limited exceptions.
When available, Class B shares of Columbia Acorn International® were subject to maximum CDSC of 5.00%, based upon the holding period after purchase, if redeemed within six years after purchase. However, as of June 30, 2017, Columbia Acorn International®’s Class B shareholders, having held their shares for the requisite period of time, were no longer subject to a CDSC upon redemption of their shares. Effective July 17, 2017, Class B shares were automatically converted to Class A shares, and Columbia Acorn International® no longer accepts any investments by new or existing investors in Class B shares.
Class C shares are offered at net asset value but are subject to a CDSC on redemptions made within one year after purchase.
Class R, Class R4, Class R5 and Class Y shares are offered at net asset value. There are certain restrictions on who may purchase these share classes.
Effective March 27, 2017, Class I shares are no longer offered for sale. Class I shares, when available, were not subject to sales charges or distribution and service (12b-1) fees, and were made only to the Columbia Family of Funds. On March 27, 2017, Class I shares were redeemed or exchanged for Class Y shares of the applicable Fund in a tax free transaction that had no impact on the fees and expenses paid by shareholders.
Class Z shares are offered at net asset value. There are certain restrictions on who may purchase Class Z shares. Generally, Class Z shares of a Fund may be exchanged for shares of another fund distributed by Columbia Management Investment Distributors, Inc. (CMID) at no additional charge.
| 128 | Columbia Acorn Family of Funds | Semiannual Report 2017 |
Notes to Financial Statements (continued)
June 30, 2017 (Unaudited)
Investment income, realized and unrealized gains and losses, and certain fund-level expenses are allocated pro rata on the basis of the relative net assets of all classes, except that each class bears certain expenses specific to that class such as distribution services, transfer agent fees, and certain other class specific expenses. Differences in class expenses may result in payment of different dividend distributions for each class. All of the Funds’ share classes have equal rights with respect to voting, subject to Fund or class-specific matters.
Note 2. Summary of significant accounting policies
Basis of preparation
Each Fund is an investment company that applies the accounting and reporting guidance in the Financial Accounting Standards Board (FASB) Accounting Standards Codification Topic 946, Financial Services - Investment Companies (ASC 946). The financial statements are prepared in accordance with U.S. generally accepted accounting principles (GAAP), which requires management to make certain estimates and assumptions that affect the reported amounts of assets and liabilities, the disclosure of contingent assets and liabilities at the date of the financial statements and the reported amounts of income and expenses during the reporting period. Actual results could differ from those estimates.
The following is a summary of significant accounting policies followed by the Funds in the preparation of their financial statements.
Security valuation
Securities of the Funds are valued at market value or, if a market quotation for a security is not readily available or is deemed not to be reliable because of events or circumstances that have occurred between the market quotation and the time as of which the security is to be valued, the security is valued at a fair value determined in good faith under consistently applied procedures established by the Board of Trustees. With respect to Columbia Thermostat FundSM, investments in underlying funds are valued at their net asset values as reported by the underlying funds. A security traded on a securities exchange or in an over-the-counter market in which transaction prices are reported is valued at the last sales price at the time of valuation. A security traded principally on NASDAQ is valued at the NASDAQ official closing price. Exchange traded funds are valued at their closing net asset value as reported on the applicable exchange. A security for which there is no reported sale on the valuation date is valued by comparison of the mean of the latest bid and ask quotations.
Foreign equity securities are generally valued based on the closing price on the foreign exchange in which such securities are primarily traded. If any foreign equity security closing prices are not readily available, the securities are valued at the mean of the latest quoted bid and ask prices on such exchanges or markets. Foreign currency exchange rates are generally determined at 4:00 p.m. Eastern (U.S.) time. Many securities markets and exchanges outside the U.S. close prior to the close of the New York Stock Exchange; therefore, the closing prices for securities in such markets or on such exchanges may not fully reflect events that occur after such close but before the close of the New York Stock Exchange. In situations where foreign markets are closed, where a significant event has occurred after the foreign exchange closes but before the time at which the Fund’s share price is calculated, and in the event of significant movement in the trigger index for the statistical fair valuation process established by the Board of Trustees, foreign securities will be fair valued pursuant to a policy adopted by the Board of Trustees. The Trust has retained an independent statistical fair value pricing service that employs a systematic methodology to assist in the fair valuation process for securities principally traded in a foreign market in order to adjust for possible changes in value that may occur between the close of the foreign market and the time as of which the securities are to be valued. If a security is valued at a fair value, that value may be different from the last quoted market price for the security.
Short-term investments maturing in 60 days or less are valued at amortized cost, which approximates market value.
The Trust has retained an independent statistical fair value pricing service that employs a systematic methodology to assist in the fair valuation process for securities principally traded in a foreign market in order to adjust for possible changes in value that may occur between the close of the foreign exchange and the time as of which the securities are to be valued. If a security is valued at fair value, that value may be different from the last quoted market price for the security.
Columbia Acorn Family of Funds | Semiannual Report 2017
| 129 |
Notes to Financial Statements (continued)
June 30, 2017 (Unaudited)
Foreign currency transactions and translations
Values of investments denominated in foreign currencies are converted into U.S. dollars using the New York spot market rate of exchange at the time of valuation. Purchases and sales of investments and dividend and interest income are translated into U.S. dollars using the spot market rate of exchange prevailing on the respective dates of such transactions. The gain or loss resulting from changes in foreign exchange rates is included with net realized and unrealized gain or loss from investments, as appropriate.
Security transactions and investment income
Security transactions, investment income and shareholder fund transactions are accounted for on the trade date (date the order to buy or sell is executed) and dividend income and realized gain distributions from other funds are recorded on the ex-dividend date, except that certain dividends from foreign securities are recorded as soon as the information is available to the Funds. Interest income is recorded on the accrual basis and includes amortization of discounts on debt obligations when required for federal income tax purposes. Realized gains and losses from security transactions are recorded on an identified cost basis.
Awards, if any, from class action litigation related to securities owned may be recorded as a reduction of cost of those securities. If the applicable securities are no longer owned, the proceeds are recorded as realized gains.
The Funds may receive distributions from holdings in exchange-traded funds (ETFs), other regulated investment companies (RICs), and real estate investment trusts (REITs), which report information on the character of their distributions annually. These distributions are allocated to dividend income, capital gain and return of capital based on actual information reported. To the extent actual information has not yet been reported by the REITs, estimates for return of capital may be made by the Funds’ management. Return of capital is recorded as a reduction of the cost basis of securities held. If the Funds no longer own the applicable securities, return of capital is recorded as a realized gain. Management’s estimates are subsequently adjusted when the actual character of the distributions is disclosed by the REITs, which could result in a proportionate change in return of capital to shareholders. No estimates are made for ETFs and RICs.
Fund share valuation
Fund shares are sold and redeemed on a daily basis at net asset value, subject to any applicable sales charge. Net asset value per share is determined daily as of the close of trading on the New York Stock Exchange (NYSE) on each day the NYSE is open for trading. Generally, income, expenses and realized and unrealized gain/(losses) of a Fund are allocated to each class proportionately on a daily basis for purposes of determining the net asset value of each class. The distribution and service fees and transfer agent fees are charged to each specific class as expenses are incurred. Redemption fees are accounted for as an addition to paid in capital for purposes of determining the net asset value of each class.
Securities lending
Each Fund, except Columbia Thermostat FundSM, may lend securities up to one-third of the value of its total assets to certain approved brokers, dealers and other financial institutions to earn additional income. The Funds retain the benefits of owning the securities, including the economic equivalent of dividends or interest generated by the security. The Funds also receive a fee for the loan. The Funds have the ability to recall the loans at any time and could do so in order to vote proxies or to sell the loaned securities. Each loan is collateralized by cash that exceeds the value of the securities on loan. The market value of the loaned securities is determined daily at the close of business of a Fund and any additional required collateral is delivered to the Fund on the next business day. The Funds have elected to invest the cash collateral in the Dreyfus Government Cash Management Fund. The income earned from the securities lending program is paid to each Fund, net of any fees remitted to Goldman Sachs Agency Lending, the Funds’ lending agent, and net of any borrower rebates. The Investment Manager does not retain any fees earned by the lending program. Generally, in the event of borrower default, a Fund has the right to use the collateral to offset any losses incurred. In the event a Fund is delayed or prevented from exercising its right to dispose of the collateral, there may be a potential loss to the Fund. Some of these losses may be indemnified by the lending agent. The Funds bear the risk of loss with respect to the investment of collateral. The net securities lending income earned as of June 30, 2017 by each Fund is included in the Statements of Operations.
| 130 | Columbia Acorn Family of Funds | Semiannual Report 2017 |
Notes to Financial Statements (continued)
June 30, 2017 (Unaudited)
Offsetting of assets and liabilities
The following table presents each Fund’s gross and net amount of assets and liabilities available for offset under netting agreements and under a securities lending agreement as well as the related collateral received by each Fund as of June 30, 2017:
| | Columbia Acorn
Fund® | Columbia Acorn
International® | Columbia Acorn
USA® | Columbia Acorn
International SelectSM | Columbia Acorn
European FundSM | | | | |
| | Goldman
Sachs ($) | Goldman
Sachs ($) | Goldman
Sachs ($) | Goldman
Sachs ($) | Goldman
Sachs ($) | | | | |
| Liabilities | | | | | | | | | |
| Collateral on Securities loaned | 121,051,730 | 194,056,021 | 9,894,600 | 4,554,276 | 3,054,871 | | | | |
| Total Liabilities | 121,051,730 | 194,056,021 | 9,894,600 | 4,554,276 | 3,054,871 | | | | |
| Total Financial and Derivative Net Assets | (121,051,730) | (194,056,021) | (9,894,600) | (4,554,276) | (3,054,871) | | | | |
| Financial Instruments | 119,231,924 | 184,924,231 | 9,705,947 | 4,339,293 | 2,907,619 | | | | |
| Net Amount (a) | (1,819,806) | (9,131,790) | (188,653) | (214,983) | (147,252) | | | | |
| (a) | Represents the net amount due from/(to) counterparties in the event of default. |
Securities lending transactions
The following table indicates the total amount of securities loaned by type, reconciled to gross liability payable upon return of the securities loaned by the Fund as of June 30, 2017:
| | Overnight and
continuous | Up to
30 days | 30-90
days | Greater than
90 days | Total |
| Columbia Acorn® Fund | | | | | |
| Securities lending transactions | | | | | |
| Equity securities | $119,231,924 | $— | $— | $— | $119,231,924 |
| Gross amount of recognized liabilities for securities lending (collateral received) | | | | | 121,051,730 |
| Amounts due to counterparty | | | | | $1,819,806 |
| Columbia Acorn International® | | | | | |
| Securities lending transactions | | | | | |
| Equity securities | $184,924,231 | $— | $— | $— | $184,924,231 |
| Gross amount of recognized liabilities for securities lending (collateral received) | | | | | 194,056,021 |
| Amounts due to counterparty | | | | | $9,131,790 |
| Columbia Acorn USA® | | | | | |
| Securities lending transactions | | | | | |
| Equity securities | $9,705,947 | $— | $— | $— | $9,705,947 |
| Gross amount of recognized liabilities for securities lending (collateral received) | | | | | 9,894,600 |
| Amounts due to counterparty | | | | | $188,653 |
| Columbia Acorn International SelectSM | | | | | |
| Securities lending transactions | | | | | |
| Equity securities | $4,339,293 | $— | $— | $— | $4,339,293 |
| Gross amount of recognized liabilities for securities lending (collateral received) | | | | | 4,554,276 |
| Amounts due to counterparty | | | | | $214,983 |
| Columbia Acorn European FundSM | | | | | |
| Securities lending transactions | | | | | |
| Equity securities | $2,907,619 | $— | $— | $— | $2,907,619 |
| Gross amount of recognized liabilities for securities lending (collateral received) | | | | | 3,054,871 |
| Amounts due to counterparty | | | | | $147,252 |
Federal income tax status
It is each Fund’s policy to comply with the provisions of the Internal Revenue Code available to regulated investment companies and, in the manner provided therein, distribute substantially all their taxable income, as well as any net realized gain on sales of investments and foreign currency transactions reportable for federal income tax purposes. Columbia
Columbia Acorn Family of Funds | Semiannual Report 2017
| 131 |
Notes to Financial Statements (continued)
June 30, 2017 (Unaudited)
Thermostat FundSM distributes all of its taxable income, as well as any net realized gain on sales of portfolio fund shares and any distributions of net realized gains received by the Fund from its portfolio funds, reportable for federal income tax purposes. Accordingly, the Funds paid no federal income taxes and no federal income tax provision was required.
Foreign taxes
Realized gains in certain countries may be subject to foreign taxes at the fund level. The Funds accrue for such foreign taxes on realized and unrealized gains at the appropriate rate for each jurisdiction. The amount, if any, is disclosed as a liability on the Statements of Assets and Liabilities.
Distributions to shareholders
Distributions to shareholders are recorded on the ex-dividend date.
Guarantees and indemnification
In the normal course of business, the Trust on behalf of the Funds enters into contracts that contain a variety of representations and warranties and that provide general indemnities. A Fund’s maximum exposure under these arrangements is unknown, as this would involve future claims against the Fund. Also, under the Trust’s organizational documents, the trustees and officers of the Trust are indemnified against certain liabilities that may arise out of their duties to the Trust. However, based on experience, the Funds expect the risk of loss due to these warranties and indemnities to be remote.
Investment company reporting modernization
In October 2016, the U.S. Securities and Exchange Commission adopted new rules and forms, and amendments to certain current rules and forms, to modernize reporting and disclosure of information by registered investment companies. The amendments to Regulation S-X will require standardized, enhanced disclosure about derivatives in investment company financial statements, and will also change the rules governing the form and content of such financial statements. The amendments to Regulation S-X take effect on August 1, 2017. At this time, management is assessing the anticipated impact of these regulatory developments.
Note 3. Fees and other transactions with affiliates
Investment management fees
CWAM is a wholly-owned subsidiary of Columbia Management Investment Advisers, LLC (Columbia Management), which is a wholly-owned subsidiary of Ameriprise Financial, Inc. (Ameriprise Financial). CWAM furnishes continuing investment supervision to the Funds and is responsible for the overall management of the Funds’ business affairs.
CWAM receives a monthly advisory fee based on each Fund’s daily net assets at the following annual rates:
| Columbia Acorn® Fund |
| Average daily net assets | Annual
fee rate |
| Up to $700 million | 0.74% |
| $700 million to $2 billion | 0.69% |
| $2 billion to $6 billion | 0.64% |
| $6 billion and over | 0.63% |
| Columbia Acorn International |
| Average daily net assets | Annual
fee rate |
| Up to $100 million | 1.19% |
| $100 million to $500 million | 0.94% |
| $500 million and over | 0.74% |
| 132 | Columbia Acorn Family of Funds | Semiannual Report 2017 |
Notes to Financial Statements (continued)
June 30, 2017 (Unaudited)
| Columbia Acorn USA |
| Average daily net assets | Annual
fee rate |
| Up to $200 million | 0.94% |
| $200 million to $500 million | 0.89% |
| $500 million to $2 billion | 0.84% |
| $2 billion to $3 billion | 0.80% |
| $3 billion and over | 0.70% |
| Columbia Acorn International SelectSM |
| Average daily net assets | Annual
fee rate |
| Up to $500 million | 0.89% |
| $500 million and over | 0.85% |
| Columbia Acorn SelectSM |
| Average daily net assets | Annual
fee rate |
| Up to $700 million | 0.85% |
| $700 million to $2 billion | 0.80% |
| $2 billion to $3 billion | 0.75% |
| $3 billion and over | 0.70% |
| Columbia Thermostat FundSM |
| | Annual
fee rate |
| All Average Daily Net Assets | 0.10% |
| Columbia Acorn Emerging Markets Fund |
| Average daily net assets | Annual
fee rate |
| Up to $100 million | 1.25% |
| $100 million to $500 million | 1.00% |
| $500 million and over | 0.80% |
| Columbia Acorn European Fund |
| Average daily net assets | Annual
fee rate |
| Up to $100 million | 1.19% |
| $100 million to $500 million | 0.94% |
| $500 million and over | 0.74% |
Through April 30, 2018, CWAM has contractually agreed to waive 0.20% of the advisory fee otherwise payable to it by Columbia Acorn Select. When determining whether the Fund’s total expenses exceed the voluntary expense cap described below, the Fund’s net advisory fee, reflecting application of the 0.20% waiver, will be used to calculate the Fund’s total expenses. This arrangement may be modified or amended with approval from all parties to the arrangement, including the Fund and CWAM.
Columbia Acorn Family of Funds | Semiannual Report 2017
| 133 |
Notes to Financial Statements (continued)
June 30, 2017 (Unaudited)
For the six months ended June 30, 2017, the annualized effective investment advisory fee rates (net of the advisory fee waiver for Columbia Acorn SelectSM) were as follows:
| Fund | Effective investment advisory fee rate (%) |
| Columbia Acorn® Fund | 0.67 |
| Columbia Acorn International® | 0.77 |
| Columbia Acorn USA® | 0.89 |
| Columbia Acorn International SelectSM | 0.89 |
| Columbia Acorn SelectSM | 0.65 |
| Columbia Thermostat FundSM | 0.10 |
| Columbia Acorn Emerging Markets FundSM | 1.24 |
| Columbia Acorn European FundSM | 1.19 |
Administration fees
CWAM provides administrative services and receives an administration fee from the Funds at the following annual rates:
| Columbia Acorn Trust |
Aggregate average daily
net assets of the trust | Annual
fee rate |
| Up to $8 billion | 0.050% |
| $8 billion to $16 billion | 0.040% |
| $16 billion to $35 billion | 0.030% |
| $35 billion to $45 billion | 0.025% |
| $45 billion and over | 0.015% |
For the six months ended June 30, 2017, the annualized effective administration fee rate was 0.047% of each Fund’s average daily net assets. CWAM has delegated to Columbia Management responsibility to provide certain sub-administrative services to the Funds.
Compensation of board members
Certain officers and trustees of the Trust are also officers of CWAM or Columbia Management. The Trust makes no direct payments to its officers and trustees who are affiliated with CWAM or Columbia Management. The Trust offers a deferred compensation plan for its independent trustees. Under that plan, a trustee may elect to defer all or a portion of his or her compensation. Amounts deferred are retained by the Trust and may represent an unfunded obligation of the Trust. The value of amounts deferred is determined by reference to the change in value of Class Z shares of one or more series of Columbia Acorn Trust or a money market fund as specified by the trustee. Benefits under the deferred compensation plan are payable in accordance with the plan.
Compensation of Chief Compliance Officer
The Board of Trustees has appointed a Chief Compliance Officer of the Funds in accordance with federal securities regulations. A portion of the Chief Compliance Officer’s total compensation is allocated to the Funds, along with other affiliated funds governed by the Board, based on relative net assets. The total amount allocated to all affiliated funds governed by the Board will not exceed $40,000 annually.
Transactions with affiliates
An affiliated person of a Fund may include any company in which a Fund owns five percent or more of its outstanding voting shares during the year. On June 30, 2017, Columbia Thermostat FundSM held five percent or more of the outstanding voting securities of one or more companies or a company which is under common ownership or control with the Funds. Details of investments in those affiliated companies are presented in the Notes to Portfolio of Investments of each Fund listed above.
| 134 | Columbia Acorn Family of Funds | Semiannual Report 2017 |
Notes to Financial Statements (continued)
June 30, 2017 (Unaudited)
For the six months ended June 30, 2017, the Funds engaged in purchase and sales transactions with funds that have a common investment manager (or affiliated investment managers), common directors/trustees, and/or common officers. Those transactions complied with Rule 17a-7 under the 1940 Act and totaled as follows.
| Fund | Purchases ($) | Sales ($) | Realized
gain/(loss)
from sale
transactions ($) |
| Columbia Acorn International® | — | (762,759) | 354,209 |
Transfer agency fees
Under a Transfer and Dividend Disbursing Agent Agreement, Columbia Management Investment Services Corp. (the Transfer Agent), an affiliate of the Investment Manager and a wholly-owned subsidiary of Ameriprise Financial, is responsible for providing transfer agency services to the Fund. The Transfer Agent has contracted with Boston Financial Data Services (BFDS) to serve as sub-transfer agent. The Transfer Agent pays the fees of BFDS for services as sub-transfer agent and BFDS is not entitled to reimbursement for such fees from the Fund (with the exception of out-of-pocket fees).
The Fund pays the Transfer Agent a monthly transfer agency fee based on the number or the average value of accounts, depending on the type of account. In addition, the Fund pays the Transfer Agent a fee for shareholder services based on the number of accounts or on a percentage of the average aggregate value of the Fund’s shares maintained in omnibus accounts up to the lesser of the amount charged by the financial intermediary or a cap established by the Board of Trustees from time to time.
The Transfer Agent also receives compensation from fees for various shareholder services and reimbursements for certain out-of-pocket fees. Effective July 1, 2017 total transfer agency fees for Class R5 and Class Y shares are subject to an annual limitation of not more than 0.07% and 0.02%, respectively, of the average daily net assets attributable to each share class. In addition, effective July 1, 2017 through June 30, 2019, Class R5 and Class Y shares are subject to a contractual transfer agency fee annual limitation of not more than 0.05% and 0.00%, respectively, of the average daily net assets attributable to each share class. Prior to July 1, 2017, total transfer agency fees for Class R5 shares were subject to an annual limitation of not more than 0.05% of the average daily net assets attributable to Class R5 shares and Class Y did not pay transfer agency fees. Prior to March 27, 2017, Class I shares did not pay transfer agency fees.
Effective July 1, 2017 through June 30, 2019, CMIS has contractually agreed to limit the total transfer agency fees to an annual rate of not more than 0.07% for Class A, Class C, Class R4 and Class Z shares of Columbia Acorn® Fund, unless sooner terminated at the sole discretion of the Board of Trustees.
Effective July 1, 2017 through June 30, 2019, CMIS has contractually agreed to limit the total transfer agency fees to an annual rate of not more than 0.11% for Class A, Class C, Class R, Class R4 and Class Z shares of Columbia Acorn International®, unless sooner terminated at the sole discretion of the Board of Trustees.
Effective July 1, 2017 through June 30, 2019, CMIS has contractually agreed to limit the total transfer agency fees to an annual rate of not more than 0.11% for Class A, Class C, Class R4 and Class Z shares of Columbia Acorn SelectSM, unless sooner terminated at the sole discretion of the Board of Trustees.
Effective July 1, 2017 through June 30, 2019, CMIS has contractually agreed to limit the total transfer agency fees to an annual rate of not more than 0.14% for Class A, Class C, Class R4 and Class Z shares of Columbia Acorn USA®, unless sooner terminated at the sole discretion of the Board of Trustees.
Columbia Acorn Family of Funds | Semiannual Report 2017
| 135 |
Notes to Financial Statements (continued)
June 30, 2017 (Unaudited)
For the six months ended June 30, 2017, the Funds’ annualized effective transfer agency fee rates, excluding any voluntary transfer agency fee waivers, as a percentage of average daily net assets of each class were as follows:
| Fund | Class A
(%) | Class B
(%) | Class C
(%) | Class R
(%) | Class R4
(%) | Class R5
(%) | Class Y
(%) | Class Z
(%) |
| Columbia Acorn® Fund | 0.07 | — | 0.07 | — | 0.07 | 0.05 | — | 0.07 |
| Columbia Acorn International® | 0.09 | — | 0.09 | 0.09 | 0.09 | 0.05 | — | 0.09 |
| Columbia Acorn USA® | 0.14 | — | 0.14 | — | 0.14 | 0.05 | — | 0.14 |
| Columbia Acorn International SelectSM | 0.12 | — | 0.12 | — | 0.12 | 0.05 | — | 0.12 |
| Columbia Acorn SelectSM | 0.11 | — | 0.11 | — | 0.11 | 0.05 | — | 0.11 |
| Columbia Thermostat FundSM | 0.07 | — | 0.07 | — | 0.07 | 0.05 | — | 0.07 |
| Columbia Acorn Emerging Markets FundSM | 0.16 | — | 0.16 | — | 0.16 | 0.05 | — | 0.16 |
| Columbia Acorn European FundSM | 0.11 | — | 0.11 | — | 0.11 | 0.05 | — | 0.10 |
Columbia Acorn International® and certain other associated investment companies, have severally, but not jointly, guaranteed the performance and observance of all the terms and conditions of a lease entered into by Seligman Data Corp. (SDC), the former transfer agent to certain associated investment companies, including the payment of rent by SDC (the Guaranty). The lease and the Guaranty expire in January 2019. At June 30, 2017, Columbia Acorn International®’s total potential future obligation over the life of the Guaranty is $32,324. The liability remaining at June 30, 2017 for non-recurring charges associated with the lease amounted to $24,030 and is included within the payable for other liabilities in the Statements of Assets and Liabilities.
An annual minimum account balance fee of $20 may apply to certain accounts with a value below the applicable share class’s initial minimum investment requirements to reduce the impact of small accounts on transfer agency fees. These minimum account balance fees are remitted to the Funds and recorded as part of expense reductions in the Statement of Operations.
For the six months ended June 30, 2017, these minimum account balance fees reduced total expenses as follows:
| Fund | Amount ($) |
| Columbia Acorn® Fund | 10,246 |
| Columbia Acorn International® | 10,491 |
| Columbia Acorn USA® | 1,760 |
| Columbia Acorn International SelectSM | 816 |
| Columbia Acorn SelectSM | 1,847 |
| Columbia Thermostat FundSM | 680 |
| Columbia Acorn Emerging Markets FundSM | 80 |
| Columbia Acorn European FundSM | 20 |
CMIS has contractually agreed to waive transfer agency fees payable by Class B shares of Columbia Acorn International® through the conversion of Class B to Class A shares. This fee waiver may only be modified or amended with approval from the Fund’s Board and CMIS. Prior to July 1, 2017, CMIS had voluntarily agreed to waive a portion of the total annual Fund operating expenses attributable to transfer agency fees incurred by Class A and Class C shares of Columbia Acorn International® such that the Fund’s total annual Fund operating expenses would be reduced by 0.04% and 0.02% for Class A and Class C shares of the Fund, respectively.
Distribution and service fees
CMID, a wholly owned subsidiary of Ameriprise Financial, is the distributor of the Funds. Each Fund has adopted a distribution and service plan which requires it to pay CMID a monthly service fee equal to 0.25% annually of the average daily net assets attributable to Class A, Class B and Class C shares and a monthly distribution fee equal to 0.50%, 0.75% and 0.50%, annually, of the average daily net assets attributable to Class B, Class C and Class R shares, respectively. CMID receives no compensation with respect to Class R4, Class R5, Class Y and Class Z shares.
| 136 | Columbia Acorn Family of Funds | Semiannual Report 2017 |
Notes to Financial Statements (continued)
June 30, 2017 (Unaudited)
Sales charges
Sales charges, including front-end charges and CDSCs, received by the Distributor for distributing Fund shares for the six months ended June 30, 2017, if any, are listed below:
| | Underwriting discounts ($) | | |
| Fund | Class A | Class A | Class C |
| Columbia Acorn® Fund | 176,540 | 228 | 2,822 |
| Columbia Acorn International® | 134,056 | 54 | 421 |
| Columbia Acorn USA® | 19,542 | 11 | 95 |
| Columbia Acorn International SelectSM | 26,709 | — | 138 |
| Columbia Acorn SelectSM | 18,160 | 11 | 44 |
| Columbia Thermostat FundSM | 165,488 | 105 | 25,719 |
| Columbia Acorn Emerging Markets FundSM | 16,229 | 63 | 245 |
| Columbia Acorn European FundSM | 51,135 | — | 564 |
Expenses waived/reimbursed by the Investment Manager and its affiliates
Effective July 1, 2017, CWAM has contractually agreed to waive fees and/or reimburse expenses through June 30, 2019 so that the Funds’ ordinary operating expenses (excluding transaction costs and certain other investment-related expenses, interest and fees on borrowings and expenses associated with the Fund’s investments in other investment companies, if any) do not exceed the following annual rates as a percentage of each class’ average daily net assets:
| Fund | Class A | Class C | Class R4 | Class R5 | Class Y | Class Z |
| Columbia Acorn Emerging Markets FundSM | 1.55% | 2.30% | 1.30% | 1.19% | 1.14% | 1.30% |
| Columbia Acorn European FundSM | 1.45% | 2.20% | 1.20% | 1.13% | 1.08% | 1.20% |
This arrangement may not be modified or terminated, except by a vote of the Fund’s Board and CWAM.
From May 1, 2017 through June 30, 2017, CWAM contractually agreed to waive fees and/or reimburse expenses so that the Funds’ ordinary operating expenses (excluding transaction costs and certain other investment-related expenses, interest and fees on borrowings and expenses associated with the Fund’s investments in other investment companies, if any) did not exceed the following annual rates as a percentage of each class’ average daily net assets:
| Fund | Class A | Class C | Class R4 | Class R5 | Class Y | Class Z |
| Columbia Acorn Emerging Markets FundSM | 1.85% | 2.60% | 1.60% | 1.49% | 1.44% | 1.60% |
| Columbia Acorn European FundSM | 1.75% | 2.50% | 1.50% | 1.43% | 1.38% | 1.50% |
Effective May 1, 2017, CWAM has voluntarily agreed to reimburse expenses so that the Fund’s ordinary operating expenses (excluding transaction costs and certain other investment-related expenses, interest and fees on borrowings and expenses associated with each Fund’s investments in other investment companies, if any) after giving effect to any balance credits or overdraft charges from the Funds’ custodian, do not exceed the following annual rates as a percentage of each class’ average daily net assets:
| Fund | Class A | Class C | Class R4 | Class R5 | Class Y | Class Z |
| Columbia Acorn SelectSM | 1.60% | 2.35% | 1.35% | 1.29% | 1.24% | 1.35% |
This arrangement may be modified or terminated by either the Fund or CWAM on 30 days notice.
Columbia Acorn Family of Funds | Semiannual Report 2017
| 137 |
Notes to Financial Statements (continued)
June 30, 2017 (Unaudited)
Effective May 1, 2017, CWAM has contractually agreed to waive fees and/or reimburse expenses through April 30, 2018, so that the Funds’ ordinary operating expenses (excluding transaction costs and certain other investment-related expenses, interest and fees on borrowings and expenses associated with each Fund’s investments in other investment companies, if any, and in the case of Columbia Thermostat FundSM its underlying portfolio funds), do not exceed the following annual rates as a percentage of each class’ average daily net assets:
| Fund | Class A | Class C | Class R4 | Class R5 | Class Y | Class Z |
| Columbia Acorn International Select | 1.40% | 2.15% | 1.15% | 1.08% | 1.03% | 1.15% |
| Columbia Thermostat Fund | 0.50% | 1.25% | 0.25% | 0.23% | 0.18% | 0.25% |
There is no guarantee that these agreements will continue thereafter.
Prior to May 1, 2017, CWAM voluntarily agreed to reimburse expenses so that the Funds’ ordinary operating expenses (excluding transaction costs and certain other investment-related expenses, interest and fees on borrowings and expenses associated with each Fund’s investments in other investment companies, if any) after giving effect to any balance credits or overdraft charges from the Funds’ custodian, did not exceed the following annual rates as a percentage of each class’ average daily net assets:
| Fund | Class A | Class C | Class R4 | Class R5 | Class Y | Class Z |
| Columbia Acorn SelectSM | 1.60% | 2.35% | 1.35% | 1.30% | 1.25% | 1.35% |
Prior to May 1, 2017, CWAM contractually waived fees and/or reimburse expenses so that the Funds’ ordinary operating expenses (excluding transaction costs and certain other investment-related expenses, interest and fees on borrowings and expenses associated with each Fund’s investments in other investment companies, if any, and in the case of Columbia Thermostat FundSM its underlying portfolio funds), did not exceed the following annual rates as a percentage of each class’ average daily net assets:
| Fund | Class A | Class C | Class R4 | Class R5 | Class Y | Class Z |
| Columbia Acorn International SelectSM | 1.40% | 2.15% | 1.15% | 1.07% | 1.02% | 1.15% |
| Columbia Thermostat FundSM | 0.50% | 1.25% | 0.25% | 0.24% | 0.19% | 0.25% |
| Columbia Acorn Emerging Markets FundSM | 1.85% | 2.60% | 1.60% | 1.50% | 1.45% | 1.60% |
| Columbia Acorn European FundSM | 1.75% | 2.50% | 1.50% | 1.47% | 1.42% | 1.50% |
In addition to the contractual agreement, CWAM has voluntarily agreed to waive fees and/or reimburse Fund expenses (excluding certain fees and expenses described above) so that Columbia Acorn International SelectSM and Columbia Acorn European FundSM level expenses (expenses directly attributable to the Fund and not to a specific share class) are waived proportionately across all share classes, but each Fund’s net operating expenses shall not exceed the contractual annual rates listed in the table above. This arrangement may be revised or discontinued at any time.
Expenses waived and/or reimbursed by CWAM and its affiliates for the six months ended June 30, 2017, were as follows:
| Fund | Expenses Waived and/or
reimbursed ($) |
| Columbia Acorn International® | 114,497 |
| Columbia Acorn International SelectSM | 71,725 |
| Columbia Acorn SelectSM | 312,480 |
| Columbia Thermostat FundSM | 126,713 |
| Columbia Acorn Emerging Markets FundSM | 97,355 |
| Columbia Acorn European FundSM | 63,613 |
Prior to July 1, 2017, CWAM was contractually entitled to recoup from each of Columbia Acorn Emerging Markets FundSM and Columbia Acorn European FundSM any fees waived and/or expenses reimbursed with respect to any share class offered by Columbia Acorn Emerging Markets FundSM and Columbia Acorn European FundSM for a one year period following the date of such fee waiver and/or reimbursement, if such recovery did not cause the ordinary operating expenses of the Fund (excluding transaction costs and certain other investment-related expenses, interest and fees on borrowings and expenses associated
| 138 | Columbia Acorn Family of Funds | Semiannual Report 2017 |
Notes to Financial Statements (continued)
June 30, 2017 (Unaudited)
with the Fund’s investment in other investment companies, if any) to exceed the annual rates set forth above, or to exceed such annual rate as was in place at the time of the recoupment, whichever was less. For the six months ended June 30, 2017, there was no recoupment of fees.
Note 4. Federal tax information
The timing and character of income and capital gain distributions are determined in accordance with income tax regulations, which may differ from GAAP because of temporary or permanent book to tax differences.
At June 30, 2017, the approximate cost of investments for federal income tax purposes and the aggregate gross approximate unrealized appreciation and depreciation based on that cost was:
| Fund | Tax cost ($) | Gross
unrealized
appreciation ($) | Gross
unrealized
(depreciation) ($) | Net unrealized
appreciation ($) |
| Columbia Acorn® Fund | 3,572,738,000 | 1,389,336,000 | (97,189,000) | 1,292,147,000 |
| Columbia Acorn International® | 3,681,444,000 | 1,557,094,000 | (40,561,000) | 1,516,533,000 |
| Columbia Acorn USA® | 493,680,000 | 171,843,000 | (12,239,000) | 159,604,000 |
| Columbia Acorn International SelectSM | 86,242,000 | 36,244,000 | (1,420,000) | 34,824,000 |
| Columbia Acorn SelectSM | 249,644,000 | 66,278,000 | (1,489,000) | 64,789,000 |
| Columbia Thermostat FundSM | 931,956,000 | 34,869,000 | (897,000) | 33,972,000 |
| Columbia Acorn Emerging Markets FundSM | 82,729,000 | 22,574,000 | (1,805,000) | 20,769,000 |
| Columbia Acorn European FundSM | 54,369,000 | 15,263,000 | (601,000) | 14,662,000 |
The following capital loss carryforwards, determined at December 31, 2016, may be available to reduce taxable income arising from future net realized gains on investments, if any, to the extent permitted by the Internal Revenue Code. Capital loss carryforwards with no expiration are required to be utilized prior to any capital losses which carry an expiration date. As a result of this ordering rule, capital loss carryforwards which carry an expiration date may be more likely to expire unused.
| Fund | 2017 ($) | 2018 ($) | 2019 ($) | No expiration
short-term ($) | No expiration
long-term ($) | Total ($) |
| Columbia Acorn International® | — | — | — | 46,821,711 | — | 46,821,711 |
| Columbia Acorn International SelectSM | — | — | — | 14,662,013 | — | 14,662,013 |
| Columbia Acorn Emerging Markets FundSM | — | — | — | 44,001,715 | 41,697,803 | 85,699,518 |
| Columbia Acorn European FundSM | — | — | — | 5,868,008 | 3,575,836 | 9,443,844 |
Under current tax rules, regulated investment companies can elect to treat certain late-year ordinary losses incurred and post-October capital losses (capital losses realized after October 31) as arising on the first day of the following taxable year. The Funds will elect to treat the following late-year ordinary losses and post-October capital losses at December 31, 2016 as arising on January 1, 2017.
| Fund | Late year
ordinary losses ($) | Post-October
capital losses ($) |
| Columbia Acorn International SelectSM | 8,631 | — |
| Columbia Acorn Emerging Markets FundSM | 297,319 | — |
Management of the Funds has concluded that there are no significant uncertain tax positions in the Funds that would require recognition in the financial statements. However, management’s conclusion may be subject to review and adjustment at a later date based on factors including, but not limited to, new tax laws, regulations, and administrative interpretations (including relevant court decisions). Generally, the Funds’ federal tax returns for the prior three fiscal years remain subject to examination by the Internal Revenue Service.
Columbia Acorn Family of Funds | Semiannual Report 2017
| 139 |
Notes to Financial Statements (continued)
June 30, 2017 (Unaudited)
Note 5. Line of credit
Effective April 25, 2017, each Fund has access to a revolving credit facility with a syndicate of banks led by Citibank, N.A., HSBC Bank USA, N.A. and JPMorgan Chase Bank, N.A. whereby each Fund may borrow for the temporary funding of shareholder redemptions or for other temporary or emergency purposes. The credit facility, which is a collective agreement between each Fund and other participating Funds, including other funds managed by another affiliated investment manager, severally and not jointly, permits collective borrowings up to $1 billion. Interest is charged to each participating fund based on its borrowings at a rate equal to the higher of (i) the overnight federal funds rate plus 1.00% or (ii) the one-month LIBOR rate plus 1.00%. Each borrowing under the credit facility matures no later than 60 days after the date of borrowing. Each Fund also pays a commitment fee equal to its pro rata share of the amount of the credit facility at a rate of 0.15% per annum. Prior to April 25, 2017, the Trust participated together with Wanger Advisors Trust, another trust managed by the Investment Manager, in a revolving credit facility in the amount of $200 million with a syndicate of banks led by JPMorgan Chase Bank, N.A. Under this facility, interest was charged to each participating fund based on its borrowings at a rate per annum equal to the Federal Funds Rate plus 1.00%. In addition, a commitment fee of 0.15% per annum of the unutilized line of credit was accrued and apportioned among the participating funds based on their relative net assets. The commitment fee is disclosed as a part of other expenses in the Statement of Operations.
No Fund had borrowings during the six months ended June 30, 2017.
Note 6. Portfolio information
The aggregate cost of purchases and proceeds from sales, other than short-term obligations, for the six months ended June 30, 2017, were:
| | Purchases
($) | Proceeds
from sales
($) |
| Columbia Acorn® Fund | 1,667,231,800 | 2,413,767,334 |
| Columbia Acorn International® | 1,034,903,673 | 1,531,678,054 |
| Columbia Acorn USA® | 260,160,589 | 352,468,283 |
| Columbia Acorn International SelectSM | 29,913,557 | 31,068,002 |
| Columbia Acorn SelectSM | 88,691,359 | 118,070,849 |
| Columbia Thermostat FundSM | 213,865,759 | 370,265,697 |
| Columbia Acorn Emerging Markets FundSM | 28,478,930 | 48,372,123 |
| Columbia Acorn European FundSM | 16,060,677 | 8,684,139 |
The amount of purchase and sales activity impacts the portfolio turnover rate reported in the Financial Highlights.
Note 7. Regulatory settlements
During the six months ended June 30, 2017, Columbia Acorn International SelectSM recorded a receivable of $33,279 as a result of a regulatory settlement proceeding brought by the Securities and Exchange Commission against a third party relating to market timing and/or late trading of mutual funds. This amount represented the Fund’s portion of the proceeds from the settlement (neither the Fund nor the Investment Manager were a party to the proceeding) and is disclosed as a receivable on the Statement of Assets and Liabilities.
Note 8. Significant risks
Consumer discretionary sector risk
Columbia Acorn International®, Columbia Acorn USA® , Columbia Acorn Emerging Markets FundSM and Columbia Acorn European FundSM may be more susceptible to the particular risks that may affect companies in the consumer discretionary sector than if it were invested in a wider variety of companies in unrelated sectors. Companies in the discretionary sector are
| 140 | Columbia Acorn Family of Funds | Semiannual Report 2017 |
Notes to Financial Statements (continued)
June 30, 2017 (Unaudited)
subject to certain risks, including fluctuations in the performance of the overall domestic and international economy, interest rate changes, increased competition and consumer confidence. Performance of such companies may be affected by factors including reduced disposable household income, reduced consumer spending, changing demographics and consumer tastes.
Foreign securities and emerging market countries risk
Investing in foreign securities may include certain risks and considerations not typically associated with investing in U.S. securities, such as fluctuating currency values and changing local and regional economic, political and social conditions, which may result in greater market volatility. In addition, certain foreign securities may not be as liquid as U.S. securities. Investing in emerging markets may accentuate these risks. These countries are also more likely to experience high levels of inflation, deflation or currency devaluation which could hurt their economies and securities markets. To the extent that Columbia Acorn International® , Columbia Acorn International SelectSM, Columbia Acorn Emerging Markets FundSM and Columbia Acorn European FundSM concentrates their investment exposure to any one or a few specific countries, the Funds will be particularly susceptible to the various conditions, events or other factors impacting those countries and may, therefore, have a greater risk than that of a fund which is more geographically diversified.
Health care sector risk
Columbia Acorn Fund® and Columbia Acorn USA® may be more susceptible to the particular risks that may affect companies in the health care sector than if it were invested in a wider variety of companies in unrelated sectors. Companies in the health care sector are subject to certain risks, including restrictions on government reimbursement for medical expenses, government approval of medical products and services, competitive pricing pressures, and the rising cost of medical products and services (especially for companies dependent upon a relatively limited number of products or services). Performance of such companies may be affected by factors including, government regulation, obtaining and protecting patents (or the failure to do so), product liability and other similar litigation as well as product obsolescence.
Industrial sector risk
Columbia Acorn International®, Columbia Acorn International Select SM , Columbia Acorn SelectSM and Columbia Acorn European FundSM may be more susceptible to the particular risks that may affect companies in the industrials sector than if it were invested in a wider variety of companies in unrelated sectors. Companies in the industrials sector are subject to certain risks, including changes in supply and demand for their specific product or service and for industrial sector products in general, including decline in demand for such products due to rapid technological developments and frequent new product introduction. Performance of such companies may be affected by factors including government regulation, world events and economic conditions and risks for environmental damage and product liability claims.
Shareholder concentration risk
At June 30, 2017, the table below details the affiliated and significant unaffiliated shareholder account ownership of outstanding shares of each Fund. The Funds have no knowledge about whether any portion of these unaffiliated shares were owned beneficially. Subscription and redemption activity of these accounts may have a significant effect on the operations of the Funds.
| Fund | Number of
unaffiliated
accounts | Percentage of
shares
outstanding
held —
unaffiliated (%) | Percentage of
shares
outstanding
held —
affiliated (%) |
| Columbia Acorn® Fund | 1 | 10.3 | — |
| Columbia Acorn International® | 2 | 29.5 | — |
| Columbia Acorn USA® | 2 | 59.4 | — |
| Columbia Acorn International SelectSM | 2 | 29.0 | 12.5 |
| Columbia Acorn SelectSM | 1 | 18.9 | 15.2 |
| Columbia Thermostat FundSM | 1 | 17.4 | 24.5 |
| Columbia Acorn Emerging Markets FundSM | 2 | 21.9 | 31.8 |
| Columbia Acorn European FundSM | — | — | 35.6 |
Columbia Acorn Family of Funds | Semiannual Report 2017
| 141 |
Notes to Financial Statements (continued)
June 30, 2017 (Unaudited)
Technology and technology-related investment risk
Columbia Acorn® Fund, Columbia Acorn USA®, Columbia Acorn International Select SM and Columbia Acorn European FundSM may be more susceptible to the particular risks that may affect companies in the information technology sector, as well as other technology-related sectors (collectively, the technology sectors) than if it were invested in a wider variety of companies in unrelated sectors. Companies in the technology sectors are subject to certain risks, including the risk that new services, equipment or technologies will not be accepted by consumers and businesses or will become rapidly obsolete. Performance of such companies may be affected by factors including obtaining and protecting patents (or the failure to do so) and significant competitive pressures, including aggressive pricing of their products or services, new market entrants, competition for market share and short product cycles due to an accelerated rate of technological developments. Such competitive pressures may lead to limited earnings and/or falling profit margins. As a result, the value of their securities may fall or fail to rise. In addition, many technology sector companies have limited operating histories and prices of these companies’ securities historically have been more volatile than other securities, especially over the short term.
Subsequent Events
Management has evaluated the events and transactions that have occurred through the date the financial statements were issued. Other than as noted in Note 1, Note 3 and below, there were no items requiring adjustment of the financial statements or additional disclosure.
On July 7, 2017, an affiliated shareholder of Columbia Acorn USA® redeemed $299,386,352, through an in-kind transaction. This amount represented approximately 47% of Columbia Acorn USA® Fund’s net assets as of that date.
Note 9. Information regarding pending and settled legal proceedings
Ameriprise Financial and certain of its affiliates have historically been involved in a number of legal, arbitration and regulatory proceedings, including routine litigation, class actions, and governmental actions, concerning matters arising in connection with the conduct of their business activities. Ameriprise Financial believes that the Funds are not currently the subject of, and that neither Ameriprise Financial nor any of its affiliates are the subject of, any pending legal, arbitration or regulatory proceedings that are likely to have a material adverse effect on the Funds or the ability of Ameriprise Financial or its affiliates to perform under their contracts with the Funds. Ameriprise Financial is required to make quarterly (10-Q), annual (10-K) and, as necessary, 8-K filings with the Securities and Exchange Commission (SEC) on legal and regulatory matters that relate to Ameriprise Financial and its affiliates. Copies of these filings may be obtained by accessing the SEC website at www.sec.gov.
There can be no assurance that these matters, or the adverse publicity associated with them, will not result in increased Fund redemptions, reduced sale of Fund shares or other adverse consequences to the Funds. Further, although we believe proceedings are not likely to have a material adverse effect on the Funds or the ability of Ameriprise Financial or its affiliates to perform under their contracts with the Funds, these proceedings are subject to uncertainties and, as such, we are unable to estimate the possible loss or range of loss that may result. An adverse outcome in one or more of these proceedings could result in adverse judgments, settlements, fines, penalties or other relief that could have a material adverse effect on the consolidated financial condition or results of operations of Ameriprise Financial.
| 142 | Columbia Acorn Family of Funds | Semiannual Report 2017 |
Board Approval of the Advisory Agreement
Columbia Acorn Trust (the "Trust") has an investment advisory agreement (the "Advisory Agreement") with Columbia Wanger Asset Management, LLC ("CWAM") under which CWAM manages the Columbia Acorn Funds (each, a "Fund," and together, the "Funds"). More than 75% of the trustees of the Trust (the "Trustees") are persons who have no direct or indirect interest in the Advisory Agreement and are not "interested persons" (as defined in the Investment Company Act of 1940, as amended (the "1940 Act")) of the Trust (the "Independent Trustees"). The Trustees oversee the management of each Fund and, as required by law, determine at least annually whether to continue the Advisory Agreement for each Fund.
The Contract Committee (the "Contract Committee") of the Board of Trustees (the "Board"), which is comprised solely of Independent Trustees, makes recommendations to the Board regarding any proposed continuation of the Advisory Agreement. After the Contract Committee has made its recommendations, the full Board determines whether to approve continuation of the Advisory Agreement. The Board also considers matters bearing on the Advisory Agreement at its various meetings throughout the year, meets at least quarterly with CWAM investment personnel (as does the Board’s Investment Performance Analysis Committee (the "Performance Committee")), and receives monthly reports from CWAM on the performance of the Funds.
In connection with their most recent consideration of the Advisory Agreement for the Funds, the Contract Committee and all Trustees received and reviewed a substantial amount of information provided by CWAM, Columbia Management Investment Advisers, LLC ("Columbia Management") and the parent of CWAM and Columbia Management, Ameriprise Financial, Inc. ("Ameriprise"), in response to written requests from the Independent Trustees and their independent legal counsel. Throughout the process, the Trustees had numerous opportunities to ask questions of and request additional materials from CWAM, Columbia Management and Ameriprise.
During each meeting at which the Contract Committee or the Independent Trustees considered the Advisory Agreement, they met in at least one executive session with their independent legal counsel. The Contract Committee also met with representatives of CWAM, Columbia Management and Ameriprise on several occasions. In all,
the Contract Committee convened formally on nine separate occasions to consider the continuation of the Advisory Agreement. The Board and/or some or all of the Independent Trustees met on other occasions to receive the Contract Committee’s status reports, receive presentations from CWAM, Columbia Management and Ameriprise representatives, and/or to discuss outstanding issues. In addition, the Performance Committee, also comprised exclusively of Independent Trustees, reviewed the performance of the Funds, met in joint meetings with the Contract Committee, and reported to the Board and/or the Contract Committee throughout the year. The chair of the Compliance Committee of the Board (the "Compliance Committee") made available relevant information with respect to matters within the realm of its oversight responsibilities.
The materials reviewed by the Contract Committee and the Trustees included, among other items: (i) information on the investment performance of each Fund relative to independently selected peer groups of funds and the Funds’ performance benchmarks over various time periods, as presented and analyzed by two independent consultants; (ii) information on each Fund’s advisory fees and other expenses, including information comparing the Fund’s fees and expenses to those of peer groups of funds and information about any applicable expense limitations and fee breakpoints; (iii) data on sales and redemptions of Fund shares; and (iv) information on the profitability to CWAM and Ameriprise, as well as potential "fall-out" or ancillary benefits that CWAM and its affiliates may receive as a result of their relationships with the Funds. The Contract Committee and the Board also considered other information such as: (i) CWAM’s financial condition; (ii) each Fund’s investment objective and strategies; (iii) the size, education and experience of CWAM’s investment staff and its use of technology, external research and trading cost measurement tools and level of resources devoted to the Funds; (iv) the portfolio manager compensation framework; (v) the allocation of the Funds’ brokerage, and the use of "soft" commission dollars to pay for research products and services; (vi) CWAM’s risk management program; (vii) the resources devoted to, and the record of compliance with, the Funds’ investment policies and restrictions, policies on personal securities transactions and other compliance policies and procedures; and (viii) CWAM’s and its affiliates’ conflicts of interest.
Columbia Acorn Family of Funds | Semiannual Report 2017
| 143 |
Board Approval of the Advisory Agreement (continued)
At a meeting held on June 13, 2017, the Board considered and unanimously approved the continuation of the Advisory Agreement for each Fund. In considering the continuation of the Advisory Agreement, the Trustees reviewed and analyzed various factors that they determined were relevant, none of which by itself was considered dispositive. The material factors and conclusions that formed the basis for the Trustees’ determination to approve the continuation of the Advisory Agreement are discussed below.
Nature, quality and extent of services
The Trustees reviewed the nature, quality and extent of the services provided by CWAM and its affiliates to the Funds under the Advisory Agreement, taking into account the investment objective and strategy of each Fund, its shareholder base, and knowledge gained from meetings with management, which were held on at least a quarterly basis. In addition, the Trustees reviewed the available resources and key personnel of CWAM and its affiliates, especially those providing investment management services to the Funds. The Trustees also considered other services provided to the Funds by CWAM and its affiliates, including: managing the execution of portfolio transactions and selecting broker-dealers for those transactions; monitoring adherence to the Funds’ investment restrictions; providing support services for the Board and committees of the Board; managing the Funds’ securities lending program; communicating with shareholders; serving as the Funds’ administrator; and overseeing the activities of the Funds’ other service providers, including monitoring for compliance with various policies and procedures as well as applicable securities laws and regulations. The Trustees also noted the quality of CWAM’s compliance record.
The Trustees took into account the extensive process changes made by CWAM affecting Columbia Acorn Fund, Columbia Acorn USA and Columbia Acorn Select in the past year to improve Fund performance, including but not limited to: the continued addition of more systematic and quantitative tools and risk-based analyses into the portfolio management and construction process; the significant reduction in the number of Fund holdings and the increased concentration of the portfolios in high conviction names; and certain portfolio manager and analyst changes. In the case of Columbia Thermostat Fund, the Trustees also considered recent changes made by CWAM in the Fund’s investment allocation model. The Trustees believed that CWAM’s extensive and focused efforts to improve these domestic Funds’ performance were reasonable and appropriate.
For the four international Funds, the Trustees took into account changes made by CWAM in the past year to improve Fund performance, including but not limited to: changes to Fund portfolio holdings, which began in 2015; the addition of more systematic and quantitative tools and risk-based analyses into the portfolio management and construction process; an emphasis on more liquid stocks with more growth potential; and certain portfolio and analyst changes.
The Trustees concluded that the nature, quality and extent of the services provided by CWAM and its affiliates to each Fund under the Advisory Agreement were appropriate for the Funds and that the Funds were likely to benefit from the continued provision of those services by CWAM. They also concluded that CWAM currently had sufficient personnel, with appropriate education and experience, to serve the Funds effectively, and that the firm had demonstrated its continuing ability to attract and retain well-qualified personnel. The Trustees also considered that Ameriprise had previously committed to the Board that CWAM would have sufficient investment management resources to continue to improve performance, including but not limited to resources to continue hiring additional analysts and other investment and operational personnel.
Performance of the Funds
The Trustees received and considered detailed performance information at various meetings of the Board, the Contract Committee and the Performance Committee throughout the year. They reviewed information comparing each Fund’s performance with that of its benchmarks and with the performance of comparable funds and peer groups as identified by independent consultants Broadridge Financial Solutions, Inc. ("Broadridge") and Morningstar, Inc. ("Morningstar"), taking into account that each service had a different methodology for calculating the Funds’ total returns. The Trustees evaluated the performance and risk characteristics of the Funds over various time periods, including over the one-, three- and five-year periods ended December 31, 2016. The Trustees also considered more recent peer performance rankings for certain Funds in order to evaluate CWAM’s progress in improving Fund performance.
| 144 | Columbia Acorn Family of Funds | Semiannual Report 2017 |
Board Approval of the Advisory Agreement (continued)
The Trustees noted that Columbia Acorn International’s performance was ranked above median against its Morningstar peers and below median against its Broadridge peers over the one-year period ended December 1, 2016, and below median against its peer groups over the three- and five-year periods. For the one-year period ended April 30, 2017, the Trustees took into account that the Fund had underperformed its peer groups but that performance relative to its primary benchmark had improved. The Trustees considered CWAM’s explanation for the Fund’s underperformance and the steps being taken to improve returns.
The Trustees considered that Columbia Acorn International Select’s performance was ranked above median among its Broadridge and Morningstar peers, respectively, for the one-year period ended December 31, 2016 and was ranked below the median of its peer groups for the three- and five-year periods. For the one-year period ended April 30, 2017, the Trustees took into account the Fund’s top quartile performance in both peer groups and that performance relative to its primary benchmark was satisfactory. The Trustees believed that the Fund’s improved performance was evidence that CWAM’s remediation efforts, including a focus on higher capitalization and more liquid stocks, were contributing positively to the Fund’s returns.
The Trustees noted that the Columbia Acorn European Fund had outperformed its Broadridge and Morningstar peer groups for the five-year period ended December 31, 2016 but had underperformed its peer groups for the one-year period, while performance for the three-year period was mixed. For the one-year period ended April 30, 2017, the Trustees took into account that the Fund had outperformed both of its peer groups but that performance relative to its primary benchmark was below expectations. The Trustees considered CWAM’s assessment of the reasons for the Fund’s underperformance and the steps being undertaken to improve returns.
The Trustees noted that Columbia Acorn Emerging Markets Fund had performed below the median of its Morningstar peer rankings for the one-, three-, and five-year periods ended December 31, 2016, and had performed below the Broadridge peer group median for the one- and three-year periods but outperformed the Broadridge peer group median for the five-year period. More recent Fund performance was also disappointing, with the Fund having underperformed its Broadridge and Morningstar peers and its primary benchmark as of April 30, 2017. The Trustees considered CWAM’s explanation for the Fund’s underperformance and the plan being implemented to improve returns.
The Trustees considered that the Columbia Acorn Fund had outperformed its Morningstar and Broadridge peer group medians over the one-year period ended December 31, 2016, but had underperformed over the three- and five-year periods. The Trustees also considered the Fund’s substantially improved performance for the one-year period ended April 30, 2017, and that performance relative to its primary benchmark was satisfactory. Based on this information, the Trustees believed that the steps taken by CWAM were having a positive impact on Fund performance.
The Trustees considered that Columbia Acorn Select had outperformed its Broadridge peer group median over the one-year period ended December 31, 2016, and had equaled or outperformed its Broadridge peer group medians for the three- and five-year periods. They also considered that the Fund had slightly outperformed its Morningstar peer median for the one- and three-periods but had underperformed for the five-year period. For the one-year period ended April 30, 2017, the Trustees noted that the Fund had substantially outperformed both peer groups as well as its primary benchmark. Based on this information, the Trustees believed that CWAM’s performance remediation efforts, including the additional management resources provided to the Fund over the past two years, were having a positive impact on performance.
The Trustees considered that Columbia Acorn USA had outperformed the medians of its Morningstar and Broadridge peer groups for the one-, three- and five-year periods ended December 31, 2016, and that more recent performance as of April 30, 2017 was in the first quartile, with the Fund’s performance relative to its primary benchmark having improved as well. Based on this information, the Trustees believed that the performance remediation plan implemented by CWAM over the past two years was having a positive impact on this Fund’s performance.
The Trustees considered that Columbia Thermostat Fund had underperformed its Morningstar peer group median over the one-year period ended December 31, 2016, but it slightly outperformed its peer medians over the three- and five-year periods. They also took into account that as of April 30, 2017 the Fund had underperformed its Morningstar peer group and primary equity benchmark, but had outperformed its primary debt benchmark. The Trustees noted that Broadridge could not construct an appropriate peer group for the Fund because of its unique strategy and that its Morningstar peers had investment strategies that were not necessarily comparable to the Fund’s strategies.
Columbia Acorn Family of Funds | Semiannual Report 2017
| 145 |
Board Approval of the Advisory Agreement (continued)
The Trustees concluded that CWAM had taken, and continued to take, a number of corrective steps to improve performance of the underperforming Funds, although it would take some time to determine their effectiveness, and that the Performance Committee was monitoring the underperforming Funds’ performance closely. In addition the Trustees considered that CWAM’s Chief Investment Officer, Director of Research (U.S.) and Director of International Research had reported to them at numerous Contract Committee, Performance Committee and Board meetings on the corrective steps being taken to improve Fund performance.
Costs of services and profits realized by CWAM
At various Committee and Board meetings, the Trustees examined detailed information on the fees and expenses of each Fund in comparison to information for comparable funds provided by Broadridge and Morningstar. The Trustees noted that Columbia Acorn USA, Columbia Acorn International Select, and Columbia Acorn Fund had total net operating expenses that were lower than the peer group median identified by one of Morningstar or Broadridge but higher than the peer group median identified by the other consultant. They considered that Columbia Acorn Select, Columbia Thermostat and Columbia Acorn International had total net operating expenses that were lower than the peer group medians identified by both Morningstar and Broadridge. They also considered that Columbia Acorn Emerging Markets Fund and Columbia Acorn European Fund had total net expenses that were above the peer group median identified by both consultants, but that after factoring in expense reductions agreed to by CWAM, Columbia Acorn Emerging Markets Fund’s expenses were below the median of both peer groups, while Columbia Acorn European Fund’s expenses were below the peer group median identified by one consultant but higher than the median identified by the other.
The Trustees also took into account that: the actual advisory fees paid by Columbia Acorn Fund, Columbia Acorn Select, and Columbia Thermostat Fund were below median in one peer group but higher than the median of the other peer group; the actual advisory fees paid by Columbia Acorn International Select and Columbia Acorn European Fund were higher than the median advisory fees of both peer groups; and the actual advisory fee paid by Columbia Acorn USA was equal to the median of one peer group, but higher than the other; the advisory fees paid by Columbia Acorn Emerging Markets Fund were equal to the median of one peer group, but above the median of the other; and the advisory fees paid by Columbia Acorn International were below the median in both peer groups.
The Trustees considered that CWAM had contractually waived 20 basis points of its advisory fee for Columbia Acorn Select for the years ended April 30, 2017 and April 30, 2018. They also considered that for Columbia Acorn International Select, CWAM had agreed as of July 1, 2016 to permanently reduce its advisory fee by five basis points and to implement an expense cap that reduced the Fund’s expenses by an additional 15 basis points, and that beginning July 1, 2017 CWAM had agreed to waive an additional 30 basis points of its advisory fees (and/or reimburse expenses) for both Columbia Acorn Emerging Markets Fund and Columbia European Fund beyond the existing CWAM imposed expense cap. The Trustees also considered that Columbia Thermostat Fund was subject to a CWAM imposed expense cap.
The Trustees also reviewed the advisory fee rates charged by CWAM for managing other investment companies and other institutional separate accounts that had investment strategies similar to Columbia Acorn Fund, as detailed in materials provided to the Contract Committee by CWAM. The Trustees noted that the Fund’s advisory fees were somewhat higher than the institutional account advisory fees. The Trustees considered the information provided by CWAM that it performed significant additional services for Columbia Acorn Fund that it did not provide to non-mutual fund clients, including administrative and fund accounting services, oversight of the Fund’s other service providers, Trustee support, regulatory compliance and numerous other services, and that, in servicing the Fund, CWAM assumed many legal and business risks that it does not assume in servicing many of its non-fund clients. It was noted that the advisory fees charged by Columbia Acorn USA, Columbia Acorn Select and Columbia Acorn International were generally comparable to their Columbia Wanger Fund counterparts at the same asset levels.
The Trustees reviewed the analysis of CWAM’s profitability in serving as each Fund’s investment manager and of CWAM and its affiliates in their relationships with each Fund. The Contract Committee and the Board met with representatives from Ameriprise to discuss its methodologies for calculating profitability and allocating costs. They considered that Ameriprise calculated profitability and allocated costs on a contract-by-contract and Fund-by-Fund basis. The Trustees also reviewed the methodology used by CWAM and Ameriprise in determining compensation payable to portfolio managers and the competitive market for investment management talent. The Trustees were also provided with profitability information from a third-party
| 146 | Columbia Acorn Family of Funds | Semiannual Report 2017 |
Board Approval of the Advisory Agreement (continued)
consultant, Strategic Insight, which compared CWAM’s profitability to other similar investment managers in the mutual fund industry. The Trustees discussed, however, that profitability comparisons among fund managers may not always be meaningful due to the lack of consistency in data, small number of publicly-owned managers, and the fact that profitability of any investment manager is affected by numerous factors, including its particular organizational structure, the types of funds and other accounts managed, other lines of business, expense allocation methodology, capital structure and other factors. The Trustees evaluated CWAM’s profitability in light of the additional resources that had been, and would continue to be, provided to it by Ameriprise to assist in improving performance.
Economies of scale
At various Committee and Board meetings and other informal meetings, the Trustees considered information about the extent to which CWAM realized economies of scale in connection with an increase in Fund assets. The Trustees noted that the advisory fee schedule for each Fund, other than Columbia Thermostat Fund, includes breakpoints in the rate of fees at various asset levels. In evaluating whether CWAM was sharing economies of scale with Fund shareholders, the Trustees also took into account the various fee waivers/reimbursements and expense cap that CWAM had agreed to for many of the Funds for 2017 and 2018. The Trustees concluded that the fee structure of the Advisory Agreement for each Fund reflected a sharing of economies of scale between CWAM and the Funds.
Other benefits to CWAM
The Trustees also reviewed benefits that accrued to CWAM and its affiliates from their relationships with the Funds, based upon information provided to them by Ameriprise. They noted that the Funds’ transfer agency services were performed by Columbia Management Investment Services Corp., an affiliate of Ameriprise, which receives compensation from the Funds for its transfer agent services. They considered that another affiliate of Ameriprise, Columbia Management Investment Distributors, Inc. (“CMID”), served as the Funds’ distributor under a distribution agreement, and that it received fees under the Trust’s Rule 12b-1 Plan, most of which CMID paid to broker-dealers, but received no additional compensation for its services to the Funds. In addition, they considered that Columbia Management provided sub-administration services to the Funds. The Contract Committee and the Board received information regarding the profitability of these Fund agreements to the CWAM affiliates and also reviewed information about and discussed the capabilities of each affiliated entity in performing its respective duties.
The Trustees considered other ways that the Funds and CWAM might potentially benefit from their relationship with each other. For example, the Trustees considered CWAM’s use of commissions paid by each Fund on its portfolio brokerage transactions to obtain research products and services benefiting the Funds and/or other clients of CWAM. They noted that the Compliance Committee reviewed CWAM’s annual "soft dollar" report during the year and met with representatives from CWAM to review CWAM’s soft dollar spending. The Trustees also considered that the Compliance Committee regularly reviewed third-party prepared reports that evaluated the quality of CWAM’s execution of the Funds’ portfolio transactions. The Trustees determined that CWAM’s use of the Funds’ "soft" commission dollars to obtain research products and services was consistent with current regulatory requirements and guidance. They also concluded that CWAM benefited from the receipt of proprietary research products and services acquired through commissions paid on portfolio transactions of the Funds, and that the Funds benefitted from CWAM’s receipt of those products and services as well as research products and services acquired through commissions paid by other clients of CWAM. Finally, the Trustees considered that CWAM’s affiliates benefited from management fees received from Columbia Thermostat Fund’s investment in other Columbia mutual funds.
After full consideration of the above factors, as well as other factors that were instructive in evaluating the Advisory Agreement, the Trustees, including the Independent Trustees by separate vote, concluded that the advisory fees were reasonable and that the continuation of the Advisory Agreement was in the best interest of each Fund. At the Board meeting held on June 13, 2017 the Trustees approved continuation of the Advisory Agreement for each Fund through July 31, 2018.
Columbia Acorn Family of Funds | Semiannual Report 2017
| 147 |
Expense Information
as of June 30, 2017
| Columbia Acorn® Fund | Class A | Class B (a) | Class C | Class R | Class R4 | Class R5 | Class Y | Class Z |
| Investment advisory fee | 0.67% | | 0.67% | | 0.67% | 0.67% | 0.67% | 0.67% | |
| Distribution and/or service fees | 0.25% | | 1.00% | | 0.00% | 0.00% | 0.00% | 0.00% | |
| Other expenses | 0.16% | | 0.16% | | 0.16% | 0.14% | 0.09% | 0.16% | |
| Net expense ratio | 1.08% | | 1.83% | | 0.83% | 0.81% | 0.76% | 0.83% | |
| Columbia Acorn International® |
| Investment advisory fee | 0.77% | 0.77% | 0.77% | 0.77% | 0.77% | 0.77% | 0.77% | 0.77% | |
| Distribution and/or service fees | 0.25% | 0.75% | 1.00% | 0.50% | 0.00% | 0.00% | 0.00% | 0.00% | |
| Other expenses | 0.15% | 0.10% | 0.17% | 0.19% | 0.19% | 0.16% | 0.11% | 0.19% | |
| Net expense ratio | 1.17% | 1.62% | 1.94% | 1.46% | 0.96% | 0.93% | 0.88% | 0.96% | |
| Columbia Acorn USA® |
| Investment advisory fee | 0.89% | | 0.89% | | 0.89% | 0.89% | 0.89% | 0.89% | |
| Distribution and/or service fees | 0.25% | | 1.00% | | 0.00% | 0.00% | 0.00% | 0.00% | |
| Other expenses | 0.25% | | 0.25% | | 0.27% | 0.16% | 0.12% | 0.26% | |
| Net expense ratio | 1.39% | | 2.14% | | 1.16% | 1.05% | 1.01% | 1.15% | |
| Columbia Acorn International SelectSM |
| Investment advisory fee | 0.89% | | 0.89% | | 0.89% | 0.89% | 0.89% | 0.89% | |
| Distribution and/or service fees | 0.25% | | 1.00% | | 0.00% | 0.00% | 0.00% | 0.00% | |
| Other expenses | 0.25% | | 0.25% | | 0.25% | 0.18% | 0.13% | 0.25% | |
| Net expense ratio | 1.39% | | 2.14% | | 1.14% | 1.07% | 1.02% | 1.14% | |
| Columbia Acorn SelectSM |
| Investment advisory fee | 0.65% | | 0.65% | | 0.65% | 0.65% | 0.65% | 0.65% | |
| Distribution and/or service fees | 0.25% | | 1.00% | | 0.00% | 0.00% | 0.00% | 0.00% | |
| Other expenses | 0.26% | | 0.25% | | 0.26% | 0.20% | 0.15% | 0.26% | |
| Net expense ratio | 1.16% | | 1.90% | | 0.91% | 0.85% | 0.80% | 0.91% | |
| Columbia Thermostat FundSM |
| Investment advisory fee | 0.10% | | 0.10% | | 0.10% | 0.10% | 0.10% | 0.10% | |
| Distribution and/or service fees | 0.25% | | 1.00% | | 0.00% | 0.00% | 0.00% | 0.00% | |
| Other expenses | 0.15% | | 0.15% | | 0.15% | 0.14% | 0.09% | 0.15% | |
| Net expense ratio (b) | 0.50% | | 1.25% | | 0.25% | 0.24% | 0.19% | 0.25% | |
| Columbia Acorn Emerging Markets FundSM |
| Investment advisory fee | 1.24% | | 1.24% | | 1.24% | 1.24% | 1.24% | 1.24% | |
| Distribution and/or service fees | 0.25% | | 1.00% | | 0.00% | 0.00% | 0.00% | 0.00% | |
| Other expenses | 0.36% | | 0.36% | | 0.36% | 0.26% | 0.21% | 0.36% | |
| Net expense ratio | 1.85% | | 2.60% | | 1.60% | 1.50% | 1.45% | 1.60% | |
| Columbia Acorn European FundSM |
| Investment advisory fee | 1.19% | | 1.19% | | 1.19% | 1.19% | 1.19% | 1.19% | |
| Distribution and/or service fees | 0.25% | | 1.00% | | 0.00% | 0.00% | 0.00% | 0.00% | |
| Other expenses | 0.30% | | 0.30% | | 0.30% | 0.26% | 0.19% | 0.30% | |
| Net expense ratio | 1.74% | | 2.49% | | 1.49% | 1.45% | 1.38% | 1.49% | |
See the Funds’ prospectuses for information on minimum initial investment amounts and other details of buying, selling and exchanging shares of the Funds.
Fees and expenses are for the six months ended June 30, 2017. Please see Note 3, “Fees and Other Transactions With Affiliates” in the Notes to Financial Statements of this report for information on fee waivers and/or expense reimbursements in place for Columbia Acorn International, Columbia Acorn International Select, Columbia Acorn Select, Columbia Acorn Emerging Markets Fund, Columbia Acorn European Fund and Columbia Thermostat Fund.
| (a) | Effective July 17, 2017, Class B shares were automatically converted to Class A shares, and the Fund no longer accepts any investment by new or existing investors in Class B shares. |
| (b) | Does not include estimated fees and expenses of 0.48% incurred by the Fund from the underlying portfolio funds in which it invests. |
| 148 | Columbia Acorn Family of Funds | Semiannual Report 2017 |
[THIS PAGE INTENTIONALLY LEFT BLANK]
The Fund mails one shareholder report to each shareholder address. If you would like more than one report, please call shareholder services at 800.345.6611 and additional reports will be sent to you.
Proxy voting policies and procedures
The policy of the Board is to vote the proxies of the companies in which the Fund holds investments consistent with the procedures that can be found by visiting investor.columbiathreadneedleus.com. Information regarding how the Fund voted proxies relating to portfolio securities is filed with the SEC by August 31 for the most recent 12-month period ending June 30 of that year, and is available without charge by visiting investor.columbiathreadneedleus.com; or searching the website of the SEC at sec.gov.
Quarterly schedule of investments
The Fund files a complete schedule of portfolio holdings with the SEC for the first and third quarters of each fiscal year on Form N-Q. The Fund’s Form N-Q is available on the SEC’s website at sec.gov and may be reviewed and copied at the SEC’s Public Reference Room in Washington, D.C. Information on the operation of the Public Reference Room may be obtained by calling 800.SEC.0330. The Fund’s complete schedule of portfolio holdings, as filed on Form N-Q, can also be obtained without charge, upon request, by calling 800.345.6611.
Additional Fund information
For more information about the Fund, please visit investor.columbiathreadneedleus.com or call 800.345.6611. Customer Service Representatives are available to answer your questions Monday through Friday from 8 a.m. to 7 p.m. Eastern time.
Fund investment manager
Columbia Wanger Asset Management, LLC
227 West Monroe, Suite 3000
Chicago, IL 60606
888.4.WANGER
(888.492.6437)
Fund distributor
Columbia Management Investment Distributors, Inc.
225 Franklin Street
Boston, MA 02110
Fund transfer agent
Columbia Management Investment Services Corp.
P.O. Box 8081
Boston, MA 02266-8081
| 150 | Columbia Acorn Family of Funds | Semiannual Report 2017 |
Additional information (continued)
Trustees
Laura M. Born, Chair of the Board
David J. Rudis, Vice Chair of the Board
Maureen M. Culhane
P. Zachary Egan
Margaret M. Eisen
Thomas M. Goldstein
John C. Heaton
Charles R. Phillips
Ralph Wanger (Trustee Emeritus)
Officers
P. Zachary Egan, President
Alan G. Berkshire, Vice President
Michael G. Clarke, Assistant Treasurer
William J. Doyle, Vice President
David L. Frank, Vice President
Paul B. Goucher, Assistant Secretary
John M. Kunka, Vice President, Treasurer and Principal Financial and Accounting Officer
Stephen Kusmierczak, Vice President
Joseph C. LaPalm, Vice President
Ryan C. Larrenaga, Assistant Secretary
Matthew A. Litfin, Vice President
Satoshi Matsunaga, Vice President
Thomas P. McGuire, Chief Compliance Officer
Louis J. Mendes, Vice President
Julian Quero, Assistant Treasurer
Martha A. Skinner, Assistant Treasurer
Matthew S. Szafranski, Vice President
Andreas Waldburg-Wolfegg, Vice President
Linda K. Roth-Wiszowaty, Secretary
Columbia Acorn Family of Funds | Semiannual Report 2017
| 151 |
Columbia Acorn Family of Funds
P.O. Box 8081
Boston, MA 02266-8081
Please read and consider the investment objectives, risks, charges and expenses for any fund carefully before investing. For a prospectus and summary prospectus, which contains this and other important information about the Fund, go to investor.columbiathreadneedleus.com. Columbia Acorn Family of Funds are distributed by Columbia Management Investment Distributors, Inc., member FINRA and managed by Columbia Wanger Asset Management, LLC.
Columbia Threadneedle Investments (Columbia Threadneedle) is the global brand name of the Columbia and Threadneedle group of companies. All rights reserved. Columbia Management Investment Distributors, Inc., 225 Franklin Street, Boston, MA 02110-2804
© 2017 Columbia Management Investment Advisers, LLC.
investor.columbiathreadneedleus.com
Item 2. Code of Ethics.
Not applicable for semiannual reports.
Item 3. Audit Committee Financial Expert.
Not applicable for semiannual reports.
Item 4. Principal Accountant Fees and Services.
Not applicable for semiannual reports.
Item 5. Audit Committee of Listed Registrants.
Not applicable.
Item 6. Investments
| | (a) | The registrant’s “Schedule I – Investments in securities of unaffiliated issuers” (as set forth in 17 CFR 210.12-12) is included in Item 1 of this Form N-CSR. |
Item 7. Disclosure of Proxy Voting Policies and Procedures for Closed-End Management Investment Companies.
Not applicable.
Item 8. Portfolio Managers of Closed-End Management Investment Companies.
Not applicable.
Item 9. Purchases of Equity Securities by Closed-End Management Investment Company and Affiliated Purchasers.
Not applicable.
Item 10. Submission of Matters to a Vote of Security Holders.
There were no material changes to the procedures by which shareholders may recommend nominees to the registrant’s board of directors.
Item 11. Controls and Procedures.
| | (a) | The registrant’s principal executive officer and principal financial officers, based on their evaluation of the registrant’s disclosure controls and procedures as of a date within 90 days of the filing of this report, have concluded that such controls and procedures are adequately designed to ensure that material information required to be disclosed by the registrant in Form N-CSR is accumulated and communicated to the registrant’s management, including the principal executive officer and principal financial officer, or persons performing similar functions, as appropriate to allow timely decisions regarding required disclosure. |
| | (b) | There was no change in the registrant’s internal control over financial reporting that occurred during the registrant’s second fiscal quarter of the period covered by this report that has materially affected, or is reasonably likely to materially affect, the registrant’s internal control over financial reporting. |
Item 12. Exhibits.
(a)(1) Code of ethics required to be disclosed under Item 2 of Form N-CSR: Not applicable for semiannual reports.
(a)(2) Certifications pursuant to Rule 30a-2(a) under the Investment Company Act of 1940 (17 CFR 270.30a-2(a)) attached hereto as Exhibit 99.CERT.
(a)(3) Not applicable.
(b) Certification pursuant to Rule 30a-2(b) under the Investment Company Act of 1940 (17 CFR 270.30a-2(b)) attached hereto as Exhibit 99.906CERT.
SIGNATURES
Pursuant to the requirements of the Securities Exchange Act of 1934 and the Investment Company Act of 1940, the registrant has duly caused this report to be signed on its behalf by the undersigned, thereunto duly authorized.
| | |
| (registrant) | | Columbia Acorn Trust |
| | |
| By (Signature and Title) | | /s/ P. Zachary Egan |
| | P. Zachary Egan, President and Principal Executive Officer |
Pursuant to the requirements of the Securities Exchange Act of 1934 and the Investment Company Act of 1940, this report has been signed below by the following persons on behalf of the registrant and in the capacities and on the dates indicated.
| | |
| By (Signature and Title) | | /s/ P. Zachary Egan |
| | P. Zachary Egan, President and Principal Executive Officer |
| | |
| By (Signature and Title) | | /s/ John M. Kunka |
| | John M. Kunka, Treasurer and Principal Accounting and Financial Officer |